UNITED STATES
SECURITIES AND EXCHANGE COMMISSION
Washington, D.C. 20549
FORM N-CSR
CERTIFIED SHAREHOLDER REPORT OF REGISTERED
MANAGEMENT INVESTMENT COMPANIES
Investment Company Act file number 811- 02753
Guggenheim Variable Funds Trust
(Exact name of registrant as specified in charter)
805 King Farm Boulevard, Suite 600
Rockville, Maryland 20850
(Address of principal executive offices) (Zip code)
Amy J. Lee
Guggenheim Variable Funds Trust
805 King Farm Boulevard, Suite 600
Rockville, Maryland 20850
(Name and address of agent for service)
Registrant's telephone number, including area code: 1-301-296-5100
Date of fiscal year end: December 31
Date of reporting period: December 31, 2016
Form N-CSR is to be used by management investment companies to file reports with the Commission not later than 10 days after the transmission to stockholders of any report that is required to be transmitted to stockholders under Rule 30e‑1 under the Investment Company Act of 1940 (17 CFR 270.30e‑1). The Commission may use the information provided on Form N‑CSR in its regulatory, disclosure review, inspection, and policymaking roles.
A registrant is required to disclose the information specified by Form N‑CSR, and the Commission will make this information public. A registrant is not required to respond to the collection of information contained in Form N‑CSR unless the Form displays a currently valid Office of Management and Budget ("OMB") control number. Please direct comments concerning the accuracy of the information collection burden estimate and any suggestions for reducing the burden to Secretary, Securities and Exchange Commission, 450 Fifth Street, NW, Washington, DC 20549‑0609. The OMB has reviewed this collection of information under the clearance requirements of 44 U.S.C. §3507.
| Item 1. | Reports to Stockholders. |
12.31.2016
Guggenheim Variable Funds Trust Annual Report
Series |
Series A | (StylePlus—Large Core Series) |
Series B | (Large Cap Value Series) |
Series D | (World Equity Income Series) |
Series E | (Total Return Bond Series) |
Series F | (Floating Rate Strategies Series) |
Series J | (StylePlus—Mid Growth Series) |
Series N | (Managed Asset Allocation Series) |
Series O | (All Cap Value Series) |
Series P | (High Yield Series) |
Series Q | (Small Cap Value Series) |
Series V | (Mid Cap Value Series) |
Series X | (StylePlus—Small Growth Series) |
Series Y | (StylePlus—Large Growth Series) |
Series Z | (Alpha Opportunity Series) |
GuggenheimInvestments.com | GVFT-ANN-2-1216x1217 |
DEAR SHAREHOLDER | 2 |
ECONOMIC AND MARKET OVERVIEW | 5 |
ABOUT SHAREHOLDERS’ FUND EXPENSES | 7 |
SERIES A (STYLEPLUS—LARGE CORE SERIES) | 9 |
SERIES B (LARGE CAP VALUE SERIES) | 18 |
SERIES D (WORLD EQUITY INCOME SERIES) | 27 |
SERIES E (TOTAL RETURN BOND SERIES) | 37 |
SERIES F (FLOATING RATE STRATEGIES SERIES) | 50 |
SERIES J (STYLEPLUS—MID GROWTH SERIES) | 61 |
SERIES N (MANAGED ASSET ALLOCATION SERIES) | 70 |
SERIES O (ALL CAP VALUE SERIES) | 78 |
SERIES P (HIGH YIELD SERIES) | 88 |
SERIES Q (SMALL CAP VALUE SERIES) | 102 |
SERIES V (MID CAP VALUE SERIES) | 112 |
SERIES X (STYLEPLUS—SMALL GROWTH SERIES) | 122 |
SERIES Y (STYLEPLUS—LARGE GROWTH SERIES) | 132 |
SERIES Z (ALPHA OPPORTUNITY SERIES) | 140 |
NOTES TO FINANCIAL STATEMENTS | 153 |
REPORT OF INDEPENDENT REGISTERED PUBLIC ACCOUNTING FIRM | 175 |
OTHER INFORMATION | 176 |
INFORMATION ON BOARD OF TRUSTEES AND OFFICERS | 178 |
GUGGENHEIM INVESTMENTS PRIVACY POLICIES | 182 |
| | THE GUGGENHEIM FUNDS ANNUAL REPORT | 1 |
Dear Shareholder:
Security Investors, LLC and Guggenheim Partners Investment Management (the “Investment Advisers”) are pleased to present the annual shareholder report for funds that are part of the Guggenheim Variable Funds Trust (the “Funds”). This report covers performance of the Funds for the annual period ended December 31, 2016.
The Investment Advisers are part of Guggenheim Investments, which represents the investment management businesses of Guggenheim Partners, LLC (“Guggenheim”), a global, diversified financial services firm.
Guggenheim Funds Distributors, LLC is the distributor of the Funds. Guggenheim Funds Distributors, LLC is affiliated with Guggenheim and the Investment Advisers.
We encourage you to read the Economic and Market Overview section of the report, which follows this letter, and then the Manager’s Commentary for each Fund.
We are committed to providing innovative investment solutions and appreciate the trust you place in us.
Sincerely,

Donald C. Cacciapaglia
President
January 31, 2017
Read a prospectus and summary prospectus (if available) carefully before investing. It contains the investment objectives, risks, charges, expenses and other information, which should be considered carefully before investing. Obtain a prospectus and summary prospectus (if available) at guggenheiminvestments.com or call 800.820.0888.
The Series StylePlus Funds may not be suitable for all investors. Investments in large capitalization stocks may underperform other segments of the equity market or the equity market as a whole. ● Investments in small-sized company securities may present additional risks such as less predictable earnings, higher volatility and less liquidity than larger, more established companies. ● Growth stocks may be more volatile than other stocks because they are more sensitive to investor perceptions regarding the growth potential of the issuing companies. ● The Funds may invest in derivative instruments, which may be more volatile and less liquid, increasing the risk of loss when compared to traditional securities. Some of the derivative instruments are also subject to the risks of counterparty default and adverse tax treatment. ● The Funds’ use of leverage, through borrowings or instruments such as derivatives, may cause the Funds to be more volatile than if it had not been leveraged. ● The Funds’ investments in other investment vehicles subject the Funds to those risks and expenses affecting the investment vehicle. ● The Funds may invest in foreign securities which carry additional risks when compared to U.S. securities, due to the impact of diplomatic, political or economic developments in the country in question (investments in emerging markets securities are generally subject to an even greater level of risks). ● The Funds may invest in fixed income securities whose market value will change in response to interest rate changes and market conditions among other factors. In general, bond prices rise when interest rates fall and vice versa. ● The Fund’s exposure to high yield securities may subject the Fund to greater volatility. ● The Funds may invest in bank loans and asset-backed securities, including mortgage backed, which involve special types of risks. ● The Funds may invest in restricted securities which may involve financial and liquidity risk. ● You may have a gain or loss when you sell your shares. ● It is important to note that the Funds are not guaranteed by the U.S. government. ● Please read the prospectus for more detailed information regarding these and other risks.
The Series Value Funds may not be suitable for all investors. ● An investment in the Funds will fluctuate and is subject to investment risks, which means investors could lose money. The intrinsic value of the underlying stocks may never be realized or the stocks may decline in value. Investments in small- and/or mid-sized company securities may present additional risks such as less predictable earnings, higher volatility and less liquidity than larger, more established companies. ● Please read the prospectus for more detailed information regarding these and other risks.
2 | THE GUGGENHEIM FUNDS ANNUAL REPORT | |
The Series D (World Equity Income Series) may not be suitable for all investors. ● Investments in securities in general are subject to market risks that may cause their prices to fluctuate over time. ● The Fund’s investments in foreign securities carry additional risks when compared to U.S. securities, due to the impact of diplomatic, political or economic developments in the country in question (investments in emerging markets are generally subject to an even greater level of risks). Additionally, the Fund’s exposure to foreign currencies subjects the Fund to the risk that those currencies will decline in value relative to the U.S. Dollar. ● The Fund’s investments in derivatives may pose risks in addition to those associated with investing directly in securities or other investments, including illiquidity of the derivatives, imperfect correlations with underlying investments or the Fund’s other portfolio holdings, lack of availability and counterparty risk. ● The Fund’s use of leverage, through instruments such as derivatives, may cause the Fund to be more volatile than if it had not been leveraged. ● The Fund’s investments in other investment vehicles subject the Fund to those risks and expenses affecting the investment vehicle. ● The Fund may have significant exposure to securities in a particular capitalization range e.g., large-, mid- or small-cap securities. As a result, the Fund may be subject to the risk that the pre-denominate capitalization range may underperform other segments of the equity market or the equity market as a whole. ● Please read the prospectus for more detailed information regarding these and other risks.
The Series E (Total Return Bond Series) may not be suitable for all investors. ● The Fund’s market value will change in response to interest rate changes and market conditions among other factors. In general, bond prices rise when interest rates fall and vice versa. ● The Fund’s exposure to high yield securities may subject the Fund to greater volatility. ● When market conditions are deemed appropriate, the Fund will leverage to the full extent permitted by its investment policies and restrictions and applicable law. Leveraging will exaggerate the effect on net asset value of any increase or decrease in the market value of the Fund’s portfolio. ● The Fund may invest in derivative instruments, which may be more volatile and less liquid, increasing the risk of loss when compared to traditional securities. Some of the derivative instruments are also subject to the risks of counterparty default and adverse tax treatment. ● Instruments and strategies (such as borrowing transactions and reverse repurchase agreements) may provide leveraged exposure to a particular investment, which will magnify any gains or losses on those investments. ● Investments in reverse repurchase agreements expose the Fund to many of the same risks as investments in derivatives. ● The Fund’s investments in other investment vehicles subject the Fund to those risks and expenses affecting the investment vehicle. ● The Fund’s investments in foreign securities carry additional risks when compared to U.S. securities, due to the impact of diplomatic, political or economic developments in the country in question (investments in emerging markets securities are generally subject to an even greater level of risks). ● Investments in syndicated bank loans generally offer a floating interest rate and involve special types of risks. ● The Fund’s investments in municipal securities can be affected by events that affect the municipal bond market. ● The Fund’s investments in real estate securities subject the Fund to the same risks as direct investments in real estate, which is particularly sensitive to economic downturns. ● The Fund’s investments in restricted securities may involve financial and liquidity risk. ● You may have a gain or loss when you sell your shares. ● It is important to note that the Fund is not guaranteed by the U.S. government. ● Please read the prospectus for more detailed information regarding these and other risks.
The Series F (Floating Rate Strategies Series) may not be suitable for all investors. ● Investments in floating rate senior secured syndicated bank loans and other floating rate securities involve special types of risks, including credit rate risk, interest rate risk, liquidity risk and prepayment risk. ● The Fund’s market value will change in response to interest rate changes and market conditions among other factors. In general, bond prices rise when interest rates fall and vice versa. ● The Fund’s exposure to high yield securities may subject the Fund to greater volatility. ● When market conditions are deemed appropriate, the Fund will leverage to the full extent permitted by its investment policies and restrictions and applicable law. Leveraging will exaggerate the effect on net asset value of any increase or decrease in the market value of the Fund’s portfolio. ● The Fund may invest in derivative instruments, which may be more volatile and less liquid, increasing the risk of loss when compared to traditional securities. Certain of the derivative instruments are also subject to the risks of counterparty default and adverse tax treatment. ● Instruments and strategies (such as borrowing transactions and reverse repurchase agreements) may provide leveraged exposure to a particular investment, which will magnify any gains or losses on those investments. ● Investments in reverse repurchase agreements and synthetic instruments (such as synthetic collateralized debt obligations) expose the Fund to many of the same risks as investments in derivatives. ● The Fund’s investments in other investment vehicles subject the Fund to those risks and expenses affecting the investment vehicle. ● The Fund’s investments in foreign securities carry additional risks when compared to U.S. securities, due to the impact of diplomatic, political or economic developments in the country in question (investments in emerging markets securities are generally subject to an even greater level of risks). ● The Fund’s investments in real estate securities subject the Fund to the same risks as direct investments in real estate, which is particularly sensitive to economic downturns. ● The Fund’s investments in restricted securities may involve financial and liquidity risk. ● The Fund is subject to active trading risks that may increase volatility and impact its ability to achieve its investment objective. ● You may have a gain or loss when you sell your shares. ● It is important to note that the Fund is not guaranteed by the U.S. government. ● Please read the prospectus for more detailed information regarding these and other risks.
The Series N (Managed Asset Allocation Series) may not be suitable for all investors. ● The value of an investment in the Fund will fluctuate and is subject to investment risks, which means investors could lose money. The Fund could lose money if the issuer of a bond or a counterparty to a derivatives transaction or other transaction is unable to repay interest and principal on time or defaults. The issuer of a bond could also suffer a decrease in quality rating, which would affect the volatility and liquidity of the bond. Derivatives may pose risks in addition to those associated with investing directly in securities or other investments, including the risk that the Fund will be unable to sell, unwind or value the derivative because of an illiquid market, the risk that the derivative is not well correlated with underlying investments or the Fund’s other portfolio holdings, and the risk that the counterparty is unwilling or unable to meet its obligation. The use of derivatives by the Fund to hedge risk may reduce the opportunity for gain by offsetting the positive effect of favorable price movements. Furthermore, if the Investment Manager is incorrect about its expectations of market conditions, the use of derivatives could result in a loss, which in some cases may be unlimited. Foreign securities carry additional risks when compared to U.S. securities, including currency fluctuations, adverse political and economic developments, unreliable or untimely information, less liquidity, limited legal recourse and higher transactional costs. The Investment Manager may not be able to cause certain of the underlying funds’ performance to match or correlate to that of the underlying funds’ respective underlying index or benchmark, either on a daily or aggregate basis. Factors such as underlying fund expenses, imperfect correlation between an underlying fund’s investments and those of its underlying index or underlying benchmark, rounding of share prices, changes to the composition of the underlying index or underlying benchmark, regulatory policies, high portfolio turnover rate, and the use of leverage all contribute to tracking error. Tracking error may cause an underlying fund’s and, thus the Fund’s, performance to be less than you expect. ● Please read the prospectus for more detailed information regarding these and other risks.
The Series P (High Yield Series) may not be suitable for all investors. ● The Fund’s market value will change in response to interest rate changes and market conditions among other factors. In general, bond prices rise when interest rates fall and vice versa. ● The Fund’s exposure to high yield securities may subject the Fund to greater volatility. ● The Fund may invest in derivative instruments, which may be more volatile and less liquid, increasing the risk of loss when compared to traditional securities. Some of the derivative instruments are also subject to the risks of counterparty default and adverse tax treatment. ● The Fund’s use of leverage, through borrowings or instruments such as derivatives, may cause the Fund to be more volatile than if it had not been leveraged. ● Instruments and strategies (such as borrowing transactions and reverse repurchase agreements) may provide leveraged exposure to a particular investment, which will magnify any gains or losses on those investments. ● The Fund may invest in foreign securities which carry additional risks when compared to U.S. securities, due to the impact of diplomatic, political or economic developments in the country in question (investments in emerging markets securities are generally subject to an even greater level of risks). ● Investments in syndicated bank loans generally
| | THE GUGGENHEIM FUNDS ANNUAL REPORT | 3 |
offer a floating interest rate and involve special types of risks. ● The Fund’s investments in other investment vehicles subject the Fund to those risks and expenses affecting the investment vehicle. ● The Fund’s investments in restricted securities may involve financial and liquidity risk. ● You may have a gain or loss when you sell your shares. ● It is important to note that the Fund is not guaranteed by the U.S. government. ● Please read the prospectus for more detailed information regarding these and other risks.
The Series Z (Alpha Opportunity Series) may not be suitable for all investors. ● The Alpha Opportunity Fund is subject to a number of risks and is not suitable for all investors. ● Investments in securities and derivatives, in general, are subject to market risks that may cause their prices to fluctuate over time. An investment in the Fund may lose money. There can be no guarantee the Fund will achieve it investment objective. ● The Fund’s use of derivatives such as futures, options and swap agreements may expose the Fund to additional risks that it would not be subject to if it invested directly in the securities underlying those derivatives. ● Certain of the derivative instruments, such as swaps and structured notes, are also subject to the risks of counterparty default and adverse tax treatment. ● The more the Fund invests in leveraged instruments, the more the leverage will magnify any gains or losses on those investments. ● The Fund’s use of short selling involves increased risk and costs, including paying more for a security than it received from its sale and the risk of unlimited losses. ● In certain circumstances the Fund may be subject to liquidity risk and it may be difficult for the Fund to purchase and sell particular investments within a reasonable time at a fair price. ● In certain circumstances, it may be difficult for the Fund to purchase and sell particular investments within a reasonable time at a fair price. ● The Fund’s fixed income investments will change in value in response to interest rate changes and other factors. ● See the prospectus for more information on these and additional risks.
4 | THE GUGGENHEIM FUNDS ANNUAL REPORT | |
ECONOMIC AND MARKET OVERVIEW (Unaudited) | December 31, 2016 |
Behind the performance numbers for the past 12 months are a multitude of events that unfolded throughout 2016, including an increase in U.S. corporate defaults, several quarters of negative earnings growth, stubbornly low inflation across the globe, the British vote to exit the European Union, and a U.S. presidential election outcome that defied investor expectations and polling trends. That was on top of one of the worst selloffs for U.S. corporate bonds since the financial crisis in the first six weeks of the year, and one of the worst selloffs in government bonds since 2013’s taper tantrum in the fourth quarter, and the Standard & Poor’s 500® (“S&P 500”) Index* falling almost 11% early in the year. Nevertheless, or perhaps because of all the pre-election turmoil, between election day and the end of December, the S&P 500 rallied 4.6%, high-yield spreads tightened 83 basis points, and 10-year Treasury yields rose 57 basis points.
The market reaction to the outcome of the U.S. presidential election set the stage for the U.S. Federal Reserve (the “Fed”) to hike in December. As widely expected, the Fed raised target interest rates by 25 basis points from a range of 0.25–0.50% to 0.50–0.75%. More importantly, the Federal Open Market Committee (“FOMC”) now projects three rate increases in 2017, up from two in September.
The upward shift appears to reflect the view that there may be less room for accommodative policy to continue in light of recent labor market data. We believe the participation rate introduces meaningful uncertainty to the pace of Fed tightening. In 2016, a rising participation rate helped keep the Fed at bay for most of the year as it stabilized the unemployment rate slightly above what the Fed considers full employment. However, the participation trend reversed in October and November, causing the unemployment rate to decline to only 4.7% by December.
Early indications that fiscal spending (and/or tax cuts) will be prioritized in the new administration suggest that the risks to real Gross Domestic Product (“GDP”) growth in 2017 and 2018 are now skewed to the upside. U.S. real GDP grew by 3.5% in the third quarter, up from 1.4% in the second quarter. We expect output to rise by around 2% on average in coming quarters, a bit faster than the trend rate over the past year, as drags from past dollar strength and an inventory adjustment cycle fade.
A post-election rise in consumer confidence, along with continued income growth and healthier household balance sheets, bodes well for consumption in the coming quarters. The trend rate of job growth should slow as we near full employment. Even so, the unemployment rate should continue to fall toward 4.0% as employment growth outstrips labor force growth. A tighter labor market will begin to put more upward pressure on wage growth, which is being held back by meager productivity gains. An improving labor market, low borrowing costs, and rising household formation will continue to bolster housing, as evidenced by housing starts at cyclical highs. Key inflation measures will rise over the next year due to energy price base effects and reductions in labor market slack.
Given our view that the Fed will raise rates three, possibly four, times in 2017, the effects of monetary policy divergence will be important to watch as two major central banks, the European Central Bank (“ECB”) and the Bank of Japan (“BOJ”), continue their purchase programs. In December, the ECB committed to extend its asset-purchase program through the end of 2017, albeit at a reduced monthly pace of €60 billion (from €80 billion currently) beginning in April. The ECB also changed its criteria for asset purchases, allowing the purchase of sovereign bonds with yields lower than the -0.40% deposit rate. In our view, the extension of the program to at least the end of 2017 makes it highly likely that the ECB will continue to buy assets well into 2018. The growing gap in policy rates and global yields could drive further U.S. dollar appreciation, which would weigh on oil prices and stem the recovery in the energy market. Currently, our oil model projects oil prices will remain below $60 per barrel through the end of 2017.
For the year ended December 31, 2016, the S&P 500 Index returned 11.96%. The MSCI Europe-Australasia-Far East (“EAFE”) Index* returned 1.00%. The return of the MSCI Emerging Markets Index* was 11.19%.
In the bond market, the Bloomberg Barclays U.S. Aggregate Bond Index* posted a 2.65% return for the year, while the Bloomberg Barclays U.S. Corporate High Yield Index* returned 17.13%. The return of the Bank of America (“BofA”) Merrill Lynch 3-Month U.S. Treasury Bill Index* was 0.33% for the 12-month period.
The opinions and forecasts expressed may not actually come to pass. This information is subject to change at any time, based on market and other conditions, and should not be construed as a recommendation of any specific security or strategy.
| | THE GUGGENHEIM FUNDS ANNUAL REPORT | 5 |
ECONOMIC AND MARKET OVERVIEW (Unaudited)(concluded) | December 31, 2016 |
*Index Definitions:
The following indices are referenced throughout this report. Indices are unmanaged and not available for direct investment. Index performance does not reflect transaction costs, fees, or expenses.
Bloomberg Barclays U.S. Aggregate Bond Index is a broad-based flagship benchmark that measures the investment grade, U.S. dollar-denominated, fixed-rate taxable bond market, including U.S. Treasuries, government-related and corporate securities, mortgage-backed securities or “MBS” (agency fixed-rate and hybrid adjustable-rate mortgage, or “ARM”, pass-throughs), asset-backed securities (“ABS”), and commercial mortgage-backed securities (“CMBS”) (agency and non-agency).
Bloomberg Barclays U.S. Corporate High Yield Index measures the U.S. dollar-denominated, high yield, fixed-rate corporate bond market. Securities are classified as high yield if the middle rating of Moody’s, Fitch, and S&P is Ba1/BB +/BB + or below.
BofA Merrill Lynch 3-Month U.S. Treasury Bill Index is an unmanaged market index of U.S. Treasury securities maturing in 90 days that assumes reinvestment of all income.
Credit Suisse Leveraged Loan Index is designed to mirror the investable universe of the U.S. dollar-denominated leveraged loan market.
MSCI EAFE Index is a free float-adjusted market capitalization index that is designed to measure the equity market performance of developed markets, excluding the U.S. & Canada.
MSCI Emerging Markets Index is a free float-adjusted market capitalization weighted index that is designed to measure equity market performance in the global emerging markets.
MSCI World Index is a free float-adjusted market capitalization weighted index that is designed to measure the equity market performance of developed markets.
Morningstar Long/Short Equity Category Average is an average return of the funds in the Morningstar Long/Short Equity Category. The categories assist investors and investment professionals in making meaningful comparisons between funds, making it easier to build well-diversified portfolios, assess potential risk, and identify top-performing funds.
S&P 500® Index is a capitalization-weighted index of 500 stocks designed to measure the performance of the broad economy, representing all major industries and is considered a representation of the U.S. stock market.
Russell 3000® Value Index measures the performance of the broad value segment of the U.S. equity value universe. It includes those Russell 3000 companies with lower price-to-book ratios and lower forecasted growth values.
Russell 2500® Value Index measures the performance of the small- to mid-cap value segment of the U.S. equity universe. It includes those Russell 2500 companies with lower price-to-book ratios and lower forecasted growth values.
Russell 2000® Growth Index measures the performance of the small-cap growth segment of the U.S. equity universe. It includes those Russell 2000 companies with higher price-to-book ratios and higher forecasted growth values.
Russell 2000® Value Index measures the performance of the small-cap value segment of the U.S. equity universe. It includes those Russell 2000 companies with lower price-to-book ratios and lower forecasted growth values.
Russell 1000® Growth Index measures the performance of the large-cap growth segment of the U.S. equity universe. It includes those Russell 1000 companies with higher price-to-book ratios and higher forecasted growth value.
Russell 1000® Value Index: measures the performance for the large-cap value segment of the U.S. equity universe. It includes those Russell 1000 companies with lower price-to-book ratios and lower expected growth values.
Russell Midcap® Growth Index measures the performance of the mid-cap growth segment of the U.S. equity universe. It includes those Russell Midcap Index companies with higher price-to-book ratios and higher forecasted growth values.
6 | THE GUGGENHEIM FUNDS ANNUAL REPORT | |
ABOUT SHAREHOLDERS’ FUND EXPENSES (Unaudited) | |
All mutual funds have operating expenses, and it is important for our shareholders to understand the impact of costs on their investments. Shareholders of a fund incur two types of costs: (i) transaction costs, including sales charges (loads) on purchase payments, reinvested dividends, other distributions, and exchange fees, and (ii) ongoing costs, including management fees, administrative services, and shareholder reports, among others. These ongoing costs, or operating expenses, are deducted from a fund’s gross income and reduce the investment return of the fund.
A fund’s expenses are expressed as a percentage of its average net assets, which is known as the expense ratio. The following examples are intended to help investors understand the ongoing costs (in dollars) of investing in a fund and to compare these costs with the ongoing costs of investing in other mutual funds.
The examples are based on an investment of $1,000 made at the beginning of the period and held for the entire six-month period beginning June 30, 2016 and ending December 31, 2016.
The following tables illustrate the Funds’ costs in two ways:
Table 1. Based on actual Fund return: This section helps investors estimate the actual expenses paid over the period. The “Ending Account Value” shown is derived from the Fund’s actual return, and the fifth column shows the dollar amount that would have been paid by an investor who started with $1,000 in the Fund. Investors may use the information here, together with the amount invested, to estimate the expenses paid over the period. Simply divide the Fund’s account value by $1,000 (for example, an $8,600 account value divided by $1,000 = 8.6), then multiply the result by the number provided under the heading “Expenses Paid During Period.”
Table 2. Based on hypothetical 5% return: This section is intended to help investors compare a Fund’s cost with those of other mutual funds. The table provides information about hypothetical account values and hypothetical expenses based on the Fund’s actual expense ratio and an assumed rate of return of 5% per year before expenses, which is not the Fund’s actual return. The hypothetical account values and expenses may not be used to estimate the actual ending account balance or expenses paid during the period. The example is useful in making comparisons because the U.S. Securities and Exchange Commission (the “SEC”) requires all mutual funds to calculate expenses based on the 5% return. Investors can assess a Fund’s costs by comparing this hypothetical example with the hypothetical examples that appear in shareholder reports of other funds.
The calculations illustrated above assume no shares were bought or sold during the period. Actual costs may have been higher or lower, depending on the amount of investment and the timing of any purchases or redemptions.
Please note that the expenses shown in the table are meant to highlight your ongoing costs only and do not reflect any transactional costs, such as sales charges (loads) on purchase payments, and contingent deferred sales charges (“CDSC”) on redemptions, if any. Therefore, the second table is useful in comparing ongoing costs only, and will not help you determine the relative total costs of owning different funds. In addition, if these transactional costs were included, your costs would have been higher.
More information about the Funds’ expenses, including annual expense ratios for periods up to five years (subject to the Fund’s inception date), can be found in the Financial Highlights section of this report. For additional information on operating expenses and other shareholder costs, please refer to the appropriate Fund prospectus.
| | THE GUGGENHEIM FUNDS ANNUAL REPORT | 7 |
ABOUT SHAREHOLDERS’ FUND EXPENSES (Unaudited)(concluded) | |
| Expense
Ratio1 | Fund
Return | Beginning
Account Value
June 30, 2016 | Ending
Account Value
December 31, 2016 | Expenses
Paid During
Period2 |
Table 1. Based on actual Fund return3 | | | | | |
Series A (StylePlus—Large Core Series) | 0.91% | 8.81% | $ 1,000.00 | $ 1,088.10 | $ 4.79 |
Series B (Large Cap Value Series) | 0.82% | 13.93% | 1,000.00 | 1,139.30 | 4.42 |
Series D (World Equity Income Series) | 0.90% | 3.14% | 1,000.00 | 1,031.40 | 4.61 |
Series E (Total Return Bond Series) | 0.81% | 2.02% | 1,000.00 | 1,020.20 | 4.12 |
Series F (Floating Rate Strategies Series) | 1.17% | 4.93% | 1,000.00 | 1,049.30 | 6.04 |
Series J (StylePlus—Mid Growth Series) | 0.95% | 5.98% | 1,000.00 | 1,059.80 | 4.93 |
Series N (Managed Asset Allocation Series) | 0.92% | 3.67% | 1,000.00 | 1,036.70 | 4.72 |
Series O (All Cap Value Series) | 0.90% | 14.98% | 1,000.00 | 1,149.80 | 4.88 |
Series P (High Yield Series) | 1.12% | 9.03% | 1,000.00 | 1,090.30 | 5.90 |
Series Q (Small Cap Value Series) | 1.13% | 19.59% | 1,000.00 | 1,195.90 | 6.25 |
Series V (Mid Cap Value Series) | 0.91% | 16.72% | 1,000.00 | 1,167.20 | 4.97 |
Series X (StylePlus—Small Growth Series) | 1.25% | 14.52% | 1,000.00 | 1,145.20 | 6.76 |
Series Y (StylePlus—Large Growth Series) | 1.07% | 6.81% | 1,000.00 | 1,068.10 | 5.58 |
Series Z (Alpha Opportunity Series) | 2.87% | 9.17% | 1,000.00 | 1,091.70 | 15.13 |
|
Table 2. Based on hypothetical 5% return (before expenses) | | | | |
Series A (StylePlus—Large Core Series) | 0.91% | 5.00% | $ 1,000.00 | $ 1,020.62 | $ 4.63 |
Series B (Large Cap Value Series) | 0.82% | 5.00% | 1,000.00 | 1,021.07 | 4.18 |
Series D (World Equity Income Series) | 0.90% | 5.00% | 1,000.00 | 1,020.67 | 4.58 |
Series E (Total Return Bond Series) | 0.81% | 5.00% | 1,000.00 | 1,021.12 | 4.13 |
Series F (Floating Rate Strategies Series) | 1.17% | 5.00% | 1,000.00 | 1,019.31 | 5.96 |
Series J (StylePlus—Mid Growth Series) | 0.95% | 5.00% | 1,000.00 | 1,020.42 | 4.84 |
Series N (Managed Asset Allocation Series) | 0.92% | 5.00% | 1,000.00 | 1,020.57 | 4.69 |
Series O (All Cap Value Series) | 0.90% | 5.00% | 1,000.00 | 1,020.67 | 4.58 |
Series P (High Yield Series) | 1.12% | 5.00% | 1,000.00 | 1,019.56 | 5.70 |
Series Q (Small Cap Value Series) | 1.13% | 5.00% | 1,000.00 | 1,019.51 | 5.75 |
Series V (Mid Cap Value Series) | 0.91% | 5.00% | 1,000.00 | 1,020.62 | 4.63 |
Series X (StylePlus—Small Growth Series) | 1.25% | 5.00% | 1,000.00 | 1,018.90 | 6.36 |
Series Y (StylePlus—Large Growth Series) | 1.07% | 5.00% | 1,000.00 | 1,019.81 | 5.45 |
Series Z (Alpha Opportunity Series) | 2.87% | 5.00% | 1,000.00 | 1,010.74 | 14.55 |
1 | Annualized and excludes expenses of the underlying funds in which the Funds invest. This ratio represents net expenses, which may include expenses that are excluded from the expense limitation agreement. Excluding these expenses, the net expense ratios for the period would be: |
| | Funds | 12/31/16 | |
| | Series E (Total Return Bond Series) | 0.78% | |
| | Series F (Floating Rate Strategies Series) | 1.15% | |
| | Series P (High Yield Series) | 1.07% | |
| | Series Z (Alpha Opportunity Series) | 2.34% | |
2 | Expenses are equal to the Fund's annualized expense ratio, net of any applicable fee waivers, multiplied by the average account value over the period, multiplied by 184/365 (to reflect the one-half year period). Expenses shown do not include fees charged by insurance companies. |
3 | Actual cumulative return at net asset value for the period June 30, 2016 to December 31, 2016. |
8 | THE GUGGENHEIM FUNDS ANNUAL REPORT | |
MANAGER’S COMMENTARY (Unaudited) | December 31, 2016 |
To Our Shareholders:
The Series A (StylePlusTM—Large Core Series) is managed by a team of seasoned professionals, including B. Scott Minerd, Chairman of Investments and Global Chief Investment Officer; Farhan Sharaff, Senior Managing Director and Assistant Chief Investment Officer, Equities; Jayson Flowers, Senior Managing Director and Portfolio Manager; Scott Hammond, Managing Director and Portfolio Manager; and Qi Yan, Managing Director and Portfolio Manager. In the following paragraphs, the investment team discusses performance for the fiscal year ended December 31, 2016.
For the year ended December 31, 2016, the Series A (StylePlus—Large Core Series) returned 13.34%, compared with the 11.96% return of its benchmark, the S&P 500 Index.
Through a combination of an allocation to actively managed individual equity, passive equity, and actively managed fixed income, the Fund seeks to exceed the total return of the S&P 500 Index. The actively managed equity and fixed income components seek to provide multiple sources of outperformance and take advantage of Guggenheim’s competencies in both fixed income and systematic stock selection.
The allocation to actively managed individual equity via stocks, and passive equity via derivatives, is designed to provide exposure to large core equity. Remaining Fund assets are invested in the Guggenheim Strategy Funds, short-term fixed-income investment companies advised by Guggenheim Investments. The Strategy Funds invest in a diversified portfolio of debt securities and financial instruments providing exposure to fixed income markets. The investment objective of the Guggenheim Strategy Funds is to seek a high level of income consistent with the preservation of capital.
The passive equity position uses derivatives such as swap agreements to gain exposure to the index. The Fund’s fixed income component invests in a variety of fixed income sectors, including asset-backed securities (ABS), mortgage-backed securities, corporate bonds, and bank loans.
The active and passive decisions seek to add value by tactically allocating to actively managed equity through quantitative selection models when stock picking opportunities are high. During periods when Guggenheim views these opportunities to be less attractive, the Fund seeks to increase its passive exposure to equities and the allocation to fixed-income securities. The prospective return during such periods is the equity index plus an “alpha” component coming from the yield of the fixed-income overlay.
Performance Review
The Fund outperformed the S&P 500 Index for the one-year period ended December 31, 2016. The fixed income sleeve was the largest positive contributor. The investments in the Guggenheim Strategy Funds benefited Fund performance relative to investing in other short-term investments. The actively managed equity sleeve contributed slightly to performance. The passive equity position, maintained through swap agreements and futures contracts, also contributed to performance for the period.
For the Fund’s total equity position over the period, 15-20% was allocated to actively managed equity and 80-85% to passive equity.
When compared with the index, the total equity position (actively managed individual equity plus passive equity derivatives) was most overweight the Health Care and Consumer Staples sectors and most underweight the Consumer Discretionary and Financials sectors.
Uncorrelated with the Fund’s active equity component, the fixed-income component was largely invested in ABS, investment-grade corporates, and NA RMBS. These positions constituted the majority of the fixed income sleeve’s total return.
Performance displayed represents past performance which is no guarantee of future results.
The opinions and forecast expressed may not actually come to pass. This information is subject to change at any time, based on market and other conditions, and should not be construed as a recommendation of any specific security or strategy.
| | THE GUGGENHEIM FUNDS ANNUAL REPORT | 9 |
PERFORMANCE REPORT AND FUND PROFILE (Unaudited) | December 31, 2016 |
SERIES A (STYLEPLUS—LARGE CORE SERIES)
OBJECTIVE: Seeks long-term growth of capital.
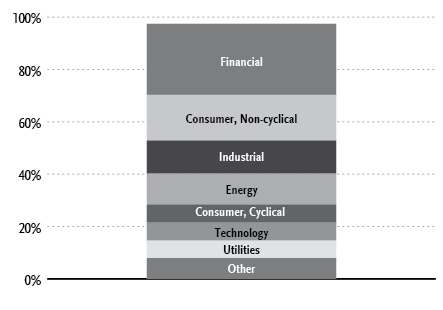
Holdings Diversification (Market Exposure as % of Net Assets)
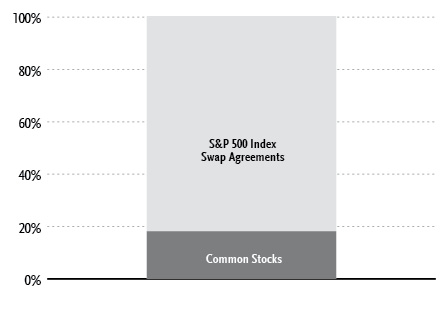
“Holdings Diversification (Market Exposure as % of Net Assets)” excludes any temporary cash investments or investments in Guggenheim Strategy Funds Trust mutual funds. Investments in those Funds will significantly increase the portfolio’s exposure to certain other asset categories (and their associated risks), which may cause the Fund to deviate from its principal investment strategy, including: (i) high yield, high risk debt securities rated below the top four long-term rating categories by a nationally recognized statistical rating organization (also known as “junk bonds”); (ii) securities issued by the U.S. government or its agencies and instrumentalities; (iii) CLOs and similar investments; and (iv) other short-term fixed income securities.
Inception Date: May 1, 1979 |
Ten Largest Holdings (% of Total Net Assets) |
Guggenheim Variable Insurance Strategy Fund III | 26.2% |
Guggenheim Strategy Fund II | 25.6% |
Guggenheim Strategy Fund III | 16.1% |
Guggenheim Strategy Fund I | 9.8% |
Apple, Inc. | 0.8% |
Verizon Communications, Inc. | 0.4% |
Procter & Gamble Co. | 0.4% |
Pfizer, Inc. | 0.4% |
Intel Corp. | 0.3% |
Comcast Corp. — Class A | 0.3% |
Top Ten Total | 80.3% |
“Ten Largest Holdings” excludes any temporary cash or derivative investments.
10 | THE GUGGENHEIM FUNDS ANNUAL REPORT | |
PERFORMANCE REPORT AND FUND PROFILE (Unaudited)(concluded) | December 31, 2016 |
Cumulative Fund Performance*,†
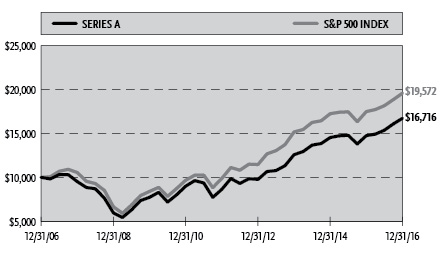
Average Annual Returns*
Periods Ended December 31, 2016†
| 1 Year | 5 Year | 10 Year |
Series A (StylePlus—Large Core Series) | 13.34% | 14.12% | 5.27% |
S&P 500 Index | 11.96% | 14.66% | 6.95% |
* | The performance data above represents past performance that is not predictive of future results. Effective April 30, 2013, certain changes were made to the Series’ investment objective and principal investment strategies. The investment return and principal value of an investment in the Fund will fluctuate so that an investor’s shares, when redeemed, may be worth more or less than their original cost. Returns are historical and include changes in principal and reinvested dividends and capital gains and do not reflect the effect of taxes. The S&P 500 Index is an unmanaged index and, unlike the Fund, has no management fees or operating expenses to reduce its reported return. |
† | Performance figures do not reflect fees and expenses associated with an investment in variable insurance products. If returns had taken into account these fees and expenses, performance would have been lower. Shares of a series of Guggenheim Variable Funds Trust are available only through the purchase of such products. |
| | THE GUGGENHEIM FUNDS ANNUAL REPORT | 11 |
SCHEDULE OF INVESTMENTS | December 31, 2016 |
SERIES A (STYLEPLUS—LARGE CORE SERIES) | |
| | Shares | | | Value | |
| | | | | | | |
COMMON STOCKS† - 18.1% | |
| | | | | | | |
Consumer, Non-cyclical - 6.0% | |
Procter & Gamble Co. | | | 10,428 | | | $ | 876,786 | |
Pfizer, Inc. | | | 25,541 | | | | 829,573 | |
Merck & Company, Inc. | | | 12,568 | | | | 739,878 | |
UnitedHealth Group, Inc. | | | 4,623 | | | | 739,865 | |
PepsiCo, Inc. | | | 6,926 | | | | 724,667 | |
Amgen, Inc. | | | 4,321 | | | | 631,773 | |
AbbVie, Inc. | | | 9,828 | | | | 615,429 | |
Allergan plc* | | | 2,893 | | | | 607,559 | |
Medtronic plc | | | 8,485 | | | | 604,386 | |
Gilead Sciences, Inc. | | | 8,350 | | | | 597,944 | |
Danaher Corp. | | | 6,467 | | | | 503,391 | |
Kroger Co. | | | 14,163 | | | | 488,765 | |
Kimberly-Clark Corp. | | | 4,267 | | | | 486,950 | |
Biogen, Inc.* | | | 1,704 | | | | 483,220 | |
Becton Dickinson and Co. | | | 2,885 | | | | 477,612 | |
Boston Scientific Corp.* | | | 22,068 | | | | 477,331 | |
Sysco Corp. | | | 8,503 | | | | 470,811 | |
Archer-Daniels-Midland Co. | | | 10,204 | | | | 465,813 | |
HCA Holdings, Inc.* | | | 6,260 | | | | 463,365 | |
McKesson Corp. | | | 3,229 | | | | 453,513 | |
Express Scripts Holding Co.* | | | 6,550 | | | | 450,575 | |
Johnson & Johnson | | | 3,251 | | | | 374,548 | |
General Mills, Inc. | | | 3,377 | | | | 208,597 | |
Abbott Laboratories | | | 3,572 | | | | 137,201 | |
Thermo Fisher Scientific, Inc. | | | 951 | | | | 134,186 | |
Mondelez International, Inc. — Class A | | | 2,960 | | | | 131,217 | |
Aetna, Inc. | | | 925 | | | | 114,709 | |
Anthem, Inc. | | | 703 | | | | 101,070 | |
Total Consumer, Non-cyclical | | | | | | | 13,390,734 | |
| | | | | | | | | |
Technology - 2.5% | |
Apple, Inc. | | | 15,032 | | | | 1,741,007 | |
Intel Corp. | | | 21,315 | | | | 773,095 | |
Oracle Corp. | | | 16,426 | | | | 631,580 | |
International Business Machines Corp. | | | 3,801 | | | | 630,928 | |
Microsoft Corp. | | | 9,629 | | | | 598,346 | |
Activision Blizzard, Inc. | | | 12,335 | | | | 445,417 | |
HP, Inc. | | | 29,116 | | | | 432,081 | |
QUALCOMM, Inc. | | | 2,482 | | | | 161,826 | |
Broadcom Ltd. | | | 729 | | | | 128,865 | |
Hewlett Packard Enterprise Co. | | | 4,273 | | | | 98,877 | |
Total Technology | | | | | | | 5,642,022 | |
| | | | | | | | | |
Consumer, Cyclical - 2.0% | |
Wal-Mart Stores, Inc. | | | 8,931 | | | | 617,311 | |
CVS Health Corp. | | | 7,238 | | | | 571,151 | |
Walgreens Boots Alliance, Inc. | | | 6,540 | | | | 541,250 | |
General Motors Co. | | | 14,573 | | | | 507,723 | |
Ford Motor Co. | | | 40,001 | | | | 485,212 | |
Target Corp. | | | 6,462 | | | | 466,750 | |
Delta Air Lines, Inc. | | | 8,029 | | | | 394,946 | |
American Airlines Group, Inc. | | | 8,020 | | | | 374,454 | |
Southwest Airlines Co. | | | 7,189 | | | | 358,300 | |
Lowe’s Companies, Inc. | | | 3,180 | | | | 226,162 | |
Total Consumer, Cyclical | | | | | | | 4,543,259 | |
| | | | | | | | | |
Communications - 2.0% | |
Verizon Communications, Inc. | | | 16,530 | | | | 882,370 | |
Comcast Corp. — Class A | | | 11,042 | | | | 762,450 | |
Cisco Systems, Inc. | | | 24,394 | | | | 737,187 | |
AT&T, Inc. | | | 13,403 | | | | 570,030 | |
Alphabet, Inc. — Class C* | | | 717 | | | | 553,395 | |
eBay, Inc.* | | | 16,385 | | | | 486,471 | |
Amazon.com, Inc.* | | | 285 | | | | 213,713 | |
Facebook, Inc. — Class A* | | | 1,413 | | | | 162,566 | |
Total Communications | | | | | | | 4,368,182 | |
| | | | | | | | | |
Financial - 1.8% | |
MetLife, Inc. | | | 9,563 | | | | 515,350 | |
Prudential Financial, Inc. | | | 4,787 | | | | 498,135 | |
Travelers Companies, Inc. | | | 4,037 | | | | 494,210 | |
Allstate Corp. | | | 6,435 | | | | 476,962 | |
Aflac, Inc. | | | 6,743 | | | | 469,313 | |
State Street Corp. | | | 5,824 | | | | 452,641 | |
JPMorgan Chase & Co. | | | 4,131 | | | | 356,464 | |
Berkshire Hathaway, Inc. — Class B* | | | 1,509 | | | | 245,937 | |
Wells Fargo & Co. | | | 4,365 | | | | 240,555 | |
Citigroup, Inc. | | | 2,222 | | | | 132,053 | |
Chubb Ltd. | | | 924 | | | | 122,079 | |
Bank of America Corp. | | | 5,430 | | | | 120,003 | |
Total Financial | | | | | | | 4,123,702 | |
| | | | | | | | | |
Industrial - 1.6% | |
Boeing Co. | | | 3,866 | | | | 601,860 | |
Union Pacific Corp. | | | 5,659 | | | | 586,726 | |
FedEx Corp. | | | 2,589 | | | | 482,072 | |
CSX Corp. | | | 13,168 | | | | 473,126 | |
Waste Management, Inc. | | | 6,631 | | | | 470,204 | |
Cummins, Inc. | | | 3,141 | | | | 429,280 | |
United Technologies Corp. | | | 1,837 | | | | 201,372 | |
General Electric Co. | | | 6,269 | | | | 198,100 | |
Honeywell International, Inc. | | | 1,697 | | | | 196,597 | |
Total Industrial | | | | | | | 3,639,337 | |
| | | | | | | | | |
Energy - 1.4% | |
Schlumberger Ltd. | | | 7,750 | | | | 650,613 | |
Valero Energy Corp. | | | 7,103 | | | | 485,276 | |
Marathon Petroleum Corp. | | | 9,628 | | | | 484,770 | |
ConocoPhillips | | | 9,585 | | | | 480,592 | |
Exxon Mobil Corp. | | | 4,180 | | | | 377,287 | |
Kinder Morgan, Inc. | | | 18,209 | | | | 377,108 | |
Chevron Corp. | | | 1,066 | | | | 125,468 | |
Occidental Petroleum Corp. | | | 1,708 | | | | 121,661 | |
Total Energy | | | | | | | 3,102,775 | |
| | | | | | | | | |
Utilities - 0.7% | |
Duke Energy Corp. | | | 6,871 | | | | 533,327 | |
Exelon Corp. | | | 14,045 | | | | 498,457 | |
American Electric Power Company, Inc. | | | 7,766 | | | | 488,947 | |
12 | THE GUGGENHEIM FUNDS ANNUAL REPORT | SEE NOTES TO FINANCIAL STATEMENTS. |
SCHEDULE OF INVESTMENTS (continued) | December 31, 2016 |
SERIES A (STYLEPLUS—LARGE CORE SERIES) | |
| | Shares | | | Value | |
| | | | | | | |
NextEra Energy, Inc. | | | 1,149 | | | $ | 137,260 | |
Total Utilities | | | | | | | 1,657,991 | |
| | | | | | | | | |
Basic Materials - 0.1% | |
Dow Chemical Co. | | | 2,012 | | | | 115,127 | |
| | | | | | | | | |
Total Common Stocks | | | | | | | | |
(Cost $38,321,732) | | | | | | | 40,583,129 | |
| | | | | | | | | |
MUTUAL FUNDS† - 77.7% | |
Guggenheim Variable Insurance Strategy Fund III1 | | | 2,338,972 | | | | 58,544,462 | |
Guggenheim Strategy Fund II1 | | | 2,295,013 | | | | 57,260,566 | |
Guggenheim Strategy Fund III1 | | | 1,441,924 | | | | 36,004,831 | |
Guggenheim Strategy Fund I1 | | | 875,888 | | | | 21,897,209 | |
Total Mutual Funds | | | | | | | | |
(Cost $173,121,357) | | | | | | | 173,707,068 | |
| | |
SHORT-TERM INVESTMENTS† - 4.6% | |
Dreyfus Treasury Securities Cash Management Fund - Institutional Shares 0.31%2 | | | 10,205,961 | | | | 10,205,961 | |
Total Short-Term Investments | | | | | | | | |
(Cost $10,205,961) | | | | | | | 10,205,961 | |
| | | | | | | | | |
Total Investments - 100.4% | | | | | | | | |
(Cost $221,649,050) | | | | | | $ | 224,496,158 | |
Other Assets & Liabilities, net - (0.4)% | | | | | | | (791,422 | ) |
Total Net Assets - 100.0% | | | | | | $ | 223,704,736 | |
| | Units | | | Unrealized
Gain | |
| | | | | | | |
OTC EQUITY INDEX SWAP AGREEMENTS†† | |
Bank of America
April 2017 S&P 500 Index Swap 0.90%3, Terminating 04/04/17
(Notional Value $184,204,216) | | | 82,277 | | | $ | 6,394,335 | |
* | Non-income producing security. |
† | Value determined based on Level 1 inputs — See Note 4. |
†† | Value determined based on Level 2 inputs — See Note 4. |
1 | Affiliated issuer — See Note 8. |
2 | Rate indicated is the 7 day yield as of December 31, 2016. |
3 | Total Return based on S&P 500 Index +/- financing at a variable rate. Rate indicated is the rate effective at December 31, 2016. |
| | plc — Public Limited Company |
| | |
| | See Sector Classification in Other Information section. |
SEE NOTES TO FINANCIAL STATEMENTS. | THE GUGGENHEIM FUNDS ANNUAL REPORT | 13 |
SCHEDULE OF INVESTMENTS (concluded) | December 31, 2016 |
SERIES A (STYLEPLUS—LARGE CORE SERIES) | |
The following table summarizes the inputs used to value the Fund’s investments at December 31, 2016 (See Note 4 in the Notes to Financial Statements):
Investments in Securities (Assets) | | Level 1 | | | Level 2 | | | Level 2 - Other* | | | Level 3 | | | Total | |
Common Stocks | | $ | 40,583,129 | | | $ | — | | | $ | — | | | $ | — | | | $ | 40,583,129 | |
Equity Index Swap Agreements | | | — | | | | — | | | | 6,394,335 | | | | — | | | | 6,394,335 | |
Mutual Funds | | | 173,707,068 | | | | — | | | | — | | | | — | | | | 173,707,068 | |
Short-Term Investments | | | 10,205,961 | | | | — | | | | — | | | | — | | | | 10,205,961 | |
Total | | $ | 224,496,158 | | | $ | — | | | $ | 6,394,335 | | | $ | — | | | $ | 230,890,493 | |
* | Other financial instruments include swaps, which are reported as unrealized gain/loss at period end. |
Transfers between investment levels may occur as the markets fluctuate and/or the availability of data used in an investment’s valuation changes. Transfers between valuation levels, if any, are in comparison to the valuation levels at the end of the previous fiscal year, and are effective using the fair value as of the end of the previous fiscal period.
For the year ended December 31, 2016, there were no transfers between levels.
14 | THE GUGGENHEIM FUNDS ANNUAL REPORT | SEE NOTES TO FINANCIAL STATEMENTS. |
SERIES A (STYLEPLUS—LARGE CORE SERIES) | |
STATEMENT OF ASSETS AND LIABILITIES | |
December 31, 2016 | |
Assets: | |
Investments in unaffiliated issuers, at value (cost $48,527,693) | | $ | 50,789,090 | |
Investments in affiliated issuers, at value (cost $173,121,357) | | | 173,707,068 | |
Total investments (cost $221,649,050) | | | 224,496,158 | |
Unrealized appreciation on swap agreements | | | 6,394,335 | |
Cash | | | 794,843 | |
Prepaid expenses | | | 2,074 | |
Receivables: | |
Fund shares sold | | | 29,506 | |
Dividends | | | 393,638 | |
Foreign taxes reclaim | | | 575 | |
Total assets | | | 232,111,129 | |
| | | | | |
Liabilities: | |
Segregated cash due to broker | | | 7,290,000 | |
Payable for: | |
Fund shares redeemed | | | 479,508 | |
Securities purchased | | | 374,298 | |
Management fees | | | 143,064 | |
Fund accounting/administration fees | | | 15,260 | |
Trustees’ fees* | | | 12,652 | |
Transfer agent/maintenance fees | | | 1,929 | |
Miscellaneous | | | 89,682 | |
Total liabilities | | | 8,406,393 | |
Commitments and contingent liabilities (Note 14) | | | — | |
Net assets | | $ | 223,704,736 | |
| | | | | |
Net assets consist of: | |
Paid in capital | | $ | 217,349,316 | |
Undistributed net investment income | | | 2,814,662 | |
Accumulated net realized loss on investments | | | (5,700,685 | ) |
Net unrealized appreciation on investments | | | 9,241,443 | |
Net assets | | $ | 223,704,736 | |
Capital shares outstanding | | | 5,855,684 | |
Net asset value per share | | $ | 38.20 | |
STATEMENT OF OPERATIONS |
Year Ended December 31, 2016 |
Investment Income: | |
Dividends from securities of affiliated issuers | | $ | 3,933,205 | |
Dividends from securities of unaffiliated issuers | | | 889,265 | |
Interest | | | 11,767 | |
Other income | | | 416 | |
Total investment income | | | 4,834,653 | |
| | | | | |
Expenses: | |
Management fees | | | 1,618,782 | |
Transfer agent/maintenance fees | | | 24,003 | |
Fund accounting/administration fees | | | 197,082 | |
Line of credit fees | | | 29,966 | |
Trustees’ fees* | | | 14,825 | |
Custodian fees | | | 6,373 | |
Miscellaneous | | | 110,462 | |
Total expenses | | | 2,001,493 | |
Net investment income | | | 2,833,160 | |
| | | | | |
Net Realized and Unrealized Gain (Loss): | |
Net realized gain (loss) on: | |
Investments in unaffiliated issuers | | | 2,358,325 | |
Investments in affiliated issuers | | | (91,903 | ) |
Swap agreements | | | 9,632,638 | |
Futures contracts | | | 73,021 | |
Net realized gain | | | 11,972,081 | |
Net change in unrealized appreciation (depreciation) on: | |
Investments in unaffiliated issuers | | | 1,686,246 | |
Investments in affiliated issuers | | | 1,260,252 | |
Swap agreements | | | 9,377,987 | |
Futures contracts | | | 4,381 | |
Net change in unrealized appreciation (depreciation) | | | 12,328,866 | |
Net realized and unrealized gain | | | 24,300,947 | |
Net increase in net assets resulting from operations | | $ | 27,134,107 | |
* | Relates to Trustees not deemed “interested persons” within the meaning of Section 2(a)(19) of the 1940 Act. |
SEE NOTES TO FINANCIAL STATEMENTS. | THE GUGGENHEIM FUNDS ANNUAL REPORT | 15 |
SERIES A (STYLEPLUS—LARGE CORE SERIES) | |
STATEMENTS OF CHANGES IN NET ASSETS |
| | Year Ended
December 31,
2016 | | | Year Ended
December 31,
2015 | |
Increase (Decrease) in Net Assets from Operations: | | | | | | |
Net investment income | | $ | 2,833,160 | | | $ | 1,908,621 | |
Net realized gain on investments | | | 11,972,081 | | | | 11,022,044 | |
Net change in unrealized appreciation (depreciation) on investments | | | 12,328,866 | | | | (9,256,807 | ) |
Net increase in net assets resulting from operations | | | 27,134,107 | | | | 3,673,858 | |
| | | | | | | | | |
Distributions to shareholders from: | | | | | | | | |
Net investment income | | | (1,891,371 | ) | | | (3,137,523 | ) |
Net realized gains | | | (2,234,605 | ) | | | (20,083,072 | ) |
Total distributions to shareholders | | | (4,125,976 | ) | | | (23,220,595 | ) |
| | | | | | | | | |
Capital share transactions: | | | | | | | | |
Proceeds from sale of shares | | | 8,969,840 | | | | 12,564,041 | |
Distributions reinvested | | | 4,125,976 | | | | 23,220,595 | |
Cost of shares redeemed | | | (31,279,332 | ) | | | (36,433,210 | ) |
Net decrease from capital share transactions | | | (18,183,516 | ) | | | (648,574 | ) |
Net increase (decrease) in net assets | | | 4,824,615 | | | | (20,195,311 | ) |
| | | | | | | | | |
Net assets: | | | | | | | | |
Beginning of year | | | 218,880,121 | | | | 239,075,432 | |
End of year | | $ | 223,704,736 | | | $ | 218,880,121 | |
Undistributed net investment income at end of year | | $ | 2,814,662 | | | $ | 1,900,343 | |
| | | | | | | | | |
Capital share activity: | | | | | | | | |
Shares sold | | | 255,646 | | | | 343,003 | |
Shares issued from reinvestment of distributions | | | 113,569 | | | | 660,051 | |
Shares redeemed | | | (887,152 | ) | | | (1,000,356 | ) |
Net increase (decrease) in shares | | | (517,937 | ) | | | 2,698 | |
16 | THE GUGGENHEIM FUNDS ANNUAL REPORT | SEE NOTES TO FINANCIAL STATEMENTS. |
SERIES A (STYLEPLUS—LARGE CORE SERIES) | |
This table is presented to show selected data for a share outstanding throughout each period and to assist shareholders in evaluating a Fund’s performance for the periods presented.
| | Year Ended
December 31,
2016 | | | Year Ended
December 31,
2015 | | | Year Ended
December 31,
2014 | | | Year Ended
December 31,
2013 | | | Year Ended
December 31,
2012 | |
Per Share Data | | | | | | | | | | | | | | | |
Net asset value, beginning of period | | $ | 34.34 | | | $ | 37.53 | | | $ | 32.50 | | | $ | 25.22 | | | $ | 22.31 | |
Income (loss) from investment operations: | |
Net investment income (loss)a | | | .46 | | | | .30 | | | | .44 | | | | .16 | | | | .23 | |
Net gain (loss) on investments (realized and unrealized) | | | 4.09 | | | | .36 | | | | 4.59 | | | | 7.12 | | | | 2.68 | |
Total from investment operations | | | 4.55 | | | | .66 | | | | 5.03 | | | | 7.28 | | | | 2.91 | |
Less distributions from: | |
Net investment income | | | (.32 | ) | | | (.52 | ) | | | — | | | | — | | | | — | |
Net realized gains | | | (.37 | ) | | | (3.33 | ) | | | — | | | | — | | | | — | |
Total distributions | | | (.69 | ) | | | (3.85 | ) | | | — | | | | — | | | | — | |
Net asset value, end of period | | $ | 38.20 | | | $ | 34.34 | | | $ | 37.53 | | | $ | 32.50 | | | $ | 25.22 | |
| |
Total Returnb | | | 13.34 | % | | | 1.50 | % | | | 15.48 | % | | | 28.87 | % | | | 13.04 | % |
Ratios/Supplemental Data | |
Net assets, end of period (in thousands) | | $ | 223,705 | | | $ | 218,880 | | | $ | 239,075 | | | $ | 231,194 | | | $ | 198,615 | |
Ratios to average net assets: | |
Net investment income (loss) | | | 1.31 | % | | | 0.83 | % | | | 1.28 | % | | | 0.56 | % | | | 0.92 | % |
Total expensesc | | | 0.93 | % | | | 0.96 | % | | | 0.97 | % | | | 0.96 | % | | | 0.94 | % |
Net expenses | | | 0.93 | % | | | 0.96 | % | | | 0.95 | %d | | | 0.96 | %d | | | 0.94 | %d |
Portfolio turnover rate | | | 43 | % | | | 66 | % | | | 88 | % | | | 267 | % | | | 103 | % |
a | Net investment income (loss) per share was computed using average shares outstanding throughout the period. |
b | Total return does not take into account any of the expenses associated with an investment in variable insurance products. If total return had taken into account these expenses, performance would have been lower. Shares of a series of Guggenheim Variable Funds Trust are available only through the purchase of such products. |
c | Does not include expenses of the underlying funds in which the Fund invests. |
d | Net expense information reflects the expense ratio after expense waivers. |
SEE NOTES TO FINANCIAL STATEMENTS. | THE GUGGENHEIM FUNDS ANNUAL REPORT | 17 |
MANAGER’S COMMENTARY (Unaudited) | December 31, 2016 |
To Our Shareholders:
The Series B (Large Cap Value Series) is managed by a team of seasoned professionals led by James Schier, CFA, Managing Director and Senior Portfolio Manager; Scott Hammond, Managing Director and Portfolio Manager; Farhan Sharaff, Assistant Chief Investment Officer, Equities, and Portfolio Manager; and Gregg Strohkorb, CFA, Portfolio Manager. In the following paragraphs, the team discusses performance of the Fund for the fiscal year ended December 31, 2016.
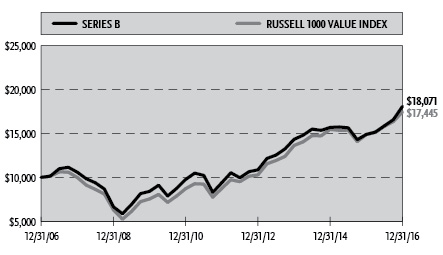
For the fiscal year ended December 31, 2016, the Series B (Large Cap Value Series) returned 21.41%, compared with the Russell 1000® Value Index, which returned 17.34%.
Strategy and Market Overview
Our investment approach focuses on understanding how companies make money and how easily companies can improve returns, maintain existing high levels of profitability, or benefit from change that occurs within the industry in which they operate. In today’s rapidly changing environment marked by very sharp and quick, but constrained volatility, our long-term orientation and discipline are a competitive advantage. This should become especially critical when the current market environment becomes more discriminating, and fundamentals once again become a more dominant factor in the market.
Performance Review
Most of the performance differential was due to stock selection, but sector allocation decisions also contributed. The largest positive impact was in the Industrials, the best-performing sector in the Fund, and Health Care sectors. On the negative side, the largest impact was in the Consumer Staples, the poorest-performing sector in the Fund, and the Materials sectors.
Among the individual contributors were regional bank holding Zions Bancorporation and large bank holding JP Morgan & Co., as the Fund’s asset-sensitive bank holdings performed particularly well late in the period in anticipation of a hike in short term interest rates. DRAM chip leader Micron Technology was another large contributor to performance for the period. After a decline in DRAM demand a year ago, many makers left the market, but not Micron, and its shares rebounded as demand revived in 2016.
Among leading individual detractors were CVS Health and CSRA. CSRA was a spin-off from Computer Sciences Corp. and merged with SRA International to form a dedicated IT government services provider. Spending on information technology by the federal government has been slowing over the past several years. CVS, which operates drugstores and serves as a pharmacy benefit manager, said in the fourth quarter it would lose 40 million prescriptions to competitors in 2017.
Portfolio Positioning
The largest relative sector exposures for the year were underweights in Energy and Real Estate, and overweights in Tech and Materials. Of these, the Energy underweight detracted from Fund performance for the year, while the Real Estate underweight, along with lack of exposure to retail/mall-based REITs, contributed to performance. The Real Estate Investment Trust industry was extracted from Financials to form a separate sector in September 2016. The Tech and Materials overweights contributed to performance.
In Energy, the Fund focused on holdings with manageable leverage and liquidity that were believed to enable them to weather the storm in commodity prices.
The overweights were driven by our bottom-up fundamental research having identified several companies with favorable risk-return profiles.
18 | THE GUGGENHEIM FUNDS ANNUAL REPORT | |
MANAGER’S COMMENTARY (Unaudited)(concluded) | December 31, 2016 |
Portfolio and Market Outlook
The 2016 election results affected the market as investors began to discount the possibility of a stronger economy brought about by reduced regulation and broad based tax cuts. In addition, the market appears to be getting comfortable with the notion that any interest rate increases will be gradual and enacted with extreme caution. Therefore, the market seems unusually complacent about the risks and optimistic with the future direction of the economy.
Our portfolios tend to reflect a bias toward companies with balance sheet quality. We continue to find niche companies with what we believe to be attractive growth opportunities, and, as such, are constructive on the outlook.
Performance displayed represents past performance which is no guarantee of future results.
The opinions and forecast expressed may not actually come to pass. This information is subject to change at any time, based on market and other conditions, and should not be construed as a recommendation of any specific security or strategy.
| | THE GUGGENHEIM FUNDS ANNUAL REPORT | 19 |
PERFORMANCE REPORT AND FUND PROFILE (Unaudited) | December 31, 2016 |
SERIES B (LARGE CAP VALUE SERIES)
OBJECTIVE: Seeks long-term growth of capital.
Holdings Diversification (Market Exposure as % of Net Assets)
“Holdings Diversification (Market Exposure as % of Net Assets)” excludes any temporary cash investments.
Inception Date: May 1, 1979 |
Ten Largest Holdings (% of Total Net Assets) |
JPMorgan Chase & Co. | 3.5% |
Berkshire Hathaway, Inc. — Class B | 2.7% |
Chevron Corp. | 2.6% |
Johnson & Johnson | 2.6% |
Exxon Mobil Corp. | 2.6% |
Citigroup, Inc. | 2.4% |
Bank of America Corp. | 2.3% |
Cisco Systems, Inc. | 2.2% |
Wells Fargo & Co. | 1.9% |
Intel Corp. | 1.7% |
Top Ten Total | 24.5% |
“Ten Largest Holdings” excludes any temporary cash investments.
20 | THE GUGGENHEIM FUNDS ANNUAL REPORT | |
PERFORMANCE REPORT AND FUND PROFILE (Unaudited)(concluded) | December 31, 2016 |
Cumulative Fund Performance*,†
Average Annual Returns*
Periods Ended December 31, 2016†
| 1 Year | 5 Year | 10 Year |
Series B (Large Cap Value Series) | 21.41% | 13.99% | 6.10% |
Russell 1000 Value Index | 17.34% | 14.80% | 5.72% |
* | The performance data above represents past performance that is not predictive of future results. The investment return and principal value of an investment in the Fund will fluctuate so that an investor’s shares, when redeemed, may be worth more or less than their original cost. Returns are historical and include changes in principal and reinvested dividends and capital gains and do not reflect the effect of taxes. The Russell 1000 Value Index is an unmanaged index and, unlike the Fund, has no management fees or operating expenses to reduce its reported return. |
† | Performance figures do not reflect fees and expenses associated with an investment in variable insurance products. If returns had taken into account these fees and expenses, performance would have been lower. Shares of a series of Guggenheim Variable Funds Trust are available only through the purchase of such products. |
| | THE GUGGENHEIM FUNDS ANNUAL REPORT | 21 |
SCHEDULE OF INVESTMENTS | December 31, 2016 |
SERIES B (LARGE CAP VALUE SERIES) | |
| | Shares | | | Value | |
| | | | | | | |
COMMON STOCKS† - 97.5% | |
| | | | | | | |
Financial - 27.2% | |
JPMorgan Chase & Co. | | | 106,867 | | | $ | 9,221,554 | |
Berkshire Hathaway, Inc. — Class B* | | | 43,881 | | | | 7,151,725 | |
Citigroup, Inc. | | | 107,234 | | | | 6,372,917 | |
Bank of America Corp. | | | 269,201 | | | | 5,949,342 | |
Wells Fargo & Co. | | | 91,802 | | | | 5,059,208 | |
American International Group, Inc. | | | 49,128 | | | | 3,208,549 | |
BB&T Corp. | | | 66,310 | | | | 3,117,897 | |
Unum Group | | | 65,087 | | | | 2,859,272 | |
Sun Communities, Inc. | | | 34,330 | | | | 2,630,021 | |
Zions Bancorporation | | | 61,010 | | | | 2,625,870 | |
SunTrust Banks, Inc. | | | 47,058 | | | | 2,581,131 | |
Assured Guaranty Ltd. | | | 65,386 | | | | 2,469,629 | |
Charles Schwab Corp. | | | 62,301 | | | | 2,459,021 | |
Piedmont Office Realty Trust, Inc. — Class A | | | 105,881 | | | | 2,213,972 | |
Equity Residential | | | 30,815 | | | | 1,983,253 | |
KeyCorp | | | 102,606 | | | | 1,874,612 | |
Morgan Stanley | | | 35,168 | | | | 1,485,848 | |
Allstate Corp. | | | 17,615 | | | | 1,305,624 | |
E*TRADE Financial Corp.* | | | 33,253 | | | | 1,152,216 | |
Prudential Financial, Inc. | | | 10,662 | | | | 1,109,488 | |
Regions Financial Corp. | | | 77,187 | | | | 1,108,405 | |
Ally Financial, Inc. | | | 51,831 | | | | 985,826 | |
Hanover Insurance Group, Inc. | | | 9,654 | | | | 878,611 | |
T. Rowe Price Group, Inc. | | | 9,352 | | | | 703,832 | |
Hartford Financial Services Group, Inc. | | | 8,000 | | | | 381,200 | |
Total Financial | | | | | | | 70,889,023 | |
| | | | | | | | | |
Consumer, Non-cyclical - 17.5% | |
Johnson & Johnson | | | 58,430 | | | | 6,731,720 | |
Pfizer, Inc. | | | 136,305 | | | | 4,427,186 | |
Merck & Company, Inc. | | | 63,152 | | | | 3,717,758 | |
Bunge Ltd. | | | 49,990 | | | | 3,611,278 | |
Procter & Gamble Co. | | | 39,813 | | | | 3,347,477 | |
Quest Diagnostics, Inc. | | | 35,050 | | | | 3,221,095 | |
HCA Holdings, Inc.* | | | 41,234 | | | | 3,052,141 | |
United Rentals, Inc.* | | | 24,655 | | | | 2,603,075 | |
Medtronic plc | | | 35,620 | | | | 2,537,213 | |
Zimmer Biomet Holdings, Inc. | | | 24,050 | | | | 2,481,960 | |
Hormel Foods Corp. | | | 53,142 | | | | 1,849,873 | |
Mondelez International, Inc. — Class A | | | 41,157 | | | | 1,824,490 | |
UnitedHealth Group, Inc. | | | 8,407 | | | | 1,345,456 | |
Hershey Co. | | | 12,928 | | | | 1,337,143 | |
DaVita, Inc.* | | | 20,476 | | | | 1,314,559 | |
Dr Pepper Snapple Group, Inc. | | | 12,227 | | | | 1,108,622 | |
Philip Morris International, Inc. | | | 12,018 | | | | 1,099,527 | |
Total Consumer, Non-cyclical | | | | | | | 45,610,573 | |
| | | | | | | | | |
Industrial - 12.6% | |
General Electric Co. | | | 108,292 | | | | 3,422,027 | |
FLIR Systems, Inc. | | | 75,935 | | | | 2,748,088 | |
Republic Services, Inc. — Class A | | | 46,828 | | | | 2,671,537 | |
WestRock Co. | | | 50,722 | | | | 2,575,156 | |
Corning, Inc. | | | 83,608 | | | | 2,029,165 | |
Timken Co. | | | 51,059 | | | | 2,027,042 | |
Jabil Circuit, Inc. | | | 81,583 | | | | 1,931,070 | |
United Technologies Corp. | | | 17,470 | | | | 1,915,061 | |
CSX Corp. | | | 45,139 | | | | 1,621,844 | |
Harris Corp. | | | 15,370 | | | | 1,574,964 | |
Huntington Ingalls Industries, Inc. | | | 7,651 | | | | 1,409,238 | |
Eaton Corp. plc | | | 19,215 | | | | 1,289,134 | |
Carlisle Companies, Inc. | | | 11,657 | | | | 1,285,651 | |
Snap-on, Inc. | | | 7,495 | | | | 1,283,669 | |
CH Robinson Worldwide, Inc. | | | 17,018 | | | | 1,246,739 | |
Honeywell International, Inc. | | | 10,534 | | | | 1,220,364 | |
Owens Corning | | | 22,596 | | | | 1,165,050 | |
Spirit AeroSystems Holdings, Inc. — Class A | | | 12,420 | | | | 724,707 | |
General Dynamics Corp. | | | 4,056 | | | | 700,309 | |
Total Industrial | | | | | | | 32,840,815 | |
| | | | | | | | | |
Energy - 11.8% | |
Chevron Corp. | | | 58,240 | | | | 6,854,848 | |
Exxon Mobil Corp. | | | 74,505 | | | | 6,724,821 | |
Kinder Morgan, Inc. | | | 149,804 | | | | 3,102,441 | |
Marathon Oil Corp. | | | 160,387 | | | | 2,776,299 | |
Hess Corp. | | | 41,670 | | | | 2,595,624 | |
Rowan Companies plc — Class A* | | | 107,041 | | | | 2,022,004 | |
Valero Energy Corp. | | | 25,827 | | | | 1,764,501 | |
Apache Corp. | | | 21,782 | | | | 1,382,504 | |
Whiting Petroleum Corp.* | | | 88,190 | | | | 1,060,044 | |
QEP Resources, Inc.* | | | 34,741 | | | | 639,582 | |
Chesapeake Energy Corp.* | | | 89,301 | | | | 626,893 | |
Laredo Petroleum, Inc.* | | | 44,160 | | | | 624,422 | |
Schlumberger Ltd. | | | 7,102 | | | | 596,213 | |
Total Energy | | | | | | | 30,770,196 | |
| | | | | | | | | |
Consumer, Cyclical - 6.9% | |
Lear Corp. | | | 20,822 | | | | 2,756,208 | |
Wal-Mart Stores, Inc. | | | 36,300 | | | | 2,509,057 | |
Southwest Airlines Co. | | | 47,872 | | | | 2,385,940 | |
Target Corp. | | | 31,509 | | | | 2,275,895 | |
CVS Health Corp. | | | 27,334 | | | | 2,156,926 | |
Goodyear Tire & Rubber Co. | | | 55,628 | | | | 1,717,236 | |
PACCAR, Inc. | | | 20,547 | | | | 1,312,953 | |
MGM Resorts International* | | | 43,478 | | | | 1,253,471 | |
PVH Corp. | | | 13,030 | | | | 1,175,827 | |
DR Horton, Inc. | | | 18,699 | | | | 511,044 | |
Total Consumer, Cyclical | | | | | | | 18,054,557 | |
| | | | | | | | | |
Technology - 6.9% | |
Intel Corp. | | | 125,620 | | | | 4,556,238 | |
Micron Technology, Inc.* | | | 150,109 | | | | 3,290,389 | |
Lam Research Corp. | | | 29,550 | | | | 3,124,322 | |
QUALCOMM, Inc. | | | 47,020 | | | | 3,065,704 | |
Teradata Corp.* | | | 69,961 | | | | 1,900,840 | |
Apple, Inc. | | | 11,326 | | | | 1,311,777 | |
NCR Corp.* | | | 16,583 | | | | 672,606 | |
Total Technology | | | | | | | 17,921,876 | |
22 | THE GUGGENHEIM FUNDS ANNUAL REPORT | SEE NOTES TO FINANCIAL STATEMENTS. |
SCHEDULE OF INVESTMENTS (concluded) | December 31, 2016 |
SERIES B (LARGE CAP VALUE SERIES) | |
| | Shares | | | Value | |
| | | | | | | |
Utilities - 6.7% | |
OGE Energy Corp. | | | 88,860 | | | $ | 2,972,368 | |
Ameren Corp. | | | 53,439 | | | | 2,803,410 | |
Exelon Corp. | | | 73,492 | | | | 2,608,231 | |
Public Service Enterprise Group, Inc. | | | 57,292 | | | | 2,513,973 | |
UGI Corp. | | | 45,281 | | | | 2,086,548 | |
Edison International | | | 28,058 | | | | 2,019,895 | |
FirstEnergy Corp. | | | 58,688 | | | | 1,817,567 | |
Duke Energy Corp. | | | 8,550 | | | | 663,651 | |
Total Utilities | | | | | | | 17,485,643 | |
| | | | | | | | | |
Communications - 5.0% | |
Cisco Systems, Inc. | | | 189,990 | | | | 5,741,498 | |
AT&T, Inc. | | | 55,746 | | | | 2,370,878 | |
Time Warner, Inc. | | | 14,005 | | | | 1,351,903 | |
Walt Disney Co. | | | 12,751 | | | | 1,328,909 | |
Scripps Networks Interactive, Inc. — Class A | | | 17,381 | | | | 1,240,482 | |
Verizon Communications, Inc. | | | 21,246 | | | | 1,134,111 | |
Total Communications | | | | | | | 13,167,781 | |
| | | | | | | | | |
Basic Materials - 2.9% | |
Dow Chemical Co. | | | 71,129 | | | | 4,070,001 | |
Reliance Steel & Aluminum Co. | | | 25,607 | | | | 2,036,781 | |
Nucor Corp. | | | 12,292 | | | | 731,620 | |
Freeport-McMoRan, Inc.* | | | 54,442 | | | | 718,090 | |
Total Basic Materials | | | | | | | 7,556,492 | |
| | | | | | | | | |
Total Common Stocks | | | | | | | | |
(Cost $205,216,113) | | | | | | | 254,296,956 | |
| | | | | | | | | |
SHORT-TERM INVESTMENTS† - 2.3% | |
Dreyfus Treasury Securities Cash Management Fund - Institutional Class 0.31%1 | | | 6,001,003 | | | | 6,001,003 | |
Total Short-Term Investments | | | | | | | | |
(Cost $6,001,003) | | | | | | | 6,001,003 | |
| | | | | | | | | |
Total Investments - 99.8% | | | | | | | | |
(Cost $211,217,116) | | | | | | $ | 260,297,959 | |
Other Assets & Liabilities, net - 0.2% | | | | | | | 393,714 | |
Total Net Assets - 100.0% | | | | | | $ | 260,691,673 | |
* | Non-income producing security. |
† | Value determined based on Level 1 inputs — See Note 4. |
1 | Rate indicated is the 7 day yield as of December 31, 2016. |
| | plc — Public Limited Company |
| | |
| | See Sector Classification in Other Information section. |
The following table summarizes the inputs used to value the Fund’s investments at December 31, 2016 (See Note 4 in the Notes to Financial Statements):
Investments in Securities (Assets) | | Level 1 | | | Level 2 | | | Level 3 | | | Total | |
Common Stocks | | $ | 254,296,956 | | | $ | — | | | $ | — | | | $ | 254,296,956 | |
Short-Term Investments | | | 6,001,003 | | | | — | | | | — | | | | 6,001,003 | |
Total | | $ | 260,297,959 | | | $ | — | | | $ | — | | | $ | 260,297,959 | |
Transfers between investment levels may occur as the markets fluctuate and/or the availability of data used in an investment’s valuation changes. Transfers between valuation levels, if any, are in comparison to the valuation levels at the end of the previous fiscal year, and are effective using the fair value as of the end of the previous fiscal period.
For the year ended December 31, 2016, there were no transfers between levels.
SEE NOTES TO FINANCIAL STATEMENTS. | THE GUGGENHEIM FUNDS ANNUAL REPORT | 23 |
SERIES B (LARGE CAP VALUE SERIES) | |
STATEMENT OF ASSETS AND LIABILITIES | |
December 31, 2016 | |
Assets: | |
Investments, at value (cost $211,217,116) | | $ | 260,297,959 | |
Prepaid expenses | | | 15,532 | |
Receivables: | |
Fund shares sold | | | 395,189 | |
Dividends | | | 310,371 | |
Foreign taxes reclaim | | | 8,622 | |
Total assets | | | 261,027,673 | |
| | | | | |
Liabilities: | |
Payable for: | |
Management fees | | | 143,650 | |
Fund shares redeemed | | | 106,096 | |
Direct shareholders expense | | | 25,335 | |
Legal fees | | | 20,657 | |
Fund accounting/administration fees | | | 17,680 | |
Trustees’ fees* | | | 4,924 | |
Transfer agent/maintenance fees | | | 2,205 | |
Miscellaneous | | | 15,453 | |
Total liabilities | | | 336,000 | |
Commitments and contingent liabilities (Note 14) | | | — | |
Net assets | | $ | 260,691,673 | |
| | | | | |
Net assets consist of: | |
Paid in capital | | $ | 203,392,094 | |
Undistributed net investment income | | | 3,482,075 | |
Accumulated net realized gain on investments | | | 4,736,661 | |
Net unrealized appreciation on investments | | | 49,080,843 | |
Net assets | | $ | 260,691,673 | |
Capital shares outstanding | | | 6,671,337 | |
Net asset value per share | | $ | 39.08 | |
STATEMENT OF OPERATIONS | |
Year Ended December 31, 2016 | |
Investment Income: | |
Dividends (net of foreign withholding tax of $5,823) | | $ | 5,315,012 | |
Interest | | | 12,696 | |
Total investment income | | | 5,327,708 | |
| | | | | |
Expenses: | |
Management fees | | | 1,532,828 | |
Transfer agent/maintenance fees | | | 23,951 | |
Fund accounting/administration fees | | | 215,064 | |
Line of credit fees | | | 37,262 | |
Trustees’ fees* | | | 7,086 | |
Custodian fees | | | 2,784 | |
Miscellaneous | | | 114,795 | |
Total expenses | | | 1,933,770 | |
Net investment income | | | 3,393,938 | |
| | | | | |
Net Realized and Unrealized Gain (Loss): | |
Net realized gain (loss) on: | |
Investments | | | 18,444,523 | |
Net realized gain | | | 18,444,523 | |
Net change in unrealized appreciation (depreciation) on: | |
Investments | | | 25,148,725 | |
Net change in unrealized appreciation (depreciation) | | | 25,148,725 | |
Net realized and unrealized gain | | | 43,593,248 | |
Net increase in net assets resulting from operations | | $ | 46,987,186 | |
* | Relates to Trustees not deemed “interested persons” within the meaning of Section 2(a)(19) of the 1940 Act. |
24 | THE GUGGENHEIM FUNDS ANNUAL REPORT | SEE NOTES TO FINANCIAL STATEMENTS. |
SERIES B (LARGE CAP VALUE SERIES) | |
STATEMENTS OF CHANGES IN NET ASSETS |
| | Year Ended
December 31,
2016 | | | Year Ended
December 31,
2015 | |
Increase (Decrease) in Net Assets from Operations: | | | | | | |
Net investment income | | $ | 3,393,938 | | | $ | 4,189,404 | |
Net realized gain on investments | | | 18,444,523 | | | | 14,222,606 | |
Net change in unrealized appreciation (depreciation) on investments | | | 25,148,725 | | | | (31,474,677 | ) |
Net increase (decrease) in net assets resulting from operations | | | 46,987,186 | | | | (13,062,667 | ) |
| | | | | | | | | |
Distributions to shareholders from: | | | | | | | | |
Net investment income | | | (4,101,267 | ) | | | (2,928,952 | ) |
Net realized gains | | | (3,255,199 | ) | | | (37,933,710 | ) |
Total distributions to shareholders | | | (7,356,466 | ) | | | (40,862,662 | ) |
| | | | | | | | | |
Capital share transactions: | | | | | | | | |
Proceeds from sale of shares | | | 16,708,176 | | | | 7,860,711 | |
Distributions reinvested | | | 7,356,466 | | | | 40,862,662 | |
Cost of shares redeemed | | | (36,101,306 | ) | | | (36,900,523 | ) |
Net increase (decrease) from capital share transactions | | | (12,036,664 | ) | | | 11,822,850 | |
Net increase (decrease) in net assets | | | 27,594,056 | | | | (42,102,479 | ) |
| | | | | | | | | |
Net assets: | | | | | | | | |
Beginning of year | | | 233,097,617 | | | | 275,200,096 | |
End of year | | $ | 260,691,673 | | | $ | 233,097,617 | |
Undistributed net investment income at end of year | | $ | 3,482,075 | | | $ | 4,169,230 | |
| | | | | | | | | |
Capital share activity: | | | | | | | | |
Shares sold | | | 482,148 | | | | 208,647 | |
Shares issued from reinvestment of distributions | | | 208,872 | | | | 1,153,010 | |
Shares redeemed | | | (1,041,682 | ) | | | (986,485 | ) |
Net increase (decrease) in shares | | | (350,662 | ) | | | 375,172 | |
SEE NOTES TO FINANCIAL STATEMENTS. | THE GUGGENHEIM FUNDS ANNUAL REPORT | 25 |
SERIES B (LARGE CAP VALUE SERIES) | |
This table is presented to show selected data for a share outstanding throughout each period and to assist shareholders in evaluating a Fund’s performance for the periods presented.
| | Year Ended
December 31,
2016 | | | Year Ended
December 31,
2015 | | | Year Ended
December 31,
2014 | | | Year Ended
December 31,
2013 | | | Year Ended
December 31,
2012 | |
Per Share Data | | | | | | | | | | | | | | | |
Net asset value, beginning of period | | $ | 33.20 | | | $ | 41.40 | | | $ | 37.82 | | | $ | 28.66 | | | $ | 24.79 | |
Income (loss) from investment operations: | |
Net investment income (loss)a | | | .50 | | | | .61 | | | | .41 | | | | .35 | | | | .35 | |
Net gain (loss) on investments (realized and unrealized) | | | 6.48 | | | | (2.29 | ) | | | 3.17 | | | | 8.81 | | | | 3.52 | |
Total from investment operations | | | 6.98 | | | | (1.68 | ) | | | 3.58 | | | | 9.16 | | | | 3.87 | |
Less distributions from: | |
Net investment income | | | (.61 | ) | | | (.47 | ) | | | — | | | | — | | | | — | |
Net realized gains | | | (.49 | ) | | | (6.05 | ) | | | — | | | | — | | | | — | |
Total distributions | | | (1.10 | ) | | | (6.52 | ) | | | — | | | | — | | | | — | |
Net asset value, end of period | | $ | 39.08 | | | $ | 33.20 | | | $ | 41.40 | | | $ | 37.82 | | | $ | 28.66 | |
| |
Total Returnb | | | 21.41 | % | | | (5.08 | %) | | | 9.47 | % | | | 31.96 | % | | | 15.61 | % |
Ratios/Supplemental Data | |
Net assets, end of period (in thousands) | | $ | 260,692 | | | $ | 233,098 | | | $ | 275,200 | | | $ | 283,527 | | | $ | 246,107 | |
Ratios to average net assets: | |
Net investment income (loss) | | | 1.44 | % | | | 1.63 | % | | | 1.04 | % | | | 1.05 | % | | | 1.28 | % |
Total expenses | | | 0.82 | % | | | 0.84 | % | | | 0.83 | % | | | 0.83 | % | | | 0.83 | % |
Portfolio turnover rate | | | 44 | % | | | 38 | % | | | 47 | % | | | 26 | % | | | 17 | % |
a | Net investment income (loss) per share was computed using average shares outstanding throughout the period. |
b | Total return does not take into account any of the expenses associated with an investment in variable insurance products. If total return had taken into account these expenses, performance would have been lower. Shares of a series of Guggenheim Variable Funds Trust are available only through the purchase of such products. |
26 | THE GUGGENHEIM FUNDS ANNUAL REPORT | SEE NOTES TO FINANCIAL STATEMENTS. |
MANAGER’S COMMENTARY (Unaudited) | December 31, 2016 |
To Our Shareholders:
The Series D (World Equity Income Series) is managed by a team of seasoned professionals, including Farhan Sharaff , Senior Managing Director and Assistant Chief Investment Officer, Equities; Jayson Flowers, Senior Managing Director and Portfolio Manager; Scott Hammond, Managing Director and Senior Portfolio Manager; and Evan Einstein, Vice President and Quantitative Analyst. In the following paragraphs, the investment team discusses performance for the fiscal year ended December 31, 2016.
For the one year period ended December 31, 2016, the Series D (World Equity Income Series) returned 10.37%, compared with the 7.53% return of its benchmark, the MSCI World Index.
The Fund seeks to deliver superior risk-adjusted returns by taking advantage of market inefficiencies that, at times, misprice stable companies. To identify the degree to which the market could potentially reward stability and other factors, the Fund’s investment team distills the global equity market down to 60 discrete fundamental stock characteristics which it uses to rank stocks it considers for the portfolio.
The Fund seeks to invest sensibly in a world with a rising number of risks; its focus on stable companies (those with factor characteristics like strong balance sheets, attractive earnings, healthy margins and lower market volatility) is designed to offer protection when the market sells off, but presents a challenge when companies lacking in these characteristics outperform.
Performance Review
The Fund’s high-level views for much of the period were the attractiveness of banks, in both the U.S. and selectively in Europe, as well as, relatively speaking, foreign markets, due to ongoing monetary stimulus. The Fund also believed U.S. equity markets were relatively stretched on a price/earnings-multiple basis and cited a need for either corporate earnings to increase, or prices to go down. Generally speaking, the year unfolded relatively close to these high-level views. To the extent there was variance, the surprise presidential election resulted in banks getting slightly more of boost than a pure valuation view would have warranted. Conversely, the post-election rally continued the multiple expansion that was described as unsustainable.
Selection was the major contributor to outperformance for the period, especially in Health Care and Financials. While the Fund is overweight defensive sectors and underweight cyclical sectors, it is near market weight in Health Care, and the Fund’s holdings rose while the Index holdings fell over the period.
A key factor in the outperformance of the Financials sector was the Fund’s increased exposure to European banks during the dislocation caused by Brexit. We took advantage of the turmoil to buy quality companies that sold off in sympathy as a result of negative sentiment toward the entire sector.
Among leading detractors from performance were underweights in Materials and Energy, and poor stock selection in the Consumer Discretionary sector, where stocks historically tend to have higher volatility and lower yields than other sectors, thus not attractive candidates for inclusion in the Fund.
Some of the Fund’s outperformance was attributable to its tactical currency overlay. The ability to selectively hedge currency exposure has been an element of the Fund’s tool box for some time. However a consolidating dollar over the last two years has resulted in limited opportunity to added value through hedging. This trend changed following the presidential elections as the dollar broke out and strengthened notably against most major global currencies.
Portfolio Positioning
While the Fund’s slight overweight in U.S. banks was beneficial, the majority of the names held by the Fund were mega cap banks, which did not perform as well as smaller regional banks that could potentially be the greatest beneficiaries of scaled back regulation.
The underweight to the Energy sector worked against the portfolio for much of the period, as oil rallied from the February low. While the Fund navigated June Brexit-related volatility, the risk-on trade that followed benefited economically sensitive securities in Information Technology, Materials, and Consumer Discretionary sectors, where the Fund is also underweight.
| | THE GUGGENHEIM FUNDS ANNUAL REPORT | 27 |
MANAGER’S COMMENTARY (Unaudited)(concluded) | December 31, 2016 |
As the probability of a Fed hike grew in 2016, investors responded by decreasing exposure to rate-sensitive equities, which manifested itself in negative returns in the Real Estate, Telecom, and Utilities sectors. The portfolio positioned for this obstacle by reducing dividend exposure, specifically reducing the overweights in the Utilities and Telecom sectors.
From a geographic perspective, the Fund’s largest overweights were in Singapore, Canada, and Australia, where markets are poised for continuing improvement in commodity markets. The largest underweights were in Europe, the UK, and the U.S., although the Fund added to UK exposure in the Brexit aftermath.
The spread between price levels and corporate earnings continues to widen, despite a slight improvement on the earnings front at the end of 2016. While there is likely room for earnings to edge higher in the near term, over the long-term structural changes related to an aging population are going to represent a significant constraint to potential GDP. The only means of combatting this will be for much higher levels of immigration, or greatly improved productivity, and trends in each of these categories are not in favor of economic growth.
Performance displayed represents past performance which is no guarantee of future results.
The opinions and forecast expressed may not actually come to pass. This information is subject to change at any time, based on market and other conditions, and should not be construed as a recommendation of any specific security or strategy.
28 | THE GUGGENHEIM FUNDS ANNUAL REPORT | |
PERFORMANCE REPORT AND FUND PROFILE (Unaudited) | December 31, 2016 |
SERIES D (WORLD EQUITY INCOME SERIES)
OBJECTIVE: Seeks to provide total return, comprised of capital appreciation and income.
Holdings Diversification (Market Exposure as % of Net Assets)
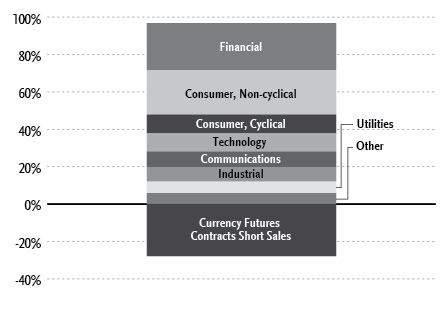
“Holdings Diversification (Market Exposure as % of Net Assets)” excludes any temporary cash investments.
COUNTRY DIVERSIFICATION
At December 31, 2016, the investment diversification of the Fund by country was as follows:
Country | % of Common Stocks | Value |
United States | 56.0% | $ 86,703,199 |
United Kingdom | 8.3% | 12,812,547 |
Japan | 6.0% | 9,380,464 |
Canada | 5.6% | 8,758,450 |
Switzerland | 3.7% | 5,686,853 |
Sweden | 2.6% | 3,979,704 |
Singapore | 2.6% | 3,979,621 |
Other | 15.2% | 23,486,917 |
Total Investments | 100.0% | $154,787,755 |
Inception Date: April 19, 1984 |
Ten Largest Holdings (% of Total Net Assets) |
Johnson & Johnson | 1.8% |
AT&T, Inc. | 1.5% |
Wells Fargo & Co. | 1.5% |
Procter & Gamble Co. | 1.4% |
Verizon Communications, Inc. | 1.4% |
Pfizer, Inc. | 1.3% |
International Business Machines Corp. | 1.3% |
Merck & Company, Inc. | 1.3% |
Home Depot, Inc. | 1.2% |
U.S. Bancorp | 1.2% |
Top Ten Total | 13.9% |
“Ten Largest Holdings” excludes any temporary cash or derivative investments. |
| | THE GUGGENHEIM FUNDS ANNUAL REPORT | 29 |
PERFORMANCE REPORT AND FUND PROFILE (Unaudited)(concluded) | December 31, 2016 |
Cumulative Fund Performance*,†
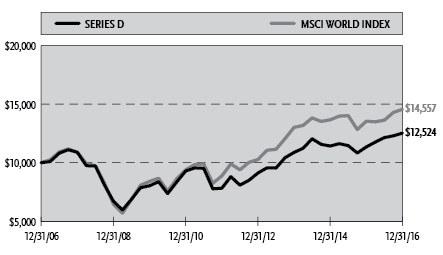
Average Annual Returns*
Periods Ended December 31, 2016†
| 1 Year | 5 Year | 10 Year |
Series D (World Equity Income Series) | 10.37% | 9.87% | 2.28% |
MSCI World Index | 7.53% | 10.41% | 3.82% |
* | The performance data above represents past performance that is not predictive of future results. The investment return and principal value of an investment in the Fund will fluctuate so that an investor’s shares, when redeemed, may be worth more or less than their original cost. Returns are historical and include changes in principal and reinvested dividends and capital gains and do not reflect the effect of taxes. The MSCI World Index is an unmanaged index and, unlike the Fund, has no management fees or operating expenses to reduce its reported return. |
† | Performance figures do not reflect fees and expenses associated with an investment in variable insurance products. If returns had taken into account these fees and expenses, performance would have been lower. Shares of a series of Guggenheim Variable Funds Trust are available only through the purchase of such products. |
30 | THE GUGGENHEIM FUNDS ANNUAL REPORT | |
SCHEDULE OF INVESTMENTS | December 31, 2016 |
SERIES D (WORLD EQUITY INCOME SERIES) | |
| | Shares | | | Value | |
| | | | | | | |
COMMON STOCKS† - 96.8% | |
| | | | | | | |
Financial - 25.3% | |
Wells Fargo & Co. | | | 44,500 | | | $ | 2,452,395 | |
U.S. Bancorp | | | 37,200 | | | | 1,910,964 | |
HSBC Holdings plc | | | 234,400 | | | | 1,897,199 | |
CME Group, Inc. — Class A | | | 12,400 | | | | 1,430,340 | |
Marsh & McLennan Companies, Inc. | | | 20,700 | | | | 1,399,113 | |
Nordea Bank AB | | | 125,600 | | | | 1,396,904 | |
Everest Re Group Ltd. | | | 6,200 | | | | 1,341,680 | |
Cincinnati Financial Corp. | | | 17,300 | | | | 1,310,475 | |
Swedbank AB — Class A | | | 54,000 | | | | 1,306,099 | |
Skandinaviska Enskilda Banken AB — Class A | | | 121,700 | | | | 1,276,701 | |
Swiss Re AG | | | 12,400 | | | | 1,175,050 | |
Annaly Capital Management, Inc. | | | 115,400 | | | | 1,150,538 | |
Hang Seng Bank Ltd. | | | 57,900 | | | | 1,077,445 | |
Allianz AG | | | 6,500 | | | | 1,074,097 | |
People’s United Financial, Inc. | | | 55,400 | | | | 1,072,544 | |
RenaissanceRe Holdings Ltd. | | | 7,300 | | | | 994,406 | |
Vicinity Centres | | | 450,101 | | | | 971,137 | |
CoreCivic, Inc. | | | 38,000 | | | | 929,480 | |
AGNC Investment Corp. | | | 51,200 | | | | 928,256 | |
Axis Capital Holdings Ltd. | | | 13,800 | | | | 900,726 | |
CI Financial Corp. | | | 40,600 | | | | 872,881 | |
Singapore Exchange Ltd. | | | 174,100 | | | | 860,810 | |
Lloyds Banking Group plc | | | 1,081,800 | | | | 833,333 | |
Gecina S.A. | | | 6,000 | | | | 830,123 | |
Government Properties Trust, Inc. | | | 226,200 | | | | 821,032 | |
T. Rowe Price Group, Inc. | | | 10,600 | | | | 797,756 | |
First Capital Realty, Inc. | | | 49,000 | | | | 754,256 | |
H&R Real Estate Investment Trust | | | 44,600 | | | | 742,990 | |
Liberty Property Trust | | | 18,100 | | | | 714,950 | |
Ascendas Real Estate Investment Trust | | | 455,400 | | | | 713,862 | |
CapitaLand Mall Trust | | | 499,100 | | | | 649,672 | |
ING Groep N.V. | | | 44,300 | | | | 623,399 | |
Japan Retail Fund Investment Corp. | | | 300 | | | | 607,264 | |
Sampo Oyj — Class A | | | 12,800 | | | | 573,784 | |
Chubb Ltd. | | | 3,900 | | | | 515,268 | |
Bank of Montreal | | | 7,000 | | | | 503,411 | |
Suncorp Group Ltd. | | | 47,000 | | | | 458,537 | |
JPMorgan Chase & Co. | | | 5,200 | | | | 448,708 | |
Loews Corp. | | | 8,600 | | | | 402,738 | |
CNP Assurances | | | 21,700 | | | | 401,979 | |
Intact Financial Corp. | | | 5,300 | | | | 379,299 | |
Societe Generale S.A. | | | 6,800 | | | | 334,561 | |
Federal Realty Investment Trust | | | 2,300 | | | | 326,853 | |
WR Berkley Corp. | | | 1,500 | | | | 99,765 | |
Daito Trust Construction Company Ltd. | | | 500 | | | | 75,202 | |
Tryg A/S | | | 1,200 | | | | 21,695 | |
Total Financial | | | | | | | 40,359,677 | |
| | | | | | | | | |
Consumer, Non-cyclical - 23.6% | |
Johnson & Johnson | | | 24,600 | | | | 2,834,167 | |
Procter & Gamble Co. | | | 26,462 | | | | 2,224,925 | |
Pfizer, Inc. | | | 65,400 | | | | 2,124,192 | |
Merck & Company, Inc. | | | 35,200 | | | | 2,072,224 | |
PepsiCo, Inc. | | | 17,400 | | | | 1,820,562 | |
UnitedHealth Group, Inc. | | | 11,300 | | | | 1,808,452 | |
Roche Holding AG | | | 7,700 | | | | 1,758,764 | |
Automatic Data Processing, Inc. | | | 15,700 | | | | 1,613,646 | |
GlaxoSmithKline plc | | | 81,200 | | | | 1,563,001 | |
Diageo plc | | | 56,500 | | | | 1,469,106 | |
Reynolds American, Inc. | | | 26,000 | | | | 1,457,040 | |
Sysco Corp. | | | 26,000 | | | | 1,439,620 | |
Eli Lilly & Co. | | | 18,600 | | | | 1,368,030 | |
Conagra Brands, Inc. | | | 32,200 | | | | 1,273,510 | |
Kimberly-Clark Corp. | | | 9,900 | | | | 1,129,788 | |
Dr Pepper Snapple Group, Inc. | | | 12,300 | | | | 1,115,241 | |
Clorox Co. | | | 8,900 | | | | 1,068,178 | |
Transurban Group | | | 129,900 | | | | 967,361 | |
Cardinal Health, Inc. | | | 13,000 | | | | 935,610 | |
Wm Morrison Supermarkets plc | | | 322,100 | | | | 915,318 | |
Otsuka Holdings Company Ltd. | | | 18,000 | | | | 784,309 | |
Novartis AG | | | 10,200 | | | | 742,208 | |
Singapore Press Holdings Ltd. | | | 295,600 | | | | 720,567 | |
Nissin Foods Holdings Company Ltd. | | | 12,600 | | | | 661,881 | |
Asahi Group Holdings Ltd. | | | 18,200 | | | | 574,565 | |
Hutchison Port Holdings Trust — Class U | | | 1,068,500 | | | | 464,798 | |
H&R Block, Inc. | | | 18,200 | | | | 418,418 | |
General Mills, Inc. | | | 6,600 | | | | 407,682 | |
Takeda Pharmaceutical Company Ltd. | | | 8,500 | | | | 351,606 | |
United Rentals, Inc.* | | | 3,000 | | | | 316,740 | |
Reed Elsevier plc | | | 13,100 | | | | 233,755 | |
Atlantia SpA | | | 9,800 | | | | 229,605 | |
Imperial Brands plc | | | 5,000 | | | | 218,243 | |
Unilever plc | | | 4,800 | | | | 194,755 | |
RELX N.V. | | | 11,400 | | | | 191,860 | |
Colgate-Palmolive Co. | | | 2,900 | | | | 189,776 | |
Abbott Laboratories | | | 1,800 | | | | 69,138 | |
Total Consumer, Non-cyclical | | | | | | | 37,728,641 | |
| | | | | | | | | |
Consumer, Cyclical - 10.1% | |
Home Depot, Inc. | | | 14,700 | | | | 1,970,976 | |
Wal-Mart Stores, Inc. | | | 23,900 | | | | 1,651,968 | |
McDonald’s Corp. | | | 13,500 | | | | 1,643,219 | |
Darden Restaurants, Inc. | | | 17,400 | | | | 1,265,328 | |
Mitsui & Company Ltd. | | | 90,500 | | | | 1,244,245 | |
Next plc | | | 19,500 | | | | 1,197,183 | |
Compass Group plc | | | 64,300 | | | | 1,189,361 | |
WW Grainger, Inc. | | | 5,100 | | | | 1,184,475 | |
Lawson, Inc. | | | 12,700 | | | | 892,047 | |
Sankyo Company Ltd. | | | 25,300 | | | | 817,107 | |
Yue Yuen Industrial Holdings Ltd. | | | 200,400 | | | | 727,489 | |
Berkeley Group Holdings plc | | | 20,200 | | | | 698,741 | |
Fastenal Co. | | | 12,600 | | | | 591,948 | |
Wolseley plc | | | 8,600 | | | | 525,763 | |
FamilyMart UNY Holdings Company Ltd. | | | 4,100 | | | | 272,901 | |
Costco Wholesale Corp. | | | 1,500 | | | | 240,165 | |
Mitsubishi Corp. | | | 3,400 | | | | 72,430 | |
Total Consumer, Cyclical | | | | | | | 16,185,346 | |
SEE NOTES TO FINANCIAL STATEMENTS. | THE GUGGENHEIM FUNDS ANNUAL REPORT | 31 |
SCHEDULE OF INVESTMENTS (continued) | December 31, 2016 |
SERIES D (WORLD EQUITY INCOME SERIES) | |
| | Shares | | | Value | |
| | | | | | | |
Technology - 9.7% | |
International Business Machines Corp. | | | 12,700 | | | $ | 2,108,073 | |
Apple, Inc. | | | 15,700 | | | | 1,818,374 | |
Accenture plc — Class A | | | 14,600 | | | | 1,710,098 | |
Canon, Inc. | | | 53,600 | | | | 1,510,989 | |
Paychex, Inc. | | | 23,500 | | | | 1,430,680 | |
Fidelity National Information Services, Inc. | | | 17,700 | | | | 1,338,828 | |
CA, Inc. | | | 36,700 | | | | 1,165,959 | |
Microsoft Corp. | | | 16,100 | | | | 1,000,454 | |
NTT Data Corp. | | | 17,600 | | | | 850,751 | |
Oracle Corporation Japan | | | 13,200 | | | | 665,167 | |
Seagate Technology plc | | | 17,100 | | | | 652,707 | |
Western Digital Corp. | | | 7,200 | | | | 489,240 | |
VMware, Inc. — Class A* | | | 5,100 | | | | 401,523 | |
Lam Research Corp. | | | 3,600 | | | | 380,628 | |
Total Technology | | | | | | | 15,523,471 | |
| | | | | | | | | |
Communications - 8.3% | |
AT&T, Inc. | | | 57,700 | | | | 2,453,982 | |
Verizon Communications, Inc. | | | 40,900 | | | | 2,183,242 | |
Thomson Reuters Corp. | | | 26,700 | | | | 1,168,356 | |
Shaw Communications, Inc. — Class B | | | 55,800 | | | | 1,119,474 | |
Alphabet, Inc. — Class C* | | | 1,200 | | | | 926,184 | |
BCE, Inc. | | | 20,600 | | | | 890,229 | |
Singapore Telecommunications Ltd. | | | 288,500 | | | | 727,167 | |
HKT Trust & HKT Ltd. | | | 520,900 | | | | 638,830 | |
Bezeq The Israeli Telecommunication Corporation Ltd. | | | 308,400 | | | | 585,934 | |
StarHub Ltd. | | | 290,300 | | | | 563,312 | |
Motorola Solutions, Inc. | | | 5,500 | | | | 455,895 | |
Amazon.com, Inc.* | | | 500 | | | | 374,935 | |
TDC A/S* | | | 63,300 | | | | 324,948 | |
Facebook, Inc. — Class A* | | | 2,800 | | | | 322,140 | |
Frontier Communications Corp. | | | 93,700 | | | | 316,706 | |
SES S.A. | | | 11,800 | | | | 259,883 | |
Comcast Corp. — Class A | | | 300 | | | | 20,715 | |
Total Communications | | | | | | | 13,331,932 | |
| | | | | | | | | |
Industrial - 7.8% | |
Waste Management, Inc. | | | 22,000 | | | | 1,560,020 | |
3M Co. | | | 8,300 | | | | 1,482,131 | |
Lockheed Martin Corp. | | | 5,928 | | | | 1,481,644 | |
Republic Services, Inc. — Class A | | | 25,900 | | | | 1,477,595 | |
CH Robinson Worldwide, Inc. | | | 16,500 | | | | 1,208,790 | |
Garmin Ltd. | | | 20,000 | | | | 969,800 | |
MTR Corporation Ltd. | | | 195,000 | | | | 948,039 | |
Expeditors International of Washington, Inc. | | | 17,400 | | | | 921,504 | |
Honeywell International, Inc. | | | 7,500 | | | | 868,875 | |
CAE, Inc. | | | 24,600 | | | | 344,043 | |
General Electric Co. | | | 10,400 | | | | 328,640 | |
Fraport AG Frankfurt Airport Services Worldwide | | | 5,000 | | | | 295,600 | |
Northrop Grumman Corp. | | | 1,200 | | | | 279,096 | |
BAE Systems plc | | | 33,300 | | | | 242,524 | |
Total Industrial | | | | | | | 12,408,301 | |
| | | | | | | | | |
Utilities - 6.1% | |
Southern Co. | | | 22,700 | | | | 1,116,612 | |
CLP Holdings Ltd. | | | 111,138 | | | | 1,021,169 | |
PPL Corp. | | | 29,900 | | | | 1,018,095 | |
Duke Energy Corp. | | | 11,500 | | | | 892,630 | |
Red Electrica Corporation S.A. | | | 41,100 | | | | 775,411 | |
Terna Rete Elettrica Nazionale SpA | | | 163,400 | | | | 748,465 | |
Snam SpA | | | 177,200 | | | | 729,987 | |
Emera, Inc. | | | 18,900 | | | | 638,858 | |
Dominion Resources, Inc. | | | 7,900 | | | | 605,061 | |
DTE Energy Co. | | | 5,200 | | | | 512,252 | |
CenterPoint Energy, Inc. | | | 18,500 | | | | 455,840 | |
SCANA Corp. | | | 5,100 | | | | 373,728 | |
SSE plc | | | 17,700 | | | | 338,740 | |
Sempra Energy | | | 2,200 | | | | 221,408 | |
FirstEnergy Corp. | | | 6,900 | | | | 213,693 | |
Severn Trent plc | | | 4,800 | | | | 131,375 | |
Fortis, Inc. | | | 900 | | | | 27,788 | |
Total Utilities | | | | | | | 9,821,112 | |
| | | | | | | | | |
Energy - 4.1% | |
BP plc | | | 278,300 | | | | 1,747,349 | |
Exxon Mobil Corp. | | | 16,700 | | | | 1,507,342 | |
Neste Oyj | | | 24,500 | | | | 941,217 | |
Kinder Morgan, Inc. | | | 31,000 | | | | 642,010 | |
Eni SpA | | | 34,700 | | | | 565,002 | |
OMV AG | | | 12,600 | | | | 445,065 | |
Petrofac Ltd. | | | 36,100 | | | | 386,366 | |
Repsol S.A. | | | 27,100 | | | | 382,783 | |
Total Energy | | | | | | | 6,617,134 | |
| | | | | | | | | |
Basic Materials - 1.3% | |
Potash Corporation of Saskatchewan, Inc. | | | 72,800 | | | | 1,316,865 | |
Rio Tinto plc | | | 13,900 | | | | 540,940 | |
BHP Billiton plc | | | 13,200 | | | | 212,441 | |
Total Basic Materials | | | | | | | 2,070,246 | |
| | | | | | | | | |
Financials - 0.5% | |
Hysan Development Company Ltd. — Class A | | | 179,500 | | | | 741,895 | |
| | | | | | | | | |
Total Common Stocks | | | | | | | | |
(Cost $146,578,390) | | | | | | | 154,787,755 | |
| | | | | | | | | |
SHORT-TERM INVESTMENTS† - 2.0% | |
Goldman Sachs Financial Square - Treasury Instruments Fund 0.35%1 | | | 3,203,633 | | | | 3,203,633 | |
Total Short-Term Investments | | | | | | | | |
(Cost $3,203,633) | | | | | | | 3,203,633 | |
| | | | | | | | | |
Total Investments - 98.8% | | | | | | | | |
(Cost $149,782,023) | | | | | | $ | 157,991,388 | |
Other Assets & Liabilities, net - 1.2% | | | | | | | 1,987,060 | |
Total Net Assets - 100.0% | | | | | | $ | 159,978,448 | |
32 | THE GUGGENHEIM FUNDS ANNUAL REPORT | SEE NOTES TO FINANCIAL STATEMENTS. |
SCHEDULE OF INVESTMENTS (concluded) | December 31, 2016 |
SERIES D (WORLD EQUITY INCOME SERIES) | |
| | Contracts | | | Unrealized
Gain | |
| | | | | | | |
CURRENCY FUTURES CONTRACTS SOLD SHORT† | |
March 2017 Japanese Yen
Futures Contracts
(Aggregate Value of Contracts $9,332,925) | | | 87 | | | $ | 162,894 | |
March 2017 Australian Dollar
Futures Contracts
(Aggregate Value of Contracts $3,169,320) | | | 44 | | | | 133,169 | |
March 2017 Euro FX
Futures Contracts
(Aggregate Value of Contracts $9,372,888) | | | 71 | | | | 126,703 | |
March 2017 British Pound
Futures Contracts
(Aggregate Value of Contracts $14,271,593) | | | 185 | | | | 76,714 | |
March 2017 Canadian Dollar
Futures Contracts
(Aggregate Value of Contracts $8,646,060) | | | 116 | | | | 43,439 | |
(Total Aggregate Value of Contracts $44,792,786) | | | $ | 542,919 | |
* | Non-income producing security. |
† | Value determined based on Level 1 inputs — See Note 4. |
1 | Rate indicated is the 7 day yield as of December 31, 2016. |
| | plc — Public Limited Company |
| | |
| | See Sector Classification in Other Information section. |
The following table summarizes the inputs used to value the Fund’s investments at December 31, 2016 (See Note 4 in the Notes to Financial Statements):
Investments in Securities (Assets) | | Level 1 | | | Level 1 - Other* | | | Level 2 | | | Level 3 | | | Total | |
Common Stocks | | $ | 154,787,755 | | | $ | — | | | $ | — | | | $ | — | | | $ | 154,787,755 | |
Currency Futures Contracts | | | — | | | | 542,919 | | | | — | | | | — | | | | 542,919 | |
Short-Term Investments | | | 3,203,633 | | | | — | | | | — | | | | — | | | | 3,203,633 | |
Total | | $ | 157,991,388 | | | $ | 542,919 | | | $ | — | | | $ | — | | | $ | 158,534,307 | |
* | Other financial instruments include futures contracts, which are reported as unrealized gain/loss at period end. |
Transfers between investment levels may occur as the markets fluctuate and/or the availability of data used in an investment’s valuation changes. Transfers between valuation levels, if any, are in comparison to the valuation levels at the end of the previous fiscal year, and are effective using the fair value as of the end of the previous fiscal period.
For the year ended December 31, 2016, there were no transfers between levels.
SEE NOTES TO FINANCIAL STATEMENTS. | THE GUGGENHEIM FUNDS ANNUAL REPORT | 33 |
SERIES D (WORLD EQUITY INCOME SERIES) | |
STATEMENT OF ASSETS AND LIABILITIES | |
December 31, 2016 | |
Assets: | |
Investments, at value (cost $149,782,023) | | $ | 157,991,388 | |
Foreign currency, at value (cost $33,397) | | | 33,228 | |
Segregated cash with broker | | | 1,561,850 | |
Prepaid expenses | | | 13,870 | |
Receivables: | |
Securities sold | | | 320,266 | |
Fund shares sold | | | 4,862 | |
Dividends | | | 441,971 | |
Foreign taxes reclaim | | | 345,253 | |
Total assets | | | 160,712,688 | |
| | | | | |
Liabilities: | |
Overdraft due to custodian bank | | | 3,335 | |
Payable for: | |
Securities purchased | | | 338,678 | |
Variation margin | | | 140,443 | |
Management fees | | | 94,660 | |
Fund shares redeemed | | | 87,598 | |
Fund accounting/administration fees | | | 10,818 | |
Trustees’ fees* | | | 4,534 | |
Transfer agent/maintenance fees | | | 2,395 | |
Miscellaneous | | | 51,779 | |
Total liabilities | | | 734,240 | |
Commitments and contingent liabilities (Note 14) | | | — | |
Net assets | | $ | 159,978,448 | |
| | | | | |
Net assets consist of: | |
Paid in capital | | $ | 163,931,185 | |
Undistributed net investment income | | | 4,655,075 | |
Accumulated net realized loss on investments and foreign currency | | | (17,330,006 | ) |
Net unrealized appreciation on investments and foreign currency | | | 8,722,194 | |
Net assets | | $ | 159,978,448 | |
Capital shares outstanding | | | 12,322,818 | |
Net asset value per share | | $ | 12.98 | |
STATEMENT OF OPERATIONS |
Year Ended December 31, 2016 |
Investment Income: | |
Dividends (net of foreign withholding tax of $510,588) | | $ | 6,129,966 | |
Other income | | | 1,443 | |
Total investment income | | | 6,131,409 | |
| | | | | |
Expenses: | |
Management fees | | | 1,118,319 | |
Transfer agent/maintenance fees | | | 24,065 | |
Fund accounting/administration fees | | | 189,537 | |
Line of credit fees | | | 24,881 | |
Custodian fees | | | 12,165 | |
Trustees’ fees* | | | 7,740 | |
Tax expense | | | 207 | |
Miscellaneous | | | 83,788 | |
Total expenses | | | 1,460,702 | |
Net investment income | | | 4,670,707 | |
| | | | | |
Net Realized and Unrealized Gain (Loss): | |
Net realized gain (loss) on: | |
Investments | | | 582,873 | |
Futures contracts | | | 115,155 | |
Foreign currency | | | (21,435 | ) |
Net realized gain on investments and foreign currency | | | 676,593 | |
Net change in unrealized appreciation (depreciation) on: | |
Investments | | | 9,911,336 | |
Futures contracts | | | 542,919 | |
Foreign currency | | | 9,715 | |
Net change in unrealized appreciation (depreciation) on investments and foreign currency | | | 10,463,970 | |
Net realized and unrealized gain on investments and foreign currency | | | 11,140,563 | |
Net increase in net assets resulting from operations | | $ | 15,811,270 | |
* | Relates to Trustees not deemed “interested persons” within the meaning of Section 2(a)(19) of the 1940 Act. |
34 | THE GUGGENHEIM FUNDS ANNUAL REPORT | SEE NOTES TO FINANCIAL STATEMENTS. |
SERIES D (WORLD EQUITY INCOME SERIES) | |
STATEMENTS OF CHANGES IN NET ASSETS |
| | Year Ended
December 31,
2016 | | | Year Ended
December 31,
2015 | |
Increase (Decrease) in Net Assets from Operations: | | | | | | |
Net investment income | | $ | 4,670,707 | | | $ | 4,917,694 | |
Net realized gain (loss) on investments and foreign currency | | | 676,593 | | | | (2,047,178 | ) |
Net change in unrealized appreciation (depreciation) on investments and foreign currency | | | 10,463,970 | | | | (3,729,132 | ) |
Net increase (decrease) in net assets resulting from operations | | | 15,811,270 | | | | (858,616 | ) |
| | | | | | | | | |
Distributions to shareholders from: | | | | | | | | |
Net investment income | | | (4,893,739 | ) | | | (5,474,029 | ) |
Total distributions to shareholders | | | (4,893,739 | ) | | | (5,474,029 | ) |
| | | | | | | | | |
Capital share transactions: | | | | | | | | |
Proceeds from sale of shares | | | 11,580,964 | | | | 5,158,083 | |
Distributions reinvested | | | 4,893,739 | | | | 5,474,029 | |
Cost of shares redeemed | | | (25,477,140 | ) | | | (24,784,500 | ) |
Net decrease from capital share transactions | | | (9,002,437 | ) | | | (14,152,388 | ) |
Net increase (decrease) in net assets | | | 1,915,094 | | | | (20,485,033 | ) |
| | | | | | | | | |
Net assets: | | | | | | | | |
Beginning of year | | | 158,063,354 | | | | 178,548,387 | |
End of year | | $ | 159,978,448 | | | $ | 158,063,354 | |
Undistributed net investment income at end of year | | $ | 4,655,075 | | | $ | 4,898,476 | |
| | | | | | | | | |
Capital share activity: | | | | | | | | |
Shares sold | | | 944,472 | | | | 409,045 | |
Shares issued from reinvestment of distributions | | | 383,222 | | | | 437,922 | |
Shares redeemed | | | (2,042,647 | ) | | | (1,982,543 | ) |
Net decrease in shares | | | (714,953 | ) | | | (1,135,576 | ) |
SEE NOTES TO FINANCIAL STATEMENTS. | THE GUGGENHEIM FUNDS ANNUAL REPORT | 35 |
SERIES D (WORLD EQUITY INCOME SERIES) | |
This table is presented to show selected data for a share outstanding throughout each period and to assist shareholders in evaluating a Fund’s performance for the periods presented.
| | Year Ended
December 31,
2016 | | | Year Ended
December 31,
2015 | | | Year Ended
December 31,
2014 | | | Year Ended
December 31,
2013 | | | Year Ended
December 31,
2012 | |
Per Share Data | | | | | | | | | | | | | | | |
Net asset value, beginning of period | | $ | 12.12 | | | $ | 12.60 | | | $ | 12.00 | | | $ | 10.06 | | | $ | 8.63 | |
Income (loss) from investment operations: | |
Net investment income (loss)a | | | .37 | | | | .36 | | | | .37 | | | | .28 | | | | .19 | |
Net gain (loss) on investments (realized and unrealized) | | | .88 | | | | (.43 | ) | | | .23 | | | | 1.66 | | | | 1.24 | |
Total from investment operations | | | 1.25 | | | | (.07 | ) | | | .60 | | | | 1.94 | | | | 1.43 | |
Less distributions from: | |
Net investment income | | | (.39 | ) | | | (.41 | ) | | | (— | )b | | | — | | | | — | |
Total distributions | | | (.39 | ) | | | (.41 | ) | | | (— | )b | | | — | | | | — | |
Net asset value, end of period | | $ | 12.98 | | | $ | 12.12 | | | $ | 12.60 | | | $ | 12.00 | | | $ | 10.06 | |
| |
Total Returnc | | | 10.37 | % | | | (0.67 | %) | | | 5.00 | % | | | 19.28 | % | | | 16.57 | % |
Ratios/Supplemental Data | |
Net assets, end of period (in thousands) | | $ | 159,978 | | | $ | 158,063 | | | $ | 178,548 | | | $ | 193,594 | | | $ | 185,233 | |
Ratios to average net assets: | |
Net investment income (loss) | | | 2.92 | % | | | 2.88 | % | | | 2.95 | % | | | 2.50 | % | | | 2.03 | % |
Total expensesd | | | 0.91 | % | | | 0.96 | % | | | 1.01 | % | | | 1.14 | % | | | 1.17 | % |
Portfolio turnover rate | | | 43 | % | | | 110 | % | | | 132 | % | | | 150 | % | | | 36 | % |
a | Net investment income (loss) per share was computed using average shares outstanding throughout the period. |
b | Distributions from net investment income are less than $0.01 per share. |
c | Total return does not take into account any of the expenses associated with an investment in variable insurance products. If total return had taken into account these expenses, performance would have been lower. Shares of a series of Guggenheim Variable Funds Trust are available only through the purchase of such products. |
d | Does not include expenses of the underlying funds in which the Fund invests. |
36 | THE GUGGENHEIM FUNDS ANNUAL REPORT | SEE NOTES TO FINANCIAL STATEMENTS. |
MANAGER’S COMMENTARY (Unaudited) | December 31, 2016 |
To Our Shareholders:
The Series E (Total Return Bond Series) is managed by a team of seasoned professionals, including B. Scott Minerd, Chairman of Investments and Global Chief Investment Officer; Anne B. Walsh, Senior Managing Director and Assistant Chief Investment Officer; Jeffrey B. Abrams, Senior Managing Director and Portfolio Manager; James W. Michal, Senior Managing Director and Portfolio Manager; Steven H. Brown, CFA, Managing Director and Portfolio Manager; and Adam Bloch, Director and Portfolio Manager. In the following paragraphs, the investment team discusses the market environment and the Fund’s performance for the fiscal year ended December 31, 2016.
For the one-year period ended December 31, 2016, the Series E (Total Return Bond Series) returned 6.83%, compared with the 2.65% return of its benchmark, the Bloomberg Barclays U.S. Aggregate Bond Index.
The Fund seeks to provide total return, comprised of current income and capital appreciation. The Fund pursues its investment objective by investing primarily in high-quality, investment-grade fixed-income securities across multiple sectors. The Fund employs a tactical sector allocation strategy, offering the opportunity to capitalize on total return potential created by changing market conditions.
The rally in risk assets that began in February 2016, interrupted in June by the U.K.’s vote to leave the E.U., continued through the end of the year. Donald Trump’s win in the November U.S. Presidential election defied investor expectations and polling trends. Between Election Day and the end of December 2016, the S&P 500 rallied 4.6%, high-yield spreads tightened 83 basis points, and 10-year Treasury yields rose 57 basis points.
The market reaction to the outcome of the U.S. presidential election set the stage for the Fed to hike in December. As widely expected, the Fed raised target interest rates by 25 basis points from a range of 0.25–0.50% to 0.50–0.75%. More importantly, the Federal Open Market Committee (FOMC) now projects three rate increases in 2017, up from two in September. The upward shift appears to reflect the view that there may be less room for accommodative policy to continue in light of recent labor market data. We believe the participation rate introduces meaningful uncertainty to the pace of Fed tightening. In 2016, a rising participation rate helped keep the Fed at bay for most of the year as it stabilized the unemployment rate slightly above what the Fed considers full employment. However, the participation trend reversed in October and November, causing the unemployment rate to decline to only 4.7% by December.
The Fund saw positive performance primarily attributable to tightening credit spreads across fixed income sectors, as well as the Portfolio’s high carry. The credit rally continued through the year despite one of the worst selloffs in government bond markets since the 2013 taper tantrum. Positive returns were driven largely by good credit selection in asset-backed securities (including collateralized loan obligations, or CLOs, and aircraft securitizations), bank loans, mortgage-backed securities (including commercial mortgage-backed securities, or CMBS, and non-agency residential mortgage-backed securities, or NA RMBS), high yield bonds, bank loans and preferred securities.
A majority of the Fund’s structured credit holdings feature floating rates, yields higher than traditional securitized assets like auto or credit-card receivables, and, often, investment-grade ratings. The Fund believes that commercial ABS and CLOs offer some downside protection, and amortizing structures to keep credit exposure lower over time. Many of the NA RMBS were purchased at discounts and also typically have floating coupons that help keep duration short. Floating rate instruments accounted for about half the portfolio at the end of the period.
Given the Federal Reserve interest rate hike in December 2016, the upward trend in the 10-year U.S. Treasury note yield, and the anticipation of three additional rate hikes in 2017, the Portfolio remains adherent to a “barbell” duration strategy. Around half of the Portfolio has an effective duration of less than one year. A majority of these securities have floating or adjustable rates whose coupons reset every 30 or 90 days based on the then current level of LIBOR. At the other end of the “barbell” are longer-term bank preferred and sovereign debt, with higher yields and longer durations. We anticipate over time the yield curve will bear flatten and thus we believe the longer duration securities to be more insulated to losses than the intermediate part of the curve.
Performance displayed represents past performance which is no guarantee of future results.
The opinions and forecast expressed may not actually come to pass. This information is subject to change at any time, based on market and other conditions, and should not be construed as a recommendation of any specific security or strategy.
| | THE GUGGENHEIM FUNDS ANNUAL REPORT | 37 |
PERFORMANCE REPORT AND FUND PROFILE (Unaudited) | December 31, 2016 |
SERIES E (TOTAL RETURN BOND SERIES)
OBJECTIVE: Seeks to provide total return, comprised of current income and capital appreciation.
Holdings Diversification (Market Exposure as % of Net Assets)
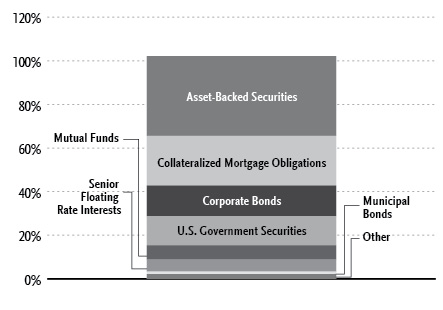
“Holdings Diversification (Market Exposure as % of Net Assets)” excludes any temporary cash investments or investments in Guggenheim Strategy Funds Trust mutual funds. Investments in those Funds do not provide “market exposure” to meet the Fund’s investment objective, but will significantly increase the portfolio’s exposure to certain other asset categories (and their associated risks), which may cause the Fund to deviate from its principal investment strategy, including: (i) high yield, high risk debt securities rated below the top four long-term rating categories by a nationally recognized statistical rating organization (also known as “junk bonds”); (ii) securities issued by the U.S. government or its agencies and instrumentalities; (iii) CLOs and similar investments; and (iv) other short-term fixed income securities.
Inception Date: April 26, 1985 |
Ten Largest Holdings (% of Total Net Assets) |
Guggenheim Total Return Bond Fund - Institutional Class | 4.7% |
U.S. Treasury Notes | 4.4% |
U.S. Treasury Bonds | 4.4% |
Guggenheim Strategy Fund I | 2.7% |
Guggenheim Limited Duration Fund - Institutional Class | 1.8% |
Willis Engine Securitization Trust II | 1.4% |
OCP CLO Ltd. | 1.1% |
Grayson CLO Ltd. | 1.1% |
Store Master Funding I-VII | 1.0% |
Citigroup Commercial Mortgage Trust | 1.0% |
Top Ten Total | 23.6% |
“Ten Largest Holdings” excludes any temporary cash or derivative investments. |
38 | THE GUGGENHEIM FUNDS ANNUAL REPORT | |
PERFORMANCE REPORT AND FUND PROFILE (Unaudited)(concluded) | December 31, 2016 |
Cumulative Fund Performance*,†
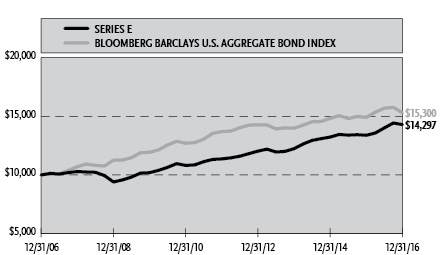
Average Annual Returns*
Periods Ended December 31, 2016†
| 1 Year | 5 Year | 10 Year |
Series E (Total Return Bond Series) | 6.83% | 4.70% | 3.64% |
Bloomberg Barclays U.S. Aggregate Bond Index | 2.65% | 2.23% | 4.34% |
Portfolio Composition by Quality Rating** |
Rating | |
Fixed Income Instruments | |
AAA | 18.8% |
AA | 11.8% |
A | 18.6% |
BBB | 9.6% |
BB | 7.2% |
B | 5.6% |
CCC | 3.7% |
CC | 0.7% |
NR1 | 10.5% |
Other Instruments | 13.5% |
Total Investments | 100.0% |
The chart above reflects percentages of the value of total investments. |
* | The performance data above represents past performance that is not predictive of future results. The investment return and principal value of an investment in the Fund will fluctuate so that an investor’s shares, when redeemed, may be worth more or less than their original cost. Returns are historical and include changes in principal and reinvested dividends and capital gains and do not reflect the effect of taxes. The Bloomberg Barclays U.S. Aggregate Bond Index is an unmanaged index and, unlike the Fund, has no management fees or operating expenses to reduce its reported return. |
** | Source: BlackRock Solutions. Credit quality ratings are measured on a scale that generally ranges from AAA (highest) to D (lowest). All securities except for those labeled “NR” have been rated by Moody’s, Standard & Poor’s (“S&P”), or Fitch, which are all a Nationally Recognized Statistical Rating Organization (“NRSRO”). For purposes of this presentation, when ratings are available from more than one agency, the highest rating is used. Guggenheim Investments has converted Moody’s and Fitch ratings to the equivalent S&P rating. Security ratings are determined at the time of purchase and may change thereafter. |
† | Performance figures do not reflect fees and expenses associated with an investment in variable insurance products. If returns had taken into account these fees and expenses, performance would have been lower. Shares of a series of Guggenheim Variable Funds Trust are available only through the purchase of such products. |
1 | NR securities do not necessarily indicate low credit quality. |
| | THE GUGGENHEIM FUNDS ANNUAL REPORT | 39 |
SCHEDULE OF INVESTMENTS | December 31, 2016 |
SERIES E (TOTAL RETURN BOND SERIES) | |
| | Shares | | | Value | |
| | | | | | | |
UNIT INVESTMENTS TRUSTS† - 0.1% | |
| | | | | | | |
Financial - 0.1% | |
Rescap Liquidating Trust* | | | 9,655 | | | $ | 97,516 | |
Total Unit Investment Trusts | | | | | | | | |
(Cost $487,486) | | | | | | | 97,516 | |
| | | | | | | | | |
PREFERRED STOCKS†† - 1.0% | |
Financial - 0.6% | |
Woodbourne Capital Trust III 2.83%†††,1,3,13 | | | 300,000 | | | | 179,498 | |
Woodbourne Capital Trust IV 2.83%†††,1,3,13 | | | 300,000 | | | | 179,498 | |
Woodbourne Capital Trust I 2.83%†††,1,3,13 | | | 300,000 | | | | 179,497 | |
Woodbourne Capital Trust II 2.83%†††,1,3,13 | | | 300,000 | | | | 179,497 | |
Total Financial | | | | | | | 717,990 | |
| | | | | | | | | |
Industrial - 0.4% | |
Seaspan Corp. 6.38% due 04/30/19,2 | | | 17,550 | | | | 441,558 | |
Total Preferred Stocks | | | | | | | | |
(Cost $1,644,546) | | | | | | | 1,159,548 | |
| | | | | | | | | |
MUTUAL FUNDS† - 9.2% | |
Guggenheim Total Return Bond Fund - Institutional Class5 | | | 201,056 | | | | 5,317,937 | |
Guggenheim Strategy Fund I5 | | | 122,583 | | | | 3,064,585 | |
Guggenheim Limited Duration Fund - Institutional Class5 | | | 84,139 | | | | 2,074,867 | |
Total Mutual Funds | | | | | | | | |
(Cost $10,418,290) | | | | | | | 10,457,389 | |
| | | | | | | | | |
SHORT-TERM INVESTMENTS† - 4.5% | |
Dreyfus Treasury Securities Cash Management Fund - Institutional Class 0.31%6 | | | 5,083,909 | | | | 5,083,909 | |
Total Short-Term Investments | | | | | | | | |
(Cost $5,083,909) | | | | | | | 5,083,909 | |
| | | | | | | | | |
| | | Face
Amount | | | | | |
| | | | | | | | | |
ASSET-BACKED SECURITIES†† - 36.6% | |
Collateralized Loan Obligations - 21.8% | |
OCP CLO Ltd. | | | | | | | | |
2014-6A, 5.83% due 07/17/261,4 | | $ | 1,400,000 | | | | 1,266,585 | |
2016-11A, 3.28% due 04/26/281,4 | | | 1,000,000 | | | | 1,000,034 | |
2016-2A, 3.73% due 11/22/251,4 | | | 1,000,000 | | | | 998,797 | |
Great Lakes CLO Ltd. | | | | | | | | |
2012-1A, 4.98% due 01/15/231,4 | | | 1,000,000 | | | | 998,601 | |
2014-1A, 4.58% due 04/15/251,4 | | | 250,000 | | | | 243,248 | |
Grayson CLO Ltd. | | | | | | | | |
2006-1A, 1.30% due 11/01/211,4 | | | 1,250,000 | | | | 1,205,818 | |
ACIS CLO Ltd. | | | | | | | | |
2013-2A, 4.09% due 10/14/221,4 | | | 750,000 | | | | 748,828 | |
2013-1A, 3.83% due 04/18/241,4 | | | 400,000 | | | | 393,298 | |
WhiteHorse VIII Ltd. | | | | | | | | |
2014-1A, 2.94% due 05/01/261,4 | | | 1,100,000 | | | | 1,087,730 | |
Northwoods Capital XIV Ltd. | | | | | | |
2014-14A, 3.36% due 11/12/251,4 | | | 1,000,000 | | | | 1,012,591 | |
Oaktree EIF I Series A1 Ltd. | | | | | | | | |
2016-A1, 3.48% due 10/18/271,4 | | | 1,000,000 | | | | 1,001,152 | |
Atrium XI | | | | | | | | |
2014-11A, 4.08% due 10/23/251,4 | | | 1,000,000 | | | | 1,000,076 | |
Marathon CLO IV Ltd. | | | | | | | | |
2012-4A, 3.91% due 05/20/231,4 | | | 1,000,000 | | | | 1,000,057 | |
Telos CLO Ltd. | | | | | | | | |
2013-3A, 3.88% due 01/17/241,4 | | | 1,000,000 | | | | 999,949 | |
Fortress Credit Opportunities V CLO Ltd. | | | | | | | | |
2014-5A, 3.53% due 10/15/261,4 | | | 1,000,000 | | | | 993,247 | |
Dryden 37 Senior Loan Fund | | | | | | | | |
2015-37A, due 04/15/274,7 | | | 1,000,000 | | | | 961,616 | |
Rockwall CDO Ltd. | | | | | | | | |
2007-1A, 1.44% due 08/01/241,4 | | | 900,000 | | | | 883,173 | |
Babson CLO Ltd. | | | | | | | | |
2012-2A, due 05/15/234,7 | | | 750,000 | | | | 445,120 | |
2014-IA, due 07/20/254,7 | | | 550,000 | | | | 318,377 | |
Ivy Hill Middle Market Credit Fund VII Ltd. | | | | | | | | |
2013-7A, 4.33% due 10/20/251,4 | | | 600,000 | | | | 572,484 | |
Black Diamond CLO Ltd. | | | | | | | | |
2013-1A, 4.14% due 02/01/231,4 | | | 550,000 | | | | 553,186 | |
Newstar Trust | | | | | | | | |
2012-2A, 4.13% due 01/20/231,4 | | | 500,000 | | | | 502,994 | |
Dryden XXIII Senior Loan Fund | | | | | | | | |
2014-23A, 3.83% due 07/17/231,4 | | | 500,000 | | | | 500,326 | |
KKR Financial CLO Ltd. | | | | | | | | |
2012-1A, 4.26% due 12/15/241,4 | | | 500,000 | | | | 500,243 | |
Cent CLO | | | | | | | | |
2014-16A, 3.14% due 08/01/241,4 | | | 500,000 | | | | 500,045 | |
Venture CLO Ltd. | | | | | | | | |
2013-14A, 3.69% due 08/28/251,4 | | | 500,000 | | | | 498,986 | |
Fortress Credit Opportunities III CLO, LP | | | | | | | | |
2014-3A, 3.37% due 04/28/261,4 | | | 300,000 | | | | 297,926 | |
2014-3A, 4.12% due 04/28/261,4 | | | 200,000 | | | | 188,990 | |
MCF CLO III LLC | | | | | | | | |
2014-3A, 3.73% due 01/20/241,4 | | | 500,000 | | | | 480,312 | |
Treman Park CLO Ltd. | | | | | | | | |
2015-1A, due 04/20/274,7 | | | 500,000 | | | | 442,982 | |
Eastland CLO Ltd. | | | | | | | | |
2007-1A, 1.29% due 05/01/221,4 | | | 400,000 | | | | 381,223 | |
KVK CLO Ltd. | | | | | | | | |
2013-1A, due 04/14/254,7 | | | 900,000 | | | | 364,546 | |
Halcyon Loan Advisors Funding Ltd. | | | | | | | | |
2012-2A, 5.50% due 12/20/241,4 | | | 350,000 | | | | 344,781 | |
Newstar Commercial Loan Funding LLC | | | | | | | | |
2013-1A, 5.41% due 09/20/231,4 | | | 350,000 | | | | 335,175 | |
Westwood CDO I Ltd. | | | | | | | | |
2007-1A, 1.67% due 03/25/211,4 | | | 300,000 | | | | 290,263 | |
TICC CLO LLC | | | | | | | | |
2012-1A, 5.68% due 08/25/231,4 | | | 250,000 | | | | 250,127 | |
Gallatin CLO VII Ltd. | | | | | | | | |
2014-1A, 3.78% due 07/15/231,4 | | | 250,000 | | | | 250,020 | |
Golub Capital Partners CLO Ltd. | | | | | | | | |
2013-17A, 4.71% due 10/25/251,4 | | | 250,000 | | | | 248,809 | |
40 | THE GUGGENHEIM FUNDS ANNUAL REPORT | SEE NOTES TO FINANCIAL STATEMENTS. |
SCHEDULE OF INVESTMENTS (continued) | December 31, 2016 |
SERIES E (TOTAL RETURN BOND SERIES) | |
| | Face
Amount | | | Value | |
| | | | | | | |
ALM XIV Ltd. | | | | | | |
2014-14A, 3.84% due 07/28/261,4 | | $ | 250,000 | | | $ | 247,839 | |
NewStar Arlington Senior Loan Program LLC | | | | | | | | |
2014-1A, 4.18% due 07/25/251,4 | | | 250,000 | | | | 242,839 | |
Copper River CLO Ltd. | | | | | | | | |
2007-1A, due 01/20/211,7,13 | | | 600,000 | | | | 141,541 | |
Keuka Park CLO Ltd. | | | | | | | | |
2013-1A, due 10/21/244,7 | | | 250,000 | | | | 129,929 | |
ICE EM CLO | | | | | | | | |
2007-1A, 1.80% due 08/15/221,4 | | | 52,860 | | | | 52,706 | |
Total Collateralized Loan Obligations | | | | | | | 24,876,569 | |
| | | | | | | | | |
Transport-Aircraft - 8.4% | |
Apollo Aviation Securitization Equity Trust | | | | | | | | |
2014-1, 5.13% due 12/15/29 | | | 1,057,692 | | | | 1,050,288 | |
2016-1A, 4.88% due 03/17/364 | | | 925,000 | | | | 935,551 | |
2014-1, 7.38% due 12/15/291 | | | 634,615 | | | | 630,173 | |
Willis Engine Securitization Trust II | | | | | | | | |
2012-A, 5.50% due 09/15/374 | | | 1,612,737 | | | | 1,600,641 | |
Castlelake Aircraft Securitization Trust | | | | | | | | |
2015-1A, 4.70% due 12/15/404 | | | 889,430 | | | | 900,549 | |
2014-1, 5.25% due 02/15/294 | | | 383,489 | | | | 381,955 | |
2014-1, 7.50% due 02/15/29 | | | 192,611 | | | | 192,129 | |
Emerald Aviation Finance Ltd. | | | | | | | | |
2013-1, 4.65% due 10/15/384 | | | 940,295 | | | | 953,224 | |
2013-1, 6.35% due 10/15/384 | | | 188,059 | | | | 188,059 | |
Rise Ltd. | | | | | | | | |
2014-1, 4.75% due 02/12/39 | | | 949,169 | | | | 942,999 | |
AIM Aviation Finance Ltd. | | | | | | | | |
2015-1A, 4.21% due 02/15/404 | | | 869,048 | | | | 862,530 | |
Turbine Engines Securitization Ltd. | | | | | | | | |
2013-1A, 5.13% due 12/13/4813 | | | 657,089 | | | | 644,809 | |
AABS Ltd. | | | | | | | | |
2013-1, 4.88% due 01/15/38 | | | 275,119 | | | | 273,606 | |
Total Transport-Aircraft | | | | | | | 9,556,513 | |
| | | | | | | | | |
Collateralized Debt Obligations - 3.8% | |
FDF II Ltd. | | | | | | | | |
2016-2A, 4.29% due 05/12/314 | | | 1,000,000 | | | | 979,070 | |
Anchorage Credit Funding 4 Ltd. | | | | | | | | |
2016-4A, 3.50% due 02/15/354 | | | 1,000,000 | | | | 971,477 | |
Putnam Structured Product Funding Ltd. | | | | | | | | |
2003-1A, 1.70% due 10/15/381,4 | | | 995,907 | | | | 876,851 | |
Triaxx Prime CDO Ltd. | | | | | | | | |
2006-2A, 0.88% due 10/02/391,4 | | | 607,226 | | | | 587,424 | |
N-Star REL CDO VIII Ltd. | | | | | | | | |
2006-8A, 0.98% due 02/01/411,4 | | | 311,632 | | | | 307,679 | |
RAIT CRE CDO I Ltd. | | | | | | | | |
2006-1X A1B, 1.07% due 11/20/46 | | | 305,783 | | | | 299,148 | |
SRERS Funding Ltd. | | | | | | | | |
2011-RS, 0.90% due 05/09/461,4 | | | 265,422 | | | | 261,502 | |
Gramercy Real Estate CDO Ltd. | | | | | | | | |
2006-1A, 1.25% due 07/25/411,4 | | | 44,441 | | | | 44,374 | |
Total Collateralized Debt Obligations | | | | | | | 4,327,525 | |
| | | | | | | | | |
Net Lease - 1.0% | |
Store Master Funding I-VII | | | | | | | | |
2016-1A, 3.96% due 10/20/464 | | | 1,246,392 | | | | 1,194,857 | |
| | | | | | | | | |
Whole Business - 0.9% | |
Taco Bell Funding LLC | | | | | | | | |
2016-1A, 4.97% due 05/25/464 | | | 997,500 | | | | 990,615 | |
| | | | | | | | | |
Insurance - 0.5% | |
Chesterfield Financial Holdings LLC | | | | | | | | |
2014-1A, 4.50% due 12/15/344 | | | 615,750 | | | | 611,791 | |
| | | | | | | | | |
Financial - 0.2% | |
Garanti Diversified Payment Rights Finance Co. | | | | | | | | |
2007-A, 1.06% due 07/09/171 | | | 240,000 | | | | 238,891 | |
Total Asset-Backed Securities | | | | | | | | |
(Cost $41,736,813) | | | | | | | 41,796,761 | |
| | | | | | | | | |
COLLATERALIZED MORTGAGE OBLIGATIONS†† - 22.8% | |
Residential Mortgage Backed Securities - 16.7% | |
LSTAR Securities Investment Trust | | | | | | | | |
2016-2, 2.62% due 03/01/211,4 | | | 1,030,868 | | | | 1,017,546 | |
2015-4, 2.62% due 04/01/201,4 | | | 744,076 | | | | 742,681 | |
2015-3, 2.62% due 03/01/201,4 | | | 741,212 | | | | 735,015 | |
2015-2, 2.62% due 01/01/201,4 | | | 598,864 | | | | 595,857 | |
American Home Mortgage Investment Trust | | | | | | | | |
2006-1, 0.98% due 03/25/461 | | | 1,011,355 | | | | 837,622 | |
2007-1, 5.85% due 05/25/478 | | | 3,303,181 | | | | 576,381 | |
LSTAR Commercial Mortgage Trust 2016-7 | | | | | | | | |
2016-7, 2.61% due 12/01/211,4 | | | 1,100,000 | | | | 1,083,845 | |
CSMC Series | | | | | | | | |
2015-12R, 1.08% due 11/30/371,4 | | | 1,150,000 | | | | 1,081,255 | |
LSTAR Securities Investment Ltd. | | | | | | | | |
2016-4, 2.62% due 10/01/211,4 | | | 1,075,467 | | | | 1,063,673 | |
VOLT L LLC | | | | | | | | |
2016-NP10, 3.50% due 09/25/461,4 | | | 986,626 | | | | 984,006 | |
GSAA Trust | | | | | | | | |
2005-10, 1.41% due 06/25/351 | | | 1,050,000 | | | | 968,642 | |
American Home Mortgage Assets Trust | | | | | | | | |
2007-1, 1.27% due 02/25/471 | | | 1,564,677 | | | | 916,442 | |
Wachovia Asset Securitization Issuance II LLC Trust | | | | | | | | |
2007-HE2A, 0.89% due 07/25/371,4 | | | 1,036,283 | | | | 913,624 | |
Bayview Opportunity Master Fund IIIa Trust | | | | | | | | |
2016-RN3, 3.60% due 09/29/314 | | | 911,557 | | | | 908,153 | |
CIT Mortgage Loan Trust | | | | | | | | |
2007-1, 2.21% due 10/25/371,4 | | | 897,616 | | | | 879,441 | |
Luminent Mortgage Trust | | | | | | | | |
2006-2, 0.96% due 02/25/461 | | | 1,083,957 | | | | 761,526 | |
VOLT XLI LLC | | | | | | | | |
2016-NPL1, 4.25% due 02/26/464,9 | | | 749,908 | | | | 757,858 | |
HarborView Mortgage Loan Trust | | | | | | | | |
2006-14, 0.89% due 01/25/471 | | | 807,277 | | | | 661,345 | |
VOLT XL LLC | | | | | | | | |
2015-NP14, 4.38% due 11/27/454 | | | 623,422 | | | | 628,176 | |
VOLT XXXVI LLC | | | | | | | | |
2015-NP10, 3.63% due 07/25/451,4 | | | 577,630 | | | | 578,334 | |
Banc of America Funding Ltd. | | | | | | | | |
2013-R1, 0.75% due 11/03/411,4 | | | 617,132 | | | | 562,381 | |
Nationstar HECM Loan Trust | | | | | | | | |
2016-1A, 2.98% due 02/25/264 | | | 552,276 | | | | 551,443 | |
SEE NOTES TO FINANCIAL STATEMENTS. | THE GUGGENHEIM FUNDS ANNUAL REPORT | 41 |
SCHEDULE OF INVESTMENTS (continued) | December 31, 2016 |
SERIES E (TOTAL RETURN BOND SERIES) | |
| | Face
Amount | | | Value | |
| | | | | | | |
NRPL Trust | | | | | | |
2015-1A, 3.88% due 11/01/544 | $ | 541,504 | | | $ | 537,097 | |
Washington Mutual Mortgage Pass-Through Certificates WMALT Series Trust | | | | | | | |
2006-AR9, 1.41% due 11/25/461 | | 498,059 | | | | 357,751 | |
UCFC Manufactured Housing Contract | | | | | | | |
1997-2, 7.38% due 10/15/28 | | 201,508 | | | | 207,539 | |
Morgan Stanley Re-REMIC Trust | | | | | | | |
2010-R5, 1.26% due 06/26/361,4 | | 140,696 | | | | 103,018 | |
Nomura Resecuritization Trust | | | | | | | |
2012-1R, 1.20% due 08/27/471,4 | | 99,183 | | | | 97,240 | |
Total Residential Mortgage Backed Securities | | | | | | 19,107,891 | |
| | | | | | | | |
Commercial Mortgage Backed Securities - 5.0% | |
Citigroup Commercial Mortgage Trust | | | | | | | |
2016-GC36, 4.76% due 02/10/491 | | 1,100,000 | | | | 1,108,580 | |
2016-GC37, 4.36% due 04/10/498 | | 3,835,502 | | | | 467,793 | |
GS Mortgage Securities Corporation Trust | | | | | | | |
2016-ICE2, 4.79% due 02/15/331,4 | | 1,000,000 | | | | 1,012,568 | |
Cosmopolitan Hotel Trust | | | | | | | |
2016-CSMO, 3.35% due 11/15/331,4 | | 1,000,000 | | | | 1,005,639 | |
Wells Fargo Commercial Mortgage Trust | | | | | | | |
2016-NXS5, 4.73% due 01/15/598 | | 4,965,469 | | | | 460,691 | |
2016-C32, 4.71% due 01/15/598 | | 5,315,613 | | | | 458,948 | |
COMM Mortgage Trust | | | | | | | |
2015-CR26, 5.01% due 10/10/488 | | 6,948,816 | | | | 446,023 | |
CFCRE Commercial Mortgage Trust | | | | | | | |
2016-C3, 4.65% due 01/10/488 | | 5,958,129 | | | | 435,167 | |
Hilton USA Trust | | | | | | | |
2013-HLT, 4.45% due 11/05/301,4 | | 300,000 | | | | 300,448 | |
2013-HLT, 4.41% due 11/05/304 | | 1,441 | | | | 1,435 | |
Total Commercial Mortgage Backed Securities | | | | 5,697,292 | |
| | | | | | | | |
Military Housing - 1.1% | |
GMAC Commercial Mortgage Asset Corp. | | | | | | | |
2007-HCKM, 6.11% due 08/10/52†††,13 | | 977,605 | | | | 985,544 | |
2003-PRES, 6.24% due 10/10/414 | | 234,058 | | | | 264,247 | |
Total Military Housing | | | | | | 1,249,791 | |
Total Collateralized Mortgage Obligations | | | | | | | |
(Cost $26,024,945) | | | | | | 26,054,974 | |
| | | | | | | | |
CORPORATE BONDS†† - 14.0% | |
Financial - 6.1% | |
Citigroup, Inc. | | | | | | | |
| | 6.25%1,3 | | 950,000 | | | | 977,549 | |
| | 5.95%1,3 | | 370,000 | | | | 375,532 | |
Mid-Atlantic Military Family Communities LLC | | | | | | | |
5.30% due 08/01/504 | | 949,453 | | | | 888,147 | |
AmTrust Financial Services, Inc. | | | | | | | |
6.13% due 08/15/232 | | 825,000 | | | | 858,223 | |
Hospitality Properties Trust | | | | | | | |
5.25% due 02/15/26 | | 700,000 | | | | 708,479 | |
BBC Military Housing-Navy Northeast LLC | | | | | | | |
6.30% due 10/15/49†††,2 | | 485,000 | | | | 480,050 | |
Pacific Northwest Communities LLC | | | | | | | |
5.91% due 06/15/5013 | | 400,000 | | | | 430,128 | |
Wilton Re Finance LLC | | | | | | | |
5.88% due 03/30/331,4 | | 375,000 | | | | 382,031 | |
Kennedy-Wilson, Inc. | | | | | | | |
5.88% due 04/01/24 | | 350,000 | | | | 356,563 | |
Atlantic Marine Corporations Communities LLC | | | | | | | |
5.43% due 12/01/5013 | | 332,887 | | | | 323,000 | |
GEO Group, Inc. | | | | | | | |
5.88% due 10/15/24 | | 300,000 | | | | 295,875 | |
ACC Group Housing LLC | | | | | | | |
6.35% due 07/15/54†††,13 | | 250,000 | | | | 268,573 | |
Bank of America Corp. | | | | | | | |
| | 6.30%1,3 | | 250,000 | | | | 261,250 | |
CIC Receivables Master Trust | | | | | | | |
4.89% due 10/07/21††† | | 183,946 | | | | 185,371 | |
Cadence Bank North America | | | | | | | |
6.25% due 06/28/291,13 | | 150,000 | | | | 131,426 | |
Total Financial | | | | | | 6,922,197 | |
| | | | | | | | | |
Energy - 2.7% | |
Sunoco Logistics Partners Operations, LP | | | | | | | |
5.95% due 12/01/2510 | | 750,000 | | | | 835,575 | |
4.25% due 04/01/24 | | 150,000 | | | | 151,159 | |
ConocoPhillips | | | | | | | |
6.50% due 02/01/39 | | 500,000 | | | | 632,957 | |
Buckeye Partners, LP | | | | | | | |
4.35% due 10/15/24 | | 300,000 | | | | 306,159 | |
3.95% due 12/01/26 | | 300,000 | | | | 291,962 | |
MPLX, LP | | | | | | | |
4.88% due 12/01/24 | | 350,000 | | | | 360,393 | |
Gulfstream Natural Gas System LLC | | | | | | | |
4.60% due 09/15/254 | | 300,000 | | | | 310,817 | |
Hess Corp. | | | | | | | |
4.30% due 04/01/27 | | 150,000 | | | | 149,313 | |
Total Energy | | | | | | 3,038,335 | |
| | | | | | | | | |
Basic Materials - 1.9% | |
Yamana Gold, Inc. | | | | | | | |
4.95% due 07/15/24 | | 865,000 | | | | 847,700 | |
Newcrest Finance Pty Ltd. | | | | | | | |
4.20% due 10/01/224,10 | | 760,000 | | | | 764,202 | |
BHP Billiton Finance USA Ltd. | | | | | | | |
6.75% due 10/19/751,4 | | 300,000 | | | | 336,750 | |
Alcoa Nederland Holding BV | | | | | | | |
7.00% due 09/30/264 | | 200,000 | | | | 219,000 | |
Total Basic Materials | | | | | | 2,167,652 | |
| | | | | | | | | |
Communications - 1.2% | |
CSC Holdings LLC | | | | | | | |
6.63% due 10/15/254 | | 360,000 | | | | 393,300 | |
6.75% due 11/15/21 | | 200,000 | | | | 215,000 | |
Sprint Communications, Inc. | | | | | | | |
9.00% due 11/15/184 | | 400,000 | | | | 441,000 | |
DISH DBS Corp. | | | | | | | |
5.88% due 11/15/24 | | 325,000 | | | | 334,425 | |
Total Communications | | | | | | 1,383,725 | |
42 | THE GUGGENHEIM FUNDS ANNUAL REPORT | SEE NOTES TO FINANCIAL STATEMENTS. |
SCHEDULE OF INVESTMENTS (continued) | December 31, 2016 |
SERIES E (TOTAL RETURN BOND SERIES) | |
| | Face
Amount | | | Value | |
| | | | | | | |
Consumer, Non-cyclical - 0.9% | |
Tenet Healthcare Corp. | | | | | | |
4.46% due 06/15/201 | | $ | 500,000 | | | $ | 503,750 | |
Vector Group Ltd. | | | | | | | | |
7.75% due 02/15/21 | | | 475,000 | | | | 495,188 | |
Total Consumer, Non-cyclical | | | | | | | 998,938 | |
| | | | | | | | | |
Consumer, Cyclical - 0.6% | |
Northern Group Housing LLC | | | | | | | | |
6.80% due 08/15/5313 | | | 600,000 | | | | 715,998 | |
| | | | | | | | | |
Utilities - 0.3% | |
AES Corp. | | | | | | | | |
6.00% due 05/15/26 | | | 400,000 | | | | 406,000 | |
| | | | | | | | | |
Diversified - 0.3% | |
HRG Group, Inc. | | | | | | | | |
7.88% due 07/15/19 | | | 325,000 | | | | 338,813 | |
Total Corporate Bonds | | | | | | | | |
(Cost $15,469,291) | | | | | | | 15,971,658 | |
| | | | | | | | | |
U.S. GOVERNMENT SECURITIES†† - 8.7% | |
U.S. Treasury Notes | | | | | | | | |
2.00% due 11/15/2610 | | | 5,202,000 | | | | 5,005,094 | |
U.S. Treasury Bonds | | | | | | | | |
due 11/15/4410,11 | | | 11,963,000 | | | | 4,978,833 | |
Total U.S. Government Securities | | | | | | | | |
(Cost $10,587,444) | | | | | | | 9,983,927 | |
| | | | | | | | | |
Federal Agency Bonds†† - 4.8% | |
Fannie Mae Principal Strip12 | | | | | | | | |
due 05/15/3011 | | | 1,350,000 | | | | 868,127 | |
due 05/15/2911 | | | 1,250,000 | | | | 815,224 | |
due 01/15/3011 | | | 600,000 | | | | 384,868 | |
Total Fannie Mae Principal Strip | | | | | | | 2,068,219 | |
Freddie Mac Strips12 | | | | | | | | |
due 03/15/3111 | | | 1,500,000 | | | | 920,447 | |
due 07/15/3211 | | | 800,000 | | | | 463,295 | |
Total Freddie Mac Strips | | | | | | | 1,383,742 | |
Freddie Mac12 | | | | | | | | |
due 12/14/2910,11 | | | 1,600,000 | | | | 1,042,951 | |
Tennessee Valley Authority | | | | | | | | |
5.38% due 04/01/5610 | | | 750,000 | | | | 937,897 | |
Total Federal Agency Bonds | | | | | | | | |
(Cost $5,628,117) | | | | | | | 5,432,809 | |
| | | | | | | | | |
SENIOR FLOATING RATE INTERESTS††,1 - 5.5% | |
Technology - 1.6% | |
Epicor Software | | | | | | | | |
4.75% due 06/01/22 | | | 587,893 | | | | 589,573 | |
EIG Investors Corp. | | | | | | | | |
6.00% due 02/09/23 | | | 418,593 | | | | 414,930 | |
Greenway Medical Technologies | | | | | | | | |
6.00% due 11/04/202 | | | 330,905 | | | | 327,596 | |
Landslide Holdings, Inc. | | | | | | | | |
5.50% due 09/27/22 | | | 277,570 | | | | 280,693 | |
Solera LLC | | | | | | | | |
5.75% due 03/03/23 | | | 248,125 | | | | 251,227 | |
Total Technology | | | | | | | 1,864,019 | |
| | | | | | | | | |
Industrial - 1.3% | |
Capstone Logistics | | | | | | | | |
5.50% due 10/07/21 | | | 702,789 | | | | 693,422 | |
Travelport Holdings LLC | | | | | | | | |
5.00% due 09/02/21 | | | 681,640 | | | | 687,713 | |
CareCore National LLC | | | | | | | | |
5.50% due 03/05/21 | | | 92,173 | | | | 90,560 | |
Total Industrial | | | | | | | 1,471,695 | |
| | | | | | | | | |
Consumer, Cyclical - 1.0% | |
PetSmart Inc | | | | | | | | |
4.00% due 03/11/22 | | | 595,968 | | | | 597,459 | |
Neiman Marcus Group, Inc. | | | | | | | | |
4.25% due 10/25/20 | | | 339,524 | | | | 294,282 | |
Acosta, Inc. | | | | | | | | |
4.25% due 09/26/21 | | | 198,704 | | | | 193,488 | |
Total Consumer, Cyclical | | | | | | | 1,085,229 | |
| | | | | | | | | |
Communications - 0.7% | |
Cengage Learning Acquisitions, Inc. | | | | | | | | |
5.25% due 06/07/23 | | | 696,999 | | | | 677,071 | |
MergerMarket Ltd. | | | | | | | | |
4.50% due 02/04/21 | | | 97,250 | | | | 96,521 | |
Total Communications | | | | | | | 773,592 | |
| | | | | | | | | |
Consumer, Non-cyclical - 0.6% | |
Albertson’s LLC | | | | | | | | |
4.25% due 12/21/22 | | | 497,503 | | | | 503,722 | |
NES Global Talent | | | | | | | | |
6.50% due 10/03/192 | | | 120,645 | | | | 108,580 | |
DJO Finance LLC | | | | | | | | |
4.25% due 06/08/20 | | | 100,000 | | | | 95,844 | |
Total Consumer, Non-cyclical | | | | | | | 708,146 | |
| | | | | | | | | |
Financial - 0.3% | |
Magic Newco, LLC | | | | | | | | |
5.00% due 12/12/18 | | | 241,194 | | | | 243,154 | |
American Stock Transfer & Trust | | | | | | | | |
5.75% due 06/26/20 | | | 94,412 | | | | 93,940 | |
Total Financial | | | | | | | 337,094 | |
Total Senior Floating Rate Interests | | | | | | | | |
(Cost $6,228,049) | | | | | | | 6,239,775 | |
| | | | | | | | | |
MUNICIPAL BONDS†† - 1.2% | |
Michigan - 0.8% | |
Detroit City School District General Obligation Unlimited | | | | | | | | |
7.75% due 05/01/39 | | | 750,000 | | | | 978,713 | |
SEE NOTES TO FINANCIAL STATEMENTS. | THE GUGGENHEIM FUNDS ANNUAL REPORT | 43 |
SCHEDULE OF INVESTMENTS (continued) | December 31, 2016 |
SERIES E (TOTAL RETURN BOND SERIES) | |
| | Face
Amount | | | Value | |
| | | | | | | |
Illinois - 0.4% | |
State of Illinois General Obligation Unlimited | | | | | | |
5.65% due 12/01/38 | | $ | 400,000 | | | $ | 416,312 | |
Total Municipal Bonds | | | | | | | | |
(Cost $1,364,344) | | | | | | | 1,395,025 | |
| | | | | | | | | |
FOREIGN GOVERNMENT BONDS†† - 1.0% | |
Kenya Government International Bond | | | | | | | | |
6.88% due 06/24/244 | | | 700,000 | | | | 660,022 | |
Dominican Republic International Bond | | | | | | | | |
6.85% due 01/27/454 | | | 500,000 | | | | 472,360 | |
Total Foreign Government Bonds | | | | | | | | |
(Cost $1,241,675) | | | | | | | 1,132,382 | |
| | | | | | | | | |
Total Investments - 109.4% | | | | | | | | |
(Cost $125,914,909) | | | | | | $ | 124,805,673 | |
Other Assets & Liabilities, net - (9.4)% | | | | | | | (10,763,080 | ) |
Total Net Assets - 100.0% | | | | | | $ | 114,042,593 | |
* | Non-income producing security. |
† | Value determined based on Level 1 inputs — See Note 4. |
†† | Value determined based on Level 2 inputs, unless otherwise noted — See Note 4. |
††† | Value determined based on Level 3 inputs — See Note 4. |
1 | Variable rate security. Rate indicated is rate effective at December 31, 2016. |
2 | Illiquid security. |
3 | Perpetual maturity. |
4 | Security is a 144A or Section 4(a)(2) security. The total market value of 144A or Section 4(a)(2) securities is $58,655,785 (cost $58,213,364), or 51.4% of total net assets. These securities have been determined to be liquid under guidelines established by the Board of Trustees. |
5 | Affiliated issuer — See Note 8. |
6 | Rate indicated is the 7 day yield as of December 31, 2016. |
7 | Security has no stated coupon. However, it is expected to receive residual cash flow payments on defined deal dates. |
8 | Security is an interest-only strip. Rate indicated is effective yield at December 31, 2016. |
9 | Security is a step up/step down bond. The coupon increases or decreases at regular intervals until the bond reaches full maturity. Rate indicated is as of December 31, 2016. |
10 | Security or a portion thereof is held as collateral for reverse repurchase agreements — See Note 12. |
11 | Zero coupon rate security. |
12 | On September 7, 2008, the issuer was placed in conservatorship by the Federal Housing Finance Agency (FHFA). As conservator, the FHFA has full powers to control the assets and operations of the firm. |
13 | Security is a 144A or Section 4(a)(2) security. These securities are considered illiquid and restricted under guidelines established by the Board of Trustees. The total market value of 144A or Section 4(a)(2) securities is $4,359,009 (cost $5,087,260), or 3.8% of total net assets — See Note 13. |
| | |
| | See Sector Classification in Other Information section. |
44 | THE GUGGENHEIM FUNDS ANNUAL REPORT | SEE NOTES TO FINANCIAL STATEMENTS. |
SCHEDULE OF INVESTMENTS (continued) | December 31, 2016 |
SERIES E (TOTAL RETURN BOND SERIES) | |
The following table summarizes the inputs used to value the Fund’s investments at December 31, 2016 (See Note 4 in the Notes to Financial Statements):
Investments in Securities (Assets) | | Level 1 | | | Level 2 | | | Level 3 | | | Total | |
Asset-Backed Securities | | $ | — | | | $ | 41,796,761 | | | $ | — | | | $ | 41,796,761 | |
Collateralized Mortgage Obligations | | | — | | | | 25,069,430 | | | | 985,544 | | | | 26,054,974 | |
Corporate Bonds | | | — | | | | 15,037,664 | | | | 933,994 | | | | 15,971,658 | |
Federal Agency Bonds | | | — | | | | 5,432,809 | | | | — | | | | 5,432,809 | |
Foreign Government Bonds | | | — | | | | 1,132,382 | | | | — | | | | 1,132,382 | |
Municipal Bonds | | | — | | | | 1,395,025 | | | | — | | | | 1,395,025 | |
Mutual Funds | | | 10,457,389 | | | | — | | | | — | | | | 10,457,389 | |
Preferred Stocks | | | — | | | | 441,558 | | | | 717,990 | | | | 1,159,548 | |
Senior Floating Rate Interests | | | — | | | | 6,239,775 | | | | — | | | | 6,239,775 | |
Short-Term Investments | | | 5,083,909 | | | | — | | | | — | | | | 5,083,909 | |
Unit Investment Trusts | | | 97,516 | | | | — | | | | — | | | | 97,516 | |
U.S. Government Securities | | | — | | | | 9,983,927 | | | | — | | | | 9,983,927 | |
Total | | $ | 15,638,814 | | | $ | 106,529,331 | | | $ | 2,637,528 | | | $ | 124,805,673 | |
The following is a summary of significant unobservable inputs used in the fair valuation of assets and liabilities categorized within Level 3 of the fair value hierarchy:
Category | | Level 3 | | Valuation Technique | Unobservable Inputs |
Collateralized Mortgage Obligations | | $ | 985,544 | | Option Adjusted Spread off the prior month end broker mark over the 3 month LIBOR | Indicative Quote |
Corporate Bonds | | | 933,994 | | Option Adjusted Spread off the prior month end broker mark over the 3 month LIBOR | Indicative Quote |
Preferred Stocks
| | | 717,990 | | Option Adjusted Spread off the prior month end broker mark over the 3 month LIBOR | Indicative Quote |
Total | | $ | 2,637,528 | | | |
Transfers between investment levels may occur as the markets fluctuate and/or the availability of data used in an investment’s valuation changes. Transfers between valuation levels, if any, are in comparison to the valuation levels at the end of the previous fiscal year, and are effective using the fair value as of the end of the previous fiscal period.
As of December 31, 2016, Series E (Total Return Bond Series) had securities with a total value of $965,033 transfer out of Level 3 into Level 2 due to the availability of current and reliable market-based data provided by a third-party pricing service which utilizes significant observable inputs. There were no other securities that transferred between levels.
SEE NOTES TO FINANCIAL STATEMENTS. | THE GUGGENHEIM FUNDS ANNUAL REPORT | 45 |
SCHEDULE OF INVESTMENTS (concluded) | December 31, 2016 |
SERIES E (TOTAL RETURN BOND SERIES) | |
Summary of Fair Value Level 3 Activity
Following is a reconciliation of Level 3 assets for which significant unobservable inputs were used to determine fair value for the year ended December 31, 2016:
LEVEL 3 - Fair value measurement using significant unobservable inputs
| | Collateralized
Mortgage
Obligations | | | Corporate
Bonds | | | Preferred
Stocks | | | Total | |
Assets: | | | | | | | | | | | | |
Beginning Balance | | $ | 237,977 | | | $ | 1,969,243 | | | $ | 643,284 | | | $ | 2,850,504 | |
Purchases | | | 1,129,393 | | | | — | | | | — | | | | 1,129,393 | |
Sales, maturities and paydowns | | | (1,234 | ) | | | (343,149 | ) | | | — | | | | (344,383 | ) |
Total realized gains or losses included in earnings | | | — | | | | (29,616 | ) | | | — | | | | (29,616 | ) |
Total change in unrealized gains or losses included in earnings | | | (142,615 | ) | | | 64,572 | | | | 74,706 | | | | (3,337 | ) |
Transfers into Level 3 | | | — | | | | — | | | | — | | | | — | |
Transfers out of Level 3 | | | (237,977 | ) | | | (727,056 | ) | | | — | | | | (965,033 | ) |
Ending Balance | | $ | 985,544 | | | $ | 933,994 | | | $ | 717,990 | | | $ | 2,637,528 | |
Net Change in unrealized appreciation (depreciation) for investments in securities still held at December 31, 2016 | | $ | (142,107 | ) | | $ | (2,897 | ) | | $ | 74,706 | | | $ | (70,298 | ) |
46 | THE GUGGENHEIM FUNDS ANNUAL REPORT | SEE NOTES TO FINANCIAL STATEMENTS. |
SERIES E (TOTAL RETURN BOND SERIES) | |
STATEMENT OF ASSETS AND LIABILITIES |
December 31, 2016 |
Assets: | |
Investments in unaffiliated issuers, at value (cost $115,496,619) | | $ | 114,348,284 | |
Investments in affiliated issuers, at value (cost $10,418,290) | | | 10,457,389 | |
Total investments (cost $125,914,909) | | | 124,805,673 | |
Prepaid expenses | | | 9,009 | |
Cash | | | 1,160 | |
Receivables: | |
Securities sold | | | 288,316 | |
Fund shares sold | | | 2,012,111 | |
Dividends | | | 27,767 | |
Interest | | | 592,035 | |
Total assets | | | 127,736,071 | |
| | | | | |
Liabilities: | |
Reverse Repurchase Agreements (Note 12) | | | 11,566,929 | |
Payable for: | |
Securities purchased | | | 1,955,085 | |
Fund shares redeemed | | | 42,729 | |
Management fees | | | 31,771 | |
Distribution and service fees | | | 23,396 | |
Fund accounting/administration fees | | | 7,487 | |
Interest on reverse repurchase agreements | | | 4,250 | |
Trustees’ fees* | | | 2,167 | |
Transfer agent/maintenance fees | | | 2,162 | |
Miscellaneous | | | 57,502 | |
Total liabilities | | | 13,693,478 | |
Commitments and contingent liabilities (Note 14) | | | — | |
Net assets | | $ | 114,042,593 | |
| | | | | |
Net assets consist of: | |
Paid in capital | | $ | 117,287,724 | |
Undistributed net investment income | | | 5,394,432 | |
Accumulated net realized loss on investments | | | (7,530,327 | ) |
Net unrealized depreciation on investments | | | (1,109,236 | ) |
Net assets | | $ | 114,042,593 | |
Capital shares outstanding | | | 7,105,174 | |
Net asset value per share | | $ | 16.05 | |
STATEMENT OF OPERATIONS |
Year Ended December 31, 2016 |
Investment Income: | |
Interest | | $ | 5,417,236 | |
Dividends from securities of affiliated issuers | | | 344,872 | |
Dividends from securities of unaffiliated issuers | | | 63,127 | |
Total investment income | | | 5,825,235 | |
| | | | | |
Expenses: | |
Management fees | | | 588,089 | |
Transfer agent/maintenance fees | | | 23,646 | |
Distribution and service fees | | | 294,044 | |
Fund accounting/administration fees | | | 107,561 | |
Interest expense | | | 40,813 | |
Line of credit fees | | | 17,059 | |
Custodian fees | | | 7,286 | |
Trustees’ fees* | | | 6,885 | |
Miscellaneous | | | 108,475 | |
Total expenses | | | 1,193,858 | |
Less: | |
Expenses waived by Adviser | | | (220,270 | ) |
Net expenses | | | 973,588 | |
Net investment income | | | 4,851,647 | |
| | | | | |
Net Realized and Unrealized Gain (Loss): | |
Net realized gain (loss) on: | |
Investments in unaffiliated issuers | | | 1,671,404 | |
Investments in affiliated issuers | | | (322,989 | ) |
Realized gain distributions received from investment company shares | | | 22,841 | |
Net realized gain | | | 1,371,256 | |
Net change in unrealized appreciation (depreciation) on: | |
Investments in unaffiliated issuers | | | 1,321,058 | |
Investments in affiliated issuers | | | 401,934 | |
Net change in unrealized appreciation (depreciation) | | | 1,722,992 | |
Net realized and unrealized gain | | | 3,094,248 | |
Net increase in net assets resulting from operations | | $ | 7,945,895 | |
* | Relates to Trustees not deemed “interested persons” within the meaning of Section 2(a)(19) of the 1940 Act. |
SEE NOTES TO FINANCIAL STATEMENTS. | THE GUGGENHEIM FUNDS ANNUAL REPORT | 47 |
SERIES E (TOTAL RETURN BOND SERIES) | |
STATEMENTS OF CHANGES IN NET ASSETS |
| | Year Ended
December 31,
2016 | | | Year Ended
December 31,
2015 | |
Increase (Decrease) in Net Assets from Operations: | | | | | | |
Net investment income | | $ | 4,851,647 | | | $ | 4,741,542 | |
Net realized gain on investments | | | 1,371,256 | | | | 21,757 | |
Net change in unrealized appreciation (depreciation) on investments | | | 1,722,992 | | | | (3,373,731 | ) |
Net increase in net assets resulting from operations | | | 7,945,895 | | | | 1,389,568 | |
| | | | | | | | | |
Distributions to shareholders from: | | | | | | | | |
Net investment income | | | (5,293,814 | ) | | | (2,550,797 | ) |
Total distributions to shareholders | | | (5,293,814 | ) | | | (2,550,797 | ) |
| | | | | | | | | |
Capital share transactions: | | | | | | | | |
Proceeds from sale of shares | | | 50,511,862 | | | | 45,993,430 | |
Distributions reinvested | | | 5,293,814 | | | | 2,550,797 | |
Cost of shares redeemed | | | (56,389,556 | ) | | | (63,058,796 | ) |
Net decrease from capital share transactions | | | (583,880 | ) | | | (14,514,569 | ) |
Net increase (decrease) in net assets | | | 2,068,201 | | | | (15,675,798 | ) |
| | | | | | | | | |
Net assets: | | | | | | | | |
Beginning of year | | | 111,974,392 | | | | 127,650,190 | |
End of year | | $ | 114,042,593 | | | $ | 111,974,392 | |
Undistributed net investment income at end of year | | $ | 5,394,432 | | | $ | 4,527,625 | |
| | | | | | | | | |
Capital share activity: | | | | | | | | |
Shares sold | | | 3,156,693 | | | | 2,901,918 | |
Shares issued from reinvestment of distributions | | | 333,364 | | | | 162,782 | |
Shares redeemed | | | (3,523,839 | ) | | | (3,957,752 | ) |
Net decrease in shares | | | (33,782 | ) | | | (893,052 | ) |
48 | THE GUGGENHEIM FUNDS ANNUAL REPORT | SEE NOTES TO FINANCIAL STATEMENTS. |
SERIES E (TOTAL RETURN BOND SERIES) | |
This table is presented to show selected data for a share outstanding throughout each period and to assist shareholders in evaluating a Fund’s performance for the periods presented.
| | Year Ended
December 31,
2016 | | | Year Ended
December 31,
2015 | | | Year Ended
December 31,
2014 | | | Year Ended
December 31,
2013 | | | Year Ended
December 31,
2012 | |
Per Share Data | | | | | | | | | | | | | | | |
Net asset value, beginning of period | | $ | 15.68 | | | $ | 15.89 | | | $ | 14.70 | | | $ | 14.45 | | | $ | 13.65 | |
Income (loss) from investment operations: | |
Net investment income (loss)a | | | .66 | | | | .67 | | | | .58 | | | | .54 | | | | .38 | |
Net gain (loss) on investments (realized and unrealized) | | | .41 | | | | (.50 | ) | | | .61 | | | | (.29 | ) | | | .42 | |
Total from investment operations | | | 1.07 | | | | .17 | | | | 1.19 | | | | .25 | | | | .80 | |
Less distributions from: | |
Net investment income | | | (.70 | ) | | | (.38 | ) | | | — | | | | — | | | | — | |
Total distributions | | | (.70 | ) | | | (.38 | ) | | | — | | | | — | | | | — | |
Net asset value, end of period | | $ | 16.05 | | | $ | 15.68 | | | $ | 15.89 | | | $ | 14.70 | | | $ | 14.45 | |
| |
Total Returnb | | | 6.83 | % | | | 1.15 | % | | | 8.10 | % | | | 1.73 | % | | | 5.86 | % |
Ratios/Supplemental Data | |
Net assets, end of period (in thousands) | | $ | 114,043 | | | $ | 111,974 | | | $ | 127,650 | | | $ | 94,123 | | | $ | 112,791 | |
Ratios to average net assets: | |
Net investment income (loss) | | | 4.13 | % | | | 4.19 | % | | | 3.72 | % | | | 3.69 | % | | | 2.75 | % |
Total expensesc | | | 1.02 | % | | | 1.05 | % | | | 1.05 | % | | | 1.07 | % | | | 0.94 | % |
Net expensesd,e | | | 0.83 | % | | | 0.83 | % | | | 0.85 | % | | | 0.87 | % | | | 0.81 | % |
Portfolio turnover rate | | | 88 | % | | | 85 | % | | | 62 | % | | | 109 | % | | | 79 | % |
a | Net investment income (loss) per share was computed using average shares outstanding throughout the period. |
b | Total return does not take into account any of the expenses associated with an investment in variable insurance products. If total return had taken into account these expenses, performance would have been lower. Shares of a series of Guggenheim Variable Funds Trust are available only through the purchase of such products. |
c | Does not include expenses of the underlying funds in which the Fund invests. |
d | Net expense information reflects the expense ratios after expense waivers. |
e | Net expenses may include expenses that are excluded from the expense limitation agreement and affiliated fee waivers. Excluding these expenses, the net expense ratios for the periods would be: |
12/31/16 | 12/31/15 | 12/31/14 | 12/31/13 |
0.78% | 0.78% | 0.79% | 0.81% |
SEE NOTES TO FINANCIAL STATEMENTS. | THE GUGGENHEIM FUNDS ANNUAL REPORT | 49 |
MANAGER’S COMMENTARY (Unaudited) | December 31, 2016 |
To Our Shareholders:
The Series F (Floating Rate Series) is managed by a team of seasoned professionals, including B. Scott Minerd, Chairman of Investments and Global Chief Investment Officer; Anne B. Walsh, Senior Managing Director and Assistant Chief Investment Officer; Kevin H. Gundersen, Senior Managing Director and Portfolio Manager; James W. Michal, Senior Managing Director and Portfolio Manager; and Thomas J. Hauser, Managing Director and Portfolio Manager. In the following paragraphs, the investment team discusses the market environment and Series performance for the fiscal year ended December 31, 2016.
For the one-year period ended December 31, 2016, the Series F (Floating Rate Series) returned 8.56%, compared with 9.87% for its benchmark, the Credit Suisse Leveraged Loan Index.
Fund performance for the period was primarily a result of credit selection among loans, as Guggenheim’s bottom-up, fundamental approach results in the construction of portfolios that produce favorable yield while at the same being defensively positioned. The Fund’s loan holdings’ continued underweight to energy and staples exposure relative to the broader market was also a positive for much of the period. However, underweights to consumer cyclical and basic industry detracted from return.
Earnings growth for loan issuers outpaced that of high-yield bond issuers in 2016. We expect this trend to reverse in 2017, as energy borrowers, which represent a larger portion of the high-yield market, recover. Most of this is priced into the market already, with high-yield bond spreads trading tighter than bank loan discount margins, on average.
The Fund focuses on staying up in quality, as times of uncertainty have been accompanied by higher volatility in lower-quality assets. This positioning worked against the Fund at times during the period, amid a volatile interest rate environment or when lower quality loans outperformed. The Fund’s allocations to bank loans, high yield bonds, and structured credit help to decrease volatility and diversify sources of return, and contributed to return for the period.
The CLO market rebounded during the period. Volatility during early 2016 kept many CLO issuers on the sidelines. As a result, traditional CLO debt investors entered the third quarter well behind internal CLO spending targets. Adding to demand, investors continued to increase allocations to floating-rate CLO debt in response to rising USD LIBOR and negative yields in Japan and Europe. Not surprisingly, CLO spreads tightened significantly during the period. Already hoping to issue or refinance CLOs ahead of the December 2016 risk retention deadline, CLO issuers were only too happy to meet strong CLO demand. September represented the highest monthly CLO issuance since June 2015.
We maintain our preference for senior positions in the capital structure, specifically first-lien debt. We do acknowledge however that weaker covenants and less subordinated debt (which acts to cushion losses) in post-crisis deals became more prevalent during the ultra-easy money post-crisis days. This will likely prove negative for recoveries when the credit cycle matures, highlighting the importance of careful credit selection
We continue to avoid highly levered industries and companies with heavy capital expenditure needs that can impair cash flow generation. Companies with strong cash flows, recurring revenue streams, and high-quality margins should remain the focus in the later stages of the cycle. With only 5% exposure to energy and 2% exposure to metals and mining, leveraged loans are relatively insulated to fundamental deterioration stemming from commodity markets.
New institutional loan issuance totaled $337 billion in 2016, approximately 30% higher than 2015, and was more heavily weighted to the second half of the year. The twelve-month trailing issuer-weighted default rate for loans ended the period at 1.8%. Excluding commodity-related issuers, the default rate remains near the post-crisis low at just 1.1%.
Performance displayed represents past performance which is no guarantee of future results.
The opinions and forecast expressed may not actually come to pass. This information is subject to change at any time, based on market and other conditions, and should not be construed as a recommendation of any specific security or strategy.
50 | THE GUGGENHEIM FUNDS ANNUAL REPORT | |
PERFORMANCE REPORT AND FUND PROFILE (Unaudited) | December 31, 2016 |
SERIES F (FLOATING RATE STRATEGIES SERIES)
OBJECTIVE: Seeks to provide a high level of income while maximizing total return.
Holdings Diversification (Market Exposure as % of Net Assets)
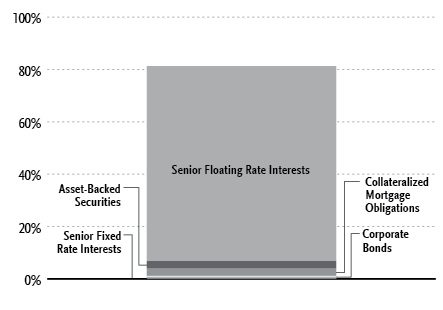
“Holdings Diversification (Market Exposure as % of Net Assets)” excludes any temporary cash investments.
Inception Date: April 24, 2013 |
Ten Largest Holdings (% of Total Net Assets) |
National Financial Partners Corp. | 1.4% |
Gates Global, Inc. | 1.2% |
Fitness International LLC | 1.1% |
Active Network LLC | 1.0% |
Cengage Learning Acquisitions, Inc. | 1.0% |
Reynolds Group Holdings | 0.9% |
Quikrete Holdings, Inc. | 0.9% |
Flex Acquisition Company, Inc. | 0.9% |
Leslie’s Poolmart, Inc. | 0.9% |
SFR Group SA | 0.9% |
Top Ten Total | 10.2% |
“Ten Largest Holdings” excludes any temporary cash or derivative investments.
| | THE GUGGENHEIM FUNDS ANNUAL REPORT | 51 |
PERFORMANCE REPORT AND FUND PROFILE (Unaudited)(concluded) | December 31, 2016 |
Cumulative Fund Performance*,†
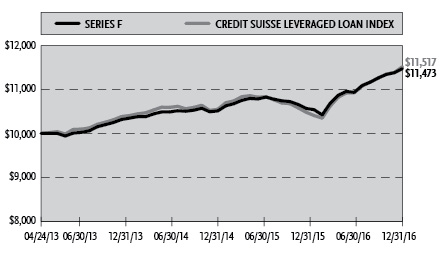
Average Annual Returns*
Periods Ended December 31, 2016†
| 1 Year | Since Inception
(04/24/13) |
Series F (Floating Rate Strategies Series) | 8.56% | 3.80% |
Credit Suisse Leveraged Loan Index | 9.87% | 3.90% |
Portfolio Composition by Quality Rating** |
Rating | |
Fixed Income Instruments | |
AA | 0.6% |
A | 0.8% |
BBB | 3.6% |
BB | 23.7% |
B | 41.8% |
CCC | 1.0% |
NR1 | 3.3% |
Other Instruments | 25.2% |
Total Investments | 100.0% |
The chart above reflects percentages of the value of total investments.
* | The performance data above represents past performance that is not predictive of future results. The investment return and principal value of an investment in the Fund will fluctuate so that an investor’s shares, when redeemed, may be worth more or less than their original cost. Returns are historical and include changes in principal and reinvested dividends and capital gains and do not reflect the effect of taxes. The Credit Suisse Leveraged Loan Index is an unmanaged index and, unlike the Fund, has no management fees or operating expenses to reduce its reported return. |
** | Source: BlackRock Solutions. Credit quality ratings are measured on a scale that generally ranges from AAA (highest) to D (lowest). All securities except for those labeled “NR” have been rated by Moody’s, Standard & Poor’s (“S&P”), or Fitch, which are all a Nationally Recognized Statistical Rating Organization (“NRSRO”). For purposes of this presentation, when ratings are available from more than one agency, the highest rating is used. Guggenheim Investments has converted Moody’s and Fitch ratings to the equivalent S&P rating. Security ratings are determined at the time of purchase and may change thereafter. |
† | Performance figures do not reflect fees and expenses associated with an investment in variable insurance products. If returns had taken into account these fees and expenses, performance would have been lower. Shares of a series of Guggenheim Variable Funds Trust are available only through the purchase of such products. |
1 | NR securities do not necessarily indicate low credit quality. |
52 | THE GUGGENHEIM FUNDS ANNUAL REPORT | |
SCHEDULE OF INVESTMENTS | December 31, 2016 |
SERIES F (FLOATING RATE STRATEGIES SERIES) | |
| | Shares | | | Value | |
| | | | | | | |
SHORT-TERM INVESTMENTS† - 27.5% | |
Federated U.S. Treasury Cash Reserve Fund 0.30%1 | | | 14,634,805 | | | $ | 14,634,805 | |
Total Short-Term Investments | | | | | | | | |
(Cost $14,634,805) | | | | | | | 14,634,805 | |
| | | | | | | | | |
| | | Face
Amount | | | | | |
| | | | | | | | | |
SENIOR FLOATING RATE INTERESTS††,3 - 74.4% | |
Industrial - 16.1% | |
Reynolds Group Holdings | | | | | | | | |
4.25% due 02/05/23 | | $ | 498,750 | | | | 504,871 | |
Quikrete Holdings, Inc. | | | | | | | | |
4.00% due 11/15/23 | | | 500,000 | | | | 504,585 | |
Flex Acquisition Company, Inc. | | | | | | | | |
4.25% due 12/29/23 | | | 500,000 | | | | 504,165 | |
Signode Industrial Group US, Inc. | | | | | | | | |
4.00% due 04/30/21 | | | 500,000 | | | | 503,750 | |
Zodiac Pool Solutions LLC | | | | | | | | |
5.50% due 12/20/23 | | | 500,000 | | | | 502,815 | |
Rexnord LLC/ RBS Global, Inc. | | | | | | | | |
3.75% due 08/21/23 | | | 500,000 | | | | 501,750 | |
Transdigm, Inc. | | | | | | | | |
3.85% due 05/14/22 | | | 491,671 | | | | 495,579 | |
Travelport Holdings LLC | | | | | | | | |
5.00% due 09/02/21 | | | 484,988 | | | | 489,309 | |
GYP Holdings III Corp. | | | | | | | | |
4.50% due 04/01/21 | | | 457,679 | | | | 461,304 | |
Pro Mach Group, Inc. | | | | | | | | |
4.75% due 10/22/21 | | | 455,984 | | | | 454,616 | |
Filtration Group Corp. | | | | | | | | |
4.25% due 11/23/20 | | | 448,841 | | | | 451,785 | |
Advanced Disposal Services, Inc. | | | | | | | | |
3.50% due 11/10/23 | | | 444,000 | | | | 447,610 | |
Engility Corp. | | | | | | | | |
5.81% due 08/14/23 | | | 428,386 | | | | 434,489 | |
Amber Bidco Ltd. | | | | | | | | |
4.87% due 06/30/21†††,2 | | | 350,000 | | | | 345,470 | |
Thermasys Corp. | | | | | | | | |
5.25% due 05/03/192 | | | 367,500 | | | | 311,916 | |
CareCore National LLC | | | | | | | | |
5.50% due 03/05/21 | | | 305,188 | | | | 299,847 | |
USIC Holding, Inc. | | | | | | | | |
4.75% due 12/08/23 | | | 250,000 | | | | 251,458 | |
Bioplan USA, Inc. | | | | | | | | |
5.75% due 09/23/21 | | | 196,500 | | | | 188,394 | |
SI Organization | | | | | | | | |
5.75% due 11/22/19 | | | 171,488 | | | | 173,203 | |
ProAmpac PG Borrower LLC | | | | | | | | |
5.00% due 11/20/23 | | | 150,000 | | | | 151,595 | |
SRS Distribution, Inc. | | | | | | | | |
5.25% due 08/25/22 | | | 128,924 | | | | 130,697 | |
Doncasters Group Ltd. | | | | | | | | |
9.50% due 10/09/20 | | | 135,172 | | | | 125,034 | |
Nielsen Finance LLC | | | | | | |
3.15% due 10/04/23 | | | 100,000 | | | | 101,042 | |
Mast Global | | | | | | | | |
7.75% due 09/12/19†††,2 | | | 87,736 | | | | 87,337 | |
Crosby Worldwide | | | | | | | | |
4.00% due 11/23/20 | | | 95,846 | | | | 85,603 | |
NANA Development Corp. | | | | | | | | |
8.00% due 03/15/182 | | | 62,500 | | | | 60,000 | |
Total Industrial | | | | | | | 8,568,224 | |
| | | | | | | | | |
Consumer, Cyclical - 14.6% | |
Gates Global, Inc. | | | | | | | | |
4.25% due 07/05/21 | | | 652,290 | | | | 652,289 | |
Fitness International LLC | | | | | | | | |
6.00% due 07/01/20 | | | 576,967 | | | | 577,330 | |
Leslie’s Poolmart, Inc. | | | | | | | | |
5.25% due 08/16/23 | | | 498,750 | | | | 504,052 | |
AlixPartners, LLP | | | | | | | | |
4.00% due 07/28/22 | | | 498,750 | | | | 502,311 | |
Smart & Final Stores LLC | | | | | | | | |
4.41% due 11/15/22 | | | 500,000 | | | | 498,595 | |
PETCO Animal Supplies, Inc. | | | | | | | | |
5.00% due 01/26/23 | | | 372,188 | | | | 373,784 | |
5.14% due 01/26/23 | | | 124,063 | | | | 124,683 | |
PetSmart Inc | | | | | | | | |
4.00% due 03/11/22 | | | 496,103 | | | | 497,343 | |
Sears Holdings Corp. | | | | | | | | |
5.50% due 06/30/18 | | | 491,139 | | | | 470,266 | |
Navistar, Inc. | | | | | | | | |
6.50% due 08/07/20 | | | 445,500 | | | | 450,623 | |
Advantage Sales & Marketing LLC | | | | | | | | |
4.25% due 07/23/21 | | | 444,819 | | | | 446,043 | |
Life Time Fitness | | | | | | | | |
4.25% due 06/10/22 | | | 438,472 | | | | 440,871 | |
National Vision, Inc. | | | | | | | | |
4.00% due 03/12/21 | | | 440,932 | | | | 438,542 | |
Burlington Coat Factory Warehouse Corp. | | | | | | | | |
3.51% due 08/13/21 | | | 400,000 | | | | 402,356 | |
PTL Acqusition, Inc. | | | | | | | | |
4.02% due 05/12/23 | | | 299,250 | | | | 303,739 | |
Belk, Inc. | | | | | | | | |
5.75% due 12/12/22 | | | 327,375 | | | | 281,271 | |
Talbots, Inc. | | | | | | | | |
5.50% due 03/19/20 | | | 245,518 | | | | 238,275 | |
1-800 Contacts | | | | | | | | |
5.25% due 01/22/23 | | | 198,500 | | | | 200,568 | |
Ascena Retail Group | | | | | | | | |
5.25% due 08/21/22 | | | 148,176 | | | | 144,324 | |
Equinox Fitness | | | | | | | | |
5.00% due 01/31/20 | | | 108,459 | | | | 109,454 | |
NPC International, Inc. | | | | | | | | |
4.75% due 12/28/18 | | | 98,196 | | | | 98,187 | |
Total Consumer, Cyclical | | | | | | | 7,754,906 | |
| | | | | | | | | |
Technology - 11.4% | |
Active Network LLC | | | | | | | | |
6.00% due 11/13/20 | | | 543,469 | | | | 542,110 | |
SEE NOTES TO FINANCIAL STATEMENTS. | THE GUGGENHEIM FUNDS ANNUAL REPORT | 53 |
SCHEDULE OF INVESTMENTS (continued) | December 31, 2016 |
SERIES F (FLOATING RATE STRATEGIES SERIES) | |
| | Face
Amount | | | Value | |
| | | | | | | |
EIG Investors Corp. | | | | | | |
6.48% due 11/08/19 | | $ | 373,689 | | | $ | 370,886 | |
6.00% due 02/09/23 | | | 108,342 | | | | 107,394 | |
Ipreo Holdings | | | | | | | | |
4.25% due 08/06/21 | | | 491,275 | | | | 472,852 | |
Landslide Holdings, Inc. | | | | | | | | |
5.50% due 09/27/22 | | | 462,617 | | | | 467,821 | |
Compucom Systems, Inc. | | | | | | | | |
4.25% due 05/11/20 | | | 580,020 | | | | 446,616 | |
Micron Technology, Inc. | | | | | | | | |
4.52% due 04/26/22 | | | 398,997 | | | | 404,683 | |
Diebold, Inc. | | | | | | | | |
5.25% due 11/06/23 | | | 398,750 | | | | 404,109 | |
Applied Systems, Inc. | | | | | | | | |
4.00% due 01/25/21 | | | 398,929 | | | | 402,420 | |
Solera LLC | | | | | | | | |
5.75% due 03/03/23 | | | 397,000 | | | | 401,963 | |
Ceridian Corp. | | | | | | | | |
4.50% due 09/15/20 | | | 403,070 | | | | 399,877 | |
Greenway Medical Technologies | | | | | | | | |
6.00% due 11/04/202 | | | 378,177 | | | | 374,395 | |
Aspect Software, Inc. | | | | | | | | |
11.28% due 05/25/20 | | | 327,469 | | | | 326,104 | |
NXP B.V. / NXP Funding LLC | | | | | | | | |
3.27% due 12/07/20 | | | 299,250 | | | | 300,597 | |
Advanced Computer Software | | | | | | | | |
6.50% due 03/18/22 | | | 245,625 | | | | 234,162 | |
Sparta Holding Corp. | | | | | | | | |
6.50% due 07/28/20†††,2 | | | 191,011 | | | | 189,873 | |
Infoblox, Inc. | | | | | | | | |
6.00% due 11/07/23 | | | 100,000 | | | | 99,375 | |
Infor, Inc. | | | | | | | | |
3.75% due 06/03/20 | | | 93,589 | | | | 93,572 | |
CPI Acquisition, Inc. | | | | | | | | |
5.50% due 08/17/22 | | | 41,839 | | | | 37,864 | |
Total Technology | | | | | | | 6,076,673 | |
| | | | | | | | | |
Consumer, Non-cyclical - 10.9% | |
Cotiviti Corp. | | | | | | | | |
3.75% due 09/28/23 | | | 500,000 | | | | 503,750 | |
Press Ganey Holdings, Inc. | | | | | | | | |
4.25% due 10/23/23 | | | 500,000 | | | | 502,499 | |
US Foods, Inc. | | | | | | | | |
3.77% due 06/27/23 | | | 497,500 | | | | 502,475 | |
Authentic Brands | | | | | | | | |
5.50% due 05/27/21 | | | 490,891 | | | | 493,345 | |
American Tire Distributors, Inc. | | | | | | | | |
5.25% due 09/01/21 | | | 491,026 | | | | 489,082 | |
Lineage Logistics LLC | | | | | | | | |
4.50% due 04/07/21 | | | 486,250 | | | | 482,603 | |
DJO Finance LLC | | | | | | | | |
4.25% due 06/08/20 | | | 493,750 | | | | 473,230 | |
Albertson’s LLC | | | | | | | | |
4.25% due 12/21/22 | | | 450,000 | | | | 455,625 | |
Pharmaceutical Product Development | | | | | | | | |
4.25% due 08/18/22 | | | 450,000 | | | | 454,613 | |
CHG Healthcare Services, Inc. | | | | | | | | |
4.75% due 06/07/23 | | | 448,869 | | | | 453,470 | |
Reddy Ice Holdings, Inc. | | | | | | | | |
6.75% due 05/01/19 | | | 385,965 | | | | 375,671 | |
NES Global Talent | | | | | | | | |
6.50% due 10/03/192 | | | 403,697 | | | | 363,328 | |
Valeant Pharmaceuticals International, Inc. | | | | | | | | |
5.50% due 04/01/22 | | | 100,124 | | | | 100,143 | |
Acadia Healthcare Company, Inc. | | | | | | | | |
3.76% due 02/16/23 | | | 99,000 | | | | 99,743 | |
CTI Foods Holding Co. LLC | | | | | | | | |
8.25% due 06/28/21 | | | 80,000 | | | | 72,000 | |
Total Consumer, Non-cyclical | | | | | | | 5,821,577 | |
| | | | | | | | | |
Communications - 10.5% | |
Cengage Learning Acquisitions, Inc. | | | | | | | | |
5.25% due 06/07/23 | | | 535,970 | | | | 520,646 | |
SFR Group SA | | | | | | | | |
4.04% due 01/14/25 | | | 500,000 | | | | 503,875 | |
WMG Acquisition Corp. | | | | | | | | |
3.75% due 11/01/23 | | | 500,000 | | | | 503,855 | |
Ziggo BV | | | | | | | | |
3.50% due 01/14/22 | | | 315,106 | | | | 316,421 | |
3.50% due 01/15/22 | | | 184,894 | | | | 185,665 | |
Virgin Media Bristol LLC | | | | | | | | |
2.75% due 01/31/25 | | | 500,000 | | | | 501,940 | |
Univision Communications, Inc. | | | | | | | | |
4.00% due 02/28/20 | | | 497,338 | | | | 499,825 | |
Radiate HoldCo LLC | | | | | | | | |
3.75% due 12/12/23 | | | 450,000 | | | | 452,750 | |
AMC Entertainment Holdings, Inc. | | | | | | | | |
3.51% due 12/15/23 | | | 400,000 | | | | 403,700 | |
Telenet Financing USD LLC | | | | | | | | |
3.70% due 01/31/25 | | | 400,000 | | | | 402,924 | |
Mcgraw-Hill Global Education Holdings LLC | | | | | | | | |
5.00% due 05/04/22 | | | 398,997 | | | | 399,061 | |
MergerMarket Ltd. | | | | | | | | |
4.50% due 02/04/21 | | | 340,375 | | | | 337,822 | |
CSC Holdings, LLC | | | | | | | | |
3.88% due 10/11/24 | | | 328,947 | | | | 332,168 | |
Anaren, Inc. | | | | | | | | |
5.50% due 02/18/212 | | | 140,393 | | | | 139,340 | |
9.25% due 08/18/212 | | | 100,000 | | | | 96,750 | |
Total Communications | | | | | | | 5,596,742 | |
| | | | | | | | | |
Financial - 6.8% | |
National Financial Partners Corp. | | | | | | | | |
6.25% due 07/01/20 | | | 735,711 | | | | 741,538 | |
4.50% due 12/09/23 | | | 500,000 | | | | 503,750 | |
York Risk Services | | | | | | | | |
4.75% due 10/01/212 | | | 489,975 | | | | 461,801 | |
Hyperion Insurance | | | | | | | | |
5.50% due 04/29/22 | | | 443,022 | | | | 443,576 | |
Americold Realty Operating Partnership, LP | | | | | | | | |
5.75% due 12/01/22 | | | 398,000 | | | | 401,733 | |
Assured Partners, Inc. | | | | | | | | |
5.25% due 10/21/22 | | | 342,404 | | | | 347,027 | |
54 | THE GUGGENHEIM FUNDS ANNUAL REPORT | SEE NOTES TO FINANCIAL STATEMENTS. |
SCHEDULE OF INVESTMENTS (continued) | December 31, 2016 |
SERIES F (FLOATING RATE STRATEGIES SERIES) | |
| | Face
Amount | | | Value | |
| | | | | | | |
American Stock Transfer & Trust | | | | | | |
5.75% due 06/26/20 | | $ | 283,236 | | | $ | 281,820 | |
Corporate Capital Trust | | | | | | | | |
4.25% due 05/20/19 | | | 194,500 | | | | 194,500 | |
Acrisure LLC | | | | | | | | |
5.75% due 11/22/23 | | | 135,238 | | | | 136,718 | |
LPL Financial Holdings, Inc. | | | | | | | | |
4.81% due 11/21/22 | | | 124,063 | | | | 125,096 | |
Total Financial | | | | | | | 3,637,559 | |
| | | | | | | | | |
Energy - 1.8% | |
Veresen Midstream LP | | | | | | | | |
5.25% due 03/31/22 | | | 497,468 | | | | 500,368 | |
Cactus Wellhead | | | | | | | | |
7.00% due 07/31/20 | | | 536,814 | | | | 483,578 | |
Total Energy | | | | | | | 983,946 | |
| | | | | | | | | |
Utilities - 1.5% | |
TPF II Power LLC | | | | | | | | |
5.00% due 10/02/21 | | | 378,812 | | | | 381,842 | |
Stonewall (Green Energy) | | | | | | | | |
6.50% due 11/15/21 | | | 300,000 | | | | 295,500 | |
Lightstone HoldCo LLC | | | | | | | | |
6.50% due 01/01/24 | | | 120,000 | | | | 121,351 | |
Total Utilities | | | | | | | 798,693 | |
| | | | | | | | | |
Basic Materials - 0.8% | |
Nexeo Solutions LLC | | | | | | | | |
5.25% due 06/09/23 | | | 373,125 | | | | 375,923 | |
WR Grace & Co. | | | | | | | | |
2.88% due 02/03/21 | | | 33,939 | | | | 34,109 | |
Total Basic Materials | | | | | | | 410,032 | |
Total Senior Floating Rate Interests | | | | | | | | |
(Cost $39,864,950) | | | | | | | 39,648,352 | |
| | | | | | | | | |
ASSET-BACKED SECURITIES†† - 2.9% | |
Collateralized Loan Obligations - 2.7% | |
Cerberus Onshore II CLO LLC | | | | | | | | |
2014-1A, 4.88% due 10/15/233,4 | | | 250,000 | | | | 247,035 | |
ALM XIV Ltd. | | | | | | | | |
2014-14A, 4.34% due 07/28/263,4 | | | 250,000 | | | | 245,321 | |
ACIS CLO Ltd. | | | | | | | | |
2013-2A, 4.73% due 10/14/223,4 | | | 250,000 | | | | 244,798 | |
NewStar Arlington Senior Loan Program LLC | | | | | | | | |
2014-1A, 4.18% due 07/25/253,4 | | | 250,000 | | | | 242,839 | |
Newstar Commercial Loan Funding LLC | | | | | | | | |
2013-1A, 5.41% due 09/20/233,4 | | | 250,000 | | | | 239,411 | |
Kingsland IV Ltd. | | | | | | |
2007-4A, 2.33% due 04/16/213,4 | | | 250,000 | | | | 237,035 | |
Total Collateralized Loan Obligations | | | | | | | 1,456,439 | |
| | | | | | | | | |
Collateralized Debt Obligations - 0.2% | |
RAIT CRE CDO I Ltd. | | | | | | | | |
2006-1X A1B, 1.07% due 11/20/46 | | | 94,087 | | | | 92,045 | |
Total Asset-Backed Securities | | | | | | | | |
(Cost $1,542,728) | | | | | | | 1,548,484 | |
| | | | | | | | | |
COLLATERALIZED MORTGAGE OBLIGATIONS†† - 2.8% | |
Residential Mortgage Backed Securities - 2.8% | |
LSTAR Securities Investment Ltd. | | | | | | | | |
2016-6, 2.62% due 11/01/213,4 | | | 496,061 | | | | 489,418 | |
2016-4, 2.62% due 10/01/213,4 | | | 488,849 | | | | 483,488 | |
LSTAR Commercial Mortgage Trust | | | | | | | | |
2016-7, 2.61% due 12/01/213,4 | | | 500,000 | | | | 492,657 | |
Total Residential Mortgage Backed Securities | | | | | | | 1,465,563 | |
Total Collateralized Mortgage Obligations | | | | | | | | |
(Cost $1,465,506) | | | | | | | 1,465,563 | |
| | | | | | | | | |
CORPORATE BONDS†† - 0.6% | |
Consumer, Non-cyclical - 0.4% | |
Tenet Healthcare Corp. | | | | | | | | |
4.46% due 06/15/203 | | | 200,000 | | | | 201,500 | |
| | | | | | | | | |
Energy - 0.2% | |
FTS International, Inc. | | | | | | | | |
8.46% due 06/15/203,4 | | | 100,000 | | | | 100,000 | |
| | | | | | | | | |
Industrial - 0.0% | |
New Day Aluminum | | | | | | | | |
10.00% due 10/28/20†††,2 | | | 2,820 | | | | 2,820 | |
Total Corporate Bonds | | | | | | | | |
(Cost $299,537) | | | | | | | 304,320 | |
| | | | | | | | | |
SENIOR FIXED RATE INTERESTS†† - 0.5% | |
Financial - 0.5% | |
Magic Newco, LLC | | | | | | | | |
12.00% due 06/12/19 | | | 250,000 | | | | 265,105 | |
Total Senior Fixed Rate Interests | | | | | | | | |
(Cost $266,294) | | | | | | | 265,105 | |
| | | | | | | | | |
Total Investments - 108.7% | | | | | | | | |
(Cost $58,073,820) | | | | | | $ | 57,866,629 | |
Other Assets & Liabilities, net - (8.7)% | | | | | | | (4,621,443 | ) |
Total Net Assets - 100.0% | | | | | | $ | 53,245,186 | |
SEE NOTES TO FINANCIAL STATEMENTS. | THE GUGGENHEIM FUNDS ANNUAL REPORT | 55 |
SCHEDULE OF INVESTMENTS (continued) | December 31, 2016 |
SERIES F (FLOATING RATE STRATEGIES SERIES) | |
† | Value determined based on Level 1 inputs — See Note 4. |
†† | Value determined based on Level 2 inputs, unless otherwise noted — See Note 4. |
††† | Value determined based on Level 3 inputs — See Note 4. |
1 | Rate indicated is the 7 day yield as of December 31, 2016. |
2 | Illiquid security. |
3 | Variable rate security. Rate indicated is rate effective at December 31, 2016. |
4 | Security is a 144A or Section 4(a)(2) security. The total market value of 144A or Section 4(a)(2) securities is $3,022,002 (cost $3,027,133), or 5.7% of total net assets. These securities have been determined to be liquid under guidelines established by the Board of Trustees. |
| | |
| | See Sector Classification in Other Information section. |
The following table summarizes the inputs used to value the Fund’s investments at December 31, 2016 (See Note 4 in the Notes to Financial Statements):
Investments in Securities (Assets) | | Level 1 | | | Level 2 | | | Level 3 | | | Total | |
Asset-Backed Securities | | $ | — | | | $ | 1,548,484 | | | $ | — | | | $ | 1,548,484 | |
Collateralized Mortgage Obligations | | | — | | | | 1,465,563 | | | | — | | | | 1,465,563 | |
Corporate Bonds | | | — | | | | 301,500 | | | | 2,820 | | | | 304,320 | |
Senior Fixed Rate Interests | | | — | | | | 265,105 | | | | — | | | | 265,105 | |
Senior Floating Rate Interests | | | — | | | | 39,025,672 | | | | 622,680 | | | | 39,648,352 | |
Short-Term Investments | | | 14,634,805 | | | | — | | | | — | | | | 14,634,805 | |
Total | | $ | 14,634,805 | | | $ | 42,606,324 | | | $ | 625,500 | | | $ | 57,866,629 | |
Transfers between investment levels may occur as the markets fluctuate and/or the availability of data used in an investment’s valuation changes. Transfers between valuation levels, if any, are in comparison to the valuation levels at the end of the previous fiscal year, and are effective using the fair value as of the end of the previous fiscal period.
For the year ended December 31, 2016, there were no transfers between levels.
The following is a summary of significant unobservable inputs used in the fair valuation of assets and liabilities categorized within Level 3 of the fair value hierarchy:
Category | | Ending Balance at 12/31/16 | | Valuation Technique | Unobservable Inputs |
Corporate Bonds | | $ | 2,820 | | Model Price | Liquidation value |
Senior Floating Rate Interests | | | 622,680 | | Model Price | Purchase Price |
Total | | $ | 625,500 | | | |
56 | THE GUGGENHEIM FUNDS ANNUAL REPORT | SEE NOTES TO FINANCIAL STATEMENTS. |
SCHEDULE OF INVESTMENTS (concluded) | December 31, 2016 |
SERIES F (FLOATING RATE STRATEGIES SERIES) | |
Summary of Fair Value Level 3 Activity
Following is a reconciliation of Level 3 assets for which significant unobservable inputs were used to determine fair value for the year ended December 31, 2016:
LEVEL 3 - Fair value measurement using significant unobservable inputs
| | Senior Floating
Rate Interests | | | Corporate Bonds | | | Total | |
Series F (Floating Rate Strategies Series) | | | | | | | | | |
Assets: | | | | | | | | | |
Beginning Balance | | $ | 704,352 | | | $ | — | | | $ | 704,352 | |
Purchases | | | — | | | | — | * | | | — | |
Sales, maturities and paydowns | | | (83,674 | ) | | | — | | | | (83,674 | ) |
Total realized gains or losses included in earnings | | | — | | | | — | | | | — | |
Total change in unrealized gains or losses included in earnings | | | 2,002 | | | | 2,820 | | | | 4,822 | |
Transfers into Level 3 | | | — | | | | — | | | | — | |
Transfers out of Level 3 | | | — | | | | — | | | | — | |
Ending Balance | | $ | 622,680 | | | $ | 2,820 | | | $ | 625,500 | |
Net Change in unrealized appreciation (depreciation) for investments in securities still held at December 31, 2016 | | $ | (9 | ) | | $ | 2,820 | | | $ | 2,811 | |
* | Includes a purchase with cost of less than $1. |
SEE NOTES TO FINANCIAL STATEMENTS. | THE GUGGENHEIM FUNDS ANNUAL REPORT | 57 |
SERIES F (FLOATING RATE STRATEGIES SERIES) | |
STATEMENT OF ASSETS AND LIABILITIES |
December 31, 2016 |
Assets: | |
Investments, at value (cost $58,073,820) | | $ | 57,866,629 | |
Cash | | | 85,481 | |
Prepaid expenses | | | 3,829 | |
Receivables: | |
Securities sold | | | 234,515 | |
Fund shares sold | | | 1,280,987 | |
Interest | | | 148,140 | |
Total assets | | | 59,619,581 | |
| | | | | |
Liabilities: | |
Unfunded loan commitments, at value (Note 9) (proceeds $248) | | | — | |
Payable for: | |
Securities purchased | | | 6,310,019 | |
Management fees | | | 28,711 | |
Distribution and service fees | | | 9,904 | |
Trustees’ fees* | | | 5,371 | |
Fund accounting/administration fees | | | 3,169 | |
Transfer agent/maintenance fees | | | 2,031 | |
Fund shares redeemed | | | 451 | |
Miscellaneous | | | 14,739 | |
Total liabilities | | | 6,374,395 | |
Commitments and contingent liabilities (Note 14) | | | — | |
Net assets | | $ | 53,245,186 | |
| | | | | |
Net assets consist of: | |
Paid in capital | | $ | 52,024,184 | |
Undistributed net investment income | | | 1,896,982 | |
Accumulated net realized loss on investments | | | (469,037 | ) |
Net unrealized depreciation on investments | | | (206,943 | ) |
Net assets | | $ | 53,245,186 | |
Capital shares outstanding | | | 2,030,780 | |
Net asset value per share | | $ | 26.22 | |
STATEMENT OF OPERATIONS |
Year Ended December 31, 2016 |
Investment Income: | |
Interest | | $ | 2,206,003 | |
Total investment income | | | 2,206,003 | |
| | | | | |
Expenses: | |
Management fees | | | 273,702 | |
Transfer agent/maintenance fees | | | 25,037 | |
Distribution and service fees | | | 105,270 | |
Fund accounting/administration fees | | | 38,459 | |
Trustees’ fees* | | | 11,170 | |
Custodian fees | | | 8,474 | |
Line of credit fees | | | 7,873 | |
Miscellaneous | | | 43,698 | |
Total expenses | | | 513,683 | |
Less: | |
Expenses waived by Adviser | | | (18,770 | ) |
Net expenses | | | 494,913 | |
Net investment income | | | 1,711,090 | |
| | | | | |
Net Realized and Unrealized Gain (Loss): | |
Net realized gain (loss) on: | |
Investments | | | (485,310 | ) |
Net realized loss | | | (485,310 | ) |
Net change in unrealized appreciation (depreciation) on: | |
Investments | | | 2,112,800 | |
Net change in unrealized appreciation (depreciation) | | | 2,112,800 | |
Net realized and unrealized gain | | | 1,627,490 | |
Net increase in net assets resulting from operations | | $ | 3,338,580 | |
* | Relates to Trustees not deemed “interested persons” within the meaning of Section 2(a)(19) of the 1940 Act. |
58 | THE GUGGENHEIM FUNDS ANNUAL REPORT | SEE NOTES TO FINANCIAL STATEMENTS. |
SERIES F (FLOATING RATE STRATEGIES SERIES) | |
STATEMENTS OF CHANGES IN NET ASSETS |
| | Year Ended
December 31,
2016 | | | Year Ended
December 31,
2015 | |
Increase (Decrease) in Net Assets from Operations: | | | | | | |
Net investment income | | $ | 1,711,090 | | | $ | 1,964,517 | |
Net realized gain (loss) on investments | | | (485,310 | ) | | | 121,044 | |
Net change in unrealized appreciation (depreciation) on investments | | | 2,112,800 | | | | (1,711,367 | ) |
Net increase in net assets resulting from operations | | | 3,338,580 | | | | 374,194 | |
| | | | | | | | | |
Distributions to shareholders from: | | | | | | | | |
Net investment income | | | (1,967,530 | ) | | | (1,565,356 | ) |
Net realized gains | | | (102,592 | ) | | | (102,831 | ) |
Total distributions to shareholders | | | (2,070,122 | ) | | | (1,668,187 | ) |
| | | | | | | | | |
Capital share transactions: | | | | | | | | |
Proceeds from sale of shares | | | 38,073,511 | | | | 63,234,862 | |
Distributions reinvested | | | 2,070,122 | | | | 1,668,187 | |
Cost of shares redeemed | | | (36,764,581 | ) | | | (60,848,174 | ) |
Net increase from capital share transactions | | | 3,379,052 | | | | 4,054,875 | |
Net increase in net assets | | | 4,647,510 | | | | 2,760,882 | |
| | | | | | | | | |
Net assets: | | | | | | | | |
Beginning of year | | | 48,597,676 | | | | 45,836,794 | |
End of year | | $ | 53,245,186 | | | $ | 48,597,676 | |
Undistributed net investment income at end of year | | $ | 1,896,982 | | | $ | 2,172,408 | |
| | | | | | | | | |
Capital share activity: | | | | | | | | |
Shares sold | | | 1,461,172 | | | | 2,378,527 | |
Shares issued from reinvestment of distributions | | | 81,985 | | | | 63,381 | |
Shares redeemed | | | (1,401,896 | ) | | | (2,299,441 | ) |
Net increase in shares | | | 141,261 | | | | 142,467 | |
SEE NOTES TO FINANCIAL STATEMENTS. | THE GUGGENHEIM FUNDS ANNUAL REPORT | 59 |
SERIES F (FLOATING RATE STRATEGIES SERIES) | |
This table is presented to show selected data for a share outstanding throughout each period and to assist shareholders in evaluating a Fund’s performance for the periods presented.
| | Year Ended
December 31,
2016 | | | Year Ended
December 31,
2015 | | | Year Ended
December 31,
2014 | | | Period Ended
December 31,
2013a | |
Per Share Data | | | | | | | | | | | | |
Net asset value, beginning of period | | $ | 25.72 | | | $ | 26.24 | | | $ | 25.61 | | | $ | 25.00 | |
Income (loss) from investment operations: | |
Net investment income (loss)b | | | 1.05 | | | | .97 | | | | .95 | | | | .49 | |
Net gain (loss) on investments (realized and unrealized) | | | 1.09 | | | | (.77 | ) | | | (.32 | ) | | | .12 | |
Total from investment operations | | | 2.14 | | | | .20 | | | | .63 | | | | .61 | |
Less distributions from: | |
Net investment income | | | (1.56 | ) | | | (.67 | ) | | | — | | | | — | |
Net realized gains | | | (.08 | ) | | | (.05 | ) | | | — | | | | — | |
Total distributions | | | (1.64 | ) | | | (.72 | ) | | | — | | | | — | |
Net asset value, end of period | | $ | 26.22 | | | $ | 25.72 | | | $ | 26.24 | | | $ | 25.61 | |
| |
Total Returnc | | | 8.56 | % | | | 0.73 | % | | | 2.38 | % | | | 2.48 | % |
Ratios/Supplemental Data | |
Net assets, end of period (in thousands) | | $ | 53,245 | | | $ | 48,598 | | | $ | 45,837 | | | $ | 46,343 | |
Ratios to average net assets: | |
Net investment income (loss) | | | 4.06 | % | | | 3.66 | % | | | 3.65 | % | | | 2.81 | % |
Total expenses | | | 1.22 | % | | | 1.27 | % | | | 1.24 | % | | | 1.35 | %d |
Net expensese,f | | | 1.18 | % | | | 1.17 | % | | | 1.16 | % | | | 1.17 | % |
Portfolio turnover rate | | | 71 | % | | | 73 | % | | | 90 | % | | | 53 | % |
a | Since commencement of operations: April 24, 2013. Percentage amounts for the period, except total return and portfolio turnover rate, have been annualized. |
b | Net investment income (loss) per share was computed using average shares outstanding throughout the period. |
c | Total return does not take into account any of the expenses associated with an investment in variable insurance products. If total return had taken into account these expenses, performance would have been lower. Shares of a series of Guggenheim Variable Funds Trust are available only through the purchase of such products. |
d | Due to limited length of Fund operations, ratios for this period may not be indicative of future performance. |
e | Net expense information reflects the expense ratios after expense waivers. |
f | Net expenses may include expenses that are excluded from the expense limitation agreement. Excluding these expenses, the net expense ratios for the periods would be: |
12/31/16 | 12/31/15 | 12/31/14 | 12/31/13 |
1.15% | 1.15% | 1.15% | 1.15% |
60 | THE GUGGENHEIM FUNDS ANNUAL REPORT | SEE NOTES TO FINANCIAL STATEMENTS. |
MANAGER’S COMMENTARY (Unaudited) | December 31, 2016 |
To Our Shareholders:
The Series J (StylePlusTM—Mid Growth Series) is managed by a team of seasoned professionals, including B. Scott Minerd, Chairman of Investments and Global Chief Investment Officer; Farhan Sharaff, Senior Managing Director and Assistant Chief Investment Officer, Equities; Jayson Flowers, Senior Managing Director and Portfolio Manager; Scott Hammond, Managing Director and Portfolio Manager; and Qi Yan, Managing Director and Portfolio Manager. In the following paragraphs, the investment team discusses performance for the fiscal year ended December 31, 2016.
For the year ended December 31, 2016, the Series J (StylePlus—Mid Growth Series) returned 8.65%, compared with the 7.33% return of its benchmark, the Russell Midcap® Growth Index.
Through a combination of an allocation to actively managed individual equity, passive equity, and actively managed fixed income, the Fund seeks to exceed the total return of the S&P 500 Index. The actively managed equity and fixed income components seek to provide multiple sources of outperformance and take advantage of Guggenheim’s competencies in both fixed income and systematic stock selection.
The allocation to actively managed individual equity via stocks, and passive equity via derivatives, is designed to provide exposure to large core equity. Remaining Fund assets are invested in the Guggenheim Strategy Funds, short-term fixed-income investment companies advised by Guggenheim Investments. The Strategy Funds invest in a diversified portfolio of debt securities and financial instruments providing exposure to fixed income markets. The investment objective of the Guggenheim Strategy Funds is to seek a high level of income consistent with the preservation of capital.
The passive equity position uses derivatives such as swap agreements to gain exposure to the index. The Fund’s fixed income component invests in a variety of fixed income sectors, including asset-backed securities (ABS), mortgage-backed securities, corporate bonds, and bank loans.
The active and passive decisions seek to add value by tactically allocating to actively managed equity through quantitative selection models when stock picking opportunities are high. During periods when Guggenheim views these opportunities to be less attractive, the Fund seeks to increase its passive exposure to equities and the allocation to fixed-income securities. The prospective return during such periods is the equity index plus an “alpha” component coming from the yield of the fixed-income overlay.
Performance Review
The Fund outperformed the Russell Midcap Growth Index for the one-year period ended December 31, 2016. The fixed income sleeve was the largest positive contributor. The investments in the Guggenheim Strategy Funds benefited Fund performance relative to investing in other short-term investments. The actively managed equity sleeve contributed slightly to performance. The passive equity position, maintained through swap agreements and futures contracts, also contributed to performance for the period.
For the Fund’s total equity position over the period, 15-20% was allocated to actively managed equity and 80-85% to passive equity.
When compared with the index, the total equity position (actively managed individual equity plus passive equity derivatives) was most overweight the Health Care and Industrials sectors and most underweight the Information Technology and Financials sectors.
Uncorrelated with the Fund’s active equity component, the fixed-income component was largely invested in ABS, investment-grade corporates, and NA RMBS. These positions constituted the majority of the fixed income sleeve’s total return.
Performance displayed represents past performance which is no guarantee of future results.
The opinions and forecast expressed may not actually come to pass. This information is subject to change at any time, based on market and other conditions, and should not be construed as a recommendation of any specific security or strategy.
| | THE GUGGENHEIM FUNDS ANNUAL REPORT | 61 |
PERFORMANCE REPORT AND FUND PROFILE (Unaudited) | December 31, 2016 |
SERIES J (STYLEPLUS—MID GROWTH SERIES)
OBJECTIVE: Seeks long-term growth of capital.
Holdings Diversification (Market Exposure as % of Net Assets)
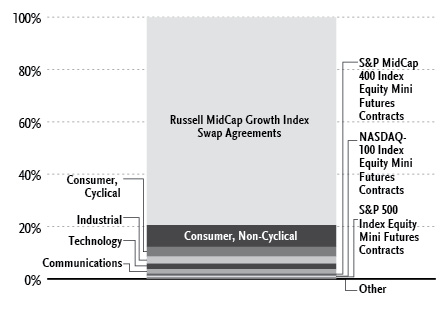
“Holdings Diversification (Market Exposure as % of Net Assets)” excludes any temporary cash investments or investments in Guggenheim Strategy Funds Trust mutual funds. Investments in those Funds will significantly increase the portfolio’s exposure to certain other asset categories (and their associated risks), which may cause the Fund to deviate from its principal investment strategy, including: (i) high yield, high risk debt securities rated below the top four long-term rating categories by a nationally recognized statistical rating organization (also known as “junk bonds”); (ii) securities issued by the U.S. government or its agencies and instrumentalities; (iii) CLOs and similar investments; and (iv) other short-term fixed income securities.
Inception Date: October 1, 1992 |
Ten Largest Holdings (% of Total Net Assets) |
Guggenheim Variable Insurance Strategy Fund III | 25.3% |
Guggenheim Strategy Fund II | 19.1% |
Guggenheim Strategy Fund III | 18.9% |
Guggenheim Strategy Fund I | 14.1% |
Conagra Brands, Inc. | 0.3% |
AmerisourceBergen Corp. — Class A | 0.3% |
Fidelity National Information Services, Inc. | 0.3% |
Intuitive Surgical, Inc. | 0.3% |
Tyson Foods, Inc. — Class A | 0.3% |
Omnicom Group, Inc. | 0.3% |
Top Ten Total | 79.2% |
“Ten Largest Holdings” excludes any temporary cash or derivative investments. |
62 | THE GUGGENHEIM FUNDS ANNUAL REPORT | |
PERFORMANCE REPORT AND FUND PROFILE (Unaudited)(concluded) | December 31, 2016 |
Cumulative Fund Performance*,†
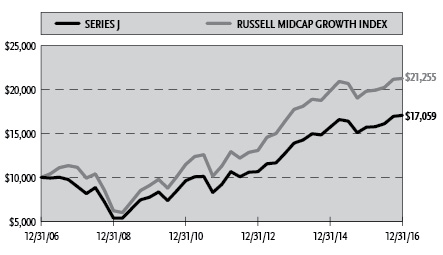
Average Annual Returns*
Periods Ended December 31, 2016†
| 1 Year | 5 Year | 10 Year |
Series J (StylePlus—Mid Growth Series) | 8.65% | 13.15% | 5.49% |
Russell Midcap Growth Index | 7.33% | 13.51% | 7.83% |
* | The performance data above represents past performance that is not predictive of future results. Effective April 30, 2013, certain changes were made to the Series’ investment objective and principal investment strategies. The investment return and principal value of an investment in the Fund will fluctuate so that an investor’s shares, when redeemed, may be worth more or less than their original cost. Returns are historical and include changes in principal and reinvested dividends and capital gains and do not reflect the effect of taxes. The Russell Midcap Growth Index is an unmanaged index and, unlike the Fund, has no management fees or operating expenses to reduce its reported return. |
† | Performance figures do not reflect fees and expenses associated with an investment in variable insurance products. If returns had taken into account these fees and expenses, performance would have been lower. Shares of a series of Guggenheim Variable Funds Trust are available only through the purchase of such products. |
| | THE GUGGENHEIM FUNDS ANNUAL REPORT | 63 |
SCHEDULE OF INVESTMENTS | December 31, 2016 |
SERIES J (STYLEPLUS—MID GROWTH SERIES) | |
| | Shares | | | Value | |
| | | | | | | |
COMMON STOCKS† - 19.1% | |
| | | | | | | |
Consumer, Non-cyclical - 8.3% | |
Conagra Brands, Inc. | | | 12,432 | | | $ | 491,685 | |
AmerisourceBergen Corp. — Class A | | | 6,179 | | | | 483,136 | |
Intuitive Surgical, Inc.* | | | 709 | | | | 449,627 | |
Tyson Foods, Inc. — Class A | | | 7,142 | | | | 440,519 | |
Zimmer Biomet Holdings, Inc. | | | 4,183 | | | | 431,686 | |
Zoetis, Inc. | | | 7,393 | | | | 395,747 | |
Centene Corp.* | | | 6,843 | | | | 386,698 | |
Nielsen Holdings plc | | | 9,195 | | | | 385,730 | |
Flowers Foods, Inc. | | | 19,144 | | | | 382,306 | |
DaVita, Inc.* | | | 5,771 | | | | 370,498 | |
Hologic, Inc.* | | | 8,586 | | | | 344,470 | |
Kroger Co. | | | 9,680 | | | | 334,057 | |
HCA Holdings, Inc.* | | | 4,492 | | | | 332,498 | |
Sysco Corp. | | | 5,884 | | | | 325,797 | |
Cardinal Health, Inc. | | | 4,498 | | | | 323,721 | |
ResMed, Inc. | | | 5,150 | | | | 319,558 | |
Laboratory Corporation of America Holdings* | | | 2,445 | | | | 313,889 | |
McKesson Corp. | | | 2,201 | | | | 309,130 | |
Dr Pepper Snapple Group, Inc. | | | 3,331 | | | | 302,022 | |
Equifax, Inc. | | | 2,534 | | | | 299,595 | |
Kellogg Co. | | | 4,039 | | | | 297,714 | |
Incyte Corp.* | | | 2,868 | | | | 287,573 | |
Molina Healthcare, Inc.* | | | 5,000 | | | | 271,300 | |
AMERCO | | | 701 | | | | 259,082 | |
Boston Scientific Corp.* | | | 11,817 | | | | 255,602 | |
United Rentals, Inc.* | | | 2,417 | | | | 255,187 | |
HealthSouth Corp. | | | 5,884 | | | | 242,656 | |
Henry Schein, Inc.* | | | 1,586 | | | | 240,612 | |
Total System Services, Inc. | | | 4,567 | | | | 223,920 | |
B&G Foods, Inc. | | | 4,986 | | | | 218,387 | |
Post Holdings, Inc.* | | | 2,574 | | | | 206,924 | |
Robert Half International, Inc. | | | 4,137 | | | | 201,803 | |
KAR Auction Services, Inc. | | | 4,649 | | | | 198,140 | |
Western Union Co. | | | 8,501 | | | | 184,642 | |
Alexion Pharmaceuticals, Inc.* | | | 1,353 | | | | 165,540 | |
Vertex Pharmaceuticals, Inc.* | | | 2,243 | | | | 165,242 | |
Hill-Rom Holdings, Inc. | | | 2,935 | | | | 164,771 | |
CoreLogic, Inc.* | | | 4,328 | | | | 159,400 | |
Charles River Laboratories International, Inc.* | | | 2,062 | | | | 157,104 | |
VCA, Inc.* | | | 2,111 | | | | 144,920 | |
Avis Budget Group, Inc.* | | | 3,794 | | | | 139,164 | |
Edwards Lifesciences Corp.* | | | 1,372 | | | | 128,556 | |
Vantiv, Inc. — Class A* | | | 2,133 | | | | 127,169 | |
Campbell Soup Co. | | | 2,009 | | | | 121,484 | |
MEDNAX, Inc.* | | | 1,757 | | | | 117,122 | |
Verisk Analytics, Inc. — Class A* | | | 1,413 | | | | 114,693 | |
Quanta Services, Inc.* | | | 3,201 | | | | 111,555 | |
WellCare Health Plans, Inc.* | | | 811 | | | | 111,172 | |
DexCom, Inc.* | | | 1,853 | | | | 110,624 | |
Herbalife Ltd.* | | | 2,253 | | | | 108,459 | |
Lamb Weston Holdings, Inc. | | | 2,839 | | | | 107,456 | |
Spectrum Brands Holdings, Inc. | | | 878 | | | | 107,406 | |
Quintiles IMS Holdings, Inc.* | | | 1,377 | | | | 104,721 | |
Seattle Genetics, Inc.* | | | 1,917 | | | | 101,160 | |
Constellation Brands, Inc. — Class A | | | 649 | | | | 99,498 | |
TreeHouse Foods, Inc.* | | | 1,374 | | | | 99,189 | |
Coty, Inc. — Class A | | | 5,373 | | | | 98,380 | |
Universal Health Services, Inc. — Class B | | | 902 | | | | 95,955 | |
S&P Global, Inc. | | | 835 | | | | 89,796 | |
Darling Ingredients, Inc.* | | | 6,889 | | | | 88,937 | |
Total Consumer, Non-cyclical | | | | | | | 13,905,384 | |
| | | | | | | | | |
Consumer, Cyclical - 3.7% | |
Delphi Automotive plc | | | 5,566 | | | | 374,871 | |
Newell Brands, Inc. | | | 7,967 | | | | 355,727 | |
Lear Corp. | | | 2,600 | | | | 344,162 | |
Alaska Air Group, Inc. | | | 3,434 | | | | 304,699 | |
JetBlue Airways Corp.* | | | 12,407 | | | | 278,165 | |
Whirlpool Corp. | | | 1,524 | | | | 277,017 | |
Liberty Interactive Corporation QVC Group — Class A* | | | 13,753 | | | | 274,785 | |
Dollar General Corp. | | | 3,702 | | | | 274,207 | |
PACCAR, Inc. | | | 3,920 | | | | 250,488 | |
Southwest Airlines Co. | | | 4,689 | | | | 233,700 | |
BorgWarner, Inc. | | | 5,796 | | | | 228,594 | |
Michael Kors Holdings Ltd.* | | | 4,945 | | | | 212,536 | |
Dollar Tree, Inc.* | | | 2,724 | | | | 210,238 | |
WW Grainger, Inc. | | | 841 | | | | 195,323 | |
Marriott International, Inc. — Class A | | | 2,317 | | | | 191,569 | |
The Gap, Inc. | | | 8,110 | | | | 181,988 | |
Lennar Corp. — Class A | | | 4,121 | | | | 176,914 | |
AutoZone, Inc.* | | | 210 | | | | 165,856 | |
Ralph Lauren Corp. — Class A | | | 1,651 | | | | 149,118 | |
Genuine Parts Co. | | | 1,431 | | | | 136,718 | |
Wyndham Worldwide Corp. | | | 1,643 | | | | 125,476 | |
DR Horton, Inc. | | | 4,566 | | | | 124,789 | |
O’Reilly Automotive, Inc.* | | | 442 | | | | 123,057 | |
Ross Stores, Inc. | | | 1,843 | | | | 120,901 | |
Casey’s General Stores, Inc. | | | 994 | | | | 118,167 | |
AutoNation, Inc.* | | | 2,317 | | | | 112,722 | |
Nordstrom, Inc. | | | 2,200 | | | | 105,446 | |
Beacon Roofing Supply, Inc.* | | | 2,206 | | | | 101,630 | |
PulteGroup, Inc. | | | 5,465 | | | | 100,447 | |
Signet Jewelers Ltd. | | | 1,026 | | | | 96,711 | |
Fastenal Co. | | | 1,999 | | | | 93,913 | |
LKQ Corp.* | | | 2,911 | | | | 89,222 | |
Total Consumer, Cyclical | | | | | | | 6,129,156 | |
| | | | | | | | | |
Industrial - 2.7% | |
SBA Communications Corp. — Class A* | | | 4,184 | | | | 432,040 | |
Spirit AeroSystems Holdings, Inc. — Class A | | | 5,320 | | | | 310,422 | |
Textron, Inc. | | | 6,116 | | | | 296,993 | |
TransDigm Group, Inc. | | | 1,169 | | | | 291,034 | |
Stericycle, Inc.* | | | 3,367 | | | | 259,394 | |
Agilent Technologies, Inc. | | | 5,633 | | | | 256,640 | |
Roper Technologies, Inc. | | | 1,359 | | | | 248,806 | |
Ingersoll-Rand plc | | | 3,026 | | | | 227,071 | |
Stanley Black & Decker, Inc. | | | 1,899 | | | | 217,796 | |
64 | THE GUGGENHEIM FUNDS ANNUAL REPORT | SEE NOTES TO FINANCIAL STATEMENTS. |
SCHEDULE OF INVESTMENTS (continued) | December 31, 2016 |
SERIES J (STYLEPLUS—MID GROWTH SERIES) | |
| | Shares | | | Value | |
| | | | | | | |
Waste Management, Inc. | | | 2,793 | | | $ | 198,052 | |
Huntington Ingalls Industries, Inc. | | | 1,016 | | | | 187,137 | |
Clean Harbors, Inc.* | | | 3,253 | | | | 181,029 | |
Rockwell Collins, Inc. | | | 1,715 | | | | 159,083 | |
Rockwell Automation, Inc. | | | 1,057 | | | | 142,061 | |
Masco Corp. | | | 4,137 | | | | 130,812 | |
Energizer Holdings, Inc. | | | 2,914 | | | | 129,994 | |
AMETEK, Inc. | | | 2,472 | | | | 120,139 | |
Fortune Brands Home & Security, Inc. | | | 2,058 | | | | 110,021 | |
Carlisle Companies, Inc. | | | 882 | | | | 97,276 | |
Ball Corp. | | | 1,293 | | | | 97,066 | |
Johnson Controls International plc | | | 2,264 | | | | 93,254 | |
CH Robinson Worldwide, Inc. | | | 1,270 | | | | 93,040 | |
Waters Corp.* | | | 691 | | | | 92,863 | |
Acuity Brands, Inc. | | | 385 | | | | 88,881 | |
Total Industrial | | | | | | | 4,460,904 | |
| | | | | | | | | |
Technology - 2.1% | |
Fidelity National Information Services, Inc. | | | 6,076 | | | | 459,588 | |
Microchip Technology, Inc. | | | 5,298 | | | | 339,867 | |
Activision Blizzard, Inc. | | | 8,721 | | | | 314,916 | |
NVIDIA Corp. | | | 2,709 | | | | 289,159 | |
Fiserv, Inc.* | | | 2,494 | | | | 265,062 | |
Electronic Arts, Inc.* | | | 2,845 | | | | 224,072 | |
Qorvo, Inc.* | | | 3,942 | | | | 207,862 | |
Teradata Corp.* | | | 7,371 | | | | 200,270 | |
Lam Research Corp. | | | 1,894 | | | | 200,253 | |
Cerner Corp.* | | | 3,479 | | | | 164,800 | |
Skyworks Solutions, Inc. | | | 1,934 | | | | 144,392 | |
Citrix Systems, Inc.* | | | 1,526 | | | | 136,287 | |
Broadridge Financial Solutions, Inc. | | | 1,979 | | | | 131,208 | |
Nuance Communications, Inc.* | | | 7,493 | | | | 111,646 | |
Pitney Bowes, Inc. | | | 6,559 | | | | 99,631 | |
Akamai Technologies, Inc.* | | | 1,478 | | | | 98,553 | |
NCR Corp.* | | | 2,410 | | | | 97,750 | |
Black Knight Financial Services, Inc. — Class A* | | | 2,553 | | | | 96,503 | |
Total Technology | | | | | | | 3,581,819 | |
| | | | | | | | | |
Communications - 1.7% | |
Omnicom Group, Inc. | | | 5,116 | | | | 435,424 | |
Expedia, Inc. | | | 2,608 | | | | 295,434 | |
Interpublic Group of Companies, Inc. | | | 12,269 | | | | 287,217 | |
IAC/InterActiveCorp* | | | 3,926 | | | | 254,366 | |
eBay, Inc.* | | | 8,035 | | | | 238,559 | |
Discovery Communications, Inc. — Class A* | | | 8,580 | | | | 235,177 | |
Palo Alto Networks, Inc.* | | | 1,848 | | | | 231,092 | |
Ciena Corp.* | | | 8,771 | | | | 214,100 | |
Sinclair Broadcast Group, Inc. — Class A | | | 5,852 | | | | 195,164 | |
Scripps Networks Interactive, Inc. — Class A | | | 2,150 | | | | 153,446 | |
DISH Network Corp. — Class A* | | | 2,299 | | | | 133,181 | |
AMC Networks, Inc. — Class A* | | | 2,031 | | | | 106,303 | |
Zayo Group Holdings, Inc.* | | | 2,833 | | | | 93,092 | |
Total Communications | | | | | | | 2,872,555 | |
| | | | | | | | | |
Financial - 0.3% | |
Alliance Data Systems Corp. | | | 1,373 | | | | 313,731 | |
Equinix, Inc. | | | 290 | | | | 103,649 | |
Senior Housing Properties Trust | | | 5,294 | | | | 100,215 | |
Total Financial | | | | | | | 517,595 | |
| | | | | | | | | |
Energy - 0.3% | |
ONEOK, Inc. | | | 3,694 | | | | 212,073 | |
Cabot Oil & Gas Corp. — Class A | | | 7,003 | | | | 163,590 | |
Williams Companies, Inc. | | | 3,058 | | | | 95,226 | |
Total Energy | | | | | | | 470,889 | |
| | | | | | | | | |
Total Common Stocks | | | | | | | | |
(Cost $31,558,211) | | | | | | | 31,938,302 | |
| | | | | | | | | |
MUTUAL FUNDS† - 77.5% | |
Guggenheim Variable Insurance Strategy Fund III1 | | | 1,683,690 | | | | 42,142,748 | |
Guggenheim Strategy Fund II1 | | | 1,278,195 | | | | 31,890,964 | |
Guggenheim Strategy Fund III1 | | | 1,266,691 | | | | 31,629,271 | |
Guggenheim Strategy Fund I1 | | | 942,667 | | | | 23,566,676 | |
Total Mutual Funds | | | | | | | | |
(Cost $128,818,888) | | | | | | | 129,229,659 | |
| | | | | | | | | |
SHORT-TERM INVESTMENTS† - 3.4% | |
Dreyfus Treasury Securities Cash Management Fund - Institutional Class 0.31%2 | | | 5,630,488 | | | | 5,630,488 | |
Total Short-Term Investments | | | | | | | | |
(Cost $5,630,488) | | | | | | | 5,630,488 | |
| | | | | | | | | |
Total Investments - 100.0% | | | | | | | | |
(Cost $166,007,587) | | | | | | $ | 166,798,449 | |
Other Assets & Liabilities, net - 0.0% | | | | | | | 15,396 | |
Total Net Assets - 100.0% | | | | | | $ | 166,813,845 | |
SEE NOTES TO FINANCIAL STATEMENTS. | THE GUGGENHEIM FUNDS ANNUAL REPORT | 65 |
SCHEDULE OF INVESTMENTS (concluded) | December 31, 2016 |
SERIES J (STYLEPLUS—MID GROWTH SERIES) | |
| | Contracts | | | Unrealized
Loss | |
| | | | | | | |
EQUITY FUTURES CONTRACTS PURCHASED† | |
March 2017 NASDAQ-100 Index
Mini Futures Contracts
(Aggregate Value of Contracts $486,500) | | | 5 | | | $ | (198 | ) |
March 2017 S&P 500 Index
Mini Futures Contracts
(Aggregate Value of Contracts $447,200) | | | 4 | | | | (2,925 | ) |
March 2017 S&P MidCap 400 Index
Mini Futures Contracts
(Aggregate Value of Contracts $1,327,040) | | | 8 | | | | (18,110 | ) |
(Total Aggregate Value of Contracts $2,260,740) | | | $ | (21,233 | ) |
| | | | | | | | | |
| | Units | | | Unrealized
Gain (Loss) | |
| | | | | | | | | |
OTC EQUITY INDEX SWAP AGREEMENTS†† | |
Deutsche Bank Swap
April 2017 Russell Midcap Growth Index Swap 0.89%3, Terminating 04/04/17 (Notional Value $116,138,501) | | | 148,331 | | | $ | 266,722 | |
Bank of America Swap
February 2017 Russell Midcap Growth Index Swap 1.34%3, Terminating 02/02/17 (Notional Value $16,402,415) | | | 20,949 | | | | (283,832 | ) |
(Total Notional Value $132,540,916) | | | | | | $ | (17,110 | ) |
* | Non-income producing security. |
† | Value determined based on Level 1 inputs — See Note 4. |
†† | Value determined based on Level 2 inputs — See Note 4. |
1 | Affiliated issuer — See Note 8. |
2 | Rate indicated is the 7 day yield as of December 31, 2016. |
3 | Total Return based on Russell Midcap Growth Index +/- financing at a variable rate. Rate indicated is the rate effective at December 31, 2016. |
| | plc — Public Limited Company |
| | |
| | See Sector Classification in Other Information section. |
The following table summarizes the inputs used to value the Fund’s investments at December 31, 2016 (See Note 4 in the Notes to Financial Statements):
Investments in Securities (Assets) | | Level 1 | | | Level 1 - Other* | | | Level 2 | | | Level 2 - Other* | | | Level 3 | | | Total | |
Common Stocks | | $ | 31,938,302 | | | $ | — | | | $ | — | | | $ | — | | | $ | — | | | $ | 31,938,302 | |
Equity Index Swap Agreements | | | — | | | | — | | | | — | | | | 266,722 | | | | — | | | | 266,722 | |
Mutual Funds | | | 129,229,659 | | | | — | | | | — | | | | — | | | | — | | | | 129,229,659 | |
Short-Term Investments | | | 5,630,488 | | | | — | | | | — | | | | — | | | | — | | | | 5,630,488 | |
Total | | $ | 166,798,449 | | | $ | — | | | $ | — | | | $ | 266,722 | | | $ | — | | | $ | 167,065,171 | |
| | | | | | | | | | | | | | | | | | | | | | | | |
Investments in Securities (Liabilities) | | Level 1 | | | Level 1 - Other* | | | Level 2 | | | Level 2 - Other* | | | Level 3 | | | Total | |
Equity Futures Contracts | | $ | — | | | $ | 21,233 | | | $ | — | | | $ | — | | | $ | — | | | $ | 21,233 | |
Equity Index Swap Agreements | | | — | | | | — | | | | — | | | | 283,832 | | | | — | | | | 283,832 | |
Total | | $ | — | | | $ | 21,233 | | | $ | — | | | $ | 283,832 | | | $ | — | | | $ | 305,065 | |
* | Other financial instruments include futures contracts and/or swaps, which are reported as unrealized gain/loss at period end. |
Transfers between investment levels may occur as the markets fluctuate and/or the availability of data used in an investment’s valuation changes. Transfers between valuation levels, if any, are in comparison to the valuation levels at the end of the previous fiscal year, and are effective using the fair value as of the end of the previous fiscal period.
For the year ended December 31, 2016, there were no transfers between levels.
66 | THE GUGGENHEIM FUNDS ANNUAL REPORT | SEE NOTES TO FINANCIAL STATEMENTS. |
SERIES J (STYLEPLUS—MID GROWTH SERIES) | |
STATEMENT OF ASSETS AND LIABILITIES |
December 31, 2016 |
Assets: | |
Investments in unaffiliated issuers, at value (cost $37,188,699) | | $ | 37,568,790 | |
Investments in affiliated issuers, at value (cost $128,818,888) | | | 129,229,659 | |
Total investments (cost $166,007,587) | | | 166,798,449 | |
Cash | | | 963,202 | |
Unrealized appreciation on swap agreements | | | 266,722 | |
Segregated cash with broker | | | 93,300 | |
Prepaid expenses | | | 2,823 | |
Receivables: | |
Fund shares sold | | | 2,852 | |
Dividends | | | 270,693 | |
Total assets | | | 168,398,041 | |
| | | | | |
Liabilities: | |
Segregated cash due to broker | | | 710,000 | |
Unrealized depreciation on swap agreements | | | 283,832 | |
Payable for: | |
Securities purchased | | | 261,850 | |
Fund shares redeemed | | | 113,786 | |
Management fees | | | 100,296 | |
Swap settlement | | | 37,768 | |
Variation margin | | | 12,930 | |
Fund accounting/administration fees | | | 10,698 | |
Trustees’ fees* | | | 4,123 | |
Transfer agent/maintenance fees | | | 1,794 | |
Miscellaneous | | | 47,119 | |
Total liabilities | | | 1,584,196 | |
Commitments and contingent liabilities (Note 14) | | | — | |
Net assets | | $ | 166,813,845 | |
| | | | | |
Net assets consist of: | |
Paid in capital | | $ | 173,567,998 | |
Undistributed net investment income | | | 1,632,442 | |
Accumulated net realized loss on investments | | | (9,139,114 | ) |
Net unrealized appreciation on investments | | | 752,519 | |
Net assets | | $ | 166,813,845 | |
Capital shares outstanding | | | 3,444,716 | |
Net asset value per share | | $ | 48.43 | |
STATEMENT OF OPERATIONS |
Year Ended December 31, 2016 |
Investment Income: | |
Dividends from securities of affiliated issuers | | $ | 2,664,967 | |
Dividends from securities of unaffiliated issuers (net of foreign withholding tax of $119) | | | 324,360 | |
Interest | | | 7,672 | |
Total investment income | | | 2,996,999 | |
| | | | | |
Expenses: | |
Management fees | | | 1,077,336 | |
Transfer agent/maintenance fees | | | 24,129 | |
Fund accounting/administration fees | | | 131,137 | |
Line of credit fees | | | 23,739 | |
Interest expense | | | 11,854 | |
Custodian fees | | | 10,273 | |
Trustees’ fees* | | | 9,752 | |
Miscellaneous | | | 77,856 | |
Total expenses | | | 1,366,076 | |
Net investment income | | | 1,630,923 | |
| | | | | |
Net Realized and Unrealized Gain (Loss): | |
Net realized gain (loss) on: | |
Investments in unaffiliated issuers | | | 643,137 | |
Investments in affiliated issuers | | | (25,668 | ) |
Swap agreements | | | 4,489,004 | |
Futures contracts | | | 87,196 | |
Net realized gain | | | 5,193,669 | |
Net change in unrealized appreciation (depreciation) on: | |
Investments in unaffiliated issuers | | | 1,026,157 | |
Investments in affiliated issuers | | | 867,210 | |
Swap agreements | | | 2,750,216 | |
Futures contracts | | | (12,887 | ) |
Net change in unrealized appreciation (depreciation) | | | 4,630,696 | |
Net realized and unrealized gain | | | 9,824,365 | |
Net increase in net assets resulting from operations | | $ | 11,455,288 | |
* | Relates to Trustees not deemed “interested persons” within the meaning of Section 2(a)(19) of the 1940 Act. |
SEE NOTES TO FINANCIAL STATEMENTS. | THE GUGGENHEIM FUNDS ANNUAL REPORT | 67 |
SERIES J (STYLEPLUS—MID GROWTH SERIES) | |
STATEMENTS OF CHANGES IN NET ASSETS |
| | Year Ended
December 31,
2016 | | | Year Ended
December 31,
2015 | |
Increase (Decrease) in Net Assets from Operations: | | | | | | |
Net investment income | | $ | 1,630,923 | | | $ | 1,014,823 | |
Net realized gain on investments | | | 5,193,669 | | | | 6,678,545 | |
Net change in unrealized appreciation (depreciation) on investments | | | 4,630,696 | | | | (7,343,718 | ) |
Net increase in net assets resulting from operations | | | 11,455,288 | | | | 349,650 | |
| | | | | | | | | |
Distributions to shareholders from: | | | | | | | | |
Net investment income | | | (1,026,057 | ) | | | (1,760,565 | ) |
Net realized gains | | | (863,754 | ) | | | (11,372,419 | ) |
Total distributions to shareholders | | | (1,889,811 | ) | | | (13,132,984 | ) |
| | | | | | | | | |
Capital share transactions: | | | | | | | | |
Proceeds from sale of shares | | | 26,528,321 | | | | 18,548,423 | |
Distributions reinvested | | | 1,889,811 | | | | 13,132,984 | |
Cost of shares redeemed | | | (19,178,723 | ) | | | (33,955,541 | ) |
Net increase (decrease) from capital share transactions | | | 9,239,409 | | | | (2,274,134 | ) |
Net increase (decrease) in net assets | | | 18,804,886 | | | | (15,057,468 | ) |
| | | | | | | | | |
Net assets: | | | | | | | | |
Beginning of year | | | 148,008,959 | | | | 163,066,427 | |
End of year | | $ | 166,813,845 | | | $ | 148,008,959 | |
Undistributed net investment income at end of year | | $ | 1,632,442 | | | $ | 1,027,576 | |
| | | | | | | | | |
Capital share activity: | | | | | | | | |
Shares sold | | | 546,859 | | | | 368,685 | |
Shares issued from reinvestment of distributions | | | 39,878 | | | | 273,490 | |
Shares redeemed | | | (420,205 | ) | | | (683,884 | ) |
Net increase (decrease) in shares | | | 166,532 | | | | (41,709 | ) |
68 | THE GUGGENHEIM FUNDS ANNUAL REPORT | SEE NOTES TO FINANCIAL STATEMENTS. |
SERIES J (STYLEPLUS—MID GROWTH SERIES) | |
This table is presented to show selected data for a share outstanding throughout each period and to assist shareholders in evaluating a Fund’s performance for the periods presented.
| | Year Ended
December 31,
2016 | | | Year Ended
December 31,
2015 | | | Year Ended
December 31,
2014 | | | Year Ended
December 31,
2013 | | | Year Ended
December 31,
2012 | |
Per Share Data | | | | | | | | | | | | | | | |
Net asset value, beginning of period | | $ | 45.15 | | | $ | 49.12 | | | $ | 43.45 | | | $ | 33.29 | | | $ | 28.75 | |
Income (loss) from investment operations: | |
Net investment income (loss)a | | | .52 | | | | .31 | | | | .49 | | | | .06 | | | | .05 | |
Net gain (loss) on investments (realized and unrealized) | | | 3.37 | | | | (.10 | ) | | | 5.18 | | | | 10.10 | | | | 4.49 | |
Total from investment operations | | | 3.89 | | | | .21 | | | | 5.67 | | | | 10.16 | | | | 4.54 | |
Less distributions from: | |
Net investment income | | | (.33 | ) | | | (.56 | ) | | | — | | | | — | | | | — | |
Net realized gains | | | (.28 | ) | | | (3.62 | ) | | | — | | | | — | | | | — | |
Total distributions | | | (.61 | ) | | | (4.18 | ) | | | — | | | | — | | | | — | |
Net asset value, end of period | | $ | 48.43 | | | $ | 45.15 | | | $ | 49.12 | | | $ | 43.45 | | | $ | 33.29 | |
| |
Total Returnb | | | 8.65 | % | | | (0.08 | %) | | | 13.05 | % | | | 30.52 | % | | | 15.79 | % |
Ratios/Supplemental Data | |
Net assets, end of period (in thousands) | | $ | 166,814 | | | $ | 148,009 | | | $ | 163,066 | | | $ | 157,131 | | | $ | 138,255 | |
Ratios to average net assets: | |
Net investment income (loss) | | | 1.14 | % | | | 0.63 | % | | | 1.06 | % | | | 0.17 | % | | | 0.14 | % |
Total expensesc | | | 0.95 | % | | | 0.97 | % | | | 0.98 | % | | | 0.98 | % | | | 0.95 | % |
Net expenses | | | 0.95 | % | | | 0.97 | % | | | 0.96 | %d | | | 0.98 | %d | | | 0.95 | %d |
Portfolio turnover rate | | | 57 | % | | | 70 | % | | | 100 | % | | | 245 | % | | | 150 | % |
a | Net investment income (loss) per share was computed using average shares outstanding throughout the period. |
b | Total return does not take into account any of the expenses associated with an investment in variable insurance products. If total return had taken into account these expenses, performance would have been lower. Shares of a series of Guggenheim Variable Funds Trust are available only through the purchase of such products. |
c | Does not include expenses of the underlying funds in which the Fund invests. |
d | Net expense information reflects the expense ratios after expense waivers. |
SEE NOTES TO FINANCIAL STATEMENTS. | THE GUGGENHEIM FUNDS ANNUAL REPORT | 69 |
MANAGER’S COMMENTARY (Unaudited) | December 31, 2016 |
To Our Shareholders:
The Series N (Managed Asset Allocation Series) is managed by a team of seasoned professionals, including Michael P. Byrum, CFA, Portfolio Manager; Ryan Harder, CFA, Portfolio Manager; and Matthew Wu, Ph.D., CFA, Portfolio Manager. In the following paragraphs, the team discusses performance of the Series for the fiscal year ended December 31, 2016.
For the fiscal year ended December 31, 2016, the Series N (Managed Asset Allocation Series) returned 8.01%, underperforming its weighted benchmark that is 60% S&P 500® Index and 40% Bloomberg Barclays U.S. Aggregate Bond Index, which returned 8.31%. The S&P 500 Index returned 11.96% over the year and the Bloomberg Barclays U.S. Aggregate Bond Index returned 2.65%.
The investment objective of the Fund is to seek to provide growth of capital and, secondarily, preservation of capital. The Fund seeks to achieve its investment objective by investing in a diversified portfolio of futures contracts and exchange-traded funds (ETFs) and other pooled investment vehicles that track major equity indexes and fixed income indexes (underlying funds) to obtain exposure to equity, fixed income, and money market assets. The precise allocation to equity and fixed income assets will depend on the outlook of Guggenheim Investments for each asset class. The Fund may obtain exposure to these asset classes through investments in the underlying funds, which may track indices such as the S&P 500 Index and Bloomberg Barclays U.S. Aggregate Bond Index, or through investments in futures contracts and other derivatives.
Under normal market conditions, the Fund’s investments are expected to achieve a moderate allocation of equity, fixed income and money market assets in approximately the following amounts: (1) 60% of total assets in equity securities from all capitalizations and both U.S. companies and non-U.S. companies; and (2) 40% of total assets in fixed income securities, which may include short and long -term corporate and government bonds and which may be of any quality, rated or unrated. However, the Investment Manager intends to utilize dynamic asset allocation techniques that will allow rapid shifts between asset classes to attempt to exploit current market trends, and the Fund may invest fully in any asset class at any time. Moreover, the Investment Manager may change the Fund’s asset class allocation, the underlying funds or weightings without shareholder notice. The Fund’s investments will, under normal market conditions, be rebalanced monthly toward the moderate allocation discussed above.
Market Review
The one-year period ended December 31, 2016, was full of surprises. The Fed continued in its divergence from the European Central Bank and the Bank of Japan, but did not raise rates as aggressively as it had predicted.
Equity markets started the year with a heavy sell-off, continuing the panic that came after China’s surprise move of weakening its currency in 2015. However, markets rebounded strongly and ended up for the first quarter. Despite the Brexit shock and uncertainty of the U.S. election, markets managed to rally strongly. After the surprise of Trump’s victory, investors became optimistic about the future, propelling equity markets, Treasury yields, and U.S. dollar up strongly. As the year ended, business leaders and owners became more positive on the outlook, and focused on what impact the new administration would have on the global economy.
All markets we invested rose in the past year. Among them, U.S. equity continued to outperform international counterparts and greatly outperformed bonds. Our dynamically managed tactical strategies enhanced returns, helping the Fund outperform the benchmark.
In this period, the best performing holdings were S&P 400 Index futures, Russell 2000 Index futures, and S&P 500 Index futures and ETFs, while bond futures and ETFs made smaller contributions.
Performance displayed represents past performance which is no guarantee of future results.
The opinions and forecast expressed may not actually come to pass. This information is subject to change at any time, based on market and other conditions, and should not be construed as a recommendation of any specific security or strategy.
70 | THE GUGGENHEIM FUNDS ANNUAL REPORT | |
PERFORMANCE REPORT AND FUND PROFILE (Unaudited) | December 31, 2016 |
SERIES N (MANAGED ASSET ALLOCATION SERIES)
OBJECTIVE: Seeks to provide growth of capital and, secondarily, preservation of capital
Holdings Diversification (Market Exposure as % of Net Assets)
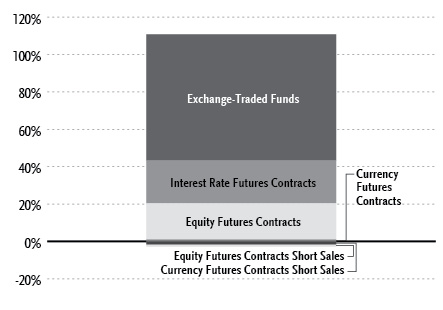
“Holdings Diversification (Market Exposure as % of Net Assets)” excludes any temporary cash investments or investments in Guggenheim Strategy Funds Trust mutual funds. Investments in those Funds do not provide “market exposure” to meet the Fund’s investment objective, but will significantly increase the portfolio’s exposure to certain other asset categories (and their associated risks), which may cause the Fund to deviate from its principal investment strategy, including: (i) high yield, high risk debt securities rated below the top four long-term rating categories by a nationally recognized statistical rating organization (also known as “junk bonds”); (ii) securities issued by the U.S. government or its agencies and instrumentalities; (iii) CLOs and similar investments; and (iv) other short-term fixed income securities.
Inception Date: June 1, 1995 |
Ten Largest Holdings (% of Total Net Assets) |
Guggenheim Variable Insurance Strategy Fund III | 18.0% |
SPDR S&P 500 ETF Trust | 17.6% |
Vanguard S&P 500 ETF | 17.0% |
iShares Core U.S. Aggregate Bond ETF | 15.2% |
iShares iBoxx $ Investment Grade Corporate Bond ETF | 7.8% |
Guggenheim Strategy Fund III | 7.1% |
iShares Core S&P Mid-Capital ETF | 5.8% |
iShares MSCI EAFE ETF | 4.2% |
Guggenheim Strategy Fund II | 3.2% |
Guggenheim Strategy Fund I | 1.8% |
Top Ten Total | 97.7% |
“Ten Largest Holdings” excludes any temporary cash or derivative investments. |
| | THE GUGGENHEIM FUNDS ANNUAL REPORT | 71 |
PERFORMANCE REPORT AND FUND PROFILE (Unaudited)(concluded) | December 31, 2016 |
Cumulative Fund Performance*,†

Average Annual Returns*
Periods Ended December 31, 2016†
| 1 Year | 5 Year | 10 Year |
Series N (Managed Asset Allocation Series) | 8.01% | 8.37% | 4.90% |
Blended Index** | 8.31% | 9.69% | 6.21% |
S&P 500 Index | 11.96% | 14.66% | 6.95% |
Bloomberg Barclays U.S. Aggregate Bond Index | 2.65% | 2.23% | 4.34% |
* | The performance data above represents past performance that is not predictive of future results. The investment return and principal value of an investment in the Fund will fluctuate so that an investor’s shares, when redeemed, may be worth more or less than their original cost. Returns are historical and include changes in principal and reinvested dividends and capital gains and do not reflect the effect of taxes. The S&P 500 Index and Bloomberg Barclays U.S. Aggregate Bond Index are unmanaged indices and, unlike the Fund, have no management fees or operating expenses to reduce their reported returns. |
** | The Blended Index is 60% S&P 500 Index and 40% Bloomberg Barclays U.S. Aggregate Bond Index. |
† | Performance figures do not reflect fees and expenses associated with an investment in variable insurance products. If returns had taken into account these fees and expenses, performance would have been lower. Shares of a series of Guggenheim Variable Funds Trust are available only through the purchase of such products. |
72 | THE GUGGENHEIM FUNDS ANNUAL REPORT | |
SCHEDULE OF INVESTMENTS | December 31, 2016 |
SERIES N (MANAGED ASSET ALLOCATION SERIES) | |
| | Shares | | | Value | |
| | | | | | | |
EXCHANGE-TRADED FUNDS† - 67.6% | |
SPDR S&P 500 ETF Trust | | | 41,688 | | | $ | 9,318,519 | |
Vanguard S&P 500 ETF | | | 43,776 | | | | 8,987,651 | |
iShares Core U.S. Aggregate Bond ETF | | | 74,406 | | | | 8,040,312 | |
iShares iBoxx $ Investment Grade Corporate Bond ETF | | | 35,057 | | | | 4,107,979 | |
iShares Core S&P Mid-Capital ETF | | | 18,424 | | | | 3,046,224 | |
iShares MSCI EAFE ETF | | | 38,211 | | | | 2,205,921 | |
iShares Core S&P 500 ETF | | | 2 | | | | 450 | |
Total Exchange-Traded Funds | | | | | | | | |
(Cost $27,510,815) | | | | | | | 35,707,056 | |
| | | | | | | | | |
MUTUAL FUNDS† - 30.2% | |
Guggenheim Variable Insurance Strategy Fund III1 | | | 380,496 | | | | 9,523,812 | |
Guggenheim Strategy Fund III1 | | | 151,012 | | | | 3,770,765 | |
Guggenheim Strategy Fund II1 | | | 67,648 | | | | 1,687,827 | |
Guggenheim Strategy Fund I1 | | | 38,140 | | | | 953,501 | |
Total Mutual Funds | | | | | | | | |
(Cost $15,896,983) | | | | | | | 15,935,905 | |
| | | | | | | | | |
SHORT-TERM INVESTMENTS† - 0.9% | |
Dreyfus Treasury Securities Cash Management Fund - Institutional Class 0.31%2 | | | 471,318 | | | | 471,318 | |
Total Short-Term Investments | | | | | | | | |
(Cost $471,318) | | | | | | | 471,318 | |
| | | | | | | | | |
| | | Face
Amount | | | | | |
| | | | | | | | | |
U.S. TREASURY BILLS†† - 1.1% | |
U.S. Treasury Bill | | | | | | | | |
0.46% due 01/12/173,4 | | $ | 600,000 | | | | 599,940 | |
Total U.S. Treasury Bills | | | | | | | | |
(Cost $599,913) | | | | | | | 599,940 | |
| | | | | | | | | |
Total Investments - 99.8% | | | | | | | | |
(Cost $44,479,029) | | | | | | $ | 52,714,219 | |
Other Assets & Liabilities, net - 0.2% | | | | | | | 125,447 | |
Total Net Assets - 100.0% | | | | | | $ | 52,839,666 | |
| | Contracts | | | Unrealized
Gain (Loss) | |
| | | | | | | |
CURRENCY FUTURES CONTRACTS PURCHASED† | |
March 2017 British Pound
Futures Contracts
(Aggregate Value of Contracts $540,006) | | | 7 | | | $ | 1,120 | |
| | | | | | | | | |
INTEREST RATE FUTURES CONTRACTS PURCHASED† | |
March 2017 U.S. Treasury 2 Year Note
Futures Contracts
(Aggregate Value of Contracts $4,116,172) | | | 19 | | | | (3,640 | ) |
March 2017 U.S. Treasury 10 Year Note
Futures Contracts
(Aggregate Value of Contracts $7,944,000) | | | 64 | | | | (51,071 | ) |
(Total Aggregate Value of Contracts $12,060,172) | | | | | | $ | (54,711 | ) |
| | | | | | | | | |
EQUITY FUTURES CONTRACTS PURCHASED† | |
January 2017 Hang Seng Index
Futures Contracts (Aggregate Value of Contracts $282,386) | | | 2 | | | $ | 1,303 | |
March 2017 S&P/TSX 60 IX Index
Futures Contracts
(Aggregate Value of Contracts $267,527) | | | 2 | | | | 301 | |
March 2017 S&P 500 Index
Mini Futures Contracts
(Aggregate Value of Contracts $782,600) | | | 7 | | | | (6,467 | ) |
March 2017 S&P MidCap 400 Index
Mini Futures Contracts
(Aggregate Value of Contracts $497,640) | | | 3 | | | | (8,984 | ) |
March 2017 Russell 2000 Index
Mini Futures Contracts
(Aggregate Value of Contracts $2,375,450) | | | 35 | | | | (43,021 | ) |
March 2017 MSCI EAFE Index
Mini Futures Contracts
(Aggregate Value of Contracts $6,028,559) | | | 72 | | | | (89,032 | ) |
(Total Aggregate Value of Contracts $10,234,162) | | | | | | $ | (145,900 | ) |
| | | | | | | | | |
CURRENCY FUTURES CONTRACTS SOLD SHORT† | |
March 2017 Japanese Yen
Futures Contracts
(Aggregate Value of Contracts $107,275) | | | 1 | | | $ | 1,885 | |
SEE NOTES TO FINANCIAL STATEMENTS. | THE GUGGENHEIM FUNDS ANNUAL REPORT | 73 |
SCHEDULE OF INVESTMENTS (concluded) | December 31, 2016 |
SERIES N (MANAGED ASSET ALLOCATION SERIES) | |
| | Contracts | | | Unrealized
Loss | |
| | | | | | | |
March 2017 Euro FX
Futures Contracts
(Aggregate Value of Contracts $528,050) | | | 4 | | | $ | (4,011 | ) |
(Total Aggregate Value of
Contracts $635,325) | | | | | | $ | (2,126 | ) |
| | |
EQUITY FUTURES CONTRACTS SOLD SHORT† | |
March 2017 SPI 200 Index
Futures Contracts
(Aggregate Value of Contracts $101,626) | | | 1 | | | $ | (2,044 | ) |
March 2017 Nikkei 225 (CME) Index
Futures Contracts
(Aggregate Value of Contracts $95,500) | | | 1 | | | | (2,279 | ) |
| | Contracts | | | Unrealized
Loss | |
| | | | | | | |
January 2017 CAC 40 10 Euro Index
Futures Contracts
(Aggregate Value of Contracts $153,173) | | | 3 | | | $ | (2,713 | ) |
March 2017 FTSE 100 Index
Futures Contracts
(Aggregate Value of Contracts $172,654) | | | 2 | | | | (2,738 | ) |
March 2017 DAX Index
Futures Contracts
(Aggregate Value of Contracts $301,126) | | | 1 | | | | (5,312 | ) |
(Total Aggregate Value of Contracts $824,079) | | | | | | $ | (15,086 | ) |
† | Value determined based on Level 1 inputs — See Note 4. |
†† | Value determined based on Level 2 inputs — See Note 4. |
1 | Affiliated issuer — See Note 8. |
2 | Rate indicated is the 7 day yield as of December 31, 2016. |
3 | All or a portion of this security is pledged as futures collateral at December 31, 2016. |
4 | Zero coupon rate security. Rate as indicated is the effective yield at the time of purchase. |
| | |
| | See Sector Classification in Other Information section. |
The following table summarizes the inputs used to value the Fund’s investments at December 31, 2016 (See Note 4 in the Notes to Financial Statements):
Investments in Securities (Assets) | | Level 1 | | | Level 1 - Other* | | | Level 2 | | | Level 3 | | | Total | |
Currency Futures Contracts | | $ | — | | | $ | 3,005 | | | $ | — | | | $ | — | | | $ | 3,005 | |
Equity Futures Contracts | | | — | | | | 1,604 | | | | — | | | | — | | | | 1,604 | |
Exchange-Traded Funds | | | 35,707,056 | | | | — | | | | — | | | | — | | | | 35,707,056 | |
Mutual Funds | | | 15,935,905 | | | | — | | | | — | | | | — | | | | 15,935,905 | |
Short-Term Investments | | | 471,318 | | | | — | | | | — | | | | — | | | | 471,318 | |
U.S. Treasury Bills | | | — | | | | — | | | | 599,940 | | | | — | | | | 599,940 | |
Total | | $ | 52,114,279 | | | $ | 4,609 | | | $ | 599,940 | | | $ | — | | | $ | 52,718,828 | |
| | | | | | | | | | | | | | | | | | | | |
Investments in Securities (Liabilities) | | Level 1 | | | Level 1 - Other* | | | Level 2 | | | Level 3 | | | Total | |
Currency Futures Contracts | | $ | — | | | $ | 4,011 | | | $ | — | | | $ | — | | | $ | 4,011 | |
Equity Futures Contracts | | | — | | | | 162,590 | | | | — | | | | — | | | | 162,590 | |
Interest Rate Futures Contracts | | | — | | | | 54,711 | | | | — | | | | — | | | | 54,711 | |
Total | | $ | — | | | $ | 221,312 | | | $ | — | | | $ | — | | | $ | 221,312 | |
* | Other financial instruments include futures contracts which are reported as unrealized gain/loss at period end. |
Transfers between investment levels may occur as the markets fluctuate and/or the availability of data used in an investment’s valuation changes. Transfers between valuation levels, if any, are in comparison to the valuation levels at the end of the previous fiscal year, and are effective using the fair value as of the end of the previous fiscal period.
For the year ended December 31, 2016, there were no transfers between levels.
74 | THE GUGGENHEIM FUNDS ANNUAL REPORT | SEE NOTES TO FINANCIAL STATEMENTS. |
SERIES N (MANAGED ASSET ALLOCATION SERIES) | |
STATEMENT OF ASSETS AND LIABILITIES |
December 31, 2016 |
Assets: | |
Investments in unaffiliated issuers, at value (cost $28,582,046) | | $ | 36,778,314 | |
Investments in affiliated issuers, at value (cost $15,896,983) | | | 15,935,905 | |
Total investments (cost $44,479,029) | | | 52,714,219 | |
Segregated cash with broker | | | 83,658 | |
Cash | | | 47,049 | |
Prepaid expenses | | | 8,427 | |
Receivables: | |
Variation margin | | | 15,262 | |
Fund shares sold | | | 1,995 | |
Dividends | | | 91,142 | |
Foreign taxes reclaim | | | 3,617 | |
Total assets | | | 52,965,369 | |
| | | | | |
Liabilities: | |
Foreign currency due to broker | | | 2,151 | |
Payable for: | |
Securities purchased | | | 36,622 | |
Management fees | | | 29,060 | |
Fund shares redeemed | | | 25,583 | |
Direct shareholders expense | | | 7,582 | |
Professional fees | | | 7,355 | |
Legal fees | | | 5,614 | |
Fund accounting/administration fees | | | 3,577 | |
Transfer agent/maintenance fees | | | 2,410 | |
Trustees’ fees* | | | 1,561 | |
Miscellaneous | | | 4,188 | |
Total liabilities | | | 125,703 | |
Commitments and contingent liabilities (Note 14) | | | — | |
Net assets | | $ | 52,839,666 | |
| | | | | |
Net assets consist of: | |
Paid in capital | | $ | 42,773,854 | |
Undistributed net investment income | | | 765,756 | |
Accumulated net realized gain on investments and foreign currency | | | 1,282,133 | |
Net unrealized appreciation on investments and foreign currency | | | 8,017,923 | |
Net assets | | $ | 52,839,666 | |
Capital shares outstanding | | | 1,838,413 | |
Net asset value per share | | $ | 28.74 | |
STATEMENT OF OPERATIONS |
Year Ended December 31, 2016 |
Investment Income: | |
Dividends from securities of unaffiliated issuers | | $ | 833,327 | |
Dividends from securities of affiliated issuers | | | 424,797 | |
Interest | | | 1,097 | |
Other income | | | 61 | |
Total investment income | | | 1,259,282 | |
| | | | | |
Expenses: | |
Management fees | | | 349,150 | |
Transfer agent/maintenance fees | | | 25,467 | |
Fund accounting/administration fees | | | 63,844 | |
Line of credit fees | | | 8,246 | |
Trustees’ fees* | | | 5,134 | |
Custodian fees | | | 1,162 | |
Miscellaneous | | | 42,579 | |
Total expenses | | | 495,582 | |
Net investment income | | | 763,700 | |
| | | | | |
Net Realized and Unrealized Gain (Loss): | |
Net realized gain (loss) on: | |
Investments in unaffiliated issuers | | | 350,699 | |
Investments in affiliated issuers | | | (14,708 | ) |
Futures contracts | | | 1,149,767 | |
Foreign currency | | | 2,056 | |
Net realized gain on investments and foreign currency | | | 1,487,814 | |
Net change in unrealized appreciation (depreciation) on: | |
Investments in unaffiliated issuers | | | 1,908,549 | |
Investments in affiliated issuers | | | 141,589 | |
Futures contracts | | | (163,454 | ) |
Foreign currency | | | (37 | ) |
Net change in unrealized appreciation (depreciation) on investments and foreign currency | | | 1,886,647 | |
Net realized and unrealized gain on investments and foreign currency | | | 3,374,461 | |
Net increase in net assets resulting from operations | | $ | 4,138,161 | |
* | Relates to Trustees not deemed “interested persons” within the meaning of Section 2(a)(19) of the 1940 Act. |
SEE NOTES TO FINANCIAL STATEMENTS. | THE GUGGENHEIM FUNDS ANNUAL REPORT | 75 |
SERIES N (MANAGED ASSET ALLOCATION SERIES) | |
STATEMENTS OF CHANGES IN NET ASSETS |
| | Year Ended
December 31,
2016 | | | Year Ended
December 31,
2015 | |
Increase (Decrease) in Net Assets from Operations: | | | | | | |
Net investment income | | $ | 763,700 | | | $ | 634,705 | |
Net realized gain on investments on investments and foreign currency | | | 1,487,814 | | | | 1,228,381 | |
Net change in unrealized appreciation (depreciation) on investments on investments and foreign currency | | | 1,886,647 | | | | (1,728,223 | ) |
Net increase in net assets resulting from operations | | | 4,138,161 | | | | 134,863 | |
| | | | | | | | | |
Distributions to shareholders from: | | | | | | | | |
Net investment income | | | (633,385 | ) | | | (538,173 | ) |
Net realized gains | | | (1,011,391 | ) | | | — | |
Total distributions to shareholders | | | (1,644,776 | ) | | | (538,173 | ) |
| | | | | | | | | |
Capital share transactions: | | | | | | | | |
Proceeds from sale of shares | | | 5,178,125 | | | | 4,288,604 | |
Distributions reinvested | | | 1,644,776 | | | | 538,173 | |
Cost of shares redeemed | | | (9,105,176 | ) | | | (12,113,611 | ) |
Net decrease from capital share transactions | | | (2,282,275 | ) | | | (7,286,834 | ) |
Net increase (decrease) in net assets | | | 211,110 | | | | (7,690,144 | ) |
| | | | | | | | | |
Net assets: | | | | | | | | |
Beginning of year | | | 52,628,556 | | | | 60,318,700 | |
End of year | | $ | 52,839,666 | | | $ | 52,628,556 | |
Undistributed net investment income at end of year | | $ | 765,756 | | | $ | 633,385 | |
| | | | | | | | | |
Capital share activity: | | | | | | | | |
Shares sold | | | 188,808 | | | | 154,613 | |
Shares issued from reinvestment of distributions | | | 58,222 | | | | 18,997 | |
Shares redeemed | | | (327,120 | ) | | | (434,736 | ) |
Net decrease in shares | | | (80,090 | ) | | | (261,126 | ) |
76 | THE GUGGENHEIM FUNDS ANNUAL REPORT | SEE NOTES TO FINANCIAL STATEMENTS. |
SERIES N (MANAGED ASSET ALLOCATION SERIES) | |
This table is presented to show selected data for a share outstanding throughout each period and to assist shareholders in evaluating a Fund’s performance for the periods presented.
| | Year Ended
December 31,
2016 | | | Year Ended
December 31,
2015 | | | Year Ended
December 31,
2014 | | | Year Ended
December 31,
2013 | | | Year Ended
December 31,
2012 | |
Per Share Data | | | | | | | | | | | | | | | |
Net asset value, beginning of period | | $ | 27.43 | | | $ | 27.67 | | | $ | 25.93 | | | $ | 22.68 | | | $ | 20.02 | |
Income (loss) from investment operations: | |
Net investment income (loss)a | | | .40 | | | | .32 | | | | .23 | | | | .08 | | | | .15 | |
Net gain (loss) on investments (realized and unrealized) | | | 1.78 | | | | (.28 | ) | | | 1.51 | | | | 3.17 | | | | 2.51 | |
Total from investment operations | | | 2.18 | | | | .04 | | | | 1.74 | | | | 3.25 | | | | 2.66 | |
Less distributions from: | |
Net investment income | | | (.33 | ) | | | (.28 | ) | | | — | | | | — | | | | — | |
Net realized gains | | | (.54 | ) | | | — | | | | — | | | | — | | | | — | |
Total distributions | | | (.87 | ) | | | (.28 | ) | | | — | | | | — | | | | — | |
Net asset value, end of period | | $ | 28.74 | | | $ | 27.43 | | | $ | 27.67 | | | $ | 25.93 | | | $ | 22.68 | |
| |
Total Returnb | | | 8.01 | % | | | 0.11 | % | | | 6.71 | % | | | 14.33 | % | | | 13.29 | % |
Ratios/Supplemental Data | |
Net assets, end of period (in thousands) | | $ | 52,840 | | | $ | 52,629 | | | $ | 60,319 | | | $ | 65,375 | | | $ | 62,181 | |
Ratios to average net assets: | |
Net investment income (loss) | | | 1.42 | % | | | 1.14 | % | | | 0.87 | % | | | 0.32 | % | | | 0.71 | % |
Total expensesc | | | 0.92 | % | | | 0.94 | % | | | 0.93 | % | | | 1.07 | % | | | 1.31 | % |
Portfolio turnover rate | | | 6 | % | | | 3 | % | | | 14 | % | | | 3 | % | | | 162 | % |
a | Net investment income (loss) per share was computed using average shares outstanding throughout the period. |
b | Total return does not take into account any of the expenses associated with an investment in variable insurance products. If total return had taken into account these expenses, performance would have been lower. Shares of a series of Guggenheim Variable Funds Trust are available only through the purchase of such products. |
c | Does not include expenses of the underlying funds in which the Fund invests. |
SEE NOTES TO FINANCIAL STATEMENTS. | THE GUGGENHEIM FUNDS ANNUAL REPORT | 77 |
MANAGER’S COMMENTARY (Unaudited) | December 31, 2016 |
To Our Shareholders:
The Series O (All Cap Value Series) is managed by a team of seasoned professionals led by James Schier, CFA, Managing Director and Senior Portfolio Manager; Scott Hammond, Managing Director and Portfolio Manager; Farhan Sharaff, Assistant Chief Investment Officer, Equities, and Portfolio Manager; and Gregg Strohkorb, CFA, Portfolio Manager. In the following paragraphs, the team discusses performance of the Fund for the fiscal year ended December 31, 2016.
For the fiscal year ended December 31, 2016, the Series O (All Cap Value Series) returned 22.71%, compared with the Russell 3000® Value Index, which returned 18.40%.
Strategy and Market Overview
Our investment approach focuses on understanding how companies make money and how easily companies can improve returns, maintain existing high levels of profitability, or benefit from change that occurs within the industry in which they operate. In today’s rapidly changing environment marked by very sharp and quick, but constrained volatility, our long-term orientation and discipline are a competitive advantage. This should become especially critical when the current market environment becomes more discriminating, and fundamentals once again become a more dominant factor in the market.
Performance Review
The performance differential was due mostly to stock selection, but sector allocation decisions also contributed. The largest positive impact was in the Financials and Industrials sectors. On the negative side, the largest impact was in the Consumer Discretionary sector.
Among the individual contributors were regional bank holding Zions Bancorporation and large bank holding JP Morgan & Co., as the Fund’s asset-sensitive bank holdings performed particularly well late in the period in anticipation of a hike in short term interest rates. DRAM chip leader Micron Technology was another large contributor to performance for the period. After a decline in DRAM demand a year ago, many makers left the market, but not Micron, and its shares rebounded as demand revived in 2016.
Among leading individual detractors were CVS Health and CSRA. CSRA was a spin-off from Computer Sciences Corp. and merged with SRA International to form a dedicated IT government services provider. Spending on information technology by the federal government has been slowing over the past several years. CVS, which operates drugstores and serves as a pharmacy benefit manager, said in the fourth quarter it would lose 40 million prescriptions to competitors in 2017.
Portfolio Positioning
The largest relative sector exposures for the year were underweights in Energy and Telecommunications Services, and overweights in Information Technology and Materials. Of these, the Energy underweight detracted from Fund performance for the year, while the Telecom underweight contributed to performance. The Tech and Materials overweights contributed to performance.
In Energy, the Fund focused on holdings with manageable leverage and liquidity that were believed to enable them to weather the storm in commodity prices.
The overweights were driven by our bottom-up fundamental research having identified several companies with favorable risk-return profiles.
78 | THE GUGGENHEIM FUNDS ANNUAL REPORT | |
MANAGER’S COMMENTARY (Unaudited)(concluded) | December 31, 2016 |
Portfolio and Market Outlook
The 2016 election results affected the market as investors began to discount the possibility of a stronger economy brought about by reduced regulation and broad based tax cuts. In addition, the market appears to be getting comfortable with the notion that any interest rate increases will be gradual and enacted with extreme caution. Therefore, the market seems unusually complacent about the risks and optimistic with the future direction of the economy.
Our portfolios tend to reflect a bias toward companies with balance sheet quality. We continue to find niche companies with what we believe to be attractive growth opportunities, and, as such, are constructive on the outlook.
Performance displayed represents past performance which is no guarantee of future results.
The opinions and forecast expressed may not actually come to pass. This information is subject to change at any time, based on market and other conditions, and should not be construed as a recommendation of any specific security or strategy.
| | THE GUGGENHEIM FUNDS ANNUAL REPORT | 79 |
PERFORMANCE REPORT AND FUND PROFILE (Unaudited) | December 31, 2016 |
SERIES O (ALL CAP VALUE SERIES)
OBJECTIVE: Seeks long-term growth of capital.
Holdings Diversification (Market Exposure as % of Net Assets)
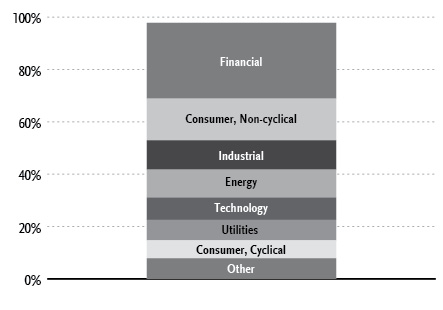
“Holdings Diversification (Market Exposure as % of Net Assets)” excludes any temporary cash investments.
Inception Date: June 1, 1995 |
Ten Largest Holdings (% of Total Net Assets) |
JPMorgan Chase & Co. | 2.4% |
Chevron Corp. | 2.3% |
Berkshire Hathaway, Inc. — Class B | 2.0% |
Exxon Mobil Corp. | 1.8% |
Citigroup, Inc. | 1.8% |
Johnson & Johnson | 1.8% |
Bank of America Corp. | 1.6% |
Cisco Systems, Inc. | 1.6% |
Zions Bancorporation | 1.5% |
Bunge Ltd. | 1.4% |
Top Ten Total | 18.2% |
“Ten Largest Holdings” excludes any temporary cash investments. |
80 | THE GUGGENHEIM FUNDS ANNUAL REPORT | |
PERFORMANCE REPORT AND FUND PROFILE (Unaudited)(concluded) | December 31, 2016 |
Cumulative Fund Performance*,†
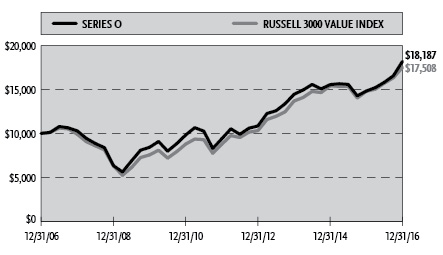
Average Annual Returns*
Periods Ended December 31, 2016†
| 1 Year | 5 Year | 10 Year |
Series O (All Cap Value Series) | 22.71% | 14.13% | 6.16% |
Russell 3000 Value Index | 18.40% | 14.81% | 5.76% |
* | The performance data above represents past performance that is not predictive of future results. The investment return and principal value of an investment in the Fund will fluctuate so that an investor’s shares, when redeemed, may be worth more or less than their original cost. Returns are historical and include changes in principal and reinvested dividends and capital gains and do not reflect the effect of taxes. The Russell 3000 Value Index is an unmanaged index and, unlike the Fund, has no management fees or operating expenses to reduce its reported return. |
† | Performance figures do not reflect fees and expenses associated with an investment in variable insurance products. If returns had taken into account these fees and expenses, performance would have been lower. Shares of a series of Guggenheim Variable Funds Trust are available only through the purchase of such products. |
| | THE GUGGENHEIM FUNDS ANNUAL REPORT | 81 |
SCHEDULE OF INVESTMENTS | December 31, 2016 |
SERIES O (ALL CAP VALUE SERIES) | |
| | Shares | | | Value | |
| | | | | | | |
COMMON STOCKS† - 97.6% | |
| | | | | | | |
Financial - 28.7% | |
JPMorgan Chase & Co. | | | 36,193 | | | $ | 3,123,093 | |
Berkshire Hathaway, Inc. — Class B* | | | 15,461 | | | | 2,519,834 | |
Citigroup, Inc. | | | 38,590 | | | | 2,293,404 | |
Bank of America Corp. | | | 93,808 | | | | 2,073,157 | |
Zions Bancorporation | | | 45,199 | | | | 1,945,365 | |
Wells Fargo & Co. | | | 31,519 | | | | 1,737,013 | |
Unum Group | | | 28,529 | | | | 1,253,279 | |
BB&T Corp. | | | 24,850 | | | | 1,168,447 | |
American International Group, Inc. | | | 16,721 | | | | 1,092,048 | |
KeyCorp | | | 53,394 | | | | 975,508 | |
Alleghany Corp.* | | | 1,560 | | | | 948,667 | |
Assured Guaranty Ltd. | | | 24,553 | | | | 927,367 | |
E*TRADE Financial Corp.* | | | 25,774 | | | | 893,069 | |
SunTrust Banks, Inc. | | | 16,269 | | | | 892,355 | |
Charles Schwab Corp. | | | 22,019 | | | | 869,090 | |
Wintrust Financial Corp. | | | 10,710 | | | | 777,225 | |
Piedmont Office Realty Trust, Inc. — Class A | | | 35,550 | | | | 743,350 | |
Huntington Bancshares, Inc. | | | 49,943 | | | | 660,246 | |
Equity Residential | | | 10,032 | | | | 645,660 | |
Trustmark Corp. | | | 17,760 | | | | 633,144 | |
Sun Communities, Inc. | | | 7,930 | | | | 607,517 | |
Morgan Stanley | | | 13,288 | | | | 561,418 | |
Fulton Financial Corp. | | | 29,088 | | | | 546,854 | |
Popular, Inc. | | | 12,383 | | | | 542,623 | |
Radian Group, Inc. | | | 27,464 | | | | 493,803 | |
Prosperity Bancshares, Inc. | | | 6,280 | | | | 450,778 | |
Allstate Corp. | | | 6,060 | | | | 449,167 | |
Hanover Insurance Group, Inc. | | | 4,774 | | | | 434,482 | |
Alexandria Real Estate Equities, Inc. | | | 3,623 | | | | 402,624 | |
CubeSmart | | | 14,670 | | | | 392,716 | |
Prudential Financial, Inc. | | | 3,683 | | | | 383,253 | |
Ally Financial, Inc. | | | 19,585 | | | | 372,507 | |
Regions Financial Corp. | | | 25,781 | | | | 370,215 | |
EastGroup Properties, Inc. | | | 4,963 | | | | 366,468 | |
Cousins Properties, Inc. | | | 37,705 | | | | 320,869 | |
Equity Commonwealth* | | | 10,387 | | | | 314,103 | |
EPR Properties | | | 4,154 | | | | 298,133 | |
T. Rowe Price Group, Inc. | | | 3,926 | | | | 295,471 | |
PacWest Bancorp | | | 4,978 | | | | 271,002 | |
Lexington Realty Trust | | | 24,950 | | | | 269,460 | |
IBERIABANK Corp. | | | 3,121 | | | | 261,384 | |
First Industrial Realty Trust, Inc. | | | 9,038 | | | | 253,516 | |
DCT Industrial Trust, Inc. | | | 4,751 | | | | 227,478 | |
National Storage Affiliates Trust | | | 9,992 | | | | 220,523 | |
Howard Hughes Corp.* | | | 1,927 | | | | 219,871 | |
Redwood Trust, Inc. | | | 14,379 | | | | 218,705 | |
Camden Property Trust | | | 2,492 | | | | 209,502 | |
Monogram Residential Trust, Inc. | | | 19,284 | | | | 208,653 | |
CoreCivic, Inc. | | | 6,568 | | | | 160,653 | |
Hancock Holding Co. | | | 3,328 | | | | 143,437 | |
Banc of California, Inc. | | | 7,526 | | | | 130,576 | |
Hartford Financial Services Group, Inc. | | | 2,687 | | | | 128,036 | |
Umpqua Holdings Corp. | | | 6,720 | | | | 126,202 | |
Genworth Financial, Inc. — Class A* | | | 27,754 | | | | 105,743 | |
Parkway, Inc.* | | | 4,713 | | | | 104,864 | |
Total Financial | | | | | | | 37,033,927 | |
| | | | | | | | | |
Consumer, Non-cyclical - 16.0% | |
Johnson & Johnson | | | 19,695 | | | | 2,269,062 | |
Bunge Ltd. | | | 25,370 | | | | 1,832,729 | |
Quest Diagnostics, Inc. | | | 18,020 | | | | 1,656,038 | |
Pfizer, Inc. | | | 47,521 | | | | 1,543,482 | |
Merck & Company, Inc. | | | 22,873 | | | | 1,346,534 | |
Procter & Gamble Co. | | | 13,284 | | | | 1,116,919 | |
HCA Holdings, Inc.* | | | 14,282 | | | | 1,057,154 | |
United Rentals, Inc.* | | | 8,809 | | | | 930,054 | |
Medtronic plc | | | 12,720 | | | | 906,046 | |
Zimmer Biomet Holdings, Inc. | | | 8,320 | | | | 858,624 | |
Hormel Foods Corp. | | | 21,001 | | | | 731,045 | |
Navigant Consulting, Inc.* | | | 23,890 | | | | 625,441 | |
Philip Morris International, Inc. | | | 6,162 | | | | 563,761 | |
Mondelez International, Inc. — Class A | | | 12,662 | | | | 561,306 | |
UnitedHealth Group, Inc. | | | 3,364 | | | | 538,374 | |
Emergent BioSolutions, Inc.* | | | 16,131 | | | | 529,742 | |
Hershey Co. | | | 4,559 | | | | 471,537 | |
DaVita, Inc.* | | | 7,079 | | | | 454,472 | |
Dr Pepper Snapple Group, Inc. | | | 4,281 | | | | 388,158 | |
Sanderson Farms, Inc. | | | 3,964 | | | | 373,567 | |
HealthSouth Corp. | | | 8,880 | | | | 366,211 | |
ICF International, Inc.* | | | 6,022 | | | | 332,414 | |
Premier, Inc. — Class A* | | | 9,350 | | | | 283,866 | |
Dean Foods Co. | | | 12,807 | | | | 278,936 | |
Ingredion, Inc. | | | 1,550 | | | | 193,688 | |
Molina Healthcare, Inc.* | | | 3,257 | | | | 176,725 | |
Surgical Care Affiliates, Inc.* | | | 3,164 | | | | 146,398 | |
Total Consumer, Non-cyclical | | | | | | | 20,532,283 | |
| | | | | | | | | |
Industrial - 11.2% | |
WestRock Co. | | | 29,197 | | | | 1,482,332 | |
General Electric Co. | | | 39,991 | | | | 1,263,715 | |
Corning, Inc. | | | 41,858 | | | | 1,015,893 | |
Republic Services, Inc. — Class A | | | 16,303 | | | | 930,086 | |
Huntington Ingalls Industries, Inc. | | | 4,482 | | | | 825,540 | |
Timken Co. | | | 17,043 | | | | 676,607 | |
Jabil Circuit, Inc. | | | 27,295 | | | | 646,073 | |
United Technologies Corp. | | | 5,724 | | | | 627,465 | |
Owens Corning | | | 11,018 | | | | 568,088 | |
CSX Corp. | | | 15,312 | | | | 550,160 | |
Crane Co. | | | 7,337 | | | | 529,145 | |
Orbital ATK, Inc. | | | 5,157 | | | | 452,424 | |
Carlisle Companies, Inc. | | | 4,094 | | | | 451,527 | |
Eaton Corp. plc | | | 6,518 | | | | 437,292 | |
Honeywell International, Inc. | | | 3,573 | | | | 413,932 | |
Snap-on, Inc. | | | 2,221 | | | | 380,391 | |
Spirit AeroSystems Holdings, Inc. — Class A | | | 6,222 | | | | 363,053 | |
FLIR Systems, Inc. | | | 9,993 | | | | 361,647 | |
Harris Corp. | | | 3,264 | | | | 334,462 | |
Summit Materials, Inc. — Class A* | | | 13,875 | | | | 330,075 | |
Werner Enterprises, Inc. | | | 11,820 | | | | 318,549 | |
82 | THE GUGGENHEIM FUNDS ANNUAL REPORT | SEE NOTES TO FINANCIAL STATEMENTS. |
SCHEDULE OF INVESTMENTS (continued) | December 31, 2016 |
SERIES O (ALL CAP VALUE SERIES) | |
| | Shares | | | Value | |
| | | | | | | |
Owens-Illinois, Inc.* | | | 18,039 | | | $ | 314,059 | |
General Dynamics Corp. | | | 1,463 | | | | 252,602 | |
Kirby Corp.* | | | 3,738 | | | | 248,577 | |
Scorpio Tankers, Inc. | | | 50,155 | | | | 227,202 | |
ITT, Inc. | | | 5,626 | | | | 216,995 | |
Covenant Transportation Group, Inc. — Class A* | | | 7,179 | | | | 138,842 | |
Total Industrial | | | | | | | 14,356,733 | |
| | | | | | | | | |
Energy - 10.7% | |
Chevron Corp. | | | 25,300 | | | | 2,977,809 | |
Exxon Mobil Corp. | | | 25,723 | | | | 2,321,758 | |
Kinder Morgan, Inc. | | | 74,160 | | | | 1,535,854 | |
Marathon Oil Corp. | | | 73,655 | | | | 1,274,968 | |
Rowan Companies plc — Class A* | | | 51,730 | | | | 977,180 | |
Hess Corp. | | | 12,900 | | | | 803,541 | |
Valero Energy Corp. | | | 10,843 | | | | 740,794 | |
Whiting Petroleum Corp.* | | | 43,557 | | | | 523,555 | |
Chesapeake Energy Corp.* | | | 62,597 | | | | 439,431 | |
Apache Corp. | | | 6,526 | | | | 414,205 | |
Laredo Petroleum, Inc.* | | | 27,205 | | | | 384,679 | |
QEP Resources, Inc.* | | | 17,476 | | | | 321,733 | |
Western Refining, Inc. | | | 8,304 | | | | 314,306 | |
Oasis Petroleum, Inc.* | | | 17,391 | | | | 263,300 | |
Tesoro Corp. | | | 2,515 | | | | 219,937 | |
Schlumberger Ltd. | | | 2,554 | | | | 214,408 | |
Total Energy | | | | | | | 13,727,458 | |
| | | | | | | | | |
Technology - 8.5% | |
Micron Technology, Inc.* | | | 75,101 | | | | 1,646,213 | |
Intel Corp. | | | 42,340 | | | | 1,535,672 | |
IXYS Corp. | | | 106,070 | | | | 1,262,233 | |
Lam Research Corp. | | | 11,675 | | | | 1,234,398 | |
CSRA, Inc. | | | 38,756 | | | | 1,233,990 | |
QUALCOMM, Inc. | | | 16,349 | | | | 1,065,955 | |
Teradata Corp.* | | | 29,946 | | | | 813,633 | |
Apple, Inc. | | | 3,896 | | | | 451,235 | |
Maxwell Technologies, Inc.* | | | 67,170 | | | | 343,911 | |
Cray, Inc.* | | | 16,255 | | | | 336,479 | |
MKS Instruments, Inc. | | | 4,648 | | | | 276,091 | |
Photronics, Inc.* | | | 22,113 | | | | 249,877 | |
NCR Corp.* | | | 5,847 | | | | 237,154 | |
Qorvo, Inc.* | | | 4,164 | | | | 219,568 | |
Total Technology | | | | | | | 10,906,409 | |
| | | | | | | | | |
Utilities - 7.8% | |
OGE Energy Corp. | | | 45,730 | | | | 1,529,668 | |
Ameren Corp. | | | 26,929 | | | | 1,412,694 | |
UGI Corp. | | | 21,026 | | | | 968,878 | |
Exelon Corp. | | | 25,408 | | | | 901,730 | |
Public Service Enterprise Group, Inc. | | | 18,645 | | | | 818,143 | |
Edison International | | | 9,238 | | | | 665,044 | |
FirstEnergy Corp. | | | 20,704 | | | | 641,203 | |
Pinnacle West Capital Corp. | | | 7,141 | | | | 557,212 | |
Black Hills Corp. | | | 8,511 | | | | 522,065 | |
Avista Corp. | | | 10,450 | | | | 417,896 | |
Portland General Electric Co. | | | 9,624 | | | | 417,008 | |
Duke Energy Corp. | | | 4,420 | | | | 343,080 | |
AES Corp. | | | 26,885 | | | | 312,404 | |
Calpine Corp.* | | | 21,488 | | | | 245,608 | |
ONE Gas, Inc. | | | 3,529 | | | | 225,715 | |
Total Utilities | | | | | | | 9,978,348 | |
| | | | | | | | | |
Consumer, Cyclical - 6.9% | |
Lear Corp. | | | 7,314 | | | | 968,154 | |
Southwest Airlines Co. | | | 15,990 | | | | 796,942 | |
Wal-Mart Stores, Inc. | | | 11,320 | | | | 782,438 | |
CVS Health Corp. | | | 9,561 | | | | 754,459 | |
Target Corp. | | | 9,280 | | | | 670,294 | |
Goodyear Tire & Rubber Co. | | | 20,861 | | | | 643,979 | |
UniFirst Corp. | | | 4,165 | | | | 598,302 | |
DR Horton, Inc. | | | 18,737 | | | | 512,082 | |
Caleres, Inc. | | | 15,523 | | | | 509,464 | |
PACCAR, Inc. | | | 7,199 | | | | 460,016 | |
PVH Corp. | | | 4,819 | | | | 434,867 | |
MGM Resorts International* | | | 14,955 | | | | 431,153 | |
Deckers Outdoor Corp.* | | | 5,402 | | | | 299,217 | |
J.C. Penney Company, Inc.* | | | 28,123 | | | | 233,702 | |
AutoNation, Inc.* | | | 4,748 | | | | 230,990 | |
CalAtlantic Group, Inc. | | | 6,304 | | | | 214,399 | |
Macy’s, Inc. | | | 5,133 | | | | 183,813 | |
Vista Outdoor, Inc.* | | | 1,983 | | | | 73,173 | |
Total Consumer, Cyclical | | | | | | | 8,797,444 | |
| | | | | | | | | |
Communications - 4.6% | |
Cisco Systems, Inc. | | | 66,576 | | | | 2,011,927 | |
Scripps Networks Interactive, Inc. — Class A | | | 11,959 | | | | 853,514 | |
DigitalGlobe, Inc.* | | | 25,656 | | | | 735,044 | |
Time Warner, Inc. | | | 4,818 | | | | 465,081 | |
Walt Disney Co. | | | 4,408 | | | | 459,402 | |
AT&T, Inc. | | | 9,760 | | | | 415,093 | |
Verizon Communications, Inc. | | | 7,439 | | | | 397,094 | |
Finisar Corp.* | | | 11,271 | | | | 341,173 | |
Infinera Corp.* | | | 26,284 | | | | 223,151 | |
Total Communications | | | | | | | 5,901,479 | |
| | | | | | | | | |
Basic Materials - 3.2% | |
Dow Chemical Co. | | | 24,480 | | | | 1,400,746 | |
Reliance Steel & Aluminum Co. | | | 13,676 | | | | 1,087,789 | |
Freeport-McMoRan, Inc.* | | | 51,453 | | | | 678,665 | |
Nucor Corp. | | | 4,422 | | | | 263,197 | |
Olin Corp. | | | 9,838 | | | | 251,951 | |
LyondellBasell Industries N.V. — Class A | | | 2,274 | | | | 195,064 | |
Clearwater Paper Corp.* | | | 1,547 | | | | 101,406 | |
Landec Corp.* | | | 7,101 | | | | 97,994 | |
Total Basic Materials | | | | | | | 4,076,812 | |
| | | | | | | | | |
Total Common Stocks | | | | | | | | |
(Cost $101,073,204) | | | | | | | 125,310,893 | |
SEE NOTES TO FINANCIAL STATEMENTS. | THE GUGGENHEIM FUNDS ANNUAL REPORT | 83 |
SCHEDULE OF INVESTMENTS (concluded) | December 31, 2016 |
SERIES O (ALL CAP VALUE SERIES) | |
| | Shares | | | Value | |
| | | | | | | |
SHORT-TERM INVESTMENTS† - 2.5% | |
Dreyfus Treasury Securities Cash Management Fund - Institutional Class 0.31%1 | | | 3,175,330 | | | $ | 3,175,330 | |
Total Short-Term Investments | | | | | | | | |
(Cost $3,175,330) | | | | | | | 3,175,330 | |
| | | | | | | | | |
Total Investments - 100.1% | | | | | | | | |
(Cost $104,248,534) | | | | | | $ | 128,486,223 | |
Other Assets & Liabilities, net - (0.1)% | | | | | | | (119,361 | ) |
Total Net Assets - 100.0% | | | | | | $ | 128,366,862 | |
* | Non-income producing security. |
† | Value determined based on Level 1 inputs — See Note 4. |
1 | Rate indicated is the 7 day yield as of December 31, 2016. |
| | plc — Public Limited Company |
| | |
| | See Sector Classification in Other Information section. |
The following table summarizes the inputs used to value the Fund’s investments at December 31, 2016 (See Note 4 in the Notes to Financial Statements):
Investments in Securities (Assets) | | Level 1 | | | Level 2 | | | Level 3 | | | Total | |
Common Stocks | | $ | 125,310,893 | | | $ | — | | | $ | — | | | $ | 125,310,893 | |
Short-Term Investments | | | 3,175,330 | | | | — | | | | — | | | | 3,175,330 | |
Total | | $ | 128,486,223 | | | $ | — | | | $ | — | | | $ | 128,486,223 | |
Transfers between investment levels may occur as the markets fluctuate and/or the availability of data used in an investment’s valuation changes. Transfers between valuation levels, if any, are in comparison to the valuation levels at the end of the previous fiscal year, and are effective using the fair value as of the end of the previous fiscal period.
For the year ended December 31, 2016, there were no transfers between levels.
84 | THE GUGGENHEIM FUNDS ANNUAL REPORT | SEE NOTES TO FINANCIAL STATEMENTS. |
SERIES O (ALL CAP VALUE SERIES) | |
STATEMENT OF ASSETS AND LIABILITIES |
December 31, 2016 |
Assets: | |
Investments, at value (cost $104,248,534) | | $ | 128,486,223 | |
Prepaid expenses | | | 12,045 | |
Receivables: | |
Fund shares sold | | | 202 | |
Dividends | | | 158,377 | |
Foreign taxes reclaim | | | 3,587 | |
Total assets | | | 128,660,434 | |
| | | | | |
Liabilities: | |
Payable for: | |
Fund shares redeemed | | | 157,439 | |
Management fees | | | 80,711 | |
Direct shareholders expense | | | 14,997 | |
Fund accounting/administration fees | | | 8,735 | |
Trustees’ fees* | | | 6,369 | |
Transfer agent/maintenance fees | | | 2,263 | |
Miscellaneous | | | 23,058 | |
Total liabilities | | | 293,572 | |
Commitments and contingent liabilities (Note 14) | | | — | |
Net assets | | $ | 128,366,862 | |
| | | | | |
Net assets consist of: | |
Paid in capital | | $ | 93,849,082 | |
Undistributed net investment income | | | 1,816,135 | |
Accumulated net realized gain on investments | | | 8,463,956 | |
Net unrealized appreciation on investments | | | 24,237,689 | |
Net assets | | $ | 128,366,862 | |
Capital shares outstanding | | | 3,770,345 | |
Net asset value per share | | $ | 34.05 | |
STATEMENT OF OPERATIONS |
Year Ended December 31, 2016 |
Investment Income: | |
Dividends (net of foreign withholding tax of $1,892) | | $ | 2,822,294 | |
Interest | | | 4,693 | |
Other income | | | 125 | |
Total investment income | | | 2,827,112 | |
| | | | | |
Expenses: | |
Management fees | | | 834,934 | |
Transfer agent/maintenance fees | | | 23,546 | |
Fund accounting/administration fees | | | 108,374 | |
Line of credit fees | | | 19,453 | |
Trustees’ fees* | | | 9,577 | |
Custodian fees | | | 3,700 | |
Miscellaneous | | | 73,307 | |
Total expenses | | | 1,072,891 | |
Net investment income | | | 1,754,221 | |
| | | | | |
Net Realized and Unrealized Gain (Loss): | |
Net realized gain (loss) on: | |
Investments | | | 9,664,729 | |
Net realized gain | | | 9,664,729 | |
Net change in unrealized appreciation (depreciation) on: | |
Investments | | | 13,190,343 | |
Net change in unrealized appreciation (depreciation) | | | 13,190,343 | |
Net realized and unrealized gain | | | 22,855,072 | |
Net increase in net assets resulting from operations | | $ | 24,609,293 | |
* | Relates to Trustees not deemed “interested persons” within the meaning of Section 2(a)(19) of the 1940 Act. |
SEE NOTES TO FINANCIAL STATEMENTS. | THE GUGGENHEIM FUNDS ANNUAL REPORT | 85 |
SERIES O (ALL CAP VALUE SERIES) | |
STATEMENTS OF CHANGES IN NET ASSETS |
| | Year Ended
December 31,
2016 | | | Year Ended
December 31,
2015 | |
Increase (Decrease) in Net Assets from Operations: | | | | | | |
Net investment income | | $ | 1,754,221 | | | $ | 1,793,008 | |
Net realized gain on investments | | | 9,664,729 | | | | 8,219,838 | |
Net change in unrealized appreciation (depreciation) on investments | | | 13,190,343 | | | | (16,228,817 | ) |
Net increase (decrease) in net assets resulting from operations | | | 24,609,293 | | | | (6,215,971 | ) |
| | | | | | | | | |
Distributions to shareholders from: | | | | | | | | |
Net investment income | | | (1,790,127 | ) | | | (1,281,376 | ) |
Net realized gains | | | (4,633,656 | ) | | | (16,826,249 | ) |
Total distributions to shareholders | | | (6,423,783 | ) | | | (18,107,625 | ) |
| | | | | | | | | |
Capital share transactions: | | | | | | | | |
Proceeds from sale of shares | | | 7,733,531 | | | | 4,474,326 | |
Distributions reinvested | | | 6,423,783 | | | | 18,107,625 | |
Cost of shares redeemed | | | (24,088,801 | ) | | | (25,462,084 | ) |
Net decrease from capital share transactions | | | (9,931,487 | ) | | | (2,880,133 | ) |
Net increase (decrease) in net assets | | | 8,254,023 | | | | (27,203,729 | ) |
| | | | | | | | | |
Net assets: | | | | | | | | |
Beginning of year | | | 120,112,839 | | | | 147,316,568 | |
End of year | | $ | 128,366,862 | | | $ | 120,112,839 | |
Undistributed net investment income at end of year | | $ | 1,816,135 | | | $ | 1,852,041 | |
| | | | | | | | | |
Capital share activity: | | | | | | | | |
Shares sold | | | 256,668 | | | | 133,321 | |
Shares issued from reinvestment of distributions | | | 210,823 | | | | 579,444 | |
Shares redeemed | | | (796,265 | ) | | | (781,405 | ) |
Net decrease in shares | | | (328,774 | ) | | | (68,640 | ) |
86 | THE GUGGENHEIM FUNDS ANNUAL REPORT | SEE NOTES TO FINANCIAL STATEMENTS. |
SERIES O (ALL CAP VALUE SERIES) | |
This table is presented to show selected data for a share outstanding throughout each period and to assist shareholders in evaluating a Fund’s performance for the periods presented.
| | Year Ended
December 31,
2016 | | | Year Ended
December 31,
2015 | | | Year Ended
December 31,
2014 | | | Year Ended
December 31,
2013 | | | Year Ended
December 31,
2012 | |
Per Share Data | | | | | | | | | | | | | | | |
Net asset value, beginning of period | | $ | 29.30 | | | $ | 35.35 | | | $ | 32.85 | | | $ | 24.66 | | | $ | 21.35 | |
Income (loss) from investment operations: | |
Net investment income (loss)a | | | .45 | | | | .43 | | | | .31 | | | | .24 | | | | .21 | |
Net gain (loss) on investments (realized and unrealized) | | | 6.01 | | | | (1.80 | ) | | | 2.19 | | | | 7.95 | | | | 3.10 | |
Total from investment operations | | | 6.46 | | | | (1.37 | ) | | | 2.50 | | | | 8.19 | | | | 3.31 | |
Less distributions from: | |
Net investment income | | | (.48 | ) | | | (.33 | ) | | | (— | )b | | | — | | | | — | |
Net realized gains | | | (1.23 | ) | | | (4.35 | ) | | | — | | | | — | | | | — | |
Total distributions | | | (1.71 | ) | | | (4.68 | ) | | | (— | )b | | | — | | | | — | |
Net asset value, end of period | | $ | 34.05 | | | $ | 29.30 | | | $ | 35.35 | | | $ | 32.85 | | | $ | 24.66 | |
| |
Total Returnc | | | 22.71 | % | | | (4.70 | %) | | | 7.61 | % | | | 33.21 | % | | | 15.50 | % |
Ratios/Supplemental Data | |
Net assets, end of period (in thousands) | | $ | 128,367 | | | $ | 120,113 | | | $ | 147,317 | | | $ | 153,702 | | | $ | 130,234 | |
Ratios to average net assets: | |
Net investment income (loss) | | | 1.48 | % | | | 1.33 | % | | | 0.92 | % | | | 0.81 | % | | | 0.91 | % |
Total expenses | | | 0.90 | % | | | 0.92 | % | | | 0.89 | % | | | 0.90 | % | | | 0.89 | % |
Net expenses | | | 0.90 | % | | | 0.92 | %d | | | 0.89 | %d | | | 0.90 | % | | | 0.89 | % |
Portfolio turnover rate | | | 47 | % | | | 39 | % | | | 49 | % | | | 22 | % | | | 14 | % |
a | Net investment income (loss) per share was computed using average shares outstanding throughout the period. |
b | Distributions from net investment income are less than $0.01 per share. |
c | Total return does not take into account any of the expenses associated with an investment in variable insurance products. If total return had taken into account these expenses, performance would have been lower. Shares of a series of Guggenheim Variable Funds Trust are available only through the purchase of such products. |
d | Net expense information reflects the expense ratios after expense waivers. |
SEE NOTES TO FINANCIAL STATEMENTS. | THE GUGGENHEIM FUNDS ANNUAL REPORT | 87 |
MANAGER’S COMMENTARY (Unaudited) | December 31, 2016 |
To Our Shareholders:
The Series P (High Yield Series) is managed by a team of seasoned professionals, including B. Scott Minerd, Chairman of Investments and Global Chief Investment Officer; Jeffrey B. Abrams, Senior Managing Director and Portfolio Manager; Kevin H. Gundersen, Senior Managing Director and Portfolio Manager; Thomas Hauser, Managing Director and Portfolio Manager; and Richard de Wet, Vice President and Portfolio Manager. In the following paragraphs, the investment team discusses the market environment and the Series’ performance for the fiscal year ended December 31, 2016.
For the one-year period ended December 31, 2016, the Series P (High Yield Series) returned 17.52%, compared with 17.13% for its benchmark, the Bloomberg Barclays U.S. Corporate High Yield Index, outperforming by 0.39%.
The Fund outperformed the broader market from the beginning of the year through mid-February, but did not keep up with the vigorous market rally that followed, marked by the bottoming of oil prices and a slew of downgrades by the credit ratings agencies primarily of commodity-related issuers. The downgrade of greater than $60 billion dollars’ worth of investment grade debt into the high yield universe (“fallen angels”) significantly increased the market’s exposure to commodity-related issuers. The market was pricing in a high level of defaults at the time; but with the easing of global growth concerns, especially in China, and the beginning of a recovery in oil and metals pricing, the market rapidly snapped back with strong returns through the end of the period. For the year, top performing sectors were Metals & Mining (+45.5%) and Energy (+37.4%). In terms of quality, CCC bonds (+31.5%) outperformed BB bonds (+12.8%) and B bonds (+15.8%).
Fund performance for the year was primarily a result of a consistent credit selection process, as Guggenheim’s bottom-up, fundamental approach results in the construction of portfolios that produce solid yield while at the same being defensively positioned. The portfolio has consistently maintained a defensive stance to interest rate volatility with an underweight to duration. A sizable allocation to bank loans that are more senior in the capital structure compared to high yield bonds reduced return volatility and contributed to performance as a whole.
The Fund ended the year facing the tightest high-yield bond spreads since August 2014. At this juncture, we are positioning for a year of clipping coupons, with a small amount of potential price appreciation in B bonds and some highly selective CCC bonds. The Fund’s allocation to BB bonds remains the largest. Our research indicates that BB bonds perform the best of the high yield universe, as the Federal Reserve tightens. At the end of the period, the Fund was positioned higher in quality and was carefully managing exposure to CCC bonds.
The Fund is consistently positioned conservatively in terms of duration, with higher exposure to short-dated bonds and overweight to floating rate securities (bank loans), which decreases volatility as well as diversifies sources of return. Beginning with the February rally, bank loan exposure detracted from performance, even though bank loans performed well on a risk-adjusted basis, although not as vigorous in absolute terms. We believe the loan market currently looks relatively attractive versus high-yield bonds, as the possibility of increasing interest rates and uncertainty over future government policy loom. In addition, bank loans stand to benefit from the phenomenon of higher interest rates, as their coupons reset at a higher rate. A small exposure to investment grade corporates assisted with performance as they provided exposure to higher quality credits and benefited from spread tightening.
While the Fund’s underweight to energy worked against the Fund during the rebound in energy prices that began in February, we prudently sought opportunities to add energy credit near the end of the commodity downgrade cycle. The Fund was roughly market neutral in the space at the end of the period, having bought a number of stable credits at discounted prices. The near-term outlook for high-yield bond defaults is improving, as the upward trajectory in the 12-month trailing default rate slows, and appears to be reversing.
Fiscal stimulus packages proposed by the new administration should encourage further economic growth. That, aided by low levels of unemployment, should help improve corporate growth, particularly in sectors tied to the strength of the consumer. Sectors with the best relative value are services, media and technology sectors, along with select consumer cyclical names.
Performance displayed represents past performance which is no guarantee of future results.
The opinions and forecast expressed may not actually come to pass. This information is subject to change at any time, based on market and other conditions, and should not be construed as a recommendation of any specific security or strategy.
88 | THE GUGGENHEIM FUNDS ANNUAL REPORT | |
PERFORMANCE REPORT AND FUND PROFILE (Unaudited) | December 31, 2016 |
SERIES P (HIGH YIELD SERIES)
OBJECTIVE: Seeks high current income. Capital appreciation is a secondary objective.
Holdings Diversification (Market Exposure as % of Net Assets)
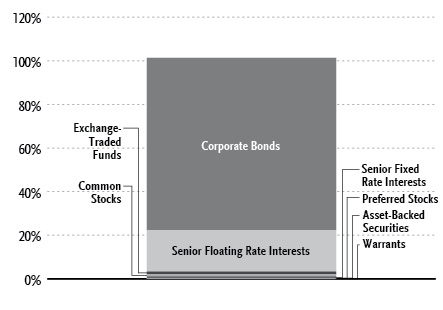
“Holdings Diversification (Market Exposure as % of Net Assets)” excludes any temporary cash investments.
Inception Date: August 5, 1996 |
Ten Largest Holdings (% of Total Net Assets) |
Kennedy-Wilson, Inc. | 1.6% |
Vector Group Ltd. | 1.4% |
SPDR Bloomberg Barclays High Yield Bond ETF | 1.2% |
DISH DBS Corp. | 1.2% |
Epicor Software | 1.2% |
Equinix, Inc. | 1.1% |
FBM Finance, Inc. | 1.0% |
Sprint Communications, Inc. | 1.0% |
LBC Tank Terminals Holding Netherlands BV | 1.0% |
CSC Holdings LLC | 1.0% |
Top Ten Total | 11.7% |
“Ten Largest Holdings” excludes any temporary cash or derivative investments. |
| | THE GUGGENHEIM FUNDS ANNUAL REPORT | 89 |
PERFORMANCE REPORT AND FUND PROFILE (Unaudited)(concluded) | December 31, 2016 |
Cumulative Fund Performance*,†
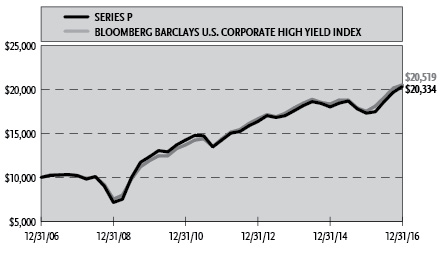
Average Annual Returns*
Periods Ended December 31, 2016†
| 1 Year | 5 Year | 10 Year |
Series P (High Yield Series) | 17.52% | 7.37% | 7.36% |
Bloomberg Barclays U.S. Corporate High Yield Index | 17.13% | 7.36% | 7.45% |
Portfolio Composition by Quality Rating** |
Rating | |
Fixed Income Instruments | |
AAA | 0.2% |
AA | 0.2% |
A | 0.3% |
BBB | 8.4% |
BB | 36.4% |
B | 35.5% |
CCC | 9.3% |
CC | 0.8% |
NR1 | 3.2% |
Other Instruments | 5.7% |
Total Investments | 100.0% |
The chart above reflects percentages of the value of total investments.
* | The performance data above represents past performance that is not predictive of future results. The investment return and principal value of an investment in the Fund will fluctuate so that an investor’s shares, when redeemed, may be worth more or less than their original cost. Returns are historical and include changes in principal and reinvested dividends and capital gains and do not reflect the effect of taxes. The Bloomberg Barclays U.S. Corporate High Yield Index is an unmanaged index and, unlike the Fund, has no management fees or operating expenses to reduce its reported return. |
** | Source: BlackRock Solutions. Credit quality ratings are measured on a scale that generally ranges from AAA (highest) to D (lowest). All securities except for those labeled “NR” have been rated by Moody’s, Standard & Poor’s (“S&P”), or Fitch, which are all a Nationally Recognized Statistical Rating Organization (“NRSRO”). For purposes of this presentation, when ratings are available from more than one agency, the highest rating is used. Guggenheim Investments has converted Moody’s and Fitch ratings to the equivalent S&P rating. Security ratings are determined at the time of purchase and may change thereafter. |
1 | NR securities do not necessarily indicate low credit quality. |
† | Performance figures do not reflect fees and expenses associated with an investment in variable insurance products. If returns had taken into account these fees and expenses, performance would have been lower. Shares of a series of Guggenheim Variable Funds Trust are available only through the purchase of such products. |
90 | THE GUGGENHEIM FUNDS ANNUAL REPORT | |
SCHEDULE OF INVESTMENTS | December 31, 2016 |
SERIES P (HIGH YIELD SERIES) | |
| | Shares | | | Value | |
| | | | | | | |
COMMON STOCKS† - 1.0% | |
| | | | | | | |
Technology - 0.5% | |
Aspect Software Parent, Inc.*,†††,1 | | | 32,624 | | | $ | 488,377 | |
| | | | | | | | | |
Energy - 0.5% | |
Titan Energy LLC*,1 | | | 10,783 | | | | 258,792 | |
SandRidge Energy, Inc.* | | | 6,468 | | | | 152,321 | |
Stallion Oilfield Holdings Ltd.*,†† | | | 19,265 | | | | 12,040 | |
Total Energy | | | | | | | 423,153 | |
| | | | | | | | | |
Communications - 0.0% | |
Cengage Learning Acquisitions, Inc.*,†† | | | 2,107 | | | | 33,010 | |
Aimia, Inc. | | | 5 | | | | 33 | |
Total Communications | | | | | | | 33,043 | |
| | | | | | | | | |
Diversified - 0.0% | |
Leucadia National Corp. | | | 247 | | | | 5,743 | |
| | | | | | | | | |
Consumer, Non-cyclical - 0.0% | |
Crimson Wine Group Ltd.* | | | 24 | | | | 225 | |
MEDIQ, Inc.*,††† | | | 92 | | | | — | |
Total Consumer, Non-cyclical | | | | | | | 225 | |
| | | | | | | | | |
Basic Materials - 0.0% | |
Mirabela Nickel Ltd.*,†††,1 | | | 1,470,315 | | | | 106 | |
| | | | | | | | | |
Consumer, Cyclical - 0.0% | |
Delta Air Lines, Inc. | | | 1 | | | | 49 | |
Chorus Aviation, Inc. | | | 3 | | | | 16 | |
Total Consumer, Cyclical | | | | | | | 65 | |
| | | | | | | | | |
Financial - 0.0% | |
Adelphia Recovery Trust†††,* | | | 5,270 | | | | 1 | |
| | | | | | | | | |
Total Common Stocks | | | | | | | | |
(Cost $2,522,222) | | | | | | | 950,713 | |
| | | | | | | | | |
PREFERRED STOCKS† - 0.2% | |
Financial - 0.2% | |
People’s United Financial, Inc. 5.63%*,2,3 | | | 5,000 | | | | 129,250 | |
| | | | | | | | | |
Industrial - 0.0% | |
U.S. Shipping Corp. due *,††,1 | | | 24,529 | | | | 24,529 | |
Total Preferred Stocks | | | | | | | | |
(Cost $750,000) | | | | | | | 153,779 | |
| | | | | | | | | |
WARRANTS†† - 0.0% | |
Comstock Resources, Inc. | | | | | | | | |
$0.01, 09/06/18* | | | 2,406 | | | | 23,675 | |
Total Warrants | | | | | | | | |
(Cost $20,248) | | | | | | | 23,675 | |
| | | | | | | | | |
EXCHANGE-TRADED FUNDS† - 1.2% | |
SPDR Bloomberg Barclays High Yield Bond ETF | | | 32,000 | | | | 1,166,400 | |
Total Exchange-Traded Funds | | | | | | | | |
(Cost $1,145,729) | | | | | | | 1,166,400 | |
| | | | | | | | | |
SHORT-TERM INVESTMENTS† - 3.4% | |
Dreyfus Treasury Securities Cash Management Fund - Institutional Class 0.31%4 | | | 3,293,944 | | | | 3,293,944 | |
Total Short-Term Investments | | | | | | | | |
(Cost $3,293,944) | | | | | | | 3,293,944 | |
| | | | | | | | | |
| | | Face
Amount11 | | | | | |
| | | | | | | | | |
CORPORATE BONDS†† - 79.0% | |
Communications - 15.6% | |
DISH DBS Corp. | | | | | | | | |
5.88% due 11/15/24 | | $ | 1,100,000 | | | | 1,131,900 | |
7.75% due 07/01/26 | | | 350,000 | | | | 394,625 | |
5.88% due 07/15/22 | | | 200,000 | | | | 210,500 | |
CSC Holdings LLC | | | | | | | | |
6.75% due 11/15/21 | | | 850,000 | | | | 913,750 | |
5.25% due 06/01/24 | | | 650,000 | | | | 635,375 | |
5.50% due 04/15/275 | | | 150,000 | | | | 151,875 | |
T-Mobile USA, Inc. | | | | | | | | |
6.25% due 04/01/21 | | | 700,000 | | | | 728,000 | |
6.50% due 01/15/26 | | | 450,000 | | | | 486,563 | |
Sprint Communications, Inc. | | | | | | | | |
9.00% due 11/15/185 | | | 900,000 | | | | 992,249 | |
6.00% due 11/15/22 | | | 100,000 | | | | 100,750 | |
SFR Group S.A. | | | | | | | | |
6.00% due 05/15/225 | | | 500,000 | | | | 513,125 | |
7.38% due 05/01/265 | | | 425,000 | | | | 435,625 | |
MDC Partners, Inc. | | | | | | | | |
6.50% due 05/01/245 | | | 925,000 | | | | 832,500 | |
Inmarsat Finance plc | | | | | | | | |
4.88% due 05/15/225 | | | 625,000 | | | | 607,813 | |
Cengage Learning, Inc. | | | | | | | | |
9.50% due 06/15/245 | | | 675,000 | | | | 599,063 | |
Sirius XM Radio, Inc. | | | | | | | | |
5.38% due 07/15/265 | | | 550,000 | | | | 537,625 | |
Virgin Media Finance plc | | | | | | | | |
6.38% due 04/15/235 | | | 500,000 | | | | 519,375 | |
Midcontinent Communications / Midcontinent Finance Corp. | | | | | | | | |
6.88% due 08/15/235 | | | 450,000 | | | | 479,250 | |
Sprint Spectrum Company LLC /
Sprint Spectrum Co II LLC /
Sprint Spectrum Co III LLC | | | | | | | | |
3.36% due 09/20/215 | | | 475,000 | | | | 475,888 | |
Cable One, Inc. | | | | | | | | |
5.75% due 06/15/225 | | | 400,000 | | | | 412,000 | |
SEE NOTES TO FINANCIAL STATEMENTS. | THE GUGGENHEIM FUNDS ANNUAL REPORT | 91 |
SCHEDULE OF INVESTMENTS (continued) | December 31, 2016 |
SERIES P (HIGH YIELD SERIES) | |
| | Face
Amount11 | | | Value | |
| | | | | | | |
CCO Holdings LLC / CCO Holdings Capital Corp. | | | | | | |
5.88% due 04/01/24 | | $ | 350,000 | | | $ | 373,625 | |
EIG Investors Corp. | | | | | | | | |
10.88% due 02/01/24 | | | 375,000 | | | | 363,750 | |
Anixter, Inc. | | | | | | | | |
5.50% due 03/01/23 | | | 300,000 | | | | 311,250 | |
Altice US Finance I Corp. | | | | | | | | |
5.50% due 05/15/265 | | | 300,000 | | | | 306,000 | |
McGraw-Hill Global Education Holdings LLC / McGraw-Hill Global Education Finance | | | | | | | | |
7.88% due 05/15/245,6 | | | 300,000 | | | | 302,250 | |
Comcast Corp. | | | | | | | | |
3.20% due 07/15/36 | | | 325,000 | | | | 292,329 | |
TIBCO Software, Inc. | | | | | | | | |
11.38% due 12/01/215 | | | 245,000 | | | | 245,000 | |
Cogent Communications Group, Inc. | | | | | | | | |
5.38% due 03/01/225 | | | 200,000 | | | | 206,500 | |
Ziggo Bond Finance BV | | | | | | | | |
5.88% due 01/15/255 | | | 200,000 | | | | 200,000 | |
Level 3 Financing, Inc. | | | | | | | | |
5.25% due 03/15/26 | | | 200,000 | | | | 198,000 | |
Ziggo Secured Finance BV | | | | | | | | |
5.50% due 01/15/275 | | | 200,000 | | | | 194,960 | |
Sprint Corp. | | | | | | | | |
7.88% due 09/15/23 | | | 100,000 | | | | 106,750 | |
7.63% due 02/15/25 | | | 50,000 | | | | 52,563 | |
Match Group, Inc. | | | | | | | | |
6.38% due 06/01/24 | | | 150,000 | | | | 158,250 | |
Zayo Group LLC / Zayo Capital, Inc. | | | | | | | | |
6.38% due 05/15/25 | | | 150,000 | | | | 156,750 | |
CenturyLink, Inc. | | | | | | | | |
5.63% due 04/01/25 | | | 150,000 | | | | 142,500 | |
Sirius XM Canada Holdings, Inc. | | | | | | | | |
5.63% due 04/23/215 | | CAD | 150,000 | | | | 111,705 | |
Total Communications | | | | | | | 14,880,033 | |
| | | | | | | | | |
Energy - 13.0% | |
Sabine Pass Liquefaction LLC | | | | | | | | |
6.25% due 03/15/22 | | | 450,000 | | | | 492,750 | |
5.63% due 04/15/23 | | | 300,000 | | | | 318,750 | |
5.88% due 06/30/26 | | | 250,000 | | | | 269,375 | |
5.00% due 03/15/27 | | | 150,000 | | | | 151,313 | |
CONSOL Energy, Inc. | | | | | | | | |
8.00% due 04/01/23 | | | 450,000 | | | | 461,813 | |
5.88% due 04/15/22 | | | 450,000 | | | | 441,000 | |
Comstock Resources, Inc. | | | | | | | | |
10.00% due 03/15/20 | | | 875,000 | | | | 896,874 | |
Gibson Energy, Inc. | | | | | | | | |
6.75% due 07/15/215 | | | 789,000 | | | | 818,587 | |
Legacy Reserves Limited Partnership / Legacy Reserves Finance Corp. | | | | | | | | |
6.63% due 12/01/21 | | | 625,000 | | | | 428,092 | |
8.00% due 12/01/20 | | | 505,000 | | | | 374,963 | |
Crestwood Midstream Partners Limited Partnership / Crestwood Midstream Finance Corp. | | | | | | | | |
6.25% due 04/01/23 | | | 750,000 | | | | 765,000 | |
Antero Resources Corp. | | | | | | | | |
5.63% due 06/01/23 | | | 350,000 | | | | 358,313 | |
5.13% due 12/01/22 | | | 256,000 | | | | 258,560 | |
5.38% due 11/01/21 | | | 100,000 | | | | 102,250 | |
BreitBurn Energy Partners Limited Partnership / BreitBurn Finance Corp. | | | | | | | | |
7.88% due 04/15/227 | | | 750,000 | | | | 532,499 | |
8.63% due 10/15/207 | | | 250,000 | | | | 176,250 | |
EP Energy LLC / Everest Acquisition Finance, Inc. | | | | | | | | |
9.38% due 05/01/20 | | | 450,000 | | | | 414,842 | |
6.38% due 06/15/23 | | | 350,000 | | | | 276,500 | |
Unit Corp. | | | | | | | | |
6.63% due 05/15/21 | | | 700,000 | | | | 678,999 | |
American Midstream Partners Limited Partnership / American Midstream Finance Corp. | | | | | | | | |
8.50% due 12/15/21 | | | 650,000 | | | | 645,125 | |
Keane Group Holdings LLC | | | | | | | | |
12.00% due 08/08/19†††,1 | | | 617,500 | | | | 566,556 | |
Halcon Resources Corp. | | | | | | | | |
8.63% due 02/01/205,6 | | | 525,000 | | | | 546,000 | |
TerraForm Power Operating LLC | | | | | | | | |
6.38% due 02/01/235,8 | | | 400,000 | | | | 405,000 | |
6.13% due 06/15/255,6,8 | | | 125,000 | | | | 129,375 | |
Cheniere Corpus Christi Holdings LLC | | | | | | | | |
5.88% due 03/31/25 | | | 400,000 | | | | 408,124 | |
Summit Midstream Holdings LLC / Summit Midstream Finance Corp. | | | | | | | | |
5.50% due 08/15/22 | | | 200,000 | | | | 195,000 | |
7.50% due 07/01/21 | | | 150,000 | | | | 157,500 | |
Alta Mesa Holdings Limited Partnership / Alta Mesa Finance Services Corp. | | | | | | | | |
7.88% due 12/15/24 | | | 300,000 | | | | 310,500 | |
FTS International, Inc. | | | | | | | | |
8.46% due 06/15/202,5 | | | 250,000 | | | | 250,000 | |
QEP Resources, Inc. | | | | | | | | |
6.88% due 03/01/21 | | | 200,000 | | | | 212,500 | |
SandRidge Energy, Inc. | | | | | | | | |
due 10/04/209 | | | 152,484 | | | | 189,938 | |
Whiting Petroleum Corp. | | | | | | | | |
5.75% due 03/15/216 | | | 175,000 | | | | 174,272 | |
Approach Resources, Inc. | | | | | | | | |
7.00% due 06/15/21 | | | 55,000 | | | | 49,500 | |
Schahin II Finance Company SPV Ltd. | | | | | | | | |
5.88% due 09/25/227,10 | | | 173,733 | | | | 20,848 | |
SandRidge Energy, Inc. Escrow Notes | | | | | | | | |
8.75% due 06/01/18†††,1,7 | | | 675,000 | | | | 68 | |
SemGroup, LP | | | | | | | | |
8.75% due 11/15/15†††,1,7 | | | 1,700,000 | | | | 2 | |
Total Energy | | | | | | | 12,477,038 | |
92 | THE GUGGENHEIM FUNDS ANNUAL REPORT | SEE NOTES TO FINANCIAL STATEMENTS. |
SCHEDULE OF INVESTMENTS (continued) | December 31, 2016 |
SERIES P (HIGH YIELD SERIES) | |
| | | Face
Amount11 | | | Value | |
| | | | | | | | |
Financial - 11.9% | |
Kennedy-Wilson, Inc. | | | | | | | |
5.88% due 04/01/24 | | | $ | 1,520,000 | | | $ | 1,548,500 | |
Jefferies Finance LLC / JFIN Company-Issuer Corp. | | | | | | | | | |
7.38% due 04/01/205 | | | | 755,000 | | | | 754,999 | |
7.50% due 04/15/215 | | | | 400,000 | | | | 396,000 | |
FBM Finance, Inc. | | | | | | | | | |
8.25% due 08/15/215 | | | | 950,000 | | | | 1,002,250 | |
American Equity Investment Life Holding Co. | | | | | | | | | |
6.63% due 07/15/21 | | | | 750,000 | | | | 781,875 | |
GEO Group, Inc. | | | | | | | | | |
5.88% due 01/15/22 | | | | 450,000 | | | | 455,625 | |
6.00% due 04/15/26 | | | | 250,000 | | | | 245,625 | |
Lincoln Finance Ltd. | | | | | | | | | |
6.88% due 04/15/21 | | | EUR | 600,000 | | | | 688,443 | |
Citigroup, Inc. | | | | | | | | | |
| | 6.30%2,3 | | | 650,000 | | | | 644,475 | |
NFP Corp. | | | | | | | | | |
9.00% due 07/15/215 | | | | 600,000 | | | | 633,000 | |
Icahn Enterprises Limited Partnership / Icahn Enterprises Finance Corp. | | | | | | | | | |
6.00% due 08/01/20 | | | | 450,000 | | | | 459,563 | |
Wilton Re Finance LLC | | | | | | | | | |
5.88% due 03/30/332,5 | | | | 400,000 | | | | 407,500 | |
NewStar Financial, Inc. | | | | | | | | | |
7.25% due 05/01/20 | | | | 400,000 | | | | 398,000 | |
EPR Properties | | | | | | | | | |
5.75% due 08/15/22 | | | | 300,000 | | | | 322,990 | |
Jefferies LoanCore LLC / JLC Finance Corp. | | | | | | | | | |
6.88% due 06/01/205 | | | | 300,000 | | | | 286,500 | |
Compass Bank | | | | | | | | | |
3.88% due 04/10/25 | | | | 300,000 | | | | 285,492 | |
Greystar Real Estate Partners LLC | | | | | | | | | |
8.25% due 12/01/225 | | | | 250,000 | | | | 270,625 | |
Hospitality Properties Trust | | | | | | | | | |
4.50% due 03/15/25 | | | | 250,000 | | | | 243,687 | |
Capital One Financial Corp. | | | | | | | | | |
3.75% due 07/28/26 | | | | 250,000 | | | | 242,349 | |
PNC Financial Services Group, Inc. | | | | | | | | | |
| | 5.00%2,3 | | | 250,000 | | | | 241,250 | |
Goldman Sachs Group, Inc. | | | | | | | | | |
| | 5.30%2,3 | | | 250,000 | | | | 239,688 | |
CyrusOne, LP / CyrusOne Finance Corp. | | | | | | | | | |
6.38% due 11/15/22 | | | | 200,000 | | | | 210,500 | |
M&T Bank Corp. | | | | | | | | | |
| | 5.13%2,3 | | | 200,000 | | | | 193,500 | |
Cabot Financial Luxembourg S.A. | | | | | | | | | |
7.50% due 10/01/23 | | | GBP | 150,000 | | | | 184,979 | |
Fidelity & Guaranty Life Holdings, Inc. | | | | | | | | | |
6.38% due 04/01/215 | | | | 180,000 | | | | 179,100 | |
HUB International Ltd. | | | | | | | | | |
9.25% due 02/15/215 | | | | 100,000 | | | | 103,500 | |
Total Financial | | | | | | | | 11,420,015 | |
| | | | | | | | | | | |
Consumer, Non-cyclical - 8.2% | |
Vector Group Ltd. | | | | | | | | | |
7.75% due 02/15/21 | | | | 1,250,000 | | | | 1,303,124 | |
Bumble Bee Holdco SCA | | | | | | | | | |
9.63% due 03/15/185 | | | | 784,000 | | | | 762,440 | |
Midas Intermediate Holdco II LLC / Midas Intermediate Holdco II Finance, Inc. | | | | | | | | | |
7.88% due 10/01/225 | | | | 700,000 | | | | 722,750 | |
Kinetic Concepts Incorporated / KCI USA Inc | | | | | | | | | |
7.88% due 02/15/215 | | | | 575,000 | | | | 623,875 | |
Tenet Healthcare Corp. | | | | | | | | | |
7.50% due 01/01/22 | | | | 525,000 | | | | 547,312 | |
Bumble Bee Holdings, Inc. | | | | | | | | | |
9.00% due 12/15/175 | | | | 550,000 | | | | 543,125 | |
WEX, Inc. | | | | | | | | | |
4.75% due 02/01/235 | | | | 550,000 | | | | 536,938 | |
KeHE Distributors LLC / KeHE Finance Corp. | | | | | | | | | |
7.63% due 08/15/215 | | | | 450,000 | | | | 447,750 | |
Halyard Health, Inc. | | | | | | | | | |
6.25% due 10/15/22 | | | | 375,000 | | | | 386,250 | |
Central Garden & Pet Co. | | | | | | | | | |
6.13% due 11/15/23 | | | | 350,000 | | | | 369,250 | |
ServiceMaster Co. LLC | | | | | | | | | |
5.13% due 11/15/245 | | | | 350,000 | | | | 355,250 | |
Acadia Healthcare Company, Inc. | | | | | | | | | |
6.50% due 03/01/24 | | | | 200,000 | | | | 204,500 | |
5.63% due 02/15/23 | | | | 125,000 | | | | 125,000 | |
ADT Corp. | | | | | | | | | |
6.25% due 10/15/21 | | | | 200,000 | | | | 217,000 | |
3.50% due 07/15/22 | | | | 115,000 | | | | 109,538 | |
HCA, Inc. | | | | | | | | | |
4.50% due 02/15/27 | | | | 250,000 | | | | 245,625 | |
AMN Healthcare, Inc. | | | | | | | | | |
5.13% due 10/01/245 | | | | 175,000 | | | | 174,563 | |
Post Holdings, Inc. | | | | | | | | | |
5.00% due 08/15/265 | | | | 150,000 | | | | 143,625 | |
Opal Acquisition, Inc. | | | | | | | | | |
8.88% due 12/15/215 | | | | 45,000 | | | | 38,475 | |
Total Consumer, Non-cyclical | | | | | | | | 7,856,390 | |
| | | | | | | | | | | |
Technology - 7.7% | |
First Data Corp. | | | | | | | | | |
5.75% due 01/15/245 | | | | 850,000 | | | | 877,098 | |
5.00% due 01/15/245 | | | | 700,000 | | | | 703,724 | |
Open Text Corp. | | | | | | | | | |
5.88% due 06/01/265 | | | | 650,000 | | | | 685,750 | |
5.63% due 01/15/235 | | | | 550,000 | | | | 574,750 | |
NCR Corp. | | | | | | | | | |
6.38% due 12/15/23 | | | | 600,000 | | | | 645,000 | |
5.88% due 12/15/21 | | | | 500,000 | | | | 523,750 | |
Epicor Software | | | | | | | | | |
9.25% due 06/21/23††† | | | | 1,150,000 | | | | 1,123,550 | |
Micron Technology, Inc. | | | | | | | | | |
5.25% due 08/01/23 | | | | 525,000 | | | | 526,968 | |
7.50% due 09/15/235 | | | | 435,000 | | | | 481,763 | |
SEE NOTES TO FINANCIAL STATEMENTS. | THE GUGGENHEIM FUNDS ANNUAL REPORT | 93 |
SCHEDULE OF INVESTMENTS (continued) | December 31, 2016 |
SERIES P (HIGH YIELD SERIES) | |
| | Face
Amount11 | | | Value | |
| | | | | | | |
Infor US, Inc. | | | | | | |
6.50% due 05/15/22 | | $ | 600,000 | | | $ | 625,500 | |
5.75% due 08/15/205 | | | 250,000 | | | | 261,875 | |
Microsoft Corp. | | | | | | | | |
4.20% due 11/03/35 | | | 200,000 | | | | 210,461 | |
Oracle Corp. | | | | | | | | |
3.85% due 07/15/36 | | | 150,000 | | | | 146,388 | |
Total Technology | | | | | | | 7,386,577 | |
| | | | | | | | | |
Consumer, Cyclical - 7.5% | |
Ferrellgas Limited Partnership / Ferrellgas Finance Corp. | | | | | | | | |
6.75% due 06/15/23 | | | 750,000 | | | | 736,874 | |
6.75% due 01/15/22 | | | 650,000 | | | | 641,875 | |
6.50% due 05/01/21 | | | 150,000 | | | | 149,250 | |
WMG Acquisition Corp. | | | | | | | | |
6.75% due 04/15/225 | | | 815,000 | | | | 857,788 | |
4.88% due 11/01/245 | | | 200,000 | | | | 199,000 | |
5.00% due 08/01/235 | | | 150,000 | | | | 150,750 | |
Wynn Las Vegas LLC / Wynn Las Vegas Capital Corp. | | | | | | | | |
5.50% due 03/01/255 | | | 650,000 | | | | 644,800 | |
L Brands, Inc. | | | | | | | | |
6.75% due 07/01/36 | | | 300,000 | | | | 303,750 | |
7.60% due 07/15/37 | | | 125,000 | | | | 127,813 | |
6.88% due 11/01/35 | | | 100,000 | | | | 102,000 | |
Nathan’s Famous, Inc. | | | | | | | | |
10.00% due 03/15/205 | | | 400,000 | | | | 435,000 | |
Carmike Cinemas, Inc. | | | | | | | | |
6.00% due 06/15/235 | | | 350,000 | | | | 369,250 | |
NPC International Inc. / NPC Operating Company A Inc / NPC Operating Company B Inc | | | | | | | | |
10.50% due 01/15/20 | | | 350,000 | | | | 360,938 | |
Suburban Propane Partners Limited Partnership/Suburban Energy Finance Corp. | | | | | | | | |
5.50% due 06/01/24 | | | 350,000 | | | | 354,375 | |
Wyndham Worldwide Corp. | | | | | | | | |
5.10% due 10/01/25 | | | 300,000 | | | | 316,125 | |
Interval Acquisition Corp. | | | | | | | | |
5.63% due 04/15/23 | | | 300,000 | | | | 306,000 | |
Seminole Hard Rock Entertainment Inc. / Seminole Hard Rock International LLC | | | | | | | | |
5.88% due 05/15/215 | | | 300,000 | | | | 297,000 | |
TVL Finance PLC | | | | | | | | |
8.50% due 05/15/23 | | GBP | 200,000 | | | | 262,483 | |
Group 1 Automotive, Inc. | | | | | | | | |
5.25% due 12/15/235 | | | 200,000 | | | | 198,000 | |
Carrols Restaurant Group, Inc. | | | | | | | | |
8.00% due 05/01/22 | | | 150,000 | | | | 161,625 | |
AMC Entertainment Holdings, Inc. | | | | | | | | |
5.88% due 11/15/26 | | | 100,000 | | | | 102,250 | |
Scotts Miracle-Gro Co. | | | | | | | | |
5.25% due 12/15/26 | | | 60,000 | | | | 60,000 | |
Total Consumer, Cyclical | | | | | | | 7,136,946 | |
| | | | | | | | | |
Industrial - 6.9% | |
Novelis Corp. | | | | | | | | |
5.88% due 09/30/265 | | | 700,000 | | | | 707,000 | |
6.25% due 08/15/245 | | | 600,000 | | | | 636,000 | |
StandardAero Aviation Holdings, Inc. | | | | | | | | |
10.00% due 07/15/235 | | | 775,000 | | | | 815,688 | |
Grinding Media Incorporated / MC Grinding Media Canada Inc | | | | | | | | |
7.38% due 12/15/235 | | | 700,000 | | | | 735,419 | |
Amsted Industries, Inc. | | | | | | | | |
5.38% due 09/15/245 | | | 650,000 | | | | 638,625 | |
Summit Materials LLC / Summit Materials Finance Corp. | | | | | | | | |
8.50% due 04/15/22 | | | 500,000 | | | | 552,500 | |
Ardagh Packaging Finance plc / Ardagh Holdings USA, Inc. | | | | | | | | |
7.25% due 05/15/245 | | | 450,000 | | | | 474,188 | |
Standard Industries, Inc. | | | | | | | | |
5.50% due 02/15/235 | | | 423,000 | | | | 437,847 | |
Actuant Corp. | | | | | | | | |
5.63% due 06/15/22 | | | 300,000 | | | | 307,500 | |
Crown Americas LLC / Crown Americas Capital Corporation V | | | | | | | | |
4.25% due 09/30/26 | | | 250,000 | | | | 235,625 | |
Reynolds Group Issuer Incorporated / Reynolds Group Issuer LLC / Reynolds Group Issuer Lu | | | | | | | | |
4.38% due 07/15/212,5 | | | 200,000 | | | | 204,500 | |
Reynolds Group Issuer, Inc. / Reynolds Group Issuer LLC | | | | | | | | |
5.13% due 07/15/235 | | | 200,000 | | | | 204,250 | |
Moto Finance plc | | | | | | | | |
6.38% due 09/01/20 | | GBP | 150,000 | | | | 192,241 | |
Infor US, Inc. | | | | | | | | |
5.75% due 05/15/22 | | EUR | 150,000 | | | | 162,464 | |
LMI Aerospace, Inc. | | | | | | | | |
7.38% due 07/15/19 | | | 125,000 | | | | 124,688 | |
Coveris Holdings S.A. | | | | | | | | |
7.88% due 11/01/195 | | | 125,000 | | | | 124,063 | |
Reynolds Group Issuer Inc. / Reynolds Group Issuer LLC / Reynolds Group Issuer | | | | | | | | |
6.88% due 02/15/21 | | | 64,814 | | | | 66,693 | |
Total Industrial | | | | | | | 6,619,291 | |
| | | | | | | | | |
Basic Materials - 3.9% | |
Alcoa Nederland Holding BV | | | | | | | | |
7.00% due 09/30/265 | | | 800,000 | | | | 876,000 | |
6.75% due 09/30/245 | | | 300,000 | | | | 325,500 | |
Eldorado Gold Corp. | | | | | | | | |
6.13% due 12/15/205 | | | 900,000 | | | | 913,500 | |
Constellium N.V. | | | | | | | | |
7.88% due 04/01/215 | | | 350,000 | | | | 376,250 | |
GCP Applied Technologies, Inc. | | | | | | | | |
9.50% due 02/01/235 | | | 300,000 | | | | 344,250 | |
Yamana Gold, Inc. | | | | | | | | |
4.95% due 07/15/24 | | | 300,000 | | | | 294,000 | |
94 | THE GUGGENHEIM FUNDS ANNUAL REPORT | SEE NOTES TO FINANCIAL STATEMENTS. |
SCHEDULE OF INVESTMENTS (continued) | December 31, 2016 |
SERIES P (HIGH YIELD SERIES) | |
| | Face
Amount11 | | | Value | |
| | | | | | | |
PQ Corp. | | | | | | |
6.75% due 11/15/225 | | $ | 200,000 | | | $ | 214,000 | |
Kaiser Aluminum Corp. | | | | | | | | |
5.88% due 05/15/24 | | | 150,000 | | | | 155,250 | |
Cascades, Inc. | | | | | | | | |
5.75% due 07/15/235 | | | 150,000 | | | | 152,250 | |
Mirabela Nickel Ltd. | | | | | | | | |
2.38% due 06/24/19†††,1,7 | | | 390,085 | | | | 71,943 | |
1.00% due 09/10/44†††,1,12 | | | 7,799 | | | | — | |
Total Basic Materials | | | | | | | 3,722,943 | |
| | | | | | | | | |
Utilities - 3.5% | |
LBC Tank Terminals Holding Netherlands BV | | | | | | | | |
6.88% due 05/15/235 | | | 950,000 | | | | 971,375 | |
AmeriGas Partners Limited Partnership / AmeriGas Finance Corp. | | | | | | | | |
5.63% due 05/20/24 | | | 500,000 | | | | 511,250 | |
5.50% due 05/20/25 | | | 350,000 | | | | 353,500 | |
Terraform Global Operating LLC | | | | | | | | |
9.75% due 08/15/225,6 | | | 800,000 | | | | 854,000 | |
AES Corp. | | | | | | | | |
6.00% due 05/15/26 | | | 550,000 | | | | 558,250 | |
3.93% due 06/01/192 | | | 66,000 | | | | 66,000 | |
Total Utilities | | | | | | | 3,314,375 | |
| | | | | | | | | |
Diversified - 0.8% | |
HRG Group, Inc. | | | | | | | | |
7.88% due 07/15/19 | | | 748,000 | | | | 779,790 | |
Total Corporate Bonds | | | | | | | | |
(Cost $75,293,240) | | | | | | | 75,593,398 | |
| | | | | | | | | |
SENIOR FLOATING RATE INTERESTS††,2 - 19.0% | |
Technology - 5.9% | |
Equinix, Inc. | | | | | | | | |
3.25% due 12/07/23 | | EUR | 1,000,000 | | | | 1,058,657 | |
Greenway Medical Technologies | | | | | | | | |
9.25% due 11/04/211 | | | 500,000 | | | | 485,000 | |
6.00% due 11/04/201 | | | 291,653 | | | | 288,736 | |
Sparta Holding Corp. | | | | | | | | |
6.50% due 07/28/20†††,1 | | | 668,540 | | | | 664,556 | |
Oberthur Technologies of America Corp. | | | | | | | | |
3.75% due 12/14/23 | | | 550,000 | | | | 554,538 | |
Masergy Holdings, Inc. | | | | | | | | |
5.50% due 12/15/23 | | | 475,000 | | | | 477,575 | |
GTT Communications, Inc. | | | | | | | | |
5.00% due 12/13/23 | | | 400,000 | | | | 405,500 | |
EIG Investors Corp. | | | | | | | | |
6.00% due 02/09/23 | | | 344,724 | | | | 341,707 | |
Verisure Cayman 2 | | | | | | | | |
3.75% due 10/21/22 | | EUR | 250,000 | | | | 265,104 | |
Landslide Holdings, Inc. | | | | | | | | |
5.50% due 09/27/22 | | | 254,439 | | | | 257,302 | |
Kronos, Inc. | | | | | | | | |
5.00% due 11/01/23 | | | 250,000 | | | | 252,930 | |
TIBCO Software, Inc. | | | | | | | | |
6.50% due 12/04/20 | | | 197,985 | | | | 198,605 | |
Advanced Computer Software | | | | | | | | |
10.50% due 01/31/231 | | | 200,000 | | | | 179,750 | |
Coherent Holding GmbH | | | | | | | | |
4.25% due 11/07/23 | | EUR | 149,625 | | | | 159,501 | |
Aspect Software, Inc. | | | | | | | | |
11.28% due 05/25/20 | | | 14,743 | | | | 14,682 | |
Total Technology | | | | | | | 5,604,143 | |
| | | | | | | | | |
Industrial - 2.9% | |
Zodiac Pool Solutions LLC | | | | | | | | |
5.50% due 12/20/23 | | | 500,000 | | | | 502,814 | |
Hardware Holdings LLC | | | | | | | | |
6.75% due 03/30/20†††,1 | | | 307,125 | | | | 300,983 | |
CareCore National LLC | | | | | | | | |
5.50% due 03/05/21 | | | 298,445 | | | | 293,222 | |
Quikrete Holdings, Inc. | | | | | | | | |
4.00% due 11/15/23 | | | 250,000 | | | | 252,293 | |
Atkore International, Inc. | | | | | | | | |
4.00% due 12/22/23 | | | 250,000 | | | | 251,875 | |
Advanced Integration Technology LP | | | | | | | | |
6.50% due 07/22/21 | | | 249,375 | | | | 249,375 | |
ProAmpac PG Borrower LLC | | | | | | | | |
5.00% due 11/20/23 | | | 200,000 | | | | 202,126 | |
Flex Acquisition Company, Inc. | | | | | | | | |
4.25% due 12/29/23 | | | 200,000 | | | | 201,666 | |
Mast Global | | | | | | | | |
7.75% due 09/12/19†††,1 | | | 175,471 | | | | 174,673 | |
Sirva Worldwide, Inc. | | | | | | | | |
7.50% due 11/22/221 | | | 159,085 | | | | 155,506 | |
USIC Holding, Inc. | | | | | | | | |
4.75% due 12/08/23 | | | 150,000 | | | | 150,875 | |
NANA Development Corp. | | | | | | | | |
8.00% due 03/15/181 | | | 37,500 | | | | 36,000 | |
Total Industrial | | | | | | | 2,771,408 | |
| | | | | | | | | |
Consumer, Non-cyclical - 2.8% | |
Halyard Health | | | | | | | | |
3.50% due 11/01/21 | | | 675,000 | | | | 676,971 | |
IHC Holding Corp. | | | | | | | | |
7.00% due 04/30/21†††,1 | | | 541,750 | | | | 535,882 | |
NES Global Talent | | | | | | | | |
6.50% due 10/03/191 | | | 565,176 | | | | 508,659 | |
Reddy Ice Holdings, Inc. | | | | | | | | |
10.75% due 10/01/191 | | | 530,000 | | | | 455,800 | |
CTI Foods Holding Co. LLC | | | | | | | | |
8.25% due 06/28/21 | | | 300,000 | | | | 270,000 | |
Give and Go Prepared Foods Corp. | | | | | | | | |
6.50% due 07/29/23 | | | 249,375 | | | | 249,375 | |
Total Consumer, Non-cyclical | | | | | | | 2,696,687 | |
| | | | | | | | | |
Communications - 2.2% | |
Virgin Media Bristol LLC | | | | | | | | |
2.75% due 01/31/25 | | | 600,000 | | | | 602,327 | |
Cengage Learning Acquisitions, Inc. | | | | | | | | |
5.25% due 06/07/23 | | | 498,747 | | | | 484,488 | |
Anaren, Inc. | | | | | | | | |
9.25% due 08/18/211 | | | 500,000 | | | | 483,750 | |
SEE NOTES TO FINANCIAL STATEMENTS. | THE GUGGENHEIM FUNDS ANNUAL REPORT | 95 |
SCHEDULE OF INVESTMENTS (continued) | December 31, 2016 |
SERIES P (HIGH YIELD SERIES) | |
| | Face
Amount11 | | | Value | |
| | | | | | | |
SFR Group SA | | | | | | |
4.04% due 01/14/25 | | $ | 300,000 | | | $ | 302,325 | |
Radiate HoldCo LLC | | | | | | | | |
3.75% due 12/12/23 | | | 250,000 | | | | 251,528 | |
Total Communications | | | | | | | 2,124,418 | |
| | | | | | | | | |
Consumer, Cyclical - 2.1% | |
Mavis Tire | | | | | | | | |
6.25% due 11/02/20†††,1 | | | 492,500 | | | | 487,185 | |
Sears Holdings Corp. | | | | | | | | |
5.50% due 06/30/18 | | | 491,456 | | | | 470,569 | |
Belk, Inc. | | | | | | | | |
5.75% due 12/12/22 | | | 426,625 | | | | 366,543 | |
Navistar, Inc. | | | | | | | | |
6.50% due 08/07/20 | | | 247,500 | | | | 250,346 | |
Amaya Holding B.V. | | | | | | | | |
5.00% due 08/01/21 | | | 200,000 | | | | 200,612 | |
Fitness International LLC | | | | | | | | |
6.00% due 07/01/20 | | | 199,500 | | | | 199,626 | |
Advantage Sales & Marketing LLC | | | | | | | | |
4.25% due 07/25/19†††,1 | | | 67,500 | | | | 63,031 | |
Total Consumer, Cyclical | | | | | | | 2,037,912 | |
| | | | | | | | | |
Financial - 1.9% | |
National Financial Partners Corp. | | | | | | | | |
4.50% due 12/09/23 | | | 500,000 | | | | 503,749 | |
Outerwall, Inc. | | | | | | | | |
5.25% due 09/27/23 | | | 399,000 | | | | 404,610 | |
York Risk Services | | | | | | | | |
4.75% due 10/01/211 | | | 372,381 | | | | 350,969 | |
Safe-Guard | | | | | | | | |
6.25% due 08/19/21 | | | 268,792 | | | | 258,040 | |
Acrisure LLC | | | | | | | | |
5.75% due 11/22/23 | | | 253,571 | | | | 256,346 | |
Total Financial | | | | | | | 1,773,714 | |
| | | | | | | | | |
Utilities - 1.0% | |
Invenergy Thermal Operating I, LLC | | | | | | | | |
6.50% due 10/19/22 | | | 386,590 | | | | 371,127 | |
Viva Alamo LLC | | | | | | | | |
5.47% due 02/22/21 | | | 349,104 | | | | 329,903 | |
Exgen Texas Power LLC | | | | | | | | |
5.75% due 09/18/21 | | | 398,979 | | | | 301,979 | |
Total Utilities | | | | | | | 1,003,009 | |
| | | | | | | | | |
Basic Materials - 0.2% | |
ASP Chromaflo Dutch I B.V. | | | | | | | | |
5.00% due 11/20/23 | | | 113,056 | | | | 113,833 | |
ASP Chromaflo Intermediate Holdings, Inc. | | | | | | | | |
5.00% due 11/20/23 | | | 86,944 | | | | 87,543 | |
Total Basic Materials | | | | | | | 201,376 | |
Total Senior Floating Rate Interests | | | | | | | | |
(Cost $18,294,432) | | | | | | | 18,212,667 | |
| | | | | | | | | |
SENIOR FIXED RATE INTERESTS†† - 0.8% | |
Financial - 0.8% | |
Magic Newco, LLC | | | | | | | | |
12.00% due 06/12/19 | | | 700,000 | | | | 742,294 | |
Total Senior Fixed Rate Interests | | | | | | | | |
(Cost $741,080) | | | | | | | 742,294 | |
| | | | | | | | | |
ASSET-BACKED SECURITIES†† - 0.1% | |
Collateralized Debt Obligations - 0.1% | |
SRERS Funding Ltd. | | | | | | | | |
2011-RS, 0.90% due 05/09/462,5 | | | 110,592 | | | | 108,959 | |
Total Asset-Backed Securities | | | | | | | | |
(Cost $109,526) | | | | | | | 108,959 | |
| | | | | | | | | |
Total Investments - 104.7% | | | | | | | | |
(Cost $102,170,421) | | | | | | $ | 100,245,829 | |
Other Assets & Liabilities, net - (4.7)% | | | | | | | (4,485,738 | ) |
Total Net Assets - 100.0% | | | | | | $ | 95,760,091 | |
FORWARD FOREIGN CURRENCY EXCHANGE CONTRACTS†† |
Counterparty | | Contracts to
Buy (Sell) | | Currency | Settlement
Date | | Settlement
Value | | | Value at
December 31,
2016 | | | Net Unrealized
Appreciation/
Depreciation | |
J.P Morgan | | | (521,000 | ) | GBP | 01/12/17 | | $ | 655,905 | | | $ | 642,199 | | | $ | 13,706 | |
Bank of America | | | (2,260,000 | ) | EUR | 01/12/17 | | | 2,385,973 | | | | 2,379,914 | | | | 6,059 | |
Morgan Stanley | | | 255,000 | | EUR | 01/12/17 | | | (266,044 | ) | | | (268,530 | ) | | | 2,486 | |
J.P Morgan | | | (151,000 | ) | CAD | 01/12/17 | | | 114,586 | | | | 112,471 | | | | 2,115 | |
Morgan Stanley | | | 204,000 | | EUR | 01/12/17 | | | (217,576 | ) | | | (214,824 | ) | | | (2,752 | ) |
Morgan Stanley | | | 409,000 | | EUR | 01/12/17 | | | (435,233 | ) | | | (430,701 | ) | | | (4,532 | ) |
| | | | | | | | | | | | | | | | | $ | 17,082 | |
96 | THE GUGGENHEIM FUNDS ANNUAL REPORT | SEE NOTES TO FINANCIAL STATEMENTS. |
SCHEDULE OF INVESTMENTS (continued) | December 31, 2016 |
SERIES P (HIGH YIELD SERIES) | |
* | Non-income producing security. |
† | Value determined based on Level 1 inputs, unless otherwise noted — See Note 4. |
†† | Value determined based on Level 2 inputs, unless otherwise noted — See Note 4. |
††† | Value determined based on Level 3 inputs — See Note 4. |
1 | Illiquid security. |
2 | Variable rate security. Rate indicated is rate effective at December 31, 2016. |
3 | Perpetual maturity. |
4 | Rate indicated is the 7 day yield as of December 31, 2016. |
5 | Security is a 144A or Section 4(a)(2) security. The total market value of 144A or Section 4(a)(2) securities is $39,696,209 (cost $38,857,468), or 41.5% of total net assets. These securities have been determined to be liquid under guidelines established by the Board of Trustees. |
6 | Security or a portion thereof is held as collateral for reverse repurchase agreements — See Note 12. |
7 | Security is in default of interest and/or principal obligations. |
8 | Security is a step up/step down bond. The coupon increases or decreases at regular intervals until the bond reaches full maturity. |
9 | Zero coupon rate security. |
10 | Security is a 144A or Section 4(a)(2) security. These securities are considered illiquid and restricted under guidelines established by the Board of Trustees. The total market value of 44A or Section 4(a)(2) securities is $20,848 (cost $111,437), or 0.0% of total net assets — See Note 13. |
11 | The face amount is denominated in U.S. dollars unless otherwise noted. |
12 | Security is a pay in-kind bond. |
| | plc — Public Limited Company |
| | REIT — Real Estate Investment Trust |
| | |
| | See Sector Classification in Other Information section. |
The following table summarizes the inputs used to value the Fund’s investments at December 31, 2016 (See Note 4 in the Notes to Financial Statements):
Investments in Securities (Assets) | | Level 1 | | | Level 2 | | | Level 2 - Other* | | | Level 3 | | | Total | |
Asset-Backed Securities | | $ | — | | | $ | 108,959 | | | $ | — | | | $ | — | | | $ | 108,959 | |
Common Stocks | | | 417,179 | | | | 45,050 | | | | — | | | | 488,484 | | | | 950,713 | |
Corporate Bonds | | | — | | | | 73,831,279 | | | | — | | | | 1,762,119 | | | | 75,593,398 | |
Forward Foreign Currency Exchange Contracts | | | — | | | | — | | | | 24,366 | | | | — | | | | 24,366 | |
Exchange-Traded Funds | | | 1,166,400 | | | | — | | | | — | | | | — | | | | 1,166,400 | |
Preferred Stocks | | | 129,250 | | | | 24,529 | | | | — | | | | — | | | | 153,779 | |
Senior Fixed Rate Interests | | | — | | | | 742,294 | | | | — | | | | — | | | | 742,294 | |
Senior Floating Rate Interests | | | — | | | | 15,986,357 | | | | — | | | | 2,226,310 | | | | 18,212,667 | |
Short-Term Investments | | | 3,293,944 | | | | — | | | | — | | | | — | | | | 3,293,944 | |
Warrants | | | — | | | | 23,675 | | | | — | | | | — | | | | 23,675 | |
Total | | $ | 5,006,773 | | | $ | 90,762,143 | | | $ | 24,366 | | | $ | 4,476,913 | | | $ | 100,270,195 | |
| | | | | | | | | | | | | | | | | | | | |
Investments in Securities (Liabilities) | | Level 1 | | | Level 2 | | | Level 2 - Other* | | | Level 3 | | | Total | |
Forward Foreign Currency Exchange Contracts | | $ | — | | | $ | — | | | $ | 7,284 | | | $ | — | | | $ | 7,284 | |
* | Other financial instruments include forward foreign currency exchange contracts, which are reported as unrealized gain/loss at period end. |
SEE NOTES TO FINANCIAL STATEMENTS. | THE GUGGENHEIM FUNDS ANNUAL REPORT | 97 |
SCHEDULE OF INVESTMENTS (concluded) | December 31, 2016 |
SERIES P (HIGH YIELD SERIES) | |
The following is a summary of significant unobservable inputs used in the fair valuation of assets and liabilities categorized within Level 3 of the fair value hierarchy:
Category | | Level 3 | | Valuation Technique | Unobservable Inputs | | Input Values | |
Common Stocks | | $ | 488,377 | | Enterprise Value | Valuation Multiple | | | 7.5 | x |
Common Stocks | | | 106 | | Model Price | Liquidation value | | | — | |
Corporate Bonds | | | 1,123,550 | | Model Price | Market Comparable Yields | | | 8.6 | % |
Corporate Bonds | | | 566,558 | | Model Price | Market Comparable Yields | | | 12.7 | % |
Corporate Bonds | | | 71,943 | | Model Price | Liquidation value | | | — | |
Senior Floating Rate Interests | | | 1,389,445 | | Model Price | Purchase Price | | | — | |
Senior Floating Rate Interests | | | 535,882 | | Model Price | Market Comparable Yields | | | 5.5 | % |
Senior Floating Rate Interests | | | 300,983 | | Option Adjusted Spread off the prior month end broker mark over the 3 month LIBOR | Indicative Quote | | | — | |
Total | | $ | 4,476,844 | | | | | | | |
Any remaining Level 3 securities held by the Fund and excluded from the table above, were not considered material to the Fund.
Transfers between investment levels may occur as the markets fluctuate and/or the availability of data used in an investment’s valuation changes. Transfers between valuation levels, if any, are in comparison to the valuation levels at the end of the previous fiscal year, and are effective using the fair value as of the end of the previous fiscal period.
As of December 31, 2016, Series P (High Yield Series) had securities with a total value of $336,105 transfer into Level 3 from Level 2 due to the availability of current and reliable market-based data provided by a third-party pricing service which utilizes significant observable inputs. There were no other securities that transferred between levels.
Summary of Fair Value Level 3 Activity
Following is a reconciliation of Level 3 assets for which significant unobservable inputs were used to determine fair value for the period ended December 31, 2016:
LEVEL 3 - Fair value measurement using significant unobservable inputs
| | Common
Stocks | | | Corporate
Bonds | | | Senior Floating
Rate Interests | | | Total | |
Series P (High Yield Series) | | | | | | | | | | | | |
Assets: | | | | | | | | | | | | |
Beginning Balance | | $ | 108 | | | $ | 2,105,082 | | | $ | 4,071,122 | | | $ | 6,176,312 | |
Purchases | | | 670,665 | | | | (1,969 | ) | | | 812,195 | | | | 1,480,891 | |
Sales, maturities and paydowns | | | — | | | | (358,250 | ) | | | (3,060,228 | ) | | | (3,418,478 | ) |
Corporate actions | | | 233,566 | | | | 2 | | | | — | | | | 233,568 | |
Earned amortization/accretion | | | — | | | | 19,046 | | | | 33,589 | | | | 52,635 | |
Total realized gains or losses included in earnings | | | — | | | | (231,429 | ) | | | (398,780 | ) | | | (630,209 | ) |
Total change in unrealized gains or losses included in earnings | | | (415,855 | ) | | | 229,637 | | | | 432,307 | | | | 246,089 | |
Transfers into Level 3 | | | — | | | | — | | | | 336,105 | | | | 336,105 | |
Transfers out of Level 3 | | | — | | | | — | | | | — | | | | — | |
Ending Balance | | $ | 488,484 | | | $ | 1,762,119 | | | $ | 2,226,310 | | | $ | 4,476,913 | |
Net Change in unrealized appreciation (depreciation) for investments in securities still held at December 31, 2016 | | $ | (415,856 | ) | | $ | 51,182 | | | $ | 5,568 | | | $ | (359,106 | ) |
98 | THE GUGGENHEIM FUNDS ANNUAL REPORT | SEE NOTES TO FINANCIAL STATEMENTS. |
SERIES P (HIGH YIELD SERIES) | |
STATEMENT OF ASSETS AND LIABILITIES |
December 31, 2016 |
Assets: | |
Investments, at value (cost $102,170,421) | | $ | 100,245,829 | |
Foreign currency, at value (cost $174,190) | | | 175,711 | |
Cash | | | 91,666 | |
Unrealized appreciation on forward foreign currency exchange contracts | | | 24,366 | |
Prepaid expenses | | | 3,756 | |
Receivables: | |
Securities sold | | | 260,058 | |
Fund shares sold | | | 341,293 | |
Dividends | | | 5,807 | |
Foreign taxes reclaim | | | 771 | |
Interest | | | 1,367,305 | |
Total assets | | | 102,516,562 | |
| | | | | |
Liabilities: | |
Reverse Repurchase Agreements (Note 12) | | | 1,319,031 | |
Unfunded loan commitments, at value (Note 9) (proceeds $662,789) | | | 361,721 | |
Unrealized depreciation on forward foreign currency exchange contracts | | | 7,284 | |
Payable for: | |
Securities purchased | | | 4,780,996 | |
Fund shares redeemed | | | 157,647 | |
Management fees | | | 46,619 | |
Distribution and service fees | | | 19,206 | |
Fund accounting/administration fees | | | 6,146 | |
Trustees’ fees* | | | 2,989 | |
Transfer agent/maintenance fees | | | 1,924 | |
Miscellaneous | | | 52,908 | |
Total liabilities | | | 6,756,471 | |
Commitments and contingent liabilities (Note 14) | | | — | |
Net assets | | $ | 95,760,091 | |
| | | | | |
Net assets consist of: | |
Paid in capital | | $ | 95,692,981 | |
Undistributed net investment income | | | 4,910,162 | |
Accumulated net realized loss on investments and foreign currency | | | (3,229,456 | ) |
Net unrealized depreciation on investments and foreign currency | | | (1,613,596 | ) |
Net assets | | $ | 95,760,091 | |
Capital shares outstanding | | | 3,106,979 | |
Net asset value per share | | $ | 30.82 | |
STATEMENT OF OPERATIONS |
Year Ended December 31, 2016 |
Investment Income: | |
Interest | | $ | 5,530,789 | |
Dividends | | | 72,810 | |
Total investment income | | | 5,603,599 | |
| | | | | |
Expenses: | |
Management fees | | | 443,039 | |
Transfer agent/maintenance fees | | | 24,198 | |
Distribution and service fees | | | 184,600 | |
Fund accounting/administration fees | | | 67,176 | |
Interest expense | | | 30,781 | |
Line of credit fees | | | 14,160 | |
Custodian fees | | | 10,570 | |
Trustees’ fees* | | | 8,854 | |
Miscellaneous | | | 83,449 | |
Total expenses | | | 866,827 | |
Less: | |
Expenses waived by Adviser | | | (30,120 | ) |
Net expenses | | | 836,707 | |
Net investment income | | | 4,766,892 | |
| | | | | |
Net Realized and Unrealized Gain (Loss): | |
Net realized gain (loss) on: | |
Investments | | | (3,503,599 | ) |
Foreign currency | | | 26,042 | |
Forward currency exchange contracts | | | 193,582 | |
Net realized loss on investments and foreign currency | | | (3,283,975 | ) |
Net change in unrealized appreciation (depreciation) on: | |
Investments | | | 10,588,663 | |
Foreign currency | | | (6,900 | ) |
Forward foreign currency exchange contracts | | | (9,533 | ) |
Net change in unrealized appreciation (depreciation) on investments and foreign currency | | | 10,572,230 | |
Net realized and unrealized gain on investments and foreign currency | | | 7,288,255 | |
Net increase in net assets resulting from operations | | $ | 12,055,147 | |
* | Relates to Trustees not deemed “interested persons” within the meaning of Section 2(a)(19) of the 1940 Act. |
SEE NOTES TO FINANCIAL STATEMENTS. | THE GUGGENHEIM FUNDS ANNUAL REPORT | 99 |
SERIES P (HIGH YIELD SERIES) | |
STATEMENTS OF CHANGES IN NET ASSETS |
| | Year Ended
December 31,
2016 | | | Year Ended
December 31,
2015 | |
Increase (Decrease) in Net Assets from Operations: | | | | | | |
Net investment income | | $ | 4,766,892 | | | $ | 5,614,236 | |
Net realized gain (loss) on investments and foreign currency | | | (3,283,975 | ) | | | 344,710 | |
Net change in unrealized appreciation (depreciation) on investments and foreign currency | | | 10,572,230 | | | | (8,369,682 | ) |
Net increase (decrease) in net assets resulting from operations | | | 12,055,147 | | | | (2,410,736 | ) |
| | | | | | | | | |
Distributions to shareholders from: | | | | | | | | |
Net investment income | | | (6,102,500 | ) | | | (8,057,853 | ) |
Net realized gains | | | — | | | | (1,595,016 | ) |
Total distributions to shareholders | | | (6,102,500 | ) | | | (9,652,869 | ) |
| | | | | | | | | |
Capital share transactions: | | | | | | | | |
Proceeds from sale of shares | | | 71,984,095 | | | | 55,427,241 | |
Distributions reinvested | | | 6,102,500 | | | | 9,652,869 | |
Cost of shares redeemed | | | (55,187,261 | ) | | | (65,300,291 | ) |
Net increase (decrease) from capital share transactions | | | 22,899,334 | | | | (220,181 | ) |
Net increase (decrease) in net assets | | | 28,851,981 | | | | (12,283,786 | ) |
| | | | | | | | | |
Net assets: | | | | | | | | |
Beginning of year | | | 66,908,110 | | | | 79,191,896 | |
End of year | | $ | 95,760,091 | | | $ | 66,908,110 | |
Undistributed net investment income at end of year | | $ | 4,910,162 | | | $ | 6,597,990 | |
| | | | | | | | | |
Capital share activity: | | | | | | | | |
Shares sold | | | 2,424,811 | | | | 1,702,233 | |
Shares issued from reinvestment of distributions | | | 211,525 | | | | 311,785 | |
Shares redeemed | | | (1,866,157 | ) | | | (2,015,583 | ) |
Net increase (decrease) in shares | | | 770,179 | | | | (1,565 | ) |
100 | THE GUGGENHEIM FUNDS ANNUAL REPORT | SEE NOTES TO FINANCIAL STATEMENTS. |
SERIES P (HIGH YIELD SERIES) | |
This table is presented to show selected data for a share outstanding throughout each period and to assist shareholders in evaluating a Fund’s performance for the periods presented.
| | Year Ended
December 31,
2016 | | | Year Ended
December 31,
2015 | | | Year Ended
December 31,
2014 | | | Year Ended
December 31,
2013 | | | Year Ended
December 31,
2012 | |
Per Share Data | | | | | | | | | | | | | | | |
Net asset value, beginning of period | | $ | 28.63 | | | $ | 33.87 | | | $ | 33.02 | | | $ | 30.75 | | | $ | 26.77 | |
Income (loss) from investment operations: | |
Net investment income (loss)a | | | 1.91 | | | | 2.17 | | | | 2.23 | | | | 2.20 | | | | 2.01 | |
Net gain (loss) on investments (realized and unrealized) | | | 2.93 | | | | (3.23 | ) | | | (1.38 | ) | | | .07 | | | | 1.97 | |
Total from investment operations | | | 4.84 | | | | (1.06 | ) | | | .85 | | | | 2.27 | | | | 3.98 | |
Less distributions from: | |
Net investment income | | | (2.65 | ) | | | (3.49 | ) | | | — | | | | — | | | | — | |
Net realized gains | | | — | | | | (.69 | ) | | | — | | | | — | | | | — | |
Total distributions | | | (2.65 | ) | | | (4.18 | ) | | | — | | | | — | | | | — | |
Net asset value, end of period | | $ | 30.82 | | | $ | 28.63 | | | $ | 33.87 | | | $ | 33.02 | | | $ | 30.75 | |
| |
Total Returnb | | | 17.52 | % | | | (3.95 | %) | | | 2.51 | % | | | 7.38 | % | | | 14.87 | % |
Ratios/Supplemental Data | |
Net assets, end of period (in thousands) | | $ | 95,760 | | | $ | 66,908 | | | $ | 79,192 | | | $ | 123,983 | | | $ | 138,253 | |
Ratios to average net assets: | |
Net investment income (loss) | | | 6.46 | % | | | 6.69 | % | | | 6.50 | % | | | 6.86 | % | | | 6.95 | % |
Total expensesc | | | 1.17 | % | | | 1.19 | % | | | 1.09 | % | | | 1.07 | % | | | 0.95 | % |
Net expensesd | | | 1.13 | %e | | | 1.15 | %e | | | 1.08 | %e | | | 1.07 | % | | | 0.95 | % |
Portfolio turnover rate | | | 84 | % | | | 101 | % | | | 90 | % | | | 100 | % | | | 95 | % |
a | Net investment income (loss) per share was computed using average shares outstanding throughout the period. |
b | Total return does not take into account any of the expenses associated with an investment in variable insurance products. If total return had taken into account these expenses, performance would have been lower. Shares of a series of Guggenheim Variable Funds Trust are available only through the purchase of such products. |
c | Does not include expenses of the underlying funds in which the Fund invests. |
d | Net expense information reflects the expense ratios after expense waivers. |
e | Net expenses may include expenses that are excluded from the expense limitation agreement. Excluding these expenses, the net expense ratios for the periods would be: |
12/31/16 | 12/31/15 | 12/31/14 |
1.07% | 1.07% | 0.97% |
SEE NOTES TO FINANCIAL STATEMENTS. | THE GUGGENHEIM FUNDS ANNUAL REPORT | 101 |
MANAGER’S COMMENTARY (Unaudited) | December 31, 2016 |
To Our Shareholders:
The Series Q (Small Cap Value Series) is managed by a team of seasoned professionals led by James Schier, CFA, Managing Director and Senior Portfolio Manager; Scott Hammond, Managing Director and Portfolio Manager; Farhan Sharaff, Assistant Chief Investment Officer, Equities and Portfolio Manager; and Gregg Strohkorb, CFA, Portfolio Manager. In the following paragraphs, the team discusses performance of the Fund for the fiscal year ended December 31, 2016.
For the fiscal year ended December 31, 2016, the Series Q (Small Cap Value Series) returned 26.60%, compared with the Russell 2000® Value Index, which returned 31.74%.
Strategy and Market Overview
Our investment approach focuses on understanding how companies make money and how easily companies can improve returns, maintain existing high levels of profitability, or benefit from change that occurs within the industry in which they operate. In today’s rapidly changing environment marked by very sharp and quick, but constrained volatility, our long-term orientation and discipline are a competitive advantage. This should become especially critical when the current market environment becomes more discriminating, and fundamentals once again become a more dominant factor in the market.
Performance Review
Most of the performance differential was due to stock selection, although sector allocation was also a detractor. The largest negative impact was in Information Technology, followed by Health Care. On the positive side, the leading contributor to return was Industrials, which was the best-returning sector in the Fund, and the Financials sector.
Among the top individual contributors were Industrials name DigitalGlobe, Inc., which benefitted from stronger-than-expected commercial as well as government business, and Zions Bancorporation. The Fund’s asset-sensitive bank holdings performed particularly well late in the period in anticipation of a hike in short term interest rates. Another strong contributor was Finisar Corporation, a provider of optical subsystems and components that advanced on strong sales among telecom clients.
Among the leading individual detractors were Tech name Maxwell Technologies, Inc., which experienced erratic order patterns out of China earlier in 2016, and Health Care holding Emergent BioSolutions, a provider of anthrax vaccines that lost ground last summer when the company was negotiating its government biodefense contracts.
Portfolio Positioning
The largest relative sector exposures for the year were underweights in Financials and Real Estate and an overweight in Health Care. The underweights in Financials and Real Estate contributed to performance for the period, with Real Estate being helped by the Fund’s lack of exposure to retail/mall-based REITs. The Health Care overweight, however, detracted from performance.
The Fund trimmed underweights in both Financials and Real Estate as the period progressed. The Real Estate Investment Trust industry was extracted from Financials to form a separate sector in September 2016.
The Health Care sector was the lowest-returning of the Fund for the period. Results were driven by fears of price controls, brought about by election year politics, severely pressuring biotechnology, device, and products stocks.
102 | THE GUGGENHEIM FUNDS ANNUAL REPORT | |
MANAGER’S COMMENTARY (Unaudited)(concluded) | December 31, 2016 |
Portfolio and Market Outlook
The 2016 election results affected market as investors began to discount the possibility of a stronger economy brought about by reduced regulation and broad based tax cuts. In addition, the market appears to be getting comfortable with the notion that any interest rate increases will be gradual and enacted with extreme caution. Therefore, the market seems unusually complacent about the risks and optimistic with the future direction of the economy.
Our portfolios tend to reflect a bias toward companies with balance sheet quality. We continue to find niche companies with what we believe to be attractive growth opportunities, and, as such, are constructive on the outlook.
Performance displayed represents past performance which is no guarantee of future results.
The opinions and forecast expressed may not actually come to pass. This information is subject to change at any time, based on market and other conditions, and should not be construed as a recommendation of any specific security or strategy.
| | THE GUGGENHEIM FUNDS ANNUAL REPORT | 103 |
PERFORMANCE REPORT AND FUND PROFILE (Unaudited) | December 31, 2016 |
SERIES Q (SMALL CAP VALUE SERIES)
OBJECTIVE: Seeks long-term capital appreciation.
Holdings Diversification (Market Exposure as % of Net Assets)
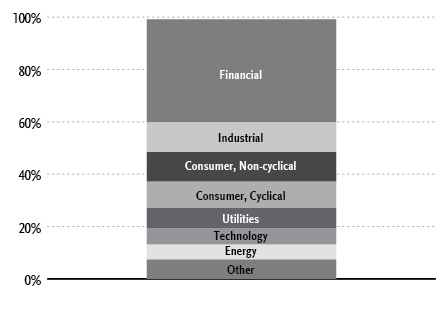
“Holdings Diversification (Market Exposure as % of Net Assets)” excludes any temporary cash investments.
Inception Date: May 1, 2000 |
Ten Largest Holdings (% of Total Net Assets) |
Trustmark Corp. | 1.9% |
Cathay General Bancorp | 1.7% |
Navigators Group, Inc. | 1.6% |
Wintrust Financial Corp. | 1.6% |
Spire, Inc. | 1.6% |
Portland General Electric Co. | 1.6% |
DigitalGlobe, Inc. | 1.5% |
Fulton Financial Corp. | 1.5% |
Berkshire Hills Bancorp, Inc. | 1.5% |
Avista Corp. | 1.4% |
Top Ten Total | 15.9% |
“Ten Largest Holdings” excludes any temporary cash investments. |
104 | THE GUGGENHEIM FUNDS ANNUAL REPORT | |
PERFORMANCE REPORT AND FUND PROFILE (Unaudited)(concluded) | December 31, 2016 |
Cumulative Fund Performance*,†
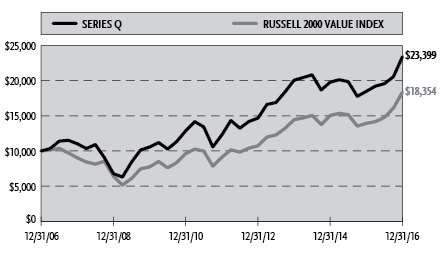
Average Annual Returns*
Periods Ended December 31, 2016†
| 1 Year | 5 Year | 10 Year |
Series Q (Small Cap Value Series) | 26.60% | 13.77% | 8.87% |
Russell 2000 Value Index | 31.74% | 15.07% | 6.26% |
* | The performance data above represents past performance that is not predictive of future results. The investment return and principal value of an investment in the Fund will fluctuate so that an investor’s shares, when redeemed, may be worth more or less than their original cost. Returns are historical and include changes in principal and reinvested dividends and capital gains and do not reflect the effect of taxes. The Russell 2000 Value Index is an unmanaged index and, unlike the Fund, has no management fees or operating expenses to reduce its reported return. |
† | Performance figures do not reflect fees and expenses associated with an investment in variable insurance products. If returns had taken into account these fees and expenses, performance would have been lower. Shares of a series of Guggenheim Variable Funds Trust are available only through the purchase of such products. |
| | THE GUGGENHEIM FUNDS ANNUAL REPORT | 105 |
SCHEDULE OF INVESTMENTS | December 31, 2016 |
SERIES Q (SMALL CAP VALUE SERIES) | |
| | Shares | | | Value | |
| | | | | | | |
COMMON STOCKS† - 99.1% | |
| | | | | | | |
Financial - 39.4% | |
Trustmark Corp. | | | 57,015 | | | $ | 2,032,584 | |
Cathay General Bancorp | | | 46,690 | | | | 1,775,621 | |
Navigators Group, Inc. | | | 14,660 | | | | 1,726,215 | |
Wintrust Financial Corp. | | | 23,644 | | | | 1,715,844 | |
Fulton Financial Corp. | | | 83,819 | | | | 1,575,797 | |
Berkshire Hills Bancorp, Inc. | | | 41,854 | | | | 1,542,320 | |
1st Source Corp. | | | 33,231 | | | | 1,484,096 | |
Hanmi Financial Corp. | | | 39,023 | | | | 1,361,903 | |
First Citizens BancShares, Inc. — Class A | | | 3,671 | | | | 1,303,205 | |
Prosperity Bancshares, Inc. | | | 17,458 | | | | 1,253,135 | |
Horace Mann Educators Corp. | | | 27,610 | | | | 1,181,708 | |
Argo Group International Holdings Ltd. | | | 17,845 | | | | 1,175,986 | |
Equity Commonwealth* | | | 37,882 | | | | 1,145,552 | |
Farmer Mac — Class C | | | 19,950 | | | | 1,142,537 | |
Umpqua Holdings Corp. | | | 60,085 | | | | 1,128,396 | |
Investors Bancorp, Inc. | | | 75,872 | | | | 1,058,414 | |
Hanover Insurance Group, Inc. | | | 11,243 | | | | 1,023,225 | |
Radian Group, Inc. | | | 56,743 | | | | 1,020,239 | |
Old National Bancorp | | | 55,117 | | | | 1,000,374 | |
TriCo Bancshares | | | 26,062 | | | | 890,799 | |
Valley National Bancorp | | | 76,261 | | | | 887,678 | |
FNB Corp. | | | 54,901 | | | | 880,063 | |
EastGroup Properties, Inc. | | | 11,645 | | | | 859,867 | |
Hersha Hospitality Trust | | | 37,741 | | | | 811,432 | |
CubeSmart | | | 28,984 | | | | 775,902 | |
EPR Properties | | | 9,656 | | | | 693,012 | |
First Merchants Corp. | | | 17,551 | | | | 660,795 | |
Hancock Holding Co. | | | 14,415 | | | | 621,287 | |
Cousins Properties, Inc. | | | 70,595 | | | | 600,763 | |
Lexington Realty Trust | | | 54,490 | | | | 588,492 | |
MB Financial, Inc. | | | 12,239 | | | | 578,048 | |
IBERIABANK Corp. | | | 6,884 | | | | 576,535 | |
Flagstar Bancorp, Inc.* | | | 21,385 | | | | 576,112 | |
Capital Bank Financial Corp. — Class A | | | 14,595 | | | | 572,854 | |
First Industrial Realty Trust, Inc. | | | 20,067 | | | | 562,879 | |
Hilltop Holdings, Inc. | | | 17,999 | | | | 536,370 | |
DCT Industrial Trust, Inc. | | | 10,831 | | | | 518,588 | |
iStar, Inc.* | | | 41,331 | | | | 511,264 | |
Genworth Financial, Inc. — Class A* | | | 133,112 | | | | 507,157 | |
Monogram Residential Trust, Inc. | | | 43,962 | | | | 475,669 | |
Washington Federal, Inc. | | | 11,976 | | | | 411,376 | |
Stifel Financial Corp.* | | | 7,447 | | | | 371,978 | |
CoreCivic, Inc. | | | 15,151 | | | | 370,593 | |
Forestar Group, Inc.* | | | 24,027 | | | | 319,559 | |
Sterling Bancorp | | | 13,443 | | | | 314,566 | |
MBIA, Inc.* | | | 26,761 | | | | 286,343 | |
Janus Capital Group, Inc. | | | 16,208 | | | | 215,080 | |
Parkway, Inc.* | | | 8,824 | | | | 196,334 | |
Hope Bancorp, Inc. | | | 2,326 | | | | 50,916 | |
Total Financial | | | | | | | 41,869,462 | |
| | | | | | | | | |
Industrial - 11.4% | |
Sanmina Corp.* | | | 39,658 | | | | 1,453,466 | |
Benchmark Electronics, Inc.* | | | 46,659 | | | | 1,423,100 | |
Argan, Inc. | | | 9,946 | | | | 701,690 | |
Werner Enterprises, Inc. | | | 25,376 | | | | 683,883 | |
GATX Corp. | | | 10,516 | | | | 647,575 | |
FLIR Systems, Inc. | | | 15,866 | | | | 574,191 | |
Methode Electronics, Inc. | | | 13,738 | | | | 568,066 | |
Marten Transport Ltd. | | | 23,746 | | | | 553,282 | |
Esterline Technologies Corp.* | | | 6,185 | | | | 551,702 | |
Summit Materials, Inc. — Class A* | | | 23,037 | | | | 548,054 | |
Crane Co. | | | 7,542 | | | | 543,929 | |
Kirby Corp.* | | | 8,069 | | | | 536,588 | |
TriMas Corp.* | | | 22,746 | | | | 534,531 | |
Ryder System, Inc. | | | 7,145 | | | | 531,874 | |
Scorpio Tankers, Inc. | | | 113,782 | | | | 515,432 | |
Oshkosh Corp. | | | 7,369 | | | | 476,111 | |
ITT, Inc. | | | 12,287 | | | | 473,910 | |
AEP Industries, Inc. | | | 3,630 | | | | 421,443 | |
Trinseo S.A. | | | 4,381 | | | | 259,793 | |
Rand Logistics, Inc.* | | | 119,809 | | | | 99,418 | |
Total Industrial | | | | | | | 12,098,038 | |
| | | | | | | | | |
Consumer, Non-cyclical - 11.2% | |
Dean Foods Co. | | | 63,212 | | | | 1,376,758 | |
Navigant Consulting, Inc.* | | | 52,245 | | | | 1,367,775 | |
Molina Healthcare, Inc.* | | | 19,367 | | | | 1,050,853 | |
Sanderson Farms, Inc. | | | 10,963 | | | | 1,033,153 | |
Emergent BioSolutions, Inc.* | | | 31,062 | | | | 1,020,076 | |
Premier, Inc. — Class A* | | | 26,870 | | | | 815,773 | |
Surgical Care Affiliates, Inc.* | | | 14,391 | | | | 665,871 | |
Carriage Services, Inc. — Class A | | | 21,530 | | | | 616,619 | |
HealthSouth Corp. | | | 14,520 | | | | 598,805 | |
AMN Healthcare Services, Inc.* | | | 15,291 | | | | 587,939 | |
Fresh Del Monte Produce, Inc. | | | 9,197 | | | | 557,614 | |
FTI Consulting, Inc.* | | | 12,341 | | | | 556,332 | |
Air Methods Corp.* | | | 15,715 | | | | 500,523 | |
Universal Corp. | | | 5,760 | | | | 367,200 | |
United Rentals, Inc.* | | | 2,988 | | | | 315,473 | |
Darling Ingredients, Inc.* | | | 15,418 | | | | 199,046 | |
Trevena, Inc.* | | | 27,736 | | | | 163,088 | |
Community Health Systems, Inc.* | | | 13,830 | | | | 77,310 | |
Total Consumer, Non-cyclical | | | | | | | 11,870,208 | |
| | | | | | | | | |
Consumer, Cyclical - 10.2% | |
Century Communities, Inc.* | | | 69,931 | | | | 1,468,552 | |
UniFirst Corp. | | | 8,149 | | | | 1,170,604 | |
International Speedway Corp. — Class A | | | 30,021 | | | | 1,104,773 | |
Wabash National Corp. | | | 65,187 | | | | 1,031,258 | |
Essendant, Inc. | | | 34,150 | | | | 713,735 | |
Hawaiian Holdings, Inc.* | | | 10,354 | | | | 590,178 | |
Unifi, Inc.* | | | 16,961 | | | | 553,437 | |
Asbury Automotive Group, Inc.* | | | 8,724 | | | | 538,271 | |
Tenneco, Inc.* | | | 8,475 | | | | 529,433 | |
Cooper Tire & Rubber Co. | | | 13,519 | | | | 525,213 | |
Meritage Homes Corp.* | | | 14,802 | | | | 515,110 | |
La-Z-Boy, Inc. | | | 14,764 | | | | 458,422 | |
Tuesday Morning Corp.* | | | 71,560 | | | | 386,424 | |
Caleres, Inc. | | | 10,184 | | | | 334,239 | |
Genesco, Inc.* | | | 4,519 | | | | 280,630 | |
106 | THE GUGGENHEIM FUNDS ANNUAL REPORT | SEE NOTES TO FINANCIAL STATEMENTS. |
SCHEDULE OF INVESTMENTS (continued) | December 31, 2016 |
SERIES Q (SMALL CAP VALUE SERIES) | |
| | Shares | | | Value | |
| | | | | | | |
DSW, Inc. — Class A | | | 9,988 | | | $ | 226,228 | |
Deckers Outdoor Corp.* | | | 3,837 | | | | 212,531 | |
Vista Outdoor, Inc.* | | | 4,587 | | | | 169,260 | |
Total Consumer, Cyclical | | | | | | | 10,808,298 | |
| | | | | | | | | |
Utilities - 7.6% | |
Spire, Inc. | | | 25,822 | | | | 1,666,811 | |
Portland General Electric Co. | | | 38,360 | | | | 1,662,139 | |
Avista Corp. | | | 38,357 | | | | 1,533,896 | |
Black Hills Corp. | | | 19,137 | | | | 1,173,864 | |
ONE Gas, Inc. | | | 10,744 | | | | 687,186 | |
Calpine Corp.* | | | 49,761 | | | | 568,768 | |
ALLETE, Inc. | | | 6,984 | | | | 448,303 | |
Southwest Gas Holdings, Inc. | | | 5,057 | | | | 387,467 | |
Total Utilities | | | | | | | 8,128,434 | |
| | | | | | | | | |
Technology - 6.2% | |
ManTech International Corp. — Class A | | | 23,067 | | | | 974,581 | |
Brooks Automation, Inc. | | | 56,730 | | | | 968,381 | |
IXYS Corp. | | | 74,091 | | | | 881,683 | |
Photronics, Inc.* | | | 69,609 | | | | 786,582 | |
MKS Instruments, Inc. | | | 11,877 | | | | 705,494 | |
Axcelis Technologies, Inc.* | | | 47,737 | | | | 694,573 | |
Cray, Inc.* | | | 26,117 | | | | 540,622 | |
Maxwell Technologies, Inc.* | | | 97,468 | | | | 499,036 | |
InnerWorkings, Inc.* | | | 27,332 | | | | 269,220 | |
MicroStrategy, Inc. — Class A* | | | 1,266 | | | | 249,908 | |
Total Technology | | | | | | | 6,570,080 | |
| | | | | | | | | |
Energy - 5.8% | |
Oasis Petroleum, Inc.* | | | 101,022 | | | | 1,529,472 | |
Laredo Petroleum, Inc.* | | | 84,335 | | | | 1,192,497 | |
Rowan Companies plc — Class A* | | | 37,020 | | | | 699,308 | |
Chesapeake Energy Corp.* | | | 92,985 | | | | 652,755 | |
Gulfport Energy Corp.* | | | 24,623 | | | | 532,842 | |
Western Refining, Inc. | | | 13,560 | | | | 513,246 | |
Jones Energy, Inc. — Class A* | | | 88,838 | | | | 444,190 | |
Delek US Holdings, Inc. | | | 13,255 | | | | 319,048 | |
MRC Global, Inc.* | | | 15,733 | | | | 318,751 | |
Total Energy | | | | | | | 6,202,109 | |
| | | | | | | | | |
Communications - 4.8% | |
DigitalGlobe, Inc.* | | | 56,600 | | | | 1,621,591 | |
Bankrate, Inc.* | | | 90,259 | | | | 997,362 | |
Finisar Corp.* | | | 19,816 | | | | 599,830 | |
Scholastic Corp. | | | 12,352 | | | | 586,596 | |
Viavi Solutions, Inc.* | | | 64,156 | | | | 524,796 | |
Infinera Corp.* | | | 59,673 | | | | 506,624 | |
Time, Inc. | | | 14,200 | | | | 253,470 | |
Total Communications | | | | | | | 5,090,269 | |
| | | | | | | | | |
Basic Materials - 2.5% | |
Reliance Steel & Aluminum Co. | | | 11,980 | | | | 952,888 | |
Olin Corp. | | | 24,301 | | | | 622,349 | |
Chemtura Corp.* | | | 16,958 | | | | 563,006 | |
Kaiser Aluminum Corp. | | | 6,774 | | | | 526,272 | |
Total Basic Materials | | | | | | | 2,664,515 | |
| | | | | | | | | |
Total Common Stocks | | | | | | | | |
(Cost $86,037,712) | | | | | | | 105,301,413 | |
| | | | | | | | | |
CONVERTIBLE PREFERRED STOCKS††† - 0.0% | |
Thermoenergy Corp. *,1,3 | | | 116,667 | | | | — | |
Total Convertible Preferred Stocks | | | | | | | | |
(Cost $111,410) | | | | | | | — | |
| | | | | | | | | |
SHORT-TERM INVESTMENTS† - 2.1% | |
Dreyfus Treasury Securities Cash Management Fund -Institutional Class 0.31%2 | | | 2,263,069 | | | | 2,263,069 | |
Total Short-Term Investments | | | | | | | | |
(Cost $2,263,069) | | | | | | | 2,263,069 | |
| | | | | | | | | |
Total Investments - 101.2% | | | | | | | | |
(Cost $88,412,191) | | | | | | $ | 107,564,482 | |
Other Assets & Liabilities, net - (1.2)% | | | | | | | (1,260,847 | ) |
Total Net Assets - 100.0% | | | | | | $ | 106,303,635 | |
* | Non-income producing security. |
† | Value determined based on Level 1 inputs — See Note 4. |
††† | Value determined based on Level 3 inputs — See Note 4. |
1 | PIPE (Private Investment in Public Equity) — Stock issued by a company in the secondary market as a means of raising capital more quickly and less expensively than through registration of a secondary public offering. |
2 | Rate indicated is the 7 day yield as of December 31, 2016. |
3 | Illiquid security. |
| | plc — Public Limited Company |
| | |
| | See Sector Classification in Other Information section. |
SEE NOTES TO FINANCIAL STATEMENTS. | THE GUGGENHEIM FUNDS ANNUAL REPORT | 107 |
SCHEDULE OF INVESTMENTS (concluded) | December 31, 2016 |
SERIES Q (SMALL CAP VALUE SERIES) | |
The following table summarizes the inputs used to value the Fund’s investments at December 31, 2016 (See Note 4 in the Notes to Financial Statements):
Investments in Securities (Assets) | | Level 1 | | | Level 2 | | | Level 3 | | | Total | |
Common Stocks | | $ | 105,301,413 | | | $ | — | | | $ | — | | | $ | 105,301,413 | |
Convertible Preferred Stocks | | | — | | | | — | | | | — | | | | — | |
Short-Term Investments | | | 2,263,069 | | | | — | | | | — | | | | 2,263,069 | |
Total | | $ | 107,564,482 | | | $ | — | | | $ | — | | | $ | 107,564,482 | |
Transfers between investment levels may occur as the markets fluctuate and/or the availability of data used in an investment’s valuation changes. Transfers between valuation levels, if any, are in comparison to the valuation levels at the end of the previous fiscal year, and are effective using the fair value as of the end of the previous fiscal period.
For the year ended December 31, 2016, there were no transfers between levels.
108 | THE GUGGENHEIM FUNDS ANNUAL REPORT | SEE NOTES TO FINANCIAL STATEMENTS. |
SERIES Q (SMALL CAP VALUE SERIES) | |
STATEMENT OF ASSETS AND LIABILITIES |
December 31, 2016 |
Assets: | |
Investments, at value (cost $88,412,191) | | $ | 107,564,482 | |
Cash | | | 9,394 | |
Prepaid expenses | | | 9,097 | |
Receivables: | |
Securities sold | | | 277,598 | |
Dividends | | | 109,820 | |
Total assets | | | 107,970,391 | |
| | | | | |
Liabilities: | |
Payable for: | |
Securities purchased | | | 1,401,847 | |
Fund shares redeemed | | | 124,233 | |
Management fees | | | 84,947 | |
Fund accounting/administration fees | | | 7,153 | |
Trustees’ fees* | | | 4,877 | |
Transfer agent/maintenance fees | | | 2,173 | |
Miscellaneous | | | 41,526 | |
Total liabilities | | | 1,666,756 | |
Commitments and contingent liabilities (Note 14) | | | — | |
Net assets | | $ | 106,303,635 | |
| | | | | |
Net assets consist of: | |
Paid in capital | | $ | 83,394,134 | |
Undistributed net investment income | | | 567,821 | |
Accumulated net realized gain on investments | | | 3,189,389 | |
Net unrealized appreciation on investments | | | 19,152,291 | |
Net assets | | $ | 106,303,635 | |
Capital shares outstanding | | | 2,310,090 | |
Net asset value per share | | $ | 46.02 | |
STATEMENT OF OPERATIONS |
Year Ended December 31, 2016 |
Investment Income: | |
Dividends (net of foreign withholding tax of $471) | | $ | 1,543,336 | |
Interest | | | 4,465 | |
Total investment income | | | 1,547,801 | |
| | | | | |
Expenses: | |
Management fees | | | 875,611 | |
Transfer agent/maintenance fees | | | 23,661 | |
Fund accounting/administration fees | | | 83,994 | |
Line of credit fees | | | 14,486 | |
Trustees’ fees* | | | 10,299 | |
Custodian fees | | | 2,520 | |
Miscellaneous | | | 58,951 | |
Total expenses | | | 1,069,522 | |
Net investment income | | | 478,279 | |
| | | | | |
Net Realized and Unrealized Gain (Loss): | |
Net realized gain (loss) on: | |
Investments | | | 4,120,880 | |
Net realized gain | | | 4,120,880 | |
Net change in unrealized appreciation (depreciation) on: | |
Investments | | | 17,847,187 | |
Net change in unrealized appreciation (depreciation) | | | 17,847,187 | |
Net realized and unrealized gain | | | 21,968,067 | |
Net increase in net assets resulting from operations | | $ | 22,446,346 | |
* | Relates to Trustees not deemed “interested persons” within the meaning of Section 2(a)(19) of the 1940 Act. |
SEE NOTES TO FINANCIAL STATEMENTS. | THE GUGGENHEIM FUNDS ANNUAL REPORT | 109 |
SERIES Q (SMALL CAP VALUE SERIES) | |
STATEMENTS OF CHANGES IN NET ASSETS |
| | Year Ended
December 31,
2016 | | | Year Ended
December 31,
2015 | |
Increase (Decrease) in Net Assets from Operations: | | | | | | |
Net investment income | | $ | 478,279 | | | $ | 265,478 | |
Net realized gain on investments | | | 4,120,880 | | | | 7,658,172 | |
Net change in unrealized appreciation (depreciation) on investments | | | 17,847,187 | | | | (14,683,247 | ) |
Net increase (decrease) in net assets resulting from operations | | | 22,446,346 | | | | (6,759,597 | ) |
| | | | | | | | | |
Distributions to shareholders from: | | | | | | | | |
Net investment income | | | (111,618 | ) | | | — | |
Net realized gains | | | (7,824,673 | ) | | | (18,520,174 | ) |
Total distributions to shareholders | | | (7,936,291 | ) | | | (18,520,174 | ) |
| | | | | | | | | |
Capital share transactions: | | | | | | | | |
Proceeds from sale of shares | | | 13,715,122 | | | | 7,140,709 | |
Distributions reinvested | | | 7,936,291 | | | | 18,520,174 | |
Cost of shares redeemed | | | (19,615,292 | ) | | | (26,556,736 | ) |
Net increase (decrease) from capital share transactions | | | 2,036,121 | | | | (895,853 | ) |
Net increase (decrease) in net assets | | | 16,546,176 | | | | (26,175,624 | ) |
| | | | | | | | | |
Net assets: | | | | | | | | |
Beginning of year | | | 89,757,459 | | | | 115,933,083 | |
End of year | | $ | 106,303,635 | | | $ | 89,757,459 | |
Undistributed net investment income at end of year | | $ | 567,821 | | | $ | 206,735 | |
| | | | | | | | | |
Capital share activity: | | | | | | | | |
Shares sold | | | 333,315 | | | | 154,490 | |
Shares issued from reinvestment of distributions | | | 201,173 | | | | 432,310 | |
Shares redeemed | | | (484,741 | ) | | | (567,478 | ) |
Net increase in shares | | | 49,747 | | | | 19,322 | |
110 | THE GUGGENHEIM FUNDS ANNUAL REPORT | SEE NOTES TO FINANCIAL STATEMENTS. |
SERIES Q (SMALL CAP VALUE SERIES) | |
This table is presented to show selected data for a share outstanding throughout each period and to assist shareholders in evaluating a Fund’s performance for the periods presented.
| | Year Ended
December 31,
2016 | | | Year Ended
December 31,
2015 | | | Year Ended
December 31,
2014 | | | Year Ended
December 31,
2013 | | | Year Ended
December 31,
2012 | |
Per Share Data | | | | | | | | | | | | | | | |
Net asset value, beginning of period | | $ | 39.71 | | | $ | 51.73 | | | $ | 52.46 | | | $ | 38.35 | | | $ | 32.09 | |
Income (loss) from investment operations: | |
Net investment income (loss)a | | | .21 | | | | .12 | | | | .08 | | | | .01 | | | | (— | )b |
Net gain (loss) on investments (realized and unrealized) | | | 9.76 | | | | (2.87 | ) | | | (.80 | ) | | | 14.10 | | | | 6.26 | |
Total from investment operations | | | 9.97 | | | | (2.75 | ) | | | (.72 | ) | | | 14.11 | | | | 6.26 | |
Less distributions from: | |
Net investment income | | | (.05 | ) | | | — | | | | (.01 | ) | | | — | | | | — | |
Net realized gains | | | (3.61 | ) | | | (9.27 | ) | | | — | | | | — | | | | — | |
Total distributions | | | (3.66 | ) | | | (9.27 | ) | | | (.01 | ) | | | — | | | | — | |
Net asset value, end of period | | $ | 46.02 | | | $ | 39.71 | | | $ | 51.73 | | | $ | 52.46 | | | $ | 38.35 | |
| |
Total Returnd | | | 26.60 | % | | | (6.62 | %) | | | (1.38 | %) | | | 36.79 | % | | | 19.51 | % |
Ratios/Supplemental Data | |
Net assets, end of period (in thousands) | | $ | 106,304 | | | $ | 89,757 | | | $ | 115,933 | | | $ | 139,943 | | | $ | 111,402 | |
Ratios to average net assets: | |
Net investment income (loss) | | | 0.52 | % | | | 0.26 | % | | | 0.15 | % | | | 0.02 | % | | | (0.00 | %)c |
Total expenses | | | 1.16 | % | | | 1.19 | % | | | 1.16 | % | | | 1.16 | % | | | 1.15 | % |
Portfolio turnover rate | | | 68 | % | | | 57 | % | | | 50 | % | | | 30 | % | | | 44 | % |
a | Net investment income (loss) per share was computed using average shares outstanding throughout the period. |
b | Net investment income is less than $0.01 per share. |
c | Net investment income (loss) ratio is less than 0.01%. |
d | Total return does not take into account any of the expenses associated with an investment in variable insurance products. If total return had taken into account these expenses, performance would have been lower. Shares of a series of Guggenheim Variable Funds Trust are available only through the purchase of such products. |
SEE NOTES TO FINANCIAL STATEMENTS. | THE GUGGENHEIM FUNDS ANNUAL REPORT | 111 |
MANAGER’S COMMENTARY (Unaudited) | December 31, 2016 |
To Our Shareholders:
The Series V (Mid Cap Value Series) is managed by a team of seasoned professionals led by James Schier, CFA, Managing Director and Senior Portfolio Manager; Scott Hammond, Managing Director and Portfolio Manager; Farhan Sharaff, Assistant Chief Investment Officer, Equities, and Portfolio Manager; and Gregg Strohkorb, CFA, Portfolio Manager. In the following paragraphs, the team discusses performance of the Fund for the fiscal year ended December 31, 2016.
For the fiscal year ended December 31, 2016, the Series V (Mid Cap Value Series) returned 26.75%, compared with the Russell 2500® Value Index, which returned 25.20%.
Strategy and Market Overview
Our investment approach focuses on understanding how companies make money and how easily companies can improve returns, maintain existing high levels of profitability, or benefit from change that occurs within the industry in which they operate. In today’s rapidly changing environment marked by very sharp and quick, but constrained volatility, our long-term orientation and discipline are a competitive advantage. This should become especially critical when the current market environment becomes more discriminating, and fundamentals once again become a more dominant factor in the market.
Performance Review
Most of the performance differential was due to stock selection, as sector allocation was negative for the period. The Financials sector had the largest positive impact on performance. Financials is the largest sector in the benchmark and the Fund, so this allocation provided almost all of the positive variance from selection. Much of the rest came from the Industrials sector. The Information Technology sector had the largest negative impact on return, followed by the Real Estate sector.
Among the top individual contributors were Industrials name DigitalGlobe, Inc., which benefitted from stronger-than-expected commercial as well as government business, and Finisar Corporation, a provider of optical subsystems and components that advanced on strong sales among telecom clients. The Fund’s asset-sensitive bank holdings performed particularly well late in the period in anticipation of a hike in short-term interest rates. Among the top performers was regional bank holding Zions Bancorporation. Endurance Specialty Holdings Ltd. also contributed strongly for the period; it agreed to be acquired during the fourth quarter by Japanese insurer Sompo.
Among the leading individual detractors were Consumer Discretionary name Essendant, Inc., which reported poor earnings last summer, and Tech name Maxwell Technologies, Inc., which experienced erratic order patterns out of China earlier in 2016. CoreCivic, Inc., a Real Estate holding formerly called Corrections Corp. of America, was affected by investor concern about the potential loss of federal funding.
Portfolio Positioning
The largest relative sector exposures for the year were an underweight in Real Estate and an overweight in Health Care. The underweight in Real Estate, along with lack of exposure to retail/mall-based REITs, contributed to performance for the period. The Health Care overweight, however, detracted from performance. The other large underweight was in Financials, which detracted from return for the year.
The Fund trimmed underweights in both Financials and Real Estate as the period progressed. The Real Estate Investment Trust industry was extracted from Financials to form a separate sector in September 2016.
Although positive as a group, the Health Care sector was among the lowest-returning of the Fund for the period. Results were driven by fears of price controls, brought about by election year politics, severely pressuring biotechnology, device, and products stocks.
112 | THE GUGGENHEIM FUNDS ANNUAL REPORT | |
MANAGER’S COMMENTARY (Unaudited)(concluded) | December 31, 2016 |
Portfolio and Market Outlook
The 2016 election results affected the market as investors began to discount the possibility of a stronger economy brought about by reduced regulation and broad based tax cuts. In addition, the market appears to be getting comfortable with the notion that any interest rate increases will be gradual and enacted with extreme caution. Therefore, the market seems unusually complacent about the risks and optimistic with the future direction of the economy.
Our portfolios tend to reflect a bias toward companies with balance sheet quality. We continue to find niche companies with what we believe to be attractive growth opportunities, and, as such, are constructive on the outlook.
Performance displayed represents past performance which is no guarantee of future results.
The opinions and forecast expressed may not actually come to pass. This information is subject to change at any time, based on market and other conditions, and should not be construed as a recommendation of any specific security or strategy.
| | THE GUGGENHEIM FUNDS ANNUAL REPORT | 113 |
PERFORMANCE REPORT AND FUND PROFILE (Unaudited) | December 31, 2016 |
SERIES V (MID CAP VALUE SERIES)
OBJECTIVE: Seeks long-term growth of capital.
Holdings Diversification (Market Exposure as % of Net Assets)
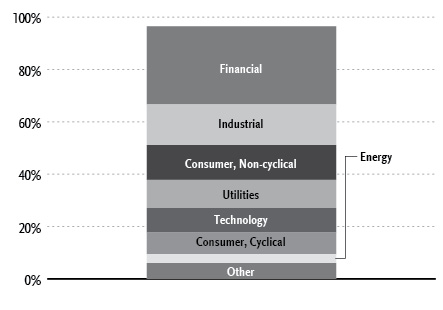
“Holdings Diversification (Market Exposure as % of Net Assets)” excludes any temporary cash investments.
Inception Date: May 1, 1997 |
Ten Largest Holdings (% of Total Net Assets) |
Zions Bancorporation | 2.8% |
Alleghany Corp. | 2.1% |
KeyCorp | 2.0% |
DigitalGlobe, Inc. | 1.7% |
Wintrust Financial Corp. | 1.7% |
Assured Guaranty Ltd. | 1.5% |
WestRock Co. | 1.4% |
OGE Energy Corp. | 1.4% |
Trustmark Corp. | 1.4% |
Huntington Bancshares, Inc. | 1.4% |
Top Ten Total | 17.4% |
“Ten Largest Holdings” excludes any temporary cash investments. |
114 | THE GUGGENHEIM FUNDS ANNUAL REPORT | |
PERFORMANCE REPORT AND FUND PROFILE (Unaudited)(concluded) | December 31, 2016 |
Cumulative Fund Performance*,†
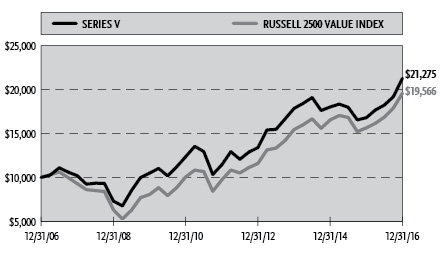
Average Annual Returns*
Periods Ended December 31, 2016†
| 1 Year | 5 Year | 10 Year |
Series V (Mid Cap Value Series) | 26.75% | 13.23% | 7.84% |
Russell 2500 Value Index | 25.20% | 15.04% | 6.94% |
* | The performance data above represents past performance that is not predictive of future results. The investment return and principal value of an investment in the Fund will fluctuate so that an investor’s shares, when redeemed, may be worth more or less than their original cost. Returns are historical and include changes in principal and reinvested dividends and capital gains and do not reflect the effect of taxes. The Russell 2500 Value Index is an unmanaged index and, unlike the Fund, has no management fees or operating expenses to reduce its reported return. |
† | Performance figures do not reflect fees and expenses associated with an investment in variable insurance products. If returns had taken into account these fees and expenses, performance would have been lower. Shares of a series of Guggenheim Variable Funds Trust are available only through the purchase of such products. |
| | THE GUGGENHEIM FUNDS ANNUAL REPORT | 115 |
SCHEDULE OF INVESTMENTS | December 31, 2016 |
SERIES V (MID CAP VALUE SERIES) | |
| | Shares | | | Value | |
| | | | | | | |
COMMON STOCKS† - 97.6% | |
| | | | | | | |
Financial - 34.8% | |
Zions Bancorporation | | | 163,271 | | | $ | 7,027,184 | |
Alleghany Corp.* | | | 8,376 | | | | 5,093,613 | |
KeyCorp | | | 274,858 | | | | 5,021,655 | |
Wintrust Financial Corp. | | | 57,866 | | | | 4,199,336 | |
Assured Guaranty Ltd. | | | 99,883 | | | | 3,772,581 | |
Trustmark Corp. | | | 99,286 | | | | 3,539,547 | |
Huntington Bancshares, Inc. | | | 267,648 | | | | 3,538,307 | |
Fulton Financial Corp. | | | 174,674 | | | | 3,283,871 | |
Popular, Inc. | | | 70,770 | | | | 3,101,141 | |
Radian Group, Inc. | | | 161,876 | | | | 2,910,530 | |
Sun Communities, Inc. | | | 36,171 | | | | 2,771,060 | |
Unum Group | | | 62,097 | | | | 2,727,921 | |
E*TRADE Financial Corp.* | | | 78,359 | | | | 2,715,139 | |
Hanover Insurance Group, Inc. | | | 27,275 | | | | 2,482,298 | |
Prosperity Bancshares, Inc. | | | 32,186 | | | | 2,310,311 | |
Alexandria Real Estate Equities, Inc. | | | 20,506 | | | | 2,278,832 | |
CubeSmart | | | 84,231 | | | | 2,254,864 | |
EastGroup Properties, Inc. | | | 28,557 | | | | 2,108,649 | |
Equity Commonwealth* | | | 59,780 | | | | 1,807,747 | |
EPR Properties | | | 23,907 | | | | 1,715,806 | |
Cousins Properties, Inc. | | | 198,975 | | | | 1,693,277 | |
First Merchants Corp. | | | 41,984 | | | | 1,580,698 | |
PacWest Bancorp | | | 28,038 | | | | 1,526,389 | |
IBERIABANK Corp. | | | 17,169 | | | | 1,437,904 | |
Lexington Realty Trust | | | 131,063 | | | | 1,415,480 | |
First Industrial Realty Trust, Inc. | | | 49,416 | | | | 1,386,119 | |
DCT Industrial Trust, Inc. | | | 26,721 | | | | 1,279,401 | |
National Storage Affiliates Trust | | | 57,431 | | | | 1,267,502 | |
Redwood Trust, Inc. | | | 82,321 | | | | 1,252,102 | |
Howard Hughes Corp.* | | | 10,717 | | | | 1,222,810 | |
Monogram Residential Trust, Inc. | | | 104,010 | | | | 1,125,388 | |
Camden Property Trust | | | 13,236 | | | | 1,112,751 | |
CoreCivic, Inc. | | | 35,256 | | | | 862,362 | |
Hancock Holding Co. | | | 18,608 | | | | 802,005 | |
Banc of California, Inc. | | | 41,544 | | | | 720,788 | |
Farmer Mac — Class C | | | 12,249 | | | | 701,500 | |
Umpqua Holdings Corp. | | | 36,238 | | | | 680,550 | |
Genworth Financial, Inc. — Class A* | | | 149,393 | | | | 569,187 | |
Apartment Investment & Management Co. — Class A | | | 12,292 | | | | 558,671 | |
Parkway, Inc.* | | | 24,871 | | | | 553,380 | |
Total Financial | | | | | | | 86,408,656 | |
| | | | | | | | | |
Industrial - 15.4% | |
WestRock Co. | | | 70,656 | | | | 3,587,204 | |
Oshkosh Corp. | | | 50,437 | | | | 3,258,735 | |
Gentex Corp. | | | 158,475 | | | | 3,120,372 | |
Sonoco Products Co. | | | 58,624 | | | | 3,089,485 | |
Corning, Inc. | | | 115,574 | | | | 2,804,981 | |
Orbital ATK, Inc. | | | 29,259 | | | | 2,566,893 | |
FLIR Systems, Inc. | | | 58,209 | | | | 2,106,584 | |
Harris Corp. | | | 18,935 | | | | 1,940,269 | |
Owens-Illinois, Inc.* | | | 104,559 | | | | 1,820,372 | |
Huntington Ingalls Industries, Inc. | | | 9,615 | | | | 1,770,987 | |
Werner Enterprises, Inc. | | | 62,922 | | | | 1,695,748 | |
Spirit AeroSystems Holdings, Inc. — Class A | | | 25,548 | | | | 1,490,726 | |
Crane Co. | | | 18,653 | | | | 1,345,254 | |
Summit Materials, Inc. — Class A* | | | 55,439 | | | | 1,318,903 | |
Kirby Corp.* | | | 19,730 | | | | 1,312,045 | |
Scorpio Tankers, Inc. | | | 267,471 | | | | 1,211,644 | |
ITT, Inc. | | | 29,282 | | | | 1,129,407 | |
Owens Corning | | | 21,090 | | | | 1,087,400 | |
Covenant Transportation Group, Inc. — Class A* | | | 39,609 | | | | 766,038 | |
Ryder System, Inc. | | | 9,023 | | | | 671,672 | |
Total Industrial | | | | | | | 38,094,719 | |
| | | | | | | | | |
Consumer, Non-cyclical - 10.4% | |
Bunge Ltd. | | | 48,153 | | | | 3,478,573 | |
Quest Diagnostics, Inc. | | | 33,785 | | | | 3,104,842 | |
Navigant Consulting, Inc.* | | | 114,131 | | | | 2,987,950 | |
Emergent BioSolutions, Inc.* | | | 89,773 | | | | 2,948,145 | |
United Rentals, Inc.* | | | 19,440 | | | | 2,052,475 | |
Sanderson Farms, Inc. | | | 21,247 | | | | 2,002,317 | |
ICF International, Inc.* | | | 34,905 | | | | 1,926,756 | |
Premier, Inc. — Class A* | | | 53,610 | | | | 1,627,600 | |
Dean Foods Co. | | | 69,969 | | | | 1,523,925 | |
HealthSouth Corp. | | | 29,142 | | | | 1,201,816 | |
Surgical Care Affiliates, Inc.* | | | 24,620 | | | | 1,139,167 | |
Molina Healthcare, Inc.* | | | 17,698 | | | | 960,293 | |
Ingredion, Inc. | | | 7,501 | | | | 937,325 | |
Total Consumer, Non-cyclical | | | | | | | 25,891,184 | |
| | | | | | | | | |
Utilities - 8.9% | |
OGE Energy Corp. | | | 106,788 | | | | 3,572,060 | |
Black Hills Corp. | | | 45,364 | | | | 2,782,628 | |
Ameren Corp. | | | 51,366 | | | | 2,694,660 | |
Portland General Electric Co. | | | 55,356 | | | | 2,398,575 | |
Avista Corp. | | | 55,805 | | | | 2,231,642 | |
Pinnacle West Capital Corp. | | | 27,240 | | | | 2,125,537 | |
UGI Corp. | | | 40,140 | | | | 1,849,651 | |
AES Corp. | | | 156,883 | | | | 1,822,980 | |
Calpine Corp.* | | | 121,546 | | | | 1,389,271 | |
ONE Gas, Inc. | | | 19,747 | | | | 1,263,018 | |
Total Utilities | | | | | | | 22,130,022 | |
| | | | | | | | | |
Technology - 8.0% | |
Micron Technology, Inc.* | �� | | 161,036 | | | | 3,529,909 | |
IXYS Corp. | | | 198,821 | | | | 2,365,970 | |
CSRA, Inc. | | | 73,658 | | | | 2,345,271 | |
Lam Research Corp. | | | 19,361 | | | | 2,047,038 | |
Cray, Inc.* | | | 95,295 | | | | 1,972,607 | |
Maxwell Technologies, Inc.* | | | 370,023 | | | | 1,894,518 | |
MKS Instruments, Inc. | | | 29,450 | | | | 1,749,329 | |
Photronics, Inc.* | | | 126,596 | | | | 1,430,535 | |
Qorvo, Inc.* | | | 23,090 | | | | 1,217,536 | |
Teradata Corp.* | | | 44,196 | | | | 1,200,805 | |
Total Technology | | | | | | | 19,753,518 | |
116 | THE GUGGENHEIM FUNDS ANNUAL REPORT | SEE NOTES TO FINANCIAL STATEMENTS. |
SCHEDULE OF INVESTMENTS (continued) | December 31, 2016 |
SERIES V (MID CAP VALUE SERIES) | |
| | Shares | | | Value | |
| | | | | | | |
Consumer, Cyclical - 7.0% | |
UniFirst Corp. | | | 24,030 | | | $ | 3,451,910 | |
PVH Corp. | | | 28,731 | | | | 2,592,685 | |
DR Horton, Inc. | | | 87,981 | | | | 2,404,521 | |
Deckers Outdoor Corp.* | | | 31,512 | | | | 1,745,450 | |
Caleres, Inc. | | | 49,114 | | | | 1,611,921 | |
AutoNation, Inc.* | | | 26,209 | | | | 1,275,068 | |
CalAtlantic Group, Inc. | | | 33,606 | | | | 1,142,940 | |
J.C. Penney Company, Inc.* | | | 127,552 | | | | 1,059,957 | |
Macy’s, Inc. | | | 28,679 | | | | 1,026,995 | |
Goodyear Tire & Rubber Co. | | | 19,687 | | | | 607,738 | |
Vista Outdoor, Inc.* | | | 11,029 | | | | 406,970 | |
Total Consumer, Cyclical | | | | | | | 17,326,155 | |
| | | | | | | | | |
Energy - 6.0% | |
Laredo Petroleum, Inc.* | | | 149,205 | | | | 2,109,758 | |
Whiting Petroleum Corp.* | | | 155,633 | | | | 1,870,709 | |
Chesapeake Energy Corp.* | | | 254,402 | | | | 1,785,902 | |
Rowan Companies plc — Class A* | | | 85,753 | | | | 1,619,874 | |
Oasis Petroleum, Inc.* | | | 97,299 | | | | 1,473,107 | |
Apache Corp. | | | 20,817 | | | | 1,321,255 | |
Marathon Oil Corp. | | | 75,485 | | | | 1,306,645 | |
Tesoro Corp. | | | 13,914 | | | | 1,216,780 | |
Western Refining, Inc. | | | 31,977 | | | | 1,210,329 | |
Gulfport Energy Corp.* | | | 39,469 | | | | 854,109 | |
HydroGen Corp.*,†††,1 | | | 672,346 | | | | 1 | |
Total Energy | | | | | | | 14,768,469 | |
| | | | | | | | | |
Communications - 3.8% | |
DigitalGlobe, Inc.* | | | 148,966 | | | | 4,267,876 | |
Finisar Corp.* | | | 64,348 | | | | 1,947,814 | |
Scripps Networks Interactive, Inc. — Class A | | | 26,984 | | | | 1,925,848 | |
Infinera Corp.* | | | 145,727 | | | | 1,237,222 | |
Total Communications | | | | | | | 9,378,760 | |
| | | | | | | | | |
Basic Materials - 3.3% | |
Reliance Steel & Aluminum Co. | | | 28,851 | | | | 2,294,809 | |
Freeport-McMoRan, Inc.* | | | 159,464 | | | | 2,103,330 | |
Olin Corp. | | | 64,200 | | | | 1,644,163 | |
LyondellBasell Industries N.V. — Class A | | | 12,707 | | | | 1,090,006 | |
Clearwater Paper Corp.* | | | 8,837 | | | | 579,265 | |
Landec Corp.* | | | 40,384 | | | | 557,299 | |
Total Basic Materials | | | | | | | 8,268,872 | |
| | | | | | | | | |
Total Common Stocks | | | | | | | | |
(Cost $197,194,325) | | | | | | | 242,020,355 | |
| | | | | | | | | |
CONVERTIBLE PREFERRED STOCKS††† - 0.0% | |
Thermoenergy Corp.*,2,4 | | | 308,333 | | | | 1 | |
Total Convertible Preferred Stocks | | | | | | | | |
(Cost $294,438) | | | | | | | 1 | |
| | | | | | | | | |
SHORT-TERM INVESTMENTS† - 2.7% | |
Dreyfus Treasury Securities Cash Management Fund - Institutional Class 0.31%3 | | | 6,673,368 | | | | 6,673,368 | |
Total Short-Term Investments | | | | | | | | |
(Cost $6,673,368) | | | | | | | 6,673,368 | |
| | | | | | | | | |
Total Investments - 100.3% | | | | | | | | |
(Cost $204,162,131) | | | | | | $ | 248,693,724 | |
Other Assets & Liabilities, net - (0.3)% | | | | | | | (632,035 | ) |
Total Net Assets - 100.0% | | | | | | $ | 248,061,689 | |
* | Non-income producing security. |
† | Value determined based on Level 1 inputs, unless otherwise noted — See Note 4. |
††† | Value determined based on Level 3 inputs — See Note 4. |
1 | Affiliated issuer — See Note 8. |
2 | PIPE (Private Investment in Public Equity) — Stock issued by a company in the secondary market as a means of raising capital more quickly and less expensively than through registration of a secondary public offering. |
3 | Rate indicated is the 7 day yield as of December 31, 2016. |
4 | Illiquid security. |
| | plc — Public Limited Company |
| | |
| | See Sector Classification in Other Information section. |
SEE NOTES TO FINANCIAL STATEMENTS. | THE GUGGENHEIM FUNDS ANNUAL REPORT | 117 |
SCHEDULE OF INVESTMENTS (concluded) | December 31, 2016 |
SERIES V (MID CAP VALUE SERIES) | |
The following table summarizes the inputs used to value the Fund’s investments at December 31, 2016 (See Note 4 in the Notes to Financial Statements):
Investments in Securities (Assets) | | Level 1 | | | Level 2 | | | Level 3 | | | Total | |
Common Stocks | | $ | 242,020,354 | | | $ | — | | | $ | 1 | | | $ | 242,020,355 | |
Convertible Preferred Stocks | | | — | | | | — | | | | 1 | | | | 1 | |
Short-Term Investments | | | 6,673,368 | | | | — | | | | — | | | | 6,673,368 | |
Total | | $ | 248,693,722 | | | $ | — | | | $ | 2 | | | $ | 248,693,724 | |
Transfers between investment levels may occur as the markets fluctuate and/or the availability of data used in an investment’s valuation changes. Transfers between valuation levels, if any, are in comparison to the valuation levels at the end of the previous fiscal year, and are effective using the fair value as of the end of the previous fiscal period.
For the year ended December 31, 2016, there were no transfers between levels.
118 | THE GUGGENHEIM FUNDS ANNUAL REPORT | SEE NOTES TO FINANCIAL STATEMENTS. |
SERIES V (MID CAP VALUE SERIES) | |
STATEMENT OF ASSETS AND LIABILITIES |
December 31, 2016 |
Assets: | |
Investments in unaffiliated issuers, at value (cost $201,590,556) | | $ | 248,693,723 | |
Investments in affiliated issuers, at value (cost $2,571,575) | | | 1 | |
Total investments (cost $204,162,131) | | | 248,693,724 | |
Prepaid expenses | | | 13,871 | |
Cash | | | 3,185 | |
Receivables: | |
Fund shares sold | | | 9,491 | |
Dividends | | | 300,607 | |
Foreign taxes reclaim | | | 5,224 | |
Total assets | | | 249,026,102 | |
| | | | | |
Liabilities: | |
Payable for: | |
Fund shares redeemed | | | 483,553 | |
Management fees | | | 158,846 | |
Direct shareholders expense | | | 57,655 | |
Fund accounting/administration fees | | | 16,944 | |
Trustees’ fees* | | | 6,457 | |
Transfer agent/maintenance fees | | | 3,229 | |
Miscellaneous | | | 237,729 | |
Total liabilities | | | 964,413 | |
Commitments and contingent liabilities (Note 14) | | | — | |
Net assets | | $ | 248,061,689 | |
| | | | | |
Net assets consist of: | |
Paid in capital | | $ | 197,709,901 | |
Undistributed net investment income | | | 3,419,630 | |
Accumulated net realized gain on investments | | | 2,400,565 | |
Net unrealized appreciation on investments | | | 44,531,593 | |
Net assets | | $ | 248,061,689 | |
Capital shares outstanding | | | 3,336,559 | |
Net asset value per share | | $ | 74.35 | |
STATEMENT OF OPERATIONS |
Year Ended December 31, 2016 |
Investment Income: | |
Dividends from securities of unaffiliated issuers (net of foreign withholding tax of $7,836) | | $ | 5,196,586 | |
Interest | | | 11,640 | |
Total investment income | | | 5,208,226 | |
| | | | | |
Expenses: | |
Management fees | | | 1,630,057 | |
Transfer agent/maintenance fees | | | 25,230 | |
Fund accounting/administration fees | | | 197,994 | |
Line of credit fees | | | 34,916 | |
Trustees’ fees* | | | 11,261 | |
Custodian fees | | | 7,353 | |
Miscellaneous | | | 118,939 | |
Total expenses | | | 2,025,750 | |
Net investment income | | | 3,182,476 | |
| | | | | |
Net Realized and Unrealized Gain (Loss): | |
Net realized gain (loss) on: | |
Investments in unaffiliated issuers | | | 4,848,974 | |
Net realized gain | | | 4,848,974 | |
Net change in unrealized appreciation (depreciation) on: | |
Investments in unaffiliated issuers | | | 44,991,587 | |
Net change in unrealized appreciation (depreciation) | | | 44,991,587 | |
Net realized and unrealized gain | | | 49,840,561 | |
Net increase in net assets resulting from operations | | $ | 53,023,037 | |
* | Relates to Trustees not deemed “interested persons” within the meaning of Section 2(a)(19) of the 1940 Act. |
SEE NOTES TO FINANCIAL STATEMENTS. | THE GUGGENHEIM FUNDS ANNUAL REPORT | 119 |
SERIES V (MID CAP VALUE SERIES) | |
STATEMENTS OF CHANGES IN NET ASSETS |
| | Year Ended
December 31,
2016 | | | Year Ended
December 31,
2015 | |
Increase (Decrease) in Net Assets from Operations: | | | | | | |
Net investment income | | $ | 3,182,476 | | | $ | 2,237,217 | |
Net realized gain on investments | | | 4,848,974 | | | | 21,149,578 | |
Net change in unrealized appreciation (depreciation) on investments | | | 44,991,587 | | | | (39,178,946 | ) |
Net increase (decrease) in net assets resulting from operations | | | 53,023,037 | | | | (15,792,151 | ) |
| | | | | | | | | |
Distributions to shareholders from: | | | | | | | | |
Net investment income | | | (2,053,048 | ) | | | (1,461,676 | ) |
Net realized gains | | | (21,634,815 | ) | | | (38,146,459 | ) |
Total distributions to shareholders | | | (23,687,863 | ) | | | (39,608,135 | ) |
| | | | | | | | | |
Capital share transactions: | | | | | | | | |
Proceeds from sale of shares | | | 22,422,562 | | | | 6,517,513 | |
Distributions reinvested | | | 23,687,863 | | | | 39,608,135 | |
Cost of shares redeemed | | | (34,776,420 | ) | | | (47,827,753 | ) |
Net increase (decrease) from capital share transactions | | | 11,334,005 | | | | (1,702,105 | ) |
Net increase (decrease) in net assets | | | 40,669,179 | | | | (57,102,391 | ) |
| | | | | | | | | |
Net assets: | | | | | | | | |
Beginning of year | | | 207,392,510 | | | | 264,494,901 | |
End of year | | $ | 248,061,689 | | | $ | 207,392,510 | |
Undistributed net investment income at end of year | | $ | 3,419,630 | | | $ | 2,290,202 | |
| | | | | | | | | |
Capital share activity: | | | | | | | | |
Shares sold | | | 330,438 | | | | 84,460 | |
Shares issued from reinvestment of distributions | | | 363,032 | | | | 558,963 | |
Shares redeemed | | | (511,605 | ) | | | (629,265 | ) |
Net increase in shares | | | 181,865 | | | | 14,158 | |
120 | THE GUGGENHEIM FUNDS ANNUAL REPORT | SEE NOTES TO FINANCIAL STATEMENTS. |
SERIES V (MID CAP VALUE SERIES) | |
This table is presented to show selected data for a share outstanding throughout each period and to assist shareholders in evaluating a Fund’s performance for the periods presented.
| | Year Ended
December 31,
2016 | | | Year Ended
December 31,
2015 | | | Year Ended
December 31,
2014 | | | Year Ended
December 31,
2013 | | | Year Ended
December 31,
2012 | |
Per Share Data | | | | | | | | | | | | | | | |
Net asset value, beginning of period | | $ | 65.74 | | | $ | 84.22 | | | $ | 83.46 | | | $ | 62.60 | | | $ | 53.45 | |
Income (loss) from investment operations: | |
Net investment income (loss)a | | | 0.99 | | | | .71 | | | | .53 | | | | .36 | | | | .25 | |
Net gain (loss) on investments (realized and unrealized) | | | 15.50 | | | | (5.42 | ) | | | .23 | | | | 20.50 | | | | 8.90 | |
Total from investment operations | | | 16.49 | | | | (4.71 | ) | | | .76 | | | | 20.86 | | | | 9.15 | |
Less distributions from: | |
Net investment income | | | (.68 | ) | | | (.51 | ) | | | (— | )b | | | — | | | | — | |
Net realized gains | | | (7.20 | ) | | | (13.26 | ) | | | — | | | | — | | | | — | |
Total distributions | | | (7.88 | ) | | | (13.77 | ) | | | (— | )b | | | — | | | | — | |
Net asset value, end of period | | $ | 74.35 | | | $ | 65.74 | | | $ | 84.22 | | | $ | 83.46 | | | $ | 62.60 | |
| |
Total Returnc | | | 26.75 | % | | | (6.79 | %) | | | 0.91 | % | | | 33.32 | % | | | 17.12 | % |
Ratios/Supplemental Data | |
Net assets, end of period (in thousands) | | $ | 248,062 | | | $ | 207,393 | | | $ | 264,495 | | | $ | 302,166 | | | $ | 249,806 | |
Ratios to average net assets: | |
Net investment income (loss) | | | 1.46 | % | | | 0.94 | % | | | 0.62 | % | | | 0.48 | % | | | 0.43 | % |
Total expenses | | | 0.93 | % | | | 0.95 | % | | | 0.93 | % | | | 0.93 | % | | | 0.93 | % |
Portfolio turnover rate | | | 60 | % | | | 50 | % | | | 53 | % | | | 22 | % | | | 24 | % |
a | Net investment income (loss) per share was computed using average shares outstanding throughout the period. |
b | Distributions from net investment income are less than $0.01 per share. |
c | Total return does not take into account any of the expenses associated with an investment in variable insurance products. If total return had taken into account these expenses, performance would have been lower. Shares of a series of Guggenheim Variable Funds Trust are available only through the purchase of such products. |
SEE NOTES TO FINANCIAL STATEMENTS. | THE GUGGENHEIM FUNDS ANNUAL REPORT | 121 |
MANAGER’S COMMENTARY (Unaudited) | December 31, 2016 |
To Our Shareholders:
The Series X (StylePlusTM—Small Growth Series) is managed by a team of seasoned professionals, including B. Scott Minerd, Chairman of Investments and Global Chief Investment Officer; Farhan Sharaff, Senior Managing Director and Assistant Chief Investment Officer, Equities; Jayson Flowers, Senior Managing Director and Portfolio Manager; Scott Hammond, Managing Director and Portfolio Manager; and Qi Yan, Managing Director and Portfolio Manager. In the following paragraphs, the investment team discusses performance for the fiscal year ended December 31, 2016.
For the year ended December 31, 2016, the Series X (StylePlus—Small Growth Series) returned 13.45%, compared with the 11.32% return of its benchmark, the Russell 2000® Growth Index.
Through a combination of an allocation to actively managed individual equity, passive equity, and actively managed fixed income, the Fund seeks to exceed the total return of the S&P 500 Index. The actively managed equity and fixed income components seek to provide multiple sources of outperformance and take advantage of Guggenheim’s competencies in both fixed income and systematic stock selection.
The allocation to actively managed individual equity via stocks, and passive equity via derivatives, is designed to provide exposure to large core equity. Remaining Fund assets are invested in the Guggenheim Strategy Funds, short-term fixed-income investment companies advised by Guggenheim Investments. The Strategy Funds invest in a diversified portfolio of debt securities and financial instruments providing exposure to fixed income markets. The investment objective of the Guggenheim Strategy Funds is to seek a high level of income consistent with the preservation of capital.
The passive equity position uses derivatives such as swap agreements to gain exposure to the index. The Fund’s fixed income component invests in a variety of fixed income sectors, including asset-backed securities (ABS), mortgage-backed securities, corporate bonds, and bank loans.
The active and passive decisions seek to add value by tactically allocating to actively managed equity through quantitative selection models when stock picking opportunities are high. During periods when Guggenheim views these opportunities to be less attractive, the Fund seeks to increase its passive exposure to equities and the allocation to fixed-income securities. The prospective return during such periods is the equity index plus an “alpha” component coming from the yield of the fixed-income overlay.
Performance Review
The Fund outperformed the Russell 2000 Growth Index for the one-year period ended December 31, 2016. The fixed income sleeve was the largest positive contributor. The investments in the Guggenheim Strategy Funds benefited Fund performance relative to investing in other short-term investments. The actively managed equity sleeve contributed slightly to performance. The passive equity position, maintained through swap agreements and futures contracts, also contributed to performance for the period.
For the Fund’s total equity position over the period, 15-20% was allocated to actively managed equity and 80-85% to passive equity.
When compared with the index, the total equity position (actively managed individual equity plus passive equity derivatives) was most overweight the Industrials and Health Care sectors and most underweight the Materials and Real Estate sectors.
Uncorrelated with the Fund’s active equity component, the fixed-income component was largely invested in ABS, investment-grade corporates, and NA RMBS. These positions constituted the majority of the fixed income sleeve’s total return.
Performance displayed represents past performance which is no guarantee of future results.
The opinions and forecast expressed may not actually come to pass. This information is subject to change at any time, based on market and other conditions, and should not be construed as a recommendation of any specific security or strategy.
122 | THE GUGGENHEIM FUNDS ANNUAL REPORT | |
PERFORMANCE REPORT AND FUND PROFILE (Unaudited) | December 31, 2016 |
SERIES X (STYLEPLUS—SMALL GROWTH SERIES)
OBJECTIVE: Seeks long-term growth of capital.
Holdings Diversification (Market Exposure as % of Net Assets)
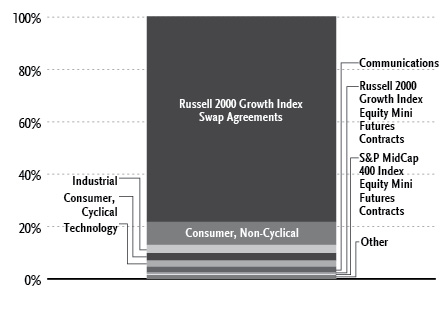
“Holdings Diversification (Market Exposure as % of Net Assets)” excludes any temporary cash investments or investments in Guggenheim Strategy Funds Trust mutual funds. Investments in those Funds will significantly increase the portfolio’s exposure to certain other asset categories (and their associated risks), which may cause the Fund to deviate from its principal investment strategy, including: (i) high yield, high risk debt securities rated below the top four long-term rating categories by a nationally recognized statistical rating organization (also known as “junk bonds”); (ii) securities issued by the U.S. government or its agencies and instrumentalities; (iii) CLOs and similar investments; and (iv) other short-term fixed income securities.
Inception Date: October 15, 1997 |
Ten Largest Holdings (% of Total Net Assets) |
Guggenheim Strategy Fund III | 26.2% |
Guggenheim Variable Insurance Strategy Fund III | 24.8% |
Guggenheim Strategy Fund II | 13.1% |
Guggenheim Strategy Fund I | 12.0% |
HealthSouth Corp. | 0.3% |
B&G Foods, Inc. | 0.3% |
Molina Healthcare, Inc. | 0.2% |
Prestige Brands Holdings, Inc. | 0.2% |
j2 Global, Inc. | 0.2% |
Deluxe Corp. | 0.2% |
Top Ten Total | 77.5% |
“Ten Largest Holdings” excludes any temporary cash or derivative investments. |
| | THE GUGGENHEIM FUNDS ANNUAL REPORT | 123 |
PERFORMANCE REPORT AND FUND PROFILE (Unaudited)(concluded) | December 31, 2016 |
Cumulative Fund Performance*,†
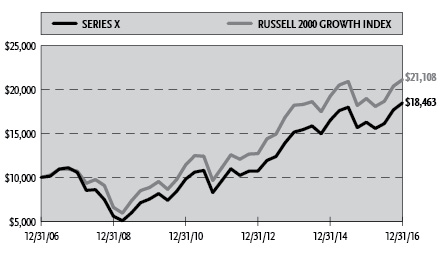
Average Annual Returns*
Periods Ended December 31, 2016†
| 1 Year | 5 Year | 10 Year |
Series X (StylePlus—Small Growth Series) | 13.45% | 13.95% | 6.32% |
Russell 2000 Growth Index | 11.32% | 13.74% | 7.76% |
* | The performance data above represents past performance that is not predictive of future results. Effective April 30, 2013, certain changes were made to the Series’ investment objective and principal investment strategies. The investment return and principal value of an investment in the Fund will fluctuate so that an investor’s shares, when redeemed, may be worth more or less than their original cost. Returns are historical and include changes in principal and reinvested dividends and capital gains and do not reflect the effect of taxes. The Russell 2000 Growth Index is an unmanaged index and, unlike the Fund, has no management fees or operating expenses to reduce its reported return. |
† | Performance figures do not reflect fees and expenses associated with an investment in variable insurance products. If returns had taken into account these fees and expenses, performance would have been lower. Shares of a series of Guggenheim Variable Funds Trust are available only through the purchase of such products. |
124 | THE GUGGENHEIM FUNDS ANNUAL REPORT | |
SCHEDULE OF INVESTMENTS | December 31, 2016 |
SERIES X (STYLEPLUS—SMALL GROWTH SERIES) | |
| | Shares | | | Value | |
| | | | | | | |
COMMON STOCKS† - 20.6% | |
| | | | | | | |
Consumer, Non-cyclical - 8.8% | |
HealthSouth Corp. | | | 2,398 | | | $ | 98,894 | |
B&G Foods, Inc. | | | 2,027 | | | | 88,783 | |
Molina Healthcare, Inc.* | | | 1,573 | | | | 85,351 | |
Prestige Brands Holdings, Inc.* | | | 1,615 | | | | 84,141 | |
Deluxe Corp. | | | 1,128 | | | | 80,776 | |
Brink’s Co. | | | 1,772 | | | | 73,095 | |
Central Garden & Pet Co. — Class A* | | | 2,336 | | | | 72,182 | |
Darling Ingredients, Inc.* | | | 5,509 | | | | 71,121 | |
PAREXEL International Corp.* | | | 1,002 | | | | 65,851 | |
NuVasive, Inc.* | | | 853 | | | | 57,458 | |
Fresh Del Monte Produce, Inc. | | | 895 | | | | 54,264 | |
Surgical Care Affiliates, Inc.* | | | 1,151 | | | | 53,257 | |
Vector Group Ltd. | | | 2,178 | | | | 49,528 | |
Tenet Healthcare Corp.* | | | 3,218 | | | | 47,755 | |
TESARO, Inc.* | | | 353 | | | | 47,470 | |
Myriad Genetics, Inc.* | | | 2,827 | | | | 47,125 | |
Travelport Worldwide Ltd. | | | 3,266 | | | | 46,051 | |
AMN Healthcare Services, Inc.* | | | 1,171 | | | | 45,024 | |
Owens & Minor, Inc. | | | 1,224 | | | | 43,195 | |
CEB, Inc. | | | 602 | | | | 36,481 | |
Magellan Health, Inc.* | | | 477 | | | | 35,894 | |
Helen of Troy Ltd.* | | | 411 | | | | 34,709 | |
Cimpress N.V.* | | | 364 | | | | 33,346 | |
Prothena Corporation plc* | | | 675 | | | | 33,203 | |
US Physical Therapy, Inc. | | | 464 | | | | 32,573 | |
Landauer, Inc. | | | 672 | | | | 32,323 | |
TriNet Group, Inc.* | | | 1,251 | | | | 32,051 | |
Integra LifeSciences Holdings Corp.* | | | 372 | | | | 31,914 | |
Medifast, Inc. | | | 760 | | | | 31,639 | |
Meridian Bioscience, Inc. | | | 1,755 | | | | 31,064 | |
Inter Parfums, Inc. | | | 938 | | | | 30,720 | |
Premier, Inc. — Class A* | | | 974 | | | | 29,570 | |
Air Methods Corp.* | | | 920 | | | | 29,302 | |
LHC Group, Inc.* | | | 620 | | | | 28,334 | |
Chefs’ Warehouse, Inc.* | | | 1,791 | | | | 28,298 | |
Bright Horizons Family Solutions, Inc.* | | | 404 | | | | 28,288 | |
Cross Country Healthcare, Inc.* | | | 1,772 | | | | 27,661 | |
Five Prime Therapeutics, Inc.* | | | 547 | | | | 27,410 | |
Amedisys, Inc.* | | | 636 | | | | 27,113 | |
Emergent BioSolutions, Inc.* | | | 824 | | | | 27,059 | |
Intersect ENT, Inc.* | | | 2,212 | | | | 26,765 | |
Insulet Corp.* | | | 685 | | | | 25,811 | |
Ligand Pharmaceuticals, Inc. — Class B* | | | 252 | | | | 25,605 | |
Kite Pharma, Inc.* | | | 570 | | | | 25,559 | |
FTI Consulting, Inc.* | | | 563 | | | | 25,380 | |
HMS Holdings Corp.* | | | 1,387 | | | | 25,188 | |
Nevro Corp.* | | | 342 | | | | 24,850 | |
Exelixis, Inc.* | | | 1,631 | | | | 24,318 | |
MiMedx Group, Inc.* | | | 2,728 | | | | 24,170 | |
On Assignment, Inc.* | | | 544 | | | | 24,023 | |
Natural Health Trends Corp. | | | 963 | | | | 23,931 | |
SP Plus Corp.* | | | 846 | | | | 23,815 | |
Supernus Pharmaceuticals, Inc.* | | | 939 | | | | 23,710 | |
Korn/Ferry International | | | 793 | | | | 23,338 | |
Coca-Cola Bottling Company Consolidated | | | 129 | | | | 23,072 | |
Genomic Health, Inc.* | | | 775 | | | | 22,778 | |
Quidel Corp.* | | | 1,063 | | | | 22,769 | |
Omega Protein Corp.* | | | 900 | | | | 22,545 | |
Providence Service Corp.* | | | 592 | | | | 22,526 | |
Great Lakes Dredge & Dock Corp.* | | | 5,337 | | | | 22,415 | |
Impax Laboratories, Inc.* | | | 1,686 | | | | 22,340 | |
Chemed Corp. | | | 138 | | | | 22,137 | |
Globus Medical, Inc. — Class A* | | | 885 | | | | 21,957 | |
Cal-Maine Foods, Inc. | | | 497 | | | | 21,955 | |
Advisory Board Co.* | | | 660 | | | | 21,945 | |
Sucampo Pharmaceuticals, Inc. — Class A* | | | 1,607 | | | | 21,775 | |
Pacira Pharmaceuticals, Inc.* | | | 674 | | | | 21,770 | |
Grand Canyon Education, Inc.* | | | 362 | | | | 21,159 | |
Cynosure, Inc. — Class A* | | | 455 | | | | 20,748 | |
Nektar Therapeutics* | | | 1,686 | | | | 20,687 | |
Repligen Corp.* | | | 664 | | | | 20,464 | |
Ultragenyx Pharmaceutical, Inc.* | | | 290 | | | | 20,390 | |
Intra-Cellular Therapies, Inc.* | | | 1,349 | | | | 20,356 | |
Insmed, Inc.* | | | 1,526 | | | | 20,189 | |
Mirati Therapeutics, Inc.* | | | 4,229 | | | | 20,088 | |
Sage Therapeutics, Inc.* | | | 387 | | | | 19,760 | |
AMAG Pharmaceuticals, Inc.* | | | 567 | | | | 19,732 | |
Spark Therapeutics, Inc.* | | | 394 | | | | 19,661 | |
Insperity, Inc. | | | 276 | | | | 19,582 | |
Huron Consulting Group, Inc.* | | | 384 | | | | 19,450 | |
Diplomat Pharmacy, Inc.* | | | 1,535 | | | | 19,341 | |
Alder Biopharmaceuticals, Inc.* | | | 915 | | | | 19,032 | |
Horizon Pharma plc* | | | 1,175 | | | | 19,012 | |
Avon Products, Inc.* | | | 3,771 | | | | 19,006 | |
Novavax, Inc.* | | | 14,772 | | | | 18,613 | |
Amicus Therapeutics, Inc.* | | | 3,535 | | | | 17,569 | |
Radius Health, Inc.* | | | 455 | | | | 17,304 | |
Cempra, Inc.* | | | 6,000 | | | | 16,800 | |
MacroGenics, Inc.* | | | 817 | | | | 16,699 | |
ARIAD Pharmaceuticals, Inc.* | | | 1,324 | | | | 16,471 | |
BioSpecifics Technologies Corp.* | | | 293 | | | | 16,320 | |
Puma Biotechnology, Inc.* | | | 515 | | | | 15,811 | |
Lexicon Pharmaceuticals, Inc.* | | | 1,127 | | | | 15,586 | |
Pacific Biosciences of California, Inc.* | | | 3,090 | | | | 11,742 | |
Total Consumer, Non-cyclical | | | | | | | 2,998,292 | |
| | | | | | | | | |
Industrial - 3.2% | |
EMCOR Group, Inc. | | | 997 | | | | 70,548 | |
Swift Transportation Co. — Class A* | | | 2,812 | | | | 68,500 | |
Hillenbrand, Inc. | | | 1,761 | | | | 67,534 | |
Dycom Industries, Inc.* | | | 763 | | | | 61,261 | |
Moog, Inc. — Class A* | | | 752 | | | | 49,391 | |
Woodward, Inc. | | | 680 | | | | 46,954 | |
Belden, Inc. | | | 580 | | | | 43,366 | |
Universal Forest Products, Inc. | | | 422 | | | | 43,120 | |
Generac Holdings, Inc.* | | | 994 | | | | 40,496 | |
Hub Group, Inc. — Class A* | | | 815 | | | | 35,657 | |
MasTec, Inc.* | | | 899 | | | | 34,387 | |
Rexnord Corp.* | | | 1,672 | | | | 32,754 | |
American Outdoor Brands Corp.* | | | 1,438 | | | | 30,313 | |
SEE NOTES TO FINANCIAL STATEMENTS. | THE GUGGENHEIM FUNDS ANNUAL REPORT | 125 |
SCHEDULE OF INVESTMENTS (continued) | December 31, 2016 |
SERIES X (STYLEPLUS—SMALL GROWTH SERIES) | |
| | Shares | | | Value | |
| | | | | | | |
Curtiss-Wright Corp. | | | 307 | | | $ | 30,197 | |
General Cable Corp. | | | 1,531 | | | | 29,166 | |
Albany International Corp. — Class A | | | 626 | | | | 28,984 | |
Matson, Inc. | | | 811 | | | | 28,701 | |
NCI Building Systems, Inc.* | | | 1,801 | | | | 28,186 | |
Builders FirstSource, Inc.* | | | 2,520 | | | | 27,644 | |
Masonite International Corp.* | | | 404 | | | | 26,583 | |
Hyster-Yale Materials Handling, Inc. | | | 412 | | | | 26,273 | |
Littelfuse, Inc. | | | 173 | | | | 26,256 | |
Tetra Tech, Inc. | | | 600 | | | | 25,890 | |
Multi-Color Corp. | | | 320 | | | | 24,832 | |
Continental Building Products, Inc.* | | | 1,055 | | | | 24,371 | |
Methode Electronics, Inc. | | | 574 | | | | 23,735 | |
Mueller Industries, Inc. | | | 587 | | | | 23,457 | |
Coherent, Inc.* | | | 167 | | | | 22,943 | |
Applied Industrial Technologies, Inc. | | | 380 | | | | 22,572 | |
Advanced Drainage Systems, Inc. | | | 1,041 | | | | 21,445 | |
EnerSys | | | 272 | | | | 21,243 | |
Total Industrial | | | | | | | 1,086,759 | |
| | | | | | | | | |
Consumer, Cyclical - 2.8% | |
Tenneco, Inc.* | | | 1,042 | | | | 65,094 | |
Tailored Brands, Inc. | | | 2,509 | | | | 64,105 | |
Bloomin’ Brands, Inc. | | | 3,537 | | | | 63,772 | |
Hawaiian Holdings, Inc.* | | | 1,071 | | | | 61,047 | |
Cooper-Standard Holdings, Inc.* | | | 573 | | | | 59,237 | |
Beacon Roofing Supply, Inc.* | | | 1,284 | | | | 59,153 | |
HNI Corp. | | | 807 | | | | 45,127 | |
Big Lots, Inc. | | | 878 | | | | 44,084 | |
Penn National Gaming, Inc.* | | | 3,114 | | | | 42,942 | |
American Eagle Outfitters, Inc. | | | 2,461 | | | | 37,333 | |
H&E Equipment Services, Inc. | | | 1,518 | | | | 35,294 | |
Allegiant Travel Co. — Class A | | | 208 | | | | 34,611 | |
Chico’s FAS, Inc. | | | 2,178 | | | | 31,341 | |
Herman Miller, Inc. | | | 879 | | | | 30,062 | |
UniFirst Corp. | | | 209 | | | | 30,023 | |
Children’s Place, Inc. | | | 287 | | | | 28,973 | |
Wolverine World Wide, Inc. | | | 1,300 | | | | 28,535 | |
LCI Industries | | | 260 | | | | 28,015 | |
La Quinta Holdings, Inc.* | | | 1,859 | | | | 26,416 | |
Steelcase, Inc. — Class A | | | 1,435 | | | | 25,687 | |
KB Home | | | 1,375 | | | | 21,739 | |
Churchill Downs, Inc. | | | 140 | | | | 21,063 | |
Sportsman’s Warehouse Holdings, Inc.* | | | 2,128 | | | | 19,982 | |
American Woodmark Corp.* | | | 258 | | | | 19,415 | |
Finish Line, Inc. — Class A | | | 937 | | | | 17,625 | |
Boyd Gaming Corp.* | | | 792 | | | | 15,975 | |
Total Consumer, Cyclical | | | | | | | 956,650 | |
| | | | | | | | | |
Technology - 2.4% | |
j2 Global, Inc. | | | 988 | | | | 80,818 | |
Syntel, Inc. | | | 2,765 | | | | 54,718 | |
Take-Two Interactive Software, Inc.* | | | 1,014 | | | | 49,980 | |
Rambus, Inc.* | | | 3,610 | | | | 49,710 | |
MaxLinear, Inc. — Class A* | | | 2,189 | | | | 47,720 | |
Omnicell, Inc.* | | | 1,239 | | | | 42,002 | |
Science Applications International Corp. | | | 486 | | | | 41,212 | |
Convergys Corp. | | | 1,576 | | | | 38,707 | |
Synaptics, Inc.* | | | 658 | | | | 35,256 | |
Unisys Corp.* | | | 2,346 | | | | 35,073 | |
Aspen Technology, Inc.* | | | 597 | | | | 32,644 | |
Synchronoss Technologies, Inc.* | | | 851 | | | | 32,593 | |
Quality Systems, Inc.* | | | 2,378 | | | | 31,271 | |
Cavium, Inc.* | | | 470 | | | | 29,347 | |
Lumentum Holdings, Inc.* | | | 727 | | | | 28,099 | |
Fair Isaac Corp. | | | 235 | | | | 28,017 | |
Cirrus Logic, Inc.* | | | 433 | | | | 24,482 | |
CSG Systems International, Inc. | | | 467 | | | | 22,603 | |
Medidata Solutions, Inc.* | | | 454 | | | | 22,550 | |
Envestnet, Inc.* | | | 638 | | | | 22,490 | |
BroadSoft, Inc.* | | | 535 | | | | 22,069 | |
Blackbaud, Inc. | | | 339 | | | | 21,696 | |
Electronics for Imaging, Inc.* | | | 492 | | | | 21,579 | |
Computer Programs & Systems, Inc. | | | 849 | | | | 20,036 | |
Total Technology | | | | | | | 834,672 | |
| | | | | | | | | |
Communications - 2.1% | |
Ciena Corp.* | | | 3,179 | | | | 77,599 | |
Sinclair Broadcast Group, Inc. — Class A | | | 2,269 | | | | 75,672 | |
General Communication, Inc. — Class A* | | | 2,574 | | | | 50,064 | |
Web.com Group, Inc.* | | | 2,319 | | | | 49,047 | |
ViaSat, Inc.* | | | 630 | | | | 41,720 | |
CalAmp Corp.* | | | 2,384 | | | | 34,568 | |
Nexstar Broadcasting Group, Inc. — Class A | | | 524 | | | | 33,169 | |
InterDigital, Inc. | | | 352 | | | | 32,155 | |
NETGEAR, Inc.* | | | 546 | | | | 29,675 | |
Gray Television, Inc.* | | | 2,669 | | | | 28,959 | |
Shenandoah Telecommunications Co. | | | 1,059 | | | | 28,911 | |
Endurance International Group Holdings, Inc.* | | | 3,093 | | | | 28,765 | |
Extreme Networks, Inc.* | | | 5,715 | | | | 28,746 | |
Vonage Holdings Corp.* | | | 4,161 | | | | 28,503 | |
Stamps.com, Inc.* | | | 246 | | | | 28,204 | |
WebMD Health Corp. — Class A* | | | 560 | | | | 27,759 | |
Plantronics, Inc. | | | 411 | | | | 22,506 | |
Cogent Communications Holdings, Inc. | | | 541 | | | | 22,370 | |
Shutterstock, Inc.* | | | 449 | | | | 21,336 | |
Infinera Corp.* | | | 2,496 | | | | 21,191 | |
LogMeIn, Inc. | | | 218 | | | | 21,048 | |
Total Communications | | | | | | | 731,967 | |
| | | | | | | | | |
Financial - 0.8% | |
Blackhawk Network Holdings, Inc.* | | | 1,813 | | | | 68,304 | |
WageWorks, Inc.* | | | 755 | | | | 54,737 | |
Primerica, Inc. | | | 520 | | | | 35,958 | |
DuPont Fabros Technology, Inc. | | | 542 | | | | 23,810 | |
Banc of California, Inc. | | | 1,348 | | | | 23,388 | |
Texas Capital Bancshares, Inc.* | | | 289 | | | | 22,658 | |
Washington Prime Group, Inc. | | | 2,124 | | | | 22,111 | |
STAG Industrial, Inc. | | | 926 | | | | 22,104 | |
Total Financial | | | | | | | 273,070 | |
126 | THE GUGGENHEIM FUNDS ANNUAL REPORT | SEE NOTES TO FINANCIAL STATEMENTS. |
SCHEDULE OF INVESTMENTS (continued) | December 31, 2016 |
SERIES X (STYLEPLUS—SMALL GROWTH SERIES) | |
| | Shares | | | Value | |
| | | | | | | |
Basic Materials - 0.3% | |
U.S. Silica Holdings, Inc. | | | 1,010 | | | $ | 57,247 | |
Univar, Inc.* | | | 1,214 | | | | 34,441 | |
Aceto Corp. | | | 1,054 | | | | 23,156 | |
Total Basic Materials | | | | | | | 114,844 | |
| | | | | | | | | |
Diversified - 0.1% | |
HRG Group, Inc.* | | | 3,389 | | | | 52,733 | |
| | | | | | | | | |
Energy - 0.1% | |
Callon Petroleum Co.* | | | 1,290 | | | | 19,827 | |
TETRA Technologies, Inc.* | | | 3,548 | | | | 17,811 | |
Total Energy | | | | | | | 37,638 | |
| | | | | | | | | |
Total Common Stocks | | | | | | | | |
(Cost $6,617,394) | | | | | | | 7,086,625 | |
| | | | | | | | | |
MUTUAL FUNDS† - 76.1% | |
Guggenheim Strategy Fund III1 | | | 358,410 | | | | 8,949,495 | |
Guggenheim Variable Insurance Strategy Fund III1 | | | 338,961 | | | | 8,484,186 | |
Guggenheim Strategy Fund II1 | | | 179,186 | | | | 4,470,690 | |
Guggenheim Strategy Fund I1 | | | 164,849 | | | | 4,121,230 | |
Total Mutual Funds | | | | | | | | |
(Cost $25,950,255) | | | | | | | 26,025,601 | |
| | | | | | | | | |
SHORT-TERM INVESTMENTS† - 2.8% | |
Dreyfus Treasury Securities Cash Management Fund - Institutional Class 0.31%2 | | | 941,570 | | | | 941,570 | |
Total Short-Term Investments | | | | | | | | |
(Cost $941,570) | | | | | | | 941,570 | |
| | | | | | | | | |
Total Investments - 99.5% | | | | | | | | |
(Cost $33,509,219) | | | | | | $ | 34,053,796 | |
Other Assets & Liabilities, net - 0.5% | | | | | | | 162,390 | |
Total Net Assets - 100.0% | | | | | | $ | 34,216,186 | |
| | Contracts | | | Unrealized
Gain (Loss) | |
| | | | | | | |
EQUITY FUTURES CONTRACTS PURCHASED† | |
March 2017 S&P MidCap 400 Index
Mini Futures Contracts
(Aggregate Value of Contracts $165,880) | | | 1 | | | | (2,264 | ) |
March 2017 Russell 2000 Index
Mini Futures Contracts
(Aggregate Value of Contracts $203,610) | | | 3 | | | | (2,329 | ) |
(Total Aggregate Value of Contracts $369,490) | | | | | | $ | (4,593 | ) |
| | | | | | | | | |
| | | Units | | | | | |
| | | | | | | | | |
OTC EQUITY INDEX SWAP AGREEMENTS†† | |
Deutsche Bank Swap
April 2017 Russell 2000 Growth Index Swap 0.12%3, Terminating 04/04/17 (Notional Value $26,865,710) | | | 34,412 | | | $ | 916,187 | |
* | Non-income producing security. |
† | Value determined based on Level 1 inputs — See Note 4. |
†† | Value determined based on Level 2 inputs — See Note 4. |
1 | Affiliated issuer — See Note 8. |
2 | Rate indicated is the 7 day yield as of December 31, 2016. |
3 | Total Return based on Russell 2000 Growth Index +/- financing at a variable rate. Rate indicated is the rate effective at December 31, 2016. |
| | plc — Public Limited Company |
| | |
| | See Sector Classification in Other Information section. |
SEE NOTES TO FINANCIAL STATEMENTS. | THE GUGGENHEIM FUNDS ANNUAL REPORT | 127 |
SCHEDULE OF INVESTMENTS (concluded) | December 31, 2016 |
SERIES X (STYLEPLUS—SMALL GROWTH SERIES) | |
The following table summarizes the inputs used to value the Fund’s investments at December 31, 2016 (See Note 4 in the Notes to Financial Statements):
Investments in Securities (Assets) | | Level 1 | | | Level 1 -
Other* | | | Level 2 | | | Level 2 -
Other* | | | Level 3 | | | Total | |
Common Stocks | | $ | 7,086,625 | | | $ | — | | | $ | — | | | $ | — | | | $ | — | | | $ | 7,086,625 | |
Equity Index Swap Agreements | | | — | | | | — | | | | — | | | | 916,187 | | | | — | | | | 916,187 | |
Mutual Funds | | | 26,025,601 | | | | — | | | | — | | | | — | | | | — | | | | 26,025,601 | |
Short-Term Investments | | | 941,570 | | | | — | | | | — | | | | — | | | | — | | | | 941,570 | |
Total | | $ | 34,053,796 | | | $ | — | | | $ | — | | | $ | 916,187 | | | $ | — | | | $ | 34,969,983 | |
| | | | | | | | | | | | | | | | | | | | | | | | |
Investments in Securities (Liabilities) | | Level 1 | | | Level 1 -
Other* | | | Level 2 | | | Level 2 -
Other* | | | Level 3 | | | Total | |
Equity Futures Contracts | | $ | — | | | $ | 4,593 | | | $ | — | | | $ | — | | | $ | — | | | $ | 4,593 | |
* | Other financial instruments include futures contracts and/or swaps, which are reported as unrealized gain/loss at period end. |
Transfers between investment levels may occur as the markets fluctuate and/or the availability of data used in an investment’s valuation changes. Transfers between valuation levels, if any, are in comparison to the valuation levels at the end of the previous fiscal year, and are effective using the fair value as of the end of the previous fiscal period.
For the year ended December 31, 2016, there were no transfers between levels.
128 | THE GUGGENHEIM FUNDS ANNUAL REPORT | SEE NOTES TO FINANCIAL STATEMENTS. |
SERIES X (STYLEPLUS—SMALL GROWTH SERIES) | |
STATEMENT OF ASSETS AND LIABILITIES |
December 31, 2016 |
Assets: | |
Investments in unaffiliated issuers, at value (cost $7,558,964) | | $ | 8,028,195 | |
Investments in affiliated issuers, at value (cost $25,950,255) | | | 26,025,601 | |
Total investments (cost $33,509,219) | | | 34,053,796 | |
Unrealized appreciation on swap agreements | | | 916,187 | |
Cash | | | 311,888 | |
Segregated cash with broker | | | 51,400 | |
Prepaid expenses | | | 4,618 | |
Receivables: | |
Dividends | | | 57,187 | |
Total assets | | | 35,395,076 | |
| | | | | |
Liabilities: | |
Segregated cash due to broker | | | 980,000 | |
Payable for: | |
Securities purchased | | | 72,361 | |
Fund shares redeemed | | | 63,507 | |
Management fees | | | 24,848 | |
Trustees’ fees* | | | 4,521 | |
Fund accounting/administration fees | | | 2,339 | |
Transfer agent/maintenance fees | | | 2,047 | |
Variation margin | | | 1,500 | |
Miscellaneous | | | 27,767 | |
Total liabilities | | | 1,178,890 | |
Commitments and contingent liabilities (Note 14) | | | — | |
Net assets | | $ | 34,216,186 | |
| | | | | |
Net assets consist of: | |
Paid in capital | | $ | 33,980,703 | |
Undistributed net investment income | | | 268,704 | |
Accumulated net realized loss on investments | | | (1,489,392 | ) |
Net unrealized appreciation on investments | | | 1,456,171 | |
Net assets | | $ | 34,216,186 | |
Capital shares outstanding | | | 1,034,250 | |
Net asset value per share | | $ | 33.08 | |
STATEMENT OF OPERATIONS |
Year Ended December 31, 2016 |
Investment Income: | |
Dividends from securities of affiliated issuers | | $ | 597,605 | |
Dividends from securities of unaffiliated issuers (net of foreign withholding tax of $29) | | | 66,072 | |
Interest | | | 1,823 | |
Total investment income | | | 665,500 | |
| | | | | |
Expenses: | |
Management fees | | | 274,132 | |
Transfer agent/maintenance fees | | | 23,272 | |
Fund accounting/administration fees | | | 29,429 | |
Professional fees | | | 20,533 | |
Custodian fees | | | 15,923 | |
Trustees’ fees* | | | 10,785 | |
Line of credit fees | | | 5,680 | |
Interest expense | | | 2,903 | |
Miscellaneous | | | 14,547 | |
Total expenses | | | 397,204 | |
Net investment income | | | 268,296 | |
| | | | | |
Net Realized and Unrealized Gain (Loss): | |
Net realized gain (loss) on: | |
Investments in unaffiliated issuers | | | (56,050 | ) |
Investments in affiliated issuers | | | (13,815 | ) |
Swap agreements | | | 127,254 | |
Futures contracts | | | 75,998 | |
Net realized gain | | | 133,387 | |
Net change in unrealized appreciation (depreciation) on: | |
Investments in unaffiliated issuers | | | 868,864 | |
Investments in affiliated issuers | | | 186,395 | |
Swap agreements | | | 2,416,122 | |
Futures contracts | | | (27,399 | ) |
Net change in unrealized appreciation (depreciation) | | | 3,443,982 | |
Net realized and unrealized gain | | | 3,577,369 | |
Net increase in net assets resulting from operations | | $ | 3,845,665 | |
* | Relates to Trustees not deemed “interested persons” within the meaning of Section 2(a)(19) of the 1940 Act. |
SEE NOTES TO FINANCIAL STATEMENTS. | THE GUGGENHEIM FUNDS ANNUAL REPORT | 129 |
SERIES X (STYLEPLUS—SMALL GROWTH SERIES) | |
STATEMENTS OF CHANGES IN NET ASSETS |
| | Year Ended
December 31,
2016 | | | Year Ended
December 31,
2015 | |
Increase (Decrease) in Net Assets from Operations: | | | | | | |
Net investment income | | $ | 268,296 | | | $ | 121,740 | |
Net realized gain on investments | | | 133,387 | | | | 3,256,356 | |
Net change in unrealized appreciation (depreciation) on investments | | | 3,443,982 | | | | (3,843,105 | ) |
Net increase (decrease) in net assets resulting from operations | | | 3,845,665 | | | | (465,009 | ) |
| | | | | | | | | |
Distributions to shareholders from: | | | | | | | | |
Net investment income | | | (126,568 | ) | | | (304,934 | ) |
Net realized gains | | | (1,846,910 | ) | | | (109,624 | ) |
Total distributions to shareholders | | | (1,973,478 | ) | | | (414,558 | ) |
| | | | | | | | | |
Capital share transactions: | | | | | | | | |
Proceeds from sale of shares | | | 2,515,724 | | | | 9,712,517 | |
Distributions reinvested | | | 1,973,478 | | | | 414,558 | |
Cost of shares redeemed | | | (10,746,152 | ) | | | (7,651,877 | ) |
Net increase (decrease) from capital share transactions | | | (6,256,950 | ) | | | 2,475,198 | |
Net increase (decrease) in net assets | | | (4,384,763 | ) | | | 1,595,631 | |
| | | | | | | | | |
Net assets: | | | | | | | | |
Beginning of year | | | 38,600,949 | | | | 37,005,318 | |
End of year | | $ | 34,216,186 | | | $ | 38,600,949 | |
Undistributed net investment income at end of year | | $ | 268,704 | | | $ | 126,976 | |
| | | | | | | | | |
Capital share activity: | | | | | | | | |
Shares sold | | | 82,490 | | | | 301,844 | |
Shares issued from reinvestment of distributions | | | 65,477 | | | | 11,855 | |
Shares redeemed | | | (357,673 | ) | | | (234,673 | ) |
Net increase (decrease) in shares | | | (209,706 | ) | | | 79,026 | |
130 | THE GUGGENHEIM FUNDS ANNUAL REPORT | SEE NOTES TO FINANCIAL STATEMENTS. |
SERIES X (STYLEPLUS—SMALL GROWTH SERIES) | |
This table is presented to show selected data for a share outstanding throughout each period and to assist shareholders in evaluating a Fund’s performance for the periods presented.
| | Year Ended
December 31,
2016 | | | Year Ended
December 31,
2015 | | | Year Ended
December 31,
2014 | | | Year Ended
December 31,
2013 | | | Year Ended
December 31,
2012 | |
Per Share Data | | | | | | | | | | | | | | | |
Net asset value, beginning of period | | $ | 31.03 | | | $ | 31.77 | | | $ | 29.20 | | | $ | 20.66 | | | $ | 18.52 | |
Income (loss) from investment operations: | |
Net investment income (loss)a | | | .25 | | | | .10 | | | | .22 | | | | (.05 | ) | | | (.11 | ) |
Net gain (loss) on investments (realized and unrealized) | | | 3.74 | | | | (.47 | ) | | | 2.35 | | | | 8.59 | | | | 2.25 | |
Total from investment operations | | | 3.99 | | | | (.37 | ) | | | 2.57 | | | | 8.54 | | | | 2.14 | |
Less distributions from: | |
Net investment income | | | (.13 | ) | | | (.27 | ) | | | — | | | | — | | | | — | |
Net realized gains | | | (1.81 | ) | | | (.10 | ) | | | — | | | | — | | | | — | |
Total distributions | | | (1.94 | ) | | | (.37 | ) | | | — | | | | — | | | | — | |
Net asset value, end of period | | $ | 33.08 | | | $ | 31.03 | | | $ | 31.77 | | | $ | 29.20 | | | $ | 20.66 | |
| |
Total Returnb | | | 13.45 | % | | | (1.29 | %) | | | 8.80 | % | | | 41.34 | % | | | 11.56 | % |
Ratios/Supplemental Data | |
Net assets, end of period (in thousands) | | $ | 34,216 | | | $ | 38,601 | | | $ | 37,005 | | | $ | 38,586 | | | $ | 32,037 | |
Ratios to average net assets: | |
Net investment income (loss) | | | 0.83 | % | | | 0.32 | % | | | 0.74 | % | | | (0.21 | %) | | | (0.56 | %) |
Total expensesc | | | 1.23 | % | | | 1.21 | % | | | 1.26 | % | | | 1.23 | % | | | 1.14 | % |
Net expenses | | | 1.23 | % | | | 1.21 | % | | | 1.24 | %d | | | 1.23 | % | | | 1.14 | % |
Portfolio turnover rate | | | 76 | % | | | 79 | % | | | 102 | % | | | 255 | % | | | 72 | % |
a | Net investment income (loss) per share was computed using average shares outstanding throughout the period. |
b | Total return does not take into account any of the expenses associated with an investment in variable insurance products. If total return had taken into account these expenses, performance would have been lower. Shares of a series of Guggenheim Variable Funds Trust are available only through the purchase of such products. |
c | Does not include expenses of the underlying funds in which the Fund invests. |
d | Net expense information reflects the expense ratios after expense waivers. |
SEE NOTES TO FINANCIAL STATEMENTS. | THE GUGGENHEIM FUNDS ANNUAL REPORT | 131 |
MANAGER’S COMMENTARY (Unaudited) | December 31, 2016 |
To Our Shareholders:
The Series Y (StylePlusTM—Large Growth Series) is managed by a team of seasoned professionals, including B. Scott Minerd, Chairman of Investments and Global Chief Investment Officer; Farhan Sharaff, Senior Managing Director and Assistant Chief Investment Officer, Equities; Jayson Flowers, Senior Managing Director and Portfolio Manager; Scott Hammond, Managing Director and Portfolio Manager; and Qi Yan, Managing Director and Portfolio Manager. In the following paragraphs, the investment team discusses performance for the fiscal year ended December 31, 2016.
For the year ended December 31, 2016, the Series Y (StylePlus—Large Growth Series) returned 8.72%, compared with the 7.08% return of its benchmark, the Russell 1000 Growth Index.
Through a combination of an allocation to actively managed individual equity, passive equity, and actively managed fixed income, the Fund seeks to exceed the total return of the S&P 500 Index. The actively managed equity and fixed income components seek to provide multiple sources of outperformance and take advantage of Guggenheim’s competencies in both fixed income and systematic stock selection.
The allocation to actively managed individual equity via stocks, and passive equity via derivatives, is designed to provide exposure to large core equity. Remaining Fund assets are invested in the Guggenheim Strategy Funds, short-term fixed-income investment companies advised by Guggenheim Investments. The Strategy Funds invest in a diversified portfolio of debt securities and financial instruments providing exposure to fixed income markets. The investment objective of the Guggenheim Strategy Funds is to seek a high level of income consistent with the preservation of capital.
The passive equity position uses derivatives such as swap agreements to gain exposure to the index. The Fund’s fixed income component invests in a variety of fixed income sectors, including asset-backed securities (ABS), mortgage-backed securities, corporate bonds, and bank loans.
The active and passive decisions seek to add value by tactically allocating to actively managed equity through quantitative selection models when stock picking opportunities are high. During periods when Guggenheim views these opportunities to be less attractive, the Fund seeks to increase its passive exposure to equities and the allocation to fixed-income securities. The prospective return during such periods is the equity index plus an “alpha” component coming from the yield of the fixed-income overlay.
Performance Review
The Fund outperformed the Russell 1000 Growth Index for the one-year period ended December 31, 2016. The fixed income sleeve was the largest positive contributor. The investments in the Guggenheim Strategy Funds benefited Fund performance relative to investing in other short-term investments. The actively managed equity sleeve contributed slightly to performance. The passive equity position, maintained through swap agreements and futures contracts, also contributed to performance for the period.
For the Fund’s total equity position over the period, 15-20% was allocated to actively managed equity and 80-85% to passive equity.
When compared with the index, the total equity position (actively managed individual equity plus passive equity derivatives) was most overweight the Health Care and Information Technology sectors and most underweight the Consumer Discretionary and Real Estate sectors.
Uncorrelated with the Fund’s active equity component, the fixed-income component was largely invested in ABS, investment-grade corporates, and NA RMBS. These positions constituted the majority of the fixed income sleeve’s total return.
Performance displayed represents past performance which is no guarantee of future results.
The opinions and forecast expressed may not actually come to pass. This information is subject to change at any time, based on market and other conditions, and should not be construed as a recommendation of any specific security or strategy.
132 | THE GUGGENHEIM FUNDS ANNUAL REPORT | |
PERFORMANCE REPORT AND FUND PROFILE (Unaudited) | December 31, 2016 |
SERIES Y (STYLEPLUS—LARGE GROWTH SERIES)
OBJECTIVE: Seeks long-term growth of capital.
Holdings Diversification (Market Exposure as % of Net Assets)
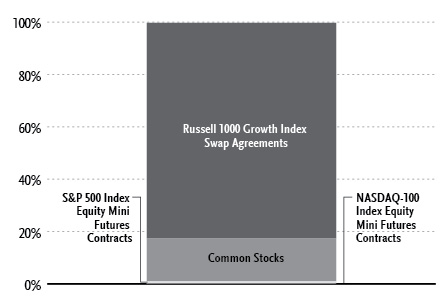
“Holdings Diversification (Market Exposure as % of Net Assets)” excludes any temporary cash investments or investments in Guggenheim Strategy Funds Trust mutual funds. Investments in those Funds will significantly increase the portfolio’s exposure to certain other asset categories (and their associated risks), which may cause the Fund to deviate from its principal investment strategy, including: (i) high yield, high risk debt securities rated below the top four long-term rating categories by a nationally recognized statistical rating organization (also known as “junk bonds”); (ii) securities issued by the U.S. government or its agencies and instrumentalities; (iii) CLOs and similar investments; and (iv) other short-term fixed income securities.
Inception Date: May 3, 1999 |
Ten Largest Holdings (% of Total Net Assets) |
Guggenheim Strategy Fund III | 26.4% |
Guggenheim Strategy Fund II | 24.6% |
Guggenheim Variable Insurance Strategy Fund III | 22.0% |
Guggenheim Strategy Fund I | 5.5% |
Apple, Inc. | 1.1% |
Microsoft Corp. | 0.9% |
Alphabet, Inc. — Class C | 0.6% |
Comcast Corp. — Class A | 0.4% |
UnitedHealth Group, Inc. | 0.4% |
Visa, Inc. — Class A | 0.4% |
Top Ten Total | 82.3% |
“Ten Largest Holdings” excludes any temporary cash or derivative investments. |
| | THE GUGGENHEIM FUNDS ANNUAL REPORT | 133 |
PERFORMANCE REPORT AND FUND PROFILE (Unaudited)(concluded) | December 31, 2016 |
Cumulative Fund Performance*,†
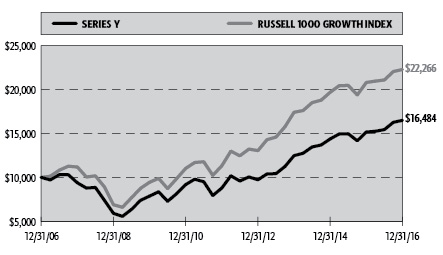
Average Annual Returns*
Periods Ended December 31, 2016†
| 1 Year | 5 Year | 10 Year |
Series Y (StylePlus—Large Growth Series) | 8.72% | 13.42% | 5.13% |
Russell 1000 Growth Index | 7.08% | 14.50% | 8.33% |
* | The performance data above represents past performance that is not predictive of future results. Effective April 30, 2013, certain changes were made to the Series’ investment objective and principal investment strategies. The investment return and principal value of an investment in the Fund will fluctuate so that an investor’s shares, when redeemed, may be worth more or less than their original cost. Returns are historical and include changes in principal and reinvested dividends and capital gains and do not reflect the effect of taxes. The Russell 1000 Growth Index is an unmanaged index and, unlike the Fund, has no management fees or operating expenses to reduce its reported return. |
† | Performance figures do not reflect fees and expenses associated with an investment in variable insurance products. If returns had taken into account these fees and expenses, performance would have been lower. Shares of a series of Guggenheim Variable Funds Trust are available only through the purchase of such products. |
134 | THE GUGGENHEIM FUNDS ANNUAL REPORT | |
SCHEDULE OF INVESTMENTS | December 31, 2016 |
SERIES Y (STYLEPLUS—LARGE GROWTH SERIES) | |
| | Shares | | | Value | |
| | | | | | | |
COMMON STOCKS† - 16.5% | |
| | | | | | | |
Consumer, Non-cyclical - 5.6% | |
UnitedHealth Group, Inc. | | | 992 | | | $ | 158,760 | |
PepsiCo, Inc. | | | 1,367 | | | | 143,029 | |
Amgen, Inc. | | | 882 | | | | 128,957 | |
AbbVie, Inc. | | | 1,971 | | | | 123,424 | |
Gilead Sciences, Inc. | | | 1,680 | | | | 120,305 | |
Allergan plc | | | 472 | | | | 99,125 | |
Biogen, Inc.* | | | 347 | | | | 98,402 | |
Johnson & Johnson | | | 850 | | | | 97,929 | |
Stryker Corp. | | | 763 | | | | 91,415 | |
General Mills, Inc. | | | 1,392 | | | | 85,984 | |
Kroger Co. | | | 2,481 | | | | 85,619 | |
Becton Dickinson and Co. | | | 509 | | | | 84,265 | |
Boston Scientific Corp.* | | | 3,820 | | | | 82,627 | |
Kimberly-Clark Corp. | | | 721 | | | | 82,281 | |
Sysco Corp. | | | 1,482 | | | | 82,058 | |
McKesson Corp. | | | 568 | | | | 79,776 | |
Express Scripts Holding Co.* | | | 1,157 | | | | 79,590 | |
Alexion Pharmaceuticals, Inc.* | | | 637 | | | | 77,937 | |
Cardinal Health, Inc. | | | 1,065 | | | | 76,648 | |
HCA Holdings, Inc.* | | | 1,011 | | | | 74,834 | |
Pfizer, Inc. | | | 2,230 | | | | 72,430 | |
Danaher Corp. | | | 911 | | | | 70,912 | |
Conagra Brands, Inc. | | | 502 | | | | 19,854 | |
Altria Group, Inc. | | | 280 | | | | 18,934 | |
Coca-Cola Co. | | | 444 | | | | 18,408 | |
Thermo Fisher Scientific, Inc. | | | 127 | | | | 17,920 | |
Total Consumer, Non-cyclical | | | | | | | 2,171,423 | |
| | | | | | | | | |
Technology - 4.1% | |
Apple, Inc. | | | 3,619 | | | | 419,154 | |
Microsoft Corp. | | | 5,607 | | | | 348,419 | |
International Business Machines Corp. | | | 759 | | | | 125,986 | |
Texas Instruments, Inc. | | | 1,486 | | | | 108,433 | |
Cognizant Technology Solutions Corp. — Class A* | | | 1,499 | | | | 83,989 | |
Applied Materials, Inc. | | | 2,444 | | | | 78,868 | |
Activision Blizzard, Inc. | | | 2,047 | | | | 73,917 | |
Intel Corp. | | | 2,030 | | | | 73,628 | |
Fidelity National Information Services, Inc. | | | 947 | | | | 71,631 | |
Oracle Corp. | | | 1,723 | | | | 66,249 | |
VMware, Inc. — Class A* | | | 797 | | | | 62,748 | |
Broadcom Ltd. | | | 130 | | | | 22,980 | |
athenahealth, Inc.* | | | 201 | | | | 21,139 | |
Skyworks Solutions, Inc. | | | 248 | | | | 18,516 | |
QUALCOMM, Inc. | | | 222 | | | | 14,474 | |
Total Technology | | | | | | | 1,590,131 | |
| | | | | | | | | |
Communications - 2.8% | |
Alphabet, Inc. — Class C* | | | 291 | | | | 224,600 | |
Comcast Corp. — Class A | | | 2,304 | | | | 159,090 | |
Verizon Communications, Inc. | | | 2,475 | | | | 132,116 | |
Amazon.com, Inc.* | | | 149 | | | | 111,730 | |
Facebook, Inc. — Class A* | | | 803 | | | | 92,385 | |
eBay, Inc.* | | | 2,801 | | | | 83,162 | |
Twenty-First Century Fox, Inc. — Class A | | | 2,814 | | | | 78,905 | |
T-Mobile US, Inc.* | | | 1,229 | | | | 70,680 | |
DISH Network Corp. — Class A* | | | 853 | | | | 49,414 | |
Walt Disney Co. | | | 470 | | | | 48,983 | |
Charter Communications, Inc. — Class A* | | | 81 | | | | 23,322 | |
Total Communications | | | | | | | 1,074,387 | |
| | | | | | | | | |
Industrial - 1.5% | |
Boeing Co. | | | 787 | | | | 122,520 | |
United Parcel Service, Inc. — Class B | | | 961 | | | | 110,170 | |
FedEx Corp. | | | 477 | | | | 88,817 | |
Waste Management, Inc. | | | 1,128 | | | | 79,986 | |
Emerson Electric Co. | | | 1,177 | | | | 65,618 | |
Honeywell International, Inc. | | | 493 | | | | 57,114 | |
Union Pacific Corp. | | | 508 | | | | 52,669 | |
Total Industrial | | | | | | | 576,894 | |
| | | | | | | | | |
Consumer, Cyclical - 1.5% | |
CVS Health Corp. | | | 1,388 | | | | 109,527 | |
Lowe’s Companies, Inc. | | | 1,403 | | | | 99,781 | |
Delta Air Lines, Inc. | | | 1,628 | | | | 80,081 | |
Southwest Airlines Co. | | | 1,457 | | | | 72,617 | |
Walgreens Boots Alliance, Inc. | | | 851 | | | | 70,429 | |
Target Corp. | | | 860 | | | | 62,118 | |
Home Depot, Inc. | | | 272 | | | | 36,470 | |
Delphi Automotive plc | | | 287 | | | | 19,329 | |
McDonald’s Corp. | | | 158 | | | | 19,232 | |
Total Consumer, Cyclical | | | | | | | 569,584 | |
| | | | | | | | | |
Financial - 0.6% | |
Visa, Inc. — Class A | | | 1,952 | | | | 152,295 | |
Discover Financial Services | | | 1,003 | | | | 72,306 | |
Total Financial | | | | | | | 224,601 | |
| | | | | | | | | |
Basic Materials - 0.3% | |
LyondellBasell Industries N.V. — Class A | | | 599 | | | | 51,383 | |
Air Products & Chemicals, Inc. | | | 192 | | | | 27,613 | |
Praxair, Inc. | | | 158 | | | | 18,516 | |
Total Basic Materials | | | | | | | 97,512 | |
| | | | | | | | | |
Energy - 0.1% | |
EOG Resources, Inc. | | | 154 | | | | 15,569 | |
Williams Companies, Inc. | | | 401 | | | | 12,487 | |
Apache Corp. | | | 189 | | | | 11,996 | |
Total Energy | | | | | | | 40,052 | |
| | | | | | | | | |
Total Common Stocks | | | | | | | | |
(Cost $5,986,101) | | | | | | | 6,344,584 | |
| | | | | | | | | |
MUTUAL FUNDS† - 78.4% | |
Guggenheim Strategy Fund III1 | | | 407,982 | | | | 10,187,301 | |
Guggenheim Strategy Fund II1 | | | 380,582 | | | | 9,495,528 | |
Guggenheim Variable Insurance Strategy Fund III1 | | | 338,511 | | | | 8,472,940 | |
Guggenheim Strategy Fund I1 | | | 83,925 | | | | 2,098,122 | |
Total Mutual Funds | | | | | | | | |
(Cost $30,152,617) | | | | | | | 30,253,891 | |
SEE NOTES TO FINANCIAL STATEMENTS. | THE GUGGENHEIM FUNDS ANNUAL REPORT | 135 |
SCHEDULE OF INVESTMENTS (concluded) | December 31, 2016 |
SERIES Y (STYLEPLUS—LARGE GROWTH SERIES) | |
| | Shares | | | Value | |
| | | | | | | |
SHORT-TERM INVESTMENTS† - 5.8% | |
Dreyfus Treasury Securities Cash Management Fund - Institutional Class 0.31%2 | | | 2,243,377 | | | $ | 2,243,377 | |
Total Short-Term Investments | | | | | | | | |
(Cost $2,243,377) | | | | | | | 2,243,377 | |
| | | | | | | | | |
Total Investments - 100.7% | | | | | | | | |
(Cost $38,382,095) | | | | | | $ | 38,841,852 | |
Other Assets & Liabilities, net - (0.7)% | | | | | | | (276,685 | ) |
Total Net Assets - 100.0% | | | | | | $ | 38,565,167 | |
| | Contracts | | | Unrealized
Gain (Loss) | |
| | | | | | | |
EQUITY FUTURES CONTRACTS PURCHASED† | |
March 2017 NASDAQ-100 Index
Mini Futures Contracts
(Aggregate Value of Contracts $97,300) | | | 1 | | | | (40 | ) |
March 2017 S&P 500 Index
Mini Futures Contracts
(Aggregate Value of Contracts $223,600) | | | 2 | | | | (1,462 | ) |
(Total Aggregate Value of Contracts $320,900) | | | | | | $ | (1,502 | ) |
| | | | | | | | | |
| | | Units | | | | | |
| | | | | | | | | |
OTC EQUITY INDEX SWAP AGREEMENTS†† | |
Bank of America
April 2017 Russell 1000 Growth Index Swap 0.90%3,
Terminating 04/04/17
(Notional Value $31,786,627) | | | 30,171 | | | $ | 246,742 | |
* | Non-income producing security. |
† | Value determined based on Level 1 inputs — See Note 4. |
†† | Value determined based on Level 2 inputs — See Note 4. |
1 | Affiliated issuer — See Note 8. |
2 | Rate indicated is the 7 day yield as of December 31, 2016. |
3 | Total Return based on Russell 1000 Growth Index +/- financing at a variable rate. Rate indicated is the rate effective at December 31, 2016. |
| | plc — Public Limited Company |
| | |
| | See Sector Classification in Other Information section. |
The following table summarizes the inputs used to value the Fund’s investments at December 31, 2016 (See Note 4 in the Notes to Financial Statements):
Investments in Securities (Assets) | | Level 1 | | | Level 1 -
Other* | | | Level 2 | | | Level 2 -
Other* | | | Level 3 | | | Total | |
Common Stocks | | $ | 6,344,584 | | | $ | — | | | $ | — | | | $ | — | | | $ | — | | | $ | 6,344,584 | |
Equity Index Swap Agreements | | | — | | | | — | | | | — | | | | 246,742 | | | | — | | | | 246,742 | |
Mutual Funds | | | 30,253,891 | | | | — | | | | — | | | | — | | | | — | | | | 30,253,891 | |
Short-Term Investments | | | 2,243,377 | | | | — | | | | — | | | | — | | | | — | | | | 2,243,377 | |
Total | | $ | 38,841,852 | | | $ | — | | | $ | — | | | $ | 246,742 | | | $ | — | | | $ | 39,088,594 | |
| | | | | | | | | | | | | | | | | | | | | | | | |
Investments in Securities (Liabilities) | | Level 1 | | | Level 1 -
Other* | | | Level 2 | | | Level 2 -
Other* | | | Level 3 | | | Total | |
Equity Futures Contracts | | $ | — | | | $ | 1,502 | | | $ | — | | | $ | — | | | $ | — | | | $ | 1,502 | |
* | Other financial instruments include futures contracts and/or swaps, which are reported as unrealized gain/loss at period end. |
Transfers between investment levels may occur as the markets fluctuate and/or the availability of data used in an investment’s valuation changes. Transfers between valuation levels, if any, are in comparison to the valuation levels at the end of the previous fiscal year, and are effective using the fair value as of the end of the previous fiscal period.
For the year ended December 31, 2016, there were no transfers between levels.
136 | THE GUGGENHEIM FUNDS ANNUAL REPORT | SEE NOTES TO FINANCIAL STATEMENTS. |
SERIES Y (STYLEPLUS—LARGE GROWTH SERIES) | |
STATEMENT OF ASSETS AND LIABILITIES |
December 31, 2016 |
Assets: | |
Investments in unaffiliated issuers, at value (cost $8,229,478) | | $ | 8,587,961 | |
Investments in affiliated issuers, at value (cost $30,152,617) | | | 30,253,891 | |
Total investments (cost $38,382,095) | | | 38,841,852 | |
Unrealized appreciation on swap agreements | | | 246,742 | |
Segregated cash with broker | | | 217,600 | |
Prepaid expenses | | | 5,550 | |
Cash | | | 125 | |
Receivables: | |
Fund shares sold | | | 6,827 | |
Dividends | | | 68,037 | |
Total assets | | | 39,386,733 | |
| | | | | |
Liabilities: | |
Segregated cash due to broker | | | 595,000 | |
Payable for: | |
Fund shares redeemed | | | 89,005 | |
Securities purchased | | | 67,083 | |
Management fees | | | 24,646 | |
Trustees’ fees* | | | 5,745 | |
Fund accounting/administration fees | | | 2,629 | |
Transfer agent/maintenance fees | | | 2,032 | |
Variation margin | | | 1,980 | |
Miscellaneous | | | 33,446 | |
Total liabilities | | | 821,566 | |
Commitments and contingent liabilities (Note 14) | | | — | |
Net assets | | $ | 38,565,167 | |
| | | | | |
Net assets consist of: | |
Paid in capital | | $ | 39,060,682 | |
Undistributed net investment income | | | 436,940 | |
Accumulated net realized loss on investments | | | (1,637,451 | ) |
Net unrealized appreciation on investments | | | 704,996 | |
Net assets | | $ | 38,565,167 | |
Capital shares outstanding | | | 2,448,553 | |
Net asset value per share | | $ | 15.75 | |
STATEMENT OF OPERATIONS |
Year Ended December 31, 2016 |
Investment Income: | |
Dividends from securities of affiliated issuers | | $ | 714,344 | |
Dividends from securities of unaffiliated issuers | | | 116,204 | |
Interest | | | 1,974 | |
Total investment income | | | 832,522 | |
| | | | | |
Expenses: | |
Management fees | | | 286,334 | |
Transfer agent/maintenance fees | | | 23,081 | |
Fund accounting/administration fees | | | 34,880 | |
Trustees’ fees* | | | 10,979 | |
Line of credit fees | | | 5,607 | |
Custodian fees | | | 716 | |
Miscellaneous | | | 33,985 | |
Total expenses | | | 395,582 | |
Net investment income | | | 436,940 | |
| | | | | |
Net Realized and Unrealized Gain (Loss): | |
Net realized gain (loss) on: | |
Investments in unaffiliated issuers | | | 314,549 | |
Investments in affiliated issuers | | | (3,602 | ) |
Swap agreements | | | 1,159,721 | |
Futures contracts | | | (4,413 | ) |
Net realized gain | | | 1,466,255 | |
Net change in unrealized appreciation (depreciation) on: | |
Investments in unaffiliated issuers | | | 179,448 | |
Investments in affiliated issuers | | | 212,199 | |
Swap agreements | | | 799,917 | |
Futures contracts | | | (16,114 | ) |
Net change in unrealized appreciation (depreciation) | | | 1,175,450 | |
Net realized and unrealized gain | | | 2,641,705 | |
Net increase in net assets resulting from operations | | $ | 3,078,645 | |
* | Relates to Trustees not deemed “interested persons” within the meaning of Section 2(a)(19) of the 1940 Act. |
SEE NOTES TO FINANCIAL STATEMENTS. | THE GUGGENHEIM FUNDS ANNUAL REPORT | 137 |
SERIES Y (STYLEPLUS—LARGE GROWTH SERIES) | |
STATEMENTS OF CHANGES IN NET ASSETS |
| | Year Ended
December 31,
2016 | | | Year Ended
December 31,
2015 | |
Increase (Decrease) in Net Assets from Operations: | | | | | | |
Net investment income | | $ | 436,940 | | | $ | 198,923 | |
Net realized gain on investments | | | 1,466,255 | | | | 2,975,808 | |
Net change in unrealized appreciation (depreciation) on investments | | | 1,175,450 | | | | (1,215,217 | ) |
Net increase in net assets resulting from operations | | | 3,078,645 | | | | 1,959,514 | |
| | | | | | | | | |
Distributions to shareholders from: | | | | | | | | |
Net investment income | | | (201,372 | ) | | | (392,674 | ) |
Net realized gains | | | (1,396,565 | ) | | | (2,676,505 | ) |
Total distributions to shareholders | | | (1,597,937 | ) | | | (3,069,179 | ) |
| | | | | | | | | |
Capital share transactions: | | | | | | | | |
Proceeds from sale of shares | | | 4,941,960 | | | | 9,360,101 | |
Distributions reinvested | | | 1,597,937 | | | | 3,069,179 | |
Cost of shares redeemed | | | (9,633,921 | ) | | | (8,083,305 | ) |
Net increase (decrease) from capital share transactions | | | (3,094,024 | ) | | | 4,345,975 | |
Net increase (decrease) in net assets | | | (1,613,316 | ) | | | 3,236,310 | |
| | | | | | | | | |
Net assets: | | | | | | | | |
Beginning of year | | | 40,178,483 | | | | 36,942,173 | |
End of year | | $ | 38,565,167 | | | $ | 40,178,483 | |
Undistributed net investment income at end of year | | $ | 436,940 | | | $ | 201,372 | |
| | | | | | | | | |
Capital share activity: | | | | | | | | |
Shares sold | | | 324,196 | | | | 604,897 | |
Shares issued from reinvestment of distributions | | | 104,372 | | | | 200,338 | |
Shares redeemed | | | (638,856 | ) | | | (517,974 | ) |
Net increase (decrease) in shares | | | (210,288 | ) | | | 287,261 | |
138 | THE GUGGENHEIM FUNDS ANNUAL REPORT | SEE NOTES TO FINANCIAL STATEMENTS. |
SERIES Y (STYLEPLUS—LARGE GROWTH SERIES) | |
This table is presented to show selected data for a share outstanding throughout each period and to assist shareholders in evaluating a Fund’s performance for the periods presented.
| | Year Ended
December 31,
2016 | | | Year Ended
December 31,
2015 | | | Year Ended
December 31,
2014 | | | Year Ended
December 31,
2013 | | | Year Ended
December 31,
2012 | |
Per Share Data | | | | | | | | | | | | | | | |
Net asset value, beginning of period | | $ | 15.11 | | | $ | 15.58 | | | $ | 13.52 | | | $ | 10.54 | | | $ | 9.52 | |
Income (loss) from investment operations: | |
Net investment income (loss)a | | | .17 | | | | .08 | | | | .15 | | | | .04 | | | | .07 | |
Net gain (loss) on investments (realized and unrealized) | | | 1.13 | | | | .79 | | | | 1.91 | | | | 2.94 | | | | .95 | |
Total from investment operations | | | 1.30 | | | | .87 | | | | 2.06 | | | | 2.98 | | | | 1.02 | |
Less distributions from: | |
Net investment income | | | (.08 | ) | | | (.17 | ) | | | — | | | | — | | | | — | |
Net realized gains | | | (.58 | ) | | | (1.17 | ) | | | — | | | | — | | | | — | |
Total distributions | | | (.66 | ) | | | (1.34 | ) | | | — | | | | — | | | | — | |
Net asset value, end of period | | $ | 15.75 | | | $ | 15.11 | | | $ | 15.58 | | | $ | 13.52 | | | $ | 10.54 | |
| |
Total Returnb | | | 8.72 | % | | | 5.49 | % | | | 15.24 | % | | | 28.27 | % | | | 10.71 | % |
Ratios/Supplemental Data | |
Net assets, end of period (in thousands) | | $ | 38,565 | | | $ | 40,178 | | | $ | 36,942 | | | $ | 40,417 | | | $ | 36,244 | |
Ratios to average net assets: | |
Net investment income (loss) | | | 1.14 | % | | | 0.52 | % | | | 1.05 | % | | | 0.33 | % | | | 0.63 | % |
Total expensesc | | | 1.04 | % | | | 1.15 | % | | | 1.18 | % | | | 1.10 | % | | | 1.01 | % |
Net expenses | | | 1.04 | % | | | 1.15 | % | | | 1.16 | %d | | | 1.10 | % | | | 1.01 | % |
Portfolio turnover rate | | | 42 | % | | | 65 | % | | | 96 | % | | | 247 | % | | | 187 | % |
a | Net investment income (loss) per share was computed using average shares outstanding throughout the period. |
b | Total return does not take into account any of the expenses associated with an investment in variable insurance products. If total return had taken into account these expenses, performance would have been lower. Shares of a series of Guggenheim Variable Funds Trust are available only through the purchase of such products. |
c | Does not include expenses of the underlying funds in which the Fund invests. |
d | Net Expense information reflects ratios after expense waivers. |
SEE NOTES TO FINANCIAL STATEMENTS. | THE GUGGENHEIM FUNDS ANNUAL REPORT | 139 |
MANAGER’S COMMENTARY (Unaudited) | December 31, 2016 |
To Our Shareholders:
The Series Z (Alpha Opportunity Series) is managed by a team of seasoned professionals, including Farhan Sharaff, Senior Managing Director and Assistant Chief Investment Officer, Equities, and Portfolio Manager; Jayson Flowers, Senior Managing Director and Head of Equity and Derivative Strategies, and Portfolio Manager; Samir Sanghani, CFA, Managing Director and Portfolio Manager; and Burak Hurmeydan, Ph.D., Vice President and Portfolio Manager. In the paragraphs below, the team discusses the performance of the Fund for the fiscal year ended December 31, 2016.
For the one year period ended December 31, 2016, the Series Z (Alpha Opportunity Series) returned 12.79%, compared with the 11.96% return of its benchmark, the S&P 500 Index. The Fund’s secondary benchmark is the Morningstar Long/Short Equity Category Average. Its return for the 12 months was 0.98%.
Investment Approach
The Fund is managed as an opportunistic long/short strategy, which employs forward-looking, fundamental analysis to measure the market’s expected return for each stock in the universe. Quantitative techniques are then applied to evaluate market- and company-specific risk factors embedded in each stock and to assess which specific risk factors (such as size, growth, or sectors) are being overvalued or undervalued by the market. Finally, a portfolio is constructed within guidelines that is long the stocks that give the portfolio both the broad risk characteristics and company-specific risks that are perceived to be undervalued and is short stocks for which those characteristics are perceived to be overpriced.
The Fund will ordinarily hold simultaneous long and short positions in equity securities or securities markets that provide exposure up to a level equal to 150% of the Fund’s net assets for both the long and short positions. The Fund intends to maintain a low overall net exposure (the difference between the notional value of long positions and the notional value of short positions), typically varying between 50% net long and 30% net short in order to maintain low correlation to traditional equity markets and lower-than-market volatility, and seek to provide consistent absolute return. The overall net exposure will change as market opportunities change, and may, based on the Fund’s view of current market conditions, be outside this range.
Performance Review
On average during the period, the Fund held about 140% of assets in long securities, and 100% short–for an average net-dollar exposure of 40%. The realized net beta (sensitivity of monthly Fund returns to broad market moves) averaged around 0.17 during the year. This low realized beta is partly by design (the Fund target net beta ranged in the 0.10 to 0.30 during the trailing year) and partly due to some significant alpha being produced during the January 2016 market drop (when the Fund ended with gains while the broad market declined more than 5%). For the period, the long positions averaged a return of +21.1%, compared to the Russell 3000 index return of 12.7%, providing the bulk of the alpha. Short positions averaged a return of +12.6%, contributing a sliver of alpha by producing slightly below market returns while hedging out the bulk of the market risk.
The year started on a sour note – with markets negatively digesting China growth and devaluation fears at the same time as the Fed began its rate increases with the first Fed Funds rate adjustment in a nine years. On top of that, Saudi Arabia continued to open its oil spigots wide to purposely drive oil prices down to hurt U.S. energy sector investment. All these macro factors created a risk-off market reaction spanning economically sensitive sectors, credit spreads in bonds, and any emerging market or natural resources based economy. In that environment, any tilt towards higher quality and lower volatility businesses paid off tremendously. The Fund’s tilt towards defensive sectors (Consumer Staples, Utilities, Telecom, and Health Care), close to zero net exposure in Energy, and net short in Materials–all paid off during the first few months of the year. In the midst of these large market moves–we began removing some of the large profitable Materials short trades (mining names in particular) as their stocks began trading at option-like valuations. That is–with heightened credit risk fears, the equity portion of their capital structure had in many cases become so small in relation to debt that the market was assuming many of the names would go bust. That risk reduction after a profitable directional move helped us avoid giving back the alpha from the beginning of the year when economies, oil, and credit spreads all rallied in a massive way during spring and summer.
140 | THE GUGGENHEIM FUNDS ANNUAL REPORT | |
MANAGER’S COMMENTARY (Unaudited)(concluded) | December 31, 2016 |
During the final six months of the fiscal year, markets were driven by both election news, as well as a broad global positive turn in economic indicators. The election season drove a few sectors, particularly health care losses and flattish returns for banks and insurance firms, under the assumption of a Democratic presidential win and possible Congress sweep. When the presidential and congressional election results surprised the markets, our value tilt, slight net long exposure, and exposures to rising rate industries kicked in with above average contributions.
Derivatives in the Fund are used only to take an equity long or short position above 100% of NAV (that is, to increase leverage). Long side average exposure was 140% for the period.
Performance displayed represents past performance which is no guarantee of future results.
The opinions and forecast expressed may not actually come to pass. This information is subject to change at any time, based on market and other conditions, and should not be construed as a recommendation of any specific security or strategy.
| | THE GUGGENHEIM FUNDS ANNUAL REPORT | 141 |
PERFORMANCE REPORT AND FUND PROFILE (Unaudited) | December 31, 2016 |
SERIES Z (ALPHA OPPORTUNITY SERIES)
OBJECTIVE: Seeks long-term growth of capital.
Holdings Diversification (Market Exposure as % of Net Assets)
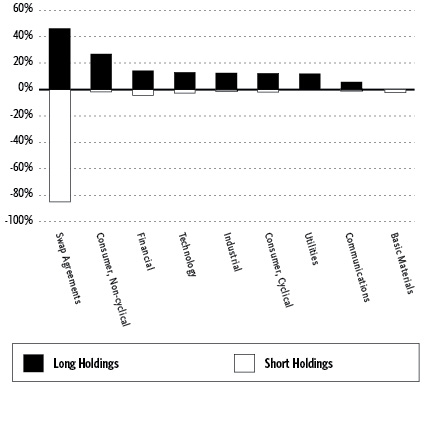
“Holdings Diversification (Market Exposure as % of Net Assets)” excludes any temporary cash investments.
Inception Date: July 7, 2003 |
Ten Largest Long Holdings (% of Total Net Assets) |
Verizon Communications, Inc. | 1.5% |
Edison International | 1.5% |
CVS Health Corp. | 1.5% |
Wal-Mart Stores, Inc. | 1.5% |
Tyson Foods, Inc. — Class A | 1.4% |
Oracle Corp. | 1.4% |
FirstEnergy Corp. | 1.3% |
Kimberly-Clark Corp. | 1.2% |
Exelon Corp. | 1.2% |
UGI Corp. | 1.2% |
Top Ten Total | 13.7% |
“Ten Largest Long Holdings” excludes any temporary cash or derivative investments. |
142 | THE GUGGENHEIM FUNDS ANNUAL REPORT | |
PERFORMANCE REPORT AND FUND PROFILE (Unaudited)(concluded) | December 31, 2016 |
Cumulative Fund Performance*,†
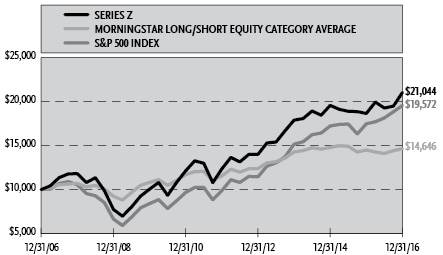
Average Annual Returns*
Periods Ended December 31, 2016†
| 1 Year | 5 Year | 10 Year |
Series Z (Alpha Opportunity Series) | 12.79% | 11.25% | 7.72% |
Morningstar Long/Short Equity Category Average | 0.98% | 4.86% | 3.89% |
S&P 500 Index | 11.96% | 14.66% | 6.95% |
* | The performance data above represents past performance that is not predictive of future results. The investment return and principal value of an investment in the Fund will fluctuate so that an investor’s shares, when redeemed, may be worth more or less than their original cost. Returns are historical and include changes in principal and reinvested dividends and capital gains and do not reflect the effect of taxes. The S&P 500 Index and Morningstar Long/Short Equity Category Average are unmanaged indices and, unlike the Fund, have no management fees or operating expenses to reduce their reported return. |
† | Performance figures do not reflect fees and expenses associated with an investment in variable insurance products. If returns had taken into account these fees and expenses, performance would have been lower. Shares of a series of Guggenheim Variable Funds Trust are available only through the purchase of such products. |
| | THE GUGGENHEIM FUNDS ANNUAL REPORT | 143 |
SCHEDULE OF INVESTMENTS | December 31, 2016 |
SERIES Z (ALPHA OPPORTUNITY SERIES) | |
| | Shares | | | Value | |
| | | | | | | |
COMMON STOCKS† - 96.0% | |
| | | | | | | |
Consumer, Non-cyclical - 26.7% | |
Tyson Foods, Inc. — Class A1 | | | 2,997 | | | $ | 184,855 | |
Kimberly-Clark Corp. | | | 1,431 | | | | 163,306 | |
Express Scripts Holding Co.*,1 | | | 2,274 | | | | 156,428 | |
HCA Holdings, Inc.*,1 | | | 1,942 | | | | 143,747 | |
Deluxe Corp.2 | | | 1,715 | | | | 122,811 | |
DaVita, Inc.*,1 | | | 1,599 | | | | 102,656 | |
ManpowerGroup, Inc.2 | | | 1,103 | | | | 98,024 | |
JM Smucker Co.1 | | | 757 | | | | 96,941 | |
AbbVie, Inc.1 | | | 1,531 | | | | 95,872 | |
Sanderson Farms, Inc.2 | | | 1,008 | | | | 94,994 | |
Danaher Corp.1 | | | 1,217 | | | | 94,731 | |
Laboratory Corporation of America Holdings* | | | 717 | | | | 92,049 | |
Johnson & Johnson | | | 783 | | | | 90,209 | |
Quest Diagnostics, Inc.1 | | | 908 | | | | 83,445 | |
Pfizer, Inc. | | | 2,393 | | | | 77,725 | |
Ingredion, Inc.2 | | | 579 | | | | 72,351 | |
Universal Corp. | | | 1,133 | | | | 72,229 | |
Flowers Foods, Inc. | | | 3,614 | | | | 72,172 | |
Medtronic plc | | | 962 | | | | 68,523 | |
Darling Ingredients, Inc.*,2 | | | 5,270 | | | | 68,036 | |
SpartanNash Co.2 | | | 1,714 | | | | 67,772 | |
Whole Foods Market, Inc. | | | 2,168 | | | | 66,688 | |
General Mills, Inc. | | | 1,067 | | | | 65,909 | |
AmerisourceBergen Corp. — Class A1 | | | 828 | | | | 64,741 | |
United Therapeutics Corp.*,2 | | | 451 | | | | 64,687 | |
Hormel Foods Corp. | | | 1,835 | | | | 63,876 | |
Sysco Corp.1 | | | 1,117 | | | | 61,848 | |
Total System Services, Inc. | | | 1,261 | | | | 61,826 | |
Robert Half International, Inc.2 | | | 1,223 | | | | 59,658 | |
Dr Pepper Snapple Group, Inc.1 | | | 654 | | | | 59,298 | |
Baxter International, Inc. | | | 1,265 | | | | 56,090 | |
MEDNAX, Inc.* | | | 826 | | | | 55,061 | |
Magellan Health, Inc.* | | | 720 | | | | 54,180 | |
Charles River Laboratories International, Inc.*,2 | | | 676 | | | | 51,504 | |
H&R Block, Inc. | | | 2,240 | | | | 51,498 | |
United Natural Foods, Inc.* | | | 1,078 | | | | 51,442 | |
Post Holdings, Inc.* | | | 634 | | | | 50,967 | |
Becton Dickinson and Co. | | | 307 | | | | 50,824 | |
United Rentals, Inc.* | | | 467 | | | | 49,306 | |
HealthSouth Corp. | | | 1,138 | | | | 46,931 | |
Zimmer Biomet Holdings, Inc.1 | | | 448 | | | | 46,234 | |
Chemed Corp.2 | | | 273 | | | | 43,792 | |
Air Methods Corp.*,2 | | | 1,351 | | | | 43,029 | |
Hill-Rom Holdings, Inc. | | | 724 | | | | 40,645 | |
Cambrex Corp.* | | | 749 | | | | 40,409 | |
Endo International plc* | | | 2,450 | | | | 40,352 | |
Henry Schein, Inc.*,2 | | | 262 | | | | 39,748 | |
Cempra, Inc.* | | | 10,500 | | | | 29,400 | |
Total Consumer, Non-cyclical | | | | | | | 3,528,819 | |
| | | | | | | | | |
Financial - 14.1% | |
Aflac, Inc.1 | | | 2,230 | | | | 155,208 | |
RenaissanceRe Holdings Ltd. | | | 1,108 | | | | 150,932 | |
Old Republic International Corp.2 | | | 5,573 | | | | 105,887 | |
Equity Residential | | | 1,389 | | | | 89,396 | |
State Street Corp.1 | | | 1,141 | | | | 88,679 | |
Discover Financial Services1 | | | 1,219 | | | | 87,878 | |
Federated Investors, Inc. — Class B | | | 2,912 | | | | 82,351 | |
Aspen Insurance Holdings Ltd.2 | | | 1,375 | | | | 75,625 | |
Prudential Financial, Inc.1 | | | 723 | | | | 75,235 | |
Interactive Brokers Group, Inc. — Class A1 | | | 2,044 | | | | 74,626 | |
Franklin Resources, Inc. | | | 1,866 | | | | 73,857 | |
MetLife, Inc.1 | | | 1,206 | | | | 64,991 | |
Visa, Inc. — Class A | | | 824 | | | | 64,288 | |
Selective Insurance Group, Inc.2 | | | 1,344 | | | | 57,859 | |
American Financial Group, Inc. | | | 656 | | | | 57,807 | |
Hanover Insurance Group, Inc.2 | | | 601 | | | | 54,697 | |
Citigroup, Inc. | | | 904 | | | | 53,725 | |
Ameriprise Financial, Inc.1 | | | 476 | | | | 52,807 | |
Cullen/Frost Bankers, Inc. | | | 548 | | | | 48,350 | |
Fifth Third Bancorp | | | 1,751 | | | | 47,225 | |
Omega Healthcare Investors, Inc. | | | 1,509 | | | | 47,171 | |
Wells Fargo & Co. | | | 849 | | | | 46,788 | |
CNO Financial Group, Inc.2 | | | 2,438 | | | | 46,688 | |
Unum Group | | | 976 | | | | 42,876 | |
Piedmont Office Realty Trust, Inc. — Class A | | | 1,956 | | | | 40,900 | |
Jones Lang LaSalle, Inc. | | | 396 | | | | 40,012 | |
Capital One Financial Corp. | | | 446 | | | | 38,909 | |
Irish Bank Resolution Corporation Ltd.††† | | | 16,638 | | | | — | |
Total Financial | | | | | | | 1,864,767 | |
| | | | | | | | | |
Technology - 13.0% | |
Oracle Corp.1 | | | 4,792 | | | | 184,252 | |
Intel Corp.1 | | | 3,952 | | | | 143,339 | |
International Business Machines Corp.1 | | | 840 | | | | 139,432 | |
Apple, Inc.1 | | | 1,163 | | | | 134,699 | |
CA, Inc.1 | | | 3,726 | | | | 118,375 | |
HP, Inc.1 | | | 6,767 | | | | 100,422 | |
NetApp, Inc.1 | | | 2,372 | | | | 83,660 | |
Broadridge Financial Solutions, Inc. | | | 1,206 | | | | 79,958 | |
CACI International, Inc. — Class A*,2 | | | 524 | | | | 65,133 | |
NCR Corp.* | | | 1,598 | | | | 64,815 | |
Activision Blizzard, Inc.1 | | | 1,782 | | | | 64,348 | |
Science Applications International Corp.2 | | | 747 | | | | 63,346 | |
Convergys Corp.2 | | | 2,521 | | | | 61,916 | |
Skyworks Solutions, Inc.1 | | | 813 | | | | 60,699 | |
Jack Henry & Associates, Inc. | | | 640 | | | | 56,819 | |
Cerner Corp.*,1 | | | 1,187 | | | | 56,228 | |
Fidelity National Information Services, Inc. | | | 579 | | | | 43,796 | |
Seagate Technology plc | | | 1,122 | | | | 42,827 | |
VeriFone Systems, Inc.* | | | 2,325 | | | | 41,222 | |
Sykes Enterprises, Inc.*,2 | | | 1,406 | | | | 40,577 | |
Allscripts Healthcare Solutions, Inc.* | | | 3,870 | | | | 39,513 | |
Icad, Inc.*,2 | | | 7,269 | | | | 23,515 | |
Total Technology | | | | | | | 1,708,891 | |
144 | THE GUGGENHEIM FUNDS ANNUAL REPORT | SEE NOTES TO FINANCIAL STATEMENTS. |
SCHEDULE OF INVESTMENTS (continued) | December 31, 2016 |
SERIES Z (ALPHA OPPORTUNITY SERIES) | |
| | Shares | | | Value | |
| | | | | | | |
Industrial - 12.5% | |
Arrow Electronics, Inc.*,2 | | | 1,408 | | | $ | 100,390 | |
Huntington Ingalls Industries, Inc.2 | | | 540 | | | | 99,463 | |
TE Connectivity Ltd.1 | | | 1,420 | | | | 98,378 | |
Timken Co.2 | | | 2,402 | | | | 95,359 | |
Stanley Black & Decker, Inc. | | | 697 | | | | 79,939 | |
Fluor Corp. | | | 1,435 | | | | 75,366 | |
Saia, Inc.*,2 | | | 1,639 | | | | 72,362 | |
Ingersoll-Rand plc | | | 953 | | | | 71,513 | |
ITT, Inc. | | | 1,794 | | | | 69,194 | |
Harris Corp. | | | 659 | | | | 67,528 | |
United Parcel Service, Inc. — Class B | | | 565 | | | | 64,772 | |
Sanmina Corp.*,2 | | | 1,697 | | | | 62,194 | |
Crane Co.2 | | | 846 | | | | 61,014 | |
Boeing Co.1 | | | 387 | | | | 60,248 | |
Vishay Intertechnology, Inc.2 | | | 3,714 | | | | 60,167 | |
Barnes Group, Inc.2 | | | 1,231 | | | | 58,374 | |
ArcBest Corp.2 | | | 2,102 | | | | 58,120 | |
Methode Electronics, Inc. | | | 1,400 | | | | 57,890 | |
Applied Industrial Technologies, Inc.2 | | | 943 | | | | 56,014 | |
Keysight Technologies, Inc.* | | | 1,480 | | | | 54,124 | |
Trinity Industries, Inc.2 | | | 1,803 | | | | 50,051 | |
Federal Signal Corp.2 | | | 3,163 | | | | 49,374 | |
Norfolk Southern Corp. | | | 382 | | | | 41,283 | |
Waters Corp.* | | | 300 | | | | 40,317 | |
Werner Enterprises, Inc.2 | | | 1,490 | | | | 40,156 | |
Total Industrial | | | | | | | 1,643,590 | |
| | | | | | | | | |
Consumer, Cyclical - 12.2% | |
CVS Health Corp.1 | | | 2,553 | | | | 201,457 | |
Wal-Mart Stores, Inc.1 | | | 2,813 | | | | 194,435 | |
UniFirst Corp.2 | | | 894 | | | | 128,423 | |
Alaska Air Group, Inc.1 | | | 1,176 | | | | 104,346 | |
Southwest Airlines Co. | | | 1,966 | | | | 97,985 | |
Hawaiian Holdings, Inc.* | | | 1,658 | | | | 94,506 | |
JetBlue Airways Corp.* | | | 3,847 | | | | 86,250 | |
Walgreens Boots Alliance, Inc.1 | | | 1,008 | | | | 83,422 | |
Herman Miller, Inc. | | | 2,334 | | | | 79,823 | |
Big Lots, Inc. | | | 1,378 | | | | 69,189 | |
Children’s Place, Inc. | | | 647 | | | | 65,314 | |
Delphi Automotive plc1 | | | 922 | | | | 62,097 | |
Brinker International, Inc. | | | 1,184 | | | | 58,644 | |
American Airlines Group, Inc.1 | | | 1,164 | | | | 54,347 | |
Foot Locker, Inc. | | | 713 | | | | 50,545 | |
Cooper-Standard Holdings, Inc.* | | | 460 | | | | 47,555 | |
Allegiant Travel Co. — Class A | | | 272 | | | | 45,261 | |
Nordstrom, Inc. | | | 897 | | | | 42,993 | |
Brunswick Corp. | | | 731 | | | | 39,869 | |
Total Consumer, Cyclical | | | | | | | 1,606,461 | |
| | | | | | | | | |
Utilities - 11.9% | |
Edison International2 | | | 2,804 | | | | 201,860 | |
FirstEnergy Corp.2 | | | 5,415 | | | | 167,703 | |
Exelon Corp. | | | 4,516 | | | | 160,273 | |
UGI Corp.2 | | | 3,399 | | | | 156,626 | |
Ameren Corp.1 | | | 2,784 | | | | 146,049 | |
American Electric Power Company, Inc.1 | | | 2,066 | | | | 130,075 | |
WEC Energy Group, Inc.1 | | | 2,080 | | | | 121,992 | |
Duke Energy Corp.1 | | | 1,233 | | | | 95,705 | |
Southwest Gas Holdings, Inc. | | | 1,116 | | | | 85,508 | |
Xcel Energy, Inc.1 | | | 2,002 | | | | 81,481 | |
AES Corp. | | | 6,157 | | | | 71,544 | |
Pinnacle West Capital Corp. | | | 738 | | | | 57,586 | |
Hawaiian Electric Industries, Inc. | | | 1,623 | | | | 53,673 | |
National Fuel Gas Co. | | | 730 | | | | 41,347 | |
Total Utilities | | | | | | | 1,571,422 | |
| | | | | | | | | |
Communications - 5.6% | |
Verizon Communications, Inc.1 | | | 3,824 | | | | 204,124 | |
eBay, Inc.*,1 | | | 3,889 | | | | 115,465 | |
VeriSign, Inc.* | | | 1,451 | | | | 110,378 | |
Discovery Communications, Inc. — Class A*,2 | | | 3,509 | | | | 96,182 | |
AMC Networks, Inc. — Class A*,2 | | | 1,525 | | | | 79,819 | |
Comcast Corp. — Class A1 | | | 1,024 | | | | 70,707 | |
Juniper Networks, Inc. | | | 2,133 | | | | 60,277 | |
Total Communications | | | | | | | 736,952 | |
| | | | | | | | | |
Total Common Stocks | | | | | | | | |
(Cost $11,796,743) | | | | | | | 12,660,902 | |
| | | | | | | | | |
SHORT-TERM INVESTMENTS† - 6.1% | |
Goldman Sachs Financial Square Treasury Instruments Fund 0.35%3 | | | 809,911 | | | | 809,911 | |
Total Short-Term Investments | | | | | | | | |
(Cost $809,911) | | | | | | | 809,911 | |
| | | | | | | | | |
Total Investments - 102.1% | | | | | | | | |
(Cost $12,606,654) | | | | | | $ | 13,470,813 | |
| | | | | | | | | |
COMMON STOCKS SOLD SHORT† - (13.9)% | |
| | |
Consumer, Non-cyclical - (0.6)% | |
Cantel Medical Corp. | | | 499 | | | | (39,296 | ) |
Monro Muffler Brake, Inc. | | | 730 | | | | (41,756 | ) |
Total Consumer, Non-cyclical | | | | | | | (81,052 | ) |
| | | | | | | | | |
Communications - (0.7)% | |
Amazon.com, Inc.* | | | 119 | | | | (89,235 | ) |
| | | | | | | | | |
Industrial - (0.9)% | |
Louisiana-Pacific Corp.* | | | 2,554 | | | | (48,347 | ) |
EnPro Industries, Inc. | | | 947 | | | | (63,790 | ) |
Total Industrial | | | | | | | (112,137 | ) |
| | | | | | | | | |
Consumer, Cyclical - (2.0)% | |
Crocs, Inc.* | | | 5,605 | | | | (38,450 | ) |
Popeyes Louisiana Kitchen, Inc.* | | | 700 | | | | (42,336 | ) |
Pool Corp. | | | 498 | | | | (51,961 | ) |
Papa John’s International, Inc. | | | 651 | | | | (55,713 | ) |
LKQ Corp.* | | | 2,416 | | | | (74,051 | ) |
Total Consumer, Cyclical | | | | | | | (262,511 | ) |
SEE NOTES TO FINANCIAL STATEMENTS. | THE GUGGENHEIM FUNDS ANNUAL REPORT | 145 |
SCHEDULE OF INVESTMENTS (continued) | December 31, 2016 |
SERIES Z (ALPHA OPPORTUNITY SERIES) | |
| | Shares | | | Value | |
| | | | | | | |
Basic Materials - (2.4)% | |
NewMarket Corp. | | | 112 | | | $ | (47,470 | ) |
Sensient Technologies Corp. | | | 1,650 | | | | (129,658 | ) |
Royal Gold, Inc. | | | 2,107 | | | | (133,478 | ) |
Total Basic Materials | | | | | | | (310,606 | ) |
| | | | | | | | | |
Technology - (2.8)% | |
CommVault Systems, Inc.* | | | 962 | | | | (49,447 | ) |
Medidata Solutions, Inc.* | | | 1,327 | | | | (65,912 | ) |
Silicon Laboratories, Inc.* | | | 1,017 | | | | (66,105 | ) |
Ultimate Software Group, Inc.* | | | 377 | | | | (68,746 | ) |
Cypress Semiconductor Corp. | | | 10,447 | | | | (119,514 | ) |
Total Technology | | | | | | | (369,724 | ) |
| | | | | | | | | |
Financial - (4.5)% | |
Safety Insurance Group, Inc. | | | 533 | | | | (39,282 | ) |
American Assets Trust, Inc. | | | 936 | | | | (40,323 | ) |
Life Storage, Inc. | | | 475 | | | | (40,499 | ) |
Liberty Property Trust | | | 1,062 | | | | (41,949 | ) |
EastGroup Properties, Inc. | | | 754 | | | | (55,675 | ) |
Glacier Bancorp, Inc. | | | 1,565 | | | | (56,700 | ) |
Community Bank System, Inc. | | | 931 | | | | (57,526 | ) |
Webster Financial Corp. | | | 1,582 | | | | (85,871 | ) |
Federal Realty Investment Trust | | | 652 | | | | (92,656 | ) |
Associated Banc-Corp. | | | 3,812 | | | | (94,155 | ) |
Total Financial | | | | | | | (604,636 | ) |
| | | | | | | | | |
Total Common Stocks Sold Short | | | | | | | | |
(Proceeds $1,571,261) | | | | | | | (1,829,901 | ) |
Total Securities Sold Short- (13.9)% | | | | | | | | |
(Proceeds $1,571,261) | | | | | | $ | (1,829,901 | ) |
Other Assets & Liabilities, net - 11.8% | | | | | | | 1,551,425 | |
Total Net Assets - 100.0% | | | | | | $ | 13,192,337 | |
| | Units | | | Unrealized
Gain (Loss) | |
| | | | | | | | | |
OTC EQUITY SWAP AGREEMENTS SOLD SHORT†† | |
Morgan Stanley February 2017 Alpha Opportunity Portfolio Short Custom Basket Swap 0.31%5 ,
Terminating 02/03/17 (Notional Value $11,230,852) | | | | | | $ | (845,661 | ) |
OTC EQUITY SWAP AGREEMENTS†† | |
Morgan Stanley February 2017 Alpha Opportunity Portfolio Long Custom Basket Swap 1.11%4 , Terminating 02/03/17
(Notional Value $6,100,793) | | | | | | $ | 632,489 | |
| | Shares | | | Unrealized
Gain | |
| | | | | | | |
CUSTOM BASKET OF LONG SECURITIES4 | | | | | | |
InterDigital, Inc. | | | 1,316 | | | | 60,490 | |
WellCare Health Plans, Inc.* | | | 801 | | | | 47,514 | |
United Continental Holdings, Inc.* | | | 1,243 | | | | 29,248 | |
EMCOR Group, Inc. | | | 1,145 | | | | 27,885 | |
Cisco Systems, Inc. | | | 5,665 | | | | 25,153 | |
Teradyne, Inc. | | | 3,289 | | | | 21,633 | |
Principal Financial Group, Inc. | | | 1,064 | | | | 21,357 | |
UnitedHealth Group, Inc. | | | 630 | | | | 20,538 | |
Delta Air Lines, Inc. | | | 2,501 | | | | 20,044 | |
SYNNEX Corp. | | | 549 | | | | 20,003 | |
CenterPoint Energy, Inc. | | | 7,099 | | | | 18,967 | |
Energizer Holdings, Inc. | | | 1,685 | | | | 18,278 | |
Wabash National Corp. | | | 3,625 | | | | 16,973 | |
Everest Re Group Ltd. | | | 681 | | | | 16,891 | |
Lincoln National Corp. | | | 621 | | | | 16,480 | |
Scripps Networks Interactive, Inc. — Class A | | | 1,750 | | | | 16,118 | |
Conagra Brands, Inc. | | | 3,394 | | | | 15,945 | |
Western Union Co. | | | 5,562 | | | | 15,233 | |
Cummins, Inc. | | | 1,050 | | | | 15,002 | |
Synchrony Financial | | | 1,487 | | | | 11,943 | |
AECOM* | | | 1,447 | | | | 11,671 | |
F5 Networks, Inc.* | | | 530 | | | | 11,565 | |
McKesson Corp. | | | 532 | | | | 11,367 | |
WR Berkley Corp. | | | 680 | | | | 11,043 | |
Travelers Companies, Inc. | | | 1,033 | | | | 10,603 | |
IPG Photonics Corp.* | | | 585 | | | | 10,326 | |
CSX Corp. | | | 1,720 | | | | 9,593 | |
Northern Trust Corp. | | | 641 | | | | 9,338 | |
Textron, Inc. | | | 998 | | | | 8,995 | |
Archer-Daniels-Midland Co. | | | 2,493 | | | | 8,490 | |
Telephone & Data Systems, Inc. | | | 4,044 | | | | 8,042 | |
Motorola Solutions, Inc. | | | 1,216 | | | | 7,941 | |
Owens & Minor, Inc. | | | 2,883 | | | | 7,554 | |
Wyndham Worldwide Corp. | | | 649 | | | | 7,152 | |
Best Buy Co., Inc. | | | 1,623 | | | | 6,919 | |
Hartford Financial Services Group, Inc. | | | 974 | | | | 6,519 | |
Allstate Corp. | | | 1,048 | | | | 6,148 | |
Fiserv, Inc.* | | | 986 | | | | 6,074 | |
Carlisle Companies, Inc. | | | 883 | | | | 5,569 | |
BorgWarner, Inc. | | | 1,170 | | | | 5,297 | |
Public Service Enterprise Group, Inc. | | | 2,134 | | | | 5,261 | |
Progressive Corp. | | | 1,953 | | | | 5,168 | |
Cognizant Technology Solutions Corp. — Class A* | | | 853 | | | | 4,657 | |
Texas Instruments, Inc. | | | 1,455 | | | | 4,625 | |
Entergy Corp. | | | 1,290 | | | | 4,577 | |
Kroger Co. | | | 2,428 | | | | 3,860 | |
DST Systems, Inc. | | | 606 | | | | 3,858 | |
Teradata Corp.* | | | 1,804 | | | | 3,776 | |
Hologic, Inc.* | | | 1,147 | | | | 3,690 | |
TRI Pointe Group, Inc.* | | | 3,752 | | | | 3,423 | |
Target Corp. | | | 1,037 | | | | 2,885 | |
Cal-Maine Foods, Inc. | | | 1,730 | | | | 2,885 | |
PPL Corp. | | | 3,930 | | | | 2,437 | |
Interpublic Group of Companies, Inc. | | | 1,957 | | | | 2,419 | |
146 | THE GUGGENHEIM FUNDS ANNUAL REPORT | SEE NOTES TO FINANCIAL STATEMENTS. |
SCHEDULE OF INVESTMENTS (continued) | December 31, 2016 |
SERIES Z (ALPHA OPPORTUNITY SERIES) | |
| | Shares | | | Unrealized
Gain (Loss) | |
| | | | | | | |
Bed Bath & Beyond, Inc. | | | 2,635 | | | $ | 2,160 | |
Biogen, Inc.* | | | 165 | | | | 1,746 | |
Masco Corp. | | | 2,231 | | | | 1,251 | |
Molina Healthcare, Inc.* | | | 1,218 | | | | 1,200 | |
Casey’s General Stores, Inc. | | | 391 | | | | (208 | ) |
PepsiCo, Inc. | | | 778 | | | | (217 | ) |
Amgen, Inc. | | | 1,150 | | | | (1,222 | ) |
Procter & Gamble Co. | | | 1,040 | | | | (1,581 | ) |
Philip Morris International, Inc. | | | 492 | | | | (2,079 | ) |
Consolidated Edison, Inc. | | | 2,017 | | | | (3,324 | ) |
Cardinal Health, Inc. | | | 1,864 | | | | (3,762 | ) |
Mallinckrodt plc* | | | 768 | | | | (3,769 | ) |
Pitney Bowes, Inc. | | | 4,374 | | | | (6,803 | ) |
Merck & Company, Inc. | | | 1,509 | | | | (6,810 | ) |
Ford Motor Co. | | | 6,526 | | | | (7,084 | ) |
Michael Kors Holdings Ltd.* | | | 1,392 | | | | (9,516 | ) |
Gilead Sciences, Inc. | | | 1,735 | | | | (19,513 | ) |
Total Custom Basket of Long Securities | | | | | | | 619,891 | |
| | | | | | | | | |
CUSTOM BASKET OF SHORT SECURITIES5 | | | | | | | | |
Hanesbrands, Inc. | | | (2,502 | ) | | | 23,447 | |
TripAdvisor, Inc.* | | | (987 | ) | | | 17,633 | |
Mattel, Inc. | | | (3,155 | ) | | | 13,511 | |
International Flavors & Fragrances, Inc. | | | (858 | ) | | | 13,003 | |
Fortinet, Inc.* | | | (1,339 | ) | | | 6,496 | |
Simon Property Group, Inc. | | | (280 | ) | | | 6,052 | |
American Tower Corp. — Class A | | | (639 | ) | | | 6,017 | |
Crown Castle International Corp. | | | (1,310 | ) | | | 5,988 | |
Sempra Energy | | | (1,145 | ) | | | 5,291 | |
Wynn Resorts Ltd. | | | (437 | ) | | | 5,245 | |
Realty Income Corp. | | | (1,069 | ) | | | 4,843 | |
Red Hat, Inc.* | | | (716 | ) | | | 4,498 | |
Healthcare Realty Trust, Inc. | | | (1,660 | ) | | | 4,394 | |
Newell Brands, Inc. | | | (1,419 | ) | | | 4,267 | |
MarketAxess Holdings, Inc. | | | (248 | ) | | | 3,711 | |
salesforce.com, Inc.* | | | (673 | ) | | | 3,662 | |
Extra Space Storage, Inc. | | | (597 | ) | | | 3,507 | |
Allegion plc | | | (618 | ) | | | 3,247 | |
Expedia, Inc. | | | (442 | ) | | | 2,790 | |
NIKE, Inc. — Class B | | | (1,940 | ) | | | 2,576 | |
FactSet Research Systems, Inc. | | | (260 | ) | | | 2,441 | |
Buffalo Wild Wings, Inc.* | | | (341 | ) | | | 2,324 | |
Cintas Corp. | | | (436 | ) | | | 2,237 | |
NiSource, Inc. | | | (2,469 | ) | | | 2,050 | |
American Campus Communities, Inc. | | | (1,984 | ) | | | 1,734 | |
Fastenal Co. | | | (1,249 | ) | | | 1,417 | |
Global Payments, Inc. | | | (605 | ) | | | 1,250 | |
Ligand Pharmaceuticals, Inc. — Class B* | | | (374 | ) | | | 1,239 | |
Home Depot, Inc. | | | (569 | ) | | | 1,171 | |
Facebook, Inc. — Class A* | | | (337 | ) | | | 1,065 | |
Bemis Company, Inc. | | | (1,079 | ) | | | 1,012 | |
Healthcare Services Group, Inc. | | | (1,781 | ) | | | 923 | |
Loews Corp. | | | (1,883 | ) | | | 851 | |
Washington Federal, Inc. | | | (1,940 | ) | | | 669 | |
International Paper Co. | | | (1,061 | ) | | | 571 | |
Innospec, Inc. | | | (632 | ) | | | 545 | |
SCANA Corp. | | | (915 | ) | | | 510 | |
U.S. Bancorp | | | (1,501 | ) | | | 483 | |
Quaker Chemical Corp. | | | (489 | ) | | | 446 | |
Priceline Group, Inc.* | | | (34 | ) | | | 379 | |
Electronics for Imaging, Inc.* | | | (905 | ) | | | 325 | |
Acadia Realty Trust | | | (1,381 | ) | | | 257 | |
Aqua America, Inc. | | | (1,540 | ) | | | 214 | |
AptarGroup, Inc. | | | (786 | ) | | | 132 | |
Sealed Air Corp. | | | (2,136 | ) | | | 115 | |
Prologis, Inc. | | | (1,333 | ) | | | 14 | |
HCP, Inc. | | | (1,463 | ) | | | (2 | ) |
Communications Sales & Leasing, Inc. | | | (1,588 | ) | | | (14 | ) |
PPG Industries, Inc. | | | (510 | ) | | | (46 | ) |
Equinix, Inc. | | | (368 | ) | | | (174 | ) |
Commerce Bancshares, Inc. | | | (1,187 | ) | | | (189 | ) |
Tyler Technologies, Inc.* | | | (284 | ) | | | (234 | ) |
Orbital ATK, Inc. | | | (488 | ) | | | (344 | ) |
Atmos Energy Corp. | | | (1,356 | ) | | | (362 | ) |
Provident Financial Services, Inc. | | | (1,425 | ) | | | (367 | ) |
Ross Stores, Inc. | | | (1,169 | ) | | | (568 | ) |
Citizens Financial Group, Inc. | | | (1,142 | ) | | | (602 | ) |
BB&T Corp. | | | (1,433 | ) | | | (652 | ) |
Weyerhaeuser Co. | | | (2,027 | ) | | | (745 | ) |
New Jersey Resources Corp. | | | (2,591 | ) | | | (808 | ) |
Trustmark Corp. | | | (1,884 | ) | | | (827 | ) |
Duke Realty Corp. | | | (2,737 | ) | | | (966 | ) |
Kilroy Realty Corp. | | | (670 | ) | | | (1,079 | ) |
National Retail Properties, Inc. | | | (1,017 | ) | | | (1,108 | ) |
Digital Realty Trust, Inc. | | | (426 | ) | | | (1,184 | ) |
BlackRock, Inc. — Class A | | | (103 | ) | | | (1,263 | ) |
CoreSite Realty Corp. | | | (958 | ) | | | (1,278 | ) |
First Industrial Realty Trust, Inc. | | | (3,967 | ) | | | (1,330 | ) |
STERIS plc | | | (691 | ) | | | (1,420 | ) |
Adobe Systems, Inc.* | | | (426 | ) | | | (1,430 | ) |
UDR, Inc. | | | (1,494 | ) | | | (1,602 | ) |
Align Technology, Inc.* | | | (413 | ) | | | (1,942 | ) |
Flowserve Corp. | | | (850 | ) | | | (2,044 | ) |
Chuy’s Holdings, Inc.* | | | (1,189 | ) | | | (2,249 | ) |
O’Reilly Automotive, Inc.* | | | (300 | ) | | | (2,342 | ) |
Intercontinental Exchange, Inc. | | | (1,028 | ) | | | (2,383 | ) |
Corning, Inc. | | | (1,638 | ) | | | (2,584 | ) |
Taubman Centers, Inc. | | | (1,076 | ) | | | (2,706 | ) |
Netflix, Inc.* | | | (345 | ) | | | (2,849 | ) |
Belmond Ltd. — Class A* | | | (3,886 | ) | | | (3,055 | ) |
Bottomline Technologies de, Inc.* | | | (1,635 | ) | | | (3,112 | ) |
Four Corners Property Trust, Inc. | | | (1,994 | ) | | | (3,130 | ) |
Tiffany & Co. | | | (617 | ) | | | (3,137 | ) |
Alexander & Baldwin, Inc. | | | (914 | ) | | | (3,664 | ) |
Ecolab, Inc. | | | (1,396 | ) | | | (3,734 | ) |
McDonald’s Corp. | | | (524 | ) | | | (3,788 | ) |
Core-Mark Holding Company, Inc. | | | (1,317 | ) | | | (4,053 | ) |
Alexandria Real Estate Equities, Inc. | | | (937 | ) | | | (4,127 | ) |
Tractor Supply Co. | | | (1,269 | ) | | | (4,163 | ) |
MDC Holdings, Inc. | | | (2,489 | ) | | | (4,205 | ) |
DCT Industrial Trust, Inc. | | | (1,454 | ) | | | (4,487 | ) |
Texas Roadhouse, Inc. — Class A | | | (1,329 | ) | | | (4,614 | ) |
General Electric Co. | | | (3,617 | ) | | | (4,640 | ) |
SEE NOTES TO FINANCIAL STATEMENTS. | THE GUGGENHEIM FUNDS ANNUAL REPORT | 147 |
SCHEDULE OF INVESTMENTS (continued) | December 31, 2016 |
SERIES Z (ALPHA OPPORTUNITY SERIES) | |
| | Shares | | | Unrealized Loss | |
| | | | | | | |
Education Realty Trust, Inc. | | | (1,636 | ) | | $ | (4,674 | ) |
Starbucks Corp. | | | (1,961 | ) | | | (4,793 | ) |
Dominion Resources, Inc. | | | (1,648 | ) | | | (5,058 | ) |
Deltic Timber Corp. | | | (1,044 | ) | | | (5,211 | ) |
Essex Property Trust, Inc. | | | (387 | ) | | | (5,291 | ) |
Royal Caribbean Cruises Ltd. | | | (496 | ) | | | (5,422 | ) |
Five Below, Inc.* | | | (1,466 | ) | | | (5,644 | ) |
Cheesecake Factory, Inc. | | | (999 | ) | | | (5,662 | ) |
Public Storage | | | (379 | ) | | | (5,704 | ) |
Trimble, Inc.* | | | (1,387 | ) | | | (5,844 | ) |
CME Group, Inc. — Class A | | | (914 | ) | | | (5,852 | ) |
Alliant Energy Corp. | | | (2,942 | ) | | | (5,930 | ) |
Advance Auto Parts, Inc. | | | (299 | ) | | | (6,131 | ) |
Donaldson Company, Inc. | | | (1,077 | ) | | | (6,889 | ) |
Air Products & Chemicals, Inc. | | | (669 | ) | | | (6,963 | ) |
Panera Bread Co. — Class A* | | | (530 | ) | | | (6,998 | ) |
Domino’s Pizza, Inc. | | | (413 | ) | | | (7,392 | ) |
RPM International, Inc. | | | (1,825 | ) | | | (7,959 | ) |
Marriott Vacations Worldwide Corp. | | | (539 | ) | | | (7,989 | ) |
Compass Minerals International, Inc. | | | (1,524 | ) | | | (8,689 | ) |
American International Group, Inc. | | | (1,067 | ) | | | (8,873 | ) |
Allegheny Technologies, Inc. | | | (3,589 | ) | | | (9,073 | ) |
Lexington Realty Trust | | | (3,937 | ) | | | (9,084 | ) |
Take-Two Interactive Software, Inc.* | | | (1,475 | ) | | | (9,248 | ) |
Lithia Motors, Inc. — Class A | | | (805 | ) | | | (9,379 | ) |
West Pharmaceutical Services, Inc. | | | (924 | ) | | | (9,506 | ) |
Group 1 Automotive, Inc. | | | (574 | ) | | | (9,628 | ) |
S&P Global, Inc. | | | (452 | ) | | | (9,690 | ) |
Douglas Emmett, Inc. | | | (2,079 | ) | | | (9,980 | ) |
Bank of the Ozarks, Inc. | | | (1,040 | ) | | | (10,084 | ) |
Financial Engines, Inc. | | | (1,408 | ) | | | (10,284 | ) |
Vornado Realty Trust | | | (706 | ) | | | (10,689 | ) |
Old National Bancorp | | | (2,888 | ) | | | (10,822 | ) |
Eagle Materials, Inc. | | | (671 | ) | | | (10,830 | ) |
Ulta Salon Cosmetics & Fragrance, Inc.* | | | (251 | ) | | | (11,224 | ) |
Bio-Rad Laboratories, Inc. — Class A* | | | (516 | ) | | | (11,317 | ) |
Deere & Co. | | | (554 | ) | | | (11,427 | ) |
Scotts Miracle-Gro Co. — Class A | | | (1,402 | ) | | | (12,274 | ) |
Sterling Bancorp | | | (2,039 | ) | | | (12,738 | ) |
Mercury General Corp. | | | (973 | ) | | | (12,839 | ) |
MB Financial, Inc. | | | (1,561 | ) | | | (13,627 | ) |
CF Industries Holdings, Inc. | | | (1,814 | ) | | | (13,860 | ) |
BancorpSouth, Inc. | | | (1,759 | ) | | | (13,900 | ) |
Jack in the Box, Inc. | | | (539 | ) | | | (14,376 | ) |
Dunkin’ Brands Group, Inc. | | | (1,909 | ) | | | (14,448 | ) |
Copart, Inc.* | | | (1,176 | ) | | | (14,649 | ) |
Fulton Financial Corp. | | | (3,334 | ) | | | (14,814 | ) |
New York Community Bancorp, Inc. | | | (10,136 | ) | | | (15,434 | ) |
First Horizon National Corp. | | | (3,897 | ) | | | (15,731 | ) |
Autodesk, Inc.* | | | (1,576 | ) | | | (15,741 | ) |
South Jersey Industries, Inc. | | | (1,950 | ) | | | (16,062 | ) |
Wendy’s Co. | | | (6,256 | ) | | | (16,825 | ) |
Semtech Corp.* | | | (1,579 | ) | | | (16,856 | ) |
US Concrete, Inc.* | | | (1,081 | ) | | | (17,169 | ) |
Freeport-McMoRan, Inc.* | | | (5,919 | ) | | | (17,343 | ) |
Goldman Sachs Group, Inc. | | | (353 | ) | | | (18,131 | ) |
Bob Evans Farms, Inc. | | | (1,185 | ) | | | (18,224 | ) |
PTC, Inc.* | | | (1,818 | ) | | | (18,274 | ) |
Leucadia National Corp. | | | (2,898 | ) | | | (20,090 | ) |
NVIDIA Corp. | | | (675 | ) | | | (23,141 | ) |
Vulcan Materials Co. | | | (1,386 | ) | | | (23,553 | ) |
People’s United Financial, Inc. | | | (7,026 | ) | | | (23,724 | ) |
FMC Corp. | | | (2,171 | ) | | | (24,821 | ) |
Balchem Corp. | | | (1,164 | ) | | | (28,407 | ) |
Itron, Inc.* | | | (999 | ) | | | (29,384 | ) |
United States Steel Corp. | | | (2,335 | ) | | | (31,738 | ) |
Martin Marietta Materials, Inc. | | | (762 | ) | | | (33,518 | ) |
CarMax, Inc.* | | | (1,791 | ) | | | (34,789 | ) |
Total Custom Basket of Short Securities | | | | | | | (818,763 | ) |
* | Non-income producing security. |
† | Value determined based on Level 1 inputs — See Note 4. |
†† | Value determined based on Level 2 inputs — See Note 4. |
††† | Value determined based on Level 3 inputs — See Note 4. |
1 | All or a portion of this security is pledged as equity swap collateral at December 31, 2016. |
2 | All or a portion of this security is pledged as short security collateral at December 31, 2016. |
3 | Rate indicated is the 7 day yield as of December 31, 2016. |
4 | Total Return is based on the return of custom long basket of securities +/- financing at a variable rate. Rate indicated is rate effective at December 31, 2016. |
5 | Total Return is based on the return of custom short basket of securities +/- financing at a variable rate. Rate indicated is rate effective at December 31, 2016. |
| | plc — Public Limited Company |
| | |
| | See Sector Classification in Other Information section. |
148 | THE GUGGENHEIM FUNDS ANNUAL REPORT | SEE NOTES TO FINANCIAL STATEMENTS. |
SCHEDULE OF INVESTMENTS (concluded) | December 31, 2016 |
SERIES Z (ALPHA OPPORTUNITY SERIES) | |
The following table summarizes the inputs used to value the Fund’s investments at December 31, 2016 (See Note 4 in the Notes to Financial Statements):
Investments in Securities (Assets) | | Level 1 | | | Level 2 | | | Level 2 - Other* | | | Level 3 | | | Total | |
Common Stocks | | $ | 12,660,902 | | | $ | — | | | $ | — | | | $ | — | | | $ | 12,660,902 | |
Equity Index Swap Agreements | | | — | | | | — | | | | 632,489 | | | | — | | | | 632,489 | |
Short-Term Investments | | | 809,911 | | | | — | | | | — | | | | — | | | | 809,911 | |
Total | | $ | 13,470,813 | | | $ | — | | | $ | 632,489 | | | $ | — | | | $ | 14,103,302 | |
| | | | | | | | | | | | | | | | | | | | |
Investments in Securities (Liabilities) | | Level 1 | | | Level 2 | | | Level 2 - Other* | | | Level 3 | | | Total | |
Common Stocks | | $ | 1,829,901 | | | $ | — | | | $ | — | | | $ | — | | | $ | 1,829,901 | |
Equity Index Swap Agreements | | | — | | | | — | | | | 845,661 | | | | — | | | | 845,661 | |
Total | | $ | 1,829,901 | | | $ | — | | | $ | 845,661 | | | $ | — | | | $ | 2,675,562 | |
* | Other financial instruments include swaps, which are reported as unrealized gain/loss at period end. |
Transfers between investment levels may occur as the markets fluctuate and/or the availability of data used in an investment’s valuation changes. Transfers between valuation levels, if any, are in comparison to the valuation levels at the end of the previous fiscal year, and are effective using the fair value as of the end of the previous fiscal period.
For the year ended December 31, 2016, there were no transfers between levels.
SEE NOTES TO FINANCIAL STATEMENTS. | THE GUGGENHEIM FUNDS ANNUAL REPORT | 149 |
SERIES Z (ALPHA OPPORTUNITY SERIES) | |
STATEMENT OF ASSETS AND LIABILITIES |
December 31, 2016 |
Assets: | |
Investments, at value (cost $12,606,654) | | $ | 13,470,813 | |
Segregated cash with broker | | | 1,836,175 | |
Unrealized appreciation on swap agreements | | | 632,489 | |
Prepaid expenses | | | 3,802 | |
Receivables: | |
Swap settlement | | | 41,045 | |
Fund shares sold | | | 319 | |
Dividends | | | 15,784 | |
Other assets | | | 239 | |
Total assets | | | 16,000,666 | |
| | | | | |
Liabilities: | |
Securities sold short, at value (proceeds $1,571,261) | | | 1,829,901 | |
Unrealized depreciation on swap agreements | | | 845,661 | |
Overdraft due to custodian bank | | | 251 | |
Payable for: | |
Management fees | | | 51,357 | |
Securities purchased | | | 28,029 | |
Fund accounting/administration fees | | | 4,473 | |
Trustees’ fees* | | | 4,424 | |
Transfer agent/maintenance fees | | | 2,108 | |
Fund shares redeemed | | | 253 | |
Miscellaneous | | | 41,872 | |
Total liabilities | | | 2,808,329 | |
Commitments and contingent liabilities (Note 14) | | | — | |
Net assets | | $ | 13,192,337 | |
| | | | | |
Net assets consist of: | |
Paid in capital | | $ | 12,707,868 | |
Undistributed net investment income | | | 172,127 | |
Accumulated net realized loss on investments | | | (80,005 | ) |
Net unrealized appreciation on investments | | | 392,347 | |
Net assets | | $ | 13,192,337 | |
Capital shares outstanding | | | 705,497 | |
Net asset value per share | | $ | 18.70 | |
STATEMENT OF OPERATIONS |
Year Ended December 31, 2016 |
Investment Income: | |
Dividends | | $ | 223,225 | |
Interest | | | 1,278 | |
Total investment income | | | 224,503 | |
| | | | | |
Expenses: | |
Management fees | | | 183,050 | |
Transfer agent/maintenance fees | | | 23,088 | |
Fund accounting/administration fees | | | 25,254 | |
Short sales dividend expense | | | 55,388 | |
Printing expense | | | 19,174 | |
Prime broker interest expense | | | 18,683 | |
Trustees’ fees* | | | 10,440 | |
Custodian fees | | | 7,355 | |
Miscellaneous | | | 34,408 | |
Total expenses | | | 376,840 | |
Net investment loss | | | (152,337 | ) |
| | | | | |
Net Realized and Unrealized Gain (Loss): | |
Net realized gain (loss) on: | |
Investments | | | 888,215 | |
Swap agreements | | | (361,892 | ) |
Securities sold short | | | (90,922 | ) |
Net realized gain | | | 435,401 | |
Net change in unrealized appreciation (depreciation) on: | |
Investments | | | 1,418,144 | |
Securities sold short | | | (194,095 | ) |
Swap agreements | | | 27,232 | |
Net change in unrealized appreciation (depreciation) | | | 1,251,281 | |
Net realized and unrealized gain | | | 1,686,682 | |
Net increase in net assets resulting from operations | | $ | 1,534,345 | |
* | Relates to Trustees not deemed “interested persons” within the meaning of Section 2(a)(19) of the 1940 Act. |
150 | THE GUGGENHEIM FUNDS ANNUAL REPORT | SEE NOTES TO FINANCIAL STATEMENTS. |
SERIES Z (ALPHA OPPORTUNITY SERIES) | |
STATEMENTS OF CHANGES IN NET ASSETS |
| | Year Ended
December 31,
2016 | | | Year Ended
December 31,
2015 | |
Increase (Decrease) in Net Assets from Operations: | | | | | | |
Net investment loss | | $ | (152,337 | ) | | $ | (282,580 | ) |
Net realized gain on investments | | | 435,401 | | | | 651,047 | |
Net change in unrealized appreciation (depreciation) on investments | | | 1,251,281 | | | | (1,024,889 | ) |
Net increase (decrease) in net assets resulting from operations | | | 1,534,345 | | | | (656,422 | ) |
| | | | | | | | | |
Distributions to shareholders from: | | | | | | | | |
Net realized gains | | | — | | | | (4,910,631 | ) |
Total distributions to shareholders | | | — | | | | (4,910,631 | ) |
| | | | | | | | | |
Capital share transactions: | | | | | | | | |
Proceeds from sale of shares | | | 1,222,864 | | | | 1,135,619 | |
Distributions reinvested | | | — | | | | 4,910,631 | |
Cost of shares redeemed | | | (2,113,031 | ) | | | (3,542,147 | ) |
Net increase (decrease) from capital share transactions | | | (890,167 | ) | | | 2,504,103 | |
Net increase (decrease) in net assets | | | 644,178 | | | | (3,062,950 | ) |
| | | | | | | | | |
Net assets: | | | | | | | | |
Beginning of year | | | 12,548,159 | | | | 15,611,109 | |
End of year | | $ | 13,192,337 | | | $ | 12,548,159 | |
Undistributed net investment income at end of year | | $ | 172,127 | | | $ | 240,404 | |
| | | | | | | | | |
Capital share activity: | | | | | | | | |
Shares sold | | | 70,252 | | | | 57,194 | |
Shares issued from reinvestment of distributions | | | — | | | | 291,605 | |
Shares redeemed | | | (121,346 | ) | | | (163,462 | ) |
Net increase (decrease) in shares | | | (51,094 | ) | | | 185,337 | |
SEE NOTES TO FINANCIAL STATEMENTS. | THE GUGGENHEIM FUNDS ANNUAL REPORT | 151 |
SERIES Z (ALPHA OPPORTUNITY SERIES) | |
This table is presented to show selected data for a share outstanding throughout each period and to assist shareholders in evaluating a Fund’s performance for the periods presented.
| | Year Ended
December 31,
2016 | | | Year Ended
December 31,
2015 | | | Year Ended
December 31,
2014 | | | Year Ended
December 31,
2013 | | | Year Ended
December 31,
2012 | |
Per Share Data | | | | | | | | | | | | | | | |
Net asset value, beginning of period | | $ | 16.59 | | | $ | 27.33 | | | $ | 25.00 | | | $ | 19.55 | | | $ | 17.24 | |
Income (loss) from investment operations: | |
Net investment income (loss)a | | | (.21 | ) | | | (.43 | ) | | | (.43 | ) | | | (.15 | ) | | | (.08 | ) |
Net gain (loss) on investments (realized and unrealized) | | | 2.32 | | | | (.69 | ) | | | 2.76 | | | | 5.60 | | | | 2.36 | |
Payments by affiliates | | | — | | | | — | | | | — | | | | — | | | | .03 | b |
Total from investment operations | | | 2.11 | | | | (1.12 | ) | | | 2.33 | | | | 5.45 | | | | 2.31 | |
Less distributions from: | |
Net realized gains | | | — | | | | (9.62 | ) | | | — | | | | — | | | | — | |
Total distributions | | | — | | | | (9.62 | ) | | | — | | | | — | | | | — | |
Net asset value, end of period | | $ | 18.70 | | | $ | 16.59 | | | $ | 27.33 | | | $ | 25.00 | | | $ | 19.55 | |
| |
Total Returnc | | | 12.79 | % | | | (4.69 | %) | | | 9.36 | % | | | 27.83 | % | | | 13.40 | %b |
Ratios/Supplemental Data | |
Net assets, end of period (in thousands) | | $ | 13,192 | | | $ | 12,548 | | | $ | 15,611 | | | $ | 16,707 | | | $ | 15,571 | |
Ratios to average net assets: | |
Net investment income (loss) | | | (1.18 | %) | | | (2.03 | %) | | | (1.65 | %) | | | (0.69 | %) | | | (0.41 | %) |
Total expenses | | | 2.92 | % | | | 3.54 | % | | | 2.71 | % | | | 3.03 | % | | | 2.22 | % |
Net expensesd,e | | | 2.92 | % | | | 3.46 | % | | | 2.33 | % | | | 2.44 | % | | | 2.22 | % |
Portfolio turnover rate | | | 198 | % | | | 446 | % | | | — | | | | 548 | % | | | 720 | % |
a | Net investment income (loss) per share was computed using average shares outstanding throughout the period. |
b | For the year ended December 31, 2012, 0.17% of the Series total return consisted of a voluntary reimbursement by the Adviser for losses incurred during fund trading. Excluding the item, total return would have been 13.23% for the Series. |
c | Total return does not take into account any of the expenses associated with an investment in variable insurance products. If total return had taken into account these expenses, performance would have been lower. Shares of a series of Guggenheim Variable Funds Trust are available only through the purchase of such products. |
d | Net expense information reflects the expense ratios after expense waivers. |
e | Net expenses may include expenses that are excluded from the expense limitation agreement. Excluding those amounts, the net expense ratios for the periods presented would be: |
12/31/16 | 12/31/15 | 12/31/14 | 12/31/13 | 12/31/12 |
2.35% | 2.35% | 2.32% | 2.35% | 2.06% |
152 | THE GUGGENHEIM FUNDS ANNUAL REPORT | SEE NOTES TO FINANCIAL STATEMENTS. |
NOTES TO FINANCIAL STATEMENTS |
1. Organization and Significant Accounting Policies
Organization
Guggenheim Variable Funds Trust (the “Trust”), a Delaware statutory trust, is registered with the SEC under the Investment Company Act of 1940 (“1940 Act”), as an open-ended investment company of the series type. Each series, in effect, is representing a separate Fund. The Trust is authorized to issue an unlimited number of shares. The Trust accounts for the assets of each Fund separately. At December 31, 2016, the Trust consisted of fourteen funds.
This report covers the Series Series A (StylePlus—Large Core Series), Series D (World Equity Income Series), Series E (Total Return Bond Series), Series F (Floating Rate Strategies Series), Series J (StylePlus—Mid Growth Series), Series N (Managed Asset Allocation Series), Series O (All Cap Value Series), Series P (High Yield Series), Series Q (Small Cap Value Series), Series V (Mid Cap Value Series), Series X (StylePlus—Small Growth Series) and Series Z (Alpha Opportunity Series) (the “Funds”), each a diversified investment company, with the exception of Series B (Large Cap Value Series) and Series Y (StylePlus—Large Growth Series), which are each a non-diversified investment company.
Guggenheim Investments (“GI”) provides advisory services. Guggenheim Funds Distributors, LLC (“GFD”) acts as principal underwriter for the Trust. GI and GFD are affiliated entities.
Significant Accounting Policies
The Funds operate as investment companies and, accordingly, follow the investment company accounting and reporting guidance of the Financial Accounting Standards Board (“FASB”) Accounting Standards Codification Topic 946 Financial Services – Investment Companies.
The following significant accounting policies are in conformity with U.S. generally accepted accounting principles (“U.S. GAAP”) and are consistently followed by the Trust. This requires management to make estimates and assumptions that affect the reported amount of assets and liabilities, contingent assets and liabilities at the date of the financial statements, and the reported amounts of revenues and expenses during the reporting period. Actual results could differ from these estimates. All time references are based on Eastern Time.
The net asset value per share (“NAV”) of a fund is calculated by dividing the market value of the fund’s securities and other assets, less all liabilities, by the number of outstanding shares of the fund.
A. The Board of Trustees of the Funds (the “Board”) has adopted policies and procedures for the valuation of the Funds’ investments (the “Valuation Procedures”). Pursuant to the Valuation Procedures, the Board has delegated to a valuation committee, consisting of representatives from Guggenheim’s investment management, fund administration, legal and compliance departments (the “Valuation Committee”), the day-to-day responsibility for implementing the Valuation Procedures, including, under most circumstances, the responsibility for determining the fair value of the Funds’ securities and/or other assets.
Valuations of the Funds’ securities are supplied primarily by pricing services appointed pursuant to the processes set forth in the Valuation Procedures. The Valuation Committee convenes monthly, or more frequently as needed, to review the valuation of all assets which have been fair valued for reasonableness. The Funds’ officers, through the Valuation Committee and consistent with the monitoring and review responsibilities set forth in the Valuation Procedures, regularly review procedures used and valuations provided by the pricing services.
If the pricing service cannot or does not provide a valuation for a particular investment or such valuation is deemed unreliable, such investment is fair valued by the Valuation Committee.
Equity securities listed on an exchange (New York Stock Exchange (“NYSE”) or American Stock Exchange) are valued at the last quoted sales price as of the close of business on the NYSE, usually 4:00 p.m. on the valuation date. Equity securities listed on the NASDAQ market system are valued at the NASDAQ Official Closing Price on the valuation date, which may not necessarily represent the last sale price. If there has been no sale on such exchange or NASDAQ on a given day, the security is valued at the closing bid price on that day.
Generally, trading in foreign securities markets is substantially completed each day at various times prior to the close of the NYSE. The values of foreign securities are determined as of the close of such foreign markets or the close of the NYSE, if earlier. All investments quoted in foreign currencies are valued in U.S. dollars on the basis of the foreign currency exchange rates prevailing at the close of business. Investments in foreign securities may involve risks not present in domestic investments. The Valuation Committee will determine the current value of such foreign securities by taking into consideration certain factors which may include those discussed above, as well as the following factors, among others: the value of the securities traded on other foreign markets, ADR trading, closed-end fund trading, foreign currency exchange activity, and the trading prices of financial products that are tied to foreign securities. In addition, the Board has authorized the Valuation Committee and GI to use prices and other information supplied by a third party pricing vendor in valuing foreign securities.
| | THE GUGGENHEIM FUNDS ANNUAL REPORT | 153 |
NOTES TO FINANCIAL STATEMENTS (continued) |
Open-end investment companies (“mutual funds”) are valued at their NAV as of the close of business, on the valuation date. Exchange-traded funds (“ETFs”) and closed-end investment companies (“CEFs”) are valued at the last quoted sales price.
U.S. Government securities are valued by either independent pricing services, the last traded fill price, or at the reported bid price at the close of business.
Debt securities with a maturity of greater than 60 days at acquisition are valued at prices that reflect broker-dealer supplied valuations or are obtained from independent pricing services, which may consider the trade activity, treasury spreads, yields or price of bonds of comparable quality, coupon, maturity, and type, as well as prices quoted by dealers who make markets in such securities. Short-term debt securities with a maturity of 60 days or less at acquisition are valued at amortized cost, provided such amount approximates market value.
Typically, loans are valued using information provided by an independent third party pricing service which uses broker quotes in a non-active market.
The value of futures contracts is accounted for using the unrealized gain or loss on the contracts that is determined by marking the contracts to their current realized settlement prices. Financial futures contracts are valued at the 4:00 p.m. price on the valuation date. In the event that the exchange for a specific futures contract closes earlier than 4:00 p.m., the futures contract is valued at the Official Settlement Price of the exchange. However, the underlying securities from which the futures contract value is derived are monitored until 4:00 p.m. to determine if fair valuation would provide a more accurate valuation.
The values of OTC swap agreements entered into by a Fund are accounted for using the unrealized gains or losses on the agreements that are determined by marking the agreements to the last quoted value of the index that the swaps pertain to at the close of the NYSE. The swaps’ values are then adjusted to include dividends accrued, financing charges and/or interest associated with the swap agreements.
The value of equity swaps with custom portfolio baskets shall be computed by using the last exchange sale price for each underlying equity security within the swap agreement. A custom portfolio equity swap will be adjusted to include dividends accrued, financing charges and/or interest, as applicable, under the swap agreement.
Forward foreign currency exchange contracts are valued daily based on the applicable exchange rate of the underlying currency.
Investments for which market quotations are not readily available are fair-valued as determined in good faith by GI under the direction of the Board using methods established or ratified by the Board. Valuations in accordance with these methods are intended to reflect each security’s (or asset’s) “fair value.” Each such determination is based on a consideration of all relevant factors, which are likely to vary from one pricing context to another. Examples of such factors may include, but are not limited to market prices; sale prices; broker quotes; and models which derive prices based on inputs such as prices of securities with comparable maturities and characteristics, or based on inputs such as anticipated cash flows or collateral, spread over Treasuries, and other information analysis.
In connection with futures contracts and other derivative investments, such factors may include obtaining information as to how (a) these contracts and other derivative investments trade in the futures or other derivative markets, respectively, and (b) the securities underlying these contracts and other derivative investments trade in the cash market.
B. Certain U.S. Government and Agency Obligations are traded on a discount basis; the interest rates shown on the Schedules of Investments reflect the effective rates paid at the time of purchase by the Funds. Other securities bear interest at the rates shown, payable at fixed dates through maturity.
C. Senior loans in which the Funds invest generally pay interest rates which are periodically adjusted by reference to a base short-term floating rate, plus a premium. These base lending rates are generally (i) the lending rate offered by one or more major European banks, such as the one-month or three-month London Inter-Bank Offered Rate (LIBOR), (ii) the prime rate offered by one or more major United States banks, or (iii) the bank’s certificate of deposit rate. Senior floating rate interests often require prepayments from excess cash flows or permit the borrower to repay at its election. The rate at which the borrower repays cannot be predicted with accuracy. As a result, the actual remaining maturity may be substantially less than the stated maturities shown. The interest rate indicated is the rate in effect at December 31, 2016.
D. The Funds may purchase and sell interests in securities on a when-issued and delayed delivery basis, with payment and delivery scheduled for a future date. No income accrues to the Funds on such interests or securities in connection with such transactions prior to the date the Funds actually take delivery of such interests or securities. These transactions are subject to market fluctuations and are subject to the risk that the value at delivery may be more or less than the trade date purchase price. Although the Funds will generally purchase these securities with the intention of acquiring such securities, they may sell such securities before the settlement date.
154 | THE GUGGENHEIM FUNDS ANNUAL REPORT | |
NOTES TO FINANCIAL STATEMENTS (continued) |
E. When a Fund engages in a short sale of a security, an amount equal to the proceeds is reflected as an asset and an equivalent liability. The amount of the liability is subsequently marked-to-market to reflect the market value of the short sale. The Fund maintains a segregated account of cash and/or securities as collateral for short sales.
Fees, if any, paid to brokers to borrow securities in connection with short sales are recorded as interest expense. In addition, the Fund must pay out the dividend rate of the equity or coupon rate of the obligation to the lender and record this as an expense. Short dividend or interest expense is a cost associated with the investment objective of short sales transactions, rather than an operational cost associated with the day-to-day management of any mutual fund. The Fund may also receive rebate income from the broker resulting from the investment of the proceeds from securities sold short.
F. Upon entering into a futures contract, a Fund deposits and maintains as collateral such initial margin as required by the exchange on which the transaction is affected. Pursuant to the contract, the Fund agrees to receive from or pay to the broker an amount of cash equal to the daily fluctuation in value of the contract. Such receipts or payments are known as variation margin and are recorded by the Fund as unrealized gains or losses. When the contract is closed, the Fund records a realized gain or loss equal to the difference between the value of the contract at the time it was opened and the value at the time it was closed.
G. Swap agreements are marked-to-market daily and the change, if any, is recorded as unrealized gain or loss. Payments received or made as a result of an agreement or termination of an agreement are recognized as realized gains or losses.
H. Forward foreign currency exchange contracts change in value recorded as unrealized appreciation or depreciation until the contract is closed. When the contract is closed, the Funds record a realized gain or loss equal to the difference between the value at the time the contract was opened and the value at the time it was closed.
I. Security transactions are recorded on the trade date for financial reporting purposes. Realized gains and losses from securities transactions are recorded using the identified cost basis. Proceeds from lawsuits related to investment holdings are recorded as realized gains in the respective Fund. Dividend income is recorded on the ex-dividend date, net of applicable taxes withheld by foreign countries. Taxable non-cash dividends are recorded as dividend income. Interest income, including amortization of premiums and accretion of discounts, is accrued on a daily basis. Interest income also includes paydown gains and losses on mortgage-backed and asset-backed securities and senior and subordinated loans. Amendment fees are earned as compensation for evaluating and accepting changes to the original loan agreement and are recognized when received. Dividend income from REITs is recorded based on the income included in the distributions received from the REIT investments using published REIT classifications, including some management estimates when actual amounts are not available. Distributions received in excess of this estimated amount are recorded as a reduction of the cost of investments or reclassified to capital gains. The actual amounts of income, return of capital, and capital gains are only determined by each REIT after its fiscal year-end, and may differ from the estimated amounts.
J. Distributions of net investment income and net realized gains, if any, are declared and paid at least annually. Normally, all such distributions of a Fund will automatically be reinvested without charge in additional shares of the same Fund. Distributions are recorded on the ex-dividend date and are determined in accordance with income tax regulations which may differ from U.S. GAAP.
K. Expenses directly attributable to a Fund are charged directly to the Fund. Other expenses common to various funds within the fund complex are generally allocated amongst such funds on the basis of average net assets.
L. Under the fee arrangement with the custodian, the Funds may earn credits based on overnight custody cash balances. These credits are utilized to reduce related custodial expenses. The custodian fees disclosed in the Statement of Operations are before the reduction in expense from the related earnings credits, if any. For the year ended December 31, 2016, there were no earnings credits received.
M. The Funds may leave cash overnight in their cash account with the custodian. Periodically, a Fund may have cash due to the custodian bank as an overdraft balance. A fee is incurred on this overdraft, calculated by multiplying the overdraft by a rate based on the federal funds rate, which was 0.55% at December 31, 2016.
N. The accounting records of the Fund are maintained in U.S. dollars. All assets and liabilities initially expressed in foreign currencies are converted into U.S. dollars at prevailing exchange rates. Purchases and sales of investment securities, dividend and interest income, and certain expenses are translated at the rates of exchange prevailing on the respective dates of such transactions. Changes in the relationship of these foreign currencies to the U.S. dollar can significantly affect the value of the investments and earnings of the Funds. Foreign investments may also subject the Funds to foreign government exchange restrictions, expropriation, taxation or other political, social or economic developments, all of which could affect the market and/or credit risk of the investments.
| | THE GUGGENHEIM FUNDS ANNUAL REPORT | 155 |
NOTES TO FINANCIAL STATEMENTS (continued) |
The Funds do not isolate that portion of the results of operations resulting from changes in the foreign exchange rates on investments from the fluctuations arising from changes in the market prices of securities held. Such fluctuations are included with the net realized and unrealized gain or loss on investments.
Reported net realized foreign exchange gains and losses arise from sales of foreign currencies and currency gains or losses realized between the trade and settlement dates on investment transactions. Net unrealized exchange gains and losses arise from changes in the fair values of assets and liabilities other than investments in securities at the fiscal period end, resulting from changes in exchange rates.
O. Under the Funds’ organizational documents, the Trustees and Officers are indemnified against certain liabilities arising out of the performance of their duties to the Trust. In addition, throughout the normal course of business, the Funds enter into contracts that contain a variety of representations and warranties which provide general indemnifications. The Funds’ maximum exposure under these arrangements is unknown, as this would involve future claims that may be made against the Funds and/or their affiliates that have not yet occurred. However, based on experience, the Funds expect the risk of loss to be remote.
2. Financial Instruments and Derivatives
As part of their investment strategy, the Funds utilize short sales and a variety of derivative instruments. These investments involve, to varying degrees, elements of market risk and risks in excess of the amounts recognized in the Statements of Assets and Liabilities. Valuation and accounting treatment of these instruments can be found under Significant Accounting Policies in Note 1 of these Notes to Financial Statements.
Short Sales
A short sale is a transaction in which a Fund sells a security it does not own. If the security sold short decreases in price between the time the Fund sells the security and closes its short position, the Fund will realize a gain on the transaction. Conversely, if the security increases in price during the period, the Fund will realize a loss on the transaction. The risk of such price increases is the principal risk of engaging in short sales.
Derivatives
Derivatives are instruments whose values depend on, or are derived from, in whole or in part, the value of one or more other assets, such as securities, currencies, commodities or indices. Derivative instruments may be used to increase investment flexibility (including to maintain cash reserves while maintaining exposure to certain other assets), for risk management (hedging) purposes, to facilitate trading, to reduce transaction costs and to pursue higher investment returns. Derivative instruments may also be used to mitigate certain investment risks, such as foreign currency exchange rate risk, interest rate risk and credit risk. U.S. GAAP requires disclosures to enable investors to better understand how and why a Fund uses derivative instruments, how these derivative instruments are accounted for and their effects on the Fund’s financial position and results of operations. The Funds may utilize derivatives for the following purposes:
Hedge: an investment made in order to reduce the risk of adverse price movements in a security, by taking an offsetting position to protect against broad market moves.
Index Exposure: the use of an instrument to obtain exposure to a listed or other type of index.
Leverage: gaining total exposure to equities or other assets on the long and short sides at greater than 100% of invested capital.
Speculation: the use of an instrument to express macro-economic and other investment views.
For any Fund whose investment strategy consistently involves applying leverage, the value of the Fund’s shares will tend to increase or decrease more than the value of any increase or decrease in the underlying index or other asset. In addition, because an investment in derivative instruments generally requires a small investment relative to the amount of investment exposure assumed, an opportunity for increased net income is created; but, at the same time, leverage risk will increase. The Fund’s use of leverage, through borrowings or instruments such as derivatives, may cause the Fund to be more volatile and riskier than if they had not been leveraged.
Futures
A futures contract is an agreement to purchase (long) or sell (short) an agreed amount of securities or other instruments at a set price for delivery at a future date. There are significant risks associated with a Fund’s use of futures contracts, including (i) there may be an imperfect or no correlation between the changes in market value of the underlying asset and the prices of futures contracts; (ii) there may not be a liquid secondary market for a futures contract; (iii) trading restrictions or limitations may be imposed by an exchange; and (iv) government regulations may restrict trading in futures contracts. When investing in futures, there is minimal counterparty credit risk to a Fund because futures are exchange-traded and the exchange’s clearinghouse, as counterparty to all exchange-traded futures, guarantees against default. Cash deposits are shown as segregated cash with broker on the Statements of Assets and Liabilities; securities held as collateral are noted on the Schedules of Investments.
156 | THE GUGGENHEIM FUNDS ANNUAL REPORT | |
NOTES TO FINANCIAL STATEMENTS (continued) |
The following table represents the Funds’ use and volume of futures on a quarterly basis:
| | | | Average Notional | |
Fund | Use | | Long | | | Short | |
Series A (StylePlus—Large Core Series) | Index exposure | | $ | 1,499,634 | | | $ | — | |
Series D (World Equity Income Series) | Hedge | | | — | | | | 19,916,907 | |
Series J (StylePlus—Mid Growth Series) | Index exposure | | | 1,595,909 | | | | — | |
Series N (Managed Asset Allocation Series) | Index exposure, Speculation | | | 24,287,385 | | | | 1,289,087 | |
Series X (StylePlus—Small Growth Series) | Index exposure | | | 727,423 | | | | — | |
Series Y (StylePlus—Large Growth Series) | Index exposure | | | 836,456 | | | | — | |
Swaps
A swap is an agreement that obligates two parties to exchange a series of cash flows at specified intervals based upon or calculated by reference to changes in specified prices or rates for a specified amount of an underlying asset. A Fund utilizing OTC swaps bears the risk of loss of the amount expected to be received under a swap agreement in the event of the default or bankruptcy of a swap agreement counterparty or if the underlying asset declines in value. Certain standardized swaps are subject to mandatory central clearing. Central clearing generally reduces counterparty credit risk and increases liquidity, but central clearing does not make swap transactions risk-free. Additionally, there is no guarantee that a Fund or an underlying fund could eliminate its exposure under an outstanding swap agreement by entering into an offsetting swap agreement with the same or another party.
Total return swaps involve commitments where single or multiple cash flows are exchanged based on the price of an underlying reference asset (such as index or basket) or a fixed or variable interest rate. Index swaps will usually be computed based on the current index value as of the close of regular trading on the NYSE or other exchange, with the swap value being adjusted to include dividends accrued, financing charges and/or interest associated with the swap agreement. A fund utilizing a total return index swap bears the risk of loss of the amount expected to be received under a swap agreement in the event of the default or bankruptcy of a swap agreement counterparty or if the underlying index declines in value.
The following table represents the Funds’ use and volume of total return swaps on a quarterly basis:
| | | | Average Notional | |
Fund | Use | | Long | | | Short | |
Series A (StylePlus—Large Core Series) | Index exposure | | $ | 178,751,276 | | | $ | — | |
Series J (StylePlus—Mid Growth Series) | Index exposure | | | 121,762,295 | | | | — | |
Series X (StylePlus—Small Growth Series) | Index exposure | | | 25,475,834 | | | | — | |
Series Y (StylePlus—Large Growth Series) | Index exposure | | | 31,410,970 | | | | — | |
Series Z (Alpha Opportunity Series) | Hedge, Leverage | | | 7,847,683 | | | | 10,518,805 | |
Forward Foreign Currency Exchange Contracts
A forward foreign currency exchange contract is an agreement between two parties to exchange two designated currencies at a specific time in the future. Certain types of contracts may be cash settled, in an amount equal to the change in exchange rates during the term of the contract. The contracts can be used to hedge or manage exposure to foreign currency risks with portfolio investments or to gain exposure to foreign currencies.
The market value of a forward foreign currency exchange contract changes with fluctuations in foreign currency exchange rates. Furthermore, the Funds may be exposed to risk if the counterparties cannot meet the contract terms or if the currency value changes unfavorably as compared to the U.S. dollar.
The following table represents the Funds’ use and volume of forward foreign currency exchange contracts on a quarterly basis:
| | | | Average Settlement | |
Fund | Use | | Purchased | | | Sold | |
Series P (High Yield Series) | Hedge | | $ | 5,093,915 | | | $ | 451,103 | |
| | THE GUGGENHEIM FUNDS ANNUAL REPORT | 157 |
NOTES TO FINANCIAL STATEMENTS (continued) |
Derivative Investment Holdings Categorized by Risk Exposure
The following is a summary of the location of derivative investments on the Funds’ Statements of Assets and Liabilities as of December 31, 2016:
Derivative Investment Type | Asset Derivatives | Liability Derivatives |
Equity/Interest Rate contracts | Variation margin | Variation margin |
| Unrealized appreciation on swap agreements | Unrealized depreciation on swap agreements |
Currency contracts | Variation margin | Variation margin |
| | Unrealized appreciation on forward foreign currency exchange contracts | Unrealized depreciation on forward foreign currency exchange contracts |
The following table sets forth the fair value of the Funds’ derivative investments categorized by primary risk exposure at December 31, 2016:
Asset Derivative Investments Value | |
Fund | | Futures
Equity
Contracts* | | | Swaps
Equity
Contracts | | | Futures
Currency
Contracts* | | | Futures
Interest Rate
Contracts* | | | Forward
Foreign
Currency
Exchange
Contracts | | | Total
Value at
December 31,
2016 | |
Series A (StylePlus—Large Core Series) | | $ | — | | | $ | 6,394,335 | | | $ | — | | | $ | — | | | $ | — | | | $ | 6,394,335 | |
Series D (World Equity Income Series) | | | — | | | | — | | | | 542,919 | | | | — | | | | — | | | | 542,919 | |
Series J (StylePlus—Mid Growth Series) | | | — | | | | 266,722 | | | | — | | | | — | | | | — | | | | 266,722 | |
Series N (Managed Asset Allocation Series) | | | 1,604 | | | | — | | | | 3,005 | | | | — | | | | — | | | | 4,609 | |
Series P (High Yield Series) | | | — | | | | — | | | | — | | | | — | | | | 24,366 | | | | 24,366 | |
Series X (StylePlus—Small Growth Series) | | | — | | | | 916,187 | | | | — | | | | — | | | | — | | | | 916,187 | |
Series Y (StylePlus—Large Growth Series) | | | — | | | | 246,742 | | | | — | | | | — | | | | — | | | | 246,742 | |
Series Z (Alpha Opportunity Series) | | | — | | | | 632,489 | | | | — | | | | — | | | | — | | | | 632,489 | |
Liability Derivative Investments Value | |
| | Futures
Equity
Contracts* | | | Swaps
Equity
Contracts | | | Futures
Currency
Contracts* | | | Futures
Interest Rate
Contracts* | | | Forward Foreign
Currency
Exchange
Contracts | | | Total
Value at
December 31,
2016 | |
Series J (StylePlus—Mid Growth Series) | | $ | 21,233 | | | $ | 283,832 | | | $ | — | | | $ | — | | | $ | — | | | $ | 305,065 | |
Series N (Managed Asset Allocation Series) | | | 162,590 | | | | — | | | | 4,011 | | | | 54,711 | | | | — | | | | 221,312 | |
Series P (High Yield Series) | | | — | | | | — | | | | — | | | | — | | | | 7,284 | | | | 7,284 | |
Series X (StylePlus—Small Growth Series) | | | 4,593 | | | | — | | | | — | | | | — | | | | — | | | | 4,593 | |
Series Y (StylePlus—Large Growth Series) | | | 1,502 | | | | — | | | | — | | | | — | | | | — | | | | 1,502 | |
Series Z (Alpha Opportunity Series) | | | — | | | | 845,661 | | | | — | | | | — | | | | — | | | | 845,661 | |
* | Includes cumulative appreciation (depreciation) of futures contracts as reported on the Schedules of Investments. Only current day’s variation margin is reported within the Statements of Assets and Liabilities. |
The following is a summary of the location of derivative investments on the Funds’ Statements of Operations for the year ended December 31, 2016:
Derivative Investment Type | Location of Gain (Loss) on Derivatives |
Currency contract | Net realized gain (loss) on forward foreign currency exchange contracts |
| | Net change in unrealized appreciation (depreciation) on forward foreign currency exchange contracts |
Equity/Currency/Interest Rate contracts | Net realized gain (loss) on futures contracts |
| | Net change in unrealized appreciation (depreciation) on futures contracts |
Equity/Currency/Interest Rate contracts | Net realized gain (loss) on swap agreements |
| | Net change in unrealized appreciation (depreciation) on swap agreements |
158 | THE GUGGENHEIM FUNDS ANNUAL REPORT | |
NOTES TO FINANCIAL STATEMENTS (continued) |
The following is a summary of the Funds’ realized gain (loss) and change in unrealized appreciation (depreciation) on derivative investments recognized on the Statements of Operations categorized by primary risk exposure for the year ended December 31, 2016:
Realized Gain (Loss) on Derivative Investments Recognized on the Statements of Operations | |
Fund | | Futures
Equity
Contracts | | | Swaps
Equity
Contracts | | | Futures
Currency
Contracts | | | Futures
Interest Rate
Contracts | | | Forward
Foreign
Currency
Exchange
Contracts | | | Total | |
Series A (StylePlus—Large Core Series) | | $ | 73,021 | | | $ | 9,632,638 | | | $ | — | | | $ | — | | | $ | — | | | $ | 9,705,659 | |
Series D (World Equity Income Series) | | | — | | | | — | | | | 115,155 | | | | — | | | | — | | | | 115,155 | |
Series J (StylePlus—Mid Growth Series) | | | 87,196 | | | | 4,489,004 | | | | — | | | | — | | | | — | | | | 4,576,200 | |
Series N (Managed Asset Allocation Series) | | | 1,074,007 | | | | — | | | | 34,189 | | | | 41,571 | | | | — | | | | 1,149,767 | |
Series P (High Yield Series) | | | — | | | | — | | | | — | | | | — | | | | 193,582 | | | | 193,582 | |
Series X (StylePlus—Small Growth Series) | | | 75,998 | | | | 127,254 | | | | — | | | | — | | | | — | | | | 203,252 | |
Series Y (StylePlus—Large Growth Series) | | | (4,413 | ) | | | 1,159,721 | | | | — | | | | — | | | | — | | | | 1,155,308 | |
Series Z (Alpha Opportunity Series) | | | — | | | | (361,892 | ) | | | — | | | | — | | | | — | | | | (361,892 | ) |
Change in Unrealized Appreciation (Depreciation) on Derivative Investments Recognized on the Statements of Operations | |
Operations | | Futures
Equity
Contracts | | | Swaps
Equity
Contracts | | | Futures
Currency
Contracts | | | Futures
Interest Rate
Contracts | | | Forward
Foreign
Currency
Exchange
Contracts | | | Total | |
Series A (StylePlus—Large Core Series) | | $ | 4,381 | | | $ | 9,377,987 | | | $ | — | | | $ | — | | | $ | — | | | $ | 9,382,368 | |
Series D (World Equity Income Series) | | | — | | | | — | | | | 542,919 | | | | — | | | | — | | | | 542,919 | |
Series J (StylePlus—Mid Growth Series) | | | (12,887 | ) | | | 2,750,216 | | | | — | | | | — | | | | — | | | | 2,737,329 | |
Series N (Managed Asset Allocation Series) | | | (152,935 | ) | | | — | | | | 11,992 | | | | (22,511 | ) | | | — | | | | (163,454 | ) |
Series P (High Yield Series) | | | — | | | | — | | | | — | | | | — | | | | (9,533 | ) | | | (9,533 | ) |
Series X (StylePlus—Small Growth Series) | | | (27,399 | ) | | | 2,416,122 | | | | — | | | | — | | | | — | | | | 2,388,723 | |
Series Y (StylePlus—Large Growth Series) | | | (16,114 | ) | | | 799,917 | | | | — | | | | — | | | | — | | | | 783,803 | |
Series Z (Alpha Opportunity Series) | | | — | | | | 27,232 | | | | — | | | | — | | | | — | | | | 27,232 | |
In conjunction with the use of short sales and derivative instruments, the Funds are required to maintain collateral in various forms. The Funds use, where appropriate, depending on the financial instrument utilized and the broker involved, margin deposits at the broker, cash and/or securities segregated at the custodian bank allocated to the Funds.
There are several risks associated with exposure to foreign currencies, foreign issuers and emerging markets. A Fund’s indirect and direct exposure to foreign currencies subjects the Fund to the risk that those currencies will decline in value relative to the U.S. dollar, or in the case of short positions, that the U.S. dollar will decline in value relative to the currency being hedged. Currency rates in foreign countries may fluctuate significantly over short periods of time for a number of reasons, including changes in interest rates and the imposition of currency controls or other political developments in the U.S. or abroad. In addition, the Fund may incur transaction costs in connection with conversions between various currencies. The Fund may, but is not obligated to, engage in currency hedging transactions, which generally involve buying currency forward, options or futures contracts. However, not all currency risks may be effectively hedged, and in some cases the costs of hedging techniques may outweigh expected benefits. In such instances, the value of securities denominated in foreign currencies can change significantly when foreign currencies strengthen or weaken relative to the U.S. dollar.
Certain Funds may invest in securities of foreign companies directly, or in financial instruments, such as ADRs and exchange-traded funds, which are indirectly linked to the performance of foreign issuers. Foreign markets can be more volatile than the U.S. market due to increased risks of adverse issuer, political, regulatory, market, or economic developments and can perform differently from the U.S. market. Investing in securities of foreign companies directly, or in financial instruments that are indirectly linked to the performance of foreign issuers, may involve risks not typically associated with investing in U.S. issuers. The value of securities denominated in foreign currencies, and of dividends from such securities, can change significantly when foreign currencies strengthen or weaken relative to the U.S. dollar. Foreign securities markets generally have less trading volume and less liquidity than U.S. markets, and prices in some foreign markets may fluctuate more than those of securities traded on U.S. markets. Many foreign countries lack accounting and disclosure standards comparable to those that apply to U.S. companies,
| | THE GUGGENHEIM FUNDS ANNUAL REPORT | 159 |
NOTES TO FINANCIAL STATEMENTS (continued) |
and it may be more difficult to obtain reliable information regarding a foreign issuer’s financial condition and operations. Transaction costs and costs associated with custody services are generally higher for foreign securities than they are for U.S. securities. Some foreign governments levy withholding taxes against dividend and interest income. Although in some countries portions of these taxes are recoverable, the non-recovered portion will reduce the income received by the Fund.
The Trust has established counterparty credit guidelines and enters into transactions only with financial institutions of investment grade or better. The Trust monitors the counterparty credit risk.
3. Fees and Other Transactions with Affiliates
Under the terms of an investment advisory contract, the Funds pay GI investment advisory fees calculated at the annualized rates below, based on the average daily net assets of the Funds:
Fund | Management Fees
(as a % of Net Assets) |
Series A (StylePlus—Large Core Series) | 0.75% |
Series B (Large Cap Value Series) | 0.65% |
Series D (World Equity Income Series) | 0.70% |
Series E (Total Return Bond Series) | 0.50% |
Series F (Floating Rate Strategies Series) | 0.65% |
Series J (StylePlus—Mid Growth Series) | 0.75% |
Series N (Managed Asset Allocation Series) | 0.65% |
Series O (All Cap Value Series) | 0.70% |
Series P (High Yield Series) | 0.60% |
Series Q (Small Cap Value Series) | 0.95% |
Series V (Mid Cap Value Series) | 0.75% |
Series X (StylePlus—Small Growth Series) | 0.85% |
Series Y (StylePlus—Large Growth Series) | 0.75% |
Series Z (Alpha Opportunity Series) | 1.25% |
GI engages external service providers to perform other necessary services for the Trust, such as audit and accounting related services, legal services, custody, printing and mailing, etc., on a pass-through basis. Such expenses are allocated to various Funds within the complex based on relative net assets.
Series E (Total Return Bond Series), Series F (Floating Rate Strategies Series), and Series P (High Yield Series) have adopted a Distribution and Shareholder Services Plan pursuant to Rule 12b-1 under the 1940 Act that allows those Funds to pay distribution and shareholder services fees to GFD. The Funds will pay distribution and shareholder services fees to GFD at an annual rate not to exceed 0.25% of average daily net assets. GFD may, in turn, pay all or a portion of the proceeds from the distribution and shareholder services fees to insurance companies or their affiliates and qualified plan administrators (“intermediaries”) for services they provide on behalf of the Funds to current and prospective variable contract owners and qualified plan participants that invest in the Funds through the intermediaries.
The investment advisory contracts for the following Funds provide that the total expenses be limited to a percentage of average net assets for the Funds, exclusive of brokerage costs, dividends on securities sold short, expenses of other investment companies in which a Fund invests, interest, taxes, litigation, indemnification and extraordinary expenses. The limits are listed below:
Fund | Limit | Effective Date | Contract End Date |
Series E (Total Return Bond Series) | 0.81% | 11/30/12 | 05/01/18 |
Series F (Floating Rate Strategies Series) | 1.15% | 04/22/13 | 05/01/18 |
Series O (All Cap Value Series) | 1.00% | 11/30/12 | 05/01/18 |
Series P (High Yield Series) | 1.07% | 10/20/14 | 05/01/18 |
Series Z (Alpha Opportunity Series) | 2.35% | 11/30/12 | 05/01/18 |
160 | THE GUGGENHEIM FUNDS ANNUAL REPORT | |
NOTES TO FINANCIAL STATEMENTS (continued) |
GI is entitled to reimbursement by the Funds for fees waived or expenses reimbursed during any of the previous 36 months, beginning on the date of the expense limitation agreement, if on any day the estimated operating expenses are less than the indicated percentages. At December 31, 2016, the amount of fees waived or expenses reimbursed that are subject to recoupment are presented in the following table:
Fund | | Expires 2017 | | | Expires 2018 | | | Expires 2019 | | | Total | |
Series E (Total Return Bond Series) | | $ | 189,173 | | | $ | 220,171 | | | $ | 182,326 | | | $ | 591,670 | |
Series F (Floating Rate Strategies Series) | | | 36,089 | | | | 52,144 | | | | 18,770 | | | | 107,003 | |
Series O (All Cap Value Series) | | | — | | | | — | | | | — | | | | — | |
Series P (High Yield Series) | | | 14,814 | | | | 30,918 | | | | 30,120 | | | | 75,852 | |
Series Z (Alpha Opportunity Series) | | | 37,727 | | | | 11,875 | | | | — | | | | 49,602 | |
For the year ended December 31, 2016, GI recouped the following amounts:
Fund | | Amount | |
Series O (All Cap Value Series) | | $ | 3,755 | |
Series Z (Alpha Opportunity Series) | | | 21,953 | |
If a Fund invests in an affiliated fund other than the Strategy Funds which pay no management fees, the investing Fund’s adviser has agreed to waive fees at the investing fund level. Fee waivers will be calculated at the investing Fund level without regard to any expense cap, if any, in effect for the investing Fund. Fees waived under this arrangement are not subject to reimbursement to GI. For the year December 31, 2016, the following Fund waived advisory fees related to investments in affiliated funds.
Fund | | Amount | |
Series E (Total Return Bond Series) | | $ | 37,944 | |
Certain trustees and officers of the Trust are also officers of GI and GFD.
On October 4, 2016, Rydex Fund Services, LLC (“RFS”) was purchased by MUFG Investor Services and as of that date RFS ceased to be an affiliate of GI. In connection with its acquisition, RFS changed its name to MUFG Investor Services (US), LLC (“MUIS”). This change had no impact on the financial statements of the Trust.
MUIS acts as the Trust’s administrator, transfer agent and accounting agent. As administrator, transfer agent and accounting agent, MUIS is responsible for maintaining the books and records of the Trust’s securities and cash. For providing the aforementioned administrative and accounting services, MUIS is entitled to receive a monthly fee equal to a percentage of the Funds’ average daily net assets and out of pocket expenses. For providing the aforementioned transfer agent services, MUIS is entitled to receive a monthly fee based on the number of transactions during the month and the number of accounts under management subject to certain minimum monthly fees and out of pocket expenses.
| | THE GUGGENHEIM FUNDS ANNUAL REPORT | 161 |
NOTES TO FINANCIAL STATEMENTS (continued) |
At December 31, 2016, GI and its affiliates owned over twenty percent of the outstanding shares of the Funds, as follows:
Fund | Percent of outstanding shares owned |
Series A (StylePlus—Large Core Series) | 100% |
Series B (Large Cap Value Series) | 100% |
Series D (World Equity Income Series) | 99% |
Series E (Total Return Bond Series) | 70% |
Series J (StylePlus—Mid Growth Series) | 99% |
Series N (Managed Asset Allocation Series) | 98% |
Series O (All Cap Value Series) | 99% |
Series P (High Yield Series) | 76% |
Series Q (Small Cap Value Series) | 94% |
Series V (Mid Cap Value Series) | 98% |
Series X (StylePlus-Small Growth Series) | 98% |
Series Y (StylePlus—Large Growth Series) | 96% |
Series Z (Alpha Opportunity Series) | 100% |
4. Fair Value Measurement
In accordance with U.S. GAAP, fair value is defined as the price that the Funds would receive to sell an investment or pay to transfer a liability in an orderly transaction with an independent buyer in the principal market, or in the absence of a principal market, the most advantageous market for the investment or liability. U.S. GAAP establishes a three-tier fair value hierarchy based on the types of inputs used to value assets and liabilities and requires corresponding disclosure. The hierarchy and the corresponding inputs are summarized below:
Level 1 — | quoted prices in active markets for identical assets or liabilities. |
Level 2 — | significant other observable inputs (for example quoted prices for securities that are similar based on characteristics such as interest rates, prepayment speeds, credit risk, etc.). |
Level 3 — | significant unobservable inputs based on the best information available under the circumstances, to the extent observable inputs are not available, which may include assumptions. |
The types of inputs available depend on a variety of factors, such as the type of security and the characteristics of the markets in which it trades, if any. Fair valuation determinations that rely on fewer or no observable inputs require greater judgment. Accordingly, fair value determinations for Level 3 securities require the greatest amount of judgment.
The inputs or methodologies used for valuing securities are not necessarily an indication of the risk associated with investing in those securities. The suitability of the techniques and sources employed to determine fair valuation are regularly monitored and subject to change.
5. Offsetting
In the normal course of business, the Funds enter into transactions subject to enforceable master netting arrangements or other similar arrangements. Generally, the right to offset in those agreements allows the Funds to counteract the exposure to a specific counterparty with collateral received from or delivered to that counterparty based on the terms of the arrangements. These arrangements provide for the right to liquidate upon the occurrence of an event of default, credit event upon merger or additional termination event.
In order to better define their contractual rights and to secure rights that will help the Funds mitigate their counterparty risk, the Funds may enter into an International Swaps and Derivatives Association, Inc. Master Agreement (“ISDA Master Agreement”) or similar agreement with their derivative contract counterparties. An ISDA Master Agreement is a bilateral agreement between a Fund and a counterparty that governs OTC derivatives, including foreign exchange contracts, and typically contains, among other things, collateral posting terms and netting provisions in the event of a default and/or termination event. The provisions of the ISDA Master Agreement typically permit a single net payment in the event of a default (close-out netting) or similar event, including the bankruptcy or insolvency of the counterparty.
162 | THE GUGGENHEIM FUNDS ANNUAL REPORT | |
NOTES TO FINANCIAL STATEMENTS (continued) |
For derivatives traded under an ISDA Master Agreement, the collateral requirements are typically calculated by netting the mark-to-market amount for each transaction under such agreement and comparing that amount to the value of any collateral currently pledged by the Funds and the counterparty. For financial reporting purposes, cash collateral that has been pledged to cover obligations of the Funds and cash collateral received from the counterparty, if any, are reported separately on the Statements of Assets and Liabilities as segregated cash with broker/receivable for variation margin, or payable for swap settlement/variation margin. Generally, the amount of collateral due from or to a counterparty must exceed a minimum transfer amount threshold (e.g., $300,000) before a transfer is required to be made. To the extent amounts due to the Funds from their counterparties are not fully collateralized, contractually or otherwise, the Funds bear the risk of loss from counterparty nonperformance. The Funds attempt to mitigate counterparty risk by only entering into agreements with counterparties that they believe to be of good standing and by monitoring the financial stability of those counterparties.
For financial reporting purposes, the Funds do not offset derivative assets and derivative liabilities that are subject to netting arrangements in the Statements of Assets and Liabilities.
The following tables present derivative financial instruments and secured financing transactions that are subject to enforceable netting arrangements and offset in the Statements of Assets and Liabilities in conformity with U.S. GAAP:
| | | | | | | | | | | | | Gross Amounts Not Offset
in the Statements of
Assets and Liabilities | | | | |
Fund | Instrument | | Gross
Amounts of
Recognized
Assets1 | | | Gross
Amounts
Offset In the
Statements
of Assets and
Liabilities | | | Net Amount
of Assets
Presented on the Statements
of Assets and
Liabilities | | | Financial
Instruments | | | Cash
Collateral
Received | | | Net
Amount | |
Series A (StylePlus—Large Core Series) | Swap equity contracts | | $ | 6,394,335 | | | $ | — | | | $ | 6,394,335 | | | $ | — | | | $ | 6,394,355 | | | $ | — | |
Series J (StylePlus—Mid Growth Series) | Swap equity contracts | | | 266,722 | | | | — | | | | 266,722 | | | | — | | | | 266,722 | | | | — | |
Series P (High Yield Series) | Forward foreign currency exchange contracts | | | 24,366 | | | | — | | | | 24,366 | | | | 2,486 | | | | — | | | | 21,880 | |
Series X (StylePlus—Small Growth Series) | Swap equity contracts | | | 916,187 | | | | — | | | | 916,187 | | | | — | | | | 916,187 | | | | — | |
Series Y (StylePlus—Large Growth Series) | Swap equity contracts | | | 246,742 | | | | — | | | | 246,742 | | | | — | | | | 246,742 | | | | — | |
Series Z (Alpha Opportunity Series) | Swap equity contracts | | | 632,489 | | | | — | | | | 632,489 | | | | 632,489 | | | | — | | | | — | |
| | | | | | | | | | | | | Gross Amounts Not Offset
in the Statements of
Assets and Liabilities | | | | |
Fund | Instrument | | Gross
Amounts of
Recognized
Liabilities1 | | | Gross
Amounts
Offset In the
Statements
of Assets and
Liabilities | | | Net Amount
of Liabilities
Presented on the Statements
of Assets and
Liabilities | | | Financial
Instruments | | | Cash
Collateral
Pledged | | | Net
Amount | |
Series J (StylePlus—Mid Growth Series) | Swap equity contracts | | $ | 283,832 | | | $ | — | | | $ | 283,832 | | | $ | — | | | $ | — | | | $ | 283,832 | |
Series P (High Yield Series) | Forward foreign currency exchange contracts | | | 7,284 | | | | — | | | | 7,284 | | | | 2,486 | | | | — | | | | 4,798 | |
Series Z (Alpha Opportunity Series) | Swap equity contracts | | | 845,661 | | | | — | | | | 845,661 | | | | 845,661 | | | | — | | | | — | |
1 | Exchange-traded futures are excluded from these reported amounts. |
| | THE GUGGENHEIM FUNDS ANNUAL REPORT | 163 |
NOTES TO FINANCIAL STATEMENTS (continued) |
6. Federal Income Tax Information
The Funds intend to comply with the provisions of Subchapter M of the Internal Revenue Code applicable to regulated investment companies and will distribute substantially all taxable net investment income and capital gains sufficient to relieve the Funds from all, or substantially all, federal income, excise and state income taxes. Therefore, no provision for federal or state income tax is required.
Tax positions taken or expected to be taken in the course of preparing the Funds’ tax returns are evaluated to determine whether the tax positions are “more-likely-than-not” of being sustained by the applicable tax authority. Tax positions not deemed to meet the more-likely-than-not threshold would be recorded as a tax benefit or expense in the current year. Management has analyzed the Funds’ tax positions taken, or to be taken, on federal income tax returns for all open tax years, and has concluded that no provision for income tax is required in the Funds’ financial statements. The Funds’ federal tax returns are subject to examination by the Internal Revenue Service for a period of three years after they are filed.
Tax basis capital losses in excess of capital gains are carried forward to offset future net capital gains. For the year ended December 31, 2016, the following capital loss carryforward amounts were expired or used:
Fund | | Expired | | | Utilized | | | Total | |
Series A (StylePlus—Large Core Series) | | $ | — | | | $ | 8,855,698 | | | $ | 8,855,698 | |
Series B (Large Cap Value Series) | | | — | | | | 10,999,919 | | | | 10,999,919 | |
Series D (World Equity Income Series) | | | 37,118,185 | | | | — | | | | 37,118,185 | |
Series E (Total Return Bond Series) | | | — | | | | 989,257 | | | | 989,257 | |
Series J (StylePlus—Mid Growth Series) | | | | | | | 5,262,620 | | | | 5,262,620 | |
Series X (StylePlus—Small Growth Series) | | | 1,350,266 | | | | 105,232 | | | | 1,455,498 | |
Series Y (StylePlus—Large Growth Series) | | | 133,127 | | | | 1,465,148 | | | | 1,598,275 | |
Series Z (Alpha Opportunity Series) | | | 1,131,138 | | | | 430,335 | | | | 1,561,473 | |
The tax character of distributions paid during the year ended December 31, 2016 was as follows:
Fund | | Ordinary
Income | | | Long-Term
Capital Gain | | | Total
Distributions | |
Series A (StylePlus—Large Core Series) | | $ | 1,891,371 | | | $ | 2,234,605 | | | $ | 4,125,976 | |
Series B (Large Cap Value Series) | | | 4,101,267 | | | | 3,255,199 | | | | 7,356,466 | |
Series D (World Equity Income Series) | | | 4,893,739 | | | | — | | | | 4,893,739 | |
Series E (Total Return Bond Series) | | | 5,293,814 | | | | — | | | | 5,293,814 | |
Series F (Floating Rate Strategies Series) | | | 2,003,594 | | | | 66,528 | | | | 2,070,122 | |
Series J (StylePlus—Mid Growth Series) | | | 1,026,057 | | | | 863,754 | | | | 1,889,811 | |
Series N (Managed Asset Allocation Series) | | | 633,385 | | | | 1,011,391 | | | | 1,644,776 | |
Series O (All Cap Value Series) | | | 1,790,127 | | | | 4,633,656 | | | | 6,423,783 | |
Series P (High Yield Series) | | | 6,102,500 | | | | — | | | | 6,102,500 | |
Series Q (Small Cap Value Series) | | | 111,618 | | | | 7,824,673 | | | | 7,936,291 | |
Series V (Mid Cap Value Series) | | | 2,053,048 | | | | 21,634,815 | | | | 23,687,863 | |
Series X (StylePlus—Small Growth Series) | | | 1,663,755 | | | | 309,723 | | | | 1,973,478 | |
Series Y (StylePlus—Large Growth Series) | | | 1,069,061 | | | | 528,876 | | | | 1,597,937 | |
Series Z (Alpha Opportunity Series) | | | — | | | | — | | | | — | |
164 | THE GUGGENHEIM FUNDS ANNUAL REPORT | |
NOTES TO FINANCIAL STATEMENTS (continued) |
The tax character of distributions paid during the year ended December 31, 2015 was as follows:
Fund | | Ordinary
Income | | | Long-Term
Capital Gain | | | Total
Distributions | |
Series A (StylePlus—Large Core Series) | | $ | 20,903,046 | | | $ | 2,317,549 | | | $ | 23,220,595 | |
Series B (Large Cap Value Series) | | | 2,928,952 | | | | 37,933,710 | | | | 40,862,662 | |
Series D (World Equity Income Series) | | | 5,474,029 | | | | — | | | | 5,474,029 | |
Series E (Total Return Bond Series) | | | 2,550,797 | | | | — | | | | 2,550,797 | |
Series F (Floating Rate Strategies Series) | | | 1,637,353 | | | | 30,834 | | | | 1,668,187 | |
Series J (StylePlus—Mid Growth Series) | | | 12,182,643 | | | | 950,341 | | | | 13,132,984 | |
Series N (Managed Asset Allocation Series) | | | 538,173 | | | | — | | | | 538,173 | |
Series O (All Cap Value Series) | | | 1,281,376 | | | | 16,826,249 | | | | 18,107,625 | |
Series P (High Yield Series) | | | 8,426,705 | | | | 1,226,164 | | | | 9,652,869 | |
Series Q (Small Cap Value Series) | | | 176,778 | | | | 18,343,396 | | | | 18,520,174 | |
Series V (Mid Cap Value Series) | | | 2,218,484 | | | | 37,389,651 | | | | 39,608,135 | |
Series X (StylePlus—Small Growth Series) | | | 304,934 | | | | 109,624 | | | | 414,558 | |
Series Y (StylePlus—Large Growth Series) | | | 2,811,784 | | | | 257,395 | | | | 3,069,179 | |
Series Z (Alpha Opportunity Series) | | | — | | | | 4,910,631 | | | | 4,910,631 | |
The tax character of distributable earnings/(accumulated losses) at December 31, 2016 was as follows:
Fund | | Undistributed
Ordinary
Income | | | Undistributed
Long-Term
Capital Gain | | | Accumulated
Capital and
Other Losses | | | Net Unrealized
Appreciation/(Depreciation) | | | Other
Temporary
Differences | |
Series A (StylePlus—Large Core Series) | | $ | 5,241,216 | | | $ | 804,516 | | | $ | (8,648,924 | ) | | $ | 8,958,612 | | | $ | — | |
Series B (Large Cap Value Series) | | | 3,482,075 | | | | 7,255,270 | | | | (2,375,815 | ) | | | 48,938,049 | | | | — | |
Series D (World Equity Income Series) | | | 4,759,868 | | | | — | | | | (16,540,707 | ) | | | 7,828,102 | | | | — | |
Series E (Total Return Bond Series) | | | 5,311,377 | | | | — | | | | (6,586,955 | ) | | | (1,969,553 | ) | | | — | |
Series F (Floating Rate Strategies Series) | | | 1,683,851 | | | | — | | | | (469,037 | ) | | | 6,188 | | | | — | |
Series J (StylePlus—Mid Growth Series) | | | 1,632,442 | | | | — | | | | (9,045,652 | ) | | | 659,057 | | | | — | |
Series N (Managed Asset Allocation Series) | | | 1,203,136 | | | | 660,699 | | | | — | | | | 8,201,977 | | | | — | |
Series O (All Cap Value Series) | | | 3,054,847 | | | | 7,279,210 | | | | — | | | | 24,183,723 | | | | — | |
Series P (High Yield Series) | | | 4,444,487 | | | | — | | | | (3,198,235 | ) | | | (1,107,350 | ) | | | (71,792 | ) |
Series Q (Small Cap Value Series) | | | 2,055,296 | | | | 1,844,335 | | | | — | | | | 19,009,870 | | | | — | |
Series V (Mid Cap Value Series) | | | 3,916,246 | | | | 2,570,697 | | | | — | | | | 43,864,845 | | | | — | |
Series X (StylePlus—Small Growth Series) | | | 268,704 | | | | — | | | | (1,455,499 | ) | | | 1,422,278 | | | | — | |
Series Y (StylePlus—Large Growth Series) | | | 436,940 | | | | — | | | | (1,598,274 | ) | | | 665,819 | | | | — | |
Series Z (Alpha Opportunity Series) | | | — | | | | — | | | | — | | | | 484,410 | | | | — | |
| | THE GUGGENHEIM FUNDS ANNUAL REPORT | 165 |
NOTES TO FINANCIAL STATEMENTS (continued) |
For Federal income tax purposes, capital loss carryforwards represent realized losses of the Funds that may be carried forward and applied against future capital gains. For taxable years beginning on or before December 22, 2010, such capital losses may be carried forward for a maximum of eight years. Under the RIC Modernization Act of 2010, the Funds are permitted to carry forward capital losses incurred in taxable years beginning after December 22, 2010 for an unlimited period. However, any losses incurred during those taxable years must be utilized prior to the losses incurred in pre-enactment taxable years. As a result of this ordering rule, pre-enactment capital loss carryforwards may be more likely to expire unused. Additionally, post-enactment capital losses that are carried forward will retain their character as either short-term or long-term capital losses rather than being considered all short-term as under previous law. As of December 31, 2016, capital loss carryforwards for the Funds were as follows:
| | | | | | | | | Unlimited | | | | |
Fund | | Expires in 2017 | | | Expires in 2018 | | | Short-Term | | | Long-Term | | | Capital Loss Carryforward | |
Series A (StylePlus—Large Core Series) | | $ | (8,648,924 | ) | | $ | — | | | $ | — | | | $ | — | | | $ | (8,648,924 | ) |
Series B (Large Cap Value Series) | | | (2,375,815 | ) | | | — | | | | — | | | | — | | | | (2,375,815 | ) |
Series D (World Equity Income Series) | | | (15,850,751 | ) | | | — | | | | (689,956 | ) | | | — | | | | (16,540,707 | ) |
Series E (Total Return Bond Series) | | | (6,226,799 | ) | | | (360,156 | ) | | | — | | | | — | | | | (6,586,955 | ) |
Series F (Floating Rate Strategies Series) | | | — | | | | — | | | | (19,419 | ) | | | (449,618 | ) | | | (469,037 | ) |
Series J (StylePlus—Mid Growth Series) | | | (9,045,652 | ) | | | — | | | | — | | | | — | | | | (9,045,652 | ) |
Series P (High Yield Series) | | | — | | | | — | | | | — | | | | (3,198,235 | ) | | | (3,198,235 | ) |
Series X (StylePlus—Small Growth Series) | | | (1,455,499 | ) | | | — | | | | — | | | | — | | | | (1,455,499 | ) |
Series Y (StylePlus—Large Growth Series) | | | (1,598,274 | ) | | | — | | | | — | | | | — | | | | (1,598,274 | ) |
Net investment income and net realized gains (losses) may differ for financial statement and tax purposes because of temporary or permanent book/tax differences. These differences are primarily due to wash sales, return of capital on investments, foreign currency gains and losses, bond premium/discount adjustments, bond bifurcation, accruals on defaulted bonds, short dividend expenses, REIT adjustments, PFIC adjustments, market discount reclasses, equity to debt sales adjustments, equalization accounting and CLO adjustments. Additional differences may result from the tax treatment of net investment losses and expired capital loss carryforwards. To the extent these differences are permanent, reclassifications are made to the appropriate equity accounts in the period that the differences arise. These reclassifications have no effect on net assets or NAV.
Fund | | Paid-In Capital | | | Undistributed
Net Investment
Income | | | Accumulated
Net Realized
Gain/(Loss) | |
Series A (StylePlus—Large Core Series) | | $ | — | | | $ | (27,470 | ) | | $ | 27,470 | |
Series B (Large Cap Value Series) | | | 137,949 | | | | 20,174 | | | | (158,123 | ) |
Series D (World Equity Income Series) | | | (37,118,185 | ) | | | (20,369 | ) | | | 37,138,554 | |
Series E (Total Return Bond Series) | | | — | | | | 1,308,974 | | | | (1,308,974 | ) |
Series F (Floating Rate Strategies Series) | | | (1 | ) | | | (18,986 | ) | | | 18,987 | |
Series J (StylePlus—Mid Growth Series) | | | (1 | ) | | | — | | | | 1 | |
Series N (Managed Asset Allocation Series) | | | 254,128 | | | | 2,056 | | | | (256,184 | ) |
Series O (All Cap Value Series) | | | 1,074,778 | | | | — | | | | (1,074,778 | ) |
Series P (High Yield Series) | | | (2 | ) | | | (352,220 | ) | | | 352,222 | |
Series Q (Small Cap Value Series) | | | 568,930 | | | | (5,575 | ) | | | (563,355 | ) |
Series V (Mid Cap Value Series) | | | 1,848,812 | | | | — | | | | (1,848,812 | ) |
Series X (StylePlus—Small Growth Series) | | | (1,350,266 | ) | | | — | | | | 1,350,266 | |
Series Y (StylePlus—Large Growth Series) | | | (133,127 | ) | | | — | | | | 133,127 | |
Series Z (Alpha Opportunity Series) | | | (1,330,146 | ) | | | 84,060 | | | | 1,246,086 | |
166 | THE GUGGENHEIM FUNDS ANNUAL REPORT | |
NOTES TO FINANCIAL STATEMENTS (continued) |
At December 31, 2016, the identified cost of investments in securities owned by each Fund for Federal income tax purposes and the gross unrealized appreciation and depreciation were as follows:
Fund | | Tax Cost | | | Tax
Unrealized Gain | | | Tax
Unrealized Loss | | | Net Unrealized
Gain/(Loss) | |
Series A (StylePlus—Large Core Series) | | $ | 221,931,881 | | | $ | 3,751,904 | | | $ | (1,187,627 | ) | | $ | 2,564,277 | |
Series B (Large Cap Value Series) | | | 211,359,910 | | | | 52,122,441 | | | | (3,184,392 | ) | | | 48,938,049 | |
Series D (World Equity Income Series) | | | 150,133,196 | | | | 14,297,744 | | | | (6,439,552 | ) | | | 7,858,192 | |
Series E (Total Return Bond Series) | | | 126,775,226 | | | | 2,724,841 | | | | (4,694,394 | ) | | | (1,969,553 | ) |
Series F (Floating Rate Strategies Series) | | | 57,860,689 | | | | 373,693 | | | | (367,753 | ) | | | 5,940 | |
Series J (StylePlus—Mid Growth Series) | | | 166,122,282 | | | | 2,081,922 | | | | (1,405,755 | ) | | | 676,167 | |
Series N (Managed Asset Allocation Series) | | | 44,511,237 | | | | 8,538,827 | | | | (335,845 | ) | | | 8,202,982 | |
Series O (All Cap Value Series) | | | 104,302,500 | | | | 26,438,447 | | | | (2,254,724 | ) | | | 24,183,723 | |
Series P (High Yield Series) | | | 101,647,094 | | | | 2,604,373 | | | | (4,005,638 | ) | | | (1,401,265 | ) |
Series Q (Small Cap Value Series) | | | 88,554,612 | | | | 22,521,107 | | | | (3,511,237 | ) | | | 19,009,870 | |
Series V (Mid Cap Value Series) | | | 204,828,879 | | | | 51,604,132 | | | | (7,739,287 | ) | | | 43,864,845 | |
Series X (StylePlus—Small Growth Series) | | | 33,547,705 | | | | 861,846 | | | | (355,755 | ) | | | 506,091 | |
Series Y (StylePlus—Large Growth Series) | | | 38,422,774 | | | | 635,068 | | | | (215,990 | ) | | | 419,078 | |
Series Z (Alpha Opportunity Series) | | | 12,686,718 | | | | 1,120,088 | | | | (335,993 | ) | | | 784,095 | |
7. Securities Transactions
For the year ended December 31, 2016, the cost of purchases and proceeds from sales of investment securities, excluding government securities, short-term investments and derivatives, were as follows:
Fund | | Purchases | | | Sales | |
Series A (StylePlus—Large Core Series) | | $ | 87,396,772 | | | $ | 89,293,674 | |
Series B (Large Cap Value Series) | | | 101,661,644 | | | | 121,503,414 | |
Series D (World Equity Income Series) | | | 67,582,656 | | | | 79,506,051 | |
Series E (Total Return Bond Series) | | | 66,639,211 | | | | 67,554,127 | |
Series F (Floating Rate Strategies Series) | | | 26,610,665 | | | | 28,592,058 | |
Series J (StylePlus—Mid Growth Series) | | | 93,302,814 | | | | 79,028,978 | |
Series N (Managed Asset Allocation Series) | | | 3,224,761 | | | | 5,748,979 | |
Series O (All Cap Value Series) | | | 54,702,152 | | | | 69,189,005 | |
Series P (High Yield Series) | | | 80,705,623 | | | | 64,440,658 | |
Series Q (Small Cap Value Series) | | | 61,842,875 | | | | 67,224,287 | |
Series V (Mid Cap Value Series) | | | 127,442,320 | | | | 134,730,717 | |
Series X (StylePlus—Small Growth Series) | | | 23,988,426 | | | | 29,998,078 | |
Series Y (StylePlus—Large Growth Series) | | | 14,956,647 | | | | 17,753,423 | |
Series Z (Alpha Opportunity Series) | | | 32,078,958 | | | | 29,720,157 | |
For the year ended December 31, 2016, the cost of purchases and proceeds from the sales of government securities were as follows:
Fund | | Purchases | | | Sales | |
Series E (Total Return Bond Series) | | $ | 42,140,289 | | | $ | 38,046,633 | |
| | THE GUGGENHEIM FUNDS ANNUAL REPORT | 167 |
NOTES TO FINANCIAL STATEMENTS (continued) |
The Funds are permitted to purchase or sell securities from or to certain affiliated funds under specified conditions outlined in procedures adopted by the Board of the Trust. The procedures have been designed to ensure that any purchase or sale of securities by a Fund from or to another fund or portfolio that is or could be considered an affiliate by virtue of having a common investment adviser (or affiliated investment advisers), common Trustees and/or common officers complies with Rule 17a-7 of the 1940 Act. Further, as defined under these procedures, each transaction is effected at the current market price to save costs, where permissible. For the year ended December 31, 2016, the Funds engaged in purchases and sales of securities, pursuant to Rule 17a-7 of the 1940 Act, as follows:
Fund | | Purchases | | | Sales | | | Realized
Gain | |
Series E (Total Return Bond Series) | | $ | 918,174 | | | $ | 26,016 | | | $ | 1,016 | |
Series P (High Yield Series) | | | 3,386,219 | | | | 6,736,938 | | | | 28,117 | |
8. Affiliated Transactions
Investments representing 5% or more of the outstanding voting shares of a portfolio company of a fund, or control of or by, or common control under GI, result in that portfolio company being considered an affiliated company of such fund, as defined in the 1940 Act.
The Funds may invest in the Guggenheim Strategy Funds Trust consisting of Guggenheim Strategy Fund I, Guggenheim Strategy Fund II, Guggenheim Strategy Fund III, and Guggenheim Variable Insurance Strategy Fund III (collectively, the “Cash Management Funds”), open-end management investment companies managed by GI. The Cash Management Funds, which launched on March 11, 2014, are offered as cash management options only to mutual funds, trusts, and other accounts managed by GI and/or its affiliates, and are not available to the public. The Cash Management Funds pay no investment management fees. The Cash Management Funds’ annual report on Form N-CSR dated September 30, 2016, is available publicly or upon request. This information is available from the EDGAR database on the SEC’s website at https://www.sec.gov/Archives/edgar/data/1601445/000089180416001923/gug65857-ncsr.htm.
Transactions during the year ended December 31, 2016, in which the portfolio company is an “affiliated person,” were as follows:
Affiliated issuers by Fund | | Value
12/31/15 | | | Additions | | | Reductions | | | Value
12/31/16 | | | Shares
12/31/16 | | | Investment
Income | | | Realized
Gain (Loss) | | | Capital Gain
Distributions | |
Series A (StylePlus—Large Core Series) | | | | | | | | | | | | | | | | | | | | | | | | |
Guggenheim Strategy Fund I | | $ | 33,290,070 | | | $ | 13,221,781 | | | $ | (24,706,177 | ) | | $ | 21,897,209 | | | | 875,888 | | | $ | 320,635 | | | $ | (31,125 | ) | | $ | — | |
Guggenheim Strategy Fund II | | | 53,725,999 | | | | 9,212,062 | | | | (6,000,000 | ) | | | 57,260,566 | | | | 2,295,013 | | | | 1,214,067 | | | | (60,778 | ) | | | — | |
Guggenheim Strategy Fund III | | | 31,299,067 | | | | 4,439,755 | | | | — | | | | 36,004,831 | | | | 1,441,924 | | | | 940,241 | | | | — | | | | — | |
Guggenheim Variable Insurance Strategy Fund III | | | 56,599,406 | | | | 1,456,757 | | | | — | | | | 58,544,462 | | | | 2,338,972 | | | | 1,458,262 | | | | — | | | | — | |
| | | $ | 174,914,542 | | | $ | 28,330,355 | | | $ | (30,706,177 | ) | | $ | 173,707,068 | | | | | | | $ | 3,933,205 | | | $ | (91,903 | ) | | $ | — | |
| | | | | | | | | | | | | | | | | | | | | | | | | | | | | | | | | |
Series E (Total Return Bond Series) | | | | | | | | | | | | | | | | | | | | | | | | | | | | | | | | |
Guggenheim Floating Rate Strategies Fund - Institutional Class | | $ | 3,209,978 | | | $ | 2,925 | | | $ | (3,212,904 | ) | | $ | — | | | | — | | | $ | 3,847 | | | $ | (68,225 | ) | | $ | — | |
Guggenheim BulletShares 2019 High Yield Corporate Bond ETF | | | 1,923,026 | | | | — | | | | (1,877,306 | ) | | | — | | | | — | | | | — | | | | (123,530 | ) | | | — | |
Guggenheim Strategy Fund I | | | — | | | | 3,048,053 | | | | — | | | | 3,064,585 | | | | 122,583 | | | | 47,811 | | | | — | | | | — | |
Guggenheim Limited Duration Fund - Institutional Class | | | 4,993,596 | | | | 65,767 | | | | (3,000,000 | ) | | | 2,074,867 | | | | 84,139 | | | | 66,108 | | | | (44,262 | ) | | | 362 | |
Guggenheim Total Return Bond Fund - Institutional Class | | | 9,977,489 | | | | 247,820 | | | | (5,000,000 | ) | | | 5,317,937 | | | | 201,056 | | | | 227,106 | | | | (86,972 | ) | | | 22,479 | |
| | | $ | 20,104,089 | | | $ | 3,364,565 | | | $ | (13,090,210 | ) | | $ | 10,457,389 | | | | | | | $ | 344,872 | | | $ | (322,989 | ) | | $ | 22,841 | |
168 | THE GUGGENHEIM FUNDS ANNUAL REPORT | |
NOTES TO FINANCIAL STATEMENTS (continued) |
Affiliated issuers by Fund | | Value
12/31/15 | | | Additions | | | Reductions | | | Value
12/31/16 | | | Shares
12/31/16 | | | Investment
Income | | | Realized
Gain (Loss) | | | Capital Gain
Distributions | |
Series J (StylePlus—Mid Growth Series) | | | | | | | | | | | | | | | | | | | | | | |
Guggenheim Strategy Fund I | | $ | 27,663,301 | | | $ | 25,302,809 | | | $ | (29,497,546 | ) | | $ | 23,566,676 | | | | 942,667 | | | $ | 271,475 | | | $ | 21,262 | | | $ | — | |
Guggenheim Strategy Fund II | | | 35,011,598 | | | | 708,228 | | | | (4,000,000 | ) | | | 31,890,964 | | | | 1,278,195 | | | | 710,101 | | | | (46,930 | ) | | | — | |
Guggenheim Strategy Fund III | | | 18,984,975 | | | | 12,444,018 | | | | — | | | | 31,629,271 | | | | 1,266,691 | | | | 642,964 | | | | — | | | | — | |
Guggenheim Variable Insurance Strategy Fund III | | | 38,430,993 | | | | 3,339,741 | | | | — | | | | 42,142,748 | | | | 1,683,690 | | | | 1,040,427 | | | | — | | | | — | |
| | | $ | 120,090,867 | | | $ | 41,794,796 | | | $ | (33,497,546 | ) | | $ | 129,229,659 | | | | | | | $ | 2,664,967 | | | $ | (25,668 | ) | | $ | — | |
| | | | | | | | | | | | | | | | | | | | | | | | | | | | | | | | | |
Series N (Managed Asset Allocation Series) | | | | | | | | | | | | | | | | | | | | | | | | | | | | | |
Guggenheim Strategy Fund I | | $ | 1,424,053 | | | $ | 21,929 | | | $ | (500,000 | ) | | $ | 953,501 | | | | 38,140 | | | $ | 21,877 | | | $ | 600 | | | $ | — | |
Guggenheim Strategy Fund II | | | 1,641,155 | | | | 36,589 | | | | — | | | | 1,687,827 | | | | 67,648 | | | | 36,657 | | | | — | | | | — | |
Guggenheim Strategy Fund III | | | 1,646,124 | | | | 2,099,157 | | | | — | | | | 3,770,765 | | | | 151,012 | | | | 98,926 | | | | — | | | | — | |
Guggenheim Variable Insurance Strategy Fund III | | | 12,223,431 | | | | 266,585 | | | | (3,050,000 | ) | | | 9,523,812 | | | | 380,496 | | | | 267,337 | | | | (15,308 | ) | | | — | |
| | | $ | 16,934,763 | | | $ | 2,424,260 | | | $ | (3,550,000 | ) | | $ | 15,935,905 | | | | | | | $ | 424,797 | | | $ | (14,708 | ) | | $ | — | |
| | | | | | | | | | | | | | | | | | | | | | | | | | | | | | | | | |
Series V (Mid Cap Value Series) | | | | | | | | | | | | | | | | | | | | | | | | | | | | | | | | |
HydroGen Corp. | | $ | 1 | | | $ | — | | | $ | — | | | $ | 1 | | | | 672,346 | | | $ | — | | | $ | — | | | $ | — | |
| | | | | | | | | | | | | | | | | | | | | | | | | | | | | | | | | |
Series X (StylePlus—Small Growth Series) | | | | | | | | | | | | | | | | | | | | | | | | | | | | | |
Guggenheim Strategy Fund I | | $ | 7,807,121 | | | $ | 8,057,612 | | | $ | (11,767,944 | ) | | $ | 4,121,230 | | | | 164,849 | | | $ | 52,499 | | | $ | 17,934 | | | $ | — | |
Guggenheim Strategy Fund II | | | 6,880,775 | | | | 471,816 | | | | (2,900,000 | ) | | | 4,470,690 | | | | 179,186 | | | | 97,385 | | | | (18,372 | ) | | | — | |
Guggenheim Strategy Fund III | | | 8,000,373 | | | | 883,369 | | | | — | | | | 8,949,495 | | | | 358,410 | | | | 233,531 | | | | — | | | | — | |
Guggenheim Variable Insurance Strategy Fund III | | | 9,206,097 | | | | 213,801 | | | | (1,000,000 | ) | | | 8,484,186 | | | | 338,961 | | | | 214,190 | | | | (13,377 | ) | | | — | |
| | | $ | 31,894,366 | | | $ | 9,626,598 | | | $ | (15,667,944 | ) | | $ | 26,025,601 | | | | | | | $ | 597,605 | | | $ | (13,815 | ) | | $ | — | |
| | | | | | | | | | | | | | | | | | | | | | | | | | | | | | | | | |
Series Y (StylePlus—Large Growth Series) | | | | | | | | | | | | | | | | | | | | | | | | | | | | | |
Guggenheim Strategy Fund I | | $ | 8,784,283 | | | $ | 818,354 | | | $ | (7,517,289 | ) | | $ | 2,098,122 | | | | 83,925 | | | $ | 58,369 | | | $ | (3,602 | ) | | $ | — | |
Guggenheim Strategy Fund II | | | 7,592,273 | | | | 1,844,570 | | | | — | | | | 9,495,528 | | | | 380,582 | | | | 194,723 | | | | — | | | | — | |
Guggenheim Strategy Fund III | | | 8,400,709 | | | | 1,720,123 | | | | — | | | | 10,187,301 | | | | 407,982 | | | | 250,203 | | | | — | | | | — | |
Guggenheim Variable Insurance Strategy Fund III | | | 8,191,438 | | | | 210,831 | | | | — | | | | 8,472,940 | | | | 338,511 | | | | 211,049 | | | | — | | | | — | |
| | | $ | 32,968,703 | | | $ | 4,593,878 | | | $ | (7,517,289 | ) | | $ | 30,253,891 | | | | | | | $ | 714,344 | | | $ | (3,602 | ) | | $ | — | |
9. Loan Commitments
Pursuant to the terms of certain loan agreements, certain Funds held unfunded loan commitments as of December 31, 2016. The Funds are obligated to fund these loan commitments at the borrower’s discretion.
| | THE GUGGENHEIM FUNDS ANNUAL REPORT | 169 |
NOTES TO FINANCIAL STATEMENTS (continued) |
The unfunded loan commitments as of December 31, 2016, were as follows:
Borrower | Maturity Date | | Face Amount | | | Value | |
Series F (Floating Rate Strategies Series) | | | | | | | |
Acrisure LLC | 11/22/23 | | $ | 24,762 | | | $ | — | |
Grinding Media, Inc. | 03/03/17 | | | 100,000 | | | | — | |
| | | | $ | 124,762 | | | $ | — | |
Series P (High Yield Series) | | | | | | | | | |
Acosta, Inc. | 09/26/19 | | $ | 1,000,000 | | | $ | 72,870 | |
Acrisure LLC | 11/22/23 | | | 46,429 | | | | — | |
Advantage Sales & Marketing LLC | 07/25/19 | | | 832,500 | | | | 54,997 | |
BBB Industries, LLC | 11/04/19 | | | 775,000 | | | | 61,035 | |
Epicor Software | 06/01/20 | | | 600,000 | | | | 50,996 | |
Eyemart Express | 12/18/19 | | | 400,000 | | | | 28,771 | |
Grinding Media, Inc. | 03/03/17 | | | 200,000 | | | | — | |
Signode Industrial Group US, Inc. | 05/01/19 | | | 1,600,000 | | | | 93,052 | |
| | | | $ | 5,453,929 | | | $ | 361,721 | |
10. Line of Credit
The Trust, with the exception of Series Z (Alpha Opportunity Series) Fund, and certain affiliated funds, secured a 364-day committed, $800,000,000 line of credit from Citibank, N.A., which was in place through October 6, 2016, at which time the line of credit was renewed, with an increased commitment amount to $1,000,000,000. A Fund may draw (borrow) from the line of credit as a temporary measure for emergency purposes, to facilitate redemption requests, or for other short-term liquidity purposes consistent with the Fund’s investment objective and program. For example, it may be advantageous for the Fund to borrow money rather than sell existing portfolio positions to meet redemption requests. Fees related to borrowings, if any, vary under this arrangement between the greater of Citibank’s “base rate”, LIBOR plus 1%, or the federal funds rate 0.55% at December 31, 2016, plus 1/2 of 1%. Upfront costs of $2,032,388 were paid to renew the line of credit.
The commitment fee that may be paid by the Funds is at an annualized rate of 0.15% of the average daily amount of their unused commitment amount. The Funds did not have any borrowings under this agreement as of and for the period ended December 31, 2016.
The allocated commitment fee amount for each Fund is referenced in the Statement of Operations under “Line of credit fees” and the effect on the expense ratio is included in the Financial Highlights.
In addition, Series E (Total Return Bond Series) and Series F (Floating Rate Strategies Series)(the “Funds”) entered into an additional unlimited credit facility agreement with BNP Paribas Prime Brokerage, Inc. (the “counterparty”) whereby the counterparty has agreed to provide secured financing to the Funds and the Funds will provide pledged collateral to the counterparty. Fees related to borrowings, if any, equate to LIBOR plus 0.90%. The Funds did not have any borrowings under this agreement at or during the period ended December 31, 2016.
11. Other Liabilities
Series A (StylePlus—Large Core Series) and Series V (Mid Cap Value Series) each wrote put option contracts through Lehman Brothers, Inc. (“Lehman”) that were exercised prior to the option contracts expiration and prior to the bankruptcy filing by Lehman, during September 2008. However, these transactions have not settled and the securities have not been delivered to the Funds as of December 31, 2016.
Although the ultimate resolution of these transactions is uncertain, the Funds have recorded a liability on their respective books equal to the difference between the strike price on the put options and the market prices of the underlying security on the exercise date. The amount of liability recorded by the Funds as of December 31, 2016 was $18,615 for Series A (StylePlus—Large Core Series) and $205,716 for Series V (Mid Cap Value Series) and included in payable for miscellaneous in the Statements of Assets and Liabilities.
170 | THE GUGGENHEIM FUNDS ANNUAL REPORT | |
NOTES TO FINANCIAL STATEMENTS (continued) |
12. Reverse Repurchase Agreements
Each of the Funds may enter into reverse repurchase agreements. Under a reverse repurchase agreement, a Fund sells securities and agrees to repurchase them at a particular price at a future date. In the event the buyer of securities under a reverse repurchase agreement files for bankruptcy or becomes insolvent, such buyer or its trustee or receiver may receive an extension of time to determine whether to enforce the Fund’s obligation to repurchase the securities, and the Fund’s use of the proceeds of the reverse repurchase agreement may effectively be restricted pending such decision.
For the year ended December 31, 2016 the following Funds entered into reverse repurchase agreements:
Fund | | Number of Days Outstanding | | | Balance at
December 31, 2016 | | | Average Balance Outstanding | | | Average Interest Rate | |
Series E (Total Return Bond Series) | | | 366 | | | $ | 11,566,929 | | | $ | 6,700,239 | | | | 0.61 | % |
Series P (High Yield Series) | | | 366 | | | | 1,319,031 | | | | 5,373,980 | | | | 0.57 | % |
The following table presents reverse repurchase agreements that are subject to netting arrangements and offset in the Statements of Assets of Liabilities in conformity with U.S. GAAP.
| | | | | | | | | | | | | Gross Amounts Not Offset
in the Statements of
Assets and Liabilities | | | | |
Fund | Instrument | | Gross
Amounts of
Recognized
Liabilities | | | Gross
Amounts
Offset In the
Statements
of Assets and
Liabilities | | | Net Amount
of Liabilities
Statements
of Assets and
Liabilities | | | Financial
Instruments | | | Cash
Collateral
Pledged | | | Net
Amount | |
Series E (Total Return Bond Series) | Reverse repurchase agreements | | $ | 11,566,929 | | | $ | — | | | $ | 11,566,929 | | | $ | 11,566,929 | | | $ | — | | | $ | — | |
Series P (High Yield Series) | Reverse repurchase agreements | | | 1,319,031 | | | | — | | | | 1,319,031 | | | | 1,319,031 | | | | — | | | | — | |
The following is a summary of the remaining contractual maturities of the reverse repurchase agreements outstanding as of year-end, aggregated by asset class of the related collateral pledged by the Fund:
Fund | | Overnight and
Continuous | | | Up to
30 days | | | Total | |
Series E (Total Return Bond Series) | | | | | | | | | |
U.S. Treasury Strips | | $ | — | | | $ | 4,458,233 | | | $ | 4,458,233 | |
U.S. Treasury Note | | | — | | | | 3,706,155 | | | | 3,706,155 | |
Federal Agency Notes | | | — | | | | 1,906,891 | | | | 1,906,891 | |
Corporate Bonds | | | — | | | | 1,495,650 | | | | 1,495,650 | |
Gross amount of recognized liabilities for reverse repurchase agreements | | $ | — | | | $ | 11,566,929 | | | $ | 11,566,929 | |
| | | | | | | | | | | | | |
Series P (High Yield Series) | | | | | | | | | | | | |
Corporate Bonds | | $ | 1,319,031 | | | $ | — | | | $ | 1,319,031 | |
Gross amount of recognized liabilities for reverse repurchase agreements | | $ | 1,319,031 | | | $ | — | | | $ | 1,319,031 | |
| | THE GUGGENHEIM FUNDS ANNUAL REPORT | 171 |
NOTES TO FINANCIAL STATEMENTS (continued) |
13. Restricted Securities
The securities below are considered illiquid and restricted under guidelines established by the Board:
Fund | | Restricted Securities | | Acquisition Date | | Cost | | | Value | |
Series E (Total Return Bond Series) | | ACC Group Housing LLC | | | | | | | | |
| | | 6.35% due 07/15/54 | | 06/03/14 | | $ | 250,000 | | | $ | 268,573 | |
| | | Atlantic Marine Corporations Communities LLC | | | | | | | | | | |
| | | 5.43% due 12/01/50 | | 07/25/14 | | | 320,308 | | | | 323,000 | |
| | | Cadence Bank North America | | | | | | | | | | |
| | | 6.25% due 06/28/29 | | 06/06/14 | | | 150,000 | | | | 131,426 | |
| | | Copper River CLO Ltd. | | | | | | | | | | |
| | | 2007-1A, due 01/20/21 | | 05/09/14 | | | 382,551 | | | | 141,541 | |
| | | GMAC Commercial Mortgage Asset Corp 2007-HCKM | | | | | | | | | | |
| | | 6.11% due 08/10/52 | | 10/07/16 | | | 1,127,651 | | | | 985,544 | |
| | | Northern Group Housing LLC | | | | | | | | | | |
| | | 6.80% due 08/15/53 | | 07/25/13 | | | 600,000 | | | | 715,998 | |
| | | Pacific Northwest Communities LLC | | | | | | | | | | |
| | | 5.91% due 06/15/50 | | 05/22/14 | | | 400,000 | | | | 430,128 | |
| | | Turbine Engines Securitization Ltd. | | | | | | | | | | |
| | | | 2013-1A, | | | | | | | | | | |
| | | 5.13% due 12/13/48 | | 11/27/13 | | | 650,954 | | | | 644,809 | |
| | | Woodbourne Capital Trust I | | | | | | | | | | |
| | | | 2.83% | | 01/20/06 | | | 301,449 | | | | 179,497 | |
| | | Woodbourne Capital Trust II | | | | | | | | | | |
| | | | 2.83% | | 01/20/06 | | | 301,449 | | | | 179,497 | |
| | | Woodbourne Capital Trust III | | | | | | | | | | |
| | | | 2.83% | | 01/20/06 | | | 301,449 | | | | 179,498 | |
| | | Woodbourne Capital Trust IV | | | | | | | | | | |
| | | | 2.83% | | 01/20/06 | | | 301,449 | | | | 179,498 | |
| | | | | | | | | 5,087,260 | | | | 4,359,009 | |
| | | | | | | | | | | | | | |
Series P (High Yield Series) | | Schahin II Finance Company SPV Ltd. | | | | | | | | | | |
| | | 5.88% due 09/25/22 | | 03/12/15 | | | 111,437 | | | | 20,848 | |
14. Legal Proceedings
Tribune Company
Guggenheim Variable Funds Trust f/k/a SBL Fund has been named as a defendant and a putative member of the proposed defendant class of shareholders in the case entitled Kirschner v. FitzSimons, No. 12-2652 (S.D.N.Y.) (formerly Official Committee of Unsecured Creditors of Tribune Co. v. FitzSimons, Adv. Pro. No. 10-54010 (Bankr. D. Del.)) (the “FitzSimons action”), as a result of ownership by certain series of the SBL Fund of shares in the Tribune Company (“Tribune”) in 2007, when Tribune effected a leveraged buyout transaction (“LBO”) by which Tribune converted to a privately-held company. In his complaint, the plaintiff has alleged that, in connection with the LBO, Tribune insiders and shareholders were overpaid for their Tribune stock using financing that the insiders knew would, and ultimately did, leave Tribune insolvent. The plaintiff has asserted claims against certain insiders, major shareholders, professional advisers, and others involved in the LBO. The plaintiff is also attempting to obtain from former Tribune shareholders, including the SBL Fund, the proceeds they received in connection with the LBO.
In June 2011, a group of Tribune creditors filed multiple actions against former Tribune shareholders involving state law constructive fraudulent conveyance claims arising out of the 2007 LBO (the “SLCFC actions”). SBL Fund has been named as a defendant in two of the SLCFC actions: Deutsche Bank Trust Co. Americas v. Ohlson Enter., No. 12-0064 (S.D.N.Y.) and Deutsche Bank Trust Co. Americas v. Cantor Fitzgerald & Co., No. 11-4900 (S.D.N.Y.). In those actions, the creditors seek to recover from Tribune’s former shareholders the proceeds received in connection with the 2007 LBO.
The FitzSimons action and the SLCFC actions have been consolidated with the majority of the other Tribune LBO-related lawsuits in a multidistrict litigation proceeding captioned In re Tribune Company Fraudulent Conveyance Litig., No. 11-md-2696 (S.D.N.Y.) (the “MDL Proceeding”).
172 | THE GUGGENHEIM FUNDS ANNUAL REPORT | |
NOTES TO FINANCIAL STATEMENTS (continued) |
On September 23, 2013, the District Court granted the defendants’ omnibus motion to dismiss the SLCFC actions, on the basis that the creditors lacked standing. On September 30, 2013, the creditors filed a notice of appeal of the September 23 order. On October 28, 2013, the defendants filed a joint notice of cross-appeal of that same order. On March 29, 2016, the U.S. Court of Appeals for the Second Circuit issued its opinion on the appeal of the SLCFC actions. The appeals court affirmed the district court’s dismissal of those lawsuits, but on different grounds than the district court. The appeals court held that while the plaintiffs have standing under the U.S. Bankruptcy Code, their claims were preempted by Section 546(e) of the Bankruptcy Code—the statutory safe harbor for settlement payments. On April 12, 2016, the Plaintiffs in the SLCFC actions filed a petition seeking rehearing en banc before the appeals court. On July 22, 2016, the appeals court denied the petition. On September 9, 2016, the plaintiffs filed a petition for writ of certiorari in the U.S. Supreme Court challenging the Second Circuit’s decision that the safe harbor of Section 546(e) applied to their claims. The shareholder defendants, including the Funds, filed a joint brief in opposition to the petition for certiorari on October 24, 2016. The Supreme Court has not yet granted or denied the petition for certiorari.
On May 23, 2014, the defendants filed motions to dismiss the FitzSimons action, including a global motion to dismiss Count I, which is the claim brought against former Tribune shareholders for intentional fraudulent conveyance under U.S. federal law. On January 6, 2017, the United States District Court for the Southern District of New York granted the shareholder defendants’ motion to dismiss the intentional fraudulent conveyance claim in the FitzSimons action. The Court concluded that the plaintiff had failed to allege that Tribune entered the LBO with actual intent to hinder, delay, or defraud its creditors, and therefore the complaint failed to state a claim. In dismissing the intentional fraudulent conveyance claim, the Court denied the plaintiff’s request to amend the complaint. The Court’s order is not immediately appealable, but any party might ask the Court to direct entry of a final judgment in order to make the order immediately appealable.
None of these lawsuits alleges any wrongdoing on the part of Guggenheim Variable Funds Trust. The following series of Guggenheim Variable Funds Trust held shares of Tribune and tendered these shares as part of Tribune’s LBO: Series A (StylePlus – Large Core Series) f/k/a Series H (Enhanced Index Series), Series N (Managed Asset Allocation Series) and Series O (All Cap Value Series) (the “Funds”). The value of the proceeds received by the foregoing Funds was $158,950, $51,000 and $3,774,000, respectively. At this stage of the proceedings, Guggenheim Variable Funds Trust is not able to make a reliable predication as to the outcome of these lawsuits or the effect, if any, on a Fund’s net asset value.
Lyondell Chemical Company
Guggenheim Variable Funds Trust f/k/a SBL Fund may be a putative member of the proposed defendant classes in Weisfelner, as Trustee of the LB Litigation Trust v. A. Holmes & H. Holmes TTEE (In re Lyondell Co.), Adv. Pro. No. 10-5525 (Bankr. S.D.N.Y.) (the “Litigation Trust Action”) and Weisfelner, as Trustee of the LB Creditor Trust, v. Reichman (In re Lyondell Chemical Co.), Adv. Pro. No. 12-1570 (Bankr. S.D.N.Y.).
Similar to the claims made in the Tribune matter, the Weisfelner complaints seek to have set aside and recovered as fraudulent transfers from former Lyondell Chemical Company (“Lyondell”) shareholders the consideration paid to them pursuant to the cash out merger of Lyondell shareholders in connection with the combination of Lyondell and Basell AF in 2007. Lyondell filed for bankruptcy in 2008. The Litigation Trust Action alleges a claim against the former Lyondell shareholders under federal law for intentional fraudulent transfer. Reichman alleges claims against the former Lyondell shareholders under state law for both constructive fraudulent transfer and intentional fraudulent transfer.
On April 7, 2014, the plaintiff filed a Second Amended Complaint in the Litigation Trust Action and an Amended Complaint in Reichman. A third related action against the former Lyondell shareholders, Weisfelner, as Trustee of the LB Creditor Trust v. Fund 1 (In re Lyondell Chemical Co.), Adv. Pro. No. 10-4609 (Bankr. S.D.N.Y.) (the “Creditor Trust Action”), is pending as well. Like Reichman, the Creditor Trust Action alleges claims against the former Lyondell shareholders under state law for both constructive fraudulent transfer and intentional fraudulent transfer.
On May 8, 2014, the plaintiff in the Litigation Trust Action filed a motion to certify a defendant class generally comprised of all former Lyondell shareholders that received proceeds in exchange for their shares in the 2007 merger transaction.
On July 30, 2014, the defendants filed a motion to dismiss these lawsuits. The Bankruptcy Court held oral argument on the motion to dismiss and on the motion for class certification on January 14 and January 15, 2015. On September 15, 2015, the Bankruptcy Court denied the motion for class certification without prejudice to the plaintiff’s right to file a renewed motion. On November 18, 2015, the Bankruptcy Court granted the defendants’ motion to dismiss the intentional fraudulent transfer claims in the Creditor Trust Action, the Litigation Trust Action, and in
| | THE GUGGENHEIM FUNDS ANNUAL REPORT | 173 |
NOTES TO FINANCIAL STATEMENTS (concluded) |
Reichman, but denied the motion to dismiss the constructive fraudulent transfer claims in the Creditor Trust Action and in Reichman. The Bankruptcy Court entered final judgment dismissing the Litigation Trust Action, but the plaintiff has appealed the dismissal to the U.S. District Court for the Southern District of New York.
On May 4, 2016, the defendants filed a motion to dismiss, or in the alternative, for a stay of, the Creditor Trust Action and Reichman in light of the U.S. Court of Appeals for the Second Circuit’s opinion in the appeal of the Tribune SLCFC actions. On July 20, 2016, the Bankruptcy Court issued a report and recommendation granting the defendants’ motion to dismiss. The U.S. District Court for the Southern District of New York has not yet accepted the Bankruptcy Court’s recommendation or entered a final judgment.
On July 27, 2016, the District Court reversed the Bankruptcy Court and reinstated the federal law intentional fraudulent transfer claim in the Litigation Trust Action and remanded to the Bankruptcy Court for further proceedings. The District Court found that the fraudulent intent that mattered was that of Lyondell’s CEO, not its board, because the CEO’s intent could be imputed to Lyondell under Delaware law agency principles. The District Court did note, however, that plaintiff faces a high standard for proving “actual intent” to harm creditors, and that it remains to be seen whether plaintiff will be able to make this showing. On August 11, 2016, the shareholder defendants filed a motion for reconsideration and/or to certify an interlocutory appeal of the District Court’s opinion. On October 5, 2016, the District Court denied the motion for reconsideration and/or to certify an interlocutory appeal. In light of this ruling, the federal intentional fraudulent conveyance claim will move forward before the Bankruptcy Court, but a schedule for that case has not yet been set.
These lawsuits do not allege any wrongdoing on the part of Guggenheim Variable Funds Trust. The following series of Guggenheim Variable Funds Trust received cash proceeds from the cash out merger in the following amounts: Series N (Managed Asset Allocation Series) - $28,800. At this stage of the proceedings, Guggenheim Variable Funds Trust is not able to make a reliable predication as to the outcome of these lawsuits or the effect, if any, on a Fund’s net asset value.
174 | THE GUGGENHEIM FUNDS ANNUAL REPORT | |
REPORT OF INDEPENDENT REGISTERED PUBLIC ACCOUNTING FIRM |
The Board of Trustees and Shareholders
of Guggenheim Variable Fund Trust:
We have audited the accompanying statements of assets and liabilities, including the schedules of investments, of Guggenheim Variable Funds Trust (comprised of Series A (Styleplus—Large Core Series), Series B (Large Cap Value Series), Series D (World Equity Income Series), Series E (Total Return Bond Series), Series F (Floating Rate Strategies Series), Series J (Styleplus—Mid Growth Series), Series N (Managed Asset Allocation Series), Series O (All Cap Value Series), Series P (High Yield Series), Series Q (Small Cap Value Series), Series V (Mid Cap Value Series), Series X (Styleplus—Small Growth Series), Series Y (Styleplus—Large Growth Series) and Series Z (Alpha Opportunity Series)) (the “Funds”) as of December 31, 2016, and the related statements of operations for the year then ended, the statements of changes in net assets for each of the two years in the period then ended, and the financial highlights for each of the years or periods indicated therein. These financial statements and financial highlights are the responsibility of the Funds’ management. Our responsibility is to express an opinion on these financial statements and financial highlights based on our audits.
We conducted our audits in accordance with the standards of the Public Company Accounting Oversight Board (United States). Those standards require that we plan and perform the audit to obtain reasonable assurance about whether the financial statements and financial highlights are free of material misstatement. We were not engaged to perform an audit of the Funds’ internal control over financial reporting. Our audits included consideration of internal control over financial reporting as a basis for designing audit procedures that are appropriate in the circumstances, but not for the purpose of expressing an opinion on the effectiveness of the Funds’ internal control over financial reporting. Accordingly, we express no such opinion. An audit also includes examining, on a test basis, evidence supporting the amounts and disclosures in the financial statements and financial highlights, assessing the accounting principles used and significant estimates made by management, and evaluating the overall financial statement presentation. Our procedures included confirmation of securities owned as of December 31, 2016, by correspondence with the custodian, paying agents and brokers or by other appropriate auditing procedures where replies from paying agents or brokers were not received. We believe that our audits provide a reasonable basis for our opinion.
In our opinion, the financial statements and financial highlights referred to above present fairly, in all material respects, the financial position of each of the respective series constituting the Guggenheim Variable Funds Trust at December 31, 2016, the results of their operations for the year then ended, the changes in their net assets for each of the two years in the period then ended, and their financial highlights for each of the years or periods indicated therein, in conformity with U.S. generally accepted accounting principles.

McLean, Virginia
February 28, 2017
| | THE GUGGENHEIM FUNDS ANNUAL REPORT | 175 |
OTHER INFORMATION (Unaudited) |
Tax Information
In January 2017, shareholders will be advised on IRS Form 1099 DIV or substitute 1099 DIV as to the federal tax status of the distributions received by shareholders in the calendar year 2016.
The Funds’ investment income (dividend income plus short-term gains, if any) qualifies as follows:
Of the ordinary income distributions paid during the year, the following funds had the corresponding percentages qualify for the dividends received deduction for corporations:
Fund | % Qualifying |
Series A (StylePlus—Large Core Series) | 40.08% |
Series B (Large Cap Value Series) | 100.00% |
Series D (World Equity Income Series) | 64.50% |
Series E (Total Return Bond Series) | 0.56% |
Series J (StylePlus—Mid Growth Series) | 27.22% |
Series N (Managed Asset Allocation Series) | 100.00% |
Series O (All Cap Value Series) | 100.00% |
Series P (High Yield Series) | 0.67% |
Series Q (Small Cap Value Series) | 100.00% |
Series V (Mid Cap Value Series) | 100.00% |
Series X (StylePlus—Small Growth Series) | 2.39% |
Series Y (StylePlus—Large Growth Series) | 8.98% |
With respect to the taxable year ended December 31, 2016, the Funds hereby designate as capital gain dividends the amounts listed below, or, if subsequently determined to be different, the net capital gain of such year:
Fund | | Subject to
the 15% rate: | | | From Proceeds of Shareholder Redemptions | |
Series A (StylePlus—Large Core Series) | | $ | 2,234,605 | | | $ | — | |
Series B (Large Cap Value Series) | | | 3,255,199 | | | | 137,949 | |
Series F (Floating Rate Strategies Series) | | | 66,528 | | | | — | |
Series J (StylePlus—Mid Growth Series) | | | 863,754 | | | | — | |
Series N (Managed Asset Allocation Series) | | | 1,011,391 | | | | 254,128 | |
Series O (All Cap Value Series) | | | 4,633,656 | | | | 1,074,778 | |
Series Q (Small Cap Value Series) | | | 7,824,673 | | | | 568,931 | |
Series V (Mid Cap Value Series) | | | 21,634,815 | | | | 1,848,812 | |
Series X (StylePlus—Small Growth Series) | | | 309,723 | | | | — | |
Series Y (StylePlus—Large Growth Series) | | | 528,876 | | | | — | |
Proxy Voting Information
A description of the policies and procedures that the Trust uses to determine how to vote proxies relating to securities held in the Funds’ portfolios is available, without charge and upon request, by calling 800.820.0888. This information is also available from the EDGAR database on the SEC’s website at https://www.sec.gov.
Information regarding how the Funds voted proxies relating to portfolio securities during the most recent 12-month period ended June 30 is available without charge, upon request, by calling 800.820.0888. This information is also available from the EDGAR database on the SEC’s website at https://www.sec.gov.
176 | THE GUGGENHEIM FUNDS ANNUAL REPORT | |
OTHER INFORMATION (Unaudited)(concluded) |
At a special meeting of shareholders held on July 29, 2016, the shareholders of the Funds voted on whether to approve the Plan of Liquidation with respect to Series M (Macro Opportunities Series). A description of the number of shares voted is as follows:
Votes for: | 1,250,026 |
Votes against: | 11,725 |
Abstain: | 6,227 |
Sector Classification
Information in the “Schedule of Investments” is categorized by sectors using sector-level Classifications defined by the Bloomberg Industry Classification System, a widely recognized industry classification system provider. Each Fund’s registration statement has investment policies relating to concentration in specific sectors/industries. For purposes of these investment policies, the Funds usually classify sectors/industries based on industry-level Classifications used by widely recognized industry classification system providers such as Bloomberg Industry Classification System, Global Industry Classification Standards and Barclays Global Classification Scheme.
Quarterly Portfolio Schedules Information
The Trust files its complete schedule of portfolio holdings with the SEC for the first and third quarters of each fiscal year on Form N-Q; which are available on the SEC’s website at https://www.sec.gov. The Funds’ Forms N-Q may be reviewed and copied at the SEC’s Public Reference Room in Washington, DC, and that information on the operation of the Public Reference Room may be obtained by calling 800-SEC-0330. Copies of the portfolio holdings are also available to shareholders, without charge and upon request, by calling 800.820.0888.
| | THE GUGGENHEIM FUNDS ANNUAL REPORT | 177 |
INFORMATION ON BOARD OF TRUSTEES AND OFFICERS (Unaudited) |
Name, Address*
and Year of Birth | Position(s)
Held with
the Trust | Term of Office
and Length of
Time Served** | Principal Occupation(s)
During Past Five Years | Number of
Portfolios
in Fund
Complex
Overseen | Other Directorships Held by Trustees |
INDEPENDENT TRUSTEES | | | |
Randall C. Barnes
(1951) | Trustee | Since 2014 | Current: Private Investor (2001-present). Former: Senior Vice President and Treasurer, PepsiCo, Inc. (1993-1997); President, Pizza Hut International (1991-1993); Senior Vice President, Strategic Planning and New Business Development, PepsiCo, Inc. (1987-1990). | 98 | Current: Trustee, Purpose Investments Inc. (2014-Present). |
Donald A. Chubb, Jr.
(1946 ) | Trustee | Since 1994 | Current: Business broker and manager of commercial real estate, Griffith & Blair, Inc. (1997-present). | 95 | Current: Midland Care, Inc. (2011-present). |
Jerry B. Farley
(1946) | Trustee | Since 2005 | Current: President, Washburn University (1997-present). | 95 | Current: Westar Energy, Inc. (2004-present); CoreFirst Bank & Trust (2000-present). |
Roman Friedrich III
(1946) | Trustee and Chairman of the Contracts Review Committee | Since 2014 | Current: Founder and Managing Partner, Roman Friedrich & Company (1998-present). Former: Senior Managing Director, MLV & Co. LLC (2010-2011). | 95 | Current: Zincore Metals, Inc. (2009-present). Former: Axiom Gold and Silver Corp. (2011-2012). |
Robert B. Karn III
(1942) | Trustee and Chairman of the Audit Committee | Since 2014 | Current: Consultant (1998-present). Former: Arthur Andersen (1965-1997) and Managing Partner, Financial and Economic Consulting, St. Louis office (1987-1997). | 95 | Current: Peabody Energy Company (2003-present); GP Natural Resource Partners, LLC (2002- present). |
Ronald A. Nyberg
(1953) | Trustee and Chairman of the Nominating and Governance Committee | Since 2014 | Current: Partner, Momkus McCluskey Roberts, LLC (2016-present). Former: Partner, Nyberg & Cassioppi, LLC (2000-2016); Executive Vice President, General Counsel, and Corporate Secretary, Van Kampen Investments (1982-1999). | 100 | Current: Edward-Elmhurst Healthcare System (2012-present). |
178 | THE GUGGENHEIM FUNDS ANNUAL REPORT | |
INFORMATION ON BOARD OF TRUSTEES AND OFFICERS (Unaudited)(continued) |
Name, Address*
and Year of Birth | Position(s)
Held with
the Trust | Term of Office
and Length of
Time Served** | Principal Occupation(s)
During Past Five Years | Number of
Portfolios
in Fund
Complex
Overseen | Other Directorships Held by Trustees |
INDEPENDENT TRUSTEES - continued | | |
Maynard F. Oliverius
(1943) | Trustee | Since 1998 | Current: Retired. Former: President and CEO, Stormont-Vail HealthCare (1996-2012). | 95 | Current: Fort Hays State University Foundation (1999-present); Stormont-Vail Foundation (2013-present); University of Minnesota Healthcare Alumni Association Foundation (2009-present). Former: Topeka Community Foundation (2009-2014). |
Ronald E. Toupin, Jr.
(1958) | Trustee and Chairman of the Board | Since 2014 | Current: Portfolio Consultant (2010-present). Former: Vice President, Manager and Portfolio Manager, Nuveen Asset Management (1998-1999); Vice President, Nuveen Investment Advisory Corp. (1992-1999); Vice President and Manager, Nuveen Unit Investment Trusts (1991-1999); and Assistant Vice President and Portfolio Manager, Nuveen Unit Investment Trusts (1988-1999), each of John Nuveen & Co., Inc. (1982-1999). | 97 | Former: Bennett Group of Funds (2011-2013). |
INTERESTED TRUSTEE | |
Donald C. Cacciapaglia***
(1951) | President, Chief Executive Officer and Trustee | Since 2012 | Current: President and CEO, certain other funds in the Fund Complex (2012-present); Vice Chairman, Guggenheim Investments (2010-present). Former: Chairman and CEO, Channel Capital Group, Inc. (2002-2010). | 230 | Current: Clear Spring Life Insurance Company (2015-present); Guggenheim Partners Japan, Ltd. (2014-present); Guggenheim Partners Investment Management Holdings, LLC (2014-present); Delaware Life (2013-present); Guggenheim Life and Annuity Company (2011-present); Paragon Life Insurance Company of Indiana (2011-present). |
* | The business address of each Trustee is c/o Guggenheim Investments, 227 West Monroe Street, Chicago, Illinois 60606. |
** | Each Trustee serves an indefinite term, until his successor is elected and qualified. Time served includes time served in the respective position for the Predecessor Corporation. |
*** | This Trustee is deemed to be an “interested person” of the Funds under the 1940 Act by reason of his position with the Funds' Investment Manager and/or the parent of the Investment Manager. |
| | THE GUGGENHEIM FUNDS ANNUAL REPORT | 179 |
INFORMATION ON BOARD OF TRUSTEES AND OFFICERS (Unaudited)(continued) |
Name, Address*
and Year of Birth | Position(s)
Held with
the Trust | Term of Office
and Length of
Time Served** | Principal Occupations
During Past Five Years |
OFFICERS | | | |
William H. Belden, III
(1965) | Vice President | Since 2014 | Current: Vice President, certain other funds in the Fund Complex (2006-present); Managing Director, Guggenheim Funds Investment Advisors, LLC (2005-present). Former: Vice President of Management, Northern Trust Global Investments (1999-2005). |
Joanna M. Catalucci
(1966) | AML Officer | Since 2016 | Current: Chief Compliance Officer, certain funds in the Fund Complex (2012-present); Senior Managing Director, Guggenheim Investments (2012-present); AML Officer, certain funds in the Fund Complex (2016-present). Former: Chief Compliance Officer and Secretary, certain other funds in the Fund Complex (2008-2012); Senior Vice President & Chief Compliance Officer, Security Investors, LLC and certain affiliates (2010-2012); Chief Compliance Officer and Senior Vice President, Rydex Advisors, LLC and certain affiliates (2010-2011). |
James M. Howley
(1972) | Assistant Treasurer | Since 2014 | Current: Director, Guggenheim Investments (2004-present); Assistant Treasurer, certain other funds in the Fund Complex (2006-present). Former: Manager, Mutual Fund Administration of Van Kampen Investments, Inc. (1996-2004). |
Keith D. Kemp
(1960) | Assistant Treasurer | Since 2016 | Current: Managing Director of Transparent Value, LLC (April 2015-present); Managing Director of Guggenheim Investments (April 2015-present). Former: Director, Transparent Value, LLC (2010-2015); Director, Guggenheim Investments (2010-2015); Chief Operating Officer, Macquarie Capital Investment Management (2007-2009). |
Amy J. Lee
(1961) | Vice President and Chief Legal Officer | Since 2007
(Vice President) Since 2014
(Chief Legal Officer) | Current: Chief Legal Officer, certain other funds in the Fund Complex (2013-present); Senior Managing Director, Guggenheim Investments (2012-present). Former: Vice President, Associate General Counsel and Assistant Secretary, Security Benefit Life Insurance Company and Security Benefit Corporation (2004-2012). |
Mark E. Mathiasen
(1978) | Secretary | Since 2014 | Current: Secretary, certain other funds in the Fund Complex (2007-present); Managing Director, Guggenheim Investments (2007-present). |
Glenn McWhinnie
(1969) | Assistant Treasurer | Since 2016 | Current: Vice President, Guggenheim Investments (2009-present). Former: Tax Compliance Manager, Ernst & Young LLP (1996-2009). |
Michael P. Megaris
(1984) | Assistant Secretary | Since 2014 | Current: Assistant Secretary, certain other funds in the Fund Complex (2014-present); Vice President, Guggenheim Investments (2012-present). Former: J.D., University of Kansas School of Law (2009-2012). |
Elisabeth Miller
(1968) | Chief Compliance Officer | Since 2012 | Current: CCO, certain other funds in the Fund Complex (2012-present); CCO, Security Investors, LLC (2012-present); CCO, Guggenheim Funds Investment Advisors, LLC (2012-present); Managing Director, Guggenheim Investments (2012-present); Vice President, Guggenheim Funds Distributors, LLC (March 2014-present). Former: CCO, Guggenheim Distributors, LLC (2009-March 2014); Senior Manager, Security Investors, LLC (2004-2009); Senior Manager, Guggenheim Distributors, LLC (2004-2009). |
180 | THE GUGGENHEIM FUNDS ANNUAL REPORT | |
INFORMATION ON BOARD OF TRUSTEES AND OFFICERS (Unaudited)(concluded) |
Name, Address*
and Year of Birth | Position(s)
Held with
the Trust | Term of Office
and Length of
Time Served** | Principal Occupations
During Past Five Years |
OFFICERS - continued | |
Adam J. Nelson
(1979) | Assistant Treasurer | Since 2015 | Current: Vice President, Guggenheim Investments (2015-present); Assistant Treasurer, certain other funds in the Fund Complex (2015-present). Former: Assistant Vice President and Fund Administration Director, State Street Corporation (2013-2015); Fund Administration Assistant Director, State Street (2011-2013); Fund Administration Manager, State Street (2009-2011). |
Kimberly J. Scott
(1974) | Assistant Treasurer | Since 2014 | Current: Vice President, Guggenheim Investments (2012-present) ; Assistant Treasurer, certain other funds in the Fund Complex (2012-present). Former: Financial Reporting Manager, Invesco, Ltd. (2010-2011); Vice President/Assistant Treasurer, Mutual Fund Administration for Van Kampen Investments, Inc./Morgan Stanley Investment Management (2009-2010); Manager of Mutual Fund Administration, Van Kampen Investments, Inc./Morgan Stanley Investment Management (2005-2009). |
Bryan Stone
(1979) | Vice President | Since 2014 | Current: Vice President, certain other funds in the Fund Complex (2014-present); Director, Guggenheim Investments (2013-present). Former: Senior Vice President, Neuberger Berman Group LLC (2009-2013); Vice President, Morgan Stanley (2002-2009). |
John L. Sullivan
(1955) | Chief Financial Officer and Treasurer | Since 2014 | Current: CFO, Chief Accounting Officer and Treasurer, certain other funds in the Fund Complex (2010-present); Senior Managing Director, Guggenheim Investments (2010-present). Former: Managing Director and CCO, each of the funds in the Van Kampen Investments fund complex (2004-2010); Managing Director and Head of Fund Accounting and Administration, Morgan Stanley Investment Management (2002-2004); CFO and Treasurer, Van Kampen Funds (1996-2004). |
* | The business address of each officer is c/o Guggenheim Investments, 227 West Monroe Street, Chicago, Illinois 60606. |
** | Each officer serves an indefinite term, until his or her successor is duly elected and qualified. Time served includes time served in the respective position for the Predecessor Corporation. |
| | THE GUGGENHEIM FUNDS ANNUAL REPORT | 181 |
GUGGENHEIM INVESTMENTS PRIVACY POLICIES (Unaudited) |
Guggenheim Investments as used herein refers to Guggenheim Partners, LLC, Guggenheim Funds Investment Advisors, LLC, Guggenheim Partners Investment Management, LLC, Guggenheim Funds Distributors, LLC and Security Investors, LLC as well as the funds in the Guggenheim Funds complex (the “funds”).
Our Commitment to You
When you become a Guggenheim Investments investor, you entrust us with not only your hard-earned money but also with personal and financial information about you. We recognize that your relationship with us is based on trust and that you expect us to act responsibly and in your best interests. Because we have access to personal information about you, we hold ourselves to high standards in its safekeeping and use. This means, most importantly, that we do not sell client or account information to anyone—whether you are a current or former Guggenheim Investments client.
The Information We Collect About You and How We Collect It
In the course of doing business with shareholders and investors, we collect nonpublic personal information about you. You typically provide personal information when you complete a Guggenheim Investments account application or when you request a transaction that involves Rydex and Guggenheim Funds or one of the Guggenheim affiliated companies. “Nonpublic personal information” is personally identifiable information about you. For example it includes your name and address, Social Security or taxpayer identification number, assets, income, account balance, bank account information and investment activity (e.g. purchase and redemption history).
How We Share Your Personal Information
As a matter of policy, we do not disclose your nonpublic personal information to nonaffiliated third parties except as required or permitted by law. As emphasized above, we do not sell information about current or former clients or their accounts to third parties. Nor do we share such information, except when necessary to complete transactions at your request or to make you aware of related investment products and services that we offer. Additional details about how we handle your personal information are provided below.
To complete certain transactions or account changes that you direct, it may be necessary to provide your personal information to companies, individuals or groups that are not affiliated with Guggenheim Investments. For example if you ask to transfer assets from another financial institution to Guggenheim Investments, we will need to provide certain information about you to that company to complete the transaction. In connection with servicing your accounts or to alert you to other Guggenheim Investments investment products and services, we may share your information within the Guggenheim Investments family of affiliated companies. This would include, for example, sharing your information within Guggenheim Investments so we can make you aware of new funds or the services offered through another Guggenheim Investments affiliated company. In certain instances, we may contract with nonaffiliated companies to perform services for us. Where necessary, we will disclose information we have about you to these third parties. In all such cases, we provide the third party with only the information necessary to carry out its assigned responsibilities and only for that purpose. And we require these third parties to treat your personal information with the same high degree of confidentiality that we do. In certain instances, we may share information with other financial institutions regarding individuals and entities in response to the U.S.A. Patriot Act. Finally we will share personal information about you if we are compelled by law to do so, if you direct us to do so with your consent, or in other circumstances as permitted by law.
How We Safeguard Your Personal Information
We maintain physical, electronic and procedural safeguards to protect your personal information. Within Guggenheim Investments, access to such information is limited to those who need it to perform their jobs such as servicing your account, resolving problems or informing you of new products and services.
182 | THE GUGGENHEIM FUNDS ANNUAL REPORT | |
This page intentionally left blank.
This page intentionally left blank.
This page intentionally left blank.
This page intentionally left blank.
This page intentionally left blank.
This page intentionally left blank.
This page intentionally left blank.
The registrant's Board of Trustees has adopted a code of ethics that applies to the registrant's principal executive officer and principal financial officer. No substantive amendments were approved or waivers were granted to the Code during the period covered by this report. The Code is filed as an exhibit to this Form N-CSR.
| Item 3. | Audit Committee Financial Expert. |
The registrant's Board of Trustees has determined that Robert B. Karn III, an "independent" Trustee serving on the registrant's audit committee, is an "audit committee financial expert," as defined in Item 3 of Form N-CSR. Under applicable securities laws, a person who is determined to be an audit committee financial expert will not be deemed an "expert" for any purpose, including without limitation for the purposes of Section 11 of the Securities Act of 1933, as a result of being designated or identified as an audit committee financial expert. The designation or identification of a person as an audit committee financial expert does not impose on such person any duties, obligations, or liabilities that are greater than the duties, obligations, and liabilities imposed on such person as a member of the audit committee and Board of Trustees in the absence of such designation or identification.
| Item 4. | Principal Accountant Fees and Services. |
(a) Audit Fees. The aggregate Audit Fees billed by the registrant's principal accountant, for the audit of the annual financial statements in connection with statutory and regulatory filings for the fiscal years ended December 31, 2016 and December 31, 2015 were $343,750 and $353,087, respectively.
(b) Audit-Related Fees. The aggregate Audit Related Fees billed by the registrant's principal accountant for the fiscal years ended December 31, 2016 and December 31, 2015 were $0 and $0, respectively.
The aggregate fees billed in the Reporting Periods for assurance and related services by the Auditor to the registrant's investment adviser (not including any sub‑investment adviser whose role is primarily portfolio management and is subcontracted with or overseen by another investment adviser), and any entity controlling, controlled by or under common control with the investment adviser that provides ongoing services to the Registrant ("Service Affiliates") which required pre‑approval by the Audit Committee which related to the review of the transfer agent function for the fiscal years ended December 31, 2016 and December 31, 2015 were $0 and $38,585, respectively.
(c) Tax Fees. The aggregate Tax Fees billed by the registrant's principal accountant for professional services rendered for tax compliance, tax advice, and tax planning, including preparation of tax returns and distribution assistance, for the fiscal years ended December 31, 2016 and December 31, 2015 were $82,104 and $113,380, respectively.
(d) All Other Fees. The aggregate All Other Fees billed by the registrant's principal accountant for products and services provided by the Auditor, other than the services reported in paragraphs (a) through (c) of this Item, for the fiscal years ended December 31, 2016 and December 31, 2015 were $0 and $0, respectively.
(e) Audit Committee Pre-Approval Policies and Procedures. The audit committee has adopted a policy whereby audit and non-audit services performed by the registrant's principal accountant for the registrant, its investment advisor, and any entity controlling, controlled by, or under common control with the investment advisor that provides ongoing services to the registrant require pre-approval in advance at regularly scheduled audit committee meetings. If such service is required between regularly scheduled audit committee meetings, the chairman of the audit committee is authorized to pre-approve the service with full committee approval at the next scheduled meeting. There shall be no waivers of the pre-approval process. No services described in (b)-(d) above were approved pursuant to paragraph (c)(7)(i)(C) of Rule 2-01 of Regulation S-X.
(f) Not applicable.
(g) Non-Audit Fees. The aggregate non-audit fees billed by the registrant's accountant for the most recent fiscal year and the preceding fiscal year for services rendered to the registrant, the investment advisor, and any entity controlling, controlled by, or under common control with the advisor that provides ongoing services to the registrant were $149,677 and $151,965, respectively. These aggregate fees were less than the aggregate fees billed for the same periods by the registrant's principal accountant for audit services rendered to the registrant, the investment advisor, and any entity controlling, controlled by, or under common control with the advisor that provides ongoing services to the registrant.
(h) Auditor Independence. All non-audit services rendered in (g) above were pre-approved by the registrant's audit committee. As such, the audit committee has considered these services in maintaining the principal accountant's independence.
| Item 5. | Audit Committee of Listed Registrants. |
Not applicable.
Schedule of Investments is included as part of the report to shareholders filed under Item 1 of this form.
| Item 7. | Disclosure of Proxy Voting Policies and Procedures for Closed-End Management Investment Companies. |
Not applicable.
Item 8. Portfolio Mangers of Closed-end Management Investment Companies
Not applicable
| Item 9. | Purchases of Equity Securities by Closed-End Management Investment Company and Affiliated Purchasers. |
Not applicable.
| Item 10. | Submission of Matters to a Vote of Security Holders. |
The registrant does not currently have in place procedures by which shareholders may recommend nominees to the registrant's board.
There have been no changes to the procedures by which shareholders may recommend nominees to the registrant's board.
| Item 11. | Controls and Procedures. |
(a) The registrant's President (principal executive officer) and Treasurer (principal financial officer) have evaluated the registrant's disclosure controls and procedures within 90 days of this filing and have concluded that the registrant's disclosure controls and procedures were effective as of that date in ensuring that information required to be disclosed by the registrant in this Form N-CSR was recorded, processed, summarized, and reported timely.
(b) The registrant's principal executive officer and principal financial officer are aware of no change in the registrant's internal control over financial reporting that occurred during the registrant's second fiscal quarter covered by this report that has materially affected, or is reasonably likely to materially affect, the registrant's internal control over financial reporting.
(a)(1) The registrant's code of ethics pursuant to Item 2 of Form N-CSR is attached.
(a)(2) Separate certifications by the President (principal executive officer) and Treasurer (principal financial officer) of the registrant as required by Rule 30a-2(a) under the Act (17 CFR 270.30a-2(a)) are attached.
(b) A certification by the registrant's President (principal executive officer) and Treasurer (principal financial officer) as required by Rule 30a-2(b) under the Act (17 CFR 270.30a-2(b)) is attached.
SIGNATURES
Pursuant to the requirements of the Securities Exchange Act of 1934 and the Investment Company Act of 1940, the registrant has duly caused this report to be signed on its behalf by the undersigned, thereunto duly authorized.
| (Registrant) | Guggenheim Variable Funds Trust | |
| | | |
By (Signature and Title)* | /s/ Donald C. Cacciapaglia | |
| | Donald C. Cacciapaglia, President and Chief Executive Officer |
| | | |
| Date | March 10, 2017 | |
Pursuant to the requirements of the Securities Exchange Act of 1934 and the Investment Company Act of 1940, this report has been signed below by the following persons on behalf of the registrant and in the capacities and on the dates indicated.
| By (Signature and Title)* | /s/ Donald C. Cacciapaglia | |
| | Donald C. Cacciapaglia, President and Chief Executive Officer |
| | | |
| Date | March 10, 2017 | |
| | | |
| By (Signature and Title)* | /s/ John L. Sullivan | |
| | John L. Sullivan, Chief Financial Officer and Treasurer | |
| | | |
| Date | March 10, 2017 | |
* | Print the name and title of each signing officer under his or her signature. |
