UNITED STATES
SECURITIES AND EXCHANGE COMMISSION
Washington, D.C. 20549
FORM N-CSR
CERTIFIED SHAREHOLDER REPORT OF REGISTERED
MANAGEMENT INVESTMENT COMPANIES
Investment Company Act file number 811- 02753
Guggenheim Variable Funds Trust
(Exact name of registrant as specified in charter)
702 King Farm Boulevard, Suite 200
Rockville, Maryland 20850
(Address of principal executive offices) (Zip code)
Amy J. Lee
Guggenheim Variable Funds Trust
702 King Farm Boulevard, Suite 200
Rockville, Maryland 20850
(Name and address of agent for service)
Registrant's telephone number, including area code: 1-301-296-5100
Date of fiscal year end: December 31
Date of reporting period: January 1, 2018 through June 30, 2018
Form N-CSR is to be used by management investment companies to file reports with the Commission not later than 10 days after the transmission to stockholders of any report that is required to be transmitted to stockholders under Rule 30e-1 under the Investment Company Act of 1940 (17 CFR 270.30e-1). The Commission may use the information provided on Form N-CSR in its regulatory, disclosure review, inspection, and policymaking roles.
A registrant is required to disclose the information specified by Form N-CSR, and the Commission will make this information public. A registrant is not required to respond to the collection of information contained in Form N-CSR unless the Form displays a currently valid Office of Management and Budget (“OMB”) control number. Please direct comments concerning the accuracy of the information collection burden estimate and any suggestions for reducing the burden to Secretary, Securities and Exchange Commission, 450 Fifth Street, NW, Washington, DC 20549-0609. The OMB has reviewed this collection of information under the clearance requirements of 44 U.S.C. §3507.
| Item 1. | Reports to Stockholders. |
The registrant’s semi-annual report transmitted to shareholders pursuant to Rule 30e-1 under the Investment Company Act of 1940, as amended (the “Investment Company Act”), is as follows:
|

6.30.2018
Guggenheim Variable Funds Trust Semi-Annual Report
Series | ||
Series A | (StylePlus—Large Core Series) | |
Series B | (Large Cap Value Series) | |
Series D | (World Equity Income Series) | |
Series E | (Total Return Bond Series) | |
Series F | (Floating Rate Strategies Series) | |
Series J | (StylePlus—Mid Growth Series) | |
Series N | (Managed Asset Allocation Series) | |
Series O | (All Cap Value Series) | |
Series P | (High Yield Series) | |
Series Q | (Small Cap Value Series) | |
Series V | (Mid Cap Value Series) | |
Series X | (StylePlus—Small Growth Series) | |
Series Y | (StylePlus—Large Growth Series) | |
Series Z | (Alpha Opportunity Series) | |
GuggenheimInvestments.com | GVFT-SEMI-0618x1218 |

TABLE OF CONTENTS |
DEAR SHAREHOLDER | 2 |
ECONOMIC AND MARKET OVERVIEW | 4 |
ABOUT SHAREHOLDERS’ FUND EXPENSES | 6 |
SERIES A (STYLEPLUS—LARGE CORE SERIES) | 8 |
SERIES B (LARGE CAP VALUE SERIES) | 15 |
SERIES D (WORLD EQUITY INCOME SERIES) | 21 |
SERIES E (TOTAL RETURN BOND SERIES) | 28 |
SERIES F (FLOATING RATE STRATEGIES SERIES) | 41 |
SERIES J (STYLEPLUS—MID GROWTH SERIES) | 53 |
SERIES N (MANAGED ASSET ALLOCATION SERIES) | 61 |
SERIES O (ALL CAP VALUE SERIES) | 68 |
SERIES P (HIGH YIELD SERIES) | 75 |
SERIES Q (SMALL CAP VALUE SERIES) | 89 |
SERIES V (MID CAP VALUE SERIES) | 96 |
SERIES X (STYLEPLUS—SMALL GROWTH SERIES) | 103 |
SERIES Y (STYLEPLUS—LARGE GROWTH SERIES) | 111 |
SERIES Z (ALPHA OPPORTUNITY SERIES) | 118 |
NOTES TO FINANCIAL STATEMENTS | 130 |
OTHER INFORMATION | 151 |
INFORMATION ON BOARD OF TRUSTEES AND OFFICERS | 158 |
GUGGENHEIM INVESTMENTS PRIVACY NOTICE | 163 |
THE GUGGENHEIM FUNDS SEMI-ANNUAL REPORT 1 |
June 30, 2018 |
Dear Shareholder:
Security Investors, LLC and Guggenheim Partners Investment Management, LLC (the “Investment Advisers”) are pleased to present the semiannual shareholder report for funds that are part of the Guggenheim Variable Funds Trust (the “Funds”). This report covers performance of the Funds for the semiannual period ended June 30, 2018.
The Investment Advisers are part of Guggenheim Investments, which represents the investment management businesses of Guggenheim Partners, LLC (“Guggenheim”), a global, diversified financial services firm.
Guggenheim Funds Distributors, LLC is the distributor of the Funds. Guggenheim Funds Distributors, LLC is affiliated with Guggenheim and the Investment Advisers.
We encourage you to read the Economic and Market Overview section of the report, which follows this letter, and then the Performance Report and Fund Profile for each Fund.
We are committed to providing innovative investment solutions and appreciate the trust you place in us.
Sincerely,
Security Investors, LLC
Guggenheim Partners Investment Management, LLC
July 31, 2018
Read a prospectus and summary prospectus (if available) carefully before investing. It contains the investment objectives, risks, charges, expenses and other information, which should be considered carefully before investing. Obtain a prospectus and summary prospectus (if available) at guggenheiminvestments.com or call 800.820.0888.
This material is not intended as a recommendation or as investment advice of any kind, including in connection with rollovers, transfers, and distributions. Such material is not provided in a fiduciary capacity, may not be relied upon for or in connection with the making of investment decisions, and does not constitute a solicitation of an offer to buy or sell securities. All content has been provided for informational or educational purposes only and is not intended to be and should not be construed as legal or tax advice and/or a legal opinion. Always consult a financial, tax and/or legal professional regarding your specific situation.
The Series StylePlus Funds may not be suitable for all investors. Investments in large capitalization stocks may underperform other segments of the equity market or the equity market as a whole. ● Investments in small-sized company securities may present additional risks such as less predictable earnings, higher volatility and less liquidity than larger, more established companies. ● Growth stocks may be more volatile than other stocks because they are more sensitive to investor perceptions regarding the growth potential of the issuing companies. ● The Funds may invest in derivative instruments, which may be more volatile and less liquid, increasing the risk of loss when compared to traditional securities. Certain of the derivative instruments are also subject to the risks of counterparty default and adverse tax treatment. ● The Funds’ use of leverage, through borrowings or instruments such as derivatives, may cause the Funds to be more volatile than if it had not been leveraged. ● The Funds’ investments in other investment vehicles subject the Funds to those risks and expenses affecting the investment vehicle. ● The Funds may invest in foreign securities which carry additional risks when compared to U.S. securities, due to the impact of diplomatic, political or economic developments in the country in question (investments in emerging markets securities are generally subject to an even greater level of risks). ● The Funds may invest in fixed income securities whose market value will change in response to interest rate changes and market conditions among other factors. In general, bond prices rise when interest rates fall and vice versa. ● The Fund’s exposure to high yield securities may subject the Fund to greater volatility. ● The Funds may invest in bank loans and asset-backed securities, including mortgage backed, which involve special types of risks. ● The Funds may invest in restricted securities which may involve financial and liquidity risk. ● You may have a gain or loss when you sell your shares. ● It is important to note that the Funds are not guaranteed by the U.S. government. ● Please read the prospectus for more detailed information regarding these and other risks.
The Series Value Funds may not be suitable for all investors. ● An investment in the Funds will fluctuate and is subject to investment risks, which means investors could lose money. The intrinsic value of the underlying stocks may never be realized or the stocks may decline in value. Investments in small- and/or mid-sized company securities may present additional risks such as less predictable earnings, higher volatility and less liquidity than larger, more established companies. ● Please read the prospectus for more detailed information regarding these and other risks.
The Series D (World Equity Income Series) may not be suitable for all investors. ● Investments in securities in general are subject to market risks that may cause their prices to fluctuate over time. ●The Fund’s investments in foreign securities carry additional risks when compared to U.S. securities, due to the impact of diplomatic, political or economic developments in the country in question (investments in emerging markets are generally subject to an even greater level of risks). Additionally, the Funds exposure to foreign currencies subjects the fund to the risk that those currencies will decline in value relative to the U.S. Dollar. ● The Fund’s investments in derivatives may pose risks in addition to those associated with investing directly in securities or other investments, including illiquidity of the derivatives, imperfect correlations with underlying investments or the Fund’s other portfolio holdings, lack of availability and counterparty risk. ●The Funds use of leverage, through instruments such as derivatives, may cause the fund to be more volatile than if it had not been leveraged. ●The Fund’s investments in other investment vehicles subject the Fund to those risks and expenses affecting the investment vehicle. ●The Fund may have significant exposure to securities in a particular capitalization range e.g., large-, mid- or small-cap securities. As a result, the Fund may be subject to the risk that the pre-denominate capitalization range may underperform other segments of the equity market or the equity market as a whole. ● Please read the prospectus for more detailed information regarding these and other risks.
2 | THE GUGGENHEIM FUNDS SEMI-ANNUAL REPORT |
June 30, 2018 |
The Series E (Total Return Bond Series) may not be suitable for all investors. ● Investments in fixed-income instruments are subject to the possibility that interest rates could rise, causing the value of the Fund’s holdings and share price to decline. ● Investors in asset-backed securities, including collateralized loan obligations (“CLOs”), generally receive payments that are part interest and part return of principal. These payments may vary based on the rate loans are repaid. Some asset-backed securities may have structures that make their reaction to interest rates and other factors difficult to predict, making their prices volatile and they are subject to liquidity and valuation risk. CLOs bear similar risks to investing in loans directly. ● Investments in loans involve special types of risks, including credit, interest rate, counterparty, prepayment, liquidity, and valuation risks. Loans are often below investment grade, may be unrated, and typically offer a fixed or floating interest rate. ● High yield and unrated debt securities are at a greater risk of default than investment grade bonds and may be less liquid, which may increase volatility. ● The Fund’s use of leverage, through borrowings or instruments such as derivatives, may cause the Fund to be more volatile and riskier than if it had not been leveraged. The more a Fund invests in leveraged instruments, the more the leverage will magnify any gains or losses on those investments. ● Investments in reverse repurchase agreements expose the Fund to many of the same risks as leveraged instruments, such as derivatives. ● You may have a gain or loss when you sell your shares. ● Please read the prospectus for more detailed information regarding these and other risks.
The Series F (Floating Rate Strategies Series) may not be suitable for all investors. ● Investments in floating rate senior secured syndicated bank loans and other floating rate securities involve special types of risks, including credit rate risk, interest rate risk, liquidity risk and prepayment risk. ● The Fund’s market value will change in response to interest rate changes and market conditions among other factors. In general, bond prices rise when interest rates fall and vice versa. ● The Fund’s exposure to high yield securities may subject the Fund to greater volatility. ● When market conditions are deemed appropriate, the Fund will leverage to the full extent permitted by its investment policies and restrictions and applicable law. Leveraging will exaggerate the effect on net asset value of any increase or decrease in the market value of the Fund’s portfolio. ● The Fund may invest in derivative instruments, which may be more volatile and less liquid, increasing the risk of loss when compared to traditional securities. Certain of the derivative instruments are also subject to the risks of counterparty default and adverse tax treatment. ● Instruments and strategies (such as borrowing transactions and reverse repurchase agreements) may provide leveraged exposure to a particular investment, which will magnify any gains or losses on those investments. ● Investments in reverse repurchase agreements and synthetic instruments (such as synthetic collateralized debt obligations) expose the Fund to the many of the same risks as investments in derivatives. ● The Fund’s investments in other investment vehicles subject the Fund to those risks and expenses affecting the investment vehicle. ● The Fund’s investments in foreign securities carry additional risks when compared to U.S. securities, due to the impact of diplomatic, political or economic developments in the country in question (investments in emerging markets securities are generally subject to an even greater level of risks). ● The Fund’s investments in real estate securities subject the Fund to the same risks as direct investments in real estate, which is particularly sensitive to economic downturns. ● The Fund’s investments in restricted securities may involve financial and liquidity risk. ● The Fund is subject to active trading risks that may increase volatility and impact its ability to achieve its investment objective. ● You may have a gain or loss when you sell your shares. ● It is important to note that the Fund is not guaranteed by the U.S. government. ● Please read the prospectus for more detailed information regarding these and other risks.
The Series N (Managed Asset Allocation Series) may not be suitable for all investors. ● The value of an investment in the Fund will fluctuate and is subject to investment risks, which means investors could lose money. The Fund could lose money if the issuer of a bond or a counterparty to a derivatives transaction or other transaction is unable to repay interest and principal on time or defaults. The issuer of a bond could also suffer a decrease in quality rating, which would affect the volatility and liquidity of the bond. Derivatives may pose risks in addition to those associated with investing directly in securities or other investments, including the risk that the Fund will be unable to sell, unwind or value the derivative because of an illiquid market, the risk that the derivative is not well correlated with underlying investments or the Fund’s other portfolio holdings, and the risk that the counterparty is unwilling or unable to meet its obligation. The use of derivatives by the Fund to hedge risk may reduce the opportunity for gain by offsetting the positive effect of favorable price movements. Furthermore, if the Investment Manager is incorrect about its expectations of market conditions, the use of derivatives could result in a loss, which in some cases may be unlimited. Foreign securities carry additional risks when compared to U.S. securities, including currency fluctuations, adverse political and economic developments, unreliable or untimely information, less liquidity, limited legal recourse and higher transactional costs. The Investment Manager may not be able to cause certain of the underlying funds’ performance to match or correlate to that of the underlying funds’ respective underlying index or benchmark, either on a daily or aggregate basis. Factors such as underlying fund expenses, imperfect correlation between an underlying fund’s investments and those of its underlying index or underlying benchmark, rounding of share prices, changes to the composition of the underlying index or underlying benchmark, regulatory policies, high portfolio turnover rate, and the use of leverage all contribute to tracking error. Tracking error may cause an underlying fund’s and, thus the Fund’s, performance to be less than you expect. ● Please read the prospectus for more detailed information regarding these and other risks.
The Series P (High Yield Series) may not be suitable for all investors. ● The Fund’s market value will change in response to interest rate changes and market conditions among other factors. In general, bond prices rise when interest rates fall and vice versa. ● The Fund’s exposure to high yield securities may subject the Fund to greater volatility. ● The Fund may invest in derivative instruments, which may be more volatile and less liquid, increasing the risk of loss when compared to traditional securities. Certain of the derivative instruments are also subject to the risks of counterparty default and adverse tax treatment. ●The Fund’s use of leverage, through borrowings or instruments such as derivatives, may cause the Fund to be more volatile than if it had not been leveraged. ● Instruments and strategies (such as borrowing transactions and reverse repurchase agreements) may provide leveraged exposure to a particular investment, which will magnify any gains or losses on those investments. ● The Fund may invest in foreign securities which carry additional risks when compared to U.S. securities, due to the impact of diplomatic, political or economic developments in the country in question (investments in emerging markets securities are generally subject to an even greater level of risks). ● Investments in syndicated bank loans generally offer a floating interest rate and involve special types of risks. ● The Fund’s investments in other investment vehicles subject the Fund to those risks and expenses affecting the investment vehicle. ● The Fund’s investments in restricted securities may involve financial and liquidity risk. ● You may have a gain or loss when you sell your shares. ● It is important to note that the Fund is not guaranteed by the U.S. government. ● Please read the prospectus for more detailed information regarding these and other risks.
The Series Z (Alpha Opportunity Series) may not be suitable for all investors. ● The Alpha Opportunity Fund is subject to a number of risks and is not suitable for all investors. ● Investments in securities and derivatives, in general, are subject to market risks that may cause their prices to fluctuate over time. An investment in the fund may lose money. There can be no guarantee the Fund will achieve it investment objective. ●The fund’s use of derivatives such as futures, options and swap agreements may expose the fund to additional risks that it would not be subject to if it invested directly in the securities underlying those derivatives. ● Certain of the derivative instruments, such as swaps and structured notes, are also subject to the risks of counterparty default and adverse tax treatment. ●The more the fund invests in leveraged instruments, the more the leverage will magnify any gains or losses on those investments. ● The fund’s use of short selling involves increased risk and costs, including paying more for a security than it received from its sale and the risk of unlimited losses. ●In certain circumstances the fund may be subject to liquidity risk and it may be difficult for the fund to purchase and sell particular investments within a reasonable time at a fair price. ●In certain circumstances, it may be difficult for the fund to purchase and sell particular investments within a reasonable time at a fair price. ●The Fund’s fixed income investments will change in value in response to interest rate changes and other factors. ●See the prospectus for more information on these and additional risks.
THE GUGGENHEIM FUNDS SEMI-ANNUAL REPORT 3 |
ECONOMIC AND MARKET OVERVIEW (Unaudited) | June 30, 2018 |
As the U.S. economy powers along, with second quarter 2018 gross domestic product (“GDP”) coming in at 4.1% annualized, geopolitical risk continues to weigh on the market. Positive headlines surrounding growth and the labor market are offset by concerns over trade tariffs launched by the U.S. against both its rivals and its allies. In May, the Trump administration allowed the aluminum and steel tariff exemptions to expire for Canada, Mexico, and the European Union, instituting 25% tariffs on steel and 10% tariffs on aluminum imported from these regions. In June, the U.S. administration announced it would also impose 25% tariffs on $50 billion worth of Chinese imports ($34 billion of which would be tariffed beginning in July), followed by the publication of a list of $200 billion in additional Chinese goods to be targeted, to which China promised retaliation. The European Union has also announced retaliation, approving tariffs of 25% on a long list of American goods. Over this period, 10-year U.S. Treasury yields peaked at 3.1% and finished the quarter at 2.9%.
The bond market’s reaction to trade rhetoric indicates that there is a tug of war at hand. While fiscal stimulus pushed up bond yields initially, tariffs are weighing them down. Markets are right to be concerned about the consequences of trade tariffs. Outside of the U.S., these trade tariffs may have the intended impact of squeezing economic growth in export-heavy regions, but among the losers will also be U.S. consumers. Some corporations may slow or postpone hiring as they manage for rising input costs. Others will pass higher prices on to the consumer, causing disposable incomes to suffer. In either case, tariffs reduce the benefit of the fiscal stimulus.
The U.S. Federal Reserve’s (the “Fed”) confidence in the U.S. economy seems to have sharpened in recent weeks despite trade uncertainty. In the June Summary of Economic Projections (“SEP”), the U.S. Federal Reserve Open Market Committee’s (“FOMC”) median expectations for 2018 GDP growth rose from 2.7% to 2.8%. The FOMC now expects a lower unemployment rate, higher personal consumption expenditures inflation and a higher federal funds rate for 2018 and 2019 than previously expected. The Fed is determined to tighten financial conditions until economic growth and hiring slow to a more sustainable pace.
We believe that the net effect of all factors affecting rates—fiscal stimulus, trade tariffs, and monetary policy tightening—will keep long-term interest rates from moving much higher than current levels. The market is currently pricing this in to the yield curve; in July the difference between 30-year and two-year U.S. Treasury yields hit its lowest level since July 2007. The bond market is sending a warning signal that makes us wary of taking on too much credit risk at this stage.
We maintain our view that a recession could come in 2020 and markets may discount this as early as 2019. In the meantime, we are watching for exogenous factors that could cause a recession to come sooner.
For the six months ended June 30, 2018, the Standard & Poor’s 500® (“S&P 500”) Index* returned 2.65%. The MSCI Europe-Australasia-Far East (“EAFE”) Index* returned -2.37%. The return of the MSCI Emerging Markets Index* was -6.51%.
In the bond market, the Bloomberg Barclays U.S. Aggregate Bond Index* posted a -1.62% return for the period, while the Bloomberg Barclays U.S. Corporate High Yield Index* returned 0.16%. The return of the ICE Bank of America (“BofA”) Merrill Lynch 3-Month U.S. Treasury Bill Index* was 0.81% for the six-month period.
The opinions and forecasts expressed may not actually come to pass. This information is subject to change at any time, based on market and other conditions, and should not be construed as a recommendation of any specific security or strategy.
*Index Definitions:
The following indices are referenced throughout this report. Indices are unmanaged and not available for direct investment. Index performance does not reflect transaction costs, fees, or expenses.
Bloomberg Barclays U.S. Aggregate Bond Index is a broad-based flagship benchmark that measures the investment grade, U.S. dollar-denominated, fixed-rate taxable bond market, including U.S. Treasuries, government-related and corporate securities, mortgage-backed securities or “MBS” (agency fixed-rate and hybrid adjustable-rate mortgage, or “ARM”, pass-throughs), asset-backed securities (“ABS”), and commercial mortgage-backed securities (“CMBS”) (agency and non-agency).
Bloomberg Barclays U.S. Corporate High Yield Index measures the U.S. dollar-denominated, high yield, fixed-rate corporate bond market. Securities are classified as high yield if the middle rating of Moody’s, Fitch, and S&P is Ba1/BB +/BB + or below.
Credit Suisse Leveraged Loan Index is designed to mirror the investable universe of the U.S. dollar-denominated leveraged loan market.
4 | THE GUGGENHEIM FUNDS SEMI-ANNUAL REPORT |
ECONOMIC AND MARKET OVERVIEW (Unaudited)(concluded) | June 30, 2018 |
ICE BofA Merrill Lynch 3-Month U.S. Treasury Bill Index is an unmanaged market Index of U.S. Treasury securities maturing in 90 days that assumes reinvestment of all income.
MSCI EAFE Index is a free float-adjusted market capitalization index that is designed to measure the equity market performance of developed markets, excluding the U.S. & Canada.
MSCI Emerging Markets Index is a free float-adjusted market capitalization weighted index that is designed to measure equity market performance in the global emerging markets.
MSCI World Index is a free float-adjusted market capitalization weighted index that is designed to measure the equity market performance of developed markets.
Morningstar Long/Short Equity Category Average is an average return of the funds in the Morningstar Long/Short Equity Category. The categories assist investors and investment professionals in making meaningful comparisons between funds, making it easier to build well-diversified portfolios, assess potential risk, and identify top-performing funds.
Russell 3000® Index measures the performance of the largest 3,000 U.S. companies, representing approximately 98% of the investable U.S. equity market.
Russell 3000® Value Index measures the performance of the broad value segment of the U.S. equity value universe. It includes those Russell 3000 companies with lower price-to-book ratios and lower forecasted growth values.
Russell 2500® Value Index measures the performance of the small- to mid-cap value segment of the U.S. equity universe. It includes those Russell 2500 companies with lower price-to-book ratios and lower forecasted growth values.
Russell 2000® Growth Index measures the performance of the small-cap growth segment of the U.S. equity universe. It includes those Russell 2000 companies with higher price-to-book ratios and higher forecasted growth values.
Russell 2000® Value Index measures the performance of the small-cap value segment of the U.S. equity universe. It includes those Russell 2000 companies with lower price-to-book ratios and lower forecasted growth values.
Russell 1000® Growth Index measures the performance of the large-cap growth segment of the U.S. equity universe. It includes those Russell 1000 companies with higher price-to-book ratios and higher forecasted growth value.
Russell 1000® Value Index: A measure of the performance for the large-cap value segment of the U.S. equity universe. It includes those Russell 1000 companies with lower price-to-book ratios and lower expected growth values.
Russell Midcap® Growth Index measures the performance of the mid-cap growth segment of the U.S. equity universe. It includes those Russell Midcap Index companies with higher price-to-book ratios and higher forecasted growth values.
S&P 500® Index is a broad-based index, the performance of which is based on the performance of 500 widely held common stocks chosen for market size, liquidity, and industry group representation.
THE GUGGENHEIM FUNDS SEMI-ANNUAL REPORT 5 |
ABOUT SHAREHOLDERS’ FUND EXPENSES (Unaudited) |
|
All mutual funds have operating expenses, and it is important for our shareholders to understand the impact of costs on their investments. Shareholders of a fund incur two types of costs: (i) transaction costs, including sales charges (loads) on purchase payments, reinvested dividends, other distributions, and exchange fees, and (ii) ongoing costs, including management fees, administrative services, and shareholder reports, among others. These ongoing costs, or operating expenses, are deducted from a fund’s gross income and reduce the investment return of the fund.
A fund’s expenses are expressed as a percentage of its average net assets, which is known as the expense ratio. The following examples are intended to help investors understand the ongoing costs (in dollars) of investing in a fund and to compare these costs with the ongoing costs of investing in other mutual funds.
The examples are based on an investment of $1,000 made at the beginning of the period and held for the entire six-month period beginning December 31, 2017 and ending June 30, 2018.
The following tables illustrate the Funds’ costs in two ways:
Table 1. Based on actual Fund return: This section helps investors estimate the actual expenses paid over the period. The “Ending Account Value” shown is derived from the Fund’s actual return, and the fifth column shows the dollar amount that would have been paid by an investor who started with $1,000 in the Fund. Investors may use the information here, together with the amount invested, to estimate the expenses paid over the period. Simply divide the Fund’s account value by $1,000 (for example, an $8,600 account value divided by $1,000 = 8.6), then multiply the result by the number provided under the heading “Expenses Paid During Period.”
Table 2. Based on hypothetical 5% return: This section is intended to help investors compare a fund’s cost with those of other mutual funds. The table provides information about hypothetical account values and hypothetical expenses based on the Fund’s actual expense ratio and an assumed rate of return of 5% per year before expenses, which is not the Fund’s actual return. The hypothetical account values and expenses may not be used to estimate the actual ending account balance or expenses paid during the period. The example is useful in making comparisons because the U.S. Securities and Exchange Commission (the “SEC”) requires all mutual funds to calculate expenses based on the 5% return. Investors can assess a fund’s costs by comparing this hypothetical example with the hypothetical examples that appear in shareholder reports of other funds.
The calculations illustrated above assume no shares were bought or sold during the period. Actual costs may have been higher or lower, depending on the amount of investment and the timing of any purchases or redemptions.
Please note that the expenses shown in the table are meant to highlight your ongoing costs only and do not reflect any transactional costs, such as sales charges (loads) on purchase payments, and contingent deferred sales charges (“CDSC”) on redemptions, if any. Therefore, the second table is useful in comparing ongoing costs only, and will not help you determine the relative total costs of owning different funds. In addition, if these transactional costs were included, your costs would have been higher.
More information about the Funds’ expenses, including annual expense ratios for periods up to five years (subject to the Fund’s inception date), can be found in the Financial Highlights section of this report. For additional information on operating expenses and other shareholder costs, please refer to the appropriate Fund prospectus.
6 | THE GUGGENHEIM FUNDS SEMI-ANNUAL REPORT |
ABOUT SHAREHOLDERS’ FUND EXPENSES (Unaudited)(concluded) |
|
Expense | Fund | Beginning | Ending | Expenses | |
Table 1. Based on actual Fund return3 | |||||
Series A (StylePlus—Large Core Series) | 0.98% | 1.63% | $ 1,000.00 | $ 1,016.30 | $ 4.90 |
Series B (Large Cap Value Series) | 0.80% | (0.99%) | 1,000.00 | 990.10 | 3.95 |
Series D (World Equity Income Series) | 0.90% | 0.07% | 1,000.00 | 1,000.70 | 4.46 |
Series E (Total Return Bond Series) | 0.77% | 0.49% | 1,000.00 | 1,004.90 | 3.83 |
Series F (Floating Rate Strategies Series) | 1.16% | 1.03% | 1,000.00 | 1,010.30 | 5.78 |
Series J (StylePlus—Mid Growth Series) | 0.94% | 4.20% | 1,000.00 | 1,042.00 | 4.76 |
Series N (Managed Asset Allocation Series) | 0.93% | 0.00% | 1,000.00 | 1,000.00 | 4.61 |
Series O (All Cap Value Series) | 0.88% | 0.78% | 1,000.00 | 1,007.80 | 4.38 |
Series P (High Yield Series) | 1.26% | (0.96%) | 1,000.00 | 990.40 | 6.22 |
Series Q (Small Cap Value Series) | 1.14% | 3.60% | 1,000.00 | 1,036.00 | 5.75 |
Series V (Mid Cap Value Series) | 0.91% | 4.33% | 1,000.00 | 1,043.30 | 4.61 |
Series X (StylePlus—Small Growth Series) | 1.06% | 8.78% | 1,000.00 | 1,087.80 | 5.49 |
Series Y (StylePlus—Large Growth Series) | 1.02% | 6.11% | 1,000.00 | 1,061.10 | 5.21 |
Series Z (Alpha Opportunity Series) | 2.00% | (9.18%) | 1,000.00 | 908.20 | 9.46 |
Table 2. Based on hypothetical 5% return (before expenses) | |||||
Series A (StylePlus—Large Core Series) | 0.98% | 5.00% | $ 1,000.00 | $ 1,019.93 | $ 4.91 |
Series B (Large Cap Value Series) | 0.80% | 5.00% | 1,000.00 | 1,020.83 | 4.01 |
Series D (World Equity Income Series) | 0.90% | 5.00% | 1,000.00 | 1,020.33 | 4.51 |
Series E (Total Return Bond Series) | 0.77% | 5.00% | 1,000.00 | 1,020.98 | 3.86 |
Series F (Floating Rate Strategies Series) | 1.16% | 5.00% | 1,000.00 | 1,019.04 | 5.81 |
Series J (StylePlus—Mid Growth Series) | 0.94% | 5.00% | 1,000.00 | 1,020.13 | 4.71 |
Series N (Managed Asset Allocation Series) | 0.93% | 5.00% | 1,000.00 | 1,020.18 | 4.66 |
Series O (All Cap Value Series) | 0.88% | 5.00% | 1,000.00 | 1,020.43 | 4.41 |
Series P (High Yield Series) | 1.26% | 5.00% | 1,000.00 | 1,018.55 | 6.31 |
Series Q (Small Cap Value Series) | 1.14% | 5.00% | 1,000.00 | 1,019.14 | 5.71 |
Series V (Mid Cap Value Series) | 0.91% | 5.00% | 1,000.00 | 1,020.28 | 4.56 |
Series X (StylePlus—Small Growth Series) | 1.06% | 5.00% | 1,000.00 | 1,019.54 | 5.31 |
Series Y (StylePlus—Large Growth Series) | 1.02% | 5.00% | 1,000.00 | 1,019.74 | 5.11 |
Series Z (Alpha Opportunity Series) | 2.00% | 5.00% | 1,000.00 | 1,014.88 | 9.99 |
| 1 | Annualized and excludes expenses of the underlying funds in which the Funds invest, if any. This ratio represents net expenses, which may include expenses that are excluded from the expense limitation agreement and affiliated waivers. Excluding these expenses, the net expense ratios for the period would be: |
Fund | 06/30/18 |
Series A (StylePlus—Large Core Series) | 0.91% |
Series B (Large Cap Value Series) | 0.80% |
Series D (World Equity Income Series) | 0.90% |
Series E (Total Return Bond Series) | 0.77% |
Series F (Floating Rate Strategies Series) | 1.15% |
Series J (StylePlus—Mid Growth Series) | 0.94% |
Series O (All Cap Value Series) | 0.88% |
Series P (High Yield Series) | 1.07% |
Series Q (Small Cap Value Series) | 1.14% |
Series V (Mid Cap Value Series) | 0.91% |
Series X (StylePlus—Small Growth Series) | 1.06% |
Series Y (StylePlus—Large Growth Series) | 0.93% |
Series Z (Alpha Opportunity Series) | 2.00% |
| 2 | Expenses are equal to the Fund's annualized expense ratio, net of any applicable fee waivers, multiplied by the average account value over the period, multiplied by 181/365 (to reflect the one-half year period). Expenses shown do not include fees charged by insurance companies. |
| 3 | Actual cumulative return at net asset value for the period December 31, 2017 to June 30, 2018. |
THE GUGGENHEIM FUNDS SEMI-ANNUAL REPORT 7 |
PERFORMANCE REPORT AND FUND PROFILE (Unaudited) | June 30, 2018 |
SERIES A (STYLEPLUS—LARGE CORE SERIES)
OBJECTIVE: Seeks long-term growth of capital.
Holdings Diversification (Market Exposure as % of Net Assets)
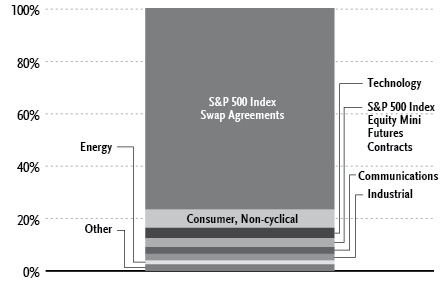
“Holdings Diversification (Market Exposure as % of Net Assets)” excludes any temporary cash investments or investments in Guggenheim Strategy Funds Trust mutual funds.
Inception Date: May 1, 1979 |
Ten Largest Holdings (% of Total Net Assets) | |
Guggenheim Variable Insurance Strategy Fund III | 33.9% |
Guggenheim Strategy Fund III | 30.2% |
Guggenheim Strategy Fund II | 12.2% |
Guggenheim Strategy Fund I | 1.2% |
Apple, Inc. | 0.6% |
Exxon Mobil Corp. | 0.5% |
Microsoft Corp. | 0.5% |
Alphabet, Inc. — Class C | 0.4% |
Chevron Corp. | 0.4% |
Amazon.com, Inc. | 0.4% |
Top Ten Total | 80.3% |
“Ten Largest Holdings” excludes any temporary cash or derivative investments.
Average Annual Returns*,†
Periods Ended June 30, 2018
6 Month‡ | 1 Year | 5 Year | 10 Year | |
Series A (StylePlus—Large Core Series) | 1.63% | 13.59% | 14.02% | 9.09% |
S&P 500 Index | 2.65% | 14.37% | 13.42% | 10.17% |
| * | The performance data above represents past performance that is not predictive of future results. Effective April 30, 2013, certain changes were made to the Series’ investment objective and principal strategies. The investment return and principal value of an investment in the Fund will fluctuate so that an investor’s shares, when redeemed, may be worth more or less than their original cost. Returns are historical and include changes in principal and reinvested dividends and capital gains and do not reflect the effect of taxes. The S&P 500 Index is an unmanaged index and, unlike the Fund, has no management fees or operating expenses to reduce its reported return. |
| † | Performance figures do not reflect fees and expenses associated with an investment in variable insurance products. If returns had taken into account these fees and expenses, performance would have been lower. Shares of a series of Guggenheim Variable Funds Trust are available only through the purchase of such products. |
| ‡ | 6 month returns are not annualized. |
8 | THE GUGGENHEIM FUNDS SEMI-ANNUAL REPORT |
SCHEDULE OF INVESTMENTS (Unaudited) | June 30, 2018 |
SERIES A (STYLEPLUS—LARGE CORE SERIES) |
| Value | |||||||
COMMON STOCKS† - 20.0% | ||||||||
Consumer, Non-cyclical - 7.0% | ||||||||
Pfizer, Inc. | 24,807 | $ | 899,998 | |||||
Procter & Gamble Co. | 11,127 | 868,574 | ||||||
PepsiCo, Inc. | 7,299 | 794,642 | ||||||
Amgen, Inc. | 3,869 | 714,179 | ||||||
Gilead Sciences, Inc. | 9,179 | 650,240 | ||||||
Mondelez International, Inc. — Class A | 14,589 | 598,149 | ||||||
Biogen, Inc.* | 1,958 | 568,290 | ||||||
Sysco Corp. | 8,120 | 554,515 | ||||||
Kimberly-Clark Corp. | 5,245 | 552,508 | ||||||
Archer-Daniels-Midland Co. | 11,563 | 529,932 | ||||||
Molson Coors Brewing Co. — Class B | 7,484 | 509,212 | ||||||
JM Smucker Co. | 4,672 | 502,147 | ||||||
Tyson Foods, Inc. — Class A | 7,184 | 494,618 | ||||||
Allergan plc | 2,859 | 476,653 | ||||||
Altria Group, Inc. | 8,171 | 464,031 | ||||||
Humana, Inc. | 1,500 | 446,445 | ||||||
Centene Corp.* | 3,493 | 430,372 | ||||||
Kellogg Co. | 6,136 | 428,722 | ||||||
Kroger Co. | 14,420 | 410,249 | ||||||
Mylan N.V.* | 11,146 | 402,816 | ||||||
Western Union Co. | 18,760 | 381,391 | ||||||
Anthem, Inc. | 1,594 | 379,420 | ||||||
McKesson Corp. | 2,669 | 356,045 | ||||||
United Rentals, Inc.* | 2,383 | 351,778 | ||||||
Cardinal Health, Inc. | 6,556 | 320,130 | ||||||
AbbVie, Inc. | 3,368 | 312,045 | ||||||
Conagra Brands, Inc. | 8,094 | 289,199 | ||||||
Johnson & Johnson | 2,280 | 276,655 | ||||||
CVS Health Corp. | 4,258 | 274,002 | ||||||
Bristol-Myers Squibb Co. | 4,666 | 258,216 | ||||||
Perrigo Company plc | 3,427 | 249,863 | ||||||
Quanta Services, Inc.* | 6,478 | 216,365 | ||||||
Becton Dickinson and Co. | 604 | 144,694 | ||||||
UnitedHealth Group, Inc. | 556 | 136,409 | ||||||
Cigna Corp. | 619 | 105,199 | ||||||
Total Consumer, Non-cyclical | 15,347,703 | |||||||
Technology - 3.9% | ||||||||
Apple, Inc. | 7,582 | 1,403,504 | ||||||
Microsoft Corp. | 11,548 | 1,138,748 | ||||||
Intel Corp. | 16,125 | 801,574 | ||||||
Oracle Corp. | 15,694 | 691,478 | ||||||
International Business Machines Corp. | 4,905 | 685,229 | ||||||
NetApp, Inc. | 6,710 | 526,936 | ||||||
CA, Inc. | 13,291 | 473,824 | ||||||
Applied Materials, Inc. | 9,455 | 436,726 | ||||||
Seagate Technology plc | 7,172 | 405,003 | ||||||
DXC Technology Co. | 5,016 | 404,340 | ||||||
Western Digital Corp. | 5,184 | 401,293 | ||||||
HP, Inc. | 17,265 | 391,743 | ||||||
Lam Research Corp. | 2,250 | 388,912 | ||||||
Micron Technology, Inc.* | 5,181 | 271,692 | ||||||
QUALCOMM, Inc. | 3,361 | 188,619 | ||||||
Total Technology | 8,609,621 | |||||||
Communications - 2.6% | ||||||||
Alphabet, Inc. — Class C* | 862 | 961,690 | ||||||
Amazon.com, Inc.* | 544 | 924,691 | ||||||
Cisco Systems, Inc. | 20,241 | 870,971 | ||||||
Facebook, Inc. — Class A* | 2,782 | 540,598 | ||||||
Omnicom Group, Inc. | 6,685 | 509,865 | ||||||
Juniper Networks, Inc. | 17,579 | 482,016 | ||||||
Comcast Corp. — Class A | 14,556 | 477,582 | ||||||
News Corp. — Class A | 30,189 | 467,930 | ||||||
AT&T, Inc. | 5,519 | 177,215 | ||||||
Walt Disney Co. | 1,353 | 141,808 | ||||||
Netflix, Inc.* | 257 | 100,598 | ||||||
Total Communications | 5,654,964 | |||||||
Industrial - 2.6% | ||||||||
Honeywell International, Inc. | 3,947 | 568,565 | ||||||
Caterpillar, Inc. | 4,168 | 565,473 | ||||||
WestRock Co. | 8,121 | 463,060 | ||||||
Snap-on, Inc. | 2,784 | 447,444 | ||||||
Eaton Corporation plc | 5,540 | 414,059 | ||||||
Textron, Inc. | 6,057 | 399,217 | ||||||
Huntington Ingalls Industries, Inc. | 1,808 | 391,956 | ||||||
Cummins, Inc. | 2,934 | 390,222 | ||||||
Dover Corp. | 5,099 | 373,247 | ||||||
Pentair plc | 8,866 | 373,081 | ||||||
Acuity Brands, Inc. | 3,036 | 351,781 | ||||||
Kansas City Southern | 2,426 | 257,059 | ||||||
United Technologies Corp. | 1,670 | 208,800 | ||||||
Stanley Black & Decker, Inc. | 1,434 | 190,450 | ||||||
Johnson Controls International plc | 5,492 | 183,708 | ||||||
Total Industrial | 5,578,122 | |||||||
Energy - 1.4% | ||||||||
Exxon Mobil Corp. | 14,207 | 1,175,345 | ||||||
Chevron Corp. | 7,517 | 950,374 | ||||||
Valero Energy Corp. | 3,671 | 406,857 | ||||||
Occidental Petroleum Corp. | 3,603 | 301,499 | ||||||
ConocoPhillips | 2,033 | 141,538 | ||||||
Total Energy | 2,975,613 | |||||||
Consumer, Cyclical - 1.3% | ||||||||
Walmart, Inc. | 5,256 | 450,176 | ||||||
Delta Air Lines, Inc. | 8,177 | 405,088 | ||||||
PACCAR, Inc. | 6,481 | 401,563 | ||||||
Southwest Airlines Co. | 7,795 | 396,610 | ||||||
Alaska Air Group, Inc. | 5,535 | 334,259 | ||||||
American Airlines Group, Inc. | 6,275 | 238,199 | ||||||
Walgreens Boots Alliance, Inc. | 3,518 | 211,133 | ||||||
United Continental Holdings, Inc.* | 2,601 | 181,368 | ||||||
Yum! Brands, Inc. | 1,130 | 88,389 | ||||||
General Motors Co. | 2,131 | 83,961 | ||||||
Home Depot, Inc. | 232 | 45,263 | ||||||
Total Consumer, Cyclical | 2,836,009 | |||||||
SEE NOTES TO FINANCIAL STATEMENTS. | THE GUGGENHEIM FUNDS SEMI-ANNUAL REPORT | 9 |
SCHEDULE OF INVESTMENTS (Unaudited)(continued) | June 30, 2018 |
SERIES A (STYLEPLUS—LARGE CORE SERIES) |
| Value | |||||||
Financial - 1.0% | ||||||||
State Street Corp. | 5,207 | $ | 484,720 | |||||
JPMorgan Chase & Co. | 3,870 | 403,254 | ||||||
Prudential Financial, Inc. | 3,454 | 322,983 | ||||||
Berkshire Hathaway, Inc. — Class B* | 1,415 | 264,110 | ||||||
Visa, Inc. — Class A | 1,745 | 231,125 | ||||||
Bank of America Corp. | 6,299 | 177,569 | ||||||
Wells Fargo & Co. | 2,588 | 143,479 | ||||||
Citigroup, Inc. | 2,020 | 135,178 | ||||||
MetLife, Inc. | 2,973 | 129,623 | ||||||
Total Financial | 2,292,041 | |||||||
Basic Materials - 0.2% | ||||||||
LyondellBasell Industries N.V. — Class A | 3,011 | 330,758 | ||||||
Total Common Stocks | ||||||||
(Cost $42,492,013) | 43,624,831 | |||||||
MUTUAL FUNDS† - 77.5% | ||||||||
Guggenheim Variable Insurance Strategy Fund III1 | 2,953,479 | 74,043,712 | ||||||
Guggenheim Strategy Fund III1 | 2,643,098 | 66,051,017 | ||||||
Guggenheim Strategy Fund II1 | 1,069,781 | 26,733,815 | ||||||
Guggenheim Strategy Fund I1 | 100,969 | 2,528,252 | ||||||
Total Mutual Funds | ||||||||
(Cost $168,858,324) | 169,356,796 | |||||||
MONEY MARKET FUND† - 2.3% | ||||||||
Dreyfus Treasury Prime Cash Management — Institutional Class, 1.68%2 | 5,077,540 | 5,077,540 | ||||||
Total Money Market Fund | ||||||||
(Cost $5,077,540) | 5,077,540 | |||||||
Total Investments - 99.8% | ||||||||
(Cost $216,427,877) | $ | 218,059,167 | ||||||
Other Assets & Liabilities, net - 0.2% | 408,242 | |||||||
Total Net Assets - 100.0% | $ | 218,467,409 | ||||||
Futures Contracts | ||||||||||||||||
Description | Number of | Expiration | Notional | Value and | ||||||||||||
Equity Futures Contracts Purchased† | ||||||||||||||||
S&P 500 Index Mini Futures Contracts | 55 | Sep 2018 | $ | 7,482,063 | $ | (171,860 | ) | |||||||||
Total Return Swap Agreements | ||||||||||||||||||||||
Counterparty | Index | Financing | Payment | Maturity | Units | Notional | Value and | |||||||||||||||
OTC Equity Index Swap Agreements†† | ||||||||||||||||||||||
Wells Fargo | S&P 500 Index | 2.17 | % | At Maturity | 07/02/18 | 61,917 | $ | 168,313,315 | $ | 8,451,050 | ||||||||||||
| * | Non-income producing security. |
| ** | Includes cumulative appreciation (depreciation). Only current day’s variation margin is reported within the Statement of Assets and Liabilities. |
| † | Value determined based on Level 1 inputs — See Note 4. |
| †† | Value determined based on Level 2 inputs — See Note 4. |
| 1 | Affiliated issuer. |
| 2 | Rate indicated is the 7 day yield as of June 30, 2018. |
plc — Public Limited Company
See Sector Classification in Other Information section.
10 | THE GUGGENHEIM FUNDS SEMI-ANNUAL REPORT | SEE NOTES TO FINANCIAL STATEMENTS. |
SCHEDULE OF INVESTMENTS (Unaudited)(concluded) | June 30, 2018 |
SERIES A (STYLEPLUS—LARGE CORE SERIES) |
The following table summarizes the inputs used to value the Fund’s investments at June 30, 2018 (See Note 4 in the Notes to Financial Statements):
Investments in Securities (Assets) | Level 1 | Level 2 | Level 3 | Total | ||||||||||||
Common Stocks | $ | 43,624,831 | $ | — | $ | — | $ | 43,624,831 | ||||||||
Mutual Funds | 169,356,796 | — | — | 169,356,796 | ||||||||||||
Money Market Fund | 5,077,540 | — | — | 5,077,540 | ||||||||||||
Equity Index Swap Agreements* | — | 8,451,050 | — | 8,451,050 | ||||||||||||
Total Assets | $ | 218,059,167 | $ | 8,451,050 | $ | — | $ | 226,510,217 | ||||||||
| ||||||||||||||||
Investments in Securities (Liabilities) | Level 1 | Level 2 | Level 3 | Total | ||||||||||||
Equity Futures Contracts* | $ | 171,860 | $ | — | $ | — | $ | 171,860 | ||||||||
| * | This derivative is reported as unrealized appreciation/depreciation at period end. |
Transfers between investment levels may occur as the markets fluctuate and/or the availability of data used in an investment’s valuation changes. Transfers between valuation levels, if any, are in comparison to the valuation levels at the end of the previous fiscal year, and are effective using the fair value as of the end of the current fiscal period.
For the period ended June 30, 2018, there were no transfers between levels.
Affiliated Transactions
Investments representing 5% or more of the outstanding voting shares of a portfolio company of a fund, or control of or by, or common control under Guggenheim Investments (“GI”), result in that portfolio company being considered an affiliated company of such fund, as defined in the 1940 Act.
The Fund may invest in certain of the underlying series of Guggenheim Strategy Funds Trust, including Guggenheim Strategy Fund I, Guggenheim Strategy Fund II, Guggenheim Strategy Fund III, and Guggenheim Variable Insurance Strategy Fund III (collectively, the “Cash Management Funds”), each of which are open-end management investment companies managed by GI. The Cash Management Funds, which launched on March 11, 2014, are offered as cash management options only to mutual funds, trusts, and other accounts managed by GI and/or its affiliates, and are not available to the public. The Cash Management Funds pay no investment management fees. The Cash Management Funds’ annual report on Form N-CSR dated September 30, 2017, is available publicly or upon request. This information is available from the EDGAR database on the SEC’s website at https://www.sec.gov/Archives/edgar/data/1601445/000089180417000715/gug72218.htm.
Transactions during the period ended June 30, 2018, in which the portfolio company is an “affiliated person”, were as follows:
Security Name | Value | Additions | Reductions | Realized | Change in | Value | Shares | Investment | ||||||||||||||||||||||||
Mutual Funds | ||||||||||||||||||||||||||||||||
Guggenheim Strategy Fund I | $ | 26,350,212 | $ | 164,194 | $ | (23,983,716 | ) | $ | 147,342 | $ | (149,780 | ) | $ | 2,528,252 | 100,969 | $ | 165,248 | |||||||||||||||
Guggenheim Strategy Fund II | 36,603,488 | 451,761 | (10,299,994 | ) | 53,715 | (75,155 | ) | 26,733,815 | 1,069,781 | 451,368 | ||||||||||||||||||||||
Guggenheim Strategy Fund III | 65,316,993 | 813,448 | — | — | (79,424 | ) | 66,051,017 | 2,643,098 | 810,966 | |||||||||||||||||||||||
Guggenheim Variable Insurance Strategy Fund III | 67,887,722 | 6,276,077 | — | — | (120,087 | ) | 74,043,712 | 2,953,479 | 945,410 | |||||||||||||||||||||||
| $ | 196,158,415 | $ | 7,705,480 | $ | (34,283,710 | ) | $ | 201,057 | $ | (424,446 | ) | $ | 169,356,796 | $ | 2,372,992 | |||||||||||||||||
SEE NOTES TO FINANCIAL STATEMENTS. | THE GUGGENHEIM FUNDS SEMI-ANNUAL REPORT | 11 |
SERIES A (STYLEPLUS—LARGE CORE SERIES) |
STATEMENT OF ASSETS AND LIABILITIES (Unaudited) | ||||
June 30, 2018 | ||||
Assets: | ||||
Investments in unaffiliated issuers, at value (cost $47,569,553) | $ | 48,702,371 | ||
Investments in affiliated issuers, at value (cost $168,858,324) | 169,356,796 | |||
Segregated cash with broker | 308,000 | |||
Unrealized appreciation on swap agreements | 8,451,050 | |||
Prepaid expenses | 1,210 | |||
Receivables: | ||||
Dividends | 487,154 | |||
Interest | 9,413 | |||
Variation margin on futures contracts | 3,438 | |||
Total assets | 227,319,432 | |||
Liabilities: | ||||
Overdraft due to custodian bank | 1,460,146 | |||
Segregated cash due to broker | 6,480,000 | |||
Payable for: | ||||
Securities purchased | 464,014 | |||
Fund shares redeemed | 204,173 | |||
Management fees | 79,125 | |||
Distribution and service fees | 48,131 | |||
Swap settlement | 38,737 | |||
Fund accounting/administration fees | 15,402 | |||
Trustees’ fees* | 3,271 | |||
Due to advisor | 2,658 | |||
Transfer agent/maintenance fees | 2,304 | |||
Miscellaneous (Note 11) | 54,062 | |||
Total liabilities | 8,852,023 | |||
Commitments and contingent liabilities (Note 13) | — | |||
Net assets | $ | 218,467,409 | ||
Net assets consist of: | ||||
Paid in capital | $ | 167,638,923 | ||
Undistributed net investment income | 5,254,092 | |||
Accumulated net realized gain on investments | 35,663,914 | |||
Net unrealized appreciation on investments | 9,910,480 | |||
Net assets | $ | 218,467,409 | ||
Capital shares outstanding | 4,724,729 | |||
Net asset value per share | $ | 46.24 | ||
STATEMENT OF OPERATIONS (Unaudited) | ||||
Period Ended June 30, 2018 | ||||
Investment Income: | ||||
Dividends from securities of unaffiliated issuers (net of foreign withholding tax of $575) | $ | 497,364 | ||
Dividends from securities of affiliated issuers | 2,372,992 | |||
Interest | 54,395 | |||
Total investment income | 2,924,751 | |||
Expenses: | ||||
Management fees | 916,962 | |||
Distribution and service fees | 305,654 | |||
Recoupment of previously waived fees | 2,658 | |||
Transfer agent/maintenance fees | 12,598 | |||
Fund accounting/administration fees | 97,810 | |||
Interest expense | 83,466 | |||
Custodian fees | 9,497 | |||
Line of credit fees | 5,106 | |||
Trustees’ fees* | 2,715 | |||
Miscellaneous | 49,967 | |||
Total expenses | 1,486,433 | |||
Less: | ||||
Expenses waived by Adviser | (298,250 | ) | ||
Net expenses | 1,188,183 | |||
Net investment income | 1,736,568 | |||
Net Realized and Unrealized Gain (Loss): | ||||
Net realized gain (loss) on: | ||||
Investments in unaffiliated issuers | 2,737,131 | |||
Investments in affiliated issuers | 201,057 | |||
Swap agreements | 6,089,606 | |||
Futures contracts | 136,691 | |||
Net realized gain | 9,164,485 | |||
Net change in unrealized appreciation (depreciation) on: | ||||
Investments in unaffiliated issuers | (3,368,756 | ) | ||
Investments in affiliated issuers | (424,446 | ) | ||
Swap agreements | (2,433,124 | ) | ||
Futures contracts | (184,432 | ) | ||
Net change in unrealized appreciation (depreciation) | (6,410,758 | ) | ||
Net realized and unrealized gain | 2,753,727 | |||
Net increase in net assets resulting from operations | $ | 4,490,295 | ||
| * | Relates to Trustees not deemed “interested persons” within the meaning of Section 2(a)(19) of the 1940 Act. |
12 | THE GUGGENHEIM FUNDS SEMI-ANNUAL REPORT | SEE NOTES TO FINANCIAL STATEMENTS. |
SERIES A (STYLEPLUS—LARGE CORE SERIES) |
STATEMENTS OF CHANGES IN NET ASSETS |
Period Ended June 30, 2018 | Year Ended | |||||||
Increase (Decrease) in Net Assets from Operations: | ||||||||
Net investment income | $ | 1,736,568 | $ | 3,513,001 | ||||
Net realized gain on investments | 9,164,485 | 36,947,690 | ||||||
Net change in unrealized appreciation (depreciation) on investments | (6,410,758 | ) | 7,079,795 | |||||
Net increase in net assets resulting from operations | 4,490,295 | 47,540,486 | ||||||
Distributions to shareholders from: | ||||||||
Net investment income | — | (2,810,139 | ) | |||||
Net realized gains | — | (3,235,435 | ) | |||||
Total distributions to shareholders | — | (6,045,574 | ) | |||||
Capital share transactions: | ||||||||
Proceeds from sale of shares | 2,611,960 | 7,868,127 | ||||||
Distributions reinvested | — | 6,045,574 | ||||||
Cost of shares redeemed | (40,429,704 | ) | (27,318,491 | ) | ||||
Net decrease from capital share transactions | (37,817,744 | ) | (13,404,790 | ) | ||||
Net increase (decrease) in net assets | (33,327,449 | ) | 28,090,122 | |||||
Net assets: | ||||||||
Beginning of period | 251,794,858 | 223,704,736 | ||||||
End of period | $ | 218,467,409 | $ | 251,794,858 | ||||
Undistributed net investment income at end of period | $ | 5,254,092 | $ | 3,517,524 | ||||
Capital share activity: | ||||||||
Shares sold | 56,032 | 189,083 | ||||||
Shares issued from reinvestment of distributions | — | 146,205 | ||||||
Shares redeemed | (864,855 | ) | (657,420 | ) | ||||
Net decrease in shares | (808,823 | ) | (322,132 | ) | ||||
SEE NOTES TO FINANCIAL STATEMENTS. | THE GUGGENHEIM FUNDS SEMI-ANNUAL REPORT | 13 |
SERIES A (STYLEPLUS—LARGE CORE SERIES) |
FINANCIAL HIGHLIGHTS |
This table is presented to show selected data for a share outstanding throughout each period and to assist shareholders in evaluating a Fund’s performance for the periods presented.
Period Ended | Year Ended December 31, 2017 | Year Ended December 31, 2016 | Year Ended December 31, 2015 | Year Ended December 31, 2014 | Year Ended December 31, 2013 | |||||||||||||||||||
| Per Share Data | ||||||||||||||||||||||||
| Net asset value, beginning of period | $ | 45.50 | $ | 38.20 | $ | 34.34 | $ | 37.53 | $ | 32.50 | $ | 25.22 | ||||||||||||
| Income (loss) from investment operations: | ||||||||||||||||||||||||
Net investment income (loss)b | .33 | .62 | .46 | .30 | .44 | .16 | ||||||||||||||||||
| Net gain (loss) on investments (realized and unrealized) | .41 | 7.76 | 4.09 | .36 | 4.59 | 7.12 | ||||||||||||||||||
| Total from investment operations | .74 | 8.38 | 4.55 | .66 | 5.03 | 7.28 | ||||||||||||||||||
| Less distributions from: | ||||||||||||||||||||||||
| Net investment income | — | (.50 | ) | (.32 | ) | (.52 | ) | — | — | |||||||||||||||
| Net realized gains | — | (.58 | ) | (.37 | ) | (3.33 | ) | — | — | |||||||||||||||
| Total distributions | — | (1.08 | ) | (.69 | ) | (3.85 | ) | — | — | |||||||||||||||
| Net asset value, end of period | $ | 46.24 | $ | 45.50 | $ | 38.20 | $ | 34.34 | $ | 37.53 | $ | 32.50 | ||||||||||||
Total Returnc | 1.63 | % | 22.22 | % | 13.34 | % | 1.50 | % | 15.48 | % | 28.87 | % | ||||||||||||
| Ratios/Supplemental Data | ||||||||||||||||||||||||
| Net assets, end of period (in thousands) | $ | 218,467 | $ | 251,795 | $ | 223,705 | $ | 218,880 | $ | 239,075 | $ | 231,194 | ||||||||||||
| Ratios to average net assets: | ||||||||||||||||||||||||
| Net investment income (loss) | 1.42 | % | 1.48 | % | 1.31 | % | 0.83 | % | 1.28 | % | 0.56 | % | ||||||||||||
Total expensesd | 1.22 | % | 1.12 | % | 0.93 | % | 0.96 | % | 0.97 | % | 0.96 | % | ||||||||||||
Net expensese,f,g | 0.98 | % | 0.91 | % | 0.93 | % | 0.96 | % | 0.95 | % | 0.96 | % | ||||||||||||
| Portfolio turnover rate | 25 | % | 44 | % | 43 | % | 66 | % | 88 | % | 267 | % | ||||||||||||
| a | Unaudited figures for the period ended June 30, 2018. Percentage amounts for the period, except total return and portfolio turnover rate, have been annualized. |
| b | Net investment income (loss) per share was computed using average shares outstanding throughout the period. |
| c | Total return does not take into account any of the expenses associated with an investment in variable insurance products. If total return had taken into account these expenses, performance would have been lower. Shares of a series of Guggenheim Variable Funds Trust are available only through the purchase of such products. |
| d | Does not include expenses of the underlying funds in which the Fund invests. |
| e | Net expense information reflects the expense ratios after expense waivers and reimbursements, as applicable. |
| f | Net expenses may include expenses that are excluded from the expense limitation agreement. Excluding these expenses, the net expense ratios for the periods would be: |
06/30/18 | 12/31/17 | 12/31/16 | 12/31/15 | 12/31/14 | 12/31/13 |
0.91% | 0.90% | N/A | N/A | N/A | N/A |
| g | The portion of the ratios of net expenses to average net assets attributable to recoupments of prior fee reductions of expense reimbursements for the periods presented would be: |
06/30/18 | 12/31/17 | 12/31/16 | 12/31/15 | 12/31/14 | 12/31/13 |
0.00%* | N/A | N/A | N/A | N/A | N/A |
| * | Less than 0.01%. |
14 | THE GUGGENHEIM FUNDS SEMI-ANNUAL REPORT | SEE NOTES TO FINANCIAL STATEMENTS. |
PERFORMANCE REPORT AND FUND PROFILE (Unaudited) | June 30, 2018 |
SERIES B (LARGE CAP VALUE SERIES)
OBJECTIVE: Seeks long-term growth of capital.
Holdings Diversification (Market Exposure as % of Net Assets)
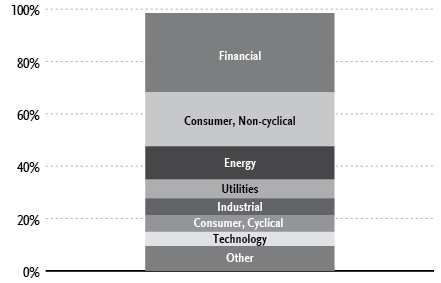
“Holdings Diversification (Market Exposure as % of Net Assets)” excludes any temporary cash investments.
Inception Date: May 1, 1979 |
Ten Largest Holdings (% of Total Net Assets) | |
JPMorgan Chase & Co. | 4.1% |
Exxon Mobil Corp. | 3.1% |
Chevron Corp. | 3.0% |
Bank of America Corp. | 3.0% |
Berkshire Hathaway, Inc. — Class B | 2.5% |
Citigroup, Inc. | 2.4% |
Intel Corp. | 2.4% |
Cisco Systems, Inc. | 2.1% |
Wells Fargo & Co. | 2.1% |
Merck & Company, Inc. | 2.0% |
Top Ten Total | 26.7% |
“Ten Largest Holdings” excludes any temporary cash investments.
Average Annual Returns*,†
Periods Ended June 30, 2018
6 Month‡ | 1 Year | 5 Year | 10 Year | |
Series B (Large Cap Value Series) | (0.99%) | 9.93% | 10.58% | 8.24% |
Russell 1000 Value Index | (1.69%) | 6.77% | 10.34% | 8.49% |
| * | The performance data above represents past performance that is not predictive of future results. The investment return and principal value of an investment in the Fund will fluctuate so that an investor’s shares, when redeemed, may be worth more or less than their original cost. Returns are historical and include changes in principal and reinvested dividends and capital gains and do not reflect the effect of taxes. The Russell 1000 Value Index is an unmanaged index and, unlike the Fund, has no management fees or operating expenses to reduce its reported return. |
| † | Performance figures do not reflect fees and expenses associated with an investment in variable insurance products. If returns had taken into account these fees and expenses, performance would have been lower. Shares of a series of Guggenheim Variable Funds Trust are available only through the purchase of such products. |
| ‡ | 6 month returns are not annualized. |
THE GUGGENHEIM FUNDS SEMI-ANNUAL REPORT 15 |
SCHEDULE OF INVESTMENTS (Unaudited) | June 30, 2018 |
SERIES B (LARGE CAP VALUE SERIES) |
| Value | |||||||
COMMON STOCKS† - 98.5% | ||||||||
Financial - 30.3% | ||||||||
JPMorgan Chase & Co. | 95,515 | $ | 9,952,663 | |||||
Bank of America Corp. | 256,481 | 7,230,199 | ||||||
Berkshire Hathaway, Inc. — Class B* | 32,111 | 5,993,518 | ||||||
Citigroup, Inc. | 86,257 | 5,772,318 | ||||||
Wells Fargo & Co. | 90,492 | 5,016,877 | ||||||
BB&T Corp. | 65,362 | 3,296,859 | ||||||
Zions Bancorporation | 60,137 | 3,168,619 | ||||||
SunTrust Banks, Inc. | 46,386 | 3,062,404 | ||||||
Allstate Corp. | 23,741 | 2,166,841 | ||||||
Welltower, Inc. REIT | 33,237 | 2,083,627 | ||||||
Piedmont Office Realty Trust, Inc. — Class A REIT | 104,367 | 2,080,034 | ||||||
Charles Schwab Corp. | 40,347 | 2,061,732 | ||||||
Principal Financial Group, Inc. | 37,423 | 1,981,548 | ||||||
Jefferies Financial Group, Inc. | 84,080 | 1,911,979 | ||||||
Liberty Property Trust REIT | 41,187 | 1,825,820 | ||||||
Omega Healthcare Investors, Inc. REIT | 58,239 | 1,805,409 | ||||||
Loews Corp. | 36,285 | 1,751,840 | ||||||
Morgan Stanley | 34,665 | 1,643,121 | ||||||
Assured Guaranty Ltd. | 45,312 | 1,618,998 | ||||||
Unum Group | 41,540 | 1,536,564 | ||||||
Regions Financial Corp. | 76,086 | 1,352,809 | ||||||
KeyCorp | 64,668 | 1,263,613 | ||||||
T. Rowe Price Group, Inc. | 10,273 | 1,192,593 | ||||||
Realogy Holdings Corp. | 50,262 | 1,145,974 | ||||||
American International Group, Inc. | 20,706 | 1,097,832 | ||||||
Equity Commonwealth REIT* | 23,702 | 746,613 | ||||||
Federated Investors, Inc. — Class B | 29,308 | 683,462 | ||||||
Total Financial | 73,443,866 | |||||||
Consumer, Non-cyclical - 20.6% | ||||||||
Merck & Company, Inc. | 81,134 | 4,924,834 | ||||||
Pfizer, Inc. | 127,456 | 4,624,104 | ||||||
Johnson & Johnson | 32,817 | 3,982,015 | ||||||
Amgen, Inc. | 16,845 | 3,109,419 | ||||||
Procter & Gamble Co. | 39,244 | 3,063,386 | ||||||
Hormel Foods Corp. | 71,296 | 2,652,924 | ||||||
HCA Healthcare, Inc. | 21,438 | 2,199,539 | ||||||
Tyson Foods, Inc. — Class A | 30,226 | 2,081,060 | ||||||
UnitedHealth Group, Inc. | 8,286 | 2,032,887 | ||||||
Archer-Daniels-Midland Co. | 43,946 | 2,014,045 | ||||||
Quest Diagnostics, Inc. | 17,512 | 1,925,269 | ||||||
Bunge Ltd. | 25,800 | 1,798,518 | ||||||
CVS Health Corp. | 26,943 | 1,733,782 | ||||||
Express Scripts Holding Co.* | 22,381 | 1,728,037 | ||||||
Zimmer Biomet Holdings, Inc. | 14,681 | 1,636,050 | ||||||
United Therapeutics Corp.* | 14,302 | 1,618,271 | ||||||
Humana, Inc. | 5,395 | 1,605,714 | ||||||
DaVita, Inc.* | 20,183 | 1,401,508 | ||||||
AmerisourceBergen Corp. — Class A | 14,464 | 1,233,345 | ||||||
Conagra Brands, Inc. | 33,664 | 1,202,815 | ||||||
Medtronic plc | 13,608 | 1,164,981 | ||||||
Mylan N.V.* | 19,130 | 691,358 | ||||||
Ingredion, Inc. | 5,434 | 601,544 | ||||||
Philip Morris International, Inc. | 6,382 | 515,283 | ||||||
Patterson Companies, Inc. | 21,970 | 498,060 | ||||||
Total Consumer, Non-cyclical | 50,038,748 | |||||||
Energy - 12.7% | ||||||||
Exxon Mobil Corp. | 90,329 | 7,472,918 | ||||||
Chevron Corp. | 57,407 | 7,257,967 | ||||||
Kinder Morgan, Inc. | 188,943 | 3,338,623 | ||||||
Marathon Oil Corp. | 158,094 | 3,297,841 | ||||||
Hess Corp. | 41,074 | 2,747,440 | ||||||
Whiting Petroleum Corp.* | 38,939 | 2,052,864 | ||||||
Range Resources Corp. | 107,163 | 1,792,837 | ||||||
Diamondback Energy, Inc. | 13,123 | 1,726,593 | ||||||
Antero Resources Corp.* | 56,985 | 1,216,630 | ||||||
Total Energy | 30,903,713 | |||||||
Utilities - 7.2% | ||||||||
Exelon Corp. | 72,444 | 3,086,114 | ||||||
Public Service Enterprise Group, Inc. | 56,473 | 3,057,448 | ||||||
Duke Energy Corp. | 32,516 | 2,571,365 | ||||||
Ameren Corp. | 41,280 | 2,511,888 | ||||||
OGE Energy Corp. | 58,117 | 2,046,300 | ||||||
Edison International | 27,657 | 1,749,858 | ||||||
Pinnacle West Capital Corp. | 15,680 | 1,263,181 | ||||||
SCANA Corp. | 31,222 | 1,202,672 | ||||||
Total Utilities | 17,488,826 | |||||||
Industrial - 6.4% | ||||||||
Republic Services, Inc. — Class A | 34,123 | 2,332,648 | ||||||
Corning, Inc. | 82,413 | 2,267,182 | ||||||
WestRock Co. | 31,950 | 1,821,789 | ||||||
Carlisle Companies, Inc. | 16,256 | 1,760,687 | ||||||
Owens Corning | 26,430 | 1,674,869 | ||||||
Eaton Corporation plc | 18,940 | 1,415,576 | ||||||
General Electric Co. | 97,873 | 1,332,052 | ||||||
Jabil, Inc. | 43,618 | 1,206,474 | ||||||
Honeywell International, Inc. | 6,020 | 867,181 | ||||||
Timken Co. | 19,855 | 864,685 | ||||||
Total Industrial | 15,543,143 | |||||||
Consumer, Cyclical - 6.4% | ||||||||
Walmart, Inc. | 31,959 | 2,737,288 | ||||||
Southwest Airlines Co. | 47,188 | 2,400,926 | ||||||
PVH Corp. | 12,844 | 1,923,004 | ||||||
Lear Corp. | 10,067 | 1,870,549 | ||||||
JetBlue Airways Corp.* | 77,479 | 1,470,551 | ||||||
Carnival Corp. | 23,157 | 1,327,128 | ||||||
DR Horton, Inc. | 32,193 | 1,319,913 | ||||||
PACCAR, Inc. | 20,253 | 1,254,876 | ||||||
Macy’s, Inc. | 17,763 | 664,869 | ||||||
Goodyear Tire & Rubber Co. | 24,587 | 572,631 | ||||||
Total Consumer, Cyclical | 15,541,735 | |||||||
Technology - 5.5% | ||||||||
Intel Corp. | 114,952 | 5,714,264 | ||||||
Apple, Inc. | 11,164 | 2,066,568 | ||||||
Xerox Corp. | 72,023 | 1,728,552 | ||||||
16 | THE GUGGENHEIM FUNDS SEMI-ANNUAL REPORT | SEE NOTES TO FINANCIAL STATEMENTS. |
SCHEDULE OF INVESTMENTS (Unaudited)(concluded) | June 30, 2018 |
SERIES B (LARGE CAP VALUE SERIES) |
| Value | |||||||
VMware, Inc. — Class A* | 11,664 | $ | 1,714,258 | |||||
Oracle Corp. | 28,737 | 1,266,152 | ||||||
QUALCOMM, Inc. | 16,170 | 907,461 | ||||||
Total Technology | 13,397,255 | |||||||
Basic Materials - 5.1% | ||||||||
Nucor Corp. | 38,756 | 2,422,250 | ||||||
Reliance Steel & Aluminum Co. | 25,241 | 2,209,597 | ||||||
Steel Dynamics, Inc. | 47,307 | 2,173,757 | ||||||
Cabot Corp. | 33,822 | 2,089,185 | ||||||
DowDuPont, Inc. | 29,631 | 1,953,275 | ||||||
Freeport-McMoRan, Inc. | 82,050 | 1,416,183 | ||||||
Total Basic Materials | 12,264,247 | |||||||
Communications - 4.3% | ||||||||
Cisco Systems, Inc. | 118,524 | 5,100,088 | ||||||
Verizon Communications, Inc. | 62,050 | 3,121,735 | ||||||
AT&T, Inc. | 65,948 | 2,117,590 | ||||||
Total Communications | 10,339,413 | |||||||
Total Common Stocks | ||||||||
(Cost $188,700,534) | 238,960,946 | |||||||
MONEY MARKET FUND† - 1.4% | ||||||||
Dreyfus Treasury Prime Cash Management — Institutional Class 1.68%1 | 3,513,142 | 3,513,142 | ||||||
Total Money Market Fund | ||||||||
(Cost $3,513,142) | 3,513,142 | |||||||
Total Investments - 99.9% | ||||||||
(Cost $192,213,676) | $ | 242,474,088 | ||||||
Other Assets & Liabilities, net - 0.1% | 163,823 | |||||||
Total Net Assets - 100.0% | $ | 242,637,911 | ||||||
| * | Non-income producing security. |
| † | Value determined based on Level 1 inputs — See Note 4. |
| 1 | Rate indicated is the 7 day yield as of June 30, 2018. |
plc — Public Limited Company
REIT — Real Estate Investment Trust
See Sector Classification in Other Information section.
The following table summarizes the inputs used to value the Fund’s investments at June 30, 2018 (See Note 4 in the Notes to Financial Statements):
Investments in Securities (Assets) | Level 1 | Level 2 | Level 3 | Total | ||||||||||||
Common Stocks | $ | 238,960,946 | $ | — | $ | — | $ | 238,960,946 | ||||||||
Money Market Fund | 3,513,142 | — | — | 3,513,142 | ||||||||||||
Total Assets | $ | 242,474,088 | $ | — | $ | — | $ | 242,474,088 | ||||||||
Transfers between investment levels may occur as the markets fluctuate and/or the availability of data used in an investment’s valuation changes. Transfers between valuation levels, if any, are in comparison to the valuation levels at the end of the previous fiscal year, and are effective using the fair value as of the end of the current fiscal period.
For the period ended June 30, 2018, there were no transfers between levels.
SEE NOTES TO FINANCIAL STATEMENTS. | THE GUGGENHEIM FUNDS SEMI-ANNUAL REPORT | 17 |
SERIES B (LARGE CAP VALUE SERIES) |
STATEMENT OF ASSETS AND LIABILITIES (Unaudited) | ||||
June 30, 2018 | ||||
Assets: | ||||
Investments, at value (cost $192,213,676) | $ | 242,474,088 | ||
Prepaid expenses | 2,625 | |||
Receivables: | ||||
Securities sold | 2,697,242 | |||
Dividends | 186,449 | |||
Interest | 3,221 | |||
Total assets | 245,363,625 | |||
Liabilities: | ||||
Payable for: | ||||
Securities purchased | 2,407,350 | |||
Fund shares redeemed | 116,849 | |||
Management fees | 85,418 | |||
Distribution and service fees | 51,508 | |||
Fund accounting/administration fees | 16,483 | |||
Transfer agent/maintenance fees | 2,605 | |||
Trustees’ fees* | 1,508 | |||
Miscellaneous | 43,993 | |||
Total liabilities | 2,725,714 | |||
Commitments and contingent liabilities (Note 13) | — | |||
Net assets | $ | 242,637,911 | ||
Net assets consist of: | ||||
Paid in capital | $ | 161,802,019 | ||
Undistributed net investment income | 5,065,671 | |||
Accumulated net realized gain on investments | 25,509,809 | |||
Net unrealized appreciation on investments | 50,260,412 | |||
Net assets | $ | 242,637,911 | ||
Capital shares outstanding | 5,651,713 | |||
Net asset value per share | $ | 42.93 | ||
STATEMENT OF OPERATIONS (Unaudited) | ||||
Period Ended June 30, 2018 | ||||
Investment Income: | ||||
Dividends (net of foreign withholding tax of $878) | $ | 2,827,780 | ||
Interest | 14,345 | |||
Total investment income | 2,842,125 | |||
Expenses: | ||||
Management fees | 837,775 | |||
Distribution and service fees | 322,221 | |||
Transfer agent/maintenance fees | 12,796 | |||
Fund accounting/administration fees | 103,112 | |||
Trustees’ fees* | 5,172 | |||
Custodian fees | 4,365 | |||
Line of credit fees | 5,350 | |||
Miscellaneous | 43,189 | |||
Total expenses | 1,333,980 | |||
Less: | ||||
Expenses waived by Adviser | (305,493 | ) | ||
Net expenses | 1,028,487 | |||
Net investment income | 1,813,638 | |||
Net Realized and Unrealized Gain (Loss): | ||||
Net realized gain (loss) on: | ||||
Investments | 9,540,640 | |||
Net realized gain | 9,540,640 | |||
Net change in unrealized appreciation (depreciation) on: | ||||
Investments | (13,722,573 | ) | ||
Net change in unrealized appreciation (depreciation) | (13,722,573 | ) | ||
Net realized and unrealized loss | (4,181,933 | ) | ||
Net decrease in net assets resulting from operations | $ | (2,368,295 | ) | |
| * | Relates to Trustees not deemed “interested persons” within the meaning of Section 2(a)(19) of the 1940 Act. |
18 | THE GUGGENHEIM FUNDS SEMI-ANNUAL REPORT | SEE NOTES TO FINANCIAL STATEMENTS. |
SERIES B (LARGE CAP VALUE SERIES) |
STATEMENTS OF CHANGES IN NET ASSETS |
Period Ended | Year Ended | |||||||
Increase (Decrease) in Net Assets from Operations: | ||||||||
Net investment income | $ | 1,813,638 | $ | 3,059,968 | ||||
Net realized gain on investments | 9,540,640 | 20,432,360 | ||||||
Net change in unrealized appreciation (depreciation) on investments | (13,722,573 | ) | 14,902,142 | |||||
Net increase (decrease) in net assets resulting from operations | (2,368,295 | ) | 38,394,470 | |||||
Distributions to shareholders from: | ||||||||
Net investment income | — | (3,290,010 | ) | |||||
Net realized gains | — | (7,443,276 | ) | |||||
Total distributions to shareholders | — | (10,733,286 | ) | |||||
Capital share transactions: | ||||||||
Proceeds from sale of shares | 2,049,336 | 4,647,149 | ||||||
Distributions reinvested | — | 10,733,286 | ||||||
Cost of shares redeemed | (26,301,265 | ) | (34,475,157 | ) | ||||
Net decrease from capital share transactions | (24,251,929 | ) | (19,094,722 | ) | ||||
Net increase (decrease) in net assets | (26,620,224 | ) | 8,566,462 | |||||
Net assets: | ||||||||
Beginning of period | 269,258,135 | 260,691,673 | ||||||
End of period | $ | 242,637,911 | $ | 269,258,135 | ||||
Undistributed net investment income at end of period | $ | 5,065,671 | $ | 3,252,033 | ||||
Capital share activity: | ||||||||
Shares sold | 47,189 | 115,794 | ||||||
Shares issued from reinvestment of distributions | — | 272,488 | ||||||
Shares redeemed | (605,578 | ) | (849,517 | ) | ||||
Net decrease in shares | (558,389 | ) | (461,235 | ) | ||||
SEE NOTES TO FINANCIAL STATEMENTS. | THE GUGGENHEIM FUNDS SEMI-ANNUAL REPORT | 19 |
SERIES B (LARGE CAP VALUE SERIES) |
FINANCIAL HIGHLIGHTS |
This table is presented to show selected data for a share outstanding throughout each period and to assist shareholders in evaluating a Fund’s performance for the periods presented.
Period Ended | Year Ended December 31, 2017 | Year Ended December 31, 2016 | Year Ended December 31, 2015 | Year Ended December 31, 2014 | Year Ended December 31, 2013 | |||||||||||||||||||
| Per Share Data | ||||||||||||||||||||||||
| Net asset value, beginning of period | $ | 43.36 | $ | 39.08 | $ | 33.20 | $ | 41.40 | $ | 37.82 | $ | 28.66 | ||||||||||||
| Income (loss) from investment operations: | ||||||||||||||||||||||||
Net investment income (loss)b | .30 | .48 | .50 | .61 | .41 | .35 | ||||||||||||||||||
| Net gain (loss) on investments (realized and unrealized) | (.73 | ) | 5.52 | 6.48 | (2.29 | ) | 3.17 | 8.81 | ||||||||||||||||
| Total from investment operations | (.43 | ) | 6.00 | 6.98 | (1.68 | ) | 3.58 | 9.16 | ||||||||||||||||
| Less distributions from: | ||||||||||||||||||||||||
| Net investment income | — | (.53 | ) | (.61 | ) | (.47 | ) | — | — | |||||||||||||||
| Net realized gains | — | (1.19 | ) | (.49 | ) | (6.05 | ) | — | — | |||||||||||||||
| Total distributions | — | (1.72 | ) | (1.10 | ) | (6.52 | ) | — | — | |||||||||||||||
| Net asset value, end of period | $ | 42.93 | $ | 43.36 | $ | 39.08 | $ | 33.20 | $ | 41.40 | $ | 37.82 | ||||||||||||
Total Returnc | (0.99 | %) | 15.81 | % | 21.41 | % | (5.08 | %) | 9.47 | % | 31.96 | % | ||||||||||||
| Ratios/Supplemental Data | ||||||||||||||||||||||||
| Net assets, end of period (in thousands) | $ | 242,638 | $ | 269,258 | $ | 260,692 | $ | 233,098 | $ | 275,200 | $ | 283,527 | ||||||||||||
| Ratios to average net assets: | ||||||||||||||||||||||||
| Net investment income (loss) | 1.41 | % | 1.17 | % | 1.44 | % | 1.63 | % | 1.04 | % | 1.05 | % | ||||||||||||
Total expensese | 1.03 | % | 1.02 | % | 0.82 | % | 0.84 | % | 0.83 | % | 0.83 | % | ||||||||||||
Net expensesd,f | 0.80 | % | 0.81 | % | 0.82 | % | 0.84 | % | 0.83 | % | 0.83 | % | ||||||||||||
| Portfolio turnover rate | 9 | % | 27 | % | 44 | % | 38 | % | 47 | % | 26 | % | ||||||||||||
| a | Unaudited figures for the period ended June 30, 2018. Percentage amounts for the period, except total return and portfolio turnover rate, have been annualized. |
| b | Net investment income (loss) per share was computed using average shares outstanding throughout the period. |
| c | Total return does not take into account any of the expenses associated with an investment in variable insurance products. If total return had taken into account these expenses, performance would have been lower. Shares of a series of Guggenheim Variable Funds Trust are available only through the purchase of such products. |
| d | Net expense information reflects the expense ratios after expense waivers and reimbursements, as applicable. |
| e | Does not include expenses of the underlying funds in which the Fund invests. |
| f | Net expenses may include expenses that are excluded from the expense limitation agreement. Excluding these expenses, the net expense ratios for the periods would be: |
06/30/18 | 12/31/17 | 12/31/16 | 12/31/15 | 12/31/14 | 12/31/13 |
0.80% | 0.79% | N/A | N/A | N/A | N/A |
20 | THE GUGGENHEIM FUNDS SEMI-ANNUAL REPORT | SEE NOTES TO FINANCIAL STATEMENTS. |
PERFORMANCE REPORT AND FUND PROFILE (Unaudited) | June 30, 2018 |
SERIES D (WORLD EQUITY INCOME SERIES)
OBJECTIVE: Seeks to provide total return, comprised of capital appreciation and income.
Holdings Diversification (Market Exposure as % of Net Assets)
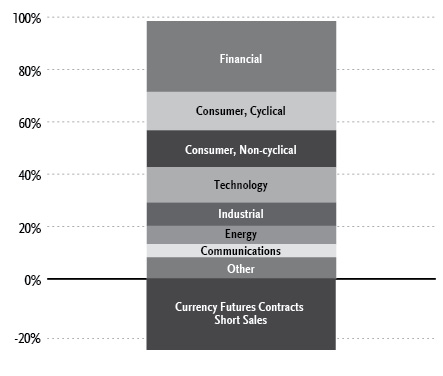
“Holdings Diversification (Market Exposure as % of Net Assets)” excludes any temporary cash investments.
COUNTRY DIVERSIFICATION
At June 30, 2018, the investment diversification of the Fund by country was as follows:
Country | % of Long Term |
United States | 54.7% |
Canada | 6.5% |
Japan | 6.1% |
France | 5.2% |
Australia | 3.7% |
United Kingdom | 3.0% |
Switzerland | 2.9% |
Other | 17.9% |
Total Long Term Investments | 100.0% |
Inception Date: April 19, 1984 |
Ten Largest Holdings (% of Total Net Assets) | |
Apple, Inc. | 1.8% |
Home Depot, Inc. | 1.3% |
Mastercard, Inc. — Class A | 1.3% |
Johnson & Johnson | 1.3% |
UnitedHealth Group, Inc. | 1.3% |
Microsoft Corp. | 1.2% |
Accenture plc — Class A | 1.1% |
TOTAL S.A. | 1.1% |
Pfizer, Inc. | 1.1% |
Alphabet, Inc. — Class C | 1.1% |
Top Ten Total | 12.6% |
“Ten Largest Holdings” excludes any temporary cash or derivative investments.
Average Annual Returns*,†
Periods Ended June 30, 2018
6 month‡ | 1 Year | 5 Year | 10 Year | |
Series D (World Equity Income Series) | 0.07% | 8.77% | 8.58% | 4.02% |
MSCI World Index | 0.43% | 11.09% | 9.94% | 6.26% |
| * | The performance data above represents past performance that is not predictive of future results. The investment return and principal value of an investment in the Fund will fluctuate so that an investor’s shares, when redeemed, may be worth more or less than their original cost. Returns are historical and include changes in principal and reinvested dividends and capital gains and do not reflect the effect of taxes. The MSCI World Index is an unmanaged index and, unlike the Fund, has no management fees or operating expenses to reduce its reported return. |
| † | Performance figures do not reflect fees and expenses associated with an investment in variable insurance products. If returns had taken into account these fees and expenses, performance would have been lower. Shares of a series of Guggenheim Variable Funds Trust are available only through the purchase of such products. |
| ‡ | 6 month returns are not annualized. |
THE GUGGENHEIM FUNDS SEMI-ANNUAL REPORT 21 |
SCHEDULE OF INVESTMENTS (Unaudited) | June 30, 2018 |
SERIES D (WORLD EQUITY INCOME SERIES) |
| Value | |||||||
COMMON STOCKS† - 98.5% | ||||||||
Financial - 27.0% | ||||||||
Mastercard, Inc. — Class A | 9,700 | $ | 1,906,244 | |||||
JPMorgan Chase & Co. | 12,400 | 1,292,080 | ||||||
DNB ASA†† | 65,600 | 1,277,361 | ||||||
MetLife, Inc. | 26,800 | 1,168,480 | ||||||
Bank of Montreal | 14,900 | 1,151,760 | ||||||
BNP Paribas S.A.†† | 18,600 | 1,150,419 | ||||||
Progressive Corp. | 19,100 | 1,129,765 | ||||||
T. Rowe Price Group, Inc. | 9,500 | 1,102,855 | ||||||
Swiss Re AG†† | 12,400 | 1,082,564 | ||||||
Kinnevik AB — Class B†† | 30,500 | 1,039,411 | ||||||
Bank Leumi Le-Israel BM | 175,500 | 1,036,219 | ||||||
Nippon Building Fund, Inc. REIT†† | 170 | 980,651 | ||||||
Israel Discount Bank Ltd. — Class A†† | 174,900 | 976,198 | ||||||
Prudential plc | 41,600 | 952,330 | ||||||
SEI Investments Co. | 14,900 | 931,548 | ||||||
Everest Re Group Ltd. | 4,000 | 921,920 | ||||||
Bank Hapoalim BM | 134,600 | 910,628 | ||||||
Canadian Imperial Bank of Commerce | 10,360 | 901,219 | ||||||
Japan Real Estate Investment Corp. REIT†† | 170 | 899,346 | ||||||
Hongkong Land Holdings Ltd.†† | 122,300 | 874,314 | ||||||
PNC Financial Services Group, Inc. | 6,400 | 864,640 | ||||||
SmartCentres Real Estate Investment Trust | 36,600 | 849,971 | ||||||
Barclays plc†† | 328,700 | 812,426 | ||||||
Aflac, Inc. | 18,500 | 795,870 | ||||||
Unibail-Rodamco-Westfield | 3,609 | 794,578 | ||||||
First Capital Realty, Inc. | 50,000 | 785,773 | ||||||
United Urban Investment Corp. REIT†† | 500 | 776,991 | ||||||
Assurant, Inc. | 7,387 | 764,481 | ||||||
RioCan Real Estate Investment Trust | 40,500 | 743,993 | ||||||
Cboe Global Markets, Inc. | 6,700 | 697,269 | ||||||
H&R Real Estate Investment Trust | 44,700 | 684,120 | ||||||
Public Storage REIT | 3,000 | 680,580 | ||||||
Allianz AG†† | 3,300 | 679,910 | ||||||
Power Financial Corp. | 24,000 | 561,375 | ||||||
ING Groep N.V.†† | 31,700 | 454,991 | ||||||
Societe Generale S.A.†† | 10,500 | 441,268 | ||||||
Visa, Inc. — Class A | 3,200 | 423,840 | ||||||
IGM Financial, Inc. | 14,200 | 411,646 | ||||||
New York Community Bancorp, Inc. | 35,000 | 386,400 | ||||||
Lloyds Banking Group plc | 458,200 | 381,294 | ||||||
Henderson Land Development Company Ltd.†† | 71,916 | 379,231 | ||||||
ASX Ltd.†† | 7,900 | 376,620 | ||||||
Great-West Lifeco, Inc. | 14,300 | 351,564 | ||||||
Arthur J Gallagher & Co. | 5,300 | 345,984 | ||||||
Wells Fargo & Co. | 6,200 | 343,728 | ||||||
BB&T Corp. | 6,600 | 332,904 | ||||||
CI Financial Corp. | 17,000 | 305,569 | ||||||
United Overseas Bank Ltd.†† | 15,200 | 297,899 | ||||||
Assicurazioni Generali SpA†† | 17,700 | 295,877 | ||||||
People’s United Financial, Inc. | 15,900 | 287,631 | ||||||
Comerica, Inc. | 3,100 | 281,852 | ||||||
U.S. Bancorp | 5,577 | 278,961 | ||||||
CME Group, Inc. — Class A | 1,700 | 278,664 | ||||||
BlackRock, Inc. — Class A | 500 | 249,520 | ||||||
SVB Financial Group* | 800 | 231,008 | ||||||
Total Financial | 39,313,740 | |||||||
Consumer, Cyclical - 14.8% | ||||||||
Home Depot, Inc. | 10,000 | 1,951,000 | ||||||
L Brands, Inc. | 37,200 | 1,371,936 | ||||||
Target Corp. | 17,400 | 1,324,488 | ||||||
TJX Companies, Inc. | 13,468 | 1,281,884 | ||||||
Ford Motor Co. | 114,900 | 1,271,943 | ||||||
LVMH Moet Hennessy Louis Vuitton SE†† | 3,634 | 1,206,432 | ||||||
Las Vegas Sands Corp. | 15,600 | 1,191,216 | ||||||
WW Grainger, Inc. | 3,700 | 1,141,080 | ||||||
Cie Generale des Etablissements Michelin — Class B†† | 9,200 | 1,112,883 | ||||||
Bandai Namco Holdings, Inc.†† | 26,400 | 1,087,505 | ||||||
Kohl’s Corp. | 14,900 | 1,086,210 | ||||||
Macy’s, Inc. | 29,000 | 1,085,470 | ||||||
Fastenal Co. | 19,500 | 938,535 | ||||||
Iida Group Holdings Company Ltd.†† | 47,700 | 918,340 | ||||||
Carnival plc†† | 14,800 | 845,753 | ||||||
Crown Resorts Ltd.†† | 76,200 | 760,401 | ||||||
Domino’s Pizza, Inc. | 2,000 | 564,340 | ||||||
Polaris Industries, Inc. | 4,400 | 537,592 | ||||||
Darden Restaurants, Inc. | 4,600 | 492,476 | ||||||
Harvey Norman Holdings Ltd.†† | 191,900 | 471,502 | ||||||
Ferguson plc | 4,736 | 384,421 | ||||||
McDonald’s Corp. | 1,800 | 282,042 | ||||||
Hugo Boss AG†† | 2,600 | 235,767 | ||||||
Total Consumer, Cyclical | 21,543,216 | |||||||
Consumer, Non-cyclical - 14.0% | ||||||||
Johnson & Johnson | 15,600 | 1,892,904 | ||||||
UnitedHealth Group, Inc. | 7,600 | 1,864,584 | ||||||
Pfizer, Inc. | 42,700 | 1,549,156 | ||||||
Roche Holding AG†† | 6,700 | 1,486,360 | ||||||
AbbVie, Inc. | 14,800 | 1,371,220 | ||||||
Koninklijke Ahold Delhaize N.V.†† | 37,400 | 892,929 | ||||||
Swedish Match AB†† | 17,500 | 864,928 | ||||||
ABIOMED, Inc.* | 2,000 | 818,100 | ||||||
Wesfarmers Ltd.†† | 21,300 | 777,250 | ||||||
Western Union Co. | 37,300 | 758,309 | ||||||
Danone S.A.†† | 10,300 | 751,951 | ||||||
Automatic Data Processing, Inc. | 5,500 | 737,770 | ||||||
Coca-Cola Amatil Ltd.†† | 106,900 | 727,183 | ||||||
Dairy Farm International Holdings Ltd. | 80,000 | 703,200 | ||||||
George Weston Ltd. | 8,300 | 677,193 | ||||||
Taisho Pharmaceutical Holdings Company Ltd.†† | 5,300 | 620,040 | ||||||
Gilead Sciences, Inc. | 8,400 | 595,056 | ||||||
Cochlear Ltd.†† | 4,000 | 592,277 | ||||||
Moody’s Corp. | 3,000 | 511,680 | ||||||
Shionogi & Company Ltd.†† | 8,800 | 451,583 | ||||||
Robert Half International, Inc. | 6,600 | 429,660 | ||||||
Otsuka Holdings Company Ltd.†† | 8,800 | 425,699 | ||||||
Marine Harvest ASA†† | 17,700 | 351,907 | ||||||
22 | THE GUGGENHEIM FUNDS SEMI-ANNUAL REPORT | SEE NOTES TO FINANCIAL STATEMENTS. |
SCHEDULE OF INVESTMENTS (Unaudited)(continued) | June 30, 2018 |
SERIES D (WORLD EQUITY INCOME SERIES) |
| Value | |||||||
MEIJI Holdings Company Ltd.†† | 4,000 | $ | 337,832 | |||||
Amgen, Inc. | 1,598 | 294,975 | ||||||
Total Consumer, Non-cyclical | 20,483,746 | |||||||
Technology - 13.6% | ||||||||
Apple, Inc. | 14,100 | 2,610,051 | ||||||
Microsoft Corp. | 17,100 | 1,686,231 | ||||||
Accenture plc — Class A | 10,100 | 1,652,259 | ||||||
NVIDIA Corp. | 6,500 | 1,539,850 | ||||||
International Business Machines Corp. | 11,000 | 1,536,700 | ||||||
Texas Instruments, Inc. | 13,700 | 1,510,425 | ||||||
Western Digital Corp. | 15,900 | 1,230,819 | ||||||
Paychex, Inc. | 15,800 | 1,079,930 | ||||||
CA, Inc. | 26,700 | 951,855 | ||||||
Intel Corp. | 19,000 | 944,490 | ||||||
Intuit, Inc. | 4,301 | 878,716 | ||||||
Splunk, Inc.* | 7,300 | 723,503 | ||||||
Xilinx, Inc. | 10,600 | 691,756 | ||||||
Broadridge Financial Solutions, Inc. | 4,900 | 563,990 | ||||||
Lam Research Corp. | 2,800 | 483,980 | ||||||
Canon, Inc.†† | 11,800 | 386,957 | ||||||
Jack Henry & Associates, Inc. | 2,900 | 378,044 | ||||||
Cognizant Technology Solutions Corp. — Class A | 3,500 | 276,465 | ||||||
Red Hat, Inc.* | 2,000 | 268,740 | ||||||
Veeva Systems, Inc. — Class A* | 2,500 | 192,150 | ||||||
ServiceNow, Inc.* | 1,000 | 172,470 | ||||||
Total Technology | 19,759,381 | |||||||
Industrial - 8.9% | ||||||||
TE Connectivity Ltd. | 14,100 | 1,269,846 | ||||||
Vinci S.A.†† | 12,700 | 1,218,961 | ||||||
Lockheed Martin Corp. | 3,728 | 1,101,363 | ||||||
Cummins, Inc. | 8,000 | 1,064,000 | ||||||
SKF AB — Class B†† | 52,100 | 964,544 | ||||||
United Parcel Service, Inc. — Class B | 8,200 | 871,086 | ||||||
Pentair plc | 18,800 | 791,104 | ||||||
Trinity Industries, Inc.†† | 461,800 | 777,930 | ||||||
Emerson Electric Co. | 11,100 | 767,454 | ||||||
Avnet, Inc. | 17,100 | 733,419 | ||||||
BHP Billiton Ltd.†† | 24,692 | 617,917 | ||||||
3M Co. | 2,900 | 570,488 | ||||||
Raytheon Co. | 2,900 | 560,222 | ||||||
Makita Corp.†† | 12,400 | 554,715 | ||||||
CH Robinson Worldwide, Inc. | 4,971 | 415,874 | ||||||
Hexagon AB — Class B†† | 6,389 | 355,038 | ||||||
CRH plc | 8,000 | 282,445 | ||||||
Total Industrial | 12,916,406 | |||||||
Energy - 6.9% | ||||||||
Total S.A.†† | 26,700 | 1,621,210 | ||||||
Neste Oyj†† | 16,600 | 1,298,630 | ||||||
Valero Energy Corp. | 10,600 | 1,174,798 | ||||||
Woodside Petroleum Ltd.†† | 37,200 | 974,997 | ||||||
Exxon Mobil Corp. | 11,000 | 910,030 | ||||||
Targa Resources Corp. | 16,800 | 831,432 | ||||||
Plains GP Holdings, LP — Class A* | 31,100 | 743,601 | ||||||
Koninklijke Vopak N.V.†† | 14,100 | 649,829 | ||||||
HollyFrontier Corp. | 7,800 | 533,754 | ||||||
Hess Corp. | 7,000 | 468,230 | ||||||
TransCanada Corp. | 8,000 | 346,135 | ||||||
Phillips 66 | 2,800 | 314,468 | ||||||
Marathon Petroleum Corp. | 3,000 | 210,480 | ||||||
Total Energy | 10,077,594 | |||||||
Communications - 5.1% | ||||||||
Alphabet, Inc. — Class C* | 1,381 | 1,540,713 | ||||||
Amazon.com, Inc.* | 800 | 1,359,840 | ||||||
BCE, Inc. | 20,100 | 814,012 | ||||||
F5 Networks, Inc.* | 4,500 | 776,025 | ||||||
TELUS Corp. | 21,100 | 749,542 | ||||||
Nokia Oyj†† | 100,000 | 573,528 | ||||||
Facebook, Inc. — Class A* | 2,935 | 570,329 | ||||||
Arista Networks, Inc.* | 2,000 | 514,980 | ||||||
Palo Alto Networks, Inc.* | 1,500 | 308,205 | ||||||
Elisa Oyj†† | 6,000 | 277,155 | ||||||
Total Communications | 7,484,329 | |||||||
Utilities - 4.6% | ||||||||
Dominion Energy, Inc. | 20,500 | 1,397,690 | ||||||
CLP Holdings Ltd.†† | 120,638 | 1,299,432 | ||||||
Duke Energy Corp. | 14,800 | 1,170,384 | ||||||
Hong Kong & China Gas Company Ltd.†† | 522,830 | 999,402 | ||||||
PPL Corp. | 33,200 | 947,860 | ||||||
Tokyo Gas Company Ltd.†† | 20,000 | 531,070 | ||||||
FirstEnergy Corp. | 12,400 | 445,284 | ||||||
Total Utilities | 6,791,122 | |||||||
Basic Materials - 3.2% | ||||||||
Umicore S.A.†† | 22,600 | 1,290,042 | ||||||
Stora Enso Oyj — Class R†† | 64,400 | 1,254,508 | ||||||
LyondellBasell Industries N.V. — Class A | 10,300 | 1,131,455 | ||||||
Anglo American plc†† | 26,700 | 592,733 | ||||||
Eastman Chemical Co. | 3,500 | 349,860 | ||||||
Total Basic Materials | 4,618,598 | |||||||
Diversified - 0.4% | ||||||||
Jardine Matheson Holdings Ltd.†† | 10,100 | 636,434 | ||||||
Total Common Stocks | ||||||||
(Cost $136,424,635) | 143,624,566 | |||||||
MONEY MARKET FUND† - 1.0% | ||||||||
Goldman Sachs Financial Square Treasury Instruments Fund — Institutional Class 1.72%1 | 1,385,575 | 1,385,575 | ||||||
Total Money Market Fund | ||||||||
(Cost $1,385,575) | 1,385,575 | |||||||
Total Investments - 99.5% | ||||||||
(Cost $137,810,210) | $ | 145,010,141 | ||||||
Other Assets & Liabilities, net - 0.5% | 690,662 | |||||||
Total Net Assets - 100.0% | $ | 145,700,803 | ||||||
SEE NOTES TO FINANCIAL STATEMENTS. | THE GUGGENHEIM FUNDS SEMI-ANNUAL REPORT | 23 |
SCHEDULE OF INVESTMENTS (Unaudited)(concluded) | June 30, 2018 |
SERIES D (WORLD EQUITY INCOME SERIES) |
Futures Contracts | ||||||||||||||||
Description | Number of | Expiration | Notional | Value and | ||||||||||||
Currency Futures Contracts Sold Short† | ||||||||||||||||
Euro FX Futures Contracts | 113 | Sep 2018 | $ | 16,588,400 | $ | 164,972 | ||||||||||
Canadian Dollar Futures Contracts | 124 | Sep 2018 | 9,443,840 | 126,170 | ||||||||||||
British Pound Futures Contracts | 54 | Sep 2018 | 4,469,513 | 59,936 | ||||||||||||
Australian Dollar Futures Contracts | 70 | Sep 2018 | 5,182,100 | (15,031 | ) | |||||||||||
| $ | 35,683,853 | $ | 336,047 | |||||||||||||
| * | Non-income producing security. |
| ** | Includes cumulative appreciation (depreciation). Only current day’s variation margin is reported within the Statement of Assets and Liabilities. |
| † | Value determined based on Level 1 inputs — See Note 4. |
| †† | Value determined based on Level 2 inputs — See Note 4. |
| 1 | Rate indicated is the 7 day yield as of June 30, 2018. |
plc — Public Limited Company
REIT — Real Estate Investment Trust
See Sector Classification in Other Information section.
The following table summarizes the inputs used to value the Fund’s investments at June 30, 2018 (See Note 4 in the Notes to Financial Statements):
Investments in Securities (Assets) | Level 1 | Level 2 | Level 3 | Total | ||||||||||||
Common Stocks | $ | 99,035,535 | $ | 44,589,031 | $ | — | $ | 143,624,566 | ||||||||
Money Market Fund | 1,385,575 | — | — | 1,385,575 | ||||||||||||
Currency Futures Contracts* | 351,078 | — | — | 351,078 | ||||||||||||
Total Assets | $ | 100,772,188 | $ | 44,589,031 | $ | — | $ | 145,361,219 | ||||||||
| ||||||||||||||||
Investments in Securities (Liabilities) | Level 1 | Level 2 | Level 3 | Total | ||||||||||||
Currency Futures Contracts* | $ | 15,031 | $ | — | $ | — | $ | 15,031 | ||||||||
| * | This derivative is reported as unrealized appreciation/(depreciation) at period end. |
Transfers between investment levels may occur as the markets fluctuate and/or the availability of data used in an investment’s valuation changes. Transfers between valuation levels, if any, are in comparison to the valuation levels at the end of the previous fiscal year, and are effective using the fair value as of the end of the current fiscal period.
For the period ended June 30, 2018, the Fund had securities with a total value of $27,339,833 transfer out of Level 1 into Level 2 due to utilizing fair value pricing for certain foreign equity securities at period end.
24 | THE GUGGENHEIM FUNDS SEMI-ANNUAL REPORT | SEE NOTES TO FINANCIAL STATEMENTS. |
SERIES D (WORLD EQUITY INCOME SERIES) |
STATEMENT OF ASSETS AND LIABILITIES (Unaudited) | ||||
June 30, 2018 | ||||
Assets: | ||||
Investments, at value (cost $137,810,210) | $ | 145,010,141 | ||
Foreign currency, at value (cost $56,866) | 56,990 | |||
Segregated cash with broker | 597,000 | |||
Prepaid expenses | 2,397 | |||
Receivables: | ||||
Foreign tax reclaims | 459,714 | |||
Dividends | 125,576 | |||
Foreign Currency | 21,261 | |||
Fund shares sold | 3,553 | |||
Interest | 2,095 | |||
Total assets | 146,278,727 | |||
Liabilities: | ||||
Payable for: | ||||
Variation margin on futures contracts | 339,301 | |||
Management fees | 58,305 | |||
Fund shares redeemed | 53,882 | |||
Direct shareholders expense | 32,147 | |||
Distribution and service fees | 31,437 | |||
Fund accounting/administration fees | 10,060 | |||
Transfer agent/maintenance fees | 2,624 | |||
Trustees’ fees* | 323 | |||
Miscellaneous | 49,845 | |||
Total liabilities | 577,924 | |||
Commitments and contingent liabilities (Note 13) | — | |||
Net assets | $ | 145,700,803 | ||
Net assets consist of: | ||||
Paid in capital | $ | 125,455,109 | ||
Undistributed net investment income | 6,125,099 | |||
Accumulated net realized gain on investments | 6,580,359 | |||
Net unrealized appreciation on investments | 7,540,236 | |||
Net assets | $ | 145,700,803 | ||
Capital shares outstanding | 10,030,962 | |||
Net asset value per share | $ | 14.53 | ||
STATEMENT OF OPERATIONS (Unaudited) | ||||
Period Ended June 30, 2018 | ||||
Investment Income: | ||||
Dividends (net of foreign withholding tax of $220,568) | $ | 2,640,978 | ||
Interest | 8,431 | |||
Total investment income | 2,649,409 | |||
Expenses: | ||||
Management fees | 550,479 | |||
Distribution and service fees | 196,599 | |||
Transfer agent/maintenance fees | 12,710 | |||
Fund accounting/administration fees | 62,912 | |||
Custodian fees | 14,361 | |||
Trustees’ fees* | 5,109 | |||
Line of credit fees | 2,759 | |||
Miscellaneous | 55,493 | |||
Total expenses | 900,422 | |||
Less: | ||||
Expenses waived by Adviser | (196,688 | ) | ||
Net expenses | 703,734 | |||
Net investment income | 1,945,675 | |||
Net Realized and Unrealized Gain (Loss): | ||||
Net realized gain (loss) on: | ||||
Investments | 7,065,732 | |||
Futures contracts | (261,668 | ) | ||
Foreign currency transactions | (19,160 | ) | ||
Net realized gain | 6,784,904 | |||
Net change in unrealized appreciation (depreciation) on: | ||||
Investments | (8,741,063 | ) | ||
Futures contracts | 336,047 | |||
Foreign currency translations | (6,981 | ) | ||
Net change in unrealized appreciation (depreciation) | (8,411,997 | ) | ||
Net realized and unrealized loss | (1,627,093 | ) | ||
Net increase in net assets resulting from operations | $ | 318,582 | ||
| * | Relates to Trustees not deemed “interested persons” within the meaning of Section 2(a)(19) of the 1940 Act. |
SEE NOTES TO FINANCIAL STATEMENTS. | THE GUGGENHEIM FUNDS SEMI-ANNUAL REPORT | 25 |
SERIES D (WORLD EQUITY INCOME SERIES) |
STATEMENTS OF CHANGES IN NET ASSETS |
Period Ended June 30, 2018 (Unaudited) | Year Ended December 31, 2017 | |||||||
Increase (Decrease) in Net Assets from Operations: | ||||||||
Net investment income | $ | 1,945,675 | $ | 3,809,763 | ||||
Net realized gain on investments | 6,784,904 | 11,398,423 | ||||||
Net change in unrealized appreciation (depreciation) on investments | (8,411,997 | ) | 7,230,039 | |||||
Net increase in net assets resulting from operations | 318,582 | 22,438,225 | ||||||
Distributions to shareholders from: | ||||||||
Net investment income | — | (4,436,814 | ) | |||||
Total distributions to shareholders | — | (4,436,814 | ) | |||||
Capital share transactions: | ||||||||
Proceeds from sale of shares | 1,908,936 | 3,125,858 | ||||||
Distributions reinvested | — | 4,436,814 | ||||||
Cost of shares redeemed | (17,638,212 | ) | (24,431,034 | ) | ||||
Net decrease from capital share transactions | (15,729,276 | ) | (16,868,362 | ) | ||||
Net increase (decrease) in net assets | (15,410,694 | ) | 1,133,049 | |||||
Net assets: | ||||||||
Beginning of period | 161,111,497 | 159,978,448 | ||||||
End of period | $ | 145,700,803 | $ | 161,111,497 | ||||
Undistributed net investment income at end of period | $ | 6,125,099 | $ | 4,179,424 | ||||
Capital share activity: | ||||||||
Shares sold | 128,429 | 228,681 | ||||||
Shares issued from reinvestment of distributions | — | 328,167 | ||||||
Shares redeemed | (1,193,299 | ) | (1,783,834 | ) | ||||
Net decrease in shares | (1,064,870 | ) | (1,226,986 | ) | ||||
26 | THE GUGGENHEIM FUNDS SEMI-ANNUAL REPORT | SEE NOTES TO FINANCIAL STATEMENTS. |
SERIES D (WORLD EQUITY INCOME SERIES) |
FINANCIAL HIGHLIGHTS |
This table is presented to show selected data for a share outstanding throughout each period and to assist shareholders in evaluating a Fund’s performance for the periods presented.
Period Ended | Year Ended December 31, 2017 | Year Ended December 31, 2016 | Year Ended December 31, 2015 | Year Ended December 31, 2014 | Year Ended December 31, 2013 | ||||||||||||||||||||
| Per Share Data | |||||||||||||||||||||||||
| Net asset value, beginning of period | $ | 14.52 | $ | 12.98 | $ | 12.12 | $ | 12.60 | $ | 12.00 | $ | 10.06 | |||||||||||||
| Income (loss) from investment operations: | |||||||||||||||||||||||||
Net investment income (loss)b | .18 | .33 | .37 | .36 | .37 | .28 | |||||||||||||||||||
| Net gain (loss) on investments (realized and unrealized) | (.17 | ) | 1.60 | .88 | (.43 | ) | .23 | 1.66 | |||||||||||||||||
| Total from investment operations | .01 | 1.93 | 1.25 | (.07 | ) | .60 | 1.94 | ||||||||||||||||||
| Less distributions from: | |||||||||||||||||||||||||
| Net investment income | — | (.39 | ) | (.39 | ) | (.41 | ) | (— | )c | — | |||||||||||||||
| Total distributions | — | (.39 | ) | (.39 | ) | (.41 | ) | (— | )c | — | |||||||||||||||
| Net asset value, end of period | $ | 14.53 | $ | 14.52 | $ | 12.98 | $ | 12.12 | $ | 12.60 | $ | 12.00 | |||||||||||||
Total Returnd | 0.07 | % | 15.06 | % | 10.37 | % | (0.67 | %) | 5.00 | % | 19.28 | % | |||||||||||||
| Ratios/Supplemental Data | |||||||||||||||||||||||||
| Net assets, end of period (in thousands) | $ | 145,701 | $ | 161,111 | $ | 159,978 | $ | 158,063 | $ | 178,548 | $ | 193,594 | |||||||||||||
| Ratios to average net assets: | |||||||||||||||||||||||||
| Net investment income (loss) | 2.47 | % | 2.38 | % | 2.92 | % | 2.88 | % | 2.95 | % | 2.50 | % | |||||||||||||
Total expensesf | 1.14 | % | 1.12 | % | 0.91 | % | 0.96 | % | 1.01 | % | 1.14 | % | |||||||||||||
Net expensese,g | 0.90 | % | 0.90 | % | 0.91 | % | 0.96 | % | 1.01 | % | 1.14 | % | |||||||||||||
| Portfolio turnover rate | 57 | % | 112 | % | 43 | % | 110 | % | 132 | % | 150 | % | |||||||||||||
| a | Unaudited figures for the period ended June 30, 2018. Percentage amounts for the period, except total return and portfolio turnover rate, have been annualized. |
| b | Net investment income (loss) per share was computed using average shares outstanding throughout the period. |
| c | Distributions from net investment income are less than $0.01 per share. |
| d | Total return does not take into account any of the expenses associated with an investment in variable insurance products. If total return had taken into account these expenses, performance would have been lower. Shares of a series of Guggenheim Variable Funds Trust are available only through the purchase of such products. |
| e | Net expense information reflects the expense ratios after expense waivers and reimbursements, as applicable. |
| f | Does not include expenses of the underlying funds in which the Fund invests. |
| g | Net expenses may include expense that are excluded from the expense limitation agreement. Excluding these expenses, the net expense ratios for the periods would be: |
06/30/18 | 12/31/17 | 12/31/16 | 12/31/15 | 12/31/14 | 12/31/13 |
0.90% | 0.88% | N/A | N/A | N/A | N/A |
SEE NOTES TO FINANCIAL STATEMENTS. | THE GUGGENHEIM FUNDS SEMI-ANNUAL REPORT | 27 |
PERFORMANCE REPORT AND FUND PROFILE (Unaudited) | June 30, 2018 |
SERIES E (TOTAL RETURN BOND SERIES)
OBJECTIVE: Seeks to provide total return, comprised of current income and capital appreciation.
Holdings Diversification (Market Exposure as % of Net Assets)
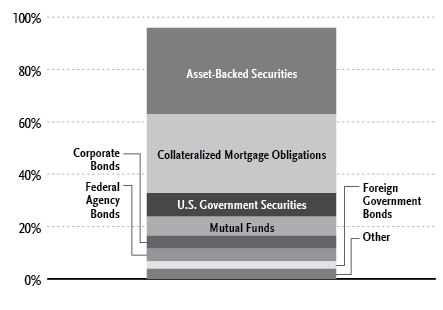
“Holdings Diversification (Market Exposure as % of Net Assets)” excludes any temporary cash investments or investments in Guggenheim Strategy Funds Trust mutual funds.
Inception Date: April 26, 1985 |
Ten Largest Holdings (% of Total Net Assets) | |
U.S. Treasury Bond, 11/15/46 | 7.8% |
Guggenheim Total Return Bond Fund - Institutional Class | 4.8% |
Guggenheim Limited Duration Fund - Institutional Class | 2.4% |
Guggenheim Strategy Fund I | 2.1% |
Government of Japan | 1.7% |
Ladder Capital Commercial Mortgage 2017-FL1 Mortgage Trust, 2.95% | 1.3% |
U.S. Treasury Bond, 11/15/44 | 1.2% |
Willis Engine Securitization Trust II, 5.50% | 1.2% |
Fortress Credit Opportunities IX CLO Ltd., 3.89% | 1.1% |
Fannie Mae, 3.16% | 1.0% |
Top Ten Total | 24.6% |
“Ten Largest Holdings” excludes any temporary cash or derivative investments.
28 | THE GUGGENHEIM FUNDS SEMI-ANNUAL REPORT |
PERFORMANCE REPORT AND FUND PROFILE (Unaudited)(concluded) | June 30, 2018 |
Average Annual Returns*,†
Periods Ended June 30, 2018
6 month‡ | 1 Year | 5 Year | 10 Year | |
Series E (Total Return Bond Series) | 0.49% | 3.19% | 5.11% | 4.14% |
Bloomberg Barclays U.S. Aggregate Bond Index | (1.62%) | (0.40%) | 2.27% | 3.72% |
Portfolio Composition by Quality Rating1 | |
Rating | % of Total Investments |
Fixed Income Instruments | |
AAA | 77.0% |
AA | 2.5% |
A | 4.2% |
BBB | 1.3% |
BB | 0.4% |
B | 2.2% |
CC | 0.3% |
NR2 | 0.2% |
Other Instruments | 11.9% |
Total Investments | 100.0% |
| * | The performance data above represents past performance that is not predictive of future results. The investment return and principal value of an investment in the Fund will fluctuate so that an investor’s shares, when redeemed, may be worth more or less than their original cost. Returns are historical and include changes in principal and reinvested dividends and capital gains and do not reflect the effect of taxes. The Bloomberg Barclays U.S. Aggregate Bond Index is an unmanaged index and, unlike the Fund, has no management fees or operating expenses to reduce its reported return. |
| † | Performance figures do not reflect fees and expenses associated with an investment in variable insurance products. If returns had taken into account these fees and expenses, performance would have been lower. Shares of a series of Guggenheim Variable Funds Trust are available only through the purchase of such products. |
| ‡ | 6 month returns are not annualized. |
| 1 | Source: BlackRock Solutions. Credit quality ratings are measured on a scale that generally ranges from AAA (highest) to D (lowest). All securities except for those labeled “NR” have been rated by Moody’s, Standard & Poors (“S&P”), or Fitch, which are all a Nationally Recognized Statistical Rating Organization (“NRSRO”). For purposes of this presentation, when ratings are available from more than one agency, the highest rating is used. Guggenheim Investments has converted ratings to the equivalent S&P rating. Security ratings are determined at the time of purchase and may change thereafter. |
| 2 | NR securities do not necessarily indicate low credit quality. |
THE GUGGENHEIM FUNDS SEMI-ANNUAL REPORT 29 |
SCHEDULE OF INVESTMENTS (Unaudited) | June 30, 2018 |
SERIES E (TOTAL RETURN BOND SERIES) |
| Value | |||||||
UNIT INVESTMENT TRUSTS† - 0.0% | ||||||||
Financial - 0.0% | ||||||||
Rescap Liquidating Trust* | 9,655 | $ | 60,344 | |||||
Total Unit Investment Trusts | ||||||||
(Cost $487,486) | 60,344 | |||||||
PREFERRED STOCKS†† - 0.9% | ||||||||
Financial - 0.8% | ||||||||
Woodbourne Capital Trust III, 3.91% (1 month USD LIBOR + 2.50%)*,†††,1,2,3 | 300,000 | 234,747 | ||||||
Woodbourne Capital Trust IV, 3.91% (1 month USD LIBOR + 2.50%) *,†††,1,2,3 | 300,000 | 234,747 | ||||||
Woodbourne Capital Trust I, 3.90% (1 month USD LIBOR +2.50%)*,†††,1,2,3 | 300,000 | 234,747 | ||||||
Woodbourne Capital Trust II, 3.90% (1 month USD LIBOR + 2.50%) *,†††,1,2,3 | 300,000 | 234,747 | ||||||
Total Financial | 938,988 | |||||||
Industrial - 0.1% | ||||||||
Seaspan Corp., 6.38% due 04/30/19 | 7,060 | 180,171 | ||||||
Total Preferred Stocks | ||||||||
(Cost $1,382,296) | 1,119,159 | |||||||
MUTUAL FUNDS† - 9.5% | ||||||||
Guggenheim Total Return Bond Fund - Institutional Class4 | 213,558 | 5,744,699 | ||||||
Guggenheim Limited Duration Fund - Institutional Class4 | 118,796 | 2,933,083 | ||||||
Guggenheim Strategy Fund I4 | 98,304 | 2,461,542 | ||||||
Guggenheim Floating Rate Strategies Fund - Institutional Class4 | 7,971 | 205,418 | ||||||
Total Mutual Funds | ||||||||
(Cost $11,218,399) | 11,344,742 | |||||||
MONEY MARKET FUND† - 1.1% | ||||||||
Dreyfus Treasury Securities Cash Management Fund — Institutional Class 1.68%5 | 1,342,539 | 1,342,539 | ||||||
Total Money Market Fund | ||||||||
(Cost $1,342,539) | 1,342,539 | |||||||
Face Amount~ | ||||||||
ASSET-BACKED SECURITIES†† - 33.0% | ||||||||
Collateralized Loan Obligations - 21.0% | ||||||||
KVK CLO Ltd. | ||||||||
2018-1A, 3.26% (3 Month USD LIBOR + 0.93%) due 05/20/291,6 | 1,000,000 | 999,935 | ||||||
2017-1A, 4.14% (3 Month USD LIBOR + 1.80%) due 05/15/261,6 | 1,000,000 | 999,850 | ||||||
2013-1A, due 01/15/286,7 | 900,000 | 426,559 | ||||||
Ladder Capital Commercial Mortgage 2017-FL1 Mortgage Trust | ||||||||
2017-FL1, 2.95% (1 Month USD LIBOR + 0.88%) due 09/15/341,6 | 1,500,000 | 1,495,249 | ||||||
Fortress Credit Opportunities IX CLO Ltd. | ||||||||
2017-9A, 3.89% (3 Month USD LIBOR + 1.55%) due 11/15/291,6 | 1,300,000 | 1,300,111 | ||||||
Northwoods Capital XIV Ltd. | ||||||||
2017-14A, 4.06% (3 Month USD LIBOR + 1.70%) due 11/12/251,6 | 1,250,000 | 1,250,267 | ||||||
Golub Capital Partners CLO 36m Ltd. | ||||||||
2018-36A, 3.39% (3 Month USD LIBOR + 1.30%) due 02/05/311,6 | 1,200,000 | 1,200,115 | ||||||
OCP CLO Ltd. | ||||||||
2016-2A, 5.18% (3 Month USD LIBOR + 2.85%) due 11/22/251,6 | 1,000,000 | 1,004,762 | ||||||
NXT Capital CLO LLC | ||||||||
2017-1A, 4.06% (3 Month USD LIBOR + 1.70%) due 04/20/291,6 | 1,000,000 | 1,002,486 | ||||||
Marathon CLO VII Ltd. | ||||||||
2017-7A, 4.01% (3 Month USD LIBOR + 1.65%) due 10/28/251,6 | 1,000,000 | 1,001,408 | ||||||
York CLO 1 Ltd. | ||||||||
2017-1A, 4.06% (3 Month USD LIBOR + 1.70%) due 01/22/271,6 | 1,000,000 | 1,001,067 | ||||||
Vibrant CLO II Ltd. | ||||||||
2017-2A, 3.81% (3 Month USD LIBOR + 1.45%) due 07/24/241,6 | 1,000,000 | 1,000,274 | ||||||
FDF II Ltd. | ||||||||
2016-2A, 4.29% due 05/12/316 | 1,000,000 | 1,000,108 | ||||||
CIFC Funding Ltd. | ||||||||
2017-3A, 3.31% (3 Month USD LIBOR + 0.95%) due 07/22/261,6 | 1,000,000 | 1,000,030 | ||||||
Flagship CLO VIII Ltd. | ||||||||
2018-8A, 3.74% (3 Month USD LIBOR + 1.40%) due 01/16/261,6 | 1,000,000 | 1,000,000 | ||||||
OZLM IX Ltd. | ||||||||
2017-9A, 4.01% (3 Month USD LIBOR + 1.65%) due 01/20/271,6 | 1,000,000 | 999,829 | ||||||
BSPRT Issuer Ltd. | ||||||||
2017-FL2, 2.89% (1 Month USD LIBOR + 0.82%) due 10/15/341,6 | 1,000,000 | 999,641 | ||||||
MP CLO VIII Ltd. | ||||||||
2018-2A, 3.27% (3 Month USD LIBOR + 0.91%) due 10/28/271,6 | 1,000,000 | 998,273 | ||||||
Cerberus Loan Funding XXIII, LP | ||||||||
2018-2A, 3.28% (3 Month USD LIBOR + 1.00%) due 04/15/281,6 | 1,000,000 | 998,017 | ||||||
Hunt CRE Ltd. | ||||||||
2017-FL1, 3.07% (1 Month USD LIBOR + 1.00%) due 08/15/341,6 | 1,000,000 | 995,205 | ||||||
Venture XII CLO Ltd. | ||||||||
2018-12A, 3.52% (3 Month USD LIBOR + 1.20%) due 02/28/261,6 | 1,000,000 | 993,959 | ||||||
Dryden 37 Senior Loan Fund | ||||||||
2015-37A, due 01/15/316,7 | 1,000,000 | 948,285 | ||||||
30 | THE GUGGENHEIM FUNDS SEMI-ANNUAL REPORT | SEE NOTES TO FINANCIAL STATEMENTS. |
SCHEDULE OF INVESTMENTS (Unaudited)(continued) | June 30, 2018 |
SERIES E (TOTAL RETURN BOND SERIES) |
Face | Value | |||||||
Resource Capital Corporation Ltd. | ||||||||
2017-CRE5, 2.87% (1 Month USD LIBOR + 0.80%) due 07/15/341,6 | 847,541 | $ | 847,540 | |||||
Fortress Credit Opportunities XI CLO Ltd. | ||||||||
2018-11A, 3.65% (3 Month USD LIBOR + 1.30%) due 04/15/311,6 | 750,000 | 747,934 | ||||||
Treman Park CLO Ltd. | ||||||||
2015-1A, due 04/20/276,7 | 500,000 | 429,918 | ||||||
ACIS CLO Ltd. | ||||||||
2013-1A, 5.31% (3 Month USD LIBOR + 2.95%) due 04/18/241,6 | 400,000 | 400,063 | ||||||
Copper River CLO Ltd. | ||||||||
2007-1A, due 01/20/213,7 | 600,000 | 71,977 | ||||||
Babson CLO Ltd. | ||||||||
2012-2A, due 05/15/236,7 | 750,000 | 30,245 | ||||||
Keuka Park CLO Ltd. | ||||||||
2013-1A, due 10/21/246,7 | 250,000 | 8,315 | ||||||
Total Collateralized Loan Obligations | 25,151,422 | |||||||
Transport-Aircraft - 6.3% | ||||||||
Castlelake Aircraft Securitization Trust | ||||||||
2017-1, 3.97% due 07/15/42 | 917,062 | 910,120 | ||||||
2015-1A, 4.70% due 12/15/406 | 594,156 | 599,830 | ||||||
Willis Engine Securitization Trust II | ||||||||
2012-A, 5.50% due 09/15/376 | 1,433,825 | 1,409,549 | ||||||
Emerald Aviation Finance Ltd. | ||||||||
2013-1, 4.65% due 10/15/386 | 830,390 | 835,164 | ||||||
2013-1, 6.35% due 10/15/386 | 166,078 | 168,421 | ||||||
Apollo Aviation Securitization Equity Trust | ||||||||
2016-1A, 4.88% due 03/17/366 | 730,593 | 745,977 | ||||||
Raspro Trust | ||||||||
2005-1A, 2.98% (3 Month USD LIBOR + 0.63%) due 03/23/241,6 | 746,067 | 723,394 | ||||||
Rise Ltd. | ||||||||
2014-1A, 4.75% due 02/12/39 | 644,575 | 639,406 | ||||||
AIM Aviation Finance Ltd. | ||||||||
2015-1A, 4.21% due 02/15/406 | 633,786 | 638,035 | ||||||
Falcon Aerospace Ltd. | ||||||||
2017-1, 4.58% due 02/15/426 | 455,550 | 456,312 | ||||||
Turbine Engines Securitization Ltd. | ||||||||
2013-1A, 5.13% due 12/13/483 | 486,007 | 455,957 | ||||||
Total Transport-Aircraft | 7,582,165 | |||||||
Whole Business - 2.0% | ||||||||
Taco Bell Funding LLC | ||||||||
2016-1A, 4.97% due 05/25/466 | 985,000 | 1,016,983 | ||||||
Jimmy Johns Funding LLC | ||||||||
2017-1A, 3.61% due 07/30/476 | 818,632 | 813,262 | ||||||
Domino’s Pizza Master Issuer LLC | ||||||||
2017-1A, 3.61% (3 Month USD LIBOR + 1.25%) due 07/25/471,6 | 496,250 | 497,322 | ||||||
Total Whole Business | 2,327,567 | |||||||
Collateralized Debt Obligations - 1.4% | ||||||||
Anchorage Credit Funding Ltd. | ||||||||
2016-4A, 3.50% due 02/15/356 | 1,000,000 | 957,881 | ||||||
Putnam Structured Product Funding Ltd. | ||||||||
2003-1A, 3.07% (1 Month USD LIBOR + 1.00%) due 10/15/381,6 | 502,052 | 496,536 | ||||||
N-Star REL CDO VIII Ltd. | ||||||||
2006-8A, 2.45% (1 Month USD LIBOR + 0.36%) due 02/01/411,6 | 265,968 | 264,490 | ||||||
Total Collateralized Debt Obligations | 1,718,907 | |||||||
Net Lease - 1.0% | ||||||||
Store Master Funding I-VII | ||||||||
2016-1A, 3.96% due 10/20/466 | 1,212,816 | 1,164,303 | ||||||
Transport-Container - 0.8% | ||||||||
Textainer Marine Containers Ltd. | ||||||||
2017-2A, 3.52% due 06/20/426 | 1,013,230 | 990,444 | ||||||
Insurance - 0.4% | ||||||||
Chesterfield Financial Holdings LLC | ||||||||
2014-1A, 4.50% due 12/15/346 | 464,250 | 467,835 | ||||||
Diversified Payment Rights 0.1% | ||||||||
CIC Receivables Master Trust | ||||||||
REGD, 4.89% due 10/07/21 | 133,375 | 135,776 | ||||||
Total Asset-Backed Securities | ||||||||
(Cost $39,974,817) | 39,538,419 | |||||||
COLLATERALIZED MORTGAGE OBLIGATIONS†† - 30.1% | ||||||||
Residential Mortgage Backed Securities - 13.6% | ||||||||
American Home Mortgage Investment Trust | ||||||||
2006-1, 2.49% (1 Month USD LIBOR + 0.40%) due 03/25/461 | 853,296 | 829,568 | ||||||
2007-1, 2.08% due 05/25/478 | 2,842,253 | 430,450 | ||||||
Home Equity Loan Trust | ||||||||
2007-FRE1, 2.28% (1 Month USD LIBOR + 0.19%) due 04/25/371 | 1,264,870 | 1,188,632 | ||||||
Saxon Asset Securities Trust | ||||||||
2007-3, 2.40% (1 Month USD LIBOR + 0.31%) due 09/25/471 | 1,192,817 | 1,169,264 | ||||||
Soundview Home Loan Trust | ||||||||
2006-OPT5, 2.23% (1 Month USD LIBOR + 0.14%) due 07/25/361 | 1,156,149 | 1,120,596 | ||||||
GSAA Trust | ||||||||
2005-10, 2.74% (1 Month USD LIBOR + 0.65%) due 06/25/351 | 1,050,000 | 1,040,487 | ||||||
JP Morgan Mortgage Acquisition Trust | ||||||||
2006-WMC4, 2.21% (1 Month USD LIBOR + 0.12%) due 12/25/361 | 1,681,415 | 1,033,786 | ||||||
IndyMac INDX Mortgage Loan Trust | ||||||||
2006-AR6, 2.48% (1 Year CMT Rate + 0.92%) due 06/25/461 | 1,046,383 | 978,984 | ||||||
NovaStar Mortgage Funding Trust Series | ||||||||
2007-2, 2.29% (1 Month USD LIBOR + 0.20%) due 09/25/371 | 987,160 | 955,076 | ||||||
CIM Trust | ||||||||
2018-R2, 3.69% (WAC) due 08/25/571,6 | 942,985 | 939,110 | ||||||
Towd Point Mortgage Trust | ||||||||
2018-1, 3.00% (WAC) due 01/25/581,6 | 939,149 | 924,708 | ||||||
SEE NOTES TO FINANCIAL STATEMENTS. | THE GUGGENHEIM FUNDS SEMI-ANNUAL REPORT | 31 |
SCHEDULE OF INVESTMENTS (Unaudited)(continued) | June 30, 2018 |
SERIES E (TOTAL RETURN BOND SERIES) |
Face | Value | |||||||
CSMC Series | ||||||||
2015-12R, 2.46% (1 Month USD LIBOR + 0.50%) due 11/30/371,6 | 904,420 | $ | 901,392 | |||||
American Home Mortgage Assets Trust | ||||||||
2007-1, 2.26% (1 Year CMT Rate + 0.70%) due 02/25/471 | 1,349,680 | 877,260 | ||||||
Luminent Mortgage Trust | ||||||||
2006-2, 2.29% (1 Month USD LIBOR + 0.20%) due 02/25/461 | 924,523 | 843,112 | ||||||
CIT Mortgage Loan Trust | ||||||||
2007-1, 3.54% (1 Month USD LIBOR + 1.45%) due 10/25/371,6 | 575,433 | 579,337 | ||||||
2007-1, 3.44% (1 Month USD LIBOR + 1.35%) due 10/25/371,6 | 227,837 | 229,756 | ||||||
Wachovia Asset Securitization Issuance II LLC Trust | ||||||||
2007-HE2A, 2.22% (1 Month USD LIBOR + 0.13%) due 07/25/371,6 | 814,708 | 768,411 | ||||||
HarborView Mortgage Loan Trust | ||||||||
2006-14, 2.23% (1 Month USD LIBOR + 0.15%) due 01/25/471 | 684,191 | 650,222 | ||||||
Washington Mutual Mortgage Pass-Through Certificates WMALT Series Trust | ||||||||
2006-AR9, 2.40% (1 Year CMT Rate + 0.84%) due 11/25/461 | 427,037 | 371,639 | ||||||
VOLT XL LLC | ||||||||
2015-NP14, 4.38% due 11/27/456 | 169,857 | 171,191 | ||||||
UCFC Manufactured Housing Contract | ||||||||
1997-2, 7.38% due 10/15/28 | 155,961 | 164,651 | ||||||
Morgan Stanley Re-REMIC Trust | ||||||||
2010-R5, 3.63% due 06/26/366 | 104,762 | 92,217 | ||||||
Total Residential Mortgage Backed Securities | 16,259,849 | |||||||
Government Agency - 12.2% | ||||||||
Fannie Mae 11 | ||||||||
3.16% due 01/01/30 | 1,300,000 | 1,252,325 | ||||||
3.00% due 12/01/29 | 1,250,000 | 1,184,878 | ||||||
2.94% due 10/01/32 | 1,186,152 | 1,119,579 | ||||||
3.33% due 04/01/30 | 995,152 | 977,049 | ||||||
3.01% due 12/01/27 | 1,000,000 | 963,461 | ||||||
3.11% due 10/01/29 | 500,000 | 476,699 | ||||||
3.08% due 10/01/32 | 500,000 | 472,007 | ||||||
2.99% due 09/01/29 | 500,000 | 471,875 | ||||||
2.96% due 11/01/29 | 500,000 | 470,765 | ||||||
2.86% due 09/01/29 | 500,000 | 470,041 | ||||||
2.90% due 11/01/29 | 500,000 | 467,691 | ||||||
Freddie Mac Multifamily Structured Pass Through Certificates 11 | ||||||||
2017-KGX1, 3.00% due 10/25/27 | 1,200,000 | 1,152,716 | ||||||
2017-KW03, 3.02% due 06/25/27 | 1,050,000 | 1,013,937 | ||||||
2018-K074, 3.60% due 02/25/28 | 1,000,000 | 1,006,301 | ||||||
Freddie Mac Seasoned Credit Risk Transfer Trust11 | ||||||||
2017-4, 2.50% due 06/25/57 | 1,206,642 | 1,175,460 | ||||||
2017-3, 3.00% due 07/25/56 | 1,142,864 | 1,098,253 | ||||||
Fannie Mae-Aces11 | ||||||||
2017-M11, 2.98% due 08/25/29 | 900,000 | 851,189 | ||||||
Total Government Agency | 14,624,226 | |||||||
Commercial Mortgage Backed Securities - 2.3% | ||||||||
Citigroup Commercial Mortgage Trust | ||||||||
2017-P7, 1.29% (WAC) due 04/14/508 | 5,978,194 | 449,131 | ||||||
2016-GC37, 1.96% (WAC) due 04/10/498 | 3,797,060 | 400,803 | ||||||
Wells Fargo Commercial Mortgage Trust | ||||||||
2016-C32, 1.49% (WAC) due 01/15/598 | 5,240,341 | 390,481 | ||||||
2016-NXS5, 1.70% (WAC) due 01/15/598 | 4,893,192 | 374,851 | ||||||
BANK | ||||||||
2017-BNK4, 1.61% (WAC) due 05/15/508 | 4,954,069 | 447,261 | ||||||
COMM Mortgage Trust | ||||||||
2015-CR26, 1.18% (WAC) due 10/10/488 | 6,857,671 | 377,913 | ||||||
CFCRE Commercial Mortgage Trust | ||||||||
2016-C3, 1.22% (WAC) due 01/10/488 | 5,875,276 | 372,868 | ||||||
Total Commercial Mortgage Backed Securities | 2,813,308 | |||||||
Military Housing - 2.0% | ||||||||
GMAC Commercial Mortgage Asset Corp. | ||||||||
2007-HCKM, 6.11% due 08/10/526 | 965,912 | 1,049,667 | ||||||
2003-PRES, 6.24% due 10/10/416 | 228,294 | 245,622 | ||||||
Freddie Mac Military Housing Bonds Resecuritization Trust Certificates | ||||||||
2015-R1, 12.43% (WAC) due 11/25/551,6 | 972,137 | 1,051,088 | ||||||
Total Military Housing | 2,346,377 | |||||||
Total Collateralized Mortgage Obligations | ||||||||
(Cost $36,203,819) | 36,043,760 | |||||||
U.S. GOVERNMENT SECURITIES†† - 9.0% | ||||||||
U.S. Treasury Bonds | ||||||||
due 11/15/469 | 21,703,000 | 9,348,021 | ||||||
due 11/15/449 | 3,115,500 | 1,428,354 | ||||||
Total U.S. Treasury Bonds | 10,776,375 | |||||||
Total U.S. Government Securities | ||||||||
(Cost $10,782,080) | 10,776,375 | |||||||
CORPORATE BONDS†† - 4.9% | ||||||||
Financial - 3.7% | ||||||||
Station Place Securitization Trust Series | ||||||||
3.09% (1 Month USD LIBOR + 1.00%) due 03/24/191,6 | 1,000,000 | 1,000,000 | ||||||
Mid-Atlantic Military Family Communities LLC | ||||||||
5.30% due 08/01/503 | 933,548 | 858,253 | ||||||
BBC Military Housing-Navy Northeast LLC | ||||||||
6.30% due 10/15/49††† | 485,000 | 517,408 | ||||||
Citigroup, Inc. | ||||||||
6.25% 2,10 | 418,000 | 433,675 | ||||||
Pacific Northwest Communities LLC | ||||||||
5.91% due 06/15/503 | 400,000 | 420,174 | ||||||
Assurant, Inc. | ||||||||
3.59% (3 Month USD LIBOR + 1.25%) due 03/26/211 | 350,000 | 350,880 | ||||||
32 | THE GUGGENHEIM FUNDS SEMI-ANNUAL REPORT | SEE NOTES TO FINANCIAL STATEMENTS. |
SCHEDULE OF INVESTMENTS (Unaudited)(continued) | June 30, 2018 |
SERIES E (TOTAL RETURN BOND SERIES) |
Face | Value | |||||||
American Equity Investment Life Holding Co. | ||||||||
5.00% due 06/15/27 | 354,000 | $ | 345,488 | |||||
Atlantic Marine Corporations Communities LLC | ||||||||
5.43% due 12/01/506 | 327,679 | 327,581 | ||||||
Hospitality Properties Trust | ||||||||
5.25% due 02/15/26 | 189,000 | 191,773 | ||||||
Total Financial | 4,445,232 | |||||||
Consumer, Cyclical - 0.6% | ||||||||
Northern Group Housing LLC | ||||||||
6.80% due 08/15/536 | 600,000 | 749,020 | ||||||
Basic Materials - 0.5% | ||||||||
Yamana Gold, Inc. | ||||||||
4.95% due 07/15/24 | 483,000 | 482,474 | ||||||
BHP Billiton Finance USA Ltd. | ||||||||
6.75% due 10/19/756,10 | 100,000 | 108,450 | ||||||
Total Basic Materials | 590,924 | |||||||
Industrial - 0.1% | ||||||||
Reynolds Group Issuer Inc. / Reynolds Group Issuer LLC / Reynolds Group Issuer Luxembourg | ||||||||
5.85% (3 Month USD LIBOR + 3.50%) due 07/15/211,6 | 100,000 | 100,930 | ||||||
Total Corporate Bonds | ||||||||
(Cost $5,746,332) | 5,886,106 | |||||||
FEDERAL AGENCY BONDS†† - 4.8% | ||||||||
Fannie Mae Principal Strips11 | ||||||||
due 05/15/309 | 1,350,000 | 900,411 | ||||||
due 05/15/299 | 1,250,000 | 864,498 | ||||||
due 01/15/309 | 600,000 | 404,760 | ||||||
Total Fannie Mae Principal Strips | 2,169,669 | |||||||
Freddie Mac Strips Principal Strips11 | ||||||||
due 03/15/319 | 1,500,000 | 969,984 | ||||||
due 07/15/329 | 800,000 | 494,186 | ||||||
Total Freddie Mac Principal Strips | 1,464,170 | |||||||
Freddie Mac11 | ||||||||
due 12/14/299 | 1,600,000 | 1,082,714 | ||||||
Tennessee Valley Authority | ||||||||
5.38% due 04/01/56 | 750,000 | 1,009,646 | ||||||
Total Federal Agency Bonds | ||||||||
(Cost $5,843,878) | 5,726,199 | |||||||
FOREIGN GOVERNMENT DEBT†† - 2.9% | ||||||||
Government of Japan | ||||||||
due 07/09/189 | JPY | 224,000,000 | 2,023,339 | |||||
due 09/03/189 | JPY | 32,000,000 | 289,106 | |||||
due 07/20/189 | JPY | 10,800,000 | 97,557 | |||||
Total Government of Japan | 2,410,002 | |||||||
State of Israel | ||||||||
due 10/31/189 | ILS | 2,760,000 | 757,920 | |||||
Hungary (Republic Of) | ||||||||
due 07/25/189 | HUF | 81,000,000 | 287,179 | |||||
Total Foreign Government Debt | ||||||||
(Cost $3,554,792) | 3,455,101 | |||||||
SENIOR FLOATING RATE INTERESTS††,1 - 2.0% | ||||||||
Technology - 0.7% | ||||||||
Misys Ltd. | ||||||||
5.81% (3 Month USD LIBOR + 3.50%) due 06/13/24 | 496,250 | 487,015 | ||||||
Blackhawk Network | ||||||||
5.07% (3 Month USD LIBOR + 3.00%) due 06/15/25 | 200,000 | 199,250 | ||||||
Epicor Software | ||||||||
5.35% (1 Month USD LIBOR + 3.25%) due 06/01/22 | 176,551 | 175,889 | ||||||
Total Technology | 862,154 | |||||||
Industrial - 0.6% | ||||||||
Capstone Logistics | ||||||||
6.59% (1 Month USD LIBOR + 4.50%) due 10/07/21 | 669,650 | 662,451 | ||||||
Communications - 0.5% | ||||||||
Cengage Learning Acquisitions, Inc. | ||||||||
6.34% (1 Month USD LIBOR + 4.25%) due 06/07/23 | 683,862 | 626,589 | ||||||
Consumer, Non-cyclical - 0.1% | ||||||||
DJO Finance LLC | ||||||||
5.45% (3 Month USD LIBOR + 3.25%) due 06/08/20 | 98,481 | 97,927 | ||||||
Financial - 0.1% | ||||||||
American Stock Transfer & Trust | ||||||||
8.50% (3 Month USD LIBOR + 4.50%) due 06/26/20 | 93,169 | 93,285 | ||||||
Total Senior Floating Rate Interests | ||||||||
(Cost $2,411,976) | 2,342,406 | |||||||
MUNICIPAL BONDS†† - 0.9% | ||||||||
California - 0.5% | ||||||||
Cypress School District General Obligation Unlimited | ||||||||
due 08/01/489 | 1,000,000 | 264,970 | ||||||
Newport Mesa Unified School District General Obligation Unlimited | ||||||||
due 08/01/469 | 700,000 | 228,963 | ||||||
Beverly Hills Unified School District California General Obligation Unlimited | ||||||||
due 08/01/379 | 400,000 | 188,152 | ||||||
Total California | 682,085 | |||||||
SEE NOTES TO FINANCIAL STATEMENTS. | THE GUGGENHEIM FUNDS SEMI-ANNUAL REPORT | 33 |
SCHEDULE OF INVESTMENTS (Unaudited)(continued) | June 30, 2018 |
SERIES E (TOTAL RETURN BOND SERIES) |
Face | Value | |||||||
Illinois - 0.4% | ||||||||
State of Illinois General Obligation Unlimited | ||||||||
5.65% due 12/01/38 | 400,000 | $ | 437,000 | |||||
Total Municipal Bonds | ||||||||
(Cost $1,102,009) | 1,119,085 | |||||||
Contracts | ||||||||
OTC OPTIONS PURCHASED†† - 0.0% | ||||||||
Call options on: | ||||||||
Bank of America Merrill Lynch iShares MSCI Emerging Markets ETF Expiring January 2019 with strike price of $55.00 (Notional Value $3,306,079) | 763 | 5,341 | ||||||
Bank of America Merrill Lynch S&P 500 Index Expiring January 2019 with strike price of $3,000.00 (Notional Value $4,621,229) | 17 | 17,765 | ||||||
Total OTC Options Purchased | ||||||||
(Cost $214,107) | 23,106 | |||||||
Total Investments - 99.1% | ||||||||
(Cost $120,264,530) | $ | 118,777,341 | ||||||
Other Assets & Liabilities, net - 0.9% | 1,100,420 | |||||||
Total Net Assets - 100.0% | $ | 119,877,761 | ||||||
CENTRALLY CLEARED INTEREST RATE SWAP AGREEMENTS†† | ||||||||||||||||||||||
Counterparty | Exchange | Floating | Floating | Fixed | Payment | Maturity | Notional | Market | Premiums | Unrealized | ||||||||||||
BofA Merrill Lynch | CME | Receive | 3-Month USD-LIBOR | 2.82% | Quarterly | 04/13/28 | $ | 12,110,000 | $ | 146,288 | $ | 52,654 | $ | 93,634 | ||||||||
BofA Merrill Lynch | CME | Receive | 3-Month USD-LIBOR | 2.59% | Quarterly | 11/13/47 | 700,000 | 55,334 | 305 | 55,029 | ||||||||||||
BofA Merrill Lynch | CME | Receive | 3-Month USD-LIBOR | 2.77% | Quarterly | 04/13/25 | 5,100,000 | 46,819 | 8,950 | 37,869 | ||||||||||||
BofA Merrill Lynch | CME | Receive | 3-Month USD-LIBOR | 2.69% | Quarterly | 04/13/21 | 9,490,000 | 41,661 | 2,067 | 39,594 | ||||||||||||
BofA Merrill Lynch | CME | Receive | 3-Month USD-LIBOR | 2.73% | Quarterly | 04/13/23 | 4,400,000 | 32,825 | 5,402 | 27,423 | ||||||||||||
| $ | 322,927 | $ | 69,378 | $ | 253,549 | |||||||||||||||||
FORWARD FOREIGN CURRENCY EXCHANGE CONTRACTS†† | |||||||||||||||
Counterparty | Contracts to Sell | Currency | Settlement | Settlement | Value at | Net Unrealized | |||||||||
Goldman Sachs | 224,000,000 | JPY | 07/09/18 | $ | 2,095,985 | $ | 2,024,143 | $ | 71,842 | ||||||
Goldman Sachs | 570,000 | EUR | 09/14/18 | 701,275 | 669,501 | 31,774 | |||||||||
Citigroup | 1,708,500 | ILS | 10/31/18 | 487,822 | 471,707 | 16,115 | |||||||||
Morgan Stanley | 81,000,000 | HUF | 07/25/18 | 300,729 | 287,791 | 12,938 | |||||||||
Goldman Sachs | 1,065,300 | ILS | 10/31/18 | 302,870 | 294,123 | 8,747 | |||||||||
Morgan Stanley | 32,000,000 | JPY | 09/04/18 | 292,753 | 290,342 | 2,411 | |||||||||
Goldman Sachs | 10,800,000 | JPY | 07/20/18 | 99,310 | 97,667 | 1,643 | |||||||||
| $ | 145,470 | ||||||||||||||
34 | THE GUGGENHEIM FUNDS SEMI-ANNUAL REPORT | SEE NOTES TO FINANCIAL STATEMENTS. |
SCHEDULE OF INVESTMENTS (Unaudited)(continued) | June 30, 2018 |
SERIES E (TOTAL RETURN BOND SERIES) |
FORWARD FOREIGN CURRENCY EXCHANGE CONTRACTS††
| Counterparty | Contracts to Buy | Currency | Settlement Date | Settlement Value | Value at June 30, 2018 | Net Unrealized Depreciation | |||||||||
| Goldman Sachs | 570,000 | EUR | 09/14/18 | $ | 669,667 | $ | 669,500 | $ | (167 | ) | |||||
| ~ | The face amount is denominated in U.S. dollars unless otherwise indicated. |
| * | Non-income producing security. |
| ** | Includes cumulative appreciation (depreciation). Only current day’s variation margin is reported within the Statement of Assets and Liabilities. |
| † | Value determined based on Level 1 inputs — See Note 4. |
| †† | Value determined based on Level 2 inputs, unless otherwise noted — See Note 4. |
| ††† | Value determined based on Level 3 inputs — See Note 4. |
| 1 | Variable rate security. Rate indicated is the rate effective at June 30, 2018. In some instances, the underlying reference rate shown was below the minimum rate earned by the security or has been adjusted by a predetermined factor. The settlement status of a position may also impact the effective rate indicated. In instances where multiple underlying reference rates and spread amounts are shown, the effective rate is based on a weighted average. |
| 2 | Perpetual maturity. |
| 3 | Security is a 144A or Section 4(a)(2) security. These securities have been determined to be illiquid and restricted under guidelines established by the Board of Trustees. The total market value of 144A or Section 4(a)(2) illiquid and restricted securities is $2,745,349 (cost $3,699,006), or 2.3% of total net assets — See Note 9. |
| 4 | Affiliated issuer. |
| 5 | Rate indicated is the 7 day yield as of June 30, 2018. |
| 6 | Security is a 144A or Section 4(a)(2) security. These securities have been determined to be liquid under guidelines established by the Board of Trustees. The total market value of 144A or Section 4(a)(2) securities is $46,563,665 (cost $46,086,638), or 38.8% of total net assets. |
| 7 | Security has no stated coupon. However, it is expected to receive residual cash flow payments on defined deal dates. |
| 8 | Security is an interest-only strip. Rate indicated is effective yield at June 30, 2018. |
| 9 | Zero coupon rate security. |
| 10 | Security has a fixed rate coupon which will convert to a floating or variable rate coupon on a future date. |
| 11 | On September 7, 2008, the issuer was placed in conservatorship by the Federal Housing Finance Agency (FHFA). As conservator, the FHFA has full powers to control the assets and operations of the firm. |
BofA — Bank of America
CME — Chicago Mercantile Exchange
CMT — Constant Maturity Treasury
EUR — Euro
HUF — Hungarian Forint
ILS — Israeli New Shekel
JPY — Japanese Yen
LIBOR — London Interbank Offered Rate
OTC — Over the counter
REMIC — Real Estate Mortgage Investment Conduit
USD — United States Dollar
WAC — Weighted Average Coupon
See Sector Classification in Other Information section.
SEE NOTES TO FINANCIAL STATEMENTS. | THE GUGGENHEIM FUNDS SEMI-ANNUAL REPORT | 35 |
SCHEDULE OF INVESTMENTS (Unaudited)(continued) | June 30, 2018 |
SERIES E (TOTAL RETURN BOND SERIES) |
The following table summarizes the inputs used to value the Fund’s investments at June 30, 2018 (See Note 4 in the Notes to Financial Statements):
Investments in Securities (Assets) | Level 1 | Level 2 | Level 3 | Total | ||||||||||||
Unit Investment Trusts | $ | 60,344 | $ | — | $ | — | $ | 60,344 | ||||||||
Preferred Stocks | — | 180,171 | 938,988 | 1,119,159 | ||||||||||||
Mutual Funds | 11,344,742 | — | — | 11,344,742 | ||||||||||||
Money Market Fund | 1,342,539 | — | — | 1,342,539 | ||||||||||||
Asset-Backed Securities | — | 39,538,419 | — | 39,538,419 | ||||||||||||
Collateralized Mortgage Obligations | — | 36,043,760 | — | 36,043,760 | ||||||||||||
U.S. Government Securities | — | 10,776,375 | — | 10,776,375 | ||||||||||||
Corporate Bonds | — | 5,368,698 | 517,408 | 5,886,106 | ||||||||||||
Federal Agency Bonds | — | 5,726,199 | — | 5,726,199 | ||||||||||||
Foreign Government Debt | — | 3,455,101 | — | 3,455,101 | ||||||||||||
Senior Floating Rate Interests | — | 2,342,406 | — | 2,342,406 | ||||||||||||
Municipal Bonds | — | 1,119,085 | — | 1,119,085 | ||||||||||||
Options Purchased | — | 23,106 | — | 23,106 | ||||||||||||
Interest Rate Swap Agreements* | — | 253,549 | — | 253,549 | ||||||||||||
Forward Foreign Currency Exchange Contracts* | — | 145,470 | — | 145,470 | ||||||||||||
Total Assets | $ | 12,747,625 | $ | 104,972,339 | $ | 1,456,396 | $ | 119,176,360 | ||||||||
Investments in Securities (Liabilities) | Level 1 | Level 2 | Level 3 | Total | ||||||||||||
Forward Foreign Currency Exchange Contracts* | $ | — | $ | 167 | $ | — | $ | 167 | ||||||||
| * | This derivative is reported as unrealized appreciation/(depreciation) at period end. |
The following is a summary of significant unobservable inputs used in the fair valuation of assets and liabilities categorized within Level 3 of the fair value hierarchy:
Category | Ending Balance | Valuation Technique | Unobservable Inputs | Input Range | Weighted | |||||||||
Assets: |
|
|
|
| ||||||||||
Corporate Bonds | $ | 517,408 | Option Adjusted Spread off the prior month end broker mark over the 3 month LIBOR | Indicative Quote | _ | _ | ||||||||
Preferred Stocks | 938,988 | Option Adjusted Spread off the prior month end broker mark over the 3 month LIBOR | Indicative Quote | _ | _ | |||||||||
Total Assets | $ | 1,456,396 |
|
| ||||||||||
Transfers between investment levels may occur as the markets fluctuate and/or the availability of data used in an investment’s valuation changes. Transfers between valuation levels, if any, are in comparison to the valuation levels at the end of the previous fiscal year, and are effective using the fair value as of the end of the current fiscal period.
For the period ended June 30, 2018, the Fund had securities with a total value of $135,776 transfer out of Level 3 into Level 2 due to changes in the securities valuation methods based on availability of vendor prices. There were no other securities that transferred between levels.
36 | THE GUGGENHEIM FUNDS SEMI-ANNUAL REPORT | SEE NOTES TO FINANCIAL STATEMENTS. |
SCHEDULE OF INVESTMENTS (Unaudited)(concluded) | June 30, 2018 |
SERIES E (TOTAL RETURN BOND SERIES) |
Summary of Fair Value Level 3 Activity
Following is a reconciliation of Level 3 assets for which significant unobservable inputs were used to determine fair value for the period ended June 30, 2018:
Assets | ||||||||||||||||
Asset-Backed | Corporate | Preferred | Total | |||||||||||||
Beginning Balance | $ | 155,587 | $ | 534,191 | $ | 916,580 | $ | 1,606,358 | ||||||||
(Sales, maturities and paydowns) | (17,268 | ) | — | — | (17,268 | ) | ||||||||||
Amortization of discount/premiums | — | (120 | ) | — | (120 | ) | ||||||||||
Total change in unrealized appreciation or (depreciation) included in earnings | (2,543 | ) | (16,663 | ) | 22,408 | 3,202 | ||||||||||
Transfers out of Level 3 | (135,776 | ) | — | — | (135,776 | ) | ||||||||||
Ending Balance | $ | — | $ | 517,408 | $ | 938,988 | $ | 1,456,396 | ||||||||
Net change in unrealized appreciation (depreciation) for investments in Level 3 securities still held at June 30, 2018 | $ | — | $ | (16,663 | ) | $ | 22,408 | $ | 5,745 | |||||||
Affiliated Transactions
Investments representing 5% or more of the outstanding voting shares of a portfolio company of a fund, or control of or by, or common control under Guggenheim Investments ("GI"), result in that portfolio company being considered an affiliated company of such fund, as defined in the 1940 Act.
The Fund may invest in certain of the underlying series of Guggenheim Strategy Funds Trust, including Guggenheim Strategy Fund I, Guggenheim Strategy Fund II, Guggenheim Strategy Fund III and Guggenheim Variable Insurance Strategy Fund III, (collectively, the “Cash Management Funds”), each of which are open-end management investment companies managed by GI. The Cash Management Funds, which launched on March 11, 2014, are offered as cash management options only to mutual funds, trusts, and other accounts managed by GI and/or its affiliates, and are not available to the public. The Cash Management Funds pay no investment management fees. The Cash Management Funds’ annual report on Form N-CSR dated September 30, 2017, is available publicly or upon request. This information is available from the EDGAR database on the SEC’s website at https://www.sec.gov/Archives/edgar/data/1601445/000089180417000715/gug72218.htm.
Transactions during the period ended June 30, 2018, in which the portfolio company is an “affiliated person”, were as follows:
Security Name | Value | Additions | Reductions | Realized | Change in | Value | Shares | Investment | ||||||||||||||||||||||||
Mutual Funds | ||||||||||||||||||||||||||||||||
Guggenheim Floating Rate Strategies Fund - Institutional Class | $ | 202,861 | $ | 4,460 | $ | — | $ | — | $ | (1,903 | ) | $ | 205,418 | 7,971 | $ | 4,458 | ||||||||||||||||
Guggenheim Strategy Fund I | 2,433,392 | 30,112 | — | — | (1,962 | ) | 2,461,542 | 98,304 | 30,038 | |||||||||||||||||||||||
Guggenheim Limited Duration Fund - Institutional Class | 2,911,685 | 32,026 | — | — | (10,628 | ) | 2,933,083 | 118,796 | 31,951 | |||||||||||||||||||||||
Guggenheim Total Return Bond Fund - Institutional Class | 6,193,398 | 86,247 | (460,000 | ) | 8,417 | (83,363 | ) | 5,744,699 | 213,558 | 86,300 | ||||||||||||||||||||||
| $ | 11,741,336 | $ | 152,845 | $ | (460,000 | ) | $ | 8,417 | $ | (97,856 | ) | $ | 11,344,742 | $ | 152,747 | |||||||||||||||||
SEE NOTES TO FINANCIAL STATEMENTS. | THE GUGGENHEIM FUNDS SEMI-ANNUAL REPORT | 37 |
SERIES E (TOTAL RETURN BOND SERIES) |
STATEMENT OF ASSETS AND LIABILITIES (Unaudited) | ||||
June 30, 2018 | ||||
Assets: | ||||
Investments in unaffiliated issuers, at value (cost $109,046,131) | $ | 107,432,599 | ||
Investments in affiliated issuers, at value(cost $11,218,399) | 11,344,742 | |||
Segregated cash with broker | 859,726 | |||
Unamortized upfront premiums paid on interest rate swaps | 69,378 | |||
Unrealized appreciation on forward foreign currency exchange contracts | 145,470 | |||
Prepaid expenses | 2,711 | |||
Receivables: | ||||
Interest | 372,941 | |||
Securities sold | 88,425 | |||
Fund shares sold | 87,188 | |||
Dividends | 26,106 | |||
Variation margin on swap agreements | 23 | |||
Total assets | 120,429,309 | |||
Liabilities: | ||||
Overdraft due to custodian bank | 1,943 | |||
Segregated cash due to broker | 395,184 | |||
Unrealized depreciation on forward foreign currency exchange contracts | 167 | |||
Payable for: | ||||
Securities purchased | 38,265 | |||
Distribution and service fees | 24,685 | |||
Management fees | 24,632 | |||
Swap settlement | 23,460 | |||
Fund shares redeemed | 8,241 | |||
Fund accounting/administration fees | 7,900 | |||
Transfer agent/maintenance fees | 2,527 | |||
Trustees’ fees* | 357 | |||
Miscellaneous | 24,187 | |||
Total liabilities | 551,548 | |||
Commitments and contingent liabilities (Note 13) | — | |||
Net assets | $ | 119,877,761 | ||
Net assets consist of: | ||||
Paid in capital | $ | 114,833,750 | ||
Undistributed net investment income | 7,094,551 | |||
Accumulated net realized loss on investments | (962,203 | ) | ||
Net unrealized depreciation on investments | (1,088,337 | ) | ||
Net assets | $ | 119,877,761 | ||
Capital shares outstanding | 7,272,143 | |||
Net asset value per share | $ | 16.48 | ||
STATEMENT OF OPERATIONS (Unaudited) | ||||
Period Ended June 30, 2018 | ||||
Investment Income: | ||||
Dividends from securities of unaffiliated issuers | $ | 33,429 | ||
Dividends from securities of affiliated issuers | 152,747 | |||
Interest | 2,151,459 | |||
Total investment income | 2,337,635 | |||
Expenses: | ||||
Management fees | 238,561 | |||
Distribution and service fees | 152,924 | |||
Recoupment of previously waived fees | 13 | |||
Transfer agent/maintenance fees | 12,681 | |||
Fund accounting/administration fees | 48,936 | |||
Custodian fees | 9,545 | |||
Trustees’ fees* | 8,461 | |||
Interest expense | 911 | |||
Line of credit fees | 3,566 | |||
Miscellaneous | 61,492 | |||
Total expenses | 537,090 | |||
Less: | ||||
Expenses waived by Adviser | (63,148 | ) | ||
Net expenses | 473,942 | |||
Net investment income | 1,863,693 | |||
Net Realized and Unrealized Gain (Loss): | ||||
Net realized gain (loss) on: | ||||
Investments in unaffiliated issuers | (54,159 | ) | ||
Investments in affiliated issuers | 8,417 | |||
Swap agreements | 1,251,301 | |||
Foreign currency transactions | 50,026 | |||
Forward foreign currency exchange contracts | (59,881 | ) | ||
Net realized gain | 1,195,704 | |||
Net change in unrealized appreciation | ||||
Investments in unaffiliated issuers | (2,287,435 | ) | ||
Investments in affiliated issuers | (97,856 | ) | ||
Swap agreements | (102,435 | ) | ||
Options purchased | (191,001 | ) | ||
Forward foreign currency exchange contracts | 128,379 | |||
Net change in unrealized appreciation(depreciation) | (2,550,348 | ) | ||
Net realized and unrealized loss | (1,354,644 | ) | ||
Net increase in net assets resulting from operations | $ | 509,049 | ||
| * | Relates to Trustees not deemed “interested persons” within the meaning of Section 2(a)(19) of the 1940 Act. |
38 | THE GUGGENHEIM FUNDS SEMI-ANNUAL REPORT | SEE NOTES TO FINANCIAL STATEMENTS. |
SERIES E (TOTAL RETURN BOND SERIES) |
STATEMENTS OF CHANGES IN NET ASSETS |
Period Ended | Year Ended | |||||||
Increase (Decrease) in Net Assets from Operations: | ||||||||
Net investment income | $ | 1,863,693 | $ | 4,649,080 | ||||
Net realized gain on investments | 1,195,704 | 761,054 | ||||||
Net change in unrealized appreciation (depreciation) on investments | (2,550,348 | ) | 2,571,247 | |||||
Net increase in net assets resulting from operations | 509,049 | 7,981,381 | ||||||
Distributions to shareholders from: | ||||||||
Net investment income | — | (5,311,377 | ) | |||||
Total distributions to shareholders | — | (5,311,377 | ) | |||||
Capital share transactions: | ||||||||
Proceeds from sale of shares | 12,713,758 | 39,888,049 | ||||||
Distributions reinvested | — | 5,311,377 | ||||||
Cost of shares redeemed | (23,844,293 | ) | (31,412,776 | ) | ||||
Net increase (decrease) from capital share transactions | (11,130,535 | ) | 13,786,650 | |||||
Net increase (decrease) in net assets | (10,621,486 | ) | 16,456,654 | |||||
Net assets: | ||||||||
Beginning of period | 130,499,247 | 114,042,593 | ||||||
End of period | $ | 119,877,761 | $ | 130,499,247 | ||||
Undistributed net investment income at end of period | $ | 7,094,551 | $ | 5,230,858 | ||||
Capital share activity: | ||||||||
Shares sold | 777,992 | 2,439,034 | ||||||
Shares issued from reinvestment of distributions | — | 331,547 | ||||||
Shares redeemed | (1,461,887 | ) | (1,919,717 | ) | ||||
Net increase (decrease) in shares | (683,895 | ) | 850,864 | |||||
SEE NOTES TO FINANCIAL STATEMENTS. | THE GUGGENHEIM FUNDS SEMI-ANNUAL REPORT | 39 |
SERIES E (TOTAL RETURN BOND SERIES) |
FINANCIAL HIGHLIGHTS |
This table is presented to show selected data for a share outstanding throughout each period and to assist shareholders in evaluating a Fund’s performance for the periods presented.
Period Ended | Year Ended December 31, 2017 | Year Ended December 31, 2016 | Year Ended December 31, 2015 | Year Ended December 31, 2014 | Year Ended December 31, 2013 | |||||||||||||||||||
| Per Share Data | ||||||||||||||||||||||||
| Net asset value, beginning of period | $ | 16.40 | $ | 16.05 | $ | 15.68 | $ | 15.89 | $ | 14.70 | $ | 14.45 | ||||||||||||
| Income (loss) from investment operations: | ||||||||||||||||||||||||
Net investment income (loss)b | .25 | .61 | .66 | .67 | .58 | .54 | ||||||||||||||||||
| Net gain (loss) on investments (realized and unrealized) | (.17 | ) | .45 | .41 | (.50 | ) | .61 | (.29 | ) | |||||||||||||||
| Total from investment operations | .08 | 1.06 | 1.07 | .17 | 1.19 | .25 | ||||||||||||||||||
| Less distributions from: | ||||||||||||||||||||||||
| Net investment income | — | (.71 | ) | (.70 | ) | (.38 | ) | — | — | |||||||||||||||
| Total distributions | — | (.71 | ) | (.70 | ) | (.38 | ) | — | — | |||||||||||||||
| Net asset value, end of period | $ | 16.48 | $ | 16.40 | $ | 16.05 | $ | 15.68 | $ | 15.89 | $ | 14.70 | ||||||||||||
Total Returnc | 0.49 | % | 6.72 | % | 6.83 | % | 1.15 | % | 8.10 | % | 1.73 | % | ||||||||||||
| Ratios/Supplemental Data | ||||||||||||||||||||||||
| Net assets, end of period (in thousands) | $ | 119,878 | $ | 130,499 | $ | 114,043 | $ | 111,974 | $ | 127,650 | $ | 94,123 | ||||||||||||
| Ratios to average net assets: | ||||||||||||||||||||||||
| Net investment income (loss) | 3.05 | % | 3.76 | % | 4.13 | % | 4.19 | % | 3.72 | % | 3.69 | % | ||||||||||||
Total expensesd | 0.88 | % | 0.99 | % | 1.02 | % | 1.05 | % | 1.05 | % | 1.07 | % | ||||||||||||
Net expensese,f,g | 0.77 | % | 0.81 | % | 0.83 | % | 0.83 | % | 0.85 | % | 0.87 | % | ||||||||||||
| Portfolio turnover rate | 18 | % | 76 | % | 88 | % | 85 | % | 62 | % | 109 | % | ||||||||||||
| a | Unaudited figures for the period ended June 30, 2018. Percentage amounts for the period, except total return and portfolio turnover rate, have been annualized. |
| b | Net investment income (loss) per share was computed using average shares outstanding throughout the period. |
| c | Total return does not take into account any of the expenses associated with an investment in variable insurance products. If total return had taken into account these expenses, performance would have been lower. Shares of a series of Guggenheim Variable Funds Trust are available only through the purchase of such products. |
| d | Does not include expenses of the underlying funds in which the Fund invests. |
| e | Net expense information reflects the expense ratios after expense waivers and reimbursements, as applicable. |
| f | Net expenses may include expenses that are excluded from the expense limitation agreement and affiliated fee waivers. Excluding these expenses, the net expense ratios for the period would be: |
06/30/18 | 12/31/17 | 12/31/16 | 12/31/15 | 12/31/14 | 12/31/13 |
0.77% | 0.77% | 0.78% | 0.78% | 0.79% | 0.81% |
| g | The portion of the ratios of net expenses to average net assets attributable to recoupments of prior fee reductions or expense reimbursements for the periods presented would be: |
06/30/18 | 12/31/17 | 12/31/16 | 12/31/15 | 12/31/14 | 12/31/13 |
0.00%* | N/A | N/A | N/A | N/A | N/A |
| * | Less than 0.01%. |
40 | THE GUGGENHEIM FUNDS SEMI-ANNUAL REPORT | SEE NOTES TO FINANCIAL STATEMENTS. |
PERFORMANCE REPORT AND FUND PROFILE (Unaudited) | June 30, 2018 |
SERIES F (FLOATING RATE STRATEGIES SERIES)
OBJECTIVE: Seeks to provide a high level of current income while maximizing total return.
Holdings Diversification (Market Exposure as % of Net Assets)
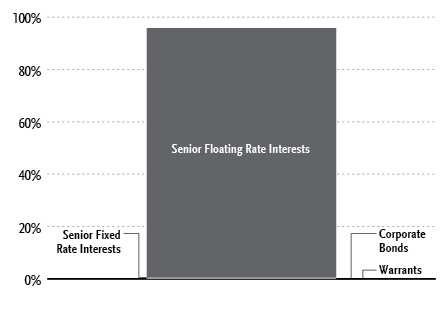
“Holdings Diversification (Market Exposure as % of Net Assets)” excludes any temporary cash investments.
Inception Date: April 24, 2013 |
Ten Largest Holdings (% of Total Net Assets) | |
Invictus MD Strategies Corp. 5.10% | 1.6% |
Safe Fleet Holdings LLC 4.99% | 1.3% |
Northstar Financial Services LLC 5.59% | 1.0% |
Realogy Group LLC 4.30% | 1.0% |
Blackhawk Network 5.07% | 1.0% |
Zodiac Pool Solutions LLC 2.25% | 1.0% |
Reece Ltd. 2.00% | 1.0% |
Berlin Packaging LLC 5.04% | 1.0% |
Unitymedia Finance LLC 4.07% | 1.0% |
WMG Acquisition Corp. 4.22% | 1.0% |
Top Ten Total | 10.9% |
“Ten Largest Holdings” excludes any temporary cash investments.
THE GUGGENHEIM FUNDS SEMI-ANNUAL REPORT 41 |
PERFORMANCE REPORT AND FUND PROFILE (Unaudited)(concluded) | June 30, 2018 |
Average Annual Returns*,†
Periods Ended June 30, 2018
6 month‡ | 1 Year | 5 Year | Since Inception (04/24/13) | |
Series F (Floating Rate Strategies Series) | 1.03% | 3.03% | 3.83% | 3.57% |
Credit Suisse Leveraged Loan Index | 2.39% | 4.68% | 4.24% | 4.06% |
Portfolio Composition by Quality Rating1 | |
Rating | % of Total Investments |
Fixed Income Instruments | |
BBB | 4.0% |
BB | 31.8% |
B | 53.9% |
CCC | 1.1% |
NR2 | 0.0%3 |
Other Instruments | 9.2% |
Total Investments | 100.0% |
| * | The performance data above represents past performance that is not predictive of future results. The investment return and principal value of an investment in the Fund will fluctuate so that an investor’s shares, when redeemed, may be worth more or less than their original cost. Returns are historical and include changes in principal and reinvested dividends and capital gains and do not reflect the effect of taxes. The Credit Suisse Leveraged Loan Index is an unmanaged index and, unlike the Fund, has no management fees or operating expenses to reduce its reported return. |
| † | Performance figures do not reflect fees and expenses associated with an investment in variable insurance products. If returns had taken into account these fees and expenses, performance would have been lower. Shares of a series of Guggenheim Variable Funds Trust are available only through the purchase of such products. |
| ‡ | 6 month returns are not annualized. |
| 1 | Source: BlackRock Solutions. Credit quality ratings are measured on a scale that generally ranges from AAA (highest) to D (lowest). All securities except for those labeled “NR” have been rated by Moody’s, Standard & Poors (“S&P”), or Fitch, which are all a Nationally Recognized Statistical Rating Organization (“NRSRO”). For purposes of this presentation, when ratings are available from more than one agency, the highest rating is used. Guggenheim Investments has converted ratings to the equivalent S&P rating. Security ratings are determined at the time of purchase and may change thereafter. |
| 2 | NR securities do not necessarily indicate low credit quality. |
| 3 | Value of securities is less than 0.1% of total investments. |
42 | THE GUGGENHEIM FUNDS SEMI-ANNUAL REPORT |
SCHEDULE OF INVESTMENTS (Unaudited) | June 30, 2018 |
SERIES F (FLOATING RATE STRATEGIES SERIES) |
| Value | |||||||
MONEY MARKET FUND† - 9.7% | ||||||||
Federated U.S. Treasury Cash Reserve Fund — Institutional Shares 1.70%2 | 6,765,703 | $ | 6,765,703 | |||||
Total Money Market Fund | ||||||||
(Cost $6,765,703) | 6,765,703 | |||||||
Face | ||||||||
SENIOR FLOATING RATE INTERESTS††,4 - 95.8% | ||||||||
Industrial - 21.2% | ||||||||
Zodiac Pool Solutions LLC | ||||||||
2.25% (3 Month USD LIBOR + 2.25%) due 03/07/25 | $ | 700,000 | 696,794 | |||||
8.00% (Commercial Prime Lending Rate + 3.00%) due 12/20/23 | 375,922 | 375,453 | ||||||
Reece Ltd. | ||||||||
2.00% (3 Month USD LIBOR + 2.00%) due 05/31/25 | 700,000 | 696,500 | ||||||
Berlin Packaging LLC | ||||||||
5.04% (1 Month USD LIBOR + 3.00%) due 11/07/25 | 700,000 | 695,275 | ||||||
Kuehg Corp. - Kindercare | ||||||||
6.08% (3 Month USD LIBOR + 3.75%) due 08/12/22 | 672,475 | 669,953 | ||||||
Southwire Co. | ||||||||
4.09% (1 Month USD LIBOR + 2.00%) due 05/19/25 | 650,000 | 648,915 | ||||||
Flex Acquisition Company, Inc. | ||||||||
5.31% (3 Month USD LIBOR + 3.00%) due 12/29/23 | 495,000 | 492,446 | ||||||
3.25% (3 Month USD LIBOR + 3.25%) due 06/21/25 | 150,000 | 149,562 | ||||||
TransDigm Group, Inc. | ||||||||
4.59% (1 Month USD LIBOR + 2.50%) due 05/31/25 | 624,096 | 618,735 | ||||||
Engineered Machinery Holdings, Inc. | ||||||||
5.58% (3 Month USD LIBOR + 3.25%) due 07/19/24 | 559,771 | 556,625 | ||||||
ProAmpac PG Borrower LLC | ||||||||
5.61% (1 Month USD LIBOR + 3.50% and 3 Month USD LIBOR + 3.50%) due 11/20/23 | 527,623 | 524,162 | ||||||
Charter Nex US, Inc. | ||||||||
5.09% (1 Month USD LIBOR + 3.00%) due 05/16/24 | 521,994 | 518,993 | ||||||
GYP Holdings III Corp. | ||||||||
4.84% (1 Month USD LIBOR + 2.75% and 2 Month USD LIBOR + 2.75%) due 06/01/25 | 509,831 | 505,585 | ||||||
Reynolds Group Holdings, Inc. | ||||||||
4.84% (1 Month USD LIBOR + 2.75%) due 02/05/23 | 491,269 | 489,765 | ||||||
Pregis Holding I Corp. | ||||||||
5.83% (3 Month USD LIBOR + 3.50%) due 05/20/21 | 488,701 | 485,955 | ||||||
Hillman Group, Inc. | ||||||||
5.83% (3 Month USD LIBOR + 3.50%) due 05/30/25 | 457,554 | 455,554 | ||||||
Vectra Co. | ||||||||
5.34% (1 Month USD LIBOR + 3.25%) due 03/08/25 | 450,000 | 446,998 | ||||||
BWAY Holding Co. | ||||||||
5.59% (3 Month USD LIBOR + 3.25%) due 04/03/24 | 446,625 | 443,905 | ||||||
CHI Overhead Doors, Inc. | ||||||||
5.34% (1 Month USD LIBOR + 3.25%) due 07/29/22 | 439,237 | 440,151 | ||||||
Engility Corp. | ||||||||
4.84% (1 Month USD LIBOR + 2.75% and 3 Month USD LIBOR + 5.00%) due 08/14/23 | 392,858 | 391,813 | ||||||
Filtration Group Corp. | ||||||||
5.09% (3 Month USD LIBOR + 3.00%) due 03/29/25 | 350,000 | 349,650 | ||||||
CPG International LLC | ||||||||
6.25% (6 Month USD LIBOR + 3.75%) due 05/05/24 | 349,116 | 348,533 | ||||||
Thermasys Corp. | ||||||||
6.34% (3 Month USD LIBOR + 4.00%) due 05/03/19 | 352,500 | 341,044 | ||||||
WP CPP Holdings LLC | ||||||||
6.28% (3 Month USD LIBOR + 3.75%) due 04/30/25 | 300,000 | 301,050 | ||||||
DAE Aviation | ||||||||
5.84% (1 Month USD LIBOR + 3.75%) due 07/07/22 | 297,704 | 297,829 | ||||||
Springs Window Fashions | ||||||||
6.32% (3 Month USD LIBOR + 4.25%) due 06/15/25 | 200,000 | 200,750 | ||||||
10.57% (3 Month USD LIBOR + 8.50%) due 06/15/26 | 100,000 | 96,000 | ||||||
VC GB Holdings, Inc. | ||||||||
5.09% (1 Month USD LIBOR + 3.00%) due 02/28/24 | 271,671 | 270,992 | ||||||
American Bath Group LLC | ||||||||
6.58% (3 Month USD LIBOR + 4.25%) due 09/30/23 | 268,856 | 269,865 | ||||||
Hayward Industries, Inc. | ||||||||
5.59% (1 Month USD LIBOR + 3.50%) due 08/05/24 | 262,883 | 263,049 | ||||||
Travelport Finance | ||||||||
4.83% (3 Month USD LIBOR + 2.50%) due 03/17/25 | 250,000 | 248,875 | ||||||
SEE NOTES TO FINANCIAL STATEMENTS. | THE GUGGENHEIM FUNDS SEMI-ANNUAL REPORT | 43 |
SCHEDULE OF INVESTMENTS (Unaudited)(continued) | June 30, 2018 |
SERIES F (FLOATING RATE STRATEGIES SERIES) |
Face | Value | |||||||
RBS Global, Inc. | ||||||||
4.34% (1 Month USD LIBOR + 2.25%) due 08/21/24 | $ | 249,008 | $ | 248,542 | ||||
Beacon Roofing Supply, Inc. | ||||||||
4.28% (1 Month USD LIBOR + 2.25%) due 01/02/25 | 250,000 | 248,230 | ||||||
Wrangler Buyer Corp. | ||||||||
4.84% (1 Month USD LIBOR + 2.75%) due 09/28/24 | 199,499 | 198,900 | ||||||
Titan Acquisition Ltd. (Husky) | ||||||||
5.09% (1 Month USD LIBOR + 3.00%) due 03/28/25 | 199,500 | 196,234 | ||||||
Arctic Long Carriers | ||||||||
6.59% (1 Month USD LIBOR + 4.50%) due 05/18/23 | 173,250 | 173,467 | ||||||
Bioplan USA, Inc. | ||||||||
6.84% (1 Month USD LIBOR + 4.75%) due 09/23/21 | 175,437 | 163,156 | ||||||
Argo Merchants | ||||||||
6.08% (3 Month USD LIBOR + 3.75%) due 12/06/24 | 124,392 | 124,548 | ||||||
Nielsen Finance LLC | ||||||||
4.05% (1 Month USD LIBOR + 2.00%) due 10/04/23 | 98,505 | 98,359 | ||||||
2.00% (3 Month USD LIBOR + 2.00%) due 10/04/23 | 10,000 | 9,985 | ||||||
Total Industrial | 14,752,197 | |||||||
Consumer, Non-cyclical - 17.4% | ||||||||
Nomad Foods Lux S.A.R.L | ||||||||
4.32% (1 Month USD LIBOR + 2.25%) due 05/15/24 | 544,500 | 541,777 | ||||||
5.31% (3 Month USD LIBOR + 3.25%) due 05/15/24 | 155,500 | 154,723 | ||||||
BRP, Inc. | ||||||||
4.09% (1 Month USD LIBOR + 2.00%) due 05/23/25 | 700,000 | 693,525 | ||||||
Examworks Group, Inc. | ||||||||
5.34% (1 Month USD LIBOR + 3.25%) due 07/27/23 | 648,375 | 648,103 | ||||||
CHG Healthcare Services, Inc. | ||||||||
5.36% (3 Month USD LIBOR + 3.00%) due 06/07/23 | 632,840 | 633,036 | ||||||
JBS USA Lux SA | ||||||||
4.83% (3 Month USD LIBOR + 2.50%) due 10/30/22 | 598,485 | 593,398 | ||||||
Sterigenics-Norion Holdings | ||||||||
5.33% (3 Month USD LIBOR + 3.00%) due 05/15/22 | 555,779 | 553,695 | ||||||
Aspen Dental | ||||||||
5.34% (1 Month USD LIBOR + 3.25%) due 04/30/25 | 550,000 | 548,284 | ||||||
CHG PPC Parent LLC | ||||||||
4.84% (1 Month USD LIBOR + 2.75%) due 03/31/25 | 550,000 | 547,250 | ||||||
Endo Luxembourg Finance Co. | ||||||||
6.38% (1 Month USD LIBOR + 4.25%) due 04/29/24 | 547,365 | 545,997 | ||||||
Hearthside Group Holdings LLC | ||||||||
5.09% (1 Month USD LIBOR + 3.00%) due 05/23/25 | 550,000 | 544,280 | ||||||
Post Holdings, Inc. | ||||||||
4.10% (1 Month USD LIBOR + 2.00%) due 05/24/24 | 495,000 | 491,664 | ||||||
Albertson’s LLC | ||||||||
5.34% (3 Month USD LIBOR + 3.00%) due 12/21/22 | 493,762 | 488,919 | ||||||
DJO Finance LLC | ||||||||
5.45% (1 Month USD LIBOR + 3.25% and 3 Month USD LIBOR + 3.25%) due 06/08/20 | 486,250 | 483,517 | ||||||
Equian LLC | ||||||||
5.33% (1 Month USD LIBOR + 3.25%) due 05/20/24 | 446,246 | 444,385 | ||||||
PPDI (Pharmaceutical Product Development, Inc.) | ||||||||
4.59% (1 Month USD LIBOR + 2.50%) due 08/18/22 | 442,025 | 439,431 | ||||||
NVA Holdings, Inc | ||||||||
4.84% (1 Month USD LIBOR + 2.75%) due 02/03/25 | 399,000 | 397,504 | ||||||
CPI Holdco LLC | ||||||||
5.59% (1 Month USD LIBOR + 3.50%) due 03/21/24 | 395,001 | 396,483 | ||||||
Lineage Logistics LLC | ||||||||
5.09% (1 Month USD LIBOR + 3.00%) due 02/27/25 | 399,000 | 396,007 | ||||||
Reddy Ice Holdings, Inc. | ||||||||
7.88% (3 Month USD LIBOR + 5.50% and Commercial Prime Lending Rate + 4.50%) due 05/01/19 | 380,952 | 378,286 | ||||||
American Tire Distributors, Inc. | ||||||||
6.34% (1 Month USD LIBOR + 4.25%) due 09/01/21 | 483,530 | 312,631 | ||||||
Smart & Final Stores LLC | ||||||||
5.59% (1 Month USD LIBOR + 3.50%) due 11/15/22 | 317,900 | 309,952 | ||||||
IQVIA Holdings, Inc. | ||||||||
4.08% (3 Month USD LIBOR + 1.75%) due 06/07/25 | 300,000 | 297,000 | ||||||
Diamond (BC) B.V. | ||||||||
5.10% (2 Month USD LIBOR + 3.00%) due 09/06/24 | 297,750 | 291,795 | ||||||
Sigma Holding BV (Flora Food) | ||||||||
3.00% (3 Month USD LIBOR + 3.00%) due 03/07/25 | 250,000 | 247,345 | ||||||
BCPE Eagle Buyer LLC | ||||||||
6.34% (1 Month USD LIBOR + 4.25%) due 03/18/24 | 198,492 | 187,575 | ||||||
44 | THE GUGGENHEIM FUNDS SEMI-ANNUAL REPORT | SEE NOTES TO FINANCIAL STATEMENTS. |
SCHEDULE OF INVESTMENTS (Unaudited)(continued) | June 30, 2018 |
SERIES F (FLOATING RATE STRATEGIES SERIES) |
Face | Value | |||||||
Authentic Brands | ||||||||
5.59% (1 Month USD LIBOR + 3.50%) due 09/27/24 | $ | 173,688 | $ | 172,963 | ||||
Immucor, Inc. | ||||||||
7.09% (1 Month USD LIBOR + 5.00%) due 06/15/21 | 148,500 | 150,047 | ||||||
Acadia Healthcare Co., Inc. | ||||||||
4.59% (1 Month USD LIBOR + 2.50%) due 02/16/23 | 95,172 | 95,309 | ||||||
CTI Foods Holding Co. LLC | ||||||||
9.35% (1 Month USD LIBOR + 7.25%) due 06/28/21 | 80,000 | 59,500 | ||||||
Valeant Pharmaceuticals International, Inc. | ||||||||
4.98% (1 Month USD LIBOR + 3.00%) due 06/01/25 | 47,812 | 47,618 | ||||||
Total Consumer, Non-cyclical | 12,091,999 | |||||||
Technology - 15.7% | ||||||||
Blackhawk Network | ||||||||
5.07% (3 Month USD LIBOR + 3.00%) due 06/15/25 | 700,000 | 697,375 | ||||||
Micron Technology, Inc. | ||||||||
3.85% (1 Month USD LIBOR + 1.75%) due 04/26/22 | 392,982 | 393,572 | ||||||
4.10% (1 Month USD LIBOR + 2.00%) due 05/29/25 | 300,000 | 299,376 | ||||||
SS&C Technologies, Inc. | ||||||||
4.59% (1 Month USD LIBOR + 2.50%) due 04/16/25 | 669,235 | 668,860 | ||||||
Flexera Software LLC | ||||||||
5.35% (1 Month USD LIBOR + 3.25%) due 02/26/25 | �� | 548,625 | 546,398 | |||||
Press Ganey Holdings, Inc. | ||||||||
4.84% (1 Month USD LIBOR + 2.75%) due 10/23/23 | 542,373 | 541,017 | ||||||
Informatica LLC | ||||||||
5.34% (1 Month USD LIBOR + 3.25%) due 08/05/22 | 497,493 | 497,762 | ||||||
Sabre GLBL, Inc. | ||||||||
4.09% (1 Month USD LIBOR + 2.00%) due 02/22/24 | 497,500 | 496,177 | ||||||
TIBCO Software, Inc. | ||||||||
5.60% (1 Month USD LIBOR + 3.50%) due 12/04/20 | 493,734 | 493,270 | ||||||
Peak 10 Holding Corp. | ||||||||
5.83% (3 Month USD LIBOR + 3.50%) due 08/01/24 | 496,250 | 489,893 | ||||||
Misys Ltd. | ||||||||
5.81% (3 Month USD LIBOR + 3.50%) due 06/13/24 | 496,250 | 487,015 | ||||||
Ipreo Holdings | ||||||||
5.09% (1 Month USD LIBOR + 3.00%) due 08/06/21 | 483,813 | 483,208 | ||||||
Solera LLC | ||||||||
4.84% (1 Month USD LIBOR + 2.75%) due 03/03/23 | 479,640 | 476,522 | ||||||
AVSC Holding Corp. | ||||||||
5.24% (1 Month USD LIBOR + 3.25%) due 03/03/25 | 468,825 | 463,354 | ||||||
Kronos, Inc. | ||||||||
5.36% (3 Month USD LIBOR + 3.00%) due 11/01/23 | 444,395 | 443,204 | ||||||
LANDesk Group, Inc. | ||||||||
6.35% (1 Month USD LIBOR + 4.25%) due 01/20/24 | 424,920 | 420,407 | ||||||
Optiv, Inc. | ||||||||
5.31% (1 Month USD LIBOR + 3.25%) due 02/01/24 | 415,461 | 402,997 | ||||||
Advanced Computer Software | ||||||||
6.78% (1 Month USD LIBOR + 4.75%) due 05/31/24 | 400,000 | 401,000 | ||||||
Go Daddy Operating Company LLC | ||||||||
4.34% (1 Month USD LIBOR + 2.25%) due 02/15/24 | 296,678 | 294,930 | ||||||
Aspect Software, Inc. | ||||||||
12.59% (1 Month USD LIBOR + 10.50%) due 05/25/203 | 315,034 | 292,194 | ||||||
Seattle Spnco | ||||||||
4.84% (1 Month USD LIBOR + 2.75%) due 06/21/24 | 260,653 | 259,188 | ||||||
Internet Brands, Inc. | ||||||||
5.84% (1 Month USD LIBOR + 3.75%) due 09/13/24 | 253,722 | 253,476 | ||||||
Greenway Health LLC | ||||||||
6.08% (3 Month USD LIBOR + 3.75%) due 02/16/24 | 199,496 | 199,123 | ||||||
EIG Investors Corp. | ||||||||
6.07% (3 Month USD LIBOR + 3.75%) due 02/09/23 | 172,274 | 171,916 | ||||||
Cypress Intermediate Holdings III, Inc. | ||||||||
5.10% (1 Month USD LIBOR + 3.00%) due 04/29/24 | 168,076 | 167,536 | ||||||
Ascend Learning LLC | ||||||||
5.09% (1 Month USD LIBOR + 3.00%) due 07/12/24 | 148,875 | 148,317 | ||||||
Project Accelerate Parent, LLC | ||||||||
6.25% (1 Month USD LIBOR + 4.25%) due 01/02/25 | 124,688 | 124,606 | ||||||
Cvent, Inc. | ||||||||
5.84% (1 Month USD LIBOR + 3.75%) due 11/29/24 | 99,750 | 99,501 | ||||||
MA Financeco LLC | ||||||||
4.59% (1 Month USD LIBOR + 2.50%) due 11/19/21 | 99,750 | 99,251 | ||||||
Infor (US), Inc. | ||||||||
4.84% (1 Month USD LIBOR + 2.75%) due 02/01/22 | 69,899 | 69,497 | ||||||
Miami Escrow Borrower LLC | ||||||||
4.84% (1 Month USD LIBOR + 2.75%) due 06/21/24 | 38,597 | 38,380 | ||||||
SEE NOTES TO FINANCIAL STATEMENTS. | THE GUGGENHEIM FUNDS SEMI-ANNUAL REPORT | 45 |
SCHEDULE OF INVESTMENTS (Unaudited)(continued) | June 30, 2018 |
SERIES F (FLOATING RATE STRATEGIES SERIES) |
Face | Value | |||||||
CPI Acquisition, Inc. | ||||||||
6.36% (3 Month USD LIBOR + 4.50%) due 08/17/22 | $ | 41,839 | $ | 24,476 | ||||
Total Technology | 10,943,798 | |||||||
Consumer, Cyclical - 15.4% | ||||||||
Safe Fleet Holdings LLC | ||||||||
4.99% (1 Month USD LIBOR + 3.00%) due 02/03/25 | 900,000 | 890,442 | ||||||
Realogy Group LLC | ||||||||
4.30% (1 Month USD LIBOR + 2.25%) due 02/08/25 | 700,000 | 697,816 | ||||||
Packers Sanitation Services, Inc. | ||||||||
5.27% (1 Month USD LIBOR + 3.25%) due 12/04/24 | 597,249 | 593,021 | ||||||
AlixPartners, LLP | ||||||||
4.84% (1 Month USD LIBOR + 2.75%) due 04/04/24 | 593,198 | 592,160 | ||||||
Learning Care Group (US), Inc. | ||||||||
5.49% (1 Month USD LIBOR + 3.25% and 3 Month USD LIBOR + 3.25%) due 03/13/25 | 550,000 | 546,563 | ||||||
USIC Holding, Inc. | ||||||||
5.34% (3 Month USD LIBOR + 3.50%) due 12/08/23 | 498,762 | 497,305 | ||||||
Crown Finance US, Inc. | ||||||||
4.59% (1 Month USD LIBOR + 2.50%) due 02/28/25 | 498,750 | 494,655 | ||||||
Greektown Holdings LLC | ||||||||
5.09% (1 Month USD LIBOR + 3.00%) due 04/25/24 | 495,000 | 492,733 | ||||||
Equinox Holdings, Inc. | ||||||||
5.09% (1 Month USD LIBOR + 3.00%) due 03/08/24 | 493,769 | 492,658 | ||||||
Gates Global LLC | ||||||||
5.08% (3 Month USD LIBOR + 2.75%) due 04/01/24 | 467,933 | 467,180 | ||||||
DG Investment Intermediate Holdings 2, Inc. | ||||||||
5.09% (1 Month USD LIBOR + 3.00%) due 02/03/25 | 464,194 | 460,712 | ||||||
Navistar Inc. | ||||||||
5.53% (1 Month USD LIBOR + 3.50%) due 11/06/24 | 448,875 | 448,597 | ||||||
Mavis Tire Express Services Corp. | ||||||||
5.33% (1 Month USD LIBOR + 3.25%) due 03/20/25 | 391,316 | 387,403 | ||||||
Burlington Stores, Inc. | ||||||||
4.60% (1 Month USD LIBOR + 2.50%) due 11/17/24 | 344,285 | 344,715 | ||||||
Eldorado Resorts, Inc. | ||||||||
4.38% (2 Month USD LIBOR + 2.25%) due 04/17/24 | 329,914 | 328,472 | ||||||
National Vision, Inc. | ||||||||
4.84% (1 Month USD LIBOR + 2.75%) due 11/20/24 | 307,065 | 306,297 | ||||||
Amaya Holdings B.V. | ||||||||
3.50% (3 Month USD LIBOR + 3.50%) due 07/29/25 | 300,000 | 299,250 | ||||||
EG Finco Ltd. | ||||||||
6.33% (3 Month USD LIBOR + 4.00%) due 02/07/25 | 299,250 | 296,407 | ||||||
Petco Animal Supplies, Inc. | ||||||||
5.61% (3 Month USD LIBOR + 3.25%) due 01/26/23 | 354,467 | 255,216 | ||||||
Talbots, Inc. | ||||||||
6.59% (1 Month USD LIBOR + 4.50%) due 03/19/20 | 219,114 | 215,417 | ||||||
Truck Hero, Inc. | ||||||||
5.84% (1 Month USD LIBOR + 3.75%) due 04/22/24 | 200,000 | 199,666 | ||||||
Samsonite IP Holdings S.A.R.L. | ||||||||
3.84% (1 Month USD LIBOR + 1.75%) due 04/25/25 | 200,000 | 197,416 | ||||||
1-800 Contacts | ||||||||
5.35% (1 Month USD LIBOR + 3.25%) due 01/22/23 | 195,523 | 190,635 | ||||||
Wyndham Hotels & Resorts, Inc. | ||||||||
3.73% (3 Month USD LIBOR + 1.75%) due 05/30/25 | 150,000 | 149,625 | ||||||
Amaya Holdings B.V. | ||||||||
5.09% (1 Month USD LIBOR + 3.00%) due 04/06/25 | 149,625 | 149,326 | ||||||
GVC Holdings plc | ||||||||
4.60% (1 Month USD LIBOR + 2.50%) due 03/29/24 | 149,625 | 149,158 | ||||||
Life Time Fitness, Inc. | ||||||||
5.06% (3 Month USD LIBOR + 2.75%) due 06/10/22 | 139,648 | 138,845 | ||||||
Sears Roebuck Acceptance Corp. | ||||||||
6.51% (1 Month USD LIBOR + 4.50%) due 01/18/19 | 139,053 | 138,242 | ||||||
Leslie’s Poolmart, Inc. | ||||||||
5.59% (1 Month USD LIBOR + 3.50%) due 08/16/23 | 129,350 | 129,091 | ||||||
Penn Engineering & Manufacturing Corp. | ||||||||
4.84% (1 Month USD LIBOR + 2.75%) due 06/27/24 | 99,250 | 99,126 | ||||||
Belk, Inc. | ||||||||
7.09% (3 Month USD LIBOR + 4.75%) due 12/12/22 | 98,696 | 76,119 | ||||||
Total Consumer, Cyclical | 10,724,268 | |||||||
Communications - 11.9% | ||||||||
Unitymedia Finance LLC | ||||||||
4.07% (1 Month USD LIBOR + 2.00%) due 06/01/23 | 700,000 | 694,603 | ||||||
WMG Acquisition Corp. | ||||||||
4.22% (1 Month USD LIBOR + 2.13%) due 11/01/23 | 700,000 | 694,085 | ||||||
46 | THE GUGGENHEIM FUNDS SEMI-ANNUAL REPORT | SEE NOTES TO FINANCIAL STATEMENTS. |
SCHEDULE OF INVESTMENTS (Unaudited)(continued) | June 30, 2018 |
SERIES F (FLOATING RATE STRATEGIES SERIES) |
Face | Value | |||||||
Telenet Financing USD LLC | ||||||||
4.32% (1 Month USD LIBOR + 2.25%) due 08/15/26 | $ | 700,000 | $ | 692,706 | ||||
NAI Entertainment Holdings LLC | ||||||||
4.60% (1 Month USD LIBOR + 2.50%) due 05/08/25 | 650,000 | 645,938 | ||||||
GTT Communications, Inc. | ||||||||
4.88% (3 Month USD LIBOR + 2.75%) due 05/31/25 | 650,000 | 639,763 | ||||||
Neustar, Inc. | ||||||||
5.59% (1 Month USD LIBOR + 3.50%) due 08/08/24 | 548,618 | 548,618 | ||||||
CSC Holdings, LLC | ||||||||
4.32% (1 Month USD LIBOR + 2.25%) due 07/17/25 | 522,844 | 518,922 | ||||||
Altice US Finance I Corp. | ||||||||
4.34% (1 Month USD LIBOR + 2.25%) due 07/28/25 | 495,000 | 490,981 | ||||||
SFR Group S.A. | ||||||||
5.35% (3 Month USD LIBOR + 3.00%) due 01/31/26 | 493,769 | 484,777 | ||||||
Cengage Learning Acquisitions, Inc. | ||||||||
6.34% (1 Month USD LIBOR + 4.25%) due 06/07/23 | 525,869 | 481,827 | ||||||
Mcgraw-Hill Global Education Holdings LLC | ||||||||
6.09% (1 Month USD LIBOR + 4.00%) due 05/04/22 | 492,183 | 480,700 | ||||||
Ziggo Secured Finance BV | ||||||||
4.57% (1 Month USD LIBOR + 2.50%) due 04/15/25 | 450,000 | 444,658 | ||||||
Radiate HoldCo LLC | ||||||||
5.09% (1 Month USD LIBOR + 3.00%) due 02/01/24 | 324,980 | 320,053 | ||||||
Sprint Communications, Inc. | ||||||||
4.63% (1 Month USD LIBOR + 2.50%) due 02/02/24 | 296,250 | 294,644 | ||||||
Univision Communications, Inc. | ||||||||
4.84% (1 Month USD LIBOR + 2.75%) due 03/15/24 | 257,912 | 248,993 | ||||||
Virgin Media Bristol LLC | ||||||||
4.57% (1 Month USD LIBOR + 2.50%) due 01/15/26 | 250,000 | 247,970 | ||||||
Charter Communications Operating, LLC | ||||||||
4.10% (1 Month USD LIBOR + 2.00%) due 04/30/25 | 199,000 | 198,564 | ||||||
Market Track LLC | ||||||||
6.58% (3 Month USD LIBOR + 4.25% and Commercial Prime Lending Rate + 3.25%) due 06/05/24 | 198,500 | 197,508 | ||||||
Total Communications | 8,325,310 | |||||||
Financial - 6.7% | ||||||||
Northstar Financial Services LLC | ||||||||
5.59% (1 Month USD LIBOR + 3.50%) due 05/25/25 | 700,000 | 698,831 | ||||||
National Financial Partners Corp. | ||||||||
5.09% (1 Month USD LIBOR + 3.00%) due 01/08/24 | 601,394 | 596,884 | ||||||
LPL Holdings, Inc. | ||||||||
4.49% (1 Month USD LIBOR + 2.25% and 3 Month USD LIBOR + 2.25%) due 09/23/24 | 496,256 | 493,155 | ||||||
Geo Group, Inc. | ||||||||
4.10% (1 Month USD LIBOR + 2.00%) due 03/22/24 | 493,750 | 491,074 | ||||||
York Risk Services | ||||||||
5.84% (1 Month USD LIBOR + 3.75%) due 10/01/21 | 482,456 | 467,119 | ||||||
Capital Automotive L.P. | ||||||||
4.60% (1 Month USD LIBOR + 2.50%) due 03/25/24 | 365,209 | 362,926 | ||||||
USI, Inc. | ||||||||
5.33% (3 Month USD LIBOR + 3.00%) due 05/16/24 | 358,700 | 356,279 | ||||||
American Stock Transfer & Trust | ||||||||
8.50% (3 Month USD LIBOR + 4.50%) due 06/26/20 | 279,506 | 279,855 | ||||||
iStar, Inc. | ||||||||
2.75% (3 Month USD LIBOR + 2.75%) due 06/19/23 | 250,000 | 249,062 | ||||||
HUB International Ltd. | ||||||||
5.36% (2 Month USD LIBOR + 3.00%) due 04/25/25 | 250,000 | 248,320 | ||||||
HarbourVest Partners LP | ||||||||
4.34% (1 Month USD LIBOR + 2.25%) due 03/03/25 | 207,321 | 206,388 | ||||||
Corporate Capital Trust | ||||||||
5.38% (1 Month USD LIBOR + 3.25%) due 05/20/19 | 191,500 | 191,500 | ||||||
Total Financial | 4,641,393 | |||||||
Basic Materials - 6.0% | ||||||||
Invictus MD Strategies Corp. | ||||||||
5.10% (2 Month USD LIBOR + 3.00%) due 03/28/25 | 1,097,250 | 1,095,879 | ||||||
HB Fuller Co. | ||||||||
4.08% (1 Month USD LIBOR + 2.00%) due 10/20/24 | 694,012 | 688,154 | ||||||
Alpha 3 B.V. | ||||||||
5.33% (3 Month USD LIBOR + 3.00%) due 01/31/24 | 606,250 | 602,716 | ||||||
GrafTech Finance, Inc. | ||||||||
5.50% (1 Month USD LIBOR + 3.50%) due 02/12/25 | 580,000 | 576,015 | ||||||
PQ Corp. | ||||||||
4.59% (1 Month USD LIBOR + 2.50%) due 02/08/25 | 443,261 | 441,045 | ||||||
Nexeo Solutions LLC | ||||||||
5.58% (3 Month USD LIBOR + 3.25%) due 06/09/23 | 367,549 | 367,395 | ||||||
SEE NOTES TO FINANCIAL STATEMENTS. | THE GUGGENHEIM FUNDS SEMI-ANNUAL REPORT | 47 |
SCHEDULE OF INVESTMENTS (Unaudited)(continued) | June 30, 2018 |
SERIES F (FLOATING RATE STRATEGIES SERIES) |
Face | Value | |||||||
PMHC II, Inc. (Prince) | ||||||||
5.90% (3 Month USD LIBOR + 3.50%) due 03/29/25 | $ | 199,500 | $ | 199,334 | ||||
WR Grace & Co. | ||||||||
4.08% (3 Month USD LIBOR + 1.75%) due 04/03/25 | 200,000 | 199,208 | ||||||
Total Basic Materials | 4,169,746 | |||||||
Energy - 1.2% | ||||||||
Houston Fuel Oil Terminal Company | ||||||||
2.75% (3 Month USD LIBOR + 2.75%) due 06/19/25 | 450,000 | 448,313 | ||||||
Ultra Petroleum, Inc. | ||||||||
5.09% (1 Month USD LIBOR + 3.00%) due 04/12/24 | 400,000 | 367,752 | ||||||
Total Energy | 816,065 | |||||||
Utilities - 0.3% | ||||||||
Stonewall | ||||||||
7.83% (3 Month USD LIBOR + 5.50%) due 11/13/21 | 218,151 | 216,515 | ||||||
Total Senior Floating Rate Interests | ||||||||
(Cost $67,469,980) | 66,681,291 | |||||||
CORPORATE BONDS††† - 0.0% | ||||||||
Basic Materials - 0.0% | ||||||||
New Day Aluminum | ||||||||
10.00% due 10/28/201 | 2,750 | 2,750 | ||||||
Total Corporate Bonds | ||||||||
(Cost $229) | 2,750 | |||||||
Total Investments - 105.5% | ||||||||
(Cost $74,235,912) | $ | 73,449,744 | ||||||
Other Assets & Liabilities, net - (5.5)% | (3,809,055 | ) | ||||||
Total Net Assets - 100.0% | $ | 69,640,689 | ||||||
| * | Non-income producing security. |
| † | Value determined based on Level 1 inputs — See Note 4. |
| †† | Value determined based on Level 2 inputs — See Note 4. |
| ††† | Value determined based on Level 3 inputs — See Note 4. |
| 1 | Security was fair valued by the Valuation Committee at June 30, 2018. The total market value of fair valued securities amounts to $2,750, (cost $229) or less than 0.1% of total net assets. |
| 2 | Rate indicated is the 7 day yield as of June 30, 2018. |
| 3 | Affiliated issuer. |
| 4 | Variable rate security. Rate indicated is rate effective at June 30, 2018. In some instances, the underlying reference rate shown was below the minimum rate earned by the security or has been adjusted by a predetermined factor. The settlement status of a position may also impact the effective rate indicated. In instances where multiple underlying reference rates and spread amounts are shown, the effective rate is based on a weighted average. |
plc — Public Limited Company
LIBOR— London Interbank Offered Rate
USD — United States Dollar
See Sector Classification in Other Information section.
48 | THE GUGGENHEIM FUNDS SEMI-ANNUAL REPORT | SEE NOTES TO FINANCIAL STATEMENTS. |
SCHEDULE OF INVESTMENTS (Unaudited)(concluded) | June 30, 2018 |
SERIES F (FLOATING RATE STRATEGIES SERIES) |
The following table summarizes the inputs used to value the Fund’s investments at June 30, 2018 (See Note 4 in the Notes to Financial Statements):
Investments in Securities (Assets) | Level 1 | Level 2 | Level 3 | Total | ||||||||||||
Money Market Fund | $ | 6,765,703 | $ | — | $ | — | $ | 6,765,703 | ||||||||
Senior Floating Rate Interests | — | 66,681,291 | — | 66,681,291 | ||||||||||||
Corporate Bonds | — | — | 2,750 | 2,750 | ||||||||||||
Total Assets | $ | 6,765,703 | $ | 66,681,291 | $ | 2,750 | $ | 73,449,744 | ||||||||
| ||||||||||||||||
Investments in Securities (Liabilities) | Level 1 | Level 2 | Level 3 | Total | ||||||||||||
Unfunded Loan Commitments (Note 8) | $ | — | $ | 847 | $ | —* | $ | 847 | ||||||||
| * | Security has a market value of $0. |
Transfers between investment levels may occur as the markets fluctuate and/or the availability of data used in an investment’s valuation changes. Transfers between valuation levels, if any, are in comparison to the valuation levels at the end of the previous fiscal year, and are effective using the fair value as of the end of the current fiscal period.
For the period ended June 30, 2018, there were no transfers between levels.
Affiliated Transactions
Investments representing 5% or more of the outstanding voting shares of a portfolio company of a fund, or control of or by, or common control under Guggenheim Investments ("GI"), result in that portfolio company being considered an affiliated company of such fund, as defined in the 1940 Act.
Transactions during the period ended June 30, 2018, in which the portfolio company is an “affiliated person”, were as follows:
Security Name | Value | Additions | Reductions | Realized | Change in | Value | Shares | Investment | ||||||||||||||||||||||||
Senior Floating Rate Interests | ||||||||||||||||||||||||||||||||
Aspect Software, Inc. 12.59% (1 Month USD LIBOR + 10.50%) due 05/25/201 | $ | 314,391 | $ | — | $ | (4,145 | ) | $ | — | $ | (18,052 | ) | $ | 292,194 | 315,034 | $ | 19,676 | |||||||||||||||
| 1 | Variable rate security. Rate indicated is rate effective at June 30, 2018. In some instances, the underlying reference rate shown was below the minimum rate earned by the security or has been adjusted by a predetermined factor. The settlement status of a position may also impact the effective rate indicated. In instances where multiple underlying reference rates and spread amounts are shown, the effective rate is based on a weighted average. |
SEE NOTES TO FINANCIAL STATEMENTS. | THE GUGGENHEIM FUNDS SEMI-ANNUAL REPORT | 49 |
SERIES F (FLOATING RATE STRATEGIES SERIES) |
STATEMENT OF ASSETS AND LIABILITIES (Unaudited) | ||||
June 30, 2018 | ||||
Assets: | ||||
Investments in unaffiliated issuers, at value (cost $73,920,878) | $ | 73,157,550 | ||
Investments in affiliated issuers, at value (cost $315,034) | 292,194 | |||
Cash | 172,913 | |||
Prepaid expenses | 1,649 | |||
Receivables: | ||||
Securities sold | 1,486,940 | |||
Interest | 175,793 | |||
Fund shares sold | 114,837 | |||
Total assets | 75,401,876 | |||
Liabilities: | ||||
Unfunded loan commitments, at value (Note 8) (proceeds $293) | 847 | |||
Payable for: | ||||
Securities purchased | 5,373,952 | |||
Fund shares redeemed | 313,298 | |||
Management fees | 31,012 | |||
Distribution and service fees | 14,474 | |||
Fund accounting/administration fees | 4,631 | |||
Transfer agent/maintenance fees | 2,098 | |||
Recoupment of previously waived expenses | 343 | |||
Trustees’ fees* | 178 | |||
Miscellaneous | 20,354 | |||
Total liabilities | 5,761,187 | |||
Commitments and contingent liabilities (Note 13) | — | |||
Net assets | $ | 69,640,689 | ||
Net assets consist of: | ||||
Paid in capital | $ | 67,803,037 | ||
Undistributed net investment income | 3,186,076 | |||
Accumulated net realized loss on investments | (561,702 | ) | ||
Net unrealized depreciation on investments | (786,722 | ) | ||
Net assets | $ | 69,640,689 | ||
Capital shares outstanding | 2,624,974 | |||
Net asset value per share | $ | 26.53 | ||
STATEMENT OF OPERATIONS (Unaudited) | ||||
Period Ended June 30, 2018 | ||||
Investment Income: | ||||
Interest from securities of affiliated issuers | $ | 19,676 | ||
Interest from securities of unaffiliated issuers | 1,411,808 | |||
Total investment income | 1,431,484 | |||
Expenses: | ||||
Management fees | 195,813 | |||
Distribution and service fees | 75,312 | |||
Recoupment of previously waived fees | 1,430 | |||
Transfer agent/maintenance fees | 12,461 | |||
Fund accounting/administration fees | 24,100 | |||
Professional fees | 20,603 | |||
Custodian fees | 12,350 | |||
Trustees’ fees* | 4,624 | |||
Line of credit fees | 438 | |||
Miscellaneous | 27,822 | |||
Total expenses | 374,953 | |||
Less: | ||||
Expenses waived by Adviser | (26,615 | ) | ||
Net expenses | 348,338 | |||
Net investment income | 1,083,146 | |||
Net Realized and Unrealized Gain (Loss): | ||||
Net realized gain (loss) on: | ||||
Investments in unaffiliated issuers | (89,829 | ) | ||
Net realized loss | (89,829 | ) | ||
Net change in unrealized appreciation (depreciation) on: | ||||
Investments in unaffiliated issuers | (451,355 | ) | ||
Investments in affiliated issuers | (18,052 | ) | ||
Net change in unrealized appreciation (depreciation) | (469,407 | ) | ||
Net realized and unrealized loss | (559,236 | ) | ||
Net increase in net assets resulting from operations | $ | 523,910 | ||
| * | Relates to Trustees not deemed “interested persons” within the meaning of Section 2(a)(19) of the 1940 Act. |
50 | THE GUGGENHEIM FUNDS SEMI-ANNUAL REPORT | SEE NOTES TO FINANCIAL STATEMENTS. |
SERIES F (FLOATING RATE STRATEGIES SERIES) |
STATEMENTS OF CHANGES IN NET ASSETS |
Period Ended | Year Ended | |||||||
Increase (Decrease) in Net Assets from Operations: | ||||||||
Net investment income | $ | 1,083,146 | $ | 1,816,616 | ||||
Net realized gain (loss) on investments | (89,829 | ) | 70,347 | |||||
Net change in unrealized appreciation (depreciation) on investments | (469,407 | ) | (110,372 | ) | ||||
Net increase in net assets resulting from operations | 523,910 | 1,776,591 | ||||||
Distributions to shareholders from: | ||||||||
Net investment income | — | (1,683,851 | ) | |||||
Total distributions to shareholders | — | (1,683,851 | ) | |||||
Capital share transactions: | ||||||||
Proceeds from sale of shares | 30,871,133 | 31,537,727 | ||||||
Distributions reinvested | — | 1,683,851 | ||||||
Cost of shares redeemed | (12,792,639 | ) | (35,521,219 | ) | ||||
Net increase (decrease) from capital share transactions | 18,078,494 | (2,299,641 | ) | |||||
Net increase (decrease) in net assets | 18,602,404 | (2,206,901 | ) | |||||
Net assets: | ||||||||
Beginning of period | 51,038,285 | 53,245,186 | ||||||
End of period | $ | 69,640,689 | $ | 51,038,285 | ||||
Undistributed net investment income at end of period | $ | 3,186,076 | $ | 2,102,930 | ||||
Capital share activity: | ||||||||
Shares sold | 1,164,190 | 1,198,589 | ||||||
Shares issued from reinvestment of distributions | — | 65,190 | ||||||
Shares redeemed | (482,881 | ) | (1,350,894 | ) | ||||
Net increase (decrease) in shares | 681,309 | (87,115 | ) | |||||
SEE NOTES TO FINANCIAL STATEMENTS. | THE GUGGENHEIM FUNDS SEMI-ANNUAL REPORT | 51 |
SERIES F (FLOATING RATE STRATEGIES SERIES) |
FINANCIAL HIGHLIGHTS |
This table is presented to show selected data for a share outstanding throughout each period and to assist shareholders in evaluating a Fund’s performance for the periods presented.
Period Ended | Year Ended December 31, 2017 | Year Ended December 31, 2016 | Year Ended December 31, 2015 | Year Ended December 31, 2014 | Period Ended | |||||||||||||||||||
| Per Share Data | ||||||||||||||||||||||||
| Net asset value, beginning of period | $ | 26.26 | $ | 26.22 | $ | 25.72 | $ | 26.24 | $ | 25.61 | $ | 25.00 | ||||||||||||
| Income (loss) from investment operations: | ||||||||||||||||||||||||
Net investment income (loss)c | .47 | .91 | 1.05 | .97 | .95 | .49 | ||||||||||||||||||
| Net gain (loss) on investments (realized and unrealized) | (.20 | ) | (.02 | ) | 1.09 | (.77 | ) | (.32 | ) | .12 | ||||||||||||||
| Total from investment operations | .27 | .89 | 2.14 | .20 | .63 | .61 | ||||||||||||||||||
| Less distributions from: | ||||||||||||||||||||||||
| Net investment income | — | (.85 | ) | (1.56 | ) | (.67 | ) | — | — | |||||||||||||||
| Net realized gains | — | — | (.08 | ) | (.05 | ) | — | — | ||||||||||||||||
| Total distributions | — | (.85 | ) | (1.64 | ) | (.72 | ) | — | — | |||||||||||||||
| Net asset value, end of period | $ | 26.53 | $ | 26.26 | $ | 26.22 | $ | 25.72 | $ | 26.24 | $ | 25.61 | ||||||||||||
Total Returnd | 1.03 | % | 3.46 | % | 8.56 | % | 0.73 | % | 2.38 | % | 2.48 | % | ||||||||||||
| Ratios/Supplemental Data | ||||||||||||||||||||||||
| Net assets, end of period (in thousands) | $ | 69,641 | $ | 51,038 | $ | 53,245 | $ | 48,598 | $ | 45,837 | $ | 46,343 | ||||||||||||
| Ratios to average net assets: | ||||||||||||||||||||||||
| Net investment income (loss) | 3.60 | % | 3.44 | % | 4.06 | % | 3.66 | % | 3.65 | % | 2.81 | % | ||||||||||||
| Total expenses | 1.24 | % | 1.28 | % | 1.22 | % | 1.27 | % | 1.24 | % | 1.35 | %f | ||||||||||||
Net expensese,g,h | 1.16 | % | 1.18 | % | 1.18 | % | 1.17 | % | 1.16 | % | 1.17 | % | ||||||||||||
| Portfolio turnover rate | 24 | % | 57 | % | 71 | % | 73 | % | 90 | % | 53 | % | ||||||||||||
| a | Unaudited figures for the period ended June 30, 2018. Percentage amounts for the period, except total return and portfolio turnover rate, have been annualized. |
| b | Since commencement of operations: April 24, 2013. Percentage amounts for the period, except total return and portfolio turnover rate, have been annualized. |
| c | Net investment income (loss) per share was computed using average shares outstanding throughout the period. |
| d | Total return does not take into account any of the expenses associated with an investment in variable insurance products. If total return had taken into account these expenses, performance would have been lower. Shares of a series of Guggenheim Variable Funds Trust are available only through the purchase of such products. |
| e | Net expense information reflects the expense ratios after expense waivers and reimbursements, as applicable. |
| f | Due to limited length of Fund operations, ratios for this period may not be indicative of future performance. |
| g | Net expenses may include expenses that are excluded from the expense limitation agreement. Excluding these expenses, the net expense ratios for the periods would be: |
06/30/18 | 12/31/17 | 12/31/16 | 12/31/15 | 12/31/14 | 12/31/13 |
1.15% | 1.15% | 1.15% | 1.15% | 1.15% | 1.15% |
| h | The portion of the ratios of net expenses to average net assets attributable to recoupments of prior fee reductions or expense reimbursements for the periods presented would be: |
06/30/18 | 12/31/17 | 12/31/16 | 12/31/15 | 12/31/14 | 12/31/13 |
0.00%* | 0.01% | N/A | N/A | N/A | N/A |
* | Less than 0.01%. |
52 | THE GUGGENHEIM FUNDS SEMI-ANNUAL REPORT | SEE NOTES TO FINANCIAL STATEMENTS. |
PERFORMANCE REPORT AND FUND PROFILE (Unaudited) | June 30, 2018 |
SERIES J (STYLEPLUS—MID GROWTH SERIES)
OBJECTIVE: Seeks long-term growth of capital.
Holdings Diversification (Market Exposure as % of Net Assets)
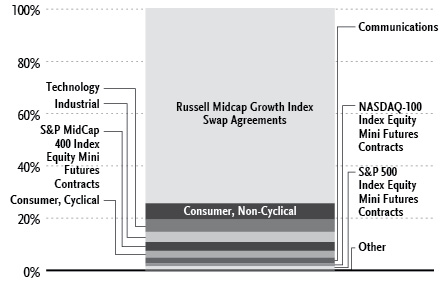
“Holdings Diversification (Market Exposure as % of Net Assets)” excludes any temporary cash investments or investments in Guggenheim Strategy Funds Trust mutual funds.
Inception Date: October 1, 1992 |
Ten Largest Holdings (% of Total Net Assets) | |
Guggenheim Variable Insurance Strategy Fund III | 32.7% |
Guggenheim Strategy Fund III | 29.5% |
Guggenheim Strategy Fund II | 13.5% |
Guggenheim Strategy Fund I | 1.5% |
NetApp, Inc. | 0.4% |
Clorox Co. | 0.3% |
Citrix Systems, Inc. | 0.3% |
Waters Corp. | 0.3% |
Omnicom Group, Inc. | 0.3% |
Hershey Co. | 0.3% |
Top Ten Total | 79.1% |
“Ten Largest Holdings” excludes any temporary cash or derivative investments.
Average Annual Returns*,†
Periods Ended June 30, 2018
6 month‡ | 1 Year | 5 Year | 10 Year | |
Series J (StylePlus—Mid Growth Series) | 4.20% | 16.67% | 13.73% | 9.63% |
Russell Midcap Growth Index | 5.40% | 18.52% | 13.37% | 10.45% |
| * | The performance data above represents past performance that is not predictive of future results. The investment return and principal value of an investment in the Fund will fluctuate so that an investor’s shares, when redeemed, may be worth more or less than their original cost. Returns are historical and include changes in principal and reinvested dividends and capital gains and do not reflect the effect of taxes. The Russell Midcap Growth Index is an unmanaged index and, unlike the Fund, has no management fees or operating expenses to reduce its reported return. |
| † | Performance figures do not reflect fees and expenses associated with an investment in variable insurance products. If returns had taken into account these fees and expenses, performance would have been lower. Shares of a series of Guggenheim Variable Funds Trust are available only through the purchase of such products. |
| ‡ | 6 month returns are not annualized. |
THE GUGGENHEIM FUNDS SEMI-ANNUAL REPORT 53 |
SCHEDULE OF INVESTMENTS (Unaudited) | June 30, 2018 |
SERIES J (STYLEPLUS—MID GROWTH SERIES) |
| Value | |||||||
COMMON STOCKS† - 20.2% | ||||||||
Consumer, Non-cyclical - 6.2% | ||||||||
Clorox Co. | 4,047 | $ | 547,357 | |||||
Hershey Co. | 5,138 | 478,142 | ||||||
Kellogg Co. | 6,196 | 432,914 | ||||||
Varian Medical Systems, Inc.* | 3,470 | 394,609 | ||||||
United Rentals, Inc.* | 2,594 | 382,926 | ||||||
Total System Services, Inc. | 4,397 | 371,634 | ||||||
US Foods Holding Corp.* | 9,662 | 365,417 | ||||||
Sysco Corp. | 5,288 | 361,118 | ||||||
Performance Food Group Co.* | 9,782 | 358,999 | ||||||
CoreLogic, Inc.* | 6,897 | 357,954 | ||||||
Kimberly-Clark Corp. | 3,361 | 354,047 | ||||||
Baxter International, Inc. | 4,648 | 343,208 | ||||||
Zoetis, Inc. | 4,017 | 342,208 | ||||||
Vector Group Ltd. | 17,421 | 332,393 | ||||||
Herbalife Nutrition Ltd.* | 6,023 | 323,556 | ||||||
ResMed, Inc. | 3,048 | 315,712 | ||||||
Western Union Co. | 14,737 | 299,603 | ||||||
Edwards Lifesciences Corp.* | 2,035 | 296,235 | ||||||
McCormick & Company, Inc. | 2,518 | 292,315 | ||||||
Hill-Rom Holdings, Inc. | 3,202 | 279,663 | ||||||
Centene Corp.* | 1,952 | 240,506 | ||||||
McKesson Corp. | 1,745 | 232,783 | ||||||
Quanta Services, Inc.* | 6,682 | 223,179 | ||||||
Humana, Inc. | 647 | 192,567 | ||||||
Monster Beverage Corp.* | 3,165 | 181,354 | ||||||
AmerisourceBergen Corp. — Class A | 2,113 | 180,175 | ||||||
Constellation Brands, Inc. — Class A | 788 | 172,470 | ||||||
Euronet Worldwide, Inc.* | 1,983 | 166,116 | ||||||
Alexion Pharmaceuticals, Inc.* | 1,314 | 163,133 | ||||||
Brown-Forman Corp. — Class B | 3,223 | 157,959 | ||||||
Square, Inc. — Class A* | 2,301 | 141,834 | ||||||
Molina Healthcare, Inc.* | 1,407 | 137,801 | ||||||
Sabre Corp. | 5,515 | 135,890 | ||||||
Charles River Laboratories International, Inc.* | 1,203 | 135,049 | ||||||
Avis Budget Group, Inc.* | 3,865 | 125,613 | ||||||
Catalent, Inc.* | 2,850 | 119,386 | ||||||
Sprouts Farmers Market, Inc.* | 5,395 | 119,068 | ||||||
Align Technology, Inc.* | 295 | 100,931 | ||||||
Cardinal Health, Inc. | 1,961 | 95,756 | ||||||
Nektar Therapeutics* | 1,960 | 95,707 | ||||||
Total Consumer, Non-cyclical | 10,347,287 | |||||||
Technology - 4.7% | ||||||||
NetApp, Inc. | 7,644 | 600,283 | ||||||
Citrix Systems, Inc.* | 4,876 | 511,200 | ||||||
Lam Research Corp. | 2,764 | 477,757 | ||||||
Analog Devices, Inc. | 4,104 | 393,656 | ||||||
Fidelity National Information Services, Inc. | 3,590 | 380,648 | ||||||
Dell Technologies Inc. — Class V* | 4,209 | 355,997 | ||||||
ON Semiconductor Corp.* | 15,705 | 349,201 | ||||||
Teradyne, Inc. | 8,549 | 325,461 | ||||||
Autodesk, Inc.* | 2,477 | 324,710 | ||||||
Fiserv, Inc.* | 4,273 | 316,587 | ||||||
Skyworks Solutions, Inc. | 3,176 | 306,960 | ||||||
KLA-Tencor Corp. | 2,944 | 301,848 | ||||||
Microchip Technology, Inc. | 2,830 | 257,389 | ||||||
ServiceNow, Inc.* | 1,339 | 230,937 | ||||||
Maxim Integrated Products, Inc. | 3,877 | 227,425 | ||||||
Synopsys, Inc.* | 2,647 | 226,504 | ||||||
Cypress Semiconductor Corp. | 12,733 | 198,380 | ||||||
Zebra Technologies Corp. — Class A* | 1,383 | 198,114 | ||||||
Akamai Technologies, Inc.* | 2,272 | 166,379 | ||||||
MAXIMUS, Inc. | 2,438 | 151,424 | ||||||
Xilinx, Inc. | 2,274 | 148,401 | ||||||
First Data Corp. — Class A* | 6,627 | 138,703 | ||||||
MKS Instruments, Inc. | 1,296 | 124,027 | ||||||
Paychex, Inc. | 1,790 | 122,346 | ||||||
Tableau Software, Inc. — Class A* | 1,194 | 116,713 | ||||||
NCR Corp.* | 3,861 | 115,753 | ||||||
SS&C Technologies Holdings, Inc. | 2,009 | 104,267 | ||||||
Broadridge Financial Solutions, Inc. | 903 | 103,935 | ||||||
Teradata Corp.* | 2,561 | 102,824 | ||||||
Fortinet, Inc.* | 1,638 | 102,261 | ||||||
Workday, Inc. — Class A* | 829 | 100,408 | ||||||
Atlassian Corp. plc — Class A* | 1,586 | 99,157 | ||||||
Splunk, Inc.* | 988 | 97,921 | ||||||
Red Hat, Inc.* | 605 | 81,294 | ||||||
Total Technology | 7,858,870 | |||||||
Industrial - 4.0% | ||||||||
Waters Corp.* | 2,499 | 483,781 | ||||||
Rockwell Automation, Inc. | 2,388 | 396,957 | ||||||
Ingersoll-Rand plc | 4,244 | 380,814 | ||||||
Cummins, Inc. | 2,591 | 344,603 | ||||||
Spirit AeroSystems Holdings, Inc. — Class A | 3,879 | 333,245 | ||||||
XPO Logistics, Inc.* | 3,195 | 320,075 | ||||||
Roper Technologies, Inc. | 1,145 | 315,917 | ||||||
Textron, Inc. | 4,620 | 304,504 | ||||||
Xylem, Inc. | 4,487 | 302,334 | ||||||
Parker-Hannifin Corp. | 1,886 | 293,933 | ||||||
Masco Corp. | 7,733 | 289,369 | ||||||
Huntington Ingalls Industries, Inc. | 1,332 | 288,764 | ||||||
Genesee & Wyoming, Inc. — Class A* | 3,458 | 281,205 | ||||||
Expeditors International of Washington, Inc. | 3,793 | 277,268 | ||||||
Hubbell, Inc. | 2,571 | 271,858 | ||||||
Barnes Group, Inc. | 3,912 | 230,417 | ||||||
EMCOR Group, Inc. | 2,721 | 207,286 | ||||||
TransDigm Group, Inc. | 497 | 171,535 | ||||||
Fortune Brands Home & Security, Inc. | 3,004 | 161,285 | ||||||
Werner Enterprises, Inc. | 4,039 | 151,664 | ||||||
MasTec, Inc.* | 2,917 | 148,038 | ||||||
Amphenol Corp. — Class A | 1,497 | 130,464 | ||||||
Rexnord Corp.* | 4,349 | 126,382 | ||||||
Coherent, Inc.* | 786 | 122,946 | ||||||
FLIR Systems, Inc. | 2,152 | 111,839 | ||||||
54 | THE GUGGENHEIM FUNDS SEMI-ANNUAL REPORT | SEE NOTES TO FINANCIAL STATEMENTS. |
SCHEDULE OF INVESTMENTS (Unaudited)(continued) | June 30, 2018 |
SERIES J (STYLEPLUS—MID GROWTH SERIES) |
| Value | |||||||
Harris Corp. | 708 | $ | 102,334 | |||||
Total Industrial | 6,548,817 | |||||||
Consumer, Cyclical - 2.7% | ||||||||
Southwest Airlines Co. | 6,871 | 349,596 | ||||||
Lear Corp. | 1,737 | 322,752 | ||||||
Live Nation Entertainment, Inc.* | 6,617 | 321,388 | ||||||
HD Supply Holdings, Inc.* | 7,177 | 307,821 | ||||||
Delta Air Lines, Inc. | 5,135 | 254,388 | ||||||
Allison Transmission Holdings, Inc. | 6,050 | 244,964 | ||||||
Lions Gate Entertainment Corp. — Class A | 9,243 | 229,411 | ||||||
Nu Skin Enterprises, Inc. — Class A | 2,630 | 205,640 | ||||||
PulteGroup, Inc. | 6,122 | 176,008 | ||||||
WW Grainger, Inc. | 569 | 175,480 | ||||||
Toll Brothers, Inc. | 4,309 | 159,390 | ||||||
Dollar Tree, Inc.* | 1,843 | 156,655 | ||||||
Hanesbrands, Inc. | 6,782 | 149,340 | ||||||
Best Buy Company, Inc. | 1,957 | 145,953 | ||||||
Skechers U.S.A., Inc. — Class A* | 3,652 | 109,596 | ||||||
Hasbro, Inc. | 1,151 | 106,249 | ||||||
Ross Stores, Inc. | 1,225 | 103,819 | ||||||
AutoZone, Inc.* | 153 | 102,652 | ||||||
Burlington Stores, Inc.* | 670 | 100,855 | ||||||
Lennar Corp. — Class A | 1,920 | 100,800 | ||||||
Hilton Worldwide Holdings, Inc. | 1,253 | 99,187 | ||||||
Wynn Resorts Ltd. | 584 | 97,727 | ||||||
Chipotle Mexican Grill, Inc. — Class A* | 223 | 96,196 | ||||||
NVR, Inc.* | 32 | 95,051 | ||||||
Aptiv plc | 1,029 | 94,287 | ||||||
Dana, Inc. | 4,603 | 92,935 | ||||||
Under Armour, Inc. — Class C* | 3,164 | 66,697 | ||||||
Total Consumer, Cyclical | 4,464,837 | |||||||
Communications - 2.1% | ||||||||
Omnicom Group, Inc. | 6,327 | 482,560 | ||||||
Motorola Solutions, Inc. | 3,302 | 384,254 | ||||||
Twitter, Inc.* | 7,376 | 322,110 | ||||||
AMC Networks, Inc. — Class A* | 5,140 | 319,708 | ||||||
eBay, Inc.* | 8,658 | 313,939 | ||||||
CDW Corp. | 3,857 | 311,607 | ||||||
Palo Alto Networks, Inc.* | 1,174 | 241,222 | ||||||
F5 Networks, Inc.* | 1,322 | 227,979 | ||||||
Interpublic Group of Companies, Inc. | 9,596 | 224,930 | ||||||
CBS Corp. — Class B | 3,070 | 172,596 | ||||||
Nexstar Media Group, Inc. — Class A | 1,493 | 109,586 | ||||||
GoDaddy, Inc. — Class A* | 1,455 | 102,723 | ||||||
Expedia Group, Inc. | 843 | 101,320 | ||||||
InterDigital, Inc. | 1,250 | 101,125 | ||||||
GrubHub, Inc.* | 930 | 97,566 | ||||||
Total Communications | 3,513,225 | |||||||
Energy - 0.2% | ||||||||
ONEOK, Inc. | 2,826 | 197,340 | ||||||
Cheniere Energy, Inc.* | 3,017 | 196,678 | ||||||
Total Energy | 394,018 | |||||||
Financial - 0.2% | ||||||||
Alliance Data Systems Corp. | 1,099 | 256,287 | ||||||
Basic Materials - 0.1% | ||||||||
Univar, Inc.* | 5,297 | 138,993 | ||||||
Total Common Stocks | ||||||||
(Cost $32,805,681) | 33,522,334 | |||||||
MUTUAL FUNDS† - 77.2% | ||||||||
Guggenheim Variable Insurance Strategy Fund III1 | 2,166,123 | 54,304,706 | ||||||
Guggenheim Strategy Fund III1 | 1,962,605 | 49,045,498 | ||||||
Guggenheim Strategy Fund II1 | 897,290 | 22,423,267 | ||||||
Guggenheim Strategy Fund I1 | 101,511 | 2,541,839 | ||||||
Total Mutual Funds | ||||||||
(Cost $127,912,513) | 128,315,310 | |||||||
MONEY MARKET FUND† - 2.2% | ||||||||
Dreyfus Treasury Securities Cash Management Fund — Institutional Class, 1.68%2 | 3,634,419 | 3,634,419 | ||||||
Total Money Market Fund | ||||||||
(Cost $3,634,419) | 3,634,419 | |||||||
Total Investments - 99.6% | ||||||||
(Cost $164,352,613) | $ | 165,472,063 | ||||||
Other Assets & Liabilities, net - 0.4% | 639,812 | |||||||
Total Net Assets - 100.0% | $ | 166,111,875 | ||||||
SEE NOTES TO FINANCIAL STATEMENTS. | THE GUGGENHEIM FUNDS SEMI-ANNUAL REPORT | 55 |
SCHEDULE OF INVESTMENTS (Unaudited)(continued) | June 30, 2018 |
SERIES J (STYLEPLUS—MID GROWTH SERIES) |
Futures Contracts | ||||||||||||||||
Description | Number of | Expiration | Notional | Value and | ||||||||||||
Equity Futures Contracts Purchased† | ||||||||||||||||
S&P 500 Index Mini Futures Contracts | 13 | Sep 2018 | $ | 1,768,488 | $ | (41,570 | ) | |||||||||
NASDAQ-100 Index Mini Futures Contracts | 13 | Sep 2018 | 1,836,185 | (58,040 | ) | |||||||||||
S&P MidCap 400 Index Mini Futures Contracts | 28 | Sep 2018 | 5,477,080 | (124,601 | ) | |||||||||||
| $ | 9,081,753 | $ | (224,211 | ) | ||||||||||||
Total Return Swap Agreements | ||||||||||||||||||||||
Counterparty | Index | Financing | Payment | Maturity | Units | Notional | Value and | |||||||||||||||
OTC Equity Index Swap Agreements†† | ||||||||||||||||||||||
Deutsche Bank | Russell Midcap Growth Index | 2.18 | % | At Maturity | 07/02/18 | 121,929 | $ | 124,050,565 | $ | 6,493,646 | ||||||||||||
| * | Non-income producing security. |
| ** | Includes cumulative appreciation (depreciation). Only current day’s variation margin is reported within the Statement of Assets and Liabilities. |
| † | Value determined based on Level 1 inputs — See Note 4. |
| †† | Value determined based on Level 2 inputs — See Note 4. |
| 1 | Affiliated issuer. |
| 2 | Rate indicated is the 7 day yield as of June 30, 2018. |
plc — Public Limited Company
See Sector Classification in Other Information section.
The following table summarizes the inputs used to value the Fund’s investments at June 30, 2018 (See Note 4 in the Notes to Financial Statements):
Investments in Securities (Assets) | Level 1 | Level 2 | Level 3 | Total | ||||||||||||
Common Stocks | $ | 33,522,334 | $ | — | $ | — | $ | 33,522,334 | ||||||||
Mutual Funds | 128,315,310 | — | — | 128,315,310 | ||||||||||||
Money Market Fund | 3,634,419 | — | — | 3,634,419 | ||||||||||||
Equity Index Swap Agreements* | — | 6,493,646 | — | 6,493,646 | ||||||||||||
Total Assets | $ | 165,472,063 | $ | 6,493,646 | $ | — | $ | 171,965,709 | ||||||||
| ||||||||||||||||
Investments in Securities (Liabilities) | Level 1 | Level 2 | Level 3 | Total | ||||||||||||
Equity Futures Contracts* | $ | 224,211 | $ | — | $ | — | $ | 224,211 | ||||||||
| * | This derivative is reported as unrealized appreciation/(depreciation) at period end. |
Transfers between investment levels may occur as the markets fluctuate and/or the availability of data used in an investment’s valuation changes. Transfers between valuation levels, if any, are in comparison to the valuation levels at the end of the previous fiscal year, and are effective using the fair value as of the end of the current fiscal period.
For the period ended June 30, 2018, there were no transfers between levels.
56 | THE GUGGENHEIM FUNDS SEMI-ANNUAL REPORT | SEE NOTES TO FINANCIAL STATEMENTS. |
SCHEDULE OF INVESTMENTS (Unaudited)(concluded) | June 30, 2018 |
SERIES J (STYLEPLUS—MID GROWTH SERIES) |
Affiliated Transactions
Investments representing 5% or more of the outstanding voting shares of a portfolio company of a fund, or control of or by, or common control under Guggenheim Investments ("GI"), result in that portfolio company being considered an affiliated company of such fund, as defined in the 1940 Act.
The Fund may invest in certain of the underlying series of Guggenheim Strategy Funds Trust, including Guggenheim Strategy Fund I, Guggenheim Strategy Fund II, Guggenheim Strategy Fund III and Guggenheim Variable Insurance Strategy Fund III, (collectively, the “Cash Management Funds”), each of which are open-end management investment companies managed by GI. The Cash Management Funds, which launched on March 11, 2014, are offered as cash management options only to mutual funds, trusts, and other accounts managed by GI and/or its affiliates, and are not available to the public. The Cash Management Funds pay no investment management fees. The Cash Management Funds’ annual report on Form N-CSR dated September 30, 2017, is available publicly or upon request. This information is available from the EDGAR database on the SEC’s website at https://www.sec.gov/Archives/edgar/data/1601445/000089180417000715/gug72218.htm.
Transactions during the period ended June 30, 2018, in which the portfolio company is an “affiliated person”, were as follows:
Security Name | Value | Additions | Reductions | Realized | Change in | Value | Shares | Investment | ||||||||||||||||||||||||
Mutual Funds | ||||||||||||||||||||||||||||||||
Guggenheim Strategy Fund I | $ | 17,247,482 | $ | 10,048,576 | $ | (24,752,044 | ) | $ | 34,749 | $ | (36,924 | ) | $ | 2,541,839 | 101,511 | $ | 149,228 | |||||||||||||||
Guggenheim Strategy Fund II | 26,707,218 | 334,012 | (4,599,989 | ) | 22,354 | (40,328 | ) | 22,423,267 | 897,290 | 333,478 | ||||||||||||||||||||||
Guggenheim Strategy Fund III | 48,500,456 | 604,017 | — | — | (58,975 | ) | 49,045,498 | 1,962,605 | 602,175 | |||||||||||||||||||||||
Guggenheim Variable Insurance Strategy Fund III | 50,752,162 | 5,639,854 | (1,999,993 | ) | 7,968 | (95,285 | ) | 54,304,706 | 2,166,123 | 715,762 | ||||||||||||||||||||||
| $ | 143,207,318 | $ | 16,626,459 | $ | (31,352,026 | ) | $ | 65,071 | $ | (231,512 | ) | $ | 128,315,310 | $ | 1,800,643 | |||||||||||||||||
SEE NOTES TO FINANCIAL STATEMENTS. | THE GUGGENHEIM FUNDS SEMI-ANNUAL REPORT | 57 |
SERIES J (STYLEPLUS—MID GROWTH SERIES) |
STATEMENT OF ASSETS AND LIABILITIES (Unaudited) | ||||
June 30, 2018 | ||||
Assets: | ||||
Investments in unaffiliated issuers, at value (cost $36,440,100) | $ | 37,156,753 | ||
Investments in affiliated issuers, at value (cost $127,912,513) | 128,315,310 | |||
Segregated cash with broker | 358,200 | |||
Unrealized appreciation on swap agreements | 6,493,646 | |||
Prepaid expenses | 2,430 | |||
Receivables: | ||||
Securities sold | 630,000 | |||
Dividends | 360,270 | |||
Interest | 11,616 | |||
Variation margin on futures contracts | 6,868 | |||
Fund shares sold | 165 | |||
Total assets | 173,335,258 | |||
Liabilities: | ||||
Overdraft due to custodian bank | 627,749 | |||
Segregated cash due to broker | 5,700,000 | |||
Payable for: | ||||
Securities purchased | 353,641 | |||
Swap settlement | 311,626 | |||
Management fees | 74,115 | |||
Fund shares redeemed | 64,993 | |||
Distribution and service fees | 37,588 | |||
Fund accounting/administration fees | 12,028 | |||
Transfer agent/maintenance fees | 2,362 | |||
Trustees’ fees* | 350 | |||
Miscellaneous | 38,931 | |||
Total liabilities | 7,223,383 | |||
Commitments and contingent liabilities (Note 13) | — | |||
Net assets | $ | 166,111,875 | ||
Net assets consist of: | ||||
Paid in capital | $ | 124,749,595 | ||
Undistributed net investment income | 3,416,814 | |||
Accumulated net realized gain on investments | 30,556,581 | |||
Net unrealized appreciation on investments | 7,388,885 | |||
Net assets | $ | 166,111,875 | ||
Capital shares outstanding | 2,665,091 | |||
Net asset value per share | $ | 62.33 | ||
STATEMENT OF OPERATIONS (Unaudited) | ||||
Period Ended June 30, 2018 | ||||
Investment Income: | ||||
Dividends from securities of unaffiliated issuers (net of foreign withholding tax of $261) | $ | 242,340 | ||
Dividends from securities of affiliated issuers | 1,800,643 | |||
Interest | 35,486 | |||
Total investment income | 2,078,469 | |||
Expenses: | ||||
Management fees | 703,076 | |||
Distribution and service fees: | 234,359 | |||
Transfer agent/maintenance fees | 12,748 | |||
Fund accounting/administration fees | 74,996 | |||
Custodian fees | 12,464 | |||
Trustees’ fees* | 9,482 | |||
Line of credit fees | 4,082 | |||
Miscellaneous | 57,758 | |||
Total expenses | 1,108,965 | |||
Less: | ||||
Expenses waived by Adviser | (234,821 | ) | ||
Net expenses | 874,144 | |||
Net investment income | 1,204,325 | |||
Net Realized and Unrealized Gain (Loss): | ||||
Net realized gain (loss) on: | ||||
Investments in unaffiliated issuers | 2,506,933 | |||
Investments in affiliated issuers | 65,071 | |||
Swap agreements | 8,896,223 | |||
Futures contracts | 269,562 | |||
Net realized gain | 11,737,789 | |||
Net change in unrealized appreciation (depreciation) on: | ||||
Investments in unaffiliated issuers | (1,960,246 | ) | ||
Investments in affiliated issuers | (231,512 | ) | ||
Swap agreements | (1,837,616 | ) | ||
Futures contracts | (231,584 | ) | ||
Net change in unrealized appreciation (depreciation) | (4,260,958 | ) | ||
Net realized and unrealized gain | 7,476,831 | |||
Net increase in net assets resulting from operations | $ | 8,681,156 | ||
| * | Relates to Trustees not deemed “interested persons” within the meaning of Section 2(a)(19) of the 1940 Act. |
58 | THE GUGGENHEIM FUNDS SEMI-ANNUAL REPORT | SEE NOTES TO FINANCIAL STATEMENTS. |
SERIES J (STYLEPLUS—MID GROWTH SERIES) |
STATEMENTS OF CHANGES IN NET ASSETS |
Period Ended | Year Ended | |||||||
Increase (Decrease) in Net Assets from Operations: | ||||||||
Net investment income | $ | 1,204,325 | $ | 2,211,533 | ||||
Net realized gain on investments | 11,737,789 | 25,960,711 | ||||||
Net change in unrealized appreciation (depreciation) on investments | (4,260,958 | ) | 10,897,324 | |||||
Net increase in net assets resulting from operations | 8,681,156 | 39,069,568 | ||||||
Distributions to shareholders from: | ||||||||
Net investment income | — | (1,631,486 | ) | |||||
Total distributions to shareholders | — | (1,631,486 | ) | |||||
Capital share transactions: | ||||||||
Proceeds from sale of shares | 3,632,176 | 7,756,999 | ||||||
Distributions reinvested | — | 1,631,486 | ||||||
Cost of shares redeemed | (34,098,534 | ) | (25,743,335 | ) | ||||
Net decrease from capital share transactions | (30,466,358 | ) | (16,354,850 | ) | ||||
Net increase (decrease) in net assets | (21,785,202 | ) | 21,083,232 | |||||
Net assets: | ||||||||
Beginning of period | 187,897,077 | 166,813,845 | ||||||
End of period | $ | 166,111,875 | $ | 187,897,077 | ||||
Undistributed net investment income at end of period | $ | 3,416,814 | $ | 2,212,489 | ||||
Capital share activity: | ||||||||
Shares sold | 58,672 | 144,774 | ||||||
Shares issued from reinvestment of distributions | — | 30,146 | ||||||
Shares redeemed | (534,593 | ) | (478,624 | ) | ||||
Net decrease in shares | (475,921 | ) | (303,704 | ) | ||||
SEE NOTES TO FINANCIAL STATEMENTS. | THE GUGGENHEIM FUNDS SEMI-ANNUAL REPORT | 59 |
SERIES J (STYLEPLUS—MID GROWTH SERIES) |
FINANCIAL HIGHLIGHTS |
This table is presented to show selected data for a share outstanding throughout each period and to assist shareholders in evaluating a Fund’s performance for the periods presented.
Period Ended | Year Ended December 31, 2017 | Year Ended December 31, 2016 | Year Ended December 31, 2015 | Year Ended December 31, 2014 | Year Ended December 31, 2013 | |||||||||||||||||||
| Per Share Data | ||||||||||||||||||||||||
| Net asset value, beginning of period | $ | 59.82 | $ | 48.43 | $ | 45.15 | $ | 49.12 | $ | 43.45 | $ | 33.29 | ||||||||||||
| Income (loss) from investment operations: | ||||||||||||||||||||||||
Net investment income (loss)b | .39 | .67 | .52 | .31 | .49 | .06 | ||||||||||||||||||
| Net gain (loss) on investments (realized and unrealized) | 2.12 | 11.22 | 3.37 | (.10 | ) | 5.18 | 10.10 | |||||||||||||||||
| Total from investment operations | 2.51 | 11.89 | 3.89 | .21 | 5.67 | 10.16 | ||||||||||||||||||
| Less distributions from: | ||||||||||||||||||||||||
| Net investment income | — | (.50 | ) | (.33 | ) | (.56 | ) | — | — | |||||||||||||||
| Net realized gains | — | — | (.28 | ) | (3.62 | ) | — | — | ||||||||||||||||
| Total distributions | — | (.50 | ) | (.61 | ) | (4.18 | ) | — | — | |||||||||||||||
| Net asset value, end of period | $ | 62.33 | $ | 59.82 | $ | 48.43 | $ | 45.15 | $ | 49.12 | $ | 43.45 | ||||||||||||
Total Returnc | 4.20 | % | 24.67 | % | 8.65 | % | (0.08 | %) | 13.05 | % | 30.52 | % | ||||||||||||
| Ratios/Supplemental Data | ||||||||||||||||||||||||
| Net assets, end of period (in thousands) | $ | 166,112 | $ | 187,897 | $ | 166,814 | $ | 148,009 | $ | 163,066 | $ | 157,131 | ||||||||||||
| Ratios to average net assets: | ||||||||||||||||||||||||
| Net investment income (loss) | 1.28 | % | 1.25 | % | 1.14 | % | 0.63 | % | 1.06 | % | 0.17 | % | ||||||||||||
Total expensesd | 1.18 | % | 1.14 | % | 0.98 | % | 0.97 | % | 0.98 | % | 0.98 | % | ||||||||||||
Net expensese,f | 0.94 | % | 0.94 | % | 0.95 | % | 0.97 | % | 0.96 | % | 0.98 | % | ||||||||||||
| Portfolio turnover rate | 34 | % | 49 | % | 57 | % | 70 | % | 100 | % | 245 | % | ||||||||||||
| a | Unaudited figures for the period ended June 30, 2018. Percentage amounts for the period, except total return and portfolio turnover rate, have been annualized. |
| b | Net investment income (loss) per share was computed using average shares outstanding throughout the period. |
| c | Total return does not take into account any of the expenses associated with an investment in variable insurance products. If total return had taken into account these expenses, performance would have been lower. Shares of a series of Guggenheim Variable Funds Trust are available only through the purchase of such products. |
| d | Does not include expenses of the underlying funds in which the Fund invests. |
| e | Net expense information reflects the expense ratios after expense waivers and reimbursements, as applicable. |
| f | Net expenses may include expense that are excluded from the expense limitation agreement. Excluding these expenses, the expense ratios for the periods would be: |
06/30/18 | 12/31/17 | 12/31/16 | 12/31/15 | 12/31/14 | 12/31/13 |
0.94% | 0.92% | N/A | N/A | N/A | N/A |
60 | THE GUGGENHEIM FUNDS SEMI-ANNUAL REPORT | SEE NOTES TO FINANCIAL STATEMENTS. |
PERFORMANCE REPORT AND FUND PROFILE (Unaudited) | June 30, 2018 |
SERIES N (MANAGED ASSET ALLOCATION SERIES)
OBJECTIVE: Seeks to provide growth of capital and, secondarily, preservation of capital.
Holdings Diversification (Market Exposure as % of Net Assets)
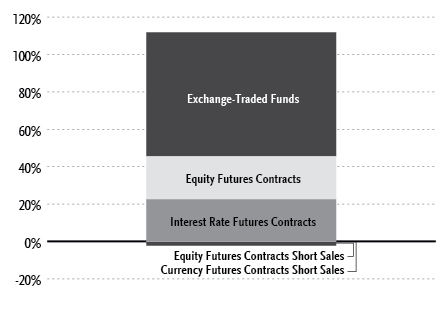
“Holdings Diversification (Market Exposure as % of Net Assets)” excludes any temporary cash investments or investments in Guggenheim Strategy Funds Trust mutual funds.
Inception Date: June 1, 1995 |
Ten Largest Holdings (% of Total Net Assets) | |
Vanguard S&P 500 ETF | 17.0% |
SPDR S&P 500 ETF Trust | 16.6% |
iShares Core U.S. Aggregate Bond ETF | 15.6% |
Guggenheim Variable Insurance Strategy Fund III | 15.0% |
Guggenheim Strategy Fund III | 10.7% |
iShares iBoxx $ Investment Grade Corporate Bond ETF | 7.8% |
iShares Core S&P Mid-Capital ETF | 6.0% |
Guggenheim Strategy Fund II | 3.7% |
iShares MSCI EAFE ETF | 3.5% |
Guggenheim Strategy Fund I | 2.1% |
Top Ten Total | 98.0% |
“Ten Largest Holdings” excludes any temporary cash or derivative investments.
Average Annual Returns*,†
Periods Ended June 30, 2018
6 month‡ | 1 Year | 5 Year | 10 Year | |
Series N (Managed Asset Allocation Series) | 0.00% | 6.81% | 7.78% | 6.44% |
Blended Index** | 1.00% | 8.34% | 8.97% | 7.84% |
S&P 500 Index | 2.65% | 14.37% | 13.42% | 10.17% |
Bloomberg Barclays U.S. Aggregate Bond Index | (1.62%) | (0.40%) | 2.27% | 3.72% |
| * | The performance data above represents past performance that is not predictive of future results. The investment return and principal value of an investment in the Fund will fluctuate so that an investor’s shares, when redeemed, may be worth more or less than their original cost. Returns are historical and include changes in principal and reinvested dividends and capital gains and do not reflect the effect of taxes. The S&P 500 Index and Bloomberg Barclays U.S. Aggregate Bond Index are unmanaged indices and, unlike the Fund, have no management fees or operating expenses to reduce their reported returns. |
| ** | The Blended Index is 60% S&P 500 Index and 40% Bloomberg Barclays U.S. Aggregate Bond Index. |
| † | Performance figures do not reflect fees and expenses associated with an investment in variable insurance products. If returns had taken into account these fees and expenses, performance would have been lower. Shares of a series of Guggenheim Variable Funds Trust are available only through the purchase of such products. |
| ‡ | 6 month returns are not annualized. |
THE GUGGENHEIM FUNDS SEMI-ANNUAL REPORT 61 |
SCHEDULE OF INVESTMENTS (Unaudited) | June 30, 2018 |
SERIES N (MANAGED ASSET ALLOCATION SERIES) |
| Value | |||||||
EXCHANGE-TRADED FUNDS† - 66.4% | ||||||||
Vanguard S&P 500 ETF | 32,632 | $ | 8,142,010 | |||||
SPDR S&P 500 ETF Trust | 29,266 | 7,939,281 | ||||||
iShares Core U.S. Aggregate Bond ETF | 70,247 | 7,468,661 | ||||||
iShares iBoxx $ Investment Grade Corporate Bond ETF | 32,507 | 3,724,327 | ||||||
iShares Core S&P Mid-Capital ETF | 14,684 | 2,860,150 | ||||||
iShares MSCI EAFE ETF | 24,928 | 1,669,428 | ||||||
iShares Core S&P 500 ETF | 2 | 546 | ||||||
Total Exchange-Traded Funds | ||||||||
(Cost $22,655,220) | 31,804,403 | |||||||
MUTUAL FUNDS† - 31.5% | ||||||||
Guggenheim Variable Insurance Strategy Fund III1 | 287,346 | 7,203,764 | ||||||
Guggenheim Strategy Fund III1 | 205,544 | 5,136,538 | ||||||
Guggenheim Strategy Fund II1 | 70,237 | 1,755,233 | ||||||
Guggenheim Strategy Fund I1 | 39,418 | 987,022 | ||||||
Total Mutual Funds | ||||||||
(Cost $15,033,279) | 15,082,557 | |||||||
MONEY MARKET FUND† - 0.2% | ||||||||
Dreyfus Treasury Securities Cash Management Fund — Institutional Class 1.68%2 | 68,236 | 68,236 | ||||||
Total Money Market Fund | ||||||||
(Cost $68,236) | 68,236 | |||||||
Face | ||||||||
U.S. TREASURY BILLS†† - 1.1% | ||||||||
U.S. Treasury Bill | ||||||||
1.72% due 07/12/183,4,5 | $ | 540,000 | 539,748 | |||||
Total U.S. Treasury Bill | ||||||||
(Cost $539,706) | 539,748 | |||||||
Total Investments - 99.2% | ||||||||
(Cost $38,296,441) | $ | 47,494,944 | ||||||
Other Assets & Liabilities, net - 0.8% | 398,074 | |||||||
Total Net Assets - 100.0% | $ | 47,893,018 | ||||||
Futures Contracts | ||||||||||||||||
Description | Number of | Expiration | Notional | Value and | ||||||||||||
Interest Rate Futures Contracts Purchased† | ||||||||||||||||
U.S. Treasury 10 Year Note Futures Contracts | 58 | Sep 2018 | $ | 6,969,969 | $ | 36,165 | ||||||||||
U.S. Treasury 2 Year Note Futures Contracts | 18 | Sep 2018 | 3,813,187 | (871 | ) | |||||||||||
| $ | 10,783,156 | $ | 35,294 | |||||||||||||
Equity Futures Contracts Purchased† | ||||||||||||||||
SPI 200 Index Futures Contracts | 1 | Sep 2018 | $ | 114,296 | $ | 212 | ||||||||||
FTSE 100 Index Futures Contracts | 2 | Sep 2018 | 199,704 | 130 | ||||||||||||
DAX Index Futures Contracts | 1 | Sep 2018 | 358,156 | 1 | ||||||||||||
Dow Jones Industrial Average Index Mini Futures Contracts | 1 | Sep 2018 | 121,300 | (2,224 | ) | |||||||||||
S&P MidCap 400 Index Mini Futures Contracts | 1 | Sep 2018 | 195,610 | (5,222 | ) | |||||||||||
CAC 40 10 Euro Index Futures Contracts | 5 | Jul 2018 | 309,377 | (8,936 | ) | |||||||||||
Russell 2000 Index Mini Futures Contracts | 26 | Sep 2018 | 2,140,710 | (33,970 | ) | |||||||||||
S&P 500 Index Mini Futures Contracts | 12 | Sep 2018 | 1,632,450 | (35,958 | ) | |||||||||||
MSCI EAFE Index Mini Futures Contracts | 61 | Sep 2018 | 5,963,665 | (204,236 | ) | |||||||||||
| $ | 11,035,268 | $ | (290,203 | ) | ||||||||||||
Equity Futures Contracts Sold Short† | ||||||||||||||||
Nikkei 225 (CME) Index Futures Contracts | 2 | Sep 2018 | $ | 222,650 | $ | 2,443 | ||||||||||
Hang Seng Index Futures Contracts†† | 1 | Jul 2018 | 182,284 | 864 | ||||||||||||
Amsterdam Index Futures Contracts | 3 | Jul 2018 | 384,633 | 29 | ||||||||||||
S&P/TSX 60 IX Index Futures Contracts | 1 | Sep 2018 | 146,627 | (154 | ) | |||||||||||
| $ | 936,194 | $ | 3,182 | |||||||||||||
Currency Futures Contracts Sold Short† | ||||||||||||||||
Japanese Yen Futures Contracts | 1 | Sep 2018 | $ | 113,494 | $ | 341 | ||||||||||
62 | THE GUGGENHEIM FUNDS SEMI-ANNUAL REPORT | SEE NOTES TO FINANCIAL STATEMENTS. |
SCHEDULE OF INVESTMENTS (Unaudited)(continued) | June 30, 2018 |
SERIES N (MANAGED ASSET ALLOCATION SERIES) |
| ** | Includes cumulative appreciation (depreciation). Only current day’s variation margin is reported within the Statement of Assets and Liabilities. |
| † | Value determined based on Level 1 inputs, unless otherwise noted — See Note 4. |
| †† | Value determined based on Level 2 inputs — See Note 4. |
| 1 | Affiliated issuer. |
| 2 | Rate indicated is the 7 day yield as of June 30, 2018. |
| 3 | Rate indicated is the effective yield at the time of purchase. |
| 4 | Zero coupon rate security. |
| 5 | All or a portion of this security is pledged as futures collateral at June 30, 2018. |
See Sector Classification in Other Information section.
The following table summarizes the inputs used to value the Fund’s investments at June 30, 2018 (See Note 4 in the Notes to Financial Statements):
Investments in Securities (Assets) | Level 1 | Level 2 | Level 3 | Total | ||||||||||||
Exchange-Traded Funds | $ | 31,804,403 | $ | — | $ | — | $ | 31,804,403 | ||||||||
Mutual Funds | 15,082,557 | — | — | 15,082,557 | ||||||||||||
Money Market Fund | 68,236 | — | — | 68,236 | ||||||||||||
U.S. Treasury Bill | — | 539,748 | — | 539,748 | ||||||||||||
Interest Rate Futures Contracts* | 36,165 | — | — | 36,165 | ||||||||||||
Equity Futures Contracts* | 2,815 | 864 | — | 3,679 | ||||||||||||
Currency Futures Contracts* | 341 | — | — | 341 | ||||||||||||
Total Assets | $ | 46,994,517 | $ | 540,612 | $ | — | $ | 47,535,129 | ||||||||
Investments in Securities (Liabilities) | Level 1 | Level 2 | Level 3 | Total | ||||||||||||
Equity Futures Contracts* | $ | 290,700 | $ | — | $ | — | $ | 290,700 | ||||||||
Interest Rate Futures Contracts* | 871 | — | — | 871 | ||||||||||||
Total Liabilities | $ | 291,571 | $ | — | $ | — | $ | 291,571 | ||||||||
| * | This derivative is reported as unrealized appreciation/(depreciation) at period end. |
Transfers between investment levels may occur as the markets fluctuate and/or the availability of data used in an investment’s valuation changes. Transfers between valuation levels, if any, are in comparison to the valuation levels at the end of the previous fiscal year, and are effective using the fair value as of the end of the current fiscal period.
For the period ended June 30, 2018, there were no transfers between levels.
SEE NOTES TO FINANCIAL STATEMENTS. | THE GUGGENHEIM FUNDS SEMI-ANNUAL REPORT | 63 |
SCHEDULE OF INVESTMENTS (Unaudited)(concluded) | June 30, 2018 |
SERIES N (MANAGED ASSET ALLOCATION SERIES) |
Affiliated Transactions
Investments representing 5% or more of the outstanding voting shares of a portfolio company of a fund, or control of or by, or common control under Guggenheim Investments ("GI"), result in that portfolio company being considered an affiliated company of such fund, as defined in the 1940 Act.
The Fund may invest in certain of the underlying series of Guggenheim Strategy Funds Trust, including Guggenheim Strategy Fund I, Guggenheim Strategy Fund II, Guggenheim Strategy Fund III and Guggenheim Variable Insurance Strategy Fund III, (collectively, the “Cash Management Funds”), each of which are open-end management investment companies managed by GI. The Cash Management Funds, which launched on March 11, 2014, are offered as cash management options only to mutual funds, trusts, and other accounts managed by GI and/or its affiliates, and are not available to the public. The Cash Management Funds pay no investment management fees. The Cash Management Funds’ annual report on Form N-CSR dated September 30, 2017, is available publicly or upon request. This information is available from the EDGAR database on the SEC’s website at https://www.sec.gov/Archives/edgar/data/1601445/000089180417000715/gug72218.htm.
Transactions during the period ended June 30, 2018, in which the portfolio company is an “affiliated person”, were as follows:
Security Name | Value | Additions | Reductions | Realized | Change in | Value | Shares | Investment | ||||||||||||||||||||||||
Mutual Funds | ||||||||||||||||||||||||||||||||
Guggenheim Strategy Fund I | $ | 975,735 | $ | 12,074 | $ | — | $ | — | $ | (787 | ) | $ | 987,022 | 39,418 | $ | 12,045 | ||||||||||||||||
Guggenheim Strategy Fund II | 1,734,496 | 22,143 | — | — | (1,406 | ) | 1,755,233 | 70,237 | 22,082 | |||||||||||||||||||||||
Guggenheim Strategy Fund III | 3,884,546 | 1,258,645 | — | — | (6,653 | ) | 5,136,538 | 205,544 | 58,393 | |||||||||||||||||||||||
Guggenheim Variable Insurance Strategy Fund III | 8,705,430 | 110,449 | (1,600,000 | ) | 7,649 | (19,764 | ) | 7,203,764 | 287,346 | 110,010 | ||||||||||||||||||||||
| $ | 15,300,207 | $ | 1,403,311 | $ | (1,600,000 | ) | $ | 7,649 | $ | (28,610 | ) | $ | 15,082,557 | $ | 202,530 | |||||||||||||||||
64 | THE GUGGENHEIM FUNDS SEMI-ANNUAL REPORT | SEE NOTES TO FINANCIAL STATEMENTS. |
SERIES N (MANAGED ASSET ALLOCATION SERIES) |
STATEMENT OF ASSETS AND LIABILITIES (Unaudited) | ||||
June 30, 2018 | ||||
Assets: | ||||
Investments in unaffiliated issuers, at value (cost $23,263,162) | $ | 32,412,387 | ||
Investments in affiliated issuers, at value (cost $15,033,279) | 15,082,557 | |||
Cash | 21,610 | |||
Segregated cash with broker | 10,579 | |||
Prepaid expenses | 742 | |||
Receivables: | ||||
Securities sold | 299,585 | |||
Dividends | 128,211 | |||
Variation margin on futures contracts | 36,693 | |||
Interest | 342 | |||
Fund shares sold | 330 | |||
Total assets | 47,993,036 | |||
Liabilities: | ||||
Foreign currency, at value (cost $2,215) | 2,229 | |||
Payable for: | ||||
Securities purchased | 41,075 | |||
Management fees | 16,303 | |||
Distribution and service fees | 10,190 | |||
Direct shareholders expense | 7,721 | |||
Fund shares redeemed | 5,260 | |||
Fund accounting/administration fees | 3,261 | |||
Transfer agent/maintenance fees | 2,368 | |||
Trustees’ fees* | 305 | |||
Miscellaneous | 11,306 | |||
Total liabilities | 100,018 | |||
Commitments and contingent liabilities (Note 13) | — | |||
Net assets | $ | 47,893,018 | ||
Net assets consist of: | ||||
Paid in capital | $ | 33,282,631 | ||
Undistributed net investment income | 994,919 | |||
Accumulated net realized gain on investments | 4,668,365 | |||
Net unrealized appreciation on investments | 8,947,103 | |||
Net assets | $ | 47,893,018 | ||
Capital shares outstanding | 1,511,810 | |||
Net asset value per share | $ | 31.68 | ||
STATEMENT OF OPERATIONS (Unaudited) | ||||
Period Ended June 30, 2018 | ||||
Investment Income: | ||||
Dividends from securities of unaffiliated issuers | $ | 348,330 | ||
Dividends from securities of affiliated issuers | 202,530 | |||
Interest | 8,134 | |||
Total investment income | 558,994 | |||
Expenses: | ||||
Management fees | 100,813 | |||
Distribution and service fees | 63,008 | |||
Transfer agent/maintenance fees | 12,618 | |||
Fund accounting/administration fees | 20,163 | |||
Professional fees | 13,884 | |||
Printing expenses | 13,254 | |||
Trustees’ fees* | 4,463 | |||
Custodian fees | 1,395 | |||
Line of credit fees | 850 | |||
Miscellaneous | 4,478 | |||
Total expenses | 234,926 | |||
Net investment income | 324,068 | |||
Net Realized and Unrealized Gain (Loss): | ||||
Net realized gain (loss) on: | ||||
Investments in unaffiliated issuers | 1,157,143 | |||
Investments in affiliated issuers | 7,649 | |||
Futures contracts | 178,092 | |||
Foreign currency transactions | (588 | ) | ||
Net realized gain | 1,342,296 | |||
Net change in unrealized appreciation (depreciation) on: | ||||
Investments in unaffiliated issuers | (1,269,056 | ) | ||
Investments in affiliated issuers | (28,610 | ) | ||
Futures contracts | (360,587 | ) | ||
Foreign currency translations | (22 | ) | ||
Net change in unrealized appreciation (depreciation) | (1,658,275 | ) | ||
Net realized and unrealized loss | (315,979 | ) | ||
Net increase in net assets resulting from operations | $ | 8,089 | ||
| * | Relates to Trustees not deemed “interested persons” within the meaning of Section 2(a)(19) of the 1940 Act. |
SEE NOTES TO FINANCIAL STATEMENTS. | THE GUGGENHEIM FUNDS SEMI-ANNUAL REPORT | 65 |
SERIES N (MANAGED ASSET ALLOCATION SERIES) |
STATEMENTS OF CHANGES IN NET ASSETS |
Period Ended | Year Ended | |||||||
Increase (Decrease) in Net Assets from Operations: | ||||||||
Net investment income | $ | 324,068 | $ | 671,191 | ||||
Net realized gain on investments | 1,342,296 | 3,715,662 | ||||||
Net change in unrealized appreciation (depreciation) on investments | (1,658,275 | ) | 2,587,455 | |||||
Net increase in net assets resulting from operations | 8,089 | 6,974,308 | ||||||
Distributions to shareholders from: | ||||||||
Net investment income | — | (765,756 | ) | |||||
Net realized gains | — | (1,098,079 | ) | |||||
Total distributions to shareholders | — | (1,863,835 | ) | |||||
Capital share transactions: | ||||||||
Proceeds from sale of shares | 2,051,889 | 2,133,618 | ||||||
Distributions reinvested | — | 1,863,835 | ||||||
Cost of shares redeemed | (5,247,115 | ) | (10,867,437 | ) | ||||
Net decrease from capital share transactions | (3,195,226 | ) | (6,869,984 | ) | ||||
Net decrease in net assets | (3,187,137 | ) | (1,759,511 | ) | ||||
Net assets: | ||||||||
Beginning of period | 51,080,155 | 52,839,666 | ||||||
End of period | $ | 47,893,018 | $ | 51,080,155 | ||||
Undistributed net investment income at end of period | $ | 994,919 | $ | 670,851 | ||||
Capital share activity: | ||||||||
Shares sold | 64,120 | 69,813 | ||||||
Shares issued from reinvestment of distributions | — | 62,107 | ||||||
Shares redeemed | (164,911 | ) | (357,732 | ) | ||||
Net decrease in shares | (100,791 | ) | (225,812 | ) | ||||
66 | THE GUGGENHEIM FUNDS SEMI-ANNUAL REPORT | SEE NOTES TO FINANCIAL STATEMENTS. |
SERIES N (MANAGED ASSET ALLOCATION SERIES) |
FINANCIAL HIGHLIGHTS |
This table is presented to show selected data for a share outstanding throughout each period and to assist shareholders in evaluating a Fund’s performance for the periods presented.
Period Ended | Year Ended December 31, 2017 | Year Ended December 31, 2016 | Year Ended December 31, 2015 | Year Ended December 31, 2014 | Year Ended December 31, 2013 | |||||||||||||||||||
| Per Share Data | ||||||||||||||||||||||||
| Net asset value, beginning of period | $ | 31.68 | $ | 28.74 | $ | 27.43 | $ | 27.67 | $ | 25.93 | $ | 22.68 | ||||||||||||
| Income (loss) from investment operations: | ||||||||||||||||||||||||
Net investment income (loss)b | .20 | .39 | .40 | .32 | .23 | .08 | ||||||||||||||||||
| Net gain (loss) on investments (realized and unrealized) | (.20 | ) | 3.68 | 1.78 | (.28 | ) | 1.51 | 3.17 | ||||||||||||||||
| Total from investment operations | — | 4.07 | 2.18 | .04 | 1.74 | 3.25 | ||||||||||||||||||
| Less distributions from: | ||||||||||||||||||||||||
| Net investment income | — | (.46 | ) | (.33 | ) | (.28 | ) | — | — | |||||||||||||||
| Net realized gains | — | (.67 | ) | (.54 | ) | — | — | — | ||||||||||||||||
| Total distributions | — | (1.13 | ) | (.87 | ) | (.28 | ) | — | — | |||||||||||||||
| Net asset value, end of period | $ | 31.68 | $ | 31.68 | $ | 28.74 | $ | 27.43 | $ | 27.67 | $ | 25.93 | ||||||||||||
Total Returnc | 0.00 | % | 14.39 | % | 8.01 | % | 0.11 | % | 6.71 | % | 14.33 | % | ||||||||||||
| Ratios/Supplemental Data | ||||||||||||||||||||||||
| Net assets, end of period (in thousands) | $ | 47,893 | $ | 51,080 | $ | 52,840 | $ | 52,629 | $ | 60,319 | $ | 65,375 | ||||||||||||
| Ratios to average net assets: | ||||||||||||||||||||||||
| Net investment income (loss) | 1.29 | % | 1.29 | % | 1.42 | % | 1.14 | % | 0.87 | % | 0.32 | % | ||||||||||||
Total expensesd | 0.93 | % | 0.98 | % | 0.92 | % | 0.94 | % | 0.93 | % | 1.07 | % | ||||||||||||
| Portfolio turnover rate | 3 | % | 1 | % | 6 | % | 3 | % | 14 | % | 3 | % | ||||||||||||
| a | Unaudited figures for the period ended June 30, 2018. Percentage amounts for the period, except total return and portfolio turnover rate, have been annualized. |
| b | Net investment income (loss) per share was computed using average shares outstanding throughout the period. |
| c | Total return does not take into account any of the expenses associated with an investment in variable insurance products. If total return had taken into account these expenses, performance would have been lower. Shares of a series of Guggenheim Variable Funds Trust are available only through the purchase of such products. |
| d | Does not include expenses of the underlying funds in which the Fund invests. |
SEE NOTES TO FINANCIAL STATEMENTS. | THE GUGGENHEIM FUNDS SEMI-ANNUAL REPORT | 67 |
PERFORMANCE REPORT AND FUND PROFILE (Unaudited) | June 30, 2018 |
SERIES O (ALL CAP VALUE SERIES)
OBJECTIVE: Seeks long-term growth of capital.
Holdings Diversification (Market Exposure as % of Net Assets)
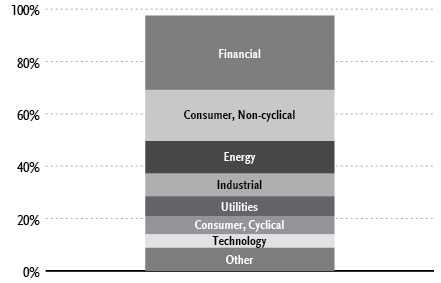
“Holdings Diversification (Market Exposure as % of Net Assets)” excludes any temporary cash investments.
Inception Date: June 1, 1995 |
Ten Largest Holdings (% of Total Net Assets) | |
JPMorgan Chase & Co. | 2.9% |
Chevron Corp. | 2.6% |
Bank of America Corp. | 2.2% |
Exxon Mobil Corp. | 2.1% |
Berkshire Hathaway, Inc. — Class B | 1.8% |
Intel Corp. | 1.7% |
Citigroup, Inc. | 1.6% |
Cisco Systems, Inc. | 1.6% |
Zions Bancorporation | 1.5% |
Merck & Company, Inc. | 1.4% |
Top Ten Total | 19.4% |
“Ten Largest Holdings” excludes any temporary cash investments.
Average Annual Returns*,†
Periods Ended June 30, 2018
6 Month‡ | 1 Year | 5 Year | 10 Year | |
Series O (All Cap Value Series) | 0.78% | 11.66% | 10.84% | 9.04% |
Russell 3000 Value Index | (1.16%) | 7.25% | 10.40% | 8.60% |
| * | The performance data above represents past performance that is not predictive of future results. The investment return and principal value of an investment in the Fund will fluctuate so that an investor’s shares, when redeemed, may be worth more or less than their original cost. Returns are historical and include changes in principal and reinvested dividends and capital gains and do not reflect the effect of taxes. The Russell 3000 Value Index is an unmanaged index and, unlike the Fund, has no management fees or operating expenses to reduce its reported return. |
| † | Performance figures do not reflect fees and expenses associated with an investment in variable insurance products. If returns had taken into account these fees and expenses, performance would have been lower. Shares of a series of Guggenheim Variable Funds Trust are available only through the purchase of such products. |
| ‡ | 6 month returns are not annualized. |
68 | THE GUGGENHEIM FUNDS SEMI-ANNUAL REPORT |
SCHEDULE OF INVESTMENTS (Unaudited) | June 30, 2018 |
SERIES O (ALL CAP VALUE SERIES) |
| Value | |||||||
COMMON STOCKS† - 97.6% | ||||||||
Financial - 28.4% | ||||||||
JPMorgan Chase & Co. | 33,517 | $ | 3,492,471 | |||||
Bank of America Corp. | 91,972 | 2,592,691 | ||||||
Berkshire Hathaway, Inc. — Class B* | 11,247 | 2,099,253 | ||||||
Citigroup, Inc. | 29,478 | 1,972,668 | ||||||
Zions Bancorporation | 33,481 | 1,764,114 | ||||||
Wells Fargo & Co. | 30,904 | 1,713,318 | ||||||
BB&T Corp. | 24,364 | 1,228,920 | ||||||
SunTrust Banks, Inc. | 15,951 | 1,053,085 | ||||||
KeyCorp | 52,349 | 1,022,899 | ||||||
Allstate Corp. | 8,262 | 754,073 | ||||||
Huntington Bancshares, Inc. | 48,966 | 722,738 | ||||||
Charles Schwab Corp. | 14,070 | 718,977 | ||||||
Welltower, Inc. REIT | 11,465 | 718,741 | ||||||
Wintrust Financial Corp. | 8,134 | 708,065 | ||||||
Jefferies Financial Group, Inc. | 30,643 | 696,822 | ||||||
Piedmont Office Realty Trust, Inc. — Class A REIT | 33,639 | 670,425 | ||||||
Principal Financial Group, Inc. | 12,297 | 651,126 | ||||||
Liberty Property Trust REIT | 14,377 | 637,332 | ||||||
Equity Commonwealth REIT* | 19,615 | 617,873 | ||||||
Morgan Stanley | 13,028 | 617,527 | ||||||
Omega Healthcare Investors, Inc. REIT | 19,280 | 597,680 | ||||||
Alleghany Corp. | 895 | 514,598 | ||||||
Loews Corp. | 10,075 | 486,421 | ||||||
Umpqua Holdings Corp. | 21,084 | 476,288 | ||||||
Alliance Data Systems Corp. | 1,943 | 453,107 | ||||||
Regions Financial Corp. | 25,276 | 449,407 | ||||||
Alexandria Real Estate Equities, Inc. REIT | 3,552 | 448,156 | ||||||
Prosperity Bancshares, Inc. | 6,157 | 420,892 | ||||||
Realogy Holdings Corp. | 17,081 | 389,447 | ||||||
Voya Financial, Inc. | 8,048 | 378,256 | ||||||
First Horizon National Corp. | 21,002 | 374,676 | ||||||
Sun Communities, Inc. REIT | 3,748 | 366,854 | ||||||
Cousins Properties, Inc. REIT | 36,967 | 358,210 | ||||||
T. Rowe Price Group, Inc. | 3,041 | 353,030 | ||||||
American International Group, Inc. | 6,054 | 320,983 | ||||||
CoreCivic, Inc. REIT | 12,899 | 308,157 | ||||||
National Storage Affiliates Trust REIT | 9,797 | 301,944 | ||||||
IBERIABANK Corp. | 3,916 | 296,833 | ||||||
Pinnacle Financial Partners, Inc. | 4,691 | 287,793 | ||||||
LaSalle Hotel Properties REIT | 7,619 | 260,798 | ||||||
Redwood Trust, Inc. REIT | 14,098 | 232,194 | ||||||
Radian Group, Inc. | 13,795 | 223,755 | ||||||
Camden Property Trust REIT | 2,443 | 222,631 | ||||||
Federated Investors, Inc. — Class B | 9,468 | 220,794 | ||||||
Lexington Realty Trust REIT | 24,463 | 213,562 | ||||||
Howard Hughes Corp.* | 1,567 | 207,627 | ||||||
Physicians Realty Trust REIT | 11,879 | 189,351 | ||||||
American National Insurance Co. | 676 | 80,843 | ||||||
Hilltop Holdings, Inc. | 3,395 | 74,928 | ||||||
Customers Bancorp, Inc.* | 698 | 19,809 | ||||||
Total Financial | 33,982,142 | |||||||
Consumer, Non-cyclical - 19.6% | ||||||||
Merck & Company, Inc. | 28,455 | 1,727,219 | ||||||
Pfizer, Inc. | 46,591 | 1,690,321 | ||||||
Hormel Foods Corp. | 44,982 | 1,673,780 | ||||||
Johnson & Johnson | 11,497 | 1,395,046 | ||||||
Bunge Ltd. | 16,852 | 1,174,753 | ||||||
Amgen, Inc. | 5,822 | 1,074,683 | ||||||
Procter & Gamble Co. | 13,024 | 1,016,653 | ||||||
UnitedHealth Group, Inc. | 3,298 | 809,131 | ||||||
HCA Healthcare, Inc. | 7,630 | 782,838 | ||||||
Quest Diagnostics, Inc. | 6,758 | 742,974 | ||||||
Tyson Foods, Inc. — Class A | 9,842 | 677,622 | ||||||
Archer-Daniels-Midland Co. | 14,304 | 655,553 | ||||||
Zimmer Biomet Holdings, Inc. | 5,837 | 650,475 | ||||||
Express Scripts Holding Co.* | 8,360 | 645,476 | ||||||
CVS Health Corp. | 9,374 | 603,217 | ||||||
Humana, Inc. | 1,852 | 551,211 | ||||||
United Therapeutics Corp.* | 4,738 | 536,104 | ||||||
Ingredion, Inc. | 4,775 | 528,593 | ||||||
DaVita, Inc.* | 6,941 | 481,983 | ||||||
Emergent BioSolutions, Inc.* | 9,459 | 477,585 | ||||||
AmerisourceBergen Corp. — Class A | 4,951 | 422,172 | ||||||
Conagra Brands, Inc. | 11,615 | 415,004 | ||||||
Eagle Pharmaceuticals, Inc.* | 5,374 | 406,597 | ||||||
Medtronic plc | 4,628 | 396,203 | ||||||
Encompass Health Corp. | 5,387 | 364,808 | ||||||
Myriad Genetics, Inc.* | 9,535 | 356,323 | ||||||
Central Garden & Pet Co. — Class A* | 8,346 | 337,763 | ||||||
Premier, Inc. — Class A* | 9,167 | 333,495 | ||||||
Euronet Worldwide, Inc.* | 3,409 | 285,572 | ||||||
Mylan N.V.* | 7,695 | 278,097 | ||||||
Philip Morris International, Inc. | 3,118 | 251,747 | ||||||
US Foods Holding Corp.* | 5,992 | 226,617 | ||||||
Hostess Brands, Inc.* | 16,594 | 225,678 | ||||||
SP Plus Corp.* | 5,599 | 208,283 | ||||||
Perrigo Company plc | 2,563 | 186,868 | ||||||
Fresh Del Monte Produce, Inc. | 4,098 | 182,566 | ||||||
Patterson Companies, Inc. | 7,141 | 161,887 | ||||||
ACCO Brands Corp. | 11,684 | 161,823 | ||||||
Sanderson Farms, Inc. | 978 | 102,837 | ||||||
Inovio Pharmaceuticals, Inc.* | 25,751 | 100,944 | ||||||
MoneyGram International, Inc.* | 12,151 | 81,290 | ||||||
Lannett Company, Inc.* | 4,895 | 66,572 | ||||||
Total Consumer, Non-cyclical | 23,448,363 | |||||||
Energy - 12.4% | ||||||||
Chevron Corp. | 24,806 | 3,136,223 | ||||||
Exxon Mobil Corp. | 30,780 | 2,546,429 | ||||||
Hess Corp. | 22,671 | 1,516,463 | ||||||
Kinder Morgan, Inc. | 80,227 | 1,417,611 | ||||||
Whiting Petroleum Corp.* | 25,364 | 1,337,190 | ||||||
Range Resources Corp. | 70,480 | 1,179,130 | ||||||
Marathon Oil Corp. | 51,739 | 1,079,276 | ||||||
Oasis Petroleum, Inc.* | 48,201 | 625,167 | ||||||
Diamondback Energy, Inc. | 4,509 | 593,249 | ||||||
Antero Resources Corp.* | 22,487 | 480,098 | ||||||
Rowan Companies plc — Class A* | 27,254 | 442,060 | ||||||
SEE NOTES TO FINANCIAL STATEMENTS. | THE GUGGENHEIM FUNDS SEMI-ANNUAL REPORT | 69 |
SCHEDULE OF INVESTMENTS (Unaudited)(continued) | June 30, 2018 |
SERIES O (ALL CAP VALUE SERIES) |
| Value | |||||||
MRC Global, Inc.* | 12,443 | $ | 269,640 | |||||
Cimarex Energy Co. | 2,173 | 221,081 | ||||||
Total Energy | 14,843,617 | |||||||
Industrial - 8.7% | ||||||||
Carlisle Companies, Inc. | 9,174 | 993,636 | ||||||
WestRock Co. | 16,904 | 963,866 | ||||||
Corning, Inc. | 34,866 | 959,164 | ||||||
Republic Services, Inc. — Class A | 12,145 | 830,232 | ||||||
Owens Corning | 8,955 | 567,478 | ||||||
General Electric Co. | 39,208 | 533,621 | ||||||
Eaton Corporation plc | 6,391 | 477,663 | ||||||
Crane Co. | 5,196 | 416,356 | ||||||
Jabil, Inc. | 14,430 | 399,134 | ||||||
FLIR Systems, Inc. | 7,049 | 366,337 | ||||||
Timken Co. | 7,048 | 306,940 | ||||||
ITT, Inc. | 5,326 | 278,390 | ||||||
Scorpio Tankers, Inc. | 99,025 | 278,260 | ||||||
Honeywell International, Inc. | 1,687 | 243,012 | ||||||
Hub Group, Inc. — Class A* | 4,876 | 242,825 | ||||||
KLX, Inc.* | 3,276 | 235,544 | ||||||
AAR Corp. | 4,967 | 230,916 | ||||||
Greenbrier Companies, Inc. | 4,282 | 225,875 | ||||||
Jacobs Engineering Group, Inc. | 3,524 | 223,739 | ||||||
Park Electrochemical Corp. | 9,552 | 221,511 | ||||||
GasLog Ltd. | 11,406 | 217,855 | ||||||
Snap-on, Inc. | 1,340 | 215,365 | ||||||
Rexnord Corp.* | 7,211 | 209,552 | ||||||
Huntington Ingalls Industries, Inc. | 964 | 208,986 | ||||||
Celadon Group, Inc.* | 66,481 | 198,778 | ||||||
Kirby Corp.* | 1,659 | 138,692 | ||||||
Astec Industries, Inc. | 1,791 | 107,102 | ||||||
Plexus Corp.* | 1,388 | 82,641 | ||||||
Total Industrial | 10,373,470 | |||||||
Utilities - 7.6% | ||||||||
Ameren Corp. | 23,564 | 1,433,869 | ||||||
OGE Energy Corp. | 35,149 | 1,237,596 | ||||||
Exelon Corp. | 24,912 | 1,061,251 | ||||||
Public Service Enterprise Group, Inc. | 18,280 | 989,679 | ||||||
Pinnacle West Capital Corp. | 11,666 | 939,813 | ||||||
Duke Energy Corp. | 11,867 | 938,442 | ||||||
Edison International | 13,828 | 874,898 | ||||||
Portland General Electric Co. | 9,436 | 403,483 | ||||||
Black Hills Corp. | 6,164 | 377,299 | ||||||
AES Corp. | 26,360 | 353,488 | ||||||
ONE Gas, Inc. | 3,460 | 258,600 | ||||||
Southwest Gas Holdings, Inc. | 2,954 | 225,302 | ||||||
Total Utilities | 9,093,720 | |||||||
Consumer, Cyclical - 7.0% | ||||||||
Walmart, Inc. | 10,632 | 910,631 | ||||||
DR Horton, Inc. | 20,844 | 854,604 | ||||||
Southwest Airlines Co. | 15,677 | 797,646 | ||||||
PVH Corp. | 4,725 | 707,427 | ||||||
Lear Corp. | 3,747 | 696,230 | ||||||
UniFirst Corp. | 3,647 | 645,154 | ||||||
JetBlue Airways Corp.* | 31,602 | 599,806 | ||||||
PACCAR, Inc. | 5,968 | 369,777 | ||||||
Carnival Corp. | 6,416 | 367,701 | ||||||
Acushnet Holdings Corp. | 13,323 | 325,880 | ||||||
Caleres, Inc. | 8,849 | 304,317 | ||||||
Goodyear Tire & Rubber Co. | 12,177 | 283,603 | ||||||
Macy’s, Inc. | 7,047 | 263,769 | ||||||
GMS, Inc.* | 9,680 | 262,231 | ||||||
Newell Brands, Inc. | 9,343 | 240,956 | ||||||
LCI Industries | 2,598 | 234,210 | ||||||
Unifi, Inc.* | 5,569 | 176,537 | ||||||
Movado Group, Inc. | 3,547 | 171,320 | ||||||
Genesco, Inc.* | 2,554 | 101,394 | ||||||
Total Consumer, Cyclical | 8,313,193 | |||||||
Technology - 5.1% | ||||||||
Intel Corp. | 41,511 | 2,063,512 | ||||||
Apple, Inc. | 3,820 | 707,120 | ||||||
Cray, Inc.* | 24,636 | 606,046 | ||||||
VMware, Inc. — Class A* | 4,024 | 591,407 | ||||||
Xerox Corp. | 24,618 | 590,832 | ||||||
Conduent, Inc.* | 19,345 | 351,499 | ||||||
Super Micro Computer, Inc.* | 11,954 | 282,712 | ||||||
Qorvo, Inc.* | 3,398 | 272,417 | ||||||
QUALCOMM, Inc. | 4,700 | 263,764 | ||||||
Maxwell Technologies, Inc.* | 45,380 | 235,976 | ||||||
Oracle Corp. | 4,202 | 185,140 | ||||||
Total Technology | 6,150,425 | |||||||
Basic Materials - 4.5% | ||||||||
Nucor Corp. | 20,291 | 1,268,188 | ||||||
Reliance Steel & Aluminum Co. | 13,408 | 1,173,736 | ||||||
Steel Dynamics, Inc. | 14,339 | 658,877 | ||||||
DowDuPont, Inc. | 9,817 | 647,137 | ||||||
Cabot Corp. | 10,312 | 636,972 | ||||||
Freeport-McMoRan, Inc. | 20,221 | 349,015 | ||||||
Alcoa Corp.* | 4,648 | 217,898 | ||||||
Ashland Global Holdings, Inc. | 2,724 | 212,962 | ||||||
Tahoe Resources, Inc.* | 40,146 | 197,518 | ||||||
Total Basic Materials | 5,362,303 | |||||||
Communications - 4.3% | ||||||||
Cisco Systems, Inc. | 43,196 | 1,858,724 | ||||||
Verizon Communications, Inc. | 23,544 | 1,184,499 | ||||||
AT&T, Inc. | 22,943 | 736,700 | ||||||
Ciena Corp.* | 19,300 | 511,643 | ||||||
Finisar Corp.* | 17,049 | 306,882 | ||||||
Acacia Communications, Inc.* | 8,746 | 304,448 | ||||||
Viavi Solutions, Inc.* | 29,156 | 298,557 | ||||||
Total Communications | 5,201,453 | |||||||
Total Common Stocks | ||||||||
(Cost $94,102,953) | 116,768,686 | |||||||
70 | THE GUGGENHEIM FUNDS SEMI-ANNUAL REPORT | SEE NOTES TO FINANCIAL STATEMENTS. |
SCHEDULE OF INVESTMENTS (Unaudited)(concluded) | June 30, 2018 |
SERIES O (ALL CAP VALUE SERIES) |
| Value | |||||||
MONEY MARKET FUND† - 2.6% | ||||||||
Dreyfus Treasury Prime Cash Management Fund — Institutional Class 1.68%1 | 3,072,202 | $ | 3,072,202 | |||||
Total Money Market Fund | ||||||||
(Cost $3,072,202) | 3,072,202 | |||||||
Total Investments - 100.2% | ||||||||
(Cost $97,175,155) | $ | 119,840,888 | ||||||
Other Assets & Liabilities, net - (0.2)% | (253,046 | ) | ||||||
Total Net Assets - 100.0% | $ | 119,587,842 | ||||||
| * | Non-income producing security. |
| † | Value determined based on Level 1 inputs — See Note 4. |
| 1 | Rate indicated is the 7 day yield as of June 30, 2018. |
plc — Public Limited Company
REIT — Real Estate Investment Trust
See Sector Classification in Other Information section.
The following table summarizes the inputs used to value the Fund’s investments at June 30, 2018 (See Note 4 in the Notes to Financial Statements):
Investments in Securities (Assets) | Level 1 | Level 2 | Level 3 | Total | ||||||||||||
Common Stocks | $ | 116,768,686 | $ | — | $ | — | $ | 116,768,686 | ||||||||
Money Market Fund | 3,072,202 | — | — | 3,072,202 | ||||||||||||
Total Assets | $ | 119,840,888 | $ | — | $ | — | $ | 119,840,888 | ||||||||
Transfers between investment levels may occur as the markets fluctuate and/or the availability of data used in an investment’s valuation changes. Transfers between valuation levels, if any, are in comparison to the valuation levels at the end of the previous fiscal year, and are effective using the fair value as of the end of the current fiscal period.
For the period ended June 30, 2018, there were no transfers between levels.
SEE NOTES TO FINANCIAL STATEMENTS. | THE GUGGENHEIM FUNDS SEMI-ANNUAL REPORT | 71 |
SERIES O (ALL CAP VALUE SERIES) |
STATEMENT OF ASSETS AND LIABILITIES (Unaudited) | ||||
June 30, 2018 | ||||
Assets: | ||||
Investments, at value (cost $97,175,155) | $ | 119,840,888 | ||
Prepaid expenses | 1,798 | |||
Receivables: | ||||
Securities sold | 937,687 | |||
Dividends | 114,286 | |||
Interest | 1,711 | |||
Total assets | 120,896,370 | |||
Liabilities: | ||||
Payable for: | ||||
Securities purchased | 1,026,590 | |||
Fund shares redeemed | 149,771 | |||
Management fees | 44,573 | |||
Distribution and service fees | 25,542 | |||
Fund accounting/administration fees | 8,174 | |||
Transfer agent/maintenance fees | 2,355 | |||
Trustees’ fees* | 493 | |||
Miscellaneous | 51,030 | |||
Total liabilities | 1,308,528 | |||
Commitments and contingent liabilities (Note 13) | — | |||
Net assets | $ | 119,587,842 | ||
Net assets consist of: | ||||
Paid in capital | $ | 78,140,805 | ||
Undistributed net investment income | 2,031,546 | |||
Accumulated net realized gain on investments | 16,749,758 | |||
Net unrealized appreciation on investments | 22,665,733 | |||
Net assets | $ | 119,587,842 | ||
Capital shares outstanding | 3,299,112 | |||
Net asset value per share | $ | 36.25 | ||
STATEMENT OF OPERATIONS (Unaudited) | ||||
Period Ended June 30, 2018 | ||||
Investment Income: | ||||
Dividends | $ | 1,256,844 | ||
Interest | 11,351 | |||
Total investment income | 1,268,195 | |||
Expenses: | ||||
Management fees | 444,118 | |||
Distribution and service fees | 158,613 | |||
Transfer agent/maintenance fees | 12,553 | |||
Fund accounting/administration fees | 50,757 | |||
Printing expenses | 35,426 | |||
Trustees’ fees* | 4,464 | |||
Custodian fees | 4,338 | |||
Line of credit fees | 2,590 | |||
Miscellaneous | 21,542 | |||
Total expenses | 734,401 | |||
Less: | ||||
Expenses waived by Adviser | (177,759 | ) | ||
Net expenses | 556,642 | |||
Net investment income | 711,553 | |||
Net Realized and Unrealized Gain (Loss): | ||||
Net realized gain (loss) on: | ||||
Investments | 7,567,048 | |||
Net realized gain | 7,567,048 | |||
Net change in unrealized appreciation (depreciation) on: | ||||
Investments | (7,200,101 | ) | ||
Net change in unrealized appreciation (depreciation) | (7,200,101 | ) | ||
Net realized and unrealized gain | 366,947 | |||
Net increase in net assets resulting from operations | $ | 1,078,500 | ||
| * | Relates to Trustees not deemed “interested persons” within the meaning of Section 2(a)(19) of the 1940 Act. |
72 | THE GUGGENHEIM FUNDS SEMI-ANNUAL REPORT | SEE NOTES TO FINANCIAL STATEMENTS. |
SERIES O (ALL CAP VALUE SERIES) |
STATEMENTS OF CHANGES IN NET ASSETS |
Period Ended | Year Ended | |||||||
Increase (Decrease) in Net Assets from Operations: | ||||||||
Net investment income | $ | 711,553 | $ | 881,214 | ||||
Net realized gain on investments | 7,567,048 | 11,334,170 | ||||||
Net change in unrealized appreciation (depreciation) on investments | (7,200,101 | ) | 5,628,145 | |||||
Net increase in net assets resulting from operations | 1,078,500 | 17,843,529 | ||||||
Distributions to shareholders from: | ||||||||
Net investment income | — | (1,377,356 | ) | |||||
Net realized gains | — | (8,869,647 | ) | |||||
Total distributions to shareholders | — | (10,247,003 | ) | |||||
Capital share transactions: | ||||||||
Proceeds from sale of shares | 1,731,339 | 9,056,833 | ||||||
Distributions reinvested | — | 10,247,003 | ||||||
Cost of shares redeemed | (15,992,870 | ) | (22,496,351 | ) | ||||
Net decrease from capital share transactions | (14,261,531 | ) | (3,192,515 | ) | ||||
Net increase (decrease) in net assets | (13,183,031 | ) | 4,404,011 | |||||
Net assets: | ||||||||
Beginning of period | 132,770,873 | 128,366,862 | ||||||
End of period | $ | 119,587,842 | $ | 132,770,873 | ||||
Undistributed net investment income at end of period | $ | 2,031,546 | $ | 1,319,993 | ||||
Capital share activity: | ||||||||
Shares sold | 47,742 | 261,539 | ||||||
Shares issued from reinvestment of distributions | — | 312,504 | ||||||
Shares redeemed | (439,757 | ) | (653,261 | ) | ||||
Net decrease in shares | (392,015 | ) | (79,218 | ) | ||||
SEE NOTES TO FINANCIAL STATEMENTS. | THE GUGGENHEIM FUNDS SEMI-ANNUAL REPORT | 73 |
SERIES O (ALL CAP VALUE SERIES) |
FINANCIAL HIGHLIGHTS |
This table is presented to show selected data for a share outstanding throughout each period and to assist shareholders in evaluating a Fund’s performance for the periods presented.
Period Ended | Year Ended December 31, 2017 | Year Ended December 31, 2016 | Year Ended December 31, 2015 | Year Ended December 31, 2014 | Year Ended December 31, 2013 | |||||||||||||||||||
| Per Share Data | ||||||||||||||||||||||||
| Net asset value, beginning of period | $ | 35.97 | $ | 34.05 | $ | 29.30 | $ | 35.35 | $ | 32.85 | $ | 24.66 | ||||||||||||
| Income (loss) from investment operations: | ||||||||||||||||||||||||
Net investment income (loss)b | .20 | .24 | .45 | .43 | .31 | .24 | ||||||||||||||||||
| Net gain (loss) on investments (realized and unrealized) | .08 | 4.51 | 6.01 | (1.80 | ) | 2.19 | 7.95 | |||||||||||||||||
| Total from investment operations | .28 | 4.75 | 6.46 | (1.37 | ) | 2.50 | 8.19 | |||||||||||||||||
| Less distributions from: | ||||||||||||||||||||||||
| Net investment income | — | (.38 | ) | (.48 | ) | (.33 | ) | (— | )c | — | ||||||||||||||
| Net realized gains | — | (2.45 | ) | (1.23 | ) | (4.35 | ) | — | — | |||||||||||||||
| Total distributions | — | (2.83 | ) | (1.71 | ) | (4.68 | ) | (— | )c | — | ||||||||||||||
| Net asset value, end of period | $ | 36.25 | $ | 35.97 | $ | 34.05 | $ | 29.30 | $ | 35.35 | $ | 32.85 | ||||||||||||
Total Returnd | 0.78 | % | 14.77 | % | 22.71 | % | (4.70 | %) | 7.61 | % | 33.21 | % | ||||||||||||
| Ratios/Supplemental Data | ||||||||||||||||||||||||
| Net assets, end of period (in thousands) | $ | 119,588 | $ | 132,771 | $ | 128,367 | $ | 120,113 | $ | 147,317 | $ | 153,702 | ||||||||||||
| Ratios to average net assets: | ||||||||||||||||||||||||
| Net investment income (loss) | 1.12 | % | 0.69 | % | 1.48 | % | 1.33 | % | 0.92 | % | 0.81 | % | ||||||||||||
| Total expenses | 1.16 | % | 1.11 | % | 0.90 | % | 0.92 | % | 0.89 | % | 0.90 | % | ||||||||||||
Net expensese,f,g | 0.88 | % | 0.89 | % | 0.90 | % | 0.92 | % | 0.89 | % | 0.90 | % | ||||||||||||
| Portfolio turnover rate | 16 | % | 33 | % | 47 | % | 39 | % | 49 | % | 22 | % | ||||||||||||
| a | Unaudited figures for the period ended June 30, 2018. Percentage amounts for the period, except total return and portfolio turnover rate, have been annualized. |
| b | Net investment income (loss) per share was computed using average shares outstanding throughout the period. |
| c | Distributions from net investment income are less than $0.01 per share. |
| d | Total return does not take into account any of the expenses associated with an investment in variable insurance products. If total return had taken into account these expenses, performance would have been lower. Shares of a series of Guggenheim Variable Funds Trust are available only through the purchase of such products. |
| e | Net expense information reflects the expense ratios after expense waivers and reimbursements, as applicable. |
| f | Net expenses may include expenses that are excluded from the expense limitation agreement. Excluding these expenses, the net expense ratios for the periods would be: |
06/30/18 | 12/31/17 | 12/31/16 | 12/31/15 | 12/31/14 | 12/31/13 |
0.88% | 0.88% | N/A | N/A | N/A | N/A |
| g | The portion of the ratios of net expenses to average net assets attributable to recoupments of prior fee reductions or expense reimbursements for the periods presented would be: |
06/30/18 | 12/31/17 | 12/31/16 | 12/31/15 | 12/31/14 | 12/31/13 |
N/A | 0.00%* | N/A | N/A | N/A | N/A |
| * | Less than 0.01%. |
74 | THE GUGGENHEIM FUNDS SEMI-ANNUAL REPORT | SEE NOTES TO FINANCIAL STATEMENTS. |
PERFORMANCE REPORT AND FUND PROFILE (Unaudited) | June 30, 2018 |
SERIES P (HIGH YIELD SERIES)
OBJECTIVE: Seeks high current income. Capital appreciation is a secondary objective.
Holdings Diversification (Market Exposure as % of Net Assets)
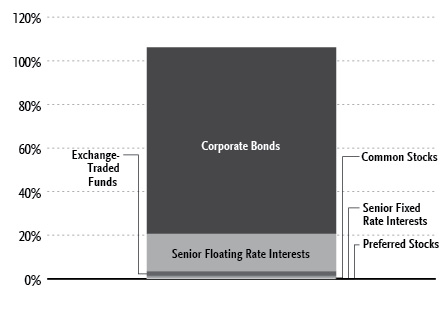
“Holdings Diversification (Market Exposure as % of Net Assets)” excludes any temporary cash investments.
Inception Date: August 5, 1996 |
Ten Largest Holdings (% of Total Net Assets) | |
Vector Group Ltd., 6.13% | 2.1% |
LBC Tank Terminals Holding Netherlands BV, 6.88% | 2.0% |
MDC Partners, Inc., 6.50% | 1.9% |
FBM Finance, Inc., 8.25% | 1.9% |
Unit Corp., 6.63% | 1.8% |
Altice France S.A., 7.38% | 1.7% |
EIG Investors Corp., 10.88% | 1.6% |
Eldorado Gold Corp., 6.13% | 1.6% |
Grinding Media Inc. / MC Grinding Media Canada Inc., 7.38% | 1.6% |
Valeant Pharmaceuticals International, Inc., 7.00% | 1.5% |
Top Ten Total | 17.7% |
“Ten Largest Holdings” excludes any temporary cash or derivative investments.
THE GUGGENHEIM FUNDS SEMI-ANNUAL REPORT 75 |
PERFORMANCE REPORT AND FUND PROFILE (Unaudited)(concluded) | June 30, 2018 |
Average Annual Returns*,†
Periods Ended June 30, 2018
6 month‡ | 1 Year | 5 Year | 10 Year | |
Series P (High Yield Series) | (0.96%) | 1.59% | 4.96% | 7.82% |
Bloomberg Barclays U.S. Corporate High Yield Index | 0.16% | 2.62% | 5.51% | 8.19% |
Portfolio Composition by Quality Rating1 | |
Rating | % of Total |
Fixed Income Instruments | |
A | 0.6% |
B | 38.1% |
BB | 42.1% |
BBB | 4.0% |
CCC | 8.3% |
NR2 | 2.7% |
Other Instruments | 4.2% |
Total Investments | 100.0% |
| * | The performance data above represents past performance that is not predictive of future results. The investment return and principal value of an investment in the Fund will fluctuate so that an investor’s shares, when redeemed, may be worth more or less than their original cost. Returns are historical and include changes in principal and reinvested dividends and capital gains and do not reflect the effect of taxes. The Bloomberg Barclays U.S. Corporate High Yield Index is an unmanaged index and, unlike the Fund, has no management fees or operating expenses to reduce its reported return. |
| † | Performance figures do not reflect fees and expenses associated with an investment in variable insurance products. If returns had taken into account these fees and expenses, performance would have been lower. Shares of a series of Guggenheim Variable Funds Trust are available only through the purchase of such products. |
| ‡ | 6 month returns are not annualized. |
| 1 | Source: BlackRock Solutions. Credit quality ratings are measured on a scale that generally ranges from AAA (highest) to D (lowest). All securities except for those labeled “NR” have been rated by Moody’s, Standard & Poors (“S&P”), or Fitch, which are all a Nationally Recognized Statistical Rating Organization (“NRSRO”). For purposes of this presentation, when ratings are available from more than one agency, the highest rating is used. Guggenheim Investments converts ratings to the equivalent S&P rating. Security ratings are determined at the time of purchase and may change thereafter. |
| 2 | NR securities do not necessarily indicate low credit quality. |
76 | THE GUGGENHEIM FUNDS SEMI-ANNUAL REPORT | SEE NOTES TO FINANCIAL STATEMENTS. |
SCHEDULE OF INVESTMENTS (Unaudited) | June 30, 2018 |
SERIES P (HIGH YIELD SERIES) |
| Value | |||||||
COMMON STOCKS† - 0.9% | ||||||||
Energy - 0.4% | ||||||||
SandRidge Energy, Inc.* | 14,596 | $ | 258,933 | |||||
Approach Resources, Inc.* | 6,367 | 15,535 | ||||||
Titan Energy LLC* | 10,783 | 3,235 | ||||||
Comstock Resources, Inc.* | 1 | 11 | ||||||
Total Energy | 277,714 | |||||||
Utilities - 0.4% | ||||||||
TexGen Power LLC*,††† | 7,929 | 273,550 | ||||||
Communications - 0.1% | ||||||||
Cengage Learning Acquisitions, Inc.*,†† | 2,107 | 19,972 | ||||||
Aimia, Inc.* | 5 | 9 | ||||||
Total Communications | 19,981 | |||||||
Technology - 0.0% | ||||||||
Aspect Software, Inc.*,†††,1,2 | 37 | 751 | ||||||
Total Technology | 751 | |||||||
Financial - 0.0% | ||||||||
Jefferies Financial Group, Inc. | 247 | 5,617 | ||||||
Adelphia Recovery Trust†††,1 | 5,270 | — | ||||||
Total Financial | 5,617 | |||||||
Consumer, Non-cyclical - 0.0% | ||||||||
Crimson Wine Group Ltd.* | 24 | 222 | ||||||
MEDIQ, Inc.*,†††,1 | 92 | — | ||||||
Total Consumer, Non-cyclical | 222 | |||||||
Consumer, Cyclical - 0.0% | ||||||||
Delta Air Lines, Inc. | 1 | 50 | ||||||
Chorus Aviation, Inc. | 3 | 16 | ||||||
Total Consumer, Cyclical | 66 | |||||||
Total Common Stocks | ||||||||
(Cost $2,261,493) | 577,901 | |||||||
PREFERRED STOCKS††† - 0.0% | ||||||||
Industrial - 0.0% | ||||||||
U.S. Shipping Corp. *,1 | 24,529 | 3 | ||||||
Total Preferred Stocks | ||||||||
(Cost $625,000) | 3 | |||||||
WARRANTS††† - 0.0% | ||||||||
Aspect Software Inc.1,2 | 1,294 | 203 | ||||||
Total Warrants | ||||||||
(Cost $—) | 203 | |||||||
EXCHANGE-TRADED FUNDS† - 2.0% | ||||||||
SPDR Bloomberg Barclays High Yield Bond ETF | 26,350 | 934,898 | ||||||
iShares iBoxx $ High Yield Corporate Bond ETF | 4,500 | 382,860 | ||||||
Total Exchange-Traded Funds | ||||||||
(Cost $1,372,954) | 1,317,758 | |||||||
MONEY MARKET FUND† - 1.6% | ||||||||
Dreyfus Treasury Prime Cash Management Institutional — Shares 1.68%3 | 1,068,009 | 1,068,009 | ||||||
Total Money Market Fund | ||||||||
(Cost $1,068,009) | 1,068,009 | |||||||
Face | ||||||||
CORPORATE BONDS†† - 85.7% | ||||||||
Financial - 18.1% | ||||||||
Jefferies Finance LLC / JFIN Company-Issuer Corp. | ||||||||
7.38% due 04/01/204 | 655,000 | 658,098 | ||||||
7.50% due 04/15/214 | 400,000 | 406,000 | ||||||
6.88% due 04/15/224 | 400,000 | 399,000 | ||||||
7.25% due 08/15/244 | 400,000 | 392,000 | ||||||
FBM Finance, Inc. | ||||||||
8.25% due 08/15/214,5 | 1,200,000 | 1,249,500 | ||||||
Fidelity & Guaranty Life Holdings, Inc. | ||||||||
5.50% due 05/01/254 | 750,000 | 731,250 | ||||||
Kennedy-Wilson, Inc. | ||||||||
5.88% due 04/01/24 | 730,000 | 708,100 | ||||||
Icahn Enterprises, LP / Icahn Enterprises Finance Corp. | ||||||||
5.88% due 02/01/22 | 700,000 | 700,875 | ||||||
Citigroup, Inc. | ||||||||
6.30% 6,7 | 650,000 | 659,692 | ||||||
Quicken Loans, Inc. | ||||||||
5.25% due 01/15/284 | 650,000 | 599,495 | ||||||
Lincoln Finance Ltd. | ||||||||
7.38% due 04/15/214 | 550,000 | 567,806 | ||||||
Hunt Companies, Inc. | ||||||||
6.25% due 02/15/264 | 575,000 | 536,188 | ||||||
GEO Group, Inc. | ||||||||
6.00% due 04/15/265 | 250,000 | 242,500 | ||||||
5.88% due 10/15/24 | 200,000 | 197,000 | ||||||
Wilton Re Finance LLC | ||||||||
5.88% due 03/30/334,7 | 400,000 | 420,234 | ||||||
Greystar Real Estate Partners LLC | ||||||||
5.75% due 12/01/254 | 375,000 | 363,750 | ||||||
CoreCivic, Inc. | ||||||||
4.75% due 10/15/27 | 400,000 | 363,000 | ||||||
LoanCore Capital Markets LLC / JLC Finance Corp. | ||||||||
6.88% due 06/01/204 | 350,000 | 354,375 | ||||||
AmWINS Group, Inc. | ||||||||
7.75% due 07/01/264 | 350,000 | 350,000 | ||||||
American Equity Investment Life Holding Co. | ||||||||
5.00% due 06/15/27 | 350,000 | 341,585 | ||||||
EPR Properties | ||||||||
5.75% due 08/15/22 | 300,000 | 314,560 | ||||||
Oxford Finance LLC / Oxford Finance Company-Issuer II, Inc. | ||||||||
6.38% due 12/15/224 | 300,000 | 304,500 | ||||||
SEE NOTES TO FINANCIAL STATEMENTS. | THE GUGGENHEIM FUNDS SEMI-ANNUAL REPORT | 77 |
SCHEDULE OF INVESTMENTS (Unaudited)(continued) | June 30, 2018 |
SERIES P (HIGH YIELD SERIES) |
Face | Value | |||||||
NFP Corp. | ||||||||
6.88% due 07/15/254 | 300,000 | $ | 294,000 | |||||
HUB International Ltd. | ||||||||
7.00% due 05/01/264 | 275,000 | 271,562 | ||||||
Goldman Sachs Group, Inc. | ||||||||
5.30% 6,7 | 250,000 | 244,375 | ||||||
USIS Merger Sub, Inc. | ||||||||
6.88% due 05/01/254 | 225,000 | 223,875 | ||||||
Assurant, Inc. | ||||||||
7.00% due 03/27/487 | 200,000 | 201,885 | ||||||
CIT Group, Inc. | ||||||||
6.13% due 03/09/28 | 50,000 | 51,375 | ||||||
Total Financial | 12,146,580 | |||||||
Communications - 18.1% | ||||||||
Altice France S.A. | ||||||||
7.38% due 05/01/264,5 | 1,175,000 | 1,148,798 | ||||||
6.00% due 05/15/224 | 200,000 | 200,710 | ||||||
MDC Partners, Inc. | ||||||||
6.50% due 05/01/244 | 1,475,000 | 1,279,563 | ||||||
CCO Holdings LLC / CCO Holdings Capital Corp. | ||||||||
5.13% due 05/01/27 | 800,000 | 748,500 | ||||||
5.00% due 02/01/28 | 425,000 | 388,875 | ||||||
EIG Investors Corp. | ||||||||
10.88% due 02/01/24 | 1,000,000 | 1,101,500 | ||||||
Cengage Learning, Inc. | ||||||||
9.50% due 06/15/244 | 1,175,000 | 989,938 | ||||||
McGraw-Hill Global Education Holdings LLC / McGraw-Hill Global Education Finance | ||||||||
7.88% due 05/15/244 | 1,050,000 | 971,250 | ||||||
DISH DBS Corp. | ||||||||
5.88% due 11/15/245 | 1,000,000 | 846,250 | ||||||
7.75% due 07/01/26 | 125,000 | 109,531 | ||||||
CSC Holdings LLC | ||||||||
5.25% due 06/01/24 | 650,000 | 614,250 | ||||||
5.50% due 04/15/274 | 150,000 | 143,250 | ||||||
Level 3 Financing, Inc. | ||||||||
5.25% due 03/15/26 | 250,000 | 237,775 | ||||||
5.38% due 01/15/24 | 200,000 | 195,900 | ||||||
5.38% due 08/15/22 | 150,000 | 150,000 | ||||||
5.38% due 05/01/25 | 100,000 | 96,250 | ||||||
Virgin Media Secured Finance plc | ||||||||
5.00% due 04/15/27 | 450,000 | 579,130 | ||||||
UPCB Finance VII Ltd. | GBP | |||||||
3.63% due 06/15/29 | EUR | 450,000 | 507,214 | |||||
Telenet Finance Lux Note | ||||||||
3.50% due 03/01/28 | EUR | 400,000 | 441,560 | |||||
Inmarsat Finance plc | ||||||||
4.88% due 05/15/224 | 425,000 | 417,562 | ||||||
Zayo Group LLC / Zayo Capital, Inc. | ||||||||
5.75% due 01/15/274 | 350,000 | 343,875 | ||||||
Charter Communications Operating LLC | ||||||||
4.20% due 03/15/28 | 225,000 | 210,640 | ||||||
Ziggo Bond Finance BV | ||||||||
5.88% due 01/15/254 | 200,000 | 186,878 | ||||||
Ziggo BV | ||||||||
5.50% due 01/15/274 | 200,000 | 186,820 | ||||||
Total Communications | 12,096,019 | |||||||
Energy - 13.0% | ||||||||
Unit Corp. | ||||||||
6.63% due 05/15/21 | 1,225,000 | 1,221,937 | ||||||
American Midstream Partners Limited Partnership / American Midstream Finance Corp. | ||||||||
9.25% due 12/15/214 | 980,000 | 960,400 | ||||||
Legacy Reserves Limited Partnership / Legacy Reserves Finance Corp. | ||||||||
6.63% due 12/01/21 | 605,000 | 480,975 | ||||||
8.00% due 12/01/20 | 410,000 | 348,500 | ||||||
Indigo Natural Resources LLC | ||||||||
6.88% due 02/15/264 | 850,000 | 820,250 | ||||||
Exterran Energy Solutions Limited Partnership / EES Finance Corp. | ||||||||
8.13% due 05/01/25 | 675,000 | 712,125 | ||||||
Moss Creek Resources Holdings, Inc. | ||||||||
7.50% due 01/15/264 | 650,000 | 637,000 | ||||||
PDC Energy, Inc. | ||||||||
5.75% due 05/15/264 | 450,000 | 445,500 | ||||||
6.13% due 09/15/24 | 50,000 | 51,000 | ||||||
Comstock Resources, Inc. | ||||||||
10.00% due 03/15/20 | 400,000 | 418,000 | ||||||
Covey Park Energy LLC / Covey Park Finance Corp. | ||||||||
7.50% due 05/15/254 | 350,000 | 357,000 | ||||||
Parkland Fuel Corp. | ||||||||
6.00% due 04/01/264 | 350,000 | 344,750 | ||||||
Pattern Energy Group, Inc. | ||||||||
5.88% due 02/01/244 | 325,000 | 325,000 | ||||||
Summit Midstream Holdings LLC / Summit Midstream Finance Corp. | �� | |||||||
5.75% due 04/15/25 | 275,000 | 261,250 | ||||||
Callon Petroleum Co. | ||||||||
6.13% due 10/01/24 | 250,000 | 253,125 | ||||||
Cheniere Corpus Christi Holdings LLC | ||||||||
5.88% due 03/31/25 | 200,000 | 208,000 | ||||||
CNX Resources Corp. | ||||||||
5.88% due 04/15/22 | 200,000 | 201,038 | ||||||
SRC Energy, Inc. | ||||||||
6.25% due 12/01/254 | 200,000 | 199,750 | ||||||
Jagged Peak Energy LLC | ||||||||
5.88% due 05/01/264 | 150,000 | 147,000 | ||||||
NuStar Logistics, LP | ||||||||
5.63% due 04/28/27 | 150,000 | 145,125 | ||||||
Trinidad Drilling Ltd. | ||||||||
6.63% due 02/15/254 | 150,000 | 144,375 | ||||||
Schahin II Finance Co. SPV Ltd. | ||||||||
5.88% due 09/25/228,9 | 173,733 | 24,323 | ||||||
Total Energy | 8,706,423 | |||||||
78 | THE GUGGENHEIM FUNDS SEMI-ANNUAL REPORT | SEE NOTES TO FINANCIAL STATEMENTS. |
SCHEDULE OF INVESTMENTS (Unaudited)(continued) | June 30, 2018 |
SERIES P (HIGH YIELD SERIES) |
Face | Value | |||||||
Consumer, Non-cyclical - 12.3% | ||||||||
Vector Group Ltd. | ||||||||
6.13% due 02/01/254,5 | 1,450,000 | $ | 1,401,063 | |||||
Valeant Pharmaceuticals International, Inc. | ||||||||
7.00% due 03/15/244 | 950,000 | 996,027 | ||||||
5.50% due 11/01/254 | 200,000 | 197,100 | ||||||
6.50% due 03/15/224,5 | 150,000 | 155,250 | ||||||
Great Lakes Dredge & Dock Corp. | ||||||||
8.00% due 05/15/22 | 900,000 | 920,250 | ||||||
Midas Intermediate Holdco II LLC | ||||||||
7.88% due 10/01/224 | 775,000 | 747,875 | ||||||
FAGE International S.A./ FAGE USA Dairy Industry, Inc. | ||||||||
5.63% due 08/15/264 | 660,000 | 607,200 | ||||||
Albertsons Companies, Inc. | ||||||||
6.09% (3 Month USD LIBOR + 3.75%) due 01/15/244,10 | 500,000 | 501,250 | ||||||
Post Holdings, Inc. | ||||||||
5.63% due 01/15/284 | 500,000 | 468,750 | ||||||
Avantor, Inc. | ||||||||
6.00% due 10/01/244 | 200,000 | 197,840 | ||||||
4.75% due 10/01/24 | EUR | 100,000 | 117,066 | |||||
Endo Dac / Endo Finance LLC / Endo Finco, Inc. | ||||||||
5.88% due 10/15/244 | 300,000 | 292,500 | ||||||
KeHE Distributors LLC / KeHE Finance Corp. | ||||||||
7.63% due 08/15/219 | 300,000 | 291,750 | ||||||
Graham Holdings Co. | ||||||||
5.75% due 06/01/264 | 250,000 | 252,500 | ||||||
Beverages & More, Inc. | ||||||||
11.50% due 06/15/224 | 250,000 | 215,000 | ||||||
Flexi-Van Leasing, Inc. | ||||||||
10.00% due 02/15/234 | 225,000 | 212,625 | ||||||
Acadia Healthcare Company, Inc. | ||||||||
6.50% due 03/01/24 | 200,000 | 205,000 | ||||||
Carriage Services, Inc. | ||||||||
6.63% due 06/01/264 | 200,000 | 202,750 | ||||||
Endo Finance LLC / Endo Finco, Inc. | ||||||||
5.38% due 01/15/234 | 125,000 | 100,000 | ||||||
7.25% due 01/15/224,5 | 75,000 | 69,000 | ||||||
Albertsons Companies LLC / Safeway Incorporated / New Albertsons Limited Partnership / Albertson’s LLC | ||||||||
5.75% due 03/15/25 | 100,000 | 88,500 | ||||||
Total Consumer, Non-cyclical | 8,239,296 | |||||||
Consumer, Cyclical - 10.2% | ||||||||
Seminole Hard Rock Entertainment Inc. / Seminole Hard Rock International LLC | ||||||||
5.88% due 05/15/214 | 650,000 | 653,250 | ||||||
Wynn Las Vegas LLC / Wynn Las Vegas Capital Corp. | ||||||||
5.50% due 03/01/254 | 550,000 | 540,375 | ||||||
AMC Entertainment Holdings, Inc. | ||||||||
6.13% due 05/15/275 | 375,000 | 363,750 | ||||||
5.88% due 11/15/265 | 150,000 | 144,375 | ||||||
Carrols Restaurant Group, Inc. | ||||||||
8.00% due 05/01/22 | 450,000 | 468,000 | ||||||
Nathan’s Famous, Inc. | ||||||||
6.63% due 11/01/254 | 450,000 | 454,500 | ||||||
Ferrellgas, LP / Ferrellgas Finance Corp. | ||||||||
6.75% due 01/15/22 | 500,000 | 452,500 | ||||||
Ferrellgas Limited Partnership / Ferrellgas Finance Corp. | ||||||||
6.75% due 06/15/235 | 450,000 | 391,500 | ||||||
Suburban Propane Partners, LP / Suburban Energy Finance Corp. | ||||||||
5.50% due 06/01/24 | 350,000 | 339,500 | ||||||
VOC Escrow Ltd. | ||||||||
5.00% due 02/15/284 | 350,000 | 330,649 | ||||||
Delphi Technologies plc | ||||||||
5.00% due 10/01/254 | 340,000 | 324,275 | ||||||
Suburban Propane Partners Limited Partnership/Suburban Energy Finance Corp. | ||||||||
5.88% due 03/01/27 | 300,000 | 280,500 | ||||||
Pinnacle Bidco plc | ||||||||
6.38% due 02/15/25 | GBP | 200,000 | 265,437 | |||||
Titan International, Inc. | ||||||||
6.50% due 11/30/234 | 250,000 | 249,375 | ||||||
Hilton Domestic Operating Company, Inc. | ||||||||
5.13% due 05/01/264 | 250,000 | 245,625 | ||||||
JB Poindexter & Company, Inc. | ||||||||
7.13% due 04/15/264 | 225,000 | 230,625 | ||||||
Williams Scotsman International, Inc. | ||||||||
7.88% due 12/15/224 | 210,000 | 217,350 | ||||||
MGM Resorts International | ||||||||
5.75% due 06/15/25 | 200,000 | 199,690 | ||||||
Lennar Corp. | ||||||||
5.00% due 06/15/27 | 170,000 | 162,775 | ||||||
L Brands, Inc. | ||||||||
7.60% due 07/15/37 | 175,000 | 159,250 | ||||||
Wyndham Hotels & Resorts, Inc. | ||||||||
5.38% due 04/15/264 | 125,000 | 124,062 | ||||||
Wabash National Corp. | ||||||||
5.50% due 10/01/254 | 115,000 | 110,400 | ||||||
Allison Transmission, Inc. | ||||||||
4.75% due 10/01/274 | 100,000 | 93,250 | ||||||
American Tire Distributors, Inc. | ||||||||
10.25% due 03/01/224 | 350,000 | 77,000 | ||||||
Total Consumer, Cyclical | 6,878,013 | |||||||
Industrial - 5.8% | ||||||||
Grinding Media Inc. / MC Grinding Media Canada Inc. | ||||||||
7.38% due 12/15/234 | 1,050,000 | 1,094,625 | ||||||
Standard Industries, Inc. | ||||||||
4.75% due 01/15/284 | 650,000 | 596,375 | ||||||
Cleaver-Brooks, Inc. | ||||||||
7.88% due 03/01/234 | 400,000 | 412,000 | ||||||
Tutor Perini Corp. | ||||||||
6.88% due 05/01/254 | 299,000 | 299,374 | ||||||
SEE NOTES TO FINANCIAL STATEMENTS. | THE GUGGENHEIM FUNDS SEMI-ANNUAL REPORT | 79 |
SCHEDULE OF INVESTMENTS (Unaudited)(continued) | June 30, 2018 |
SERIES P (HIGH YIELD SERIES) |
Face | Value | |||||||
LKQ European Holdings BV | ||||||||
4.13% due 04/01/28 | EUR | 250,000 | $ | 287,929 | ||||
BWX Technologies, Inc. | ||||||||
5.38% due 07/15/264 | 250,000 | 253,125 | ||||||
Jeld-Wen, Inc. | ||||||||
4.88% due 12/15/274 | 250,000 | 232,500 | ||||||
Novelis Corp. | ||||||||
5.88% due 09/30/264,5 | 220,000 | 210,650 | ||||||
Itron, Inc. | ||||||||
5.00% due 01/15/264 | 150,000 | 142,455 | ||||||
Ardagh Packaging Finance plc / Ardagh Holdings USA, Inc. | ||||||||
7.25% due 05/15/244 | 125,000 | 130,000 | ||||||
New Enterprise Stone & Lime Company, Inc. | ||||||||
6.25% due 03/15/264,5 | 75,000 | 75,750 | ||||||
Wrangler Buyer Corp. | ||||||||
6.00% due 10/01/254 | 80,000 | 75,600 | ||||||
Kratos Defense & Security Solutions, Inc. | ||||||||
6.50% due 11/30/254 | 50,000 | 51,875 | ||||||
Total Industrial | 3,862,258 | |||||||
Utilities - 3.7% | ||||||||
LBC Tank Terminals Holding Netherlands BV | ||||||||
6.88% due 05/15/234,5 | 1,325,000 | 1,338,250 | ||||||
Terraform Global Operating LLC | ||||||||
6.13% due 03/01/264 | 625,000 | 617,187 | ||||||
AmeriGas Partners, LP / AmeriGas Finance Corp. | ||||||||
5.75% due 05/20/27 | 350,000 | 332,500 | ||||||
Superior Plus Limited Partnership / Superior General Partner, Inc. | ||||||||
7.00% due 07/15/264 | 200,000 | 201,500 | ||||||
Total Utilities | 2,489,437 | |||||||
Basic Materials - 3.6% | ||||||||
Eldorado Gold Corp. | ||||||||
6.13% due 12/15/204,5 | 1,140,000 | 1,100,100 | ||||||
Big River Steel LLC / BRS Finance Corp. | ||||||||
7.25% due 09/01/254 | 400,000 | 411,040 | ||||||
Clearwater Paper Corp. | ||||||||
5.38% due 02/01/254 | 225,000 | 203,906 | ||||||
4.50% due 02/01/23 | 150,000 | 140,250 | ||||||
Yamana Gold, Inc. | ||||||||
4.95% due 07/15/24 | 300,000 | 299,673 | ||||||
Alcoa Nederland Holding BV | ||||||||
6.13% due 05/15/284 | 150,000 | 150,937 | ||||||
Mirabela Nickel Ltd. | ||||||||
9.50% due 06/24/198 | 390,085 | 85,819 | ||||||
Total Basic Materials | 2,391,725 | |||||||
Technology - 0.9% | ||||||||
Infor US, Inc. | ||||||||
5.75% due 08/15/204 | 350,000 | 354,375 | ||||||
CDK Global, Inc. | ||||||||
5.88% due 06/15/26 | 150,000 | 152,850 | ||||||
Ascend Learning LLC | ||||||||
6.88% due 08/01/254 | 100,000 | 100,875 | ||||||
Total Technology | 608,100 | |||||||
Total Corporate Bonds | ||||||||
(Cost $59,520,518) | 57,417,851 | |||||||
SENIOR FLOATING RATE INTERESTS††,10 - 17.5% | ||||||||
Industrial - 5.5% | ||||||||
Pregis Holding I Corp. | ||||||||
5.83% (3 Month USD LIBOR + 3.50%) due 05/20/21 | 738,052 | 733,904 | ||||||
CPG International LLC | ||||||||
6.25% (6 Month USD LIBOR + 3.75%) due 05/05/24 | 485,890 | 485,079 | ||||||
Springs Window Fashions | ||||||||
6.32% (3 Month USD LIBOR + 4.25%) due 06/15/25 | 275,000 | 276,031 | ||||||
10.57% (3 Month USD LIBOR + 8.50%) due 06/15/26 | 150,000 | 144,000 | ||||||
Zodiac Pool Solutions LLC | ||||||||
8.00% (Commercial Prime Lending Rate + 3.00%) due 12/20/23 | 375,922 | 375,453 | ||||||
Hardware Holdings LLC | ||||||||
8.59% (1 Month USD LIBOR + 6.50%) due 03/30/20†††,1 | 275,625 | 259,777 | ||||||
Resource Label Group LLC | ||||||||
10.80% (3 Month USD LIBOR + 8.50%) due 11/26/23 | 250,000 | 247,500 | ||||||
Advanced Integration Technology LP | ||||||||
7.22% (3 Month USD LIBOR + 4.75%) due 04/03/23 | 223,508 | 222,949 | ||||||
Diversitech Holdings, Inc. | ||||||||
9.84% (3 Month USD LIBOR + 7.50%) due 06/02/25 | 200,000 | 201,500 | ||||||
Arctic Long Carriers | ||||||||
6.59% (1 Month USD LIBOR + 4.50%) due 05/18/23 | 198,000 | 198,248 | ||||||
TransDigm Group, Inc. | ||||||||
4.59% (1 Month USD LIBOR + 2.50%) due 05/31/25 | 199,500 | 197,786 | ||||||
ILPEA Parent, Inc. | ||||||||
6.85% (1 Month USD LIBOR + 4.75%) due 03/02/23 | 170,217 | 170,430 | ||||||
Argo Merchants | ||||||||
6.08% (3 Month USD LIBOR + 3.75%) due 12/06/24 | 149,271 | 149,457 | ||||||
Total Industrial | 3,662,114 | |||||||
Consumer, Non-cyclical - 3.5% | ||||||||
IHC Holding Corp. | ||||||||
8.84% (1 Month USD LIBOR + 6.75%) due 04/30/21†††,1 | 520,654 | 516,961 | ||||||
Reddy Ice Holdings, Inc. | ||||||||
11.83% (3 Month USD LIBOR + 9.50%) due 11/01/19 | 530,000 | 502,837 | ||||||
80 | THE GUGGENHEIM FUNDS SEMI-ANNUAL REPORT | SEE NOTES TO FINANCIAL STATEMENTS. |
SCHEDULE OF INVESTMENTS (Unaudited)(continued) | June 30, 2018 |
SERIES P (HIGH YIELD SERIES) |
Face | Value | |||||||
Immucor, Inc. | ||||||||
7.09% (1 Month USD LIBOR + 5.00%) due 06/15/21 | 346,500 | $ | 350,111 | |||||
Endo Luxembourg Finance Co. | ||||||||
6.38% (1 Month USD LIBOR + 4.25%) due 04/29/24 | 346,500 | 345,634 | ||||||
CTI Foods Holding Co. LLC | ||||||||
9.35% (1 Month USD LIBOR + 7.25%) due 06/28/21 | 300,000 | 223,125 | ||||||
Avantor, Inc. | ||||||||
6.09% (1 Month USD LIBOR + 4.00%) due 11/21/24 | 149,250 | 149,872 | ||||||
ScribeAmerica Intermediate Holdco LLC (Healthchannels) | ||||||||
6.81% (3 Month USD LIBOR + 4.50%) due 04/03/25 | 149,625 | 149,625 | ||||||
Give and Go Prepared Foods Corp. | ||||||||
6.58% (3 Month USD LIBOR + 4.25%) due 07/29/23 | 129,025 | 120,961 | ||||||
Total Consumer, Non-cyclical | 2,359,126 | |||||||
Consumer, Cyclical - 3.0% | ||||||||
BBB Industries, LLC | ||||||||
6.39% (1 Month USD LIBOR + 4.00% and Commercial Prime Lending Rate + 3.00%) due 11/04/19†††,1 | 465,000 | 447,491 | ||||||
6.59% (1 Month USD LIBOR + 4.50%) due 11/03/21 | 283,343 | 283,343 | ||||||
4.50% (3 Month USD LIBOR + 4.50%) due 06/26/25 | 150,000 | 148,875 | ||||||
Acosta, Inc. | ||||||||
5.56% (1 Month USD LIBOR + 3.25%) due 09/26/19 | 377,778 | 283,805 | ||||||
5.48% (3 Month USD LIBOR + 3.25%) due 09/26/19 | 111,111 | 83,472 | ||||||
Blue Nile, Inc. | ||||||||
8.59% (1 Month USD LIBOR + 6.50%) due 02/17/23 | 213,750 | 214,819 | ||||||
Amaya Holdings B.V. | ||||||||
3.50% (3 Month USD LIBOR + 3.50%) due 07/29/25 | 200,000 | 199,500 | ||||||
Truck Hero, Inc. | ||||||||
5.84% (1 Month USD LIBOR + 3.75%) due 04/22/24 | 150,000 | 149,749 | ||||||
Belk, Inc. | ||||||||
7.09% (3 Month USD LIBOR + 4.75%) due 12/12/22 | 145,847 | 112,484 | ||||||
Sears Roebuck Acceptance Corp. | ||||||||
6.51% (1 Month USD LIBOR + 3.50%) due 01/18/19 | 49,512 | 49,224 | ||||||
Mavis Tire Express Services Corp. | ||||||||
5.33% (1 Month USD LIBOR + 3.25%) due 03/20/25 | 48,001 | 47,521 | ||||||
Total Consumer, Cyclical | 2,020,283 | |||||||
Communications - 2.2% | ||||||||
Cengage Learning Acquisitions, Inc. | ||||||||
6.34% (1 Month USD LIBOR + 4.25%) due 06/07/23 | 489,347 | 448,364 | ||||||
Unitymedia Finance LLC | ||||||||
4.07% (1 Month USD LIBOR + 2.00%) due 06/01/23 | 250,000 | 248,072 | ||||||
Mcgraw-Hill Global Education Holdings LLC | ||||||||
6.09% (1 Month USD LIBOR + 4.00%) due 05/04/22 | 247,455 | 241,682 | ||||||
GTT Communications, Inc. | ||||||||
4.88% (3 Month USD LIBOR + 2.75%) due 05/31/25 | 200,000 | 196,850 | ||||||
Imagine Print Solutions LLC | ||||||||
6.85% (1 Month USD LIBOR + 4.75%) due 06/21/22 | 197,500 | 181,700 | ||||||
Flight Bidco, Inc. | ||||||||
3.50% (3 Month USD LIBOR + 3.50%) due 06/07/25 | 150,000 | 149,438 | ||||||
Total Communications | 1,466,106 | |||||||
Technology - 1.7% | ||||||||
Misys Ltd. | ||||||||
5.81% (3 Month USD LIBOR + 3.50%) due 06/13/24 | 545,875 | 535,716 | ||||||
Planview, Inc. | ||||||||
7.34% (1 Month USD LIBOR + 5.25%) due 01/27/23†††,1 | 345,625 | 342,545 | ||||||
Greenway Health LLC | ||||||||
6.08% (3 Month USD LIBOR + 3.75%) due 02/16/24 | 149,622 | 149,343 | ||||||
OEConnection LLC | ||||||||
6.10% (3 Month USD LIBOR + 4.00%) due 11/22/24 | 107,814 | 107,544 | ||||||
Aspect Software, Inc. | ||||||||
12.59% (1 Month USD LIBOR + 10.50%) due 05/25/202 | 14,467 | 13,418 | ||||||
Total Technology | 1,148,566 | |||||||
Financial - 0.8% | ||||||||
York Risk Services | ||||||||
5.84% (1 Month USD LIBOR + 3.75%) due 10/01/21 | 366,667 | 355,010 | ||||||
iStar, Inc. | ||||||||
2.75% (3 Month USD LIBOR + 2.75%) due 06/19/23 | 150,000 | 149,438 | ||||||
Total Financial | 504,448 | |||||||
Utilities - 0.5% | ||||||||
Invenergy Thermal Operating I, LLC | ||||||||
7.83% (3 Month USD LIBOR + 5.50%) due 10/19/22 | 364,149 | 360,507 | ||||||
SEE NOTES TO FINANCIAL STATEMENTS. | THE GUGGENHEIM FUNDS SEMI-ANNUAL REPORT | 81 |
SCHEDULE OF INVESTMENTS (Unaudited)(continued) | June 30, 2018 |
SERIES P (HIGH YIELD SERIES) |
Face | Value | |||||||
Energy - 0.3% | ||||||||
Permian Production Partners | ||||||||
8.09% (1 Month USD LIBOR + 6.00%) due 05/20/24 | 200,000 | $ | 197,000 | |||||
Total Senior Floating Rate Interests | ||||||||
(Cost $11,940,254) | 11,718,150 | |||||||
SENIOR FIXED RATE INTERESTS†† - 0.4% | ||||||||
Energy - 0.1% | ||||||||
YAK MAT (YAK ACCESS LLC) | ||||||||
10.00% due 06/13/26 | 100,000 | 93,000 | ||||||
Total Senior Fixed Rate Interests | ||||||||
(Cost $93,000) | 93,000 | |||||||
Total Investments - 107.8% | ||||||||
(Cost $76,881,228) | $ | 72,192,875 | ||||||
Other Assets & Liabilities, net - (7.8)% | (5,193,411 | ) | ||||||
Total Net Assets - 100.0% | $ | 66,999,464 | ||||||
FORWARD FOREIGN CURRENCY EXCHANGE CONTRACTS†† | ||||||||||||||||||||
Counterparty | Contracts to Sell | Currency | Settlement | Settlement | Value at | Net Unrealized | ||||||||||||||
JPMorgan Chase & Co. | 656,000 | GBP | 07/16/18 | $ | 881,173 | $ | 866,354 | $ | 14,819 | |||||||||||
Goldman Sachs | 1,199,000 | EUR | 07/16/18 | 1,415,348 | 1,401,554 | 13,794 | ||||||||||||||
JPMorgan Chase & Co. | 615,000 | CAD | 07/16/18 | 474,719 | 467,986 | 6,733 | ||||||||||||||
| $ | 35,346 | |||||||||||||||||||
| ~ | The face amount is denominated in U.S. dollars unless otherwise indicated. |
| * | Non-income producing security. |
| † | Value determined based on Level 1 inputs, unless otherwise noted — See Note 4. |
| †† | Value determined based on Level 2 inputs, unless otherwise noted — See Note 4. |
| ††† | Value determined based on Level 3 inputs — See Note 4. |
| 1 | Security was fair valued by the Valuation Committee at June 30, 2018. The total market value of fair valued securities amounts to $1,567,731, (cost $3,392,256) or 2.3% of total net assets. |
| 2 | Affiliated issuer. |
| 3 | Rate indicated is the 7 day yield as of June 30, 2018. |
| 4 | Security is a 144A or Section 4(a)(2) security. These securities have been determined to be liquid under guidelines established by the Board of Trustees. The total market value of 144A or Section 4(a)(2) securities is $37,828,642 (cost $39,022,170), or 56.5% of total net assets. |
| 5 | All or a portion of these securities have been physically segregated or earmarked in connection with reverse repurchase agreements and/or unfunded loan commitments. As of June 30, 2018, the total market value of segregated or earmarked securities was $8,372,985. |
| 6 | Perpetual maturity. |
| 7 | Security has a fixed rate coupon which will convert to a floating or variable rate coupon on a future date. |
| 8 | Security is in default of interest and/or principal obligations. |
| 9 | Security is a 144A or Section 4(a)(2) security. These securities have been determined to be illiquid and restricted under guidelines established by the Board of Trustees. The total market value of 144A or Section 4(a)(2) illiquid and restricted securities is $316,073 (cost $414,097), or 0.5% of total net assets — See Note 9. |
| 10 | Variable rate security. Rate indicated is the rate effective at June 30, 2018. In some instances, the underlying reference rate shown was below the minimum rate earned by the security or has been adjusted by a predetermined factor. The settlement status of a position may also impact the effective rate indicated. In instances where multiple underlying reference rates and spread amounts are shown, the effective rate is based on a weighted average. |
CAD — Canadian Dollar
EUR — Euro
GBP — British Pound
LIBOR — London Interbank Offered Rate
plc — Public Limited Company
USD — United States Dollar
See Sector Classification in Other Information section.
82 | THE GUGGENHEIM FUNDS SEMI-ANNUAL REPORT | SEE NOTES TO FINANCIAL STATEMENTS. |
SCHEDULE OF INVESTMENTS (Unaudited)(continued) | June 30, 2018 |
SERIES P (HIGH YIELD SERIES) |
The following table summarizes the inputs used to value the Fund’s investments at June 30, 2018 (See Note 4 in the Notes to Financial Statements):
Investments in Securities (Assets) | Level 1 | Level 2 | Level 3 | Total | ||||||||||||
Common Stocks | $ | 283,628 | $ | 19,972 | $ | 274,301 | $ | 577,901 | ||||||||
Preferred Stocks | — | — | 3 | 3 | ||||||||||||
Warrants | — | — | 203 | 203 | ||||||||||||
Exchange-Traded Funds | 1,317,758 | — | — | 1,317,758 | ||||||||||||
Money Market Fund | 1,068,009 | — | — | 1,068,009 | ||||||||||||
Corporate Bonds | — | 57,417,851 | — | 57,417,851 | ||||||||||||
Senior Floating Rate Interests | — | 10,151,376 | 1,566,774 | 11,718,150 | ||||||||||||
Senior Fixed Rate Interests | — | 93,000 | — | 93,000 | ||||||||||||
Forward Foreign Currency Exchange Contracts* | — | 35,346 | — | 35,346 | ||||||||||||
Total Assets | $ | 2,669,395 | $ | 67,717,545 | $ | 1,841,281 | $ | 72,228,221 | ||||||||
Investments in Securities (Liabilities) | Level 1 | Level 2 | Level 3 | Total | ||||||||||||
Unfunded Loan Commitments (Note 8) | $ | — | $ | 127,210 | $ | 64,890 | $ | 192,100 | ||||||||
| * | This derivative is reported as unrealized appreciation at period end. |
The Fund may hold assets and /or liabilities in which the fair value approximates the carrying amount for financial statement purposes. As of period end, reverse repurchase agreements of $7,398,926 are categorized as Level 2 within the disclosure hierarchy.
The following is a summary of significant unobservable inputs used in the fair valuation of assets and liabilities categorized within Level 3 of the fair value hierarchy:
Category | Ending | Valuation Technique | Unobservable Inputs | Input Range | Weighted | ||||||||||
Assets | |||||||||||||||
Common Stocks | $ | 273,550 | Option Adjusted Spread off the prior month end broker mark over the 3 month LIBOR | Indicative Quote | — | — | |||||||||
Common Stocks | 751 | Enterprise Value | Valuation Multiple | 8.9x | — | ||||||||||
Senior Floating Rate Interests | 859,506 | Yield Analysis | Yield | 7.6%-9.1 | % | 8.5 | % | ||||||||
Senior Floating Rate Interests | 447,491 | Model Price | Purchase Price | — | — | ||||||||||
Senior Floating Rate Interests | 259,777 | Enterprise Value | Valuation Multiple | 9.1x | — | ||||||||||
Total Assets | $ | 1,841,075 |
|
| |||||||||||
Liabilities | |||||||||||||||
Unfunded Loan Commitments | $ | 64,890 | Model Price | Purchase Price | — | — | |||||||||
Any remaining Level 3 securities held by the Fund and excluded from the tables above, were not considered material to the Fund.
Transfers between investment levels may occur as the markets fluctuate and/or the availability of data used in an investment’s valuation changes. Transfers between valuation levels, if any, are in comparison to the valuation levels at the end of the previous fiscal year, and are effective using the fair value as of the end of the current fiscal period.
SEE NOTES TO FINANCIAL STATEMENTS. | THE GUGGENHEIM FUNDS SEMI-ANNUAL REPORT | 83 |
SCHEDULE OF INVESTMENTS (Unaudited)(concluded) | June 30, 2018 |
SERIES P (HIGH YIELD SERIES) |
For the period ended June 30, 2018, the Fund had securities with a total value of $259,783 transfer out of Level 2 into Level 3 and securities (assets) with a total value of $367,277 and securities (liabilities) with a total value of $127,138 transfer out of Level 3 into Level 2 due to changes in the security valuation methods based on availability of vendor prices. There were no other securities that transferred between levels.
Following is a reconciliation of Level 3 assets for which significant unobservable inputs were used to determine fair value for the period ended June 30, 2018:
Assets | Liabilities | |||||||||||||||||||||||
Senior Floating | Warrants | Common | Preferred | Total Assets | Unfunded Loan | |||||||||||||||||||
Beginning Balance | $ | 2,239,189 | $ | — | $ | 228,015 | $ | — | $ | 2,467,204 | $ | (186,495 | ) | |||||||||||
Purchases/(Receipts) | 696,286 | — | 257,490 | — | 953,776 | (73,179 | ) | |||||||||||||||||
(Sales, maturities and paydowns)/Fundings | (1,236,876 | ) | — | — | — | (1,236,876 | ) | 128,656 | ||||||||||||||||
Amortization of discount/premiums | 32,639 | — | — | — | 32,639 | — | ||||||||||||||||||
Total realized gains or losses included in earnings | 15,538 | — | — | — | 15,538 | 182,499 | ||||||||||||||||||
Total change in unrealized appreciation (depreciation) included in earnings | (72,505 | ) | 203 | (211,204 | ) | — | (283,506 | ) | (243,509 | ) | ||||||||||||||
Transfers into Level 3 | 259,780 | — | — | 3 | 259,783 | — | ||||||||||||||||||
Transfers out of Level 3 | (367,277 | ) | — | — | — | (367,277 | ) | 127,138 | ||||||||||||||||
Ending Balance | $ | 1,566,774 | $ | 203 | $ | 274,301 | $ | 3 | $ | 1,841,281 | $ | (64,890 | ) | |||||||||||
Net Change in unrealized appreciation (depreciation) for investments in Level 3 securities still held at June 30, 2018 | $ | 29,616 | $ | 203 | $ | (211,204 | ) | $ | (25,753 | ) | $ | (207,138 | ) | $ | (18,419 | ) | ||||||||
Affiliated Transactions
Investments representing 5% or more of the outstanding voting shares of a portfolio company of a fund, or control of or by, or common control under Guggenheim Investments ("GI"), result in that portfolio company being considered an affiliated company of such fund, as defined in the 1940 Act.
Transactions during the period ended June 30, 2018, in which the portfolio company is an “affiliated person”, were as follows:
Security Name | Value | Additions | Reductions | Realized | Change in | Value | Shares | Investment | ||||||||||||||||||||||||
Common Stocks | ||||||||||||||||||||||||||||||||
Aspect Software Parent, Inc.1,2 | $ | 228,015 | $ | — | $ | — | $ | — | $ | (227,264 | ) | $ | 751 | 37 | $ | — | ||||||||||||||||
Senior Floating Rate Interests | ||||||||||||||||||||||||||||||||
Aspect Software, Inc. 12.59% (1 Month USD LIBOR + 10.50%) due 05/25/203 | 14,155 | 283 | (328 | ) | 142 | (834 | ) | 13,418 | 14,467 | 1,169 | ||||||||||||||||||||||
Warrants | ||||||||||||||||||||||||||||||||
Aspect Software, Inc.2 | — | — | — | — | 203 | 203 | 1,294 | — | ||||||||||||||||||||||||
| $ | 242,170 | $ | 283 | $ | (328 | ) | $ | 142 | $ | (227,895 | ) | $ | 14,372 | $ | 1,169 | |||||||||||||||||
| 1 | Non-income producing security. |
| 2 | Security was fair valued by the Valuation Committee at June 30, 2018. The total market value of affiliated fair valued securities amounts to $954 (cost $922,558) or less than 0.1% of total net assets. |
| 3 | Variable rate security. Rate indicated is rate effective at June 30, 2018. In some instances, the underlying reference rate shown was below the minimum rate earned by the security or has been adjusted by a predetermined factor. The settlement status of a position may also impact the effective rate indicated. In instances where multiple underlying reference rates and spread amounts are shown, the effective rate is based on a weighted average. |
84 | THE GUGGENHEIM FUNDS SEMI-ANNUAL REPORT | SEE NOTES TO FINANCIAL STATEMENTS. |
SERIES P (HIGH YIELD SERIES) |
STATEMENT OF ASSETS AND LIABILITIES (Unaudited) | ||||
June 30, 2018 | ||||
Assets: | ||||
Investments in unaffiliated issuers, at value (cost $75,944,203) | $ | 72,178,503 | ||
Investments in affiliated issuers, at value (cost $937,025) | 14,372 | |||
Foreign currency, at value (cost $9,471) | 9,524 | |||
Cash | 11,826 | |||
Unrealized appreciation on forward foreign currency exchange contracts | 35,346 | |||
Prepaid expenses | 2,585 | |||
Receivables: | ||||
Securities sold | 3,064,233 | |||
Interest | 1,016,320 | |||
Foreign tax reclaims | 1,250 | |||
Fund shares sold | 367 | |||
Total assets | 76,334,326 | |||
Liabilities: | ||||
Unfunded loan commitments, at value (Note 8) (proceeds $301,882) | 192,100 | |||
Reverse Repurchase Agreements | 7,398,926 | |||
Payable for: | ||||
Securities purchased | 1,642,009 | |||
Management fees | 25,807 | |||
Distribution and service fees | 14,088 | |||
Fund shares redeemed | 10,579 | |||
Fund accounting/administration fees | 4,508 | |||
Transfer agent/maintenance fees | 2,319 | |||
Trustees’ fees* | 242 | |||
Miscellaneous | 44,284 | |||
Total liabilities | 9,334,862 | |||
Commitments and contingent liabilities (Note 13) | — | |||
Net assets | $ | 66,999,464 | ||
Net assets consist of: | ||||
Paid in capital | $ | 66,860,152 | ||
Undistributed net investment income | 7,901,634 | |||
Accumulated net realized loss on investments | (3,218,139 | ) | ||
Net unrealized depreciation on investments | (4,544,183 | ) | ||
Net assets | $ | 66,999,464 | ||
Capital shares outstanding | 2,173,267 | |||
Net asset value per share | $ | 30.83 | ||
STATEMENT OF OPERATIONS (Unaudited) | ||||
Period Ended June 30, 2018 | ||||
Investment Income: | ||||
Dividends from securities of unaffiliated issuers | $ | 28,448 | ||
Interest from securities of affiliated issuers | 1,169 | |||
Interest from securities of unaffiliated issuers | 2,591,892 | |||
Total investment income | 2,621,509 | |||
Expenses: | ||||
Management fees | 218,449 | |||
Distribution and service fees | 91,020 | |||
Transfer agent/maintenance fees | 12,593 | |||
Interest on reverse repurchase agreements | 73,957 | |||
Fund accounting/administration fees | 29,127 | |||
Custodian fees | 15,161 | |||
Trustees’ fees* | 5,195 | |||
Line of credit fees | 2,567 | |||
Miscellaneous | 46,802 | |||
Total expenses | 494,871 | |||
Less: | ||||
Expenses waived by Adviser | (35,829 | ) | ||
Net expenses | 459,042 | |||
Net investment income | 2,162,467 | |||
Net Realized and Unrealized Gain (Loss): | ||||
Net realized gain (loss) on: | ||||
Investments in unaffiliated issuers | (931,008 | ) | ||
Investments in affiliated issuers | 142 | |||
Foreign currency transactions | 31,173 | |||
Forward foreign currency exchange contracts | 5,885 | |||
Net realized loss | (893,808 | ) | ||
Net change in unrealized appreciation (depreciation) on: | ||||
Investments in unaffiliated issuers | (1,913,211 | ) | ||
Investments in affiliated issuers | (227,895 | ) | ||
Foreign currency translations | (313 | ) | ||
Forward foreign currency exchange contracts | 68,675 | |||
Net change in unrealized appreciation (depreciation) | (2,072,744 | ) | ||
Net realized and unrealized loss | (2,966,552 | ) | ||
Net decrease in net assets resulting from operations | $ | (804,085 | ) | |
| * | Relates to Trustees not deemed “interested persons” within the meaning of Section 2(a)(19) of the 1940 Act. |
SEE NOTES TO FINANCIAL STATEMENTS. | THE GUGGENHEIM FUNDS SEMI-ANNUAL REPORT | 85 |
SERIES P (HIGH YIELD SERIES) |
STATEMENTS OF CHANGES IN NET ASSETS |
Period Ended | Year Ended | |||||||
Increase (Decrease) in Net Assets from Operations: | ||||||||
Net investment income | $ | 2,162,467 | $ | 5,134,441 | ||||
Net realized gain (loss) on investments | (893,808 | ) | 1,378,907 | |||||
Net change in unrealized appreciation (depreciation) on investments | (2,072,744 | ) | (1,192,572 | ) | ||||
Net increase (decrease) in net assets resulting from operations | (804,085 | ) | 5,320,776 | |||||
Distributions to shareholders from: | ||||||||
Net investment income | — | (4,444,487 | ) | |||||
Total distributions to shareholders | — | (4,444,487 | ) | |||||
Capital share transactions: | ||||||||
Proceeds from sale of shares | 15,057,846 | 48,625,417 | ||||||
Distributions reinvested | — | 4,444,487 | ||||||
Cost of shares redeemed | (26,525,920 | ) | (70,434,661 | ) | ||||
Net decrease from capital share transactions | (11,468,074 | ) | (17,364,757 | ) | ||||
Net decrease in net assets | (12,272,159 | ) | (16,488,468 | ) | ||||
Net assets: | ||||||||
Beginning of period | 79,271,623 | 95,760,091 | ||||||
End of period | $ | 66,999,464 | $ | 79,271,623 | ||||
Undistributed net investment income at end of period | $ | 7,901,634 | $ | 5,739,167 | ||||
Capital share activity: | ||||||||
Shares sold | 484,494 | 1,555,665 | ||||||
Shares issued from reinvestment of distributions | — | 145,769 | ||||||
Shares redeemed | (857,816 | ) | (2,261,824 | ) | ||||
Net decrease in shares | (373,322 | ) | (560,390 | ) | ||||
86 | THE GUGGENHEIM FUNDS SEMI-ANNUAL REPORT | SEE NOTES TO FINANCIAL STATEMENTS. |
SERIES P (HIGH YIELD SERIES) |
STATEMENT OF CASH FLOWS (Unaudited) |
Period Ended June 30, 2018 |
Cash Flows from Operating Activities: | ||||
Net Decrease in net assets resulting from operations | $ | (804,085 | ) | |
Adjustments to Reconcile Net Increase in Net Assets Resulting from Operations to | ||||
Net Cash Provided by Operating and Investing Activities: | ||||
Net change in unrealized (appreciation) depreciation on investments | 2,141,106 | |||
Net change in unrealized (appreciation) depreciation on forward foreign currency exchange contracts | (68,675 | ) | ||
Net realized loss on investments | 930,866 | |||
Net realized gain on forward foreign currency exchange contracts | (5,885 | ) | ||
Net accretion of bond discount and amortization of bond premium | (64,338 | ) | ||
Purchase of long-term investments | (22,873,324 | ) | ||
Paydowns received on mortgage and asset-backed securities | 2,517,095 | |||
Proceeds from sale of long-term investments | 30,935,855 | |||
Net purchases of short-term investments | 835,355 | |||
Other payments | 18,238 | |||
Decrease in interest receivable | 21,011 | |||
Increase in securities sold receivable | (2,377,183 | ) | ||
Decrease in foreign tax reclaims receivable | 52 | |||
Increase in prepaid expenses | 4,119 | |||
Increase in securities purchased payable | 979,238 | |||
Commitment fees received and repayments of unfunded commitments | 73,179 | |||
Unfunded Loan commitment fundings | (128,656 | ) | ||
Increase in transfer agent/maintenance fees payable | 207 | |||
Decrease in Fund accounting/administration fees payable | (951 | ) | ||
Decrease in distribution and service fees payable | (2,970 | ) | ||
Decrease in trustees' fees* payable | (31 | ) | ||
Decrease in management fees payable | (6,941 | ) | ||
Decrease in recoupment of previously waived expenses payable | (3 | ) | ||
Increase in miscellaneous payable | 9,570 | |||
Net Cash Provided by Operating and Investing Activities | 12,132,849 | |||
Cash Flows From Financing Activities: | ||||
Proceeds from sales of shares | 15,077,175 | |||
Cost of shares redeemed | (26,562,908 | ) | ||
Proceeds from reverse repurchase agreements | 44,488,257 | |||
Payments made on reverse repurchase agreements | (45,316,231 | ) | ||
Net Cash Used in Financing Activities | (12,313,707 | ) | ||
Net decrease in cash | (180,858 | ) | ||
Cash at Beginning of Period (including foreign currency) | 202,208 | |||
Cash at End of Period (including foreign currency) | $ | 21,350 | ||
Supplemental Disclosure of Cash Flow Information: | ||||
Cash paid during the period for interest | $ | 130,343 |
| * | Relates to Trustees not deemed “interested persons” within the meaning of Section 2(a)(19) of the 1940 Act. |
SEE NOTES TO FINANCIAL STATEMENTS. | THE GUGGENHEIM FUNDS SEMI-ANNUAL REPORT | 87 |
SERIES P (HIGH YIELD SERIES) |
FINANCIAL HIGHLIGHTS |
This table is presented to show selected data for a share outstanding throughout each period and to assist shareholders in evaluating a Fund’s performance for the periods presented.
Period Ended | Year Ended December 31, 2017 | Year Ended December 31, 2016 | Year Ended December 31, 2015 | Year Ended December 31, 2014 | Year Ended December 31, 2013 | |||||||||||||||||||
| Per Share Data | ||||||||||||||||||||||||
| Net asset value, beginning of period | $ | 31.13 | $ | 30.82 | $ | 28.63 | $ | 33.87 | $ | 33.02 | $ | 30.75 | ||||||||||||
| Income (loss) from investment operations: | ||||||||||||||||||||||||
Net investment income (loss)b | .91 | 1.81 | 1.91 | 2.17 | 2.23 | 2.20 | ||||||||||||||||||
| Net gain (loss) on investments (realized and unrealized) | (1.21 | ) | .09 | 2.93 | (3.23 | ) | (1.38 | ) | .07 | |||||||||||||||
| Total from investment operations | (.30 | ) | 1.90 | 4.84 | (1.06 | ) | .85 | 2.27 | ||||||||||||||||
| Less distributions from: | ||||||||||||||||||||||||
| Net investment income | — | (1.59 | ) | (2.65 | ) | (3.49 | ) | — | — | |||||||||||||||
| Net realized gains | — | — | — | (.69 | ) | — | — | |||||||||||||||||
| Total distributions | — | (1.59 | ) | (2.65 | ) | (4.18 | ) | — | — | |||||||||||||||
| Net asset value, end of period | $ | 30.83 | $ | 31.13 | $ | 30.82 | $ | 28.63 | $ | 33.87 | $ | 33.02 | ||||||||||||
Total Returnc | (0.96 | %) | 6.23 | % | 17.52 | % | (3.95 | %) | 2.51 | % | 7.38 | % | ||||||||||||
| Ratios/Supplemental Data | ||||||||||||||||||||||||
| Net assets, end of period (in thousands) | $ | 66,999 | $ | 79,272 | $ | 95,760 | $ | 66,908 | $ | 79,192 | $ | 123,983 | ||||||||||||
| Ratios to average net assets: | ||||||||||||||||||||||||
| Net investment income (loss) | 5.94 | % | 5.79 | % | 6.46 | % | 6.69 | % | 6.50 | % | 6.86 | % | ||||||||||||
Total expensesd | 1.36 | % | 1.40 | % | 1.17 | % | 1.19 | % | 1.09 | % | 1.07 | % | ||||||||||||
Net expensese,g | 1.26 | %f | 1.33 | %f | 1.13 | %f | 1.15 | %f | 1.08 | %f | 1.07 | % | ||||||||||||
| Portfolio turnover rate | 30 | % | 76 | % | 84 | % | 101 | % | 90 | % | 100 | % | ||||||||||||
| a | Unaudited figures for the period ended June 30, 2018. Percentage amounts for the period, except total return and portfolio turnover rate, have been annualized. |
| b | Net investment income (loss) per share was computed using average shares outstanding throughout the period. |
| c | Total return does not take into account any of the expenses associated with an investment in variable insurance products. If total return had taken into account these expenses, performance would have been lower. Shares of a series of Guggenheim Variable Funds Trust are available only through the purchase of such products. |
| d | Does not include expenses of the underlying funds in which the Fund invests. |
| e | Net expense information reflects the expense ratios after expense waivers and reimbursements, as applicable. |
| f | Net expenses may include expenses that are excluded from the expense limitation agreement and affiliated fee waivers. Excluding these expenses, the net expense ratios for the periods would be: |
06/30/18 | 12/31/17 | 12/31/16 | 12/31/15 | 12/31/14 |
1.07% | 1.07% | 1.07% | 1.07% | 0.97% |
| g | The portion of the ratios of net expenses to average net assets attributable to recoupments of prior fee reductions or expense reimbursements for the periods presented would be: |
06/30/18 | 12/31/17 | 12/31/16 | 12/31/15 | 12/31/14 | 12/31/13 |
N/A | 0.02% | N/A | N/A | N/A | N/A |
88 | THE GUGGENHEIM FUNDS SEMI-ANNUAL REPORT | SEE NOTES TO FINANCIAL STATEMENTS. |
PERFORMANCE REPORT AND FUND PROFILE (Unaudited) | June 30, 2018 |
SERIES Q (SMALL CAP VALUE SERIES)
OBJECTIVE: Seeks long-term capital appreciation.
Holdings Diversification (Market Exposure as % of Net Assets)
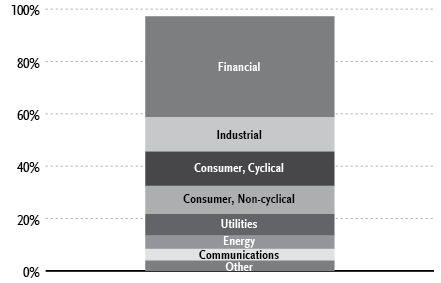
“Holdings Diversification (Market Exposure as % of Net Assets)” excludes any temporary cash investments.
Inception Date: May 1, 2000 |
Ten Largest Holdings (% of Total Net Assets) | |
Portland General Electric Co. | 1.7% |
UniFirst Corp. | 1.7% |
Berkshire Hills Bancorp, Inc. | 1.7% |
Rowan Companies plc — Class A | 1.6% |
Wintrust Financial Corp. | 1.6% |
First Citizens BancShares, Inc. — Class A | 1.5% |
Spire, Inc. | 1.5% |
Umpqua Holdings Corp. | 1.5% |
Cathay General Bancorp | 1.5% |
Viavi Solutions, Inc. | 1.5% |
Top Ten Total | 15.8% |
“Ten Largest Holdings” excludes any temporary cash investments.
Average Annual Returns*,†
Periods Ended June 30, 2018
6 month‡ | 1 Year | 5 Year | 10 Year | |
Series Q (Small Cap Value Series) | 3.60% | 7.64% | 8.27% | 8.70% |
Russell 2000 Value Index | 5.44% | 13.10% | 11.18% | 9.88% |
| * | The performance data above represents past performance that is not predictive of future results. The investment return and principal value of an investment in the Fund will fluctuate so that an investor’s shares, when redeemed, may be worth more or less than their original cost. Returns are historical and include changes in principal and reinvested dividends and capital gains and do not reflect the effect of taxes. The Russell 2000 Value Index is an unmanaged index and, unlike the Fund, has no management fees or operating expenses to reduce its reported return. |
| † | Performance figures do not reflect fees and expenses associated with an investment in variable insurance products. If returns had taken into account these fees and expenses, performance would have been lower. Shares of a series of Guggenheim Variable Funds Trust are available only through the purchase of such products. |
| ‡ | 6 month returns are not annualized. |
THE GUGGENHEIM FUNDS SEMI-ANNUAL REPORT 89 |
SCHEDULE OF INVESTMENTS (Unaudited) | June 30, 2018 |
SERIES Q (SMALL CAP VALUE SERIES) |
| Value | |||||||
COMMON STOCKS† - 97.3% | ||||||||
Financial - 38.5% | ||||||||
Berkshire Hills Bancorp, Inc. | 36,336 | $ | 1,475,242 | |||||
Wintrust Financial Corp. | 16,226 | 1,412,473 | ||||||
First Citizens BancShares, Inc. — Class A | 3,341 | 1,347,425 | ||||||
Umpqua Holdings Corp. | 59,098 | 1,335,024 | ||||||
Cathay General Bancorp | 32,715 | 1,324,630 | ||||||
Fulton Financial Corp. | 75,492 | 1,245,618 | ||||||
BancorpSouth Bank | 37,033 | 1,220,237 | ||||||
Federal Agricultural Mortgage Corp. — Class C | 12,962 | 1,159,840 | ||||||
Argo Group International Holdings Ltd. | 18,749 | 1,090,254 | ||||||
Trustmark Corp. | 31,400 | 1,024,582 | ||||||
Hanmi Financial Corp. | 35,569 | 1,008,381 | ||||||
Beneficial Bancorp, Inc. | 60,591 | 981,574 | ||||||
Redwood Trust, Inc. REIT | 58,416 | 962,112 | ||||||
TriCo Bancshares | 25,632 | 959,918 | ||||||
Hersha Hospitality Trust REIT | 44,246 | 949,077 | ||||||
Investors Bancorp, Inc. | 71,084 | 909,164 | ||||||
Radian Group, Inc. | 55,810 | 905,238 | ||||||
Tier REIT, Inc. | 36,937 | 878,362 | ||||||
MBIA, Inc.* | 84,775 | 766,366 | ||||||
RLJ Lodging Trust REIT | 33,967 | 748,972 | ||||||
Valley National Bancorp | 61,085 | 742,794 | ||||||
Flagstar Bancorp, Inc.* | 21,032 | 720,556 | ||||||
Cousins Properties, Inc. REIT | 69,436 | 672,835 | ||||||
iStar, Inc. REIT* | 60,533 | 653,151 | ||||||
Invesco Mortgage Capital, Inc. REIT | 40,987 | 651,693 | ||||||
Old National Bancorp | 34,150 | 635,190 | ||||||
LaSalle Hotel Properties REIT | 17,957 | 614,668 | ||||||
Hancock Whitney Corp. | 13,170 | 614,381 | ||||||
Genworth Financial, Inc. — Class A* | 130,931 | 589,190 | ||||||
Sunstone Hotel Investors, Inc. REIT | 35,434 | 588,913 | ||||||
MB Financial, Inc. | 12,038 | 562,175 | ||||||
Cohen & Steers, Inc. | 11,554 | 481,917 | ||||||
Summit Hotel Properties, Inc. REIT | 33,367 | 477,482 | ||||||
Cowen, Inc. — Class A* | 34,461 | 477,285 | ||||||
Equity Commonwealth REIT* | 14,912 | 469,728 | ||||||
Lexington Realty Trust REIT | 53,590 | 467,841 | ||||||
Physicians Realty Trust REIT | 26,383 | 420,545 | ||||||
1st Source Corp. | 7,566 | 404,251 | ||||||
IBERIABANK Corp. | 5,106 | 387,035 | ||||||
Washington Federal, Inc. | 11,777 | 385,108 | ||||||
Stifel Financial Corp. | 7,323 | 382,627 | ||||||
Hilltop Holdings, Inc. | 16,467 | 363,427 | ||||||
Customers Bancorp, Inc.* | 11,808 | 335,111 | ||||||
ARMOUR Residential REIT, Inc. | 10,698 | 244,021 | ||||||
Total Financial | 34,046,413 | |||||||
Industrial - 13.2% | ||||||||
GATX Corp. | 13,329 | 989,412 | ||||||
Louisiana-Pacific Corp. | 35,517 | 966,773 | ||||||
Plexus Corp.* | 16,048 | 955,498 | ||||||
Trinseo S.A. | 12,217 | 866,796 | ||||||
TriMas Corp.* | 28,534 | 838,900 | ||||||
KEMET Corp.* | 28,322 | 683,976 | ||||||
Marten Transport Ltd. | 27,509 | 645,086 | ||||||
Matson, Inc. | 16,525 | 634,230 | ||||||
ITT, Inc. | 11,612 | 606,959 | ||||||
GasLog Ltd. | 31,633 | 604,190 | ||||||
Crane Co. | 7,418 | 594,404 | ||||||
Methode Electronics, Inc. | 14,324 | 577,257 | ||||||
Worthington Industries, Inc. | 13,316 | 558,872 | ||||||
Greenbrier Companies, Inc. | 9,871 | 520,695 | ||||||
Sanmina Corp.* | 16,812 | 492,592 | ||||||
Esterline Technologies Corp.* | 6,081 | 448,778 | ||||||
Argan, Inc. | 9,780 | 400,491 | ||||||
Scorpio Tankers, Inc. | 111,905 | 314,453 | ||||||
Total Industrial | 11,699,362 | |||||||
Consumer, Cyclical - 13.1% | ||||||||
UniFirst Corp. | 8,412 | 1,488,083 | ||||||
International Speedway Corp. — Class A | 27,705 | 1,238,413 | ||||||
Hawaiian Holdings, Inc. | 31,086 | 1,117,542 | ||||||
Wabash National Corp. | 51,568 | 962,259 | ||||||
MDC Holdings, Inc. | 31,019 | 954,455 | ||||||
Meritage Homes Corp.* | 20,089 | 882,912 | ||||||
Tenneco, Inc. | 17,087 | 751,144 | ||||||
Cooper Tire & Rubber Co. | 26,380 | 693,794 | ||||||
Century Communities, Inc.* | 18,859 | 595,001 | ||||||
Asbury Automotive Group, Inc.* | 8,581 | 588,228 | ||||||
Unifi, Inc.* | 16,681 | 528,788 | ||||||
La-Z-Boy, Inc. | 14,519 | 444,281 | ||||||
Deckers Outdoor Corp.* | 3,772 | 425,821 | ||||||
Cheesecake Factory, Inc. | 6,513 | 358,606 | ||||||
Caleres, Inc. | 10,015 | 344,416 | ||||||
DSW, Inc. — Class A | 9,821 | 253,578 | ||||||
Total Consumer, Cyclical | 11,627,321 | |||||||
Consumer, Non-cyclical - 10.8% | ||||||||
Encompass Health Corp. | 14,281 | 967,109 | ||||||
AMN Healthcare Services, Inc.* | 12,646 | 741,055 | ||||||
Fresh Del Monte Produce, Inc. | 16,491 | 734,674 | ||||||
FTI Consulting, Inc.* | 12,137 | 734,046 | ||||||
Dean Foods Co. | 68,927 | 724,423 | ||||||
Emergent BioSolutions, Inc.* | 13,790 | 696,257 | ||||||
Lannett Company, Inc.* | 46,372 | 630,659 | ||||||
Navigant Consulting, Inc.* | 28,245 | 625,344 | ||||||
Premier, Inc. — Class A* | 17,104 | 622,244 | ||||||
Carriage Services, Inc. — Class A | 21,174 | 519,822 | ||||||
Innoviva, Inc.* | 37,424 | 516,451 | ||||||
AMAG Pharmaceuticals, Inc.* | 25,754 | 502,203 | ||||||
Boston Beer Company, Inc. — Class A* | 1,593 | 477,422 | ||||||
Cambrex Corp.* | 8,909 | 465,941 | ||||||
Universal Corp. | 6,815 | 450,131 | ||||||
Community Health Systems, Inc.* | 59,825 | 198,619 | ||||||
Total Consumer, Non-cyclical | 9,606,400 | |||||||
Utilities - 8.2% | ||||||||
Portland General Electric Co. | 35,024 | 1,497,626 | ||||||
Spire, Inc. | 18,968 | 1,340,089 | ||||||
PNM Resources, Inc. | 31,014 | 1,206,445 | ||||||
Black Hills Corp. | 17,554 | 1,074,480 | ||||||
90 | THE GUGGENHEIM FUNDS SEMI-ANNUAL REPORT | SEE NOTES TO FINANCIAL STATEMENTS. |
SCHEDULE OF INVESTMENTS (Unaudited)(continued) | June 30, 2018 |
SERIES Q (SMALL CAP VALUE SERIES) |
| Value | |||||||
ONE Gas, Inc. | 10,567 | $ | 789,778 | |||||
ALLETE, Inc. | 6,868 | 531,652 | ||||||
Ormat Technologies, Inc. | 8,423 | 448,020 | ||||||
Southwest Gas Holdings, Inc. | 4,971 | 379,138 | ||||||
Total Utilities | 7,267,228 | |||||||
Energy - 5.1% | ||||||||
Rowan Companies plc — Class A* | 87,273 | 1,415,568 | ||||||
Oasis Petroleum, Inc.* | 93,398 | 1,211,372 | ||||||
MRC Global, Inc.* | 25,687 | 556,637 | ||||||
Laredo Petroleum, Inc.* | 54,921 | 528,340 | ||||||
Oceaneering International, Inc. | 19,049 | 484,988 | ||||||
Gulfport Energy Corp.* | 24,215 | 304,383 | ||||||
Total Energy | 4,501,288 | |||||||
Communications - 4.5% | ||||||||
Viavi Solutions, Inc.* | 126,007 | 1,290,312 | ||||||
Ciena Corp.* | 31,207 | 827,297 | ||||||
Scholastic Corp. | 12,148 | 538,278 | ||||||
NeoPhotonics Corp.* | 83,001 | 517,096 | ||||||
InterDigital, Inc. | 5,712 | 462,101 | ||||||
Finisar Corp.* | 17,215 | 309,870 | ||||||
Total Communications | 3,944,954 | |||||||
Technology - 2.7% | ||||||||
Cray, Inc.* | 25,686 | 631,876 | ||||||
ManTech International Corp. — Class A | 10,148 | 544,339 | ||||||
Photronics, Inc.* | 64,554 | 514,818 | ||||||
MicroStrategy, Inc. — Class A* | 3,836 | 490,049 | ||||||
InnerWorkings, Inc.* | 26,879 | 233,578 | ||||||
Total Technology | 2,414,660 | |||||||
Basic Materials - 1.2% | ||||||||
Kaiser Aluminum Corp. | 10,158 | 1,057,549 | ||||||
Total Common Stocks | ||||||||
(Cost $75,066,026) | 86,165,175 | |||||||
CONVERTIBLE PREFERRED STOCKS††† - 0.0% | ||||||||
Thermoenergy Corp.*,1,2 | 116,667 | 34 | ||||||
Total Convertible Preferred Stocks | ||||||||
(Cost $111,409) | 34 | |||||||
MONEY MARKET FUND† - 2.7% | ||||||||
Dreyfus Treasury Prime Cash Management Fund — Institutional Class 1.68%3 | 2,401,129 | 2,401,129 | ||||||
Total Money Market Fund | ||||||||
(Cost $2,401,129) | 2,401,129 | |||||||
Total Investments - 100.0% | ||||||||
(Cost $77,578,564) | $ | 88,566,338 | ||||||
Other Assets & Liabilities, net - 0.0% | (29,388 | ) | ||||||
Total Net Assets - 100.0% | $ | 88,536,950 | ||||||
| * | Non-income producing security. |
| † | Value determined based on Level 1 inputs — See Note 4. |
| ††† | Value determined based on Level 3 inputs — See Note 4. |
| 1 | Security was fair valued by the Valuation Committee at June 30, 2018. The total market value of fair valued securities amounts to $34, (cost $111,409) or less than 0.01% of total net assets. |
| 2 | PIPE (Private Investment in Public Equity) — Stock issued by a company in the secondary market as a means of raising capital more quickly and less expensively than through registration of a secondary public offering. |
| 3 | Rate indicated is the 7 day yield as of June 30, 2018. |
plc — Public Limited Company
REIT — Real Estate Investment Trust
See Sector Classification in Other Information section.
SEE NOTES TO FINANCIAL STATEMENTS. | THE GUGGENHEIM FUNDS SEMI-ANNUAL REPORT | 91 |
SCHEDULE OF INVESTMENTS (Unaudited)(concluded) | June 30, 2018 |
SERIES Q (SMALL CAP VALUE SERIES) |
The following table summarizes the inputs used to value the Fund’s investments at June 30, 2018 (See Note 4 in the Notes to Financial Statements):
Investments in Securities (Assets) | Level 1 | Level 2 | Level 3 | Total | ||||||||||||
Common Stocks | $ | 86,165,175 | $ | — | $ | — | $ | 86,165,175 | ||||||||
Convertible Preferred Stocks | — | — | 34 | 34 | ||||||||||||
Money Market Fund | 2,401,129 | — | — | 2,401,129 | ||||||||||||
Total Assets | $ | 88,566,304 | $ | — | $ | 34 | $ | 88,566,338 | ||||||||
Transfers between investment levels may occur as the markets fluctuate and/or the availability of data used in an investment’s valuation changes. Transfers between valuation levels, if any, are in comparison to the valuation levels at the end of the previous fiscal year, and are effective using the fair value as of the end of the current fiscal period.
For the period ended June 30, 2018, there were no transfers between levels.
92 | THE GUGGENHEIM FUNDS SEMI-ANNUAL REPORT | SEE NOTES TO FINANCIAL STATEMENTS. |
SERIES Q (SMALL CAP VALUE SERIES) |
STATEMENT OF ASSETS AND LIABILITIES (Unaudited) | ||||
June 30, 2018 | ||||
Assets: | ||||
Investments, at value (cost $77,578,564) | $ | 88,566,338 | ||
Cash | 5,963 | |||
Prepaid expenses | 1,497 | |||
Receivables: | ||||
Dividends | 124,081 | |||
Fund shares sold | 4,502 | |||
Interest | 3,650 | |||
Total assets | 88,706,031 | |||
Liabilities: | ||||
Payable for: | ||||
Fund shares redeemed | 64,454 | |||
Management fees | 50,203 | |||
Distribution and service fees | 19,371 | |||
Direct shareholders expense | 11,525 | |||
Fund accounting/administration fees | 6,199 | |||
Transfer agent/maintenance fees | 2,163 | |||
Trustees’ fees* | 186 | |||
Miscellaneous | 14,980 | |||
Total liabilities | 169,081 | |||
Commitments and contingent liabilities (Note 13) | — | |||
Net assets | $ | 88,536,950 | ||
Net assets consist of: | ||||
Paid in capital | $ | 63,895,358 | ||
Undistributed net investment income | 559,886 | |||
Accumulated net realized gain on investments | 13,093,932 | |||
Net unrealized appreciation on investments | 10,987,774 | |||
Net assets | $ | 88,536,950 | ||
Capital shares outstanding | 1,862,537 | |||
Net asset value per share | $ | 47.54 | ||
STATEMENT OF OPERATIONS (Unaudited) | ||||
Period Ended June 30, 2018 | ||||
Investment Income: | ||||
Dividends | $ | 781,403 | ||
Interest | 13,423 | |||
Total investment income | 794,826 | |||
Expenses: | ||||
Management fees | 356,605 | |||
Distribution and service fees: | 118,868 | |||
Transfer agent/maintenance fees | 12,579 | |||
Fund accounting/administration fees | 38,038 | |||
Trustees’ fees* | 6,433 | |||
Custodian fees | 2,384 | |||
Line of credit fees | 2,098 | |||
Miscellaneous | 43,026 | |||
Total expenses | 580,031 | |||
Less: | ||||
Expenses waived by Adviser | (39,669 | ) | ||
Net expenses | 540,362 | |||
Net investment income | 254,464 | |||
Net Realized and Unrealized Gain (Loss): | ||||
Net realized gain (loss) on: | ||||
Investments | 4,736,198 | |||
Net realized gain | 4,736,198 | |||
Net change in unrealized appreciation (depreciation) on: | ||||
Investments | (1,550,679 | ) | ||
Net change in unrealized appreciation (depreciation) | (1,550,679 | ) | ||
Net realized and unrealized gain | 3,185,519 | |||
Net increase in net assets resulting from operations | $ | 3,439,983 | ||
| * | Relates to Trustees not deemed “interested persons” within the meaning of Section 2(a)(19) of the 1940 Act. |
SEE NOTES TO FINANCIAL STATEMENTS. | THE GUGGENHEIM FUNDS SEMI-ANNUAL REPORT | 93 |
SERIES Q (SMALL CAP VALUE SERIES) |
STATEMENTS OF CHANGES IN NET ASSETS |
Period Ended | Year Ended | |||||||
Increase (Decrease) in Net Assets from Operations: | ||||||||
Net investment income | $ | 254,464 | $ | 108,409 | ||||
Net realized gain on investments | 4,736,198 | 9,859,160 | ||||||
Net change in unrealized appreciation (depreciation) on investments | (1,550,679 | ) | (6,613,838 | ) | ||||
Net increase in net assets resulting from operations | 3,439,983 | 3,353,731 | ||||||
Distributions to shareholders from: | ||||||||
Net investment income | — | (370,808 | ) | |||||
Net realized gains | — | (3,397,089 | ) | |||||
Total distributions to shareholders | — | (3,767,897 | ) | |||||
Capital share transactions: | ||||||||
Proceeds from sale of shares | 3,554,850 | 12,755,388 | ||||||
Distributions reinvested | — | 3,767,897 | ||||||
Cost of shares redeemed | (17,183,935 | ) | (23,686,702 | ) | ||||
Net decrease from capital share transactions | (13,629,085 | ) | (7,163,417 | ) | ||||
Net decrease in net assets | (10,189,102 | ) | (7,577,583 | ) | ||||
Net assets: | ||||||||
Beginning of period | 98,726,052 | 106,303,635 | ||||||
End of period | $ | 88,536,950 | $ | 98,726,052 | ||||
Undistributed net investment income at end of period | $ | 559,886 | $ | 305,422 | ||||
Capital share activity: | ||||||||
Shares sold | 75,503 | 277,428 | ||||||
Shares issued from reinvestment of distributions | — | 85,035 | ||||||
Shares redeemed | (364,101 | ) | (521,418 | ) | ||||
Net decrease in shares | (288,598 | ) | (158,955 | ) | ||||
94 | THE GUGGENHEIM FUNDS SEMI-ANNUAL REPORT | SEE NOTES TO FINANCIAL STATEMENTS. |
SERIES Q (SMALL CAP VALUE SERIES) |
FINANCIAL HIGHLIGHTS |
This table is presented to show selected data for a share outstanding throughout each period and to assist shareholders in evaluating a Fund’s performance for the periods presented.
Period Ended | Year Ended December 31, 2017 | Year Ended December 31, 2016 | Year Ended December 31, 2015 | Year Ended December 31, 2014 | Year Ended December 31, 2013 | |||||||||||||||||||
| Per Share Data | ||||||||||||||||||||||||
| Net asset value, beginning of period | $ | 45.89 | $ | 46.02 | $ | 39.71 | $ | 51.73 | $ | 52.46 | $ | 38.35 | ||||||||||||
| Income (loss) from investment operations: | ||||||||||||||||||||||||
Net investment income (loss)b | .12 | .05 | .21 | .12 | .08 | .01 | ||||||||||||||||||
| Net gain (loss) on investments (realized and unrealized) | 1.53 | 1.58 | 9.76 | (2.87 | ) | (.80 | ) | 14.10 | ||||||||||||||||
| Total from investment operations | 1.65 | 1.63 | 9.97 | (2.75 | ) | (.72 | ) | 14.11 | ||||||||||||||||
| Less distributions from: | ||||||||||||||||||||||||
| Net investment income | — | (.17 | ) | (.05 | ) | — | (.01 | ) | — | |||||||||||||||
| Net realized gains | — | (1.59 | ) | (3.61 | ) | (9.27 | ) | — | — | |||||||||||||||
| Total distributions | — | (1.76 | ) | (3.66 | ) | (9.27 | ) | (.01 | ) | — | ||||||||||||||
| Net asset value, end of period | $ | 47.54 | $ | 45.89 | $ | 46.02 | $ | 39.71 | $ | 51.73 | $ | 52.46 | ||||||||||||
Total Returnc | 3.60 | % | 3.70 | % | 26.60 | % | (6.62 | %) | (1.38 | %) | 36.79 | % | ||||||||||||
| Ratios/Supplemental Data | ||||||||||||||||||||||||
| Net assets, end of period (in thousands) | $ | 88,537 | $ | 98,726 | $ | 106,304 | $ | 89,757 | $ | 115,933 | $ | 139,943 | ||||||||||||
| Ratios to average net assets: | ||||||||||||||||||||||||
| Net investment income (loss) | 0.54 | % | 0.11 | % | 0.52 | % | 0.26 | % | 0.15 | % | 0.02 | % | ||||||||||||
Total expensesd | 1.22 | % | 1.23 | % | 1.16 | % | 1.19 | % | 1.16 | % | 1.16 | % | ||||||||||||
Net expensese,f,g | 1.14 | % | 1.14 | % | 1.16 | % | 1.19 | % | 1.16 | % | 1.16 | % | ||||||||||||
| Portfolio turnover rate | 5 | % | 32 | % | 68 | % | 57 | % | 50 | % | 30 | % | ||||||||||||
| a | Unaudited figures for the period ended June 30, 2018. Percentage amounts for the period, except total return and portfolio turnover rate, have been annualized. |
| b | Net investment income (loss) per share was computed using average shares outstanding throughout the period. |
| c | Total return does not take into account any of the expenses associated with an investment in variable insurance products. If total return had taken into account these expenses, performance would have been lower. Shares of a series of Guggenheim Variable Funds Trust are available only through the purchase of such products. |
| d | Does not include expenses of the underlying funds in which the Fund invests. |
| e | Net expense information reflects the expense ratios after expense waivers and reimbursements, as applicable. |
| f | Net expenses may include expenses that are excluded from the expense limitation agreement. Excluding these expenses, the operating expense ratios for the periods ended would be: |
06/30/18 | 12/31/17 | 12/31/16 | 12/31/15 | 12/31/14 | 12/31/13 |
1.14% | 1.12% | N/A | N/A | N/A | N/A |
| g | The portion of the ratios of net expenses to average net assets attributable to recoupments of prior fee reductions of expense reimbursements for the periods presented would be: |
06/30/18 | 12/31/17 | 12/31/16 | 12/31/15 | 12/31/14 | 12/31/13 |
N/A | 0.01% | N/A | N/A | N/A | N/A |
SEE NOTES TO FINANCIAL STATEMENTS. | THE GUGGENHEIM FUNDS SEMI-ANNUAL REPORT | 95 |
PERFORMANCE REPORT AND FUND PROFILE (Unaudited) | June 30, 2018 |
SERIES V (MID CAP VALUE SERIES)
OBJECTIVE: Seeks long-term growth of capital.
Holdings Diversification (Market Exposure as % of Net Assets)
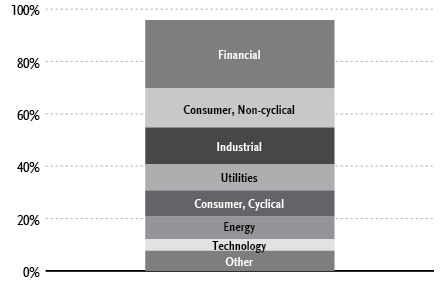
“Holdings Diversification (Market Exposure as % of Net Assets)” excludes any temporary cash investments.
Inception Date: May 1, 1997 |
Ten Largest Holdings (% of Total Net Assets) | |
Zions Bancorporation | 1.9% |
KeyCorp | 1.9% |
PVH Corp. | 1.9% |
Hormel Foods Corp. | 1.8% |
Huntington Bancshares, Inc. | 1.8% |
OGE Energy Corp. | 1.7% |
Wintrust Financial Corp. | 1.7% |
UniFirst Corp. | 1.7% |
Cray, Inc. | 1.5% |
Oasis Petroleum, Inc. | 1.5% |
Top Ten Total | 17.4% |
“Ten Largest Holdings” excludes any temporary cash investments.
Average Annual Returns*,†
Periods Ended June 30, 2018
6 month‡ | 1 Year | 5 Year | 10 Year | |
Series V (Mid Cap Value Series) | 4.33% | 15.02% | 10.30% | 10.46% |
Russell 2500 Value Index | 3.00% | 11.49% | 10.78% | 10.10% |
| * | The performance data above represents past performance that is not predictive of future results. The investment return and principal value of an investment in the Fund will fluctuate so that an investor’s shares, when redeemed, may be worth more or less than their original cost. Returns are historical and include changes in principal and reinvested dividends and capital gains and do not reflect the effect of taxes. The Russell 2500 Value Index is an unmanaged index and, unlike the Fund, has no management fees or operating expenses to reduce its reported return. |
| † | Performance figures do not reflect fees and expenses associated with an investment in variable insurance products. If returns had taken into account these fees and expenses, performance would have been lower. Shares of a series of Guggenheim Variable Funds Trust are available only through the purchase of such products. |
| ‡ | 6 month returns are not annualized. |
96 | THE GUGGENHEIM FUNDS SEMI-ANNUAL REPORT |
SCHEDULE OF INVESTMENTS (Unaudited) | June 30, 2018 |
SERIES V (MID CAP VALUE SERIES) |
| Value | |||||||
COMMON STOCKS† - 95.8% | ||||||||
Financial - 26.1% | ||||||||
Zions Bancorporation | 83,634 | $ | 4,406,675 | |||||
KeyCorp | 222,823 | 4,353,961 | ||||||
Huntington Bancshares, Inc. | 268,388 | 3,961,407 | ||||||
Wintrust Financial Corp. | 43,415 | 3,779,276 | ||||||
Equity Commonwealth REIT* | 100,532 | 3,166,758 | ||||||
Alleghany Corp. | 4,962 | 2,853,001 | ||||||
Umpqua Holdings Corp. | 121,778 | 2,750,965 | ||||||
Alexandria Real Estate Equities, Inc. REIT | 20,494 | 2,585,728 | ||||||
Alliance Data Systems Corp. | 10,750 | 2,506,900 | ||||||
Prosperity Bancshares, Inc. | 34,529 | 2,360,402 | ||||||
Sun Communities, Inc. REIT | 23,698 | 2,319,560 | ||||||
Voya Financial, Inc. | 46,021 | 2,162,987 | ||||||
First Horizon National Corp. | 120,194 | 2,144,261 | ||||||
Cousins Properties, Inc. REIT | 216,182 | 2,094,804 | ||||||
National Storage Affiliates Trust REIT | 59,234 | 1,825,592 | ||||||
CoreCivic, Inc. REIT | 72,850 | 1,740,386 | ||||||
IBERIABANK Corp. | 22,009 | 1,668,282 | ||||||
Pinnacle Financial Partners, Inc. | 25,483 | 1,563,382 | ||||||
Redwood Trust, Inc. REIT | 84,906 | 1,398,402 | ||||||
Camden Property Trust REIT | 13,652 | 1,244,107 | ||||||
Radian Group, Inc. | 74,555 | 1,209,282 | ||||||
Lexington Realty Trust REIT | 135,179 | 1,180,113 | ||||||
Federal Agricultural Mortgage Corp. — Class C | 12,634 | 1,130,490 | ||||||
Howard Hughes Corp.* | 8,070 | 1,069,275 | ||||||
Physicians Realty Trust REIT | 66,577 | 1,061,237 | ||||||
BankUnited, Inc. | 25,901 | 1,058,056 | ||||||
American National Insurance Co. | 5,001 | 598,070 | ||||||
Hilltop Holdings, Inc. | 25,225 | 556,716 | ||||||
Customers Bancorp, Inc.* | 5,494 | 155,920 | ||||||
Total Financial | 58,905,995 | |||||||
Consumer, Non-cyclical - 15.0% | ||||||||
Hormel Foods Corp. | 109,100 | 4,059,611 | ||||||
Bunge Ltd. | 47,837 | 3,334,717 | ||||||
Ingredion, Inc. | 25,850 | 2,861,595 | ||||||
Emergent BioSolutions, Inc.* | 53,207 | 2,686,421 | ||||||
Eagle Pharmaceuticals, Inc.* | 31,039 | 2,348,411 | ||||||
Premier, Inc. — Class A* | 57,590 | 2,095,124 | ||||||
Myriad Genetics, Inc.* | 54,510 | 2,037,039 | ||||||
Encompass Health Corp. | 30,052 | 2,035,121 | ||||||
Central Garden & Pet Co. — Class A* | 46,112 | 1,866,153 | ||||||
Euronet Worldwide, Inc.* | 21,831 | 1,828,783 | ||||||
US Foods Holding Corp.* | 33,943 | 1,283,725 | ||||||
SP Plus Corp.* | 30,957 | 1,151,600 | ||||||
Hostess Brands, Inc.* | 83,802 | 1,139,707 | ||||||
Fresh Del Monte Produce, Inc. | 23,911 | 1,065,235 | ||||||
Perrigo Company plc | 14,218 | 1,036,634 | ||||||
ACCO Brands Corp. | 64,326 | 890,915 | ||||||
Quest Diagnostics, Inc. | 6,409 | 704,606 | ||||||
Sanderson Farms, Inc. | 5,420 | 569,913 | ||||||
Inovio Pharmaceuticals, Inc.* | 141,243 | 553,673 | ||||||
MoneyGram International, Inc.* | 67,593 | 452,197 | ||||||
Total Consumer, Non-cyclical | 34,001,180 | |||||||
Industrial - 14.0% | ||||||||
Crane Co. | 31,473 | 2,521,931 | ||||||
FLIR Systems, Inc. | 46,683 | 2,426,116 | ||||||
Carlisle Companies, Inc. | 20,705 | 2,242,559 | ||||||
WestRock Co. | 34,088 | 1,943,698 | ||||||
Scorpio Tankers, Inc. | 564,402 | 1,585,970 | ||||||
ITT, Inc. | 29,446 | 1,539,142 | ||||||
Gentex Corp. | 66,420 | 1,528,988 | ||||||
Hub Group, Inc. — Class A* | 25,383 | 1,264,074 | ||||||
Park Electrochemical Corp. | 53,500 | 1,240,665 | ||||||
KLX, Inc.* | 17,054 | 1,226,183 | ||||||
Greenbrier Companies, Inc. | 23,057 | 1,216,257 | ||||||
Corning, Inc. | 43,993 | 1,210,247 | ||||||
AAR Corp. | 25,668 | 1,193,305 | ||||||
Jacobs Engineering Group, Inc. | 18,711 | 1,187,961 | ||||||
GasLog Ltd. | 62,120 | 1,186,492 | ||||||
Snap-on, Inc. | 7,217 | 1,159,916 | ||||||
Rexnord Corp.* | 38,972 | 1,132,526 | ||||||
Huntington Ingalls Industries, Inc. | 5,020 | 1,088,286 | ||||||
Celadon Group, Inc.* | 350,970 | 1,049,400 | ||||||
Kirby Corp.* | 9,262 | 774,303 | ||||||
Plexus Corp.* | 10,264 | 611,119 | ||||||
Valmont Industries, Inc. | 3,973 | 598,930 | ||||||
Astec Industries, Inc. | 9,826 | 587,595 | ||||||
TriMas Corp.* | 19,656 | 577,886 | ||||||
Oshkosh Corp. | 8,195 | 576,272 | ||||||
Total Industrial | 31,669,821 | |||||||
Utilities - 10.0% | ||||||||
OGE Energy Corp. | 109,636 | 3,860,283 | ||||||
Ameren Corp. | 50,333 | 3,062,763 | ||||||
Portland General Electric Co. | 58,679 | 2,509,114 | ||||||
Pinnacle West Capital Corp. | 28,023 | 2,257,533 | ||||||
AES Corp. | 166,449 | 2,232,081 | ||||||
UGI Corp. | 41,401 | 2,155,750 | ||||||
Black Hills Corp. | 34,927 | 2,137,882 | ||||||
Edison International | 26,107 | 1,651,790 | ||||||
ONE Gas, Inc. | 20,367 | 1,522,230 | ||||||
Southwest Gas Holdings, Inc. | 16,025 | 1,222,227 | ||||||
Total Utilities | 22,611,653 | |||||||
Consumer, Cyclical - 9.9% | ||||||||
PVH Corp. | 28,577 | 4,278,548 | ||||||
UniFirst Corp. | 21,125 | 3,737,013 | ||||||
DR Horton, Inc. | 68,680 | 2,815,880 | ||||||
Acushnet Holdings Corp. | 71,588 | 1,751,043 | ||||||
Caleres, Inc. | 50,867 | 1,749,316 | ||||||
GMS, Inc.* | 51,387 | 1,392,074 | ||||||
Newell Brands, Inc. | 48,871 | 1,260,383 | ||||||
LCI Industries | 13,576 | 1,223,876 | ||||||
JetBlue Airways Corp.* | 57,988 | 1,100,612 | ||||||
Unifi, Inc.* | 30,757 | 974,997 | ||||||
Movado Group, Inc. | 19,651 | 949,143 | ||||||
Genesco, Inc.* | 14,144 | 561,517 | ||||||
SEE NOTES TO FINANCIAL STATEMENTS. | THE GUGGENHEIM FUNDS SEMI-ANNUAL REPORT | 97 |
SCHEDULE OF INVESTMENTS (Unaudited)(continued) | June 30, 2018 |
SERIES V (MID CAP VALUE SERIES) |
| Value | |||||||
Goodyear Tire & Rubber Co. | 23,393 | $ | 544,823 | |||||
Total Consumer, Cyclical | 22,339,225 | |||||||
Energy - 8.7% | ||||||||
Oasis Petroleum, Inc.* | 260,550 | 3,379,334 | ||||||
Whiting Petroleum Corp.* | 58,054 | 3,060,607 | ||||||
Hess Corp. | 43,670 | 2,921,086 | ||||||
Rowan Companies plc — Class A* | 149,735 | 2,428,702 | ||||||
Range Resources Corp. | 131,607 | 2,201,785 | ||||||
Kinder Morgan, Inc. | 103,029 | 1,820,522 | ||||||
MRC Global, Inc.* | 67,242 | 1,457,134 | ||||||
Cimarex Energy Co. | 12,225 | 1,243,771 | ||||||
Antero Resources Corp.* | 31,643 | 675,578 | ||||||
Gulfport Energy Corp.* | 40,709 | 511,712 | ||||||
HydroGen Corp.*,†††,1,2 | 672,346 | 1 | ||||||
Total Energy | 19,700,232 | |||||||
Technology - 4.5% | ||||||||
Cray, Inc.* | 139,535 | 3,432,561 | ||||||
Conduent, Inc.* | 110,588 | 2,009,384 | ||||||
Super Micro Computer, Inc.* | 80,132 | 1,895,122 | ||||||
Maxwell Technologies, Inc.* | 285,110 | 1,482,572 | ||||||
Qorvo, Inc.* | 15,916 | 1,275,986 | ||||||
Total Technology | 10,095,625 | |||||||
Basic Materials - 3.9% | ||||||||
Reliance Steel & Aluminum Co. | 32,148 | 2,814,236 | ||||||
Nucor Corp. | 42,355 | 2,647,188 | ||||||
Ashland Global Holdings, Inc. | 14,691 | 1,148,542 | ||||||
Alcoa Corp.* | 23,190 | 1,087,147 | ||||||
Tahoe Resources, Inc. | 220,317 | 1,083,960 | ||||||
Total Basic Materials | 8,781,073 | |||||||
Communications - 3.7% | ||||||||
Ciena Corp.* | 110,897 | 2,939,880 | ||||||
Acacia Communications, Inc.* | 56,719 | 1,974,388 | ||||||
Finisar Corp.* | 95,489 | 1,718,802 | ||||||
Viavi Solutions, Inc.* | 163,328 | 1,672,479 | ||||||
Total Communications | 8,305,549 | |||||||
Total Common Stocks | ||||||||
(Cost $188,999,925) | 216,410,353 | |||||||
CONVERTIBLE PREFERRED STOCKS††† - 0.0% | ||||||||
Thermoenergy Corp.*,1,3 | 308,333 | 90 | ||||||
Total Convertible Preferred Stocks | ||||||||
(Cost $294,438) | 90 | |||||||
MONEY MARKET FUND† - 4.4% | ||||||||
Dreyfus Treasury Prime Cash Management Fund — Institutional Class 1.68%4 | 10,063,120 | 10,063,120 | ||||||
Total Money Market Fund | ||||||||
(Cost $10,063,120) | 10,063,120 | |||||||
Total Investments - 100.2% | ||||||||
(Cost $199,357,483) | $ | 226,473,563 | ||||||
Other Assets & Liabilities, net - (0.2)% | (453,685 | ) | ||||||
Total Net Assets - 100.0% | $ | 226,019,878 | ||||||
| * | Non-income producing security. |
| † | Value determined based on Level 1 inputs, unless otherwise noted — See Note 4. |
| ††† | Value determined based on Level 3 inputs — See Note 4. |
| 1 | Security was fair valued by the Valuation Committee at June 30, 2018. The total market value of fair valued securities amounts to $91, (cost $2,866,013) or less than 0.1% of total net assets. |
| 2 | Affiliated issuer. |
| 3 | PIPE (Private Investment in Public Equity) — Stock issued by a company in the secondary market as a means of raising capital more quickly and less expensively than through registration of a secondary public offering. |
| 4 | Rate indicated is the 7 day yield as of June 30, 2018. |
plc — Public Limited Company
REIT — Real Estate Investment Trust
See Sector Classification in Other Information section.
98 | THE GUGGENHEIM FUNDS SEMI-ANNUAL REPORT | SEE NOTES TO FINANCIAL STATEMENTS. |
SCHEDULE OF INVESTMENTS (Unaudited)(concluded) | June 30, 2018 |
SERIES V (MID CAP VALUE SERIES) |
The following table summarizes the inputs used to value the Fund’s investments at June 30, 2018 (See Note 4 in the Notes to Financial Statements):
Investments in Securities (Assets) | Level 1 | Level 2 | Level 3 | Total | ||||||||||||
Common Stocks | $ | 216,410,352 | $ | — | $ | 1 | $ | 216,410,353 | ||||||||
Convertible Preferred Stocks | — | — | 90 | 90 | ||||||||||||
Money Market Fund | 10,063,120 | — | — | 10,063,120 | ||||||||||||
Total Assets | $ | 226,473,472 | $ | — | $ | 91 | $ | 226,473,563 | ||||||||
Transfers between investment levels may occur as the markets fluctuate and/or the availability of data used in an investment’s valuation changes. Transfers between valuation levels, if any, are in comparison to the valuation levels at the end of the previous fiscal year, and are effective using the fair value as of the end of the current fiscal period.
For the period ended June 30, 2018, there were no transfers between levels.
Affiliated Transactions
Investments representing 5% or more of the outstanding voting shares of a portfolio company of a fund, or control of or by, or common control under Guggenheim Investments ("GI"), result in that portfolio company being considered an affiliated company of such fund, as defined in the 1940 Act.
Transactions during the period ended June 30, 2018, in which the portfolio company is an “affiliated person”, were as follows:
Security Name | Value | Additions | Reductions | Realized | Change in | Value | Shares | Investment | ||||||||||||||||||||||||
Common Stocks | ||||||||||||||||||||||||||||||||
HydroGen Corp.*,1 | $ | 1 | $ | — | $ | — | $ | — | $ | — | $ | 1 | 672,346 | $ | — | |||||||||||||||||
| * | Non-income producing security. |
| 1 | Security was fair valued by the Valuation Committee at June 30, 2018. The total market value of fair valued securities amounts to $1 (cost $2,571,575) or less than 0.1% of total net assets. |
SEE NOTES TO FINANCIAL STATEMENTS. | THE GUGGENHEIM FUNDS SEMI-ANNUAL REPORT | 99 |
SERIES V (MID CAP VALUE SERIES) |
STATEMENT OF ASSETS AND LIABILITIES (Unaudited) | ||||
June 30, 2018 | ||||
Assets: | ||||
Investments in unaffiliated issuers, at value (cost $196,785,908) | $ | 226,473,562 | ||
Investments in affiliated issuers, at value (cost $2,571,575) | 1 | |||
Prepaid expenses | 3,402 | |||
Receivables: | ||||
Securities sold | 367,468 | |||
Dividends | 282,612 | |||
Interest | 10,906 | |||
Fund shares sold | 400 | |||
Total assets | 227,138,351 | |||
Liabilities: | ||||
Payable for: | ||||
Securities purchased | 533,186 | |||
Fund shares redeemed | 180,015 | |||
Management fees | 97,057 | |||
Distribution and service fees | 48,452 | |||
Fund accounting/administration fees | 15,505 | |||
Trustees’ fees* | 3,517 | |||
Transfer agent/maintenance fees | 3,297 | |||
Miscellaneous (Note 11) | 237,444 | |||
Total liabilities | 1,118,473 | |||
Commitments and contingent liabilities (Note 13) | — | |||
Net assets | $ | 226,019,878 | ||
Net assets consist of: | ||||
Paid in capital | $ | 144,288,017 | ||
Undistributed net investment income | 1,927,662 | |||
Accumulated net realized gain on investments | 52,688,119 | |||
Net unrealized appreciation on investments | 27,116,080 | |||
Net assets | $ | 226,019,878 | ||
Capital shares outstanding | 2,630,382 | |||
Net asset value per share | $ | 85.93 | ||
STATEMENT OF OPERATIONS (Unaudited) | ||||
Period Ended June 30, 2018 | ||||
Investment Income: | ||||
Dividends from securities of unaffiliated issuers | $ | 1,624,536 | ||
Interest | 46,794 | |||
Total investment income | 1,671,330 | |||
Expenses: | ||||
Management fees | 881,516 | |||
Distribution and service fees | 293,839 | |||
Transfer agent/maintenance fees | 12,579 | |||
Fund accounting/administration fees | 94,029 | |||
Custodian fees | 7,270 | |||
Trustees’ fees* | 5,455 | |||
Line of credit fees | 5,248 | |||
Miscellaneous | 62,394 | |||
Total expenses | 1,362,330 | |||
Less: | ||||
Expenses waived by Adviser | (295,450 | ) | ||
Net expenses | 1,066,880 | |||
Net investment income | 604,450 | |||
Net Realized and Unrealized Gain (Loss): | ||||
Net realized gain (loss) on: | ||||
Investments in unaffiliated issuers | 23,025,278 | |||
Net realized gain | 23,025,278 | |||
Net change in unrealized appreciation (depreciation) on: | ||||
Investments in unaffiliated issuers | (13,506,734 | ) | ||
Net change in unrealized appreciation (depreciation) | (13,506,734 | ) | ||
Net realized and unrealized gain | 9,518,544 | |||
Net increase in net assets resulting from operations | $ | 10,122,994 | ||
| * | Relates to Trustees not deemed “interested persons” within the meaning of Section 2(a)(19) of the 1940 Act. |
100 | THE GUGGENHEIM FUNDS SEMI-ANNUAL REPORT | SEE NOTES TO FINANCIAL STATEMENTS. |
SERIES V (MID CAP VALUE SERIES) |
STATEMENTS OF CHANGES IN NET ASSETS |
Period Ended | Year Ended | |||||||
Increase (Decrease) in Net Assets from Operations: | ||||||||
Net investment income (loss) | $ | 604,450 | $ | (507,633 | ) | |||
Net realized gain on investments | 23,025,278 | 35,109,314 | ||||||
Net change in unrealized appreciation (depreciation) on investments | (13,506,734 | ) | (3,908,779 | ) | ||||
Net increase in net assets resulting from operations | 10,122,994 | 30,692,902 | ||||||
Distributions to shareholders from: | ||||||||
Net investment income | — | (1,588,785 | ) | |||||
Net realized gains | — | (4,492,755 | ) | |||||
Total distributions to shareholders | — | (6,081,540 | ) | |||||
Capital share transactions: | ||||||||
Proceeds from sale of shares | 1,783,582 | 4,406,300 | ||||||
Distributions reinvested | — | 6,081,540 | ||||||
Cost of shares redeemed | (28,103,956 | ) | (40,943,633 | ) | ||||
Net decrease from capital share transactions | (26,320,374 | ) | (30,455,793 | ) | ||||
Net decrease in net assets | (16,197,380 | ) | (5,844,431 | ) | ||||
Net assets: | ||||||||
Beginning of period | 242,217,258 | 248,061,689 | ||||||
End of period | $ | 226,019,878 | $ | 242,217,258 | ||||
Undistributed net investment income at end of period | $ | 1,927,662 | $ | 1,323,212 | ||||
Capital share activity: | ||||||||
Shares sold | 21,377 | 57,350 | ||||||
Shares issued from reinvestment of distributions | — | 80,401 | ||||||
Shares redeemed | (331,960 | ) | (533,345 | ) | ||||
Net decrease in shares | (310,583 | ) | (395,594 | ) | ||||
SEE NOTES TO FINANCIAL STATEMENTS. | THE GUGGENHEIM FUNDS SEMI-ANNUAL REPORT | 101 |
SERIES V (MID CAP VALUE SERIES) |
FINANCIAL HIGHLIGHTS |
This table is presented to show selected data for a share outstanding throughout each period and to assist shareholders in evaluating a Fund’s performance for the periods presented.
Period Ended | Year Ended December 31, 2017 | Year Ended December 31, 2016 | Year Ended December 31, 2015 | Year Ended December 31, 2014 | Year Ended December 31, 2013 | |||||||||||||||||||
| Per Share Data | ||||||||||||||||||||||||
| Net asset value, beginning of period | $ | 82.36 | $ | 74.35 | $ | 65.74 | $ | 84.22 | $ | 83.46 | $ | 62.60 | ||||||||||||
| Income (loss) from investment operations: | ||||||||||||||||||||||||
Net investment income (loss)b | .21 | (.16 | ) | .99 | .71 | .53 | .36 | |||||||||||||||||
| Net gain (loss) on investments (realized and unrealized) | 3.36 | 10.16 | 15.50 | (5.42 | ) | .23 | 20.50 | |||||||||||||||||
| Total from investment operations | 3.57 | 10.00 | 16.49 | (4.71 | ) | .76 | 20.86 | |||||||||||||||||
| Less distributions from: | ||||||||||||||||||||||||
| Net investment income | — | (.52 | ) | (.68 | ) | (.51 | ) | (— | )c | — | ||||||||||||||
| Net realized gains | — | (1.47 | ) | (7.20 | ) | (13.26 | ) | — | — | |||||||||||||||
| Total distributions | — | (1.99 | ) | (7.88 | ) | (13.77 | ) | (— | )c | — | ||||||||||||||
| Net asset value, end of period | $ | 85.93 | $ | 82.36 | $ | 74.35 | $ | 65.74 | $ | 84.22 | $ | 83.46 | ||||||||||||
Total Returnd | 4.33 | % | 13.71 | % | 26.75 | % | (6.79 | %) | 0.91 | % | 33.32 | % | ||||||||||||
| Ratios/Supplemental Data | ||||||||||||||||||||||||
| Net assets, end of period (in thousands) | $ | 226,020 | $ | 242,217 | $ | 248,062 | $ | 207,393 | $ | 264,495 | $ | 302,166 | ||||||||||||
| Ratios to average net assets: | ||||||||||||||||||||||||
| Net investment income (loss) | 0.51 | % | (0.21 | %) | 1.46 | % | 0.94 | % | 0.62 | % | 0.48 | % | ||||||||||||
| Total expenses | 1.16 | % | 1.10 | % | 0.93 | % | 0.95 | % | 0.93 | % | 0.93 | % | ||||||||||||
Net expensese,f | 0.91 | % | 0.91 | % | 0.93 | % | 0.95 | % | 0.93 | % | 0.93 | % | ||||||||||||
| Portfolio turnover rate | 30 | % | 54 | % | 60 | % | 50 | % | 53 | % | 22 | % | ||||||||||||
| a | Unaudited figures for the period ended June 30, 2018. Percentage amounts for the period, except total return and portfolio turnover rate, have been annualized. |
| b | Net investment income (loss) per share was computed using average shares outstanding throughout the period. |
| c | Distributions from net investment income are less than $0.01 per share. |
| d | Total return does not take into account any of the expenses associated with an investment in variable insurance products. If total return had taken into account these expenses, performance would have been lower. Shares of a series of Guggenheim Variable Funds Trust are available only through the purchase of such products. |
| e | Net expense information reflects the expense ratios after expense waivers and reimbursements, as applicable. |
| f | Net expenses may include expenses that are excluded from the expense limitation agreement and affiliated fee waivers. Excluding these expenses, the net expense ratios for the periods would be: |
06/30/18 | 12/31/17 | 12/31/16 | 12/31/15 | 12/31/14 | 12/31/13 |
0.91% | 0.89% | N/A | N/A | N/A | N/A |
102 | THE GUGGENHEIM FUNDS SEMI-ANNUAL REPORT | SEE NOTES TO FINANCIAL STATEMENTS. |
PERFORMANCE REPORT AND FUND PROFILE (Unaudited) | June 30, 2018 |
SERIES X (STYLEPLUS—SMALL GROWTH SERIES)
OBJECTIVE: Seeks long-term growth of capital.
Holdings Diversification (Market Exposure as % of Net Assets)
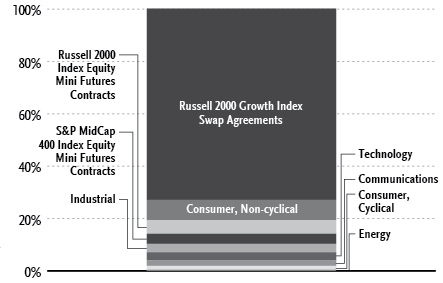
“Holdings Diversification (Market Exposure as % of Net Assets)” excludes any temporary cash investments or investments in Guggenheim Strategy Funds Trust mutual funds.
Inception Date: October 15, 1997 |
Ten Largest Holdings (% of Total Net Assets) | |
Guggenheim Variable Insurance Strategy Fund III | 31.5% |
Guggenheim Strategy Fund III | 29.8% |
Guggenheim Strategy Fund II | 11.1% |
Guggenheim Strategy Fund I | 5.4% |
Performance Food Group Co. | 0.3% |
MAXIMUS, Inc. | 0.3% |
Nexstar Media Group, Inc. — Class A | 0.3% |
j2 Global, Inc. | 0.3% |
Integrated Device Technology, Inc. | 0.3% |
ACI Worldwide, Inc. | 0.1% |
Top Ten Total | 79.4% |
“Ten Largest Holdings” excludes any temporary cash or derivative investments.
Average Annual Returns*,†
Periods Ended June 30, 2018
6 month‡ | 1 Year | 5 Year | 10 Year | |
Series X (StylePlus—Small Growth Series) | 8.78% | 21.25% | 14.72% | 11.07% |
Russell 2000 Growth Index | 9.70% | 21.86% | 13.65% | 11.24% |
| * | The performance data above represents past performance that is not predictive of future results. The investment return and principal value of an investment in the Fund will fluctuate so that an investor’s shares, when redeemed, may be worth more or less than their original cost. Returns are historical and include changes in principal and reinvested dividends and capital gains and do not reflect the effect of taxes. The Russell 2000 Growth Index is an unmanaged index and, unlike the Fund, has no management fees or operating expenses to reduce its reported return. |
| † | Performance figures do not reflect fees and expenses associated with an investment in variable insurance products. If returns had taken into account these fees and expenses, performance would have been lower. Shares of a series of Guggenheim Variable Funds Trust are available only through the purchase of such products. |
| ‡ | 6 month returns are not annualized. |
THE GUGGENHEIM FUNDS SEMI-ANNUAL REPORT 103 |
SCHEDULE OF INVESTMENTS (Unaudited) | June 30, 2018 |
SERIES X (STYLEPLUS—SMALL GROWTH SERIES) |
| Value | |||||||
COMMON STOCKS† - 20.2% | ||||||||
Consumer, Non-cyclical - 7.7% | ||||||||
Performance Food Group Co.* | 2,909 | $ | 106,760 | |||||
Calavo Growers, Inc. | 918 | 88,266 | ||||||
John B Sanfilippo & Son, Inc. | 1,167 | 86,883 | ||||||
Boston Beer Company, Inc. — Class A* | 276 | 82,717 | ||||||
Vector Group Ltd. | 4,254 | 81,166 | ||||||
Tootsie Roll Industries, Inc. | 2,597 | 80,118 | ||||||
Inter Parfums, Inc. | 1,461 | 78,164 | ||||||
Horizon Pharma plc* | 4,581 | 75,861 | ||||||
Travelport Worldwide Ltd. | 4,069 | 75,439 | ||||||
Cal-Maine Foods, Inc.* | 1,525 | 69,921 | ||||||
Loxo Oncology, Inc.* | 387 | 67,137 | ||||||
Integer Holdings Corp.* | 936 | 60,512 | ||||||
LivaNova plc* | 602 | 60,092 | ||||||
Emergent BioSolutions, Inc.* | 1,122 | 56,650 | ||||||
USANA Health Sciences, Inc.* | 489 | 56,382 | ||||||
NuVasive, Inc.* | 1,076 | 56,081 | ||||||
Central Garden & Pet Co. — Class A* | 1,354 | 54,796 | ||||||
Globus Medical, Inc. — Class A* | 991 | 50,006 | ||||||
FibroGen, Inc.* | 798 | 49,955 | ||||||
Wright Medical Group N.V.* | 1,871 | 48,571 | ||||||
Coca-Cola Bottling Company Consolidated | 347 | 46,890 | ||||||
Varex Imaging Corp.* | 1,248 | 46,288 | ||||||
CONMED Corp. | 631 | 46,189 | ||||||
Endo International plc* | 4,869 | 45,915 | ||||||
Ligand Pharmaceuticals, Inc. — Class B* | 215 | 44,541 | ||||||
Avis Budget Group, Inc.* | 1,354 | 44,005 | ||||||
Central Garden & Pet Co.* | 983 | 42,741 | ||||||
Primo Water Corp.* | 2,355 | 41,189 | ||||||
Tenet Healthcare Corp.* | 1,196 | 40,150 | ||||||
iRhythm Technologies, Inc.* | 492 | 39,916 | ||||||
Acorda Therapeutics, Inc.* | 1,369 | 39,290 | ||||||
Cardtronics plc — Class A* | 1,601 | 38,712 | ||||||
Xencor, Inc.* | 1,008 | 37,306 | ||||||
B&G Foods, Inc. | 1,240 | 37,076 | ||||||
Innoviva, Inc.* | 2,592 | 35,770 | ||||||
Ironwood Pharmaceuticals, Inc. — Class A* | 1,866 | 35,678 | ||||||
Nevro Corp.* | 441 | 35,214 | ||||||
Amicus Therapeutics, Inc.* | 2,250 | 35,145 | ||||||
Medpace Holdings, Inc.* | 813 | 34,959 | ||||||
EVERTEC, Inc. | 1,582 | 34,567 | ||||||
Ultragenyx Pharmaceutical, Inc.* | 430 | 33,054 | ||||||
Blueprint Medicines Corp.* | 517 | 32,819 | ||||||
Array BioPharma, Inc.* | 1,919 | 32,201 | ||||||
Supernus Pharmaceuticals, Inc.* | 538 | 32,199 | ||||||
Orthofix International N.V.* | 560 | 31,819 | ||||||
Immunomedics, Inc.* | 1,330 | 31,481 | ||||||
National Beverage Corp.* | 288 | 30,787 | ||||||
Cambrex Corp.* | 586 | 30,648 | ||||||
Natus Medical, Inc.* | 859 | 29,636 | ||||||
Medicines Co.* | 801 | 29,397 | ||||||
Amneal Pharmaceuticals, Inc.* | 1,769 | 29,029 | ||||||
Myriad Genetics, Inc.* | 761 | 28,439 | ||||||
Syneos Health, Inc.* | 589 | 27,624 | ||||||
Puma Biotechnology, Inc.* | 461 | 27,268 | ||||||
Haemonetics Corp.* | 294 | 26,366 | ||||||
Insmed, Inc.* | 1,108 | 26,204 | ||||||
Turning Point Brands, Inc. | 816 | 26,031 | ||||||
BioSpecifics Technologies Corp.* | 563 | 25,256 | ||||||
Halozyme Therapeutics, Inc.* | 1,490 | 25,136 | ||||||
Akebia Therapeutics, Inc.* | 2,493 | 24,880 | ||||||
Depomed, Inc.* | 3,444 | 22,972 | ||||||
CytomX Therapeutics, Inc.* | 970 | 22,174 | ||||||
MoneyGram International, Inc.* | 3,141 | 21,013 | ||||||
Total Consumer, Non-cyclical | 2,833,451 | |||||||
Industrial - 5.3% | ||||||||
Forward Air Corp. | 1,489 | 87,970 | ||||||
EMCOR Group, Inc. | 1,111 | 84,636 | ||||||
Hillenbrand, Inc. | 1,777 | 83,786 | ||||||
Methode Electronics, Inc. | 1,882 | 75,845 | ||||||
Kaman Corp. | 1,060 | 73,872 | ||||||
Watts Water Technologies, Inc. — Class A | 891 | 69,854 | ||||||
EnerSys | 888 | 66,280 | ||||||
Primoris Services Corp. | 2,427 | 66,087 | ||||||
Barnes Group, Inc. | 1,102 | 64,908 | ||||||
Rexnord Corp.* | 2,164 | 62,886 | ||||||
Generac Holdings, Inc.* | 1,201 | 62,128 | ||||||
Aerojet Rocketdyne Holdings, Inc.* | 2,064 | 60,867 | ||||||
Heartland Express, Inc. | 3,273 | 60,714 | ||||||
JELD-WEN Holding, Inc.* | 1,866 | 53,349 | ||||||
Moog, Inc. — Class A | 665 | 51,843 | ||||||
Builders FirstSource, Inc.* | 2,813 | 51,450 | ||||||
Granite Construction, Inc. | 920 | 51,207 | ||||||
Kennametal, Inc. | 1,367 | 49,075 | ||||||
ArcBest Corp. | 1,065 | 48,671 | ||||||
MasTec, Inc.* | 919 | 46,639 | ||||||
Itron, Inc.* | 765 | 45,938 | ||||||
Air Transport Services Group, Inc.* | 1,988 | 44,909 | ||||||
Actuant Corp. — Class A | 1,433 | 42,058 | ||||||
Saia, Inc.* | 519 | 41,961 | ||||||
Harsco Corp.* | 1,841 | 40,686 | ||||||
Columbus McKinnon Corp. | 856 | 37,116 | ||||||
Rogers Corp.* | 331 | 36,893 | ||||||
Advanced Energy Industries, Inc.* | 635 | 36,887 | ||||||
Masonite International Corp.* | 488 | 35,063 | ||||||
Milacron Holdings Corp.* | 1,833 | 34,699 | ||||||
OSI Systems, Inc.* | 441 | 34,103 | ||||||
Dycom Industries, Inc.* | 350 | 33,079 | ||||||
Werner Enterprises, Inc. | 836 | 31,392 | ||||||
Apogee Enterprises, Inc. | 624 | 30,058 | ||||||
NCI Building Systems, Inc.* | 1,399 | 29,379 | ||||||
Echo Global Logistics, Inc.* | 947 | 27,700 | ||||||
Continental Building Products, Inc.* | 767 | 24,199 | ||||||
Global Brass & Copper Holdings, Inc. | 767 | 24,045 | ||||||
Armstrong Flooring, Inc.* | 1,707 | 23,966 | ||||||
YRC Worldwide, Inc.* | 2,063 | 20,733 | ||||||
Total Industrial | 1,946,931 | |||||||
104 | THE GUGGENHEIM FUNDS SEMI-ANNUAL REPORT | SEE NOTES TO FINANCIAL STATEMENTS. |
SCHEDULE OF INVESTMENTS (Unaudited)(continued) | June 30, 2018 |
SERIES X (STYLEPLUS—SMALL GROWTH SERIES) |
| Value | |||||||
Technology - 3.2% | ||||||||
MAXIMUS, Inc. | 1,694 | $ | 105,214 | |||||
j2 Global, Inc. | 1,141 | 98,822 | ||||||
Integrated Device Technology, Inc.* | 3,069 | 97,840 | ||||||
ACI Worldwide, Inc.* | 3,809 | 93,968 | ||||||
CSG Systems International, Inc. | 2,075 | 84,805 | ||||||
Diodes, Inc.* | 2,015 | 69,457 | ||||||
TTEC Holdings, Inc. | 1,876 | 64,816 | ||||||
Cirrus Logic, Inc.* | 1,603 | 61,443 | ||||||
Progress Software Corp. | 1,441 | 55,940 | ||||||
CommVault Systems, Inc.* | 844 | 55,577 | ||||||
Quality Systems, Inc.* | 2,840 | 55,380 | ||||||
Entegris, Inc. | 1,540 | 52,206 | ||||||
Science Applications International Corp. | 597 | 48,315 | ||||||
HubSpot, Inc.* | 370 | 46,398 | ||||||
Unisys Corp.* | 3,262 | 42,080 | ||||||
Envestnet, Inc.* | 486 | 26,706 | ||||||
Silicon Laboratories, Inc.* | 260 | 25,896 | ||||||
Allscripts Healthcare Solutions, Inc.* | 1,952 | 23,424 | ||||||
Syntel, Inc.* | 708 | 22,720 | ||||||
Xperi Corp. | 1,143 | 18,402 | ||||||
Total Technology | 1,149,409 | |||||||
Communications - 2.1% | ||||||||
Nexstar Media Group, Inc. — Class A | 1,390 | 102,026 | ||||||
New York Times Co. — Class A | 3,523 | 91,246 | ||||||
InterDigital, Inc. | 1,035 | 83,732 | ||||||
Perficient, Inc.* | 2,689 | 70,909 | ||||||
World Wrestling Entertainment, Inc. — Class A | 791 | 57,600 | ||||||
Blucora, Inc.* | 1,295 | 47,915 | ||||||
Viavi Solutions, Inc.* | 4,055 | 41,523 | ||||||
Endurance International Group Holdings, Inc.* | 3,757 | 37,382 | ||||||
Web.com Group, Inc.* | 1,395 | 36,061 | ||||||
ePlus, Inc.* | 360 | 33,876 | ||||||
CalAmp Corp.* | 1,296 | 30,365 | ||||||
NETGEAR, Inc.* | 464 | 29,000 | ||||||
Entravision Communications Corp. — Class A | 5,251 | 26,255 | ||||||
Stamps.com, Inc.* | 103 | 26,064 | ||||||
NIC, Inc. | 1,648 | 25,627 | ||||||
Shutterfly, Inc.* | 239 | 21,517 | ||||||
Plantronics, Inc. | 278 | 21,198 | ||||||
Total Communications | 782,296 | |||||||
Consumer, Cyclical - 1.5% | ||||||||
Dana, Inc. | 2,684 | 54,190 | ||||||
Eros International plc* | 3,870 | 50,310 | ||||||
IMAX Corp.* | 2,190 | 48,508 | ||||||
Boyd Gaming Corp. | 1,276 | 44,226 | ||||||
KB Home | 1,364 | 37,156 | ||||||
Allegiant Travel Co. — Class A | 261 | 36,266 | ||||||
BMC Stock Holdings, Inc.* | 1,517 | 31,630 | ||||||
Brinker International, Inc. | 647 | 30,797 | ||||||
Meritor, Inc.* | 1,327 | 27,296 | ||||||
Scientific Games Corp. — Class A* | 527 | 25,902 | ||||||
RH* | 181 | 25,286 | ||||||
Churchill Downs, Inc. | 78 | 23,127 | ||||||
American Eagle Outfitters, Inc. | 961 | 22,343 | ||||||
Taylor Morrison Home Corp. — Class A* | 1,062 | 22,068 | ||||||
Deckers Outdoor Corp.* | 195 | 22,014 | ||||||
Tailored Brands, Inc. | 771 | 19,676 | ||||||
Beacon Roofing Supply, Inc.* | 444 | 18,923 | ||||||
Tenneco, Inc. | 378 | 16,617 | ||||||
Total Consumer, Cyclical | 556,335 | |||||||
Energy - 0.4% | ||||||||
Delek US Holdings, Inc. | 1,309 | 65,673 | ||||||
Par Pacific Holdings, Inc.* | 3,659 | 63,593 | ||||||
CVR Energy, Inc. | 785 | 29,037 | ||||||
Total Energy | 158,303 | |||||||
Total Common Stocks | ||||||||
(Cost $7,048,461) | 7,426,725 | |||||||
MUTUAL FUNDS† - 77.8% | ||||||||
Guggenheim Variable Insurance Strategy Fund III1 | 460,591 | 11,547,013 | ||||||
Guggenheim Strategy Fund III1 | 437,184 | 10,925,227 | ||||||
Guggenheim Strategy Fund II1 | 162,444 | 4,059,468 | ||||||
Guggenheim Strategy Fund I1 | 79,677 | 1,995,119 | ||||||
Total Mutual Funds | ||||||||
(Cost $28,442,677) | 28,526,827 | |||||||
MONEY MARKET FUND† - 1.6% | ||||||||
Dreyfus Treasury Prime Cash Management Fund — Institutional Class 1.68%2 | 576,712 | 576,712 | ||||||
Total Money Market Fund | ||||||||
(Cost $576,712) | 576,712 | |||||||
Total Investments - 99.6% | ||||||||
(Cost $36,067,850) | $ | 36,530,264 | ||||||
Other Assets & Liabilities, net - 0.4% | 143,031 | |||||||
Total Net Assets - 100.0% | $ | 36,673,295 | ||||||
SEE NOTES TO FINANCIAL STATEMENTS. | THE GUGGENHEIM FUNDS SEMI-ANNUAL REPORT | 105 |
SCHEDULE OF INVESTMENTS (Unaudited)(continued) | June 30, 2018 |
SERIES X (STYLEPLUS—SMALL GROWTH SERIES) |
Futures Contracts | ||||||||||||||||
Description | Number of | Expiration | Notional | Value and | ||||||||||||
Equity Futures Contracts Purchased† | ||||||||||||||||
S&P MidCap 400 Index Mini Futures Contracts | 6 | Sep 2018 | $ | 1,173,660 | $ | (26,645 | ) | |||||||||
Russell 2000 Index Mini Futures Contracts | 17 | Sep 2018 | 1,399,695 | (40,118 | ) | |||||||||||
| $ | 2,573,355 | $ | (66,763 | ) | ||||||||||||
Total Return Swap Agreements | ||||||||||||||||||||||
Counterparty | Index | Financing | Payment | Maturity | Units | Notional | Value and | |||||||||||||||
OTC Equity Index Swap Agreements†† | ||||||||||||||||||||||
Deutsche Bank | Russell 2000 Growth Index | 1.96 | % | At Maturity | 07/02/18 | 25,906 | $ | 26,812,969 | $ | 2,436,573 | ||||||||||||
| * | Non-income producing security. |
| ** | Includes cumulative appreciation (depreciation). Only current day’s variation margin is reported within the Statement of Assets and Liabilities. |
| † | Value determined based on Level 1 inputs — See Note 4. |
| †† | Value determined based on Level 2 inputs — See Note 4. |
| 1 | Affiliated issuer. |
| 2 | Rate indicated is the 7 day yield as of June 30, 2018. |
plc — Public Limited Company
See Sector Classification in Other Information section.
The following table summarizes the inputs used to value the Fund’s investments at June 30, 2018 (See Note 4 in the Notes to Financial Statements):
Investments in Securities (Assets) | Level 1 | Level 2 | Level 3 | Total | ||||||||||||
Common Stocks | $ | 7,426,725 | $ | — | $ | — | $ | 7,426,725 | ||||||||
Mutual Funds | 28,526,827 | — | — | 28,526,827 | ||||||||||||
Money Market Fund | 576,712 | — | — | 576,712 | ||||||||||||
Equity Index Swap Agreements* | — | 2,436,573 | — | 2,436,573 | ||||||||||||
Total Assets | $ | 36,530,264 | $ | 2,436,573 | $ | — | $ | 38,966,837 | ||||||||
| ||||||||||||||||
Investments in Securities (Liabilities) | Level 1 | Level 2 | Level 3 | Total | ||||||||||||
Equity Futures Contracts* | $ | 66,763 | $ | — | $ | — | $ | 66,763 | ||||||||
| * | This derivative is reported as unrealized appreciation/(depreciation) at period end. |
Transfers between investment levels may occur as the markets fluctuate and/or the availability of data used in an investment’s valuation changes. Transfers between valuation levels, if any, are in comparison to the valuation levels at the end of the previous fiscal year, and are effective using the fair value as of the end of the current fiscal period.
For the period ended June 30, 2018, there were no transfers between levels.
106 | THE GUGGENHEIM FUNDS SEMI-ANNUAL REPORT | SEE NOTES TO FINANCIAL STATEMENTS. |
SCHEDULE OF INVESTMENTS (Unaudited)(concluded) | June 30, 2018 |
SERIES X (STYLEPLUS—SMALL GROWTH SERIES) |
Affiliated Transactions
Investments representing 5% or more of the outstanding voting shares of a portfolio company of a fund, or control of or by, or common control under Guggenheim Investments ("GI"), result in that portfolio company being considered an affiliated company of such fund, as defined in the 1940 Act.
The Fund may invest in certain of the underlying series of Guggenheim Strategy Funds Trust, including Guggenheim Strategy Fund I, Guggenheim Strategy Fund II, Guggenheim Strategy Fund III and Guggenheim Variable Insurance Strategy Fund III, (collectively, the “Cash Management Funds”), each of which are open-end management investment companies managed by GI. The Cash Management Funds, which launched on March 11, 2014, are offered as cash management options only to mutual funds, trusts, and other accounts managed by GI and/or its affiliates, and are not available to the public. The Cash Management Funds pay no investment management fees. The Cash Management Funds’ annual report on Form N-CSR dated September 30, 2017, is available publicly or upon request. This information is available from the EDGAR database on the SEC’s website at https://www.sec.gov/Archives/edgar/data/1601445/000089180417000715/gug72218.htm.
Transactions during the period ended June 30, 2018, in which the portfolio company is an “affiliated person”, were as follows:
Security Name | Value | Additions | Reductions | Realized | Change in | Value | Shares | Investment | ||||||||||||||||||||||||
Mutual Funds | ||||||||||||||||||||||||||||||||
Guggenheim Strategy Fund I | $ | 3,804,188 | $ | 581,015 | $ | (2,388,710 | ) | $ | 7,905 | $ | (9,279 | ) | $ | 1,995,119 | 79,677 | $ | 36,045 | |||||||||||||||
Guggenheim Strategy Fund II | 4,594,307 | 403,553 | (934,999 | ) | 5,504 | (8,897 | ) | 4,059,468 | 162,444 | 53,464 | ||||||||||||||||||||||
Guggenheim Strategy Fund III | 10,803,816 | 134,549 | — | — | (13,138 | ) | 10,925,227 | 437,184 | 134,138 | |||||||||||||||||||||||
Guggenheim Variable Insurance Strategy Fund III | 9,706,847 | 1,858,910 | — | — | (18,744 | ) | 11,547,013 | 460,591 | 147,011 | |||||||||||||||||||||||
| $ | 28,909,158 | $ | 2,978,027 | $ | (3,323,709 | ) | $ | 13,409 | $ | (50,058 | ) | $ | 28,526,827 | $ | 370,658 | |||||||||||||||||
SEE NOTES TO FINANCIAL STATEMENTS. | THE GUGGENHEIM FUNDS SEMI-ANNUAL REPORT | 107 |
SERIES X (STYLEPLUS—SMALL GROWTH SERIES) |
STATEMENT OF ASSETS AND LIABILITIES (Unaudited) | ||||
June 30, 2018 | ||||
Assets: | ||||
Investments in unaffiliated issuers, at value (cost $7,625,173) | $ | 8,003,437 | ||
Investments in affiliated issuers, at value (cost $28,442,677) | 28,526,827 | |||
Segregated cash with broker | 98,550 | |||
Unrealized appreciation on swap agreements | 2,436,573 | |||
Prepaid expenses | 995 | |||
Receivables: | ||||
Dividends | 74,333 | |||
Interest | 2,579 | |||
Fund shares sold | 91 | |||
Total assets | 39,143,385 | |||
Liabilities: | ||||
Segregated cash due to broker | 2,210,000 | |||
Payable for: | ||||
Swap settlement | 76,654 | |||
Securities purchased | 75,239 | |||
Fund shares redeemed | 57,356 | |||
Management fees | 15,279 | |||
Distribution and service fees | 8,105 | |||
Fund accounting/administration fees | 2,593 | |||
Transfer agent/maintenance fees | 2,286 | |||
Variation margin on futures contracts | 2,200 | |||
Trustees’ fees* | 178 | |||
Miscellaneous | 20,200 | |||
Total liabilities | 2,470,090 | |||
Commitments and contingent liabilities (Note 13) | — | |||
Net assets | $ | 36,673,295 | ||
Net assets consist of: | ||||
Paid in capital | $ | 26,088,528 | ||
Undistributed net investment income | 550,491 | |||
Accumulated net realized gain on investments | 7,202,052 | |||
Net unrealized appreciation on investments | 2,832,224 | |||
Net assets | $ | 36,673,295 | ||
Capital shares outstanding | 838,781 | |||
Net asset value per share | $ | 43.72 | ||
STATEMENT OF OPERATIONS (Unaudited) | ||||
Period Ended June 30, 2018 | ||||
Investment Income: | ||||
Dividends from securities of unaffiliated issuers (net of foreign withholding tax of $115) | $ | 23,887 | ||
Dividends from securities of affiliated issuers | 370,658 | |||
Interest | 342 | |||
Total investment income | 394,887 | |||
Expenses: | ||||
Management fees | 147,508 | |||
Distribution and service fees: | 49,169 | |||
Transfer agent/maintenance fees | 12,566 | |||
Fund accounting/administration fees | 15,734 | |||
Trustees’ fees* | 6,011 | |||
Custodian fees | 4,711 | |||
Line of credit fees | 726 | |||
Miscellaneous | 27,288 | |||
Total expenses | 263,713 | |||
Less: | ||||
Expenses waived by Adviser | (57,412 | ) | ||
Net expenses | 206,301 | |||
Net investment income | 188,586 | |||
Net Realized and Unrealized Gain (Loss): | ||||
Net realized gain (loss) on: | ||||
Investments in unaffiliated issuers | 952,093 | |||
Investments in affiliated issuers | 13,409 | |||
Swap agreements | 1,049,320 | |||
Futures contracts | 88,447 | |||
Net realized gain | 2,103,269 | |||
Net change in unrealized appreciation (depreciation) on: | ||||
Investments in unaffiliated issuers | (260,051 | ) | ||
Investments in affiliated issuers | (50,058 | ) | ||
Swap agreements | 1,562,909 | |||
Futures contracts | (76,377 | ) | ||
Net change in unrealized appreciation (depreciation) | 1,176,423 | |||
Net realized and unrealized gain | 3,279,692 | |||
Net increase in net assets resulting from operations | $ | 3,468,278 | ||
| * | Relates to Trustees not deemed “interested persons” within the meaning of Section 2(a)(19) of the 1940 Act. |
108 | THE GUGGENHEIM FUNDS SEMI-ANNUAL REPORT | SEE NOTES TO FINANCIAL STATEMENTS. |
SERIES X (STYLEPLUS—SMALL GROWTH SERIES) |
STATEMENTS OF CHANGES IN NET ASSETS |
Period Ended | Year Ended | |||||||
Increase (Decrease) in Net Assets from Operations: | ||||||||
Net investment income | $ | 188,586 | $ | 360,787 | ||||
Net realized gain on investments | 2,103,269 | 6,820,362 | ||||||
Net change in unrealized appreciation (depreciation) on investments | 1,176,423 | 199,630 | ||||||
Net increase in net assets resulting from operations | 3,468,278 | 7,380,779 | ||||||
Distributions to shareholders from: | ||||||||
Net investment income | — | (267,944 | ) | |||||
Total distributions to shareholders | — | (267,944 | ) | |||||
Capital share transactions: | ||||||||
Proceeds from sale of shares | 984,464 | 3,220,199 | ||||||
Distributions reinvested | — | 267,944 | ||||||
Cost of shares redeemed | (7,338,977 | ) | (5,257,634 | ) | ||||
Net decrease from capital share transactions | (6,354,513 | ) | (1,769,491 | ) | ||||
Net increase (decrease) in net assets | (2,886,235 | ) | 5,343,344 | |||||
Net assets: | ||||||||
Beginning of period | 39,559,530 | 34,216,186 | ||||||
End of period | $ | 36,673,295 | $ | 39,559,530 | ||||
Undistributed net investment income at end of period | $ | 550,491 | $ | 361,905 | ||||
Capital share activity: | ||||||||
Shares sold | 23,445 | 89,564 | ||||||
Shares issued from reinvestment of distributions | — | 7,333 | ||||||
Shares redeemed | (168,866 | ) | (146,945 | ) | ||||
Net decrease in shares | (145,421 | ) | (50,048 | ) | ||||
SEE NOTES TO FINANCIAL STATEMENTS. | THE GUGGENHEIM FUNDS SEMI-ANNUAL REPORT | 109 |
SERIES X (STYLEPLUS—SMALL GROWTH SERIES) |
FINANCIAL HIGHLIGHTS |
This table is presented to show selected data for a share outstanding throughout each period and to assist shareholders in evaluating a Fund’s performance for the periods presented.
Period Ended | Year Ended December 31, 2017 | Year Ended December 31, 2016 | Year Ended December 31, 2015 | Year Ended December 31, 2014 | Year Ended December 31, 2013 | |||||||||||||||||||
| Per Share Data | ||||||||||||||||||||||||
| Net asset value, beginning of period | $ | 40.19 | $ | 33.08 | $ | 31.03 | $ | 31.77 | $ | 29.20 | $ | 20.66 | ||||||||||||
| Income (loss) from investment operations: | ||||||||||||||||||||||||
Net investment income (loss)b | .20 | .36 | .25 | .10 | .22 | (.05 | ) | |||||||||||||||||
| Net gain (loss) on investments (realized and unrealized) | 3.33 | 7.02 | 3.74 | (.47 | ) | 2.35 | 8.59 | |||||||||||||||||
| Total from investment operations | 3.53 | 7.38 | 3.99 | (.37 | ) | 2.57 | 8.54 | |||||||||||||||||
| Less distributions from: | ||||||||||||||||||||||||
| Net investment income | — | (.27 | ) | (.13 | ) | (.27 | ) | — | — | |||||||||||||||
| Net realized gains | — | — | (1.81 | ) | (.10 | ) | — | — | ||||||||||||||||
| Total distributions | — | (.27 | ) | (1.94 | ) | (.37 | ) | — | — | |||||||||||||||
| Net asset value, end of period | $ | 43.72 | $ | 40.19 | $ | 33.08 | $ | 31.03 | $ | 31.77 | $ | 29.20 | ||||||||||||
Total Returnc | 8.78 | % | 22.38 | % | 13.45 | % | (1.29 | %) | 8.80 | % | 41.34 | % | ||||||||||||
| Ratios/Supplemental Data | ||||||||||||||||||||||||
| Net assets, end of period (in thousands) | $ | 36,673 | $ | 39,560 | $ | 34,216 | $ | 38,601 | $ | 37,005 | $ | 38,586 | ||||||||||||
| Ratios to average net assets: | ||||||||||||||||||||||||
| Net investment income (loss) | 0.96 | % | 0.99 | % | 0.83 | % | 0.32 | % | 0.74 | % | (0.21 | %) | ||||||||||||
Total expensesd | 1.34 | % | 1.37 | % | 1.23 | % | 1.21 | % | 1.26 | % | 1.23 | % | ||||||||||||
Net expensese,f | 1.06 | % | 1.10 | % | 1.23 | % | 1.21 | % | 1.24 | % | 1.23 | % | ||||||||||||
| Portfolio turnover rate | 34 | % | 50 | % | 76 | % | 79 | % | 102 | % | 255 | % | ||||||||||||
| a | Unaudited figures for the period ended June 30, 2018. Percentage amounts for the period, except total return and portfolio turnover rate, have been annualized. |
| b | Net investment income (loss) per share was computed using average shares outstanding throughout the period. |
| c | Total return does not take into account any of the expenses associated with an investment in variable insurance products. If total return had taken into account these expenses, performance would have been lower. Shares of a series of Guggenheim Variable Funds Trust are available only through the purchase of such products. |
| d | Does not include expenses of the underlying funds in which the Fund invests. |
| e | Net expense information reflects the expense ratios after expense waivers and reimbursements, as applicable. |
| f | Net expenses may include expenses that are excluded from the expense limitation and agreement and affiliated fee waivers. Excluding these expenses, the net expense ratios for the periods would be: |
06/30/18 | 12/31/17 | 12/31/16 | 12/31/15 | 12/31/14 | 12/31/13 |
1.06% | 1.09% | N/A | N/A | N/A | N/A |
110 | THE GUGGENHEIM FUNDS SEMI-ANNUAL REPORT | SEE NOTES TO FINANCIAL STATEMENTS. |
PERFORMANCE REPORT AND FUND PROFILE (Unaudited) | June 30, 2018 |
SERIES Y (STYLEPLUS—LARGE GROWTH SERIES)
OBJECTIVE: Seeks long-term growth of capital.
Holdings Diversification (Market Exposure as % of Net Assets)
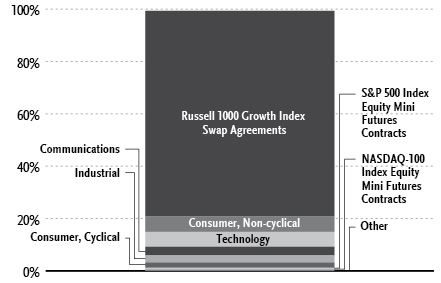
“Holdings Diversification (Market Exposure as % of Net Assets)” excludes any temporary cash investments or investments in Guggenheim Strategy Funds Trust mutual funds.
Inception Date: May 3, 1999 |
Ten Largest Holdings (% of Total Net Assets) | |
Guggenheim Variable Insurance Strategy Fund III | 32.6% |
Guggenheim Strategy Fund III | 32.5% |
Guggenheim Strategy Fund II | 9.6% |
Guggenheim Strategy Fund I | 4.0% |
Apple, Inc. | 1.4% |
Microsoft Corp. | 1.0% |
Amazon.com, Inc. | 0.9% |
Alphabet, Inc. — Class C | 0.9% |
Facebook, Inc. — Class A | 0.6% |
PepsiCo, Inc. | 0.4% |
Top Ten Total | 83.9% |
“Ten Largest Holdings” excludes any temporary cash or derivative investments.
Average Annual Returns*,†
Periods Ended June 30, 2018
6 month‡ | 1 Year | 5 Year | 10 Year | |
Series Y (StylePlus—Large Growth Series) | 6.11% | 21.40% | 16.91% | 9.90% |
Russell 1000 Growth Index | 7.25% | 22.51% | 16.36% | 11.83% |
| * | The performance data above represents past performance that is not predictive of future results. The investment return and principal value of an investment in the Fund will fluctuate so that an investor’s shares, when redeemed, may be worth more or less than their original cost. Returns are historical and include changes in principal and reinvested dividends and capital gains and do not reflect the effect of taxes. The Russell 1000 Growth Index is an unmanaged index and, unlike the Fund, has no management fees or operating expenses to reduce its reported return. |
| † | Performance figures do not reflect fees and expenses associated with an investment in variable insurance products. If returns had taken into account these fees and expenses, performance would have been lower. Shares of a series of Guggenheim Variable Funds Trust are available only through the purchase of such products. |
| ‡ | 6 month returns are not annualized. |
THE GUGGENHEIM FUNDS SEMI-ANNUAL REPORT 111 |
SCHEDULE OF INVESTMENTS (Unaudited) | June 30, 2018 |
SERIES Y (STYLEPLUS—LARGE GROWTH SERIES) |
| Value | |||||||
COMMON STOCKS† - 20.1% | ||||||||
Consumer, Non-cyclical - 5.9% | ||||||||
PepsiCo, Inc. | 1,474 | $ | 160,474 | |||||
Coca-Cola Co. | 3,493 | 153,203 | ||||||
Amgen, Inc. | 787 | 145,273 | ||||||
Altria Group, Inc. | 2,462 | 139,817 | ||||||
Gilead Sciences, Inc. | 1,657 | 117,382 | ||||||
AbbVie, Inc. | 1,236 | 114,515 | ||||||
Bristol-Myers Squibb Co. | 1,831 | 101,328 | ||||||
Sysco Corp. | 1,466 | 100,113 | ||||||
Biogen, Inc.* | 343 | 99,552 | ||||||
Kimberly-Clark Corp. | 928 | 97,755 | ||||||
Johnson & Johnson | 663 | 80,449 | ||||||
US Foods Holding Corp.* | 2,117 | 80,065 | ||||||
Kellogg Co. | 1,134 | 79,233 | ||||||
UnitedHealth Group, Inc. | 314 | 77,037 | ||||||
Herbalife Nutrition Ltd.* | 1,424 | 76,497 | ||||||
CoreLogic, Inc.* | 1,282 | 66,536 | ||||||
Western Union Co. | 3,020 | 61,397 | ||||||
United Rentals, Inc.* | 413 | 60,967 | ||||||
Quanta Services, Inc.* | 1,797 | 60,020 | ||||||
McKesson Corp. | 413 | 55,094 | ||||||
Celgene Corp.* | 603 | 47,890 | ||||||
Humana, Inc. | 151 | 44,942 | ||||||
Sabre Corp. | 1,790 | 44,105 | ||||||
Sprouts Farmers Market, Inc.* | 1,486 | 32,796 | ||||||
Centene Corp.* | 231 | 28,462 | ||||||
Stryker Corp. | 143 | 24,147 | ||||||
Molina Healthcare, Inc.* | 245 | 23,995 | ||||||
CVS Health Corp. | 349 | 22,458 | ||||||
Cardinal Health, Inc. | 434 | 21,192 | ||||||
Total Consumer, Non-cyclical | 2,216,694 | |||||||
Technology - 5.7% | ||||||||
Apple, Inc. | 2,819 | 521,825 | ||||||
Microsoft Corp. | 3,660 | 360,913 | ||||||
International Business Machines Corp. | 917 | 128,105 | ||||||
Cognizant Technology Solutions Corp. — Class A | 1,300 | 102,687 | ||||||
NetApp, Inc. | 1,174 | 92,194 | ||||||
Applied Materials, Inc. | 1,848 | 85,359 | ||||||
Citrix Systems, Inc.* | 809 | 84,816 | ||||||
Broadcom, Inc. | 320 | 77,645 | ||||||
Oracle Corp. | 1,758 | 77,457 | ||||||
Dell Technologies Incorporated Class V — Class V* | 903 | 76,376 | ||||||
Teradyne, Inc. | 2,005 | 76,330 | ||||||
ON Semiconductor Corp.* | 3,345 | 74,376 | ||||||
Lam Research Corp. | 429 | 74,153 | ||||||
Micron Technology, Inc.* | 1,133 | 59,415 | ||||||
KLA-Tencor Corp. | 437 | 44,806 | ||||||
Skyworks Solutions, Inc. | 457 | 44,169 | ||||||
Zebra Technologies Corp. — Class A* | 235 | 33,664 | ||||||
MKS Instruments, Inc. | 322 | 30,815 | ||||||
NCR Corp.* | 1,027 | 30,789 | ||||||
NVIDIA Corp. | 121 | 28,665 | ||||||
Adobe Systems, Inc.* | 92 | 22,430 | ||||||
Cypress Semiconductor Corp. | 1,342 | 20,908 | ||||||
Total Technology | 2,147,897 | |||||||
Communications - 3.3% | ||||||||
Amazon.com, Inc.* | 200 | 339,960 | ||||||
Alphabet, Inc. — Class C* | 304 | 339,158 | ||||||
Facebook, Inc. — Class A* | 1,103 | 214,335 | ||||||
Omnicom Group, Inc. | 1,117 | 85,194 | ||||||
Motorola Solutions, Inc. | 687 | 79,946 | ||||||
eBay, Inc.* | 1,592 | 57,726 | ||||||
CDW Corp. | 650 | 52,513 | ||||||
AMC Networks, Inc. — Class A* | 620 | 38,564 | ||||||
Netflix, Inc.* | 85 | 33,271 | ||||||
Walt Disney Co. | 223 | 23,373 | ||||||
Total Communications | 1,264,040 | |||||||
Industrial - 2.8% | ||||||||
Union Pacific Corp. | 923 | 130,771 | ||||||
Lockheed Martin Corp. | 382 | 112,854 | ||||||
Honeywell International, Inc. | 681 | 98,098 | ||||||
Caterpillar, Inc. | 706 | 95,783 | ||||||
Spirit AeroSystems Holdings, Inc. — Class A | 935 | 80,326 | ||||||
Huntington Ingalls Industries, Inc. | 336 | 72,841 | ||||||
Ingersoll-Rand plc | 749 | 67,208 | ||||||
Boeing Co. | 186 | 62,405 | ||||||
Textron, Inc. | 937 | 61,758 | ||||||
Cummins, Inc. | 464 | 61,712 | ||||||
Parker-Hannifin Corp. | 369 | 57,508 | ||||||
Northrop Grumman Corp. | 131 | 40,309 | ||||||
Hubbell, Inc. | 313 | 33,097 | ||||||
Genesee & Wyoming, Inc. — Class A* | 388 | 31,552 | ||||||
Raytheon Co. | 111 | 21,443 | ||||||
Xylem, Inc. | 317 | 21,359 | ||||||
Total Industrial | 1,049,024 | |||||||
Consumer, Cyclical - 1.9% | ||||||||
Southwest Airlines Co. | 1,746 | 88,837 | ||||||
Lions Gate Entertainment Corp. — Class A | 3,018 | 74,907 | ||||||
Home Depot, Inc. | 363 | 70,821 | ||||||
Delta Air Lines, Inc. | 1,234 | 61,132 | ||||||
Lear Corp. | 310 | 57,601 | ||||||
Allison Transmission Holdings, Inc. | 1,378 | 55,795 | ||||||
HD Supply Holdings, Inc.* | 967 | 41,475 | ||||||
PulteGroup, Inc. | 1,312 | 37,720 | ||||||
Nu Skin Enterprises, Inc. — Class A | 480 | 37,531 | ||||||
Live Nation Entertainment, Inc.* | 746 | 36,233 | ||||||
Costco Wholesale Corp. | 113 | 23,615 | ||||||
Lowe’s Companies, Inc. | 232 | 22,172 | ||||||
Yum! Brands, Inc. | 280 | 21,902 | ||||||
Marriott International, Inc. — Class A | 166 | 21,016 | ||||||
NVR, Inc.* | 7 | 20,793 | ||||||
NIKE, Inc. — Class B | 209 | 16,653 | ||||||
Chipotle Mexican Grill, Inc. — Class A* | 33 | 14,235 | ||||||
Total Consumer, Cyclical | 702,438 | |||||||
112 | THE GUGGENHEIM FUNDS SEMI-ANNUAL REPORT | SEE NOTES TO FINANCIAL STATEMENTS. |
SCHEDULE OF INVESTMENTS (Unaudited)(continued) | June 30, 2018 |
SERIES Y (STYLEPLUS—LARGE GROWTH SERIES) |
| Value | |||||||
Financial - 0.3% | ||||||||
Visa, Inc. — Class A | 598 | $ | 79,205 | |||||
Mastercard, Inc. — Class A | 234 | 45,986 | ||||||
Total Financial | 125,191 | |||||||
Basic Materials - 0.2% | ||||||||
Univar, Inc.* | 1,860 | 48,806 | ||||||
Praxair, Inc. | 143 | 22,616 | ||||||
Total Basic Materials | 71,422 | |||||||
Total Common Stocks | ||||||||
(Cost $6,948,854) | 7,576,706 | |||||||
MUTUAL FUNDS† - 78.7% | ||||||||
Guggenheim Variable Insurance Strategy Fund III1 | 490,515 | 12,297,216 | ||||||
Guggenheim Strategy Fund III1 | 491,031 | 12,270,868 | ||||||
Guggenheim Strategy Fund II1 | 144,296 | 3,605,957 | ||||||
Guggenheim Strategy Fund I1 | 60,420 | 1,512,908 | ||||||
Total Mutual Funds | ||||||||
(Cost $29,619,985) | 29,686,949 | |||||||
MONEY MARKET FUND† - 0.9% | ||||||||
Dreyfus Treasury Prime Cash Management Fund — Institutional Class, 1.68%2 | 334,221 | 334,221 | ||||||
Total Money Market Fund | ||||||||
(Cost $334,221) | 334,221 | |||||||
Total Investments - 99.7% | ||||||||
(Cost $36,903,060) | $ | 37,597,876 | ||||||
Other Assets & Liabilities, net - 0.3% | 127,470 | |||||||
Total Net Assets - 100.0% | $ | 37,725,346 | ||||||
Futures Contracts | ||||||||||||||||
Description | Number of | Expiration | Notional | Value and | ||||||||||||
Equity Futures Contracts Purchased† | ||||||||||||||||
S&P 500 Index Mini Futures Contracts | 1 | Sep 2018 | $ | 136,038 | $ | (3,599 | ) | |||||||||
NASDAQ-100 Index Mini Futures Contracts | 1 | Sep 2018 | 141,245 | (4,721 | ) | |||||||||||
| $ | 277,283 | $ | (8,320 | ) | ||||||||||||
Total Return Swap Agreements | ||||||||||||||||||||||
Counterparty | Index | Financing | Payment | Maturity | Units | Notional | Value and | |||||||||||||||
OTC Equity Index Swap Agreements†† | ||||||||||||||||||||||
Wells Fargo | Russell 1000 Growth Index | 2.16 | % | At Maturity | 07/02/18 | 20,571 | $ | 29,639,417 | $ | 2,168,471 | ||||||||||||
| * | Non-income producing security. |
| ** | Includes cumulative appreciation (depreciation). Only current day’s variation margin is reported within the Statement of Assets and Liabilities. |
| † | Value determined based on Level 1 inputs — See Note 4. |
| † | † Value determined based on Level 2 inputs — See Note 4. |
| 1 | Affiliated issuer. |
| 2 | Rate indicated is the 7 day yield as of June 30, 2018. |
plc — Public Limited Company
See Sector Classification in Other Information section.
SEE NOTES TO FINANCIAL STATEMENTS. | THE GUGGENHEIM FUNDS SEMI-ANNUAL REPORT | 113 |
SCHEDULE OF INVESTMENTS (Unaudited)(concluded) | June 30, 2018 |
SERIES Y (STYLEPLUS—LARGE GROWTH SERIES) |
The following table summarizes the inputs used to value the Fund’s investments at June 30, 2018 (See Note 4 in the Notes to Financial Statements):
Investments in Securities (Assets) | Level 1 | Level 2 | Level 3 | Total | ||||||||||||
Common Stocks | $ | 7,576,706 | $ | — | $ | — | $ | 7,576,706 | ||||||||
Mutual Funds | 29,686,949 | — | — | 29,686,949 | ||||||||||||
Money Market Fund | 334,221 | — | — | 334,221 | ||||||||||||
Equity Index Swap Agreements* | — | 2,168,471 | — | 2,168,471 | ||||||||||||
Total Assets | $ | 37,597,876 | $ | 2,168,471 | $ | — | $ | 39,766,347 | ||||||||
| ||||||||||||||||
Investments in Securities (Liabilities) | Level 1 | Level 2 | Level 3 | Total | ||||||||||||
Equity Futures Contracts* | $ | 8,320 | $ | — | $ | — | $ | 8,320 | ||||||||
| * | This derivative is reported as unrealized appreciation/(depreciation) at period end. |
Transfers between investment levels may occur as the markets fluctuate and/or the availability of data used in an investment’s valuation changes. Transfers between valuation levels, if any, are in comparison to the valuation levels at the end of the previous fiscal year, and are effective using the fair value as of the end of the current fiscal period.
For the period ended June 30, 2018, there were no transfers between levels.
Affiliated Transactions
Investments representing 5% or more of the outstanding voting shares of a portfolio company of a fund, or control of or by, or common control under Guggenheim Investments ("GI"), result in that portfolio company being considered an affiliated company of such fund, as defined in the 1940 Act.
The Fund may invest in certain of the underlying series of Guggenheim Strategy Funds Trust, including Guggenheim Strategy Fund I, Guggenheim Strategy Fund II, Guggenheim Strategy Fund III and Guggenheim Variable Insurance Strategy Fund III, (collectively, the “Cash Management Funds”), each of which are open-end management investment companies managed by GI. The Cash Management Funds, which launched on March 11, 2014, are offered as cash management options only to mutual funds, trusts, and other accounts managed by GI and/or its affiliates, and are not available to the public. The Cash Management Funds pay no investment management fees. The Cash Management Funds’ annual report on Form N-CSR dated September 30, 2017, is available publicly or upon request. This information is available from the EDGAR database on the SEC’s website at https://www.sec.gov/Archives/edgar/data/1601445/000089180417000715/gug72218.htm.
Transactions during the period ended June 30, 2018, in which the portfolio company is an “affiliated person”, were as follows:
Security Name | Value | Additions | Reductions | Realized | Change in | Value | Shares | Investment | ||||||||||||||||||||||||
Mutual Funds | ||||||||||||||||||||||||||||||||
Guggenheim Strategy Fund I | $ | 4,517,430 | $ | 1,286,008 | $ | (4,288,605 | ) | $ | 14,599 | $ | (16,524 | ) | $ | 1,512,908 | 60,420 | $ | 36,115 | |||||||||||||||
Guggenheim Strategy Fund II | 6,940,957 | 77,881 | (3,409,986 | ) | 17,744 | (20,639 | ) | 3,605,957 | 144,296 | 77,930 | ||||||||||||||||||||||
Guggenheim Strategy Fund III | 14,261,267 | 174,359 | (2,149,994 | ) | 10,678 | (25,442 | ) | 12,270,868 | 491,031 | 174,001 | ||||||||||||||||||||||
Guggenheim Variable Insurance Strategy Fund III | 12,792,600 | 2,525,880 | (2,999,977 | ) | 14,345 | (35,632 | ) | 12,297,216 | 490,515 | 190,043 | ||||||||||||||||||||||
| $ | 38,512,254 | $ | 4,064,128 | $ | (12,848,562 | ) | $ | 57,366 | $ | (98,237 | ) | $ | 29,686,949 | $ | 478,089 | |||||||||||||||||
114 | THE GUGGENHEIM FUNDS SEMI-ANNUAL REPORT | SEE NOTES TO FINANCIAL STATEMENTS. |
SERIES Y (STYLEPLUS—LARGE GROWTH SERIES) |
STATEMENT OF ASSETS AND LIABILITIES (Unaudited) | ||||
June 30, 2018 | ||||
Assets: | ||||
Investments in unaffiliated issuers, at value (cost $7,283,075) | $ | 7,910,927 | ||
Investments in affiliated issuers, at value (cost $29,619,985) | 29,686,949 | |||
Segregated cash with broker | 11,400 | |||
Unrealized appreciation on swap agreements | 2,168,471 | |||
Prepaid expenses | 1,094 | |||
Receivables: | ||||
Fund shares sold | 102,407 | |||
Dividends | 89,996 | |||
Interest | 3,777 | |||
Variation margin on futures contracts | 98 | |||
Total assets | 39,975,119 | |||
Liabilities: | ||||
Overdraft due to custodian bank | 249,831 | |||
Segregated cash due to broker | 1,750,000 | |||
Payable for: | ||||
Securities purchased | 86,521 | |||
Fund shares redeemed | 77,717 | |||
Swap settlement | 45,552 | |||
Management fees | 13,078 | |||
Distribution and service fees | 9,222 | |||
Fund accounting/administration fees | 2,951 | |||
Transfer agent/maintenance fees | 2,324 | |||
Trustees’ fees* | 123 | |||
Miscellaneous | 12,454 | |||
Total liabilities | 2,249,773 | |||
Commitments and contingent liabilities (Note 13) | — | |||
Net assets | $ | 37,725,346 | ||
Net assets consist of: | ||||
Paid in capital | $ | 24,540,802 | ||
Undistributed net investment income | 909,224 | |||
Accumulated net realized gain on investments | 9,420,353 | |||
Net unrealized appreciation on investments | 2,854,967 | |||
Net assets | $ | 37,725,346 | ||
Capital shares outstanding | 1,751,639 | |||
Net asset value per share | $ | 21.54 | ||
STATEMENT OF OPERATIONS (Unaudited) | ||||
Period Ended June 30, 2018 | ||||
Investment Income: | ||||
Dividends from securities of unaffiliated issuers (net of foreign withholding tax of $63) | $ | 66,731 | ||
Dividends from securities of affiliated issuers | 478,089 | |||
Interest | 12,916 | |||
Total investment income | 557,736 | |||
Expenses: | ||||
Management fees | 156,022 | |||
Distribution and service fees | 60,009 | |||
Transfer agent/maintenance fees | 12,694 | |||
Interest expense | 22,248 | |||
Fund accounting/administration fees | 19,203 | |||
Trustees’ fees* | 4,418 | |||
Custodian fees | 3,395 | |||
Line of credit fees | 904 | |||
Miscellaneous | 30,021 | |||
Total expenses | 308,914 | |||
Less: | ||||
Expenses waived by Adviser | (63,925 | ) | ||
Net expenses | 244,989 | |||
Net investment income | 312,747 | |||
Net Realized and Unrealized Gain (Loss): | ||||
Net realized gain (loss) on: | ||||
Investments in unaffiliated issuers | 603,041 | |||
Investments in affiliated issuers | 57,366 | |||
Swap agreements | 3,225,536 | |||
Futures contracts | 21,720 | |||
Net realized gain | 3,907,663 | |||
Net change in unrealized appreciation (depreciation) on: | ||||
Investments in unaffiliated issuers | (352,982 | ) | ||
Investments in affiliated issuers | (98,237 | ) | ||
Swap agreements | (517,007 | ) | ||
Futures contracts | (10,178 | ) | ||
Net change in unrealized appreciation (depreciation) | (978,404 | ) | ||
Net realized and unrealized gain | 2,929,259 | |||
Net increase in net assets resulting from operations | $ | 3,242,006 | ||
| * | Relates to Trustees not deemed “interested persons” within the meaning of Section 2(a)(19) of the 1940 Act. |
SEE NOTES TO FINANCIAL STATEMENTS. | THE GUGGENHEIM FUNDS SEMI-ANNUAL REPORT | 115 |
SERIES Y (STYLEPLUS—LARGE GROWTH SERIES) |
STATEMENTS OF CHANGES IN NET ASSETS |
Period Ended | Year Ended | |||||||
Increase (Decrease) in Net Assets from Operations: | ||||||||
Net investment income | $ | 312,747 | $ | 596,477 | ||||
Net realized gain on investments | 3,907,663 | 7,742,154 | ||||||
Net change in unrealized appreciation (depreciation) on investments | (978,404 | ) | 3,128,375 | |||||
Net increase in net assets resulting from operations | 3,242,006 | 11,467,006 | ||||||
Distributions to shareholders from: | ||||||||
Net investment income | — | (436,012 | ) | |||||
Total distributions to shareholders | — | (436,012 | ) | |||||
Capital share transactions: | ||||||||
Proceeds from sale of shares | 2,580,988 | 6,762,793 | ||||||
Distributions reinvested | — | 436,012 | ||||||
Cost of shares redeemed | (16,270,410 | ) | (8,622,204 | ) | ||||
Net decrease from capital share transactions | (13,689,422 | ) | (1,423,399 | ) | ||||
Net increase (decrease) in net assets | (10,447,416 | ) | 9,607,595 | |||||
Net assets: | ||||||||
Beginning of period | 48,172,762 | 38,565,167 | ||||||
End of period | $ | 37,725,346 | $ | 48,172,762 | ||||
Undistributed net investment income at end of period | $ | 909,224 | $ | 596,477 | ||||
Capital share activity: | ||||||||
Shares sold | 122,550 | 369,962 | ||||||
Shares issued from reinvestment of distributions | — | 23,957 | ||||||
Shares redeemed | (744,494 | ) | (468,889 | ) | ||||
Net decrease in shares | (621,944 | ) | (74,970 | ) | ||||
116 | THE GUGGENHEIM FUNDS SEMI-ANNUAL REPORT | SEE NOTES TO FINANCIAL STATEMENTS. |
SERIES Y (STYLEPLUS—LARGE GROWTH SERIES) |
FINANCIAL HIGHLIGHTS |
This table is presented to show selected data for a share outstanding throughout each period and to assist shareholders in evaluating a Fund’s performance for the periods presented.
Period Ended | Year Ended December 31, 2017 | Year Ended December 31, 2016 | Year Ended December 31, 2015 | Year Ended December 31, 2014 | Year Ended December 31, 2013 | |||||||||||||||||||
| Per Share Data | ||||||||||||||||||||||||
| Net asset value, beginning of period | $ | 20.30 | $ | 15.75 | $ | 15.11 | $ | 15.58 | $ | 13.52 | $ | 10.54 | ||||||||||||
| Income (loss) from investment operations: | ||||||||||||||||||||||||
Net investment income (loss)b | .14 | .25 | .17 | .08 | .15 | .04 | ||||||||||||||||||
| Net gain (loss) on investments (realized and unrealized) | 1.10 | 4.48 | 1.13 | .79 | 1.91 | 2.94 | ||||||||||||||||||
| Total from investment operations | 1.24 | 4.73 | 1.30 | .87 | 2.06 | 2.98 | ||||||||||||||||||
| Less distributions from: | ||||||||||||||||||||||||
| Net investment income | — | (.18 | ) | (.08 | ) | (.17 | ) | — | — | |||||||||||||||
| Net realized gains | — | — | (.58 | ) | (1.17 | ) | — | — | ||||||||||||||||
| Total distributions | — | (.18 | ) | (.66 | ) | (1.34 | ) | — | — | |||||||||||||||
| Net asset value, end of period | $ | 21.54 | $ | 20.30 | $ | 15.75 | $ | 15.11 | $ | 15.58 | $ | 13.52 | ||||||||||||
Total Returnc | 6.11 | % | 30.11 | % | 8.72 | % | 5.49 | % | 15.24 | % | 28.27 | % | ||||||||||||
| Ratios/Supplemental Data | ||||||||||||||||||||||||
| Net assets, end of period (in thousands) | $ | 37,725 | $ | 48,173 | $ | 38,565 | $ | 40,178 | $ | 36,942 | $ | 40,417 | ||||||||||||
| Ratios to average net assets: | ||||||||||||||||||||||||
| Net investment income (loss) | 1.30 | % | 1.36 | % | 1.14 | % | 0.52 | % | 1.05 | % | 0.33 | % | ||||||||||||
Total expensesd | 1.29 | % | 1.20 | % | 1.04 | % | 1.15 | % | 1.18 | % | 1.10 | % | ||||||||||||
Net expensese,f | 1.02 | % | 0.97 | % | 1.04 | % | 1.15 | % | 1.16 | % | 1.10 | % | ||||||||||||
| Portfolio turnover rate | 29 | % | 43 | % | 42 | % | 65 | % | 96 | % | 247 | % | ||||||||||||
| a | Unaudited figures for the period ended June 30, 2018. Percentage amounts for the period, except total return and portfolio turnover rate, have been annualized. |
| b | Net investment income (loss) per share was computed using average shares outstanding throughout the period. |
| c | Total return does not take into account any of the expenses associated with an investment in variable insurance products. If total return had taken into account these expenses, performance would have been lower. Shares of a series of Guggenheim Variable Funds Trust are available only through the purchase of such products. |
| d | Does not include expenses of the underlying funds in which the Fund invests. |
| e | Net expense information reflects the expense ratios after expense waivers and reimbursements, as applicable. |
| f | Net expenses may include expenses that are excluded from the expense limitation agreement and affiliated fee waivers. Excluding these expenses, the net expense ratios for the periods would be: |
06/30/18 | 12/31/17 | 12/31/16 | 12/31/15 | 12/31/14 | 12/31/13 |
0.93% | 0.97% | N/A | N/A | N/A | N/A |
SEE NOTES TO FINANCIAL STATEMENTS. | THE GUGGENHEIM FUNDS SEMI-ANNUAL REPORT | 117 |
PERFORMANCE REPORT AND FUND PROFILE (Unaudited) | June 30, 2018 |
SERIES Z (ALPHA OPPORTUNITY SERIES)
OBJECTIVE: Seeks long-term growth of capital.
Holdings Diversification (Market Exposure as % of Net Assets)
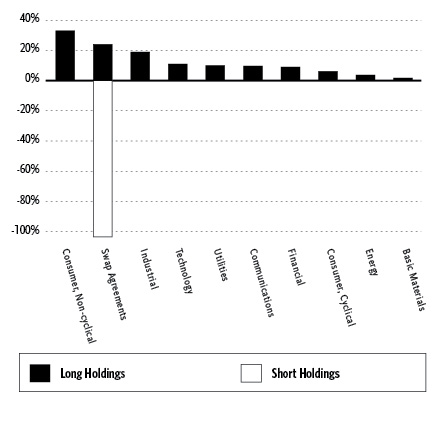
“Holdings Diversification (Market Exposure as % of Net Assets)” excludes any temporary cash investments.
Inception Date: July 7, 2003 |
Ten Largest Holdings (% of Total Net Assets) | |
Kimberly-Clark Corp. | 1.2% |
National Fuel Gas Co. | 1.2% |
Portland General Electric Co. | 1.1% |
Regal Beloit Corp. | 1.1% |
Ingredion, Inc. | 1.1% |
Senior Housing Properties Trust | 1.1% |
PNM Resources, Inc. | 1.0% |
El Paso Electric Co. | 1.0% |
Archer-Daniels-Midland Co. | 1.0% |
Amgen, Inc. | 1.0% |
Top Ten Total | 10.8% |
“Ten Largest Holdings” excludes any temporary cash or derivative investments.
Average Annual Returns*,†
Periods Ended June 30, 2018
6 month‡ | 1 Year | 5 Year | 10 Year | |
Series Z (Alpha Opportunity Series) | (9.18%) | (2.98%) | 5.88% | 6.10% |
Morningstar Long/Short Equity Category Average | (0.39%) | 5.63% | 4.15% | 4.41% |
S&P 500 Index | 2.65% | 14.37% | 13.42% | 10.17% |
ICE BofA Merrill Lynch 3-Month U.S. Treasury Bill Index | 0.81% | 1.36% | 0.42% | 0.35% |
| * | The performance data above represents past performance that is not predictive of future results. The investment return and principal value of an investment in the Fund will fluctuate so that an investor’s shares, when redeemed, may be worth more or less than their original cost. Returns are historical and include changes in principal and reinvested dividends and capital gains and do not reflect the effect of taxes. The S&P 500 Index, ICE BofA Merill Lynch 3-Month U.S. Treasury Bill Index, and Morningstar Long/Short Equity Category Average are unmanaged indices and, unlike the Fund, have no management fees or operating expenses to reduce their reported returns. |
| † | Performance figures do not reflect fees and expenses associated with an investment in variable insurance products. If returns had taken into account these fees and expenses, performance would have been lower. Shares of a series of Guggenheim Variable Funds Trust are available only through the purchase of such products. |
| ‡ | 6 month returns are not annualized. |
118 | THE GUGGENHEIM FUNDS SEMI-ANNUAL REPORT |
SCHEDULE OF INVESTMENTS (Unaudited) | June 30, 2018 |
SERIES Z (ALPHA OPPORTUNITY SERIES) |
| Value | |||||||
COMMON STOCKS† - 103.0% | ||||||||
Consumer, Non-cyclical - 33.0% | ||||||||
Kimberly-Clark Corp.1 | 1,077 | $ | 113,451 | |||||
Ingredion, Inc. | 943 | 104,390 | ||||||
Archer-Daniels-Midland Co.1 | 1,969 | 90,239 | ||||||
Amgen, Inc. | 482 | 88,973 | ||||||
Tyson Foods, Inc. — Class A1 | 1,204 | 82,895 | ||||||
Molson Coors Brewing Co. — Class B1 | 1,202 | 81,784 | ||||||
Pfizer, Inc.1 | 2,254 | 81,775 | ||||||
Edgewell Personal Care Co.* | 1,602 | 80,837 | ||||||
CVS Health Corp.1 | 1,121 | 72,136 | ||||||
Medtronic plc1 | 824 | 70,543 | ||||||
Kraft Heinz Co.1 | 1,117 | 70,170 | ||||||
McKesson Corp.1 | 511 | 68,168 | ||||||
Cardinal Health, Inc.1 | 1,389 | 67,825 | ||||||
Procter & Gamble Co.1 | 781 | 60,965 | ||||||
Western Union Co. | 2,970 | 60,380 | ||||||
Gilead Sciences, Inc.1 | 850 | 60,214 | ||||||
JM Smucker Co.1 | 555 | 59,651 | ||||||
US Foods Holding Corp.* | 1,417 | 53,591 | ||||||
Zimmer Biomet Holdings, Inc.1 | 472 | 52,600 | ||||||
Conagra Brands, Inc.1 | 1,437 | 51,344 | ||||||
STERIS plc | 487 | 51,140 | ||||||
Pilgrim’s Pride Corp.* | 2,520 | 50,728 | ||||||
Eli Lilly & Co.1 | 586 | 50,003 | ||||||
Biogen, Inc.*,1 | 172 | 49,921 | ||||||
Johnson & Johnson1 | 407 | 49,385 | ||||||
Merck & Company, Inc.1 | 788 | 47,832 | ||||||
Boston Beer Company, Inc. — Class A* | 150 | 44,955 | ||||||
Travelport Worldwide Ltd. | 2,350 | 43,569 | ||||||
CoreLogic, Inc.* | 819 | 42,506 | ||||||
Charles River Laboratories International, Inc.* | 363 | 40,750 | ||||||
PepsiCo, Inc.1 | 364 | 39,629 | ||||||
Sanderson Farms, Inc. | 371 | 39,011 | ||||||
Danaher Corp.1 | 382 | 37,696 | ||||||
Mylan N.V.*,1 | 1,005 | 36,321 | ||||||
United Therapeutics Corp.* | 317 | 35,869 | ||||||
Prestige Brands Holdings, Inc.* | 912 | 35,003 | ||||||
Darling Ingredients, Inc.* | 1,752 | 34,830 | ||||||
Abbott Laboratories1 | 558 | 34,032 | ||||||
Colgate-Palmolive Co.1 | 507 | 32,858 | ||||||
Bristol-Myers Squibb Co.1 | 592 | 32,761 | ||||||
Performance Food Group Co.* | 856 | 31,415 | ||||||
Altria Group, Inc.1 | 542 | 30,780 | ||||||
Quanta Services, Inc.* | 908 | 30,327 | ||||||
Hill-Rom Holdings, Inc. | 344 | 30,045 | ||||||
Kellogg Co.1 | 429 | 29,974 | ||||||
TreeHouse Foods, Inc.* | 570 | 29,931 | ||||||
Baxter International, Inc.1 | 399 | 29,462 | ||||||
Allergan plc1 | 173 | 28,843 | ||||||
United Natural Foods, Inc.* | 665 | 28,369 | ||||||
Dean Foods Co. | 2,648 | 27,830 | ||||||
Celgene Corp.*,1 | 348 | 27,638 | ||||||
Sabre Corp. | 1,109 | 27,326 | ||||||
United Rentals, Inc.*,1 | 183 | 27,015 | ||||||
Perrigo Company plc1 | 368 | 26,831 | ||||||
Kroger Co.1 | 922 | 26,231 | ||||||
Hologic, Inc.*,1 | 653 | 25,957 | ||||||
Regeneron Pharmaceuticals, Inc.*,1 | 72 | 24,839 | ||||||
Zoetis, Inc.1 | 281 | 23,938 | ||||||
Humana, Inc.1 | 80 | 23,811 | ||||||
Thermo Fisher Scientific, Inc.1 | 113 | 23,407 | ||||||
Philip Morris International, Inc.1 | 287 | 23,173 | ||||||
Sysco Corp.1 | 339 | 23,150 | ||||||
WellCare Health Plans, Inc.*,1 | 93 | 22,900 | ||||||
Cardtronics plc — Class A* | 913 | 22,076 | ||||||
ResMed, Inc.1 | 208 | 21,544 | ||||||
Varian Medical Systems, Inc.*,1 | 182 | 20,697 | ||||||
Bruker Corp. | 691 | 20,066 | ||||||
Church & Dwight Company, Inc.1 | 299 | 15,895 | ||||||
Lamb Weston Holdings, Inc. | 227 | 15,552 | ||||||
Hershey Co.1 | 162 | 15,076 | ||||||
Total Consumer, Non-cyclical | 3,054,828 | |||||||
Industrial - 18.9% | ||||||||
Regal Beloit Corp. | 1,290 | 105,522 | ||||||
Genesee & Wyoming, Inc. — Class A* | 1,064 | 86,525 | ||||||
Greenbrier Companies, Inc. | 1,470 | 77,543 | ||||||
EMCOR Group, Inc. | 925 | 70,467 | ||||||
AECOM* | 2,127 | 70,255 | ||||||
Cummins, Inc.1 | 510 | 67,830 | ||||||
Kansas City Southern1 | 569 | 60,291 | ||||||
Snap-on, Inc. | 367 | 58,984 | ||||||
EnerSys | 672 | 50,158 | ||||||
Eaton Corporation plc1 | 648 | 48,431 | ||||||
Masco Corp.1 | 1,109 | 41,499 | ||||||
Arrow Electronics, Inc.* | 544 | 40,952 | ||||||
Norfolk Southern Corp.1 | 267 | 40,282 | ||||||
Jabil, Inc. | 1,451 | 40,135 | ||||||
Parker-Hannifin Corp.1 | 255 | 39,742 | ||||||
Dover Corp.1 | 536 | 39,235 | ||||||
Pentair plc | 907 | 38,166 | ||||||
AGCO Corp. | 612 | 37,161 | ||||||
Trinity Industries, Inc. | 1,069 | 36,624 | ||||||
Vishay Intertechnology, Inc. | 1,574 | 36,517 | ||||||
FedEx Corp.1 | 154 | 34,967 | ||||||
Benchmark Electronics, Inc. | 1,184 | 34,514 | ||||||
Crane Co. | 428 | 34,296 | ||||||
Union Pacific Corp.1 | 236 | 33,436 | ||||||
Gibraltar Industries, Inc.* | 856 | 32,100 | ||||||
Owens Corning | 453 | 28,707 | ||||||
Oshkosh Corp. | 383 | 26,932 | ||||||
Acuity Brands, Inc. | 232 | 26,882 | ||||||
Avnet, Inc. | 626 | 26,849 | ||||||
Spirit AeroSystems Holdings, Inc. — Class A1 | 308 | 26,460 | ||||||
TE Connectivity Ltd.1 | 284 | 25,577 | ||||||
Belden, Inc. | 416 | 25,426 | ||||||
Louisiana-Pacific Corp. | 919 | 25,015 | ||||||
Mettler-Toledo International, Inc.*,1 | 43 | 24,881 | ||||||
Rexnord Corp.* | 851 | 24,730 | ||||||
KBR, Inc. | 1,319 | 23,636 | ||||||
SEE NOTES TO FINANCIAL STATEMENTS. | THE GUGGENHEIM FUNDS SEMI-ANNUAL REPORT | 119 |
SCHEDULE OF INVESTMENTS (Unaudited)(continued) | June 30, 2018 |
SERIES Z (ALPHA OPPORTUNITY SERIES) |
| Value | |||||||
Waters Corp.*,1 | 122 | $ | 23,618 | |||||
Fluor Corp. | 448 | 21,853 | ||||||
Corning, Inc.1 | 787 | 21,650 | ||||||
CSX Corp.1 | 335 | 21,366 | ||||||
Werner Enterprises, Inc. | 569 | 21,366 | ||||||
Tech Data Corp.* | 257 | 21,105 | ||||||
Coherent, Inc.* | 133 | 20,804 | ||||||
J.B. Hunt Transport Services, Inc.1 | 170 | 20,664 | ||||||
Owens-Illinois, Inc.* | 1,206 | 20,273 | ||||||
Caterpillar, Inc.1 | 143 | 19,401 | ||||||
Total Industrial | 1,752,827 | |||||||
Technology - 10.9% | ||||||||
HP, Inc.1 | 3,065 | 69,545 | ||||||
Convergys Corp. | 2,670 | 65,255 | ||||||
Skyworks Solutions, Inc.1 | 525 | 50,741 | ||||||
Cirrus Logic, Inc.* | 1,269 | 48,641 | ||||||
DXC Technology Co.1 | 594 | 47,882 | ||||||
Cognizant Technology Solutions Corp. — Class A1 | 549 | 43,365 | ||||||
International Business Machines Corp.1 | 295 | 41,211 | ||||||
MAXIMUS, Inc. | 630 | 39,129 | ||||||
Fidelity National Information Services, Inc.1 | 344 | 36,474 | ||||||
CA, Inc.1 | 1,021 | 36,399 | ||||||
ON Semiconductor Corp.*,1 | 1,615 | 35,910 | ||||||
Teradyne, Inc. | 816 | 31,065 | ||||||
Amdocs Ltd. | 441 | 29,190 | ||||||
Intel Corp.1 | 585 | 29,080 | ||||||
Dell Technologies Incorporated Class V — Class V*,1 | 314 | 26,558 | ||||||
Apple, Inc.1 | 143 | 26,471 | ||||||
Microsoft Corp.1 | 249 | 24,554 | ||||||
Oracle Corp.1 | 541 | 23,837 | ||||||
Paychex, Inc.1 | 347 | 23,717 | ||||||
Applied Materials, Inc.1 | 510 | 23,557 | ||||||
Lam Research Corp.1 | 136 | 23,508 | ||||||
Kulicke & Soffa Industries, Inc. | 985 | 23,463 | ||||||
Accenture plc — Class A1 | 142 | 23,230 | ||||||
NetApp, Inc.1 | 294 | 23,088 | ||||||
Broadridge Financial Solutions, Inc.1 | 200 | 23,020 | ||||||
Western Digital Corp.1 | 296 | 22,913 | ||||||
Fiserv, Inc.*,1 | 309 | 22,894 | ||||||
Seagate Technology plc1 | 391 | 22,080 | ||||||
Broadcom, Inc.1 | 88 | 21,352 | ||||||
Leidos Holdings, Inc. | 361 | 21,299 | ||||||
KLA-Tencor Corp.1 | 197 | 20,198 | ||||||
Icad, Inc.* | 3,893 | 11,874 | ||||||
Total Technology | 1,011,500 | |||||||
Utilities - 10.0% | ||||||||
National Fuel Gas Co. | 2,042 | 108,144 | ||||||
Portland General Electric Co. | 2,471 | 105,660 | ||||||
PNM Resources, Inc. | 2,479 | 96,433 | ||||||
El Paso Electric Co. | 1,608 | 95,033 | ||||||
Exelon Corp.1 | 2,051 | 87,373 | ||||||
Ameren Corp.1 | 1,407 | 85,616 | ||||||
UGI Corp. | 1,486 | 77,376 | ||||||
Consolidated Edison, Inc.1 | 940 | 73,301 | ||||||
AES Corp. | 3,189 | 42,765 | ||||||
Pinnacle West Capital Corp. | 522 | 42,052 | ||||||
FirstEnergy Corp.1 | 876 | 31,457 | ||||||
Entergy Corp.1 | 365 | 29,488 | ||||||
PG&E Corp.1 | 668 | 28,430 | ||||||
OGE Energy Corp. | 705 | 24,823 | ||||||
Total Utilities | 927,951 | |||||||
Communications - 9.6% | ||||||||
Verizon Communications, Inc.1 | 1,676 | 84,320 | ||||||
Telephone & Data Systems, Inc. | 2,786 | 76,392 | ||||||
News Corp. — Class A | 3,870 | 59,985 | ||||||
InterDigital, Inc. | 677 | 54,769 | ||||||
TEGNA, Inc. | 4,710 | 51,104 | ||||||
Omnicom Group, Inc.1 | 628 | 47,898 | ||||||
Vonage Holdings Corp.* | 3,040 | 39,186 | ||||||
Comcast Corp. — Class A1 | 1,186 | 38,913 | ||||||
Cisco Systems, Inc.1 | 896 | 38,555 | ||||||
Juniper Networks, Inc.1 | 1,295 | 35,509 | ||||||
Gray Television, Inc.* | 2,243 | 35,439 | ||||||
Gannett Company, Inc. | 3,286 | 35,160 | ||||||
AMC Networks, Inc. — Class A* | 555 | 34,521 | ||||||
ARRIS International plc* | 1,368 | 33,441 | ||||||
Motorola Solutions, Inc.1 | 260 | 30,256 | ||||||
New Media Investment Group, Inc. | 1,529 | 28,256 | ||||||
MSG Networks, Inc. — Class A* | 1,081 | 25,890 | ||||||
Scholastic Corp. | 584 | 25,877 | ||||||
F5 Networks, Inc.*,1 | 139 | 23,971 | ||||||
ORBCOMM, Inc.* | 2,301 | 23,240 | ||||||
Interpublic Group of Companies, Inc. | 951 | 22,291 | ||||||
CDW Corp.1 | 269 | 21,732 | ||||||
Alphabet, Inc. — Class C*,1 | 19 | 21,197 | ||||||
Total Communications | 887,902 | |||||||
Financial - 9.1% | ||||||||
Senior Housing Properties Trust REIT | 5,555 | 100,490 | ||||||
VEREIT, Inc. REIT | 10,012 | 74,489 | ||||||
Apartment Investment & Management Co. — Class A REIT | 1,297 | 54,863 | ||||||
Ventas, Inc. REIT1 | 899 | 51,198 | ||||||
Allstate Corp.1 | 549 | 50,107 | ||||||
JPMorgan Chase & Co.1 | 462 | 48,140 | ||||||
Equity Commonwealth REIT* | 1,437 | 45,266 | ||||||
Park Hotels & Resorts, Inc. REIT | 1,429 | 43,770 | ||||||
Cousins Properties, Inc. REIT | 4,077 | 39,506 | ||||||
Travelers Companies, Inc.1 | 314 | 38,415 | ||||||
Visa, Inc. — Class A1 | 270 | 35,761 | ||||||
Principal Financial Group, Inc.1 | 658 | 34,841 | ||||||
Prudential Financial, Inc.1 | 364 | 34,038 | ||||||
Host Hotels & Resorts, Inc. REIT1 | 1,587 | 33,438 | ||||||
Aflac, Inc.1 | 769 | 33,082 | ||||||
Brandywine Realty Trust REIT | 1,951 | 32,933 | ||||||
Summit Hotel Properties, Inc. REIT | 2,030 | 29,049 | ||||||
Bank of America Corp.1 | 871 | 24,554 | ||||||
CBRE Group, Inc. — Class A*,1 | 490 | 23,393 | ||||||
120 | THE GUGGENHEIM FUNDS SEMI-ANNUAL REPORT | SEE NOTES TO FINANCIAL STATEMENTS. |
SCHEDULE OF INVESTMENTS (Unaudited)(continued) | June 30, 2018 |
SERIES Z (ALPHA OPPORTUNITY SERIES) |
| Value | |||||||
Franklin Resources, Inc.1 | 655 | $ | 20,993 | |||||
Irish Bank Resolution Corporation Ltd.*,†††,2 | 16,638 | — | ||||||
Total Financial | 848,326 | |||||||
Consumer, Cyclical - 6.2% | ||||||||
Allison Transmission Holdings, Inc. | 1,748 | 70,776 | ||||||
Southwest Airlines Co.1 | 1,247 | 63,447 | ||||||
PACCAR, Inc.1 | 883 | 54,711 | ||||||
JetBlue Airways Corp.* | 2,629 | 49,898 | ||||||
Copa Holdings S.A. — Class A | 507 | 47,972 | ||||||
Lions Gate Entertainment Corp. — Class A | 1,882 | 46,711 | ||||||
Delta Air Lines, Inc.1 | 838 | 41,515 | ||||||
Meritor, Inc.* | 1,791 | 36,841 | ||||||
Lear Corp.1 | 153 | 28,429 | ||||||
Walgreens Boots Alliance, Inc.1 | 467 | 28,027 | ||||||
Casey’s General Stores, Inc. | 246 | 25,850 | ||||||
Alaska Air Group, Inc.1 | 404 | 24,398 | ||||||
Yum! Brands, Inc.1 | 268 | 20,963 | ||||||
General Motors Co.1 | 505 | 19,897 | ||||||
Tailored Brands, Inc. | 577 | 14,725 | ||||||
Total Consumer, Cyclical | 574,160 | |||||||
Energy - 3.6% | ||||||||
Chevron Corp.1 | 657 | 83,064 | ||||||
Exxon Mobil Corp.1 | 757 | 62,627 | ||||||
Valero Energy Corp.1 | 519 | 57,521 | ||||||
ConocoPhillips1 | 375 | 26,107 | ||||||
Occidental Petroleum Corp.1 | 310 | 25,941 | ||||||
Williams Companies, Inc.1 | 879 | 23,830 | ||||||
Phillips 661 | 202 | 22,687 | ||||||
HollyFrontier Corp.1 | 224 | 15,328 | ||||||
PBF Energy, Inc. — Class A | 346 | 14,508 | ||||||
Total Energy | 331,613 | |||||||
Basic Materials - 1.7% | ||||||||
Domtar Corp. | 676 | 32,272 | ||||||
LyondellBasell Industries N.V. — Class A1 | 287 | 31,527 | ||||||
Huntsman Corp. | 846 | 24,703 | ||||||
International Paper Co.1 | 442 | 23,020 | ||||||
Newmont Mining Corp.1 | 575 | 21,683 | ||||||
Alcoa Corp.* | 452 | 21,190 | ||||||
Total Basic Materials | 154,395 | |||||||
Total Common Stocks | ||||||||
(Cost $9,539,552) | �� | 9,543,502 | ||||||
MONEY MARKET FUND† - 11.8% | ||||||||
Goldman Sachs Financial Square Treasury Instruments Fund — Institutional Class 1.72%3 | 1,090,411 | 1,090,411 | ||||||
Total Money Market Fund | ||||||||
(Cost $1,090,411) | 1,090,411 | |||||||
Total Investments - 114.8% | ||||||||
(Cost $10,629,963) | $ | 10,633,913 | ||||||
Other Assets & Liabilities, net - (14.8)% | (1,371,380 | ) | ||||||
Total Net Assets - 100.0% | $ | 9,262,533 | ||||||
Total Return Swap Agreements | ||||||||||||||||||
Counterparty | Index | Financing | Payment | Maturity | Notional | Value and | ||||||||||||
OTC Custom Basket Swap Agreements Sold Short†† | ||||||||||||||||||
Morgan Stanley | Alpha Opportunity Portfolio Short Custom Basket Swap4 | (1.53 | %) | At Maturity | 02/01/19 | $ | 9,577,568 | $ | (609,956 | ) | ||||||||
OTC Custom Basket Swap Agreements†† | ||||||||||||||||||
Morgan Stanley | Alpha Opportunity Portfolio Long Custom Basket Swap5 | 2.34 | % | At Maturity | 02/01/19 | 2,235,192 | 6,175 | |||||||||||
| Percentage | Unrealized | ||||||||||
CUSTOM BASKET OF LONG SECURITIES5 | ||||||||||||
Boston Beer Company, Inc. — Class A* | 35 | 76.5 | % | $ | 4,724 | |||||||
El Paso Electric Co. | 377 | 60.7 | % | 3,751 | ||||||||
Archer-Daniels-Midland Co. | 462 | 49.6 | % | 3,060 | ||||||||
Senior Housing Properties Trust | 1,304 | 45.6 | % | 2,817 | ||||||||
UGI Corp. | 349 | 45.5 | % | 2,809 | ||||||||
Genesee & Wyoming, Inc. — Class A* | 249 | 42.7 | % | 2,638 | ||||||||
Regal Beloit Corp. | 303 | 40.1 | % | 2,477 | ||||||||
Travelport Worldwide Ltd. | 551 | 38.0 | % | 2,345 | ||||||||
Valero Energy Corp. | 121 | 36.7 | % | 2,268 | ||||||||
Cisco Systems, Inc. | 210 | 35.3 | % | 2,180 | ||||||||
Chevron Corp. | 154 | 33.0 | % | 2,036 | ||||||||
Ameren Corp. | 330 | 31.9 | % | 1,968 | ||||||||
TreeHouse Foods, Inc.* | 134 | 31.4 | % | 1,938 | ||||||||
Gray Television, Inc.* | 526 | 31.1 | % | 1,922 | ||||||||
Telephone & Data Systems, Inc. | 654 | 29.9 | % | 1,847 | ||||||||
Exelon Corp. | 481 | 29.2 | % | 1,805 | ||||||||
PNM Resources, Inc. | 582 | 29.2 | % | 1,804 | ||||||||
SEE NOTES TO FINANCIAL STATEMENTS. | THE GUGGENHEIM FUNDS SEMI-ANNUAL REPORT | 121 |
SCHEDULE OF INVESTMENTS (Unaudited)(continued) | June 30, 2018 |
SERIES Z (ALPHA OPPORTUNITY SERIES) |
| Percentage | Unrealized | ||||||||||
Vishay Intertechnology, Inc. | 369 | 28.5 | % | $ | 1,762 | |||||||
Amgen, Inc. | 113 | 25.6 | % | 1,580 | ||||||||
Exxon Mobil Corp. | 177 | 24.3 | % | 1,499 | ||||||||
Portland General Electric Co. | 580 | 23.3 | % | 1,438 | ||||||||
US Foods Holding Corp.* | 332 | 23.3 | % | 1,436 | ||||||||
Allison Transmission Holdings, Inc. | 410 | 22.0 | % | 1,358 | ||||||||
EMCOR Group, Inc. | 217 | 21.9 | % | 1,351 | ||||||||
National Fuel Gas Co. | 479 | 21.6 | % | 1,334 | ||||||||
Kroger Co. | 216 | 21.5 | % | 1,330 | ||||||||
Dean Foods Co. | 621 | 21.3 | % | 1,315 | ||||||||
Occidental Petroleum Corp. | 72 | 21.2 | % | 1,308 | ||||||||
Dell Technologies Incorporated Class V — Class V* | 73 | 20.9 | % | 1,290 | ||||||||
VEREIT, Inc. | 2,351 | 20.8 | % | 1,281 | ||||||||
Park Hotels & Resorts, Inc. | 335 | 20.4 | % | 1,257 | ||||||||
AMC Networks, Inc. — Class A* | 130 | 19.4 | % | 1,198 | ||||||||
Procter & Gamble Co. | 183 | 19.2 | % | 1,186 | ||||||||
NetApp, Inc. | 69 | 19.1 | % | 1,182 | ||||||||
Medtronic plc | 193 | 19.1 | % | 1,181 | ||||||||
Performance Food Group Co.* | 201 | 18.1 | % | 1,121 | ||||||||
CoreLogic, Inc.* | 192 | 18.0 | % | 1,113 | ||||||||
Merck & Company, Inc. | 185 | 17.9 | % | 1,107 | ||||||||
Verizon Communications, Inc. | 393 | 17.7 | % | 1,095 | ||||||||
WellCare Health Plans, Inc.* | 21 | 17.5 | % | 1,078 | ||||||||
Snap-on, Inc. | 86 | 17.3 | % | 1,070 | ||||||||
AES Corp. | 749 | 14.0 | % | 866 | ||||||||
KBR, Inc. | 309 | 13.3 | % | 823 | ||||||||
Jabil, Inc. | 340 | 13.2 | % | 815 | ||||||||
Prestige Brands Holdings, Inc.* | 214 | 13.0 | % | 800 | ||||||||
Norfolk Southern Corp. | 62 | 12.8 | % | 788 | ||||||||
F5 Networks, Inc.* | 32 | 12.6 | % | 777 | ||||||||
STERIS plc | 114 | 12.6 | % | 776 | ||||||||
Teradyne, Inc. | 191 | 12.2 | % | 753 | ||||||||
Pinnacle West Capital Corp. | 122 | 10.8 | % | 669 | ||||||||
Convergys Corp. | 626 | 10.6 | % | 654 | ||||||||
Skyworks Solutions, Inc. | 123 | 10.0 | % | 617 | ||||||||
Fidelity National Information Services, Inc. | 80 | 9.8 | % | 602 | ||||||||
EnerSys | 157 | 9.0 | % | 557 | ||||||||
Kraft Heinz Co. | 262 | 8.8 | % | 544 | ||||||||
PG&E Corp. | 156 | 8.7 | % | 534 | ||||||||
Allergan plc | 40 | 8.1 | % | 500 | ||||||||
Bristol-Myers Squibb Co. | 139 | 8.0 | % | 492 | ||||||||
Consolidated Edison, Inc. | 220 | 7.9 | % | 491 | ||||||||
Ventas, Inc. | 211 | 7.9 | % | 488 | ||||||||
Motorola Solutions, Inc. | 61 | 7.8 | % | 483 | ||||||||
Summit Hotel Properties, Inc. | 476 | 7.7 | % | 474 | ||||||||
Juniper Networks, Inc. | 304 | 7.7 | % | 473 | ||||||||
Regeneron Pharmaceuticals, Inc.* | 16 | 7.6 | % | 469 | ||||||||
Union Pacific Corp. | 55 | 7.6 | % | 467 | ||||||||
Darling Ingredients, Inc.* | 411 | 7.1 | % | 440 | ||||||||
New Media Investment Group, Inc. | 359 | 6.9 | % | 425 | ||||||||
Gannett Company, Inc. | 771 | 6.8 | % | 420 | ||||||||
Domtar Corp. | 158 | 6.8 | % | 420 | ||||||||
Gibraltar Industries, Inc.* | 201 | 6.7 | % | 412 | ||||||||
Avnet, Inc. | 147 | 6.4 | % | 393 | ||||||||
Western Union Co. | 697 | 6.0 | % | 368 | ||||||||
Vonage Holdings Corp.* | 713 | 5.9 | % | 365 | ||||||||
FirstEnergy Corp. | 205 | 5.8 | % | 358 | ||||||||
Charles River Laboratories International, Inc.* | 85 | 5.8 | % | 355 | ||||||||
Entergy Corp. | 85 | 5.6 | % | 344 | ||||||||
Brandywine Realty Trust | 458 | 5.5 | % | 343 | ||||||||
PepsiCo, Inc. | 85 | 5.4 | % | 335 | ||||||||
Kellogg Co. | 100 | 5.2 | % | 324 | ||||||||
Casey's General Stores, Inc. | 57 | 4.9 | % | 300 | ||||||||
CSX Corp. | 78 | 4.7 | % | 290 | ||||||||
Sabre Corp. | 260 | 4.5 | % | 280 | ||||||||
Cardtronics plc — Class A* | 214 | 4.3 | % | 266 | ||||||||
Church & Dwight Company, Inc. | 70 | 3.8 | % | 237 | ||||||||
Greenbrier Companies, Inc. | 345 | 3.6 | % | 224 | ||||||||
Apartment Investment & Management Co. — Class A | 304 | 3.6 | % | 224 | ||||||||
Equity Commonwealth* | 337 | 3.2 | % | 200 | ||||||||
J.B. Hunt Transport Services, Inc. | 40 | 3.2 | % | 199 | ||||||||
Interpublic Group of Companies, Inc. | 223 | 2.8 | % | 173 | ||||||||
Colgate-Palmolive Co. | 119 | 2.7 | % | 170 | ||||||||
Humana, Inc. | 18 | 2.7 | % | 167 | ||||||||
Sysco Corp. | 79 | 2.6 | % | 162 | ||||||||
Lamb Weston Holdings, Inc. | 53 | 2.3 | % | 139 | ||||||||
Eaton Corporation plc | 152 | 2.1 | % | 128 | ||||||||
MSG Networks, Inc. — Class A* | 253 | 1.8 | % | 114 | ||||||||
OGE Energy Corp. | 165 | 1.8 | % | 108 | ||||||||
ConocoPhillips | 88 | 1.5 | % | 93 | ||||||||
Edgewell Personal Care Co.* | 376 | 1.3 | % | 83 | ||||||||
Acuity Brands, Inc. | 54 | 1.1 | % | 69 | ||||||||
Cognizant Technology Solutions Corp. — Class A | 128 | 1.1 | % | 67 | ||||||||
Altria Group, Inc. | 127 | 1.0 | % | 63 | ||||||||
Kulicke & Soffa Industries, Inc. | 231 | 0.6 | % | 36 | ||||||||
Hershey Co. | 38 | 0.6 | % | 36 | ||||||||
Accenture plc — Class A | 33 | 0.5 | % | 32 | ||||||||
LyondellBasell Industries N.V. — Class A | 67 | 0.3 | % | 17 | ||||||||
Philip Morris International, Inc. | 67 | 0.0 | % | 2 | ||||||||
Broadridge Financial Solutions, Inc. | 47 | 0.0 | % | 1 | ||||||||
ORBCOMM, Inc.* | 540 | 0.0 | % | — | ||||||||
122 | THE GUGGENHEIM FUNDS SEMI-ANNUAL REPORT | SEE NOTES TO FINANCIAL STATEMENTS. |
SCHEDULE OF INVESTMENTS (Unaudited)(continued) | June 30, 2018 |
SERIES Z (ALPHA OPPORTUNITY SERIES) |
| Percentage | Unrealized | ||||||||||
CA, Inc. | 239 | (0.0 | %) | $ | (1 | ) | ||||||
Rexnord Corp.* | 199 | (0.1 | %) | (9 | ) | |||||||
Cousins Properties, Inc. | 957 | (0.1 | %) | (9 | ) | |||||||
Hologic, Inc.* | 153 | (0.2 | %) | (12 | ) | |||||||
Trinity Industries, Inc. | 251 | (0.8 | %) | (51 | ) | |||||||
CBRE Group, Inc. — Class A* | 115 | (1.0 | %) | (60 | ) | |||||||
United Natural Foods, Inc.* | 156 | (1.2 | %) | (76 | ) | |||||||
Paychex, Inc. | 81 | (1.4 | %) | (85 | ) | |||||||
Johnson & Johnson | 95 | (1.4 | %) | (86 | ) | |||||||
Scholastic Corp. | 137 | (1.5 | %) | (90 | ) | |||||||
TEGNA, Inc. | 1,106 | (1.7 | %) | (105 | ) | |||||||
Eli Lilly & Co. | 137 | (2.0 | %) | (123 | ) | |||||||
Omnicom Group, Inc. | 147 | (2.0 | %) | (124 | ) | |||||||
Host Hotels & Resorts, Inc. | 372 | (2.1 | %) | (132 | ) | |||||||
Mettler-Toledo International, Inc.* | 10 | (2.2 | %) | (133 | ) | |||||||
Baxter International, Inc. | 93 | (2.2 | %) | (135 | ) | |||||||
Werner Enterprises, Inc. | 133 | (2.3 | %) | (141 | ) | |||||||
Alcoa Corp.* | 106 | (2.3 | %) | (142 | ) | |||||||
Alphabet, Inc. — Class C* | 4 | (2.4 | %) | (151 | ) | |||||||
Waters Corp.* | 28 | (2.5 | %) | (154 | ) | |||||||
ResMed, Inc. | 49 | (2.6 | %) | (159 | ) | |||||||
Visa, Inc. — Class A | 63 | (2.6 | %) | (163 | ) | |||||||
Microsoft Corp. | 58 | (2.7 | %) | (165 | ) | |||||||
Leidos Holdings, Inc. | 84 | (2.8 | %) | (170 | ) | |||||||
Zoetis, Inc. | 66 | (2.8 | %) | (173 | ) | |||||||
Fiserv, Inc.* | 72 | (2.8 | %) | (176 | ) | |||||||
Newmont Mining Corp. | 135 | (2.9 | %) | (179 | ) | |||||||
Allstate Corp. | 129 | (2.9 | %) | (180 | ) | |||||||
Phillips 66 | 47 | (3.0 | %) | (188 | ) | |||||||
Franklin Resources, Inc. | 153 | (3.1 | %) | (190 | ) | |||||||
Apple, Inc. | 33 | (3.1 | %) | (193 | ) | |||||||
United Therapeutics Corp.* | 74 | (3.2 | %) | (195 | ) | |||||||
CDW Corp. | 63 | (3.2 | %) | (199 | ) | |||||||
Conagra Brands, Inc. | 359 | (3.3 | %) | (204 | ) | |||||||
Williams Companies, Inc. | 206 | (3.4 | %) | (207 | ) | |||||||
Comcast Corp. — Class A | 278 | (3.5 | %) | (218 | ) | |||||||
Oshkosh Corp. | 90 | (3.5 | %) | (219 | ) | |||||||
Kansas City Southern | 133 | (3.6 | %) | (223 | ) | |||||||
Thermo Fisher Scientific, Inc. | 26 | (3.6 | %) | (225 | ) | |||||||
Seagate Technology plc | 91 | (3.9 | %) | (239 | ) | |||||||
Louisiana-Pacific Corp. | 215 | (4.0 | %) | (244 | ) | |||||||
Abbott Laboratories | 131 | (4.0 | %) | (246 | ) | |||||||
Corning, Inc. | 184 | (4.0 | %) | (248 | ) | |||||||
HollyFrontier Corp. | 52 | (4.2 | %) | (256 | ) | |||||||
Gilead Sciences, Inc. | 199 | (4.2 | %) | (259 | ) | |||||||
Bank of America Corp. | 204 | (4.3 | %) | (267 | ) | |||||||
Oracle Corp. | 127 | (4.7 | %) | (288 | ) | |||||||
Caterpillar, Inc. | 33 | (4.9 | %) | (302 | ) | |||||||
Pentair plc | 213 | (4.9 | %) | (304 | ) | |||||||
Benchmark Electronics, Inc. | 278 | (5.1 | %) | (313 | ) | |||||||
Yum! Brands, Inc. | 63 | (5.2 | %) | (321 | ) | |||||||
Pfizer, Inc. | 529 | (5.3 | %) | (325 | ) | |||||||
Quanta Services, Inc.* | 213 | (5.6 | %) | (344 | ) | |||||||
Danaher Corp. | 89 | (5.6 | %) | (345 | ) | |||||||
Amdocs Ltd. | 103 | (6.1 | %) | (376 | ) | |||||||
Varian Medical Systems, Inc.* | 42 | (6.1 | %) | (377 | ) | |||||||
Dover Corp. | 125 | (6.3 | %) | (390 | ) | |||||||
Walgreens Boots Alliance, Inc. | 109 | (6.4 | %) | (395 | ) | |||||||
Hill-Rom Holdings, Inc. | 80 | (6.5 | %) | (402 | ) | |||||||
Alaska Air Group, Inc. | 94 | (6.7 | %) | (415 | ) | |||||||
JPMorgan Chase & Co. | 108 | (6.9 | %) | (426 | ) | |||||||
Spirit AeroSystems Holdings, Inc. — Class A | 72 | (7.0 | %) | (435 | ) | |||||||
JetBlue Airways Corp.* | 617 | (7.1 | %) | (439 | ) | |||||||
Delta Air Lines, Inc. | 196 | (7.2 | %) | (442 | ) | |||||||
Applied Materials, Inc. | 119 | (7.2 | %) | (444 | ) | |||||||
PBF Energy, Inc. — Class A | 81 | (7.4 | %) | (458 | ) | |||||||
ARRIS International plc* | 321 | (7.6 | %) | (469 | ) | |||||||
Arrow Electronics, Inc.* | 127 | (7.6 | %) | (470 | ) | |||||||
Aflac, Inc. | 180 | (7.7 | %) | (474 | ) | |||||||
KLA-Tencor Corp. | 46 | (7.8 | %) | (482 | ) | |||||||
Travelers Companies, Inc. | 73 | (7.8 | %) | (484 | ) | |||||||
General Motors Co. | 118 | (7.9 | %) | (486 | ) | |||||||
International Paper Co. | 103 | (8.1 | %) | (497 | ) | |||||||
Broadcom, Inc. | 20 | (8.2 | %) | (505 | ) | |||||||
Bruker Corp. | 162 | (8.5 | %) | (523 | ) | |||||||
Meritor, Inc.* | 420 | (8.7 | %) | (539 | ) | |||||||
Lam Research Corp. | 31 | (8.8 | %) | (545 | ) | |||||||
Tailored Brands, Inc. | 101 | (9.2 | %) | (571 | ) | |||||||
Lear Corp. | 36 | (9.8 | %) | (602 | ) | |||||||
Lions Gate Entertainment Corp. — Class A | 442 | (9.8 | %) | (607 | ) | |||||||
TE Connectivity Ltd. | 66 | (9.9 | %) | (613 | ) | |||||||
Masco Corp. | 260 | (10.3 | %) | (635 | ) | |||||||
Zimmer Biomet Holdings, Inc. | 111 | (10.7 | %) | (663 | ) | |||||||
Celgene Corp.* | 81 | (10.9 | %) | (671 | ) | |||||||
MAXIMUS, Inc. | 148 | (11.1 | %) | (687 | ) | |||||||
Icad, Inc.* | 1,576 | (11.6 | %) | (717 | ) | |||||||
InterDigital, Inc. | 159 | (11.7 | %) | (724 | ) | |||||||
United Rentals, Inc.* | 43 | (11.8 | %) | (726 | ) | |||||||
Perrigo Company plc | 86 | (12.1 | %) | (746 | ) | |||||||
Western Digital Corp. | 69 | (12.1 | %) | (747 | ) | |||||||
Huntsman Corp. | 198 | (12.5 | %) | (774 | ) | |||||||
HP, Inc. | 719 | (12.6 | %) | (780 | ) | |||||||
Intel Corp. | 137 | (12.7 | %) | (782 | ) | |||||||
ON Semiconductor Corp.* | 379 | (12.7 | %) | (785 | ) | |||||||
Parker-Hannifin Corp. | 60 | (12.8 | %) | (790 | ) | |||||||
News Corp. — Class A | 908 | (13.8 | %) | (854 | ) | |||||||
Kimberly-Clark Corp. | 253 | (14.2 | %) | (874 | ) | |||||||
JM Smucker Co. | 130 | (14.2 | %) | (880 | ) | |||||||
Mylan N.V.* | 236 | (14.9 | %) | (917 | ) | |||||||
Fluor Corp. | 105 | (15.2 | %) | (941 | ) | |||||||
CVS Health Corp. | 263 | (15.5 | %) | (957 | ) | |||||||
AGCO Corp. | 143 | (16.6 | %) | (1,025 | ) | |||||||
International Business Machines Corp. | 69 | (17.9 | %) | (1,105 | ) | |||||||
Crane Co. | 100 | (19.2 | %) | (1,184 | ) | |||||||
Belden, Inc. | 97 | (19.8 | %) | (1,223 | ) | |||||||
Prudential Financial, Inc. | 85 | (20.7 | %) | (1,278 | ) | |||||||
DXC Technology Co. | 139 | (21.0 | %) | (1,297 | ) | |||||||
SEE NOTES TO FINANCIAL STATEMENTS. | THE GUGGENHEIM FUNDS SEMI-ANNUAL REPORT | 123 |
SCHEDULE OF INVESTMENTS (Unaudited)(continued) | June 30, 2018 |
SERIES Z (ALPHA OPPORTUNITY SERIES) |
| Percentage | Unrealized | ||||||||||
AECOM* | 499 | (21.2 | %) | $ | (1,307 | ) | ||||||
FedEx Corp. | 36 | (21.2 | %) | (1,309 | ) | |||||||
Tech Data Corp.* | 60 | (22.0 | %) | (1,361 | ) | |||||||
Cirrus Logic, Inc.* | 298 | (22.8 | %) | (1,409 | ) | |||||||
Owens-Illinois, Inc.* | 283 | (22.9 | %) | (1,414 | ) | |||||||
Principal Financial Group, Inc. | 154 | (24.7 | %) | (1,523 | ) | |||||||
Sanderson Farms, Inc. | 87 | (25.4 | %) | (1,569 | ) | |||||||
Biogen, Inc.* | 40 | (25.5 | %) | (1,577 | ) | |||||||
Coherent, Inc.* | 31 | (26.0 | %) | (1,607 | ) | |||||||
Tyson Foods, Inc. — Class A | 282 | (27.8 | %) | (1,716 | ) | |||||||
PACCAR, Inc. | 207 | (32.8 | %) | (2,024 | ) | |||||||
Owens Corning | 106 | (33.5 | %) | (2,069 | ) | |||||||
McKesson Corp. | 120 | (34.5 | %) | (2,131 | ) | |||||||
Southwest Airlines Co. | 292 | (35.1 | %) | (2,169 | ) | |||||||
Pilgrim's Pride Corp.* | 591 | (52.8 | %) | (3,262 | ) | |||||||
Molson Coors Brewing Co. — Class B | 282 | (53.5 | %) | (3,301 | ) | |||||||
Copa Holdings S.A. — Class A | 119 | (54.4 | %) | (3,358 | ) | |||||||
Cummins, Inc. | 119 | (57.2 | %) | (3,533 | ) | |||||||
Ingredion, Inc. | 221 | (72.3 | %) | (4,466 | ) | |||||||
Cardinal Health, Inc. | 326 | (76.1 | %) | (4,699 | ) | |||||||
Total Custom Basket of Long Securities | 6,175 | |||||||||||
CUSTOM BASKET OF SHORT SECURITIES4 | ||||||||||||
Healthcare Services Group, Inc. | (1,899 | ) | (2.0 | %) | 11,978 | |||||||
Albemarle Corp. | (290 | ) | (1.9 | %) | 11,830 | |||||||
ABM Industries, Inc. | (2,376 | ) | (1.8 | %) | 10,737 | |||||||
NewMarket Corp. | (291 | ) | (1.7 | %) | 10,235 | |||||||
Goldman Sachs Group, Inc. | (370 | ) | (1.6 | %) | 9,599 | |||||||
LendingTree, Inc.* | (104 | ) | (1.1 | %) | 6,740 | |||||||
National Instruments Corp. | (977 | ) | (1.1 | %) | 6,510 | |||||||
Sensient Technologies Corp. | (568 | ) | (0.9 | %) | 5,686 | |||||||
Charles Schwab Corp. | (1,117 | ) | (0.6 | %) | 3,662 | |||||||
Nucor Corp. | (548 | ) | (0.5 | %) | 3,219 | |||||||
Robert Half International, Inc. | (627 | ) | (0.5 | %) | 2,951 | |||||||
Texas Capital Bancshares, Inc.* | (366 | ) | (0.5 | %) | 2,885 | |||||||
Marriott International, Inc. — Class A | (231 | ) | (0.5 | %) | 2,852 | |||||||
Halliburton Co. | (958 | ) | (0.4 | %) | 2,667 | |||||||
SEI Investments Co. | (449 | ) | (0.4 | %) | 2,574 | |||||||
Workday, Inc. — Class A* | (232 | ) | (0.4 | %) | 2,503 | |||||||
Compass Minerals International, Inc. | (1,100 | ) | (0.4 | %) | 2,453 | |||||||
Camden Property Trust | (728 | ) | (0.4 | %) | 2,279 | |||||||
First Horizon National Corp. | (1,911 | ) | (0.4 | %) | 2,227 | |||||||
Pinnacle Financial Partners, Inc. | (799 | ) | (0.3 | %) | 2,123 | |||||||
Capitol Federal Financial, Inc. | (6,292 | ) | (0.3 | %) | 2,111 | |||||||
Ball Corp. | (717 | ) | (0.3 | %) | 2,046 | |||||||
Air Products & Chemicals, Inc. | (189 | ) | (0.3 | %) | 1,845 | |||||||
Sterling Bancorp | (1,723 | ) | (0.3 | %) | 1,788 | |||||||
Valley National Bancorp | (3,843 | ) | (0.3 | %) | 1,745 | |||||||
Markel Corp.* | (115 | ) | (0.3 | %) | 1,570 | |||||||
Palo Alto Networks, Inc.* | (134 | ) | (0.2 | %) | 1,519 | |||||||
Martin Marietta Materials, Inc. | (199 | ) | (0.2 | %) | 1,427 | |||||||
Sealed Air Corp. | (861 | ) | (0.2 | %) | 1,414 | |||||||
FireEye, Inc.* | (1,586 | ) | (0.2 | %) | 1,410 | |||||||
salesforce.com, Inc.* | (528 | ) | (0.2 | %) | 1,406 | |||||||
Summit Materials, Inc. — Class A* | (1,016 | ) | (0.2 | %) | 1,333 | |||||||
People's United Financial, Inc. | (1,539 | ) | (0.2 | %) | 1,321 | |||||||
Mosaic Co. | (936 | ) | (0.2 | %) | 1,305 | |||||||
New York Community Bancorp, Inc. | (2,341 | ) | (0.2 | %) | 1,221 | |||||||
BB&T Corp. | (581 | ) | (0.2 | %) | 1,201 | |||||||
McDonald's Corp. | (221 | ) | (0.2 | %) | 1,192 | |||||||
Avery Dennison Corp. | (272 | ) | (0.2 | %) | 1,083 | |||||||
Aon plc | (201 | ) | (0.2 | %) | 1,077 | |||||||
Huntington Bancshares, Inc. | (1,822 | ) | (0.2 | %) | 1,061 | |||||||
RenaissanceRe Holdings Ltd. | (310 | ) | (0.2 | %) | 976 | |||||||
JBG SMITH Properties | (799 | ) | (0.1 | %) | 876 | |||||||
TripAdvisor, Inc.* | (473 | ) | (0.1 | %) | 833 | |||||||
Associated Banc-Corp. | (1,234 | ) | (0.1 | %) | 759 | |||||||
Schlumberger Ltd. | (539 | ) | (0.1 | %) | 718 | |||||||
Investors Bancorp, Inc. | (3,799 | ) | (0.1 | %) | 713 | |||||||
Wendy's Co. | (3,441 | ) | (0.1 | %) | 698 | |||||||
Waste Management, Inc. | (360 | ) | (0.1 | %) | 671 | |||||||
Nielsen Holdings plc | (877 | ) | (0.1 | %) | 421 | |||||||
MarketAxess Holdings, Inc. | (236 | ) | (0.1 | %) | 394 | |||||||
Intercontinental Exchange, Inc. | (366 | ) | (0.1 | %) | 349 | |||||||
Washington Federal, Inc. | (858 | ) | (0.1 | %) | 343 | |||||||
Duke Energy Corp. | (381 | ) | (0.0 | %) | 309 | |||||||
Charter Communications, Inc. — Class A* | (127 | ) | (0.0 | %) | 161 | |||||||
Alleghany Corp. | (48 | ) | (0.0 | %) | 146 | |||||||
Crown Castle International Corp. | (647 | ) | (0.0 | %) | 104 | |||||||
Aramark | (1,847 | ) | (0.0 | %) | 45 | |||||||
Royal Gold, Inc. | (299 | ) | 0.0 | % | (26 | ) | ||||||
IBERIABANK Corp. | (395 | ) | 0.0 | % | (44 | ) | ||||||
First Republic Bank | (689 | ) | 0.0 | % | (51 | ) | ||||||
Platform Specialty Products Corp.* | (2,286 | ) | 0.0 | % | (54 | ) | ||||||
PPG Industries, Inc. | (268 | ) | 0.0 | % | (73 | ) | ||||||
WR Grace & Co. | (762 | ) | 0.0 | % | (114 | ) | ||||||
Essex Property Trust, Inc. | (178 | ) | 0.0 | % | (193 | ) | ||||||
ServiceNow, Inc.* | (179 | ) | 0.0 | % | (268 | ) | ||||||
Vulcan Materials Co. | (476 | ) | 0.1 | % | (352 | ) | ||||||
Republic Services, Inc. — Class A | (431 | ) | 0.1 | % | (354 | ) | ||||||
Multi-Color Corp. | (569 | ) | 0.1 | % | (409 | ) | ||||||
Signature Bank* | (236 | ) | 0.1 | % | (455 | ) | ||||||
AptarGroup, Inc. | (701 | ) | 0.1 | % | (499 | ) | ||||||
KAR Auction Services, Inc. | (722 | ) | 0.1 | % | (508 | ) | ||||||
124 | THE GUGGENHEIM FUNDS SEMI-ANNUAL REPORT | SEE NOTES TO FINANCIAL STATEMENTS. |
SCHEDULE OF INVESTMENTS (Unaudited)(continued) | June 30, 2018 |
SERIES Z (ALPHA OPPORTUNITY SERIES) |
| Percentage | Unrealized | ||||||||||
Everest Re Group Ltd. | (122 | ) | 0.1 | % | $ | (560 | ) | |||||
Marsh & McLennan Companies, Inc. | (338 | ) | 0.1 | % | (572 | ) | ||||||
Commercial Metals Co. | (2,780 | ) | 0.1 | % | (719 | ) | ||||||
MSA Safety, Inc. | (641 | ) | 0.1 | % | (768 | ) | ||||||
Allegheny Technologies, Inc.* | (2,207 | ) | 0.2 | % | (976 | ) | ||||||
Equifax, Inc. | (250 | ) | 0.2 | % | (1,000 | ) | ||||||
National Oilwell Varco, Inc. | (912 | ) | 0.2 | % | (1,215 | ) | ||||||
NiSource, Inc. | (1,317 | ) | 0.2 | % | (1,334 | ) | ||||||
Sherwin-Williams Co. | (178 | ) | 0.2 | % | (1,476 | ) | ||||||
Dominion Energy, Inc. | (1,060 | ) | 0.2 | % | (1,480 | ) | ||||||
Equinix, Inc. | (115 | ) | 0.2 | % | (1,486 | ) | ||||||
Tesla, Inc.* | (54 | ) | 0.2 | % | (1,496 | ) | ||||||
Texas Roadhouse, Inc. — Class A | (455 | ) | 0.3 | % | (1,545 | ) | ||||||
Alexandria Real Estate Equities, Inc. | (715 | ) | 0.3 | % | (1,589 | ) | ||||||
Invitation Homes, Inc. | (2,555 | ) | 0.3 | % | (1,712 | ) | ||||||
Vornado Realty Trust | (870 | ) | 0.3 | % | (1,794 | ) | ||||||
DTE Energy Co. | (288 | ) | 0.3 | % | (1,944 | ) | ||||||
Costco Wholesale Corp. | (135 | ) | 0.3 | % | (2,000 | ) | ||||||
Terreno Realty Corp. | (2,669 | ) | 0.3 | % | (2,014 | ) | ||||||
Amazon.com, Inc.* | (18 | ) | 0.3 | % | (2,071 | ) | ||||||
Extraction Oil & Gas, Inc.* | (2,582 | ) | 0.3 | % | (2,072 | ) | ||||||
American Tower Corp. — Class A | (344 | ) | 0.4 | % | (2,182 | ) | ||||||
Alliant Energy Corp. | (821 | ) | 0.4 | % | (2,283 | ) | ||||||
WEC Energy Group, Inc. | (467 | ) | 0.4 | % | (2,311 | ) | ||||||
Realty Income Corp. | (836 | ) | 0.4 | % | (2,334 | ) | ||||||
Cannae Holdings, Inc.* | (2,168 | ) | 0.4 | % | (2,368 | ) | ||||||
Eversource Energy | (529 | ) | 0.4 | % | (2,524 | ) | ||||||
Douglas Emmett, Inc. | (1,780 | ) | 0.4 | % | (2,530 | ) | ||||||
Parsley Energy, Inc. — Class A* | (990 | ) | 0.4 | % | (2,627 | ) | ||||||
IHS Markit Ltd.* | (2,598 | ) | 0.4 | % | (2,630 | ) | ||||||
Equity LifeStyle Properties, Inc. | (1,108 | ) | 0.4 | % | (2,656 | ) | ||||||
Eaton Vance Corp. | (573 | ) | 0.4 | % | (2,696 | ) | ||||||
Federal Realty Investment Trust | (237 | ) | 0.4 | % | (2,711 | ) | ||||||
Glacier Bancorp, Inc. | (810 | ) | 0.5 | % | (2,758 | ) | ||||||
TransDigm Group, Inc. | (122 | ) | 0.5 | % | (3,090 | ) | ||||||
AvalonBay Communities, Inc. | (227 | ) | 0.5 | % | (3,113 | ) | ||||||
FactSet Research Systems, Inc. | (214 | ) | 0.5 | % | (3,255 | ) | ||||||
Boston Properties, Inc. | (612 | ) | 0.6 | % | (3,491 | ) | ||||||
SBA Communications Corp.* | (315 | ) | 0.6 | % | (3,570 | ) | ||||||
Equity Residential | (452 | ) | 0.6 | % | (3,666 | ) | ||||||
HCP, Inc. | (1,817 | ) | 0.6 | % | (3,672 | ) | ||||||
RPM International, Inc. | (541 | ) | 0.7 | % | (3,974 | ) | ||||||
Ellie Mae, Inc.* | (248 | ) | 0.7 | % | (4,016 | ) | ||||||
Booking Holdings, Inc.* | (21 | ) | 0.7 | % | (4,126 | ) | ||||||
Gartner, Inc.* | (348 | ) | 0.7 | % | (4,171 | ) | ||||||
Ashland Global Holdings, Inc. | (569 | ) | 0.7 | % | (4,243 | ) | ||||||
Covanta Holding Corp. | (8,472 | ) | 0.7 | % | (4,277 | ) | ||||||
Hudson Pacific Properties, Inc. | (1,406 | ) | 0.7 | % | (4,323 | ) | ||||||
CyrusOne, Inc. | (912 | ) | 0.7 | % | (4,323 | ) | ||||||
Rexford Industrial Realty, Inc. | (2,071 | ) | 0.7 | % | (4,476 | ) | ||||||
SL Green Realty Corp. | (554 | ) | 0.7 | % | (4,536 | ) | ||||||
Redwood Trust, Inc. | (2,511 | ) | 0.7 | % | (4,565 | ) | ||||||
American Water Works Company, Inc. | (804 | ) | 0.8 | % | (4,770 | ) | ||||||
Digital Realty Trust, Inc. | (705 | ) | 0.8 | % | (4,903 | ) | ||||||
Diamondback Energy, Inc. | (294 | ) | 0.8 | % | (5,052 | ) | ||||||
Howard Hughes Corp.* | (551 | ) | 0.8 | % | (5,098 | ) | ||||||
American Campus Communities, Inc. | (1,668 | ) | 0.8 | % | (5,111 | ) | ||||||
South Jersey Industries, Inc. | (1,222 | ) | 0.8 | % | (5,122 | ) | ||||||
Pegasystems, Inc. | (682 | ) | 0.8 | % | (5,127 | ) | ||||||
Healthcare Trust of America, Inc. — Class A | (4,058 | ) | 0.9 | % | (5,342 | ) | ||||||
White Mountains Insurance Group Ltd. | (78 | ) | 0.9 | % | (5,782 | ) | ||||||
Cornerstone OnDemand, Inc.* | (644 | ) | 1.0 | % | (5,839 | ) | ||||||
Axis Capital Holdings Ltd. | (1,235 | ) | 1.0 | % | (5,914 | ) | ||||||
Under Armour, Inc. — Class A* | (1,532 | ) | 1.0 | % | (6,105 | ) | ||||||
PriceSmart, Inc. | (892 | ) | 1.0 | % | (6,206 | ) | ||||||
Public Storage | (298 | ) | 1.2 | % | (7,077 | ) | ||||||
Tyler Technologies, Inc.* | (218 | ) | 1.2 | % | (7,311 | ) | ||||||
SPS Commerce, Inc.* | (528 | ) | 1.2 | % | (7,324 | ) | ||||||
Ultimate Software Group, Inc.* | (149 | ) | 1.2 | % | (7,590 | ) | ||||||
Southern Copper Corp. | (2,148 | ) | 1.3 | % | (7,625 | ) | ||||||
Duke Realty Corp. | (2,086 | ) | 1.3 | % | (8,077 | ) | ||||||
Hess Corp. | (958 | ) | 1.4 | % | (8,471 | ) | ||||||
RLI Corp. | (1,237 | ) | 1.4 | % | (8,624 | ) | ||||||
Sun Communities, Inc. | (1,257 | ) | 1.4 | % | (8,631 | ) | ||||||
Pool Corp. | (270 | ) | 1.4 | % | (8,710 | ) | ||||||
WD-40 Co. | (219 | ) | 1.4 | % | (8,807 | ) | ||||||
HB Fuller Co. | (2,490 | ) | 1.5 | % | (8,916 | ) | ||||||
Moody's Corp. | (370 | ) | 1.5 | % | (8,993 | ) | ||||||
Monolithic Power Systems, Inc. | (437 | ) | 1.5 | % | (9,094 | ) | ||||||
Kilroy Realty Corp. | (931 | ) | 1.5 | % | (9,359 | ) | ||||||
Vail Resorts, Inc. | (147 | ) | 1.5 | % | (9,392 | ) | ||||||
Semtech Corp.* | (696 | ) | 1.6 | % | (9,466 | ) | ||||||
Retail Opportunity Investments Corp. | (4,326 | ) | 1.6 | % | (9,514 | ) | ||||||
UDR, Inc. | (2,340 | ) | 1.6 | % | (9,799 | ) | ||||||
Tetra Tech, Inc. | (1,187 | ) | 1.7 | % | (10,117 | ) | ||||||
Ingevity Corp.* | (473 | ) | 1.7 | % | (10,586 | ) | ||||||
CarMax, Inc.* | (1,223 | ) | 1.7 | % | (10,660 | ) | ||||||
Ollie's Bargain Outlet Holdings, Inc.* | (369 | ) | 1.8 | % | (10,735 | ) | ||||||
EastGroup Properties, Inc. | (848 | ) | 1.8 | % | (10,969 | ) | ||||||
PTC, Inc.* | (345 | ) | 1.8 | % | (11,245 | ) | ||||||
Mobile Mini, Inc. | (2,431 | ) | 1.9 | % | (11,645 | ) | ||||||
MSCI, Inc. — Class A | (314 | ) | 2.0 | % | (11,864 | ) | ||||||
SEE NOTES TO FINANCIAL STATEMENTS. | THE GUGGENHEIM FUNDS SEMI-ANNUAL REPORT | 125 |
SCHEDULE OF INVESTMENTS (Unaudited)(concluded) | June 30, 2018 |
SERIES Z (ALPHA OPPORTUNITY SERIES) |
| Percentage | Unrealized | ||||||||||
FMC Corp. | (670 | ) | 2.1 | % | $ | (12,518 | ) | |||||
Balchem Corp. | (1,040 | ) | 2.1 | % | (12,529 | ) | ||||||
Crocs, Inc.* | (1,426 | ) | 2.4 | % | (14,354 | ) | ||||||
TransUnion | (859 | ) | 2.4 | % | (14,829 | ) | ||||||
Shake Shack, Inc. — Class A* | (574 | ) | 2.4 | % | (14,844 | ) | ||||||
ASGN, Inc.* | (1,556 | ) | 2.5 | % | (15,282 | ) | ||||||
Ecolab, Inc. | (860 | ) | 2.6 | % | (15,569 | ) | ||||||
Insperity, Inc. | (527 | ) | 3.1 | % | (18,919 | ) | ||||||
Rollins, Inc. | (2,611 | ) | 3.3 | % | (20,268 | ) | ||||||
Verisk Analytics, Inc. — Class A* | (1,260 | ) | 3.5 | % | (21,165 | ) | ||||||
Exponent, Inc. | (2,257 | ) | 3.9 | % | (23,540 | ) | ||||||
Cintas Corp. | (703 | ) | 4.0 | % | (24,511 | ) | ||||||
Team, Inc.* | (2,723 | ) | 4.5 | % | (27,424 | ) | ||||||
Copart, Inc.* | (1,348 | ) | 4.5 | % | (27,645 | ) | ||||||
CoStar Group, Inc.* | (326 | ) | 5.3 | % | (32,168 | ) | ||||||
Total Custom Basket of Short Securities | (609,956 | ) | ||||||||||
| * | Non-income producing security. |
| † | Value determined based on Level 1 inputs, unless otherwise noted — See Note 4. |
| †† | Value determined based on Level 2 inputs — See Note 4. |
| ††† | Value determined based on Level 3 inputs — See Note 4. |
| 1 | All or a portion of this security is pledged as custom basket swap collateral at June 30, 2018. |
| 2 | Security was fair valued by the Valuation Committee at June 30, 2018. The total market value of fair valued securities amounts to $0, (cost $101,261) or 0.0% of total net assets. |
| 3 | Rate indicated is the 7 day yield as of June 30, 2018. |
| 4 | Total Return based on the return of the custom short basket of securities +/- financing at a variable rate. Rate indicated is rate effective at June 30, 2018. |
| 5 | Total Return based on the return of the custom long basket of securities +/- financing at a variable rate. Rate indicated is rate effective at June 30, 2018. |
plc — Public Limited Company
REIT — Real Estate Investment Trust
See Sector Classification in Other Information section.
The following table summarizes the inputs used to value the Fund’s investments at June 30, 2018 (See Note 4 in the Notes to Financial Statements):
Investments in Securities (Assets) | Level 1 | Level 2 | Level 3 | Total | ||||||||||||
Common Stocks | $ | 9,543,502 | $ | — | $ | —* | $ | 9,543,502 | ||||||||
Money Market Fund | 1,090,411 | — | — | 1,090,411 | ||||||||||||
Custom Basket Swap Agreements** | — | 6,175 | — | 6,175 | ||||||||||||
Total Assets | $ | 10,633,913 | $ | 6,175 | $ | — | $ | 10,640,088 | ||||||||
Investments in Securities (Liabilities) | Level 1 | Level 2 | Level 3 | Total | ||||||||||||
Custom Basket Swap Agreements** | $ | — | $ | 609,956 | $ | — | $ | 609,956 | ||||||||
| * | Security has a market value of $0. |
| ** | This derivative is reported as unrealized appreciation/(depreciation) at period end. |
Transfers between investment levels may occur as the markets fluctuate and/or the availability of data used in an investment’s valuation changes. Transfers between valuation levels, if any, are in comparison to the valuation levels at the end of the previous fiscal year, and are effective using the fair value as of the end of the current fiscal period.
For the period ended June 30, 2018, there were no transfers between levels.
126 | THE GUGGENHEIM FUNDS SEMI-ANNUAL REPORT | SEE NOTES TO FINANCIAL STATEMENTS. |
SERIES Z (ALPHA OPPORTUNITY SERIES) |
STATEMENT OF ASSETS AND LIABILITIES (Unaudited) | ||||
June 30, 2018 | ||||
Assets: | ||||
Investments, at value (cost $10,629,963) | $ | 10,633,913 | ||
Unrealized appreciation on swap agreements | 6,175 | |||
Prepaid expenses | 665 | |||
Receivables: | ||||
Dividends | 15,615 | |||
Interest | 791 | |||
Fund shares sold | 70 | |||
Total assets | 10,657,229 | |||
Liabilities: | ||||
Overdraft due to custodian bank | 921 | |||
Unrealized depreciation on swap agreements | 609,956 | |||
Payable for: | ||||
Swap settlement | 746,982 | |||
Transfer agent/maintenance fees | 4,143 | |||
Fund shares redeemed | 2,208 | |||
Management fees | 2,124 | |||
Distribution and service fees | 2,052 | |||
Trustees’ fees* | 258 | |||
Miscellaneous | 26,052 | |||
Total liabilities | 1,394,696 | |||
Commitments and contingent liabilities (Note 13) | — | |||
Net assets | $ | 9,262,533 | ||
Net assets consist of: | ||||
Paid in capital | $ | 9,037,662 | ||
Undistributed net investment income | 10,479 | |||
Accumulated net realized gain on investments | 814,223 | |||
Net unrealized depreciation on investments | (599,831 | ) | ||
Net assets | $ | 9,262,533 | ||
Capital shares outstanding | 508,711 | |||
Net asset value per share | $ | 18.21 | ||
STATEMENT OF OPERATIONS (Unaudited) | ||||
Period Ended June 30, 2018 | ||||
Investment Income: | ||||
Dividends (net of foreign withholding tax of $74) | $ | 119,337 | ||
Interest | 3,028 | |||
Total investment income | 122,365 | |||
Expenses: | ||||
Management fees | 51,023 | |||
Distribution and service fees | 14,173 | |||
Transfer agent/maintenance fees | 12,332 | |||
Professional fees | 17,259 | |||
Fund accounting/administration fees | 12,397 | |||
Trustees’ fees* | 6,761 | |||
Custodian fees | 5,455 | |||
Line of credit fees | 45 | |||
Miscellaneous | 5,758 | |||
Total expenses | 125,203 | |||
Less: | ||||
Expenses reimbursed by Adviser | (523 | ) | ||
Expenses waived by Adviser | (12,794 | ) | ||
Total waived expenses | (13,317 | ) | ||
Net expenses | 111,886 | |||
Net investment income | 10,479 | |||
Net Realized and Unrealized Gain (Loss): | ||||
Net realized gain (loss) on: | ||||
Investments | 816,041 | |||
Swap agreements | (1,218,301 | ) | ||
Net realized loss | (402,260 | ) | ||
Net change in unrealized appreciation (depreciation) on: | ||||
Investments | (802,321 | ) | ||
Swap agreements | 116,492 | |||
Net change in unrealized appreciation (depreciation) | (685,829 | ) | ||
Net realized and unrealized loss | (1,088,089 | ) | ||
Net decrease in net assets resulting from operations | $ | (1,077,610 | ) | |
| * | Relates to Trustees not deemed “interested persons” within the meaning of Section 2(a)(19) of the 1940 Act. |
SEE NOTES TO FINANCIAL STATEMENTS. | THE GUGGENHEIM FUNDS SEMI-ANNUAL REPORT | 127 |
SERIES Z (ALPHA OPPORTUNITY SERIES) |
STATEMENTS OF CHANGES IN NET ASSETS |
Period Ended | Year Ended | |||||||
Increase (Decrease) in Net Assets from Operations: | ||||||||
Net investment income (loss) | $ | 10,479 | $ | (28,603 | ) | |||
Net realized gain (loss) on investments | (402,260 | ) | 1,207,189 | |||||
Net change in unrealized appreciation (depreciation) on investments | (685,829 | ) | (306,349 | ) | ||||
Net increase (decrease) in net assets resulting from operations | (1,077,610 | ) | 872,237 | |||||
Capital share transactions: | ||||||||
Proceeds from sale of shares | 64,513 | 233,931 | ||||||
Cost of shares redeemed | (2,041,015 | ) | (1,981,860 | ) | ||||
Net decrease from capital share transactions | (1,976,502 | ) | (1,747,929 | ) | ||||
Net decrease in net assets | (3,054,112 | ) | (875,692 | ) | ||||
Net assets: | ||||||||
Beginning of period | 12,316,645 | 13,192,337 | ||||||
End of period | $ | 9,262,533 | $ | 12,316,645 | ||||
Undistributed net investment income at end of period | $ | 10,479 | $ | — | ||||
Capital share activity: | ||||||||
Shares sold | 3,283 | 12,271 | ||||||
Shares redeemed | (108,775 | ) | (103,565 | ) | ||||
Net decrease in shares | (105,492 | ) | (91,294 | ) | ||||
128 | THE GUGGENHEIM FUNDS SEMI-ANNUAL REPORT | SEE NOTES TO FINANCIAL STATEMENTS. |
SERIES Z (ALPHA OPPORTUNITY SERIES) |
FINANCIAL HIGHLIGHTS |
This table is presented to show selected data for a share outstanding throughout each period and to assist shareholders in evaluating a Fund’s performance for the periods presented.
Period Ended | Year Ended December 31, 2017 | Year Ended December 31, 2016 | Year Ended December 31, 2015 | Year Ended December 31, 2014 | Year Ended December 31, 2013 | |||||||||||||||||||
| Per Share Data | ||||||||||||||||||||||||
| Net asset value, beginning of period | $ | 20.05 | $ | 18.70 | $ | 16.59 | $ | 27.33 | $ | 25.00 | $ | 19.55 | ||||||||||||
| Income (loss) from investment operations: | ||||||||||||||||||||||||
Net investment income (loss)b | .02 | (.04 | ) | (.21 | ) | (.43 | ) | (.43 | ) | (.15 | ) | |||||||||||||
| Net gain (loss) on investments (realized and unrealized) | (1.86 | ) | 1.39 | 2.32 | (.69 | ) | 2.76 | 5.60 | ||||||||||||||||
| Total from investment operations | (1.84 | ) | 1.35 | 2.11 | (1.12 | ) | 2.33 | 5.45 | ||||||||||||||||
| Less distributions from: | ||||||||||||||||||||||||
| Net realized gains | — | — | — | (9.62 | ) | — | — | |||||||||||||||||
| Total distributions | — | — | — | (9.62 | ) | — | — | |||||||||||||||||
| Net asset value, end of period | $ | 18.21 | $ | 20.05 | $ | 18.70 | $ | 16.59 | $ | 27.33 | $ | 25.00 | ||||||||||||
Total Returnc | (9.18 | %) | 7.22 | % | 12.79 | % | (4.69 | %) | 9.36 | % | 27.83 | % | ||||||||||||
| Ratios/Supplemental Data | ||||||||||||||||||||||||
| Net assets, end of period (in thousands) | $ | 9,263 | $ | 12,317 | $ | 13,192 | $ | 12,548 | $ | 15,611 | $ | 16,707 | ||||||||||||
| Ratios to average net assets: | ||||||||||||||||||||||||
| Net investment income (loss) | 0.18 | % | (0.23 | %) | (1.18 | %) | (2.03 | %) | (1.65 | %) | (0.69 | %) | ||||||||||||
| Total expenses | 2.21 | % | 2.48 | % | 2.92 | % | 3.54 | % | 2.71 | % | 3.03 | % | ||||||||||||
Net expensesd,e | 2.00 | % | 2.22 | %f | 2.92 | % | 3.46 | % | 2.33 | % | 2.44 | % | ||||||||||||
| Portfolio turnover rate | 141 | % | 182 | % | 198 | % | 446 | % | — | 548 | % | |||||||||||||
| a | Unaudited figures for the period ended June 30, 2018. Percentage amounts for the period, except total return and portfolio turnover rate, have been annualized. |
| b | Net investment income (loss) per share was computed using average shares outstanding throughout the period. |
| c | Total return does not take into account any of the expenses associated with an investment in variable insurance products. If total return had taken into account these expenses, performance would have been lower. Shares of a series of Guggenheim Variable Funds Trust are available only through the purchase of such products. |
| d | Net expense information reflects the expense ratios after expense waivers and reimbursements, as applicable. |
| e | Net expenses may include expenses that are excluded from the expense limitation agreements. Excluding those amounts, the net expense ratios for the periods presented would be: |
06/30/18 | 12/31/17 | 12/31/16 | 12/31/15 | 12/31/14 | 12/31/13 |
2.00% | 2.13% | 2.35% | 2.35% | 2.32% | 2.35% |
| f | The portion of the ratio of net expenses to average net assets attributable to recoupments of prior fee reductions of expense reimbursements is 0.15%. |
SEE NOTES TO FINANCIAL STATEMENTS. | THE GUGGENHEIM FUNDS SEMI-ANNUAL REPORT | 129 |
NOTES TO FINANCIAL STATEMENTS (Unaudited) |
Note 1 – Organization and Significant Accounting Policies
Organization
Guggenheim Variable Funds Trust (the “Trust”), a Delaware statutory trust, is registered with the SEC under the Investment Company Act of 1940 (“1940 Act”), as an open-ended investment company of the series type. Each series, in effect, is representing a separate Fund. The Trust is authorized to issue an unlimited number of shares. The Trust accounts for the assets of each Fund separately. At June 30, 2018, the Trust consisted of fourteen funds.
This report covers the Series A (StylePlus—Large Core Series), Series B (Large Cap Value Series), Series D (World Equity Income Series), Series E (Total Return Bond Series), Series F (Floating Rate Strategies Series), Series J (StylePlus—Mid Growth Series), Series N (Managed Asset Allocation Series), Series O (All Cap Value Series), Series P (High Yield Series), Series Q (Small Cap Value Series), Series V (Mid Cap Value Series), Series X (StylePlus—Small Growth Series), Series Y (StylePlus—Large Growth Series) and Series Z (Alpha Opportunity Series) (the “Funds”), each of which is a diversified investment company.
Security Investors, LLC and Guggenheim Partners Investment Management, LLC, which operates under the name Guggenheim Investments (“GI”), provides advisory services. Guggenheim Partners Investment Management, LLC provides advisory services to Series F (Floating Rate Strategies Series) and Security Investors, LLC provides advisory services to the remaining Funds covered in this report. Guggenheim Funds Distributors, LLC (“GFD”) acts as principal underwriter for the Trust. GI and GFD are affiliated entities.
Significant Accounting Policies
The Funds operate as investment companies and, accordingly, follow the investment company accounting and reporting guidance of the Financial Accounting Standards Board (“FASB”) Accounting Standards Codification Topic 946 Financial Services – Investment Companies.
The following significant accounting policies are in conformity with U.S. generally accepted accounting principles (“U.S. GAAP”) and are consistently followed by the Trust. This requires management to make estimates and assumptions that affect the reported amount of assets and liabilities, contingent assets and liabilities at the date of the financial statements, and the reported amounts of revenues and expenses during the reporting period. Actual results could differ from these estimates. All time references are based on Eastern Time.
The net asset value per share (“NAV”) of a fund is calculated by dividing the market value of a fund’s securities and other assets, less all liabilities, by the number of outstanding shares of that fund.
(a) Valuation of Investments
The Board of Trustees of the Funds (the “Board”) has adopted policies and procedures for the valuation of the Funds’ investments (the “Valuation Procedures”). Pursuant to the Valuation Procedures, the Board has delegated to a valuation committee, consisting of representatives from Guggenheim’s investment management, fund administration, legal and compliance departments (the “Valuation Committee”), the day-to-day responsibility for implementing the Valuation Procedures, including, under most circumstances, the responsibility for determining the fair value of the Funds’ securities and/or other assets.
Valuations of the Funds’ securities are supplied primarily by pricing services appointed pursuant to the processes set forth in the Valuation Procedures. The Valuation Committee convenes monthly, or more frequently as needed, to review the valuation of all assets which have been fair valued for reasonableness. The Funds’ officers, through the Valuation Committee and consistent with the monitoring and review responsibilities set forth in the Valuation Procedures, regularly review procedures used and valuations provided by the pricing services.
If the pricing service cannot or does not provide a valuation for a particular investment or such valuation is deemed unreliable, such investment is fair valued by the Valuation Committee.
Equity securities listed on an exchange (New York Stock Exchange (“NYSE”) or American Stock Exchange) are valued at the last quoted sale price as of the close of business on the NYSE, usually 4:00 p.m. on the valuation date. Equity securities listed on the NASDAQ market system are valued at the NASDAQ Official Closing Price on the valuation date, which may not necessarily represent the last sale price. If there has been no sale on such exchange or NASDAQ on a given day, the security is valued at the closing bid price on that day.
Generally, trading in foreign securities markets is substantially completed each day at various times prior to the close of the NYSE. The values of foreign securities are determined as of the close of such foreign markets or the close of the NYSE, if earlier. All investments quoted in foreign currencies are valued in U.S. dollars on the basis of the foreign currency exchange rates prevailing at the close of U.S. business at 4:00 p.m. Investments in foreign securities may involve risks not present in domestic investments. The Valuation Committee will determine the current value of such foreign securities by taking into consideration certain factors
130 | THE GUGGENHEIM FUNDS SEMI-ANNUAL REPORT |
NOTES TO FINANCIAL STATEMENTS (Unaudited)(continued) |
which may include those discussed above, as well as the following factors, among others: the value of the securities traded on other foreign markets, ADR trading, closed-end fund trading, foreign currency exchange activity, and the trading prices of financial products that are tied to foreign securities. In addition, under the Valuation Procedures, the Valuation Committee and GI are authorized to use prices and other information supplied by a third party pricing vendor in valuing foreign securities.
Open-end investment companies (“mutual funds”) are valued at their NAV as of the close of business, on the valuation date. Exchange-traded funds (“ETFs”) and closed-end investment companies (“CEFs”) are valued at their last quoted sale price.
U.S. Government securities are valued by either independent pricing services, the last traded fill price, or at the reported bid price at the close of business.
Debt securities with a maturity of greater than 60 days at acquisition are valued at prices that reflect broker-dealer supplied valuations or are obtained from independent pricing services, which may consider the trade activity, treasury spreads, yields or price of bonds of comparable quality, coupon, maturity, and type, as well as prices quoted by dealers who make markets in such securities. Short-term debt securities with a maturity of 60 days or less at acquisition are valued at amortized cost, provided such amount approximates market value. Money market funds are valued at their NAV.
Typically, loans are valued using information provided by an independent third party pricing service which uses broker quotes. If the pricing service cannot or does not provide a valuation for a particular investment or such valuation is deemed unrealiable, such investment is fair valued by the Valuation Committee.
Listed options are valued at the Official Settlement Price listed by the exchange, usually as of 4:00 p.m. Long options are valued using the bid price and short options are valued using the ask price. In the event that a settlement price is not available, fair valuation is enacted. Over-the-counter (“OTC”) options are valued using the average bid price (for long options) or average ask price (for short options) obtained from one or more security dealers.
The value of futures contracts is accounted for using the unrealized gain or loss on the contracts that is determined by marking the contracts to their current realized settlement prices. Financial futures contracts are valued at the 4:00 p.m. price on the valuation date. In the event that the exchange for a specific futures contract closes earlier than 4:00 p.m., the futures contract is valued at the Official Settlement Price of the exchange. However, the underlying securities from which the futures contract value is derived are monitored until 4:00 p.m. to determine if fair valuation would provide a more accurate valuation.
The values of OTC swap agreements entered into by a Fund are accounted for using the unrealized gains or losses on the agreements that are determined by marking the agreements to the last quoted value of the index that the swaps pertain to at the close of the NYSE. The value of interest rate swap agreements entered into by a Fund is accounted for using the unrealized gain or loss on the agreements that is determined using the spread priced off the previous day’s Chicago Mercantile Exchange (“CME”) price.
The value of equity swaps with custom portfolio baskets shall be computed by using the last exchange sale price for each underlying equity security within the swap agreement. A custom portfolio equity swap will be adjusted to include dividends accrued, financing charges and/or interest, as applicable, under the swap agreement.
Forward foreign currency exchange contracts are valued daily based on the applicable exchange rate of the underlying security.
Investments for which market quotations are not readily available are fair-valued as determined in good faith by GI, subject to review and approval by the Valuation Committee, pursuant to methods established or ratified by the Board. Valuations in accordance with these methods are intended to reflect each security’s (or asset’s or liability’s) “fair value”. Each such determination is based on a consideration of all relevant factors, which are likely to vary from one pricing context to another. Examples of such factors may include, but are not limited to market prices; sale prices; broker quotes; and models which derive prices based on inputs such as prices of securities with comparable maturities and characteristics, or based on inputs such as anticipated cash flows or collateral, spread over Treasuries, and other information analysis.
In connection with futures contracts and other derivative investments, such factors may include obtaining information as to how (a) these contracts and other derivative investments trade in the futures or other derivative markets, respectively, and (b) the securities underlying these contracts and other derivative investments trade in the cash market.
(b) U.S. Government and Agency Obligations
Certain U.S. Government and Agency Obligations are traded on a discount basis; the interest rates shown on the Schedules of Investments reflect the effective rates paid at the time of purchase by the Funds. Other securities bear interest at the rates shown, payable at fixed dates through maturity.
(c) Senior Loans
Senior loans in which the Funds invest generally pay interest rates which are periodically adjusted by reference to a base short-term floating rate, plus a premium. These base lending rates are generally (i) the lending rate offered by one or more major
THE GUGGENHEIM FUNDS SEMI-ANNUAL REPORT 131 |
NOTES TO FINANCIAL STATEMENTS (Unaudited)(continued) |
European banks, such as the one-month or three-month London Inter-Bank Offered Rate (LIBOR), (ii) the prime rate offered by one or more major United States banks, or (iii) the bank’s certificate of deposit rate. Senior floating rate interests often require prepayments from excess cash flows or permit the borrower to repay at its election. The rate at which the borrower repays cannot be predicted with accuracy. As a result, the actual remaining maturity may be substantially less than the stated maturities disclosed in the Funds’ Schedules of Investments. The interest rate indicated is the rate in effect at June 30, 2018.
(d) Interests in Securities
The Funds may purchase and sell interests in securities on a when-issued and delayed delivery basis, with payment and delivery scheduled for a future date. No income accrues to the Fund on such interests or securities in connection with such transactions prior to the date the Funds actually take delivery of such interests or securities. These transactions are subject to market fluctuations and are subject to the risk that the value at delivery may be more or less than the trade date purchase price. Although the Funds will generally purchase these securities with the intention of acquiring such securities, they may sell such securities before the settlement date.
(e) Options
Upon the purchase of an option, the premium paid is recorded as an investment, the value of which is marked-to-market daily. If a purchased option expires, the Fund realizes a loss in the amount of the cost of the option. When the Fund enters into a closing sale transaction, it realizes a gain or loss depending on whether the proceeds from the closing sale transaction are greater or less than the cost of the option. If the Fund exercises a put option, it realizes a gain or loss from the sale of the underlying security and the proceeds from such sale will be decreased by the premium originally paid. When the Fund exercises a call option, the cost of the security purchased by the Fund upon exercise increases by the premium originally paid.
When the Fund writes (sells) an option, an amount equal to the premium received is entered in that Fund’s accounting records as an asset and equivalent liability. The amount of the liability is subsequently marked-to-market to reflect the current value of the option written. When a written option expires, or if the Fund enters into a closing purchase transaction, it realizes a gain (or loss if the cost of a closing purchase transaction exceeds the premium received when the option was sold).
(f) Futures Contracts
Upon entering into a futures contract, a Fund deposits and maintains as collateral such initial margin as required by the exchange on which the transaction is affected. Pursuant to the contract, the Fund agrees to receive from or pay to the broker an amount of cash equal to the daily fluctuation in value of the contract. Such receipts or payments are known as variation margin and are recorded by the Fund as unrealized appreciation or depreciation. When the contract is closed, the Fund records a realized gain or loss equal to the difference between the value of the contract at the time it was opened and the value at the time it was closed.
(g) Swap Agreements
Swap agreements are marked-to-market daily and the change, if any, is recorded as unrealized appreciation or depreciation. Payments received or made as a result of an agreement or termination of an agreement are recognized as realized gains or losses.
(h) Forward Foreign Currency Exchange Contracts
Forward foreign currency exchange contracts are valued daily based on the applicable exchange rate of the underlying currency. The change in value of the contract is recorded as unrealized appreciation or depreciation until the contract is closed. When the contract is closed, the Funds record a realized gain or loss equal to the difference between the value at the time the contract was opened and the value at the time it was closed.
(i) Foreign Taxes
The Funds may be subject to foreign taxes (a portion of which may be reclaimable) on income, stock dividends, capital gains on investments or certain foreign currency transactions. All foreign taxes are recorded in accordance with the applicable foreign tax regulations and rates that exist in the foreign jurisdictions in which the Funds invest. These foreign taxes, if any, are paid by the Funds and reflected in their Statement of Operations as follows: foreign taxes withheld at source are presented as a reduction of income and foreign taxes on capital gains from sales of investments are included with the net realized gain (loss) on investments. Foreign taxes payable or deferred as of June 30, 2018, if any, are disclosed in the Funds’ Statements of Assets and Liabilities.
(j) Security Transactions
Security transactions are recorded on the trade date for financial reporting purposes. Realized gains and losses from securities transactions are recorded using the identified cost basis. Proceeds from lawsuits related to investment holdings are recorded as realized gains in the respective Fund. Dividend income is recorded on the ex-dividend date, net of applicable taxes withheld by foreign countries. Taxable non-cash dividends are recorded as dividend income. Interest income, including amortization of premiums and accretion of discounts, is accrued on a daily basis. Interest income also includes paydown gains and losses on mortgage-backed and asset-backed securities and senior and subordinated
132 | THE GUGGENHEIM FUNDS SEMI-ANNUAL REPORT |
NOTES TO FINANCIAL STATEMENTS (Unaudited)(continued) |
loans. Amendment fees are earned as compensation for evaluating and accepting changes to the original loan agreement and are recognized when received. Dividend income from Real Estate Investment Trusts (“REITs”) is recorded based on the income included in the distributions received from the REIT investments using published REIT classifications, including some management estimates when actual amounts are not available. Distributions received in excess of this estimated amount are recorded as a reduction of the cost of investments or reclassified to capital gains. The actual amounts of income, return of capital, and capital gains are only determined by each REIT after its fiscal year-end, and may differ from the estimated amounts.
Income from residual collateralized loan obligations is recognized using the effective interest method. At the time of purchase, management estimates the future expected cash flows and determines the effective yield and estimated maturity date based on the estimated cash flows. Subsequent to the purchase, the estimated cash flows are updated periodically and a revised yield is calculated prospectively. Cash flows received in excess of the effective yield are reflected as a return of capital.
(k) Distributions
Distributions of net investment income and net realized gains, if any, are declared and paid at least annually. Normally, all such distributions of a Fund will automatically be reinvested without charge in additional shares of the same Fund. Distributions are recorded on the ex-dividend date and are determined in accordance with income tax regulations which may differ from U.S. GAAP.
(l) Expenses
Expenses directly attributable to a Fund are charged directly to the Fund. Other expenses common to various funds within the fund complex are generally allocated amongst such funds on the basis of average net assets.
(m) Earnings Credits
Under the fee arrangement with the custodian, the Funds may earn credits based on overnight custody cash balances. These credits are utilized to reduce related custodial expenses. The custodian fees disclosed in the Statement of Operations are before the reduction in expense from the related earnings credits, if any. For the period ended June 30, 2018, there were no earnings credits received.
(n) Cash
The Funds may leave cash overnight in their cash account with the custodian. Periodically, a Fund may have cash due to the custodian bank as an overdraft balance. A fee is incurred on this overdraft, calculated by multiplying the overdraft by a rate based on the federal funds rate, which was 1.91% at June 30, 2018.
(o) Currency Translations
The accounting records of the Funds are maintained in U.S. dollars. All assets and liabilities initially expressed in foreign currencies are converted into U.S. dollars at prevailing exchange rates. Purchases and sales of investment securities, dividend and interest income, and certain expenses are translated at the rates of exchange prevailing on the respective dates of such transactions. Changes in the relationship of these foreign currencies to the U.S. dollar can significantly affect the value of the investments and earnings of the Funds. Foreign investments may also subject the Funds to foreign government exchange restrictions, expropriation, taxation or other political, social or economic developments, all of which could affect the market and/or credit risk of the investments.
The Funds do not isolate that portion of the results of operations resulting from changes in the foreign exchange rates on investments from the fluctuations arising from changes in the market prices of Securities held. Such fluctuations are included with the net realized and unrealized gain or loss on investments.
Reported net realized foreign exchange gains and losses arise from sales of foreign currencies and currency gains or losses realized between the trade and settlement dates on investment transactions. Net unrealized exchange appreciation and depreciation arise from changes in the fair values of assets and liabilities other than investments in securities at the fiscal period end, resulting from changes in exchange rates.
(p) Indemnifications
Under the Funds’ organizational documents, the Trustees and Officers are indemnified against certain liabilities arising out of the performance of their duties to the Trust. In addition, throughout the normal course of business, the Funds enter into contracts that contain a variety of representations and warranties which provide general indemnifications. The Funds’ maximum exposure under these arrangements is unknown, as this would involve future claims that may be made against the Funds and/or their affiliates that have not yet occurred. However, based on experience, the Funds expect the risk of loss to be remote.
THE GUGGENHEIM FUNDS SEMI-ANNUAL REPORT 133 |
NOTES TO FINANCIAL STATEMENTS (Unaudited)(continued) |
Note 2 – Financial Instruments and Derivatives
As part of their investment strategy, the Funds utilize short sales and a variety of derivative instruments. These investments involve, to varying degrees, elements of market risk and risks in excess of amounts recognized in the Statements of Assets and Liabilities. Valuation and accounting treatment of these instruments can be found under Significant Accounting Policies in Note 1 of these Notes to Financial Statements.
Short Sales
A short sale is a transaction in which a Fund sells a security it does not own. If the security sold short decreases in price between the time the Fund sells the security and closes its short position, the Fund will realize a gain on the transaction. Conversely, if the security increases in price during the period, the Fund will realize a loss on the transaction. The risk of such price increases is the principal risk of engaging in short sales.
Derivatives
Derivatives are instruments whose values depend on, or are derived from, in whole or in part, the value of one or more other assets, such as securities, currencies, commodities or indices. Derivative instruments may be used to increase investment flexibility (including to maintain cash reserves while maintaining exposure to certain other assets), for risk management (hedging) purposes, to facilitate trading, to reduce transaction costs and to pursue higher investment returns. Derivative instruments may also be used to mitigate certain investment risks, such as foreign currency exchange rate risk, interest rate risk and credit risk. U.S. GAAP requires disclosures to enable investors to better understand how and why a Fund uses derivative instruments, how these derivative instruments are accounted for and their effects on the Fund’s financial position and results of operations.
The Funds may utilize derivatives for the following purposes:
Duration: the use of an instrument to manage the interest rate risk of a portfolio.
Hedge: an investment made in order to reduce the risk of adverse price movements in a security, by taking an offsetting position to protect against broad market moves.
Income: the use of any instrument that distributes cash flows typically based upon some rate of interest.
Index Exposure: the use of an instrument to obtain exposure to a listed or other type of index.
Leverage: gaining total exposure to equities or other assets on the long and short sides at greater than 100% of invested capital.
Speculation: the use of an instrument to express macro-economic and other investment views.
For any Fund whose investment strategy consistently involves applying leverage, the value of the Fund’s shares will tend to increase or decrease more than the value of any increase or decrease in the underlying index or other asset. In addition, because an investment in derivative instruments generally requires a small investment relative to the amount of investment exposure assumed, an opportunity for increased net income is created; but, at the same time, leverage risk will increase. The Fund’s use of leverage, through borrowings or instruments such as derivatives, may cause the Fund to be more volatile and riskier than if they had not been leveraged.
Options Purchased and Written
A call option on a security gives the purchaser of the option the right to buy, and the writer of a call option the obligation to sell, the underlying security. The purchaser of a put option has the right to sell, and the writer of the put option the obligation to buy, the underlying security at any time during the option period. The risk associated with purchasing options is limited to the premium originally paid.
The following table represents the Fund’s use and volume of call/put options purchased on a quarterly basis:
Fund | Use | Average Number | Average Notional | ||||||
Series E (Total Return Bond Series) | Duration, Hedge | 780 | $ | 8,050,276 | |||||
134 | THE GUGGENHEIM FUNDS SEMI-ANNUAL REPORT |
NOTES TO FINANCIAL STATEMENTS (Unaudited)(continued) |
Futures
A futures contract is an agreement to purchase (long) or sell (short) an agreed amount of securities or other instruments at a set price for delivery at a future date. There are significant risks associated with a Fund’s use of futures contracts, including (i) there may be an imperfect or no correlation between the changes in market value of the underlying asset and the prices of futures contracts; (ii) there may not be a liquid secondary market for a futures contract; (iii) trading restrictions or limitations may be imposed by an exchange; and (iv) government regulations may restrict trading in futures contracts. When investing in futures, there is minimal counterparty credit risk to a Fund because futures are exchange-traded and the exchange’s clearinghouse, as counterparty to all exchange-traded futures, guarantees against default. Cash deposits are shown as segregated cash with broker on the Statements of Assets and Liabilities; securities held as collateral are noted on the Schedules of Investments.
The following table represents the Fund’s use and volume of futures on a quarterly basis:
Average Notional Amount | |||||||||
Fund | Use | Long | Short | ||||||
Series A (StylePlus—Large Core Series) | Index exposure | $ | 4,929,594 | $ | — | ||||
Series D (World Equity Income Series) | Hedge | — | 22,777,781 | ||||||
Series J (StylePlus—Mid Growth Series) | Index exposure | 4,540,876 | — | ||||||
Series N (Managed Asset Allocation Series) | Index exposure, Speculation | 22,837,520 | 982,612 | ||||||
Series X (StylePlus—Small Growth Series) | Index exposure | 2,012,500 | — | ||||||
Series Y (StylePlus—Large Growth Series) | Index exposure | 864,464 | — | ||||||
Swaps
A swap is an agreement that obligates two parties to exchange a series of cash flows at specified intervals based upon or calculated by reference to changes in specified prices or rates for a specified amount of an underlying asset. A Fund utilizing OTC swaps bears the risk of loss of the amount expected to be received under a swap agreement in the event of the default or bankruptcy of a swap agreement counterparty or if the underlying asset declines in value. Certain standardized swaps are subject to mandatory central clearing and are executed on a multi-lateral or other trade facility platform, such as a registered exchange. There is limited counterparty credit risk with respect to centrally-cleared swaps as the transaction is facilitated through a central clearinghouse, much like an exchange-traded futures contract. Upon entering into certain centrally-cleared swap transactions, a Fund is required to deposit with its clearing broker an amount of cash or securities as an initial margin. Subsequent variation margin payments or receipts are made or received by the Fund, depending on fluctuations in the fair value of the reference entity. Additionally, there is no guarantee that a Fund or an underlying fund could eliminate its exposure under an outstanding swap agreement by entering into an offsetting swap agreement with the same or another party. For Funds utilizing interest rate swaps, the exchange bears the risk of loss.
Total return swaps and custom basket swaps involve commitments where single or multiple cash flows are exchanged based on the price of an underlying reference asset (such as index or basket) or a fixed or variable interest rate. Index swaps will usually be computed based on the current index value as of the close of regular trading on the NYSE or other exchange, with the swap value being adjusted to include dividends accrued, financing charges and/or interest associated with the swap agreement. A fund utilizing a total return index swap bears the risk of loss of the amount expected to be received under a swap agreement in the event of the default or bankruptcy of a swap agreement counterparty or if the underlying index declines in value.
The following table represents the Funds’ use and volume of total return swaps on a quarterly basis:
Average Notional Amount | |||||||||
Fund | Use | Long | Short | ||||||
Series A (StylePlus—Large Core Series) | Index exposure | $ | 179,843,300 | $ | — | ||||
Series J (StylePlus—Mid Growth Series) | Index exposure | 137,158,487 | — | ||||||
Series X (StylePlus—Small Growth Series) | Index exposure | 32,466,258 | — | ||||||
Series Y (StylePlus—Large Growth Series) | Index exposure | 33,879,482 | — | ||||||
Series Z (Alpha Opportunity Series) | Hedge, Leverage | 2,664,630 | 10,504,824 | ||||||
THE GUGGENHEIM FUNDS SEMI-ANNUAL REPORT 135 |
NOTES TO FINANCIAL STATEMENTS (Unaudited)(continued) |
Interest rate swaps involve the exchange by the Funds with another party for their respective commitment to pay or receive a fixed or variable interest rate on a notional amount of principal. Interest rate swaps are generally centrally-cleared, but central clearing does not make interest rate swap transactions risk free.
The following table represents the Fund’s use and volume of interest rate swaps, based on floating rate type, on a quarterly basis:
Average Notional | |||||||||
Fund | Use | Pay | Receive | ||||||
Series E (Total Return Bond Series) | Duration, Hedge | $ | — | $ | 35,825,000 | ||||
Forward Foreign Currency Exchange Contracts
A forward foreign currency exchange contract is an agreement between two parties to exchange two designated currencies at a specific time in the future. Certain types of contracts may be cash settled, in an amount equal to the change in exchange rates during the term of the contract. The contracts can be used to hedge or manage exposure to foreign currency risks with portfolio investments or to gain exposure to foreign currencies.
The market value of a forward foreign currency exchange contract changes with fluctuations in foreign currency exchange rates. Furthermore, the Funds may be exposed to risk if the counterparties cannot meet the contract terms or if the currency value changes unfavorably as compared to the U.S. dollar.
The following table represents the Fund’s use, and volume of forward foreign currency exchange contracts on a quarterly basis:
Average Value | |||||||||
Fund | Use | Purchased | Sold | ||||||
Series E (Total Return Bond Series) | Hedge, Income | $ | 2,067,637 | $ | 334,750 | ||||
Series P (High Yield Series) | Hedge | 2,628,243 | — | ||||||
Derivative Investment Holdings Categorized by Risk Exposure
The following is a summary of the location of derivative investments on the Funds’ Statements of Assets and Liabilities as of June 30, 2018:
Derivative Investment Type | Asset Derivatives | Liability Derivatives |
Equity/Interest Rate contracts | Variation margin on swap agreements | |
| Unrealized appreciation on swap agreements | Unrealized depreciation on swap agreements |
Investments in unaffiliated issuers, at value | ||
Variation margin on futures contracts | Variation margin on futures contracts | |
Currency contracts | Unrealized appreciation on forward foreign currency exchange contracts | Unrealized depreciation on forward foreign currency exchange contracts |
Variation margin on futures contracts | Variation margin on futures contracts |
136 | THE GUGGENHEIM FUNDS SEMI-ANNUAL REPORT |
NOTES TO FINANCIAL STATEMENTS (Unaudited)(continued) |
The following table sets forth the fair value of the Funds’ derivative investments categorized by primary risk exposure at June 30, 2018:
Asset Derivative Investments Value | ||||||||||||||||||||||||||||||||
Fund | Futures | Swaps | Futures | Futures | Swaps | Options | Forward | Total | ||||||||||||||||||||||||
Series A (StylePlus—Large Core Series) | $ | — | $ | 8,451,050 | $ | — | $ | — | $ | — | $ | — | $ | — | $ | 8,451,050 | ||||||||||||||||
Series D (World Equity Income Series) | — | — | 351,078 | — | — | — | — | 351,078 | ||||||||||||||||||||||||
Series E (Total Return Bond Series) | — | — | — | — | 253,549 | 23,106 | 145,470 | 422,125 | ||||||||||||||||||||||||
Series J (StylePlus—Mid Growth Series) | — | 6,493,646 | — | — | — | — | — | 6,493,646 | ||||||||||||||||||||||||
Series N (Managed Asset Allocation Series) | 3,679 | — | 341 | 36,165 | — | — | — | 40,185 | ||||||||||||||||||||||||
Series P (High Yield Series) | — | — | — | — | — | — | 35,346 | 35,346 | ||||||||||||||||||||||||
Series X (StylePlus—Small Growth Series) | — | 2,436,573 | — | — | — | — | — | 2,436,573 | ||||||||||||||||||||||||
Series Y (StylePlus—Large Growth Series) | — | 2,168,471 | — | — | — | — | — | 2,168,471 | ||||||||||||||||||||||||
Series Z (Alpha Opportunity Series) | — | 6,175 | — | — | — | — | — | 6,175 | ||||||||||||||||||||||||
Liability Derivative Investments Value | ||||||||||||||||||||||||||||||||
Fund | Futures | Swaps | Futures | Futures | Swaps | Options | Forward | Total | ||||||||||||||||||||||||
Series A (StylePlus—Large Core Series) | $ | 171,860 | $ | — | $ | — | $ | — | $ | — | $ | — | $ | — | $ | 171,860 | ||||||||||||||||
Series D (World Equity Income Series) | — | — | 15,031 | — | — | — | — | 15,031 | ||||||||||||||||||||||||
Series E (Total Return Bond Series) | — | — | — | — | — | — | 167 | 167 | ||||||||||||||||||||||||
Series J (StylePlus—Mid Growth Series) | 224,211 | — | — | — | — | — | — | 224,211 | ||||||||||||||||||||||||
Series N (Managed Asset Allocation Series) | 290,700 | — | — | 871 | — | — | — | 291,571 | ||||||||||||||||||||||||
Series X (StylePlus—Small Growth Series) | 66,763 | — | — | — | — | — | — | 66,763 | ||||||||||||||||||||||||
Series Y (StylePlus—Large Growth Series) | 8,320 | — | — | — | — | — | — | 8,320 | ||||||||||||||||||||||||
Series Z (Alpha Opportunity Series) | — | 609,956 | — | — | — | — | — | 609,956 | ||||||||||||||||||||||||
| * | Includes cumulative appreciation (depreciation) of futures contracts and interest rate swap agreements as reported on the Schedules of Investments. Only current day’s variation margin is reported within the Statements of Assets and Liabilities. |
THE GUGGENHEIM FUNDS SEMI-ANNUAL REPORT 137 |
NOTES TO FINANCIAL STATEMENTS (Unaudited)(continued) |
The following is a summary of the location of derivative investments on the Funds’ Statements of Operations for the period ended June 30, 2018:
Derivative Investment Type | Location of Gain (Loss) on Derivatives |
Equity/Interest Rate contracts | Net realized gain (loss) on futures contracts |
| Net change in unrealized appreciation (depreciation) on futures contracts |
| Net realized gain (loss) on swap agreements |
| Net change in unrealized appreciation (depreciation) on swap agreements |
Net realized gain (loss) on options purchased | |
Net change in unrealized appreciation (depreciation) on options purchased | |
Currency contracts | Net realized gain (loss) on forward foreign currency exchange contracts |
Net change in unrealized appreciation (depreciation) on forward foreign currency exchange contracts | |
Net realized gain (loss) on futures contracts | |
Net change in unrealized appreciation (depreciation) on futures contracts |
The following is a summary of the Funds’ realized gain (loss) and change in unrealized appreciation (depreciation) on derivative investments recognized on the Statements of Operations categorized by primary risk exposure for the period ended June 30, 2018:
Realized Gain (Loss) on Derivative Investments Recognized on the Statements of Operations | ||||||||||||||||||||||||||||||||
Fund | Futures | Swaps | Futures | Futures | Swaps | Options | Forward | Total | ||||||||||||||||||||||||
Series A (StylePlus—Large Core Series) | $ | 136,691 | $ | 6,089,606 | $ | — | $ | — | $ | — | $ | — | $ | — | $ | 6,226,297 | ||||||||||||||||
Series D (World Equity Income Series) | — | (261,668 | ) | — | — | — | — | (261,668 | ) | |||||||||||||||||||||||
Series E (Total Return Bond Series) | — | — | — | — | 1,251,301 | — | (59,881 | ) | 1,191,420 | |||||||||||||||||||||||
Series J (StylePlus—Mid Growth Series) | 269,562 | 8,896,223 | — | — | — | — | — | 9,165,785 | ||||||||||||||||||||||||
Series N (Managed Asset Allocation Series) | 480,060 | — | (9,539 | ) | (292,429 | ) | — | — | — | 178,092 | ||||||||||||||||||||||
Series P (High Yield Series) | — | — | — | — | — | — | 5,885 | 5,885 | ||||||||||||||||||||||||
Series X (StylePlus—Small Growth Series) | 88,447 | 1,049,320 | — | — | — | — | — | 1,137,767 | ||||||||||||||||||||||||
Series Y (StylePlus—Large Growth Series) | 21,720 | 3,225,536 | — | — | — | — | — | 3,247,256 | ||||||||||||||||||||||||
Series Z (Alpha Opportunity Series) | — | (1,218,301 | ) | — | — | — | — | — | (1,218,301 | ) | ||||||||||||||||||||||
Change in Unrealized Appreciation (Depreciation) on Derivative Investments Recognized on the Statements of Operations | ||||||||||||||||||||||||||||||||
Fund | Futures | Swaps | Futures | Futures | Swaps | Options | Forward | Total | ||||||||||||||||||||||||
Series A (StylePlus—Large Core Series) | $ | (184,432 | ) | $ | (2,433,124 | ) | $ | — | $ | — | $ | — | $ | — | $ | — | $ | (2,617,556 | ) | |||||||||||||
Series D (World Equity Income Series) | — | — | 336,047 | — | — | — | — | 336,047 | ||||||||||||||||||||||||
Series E (Total Return Bond Series) | — | — | — | — | (102,435 | ) | (191,001 | ) | 128,379 | (165,057 | ) | |||||||||||||||||||||
Series J (StylePlus—Mid Growth Series) | (231,584 | ) | (1,837,616 | ) | — | — | — | — | — | (2,069,200 | ) | |||||||||||||||||||||
Series N (Managed Asset Allocation Series) | (448,600 | ) | — | 712 | 87,301 | — | — | — | (360,587 | ) | ||||||||||||||||||||||
Series P (High Yield Series) | — | — | — | — | — | — | 68,675 | 68,675 | ||||||||||||||||||||||||
Series X (StylePlus—Small Growth Series) | (76,377 | ) | 1,562,909 | — | — | — | — | — | 1,486,532 | |||||||||||||||||||||||
Series Y (StylePlus—Large Growth Series) | (10,178 | ) | (517,007 | ) | — | — | — | — | — | (527,185 | ) | |||||||||||||||||||||
Series Z (Alpha Opportunity Series) | — | 116,492 | — | — | — | — | — | 116,492 | ||||||||||||||||||||||||
In conjunction with the use of derivative instruments, the Funds are required to maintain collateral in various forms. The Funds use, where appropriate, depending on the financial instrument utilized and the broker involved, margin deposits at the broker, cash and/or securities segregated at the custodian bank, discount notes or repurchase agreements allocated to the Funds.
138 | THE GUGGENHEIM FUNDS SEMI-ANNUAL REPORT |
NOTES TO FINANCIAL STATEMENTS (Unaudited)(continued) |
There are several risks associated with exposure to foreign currencies, foreign issuers and emerging markets. A Fund’s indirect and direct exposure to foreign currencies subjects the Fund to the risk that those currencies will decline in value relative to the U.S. dollar, or in the case of short positions, that the U.S. dollar will decline in value relative to the currency being hedged. Currency rates in foreign countries may fluctuate significantly over short periods of time for a number of reasons, including changes in interest rates and the imposition of currency controls or other political developments in the U.S. or abroad. In addition, the Fund may incur transaction costs in connection with conversions between various currencies. The Fund may, but is not obligated to, engage in currency hedging transactions, which generally involve buying currency forward, options or futures contracts. However, not all currency risks may be effectively hedged, and in some cases the costs of hedging techniques may outweigh expected benefits. In such instances, the value of securities denominated in foreign currencies can change significantly when foreign currencies strengthen or weaken relative to the U.S. dollar.
Certain Funds may invest in securities of foreign companies directly, or in financial instruments, such as ADRs and exchange-traded funds, which are indirectly linked to the performance of foreign issuers. Foreign markets can be more volatile than the U.S. market due to increased risks of adverse issuer, political, regulatory, market, or economic developments and can perform differently from the U.S. market. Investing in securities of foreign companies directly, or in financial instruments that are indirectly linked to the performance of foreign issuers, may involve risks not typically associated with investing in U.S. issuers. The value of securities denominated in foreign currencies, and of dividends from such securities, can change significantly when foreign currencies strengthen or weaken relative to the U.S. dollar. Foreign securities markets generally have less trading volume and less liquidity than U.S. markets, and prices in some foreign markets may fluctuate more than those of securities traded on U.S. markets. Many foreign countries lack accounting and disclosure standards comparable to those that apply to U.S. companies, and it may be more difficult to obtain reliable information regarding a foreign issuer’s financial condition and operations. Transaction costs and costs associated with custody services are generally higher for foreign securities than they are for U.S. securities. Some foreign governments levy withholding taxes against dividend and interest income. Although in some countries portions of these taxes are recoverable, the non-recovered portion will reduce the income received by the Fund.
The Trust has established counterparty credit guidelines and enters into transactions only with financial institutions of investment grade or better. The Trust monitors the counterparty credit risk.
Note 3 – Offsetting
In the normal course of business, the Funds enter into transactions subject to enforceable master netting arrangements or other similar arrangements. Generally, the right to offset in those agreements allows the Funds to counteract the exposure to a specific counterparty with collateral received from or delivered to that counterparty based on the terms of the arrangements. These arrangements provide for the right to liquidate upon the occurrence of an event of default, credit event upon merger or additional termination event.
In order to better define their contractual rights and to secure rights that will help the Funds mitigate their counterparty risk, the Funds may enter into an International Swaps and Derivatives Association, Inc. Master Agreement (“ISDA Master Agreement”) or similar agreement with their derivative contract counterparties. An ISDA Master Agreement is a bilateral agreement between a fund and a counterparty that governs OTC derivatives, including foreign exchange contracts, and typically contains, among other things, collateral posting terms and netting provisions in the event of a default and/or termination event. The provisions of the ISDA Master Agreement typically permit a single net payment in the event of a default (close-out netting) or similar event, including the bankruptcy or insolvency of the counterparty.
For derivatives traded under an ISDA Master Agreement, the collateral requirements are typically calculated by netting the mark-to-market amount for each transaction under such agreement and comparing that amount to the value of any collateral currently pledged by the Funds and the counterparty. For financial reporting purposes, cash collateral that has been pledged to cover obligations of the Funds and cash collateral received from the counterparty, if any, are reported separately on the Statements of Assets and Liabilities as segregated cash with broker/receivable for variation margin, or payable for swap settlement/variation margin. Cash and/or securities pledged or received as collateral by the Funds in connection with an OTC derivative subject to an ISDA Master Agreement generally may not be invested, sold or rehypothecated by the counterparty or the Funds, as applicable, absent an event of default under such agreement, in which case such collateral generally may be applied towards obligations due to and payable by such counterparty or the Funds, as applicable. Generally, the amount of collateral due from or to a counterparty must exceed a minimum transfer amount threshold (e.g., $300,000) before a transfer is required to be made. To the extent amounts due to the Funds from their counterparties are not fully collateralized, contractually or otherwise, the Funds bear the risk of loss from counterparty nonperformance. The Funds attempt to mitigate counterparty risk by only entering into agreements with counterparties that they believe to be of good standing and by monitoring the financial stability of those counterparties.
THE GUGGENHEIM FUNDS SEMI-ANNUAL REPORT 139 |
NOTES TO FINANCIAL STATEMENTS (Unaudited)(continued) |
For financial reporting purposes, the Funds do not offset derivative assets and derivative liabilities that are subject to netting arrangements in the Statements of Assets and Liabilities.
The following tables present derivative financial instruments that are subject to enforceable netting arrangements and offset in the Statements of Assets and Liabilities in conformity with U.S. GAAP:
Gross Amounts Not Offset | |||||||||||||||||||||||||
Fund | Instrument | Gross | Gross | Net Amount on the Statements | Financial | Cash | Net Amount | ||||||||||||||||||
Series A (StylePlus—Large Core Series) | Swap equity contracts | $ | 8,451,050 | $ | — | $ | 8,451,050 | $ | — | $ | (6,480,000 | ) | $ | 1,971,050 | |||||||||||
Series E (Total Return Bond Series) | Options contracts | 23,106 | — | 23,106 | — | — | 23,106 | ||||||||||||||||||
Forward foreign currency exchange contracts | 145,470 | — | 145,470 | (167 | ) | (110,000 | ) | 35,303 | |||||||||||||||||
Series J (StylePlus—Mid Growth Series) | Swap equity contracts | 6,493,646 | — | 6,493,646 | — | (5,700,000 | ) | 793,646 | |||||||||||||||||
Series P (High Yield Series) | Forward foreign currency exchange contracts | 35,346 | — | 35,346 | — | — | 35,346 | ||||||||||||||||||
Series X (StylePlus—Small Growth Series) | Swap equity contracts | 2,436,573 | — | 2,436,573 | — | (2,210,000 | ) | 226,573 | |||||||||||||||||
Series Y (StylePlus—Large Growth Series) | Swap equity contracts | 2,168,471 | — | 2,168,471 | — | (1,750,000 | ) | 418,471 | |||||||||||||||||
Series Z (Alpha Opportunity Series) | Swap equity contracts | 6,175 | — | 6,175 | (6,175 | ) | — | — | |||||||||||||||||
Gross Amounts Not Offset | |||||||||||||||||||||||||
Fund | Instrument | Gross | Gross | Net Amount on the Statements | Financial | Cash | Net Amount | ||||||||||||||||||
Series E (Total Return Bond Series) | Forward foreign currency exchange contracts | $ | 167 | $ | — | $ | 167 | $ | (167 | ) | $ | — | $ | — | |||||||||||
Series Z (Alpha Opportunity Series) | Swap equity contracts | 609,956 | — | 609,956 | (609,956 | ) | — | — | |||||||||||||||||
| 1 | Exchange-traded, centrally cleared derivatives and listed options are excluded from these reported amounts. |
140 | THE GUGGENHEIM FUNDS SEMI-ANNUAL REPORT |
NOTES TO FINANCIAL STATEMENTS (Unaudited)(continued) |
The following table presents deposits held by others in connection with derivative investments as of June 30, 2018. The derivatives tables following the Schedule of Investments list each counterparty for which cash collateral may have been pledged or received at period end. The Funds have the right to offset these deposits against any related liabilities outstanding with each counterparty.
Fund | Counterparty | Asset Type | Cash Pledged | Cash Received | ||||||
Series A (StylePlus—Large Core Series) | Morgan Stanley | Futures contracts | $ | 308,000 | $ | — | ||||
| Wells Fargo | Total Return Swap agreements | — | 6,480,000 | ||||||
Series A (StylePlus—Large Core Series) Total |
|
| 308,000 | 6,480,000 | ||||||
Series D (World Equity Income Series) | Bank of America Merrill Lynch | Futures contracts | 597,000 | — | ||||||
Series D (World Equity Income Series) Total |
|
| 597,000 | — | ||||||
Series E (Total Return Bond Series) | Goldman Sachs Group | Forward Foreign Currency Exchange contracts | — | 110,000 | ||||||
| Bank of America Merrill Lynch | Interest Rate Swaps agreements | 859,726 | 285,184 | ||||||
Series E (Total Return Bond Series) Total |
|
| 859,726 | 395,184 | ||||||
Series J (StylePlus—Mid Growth Series) | Deutsche Bank | Total Return Swap agreements | — | 5,700,000 | ||||||
| Morgan Stanley | Futures contracts | 358,200 | — | ||||||
Series J (StylePlus—Mid Growth Series) Total |
|
| 358,200 | 5,700,000 | ||||||
Series N (Managed Asset Allocation Series) | Goldman Sachs Group | Futures contracts | 10,579 | — | ||||||
Series N (Managed Asset Allocation Series) Total |
|
| 10,579 | — | ||||||
Series X (StylePlus—Small Growth Series) | Deutsche Bank | Total Return Swap agreements | — | 2,210,000 | ||||||
| Morgan Stanley | Futures contracts | 98,550 | — | ||||||
Series X (StylePlus—Small Growth Series) Total |
|
| 98,550 | 2,210,000 | ||||||
Series Y (StylePlus—Large Growth Series) | Morgan Stanley | Futures contracts | 11,400 | — | ||||||
| Wells Fargo | Total Return Swap agreements | — | 1,750,000 | ||||||
Series Y (StylePlus—Large Growth Series) Total |
|
| 11,400 | 1,750,000 | ||||||
Note 4 – Fair Value Measurement
In accordance with U.S. GAAP, fair value is defined as the price that the Funds would receive to sell an investment or pay to transfer a liability in an orderly transaction with an independent buyer in the principal market, or in the absence of a principal market, the most advantageous market for the investment or liability. U.S. GAAP establishes a three-tier fair value hierarchy based on the types of inputs used to value assets and liabilities and requires corresponding disclosure. The hierarchy and the corresponding inputs are summarized below:
| Level 1 | — | quoted prices in active markets for identical assets or liabilities. |
| Level 2 | — | significant other observable inputs (for example quoted prices for securities that are similar based on characteristics such as interest rates, prepayment speeds, credit risk, etc.). |
| Level 3 | — | significant unobservable inputs based on the best information available under the circumstances, to the extent observable inputs are not available, which may include assumptions. |
The types of inputs available depend on a variety of factors, such as the type of security and the characteristics of the markets in which it trades, if any. Fair valuation determinations that rely on fewer or no observable inputs require greater judgment. Accordingly, fair value determinations for Level 3 securities require the greatest amount of judgment.
Independent pricing services are used to value a majority of the Funds’ investments. When values are not available from a pricing service, they will be determined using a variety of sources and techniques, including: market prices; broker quotes; and models which derive prices based on inputs such as anticipated cash flows or collateral, spread over Treasuries, and other information and analysis. A significant portion of the Funds’ assets and liabilities are categorized as Level 2, as indicated in this report.
THE GUGGENHEIM FUNDS SEMI-ANNUAL REPORT 141 |
NOTES TO FINANCIAL STATEMENTS (Unaudited)(continued) |
Indicative quotes from broker-dealers, adjusted for fluctuations in criteria such as credit spreads and interest rates, may be also used to value the Funds’ assets and liabilities, i.e. prices provided by a broker-dealer or other market participant who has not committed to trade at that price. Although indicative quotes are typically received from established market participants, the Funds may not have the transparency to view the underlying inputs which support the market quotations. Significant changes in an indicative quote would generally result in significant changes in the fair value of the security.
Certain fixed income securities are valued by obtaining a monthly indicative quote from a broker-dealer, adjusted for fluctuations in criteria such as credit spreads and interest rates.
The inputs or methodologies used for valuing securities are not necessarily an indication of the risk associated with investing in those securities. The suitability of the techniques and sources employed to determine fair valuation are regularly monitored and subject to change.
Note 5 – Investment Advisory Agreement and Other Agreements
Under the terms of an investment advisory contract, the Funds pay GI investment advisory fees calculated at the annualized rates below, based on the average daily net assets of the Funds:
Fund | Management Fees |
Series A (StylePlus—Large Core Series) | 0.75% |
Series B (Large Cap Value Series) | 0.65% |
Series D (World Equity Income Series) | 0.70% |
Series E (Total Return Bond Series) | 0.39% |
Series F (Floating Rate Strategies Series) | 0.65% |
Series J (StylePlus—Mid Growth Series) | 0.75% |
Series N (Managed Asset Allocation Series) | 0.40% |
Series O (All Cap Value Series) | 0.70% |
Series P (High Yield Series) | 0.60% |
Series Q (Small Cap Value Series) | 0.75% |
Series V (Mid Cap Value Series) | 0.75% |
Series X (StylePlus—Small Growth Series) | 0.75% |
Series Y (StylePlus—Large Growth Series) | 0.65% |
Series Z (Alpha Opportunity Series) | 0.90% |
The Board has adopted a Distribution and Shareholder Services Plan pursuant to Rule 12b-1 under the 1940 Act that allows those Funds to pay distribution and shareholder services fees to GFD. The Funds will pay distribution and shareholder services fees to GFD at an annual rate not to exceed 0.25% of average daily net assets. GFD may, in turn, pay all or a portion of the proceeds from the distribution and shareholder services fees to insurance companies or their affiliates and qualified plan administrators (“intermediaries”) for services they provide on behalf of the Funds to current and prospective variable contract owners and qualified plan participants that invest in the Funds through the intermediaries.
142 | THE GUGGENHEIM FUNDS SEMI-ANNUAL REPORT |
NOTES TO FINANCIAL STATEMENTS (Unaudited)(continued) |
Contractual expense limitation agreements for the following Funds provide that the total expenses be limited to a percentage of average net assets for the Funds, exclusive of brokerage costs, dividends on securities sold short, expenses of other investment companies in which a Fund invests, interest, taxes, litigation, indemnification and extraordinary expenses. The limits are listed below:
Limit | Effective | Contract | |
Series A (StylePlus—Large Core Series) | 0.91% | 05/01/17 | 05/01/22 |
Series B (Large Cap Value Series) | 0.80% | 05/01/17 | 05/01/22 |
Series D (World Equity Income Series) | 0.90% | 05/01/17 | 05/01/22 |
Series E (Total Return Bond Series) | 0.81% | 11/30/12 | 05/01/19 |
Series F (Floating Rate Strategies Series) | 1.15% | 04/22/13 | 05/01/19 |
Series J (StylePlus—Mid Growth Series) | 0.94% | 05/01/17 | 05/01/22 |
Series O (All Cap Value Series) | 0.88% | 05/01/17 | 05/01/22 |
Series P (High Yield Series) | 1.07% | 10/20/14 | 05/01/19 |
Series Q (Small Cap Value Series) | 1.14% | 05/01/17 | 05/01/22 |
Series V (Mid Cap Value Series) | 0.91% | 05/01/17 | 05/01/22 |
Series X (StylePlus—Small Growth Series) | 1.06% | 05/01/17 | 05/01/22 |
Series Y (StylePlus—Large Growth Series) | 0.93% | 05/01/17 | 05/01/22 |
Series Z (Alpha Opportunity Series) | 2.00% | 05/31/17 | 05/01/22 |
GI is entitled to reimbursement by the Funds for fees waived or expenses reimbursed during any of the previous 36 months, beginning on the date of the expense limitation agreement, if on any day the estimated operating expenses are less than the indicated percentages. At June 30, 2018, the amount of fees waived or expenses reimbursed that are subject to recoupment are presented in the following table:
Fund | Expires | Expires | Expires | Expires | Total | |||||||||||||||
Series A (StylePlus—Large Core Series) | $ | — | $ | — | $ | 491,586 | $ | 298,250 | $ | 789,836 | ||||||||||
Series B (Large Cap Value Series) | — | — | 555,470 | 305,493 | 860,963 | |||||||||||||||
Series D (World Equity Income Series) | — | — | 359,114 | 196,688 | 555,802 | |||||||||||||||
Series E (Total Return Bond Series) | 120,004 | 182,326 | 188,079 | 42,241 | 532,650 | |||||||||||||||
Series F (Floating Rate Strategies Series) | 36,298 | 18,770 | 52,478 | 26,615 | 134,161 | |||||||||||||||
Series J (StylePlus—Mid Growth Series) | — | — | 342,729 | 234,821 | 577,551 | |||||||||||||||
Series O (All Cap Value Series) | — | — | 272,422 | 177,759 | 450,181 | |||||||||||||||
Series P (High Yield Series) | 13,375 | 30,120 | 59,723 | 35,829 | 139,047 | |||||||||||||||
Series Q (Small Cap Value Series) | — | — | 88,099 | 39,669 | 127,768 | |||||||||||||||
Series V (Mid Cap Value Series) | — | — | 448,055 | 295,450 | 743,505 | |||||||||||||||
Series X (StylePlus—Small Growth Series) | — | — | 95,770 | 57,412 | 153,182 | |||||||||||||||
Series Y (StylePlus—Large Growth Series) | — | — | 98,362 | 63,925 | 162,287 | |||||||||||||||
Series Z (Alpha Opportunity Series) | 11,875 | — | 33,178 | 13,317 | 58,370 | |||||||||||||||
For the period ended June 30, 2018, GI recouped amounts from the Funds as follows:
Fund | Amount | |||
Series A (StylePlus—Large Core Series) | $ | 2,658 | ||
Series E (Total Return Bond Series) | 13 | |||
Series F (Floating Rate Strategies Series) | 1,430 | |||
GI engages external service providers to perform other necessary services for the Trust, such as audit and accounting related services, legal services, custody, printing and mailing, etc., on a pass-through basis. Such expenses are allocated to various Funds within the complex based on relative net assets.
If a Fund invests in an affiliated fund, the investing Fund’s adviser has agreed to waive fees at the investing fund level. Fee waivers will be calculated at the investing Fund level without regard to any expense cap, if any, in effect for the investing Fund. Fees waived under this arrangement are not subject to reimbursement to GI. For the period ended June 30, 2018, the Series E (Total Return Bond Series) Fund waived $20,907 related to investments in affiliated funds.
THE GUGGENHEIM FUNDS SEMI-ANNUAL REPORT 143 |
NOTES TO FINANCIAL STATEMENTS (Unaudited)(continued) |
Certain trustees and officers of the Trust are also officers of GI and/or GFD. The Trust does not compensate its officers or trustees who are officers, directors and/or employees of GI or GFD.
MUFG Investor Services (US), LLC (“MUIS”) acts as the Trust’s administrator, transfer agent and accounting agent. As administrator, transfer agent and accounting agent, MUIS is responsible for maintaining the books and records of the Fund’s securities and cash. The Bank of New York Mellon Corp. (“BNY”) acts as the Trust’s custodian. As custodian, BNY is responsible for the custody of the Trust’s assets. For providing the aforementioned administrative and accounting services, MUIS is entitled to receive a monthly fee equal to a percentage of the Fund’s average daily net assets and out of pocket expenses. For providing the aforementioned transfer agent and custodian services, MUIS and BNY are entitled to receive a monthly fee based on the number of transactions during the month and the number of accounts under management subject to certain minimum monthly fees and out of pocket expenses.
Note 6 – Federal Income Tax Information
The Funds intend to comply with the provisions of Subchapter M of the Internal Revenue Code applicable to regulated investment companies and will distribute substantially all taxable net investment income and capital gains sufficient to relieve the Funds from all, or substantially all, federal income, excise and state income taxes. Therefore, no provision for federal or state income tax is required.
Tax positions taken or expected to be taken in the course of preparing the Funds’ tax returns are evaluated to determine whether the tax positions are “more-likely-than-not” of being sustained by the applicable tax authority. Tax positions not deemed to meet the more-likely-than-not threshold would be recorded as a tax benefit or expense in the current year. Management has analyzed the Funds’ tax positions taken, or to be taken, on federal income tax returns for all open tax years, and has concluded that no provision for income tax is required in the Funds’ financial statements. The Funds’ federal tax returns are subject to examination by the Internal Revenue Service for a period of three years after they are filed.
At June 30, 2018, the cost of securities for Federal income tax purposes, the aggregate gross unrealized apprecation for all securities for which there was an excess of value over tax cost, and the aggregate gross unrealized depreciation for all securities for which there was an excess of tax cost over value were as follows:
Fund | Tax Cost | Tax | Tax | Net | ||||||||||||
Series A (StylePlus—Large Core Series) | $ | 216,528,494 | $ | 11,503,633 | $ | (1,693,770 | ) | $ | 9,809,863 | |||||||
Series B (Large Cap Value Series) | 192,349,507 | 55,440,268 | (5,315,687 | ) | 50,124,581 | |||||||||||
Series D (World Equity Income Series) | 138,070,834 | 12,773,282 | (5,497,928 | ) | 7,275,354 | |||||||||||
Series E (Total Return Bond Series) | 120,344,342 | 3,111,791 | (4,279,940 | ) | (1,168,149 | ) | ||||||||||
Series F (Floating Rate Strategies Series) | 74,235,922 | 47,562 | (833,740 | ) | (786,178 | ) | ||||||||||
Series J (StylePlus—Mid Growth Series) | 164,358,795 | 8,734,534 | (1,351,831 | ) | 7,382,703 | |||||||||||
Series N (Managed Asset Allocation Series) | 38,328,649 | 9,662,595 | (747,686 | ) | 8,914,909 | |||||||||||
Series O (All Cap Value Series) | 97,388,179 | 25,551,868 | (3,099,159 | ) | 22,452,709 | |||||||||||
Series P (High Yield Series) | 76,893,622 | 494,692 | (5,160,093 | ) | (4,665,401 | ) | ||||||||||
Series Q (Small Cap Value Series) | 77,709,031 | 16,550,458 | (5,693,151 | ) | 10,857,307 | |||||||||||
Series V (Mid Cap Value Series) | 199,615,397 | 36,160,024 | (9,301,858 | ) | 26,858,166 | |||||||||||
Series X (StylePlus—Small Growth Series) | 36,068,613 | 3,176,777 | (345,316 | ) | 2,831,461 | |||||||||||
Series Y (StylePlus—Large Growth Series) | 36,910,131 | 3,052,464 | (204,568 | ) | 2,847,896 | |||||||||||
Series Z (Alpha Opportunity Series) | 10,748,598 | 407,790 | (1,126,256 | ) | (718,466 | ) | ||||||||||
144 | THE GUGGENHEIM FUNDS SEMI-ANNUAL REPORT |
NOTES TO FINANCIAL STATEMENTS (Unaudited)(continued) |
Note 7 – Securities Transactions
For the period ended June 30, 2018, the cost of purchases and proceeds from sales of investment securities, excluding government securities, short-term investments and derivatives, were as follows:
Fund | Purchases | Sales | ||||||
Series A (StylePlus—Large Core Series) | $ | 59,406,128 | $ | 90,802,334 | ||||
Series B (Large Cap Value Series) | 24,027,266 | 49,079,395 | ||||||
Series D (World Equity Income Series) | 89,277,044 | 103,328,812 | ||||||
Series E (Total Return Bond Series) | 17,837,501 | 26,160,908 | ||||||
Series F (Floating Rate Strategies Series) | 33,559,591 | 13,483,741 | ||||||
Series J (StylePlus—Mid Growth Series) | 61,789,089 | 81,639,294 | ||||||
Series N (Managed Asset Allocation Series) | 1,403,312 | 4,250,640 | ||||||
Series O (All Cap Value Series) | 19,829,328 | 34,361,559 | ||||||
Series P (High Yield Series) | 22,873,324 | 30,935,855 | ||||||
Series Q (Small Cap Value Series) | 4,917,993 | 18,562,511 | ||||||
Series V (Mid Cap Value Series) | 69,442,627 | 100,579,181 | ||||||
Series X (StylePlus—Small Growth Series) | 12,823,736 | 14,971,928 | ||||||
Series Y (StylePlus—Large Growth Series) | 13,059,451 | 22,574,476 | ||||||
Series Z (Alpha Opportunity Series) | 16,606,056 | 19,891,599 | ||||||
For the period ended June 30, 2018, the cost of purchases and proceeds from the sales of government securities were as follows:
Fund | Purchases | Sales | ||||||
Series E (Total Return Bond Series) | $ | 3,469,680 | $ | 3,247,359 | ||||
The Funds are permitted to purchase or sell securities from or to certain affiliated funds under specified conditions outlined in procedures adopted by the Board of the Trust. The procedures have been designed to ensure that any purchase or sale of securities by a Fund from or to another fund or portfolio that is or could be considered an affiliate by virtue of having a common investment adviser (or affiliated investment advisers), common Trustees and/or common officers complies with Rule 17a-7 of the 1940 Act. Further, as defined under these procedures, each transaction is effected at the current market price to save costs, where permissible. For the period ended June 30, 2018, the Funds engaged in purchases and sales of securities, pursuant to Rule 17a-7 of the 1940 Act, as follows:
Fund | Purchases | Sales | Realized Gain | |||||||||
Series E (Total Return Bond Series) | $ | 103,750 | $ | 115,895 | 970 | |||||||
Series F (Floating Rate Strategies Seies) | 97,823 | — | — | |||||||||
Series P (High Yield Seies) | 1,593,172 | 5,228,749 | 103,383 | |||||||||
Note 8 – Unfunded Loan Commitments
Pursuant to the terms of certain loan agreements, certain Funds held unfunded loan commitments as of June 30, 2018. The Funds are obligated to fund these loan commitments at the borrower’s discretion.
THE GUGGENHEIM FUNDS SEMI-ANNUAL REPORT 145 |
NOTES TO FINANCIAL STATEMENTS (Unaudited)(continued) |
The unfunded loan commitments as of June 30, 2018, were as follows:
Fund | Borrower | Maturity Date | Face Amount | Value | |||||||||
Series F (Floating Rate Strategies Series) | |||||||||||||
Albertson's LLC | 08/18/18 | $ | 100,000 | $ | —* | ||||||||
BBB Industries, LLC | 11/08/18 | 700,000 | —* | ||||||||||
Convergint Technologies | 02/03/25 | 34,677 | 260 | ||||||||||
Hillman Group, Inc. | 05/15/25 | 142,446 | —* | ||||||||||
Lumentum Holdings, Inc. | 09/07/18 | 300,000 | —* | ||||||||||
Mavis Tire Express Services Corp. | 03/20/25 | 58,676 | 587 | ||||||||||
Amaya Holdings B.V. | 10/21/19 | 600,000 | —* | ||||||||||
| $ | 1,935,799 | $ | 847 | ||||||||||
Series P (High Yield Series) | |||||||||||||
Acosta, Inc. | 09/26/19 | $ | 511,111 | $ | 127,138 | ||||||||
Advantage Sales & Marketing LLC | 07/25/19 | 900,000 | 24,662 | ||||||||||
Albertson’s LLC | 08/18/18 | 200,000 | —* | ||||||||||
BBB Industries, LLC | 11/08/18 | 1,460,000 | 11,673 | ||||||||||
Epicor Software | 06/01/20 | 600,000 | 28,555 | ||||||||||
Lumentum Holdings, Inc. | 09/07/18 | 550,000 | —* | ||||||||||
Mavis Tire Express Services Corp. | 03/20/25 | 7,197 | 72 | ||||||||||
Amaya Holdings B.V. | 10/21/19 | 1,000,000 | —* | ||||||||||
| $ | 5,228,308 | $ | 192,100 | ||||||||||
| * | Security has a market value of $0. |
146 | THE GUGGENHEIM FUNDS SEMI-ANNUAL REPORT |
NOTES TO FINANCIAL STATEMENTS (Unaudited)(continued) |
Note 9 – Restricted Securities
The securities below are considered illiquid and restricted under guidelines established by the Board:
Fund | Restricted Securities | Acquisition Date | Cost | Value | |||||||||
Series E (Total Return Bond Series) | Copper River CLO Ltd. | ||||||||||||
2007-1A, due 01/20/213 | 05/09/14 | $ | 702,000 | $ | 71,977 | ||||||||
Mid-Atlantic Military Family Communities LLC | |||||||||||||
5.30% due 8/01/50 | 10/07/16 | 909,051 | 858,253 | ||||||||||
Pacific Northwest Communities LLC | |||||||||||||
5.91% due 06/15/50 | 05/22/14 | 400,000 | 420,174 | ||||||||||
Turbine Engines Securitization Ltd. | |||||||||||||
2013-1A, 5.13% due 12/13/48 | 11/27/13 | 482,159 | 455,957 | ||||||||||
Woodbourne Capital Trust I, 3.90% | |||||||||||||
(1 month USD LIBOR + 2.50%)*,1,2 | 01/20/06 | 301,449 | 234,747 | ||||||||||
Woodbourne Capital Trust II, 3.90% | |||||||||||||
(1 month USD LIBOR + 2.50%)*,1,2 | 01/20/06 | 301,449 | 234,747 | ||||||||||
Woodbourne Capital Trust III, 3.91% | |||||||||||||
(1 month USD LIBOR + 2.50%)*,1,2 | 01/20/06 | 301,449 | 234,747 | ||||||||||
Woodbourne Capital Trust IV, 3.91% | |||||||||||||
(1 month USD LIBOR + 2.50%)*,1,2 | 01/20/06 | 301,449 | 234,747 | ||||||||||
| $ | 3,699,006 | $ | 2,745,349 | ||||||||||
Series P (High Yield Series) | KeHE Distributors LLC / KeHE Finance Corp. | ||||||||||||
7.63% due 8/15/21 | 08/07/13 | $ | 302,660 | $ | 291,750 | ||||||||
Schahin II Finance Co. SPV Ltd. | |||||||||||||
5.88% due 9/25/224 | 03/12/15 | 111,437 | 24,323 | ||||||||||
| $ | 414,097 | $ | 316,073 | ||||||||||
| * | Non-income producing security. |
| 1 | Variable rate security. Rate indicated is the rate effective at June 30, 2018. In some instances, the underlying reference rate shown was below the minimum rate earned by the security or has been adjusted by a predetermined factor. The settlement status of a position may also impact the effective rate indicated. In instances where multiple underlying reference rates and spread amounts are shown, the effective rate is based on a weighted average. |
| 2 | Perpetual maturity. |
| 3 | Security has no stated coupon. However, it is expected to receive residual cash flow payments on defined deal dates. |
| 4 | Security is in default of interest and/or principal obligations. |
Note 10 – Line of Credit
The Trust, with the exception of certain affiliated funds, secured a 364-day committed, $1,000,000,000 line of credit from Citibank, N.A., which was in place through October 6, 2017, at which time the line of credit was renewed, with an increased commitment amount to $1,065,000,000. A Fund may draw (borrow) from the line of credit as a temporary measure for emergency purposes, to facilitate redemption requests, or for other short-term liquidity purposes consistent with the Fund’s investment objective and program. For example, it may be advantageous for the Fund to borrow money rather than sell existing portfolio positions to meet redemption requests. Fees related to borrowings, if any, vary under this arrangement between the greater of Citibank’s “base rate”, LIBOR plus 1%, or the federal funds rate 1.91% at June 30, 2018, plus 1/2 of 1%. The Funds that participate in the line of credit paid upfront costs of $982,952 to renew the line of credit.
The commitment fee that may be paid by the Funds is at an annualized rate of 0.15% of the average daily amount of their unused commitment amount. The Funds did not have any borrowings under this agreement as of and for the period ended June 30, 2018.
The allocated commitment fee amount for each Fund is referenced in the Statement of Operations under “Line of credit fees” and the effect on the expense ratio is included in the Financial Highlights.
THE GUGGENHEIM FUNDS SEMI-ANNUAL REPORT 147 |
NOTES TO FINANCIAL STATEMENTS (Unaudited)(continued) |
In addition, Series E (Total Return Bond Series) and Series F (Floating Rate Strategies Series)(the “Funds”) entered into an additional unlimited credit facility agreement with BNP Paribas Prime Brokerage, Inc. (the “counterparty”) whereby the counterparty has agreed to provide secured financing to the Funds and the Funds will provide pledged collateral to the counterparty. Fees related to borrowings, if any, equate to 1 month LIBOR plus 0.90%. The Funds did not have any borrowings under this agreement at or during the period ended June 30, 2018.
Note 11 – Other Liabilities
Series A (StylePlus—Large Core Series) and Series V (Mid Cap Value Series) (the “Funds”) each wrote put option contracts through Lehman Brothers, Inc. (“Lehman”) that were exercised prior to the option contracts expiration and prior to the bankruptcy filing by Lehman, during September 2008. However, these transactions have not settled and the securities have not been delivered to the Funds as of June 30, 2018.
Although the ultimate resolution of these transactions is uncertain, the Funds have recorded a liability on their respective books equal to the difference between the strike price on the put options and the market prices of the underlying security on the exercise date. The amount of liability recorded by the Funds as of June 30, 2018 was $18,615 for Series A (StylePlus—Large Core Series) and $205,716 for Series V (Mid Cap Value Series) and included in payable for miscellaneous in the Statements of Assets and Liabilities.
Note 12 – Reverse Repurchase Agreements
Each of the Funds may enter into reverse repurchase agreements. Under a reverse repurchase agreement, a Fund sells securities and agrees to repurchase them at a particular price at a future date. In the event the buyer of securities under a reverse repurchase agreement files for bankruptcy or becomes insolvent, such buyer or its trustee or receiver may receive an extension of time to determine whether to enforce the Fund’s obligation to repurchase the securities, and the Fund’s use of the proceeds of the reverse repurchase agreement may effectively be restricted pending such decision.
For the period ended June 30, 2018, the following Funds entered into reverse repurchase agreements:
Fund | Number of Days | Balance at | Average Balance | Average | ||||||||||||
Series E (Total Return Bond Series) | 13 | $ | —* | $ | 1,382,212 | 1.85 | % | |||||||||
Series P (High Yield Series) | 181 | 7,398,926 | 7,309,292 | 2.04 | % | |||||||||||
* | As of June 30, 2018, Series E (Total Return Bond Series) did not have any open reverse repurchase agreements. |
For financial reporting purposes, the Funds do not offset secured financing transactions that are subject to netting arrangements in the Statements of Assets and Liabilities.
The following table presents reverse repurchase agreements that are subject to netting arrangements and offset in the Statement of Assets of Liabilities in conformity with U.S. GAAP:
Gross Amounts Not Offset | |||||||||||||||||||||||||
Fund | Instrument | Gross | Gross | Net Amount | Financial | Cash | Net Amount | ||||||||||||||||||
Series P (High Yield Series) | Reverse repurchase agreements | $ | 7,398,926 | $ | — | $ | 7,398,926 | $ | (7,398,926 | ) | $ | — | $ | — | |||||||||||
148 | THE GUGGENHEIM FUNDS SEMI-ANNUAL REPORT |
NOTES TO FINANCIAL STATEMENTS (Unaudited)(continued) |
As of June 30, 2018, there was $7,398,926 in reverse repurchase agreements outstanding. As of June 30, 2018, Series P (High Yield Series) had outstanding reverse repurchase agreements with various counterparties. Details of the reverse repurchase agreements by counterparty are as follows:
Counterparty | Interest Rate | Maturity Dates | Face Value | |||||||||
Barclays Bank plc | (0.25)% - (0.10) | %* | Open Maturity | $ | 765,077 | |||||||
Barclays Bank plc | 2.64 | % | 07/25/18 | 1,155,071 | ||||||||
BNP Paribas | 2.62 | % | 07/16/18 | 4,787,485 | ||||||||
JPMorgan Chase & Co. | 2.25% - 1.50 | %* | 07/18/18 | 271,413 | ||||||||
Bank of America Merrill Lynch | 2.54 | % | 07/20/18 | 419,880 | ||||||||
| $ | 7,398,926 | |||||||||||
* | The rate is adjusted periodically by the counterparty, subject to approval by the Adviser, and is not based upon a set reference rate and spread. Rate indicated is the rate effective at June 30, 2018. |
The following is a summary of the remaining contractual maturities of the reverse repurchase agreements outstanding as of period end, aggregated by asset class of the related collateral pledged by the Funds:
Fund | Overnight and | Up to | 31-90 days | Greater than | Total | |||||||||||||||
Series P (High Yield Series) | ||||||||||||||||||||
Corporate Bonds | $ | 765,077 | $ | 6,633,849 | $ | — | $ | — | $ | 7,398,926 | ||||||||||
Gross amount of recognized liabilities for reverse repurchase agreements | $ | 765,077 | $ | 6,633,849 | $ | — | $ | — | $ | 7,398,926 | ||||||||||
Note 13 – Legal Proceedings
Tribune Company
SBL Fund has been named as a defendant and a putative member of the proposed defendant class of shareholders in the case entitled Kirschner v. FitzSimons, No. 12-2652 (S.D.N.Y.) (formerly Official Committee of Unsecured Creditors of Tribune Co. v. FitzSimons, Adv. Pro. No. 10-54010 (Bankr. D. Del.)) (the “FitzSimons action”), as a result of ownership by certain series of the SBL Fund of shares in the Tribune Company (“Tribune”) in 2007, when Tribune effected a leveraged buyout transaction (“LBO”) by which Tribune converted to a privately-held company. In his complaint, the plaintiff has alleged that, in connection with the LBO, Tribune insiders and shareholders were overpaid for their Tribune stock using financing that the insiders knew would, and ultimately did, leave Tribune insolvent. The plaintiff has asserted claims against certain insiders, major shareholders, professional advisers, and others involved in the LBO. The plaintiff is also attempting to obtain from former Tribune shareholders, including the SBL Fund, the proceeds they received in connection with the LBO.
In June 2011, a group of Tribune creditors filed multiple actions against former Tribune shareholders involving state law constructive fraudulent conveyance claims arising out of the 2007 LBO (the “SLCFC actions”). SBL Fund has been named as a defendant in two of the SLCFC actions: Deutsche Bank Trust Co. Americas v. Ohlson Enter., No. 12-0064 (S.D.N.Y.) and Deutsche Bank Trust Co. Americas v. Cantor Fitzgerald & Co., No. 11-4900 (S.D.N.Y.). In those actions, the creditors seek to recover from Tribune’s former shareholders the proceeds received in connection with the 2007 LBO.
The FitzSimons action and the SLCFC actions have been consolidated with the majority of the other Tribune LBO-related lawsuits in a multidistrict litigation proceeding captioned In re Tribune Company Fraudulent Conveyance Litig., No. 11-md-2696 (S.D.N.Y.) (the “MDL Proceeding”).
On September 23, 2013, the District Court granted the defendants’ omnibus motion to dismiss the SLCFC actions, on the basis that the creditors lacked standing. On September 30, 2013, the creditors filed a notice of appeal of the September 23 order. On October 28, 2013, the defendants filed a joint notice of cross-appeal of that same order. On March 29, 2016, the U.S. Court of Appeals for the Second Circuit issued its opinion on the appeal of the SLCFC actions. The appeals court affirmed the district court’s dismissal of those lawsuits, but on different grounds than the district court. The appeals court held that while the plaintiffs have standing under the U.S. Bankruptcy Code, their claims were preempted by
THE GUGGENHEIM FUNDS SEMI-ANNUAL REPORT 149 |
NOTES TO FINANCIAL STATEMENTS (Unaudited)(concluded) |
Section 546(e) of the Bankruptcy Code—the statutory safe harbor for settlement payments. On April 12, 2016, the Plaintiffs in the SLCFC actions filed a petition seeking rehearing en banc before the appeals court. On July 22, 2016, the appeals court denied the petition. On September 9, 2016, the plaintiffs filed a petition for writ of certiorari in the U.S. Supreme Court challenging the Second Circuit’s decision that the safe harbor of Section 546(e) applied to their claims. The shareholder defendants, including the Funds, filed a joint brief in opposition to the petition for certiorari on October 24, 2016. On April 3, 2018, Justice Kennedy and Justice Thomas issued a “Statement” related to the petition for certiorari suggesting that the Second Circuit and/or District Court may want to take steps to reexamine the application of the Section 546(e) safe harbor to the previously dismissed state law constructive fraudulent transfer claims based on the Supreme Court’s decision in Merit Management Group LP v. FTI Consulting, Inc. On April 10, 2018, plaintiffs filed in the Second Circuit a motion for that court to recall its mandate, vacate its prior decision, and remand to the district court for further proceedings consistent with Merit Management. On April 20, 2018, the shareholder defendants filed a response to plaintiffs’ motion to recall the mandate. On May 15, 2018, the Second Circuit issued an order recalling the mandate “in anticipation of further panel review.”
On May 23, 2014, the defendants filed motions to dismiss the FitzSimons action, including a global motion to dismiss Count I, which is the claim brought against former Tribune shareholders for intentional fraudulent conveyance under U.S. federal law. On January 6, 2017, the United States District Court for the Southern District of New York granted the shareholder defendants’ motion to dismiss the intentional fraudulent conveyance claim in the FitzSimons action. The Court concluded that the plaintiff had failed to allege that Tribune entered the LBO with actual intent to hinder, delay, or defraud its creditors, and therefore the complaint failed to state a claim. In dismissing the intentional fraudulent conveyance claim, the Court denied the plaintiff’s request to amend the complaint. The plaintiff requested that the Court direct entry of a final judgment in order to make the order immediately appealable. On February 23, 2017, the Court issued an order stating that it intends to permit an interlocutory appeal of the dismissal order, but will wait to do so until it has resolved outstanding motions to dismiss filed by other defendants. Accordingly, the timing of the appeal is uncertain.
On July 18, 2017, the plaintiff submitted a letter to the District Court seeking leave to amend its complaint to add a constructive fraudulent transfer claim. The shareholder defendants opposed that request. On August 24, 2017, the Court denied the plaintiff’s request without prejudice to renewal of the request in the event of an intervening change in the law. On March 8, 2018, the plaintiff renewed his request for leave to file a motion to amend the complaint to assert a constructive fraudulent transfer claim based on the Supreme Court’s ruling in Merit Management Group LP v. FTI Consulting, Inc. The shareholder defendants opposed that request. On June 18, 2018 the District Court ordered that the request would be stayed pending further action by the Second Circuit in the SLCFC actions.
None of these lawsuits alleges any wrongdoing on the part of Guggenheim Variable Funds Trust f/k/a SBL Fund. The following series of Guggenheim Variable Funds Trust held shares of Tribune and tendered these shares as part of Tribune’s LBO: Series A (StylePlus–Large Core Series) f/k/a Series H (Enhanced Index Series), Series N (Managed Asset Allocation Series) and Series O (All Cap Value Series) (the “Funds”). The value of the proceeds received by the foregoing Funds was $158,950, $51,000 and $3,774,000, respectively. At this stage of the proceedings, Guggenheim Variable Funds Trust is not able to make a reliable predication as to the outcome of these lawsuits or the effect, if any, on a Fund’s net asset value.
150 | THE GUGGENHEIM FUNDS SEMI-ANNUAL REPORT |
OTHER INFORMATION (Unaudited) |
Proxy Voting Information
A description of the policies and procedures that the Trust uses to determine how to vote proxies relating to securities held in the Funds’ portfolios is available, without charge and upon request, by calling 800.820.0888. This information is also available from the EDGAR database on the SEC’s website at https://www.sec.gov.
Information regarding how the Funds voted proxies relating to portfolio securities during the most recent 12-month period ended June 30 is available without charge, upon request, by calling 800.820.0888. This information is also available from the EDGAR database on the SEC’s website at https://www.sec.gov.
Sector Classification
Information in the “Schedule of Investments” is categorized by sectors using sector-level Classifications defined by the Bloomberg Industry Classification System, a widely recognized industry classification system provider. Each Fund’s registration statement has investment policies relating to concentration in specific sectors/industries. For purposes of these investment policies, the Funds usually classify sectors/industries based on industry-level Classifications used by widely recognized industry classification system providers such as Bloomberg Industry Classification System, Global Industry Classification Standards and Barclays Global Classification Scheme.
Quarterly Portfolio Schedules Information
The Trust files its complete schedule of portfolio holdings with the SEC for the first and third quarters of each fiscal year on Form N-Q; which are available on the SEC’s website at https://www.sec.gov. The Funds’ Forms N-Q may be reviewed and copied at the SEC’s Public Reference Room in Washington, DC, and that information on the operation of the Public Reference Room may be obtained by calling 800-SEC-0330. Copies of the portfolio holdings are also available to shareholders, without charge and upon request, by calling 800.820.0888.
Report of the Guggenheim Variable Funds Trust Contracts Review Committee
Guggenheim Variable Funds Trust (the “Trust”) was organized as a Delaware statutory trust on November 8, 2013, and is registered as an open-end management investment company under the Investment Company Act of 1940, as amended (the “1940 Act”). The Trust includes the following series:
● Series A (StylePlus—Large Core Series) (“Series A”)
● Series D (World Equity Income Series) (“Series D”)
● Series F (Floating Rate Strategies Series) (“Series F”)
● Series N (Managed Asset Allocation Series) (“Series N”)
● Series P (High Yield Series) (“Series P”)
● Series V (Mid Cap Value Series) (“Series V”)
● Series Y (StylePlus—Large Growth Series) (“Series Y”) | ● Series B (Large Cap Value Series) (“Series B”)
● Series E (Total Return Bond Series) (“Series E”)
● Series J (StylePlus—Mid Growth Series) (“Series J”)
● Series O (All Cap Value Series) (“Series O”)
● Series Q (Small Cap Value Series) (“Series Q”)
● Series X (StylePlus—Small Growth Series) (“Series X”)
● Series Z (Alpha Opportunity Series) (“Series Z”) |
THE GUGGENHEIM FUNDS SEMI-ANNUAL REPORT 151 |
OTHER INFORMATION (Unaudited)(continued) |
Security Investors, LLC (“Security Investors”), an indirect subsidiary of Guggenheim Partners, LLC, a privately-held, global financial services firm (“Guggenheim Partners”), serves as investment adviser to each of: (i) Series A; (ii) Series B; (iii) Series D; (iv) Series E; (v) Series J; (vi) Series N; (vii) Series O; (viii) Series P; (ix) Series Q; (x) Series V; (xi) Series X; (xii) Series Y; and (xiii) Series Z (collectively, the “SI-Advised Funds”). Guggenheim Partners Investment Management, LLC (“GPIM”) serves as investment adviser to Series F of the Trust (the “GPIM-Advised Fund” and together with the SI-Advised Funds, the “Funds” and individually, a “Fund”).1 (Guggenheim Partners, Security Investors, GPIM and their affiliates may be referred to herein collectively as “Guggenheim.” Security Investors and GPIM are also known as “Guggenheim Investments,” the global asset management and investment advisory division of Guggenheim Partners that includes other affiliated investment management businesses.)
Under the supervision of the Board of Trustees of the Trust (the “Board,” with the members of the Board referred to individually as the “Trustees”), the Advisers regularly provide investment research, advice and supervision, along with a continuous investment program for the Funds, and direct the purchase and sale of securities and other investments for each Fund’s portfolio.
Each of the Advisory Agreements continues in effect from year to year provided that such continuance is specifically approved at least annually by (i) the Board or a majority of the outstanding voting securities (as defined in the 1940 Act) of each Fund, and, in either event, (ii) the vote of a majority of the Trustees who are not “interested person[s],” as defined by the 1940 Act, of the Trust (the “Independent Trustees”) casting votes in person at a meeting called for such purpose. At meetings held in person on April 26, 2018 (the “April Meeting”) and on May 22, 2018 (the “May Meeting”), the members of the Contracts Review Committee of the Board (the “Committee”), consisting solely of the Independent Trustees, met separately from Guggenheim to consider the proposed renewal of the Advisory Agreements in connection with the Committee’s annual contract review schedule.
As part of its review process, the Committee was represented by independent legal counsel to the Independent Trustees (“Independent Legal Counsel”), from whom the Independent Trustees received separate legal advice and with whom they met separately. Independent Legal Counsel reviewed and discussed with the Committee various key aspects of the Trustees’ legal responsibilities relating to the proposed renewal of the Advisory Agreements and other principal contracts. The Committee took into account various materials received from Guggenheim and Independent Legal Counsel. Recognizing that the evaluation process with respect to the services provided by Guggenheim is an ongoing one, the Committee also considered the variety of written materials, reports and oral presentations the Board receives throughout the year regarding performance and operating results of the Funds, and other information relevant to its evaluation of the Advisory Agreements.
In connection with the contract review process, FUSE Research Network LLC (“FUSE”), an independent, third-party research provider, was engaged to prepare advisory contract renewal reports designed specifically to help the Board fulfill its advisory contract renewal responsibilities. The objective of the reports is to present the subject funds’ relative position regarding fees, expenses and total return performance, with peer group and universe comparisons. The Committee assessed the data provided in the FUSE reports as well as commentary presented by Guggenheim, including, among other things, a summary of notable distinctions between certain Funds and the applicable peer group identified in the FUSE reports. The Committee noted that although FUSE’s process typically results in the identification for each Fund of a universe of similar funds for performance comparisons and a narrower group of similar funds from the universe based on asset levels for comparative fee and expense data evaluation (i.e., the peer group), the peer group constituent funds identified by FUSE for two Funds—Series F and Series V—were the same as the performance universe constituent funds due to each Fund’s investment strategy. In addition, for Series Z, the Committee took into account that FUSE included non-variable insurance funds in the peer group due to the limited number of comparable variable insurance funds.
In addition, Guggenheim provided materials and data in response to formal requests for information sent by Independent Legal Counsel on behalf of the Independent Trustees. Guggenheim also made a presentation at the April Meeting. Throughout the process, the Committee asked questions of management and requested certain additional information, which Guggenheim provided (collectively with the foregoing reports and materials, the “Contract Review Materials”). The Committee considered the Contract Review Materials in the context of its accumulated experience governing the Trust and weighed the factors and standards discussed with Independent Legal Counsel.
| 1 | The investment advisory agreements pertaining to the SI-Advised Funds and the investment advisory agreements pertaining to the GPIM-Advised Funds are each referred to herein as an “Advisory Agreement” and together, the “Advisory Agreements” In addition, unless the context indicates otherwise, Security Investors, with respect to its service as investment adviser to the SI-Advised Funds, and GPIM, as to the GPIM-Advised Funds, are each referred to herein as the “Adviser” and together, the “Advisers.” |
152 | THE GUGGENHEIM FUNDS SEMI-ANNUAL REPORT |
OTHER INFORMATION (Unaudited)(continued) |
Following an analysis and discussion of relevant factors, including those identified below, and in the exercise of its business judgment, the Committee concluded that it was in the best interest of each Fund to recommend that the Board approve the renewal of each Advisory Agreement for an additional annual term.
Nature, Extent and Quality of Services Provided by each Adviser: With respect to the nature, extent and quality of services currently provided by each Adviser, the Committee considered the qualifications, experience and skills of key personnel performing services for the Funds, including those personnel providing compliance and risk oversight, as well as the supervisors and reporting lines for such personnel. The Committee considered Guggenheim’s resources and related efforts to retain, attract and motivate capable personnel to serve the Funds. In evaluating Guggenheim’s resources and capabilities, the Committee noted certain changes to the organization, including those in connection with the sale of Guggenheim’s exchange-traded fund business to Invesco Ltd., and considered Guggenheim’s commitment to focusing on, and investing resources in support of, the Funds.
The Committee’s review of the services provided by Guggenheim to the Funds included consideration of Guggenheim’s investment processes and resulting performance, portfolio oversight and risk management, and the related regular quarterly reports and presentations received by the Board. The Committee considered the resources dedicated by Guggenheim to compliance functions and the reporting made to the Board by Guggenheim compliance personnel regarding Guggenheim’s adherence to regulatory requirements. The Committee also considered the regular reports the Board receives from the Trust’s Chief Compliance Officer regarding compliance policies and procedures established pursuant to Rule 38a-1 under the 1940 Act. In this connection, the Committee considered enhancements to the organization’s compliance processes and programs, including in response to certain examination findings from the staff of the Securities and Exchange Commission.
In connection with the Committee’s evaluation of the overall package of services provided by Guggenheim, the Committee considered Guggenheim’s administrative services, including its role in monitoring and coordinating compliance responsibilities with the fund administrator, transfer agent, distributor, custodian and other service providers to the Funds. The Committee evaluated the Office of Chief Financial Officer (the “OCFO”), established to oversee the fund administration, accounting and transfer agency services provided to the Funds, including the OCFO’s resources, personnel and services provided.
With respect to Guggenheim’s resources and the ability of each Adviser to carry out its responsibilities under the applicable Advisory Agreement, the Chief Financial Officer of Guggenheim Investments reviewed with the Committee certain unaudited financial information concerning the holding company for Guggenheim Investments, Guggenheim Partners Investment Management Holdings, LLC (“GPIMH”). The Committee received the audited consolidated financial statements of GPIMH as supplemental information. [(Thereafter, the Committee received the audited consolidated financial statements of GPIM.)]
The Committee also considered the acceptability of the terms of each Advisory Agreement, including the scope of services required to be performed by each Adviser.
Based on the foregoing, and based on other information received (both oral and written) at the April Meeting and the May Meeting, as well as other considerations, including the Committee’s knowledge of how each Adviser performs its duties obtained through Board meetings, discussions and reports throughout the year, the Committee concluded that each Adviser and its personnel were qualified to serve the Funds in such capacity and may reasonably be expected to continue to provide a high quality of services under each Advisory Agreement with respect to the Funds.
Investment Performance: The Committee received, for each Fund, investment returns for the since-inception, ten-year, five-year, three-year, one-year and three-month periods ended December 31, 2017, as applicable. In addition, the Committee received a comparison of each Fund’s performance to the performance of a benchmark, a universe of funds and a narrower peer group of similar funds based on asset levels as identified by FUSE, in each case for the same periods, as applicable. The Committee also received from FUSE a description of the methodology for identifying each Fund’s peer group and universe for performance and expense comparisons.
In seeking to evaluate Fund performance over a full market cycle, the Committee focused its attention on five-year and three-year performance rankings as compared to the relevant universe of funds. The Committee considered more recent performance periods for those Funds that were recently launched, as well as in circumstances in which enhancements were being made to the portfolio management processes or techniques employed for a Fund.
THE GUGGENHEIM FUNDS SEMI-ANNUAL REPORT 153 |
OTHER INFORMATION (Unaudited)(continued) |
In this connection, the Committee made the following observations:
Series A (StylePlus—Large Core Series): The Fund’s returns ranked in the 8th and 2nd percentiles of its performance universe for the five-year and three-year periods ended December 31, 2017, respectively, exceeding its performance universe median for both of these periods.
Series D (World Equity Income Series): The Fund’s returns ranked in the 70th and 72nd percentiles of its performance universe for the five-year and three-year periods ended December 31, 2017, respectively. The Committee considered that the Fund implemented a strategy change and a new portfolio management team in August 2013, noting the Adviser’s statement that the Fund has experienced notable improvement as a result, but underperformed its peer funds in 2017. In this regard, the Committee considered the Adviser’s explanation that the Fund’s defensive investment approach contributed to its underperformance, with the Fund’s exposure to lower-volatility, higher-yielding equity securities detracting from performance as growth stocks performed strongly in 2017.
Series E (Total Return Bond Series): The Fund’s returns ranked in the 1st percentile of its performance universe for both the five-year and three-year periods ended December 31, 2017, exceeding its performance universe median for both of these periods.
Series F (Floating Rate Strategies Series): The Committee noted the Fund’s inception date of April 24, 2013, and observed that the Fund’s returns ranked in the 1st and 33rd percentiles of its performance universe for the three-year and one-year periods ended December 31, 2017, respectively, exceeding its performance universe median for both of these periods.
Series J (StylePlus—Mid Growth Series): The Fund’s returns ranked in the 31st and 38th percentiles of its performance universe for the five-year and three-year periods ended December 31, 2017, respectively, exceeding its performance universe median for both of these periods.
Series N (Managed Asset Allocation Series): The Fund’s returns ranked in the 65th and 33rd percentiles of its performance universe for the five-year and three-year periods ended December 31, 2017, respectively.
Series P (High Yield Series): The Fund’s returns ranked in the 10th and 9th percentiles of its performance universe for the five-year and three-year periods ended December 31, 2017, respectively, exceeding its performance universe median for both of these periods.
Series X (StylePlus—Small Growth Series): The Fund’s returns ranked in the 16th and 39th percentiles of its performance universe for the five-year and three-year periods ended December 31, 2017, respectively, exceeding its performance universe median for both of these periods.
Series Y (StylePlus—Large Growth Series): The Fund’s returns ranked in the 27th and 19th percentiles of its performance universe for the five-year and three-year periods ended December 31, 2017, respectively, exceeding its performance universe median for both of these periods.
Series Z (Alpha Opportunity Series): The Fund’s returns ranked in the 15th and 47th percentiles of its performance universe for the five-year and three-year periods ended December 31, 2017, respectively, exceeding its performance universe median for both of these periods.
Value Funds: Series B (Large Cap Value Series), Series O (All Cap Value Series), Series Q (Small Cap Value Series) and Series V (Mid Cap Value Series):
Series B (Large Cap Value Series): The Fund’s returns ranked in the 33rd and 18th percentiles of its performance universe for the five-year and three-year periods ended December 31, 2017, respectively, exceeding its performance universe median for both of these periods.
Series O (All Cap Value Series): The Fund’s returns ranked in the 35th and 15th percentiles of its performance universe for the five-year and three-year periods ended December 31, 2017, respectively, exceeding its performance universe median for both of these periods.
Series Q (Small Cap Value Series): The Fund’s returns ranked in the 94th and 88th percentiles of its performance universe for the five-year and three-year periods ended December 31, 2017, respectively, underperforming its performance universe median for both of these periods. The Committee noted measures taken by the Adviser to remedy longer-term relative underperformance with respect to the Value Funds strategy, including strategy enhancements such as implementation of a refined stock selection process and additional risk controls to enforce the strategy’s sell discipline. In this connection, the Committee noted the Adviser’s statement that, although these measures led to improved performance in 2016, the Fund underperformed its peer funds in 2017, ranking in the 88th percentile of its performance universe. The Committee
154 | THE GUGGENHEIM FUNDS SEMI-ANNUAL REPORT |
OTHER INFORMATION (Unaudited)(continued) |
considered the Adviser’s explanation that several factors detracted from performance, including its industry weightings, particularly with respect to information technology, industrials and healthcare, and its preference for value stocks over growth stocks as growth stocks performed strongly in 2017. The Committee also considered the steps being taken to improve the Fund’s performance.
Series V (Mid Cap Value Series): The Fund’s returns ranked in the 67th and 22nd percentiles of its performance universe for the five-year and three-year periods ended December 31, 2017, respectively.
After reviewing the foregoing and related factors, the Committee concluded that: (i) each Fund’s performance was acceptable; or (ii) it was satisfied with Guggenheim’s responses and efforts to improve investment performance.
Comparative Fees, Costs of Services Provided and the Profits Realized by each Adviser from Its Relationship with the Funds: The Committee compared each Fund’s contractual advisory fee and total net expense ratio to the applicable peer group. The Committee also reviewed the median advisory fees and expense ratios, including expense ratio components (e.g., transfer agency fees, administration fees, other operating expenses, distribution fees and fee waivers/reimbursements), of the peer group of funds. The Committee also reviewed aggregated advisory and administrative fees compared to the peer group average and median.
As part of its evaluation of each Fund’s advisory fee, the Committee considered how such fees compared to the advisory fee charged by the applicable Adviser to one or more other clients that it manages pursuant to similar investment strategies, to the extent applicable, noting that, in certain instances, Guggenheim charges a lower advisory fee to such other clients. In this connection, the Committee considered, among other things, Guggenheim’s representations about the significant differences between managing mutual funds as compared to other types of accounts. The Committee also considered Guggenheim’s explanation that lower fees are charged in certain instances due to various other factors, including the scope of contract, type of investors, fee structure, applicable legal, governance and capital structures, tax status and historical pricing reasons. In addition, the Committee took into account Guggenheim’s discussion of the entrepreneurial risks it faces when offering the Funds as compared to other types of accounts. The Committee concluded that the information it received demonstrated that the aggregate services provided to, or specific circumstances of, each Fund were sufficiently different from the services provided to, or the specific circumstances of, other clients with similar investment strategies and/or the risks borne by Guggenheim were sufficiently greater than those associated with managing other clients with similar investment strategies to support the difference in fees.
In further considering the comparative fee and expense data presented in the Contract Review Materials and addressed by Guggenheim, the Committee took into account those Funds with currently effective expense limitation agreements with the Adviser and made the following observations:
Series A (StylePlus—Large Core Series): The Fund’s contractual advisory fee ranks in the third quartile (64th percentile) of its peer group. The Fund’s net effective management fee2 ranks in the second quartile (29th percentile) of its peer group. The Fund’s total net expense ratio ranks in the first quartile (21st percentile) of its peer group.
Series B (Large Cap Value Series): The Fund’s contractual advisory fee is equal to the median (50th percentile) of its peer group. The Fund’s net effective management fee and total net expense ratio each rank in the first quartile (7th and 1st percentiles, respectively) of its peer group.
Series D (World Equity Income Series): The Fund’s contractual advisory fee ranks in the second quartile (29th percentile) of its peer group. The Fund’s net effective management fee and total net expense ratio each rank in the first quartile (each 7th percentile) of its peer group.
Series E (Total Return Bond Series): The Fund’s contractual advisory fee and total net expense ratio each rank in the first quartile (7th and 21st percentiles, respectively) of its peer group. The Fund’s net effective management fee ranks in the second quartile (29th percentile) of its peer group. The Committee considered that, effective November 20, 2017, the Board approved a reduction in the Fund’s contractual advisory fee to 0.39%, reduced from an advisory fee of 0.50% on average daily net assets up to $5 billion and 0.45% in excess of $5 billion.
| 2 | The “net effective management fee” represents the combined effective advisory fee and administration fee as a percentage of average net assets for the latest fiscal year, after any waivers and/or reimbursements. |
THE GUGGENHEIM FUNDS SEMI-ANNUAL REPORT 155 |
OTHER INFORMATION (Unaudited)(continued) |
Series F (Floating Rate Strategies Series): The Fund’s contractual advisory fee, net effective management fee and total net expense ratio each rank in the fourth quartile (each 83rd percentile) of its peer group. The Committee considered the Adviser’s statement explaining the higher fees and expenses that performance is driven by a unique investment approach that requires significant resources. The Committee also considered that, effective May 1, 2017, the Board approved an additional breakpoint, reducing the Fund’s advisory fee by 0.05% on assets over $5 billion. In addition, the Committee considered the Fund’s strong investment performance.
Series J (StylePlus—Mid Growth Series): The Fund’s contractual advisory fee, net effective management fee and total net expense ratio each rank in the first quartile (19th, 13th and 6th percentiles, respectively) of its peer group.
Series N (Managed Asset Allocation Series): The Fund’s contractual advisory fee and total net expense ratio each rank in the first quartile (1st and 25th percentiles, respectively) of its peer group. The Fund’s net effective management fee ranks in the second quartile (33rd percentile) of its peer group. The Committee considered that, effective May 1, 2017, the Board approved a reduction in the Fund’s contractual advisory fee from 0.65% to 0.40%.
Series O (All Cap Value Series): The Fund’s contractual advisory fee ranks in the third quartile (67th percentile) of its peer group. The Fund’s net effective management fee ranks in the second quartile (27th percentile) of its peer group. The Fund’s total net expense ratio ranks in the first quartile (13th percentile) of its peer group.
Series P (High Yield Series): The Fund’s contractual advisory fee ranks in the first quartile (21st percentile) of its peer group. The Fund’s net effective management fee ranks in the second quartile (36th percentile) of its peer group. The Fund’s total net expense ratio ranks in the fourth quartile (79th percentile) of its peer group. The Committee considered the Fund’s strong investment performance.
Series Q (Small Cap Value Series): The Fund’s contractual advisory fee ranks in the first quartile (18th percentile) of its peer group. The Fund’s net effective management fee ranks in the second quartile (27th percentile) of its peer group. The Fund’s total net expense ratio ranks in the third quartile (55th percentile) of its peer group. The Committee considered that, effective May 1, 2017, the Board approved a reduction in the Fund’s contractual advisory fee from 0.95% to 0.75%.
Series V (Mid Cap Value Series): The Fund’s contractual advisory fee ranks in the second quartile (33rd percentile) of its peer group. The Fund’s net effective management fee and total net expense ratio each rank in the first quartile (22nd and 11th percentiles, respectively) of its peer group.
Series X (StylePlus—Small Growth Series): The Fund’s contractual advisory fee and net effective management fee each rank in the first quartile (1st and 7th percentiles, respectively) of its peer group. The Fund’s total net expense ratio ranks in the second quartile (29th percentile) of its peer group. The Committee considered that, effective May 1, 2017, the Board approved a reduction in the Fund’s contractual advisory fee from 0.85% to 0.75%.
Series Y (StylePlus—Large Growth Series): The Fund’s contractual advisory fee and total net expense ratio each rank in the second quartile (36th and 29th percentiles, respectively) of its peer group. The Fund’s net effective management fee ranks in the first quartile (21st percentile) of its peer group. The Committee considered that, effective May 1, 2017, the Board approved a reduction in the Fund’s contractual advisory fee from 0.75% to 0.65%.
Series Z (Alpha Opportunities Series): The Fund’s contractual advisory fee ranks in the first quartile (1st percentile) of its peer group. The Fund’s net effective management fee and total net expense ratio each rank in the third quartile (60th and 73rd percentiles, respectively) of its peer group. The Committee considered that, effective May 31, 2017, the Board approved a reduction in the Fund’s contractual advisory fee from 1.25% to 0.90%.
With respect to the costs of services provided and profits realized by Guggenheim Investments from its relationship with the Funds, the Committee reviewed a profitability analysis and data from management for each Fund setting forth the average assets under management for the twelve months ended December 31, 2017, gross revenues received by Guggenheim Investments, expenses allocated to the Fund, expense waivers (as applicable), earnings and the operating margin/profitability rate, including variance information relative to the foregoing amounts as of December 31, 2016. In addition, the Chief Financial Officer of Guggenheim Investments reviewed with, and addressed questions from, the Committee concerning the expense allocation methodology employed in producing the profitability analysis.
156 | THE GUGGENHEIM FUNDS SEMI-ANNUAL REPORT |
OTHER INFORMATION (Unaudited)(concluded) |
In the course of its review of Guggenheim Investments’ profitability, the Committee took into account the methods used by Guggenheim Investments to determine expenses and profit. The Committee considered all of the foregoing in evaluating the costs of services provided, the profitability to Guggenheim Investments and the profitability rates presented, and concluded that the profits were not unreasonable.
The Committee considered other benefits available to each Adviser because of its relationship with the Funds and noted Guggenheim’s statement that, although the Adviser may have benefited from arrangements in the past whereby an affiliate received commissions for executing portfolio transactions on behalf of the Funds, it is not Guggenheim’s current practice to execute Fund portfolio transactions through its affiliate. In addition, the Committee noted Guggenheim’s statement that it may benefit from marketing synergies arising from offering a broad spectrum of products, including the Funds.
Economies of Scale: The Committee received and considered information regarding whether there have been economies of scale with respect to the management of the Funds as Fund assets grow, whether the Funds have appropriately benefited from any economies of scale, and whether there is potential for realization of any further economies of scale. The Committee considered whether economies of scale in the provision of services to the Funds were being passed along to the shareholders. The Committee noted the Adviser’s statements, including that Guggenheim believes it is appropriately sharing potential economies of scale and that costs continue to increase in many key areas, including compensation of portfolio managers, key analysts and support staff, as well as for infrastructure needs, with respect to risk management oversight, valuation processes and disaster recovery systems, among other things, and that, in this regard, management’s costs for providing services have increased in recent years without regard to asset levels.
The Committee also noted the process employed by the Adviser to evaluate whether it would be appropriate to institute a new breakpoint for a Fund, with consideration given to, among other things: (i) the Fund’s size and trends in asset levels over recent years; (ii) the competitiveness of the expense levels; (iii) whether expense waivers are in place; (iv) changes and trends in revenue and expenses; (v) whether there are any anticipated expenditures that may benefit the Fund in the future; (vi) Fund profit level margins; (vii) relative Fund performance; (viii) the nature, extent and quality of services management provides to the Fund; and (ix) the complexity of the Fund’s investment strategy and the resources required to support the Fund.
As part of its assessment of economies of scale, the Committee also considered Guggenheim’s view that it seeks to share economies of scale through a number of means, including expense limitations and/or advisory fees set at competitive rates pre-assuming future asset growth. Thus, the Committee considered the size of the Funds and the competitiveness of and/or other determinations made regarding the current advisory fee for each Fund, as well as whether a Fund is subject to an expense limitation. The Committee also took into account the contractual advisory fee reductions for multiple Funds and the advisory fee breakpoint with respect to Series F that were offered by the Adviser and approved by the Board and went into effect in 2017.
The Committee determined that the advisory fee for each Fund was reasonable.
Overall Conclusions
Based on the foregoing, the Committee determined that the investment advisory fees are fair and reasonable in light of the extent and quality of the services provided and other benefits received and that the continuation of each of the Advisory Agreements is in the best interest of each Fund. In reaching this conclusion, no single factor was determinative or conclusive and each Committee member, in the exercise of his business judgment, may attribute different weights to different factors. At the May Meeting, the Committee, constituting all of the Independent Trustees, recommended the renewal of each Advisory Agreement for an additional annual term.
Thereafter, on May 23, 2018, the Board, including all of the Independent Trustees, approved the renewal of each Advisory Agreement for an additional annual term.
THE GUGGENHEIM FUNDS SEMI-ANNUAL REPORT 157 |
INFORMATION ON BOARD OF TRUSTEES AND OFFICERS (Unaudited) |
Name, Address* | Position(s) | Term of Office | Principal Occupation(s) | Number of Fund Complex | Other |
INDEPENDENT TRUSTEES | |||||
Randall C. Barnes (1951) | Trustee | Since 2014 | Current: Private Investor (2001-present).
Former: Senior Vice President and Treasurer, PepsiCo, Inc. (1993-1997); President, Pizza Hut International (1991-1993); Senior Vice President, Strategic Planning and New Business Development, PepsiCo, Inc. (1987-1990). | 49 | Current: Trustee, Purpose Investments Inc. (2014-Present).
Former: Managed Duration Investment Grade Municipal Fund (2003-2016). |
Donald A. Chubb, Jr. (1946) | Trustee and Chairman of the Valuation Oversight Committee | Since 1994 | Current: Retired.
Former: Business broker and manager of commercial real estate, Griffith & Blair, Inc. (1997-2017). | 48 | Former: Midland Care, Inc. (2011-2016). |
Jerry B. Farley (1946) | Trustee and Chairman of the Audit Committee | Since 2005 | Current: President, Washburn University (1997-present). | 48 | Current: Westar Energy, Inc. (2004-present); CoreFirst Bank & Trust (2000-present). |
Roman Friedrich III (1946) | Trustee and Chairman of the Contracts Review Committee | Since 2014 | Current: Founder and Managing Partner, Roman Friedrich & Company (1998-present).
Former: Senior Managing Director, MLV & Co. LLC (2010-2011). | 48 | Current: Zincore Metals, Inc. (2009-present).
Former: Axiom Gold and Silver Corp. (2011-2012). |
Ronald A. Nyberg (1953) | Trustee and Chairman of the Nominating and Governance Committee | Since 2014 | Current: Partner, Momkus LLC (2016-present).
Former: Partner, Nyberg & Cassioppi, LLC (2000-2016); Executive Vice President, General Counsel, and Corporate Secretary, Van Kampen Investments (1982-1999). | 49 | Current: PPM Funds Board (February 2018-present); Edward-Elmhurst Healthcare System (2012-present); Western Asset Inflation-Linked Opportunities & Income Fund (2004-present); Western Asset Inflation-Linked Income Fund (2003-present).
Former: Managed Duration Investment Grade Municipal Fund (2003-2016). |
158 | THE GUGGENHEIM FUNDS SEMI-ANNUAL REPORT |
INFORMATION ON BOARD OF TRUSTEES AND OFFICERS (Unaudited)(continued) |
Name, Address* | Position(s) | Term of Office | Principal Occupation(s) | Number of Fund Complex | Other |
INDEPENDENT TRUSTEES - concluded | |||||
Maynard F. Oliverius (1943) | Trustee | Since 1998 | Current: Retired.
Former: President and CEO, Stormont-Vail HealthCare (1996-2012). | 48 | Current: Robert J. Dole Institute of Politics (2016-present); Stormont-Vail Foundation (2013-present); University of Minnesota MHA Alumni Philanthropy Committee (2009-present); Fort Hays State University Foundation (1999-present).
Former: Topeka Community Foundation (2009-2014). |
Ronald E. Toupin, Jr. (1958) | Trustee and Chairman of the Board | Since 2014 | Current: Portfolio Consultant (2010-present); Member, Governing Council (2003-present) and Executive Committee (2016-present), Independent Directors Council.
Former: Vice President, Manager and Portfolio Manager, Nuveen Asset Management (1998-1999); Vice President, Nuveen Investment Advisory Corp. (1992-1999); Vice President and Manager, Nuveen Unit Investment Trusts (1991-1999); and Assistant Vice President and Portfolio Manager, Nuveen Unit Investment Trusts (1988-1999), each of John Nuveen & Co., Inc. (1982-1999). | 48 | Current: Western Asset Inflation-Linked Opportunities & Income Fund (2004-present); Western Asset Inflation- Linked Income Fund (2003-present).
Former: Managed Duration Investment Grade Municipal Fund (2003-2016); Bennett Group of Funds (2011-2013). |
THE GUGGENHEIM FUNDS SEMI-ANNUAL REPORT 159 |
INFORMATION ON BOARD OF TRUSTEES AND OFFICERS (Unaudited)(continued) |
Name, Address* | Position(s) | Term of Office | Principal Occupation(s) | Number of Fund Complex | Other |
INTERESTED TRUSTEE | |||||
Amy J. Lee*** (1961) | Trustee, Vice President and Chief Legal Officer | Since February 2018 (Trustee)
Since 2014 (Chief Legal Officer)
Since 2007 (Vice President) | Current: Interested Trustee, certain other funds in the Fund Complex (February 2018-present); President, certain other funds in the Fund Complex (2017-present); Chief Legal Officer, certain other funds in the Fund Complex (2014-present); Vice President, certain other funds in the Fund Complex (2007-present); Senior Managing Director, Guggenheim Investments (2012-present).
Former: President and Chief Executive Officer (2017-February 2018); Vice President, Associate General Counsel and Assistant Secretary, Security Benefit Life Insurance Company and Security Benefit Corporation (2004-2012). | 158 | None. |
| * | The business address of each Trustee is c/o Guggenheim Investments, 227 West Monroe Street, Chicago, Illinois 60606. |
| ** | Each Trustee serves an indefinite term, until his or her successor is elected and qualified. Time served includes time served in the respective position for the Predecessor Corporation. |
| *** | This Trustee is deemed to be an "interested person" of the Funds under the 1940 Act by reason of her position with the Funds' Investment Manager and/or the parent of the Investment Manager. |
160 | THE GUGGENHEIM FUNDS SEMI-ANNUAL REPORT |
INFORMATION ON BOARD OF TRUSTEES AND OFFICERS (Unaudited)(continued) |
Name, Address* | Position(s) | Term of Office | Principal Occupations |
OFFICERS | |||
Brian E. Binder (1972) | President and Chief Executive Officer | Since February 2018 | Current: President and Chief Executive Officer, certain other funds in the Fund Complex (February 2018-present); President and Chief Executive Officer, Guggenheim Funds Investment Advisors, LLC and Security Investors, LLC (January 2018-present); Senior Managing Director and Chief Administrative Officer, Guggenheim Investments (January 2018-present).
Former: Managing Director and President, Deutsche Funds, and Head of US Product, Trading and Fund Administration, Deutsche Asset Management (2013-January 2018); Managing Director, Head of Business Management and Consulting, Invesco Ltd. (2010-2012). |
James M. Howley (1972) | Assistant Treasurer | Since 2014 | Current: Managing Director, Guggenheim Investments (2004-present) ; Assistant Treasurer, certain other funds in the Fund Complex (2006-present).
Former: Manager, Mutual Fund Administration of Van Kampen Investments, Inc. (1996-2004). |
Keith D. Kemp (1960) | Assistant Treasurer | Since 2016 | Current: Treasurer and Assistant Treasurer, certain other funds in the Fund Complex (2010-present); Managing Director, Guggenheim Investments (2015-present).
Former: Chief Financial Officer, Guggenheim Specialized Products, LLC (2016-April 2018); Managing Director and Director, Transparent Value, LLC (2010-2016); Director, Guggenheim Partners Investment Management, LLC (2010-2015); Chief Operating Officer, Macquarie Capital Investment Management (2007-2009). |
Mark E. Mathiasen (1978) | Secretary | Since 2014 | Current: Secretary, certain other funds in the Fund Complex (2007-present); Managing Director, Guggenheim Investments (2007-present). |
Glenn McWhinnie (1969) | Assistant Treasurer | Since 2016 | Current: Vice President, Guggenheim Investments (2009-present). Assistant Treasurer, certain other funds in the Fund complex (2016-present). |
Michael P. Megaris (1984) | Assistant Secretary | Since 2014 | Current: Assistant Secretary, certain other funds in the Fund Complex (2014-present); Director, Guggenheim Investments (2012-present). |
Elisabeth Miller (1968) | Chief Compliance Officer | Since 2012 | Current: CCO, certain other funds in the Fund Complex (2012-present); Managing Director, Guggenheim Investments (2012-present); Vice President, Guggenheim Funds Distributors, LLC (2014-present).
Former: CCO, Security Investors, LLC (2012-2018); CCO, Guggenheim Funds Investment Advisors, LLC (2012-2018); CCO, Guggenheim Distributors, LLC (2009-2014); Senior Manager, Security Investors, LLC (2004-2009); Senior Manager, Guggenheim Distributors, LLC (2004-2009). |
THE GUGGENHEIM FUNDS SEMI-ANNUAL REPORT 161 |
INFORMATION ON BOARD OF TRUSTEES AND OFFICERS (Unaudited)(concluded) |
Name, Address* | Position(s) | Term of Office | Principal Occupations |
OFFICERS - concluded | |||
Adam J. Nelson (1979) | Assistant Treasurer | Since 2015 | Current: Vice President, Guggenheim Investments (2015-present); Assistant Treasurer, certain other funds in the Fund Complex (2015-present).
Former: Assistant Vice President and Fund Administration Director, State Street Corporation (2013-2015); Fund Administration Assistant Director, State Street (2011-2013); Fund Administration Manager, State Street (2009-2011). |
Kimberly J. Scott (1974) | Assistant Treasurer | Since 2014 | Current: Director, Guggenheim Investments (2012-present); Assistant Treasurer, certain other funds in the Fund Complex (2012-present).
Former: Financial Reporting Manager, Invesco, Ltd. (2010-2011); Vice President/Assistant Treasurer, Mutual Fund Administration for Van Kampen Investments, Inc./Morgan Stanley Investment Management (2009-2010); Manager of Mutual Fund Administration, Van Kampen Investments, Inc./Morgan Stanley Investment Management (2005-2009). |
Bryan Stone (1979) | Vice President | Since 2014 | Current: Vice President, certain other funds in the Fund Complex (2014-present); Managing Director, Guggenheim Investments (2013-present).
Former: Senior Vice President, Neuberger Berman Group LLC (2009-2013); Vice President, Morgan Stanley (2002-2009). |
John L. Sullivan (1955) | Chief Financial Officer, Chief Accounting Officer and Treasurer | Since 2014 | Current: CFO, Chief Accounting Officer and Treasurer, certain other funds in the Fund Complex (2010-present); Senior Managing Director, Guggenheim Investments (2010-present).
Former: Managing Director and CCO, each of the funds in the Van Kampen Investments fund complex (2004-2010); Managing Director and Head of Fund Accounting and Administration, Morgan Stanley Investment Management (2002-2004); CFO and Treasurer, Van Kampen Funds (1996-2004). |
Jon Szafran (1989) | Assistant Treasurer | Since 2017 | Current: Vice President, Guggenheim Investments (2017-present); Assistant Treasurer, certain other funds in the Fund Complex (2017-present).
Former: Assistant Treasurer of Henderson Global Funds and Manager of US Fund Administration, Henderson Global Investors (North America) Inc. (“HGINA”), (2017); Senior Analyst of US Fund Administration, HGINA (2014-2017); Senior Associate of Fund Administration, Cortland Capital Market Services, LLC (2013-2014); Experienced Associate, PricewaterhouseCoopers LLP (2012-2013). |
| * | The business address of each officer is c/o Guggenheim Investments, 227 West Monroe Street, Chicago, Illinois 60606. |
| ** | Each officer serves an indefinite term, until his or her successor is duly elected and qualified. Time served includes time served in the respective position for the Predecessor Corporation. |
162 | THE GUGGENHEIM FUNDS SEMI-ANNUAL REPORT |
GUGGENHEIM INVESTMENTS PRIVACY NOTICE (Unaudited) |
Who We Are
This Privacy Notice describes the data protection practices of Guggenheim Investments. Guggenheim Investments as used herein refers to the affiliated investment management businesses of Guggenheim Partners, LLC: Guggenheim Funds Investment Advisors, LLC, Guggenheim Partners Investment Management, LLC, Guggenheim Funds Distributors, LLC, Security Investors, LLC, Guggenheim Investment Advisors (Europe) Limited, Guggenheim Real Estate, LLC, GS Gamma Advisors, LLC, Guggenheim Partners India Management, LLC, Guggenheim Partners Europe Limited, as well as the funds in the Guggenheim Funds complex (the “Funds”) (“Guggenheim Investments,” “we,” “us,” or “our”).
Guggenheim Partners Investment Management Holdings, LLC, located at 330 Madison Avenue, New York, New York 10017 is the data controller for your information. The Affiliates who are also controllers of certain of your information are: Guggenheim Investment Advisors (Europe) Limited, Guggenheim Partners Europe Limited, Guggenheim Partners, LLC, Guggenheim Funds Investment Advisors, LLC, Guggenheim Partners Investment Management, LLC, Guggenheim Funds Distributors, LLC and Security Investors, LLC, as well as the Funds.
Our Commitment to You
Guggenheim Investments considers your privacy our utmost concern. When you become our client or investor, you entrust us with not only your hard-earned money but also with your personal and financial information. Because we have access to your private information, we hold ourselves to the highest standards in its safekeeping and use. We strictly limit how we share your information with others, whether you are a current or former Guggenheim Investments client or investor.
The Information We Collect About You
We collect certain nonpublic personal information about you from information you provide on applications, other forms, our website, and/or from third parties including investment advisors. This information includes Social Security or other tax identification number, assets, income, tax information, retirement and estate plan information, transaction history, account balance, payment history, bank account information, marital status, family relationships, information that we collect on our website through the use of “cookies,” and other personal information that you or others provide to us. We may also collect such information through your inquiries by mail, e-mail or telephone. We may also collect customer due diligence information, as required by applicable law and regulation, through third party service providers.
How We Handle Your Personal Information
The legal basis for using your information as set out in this Privacy Notice is as follows: (a) use of your personal data is necessary to perform our obligations under any contract with you (such as a contract for us to provide financial services to you); or (b) where use of your personal data is not necessary for performance of a contract, use of your personal data is necessary for our legitimate interests or the legitimate interests of others (for example, to enforce the legal terms governing our services, operate and market our website and other services we offer, ensure safe environments for our personnel and others, make and receive payments, prevent fraud and to know the customer to whom we are providing the services). Some processing is done to comply with applicable law.
In addition to the specific uses described above, we also use your information in the following manner:
● | We use your information in connection with servicing your accounts. |
● | We use information to respond to your requests or questions. For example, we might use your information to respond to your customer feedback. |
● | We use information to improve our products and services. We may use your information to make our website and products better. We may use your information to customize your experience with us. |
● | We use information for security purposes. We may use your information to protect our company and our customers. |
● | We use information to communicate with you. For example, we will communicate with you about your account or our relationship. We may contact you about your feedback. We might also contact you about this Privacy Notice. We may also enroll you in our email newsletter. |
THE GUGGENHEIM FUNDS SEMI-ANNUAL REPORT 163 |
GUGGENHEIM INVESTMENTS PRIVACY NOTICE (Unaudited)(continued) |
● | We use information as otherwise permitted by law, as we may notify you. |
● | Aggregate/Anonymous Data. We may aggregate and/or anonymize any information collected through the website so that such information can no longer be linked to you or your device (“Aggregate/Anonymous Information”). We may use Aggregate/Anonymous Information for any purpose, including without limitation for research and marketing purposes, and may also share such data with any third parties, including advertisers, promotional partners, and sponsors. |
We do not sell information about current or former clients or their accounts to third parties. Nor do we share this information, except when necessary to complete transactions at your request, to make you aware of investment products and services that we or our affiliates offer, or as permitted or required by law.
We provide information about you to companies and individuals not affiliated with Guggenheim Investments to complete certain transactions or account changes, or to perform services for us related to your account. For example, if you ask to transfer assets from another financial institution to Guggenheim Investments, we must provide certain information about you to that company to complete the transaction. We provide the third party with only the information necessary to carry out its responsibilities and only for that purpose. And we require these third parties to treat your private information with the same high degree of confidentiality that we do. To alert you to other Guggenheim Investments products and services, we share your information within our family of affiliated companies. You may limit our sharing with affiliated companies as set out below. We may also share information with any successor to all or part of our business, or in connection with steps leading up to a merger or acquisition. For example, if part of our business was sold we may give customer information as part of that transaction. We may also share information about you with your consent.
We will release information about you if you direct us to do so, if we are compelled by law to do so, or in other circumstances as permitted by law (for example, to protect your account from fraud).
If you close your account(s) or become an inactive client or investor, we will continue to adhere to the privacy policies and practices described in this notice.
Opt-Out Provisions and Your Data Choices
The law allows you to “opt out” of certain kinds of information sharing with third parties. We do not share personal information about you with any third parties that triggers this opt-out right. This means YOU ARE ALREADY OPTED OUT.
When you are no longer our client or investor, we continue to share your information as described in this notice, and you may contact us at any time to limit our sharing by sending an email to CorporateDataPrivacy@GuggenheimPartners.com.
European Union Data Subjects and certain others: In addition to the choices set forth above, residents of the European Union and certain other jurisdictions have certain rights to (1) request access to or rectification or deletion of information we collect about them, (2) request a restriction on the processing of their information, (3) object to the processing of their information, or (4) request the portability of certain information. To exercise these or other rights, please contact us using the contact information below. We will consider all requests and provide our response within the time period stated by applicable law. Please note, however, that certain information may be exempt from such requests in some circumstances, which may include if we need to keep processing your information for our legitimate interests or to comply with a legal obligation. We may request you provide us with information necessary to confirm your identity before responding to your request.
Residents of France and certain other jurisdictions may also provide us with instructions regarding the manner in which we may continue to store, erase and share your information after your death, and where applicable, the person you have designated to exercise these rights after your death.
164 | THE GUGGENHEIM FUNDS SEMI-ANNUAL REPORT |
GUGGENHEIM INVESTMENTS PRIVACY NOTICE (Unaudited)(concluded) |
How We Protect Privacy Online
We take steps to protect your privacy when you use our web site – www.guggenheiminvestments.com – by using secure forms of online communication, including encryption technology, Secure Socket Layer (SSL) protocol, firewalls and user names and passwords. These safeguards vary based on the sensitivity of the information that we collect and store. However, we cannot and do not guarantee that these measures will prevent every unauthorized attempt to access, use, or disclose your information since despite our efforts, no Internet and/or other electronic transmissions can be completely secure. Our web site uses “http cookies”—tiny pieces of information that we ask your browser to store. We use cookies for session management and security features on the Guggenheim Investments web site. We do not use them to pull data from your hard drive, to learn your e-mail address, or to view data in cookies created by other web sites. We will not share the information in our cookies or give others access to it. See the legal information area on our web site for more details about web site security and privacy features.
How We Safeguard Your Personal Information and Data Retention
We restrict access to nonpublic personal information about you to our employees and in some cases to third parties (for example, the service providers described above) as permitted by law. We maintain strict physical, electronic and procedural safeguards that comply with federal standards to guard your nonpublic personal information.
We keep your information for no longer than necessary for the purposes for which it is processed. The length of time for which we retain information depends on the purposes for which we collected and use it and/or as required to comply with applicable laws. Information may persist in copies made for backup and business continuity purposes for additional time.
International Visitors
If you are not a resident of the United States, please be aware that your information may be transferred to, stored and processed in the United States where our servers are located and our databases are operated. The data protection and other laws of the United States and other countries might not be as comprehensive as those in your country.
In such cases, we ensure that a legal basis for such a transfer exists and that adequate protection is provided as required by applicable law, for example, by using standard contractual clauses or by transferring your data to a jurisdiction that has obtained an adequacy finding. Individuals whose data may be transferred on the basis of standard contractual clauses may contact us as described below.
We’ll Keep You Informed
If you have any questions or concerns about how we treat your personal data, we encourage you to consult with us first. You may also contact the relevant supervisory authority.
We reserve the right to modify this policy at any time and will inform you promptly of material changes. You may access our privacy policy from our web site at www.guggenheiminvestments.com. Should you have any questions regarding our privacy policy, contact us by email at CorporateDataPrivacy@GuggenheimPartners.com.
THE GUGGENHEIM FUNDS SEMI-ANNUAL REPORT 165 |
| Item 2. | Code of Ethics. |
Not required at this time.
| Item 3. | Audit Committee Financial Expert. |
Not required at this time.
| Item 4. | Principal Accountant Fees and Services. |
Not required at this time.
| Item 5. | Audit Committee of Listed Registrants. |
Not applicable.
| Item 6. | Investments. |
Schedule of Investments is included as part of the report to shareholders filed under Item 1 of this form.
| Item 7. | Disclosure of Proxy Voting Policies and Procedures for Closed-End Management Investment Companies. |
Not applicable.
| Item 8. | Portfolio Mangers of Closed-end Management Investment Companies |
Not applicable
| Item 9. | Purchases of Equity Securities by Closed-End Management Investment Company and Affiliated Purchasers. |
Not applicable.
| Item 10. | Submission of Matters to a Vote of Security Holders. |
The registrant does not currently have in place procedures by which shareholders may recommend nominees to the registrant’s board.
There have been no changes to the procedures by which shareholders may recommend nominees to the registrant’s board.
| Item 11. | Controls and Procedures. |
(a) The registrant’s President (principal executive officer) and Treasurer (principal financial officer) have evaluated the registrant’s disclosure controls and procedures (as defined in Rule 30a-3(c) under the Investment Company Act) as of a date within 90 days of this filing and have concluded that based on such evaluation as required by Rule 30a-3(b) under the Investment Company Act, that the registrant’s disclosure controls and procedures were effective as of that date in ensuring that information required to be disclosed by the registrant in this Form N-CSR was recorded, processed, summarized, and reported within the time periods specified in the Securities and Exchange Commission’s rules and forms..
(b) The registrant’s principal executive officer and principal financial officer are aware of no change in the registrant’s internal control over financial reporting that occurred during the registrant’s last fiscal quarter covered by this report that has materially affected, or is reasonably likely to materially affect, the registrant’s internal control over financial reporting.
| Item 12. | Disclosure of Securities Lending Activities for Closed End Management Investment Companies. |
Not Applicable
| Item 13. | Exhibits. |
(a)(1) Not applicable.
(a)(2) Separate certifications by the President (principal executive officer) and Treasurer (principal financial officer) of the registrant as required by Rule 30a-2(a) under the Act (17 CFR 270.30a-2(a)) are attached.
(b) A certification by the registrant’s President (principal executive officer) and Treasurer (principal financial officer) as required by Rule 30a-2(b) under the Act (17 CFR 270.30a-2(b)) is attached.
SIGNATURES
Pursuant to the requirements of the Securities Exchange Act of 1934 and the Investment Company Act of 1940, the registrant has duly caused this report to be signed on its behalf by the undersigned, thereunto duly authorized.
| (Registrant) | Guggenheim Variable Funds Trust | |
| By (Signature and Title)* | /s/ Brian Binder | |
| Brian Binder, President and Chief Executive Officer | ||
| Date | September 7, 2018 |
Pursuant to the requirements of the Securities Exchange Act of 1934 and the Investment Company Act of 1940, this report has been signed below by the following persons on behalf of the registrant and in the capacities and on the dates indicated.
| By (Signature and Title)* | /s/ Brian Binder | |
| Brian Binder, President and Chief Executive Officer | ||
| Date | September 7, 2018 | |
| By (Signature and Title)* | /s/ John L. Sullivan | |
| John L. Sullivan, Chief Financial Officer, Chief Accounting Officer and Treasurer | ||
| Date | September 7, 2018 |
| * | Print the name and title of each signing officer under his or her signature. |