UNITED STATES
SECURITIES AND EXCHANGE COMMISSION
Washington, D.C. 20549
FORM N-CSR
CERTIFIED SHAREHOLDER REPORT OF REGISTERED MANAGEMENT INVESTMENT COMPANIES
Investment Company Act file number 811- 02753
| | Guggenheim Variable Funds Trust | |
| | (Exact name of registrant as specified in charter) | |
| | 702 King Farm Boulevard, Suite 200
Rockville, Maryland 20850 | |
| | (Address of principal executive offices) (Zip code) | |
| | Amy J. Lee
Guggenheim Variable Funds Trust
702 King Farm Boulevard, Suite 200
Rockville, Maryland 20850 | |
| | (Name and address of agent for service) | |
Registrant's telephone number, including area code: 1-301-296-5100
Date of fiscal year end: December 31
Date of reporting period: January 1, 2021 to June 30, 2021
Form N-CSR is to be used by management investment companies to file reports with the Commission not later than 10 days after the transmission to stockholders of any report that is required to be transmitted to stockholders under Rule 30e-1 under the Investment Company Act of 1940 (17 CFR 270.30e-1). The Commission may use the information provided on Form N-CSR in its regulatory, disclosure review, inspection, and policymaking roles.
A registrant is required to disclose the information specified by Form N-CSR, and the Commission will make this information public. A registrant is not required to respond to the collection of information contained in Form N-CSR unless the Form displays a currently valid Office of Management and Budget (“OMB”) control number. Please direct comments concerning the accuracy of the information collection burden estimate and any suggestions for reducing the burden to Secretary, Securities and Exchange Commission, 450 Fifth Street, NW, Washington, DC 20549-0609. The OMB has reviewed this collection of information under the clearance requirements of 44 U.S.C. §3507.
| Item 1. | Reports to Stockholders. |
The registrant’s semi-annual report transmitted to shareholders pursuant to Rule 30e-1 under the Investment Company Act of 1940, as amended (the “Investment Company Act”), is as follows:
6.30.2021
Guggenheim Variable Funds Trust Semi-Annual Report
Series |
Series A | (StylePlus—Large Core Series) | | |
Series B | (Large Cap Value Series) | | |
Series D | (World Equity Income Series) | | |
Series E | (Total Return Bond Series) | | |
Series F | (Floating Rate Strategies Series) | | |
Series J | (StylePlus—Mid Growth Series) | | |
Series N | (Managed Asset Allocation Series) | | |
Series O | (All Cap Value Series) | | |
Series P | (High Yield Series) | | |
Series Q | (Small Cap Value Series) | | |
Series V | (SMid Cap Value Series) | | |
Series X | (StylePlus—Small Growth Series) | | |
Series Y | (StylePlus—Large Growth Series) | | |
Series Z | (Alpha Opportunity Series) | | |
GuggenheimInvestments.com | GVFT-SEMI-0621x1221 |
| | |
DEAR SHAREHOLDER | 2 |
ECONOMIC AND MARKET OVERVIEW | 5 |
ABOUT SHAREHOLDERS’ FUND EXPENSES | 7 |
SERIES A (STYLEPLUS—LARGE CORE SERIES) | 9 |
SERIES B (LARGE CAP VALUE SERIES) | 16 |
SERIES D (WORLD EQUITY INCOME SERIES) | 22 |
SERIES E (TOTAL RETURN BOND SERIES) | 29 |
SERIES F (FLOATING RATE STRATEGIES SERIES) | 50 |
SERIES J (STYLEPLUS—MID GROWTH SERIES) | 62 |
SERIES N (MANAGED ASSET ALLOCATION SERIES) | 70 |
SERIES O (ALL CAP VALUE SERIES) | 76 |
SERIES P (HIGH YIELD SERIES) | 83 |
SERIES Q (SMALL CAP VALUE SERIES) | 98 |
SERIES V (SMID CAP VALUE SERIES) | 105 |
SERIES X (STYLEPLUS—SMALL GROWTH SERIES) | 112 |
SERIES Y (STYLEPLUS—LARGE GROWTH SERIES) | 120 |
SERIES Z (ALPHA OPPORTUNITY SERIES) | 127 |
NOTES TO FINANCIAL STATEMENTS | 144 |
OTHER INFORMATION | 168 |
INFORMATION ON BOARD OF TRUSTEES AND OFFICERS | 175 |
GUGGENHEIM INVESTMENTS PRIVACY NOTICE | 180 |
LIQUIDITY RISK MANAGEMENT PROGRAM | 183 |
| | THE GUGGENHEIM FUNDS SEMI-ANNUAL REPORT | 1 |
Dear Shareholder:
Security Investors, LLC and Guggenheim Partners Investment Management, LLC (the “Investment Advisers”) are pleased to present the semi-annual shareholder report for funds that are part of the Guggenheim Variable Funds Trust (the “Funds”). This report covers performance of the Funds for the semi-annual period ended June 30, 2021.
The Investment Advisers are part of Guggenheim Investments, which represents the investment management businesses of Guggenheim Partners, LLC (“Guggenheim”), a global, diversified financial services firm.
Guggenheim Funds Distributors, LLC is the distributor of the Funds. Guggenheim Funds Distributors, LLC is affiliated with Guggenheim and the Investment Advisers.
We encourage you to read the Economic and Market Overview section of the report, which follows this letter.
We are committed to providing innovative investment solutions and appreciate the trust you place in us.
Sincerely,
Security Investors, LLC
Guggenheim Partners Investment Management, LLC
July 31, 2021
Read a prospectus and summary prospectus (if available) carefully before investing. It contains the investment objectives, risks, charges, expenses and other information, which should be considered carefully before investing. Obtain a prospectus and summary prospectus (if available) at guggenheiminvestments.com or call 800.820.0888.
This material is not intended as a recommendation or as investment advice of any kind, including in connection with rollovers, transfers, and distributions. Such material is not provided in a fiduciary capacity, may not be relied upon for or in connection with the making of investment decisions, and does not constitute a solicitation of an offer to buy or sell securities. All content has been provided for informational or educational purposes only and is not intended to be and should not be construed as legal or tax advice and/or a legal opinion. Always consult a financial, tax and/or legal professional regarding your specific situation.
COVID-19. The global ongoing crisis caused by the outbreak of COVID-19 and the current recovery underway is causing disruption to consumer demand and economic output and supply chains. There are still travel restrictions and quarantines, and adverse impacts on local and global economies. Investors should be aware that in light of this uncertainty, volatility and distress in economies, financial markets, and labor and health conditions all over the world, the Funds’ investments and a shareholder’s investment in a Fund are subject to sudden and substantial losses, increased volatility and other adverse events. Firms through which investors invest with the Funds, the Funds, their service providers, the markets in which they invest and market intermediaries are also impacted by quarantines and similar measures intended to respond to and contain the ongoing pandemic, which can obstruct their functioning and subject them to heightened operational and other risks.
2 THE GUGGENHEIM FUNDS SEMI-ANNUAL REPORT | |
The Series StylePlus Funds may not be suitable for all investors. Investments in large capitalization stocks may underperform other segments of the equity market or the equity market as a whole. ● Investments in small-sized company securities may present additional risks such as less predictable earnings, higher volatility and less liquidity than larger, more established companies. ● Growth stocks may be more volatile than other stocks because they are more sensitive to investor perceptions regarding the growth potential of the issuing companies. ● The Funds may invest in derivative instruments, which may be more volatile and less liquid, increasing the risk of loss when compared to traditional securities. Certain of the derivative instruments are also subject to the risks of counterparty default and adverse tax treatment. ● The Funds’ use of leverage, through borrowings or instruments such as derivatives, may cause the Funds to be more volatile than if they had not been leveraged. ● The Funds’ investments in other investment vehicles subject the Funds to those risks and expenses affecting the investment vehicle. ● The Funds may invest in foreign securities which carry additional risks when compared to U.S. securities, due to the impact of diplomatic, political or economic developments in the country in question (investments in emerging markets securities are generally subject to an even greater level of risks). ● The Funds may invest in fixed income securities whose market value will change in response to interest rate changes and market conditions among other factors. In general, bond prices rise when interest rates fall and vice versa. ● The Funds’ exposure to high yield securities may subject the Funds to greater volatility. ● The Funds may invest in bank loans and asset-backed securities, including mortgage backed, which involve special types of risks. ● The Funds may invest in restricted securities which may involve financial and liquidity risk. ● You may have a gain or loss when you sell your shares. ● It is important to note that the Funds are not guaranteed by the U.S. government. ● Please read the prospectus for more detailed information regarding these and other risks.
The Series Value Funds may not be suitable for all investors. ● An investment in the Funds will fluctuate and is subject to investment risks, which means investors could lose money. The intrinsic value of the underlying stocks may never be realized or the stocks may decline in value. Investments in small- and/or mid-sized company securities may present additional risks such as less predictable earnings, higher volatility and less liquidity than larger, more established companies. ● Please read the prospectus for more detailed information regarding these and other risks.
The Series D (World Equity Income Series) may not be suitable for all investors. ● Investments in securities in general are subject to market risks that may cause their prices to fluctuate over time. ●The Fund’s investments in foreign securities carry additional risks when compared to U.S. securities, due to the impact of diplomatic, political or economic developments in the country in question (investments in emerging markets are generally subject to an even greater level of risks). Additionally, the Fund’s exposure to foreign currencies subjects the Fund to the risk that those currencies will decline in value relative to the U.S. Dollar. ● The Fund’s investments in derivatives may pose risks in addition to those associated with investing directly in securities or other investments, including illiquidity of the derivatives, imperfect correlations with underlying investments or the Fund’s other portfolio holdings, lack of availability and counterparty risk. ●The Fund’s use of leverage, through instruments such as derivatives, may cause the Fund to be more volatile than if it had not been leveraged. ●The Fund’s investments in other investment vehicles subject the Fund to those risks and expenses affecting the investment vehicle. ●The Fund may have significant exposure to securities in a particular capitalization range e.g., large-, mid- or small-cap securities. As a result, the Fund may be subject to the risk that the pre-denominate capitalization range may underperform other segments of the equity market or the equity market as a whole. ● Please read the prospectus for more detailed information regarding these and other risks.
The Series E (Total Return Bond Series) may not be suitable for all investors. ● The Fund’s market value will change in response to interest rate changes and market conditions among other factors. In general, bond prices rise when interest rates fall and vice versa. ● The Fund’s exposure to high yield securities may subject the Fund to greater volatility. ● When market conditions are deemed appropriate, the Fund will leverage to the full extent permitted by its investment policies and restrictions and applicable law. Leveraging will exaggerate the effect on net asset value of any increase or decrease in the market value of the Fund’s portfolio. ● The Fund may invest in derivative instruments, which may be more volatile and less liquid, increasing the risk of loss when compared to traditional securities. Certain of the derivative instruments are also subject to the risks of counterparty default and adverse tax treatment. ● Instruments and strategies (such as borrowing transactions and reverse repurchase agreements) may provide leveraged exposure to a particular investment, which will magnify any gains or losses on those investments. ● Investments in reverse repurchase agreements expose the Fund to many of the same risks as investments in derivatives. ● The Fund’s investments in other investment vehicles subject the Fund to those risks and expenses affecting the investment vehicle. ● The Fund’s investments in foreign securities carry additional risks when compared to U.S. securities, due to the impact of diplomatic, political, or economic developments in the country in question (investments in emerging markets securities are generally subject to an even greater level of risk). ● Investments in syndicated bank loans generally offer a floating interest rate and involve special types of risks. ● The Fund’s investments in municipal securities can be affected by events that affect the municipal bond market. ● The Fund’s investments in real estate securities subject the Fund to the same risks as direct investments in real estate, which is particularly sensitive to economic downturns. ● The Fund’s investments in restricted securities may involve financial and liquidity risk. ● You may have a gain or loss when you sell your shares. ● It is important to note that the Fund is not guaranteed by the U.S. government. ● Please read the prospectus for more detailed information regarding these and other risks.
The Series F (Floating Rate Strategies Series) may not be suitable for all investors. ● Investments in floating rate senior secured syndicated bank loans and other floating rate securities involve special types of risks, including credit rate risk, interest rate risk, liquidity risk and prepayment risk. ● The Fund’s market value will change in response to interest rate changes and market conditions among other factors. In general, bond prices rise when interest rates fall and vice versa. ● The Fund’s exposure to high yield securities may subject the Fund to greater volatility. ● When market conditions are deemed appropriate, the Fund may use leverage to the full extent permitted by its investment policies and restrictions and applicable law. Leveraging will exaggerate the effect on net asset value of any increase or decrease in the market value of the Fund’s portfolio. ● The Fund may invest in derivative instruments, which may be more volatile and less liquid, increasing the risk of loss when compared to traditional securities. Certain of the derivative instruments are also subject to the risks of counterparty default and adverse tax treatment. ● Instruments and strategies (such as borrowing transactions and reverse repurchase agreements) may provide leveraged exposure to a particular investment, which will magnify any gains or losses on those investments. ● Investments in reverse repurchase agreements and synthetic instruments (such as synthetic collateralized debt obligations) expose the Fund to many of the same risks as investments in derivatives. ● The Fund’s investments in other investment vehicles subject the Fund to those risks and expenses affecting the investment vehicle. ● The Fund’s investments in foreign securities carry additional risks when compared to U.S. securities, due to the impact of diplomatic, political or economic developments in the country in question (investments in emerging markets securities are generally subject to an even greater level of risk). ● The Fund’s investments in real estate securities subject the Fund to the same risks as direct investments in real estate, which is particularly sensitive to economic downturns. ● The Fund’s investments in restricted securities may involve financial and liquidity risk. ● The Fund is subject to active trading risks that may increase volatility and impact its ability to achieve its investment objective. ● You may have a gain or loss when you sell your shares. ● It is important to note that the Fund is not guaranteed by the U.S. government. ● Please read the prospectus for more detailed information regarding these and other risks.
The Series N (Managed Asset Allocation Series) may not be suitable for all investors. ● The value of an investment in the Fund will fluctuate and is subject to investment risks, which means investors could lose money. The Fund could lose money if the issuer of a bond or a counterparty to a derivatives transaction or other transaction is unable to repay interest and principal on time or defaults. The issuer of a bond could also suffer a decrease in quality rating, which would affect the volatility and liquidity
| | THE GUGGENHEIM FUNDS SEMI-ANNUAL REPORT | 3 |
of the bond. Derivatives may pose risks in addition to those associated with investing directly in securities or other investments, including the risk that the Fund will be unable to sell, unwind or value the derivative because of an illiquid market, the risk that the derivative is not well correlated with underlying investments or the Fund’s other portfolio holdings, and the risk that the counterparty is unwilling or unable to meet its obligation. The use of derivatives by the Fund to hedge risk may reduce the opportunity for gain by offsetting the positive effect of favorable price movements. Furthermore, if the Investment Manager is incorrect about its expectations of market conditions, the use of derivatives could result in a loss, which in some cases may be unlimited. Foreign securities carry additional risks when compared to U.S. securities, including currency fluctuations, adverse political and economic developments, unreliable or untimely information, less liquidity, limited legal recourse and higher transactional costs. The Investment Manager may not be able to cause certain of the underlying funds’ performance to match or correlate to that of the underlying funds’ respective underlying index or benchmark, either on a daily or aggregate basis. Factors such as underlying fund expenses, imperfect correlation between an underlying fund’s investments and those of its underlying index or underlying benchmark, rounding of share prices, changes to the composition of the underlying index or underlying benchmark, regulatory policies, high portfolio turnover rate, and the use of leverage all contribute to tracking error. Tracking error may cause an underlying fund’s and, thus the Fund’s, performance to be less than you expect. ● Please read the prospectus for more detailed information regarding these and other risks.
The Series P (High Yield Series) may not be suitable for all investors. ● The Fund’s market value will change in response to interest rate changes and market conditions among other factors. In general, bond prices rise when interest rates fall and vice versa. ● The Fund’s exposure to high yield securities may subject the Fund to greater volatility. ● The Fund may invest in derivative instruments, which may be more volatile and less liquid, increasing the risk of loss when compared to traditional securities. Certain of the derivative instruments are also subject to the risks of counterparty default and adverse tax treatment. ● The Fund’s use of leverage, through borrowings or instruments such as derivatives, may cause the Fund to be more volatile than if it had not been leveraged. ● Instruments and strategies (such as borrowing transactions and reverse repurchase agreements) may provide leveraged exposure to a particular investment, which will magnify any gains or losses on those investments. ● The Fund may invest in foreign securities which carry additional risks when compared to U.S. securities, due to the impact of diplomatic, political or economic developments in the country in question (investments in emerging markets securities are generally subject to an even greater level of risks). ● Investments in syndicated bank loans generally offer a floating interest rate and involve special types of risks. ● The Fund’s investments in other investment vehicles subject the Fund to those risks and expenses affecting the investment vehicle. ● The Fund’s investments in restricted securities may involve financial and liquidity risk. ● You may have a gain or loss when you sell your shares. ● It is important to note that the Fund is not guaranteed by the U.S. government. ● Please read the prospectus for more detailed information regarding these and other risks.
The Series Z (Alpha Opportunity Series) may not be suitable for all investors. ● Investments in securities and derivatives, in general, are subject to market risks that may cause their prices to fluctuate over time. An investment in the Fund may lose money. There can be no guarantee the Fund will achieve it investment objective. ● The Fund’s use of derivatives such as futures, options and swap agreements may expose the Fund to additional risks that it would not be subject to if it invested directly in the securities underlying those derivatives. ● Certain of the derivative instruments, such as swaps and structured notes, are also subject to the risks of counterparty default and adverse tax treatment. ● The more the Fund invests in leveraged instruments, the more the leverage will magnify any gains or losses on those investments. ● The Fund’s use of short selling involves increased risk and costs, including paying more for a security than it received from its sale and the risk of unlimited losses. ● In certain circumstances the fund may be subject to liquidity risk and it may be difficult for the fund to purchase and sell particular investments within a reasonable time at a fair price. ● In certain circumstances, it may be difficult for the Fund to purchase and sell particular investments within a reasonable time at a fair price. ● The Fund’s fixed income investments will change in value in response to interest rate changes and other factors. ● Please read the prospectus for more information on these and additional risks.
4 THE GUGGENHEIM FUNDS SEMI-ANNUAL REPORT | |
ECONOMIC AND MARKET OVERVIEW | June 30, 2021 |
More states saw the end of COVID-19 related restrictions in the second quarter of 2021, including New York, California, and Illinois, marking a full reopening for almost all of the U.S. The U.S. has made solid vaccination progress, inoculating over 52% of the population. Those vaccinations have helped COVID-19 cases fall sharply from their peak, but the spread of the Delta variant is a worrying trend, particularly in areas with low vaccination rates. Though we expect cases will rise further as the Delta variant spreads, vaccination rates are high for the most vulnerable populations, which could limit hospitalizations and deaths, in turn reducing the need for a return to strict lockdowns.
Relaxed COVID-19 related measures and increased consumer comfort prompted a rapid reopening of the service sector and robust manufacturing activity. Both the ISM Manufacturing and Services Purchasing Managers Indexes cooled a bit in June but remain near the peaks of recent economic cycles.
Labor demand is also at record highs according to the National Federation of Independent Businesses (“NFIB”). The NFIB reported that nearly half of small-business owners in the U.S. could not fill job openings in June, making it the fifth consecutive month where the share of surveyed business owners citing jobs were hard to fill exceeded pre-COVID-19 historical highs. To attract more workers, business owners are raising or planning to raise compensation, especially in low-wage sectors where enhanced jobless benefits are competitive with wages. Corroborating this signal of strong labor demand is the consumer confidence data, which shows perceptions around job availability is above pre-COVID-19 highs.
Against this strong backdrop, the Federal Open Market Committee (“FOMC”) held its June meeting where, as expected, it kept rates unchanged. But the surprise came from the quarterly Summary of Economic Projections, which showed that FOMC participants now see upside risks to inflation at the highest levels in over a decade. This shift in the distribution of risk around inflation resulted in a surprise two-hike increase in their median fed funds rate forecast for 2023.
Our interpretation is that the U.S. Federal Reserve (“Fed”) is willing to be patient in reaching its dual mandate, but not irresponsible. Since the June meeting, 5-year forward Treasury Inflation-Protected Securities (“TIPS”) breakeven rates have fallen by about 0.25% as the market priced out a scenario in which the Fed lets inflation run too hot. This reassessment of the Fed’s reaction function led to a material decline in interest rates over the quarter. In the long run, keeping inflation expectations in check buys the central bank more time to keep policy accommodative.
Looking ahead, we are assessing the potential consequences of a slowdown in U.S. economic activity. Second quarter U.S. gross domestic product (“GDP”) is on track to show 8-9% annualized growth, after which we expect sequential growth could slow heading into 2022. Base effects from last year’s trough in activity could fade, as might the fiscal impulse over time. The impact of reopening businesses will also shrink. This natural slowdown in activity as we move through peak growth could present challenges if growth slows more than expected.
Inflation could fall given that much of the recent increase is coming from categories suffering temporary supply chain disruptions. Price pressures have materialized in sectors directly affected by the pandemic, such as hotels, airfares, and car rentals, where demand has bounced back faster than supply. Shortages in areas such as semiconductors and building materials are caused by factories and transportation abroad that have not returned to full capacity. As these factors are resolved and supply comes back online, a decline in inflation prints and inflation expectations over the next several quarters may prompt a rethink of the FOMC’s forecasted hikes.
The Fed may commence tapering asset purchases in 2022, but we continue to believe rate hikes will likely get pushed as far as 2025 as inflation cools and the Fed targets a historically tight labor market. This patience by the Fed would support credit conditions, which could mean low default volumes and positive risk-adjusted returns. Real U.S. interest rates could remain deeply negative, further supporting the credit sector as income-seeking investors search for yield.
For the six-month period ended June 30, 2021, the S&P 500® Index* returned 15.25%. The MSCI Europe-Australasia-Far East (“EAFE”) Index* returned 8.83%. The return of the MSCI Emerging Markets Index* was 7.45%.
In the bond market, the Bloomberg Barclays U.S. Aggregate Bond Index* posted a -1.60% return for the six-month period, while the Bloomberg Barclays U.S. Corporate High Yield Index* returned 3.62%. The return of the ICE Bank of America (“BofA”) Merrill Lynch 3-Month U.S. Treasury Bill Index* was 0.02% for the six-month period.
The opinions and forecasts expressed may not actually come to pass. This information is subject to change at any time, based on market and other conditions, and should not be construed as a recommendation of any specific security or strategy.
| | THE GUGGENHEIM FUNDS SEMI-ANNUAL REPORT | 5 |
ECONOMIC AND MARKET OVERVIEW (Unaudited)(concluded) | June 30, 2021 |
*Index Definitions:
The following indices are referenced throughout this report. Indices are unmanaged and not available for direct investment. Index performance does not reflect transaction costs, fees, or expenses.
Bloomberg Barclays U.S. Aggregate Bond Index is a broad-based flagship benchmark that measures the investment grade, U.S. dollar-denominated, fixed-rate taxable bond market, including U.S. Treasuries, government-related and corporate securities, mortgage-backed securities or “MBS” (agency fixed-rate and hybrid adjustable-rate mortgage, or “ARM”, pass-throughs), asset-backed securities (“ABS”), and commercial mortgage-backed securities (“CMBS”) (agency and non-agency).
Bloomberg Barclays U.S. Corporate High Yield Index measures the U.S. dollar-denominated, high yield, fixed-rate corporate bond market. Securities are classified as high yield if the middle rating of Moody’s, Fitch, and S&P is Ba1/BB +/BB + or below.
Credit Suisse Leveraged Loan Index is designed to mirror the investable universe of the U.S. dollar-denominated leveraged loan market.
ICE BofA Merrill Lynch 3-Month U.S. Treasury Bill Index is an unmanaged market index of U.S. Treasury securities maturing in 90 days that assumes reinvestment of all income.
MSCI EAFE Index is a free float-adjusted market capitalization index that is designed to measure the equity market performance of developed markets, excluding the U.S. & Canada.
MSCI Emerging Markets Index is a free float-adjusted market capitalization weighted index that is designed to measure equity market performance in the global emerging markets.
MSCI World Index is calculated with net dividends reinvested. It is a free float-adjusted market capitalization weighted index that is designed to measure the equity market performance of developed markets.
Morningstar Long/Short Equity Category Average represents long-short portfolios which hold sizable stakes in both long and short positions in equities and related derivatives. Some funds that fall into this category will shift their exposure to long and short positions depending on their macro outlook or the opportunities they uncover through bottom-up research. Some funds may simply hedge long stock positions through exchange traded funds or derivatives. At least 75% of the assets are in equity securities or derivatives.
Russell 1000® Growth Index measures the performance of the large-cap growth segment of the U.S. equity universe. It includes those Russell 1000 companies with higher price-to-book ratios and higher forecasted growth value.
Russell 1000® Value Index: A measure of the performance for the large-cap value segment of the U.S. equity universe. It includes those Russell 1000 companies with lower price-to-book ratios and lower expected growth values.
Russell 2000® Growth Index measures the performance of the small-cap growth segment of the U.S. equity universe. It includes those Russell 2000 companies with higher price-to-book ratios and higher forecasted growth values.
Russell 2000® Value Index measures the performance of the small-cap value segment of the U.S. equity universe. It includes those Russell 2000 companies with lower price-to-book ratios and lower forecasted growth values.
Russell 2500® Value Index measures the performance of the small- to mid-cap value segment of the U.S. equity universe. It includes those Russell 2500 companies with lower price-to-book ratios and lower forecasted growth values.
Russell 3000® Index measures the performance of the largest 3,000 U.S. companies, representing approximately 98% of the investable U.S. equity market.
Russell 3000® Value Index measures the performance of the broad value segment of the U.S. equity value universe. It includes those Russell 3000 companies with lower price-to-book ratios and lower forecasted growth values.
Russell Midcap® Growth Index measures the performance of the mid-cap growth segment of the U.S. equity universe. It includes those Russell Midcap Index companies with higher price-to-book ratios and higher forecasted growth values.
S&P 500® is a broad-based index, the performance of which is based on the performance of 500 widely held common stocks chosen for market size, liquidity, and industry group representation.
6 THE GUGGENHEIM FUNDS SEMI-ANNUAL REPORT | |
ABOUT SHAREHOLDERS’ FUND EXPENSES (Unaudited) | |
All mutual funds have operating expenses, and it is important for our shareholders to understand the impact of costs on their investments. Shareholders of a fund incur two types of costs: (i) transaction costs, including sales charges (loads) on purchase payments, reinvested dividends, other distributions, and exchange fees, and (ii) ongoing costs, including management fees, administrative services, and shareholder reports, among others. These ongoing costs, or operating expenses, are deducted from a fund’s gross income and reduce the investment return of the fund.
A fund’s expenses are expressed as a percentage of its average net assets, which is known as the expense ratio. The following examples are intended to help investors understand the ongoing costs (in dollars) of investing in a fund and to compare these costs with the ongoing costs of investing in other mutual funds.
The examples are based on an investment of $1,000 made at the beginning of the period and held for the entire six-month period beginning December 31, 2020 and ending June 30, 2021.
The following tables illustrate the Funds’ costs in two ways:
Table 1. Based on actual Fund return: This section helps investors estimate the actual expenses paid over the period. The “Ending Account Value” shown is derived from the Fund’s actual return, and the fifth column shows the dollar amount that would have been paid by an investor who started with $1,000 in the Fund. Investors may use the information here, together with the amount invested, to estimate the expenses paid over the period. Simply divide the Fund’s account value by $1,000 (for example, an $8,600 account value divided by $1,000 = 8.6), then multiply the result by the number provided under the heading “Expenses Paid During Period.”
Table 2. Based on hypothetical 5% return: This section is intended to help investors compare a fund’s cost with those of other mutual funds. The table provides information about hypothetical account values and hypothetical expenses based on the Fund’s actual expense ratio and an assumed rate of return of 5% per year before expenses, which is not the Fund’s actual return. The hypothetical account values and expenses may not be used to estimate the actual ending account balance or expenses paid during the period. The example is useful in making comparisons because the U.S. Securities and Exchange Commission (the “SEC”) requires all mutual funds to calculate expenses based on the 5% return. Investors can assess a fund’s costs by comparing this hypothetical example with the hypothetical examples that appear in shareholder reports of other funds.
The calculations illustrated above assume no shares were bought or sold during the period. Actual costs may have been higher or lower, depending on the amount of investment and the timing of any purchases or redemptions.
Please note that the expenses shown in the table are meant to highlight your ongoing costs only and do not reflect any transactional costs, such as sales charges (loads) on purchase payments, and contingent deferred sales charges (“CDSC”) on redemptions, if any. Therefore, the second table is useful in comparing ongoing costs only, and will not help you determine the relative total costs of owning different funds. In addition, if these transactional costs were included, your costs would have been higher.
More information about the Funds’ expenses, including annual expense ratios for periods up to five years (subject to the Fund’s inception date), can be found in the Financial Highlights section of this report. For additional information on operating expenses and other shareholder costs, please refer to the appropriate Fund prospectus.
| | THE GUGGENHEIM FUNDS SEMI-ANNUAL REPORT | 7 |
ABOUT SHAREHOLDERS’ FUND EXPENSES (Unaudited)(concluded) | |
| Expense
Ratio1 | Fund
Return | Beginning
Account Value
December 31, 2020 | Ending
Account Value
June 30, 2021 | Expenses
Paid During
Period2 |
Table 1. Based on actual Fund return3 | | | | | |
Series A (StylePlus—Large Core Series) | 0.85% | 15.41% | $ 1,000.00 | $ 1,154.10 | $ 4.54 |
Series B (Large Cap Value Series) | 0.79% | 18.32% | 1,000.00 | 1,183.20 | 4.28 |
Series D (World Equity Income Series) | 0.89% | 16.16% | 1,000.00 | 1,161.60 | 4.77 |
Series E (Total Return Bond Series) | 0.78% | (0.66%) | 1,000.00 | 993.40 | 3.86 |
Series F (Floating Rate Strategies Series) | 1.18% | 1.43% | 1,000.00 | 1,014.30 | 5.89 |
Series J (StylePlus—Mid Growth Series) | 0.89% | 11.05% | 1,000.00 | 1,110.50 | 4.66 |
Series N (Managed Asset Allocation Series) | 0.91% | 7.60% | 1,000.00 | 1,076.00 | 4.68 |
Series O (All Cap Value Series) | 0.87% | 19.90% | 1,000.00 | 1,199.00 | 4.74 |
Series P (High Yield Series) | 1.08% | 3.49% | 1,000.00 | 1,034.90 | 5.45 |
Series Q (Small Cap Value Series) | 1.13% | 23.30% | 1,000.00 | 1,233.00 | 6.26 |
Series V (SMid Cap Value Series) | 0.90% | 20.26% | 1,000.00 | 1,202.60 | 4.92 |
Series X (StylePlus—Small Growth Series) | 0.99% | 10.26% | 1,000.00 | 1,102.60 | 5.16 |
Series Y (StylePlus—Large Growth Series) | 0.87% | 13.38% | 1,000.00 | 1,133.80 | 4.60 |
Series Z (Alpha Opportunity Series) | 2.01% | 6.27% | 1,000.00 | 1,062.70 | 10.28 |
|
Table 2. Based on hypothetical 5% return (before expenses) | | | | |
Series A (StylePlus—Large Core Series) | 0.85% | 5.00% | $ 1,000.00 | $ 1,020.58 | $ 4.26 |
Series B (Large Cap Value Series) | 0.79% | 5.00% | 1,000.00 | 1,020.88 | 3.96 |
Series D (World Equity Income Series) | 0.89% | 5.00% | 1,000.00 | 1,020.38 | 4.46 |
Series E (Total Return Bond Series) | 0.78% | 5.00% | 1,000.00 | 1,020.93 | 3.91 |
Series F (Floating Rate Strategies Series) | 1.18% | 5.00% | 1,000.00 | 1,018.94 | 5.91 |
Series J (StylePlus—Mid Growth Series) | 0.89% | 5.00% | 1,000.00 | 1,020.38 | 4.46 |
Series N (Managed Asset Allocation Series) | 0.91% | 5.00% | 1,000.00 | 1,020.28 | 4.56 |
Series O (All Cap Value Series) | 0.87% | 5.00% | 1,000.00 | 1,020.48 | 4.36 |
Series P (High Yield Series) | 1.08% | 5.00% | 1,000.00 | 1,019.44 | 5.41 |
Series Q (Small Cap Value Series) | 1.13% | 5.00% | 1,000.00 | 1,019.19 | 5.66 |
Series V (SMid Cap Value Series) | 0.90% | 5.00% | 1,000.00 | 1,020.33 | 4.51 |
Series X (StylePlus—Small Growth Series) | 0.99% | 5.00% | 1,000.00 | 1,019.89 | 4.96 |
Series Y (StylePlus—Large Growth Series) | 0.87% | 5.00% | 1,000.00 | 1,020.48 | 4.36 |
Series Z (Alpha Opportunity Series) | 2.01% | 5.00% | 1,000.00 | 1,014.83 | 10.04 |
1 | Annualized and excludes expenses of the underlying funds in which the Funds invest, if any. This ratio represents net expenses, which may include expenses that are excluded from the expense limitation agreement and affiliated waivers. Excluding these expenses, the net expense ratios for the period would be: |
| | Fund | 06/30/21 |
| | Series A (StylePlus—Large Core Series) | 0.84% |
| | Series B (Large Cap Value Series) | 0.79% |
| | Series D (World Equity Income Series) | 0.89% |
| | Series E (Total Return Bond Series) | 0.78% |
| | Series F (Floating Rate Strategies Series) | 1.14% |
| | Series J (StylePlus—Mid Growth Series) | 0.87% |
| | Series O (All Cap Value Series) | 0.87% |
| | Series P (High Yield Series) | 1.06% |
| | Series Q (Small Cap Value Series) | 1.13% |
| | Series V (SMid Cap Value Series) | 0.90% |
| | Series X (StylePlus—Small Growth Series) | 0.99% |
| | Series Y (StylePlus—Large Growth Series) | 0.87% |
| | Series Z (Alpha Opportunity Series) | 2.00% |
2 | Expenses are equal to the Fund’s annualized expense ratio, net of any applicable fee waivers, multiplied by the average account value over the period, multiplied by 181/365 (to reflect the one-half year period). Expenses shown do not include fees charged by insurance companies. |
3 | Actual cumulative return at net asset value for the period December 31, 2020 to June 30, 2021. |
8 THE GUGGENHEIM FUNDS SEMI-ANNUAL REPORT | |
PERFORMANCE REPORT AND FUND PROFILE (Unaudited) | June 30, 2021 |
SERIES A (STYLEPLUS—LARGE CORE SERIES)
OBJECTIVE: Seeks long-term growth of capital.
Holdings Diversification (Market Exposure as % of Net Assets)
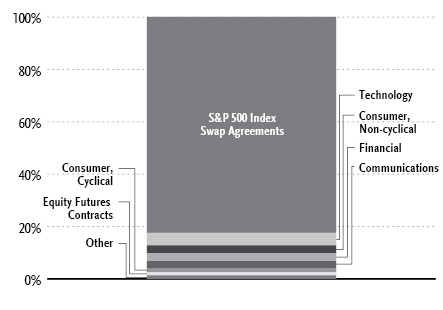
“Holdings Diversification (Market Exposure as % of Net Assets)” excludes any temporary cash investments, investments in Guggenheim Strategy Funds Trust mutual funds, or investments in Guggenheim Ultra Short Duration Fund.
Inception Date: May 1, 1979 |
Ten Largest Holdings (% of Total Net Assets) |
Guggenheim Strategy Fund III | 25.3% |
Guggenheim Ultra Short Duration Fund — Institutional Class | 24.1% |
Guggenheim Variable Insurance Strategy Fund III | 22.9% |
Guggenheim Strategy Fund II | 6.6% |
Apple, Inc. | 1.0% |
Microsoft Corp. | 1.0% |
Amazon.com, Inc. | 0.5% |
Alphabet, Inc. — Class C | 0.5% |
Berkshire Hathaway, Inc. — Class B | 0.4% |
Facebook, Inc. — Class A | 0.3% |
Top Ten Total | 82.6% |
| | |
“Ten Largest Holdings” excludes any temporary cash or derivative investments. |
Average Annual Returns*,†
Periods Ended June 30, 2021
| 6 Month‡ | 1 Year | 5 Year | 10 Year |
Series A (StylePlus—Large Core Series) | 15.41% | 42.49% | 17.23% | 13.77% |
S&P 500 Index | 15.25% | 40.79% | 17.65% | 14.84% |
* | The performance data above represents past performance that is not predictive of future results. The investment return and principal value of an investment in the Fund will fluctuate so that an investor’s shares, when redeemed, may be worth more or less than their original cost. Returns are historical and include changes in principal and reinvested dividends and capital gains and do not reflect the effect of taxes. The S&P 500 Index is an unmanaged index and, unlike the Fund, has no management fees or operating expenses to reduce its reported return. |
† | Performance figures do not reflect fees and expenses associated with an investment in variable insurance products. If returns had taken into account these fees and expenses, performance would have been lower. Shares of a series of Guggenheim Variable Funds Trust are available only through the purchase of such products. |
‡ | 6 month returns are not annualized. |
| | THE GUGGENHEIM FUNDS SEMI-ANNUAL REPORT | 9 |
SCHEDULE OF INVESTMENTS (Unaudited) | June 30, 2021 |
SERIES A (STYLEPLUS—LARGE CORE SERIES) | |
| | Shares | | | Value | |
COMMON STOCKS† - 16.4% |
| | | | | | | | | |
Technology - 4.8% |
Apple, Inc. | | | 19,387 | | | $ | 2,655,244 | |
Microsoft Corp. | | | 9,641 | | | | 2,611,756 | |
Intel Corp. | | | 11,776 | | | | 661,105 | |
QUALCOMM, Inc. | | | 4,041 | | | | 577,580 | |
Oracle Corp. | | | 7,148 | | | | 556,400 | |
Broadcom, Inc. | | | 1,162 | | | | 554,088 | |
Texas Instruments, Inc. | | | 2,698 | | | | 518,825 | |
Cerner Corp. | | | 5,396 | | | | 421,752 | |
Cadence Design Systems, Inc.* | | | 3,039 | | | | 415,796 | |
NetApp, Inc. | | | 5,030 | | | | 411,555 | |
HP, Inc. | | | 12,405 | | | | 374,507 | |
KLA Corp. | | | 996 | | | | 322,913 | |
Qorvo, Inc.* | | | 1,533 | | | | 299,931 | |
Citrix Systems, Inc. | | | 2,456 | | | | 288,015 | |
Lam Research Corp. | | | 398 | | | | 258,979 | |
NVIDIA Corp. | | | 296 | | | | 236,830 | |
Teradyne, Inc. | | | 1,636 | | | | 219,158 | |
Cognizant Technology Solutions Corp. — Class A | | | 3,035 | | | | 210,204 | |
Seagate Technology Holdings plc | | | 2,086 | | | | 183,422 | |
Applied Materials, Inc. | | | 932 | | | | 132,717 | |
International Business Machines Corp. | | | 816 | | | | 119,617 | |
Adobe, Inc.* | | | 153 | | | | 89,603 | |
Total Technology | | | | | | | 12,119,997 | |
| | | | | | | | | |
Consumer, Non-cyclical - 3.1% |
Merck & Company, Inc. | | | 7,387 | | | | 574,487 | |
Bristol-Myers Squibb Co. | | | 7,942 | | | | 530,684 | |
Amgen, Inc. | | | 2,149 | | | | 523,819 | |
HCA Healthcare, Inc. | | | 2,257 | | | | 466,612 | |
Laboratory Corporation of America Holdings* | | | 1,683 | | | | 464,256 | |
Gilead Sciences, Inc. | | | 6,725 | | | | 463,083 | |
Hologic, Inc.* | | | 6,868 | | | | 458,233 | |
Quest Diagnostics, Inc. | | | 3,352 | | | | 442,363 | |
Humana, Inc. | | | 993 | | | | 439,621 | |
Regeneron Pharmaceuticals, Inc.* | | | 605 | | | | 337,917 | |
Bio-Rad Laboratories, Inc. — Class A* | | | 447 | | | | 287,997 | |
Vertex Pharmaceuticals, Inc.* | | | 1,379 | | | | 278,048 | |
DaVita, Inc.* | | | 2,098 | | | | 252,662 | |
United Rentals, Inc.* | | | 762 | | | | 243,086 | |
Universal Health Services, Inc. — Class B | | | 1,583 | | | | 231,799 | |
Incyte Corp.* | | | 2,692 | | | | 226,478 | |
Philip Morris International, Inc. | | | 2,178 | | | | 215,861 | |
McKesson Corp. | | | 1,048 | | | | 200,419 | |
Molson Coors Beverage Co. — Class B* | | | 3,375 | | | | 181,204 | |
PayPal Holdings, Inc.* | | | 608 | | | | 177,220 | |
PerkinElmer, Inc. | | | 1,102 | | | | 170,160 | |
Altria Group, Inc. | | | 3,345 | | | | 159,490 | |
Anthem, Inc. | | | 378 | | | | 144,320 | |
UnitedHealth Group, Inc. | | | 306 | | | | 122,535 | |
Johnson & Johnson | | | 736 | | | | 121,249 | |
Pfizer, Inc. | | | 3,023 | | | | 118,381 | |
Biogen, Inc.* | | | 330 | | | | 114,269 | |
Total Consumer, Non-cyclical | | | | | | | 7,946,253 | |
| | | | | | | | | |
Financial - 2.9% |
Berkshire Hathaway, Inc. — Class B* | | | 3,547 | | | | 985,782 | |
Progressive Corp. | | | 5,048 | | | | 495,764 | |
Allstate Corp. | | | 3,474 | | | | 453,149 | |
Goldman Sachs Group, Inc. | | | 1,188 | | | | 450,882 | |
Aflac, Inc. | | | 8,043 | | | | 431,587 | |
Citigroup, Inc. | | | 6,035 | | | | 426,976 | |
Raymond James Financial, Inc. | | | 3,005 | | | | 390,350 | |
Cboe Global Markets, Inc. | | | 3,275 | | | | 389,889 | |
Regions Financial Corp. | | | 18,493 | | | | 373,189 | |
Capital One Financial Corp. | | | 2,349 | | | | 363,367 | |
Synchrony Financial | | | 7,334 | | | | 355,846 | |
Everest Re Group Ltd. | | | 1,333 | | | | 335,929 | |
Zions Bancorp North America | | | 6,151 | | | | 325,142 | |
Discover Financial Services | | | 2,704 | | | | 319,856 | |
JPMorgan Chase & Co. | | | 1,821 | | | | 283,238 | |
Western Union Co. | | | 11,887 | | | | 273,044 | |
Cincinnati Financial Corp. | | | 2,001 | | | | 233,357 | |
Mastercard, Inc. — Class A | | | 604 | | | | 220,514 | |
Visa, Inc. — Class A | | | 876 | | | | 204,826 | |
Bank of America Corp. | | | 2,949 | | | | 121,587 | |
Total Financial | | | | | | | 7,434,274 | |
| | | | | | | | | |
Communications - 2.7% |
Amazon.com, Inc.* | | | 405 | | | | 1,393,265 | |
Alphabet, Inc. — Class C* | | | 537 | | | | 1,345,894 | |
Facebook, Inc. — Class A* | | | 2,423 | | | | 842,501 | |
Cisco Systems, Inc. | | | 12,188 | | | | 645,964 | |
Motorola Solutions, Inc. | | | 2,117 | | | | 459,071 | |
VeriSign, Inc.* | | | 1,968 | | | | 448,094 | |
Juniper Networks, Inc. | | | 11,580 | | | | 316,713 | |
F5 Networks, Inc.* | | | 1,461 | | | | 272,710 | |
NortonLifeLock, Inc. | | | 9,014 | | | | 245,361 | |
AT&T, Inc. | | | 8,142 | | | | 234,327 | |
Walt Disney Co.* | | | 1,160 | | | | 203,893 | |
eBay, Inc. | | | 2,251 | | | | 158,043 | |
Fox Corp. — Class A | | | 3,915 | | | | 145,364 | |
Arista Networks, Inc.* | | | 400 | | | | 144,924 | |
Total Communications | | | | | | | 6,856,124 | |
| | | | | | | | | |
Consumer, Cyclical - 1.6% |
Lowe’s Companies, Inc. | | | 2,798 | | | | 542,728 | |
O’Reilly Automotive, Inc.* | | | 856 | | | | 484,676 | |
AutoZone, Inc.* | | | 323 | | | | 481,987 | |
Yum! Brands, Inc. | | | 3,796 | | | | 436,654 | |
PulteGroup, Inc. | | | 7,086 | | | | 386,683 | |
Whirlpool Corp. | | | 1,703 | | | | 371,288 | |
Best Buy Company, Inc. | | | 2,467 | | | | 283,656 | |
Tesla, Inc.* | | | 410 | | | | 278,677 | |
Lennar Corp. — Class A | | | 2,292 | | | | 227,710 | |
Home Depot, Inc. | | | 531 | | | | 169,330 | |
Cummins, Inc. | | | 688 | | | | 167,741 | |
LKQ Corp.* | | | 2,775 | | | | 136,586 | |
10 | THE GUGGENHEIM FUNDS SEMI-ANNUAL REPORT | SEE NOTES TO FINANCIAL STATEMENTS. |
SCHEDULE OF INVESTMENTS (Unaudited)(continued) | June 30, 2021 |
SERIES A (STYLEPLUS—LARGE CORE SERIES) | |
| | Shares | | | Value | |
Domino’s Pizza, Inc. | | | 277 | | | $ | 129,218 | |
Total Consumer, Cyclical | | | | | | | 4,096,934 | |
| | | | | | | | | |
Industrial - 1.1% |
3M Co. | | | 2,491 | | | | 494,787 | |
Northrop Grumman Corp. | | | 1,277 | | | | 464,100 | |
Masco Corp. | | | 7,312 | | | | 430,750 | |
Sealed Air Corp. | | | 5,828 | | | | 345,309 | |
Snap-on, Inc. | | | 1,136 | | | | 253,816 | |
Parker-Hannifin Corp. | | | 713 | | | | 218,970 | |
Huntington Ingalls Industries, Inc. | | | 1,017 | | | | 214,333 | |
Keysight Technologies, Inc.* | | | 1,183 | | | | 182,667 | |
Deere & Co. | | | 488 | | | | 172,123 | |
Total Industrial | | | | | | | 2,776,855 | |
| | | | | | | | | |
Energy - 0.2% |
Williams Companies, Inc. | | | 12,157 | | | | 322,768 | |
ONEOK, Inc. | | | 2,244 | | | | 124,856 | |
Total Energy | | | | | | | 447,624 | |
| | | | | | | | | |
Total Common Stocks | | | | |
(Cost $35,555,141) | | | | | | | 41,678,061 | |
| | | | | | | | | |
MUTUAL FUNDS† - 78.9% |
Guggenheim Strategy Fund III1 | | | 2,548,677 | | | | 64,124,704 | |
Guggenheim Ultra Short Duration Fund — Institutional Class1 | | | 6,120,505 | | | | 61,021,440 | |
Guggenheim Variable Insurance Strategy Fund III1 | | | 2,308,674 | | | | 57,878,452 | |
Guggenheim Strategy Fund II1 | | | 669,542 | | | | 16,731,847 | |
Total Mutual Funds | | | | |
(Cost $198,531,757) | | | | | | | 199,756,443 | |
| | | | | | | | | |
MONEY MARKET FUND† - 4.4% |
Dreyfus Treasury Securities Cash Management Fund — Institutional Shares, 0.01%2 | | | 11,032,648 | | | | 11,032,648 | |
Total Money Market Fund | | | | |
(Cost $11,032,648) | | | | | | | 11,032,648 | |
| | | | | | | | | |
Total Investments - 99.7% | | | | |
(Cost $245,119,546) | | $ | 252,467,152 | |
Other Assets & Liabilities, net - 0.3% | | | 683,404 | |
Total Net Assets - 100.0% | | $ | 253,150,556 | |
Futures Contracts |
Description | | Number of
Contracts | | | Expiration
Date | | | Notional
Amount | | | Value and
Unrealized
Appreciation** | |
Equity Futures Contracts Purchased† |
S&P 500 Index Mini Futures Contracts | | | 14 | | | | Sep 2021 | | | $ | 3,000,550 | | | $ | 34,883 | |
Total Return Swap Agreements |
Counterparty | Index | Financing
Rate Pay
(Receive) | Payment
Frequency | | Maturity
Date | | | Units | | | Notional
Amount | | | Value and
Unrealized
Appreciation | |
OTC Equity Index Swap Agreements†† |
Wells Fargo Bank, N.A. | S&P 500 Total Return Index | 0.43% (3 Month USD LIBOR + 0.23%) | At Maturity | | | 10/05/21 | | | | 23,352 | | | $ | 208,820,123 | | | $ | 11,322,988 | |
* | Non-income producing security. |
** | Includes cumulative appreciation (depreciation). Variation margin is reported within the Statement of Assets and Liabilities. |
† | Value determined based on Level 1 inputs — See Note 4. |
†† | Value determined based on Level 2 inputs — See Note 4. |
1 | Affiliated issuer. |
2 | Rate indicated is the 7-day yield as of June 30, 2021. |
| | LIBOR — London Interbank Offered Rate |
| | plc — Public Limited Company |
| | |
| | See Sector Classification in Other Information section. |
SEE NOTES TO FINANCIAL STATEMENTS. | THE GUGGENHEIM FUNDS SEMI-ANNUAL REPORT | 11 |
SCHEDULE OF INVESTMENTS (Unaudited)(concluded) | June 30, 2021 |
SERIES A (STYLEPLUS—LARGE CORE SERIES) | |
The following table summarizes the inputs used to value the Fund’s investments at June 30, 2021 (See Note 4 in the Notes to Financial Statements):
Investments in Securities (Assets) | | Level 1
Quoted
Prices | | | Level 2
Significant
Observable
Inputs | | | Level 3
Significant
Unobservable
Inputs | | | Total | |
Common Stocks | | $ | 41,678,061 | | | $ | — | | | $ | — | | | $ | 41,678,061 | |
Mutual Funds | | | 199,756,443 | | | | — | | | | — | | | | 199,756,443 | |
Money Market Fund | | | 11,032,648 | | | | — | | | | — | | | | 11,032,648 | |
Equity Futures Contracts** | | | 34,883 | | | | — | | | | — | | | | 34,883 | |
Equity Index Swap Agreements** | | | — | | | | 11,322,988 | | | | — | | | | 11,322,988 | |
Total Assets | | $ | 252,502,035 | | | $ | 11,322,988 | | | $ | — | | | $ | 263,825,023 | |
** | This derivative is reported as unrealized appreciation/depreciation at period end. |
Affiliated Transactions
Investments representing 5% or more of the outstanding voting shares of a company, or control of or by, or common control under Guggenheim Investments (“GI”), result in that company being considered an affiliated issuer, as defined in the 1940 Act.
The Fund may invest in certain of the underlying series of Guggenheim Strategy Funds Trust, including Guggenheim Strategy Fund II, Guggenheim Strategy Fund III, and Guggenheim Variable Insurance Strategy Fund III, (collectively, the “Short Term Investment Vehicles”), each of which are open-end management investment companies managed by GI. The Short Term Investment Vehicles, which launched on March 11, 2014, are offered as short term investment options only to mutual funds, trusts, and other accounts managed by GI and/or its affiliates, and are not available to the public. The Short Term Investment Vehicles pay no investment management fees. The Short Term Investment Vehicles’ annual report on Form N-CSR dated September 30, 2020, is available publicly or upon request. This information is available from the EDGAR database on the SEC’s website at https://www.sec.gov/Archives/edgar/data/1601445/000182126820000133/gug81042-ncsr.htm.
Transactions during the period ended June 30, 2021, in which the company is an affiliated issuer, were as follows:
Security Name | | Value
12/31/20 | | | Additions | | | Reductions | | | Realized
Gain (Loss) | | | Change in
Unrealized
Appreciation
(Depreciation) | | | Value
06/30/21 | | | Shares
06/30/21 | | | Investment
Income | |
Mutual Funds | | | | | | | | | | | | | | | | | | | | | | | | | | | | | | | | |
Guggenheim Strategy Fund II | | $ | 16,600,429 | | | $ | 111,492 | | | $ | — | | | $ | — | | | $ | 19,926 | | | $ | 16,731,847 | | | | 669,542 | | | $ | 113,104 | |
Guggenheim Strategy Fund III | | | 57,516,275 | | | | 6,471,019 | | | | — | | | | — | | | | 137,410 | | | | 64,124,704 | | | | 2,548,677 | | | | 477,627 | |
Guggenheim Ultra Short Duration Fund — Institutional Class | | | 47,177,063 | | | | 15,268,109 | | | | (1,367,999 | ) | | | 43,946 | | | | (99,679 | ) | | | 61,021,440 | | | | 6,120,505 | | | | 266,632 | |
Guggenheim Variable Insurance Strategy Fund III | | | 57,356,264 | | | | 453,632 | | | | — | | | | — | | | | 68,556 | | | | 57,878,452 | | | | 2,308,674 | | | | 459,793 | |
| | | $ | 178,650,031 | | | $ | 22,304,252 | | | $ | (1,367,999 | ) | | $ | 43,946 | | | $ | 126,213 | | | $ | 199,756,443 | | | | | | | $ | 1,317,156 | |
12 | THE GUGGENHEIM FUNDS SEMI-ANNUAL REPORT | SEE NOTES TO FINANCIAL STATEMENTS. |
SERIES A (STYLEPLUS—LARGE CORE SERIES) | |
STATEMENT OF ASSETS AND LIABILITIES (Unaudited) |
June 30, 2021 |
Assets: |
Investments in unaffiliated issuers, at value (cost $46,587,789) | | $ | 52,710,709 | |
Investments in affiliated issuers, at value (cost $198,531,757) | | | 199,756,443 | |
Segregated cash with broker | | | 154,000 | |
Unrealized appreciation on OTC swap agreements | | | 11,322,988 | |
Prepaid expenses | | | 11,121 | |
Receivables: |
Fund shares sold | | | 422,648 | |
Dividends | | | 254,306 | |
Variation margin on futures contracts | | | 4,270 | |
Interest | | | 31 | |
Total assets | | | 264,636,516 | |
| | | | | |
Liabilities: |
Overdraft due to custodian bank | | | 231 | |
Segregated cash due to broker | | | 10,780,000 | |
Payable for: |
Securities purchased | | | 227,872 | |
Swap settlement | | | 200,043 | |
Management fees | | | 97,559 | |
Distribution and service fees | | | 51,405 | |
Trustees’ fees* | | | 15,634 | |
Fund accounting/administration fees | | | 15,290 | |
Fund shares redeemed | | | 13,813 | |
Transfer agent/maintenance fees | | | 2,268 | |
Miscellaneous | | | 81,845 | |
Total liabilities | | | 11,485,960 | |
Commitments and contingent liabilities (Note 12) | | | — | |
Net assets | | $ | 253,150,556 | |
| | | | | |
Net assets consist of: |
Paid in capital | | $ | 163,372,324 | |
Total distributable earnings (loss) | | | 89,778,232 | |
Net assets | | $ | 253,150,556 | |
Capital shares outstanding | | | 4,441,207 | |
Net asset value per share | | $ | 57.00 | |
STATEMENT OF OPERATIONS (Unaudited) |
Six Months Ended June 30, 2021 |
Investment Income: |
Dividends from securities of unaffiliated issuers | | $ | 358,850 | |
Dividends from securities of affiliated issuers | | | 1,317,156 | |
Interest | | | 495 | |
Total investment income | | | 1,676,501 | |
| | | | | |
Expenses: |
Management fees | | | 898,367 | |
Distribution and service fees | | | 299,456 | |
Transfer agent/maintenance fees | | | 12,432 | |
Fund accounting/administration fees | | | 83,541 | |
Professional fees | | | 16,183 | |
Interest expense | | | 11,960 | |
Custodian fees | | | 9,629 | |
Trustees’ fees* | | | 8,573 | |
Line of credit fees | | | 5,004 | |
Miscellaneous | | | 8,955 | |
Total expenses | | | 1,354,100 | |
Less: |
Expenses waived by Adviser | | | (334,086 | ) |
Earnings credits applied | | | (100 | ) |
Total waived expenses | | | (334,186 | ) |
Net expenses | | | 1,019,914 | |
Net investment income | | | 656,587 | |
| | | | | |
Net Realized and Unrealized Gain (Loss): |
Net realized gain (loss) on: |
Investments in unaffiliated issuers | | | 5,259,175 | |
Investments in affiliated issuers | | | 43,946 | |
Swap agreements | | | 38,031,706 | |
Futures contracts | | | 664,975 | |
Net realized gain | | | 43,999,802 | |
Net change in unrealized appreciation (depreciation) on: |
Investments in unaffiliated issuers | | | 219,534 | |
Investments in affiliated issuers | | | 126,213 | |
Swap agreements | | | (10,366,704 | ) |
Futures contracts | | | 3,543 | |
Net change in unrealized appreciation (depreciation) | | | (10,017,414 | ) |
Net realized and unrealized gain | | | 33,982,388 | |
Net increase in net assets resulting from operations | | $ | 34,638,975 | |
* | Relates to Trustees not deemed “interested persons” within the meaning of Section 2(a)(19) of the 1940 Act. |
SEE NOTES TO FINANCIAL STATEMENTS. | THE GUGGENHEIM FUNDS SEMI-ANNUAL REPORT | 13 |
SERIES A (STYLEPLUS—LARGE CORE SERIES) | |
STATEMENTS OF CHANGES IN NET ASSETS |
| | Six Months Ended
June 30, 2021
(Unaudited) | | | Year Ended
December 31,
2020 | |
Increase (Decrease) in Net Assets from Operations: | | | | | | | | |
Net investment income | | $ | 656,587 | | | $ | 1,804,148 | |
Net realized gain on investments | | | 43,999,802 | | | | 27,369,160 | |
Net change in unrealized appreciation (depreciation) on investments | | | (10,017,414 | ) | | | 6,844,741 | |
Net increase in net assets resulting from operations | | | 34,638,975 | | | | 36,018,049 | |
| | | | | | | | | |
Distributions to shareholders | | | — | | | | (12,350,787 | ) |
| | | | | | | | | |
Capital share transactions: | | | | | | | | |
Proceeds from sale of shares | | | 1,689,383 | | | | 4,825,074 | |
Distributions reinvested | | | — | | | | 12,350,787 | |
Cost of shares redeemed | | | (13,265,542 | ) | | | (28,837,836 | ) |
Net decrease from capital share transactions | | | (11,576,159 | ) | | | (11,661,975 | ) |
Net increase in net assets | | | 23,062,816 | | | | 12,005,287 | |
| | | | | | | | | |
Net assets: | | | | | | | | |
Beginning of period | | | 230,087,740 | | | | 218,082,453 | |
End of period | | $ | 253,150,556 | | | $ | 230,087,740 | |
| | | | | | | | | |
Capital share activity: | | | | | | | | |
Shares sold | | | 31,755 | | | | 113,612 | |
Shares issued from reinvestment of distributions | | | — | | | | 294,839 | |
Shares redeemed | | | (249,580 | ) | | | (678,666 | ) |
Net decrease in shares | | | (217,825 | ) | | | (270,215 | ) |
14 | THE GUGGENHEIM FUNDS SEMI-ANNUAL REPORT | SEE NOTES TO FINANCIAL STATEMENTS. |
SERIES A (STYLEPLUS—LARGE CORE SERIES) | |
This table is presented to show selected data for a share outstanding throughout each period and to assist shareholders in evaluating a Fund’s performance for the periods presented.
| | Six Months Ended
June 30, 2021a | | | Year Ended
December 31,
2020 | | | Year Ended
December 31,
2019 | | | Year Ended
December 31,
2018 | | | Year Ended
December 31,
2017 | | | Year Ended
December 31,
2016 | |
Per Share Data |
Net asset value, beginning of period | | $ | 49.39 | | | $ | 44.24 | | | $ | 36.80 | | | $ | 45.50 | | | $ | 38.20 | | | $ | 34.34 | |
Income (loss) from investment operations: |
Net investment income (loss)b | | | .14 | | | | .38 | | | | .68 | | | | .83 | | | | .62 | | | | .46 | |
Net gain (loss) on investments (realized and unrealized) | | | 7.47 | | | | 7.46 | | | | 10.06 | | | | (3.10 | ) | | | 7.76 | | | | 4.09 | |
Total from investment operations | | | 7.61 | | | | 7.84 | | | | 10.74 | | | | (2.27 | ) | | | 8.38 | | | | 4.55 | |
Less distributions from: |
Net investment income | | | — | | | | (.74 | ) | | | (.91 | ) | | | (.75 | ) | | | (.50 | ) | | | (.32 | ) |
Net realized gains | | | — | | | | (1.95 | ) | | | (2.39 | ) | | | (5.68 | ) | | | (.58 | ) | | | (.37 | ) |
Total distributions | | | — | | | | (2.69 | ) | | | (3.30 | ) | | | (6.43 | ) | | | (1.08 | ) | | | (.69 | ) |
Net asset value, end of period | | $ | 57.00 | | | $ | 49.39 | | | $ | 44.24 | | | $ | 36.80 | | | $ | 45.50 | | | $ | 38.20 | |
|
Total Returnc | | | 15.41 | % | | | 18.78 | % | | | 29.97 | % | | | (6.56 | %) | | | 22.22 | % | | | 13.34 | % |
Ratios/Supplemental Data |
Net assets, end of period (in thousands) | | $ | 253,151 | | | $ | 230,088 | | | $ | 218,082 | | | $ | 190,644 | | | $ | 251,795 | | | $ | 223,705 | |
Ratios to average net assets: |
Net investment income (loss) | | | 0.55 | % | | | 0.88 | % | | | 1.65 | % | | | 1.89 | % | | | 1.48 | % | | | 1.31 | % |
Total expensesd | | | 1.13 | % | | | 1.22 | % | | | 1.27 | % | | | 1.26 | % | | | 1.12 | % | | | 0.93 | % |
Net expensese,f,g | | | 0.85 | % | | | 0.89 | % | | | 0.95 | % | | | 0.97 | % | | | 0.91 | % | | | 0.93 | % |
Portfolio turnover rate | | | 14 | % | | | 63 | % | | | 41 | % | | | 45 | % | | | 44 | % | | | 43 | % |
a | Unaudited figures for the period ended June 30, 2021. Percentage amounts for the period, except total return and portfolio turnover rate, have been annualized. |
b | Net investment income (loss) per share was computed using average shares outstanding throughout the period. |
c | Total return does not take into account any of the expenses associated with an investment in variable insurance products. If total return had taken into account these expenses, performance would have been lower. Shares of a series of Guggenheim Variable Funds Trust are available only through the purchase of such products. |
d | Does not include expenses of the underlying funds in which the Fund invests. |
e | Net expense information reflects the expense ratios after expense waivers and reimbursements, as applicable. |
f | Net expenses may include expenses that are excluded from the expense limitation agreement. Excluding these expenses, the net expense ratios for the periods presented would be: |
| | 06/30/21a | 12/31/20 | 12/31/19 | 12/31/18 | 12/31/17 | 12/31/16 |
| | 0.84% | 0.87% | 0.89% | 0.91% | 0.90% | 0.93% |
g | The portion of the ratios of net expenses to average net assets attributable to recoupments of prior fee reductions or expense reimbursements for the periods presented was as follows: |
| | 06/30/21a | 12/31/20 | 12/31/19 | 12/31/18 | 12/31/17 | 12/31/16 |
| | — | — | — | 0.02% | — | — |
SEE NOTES TO FINANCIAL STATEMENTS. | THE GUGGENHEIM FUNDS SEMI-ANNUAL REPORT | 15 |
PERFORMANCE REPORT AND FUND PROFILE (Unaudited) | June 30, 2021 |
SERIES B (LARGE CAP VALUE SERIES)
OBJECTIVE: Seeks long-term growth of capital.
Holdings Diversification (Market Exposure as % of Net Assets)
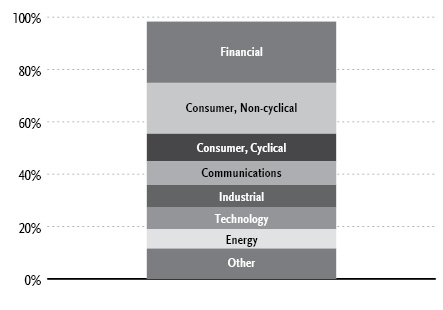
“Holdings Diversification (Market Exposure as % of Net Assets)” excludes any temporary cash investments.
Inception Date: May 1, 1979 |
Ten Largest Holdings (% of Total Net Assets) |
JPMorgan Chase & Co. | 2.6% |
Micron Technology, Inc. | 2.4% |
Verizon Communications, Inc. | 2.3% |
Berkshire Hathaway, Inc. — Class B | 2.2% |
Tyson Foods, Inc. — Class A | 2.1% |
Johnson & Johnson | 2.0% |
Comcast Corp. — Class A | 2.0% |
Wells Fargo & Co. | 2.0% |
Bank of America Corp. | 1.9% |
Humana, Inc. | 1.8% |
Top Ten Total | 21.3% |
| | |
“Ten Largest Holdings” excludes any temporary cash investments. |
Average Annual Returns*,†
Periods Ended June 30, 2021
| 6 Month‡ | 1 Year | 5 Year | 10 Year |
Series B (Large Cap Value Series) | 18.32% | 47.13% | 11.95% | 10.55% |
Russell 1000 Value Index | 17.05% | 43.68% | 11.87% | 11.61% |
* | The performance data above represents past performance that is not predictive of future results. The investment return and principal value of an investment in the Fund will fluctuate so that an investor’s shares, when redeemed, may be worth more or less than their original cost. Returns are historical and include changes in principal and reinvested dividends and capital gains and do not reflect the effect of taxes. The Russell 1000 Value Index is an unmanaged index and, unlike the Fund, has no management fees or operating expenses to reduce its reported return. |
† | Performance figures do not reflect fees and expenses associated with an investment in variable insurance products. If returns had taken into account these fees and expenses, performance would have been lower. Shares of a series of Guggenheim Variable Funds Trust are available only through the purchase of such products. |
‡ | 6 month returns are not annualized. |
16 THE GUGGENHEIM FUNDS SEMI-ANNUAL REPORT | |
SCHEDULE OF INVESTMENTS (Unaudited) | June 30, 2021 |
SERIES B (LARGE CAP VALUE SERIES) | |
| | Shares | | | Value | |
COMMON STOCKS† - 98.3% |
| | | | | | | | | |
Financial - 23.4% |
JPMorgan Chase & Co. | | | 38,094 | | | $ | 5,925,141 | |
Berkshire Hathaway, Inc. — Class B* | | | 18,228 | | | | 5,065,926 | |
Wells Fargo & Co. | | | 103,435 | | | | 4,684,571 | |
Bank of America Corp. | | | 105,080 | | | | 4,332,448 | |
Morgan Stanley | | | 34,665 | | | | 3,178,434 | |
Citigroup, Inc. | | | 40,185 | | | | 2,843,089 | |
Allstate Corp. | | | 21,352 | | | | 2,785,155 | |
Hartford Financial Services Group, Inc. | | | 34,287 | | | | 2,124,765 | |
Charles Schwab Corp. | | | 27,103 | | | | 1,973,369 | |
Voya Financial, Inc. | | | 30,830 | | | | 1,896,045 | |
Medical Properties Trust, Inc. REIT | | | 87,952 | | | | 1,767,835 | |
MetLife, Inc. | | | 27,594 | | | | 1,651,501 | |
Prudential Financial, Inc. | | | 14,614 | | | | 1,497,496 | |
Regions Financial Corp. | | | 70,117 | | | | 1,414,961 | |
KeyCorp | | | 64,668 | | | | 1,335,394 | |
Park Hotels & Resorts, Inc. REIT* | | | 64,125 | | | | 1,321,616 | |
American Tower Corp. — Class A REIT | | | 4,618 | | | | 1,247,507 | |
STAG Industrial, Inc. REIT | | | 32,775 | | | | 1,226,768 | |
Mastercard, Inc. — Class A | | | 3,197 | | | | 1,167,193 | |
Principal Financial Group, Inc. | | | 18,209 | | | | 1,150,627 | |
Synovus Financial Corp. | | | 25,902 | | | | 1,136,580 | |
Zions Bancorp North America | | | 20,791 | | | | 1,099,012 | |
Jones Lang LaSalle, Inc.* | | | 4,866 | | | | 951,108 | |
American International Group, Inc. | | | 18,813 | | | | 895,499 | |
BOK Financial Corp. | | | 9,366 | | | | 811,096 | |
Gaming and Leisure Properties, Inc. REIT | | | 12,532 | | | | 580,608 | |
Total Financial | | | | | | | 54,063,744 | |
| | | | | | | | | |
Consumer, Non-cyclical - 19.5% |
Tyson Foods, Inc. — Class A | | | 65,226 | | | | 4,811,070 | |
Johnson & Johnson | | | 28,659 | | | | 4,721,284 | |
Humana, Inc. | | | 9,178 | | | | 4,063,284 | |
HCA Healthcare, Inc. | | | 18,846 | | | | 3,896,222 | |
Archer-Daniels-Midland Co. | | | 52,046 | | | | 3,153,988 | |
McKesson Corp. | | | 14,704 | | | | 2,811,993 | |
Medtronic plc | | | 21,543 | | | | 2,674,133 | |
J M Smucker Co. | | | 17,762 | | | | 2,301,422 | |
Quest Diagnostics, Inc. | | | 17,401 | | | | 2,296,410 | |
Zimmer Biomet Holdings, Inc. | | | 13,693 | | | | 2,202,108 | |
Bunge Ltd. | | | 25,800 | | | | 2,016,270 | |
Encompass Health Corp. | | | 25,501 | | | | 1,989,843 | |
Amgen, Inc. | | | 6,861 | | | | 1,672,369 | |
Merck & Company, Inc. | | | 20,657 | | | | 1,606,495 | |
Ingredion, Inc. | | | 13,001 | | | | 1,176,591 | |
Pfizer, Inc. | | | 29,771 | | | | 1,165,832 | |
Procter & Gamble Co. | | | 8,583 | | | | 1,158,104 | |
Henry Schein, Inc.* | | | 14,934 | | | | 1,107,953 | |
Organon & Co.* | | | 2,065 | | | | 62,487 | |
Total Consumer, Non-cyclical | | | | | | | 44,887,858 | |
| | | | | | | | | |
Consumer, Cyclical - 10.5% |
Walmart, Inc. | | | 25,244 | | | | 3,559,909 | |
Kohl’s Corp. | | | 50,896 | | | | 2,804,879 | |
Southwest Airlines Co.* | | | 47,188 | | | | 2,505,211 | |
LKQ Corp.* | | | 49,954 | | | | 2,458,736 | |
Penske Automotive Group, Inc. | | | 28,787 | | | | 2,173,131 | |
Lear Corp. | | | 12,115 | | | | 2,123,517 | |
Home Depot, Inc. | | | 5,978 | | | | 1,906,324 | |
DR Horton, Inc. | | | 20,604 | | | | 1,861,984 | |
PACCAR, Inc. | | | 20,253 | | | | 1,807,580 | |
PVH Corp.* | | | 14,248 | | | | 1,532,942 | |
Ralph Lauren Corp. — Class A | | | 11,569 | | | | 1,362,944 | |
Total Consumer, Cyclical | | | | | | | 24,097,157 | |
| | | | | | | | | |
Communications - 9.1% |
Verizon Communications, Inc. | | | 94,596 | | | | 5,300,214 | |
Comcast Corp. — Class A | | | 82,304 | | | | 4,692,974 | |
Cisco Systems, Inc. | | | 46,985 | | | | 2,490,205 | |
T-Mobile US, Inc.* | | | 15,182 | | | | 2,198,809 | |
Alphabet, Inc. — Class A* | | | 859 | | | | 2,097,498 | |
FireEye, Inc.* | | | 82,418 | | | | 1,666,492 | |
Walt Disney Co.* | | | 8,284 | | | | 1,456,079 | |
Juniper Networks, Inc. | | | 43,590 | | | | 1,192,186 | |
Total Communications | | | | | | | 21,094,457 | |
| | | | | | | | | |
Industrial - 8.4% |
Honeywell International, Inc. | | | 15,835 | | | | 3,473,407 | |
Johnson Controls International plc | | | 46,562 | | | | 3,195,550 | |
L3Harris Technologies, Inc. | | | 10,969 | | | | 2,370,949 | |
Knight-Swift Transportation Holdings, Inc. | | | 46,371 | | | | 2,108,026 | |
Valmont Industries, Inc. | | | 7,628 | | | | 1,800,589 | |
FedEx Corp. | | | 6,009 | | | | 1,792,665 | |
Owens Corning | | | 17,203 | | | | 1,684,174 | |
Curtiss-Wright Corp. | | | 14,040 | | | | 1,667,390 | |
General Electric Co. | | | 97,873 | | | | 1,317,371 | |
Total Industrial | | | | | | | 19,410,121 | |
| | | | | | | | | |
Technology - 8.4% |
Micron Technology, Inc.* | | | 64,631 | | | | 5,492,342 | |
DXC Technology Co.* | | | 75,160 | | | | 2,926,730 | |
Skyworks Solutions, Inc. | | | 14,527 | | | | 2,785,552 | |
Leidos Holdings, Inc. | | | 23,089 | | | | 2,334,298 | |
Apple, Inc. | | | 16,014 | | | | 2,193,278 | |
Qorvo, Inc.* | | | 6,918 | | | | 1,353,507 | |
Amdocs Ltd. | | | 15,609 | | | | 1,207,512 | |
Cerner Corp. | | | 12,890 | | | | 1,007,483 | |
Total Technology | | | | | | | 19,300,702 | |
| | | | | | | | | |
Energy - 7.5% |
Chevron Corp. | | | 36,592 | | | | 3,832,646 | |
ConocoPhillips | | | 55,659 | | | | 3,389,633 | |
Marathon Oil Corp. | | | 158,094 | | | | 2,153,240 | |
Range Resources Corp.* | | | 107,163 | | | | 1,796,052 | |
Patterson-UTI Energy, Inc. | | | 176,554 | | | | 1,754,947 | |
Exxon Mobil Corp. | | | 26,250 | | | | 1,655,850 | |
Cabot Oil & Gas Corp. — Class A | | | 91,049 | | | | 1,589,715 | |
Pioneer Natural Resources Co. | | | 7,109 | | | | 1,155,355 | |
Total Energy | | | | | | | 17,327,438 | |
| | | | | | | | | |
SEE NOTES TO FINANCIAL STATEMENTS. | THE GUGGENHEIM FUNDS SEMI-ANNUAL REPORT | 17 |
SCHEDULE OF INVESTMENTS (Unaudited)(concluded) | June 30, 2021 |
SERIES B (LARGE CAP VALUE SERIES) | |
| | Shares | | | Value | |
Utilities - 6.7% |
Exelon Corp. | | | 76,577 | | | $ | 3,393,127 | |
Public Service Enterprise Group, Inc. | | | 48,378 | | | | 2,890,102 | |
Edison International | | | 48,175 | | | | 2,785,478 | |
Duke Energy Corp. | | | 21,954 | | | | 2,167,299 | |
Pinnacle West Capital Corp. | | | 23,291 | | | | 1,909,163 | |
NiSource, Inc. | | | 51,045 | | | | 1,250,603 | |
PPL Corp. | | | 33,862 | | | | 947,120 | |
Total Utilities | | | | | | | 15,342,892 | |
| | | | | | | | | |
Basic Materials - 4.8% |
Huntsman Corp. | | | 123,085 | | | | 3,264,214 | |
Westlake Chemical Corp. | | | 30,967 | | | | 2,789,817 | |
Reliance Steel & Aluminum Co. | | | 10,519 | | | | 1,587,317 | |
Nucor Corp. | | | 11,318 | | | | 1,085,736 | |
International Flavors & Fragrances, Inc. | | | 6,793 | | | | 1,014,874 | |
DuPont de Nemours, Inc. | | | 8,550 | | | | 661,855 | |
Dow, Inc. | | | 9,877 | | | | 625,017 | |
Total Basic Materials | | | | | | | 11,028,830 | |
| | | | | | | | | |
Total Common Stocks | | | | |
(Cost $161,974,550) | | | | | | | 226,553,199 | |
| | | | | | | | | |
MONEY MARKET FUND† - 1.7% |
Dreyfus Treasury Securities Cash Management Fund — Institutional Shares, 0.01%1 | | | 3,983,507 | | | | 3,983,507 | |
Total Money Market Fund | | | | |
(Cost $3,983,507) | | | | | | | 3,983,507 | |
| | | | | | | | | |
Total Investments - 100.0% | | | | |
(Cost $165,958,057) | | $ | 230,536,706 | |
Other Assets & Liabilities, net - 0.0% | | | 230 | |
Total Net Assets - 100.0% | | $ | 230,536,936 | |
* | Non-income producing security. |
† | Value determined based on Level 1 inputs — See Note 4. |
1 | Rate indicated is the 7-day yield as of June 30, 2021. |
| | plc — Public Limited Company |
| | REIT — Real Estate Investment Trust |
| | |
| | See Sector Classification in Other Information section. |
The following table summarizes the inputs used to value the Fund’s investments at June 30, 2021 (See Note 4 in the Notes to Financial Statements):
Investments in Securities (Assets) | | Level 1
Quoted
Prices | | | Level 2
Significant
Observable
Inputs | | | Level 3
Significant
Unobservable
Inputs | | | Total | |
Common Stocks | | $ | 226,553,199 | | | $ | — | | | $ | — | | | $ | 226,553,199 | |
Money Market Fund | | | 3,983,507 | | | | — | | | | — | | | | 3,983,507 | |
Total Assets | | $ | 230,536,706 | | | $ | — | | | $ | — | | | $ | 230,536,706 | |
18 | THE GUGGENHEIM FUNDS SEMI-ANNUAL REPORT | SEE NOTES TO FINANCIAL STATEMENTS. |
SERIES B (LARGE CAP VALUE SERIES) | |
STATEMENT OF ASSETS AND LIABILITIES (Unaudited) |
June 30, 2021 |
Assets: |
Investments, at value (cost $165,958,057) | | $ | 230,536,706 | |
Prepaid expenses | | | 1,690 | |
Receivables: |
Dividends | | | 221,555 | |
Fund shares sold | | | 18,960 | |
Interest | | | 12 | |
Total assets | | | 230,778,923 | |
| | | | | |
Liabilities: |
Payable for: |
Management fees | | | 80,658 | |
Fund shares redeemed | | | 69,537 | |
Distribution and service fees | | | 48,023 | |
Fund accounting/administration fees | | | 14,033 | |
Trustees’ fees* | | | 4,646 | |
Transfer agent/maintenance fees | | | 2,267 | |
Miscellaneous | | | 22,823 | |
Total liabilities | | | 241,987 | |
Commitments and contingent liabilities (Note 12) | | | — | |
Net assets | | $ | 230,536,936 | |
| | | | | |
Net assets consist of: |
Paid in capital | | $ | 149,226,933 | |
Total distributable earnings (loss) | | | 81,310,003 | |
Net assets | | $ | 230,536,936 | |
Capital shares outstanding | | | 5,180,228 | |
Net asset value per share | | $ | 44.50 | |
STATEMENT OF OPERATIONS (Unaudited) |
Six Months Ended June 30, 2021 |
Investment Income: |
Dividends | | $ | 2,196,752 | |
Interest | | | 182 | |
Total investment income | | | 2,196,934 | |
| | | | | |
Expenses: |
Management fees | | | 732,716 | |
Distribution and service fees | | | 281,814 | |
Transfer agent/maintenance fees | | | 12,417 | |
Fund accounting/administration fees | | | 78,982 | |
Professional fees | | | 15,425 | |
Trustees’ fees* | | | 9,613 | |
Line of credit fees | | | 4,593 | |
Custodian fees | | | 3,532 | |
Miscellaneous | | | 8,082 | |
Total expenses | | | 1,147,174 | |
Less: |
Expenses waived by Adviser | | | (256,261 | ) |
Net expenses | | | 890,913 | |
Net investment income | | | 1,306,021 | |
| | | | | |
Net Realized and Unrealized Gain (Loss): |
Net realized gain (loss) on: |
Investments | | | 10,711,960 | |
Net realized gain | | | 10,711,960 | |
Net change in unrealized appreciation (depreciation) on: |
Investments | | | 25,490,935 | |
Net change in unrealized appreciation (depreciation) | | | 25,490,935 | |
Net realized and unrealized gain | | | 36,202,895 | |
Net increase in net assets resulting from operations | | $ | 37,508,916 | |
* | Relates to Trustees not deemed “interested persons” within the meaning of Section 2(a)(19) of the 1940 Act. |
SEE NOTES TO FINANCIAL STATEMENTS. | THE GUGGENHEIM FUNDS SEMI-ANNUAL REPORT | 19 |
SERIES B (LARGE CAP VALUE SERIES) | |
STATEMENTS OF CHANGES IN NET ASSETS |
| | Six Months Ended
June 30, 2021
(Unaudited) | | | Year Ended
December 31,
2020 | |
Increase (Decrease) in Net Assets from Operations: | | | | | | | | |
Net investment income | | $ | 1,306,021 | | | $ | 4,562,466 | |
Net realized gain on investments | | | 10,711,960 | | | | 1,794,553 | |
Net change in unrealized appreciation (depreciation) on investments | | | 25,490,935 | | | | (5,308,681 | ) |
Net increase in net assets resulting from operations | | | 37,508,916 | | | | 1,048,338 | |
| | | | | | | | | |
Distributions to shareholders | | | — | | | | (17,232,283 | ) |
| | | | | | | | | |
Capital share transactions: | | | | | | | | |
Proceeds from sale of shares | | | 2,519,492 | | | | 11,205,807 | |
Distributions reinvested | | | — | | | | 17,232,283 | |
Cost of shares redeemed | | | (18,039,169 | ) | | | (30,674,259 | ) |
Net decrease from capital share transactions | | | (15,519,677 | ) | | | (2,236,169 | ) |
Net increase (decrease) in net assets | | | 21,989,239 | | | | (18,420,114 | ) |
| | | | | | | | | |
Net assets: | | | | | | | | |
Beginning of period | | | 208,547,697 | | | | 226,967,811 | |
End of period | | $ | 230,536,936 | | | $ | 208,547,697 | |
| | | | | | | | | |
Capital share activity: | | | | | | | | |
Shares sold | | | 59,035 | | | | 310,192 | |
Shares issued from reinvestment of distributions | | | — | | | | 540,197 | |
Shares redeemed | | | (423,154 | ) | | | (902,732 | ) |
Net decrease in shares | | | (364,119 | ) | | | (52,343 | ) |
20 | THE GUGGENHEIM FUNDS SEMI-ANNUAL REPORT | SEE NOTES TO FINANCIAL STATEMENTS. |
SERIES B (LARGE CAP VALUE SERIES) | |
This table is presented to show selected data for a share outstanding throughout each period and to assist shareholders in evaluating a Fund’s performance for the periods presented.
| | Six Months Ended
June 30, 2021a | | | Year Ended
December 31,
2020 | | | Year Ended
December 31,
2019 | | | Year Ended
December 31,
2018 | | | Year Ended
December 31,
2017 | | | Year Ended
December 31,
2016 | |
Per Share Data |
Net asset value, beginning of period | | $ | 37.61 | | | $ | 40.55 | | | $ | 36.14 | | | $ | 43.36 | | | $ | 39.08 | | | $ | 33.20 | |
Income (loss) from investment operations: |
Net investment income (loss)b | | | .24 | | | | .82 | | | | .72 | | | | .65 | | | | .48 | | | | .50 | |
Net gain (loss) on investments (realized and unrealized) | | | 6.65 | | | | (.51 | ) | | | 6.93 | | | | (4.42 | ) | | | 5.52 | | | | 6.48 | |
Total from investment operations | | | 6.89 | | | | .31 | | | | 7.65 | | | | (3.77 | ) | | | 6.00 | | | | 6.98 | |
Less distributions from: |
Net investment income | | | — | | | | (.74 | ) | | | (.72 | ) | | | (.58 | ) | | | (.53 | ) | | | (.61 | ) |
Net realized gains | | | — | | | | (2.51 | ) | | | (2.52 | ) | | | (2.87 | ) | | | (1.19 | ) | | | (.49 | ) |
Total distributions | | | — | | | | (3.25 | ) | | | (3.24 | ) | | | (3.45 | ) | | | (1.72 | ) | | | (1.10 | ) |
Net asset value, end of period | | $ | 44.50 | | | $ | 37.61 | | | $ | 40.55 | | | $ | 36.14 | | | $ | 43.36 | | | $ | 39.08 | |
|
Total Returnc | | | 18.32 | % | | | 2.21 | % | | | 21.82 | % | | | (9.53 | %) | | | 15.81 | % | | | 21.41 | % |
Ratios/Supplemental Data |
Net assets, end of period (in thousands) | | $ | 230,537 | | | $ | 208,548 | | | $ | 226,968 | | | $ | 207,167 | | | $ | 269,258 | | | $ | 260,692 | |
Ratios to average net assets: |
Net investment income (loss) | | | 1.16 | % | | | 2.40 | % | | | 1.86 | % | | | 1.54 | % | | | 1.17 | % | | | 1.44 | % |
Total expensesd | | | 1.02 | % | | | 1.09 | % | | | 1.07 | % | | | 1.07 | % | | | 1.02 | % | | | 0.82 | % |
Net expensese,f | | | 0.79 | % | | | 0.79 | % | | | 0.80 | % | | | 0.80 | % | | | 0.81 | % | | | 0.82 | % |
Portfolio turnover rate | | | 10 | % | | | 19 | % | | | 32 | % | | | 21 | % | | | 27 | % | | | 44 | % |
a | Unaudited figures for the period ended June 30, 2021. Percentage amounts for the period, except total return and portfolio turnover rate, have been annualized. |
b | Net investment income (loss) per share was computed using average shares outstanding throughout the period. |
c | Total return does not take into account any of the expenses associated with an investment in variable insurance products. If total return had taken into account these expenses, performance would have been lower. Shares of a series of Guggenheim Variable Funds Trust are available only through the purchase of such products. |
d | Does not include expenses of the underlying funds in which the Fund invests. |
e | Net expense information reflects the expense ratios after expense waivers and reimbursements, as applicable. |
f | Net expenses may include expenses that are excluded from the expense limitation agreement. Excluding these expenses, the net expense ratios for the periods presented would be: |
| | 06/30/21a | 12/31/20 | 12/31/19 | 12/31/18 | 12/31/17 | 12/31/16 |
| | 0.79% | 0.79% | 0.80% | 0.80% | 0.79% | 0.82% |
SEE NOTES TO FINANCIAL STATEMENTS. | THE GUGGENHEIM FUNDS SEMI-ANNUAL REPORT | 21 |
PERFORMANCE REPORT AND FUND PROFILE (Unaudited) | June 30, 2021 |
SERIES D (WORLD EQUITY INCOME SERIES)
OBJECTIVE: Seeks to provide total return, comprised of capital appreciation and income.
Holdings Diversification (Market Exposure as % of Net Assets)
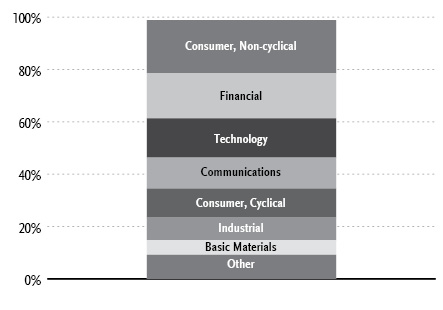
“Holdings Diversification (Market Exposure as % of Net Assets)” excludes any temporary cash investments.
COUNTRY DIVERSIFICATION
At June 30, 2021, the investment diversification of the Fund by Country was as follows:
Country | | % of Long-Term
Investments | |
United States | | | 63.6 | % |
Japan | | | 6.6 | % |
Germany | | | 4.9 | % |
United Kingdom | | | 3.4 | % |
Ireland | | | 3.0 | % |
Australia | | | 3.0 | % |
Sweden | | | 2.4 | % |
Other | | | 13.1 | % |
Total Long-Term Investments | | | 100.0 | % |
Inception Date: April 19, 1984 |
Ten Largest Holdings (% of Total Net Assets) |
Apple, Inc. | 3.2% |
Microsoft Corp. | 2.6% |
Alphabet, Inc. — Class C | 2.0% |
Amazon.com, Inc. | 1.9% |
Verizon Communications, Inc. | 1.1% |
Philip Morris International, Inc. | 1.1% |
Citigroup, Inc. | 1.1% |
Accenture plc — Class A | 1.0% |
Bristol-Myers Squibb Co. | 1.0% |
AbbVie, Inc. | 1.0% |
Top Ten Total | 16.0% |
| | |
“Ten Largest Holdings” excludes any temporary cash or derivative investments. |
Average Annual Returns*,†
Periods Ended June 30, 2021
| 6 Month‡ | 1 Year | 5 Year | 10 Year |
Series D (World Equity Income Series) | 16.16% | 38.23% | 10.39% | 7.65% |
MSCI World Index | 13.05% | 39.04% | 14.83% | 10.65% |
* | The performance data above represents past performance that is not predictive of future results. The investment return and principal value of an investment in the Fund will fluctuate so that an investor’s shares, when redeemed, may be worth more or less than their original cost. Returns are historical and include changes in principal and reinvested dividends and capital gains and do not reflect the effect of taxes. The MSCI World Index is an unmanaged index and, unlike the Fund, has no management fees or operating expenses to reduce its reported return. |
† | Performance figures do not reflect fees and expenses associated with an investment in variable insurance products. If returns had taken into account these fees and expenses, performance would have been lower. Shares of a series of Guggenheim Variable Funds Trust are available only through the purchase of such products. |
‡ | 6 month returns are not annualized. |
22 THE GUGGENHEIM FUNDS SEMI-ANNUAL REPORT | |
SCHEDULE OF INVESTMENTS (Unaudited) | June 30, 2021 |
SERIES D (WORLD EQUITY INCOME SERIES) | |
| | Shares | | | Value | |
COMMON STOCKS† - 96.8% |
| | | | | | | | | |
Consumer, Non-cyclical - 20.3% |
Philip Morris International, Inc. | | | 15,200 | | | $ | 1,506,472 | |
Bristol-Myers Squibb Co. | | | 21,094 | | | | 1,409,501 | |
AbbVie, Inc. | | | 12,408 | | | | 1,397,637 | |
PepsiCo, Inc. | | | 8,995 | | | | 1,332,789 | |
Pfizer, Inc. | | | 34,000 | | | | 1,331,440 | |
Merck & Company, Inc. | | | 16,500 | | | | 1,283,205 | |
CVS Health Corp. | | | 15,200 | | | | 1,268,288 | |
Anthem, Inc. | | | 3,123 | | | | 1,192,362 | |
Square, Inc. — Class A* | | | 4,700 | | | | 1,145,860 | |
Gilead Sciences, Inc. | | | 16,600 | | | | 1,143,076 | |
Colgate-Palmolive Co. | | | 14,039 | | | | 1,142,073 | |
Archer-Daniels-Midland Co. | | | 18,325 | | | | 1,110,495 | |
Viatris, Inc. | | | 72,800 | | | | 1,040,312 | |
Humana, Inc. | | | 2,331 | | | | 1,031,980 | |
Kimberly-Clark Corp. | | | 7,600 | | | | 1,016,728 | |
Kroger Co. | | | 25,554 | | | | 978,974 | |
Cardinal Health, Inc. | | | 16,700 | | | | 953,403 | |
Kellogg Co. | | | 14,190 | | | | 912,842 | |
Tyson Foods, Inc. — Class A | | | 12,300 | | | | 907,248 | |
Bunge Ltd. | | | 9,113 | | | | 712,181 | |
WH Group Ltd.1 | | | 770,000 | | | | 692,252 | |
Boston Scientific Corp.* | | | 15,900 | | | | 679,884 | |
Wilmar International Ltd. | | | 182,200 | | | | 609,886 | |
Cigna Corp. | | | 2,100 | | | | 497,847 | |
Mondelez International, Inc. — Class A | | | 7,845 | | | | 489,842 | |
J M Smucker Co. | | | 3,400 | | | | 440,538 | |
Japan Tobacco, Inc. | | | 18,600 | | | | 351,378 | |
McKesson Corp. | | | 1,800 | | | | 344,232 | |
AmerisourceBergen Corp. — Class A | | | 2,877 | | | | 329,388 | |
Shionogi & Company Ltd. | | | 5,100 | | | | 265,874 | |
Johnson & Johnson | | | 1,600 | | | | 263,584 | |
Campbell Soup Co. | | | 5,200 | | | | 237,068 | |
Total Consumer, Non-cyclical | | | | | | | 28,018,639 | |
| | | | | | | | | |
Financial - 17.3% |
Citigroup, Inc. | | | 20,679 | | | | 1,463,039 | |
Wells Fargo & Co. | | | 28,500 | | | | 1,290,765 | |
Oversea-Chinese Banking Corporation Ltd. | | | 139,900 | | | | 1,243,579 | |
Australia & New Zealand Banking Group Ltd. | | | 52,200 | | | | 1,102,017 | |
Allianz AG | | | 4,400 | | | | 1,097,651 | |
National Australia Bank Ltd. | | | 47,000 | | | | 924,209 | |
Synchrony Financial | | | 18,700 | | | | 907,324 | |
BOC Hong Kong Holdings Ltd. | | | 258,300 | | | | 876,644 | |
Annaly Capital Management, Inc. REIT | | | 97,800 | | | | 868,464 | |
NN Group N.V. | | | 18,300 | | | | 863,552 | |
Boston Properties, Inc. REIT | | | 7,100 | | | | 813,589 | |
Admiral Group plc | | | 18,400 | | | | 799,978 | |
Equity Residential REIT | | | 9,700 | | | | 746,900 | |
Vornado Realty Trust REIT | | | 15,972 | | | | 745,413 | |
Danske Bank A/S | | | 41,500 | | | | 730,360 | |
Western Union Co. | | | 31,500 | | | | 723,555 | |
Mitsubishi UFJ Financial Group, Inc. | | | 123,800 | | | | 668,801 | |
AXA S.A. | | | 26,000 | | | | 659,561 | |
MetLife, Inc. | | | 11,000 | | | | 658,350 | |
BNP Paribas S.A. | | | 10,400 | | | | 652,252 | |
Sumitomo Mitsui Financial Group, Inc. | | | 18,500 | | | | 637,856 | |
Medical Properties Trust, Inc. REIT | | | 28,900 | | | | 580,890 | |
United Overseas Bank Ltd. | | | 29,500 | | | | 566,586 | |
Westpac Banking Corp. | | | 28,800 | | | | 557,468 | |
KeyCorp | | | 26,700 | | | | 551,355 | |
Aegon N.V. | | | 130,700 | | | | 542,490 | |
Bank of New York Mellon Corp. | | | 10,484 | | | | 537,095 | |
Kinnevik AB — Class B | | | 12,700 | | | | 508,551 | |
Commonwealth Bank of Australia | | | 6,000 | | | | 449,393 | |
Power Corporation of Canada | | | 10,500 | | | | 331,940 | |
RenaissanceRe Holdings Ltd. | | | 2,100 | | | | 312,522 | |
Aviva plc | | | 41,800 | | | | 234,641 | |
Hang Seng Bank Ltd. | | | 10,700 | | | | 213,754 | |
Total Financial | | | | | | | 23,860,544 | |
| | | | | | | | | |
Technology - 15.0% |
Apple, Inc. | | | 31,777 | | | | 4,352,178 | |
Microsoft Corp. | | | 13,365 | | | | 3,620,579 | |
Accenture plc — Class A | | | 4,894 | | | | 1,442,702 | |
Intel Corp. | | | 23,667 | | | | 1,328,665 | |
International Business Machines Corp. | | | 8,524 | | | | 1,249,533 | |
Micron Technology, Inc.* | | | 13,900 | | | | 1,181,222 | |
NetApp, Inc. | | | 13,900 | | | | 1,137,298 | |
Advanced Micro Devices, Inc.* | | | 11,800 | | | | 1,108,374 | |
VMware, Inc. — Class A* | | | 6,259 | | | | 1,001,252 | |
Cognizant Technology Solutions Corp. — Class A | | | 13,900 | | | | 962,714 | |
HP, Inc. | | | 31,400 | | | | 947,966 | |
ASML Holding N.V. | | | 1,300 | | | | 893,500 | |
NXP Semiconductor N.V. | | | 2,600 | | | | 534,872 | |
Seagate Technology Holdings plc | | | 6,000 | | | | 527,580 | |
Citrix Systems, Inc. | | | 3,700 | | | | 433,899 | |
Total Technology | | | | | | | 20,722,334 | |
| | | | | | | | | |
Communications - 11.8% |
Alphabet, Inc. — Class C* | | | 1,106 | | | | 2,771,990 | |
Amazon.com, Inc.* | | | 779 | | | | 2,679,885 | |
Verizon Communications, Inc. | | | 27,831 | | | | 1,559,371 | |
ViacomCBS, Inc. — Class B | | | 26,100 | | | | 1,179,720 | |
KDDI Corp. | | | 33,900 | | | | 1,057,439 | |
Facebook, Inc. — Class A* | | | 2,944 | | | | 1,023,658 | |
Discovery, Inc. — Class C* | | | 34,000 | | | | 985,320 | |
Nippon Telegraph & Telephone Corp. | | | 36,400 | | | | 948,478 | |
Comcast Corp. — Class A | | | 13,800 | | | | 786,876 | |
Juniper Networks, Inc. | | | 26,200 | | | | 716,570 | |
HKT Trust & HKT Ltd. | | | 489,400 | | | | 666,911 | |
Cisco Systems, Inc. | | | 10,500 | | | | 556,500 | |
eBay, Inc. | | | 7,900 | | | | 554,659 | |
Interpublic Group of Companies, Inc. | | | 13,100 | | | | 425,619 | |
DISH Network Corp. — Class A* | | | 7,800 | | | | 326,040 | |
Total Communications | | | | | | | 16,239,036 | |
| | | | | | | | | |
Consumer, Cyclical - 9.7% |
Walgreens Boots Alliance, Inc. | | | 20,400 | | | | 1,073,244 | |
Mitsubishi Corp. | | | 38,900 | | | | 1,060,371 | |
Wesfarmers Ltd. | | | 23,600 | | | | 1,046,018 | |
Costco Wholesale Corp. | | | 2,600 | | | | 1,028,742 | |
SEE NOTES TO FINANCIAL STATEMENTS. | THE GUGGENHEIM FUNDS SEMI-ANNUAL REPORT | 23 |
SCHEDULE OF INVESTMENTS (Unaudited)(continued) | June 30, 2021 |
SERIES D (WORLD EQUITY INCOME SERIES) | |
| | Shares | | | Value | |
Best Buy Company, Inc. | | | 8,600 | | | $ | 988,828 | |
Subaru Corp. | | | 48,000 | | | | 946,968 | |
BorgWarner, Inc. | | | 18,300 | | | | 888,282 | |
Volvo AB — Class B | | | 36,400 | | | | 875,994 | |
Bunzl plc | | | 26,000 | | | | 858,862 | |
Persimmon plc | | | 20,900 | | | | 855,185 | |
Whirlpool Corp. | | | 3,686 | | | | 803,622 | |
Lawson, Inc. | | | 13,100 | | | | 606,159 | |
Electrolux AB | | | 21,200 | | | | 587,999 | |
General Motors Co.* | | | 9,400 | | | | 556,198 | |
PACCAR, Inc. | | | 4,700 | | | | 419,475 | |
Tesla, Inc.* | | | 534 | | | | 362,960 | |
Daimler AG — Class D | | | 3,100 | | | | 276,904 | |
Autoliv, Inc. | | | 2,300 | | | | 224,848 | |
Total Consumer, Cyclical | | | | | | | 13,460,659 | |
| | | | | | | | | |
Industrial - 8.6% |
3M Co. | | | 6,790 | | | | 1,348,698 | |
Deutsche Post AG | | | 19,100 | | | | 1,299,615 | |
Lockheed Martin Corp. | | | 2,622 | | | | 992,033 | |
CRH plc ADR | | | 18,600 | | | | 937,722 | |
AP Moller - Maersk A/S — Class B | | | 250 | | | | 718,674 | |
Taisei Corp. | | | 20,500 | | | | 671,750 | |
Obayashi Corp. | | | 80,200 | | | | 637,511 | |
Knight-Swift Transportation Holdings, Inc. | | | 13,100 | | | | 595,526 | |
General Dynamics Corp. | | | 3,149 | | | | 592,831 | |
Skanska AB — Class B | | | 21,000 | | | | 557,171 | |
Northrop Grumman Corp. | | | 1,519 | | | | 552,050 | |
Huntington Ingalls Industries, Inc. | | | 2,400 | | | | 505,800 | |
Venture Corporation Ltd. | | | 34,300 | | | | 490,128 | |
Arrow Electronics, Inc.* | | | 4,200 | | | | 478,086 | |
BAE Systems plc | | | 54,900 | | | | 396,271 | |
Mitsubishi Heavy Industries Ltd. | | | 13,100 | | | | 385,513 | |
FedEx Corp. | | | 1,063 | | | | 317,125 | |
ACS Actividades de Construccion y Servicios S.A. | | | 10,500 | | | | 281,370 | |
Bouygues S.A. | | | 5,200 | | | | 192,394 | |
Total Industrial | | | | | | | 11,950,268 | |
| | | | | | | | | |
Basic Materials - 5.6% |
Steel Dynamics, Inc. | | | 18,300 | | | | 1,090,680 | |
BASF SE | | | 11,400 | | | | 898,477 | |
Rio Tinto plc | | | 10,700 | | | | 880,381 | |
UPM-Kymmene Oyj | | | 22,600 | | | | 855,208 | |
Boliden AB | | | 20,900 | | | | 803,684 | |
Covestro AG1 | | | 12,300 | | | | 794,612 | |
Smurfit Kappa Group plc | | | 13,100 | | | | 710,943 | |
Johnson Matthey plc | | | 15,500 | | | | 658,886 | |
voestalpine AG | | | 15,800 | | | | 643,620 | |
LANXESS AG | | | 5,200 | | | | 356,659 | |
Total Basic Materials | | | | | | | 7,693,150 | |
| | | | | | | | | |
Utilities - 5.4% |
Edison International | | | 18,000 | | | | 1,040,760 | |
Exelon Corp. | | | 23,000 | | | | 1,019,130 | |
CLP Holdings Ltd. | | | 93,200 | | | | 921,925 | |
PPL Corp. | | | 31,800 | | | | 889,446 | |
FirstEnergy Corp. | | | 22,300 | | | | 829,783 | |
UGI Corp. | | | 16,000 | | | | 740,960 | |
Southern Co. | | | 12,000 | | | | 726,120 | |
NRG Energy, Inc. | | | 16,000 | | | | 644,800 | |
Vistra Corp. | | | 33,700 | | | | 625,135 | |
Total Utilities | | | | | | | 7,438,059 | |
| | | | | | | | | |
Energy - 2.4% |
TC Energy Corp. | | | 22,600 | | | | 1,118,557 | |
ENEOS Holdings, Inc. | | | 183,500 | | | | 767,977 | |
Suncor Energy, Inc. | | | 23,300 | | | | 558,177 | |
DCC plc | | | 6,300 | | | | 515,741 | |
Exxon Mobil Corp. | | | 6,500 | | | | 410,020 | |
Total Energy | | | | | | | 3,370,472 | |
| | | | | | | | | |
Diversified - 0.7% |
CK Hutchison Holdings Ltd. | | | 129,200 | | | | 1,006,784 | |
| | | | | | | | | |
Total Common Stocks | | | | |
(Cost $115,535,778) | | | | | | | 133,759,945 | |
| | | | | | | | | |
PREFERRED STOCKS† - 1.4% |
Consumer, Cyclical - 1.4% |
Porsche Automobil Holding SE | | | 9,200 | | | | 986,135 | |
Volkswagen AG | | | 3,900 | | | | 977,082 | |
Total Consumer, Cyclical | | | | | | | 1,963,217 | |
| | | | | | | | | |
Total Preferred Stocks | | | | |
(Cost $1,309,803) | | | | | | | 1,963,217 | |
| | | | | | | | | |
EXCHANGE-TRADED FUNDS† - 0.7% |
SPDR S&P 500 ETF Trust | | | 1,126 | | | | 481,996 | |
iShares MSCI EAFE ETF | | | 6,108 | | | | 481,799 | |
Total Exchange-Traded Funds | | | | |
(Cost $958,447) | | | | | | | 963,795 | |
| | | | | | | | | |
MONEY MARKET FUND† - 0.5% |
Goldman Sachs Financial Square Treasury Instruments Fund — Institutional Shares, 0.01%2 | | | 629,033 | | | | 629,033 | |
Total Money Market Fund | | | | |
(Cost $629,033) | | | | | | | 629,033 | |
| | | | | | | | | |
Total Investments - 99.4% | | | | |
(Cost $118,433,061) | | $ | 137,315,990 | |
Other Assets & Liabilities, net - 0.6% | | | 797,267 | |
Total Net Assets - 100.0% | | $ | 138,113,257 | |
24 | THE GUGGENHEIM FUNDS SEMI-ANNUAL REPORT | SEE NOTES TO FINANCIAL STATEMENTS. |
SCHEDULE OF INVESTMENTS (Unaudited)(concluded) | June 30, 2021 |
SERIES D (WORLD EQUITY INCOME SERIES) | |
Futures Contracts |
Description | | Number of
Contracts | | | Expiration Date | | | Notional
Amount | | | Value and
Unrealized
Appreciation** | |
Currency Futures Contracts Sold Short† |
Japanese Yen Futures Contracts | | | 81 | | | | Sep 2021 | | | $ | 9,120,094 | | | $ | 102,321 | |
Euro FX Futures Contracts | | | 48 | | | | Sep 2021 | | | | 7,125,900 | | | | 44,031 | |
Australian Dollar Futures Contracts | | | 54 | | | | Sep 2021 | | | | 4,050,540 | | | | 13,036 | |
| | | | | | | | | | | $ | 20,296,534 | | | $ | 159,388 | |
* | Non-income producing security. |
** | Includes cumulative appreciation (depreciation). Variation margin is reported within the Statement of Assets and Liabilities. |
† | Value determined based on Level 1 inputs — See Note 4. |
1 | Security is a 144A or Section 4(a)(2) security. These securities have been determined to be liquid under guidelines established by the Board of Trustees. The total market value of 144A or Section 4(a)(2) securities is $1,486,864 (cost $1,514,324), or 1.1% of total net assets. |
2 | Rate indicated is the 7-day yield as of June 30, 2021. |
| | ADR — American Depositary Receipt |
| | plc — Public Limited Company |
| | REIT — Real Estate Investment Trust |
| | |
| | See Sector Classification in Other Information section. |
The following table summarizes the inputs used to value the Fund’s investments at June 30, 2021 (See Note 4 in the Notes to Financial Statements):
Investments in Securities (Assets) | | Level 1
Quoted
Prices | | | Level 2
Significant
Observable
Inputs | | | Level 3
Significant
Unobservable
Inputs | | | Total | |
Common Stocks | | $ | 133,759,945 | | | $ | — | | | $ | — | | | $ | 133,759,945 | |
Preferred Stocks | | | 1,963,217 | | | | — | | | | — | | | | 1,963,217 | |
Exchange-Traded Funds | | | 963,795 | | | | — | | | | — | | | | 963,795 | |
Money Market Fund | | | 629,033 | | | | — | | | | — | | | | 629,033 | |
Currency Futures Contracts** | | | 159,388 | | | | — | | | | — | | | | 159,388 | |
Total Assets | | $ | 137,475,378 | | | $ | — | | | $ | — | | | $ | 137,475,378 | |
** | This derivative is reported as unrealized appreciation/depreciation at period end. |
SEE NOTES TO FINANCIAL STATEMENTS. | THE GUGGENHEIM FUNDS SEMI-ANNUAL REPORT | 25 |
SERIES D (WORLD EQUITY INCOME SERIES) | |
STATEMENT OF ASSETS AND LIABILITIES (Unaudited) |
June 30, 2021 |
Assets: |
Investments, at value (cost $118,433,061) | | $ | 137,315,990 | |
Foreign currency, at value (cost $52,691) | | | 52,694 | |
Cash | | | 1,186 | |
Segregated cash with broker | | | 322,050 | |
Prepaid expenses | | | 988 | |
Receivables: |
Dividends | | | 288,156 | |
Foreign tax reclaims | | | 208,227 | |
Variation margin on futures contracts | | | 77,423 | |
Total assets | | | 138,266,714 | |
| | | | | |
Liabilities: |
Payable for: |
Management fees | | | 54,460 | |
Distribution and service fees | | | 28,788 | |
Fund shares redeemed | | | 19,283 | |
Printing fees | | | 10,984 | |
Professional fees | | | 10,621 | |
Fund accounting/administration fees | | | 8,991 | |
Pricing fees | | | 8,374 | |
Trustees’ fees* | | | 3,693 | |
Transfer agent/maintenance fees | | | 2,441 | |
Miscellaneous | | | 5,822 | |
Total liabilities | | | 153,457 | |
Commitments and contingent liabilities (Note 12) | | | — | |
Net assets | | $ | 138,113,257 | |
| | | | | |
Net assets consist of: |
Paid in capital | | $ | 98,568,892 | |
Total distributable earnings (loss) | | | 39,544,365 | |
Net assets | | $ | 138,113,257 | |
Capital shares outstanding | | | 8,038,593 | |
Net asset value per share | | $ | 17.18 | |
STATEMENT OF OPERATIONS (Unaudited) |
Six Months Ended June 30, 2021 |
Investment Income: |
Dividends (net of foreign withholding tax of $124,156) | | $ | 2,053,758 | |
Total investment income | | | 2,053,758 | |
| | | | | |
Expenses: |
Management fees | | | 467,825 | |
Distribution and service fees | | | 167,080 | |
Transfer agent/maintenance fees | | | 12,477 | |
Fund accounting/administration fees | | | 48,540 | |
Professional fees | | | 18,296 | |
Custodian fees | | | 11,972 | |
Trustees’ fees* | | | 9,953 | |
Line of credit fees | | | 2,818 | |
Interest expense | | | 25 | |
Miscellaneous | | | 6,136 | |
Total expenses | | | 745,122 | |
Less: |
Expenses waived by Adviser | | | (149,807 | ) |
Net expenses | | | 595,315 | |
Net investment income | | | 1,458,443 | |
| | | | | |
Net Realized and Unrealized Gain (Loss): |
Net realized gain (loss) on: |
Investments | | | 20,888,347 | |
Futures contracts | | | 40,379 | |
Foreign currency transactions | | | 2,543 | |
Net realized gain | | | 20,931,269 | |
Net change in unrealized appreciation (depreciation) on: |
Investments | | | (2,610,942 | ) |
Futures contracts | | | 159,388 | |
Foreign currency translations | | | (15,661 | ) |
Net change in unrealized appreciation (depreciation) | | | (2,467,215 | ) |
Net realized and unrealized gain | | | 18,464,054 | |
Net increase in net assets resulting from operations | | $ | 19,922,497 | |
* | Relates to Trustees not deemed “interested persons” within the meaning of Section 2(a)(19) of the 1940 Act. |
26 | THE GUGGENHEIM FUNDS SEMI-ANNUAL REPORT | SEE NOTES TO FINANCIAL STATEMENTS. |
SERIES D (WORLD EQUITY INCOME SERIES) | |
STATEMENTS OF CHANGES IN NET ASSETS |
| | Six Months Ended
June 30, 2021
(Unaudited) | | | Year Ended
December 31,
2020 | |
Increase (Decrease) in Net Assets from Operations: | | | | | | | | |
Net investment income | | $ | 1,458,443 | | | $ | 1,985,000 | |
Net realized gain (loss) on investments | | | 20,931,269 | | | | (3,566,875 | ) |
Net change in unrealized appreciation (depreciation) on investments | | | (2,467,215 | ) | | | 8,231,802 | |
Net increase in net assets resulting from operations | | | 19,922,497 | | | | 6,649,927 | |
| | | | | | | | | |
Distributions to shareholders | | | — | | | | (4,694,939 | ) |
| | | | | | | | | |
Capital share transactions: | | | | | | | | |
Proceeds from sale of shares | | | 3,055,405 | | | | 2,006,847 | |
Distributions reinvested | | | — | | | | 4,694,939 | |
Cost of shares redeemed | | | (10,871,328 | ) | | | (16,408,213 | ) |
Net decrease from capital share transactions | | | (7,815,923 | ) | | | (9,706,427 | ) |
Net increase (decrease) in net assets | | | 12,106,574 | | | | (7,751,439 | ) |
| | | | | | | | | |
Net assets: | | | | | | | | |
Beginning of period | | | 126,006,683 | | | | 133,758,122 | |
End of period | | $ | 138,113,257 | | | $ | 126,006,683 | |
| | | | | | | | | |
Capital share activity: | | | | | | | | |
Shares sold | | | 186,146 | | | | 149,287 | |
Shares issued from reinvestment of distributions | | | — | | | | 362,544 | |
Shares redeemed | | | (668,469 | ) | | | (1,246,184 | ) |
Net decrease in shares | | | (482,323 | ) | | | (734,353 | ) |
SEE NOTES TO FINANCIAL STATEMENTS. | THE GUGGENHEIM FUNDS SEMI-ANNUAL REPORT | 27 |
SERIES D (WORLD EQUITY INCOME SERIES) | |
This table is presented to show selected data for a share outstanding throughout each period and to assist shareholders in evaluating a Fund’s performance for the periods presented.
| | Six Months Ended
June 30, 2021a | | | Year Ended
December 31,
2020 | | | Year Ended
December 31,
2019 | | | Year Ended
December 31,
2018 | | | Year Ended
December 31,
2017 | | | Year Ended
December 31,
2016 | |
Per Share Data |
Net asset value, beginning of period | | $ | 14.79 | | | $ | 14.45 | | | $ | 12.96 | | | $ | 14.52 | | | $ | 12.98 | | | $ | 12.12 | |
Income (loss) from investment operations: |
Net investment income (loss)b | | | .18 | | | | .22 | | | | .33 | | | | .33 | | | | .33 | | | | .37 | |
Net gain (loss) on investments (realized and unrealized) | | | 2.21 | | | | .66 | | | | 2.36 | | | | (1.47 | ) | | | 1.60 | | | | .88 | |
Total from investment operations | | | 2.39 | | | | .88 | | | | 2.69 | | | | (1.14 | ) | | | 1.93 | | | | 1.25 | |
Less distributions from: |
Net investment income | | | — | | | | (.40 | ) | | | (.40 | ) | | | (.42 | ) | | | (.39 | ) | | | (.39 | ) |
Net realized gains | | | — | | | | (.14 | ) | | | (.80 | ) | | | — | | | | — | | | | — | |
Total distributions | | | — | | | | (.54 | ) | | | (1.20 | ) | | | (.42 | ) | | | (.39 | ) | | | (.39 | ) |
Net asset value, end of period | | $ | 17.18 | | | $ | 14.79 | | | $ | 14.45 | | | $ | 12.96 | | | $ | 14.52 | | | $ | 12.98 | |
|
Total Returnc | | | 16.16 | % | | | 6.65 | % | | | 21.40 | % | | | (8.17 | %) | | | 15.06 | % | | | 10.37 | % |
Ratios/Supplemental Data |
Net assets, end of period (in thousands) | | $ | 138,113 | | | $ | 126,007 | | | $ | 133,758 | | | $ | 125,312 | | | $ | 161,111 | | | $ | 159,978 | |
Ratios to average net assets: |
Net investment income (loss) | | | 2.18 | % | | | 1.70 | % | | | 2.37 | % | | | 2.29 | % | | | 2.38 | % | | | 2.92 | % |
Total expensesd | | | 1.11 | % | | | 1.20 | % | | | 1.19 | % | | | 1.17 | % | | | 1.12 | % | | | 0.91 | % |
Net expensese,f | | | 0.89 | % | | | 0.89 | % | | | 0.90 | % | | | 0.90 | % | | | 0.90 | % | | | 0.91 | % |
Portfolio turnover rate | | | 85 | % | | | 196 | % | | | 139 | % | | | 134 | % | | | 112 | % | | | 43 | % |
a | Unaudited figures for the period ended June 30, 2021. Percentage amounts for the period, except total return and portfolio turnover rate, have been annualized. |
b | Net investment income (loss) per share was computed using average shares outstanding throughout the period. |
c | Total return does not take into account any of the expenses associated with an investment in variable insurance products. If total return had taken into account these expenses, performance would have been lower. Shares of a series of Guggenheim Variable Funds Trust are available only through the purchase of such products. |
d | Does not include expenses of the underlying funds in which the Fund invests. |
e | Net expense information reflects the expense ratios after expense waivers and reimbursements, as applicable. |
f | Net expenses may include expenses that are excluded from the expense limitation agreement. Excluding these expenses, the net expense ratios for the periods presented would be: |
| | 06/30/21a | 12/31/20 | 12/31/19 | 12/31/18 | 12/31/17 |
| | 0.89% | 0.89% | 0.90% | 0.90% | 0.88% |
28 | THE GUGGENHEIM FUNDS SEMI-ANNUAL REPORT | SEE NOTES TO FINANCIAL STATEMENTS. |
PERFORMANCE REPORT AND FUND PROFILE (Unaudited) | June 30, 2021 |
SERIES E (TOTAL RETURN BOND SERIES)
OBJECTIVE: Seeks to provide total return, comprised of current income and capital appreciation.
Holdings Diversification (Market Exposure as % of Net Assets)
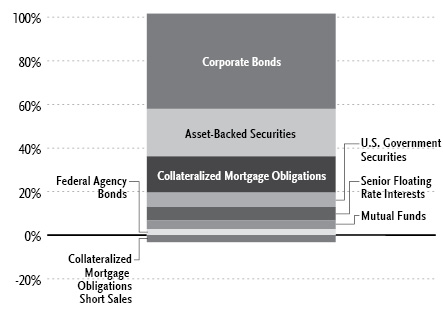
“Holdings Diversification (Market Exposure as % of Net Assets)” excludes any temporary cash investments, investments in Guggenheim Strategy Funds Trust mutual funds, or investments in Guggenheim Ultra Short Duration Fund.
Inception Date: April 26, 1985 |
Ten Largest Holdings (% of Total Net Assets) |
Uniform MBS 30 Year | 8.1% |
U.S. Treasury Notes, 1.63% | 4.3% |
Guggenheim Total Return Bond Fund — R6-Class | 4.0% |
U.S. Treasury Strips, due 2/15/50 | 1.6% |
Pershing Square Tontine Holdings, Ltd. — Class A | 1.0% |
Octagon Investment Partners 49 Ltd., 1.76% | 1.0% |
Station Place Securitization Trust 2021-7, 0.89% | 0.9% |
Station Place Securitization Trust 2020-16, 1.09% | 0.9% |
SBA Tower Trust, 2.33% | 0.7% |
Delta Air Lines, Inc., 7.00% | 0.7% |
Top Ten Total | 23.2% |
| | |
“Ten Largest Holdings” excludes any temporary cash or derivative investments. |
| | THE GUGGENHEIM FUNDS SEMI-ANNUAL REPORT | 29 |
PERFORMANCE REPORT AND FUND PROFILE (Unaudited)(concluded) | June 30, 2021 |
Average Annual Returns*,†
Periods Ended June 30, 2021
| 6 Month‡ | 1 Year | 5 Year | 10 Year |
Series E (Total Return Bond Series) | (0.66%) | 4.81% | 5.46% | 5.09% |
Bloomberg Barclays U.S. Aggregate Bond Index | (1.60%) | (0.33%) | 3.03% | 3.39% |
Portfolio Composition by Quality Rating1 |
Rating | % of Total
Investments |
Fixed Income Instruments | |
AAA | 21.2% |
AA | 9.0% |
A | 11.8% |
BBB | 28.6% |
BB | 8.7% |
B | 5.8% |
CCC | 0.4% |
CC | 1.2% |
C | 0.2% |
NR2 | 3.1% |
Other Instruments | 10.0% |
Total Investments | 100.0% |
* | The performance data above represents past performance that is not predictive of future results. The investment return and principal value of an investment in the Fund will fluctuate so that an investor’s shares, when redeemed, may be worth more or less than their original cost. Returns are historical and include changes in principal and reinvested dividends and capital gains and do not reflect the effect of taxes. The Bloomberg Barclays U.S. Aggregate Bond Index is an unmanaged index and, unlike the Fund, has no management fees or operating expenses to reduce its reported return. |
† | Performance figures do not reflect fees and expenses associated with an investment in variable insurance products. If returns had taken into account these fees and expenses, performance would have been lower. Shares of a series of Guggenheim Variable Funds Trust are available only through the purchase of such products. |
‡ | 6 month returns are not annualized. |
1 | Source: BlackRock Solutions. Credit quality ratings are measured on a scale that generally ranges from AAA (highest) to D (lowest). All securities except for those labeled “NR” have been rated by Moody’s, Standard & Poor’s (“S&P”), or Fitch, each of which is a Nationally Recognized Statistical Rating Organization (“NRSRO”). For purposes of this presentation, when ratings are available from more than one agency, the highest rating is used. Guggenheim Investments has converted ratings to the equivalent S&P rating. Security ratings are determined at the time of purchase and may change thereafter. |
2 | NR (not rated) securities do not necessarily indicate low credit quality. |
30 THE GUGGENHEIM FUNDS SEMI-ANNUAL REPORT | |
SCHEDULE OF INVESTMENTS (Unaudited) | June 30, 2021 |
SERIES E (TOTAL RETURN BOND SERIES) | |
| | Shares | | | Value | |
COMMON STOCKS† - 1.4% |
| | | | | | | | | |
Financial - 1.3% |
Pershing Square Tontine Holdings, Ltd. — Class A*,15 | | | 76,590 | | | $ | 1,743,188 | |
KKR Acquisition Holdings I Corp. — Class A*,15 | | | 33,829 | | | | 332,201 | |
RXR Acquisition Corp. — Class A*,15 | | | 6,570 | | | | 63,795 | |
MSD Acquisition Corp. — Class A*,15 | | | 4,876 | | | | 48,028 | |
Soaring Eagle Acquisition Corp. — Class A*,15 | | | 3,427 | | | | 34,133 | |
TPG Pace Beneficial II Corp.*,15 | | | 3,901 | | | | 39,322 | |
TPG Pace Solutions Corp.*,15 | | | 2,801 | | | | 27,898 | |
Colicity, Inc. — Class A*,15 | | | 1,453 | | | | 14,167 | |
Colicity, Inc.*,15 | | | 266 | | | | 2,679 | |
RXR Acquisition Corp.*,15 | | | 263 | | | | 2,619 | |
Total Financial | | | | | | | 2,308,030 | |
| | | | | | | | | |
Communications - 0.1% |
Figs, Inc. — Class A* | | | 1,346 | | | | 67,435 | |
| | | | | | | | | |
Total Common Stocks | | | | |
(Cost $2,076,029) | | | | | | | 2,375,465 | |
| | | | | | | | | |
PREFERRED STOCKS†† - 2.5% |
Financial - 2.5% |
First Republic Bank, 4.25% | | | 24,000 | | | | 641,520 | |
Bank of America Corp., 4.13% | | | 16,000 | | | | 418,560 | |
Wells Fargo & Co., 4.70% | | | 16,000 | | | | 418,400 | |
Public Storage, 4.63% | | | 14,400 | | | | 396,576 | |
W R Berkley Corp., 4.13% due 03/30/61 | | | 12,000 | | | | 321,120 | |
Bank of America Corp., 4.38% | | | 12,000 | | | | 314,400 | |
Equitable Holdings, Inc., 4.30% | | | 12,000 | | | | 303,720 | |
American Financial Group, Inc., 4.50% due 09/15/60 | | | 10,000 | | | | 277,100 | |
Arch Capital Group Ltd., 4.55%* | | | 10,000 | | | | 258,100 | |
JPMorgan Chase & Co., 4.63%* | | | 8,000 | | | | 213,040 | |
CNO Financial Group, Inc., 5.13% due 11/25/60 | | | 6,000 | | | | 161,700 | |
First Republic Bank, 4.13% | | | 6,000 | | | | 153,900 | |
Assurant, Inc., 5.25% due 01/15/61 | | | 4,000 | | | | 108,160 | |
W R Berkley Corp., 4.25% due 09/30/60 | | | 4,000 | | | | 106,680 | |
Selective Insurance Group, Inc., 4.60% | | | 4,000 | | | | 101,720 | |
Public Storage, 4.13% | | | 3,200 | | | | 83,360 | |
Total Financial | | | | | | | 4,278,056 | |
| | | | | | | | | |
Total Preferred Stocks | | | | |
(Cost $4,040,000) | | | | | | | 4,278,056 | |
| | | | | | | | | |
WARRANTS† - 0.0% |
Pershing Square Tontine Holdings, Ltd. | | | | | | | | |
Expiring 07/24/25*,15 | | | 8,510 | | | | 53,613 | |
KKR Acquisition Holdings I Corp. - Class A | | | | | | | | |
Expiring 12/31/27*,15 | | | 8,457 | | | | 9,979 | |
Soaring Eagle Acquisition Corp. - Class A | | | | | | | | |
Expiring 12/31/27*,15 | | | 684 | | | | 2,257 | |
RXR Acquisition Corp. | | | | | | | | |
Expiring 03/08/26*,15 | | | 1,312 | | | | 1,352 | |
MSD Acquisition Corp. | | | | | | | | |
Expiring 05/13/23*,15 | | | 974 | | | | 1,266 | |
Colicity, Inc. | | | | | | | | |
Expiring 12/31/27*,15 | | | 290 | | | | 447 | |
Total Warrants | | | | |
(Cost $58,977) | | | | | | | 68,914 | |
| | | | | | | | | |
MUTUAL FUNDS† - 4.0% |
Guggenheim Total Return Bond Fund — R6-Class1 | | | 238,230 | | | | 6,930,119 | |
Total Mutual Funds | | | | |
(Cost $6,330,870) | | | | | | | 6,930,119 | |
| | | | | | | | | |
MONEY MARKET FUND† - 1.9% |
Dreyfus Treasury Securities Cash Management Fund — Institutional Shares, 0.01%2 | | | 3,302,439 | | | | 3,302,439 | |
Total Money Market Fund | | | | |
(Cost $3,302,439) | | | | | | | 3,302,439 | |
| | | | | | | | | |
| | | Face
Amount~ | | | | | |
CORPORATE BONDS†† - 43.6% |
Financial - 18.7% | | | | | | | | |
Wells Fargo & Co. | | | | | | | | |
3.07% due 04/30/413 | | | 1,100,000 | | | | 1,125,910 | |
3.90%3,4 | | | 350,000 | | | | 362,355 | |
Citigroup, Inc. | | | | | | | | |
3.88%3,4 | | | 600,000 | | | | 612,750 | |
2.57% due 06/03/313 | | | 590,000 | | | | 607,186 | |
4.00%3,4 | | | 200,000 | | | | 206,200 | |
American International Group, Inc. | | | | | | | | |
3.40% due 06/30/30 | | | 660,000 | | | | 724,503 | |
4.38% due 06/30/50 | | | 550,000 | | | | 669,096 | |
Nationwide Mutual Insurance Co. | | | | | | | | |
4.35% due 04/30/505 | | | 950,000 | | | | 1,065,398 | |
Pershing Square Holdings, Ltd. | | | | | | | | |
3.25% due 11/15/305 | | | 1,000,000 | | | | 1,016,770 | |
Citizens Financial Group, Inc. | | | | | | | | |
3.25% due 04/30/30 | | | 867,000 | | | | 940,313 | |
Bank of America Corp. | | | | | | | | |
2.59% due 04/29/313 | | | 890,000 | | | | 918,554 | |
Reliance Standard Life Global Funding II | | | | | | | | |
2.75% due 05/07/255 | | | 800,000 | | | | 841,951 | |
Reinsurance Group of America, Inc. | | | | | | | | |
3.15% due 06/15/30 | | | 750,000 | | | | 802,843 | |
Charles Schwab Corp. | | | | | | | | |
4.00%3,4 | | | 500,000 | | | | 511,500 | |
5.38%3,4 | | | 239,000 | | | | 264,167 | |
Wilton RE Ltd. | | | | | | | | |
6.00%†††,3,4,5 | | | 700,000 | | | | 757,813 | |
Macquarie Bank Ltd. | | | | | | | | |
3.05% due 03/03/363,5 | | | 450,000 | | | | 447,706 | |
3.62% due 06/03/305 | | | 290,000 | | | | 306,945 | |
SEE NOTES TO FINANCIAL STATEMENTS. | THE GUGGENHEIM FUNDS SEMI-ANNUAL REPORT | 31 |
SCHEDULE OF INVESTMENTS (Unaudited)(continued) | June 30, 2021 |
SERIES E (TOTAL RETURN BOND SERIES) | |
| | Face
Amount~ | | | Value | |
Arch Capital Group Ltd. | | | | | | | | |
3.64% due 06/30/50 | | | 700,000 | | | $ | 753,612 | |
Markel Corp. | | | | | | | | |
6.00%3,4 | | | 660,000 | | | | 737,550 | |
JPMorgan Chase & Co. | | | | | | | | |
3.65%3,4 | | | 250,000 | | | | 250,350 | |
2.96% due 05/13/313 | | | 230,000 | | | | 241,864 | |
4.49% due 03/24/313 | | | 200,000 | | | | 237,091 | |
GLP Capital Limited Partnership / GLP Financing II, Inc. | | | | | | | | |
5.30% due 01/15/29 | | | 300,000 | | | | 349,500 | |
4.00% due 01/15/31 | | | 290,000 | | | | 312,469 | |
Liberty Mutual Group, Inc. | | | | | | | | |
4.30% due 02/01/61†††,5 | | | 700,000 | | | | 641,729 | |
Equitable Holdings, Inc. | | | | | | | | |
4.95%3,4 | | | 550,000 | | | | 598,125 | |
Lincoln National Corp. | | | | | | | | |
3.40% due 01/15/31 | | | 370,000 | | | | 404,478 | |
4.38% due 06/15/50 | | | 150,000 | | | | 181,001 | |
Intercontinental Exchange, Inc. | | | | | | | | |
2.65% due 09/15/40 | | | 600,000 | | | | 575,537 | |
Fidelity National Financial, Inc. | | | | | | | | |
3.40% due 06/15/30 | | | 300,000 | | | | 323,272 | |
2.45% due 03/15/31 | | | 230,000 | | | | 229,284 | |
Deloitte LLP | | | | | | | | |
3.56% due 05/07/30††† | | | 500,000 | | | | 522,705 | |
Iron Mountain, Inc. | | | | | | | | |
5.25% due 07/15/305 | | | 250,000 | | | | 264,645 | |
5.63% due 07/15/325 | | | 125,000 | | | | 133,790 | |
4.50% due 02/15/315 | | | 100,000 | | | | 101,250 | |
Fairfax Financial Holdings Ltd. | | | | | | | | |
3.38% due 03/03/315 | | | 450,000 | | | | 469,479 | |
Crown Castle International Corp. | | | | | | | | |
2.90% due 04/01/41 | | | 250,000 | | | | 243,418 | |
3.30% due 07/01/30 | | | 201,000 | | | | 215,491 | |
Host Hotels & Resorts, LP | | | | | | | | |
3.50% due 09/15/30 | | | 435,000 | | | | 456,951 | |
Global Atlantic Finance Co. | | | | | | | | |
4.70% due 10/15/513,5 | | | 250,000 | | | | 250,738 | |
3.13% due 06/15/315 | | | 200,000 | | | | 201,344 | |
OneAmerica Financial Partners, Inc. | | | | | | | | |
4.25% due 10/15/505 | | | 410,000 | | | | 425,426 | |
Ares Finance Company II LLC | | | | | | | | |
3.25% due 06/15/305 | | | 410,000 | | | | 423,883 | |
MetLife, Inc. | | | | | | | | |
3.85%3,4 | | | 400,000 | | | | 419,424 | |
Standard Chartered plc | | | | | | | | |
4.64% due 04/01/313,5 | | | 350,000 | | | | 409,715 | |
Alleghany Corp. | | | | | | | | |
3.63% due 05/15/30 | | | 370,000 | | | | 408,594 | |
National Australia Bank Ltd. | | | | | | | | |
2.99% due 05/21/315 | | | 400,000 | | | | 406,586 | |
United Wholesale Mortgage LLC | | | | | | | | |
5.50% due 04/15/295 | | | 300,000 | | | | 299,931 | |
5.50% due 11/15/255 | | | 100,000 | | | | 103,553 | |
First American Financial Corp. | | | | | | | | |
4.00% due 05/15/30 | | | 360,000 | | | | 400,724 | |
Brookfield Finance, Inc. | | | | | | | | |
3.50% due 03/30/51 | | | 280,000 | | | | 292,144 | |
4.70% due 09/20/47 | | | 50,000 | | | | 60,618 | |
Quicken Loans LLC / Quicken Loans Company-Issuer, Inc. | | | | | | | | |
3.88% due 03/01/315 | | | 350,000 | | | | 350,721 | |
Nippon Life Insurance Co. | | | | | | | | |
2.75% due 01/21/513,5 | | | 350,000 | | | | 343,000 | |
Belrose Funding Trust | | | | | | | | |
2.33% due 08/15/305 | | | 320,000 | | | | 313,935 | |
Liberty Mutual Group, Inc. | | | | | | | | |
3.95% due 05/15/605 | | | 280,000 | | | | 307,924 | |
KKR Group Finance Company VIII LLC | | | | | | | | |
3.50% due 08/25/505 | | | 290,000 | | | | 303,669 | |
Jefferies Group LLC | | | | | | | | |
2.75% due 10/15/32 | | | 300,000 | | | | 301,650 | |
LPL Holdings, Inc. | | | | | | | | |
4.00% due 03/15/295 | | | 300,000 | | | | 301,500 | |
Everest Reinsurance Holdings, Inc. | | | | | | | | |
3.50% due 10/15/50 | | | 280,000 | | | | 298,821 | |
UBS Group AG | | | | | | | | |
2.10% due 02/11/323,5 | | | 300,000 | | | | 294,233 | |
SBA Communications Corp. | | | | | | | | |
3.13% due 02/01/295 | | | 250,000 | | | | 241,017 | |
3.88% due 02/15/27 | | | 50,000 | | | | 51,345 | |
Societe Generale S.A. | | | | | | | | |
2.89% due 06/09/323,5 | | | 250,000 | | | | 252,980 | |
Assurant, Inc. | | | | | | | | |
2.65% due 01/15/32 | | | 250,000 | | | | 249,598 | |
FS KKR Capital Corp. | | | | | | | | |
2.63% due 01/15/27 | | | 250,000 | | | | 247,757 | |
Cushman & Wakefield US Borrower LLC | | | | | | | | |
6.75% due 05/15/285 | | | 225,000 | | | | 242,654 | |
NFP Corp. | | | | | | | | |
6.88% due 08/15/285 | | | 200,000 | | | | 210,542 | |
Allianz SE | | | | | | | | |
3.50%3,4,5 | | | 200,000 | | | | 206,750 | |
AmFam Holdings, Inc. | | | | | | | | |
2.81% due 03/11/315 | | | 200,000 | | | | 204,982 | |
Americo Life, Inc. | | | | | | | | |
3.45% due 04/15/315 | | | 200,000 | | | | 203,763 | |
Macquarie Group Ltd. | | | | | | | | |
2.69% due 06/23/323,5 | | | 200,000 | | | | 200,759 | |
Safehold Operating Partnership, LP | | | | | | | | |
2.80% due 06/15/31 | | | 200,000 | | | | 200,159 | |
Hunt Companies, Inc. | | | | | | | | |
5.25% due 04/15/295 | | | 200,000 | | | | 194,000 | |
Alexandria Real Estate Equities, Inc. | | | | | | | | |
4.90% due 12/15/30 | | | 150,000 | | | | 182,926 | |
Kemper Corp. | | | | | | | | |
2.40% due 09/30/30 | | | 170,000 | | | | 170,345 | |
Raymond James Financial, Inc. | | | | | | | | |
3.75% due 04/01/51 | | | 150,000 | | | | 164,674 | |
32 | THE GUGGENHEIM FUNDS SEMI-ANNUAL REPORT | SEE NOTES TO FINANCIAL STATEMENTS. |
SCHEDULE OF INVESTMENTS (Unaudited)(continued) | June 30, 2021 |
SERIES E (TOTAL RETURN BOND SERIES) | |
| | Face
Amount~ | | | Value | |
Assured Guaranty US Holdings, Inc. | | | | | | | | |
3.15% due 06/15/31 | | | 150,000 | | | $ | 155,804 | |
Kennedy-Wilson, Inc. | | | | | | | | |
4.75% due 03/01/29 | | | 150,000 | | | | 154,500 | |
Bank of New York Mellon Corp. | | | | | | | | |
4.70% 3,4 | | | 140,000 | | | | 152,775 | |
Goldman Sachs Group, Inc. | | | | | | | | |
3.80% 3,4 | | | 150,000 | | | | 152,670 | |
Prudential Financial, Inc. | | | | | | | | |
3.70% due 10/01/503 | | | 130,000 | | | | 135,525 | |
PartnerRe Finance B LLC | | | | | | | | |
4.50% due 10/01/503 | | | 110,000 | | | | 114,950 | |
Nasdaq, Inc. | | | | | | | | |
3.25% due 04/28/50 | | | 110,000 | | | | 110,377 | |
Western & Southern Life Insurance Co. | | | | | | | | |
3.75% due 04/28/615 | | | 100,000 | | | | 106,272 | |
Penn Mutual Life Insurance Co. | | | | | | | | |
3.80% due 04/29/615 | | | 100,000 | | | | 103,564 | |
Kuvare US Holdings, Inc. | | | | | | | | |
7.00% due 02/17/513,5 | | | 100,000 | | | | 103,379 | |
Westpac Banking Corp. | | | | | | | | |
2.96% due 11/16/40 | | | 100,000 | | | | 98,345 | |
Home Point Capital, Inc. | | | | | | | | |
5.00% due 02/01/265 | | | 100,000 | | | | 93,250 | |
Apollo Management Holdings, LP | | | | | | | | |
2.65% due 06/05/305 | | | 90,000 | | | | 91,492 | |
Brown & Brown, Inc. | | | | | | | | |
2.38% due 03/15/31 | | | 90,000 | | | | 90,028 | |
American Equity Investment Life Holding Co. | | | | | | | | |
5.00% due 06/15/27 | | | 69,000 | | | | 78,102 | |
CNO Financial Group, Inc. | | | | | | | | |
5.25% due 05/30/29 | | | 50,000 | | | | 59,476 | |
Brookfield Finance LLC | | | | | | | | |
3.45% due 04/15/50 | | | 50,000 | | | | 51,571 | |
Weyerhaeuser Co. | | | | | | | | |
4.00% due 04/15/30 | | | 43,000 | | | | 48,978 | |
Total Financial | | | 32,468,993 | |
| | | | | | | | | |
Consumer, Non-cyclical - 6.2% |
Sysco Corp. | | | | | | | | |
5.95% due 04/01/30 | | | 610,000 | | | | 783,096 | |
Altria Group, Inc. | | | | | | | | |
3.70% due 02/04/51 | | | 550,000 | | | | 523,021 | |
3.40% due 05/06/30 | | | 170,000 | | | | 179,473 | |
4.45% due 05/06/50 | | | 50,000 | | | | 53,333 | |
CoStar Group, Inc. | | | | | | | | |
2.80% due 07/15/305 | | | 740,000 | | | | 752,526 | |
DaVita, Inc. | | | | | | | | |
4.63% due 06/01/305 | | | 377,000 | | | | 386,975 | |
3.75% due 02/15/315 | | | 303,000 | | | | 290,880 | |
Centene Corp. | | | | | | | | |
3.00% due 10/15/30 | | | 300,000 | | | | 308,184 | |
2.50% due 03/01/31 | | | 300,000 | | | | 295,875 | |
BAT Capital Corp. | | | | | | | | |
3.98% due 09/25/50 | | | 300,000 | | | | 292,399 | |
4.70% due 04/02/27 | | | 190,000 | | | | 214,803 | |
Johns Hopkins University | | | | | | | | |
2.81% due 01/01/60 | | | 500,000 | | | | 501,486 | |
Quanta Services, Inc. | | | | | | | | |
2.90% due 10/01/30 | | | 467,000 | | | | 484,715 | |
Children’s Hospital Corp. | | | | | | | | |
2.59% due 02/01/50 | | | 500,000 | | | | 477,862 | |
Royalty Pharma plc | | | | | | | | |
3.55% due 09/02/505 | | | 310,000 | | | | 308,584 | |
2.20% due 09/02/305 | | | 160,000 | | | | 157,049 | |
Kraft Heinz Foods Co. | | | | | | | | |
4.38% due 06/01/46 | | | 180,000 | | | | 203,859 | |
4.88% due 10/01/49 | | | 75,000 | | | | 90,992 | |
5.50% due 06/01/50 | | | 50,000 | | | | 64,933 | |
5.00% due 06/04/42 | | | 50,000 | | | | 61,024 | |
Nielsen Finance LLC / Nielsen Finance Co. | | | | | | | | |
5.63% due 10/01/285 | | | 300,000 | | | | 317,010 | |
4.50% due 07/15/295 | | | 100,000 | | | | 100,375 | |
US Foods, Inc. | | | | | | | | |
6.25% due 04/15/255 | | | 200,000 | | | | 212,250 | |
4.75% due 02/15/295 | | | 150,000 | | | | 153,000 | |
Zimmer Biomet Holdings, Inc. | | | | | | | | |
3.55% due 03/20/30 | | | 283,000 | | | | 310,056 | |
California Institute of Technology | | | | | | | | |
3.65% due 09/01/19 | | | 225,000 | | | | 253,584 | |
Post Holdings, Inc. | | | | | | | | |
4.50% due 09/15/315 | | | 250,000 | | | | 249,450 | |
Global Payments, Inc. | | | | | | | | |
2.90% due 05/15/30 | | | 210,000 | | | | 219,017 | |
Triton Container International Ltd. | | | | | | | | |
3.15% due 06/15/315 | | | 200,000 | | | | 201,400 | |
Kimberly-Clark de Mexico SAB de CV | | | | | | | | |
2.43% due 07/01/315 | | | 200,000 | | | | 199,000 | |
TriNet Group, Inc. | | | | | | | | |
3.50% due 03/01/295 | | | 200,000 | | | | 197,200 | |
Central Garden & Pet Co. | | | | | | | | |
4.13% due 04/30/315 | | | 100,000 | | | | 101,125 | |
4.13% due 10/15/30 | | | 75,000 | | | | 76,594 | |
Spectrum Brands, Inc. | | | | | | | | |
5.75% due 07/15/25 | | | 150,000 | | | | 153,712 | |
Transurban Finance Company Pty Ltd. | | | | | | | | |
2.45% due 03/16/315 | | | 150,000 | | | | 151,025 | |
Universal Health Services, Inc. | | | | | | | | |
2.65% due 10/15/305 | | | 150,000 | | | | 150,830 | |
Hologic, Inc. | | | | | | | | |
3.25% due 02/15/295 | | | 150,000 | | | | 148,688 | |
Endo Luxembourg Finance Company I SARL / Endo US, Inc. | | | | | | | | |
6.13% due 04/01/295 | | | 150,000 | | | | 147,000 | |
Avantor Funding, Inc. | | | | | | | | |
4.63% due 07/15/285 | | | 125,000 | | | | 131,971 | |
Smithfield Foods, Inc. | | | | | | | | |
3.00% due 10/15/305 | | | 110,000 | | | | 111,023 | |
Gartner, Inc. | | | | | | | | |
3.75% due 10/01/305 | | | 100,000 | | | | 102,311 | |
Square, Inc. | | | | | | | | |
2.75% due 06/01/265 | | | 100,000 | | | | 101,750 | |
SEE NOTES TO FINANCIAL STATEMENTS. | THE GUGGENHEIM FUNDS SEMI-ANNUAL REPORT | 33 |
SCHEDULE OF INVESTMENTS (Unaudited)(continued) | June 30, 2021 |
SERIES E (TOTAL RETURN BOND SERIES) | |
| | Face
Amount~ | | | Value | |
Syneos Health, Inc. | | | | | | | | |
3.63% due 01/15/295 | | | 100,000 | | | $ | 99,000 | |
Service Corporation International | | | | | | | | |
3.38% due 08/15/30 | | | 100,000 | | | | 97,980 | |
Prime Security Services Borrower LLC / Prime Finance, Inc. | | | | | | | | |
3.38% due 08/31/275 | | | 100,000 | | | | 97,000 | |
Tenet Healthcare Corp. | | | | | | | | |
4.63% due 06/15/285 | | | 75,000 | | | | 77,190 | |
Charles River Laboratories International, Inc. | | | | | | | | |
3.75% due 03/15/295 | | | 57,000 | | | | 57,784 | |
Jaguar Holding Company II / PPD Development, LP | | | | | | | | |
4.63% due 06/15/255 | | | 50,000 | | | | 52,500 | |
Kronos Acquisition Holdings, Inc. / KIK Custom Products, Inc. | | | | | | | | |
5.00% due 12/31/265 | | | 50,000 | | | | 50,750 | |
Total Consumer, Non-cyclical | | | 10,751,644 | |
| | | | | | | | | |
Industrial - 4.7% |
Boeing Co. | | | | | | | | |
5.15% due 05/01/30 | | | 970,000 | | | | 1,149,732 | |
5.81% due 05/01/50 | | | 490,000 | | | | 660,307 | |
5.71% due 05/01/40 | | | 490,000 | | | | 631,568 | |
2.20% due 02/04/26 | | | 200,000 | | | | 202,090 | |
Amsted Industries, Inc. | | | | | | | | |
4.63% due 05/15/305 | | | 470,000 | | | | 481,750 | |
BAE Systems plc | | | | | | | | |
3.40% due 04/15/305 | | | 400,000 | | | | 435,200 | |
WRKCo, Inc. | | | | | | | | |
3.00% due 06/15/33 | | | 400,000 | | | | 419,291 | |
Crown Americas LLC / Crown Americas Capital Corporation VI | | | | | | | | |
4.75% due 02/01/26 | | | 400,000 | | | | 415,088 | |
Howmet Aerospace, Inc. | | | | | | | | |
6.75% due 01/15/28 | | | 300,000 | | | | 361,500 | |
Owens Corning | | | | | | | | |
3.88% due 06/01/30 | | | 320,000 | | | | 357,459 | |
Vontier Corp. | | | | | | | | |
2.95% due 04/01/315 | | | 350,000 | | | | 351,330 | |
Textron, Inc. | | | | | | | | |
2.45% due 03/15/31 | | | 350,000 | | | | 350,692 | |
Cellnex Finance Company S.A. | | | | | | | | |
3.88% due 07/07/415 | | | 350,000 | | | | 348,743 | |
Acuity Brands Lighting, Inc. | | | | | | | | |
2.15% due 12/15/30 | | | 350,000 | | | | 347,140 | |
Flowserve Corp. | | | | | | | | |
3.50% due 10/01/30 | | | 270,000 | | | | 285,084 | |
Ardagh Packaging Finance plc / Ardagh Holdings USA, Inc. | | | | | | | | |
4.13% due 08/15/265 | | | 250,000 | | | | 258,125 | |
Standard Industries, Inc. | | | | | | | | |
4.38% due 07/15/305 | | | 125,000 | | | | 128,906 | |
3.38% due 01/15/315 | | | 125,000 | | | | 119,651 | |
GATX Corp. | | | | | | | | |
4.00% due 06/30/30 | | | 140,000 | | | | 157,921 | |
3.50% due 03/15/28 | | | 50,000 | | | | 54,578 | |
Weir Group plc | | | | | | | | |
2.20% due 05/13/265 | | | 200,000 | | | | 200,905 | |
Graphic Packaging International LLC | | | | | | | | |
3.50% due 03/01/295 | | | 125,000 | | | | 123,837 | |
GXO Logistics, Inc. | | | | | | | | |
2.65% due 07/15/315 | | | 100,000 | | | | 99,197 | |
Norfolk Southern Corp. | | | | | | | | |
4.10% due 05/15/21 | | | 50,000 | | | | 54,860 | |
Oshkosh Corp. | | | | | | | | |
3.10% due 03/01/30 | | | 50,000 | | | | 53,067 | |
Berry Global, Inc. | | | | | | | | |
1.57% due 01/15/265 | | | 50,000 | | | | 50,015 | |
Total Industrial | | | 8,098,036 | |
| | | | | | | | | |
Communications - 4.1% |
ViacomCBS, Inc. | | | | | | | | |
4.95% due 01/15/31 | | | 617,000 | | | | 744,484 | |
4.95% due 05/19/50 | | | 320,000 | | | | 405,884 | |
Level 3 Financing, Inc. | | | | | | | | |
4.25% due 07/01/285 | | | 350,000 | | | | 355,166 | |
3.63% due 01/15/295 | | | 350,000 | | | | 337,750 | |
3.75% due 07/15/295 | | | 100,000 | | | | 97,250 | |
Charter Communications Operating LLC / Charter Communications Operating Capital | | | | | | | | |
2.80% due 04/01/31 | | | 625,000 | | | | 637,699 | |
3.90% due 06/01/52 | | | 50,000 | | | | 50,950 | |
AT&T, Inc. | | | | | | | | |
2.75% due 06/01/31 | | | 410,000 | | | | 426,473 | |
T-Mobile USA, Inc. | | | | | | | | |
3.88% due 04/15/30 | | | 335,000 | | | | 374,041 | |
2.88% due 02/15/31 | | | 50,000 | | | | 49,625 | |
Booking Holdings, Inc. | | | | | | | | |
4.63% due 04/13/30 | | | 350,000 | | | | 418,637 | |
CSC Holdings LLC | | | | | | | | |
4.13% due 12/01/305 | | | 200,000 | | | | 198,750 | |
3.38% due 02/15/315 | | | 200,000 | | | | 188,982 | |
Altice France S.A. | | | | | | | | |
5.13% due 07/15/295 | | | 200,000 | | | | 200,980 | |
7.38% due 05/01/265 | | | 100,000 | | | | 103,993 | |
Virgin Media Secured Finance plc | | | | | | | | |
4.50% due 08/15/305 | | | 300,000 | | | | 302,250 | |
Cable One, Inc. | | | | | | | | |
4.00% due 11/15/305 | | | 300,000 | | | | 301,125 | |
UPC Broadband Finco BV | | | | | | | | |
4.88% due 07/15/315 | | | 250,000 | | | | 250,575 | |
Vodafone Group plc | | | | | | | | |
4.13% due 06/04/813 | | | 250,000 | | | | 248,925 | |
Virgin Media Vendor Financing Notes IV DAC | | | | | | | | |
5.00% due 07/15/285 | | | 200,000 | | | | 204,000 | |
Sirius XM Radio, Inc. | | | | | | | | |
4.13% due 07/01/305 | | | 180,000 | | | | 182,250 | |
Verizon Communications, Inc. | | | | | | | | |
3.15% due 03/22/30 | | | 150,000 | | | | 161,880 | |
Qualitytech, LP / QTS Finance Corp. | | | | | | | | |
3.88% due 10/01/285 | | | 150,000 | | | | 160,410 | |
34 | THE GUGGENHEIM FUNDS SEMI-ANNUAL REPORT | SEE NOTES TO FINANCIAL STATEMENTS. |
SCHEDULE OF INVESTMENTS (Unaudited)(continued) | June 30, 2021 |
SERIES E (TOTAL RETURN BOND SERIES) | |
| | Face
Amount~ | | | Value | |
Radiate Holdco LLC / Radiate Finance, Inc. | | | | | | | | |
4.50% due 09/15/265 | | | 150,000 | | | $ | 155,250 | |
CCO Holdings LLC / CCO Holdings Capital Corp. | | | | | | | | |
4.50% due 05/01/32 | | | 100,000 | | | | 103,625 | |
4.25% due 02/01/315 | | | 50,000 | | | | 50,938 | |
Go Daddy Operating Company LLC / GD Finance Co., Inc. | | | | | | | | |
3.50% due 03/01/295 | | | 150,000 | | | | 149,025 | |
Lamar Media Corp. | | | | | | | | |
3.63% due 01/15/315 | | | 100,000 | | | | 97,750 | |
Fox Corp. | | | | | | | | |
3.50% due 04/08/30 | | | 50,000 | | | | 55,161 | |
Switch Ltd. | | | | | | | | |
3.75% due 09/15/285 | | | 50,000 | | | | 50,625 | |
Total Communications | | | 7,064,453 | |
| | | | | | | | | |
Consumer, Cyclical - 3.7% |
Delta Air Lines, Inc. | | | | | | | | |
7.00% due 05/01/255 | | | 1,070,000 | | | | 1,249,156 | |
Marriott International, Inc. | | | | | | | | |
4.63% due 06/15/30 | | | 340,000 | | | | 391,964 | |
3.50% due 10/15/32 | | | 330,000 | | | | 350,995 | |
5.75% due 05/01/25 | | | 250,000 | | | | 288,670 | |
2.85% due 04/15/31 | | | 170,000 | | | | 172,828 | |
Hyatt Hotels Corp. | | | | | | | | |
5.38% due 04/23/25 | | | 220,000 | | | | 248,473 | |
5.75% due 04/23/30 | | | 190,000 | | | | 230,854 | |
Hilton Domestic Operating Company, Inc. | | | | | | | | |
3.75% due 05/01/295 | | | 400,000 | | | | 403,080 | |
Choice Hotels International, Inc. | | | | | | | | |
3.70% due 01/15/31 | | | 360,000 | | | | 389,570 | |
Mileage Plus Holdings LLC / Mileage Plus Intellectual Property Assets Ltd. | | | | | | | | |
6.50% due 06/20/275 | | | 350,000 | | | | 385,350 | |
1011778 BC ULC / New Red Finance, Inc. | | | | | | | | |
4.00% due 10/15/305 | | | 300,000 | | | | 290,250 | |
3.88% due 01/15/285 | | | 75,000 | | | | 75,937 | |
Delta Air Lines Inc. / SkyMiles IP Ltd. | | | | | | | | |
4.50% due 10/20/255 | | | 300,000 | | | | 322,486 | |
Lowe’s Companies, Inc. | | | | | | | | |
4.50% due 04/15/30 | | | 250,000 | | | | 296,023 | |
PetSmart, Inc. / PetSmart Finance Corp. | | | | | | | | |
4.75% due 02/15/285 | | | 250,000 | | | | 259,688 | |
Aramark Services, Inc. | | | | | | | | |
6.38% due 05/01/255 | | | 200,000 | | | | 212,500 | |
5.00% due 02/01/285 | | | 10,000 | | | | 10,450 | |
Walgreens Boots Alliance, Inc. | | | | | | | | |
4.10% due 04/15/50 | | | 198,000 | | | | 216,839 | |
United Airlines, Inc. | | | | | | | | |
4.38% due 04/15/265 | | | 150,000 | | | | 155,250 | |
Scotts Miracle-Gro Co. | | | | | | | | |
4.00% due 04/01/315 | | | 150,000 | | | | 149,828 | |
Allison Transmission, Inc. | | | | | | | | |
3.75% due 01/30/315 | | | 100,000 | | | | 98,287 | |
WMG Acquisition Corp. | | | | | | | | |
3.00% due 02/15/315 | | | 75,000 | | | | 71,060 | |
Hanesbrands, Inc. | | | | | | | | |
5.38% due 05/15/255 | | | 55,000 | | | | 58,231 | |
Performance Food Group, Inc. | | | | | | | | |
6.88% due 05/01/255 | | | 50,000 | | | | 53,256 | |
Total Consumer, Cyclical | | | 6,381,025 | |
| | | | | | | | | |
Energy - 2.3% |
Galaxy Pipeline Assets Bidco Ltd. | | | | | | | | |
3.25% due 09/30/405 | | | 700,000 | | | | 695,167 | |
2.94% due 09/30/405 | | | 350,000 | | | | 347,414 | |
BP Capital Markets plc | | | | | | | | |
4.88% 3,4 | | | 880,000 | | | | 964,093 | |
Qatar Petroleum | | | | | | | | |
3.30% due 07/12/515 | | | 250,000 | | | | 250,000 | |
3.13% due 07/12/415 | | | 250,000 | | | | 249,078 | |
Sabine Pass Liquefaction LLC | | | | | | | | |
4.50% due 05/15/30 | | | 400,000 | | | | 461,162 | |
Occidental Petroleum Corp. | | | | | | | | |
4.63% due 06/15/45 | | | 200,000 | | | | 195,000 | |
3.00% due 02/15/27 | | | 70,000 | | | | 69,475 | |
ITT Holdings LLC | | | | | | | | |
6.50% due 08/01/295 | | | 250,000 | | | | 255,402 | |
Magellan Midstream Partners, LP | | | | | | | | |
3.25% due 06/01/30 | | | 190,000 | | | | 204,790 | |
Valero Energy Corp. | | | | | | | | |
2.15% due 09/15/27 | | | 140,000 | | | | 142,293 | |
NuStar Logistics, LP | | | | | | | | |
5.63% due 04/28/27 | | | 100,000 | | | | 107,088 | |
Midwest Connector Capital Company LLC | | | | | | | | |
4.63% due 04/01/295 | | | 100,000 | | | | 106,380 | |
Baker Hughes a GE Company LLC / Baker Hughes Co-Obligor, Inc. | | | | | | | | |
4.49% due 05/01/30 | | | 50,000 | | | | 59,029 | |
Total Energy | | | 4,106,371 | |
| | | | | | | | | |
Technology - 1.9% |
NetApp, Inc. | | | | | | | | |
2.70% due 06/22/30 | | | 950,000 | | | | 992,352 | |
Broadcom, Inc. | | | | | | | | |
4.15% due 11/15/30 | | | 510,000 | | | | 572,516 | |
2.45% due 02/15/315 | | | 300,000 | | | | 295,280 | |
MSCI, Inc. | | | | | | | | |
3.88% due 02/15/315 | | | 260,000 | | | | 269,818 | |
3.63% due 09/01/305 | | | 75,000 | | | | 76,576 | |
Qorvo, Inc. | | | | | | | | |
4.38% due 10/15/29 | | | 170,000 | | | | 185,252 | |
3.38% due 04/01/315 | | | 100,000 | | | | 104,222 | |
Oracle Corp. | | | | | | | | |
3.95% due 03/25/51 | | | 250,000 | | | | 273,650 | |
Leidos, Inc. | | | | | | | | |
2.30% due 02/15/31 | | | 250,000 | | | | 243,905 | |
Boxer Parent Company, Inc. | | | | | | | | |
7.13% due 10/02/255 | | | 100,000 | | | | 107,000 | |
Crowdstrike Holdings, Inc. | | | | | | | | |
3.00% due 02/15/29 | | | 100,000 | | | | 100,095 | |
NCR Corp. | | | | | | | | |
5.00% due 10/01/285 | | | 60,000 | | | | 62,044 | |
SEE NOTES TO FINANCIAL STATEMENTS. | THE GUGGENHEIM FUNDS SEMI-ANNUAL REPORT | 35 |
SCHEDULE OF INVESTMENTS (Unaudited)(continued) | June 30, 2021 |
SERIES E (TOTAL RETURN BOND SERIES) | |
| | Face
Amount~ | | | Value | |
Twilio, Inc. | | | | | | | | |
3.63% due 03/15/29 | | | 38,000 | | | $ | 38,760 | |
Entegris, Inc. | | | | | | | | |
3.63% due 05/01/295 | | | 29,000 | | | | 29,363 | |
Total Technology | | | 3,350,833 | |
| | | | | | | | | |
Basic Materials - 1.2% |
Newcrest Finance Pty Ltd. | | | | | | | | |
3.25% due 05/13/305 | | | 460,000 | | | | 494,833 | |
4.20% due 05/13/505 | | | 220,000 | | | | 251,783 | |
Anglo American Capital plc | | | | | | | | |
5.63% due 04/01/305 | | | 200,000 | | | | 244,935 | |
2.63% due 09/10/305 | | | 200,000 | | | | 200,972 | |
Alcoa Nederland Holding BV | | | | | | | | |
5.50% due 12/15/275 | | | 200,000 | | | | 216,960 | |
Minerals Technologies, Inc. | | | | | | | | |
5.00% due 07/01/285 | | | 200,000 | | | | 207,940 | |
INEOS Quattro Finance 2 plc | | | | | | | | |
3.38% due 01/15/265 | | | 150,000 | | | | 151,985 | |
Ingevity Corp. | | | | | | | | |
3.88% due 11/01/285 | | | 150,000 | | | | 148,875 | |
Reliance Steel & Aluminum Co. | | | | | | | | |
2.15% due 08/15/30 | | | 100,000 | | | | 98,629 | |
Valvoline, Inc. | | | | | | | | |
4.25% due 02/15/305 | | | 50,000 | | | | 51,624 | |
Total Basic Materials | | | 2,068,536 | |
| | | | | | | | | |
Utilities - 0.8% |
Cheniere Corpus Christi Holdings LLC | | | | | | | | |
3.52% due 12/31/39††† | | | 800,000 | | | | 815,384 | |
AES Corp. | | | | | | | | |
3.95% due 07/15/305 | | | 220,000 | | | | 240,570 | |
NRG Energy, Inc. | | | | | | | | |
2.45% due 12/02/275 | | | 200,000 | | | | 201,445 | |
Clearway Energy Operating LLC | | | | | | | | |
3.75% due 02/15/315 | | | 100,000 | | | | 99,500 | |
Total Utilities | | | 1,356,899 | |
| | | | | | | | | |
Total Corporate Bonds |
(Cost $71,948,526) | | | 75,646,790 | |
| |
ASSET-BACKED SECURITIES†† - 21.8% |
Collateralized Loan Obligations - 13.5% |
Octagon Investment Partners 49 Ltd. | | | | | | | | |
2021-5A, 1.76% (3 Month USD LIBOR + 1.55%, Rate Floor: 1.55%) due 01/15/335,6 | | | 1,750,000 | | | | 1,739,823 | |
ABPCI Direct Lending Fund CLO I LLC | | | | | | | | |
2021-1A, 1.79% (3 Month USD LIBOR + 1.60%, Rate Floor: 1.60%) due 04/20/325,6 | | | 1,000,000 | | | | 998,653 | |
2021-1A, 1.88% (3 Month USD LIBOR + 1.70%, Rate Floor: 1.70%) due 07/20/335,6 | | | 500,000 | | | | 498,490 | |
BXMT Ltd. | | | | | | | | |
2020-FL2, 1.27% (1 Month USD LIBOR + 1.15%, Rate Floor: 1.15%) due 02/15/385,6 | | | 1,000,000 | | | | 1,002,650 | |
2020-FL3, 2.68% (1 Month USD LIBOR + 2.55%, Rate Floor: 2.55%) due 03/15/375,6 | | | 250,000 | | | | 253,958 | |
LoanCore Issuer Ltd. | | | | | | | | |
2019-CRE2, 1.57% (1 Month USD LIBOR + 1.50%, Rate Floor: 1.50%) due 05/15/365,6 | | | 550,000 | | | | 551,044 | |
2018-CRE1, 1.57% (1 Month USD LIBOR + 1.50%, Rate Floor: 1.50%) due 05/15/285,6 | | | 500,000 | | | | 500,120 | |
Woodmont Trust | | | | | | | | |
2020-7A, 2.08% (3 Month USD LIBOR + 1.90%, Rate Floor: 1.90%) due 01/15/325,6 | | | 1,000,000 | | | | 1,006,522 | |
Cerberus Loan Funding XXX, LP | | | | | | | | |
2020-3A, 2.03% (3 Month USD LIBOR + 1.85%, Rate Floor: 1.85%) due 01/15/335,6 | | | 1,000,000 | | | | 1,004,482 | |
Parliament Funding II Ltd. | | | | | | | | |
2020-1A, 2.64% (3 Month USD LIBOR + 2.45%, Rate Floor: 2.45%) due 08/12/305,6 | | | 1,000,000 | | | | 1,002,867 | |
Whitebox CLO II Ltd. | | | | | | | | |
2020-2A, 1.93% (3 Month USD LIBOR + 1.75%, Rate Floor: 1.75%) due 10/24/315,6 | | | 1,000,000 | | | | 1,002,691 | |
MidOcean Credit CLO VII | | | | | | | | |
2020-7A, 1.63% (3 Month USD LIBOR + 1.45%, Rate Floor: 0.00%) due 07/15/295,6 | | | 1,000,000 | | | | 1,000,304 | |
Anchorage Credit Funding Ltd. | | | | | | | | |
due 07/27/395 | | | 1,000,000 | | | | 1,000,000 | |
Golub Capital Partners CLO Ltd. | | | | | | | | |
2018-36A, 1.48% (3 Month USD LIBOR + 1.30%, Rate Floor: 0.00%) due 02/05/315,6 | | | 850,000 | | | | 848,234 | |
Dryden 37 Senior Loan Fund | | | | | | | | |
2015-37A, due 01/15/315,7 | | | 1,000,000 | | | | 843,843 | |
Marathon CLO VII Ltd. | | | | | | | | |
2017-7A, 1.83% (3 Month USD LIBOR + 1.65%, Rate Floor: 0.00%) due 10/28/255,6 | | | 787,230 | | | | 787,011 | |
STWD Ltd. | | | | | | | | |
2019-FL1, 1.73% (1 Month USD LIBOR + 1.60%, Rate Floor: 1.60%) due 07/15/385,6 | | | 750,000 | | | | 752,527 | |
Golub Capital Partners CLO 33M Ltd. | | | | | | | | |
2021-33A, 1.98% (3 Month USD LIBOR + 1.86%, Rate Floor: 1.86%) due 08/25/335,6 | | | 750,000 | | | | 750,000 | |
36 | THE GUGGENHEIM FUNDS SEMI-ANNUAL REPORT | SEE NOTES TO FINANCIAL STATEMENTS. |
SCHEDULE OF INVESTMENTS (Unaudited)(continued) | June 30, 2021 |
SERIES E (TOTAL RETURN BOND SERIES) | |
| | Face
Amount~ | | | Value | |
Dryden 33 Senior Loan Fund | | | | | | | | |
2020-33A, 1.58% (3 Month USD LIBOR + 1.40%, Rate Floor: 1.40%) due 04/15/295,6 | | | 750,000 | | | $ | 745,860 | |
Fortress Credit Opportunities XI CLO Ltd. | | | | | | | | |
2018-11A, 1.48% (3 Month USD LIBOR + 1.30%, Rate Floor: 0.00%) due 04/15/315,6 | | | 750,000 | | | | 743,542 | |
CHCP Ltd. | | | | | | | | |
2021-FL1, 2.23% (1 Month USD LIBOR + 2.10%, Rate Floor: 2.10%) due 02/15/385,6 | | | 500,000 | | | | 504,092 | |
HERA Commercial Mortgage Ltd. | | | | | | | | |
2021-FL1, 1.68% (1 Month USD LIBOR + 1.60%, Rate Floor: 1.60%) due 02/18/385,6 | | | 500,000 | | | | 501,782 | |
ABPCI Direct Lending Fund IX LLC | | | | | | | | |
2020-9A, 2.14% (3 Month USD LIBOR + 1.95%, Rate Floor: 1.95%) due 11/18/315,6 | | | 500,000 | | | | 500,402 | |
GPMT Ltd. | | | | | | | | |
2019-FL2, 1.99% (1 Month USD LIBOR + 1.90%, Rate Floor: 1.90%) due 02/22/365,6 | | | 500,000 | | | | 500,261 | |
ABPCI DIRECT LENDING FUND CLO V Ltd. | | | | | | | | |
2021-5A, 1.59% (3 Month USD LIBOR + 1.50%, Rate Floor: 1.50%) due 04/20/315,6 | | | 500,000 | | | | 500,000 | |
Golub Capital Partners CLO 16 Ltd. | | | | | | | | |
2021-16A, 1.70% (3 Month USD LIBOR + 1.61%, Rate Floor: 1.61%) due 07/25/335,6 | | | 500,000 | | | | 500,000 | |
Cerberus Loan Funding XXVI, LP | | | | | | | | |
2021-1A, 1.57% (3 Month USD LIBOR + 1.50%, Rate Floor: 1.50%) due 04/15/315,6 | | | 500,000 | | | | 500,000 | |
Cerberus Loan Funding XXXIII, LP | | | | | | | | |
due 07/23/335,6 | | | 500,000 | | | | 500,000 | |
Wellfleet CLO Ltd. | | | | | | | | |
2020-2A, 1.25% (3 Month USD LIBOR + 1.06%, Rate Floor: 0.00%) due 10/20/295,6 | | | 500,000 | | | | 499,502 | |
THL Credit Lake Shore MM CLO I Ltd. | | | | | | | | |
2021-1A, 1.88% (3 Month USD LIBOR + 1.70%, Rate Floor: 1.70%) due 04/15/335,6 | | | 500,000 | | | | 498,600 | |
Treman Park CLO Ltd. | | | | | | | | |
2015-1A, due 10/20/285,7 | | | 500,000 | | | | 392,684 | |
Halcyon Loan Advisors Funding Ltd. | | | | | | | | |
2017-3A, 1.09% (3 Month USD LIBOR + 0.90%, Rate Floor: 0.00%) due 10/18/275,6 | | | 305,605 | | | | 305,567 | |
Diamond CLO Ltd. | | | | | | | | |
2021-1A, 1.63% (3 Month USD LIBOR + 1.45%, Rate Floor: 1.45%) due 04/25/295,6 | | | 250,000 | | | | 249,711 | |
Golub Capital Partners CLO 17 Ltd. | | | | | | | | |
2017-17A, 1.83% (3 Month USD LIBOR + 1.65%, Rate Floor: 0.00%) due 10/25/305,6 | | | 250,000 | | | | 249,592 | |
Fortress Credit Opportunities IX CLO Ltd. | | | | | | | | |
2017-9A, 1.71% (3 Month USD LIBOR + 1.55%, Rate Floor: 0.00%) due 11/15/295,6 | | | 109,000 | | | | 108,775 | |
First Eagle Clarendon Fund CLO LLC | | | | | | | | |
2019-1A, 1.48% (3 Month USD LIBOR + 1.30%, Rate Floor: 0.00%) due 01/25/275,6 | | | 65,668 | | | | 65,651 | |
Copper River CLO Ltd. | | | | | | | | |
2007-1A, due 01/20/217,8 | | | 600,000 | | | | 17,622 | |
Total Collateralized Loan Obligations | | | 23,426,862 | |
| | | | | | | | | |
Financial - 2.3% |
Station Place Securitization Trust | | | | | | | | |
2021-7, 0.89% (1 Month USD LIBOR + 0.80%, Rate Floor: 0.80%) due 09/24/21†††,5,6 | | | 1,550,000 | | | | 1,550,000 | |
2020-16, 1.09% (1 Month USD LIBOR + 1.00%, Rate Floor: 1.00%) due 12/22/21†††,5,6 | | | 1,500,000 | | | | 1,500,000 | |
Oxford Finance Funding | | | | | | | | |
2020-1A, 3.10% due 02/15/285 | | | 500,000 | | | | 514,616 | |
Madison Avenue Secured Funding Trust Series | | | | | | | | |
2020-1, 1.72% (1 Month USD LIBOR + 1.63%, Rate Floor: 0.00%) due 12/13/21†††,5,6 | | | 250,000 | | | | 250,000 | |
Nassau LLC | | | | | | | | |
2019-1, 3.98% due 08/15/345 | | | 203,487 | | | | 205,942 | |
Total Financial | | | 4,020,558 | |
| | | | | | | | | |
Transport-Aircraft - 1.6% |
Castlelake Aircraft Securitization Trust | | | | | | | | |
2017-1, 3.97% due 07/15/42 | | | 501,785 | | | | 501,412 | |
Castlelake Aircraft Structured Trust | | | | | | | | |
2021-1A, 3.47% due 01/15/465 | | | 445,246 | | | | 452,875 | |
WAVE LLC | | | | | | | | |
2019-1, 3.60% due 09/15/445 | | | 454,486 | | | | 451,711 | |
Sapphire Aviation Finance II Ltd. | | | | | | | | |
2020-1A, 3.23% due 03/15/405 | | | 433,078 | | | | 430,817 | |
AIM Aviation Finance Ltd. | | | | | | | | |
2015-1A, 4.21% due 02/15/405 | | | 447,860 | | | | 377,273 | |
Raspro Trust | | | | | | | | |
2005-1A, 1.11% (3 Month USD LIBOR + 0.93%, Rate Floor: 0.93%) due 03/23/245,6 | | | 333,911 | | | | 333,505 | |
Falcon Aerospace Ltd. | | | | | | | | |
2017-1, 4.58% due 02/15/425 | | | 174,965 | | | | 174,127 | |
Total Transport-Aircraft | | | 2,721,720 | |
| | | | | | | | | |
Net Lease - 1.0% |
Store Master Funding I-VII | | | | | | | | |
2016-1A, 3.96% due 10/20/465 | | | 1,139,317 | | | | 1,204,340 | |
SEE NOTES TO FINANCIAL STATEMENTS. | THE GUGGENHEIM FUNDS SEMI-ANNUAL REPORT | 37 |
SCHEDULE OF INVESTMENTS (Unaudited)(continued) | June 30, 2021 |
SERIES E (TOTAL RETURN BOND SERIES) | |
| | Face
Amount~ | | | Value | |
CARS-DB4, LP | | | | | | | | |
2020-1A, 3.81% due 02/15/505 | | | 249,583 | | | $ | 265,626 | |
CF Hippolyta LLC | | | | | | | | |
2020-1, 2.28% due 07/15/605 | | | 238,595 | | | | 242,608 | |
Total Net Lease | | | 1,712,574 | |
| | | | | | | | | |
Whole Business - 0.9% |
Arbys Funding LLC | | | | | | | | |
2020-1A, 3.24% due 07/30/505 | | | 992,500 | | | | 1,037,331 | |
ServiceMaster Funding LLC | | | | | | | | |
2020-1, 3.34% due 01/30/515 | | | 249,375 | | | | 261,380 | |
SERVPRO Master Issuer LLC | | | | | | | | |
2021-1A, 2.39% due 04/25/515 | | | 250,000 | | | | 252,773 | |
Taco Bell Funding LLC | | | | | | | | |
2016-1A, 4.97% due 05/25/465 | | | 96,000 | | | | 103,651 | |
Total Whole Business | | | 1,655,135 | |
| | | | | | | | | |
Collateralized Debt Obligations - 0.9% |
Anchorage Credit Funding 4 Ltd. | | | | | | | | |
2021-4A, 2.72% due 04/27/395 | | | 1,000,000 | | | | 997,453 | |
Anchorage Credit Funding 3 Ltd. | | | | | | | | |
2021-3A, 2.87% due 01/28/395 | | | 500,000 | | | | 498,735 | |
Putnam Structured Product Funding Ltd. | | | | | | | | |
2003-1A, 1.18% (1 Month USD LIBOR + 1.00%, Rate Floor: 0.00%) due 10/15/386,8 | | | 3,583 | | | | 3,577 | |
Total Collateralized Debt Obligations | | | 1,499,765 | |
| | | | | | | | | |
Infrastructure - 0.7% |
SBA Tower Trust | | | | | | | | |
2.33% due 01/15/285 | | | 1,250,000 | | | | 1,296,356 | |
| | | | | | | | | |
Transport-Container - 0.7% |
CAL Funding IV Ltd. | | | | | | | | |
2020-1A, 2.22% due 09/25/455 | | | 468,125 | | | | 472,571 | |
Textainer Marine Containers VIII Ltd. | | | | | | | | |
2020-2A, 2.10% due 09/20/455 | | | 464,910 | | | | 468,327 | |
Textainer Marine Containers VII Ltd. | | | | | | | | |
2020-1A, 2.73% due 08/21/455 | | | 228,324 | | | | 232,140 | |
Total Transport-Container | | | 1,173,038 | |
| | | | | | | | | |
Insurance - 0.2% |
Chesterfield Financial Holdings LLC | | | | | | | | |
2014-1A, 4.50% due 12/15/345 | | | 297,000 | | | | 307,389 | |
Total Asset-Backed Securities |
(Cost $37,584,709) | | | 37,813,397 | |
| |
COLLATERALIZED MORTGAGE OBLIGATIONS†† - 16.7% |
Government Agency - 9.0% |
Uniform MBS 30 Year | | | | | | | | |
due 08/12/226 | | | 13,500,000 | | | | 13,945,082 | |
Fannie Mae | | | | | | | | |
3.83% due 05/01/49 | | | 1,000,000 | | | | 1,164,094 | |
Fannie Mae-Aces | | | | | | | | |
2020-M23, 1.59% (WAC) due 03/25/356,9 | | | 3,669,788 | | | | 474,938 | |
Total Government Agency | | | 15,584,114 | |
| | | | | | | | | |
Residential Mortgage Backed Securities - 5.3% |
Ameriquest Mortgage Securities Trust | | | | | | | | |
2006-M3, 0.25% (1 Month USD LIBOR + 0.16%, Rate Floor: 0.16%) due 10/25/366 | | | 2,270,158 | | | | 1,000,489 | |
Starwood Mortgage Residential Trust | | | | | | | | |
2020-1, 2.41% (WAC) due 02/25/505,6 | | | 924,890 | | | | 934,347 | |
JP Morgan Mortgage Acquisition Trust | | | | | | | | |
2006-WMC4, 0.21% (1 Month USD LIBOR + 0.12%, Rate Floor: 0.12%) due 12/25/366 | | | 1,388,931 | | | | 880,899 | |
FKRT | | | | | | | | |
2020-C2A, 3.25% due 12/30/23†††,8 | | | 717,304 | | | | 718,165 | |
Home Equity Loan Trust | | | | | | | | |
2007-FRE1, 0.28% (1 Month USD LIBOR + 0.19%, Rate Floor: 0.19%) due 04/25/376 | | | 739,706 | | | | 697,957 | |
CSMC Trust | | | | | | | | |
2020-RPL5, 3.02% (WAC) due 08/25/605,6 | | | 673,402 | | | | 683,645 | |
LSTAR Securities Investment Ltd. | | | | | | | | |
2021-1, 1.89% (1 Month USD LIBOR + 1.80%, Rate Floor: 1.80%) due 02/01/266,8 | | | 391,573 | | | | 392,492 | |
2021-2, 1.79% (1 Month USD LIBOR + 1.70%, Rate Floor: 1.70%) due 03/02/266,8 | | | 271,669 | | | | 271,554 | |
NovaStar Mortgage Funding Trust Series | | | | | | | | |
2007-2, 0.29% (1 Month USD LIBOR + 0.20%, Rate Cap/Floor: 11.00%/0.20%) due 09/25/376 | | | 614,969 | | | | 603,659 | |
OSAT Trust | | | | | | | | |
2021-RPL1, 2.12% due 05/25/655,10 | | | 550,000 | | | | 550,248 | |
PRPM LLC | | | | | | | | |
2021-5, 1.79% due 06/25/265,10 | | | 500,000 | | | | 499,523 | |
Legacy Mortgage Asset Trust | | | | | | | | |
2021-GS3, 1.75% due 07/25/615,10 | | | 494,765 | | | | 493,536 | |
Wachovia Asset Securitization Issuance II LLC Trust | | | | | | | | |
2007-HE2A, 0.22% (1 Month USD LIBOR + 0.13%, Rate Floor: 0.13%) due 07/25/375,6 | | | 452,713 | | | | 425,607 | |
HarborView Mortgage Loan Trust | | | | | | | | |
2006-14, 0.24% (1 Month USD LIBOR + 0.15%, Rate Floor: 0.15%) due 01/25/476 | | | 443,775 | | | | 416,851 | |
American Home Mortgage Investment Trust | | | | | | | | |
2007-1, 2.08% due 05/25/479 | | | 2,105,858 | | | | 342,340 | |
Washington Mutual Mortgage Pass-Through Certificates WMALT Series Trust | | | | | | | | |
2006-AR9, 0.96% (1 Year CMT Rate + 0.84%, Rate Floor: 0.84%) due 11/25/466 | | | 263,194 | | | | 226,461 | |
UCFC Manufactured Housing Contract | | | | | | | | |
1997-2, 7.38% due 10/15/28 | | | 65,395 | | | | 66,549 | |
Morgan Stanley Re-REMIC Trust | | | | | | | | |
2010-R5, 1.20% due 06/26/365 | | | 52,349 | | | | 48,208 | |
Total Residential Mortgage Backed Securities | | | | | | | 9,252,530 | |
| | | | | | | | | |
38 | THE GUGGENHEIM FUNDS SEMI-ANNUAL REPORT | SEE NOTES TO FINANCIAL STATEMENTS. |
SCHEDULE OF INVESTMENTS (Unaudited)(continued) | June 30, 2021 |
SERIES E (TOTAL RETURN BOND SERIES) | |
| | Face
Amount~ | | | Value | |
Military Housing - 1.3% |
Freddie Mac Military Housing Bonds Resecuritization Trust Certificates | | | | | | | | |
2015-R1, 1.93% (WAC) due 11/25/555,6 | | | 936,707 | | | $ | 1,113,178 | |
GMAC Commercial Mortgage Asset Corp. | | | | | | | | |
2007-HCKM, 6.11% due 08/10/525 | | | 938,990 | | | | 1,089,356 | |
Total Military Housing | | | 2,202,534 | |
| | | | | | | | | |
Commercial Mortgage Backed Securities - 1.1% |
GS Mortgage Securities Trust | | | | | | | | |
2020-GC45, 0.79% (WAC) due 02/13/536,9 | | | 9,983,055 | | | | 472,028 | |
Wells Fargo Commercial Mortgage Trust | | | | | | | | |
2016-NXS5, 1.60% (WAC) due 01/15/596,9 | | | 3,802,741 | | | | 201,743 | |
2015-NXS1, 2.63% due 05/15/48 | | | 61,601 | | | | 61,585 | |
Life Mortgage Trust | | | | | | | | |
2021-BMR, 2.42% (1 Month USD LIBOR + 2.35%, Rate Floor: 2.35%) due 03/15/385,6 | | | 250,000 | | | | 250,777 | |
Extended Stay America Trust | | | | | | | | |
due 07/15/385,6 | | | 250,000 | | | | 250,720 | |
CFCRE Commercial Mortgage Trust | | | | | | | | |
2016-C3, 1.15% (WAC) due 01/10/486,9 | | | 5,637,289 | | | | 217,768 | |
Citigroup Commercial Mortgage Trust | | | | | | | | |
2016-GC37, 1.85% (WAC) due 04/10/496,9 | | | 3,249,817 | | | | 214,535 | |
COMM Mortgage Trust | | | | | | | | |
2015-CR26, 1.07% (WAC) due 10/10/486,9 | | | 6,194,536 | | | | 202,444 | |
Total Commercial Mortgage Backed Securities | | | 1,871,600 | |
| | | | | | | | | |
Total Collateralized Mortgage Obligations |
(Cost $28,616,617) | | | 28,910,778 | |
| |
U.S. GOVERNMENT SECURITIES†† - 6.6% |
U.S. Treasury Notes |
1.63% due 05/15/31 | | | 7,350,000 | | | | 7,471,735 | |
U.S. Treasury Strips |
due 02/15/5011,12,13 | | | 5,120,000 | | | | 2,787,808 | |
due 08/15/5012,13 | | | 2,050,000 | | | | 1,104,587 | |
U.S. Treasury Bonds |
1.88% due 02/15/51 | | | 100,000 | | | | 95,531 | |
Total U.S. Government Securities |
(Cost $12,007,892) | | | | | | | 11,459,661 | |
| | | | | | | | | |
SENIOR FLOATING RATE INTERESTS††,6 - 6.1% |
Industrial - 1.3% |
Berlin Packaging LLC | | | | | | | | |
3.10% (1 Month USD LIBOR + 3.00% and 3 Month USD LIBOR + 3.00%, Rate Floor: 3.00%) due 11/07/25 | | | 475,508 | | | | 470,900 | |
Charter Nex US Holdings, Inc. | | | | | | | | |
5.00% (1 Month USD LIBOR + 4.25%, Rate Floor: 5.00%) due 12/01/27 | | | 399,000 | | | | 399,499 | |
Mileage Plus Holdings LLC | | | | | | | | |
6.25% (3 Month USD LIBOR + 5.25%, Rate Floor: 6.25%) due 06/21/27 | | | 250,000 | | | | 266,790 | |
American Bath Group LLC | | | | | | | | |
4.25% (1 Month USD LIBOR + 3.75%, Rate Floor: 4.25%) due 11/23/27 | | | 259,350 | | | | 258,512 | |
Vertical (TK Elevator) | | | | | | | | |
4.48% (6 Month USD LIBOR + 4.25%, Rate Floor: 4.25%) due 07/30/27 | | | 199,001 | | | | 199,085 | |
Berry Global, Inc. | | | | | | | | |
1.83% (1 Month USD LIBOR + 1.75%, Rate Floor: 1.75%) due 07/01/26 | | | 134,041 | | | | 132,937 | |
TransDigm, Inc. | | | | | | | | |
2.35% (1 Month USD LIBOR + 2.25%, Rate Floor: 2.25%) due 12/09/25 | | | 128,693 | | | | 126,694 | |
Anchor Packaging LLC | | | | | | | | |
4.10% (1 Month USD LIBOR + 4.00%, Rate Floor: 4.00%) due 07/20/26 | | | 99,241 | | | | 99,365 | |
American Residential Services LLC | | | | | | | | |
4.25% (3 Month USD LIBOR + 3.50%, Rate Floor: 4.25%) due 10/15/27 | | | 99,500 | | | | 99,251 | |
Pelican Products, Inc. | | | | | | | | |
4.50% (3 Month USD LIBOR + 3.50%, Rate Floor: 4.50%) due 05/01/25 | | | 99,233 | | | | 98,334 | |
Service Logic Acquisition, Inc. | | | | | | | | |
4.75% (2 Month USD LIBOR + 4.00% and 3 Month USD LIBOR + 4.00%, Rate Floor: 4.75%) due 10/29/27 | | | 80,299 | | | | 80,499 | |
Total Industrial | | | 2,231,866 | |
| | | | | | | | | |
Consumer, Cyclical - 1.2% |
MB2 Dental Solutions LLC | | | | | | | | |
7.00% (3 Month USD LIBOR + 6.00%, Rate Floor: 7.00%) due 01/29/27††† | | | 331,934 | | | | 325,759 | |
7.58% (3 Month USD LIBOR + 6.00% and Commercial Prime Lending Rate + 5.00%, Rate Floor: 6.00%) due 01/29/27††† | | | 26,989 | | | | 26,487 | |
BGIS (BIFM CA Buyer, Inc.) | | | | | | | | |
3.60% (1 Month USD LIBOR + 3.50%, Rate Floor: 3.50%) due 06/01/26 | | | 297,102 | | | | 295,433 | |
Zephyr Bidco Ltd. | | | | | | | | |
4.80% (1 Month GBP LIBOR + 4.75%, Rate Floor: 4.75%) due 07/23/25 | | GBP | 200,000 | | | | 272,482 | |
CHG Healthcare Services, Inc. | | | | | | | | |
4.00% (3 Month USD LIBOR + 3.00%, Rate Floor: 4.00%) due 06/07/23 | | | 272,705 | | | | 272,365 | |
Mavis Tire Express Services TopCo Corp. | | | | | | | | |
4.75% (3 Month USD LIBOR + 4.00%, Rate Floor: 4.75%) due 05/04/28 | | | 200,000 | | | | 200,500 | |
CNT Holdings I Corp. | | | | | | | | |
4.50% (3 Month USD LIBOR + 3.75%, Rate Floor: 4.50%) due 11/08/27 | | | 200,000 | | | | 200,000 | |
Intrawest Resorts Holdings, Inc. | | | | | | | | |
2.85% (1 Month USD LIBOR + 2.75%, Rate Floor: 2.75%) due 07/31/24 | | | 198,458 | | | | 195,800 | |
SP PF Buyer LLC | | | | | | | | |
4.60% (1 Month USD LIBOR + 4.50%, Rate Floor: 4.50%) due 12/22/25 | | | 149,618 | | | | 147,075 | |
SEE NOTES TO FINANCIAL STATEMENTS. | THE GUGGENHEIM FUNDS SEMI-ANNUAL REPORT | 39 |
SCHEDULE OF INVESTMENTS (Unaudited)(continued) | June 30, 2021 |
SERIES E (TOTAL RETURN BOND SERIES) | |
| | Face
Amount~ | | | Value | |
New Trojan Parent, Inc. | | | | | | | | |
3.75% (1 Month USD LIBOR + 3.25%, Rate Floor: 3.75%) due 01/06/28 | | | 100,000 | | | $ | 99,458 | |
Total Consumer, Cyclical | | | 2,035,359 | |
| | | | | | | | | |
Consumer, Non-cyclical - 1.0% |
B&G Foods, Inc. | | | | | | | | |
2.60% (1 Month USD LIBOR + 2.50%, Rate Floor: 2.50%) due 10/12/26 | | | 250,000 | | | | 249,822 | |
Energizer Holdings, Inc. | | | | | | | | |
2.75% (1 Month USD LIBOR + 2.25%, Rate Floor: 2.75%) due 12/22/27 | | | 249,375 | | | | 248,565 | |
Packaging Coordinators Midco, Inc. | | | | | | | | |
4.25% (3 Month USD LIBOR + 3.50%, Rate Floor: 4.25%) due 11/30/27 | | | 199,500 | | | | 199,600 | |
Mission Veterinary Partners | | | | | | | | |
4.75% (6 Month USD LIBOR + 4.00%, Rate Floor: 4.75%) due 04/27/28 | | | 150,000 | | | | 150,187 | |
Avantor Funding, Inc. | | | | | | | | |
3.25% (1 Month USD LIBOR + 2.25%, Rate Floor: 3.25%) due 11/08/27 | | | 149,625 | | | | 149,562 | |
Southern Veterinary Partners LLC | | | | | | | | |
5.00% (3 Month USD LIBOR + 4.00%, Rate Floor: 5.00%) due 10/05/27 | | | 131,159 | | | | 131,734 | |
HAH Group Holding Co. LLC | | | | | | | | |
6.00% (3 Month USD LIBOR + 5.00%, Rate Floor: 6.00%) due 10/29/27 | | | 129,675 | | | | 129,919 | |
PPD, Inc. | | | | | | | | |
2.75% (1 Month USD LIBOR + 2.25%, Rate Floor: 2.75%) due 01/13/28 | | | 99,750 | | | | 99,578 | |
Option Care Health, Inc. | | | | | | | | |
3.85% (1 Month USD LIBOR + 3.75%, Rate Floor: 3.75%) due 08/06/26 | | | 99,495 | | | | 99,474 | |
Sunshine Investments B.V. | | | | | | | | |
3.16% (3 Month USD LIBOR + 3.00%, Rate Floor: 3.00%) due 03/28/25 | | | 98,990 | | | | 98,330 | |
National Mentor Holdings, Inc. | | | | | | | | |
4.50% (1 Month USD LIBOR + 3.75% and 3 Month USD LIBOR + 3.75%, Rate Floor: 4.50%) due 03/02/28 | | | 95,308 | | | | 95,414 | |
Elanco Animal Health, Inc. | | | | | | | | |
1.84% (1 Month USD LIBOR + 1.75%, Rate Floor: 1.75%) due 08/02/27 | | | 96,840 | | | | 95,307 | |
Total Consumer, Non-cyclical | | | 1,747,492 | |
| | | | | | | | | |
Technology - 0.9% |
Ascend Learning LLC | | | | | | | | |
4.75% (1 Month USD LIBOR + 3.75%, Rate Floor: 4.75%) due 07/12/24 | | | 397,000 | | | | 397,000 | |
Peraton Corp. | | | | | | | | |
4.50% (1 Month USD LIBOR + 3.75%, Rate Floor: 4.50%) due 02/01/28 | | | 249,375 | | | | 249,894 | |
Nielsen Finance LLC | | | | | | | | |
2.08% (1 Month USD LIBOR + 2.00%, Rate Floor: 2.00%) due 10/04/23 | | | 249,932 | | | | 249,620 | |
Planview Parent, Inc. | | | | | | | | |
4.75% (3 Month USD LIBOR + 4.00%, Rate Floor: 4.75%) due 12/17/27 | | | 248,750 | | | | 248,984 | |
Apttus Corp. | | | | | | | | |
5.00% (3 Month USD LIBOR + 4.25%, Rate Floor: 5.00%) due 05/08/28 | | | 100,000 | | | | 100,425 | |
Imprivata, Inc. | | | | | | | | |
4.00% (1 Month USD LIBOR + 3.50%, Rate Floor: 4.00%) due 12/01/27 | | | 100,000 | | | | 100,094 | |
E2open LLC | | | | | | | | |
4.00% (3 Month USD LIBOR + 3.50%, Rate Floor: 4.00%) due 02/04/28 | | | 100,000 | | | | 100,000 | |
Sabre GLBL, Inc. | | | | | | | | |
4.75% (1 Month USD LIBOR + 4.00%, Rate Floor: 4.75%) due 12/10/27 | | | 99,500 | | | | 99,997 | |
Dun & Bradstreet | | | | | | | | |
3.35% (1 Month USD LIBOR + 3.25%, Rate Floor: 3.25%) due 02/06/26 | | | 99,250 | | | | 98,738 | |
Total Technology | | | 1,644,752 | |
| | | | | | | | | |
Financial - 0.9% |
Citadel Securities, LP | | | | | | | | |
2.60% (1 Month USD LIBOR + 2.50%, Rate Floor: 2.50%) due 02/02/28 | | | 448,875 | | | | 443,919 | |
Jane Street Group LLC | | | | | | | | |
2.85% (1 Month USD LIBOR + 2.75%, Rate Floor: 2.75%) due 01/26/28 | | | 298,500 | | | | 296,900 | |
Higginbotham | | | | | | | | |
6.50% (1 Month USD LIBOR + 5.75%, Rate Floor: 6.50%) due 11/25/26††† | | | 155,679 | | | | 153,582 | |
Jefferies Finance LLC | | | | | | | | |
3.13% (1 Month USD LIBOR + 3.00%, Rate Floor: 3.00%) due 06/03/26 | | | 148,872 | | | | 148,081 | |
USI, Inc. | | | | | | | | |
3.40% (3 Month USD LIBOR + 3.25%, Rate Floor: 3.25%) due 12/02/26 | | | 148,871 | | | | 147,409 | |
HighTower Holding LLC | | | | | | | | |
4.75% (3 Month USD LIBOR + 4.00%, Rate Floor: 4.75%) due 04/21/28 | | | 120,000 | | | | 120,150 | |
Duff & Phelps | | | | | | | | |
4.75% (1 Month USD LIBOR + 3.75%, Rate Floor: 4.75%) due 04/09/27 | | | 99,499 | | | | 99,872 | |
AmWINS Group, Inc. | | | | | | | | |
3.00% (1 Month USD LIBOR + 2.25%, Rate Floor: 3.00%) due 02/19/28 | | | 99,500 | | | | 98,836 | |
Total Financial | | | 1,508,749 | |
| | | | | | | | | |
Communications - 0.3% |
Syndigo LLC | | | | | | | | |
5.25% (3 Month USD LIBOR + 4.50%, Rate Floor: 5.25%) due 12/15/27††† | | | 199,500 | | | | 198,004 | |
Xplornet Communications, Inc. | | | | | | | | |
4.85% (1 Month USD LIBOR + 4.75%, Rate Floor: 4.75%) due 06/10/27 | | | 148,500 | | | | 148,447 | |
ProQuest, LLC | | | | | | | | |
3.35% (1 Month USD LIBOR + 3.25%, Rate Floor: 3.25%) due 10/23/26 | | | 147,820 | | | | 147,650 | |
40 | THE GUGGENHEIM FUNDS SEMI-ANNUAL REPORT | SEE NOTES TO FINANCIAL STATEMENTS. |
SCHEDULE OF INVESTMENTS (Unaudited)(continued) | June 30, 2021 |
SERIES E (TOTAL RETURN BOND SERIES) | |
| | Face
Amount~ | | | Value | |
Alchemy Copyrights LLC | | | | | | | | |
3.50% (1 Month USD LIBOR + 3.00%, Rate Floor: 3.50%) due 03/10/28††† | | | 99,501 | | | $ | 99,376 | |
Total Communications | | | 593,477 | |
| | | | | | | | | |
Utilities - 0.2% |
Hamilton Projects Acquiror LLC | | | | | | | | |
5.75% (3 Month USD LIBOR + 4.75%, Rate Floor: 5.75%) due 06/17/27 | | | 387,068 | | | | 382,810 | |
| | | | | | | | | |
Basic Materials - 0.2% |
Illuminate Buyer LLC | | | | | | | | |
3.60% (1 Month USD LIBOR + 3.50%, Rate Floor: 3.50%) due 06/30/27 | | | 248,752 | | | | 247,107 | |
GrafTech Finance, Inc. | | | | | | | | |
4.00% (1 Month USD LIBOR + 3.00%, Rate Floor: 4.00%) due 02/12/25 | | | 112,648 | | | | 112,592 | |
Total Basic Materials | | | 359,699 | |
| | | | | | | | | |
Energy - 0.1% |
ITT Holdings LLC | | | | | | | | |
due 06/21/28 | | | 150,000 | | | | 149,625 | |
Total Senior Floating Rate Interests |
(Cost $10,567,345) | | | 10,653,829 | |
| |
FEDERAL AGENCY BONDS†† - 2.8% |
Fannie Mae Principal Strips |
due 07/15/3712,13 | | | 2,500,000 | | | | 1,766,590 | |
Freddie Mac Principal Strips |
due 07/15/3212,13 | | | 1,950,000 | | | | 1,597,518 | |
Tennessee Valley Authority |
5.38% due 04/01/56 | | | 750,000 | | | | 1,208,271 | |
Tennessee Valley Authority Principal Strips |
due 01/15/4812,13 | | | 500,000 | | | | 241,139 | |
Total Federal Agency Bonds |
(Cost $3,926,756) | | | | | | | 4,813,518 | |
| | | | | | | | | |
MUNICIPAL BONDS†† - 1.2% |
California - 0.4% |
Cypress School District General Obligation Unlimited | | | | | | | | |
due 08/01/4812 | | | 1,000,000 | | | | 414,222 | |
Newport Mesa Unified School District General Obligation Unlimited | | | | | | | | |
due 08/01/4612 | | | 700,000 | | | | 294,597 | |
Total California | | | 708,819 | |
| | | | | | | | | |
Texas - 0.3% |
City of San Antonio Texas Electric & Gas Systems Revenue Bonds | | | | | | | | |
2.91% due 02/01/48 | | | 500,000 | | | | 495,400 | |
| | | | | | | | | |
Illinois - 0.3% |
State of Illinois General Obligation Unlimited | | | | | | | | |
5.65% due 12/01/38 | | | 400,000 | | | | 494,016 | |
| | | | | | | | | |
New York - 0.2% |
Westchester County Local Development Corp. Revenue Bonds | | | | | | | | |
3.85% due 11/01/50 | | | 300,000 | | | | 315,185 | |
Total Municipal Bonds |
(Cost $1,786,100) | | | 2,013,420 | |
| |
| | | | | | | | | |
| | | Notional
Value~ | | | | | |
OTC OPTIONS PURCHASED†† - 0.2% |
Call options on: |
Bank of America, N.A. 2Y-10 CMS CAP Expiring July 2022 with strike price of $0.40 | | | 40,900,000 | | | | 203,682 | |
Morgan Stanley Capital Services LLC 2Y-10 CMS CAP Expiring July 2022 with strike price of $0.40 | | | 21,400,000 | | | | 106,358 | |
Goldman Sachs International 2Y-10 CMS CAP Expiring July 2022 with strike price of $0.61 | | | 15,700,000 | | | | 53,537 | |
Bank of America, N.A. 2Y-10 CMS CAP Expiring July 2022 with strike price of $0.61 | | | 4,500,000 | | | | 15,345 | |
Total OTC Options Purchased |
(Cost $175,770) | | | | | | | 378,922 | |
| | | | | | | | | |
Total Investments - 108.8% |
(Cost $182,422,030) | | $ | 188,645,308 | |
| | | | | | | | | |
| | | Face
Amount~ | | | | | |
COLLATERALIZED MORTGAGE OBLIGATIONS SOLD SHORT†† - (8.2)% |
Government Agency - (8.2)% |
Uniform MBS 30 Year | | | | | | | | |
3.50% due 08/12/22 | | | 13,500,000 | | | | (14,221,670 | ) |
| | | | | |
Total Securities Sold Short - (8.2)% | | | | |
(Proceeds $14,234,614) | | $ | (14,221,670 | ) |
Other Assets & Liabilities, net - (0.6)% | | | (1,076,799 | ) |
Total Net Assets - 100.0% | | $ | 173,346,839 | |
SEE NOTES TO FINANCIAL STATEMENTS. | THE GUGGENHEIM FUNDS SEMI-ANNUAL REPORT | 41 |
SCHEDULE OF INVESTMENTS (Unaudited)(continued) | June 30, 2021 |
SERIES E (TOTAL RETURN BOND SERIES) | |
Centrally Cleared Interest Rate Swap Agreements†† |
| |
Counterparty | Exchange | Floating
Rate
Type | Floating
Rate Index | | Fixed
Rate | | Payment
Frequency | | Maturity
Date | | | Notional
Amount | | | Value | | | Upfront
Premiums
Paid | | | Unrealized
Depreciation** | |
BofA Securities, Inc. | CME | Pay | Federal Funds Rate | 0.76% | Annually | 01/05/31 | | $ | 1,600,000 | | | $ | (66,722 | ) | | $ | 139 | | | $ | (66,861 | ) |
BofA Securities, Inc. | CME | Pay | Federal Funds Rate | 0.14% | Annually | 05/28/25 | | | 5,000,000 | | | | (90,768 | ) | | | 252 | | | | (91,020 | ) |
BofA Securities, Inc. | CME | Pay | Federal Funds Rate | 0.77% | Annually | 11/12/30 | | | 3,000,000 | | | | (117,994 | ) | | | 210 | | | | (118,204 | ) |
BofA Securities, Inc. | CME | Pay | Federal Funds Rate | 0.68% | Annually | 12/02/30 | | | 3,200,000 | | | | (154,275 | ) | | | 307 | | | | (154,582 | ) |
BofA Securities, Inc. | CME | Pay | Federal Funds Rate | 0.78% | Annually | 12/23/30 | | | 4,000,000 | | | | (156,494 | ) | | | 315 | | | | (156,809 | ) |
| | | | | | | | | | | | | | | | | | | $ | (586,253 | ) | | $ | 1,223 | | | $ | (587,476 | ) |
Forward Foreign Currency Exchange Contracts†† |
| |
Counterparty | | Contracts to Sell | | Currency | | Settlement
Date | | | Settlement
Value | | | Value at
June 30, 2021 | | | Unrealized
Appreciation
(Depreciation) | |
Citibank, N.A. | 4,780,000 | BRL | | | 07/01/21 | | | $ | 1,134,050 | | | $ | 961,403 | | | $ | 172,647 | |
Bank of America, N.A. | 176,088,000 | JPY | | | 08/02/21 | | | | 1,737,683 | | | | 1,585,621 | | | | 152,062 | |
Morgan Stanley Capital Services LLC | 88,044,000 | JPY | | | 08/02/21 | | | | 864,108 | | | | 792,810 | | | | 71,298 | |
Goldman Sachs International | 1,300,000 | BRL | | | 07/01/21 | | | | 304,556 | | | | 261,469 | | | | 43,087 | |
Goldman Sachs International | 45,222,600 | JPY | | | 12/20/21 | | | | 446,819 | | | | 407,924 | | | | 38,895 | |
JPMorgan Chase Bank, N.A. | 900,000 | BRL | | | 07/01/21 | | | | 213,802 | | | | 181,017 | | | | 32,785 | |
Barclays Bank plc | 200,000 | GBP | | | 07/16/21 | | | | 281,671 | | | | 276,671 | | | | 5,000 | |
Bank of America, N.A. | 643,550 | ILS | | | 01/31/22 | | | | 190,795 | | | | 198,368 | | | | (7,573 | ) |
Goldman Sachs International | 1,107,750 | ILS | | | 01/31/22 | | | | 327,441 | | | | 341,453 | | | | (14,012 | ) |
Goldman Sachs International | 1,148,550 | EUR | | | 07/30/21 | | | | 1,334,185 | | | | 1,363,268 | | | | (29,083 | ) |
| | | | | | | | | | | | | | | | | | | | $ | 465,106 | |
Counterparty | | Contracts to Buy | | Currency | | Settlement
Date | | | Settlement
Value | | | Value at
June 30, 2021 | | | Unrealized
Appreciation
(Depreciation) | |
Goldman Sachs International | 1,751,300 | ILS | | | 01/31/22 | | | $ | 477,074 | | | $ | 539,820 | | | $ | 62,746 | |
Goldman Sachs International | 1,148,550 | EUR | | | 07/30/21 | | | | 1,317,962 | | | | 1,363,268 | | | | 45,306 | |
Citibank, N.A. | 4,641,000 | BRL | | | 07/01/21 | | | | 890,026 | | | | 933,446 | | | | 43,420 | |
JPMorgan Chase Bank, N.A. | 2,339,000 | BRL | | | 07/01/21 | | | | 453,295 | | | | 470,444 | | | | 17,149 | |
Barclays Bank plc | 45,222,600 | JPY | | | 12/20/21 | | | | 431,061 | | | | 407,924 | | | | (23,137 | ) |
JPMorgan Chase Bank, N.A. | 264,132,000 | JPY | | | 08/02/21 | | | | 2,500,540 | | | | 2,378,431 | | | | (122,109 | ) |
| | | | | | | | | | | | | | | | | | | | $ | 23,375 | |
42 | THE GUGGENHEIM FUNDS SEMI-ANNUAL REPORT | SEE NOTES TO FINANCIAL STATEMENTS. |
SCHEDULE OF INVESTMENTS (Unaudited)(continued) | June 30, 2021 |
SERIES E (TOTAL RETURN BOND SERIES) | |
~ | The face amount is denominated in U.S. dollars unless otherwise indicated. |
* | Non-income producing security. |
** | Includes cumulative appreciation (depreciation). Variation margin is reported within the Statement of Assets and Liabilities. |
† | Value determined based on Level 1 inputs — See Note 4. |
†† | Value determined based on Level 2 inputs, unless otherwise noted — See Note 4. |
††† | Value determined based on Level 3 inputs — See Note 4. |
1 | Affiliated issuer. |
2 | Rate indicated is the 7-day yield as of June 30, 2021. |
3 | Security has a fixed rate coupon which will convert to a floating or variable rate coupon on a future date. |
4 | Perpetual maturity. |
5 | Security is a 144A or Section 4(a)(2) security. These securities have been determined to be liquid under guidelines established by the Board of Trustees. The total market value of 144A or Section 4(a)(2) securities is $77,113,318 (cost $75,866,923), or 44.5% of total net assets. |
6 | Variable rate security. Rate indicated is the rate effective at June 30, 2021. In some instances, the effective rate is limited by a minimum rate floor or a maximum rate cap established by the issuer. The settlement status of a position may also impact the effective rate indicated. In some cases, a position may be unsettled at period end and may not have a stated effective rate. In instances where multiple underlying reference rates and spread amounts are shown, the effective rate is based on a weighted average. |
7 | Security has no stated coupon. However, it is expected to receive residual cash flow payments on defined deal dates. |
8 | Security is a 144A or Section 4(a)(2) security. These securities have been determined to be illiquid and restricted under guidelines established by the Board of Trustees. The total market value of 144A or Section 4(a)(2) illiquid and restricted securities is $1,403,410 (cost $1,401,735), or 0.8% of total net assets — See Note 9. |
9 | Security is an interest-only strip. |
10 | Security is a step up/down bond. The coupon increases or decreases at regular intervals until the bond reaches full maturity. Rate indicated is the rate at June 30, 2021. See table below for additional step information for each security. |
11 | All or a portion of this security is pledged as interest rate swap collateral at June 30, 2021. |
12 | Zero coupon rate security. |
13 | Security is a principal-only strip. |
14 | Rate indicated is the effective yield at the time of purchase. |
15 | Special Purpose Acquisition Company (SPAC) |
| | BofA — Bank of America |
| | BRL — Brazilian Real |
| | CME — Chicago Mercantile Exchange |
| | CMS — Constant Maturity Swap |
| | CMT — Constant Maturity Treasury |
| | EUR — Euro |
| | GBP — British Pound |
| | ILS — Israeli New Shekel |
| | JPY — Japanese Yen |
| | LIBOR — London Interbank Offered Rate |
| | plc — Public Limited Company |
| | REMIC — Real Estate Mortgage Investment Conduit |
| | SARL — Société à Responsabilité Limitée |
| | WAC — Weighted Average Coupon |
| | |
| | See Sector Classification in Other Information section. |
SEE NOTES TO FINANCIAL STATEMENTS. | THE GUGGENHEIM FUNDS SEMI-ANNUAL REPORT | 43 |
SCHEDULE OF INVESTMENTS (Unaudited)(continued) | June 30, 2021 |
SERIES E (TOTAL RETURN BOND SERIES) | |
The following table summarizes the inputs used to value the Fund’s investments at June 30, 2021 (See Note 4 in the Notes to Financial Statements):
Investments in Securities (Assets) | | Level 1
Quoted
Prices | | | Level 2
Significant
Observable
Inputs | | | Level 3
Significant
Unobservable
Inputs | | | Total | |
Common Stocks | | $ | 2,375,465 | | | $ | — | | | $ | — | | | $ | 2,375,465 | |
Preferred Stocks | | | — | | | | 4,278,056 | | | | — | | | | 4,278,056 | |
Warrants | | | 68,914 | | | | — | | | | — | | | | 68,914 | |
Mutual Funds | | | 6,930,119 | | | | — | | | | — | | | | 6,930,119 | |
Money Market Fund | | | 3,302,439 | | | | — | | | | — | | | | 3,302,439 | |
Corporate Bonds | | | — | | | | 72,909,159 | | | | 2,737,631 | | | | 75,646,790 | |
Asset-Backed Securities | | | — | | | | 34,513,397 | | | | 3,300,000 | | | | 37,813,397 | |
Collateralized Mortgage Obligations | | | — | | | | 28,192,613 | | | | 718,165 | | | | 28,910,778 | |
U.S. Government Securities | | | — | | | | 11,459,661 | | | | — | | | | 11,459,661 | |
Senior Floating Rate Interests | | | — | | | | 9,850,621 | | | | 803,208 | | | | 10,653,829 | |
Federal Agency Bonds | | | — | | | | 4,813,518 | | | | — | | | | 4,813,518 | |
Municipal Bonds | | | — | | | | 2,013,420 | | | | — | | | | 2,013,420 | |
Options Purchased | | | — | | | | 378,922 | | | | — | | | | 378,922 | |
Forward Foreign Currency Exchange Contracts** | | | — | | | | 684,395 | | | | — | | | | 684,395 | |
Total Assets | | $ | 12,676,937 | | | $ | 169,093,762 | | | $ | 7,559,004 | | | $ | 189,329,703 | |
Investments in Securities (Liabilities) | | Level 1
Quoted
Prices | | | Level 2
Significant
Observable
Inputs | | | Level 3
Significant
Unobservable
Inputs | | | Total | |
Collateralized Mortgage Obligations Sold Short | | $ | — | | | $ | 14,221,670 | | | $ | — | | | $ | 14,221,670 | |
Interest Rate Swap Agreements** | | | — | | | | 587,476 | | | | — | | | | 587,476 | |
Forward Foreign Currency Exchange Contracts** | | | — | | | | 195,914 | | | | — | | | | 195,914 | |
Unfunded Loan Commitments (Note 8) | | | — | | | | — | | | | 2,555 | | | | 2,555 | |
Total Liabilities | | $ | — | | | $ | 15,005,060 | | | $ | 2,555 | | | $ | 15,007,615 | |
** | This derivative is reported as unrealized appreciation/depreciation at period end. |
44 | THE GUGGENHEIM FUNDS SEMI-ANNUAL REPORT | SEE NOTES TO FINANCIAL STATEMENTS. |
SCHEDULE OF INVESTMENTS (Unaudited)(continued) | June 30, 2021 |
SERIES E (TOTAL RETURN BOND SERIES) | |
The following is a summary of significant unobservable inputs used in the fair valuation of assets and liabilities categorized within Level 3 of the fair value hierarchy:
| Category | | Ending Balance at June 30, 2021 | | | Valuation Technique | | Unobservable Inputs | | Input Range | | Weighted Average* |
| Assets: | | | | | | | | | | | |
| Asset-Backed Securities | | $ | 3,300,000 | | | Option Adjusted Spread off the prior month end broker quote | | Broker Quote | | — | | — |
| Collateralized Mortgage Obligations | | | 718,165 | | | Model Price | | Purchase Price | | — | | — |
| Corporate Bonds | | | 1,399,542 | | | Third Party Pricing | | Vendor Price | | — | | — |
| Corporate Bonds | | | 1,338,089 | | | Option Adjusted Spread off the prior month end broker quote | | Broker Quote | | — | | — |
| Senior Floating Rate Interests | | | 505,828 | | | Yield Analysis | | Yield | | 6.8%-7.4% | | 7.2% |
| Senior Floating Rate Interests | | | 297,380 | | | Third Party Pricing | | Broker Quote | | — | | — |
| Total Assets | | $ | 7,559,004 | | | | | | | | | |
| Liabilities: | | | | | | | | | | | | |
| Unfunded Loan Commitments | | $ | 2,555 | | | Model Price | | Purchase Price | | — | | — |
* | Inputs are weighted by the fair value of the instruments. |
Significant changes in a quote or yield would generally result in significant changes in the fair value of the security.
The Fund’s fair valuation leveling guidelines to classify a single daily broker quote, or a vendor price based on a single daily or monthly broker quote, as Level 3, if such a quote or price cannot be supported with other available market information.
Transfers between Level 2 and Level 3 may occur as markets fluctuate and/or the availability of data used in an investment’s valuation changes. For the period ended June 30, 2021, the Fund had assets with a total value of $2,569,751 transfer into Level 3 from Level 2 due to a lack of observable inputs and had assets with a total value of $131,734 transfer out of Level 3 into Level 2 due to the availability of current and reliable market-based data provided by a third-party pricing service which utilizes significant observable inputs.
Summary of Fair Value Level 3 Activity
Following is a reconciliation of Level 3 assets for which significant unobservable inputs were used to determine fair value for the period ended June 30, 2021:
| | | Assets | | | | | | | Liabilities | |
| | Asset-Backed
Securities | | | Collateralized
Mortgage
Obligations | | | Corporate Bonds | | | Senior Floating
Rate Interests | | | Total Assets | | | Unfunded Loan
Commitments | |
Beginning Balance | | $ | 250,000 | | | $ | — | | | $ | 2,044,938 | | | $ | 763,890 | | | $ | 3,058,828 | | | $ | (1,282 | ) |
Purchases/(Receipts) | | | 1,550,000 | | | | — | | | | 700,000 | | | | 352,082 | | | | 2,602,082 | | | | (1,531 | ) |
(Sales, maturities and paydowns)/Fundings | | | — | | | | — | | | | — | | | | (542,788 | ) | | | (542,788 | ) | | | 613 | |
Amortization of premiums/discounts | | | — | | | | — | | | | — | | | | 29,070 | | | | 29,070 | | | | — | |
Total realized gains (losses) included in earnings | | | — | | | | — | | | | — | | | | — | | | | — | | | | 300 | |
Total change in unrealized appreciation (depreciation) included in earnings | | | — | | | | — | | | | (7,307 | ) | | | (18,898 | ) | | | (26,205 | ) | | | (655 | ) |
Transfers into Level 3 | | | 1,500,000 | | | | 718,165 | | | | — | | | | 351,586 | | | | 2,569,751 | | | | — | |
Transfers out of Level 3 | | | — | | | | — | | | | — | | | | (131,734 | ) | | | (131,734 | ) | | | — | |
Ending Balance | | $ | 3,300,000 | | | $ | 718,165 | | | $ | 2,737,631 | | | $ | 803,208 | | | $ | 7,559,004 | | | $ | (2,555 | ) |
Net change in unrealized appreciation (depreciation) for investments in Level 3 securities still held at June 30, 2021 | | $ | — | | | $ | — | | | $ | (7,307 | ) | | $ | (662 | ) | | $ | (7,969 | ) | | $ | (655 | ) |
SEE NOTES TO FINANCIAL STATEMENTS. | THE GUGGENHEIM FUNDS SEMI-ANNUAL REPORT | 45 |
SCHEDULE OF INVESTMENTS (Unaudited)(concluded) | June 30, 2021 |
SERIES E (TOTAL RETURN BOND SERIES) | |
Step Coupon Bonds
The following table discloses additional information related to step coupon bonds held by the Fund. Certain securities are subject to multiple rate changes prior to maturity. For those securities, a range of rates and corresponding dates have been provided. Rates for all step coupon bonds held by the Fund are scheduled to increase, none are scheduled to decrease.
Name | | Coupon Rate at
Next Reset Date | | | Next Rate Reset Date | | | Future Reset Rate(s) | | | Future Reset Date(s) | |
Legacy Mortgage Asset Trust 2021-GS3, 1.75% due 07/25/61 | | | 4.75 | % | | | 05/26/24 | | | | 5.75 | % | | | 05/26/25 | |
OSAT Trust 2021-RPL1, 2.12% due 05/25/65 | | | 4.20 | % | | | 07/26/24 | | | | 5.99 | % | | | 07/26/25 | |
PRPM LLC 2021-5, 1.79% due 06/25/26 | | | 4.79 | % | | | 06/26/24 | | | | 5.79 | % | | | 06/26/25 | |
Affiliated Transactions
Investments representing 5% or more of the outstanding voting shares of a company, or control of or by, or common control under Guggenheim Investments (“GI”), result in that company being considered an affiliated issuer, as defined in the 1940 Act.
The Fund may invest in certain of the underlying series of Guggenheim Strategy Funds Trust, including Guggenheim Strategy Fund II, Guggenheim Strategy Fund III, and Guggenheim Variable Insurance Strategy Fund III, (collectively, the “Short Term Investment Vehicles”), each of which are open-end management investment companies managed by GI. The Short Term Investment Vehicles, which launched on March 11, 2014, are offered as short term investment options only to mutual funds, trusts, and other accounts managed by GI and/or its affiliates, and are not available to the public. The Short Term Investment Vehicles pay no investment management fees. The Short Term Investment Vehicles’ annual report on Form N-CSR dated September 30, 2020, is available publicly or upon request. This information is available from the EDGAR database on the SEC’s website at https://www.sec.gov/Archives/edgar/data/1601445/000182126820000133/gug81042-ncsr.htm.
Transactions during the period ended June 30, 2021, in which the company is an affiliated issuer, were as follows:
Security Name | | Value
12/31/20 | | | Additions | | | Reductions | | | Realized
Gain (Loss) | | | Change in
Unrealized
Appreciation
(Depreciation) | | | Value
06/30/21 | | | Shares
06/30/21 | | | Investment
Income | |
Mutual Funds | | | | | | | | | | | | | | | | | | | | | | | | | | | | | | | | |
Guggenheim Strategy Fund II | | $ | 5,097,370 | | | $ | 4,240 | | | $ | (5,111,985 | ) | | $ | 56,945 | | | $ | (46,570 | ) | | $ | — | | | | — | | | $ | 4,735 | |
Guggenheim Total Return Bond Fund — R6-Class | | | 6,977,737 | | | | 99,452 | | | | — | | | | — | | | | (147,070 | ) | | | 6,930,119 | | | | 238,230 | | | | 100,846 | |
Guggenheim Ultra Short Duration Fund — Institutional Class | | | 2,084,004 | | | | 933 | | | | (2,087,025 | ) | | | 9,224 | | | | (7,136 | ) | | | — | | | | — | | | | 1,043 | |
| | | $ | 14,159,111 | | | $ | 104,625 | | | $ | (7,199,010 | ) | | $ | 66,169 | | | $ | (200,776 | ) | | $ | 6,930,119 | | | | | | | $ | 106,624 | |
46 | THE GUGGENHEIM FUNDS SEMI-ANNUAL REPORT | SEE NOTES TO FINANCIAL STATEMENTS. |
SERIES E (TOTAL RETURN BOND SERIES) | |
STATEMENT OF ASSETS AND LIABILITIES (Unaudited) |
June 30, 2021 |
Assets: |
Investments in unaffiliated issuers, at value (cost $176,091,160) | | $ | 181,715,189 | |
Investments in affiliated issuers, at value (cost $6,330,870) | | | 6,930,119 | |
Cash | | | 1,490,995 | |
Unamortized upfront premiums paid on interest rate swap agreements | | | 1,223 | |
Unrealized appreciation on forward foreign currency exchange contracts | | | 684,395 | |
Prepaid expenses | | | 2,754 | |
Receivables: |
Securities sold | | | 42,571,964 | |
Interest | | | 854,496 | |
Variation margin on interest rate swap agreements | | | 83,631 | |
Fund shares sold | | | 47,014 | |
Dividends | | | 17,818 | |
Total assets | | | 234,399,598 | |
| | | | | |
Liabilities: |
Unfunded loan commitments, at value (Note 8) (commitment fees received $1,941) | | | 2,555 | |
Securities sold short, at value (proceeds $14,234,614) | | | 14,221,670 | |
Segregated cash due to broker | | | 846,310 | |
Unrealized depreciation on forward foreign currency exchange contracts | | | 195,914 | |
Payable for: |
Securities purchased | | | 45,529,325 | |
Management fees | | | 48,771 | |
Distribution and service fees | | | 35,234 | |
Fund shares redeemed | | | 30,538 | |
Fund accounting/administration fees | | | 11,991 | |
Transfer agent/maintenance fees | | | 2,283 | |
Trustees’ fees* | | | 961 | |
Miscellaneous | | | 127,207 | |
Total liabilities | | | 61,052,759 | |
Commitments and contingent liabilities (Note 12) | | | — | |
Net assets | | $ | 173,346,839 | |
| | | | | |
Net assets consist of: |
Paid in capital | | $ | 156,492,866 | |
Total distributable earnings (loss) | | | 16,853,973 | |
Net assets | | $ | 173,346,839 | |
Capital shares outstanding | | | 9,645,918 | |
Net asset value per share | | $ | 17.97 | |
STATEMENT OF OPERATIONS (Unaudited) |
Six Months Ended June 30, 2021 |
Investment Income: |
Dividends from securities of unaffiliated issuers | | $ | 85,793 | |
Dividends from securities of affiliated issuers | | | 106,624 | |
Interest from securities of unaffiliated issuers (net of foreign withholding tax of $1,027) | | | 2,598,243 | |
Total investment income | | | 2,790,660 | |
| | | | | |
Expenses: |
Management fees | | | 325,561 | |
Distribution and service fees | | | 208,693 | |
Transfer agent/maintenance fees | | | 12,543 | |
Fund accounting/administration fees | | | 59,162 | |
Professional fees | | | 42,635 | |
Custodian fees | | | 12,489 | |
Trustees’ fees* | | | 9,828 | |
Line of credit fees | | | 7,648 | |
Miscellaneous | | | 15,799 | |
Total expenses | | | 694,358 | |
Less: |
Expenses waived by Adviser | | | (38,955 | ) |
Earnings credits applied | | | (233 | ) |
Total waived expenses | | | (39,188 | ) |
Net expenses | | | 655,170 | |
Net investment income | | | 2,135,490 | |
| | | | | |
Net Realized and Unrealized Gain (Loss): |
Net realized gain (loss) on: |
Investments in unaffiliated issuers | | | 1,792,450 | |
Investments in affiliated issuers | | | 66,169 | |
Investments sold short | | | 53,841 | |
Swap agreements | | | 57,015 | |
Options purchased | | | 313,201 | |
Forward foreign currency exchange contracts | | | 121,010 | |
Foreign currency transactions | | | 302 | |
Net realized gain | | | 2,403,988 | |
Net change in unrealized appreciation (depreciation) on: |
Investments in unaffiliated issuers | | | (4,790,522 | ) |
Investments in affiliated issuers | | | (200,776 | ) |
Investments sold short | | | 12,944 | |
Swap agreements | | | (583,317 | ) |
Options purchased | | | (141,757 | ) |
Forward foreign currency exchange contracts | | | (119,720 | ) |
Foreign currency translations | | | (1 | ) |
Net change in unrealized appreciation (depreciation) | | | (5,823,149 | ) |
Net realized and unrealized loss | | | (3,419,161 | ) |
Net decrease in net assets resulting from operations | | $ | (1,283,671 | ) |
* | Relates to Trustees not deemed “interested persons” within the meaning of Section 2(a)(19) of the 1940 Act. |
SEE NOTES TO FINANCIAL STATEMENTS. | THE GUGGENHEIM FUNDS SEMI-ANNUAL REPORT | 47 |
SERIES E (TOTAL RETURN BOND SERIES) | |
STATEMENTS OF CHANGES IN NET ASSETS |
| | Six Months Ended
June 30, 2021
(Unaudited) | | | Year Ended
December 31,
2020 | |
Increase (Decrease) in Net Assets from Operations: | | | | | | | | |
Net investment income | | $ | 2,135,490 | | | $ | 3,308,697 | |
Net realized gain on investments | | | 2,403,988 | | | | 5,727,546 | |
Net change in unrealized appreciation (depreciation) on investments | | | (5,823,149 | ) | | | 9,930,125 | |
Net increase (decrease) in net assets resulting from operations | | | (1,283,671 | ) | | | 18,966,368 | |
| | | | | | | | | |
Distributions to shareholders | | | — | | | | (2,739,180 | ) |
| | | | | | | | | |
Capital share transactions: | | | | | | | | |
Proceeds from sale of shares | | | 26,333,236 | | | | 76,319,538 | |
Distributions reinvested | | | — | | | | 2,739,180 | |
Cost of shares redeemed | | | (28,806,143 | ) | | | (46,391,432 | ) |
Net increase (decrease) from capital share transactions | | | (2,472,907 | ) | | | 32,667,286 | |
Net increase (decrease) in net assets | | | (3,756,578 | ) | | | 48,894,474 | |
| | | | | | | | | |
Net assets: | | | | | | | | |
Beginning of period | | | 177,103,417 | | | | 128,208,943 | |
End of period | | $ | 173,346,839 | | | $ | 177,103,417 | |
| | | | | | | | | |
Capital share activity: | | | | | | | | |
Shares sold | | | 1,482,791 | | | | 4,405,043 | |
Shares issued from reinvestment of distributions | | | — | | | | 156,346 | |
Shares redeemed | | | (1,625,562 | ) | | | (2,723,087 | ) |
Net increase (decrease) in shares | | | (142,771 | ) | | | 1,838,302 | |
48 | THE GUGGENHEIM FUNDS SEMI-ANNUAL REPORT | SEE NOTES TO FINANCIAL STATEMENTS. |
SERIES E (TOTAL RETURN BOND SERIES) | |
This table is presented to show selected data for a share outstanding throughout each period and to assist shareholders in evaluating a Fund’s performance for the periods presented.
| | Six Months Ended
June 30, 2021a | | | Year Ended
December 31,
2020 | | | Year Ended
December 31,
2019 | | | Year Ended
December 31,
2018 | | | Year Ended
December 31,
2017 | | | Year Ended
December 31,
2016 | |
Per Share Data |
Net asset value, beginning of period | | $ | 18.09 | | | $ | 16.13 | | | $ | 15.85 | | | $ | 16.40 | | | $ | 16.05 | | | $ | 15.68 | |
Income (loss) from investment operations: |
Net investment income (loss)b | | | .23 | | | | .39 | | | | .38 | | | | .46 | | | | .61 | | | | .66 | |
Net gain (loss) on investments (realized and unrealized) | | | (.35 | ) | | | 1.88 | | | | .34 | | | | (.29 | ) | | | .45 | | | | .41 | |
Total from investment operations | | | (.12 | ) | | | 2.27 | | | | .72 | | | | .17 | | | | 1.06 | | | | 1.07 | |
Less distributions from: |
Net investment income | | | — | | | | (.31 | ) | | | (.44 | ) | | | (.72 | ) | | | (.71 | ) | | | (.70 | ) |
Total distributions | | | — | | | | (.31 | ) | | | (.44 | ) | | | (.72 | ) | | | (.71 | ) | | | (.70 | ) |
Net asset value, end of period | | $ | 17.97 | | | $ | 18.09 | | | $ | 16.13 | | | $ | 15.85 | | | $ | 16.40 | | | $ | 16.05 | |
|
Total Returnc | | | (0.66 | %) | | | 14.21 | % | | | 4.49 | % | | | 1.14 | % | | | 6.72 | % | | | 6.83 | % |
Ratios/Supplemental Data |
Net assets, end of period (in thousands) | | $ | 173,347 | | | $ | 177,103 | | | $ | 128,209 | | | $ | 122,850 | | | $ | 130,499 | | | $ | 114,043 | |
Ratios to average net assets: |
Net investment income (loss) | | | 2.56 | % | | | 2.27 | % | | | 2.33 | % | | | 2.85 | % | | | 3.76 | % | | | 4.13 | % |
Total expensesd | | | 0.83 | % | | | 0.88 | % | | | 0.94 | % | | | 0.92 | % | | | 0.99 | % | | | 1.02 | % |
Net expensese,f,g | | | 0.78 | % | | | 0.78 | % | | | 0.78 | % | | | 0.78 | % | | | 0.81 | % | | | 0.83 | % |
Portfolio turnover rate | | | 42 | % | | | 123 | % | | | 54 | % | | | 30 | % | | | 76 | % | | | 88 | % |
a | Unaudited figures for the period ended June 30, 2021. Percentage amounts for the period, except total return and portfolio turnover rate, have been annualized. |
b | Net investment income (loss) per share was computed using average shares outstanding throughout the period. |
c | Total return does not take into account any of the expenses associated with an investment in variable insurance products. If total return had taken into account these expenses, performance would have been lower. Shares of a series of Guggenheim Variable Funds Trust are available only through the purchase of such products. |
d | Does not include expenses of the underlying funds in which the Fund invests. |
e | Net expense information reflects the expense ratios after expense waivers and reimbursements, as applicable. |
f | Net expenses may include expenses that are excluded from the expense limitation agreement. Excluding these expenses, the net expense ratios for the periods presented would be: |
| | 06/30/21a | 12/31/20 | 12/31/19 | 12/31/18 | 12/31/17 | 12/31/16 |
| | 0.78% | 0.77% | 0.77% | 0.77% | 0.77% | 0.78% |
g | The portion of the ratios of net expenses to average net assets attributable to recoupments of prior fee reductions or expense reimbursements for the periods presented was as follows: |
| | 06/30/21a | 12/31/20 | 12/31/19 | 12/31/18 | 12/31/17 | 12/31/16 |
| | — | — | — | 0.00%* | — | — |
SEE NOTES TO FINANCIAL STATEMENTS. | THE GUGGENHEIM FUNDS SEMI-ANNUAL REPORT | 49 |
PERFORMANCE REPORT AND FUND PROFILE (Unaudited) | June 30, 2021 |
SERIES F (FLOATING RATE STRATEGIES SERIES)
OBJECTIVE: Seeks to provide a high level of current income while maximizing total return.
Holdings Diversification (Market Exposure as % of Net Assets)
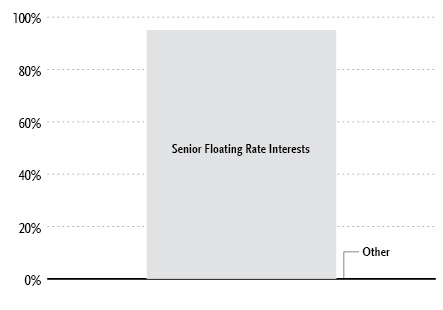
“Holdings Diversification (Market Exposure as % of Net Assets)” excludes any temporary cash investments.
Inception Date: April 24, 2013 |
Ten Largest Holdings (% of Total Net Assets) |
Power Solutions (Panther), 3.35% | 1.2% |
American Tire Distributors, Inc., 8.50% | 1.2% |
CSC Holdings LLC, 2.32% | 1.1% |
Beacon Roofing Supply, Inc., 2.60% | 1.1% |
Quikrete Holdings, Inc. | 1.1% |
GTT Communications, Inc., 2.90% | 1.1% |
Asplundh Tree Expert LLC, 1.85% | 1.1% |
Aramark Services, Inc., 1.85% | 1.1% |
Reynolds Group Holdings, Inc., 3.35% | 1.1% |
DaVita, Inc., 1.85% | 1.1% |
Top Ten Total | 11.2% |
| | |
“Ten Largest Holdings” excludes any temporary cash or derivative investments. |
50 THE GUGGENHEIM FUNDS SEMI-ANNUAL REPORT | |
PERFORMANCE REPORT AND FUND PROFILE (Unaudited)(concluded) | June 30, 2021 |
Average Annual Returns*,†
Periods Ended June 30, 2021
| 6 Month‡ | 1 Year | 5 Year | Since
Inception
(04/24/13) |
Series F (Floating Rate Strategies Series) | 1.43% | 7.36% | 3.29% | 3.11% |
Credit Suisse Leveraged Loan Index | 3.48% | 11.67% | 5.04% | 4.17% |
Portfolio Composition by Quality Rating1 |
Rating | % of Total
Investments |
Fixed Income Instruments | |
BBB | 13.5% |
BB | 37.9% |
B | 38.4% |
CCC | 3.0% |
Other Instruments | 7.2% |
Total Investments | 100.0% |
* | The performance data above represents past performance that is not predictive of future results. The investment return and principal value of an investment in the Fund will fluctuate so that an investor’s shares, when redeemed, may be worth more or less than their original cost. Returns are historical and include changes in principal and reinvested dividends and capital gains and do not reflect the effect of taxes. The Credit Suisse Leveraged Loan Index is an unmanaged index and, unlike the Fund, has no management fees or operating expenses to reduce its reported return. |
† | Performance figures do not reflect fees and expenses associated with an investment in variable insurance products. If returns had taken into account these fees and expenses, performance would have been lower. Shares of a series of Guggenheim Variable Funds Trust are available only through the purchase of such products. |
‡ | 6 month returns are not annualized. |
1 | Source: BlackRock Solutions. Credit quality ratings are measured on a scale that generally ranges from AAA (highest) to D (lowest). All securities except for those labeled “NR” have been rated by Moody’s, Standard & Poor’s (“S&P”), or Fitch, each of which is a Nationally Recognized Statistical Rating Organization (“NRSRO”). For purposes of this presentation, when ratings are available from more than one agency, the highest rating is used. Guggenheim Investments has converted ratings to the equivalent S&P rating. Security ratings are determined at the time of purchase and may change thereafter. |
| | THE GUGGENHEIM FUNDS SEMI-ANNUAL REPORT | 51 |
SCHEDULE OF INVESTMENTS (Unaudited) | June 30, 2021 |
SERIES F (FLOATING RATE STRATEGIES SERIES) | |
| | Shares | | | Value | |
COMMON STOCKS††† - 0.0% |
| | | | | | | | | |
Industrial - 0.0% |
Vector Phoenix Holdings, LP* | | | 11,609 | | | $ | 22,974 | |
BP Holdco LLC*,1 | | | 11,609 | | | | 4,093 | |
API Heat Transfer Parent LLC* | | | 278,849 | | | | — | |
Total Industrial | | | | | | | 27,067 | |
| | | | | | | | | |
Total Common Stocks | | | | |
(Cost $89,392) | | | | | | | 27,067 | |
| | | | | | | | | |
PREFERRED STOCKS††† - 0.0% |
Industrial - 0.0% |
API Heat Transfer Intermediate* | | | 36 | | | | — | |
Total Preferred Stocks | | | | |
(Cost $28,949) | | | | | | | — | |
| | | | | | | | | |
MONEY MARKET FUND† - 7.3% |
Federated Hermes U.S. Treasury Cash Reserves Fund — Institutional Shares, 0.01%2 | | | 3,240,742 | | | | 3,240,742 | |
Total Money Market Fund | | | | |
(Cost $3,240,742) | | | | | | | 3,240,742 | |
| | | | | | | | | |
| | | Face
Amount | | | | | |
SENIOR FLOATING RATE INTERESTS††,3 - 94.6% |
Industrial - 22.7% | | | | | | | | |
Beacon Roofing Supply, Inc. | | | | | | | | |
2.60% (1 Month USD LIBOR + 2.50%, Rate Floor: 2.50%) due 05/19/28 | | $ | 500,000 | | | | 496,945 | |
Quikrete Holdings, Inc. | | | | | | | | |
due 05/12/28 | | | 500,000 | | | | 495,780 | |
Reynolds Group Holdings, Inc. | | | | | | | | |
3.35% (1 Month USD LIBOR + 3.25%, Rate Floor: 3.25%) due 02/05/26 | | | 497,500 | | | | 493,948 | |
Gardner Denver, Inc. | | | | | | | | |
1.85% (1 Month USD LIBOR + 1.75%, Rate Floor: 1.75%) due 03/01/27 | | | 493,750 | | | | 487,716 | |
TransDigm, Inc. | | | | | | | | |
2.35% (1 Month USD LIBOR + 2.25%, Rate Floor: 2.25%) due 05/30/25 | | | 491,250 | | | | 483,970 | |
Altra Industrial Motion Corp. | | | | | | | | |
2.10% (1 Month USD LIBOR + 2.00%, Rate Floor: 2.00%) due 10/01/25 | | | 475,373 | | | | 472,255 | |
Gates Global LLC | | | | | | | | |
3.50% (1 Month USD LIBOR + 2.75%, Rate Floor: 3.50%) due 03/31/27 | | | 448,872 | | | | 447,705 | |
Core & Main, LP | | | | | | | | |
due 06/09/28 | | | 450,000 | | | | 446,908 | |
Cushman & Wakefield US Borrower LLC | | | | | | | | |
2.85% (1 Month USD LIBOR + 2.75%, Rate Floor: 2.75%) due 08/21/25 | | | 447,739 | | | | 443,342 | |
Alliance Laundry Systems LLC | | | | | | | | |
4.25% (3 Month USD LIBOR + 3.50%, Rate Floor: 4.25%) due 10/08/27 | | | 442,929 | | | | 443,274 | |
| | Face
Amount | | | Value | |
American Builders & Contractors Supply Co., Inc. | | | | | | | | |
2.10% (1 Month USD LIBOR + 2.00%, Rate Floor: 2.00%) due 01/15/27 | | | 442,125 | | | | 438,698 | |
Reece Ltd. | | | | | | | | |
2.15% (3 Month USD LIBOR + 2.00%, Rate Floor: 2.00%) due 01/04/27††† | | | 412,945 | | | | 411,396 | |
Genesee & Wyoming, Inc. | | | | | | | | |
2.15% (3 Month USD LIBOR + 2.00%, Rate Floor: 2.00%) due 12/30/26 | | | 395,990 | | | | 393,131 | |
LTI Holdings, Inc. | | | | | | | | |
3.60% (1 Month USD LIBOR + 3.50%, Rate Floor: 3.50%) due 09/08/25 | | | 392,969 | | | | 387,295 | |
Berry Global, Inc. | | | | | | | | |
1.83% (1 Month USD LIBOR + 1.75%, Rate Floor: 1.75%) due 07/01/26 | | | 372,879 | | | | 369,810 | |
WP CPP Holdings LLC | | | | | | | | |
4.75% (3 Month USD LIBOR + 3.75%, Rate Floor: 4.75%) due 04/30/25 | | | 375,288 | | | | 367,407 | |
Hillman Group, Inc. | | | | | | | | |
due 02/24/28 | | | 249,367 | | | | 248,629 | |
4.10% (1 Month USD LIBOR + 4.00%, Rate Floor: 4.00%) due 05/30/25 | | | 91,694 | | | | 91,465 | |
Charter Nex US Holdings, Inc. | | | | | | | | |
5.00% (1 Month USD LIBOR + 4.25%, Rate Floor: 5.00%) due 12/01/27 | | | 284,375 | | | | 284,730 | |
BWAY Holding Co. | | | | | | | | |
3.35% (1 Month USD LIBOR + 3.25%, Rate Floor: 3.25%) due 04/03/24 | | | 254,769 | | | | 248,441 | |
VC GB Holdings, Inc. | | | | | | | | |
4.00% (1 Month USD LIBOR + 3.00%, Rate Floor: 4.00%) due 02/28/24††† | | | 210,853 | | | | 210,590 | |
CPG International LLC | | | | | | | | |
3.25% (3 Month USD LIBOR + 2.50%, Rate Floor: 3.25%) due 05/06/24 | | | 199,652 | | | | 199,366 | |
Brown Group Holding LLC | | | | | | | | |
3.25% (3 Month USD LIBOR + 2.75%, Rate Floor: 3.25%) due 06/07/28 | | | 200,000 | | | | 198,900 | |
DG Investment Intermediate Holdings 2, Inc. | | | | | | | | |
4.50% (1 Month USD LIBOR + 3.75%, Rate Floor: 4.50%) due 03/31/28 | | | 191,688 | | | | 192,248 | |
Titan Acquisition Ltd. (Husky) | | | | | | | | |
3.17% (3 Month USD LIBOR + 3.00%, Rate Floor: 3.00%) due 03/28/25 | | | 193,999 | | | | 190,467 | |
Filtration Group Corp. | | | | | | | | |
3.10% (1 Month USD LIBOR + 3.00%, Rate Floor: 3.00%) due 03/31/25 | | | 184,521 | | | | 182,867 | |
TricorBraun Holdings, Inc. | | | | | | | | |
3.75% (6 Month USD LIBOR + 3.25%, Rate Floor: 3.75%) due 03/03/28 | | | 164,499 | | | | 163,205 | |
Mileage Plus Holdings LLC | | | | | | | | |
6.25% (3 Month USD LIBOR + 5.25%, Rate Floor: 6.25%) due 06/21/27 | | | 150,500 | | | | 160,608 | |
52 | THE GUGGENHEIM FUNDS SEMI-ANNUAL REPORT | SEE NOTES TO FINANCIAL STATEMENTS. |
SCHEDULE OF INVESTMENTS (Unaudited)(continued) | June 30, 2021 |
SERIES F (FLOATING RATE STRATEGIES SERIES) | |
| | Face
Amount | | | Value | |
Ravago Holdings America, Inc. | | | | | | | | |
2.65% (3 Month USD LIBOR + 2.50%, Rate Floor: 2.50%) due 03/04/28 | | $ | 149,625 | | | $ | 148,597 | |
Berlin Packaging LLC | | | | | | | | |
3.10% (1 Month USD LIBOR + 3.00%, Rate Floor: 3.00%) due 11/07/25 | | | 148,473 | | | | 147,035 | |
API Heat Transfer | | | | | | | | |
12.00% (in-kind rate was 12.00%) due 01/01/24†††,4 | | | 183,980 | | | | 78,191 | |
12.00% (in-kind rate was 12.00%) due 10/02/23†††,4 | | | 32,824 | | | | 24,618 | |
USIC Holding, Inc. | | | | | | | | |
4.25% (1 Month USD LIBOR + 3.50%, Rate Floor: 4.25%) due 05/12/28 | | | 100,000 | | | | 99,750 | |
Vertical (TK Elevator) | | | | | | | | |
4.48% (6 Month USD LIBOR + 4.25%, Rate Floor: 4.25%) due 07/30/27 | | | 99,501 | | | | 99,542 | |
United Airlines Inc. | | | | | | | | |
4.50% (3 Month USD LIBOR + 3.75%, Rate Floor: 4.50%) due 04/21/28 | | | 81,235 | | | | 82,228 | |
Total Industrial | | | | | | | 10,131,057 | |
| | | | | | | | | |
Consumer, Non-cyclical - 20.0% | | | | | | | | |
Aramark Services, Inc. | | | | | | | | |
1.85% (1 Month USD LIBOR + 1.75%, Rate Floor: 1.75%) due 03/11/25 | | | 500,000 | | | | 494,165 | |
DaVita, Inc. | | | | | | | | |
1.85% (1 Month USD LIBOR + 1.75%, Rate Floor: 1.75%) due 08/12/26 | | | 493,734 | | | | 490,515 | |
Froneri US, Inc. | | | | | | | | |
2.35% (1 Month USD LIBOR + 2.25%, Rate Floor: 2.25%) due 01/29/27 | | | 495,000 | | | | 487,204 | |
Bombardier Recreational Products, Inc. | | | | | | | | |
2.10% (1 Month USD LIBOR + 2.00%, Rate Floor: 2.00%) due 05/24/27 | | | 484,379 | | | | 478,387 | |
Elanco Animal Health, Inc. | | | | | | | | |
1.84% (1 Month USD LIBOR + 1.75%, Rate Floor: 1.75%) due 08/02/27 | | | 484,200 | | | | 476,535 | |
JBS USA Lux SA | | | | | | | | |
2.10% (1 Month USD LIBOR + 2.00%, Rate Floor: 2.00%) due 05/01/26 | | | 467,386 | | | | 465,680 | |
Hayward Industries, Inc. | | | | | | | | |
3.25% (1 Month USD LIBOR + 2.75%, Rate Floor: 3.25%) due 05/28/28 | | | 450,000 | | | | 448,735 | |
Cambrex Corp. | | | | | | | | |
4.25% (1 Month USD LIBOR + 3.50%, Rate Floor: 4.25%) due 12/04/26 | | | 447,750 | | | | 448,592 | |
SRAM LLC | | | | | | | | |
3.25% (1 Month USD LIBOR + 2.75% and 3 Month USD LIBOR + 2.75%, Rate Floor: 3.25%) due 05/18/28 | | | 445,909 | | | | 443,680 | |
US Foods, Inc. | | | | | | | | |
2.10% (1 Month USD LIBOR + 2.00%, Rate Floor: 2.00%) due 09/14/26 | | | 442,125 | | | | 435,139 | |
Triton Water Holdings, Inc. | | | | | | | | |
4.00% (1 Month USD LIBOR + 3.50%, Rate Floor: 4.00%) due 03/31/28 | | | 400,000 | | | | 399,444 | |
Catalent Pharma Solutions, Inc. | | | | | | | | |
2.50% (1 Month USD LIBOR + 2.00%, Rate Floor: 2.50%) due 02/22/28 | | | 399,000 | | | | 399,251 | |
Grifols Worldwide Operations USA, Inc. | | | | | | | | |
2.09% (1 Week USD LIBOR + 2.00%, Rate Floor: 2.00%) due 11/15/27 | | | 395,117 | | | | 391,067 | |
Hearthside Group Holdings LLC | | | | | | | | |
3.79% (1 Month USD LIBOR + 3.69%, Rate Floor: 3.69%) due 05/23/25 | | | 384,269 | | | | 381,629 | |
Valeant Pharmaceuticals International, Inc. | | | | | | | | |
2.85% (1 Month USD LIBOR + 2.75%, Rate Floor: 2.75%) due 11/27/25 | | | 375,000 | | | | 372,011 | |
Diamond (BC) BV | | | | | | | | |
3.19% (3 Month USD LIBOR + 3.00%, Rate Floor: 3.00%) due 09/06/24 | | | 290,250 | | | | 288,497 | |
Sigma Holding BV (Flora Food) | | | | | | | | |
3.26% (6 Month USD LIBOR + 3.00%, Rate Floor: 3.00%) due 07/02/25 | | | 242,500 | | | | 236,983 | |
Reynolds Consumer Products LLC | | | | | | | | |
1.85% (1 Month USD LIBOR + 1.75%, Rate Floor: 1.75%) due 02/04/27 | | | 224,353 | | | | 222,446 | |
Springs Window Fashions | | | | | | | | |
4.35% (1 Month USD LIBOR + 4.25%, Rate Floor: 4.25%) due 06/16/25 | | | 107,120 | | | | 107,120 | |
8.60% (1 Month USD LIBOR + 8.50%, Rate Floor: 8.50%) due 06/15/26 | | | 100,000 | | | | 100,063 | |
Icon Luxembourg SARL | | | | | | | | |
due 06/16/28 | | | 200,000 | | | | 200,282 | |
BCPE Eagle Buyer LLC | | | | | | | | |
5.34% (1 Month USD LIBOR + 4.34%, Rate Floor: 5.34%) due 03/18/24 | | | 192,462 | | | | 192,414 | |
National Mentor Holdings, Inc. | | | | | | | | |
4.50% (1 Month USD LIBOR + 3.75% and 3 Month USD LIBOR + 3.75%, Rate Floor: 4.50%) due 03/02/28 | | | 190,640 | | | | 190,851 | |
Aveanna Healthcare LLC | | | | | | | | |
due 06/29/28 | | | 162,264 | | | | 161,453 | |
MajorDrive Holdings IV LLC | | | | | | | | |
4.50% (3 Month USD LIBOR + 4.00%, Rate Floor: 4.50%) due 06/01/28 | | | 150,000 | | | | 150,047 | |
Energizer Holdings, Inc. | | | | | | | | |
2.75% (1 Month USD LIBOR + 2.25%, Rate Floor: 2.75%) due 12/22/27 | | | 149,625 | | | | 149,139 | |
Kronos Acquisition Holdings, Inc. | | | | | | | | |
4.25% (3 Month USD LIBOR + 3.75%, Rate Floor: 4.25%) due 12/22/26 | | | 149,625 | | | | 148,440 | |
Endo Luxembourg Finance Company I SARL | | | | | | | | |
5.75% (3 Month USD LIBOR + 5.00%, Rate Floor: 5.75%) due 03/27/28 | | | 99,750 | | | | 96,103 | |
Osmosis Holdings Australia II Pty Ltd. | | | | | | | | |
due 06/17/28 | | | 88,889 | | | | 89,111 | |
Total Consumer, Non-cyclical | | | | | | | 8,944,983 | |
| | | | | | | | | |
SEE NOTES TO FINANCIAL STATEMENTS. | THE GUGGENHEIM FUNDS SEMI-ANNUAL REPORT | 53 |
SCHEDULE OF INVESTMENTS (Unaudited)(continued) | June 30, 2021 |
SERIES F (FLOATING RATE STRATEGIES SERIES) | |
| | Face
Amount | | | Value | |
Communications - 14.3% | | | | | | | | |
Cengage Learning Acquisitions, Inc. | | | | | | | | |
5.25% (1 Month USD LIBOR + 4.25% and 3 Month USD LIBOR + 4.25%, Rate Floor: 5.25%) due 06/07/23 | | $ | 430,636 | | | $ | 430,868 | |
due 06/28/26 | | | 150,000 | | | | 150,094 | |
CSC Holdings LLC | | | | | | | | |
2.32% (1 Month USD LIBOR + 2.25%, Rate Floor: 2.25%) due 07/17/25 | | | 507,000 | | | | 499,395 | |
GTT Communications, Inc. | | | | | | | | |
2.90% (3 Month USD LIBOR + 2.75%, Rate Floor: 2.75%) due 05/30/25 | | | 630,500 | | | | 495,258 | |
SFR Group S.A. | | | | | | | | |
3.87% (3 Month USD LIBOR + 3.69%, Rate Floor: 3.69%) due 02/02/26 | | | 478,881 | | | | 474,452 | |
Virgin Media Bristol LLC | | | | | | | | |
2.57% (1 Month USD LIBOR + 2.50%, Rate Floor: 2.50%) due 01/31/28 | | | 415,406 | | | | 411,484 | |
McGraw Hill LLC | | | | | | | | |
5.75% (1 Month USD LIBOR + 4.75%, Rate Floor: 5.75%) due 11/01/24 | | | 403,459 | | | | 403,773 | |
Radiate Holdco LLC | | | | | | | | |
4.25% (1 Month USD LIBOR + 3.50%, Rate Floor: 4.25%) due 09/25/26 | | | 399,000 | | | | 399,148 | |
Zayo Group Holdings, Inc. | | | | | | | | |
3.10% (1 Month USD LIBOR + 3.00%, Rate Floor: 3.00%) due 03/09/27 | | | 401,527 | | | | 397,042 | |
Ziggo Financing Partnership | | | | | | | | |
2.57% (1 Month USD LIBOR + 2.50%, Rate Floor: 2.50%) due 04/28/28 | | | 400,000 | | | | 395,556 | |
Telenet Financing USD LLC | | | | | | | | |
2.07% (1 Month USD LIBOR + 2.00%, Rate Floor: 2.00%) due 04/28/28 | | | 400,000 | | | | 394,200 | |
ProQuest LLC | | | | | | | | |
3.35% (1 Month USD LIBOR + 3.25%, Rate Floor: 3.25%) due 10/23/26 | | | 278,969 | | | | 278,649 | |
Xplornet Communications, Inc. | | | | | | | | |
4.85% (1 Month USD LIBOR + 4.75%, Rate Floor: 4.75%) due 06/10/27 | | | 247,500 | | | | 247,411 | |
WMG Acquisition Corp. | | | | | | | | |
2.23% (1 Month USD LIBOR + 2.13%, Rate Floor: 2.13%) due 01/12/28 | | | 247,365 | | | | 245,245 | |
Internet Brands, Inc. | | | | | | | | |
3.60% (1 Month USD LIBOR + 3.50%, Rate Floor: 3.50%) due 09/13/24 | | | 246,053 | | | | 244,753 | |
UPC Broadband Holding BV | | | | | | | | |
3.07% (1 Month USD LIBOR + 3.00%, Rate Floor: 3.00%) due 01/31/29 | | | 200,000 | | | | 198,600 | |
Altice US Finance I Corp. | | | | | | | | |
2.32% (1 Month USD LIBOR + 2.25%, Rate Floor: 2.25%) due 01/15/26 | | | 195,500 | | | | 192,497 | |
Market Track LLC | | | | | | | | |
6.50% (Commercial Prime Lending Rate + 3.25%, Rate Floor: 4.25%) due 06/05/24 | | | 192,500 | | | | 192,019 | |
GTT Communications BV | | | | | | | | |
9.50% (1 Month USD LIBOR + 6.00%, Rate Floor: 7.00%) (in-kind rate was 2.50%) due 12/28/214 | | | 162,411 | | | | 163,745 | |
Authentic Brands | | | | | | | | |
4.00% (1 Month USD LIBOR + 3.25%, Rate Floor: 4.00%) due 09/27/24 | | | 160,683 | | | | 160,482 | |
Total Communications | | | | | | | 6,374,671 | |
| | | | | | | | | |
Consumer, Cyclical - 12.6% | | | | | | | | |
American Tire Distributors, Inc. | | | | | | | | |
8.50% (1 Month USD LIBOR + 7.50% and 3 Month USD LIBOR + 7.50%, Rate Floor: 8.50%) due 09/02/24 | | | 509,959 | | | | 509,704 | |
7.00% (3 Month USD LIBOR + 6.00%, Rate Floor: 7.00%) due 09/01/23 | | | 57,427 | | | | 56,900 | |
Power Solutions (Panther) | | | | | | | | |
3.35% (1 Month USD LIBOR + 3.25%, Rate Floor: 3.25%) due 04/30/26 | | | 522,476 | | | | 517,251 | |
Whatabrands LLC | | | | | | | | |
2.83% (1 Month USD LIBOR + 2.75%, Rate Floor: 2.75%) due 07/31/26 | | | 460,866 | | | | 458,668 | |
First Brands Group LLC | | | | | | | | |
6.00% (1 Month USD LIBOR + 5.00%, Rate Floor: 6.00%) due 03/30/27 | | | 399,000 | | | | 403,158 | |
Go Daddy Operating Company LLC | | | | | | | | |
1.85% (1 Month USD LIBOR + 1.75%, Rate Floor: 1.75%) due 02/15/24 | | | 397,246 | | | | 393,921 | |
CHG Healthcare Services, Inc. | | | | | | | | |
4.00% (3 Month USD LIBOR + 3.00%, Rate Floor: 4.00%) due 06/07/23 | | | 384,073 | | | | 383,593 | |
Navistar, Inc. | | | | | | | | |
3.60% (1 Month USD LIBOR + 3.50%, Rate Floor: 3.50%) due 11/06/24 | | | 383,365 | | | | 383,365 | |
Intrawest Resorts Holdings, Inc. | | | | | | | | |
2.85% (1 Month USD LIBOR + 2.75%, Rate Floor: 2.75%) due 07/31/24 | | | 356,766 | | | | 351,989 | |
PetSmart LLC | | | | | | | | |
4.50% (3 Month USD LIBOR + 3.75%, Rate Floor: 4.50%) due 02/11/28 | | | 350,000 | | | | 350,087 | |
1011778 BC Unlimited Liability Co. | | | | | | | | |
1.85% (1 Month USD LIBOR + 1.75%, Rate Floor: 1.75%) due 11/19/26 | | | 344,750 | | | | 339,741 | |
IBC Capital Ltd. | | | | | | | | |
3.87% (3 Month USD LIBOR + 3.75%, Rate Floor: 3.75%) due 09/11/23 | | | 337,658 | | | | 334,282 | |
Burlington Stores, Inc. | | | | | | | | |
due 06/24/28 | | | 250,000 | | | | 248,957 | |
Packers Holdings LLC | | | | | | | | |
4.00% (3 Month USD LIBOR + 3.25%, Rate Floor: 4.00%) due 03/09/28 | | | 249,375 | | | | 247,869 | |
Mavis Tire Express Services TopCo Corp. | | | | | | | | |
4.75% (3 Month USD LIBOR + 4.00%, Rate Floor: 4.75%) due 05/04/28 | | | 150,000 | | | | 150,375 | |
54 | THE GUGGENHEIM FUNDS SEMI-ANNUAL REPORT | SEE NOTES TO FINANCIAL STATEMENTS. |
SCHEDULE OF INVESTMENTS (Unaudited)(continued) | June 30, 2021 |
SERIES F (FLOATING RATE STRATEGIES SERIES) | |
| | Face
Amount | | | Value | |
Wyndham Hotels & Resorts, Inc. | | | | | | | | |
1.85% (1 Month USD LIBOR + 1.75%, Rate Floor: 1.75%) due 05/30/25 | | $ | 145,875 | | | $ | 144,599 | |
Prime Security Services Borrower LLC | | | | | | | | |
3.50% (1 Month USD LIBOR + 2.75% and 3 Month USD LIBOR + 2.75%, Rate Floor: 3.50%) due 09/23/26 | | | 133,695 | | | | 133,550 | |
WW International, Inc. | | | | | | | | |
4.00% (1 Month USD LIBOR + 3.50%, Rate Floor: 4.00%) due 04/13/28 | | | 100,000 | | | | 100,250 | |
Rent-A-Center, Inc. | | | | | | | | |
4.75% (1 Month USD LIBOR + 4.00%, Rate Floor: 4.75%) due 02/17/28 | | | 99,750 | | | | 99,750 | |
EG Finco Ltd. | | | | | | | | |
4.15% (3 Month USD LIBOR + 4.00%, Rate Floor: 4.00%) due 02/07/25 | | | 37,867 | | | | 37,556 | |
Total Consumer, Cyclical | | | | | | | 5,645,565 | |
| | | | | | | | | |
Financial - 12.4% | | | | | | | | |
Delos Finance SARL (International Lease Finance) | | | | | | | | |
1.90% (3 Month USD LIBOR + 1.75%, Rate Floor: 1.75%) due 10/06/23 | | | 490,000 | | | | 489,388 | |
HUB International Ltd. | | | | | | | | |
2.93% (3 Month USD LIBOR + 2.75%, Rate Floor: 2.75%) due 04/25/25 | | | 491,162 | | | | 485,459 | |
Nexus Buyer LLC | | | | | | | | |
3.84% (1 Month USD LIBOR + 3.75%, Rate Floor: 3.75%) due 11/09/26 | | | 450,000 | | | | 448,713 | |
AlixPartners, LLP | | | | | | | | |
3.25% (1 Month USD LIBOR + 2.75%, Rate Floor: 3.25%) due 02/04/28 | | | 448,875 | | | | 446,819 | |
Trans Union LLC | | | | | | | | |
1.85% (1 Month USD LIBOR + 1.75%, Rate Floor: 1.75%) due 11/13/26 | | | 446,893 | | | | 443,604 | |
Virtu Financial, Inc. | | | | | | | | |
3.09% (1 Month USD LIBOR + 3.00%, Rate Floor: 3.00%) due 03/01/26 | | | 417,000 | | | | 415,178 | |
Ryan Specialty Group LLC | | | | | | | | |
3.75% (1 Month USD LIBOR + 3.00%, Rate Floor: 3.75%) due 09/01/27 | | | 397,751 | | | | 397,377 | |
AmWINS Group, Inc. | | | | | | | | |
3.00% (1 Month USD LIBOR + 2.25%, Rate Floor: 3.00%) due 02/19/28 | | | 398,000 | | | | 395,345 | |
Focus Financial Partners LLC | | | | | | | | |
2.10% (1 Month USD LIBOR + 2.00%, Rate Floor: 2.00%) due 07/03/24 | | | 396,931 | | | | 392,731 | |
NFP Corp. | | | | | | | | |
3.35% (1 Month USD LIBOR + 3.25%, Rate Floor: 3.25%) due 02/15/27 | | | 387,658 | | | | 381,789 | |
LPL Holdings, Inc. | | | | | | | | |
1.85% (1 Month USD LIBOR + 1.75%, Rate Floor: 1.75%) due 11/12/26 | | | 350,438 | | | | 346,605 | |
Franchise Group, Inc. | | | | | | | | |
5.50% (3 Month USD LIBOR + 4.75%, Rate Floor: 5.50%) due 03/10/26 | | | 249,375 | | | | 250,467 | |
Citadel Securities, LP | | | | | | | | |
2.60% (1 Month USD LIBOR + 2.50%, Rate Floor: 2.50%) due 02/02/28 | | | 249,375 | | | | 246,622 | |
Aretec Group, Inc. | | | | | | | | |
4.35% (1 Month USD LIBOR + 4.25%, Rate Floor: 4.25%) due 10/01/25 | | | 243,750 | | | | 242,760 | |
AqGen Island Holdings, Inc. | | | | | | | | |
due 05/20/28 | | | 100,000 | | | | 99,688 | |
Jane Street Group LLC | | | | | | | | |
2.85% (1 Month USD LIBOR + 2.75%, Rate Floor: 2.75%) due 01/26/28 | | | 79,989 | | | | 79,560 | |
Total Financial | | | | | | | 5,562,105 | |
| | | | | | | | | |
Technology - 7.1% | | | | | | | | |
Dun & Bradstreet | | | | | | | | |
3.35% (1 Month USD LIBOR + 3.25%, Rate Floor: 3.25%) due 02/06/26 | | | 447,750 | | | | 445,440 | |
WEX, Inc. | | | | | | | | |
2.35% (1 Month USD LIBOR + 2.25%, Rate Floor: 2.25%) due 03/31/28 | | | 399,000 | | | | 395,760 | |
Informatica LLC | | | | | | | | |
3.35% (1 Month USD LIBOR + 3.25%, Rate Floor: 3.25%) due 02/25/27 | | | 355,500 | | | | 353,036 | |
Peraton Corp. | | | | | | | | |
4.50% (1 Month USD LIBOR + 3.75%, Rate Floor: 4.50%) due 02/01/28 | | | 299,250 | | | | 299,872 | |
Nielsen Finance LLC | | | | | | | | |
2.08% (1 Month USD LIBOR + 2.00%, Rate Floor: 2.00%) due 10/04/23 | | | 270,654 | | | | 270,316 | |
Project Ruby Ultimate Parent Corp. | | | | | | | | |
4.00% (1 Month USD LIBOR + 3.25%, Rate Floor: 4.00%) due 03/10/28 | | | 199,500 | | | | 198,814 | |
Tech Data Corp. | | | | | | | | |
3.60% (1 Month USD LIBOR + 3.50%, Rate Floor: 3.50%) due 06/30/25 | | | 198,500 | | | | 198,677 | |
Boxer Parent Co., Inc. | | | | | | | | |
3.85% (1 Month USD LIBOR + 3.75%, Rate Floor: 3.75%) due 10/02/25 | | | 170,708 | | | | 169,641 | |
Atlas CC Acquisition Corp. | | | | | | | | |
5.00% (3 Month USD LIBOR + 4.25%, Rate Floor: 5.00%) due 05/25/28 | | | 150,000 | | | | 150,375 | |
Polaris Newco LLC | | | | | | | | |
4.50% (6 Month USD LIBOR + 4.00%, Rate Floor: 4.50%) due 06/02/28 | | | 150,000 | | | | 150,357 | |
Conair Holdings LLC | | | | | | | | |
4.25% (3 Month USD LIBOR + 3.75%, Rate Floor: 4.25%) due 05/17/28 | | | 150,000 | | | | 150,300 | |
Emerald TopCo, Inc. (Press Ganey) | | | | | | | | |
3.69% (3 Month USD LIBOR + 3.50%, Rate Floor: 3.50%) due 07/24/26 | | | 147,375 | | | | 146,454 | |
TIBCO Software, Inc. | | | | | | | | |
3.86% (1 Month USD LIBOR + 3.75%, Rate Floor: 3.75%) due 06/30/26 | | | 136,620 | | | | 136,142 | |
Brave Parent Holdings, Inc. | | | | | | | | |
4.10% (1 Month USD LIBOR + 4.00%, Rate Floor: 4.00%) due 04/18/25 | | | 94,514 | | | | 94,317 | |
Total Technology | | | | | | | 3,159,501 | |
| | | | | | | | | |
SEE NOTES TO FINANCIAL STATEMENTS. | THE GUGGENHEIM FUNDS SEMI-ANNUAL REPORT | 55 |
SCHEDULE OF INVESTMENTS (Unaudited)(continued) | June 30, 2021 |
SERIES F (FLOATING RATE STRATEGIES SERIES) | |
| | Face
Amount | | | Value | |
Basic Materials - 3.2% | | | | | | | | |
Asplundh Tree Expert LLC | | | | | | | | |
1.85% (1 Month USD LIBOR + 1.75%, Rate Floor: 1.75%) due 09/04/27 | | $ | 496,250 | | | $ | 494,320 | |
Messer Industries USA, Inc. | | | | | | | | |
2.65% (3 Month USD LIBOR + 2.50%, Rate Floor: 2.50%) due 03/02/26 | | | 360,452 | | | | 357,737 | |
GrafTech Finance, Inc. | | | | | | | | |
4.00% (1 Month USD LIBOR + 3.00%, Rate Floor: 4.00%) due 02/12/25 | | | 200,599 | | | | 200,498 | |
INEOS Ltd. | | | | | | | | |
3.25% (1 Month USD LIBOR + 2.75%, Rate Floor: 3.25%) due 01/29/26 | | | 150,000 | | | | 149,484 | |
PQ Corp. | | | | | | | | |
2.44% (3 Month USD LIBOR + 2.25%, Rate Floor: 2.25%) due 02/08/27 | | | 113,991 | | | | 113,493 | |
Alpha 3 BV (Atotech) | | | | | | | | |
3.00% (3 Month USD LIBOR + 2.50%, Rate Floor: 3.00%) due 03/18/28 | | | 100,000 | | | | 99,438 | |
Total Basic Materials | | | | | | | 1,414,970 | |
| | | | | | | | | |
Energy - 1.9% | | | | | | | | |
DT Midstream, Inc. | | | | | | | | |
2.50% (3 Month USD LIBOR + 2.00% and 6 Month USD LIBOR + 2.00%, Rate Floor: 2.50%) due 06/12/28 | | | 450,000 | | | | 450,400 | |
Buckeye Partners, LP | | | | | | | | |
2.35% (1 Month USD LIBOR + 2.25%, Rate Floor: 2.25%) due 11/01/26 | | | 396,005 | | | | 393,035 | |
Total Energy | | | | | | | 843,435 | |
| | | | | | | | | |
Utilities - 0.4% | | | | | | | | |
Hamilton Projects Acquiror LLC | | | | | | | | |
5.75% (3 Month USD LIBOR + 4.75%, Rate Floor: 5.75%) due 06/17/27 | | | 178,200 | | | | 176,240 | |
Total Senior Floating Rate Interests | | | | |
(Cost $42,459,840) | | | 42,252,527 | |
| | | | | | | | | |
Total Investments - 101.9%% | | | | |
(Cost $45,818,923) | | $ | 45,520,336 | |
Other Assets & Liabilities, net - (1.9)% | | | (841,318 | ) |
Total Net Assets - 100.0% | | $ | 44,679,018 | |
* | Non-income producing security. |
† | Value determined based on Level 1 inputs — See Note 4. |
†† | Value determined based on Level 2 inputs, unless otherwise noted — See Note 4. |
††† | Value determined based on Level 3 inputs — See Note 4. |
1 | Affiliated issuer. |
2 | Rate indicated is the 7-day yield as of June 30, 2021. |
3 | Variable rate security. Rate indicated is the rate effective at June 30, 2021. In some instances, the effective rate is limited by a minimum rate floor or a maximum rate cap established by the issuer. The settlement status of a position may also impact the effective rate indicated. In some cases, a position may be unsettled at period end and may not have a stated effective rate. In instances where multiple underlying reference rates and spread amounts are shown, the effective rate is based on a weighted average. |
4 | Payment-in-kind security. |
| | LIBOR — London Interbank Offered Rate |
| | SARL — Société à Responsabilité Limitée |
| | |
| | See Sector Classification in Other Information section. |
56 | THE GUGGENHEIM FUNDS SEMI-ANNUAL REPORT | SEE NOTES TO FINANCIAL STATEMENTS. |
SCHEDULE OF INVESTMENTS (Unaudited)(continued) | June 30, 2021 |
SERIES F (FLOATING RATE STRATEGIES SERIES) | |
The following table summarizes the inputs used to value the Fund’s investments at June 30, 2021 (See Note 4 in the Notes to Financial Statements):
Investments in Securities (Assets) | | Level 1
Quoted
Prices | | | Level 2
Significant
Observable
Inputs | | | Level 3
Significant
Unobservable
Inputs | | | Total | |
Common Stocks | | $ | — | | | $ | — | | | $ | 27,067 | | | $ | 27,067 | |
Preferred Stocks | | | — | | | | — | | | | — | * | | | — | |
Money Market Fund | | | 3,240,742 | | | | — | | | | — | | | | 3,240,742 | |
Senior Floating Rate Interests | | | — | | | | 41,527,732 | | | | 724,795 | | | | 42,252,527 | |
Total Assets | | $ | 3,240,742 | | | $ | 41,527,732 | | | $ | 751,862 | | | $ | 45,520,336 | |
Investments in Securities (Liabilities) | | Level 1
Quoted
Prices | | | Level 2
Significant
Observable
Inputs | | | Level 3
Significant
Unobservable
Inputs | | | Total | |
Unfunded Loan Commitments (Note 8) | | $ | — | | | $ | — | | | $ | 442 | | | $ | 442 | |
* | Security has a market value of $0. |
The following is a summary of significant unobservable inputs used in the fair valuations of assets and liabilities categorized within Level 3 of the fair value hierarchy:
| Category | | Ending Balance at June 30, 2021 | | | Valuation Technique | | Unobservable Inputs | | Input Range | | Weighted Average* |
| Assets: | | | | | | | | | | | |
| Common Stocks | | $ | 27,067 | | | Enterprise Value | | Valuation Multiple | | 2.3x-11.9x | | 10.4x |
| Senior Floating Rate Interests | | | 724,795 | | | Third Party Pricing | | Broker Quote | | — | | — |
| Total Assets | | $ | 751,862 | | | | | | | | | |
| Liabilities: | | | | | | | | | | | | |
| Unfunded Loan Commitments | | $ | 442 | | | Model Price | | Purchase Price | | — | | — |
* | Inputs are weighted by the fair value of the instruments. |
Significant changes in a quote or valuation multiple would generally result in significant changes in the fair value of the security. Any remaining Level 3 securities held by the Fund and excluded from the table above, were not considered material to the Fund.
The Fund’s fair valuation leveling guidelines classify a single daily broker quote, or a vendor price based on a single daily or monthly broker quote, as Level 3, if such a quote or price cannot be supported with other available market information.
Transfers between Level 2 and Level 3 may occur as markets fluctuate and/or the availability of data used in an investment’s valuation changes. For the period ended June 30, 2021, the Fund had securities with a total value of $411,396 transfer into Level 3 from Level 2 due to a lack of observable inputs.
SEE NOTES TO FINANCIAL STATEMENTS. | THE GUGGENHEIM FUNDS SEMI-ANNUAL REPORT | 57 |
SCHEDULE OF INVESTMENTS (Unaudited)(concluded) | June 30, 2021 |
SERIES F (FLOATING RATE STRATEGIES SERIES) | |
Summary of Fair Value Level 3 Activity
Following is a reconciliation of Level 3 assets for which significant unobservable inputs were used to determine fair value for the period ended June 30, 2021:
| | | Assets | | | | | | | Liabilities | |
| | Senior Floating
Rate Interests | | | Common
Stocks | | | Preferred
Stocks | | | Total
Assets | | | Unfunded Loan
Commitments | |
Beginning Balance | | $ | 432,181 | | | $ | 20,114 | | | $ | 18,500 | | | $ | 470,795 | | | $ | (383 | ) |
Purchases/(Receipts) | | | 6,313 | | | | 966 | | | | — | | | | 7,279 | | | | (637 | ) |
(Sales, maturities and paydowns)/Fundings | | | (31,918 | ) | | | (21,491 | ) | | | — | | | | (53,409 | ) | | | 299 | |
Amortization of premiums/discounts | | | 11 | | | | — | | | | — | | | | 11 | | | | — | |
Total realized gains (losses) included in earnings | | | (2,251 | ) | | | 18,974 | | | | — | | | | 16,723 | | | | 604 | |
Total change in unrealized appreciation (depreciation) included in earnings | | | (90,937 | ) | | | 8,504 | | | | (18,500 | ) | | | (100,933 | ) | | | (325 | ) |
Transfers into Level 3 | | | 411,396 | | | | — | | | | — | | | | 411,396 | | | | — | |
Ending Balance | | $ | 724,795 | | | $ | 27,067 | | | $ | — | | | $ | 751,862 | | | $ | (442 | ) |
Net change in unrealized appreciation (depreciation) for investments in Level 3 securities still held at June 30, 2021 | | $ | (91,614 | ) | | $ | 7,679 | | | $ | (18,500 | ) | | $ | (102,435 | ) | | $ | (38 | ) |
Affiliated Transactions
Investments representing 5% or more of the outstanding voting shares of a company, or control of or by, or common control under Guggenheim Investments, result in that company being considered an affiliated issuer, as defined in the 1940 Act.
Transactions during the period ended June 30, 2021, in which the company is an affiliated issuer, were as follows:
Security Name | | Value
12/31/20 | | | Additions | | | Reductions | | | Realized
Gain (Loss) | | | Change in
Unrealized
Appreciation
(Depreciation) | | | Value
06/30/21 | | | Shares
06/30/21 | |
Common Stock | | | | | | | | | | | | | | | | | | | | | | | | | | | | |
BP Holdco LLC* | | $ | 4,093 | | | $ | — | | | $ | — | | | $ | — | | | $ | — | | | $ | 4,093 | | | | 11,609 | |
* | Non-income producing security. |
58 | THE GUGGENHEIM FUNDS SEMI-ANNUAL REPORT | SEE NOTES TO FINANCIAL STATEMENTS. |
SERIES F (FLOATING RATE STRATEGIES SERIES) | |
STATEMENT OF ASSETS AND LIABILITIES (Unaudited) |
June 30, 2021 |
Assets: |
Investments in unaffiliated issuers, at value (cost $45,814,824) | | $ | 45,516,243 | |
Investments in affiliated issuers, at value (cost $4,099) | | | 4,093 | |
Cash | | | 409,711 | |
Prepaid expenses | | | 2,870 | |
Receivables: |
Securities sold | | | 906,053 | |
Interest | | | 69,705 | |
Fund shares sold | | | 30,846 | |
Total assets | | | 46,939,521 | |
| | | | | |
Liabilities: |
Unfunded loan commitments, at value (Note 8) (commitment fees received $404) | | | 442 | |
Payable for: |
Securities purchased | | | 2,175,344 | |
Management fees | | | 17,241 | |
Fund shares redeemed | | | 15,429 | |
Distribution and service fees | | | 9,064 | |
Fund accounting/administration fees | | | 4,851 | |
Transfer agent/maintenance fees | | | 2,273 | |
Trustees’ fees* | | | 1,489 | |
Miscellaneous | | | 34,370 | |
Total liabilities | | | 2,260,503 | |
Commitments and contingent liabilities (Note 12) | | | — | |
Net assets | | $ | 44,679,018 | |
| | | | | |
Net assets consist of: |
Paid in capital | | $ | 47,085,664 | |
Total distributable earnings (loss) | | | (2,406,646 | ) |
Net assets | | $ | 44,679,018 | |
Capital shares outstanding | | | 1,804,690 | |
Net asset value per share | | $ | 24.76 | |
STATEMENT OF OPERATIONS (Unaudited) |
Six Months Ended June 30, 2021 |
Investment Income: |
Interest from securities of unaffiliated issuers | | $ | 749,845 | |
Total investment income | | | 749,845 | |
| | | | | |
Expenses: |
Management fees | | | 137,524 | |
Distribution and service fees | | | 52,894 | |
Transfer agent/maintenance fees | | | 12,544 | |
Professional fees | | | 27,941 | |
Fund accounting/administration fees | | | 17,898 | |
Custodian fees | | | 11,014 | |
Trustees’ fees* | | | 9,189 | |
Line of credit fees | | | 8,051 | |
Miscellaneous | | | 5,117 | |
Total expenses | | | 282,172 | |
Less: |
Expenses waived by Adviser | | | (32,919 | ) |
Earnings credits applied | | | (25 | ) |
Total waived expenses | | | (32,944 | ) |
Net expenses | | | 249,228 | |
Net investment income | | | 500,617 | |
| | | | | |
Net Realized and Unrealized Gain (Loss): |
Net realized gain (loss) on: |
Investments in unaffiliated issuers | | | 18,704 | |
Net realized gain | | | 18,704 | |
Net change in unrealized appreciation (depreciation) on: |
Investments in unaffiliated issuers | | | 86,664 | |
Net change in unrealized appreciation (depreciation) | | | 86,664 | |
Net realized and unrealized gain | | | 105,368 | |
Net increase in net assets resulting from operations | | $ | 605,985 | |
* | Relates to Trustees not deemed “interested persons” within the meaning of Section 2(a)(19) of the 1940 Act. |
SEE NOTES TO FINANCIAL STATEMENTS. | THE GUGGENHEIM FUNDS SEMI-ANNUAL REPORT | 59 |
SERIES F (FLOATING RATE STRATEGIES SERIES) | |
STATEMENTS OF CHANGES IN NET ASSETS |
| | Six Months Ended
June 30, 2021
(Unaudited) | | | Year Ended
December 31,
2020 | |
Increase (Decrease) in Net Assets from Operations: | | | | | | | | |
Net investment income | | $ | 500,617 | | | $ | 1,106,221 | |
Net realized gain (loss) on investments | | | 18,704 | | | | (2,206,068 | ) |
Net change in unrealized appreciation (depreciation) on investments | | | 86,664 | | | | 396,917 | |
Net increase (decrease) in net assets resulting from operations | | | 605,985 | | | | (702,930 | ) |
| | | | | | | | | |
Distributions to shareholders | | | — | | | | (2,229,065 | ) |
| | | | | | | | | |
Capital share transactions: | | | | | | | | |
Proceeds from sale of shares | | | 7,905,872 | | | | 25,343,213 | |
Distributions reinvested | | | — | | | | 2,229,065 | |
Cost of shares redeemed | | | (4,836,550 | ) | | | (29,683,817 | ) |
Net increase (decrease) from capital share transactions | | | 3,069,322 | | | | (2,111,539 | ) |
Net increase (decrease) in net assets | | | 3,675,307 | | | | (5,043,534 | ) |
| | | | | | | | | |
Net assets: | | | | | | | | |
Beginning of period | | | 41,003,711 | | | | 46,047,245 | |
End of period | | $ | 44,679,018 | | | $ | 41,003,711 | |
| | | | | | | | | |
Capital share activity: | | | | | | | | |
Shares sold | | | 321,239 | | | | 1,049,495 | |
Shares issued from reinvestment of distributions | | | — | | | | 94,854 | |
Shares redeemed | | | (196,641 | ) | | | (1,237,868 | ) |
Net increase (decrease) in shares | | | 124,598 | | | | (93,519 | ) |
60 | THE GUGGENHEIM FUNDS SEMI-ANNUAL REPORT | SEE NOTES TO FINANCIAL STATEMENTS. |
SERIES F (FLOATING RATE STRATEGIES SERIES) | |
This table is presented to show selected data for a share outstanding throughout each period and to assist shareholders in evaluating a Fund’s performance for the periods presented.
| | Six Months Ended
June 30, 2021a | | | Year Ended
December 31,
2020 | | | Year Ended
December 31,
2019 | | | Year Ended
December 31,
2018 | | | Year Ended
December 31,
2017 | | | Year Ended
December 31,
2016 | |
Per Share Data |
Net asset value, beginning of period | | $ | 24.41 | | | $ | 25.96 | | | $ | 25.30 | | | $ | 26.26 | | | $ | 26.22 | | | $ | 25.72 | |
Income (loss) from investment operations: |
Net investment income (loss)b | | | .29 | | | | .68 | | | | 1.06 | | | | 1.01 | | | | .91 | | | | 1.05 | |
Net gain (loss) on investments (realized and unrealized) | | | .06 | | | | (.74 | ) | | | .85 | | | | (1.21 | ) | | | (.02 | ) | | | 1.09 | |
Total from investment operations | | | .35 | | | | (.06 | ) | | | 1.91 | | | | (.20 | ) | | | .89 | | | | 2.14 | |
Less distributions from: |
Net investment income | | | — | | | | (1.49 | ) | | | (1.25 | ) | | | (.76 | ) | | | (.85 | ) | | | (1.56 | ) |
Net realized gains | | | — | | | | — | | | | — | | | | — | | | | — | | | | (.08 | ) |
Total distributions | | | — | | | | (1.49 | ) | | | (1.25 | ) | | | (.76 | ) | | | (.85 | ) | | | (1.64 | ) |
Net asset value, end of period | | $ | 24.76 | | | $ | 24.41 | | | $ | 25.96 | | | $ | 25.30 | | | $ | 26.26 | | | $ | 26.22 | |
|
Total Returnc | | | 1.43 | % | | | 0.01 | % | | | 7.60 | % | | | (0.84 | %) | | | 3.46 | % | | | 8.56 | % |
Ratios/Supplemental Data |
Net assets, end of period (in thousands) | | $ | 44,679 | | | $ | 41,004 | | | $ | 46,047 | | | $ | 58,798 | | | $ | 51,038 | | | $ | 53,245 | |
Ratios to average net assets: |
Net investment income (loss) | | | 2.37 | % | | | 2.81 | % | | | 4.10 | % | | | 3.85 | % | | | 3.44 | % | | | 4.06 | % |
Total expenses | | | 1.33 | % | | | 1.47 | % | | | 1.38 | % | | | 1.26 | % | | | 1.28 | % | | | 1.22 | % |
Net expensesd,e,f | | | 1.18 | % | | | 1.23 | % | | | 1.21 | % | | | 1.16 | % | | | 1.18 | % | | | 1.18 | % |
Portfolio turnover rate | | | 22 | % | | | 60 | % | | | 28 | % | | | 80 | % | | | 57 | % | | | 71 | % |
a | Unaudited figures for the period ended June 30, 2021. Percentage amounts for the period, except total return and portfolio turnover rate, have been annualized. |
b | Net investment income (loss) per share was computed using average shares outstanding throughout the period. |
c | Total return does not take into account any of the expenses associated with an investment in variable insurance products. If total return had taken into account these expenses, performance would have been lower. Shares of a series of Guggenheim Variable Funds Trust are available only through the purchase of such products. |
d | Net expense information reflects the expense ratios after expense waivers and reimbursements, as applicable. |
e | Net expenses may include expenses that are excluded from the expense limitation agreement. Excluding these expenses, the net expense ratios for the periods presented would be: |
| | 06/30/21a | 12/31/20 | 12/31/19 | 12/31/18 | 12/31/17 | 12/31/16 |
| | 1.14% | 1.15% | 1.15% | 1.15% | 1.15% | 1.15% |
f | The portion of the ratios of net expenses to average net assets attributable to recoupments of prior fee reductions or expense reimbursements for the periods was as follows: |
| | 06/30/21a | 12/31/20 | 12/31/19 | 12/31/18 | 12/31/17 | 12/31/16 |
| | — | — | — | 0.00%* | 0.01% | — |
SEE NOTES TO FINANCIAL STATEMENTS. | THE GUGGENHEIM FUNDS SEMI-ANNUAL REPORT | 61 |
PERFORMANCE REPORT AND FUND PROFILE (Unaudited) | June 30, 2021 |
SERIES J (STYLEPLUS—MID GROWTH SERIES)
OBJECTIVE: Seeks long-term growth of capital.
Holdings Diversification (Market Exposure as % of Net Assets)
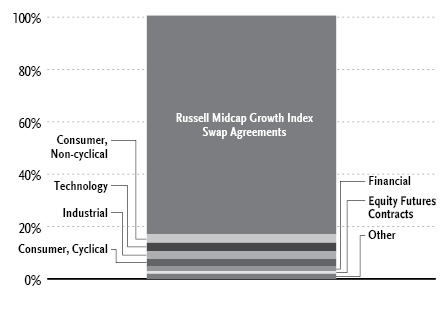
“Holdings Diversification (Market Exposure as % of Net Assets)” excludes any temporary cash investments, investments in Guggenheim Strategy Funds Trust mutual funds, or investments in Guggenheim Ultra Short Duration Fund.
Inception Date: October 1, 1992 |
Ten Largest Holdings (% of Total Net Assets) |
Guggenheim Strategy Fund III | 26.0% |
Guggenheim Ultra Short Duration Fund — Institutional Class | 22.2% |
Guggenheim Variable Insurance Strategy Fund III | 20.2% |
Guggenheim Strategy Fund II | 12.7% |
Fair Isaac Corp. | 0.3% |
Toro Co. | 0.3% |
Chemed Corp. | 0.3% |
Molina Healthcare, Inc. | 0.2% |
Interactive Brokers Group, Inc. — Class A | 0.2% |
Lumentum Holdings, Inc. | 0.2% |
Top Ten Total | 82.6% |
| | |
“Ten Largest Holdings” excludes any temporary cash or derivative investments. |
Average Annual Returns*,†
Periods Ended June 30, 2021
| 6 Month‡ | 1 Year | 5 Year | 10 Year |
Series J (StylePlus—Mid Growth Series) | 11.05% | 45.93% | 19.03% | 14.30% |
Russell Midcap Growth Index | 10.44% | 43.77% | 20.52% | 15.13% |
* | The performance data above represents past performance that is not predictive of future results. The investment return and principal value of an investment in the Fund will fluctuate so that an investor’s shares, when redeemed, may be worth more or less than their original cost. Returns are historical and include changes in principal and reinvested dividends and capital gains and do not reflect the effect of taxes. The Russell Midcap Growth Index is an unmanaged index and, unlike the Fund, has no management fees or operating expenses to reduce its reported return. |
† | Performance figures do not reflect fees and expenses associated with an investment in variable insurance products. If returns had taken into account these fees and expenses, performance would have been lower. Shares of a series of Guggenheim Variable Funds Trust are available only through the purchase of such products. |
‡ | 6 month returns are not annualized. |
62 THE GUGGENHEIM FUNDS SEMI-ANNUAL REPORT | |
SCHEDULE OF INVESTMENTS (Unaudited) | June 30, 2021 |
SERIES J (STYLEPLUS—MID GROWTH SERIES) | |
| | Shares | | | Value | |
COMMON STOCKS† - 16.1% |
| | | | | | | | | |
Consumer, Non-cyclical - 3.4% |
Chemed Corp. | | | 1,150 | | | $ | 545,675 | |
Molina Healthcare, Inc.* | | | 1,986 | | | | 502,577 | |
United Therapeutics Corp.* | | | 2,044 | | | | 366,714 | |
Hologic, Inc.* | | | 5,190 | | | | 346,277 | |
Neurocrine Biosciences, Inc.* | | | 3,483 | | | | 338,966 | |
Bio-Techne Corp. | | | 708 | | | | 318,784 | |
Jazz Pharmaceuticals plc* | | | 1,718 | | | | 305,185 | |
Encompass Health Corp. | | | 3,904 | | | | 304,629 | |
Exelixis, Inc.* | | | 16,176 | | | | 294,727 | |
Bio-Rad Laboratories, Inc. — Class A* | | | 431 | | | | 277,689 | |
Halozyme Therapeutics, Inc.* | | | 5,845 | | | | 265,421 | |
Quidel Corp.* | | | 1,938 | | | | 248,296 | |
Arrowhead Pharmaceuticals, Inc.* | | | 2,995 | | | | 248,046 | |
DaVita, Inc.* | | | 2,039 | | | | 245,557 | |
Hill-Rom Holdings, Inc. | | | 1,961 | | | | 222,750 | |
PerkinElmer, Inc. | | | 1,436 | | | | 221,733 | |
STAAR Surgical Co.* | | | 1,370 | | | | 208,925 | |
Boston Beer Company, Inc. — Class A* | | | 202 | | | | 206,202 | |
Emergent BioSolutions, Inc.* | | | 2,852 | | | | 179,647 | |
Humana, Inc. | | | 361 | | | | 159,822 | |
McKesson Corp. | | | 831 | | | | 158,920 | |
Incyte Corp.* | | | 1,823 | | | | 153,369 | |
Darling Ingredients, Inc.* | | | 2,252 | | | | 152,010 | |
Regeneron Pharmaceuticals, Inc.* | | | 265 | | | | 148,013 | |
Select Medical Holdings Corp. | | | 3,061 | | | | 129,358 | |
Vertex Pharmaceuticals, Inc.* | | | 576 | | | | 116,139 | |
United Rentals, Inc.* | | | 353 | | | | 112,611 | |
Alarm.com Holdings, Inc.* | | | 1,253 | | | | 106,129 | |
Total Consumer, Non-cyclical | | | | | | | 6,884,171 | |
| | | | | | | | | |
Technology - 3.2% |
Fair Isaac Corp.* | | | 1,106 | | | | 555,964 | |
Lumentum Holdings, Inc.* | | | 5,657 | | | | 464,044 | |
Synaptics, Inc.* | | | 2,658 | | | | 413,532 | |
MAXIMUS, Inc. | | | 4,296 | | | | 377,919 | |
Cirrus Logic, Inc.* | | | 4,429 | | | | 376,997 | |
CDK Global, Inc. | | | 7,491 | | | | 372,228 | |
Manhattan Associates, Inc.* | | | 2,309 | | | | 334,436 | |
Cadence Design Systems, Inc.* | | | 2,189 | | | | 299,499 | |
MKS Instruments, Inc. | | | 1,679 | | | | 298,778 | |
Genpact Ltd. | | | 6,394 | | | | 290,479 | |
Lattice Semiconductor Corp.* | | | 5,091 | | | | 286,012 | |
Cerner Corp. | | | 3,639 | | | | 284,424 | |
Aspen Technology, Inc.* | | | 1,701 | | | | 233,955 | |
ACI Worldwide, Inc.* | | | 5,917 | | | | 219,757 | |
Qualys, Inc.* | | | 2,167 | | | | 218,195 | |
Qorvo, Inc.* | | | 1,095 | | | | 214,237 | |
Teradyne, Inc. | | | 1,271 | | | | 170,263 | |
Power Integrations, Inc. | | | 2,004 | | | | 164,448 | |
KLA Corp. | | | 426 | | | | 138,113 | |
Teradata Corp.* | | | 2,659 | | | | 132,870 | |
Citrix Systems, Inc. | | | 1,106 | | | | 129,701 | |
Silicon Laboratories, Inc.* | | | 763 | | | | 116,930 | |
Cree, Inc.* | | | 1,190 | | | | 116,537 | |
Amkor Technology, Inc. | | | 4,903 | | | | 116,054 | |
J2 Global, Inc.* | | | 809 | | | | 111,278 | |
Total Technology | | | | | | | 6,436,650 | |
| | | | | | | | | |
Industrial - 3.0% |
Toro Co. | | | 4,998 | | | | 549,180 | |
Eagle Materials, Inc. | | | 2,970 | | | | 422,067 | |
Timken Co. | | | 5,117 | | | | 412,379 | |
Universal Display Corp. | | | 1,596 | | | | 354,839 | |
Louisiana-Pacific Corp. | | | 5,338 | | | | 321,828 | |
Cognex Corp. | | | 3,405 | | | | 286,191 | |
Lennox International, Inc. | | | 751 | | | | 263,451 | |
UFP Industries, Inc. | | | 3,478 | | | | 258,554 | |
Carlisle Companies, Inc. | | | 1,301 | | | | 248,985 | |
Curtiss-Wright Corp. | | | 2,083 | | | | 247,377 | |
Axon Enterprise, Inc.* | | | 1,352 | | | | 239,034 | |
AGCO Corp. | | | 1,769 | | | | 230,642 | |
II-VI, Inc.* | | | 3,117 | | | | 226,263 | |
Advanced Energy Industries, Inc. | | | 1,966 | | | | 221,588 | |
TopBuild Corp.* | | | 1,104 | | | | 218,349 | |
Masco Corp. | | | 3,317 | | | | 195,404 | |
Middleby Corp.* | | | 1,046 | | | | 181,230 | |
Simpson Manufacturing Company, Inc. | | | 1,580 | | | | 174,495 | |
Terex Corp. | | | 3,477 | | | | 165,575 | |
Trex Company, Inc.* | | | 1,593 | | | | 162,821 | |
Sealed Air Corp. | | | 2,546 | | | | 150,850 | |
Worthington Industries, Inc. | | | 2,269 | | | | 138,817 | |
Keysight Technologies, Inc.* | | | 832 | | | | 128,469 | |
Builders FirstSource, Inc.* | | | 2,994 | | | | 127,724 | |
Woodward, Inc. | | | 942 | | | | 115,753 | |
Graco, Inc. | | | 1,327 | | | | 100,454 | |
Total Industrial | | | | | | | 6,142,319 | |
| | | | | | | | | |
Consumer, Cyclical - 2.8% |
Williams-Sonoma, Inc. | | | 2,814 | | | | 449,255 | |
Brunswick Corp. | | | 4,196 | | | | 418,006 | |
Deckers Outdoor Corp.* | | | 951 | | | | 365,250 | |
Tempur Sealy International, Inc. | | | 9,224 | | | | 361,489 | |
Gentex Corp. | | | 10,921 | | | | 361,376 | |
AutoZone, Inc.* | | | 236 | | | | 352,164 | |
Lithia Motors, Inc. — Class A | | | 1,000 | | | | 343,640 | |
Polaris, Inc. | | | 2,109 | | | | 288,849 | |
Crocs, Inc.* | | | 2,330 | | | | 271,492 | |
RH* | | | 359 | | | | 243,761 | |
Mattel, Inc.* | | | 11,479 | | | | 230,728 | |
Scotts Miracle-Gro Co. — Class A | | | 1,143 | | | | 219,364 | |
MSC Industrial Direct Company, Inc. — Class A | | | 2,320 | | | | 208,174 | |
YETI Holdings, Inc.* | | | 2,192 | | | | 201,269 | |
Jack in the Box, Inc. | | | 1,801 | | | | 200,703 | |
PulteGroup, Inc. | | | 3,473 | | | | 189,522 | |
Meritage Homes Corp.* | | | 1,864 | | | | 175,365 | |
Ollie’s Bargain Outlet Holdings, Inc.* | | | 1,819 | | | | 153,032 | |
Toll Brothers, Inc. | | | 2,384 | | | | 137,819 | |
Papa John’s International, Inc. | | | 1,271 | | | | 132,743 | |
LGI Homes, Inc.* | | | 670 | | | | 108,500 | |
Wingstop, Inc. | | | 668 | | | | 105,297 | |
SEE NOTES TO FINANCIAL STATEMENTS. | THE GUGGENHEIM FUNDS SEMI-ANNUAL REPORT | 63 |
SCHEDULE OF INVESTMENTS (Unaudited)(continued) | June 30, 2021 |
SERIES J (STYLEPLUS—MID GROWTH SERIES) | |
| | Shares | | | Value | |
Yum! Brands, Inc. | | | 821 | | | $ | 94,440 | |
Total Consumer, Cyclical | | | | | | | 5,612,238 | |
| | | | | | | | | |
Financial - 1.8% |
Interactive Brokers Group, Inc. — Class A | | | 7,444 | | | | 489,281 | |
Brighthouse Financial, Inc.* | | | 8,487 | | | | 386,498 | |
Evercore, Inc. — Class A | | | 2,557 | | | | 359,949 | |
Umpqua Holdings Corp. | | | 18,480 | | | | 340,956 | |
PacWest Bancorp | | | 7,727 | | | | 318,043 | |
Stifel Financial Corp. | | | 4,864 | | | | 315,447 | |
RenaissanceRe Holdings Ltd. | | | 2,080 | | | | 309,546 | |
Essent Group Ltd. | | | 6,818 | | | | 306,469 | |
Primerica, Inc. | | | 1,429 | | | | 218,837 | |
Federated Hermes, Inc. — Class B | | | 5,539 | | | | 187,827 | |
SLM Corp. | | | 8,046 | | | | 168,483 | |
Cboe Global Markets, Inc. | | | 975 | | | | 116,074 | |
Brown & Brown, Inc. | | | 1,882 | | | | 100,009 | |
Total Financial | | | | | | | 3,617,419 | |
| | | | | | | | | |
Communications - 1.0% |
Viavi Solutions, Inc.* | | | 18,584 | | | | 328,194 | |
TEGNA, Inc. | | | 16,150 | | | | 302,974 | |
VeriSign, Inc.* | | | 1,326 | | | | 301,917 | |
Ciena Corp.* | | | 5,293 | | | | 301,119 | |
Motorola Solutions, Inc. | | | 958 | | | | 207,742 | |
F5 Networks, Inc.* | | | 1,024 | | | | 191,140 | |
Cable One, Inc. | | | 99 | | | | 189,368 | |
FactSet Research Systems, Inc. | | | 512 | | | | 171,832 | |
Total Communications | | | | | | | 1,994,286 | |
| | | | | | | | | |
Energy - 0.5% |
SolarEdge Technologies, Inc.* | | | 1,410 | | | | 389,682 | |
First Solar, Inc.* | | | 2,401 | | | | 217,314 | |
Antero Midstream Corp. | | | 19,864 | | | | 206,387 | |
Equitrans Midstream Corp. | | | 17,513 | | | | 149,036 | |
Total Energy | | | | | | | 962,419 | |
| | | | | | | | | |
Basic Materials - 0.4% |
Ingevity Corp.* | | | 3,871 | | | | 314,945 | |
NewMarket Corp. | | | 681 | | | | 219,268 | |
Valvoline, Inc. | | | 6,244 | | | | 202,680 | |
Chemours Co. | | | 4,011 | | | | 139,583 | |
Total Basic Materials | | | | | | | 876,476 | |
| | | | | | | | | |
Total Common Stocks | | | | |
(Cost $29,278,681) | | | | | | | 32,525,978 | |
| | | | | | | | | |
MUTUAL FUNDS† - 81.1% |
Guggenheim Strategy Fund III1 | | | 2,088,442 | | | | 52,545,206 | |
Guggenheim Ultra Short Duration Fund — Institutional Class1 | | | 4,511,901 | | | | 44,983,650 | |
Guggenheim Variable Insurance Strategy Fund III1 | | | 1,627,059 | | | | 40,790,376 | |
Guggenheim Strategy Fund II1 | | | 1,029,734 | | | | 25,733,051 | |
Total Mutual Funds | | | | |
(Cost $163,357,223) | | | | | | | 164,052,283 | |
| | | | | | | | | |
MONEY MARKET FUND† - 3.2% |
Dreyfus Treasury Securities Cash Management Fund — Institutional Shares, 0.01%2 | | | 6,528,510 | | | | 6,528,510 | |
Total Money Market Fund | | | | |
(Cost $6,528,510) | | | | | | | 6,528,510 | |
| | | | | | | | | |
Total Investments - 100.4% | | | | |
(Cost $199,164,414) | | $ | 203,106,771 | |
Other Assets & Liabilities, net - (0.4)% | | | (852,351 | ) |
Total Net Assets - 100.0% | | $ | 202,254,420 | |
Futures Contracts |
Description | | Number of
Contracts | | | Expiration
Date | | | Notional
Amount | | | Value and
Unrealized
Appreciation
(Depreciation)** | |
Equity Futures Contracts Purchased† |
NASDAQ-100 Index Mini Futures Contracts | | | 1 | | | | Sep 2021 | | | $ | 290,870 | | | $ | 10,435 | |
S&P 500 Index Mini Futures Contracts | | | 2 | | | | Sep 2021 | | | | 428,650 | | | | 4,983 | |
S&P MidCap 400 Index Mini Futures Contracts | | | 5 | | | | Sep 2021 | | | | 1,345,350 | | | | (14,542 | ) |
| | | | | | | | | | | $ | 2,064,870 | | | $ | 876 | |
Total Return Swap Agreements |
Counterparty | Index | Financing
Rate Pay
(Receive) | Payment
Frequency | | Maturity Date | | | Units | | | Notional
Amount | | | Value and
Unrealized
Appreciation | |
OTC Equity Index Swap Agreements†† |
Citibank, N.A. | Russell MidCap Growth Index Total Return | 0.29% (3 Month USD LIBOR + 0.09%) | At Maturity | | | 10/05/21 | | | | 30,849 | | | $ | 168,884,393 | | | $ | 12,986,072 | |
64 | THE GUGGENHEIM FUNDS SEMI-ANNUAL REPORT | SEE NOTES TO FINANCIAL STATEMENTS. |
SCHEDULE OF INVESTMENTS (Unaudited)(continued) | June 30, 2021 |
SERIES J (STYLEPLUS—MID GROWTH SERIES) | |
* | Non-income producing security. |
** | Includes cumulative appreciation (depreciation). Variation margin is reported within the Statement of Assets and Liabilities. |
† | Value determined based on Level 1 inputs — See Note 4. |
†† | Value determined based on Level 2 inputs — See Note 4. |
1 | Affiliated issuer. |
2 | Rate indicated is the 7-day yield as of June 30, 2021. |
| | LIBOR — London Interbank Offered Rate |
| | plc — Public Limited Company |
| | |
| | See Sector Classification in Other Information section. |
The following table summarizes the inputs used to value the Fund’s investments at June 30, 2021 (See Note 4 in the Notes to Financial Statements):
Investments in Securities (Assets) | | Level 1
Quoted
Prices | | | Level 2
Significant
Observable
Inputs | | | Level 3
Significant
Unobservable
Inputs | | | Total | |
Common Stocks | | $ | 32,525,978 | | | $ | — | | | $ | — | | | $ | 32,525,978 | |
Mutual Funds | | | 164,052,283 | | | | — | | | | — | | | | 164,052,283 | |
Money Market Fund | | | 6,528,510 | | | | — | | | | — | | | | 6,528,510 | |
Equity Futures Contracts** | | | 15,418 | | | | — | | | | — | | | | 15,418 | |
Equity Index Swap Agreements** | | | — | | | | 12,986,072 | | | | — | | | | 12,986,072 | |
Total Assets | | $ | 203,122,189 | | | $ | 12,986,072 | | | $ | — | | | $ | 216,108,261 | |
Investments in Securities (Liabilities) | | Level 1
Quoted
Prices | | | Level 2
Significant
Observable
Inputs | | | Level 3
Significant
Unobservable
Inputs | | | Total | |
Equity Futures Contracts** | | $ | 14,542 | | | $ | — | | | $ | — | | | $ | 14,542 | |
** | This derivative is reported as unrealized appreciation/depreciation at period end. |
SEE NOTES TO FINANCIAL STATEMENTS. | THE GUGGENHEIM FUNDS SEMI-ANNUAL REPORT | 65 |
SCHEDULE OF INVESTMENTS (Unaudited)(concluded) | June 30, 2021 |
SERIES J (STYLEPLUS—MID GROWTH SERIES) | |
Affiliated Transactions
Investments representing 5% or more of the outstanding voting shares of a company, or control of or by, or common control under Guggenheim Investments (“GI”), result in that company being considered an affiliated issuer, as defined in the 1940 Act.
The Fund may invest in certain of the underlying series of Guggenheim Strategy Funds Trust, including Guggenheim Strategy Fund II, Guggenheim Strategy Fund III, and Guggenheim Variable Insurance Strategy Fund III, (collectively, the “Short Term Investment Vehicles”), each of which are open-end management investment companies managed by GI. The Short Term Investment Vehicles, which launched on March 11, 2014, are offered as short term investment options only to mutual funds, trusts, and other accounts managed by GI and/or its affiliates, and are not available to the public. The Short Term Investment Vehicles pay no investment management fees. The Short Term Investment Vehicles’ annual report on Form N-CSR dated September 30, 2020, is available publicly or upon request. This information is available from the EDGAR database on the SEC’s website at https://www.sec.gov/Archives/edgar/data/1601445/000182126820000133/gug81042-ncsr.htm.
Transactions during the period ended June 30, 2021, in which the company is an affiliated issuer, were as follows:
Security Name | | Value
12/31/20 | | | Additions | | | Reductions | | | Realized
Gain (Loss) | | | Change in
Unrealized
Appreciation
(Depreciation) | | | Value
06/30/21 | | | Shares
06/30/21 | | | Investment
Income | |
Mutual Funds | | | | | | | | | | | | | | | | | | | | | | | | | | | | | | | | |
Guggenheim Strategy Fund II | | $ | 19,620,773 | | | $ | 6,090,395 | | | $ | — | | | $ | — | | | $ | 21,883 | | | $ | 25,733,051 | | | | 1,029,734 | | | $ | 168,333 | |
Guggenheim Strategy Fund III | | | 40,513,796 | | | | 11,934,621 | | | | — | | | | — | | | | 96,789 | | | | 52,545,206 | | | | 2,088,442 | | | | 339,275 | |
Guggenheim Ultra Short Duration Fund — Institutional Class | | | 53,557,922 | | | | 13,573,579 | | | | (22,105,988 | ) | | | 387,980 | | | | (429,843 | ) | | | 44,983,650 | | | | 4,511,901 | | | | 212,435 | |
Guggenheim Variable Insurance Strategy Fund III | | | 40,422,360 | | | | 319,702 | | | | — | | | | — | | | | 48,314 | | | | 40,790,376 | | | | 1,627,059 | | | | 324,043 | |
| | | $ | 154,114,851 | | | $ | 31,918,297 | | | $ | (22,105,988 | ) | | $ | 387,980 | | | $ | (262,857 | ) | | $ | 164,052,283 | | | | | | | $ | 1,044,086 | |
66 | THE GUGGENHEIM FUNDS SEMI-ANNUAL REPORT | SEE NOTES TO FINANCIAL STATEMENTS. |
SERIES J (STYLEPLUS—MID GROWTH SERIES) | |
STATEMENT OF ASSETS AND LIABILITIES (Unaudited) |
June 30, 2021 |
Assets: |
Investments in unaffiliated issuers, at value (cost $35,807,191) | | $ | 39,054,488 | |
Investments in affiliated issuers, at value (cost $163,357,223) | | | 164,052,283 | |
Segregated cash with broker | | | 105,500 | |
Unrealized appreciation on OTC swap agreements | | | 12,986,072 | |
Prepaid expenses | | | 1,367 | |
Receivables: |
Dividends | | | 186,881 | |
Variation margin on futures contracts | | | 1,680 | |
Interest | | | 37 | |
Total assets | | | 216,388,308 | |
| | | | | |
Liabilities: |
Overdraft due to custodian bank | | | 421 | |
Segregated cash due to broker | | | 13,650,000 | |
Payable for: |
Securities purchased | | | 176,874 | |
Swap settlement | | | 106,656 | |
Management fees | | | 77,934 | |
Distribution and service fees | | | 40,199 | |
Fund accounting/administration fees | | | 11,982 | |
Fund shares redeemed | | | 7,023 | |
Transfer agent/maintenance fees | | | 2,283 | |
Trustees’ fees* | | | 1,668 | |
Miscellaneous | | | 58,848 | |
Total liabilities | | | 14,133,888 | |
Commitments and contingent liabilities (Note 12) | | | — | |
Net assets | | $ | 202,254,420 | |
| | | | | |
Net assets consist of: |
Paid in capital | | $ | 123,260,405 | |
Total distributable earnings (loss) | | | 78,994,015 | |
Net assets | | $ | 202,254,420 | |
Capital shares outstanding | | | 2,513,352 | |
Net asset value per share | | $ | 80.47 | |
STATEMENT OF OPERATIONS (Unaudited) |
Six Months Ended June 30, 2021 |
Investment Income: |
Dividends from securities of unaffiliated issuers | | $ | 106,282 | |
Dividends from securities of affiliated issuers | | | 1,044,086 | |
Interest | | | 343 | |
Total investment income | | | 1,150,711 | |
| | | | | |
Expenses: |
Management fees | | | 719,391 | |
Distribution and service fees | | | 239,797 | |
Transfer agent/maintenance fees | | | 12,602 | |
Fund accounting/administration fees | | | 67,851 | |
Professional fees | | | 17,519 | |
Interest expense | | | 14,280 | |
Custodian fees | | | 10,818 | |
Trustees’ fees* | | | 10,181 | |
Line of credit fees | | | 3,894 | |
Miscellaneous | | | 8,175 | |
Total expenses | | | 1,104,508 | |
Less: |
Expenses waived by Adviser | | | (254,523 | ) |
Net expenses | | | 849,985 | |
Net investment income | | | 300,726 | |
| | | | | |
Net Realized and Unrealized Gain (Loss): |
Net realized gain (loss) on: |
Investments in unaffiliated issuers | | | 5,235,679 | |
Investments in affiliated issuers | | | 387,980 | |
Swap agreements | | | 28,403,681 | |
Futures contracts | | | 349,194 | |
Net realized gain | | | 34,376,534 | |
Net change in unrealized appreciation (depreciation) on: |
Investments in unaffiliated issuers | | | (1,811,304 | ) |
Investments in affiliated issuers | | | (262,857 | ) |
Swap agreements | | | (12,127,944 | ) |
Futures contracts | | | (15,797 | ) |
Net change in unrealized appreciation (depreciation) | | | (14,217,902 | ) |
Net realized and unrealized gain | | | 20,158,632 | |
Net increase in net assets resulting from operations | | $ | 20,459,358 | |
* | Relates to Trustees not deemed “interested persons” within the meaning of Section 2(a)(19) of the 1940 Act. |
SEE NOTES TO FINANCIAL STATEMENTS. | THE GUGGENHEIM FUNDS SEMI-ANNUAL REPORT | 67 |
SERIES J (STYLEPLUS—MID GROWTH SERIES) | |
STATEMENTS OF CHANGES IN NET ASSETS |
| | Six Months Ended
June 30, 2021
(Unaudited) | | | Year Ended
December 31,
2020 | |
Increase (Decrease) in Net Assets from Operations: | | | | | | | | |
Net investment income | | $ | 300,726 | | | $ | 1,028,980 | |
Net realized gain on investments | | | 34,376,534 | | | | 28,212,196 | |
Net change in unrealized appreciation (depreciation) on investments | | | (14,217,902 | ) | | | 17,383,447 | |
Net increase in net assets resulting from operations | | | 20,459,358 | | | | 46,624,623 | |
| | | | | | | | | |
Distributions to shareholders | | | — | | | | (9,832,328 | ) |
| | | | | | | | | |
Capital share transactions: | | | | | | | | |
Proceeds from sale of shares | | | 2,223,067 | | | | 4,851,242 | |
Distributions reinvested | | | — | | | | 9,832,328 | |
Cost of shares redeemed | | | (11,348,005 | ) | | | (18,230,591 | ) |
Net decrease from capital share transactions | | | (9,124,938 | ) | | | (3,547,021 | ) |
Net increase in net assets | | | 11,334,420 | | | | 33,245,274 | |
| | | | | | | | | |
Net assets: | | | | | | | | |
Beginning of period | | | 190,920,000 | | | | 157,674,726 | |
End of period | | $ | 202,254,420 | | | $ | 190,920,000 | |
| | | | | | | | | |
Capital share activity: | | | | | | | | |
Shares sold | | | 29,597 | | | | 80,991 | |
Shares issued from reinvestment of distributions | | | — | | | | 169,086 | |
Shares redeemed | | | (150,934 | ) | | | (311,264 | ) |
Net decrease in shares | | | (121,337 | ) | | | (61,187 | ) |
68 | THE GUGGENHEIM FUNDS SEMI-ANNUAL REPORT | SEE NOTES TO FINANCIAL STATEMENTS. |
SERIES J (STYLEPLUS—MID GROWTH SERIES) | |
This table is presented to show selected data for a share outstanding throughout each period and to assist shareholders in evaluating a Fund’s performance for the periods presented.
| | Six Months Ended
June 30, 2021a | | | Year Ended
December 31,
2020 | | | Year Ended
December 31,
2019 | | | Year Ended
December 31,
2018 | | | Year Ended
December 31,
2017 | | | Year Ended
December 31,
2016 | |
Per Share Data |
Net asset value, beginning of period | | $ | 72.46 | | | $ | 58.49 | | | $ | 48.75 | | | $ | 59.82 | | | $ | 48.43 | | | $ | 45.15 | |
Income (loss) from investment operations: |
Net investment income (loss)b | | | .12 | | | | .39 | | | | .79 | | | | .97 | | | | .67 | | | | .52 | |
Net gain (loss) on investments (realized and unrealized) | | | 7.89 | | | | 17.43 | | | | 14.90 | | | | (4.08 | ) | | | 11.22 | | | | 3.37 | |
Total from investment operations | | | 8.01 | | | | 17.82 | | | | 15.69 | | | | (3.11 | ) | | | 11.89 | | | | 3.89 | |
Less distributions from: |
Net investment income | | | — | | | | (.84 | ) | | | (.49 | ) | | | (.83 | ) | | | (.50 | ) | | | (.33 | ) |
Net realized gains | | | — | | | | (3.01 | ) | | | (5.46 | ) | | | (7.13 | ) | | | — | | | | (.28 | ) |
Total distributions | | | — | | | | (3.85 | ) | | | (5.95 | ) | | | (7.96 | ) | | | (.50 | ) | | | (.61 | ) |
Net asset value, end of period | | $ | 80.47 | | | $ | 72.46 | | | $ | 58.49 | | | $ | 48.75 | | | $ | 59.82 | | | $ | 48.43 | |
|
Total Returnc | | | 11.05 | % | | | 32.10 | % | | | 32.70 | % | | | (7.10 | %) | | | 24.67 | % | | | 8.65 | % |
Ratios/Supplemental Data |
Net assets, end of period (in thousands) | | $ | 202,254 | | | $ | 190,920 | | | $ | 157,675 | | | $ | 137,116 | | | $ | 187,897 | | | $ | 166,814 | |
Ratios to average net assets: |
Net investment income (loss) | | | 0.31 | % | | | 0.66 | % | | | 1.39 | % | | | 1.64 | % | | | 1.25 | % | | | 1.14 | % |
Total expensesd | | | 1.15 | % | | | 1.22 | % | | | 1.30 | % | | | 1.28 | % | | | 1.14 | % | | | 0.95 | % |
Net expensese,f | | | 0.89 | % | | | 0.89 | % | | | 1.00 | % | | | 1.01 | % | | | 0.94 | % | | | 0.95 | % |
Portfolio turnover rate | | | 29 | % | | | 71 | % | | | 57 | % | | | 66 | % | | | 49 | % | | | 57 | % |
a | Unaudited figures for the period ended June 30, 2021. Percentage amounts for the period, except total return and portfolio turnover rate, have been annualized. |
b | Net investment income (loss) per share was computed using average shares outstanding throughout the period. |
c | Total return does not take into account any of the expenses associated with an investment in variable insurance products. If total return had taken into account these expenses, performance would have been lower. Shares of a series of Guggenheim Variable Funds Trust are available only through the purchase of such products. |
d | Does not include expenses of the underlying funds in which the Fund invests. |
e | Net expense information reflects the expense ratios after expense waivers and reimbursements, as applicable. |
f | Net expenses may include expenses that are excluded from the expense limitation agreement. Excluding these expenses, the net expense ratios for the periods presented would be: |
| | 06/30/21a | 12/31/20 | 12/31/19 | 12/31/18 | 12/31/17 | 12/31/16 |
| | 0.87% | 0.88% | 0.92% | 0.94% | 0.92% | 0.95% |
SEE NOTES TO FINANCIAL STATEMENTS. | THE GUGGENHEIM FUNDS SEMI-ANNUAL REPORT | 69 |
PERFORMANCE REPORT AND FUND PROFILE (Unaudited) | June 30, 2021 |
SERIES N (MANAGED ASSET ALLOCATION SERIES)
OBJECTIVE: Seeks to provide growth of capital and, secondarily, preservation of capital.
Holdings Diversification (Market Exposure as % of Net Assets)
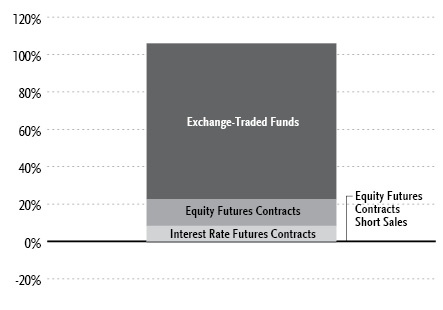
“Holdings Diversification (Market Exposure as % of Net Assets)” excludes any temporary cash investments, investments in Guggenheim Strategy Funds Trust mutual funds, or investments in Guggenheim Ultra Short Duration Fund.
Inception Date: June 1, 1995 |
Ten Largest Holdings (% of Total Net Assets) |
SPDR S&P 500 ETF Trust | 19.7% |
Vanguard S&P 500 ETF | 17.6% |
Schwab U.S. Aggregate Bond ETF | 15.3% |
iShares iBoxx $ Investment Grade Corporate Bond ETF | 6.6% |
iShares Core S&P Mid-Cap ETF | 5.8% |
iShares MSCI EAFE ETF | 5.7% |
Guggenheim Strategy Fund III | 4.8% |
iShares 7-10 Year Treasury Bond ETF | 4.6% |
Guggenheim Variable Insurance Strategy Fund III | 4.4% |
iShares 1-3 Year Treasury Bond ETF | 4.3% |
Top Ten Total | 88.8% |
| | |
“Ten Largest Holdings” excludes any temporary cash or derivative investments. |
Average Annual Returns*,†
Periods Ended June 30, 2021
| 6 Month‡ | 1 Year | 5 Year | 10 Year |
Series N (Managed Asset Allocation Series) | 7.60% | 23.85% | 10.22% | 8.51% |
Blended Index** | 8.28% | 23.02% | 11.89% | 10.39% |
Bloomberg Barclays U.S. Aggregate Bond Index | (1.60%) | (0.33%) | 3.03% | 3.39% |
S&P 500 Index | 15.25% | 40.79% | 17.65% | 14.84% |
* | The performance data above represents past performance that is not predictive of future results. The investment return and principal value of an investment in the Fund will fluctuate so that an investor’s shares, when redeemed, may be worth more or less than their original cost. Returns are historical and include changes in principal and reinvested dividends and capital gains and do not reflect the effect of taxes. The S&P 500 Index and the Bloomberg Barclays U.S. Aggregate Bond Index are unmanaged indices and, unlike the Fund, have no management fees or operating expenses to reduce their reported returns. |
** | Blended index is 60% S&P 500 Index and 40% Bloomberg Barclays U.S. Aggregate Bond Index. |
† | Performance figures do not reflect fees and expenses associated with an investment in variable insurance products. If returns had taken into account these fees and expenses, performance would have been lower. Shares of a series of Guggenheim Variable Funds Trust are available only through the purchase of such products. |
‡ | 6 month returns are not annualized. |
70 THE GUGGENHEIM FUNDS SEMI-ANNUAL REPORT | |
SCHEDULE OF INVESTMENTS (Unaudited) | June 30, 2021 |
SERIES N (MANAGED ASSET ALLOCATION SERIES) | |
| | Shares | | | Value | |
EXCHANGE-TRADED FUNDS† - 83.3% |
SPDR S&P 500 ETF Trust | | | 21,641 | | | $ | 9,263,646 | |
Vanguard S&P 500 ETF | | | 21,086 | | | | 8,297,763 | |
Schwab U.S. Aggregate Bond ETF | | | 132,248 | | | | 7,220,741 | |
iShares iBoxx $ Investment Grade Corporate Bond ETF | | | 23,033 | | | | 3,094,714 | |
iShares Core S&P Mid-Cap ETF | | | 10,147 | | | | 2,726,803 | |
iShares MSCI EAFE ETF | | | 33,919 | | | | 2,675,531 | |
iShares 7-10 Year Treasury Bond ETF | | | 18,601 | | | | 2,148,230 | |
iShares 1-3 Year Treasury Bond ETF | | | 23,731 | | | | 2,044,663 | |
iShares Russell 1000 Value ETF | | | 4,533 | | | | 719,024 | |
iShares TIPS Bond ETF | | | 3,987 | | | | 510,376 | |
iShares iBoxx High Yield Corporate Bond ETF | | | 5,736 | | | | 504,997 | |
iShares Core S&P 500 ETF | | | 2 | | | | 860 | |
Total Exchange-Traded Funds | | | | |
(Cost $25,934,422) | | | | | | | 39,207,348 | |
| | | | | | | | | |
MUTUAL FUNDS† - 15.4% |
Guggenheim Strategy Fund III1 | | | 90,611 | | | | 2,279,774 | |
Guggenheim Variable Insurance Strategy Fund III1 | | | 81,703 | | | | 2,048,307 | |
Guggenheim Strategy Fund II1 | | | 75,483 | | | | 1,886,319 | |
Guggenheim Ultra Short Duration Fund — Institutional Class1 | | | 104,727 | | | | 1,044,128 | |
Total Mutual Funds | | | | |
(Cost $7,228,992) | | | | | | | 7,258,528 | |
| | | | | | | | | |
| | | Face
Amount | | | | | |
U.S. TREASURY BILLS†† - 1.0% |
U.S. Treasury Bills |
0.04% due 08/03/212,3 | | $ | 467,000 | | | | 466,980 | |
0.01% due 08/03/212,3 | | | 1,000 | | | | 1,000 | |
Total U.S. Treasury Bills | | | | |
(Cost $467,996) | | | | | | | 467,980 | |
| | | | | | | | | |
Total Investments - 99.7% | | | | |
(Cost $33,631,410) | | $ | 46,933,856 | |
Other Assets & Liabilities, net - 0.3% | | | 131,757 | |
Total Net Assets - 100.0% | | $ | 47,065,613 | |
Futures Contracts |
Description | | Number of
Contracts | | | Expiration
Date | | | Notional
Amount | | | Value and
Unrealized
Appreciation
(Depreciation)** | |
Interest Rate Futures Contracts Purchased† |
U.S. Treasury 10 Year Note Futures Contracts | | | 21 | | | | Sep 2021 | | | $ | 2,780,859 | | | $ | 16,613 | |
U.S. Treasury 2 Year Note Futures Contracts | | | 5 | | | | Sep 2021 | | | | 1,101,641 | | | | (1,328 | ) |
| | | | | | | | | | | $ | 3,882,500 | | | $ | 15,285 | |
Equity Futures Contracts Purchased† | | | | | | | | | | | | | | | | |
Russell 2000 Index Mini Futures Contracts | | | 12 | | | | Sep 2021 | | | | 1,383,480 | | | | 3,740 | |
Dow Jones Industrial Average Index Mini Futures Contracts | | | 1 | | | | Sep 2021 | | | | 171,910 | | | | 136 | |
S&P MidCap 400 Index Mini Futures Contracts | | | 2 | | | | Sep 2021 | | | | 538,140 | | | | (7,025 | ) |
MSCI EAFE Index Futures Contracts | | | 41 | | | | Sep 2021 | | | | 4,724,020 | | | | (118,929 | ) |
| | | | | | | | | | | $ | 6,817,550 | | | $ | (122,078 | ) |
Equity Futures Contracts Sold Short† | | | | | | | | | | | | | | | | |
FTSE 100 Index Futures Contracts | | | 1 | | | | Sep 2021 | | | | 96,699 | | | | 888 | |
Nikkei 225 (CME) Index Futures Contracts | | | 1 | | | | Sep 2021 | | | | 143,900 | | | | (229 | ) |
| | | | | | | | | | | $ | 240,599 | | | $ | 659 | |
** | Includes cumulative appreciation (depreciation). Variation margin is reported within the Statement of Assets and Liabilities. |
† | Value determined based on Level 1 inputs — See Note 4. |
†† | Value determined based on Level 2 inputs — See Note 4. |
1 | Affiliated issuer. |
2 | All or a portion of this security is pledged as futures collateral at June 30, 2021. |
3 | Rate indicated is the effective yield at the time of purchase. |
| | CME — Chicago Mercantile Exchange |
| | |
| | See Sector Classification in Other Information section. |
SEE NOTES TO FINANCIAL STATEMENTS. | THE GUGGENHEIM FUNDS SEMI-ANNUAL REPORT | 71 |
SCHEDULE OF INVESTMENTS (Unaudited)(concluded) | June 30, 2021 |
SERIES N (MANAGED ASSET ALLOCATION SERIES) | |
The following table summarizes the inputs used to value the Fund’s investments at June 30, 2021 (See Note 4 in the Notes to Financial Statements):
Investments in Securities (Assets) | | Level 1
Quoted
Prices | | | Level 2
Significant
Observable
Inputs | | | Level 3
Significant
Unobservable
Inputs | | | Total | |
Exchange-Traded Funds | | $ | 39,207,348 | | | $ | — | | | $ | — | | | $ | 39,207,348 | |
Mutual Funds | | | 7,258,528 | | | | — | | | | — | | | | 7,258,528 | |
U.S. Treasury Bills | | | — | | | | 467,980 | | | | — | | | | 467,980 | |
Interest Rate Futures Contracts** | | | 16,613 | | | | — | | | | — | | | | 16,613 | |
Equity Futures Contracts** | | | 4,764 | | | | — | | | | — | | | | 4,764 | |
Total Assets | | $ | 46,487,253 | | | $ | 467,980 | | | $ | — | | | $ | 46,955,233 | |
Investments in Securities (Liabilities) | | Level 1
Quoted
Prices | | | Level 2
Significant
Observable
Inputs | | | Level 3
Significant
Unobservable
Inputs | | | Total | |
Equity Futures Contracts** | | $ | 126,183 | | | $ | — | | | $ | — | | | $ | 126,183 | |
Interest Rate Futures Contracts** | | | 1,328 | | | | — | | | | — | | | | 1,328 | |
Total Liabilities | | $ | 127,511 | | | $ | — | | | $ | — | | | $ | 127,511 | |
** | This derivative is reported as unrealized appreciation/depreciation at period end. |
Affiliated Transactions
Investments representing 5% or more of the outstanding voting shares of a company, or control of or by, or common control under Guggenheim Investments (“GI”), result in that company being considered an affiliated issuer, as defined in the 1940 Act.
The Fund may invest in certain of the underlying series of Guggenheim Strategy Funds Trust, including Guggenheim Strategy Fund II, Guggenheim Strategy Fund III, and Guggenheim Variable Insurance Strategy Fund III, (collectively, the “Short Term Investment Vehicles”), each of which are open-end management investment companies managed by GI. The Short Term Investment Vehicles, which launched on March 11, 2014, are offered as short term investment options only to mutual funds, trusts, and other accounts managed by GI and/or its affiliates, and are not available to the public. The Short Term Investment Vehicles pay no investment management fees. The Short Term Investment Vehicles’ annual report on Form N-CSR dated September 30, 2020, is available publicly or upon request. This information is available from the EDGAR database on the SEC’s website at https://www.sec.gov/Archives/edgar/data/1601445/000182126820000133/gug81042-ncsr.htm.
Transactions during the period ended June 30, 2021, in which the company is an affiliated issuer, were as follows:
Security Name | | Value
12/31/20 | | | Additions | | | Reductions | | | Realized
Gain (Loss) | | | Change in
Unrealized
Appreciation
(Depreciation) | | | Value
06/30/21 | | | Shares
06/30/21 | | | Investment
Income | |
Mutual Funds | | | | | | | | | | | | | | | | | | | | | | | | | | | | | | | | |
Guggenheim Strategy Fund II | | $ | 1,871,503 | | | $ | 12,570 | | | $ | — | | | $ | — | | | $ | 2,246 | | | $ | 1,886,319 | | | | 75,483 | | | $ | 12,751 | |
Guggenheim Strategy Fund III | | | 2,256,685 | | | | 17,697 | | | | — | | | | — | | | | 5,392 | | | | 2,279,774 | | | | 90,611 | | | | 17,957 | |
Guggenheim Ultra Short Duration Fund — Institutional Class | | | 1,040,355 | | | | 4,818 | | | | — | | | | — | | | | (1,045 | ) | | | 1,044,128 | | | | 104,727 | | | | 4,873 | |
Guggenheim Variable Insurance Strategy Fund III | | | 2,327,726 | | | | 17,799 | | | | (300,000 | ) | | | 1,077 | | | | 1,705 | | | | 2,048,307 | | | | 81,703 | | | | 18,049 | |
| | | $ | 7,496,269 | | | $ | 52,884 | | | $ | (300,000 | ) | | $ | 1,077 | | | $ | 8,298 | | | $ | 7,258,528 | | | | | | | $ | 53,630 | |
72 | THE GUGGENHEIM FUNDS SEMI-ANNUAL REPORT | SEE NOTES TO FINANCIAL STATEMENTS. |
SERIES N (MANAGED ASSET ALLOCATION SERIES) | |
STATEMENT OF ASSETS AND LIABILITIES (Unaudited) |
June 30, 2021 |
Assets: |
Investments in unaffiliated issuers, at value (cost $26,402,418) | | $ | 39,675,328 | |
Investments in affiliated issuers, at value (cost $7,228,992) | | | 7,258,528 | |
Prepaid expenses | | | 381 | |
Receivables: |
Securities sold | | | 200,442 | |
Dividends | | | 67,007 | |
Fund shares sold | | | 60 | |
Total assets | | | 47,201,746 | |
| | | | | |
Liabilities: |
Overdraft due to custodian bank | | | 8,145 | |
Payable for: |
Fund shares redeemed | | | 35,038 | |
Variation margin on futures contracts | | | 30,833 | |
Management fees | | | 15,269 | |
Professional fees | | | 14,311 | |
Distribution and service fees | | | 9,677 | |
Securities purchased | | | 8,805 | |
Fund accounting/administration fees | | | 3,982 | |
Transfer agent/maintenance fees | | | 2,273 | |
Trustees’ fees* | | | 840 | |
Miscellaneous | | | 6,960 | |
Total liabilities | | | 136,133 | |
Commitments and contingent liabilities (Note 12) | | | — | |
Net assets | | $ | 47,065,613 | |
| | | | | |
Net assets consist of: |
Paid in capital | | $ | 27,991,167 | |
Total distributable earnings (loss) | | | 19,074,446 | |
Net assets | | $ | 47,065,613 | |
Capital shares outstanding | | | 1,309,024 | |
Net asset value per share | | $ | 35.95 | |
STATEMENT OF OPERATIONS (Unaudited) |
Six Months Ended June 30, 2021 |
Investment Income: |
Dividends from securities of unaffiliated issuers | | $ | 286,878 | |
Dividends from securities of affiliated issuers | | | 53,630 | |
Interest | | | 138 | |
Total investment income | | | 340,646 | |
| | | | | |
Expenses: |
Management fees | | | 91,902 | |
Distribution and service fees | | | 57,438 | |
Transfer agent/maintenance fees | | | 12,492 | |
Fund accounting/administration fees | | | 19,452 | |
Professional fees | | | 13,603 | |
Trustees’ fees* | | | 8,961 | |
Custodian fees | | | 2,585 | |
Line of credit fees | | | 1,020 | |
Miscellaneous | | | 1,973 | |
Total expenses | | | 209,426 | |
Less: |
Expenses waived by Adviser | | | (1,292 | ) |
Earnings credits applied | | | (18 | ) |
Total waived expenses | | | (1,310 | ) |
Net expenses | | | 208,116 | |
Net investment income | | | 132,530 | |
| | | | | |
Net Realized and Unrealized Gain (Loss): |
Net realized gain (loss) on: |
Investments in unaffiliated issuers | | | 1,430,173 | |
Investments in affiliated issuers | | | 1,077 | |
Futures contracts | | | 1,068,675 | |
Foreign currency transactions | | | 221 | |
Net realized gain | | | 2,500,146 | |
Net change in unrealized appreciation (depreciation) on: |
Investments in unaffiliated issuers | | | 1,061,720 | |
Investments in affiliated issuers | | | 8,298 | |
Futures contracts | | | (301,405 | ) |
Foreign currency translations | | | (9 | ) |
Net change in unrealized appreciation (depreciation) | | | 768,604 | |
Net realized and unrealized gain | | | 3,268,750 | |
Net increase in net assets resulting from operations | | $ | 3,401,280 | |
* | Relates to Trustees not deemed “interested persons” within the meaning of Section 2(a)(19) of the 1940 Act. |
SEE NOTES TO FINANCIAL STATEMENTS. | THE GUGGENHEIM FUNDS SEMI-ANNUAL REPORT | 73 |
SERIES N (MANAGED ASSET ALLOCATION SERIES) | |
STATEMENTS OF CHANGES IN NET ASSETS |
| | Six Months Ended
June 30, 2021
(Unaudited) | | | Year Ended
December 31,
2020 | |
Increase (Decrease) in Net Assets from Operations: | | | | | | | | |
Net investment income | | $ | 132,530 | | | $ | 332,700 | |
Net realized gain on investments | | | 2,500,146 | | | | 3,324,169 | |
Net change in unrealized appreciation (depreciation) on investments | | | 768,604 | | | | 1,388,054 | |
Net increase in net assets resulting from operations | | | 3,401,280 | | | | 5,044,923 | |
| | | | | | | | | |
Distributions to shareholders | | | — | | | | (3,200,030 | ) |
| | | | | | | | | |
Capital share transactions: | | | | | | | | |
Proceeds from sale of shares | | | 604,462 | | | | 1,360,017 | |
Distributions reinvested | | | — | | | | 3,200,030 | |
Cost of shares redeemed | | | (2,613,014 | ) | | | (6,950,594 | ) |
Net decrease from capital share transactions | | | (2,008,552 | ) | | | (2,390,547 | ) |
Net increase (decrease) in net assets | | | 1,392,728 | | | | (545,654 | ) |
| | | | | | | | | |
Net assets: | | | | | | | | |
Beginning of period | | | 45,672,885 | | | | 46,218,539 | |
End of period | | $ | 47,065,613 | | | $ | 45,672,885 | |
| | | | | | | | | |
Capital share activity: | | | | | | | | |
Shares sold | | | 17,469 | | | | 43,430 | |
Shares issued from reinvestment of distributions | | | — | | | | 106,597 | |
Shares redeemed | | | (75,371 | ) | | | (225,315 | ) |
Net decrease in shares | | | (57,902 | ) | | | (75,288 | ) |
74 | THE GUGGENHEIM FUNDS SEMI-ANNUAL REPORT | SEE NOTES TO FINANCIAL STATEMENTS. |
SERIES N (MANAGED ASSET ALLOCATION SERIES) | |
This table is presented to show selected data for a share outstanding throughout each period and to assist shareholders in evaluating a Fund’s performance for the periods presented.
| | Six Months Ended
June 30, 2021a | | | Year Ended
December 31,
2020 | | | Year Ended
December 31,
2019 | | | Year Ended
December 31,
2018 | | | Year Ended
December 31,
2017 | | | Year Ended
December 31,
2016 | |
Per Share Data |
Net asset value, beginning of period | | $ | 33.41 | | | $ | 32.05 | | | $ | 27.34 | | | $ | 31.68 | | | $ | 28.74 | | | $ | 27.43 | |
Income (loss) from investment operations: |
Net investment income (loss)b | | | .10 | | | | .24 | | | | .44 | | | | .47 | | | | .39 | | | | .40 | |
Net gain (loss) on investments (realized and unrealized) | | | 2.44 | | | | 3.52 | | | | 5.02 | | | | (2.08 | ) | | | 3.68 | | | | 1.78 | |
Total from investment operations | | | 2.54 | | | | 3.76 | | | | 5.46 | | | | (1.61 | ) | | | 4.07 | | | | 2.18 | |
Less distributions from: |
Net investment income | | | — | | | | (.49 | ) | | | (.51 | ) | | | (.44 | ) | | | (.46 | ) | | | (.33 | ) |
Net realized gains | | | — | | | | (1.91 | ) | | | (.24 | ) | | | (2.29 | ) | | | (.67 | ) | | | (.54 | ) |
Total distributions | | | — | | | | (2.40 | ) | | | (.75 | ) | | | (2.73 | ) | | | (1.13 | ) | | | (.87 | ) |
Net asset value, end of period | | $ | 35.95 | | | $ | 33.41 | | | $ | 32.05 | | | $ | 27.34 | | | $ | 31.68 | | | $ | 28.74 | |
|
Total Returnc | | | 7.60 | % | | | 12.59 | % | | | 20.11 | % | | | (5.73 | %) | | | 14.39 | % | | | 8.01 | % |
Ratios/Supplemental Data |
Net assets, end of period (in thousands) | | $ | 47,066 | | | $ | 45,673 | | | $ | 46,219 | | | $ | 42,636 | | | $ | 51,080 | | | $ | 52,840 | |
Ratios to average net assets: |
Net investment income (loss) | | | 0.58 | % | | | 0.77 | % | | | 1.45 | % | | | 1.53 | % | | | 1.29 | % | | | 1.42 | % |
Total expensesd | | | 0.91 | % | | | 1.01 | % | | | 1.01 | % | | | 0.99 | % | | | 0.98 | % | | | 0.92 | % |
Net expensese | | | 0.91 | % | | | 1.00 | % | | | 1.00 | % | | | 0.99 | % | | | 0.98 | % | | | 0.92 | % |
Portfolio turnover rate | | | 21 | % | | | 6 | % | | | 14 | % | | | 4 | % | | | 1 | % | | | 6 | % |
a | Unaudited figures for the period ended June 30, 2021. Percentage amounts for the period, except total return and portfolio turnover rate, have been annualized. |
b | Net investment income (loss) per share was computed using average shares outstanding throughout the period. |
c | Total return does not take into account any of the expenses associated with an investment in variable insurance products. If total return had taken into account these expenses, performance would have been lower. Shares of a series of Guggenheim Variable Funds Trust are available only through the purchase of such products. |
d | Does not include expenses of the underlying funds in which the Fund invests. |
e | Net expense information reflects the expense ratios after expense waivers and reimbursements, as applicable. |
SEE NOTES TO FINANCIAL STATEMENTS. | THE GUGGENHEIM FUNDS SEMI-ANNUAL REPORT | 75 |
PERFORMANCE REPORT AND FUND PROFILE (Unaudited) | June 30, 2021 |
SERIES O (ALL CAP VALUE SERIES)
OBJECTIVE: Seeks long-term growth of capital.
Holdings Diversification (Market Exposure as % of Net Assets)

“Holdings Diversification (Market Exposure as % of Net Assets)” excludes any temporary cash investments.
Inception Date: June 1, 1995 |
Ten Largest Holdings (% of Total Net Assets) |
JPMorgan Chase & Co. | 1.8% |
Chevron Corp. | 1.7% |
Berkshire Hathaway, Inc. — Class B | 1.6% |
Tyson Foods, Inc. — Class A | 1.6% |
Micron Technology, Inc. | 1.6% |
Verizon Communications, Inc. | 1.5% |
Huntsman Corp. | 1.4% |
Wells Fargo & Co. | 1.4% |
Comcast Corp. — Class A | 1.3% |
Johnson & Johnson | 1.3% |
Top Ten Total | 15.2% |
| | |
“Ten Largest Holdings” excludes any temporary cash investments. |
Average Annual Returns*,†
Periods Ended June 30, 2021
| 6 Month‡ | 1 Year | 5 Year | 10 Year |
Series O (All Cap Value Series) | 19.90% | 50.30% | 12.26% | 10.64% |
Russell 3000 Value Index | 17.67% | 45.40% | 11.99% | 11.54% |
* | The performance data above represents past performance that is not predictive of future results. The investment return and principal value of an investment in the Fund will fluctuate so that an investor’s shares, when redeemed, may be worth more or less than their original cost. Returns are historical and include changes in principal and reinvested dividends and capital gains and do not reflect the effect of taxes. The Russell 3000 Value Index is an unmanaged index and, unlike the Fund, has no management fees or operating expenses to reduce its reported return. |
† | Performance figures do not reflect fees and expenses associated with an investment in variable insurance products. If returns had taken into account these fees and expenses, performance would have been lower. Shares of a series of Guggenheim Variable Funds Trust are available only through the purchase of such products. |
‡ | 6 month returns are not annualized. |
76 THE GUGGENHEIM FUNDS SEMI-ANNUAL REPORT | |
SCHEDULE OF INVESTMENTS (Unaudited) | June 30, 2021 |
SERIES O (ALL CAP VALUE SERIES) | |
| | Shares | | | Value | |
COMMON STOCKS† - 96.9% |
| | | | | | | | | |
Financial - 23.5% |
JPMorgan Chase & Co. | | | 11,885 | | | $ | 1,848,593 | |
Berkshire Hathaway, Inc. — Class B* | | | 6,100 | | | | 1,695,312 | |
Wells Fargo & Co. | | | 31,201 | | | | 1,413,093 | |
Bank of America Corp. | | | 33,505 | | | | 1,381,411 | |
Voya Financial, Inc. | | | 19,595 | | | | 1,205,093 | |
Morgan Stanley | | | 10,629 | | | | 974,573 | |
Allstate Corp. | | | 6,837 | | | | 891,818 | |
Citigroup, Inc. | | | 11,730 | | | | 829,898 | |
Medical Properties Trust, Inc. REIT | | | 39,458 | | | | 793,106 | |
First Horizon Corp. | | | 44,618 | | | | 770,999 | |
Alleghany Corp.* | | | 1,079 | | | | 719,769 | |
BOK Financial Corp. | | | 7,672 | | | | 664,395 | |
KeyCorp | | | 30,753 | | | | 635,049 | |
Hartford Financial Services Group, Inc. | | | 9,818 | | | | 608,421 | |
Park Hotels & Resorts, Inc. REIT* | | | 28,247 | | | | 582,170 | |
STAG Industrial, Inc. REIT | | | 14,703 | | | | 550,333 | |
Physicians Realty Trust REIT | | | 29,711 | | | | 548,762 | |
Charles Schwab Corp. | | | 7,419 | | | | 540,178 | |
Zions Bancorp North America | | | 9,860 | | | | 521,200 | |
Prudential Financial, Inc. | | | 5,043 | | | | 516,756 | |
MetLife, Inc. | | | 8,252 | | | | 493,882 | |
Alexandria Real Estate Equities, Inc. REIT | | | 2,480 | | | | 451,211 | |
Regions Financial Corp. | | | 22,189 | | | | 447,774 | |
VICI Properties, Inc. REIT | | | 13,634 | | | | 422,927 | |
Principal Financial Group, Inc. | | | 6,535 | | | | 412,947 | |
Axis Capital Holdings Ltd. | | | 8,236 | | | | 403,646 | |
American Tower Corp. — Class A REIT | | | 1,450 | | | | 391,703 | |
Sun Communities, Inc. REIT | | | 2,052 | | | | 351,713 | |
Synovus Financial Corp. | | | 7,986 | | | | 350,426 | |
Prosperity Bancshares, Inc. | | | 4,649 | | | | 333,798 | |
Gaming and Leisure Properties, Inc. REIT | | | 7,190 | | | | 333,113 | |
Radian Group, Inc. | | | 14,675 | | | | 326,519 | |
Hilltop Holdings, Inc. | | | 8,902 | | | | 324,033 | |
Stifel Financial Corp. | | | 4,680 | | | | 303,545 | |
American International Group, Inc. | | | 5,605 | | | | 266,798 | |
Mastercard, Inc. — Class A | | | 715 | | | | 261,039 | |
Apple Hospitality REIT, Inc. | | | 15,426 | | | | 235,401 | |
Old Republic International Corp. | | | 9,140 | | | | 227,677 | |
Heartland Financial USA, Inc. | | | 3,967 | | | | 186,409 | |
Heritage Insurance Holdings, Inc. | | | 20,639 | | | | 177,083 | |
Unum Group | | | 6,038 | | | | 171,479 | |
Total Financial | | | | | | | 24,564,052 | |
| | | | | | | | | |
Consumer, Non-cyclical - 15.5% |
Tyson Foods, Inc. — Class A | | | 22,928 | | | | 1,691,169 | |
Johnson & Johnson | | | 8,556 | | | | 1,409,516 | |
Bunge Ltd. | | | 17,942 | | | | 1,402,167 | |
HCA Healthcare, Inc. | | | 5,922 | | | | 1,224,314 | |
Archer-Daniels-Midland Co. | | | 16,063 | | | | 973,418 | |
Humana, Inc. | | | 1,823 | | | | 807,079 | |
Medtronic plc | | | 6,276 | | | | 779,040 | |
J M Smucker Co. | | | 5,869 | | | | 760,446 | |
Quest Diagnostics, Inc. | | | 5,569 | | | | 734,941 | |
Encompass Health Corp. | | | 8,850 | | | | 690,565 | |
Zimmer Biomet Holdings, Inc. | | | 4,163 | | | | 669,494 | |
Ingredion, Inc. | | | 7,045 | | | | 637,573 | |
McKesson Corp. | | | 3,206 | | | | 613,115 | |
Merck & Company, Inc. | | | 6,587 | | | | 512,271 | |
Henry Schein, Inc.* | | | 6,656 | | | | 493,809 | |
Amgen, Inc. | | | 1,636 | | | | 398,775 | |
Central Garden & Pet Co. — Class A* | | | 7,922 | | | | 382,633 | |
Sabre Corp.* | | | 27,673 | | | | 345,359 | |
US Foods Holding Corp.* | | | 8,453 | | | | 324,257 | |
Pfizer, Inc. | | | 7,912 | | | | 309,834 | |
Integer Holdings Corp.* | | | 3,227 | | | | 303,983 | |
Emergent BioSolutions, Inc.* | | | 4,318 | | | | 271,991 | |
Procter & Gamble Co. | | | 1,893 | | | | 255,422 | |
Pacira BioSciences, Inc.* | | | 2,997 | | | | 181,858 | |
Organon & Co.* | | | 658 | | | | 19,911 | |
Total Consumer, Non-cyclical | | | | | | | 16,192,940 | |
| | | | | | | | | |
Consumer, Cyclical - 12.3% |
Kohl’s Corp. | | | 22,521 | | | | 1,241,132 | |
Walmart, Inc. | | | 8,159 | | | | 1,150,582 | |
Penske Automotive Group, Inc. | | | 12,738 | | | | 961,592 | |
DR Horton, Inc. | | | 10,096 | | | | 912,376 | |
Lear Corp. | | | 4,829 | | | | 846,427 | |
PVH Corp.* | | | 7,568 | | | | 814,241 | |
Southwest Airlines Co.* | | | 14,749 | | | | 783,025 | |
LKQ Corp.* | | | 13,820 | | | | 680,220 | |
Ralph Lauren Corp. — Class A | | | 5,600 | | | | 659,736 | |
Home Depot, Inc. | | | 1,752 | | | | 558,695 | |
PACCAR, Inc. | | | 5,968 | | | | 532,644 | |
MSC Industrial Direct Company, Inc. — Class A | | | 4,351 | | | | 390,415 | |
Alaska Air Group, Inc.* | | | 5,933 | | | | 357,819 | |
KAR Auction Services, Inc.* | | | 19,503 | | | | 342,278 | |
Abercrombie & Fitch Co. — Class A* | | | 6,687 | | | | 310,477 | |
Dick’s Sporting Goods, Inc. | | | 3,056 | | | | 306,181 | |
Urban Outfitters, Inc.* | | | 6,291 | | | | 259,315 | |
Methode Electronics, Inc. | | | 5,202 | | | | 255,991 | |
Avient Corp. | | | 4,732 | | | | 232,625 | |
Skechers USA, Inc. — Class A* | | | 4,308 | | | | 214,668 | |
Movado Group, Inc. | | | 6,583 | | | | 207,167 | |
Zumiez, Inc.* | | | 4,142 | | | | 202,917 | |
Big Lots, Inc. | | | 2,792 | | | | 184,300 | |
Dana, Inc. | | | 7,474 | | | | 177,582 | |
Lakeland Industries, Inc.* | | | 6,577 | | | | 146,864 | |
La-Z-Boy, Inc. | | | 2,400 | | | | 88,896 | |
Total Consumer, Cyclical | | | | | | | 12,818,165 | |
| | | | | | | | | |
Industrial - 11.2% |
Johnson Controls International plc | | | 19,318 | | | | 1,325,794 | |
Honeywell International, Inc. | | | 4,964 | | | | 1,088,853 | |
Knight-Swift Transportation Holdings, Inc. | | | 21,358 | | | | 970,935 | |
Valmont Industries, Inc. | | | 3,681 | | | | 868,900 | |
Owens Corning | | | 7,635 | | | | 747,467 | |
L3Harris Technologies, Inc. | | | 2,536 | | | | 548,156 | |
FedEx Corp. | | | 1,764 | | | | 526,254 | |
Jacobs Engineering Group, Inc. | | | 3,679 | | | | 490,852 | |
Kirby Corp.* | | | 6,945 | | | | 421,145 | |
SEE NOTES TO FINANCIAL STATEMENTS. | THE GUGGENHEIM FUNDS SEMI-ANNUAL REPORT | 77 |
SCHEDULE OF INVESTMENTS (Unaudited)(continued) | June 30, 2021 |
SERIES O (ALL CAP VALUE SERIES) | |
| | Shares | | | Value | |
General Electric Co. | | | 30,573 | | | $ | 411,513 | |
Altra Industrial Motion Corp. | | | 5,805 | | | | 377,441 | |
Graphic Packaging Holding Co. | | | 20,768 | | | | 376,731 | |
Rexnord Corp. | | | 7,322 | | | | 366,393 | |
Plexus Corp.* | | | 3,908 | | | | 357,230 | |
Colfax Corp.* | | | 7,300 | | | | 334,413 | |
EnerSys | | | 3,421 | | | | 334,334 | |
PGT Innovations, Inc.* | | | 14,325 | | | | 332,770 | |
Energizer Holdings, Inc. | | | 7,171 | | | | 308,210 | |
Terex Corp. | | | 5,590 | | | | 266,196 | |
Curtiss-Wright Corp. | | | 2,055 | | | | 244,052 | |
GATX Corp. | | | 2,150 | | | | 190,210 | |
Littelfuse, Inc. | | | 746 | | | | 190,073 | |
II-VI, Inc.* | | | 2,538 | | | | 184,234 | |
Kennametal, Inc. | | | 4,942 | | | | 177,517 | |
Park Aerospace Corp. | | | 11,271 | | | | 167,938 | |
Howmet Aerospace, Inc.* | | | 2,557 | | | | 88,140 | |
Total Industrial | | | | | | | 11,695,751 | |
| | | | | | | | | |
Technology - 8.0% |
Micron Technology, Inc.* | | | 19,418 | | | | 1,650,142 | |
DXC Technology Co.* | | | 31,741 | | | | 1,235,995 | |
Leidos Holdings, Inc. | | | 10,336 | | | | 1,044,970 | |
Skyworks Solutions, Inc. | | | 5,189 | | | | 994,991 | |
Parsons Corp.* | | | 17,420 | | | | 685,651 | |
Apple, Inc. | | | 4,767 | | | | 652,888 | |
Qorvo, Inc.* | | | 3,090 | | | | 604,558 | |
Evolent Health, Inc. — Class A* | | | 22,593 | | | | 477,164 | |
Amdocs Ltd. | | | 4,891 | | | | 378,368 | |
Science Applications International Corp. | | | 4,099 | | | | 359,605 | |
Cerner Corp. | | | 2,940 | | | | 229,790 | |
Total Technology | | | | | | | 8,314,122 | |
| | | | | | | | | |
Energy - 7.8% |
Chevron Corp. | | | 16,722 | | | | 1,751,462 | |
Pioneer Natural Resources Co. | | | 8,092 | | | | 1,315,112 | |
ConocoPhillips | | | 20,031 | | | | 1,219,888 | |
Range Resources Corp.* | | | 70,480 | | | | 1,181,245 | |
Patterson-UTI Energy, Inc. | | | 108,168 | | | | 1,075,190 | |
Marathon Oil Corp. | | | 51,739 | | | | 704,685 | |
Cabot Oil & Gas Corp. — Class A | | | 29,092 | | | | 507,946 | |
Exxon Mobil Corp. | | | 6,914 | | | | 436,135 | |
Total Energy | | | | | | | 8,191,663 | |
| | | | | | | | | |
Communications - 7.4% |
Verizon Communications, Inc. | | | 27,789 | | | | 1,557,017 | |
Comcast Corp. — Class A | | | 24,742 | | | | 1,410,789 | |
FireEye, Inc.* | | | 37,417 | | | | 756,572 | |
Cisco Systems, Inc. | | | 14,121 | | | | 748,413 | |
T-Mobile US, Inc.* | | | 4,919 | | | | 712,419 | |
Alphabet, Inc. — Class A* | | | 257 | | | | 627,540 | |
Infinera Corp.* | | | 52,464 | | | | 535,133 | |
Viavi Solutions, Inc.* | | | 22,862 | | | | 403,743 | |
Juniper Networks, Inc. | | | 13,304 | | | | 363,864 | |
TEGNA, Inc. | | | 18,288 | | | | 343,083 | |
Ciena Corp.* | | | 4,620 | | | | 262,832 | |
Total Communications | | | | | | | 7,721,405 | |
| | | | | | | | | |
Basic Materials - 5.6% |
Huntsman Corp. | | | 54,063 | | | | 1,433,751 | |
Westlake Chemical Corp. | | | 13,907 | | | | 1,252,882 | |
Reliance Steel & Aluminum Co. | | | 5,239 | | | | 790,565 | |
Nucor Corp. | | | 5,050 | | | | 484,447 | |
Ashland Global Holdings, Inc. | | | 4,903 | | | | 429,012 | |
Commercial Metals Co. | | | 10,724 | | | | 329,441 | |
International Flavors & Fragrances, Inc. | | | 1,983 | | | | 296,260 | |
Element Solutions, Inc. | | | 11,935 | | | | 279,040 | |
Dow, Inc. | | | 3,272 | | | | 207,052 | |
DuPont de Nemours, Inc. | | | 2,496 | | | | 193,215 | |
Kraton Corp.* | | | 5,854 | | | | 189,026 | |
Total Basic Materials | | | | | | | 5,884,691 | |
| | | | | | | | | |
Utilities - 5.6% |
Exelon Corp. | | | 23,741 | | | | 1,051,964 | |
Public Service Enterprise Group, Inc. | | | 16,529 | | | | 987,442 | |
Pinnacle West Capital Corp. | | | 10,663 | | | | 874,046 | |
Edison International | | | 14,568 | | | | 842,322 | |
Duke Energy Corp. | | | 6,639 | | | | 655,402 | |
NiSource, Inc. | | | 14,452 | | | | 354,074 | |
PPL Corp. | | | 9,865 | | | | 275,924 | |
Avista Corp. | | | 6,144 | | | | 262,164 | |
Southwest Gas Holdings, Inc. | | | 3,787 | | | | 250,662 | |
Spire, Inc. | | | 3,327 | | | | 240,442 | |
Total Utilities | | | | | | | 5,794,442 | |
| | | | | | | | | |
Total Common Stocks | | | | |
(Cost $73,637,475) | | | | | | | 101,177,231 | |
| | | | | | | | | |
RIGHTS† - 0.0% |
Basic Materials - 0.0% |
Pan American Silver Corp.* | | | 40,146 | | | | 34,124 | |
Total Rights | | | | |
(Cost $—) | | | | | | | 34,124 | |
| | | | | | | | | |
MONEY MARKET FUND† - 3.1% |
Dreyfus Treasury Securities Cash Management Fund — Institutional Shares, 0.01%1 | | | 3,225,025 | | | | 3,225,025 | |
Total Money Market Fund | | | | |
(Cost $3,225,025) | | | | | | | 3,225,025 | |
| | | | | | | | | |
Total Investments - 100.0% | | | | |
(Cost $76,862,500) | | $ | 104,436,380 | |
Other Assets & Liabilities, net - 0.0% | | | 32,191 | |
Total Net Assets - 100.0% | | $ | 104,468,571 | |
78 | THE GUGGENHEIM FUNDS SEMI-ANNUAL REPORT | SEE NOTES TO FINANCIAL STATEMENTS. |
SCHEDULE OF INVESTMENTS (Unaudited)(concluded) | June 30, 2021 |
SERIES O (ALL CAP VALUE SERIES) | |
* | Non-income producing security. |
† | Value determined based on Level 1 inputs — See Note 4. |
1 | Rate indicated is the 7-day yield as of June 30, 2021. |
| | plc — Public Limited Company |
| | REIT — Real Estate Investment Trust |
| | |
| | See Sector Classification in Other Information section. |
The following table summarizes the inputs used to value the Fund’s investments at June 30, 2021 (See Note 4 in the Notes to Financial Statements):
Investments in Securities (Assets) | | Level 1
Quoted
Prices | | | Level 2
Significant
Observable
Inputs | | | Level 3
Significant
Unobservable
Inputs | | | Total | |
Common Stocks | | $ | 101,177,231 | | | $ | — | | | $ | — | | | $ | 101,177,231 | |
Rights | | | 34,124 | | | | — | | | | — | | | | 34,124 | |
Money Market Fund | | | 3,225,025 | | | | — | | | | — | | | | 3,225,025 | |
Total Assets | | $ | 104,436,380 | | | $ | — | | | $ | — | | | $ | 104,436,380 | |
SEE NOTES TO FINANCIAL STATEMENTS. | THE GUGGENHEIM FUNDS SEMI-ANNUAL REPORT | 79 |
SERIES O (ALL CAP VALUE SERIES) | |
STATEMENT OF ASSETS AND LIABILITIES (Unaudited) |
June 30, 2021 |
Assets: |
Investments, at value (cost $76,862,500) | | $ | 104,436,380 | |
Prepaid expenses | | | 681 | |
Receivables: |
Securities sold | | | 241,488 | |
Dividends | | | 110,808 | |
Interest | | | 11 | |
Total assets | | | 104,789,368 | |
| | | | | |
Liabilities: |
Payable for: |
Securities purchased | | | 182,123 | |
Management fees | | | 37,409 | |
Fund shares redeemed | | | 35,539 | |
Distribution and service fees | | | 21,687 | |
Printing fees | | | 18,618 | |
Fund accounting/administration fees | | | 7,128 | |
Transfer agent/maintenance fees | | | 2,269 | |
Trustees’ fees* | | | 2,092 | |
Miscellaneous | | | 13,932 | |
Total liabilities | | | 320,797 | |
Commitments and contingent liabilities (Note 12) | | | — | |
Net assets | | $ | 104,468,571 | |
| | | | | |
Net assets consist of: |
Paid in capital | | $ | 67,347,336 | |
Total distributable earnings (loss) | | | 37,121,235 | |
Net assets | | $ | 104,468,571 | |
Capital shares outstanding | | | 2,805,636 | |
Net asset value per share | | $ | 37.24 | |
STATEMENT OF OPERATIONS (Unaudited) |
Six Months Ended June 30, 2021 |
Investment Income: |
Dividends | | $ | 939,553 | |
Interest | | | 63 | |
Total investment income | | | 939,616 | |
| | | | | |
Expenses: |
Management fees | | | 351,830 | |
Distribution and service fees | | | 125,653 | |
Transfer agent/maintenance fees | | | 12,485 | |
Fund accounting/administration fees | | | 37,545 | |
Professional fees | | | 17,568 | |
Trustees’ fees* | | | 9,678 | |
Custodian fees | | | 3,342 | |
Line of credit fees | | | 2,020 | |
Miscellaneous | | | 3,380 | |
Total expenses | | | 563,501 | |
Less: |
Expenses waived by Adviser | | | (126,090 | ) |
Net expenses | | | 437,411 | |
Net investment income | | | 502,205 | |
| | | | | |
Net Realized and Unrealized Gain (Loss): |
Net realized gain (loss) on: |
Investments | | | 6,715,908 | |
Net realized gain | | | 6,715,908 | |
Net change in unrealized appreciation (depreciation) on: |
Investments | | | 10,621,795 | |
Net change in unrealized appreciation (depreciation) | | | 10,621,795 | |
Net realized and unrealized gain | | | 17,337,703 | |
Net increase in net assets resulting from operations | | $ | 17,839,908 | |
* | Relates to Trustees not deemed “interested persons” within the meaning of Section 2(a)(19) of the 1940 Act. |
80 | THE GUGGENHEIM FUNDS SEMI-ANNUAL REPORT | SEE NOTES TO FINANCIAL STATEMENTS. |
SERIES O (ALL CAP VALUE SERIES) | |
STATEMENTS OF CHANGES IN NET ASSETS |
| | Six Months Ended
June 30, 2021
(Unaudited) | | | Year Ended
December 31,
2020 | |
Increase (Decrease) in Net Assets from Operations: | | | | | | | | |
Net investment income | | $ | 502,205 | | | $ | 1,749,986 | |
Net realized gain on investments | | | 6,715,908 | | | | 1,258,735 | |
Net change in unrealized appreciation (depreciation) on investments | | | 10,621,795 | | | | (3,137,740 | ) |
Net increase (decrease) in net assets resulting from operations | | | 17,839,908 | | | | (129,019 | ) |
| | | | | | | | | |
Distributions to shareholders | | | — | | | | (6,300,999 | ) |
| | | | | | | | | |
Capital share transactions: | | | | | | | | |
Proceeds from sale of shares | | | 2,538,063 | | | | 2,686,231 | |
Distributions reinvested | | | — | | | | 6,300,999 | |
Cost of shares redeemed | | | (7,570,454 | ) | | | (18,530,135 | ) |
Net decrease from capital share transactions | | | (5,032,391 | ) | | | (9,542,905 | ) |
Net increase (decrease) in net assets | | | 12,807,517 | | | | (15,972,923 | ) |
| | | | | | | | | |
Net assets: | | | | | | | | |
Beginning of period | | | 91,661,054 | | | | 107,633,977 | |
End of period | | $ | 104,468,571 | | | $ | 91,661,054 | |
| | | | | | | | | |
Capital share activity: | | | | | | | | |
Shares sold | | | 68,063 | | | | 103,876 | |
Shares issued from reinvestment of distributions | | | — | | | | 241,418 | |
Shares redeemed | | | (213,608 | ) | | | (666,704 | ) |
Net decrease in shares | | | (145,545 | ) | | | (321,410 | ) |
SEE NOTES TO FINANCIAL STATEMENTS. | THE GUGGENHEIM FUNDS SEMI-ANNUAL REPORT | 81 |
SERIES O (ALL CAP VALUE SERIES) | |
This table is presented to show selected data for a share outstanding throughout each period and to assist shareholders in evaluating a Fund’s performance for the periods presented.
| | Six Months Ended
June 30, 2021a | | | Year Ended
December 31,
2020 | | | Year Ended
December 31,
2019 | | | Year Ended
December 31,
2018 | | | Year Ended
December 31,
2017 | | | Year Ended
December 31,
2016 | |
Per Share Data |
Net asset value, beginning of period | | $ | 31.06 | | | $ | 32.89 | | | $ | 29.31 | | | $ | 35.97 | | | $ | 34.05 | | | $ | 29.30 | |
Income (loss) from investment operations: |
Net investment income (loss)b | | | .18 | | | | .56 | | | | .51 | | | | .43 | | | | .24 | | | | .45 | |
Net gain (loss) on investments (realized and unrealized) | | | 6.00 | | | | (.33 | ) | | | 6.19 | | | | (3.83 | ) | | | 4.51 | | | | 6.01 | |
Total from investment operations | | | 6.18 | | | | .23 | | | | 6.70 | | | | (3.40 | ) | | | 4.75 | | | | 6.46 | |
Less distributions from: |
Net investment income | | | — | | | | (.52 | ) | | | (.49 | ) | | | (.40 | ) | | | (.38 | ) | | | (.48 | ) |
Net realized gains | | | — | | | | (1.54 | ) | | | (2.63 | ) | | | (2.86 | ) | | | (2.45 | ) | | | (1.23 | ) |
Total distributions | | | — | | | | (2.06 | ) | | | (3.12 | ) | | | (3.26 | ) | | | (2.83 | ) | | | (1.71 | ) |
Net asset value, end of period | | $ | 37.24 | | | $ | 31.06 | | | $ | 32.89 | | | $ | 29.31 | | | $ | 35.97 | | | $ | 34.05 | |
|
Total Returnc | | | 19.90 | % | | | 1.88 | % | | | 23.74 | % | | | (10.62 | %) | | | 14.77 | % | | | 22.71 | % |
Ratios/Supplemental Data |
Net assets, end of period (in thousands) | | $ | 104,469 | | | $ | 91,661 | | | $ | 107,634 | | | $ | 100,916 | | | $ | 132,771 | | | $ | 128,367 | |
Ratios to average net assets: |
Net investment income (loss) | | | 1.00 | % | | | 2.03 | % | | | 1.62 | % | | | 1.23 | % | | | 0.69 | % | | | 1.48 | % |
Total expensesd | | | 1.12 | % | | | 1.21 | % | | | 1.18 | % | | | 1.17 | % | | | 1.11 | % | | | 0.90 | % |
Net expensese,f,g | | | 0.87 | % | | | 0.87 | % | | | 0.88 | % | | | 0.88 | % | | | 0.89 | % | | | 0.90 | % |
Portfolio turnover rate | | | 14 | % | | | 22 | % | | | 33 | % | | | 36 | % | | | 33 | % | | | 47 | % |
a | Unaudited figures for the period ended June 30, 2021.Percentage amounts for the period, except total return and portfolio turnover rate, have been annualized. |
b | Net investment income (loss) per share was computed using average shares outstanding throughout the period. |
c | Total return does not take into account any of the expenses associated with an investment in variable insurance products. If total return had taken into account these expenses, performance would have been lower. Shares of a series of Guggenheim Variable Funds Trust are available only through the purchase of such products. |
d | Does not include expenses of the underlying funds in which the Fund invests. |
e | Net expense information reflects the expense ratios after expense waivers and reimbursements, as applicable. |
f | Net expenses may include expenses that are excluded from the expense limitation agreement. Excluding these expenses, the net expense ratios for the periods presented would be: |
| | 06/30/21a | 12/31/20 | 12/31/19 | 12/31/18 | 12/31/17 | 12/31/16 |
| | 0.87% | 0.87% | 0.88% | 0.88% | 0.88% | 0.90% |
g | The portion of the ratios of net expenses to average net assets attributable to recoupments of prior fee reductions or expense reimbursements for the periods was as follows: |
| | 06/30/21a | 12/31/20 | 12/31/19 | 12/31/18 | 12/31/17 | 12/31/16 |
| | — | — | — | — | 0.00%* | — |
82 | THE GUGGENHEIM FUNDS SEMI-ANNUAL REPORT | SEE NOTES TO FINANCIAL STATEMENTS. |
PERFORMANCE REPORT AND FUND PROFILE (Unaudited) | June 30, 2021 |
SERIES P (HIGH YIELD SERIES)
OBJECTIVE: Seeks high current income. Capital appreciation is a secondary objective.
Holdings Diversification (Market Exposure as % of Net Assets)
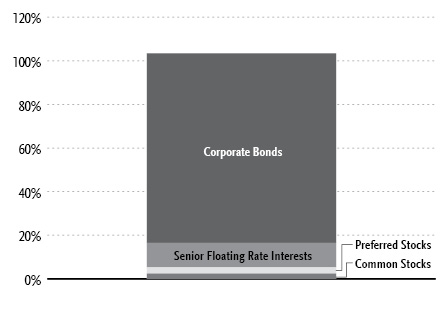
“Holdings Diversification (Market Exposure as % of Net Assets)” excludes any temporary cash investments.
Inception Date: August 5, 1996 |
Ten Largest Holdings (% of Total Net Assets) |
Terraform Global Operating LLC, 6.13% | 1.6% |
LBC Tank Terminals Holding Netherlands BV, 6.88% | 1.5% |
CCO Holdings LLC / CCO Holdings Capital Corp., 4.50% due 05/01/32 | 1.2% |
Hunt Companies, Inc., 5.25% | 1.2% |
NFP Corp., 6.88% | 1.1% |
Iron Mountain, Inc., 5.63% | 1.1% |
Cleaver-Brooks, Inc., 7.88% | 1.0% |
PowerTeam Services LLC, 9.03% | 0.9% |
Carpenter Technology Corp., 6.38% | 0.9% |
Grinding Media, Inc. / Moly-Cop AltaSteel Ltd., 7.38% | 0.9% |
Top Ten Total | 11.4% |
| | |
“Ten Largest Holdings” excludes any temporary cash or derivative investments. |
| | THE GUGGENHEIM FUNDS SEMI-ANNUAL REPORT | 83 |
PERFORMANCE REPORT AND FUND PROFILE (Unaudited)(concluded) | June 30, 2021 |
Average Annual Returns*,†
Periods Ended June 30, 2021
| 6 Month‡ | 1 Year | 5 Year | 10 Year |
Series P (High Yield Series) | 3.49% | 14.97% | 6.07% | 5.45% |
Bloomberg Barclays U.S. Corporate High Yield Index | 3.62% | 15.37% | 7.48% | 6.66% |
Portfolio Composition by Quality Rating1 |
Rating | % of Total
Investments |
Fixed Income Instruments | |
A | 0.3% |
BBB | 8.2% |
BB | 47.8% |
B | 29.5% |
CCC | 5.4% |
C | 0.1% |
NR2 | 0.6% |
Other Instruments | 8.1% |
Total Investments | 100.0% |
* | The performance data above represents past performance that is not predictive of future results. The investment return and principal value of an investment in the Fund will fluctuate so that an investor’s shares, when redeemed, may be worth more or less than their original cost. Returns are historical and include changes in principal and reinvested dividends and capital gains and do not reflect the effect of taxes. The Bloomberg Barclays U.S. Corporate High Yield Index is an unmanaged index and, unlike the Fund, has no management fees or operating expenses to reduce its reported return. |
† | Performance figures do not reflect fees and expenses associated with an investment in variable insurance products. If returns had taken into account these fees and expenses, performance would have been lower. Shares of a series of Guggenheim Variable Funds Trust are available only through the purchase of such products. |
‡ | 6 month returns are not annualized. |
1 | Source: BlackRock Solutions. Credit quality ratings are measured on a scale that generally ranges from AAA (highest) to D (lowest). All securities except for those labeled “NR” have been rated by Moody’s, Standard & Poor’s (“S&P”), or Fitch, each of which is a Nationally Recognized Statistical Rating Organization (“NRSRO”). For purposes of this presentation, when ratings are available from more than one agency, the highest rating is used. Guggenheim Investments has converted ratings to the equivalent S&P rating. Security ratings are determined at the time of purchase and may change thereafter. |
2 | NR (not rated) securities do not necessarily indicate low credit quality. |
84 THE GUGGENHEIM FUNDS SEMI-ANNUAL REPORT | |
SCHEDULE OF INVESTMENTS (Unaudited) | June 30, 2021 |
SERIES P (HIGH YIELD SERIES) | |
| | Shares | | | Value | |
COMMON STOCKS† - 2.4% |
| | | | | | | | | |
Utilities - 0.7% |
TexGen Power LLC†† | | | 7,929 | | | $ | 309,231 | |
| | | | | | | | | |
Consumer, Non-cyclical - 0.5% |
ATD New Holdings, Inc.*,††† | | | 3,166 | | | | 169,381 | |
Cengage Learning Holdings II, Inc.*,†† | | | 2,107 | | | | 46,354 | |
Spectrum Brands Holdings, Inc. | | | 6 | | | | 510 | |
Crimson Wine Group Ltd.* | | | 24 | | | | 220 | |
MEDIQ, Inc.*,††† | | | 92 | | | | — | |
Total Consumer, Non-cyclical | | | | | | | 216,465 | |
| | | | | | | | | |
Financial - 0.4% |
TPG Pace Solutions Corp.* ,11 | | | 14,071 | | | | 140,147 | |
TPG Pace Beneficial II Corp.* ,11 | | | 5,300 | | | | 53,424 | |
Jefferies Financial Group, Inc. | | | 247 | | | | 8,447 | |
Total Financial | | | | | | | 202,018 | |
| | | | | | | | | |
Energy - 0.4% |
Unit Corp.* | | | 10,560 | | | | 177,936 | |
Permian Production Partners LLC††† | | | 9,124 | | | | 11,588 | |
Legacy Reserves, Inc.*,††† | | | 1,969 | | | | 9,845 | |
Bruin E&P Partnership Units*,††† | | | 6,071 | | | | 364 | |
Total Energy | | | | | | | 199,733 | |
| | | | | | | | | |
Diversified - 0.4% |
KKR Acquisition Holdings I Corp. — Class A* ,11 | | | 16,530 | | | | 162,324 | |
MSD Acquisition Corp. — Class A* ,11 | | | 84 | | | | 827 | |
RXR Acquisition Corp. — Class A* ,11 | | | 84 | | | | 816 | |
Colicity, Inc.* ,11 | | | 30 | | | | 302 | |
RXR Acquisition Corp.* ,11 | | | 28 | | | | 279 | |
Colicity, Inc. — Class A* ,11 | | | 28 | | | | 273 | |
Soaring Eagle Acquisition Corp. — Class A* ,11 | | | 3 | | | | 30 | |
Total Diversified | | | | | | | 164,851 | |
| | | | | | | | | |
Industrial - 0.0% |
Vector Phoenix Holdings, LP*,††† | | | 523 | | | | 1,035 | |
BP Holdco LLC*,†††,1 | | | 523 | | | | 184 | |
Total Industrial | | | | | | | 1,219 | |
| | | | | | | | | |
Consumer, Cyclical - 0.0% |
Delta Air Lines, Inc.* | | | 1 | | | | 43 | |
Chorus Aviation, Inc.* | | | 3 | | | | 11 | |
Total Consumer, Cyclical | | | | | | | 54 | |
| | | | | | | | | |
Total Common Stocks | | | | |
(Cost $990,389) | | | | | | | 1,093,571 | |
| | | | | | | | | |
PREFERRED STOCKS†† - 2.9% |
Financial - 2.9% |
Wells Fargo & Co., 4.38% | | | 9,000 | | | | 228,510 | |
JPMorgan Chase & Co., 4.55% | | | 8,000 | | | | 212,960 | |
American Equity Investment Life Holding Co., 5.95% | | | 6,000 | | | | 168,480 | |
Bank of America Corp., 4.38% | | | 6,000 | | | | 157,200 | |
Arch Capital Group Ltd., 4.55%* | | | 6,000 | | | | 154,860 | |
First Republic Bank, 4.13% | | | 6,000 | | | | 153,900 | |
JPMorgan Chase & Co., 4.63%* | | | 5,000 | | | | 133,150 | |
Bank of America Corp., 4.13% | | | 4,000 | | | | 104,640 | |
Globe Life, Inc., 4.25% due 06/15/61 | | | 2,000 | | | | 52,220 | |
Total Financial | | | | | | | 1,365,920 | |
| | | | | | | | | |
Industrial - 0.0% |
U.S. Shipping Corp.*,††† | | | 24,529 | | | | — | |
Total Preferred Stocks | | | | |
(Cost $1,925,000) | | | | | | | 1,365,920 | |
| | | | | | | | | |
WARRANTS† - 0.0% |
KKR Acquisition Holdings I Corp. - Class A | | | | | | | | |
Expiring 12/31/27* ,11 | | | 4,132 | | | | 4,876 | |
MSD Acquisition Corp. | | | | | | | | |
Expiring 05/13/23* ,11 | | | 16 | | | | 21 | |
RXR Acquisition Corp. | | | | | | | | |
Expiring 03/08/26* ,11 | | | 15 | | | | 15 | |
Colicity, Inc. - Class A | | | | | | | | |
Expiring 12/31/27* ,11 | | | 4 | | | | 6 | |
Total Warrants | | | | |
(Cost $4,374) | | | | | | | 4,918 | |
| | | | | | | | | |
MONEY MARKET FUND† - 3.3% |
Dreyfus Treasury Securities Cash Management Fund — Institutional Shares, 0.01%3 | | | 1,538,057 | | | | 1,538,057 | |
Total Money Market Fund | | | | |
(Cost $1,538,057) | | | | | | | 1,538,057 | |
| | | | | | | | | |
| | | Face
Amount~ | | | | | |
CORPORATE BONDS†† - 86.9% |
Consumer, Non-cyclical - 17.7% | | | | | | | | |
Kraft Heinz Foods Co. | | | | | | | | |
5.00% due 06/04/424 | | | 350,000 | | | | 427,165 | |
4.88% due 10/01/49 | | | 200,000 | | | | 242,644 | |
4.38% due 06/01/46 | | | 125,000 | | | | 141,569 | |
5.20% due 07/15/45 | | | 25,000 | | | | 31,002 | |
Nielsen Finance LLC / Nielsen Finance Co. | | | | | | | | |
5.88% due 10/01/305 | | | 275,000 | | | | 299,316 | |
4.75% due 07/15/315 | | | 250,000 | | | | 250,625 | |
US Foods, Inc. | | | | | | | | |
6.25% due 04/15/255 | | | 275,000 | | | | 291,844 | |
4.75% due 02/15/295 | | | 150,000 | | | | 153,000 | |
Tenet Healthcare Corp. | | | | | | | | |
7.50% due 04/01/255 | | | 200,000 | | | | 215,750 | |
4.25% due 06/01/295 | | | 125,000 | | | | 126,563 | |
5.13% due 11/01/275 | | | 75,000 | | | | 78,656 | |
FAGE International S.A. / FAGE USA Dairy Industry, Inc. | | | | | | | | |
5.63% due 08/15/264,5 | | | 385,000 | | | | 396,550 | |
Bausch Health Companies, Inc. | | | | | | | | |
4.88% due 06/01/285 | | | 375,000 | | | | 382,969 | |
SEE NOTES TO FINANCIAL STATEMENTS. | THE GUGGENHEIM FUNDS SEMI-ANNUAL REPORT | 85 |
SCHEDULE OF INVESTMENTS (Unaudited)(continued) | June 30, 2021 |
SERIES P (HIGH YIELD SERIES) | |
| | Face
Amount~ | | | Value | |
CPI CG, Inc. | | | | | | | | |
8.63% due 03/15/265 | | | 350,000 | | | $ | 371,875 | |
Sabre GLBL, Inc. | | | | | | | | |
9.25% due 04/15/255 | | | 175,000 | | | | 208,045 | |
7.38% due 09/01/255 | | | 150,000 | | | | 163,125 | |
Cheplapharm Arzneimittel GmbH | | | | | | | | |
5.50% due 01/15/285 | | | 325,000 | | | | 333,125 | |
Post Holdings, Inc. | | | | | | | | |
4.50% due 09/15/315 | | | 325,000 | | | | 324,285 | |
AMN Healthcare, Inc. | | | | | | | | |
4.63% due 10/01/275 | | | 200,000 | | | | 207,840 | |
4.00% due 04/15/295 | | | 100,000 | | | | 100,707 | |
DaVita, Inc. | | | | | | | | |
3.75% due 02/15/315 | | | 300,000 | | | | 288,000 | |
Rent-A-Center, Inc. | | | | | | | | |
6.38% due 02/15/295 | | | 250,000 | | | | 268,438 | |
Centene Corp. | | | | | | | | |
4.25% due 12/15/27 | | | 125,000 | | | | 131,719 | |
3.00% due 10/15/30 | | | 100,000 | | | | 102,728 | |
Par Pharmaceutical, Inc. | | | | | | | | |
7.50% due 04/01/275 | | | 225,000 | | | | 230,062 | |
KeHE Distributors LLC / KeHE Finance Corp. | | | | | | | | |
8.63% due 10/15/265 | | | 201,000 | | | | 219,655 | |
Service Corporation International | | | | | | | | |
4.00% due 05/15/31 | | | 200,000 | | | | 204,135 | |
Bidfair Holdings, Inc. | | | | | | | | |
5.88% due 06/01/295 | | | 200,000 | | | | 203,000 | |
Prime Security Services Borrower LLC / Prime Finance, Inc. | | | | | | | | |
3.38% due 08/31/275 | | | 200,000 | | | | 194,000 | |
Sotheby’s | | | | | | | | |
7.38% due 10/15/275 | | | 175,000 | | | | 188,781 | |
Nathan’s Famous, Inc. | | | | | | | | |
6.63% due 11/01/255 | | | 175,000 | | | | 179,594 | |
Kronos Acquisition Holdings, Inc. / KIK Custom Products, Inc. | | | | | | | | |
7.00% due 12/31/275 | | | 107,000 | | | | 107,410 | |
5.00% due 12/31/265 | | | 50,000 | | | | 50,750 | |
WW International, Inc. | | | | | | | | |
4.50% due 04/15/295 | | | 150,000 | | | | 151,125 | |
Molina Healthcare, Inc. | | | | | | | | |
4.38% due 06/15/285 | | | 125,000 | | | | 130,312 | |
Carriage Services, Inc. | | | | | | | | |
4.25% due 05/15/295 | | | 125,000 | | | | 124,810 | |
Syneos Health, Inc. | | | | | | | | |
3.63% due 01/15/295 | | | 125,000 | | | | 123,750 | |
Endo Luxembourg Finance Company I SARL / Endo US, Inc. | | | | | | | | |
6.13% due 04/01/295 | | | 125,000 | | | | 122,500 | |
Legends Hospitality Holding Company LLC / Legends Hospitality Co-Issuer, Inc. | | | | | | | | |
5.00% due 02/01/265 | | | 100,000 | | | | 104,250 | |
Spectrum Brands, Inc. | | | | | | | | |
3.88% due 03/15/315 | | | 100,000 | | | | 98,263 | |
Gartner, Inc. | | | | | | | | |
3.63% due 06/15/295 | | | 75,000 | | | | 76,125 | |
Central Garden & Pet Co. | | | | | | | | |
4.13% due 04/30/315 | | | 75,000 | | | | 75,844 | |
Prestige Brands, Inc. | | | | | | | | |
3.75% due 04/01/315 | | | 50,000 | | | | 48,206 | |
Total Consumer, Non-cyclical | | | | | | | 8,170,112 | |
| | | | | | | | | |
Communications - 14.5% | | | | | | | | |
CCO Holdings LLC / CCO Holdings Capital Corp. | | | | | | | | |
4.50% due 05/01/324 | | | 525,000 | | | | 544,031 | |
4.50% due 06/01/335 | | | 250,000 | | | | 255,815 | |
4.25% due 02/01/315 | | | 100,000 | | | | 101,875 | |
CSC Holdings LLC | | | | | | | | |
4.13% due 12/01/305 | | | 225,000 | | | | 223,594 | |
4.63% due 12/01/305 | | | 200,000 | | | | 196,222 | |
3.38% due 02/15/315 | | | 200,000 | | | | 188,982 | |
6.50% due 02/01/295 | | | 150,000 | | | | 166,140 | |
Altice France S.A. | | | | | | | | |
5.13% due 07/15/295 | | | 225,000 | | | | 226,102 | |
8.13% due 02/01/275 | | | 200,000 | | | | 217,900 | |
5.13% due 01/15/295 | | | 200,000 | | | | 201,000 | |
Level 3 Financing, Inc. | | | | | | | | |
4.25% due 07/01/285 | | | 300,000 | | | | 304,428 | |
3.63% due 01/15/295 | | | 300,000 | | | | 289,500 | |
Sirius XM Radio, Inc. | | | | | | | | |
4.00% due 07/15/285 | | | 175,000 | | | | 180,436 | |
5.50% due 07/01/295 | | | 125,000 | | | | 136,212 | |
4.13% due 07/01/305 | | | 100,000 | | | | 101,250 | |
UPC Broadband Finco BV | | | | | | | | |
4.88% due 07/15/315 | | | 350,000 | | | | 350,805 | |
McGraw Hill LLC / McGraw-Hill Global Education Finance, Inc. | | | | | | | | |
8.00% due 11/30/245 | | | 318,000 | | | | 325,155 | |
Cengage Learning, Inc. | | | | | | | | |
9.50% due 06/15/245 | | | 290,000 | | | | 296,887 | |
Virgin Media Finance plc | | | | | | | | |
5.00% due 07/15/305 | | | 275,000 | | | | 276,375 | |
Go Daddy Operating Company LLC / GD Finance Co., Inc. | | | | | | | | |
3.50% due 03/01/295 | | | 225,000 | | | | 223,538 | |
Houghton Mifflin Harcourt Publishers, Inc. | | | | | | | | |
9.00% due 02/15/255 | | | 200,000 | | | | 214,000 | |
Telenet Finance Lux Note | | | | | | | | |
5.50% due 03/01/28 | | | 200,000 | | | | 210,400 | |
Virgin Media Secured Finance plc | | | | | | | | |
4.50% due 08/15/305 | | | 200,000 | | | | 201,500 | |
Vmed O2 UK Financing I plc | | | | | | | | |
4.25% due 01/31/315 | | | 200,000 | | | | 196,476 | |
LCPR Senior Secured Financing DAC | | | | | | | | |
6.75% due 10/15/275 | | | 175,000 | | | | 188,560 | |
Radiate Holdco LLC / Radiate Finance, Inc. | | | | | | | | |
4.50% due 09/15/265 | | | 150,000 | | | | 155,250 | |
T-Mobile USA, Inc. | | | | | | | | |
3.30% due 02/15/51 | | | 150,000 | | | | 149,753 | |
Switch Ltd. | | | | | | | | |
4.13% due 06/15/295 | | | 125,000 | | | | 128,281 | |
86 | THE GUGGENHEIM FUNDS SEMI-ANNUAL REPORT | SEE NOTES TO FINANCIAL STATEMENTS. |
SCHEDULE OF INVESTMENTS (Unaudited)(continued) | June 30, 2021 |
SERIES P (HIGH YIELD SERIES) | |
| | Face
Amount~ | | | Value | |
AMC Networks, Inc. | | | | | | | | |
4.25% due 02/15/29 | | | 125,000 | | | $ | 126,094 | |
Match Group Holdings II LLC | | | | | | | | |
4.63% due 06/01/285 | | | 100,000 | | | | 103,625 | |
Zayo Group Holdings, Inc. | | | | | | | | |
4.00% due 03/01/275 | | | 100,000 | | | | 99,312 | |
TripAdvisor, Inc. | | | | | | | | |
7.00% due 07/15/255 | | | 50,000 | | | | 53,800 | |
Cogent Communications Group, Inc. | | | | | | | | |
3.50% due 05/01/265 | | | 50,000 | | | | 51,125 | |
Total Communications | | | | | | | 6,684,423 | |
| | | | | | | | | |
Consumer, Cyclical - 13.3% | | | | | | | | |
LBC Tank Terminals Holding Netherlands BV | | | | | | | | |
6.88% due 05/15/235 | | | 675,000 | | | | 673,313 | |
1011778 BC ULC / New Red Finance, Inc. | | | | | | | | |
4.00% due 10/15/305 | | | 225,000 | | | | 217,687 | |
3.88% due 01/15/285 | | | 150,000 | | | | 151,875 | |
3.50% due 02/15/295 | | | 125,000 | | | | 123,437 | |
Hilton Domestic Operating Company, Inc. | | | | | | | | |
3.63% due 02/15/325 | | | 250,000 | | | | 246,875 | |
4.00% due 05/01/315 | | | 150,000 | | | | 151,331 | |
5.75% due 05/01/285 | | | 50,000 | | | | 54,103 | |
Suburban Propane Partners Limited Partnership/Suburban Energy Finance Corp. | | | | | | | | |
5.88% due 03/01/27 | | | 275,000 | | | | 288,724 | |
5.00% due 06/01/315 | | | 150,000 | | | | 153,563 | |
JB Poindexter & Company, Inc. | | | | | | | | |
7.13% due 04/15/265 | | | 350,000 | | | | 370,125 | |
Boyd Gaming Corp. | | | | | | | | |
8.63% due 06/01/255 | | | 250,000 | | | | 275,593 | |
Wabash National Corp. | | | | | | | | |
5.50% due 10/01/255 | | | 255,000 | | | | 260,100 | |
Clarios Global, LP | | | | | | | | |
6.75% due 05/15/255 | | | 201,000 | | | | 214,061 | |
Wolverine World Wide, Inc. | | | | | | | | |
6.38% due 05/15/255 | | | 200,000 | | | | 212,774 | |
Yum! Brands, Inc. | | | | | | | | |
4.63% due 01/31/32 | | | 100,000 | | | | 105,000 | |
3.63% due 03/15/31 | | | 100,000 | | | | 99,500 | |
Allison Transmission, Inc. | | | | | | | | |
3.75% due 01/30/315 | | | 200,000 | | | | 196,574 | |
Superior Plus Limited Partnership / Superior General Partner, Inc. | | | | | | | | |
4.50% due 03/15/295 | | | 175,000 | | | | 180,253 | |
Tempur Sealy International, Inc. | | | | | | | | |
4.00% due 04/15/295 | | | 175,000 | | | | 177,179 | |
Live Nation Entertainment, Inc. | | | | | | | | |
6.50% due 05/15/275 | | | 150,000 | | | | 166,470 | |
Crocs, Inc. | | | | | | | | |
4.25% due 03/15/295 | | | 150,000 | | | | 153,000 | |
Scotts Miracle-Gro Co. | | | | | | | | |
4.00% due 04/01/315 | | | 150,000 | | | | 149,827 | |
Murphy Oil USA, Inc. | | | | | | | | |
3.75% due 02/15/315 | | | 150,000 | | | | 148,313 | |
CD&R Smokey Buyer, Inc. | | | | | | | | |
6.75% due 07/15/255 | | | 125,000 | | | | 133,985 | |
Powdr Corp. | | | | | | | | |
6.00% due 08/01/255 | | | 125,000 | | | | 131,250 | |
Cedar Fair, LP / Canada’s Wonderland Co. / Magnum Management Corp. / Millennium Operations LLC | | | | | | | | |
5.50% due 05/01/255 | | | 125,000 | | | | 130,469 | |
Beacon Roofing Supply, Inc. | | | | | | | | |
4.13% due 05/15/295 | | | 125,000 | | | | 124,681 | |
Hawaiian Brand Intellectual Property Ltd. / HawaiianMiles Loyalty Ltd. | | | | | | | | |
5.75% due 01/20/265 | | | 115,000 | | | | 123,625 | |
Mileage Plus Holdings LLC / Mileage Plus Intellectual Property Assets Ltd. | | | | | | | | |
6.50% due 06/20/275 | | | 100,000 | | | | 110,100 | |
Aramark Services, Inc. | | | | | | | | |
6.38% due 05/01/255 | | | 100,000 | | | | 106,250 | |
Penn National Gaming, Inc. | | | | | | | | |
4.13% due 07/01/295 | | | 100,000 | | | | 99,500 | |
American Builders & Contractors Supply Company, Inc. | | | | | | | | |
3.88% due 11/15/295 | | | 100,000 | | | | 99,375 | |
Six Flags Theme Parks, Inc. | | | | | | | | |
7.00% due 07/01/255 | | | 75,000 | | | | 80,827 | |
Boyne USA, Inc. | | | | | | | | |
4.75% due 05/15/295 | | | 75,000 | | | | 77,380 | |
Superior Plus, LP | | | | | | | | |
4.25% due 05/18/285 | | | CAD 75,000 | | | | 62,104 | |
Hanesbrands, Inc. | | | | | | | | |
5.38% due 05/15/255 | | | 50,000 | | | | 52,937 | |
Williams Scotsman International, Inc. | | | | | | | | |
4.63% due 08/15/285 | | | 50,000 | | | | 51,635 | |
Total Consumer, Cyclical | | | | | | | 6,153,795 | |
| | | | | | | | | |
Financial - 13.2% | | | | | | | | |
Iron Mountain, Inc. | | | | | | | | |
5.63% due 07/15/324,5 | | | 475,000 | | | | 508,402 | |
4.88% due 09/15/295 | | | 120,000 | | | | 123,864 | |
5.25% due 07/15/305 | | | 75,000 | | | | 79,394 | |
Hunt Companies, Inc. | | | | | | | | |
5.25% due 04/15/294,5 | | | 550,000 | | | | 533,500 | |
NFP Corp. | | | | | | | | |
6.88% due 08/15/285 | | | 500,000 | | | | 526,355 | |
LPL Holdings, Inc. | | | | | | | | |
4.00% due 03/15/295 | | | 351,000 | | | | 352,755 | |
4.38% due 05/15/315 | | | 100,000 | | | | 101,125 | |
OneMain Finance Corp. | | | | | | | | |
3.50% due 01/15/27 | | | 125,000 | | | | 125,938 | |
7.13% due 03/15/26 | | | 75,000 | | | | 87,353 | |
4.00% due 09/15/30 | | | 75,000 | | | | 74,226 | |
6.63% due 01/15/28 | | | 50,000 | | | | 57,318 | |
8.88% due 06/01/25 | | | 50,000 | | | | 55,434 | |
United Wholesale Mortgage LLC | | | | | | | | |
5.50% due 04/15/295 | | | 225,000 | | | | 224,948 | |
5.50% due 11/15/255 | | | 120,000 | | | | 124,264 | |
SEE NOTES TO FINANCIAL STATEMENTS. | THE GUGGENHEIM FUNDS SEMI-ANNUAL REPORT | 87 |
SCHEDULE OF INVESTMENTS (Unaudited)(continued) | June 30, 2021 |
SERIES P (HIGH YIELD SERIES) | |
| | Face
Amount~ | | | Value | |
Jefferies Finance LLC / JFIN Company-Issuer Corp. | | | | | | | | |
6.25% due 06/03/265 | | | 325,000 | | | $ | 339,625 | |
Cushman & Wakefield US Borrower LLC | | | | | | | | |
6.75% due 05/15/285 | | | 250,000 | | | | 269,615 | |
SBA Communications Corp. | | | | | | | | |
3.13% due 02/01/295 | | | 275,000 | | | | 265,118 | |
Assurant, Inc. | | | | | | | | |
7.00% due 03/27/482 | | | 200,000 | | | | 230,974 | |
AmWINS Group, Inc. | | | | | | | | |
7.75% due 07/01/265 | | | 200,000 | | | | 212,130 | |
Kennedy-Wilson, Inc. | | | | | | | | |
5.00% due 03/01/31 | | | 150,000 | | | | 154,312 | |
4.75% due 03/01/29 | | | 50,000 | | | | 51,500 | |
Quicken Loans LLC / Quicken Loans Company-Issuer, Inc. | | | | | | | | |
3.88% due 03/01/315 | | | 200,000 | | | | 200,412 | |
Home Point Capital, Inc. | | | | | | | | |
5.00% due 02/01/265 | | | 200,000 | | | | 186,500 | |
USI, Inc. | | | | | | | | |
6.88% due 05/01/255 | | | 175,000 | | | | 177,193 | |
Wilton Re Finance LLC | | | | | | | | |
5.88% due 03/30/332,5 | | | 150,000 | | | | 154,392 | |
Greystar Real Estate Partners LLC | | | | | | | | |
5.75% due 12/01/255 | | | 150,000 | | | | 154,200 | |
Charles Schwab Corp. | | | | | | | | |
4.00%2,6 | | | 150,000 | | | | 153,450 | |
PHM Group Holding Oy | | | | | | | | |
4.75% due 06/18/26 | | EUR | 100,000 | | | | 119,440 | |
Goldman Sachs Group, Inc. | | | | | | | | |
5.30%2,6 | | | 100,000 | | | | 112,110 | |
HUB International Ltd. | | | | | | | | |
7.00% due 05/01/265 | | | 100,000 | | | | 103,709 | |
Liberty Mutual Group, Inc. | | | | | | | | |
4.30% due 02/01/61†††,5 | | | 100,000 | | | | 91,676 | |
Quicken Loans LLC | | | | | | | | |
5.25% due 01/15/285 | | | 75,000 | | | | 78,750 | |
Alliant Holdings Intermediate LLC / Alliant Holdings Company-Issuer | | | | | | | | |
4.25% due 10/15/275 | | | 75,000 | | | | 76,124 | |
Total Financial | | | | | | | 6,106,106 | |
| | | | | | | | | |
Industrial - 12.0% | | | | | | | | |
New Enterprise Stone & Lime Company, Inc. | | | | | | | | |
9.75% due 07/15/285 | | | 250,000 | | | | 280,000 | |
6.25% due 03/15/265 | | | 200,000 | | | | 205,500 | |
Cleaver-Brooks, Inc. | | | | | | | | |
7.88% due 03/01/234,5 | | | 450,000 | | | | 445,536 | |
PowerTeam Services LLC | | | | | | | | |
9.03% due 12/04/254,5 | | | 400,000 | | | | 440,000 | |
Grinding Media, Inc. / Moly-Cop AltaSteel Ltd. | | | | | | | | |
7.38% due 12/15/235 | | | 425,000 | | | | 434,580 | |
TransDigm, Inc. | | | | | | | | |
6.25% due 03/15/265 | | | 275,000 | | | | 290,125 | |
8.00% due 12/15/255 | | | 100,000 | | | | 108,050 | |
Harsco Corp. | | | | | | | | |
5.75% due 07/31/275 | | | 377,000 | | | | 396,321 | |
Masonite International Corp. | | | | | | | | |
5.38% due 02/01/285 | | | 175,000 | | | | 185,444 | |
5.75% due 09/15/265 | | | 150,000 | | | | 155,250 | |
Howmet Aerospace, Inc. | | | | | | | | |
5.95% due 02/01/37 | | | 275,000 | | | | 332,791 | |
Standard Industries, Inc. | | | | | | | | |
3.38% due 01/15/315 | | | 175,000 | | | | 167,512 | |
4.38% due 07/15/305 | | | 100,000 | | | | 103,125 | |
5.00% due 02/15/275 | | | 50,000 | | | | 51,781 | |
Brundage-Bone Concrete Pumping Holdings, Inc. | | | | | | | | |
6.00% due 02/01/265 | | | 275,000 | | | | 289,493 | |
GrafTech Finance, Inc. | | | | | | | | |
4.63% due 12/15/285 | | | 255,000 | | | | 261,694 | |
EnerSys | | | | | | | | |
4.38% due 12/15/275 | | | 250,000 | | | | 260,172 | |
Great Lakes Dredge & Dock Corp. | | | | | | | | |
5.25% due 06/01/295 | | | 225,000 | | | | 231,773 | |
Amsted Industries, Inc. | | | | | | | | |
4.63% due 05/15/305 | | | 200,000 | | | | 205,000 | |
JELD-WEN, Inc. | | | | | | | | |
6.25% due 05/15/255 | | | 175,000 | | | | 186,639 | |
Intertape Polymer Group, Inc. | | | | | | | | |
4.38% due 06/15/295 | | | 100,000 | | | | 101,501 | |
Summit Materials LLC / Summit Materials Finance Corp. | | | | | | | | |
6.50% due 03/15/275 | | | 75,000 | | | | 79,386 | |
Arcosa, Inc. | | | | | | | | |
4.38% due 04/15/295 | | | 75,000 | | | | 76,312 | |
Mueller Water Products, Inc. | | | | | | | | |
4.00% due 06/15/295 | | | 50,000 | | | | 51,381 | |
Atkore, Inc. | | | | | | | | |
4.25% due 06/01/315 | | | 50,000 | | | | 50,640 | |
Hillenbrand, Inc. | | | | | | | | |
3.75% due 03/01/31 | | | 50,000 | | | | 49,578 | |
TopBuild Corp. | | | | | | | | |
3.63% due 03/15/295 | | | 50,000 | | | | 49,500 | |
PGT Innovations, Inc. | | | | | | | | |
6.75% due 08/01/265 | | | 35,000 | | | | 36,945 | |
Total Industrial | | | | | | | 5,526,029 | |
| | | | | | | | | |
Energy - 6.4% | | | | | | | | |
NuStar Logistics, LP | | | | | | | | |
5.63% due 04/28/27 | | | 200,000 | | | | 214,176 | |
6.38% due 10/01/30 | | | 100,000 | | | | 110,490 | |
6.00% due 06/01/26 | | | 75,000 | | | | 81,375 | |
ITT Holdings LLC | | | | | | | | |
6.50% due 08/01/295 | | | 325,000 | | | | 332,023 | |
Exterran Energy Solutions Limited Partnership / EES Finance Corp. | | | | | | | | |
8.13% due 05/01/25 | | | 325,000 | | | | 287,625 | |
Global Partners Limited Partnership / GLP Finance Corp. | | | | | | | | |
7.00% due 08/01/27 | | | 200,000 | | | | 212,000 | |
6.88% due 01/15/29 | | | 50,000 | | | | 53,625 | |
88 | THE GUGGENHEIM FUNDS SEMI-ANNUAL REPORT | SEE NOTES TO FINANCIAL STATEMENTS. |
SCHEDULE OF INVESTMENTS (Unaudited)(continued) | June 30, 2021 |
SERIES P (HIGH YIELD SERIES) | |
| | Face
Amount~ | | | Value | |
Rattler Midstream, LP | | | | | | | | |
5.63% due 07/15/255 | | | 250,000 | | | $ | 262,813 | |
Indigo Natural Resources LLC | | | | | | | | |
5.38% due 02/01/295 | | | 250,000 | | | | 261,250 | |
PDC Energy, Inc. | | | | | | | | |
6.13% due 09/15/24 | | | 250,000 | | | | 255,675 | |
Parkland Corp. | | | | | | | | |
4.50% due 10/01/295 | | | 200,000 | | | | 203,238 | |
CVR Energy, Inc. | | | | | | | | |
5.75% due 02/15/285 | | | 200,000 | | | | 201,540 | |
Occidental Petroleum Corp. | | | | | | | | |
4.63% due 06/15/45 | | | 125,000 | | | | 121,875 | |
4.10% due 02/15/47 | | | 50,000 | | | | 46,556 | |
Crestwood Midstream Partners Limited Partnership / Crestwood Midstream Finance Corp. | | | | | | | | |
5.63% due 05/01/275 | | | 150,000 | | | | 153,937 | |
DT Midstream, Inc. | | | | | | | | |
4.13% due 06/15/295 | | | 75,000 | | | | 76,150 | |
TransMontaigne Partners Limited Partnership / TLP Finance Corp. | | | | | | | | |
6.13% due 02/15/26 | | | 50,000 | | | | 51,125 | |
Basic Energy Services, Inc. | | | | | | | | |
10.75% due 10/15/237 | | | 175,000 | | | | 33,250 | |
Total Energy | | | | | | | 2,958,723 | |
| | | | | | | | | |
Basic Materials - 5.0% | | | | | | | | |
Carpenter Technology Corp. | | | | | | | | |
6.38% due 07/15/284 | | | 400,000 | | | | 439,254 | |
Minerals Technologies, Inc. | | | | | | | | |
5.00% due 07/01/285 | | | 325,000 | | | | 337,903 | |
Kaiser Aluminum Corp. | | | | | | | | |
4.63% due 03/01/285 | | | 235,000 | | | | 242,785 | |
4.50% due 06/01/315 | | | 75,000 | | | | 76,915 | |
Valvoline, Inc. | | | | | | | | |
3.63% due 06/15/315 | | | 250,000 | | | | 250,000 | |
4.25% due 02/15/305 | | | 25,000 | | | | 25,812 | |
Arconic Corp. | | | | | | | | |
6.00% due 05/15/255 | | | 200,000 | | | | 213,154 | |
Alcoa Nederland Holding BV | | | | | | | | |
7.00% due 09/30/265 | | | 200,000 | | | | 209,000 | |
Ingevity Corp. | | | | | | | | |
4.50% due 02/01/265 | | | 100,000 | | | | 101,763 | |
3.88% due 11/01/285 | | | 100,000 | | | | 99,250 | |
Compass Minerals International, Inc. | | | | | | | | |
6.75% due 12/01/275 | | | 125,000 | | | | 134,375 | |
WR Grace & Company-Conn | | | | | | | | |
4.88% due 06/15/275 | | | 125,000 | | | | 132,537 | |
Clearwater Paper Corp. | | | | | | | | |
4.75% due 08/15/285 | | | 50,000 | | | | 49,813 | |
Mirabela Nickel Ltd. | | | | | | | | |
due 06/24/197,8 | | | 390,085 | | | | 15,603 | |
Total Basic Materials | | | | | | | 2,328,164 | |
| | | | | | | | | |
Technology - 3.0% | | | | | | | | |
NCR Corp. | | | | | | | | |
8.13% due 04/15/255 | | | 300,000 | | | | 328,050 | |
6.13% due 09/01/295 | | | 200,000 | | | | 218,000 | |
5.13% due 04/15/295 | | | 75,000 | | | | 77,344 | |
Entegris, Inc. | | | | | | | | |
3.63% due 05/01/295 | | | 125,000 | | | | 126,562 | |
Boxer Parent Company, Inc. | | | | | | | | |
7.13% due 10/02/255 | | | 100,000 | | | | 107,000 | |
Qorvo, Inc. | | | | | | | | |
3.38% due 04/01/315 | | | 100,000 | | | | 104,222 | |
MSCI, Inc. | | | | | | | | |
3.88% due 02/15/315 | | | 100,000 | | | | 103,776 | |
Open Text Holdings, Inc. | | | | | | | | |
4.13% due 02/15/305 | | | 100,000 | | | | 101,980 | |
CDK Global, Inc. | | | | | | | | |
5.25% due 05/15/295 | | | 50,000 | | | | 54,570 | |
PTC, Inc. | | | | | | | | |
4.00% due 02/15/285 | | | 50,000 | | | | 51,650 | |
Twilio, Inc. | | | | | | | | |
3.63% due 03/15/29 | | | 50,000 | | | | 51,000 | |
Playtika Holding Corp. | | | | | | | | |
4.25% due 03/15/295 | | | 50,000 | | | | 49,966 | |
Total Technology | | | | | | | 1,374,120 | |
| | | | | | | | | |
Utilities - 1.8% | | | | | | | | |
Terraform Global Operating LLC | | | | | | | | |
6.13% due 03/01/265 | | | 695,000 | | | | 716,719 | |
AmeriGas Partners Limited Partnership / AmeriGas Finance Corp. | | | | | | | | |
5.75% due 05/20/27 | | | 100,000 | | | | 111,500 | |
Total Utilities | | | | | | | 828,219 | |
| | | | | | | | | |
Total Corporate Bonds | | | | |
(Cost $39,474,442) | | | 40,129,691 | |
| |
SENIOR FLOATING RATE INTERESTS††,9 - 11.2% |
Consumer, Cyclical - 3.1% | | | | | | | | |
PetSmart LLC | | | | | | | | |
4.50% (3 Month USD LIBOR + 3.75%, Rate Floor: 4.50%) due 02/11/28 | | | 300,000 | | | | 300,075 | |
ScribeAmerica Intermediate Holdco LLC (Healthchannels) | | | | | | | | |
4.60% (1 Month USD LIBOR + 4.50%, Rate Floor: 4.50%) due 04/03/25 | | | 191,280 | | | | 183,868 | |
Blue Nile, Inc. | | | | | | | | |
7.50% (3 Month USD LIBOR + 6.50%, Rate Floor: 7.50%) due 02/17/23 | | | 182,813 | | | | 170,016 | |
First Brands Group LLC | | | | | | | | |
6.00% (1 Month USD LIBOR + 5.00%, Rate Floor: 6.00%) due 03/30/27 | | | 99,750 | | | | 100,789 | |
Apro LLC | | | | | | | | |
4.50% (3 Month USD LIBOR + 3.75%, Rate Floor: 4.50%) due 11/14/26 | | | 99,750 | | | | 99,501 | |
PT Intermediate Holdings III LLC | | | | | | | | |
6.50% (3 Month USD LIBOR + 5.50%, Rate Floor: 6.50%) due 10/15/25††† | | | 98,500 | | | | 96,776 | |
BBB Industries LLC | | | | | | | | |
4.60% (1 Month USD LIBOR + 4.50%, Rate Floor: 4.50%) due 08/01/25 | | | 89,561 | | | | 88,688 | |
SEE NOTES TO FINANCIAL STATEMENTS. | THE GUGGENHEIM FUNDS SEMI-ANNUAL REPORT | 89 |
SCHEDULE OF INVESTMENTS (Unaudited)(continued) | June 30, 2021 |
SERIES P (HIGH YIELD SERIES) | |
| | Face
Amount~ | | | Value | |
Mavis Tire Express Services TopCo Corp. | | | | | | | | |
4.75% (3 Month USD LIBOR + 4.00%, Rate Floor: 4.75%) due 05/04/28 | | | 75,000 | | | $ | 75,187 | |
CCRR Parent, Inc. | | | | | | | | |
5.00% (3 Month USD LIBOR + 4.25%, Rate Floor: 5.00%) due 03/06/28 | | | 74,813 | | | | 75,187 | |
Holding SOCOTEC | | | | | | | | |
due 05/07/28††† | | | 75,000 | | | | 75,000 | |
BidFair MergeRight, Inc. | | | | | | | | |
5.50% (3 Month USD LIBOR + 4.75%, Rate Floor: 5.50%) due 01/15/27 | | | 52,405 | | | | 52,645 | |
Rent-A-Center, Inc. | | | | | | | | |
4.75% (1 Month USD LIBOR + 4.00%, Rate Floor: 4.75%) due 02/17/28 | | | 49,875 | | | | 49,875 | |
American Tire Distributors, Inc. | | | | | | | | |
7.00% (3 Month USD LIBOR + 6.00%, Rate Floor: 7.00%) due 09/01/23 | | | 29,221 | | | | 28,953 | |
8.50% (1 Month USD LIBOR + 7.50% and 3 Month USD LIBOR + 7.50%, Rate Floor: 8.50%) due 09/02/24 | | | 18,996 | | | | 18,986 | |
Total Consumer, Cyclical | | | | | | | 1,415,546 | |
| | | | | | | | | |
Communications - 2.5% | | | | | | | | |
Cengage Learning Acquisitions, Inc. | | | | | | | | |
5.25% (1 Month USD LIBOR + 4.25% and 3 Month USD LIBOR + 4.25%, Rate Floor: 5.25%) due 06/07/23 | | | 345,277 | | | | 345,464 | |
due 06/28/26 | | | 75,000 | | | | 75,047 | |
Resource Label Group LLC | | | | | | | | |
9.50% (3 Month USD LIBOR + 8.50%, Rate Floor: 9.50%) due 11/27/23††† | | | 250,000 | | | | 240,000 | |
McGraw Hill LLC | | | | | | | | |
5.75% (1 Month USD LIBOR + 4.75%, Rate Floor: 5.75%) due 11/01/24 | | | 202,847 | | | | 203,005 | |
GTT Communications, Inc. | | | | | | | | |
2.90% (3 Month USD LIBOR + 2.75%, Rate Floor: 2.75%) due 05/30/25 | | | 194,000 | | | | 152,387 | |
Playtika Holding Corp. | | | | | | | | |
2.85% (1 Month USD LIBOR + 2.75%, Rate Floor: 2.75%) due 03/13/28 | | | 99,750 | | | | 99,240 | |
GTT Communications BV | | | | | | | | |
9.50% (1 Month USD LIBOR + 6.00%, Rate Floor: 7.00%) (in-kind rate was 2.50%) due 12/28/2110 | | | 49,884 | | | | 50,293 | |
Total Communications | | | | | | | 1,165,436 | |
| | | | | | | | | |
Consumer, Non-cyclical - 2.4% | | | | | | | | |
Springs Window Fashions | | | | | | | | |
8.60% (1 Month USD LIBOR + 8.50%, Rate Floor: 8.50%) due 06/15/26 | | | 150,000 | | | | 150,095 | |
Diamond (BC) BV | | | | | | | | |
3.19% (3 Month USD LIBOR + 3.00%, Rate Floor: 3.00%) due 09/06/24 | | | 146,591 | | | | 145,705 | |
HAH Group Holding Co. LLC | | | | | | | | |
6.00% (3 Month USD LIBOR + 5.00%, Rate Floor: 6.00%) due 10/29/27 | | | 129,675 | | | | 129,919 | |
SCP Eye Care Services LLC | | | | | | | | |
5.25% (3 Month USD LIBOR + 4.50%, Rate Floor: 5.25%) due 03/16/28††† | | | 127,841 | | | | 127,681 | |
Women’s Care Holdings, Inc. | | | | | | | | |
5.25% (3 Month USD LIBOR + 4.50%, Rate Floor: 5.25%) due 01/15/28 | | | 100,000 | | | | 99,938 | |
Quirch Foods Holdings LLC | | | | | | | | |
5.75% (3 Month USD LIBOR + 4.75% and 3 Month USD LIBOR + 5.25%, Rate Floor: 5.75%) due 10/27/27 | | | 99,500 | | | | 99,749 | |
Blue Ribbon LLC | | | | | | | | |
6.75% (3 Month USD LIBOR + 6.00%, Rate Floor: 6.75%) due 05/08/28 | | | 99,375 | | | | 97,934 | |
National Mentor Holdings, Inc. | | | | | | | | |
4.50% (1 Month USD LIBOR + 3.75% and 3 Month USD LIBOR + 3.75%, Rate Floor: 4.50%) due 03/02/28 | | | 95,308 | | | | 95,414 | |
Gibson Brands, Inc. | | | | | | | | |
due 06/23/28 | | | 75,000 | | | | 74,625 | |
Kronos Acquisition Holdings, Inc. | | | | | | | | |
4.25% (3 Month USD LIBOR + 3.75%, Rate Floor: 4.25%) due 12/22/26 | | | 74,813 | | | | 74,220 | |
Total Consumer, Non-cyclical | | | | | | | 1,095,280 | |
| | | | | | | | | |
Industrial - 1.4% | | | | | | | | |
Diversitech Holdings, Inc. | | | | | | | | |
8.50% (3 Month USD LIBOR + 7.50%, Rate Floor: 8.50%) due 06/02/25††† | | | 200,000 | | | | 200,500 | |
YAK MAT (YAK ACCESS LLC) | | | | | | | | |
10.13% (3 Month USD LIBOR + 10.00%, Rate Floor: 10.00%) due 07/10/26 | | | 150,000 | | | | 122,250 | |
Arcline FM Holdings LLC | | | | | | | | |
5.50% (3 Month USD LIBOR + 4.75%, Rate Floor: 5.50%) due 06/14/28 | | | 100,000 | | | | 100,063 | |
Dispatch Terra Acquisition LLC | | | | | | | | |
5.00% (3 Month USD LIBOR + 4.25%, Rate Floor: 5.00%) due 03/27/28 | | | 100,000 | | | | 99,813 | |
Aegion Corp. | | | | | | | | |
5.50% (3 Month USD LIBOR + 4.75%, Rate Floor: 5.50%) due 05/17/28 | | | 75,000 | | | | 75,656 | |
United Airlines Inc. | | | | | | | | |
4.50% (3 Month USD LIBOR + 3.75%, Rate Floor: 4.50%) due 04/21/28 | | | 50,000 | | | | 50,611 | |
JetBlue Airways Corp. | | | | | | | | |
6.25% (3 Month USD LIBOR + 5.25%, Rate Floor: 6.25%) due 06/17/24 | | | 1,250 | | | | 1,275 | |
Total Industrial | | | | | | | 650,168 | |
| | | | | | | | | |
Technology - 1.0% | | | | | | | | |
Peraton Corp. | | | | | | | | |
4.50% (1 Month USD LIBOR + 3.75%, Rate Floor: 4.50%) due 02/01/28 | | | 149,625 | | | | 149,936 | |
Polaris Newco LLC | | | | | | | | |
4.50% (6 Month USD LIBOR + 4.00%, Rate Floor: 4.50%) due 06/02/28 | | | 130,000 | | | | 130,309 | |
Apttus Corp. | | | | | | | | |
5.00% (3 Month USD LIBOR + 4.25%, Rate Floor: 5.00%) due 05/08/28 | | | 75,000 | | | | 75,319 | |
90 | THE GUGGENHEIM FUNDS SEMI-ANNUAL REPORT | SEE NOTES TO FINANCIAL STATEMENTS. |
SCHEDULE OF INVESTMENTS (Unaudited)(continued) | June 30, 2021 |
SERIES P (HIGH YIELD SERIES) | |
| | Face
Amount~ | | | Value | |
Atlas CC Acquisition Corp. | | | | | | | | |
5.00% (3 Month USD LIBOR + 4.25%, Rate Floor: 5.00%) due 05/25/28 | | | 75,000 | | | $ | 75,188 | |
Planview Parent, Inc. | | | | | | | | |
4.75% (3 Month USD LIBOR + 4.00%, Rate Floor: 4.75%) due 12/17/27 | | | 49,750 | | | | 49,797 | |
Total Technology | | | | | | | 480,549 | |
| | | | | | | | | |
Financial - 0.4% | | | | | | | | |
Franchise Group, Inc. | | | | | | | | |
5.50% (3 Month USD LIBOR + 4.75%, Rate Floor: 5.50%) due 03/10/26 | | | 124,688 | | | | 125,233 | |
Jefferies Finance LLC | | | | | | | | |
3.13% (1 Month USD LIBOR + 3.00%, Rate Floor: 3.00%) due 06/03/26 | | | 74,436 | | | | 74,041 | |
Total Financial | | | | | | | 199,274 | |
| | | | | | | | | |
Utilities - 0.2% | | | | | | | | |
RS Ivy Holdco, Inc. | | | | | | | | |
6.50% (1 Month USD LIBOR + 5.50%, Rate Floor: 6.50%) due 12/23/27 | | | 74,625 | | | | 74,625 | |
| | | | | | | | | |
Basic Materials - 0.1% | | | | | | | | |
NIC Acquisition Corp. | | | | | | | | |
4.50% (3 Month USD LIBOR + 3.75%, Rate Floor: 4.50%) due 12/29/27 | | | 50,000 | | | | 49,859 | |
| | | | | | | | | |
Energy - 0.1% | | | | | | | | |
Permian Production Partners LLC | | | | | | | | |
10.00% (1 Month USD LIBOR + 7.00%, Rate Floor: 8.00%) (in-kind rate was 2.00%) due 11/24/25†††,10 | | | 36,330 | | | | 32,697 | |
Total Senior Floating Rate Interests | | | | |
(Cost $5,188,025) | | | 5,163,434 | |
| | | | | | | | | |
Total Investments - 106.7% | | | | |
(Cost $49,120,287) | | $ | 49,295,591 | |
Other Assets & Liabilities, net - (6.7)% | | | (3,103,855 | ) |
Total Net Assets - 100.0% | | $ | 46,191,736 | |
Total Return Swap Agreements |
Counterparty | Reference Obligation | Financing
Rate Pay
(Receive) | Payment
Frequency | | Maturity
Date | | | Units | | | Notional
Amount | | | Value and
Unrealized
Appreciation | |
OTC Credit Index Swap Agreements†† |
BNP Paribas | VanEck Vectors Fallen Angel High Yield Bond ETF | 0.39% (1 Month USD LIBOR + 0.30%) | At Maturity | | | 11/19/21 | | | | 22,100 | | | $ | 727,090 | | | $ | 17,680 | |
BNP Paribas | VanEck Vectors Fallen Angel High Yield Bond ETF | 0.32% (1 Month USD LIBOR + 0.25%) | At Maturity | | | 11/17/21 | | | | 22,100 | | | | 727,090 | | | | 16,796 | |
BNP Paribas | VanEck Vectors Fallen Angel High Yield Bond ETF | 0.32% (1 Month USD LIBOR + 0.25%) | At Maturity | | | 11/15/21 | | | | 22,300 | | | | 733,670 | | | | 15,833 | |
| | | | | | | | | | | | | | $ | 2,187,850 | | | $ | 50,309 | |
Forward Foreign Currency Exchange Contracts†† |
Counterparty | | Contracts
to Sell | | | Currency | | | Settlement
Date | | | Settlement
Value | | | Value at
June 30, 2021 | | | Unrealized
Appreciation | |
JPMorgan Chase Bank, N.A. | | | 100,000 | | | | EUR | | | | 07/16/21 | | | $ | 121,255 | | | $ | 118,660 | | | $ | 2,595 | |
Goldman Sachs International | | | 77,000 | | | | CAD | | | | 07/16/21 | | | | 63,166 | | | | 62,129 | | | | 1,037 | |
| | | | | | | | | | | | | | | | | | | | | | | $ | 3,632 | |
SEE NOTES TO FINANCIAL STATEMENTS. | THE GUGGENHEIM FUNDS SEMI-ANNUAL REPORT | 91 |
SCHEDULE OF INVESTMENTS (Unaudited)(continued) | June 30, 2021 |
SERIES P (HIGH YIELD SERIES) | |
~ | The face amount is denominated in U.S. dollars unless otherwise indicated. |
* | Non-income producing security. |
† | Value determined based on Level 1 inputs, unless otherwise noted — See Note 4. |
†† | Value determined based on Level 2 inputs, unless otherwise noted — See Note 4. |
††† | Value determined based on Level 3 inputs — See Note 4. |
1 | Affiliated issuer. |
2 | Security has a fixed rate coupon which will convert to a floating or variable rate coupon on a future date. |
3 | Rate indicated is the 7-day yield as of June 30, 2021. |
4 | All or a portion of this security has been physically segregated or earmarked in connection with reverse repurchase agreements. At June 30, 2021, the total market value of segregated or earmarked security was $3,734,438 — See Note 11. |
5 | Security is a 144A or Section 4(a)(2) security. These securities have been determined to be liquid under guidelines established by the Board of Trustees. The total market value of 144A or Section 4(a)(2) securities is $33,635,674 (cost $32,820,895), or 72.8% of total net assets. |
6 | Perpetual maturity. |
7 | Security is a 144A or Section 4(a)(2) security. These securities have been determined to be illiquid and restricted under guidelines established by the Board of Trustees. The total market value of 144A or Section 4(a)(2) illiquid and restricted securities is $48,853 (cost $528,034), or 0.1% of total net assets — See Note 9. |
8 | Security is in default of interest and/or principal obligations. |
9 | Variable rate security. Rate indicated is the rate effective at June 30, 2021. In some instances, the effective rate is limited by a minimum rate floor or a maximum rate cap established by the issuer. The settlement status of a position may also impact the effective rate indicated. In some cases, a position may be unsettled at period end and may not have a stated effective rate. In instances where multiple underlying reference rates and spread amounts are shown, the effective rate is based on a weighted average. |
10 | Payment-in-kind security. |
11 | Special Purpose Acquisition Company (SPAC) |
| | CAD — Canadian Dollar |
| | EUR — Euro |
| | LIBOR — London Interbank Offered Rate |
| | plc — Public Limited Company |
| | SARL — Société à Responsabilité Limitée |
| | |
| | See Sector Classification in Other Information section. |
The following table summarizes the inputs used to value the Fund’s investments at June 30, 2021 (See Note 4 in the Notes to Financial Statements):
Investments in Securities (Assets) | | Level 1
Quoted
Prices | | | Level 2
Significant
Observable
Inputs | | | Level 3
Significant
Unobservable
Inputs | | | Total | |
Common Stocks | | $ | 545,589 | | | $ | 355,585 | | | $ | 192,397 | | | $ | 1,093,571 | |
Preferred Stocks | | | — | | | | 1,365,920 | | | | — | * | | | 1,365,920 | |
Warrants | | | 4,918 | | | | — | | | | — | | | | 4,918 | |
Money Market Fund | | | 1,538,057 | | | | — | | | | — | | | | 1,538,057 | |
Corporate Bonds | | | — | | | | 40,038,015 | | | | 91,676 | | | | 40,129,691 | |
Senior Floating Rate Interests | | | — | | | | 4,390,780 | | | | 772,654 | | | | 5,163,434 | |
Credit Index Swap Agreements** | | | — | | | | 50,309 | | | | — | | | | 50,309 | |
Forward Foreign Currency Exchange Contracts** | | | — | | | | 3,632 | | | | — | | | | 3,632 | |
Total Assets | | $ | 2,088,564 | | | $ | 46,204,241 | | | $ | 1,056,727 | | | $ | 49,349,532 | |
Investments in Securities (Liabilities) | | Level 1
Quoted
Prices | | | Level 2
Significant
Observable
Inputs | | | Level 3
Significant
Unobservable
Inputs | | | Total | |
Unfunded Loan Commitments (Note 8) | | $ | — | | | $ | — | | | $ | 541 | | | $ | 541 | |
* | Security has a market value of $0. |
** | This derivative is reported as unrealized appreciation/depreciation at period end. |
92 | THE GUGGENHEIM FUNDS SEMI-ANNUAL REPORT | SEE NOTES TO FINANCIAL STATEMENTS. |
SCHEDULE OF INVESTMENTS (Unaudited)(continued) | June 30, 2021 |
SERIES P (HIGH YIELD SERIES) | |
The Fund may hold assets and/or liabilities in which the fair value approximates the carrying amount for financial statement purposes. As of the period end, reverse repurchase agreements of $2,983,439 are categorized as Level 2 within the disclosure hierarchy — See Note 11.
The following is a summary of significant unobservable inputs used in the fair valuation of assets and liabilities categorized within Level 3 of the fair value hierarchy:
| Category | | Ending Balance at June 30, 2021 | | | Valuation Technique | | Unobservable Inputs | | Input Range | | Weighted Average* |
| Assets: | | | | | | | | | | | |
| Common Stocks | | $ | 169,381 | | | Third Party Pricing | | Broker Quote | | — | | — |
| Common Stocks | | | 11,588 | | | Yield Analysis | | Yield | | 11.9% | | — |
| Common Stocks | | | 11,064 | | | Enterprise Value | | Valuation Multiple | | 2.3x-11.9x | | 4.7x |
| Common Stocks | | | 364 | | | Model Price | | Liquidation Value | | — | | — |
| Corporate Bonds | | | 91,676 | | | Third Party Pricing | | Vendor Price | | — | | — |
| Senior Floating Rate Interests | | | 772,654 | | | Third Party Pricing | | Broker Quote | | — | | — |
| Total Assets | | $ | 1,056,727 | | | | | | | | | |
| Liabilities: | | | | | | | | | | | | |
| Unfunded Loan Commitments | | $ | 541 | | | Model Price | | Purchase Price | | — | | — |
* | Inputs are weighted by the fair value of the instruments. |
Significant changes in a quote, yield, liquidation value or valuation multiple would generally result in significant changes in the fair value of the security.
The Fund’s fair valuation leveling guidelines classify a single daily broker quote, or a vendor price based on a single daily or monthly broker quote, as Level 3, if such a quote or price cannot be supported with other available market information.
Transfers between Level 2 and Level 3 may occur as markets fluctuate and/or the availability of data used in an investment’s valuation changes. For the period ended June 30, 2021, the Fund had securities with a total value of $266,157 transfer into Level 3 from Level 2 due to lack of observable inputs and had securities with a total market value of $177,936 transfer out of Level 3 to Level 2 due to the availability of current and reliable market-based data provided by a third-party pricing service which utilizes significant observable inputs.
Summary of Fair Value Level 3 Activity
Following is a reconciliation of Level 3 assets for which significant unobservable inputs were used to determine fair value for the period ended June 30, 2021:
| | | Assets | | | | | | | Liabilities | |
| | Corporate
Bonds | | | Senior Floating
Rate Interests | | | Common
Stocks | | | Total
Assets | | | Unfunded Loan
Commitments | |
Beginning Balance | | $ | 70 | | | $ | 466,283 | | | $ | 108,858 | | | $ | 575,211 | | | $ | (408 | ) |
Purchases/(Receipts) | | | 100,000 | | | | 202,709 | | | | 3,476 | | | | 306,185 | | | | (169 | ) |
(Sales, maturities and paydowns)/Fundings | | | (3,475 | ) | | | (58,199 | ) | | | (7,266 | ) | | | (68,940 | ) | | | 128 | |
Amortization of premiums/discounts | | | (1,594 | ) | | | 14,694 | | | | — | | | | 13,100 | | | | — | |
Total realized gains (losses) included in earnings | | | (130,304 | ) | | | (8,440 | ) | | | (2,172 | ) | | | (140,916 | ) | | | 85 | |
Total change in unrealized appreciation (depreciation) included in earnings | | | 126,979 | | | | 58,831 | | | | 98,056 | | | | 283,866 | | | | (177 | ) |
Transfers into Level 3 | | | — | | | | 96,776 | | | | 169,381 | | | | 266,157 | | | | — | |
Transfers out of Level 3 | | | — | | | | — | | | | (177,936 | ) | | | (177,936 | ) | | | — | |
Ending Balance | | $ | 91,676 | | | $ | 772,654 | | | $ | 192,397 | | | $ | 1,056,727 | | | $ | (541 | ) |
Net change in unrealized appreciation (depreciation) for investments in Level 3 securities still held at June 30, 2021 | | $ | (8,324 | ) | | $ | 56,292 | | | $ | 17,336 | | | $ | 65,304 | | | $ | (164 | ) |
SEE NOTES TO FINANCIAL STATEMENTS. | THE GUGGENHEIM FUNDS SEMI-ANNUAL REPORT | 93 |
SCHEDULE OF INVESTMENTS (Unaudited)(concluded) | June 30, 2021 |
SERIES P (HIGH YIELD SERIES) | |
Affiliated Transactions
Investments representing 5% or more of the outstanding voting shares of a company, or control of or by, or common control under Guggenheim Investments (“GI”), result in that company being considered an affiliated issuer, as defined in the 1940 Act.
Transactions during the period ended June 30, 2021, in which the company is an affiliated issuer, were as follows:
Security Name | | Value
12/31/20 | | | Additions | | | Reductions | | | Realized
Gain (Loss) | | | Change in
Unrealized
Appreciation
(Depreciation) | | | Value
06/30/21 | | | Shares
06/30/21 | |
Common Stocks | | | | | | | | | | | | | | | | | | | | | | | | | | | | |
BP Holdco LLC* | | $ | 184 | | | $ | — | | | $ | — | | | $ | — | | | $ | — | | | $ | 184 | | | | 523 | |
* | Non-income producing security. |
94 | THE GUGGENHEIM FUNDS SEMI-ANNUAL REPORT | SEE NOTES TO FINANCIAL STATEMENTS. |
SERIES P (HIGH YIELD SERIES) | |
STATEMENT OF ASSETS AND LIABILITIES (Unaudited) |
June 30, 2021 |
Assets: |
Investments in unaffiliated issuers, at value (cost $49,120,102) | | $ | 49,295,407 | |
Investments in affiliated issuers, at value (cost $185) | | | 184 | |
Cash | | | 9,634 | |
Unrealized appreciation on OTC swap agreements | | | 50,309 | |
Unrealized appreciation on forward foreign currency exchange contracts | | | 3,632 | |
Prepaid expenses | | | 702 | |
Receivables: |
Interest | | | 588,623 | |
Securities sold | | | 188,879 | |
Fund shares sold | | | 996 | |
Total assets | | | 50,138,366 | |
| | | | | |
Liabilities: |
Unfunded loan commitments, at value (Note 8) (commitment fees received $386) | | | 541 | |
Reverse repurchase agreements | | | 2,983,439 | |
Payable for: |
Securities purchased | | | 877,875 | |
Management fees | | | 15,865 | |
Distribution and service fees | | | 9,673 | |
Fund shares redeemed | | | 8,343 | |
Fund accounting/administration fees | | | 3,981 | |
Transfer agent/maintenance fees | | | 2,274 | |
Trustees’ fees* | | | 1,272 | |
Swap settlement | | | 992 | |
Miscellaneous | | | 42,375 | |
Total liabilities | | | 3,946,630 | |
Commitments and contingent liabilities (Note 12) | | | — | |
Net assets | | $ | 46,191,736 | |
| | | | | |
Net assets consist of: |
Paid in capital | | $ | 51,121,755 | |
Total distributable earnings (loss) | | | (4,930,019 | ) |
Net assets | | $ | 46,191,736 | |
Capital shares outstanding | | | 1,623,640 | |
Net asset value per share | | $ | 28.45 | |
STATEMENT OF OPERATIONS (Unaudited) |
Six Months Ended June 30, 2021 |
Investment Income: |
Dividends from securities of unaffiliated issuers | | $ | 149,146 | |
Interest from securities of unaffiliated issuers | | | 1,258,957 | |
Total investment income | | | 1,408,103 | |
| | | | | |
Expenses: |
Management fees | | | 136,918 | |
Distribution and service fees | | | 57,049 | |
Transfer agent/maintenance fees | | | 12,575 | |
Professional fees | | | 26,326 | |
Fund accounting/administration fees | | | 19,347 | |
Trustees’ fees* | | | 9,083 | |
Custodian fees | | | 7,721 | |
Interest expense | | | 3,046 | |
Line of credit fees | | | 2,026 | |
Miscellaneous | | | 15,452 | |
Total expenses | | | 289,543 | |
Less: |
Expenses waived by Adviser | | | (43,283 | ) |
Earnings credits applied | | | (8 | ) |
Total waived expenses | | | (43,291 | ) |
Net expenses | | | 246,252 | |
Net investment income | | | 1,161,851 | |
| | | | | |
Net Realized and Unrealized Gain (Loss): |
Net realized gain (loss) on: |
Investments in unaffiliated issuers | | | 383,501 | |
Swap agreements | | | 172,650 | |
Forward foreign currency exchange contracts | | | 3,061 | |
Foreign currency transactions | | | (2,107 | ) |
Net realized gain | | | 557,105 | |
Net change in unrealized appreciation (depreciation) on: |
Investments in unaffiliated issuers | | | (42,026 | ) |
Swap agreements | | | (105,530 | ) |
Forward foreign currency exchange contracts | | | 3,632 | |
Foreign currency translations | | | (8 | ) |
Net change in unrealized appreciation (depreciation) | | | (143,932 | ) |
Net realized and unrealized gain | | | 413,173 | |
Net increase in net assets resulting from operations | | $ | 1,575,024 | |
* | Relates to Trustees not deemed “interested persons” within the meaning of Section 2(a)(19) of the 1940 Act. |
SEE NOTES TO FINANCIAL STATEMENTS. | THE GUGGENHEIM FUNDS SEMI-ANNUAL REPORT | 95 |
SERIES P (HIGH YIELD SERIES) | |
STATEMENTS OF CHANGES IN NET ASSETS |
| | Six Months Ended
June 30, 2021
(Unaudited) | | | Year Ended
December 31,
2020 | |
Increase (Decrease) in Net Assets from Operations: | | | | | | | | |
Net investment income | | $ | 1,161,851 | | | $ | 2,212,603 | |
Net realized gain (loss) on investments | | | 557,105 | | | | (3,370,145 | ) |
Net change in unrealized appreciation (depreciation) on investments | | | (143,932 | ) | | | 2,805,377 | |
Net increase in net assets resulting from operations | | | 1,575,024 | | | | 1,647,835 | |
| | | | | | | | | |
Distributions to shareholders | | | — | | | | (3,157,421 | ) |
| | | | | | | | | |
Capital share transactions: | | | | | | | | |
Proceeds from sale of shares | | | 39,295,886 | | | | 17,515,926 | |
Distributions reinvested | | | — | | | | 3,157,421 | |
Cost of shares redeemed | | | (39,832,148 | ) | | | (28,298,902 | ) |
Net decrease from capital share transactions | | | (536,262 | ) | | | (7,625,555 | ) |
Net increase (decrease) in net assets | | | 1,038,762 | | | | (9,135,141 | ) |
| | | | | | | | | |
Net assets: | | | | | | | | |
Beginning of period | | | 45,152,974 | | | | 54,288,115 | |
End of period | | $ | 46,191,736 | | | $ | 45,152,974 | |
| | | | | | | | | |
Capital share activity: | | | | | | | | |
Shares sold | | | 1,407,534 | | | | 669,412 | |
Shares issued from reinvestment of distributions | | | — | | | | 123,918 | |
Shares redeemed | | | (1,426,155 | ) | | | (1,063,235 | ) |
Net decrease in shares | | | (18,621 | ) | | | (269,905 | ) |
96 | THE GUGGENHEIM FUNDS SEMI-ANNUAL REPORT | SEE NOTES TO FINANCIAL STATEMENTS. |
SERIES P (HIGH YIELD SERIES) | |
This table is presented to show selected data for a share outstanding throughout each period and to assist shareholders in evaluating a Fund’s performance for the periods presented.
| | Six Months Ended
June 30, 2021a | | | Year Ended
December 31,
2020 | | | Year Ended
December 31,
2019 | | | Year Ended
December 31,
2018 | | | Year Ended
December 31,
2017 | | | Year Ended
December 31,
2016 | |
Per Share Data |
Net asset value, beginning of period | | $ | 27.49 | | | $ | 28.39 | | | $ | 27.51 | | | $ | 31.13 | | | $ | 30.82 | | | $ | 28.63 | |
Income (loss) from investment operations: |
Net investment income (loss)b | | | .70 | | | | 1.37 | | | | 1.68 | | | | 1.79 | | | | 1.81 | | | | 1.91 | |
Net gain (loss) on investments (realized and unrealized) | | | .26 | | | | (.21 | ) | | | 1.45 | | | | (2.99 | ) | | | .09 | | | | 2.93 | |
Total from investment operations | | | .96 | | | | 1.16 | | | | 3.13 | | | | (1.20 | ) | | | 1.90 | | | | 4.84 | |
Less distributions from: |
Net investment income | | | — | | | | (2.06 | ) | | | (2.25 | ) | | | (2.42 | ) | | | (1.59 | ) | | | (2.65 | ) |
Total distributions | | | — | | | | (2.06 | ) | | | (2.25 | ) | | | (2.42 | ) | | | (1.59 | ) | | | (2.65 | ) |
Net asset value, end of period | | $ | 28.45 | | | $ | 27.49 | | | $ | 28.39 | | | $ | 27.51 | | | $ | 31.13 | | | $ | 30.82 | |
|
Total Returnc | | | 3.49 | % | | | 4.64 | % | | | 11.59 | % | | | (4.16 | %) | | | 6.23 | % | | | 17.52 | % |
Ratios/Supplemental Data |
Net assets, end of period (in thousands) | | $ | 46,192 | | | $ | 45,153 | | | $ | 54,288 | | | $ | 52,504 | | | $ | 79,272 | | | $ | 95,760 | |
Ratios to average net assets: |
Net investment income (loss) | | | 5.09 | % | | | 5.13 | % | | | 5.89 | % | | | 5.98 | % | | | 5.79 | % | | | 6.46 | % |
Total expensesd | | | 1.27 | % | | | 1.38 | % | | | 1.31 | % | | | 1.42 | % | | | 1.40 | % | | | 1.17 | % |
Net expensese,f,g | | | 1.08 | % | | | 1.12 | % | | | 1.10 | % | | | 1.26 | % | | | 1.33 | % | | | 1.13 | % |
Portfolio turnover rate | | | 37 | % | | | 84 | % | | | 58 | % | | | 51 | % | | | 76 | % | | | 84 | % |
a | Unaudited figures for the period ended June 30, 2021. Percentage amounts for the period, except total return and portfolio turnover rate, have been annualized. |
b | Net investment income (loss) per share was computed using average shares outstanding throughout the period. |
c | Total return does not take into account any of the expenses associated with an investment in variable insurance products. If total return had taken into account these expenses, performance would have been lower. Shares of a series of Guggenheim Variable Funds Trust are available only through the purchase of such products. |
d | Does not include expenses of the underlying funds in which the Fund invests, if any. |
e | Net expense information reflects the expense ratios after expense waivers and reimbursements, as applicable. |
f | Net expenses may include expenses that are excluded from the expense limitation agreement. Excluding these expenses, the net expense ratios for the periods presented would be: |
| | 06/30/21a | 12/31/20 | 12/31/19 | 12/31/18 | 12/31/17 | 12/31/16 |
| | 1.06% | 1.07% | 1.07% | 1.07% | 1.07% | 1.07% |
g | The portion of the ratios of net expenses to average net assets attributable to recoupments of prior fee reductions or expense reimbursements for the periods presented was as follows: |
| | 06/30/21a | 12/31/20 | 12/31/19 | 12/31/18 | 12/31/17 | 12/31/16 |
| | — | — | — | 0.00%* | 0.02% | — |
SEE NOTES TO FINANCIAL STATEMENTS. | THE GUGGENHEIM FUNDS SEMI-ANNUAL REPORT | 97 |
PERFORMANCE REPORT AND FUND PROFILE (Unaudited) | June 30, 2021 |
SERIES Q (SMALL CAP VALUE SERIES)
OBJECTIVE: Seeks long-term capital appreciation.
Holdings Diversification (Market Exposure as % of Net Assets)
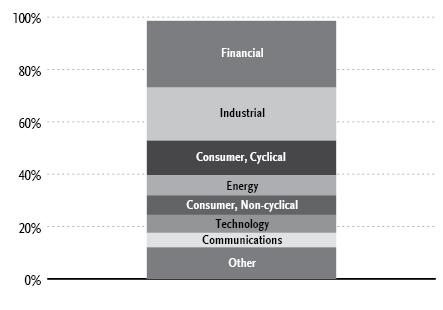
“Holdings Diversification (Market Exposure as % of Net Assets)” excludes any temporary cash investments.
Inception Date: May 1, 2000 |
Ten Largest Holdings (% of Total Net Assets) |
Range Resources Corp. | 2.6% |
Pioneer Natural Resources Co. | 2.5% |
iShares Russell 2000 Value ETF | 2.5% |
First Horizon Corp. | 2.0% |
Parsons Corp. | 2.0% |
MDU Resources Group, Inc. | 1.6% |
Physicians Realty Trust | 1.5% |
Encompass Health Corp. | 1.5% |
Patterson-UTI Energy, Inc. | 1.4% |
Evolent Health, Inc. — Class A | 1.4% |
Top Ten Total | 19.0% |
| | |
“Ten Largest Holdings” excludes any temporary cash investments. |
Average Annual Returns*,†
Periods Ended June 30, 2021
| 6 Month‡ | 1 Year | 5 Year | 10 Year |
Series Q (Small Cap Value Series) | 23.30% | 55.69% | 10.15% | 8.98% |
Russell 2000 Value Index | 26.69% | 73.28% | 13.62% | 10.85% |
* | The performance data above represents past performance that is not predictive of future results. The investment return and principal value of an investment in the Fund will fluctuate so that an investor’s shares, when redeemed, may be worth more or less than their original cost. Returns are historical and include changes in principal and reinvested dividends and capital gains and do not reflect the effect of taxes. The Russell 2000 Value Index is an unmanaged index and, unlike the Fund, has no management fees or operating expenses to reduce its reported return. |
† | Performance figures do not reflect fees and expenses associated with an investment in variable insurance products. If returns had taken into account these fees and expenses, performance would have been lower. Shares of a series of Guggenheim Variable Funds Trust are available only through the purchase of such products. |
‡ | 6 month returns are not annualized. |
98 THE GUGGENHEIM FUNDS SEMI-ANNUAL REPORT | |
SCHEDULE OF INVESTMENTS (Unaudited) | June 30, 2021 |
SERIES Q (SMALL CAP VALUE SERIES) | |
| | Shares | | | Value | |
COMMON STOCKS† - 96.0% |
| | | | | | | | | |
Financial - 25.5% |
First Horizon Corp. | | | 89,171 | | | $ | 1,540,875 | |
Physicians Realty Trust REIT | | | 62,421 | | | | 1,152,916 | |
Lexington Realty Trust REIT | | | 81,504 | | | | 973,973 | |
CNO Financial Group, Inc. | | | 40,859 | | | | 965,089 | |
Axis Capital Holdings Ltd. | | | 17,543 | | | | 859,782 | |
Cathay General Bancorp | | | 21,370 | | | | 841,123 | |
Investors Bancorp, Inc. | | | 52,455 | | | | 748,009 | |
Prosperity Bancshares, Inc. | | | 10,367 | | | | 744,351 | |
Simmons First National Corp. — Class A | | | 25,348 | | | | 743,710 | |
BOK Financial Corp. | | | 8,584 | | | | 743,374 | |
Stifel Financial Corp. | | | 10,984 | | | | 712,422 | |
Radian Group, Inc. | | | 31,547 | | | | 701,921 | |
Hanmi Financial Corp. | | | 35,569 | | | | 677,945 | |
MGIC Investment Corp. | | | 47,910 | | | | 651,576 | |
Hancock Whitney Corp. | | | 13,170 | | | | 585,275 | |
Berkshire Hills Bancorp, Inc. | | | 21,325 | | | | 584,518 | |
Hilltop Holdings, Inc. | | | 15,584 | | | | 567,258 | |
Flagstar Bancorp, Inc. | | | 12,439 | | | | 525,797 | |
Independent Bank Group, Inc. | | | 6,785 | | | | 501,954 | |
Heritage Insurance Holdings, Inc. | | | 58,346 | | | | 500,609 | |
Apple Hospitality REIT, Inc. | | | 30,185 | | | | 460,623 | |
Sunstone Hotel Investors, Inc. REIT* | | | 35,434 | | | | 440,090 | |
Old Republic International Corp. | | | 17,213 | | | | 428,776 | |
Piedmont Office Realty Trust, Inc. — Class A REIT | | | 22,755 | | | | 420,285 | |
Kennedy-Wilson Holdings, Inc. | | | 20,793 | | | | 413,157 | |
STAG Industrial, Inc. REIT | | | 10,756 | | | | 402,597 | |
Park Hotels & Resorts, Inc. REIT* | | | 19,249 | | | | 396,722 | |
Zions Bancorp North America | | | 7,193 | | | | 380,222 | |
Heartland Financial USA, Inc. | | | 7,689 | | | | 361,306 | |
RMR Group, Inc. — Class A | | | 7,220 | | | | 278,981 | |
Unum Group | | | 4,415 | | | | 125,386 | |
Total Financial | | | | | | | 19,430,622 | |
| | | | | | | | | |
Industrial - 20.3% |
MDU Resources Group, Inc. | | | 38,023 | | | | 1,191,641 | |
Owens Corning | | | 10,556 | | | | 1,033,432 | |
Kirby Corp.* | | | 15,172 | | | | 920,030 | |
Rexnord Corp. | | | 17,141 | | | | 857,736 | |
GATX Corp. | | | 9,649 | | | | 853,647 | |
Altra Industrial Motion Corp. | | | 12,814 | | | | 833,166 | |
Plexus Corp.* | | | 8,628 | | | | 788,686 | |
Sanmina Corp.* | | | 19,739 | | | | 769,031 | |
Knight-Swift Transportation Holdings, Inc. | | | 16,678 | | | | 758,182 | |
Valmont Industries, Inc. | | | 3,161 | | | | 746,154 | |
PGT Innovations, Inc.* | | | 31,621 | | | | 734,556 | |
Graphic Packaging Holding Co. | | | 39,961 | | | | 724,893 | |
Colfax Corp.* | | | 15,643 | | | | 716,606 | |
Energizer Holdings, Inc. | | | 16,081 | | | | 691,161 | |
EnerSys | | | 6,949 | | | | 679,126 | |
Terex Corp. | | | 12,374 | | | | 589,250 | |
Curtiss-Wright Corp. | | | 4,017 | | | | 477,059 | |
Littelfuse, Inc. | | | 1,568 | | | | 399,511 | |
Kennametal, Inc. | | | 11,020 | | | | 395,838 | |
Encore Wire Corp. | | | 5,174 | | | | 392,137 | |
II-VI, Inc.* | | | 5,363 | | | | 389,300 | |
Park Aerospace Corp. | | | 22,473 | | | | 334,848 | |
Howmet Aerospace, Inc.* | | | 6,358 | | | | 219,160 | |
Total Industrial | | | | | | | 15,495,150 | |
| | | | | | | | | |
Consumer, Cyclical - 13.3% |
Abercrombie & Fitch Co. — Class A* | | | 19,162 | | | | 889,691 | |
KAR Auction Services, Inc.* | | | 43,801 | | | | 768,707 | |
Hawaiian Holdings, Inc.* | | | 31,086 | | | | 757,566 | |
MSC Industrial Direct Company, Inc. — Class A | | | 8,379 | | | | 751,848 | |
Alaska Air Group, Inc.* | | | 12,258 | | | | 739,280 | |
Penske Automotive Group, Inc. | | | 9,418 | | | | 710,965 | |
Avient Corp. | | | 11,923 | | | | 586,135 | |
Dick’s Sporting Goods, Inc. | | | 5,840 | | | | 585,109 | |
International Game Technology plc* | | | 23,298 | | | | 558,220 | |
Meritage Homes Corp.* | | | 5,862 | | | | 551,497 | |
Methode Electronics, Inc. | | | 9,889 | | | | 486,638 | |
Urban Outfitters, Inc.* | | | 11,467 | | | | 472,670 | |
Zumiez, Inc.* | | | 8,816 | | | | 431,896 | |
Movado Group, Inc. | | | 12,832 | | | | 403,823 | |
Big Lots, Inc. | | | 5,985 | | | | 395,070 | |
Dana, Inc. | | | 15,507 | | | | 368,446 | |
Tenneco, Inc. — Class A* | | | 17,087 | | | | 330,121 | |
Lakeland Industries, Inc.* | | | 14,009 | | | | 312,821 | |
Total Consumer, Cyclical | | | | | | | 10,100,503 | |
| | | | | | | | | |
Energy - 7.6% |
Range Resources Corp.* | | | 118,684 | | | | 1,989,144 | |
Pioneer Natural Resources Co. | | | 11,717 | | | | 1,904,247 | |
Patterson-UTI Energy, Inc. | | | 111,109 | | | | 1,104,424 | |
CNX Resources Corp.* | | | 40,226 | | | | 549,487 | |
Oil States International, Inc.* | | | 30,739 | | | | 241,301 | |
Total Energy | | | | | | | 5,788,603 | |
| | | | | | | | | |
Consumer, Non-cyclical - 7.5% |
Encompass Health Corp. | | | 14,281 | | | | 1,114,347 | |
Central Garden & Pet Co. — Class A* | | | 16,553 | | | | 799,510 | |
Ingredion, Inc. | | | 8,743 | | | | 791,242 | |
Sabre Corp.* | | | 57,177 | | | | 713,569 | |
US Foods Holding Corp.* | | | 16,542 | | | | 634,551 | |
Integer Holdings Corp.* | | | 6,366 | | | | 599,677 | |
Emergent BioSolutions, Inc.* | | | 7,378 | | | | 464,740 | |
Pacira BioSciences, Inc.* | | | 6,247 | | | | 379,068 | |
Perdoceo Education Corp.* | | | 20,801 | | | | 255,228 | |
Total Consumer, Non-cyclical | | | | | | | 5,751,932 | |
| | | | | | | | | |
Technology - 6.8% |
Parsons Corp.* | | | 38,227 | | | | 1,504,615 | |
Evolent Health, Inc. — Class A* | | | 50,502 | | | | 1,066,602 | |
DXC Technology Co.* | | | 24,545 | | | | 955,782 | |
Conduent, Inc.* | | | 109,019 | | | | 817,643 | |
Science Applications International Corp. | | | 9,254 | | | | 811,853 | |
Total Technology | | | | | | | 5,156,495 | |
| | | | | | | | | |
SEE NOTES TO FINANCIAL STATEMENTS. | THE GUGGENHEIM FUNDS SEMI-ANNUAL REPORT | 99 |
SCHEDULE OF INVESTMENTS (Unaudited)(continued) | June 30, 2021 |
SERIES Q (SMALL CAP VALUE SERIES) | |
| | Shares | | | Value | |
Communications - 5.6% |
Infinera Corp.* | | | 102,982 | | | $ | 1,050,416 | |
TEGNA, Inc. | | | 40,898 | | | | 767,246 | |
Gray Television, Inc. | | | 25,944 | | | | 607,090 | |
Ciena Corp.* | | | 10,256 | | | | 583,464 | |
FireEye, Inc.* | | | 27,506 | | | | 556,171 | |
Viavi Solutions, Inc.* | | | 24,430 | | | | 431,434 | |
Entercom Communications Corp.* | | | 57,603 | | | | 248,269 | |
Total Communications | | | | | | | 4,244,090 | |
| | | | | | | | | |
Basic Materials - 5.3% |
Huntsman Corp. | | | 34,999 | | | | 928,173 | |
Commercial Metals Co. | | | 21,704 | | | | 666,747 | |
Ashland Global Holdings, Inc. | | | 6,799 | | | | 594,913 | |
Reliance Steel & Aluminum Co. | | | 3,874 | | | | 584,586 | |
Element Solutions, Inc. | | | 24,781 | | | | 579,380 | |
Kraton Corp.* | | | 11,022 | | | | 355,900 | |
Verso Corp. — Class A | | | 19,294 | | | | 341,504 | |
Total Basic Materials | | | | | | | 4,051,203 | |
| | | | | | | | | |
Utilities - 4.1% |
Black Hills Corp. | | | 12,958 | | | | 850,433 | |
Avista Corp. | | | 16,495 | | | | 703,842 | |
Southwest Gas Holdings, Inc. | | | 8,470 | | | | 560,629 | |
Spire, Inc. | | | 7,249 | | | | 523,885 | |
ALLETE, Inc. | | | 6,868 | | | | 480,623 | |
Total Utilities | | | | | | | 3,119,412 | |
| | | | | | | | | |
Total Common Stocks | | | | |
(Cost $58,078,688) | | | | | | | 73,138,010 | |
| | | | | | | | | |
CONVERTIBLE PREFERRED STOCKS††† - 0.0% |
Industrial - 0.0% |
Thermoenergy Corp.*,1 | | | 116,667 | | | | 34 | |
Total Convertible Preferred Stocks | | | | |
(Cost $111,410) | | | | | | | 34 | |
| | | | | | | | | |
RIGHTS† - 0.1% |
Basic Materials - 0.1% |
Pan American Silver Corp.* | | | 81,258 | | | | 69,069 | |
Total Rights | | | | |
(Cost $—) | | | | | | | 69,069 | |
| | | | | | | | | |
EXCHANGE-TRADED FUNDS† - 2.5% |
iShares Russell 2000 Value ETF | | | 11,483 | | | | 1,903,537 | |
Total Exchange-Traded Funds | | | | |
(Cost $1,301,506) | | | | | | | 1,903,537 | |
| | | | | | | | | |
MONEY MARKET FUND† - 1.4% |
Dreyfus Treasury Securities Cash Management Fund — Institutional Shares, 0.01%2 | | | 1,045,871 | | | | 1,045,871 | |
Total Money Market Fund | | | | |
(Cost $1,045,871) | | | | | | | 1,045,871 | |
| | | | | | | | | |
Total Investments - 100.0% | | | | |
(Cost $60,537,475) | | $ | 76,156,521 | |
Other Assets & Liabilities, net - 0.0% | | | 14,221 | |
Total Net Assets - 100.0% | | $ | 76,170,742 | |
* | Non-income producing security. |
† | Value determined based on Level 1 inputs — See Note 4. |
††† | Value determined based on Level 3 inputs — See Note 4. |
1 | PIPE (Private Investment in Public Equity) — Stock issued by a company in the secondary market as a means of raising capital more quickly and less expensively than through registration of a secondary public offering. |
2 | Rate indicated is the 7-day yield as of June 30, 2021. |
| | plc — Public Limited Company |
| | REIT — Real Estate Investment Trust |
| | |
| | See Sector Classification in Other Information section. |
100 | THE GUGGENHEIM FUNDS SEMI-ANNUAL REPORT | SEE NOTES TO FINANCIAL STATEMENTS. |
SCHEDULE OF INVESTMENTS (Unaudited)(concluded) | June 30, 2021 |
SERIES Q (SMALL CAP VALUE SERIES) | |
The following table summarizes the inputs used to value the Fund’s investments at June 30, 2021 (See Note 4 in the Notes to Financial Statements):
Investments in Securities (Assets) | | Level 1
Quoted
Prices | | | Level 2
Significant
Observable
Inputs | | | Level 3
Significant
Unobservable
Inputs | | | Total | |
Common Stocks | | $ | 73,138,010 | | | $ | — | | | $ | — | | | $ | 73,138,010 | |
Convertible Preferred Stocks | | | — | | | | — | | | | 34 | | | | 34 | |
Rights | | | 69,069 | | | | — | | | | — | | | | 69,069 | |
Exchange-Traded Funds | | | 1,903,537 | | | | — | | | | — | | | | 1,903,537 | |
Money Market Fund | | | 1,045,871 | | | | — | | | | — | | | | 1,045,871 | |
Total Assets | | $ | 76,156,487 | | | $ | — | | | $ | 34 | | | $ | 76,156,521 | |
SEE NOTES TO FINANCIAL STATEMENTS. | THE GUGGENHEIM FUNDS SEMI-ANNUAL REPORT | 101 |
SERIES Q (SMALL CAP VALUE SERIES) | |
STATEMENT OF ASSETS AND LIABILITIES (Unaudited) |
June 30, 2021 |
Assets: |
Investments, at value (cost $60,537,475) | | $ | 76,156,521 | |
Prepaid expenses | | | 442 | |
Receivables: |
Securities sold | | | 392,317 | |
Dividends | | | 99,166 | |
Fund shares sold | | | 1,456 | |
Interest | | | 3 | |
Total assets | | | 76,649,905 | |
| | | | | |
Liabilities: |
Payable for: |
Securities purchased | | | 379,620 | |
Management fees | | | 43,596 | |
Distribution and service fees | | | 15,975 | |
Fund accounting/administration fees | | | 5,633 | |
Trustees’ fees* | | | 2,290 | |
Transfer agent/maintenance fees | | | 2,286 | |
Fund shares redeemed | | | 2,173 | |
Miscellaneous | | | 27,590 | |
Total liabilities | | | 479,163 | |
Commitments and contingent liabilities (Note 12) | | | — | |
Net assets | | $ | 76,170,742 | |
| | | | | |
Net assets consist of: |
Paid in capital | | $ | 58,987,275 | |
Total distributable earnings (loss) | | | 17,183,467 | |
Net assets | | $ | 76,170,742 | |
Capital shares outstanding | | | 1,656,284 | |
Net asset value per share | | $ | 45.99 | |
STATEMENT OF OPERATIONS (Unaudited) |
Six Months Ended June 30, 2021 |
Investment Income: |
Dividends | | $ | 595,128 | |
Interest | | | 66 | |
Total investment income | | | 595,194 | |
| | | | | |
Expenses: |
Management fees | | | 276,321 | |
Distribution and service fees | | | 92,107 | |
Transfer agent/maintenance fees | | | 12,690 | |
Fund accounting/administration fees | | | 28,645 | |
Professional fees | | | 16,537 | |
Trustees’ fees* | | | 9,325 | |
Custodian fees | | | 2,735 | |
Line of credit fees | | | 1,388 | |
Miscellaneous | | | 5,134 | |
Total expenses | | | 444,882 | |
Less: |
Expenses waived by Adviser | | | (28,557 | ) |
Earnings credits applied | | | (2 | ) |
Total waived expenses | | | (28,559 | ) |
Net expenses | | | 416,323 | |
Net investment income | | | 178,871 | |
| | | | | |
Net Realized and Unrealized Gain (Loss): |
Net realized gain (loss) on: |
Investments | | | 5,187,820 | |
Net realized gain | | | 5,187,820 | |
Net change in unrealized appreciation (depreciation) on: |
Investments | | | 9,448,052 | |
Net change in unrealized appreciation (depreciation) | | | 9,448,052 | |
Net realized and unrealized gain | | | 14,635,872 | |
Net increase in net assets resulting from operations | | $ | 14,814,743 | |
* | Relates to Trustees not deemed “interested persons” within the meaning of Section 2(a)(19) of the 1940 Act. |
102 | THE GUGGENHEIM FUNDS SEMI-ANNUAL REPORT | SEE NOTES TO FINANCIAL STATEMENTS. |
SERIES Q (SMALL CAP VALUE SERIES) | |
STATEMENTS OF CHANGES IN NET ASSETS |
| | Six Months Ended
June 30, 2021
(Unaudited) | | | Year Ended
December 31,
2020 | |
Increase (Decrease) in Net Assets from Operations: | | | | | | | | |
Net investment income | | $ | 178,871 | | | $ | 552,276 | |
Net realized gain (loss) on investments | | | 5,187,820 | | | | (4,256,850 | ) |
Net change in unrealized appreciation (depreciation) on investments | | | 9,448,052 | | | | 1,558,527 | |
Net increase (decrease) in net assets resulting from operations | | | 14,814,743 | | | | (2,146,047 | ) |
| | | | | | | | | |
Distributions to shareholders | | | — | | | | (4,948,061 | ) |
| | | | | | | | | |
Capital share transactions: | | | | | | | | |
Proceeds from sale of shares | | | 3,893,293 | | | | 3,971,913 | |
Distributions reinvested | | | — | | | | 4,948,061 | |
Cost of shares redeemed | | | (6,955,533 | ) | | | (11,422,980 | ) |
Net decrease from capital share transactions | | | (3,062,240 | ) | | | (2,503,006 | ) |
Net increase (decrease) in net assets | | | 11,752,503 | | | | (9,597,114 | ) |
| | | | | | | | | |
Net assets: | | | | | | | | |
Beginning of period | | | 64,418,239 | | | | 74,015,353 | |
End of period | | $ | 76,170,742 | | | $ | 64,418,239 | |
| | | | | | | | | |
Capital share activity: | | | | | | | | |
Shares sold | �� | | 87,645 | | | | 120,097 | |
Shares issued from reinvestment of distributions | | | — | | | | 161,070 | |
Shares redeemed | | | (158,564 | ) | | | (342,024 | ) |
Net decrease in shares | | | (70,919 | ) | | | (60,857 | ) |
SEE NOTES TO FINANCIAL STATEMENTS. | THE GUGGENHEIM FUNDS SEMI-ANNUAL REPORT | 103 |
SERIES Q (SMALL CAP VALUE SERIES) | |
This table is presented to show selected data for a share outstanding throughout each period and to assist shareholders in evaluating a Fund’s performance for the periods presented.
| | Six Months Ended
June 30, 2021a | | | Year Ended
December 31,
2020 | | | Year Ended
December 31,
2019 | | | Year Ended
December 31,
2018 | | | Year Ended
December 31,
2017 | | | Year Ended
December 31,
2016 | |
Per Share Data |
Net asset value, beginning of period | | $ | 37.30 | | | $ | 41.39 | | | $ | 36.18 | | | $ | 45.89 | | | $ | 46.02 | | | $ | 39.71 | |
Income (loss) from investment operations: |
Net investment income (loss)b | | | .11 | | | | .32 | | | | .32 | | | | .30 | | | | .05 | | | | .21 | |
Net gain (loss) on investments (realized and unrealized) | | | 8.58 | | | | (1.36 | ) | | | 7.62 | | | | (5.28 | ) | | | 1.58 | | | | 9.76 | |
Total from investment operations | | | 8.69 | | | | (1.04 | ) | | | 7.94 | | | | (4.98 | ) | | | 1.63 | | | | 9.97 | |
Less distributions from: |
Net investment income | | | — | | | | (.37 | ) | | | (.33 | ) | | | (.16 | ) | | | (.17 | ) | | | (.05 | ) |
Net realized gains | | | — | | | | (2.68 | ) | | | (2.40 | ) | | | (4.57 | ) | | | (1.59 | ) | | | (3.61 | ) |
Total distributions | | | — | | | | (3.05 | ) | | | (2.73 | ) | | | (4.73 | ) | | | (1.76 | ) | | | (3.66 | ) |
Net asset value, end of period | | $ | 45.99 | | | $ | 37.30 | | | $ | 41.39 | | | $ | 36.18 | | | $ | 45.89 | | | $ | 46.02 | |
|
Total Returnc | | | 23.30 | % | | | (0.97 | %) | | | 22.58 | % | | | (12.66 | %) | | | 3.70 | % | | | 26.60 | % |
Ratios/Supplemental Data |
Net assets, end of period (in thousands) | | $ | 76,171 | | | $ | 64,418 | | | $ | 74,015 | | | $ | 68,349 | | | $ | 98,726 | | | $ | 106,304 | |
Ratios to average net assets: |
Net investment income (loss) | | | 0.49 | % | | | 0.97 | % | | | 0.80 | % | | | 0.68 | % | | | 0.11 | % | | | 0.52 | % |
Total expensesd | | | 1.21 | % | | | 1.29 | % | | | 1.29 | % | | | 1.26 | % | | | 1.23 | % | | | 1.16 | % |
Net expensese,f,g | | | 1.13 | % | | | 1.14 | % | | | 1.14 | % | | | 1.14 | % | | | 1.14 | % | | | 1.16 | % |
Portfolio turnover rate | | | 17 | % | | | 32 | % | | | 54 | % | | | 37 | % | | | 32 | % | | | 68 | % |
a | Unaudited figures for the period ended June 30, 2021. Percentage amounts for the period, except total return and portfolio turnover rate, have been annualized. |
b | Net investment income (loss) per share was computed using average shares outstanding throughout the period. |
c | Total return does not take into account any of the expenses associated with an investment in variable insurance products. If total return had taken into account these expenses, performance would have been lower. Shares of a series of Guggenheim Variable Funds Trust are available only through the purchase of such products. |
d | Does not include expenses of the underlying funds in which the Fund invests. |
e | Net expense information reflects the expense ratios after expense waivers and reimbursements, as applicable. |
f | Net expense may include expenses that are excluded from the expense limitation agreement. Excluding these expenses, the net expense ratios for the periods would be: |
| | 06/30/21a | 12/31/20 | 12/31/19 | 12/31/18 | 12/31/17 | 12/31/16 |
| | 1.13% | 1.13% | 1.14% | 1.14% | 1.12% | 1.16% |
g | The portion of the ratios of net expenses to average net assets attributable to recoupments of prior fee reductions or expense reimbursements for the periods was as follows: |
| | 06/30/21a | 12/31/20 | 12/31/19 | 12/31/18 | 12/31/17 | 12/31/16 |
| | — | — | — | — | 0.00%* | — |
104 | THE GUGGENHEIM FUNDS SEMI-ANNUAL REPORT | SEE NOTES TO FINANCIAL STATEMENTS. |
PERFORMANCE REPORT AND FUND PROFILE (Unaudited) | June 30, 2021 |
SERIES V (SMID CAP VALUE SERIES)
OBJECTIVE: Seeks long-term growth of capital.
Holdings Diversification (Market Exposure as % of Net Assets)
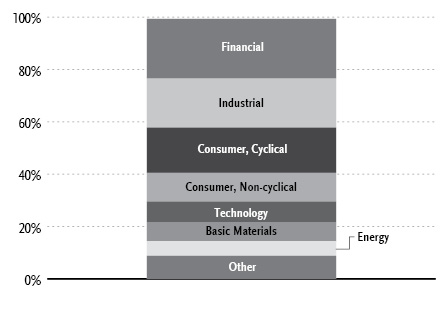
“Holdings Diversification (Market Exposure as % of Net Assets)” excludes any temporary cash investments.
Inception Date: May 1, 1997 |
Ten Largest Holdings (% of Total Net Assets) |
Pioneer Natural Resources Co. | 2.6% |
Bunge Ltd. | 2.2% |
First Horizon Corp. | 2.2% |
Alleghany Corp. | 2.0% |
Parsons Corp. | 2.0% |
LKQ Corp. | 1.8% |
Voya Financial, Inc. | 1.8% |
Range Resources Corp. | 1.6% |
Physicians Realty Trust | 1.6% |
Infinera Corp. | 1.5% |
Top Ten Total | 19.3% |
| | |
“Ten Largest Holdings” excludes any temporary cash investments. |
Average Annual Returns*,†
Periods Ended June 30, 2021
| 6 Month‡ | 1 Year | 5 Year | 10 Year |
Series V (SMid Cap Value Series) | 20.26% | 53.04% | 12.92% | 9.97% |
Russell 2500 Value Index | 22.68% | 63.23% | 12.29% | 10.93% |
* | The performance data above represents past performance that is not predictive of future results. The investment return and principal value of an investment in the Fund will fluctuate so that an investor’s shares, when redeemed, may be worth more or less than their original cost. Returns are historical and include changes in principal and reinvested dividends and capital gains and do not reflect the effect of taxes. The Russell 2500 Value Index is an unmanaged index and, unlike the Fund, has no management fees or operating expenses to reduce its reported return. |
† | Performance figures do not reflect fees and expenses associated with an investment in variable insurance products. If returns had taken into account these fees and expenses, performance would have been lower. Shares of a series of Guggenheim Variable Funds Trust are available only through the purchase of such products. |
‡ | 6 month returns are not annualized. |
| | THE GUGGENHEIM FUNDS SEMI-ANNUAL REPORT | 105 |
SCHEDULE OF INVESTMENTS (Unaudited) | June 30, 2021 |
SERIES V (SMID CAP VALUE SERIES) | |
| | Shares | | | Value | |
COMMON STOCKS† - 99.3% |
| | | | | | | | | |
Financial - 22.9% |
First Horizon Corp. | | | 245,918 | | | $ | 4,249,463 | |
Alleghany Corp.* | | | 5,855 | | | | 3,905,695 | |
Voya Financial, Inc. | | | 55,773 | | | | 3,430,040 | |
Physicians Realty Trust REIT | | | 164,446 | | | | 3,037,318 | |
Alexandria Real Estate Equities, Inc. REIT | | | 14,205 | | | | 2,584,458 | |
Axis Capital Holdings Ltd. | | | 46,003 | | | | 2,254,607 | |
VICI Properties, Inc. REIT | | | 70,712 | | | | 2,193,486 | |
Prosperity Bancshares, Inc. | | | 26,579 | | | | 1,908,372 | |
BOK Financial Corp. | | | 21,837 | | | | 1,891,084 | |
Radian Group, Inc. | | | 81,944 | | | | 1,823,254 | |
Sun Communities, Inc. REIT | | | 10,576 | | | | 1,812,726 | |
Hilltop Holdings, Inc. | | | 48,143 | | | | 1,752,405 | |
Stifel Financial Corp. | | | 26,146 | | | | 1,695,829 | |
KeyCorp | | | 72,582 | | | | 1,498,819 | |
Apple Hospitality REIT, Inc. | | | 82,613 | | | | 1,260,674 | |
Old Republic International Corp. | | | 46,321 | | | | 1,153,856 | |
Medical Properties Trust, Inc. REIT | | | 53,620 | | | | 1,077,762 | |
Heritage Insurance Holdings, Inc. | | | 124,542 | | | | 1,068,570 | |
Park Hotels & Resorts, Inc. REIT* | | | 50,975 | | | | 1,050,595 | |
STAG Industrial, Inc. REIT | | | 27,704 | | | | 1,036,961 | |
Heartland Financial USA, Inc. | | | 21,485 | | | | 1,009,580 | |
Zions Bancorp North America | | | 18,375 | | | | 971,303 | |
Unum Group | | | 33,388 | | | | 948,219 | |
Gaming and Leisure Properties, Inc. REIT | | | 19,571 | | | | 906,724 | |
Total Financial | | | | | | | 44,521,800 | |
| | | | | | | | | |
Industrial - 18.7% |
Jacobs Engineering Group, Inc. | | | 19,651 | | | | 2,621,836 | |
Kirby Corp.* | | | 38,649 | | | | 2,343,675 | |
Johnson Controls International plc | | | 32,961 | | | | 2,262,114 | |
Graphic Packaging Holding Co. | | | 119,885 | | | | 2,174,714 | |
Rexnord Corp. | | | 42,569 | | | | 2,130,153 | |
Altra Industrial Motion Corp. | | | 32,424 | | | | 2,108,208 | |
Plexus Corp.* | | | 21,533 | | | | 1,968,331 | |
Knight-Swift Transportation Holdings, Inc. | | | 42,599 | | | | 1,936,551 | |
Valmont Industries, Inc. | | | 7,997 | | | | 1,887,692 | |
PGT Innovations, Inc.* | | | 79,587 | | | | 1,848,806 | |
Colfax Corp.* | | | 39,965 | | | | 1,830,797 | |
EnerSys | | | 18,562 | | | | 1,814,064 | |
Energizer Holdings, Inc. | | | 40,672 | | | | 1,748,083 | |
Terex Corp. | | | 31,725 | | | | 1,510,744 | |
Owens Corning | | | 14,008 | | | | 1,371,383 | |
Curtiss-Wright Corp. | | | 10,964 | | | | 1,302,085 | |
Kennametal, Inc. | | | 28,392 | | | | 1,019,841 | |
Littelfuse, Inc. | | | 3,990 | | | | 1,016,612 | |
II-VI, Inc.* | | | 13,730 | | | | 996,661 | |
GATX Corp. | | | 10,780 | | | | 953,706 | |
Park Aerospace Corp. | | | 63,025 | | | | 939,073 | |
Howmet Aerospace, Inc.* | | | 16,386 | | | | 564,825 | |
Total Industrial | | | | | | | 36,349,954 | |
| | | | | | | | | |
Consumer, Cyclical - 17.3% |
LKQ Corp.* | | | 72,822 | | | | 3,584,299 | |
Kohl’s Corp. | | | 41,202 | | | | 2,270,642 | |
MSC Industrial Direct Company, Inc. — Class A | | | 22,407 | | | | 2,010,580 | |
PVH Corp.* | | | 18,398 | | | | 1,979,441 | |
KAR Auction Services, Inc.* | | | 112,121 | | | | 1,967,723 | |
Alaska Air Group, Inc.* | | | 32,117 | | | | 1,936,976 | |
Penske Automotive Group, Inc. | | | 24,295 | | | | 1,834,030 | |
Abercrombie & Fitch Co. — Class A* | | | 37,831 | | | | 1,756,493 | |
Ralph Lauren Corp. — Class A | | | 13,536 | | | | 1,594,676 | |
Dick’s Sporting Goods, Inc. | | | 15,861 | | | | 1,589,114 | |
Avient Corp. | | | 30,730 | | | | 1,510,687 | |
Urban Outfitters, Inc.* | | | 32,119 | | | | 1,323,945 | |
Methode Electronics, Inc. | | | 26,885 | | | | 1,323,011 | |
Lear Corp. | | | 7,479 | | | | 1,310,919 | |
Skechers USA, Inc. — Class A* | | | 23,767 | | | | 1,184,310 | |
DR Horton, Inc. | | | 12,860 | | | | 1,162,158 | |
Zumiez, Inc.* | | | 22,656 | | | | 1,109,917 | |
Movado Group, Inc. | | | 34,347 | | | | 1,080,900 | |
Big Lots, Inc. | | | 14,858 | | | | 980,777 | |
Dana, Inc. | | | 38,966 | | | | 925,832 | |
Lakeland Industries, Inc.* | | | 35,963 | | | | 803,054 | |
La-Z-Boy, Inc. | | | 13,202 | | | | 489,002 | |
Total Consumer, Cyclical | | | | | | | 33,728,486 | |
| | | | | | | | | |
Consumer, Non-cyclical - 11.0% |
Bunge Ltd. | | | 54,912 | | | | 4,291,373 | |
Encompass Health Corp. | | | 31,114 | | | | 2,427,825 | |
Central Garden & Pet Co. — Class A* | | | 43,114 | | | | 2,082,406 | |
Sabre Corp.* | | | 153,048 | | | | 1,910,039 | |
US Foods Holding Corp.* | | | 45,191 | | | | 1,733,527 | |
Integer Holdings Corp.* | | | 17,381 | | | | 1,637,290 | |
Ingredion, Inc. | | | 16,839 | | | | 1,523,930 | |
Emergent BioSolutions, Inc.* | | | 22,794 | | | | 1,435,794 | |
Tyson Foods, Inc. — Class A | | | 18,994 | | | | 1,400,997 | |
J M Smucker Co. | | | 8,196 | | | | 1,061,956 | |
Pacira BioSciences, Inc.* | | | 15,959 | | | | 968,392 | |
Henry Schein, Inc.* | | | 12,473 | | | | 925,372 | |
Total Consumer, Non-cyclical | | | | | | | 21,398,901 | |
| | | | | | | | | |
Technology - 7.8% |
Parsons Corp.* | | | 97,262 | | | | 3,828,232 | |
Evolent Health, Inc. — Class A* | | | 129,629 | | | | 2,737,765 | |
DXC Technology Co.* | | | 61,893 | | | | 2,410,114 | |
Science Applications International Corp. | | | 23,262 | | | | 2,040,775 | |
Leidos Holdings, Inc. | | | 19,309 | | | | 1,952,140 | |
Skyworks Solutions, Inc. | | | 6,098 | | | | 1,169,291 | |
Qorvo, Inc.* | | | 5,812 | | | | 1,137,118 | |
Total Technology | | | | | | | 15,275,435 | |
| | | | | | | | | |
Basic Materials - 7.2% |
Huntsman Corp. | | | 95,151 | | | | 2,523,405 | |
Ashland Global Holdings, Inc. | | | 27,027 | | | | 2,364,863 | |
Westlake Chemical Corp. | | | 25,390 | | | | 2,287,385 | |
Commercial Metals Co. | | | 59,376 | | | | 1,824,031 | |
Element Solutions, Inc. | | | 67,298 | | | | 1,573,427 | |
Reliance Steel & Aluminum Co. | | | 9,765 | | | | 1,473,538 | |
Kraton Corp.* | | | 29,931 | | | | 966,472 | |
106 | THE GUGGENHEIM FUNDS SEMI-ANNUAL REPORT | SEE NOTES TO FINANCIAL STATEMENTS. |
SCHEDULE OF INVESTMENTS (Unaudited)(continued) | June 30, 2021 |
SERIES V (SMID CAP VALUE SERIES) | |
| | Shares | | | Value | |
Nucor Corp. | | | 9,527 | | | $ | 913,925 | |
Total Basic Materials | | | | | | | 13,927,046 | |
| | | | | | | | | |
Energy - 5.6% |
Pioneer Natural Resources Co. | | | 30,929 | | | | 5,026,581 | |
Range Resources Corp.* | | | 184,618 | | | | 3,094,198 | |
Patterson-UTI Energy, Inc. | | | 284,964 | | | | 2,832,542 | |
HydroGen Corp.*,†††,1 | | | 672,346 | | | | 1 | |
Total Energy | | | | | | | 10,953,322 | |
| | | | | | | | | |
Communications - 5.1% |
Infinera Corp.* | | | 285,587 | | | | 2,912,987 | |
Viavi Solutions, Inc.* | | | 121,514 | | | | 2,145,937 | |
TEGNA, Inc. | | | 104,531 | | | | 1,961,002 | |
Ciena Corp.* | | | 25,828 | | | | 1,469,355 | |
FireEye, Inc.* | | | 69,983 | | | | 1,415,056 | |
Total Communications | | | | | | | 9,904,337 | |
| | | | | | | | | |
Utilities - 3.7% |
Black Hills Corp. | | | 23,547 | | | | 1,545,390 | |
Pinnacle West Capital Corp. | | | 18,086 | | | | 1,482,509 | |
Avista Corp. | | | 33,993 | | | | 1,450,481 | |
Southwest Gas Holdings, Inc. | | | 21,495 | | | | 1,422,754 | |
Spire, Inc. | | | 17,968 | | | | 1,298,548 | |
Total Utilities | | | | | | | 7,199,682 | |
| | | | | | | | | |
Total Common Stocks | | | | |
(Cost $151,984,622) | | | | | | | 193,258,963 | |
| | | | | | | | | |
CONVERTIBLE PREFERRED STOCKS††† - 0.0% |
Industrial - 0.0% |
Thermoenergy Corp.*,2 | | | 308,333 | | | | 90 | |
Total Convertible Preferred Stocks | | | | |
(Cost $294,438) | | | | | | | 90 | |
| | | | | | | | | |
RIGHTS† - 0.1% |
Basic Materials - 0.1% |
Pan American Silver Corp.* | | | 220,317 | | | | 187,270 | |
Total Rights | | | | |
(Cost $—) | | | | | | | 187,270 | |
| | | | | | | | | |
MONEY MARKET FUND† - 0.3% |
Dreyfus Treasury Securities Cash Management Fund — Institutional Shares, 0.01%3 | | | 629,195 | | | | 629,195 | |
Total Money Market Fund | | | | |
(Cost $629,195) | | | | | | | 629,195 | |
| | | | | | | | | |
Total Investments - 99.7% | | | | |
(Cost $152,908,255) | | $ | 194,075,518 | |
Other Assets & Liabilities, net - 0.3% | | | 584,199 | |
Total Net Assets - 100.0% | | $ | 194,659,717 | |
* | Non-income producing security. |
† | Value determined based on Level 1 inputs, unless otherwise noted — See Note 4. |
††† | Value determined based on Level 3 inputs — See Note 4. |
1 | Affiliated issuer. |
2 | PIPE (Private Investment in Public Equity) — Stock issued by a company in the secondary market as a means of raising capital more quickly and less expensively than through registration of a secondary public offering. |
3 | Rate indicated is the 7-day yield as of June 30, 2021. |
| | plc — Public Limited Company |
| | REIT — Real Estate Investment Trust |
| | |
| | See Sector Classification in Other Information section. |
The following table summarizes the inputs used to value the Fund’s investments at June 30, 2021 (See Note 4 in the Notes to Financial Statements):
Investments in Securities (Assets) | | Level 1
Quoted
Prices | | | Level 2
Significant
Observable
Inputs | | | Level 3
Significant
Unobservable
Inputs | | | Total | |
Common Stocks | | $ | 193,258,962 | | | $ | — | | | $ | 1 | | | $ | 193,258,963 | |
Convertible Preferred Stocks | | | — | | | | — | | | | 90 | | | | 90 | |
Rights | | | 187,270 | | | | — | | | | — | | | | 187,270 | |
Money Market Fund | | | 629,195 | | | | — | | | | — | | | | 629,195 | |
Total Assets | | $ | 194,075,427 | | | $ | — | | | $ | 91 | | | $ | 194,075,518 | |
SEE NOTES TO FINANCIAL STATEMENTS. | THE GUGGENHEIM FUNDS SEMI-ANNUAL REPORT | 107 |
SCHEDULE OF INVESTMENTS (Unaudited)(concluded) | June 30, 2021 |
SERIES V (SMID CAP VALUE SERIES) | |
Affiliated Transactions
Investments representing 5% or more of the outstanding voting shares of a company, or control of or by, or common control under Guggenheim Investments, result in that company being considered an affiliated issuer, as defined in the 1940 Act.
Transactions during the period ended June 30, 2021, in which the company is an affiliated issuer, were as follows:
Security Name | | Value
12/31/20 | | | Additions | | | Reductions | | | Realized
Gain (Loss) | | | Change in
Unrealized
Appreciation
(Depreciation) | | | Value
06/30/21 | | | Shares
06/30/21 | |
Common Stock | | | | | | | | | | | | | | | | | | | | | | | | | | | | |
HydroGen Corp.* | | $ | 1 | | | $ | — | | | $ | — | | | $ | — | | | $ | — | | | $ | 1 | | | | 672,346 | |
* | Non-income producing security. |
108 | THE GUGGENHEIM FUNDS SEMI-ANNUAL REPORT | SEE NOTES TO FINANCIAL STATEMENTS. |
SERIES V (SMID CAP VALUE SERIES) | |
STATEMENT OF ASSETS AND LIABILITIES (Unaudited) |
June 30, 2021 |
Assets: |
Investments in unaffiliated issuers, at value (cost $150,336,680) | | $ | 194,075,517 | |
Investments in affiliated issuers, at value (cost $2,571,575) | | | 1 | |
Prepaid expenses | | | 1,256 | |
Receivables: |
Securities sold | | | 1,442,842 | |
Dividends | | | 264,850 | |
Fund shares sold | | | 60,494 | |
Interest | | | 2 | |
Total assets | | | 195,844,962 | |
| | | | | |
Liabilities: |
Payable for: |
Securities purchased | | | 969,801 | |
Management fees | | | 85,736 | |
Distribution and service fees | | | 40,814 | |
Fund shares redeemed | | | 25,172 | |
Fund accounting/administration fees | | | 12,143 | |
Trustees’ fees* | | | 3,435 | |
Transfer agent/maintenance fees | | | 3,192 | |
Miscellaneous | | | 44,952 | |
Total liabilities | | | 1,185,245 | |
Commitments and contingent liabilities (Note 12) | | | — | |
Net assets | | $ | 194,659,717 | |
| | | | | |
Net assets consist of: |
Paid in capital | | $ | 136,091,589 | |
Total distributable earnings (loss) | | | 58,568,128 | |
Net assets | | $ | 194,659,717 | |
Capital shares outstanding | | | 2,369,550 | |
Net asset value per share | | $ | 82.15 | |
STATEMENT OF OPERATIONS (Unaudited) |
Six Months Ended June 30, 2021 |
Investment Income: |
Dividends from securities of unaffiliated issuers | | $ | 1,496,615 | |
Interest | | | 114 | |
Total investment income | | | 1,496,729 | |
| | | | | |
Expenses: |
Management fees | | | 716,107 | |
Distribution and service fees | | | 238,702 | |
Transfer agent/maintenance fees | | | 12,462 | |
Fund accounting/administration fees | | | 67,542 | |
Professional fees | | | 21,392 | |
Trustees’ fees* | | | 10,679 | |
Custodian fees | | | 4,257 | |
Line of credit fees | | | 3,827 | |
Miscellaneous | | | 7,839 | |
Total expenses | | | 1,082,807 | |
Less: |
Expenses waived by Adviser | | | (223,227 | ) |
Net expenses | | | 859,580 | |
Net investment income | | | 637,149 | |
| | | | | |
Net Realized and Unrealized Gain (Loss): |
Net realized gain (loss) on: |
Investments in unaffiliated issuers | | | 16,773,359 | |
Net realized gain | | | 16,773,359 | |
Net change in unrealized appreciation (depreciation) on: |
Investments in unaffiliated issuers | | | 16,989,349 | |
Net change in unrealized appreciation (depreciation) | | | 16,989,349 | |
Net realized and unrealized gain | | | 33,762,708 | |
Net increase in net assets resulting from operations | | $ | 34,399,857 | |
* | Relates to Trustees not deemed “interested persons” within the meaning of Section 2(a)(19) of the 1940 Act. |
SEE NOTES TO FINANCIAL STATEMENTS. | THE GUGGENHEIM FUNDS SEMI-ANNUAL REPORT | 109 |
SERIES V (SMID CAP VALUE SERIES) | |
STATEMENTS OF CHANGES IN NET ASSETS |
| | Six Months Ended
June 30, 2021
(Unaudited) | | | Year Ended
December 31,
2020 | |
Increase (Decrease) in Net Assets from Operations: | | | | | | | | |
Net investment income | | $ | 637,149 | | | $ | 3,240,442 | |
Net realized gain (loss) on investments | | | 16,773,359 | | | | (3,032,217 | ) |
Net change in unrealized appreciation (depreciation) on investments | | | 16,989,349 | | | | 2,945,264 | |
Net increase in net assets resulting from operations | | | 34,399,857 | | | | 3,153,489 | |
| | | | | | | | | |
Distributions to shareholders | | | — | | | | (8,192,481 | ) |
| | | | | | | | | |
Capital share transactions: | | | | | | | | |
Proceeds from sale of shares | | | 3,914,296 | | | | 3,673,402 | |
Distributions reinvested | | | — | | | | 8,192,481 | |
Cost of shares redeemed | | | (16,094,611 | ) | | | (29,593,956 | ) |
Net decrease from capital share transactions | | | (12,180,315 | ) | | | (17,728,073 | ) |
Net increase (decrease) in net assets | | | 22,219,542 | | | | (22,767,065 | ) |
| | | | | | | | | |
Net assets: | | | | | | | | |
Beginning of period | | | 172,440,175 | | | | 195,207,240 | |
End of period | | $ | 194,659,717 | | | $ | 172,440,175 | |
| | | | | | | | | |
Capital share activity: | | | | | | | | |
Shares sold | | | 49,110 | | | | 65,752 | |
Shares issued from reinvestment of distributions | | | — | | | | 145,257 | |
Shares redeemed | | | (203,819 | ) | | | (508,289 | ) |
Net decrease in shares | | | (154,709 | ) | | | (297,280 | ) |
110 | THE GUGGENHEIM FUNDS SEMI-ANNUAL REPORT | SEE NOTES TO FINANCIAL STATEMENTS. |
SERIES V (SMID CAP VALUE SERIES) | |
This table is presented to show selected data for a share outstanding throughout each period and to assist shareholders in evaluating a Fund’s performance for the periods presented.
| | Six Months Ended
June 30, 2021a | | | Year Ended
December 31,
2020 | | | Year Ended
December 31,
2019 | | | Year Ended
December 31,
2018 | | | Year Ended
December 31,
2017 | | | Year Ended
December 31,
2016 | |
Per Share Data |
Net asset value, beginning of period | | $ | 68.31 | | | $ | 69.18 | | | $ | 61.70 | | | $ | 82.36 | | | $ | 74.35 | | | $ | 65.74 | |
Income (loss) from investment operations: |
Net investment income (loss)b | | | .26 | | | | 1.21 | | | | .68 | | | | .53 | | | | (.16 | ) | | | .99 | |
Net gain (loss) on investments (realized and unrealized) | | | 13.58 | | | | 1.10 | f | | | 15.01 | | | | (9.07 | ) | | | 10.16 | | | | 15.50 | |
Total from investment operations | | | 13.84 | | | | 2.31 | | | | 15.69 | | | | (8.54 | ) | | | 10.00 | | | | 16.49 | |
Less distributions from: |
Net investment income | | | — | | | | (.77 | ) | | | (.64 | ) | | | (.49 | ) | | | (.52 | ) | | | (.68 | ) |
Net realized gains | | | — | | | | (2.41 | ) | | | (7.57 | ) | | | (11.63 | ) | | | (1.47 | ) | | | (7.20 | ) |
Total distributions | | | — | | | | (3.18 | ) | | | (8.21 | ) | | | (12.12 | ) | | | (1.99 | ) | | | (7.88 | ) |
Net asset value, end of period | | $ | 82.15 | | | $ | 68.31 | | | $ | 69.18 | | | $ | 61.70 | | | $ | 82.36 | | | $ | 74.35 | |
|
Total Returnc | | | 20.26 | % | | | 4.30 | % | | | 26.70 | % | | | (12.97 | %) | | | 13.71 | % | | | 26.75 | % |
Ratios/Supplemental Data |
Net assets, end of period (in thousands) | | $ | 194,660 | | | $ | 172,440 | | | $ | 195,207 | | | $ | 176,113 | | | $ | 242,217 | | | $ | 248,062 | |
Ratios to average net assets: |
Net investment income (loss) | | | 0.67 | % | | | 2.05 | % | | | 1.01 | % | | | 0.68 | % | | | (0.21 | %) | | | 1.46 | % |
Total expenses | | | 1.13 | % | | | 1.22 | % | | | 1.19 | % | | | 1.19 | % | | | 1.10 | % | | | 0.93 | % |
Net expensesd,e | | | 0.90 | % | | | 0.90 | % | | | 0.91 | % | | | 0.91 | % | | | 0.91 | % | | | 0.93 | % |
Portfolio turnover rate | | | 21 | % | | | 38 | % | | | 41 | % | | | 65 | % | | | 54 | % | | | 60 | % |
a | Unaudited figures for the period ended June 30, 2021. Percentage amounts for the period, except total return and portfolio turnover rate, have been annualized. |
b | Net investment income (loss) per share was computed using average shares outstanding throughout the period. |
c | Total return does not take into account any of the expenses associated with an investment in variable insurance products. If total return had taken into account these expenses, performance would have been lower. Shares of a series of Guggenheim Variable Funds Trust are available only through the purchase of such products. |
d | Net expense information reflects the expense ratios after expense waivers and reimbursements, as applicable. |
e | Net expenses may include expenses that are excluded from the expense limitation agreement. Excluding these expenses, the net expense ratios for the periods presented would be: |
| | 06/30/21a | 12/31/20 | 12/31/19 | 12/31/18 | 12/31/17 | 12/31/16 |
| | 0.90% | 0.90% | 0.91% | 0.91% | 0.89% | 0.93% |
f | The amount shown for a share outstanding throughout the period does not agree with the aggregate net loss on investments for the period because of the sales and repurchases of fund shares in relation to fluctuating market value of the investments of the Fund. |
SEE NOTES TO FINANCIAL STATEMENTS. | THE GUGGENHEIM FUNDS SEMI-ANNUAL REPORT | 111 |
PERFORMANCE REPORT AND FUND PROFILE (Unaudited) | June 30, 2021 |
SERIES X (STYLEPLUS—SMALL GROWTH SERIES)
OBJECTIVE: Seeks long-term growth of capital.
Holdings Diversification (Market Exposure as % of Net Assets)
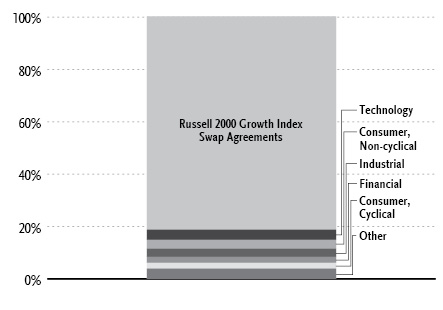
“Holdings Diversification (Market Exposure as % of Net Assets)” excludes any temporary cash investments, investments in Guggenheim Strategy Funds Trust mutual funds, or investments in Guggenheim Ultra Short Duration Fund.
Inception Date: October 15, 1997 |
Ten Largest Holdings (% of Total Net Assets) |
Guggenheim Ultra Short Duration Fund — Institutional Class | 21.8% |
Guggenheim Strategy Fund III | 19.8% |
Guggenheim Variable Insurance Strategy Fund III | 19.8% |
Guggenheim Strategy Fund II | 16.6% |
Viavi Solutions, Inc. | 0.3% |
Power Integrations, Inc. | 0.2% |
Advanced Energy Industries, Inc. | 0.2% |
Hillenbrand, Inc. | 0.2% |
CSG Systems International, Inc. | 0.2% |
Axos Financial, Inc. | 0.2% |
Top Ten Total | 79.3% |
| | |
“Ten Largest Holdings” excludes any temporary cash or derivative investments. |
Average Annual Returns*,†
Periods Ended June 30, 2021
| 6 Month‡ | 1 Year | 5 Year | 10 Year |
Series X (StylePlus—Small Growth Series) | 10.26% | 53.96% | 18.09% | 13.12% |
Russell 2000 Growth Index | 8.98% | 51.36% | 18.76% | 13.52% |
* | The performance data above represents past performance that is not predictive of future results. The investment return and principal value of an investment in the Fund will fluctuate so that an investor’s shares, when redeemed, may be worth more or less than their original cost. Returns are historical and include changes in principal and reinvested dividends and capital gains and do not reflect the effect of taxes. The Russell 2000 Growth Index is an unmanaged index and, unlike the Fund, has no management fees or operating expenses to reduce its reported return. |
† | Performance figures do not reflect fees and expenses associated with an investment in variable insurance products. If returns had taken into account these fees and expenses, performance would have been lower. Shares of a series of Guggenheim Variable Funds Trust are available only through the purchase of such products. |
‡ | 6 month returns are not annualized. |
112 THE GUGGENHEIM FUNDS SEMI-ANNUAL REPORT | |
SCHEDULE OF INVESTMENTS (Unaudited) | June 30, 2021 |
SERIES X (STYLEPLUS—SMALL GROWTH SERIES) | |
| | Shares | | | Value | |
COMMON STOCKS† - 16.4% |
| | | | | | | | | |
Technology - 3.9% |
Power Integrations, Inc. | | | 1,135 | | | $ | 93,138 | |
CSG Systems International, Inc. | | | 1,699 | | | | 80,159 | |
Rambus, Inc.* | | | 3,295 | | | | 78,125 | |
Progress Software Corp. | | | 1,663 | | | | 76,914 | |
FormFactor, Inc.* | | | 1,996 | | | | 72,774 | |
Diodes, Inc.* | | | 856 | | | | 68,283 | |
ExlService Holdings, Inc.* | | | 592 | | | | 62,906 | |
Kulicke & Soffa Industries, Inc. | | | 1,005 | | | | 61,506 | |
Onto Innovation, Inc.* | | | 811 | | | | 59,235 | |
SPS Commerce, Inc.* | | | 590 | | | | 58,912 | |
MicroStrategy, Inc. — Class A* | | | 80 | | | | 53,160 | |
LivePerson, Inc.* | | | 798 | | | | 50,466 | |
MaxLinear, Inc. — Class A* | | | 1,110 | | | | 47,164 | |
Computer Programs & Systems, Inc. | | | 1,380 | | | | 45,857 | |
CEVA, Inc.* | | | 944 | | | | 44,651 | |
Synaptics, Inc.* | | | 281 | | | | 43,718 | |
Cirrus Logic, Inc.* | | | 498 | | | | 42,390 | |
Xperi Holding Corp. | | | 1,881 | | | | 41,833 | |
CTS Corp. | | | 1,048 | | | | 38,944 | |
TTEC Holdings, Inc. | | | 355 | | | | 36,597 | |
Allscripts Healthcare Solutions, Inc.* | | | 1,917 | | | | 35,484 | |
Axcelis Technologies, Inc.* | | | 865 | | | | 34,963 | |
Photronics, Inc.* | | | 2,472 | | | | 32,655 | |
Ultra Clean Holdings, Inc.* | | | 606 | | | | 32,554 | |
NextGen Healthcare, Inc.* | | | 1,916 | | | | 31,787 | |
8x8, Inc.* | | | 1,116 | | | | 30,980 | |
Agilysys, Inc.* | | | 544 | | | | 30,937 | |
Lumentum Holdings, Inc.* | | | 368 | | | | 30,187 | |
Veeco Instruments, Inc.* | | | 1,255 | | | | 30,170 | |
Simulations Plus, Inc. | | | 486 | | | | 26,686 | |
DSP Group, Inc.* | | | 1,667 | | | | 24,672 | |
Digi International, Inc.* | | | 1,049 | | | | 21,095 | |
CDK Global, Inc. | | | 417 | | | | 20,721 | |
Qualys, Inc.* | | | 193 | | | | 19,433 | |
Total Technology | | | | | | | 1,559,056 | |
| | | | | | | | | |
Consumer, Non-cyclical - 3.4% |
Ensign Group, Inc. | | | 910 | | | | 78,870 | |
Alarm.com Holdings, Inc.* | | | 806 | | | | 68,268 | |
EVERTEC, Inc. | | | 1,509 | | | | 65,868 | |
Select Medical Holdings Corp. | | | 1,333 | | | | 56,332 | |
Innoviva, Inc.* | | | 4,192 | | | | 56,215 | |
Omnicell, Inc.* | | | 367 | | | | 55,582 | |
Eagle Pharmaceuticals, Inc.* | | | 1,282 | | | | 54,870 | |
Coherus Biosciences, Inc.* | | | 3,724 | | | | 51,503 | |
Vanda Pharmaceuticals, Inc.* | | | 2,231 | | | | 47,989 | |
Corcept Therapeutics, Inc.* | | | 2,129 | | | | 46,838 | |
Fulgent Genetics, Inc.* | | | 491 | | | | 45,285 | |
Chemed Corp. | | | 90 | | | | 42,705 | |
Supernus Pharmaceuticals, Inc.* | | | 1,368 | | | | 42,121 | |
Vector Group Ltd. | | | 2,929 | | | | 41,416 | |
Surmodics, Inc.* | | | 741 | | | | 40,200 | |
Xencor, Inc.* | | | 1,157 | | | | 39,905 | |
Medifast, Inc. | | | 140 | | | | 39,617 | |
Pacira BioSciences, Inc.* | | | 627 | | | | 38,046 | |
CorVel Corp.* | | | 275 | | | | 36,933 | |
Rent-A-Center, Inc. | | | 672 | | | | 35,663 | |
US Physical Therapy, Inc. | | | 289 | | | | 33,486 | |
Collegium Pharmaceutical, Inc.* | | | 1,380 | | | | 32,623 | |
Meridian Bioscience, Inc.* | | | 1,428 | | | | 31,673 | |
United Therapeutics Corp.* | | | 165 | | | | 29,603 | |
Owens & Minor, Inc. | | | 691 | | | | 29,250 | |
NeoGenomics, Inc.* | | | 640 | | | | 28,909 | |
Enanta Pharmaceuticals, Inc.* | | | 655 | | | | 28,826 | |
RadNet, Inc.* | | | 788 | | | | 26,548 | |
ModivCare, Inc.* | | | 156 | | | | 26,531 | |
Community Health Systems, Inc.* | | | 1,705 | | | | 26,325 | |
Tivity Health, Inc.* | | | 990 | | | | 26,047 | |
Halozyme Therapeutics, Inc.* | | | 510 | | | | 23,159 | |
Perdoceo Education Corp.* | | | 1,696 | | | | 20,810 | |
Cara Therapeutics, Inc.* | | | 1,420 | | | | 20,263 | |
Exelixis, Inc.* | | | 1,037 | | | | 18,894 | |
Total Consumer, Non-cyclical | | | | | | | 1,387,173 | |
| | | | | | | | | |
Industrial - 3.1% |
Advanced Energy Industries, Inc. | | | 767 | | | | 86,449 | |
Hillenbrand, Inc. | | | 1,936 | | | | 85,339 | |
Mueller Industries, Inc. | | | 1,737 | | | | 75,229 | |
OSI Systems, Inc.* | | | 693 | | | | 70,437 | |
UFP Industries, Inc. | | | 891 | | | | 66,237 | |
Alamo Group, Inc. | | | 407 | | | | 62,141 | |
Chart Industries, Inc.* | | | 416 | | | | 60,869 | |
Comfort Systems USA, Inc. | | | 740 | | | | 58,304 | |
Eagle Materials, Inc. | | | 397 | | | | 56,418 | |
Applied Industrial Technologies, Inc. | | | 555 | | | | 50,538 | |
Sturm Ruger & Company, Inc. | | | 538 | | | | 48,409 | |
Albany International Corp. — Class A | | | 542 | | | | 48,379 | |
Tennant Co. | | | 591 | | | | 47,191 | |
John Bean Technologies Corp. | | | 314 | | | | 44,783 | |
MYR Group, Inc.* | | | 489 | | | | 44,460 | |
Badger Meter, Inc. | | | 420 | | | | 41,210 | |
Matson, Inc. | | | 633 | | | | 40,512 | |
Patrick Industries, Inc. | | | 500 | | | | 36,500 | |
Proto Labs, Inc.* | | | 372 | | | | 34,150 | |
AeroVironment, Inc.* | | | 338 | | | | 33,851 | |
Insteel Industries, Inc. | | | 1,012 | | | | 32,536 | |
Louisiana-Pacific Corp. | | | 491 | | | | 29,602 | |
Timken Co. | | | 353 | | | | 28,448 | |
American Woodmark Corp.* | | | 275 | | | | 22,465 | |
Saia, Inc.* | | | 96 | | | | 20,111 | |
Dorian LPG Ltd.* | | | 1,392 | | | | 19,655 | |
Total Industrial | | | | | | | 1,244,223 | |
| | | | | | | | | |
Financial - 2.3% |
Axos Financial, Inc.* | | | 1,715 | | | | 79,559 | |
Walker & Dunlop, Inc. | | | 578 | | | | 60,331 | |
NMI Holdings, Inc. — Class A* | | | 2,387 | | | | 53,660 | |
Brighthouse Financial, Inc.* | | | 1,141 | | | | 51,961 | |
Piper Sandler Cos. | | | 383 | | | | 49,621 | |
ServisFirst Bancshares, Inc. | | | 707 | | | | 48,062 | |
Hilltop Holdings, Inc. | | | 1,262 | | | | 45,937 | |
SEE NOTES TO FINANCIAL STATEMENTS. | THE GUGGENHEIM FUNDS SEMI-ANNUAL REPORT | 113 |
SCHEDULE OF INVESTMENTS (Unaudited)(continued) | June 30, 2021 |
SERIES X (STYLEPLUS—SMALL GROWTH SERIES) | |
| | Shares | | | Value | |
Umpqua Holdings Corp. | | | 2,474 | | | $ | 45,645 | |
Interactive Brokers Group, Inc. — Class A | | | 684 | | | | 44,959 | |
Virtus Investment Partners, Inc. | | | 154 | | | | 42,777 | |
Innovative Industrial Properties, Inc. REIT | | | 223 | | | | 42,597 | |
Great Western Bancorp, Inc. | | | 1,157 | | | | 37,938 | |
Federated Hermes, Inc. — Class B | | | 993 | | | | 33,673 | |
PacWest Bancorp | | | 792 | | | | 32,599 | |
AMERISAFE, Inc. | | | 535 | | | | 31,934 | |
Mr Cooper Group, Inc.* | | | 955 | | | | 31,572 | |
Meta Financial Group, Inc. | | | 606 | | | | 30,682 | |
PRA Group, Inc.* | | | 776 | | | | 29,853 | |
Evercore, Inc. — Class A | | | 209 | | | | 29,421 | |
Essent Group Ltd. | | | 574 | | | | 25,801 | |
HCI Group, Inc. | | | 222 | | | | 22,074 | |
World Acceptance Corp.* | | | 123 | | | | 19,709 | |
Essential Properties Realty Trust, Inc. REIT | | | 698 | | | | 18,874 | |
Agree Realty Corp. REIT | | | 185 | | | | 13,041 | |
Total Financial | | | | | | | 922,280 | |
| | | | | | | | | |
Consumer, Cyclical - 2.2% |
Meritage Homes Corp.* | | | 740 | | | | 69,619 | |
LGI Homes, Inc.* | | | 413 | | | | 66,881 | |
Vista Outdoor, Inc.* | | | 1,297 | | | | 60,025 | |
Sleep Number Corp.* | | | 527 | | | | 57,944 | |
Century Communities, Inc. | | | 798 | | | | 53,099 | |
iRobot Corp.* | | | 507 | | | | 47,349 | |
Methode Electronics, Inc. | | | 928 | | | | 45,667 | |
Big Lots, Inc. | | | 681 | | | | 44,953 | |
Installed Building Products, Inc. | | | 356 | | | | 43,560 | |
Dorman Products, Inc.* | | | 404 | | | | 41,883 | |
LCI Industries | | | 310 | | | | 40,740 | |
MarineMax, Inc.* | | | 775 | | | | 37,773 | |
Tupperware Brands Corp.* | | | 1,499 | | | | 35,601 | |
Kontoor Brands, Inc. | | | 557 | | | | 31,420 | |
Gentherm, Inc.* | | | 439 | | | | 31,191 | |
Winnebago Industries, Inc. | | | 410 | | | | 27,864 | |
Brunswick Corp. | | | 245 | | | | 24,407 | |
Polaris, Inc. | | | 153 | | | | 20,955 | |
Haverty Furniture Companies, Inc. | | | 482 | | | | 20,610 | |
PetMed Express, Inc. | | | 646 | | | | 20,575 | |
Universal Electronics, Inc.* | | | 406 | | | | 19,691 | |
Jack in the Box, Inc. | | | 168 | | | | 18,722 | |
Shake Shack, Inc. — Class A* | | | 133 | | | | 14,234 | |
MDC Holdings, Inc. | | | 1 | | | | 41 | |
Total Consumer, Cyclical | | | | | | | 874,804 | |
| | | | | | | | | |
Communications - 0.9% |
Viavi Solutions, Inc.* | | | 6,856 | | | | 121,077 | |
Stamps.com, Inc.* | | | 298 | | | | 59,686 | |
HealthStream, Inc.* | | | 2,067 | | | | 57,752 | |
Shutterstock, Inc. | | | 376 | | | | 36,912 | |
Extreme Networks, Inc.* | | | 2,899 | | | | 32,353 | |
Plantronics, Inc.* | | | 553 | | | | 23,077 | |
Shenandoah Telecommunications Co. | | | 456 | | | | 22,120 | |
Vonage Holdings Corp.* | | | 907 | | | | 13,070 | |
Total Communications | | | | | | | 366,047 | |
| | | | | | | | | |
Basic Materials - 0.4% |
Ingevity Corp.* | | | 623 | | | | 50,687 | |
Rogers Corp.* | | | 173 | | | | 34,739 | |
NewMarket Corp. | | | 83 | | | | 26,724 | |
Valvoline, Inc. | | | 791 | | | | 25,676 | |
Balchem Corp. | | | 101 | | | | 13,257 | |
Total Basic Materials | | | | | | | 151,083 | |
| | | | | | | | | |
Energy - 0.2% |
Renewable Energy Group, Inc.* | | | 660 | | | | 41,144 | |
Antero Midstream Corp. | | | 1,889 | | | | 19,627 | |
Equitrans Midstream Corp. | | | 2,079 | | | | 17,692 | |
Total Energy | | | | | | | 78,463 | |
| | | | | | | | | |
Total Common Stocks | | | | |
(Cost $5,772,629) | | | | | | | 6,583,129 | |
| | | | | | | | | |
MUTUAL FUNDS† - 78.0% |
Guggenheim Ultra Short Duration Fund — Institutional Class1 | | | 879,256 | | | | 8,766,186 | |
Guggenheim Strategy Fund III1 | | | 316,471 | | | | 7,962,410 | |
Guggenheim Variable Insurance Strategy Fund III1 | | | 316,818 | | | | 7,942,636 | |
Guggenheim Strategy Fund II1 | | | 266,339 | | | | 6,655,818 | |
Total Mutual Funds | | | | |
(Cost $31,207,154) | | | | | | | 31,327,050 | |
| | | | | | | | | |
MONEY MARKET FUND† - 5.4% |
Dreyfus Treasury Securities Cash Management Fund — Institutional Shares, 0.01%2 | | | 2,169,280 | | | | 2,169,280 | |
Total Money Market Fund | | | | |
(Cost $2,169,280) | | | | | | | 2,169,280 | |
| | | | | | | | | |
Total Investments - 99.8% | | | | |
(Cost $39,149,063) | | $ | 40,079,459 | |
Other Assets & Liabilities, net - 0.2% | | | 61,234 | |
Total Net Assets - 100.0% | | $ | 40,140,693 | |
114 | THE GUGGENHEIM FUNDS SEMI-ANNUAL REPORT | SEE NOTES TO FINANCIAL STATEMENTS. |
SCHEDULE OF INVESTMENTS (Unaudited)(continued) | June 30, 2021 |
SERIES X (STYLEPLUS—SMALL GROWTH SERIES) | |
Futures Contracts |
Description | | Number of
Contracts | | | Expiration
Date | | | Notional
Amount | | | Value and
Unrealized
Depreciation** | |
Equity Futures Contracts Purchased† |
Russell 2000 Index Mini Futures Contracts | | | 4 | | | | Sep 2021 | | | $ | 461,160 | | | $ | (2,063 | ) |
S&P MidCap 400 Index Mini Futures Contracts | | | 2 | | | | Sep 2021 | | | | 538,140 | | | | (5,817 | ) |
| | | | | | | | | | | $ | 999,300 | | | $ | (7,880 | ) |
Total Return Swap Agreements |
Counterparty | Index | Financing
Rate Pay
(Receive) | Payment
Frequency | | Maturity Date | | | Units | | | Notional
Amount | | | Value and
Unrealized
Appreciation | |
OTC Equity Index Swap Agreements†† |
Wells Fargo Bank, N.A. | Russell 2000 Growth Index | 0.25% (3 Month USD LIBOR + 0.05%) | At Maturity | | | 10/05/21 | | | | 20,654 | | | $ | 32,696,893 | | | $ | 497,534 | |
* | Non-income producing security. |
** | Includes cumulative appreciation (depreciation). Variation margin is reported within the Statement of Assets and Liabilities. |
† | Value determined based on Level 1 inputs — See Note 4. |
†† | Value determined based on Level 2 inputs — See Note 4. |
1 | Affiliated issuer. |
2 | Rate indicated is the 7-day yield as of June 30, 2021. |
| | LIBOR — London Interbank Offered Rate |
| | REIT — Real Estate Investment Trust |
| | |
| | See Sector Classification in Other Information section. |
The following table summarizes the inputs used to value the Fund’s investments at June 30, 2021 (See Note 4 in the Notes to Financial Statements):
Investments in Securities (Assets) | | Level 1
Quoted
Prices | | | Level 2
Significant
Observable
Inputs | | | Level 3
Significant
Unobservable
Inputs | | | Total | |
Common Stocks | | $ | 6,583,129 | | | $ | — | | | $ | — | | | $ | 6,583,129 | |
Mutual Funds | | | 31,327,050 | | | | — | | | | — | | | | 31,327,050 | |
Money Market Fund | | | 2,169,280 | | | | — | | | | — | | | | 2,169,280 | |
Equity Index Swap Agreements** | | | — | | | | 497,534 | | | | — | | | | 497,534 | |
Total Assets | | $ | 40,079,459 | | | $ | 497,534 | | | $ | — | | | $ | 40,576,993 | |
Investments in Securities (Liabilities) | | Level 1
Quoted
Prices | | | Level 2
Significant
Observable
Inputs | | | Level 3
Significant
Unobservable
Inputs | | | Total | |
Equity Futures Contracts** | | $ | 7,880 | | | $ | — | | | $ | — | | | $ | 7,880 | |
** | This derivative is reported as unrealized appreciation/depreciation at period end. |
SEE NOTES TO FINANCIAL STATEMENTS. | THE GUGGENHEIM FUNDS SEMI-ANNUAL REPORT | 115 |
SCHEDULE OF INVESTMENTS (Unaudited)(concluded) | June 30, 2021 |
SERIES X (STYLEPLUS—SMALL GROWTH SERIES) | |
Affiliated Transactions
Investments representing 5% or more of the outstanding voting shares of a company, or control of or by, or common control under Guggenheim Investments (“GI”), result in that company being considered an affiliated issuer, as defined in the 1940 Act.
The Fund may invest in certain of the underlying series of Guggenheim Strategy Funds Trust, including Guggenheim Strategy Fund II, Guggenheim Strategy Fund III, and Guggenheim Variable Insurance Strategy Fund III, (collectively, the “Short Term Investment Vehicles”), each of which are open-end management investment companies managed by GI. The Short Term Investment Vehicles, which launched on March 11, 2014, are offered as short term investment options only to mutual funds, trusts, and other accounts managed by GI and/or its affiliates, and are not available to the public. The Short Term Investment Vehicles pay no investment management fees. The Short Term Investment Vehicles’ annual report on Form N-CSR dated September 30, 2020, is available publicly or upon request. This information is available from the EDGAR database on the SEC’s website at https://www.sec.gov/Archives/edgar/data/1601445/000182126820000133/gug81042-ncsr.htm.
Transactions during the period ended June 30, 2021, in which the company is an affiliated issuer, were as follows:
Security Name | | Value
12/31/20 | | | Additions | | | Reductions | | | Realized
Gain (Loss) | | | Change in
Unrealized
Appreciation
(Depreciation) | | | Value
06/30/21 | | | Shares
06/30/21 | | | Investment
Income | |
Mutual Funds | | | | | | | | | | | | | | | | | | | | | | | | | | | | | | | | |
Guggenheim Strategy Fund II | | $ | 4,236,714 | | | $ | 2,415,116 | | | $ | — | | | $ | — | | | $ | 3,988 | | | $ | 6,655,818 | | | | 266,339 | | | $ | 42,531 | |
Guggenheim Strategy Fund III | | | 7,881,769 | | | | 61,810 | | | | — | | | | — | | | | 18,831 | | | | 7,962,410 | | | | 316,471 | | | | 62,716 | |
Guggenheim Ultra Short Duration Fund — Institutional Class | | | 10,787,486 | | | | 5,578,089 | | | | (7,586,956 | ) | | | 60,242 | | | | (72,675 | ) | | | 8,766,186 | | | | 879,256 | | | | 45,687 | |
Guggenheim Variable Insurance Strategy Fund III | | | 7,870,976 | | | | 62,252 | | | | — | | | | — | | | | 9,408 | | | | 7,942,636 | | | | 316,818 | | | | 63,097 | |
| | | $ | 30,776,945 | | | $ | 8,117,267 | | | $ | (7,586,956 | ) | | $ | 60,242 | | | $ | (40,448 | ) | | $ | 31,327,050 | | | | | | | $ | 214,031 | |
116 | THE GUGGENHEIM FUNDS SEMI-ANNUAL REPORT | SEE NOTES TO FINANCIAL STATEMENTS. |
SERIES X (STYLEPLUS—SMALL GROWTH SERIES) | |
STATEMENT OF ASSETS AND LIABILITIES (Unaudited) |
June 30, 2021 |
Assets: |
Investments in unaffiliated issuers, at value (cost $7,941,909) | | $ | 8,752,409 | |
Investments in affiliated issuers, at value (cost $31,207,154) | | | 31,327,050 | |
Cash | | | 2,390 | |
Segregated cash with broker | | | 53,000 | |
Unrealized appreciation on OTC swap agreements | | | 497,534 | |
Prepaid expenses | | | 261 | |
Receivables: |
Dividends | | | 37,342 | |
Swap settlement | | | 13,955 | |
Fund shares sold | | | 77 | |
Interest | | | 6 | |
Total assets | | | 40,684,024 | |
| | | | | |
Liabilities: |
Segregated cash due to broker | | | 450,000 | |
Payable for: |
Securities purchased | | | 35,520 | |
Management fees | | | 11,971 | |
Distribution and service fees | | | 8,085 | |
Fund accounting/administration fees | | | 3,565 | |
Transfer agent/maintenance fees | | | 2,275 | |
Variation margin on futures contracts | | | 1,900 | |
Trustees’ fees* | | | 1,780 | |
Fund shares redeemed | | | 992 | |
Miscellaneous | | | 27,243 | |
Total liabilities | | | 543,331 | |
Commitments and contingent liabilities (Note 12) | | | — | |
Net assets | | $ | 40,140,693 | |
| | | | | |
Net assets consist of: |
Paid in capital | | $ | 26,779,937 | |
Total distributable earnings (loss) | | | 13,360,756 | |
Net assets | | $ | 40,140,693 | |
Capital shares outstanding | | | 810,658 | |
Net asset value per share | | $ | 49.52 | |
STATEMENT OF OPERATIONS (Unaudited) |
Six Months Ended June 30, 2021 |
Investment Income: |
Dividends from securities of unaffiliated issuers | | $ | 19,238 | |
Dividends from securities of affiliated issuers | | | 214,031 | |
Interest | | | 72 | |
Total investment income | | | 233,341 | |
| | | | | |
Expenses: |
Management fees | | | 148,505 | |
Distribution and service fees | | | 49,502 | |
Transfer agent/maintenance fees | | | 12,479 | |
Fund accounting/administration fees | | | 17,359 | |
Professional fees | | | 16,568 | |
Custodian fees | | | 10,829 | |
Trustees’ fees* | | | 8,822 | |
Prime broker interest expense | | | 4,363 | |
Line of credit fees | | | 773 | |
Miscellaneous | | | 4,443 | |
Total expenses | | | 273,643 | |
Less: |
Expenses waived by Adviser | | | (72,325 | ) |
Net expenses | | | 201,318 | |
Net investment income | | | 32,023 | |
| | | | | |
Net Realized and Unrealized Gain (Loss): |
Net realized gain (loss) on: |
Investments in unaffiliated issuers | | | 1,076,548 | |
Investments in affiliated issuers | | | 60,242 | |
Swap agreements | | | 9,241,297 | |
Futures contracts | | | 143,447 | |
Net realized gain | | | 10,521,534 | |
Net change in unrealized appreciation (depreciation) on: |
Investments in unaffiliated issuers | | | (138,569 | ) |
Investments in affiliated issuers | | | (40,448 | ) |
Swap agreements | | | (6,486,004 | ) |
Futures contracts | | | (11,887 | ) |
Net change in unrealized appreciation (depreciation) | | | (6,676,908 | ) |
Net realized and unrealized gain | | | 3,844,626 | |
Net increase in net assets resulting from operations | | $ | 3,876,649 | |
* | Relates to Trustees not deemed “interested persons” within the meaning of Section 2(a)(19) of the 1940 Act. |
SEE NOTES TO FINANCIAL STATEMENTS. | THE GUGGENHEIM FUNDS SEMI-ANNUAL REPORT | 117 |
SERIES X (STYLEPLUS—SMALL GROWTH SERIES) | |
STATEMENTS OF CHANGES IN NET ASSETS |
| | Six Months Ended
June 30, 2021
(Unaudited) | | | Year Ended
December 31,
2020 | |
Increase (Decrease) in Net Assets from Operations: | | | | | | | | |
Net investment income | | $ | 32,023 | | | $ | 149,056 | |
Net realized gain on investments | | | 10,521,534 | | | | 4,165,403 | |
Net change in unrealized appreciation (depreciation) on investments | | | (6,676,908 | ) | | | 4,700,737 | |
Net increase in net assets resulting from operations | | | 3,876,649 | | | | 9,015,196 | |
| | | | | | | | | |
Distributions to shareholders | | | — | | | | (390,463 | ) |
| | | | | | | | | |
Capital share transactions: | | | | | | | | |
Proceeds from sale of shares | | | 683,041 | | | | 951,691 | |
Distributions reinvested | | | — | | | | 390,463 | |
Cost of shares redeemed | | | (2,407,828 | ) | | | (5,013,878 | ) |
Net decrease from capital share transactions | | | (1,724,787 | ) | | | (3,671,724 | ) |
Net increase in net assets | | | 2,151,862 | | | | 4,953,009 | |
| | | | | | | | | |
Net assets: | | | | | | | | |
Beginning of period | | | 37,988,831 | | | | 33,035,822 | |
End of period | | $ | 40,140,693 | | | $ | 37,988,831 | |
| | | | | | | | | |
Capital share activity: | | | | | | | | |
Shares sold | | | 14,105 | | | | 29,544 | |
Shares issued from reinvestment of distributions | | | — | | | | 11,666 | |
Shares redeemed | | | (49,331 | ) | | | (152,191 | ) |
Net decrease in shares | | | (35,226 | ) | | | (110,981 | ) |
118 | THE GUGGENHEIM FUNDS SEMI-ANNUAL REPORT | SEE NOTES TO FINANCIAL STATEMENTS. |
SERIES X (STYLEPLUS—SMALL GROWTH SERIES) | |
This table is presented to show selected data for a share outstanding throughout each period and to assist shareholders in evaluating a Fund’s performance for the periods presented.
| | Six Months Ended
June 30, 2021a | | | Year Ended
December 31,
2020 | | | Year Ended
December 31,
2019 | | | Year Ended
December 31,
2018 | | | Year Ended
December 31,
2017 | | | Year Ended
December 31,
2016 | |
Per Share Data |
Net asset value, beginning of period | | $ | 44.91 | | | $ | 34.53 | | | $ | 30.87 | | | $ | 40.19 | | | $ | 33.08 | | | $ | 31.03 | |
Income (loss) from investment operations: |
Net investment income (loss)b | | | .04 | | | | .17 | | | | .42 | | | | .56 | | | | .36 | | | | .25 | |
Net gain (loss) on investments (realized and unrealized) | | | 4.57 | | | | 10.65 | | | | 7.28 | | | | (3.33 | ) | | | 7.02 | | | | 3.74 | |
Total from investment operations | | | 4.61 | | | | 10.82 | | | | 7.70 | | | | (2.77 | ) | | | 7.38 | | | | 3.99 | |
Less distributions from: |
Net investment income | | | — | | | | (.44 | ) | | | (.22 | ) | | | (.43 | ) | | | (.27 | ) | | | (.13 | ) |
Net realized gains | | | — | | | | — | | | | (3.82 | ) | | | (6.12 | ) | | | — | | | | (1.81 | ) |
Total distributions | | | — | | | | (.44 | ) | | | (4.04 | ) | | | (6.55 | ) | | | (.27 | ) | | | (1.94 | ) |
Net asset value, end of period | | $ | 49.52 | | | $ | 44.91 | | | $ | 34.53 | | | $ | 30.87 | | | $ | 40.19 | | | $ | 33.08 | |
|
Total Returnc | | | 10.26 | % | | | 31.82 | % | | | 25.68 | % | | | (10.30 | %) | | | 22.38 | % | | | 13.45 | % |
Ratios/Supplemental Data |
Net assets, end of period (in thousands) | | $ | 40,141 | | | $ | 37,989 | | | $ | 33,036 | | | $ | 28,644 | | | $ | 39,560 | | | $ | 34,216 | |
Ratios to average net assets: |
Net investment income (loss) | | | 0.16 | % | | | 0.49 | % | | | 1.24 | % | | | 1.42 | % | | | 0.99 | % | | | 0.83 | % |
Total expensesd | | | 1.36 | % | | | 1.50 | % | | | 1.62 | % | | | 1.47 | % | | | 1.37 | % | | | 1.23 | % |
Net expensese,f | | | 0.99 | % | | | 1.02 | % | | | 1.11 | % | | | 1.12 | % | | | 1.10 | % | | | 1.23 | % |
Portfolio turnover rate | | | 36 | % | | | 86 | % | | | 59 | % | | | 65 | % | | | 50 | % | | | 76 | % |
a | Unaudited figures for the period ended June 30, 2021. Percentage amounts for the period, except total return and portfolio turnover rate, have been annualized. |
b | Net investment income (loss) per share was computed using average shares outstanding throughout the period. |
c | Total return does not take into account any of the expenses associated with an investment in variable insurance products. If total return had taken into account these expenses, performance would have been lower. Shares of a series of Guggenheim Variable Funds Trust are available only through the purchase of such products. |
d | Does not include expenses of the underlying funds in which the Fund invests. |
e | Net expenses may include expenses that are excluded from the expense limitation agreement. Excluding these expenses, the net expense ratios for the periods presented would be: |
| | 06/30/21a | 12/31/20 | 12/31/19 | 12/31/18 | 12/31/17 | 12/31/16 |
| | 0.99% | 1.01% | 1.03% | 1.06% | 1.09% | 1.23% |
f | The portion of the ratios of net expenses to average net assets attributable to recoupment of prior fee reductions or expenses reimbursements for the periods presented was as follows: |
| | 06/30/21a | 12/31/20 | 12/31/19 | 12/31/18 | 12/31/17 | 12/31/16 |
| | — | — | — | 0.00%* | — | — |
SEE NOTES TO FINANCIAL STATEMENTS. | THE GUGGENHEIM FUNDS SEMI-ANNUAL REPORT | 119 |
PERFORMANCE REPORT AND FUND PROFILE (Unaudited) | June 30, 2021 |
SERIES Y (STYLEPLUS—LARGE GROWTH SERIES)
OBJECTIVE: Seeks long-term growth of capital.
Holdings Diversification (Market Exposure as % of Net Assets)

“Holdings Diversification (Market Exposure as % of Net Assets)” excludes any temporary cash investments, investments in Guggenheim Strategy Funds Trust mutual funds, or investments in Guggenheim Ultra Short Duration Fund.
Inception Date: May 3, 1999 |
Ten Largest Holdings (% of Total Net Assets) |
Guggenheim Ultra Short Duration Fund — Institutional Class | 22.0% |
Guggenheim Variable Insurance Strategy Fund III | 21.8% |
Guggenheim Strategy Fund III | 19.8% |
Guggenheim Strategy Fund II | 13.4% |
Apple, Inc. | 2.0% |
Microsoft Corp. | 1.7% |
Alphabet, Inc. — Class C | 1.2% |
Amazon.com, Inc. | 1.1% |
Facebook, Inc. — Class A | 0.7% |
QUALCOMM, Inc. | 0.3% |
Top Ten Total | 84.0% |
| | |
“Ten Largest Holdings” excludes any temporary cash or derivative investments. |
Average Annual Returns*,†
Periods Ended June 30, 2021
| 6 Month‡ | 1 Year | 5 Year | 10 Year |
Series Y (StylePlus—Large Growth Series) | 13.38% | 44.37% | 22.90% | 16.37% |
Russell 1000 Growth Index | 12.99% | 42.50% | 23.66% | 17.87% |
* | The performance data above represents past performance that is not predictive of future results. The investment return and principal value of an investment in the Fund will fluctuate so that an investor’s shares, when redeemed, may be worth more or less than their original cost. Returns are historical and include changes in principal and reinvested dividends and capital gains and do not reflect the effect of taxes. The Russell 1000 Growth Index is an unmanaged index and, unlike the Fund, has no management fees or operating expenses to reduce its reported return. |
† | Performance figures do not reflect fees and expenses associated with an investment in variable insurance products. If returns had taken into account these fees and expenses, performance would have been lower. Shares of a series of Guggenheim Variable Funds Trust are available only through the purchase of such products. |
‡ | 6 month returns are not annualized. |
120 THE GUGGENHEIM FUNDS SEMI-ANNUAL REPORT | |
SCHEDULE OF INVESTMENTS (Unaudited) | June 30, 2021 |
SERIES Y (STYLEPLUS—LARGE GROWTH SERIES) | |
| | Shares | | | Value | |
COMMON STOCKS† - 16.9% |
| | | | | | | | | |
Technology - 6.4% |
Apple, Inc. | | | 7,987 | | | $ | 1,093,899 | |
Microsoft Corp. | | | 3,336 | | | | 903,722 | |
QUALCOMM, Inc. | | | 1,131 | | | | 161,654 | |
NVIDIA Corp. | | | 200 | | | | 160,020 | |
Broadcom, Inc. | | | 281 | | | | 133,992 | |
Oracle Corp. | | | 1,567 | | | | 121,975 | |
Lam Research Corp. | | | 165 | | | | 107,366 | |
Teradyne, Inc. | | | 769 | | | | 103,015 | |
KLA Corp. | | | 294 | | | | 95,318 | |
Cognizant Technology Solutions Corp. — Class A | | | 1,364 | | | | 94,471 | |
Cerner Corp. | | | 1,145 | | | | 89,493 | |
Qorvo, Inc.* | | | 439 | | | | 85,890 | |
Citrix Systems, Inc. | | | 704 | | | | 82,558 | |
Microchip Technology, Inc. | | | 551 | | | | 82,507 | |
Adobe, Inc.* | | | 104 | | | | 60,907 | |
Advanced Micro Devices, Inc.* | | | 580 | | | | 54,479 | |
salesforce.com, Inc.* | | | 109 | | | | 26,626 | |
Total Technology | | | | | | | 3,457,892 | |
| | | | | | | | | |
Communications - 3.7% |
Alphabet, Inc. — Class C* | | | 255 | | | | 639,112 | |
Amazon.com, Inc.* | | | 175 | | | | 602,028 | |
Facebook, Inc. — Class A* | | | 1,037 | | | | 360,575 | |
Motorola Solutions, Inc. | | | 449 | | | | 97,366 | |
Arista Networks, Inc.* | | | 263 | | | | 95,287 | |
Corning, Inc. | | | 2,009 | | | | 82,168 | |
F5 Networks, Inc.* | | | 374 | | | | 69,811 | |
Netflix, Inc.* | | | 72 | | | | 38,031 | |
Total Communications | | | | | | | 1,984,378 | |
| | | | | | | | | |
Consumer, Non-cyclical - 3.1% |
AbbVie, Inc. | | | 1,139 | | | | 128,297 | |
Merck & Company, Inc. | | | 1,596 | | | | 124,121 | |
Bristol-Myers Squibb Co. | | | 1,711 | | | | 114,329 | |
Amgen, Inc. | | | 457 | | | | 111,394 | |
Regeneron Pharmaceuticals, Inc.* | | | 197 | | | | 110,032 | |
Humana, Inc. | | | 240 | | | | 106,253 | |
United Rentals, Inc.* | | | 325 | | | | 103,678 | |
PayPal Holdings, Inc.* | | | 348 | | | | 101,435 | |
PerkinElmer, Inc. | | | 652 | | | | 100,675 | |
Bio-Rad Laboratories, Inc. — Class A* | | | 155 | | | | 99,865 | |
Vertex Pharmaceuticals, Inc.* | | | 485 | | | | 97,791 | |
DaVita, Inc.* | | | 755 | | | | 90,925 | |
Hologic, Inc.* | | | 1,356 | | | | 90,472 | |
Incyte Corp.* | | | 958 | | | | 80,596 | |
S&P Global, Inc. | | | 113 | | | | 46,381 | |
McKesson Corp. | | | 224 | | | | 42,838 | |
Biogen, Inc.* | | | 89 | | | | 30,818 | |
UnitedHealth Group, Inc. | | | 65 | | | | 26,028 | |
Johnson & Johnson | | | 157 | | | | 25,864 | |
Thermo Fisher Scientific, Inc. | | | 37 | | | | 18,666 | |
Organon & Co.* | | | 1 | | | | 27 | |
Total Consumer, Non-cyclical | | | | | | | 1,650,485 | |
| | | | | | | | | |
Consumer, Cyclical - 1.9% |
Tesla, Inc.* | | | 221 | | | | 150,214 | |
Lowe’s Companies, Inc. | | | 623 | | | | 120,843 | |
O’Reilly Automotive, Inc.* | | | 189 | | | | 107,014 | |
AutoZone, Inc.* | | | 69 | | | | 102,963 | |
Target Corp. | | | 413 | | | | 99,839 | |
PulteGroup, Inc. | | | 1,695 | | | | 92,496 | |
Cummins, Inc. | | | 379 | | | | 92,404 | |
Yum! Brands, Inc. | | | 801 | | | | 92,139 | |
Best Buy Company, Inc. | | | 682 | | | | 78,416 | |
Home Depot, Inc. | | | 213 | | | | 67,924 | |
Total Consumer, Cyclical | | | | | | | 1,004,252 | |
| | | | | | | | | |
Industrial - 0.9% |
Deere & Co. | | | 374 | | | | 131,914 | |
Parker-Hannifin Corp. | | | 322 | | | | 98,889 | |
Keysight Technologies, Inc.* | | | 640 | | | | 98,822 | |
Masco Corp. | | | 1,558 | | | | 91,782 | |
Sealed Air Corp. | | | 1,260 | | | | 74,655 | |
Total Industrial | | | | | | | 496,062 | |
| | | | | | | | | |
Financial - 0.7% |
Progressive Corp. | | | 1,119 | | | | 109,897 | |
SVB Financial Group* | | | 167 | | | | 92,924 | |
Cboe Global Markets, Inc. | | | 723 | | | | 86,073 | |
Visa, Inc. — Class A | | | 262 | | | | 61,261 | |
Mastercard, Inc. — Class A | | | 96 | | | | 35,048 | |
Total Financial | | | | | | | 385,203 | |
| | | | | | | | | |
Utilities - 0.2% |
AES Corp. | | | 3,583 | | | | 93,409 | |
| | | | | | | | | |
Total Common Stocks | | | | |
(Cost $7,042,616) | | | | | | | 9,071,681 | |
| | | | | | | | | |
MUTUAL FUNDS† - 77.0% |
Guggenheim Ultra Short Duration Fund — Institutional Class1 | | | 1,187,000 | | | | 11,834,391 | |
Guggenheim Variable Insurance Strategy Fund III1 | | | 466,978 | | | | 11,707,146 | |
Guggenheim Strategy Fund III1 | | | 422,943 | | | | 10,641,245 | |
Guggenheim Strategy Fund II1 | | | 287,690 | | | | 7,189,372 | |
Total Mutual Funds | | | | |
(Cost $41,186,503) | | | | | | | 41,372,154 | |
| | | | | | | | | |
MONEY MARKET FUND† - 5.9% |
Dreyfus Treasury Securities Cash Management Fund — Institutional Shares, 0.01%2 | | | 3,193,837 | | | | 3,193,837 | |
Total Money Market Fund | | | | |
(Cost $3,193,837) | | | | | | | 3,193,837 | |
| | | | | | | | | |
Total Investments - 99.8% | | | | |
(Cost $51,422,956) | | $ | 53,637,672 | |
Other Assets & Liabilities, net - 0.2% | | | 94,704 | |
Total Net Assets - 100.0% | | $ | 53,732,376 | |
SEE NOTES TO FINANCIAL STATEMENTS. | THE GUGGENHEIM FUNDS SEMI-ANNUAL REPORT | 121 |
SCHEDULE OF INVESTMENTS (Unaudited)(continued) | June 30, 2021 |
SERIES Y (STYLEPLUS—LARGE GROWTH SERIES) | |
Futures Contracts |
Description | | Number of
Contracts | | | Expiration
Date | | | Notional
Amount | | | Value and
Unrealized
Appreciation** | |
Equity Futures Contracts Purchased† |
S&P 500 Index Mini Futures Contracts | | | 5 | | | | Sep 2021 | | | $ | 1,071,625 | | | $ | 12,458 | |
NASDAQ-100 Index Mini Futures Contracts | | | 1 | | | | Sep 2021 | | | | 290,870 | | | | 10,435 | |
| | | | | | | | | | | $ | 1,362,495 | | | $ | 22,893 | |
Total Return Swap Agreements |
Counterparty | Index | Financing
Rate Pay
(Receive) | Payment
Frequency | | Maturity Date | | | Units | | | Notional
Amount | | | Value and
Unrealized
Appreciation | |
OTC Equity Index Swap Agreements†† |
Wells Fargo Bank, N.A. | Russell 1000 Growth Index | 0.42% (3 Month USD LIBOR + 0.22%) | At Maturity | | | 10/05/21 | | | | 15,979 | | | $ | 43,662,506 | | | $ | 3,263,583 | |
* | Non-income producing security. |
** | Includes cumulative appreciation (depreciation). Variation margin is reported within the Statement of Assets and Liabilities. |
† | Value determined based on Level 1 inputs — See Note 4. |
†† | Value determined based on Level 2 inputs — See Note 4. |
1 | Affiliated issuer. |
2 | Rate indicated is the 7-day yield as of June 30, 2021. |
| | LIBOR — London Interbank Offered Rate |
| | |
| | See Sector Classification in Other Information section. |
The following table summarizes the inputs used to value the Fund’s investments at June 30, 2021 (See Note 4 in the Notes to Financial Statements):
Investments in Securities (Assets) | | Level 1
Quoted
Prices | | | Level 2
Significant
Observable
Inputs | | | Level 3
Significant
Unobservable
Inputs | | | Total | |
Common Stocks | | $ | 9,071,681 | | | $ | — | | | $ | — | | | $ | 9,071,681 | |
Mutual Funds | | | 41,372,154 | | | | — | | | | — | | | | 41,372,154 | |
Money Market Fund | | | 3,193,837 | | | | — | | | | — | | | | 3,193,837 | |
Equity Futures Contracts** | | | 22,893 | | | | — | | | | — | | | | 22,893 | |
Equity Index Swap Agreements** | | | — | | | | 3,263,583 | | | | — | | | | 3,263,583 | |
Total Assets | | $ | 53,660,565 | | | $ | 3,263,583 | | | $ | — | | | $ | 56,924,148 | |
** | This derivative is reported as unrealized appreciation/depreciation at period end. |
122 | THE GUGGENHEIM FUNDS SEMI-ANNUAL REPORT | SEE NOTES TO FINANCIAL STATEMENTS. |
SCHEDULE OF INVESTMENTS (Unaudited)(concluded) | June 30, 2021 |
SERIES Y (STYLEPLUS—LARGE GROWTH SERIES) | |
Affiliated Transactions
Investments representing 5% or more of the outstanding voting shares of a company, or control of or by, or common control under Guggenheim Investments (“GI”), result in that company being considered an affiliated issuer, as defined in the 1940 Act.
The Fund may invest in certain of the underlying series of Guggenheim Strategy Funds Trust, including Guggenheim Strategy Fund II, Guggenheim Strategy Fund III, and Guggenheim Variable Insurance Strategy Fund III, (collectively, the “Short Term Investment Vehicles”), each of which are open-end management investment companies managed by GI. The Short Term Investment Vehicles, which launched on March 11, 2014, are offered as short term investment options only to mutual funds, trusts, and other accounts managed by GI and/or its affiliates, and are not available to the public. The Short Term Investment Vehicles pay no investment management fees. The Short Term Investment Vehicles’ annual report on Form N-CSR dated September 30, 2020, is available publicly or upon request. This information is available from the EDGAR database on the SEC’s website at https://www.sec.gov/Archives/edgar/data/1601445/000182126820000133/gug81042-ncsr.htm.
Transactions during the period ended June 30, 2021, in which the company is an affiliated issuer, were as follows:
Security Name | | Value
12/31/20 | | | Additions | | | Reductions | | | Realized
Gain (Loss) | | | Change in
Unrealized
Appreciation
(Depreciation) | | | Value
06/30/21 | | | Shares
06/30/21 | | | Investment
Income | |
Mutual Funds | | | | | | | | | | | | | | | | | | | | | | | | | | | | | | | | |
Guggenheim Strategy Fund II | | $ | 7,132,904 | | | $ | 47,906 | | | $ | — | | | $ | — | | | $ | 8,562 | | | $ | 7,189,372 | | | | 287,690 | | | $ | 48,601 | |
Guggenheim Strategy Fund III | | | 10,533,474 | | | | 82,605 | | | | — | | | | — | | | | 25,166 | | | | 10,641,245 | | | | 422,943 | | | | 83,814 | |
Guggenheim Ultra Short Duration Fund — Institutional Class | | | 9,026,315 | | | | 6,428,283 | | | | (3,610,976 | ) | | | 53,051 | | | | (62,282 | ) | | | 11,834,391 | | | | 1,187,000 | | | | 47,786 | |
Guggenheim Variable Insurance Strategy Fund III | | | 11,601,522 | | | | 91,757 | | | | — | | | | — | | | | 13,867 | | | | 11,707,146 | | | | 466,978 | | | | 93,002 | |
| | | $ | 38,294,215 | | | $ | 6,650,551 | | | $ | (3,610,976 | ) | | $ | 53,051 | | | $ | (14,687 | ) | | $ | 41,372,154 | | | | | | | $ | 273,203 | |
SEE NOTES TO FINANCIAL STATEMENTS. | THE GUGGENHEIM FUNDS SEMI-ANNUAL REPORT | 123 |
SERIES Y (STYLEPLUS—LARGE GROWTH SERIES) | |
STATEMENT OF ASSETS AND LIABILITIES (Unaudited) |
June 30, 2021 |
Assets: |
Investments in unaffiliated issuers, at value (cost $10,236,453) | | $ | 12,265,518 | |
Investments in affiliated issuers, at value (cost $41,186,503) | | | 41,372,154 | |
Segregated cash with broker | | | 71,000 | |
Unrealized appreciation on OTC swap agreements | | | 3,263,583 | |
Prepaid expenses | | | 383 | |
Receivables: |
Dividends | | | 50,263 | |
Swap settlement | | | 38,847 | |
Fund shares sold | | | 8,396 | |
Variation margin on futures contracts | | | 2,145 | |
Interest | | | 10 | |
Total assets | | | 57,072,299 | |
| | | | | |
Liabilities: |
Segregated cash due to broker | | | 3,180,000 | |
Payable for: |
Securities purchased | | | 46,391 | |
Fund shares redeemed | | | 46,327 | |
Management fees | | | 14,923 | |
Distribution and service fees | | | 10,703 | |
Fund accounting/administration fees | | | 4,251 | |
Transfer agent/maintenance fees | | | 2,267 | |
Trustees’ fees* | | | 1,021 | |
Miscellaneous | | | 34,040 | |
Total liabilities | | | 3,339,923 | |
Commitments and contingent liabilities (Note 12) | | | — | |
Net assets | | $ | 53,732,376 | |
| | | | | |
Net assets consist of: |
Paid in capital | | $ | 30,001,360 | |
Total distributable earnings (loss) | | | 23,731,016 | |
Net assets | | $ | 53,732,376 | |
Capital shares outstanding | | | 1,837,904 | |
Net asset value per share | | $ | 29.24 | |
STATEMENT OF OPERATIONS (Unaudited) |
Six Months Ended June 30, 2021 |
Investment Income: |
Dividends from securities of unaffiliated issuers | | $ | 42,902 | |
Dividends from securities of affiliated issuers | | | 273,203 | |
Interest | | | 107 | |
Total investment income | | | 316,212 | |
| | | | | |
Expenses: |
Management fees | | | 162,958 | |
Distribution and service fees | | | 62,676 | |
Transfer agent/maintenance fees | | | 12,426 | |
Fund accounting/administration fees | | | 20,841 | |
Professional fees | | | 17,831 | |
Trustees’ fees* | | | 8,853 | |
Custodian fees | | | 7,400 | |
Interest expense | | | 1,896 | |
Line of credit fees | | | 1,046 | |
Miscellaneous | | | 2,361 | |
Total expenses | | | 298,288 | |
Less: |
Expenses waived by Adviser | | | (78,312 | ) |
Net expenses | | | 219,976 | |
Net investment income | | | 96,236 | |
| | | | | |
Net Realized and Unrealized Gain (Loss): |
Net realized gain (loss) on: |
Investments in unaffiliated issuers | | | 906,578 | |
Investments in affiliated issuers | | | 53,051 | |
Swap agreements | | | 6,153,919 | |
Futures contracts | | | 92,000 | |
Net realized gain | | | 7,205,548 | |
Net change in unrealized appreciation (depreciation) on: |
Investments in unaffiliated issuers | | | 283,376 | |
Investments in affiliated issuers | | | (14,687 | ) |
Swap agreements | | | (1,134,553 | ) |
Futures contracts | | | 14,837 | |
Net change in unrealized appreciation (depreciation) | | | (851,027 | ) |
Net realized and unrealized gain | | | 6,354,521 | |
Net increase in net assets resulting from operations | | $ | 6,450,757 | |
* | Relates to Trustees not deemed “interested persons” within the meaning of Section 2(a)(19) of the 1940 Act. |
124 | THE GUGGENHEIM FUNDS SEMI-ANNUAL REPORT | SEE NOTES TO FINANCIAL STATEMENTS. |
SERIES Y (STYLEPLUS—LARGE GROWTH SERIES) | |
STATEMENTS OF CHANGES IN NET ASSETS |
| | Six Months Ended
June 30, 2021
(Unaudited) | | | Year Ended
December 31,
2020 | |
Increase (Decrease) in Net Assets from Operations: | | | | | | | | |
Net investment income | | $ | 96,236 | | | $ | 310,704 | |
Net realized gain on investments | | | 7,205,548 | | | | 12,023,032 | |
Net change in unrealized appreciation (depreciation) on investments | | | (851,027 | ) | | | 1,790,062 | |
Net increase in net assets resulting from operations | | | 6,450,757 | | | | 14,123,798 | |
| | | | | | | | | |
Distributions to shareholders | | | — | | | | (2,463,223 | ) |
| | | | | | | | | |
Capital share transactions: | | | | | | | | |
Proceeds from sale of shares | | | 1,771,536 | | | | 5,759,960 | |
Distributions reinvested | | | — | | | | 2,463,223 | |
Cost of shares redeemed | | | (3,967,419 | ) | | | (10,593,308 | ) |
Net decrease from capital share transactions | | | (2,195,883 | ) | | | (2,370,125 | ) |
Net increase in net assets | | | 4,254,874 | | | | 9,290,450 | |
| | | | | | | | | |
Net assets: | | | | | | | | |
Beginning of period | | | 49,477,502 | | | | 40,187,052 | |
End of period | | $ | 53,732,376 | | | $ | 49,477,502 | |
| | | | | | | | | |
Capital share activity: | | | | | | | | |
Shares sold | | | 66,490 | | | | 280,129 | |
Shares issued from reinvestment of distributions | | | — | | | | 116,354 | |
Shares redeemed | | | (147,195 | ) | | | (504,964 | ) |
Net decrease in shares | | | (80,705 | ) | | | (108,481 | ) |
SEE NOTES TO FINANCIAL STATEMENTS. | THE GUGGENHEIM FUNDS SEMI-ANNUAL REPORT | 125 |
SERIES Y (STYLEPLUS—LARGE GROWTH SERIES) | |
This table is presented to show selected data for a share outstanding throughout each period and to assist shareholders in evaluating a Fund’s performance for the periods presented.
| | Six Months Ended
June 30, 2021a | | | Year Ended
December 31,
2020 | | | Year Ended
December 31,
2019 | | | Year Ended
December 31,
2018 | | | Year Ended
December 31,
2017 | | | Year Ended
December 31,
2016 | |
Per Share Data |
Net asset value, beginning of period | | $ | 25.79 | | | $ | 19.82 | | | $ | 16.47 | | | $ | 20.30 | | | $ | 15.75 | | | $ | 15.11 | |
Income (loss) from investment operations: |
Net investment income (loss)b | | | .05 | | | | .16 | | | | .28 | | | | .34 | | | | .25 | | | | .17 | |
Net gain (loss) on investments (realized and unrealized) | | | 3.40 | | | | 7.07 | | | | 5.13 | | | | (.63 | ) | | | 4.48 | | | | 1.13 | |
Total from investment operations | | | 3.45 | | | | 7.23 | | | | 5.41 | | | | (.29 | ) | | | 4.73 | | | | 1.30 | |
Less distributions from: |
Net investment income | | | — | | | | (.28 | ) | | | (.38 | ) | | | (.34 | ) | | | (.18 | ) | | | (.08 | ) |
Net realized gains | | | — | | | | (.98 | ) | | | (1.68 | ) | | | (3.20 | ) | | | — | | | | (.58 | ) |
Total distributions | | | — | | | | (1.26 | ) | | | (2.06 | ) | | | (3.54 | ) | | | (.18 | ) | | | (.66 | ) |
Net asset value, end of period | | $ | 29.24 | | | $ | 25.79 | | | $ | 19.82 | | | $ | 16.47 | | | $ | 20.30 | | | $ | 15.75 | |
|
Total Returnc | | | 13.38 | % | | | 37.87 | % | | | 33.92 | % | | | (3.68 | %) | | | 30.11 | % | | | 8.72 | % |
Ratios/Supplemental Data |
Net assets, end of period (in thousands) | | $ | 53,732 | | | $ | 49,478 | | | $ | 40,187 | | | $ | 31,737 | | | $ | 48,173 | | | $ | 38,565 | |
Ratios to average net assets: |
Net investment income (loss) | | | 0.38 | % | | | 0.73 | % | | | 1.51 | % | | | 1.70 | % | | | 1.36 | % | | | 1.14 | % |
Total expensesd | | | 1.18 | % | | | 1.29 | % | | | 1.44 | % | | | 1.38 | % | | | 1.20 | % | | | 1.04 | % |
Net expensese,f,g | | | 0.87 | % | | | 0.88 | % | | | 0.97 | % | | | 1.02 | % | | | 0.97 | % | | | 1.04 | % |
Portfolio turnover rate | | | 19 | % | | | 66 | % | | | 47 | % | | | 59 | % | | | 43 | % | | | 42 | % |
a | Unaudited figures for the period ended June 30, 2021. Percentage amounts for the period, except total return and portfolio turnover rate, have been annualized. |
b | Net investment income (loss) per share was computed using average shares outstanding throughout the period. |
c | Total return does not take into account any of the expenses associated with an investment in variable insurance products. If total return had taken into account these expenses, performance would have been lower. Shares of a series of Guggenheim Variable Funds Trust are available only through the purchase of such products. |
d | Does not include expenses of the underlying funds in which the Fund invests. |
e | Net expense information reflects the expense ratios after expense waivers and reimbursements, as applicable. |
f | Net expenses may include expenses that are excluded from the expense limitation agreement. Excluding these expenses, the net expense ratios for the periods presented would be: |
| | 06/30/21a | 12/31/20 | 12/31/19 | 12/31/18 | 12/31/17 | 12/31/16 |
| | 0.87% | 0.88% | 0.90% | 0.93% | 0.97% | 1.04% |
g | The portion of the ratios of net expenses to average net assets attributable to recoupments of prior fee reductions of expense reimbursements for the periods presented was as follows: |
| | 06/30/21a | 12/31/20 | 12/31/19 | 12/31/18 | 12/31/17 | 12/31/16 |
| | — | — | 0.00%* | — | — | — |
126 | THE GUGGENHEIM FUNDS SEMI-ANNUAL REPORT | SEE NOTES TO FINANCIAL STATEMENTS. |
PERFORMANCE REPORT AND FUND PROFILE (Unaudited) | June 30, 2021 |
SERIES Z (ALPHA OPPORTUNITY SERIES)
OBJECTIVE: Seeks long-term growth of capital.
Holdings Diversification (Market Exposure as % of Net Assets)
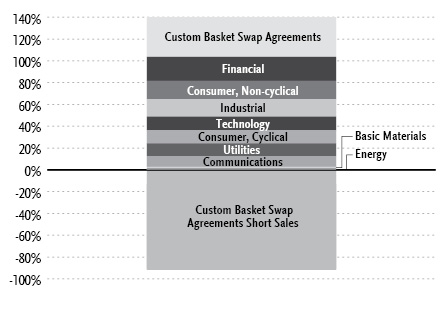
“Holdings Diversification (Market Exposure as % of Net Assets)” excludes any temporary cash investments.
Inception Date: July 7, 2003 |
Ten Largest Holdings (% of Total Net Assets) |
Toro Co. | 1.1% |
Merck & Company, Inc. | 1.1% |
CSG Systems International, Inc. | 1.1% |
AutoZone, Inc. | 1.1% |
Alphabet, Inc. — Class C | 1.0% |
VeriSign, Inc. | 1.0% |
Gilead Sciences, Inc. | 1.0% |
Verizon Communications, Inc. | 1.0% |
Johnson & Johnson | 1.0% |
Berkshire Hathaway, Inc. — Class B | 1.0% |
Top Ten Total | 10.4% |
| | |
“Ten Largest Holdings” excludes any temporary cash or derivative investments. |
Average Annual Returns*,†
Periods Ended June 30, 2021
| 6 Month‡ | 1 Year | 5 Year | 10 Year |
Series Z (Alpha Opportunity Series) | 6.27% | 11.04% | 1.49% | 4.79% |
Morningstar Long/Short Equity Category Average | 8.95% | 20.04% | 5.95% | 4.55% |
ICE BofA Merrill Lynch 3-Month U.S. Treasury Bill Index | 0.02% | 0.09% | 1.17% | 0.63% |
* | The performance data above represents past performance that is not predictive of future results. The investment return and principal value of an investment in the Fund will fluctuate so that an investor’s shares, when redeemed, may be worth more or less than their original cost. Returns are historical and include changes in principal and reinvested dividends and capital gains and do not reflect the effect of taxes. The ICE BofA Merrill Lynch 3-Month U.S. Treasury Bill Index and Morningstar Long/Short Equity Category Average are unmanaged indices and, unlike the Fund, have no management fees or operating expenses to reduce their reported returns. |
† | Performance figures do not reflect fees and expenses associated with an investment in variable insurance products. If returns had taken into account these fees and expenses, performance would have been lower. Shares of a series of Guggenheim Variable Funds Trust are available only through the purchase of such products. |
‡ | 6 month returns are not annualized. |
| | THE GUGGENHEIM FUNDS SEMI-ANNUAL REPORT | 127 |
SCHEDULE OF INVESTMENTS (Unaudited) | June 30, 2021 |
SERIES Z (ALPHA OPPORTUNITY SERIES) | |
| | Shares | | | Value | |
COMMON STOCKS† - 103.7% |
| | | | | | | | | |
Financial - 22.0% |
Berkshire Hathaway, Inc. — Class B*,1 | | | 160 | | | $ | 44,467 | |
Hanover Insurance Group, Inc. | | | 277 | | | | 37,572 | |
Aflac, Inc.1 | | | 666 | | | | 35,738 | |
Highwoods Properties, Inc. REIT1 | | | 779 | | | | 35,187 | |
Synchrony Financial | | | 724 | | | | 35,129 | |
Allstate Corp.1 | | | 266 | | | | 34,697 | |
Raymond James Financial, Inc. | | | 264 | | | | 34,294 | |
Mercury General Corp. | | | 526 | | | | 34,164 | |
Old Republic International Corp. | | | 1,253 | | | | 31,212 | |
Safety Insurance Group, Inc. | | | 386 | | | | 30,216 | |
Brandywine Realty Trust REIT1 | | | 2,168 | | | | 29,723 | |
Healthcare Realty Trust, Inc. REIT | | | 940 | | | | 28,388 | |
Discover Financial Services | | | 212 | | | | 25,078 | |
Progressive Corp. | | | 247 | | | | 24,258 | |
Jefferies Financial Group, Inc. | | | 704 | | | | 24,077 | |
Enstar Group Ltd.* | | | 93 | | | | 22,220 | |
Markel Corp.* | | | 18 | | | | 21,361 | |
Evercore, Inc. — Class A | | | 151 | | | | 21,256 | |
Everest Re Group Ltd. | | | 84 | | | | 21,169 | |
Travelers Companies, Inc.1 | | | 139 | | | | 20,810 | |
Associated Banc-Corp. | | | 1,011 | | | | 20,705 | |
Arch Capital Group Ltd.* | | | 526 | | | | 20,482 | |
Brighthouse Financial, Inc.* | | | 447 | | | | 20,356 | |
Essent Group Ltd. | | | 423 | | | | 19,014 | |
Houlihan Lokey, Inc. | | | 229 | | | | 18,730 | |
Federated Hermes, Inc. — Class B | | | 552 | | | | 18,718 | |
Interactive Brokers Group, Inc. — Class A | | | 281 | | | | 18,470 | |
AMERISAFE, Inc. | | | 306 | | | | 18,265 | |
Capital One Financial Corp. | | | 118 | | | | 18,253 | |
Marsh & McLennan Companies, Inc. | | | 127 | | | | 17,866 | |
Cboe Global Markets, Inc. | | | 149 | | | | 17,738 | |
Janus Henderson Group plc | | | 431 | | | | 16,727 | |
BankUnited, Inc. | | | 378 | | | | 16,137 | |
RenaissanceRe Holdings Ltd. | | | 106 | | | | 15,775 | |
Radian Group, Inc. | | | 696 | | | | 15,486 | |
Affiliated Managers Group, Inc. | | | 100 | | | | 15,421 | |
SEI Investments Co. | | | 244 | | | | 15,121 | |
OneMain Holdings, Inc. | | | 233 | | | | 13,959 | |
Lexington Realty Trust REIT | | | 1,127 | | | | 13,468 | |
First American Financial Corp. | | | 215 | | | | 13,405 | |
Cincinnati Financial Corp. | | | 113 | | | | 13,178 | |
Stewart Information Services Corp. | | | 231 | | | | 13,095 | |
Artisan Partners Asset Management, Inc. — Class A | | | 217 | | | | 11,028 | |
MGIC Investment Corp. | | | 798 | | | | 10,853 | |
Sabra Health Care REIT, Inc. | | | 569 | | | | 10,356 | |
Western Union Co. | | | 431 | | | | 9,900 | |
Total Financial | | | | | | | 1,003,522 | |
| | | | | | | | | |
Consumer, Non-cyclical - 16.9% |
Merck & Company, Inc.1 | | | 660 | | | | 51,276 | |
Gilead Sciences, Inc.1 | | | 669 | | | | 46,067 | |
Johnson & Johnson1 | | | 274 | | | | 45,139 | |
Bristol-Myers Squibb Co.1 | | | 639 | | | | 42,698 | |
Amgen, Inc.1 | | | 152 | | | | 37,050 | |
McKesson Corp.1 | | | 169 | | | | 32,320 | |
Bio-Rad Laboratories, Inc. — Class A* | | | 48 | | | | 30,926 | |
Molson Coors Beverage Co. — Class B*,1 | | | 545 | | | | 29,261 | |
Regeneron Pharmaceuticals, Inc.*,1 | | | 50 | | | | 27,927 | |
Thermo Fisher Scientific, Inc. | | | 55 | | | | 27,746 | |
John B Sanfilippo & Son, Inc.1 | | | 298 | | | | 26,394 | |
Pfizer, Inc.1 | | | 666 | | | | 26,081 | |
Hologic, Inc.*,1 | | | 365 | | | | 24,353 | |
United Therapeutics Corp.*,1 | | | 135 | | | | 24,220 | |
Hershey Co.1 | | | 120 | | | | 20,902 | |
Incyte Corp.*,1 | | | 235 | | | | 19,771 | |
Prestige Consumer Healthcare, Inc.*,1 | | | 378 | | | | 19,694 | |
Eagle Pharmaceuticals, Inc.* | | | 448 | | | | 19,174 | |
PerkinElmer, Inc. | | | 117 | | | | 18,066 | |
Vector Group Ltd.1 | | | 1,248 | | | | 17,647 | |
H&R Block, Inc.1 | | | 737 | | | | 17,305 | |
Blueprint Medicines Corp.* | | | 190 | | | | 16,712 | |
Vertex Pharmaceuticals, Inc.* | | | 77 | | | | 15,526 | |
Innoviva, Inc.*,1 | | | 1,085 | | | | 14,550 | |
Coherus Biosciences, Inc.* | | | 985 | | | | 13,622 | |
Quest Diagnostics, Inc.1 | | | 103 | | | | 13,593 | |
Vanda Pharmaceuticals, Inc.* | | | 587 | | | | 12,626 | |
Hill-Rom Holdings, Inc.1 | | | 111 | | | | 12,608 | |
Chemed Corp. | | | 26 | | | | 12,337 | |
Humana, Inc. | | | 26 | | | | 11,511 | |
Grand Canyon Education, Inc.* | | | 127 | | | | 11,426 | |
Exelixis, Inc.* | | | 579 | | | | 10,549 | |
Laboratory Corporation of America Holdings* | | | 38 | | | | 10,482 | |
PepsiCo, Inc. | | | 67 | | | | 9,927 | |
Total Consumer, Non-cyclical | | | | | | | 769,486 | |
| | | | | | | | | |
Industrial - 16.0% |
Toro Co.1 | | | 468 | | | | 51,424 | |
Donaldson Company, Inc.1 | | | 645 | | | | 40,977 | |
MDU Resources Group, Inc.1 | | | 1,301 | | | | 40,773 | |
Watts Water Technologies, Inc. — Class A | | | 231 | | | | 33,705 | |
Garmin Ltd. | | | 231 | | | | 33,412 | |
Eagle Materials, Inc. | | | 228 | | | | 32,401 | |
Vishay Intertechnology, Inc.1 | | | 1,371 | | | | 30,916 | |
OSI Systems, Inc.* | | | 292 | | | | 29,679 | |
Oshkosh Corp.1 | | | 214 | | | | 26,673 | |
Mettler-Toledo International, Inc.*,1 | | | 18 | | | | 24,936 | |
3M Co.1 | | | 112 | | | | 22,247 | |
Masco Corp.1 | | | 373 | | | | 21,974 | |
Snap-on, Inc.1 | | | 98 | | | | 21,896 | |
Northrop Grumman Corp.1 | | | 56 | | | | 20,352 | |
Timken Co.1 | | | 233 | | | | 18,777 | |
Parker-Hannifin Corp.1 | | | 61 | | | | 18,734 | |
Owens Corning1 | | | 191 | | | | 18,699 | |
Agilent Technologies, Inc.1 | | | 121 | | | | 17,885 | |
Louisiana-Pacific Corp. | | | 290 | | | | 17,484 | |
Fortive Corp.1 | | | 244 | | | | 17,017 | |
Waters Corp.*,1 | | | 49 | | | | 16,935 | |
Carlisle Companies, Inc. | | | 79 | | | | 15,119 | |
Huntington Ingalls Industries, Inc.1 | | | 71 | | | | 14,963 | |
128 | THE GUGGENHEIM FUNDS SEMI-ANNUAL REPORT | SEE NOTES TO FINANCIAL STATEMENTS. |
SCHEDULE OF INVESTMENTS (Unaudited)(continued) | June 30, 2021 |
SERIES Z (ALPHA OPPORTUNITY SERIES) | |
| | Shares | | | Value | |
Lincoln Electric Holdings, Inc. | | | 108 | | | $ | 14,225 | |
Lennox International, Inc.1 | | | 40 | | | | 14,032 | |
Acuity Brands, Inc.1 | | | 75 | | | | 14,027 | |
Boise Cascade Co. | | | 237 | | | | 13,829 | |
Sealed Air Corp.1 | | | 226 | | | | 13,390 | |
Hillenbrand, Inc.1 | | | 303 | | | | 13,356 | |
AGCO Corp.1 | | | 102 | | | | 13,299 | |
Sanmina Corp.*,1 | | | 322 | | | | 12,545 | |
Keysight Technologies, Inc.* | | | 81 | | | | 12,507 | |
Sturm Ruger & Company, Inc. | | | 128 | | | | 11,517 | |
Worthington Industries, Inc. | | | 187 | | | | 11,441 | |
Total Industrial | | | | | | | 731,146 | |
| | | | | | | | | |
Technology - 12.3% |
CSG Systems International, Inc.1 | | | 1,045 | | | | 49,303 | |
Microsoft Corp. | | | 128 | | | | 34,675 | |
Activision Blizzard, Inc. | | | 353 | | | | 33,690 | |
Cadence Design Systems, Inc.* | | | 223 | | | | 30,511 | |
Electronic Arts, Inc. | | | 204 | | | | 29,341 | |
Texas Instruments, Inc.1 | | | 150 | | | | 28,845 | |
Rambus, Inc.* | | | 1,172 | | | | 27,788 | |
CDK Global, Inc.1 | | | 434 | | | | 21,566 | |
HP, Inc.1 | | | 691 | | | | 20,861 | |
Seagate Technology Holdings plc1 | | | 236 | | | | 20,751 | |
Cerner Corp.1 | | | 257 | | | | 20,087 | |
Cirrus Logic, Inc.*,1 | | | 234 | | | | 19,918 | |
Take-Two Interactive Software, Inc.* | | | 108 | | | | 19,118 | |
Progress Software Corp. | | | 384 | | | | 17,760 | |
Cognizant Technology Solutions Corp. — Class A1 | | | 241 | | | | 16,692 | |
Broadcom, Inc.1 | | | 35 | | | | 16,689 | |
Kulicke & Soffa Industries, Inc.1 | | | 268 | | | | 16,402 | |
International Business Machines Corp.1 | | | 110 | | | | 16,125 | |
NetApp, Inc.1 | | | 191 | | | | 15,628 | |
Lumentum Holdings, Inc.* | | | 173 | | | | 14,191 | |
Intel Corp.1 | | | 244 | | | | 13,698 | |
MAXIMUS, Inc. | | | 130 | | | | 11,436 | |
Qorvo, Inc.* | | | 58 | | | | 11,348 | |
Synaptics, Inc.* | | | 72 | | | | 11,202 | |
ExlService Holdings, Inc.* | | | 102 | | | | 10,839 | |
Paychex, Inc. | | | 101 | | | | 10,837 | |
QUALCOMM, Inc. | | | 74 | | | | 10,577 | |
Dropbox, Inc. — Class A* | | | 334 | | | | 10,124 | |
Total Technology | | | | | | | 560,002 | |
| | | | | | | | | |
Consumer, Cyclical - 12.2% |
AutoZone, Inc.*,1 | | | 33 | | | | 49,243 | |
O’Reilly Automotive, Inc.*,1 | | | 77 | | | | 43,598 | |
Gentex Corp.1 | | | 1,262 | | | | 41,760 | |
Yum! Brands, Inc. | | | 310 | | | | 35,659 | |
Lowe’s Companies, Inc. | | | 173 | | | | 33,557 | |
Allison Transmission Holdings, Inc.1 | | | 706 | | | | 28,056 | |
Cummins, Inc.1 | | | 112 | | | | 27,307 | |
WW Grainger, Inc.1 | | | 59 | | | | 25,842 | |
Brunswick Corp.1 | | | 241 | | | | 24,009 | |
Dolby Laboratories, Inc. — Class A1 | | | 243 | | | | 23,884 | |
MSC Industrial Direct Company, Inc. — Class A1 | | | 258 | | | | 23,150 | |
Best Buy Company, Inc. | | | 178 | | | | 20,467 | |
Gentherm, Inc.*,1 | | | 281 | | | | 19,965 | |
PulteGroup, Inc.1 | | | 355 | | | | 19,372 | |
Carter’s, Inc. | | | 184 | | | | 18,983 | |
AutoNation, Inc.*,1 | | | 197 | | | | 18,678 | |
Murphy USA, Inc.1 | | | 138 | | | | 18,405 | |
Whirlpool Corp. | | | 76 | | | | 16,570 | |
Polaris, Inc. | | | 118 | | | | 16,161 | |
Meritage Homes Corp.* | | | 131 | | | | 12,325 | |
Lennar Corp. — Class A | | | 109 | | | | 10,829 | |
Dick’s Sporting Goods, Inc. | | | 107 | | | | 10,720 | |
Tri Pointe Homes, Inc.* | | | 494 | | | | 10,586 | |
NVR, Inc.* | | | 2 | | | | 9,947 | |
Total Consumer, Cyclical | | | | | | | 559,073 | |
| | | | | | | | | |
Utilities - 11.8% |
CMS Energy Corp. | | | 715 | | | | 42,242 | |
IDACORP, Inc.1 | | | 430 | | | | 41,925 | |
UGI Corp.1 | | | 905 | | | | 41,911 | |
Public Service Enterprise Group, Inc.1 | | | 698 | | | | 41,698 | |
Southern Co.1 | | | 674 | | | | 40,784 | |
DTE Energy Co. | | | 311 | | | | 40,306 | |
MGE Energy, Inc. | | | 526 | | | | 39,155 | |
American States Water Co. | | | 486 | | | | 38,666 | |
Chesapeake Utilities Corp. | | | 266 | | | | 32,008 | |
New Jersey Resources Corp. | | | 753 | | | | 29,796 | |
Pinnacle West Capital Corp.1 | | | 308 | | | | 25,247 | |
Sempra Energy1 | | | 188 | | | | 24,906 | |
American Water Works Company, Inc. | | | 160 | | | | 24,661 | |
Avista Corp. | | | 538 | | | | 22,956 | |
WEC Energy Group, Inc. | | | 209 | | | | 18,591 | |
National Fuel Gas Co. | | | 353 | | | | 18,444 | |
Portland General Electric Co.1 | | | 302 | | | | 13,916 | |
Total Utilities | | | | | | | 537,212 | |
| | | | | | | | | |
Communications - 9.7% |
Alphabet, Inc. — Class C* | | | 19 | | | | 47,620 | |
VeriSign, Inc.*,1 | | | 209 | | | | 47,587 | |
Verizon Communications, Inc.1 | | | 807 | | | | 45,216 | |
Viavi Solutions, Inc.*,1 | | | 2,462 | | | | 43,479 | |
Omnicom Group, Inc.1 | | | 515 | | | | 41,195 | |
Cisco Systems, Inc.1 | | | 579 | | | | 30,687 | |
Cogent Communications Holdings, Inc. | | | 278 | | | | 21,376 | |
Juniper Networks, Inc.1 | | | 738 | | | | 20,184 | |
TEGNA, Inc. | | | 1,038 | | | | 19,473 | |
Telephone & Data Systems, Inc.1 | | | 844 | | | | 19,125 | |
InterDigital, Inc.1 | | | 225 | | | | 16,432 | |
Motorola Solutions, Inc.1 | | | 70 | | | | 15,180 | |
Nexstar Media Group, Inc. — Class A1 | | | 90 | | | | 13,309 | |
F5 Networks, Inc.* | | | 70 | | | | 13,066 | |
Ciena Corp.*,1 | | | 224 | | | | 12,743 | |
World Wrestling Entertainment, Inc. — Class A | | | 219 | | | | 12,678 | |
Fox Corp. — Class A | | | 321 | | | | 11,919 | |
SEE NOTES TO FINANCIAL STATEMENTS. | THE GUGGENHEIM FUNDS SEMI-ANNUAL REPORT | 129 |
SCHEDULE OF INVESTMENTS (Unaudited)(continued) | June 30, 2021 |
SERIES Z (ALPHA OPPORTUNITY SERIES) | |
| | Shares | | | Value | |
Yelp, Inc. — Class A* | | | 273 | | | $ | 10,909 | |
Total Communications | | | | | | | 442,178 | |
| | | | | | | | | |
Basic Materials - 1.5% |
Reliance Steel & Aluminum Co. | | | 150 | | | | 22,635 | |
NewMarket Corp. | | | 61 | | | | 19,641 | |
Commercial Metals Co. | | | 443 | | | | 13,609 | |
Ingevity Corp.* | | | 167 | | | | 13,587 | |
Total Basic Materials | | | | | | | 69,472 | |
| | | | | | | | | |
Energy - 1.3% |
Williams Companies, Inc. | | | 754 | | | | 20,019 | |
Kinder Morgan, Inc. | | | 999 | | | | 18,212 | |
Antero Midstream Corp. | | | 1,173 | | | | 12,187 | |
Equitrans Midstream Corp. | | | 1,112 | | | | 9,463 | |
Total Energy | | | | | | | 59,881 | |
| | | | | | | | | |
Total Common Stocks | | | | |
(Cost $4,434,545) | | | | | | | 4,731,972 | |
| | | | | | | | | |
MONEY MARKET FUND† - 11.5% |
Goldman Sachs Financial Square Treasury Instruments Fund — Institutional Shares, 0.01%2 | | | 526,253 | | | | 526,253 | |
Total Money Market Fund | | | | |
(Cost $526,253) | | | | | | | 526,253 | |
| | | | | | | | | |
Total Investments - 115.2% | | | | |
(Cost $4,960,798) | | $ | 5,258,225 | |
Other Assets & Liabilities, net - (15.2)% | | | (694,771 | ) |
Total Net Assets - 100.0% | | $ | 4,563,454 | |
Custom Basket Swap Agreements |
Counterparty | Reference Obligation | Financing Rate
Pay (Receive) | Payment
Frequency | | Maturity Date | | | Notional
Amount | | | Value and
Unrealized
Appreciation
(Depreciation) | |
OTC Custom Basket Swap Agreements†† |
Goldman Sachs International | GS Equity Custom Basket | 0.55% (Federal Funds Rate + 0.45%) | At Maturity | | | 05/06/24 | | | $ | 828,343 | | | $ | 5,618 | |
Morgan Stanley Capital Services LLC | MS Equity Custom Basket | 0.50% (Federal Funds Rate + 0.40%) | At Maturity | | | 02/01/24 | | | | 828,189 | | | | 5,561 | |
| | | | | | | | | | $ | 1,656,532 | | | $ | 11,179 | |
OTC Custom Basket Swap Agreements Sold Short†† |
Morgan Stanley Capital Services LLC | MS Equity Custom Basket | (0.20)% (Federal Funds Rate - 0.30%) | At Maturity | | | 02/01/24 | | | $ | 2,059,342 | | | $ | (100,954 | ) |
Goldman Sachs International | GS Equity Custom Basket | (0.10)% (Federal Funds Rate - 0.20%) | At Maturity | | | 05/06/24 | | | | 2,127,193 | | | | (103,295 | ) |
| | | | | | | | | | $ | 4,186,535 | | | $ | (204,249 | ) |
130 | THE GUGGENHEIM FUNDS SEMI-ANNUAL REPORT | SEE NOTES TO FINANCIAL STATEMENTS. |
SCHEDULE OF INVESTMENTS (Unaudited)(continued) | June 30, 2021 |
SERIES Z (ALPHA OPPORTUNITY SERIES) | |
| | Shares | | | Percentage
Notional
Amount | | | Value and
Unrealized
Appreciation
(Depreciation) | |
MS EQUITY LONG CUSTOM BASKET | | | | | | | | |
Financial | | | | | | | | | | | | |
Mercury General Corp. | | | 96 | | | | 0.72 | % | | $ | 431 | |
Allstate Corp. | | | 48 | | | | 0.74 | % | | | 398 | |
Jefferies Financial Group, Inc. | | | 127 | | | | 0.52 | % | | | 276 | |
Synchrony Financial | | | 131 | | | | 0.77 | % | | | 216 | |
Progressive Corp. | | | 44 | | | | 0.52 | % | | | 212 | |
Cboe Global Markets, Inc. | | | 27 | | | | 0.39 | % | | | 149 | |
Federated Hermes, Inc. — Class B | | | 100 | | | | 0.41 | % | | | 148 | |
Houlihan Lokey, Inc. | | | 41 | | | | 0.40 | % | | | 98 | |
Marsh & McLennan Companies, Inc. | | | 23 | | | | 0.39 | % | | | 53 | |
Sabra Health Care REIT, Inc. | | | 103 | | | | 0.23 | % | | | 31 | |
OneMain Holdings, Inc. | | | 42 | | | | 0.30 | % | | | 27 | |
Interactive Brokers Group, Inc. — Class A | | | 50 | | | | 0.40 | % | | | 24 | |
Janus Henderson Group plc | | | 78 | | | | 0.37 | % | | | (16 | ) |
Arch Capital Group Ltd. | | | 95 | | | | 0.45 | % | | | (21 | ) |
Berkshire Hathaway, Inc. — Class B | | | 29 | | | | 0.97 | % | | | (22 | ) |
Evercore, Inc. — Class A | | | 27 | | | | 0.46 | % | | | (27 | ) |
SEI Investments Co. | | | 44 | | | | 0.33 | % | | | (29 | ) |
RenaissanceRe Holdings Ltd. | | | 19 | | | | 0.34 | % | | | (36 | ) |
Everest Re Group Ltd. | | | 15 | | | | 0.46 | % | | | (39 | ) |
Raymond James Financial, Inc. | | | 47 | | | | 0.74 | % | | | (40 | ) |
Markel Corp. | | | 3 | | | | 0.43 | % | | | (54 | ) |
Highwoods Properties, Inc. | | | 141 | | | | 0.77 | % | | | (58 | ) |
Brighthouse Financial, Inc. | | | 81 | | | | 0.45 | % | | | (84 | ) |
Radian Group, Inc. | | | 126 | | | | 0.34 | % | | | (85 | ) |
Aflac, Inc. | | | 120 | | | | 0.78 | % | | | (87 | ) |
Cincinnati Financial Corp. | | | 20 | | | | 0.28 | % | | | (102 | ) |
Stewart Information Services Corp. | | | 42 | | | | 0.29 | % | | | (113 | ) |
Capital One Financial Corp. | | | 21 | | | | 0.39 | % | | | (114 | ) |
Artisan Partners Asset Management, Inc. — Class A | | | 39 | | | | 0.24 | % | | | (116 | ) |
MGIC Investment Corp. | | | 144 | | | | 0.24 | % | | | (121 | ) |
Affiliated Managers Group, Inc. | | | 18 | | | | 0.34 | % | | | (122 | ) |
First American Financial Corp. | | | 39 | | | | 0.29 | % | | | (135 | ) |
Enstar Group Ltd. | | | 16 | | | | 0.46 | % | | | (138 | ) |
AMERISAFE, Inc. | | | 55 | | | | 0.40 | % | | | (142 | ) |
Travelers Companies, Inc. | | | 25 | | | | 0.45 | % | | | (152 | ) |
Safety Insurance Group, Inc. | | | 70 | | | | 0.66 | % | | | (163 | ) |
Western Union Co. | | | 78 | | | | 0.22 | % | | | (184 | ) |
Hanover Insurance Group, Inc. | | | 50 | | | | 0.82 | % | | | (188 | ) |
Discover Financial Services | | | 38 | | | | 0.54 | % | | | (201 | ) |
Essent Group Ltd. | | | 76 | | | | 0.41 | % | | | (203 | ) |
Lexington Realty Trust | | | 204 | | | | 0.29 | % | | | (208 | ) |
BankUnited, Inc. | | | 68 | | | | 0.35 | % | | | (239 | ) |
Brandywine Realty Trust | | | 393 | | | | 0.65 | % | | | (254 | ) |
Old Republic International Corp. | | | 227 | | | | 0.68 | % | | | (320 | ) |
Healthcare Realty Trust, Inc. | | | 170 | | | | 0.62 | % | | | (334 | ) |
Associated Banc-Corp. | | | 183 | | | | 0.45 | % | | | (335 | ) |
Total Financial | | | | | | | | | | | (2,419 | ) |
| | | | | | | | | | | | | |
Industrial | | | | | | | | | | | | |
Acuity Brands, Inc. | | | 13 | | | | 0.29 | % | | | 643 | |
Toro Co. | | | 84 | | | | 1.11 | % | | | 342 | |
Waters Corp. | | | 8 | | | | 0.33 | % | | | 307 | |
Agilent Technologies, Inc. | | | 21 | | | | 0.37 | % | | | 261 | |
Sturm Ruger & Company, Inc. | | | 23 | | | | 0.25 | % | | | 253 | |
Owens Corning | | | 34 | | | | 0.40 | % | | | 248 | |
Donaldson Company, Inc. | | | 116 | | | | 0.89 | % | | | 229 | |
Sealed Air Corp. | | | 40 | | | | 0.29 | % | | | 226 | |
Mettler-Toledo International, Inc. | | | 3 | | | | 0.50 | % | | | 199 | |
Northrop Grumman Corp. | | | 10 | | | | 0.44 | % | | | 190 | |
OSI Systems, Inc. | | | 52 | | | | 0.64 | % | | | 188 | |
Lennox International, Inc. | | | 7 | | | | 0.30 | % | | | 182 | |
3M Co. | | | 20 | | | | 0.48 | % | | | 161 | |
Watts Water Technologies, Inc. — Class A | | | 42 | | | | 0.74 | % | | | 141 | |
Oshkosh Corp. | | | 38 | | | | 0.57 | % | | | 129 | |
Lincoln Electric Holdings, Inc. | | | 19 | | | | 0.30 | % | | | 122 | |
Keysight Technologies, Inc. | | | 14 | | | | 0.26 | % | | | 102 | |
Carlisle Companies, Inc. | | | 14 | | | | 0.32 | % | | | 35 | |
Masco Corp. | | | 67 | | | | 0.48 | % | | | 34 | |
Parker-Hannifin Corp. | | | 11 | | | | 0.41 | % | | | 34 | |
Garmin Ltd. | | | 41 | | | | 0.72 | % | | | 13 | |
Louisiana-Pacific Corp. | | | 52 | | | | 0.38 | % | | | 4 | |
Huntington Ingalls Industries, Inc. | | | 12 | | | | 0.31 | % | | | (49 | ) |
AGCO Corp. | | | 18 | | | | 0.28 | % | | | (82 | ) |
Fortive Corp. | | | 44 | | | | 0.37 | % | | | (85 | ) |
Timken Co. | | | 42 | | | | 0.41 | % | | | (108 | ) |
Sanmina Corp. | | | 58 | | | | 0.27 | % | | | (124 | ) |
Worthington Industries, Inc. | | | 34 | | | | 0.25 | % | | | (130 | ) |
Boise Cascade Co. | | | 42 | | | | 0.30 | % | | | (154 | ) |
Snap-on, Inc. | | | 17 | | | | 0.46 | % | | | (158 | ) |
Hillenbrand, Inc. | | | 55 | | | | 0.29 | % | | | (202 | ) |
SEE NOTES TO FINANCIAL STATEMENTS. | THE GUGGENHEIM FUNDS SEMI-ANNUAL REPORT | 131 |
SCHEDULE OF INVESTMENTS (Unaudited)(continued) | June 30, 2021 |
SERIES Z (ALPHA OPPORTUNITY SERIES) | |
| | Shares | | | Percentage
Notional
Amount | | | Value and
Unrealized
Appreciation
(Depreciation) | |
Eagle Materials, Inc. | | | 41 | | | | 0.70 | % | | $ | (353 | ) |
Vishay Intertechnology, Inc. | | | 248 | | | | 0.68 | % | | | (396 | ) |
MDU Resources Group, Inc. | | | 235 | | | | 0.89 | % | | | (475 | ) |
Total Industrial | | | | | | | | | | | 1,727 | |
| | | | | | | | | | | | | |
Consumer, Cyclical | | | | | | | | | | | | |
AutoZone, Inc. | | | 6 | | | | 1.08 | % | | | 672 | |
O’Reilly Automotive, Inc. | | | 13 | | | | 0.89 | % | | | 488 | |
Lennar Corp. — Class A | | | 19 | | | | 0.23 | % | | | 171 | |
Polaris, Inc. | | | 21 | | | | 0.35 | % | | | 159 | |
PulteGroup, Inc. | | | 64 | | | | 0.42 | % | | | 158 | |
AutoNation, Inc. | | | 35 | | | | 0.40 | % | | | 140 | |
Brunswick Corp. | | | 43 | | | | 0.52 | % | | | 140 | |
Lowe’s Companies, Inc. | | | 31 | | | | 0.73 | % | | | 113 | |
Dick’s Sporting Goods, Inc. | | | 19 | | | | 0.23 | % | | | 14 | |
Best Buy Company, Inc. | | | 32 | | | | 0.44 | % | | | 13 | |
MSC Industrial Direct Company, Inc. — Class A | | | 46 | | | | 0.50 | % | | | 4 | |
Carter’s, Inc. | | | 33 | | | | 0.41 | % | | | (47 | ) |
WW Grainger, Inc. | | | 10 | | | | 0.53 | % | | | (51 | ) |
Tri Pointe Homes, Inc. | | | 89 | | | | 0.23 | % | | | (58 | ) |
Dolby Laboratories, Inc. — Class A | | | 44 | | | | 0.52 | % | | | (62 | ) |
Whirlpool Corp. | | | 13 | | | | 0.34 | % | | | (93 | ) |
Meritage Homes Corp. | | | 23 | | | | 0.26 | % | | | (101 | ) |
Murphy USA, Inc. | | | 25 | | | | 0.40 | % | | | (116 | ) |
Gentherm, Inc. | | | 51 | | | | 0.44 | % | | | (191 | ) |
Yum! Brands, Inc. | | | 56 | | | | 0.78 | % | | | (253 | ) |
Cummins, Inc. | | | 20 | | | | 0.59 | % | | | (276 | ) |
Allison Transmission Holdings, Inc. | | | 128 | | | | 0.61 | % | | | (350 | ) |
Gentex Corp. | | | 228 | | | | 0.91 | % | | | (401 | ) |
Total Consumer, Cyclical | | | | | | | | | | | 73 | |
| | | | | | | | | | | | | |
Communications | | | | | | | | | | | | |
Cisco Systems, Inc. | | | 105 | | | | 0.67 | % | | | 828 | |
VeriSign, Inc. | | | 38 | | | | 1.04 | % | | | 627 | |
Viavi Solutions, Inc. | | | 446 | | | | 0.95 | % | | | 351 | |
Motorola Solutions, Inc. | | | 12 | | | | 0.31 | % | | | 310 | |
Juniper Networks, Inc. | | | 133 | | | | 0.44 | % | | | 247 | |
Ciena Corp. | | | 40 | | | | 0.27 | % | | | 185 | |
Cogent Communications Holdings, Inc. | | | 50 | | | | 0.46 | % | | | 15 | |
Alphabet, Inc. — Class C | | | 3 | | | | 0.91 | % | | | 1 | |
Verizon Communications, Inc. | | | 68 | | | | 0.46 | % | | | (10 | ) |
Yelp, Inc. — Class A | | | 49 | | | | 0.24 | % | | | (24 | ) |
Fox Corp. — Class A | | | 58 | | | | 0.26 | % | | | (40 | ) |
Nexstar Media Group, Inc. — Class A | | | 16 | | | | 0.29 | % | | | (46 | ) |
F5 Networks, Inc. | | | 12 | | | | 0.27 | % | | | (61 | ) |
TEGNA, Inc. | | | 188 | | | | 0.43 | % | | | (67 | ) |
InterDigital, Inc. | | | 40 | | | | 0.35 | % | | | (106 | ) |
World Wrestling Entertainment, Inc. — Class A | | | 39 | | | | 0.27 | % | | | (162 | ) |
Omnicom Group, Inc. | | | 93 | | | | 0.90 | % | | | (198 | ) |
Telephone & Data Systems, Inc. | | | 153 | | | | 0.42 | % | | | (382 | ) |
Total Communications | | | | | | | | | | | 1,468 | |
| | | | | | | | | | | | | |
Energy | | | | | | | | | | | | |
Antero Midstream Corp. | | | 212 | | | | 0.27 | % | | | (39 | ) |
Kinder Morgan, Inc. | | | 181 | | | | 0.40 | % | | | (170 | ) |
Williams Companies, Inc. | | | 136 | | | | 0.44 | % | | | (170 | ) |
Equitrans Midstream Corp. | | | 201 | | | | 0.21 | % | | | (227 | ) |
Total Energy | | | | | | | | | | | (606 | ) |
| | | | | | | | | | | | | |
Utilities | | | | | | | | | | | | |
UGI Corp. | | | 164 | | | | 0.92 | % | | | 416 | |
Chesapeake Utilities Corp. | | | 48 | | | | 0.70 | % | | | 7 | |
IDACORP, Inc. | | | 77 | | | | 0.91 | % | | | (61 | ) |
Public Service Enterprise Group, Inc. | | | 126 | | | | 0.91 | % | | | (100 | ) |
Pinnacle West Capital Corp. | | | 55 | | | | 0.54 | % | | | (104 | ) |
WEC Energy Group, Inc. | | | 37 | | | | 0.40 | % | | | (142 | ) |
American Water Works Company, Inc. | | | 29 | | | | 0.54 | % | | | (161 | ) |
MGE Energy, Inc. | | | 95 | | | | 0.85 | % | | | (165 | ) |
National Fuel Gas Co. | | | 64 | | | | 0.40 | % | | | (181 | ) |
CMS Energy Corp. | | | 129 | | | | 0.92 | % | | | (186 | ) |
Sempra Energy | | | 34 | | | | 0.54 | % | | | (203 | ) |
American States Water Co. | | | 88 | | | | 0.85 | % | | | (215 | ) |
Southern Co. | | | 122 | | | | 0.89 | % | | | (236 | ) |
Portland General Electric Co. | | | 54 | | | | 0.30 | % | | | (237 | ) |
Avista Corp. | | | 97 | | | | 0.50 | % | | | (268 | ) |
DTE Energy Co. | | | 56 | | | | 0.88 | % | | | (363 | ) |
New Jersey Resources Corp. | | | 136 | | | | 0.65 | % | | | (595 | ) |
Total Utilities | | | | | | | | | | | (2,794 | ) |
| | | | | | | | | | | | | |
Consumer, Non-cyclical | | | | | | | | | | | | |
Molson Coors Beverage Co. — Class B | | | 99 | | | | 0.64 | % | | | 1,456 | |
Regeneron Pharmaceuticals, Inc. | | | 9 | | | | 0.61 | % | | | 474 | |
Thermo Fisher Scientific, Inc. | | | 10 | | | | 0.61 | % | | | 406 | |
Bio-Rad Laboratories, Inc. — Class A | | | 8 | | | | 0.62 | % | | | 355 | |
Merck & Company, Inc. | | | 55 | | | | 0.52 | % | | | 287 | |
Vanda Pharmaceuticals, Inc. | | | 106 | | | | 0.28 | % | | | 255 | |
Bristol-Myers Squibb Co. | | | 115 | | | | 0.93 | % | | | 254 | |
132 | THE GUGGENHEIM FUNDS SEMI-ANNUAL REPORT | SEE NOTES TO FINANCIAL STATEMENTS. |
SCHEDULE OF INVESTMENTS (Unaudited)(continued) | June 30, 2021 |
SERIES Z (ALPHA OPPORTUNITY SERIES) | |
| | Shares | | | Percentage
Notional
Amount | | | Value and
Unrealized
Appreciation
(Depreciation) | |
Innoviva, Inc. | | | 196 | | | | 0.32 | % | | $ | 223 | |
Gilead Sciences, Inc. | | | 121 | | | | 1.01 | % | | | 181 | |
United Therapeutics Corp. | | | 24 | | | | 0.52 | % | | | 177 | |
Laboratory Corporation of America Holdings | | | 6 | | | | 0.20 | % | | | 172 | |
McKesson Corp. | | | 30 | | | | 0.69 | % | | | 171 | |
PerkinElmer, Inc. | | | 21 | | | | 0.39 | % | | | 169 | |
Prestige Consumer Healthcare, Inc. | | | 68 | | | | 0.43 | % | | | 166 | |
Vector Group Ltd. | | | 67 | | | | 0.11 | % | | | 163 | |
Pfizer, Inc. | | | 120 | | | | 0.57 | % | | | 162 | |
Eagle Pharmaceuticals, Inc. | | | 81 | | | | 0.42 | % | | | 162 | |
Humana, Inc. | | | 4 | | | | 0.21 | % | | | 141 | |
Quest Diagnostics, Inc. | | | 18 | | | | 0.29 | % | | | 130 | |
Amgen, Inc. | | | 27 | | | | 0.79 | % | | | 117 | |
Hershey Co. | | | 21 | | | | 0.44 | % | | | 115 | |
H&R Block, Inc. | | | 133 | | | | 0.38 | % | | | 104 | |
Incyte Corp. | | | 42 | | | | 0.43 | % | | | 88 | |
Johnson & Johnson | | | 23 | | | | 0.46 | % | | | 84 | |
Vertex Pharmaceuticals, Inc. | | | 14 | | | | 0.34 | % | | | 75 | |
Blueprint Medicines Corp. | | | 34 | | | | 0.36 | % | | | 64 | |
Hill-Rom Holdings, Inc. | | | 20 | | | | 0.27 | % | | | 45 | |
Hologic, Inc. | | | 66 | | | | 0.53 | % | | | 24 | |
PepsiCo, Inc. | | | 12 | | | | 0.21 | % | | | 17 | |
Chemed Corp. | | | 4 | | | | 0.23 | % | | | (27 | ) |
Grand Canyon Education, Inc. | | | 23 | | | | 0.25 | % | | | (74 | ) |
Coherus Biosciences, Inc. | | | 178 | | | | 0.30 | % | | | (114 | ) |
John B Sanfilippo & Son, Inc. | | | 54 | | | | 0.58 | % | | | (149 | ) |
Exelixis, Inc. | | | 104 | | | | 0.23 | % | | | (493 | ) |
Total Consumer, Non-cyclical | | | | | | | | | | | 5,380 | |
| | | | | | | | | | | | | |
Technology | | | | | | | | | | | | |
Rambus, Inc. | | | 212 | | | | 0.61 | % | | | 814 | |
Kulicke & Soffa Industries, Inc. | | | 48 | | | | 0.35 | % | | | 551 | |
International Business Machines Corp. | | | 19 | | | | 0.34 | % | | | 489 | |
Seagate Technology Holdings plc | | | 42 | | | | 0.45 | % | | | 361 | |
CSG Systems International, Inc. | | | 189 | | | | 1.08 | % | | | 335 | |
Microsoft Corp. | | | 23 | | | | 0.75 | % | | | 323 | |
Dropbox, Inc. — Class A | | | 60 | | | | 0.22 | % | | | 317 | |
Cadence Design Systems, Inc. | | | 40 | | | | 0.66 | % | | | 314 | |
NetApp, Inc. | | | 34 | | | | 0.34 | % | | | 268 | |
Cerner Corp. | | | 46 | | | | 0.43 | % | | | 255 | |
Cirrus Logic, Inc. | | | 42 | | | | 0.43 | % | | | 206 | |
Synaptics, Inc. | | | 13 | | | | 0.24 | % | | | 203 | |
Texas Instruments, Inc. | | | 27 | | | | 0.63 | % | | | 188 | |
Qorvo, Inc. | | | 10 | | | | 0.24 | % | | | 188 | |
Paychex, Inc. | | | 18 | | | | 0.23 | % | | | 129 | |
Broadcom, Inc. | | | 6 | | | | 0.35 | % | | | 121 | |
QUALCOMM, Inc. | | | 13 | | | | 0.22 | % | | | 103 | |
Lumentum Holdings, Inc. | | | 31 | | | | 0.31 | % | | | 40 | |
ExlService Holdings, Inc. | | | 18 | | | | 0.23 | % | | | 23 | |
HP, Inc. | | | 125 | | | | 0.46 | % | | | (73 | ) |
Electronic Arts, Inc. | | | 37 | | | | 0.64 | % | | | (89 | ) |
Progress Software Corp. | | | 69 | | | | 0.39 | % | | | (111 | ) |
MAXIMUS, Inc. | | | 23 | | | | 0.24 | % | | | (126 | ) |
Take-Two Interactive Software, Inc. | | | 19 | | | | 0.41 | % | | | (172 | ) |
Activision Blizzard, Inc. | | | 64 | | | | 0.74 | % | | | (173 | ) |
Cognizant Technology Solutions Corp. — Class A | | | 43 | | | | 0.36 | % | | | (223 | ) |
Intel Corp. | | | 44 | | | | 0.30 | % | | | (259 | ) |
CDK Global, Inc. | | | 78 | | | | 0.47 | % | | | (263 | ) |
Total Technology | | | | | | | | | | | 3,739 | |
| | | | | | | | | | | | | |
Basic Materials | | | | | | | | | | | | |
Ingevity Corp. | | | 30 | | | | 0.29 | % | | | (67 | ) |
NewMarket Corp. | | | 11 | | | | 0.43 | % | | | (154 | ) |
Commercial Metals Co. | | | 80 | | | | 0.30 | % | | | (192 | ) |
Reliance Steel & Aluminum Co. | | | 27 | | | | 0.49 | % | | | (594 | ) |
Total Basic Materials | | | | | | | | | | | (1,007 | ) |
Total MS Equity Long Custom Basket | | | | | | | | | | $ | 5,561 | |
| | | | | | | | | | | | | |
MS EQUITY SHORT CUSTOM BASKET | | | | | | | | |
Financial | | | | | | | | | | | | |
JBG SMITH Properties | | | 921 | | | | (1.44 | )% | | $ | 1,354 | |
Lincoln National Corp. | | | 257 | | | | (0.78 | )% | | | 1,235 | |
American International Group, Inc. | | | 241 | | | | (0.56 | )% | | | 1,060 | |
U.S. Bancorp | | | 501 | | | | (1.39 | )% | | | 1,033 | |
Alexandria Real Estate Equities, Inc. | | | 96 | | | | (0.85 | )% | | | 1,031 | |
Truist Financial Corp. | | | 404 | | | | (1.09 | )% | | | 1,014 | |
Prudential Financial, Inc. | | | 280 | | | | (1.39 | )% | | | 856 | |
Global Net Lease, Inc. | | | 512 | | | | (0.46 | )% | | | 852 | |
CyrusOne, Inc. | | | 169 | | | | (0.59 | )% | | | 433 | |
Bank of America Corp. | | | 813 | | | | (1.63 | )% | | | 418 | |
Comerica, Inc. | | | 174 | | | | (0.60 | )% | | | 402 | |
State Street Corp. | | | 244 | | | | (0.97 | )% | | | 353 | |
Equitable Holdings, Inc. | | | 428 | | | | (0.63 | )% | | | 290 | |
Mid-America Apartment Communities, Inc. | | | 100 | | | | (0.82 | )% | | | 259 | |
UDR, Inc. | | | 585 | | | | (1.39 | )% | | | 226 | |
Ryman Hospitality Properties, Inc. | | | 108 | | | | (0.41 | )% | | | 202 | |
Wells Fargo & Co. | | | 238 | | | | (0.52 | )% | | | 53 | |
Americold Realty Trust | | | 605 | | | | (1.11 | )% | | | (27 | ) |
SEE NOTES TO FINANCIAL STATEMENTS. | THE GUGGENHEIM FUNDS SEMI-ANNUAL REPORT | 133 |
SCHEDULE OF INVESTMENTS (Unaudited)(continued) | June 30, 2021 |
SERIES Z (ALPHA OPPORTUNITY SERIES) | |
| | Shares | | | Percentage
Notional
Amount | | | Value and
Unrealized
Appreciation
(Depreciation) | |
SBA Communications Corp. | | | 27 | | | | (0.42 | )% | | $ | (48 | ) |
Crown Castle International Corp. | | | 75 | | | | (0.71 | )% | | | (67 | ) |
Bank of New York Mellon Corp. | | | 136 | | | | (0.34 | )% | | | (124 | ) |
Host Hotels & Resorts, Inc. | | | 948 | | | | (0.79 | )% | | | (238 | ) |
Digital Realty Trust, Inc. | | | 143 | | | | (1.04 | )% | | | (387 | ) |
Welltower, Inc. | | | 166 | | | | (0.67 | )% | | | (648 | ) |
American Homes 4 Rent — Class A | | | 256 | | | | (0.48 | )% | | | (816 | ) |
Federal Realty Investment Trust | | | 86 | | | | (0.49 | )% | | | (887 | ) |
Invitation Homes, Inc. | | | 406 | | | | (0.74 | )% | | | (1,156 | ) |
Charles Schwab Corp. | | | 382 | | | | (1.35 | )% | | | (1,236 | ) |
Healthpeak Properties, Inc. | | | 847 | | | | (1.37 | )% | | | (1,324 | ) |
American Tower Corp. — Class A | | | 42 | | | | (0.55 | )% | | | (2,803 | ) |
Howard Hughes Corp. | | | 133 | | | | (0.63 | )% | | | (2,803 | ) |
Rayonier, Inc. | | | 436 | | | | (0.76 | )% | | | (2,885 | ) |
Prologis, Inc. | | | 176 | | | | (1.02 | )% | | | (3,387 | ) |
Loews Corp. | | | 216 | | | | (0.57 | )% | | | (3,485 | ) |
Brookline Bancorp, Inc. | | | 910 | | | | (0.66 | )% | | | (3,806 | ) |
Equinix, Inc. | | | 31 | | | | (1.21 | )% | | | (4,686 | ) |
Camden Property Trust | | | 152 | | | | (0.98 | )% | | | (4,867 | ) |
Sun Communities, Inc. | | | 134 | | | | (1.12 | )% | | | (6,714 | ) |
Rexford Industrial Realty, Inc. | | | 399 | | | | (1.10 | )% | | | (8,319 | ) |
First Republic Bank | | | 177 | | | | (1.61 | )% | | | (9,804 | ) |
Total Financial | | | | | | | | | | | (49,446 | ) |
| | | | | | | | | | | | | |
Industrial | | | | | | | | | | | | |
Jacobs Engineering Group, Inc. | | | 240 | | | | (1.55 | )% | | | 1,575 | |
Ball Corp. | | | 150 | | | | (0.59 | )% | | | 1,354 | |
Stericycle, Inc. | | | 411 | | | | (1.43 | )% | | | 1,082 | |
XPO Logistics, Inc. | | | 107 | | | | (0.73 | )% | | | 929 | |
Norfolk Southern Corp. | | | 109 | | | | (1.40 | )% | | | 691 | |
Exponent, Inc. | | | 86 | | | | (0.37 | )% | | | 570 | |
MSA Safety, Inc. | | | 87 | | | | (0.70 | )% | | | 32 | |
US Ecology, Inc. | | | 276 | | | | (0.50 | )% | | | (17 | ) |
FedEx Corp. | | | 56 | | | | (0.81 | )% | | | (169 | ) |
Republic Services, Inc. — Class A | | | 311 | | | | (1.66 | )% | | | (209 | ) |
United Parcel Service, Inc. — Class B | | | 50 | | | | (0.50 | )% | | | (282 | ) |
Boeing Co. | | | 63 | | | | (0.73 | )% | | | (477 | ) |
TransDigm Group, Inc. | | | 14 | | | | (0.44 | )% | | | (637 | ) |
Raytheon Technologies Corp. | | | 333 | | | | (1.38 | )% | | | (679 | ) |
Waste Management, Inc. | | | 242 | | | | (1.65 | )% | | | (843 | ) |
Ingersoll Rand, Inc. | | | 321 | | | | (0.76 | )% | | | (2,214 | ) |
Tetra Tech, Inc. | | | 94 | | | | (0.56 | )% | | | (2,908 | ) |
Casella Waste Systems, Inc. — Class A | | | 346 | | | | (1.07 | )% | | | (3,705 | ) |
Total Industrial | | | | | | | | | | | (5,907 | ) |
| | | | | | | | | | | | | |
Utilities | | | | | | | | | | | | |
Atmos Energy Corp. | | | 284 | | | | (1.33 | )% | | | 1,510 | |
Exelon Corp. | | | 608 | | | | (1.31 | )% | | | 1,434 | |
Xcel Energy, Inc. | | | 373 | | | | (1.19 | )% | | | 1,270 | |
ONE Gas, Inc. | | | 387 | | | | (1.39 | )% | | | 1,263 | |
Black Hills Corp. | | | 197 | | | | (0.63 | )% | | | 736 | |
OGE Energy Corp. | | | 453 | | | | (0.74 | )% | | | 665 | |
CenterPoint Energy, Inc. | | | 377 | | | | (0.45 | )% | | | 510 | |
Edison International | | | 511 | | | | (1.43 | )% | | | (19 | ) |
Total Utilities | | | | | | | | | | | 7,369 | |
| | | | | | | | | | | | | |
Consumer, Non-cyclical | | | | | | | | | | | | |
Verisk Analytics, Inc. — Class A | | | 199 | | | | (1.69 | )% | | | 2,148 | |
Archer-Daniels-Midland Co. | | | 387 | | | | (1.14 | )% | | | 1,985 | |
ManpowerGroup, Inc. | | | 148 | | | | (0.85 | )% | | | 517 | |
CoStar Group, Inc. | | | 210 | | | | (0.84 | )% | | | 207 | |
Cooper Companies, Inc. | | | 19 | | | | (0.37 | )% | | | 140 | |
McCormick & Company, Inc. | | | 221 | | | | (0.95 | )% | | | 23 | |
Brink’s Co. | | | 123 | | | | (0.46 | )% | | | (79 | ) |
Alnylam Pharmaceuticals, Inc. | | | 53 | | | | (0.44 | )% | | | (330 | ) |
Guardant Health, Inc. | | | 91 | | | | (0.55 | )% | | | (338 | ) |
Rollins, Inc. | | | 402 | �� | | | (0.67 | )% | | | (376 | ) |
TransUnion | | | 196 | | | | (1.05 | )% | | | (1,568 | ) |
Avalara, Inc. | | | 34 | | | | (0.27 | )% | | | (2,215 | ) |
Cintas Corp. | | | 97 | | | | (1.80 | )% | | | (2,889 | ) |
Equifax, Inc. | | | 77 | | | | (0.90 | )% | | | (5,703 | ) |
Total Consumer, Non-cyclical | | | | | | | | | | | (8,478 | ) |
| | | | | | | | | | | | | |
Energy | | | | | | | | | | | | |
Baker Hughes Co. | | | 498 | | | | (0.55 | )% | | | 1,487 | |
Schlumberger N.V. | | | 970 | | | | (1.51 | )% | | | 1,153 | |
Phillips 66 | | | 130 | | | | (0.54 | )% | | | 28 | |
Pioneer Natural Resources Co. | | | 208 | | | | (1.64 | )% | | | (1,312 | ) |
NOV, Inc. | | | 564 | | | | (0.42 | )% | | | (1,929 | ) |
Hess Corp. | | | 175 | | | | (0.74 | )% | | | (3,309 | ) |
ChampionX Corp. | | | 672 | | | | (0.84 | )% | | | (5,402 | ) |
Halliburton Co. | | | 1,417 | | | | (1.59 | )% | | | (5,888 | ) |
Ovintiv, Inc. | | | 677 | | | | (1.03 | )% | | | (8,813 | ) |
Total Energy | | | | | | | | | | | (23,985 | ) |
| | | | | | | | | | | | | |
Consumer, Cyclical | | | | | | | | | | | | |
JetBlue Airways Corp. | | | 992 | | | | (0.81 | )% | | | 1,828 | |
United Airlines Holdings, Inc. | | | 390 | | | | (0.99 | )% | | | 1,714 | |
IAA, Inc. | | | 232 | | | | (0.61 | )% | | | 1,243 | |
134 | THE GUGGENHEIM FUNDS SEMI-ANNUAL REPORT | SEE NOTES TO FINANCIAL STATEMENTS. |
SCHEDULE OF INVESTMENTS (Unaudited)(continued) | June 30, 2021 |
SERIES Z (ALPHA OPPORTUNITY SERIES) | |
| | Shares | | | Percentage
Notional
Amount | | | Value and
Unrealized
Appreciation
(Depreciation) | |
Marriott International, Inc. — Class A | | | 64 | | | | (0.42 | )% | | $ | 435 | |
Freshpet, Inc. | | | 90 | | | | (0.71 | )% | | | 389 | |
Hilton Worldwide Holdings, Inc. | | | 82 | | | | (0.48 | )% | | | 247 | |
Delta Air Lines, Inc. | | | 635 | | | | (1.33 | )% | | | 54 | |
Alaska Air Group, Inc. | | | 345 | | | | (1.01 | )% | | | (686 | ) |
Southwest Airlines Co. | | | 511 | | | | (1.32 | )% | | | (2,627 | ) |
Copart, Inc. | | | 180 | | | | (1.15 | )% | | | (5,159 | ) |
Total Consumer, Cyclical | | | | | | | | | | | (2,562 | ) |
| | | | | | | | | | | | | |
Technology | | | | | | | | | | | | |
KBR, Inc. | | | 524 | | | | (0.97 | )% | | | 927 | |
Leidos Holdings, Inc. | | | 151 | | | | (0.74 | )% | | | 796 | |
Blackline, Inc. | | | 44 | | | | (0.24 | )% | | | 226 | |
Sailpoint Technologies Holdings, Inc. | | | 98 | | | | (0.24 | )% | | | (279 | ) |
Clarivate plc | | | 406 | | | | (0.54 | )% | | | (280 | ) |
Twilio, Inc. — Class A | | | 14 | | | | (0.27 | )% | | | (406 | ) |
Tyler Technologies, Inc. | | | 11 | | | | (0.24 | )% | | | (758 | ) |
Ceridian HCM Holding, Inc. | | | 111 | | | | (0.52 | )% | | | (884 | ) |
Coupa Software, Inc. | | | 42 | | | | (0.53 | )% | | | (989 | ) |
Smartsheet, Inc. — Class A | | | 71 | | | | (0.25 | )% | | | (1,755 | ) |
Rapid7, Inc. | | | 109 | | | | (0.50 | )% | | | (2,384 | ) |
HubSpot, Inc. | | | 9 | | | | (0.25 | )% | | | (2,985 | ) |
Total Technology | | | | | | | | | | | (8,771 | ) |
| | | | | | | | | | | | | |
Communications | | | | | | | | | | | | |
Anaplan, Inc. | | | 89 | | | | (0.23 | )% | | | 322 | |
Okta, Inc. | | | 46 | | | | (0.55 | )% | | | (31 | ) |
Uber Technologies, Inc. | | | 320 | | | | (0.78 | )% | | | (112 | ) |
Q2 Holdings, Inc. | | | 156 | | | | (0.78 | )% | | | (1,953 | ) |
Zendesk, Inc. | | | 73 | | | | (0.51 | )% | | | (2,781 | ) |
Liberty Broadband Corp. — Class C | | | 99 | | | | (0.83 | )% | | | (3,010 | ) |
Total Communications | | | | | | | | | | | (7,565 | ) |
| | | | | | | | | | | | | |
Basic Materials | | | | | | | | | | | | |
Linde plc | | | 24 | | | | (0.34 | )% | | | (288 | ) |
Quaker Chemical Corp. | | | 42 | | | | (0.48 | )% | | | (1,321 | ) |
Total Basic Materials | | | | | | | | | | | (1,609 | ) |
Total MS Equity Short Custom Basket | | | | | | | | | | $ | (100,954 | ) |
| | | | | | | | | |
GS EQUITY LONG CUSTOM BASKET | | | | | | | | |
Industrial | | | | | | | | | | | | |
Acuity Brands, Inc. | | | 14 | | | | 0.28 | % | | $ | 725 | |
Toro Co. | | | 84 | | | | 1.08 | % | | | 331 | |
Waters Corp. | | | 8 | | | | 0.33 | % | | | 308 | |
Agilent Technologies, Inc. | | | 21 | | | | 0.37 | % | | | 261 | |
Sturm Ruger & Company, Inc. | | | 23 | | | | 0.25 | % | | | 254 | |
Owens Corning | | | 34 | | | | 0.40 | % | | | 248 | |
Sealed Air Corp. | | | 40 | | | | 0.29 | % | | | 227 | |
Donaldson Company, Inc. | | | 116 | | | | 0.89 | % | | | 226 | |
Mettler-Toledo International, Inc. | | | 3 | | | | 0.50 | % | | | 207 | |
Northrop Grumman Corp. | | | 10 | | | | 0.44 | % | | | 198 | |
OSI Systems, Inc. | | | 52 | | | | 0.64 | % | | | 186 | |
Lennox International, Inc. | | | 7 | | | | 0.30 | % | | | 181 | |
3M Co. | | | 20 | | | | 0.48 | % | | | 169 | |
Watts Water Technologies, Inc. — Class A | | | 42 | | | | 0.74 | % | | | 144 | |
Oshkosh Corp. | | | 38 | | | | 0.57 | % | | | 131 | |
Lincoln Electric Holdings, Inc. | | | 19 | | | | 0.30 | % | | | 115 | |
Keysight Technologies, Inc. | | | 14 | | | | 0.26 | % | | | 102 | |
Carlisle Companies, Inc. | | | 14 | | | | 0.32 | % | | | 39 | |
Parker-Hannifin Corp. | | | 11 | | | | 0.41 | % | | | 35 | |
Masco Corp. | | | 67 | | | | 0.48 | % | | | 32 | |
Garmin Ltd. | | | 41 | | | | 0.72 | % | | | 24 | |
Louisiana-Pacific Corp. | | | 52 | | | | 0.38 | % | | | 2 | |
Huntington Ingalls Industries, Inc. | | | 12 | | | | 0.31 | % | | | (52 | ) |
Fortive Corp. | | | 44 | | | | 0.37 | % | | | (89 | ) |
AGCO Corp. | | | 18 | | | | 0.28 | % | | | (91 | ) |
Timken Co. | | | 42 | | | | 0.41 | % | | | (98 | ) |
Worthington Industries, Inc. | | | 34 | | | | 0.25 | % | | | (124 | ) |
Sanmina Corp. | | | 58 | | | | 0.27 | % | | | (125 | ) |
Boise Cascade Co. | | | 42 | | | | 0.30 | % | | | (161 | ) |
Snap-on, Inc. | | | 17 | | | | 0.46 | % | | | (163 | ) |
Hillenbrand, Inc. | | | 55 | | | | 0.29 | % | | | (203 | ) |
Eagle Materials, Inc. | | | 41 | | | | 0.70 | % | | | (363 | ) |
Vishay Intertechnology, Inc. | | | 248 | | | | 0.68 | % | | | (397 | ) |
MDU Resources Group, Inc. | | | 235 | | | | 0.89 | % | | | (473 | ) |
Total Industrial | | | | | | | | | | | 1,806 | |
| | | | | | | | | | | | | |
Financial | | | | | | | | | | | | |
Mercury General Corp. | | | 96 | | | | 0.74 | % | | | 429 | |
Allstate Corp. | | | 48 | | | | 0.76 | % | | | 397 | |
Jefferies Financial Group, Inc. | | | 127 | | | | 0.52 | % | | | 264 | |
Progressive Corp. | | | 44 | | | | 0.52 | % | | | 214 | |
Synchrony Financial | | | 131 | | | | 0.77 | % | | | 213 | |
Federated Hermes, Inc. — Class B | | | 100 | | | | 0.41 | % | | | 156 | |
Cboe Global Markets, Inc. | | | 27 | | | | 0.39 | % | | | 155 | |
Houlihan Lokey, Inc. | | | 41 | | | | 0.40 | % | | | 106 | |
Marsh & McLennan Companies, Inc. | | | 23 | | | | 0.39 | % | | | 55 | |
Sabra Health Care REIT, Inc. | | | 103 | | | | 0.23 | % | | | 31 | |
Interactive Brokers Group, Inc. — Class A | | | 50 | | | | 0.40 | % | | | 21 | |
SEE NOTES TO FINANCIAL STATEMENTS. | THE GUGGENHEIM FUNDS SEMI-ANNUAL REPORT | 135 |
SCHEDULE OF INVESTMENTS (Unaudited)(continued) | June 30, 2021 |
SERIES Z (ALPHA OPPORTUNITY SERIES) | |
| | Shares | | | Percentage
Notional
Amount | | | Value and
Unrealized
Appreciation
(Depreciation) | |
OneMain Holdings, Inc. | | | 42 | | | | 0.30 | % | | $ | 20 | |
Janus Henderson Group plc | | | 78 | | | | 0.37 | % | | | (15 | ) |
Berkshire Hathaway, Inc. — Class B | | | 29 | | | | 0.97 | % | | | (23 | ) |
Arch Capital Group Ltd. | | | 95 | | | | 0.45 | % | | | (23 | ) |
SEI Investments Co. | | | 44 | | | | 0.33 | % | | | (27 | ) |
Evercore, Inc. — Class A | | | 27 | | | | 0.46 | % | | | (29 | ) |
RenaissanceRe Holdings Ltd. | | | 19 | | | | 0.34 | % | | | (40 | ) |
Everest Re Group Ltd. | | | 15 | | | | 0.46 | % | | | (40 | ) |
Raymond James Financial, Inc. | | | 47 | | | | 0.74 | % | | | (46 | ) |
Markel Corp. | | | 3 | | | | 0.43 | % | | | (58 | ) |
Highwoods Properties, Inc. | | | 141 | | | | 0.77 | % | | | (61 | ) |
Aflac, Inc. | | | 120 | | | | 0.78 | % | | | (87 | ) |
Brighthouse Financial, Inc. | | | 81 | | | | 0.45 | % | | | (89 | ) |
Radian Group, Inc. | | | 126 | | | | 0.34 | % | | | (91 | ) |
Cincinnati Financial Corp. | | | 20 | | | | 0.28 | % | | | (104 | ) |
Stewart Information Services Corp. | | | 42 | | | | 0.29 | % | | | (114 | ) |
Artisan Partners Asset Management, Inc. — Class A | | | 39 | | | | 0.24 | % | | | (116 | ) |
Capital One Financial Corp. | | | 21 | | | | 0.39 | % | | | (117 | ) |
Affiliated Managers Group, Inc. | | | 18 | | | | 0.34 | % | | | (124 | ) |
MGIC Investment Corp. | | | 144 | | | | 0.24 | % | | | (128 | ) |
First American Financial Corp. | | | 39 | | | | 0.29 | % | | | (134 | ) |
Enstar Group Ltd. | | | 16 | | | | 0.46 | % | | | (140 | ) |
AMERISAFE, Inc. | | | 55 | | | | 0.40 | % | | | (144 | ) |
Travelers Companies, Inc. | | | 25 | | | | 0.45 | % | | | (150 | ) |
Safety Insurance Group, Inc. | | | 70 | | | | 0.66 | % | | | (161 | ) |
Western Union Co. | | | 78 | | | | 0.22 | % | | | (182 | ) |
Hanover Insurance Group, Inc. | | | 50 | | | | 0.82 | % | | | (187 | ) |
Lexington Realty Trust | | | 204 | | | | 0.29 | % | | | (202 | ) |
Discover Financial Services | | | 38 | | | | 0.54 | % | | | (207 | ) |
Essent Group Ltd. | | | 76 | | | | 0.41 | % | | | (214 | ) |
BankUnited, Inc. | | | 68 | | | | 0.35 | % | | | (251 | ) |
Brandywine Realty Trust | | | 393 | | | | 0.65 | % | | | (258 | ) |
Old Republic International Corp. | | | 227 | | | | 0.68 | % | | | (320 | ) |
Healthcare Realty Trust, Inc. | | | 170 | | | | 0.62 | % | | | (329 | ) |
Associated Banc-Corp. | | | 183 | | | | 0.45 | % | | | (343 | ) |
Total Financial | | | | | | | | | | | (2,493 | ) |
| | | | | | | | | | | | | |
Utilities | | | | | | | | | | | | |
UGI Corp. | | | 164 | | | | 0.92 | % | | | 414 | |
Chesapeake Utilities Corp. | | | 48 | | | | 0.70 | % | | | (3 | ) |
IDACORP, Inc. | | | 77 | | | | 0.91 | % | | | (50 | ) |
Public Service Enterprise Group, Inc. | | | 126 | | | | 0.91 | % | | | (90 | ) |
Pinnacle West Capital Corp. | | | 55 | | | | 0.54 | % | | | (97 | ) |
WEC Energy Group, Inc. | | | 37 | | | | 0.40 | % | | | (131 | ) |
American Water Works Company, Inc. | | | 29 | | | | 0.54 | % | | | (157 | ) |
CMS Energy Corp. | | | 129 | | | | 0.92 | % | | | (165 | ) |
MGE Energy, Inc. | | | 95 | | | | 0.85 | % | | | (168 | ) |
National Fuel Gas Co. | | | 64 | | | | 0.40 | % | | | (180 | ) |
Sempra Energy | | | 34 | | | | 0.54 | % | | | (192 | ) |
American States Water Co. | | | 88 | | | | 0.85 | % | | | (223 | ) |
Southern Co. | | | 122 | | | | 0.89 | % | | | (227 | ) |
Portland General Electric Co. | | | 54 | | | | 0.30 | % | | | (233 | ) |
Avista Corp. | | | 97 | | | | 0.50 | % | | | (271 | ) |
DTE Energy Co. | | | 56 | | | | 0.88 | % | | | (334 | ) |
New Jersey Resources Corp. | | | 136 | | | | 0.65 | % | | | (586 | ) |
Total Utilities | | | | | | | | | | | (2,693 | ) |
| | | | | | | | | | | | | |
Consumer, Cyclical | | | | | | | | | | | | |
AutoZone, Inc. | | | 6 | | | | 1.08 | % | | | 663 | |
O’Reilly Automotive, Inc. | | | 13 | | | | 0.89 | % | | | 484 | |
Lennar Corp. — Class A | | | 19 | | | | 0.23 | % | | | 166 | |
Polaris, Inc. | | | 21 | | | | 0.35 | % | | | 160 | |
PulteGroup, Inc. | | | 64 | | | | 0.42 | % | | | 157 | |
AutoNation, Inc. | | | 35 | | | | 0.40 | % | | | 137 | |
Brunswick Corp. | | | 43 | | | | 0.52 | % | | | 135 | |
Lowe’s Companies, Inc. | | | 31 | | | | 0.73 | % | | | 110 | |
Best Buy Company, Inc. | | | 32 | | | | 0.44 | % | | | 12 | |
Dick’s Sporting Goods, Inc. | | | 19 | | | | 0.23 | % | | | 11 | |
MSC Industrial Direct Company, Inc. — Class A | | | 46 | | | | 0.50 | % | | | 4 | |
Carter’s, Inc. | | | 33 | | | | 0.41 | % | | | (48 | ) |
WW Grainger, Inc. | | | 10 | | | | 0.53 | % | | | (48 | ) |
Dolby Laboratories, Inc. — Class A | | | 44 | | | | 0.52 | % | | | (54 | ) |
Tri Pointe Homes, Inc. | | | 89 | | | | 0.23 | % | | | (61 | ) |
Whirlpool Corp. | | | 13 | | | | 0.34 | % | | | (92 | ) |
Meritage Homes Corp. | | | 23 | | | | 0.26 | % | | | (100 | ) |
Murphy USA, Inc. | | | 25 | | | | 0.40 | % | | | (117 | ) |
Gentherm, Inc. | | | 51 | | | | 0.44 | % | | | (191 | ) |
Yum! Brands, Inc. | | | 56 | | | | 0.78 | % | | | (251 | ) |
Cummins, Inc. | | | 20 | | | | 0.59 | % | | | (282 | ) |
Allison Transmission Holdings, Inc. | | | 128 | | | | 0.61 | % | | | (339 | ) |
Gentex Corp. | | | 228 | | | | 0.91 | % | | | (406 | ) |
Total Consumer, Cyclical | | | | | | | | | | | 50 | |
| | | | | | | | | | | | | |
136 | THE GUGGENHEIM FUNDS SEMI-ANNUAL REPORT | SEE NOTES TO FINANCIAL STATEMENTS. |
SCHEDULE OF INVESTMENTS (Unaudited)(continued) | June 30, 2021 |
SERIES Z (ALPHA OPPORTUNITY SERIES) | |
| | Shares | | | Percentage
Notional
Amount | | | Value and
Unrealized
Appreciation
(Depreciation) | |
Consumer, Non-cyclical | | | | | | | | | | | | |
Molson Coors Beverage Co. — Class B | | | 99 | | | | 0.64 | % | | $ | 1,455 | |
Regeneron Pharmaceuticals, Inc. | | | 9 | | | | 0.61 | % | | | 478 | |
Thermo Fisher Scientific, Inc. | | | 10 | | | | 0.61 | % | | | 410 | |
Bio-Rad Laboratories, Inc. — Class A | | | 8 | | | | 0.62 | % | | | 351 | |
Merck & Company, Inc. | | | 55 | | | | 0.52 | % | | | 286 | |
Bristol-Myers Squibb Co. | | | 115 | | | | 0.93 | % | | | 259 | |
Vanda Pharmaceuticals, Inc. | | | 106 | | | | 0.28 | % | | | 243 | |
Innoviva, Inc. | | | 196 | | | | 0.32 | % | | | 228 | |
Gilead Sciences, Inc. | | | 121 | | | | 1.01 | % | | | 188 | |
United Therapeutics Corp. | | | 24 | | | | 0.52 | % | | | 183 | |
PerkinElmer, Inc. | | | 21 | | | | 0.39 | % | | | 170 | |
Laboratory Corporation of America Holdings | | | 6 | | | | 0.20 | % | | | 169 | |
Prestige Consumer Healthcare, Inc. | | | 68 | | | | 0.43 | % | | | 169 | |
Vector Group Ltd. | | | 67 | | | | 0.11 | % | | | 162 | |
Pfizer, Inc. | | | 120 | | | | 0.57 | % | | | 162 | |
McKesson Corp. | | | 30 | | | | 0.69 | % | | | 155 | |
Humana, Inc. | | | 4 | | | | 0.21 | % | | | 142 | |
Eagle Pharmaceuticals, Inc. | | | 81 | | | | 0.42 | % | | | 133 | |
Quest Diagnostics, Inc. | | | 18 | | | | 0.29 | % | | | 130 | |
Hershey Co. | | | 21 | | | | 0.44 | % | | | 120 | |
Amgen, Inc. | | | 27 | | | | 0.79 | % | | | 118 | |
H&R Block, Inc. | | | 133 | | | | 0.38 | % | | | 111 | |
Johnson & Johnson | | | 23 | | | | 0.46 | % | | | 93 | |
Incyte Corp. | | | 42 | | | | 0.43 | % | | | 93 | |
Vertex Pharmaceuticals, Inc. | | | 14 | | | | 0.34 | % | | | 86 | |
Blueprint Medicines Corp. | | | 34 | | | | 0.36 | % | | | 66 | |
Hill-Rom Holdings, Inc. | | | 20 | | | | 0.27 | % | | | 43 | |
Hologic, Inc. | | | 66 | | | | 0.53 | % | | | 30 | |
PepsiCo, Inc. | | | 12 | | | | 0.21 | % | | | 17 | |
Chemed Corp. | | | 4 | | | | 0.23 | % | | | (23 | ) |
Grand Canyon Education, Inc. | | | 23 | | | | 0.25 | % | | | (73 | ) |
Coherus Biosciences, Inc. | | | 178 | | | | 0.30 | % | | | (110 | ) |
John B Sanfilippo & Son, Inc. | | | 54 | | | | 0.58 | % | | | (161 | ) |
Exelixis, Inc. | | | 104 | | | | 0.23 | % | | | (492 | ) |
Total Consumer, Non-cyclical | | | | | | | | | | | 5,391 | |
| | | | | | | | | | | | | |
Communications | | | | | | | | | | | | |
Cisco Systems, Inc. | | | 105 | | | | 0.67 | % | | | 831 | |
VeriSign, Inc. | | | 38 | | | | 1.04 | % | | | 624 | |
Viavi Solutions, Inc. | | | 446 | | | | 0.95 | % | | | 353 | |
Motorola Solutions, Inc. | | | 12 | | | | 0.31 | % | | | 304 | |
Juniper Networks, Inc. | | | 133 | | | | 0.44 | % | | | 250 | |
Ciena Corp. | | | 40 | | | | 0.27 | % | | | 186 | |
Cogent Communications Holdings, Inc. | | | 50 | | | | 0.46 | % | | | 17 | |
Alphabet, Inc. — Class C | | | 3 | | | | 0.91 | % | | | 7 | |
Yelp, Inc. — Class A | | | 49 | | | | 0.24 | % | | | (15 | ) |
Fox Corp. — Class A | | | 58 | | | | 0.26 | % | | | (41 | ) |
Nexstar Media Group, Inc. — Class A | | | 16 | | | | 0.29 | % | | | (46 | ) |
Verizon Communications, Inc. | | | 68 | | | | 0.46 | % | | | (56 | ) |
F5 Networks, Inc. | | | 12 | | | | 0.27 | % | | | (63 | ) |
TEGNA, Inc. | | | 188 | | | | 0.43 | % | | | (71 | ) |
InterDigital, Inc. | | | 40 | | | | 0.35 | % | | | (106 | ) |
World Wrestling Entertainment, Inc. — Class A | | | 39 | | | | 0.27 | % | | | (160 | ) |
Omnicom Group, Inc. | | | 93 | | | | 0.90 | % | | | (195 | ) |
Telephone & Data Systems, Inc. | | | 153 | | | | 0.42 | % | | | (386 | ) |
Total Communications | | | | | | | | | | | 1,433 | |
| | | | | | | | | | | | | |
Technology | | | | | | | | | | | | |
Rambus, Inc. | | | 212 | | | | 0.61 | % | | | 813 | |
Kulicke & Soffa Industries, Inc. | | | 48 | | | | 0.35 | % | | | 555 | |
International Business Machines Corp. | | | 19 | | | | 0.34 | % | | | 486 | |
Seagate Technology Holdings plc | | | 42 | | | | 0.45 | % | | | 361 | |
Cadence Design Systems, Inc. | | | 40 | | | | 0.66 | % | | | 319 | |
CSG Systems International, Inc. | | | 189 | | | | 1.08 | % | | | 319 | |
Dropbox, Inc. — Class A | | | 60 | | | | 0.22 | % | | | 316 | |
Microsoft Corp. | | | 23 | | | | 0.75 | % | | | 314 | |
NetApp, Inc. | | | 34 | | | | 0.34 | % | | | 268 | |
Cerner Corp. | | | 46 | | | | 0.43 | % | | | 264 | |
Cirrus Logic, Inc. | | | 42 | | | | 0.43 | % | | | 206 | |
Synaptics, Inc. | | | 13 | | | | 0.24 | % | | | 205 | |
Texas Instruments, Inc. | | | 27 | | | | 0.63 | % | | | 189 | |
Qorvo, Inc. | | | 10 | | | | 0.24 | % | | | 188 | |
Paychex, Inc. | | | 18 | | | | 0.23 | % | | | 130 | |
Broadcom, Inc. | | | 6 | | | | 0.35 | % | | | 118 | |
QUALCOMM, Inc. | | | 13 | | | | 0.22 | % | | | 103 | |
Lumentum Holdings, Inc. | | | 31 | | | | 0.31 | % | | | 38 | |
ExlService Holdings, Inc. | | | 18 | | | | 0.23 | % | | | 20 | |
HP, Inc. | | | 125 | | | | 0.46 | % | | | (70 | ) |
Electronic Arts, Inc. | | | 37 | | | | 0.64 | % | | | (87 | ) |
Progress Software Corp. | | | 69 | | | | 0.39 | % | | | (105 | ) |
MAXIMUS, Inc. | | | 23 | | | | 0.24 | % | | | (128 | ) |
Take-Two Interactive Software, Inc. | | | 19 | | | | 0.41 | % | | | (168 | ) |
Activision Blizzard, Inc. | | | 64 | | | | 0.74 | % | | | (175 | ) |
SEE NOTES TO FINANCIAL STATEMENTS. | THE GUGGENHEIM FUNDS SEMI-ANNUAL REPORT | 137 |
SCHEDULE OF INVESTMENTS (Unaudited)(continued) | June 30, 2021 |
SERIES Z (ALPHA OPPORTUNITY SERIES) | |
| | Shares | | | Percentage
Notional
Amount | | | Value and
Unrealized
Appreciation
(Depreciation) | |
Cognizant Technology Solutions Corp. — Class A | | | 43 | | | | 0.36 | % | | $ | (225 | ) |
Intel Corp. | | | 44 | | | | 0.30 | % | | | (253 | ) |
CDK Global, Inc. | | | 78 | | | | 0.47 | % | | | (257 | ) |
Total Technology | | | | | | | | | | | 3,744 | |
| | | | | | | | | | | | | |
Energy | | | | | | | | | | | | |
Antero Midstream Corp. | | | 212 | | | | 0.27 | % | | | (36 | ) |
Williams Companies, Inc. | | | 136 | | | | 0.44 | % | | | (172 | ) |
Kinder Morgan, Inc. | | | 181 | | | | 0.40 | % | | | (172 | ) |
Equitrans Midstream Corp. | | | 201 | | | | 0.21 | % | | | (230 | ) |
Total Energy | | | | | | | | | | | (610 | ) |
| | | | | | | | | | | | | |
Basic Materials | | | | | | | | | | | | |
Ingevity Corp. | | | 31 | | | | 0.29 | % | | | (59 | ) |
NewMarket Corp. | | | 11 | | | | 0.43 | % | | | (153 | ) |
Commercial Metals Co. | | | 80 | | | | 0.30 | % | | | (205 | ) |
Reliance Steel & Aluminum Co. | | | 27 | | | | 0.49 | % | | | (593 | ) |
Total Basic Materials | | | | | | | | | | | (1,010 | ) |
Total GS Equity Long Custom Basket | | | | | | | | | | $ | 5,618 | |
| | | | | | | | | | | | | |
GS EQUITY SHORT CUSTOM BASKET | | | | |
Consumer, Non-cyclical | | | | | | | | | | | | |
Verisk Analytics, Inc. — Class A | | | 199 | | | | (1.61 | )% | | $ | 2,143 | |
Archer-Daniels-Midland Co. | | | 387 | | | | (1.08 | )% | | | 1,955 | |
ManpowerGroup, Inc. | | | 148 | | | | (0.83 | )% | | | 506 | |
CoStar Group, Inc. | | | 210 | | | | (0.82 | )% | | | 193 | |
Cooper Companies, Inc. | | | 19 | | | | (0.35 | )% | | | 141 | |
McCormick & Company, Inc. | | | 221 | | | | (0.92 | )% | | | 5 | |
Brink’s Co. | | | 123 | | | | (0.44 | )% | | | (87 | ) |
Alnylam Pharmaceuticals, Inc. | | | 53 | | | | (0.42 | )% | | | (325 | ) |
Guardant Health, Inc. | | | 91 | | | | (0.53 | )% | | | (345 | ) |
Rollins, Inc. | | | 402 | | | | (0.65 | )% | | | (377 | ) |
TransUnion | | | 196 | | | | (1.01 | )% | | | (1,576 | ) |
Avalara, Inc. | | | 34 | | | | (0.26 | )% | | | (1,980 | ) |
Cintas Corp. | | | 97 | | | | (1.74 | )% | | | (2,929 | ) |
Equifax, Inc. | | | 77 | | | | (0.87 | )% | | | (5,715 | ) |
Total Consumer, Non-cyclical | | | | | | | | | | | (8,391 | ) |
| | | | | | | | | | | | | |
Financial | | | | | | | | | | | | |
JBG SMITH Properties | | | 921 | | | | (1.36 | )% | | | 1,353 | |
Lincoln National Corp. | | | 257 | | | | (0.76 | )% | | | 1,286 | |
American International Group, Inc. | | | 241 | | | | (0.54 | )% | | | 1,071 | |
U.S. Bancorp | | | 501 | | | | (1.34 | )% | | | 1,033 | |
Alexandria Real Estate Equities, Inc. | | | 96 | | | | (0.82 | )% | | | 1,025 | |
Truist Financial Corp. | | | 404 | | | | (1.05 | )% | | | 1,017 | |
Prudential Financial, Inc. | | | 280 | | | | (1.35 | )% | | | 893 | |
Global Net Lease, Inc. | | | 512 | | | | (0.45 | )% | | | 847 | |
Comerica, Inc. | | | 174 | | | | (0.58 | )% | | | 435 | |
Bank of America Corp. | | | 813 | | | | (1.58 | )% | | | 423 | |
CyrusOne, Inc. | | | 169 | | | | (0.57 | )% | | | 410 | |
State Street Corp. | | | 244 | | | | (0.94 | )% | | | 366 | |
Equitable Holdings, Inc. | | | 428 | | | | (0.61 | )% | | | 300 | |
Mid-America Apartment Communities, Inc. | | | 100 | | | | (0.79 | )% | | | 260 | |
UDR, Inc. | | | 585 | | | | (1.35 | )% | | | 234 | |
Ryman Hospitality Properties, Inc. | | | 108 | | | | (0.40 | )% | | | 212 | |
Wells Fargo & Co. | | | 238 | | | | (0.51 | )% | | | 56 | |
SBA Communications Corp. | | | 27 | | | | (0.40 | )% | | | (49 | ) |
Crown Castle International Corp. | | | 75 | | | | (0.69 | )% | | | (64 | ) |
Bank of New York Mellon Corp. | | | 136 | | | | (0.33 | )% | | | (123 | ) |
Host Hotels & Resorts, Inc. | | | 948 | | | | (0.76 | )% | | | (208 | ) |
Digital Realty Trust, Inc. | | | 143 | | | | (1.01 | )% | | | (382 | ) |
Welltower, Inc. | | | 166 | | | | (0.65 | )% | | | (647 | ) |
American Homes 4 Rent — Class A | | | 256 | | | | (0.47 | )% | | | (806 | ) |
Federal Realty Investment Trust | | | 86 | | | | (0.47 | )% | | | (840 | ) |
Invitation Homes, Inc. | | | 406 | | | | (0.71 | )% | | | (1,139 | ) |
Americold Realty Trust | | | 605 | | | | (1.08 | )% | | | (1,150 | ) |
Charles Schwab Corp. | | | 382 | | | | (1.31 | )% | | | (1,224 | ) |
Healthpeak Properties, Inc. | | | 847 | | | | (1.33 | )% | | | (1,319 | ) |
Howard Hughes Corp. | | | 133 | | | | (0.61 | )% | | | (2,767 | ) |
American Tower Corp. — Class A | | | 42 | | | | (0.53 | )% | | | (2,803 | ) |
Rayonier, Inc. | | | 436 | | | | (0.74 | )% | | | (2,875 | ) |
Prologis, Inc. | | | 176 | | | | (0.99 | )% | | | (3,364 | ) |
Loews Corp. | | | 216 | | | | (0.55 | )% | | | (3,482 | ) |
Brookline Bancorp, Inc. | | | 910 | | | | (0.64 | )% | | | (3,811 | ) |
Equinix, Inc. | | | 31 | | | | (1.17 | )% | | | (4,133 | ) |
Morgan Stanley | | | 740 | | | | (3.19 | )% | | | (4,649 | ) |
Camden Property Trust | | | 152 | | | | (0.95 | )% | | | (4,864 | ) |
Sun Communities, Inc. | | | 134 | | | | (1.08 | )% | | | (5,592 | ) |
Rexford Industrial Realty, Inc. | | | 399 | | | | (1.07 | )% | | | (6,862 | ) |
First Republic Bank | | | 177 | | | | (1.56 | )% | | | (9,787 | ) |
Total Financial | | | | | | | | | | | (51,719 | ) |
| | | | | | | | | | | | | |
Utilities | | | | | | | | | | | | |
Atmos Energy Corp. | | | 284 | | | | (1.28 | )% | | | 1,489 | |
Exelon Corp. | | | 608 | | | | (1.27 | )% | | | 1,323 | |
ONE Gas, Inc. | | | 387 | | | | (1.35 | )% | | | 1,254 | |
Xcel Energy, Inc. | | | 373 | | | | (1.16 | )% | | | 1,212 | |
Black Hills Corp. | | | 197 | | | | (0.61 | )% | | | 721 | |
OGE Energy Corp. | | | 453 | | | | (0.72 | )% | | | 634 | |
138 | THE GUGGENHEIM FUNDS SEMI-ANNUAL REPORT | SEE NOTES TO FINANCIAL STATEMENTS. |
SCHEDULE OF INVESTMENTS (Unaudited)(continued) | June 30, 2021 |
SERIES Z (ALPHA OPPORTUNITY SERIES) | |
| | Shares | | | Percentage
Notional
Amount | | | Value and
Unrealized
Appreciation
(Depreciation) | |
CenterPoint Energy, Inc. | | | 377 | | | | (0.43 | )% | | $ | 510 | |
Edison International | | | 511 | | | | (1.39 | )% | | | (78 | ) |
Total Utilities | | | | | | | | | | | 7,065 | |
| | | | | | | | | | | | | |
Industrial | | | | | | | | | | | | |
Jacobs Engineering Group, Inc. | | | 240 | | | | (1.51 | )% | | | 1,580 | |
Ball Corp. | | | 150 | | | | (0.57 | )% | | | 1,355 | |
Stericycle, Inc. | | | 411 | | | | (1.38 | )% | | | 1,075 | |
XPO Logistics, Inc. | | | 107 | | | | (0.70 | )% | | | 916 | |
Norfolk Southern Corp. | | | 109 | | | | (1.36 | )% | | | 688 | |
Exponent, Inc. | | | 86 | | | | (0.36 | )% | | | 583 | |
MSA Safety, Inc. | | | 87 | | | | (0.68 | )% | | | 49 | |
US Ecology, Inc. | | | 276 | | | | (0.49 | )% | | | (15 | ) |
FedEx Corp. | | | 56 | | | | (0.79 | )% | | | (165 | ) |
Republic Services, Inc. — Class A | | | 311 | | | | (1.61 | )% | | | (275 | ) |
United Parcel Service, Inc. — Class B | | | 50 | | | | (0.49 | )% | | | (283 | ) |
Boeing Co. | | | 63 | | | | (0.71 | )% | | | (477 | ) |
TransDigm Group, Inc. | | | 14 | | | | (0.43 | )% | | | (632 | ) |
Raytheon Technologies Corp. | | | 333 | | | | (1.34 | )% | | | (672 | ) |
Waste Management, Inc. | | | 242 | | | | (1.59 | )% | | | (846 | ) |
Ingersoll Rand, Inc. | | | 321 | | | | (0.74 | )% | | | (2,222 | ) |
Tetra Tech, Inc. | | | 94 | | | | (0.54 | )% | | | (2,913 | ) |
Casella Waste Systems, Inc. — Class A | | | 346 | | | | (1.03 | )% | | | (3,718 | ) |
Total Industrial | | | | | | | | | | | (5,972 | ) |
| | | | | | | | | | | | | |
Technology | | | | | | | | | | | | |
KBR, Inc. | | | 524 | | | | (0.94 | )% | | | 898 | |
Leidos Holdings, Inc. | | | 151 | | | | (0.72 | )% | | | 747 | |
Blackline, Inc. | | | 44 | | | | (0.23 | )% | | | 221 | |
Clarivate plc | | | 406 | | | | (0.53 | )% | | | (285 | ) |
Sailpoint Technologies Holdings, Inc. | | | 98 | | | | (0.24 | )% | | | (288 | ) |
Twilio, Inc. — Class A | | | 14 | | | | (0.26 | )% | | | (421 | ) |
Tyler Technologies, Inc. | | | 11 | | | | (0.23 | )% | | | (759 | ) |
Ceridian HCM Holding, Inc. | | | 111 | | | | (0.50 | )% | | | (897 | ) |
Coupa Software, Inc. | | | 42 | | | | (0.52 | )% | | | (988 | ) |
Smartsheet, Inc. — Class A | | | 71 | | | | (0.24 | )% | | | (1,757 | ) |
Rapid7, Inc. | | | 109 | | | | (0.48 | )% | | | (2,333 | ) |
HubSpot, Inc. | | | 9 | | | | (0.25 | )% | | | (2,926 | ) |
Total Technology | | | | | | | | | | | (8,788 | ) |
| | | | | | | | | | | | | |
Energy | | | | | | | | | | | | |
Baker Hughes Co. | | | 498 | | | | (0.54 | )% | | | 1,481 | |
Schlumberger N.V. | | | 970 | | | | (1.46 | )% | | | 1,178 | |
Phillips 66 | | | 130 | | | | (0.52 | )% | | | 36 | |
Pioneer Natural Resources Co. | | | 208 | | | | (1.59 | )% | | | (1,336 | ) |
NOV, Inc. | | | 564 | | | | (0.41 | )% | | | (1,933 | ) |
Hess Corp. | | | 175 | | | | (0.72 | )% | | | (3,323 | ) |
ChampionX Corp. | | | 672 | | | | (0.81 | )% | | | (5,405 | ) |
Halliburton Co. | | | 1,417 | | | | (1.54 | )% | | | (5,901 | ) |
Ovintiv, Inc. | | | 677 | | | | (1.00 | )% | | | (8,771 | ) |
Total Energy | | | | | | | | | | | (23,974 | ) |
| | | | | | | | | | | | | |
Communications | | | | | | | | | | | | |
Anaplan, Inc. | | | 89 | | | | (0.22 | )% | | | 320 | |
Okta, Inc. | | | 46 | | | | (0.53 | )% | | | (53 | ) |
Uber Technologies, Inc. | | | 320 | | | | (0.75 | )% | | | (107 | ) |
Q2 Holdings, Inc. | | | 156 | | | | (0.75 | )% | | | (1,721 | ) |
Zendesk, Inc. | | | 73 | | | | (0.50 | )% | | | (2,767 | ) |
Liberty Broadband Corp. — Class C | | | 99 | | | | (0.81 | )% | | | (3,010 | ) |
Total Communications | | | | | | | | | | | (7,338 | ) |
| | | | | | | | | | | | | |
Basic Materials | | | | | | | | | | | | |
Linde plc | | | 24 | | | | (0.33 | )% | | | (291 | ) |
Quaker Chemical Corp. | | | 42 | | | | (0.47 | )% | | | (1,342 | ) |
Total Basic Materials | | | | | | | | | | | (1,633 | ) |
| | | | | | | | | | | | | |
Consumer, Cyclical | | | | | | | | | | | | |
JetBlue Airways Corp. | | | 992 | | | | (0.78 | )% | | | 1,840 | |
United Airlines Holdings, Inc. | | | 390 | | | | (0.96 | )% | | | 1,722 | |
IAA, Inc. | | | 232 | | | | (0.59 | )% | | | 1,247 | |
Marriott International, Inc. — Class A | | | 64 | | | | (0.41 | )% | | | 438 | |
Freshpet, Inc. | | | 90 | | | | (0.69 | )% | | | 391 | |
Hilton Worldwide Holdings, Inc. | | | 82 | | | | (0.46 | )% | | | 254 | |
Delta Air Lines, Inc. | | | 635 | | | | (1.29 | )% | | | 62 | |
Alaska Air Group, Inc. | | | 345 | | | | (0.98 | )% | | | (716 | ) |
Southwest Airlines Co. | | | 511 | | | | (1.28 | )% | | | (2,622 | ) |
Copart, Inc. | | | 180 | | | | (1.12 | )% | | | (5,161 | ) |
Total Consumer, Cyclical | | | | | | | | | | | (2,545 | ) |
Total GS Equity Short Custom Basket | | | | | | | | | | $ | (103,295 | ) |
SEE NOTES TO FINANCIAL STATEMENTS. | THE GUGGENHEIM FUNDS SEMI-ANNUAL REPORT | 139 |
SCHEDULE OF INVESTMENTS (Unaudited)(concluded) | June 30, 2021 |
SERIES Z (ALPHA OPPORTUNITY SERIES) | |
* | Non-income producing security. |
† | Value determined based on Level 1 inputs — See Note 4. |
†† | Value determined based on Level 2 inputs — See Note 4. |
1 | All or a portion of this security is pledged as custom basket swap collateral at June 30, 2021. |
2 | Rate indicated is the 7-day yield as of June 30, 2021. |
| | GS — Goldman Sachs International |
| | MS — Morgan Stanley Capital Services LLC |
| | plc — Public Limited Company |
| | REIT — Real Estate Investment Trust |
| | |
| | See Sector Classification in Other Information section. |
The following table summarizes the inputs used to value the Fund’s investments at June 30, 2021 (See Note 4 in the Notes to Financial Statements):
Investments in Securities (Assets) | | Level 1
Quoted
Prices | | | Level 2
Significant
Observable
Inputs | | | Level 3
Significant
Unobservable
Inputs | | | Total | |
Common Stocks | | $ | 4,731,972 | | | $ | — | | | $ | — | | | $ | 4,731,972 | |
Money Market Fund | | | 526,253 | | | | — | | | | — | | | | 526,253 | |
Equity Custom Basket Swap Agreements** | | | — | | | | 11,179 | | | | — | | | | 11,179 | |
Total Assets | | $ | 5,258,225 | | | $ | 11,179 | | | $ | — | | | $ | 5,269,404 | |
Investments in Securities (Liabilities) | | Level 1
Quoted
Prices | | | Level 2
Significant
Observable
Inputs | | | Level 3
Significant
Unobservable
Inputs | | | Total | |
Equity Custom Basket Swap Agreements** | | $ | — | | | $ | 204,249 | | | $ | — | | | $ | 204,249 | |
** | This derivative is reported as unrealized appreciation/depreciation at period end. |
140 | THE GUGGENHEIM FUNDS SEMI-ANNUAL REPORT | SEE NOTES TO FINANCIAL STATEMENTS. |
SERIES Z (ALPHA OPPORTUNITY SERIES) | |
STATEMENT OF ASSETS AND LIABILITIES (Unaudited) |
June 30, 2021 |
Assets: |
Investments, at value (cost $4,960,798) | | $ | 5,258,225 | |
Unrealized appreciation on OTC swap agreements | | | 11,179 | |
Prepaid expenses | | | 52 | |
Receivables: |
Investment Adviser | | | 5,457 | |
Dividends | | | 4,833 | |
Interest | | | 2 | |
Total assets | | | 5,279,748 | |
| | | | | |
Liabilities: |
Overdraft due to custodian bank | | | 762 | |
Unrealized depreciation on OTC swap agreements | | | 204,249 | |
Payable for: |
Swap settlement | | | 481,194 | |
Fund accounting/administration fees | | | 4,088 | |
Transfer agent/maintenance fees | | | 2,270 | |
Distribution and service fees | | | 936 | |
Trustees’ fees* | | | 500 | |
Fund shares redeemed | | | 124 | |
Miscellaneous | | | 22,171 | |
Total liabilities | | | 716,294 | |
Commitments and contingent liabilities (Note 12) | | | — | |
Net assets | | $ | 4,563,454 | |
| | | | | |
Net assets consist of: |
Paid in capital | | $ | 5,811,955 | |
Total distributable earnings (loss) | | | (1,248,501 | ) |
Net assets | | $ | 4,563,454 | |
Capital shares outstanding | | | 289,584 | |
Net asset value per share | | $ | 15.76 | |
STATEMENT OF OPERATIONS (Unaudited) |
Six Months Ended June 30, 2021 |
Investment Income: |
Dividends | | $ | 56,284 | |
Interest | | | 6 | |
Total investment income | | | 56,290 | |
| | | | | |
Expenses: |
Management fees | | | 20,645 | |
Distribution and service fees | | | 5,735 | |
Transfer agent/maintenance fees | | | 12,470 | |
Professional fees | | | 20,281 | |
Fund accounting/administration fees | | | 16,409 | |
Custodian fees | | | 12,458 | |
Trustees’ fees* | | | 8,539 | |
Pricing service expense | | | 5,520 | |
Line of credit fees | | | 107 | |
Interest expense | | | 10 | |
Miscellaneous | | | 1,687 | |
Total expenses | | | 103,861 | |
Less: |
Expenses reimbursed by Adviser | | | (37,221 | ) |
Expenses waived by Adviser | | | (20,645 | ) |
Earnings credits applied | | | (2 | ) |
Total waived/reimbursed expenses | | | (57,868 | ) |
Net expenses | | | 45,993 | |
Net investment income | | | 10,297 | |
| | | | | |
Net Realized and Unrealized Gain (Loss): |
Net realized gain (loss) on: |
Investments | | | 906,925 | |
Swap agreements | | | (728,610 | ) |
Net realized gain | | | 178,315 | |
Net change in unrealized appreciation (depreciation) on: |
Investments | | | (165,077 | ) |
Swap agreements | | | 255,826 | |
Net change in unrealized appreciation (depreciation) | | | 90,749 | |
Net realized and unrealized gain | | | 269,064 | |
Net increase in net assets resulting from operations | | $ | 279,361 | |
* | Relates to Trustees not deemed “interested persons” within the meaning of Section 2(a)(19) of the 1940 Act. |
SEE NOTES TO FINANCIAL STATEMENTS. | THE GUGGENHEIM FUNDS SEMI-ANNUAL REPORT | 141 |
SERIES Z (ALPHA OPPORTUNITY SERIES) | |
STATEMENTS OF CHANGES IN NET ASSETS |
| | Six Months Ended
June 30, 2021
(Unaudited) | | | Year Ended
December 31,
2020 | |
Increase (Decrease) in Net Assets from Operations: | | | | | | | | |
Net investment income | | $ | 10,297 | | | $ | 21,165 | |
Net realized gain (loss) on investments | | | 178,315 | | | | (7,970 | ) |
Net change in unrealized appreciation (depreciation) on investments | | | 90,749 | | | | (63,272 | ) |
Net increase (decrease) in net assets resulting from operations | | | 279,361 | | | | (50,077 | ) |
| | | | | | | | | |
Distributions to shareholders | | | — | | | | (31,639 | ) |
| | | | | | | | | |
Capital share transactions: | | | | | | | | |
Proceeds from sale of shares | | | 11,997 | | | | 78,547 | |
Distributions reinvested | | | — | | | | 31,639 | |
Cost of shares redeemed | | | (263,288 | ) | | | (1,722,128 | ) |
Net decrease from capital share transactions | | | (251,291 | ) | | | (1,611,942 | ) |
Net increase (decrease) in net assets | | | 28,070 | | | | (1,693,658 | ) |
| | | | | | | | | |
Net assets: | | | | | | | | |
Beginning of period | | | 4,535,384 | | | | 6,229,042 | |
End of period | | $ | 4,563,454 | | | $ | 4,535,384 | |
| | | | | | | | | |
Capital share activity: | | | | | | | | |
Shares sold | | | 779 | | | | 5,512 | |
Shares issued from reinvestment of distributions | | | — | | | | 2,180 | |
Shares redeemed | | | (17,078 | ) | | | (120,777 | ) |
Net decrease in shares | | | (16,299 | ) | | | (113,085 | ) |
142 | THE GUGGENHEIM FUNDS SEMI-ANNUAL REPORT | SEE NOTES TO FINANCIAL STATEMENTS. |
SERIES Z (ALPHA OPPORTUNITY SERIES) | |
This table is presented to show selected data for a share outstanding throughout each period and to assist shareholders in evaluating a Fund’s performance for the periods presented.
| | Six Months Ended
June 30, 2021a | | | Year Ended
December 31,
2020 | | | Year Ended
December 31,
2019 | | | Year Ended
December 31,
2018 | | | Year Ended
December 31,
2017 | | | Year Ended
December 31,
2016 | |
Per Share Data |
Net asset value, beginning of period | | $ | 14.83 | | | $ | 14.87 | | | $ | 15.27 | | | $ | 20.05 | | | $ | 18.70 | | | $ | 16.59 | |
Income (loss) from investment operations: |
Net investment income (loss)b | | | .03 | | | | .06 | | | | .07 | | | | .04 | | | | (.04 | ) | | | (.21 | ) |
Net gain (loss) on investments (realized and unrealized) | | | .90 | | | | (.01 | ) | | | (.45 | ) | | | (2.28 | ) | | | 1.39 | | | | 2.32 | |
Total from investment operations | | | .93 | | | | .05 | | | | (.38 | ) | | | (2.24 | ) | | | 1.35 | | | | 2.11 | |
Less distributions from: |
Net investment income | | | — | | | | (.09 | ) | | | (.02 | ) | | | — | | | | — | | | | — | |
Net realized gains | | | — | | | | — | | | | — | | | | (2.54 | ) | | | — | | | | — | |
Total distributions | | | — | | | | (.09 | ) | | | (.02 | ) | | | (2.54 | ) | | | — | | | | — | |
Net asset value, end of period | | $ | 15.76 | | | $ | 14.83 | | | $ | 14.87 | | | $ | 15.27 | | | $ | 20.05 | | | $ | 18.70 | |
|
Total Returnc | | | 6.27 | % | | | 0.27 | % | | | (2.45 | %) | | | (11.57 | %) | | | 7.22 | % | | | 12.79 | % |
Ratios/Supplemental Data |
Net assets, end of period (in thousands) | | $ | 4,563 | | | $ | 4,535 | | | $ | 6,229 | | | $ | 8,056 | | | $ | 12,317 | | | $ | 13,192 | |
Ratios to average net assets: |
Net investment income (loss) | | | 0.45 | % | | | 0.41 | % | | | 0.44 | % | | | 0.22 | % | | | (0.23 | %) | | | (1.18 | %) |
Total expensesd | | | 4.53 | % | | | 3.98 | % | | | 3.52 | % | | | 2.47 | % | | | 2.48 | % | | | 2.92 | % |
Net expensese,f,g | | | 2.01 | % | | | 2.01 | % | | | 2.00 | % | | | 1.99 | % | | | 2.22 | % | | | 2.92 | % |
Portfolio turnover rate | | | 103 | % | | | 171 | % | | | 172 | % | | | 219 | % | | | 182 | % | | | 198 | % |
a | Unaudited figures for the period ended June 30, 2021. Percentage amounts for the period, except total return and portfolio turnover rate, have been annualized. |
b | Net investment income (loss) per share was computed using average shares outstanding throughout the period. |
c | Total return does not take into account any of the expenses associated with an investment in variable insurance products. If total return had taken into account these expenses, performance would have been lower. Shares of a series of Guggenheim Variable Funds Trust are available only through the purchase of such products. |
d | Does not include expenses of the underlying funds in which the Fund invests. |
e | Net expense information reflects the expense ratios after expense waivers and reimbursements, as applicable. |
f | Net expenses may include expenses that are excluded from the expense limitation agreement. Excluding these expenses, the net expense ratios for the periods presented would be: |
| | 06/30/21a | 12/31/20 | 12/31/19 | 12/31/18 | 12/31/17 | 12/31/16 |
| | 2.00% | 2.00% | 2.00% | 1.99% | 2.13% | 2.35% |
g | The portion of the ratios of net expenses to average net assets attributable to recoupments of prior fee reductions or expense reimbursements for the periods presented was as follows: |
| | 06/30/21a | 12/31/20 | 12/31/19 | 12/31/18 | 12/31/17 | 12/31/16 |
| | — | — | — | — | 0.15% | — |
SEE NOTES TO FINANCIAL STATEMENTS. | THE GUGGENHEIM FUNDS SEMI-ANNUAL REPORT | 143 |
NOTES TO FINANCIAL STATEMENTS (Unaudited) |
Note 1 – Organization and Significant Accounting Policies
Organization
Guggenheim Variable Funds Trust (the “Trust”), a Delaware statutory trust, is registered with the SEC under the Investment Company Act of 1940 (“1940 Act”), as an open-ended investment company of the series type. Each series, in effect, is representing a separate fund (each, a “Fund”). The Trust may issue an unlimited number of authorized shares. The Trust accounts for the assets of each Fund separately. At June 30, 2021, the Trust consisted of fourteen funds. The Trust offers shares of the funds to insurance companies for their variable annuity and variable life insurance contracts.
This report covers the following funds (collectively, the “Funds”):
Fund Name | Investment
Company Type |
Series A (StylePlus—Large Core Series) | Diversified |
Series B (Large Cap Value Series) | Diversified |
Series D (World Equity Income Series) | Diversified |
Series E (Total Return Bond Series) | Diversified |
Series F (Floating Rate Strategies Series) | Diversified |
Series J (StylePlus—Mid Growth Series) | Diversified |
Series N (Managed Asset Allocation Series) | Diversified |
Series O (All Cap Value Series) | Diversified |
Series P (High Yield Series) | Diversified |
Series Q (Small Cap Value Series) | Diversified |
Series V (SMid Cap Value Series) | Diversified |
Series X (StylePlus—Small Growth Series) | Diversified |
Series Y (StylePlus—Large Growth Series) | Diversified |
Series Z (Alpha Opportunity Series) | Diversified |
Security Investors, LLC and Guggenheim Partners Investment Management, LLC (“GPIM”), which operates under the name Guggenheim Investments (“GI”), provide advisory services. GPIM provides advisory services to Series F (Floating Rate Strategies Series) and Security Investors, LLC provides advisory services to the remaining Funds covered in this report. Guggenheim Funds Distributors, LLC (“GFD”) acts as principal underwriter for the Trust. GI and GFD are affiliated entities.
Significant Accounting Policies
The Funds operate as investment companies and, accordingly, follow the investment company accounting and reporting guidance of the Financial Accounting Standards Board (“FASB”) Accounting Standards Codification Topic 946 Financial Services – Investment Companies.
The following significant accounting policies are in conformity with U.S. generally accepted accounting principles (“U.S. GAAP”) and are consistently followed by the Trust. This requires management to make estimates and assumptions that affect the reported amount of assets and liabilities, contingent assets and liabilities at the date of the financial statements, and the reported amounts of revenues and expenses during the reporting period. Actual results could differ from these estimates. All time references are based on Eastern Time.
The net asset value per share (“NAV”) of a fund is calculated by dividing the market value of a fund’s securities and other assets, less all liabilities, by the number of outstanding shares of that fund.
(a) Valuation of Investments
The Board of Trustees of the Funds (the “Board”) has adopted policies and procedures for the valuation of the Funds’ investments (the “Valuation Procedures”). Pursuant to the Valuation Procedures, the Board has delegated to a valuation committee, consisting of representatives from Guggenheim’s investment management, fund administration, legal and compliance departments (the “Valuation Committee”), the day-to-day responsibility for implementing the Valuation Procedures, including, under most circumstances, the responsibility for determining the fair value of the Funds’ securities and/or other assets.
Valuations of the Funds’ securities and other assets are supplied primarily by pricing services appointed pursuant to the processes set forth in the Valuation Procedures. The Valuation Committee convenes monthly, or more frequently as needed, to review the valuation of all assets which have been fair valued for reasonableness. The Funds’ officers, through the Valuation Committee and consistent with the monitoring and review responsibilities set forth in the Valuation Procedures, regularly review procedures used and valuations provided by the pricing services.
If the pricing service cannot or does not provide a valuation for a particular investment or such valuation is deemed unreliable, such investment is fair valued by the Valuation Committee.
Equity securities listed or traded on a recognized U.S. securities exchange or the National Association of Securities Dealers Automated Quotations (“NASDAQ”) National Market System shall generally be valued on the basis of the last sale price on the primary U.S. exchange or market on which the security is listed or traded; provided, however, that securities listed on NASDAQ will be valued at the NASDAQ Official Closing Price, which may not necessarily represent the last sale price. If there is no sale on the valuation date, exchange-traded U.S. equity securities will be valued on the basis of the last bid price.
Generally, trading in foreign securities markets is substantially completed each day at various times prior to the close of the New York Stock Exchange (“NYSE”). The values of foreign securities are
144 THE GUGGENHEIM FUNDS SEMI-ANNUAL REPORT | |
NOTES TO FINANCIAL STATEMENTS (Unaudited)(continued) |
determined as of the close of such foreign markets or the close of the NYSE, if earlier. All investments quoted in foreign currencies are valued in U.S. dollars on the basis of the foreign currency exchange rates prevailing at the close of U.S. business at 4:00 p.m. Investments in foreign securities may involve risks not present in domestic investments. The Valuation Committee will determine the current value of such foreign securities by taking into consideration certain factors which may include those discussed above, as well as the following factors, among others: the value of the securities traded on other foreign markets, ADR trading, closed-end fund trading, foreign currency exchange activity, and the trading prices of financial products that are tied to foreign securities. In addition, under the Valuation Procedures, the Valuation Committee and Guggenheim Funds Investment Advisors, LLC (“GFIA” or the “Adviser”) are authorized to use prices and other information supplied by a third party pricing vendor in valuing foreign securities.
Open-end investment companies are valued at their NAV as of the close of business, on the valuation date. Exchange-traded funds and closed-end investment companies are valued at the last quoted sale price.
U.S. Government securities are valued by independent pricing services, the last traded fill price, or at the reported bid price at the close of business.
Repurchase agreements are generally valued at amortized cost, provided such amounts approximate market value.
Debt securities with a maturity of greater than 60 days at acquisition are valued at prices that reflect broker-dealer supplied valuations or are obtained from independent pricing services, which may consider the trade activity, treasury spreads, yields or price of bonds of comparable quality, coupon, maturity, and type, as well as prices quoted by dealers who make markets in such securities. Short-term debt securities with a maturity of 60 days or less at acquisition are valued at amortized cost, provided such amount approximates market value.
Typically, loans are valued using information provided by an independent third party pricing service that uses broker quotes, among other inputs. If the pricing service cannot or does not provide a valuation for a particular loan, or such valuation is deemed unreliable, such investment is valued based on a quote from a broker-dealer or is fair valued by the Valuation Committee.
Exchange-traded options are valued at the mean of the bid and ask prices on the principal exchange on which they are traded. Over-the-counter (“OTC”) options are valued using a price provided by a pricing service.
The value of futures contracts is accounted for using the unrealized appreciation or depreciation on the contracts that is determined by marking the contracts to their current realized settlement prices. Financial futures contracts are valued at the 4:00 p.m. price on the valuation date. In the event that the exchange for a specific futures contract closes earlier than 4:00 p.m., the futures contract is valued at the official settlement price of the exchange. However, the underlying securities from which the futures contract value is derived are monitored until 4:00 p.m. to determine if fair valuation would provide a more accurate valuation.
The value of interest rate swap agreements entered into by a fund is accounted for using the unrealized appreciation or depreciation on the agreements that is determined using the previous day’s Chicago Mercantile Exchange close price, adjusted for the current day’s spreads.
The values of other swap agreements entered into by a fund are accounted for using the unrealized appreciation or depreciation on the agreements that are determined by marking the agreements to the last quoted value of the index or other underlying position that the swaps pertain to at the close of the NYSE.
Forward foreign currency exchange contracts are valued daily based on the applicable exchange rate of the underlying currency.
Investments for which market quotations are not readily available are fair-valued as determined in good faith by GI, subject to review and approval by the Valuation Committee, pursuant to methods established or ratified by the Board. Valuations in accordance with these methods are intended to reflect each security’s (or asset’s or liability’s) “fair value”. Each such determination is based on a consideration of all relevant factors, which are likely to vary from one pricing context to another. Examples of such factors may include, but are not limited to market prices; sale prices; broker quotes; and models which derive prices based on inputs such as prices of securities with comparable maturities and characteristics, or based on inputs such as anticipated cash flows or collateral, spread over U.S. Treasury securities, and other information analysis. In connection with futures contracts and other derivative investments, such factors may include obtaining information as to how (a) these contracts and other derivative investments trade in the futures or other derivative markets, respectively, and (b) the securities underlying these contracts and other derivative investments trade in the cash market.
(b) U.S. Government and Agency Obligations
Certain U.S. Government and Agency Obligations are traded on a discount basis; the interest rates shown on the Schedules of Investments reflect the effective rates paid at the time of purchase by the Funds. Other securities bear interest at the rates shown, payable at fixed dates through maturity.
| | THE GUGGENHEIM FUNDS SEMI-ANNUAL REPORT | 145 |
NOTES TO FINANCIAL STATEMENTS (Unaudited)(continued) |
(c) Senior Floating Rate Interests and Loan Investments
Senior floating rate interests in which the Trust invests generally pay interest rates which are periodically adjusted by reference to a base short-term floating rate, plus a premium. These base lending rates are generally (i) the lending rate offered by one or more major European banks, such as the one-month or three-month London Inter-Bank Offered Rate (“LIBOR”), (ii) the prime rate offered by one or more major United States banks, or (iii) the bank’s certificate of deposit rate. Senior floating rate interests often require prepayments from excess cash flows or permit the borrower to repay at its election. The rate at which the borrower repays cannot be predicted with accuracy. As a result, the actual remaining maturity may be substantially less than the stated maturities disclosed in the Funds’ Schedules of Investments.
The Funds invest in loans and other similar debt obligations (“obligations”). A portion of the Funds’ investments in these obligations is sometimes referred to as “covenant lite” loans or obligations (“covenant lite obligations”), which are obligations that lack covenants or possess fewer or less restrictive covenants or constraints on borrowers than certain other types of obligations. The Funds may also obtain exposure to covenant lite obligations through investment in securitization vehicles and other structured products. In recent market conditions, many new or reissued obligations have not featured traditional covenants, which are intended to protect lenders and investors by (i) imposing certain restrictions or other limitations on a borrower’s operations or assets or (ii) providing certain rights to lenders. The Funds may have fewer rights with respect to covenant lite obligations, including fewer protections against the possibility of default and fewer remedies in the event of default. As a result, investments in (or exposure to) covenant lite obligations are subject to more risk than investments in (or exposure to) certain other types of obligations. The Funds are subject to other risks associated with investments in (or exposure to) obligations, including that obligations may not be considered “securities” and, as a result, the Funds may not be entitled to rely on the anti-fraud protections under the federal securities laws and instead may have to resort to state law and direct claims.
(d) Interest on When-Issued Securities
The Funds may purchase and sell interests in securities on a when-issued and delayed delivery basis, with payment and delivery scheduled for a future date. No income accrues to the Funds on such interests or securities in connection with such transactions prior to the date the Funds actually take delivery of such interests or securities. These transactions are subject to market fluctuations and are subject to the risk that the value at delivery may be more or less than the trade date purchase price. Although the Funds will generally purchase these securities with the intention of acquiring such securities, they may sell such securities before the settlement date.
(e) Short Sales
When a Fund engages in a short sale of a security, an amount equal to the proceeds is reflected as an asset and an equivalent liability. The amount of the liability is subsequently marked-to-market to reflect the market value of the short sale. The Fund maintains a segregated account of cash and/or securities as collateral for short sales.
Fees, if any, paid to brokers to borrow securities in connection with short sales are recorded as interest expense. In addition, the Fund must pay out the dividend rate of the equity or coupon rate of the obligation to the lender and record this as an expense. Short dividend or interest expense is a cost associated with the investment objective of short sales transactions, rather than an operational cost associated with the day-to-day management of any mutual fund. The Fund may also receive rebate income from the broker resulting from the investment of the proceeds from securities sold short.
(f) Options
Upon the purchase of an option, the premium paid is recorded as an investment, the value of which is marked-to-market daily. If a purchased option expires, the Fund realizes a loss in the amount of the cost of the option. When the Fund enters into a closing sale transaction, it realizes a gain or loss depending on whether the proceeds from the closing sale transaction are greater or less than the cost of the option. If the Fund exercises a put option, it realizes a gain or loss from the sale of the underlying security and the proceeds from such sale will be decreased by the premium originally paid. When the Fund exercises a call option, the cost of the security purchased by the Fund upon exercise increases by the premium originally paid.
When the Fund writes (sells) an option, an amount equal to the premium received is entered in that Fund’s accounting records as an asset and equivalent liability. The amount of the liability is subsequently marked-to-market to reflect the current value of the option written. When a written option expires, or if the Fund enters into a closing purchase transaction, it realizes a gain (or loss if the cost of a closing purchase transaction exceeds the premium received when the option was sold).
(g) Futures Contracts
Upon entering into a futures contract, a Fund deposits and maintains as collateral such initial margin as required by the exchange on which the transaction is affected. Pursuant to the contract, the Fund agrees to receive from or pay to the broker an amount of cash equal to the daily fluctuation in value of the contract. Such receipts or payments are known as variation margin and are recorded by the Fund as unrealized appreciation or depreciation. When the contract is closed, the Fund records a
146 THE GUGGENHEIM FUNDS SEMI-ANNUAL REPORT | |
NOTES TO FINANCIAL STATEMENTS (Unaudited)(continued) |
realized gain or loss equal to the difference between the value of the contract at the time it was opened and the value at the time it was closed.
(h) Swap Agreements
Swap agreements are marked-to-market daily and the change, if any, is recorded as unrealized appreciation or depreciation. Payments received or made as a result of an agreement or termination of an agreement are recognized as realized gains or losses.
Upon entering into certain centrally-cleared swap transactions, a Fund is required to deposit with its clearing broker an amount of cash or securities as an initial margin. Subsequent variation margin receipts or payments are received or made by the Fund depending on fluctuations in the fair value of the reference entity and are recorded by the Fund as unrealized appreciation or depreciation. When the contract is closed, the Fund records a realized gain or loss equal to the difference between the value of the contract at the time it was opened and the value at the time it was closed.
Upfront payments received or made by a Fund on credit default swap agreements and interest rate swap agreements are amortized over the expected life of the agreement. Periodic payments received or paid by a Fund are recorded as realized gains or losses. Payments received or made as a result of a credit event or termination of the contract are recognized, net of a proportional amount of the upfront payment, as realized gains or losses.
(i) Forward Foreign Currency Exchange Contracts
The change in value of a forward foreign currency exchange contract is recorded as unrealized appreciation or depreciation until the contract is closed. When the contract is closed, the Funds record a realized gain or loss equal to the difference between the value at the time the contract was opened and the value at the time it was closed.
(j) Currency Translations
The accounting records of the Funds are maintained in U.S. dollars. All assets and liabilities initially expressed in foreign currencies are converted into U.S. dollars at prevailing exchange rates. Purchases and sales of investment securities, dividend and interest income, and certain expenses are translated at the rates of exchange prevailing on the respective dates of such transactions. Changes in the relationship of these foreign currencies to the U.S. dollar can significantly affect the value of the investments and earnings of the Funds. Foreign investments may also subject the Funds to foreign government exchange restrictions, expropriation, taxation, or other political, social or economic developments, all of which could affect the market and/or credit risk of the investments.
The Funds do not isolate that portion of the results of operations resulting from changes in the foreign exchange rates on investments from the fluctuations arising from changes in the market prices of securities held. Such fluctuations are included with the net realized gain or loss and unrealized appreciation or depreciation on investments.
Reported net realized foreign exchange gains and losses arise from sales of foreign currencies and currency gains or losses realized between the trade and settlement dates on investment transactions. Net unrealized appreciation and depreciation arise from changes in the fair values of assets and liabilities other than investments in securities at the fiscal period end, resulting from changes in exchange rates.
(k) Foreign Taxes
The Funds may be subject to foreign taxes (a portion of which may be reclaimable) on income, stock dividends, capital gains on investments or certain foreign currency transactions. All foreign taxes are recorded in accordance with the applicable foreign tax regulations and rates that exist in the foreign jurisdictions in which the Funds invest. These foreign taxes, if any, are paid by the Funds and reflected in their Statements of Operations as follows: foreign taxes withheld at source are presented as a reduction of income and foreign taxes on capital gains from sales of investments are included with the net realized gain (loss) on investments. Foreign taxes payable or deferred as of June 30, 2021, if any, are disclosed in the Funds’ Statements of Assets and Liabilities.
(l) Security Transactions
Security transactions are recorded on the trade date for financial reporting purposes. Realized gains and losses from securities transactions are recorded using the identified cost basis. Proceeds from lawsuits related to investment holdings are recorded as a reduction to cost if the securities are still held and as realized gains if no longer held in the respective Fund. Dividend income is recorded on the ex-dividend date, net of applicable taxes withheld by foreign countries, if any. Taxable non-cash dividends are recorded as dividend income. Interest income, including amortization of premiums and accretion of discounts, is accrued on a daily basis. Interest income also includes paydown gains and losses on mortgage-backed and asset-backed securities and senior and subordinated loans. Amendment fees are earned as compensation for evaluating and accepting changes to the original loan agreement and are recognized when received. Dividend income from Real Estate Investment Trusts (“REITs”) is recorded based on the income included in the distributions received from the REIT investments using published REIT classifications, including some management estimates when actual amounts are not available. Distributions received in excess of this estimated amount are recorded as a reduction of the cost of investments or reclassified to realized gains. The actual amounts of income,
| | THE GUGGENHEIM FUNDS SEMI-ANNUAL REPORT | 147 |
NOTES TO FINANCIAL STATEMENTS (Unaudited)(continued) |
return of capital, and realized gains are only determined by each REIT after its fiscal year-end, and may differ from the estimated amounts.
Income from residual collateralized loan obligations is recognized using the effective interest method. At the time of purchase, management estimates the future expected cash flows and determines the effective yield and estimated maturity date based on the estimated cash flows. Subsequent to the purchase, the estimated cash flows are updated periodically and a revised yield is calculated prospectively.
Certain Funds may receive other income from investments in senior loan interests including amendment fees, consent fees and commitment fees. For funded loans, these fees are recorded as income when received by the Funds and included in interest income on the Statements of Operations. For unfunded loans, commitment fees are included in realized gain on investments on the Statements of Operations at the end of the commitment period.
(m) Distributions
Distributions of net investment income and net realized gains, if any, are declared and paid at least annually. Normally, all distributions of a Fund will automatically be reinvested without charge in additional shares of the same Fund. Distributions are recorded on the ex-dividend date and are determined in accordance with U.S. federal income tax regulations which may differ from U.S. GAAP.
(n) Expenses
Expenses directly attributable to a Fund are charged directly to the Fund. Other expenses common to various funds within the fund complex are generally allocated amongst such funds on the basis of average net assets.
(o) Earnings Credits
Under the fee arrangement with the custodian, the Funds may earn credits based on overnight custody cash balances. These credits are utilized to reduce related custodial expenses. The custodian fees disclosed in the Statements of Operations are before the reduction in expense from the related earnings credits, if any. Earnings credits for the period ended June 30, 2021, are disclosed in the Statements of Operations.
(p) Cash
The Funds may leave cash overnight in their cash account with the custodian. Periodically, a Fund may have cash due to the custodian bank as an overdraft balance. A fee is incurred on this overdraft, calculated by multiplying the overdraft by a rate based on the federal funds rate, which was 0.08% at June 30, 2021.
(q) Indemnifications
Under the Funds’ organizational documents, the Trustees and Officers are indemnified against certain liabilities arising out of the performance of their duties to the Trust. In addition, throughout the normal course of business, the Funds enter into contracts that contain a variety of representations and warranties which provide general indemnifications. The Funds’ maximum exposure under these arrangements is unknown, as this would involve future claims that may be made against the Funds and/or their affiliates that have not yet occurred. However, based on experience, the Funds expect the risk of loss to be remote.
(r) Special Purpose Acquisition Companies
The Funds may acquire an interest in a special purpose acquisition company (“SPAC”) in an initial public offering or a secondary market transaction. SPAC investments carry many of the same risks as investments in initial public offering securities, such as erratic price movements, greater risk of loss, lack of information about the issuer, limited operating and little public or no trading history, and higher transaction costs. An investment in a SPAC is typically subject to a higher risk of dilution by additional later offerings of interests in the SPAC or by other investors exercising existing rights to purchase shares of the SPAC and interests in SPACs may be illiquid and/or be subject to restrictions on resale. A SPAC is a publicly traded company that raises investment capital for the purpose of acquiring the equity securities of one or more existing companies (or interests therein) via merger, combination, acquisition or other similar transactions. Unless and until an acquisition is completed, a SPAC generally invests its assets (less a portion retained to cover expenses) in U.S. government securities, money market securities and cash and does not typically pay dividends in respect of its common stock. SPAC investments are also subject to the risk that a significant portion of the funds raised by the SPAC may be expended during the search for a target acquisition or merger and that the SPAC may have limited time in which to conduct due diligence on potential business combination targets. Because SPACs are in essence blank check companies without operating history or ongoing business other than seeking acquisitions, the value of their securities is particularly dependent on the ability of the entity’s management to identify and complete a profitable acquisition. Among other conflicts of interest, the economic interests of the management, directors, officers and related parties of a SPAC can differ from the economic interests of public shareholders, which may lead to conflicts as they evaluate,
148 THE GUGGENHEIM FUNDS SEMI-ANNUAL REPORT | |
NOTES TO FINANCIAL STATEMENTS (Unaudited)(continued) |
negotiate and recommend business combination transactions to shareholders. This risk may become more acute as the deadline for the completion of a business combination nears. There is no guarantee that the SPACs in which the Funds invest will complete an acquisition or that any acquisitions that are completed will be profitable.
Note 2 – Financial Instruments and Derivatives
As part of their investment strategy, the Funds may utilize short sales and a variety of derivative instruments. These investments involve, to varying degrees, elements of market risk and risks in excess of amounts recognized on the Statements of Assets and Liabilities. Valuation and accounting treatment of these instruments can be found under Significant Accounting Policies in Note 1 of these Notes to Financial Statements.
Short Sales
A short sale is a transaction in which a Fund sells a security it does not own. If the security sold short decreases in price between the time the Fund sells the security and closes its short position, the Fund will realize a gain on the transaction. Conversely, if the security increases in price during the period, the Fund will realize a loss on the transaction. The risk of such price increases is the principal risk of engaging in short sales.
Derivatives
Derivatives are instruments whose values depend on, or are derived from, in whole or in part, the value of one or more other assets, such as securities, currencies, commodities or indices. Derivative instruments may be used to increase investment flexibility (including to maintain cash reserves while maintaining exposure to certain other assets), for risk management (hedging) purposes, to facilitate trading, to reduce transaction costs and to pursue higher investment returns. Derivative instruments may also be used to mitigate certain investment risks, such as foreign currency exchange rate risk, interest rate risk and credit risk. U.S. GAAP requires disclosures to enable investors to better understand how and why a Fund uses derivative instruments, how these derivative instruments are accounted for and their effects on the Fund’s financial position and results of operations.
The Funds may utilize derivatives for the following purposes:
Duration: the use of an instrument to manage the interest rate risk of a portfolio.
Hedge: an investment made in order to reduce the risk of adverse price movements in a security, by taking an offsetting position to protect against broad market moves.
Income: the use of any instrument that distributes cash flows typically based upon some rate of interest.
Index Exposure: the use of an instrument to obtain exposure to a listed or other type of index.
Leverage: gaining total exposure to equities or other assets on the long and short sides at greater than 100% of invested capital.
Speculation: the use of an instrument to express macro-economic and other investment views.
For any Fund whose investment strategy consistently involves applying leverage, the value of the Fund’s shares will tend to increase or decrease more than the value of any increase or decrease in the underlying index or other asset. In addition, because an investment in derivative instruments generally requires a small investment relative to the amount of investment exposure assumed, an opportunity for increased net income is created; but, at the same time, leverage risk will increase. The Fund’s use of leverage, through borrowings or instruments such as derivatives, may cause the Fund to be more volatile and riskier than if they had not been leveraged.
Options Purchased and Written
A call option on a security gives the purchaser of the option the right to buy, and the writer of a call option the obligation to sell, the underlying security. The purchaser of a put option has the right to sell, and the writer of the put option the obligation to buy, the underlying security at any time during the option period. The risk associated with purchasing options is limited to the premium originally paid.
| | THE GUGGENHEIM FUNDS SEMI-ANNUAL REPORT | 149 |
NOTES TO FINANCIAL STATEMENTS (Unaudited)(continued) |
The following table represents the Funds’ use and volume of call/put options purchased on a monthly basis:
| | | | Average Notional Amount | |
Fund | Use | | Call | | | Put | |
Series E (Total Return Bond Series) | Duration, Hedge | | $ | 93,716,667 | | | $ | — | |
Futures Contracts
A futures contract is an agreement to purchase (long) or sell (short) an agreed amount of securities or other instruments at a set price for delivery at a future date. There are significant risks associated with a Fund’s use of futures contracts, including (i) there may be an imperfect or no correlation between the changes in market value of the underlying asset and the prices of futures contracts; (ii) there may not be a liquid secondary market for a futures contract; (iii) trading restrictions or limitations may be imposed by an exchange; and (iv) government regulations may restrict trading in futures contracts. When investing in futures, there is minimal counterparty credit risk to a Fund because futures are exchange-traded and the exchange’s clearinghouse, as counterparty to all exchange-traded futures, guarantees against default. Cash deposits are shown as segregated cash with broker on the Statements of Assets and Liabilities; securities held as collateral are noted on the Schedules of Investments.
The following table represents the Funds’ use and volume of futures on a monthly basis:
| | | | Average Notional Amount | |
Fund | Use | | Long | | | Short | |
Series A (StylePlus—Large Core Series) | Index exposure | | $ | 4,928,079 | | | $ | — | |
Series D (World Equity Income Series) | Hedge | | | — | | | | 8,676,912 | |
Series J (StylePlus—Mid Growth Series) | Index exposure | | | 2,927,273 | | | | — | |
Series N (Managed Asset Allocation Series) | Index exposure, Speculation | | | 12,129,734 | | | | 626,155 | |
Series X (StylePlus—Small Growth Series) | Index exposure | | | 959,531 | | | | — | |
Series Y (StylePlus—Large Growth Series) | Index exposure | | | 1,052,301 | | | | — | |
Swap Agreements
A swap is an agreement that obligates two parties to exchange a series of cash flows at specified intervals based upon or calculated by reference to changes in specified prices or rates for a specified amount of an underlying asset. When utilizing OTC swaps, a fund bears the risk of loss of the amount expected to be received under a swap agreement in the event of the default or bankruptcy of a swap agreement counterparty or if the underlying asset declines in value. Certain standardized swaps are subject to mandatory central clearing and are executed on a multi-lateral or other trade facility platform, such as a registered exchange. There is limited counterparty credit risk with respect to centrally-cleared swaps as the transaction is facilitated through a central clearinghouse, much like exchange-traded futures contracts. For a fund utilizing centrally-cleared swaps, the exchange bears the risk of loss resulting from a counterparty not being able to pay. There is no guarantee that a fund or an underlying fund could eliminate its exposure under an outstanding swap agreement by entering into an offsetting swap agreement with the same or another party.
Total return and custom basket swaps involve commitments where single or multiple cash flows are exchanged based on the price of an underlying reference asset (such as an index or custom basket of securities) for a fixed or variable interest rate. Total return and custom basket swaps will usually be computed based on the current value of the reference asset as of the close of regular trading on the NYSE or other exchange, with the swap value being adjusted to include dividends accrued, financing charges and/or interest associated with the swap agreement. When utilizing total return or custom basket swaps, a fund bears the risk of loss of the amount expected to be received under a swap agreement in the event of the default or bankruptcy of a swap agreement counterparty or if the underlying reference asset declines in value.
150 THE GUGGENHEIM FUNDS SEMI-ANNUAL REPORT | |
NOTES TO FINANCIAL STATEMENTS (Unaudited)(continued) |
The following table represents the Funds’ use and volume of total return swaps on a monthly basis:
| | | | Average Notional Amount | |
Fund | Use | | Long | | | Short | |
Series A (StylePlus—Large Core Series) | Index exposure | | $ | 198,254,984 | | | $ | — | |
Series E (Total Return Bond Series) | Income, Index exposure, Speculation | | | 690,616 | | | | 108,410 | |
Series J (StylePlus—Mid Growth Series) | Index exposure | | | 159,506,261 | | | | — | |
Series P (High Yield Series) | Income, Index exposure | | | 1,787,963 | | | | — | |
Series X (StylePlus—Small Growth Series) | Index exposure | | | 32,636,549 | | | | — | |
Series Y (StylePlus—Large Growth Series) | Index exposure | | | 41,369,725 | | | | — | |
The following table represents the Funds’ use and volume of custom basket swaps on a monthly basis:
| | | | Average Notional Amount | |
Fund | Use | | Long | | | Short | |
Series Z (Alpha Opportunity Series) | Hedge, Leverage | | $ | 714,715 | | | $ | 3,767,358 | |
Interest rate swaps involve the exchange by the Funds with another party for their respective commitment to pay or receive a fixed or variable interest rate on a notional amount of principal. Interest rate swaps are generally centrally-cleared, but central clearing does not make interest rate swap transactions risk free.
The following table represents the Funds’ use and volume of interest rate swaps on a monthly basis:
| | | | Average Notional Amount | |
Fund | Use | | Pay Floating Rate | | | Receive Floating Rate | |
Series E (Total Return Bond Series) | Duration, Hedge | | $ | 17,133,333 | | | $ | — | |
Credit default swaps are instruments which allow for the full or partial transfer of third party credit risk, with respect to a particular entity or entities, from one counterparty to the other. A fund enters into credit default swaps as a “seller” or “buyer” of protection primarily to gain or reduce exposure to the investment grade and/or high yield bond market. A seller of credit default swaps is selling credit protection or assuming credit risk with respect to the underlying entity or entities. The buyer in a credit default swap is obligated to pay the seller a periodic stream of payments over the term of the contract provided that no event of default on an underlying reference obligation has occurred. If a credit event occurs, as defined under the terms of the swap agreement, the seller will either (i) pay to the buyer of protection an amount equal to the notional amount of the swap and take delivery of the referenced obligation or underlying securities comprising the referenced index or (ii) pay a net settlement amount in the form of cash or securities equal to the notional amount of the swap less the recovery value of the referenced obligation or underlying securities comprising the referenced index. The notional amount reflects the maximum potential amount the seller of credit protection could be required to pay to the buyer if a credit event occurs. The seller of protection receives periodic premium payments from the buyer and may also receive or pay an upfront premium adjustment to the stated periodic payments. In the event a credit default occurs on a credit default swap referencing an index, a factor adjustment will take place and the buyer of protection will receive a payment reflecting the par less the default recovery rate of the defaulted index component based on its weighting in the index. If no default occurs, the counterparty will pay the stream of payments and have no further obligations to the fund selling the credit protection. For a fund utilizing centrally cleared credit default swaps, the exchange bears the risk of loss resulting from a counterparty not being able to pay. For OTC credit default swaps, a fund bears the risk of loss of the amount expected to be received under a swap agreement in the event of the default or bankruptcy of a swap agreement counterparty, or in the case of a credit default swap in which a fund is selling credit protection, the default of a third party issuer.
The quoted market prices and resulting market values for credit default swap agreements on securities and credit indices serve as an indicator of the current status of the payment/performance risk and represent the likelihood of an expected liability (or profit) for the credit derivative had the notional amount of the swap agreement been closed/sold as of the period end. Increasing market values, in absolute terms when compared to the notional amount of the swap, represent a deterioration of the referenced entity’s credit soundness and a greater likelihood or risk of default or other credit event occurring as defined under the terms of the agreement.
| | THE GUGGENHEIM FUNDS SEMI-ANNUAL REPORT | 151 |
NOTES TO FINANCIAL STATEMENTS (Unaudited)(continued) |
The following table represents the Funds’ use and volume of credit default swaps on a monthly basis:
| | | | Average Notional Amount | |
Fund | Use | | Protection Sold | | | Protection Purchased | |
Series E (Total Return Bond Series) | Income, Index exposure | | $ | 326,667 | | | $ | — | |
Series P (High Yield Series) | Index exposure | | | 933,333 | | | | — | |
Forward Foreign Currency Exchange Contracts
A forward foreign currency exchange contract is an agreement between two parties to exchange two designated currencies at a specific time in the future. Certain types of contracts may be cash settled, in an amount equal to the change in exchange rates during the term of the contract. The contracts can be used to hedge or manage exposure to foreign currency risks with portfolio investments or to gain exposure to foreign currencies.
The market value of a forward foreign currency exchange contract changes with fluctuations in foreign currency exchange rates. Furthermore, the Funds may be exposed to risk if the counterparties cannot meet the contract terms or if the currency value changes unfavorably as compared to the U.S. dollar.
The following table represents the Funds’ use and volume of forward foreign currency exchange contracts on a monthly basis:
| | | | Average Value | |
Fund | Use | | Purchased | | | Sold | |
Series E (Total Return Bond Series) | Hedge, Income | | $ | 7,727,194 | | | $ | 7,865,023 | |
Series P (High Yield Series) | Hedge | | | 24,435 | | | | 90,084 | |
Derivative Investment Holdings Categorized by Risk Exposure
The following is a summary of the location of derivative investments on the Funds’ Statements of Assets and Liabilities as of June 30, 2021:
Derivative Investment Type | Asset Derivatives | Liability Derivatives |
Equity contracts | Unrealized appreciation on OTC swap agreements | Unrealized depreciation on OTC swap agreements |
| Variation margin on futures contracts | Variation margin on futures contracts |
Interest Rate contracts | Investments in unaffiliated issuers, at value Unamortized upfront premiums paid on interest rate swap agreements | |
| | Variation margin on interest rate swap agreements | |
| Variation margin on futures contracts | |
Currency contracts | Unrealized appreciation on forward foreign currency exchange contracts | Unrealized depreciation on forward foreign currency exchange contracts |
| Variation margin on futures contracts | |
Credit contracts | Unrealized appreciation on OTC swap agreements | |
152 THE GUGGENHEIM FUNDS SEMI-ANNUAL REPORT | |
NOTES TO FINANCIAL STATEMENTS (Unaudited)(continued) |
The following table sets forth the fair value of the Funds’ derivative investments categorized by primary risk exposure at June 30, 2021:
Asset Derivative Investments Value |
Fund | | Futures
Equity
Risk* | | | Swaps
Equity
Risk | | | Futures
Foreign
Currency
Exchange
Risk* | | | Futures
Interest
Rate
Risk* | | | Swaps
Interest
Rate
Risk* | | | Swaps
Credit
Risk | | | Options
Purchased
Interest
Rate
Risk | | | Forward
Foreign
Currency
Exchange
Risk | | | Total
Value at
June 30,
2021 | |
Series A (StylePlus—Large Core Series) | | $ | 34,883 | | | $ | 11,322,988 | | | $ | — | | | $ | — | | | $ | — | | | $ | — | | | $ | — | | | $ | — | | | $ | 11,357,871 | |
Series D (World Equity Income Series) | | | — | | | | — | | | | 159,388 | | | | — | | | | — | | | | — | | | | — | | | | — | | | | 159,388 | |
Series E (Total Return Bond Series) | | | — | | | | — | | | | — | | | | — | | | | — | | | | — | | | | 378,922 | | | | 684,395 | | | | 1,063,317 | |
Series J (StylePlus—Mid Growth Series) | | | 15,418 | | | | 12,986,072 | | | | — | | | | — | | | | — | | | | — | | | | — | | | | — | | | | 13,001,490 | |
Series N (Managed Asset Allocation Series) | | | 4,764 | | | | — | | | | — | | | | 16,613 | | | | — | | | | — | | | | — | | | | — | | | | 21,377 | |
Series P (High Yield Series) | | | — | | | | — | | | | — | | | | — | | | | — | | | | 50,309 | | | | — | | | | 3,632 | | | | 53,941 | |
Series X (StylePlus—Small Growth Series) | | | — | | | | 497,534 | | | | — | | | | — | | | | — | | | | — | | | | — | | | | — | | | | 497,534 | |
Series Y (StylePlus—Large Growth Series) | | | 22,893 | | | | 3,263,583 | | | | — | | | | — | | | | — | | | | — | | | | — | | | | — | | | | 3,286,476 | |
Series Z (Alpha Opportunity Series) | | | — | | | | 11,179 | | | | — | | | | — | | | | — | | | | — | | | | — | | | | — | | | | 11,179 | |
Liability Derivative Investments Value |
Fund | | Futures
Equity
Risk* | | | Swaps
Equity
Risk | | | Futures
Foreign
Currency
Exchange
Risk* | | | Futures
Interest
Rate
Risk* | | | Swaps
Interest
Rate
Risk* | | | Swaps
Credit
Risk | | | Options
Purchased
Equity
Risk | | | Forward
Foreign
Currency
Exchange
Risk | | | Total
Value at
June 30,
2021 | |
Series E (Total Return Bond Series) | | $ | — | | | $ | — | | | $ | — | | | $ | — | | | $ | 587,476 | | | $ | — | | | $ | — | | | $ | 195,914 | | | $ | 783,390 | |
Series J (StylePlus—Mid Growth Series) | | | 14,542 | | | | — | | | | — | | | | — | | | | — | | | | — | | | | — | | | | — | | | | 14,542 | |
Series N (Managed Asset Allocation Series) | | | 126,183 | | | | — | | | | — | | | | 1,328 | | | | — | | | | — | | | | — | | | | — | | | | 127,511 | |
Series X (StylePlus—Small Growth Series) | | | 7,880 | | | | — | | | | — | | | | — | | | | — | | | | — | | | | — | | | | — | | | | 7,880 | |
Series Z (Alpha Opportunity Series) | | | — | | | | 204,249 | | | | — | | | | — | | | | — | | | | — | | | | — | | | | — | | | | 204,249 | |
* | Includes cumulative appreciation (depreciation) of exchange-traded, OTC and centrally-cleared derivatives contracts as reported on the Schedules of Investments. For exchange-traded and centrally-cleared derivatives, variation margin is reported within the Statements of Assets and Liabilities. |
| | THE GUGGENHEIM FUNDS SEMI-ANNUAL REPORT | 153 |
NOTES TO FINANCIAL STATEMENTS (Unaudited)(continued) |
The following is a summary of the location of derivative investments on the Funds’ Statements of Operations for the period ended June 30, 2021:
Derivative Investment Type | Location of Gain (Loss) on Derivatives |
Equity/Interest Rate contracts | Net realized gain (loss) on futures contracts |
| | Net change in unrealized appreciation (depreciation) on futures contracts |
| | Net realized gain (loss) on options purchased |
| | Net change in unrealized appreciation (depreciation) on options purchased |
| | Net realized gain (loss) on swap agreements |
| Net change in unrealized appreciation (depreciation) on swap agreements |
Currency contracts | Net realized gain (loss) on futures contracts |
| | Net change in unrealized appreciation (depreciation) on futures contracts |
| | Net realized gain (loss) on forward foreign currency exchange contracts |
| Net change in unrealized appreciation (depreciation) on forward foreign currency exchange contracts |
Credit contracts | Net realized gain (loss) on swap agreements |
| | Net change in unrealized appreciation (depreciation) on swap agreements |
The following is a summary of the Funds’ realized gain (loss) and change in unrealized appreciation (depreciation) on derivative investments recognized on the Statements of Operations categorized by primary risk exposure for the period ended June 30, 2021:
Realized Gain (Loss) on Derivative Investments Recognized on the Statements of Operations |
Fund | | Futures
Equity
Risk | | | Swaps
Equity
Risk | | | Futures
Foreign
Currency
Exchange
Risk | | | Futures
Interest
Rate
Risk | | | Swaps
Interest
Rate
Risk | | | Swaps
Credit
Risk | | | Options
Purchased
Interest
Rate
Risk | | | Forward
Foreign
Currency
Exchange
Risk | | | Total | |
Series A (StylePlus—Large Core Series) | | $ | 664,975 | | | $ | 38,031,706 | | | $ | — | | | $ | — | | | $ | — | | | $ | — | | | $ | — | | | $ | — | | | $ | 38,696,681 | |
Series D (World Equity Income Series) | | | — | | | | — | | | | 40,379 | | | | — | | | | — | | | | — | | | | — | | | | — | | | | 40,379 | |
Series E (Total Return Bond Series) | | | — | | | | — | | | | — | | | | — | | | | (10,975 | ) | | | 67,990 | | | | 313,201 | | | | 121,010 | | | | 491,226 | |
Series J (StylePlus—Mid Growth Series) | | | 349,194 | | | | 28,403,681 | | | | — | | | | — | | | | — | | | | — | | | | — | | | | — | | | | 28,752,875 | |
Series N (Managed Asset Allocation Series) | | | 1,200,227 | | | | — | | | | (10,076 | ) | | | (121,476 | ) | | | — | | | | — | | | | — | | | | — | | | | 1,068,675 | |
Series P (High Yield Series) | | | — | | | | — | | | | — | | | | — | | | | — | | | | 172,650 | | | | — | | | | 3,061 | | | | 175,711 | |
Series X (StylePlus—Small Growth Series) | | | 143,447 | | | | 9,241,297 | | | | — | | | | — | | | | — | | | | — | | | | — | | | | — | | | | 9,384,744 | |
Series Y (StylePlus—Large Growth Series) | | | 92,000 | | | | 6,153,919 | | | | — | | | | — | | | | — | | | | — | | | | — | | | | — | | | | 6,245,919 | |
Series Z (Alpha Opportunity Series) | | | — | | | | (728,610 | ) | | | — | | | | — | | | | — | | | | — | | | | — | | | | — | | | | (728,610 | ) |
154 THE GUGGENHEIM FUNDS SEMI-ANNUAL REPORT | |
NOTES TO FINANCIAL STATEMENTS (Unaudited)(continued) |
Change in Unrealized Appreciation (Depreciation) on Derivative Investments Recognized on the Statements of Operations |
Fund | | Futures
Equity
Risk | | | Swaps
Equity
Risk | | | Futures
Foreign
Currency
Exchange
Risk | | | Futures
Interest
Rate
Risk | | | Swaps
Interest
Rate
Risk | | | Swaps
Credit
Risk | | | Options
Purchased
Interest
Rate
Risk | | | Forward
Foreign
Currency
Exchange
Risk | | | Total | |
Series A (StylePlus—Large Core Series) | | $ | 3,543 | | | $ | (10,366,704 | ) | | $ | — | | | $ | — | | | $ | — | | | $ | — | | | $ | — | | | $ | — | | | $ | (10,363,161 | ) |
Series D (World Equity Income Series) | | | — | | | | — | | | | 159,388 | | | | — | | | | — | | | | — | | | | — | | | | — | | | | 159,388 | |
Series E (Total Return Bond Series) | | | — | | | | — | | | | — | | | | — | | | | (533,090 | ) | | | (50,227 | ) | | | (141,757 | ) | | | (119,720 | ) | | | (844,794 | ) |
Series J (StylePlus—Mid Growth Series) | | | (15,797 | ) | | | (12,127,944 | ) | | | — | | | | — | | | | — | | | | — | | | | — | | | | — | | | | (12,143,741 | ) |
Series N (Managed Asset Allocation Series) | | | (315,246 | ) | | | — | | | | 865 | | | | 12,976 | | | | — | | | | — | | | | — | | | | — | | | | 301,405 | |
Series P (High Yield Series) | | | — | | | | — | | | | — | | | | — | | | | — | | | | (105,530 | ) | | | — | | | | 3,632 | | | | (101,898 | ) |
Series X (StylePlus—Small Growth Series) | | | (11,887 | ) | | | (6,486,004 | ) | | | — | | | | — | | | | — | | | | — | | | | — | | | | — | | | | (6,497,891 | ) |
Series Y (StylePlus—Large Growth Series) | | | 14,837 | | | | (1,134,553 | ) | | | — | | | | — | | | | — | | | | — | | | | — | | | | — | | | | (1,119,716 | ) |
Series Z (Alpha Opportunity Series) | | | — | | | | 255,826 | | | | — | | | | — | | | | — | | | | — | | | | — | | | | — | | | | 255,826 | |
In conjunction with short sales and the use of derivative instruments, the Funds are required to maintain collateral in various forms. Depending on the financial instrument utilized and the broker involved, the Funds use margin deposits at the broker, cash and/or securities segregated at the custodian bank, discount notes or repurchase agreements allocated to the Funds as collateral.
The Trust has established counterparty credit guidelines and enters into transactions only with financial institutions of investment grade or better. The Trust monitors the counterparty credit risk.
Foreign Investments
There are several risks associated with exposure to foreign currencies, foreign issuers and emerging markets. A fund’s indirect and direct exposure to foreign currencies subjects the Fund to the risk that those currencies will decline in value relative to the U.S. dollar, or in the case of short positions, that the U.S. dollar will decline in value relative to the currency being hedged. Currency rates in foreign countries may fluctuate significantly over short periods of time for a number of reasons, including changes in interest rates and the imposition of currency controls or other political developments in the U.S. or abroad. In addition, the Funds may incur transaction costs in connection with conversions between various currencies. The Funds may, but is not obligated to, engage in currency hedging transactions, which generally involve buying currency forward, options or futures contracts. However, not all currency risks may be effectively hedged, and in some cases the costs of hedging techniques may outweigh expected benefits. In such instances, the value of securities denominated in foreign currencies can change significantly when foreign currencies strengthen or weaken relative to the U.S. dollar.
The Funds may invest in securities of foreign companies directly, or in financial instruments, such as ADRs and exchange-traded funds, which are indirectly linked to the performance of foreign issuers. Foreign markets can be more volatile than the U.S. market due to increased risks of adverse issuer, political, regulatory, market, or economic developments and can perform differently from the U.S. market. Investing in securities of foreign companies directly, or in financial instruments that are indirectly linked to the performance of foreign issuers, may involve risks not typically associated with investing in U.S. issuers. The value of securities denominated in foreign currencies, and of dividends from such securities, can change significantly when foreign currencies strengthen or weaken relative to the U.S. dollar. Foreign securities markets generally have less trading volume and less liquidity than U.S. markets, and prices in some foreign markets may fluctuate more than those of securities traded on U.S. markets. Many foreign countries lack accounting and disclosure standards comparable to those that apply to U.S. companies, and it may be more difficult to obtain reliable information regarding a foreign issuer’s financial condition and operations. Transaction costs and costs associated with custody services are generally higher for foreign securities than they are for U.S. securities. Some foreign governments levy withholding taxes against dividend and interest income. Although in some countries portions of these taxes are recoverable, the non-recovered portion will reduce the income received by the Funds.
| | THE GUGGENHEIM FUNDS SEMI-ANNUAL REPORT | 155 |
NOTES TO FINANCIAL STATEMENTS (Unaudited)(continued) |
Note 3 – Offsetting
In the normal course of business, the Funds enter into transactions subject to enforceable master netting arrangements or other similar arrangements. Generally, the right to offset in those agreements allows the Funds to counteract the exposure to a specific counterparty with collateral received from or delivered to that counterparty based on the terms of the arrangements. These arrangements provide for the right to liquidate upon the occurrence of an event of default, credit event upon merger or additional termination event.
In order to better define their contractual rights and to secure rights that will help the Funds mitigate their counterparty risk, the Funds may enter into an International Swaps and Derivatives Association, Inc. Master Agreement (“ISDA Master Agreement”) or similar agreement with their derivative contract counterparties. An ISDA Master Agreement is a bilateral agreement between a fund and a counterparty that governs OTC derivatives, including foreign exchange contracts, and typically contains, among other things, collateral posting terms and netting provisions in the event of a default and/or termination event. The provisions of the ISDA Master Agreement typically permit a single net payment in the event of a default (close-out netting) or similar event, including the bankruptcy or insolvency of the counterparty.
For derivatives traded under an ISDA Master Agreement, the collateral requirements are typically calculated by netting the mark-to-market amount for each transaction under such agreement and comparing that amount to the value of any collateral currently pledged by the Funds and the counterparty. For financial reporting purposes, cash collateral that has been pledged to cover obligations of the Funds and cash collateral received from the counterparty, if any, are reported separately on the Statements of Assets and Liabilities as segregated cash with broker/receivable for variation margin, or payable for swap settlement/variation margin. Cash and/or securities pledged or received as collateral by the Funds in connection with an OTC derivative subject to an ISDA Master Agreement generally may not be invested, sold or rehypothecated by the counterparty or the Funds, as applicable, absent an event of default under such agreement, in which case such collateral generally may be applied towards obligations due to and payable by such counterparty or the Funds, as applicable. Generally, the amount of collateral due from or to a counterparty must exceed a minimum transfer amount threshold (e.g., $300,000) before a transfer is required to be made. To the extent amounts due to the Funds from their counterparties are not fully collateralized, contractually or otherwise, the Funds bear the risk of loss from counterparty nonperformance. The Funds attempt to mitigate counterparty risk by only entering into agreements with counterparties that they believe to be of good standing and by monitoring the financial stability of those counterparties.
For financial reporting purposes, the Funds do not offset derivative assets and derivative liabilities that are subject to netting arrangements in the Statements of Assets and Liabilities.
156 THE GUGGENHEIM FUNDS SEMI-ANNUAL REPORT | |
NOTES TO FINANCIAL STATEMENTS (Unaudited)(continued) |
The following tables present derivative financial instruments and secured financing transactions that are subject to enforceable netting arrangements:
| | | | | | | | | | | | | | | | Gross Amounts Not Offset
in the Statements of
Assets and Liabilities | | | | | |
Fund | Instrument | | Gross
Amounts of
Recognized
Assets1 | | | Gross
Amounts
Offset in the
Statements
of Assets and
Liabilities | | | Net Amount
of Assets
Presented on
the Statements
of Assets and
Liabilities | | | Financial
Instruments | | | Cash
Collateral
Received | | | Net
Amount | |
Series A (StylePlus—Large Core Series) | Swap equity contracts | | $ | 11,322,988 | | | $ | — | | | $ | 11,322,988 | | | $ | — | | | $ | (10,780,000 | ) | | $ | 542,988 | |
Series E (Total Return Bond Series) | Forward foreign currency exchange contracts | | | 684,395 | | | | — | | | | 684,395 | | | | (105,602 | ) | | | (434,304 | ) | | | 144,489 | |
| Options purchased | | | 378,922 | | | | — | | | | 378,922 | | | | — | | | | (159,895 | ) | | | 219,027 | |
Series J (StylePlus—Mid Growth Series) | Swap equity contracts | | | 12,986,072 | | | | — | | | | 12,986,072 | | | | — | | | | (12,986,072 | ) | | | — | |
Series P (High Yield Series) | Credit index swap agreements | | | 50,309 | | | | — | | | | 50,309 | | | | — | | | | — | | | | 50,309 | |
| | Forward foreign currency exchange contracts | | | 3,632 | | | | — | | | | 3,632 | | | | — | | | | — | | | | 3,632 | |
Series X (StylePlus—Small Growth Series) | Swap equity contracts | | | 497,534 | | | | — | | | | 497,534 | | | | — | | | | (450,000 | ) | | | 47,534 | |
Series Y (StylePlus—Large Growth Series) | Swap equity contracts | | | 3,263,583 | | | | — | | | | 3,263,583 | | | | — | | | | (3,180,000 | ) | | | 83,583 | |
Series Z (Alpha Opportunity Series) | Custom basket swap agreements | | | 11,179 | | | | — | | | | 11,179 | | | | (11,179 | ) | | | — | | | | — | |
| | | | | | | | | | | | | | | | Gross Amounts Not Offset
in the Statements of
Assets and Liabilities | | | | | |
Fund | Instrument | | Gross
Amounts of
Recognized
Liabilities1 | | | Gross
Amounts
Offset in the
Statements
of Assets and
Liabilities | | | Net Amount
of Liabilities
Presented on
the Statements
of Assets and
Liabilities | | | Financial
Instruments | | | Cash
Collateral
Pledged | | | Net
Amount | |
Series E (Total Return Bond Series) | Forward foreign currency exchange contracts | | $ | 195,914 | | | $ | — | | | $ | 195,914 | | | $ | (105,602 | ) | | $ | — | | | $ | 90,312 | |
Series Z (Alpha Opportunity Series) | Custom basket swap agreements | | | 204,249 | | | | — | | | | 204,249 | | | | (204,249 | ) | | | — | | | | — | |
1 | Exchange-traded or centrally-cleared derivatives are excluded from these reported amounts. |
| | THE GUGGENHEIM FUNDS SEMI-ANNUAL REPORT | 157 |
NOTES TO FINANCIAL STATEMENTS (Unaudited)(continued) |
The Funds have the right to offset deposits against any related derivative liabilities outstanding with each counterparty with the exception of exchange-traded or centrally-cleared derivatives. The following table presents deposits held by others in connection with derivative investments as of June 30, 2021.
Fund | Counterparty | Asset Type | | Cash Pledged | | | Cash Received | |
Series A (StylePlus—Large Core Series) | Morgan Stanley Capital Services LLC | Futures contracts | | $ | 154,000 | | | $ | — | |
| Wells Fargo Bank, N.A. | Total return swap agreements | | | — | | | | 10,780,000 | |
Series A (StylePlus—Large Core Series) Total | | | | | 154,000 | | | | 10,780,000 | |
Series D (World Equity Income Series) | BofA Securities, Inc. | Futures contracts | | | 322,050 | | | | — | |
Series E (Total Return Bond Series) | BofA Securities, Inc. | Interest rate swap agreements | | | — | | | | 45,953 | |
| | Citibank, N.A. | Forward foreign currency exchange contracts | | | — | | | | 280,000 | |
| | Goldman Sachs International | Forward foreign currency exchange contracts, Options | | | — | | | | 300,000 | |
| Morgan Stanley Capital Services LLC | Forward foreign currency exchange contracts, Options | | | — | | | | 220,357 | |
Series E (Total Return Bond Series) Total | | | | | — | | | | 846,310 | |
Series J (StylePlus—Mid Growth Series) | Citibank, N.A. | Total return swap agreements | | | — | | | | 13,650,000 | |
| Morgan Stanley Capital Services LLC | Futures contracts | | | 105,500 | | | | — | |
Series J (StylePlus—Mid Growth Series) Total | | | | | 105,500 | | | | 13,650,000 | |
Series X (StylePlus—Small Growth Series) | Morgan Stanley Capital Services LLC | Futures contracts | | | 53,000 | | | | — | |
| Wells Fargo Bank, N.A. | Total return swap agreements | | | — | | | | 450,000 | |
Series X (StylePlus—Small Growth Series) Total | | | | | 53,000 | | | | 450,000 | |
Series Y (StylePlus—Large Growth Series) | Morgan Stanley Capital Services LLC | Futures contracts | | | 71,000 | | | | — | |
| Wells Fargo Bank, N.A. | Total return swap agreements | | | — | | | | 3,180,000 | |
Series Y (StylePlus—Large Growth Series) Total | | | | | 71,000 | | | | 3,180,000 | |
Note 4 – Fair Value Measurement
In accordance with U.S. GAAP, fair value is defined as the price that the Funds would receive to sell an investment or pay to transfer a liability in an orderly transaction with an independent buyer in the principal market, or in the absence of a principal market, the most advantageous market for the investment or liability. U.S. GAAP establishes a three-tier fair value hierarchy based on the types of inputs used to value assets and liabilities and requires corresponding disclosure. The hierarchy and the corresponding inputs are summarized below:
Level 1 — | quoted prices in active markets for identical assets or liabilities. |
Level 2 — | significant other observable inputs (for example quoted prices for securities that are similar based on characteristics such as interest rates, prepayment speeds, credit risk, etc.). |
Level 3 — | significant unobservable inputs based on the best information available under the circumstances, to the extent observable inputs are not available, which may include assumptions. |
The types of inputs available depend on a variety of factors, such as the type of security and the characteristics of the markets in which it trades, if any. Fair valuation determinations that rely on fewer or no observable inputs require greater judgment. Accordingly, fair value determinations for Level 3 securities require the greatest amount of judgment.
Independent pricing services are used to value a majority of the Funds’ investments. When values are not available from a pricing service, they will be determined using a variety of sources and techniques, including: market prices; broker quotes; and models which derive prices based on inputs such as prices of securities with comparable maturities and characteristics or based on inputs such as anticipated cash flows or collateral, spread over U.S. Treasury securities, and other information and analysis. A significant portion of the Funds’ assets and liabilities are categorized as Level 2, as indicated in this report.
158 THE GUGGENHEIM FUNDS SEMI-ANNUAL REPORT | |
NOTES TO FINANCIAL STATEMENTS (Unaudited)(continued) |
Quotes from broker-dealers, adjusted for fluctuations in criteria such as credit spreads and interest rates, may also be used to value the Funds’ assets and liabilities, i.e. prices provided by a broker-dealer or other market participant who has not committed to trade at that price. Although quotes are typically received from established market participants, the Funds may not have the transparency to view the underlying inputs which support the market quotations. Significant changes in a quote would generally result in significant changes in the fair value of the security.
Certain fixed income securities are valued by obtaining a monthly quote from a broker-dealer, adjusted for fluctuations in criteria such as credit spreads and interest rates. Certain loans and other securities are valued using a single daily broker quote or a price from a third party vendor based on a single daily or monthly broker quote.
The inputs or methodologies used for valuing securities are not necessarily an indication of the risk associated with investing in those securities. The suitability of the techniques and sources employed to determine fair valuation are regularly monitored and subject to change.
Note 5 – Investment Advisory Agreement and Other Agreements
Under the terms of an investment advisory contract, the Funds pay GI investment advisory fees calculated at the annualized rates below, based on the average daily net assets of the Funds:
Fund | | Management Fees
(as a % of Net Assets) | |
Series A (StylePlus—Large Core Series) | | | 0.75 | % |
Series B (Large Cap Value Series) | | | 0.65 | % |
Series D (World Equity Income Series) | | | 0.70 | % |
Series E (Total Return Bond Series) | | | 0.39 | % |
Series F (Floating Rate Strategies Series) | | | 0.65 | %1 |
Series J (StylePlus—Mid Growth Series) | | | 0.75 | % |
Series N (Managed Asset Allocation Series) | | | 0.40 | % |
Series O (All Cap Value Series) | | | 0.70 | % |
Series P (High Yield Series) | | | 0.60 | % |
Series Q (Small Cap Value Series) | | | 0.75 | % |
Series V (SMid Cap Value Series) | | | 0.75 | % |
Series X (StylePlus—Small Growth Series) | | | 0.75 | % |
Series Y (StylePlus—Large Growth Series) | | | 0.65 | % |
Series Z (Alpha Opportunity Series) | | | 0.90 | % |
1 | The Series’ management fee is subject to a 0.05% reduction on assets over $5 billion. |
GI pays operating expenses on behalf of the Trust, such as audit and accounting related services, legal services, custody, printing and mailing, among others, on a pass-through basis. Such expenses are allocated to various Funds within the complex based on relative net assets.
The Board has adopted a Distribution and Shareholder Services Plan pursuant to Rule 12b-1 under the 1940 Act that allows those Funds to pay distribution and shareholder services fees to GFD. The Funds will pay distribution and shareholder services fees to GFD at an annual rate not to exceed 0.25% of average daily net assets. GFD may, in turn, pay all or a portion of the proceeds from the distribution and shareholder services fees to insurance companies or their affiliates and qualified plan administrators (“intermediaries”) for services they provide on behalf of the Funds to current and prospective variable contract owners and qualified plan participants that invest in the Funds through the intermediaries.
| | THE GUGGENHEIM FUNDS SEMI-ANNUAL REPORT | 159 |
NOTES TO FINANCIAL STATEMENTS (Unaudited)(continued) |
Contractual expense limitation agreements for the following Funds provide that the total expenses be limited to a percentage of average net assets for the Funds, exclusive of brokerage costs, dividends or interest on securities sold short, expenses of other investment companies in which a Fund invests, interest, taxes, litigation, indemnification and extraordinary expenses. The limits are listed below:
| | Limit | | | Effective
Date | | | Contract
End Date | |
Series A (StylePlus—Large Core Series) | | | 0.91 | % | | | 05/01/17 | | | | 05/01/22 | |
Series B (Large Cap Value Series) | | | 0.80 | % | | | 05/01/17 | | | | 05/01/22 | |
Series D (World Equity Income Series) | | | 0.90 | % | | | 05/01/17 | | | | 05/01/22 | |
Series E (Total Return Bond Series) | | | 0.81 | % | | | 11/30/12 | | | | 05/01/22 | |
Series F (Floating Rate Strategies Series) | | | 1.15 | % | | | 04/22/13 | | | | 05/01/22 | |
Series J (StylePlus—Mid Growth Series) | | | 0.94 | % | | | 05/01/17 | | | | 05/01/22 | |
Series O (All Cap Value Series) | | | 0.88 | % | | | 05/01/17 | | | | 05/01/22 | |
Series P (High Yield Series) | | | 1.07 | % | | | 10/20/14 | | | | 05/01/22 | |
Series Q (Small Cap Value Series) | | | 1.14 | % | | | 05/01/17 | | | | 05/01/22 | |
Series V (Mid Cap Value Series) | | | 0.91 | % | | | 05/01/17 | | | | 05/01/22 | |
Series X (StylePlus—Small Growth Series) | | | 1.06 | % | | | 05/01/17 | | | | 05/01/22 | |
Series Y (StylePlus—Large Growth Series) | | | 0.93 | % | | | 05/01/17 | | | | 05/01/22 | |
Series Z (Alpha Opportunity Series) | | | 2.00 | % | | | 05/31/17 | | | | 05/01/22 | |
GI is entitled to reimbursement by the Funds for fees waived or expenses reimbursed during any of the previous 36 months, beginning on the date of the expense limitation agreement, if on any day the estimated operating expenses are less than the indicated percentages. For purposes of this arrangement, GI is entitled to recoupment of previously waived fees or reimbursed expenses for 36 months from the date of the waiver or reimbursement by GI. At June 30, 2021, the amount of fees waived or expenses reimbursed that are subject to recoupment and will expire during the years ended December 31, are presented in the following table:
Fund | | 2021 | | | 2022 | | | 2023 | | | 2024 | | | Total | |
Series A (StylePlus - Large Core Series) | | $ | 398,625 | | | $ | 627,973 | | | $ | 609,622 | | | $ | 263,609 | | | $ | 1,899,829 | |
Series B (Large Cap Value Series) | | | 402,473 | | | | 596,531 | | | | 569,190 | | | | 256,261 | | | | 1,824,455 | |
Series D (World Equity Income Series) | | | 254,721 | | | | 384,683 | | | | 358,470 | | | | 149,807 | | | | 1,147,681 | |
Series E (Total Return Bond Series) | | | 109,348 | | | | 159,891 | | | | 102,283 | | | | 21,715 | | | | 393,237 | |
Series F (Floating Rate Strategies Series) | | | 31,761 | | | | 92,992 | | | | 97,708 | | | | 32,919 | | | | 255,380 | |
Series J (StylePlus—Mid Growth Series) | | | 274,454 | | | | 429,212 | | | | 445,780 | | | | 197,996 | | | | 1,347,442 | |
Series O (All Cap Value Series) | | | 224,011 | | | | 319,350 | | | | 288,584 | | | | 126,090 | | | | 958,035 | |
Series P (High Yield Series) | | | 62,373 | | | | 112,110 | | | | 111,843 | | | | 43,283 | | | | 329,609 | |
Series Q (Small Cap Value Series) | | | 74,408 | | | | 107,646 | | | | 89,756 | | | | 28,557 | | | | 300,367 | |
Series V (Mid Cap Value Series) | | | 390,235 | | | | 531,107 | | | | 493,187 | | | | 223,227 | | | | 1,637,756 | |
Series X (StylePlus - Small Growth Series) | | | 72,590 | | | | 151,315 | | | | 130,501 | | | | 60,123 | | | | 414,529 | |
Series Y (StylePlus - Large Growth Series) | | | 88,483 | | | | 163,763 | | | | 153,061 | | | | 65,667 | | | | 470,974 | |
Series Z (Alpha Opportunity Series) | | | 27,357 | | | | 108,215 | | | | 101,516 | | | | 57,866 | | | | 294,954 | |
For the period ended June 30, 2021, no amounts were recouped by GI.
If a Fund invests in a fund that is advised by the same adviser or an affiliated adviser, the investing Fund’s adviser has agreed to waive fees at the investing fund level to the extent necessary to offset the proportionate share of any management fee paid by each Fund with respect to its investment in such affiliated fund. Fee waivers will be calculated at the investing Fund level without regard to any expense cap in effect for the investing Fund. Fees waived under this arrangement are not subject to reimbursement to GI. For the period ended June 30, 2021, the following Funds waived fees related to investments in affiliated funds:
Fund | | Amount Waived | |
Series A (StylePlus—Large Core Series) | | $ | 70,477 | |
Series E (Total Return Bond Series) | | | 17,240 | |
Series J (StylePlus—Mid Growth Series) | | | 56,527 | |
Series N (Managed Asset Allocation Series) | | | 1,292 | |
Series X (StylePlus—Small Growth Series) | | | 12,202 | |
Series Y (StylePlus—Large Growth Series) | | | 12,645 | |
160 THE GUGGENHEIM FUNDS SEMI-ANNUAL REPORT | |
NOTES TO FINANCIAL STATEMENTS (Unaudited)(continued) |
Certain trustees and officers of the Trust are also officers of GI and/or GFD. The Trust does not compensate its officers or trustees who are officers, directors and/or employees of GI or GFD.
MUFG Investor Services (US), LLC (“MUIS”) acts as the Funds’ administrator, transfer agent and accounting agent. As administrator, transfer agent and accounting agent, MUIS maintains the books and records of the Funds’ securities and cash. The Bank of New York Mellon Corp. (“BNY”) acts as the Funds’ custodian. As custodian, BNY is responsible for the custody of the Funds’ assets. For providing the aforementioned administrative and accounting services, MUIS is entitled to receive a monthly fee equal to a percentage of the Funds’ average daily net assets and out of pocket expenses. For providing the aforementioned transfer agent and custodian services, MUIS and BNY are entitled to receive a monthly fee based on the number of transactions during the month and the number of accounts under management, subject to certain minimum monthly fees, and out of pocket expenses.
Note 6 – Federal Income Tax Information
The Funds intend to comply with the provisions of Subchapter M of the Internal Revenue Code applicable to regulated investment companies and will distribute substantially all taxable net investment income and capital gains sufficient to relieve the Funds from all, or substantially all, federal income, excise and state income taxes. Therefore, no provision for federal or state income tax or federal excise tax is required.
Tax positions taken or expected to be taken in the course of preparing the Funds’ tax returns are evaluated to determine whether the tax positions are “more-likely-than-not” of being sustained by the applicable tax authority. Tax positions not deemed to meet the more-likely-than-not threshold would be recorded as a tax benefit or expense in the current year. Management has analyzed the Funds’ tax positions taken, or to be taken, on U.S. federal income tax returns for all open tax years, and has concluded that no provision for income tax is required in the Funds’ financial statements. The Funds’ U.S. federal income tax returns are subject to examination by the Internal Revenue Service for a period of three years after they are filed.
At June 30, 2021, the cost of investments for U.S. federal income tax purposes, the aggregate gross unrealized appreciation for all investments for which there was an excess of value over tax cost, and the aggregate gross unrealized depreciation for all investments for which there was an excess of tax cost over value, were as follows:
Fund | | Tax Cost | | | Tax
Unrealized
Appreciation | | | Tax
Unrealized
Depreciation | | | Net Tax
Unrealized
Appreciation
(Depreciation) | |
Series A (StylePlus—Large Core Series) | | $ | 245,285,097 | | | $ | 18,924,345 | | | $ | (384,419 | ) | | $ | 18,539,926 | |
Series B (Large Cap Value Series) | | | 165,964,167 | | | | 67,358,209 | | | | (2,785,670 | ) | | | 64,572,539 | |
Series D (World Equity Income Series) | | | 118,504,250 | | | | 21,174,387 | | | | (2,203,259 | ) | | | 18,971,128 | |
Series E ( Total Return Bond Series) | | | 168,187,416 | | | | 8,166,993 | | | | (2,029,766 | ) | | | 6,137,227 | |
Series F (Floating Rate Strategies Series) | | | 45,887,864 | | | | 194,159 | | | | (561,687 | ) | | | (367,528 | ) |
Series J (StylePlus—Mid Growth Series) | | | 199,372,747 | | | | 17,253,103 | | | | (532,131 | ) | | | 16,720,972 | |
Series N (Managed Asset Allocation Series) | | | 33,638,743 | | | | 13,450,157 | | | | (261,178 | ) | | | 13,188,979 | |
Series O (All Cap Value Series) | | | 76,874,192 | | | | 28,921,078 | | | | (1,358,890 | ) | | | 27,562,188 | |
Series P (High Yield Series) | | | 49,155,640 | | | | 1,667,540 | | | | (1,473,648 | ) | | | 193,892 | |
Series Q (Small Cap Value Series) | | | 60,537,475 | | | | 18,647,754 | | | | (3,028,708 | ) | | | 15,619,046 | |
Series V (SMid Cap Value Series) | | | 152,992,037 | | | | 46,318,650 | | | | (5,235,169 | ) | | | 41,083,481 | |
Series X (StylePlus—Small Growth Series) | | | 39,189,924 | | | | 1,546,527 | | | | (167,338 | ) | | | 1,379,189 | |
Series Y (StylePlus—Large Growth Series) | | | 51,476,263 | | | | 5,510,613 | | | | (62,728 | ) | | | 5,447,885 | |
Series Z (Alpha Opportunity Series) | | | 4,972,197 | | | | 371,753 | | | | (278,795 | ) | | | 92,958 | |
| | THE GUGGENHEIM FUNDS SEMI-ANNUAL REPORT | 161 |
NOTES TO FINANCIAL STATEMENTS (Unaudited)(continued) |
Note 7 – Securities Transactions
For the period ended June 30, 2021, the cost of purchases and proceeds from sales of investment securities, excluding government securities, short-term investments and derivatives, were as follows:
Fund | | Purchases | | | Sales | |
Series A (StylePlus—Large Core Series) | | $ | 54,611,205 | | | $ | 33,158,917 | |
Series B (Large Cap Value Series) | | | 22,494,252 | | | | 36,176,699 | |
Series D (World Equity Income Series) | | | 112,484,750 | | | | 118,772,172 | |
Series E (Total Return Bond Series) | | | 51,335,988 | | | | 65,177,896 | |
Series F (Floating Rate Strategies Series) | | | 13,458,898 | | | | 8,644,627 | |
Series J (StylePlus—Mid Growth Series) | | | 64,934,868 | | | | 54,961,337 | |
Series N (Managed Asset Allocation Series) | | | 10,456,284 | | | | 9,550,834 | |
Series O (All Cap Value Series) | | | 13,358,083 | | | | 19,715,033 | |
Series P (High Yield Series) | | | 19,667,655 | | | | 17,012,491 | |
Series Q (Small Cap Value Series) | | | 11,975,314 | | | | 14,967,433 | |
Series V (SMid Cap Value Series) | | | 38,311,002 | | | | 50,266,704 | |
Series X (StylePlus—Small Growth Series) | | | 14,150,490 | | | | 13,587,532 | |
Series Y (StylePlus—Large Growth Series) | | | 12,344,578 | | | | 9,222,989 | |
Series Z (Alpha Opportunity Series) | | | 5,106,808 | | | | 6,065,330 | |
For the period ended June 30, 2021, the cost of purchases and proceeds from the sales of government securities were as follows:
| Fund | | Purchases | | | Sales | |
| Series E (Total Return Bond Series) | | $ | 18,059,234 | | | $ | 10,652,342 | |
The Funds are permitted to purchase or sell securities from or to certain affiliated funds under specified conditions outlined in procedures adopted by the Board. The procedures have been designed to ensure that any purchase or sale of securities by a Fund from or to another fund or portfolio that is or could be considered an affiliate by virtue of having a common investment adviser (or affiliated investment advisers), common trustees and/or common officers complies with Rule 17a-7 of the 1940 Act. Further, as defined under these procedures, each transaction is effected at the current market price to save costs, where permissible. For the period ended June 30, 2021, the Funds engaged in purchases and sales of securities, pursuant to Rule 17a-7 of the 1940 Act, as follows:
| Fund | | Purchases | | | Sales | | | Realized Gain | |
| Series E (Total Return Bond Series) | | $ | 739,384 | | | $ | 3,511,334 | | | $ | 331,549 | |
| Series F (Floating Rate Strategies Series) | | | — | | | | 356,561 | | | | 8,828 | |
| Series P (High Yield Series) | | | 155,484 | | | | 1,658,323 | | | | 81,373 | |
162 THE GUGGENHEIM FUNDS SEMI-ANNUAL REPORT | |
NOTES TO FINANCIAL STATEMENTS (Unaudited)(continued) |
Note 8 – Unfunded Loan Commitments
Pursuant to the terms of certain loan agreements, certain Funds held unfunded loan commitments as of June 30, 2021. The Funds are obligated to fund these loan commitments at the borrower’s discretion.
The unfunded loan commitments as of June 30, 2021, were as follows:
Fund | Borrower | | Maturity Date | | | | Face Amount* | | | Value | |
Series E (Total Return Bond Series) | | | | | | | | | | | | | |
| | HAH Group Holding Co. LLC | 10/29/27 | | | $ | 20,000 | | | $ | 270 | |
| | Higginbotham | 11/25/22 | | | | 43,931 | | | | 230 | |
| | HighTower Holding LLC | 04/21/28 | | | | 30,000 | | | | — | |
| | MB2 Dental Solutions LLC | 01/29/27 | | | | 91,009 | | | | 1,693 | |
| | National Mentor Holdings, Inc. | 03/02/28 | | | | 4,467 | | | | 21 | |
| | Service Logic Acquisition, Inc. | 10/22/27 | | | | 19,701 | | | | 178 | |
| | Southern Veterinary Partners LLC | 10/05/27 | | | | 18,182 | | | | 163 | |
| | Datix Bidco Ltd. | 09/22/21 | GBP | | | 300,000 | | | | — | |
| | | | | | | | | | | | | $ | 2,555 | |
Series F (Floating Rate Strategies Series) | | | | | | | | | | | | | |
| | DG Investment Intermediate Holdings 2, Inc. | 03/17/28 | | | $ | 8,312 | | | $ | — | |
| | Hillman Group, Inc. | 02/24/28 | | | | 50,633 | | | | 120 | |
| | National Mentor Holdings, Inc. | 03/02/28 | | | | 8,933 | | | | 42 | |
| | Osmosis Holdings Australia II Pty Ltd. | 06/17/28 | | | | 11,111 | | | | — | |
| | TricorBraun Holdings, Inc. | 03/03/28 | | | | 35,501 | | | | 280 | |
| | | | | | | | | | | | | $ | 442 | |
Series P (High Yield Series) | | | | | | | | | | | | | |
| | HAH Group Holding Co. LLC | 10/29/27 | | | $ | 20,000 | | | $ | 270 | |
| | National Mentor Holdings, Inc. | 03/02/28 | | | | 4,467 | | | | 21 | |
| | PT Intermediate Holdings III LLC | 10/15/25 | | | | 12,664 | | | | 222 | |
| | SCP Eye Care Services LLC | 03/16/28 | | | | 22,159 | | | | 28 | |
| | Datix Bidco Ltd. | 09/22/21 | GBP | | | 225,000 | | | | — | |
| | | | | | | | | | | | | $ | 541 | |
* | The face amount is denominated in U.S. dollars unless otherwise indicated. |
| | GBP — British Pound |
| | THE GUGGENHEIM FUNDS SEMI-ANNUAL REPORT | 163 |
NOTES TO FINANCIAL STATEMENTS (Unaudited)(continued) |
Note 9 – Restricted Securities
The securities below are considered illiquid and restricted under guidelines established by the Board:
Fund | Restricted Securities | | Acquisition Date | | | Cost | | | Value | |
Series E (Total Return Bond Series) | | | | | | | | | | | | | |
| | Copper River CLO Ltd. | | | | | | | | | | | | |
| | 2007-1A, due 01/20/211 | | | 05/09/14 | | | $ | 17,460 | | | $ | 17,622 | |
| | FKRT | | | | | | | | | | | | |
| | 2020-C2A, 3.25% due 12/30/23 | | | 12/03/20 | | | | 717,677 | | | | 718,165 | |
| | LSTAR Securities Investment Ltd. | | | | | | | | | | | | |
| | 2021-1, 1.89% (1 Month USD LIBOR + 1.80%, Rate Floor: 1.80%) due 02/01/262 | | | 02/04/21 | | | | 391,572 | | | | 392,492 | |
| | LSTAR Securities Investment Ltd. | | | | | | | | | | | | |
| | 2021-2, 1.79% (1 Month USD LIBOR + 1.70%, Rate Floor: 1.70%) due 03/02/262 | | | 03/17/21 | | | | 271,670 | | | | 271,554 | |
| | Putnam Structured Product Funding Ltd. | | | | | | | | | | | | |
| | 2003-1A, 1.18% (1 Month USD LIBOR + 1.00%, Rate Floor: 0.00%) due 10/15/382 | | | 06/01/16 | | | | 3,356 | | | | 3,577 | |
| | | | | | | | $ | 1,401,735 | | | $ | 1,403,410 | |
Series P (High Yield Series) | | | | | | | | | | | | | |
| | Basic Energy Services, Inc. | | | | | | | | | | | | |
| | 10.75% due 10/15/23 | | | 09/25/18 | | | $ | 174,125 | | | $ | 33,250 | |
| | Mirabela Nickel Ltd. | | | | | | | | | | | | |
| | due 06/24/193 | | | 12/31/13 | | | | 353,909 | | | | 15,603 | |
| | | | | | | | $ | 528,034 | | | $ | 48,853 | |
1 | Security has no stated coupon. However, it is expected to receive residual cash flow payments on defined deal dates. |
2 | Variable rate security. Rate indicated is the rate effective at June 30, 2021. In some instances, the effective rate is limited by a minimum rate floor or a maximum rate cap established by the issuer. The settlement status of a position may also impact the effective rate indicated. In some cases, a position may be unsettled at period end and may not have a stated effective rate. In instances where multiple underlying reference rates and spread amounts are shown, the effective rate is based on a weighted average. |
3 | Security is in default of interest and/or principal obligations. |
Note 10 – Line of Credit
The Trust, along with other affiliated trusts, secured a 364-day committed, $1,230,000,000 line of credit from Citibank, N.A., which was in place through October 2, 2020, at which time the line of credit was renewed. A Fund may draw (borrow) from the line of credit as a temporary measure for emergency purposes, to facilitate redemption requests, or for other short-term liquidity purposes consistent with the Fund’s investment objective and program. For example, it may be advantageous for the Fund to borrow money rather than sell existing portfolio positions to meet redemption requests. Fees related to borrowings, if any, vary under this arrangement between the greater of Citibank’s “base rate”, LIBOR plus 1%, or the federal funds rate plus 1/2 of 1%.
The commitment fee that may be paid by the Funds is at an annualized rate of 0.15% of the average daily amount of their allocated unused commitment amount. The commitment fee amount is allocated to the individual Funds based on the respective net assets of each participating Fund and is referenced in the Statement of Operations under “Line of credit fees”. The Funds did not have any borrowings under this agreement as of and for the period ended June 30, 2021.
In addition, Series E (Total Return Bond Series) and Series F (Floating Rate Strategies Series)(the “Funds”) entered into an additional unlimited credit facility agreement with BNP Paribas Prime Brokerage, Inc. (the “counterparty”) whereby the counterparty has agreed to provide secured financing to the Funds and the Funds will provide pledged collateral to the counterparty. Fees related to borrowings, if any, equate to 1 month LIBOR plus 0.90%. The Funds did not have any borrowings under this agreement at or during the period ended June 30, 2021.
164 THE GUGGENHEIM FUNDS SEMI-ANNUAL REPORT | |
NOTES TO FINANCIAL STATEMENTS (Unaudited)(continued) |
Note 11 – Reverse Repurchase Agreements
Each of the Funds may enter into reverse repurchase agreements. Under a reverse repurchase agreement, a Fund sells securities and agrees to repurchase them at a particular price at a future date. In the event the buyer of securities under a reverse repurchase agreement files for bankruptcy or becomes insolvent, such buyer or its trustee or receiver may receive an extension of time to determine whether to enforce the Fund’s obligation to repurchase the securities, and the Fund’s use of the proceeds of the reverse repurchase agreement may effectively be restricted pending such decision.
For the period ended June 30, 2021, the following Funds entered into reverse repurchase agreements:
Fund | | Number
of Days
Outstanding | | | Balance at
June 30,
2021 | | | Average
Balance
Outstanding | | | Average
Interest
Rate | |
Series E (Total Return Bond Series) | | | 106 | | | $ | — | * | | $ | 3,443,831 | | | | (0.08 | %) |
Series P (High Yield Series) | | | 181 | | | | 2,983,439 | | | | 1,496,096 | | | | 0.41 | % |
* | As of June 30, 2021, Series E (Total Return Bond Series) did not have any open reverse repurchase agreements. |
The following table presents reverse repurchase agreements that are subject to netting arrangements and offset in the Statements of Assets of Liabilities in conformity with U.S. GAAP:
| | | | | | | | | | | | | | | | Gross Amounts Not Offset
in the Statements of
Assets and Liabilities | | | | | |
Fund | Instrument | | Gross
Amounts of
Recognized
Liabilities1 | | | Gross
Amounts
Offset in the
Statements
of Assets and
Liabilities | | | Net Amount
of Liabilities
Presented on
the Statements
of Assets and
Liabilities | | | Financial
Instruments | | | Cash
Collateral
Pledged | | | Net
Amount | |
Series P (High Yield Series) | Reverse repurchase agreements | | $ | 2,983,439 | | | $ | — | | | $ | 2,983,439 | | | $ | (2,983,439 | ) | | $ | — | | | $ | — | |
As of June 30, 2021, Series P (High Yield Series) had outstanding reverse repurchase agreements with various counterparties. Details of the reverse repurchase agreements by counterparty are as follows:
Counterparty | Interest Rate(s) | Maturity Date(s) | | Face Value | |
BNP Paribas | (0.10%)* | Open Maturity | | $ | 99,320 | |
BMO Capital Markets Corp. | 0.40%* | Open Maturity | | | 2,884,119 | |
| | | | $ | 2,983,439 | |
* | The rate is adjusted periodically by the counterparty, subject to approval by the Adviser, and is not based upon a set reference rate and spread. Rate indicated is the rate effective as of June 30, 2021. |
The following is a summary of the remaining contractual maturities of the reverse repurchase agreements outstanding as of period-end, aggregated by asset class of the related collateral pledged by the Fund:
Fund | Asset Type | | Overnight and
Continuous | | | Total | |
Series P (High Yield Series) | Corporate Bonds | | $ | 2,983,439 | | | $ | 2,983,439 | |
Gross amount of recognized liabilities for reverse repurchase agreements | | | $ | 2,983,439 | | | $ | 2,983,439 | |
| | THE GUGGENHEIM FUNDS SEMI-ANNUAL REPORT | 165 |
NOTES TO FINANCIAL STATEMENTS (Unaudited)(continued) |
Note 12 – Legal Proceedings
Tribune Company
SBL Fund has been named as a defendant and a putative member of the proposed defendant class of shareholders in the case entitled Kirschner v. FitzSimons, No. 12-2652 (S.D.N.Y.) (formerly Official Committee of Unsecured Creditors of Tribune Co. v. FitzSimons, Adv. Pro. No. 10-54010 (Bankr. D. Del.)) (the “FitzSimons action”), as a result of ownership by certain series of the SBL Fund of shares in the Tribune Company (“Tribune”) in 2007, when Tribune effected a leveraged buyout transaction (“LBO”) by which Tribune converted to a privately-held company. In his complaint, the plaintiff has alleged that, in connection with the LBO, Tribune insiders and shareholders were overpaid for their Tribune stock using financing that the insiders knew would, and ultimately did, leave Tribune insolvent. The plaintiff has asserted claims against certain insiders, major shareholders, professional advisers, and others involved in the LBO. The plaintiff is also attempting to obtain from former Tribune shareholders, including the SBL Fund, the proceeds they received in connection with the LBO.
In June 2011, a group of Tribune creditors filed multiple actions against former Tribune shareholders involving state law constructive fraudulent conveyance claims arising out of the 2007 LBO (the “SLCFC actions”). SBL Fund has been named as a defendant in two of the SLCFC actions: Deutsche Bank Trust Co. Americas v. Ohlson Enter., No. 12-0064 (S.D.N.Y.) and Deutsche Bank Trust Co. Americas v. Cantor Fitzgerald & Co., No. 11-4900 (S.D.N.Y.). In those actions, the creditors seek to recover from Tribune’s former shareholders the proceeds received in connection with the 2007 LBO.
The FitzSimons action and the SLCFC actions have been consolidated with the majority of the other Tribune LBO-related lawsuits in a multidistrict litigation proceeding captioned In re Tribune Company Fraudulent Conveyance Litig., No. 11-md-2296 (S.D.N.Y.) (the “MDL Proceeding”).
On September 23, 2013, the District Court granted the defendants’ omnibus motion to dismiss the SLCFC actions, on the basis that the creditors lacked standing. On September 30, 2013, the creditors filed a notice of appeal of the September 23 order. On October 28, 2013, the defendants filed a joint notice of cross-appeal of that same order. On March 29, 2016, the U.S. Court of Appeals for the Second Circuit issued its opinion on the appeal of the SLCFC actions. The appeals court affirmed the district court’s dismissal of those lawsuits, but on different grounds than the district court. The appeals court held that while the plaintiffs have standing under the U.S. Bankruptcy Code, their claims were preempted by Section 546(e) of the Bankruptcy Code—the statutory safe harbor for settlement payments. On April 12, 2016, the Plaintiffs in the SLCFC actions filed a petition seeking rehearing en banc before the appeals court. On July 22, 2016, the appeals court denied the petition. On September 9, 2016, the plaintiffs filed a petition for writ of certiorari in the U.S. Supreme Court challenging the Second Circuit’s decision that the safe harbor of Section 546(e) applied to their claims. The shareholder defendants, including the Funds, filed a joint brief in opposition to the petition for certiorari on October 24, 2016. On April 3, 2018, Justice Kennedy and Justice Thomas issued a “Statement” related to the petition for certiorari suggesting that the Second Circuit and/or District Court may want to take steps to reexamine the application of the Section 546(e) safe harbor to the previously dismissed state law constructive fraudulent transfer claims based on the Supreme Court’s decision in Merit Management Group LP v. FTI Consulting, Inc. On April 10, 2018, plaintiffs filed in the Second Circuit a motion for that court to recall its mandate, vacate its prior decision, and remand to the district court for further proceedings consistent with Merit Management. On April 20, 2018, the shareholder defendants filed a response to plaintiffs’ motion to recall the mandate. On May 15, 2018, the Second Circuit issued an order recalling the mandate “in anticipation of further panel review.” On December 19, 2019, the Second Circuit issued an amended opinion that again affirmed the district court’s ruling on the basis that plaintiffs’ claims were preempted by Section 546(e) of the Bankruptcy Code. Plaintiffs filed a motion for rehearing and rehearing en banc on January 2, 2020. The Second Circuit denied the petition on February 6, 2020. On July 6, 2020, plaintiffs filed a new petition for a writ of certiorari in the U.S. Supreme Court. In that petition, plaintiffs stated that “[t]o make it more likely that there will be a quorum for this petition,” they have “abandon[ed] the case and let the judgment below stand” with respect to certain defendants. That list did not include SBL Fund. Defendants filed an opposition to the petition for certiorari on August 26, 2020, and plaintiffs filed a reply in support of the petition for certiorari on September 8, 2020. The Court denied the petition for certiorari on April 19, 2021.
On May 23, 2014, the defendants filed motions to dismiss the FitzSimons action, including a global motion to dismiss Count I, which is the claim brought against former Tribune shareholders for intentional fraudulent conveyance under U.S. federal law. On January 6, 2017, the United States District Court for the Southern District of New York granted the shareholder defendants’ motion to dismiss the intentional fraudulent conveyance claim in the FitzSimons action. The Court concluded that the plaintiff had failed to allege that Tribune entered the LBO with actual intent to hinder, delay, or defraud its creditors, and therefore the complaint failed to state a claim. In dismissing the intentional fraudulent conveyance claim, the Court denied the plaintiff’s request to amend the complaint. The plaintiff requested that the Court direct entry of a final
166 THE GUGGENHEIM FUNDS SEMI-ANNUAL REPORT | |
NOTES TO FINANCIAL STATEMENTS (Unaudited)(concluded) |
judgment in order to make the order immediately appealable. On February 23, 2017, the Court issued an order stating that it intended to permit an interlocutory appeal of the dismissal order, but would wait to do so until it has resolved outstanding motions to dismiss filed by other defendants.
On July 18, 2017, the plaintiff submitted a letter to the District Court seeking leave to amend its complaint to add a constructive fraudulent transfer claim. The shareholder defendants opposed that request. On August 24, 2017, the Court denied the plaintiff’s request without prejudice to renewal of the request in the event of an intervening change in the law. On March 8, 2018, the plaintiff renewed his request for leave to file a motion to amend the complaint to assert a constructive fraudulent transfer claim based on the Supreme Court’s ruling in Merit Management Group LP v. FTI Consulting, Inc. The shareholder defendants opposed that request. On June 18, 2018 the District Court ordered that the request would be stayed pending further action by the Second Circuit in the SLCFC actions.
On December 18, 2018, plaintiff filed a letter with the District Court requesting that the stay be dissolved in order to permit briefing on the motion to amend the complaint and indicating plaintiff’s intention to file another motion to amend the complaint to reinstate claims for intentional fraudulent transfer. The shareholder defendants opposed that request. On January 14, 2019, the court held a case management conference, during which the court stated that it would not lift the stay prior to further action from the Second Circuit in the SLCFC actions. The court further stated that it would allow the plaintiff to file a motion to amend to try to reinstate its intentional fraudulent transfer claim. On January 23, 2019, the court ordered the parties still facing pending claims to participate in a mediation, to commence on January 28, 2019. The mediation did not result in a settlement of the claims against the shareholder defendants.
On April 4, 2019, plaintiff filed a motion to amend the Fifth Amended Complaint to assert a federal constructive fraudulent transfer claim against certain shareholder defendants. On April 10, 2019, the shareholder defendants filed a brief in opposition to plaintiff’s motion to amend. On April 12, 2019, the plaintiff filed a reply brief. On April 23, 2019, the court denied the plaintiff’s motion to amend. On June 13, 2019, the court entered judgment pursuant to Rule 54(b). On July 12, 2019, the Plaintiff filed a notice of appeal with respect to the dismissal of his claims and the District Court’s denial of his motion for leave to amend. Plaintiff filed an appellate brief on January 7, 2020. The shareholder defendants’ brief was filed on April 27, 2020. Plaintiff filed a reply brief on May 18, 2020. The Court held oral argument on August 24, 2020.
None of these lawsuits alleges any wrongdoing on the part of Guggenheim Variable Funds Trust f/k/a SBL Fund. The following series of Guggenheim Variable Funds Trust held shares of Tribune and tendered these shares as part of Tribune’s LBO: Series A (StylePlus–Large Core Series) f/k/a Series H (Enhanced Index Series), Series N (Managed Asset Allocation Series) and Series O (All Cap Value Series) (the “Funds”). The value of the proceeds received by the foregoing Funds was $158,950, $51,000 and $3,774,000, respectively. At this stage of the proceedings, Guggenheim Variable Funds Trust is not able to make a reliable predication as to the outcome of these lawsuits or the effect, if any, on a Fund’s net asset value.
Note 13 – COVID-19
The global ongoing crisis caused by the outbreak of COVID-19 and the current recovery underway is causing disruption to consumer demand and economic output and supply chains. There are still travel restrictions and quarantines, and adverse impacts on local and global economies. Investors should be aware that in light of the current uncertainty, volatility and distress in economies, financial markets, and labor and public health conditions around the world, the Funds’ investments and a shareholder’s investment in a Fund are subject to sudden and substantial losses, increased volatility and other adverse events. Firms through which investors invest with the Funds, the Funds, their service providers, the markets in which they invest and market intermediaries are also impacted by quarantines and similar measures intended to respond to and contain the ongoing pandemic, which can obstruct their functioning and subject them to heightened operational and other risks.
Note 14 – Subsequent Events
The Funds evaluated subsequent events through the date the financial statements were available for issue and determined there were no material events that would require adjustment to or disclosure in the Funds’ financial statements.
| | THE GUGGENHEIM FUNDS SEMI-ANNUAL REPORT | 167 |
OTHER INFORMATION (Unaudited) |
Delivery of Shareholder Reports
Paper copies of the Funds’ annual and semi-annual shareholder reports are not sent by mail, unless you specifically request paper copies of the reports from the insurance company that offers your contract or from your financial intermediary. Instead, the reports are made available on a website, and you are notified by mail each time a report is posted and provided with a website address to access the report.
You may elect to receive paper copies of all future shareholder reports free of charge. You can inform the insurance company that you wish to receive paper copies of reports by following the instructions provided by the insurance company. Your election to receive reports in paper may apply to all portfolio companies available under your contract.
Proxy Voting Information
A description of the policies and procedures that the Trust uses to determine how to vote proxies relating to securities held in the Funds’ portfolios is available, without charge and upon request, by calling 800.820.0888. This information is also available from the EDGAR database on the SEC’s website at https://www.sec.gov.
Information regarding how the Funds’ voted proxies relating to portfolio securities during the most recent 12-month period ended June 30 is available without charge, upon request, by calling 800.820.0888. This information is also available from the EDGAR database on the SEC’s website at https://www.sec.gov.
Sector Classification
Information in the “Schedule of Investments” is categorized by sectors using sector-level Classifications defined by the Bloomberg Industry Classification System, a widely recognized industry classification system provider. Each Fund’s registration statement has investment policies relating to concentration in specific sectors/industries. For purposes of these investment policies, the Funds usually classify sectors/industries based on industry-level Classifications used by widely recognized industry classification system providers such as Bloomberg Industry Classification System, Global Industry Classification Standards and Barclays Global Classification Scheme.
Quarterly Portfolio Schedules Information
The Trust files its complete schedule of portfolio holdings with the SEC for the first and third quarters of each fiscal year as an exhibit to its reports on Form N-PORT, and for reporting periods ended prior to March 31, 2019, filed such information on Form N-Q. The Funds’ Forms N-PORT and N-Q are available on the SEC’s website at https://www.sec.gov. Copies of the portfolio holdings are also available to shareholders, without charge and upon request, by calling 800.820.0888.
Report of the Guggenheim Variable Funds Trust Contracts Review Committee
Guggenheim Variable Funds Trust (the “Trust”) was organized as a Delaware statutory trust on November 8, 2013, and is registered as an open-end management investment company under the Investment Company Act of 1940, as amended (the “1940 Act”). The Trust includes the following series:
● Series A (StylePlus—Large Core Series) (“Series A”) ● Series D (World Equity Income Series) (“Series D”) ● Series F (Floating Rate Strategies Series) (“Series F”) ● Series N (Managed Asset Allocation Series) (“Series N”) ● Series P (High Yield Series) (“Series P”) ● Series V (SMid Cap Value Series) (“Series V”) ● Series Y (StylePlus—Large Growth Series) (“Series Y”) | ● Series B (Large Cap Value Series) (“Series B”) ● Series E (Total Return Bond Series) (“Series E”) ● Series J (StylePlus—Mid Growth Series) (“Series J”) ● Series O (All Cap Value Series) (“Series O”) ● Series Q (Small Cap Value Series) (“Series Q”) ● Series X (StylePlus—Small Growth Series) (“Series X”) ● Series Z (Alpha Opportunity Series) (“Series Z”) |
168 THE GUGGENHEIM FUNDS SEMI-ANNUAL REPORT | |
OTHER INFORMATION (Unaudited)(continued) |
Security Investors, LLC (“Security Investors”), an indirect subsidiary of Guggenheim Partners, LLC, a privately-held, global investment and advisory firm (“Guggenheim Partners”), serves as investment adviser to each of: (i) Series A; (ii) Series B; (iii) Series D; (iv) Series E; (v) Series J; (vi) Series N; (vii) Series O; (viii) Series P; (ix) Series Q; (x) Series V; (xi) Series X; (xii) Series Y; and (xiii) Series Z (collectively, the “SI-Advised Funds”). Guggenheim Partners Investment Management, LLC (“GPIM”) serves as investment adviser to Series F (the “GPIM-Advised Fund” and together with the SI-Advised Funds, the “Funds” and individually, a “Fund”).1 (Guggenheim Partners, Security Investors, GPIM and their affiliates may be referred to herein collectively as “Guggenheim.” Security Investors and GPIM are also known as “Guggenheim Investments,” the global asset management and investment advisory division of Guggenheim Partners that includes other affiliated investment management businesses.)
Under the supervision of the Board of Trustees of the Trust (the “Board,” with the members of the Board referred to individually as the “Trustees”), the Advisers regularly provide investment research, advice and supervision, along with a continuous investment program for the Funds, and direct the purchase and sale of securities and other investments for each Fund’s portfolio.
Each of the Advisory Agreements continues in effect from year to year provided that such continuance is specifically approved at least annually by (i) the Board or a majority of the outstanding voting securities (as defined in the 1940 Act) of each Fund, and, in either event, (ii) the vote of a majority of the Trustees who are not “interested person[s],” as defined by the 1940 Act, of the Trust (the “Independent Trustees”) casting votes in person at a meeting called for such purpose.2 At meetings held by videoconference on April 20, 2021 (the “April Meeting”) and on May 26, 2021 (the “May Meeting”), the members of the Contracts Review Committee of the Board (the “Committee”), consisting solely of the Independent Trustees, met separately from Guggenheim to consider the proposed renewal of the Advisory Agreements in connection with the Committee’s annual contract review schedule.
As part of its review process, the Committee was represented by independent legal counsel to the Independent Trustees (“Independent Legal Counsel”), from whom the Independent Trustees received separate legal advice and with whom they met separately. Independent Legal Counsel reviewed and discussed with the Committee various key aspects of the Trustees’ legal responsibilities relating to the proposed renewal of the Advisory Agreements and other principal contracts. The Committee took into account various materials received from Guggenheim and Independent Legal Counsel. The Committee also considered the variety of written materials, reports and oral presentations the Board received throughout the year regarding performance and operating results of the Funds, and other information relevant to its evaluation of the Advisory Agreements.
In connection with the contract review process, FUSE Research Network LLC (“FUSE”), an independent, third-party research provider, was engaged to prepare advisory contract renewal reports designed specifically to help the Board fulfill its advisory contract renewal responsibilities. The objective of the reports is to present the subject funds’ relative position regarding fees, expenses and total return performance, with peer group and universe comparisons. The Committee assessed the data provided in the FUSE reports as well as commentary presented by Guggenheim. The Committee noted that although FUSE’s process typically results in the identification for each Fund of a universe of similar funds for performance comparisons and a narrower group of similar funds from the universe based on asset levels for comparative fee and expense data evaluation (i.e., the peer group), the peer group constituent funds identified by FUSE for Series D, Series F and Series Z were the same as the performance universe constituent funds due to each Fund’s investment strategy and pricing.
In addition, Guggenheim provided materials and data in response to formal requests for information sent by Independent Legal Counsel on behalf of the Independent Trustees. Guggenheim also made a presentation at the April Meeting. Throughout the process, the Committee asked questions of management and requested certain additional information, which Guggenheim provided (collectively with the foregoing reports and materials, the “Contract Review Materials”). The Committee considered the Contract Review Materials in the context of its accumulated experience governing the Trust and other Guggenheim funds and weighed the factors and standards discussed with Independent Legal Counsel.
1 | The investment advisory agreements pertaining to the SI-Advised Funds and the investment advisory agreement pertaining to the GPIM-Advised Fund are each referred to herein as an “Advisory Agreement” and together, the “Advisory Agreements.” In addition, unless the context indicates otherwise, Security Investors, with respect to its service as investment adviser to the SI-Advised Funds, and GPIM as to the GPIM-Advised Fund, are each referred to herein as an “Adviser” and together, the “Advisers.” |
2 | On March 13, 2020, the Securities and Exchange Commission issued an exemptive order providing relief to registered management investment companies from certain provisions of the 1940 Act in light of the outbreak of coronavirus disease 2019 (COVID-19), including the in-person voting requirements under Section 15(c) of the 1940 Act with respect to approving or renewing an investment advisory agreement, subject to certain conditions. The relief, initially provided for a limited period of time, has been extended multiple times and was in effect as of May 26, 2021. The Board, including the Independent Trustees, relied on this relief in voting to renew the Advisory Agreements at a meeting of the Board held by videoconference on May 26, 2021. |
| | THE GUGGENHEIM FUNDS SEMI-ANNUAL REPORT | 169 |
OTHER INFORMATION (Unaudited)(continued) |
Following an analysis and discussion of relevant factors, including those identified below, and in the exercise of its business judgment, the Committee concluded that it was in the best interest of each Fund to recommend that the Board approve the renewal of each of the Advisory Agreements for an additional annual term.
Nature, Extent and Quality of Services Provided by Each Adviser: With respect to the nature, extent and quality of services currently provided by each Adviser, the Committee considered the qualifications, experience and skills of key personnel performing services for the Funds, including those personnel providing compliance and risk oversight, as well as the supervisors and reporting lines for such personnel. The Committee also considered other information, including Guggenheim’s resources and related efforts to retain, attract and motivate capable personnel to serve the Funds. In evaluating Guggenheim’s resources and capabilities, the Committee considered Guggenheim’s commitment to focusing on, and investing resources in support of, funds in the Guggenheim fund complex, including the Funds.
The Committee’s review of the services provided by Guggenheim to the Funds included consideration of Guggenheim’s investment processes and resulting performance, portfolio oversight and risk management, and the related regular quarterly reports and presentations received by the Board. The Committee took into account the risks borne by Guggenheim in sponsoring and providing services to the Funds, including entrepreneurial, legal, regulatory and operational risks. The Committee considered the resources dedicated by Guggenheim to compliance functions and the reporting made to the Board by Guggenheim compliance personnel regarding Guggenheim’s adherence to regulatory requirements. The Committee also considered the regular reports the Board receives from the Trust’s Chief Compliance Officer regarding compliance policies and procedures established pursuant to Rule 38a-1 under the 1940 Act.
In connection with the Committee’s evaluation of the overall package of services provided by Guggenheim, the Committee considered Guggenheim’s administrative services, including its role in supervising, monitoring, coordinating and evaluating the various services provided by the fund administrator, transfer agent, distributor, custodian and other service providers to the Funds. The Committee evaluated the Office of Chief Financial Officer (the “OCFO”), established to oversee the fund administration, accounting and transfer agency services provided to the Funds and other Guggenheim funds, including the OCFO’s resources, personnel and services provided.
With respect to Guggenheim’s resources and the ability of each Adviser to carry out its responsibilities under the applicable Advisory Agreement, the Chief Financial Officer of Guggenheim Investments reviewed with the Committee financial information concerning the holding company for Guggenheim Investments, Guggenheim Partners Investment Management Holdings, LLC (“GPIMH”), and the various entities comprising Guggenheim Investments, and provided the audited consolidated financial statements of GPIMH. (Thereafter, the Committee received the audited consolidated financial statements of GPIM.)
The Committee also considered the acceptability of the terms of each Advisory Agreement, including the scope of services required to be performed by each Adviser.
Based on the foregoing, and based on other information received (both oral and written) at the April Meeting and the May Meeting, as well as other considerations, including the Committee’s knowledge of how each Adviser performs its duties obtained through Board meetings, discussions and reports throughout the year, the Committee concluded that each Adviser and its personnel were qualified to serve the Funds in such capacity and may reasonably be expected to continue to provide a high quality of services under each Advisory Agreement with respect to the Funds.
Investment Performance: The Committee received, for each Fund, investment returns for the since-inception, ten-year, five-year, three-year, one-year and three-month periods ended December 31, 2020, as applicable. In addition, the Committee received a comparison of each Fund’s performance to the performance of a benchmark, a universe of funds and a narrower peer group of similar funds based on asset levels as identified by FUSE, in each case for the same periods, as applicable. The Committee also received from FUSE a description of the methodology for identifying each Fund’s peer group and universe for performance and expense comparisons. The Committee also received certain updated performance information as of March 31, 2021.
In seeking to evaluate Fund performance over a full market cycle, the Committee focused its attention on five-year and three-year performance rankings as compared to the relevant universe of funds. Except as to the individual Funds discussed below, the Committee observed that the returns of each Fund ranked in the third quartile or better of such Fund’s performance universe for each of the relevant periods considered.
170 THE GUGGENHEIM FUNDS SEMI-ANNUAL REPORT | |
OTHER INFORMATION (Unaudited)(continued) |
In addition, the Committee made the following observations:
Series B (Large Cap Value Series): The Fund’s returns ranked in the 42nd and 76th percentiles of its performance universe for the five-year and three-year periods ended December 31, 2020, respectively. The Committee noted management’s explanation that the Fund’s relative underperformance over the three-year time period was primarily due to stock selection in certain sectors, notably healthcare and utilities in 2019 and materials in 2018. The Committee considered the Fund’s competitive performance over the five-year period, noting management’s statement that strong long-term performance is due to the investment team implementing enhancements to its investment process in August 2014, including a more systematic implementation of the team’s proprietary Delta Y metric, a rigorous sell discipline, and a stock selection tool called Compass, which is a natural extension and evolution of the Delta Y measurement. The Committee noted that, as of March 31, 2021, the five-year and three-year performance rankings had improved to the 33rd and 61st percentiles, respectively.
Series F (Floating Rate Strategies Series): The Fund’s returns ranked in the 100th percentile of its performance universe for the five-year and three-year periods ended December 31, 2020. The Committee noted management’s explanation that the majority of the Fund’s relative underperformance over the five-year and three-year time periods was generated in 2018 and 2020, as the Fund was generally positioned more defensively than peers, with an underweight to lower quality loans in 2018 and a higher liquidity profile in 2020 after the markets rapidly appreciated following volatility in the first quarter, although the Fund performed well through the volatility in the first quarter. The Committee noted management’s statement that the investment management team continues to believe a more defensive approach is warranted and that more attractive risk-adjusted returns will be realized when volatility and downside risk increases. The Committee noted that, as of March 31, 2021, the five-year and three-year performance rankings had improved to the 74th and 83rd percentiles, respectively.
Series O (All Cap Value Series): The Fund’s returns ranked in the 39th and 76th percentiles of its performance universe for the five-year and three-year periods ended December 31, 2020, respectively. The Committee noted management’s explanation that the Fund’s relative underperformance over the three-year time period was primarily due poor stock selection in the healthcare and utilities sectors in 2019 and in the healthcare sector in 2018. The Committee considered the Fund’s competitive performance over the five-year period, noting management’s statement that strong long-term performance is due to the investment team implementing enhancements to its investment process in August 2014, including a more systematic implementation of the team’s proprietary Delta Y metric, a rigorous sell discipline, and a stock selection tool called Compass, which is a natural extension and evolution of the Delta Y measurement. The Committee noted that, as of March 31, 2021, the five-year and three-year performance rankings had improved to the 29th and 52nd percentiles, respectively.
Series P (High Yield Series): The Fund’s returns ranked in the 70th and 87th percentiles of its performance universe for the five-year and three-year periods ended December 31, 2020, respectively. The Committee noted management’s explanation that the Fund’s defensive positioning in 2019, notably lower duration and average maturity and an underweight to credit risks, which reflected Guggenheim’s market views that were implemented beginning in 2018, contributed to relative underperformance. The Committee noted management’s statement that, although the Fund experienced strong downside protection in the first quarter of 2020, the Fund’s continued lower exposure to the most speculative names, which outperformed for the remainder of 2020, hurt relative performance. The Committee also took into account management’s statement that the investment team believes a defensive approach is warranted given deteriorating credit fundamentals and disproportionately tight markets and that more attractive risk-adjusted returns will be realized when volatility and downside risk increases. The Committee noted that, as of March 31, 2021, the five-year and three-year performance rankings had improved to the 47th and 84th percentiles, respectively.
Series Q (Small Cap Value Series): The Fund’s returns ranked in the 90th and 55th percentiles of its performance universe for the five-year and three-year periods ended December 31, 2020, respectively. The Committee noted management’s explanation that the Fund’s relative underperformance over the five-year time period was primarily due to the outperformance of microcap stocks and low quality stocks in the fourth quarter of 2020 as the market reacted to news of successful COVID-19 vaccines, as well as poor stock selection in 2017 and 2016 in several sectors, notably in the information technology sector. The Committee noted that, as of March 31, 2021, the five-year and three-year performance rankings were in the 78th and 65th percentiles, respectively.
Series X (StylePlus—Small Growth Series): The Fund’s returns ranked in the 79th and 85th percentiles of its performance universe for the five-year and three-year periods ended December 31, 2020, respectively. The Committee noted management’s explanation that the Fund’s relative underperformance over these time periods was attributable to the Fund’s defensively-positioned portfolio, in particular its holdings in Guggenheim’s Enhanced Strategy funds that were defensively positioned beginning in 2018, reflecting Guggenheim’s market views, as well as the Fund’s style tilt to value-oriented, lower-growth companies. The Committee noted that, as of March 31, 2021, the five-year and three-year performance rankings had improved to the 66th and 79th percentiles, respectively.
| | THE GUGGENHEIM FUNDS SEMI-ANNUAL REPORT | 171 |
OTHER INFORMATION (Unaudited)(continued) |
Series Z (Alpha Opportunity Series): The Fund’s returns ranked in the 80th and 100th percentiles of its performance universe for the five-year and three-year periods ended December 31, 2020, respectively. The Committee noted management’s explanation that the Fund’s relative underperformance over these time periods was primarily due to the Fund’s beta profile and fundamental factor tilts. The Committee noted management’s statement that the Fund’s lower beta profile to broad market U.S. equities relative to its peers, long exposure to value and short exposure to growth, and negative sector exposures to well-performing sectors have detracted from investment performance. The Committee noted that, as of March 31, 2021, the five-year and three-year performance rankings were in the 91st and 92nd percentiles, respectively, but that management continued to attribute the underperformance to the unfavorable market conditions for the Fund’s investment strategy.
Based on the foregoing, and based on other information received (both oral and written) at the April Meeting and the May Meeting, as well as other considerations, the Committee concluded that: (i) each Fund’s performance was acceptable; or (ii) it was satisfied with Guggenheim’s responses and efforts to improve investment performance.
Comparative Fees, Costs of Services Provided and the Benefits Realized by Each Adviser from Its Relationship with the Funds: The Committee compared each Fund’s contractual advisory fee, net effective management fee3 and total net expense ratio to the applicable peer group. The Committee also reviewed the median advisory fees and expense ratios, including expense ratio components (e.g., transfer agency fees, administration fees, other operating expenses, distribution fees and fee waivers/reimbursements), of the peer group of funds. In addition, the Committee considered information regarding Guggenheim’s process for evaluating the competitiveness of each Fund’s fees and expenses, noting Guggenheim’s statement that evaluations seek to incorporate a variety of factors with a general focus on ensuring fees and expenses: (i) are competitive; (ii) give consideration to resource support requirements; and (iii) ensure Funds are able to deliver on shareholder return expectations.
As part of its evaluation of each Fund’s advisory fee, the Committee considered how such fees compared to the advisory fee charged by Guggenheim to one or more other clients that it manages pursuant to similar investment strategies, to the extent applicable, noting that, in certain instances, Guggenheim charges a lower advisory fee to such other clients. In this connection, the Committee considered, among other things, Guggenheim’s representations about the significant differences between managing mutual funds as compared to other types of accounts. The Committee also considered Guggenheim’s explanation that lower fees are charged in certain instances due to various other factors, including the scope of contract, type of investors, fee structure, applicable legal, governance and capital structures, tax status and historical pricing reasons. In addition, the Committee took into account Guggenheim’s discussion of the entrepreneurial, legal, regulatory and operational risks it faces when offering the Funds as compared to other types of accounts. The Committee concluded that the information it received demonstrated that the aggregate services provided to, or the specific circumstances of, each Fund were sufficiently different from the services provided to, or the specific circumstances of, other clients with similar investment strategies and/or that the risks borne by Guggenheim were sufficiently greater than those associated with managing other clients with similar investment strategies to support the difference in fees.
In further considering the comparative fee and expense data presented in the Contract Review Materials and addressed by Guggenheim, the Committee took into account those Funds with currently effective expense limitation agreements with the Adviser. Except as to the individual Funds discussed below, the Committee observed that each Fund’s contractual advisory fee, net effective management fee and total net expense ratio each rank in the third quartile or better of such Fund’s peer group.
In addition, the Committee made the following observations:
Series F (Floating Rate Strategies Series): The Fund’s contractual advisory fee ranks in the fourth quartile (100th percentile) of its peer group. The Fund’s net effective management fee ranks in the first quartile (1st percentile) of its peer group, reflecting a waiver in place for the Fund. The Fund’s total net expense ratio ranks in the fourth quartile (100th percentile) of its peer group, which the Committee noted was largely driven by the small size of the Fund and the higher other operating expense ratio in comparison to its peers. The Committee considered the Adviser’s statement explaining the higher contractual advisory fee that performance is driven by a unique investment approach that requires significant resources. In this regard, the Committee took into consideration the Fund’s strong investment performance for the since-inception period ended December 31, 2020. The Committee also considered that the peer group is limited in number, comprised only of five funds. In addition, the Committee took into account the Adviser’s statement that the Fund’s currently effective expense limitation agreement with the Adviser is intended to limit the impact of the Fund’s small size.
3 | The “net effective management fee” for each Fund represents the combined effective advisory fee and administration fee as a percentage of average net assets for the latest fiscal year, after any waivers and/or reimbursements. |
172 THE GUGGENHEIM FUNDS SEMI-ANNUAL REPORT | |
OTHER INFORMATION (Unaudited)(continued) |
Series O (All Cap Value Series): The Fund’s contractual advisory fee ranks in the fourth quartile (77th percentile) of its peer group. The Committee considered that the Fund’s net effective management fee and total net expense ratio each rank in the first quartile (8th and 23rd percentiles, respectively) of its peer group. The Committee also took into account the Fund’s currently effective expense limitation agreement with the Adviser.
Series P (High Yield Series): The Fund’s contractual advisory fee and net effective management fee each rank in the first quartile (23rd and 8th percentiles, respectively) of its peer group, with the net effective management fee ranking reflecting a waiver in place for the Fund. The Fund’s total net expense ratio ranks in the fourth quartile (77th percentile) of its peer group, which the Committee noted was largely driven by the small size of the Fund and the higher other operating expense ratio in comparison to its peers. The Committee considered the Adviser’s statement that performance is driven by a unique investment approach that requires significant resources. In this regard, the Committee took into consideration the Fund’s strong investment performance for the since-inception period ended December 31, 2020. The Committee also took into account the Adviser’s statement that the Fund’s currently effective expense limitation agreement with the Adviser is intended to limit the impact of the Fund’s small size.
Series Z (Alpha Opportunities Series): The Fund’s contractual advisory fee ranks in the fourth quartile (80th percentile) of its peer group. The Fund’s net effective management fee ranks in the first quartile (1st percentile) of its peer group, reflecting a waiver in place for the Fund. The Fund’s total net expense ratio ranks in the fourth quartile (100th percentile) of its peer group, which the Committee noted was largely driven by the small size of the Fund and the higher operating expense ratio in comparison to its peers. The Committee considered the Adviser’s statement explaining the higher contractual advisory fee that the Fund employs a sophisticated quantitative methodology that seeks to generate absolute returns through factor and stock selection with minimal market exposure. The Committee also took into account the Adviser’s statement that the Fund’s currently effective expense limitation agreement with the Adviser is intended to limit the impact of the Fund’s small size. The Committee noted that the Fund’s size is the smallest of its peer group and the Fund’s other operating expenses are the highest of its peer group.
With respect to the costs of services provided and benefits realized by Guggenheim Investments from its relationship with the Funds, the Committee reviewed a profitability analysis and data from management for each Fund setting forth the average assets under management for the twelve months ended December 31, 2020, gross revenues received by Guggenheim Investments, expenses allocated to the Fund, expense waivers (as applicable), earnings and the operating margin/profitability rate, including variance information relative to the foregoing amounts as of December 31, 2019. In addition, the Chief Financial Officer of Guggenheim Investments reviewed with, and addressed questions from, the Committee concerning the expense allocation methodology employed in producing the profitability analysis.
In the course of its review of Guggenheim Investments’ profitability, the Committee took into account the methods used by Guggenheim Investments to determine expenses and profit. The Committee considered all of the foregoing, among other things, in evaluating the costs of services provided, the profitability to Guggenheim Investments and the profitability rates presented.
The Committee also considered other benefits available to each Adviser because of its relationship with the Funds and noted Guggenheim’s statement that it does not believe the Advisers derive any such “fall-out” benefits. In this regard, the Committee noted Guggenheim’s statement that, although it does not consider such benefits to be fall-out benefits, the Advisers may benefit from certain economies of scale and synergies, such as enhanced visibility of the Advisers, enhanced leverage in fee negotiations and other synergies arising from offering a broad spectrum of products, including the Funds.
Based on the foregoing, and based on other information received (both oral and written) at the April Meeting and the May Meeting, as well as other considerations, the Committee concluded that the comparative fees and the benefits realized by each Adviser from its relationship with the Funds were appropriate and that each Adviser’s profitability from its relationship with the Funds was not unreasonable.
Economies of Scale: The Committee received and considered information regarding whether there have been economies of scale with respect to the management of the Funds as Fund assets grow, whether the Funds have appropriately benefited from any economies of scale, and whether there is potential for realization of any further economies of scale. The Committee considered whether economies of scale in the provision of services to the Funds were being passed along to and shared with the shareholders. The Committee considered that Guggenheim believes it is appropriately sharing potential economies of scale and that, although Guggenheim’s overall expenses declined in 2020, generally, costs are anticipated to increase in many key areas, including compensation of portfolio managers, key analysts and support staff, as well as for infrastructure needs, with respect to risk management oversight, valuation processes and disaster recovery systems, among other things.
| | THE GUGGENHEIM FUNDS SEMI-ANNUAL REPORT | 173 |
OTHER INFORMATION (Unaudited)(concluded) |
The Committee also noted the process employed by the Adviser to evaluate whether it would be appropriate to institute a new breakpoint for a Fund, with consideration given to, among other things: (i) the Fund’s size and trends in asset levels over recent years; (ii) the competitiveness of the expense levels; (iii) whether expense waivers are in place; (iv) changes and trends in revenue and expenses; (v) whether there are any anticipated expenditures that may benefit the Fund in the future; (vi) Fund profit level margins; (vii) relative Fund performance; (viii) the nature, extent and quality of services management provides to the Fund; and (ix) the complexity of the Fund’s investment strategy and the resources required to support the Fund.
As part of its assessment of economies of scale, the Committee considered Guggenheim’s view that it seeks to share economies of scale through a number of means, including breakpoints, advisory fees set at competitive rates pre-assuming future asset growth, expense waivers and limitations, and investments in personnel, operations and infrastructure to support the Fund business. The Committee also received information regarding amounts that had been shared with shareholders through such expense waivers and limitations. Thus, the Committee considered the size of the Funds and the competitiveness of and/or other determinations made regarding the current advisory fee for each Fund, as well as whether a Fund is subject to an expense limitation.
Based on the foregoing, and based on other information received (both oral and written) at the April Meeting and the May Meeting, as well as other considerations, the Committee concluded that the advisory fee for each Fund was reasonable.
Overall Conclusions
The Committee concluded that the investment advisory fees are fair and reasonable in light of the extent and quality of the services provided and other benefits received and that the continuation of each of the Advisory Agreements is in the best interest of each Fund. In reaching this conclusion, no single factor was determinative or conclusive and each Committee member, in the exercise of his or her well-informed business judgment, may afford different weights to different factors. At the May Meeting, the Committee, constituting all of the Independent Trustees, recommended the renewal of each Advisory Agreement for an additional annual term.
174 THE GUGGENHEIM FUNDS SEMI-ANNUAL REPORT | |
INFORMATION ON BOARD OF TRUSTEES AND OFFICERS (Unaudited) |
A Board of Trustees oversees the Trust, as well as other trusts of GI, in which its members have no stated term of service, and continue to serve after election until resignation. The Statement of Additional Information includes further information about Fund Trustees and Officers, and can be obtained without charge by visiting guggenheiminvestments.com or by calling 800.820.0888.
Name, Address*
and Year of Birth | Position(s)
Held with
Trust | Term of Office
and Length of
Time Served** | Principal Occupation(s)
During Past Five Years | Number of
Portfolios
in Fund
Complex
Overseen | Other
Directorships Held
by Trustees*** |
INDEPENDENT TRUSTEES | | | |
Randall C. Barnes (1951) | Trustee and Chair of the Valuation Oversight Committee | Since 2014 (Trustee) Since 2020 (Chair of the Valuation Oversight Committee) | Current: Private Investor (2001-present).
Former: Senior Vice President and Treasurer, PepsiCo, Inc. (1993-1997); President, Pizza Hut International (1991-1993); Senior Vice President, Strategic Planning and New Business Development, PepsiCo, Inc. (1987-1990). | 157 | Current: Purpose Investments Funds (2013-present).
Former: Managed Duration Investment Grade Municipal Fund (2006-2016). |
Angela Brock-Kyle (1959) | Trustee | Since 2019 | Current: Founder and Chief Executive Officer, B.O.A.R.D.S. (2013-present).
Former: Senior Leader, TIAA (1987-2012). | 156 | Current: Bowhead Insurance GP, LLC (2020-present); Hunt Companies, Inc. (2019-present).
Former: Infinity Property & Casualty Corp. (2014-2018). |
Thomas F. Lydon, Jr. (1960) | Trustee and Chair of the Contracts Review Committee | Since 2019 (Trustee) Since 2020 (Chair of the Contracts Review Committee) | Current: President, Global Trends Investments (1996-present); Co-Chief Executive Officer, ETF Flows, LLC (2019-present); Chief Executive Officer, Lydon Media (2016-present). | 156 | Current: US Global Investors (GROW) (1995-present).
Former: Harvest Volatility Edge Trust (3) (2017-2019). |
Ronald A. Nyberg (1953) | Trustee and Chair of the Nominating and Governance Committee | Since 2014 | Current: Of Counsel, Momkus LLP (2016-present). Former: Partner, Nyberg & Cassioppi, LLC (2000-2016); Executive Vice President, General Counsel, and Corporate Secretary, Van Kampen Investments (1982-1999). | 157 | Current: PPM Funds (2) (2018-present); Edward-Elmhurst Healthcare System (2012-present). Former: Western Asset Inflation-Linked Opportunities & Income Fund (2004-2020); Western Asset Inflation-Linked Income Fund (2003-2020); Managed Duration Investment Grade Municipal Fund (2003-2016). |
| | THE GUGGENHEIM FUNDS SEMI-ANNUAL REPORT | 175 |
INFORMATION ON BOARD OF TRUSTEES AND OFFICERS (Unaudited)(continued) |
Name, Address*
and Year of Birth | Position(s)
Held with
Trust | Term of Office
and Length of
Time Served** | Principal Occupation(s)
During Past Five Years | Number of
Portfolios
in Fund
Complex
Overseen | Other
Directorships Held
by Trustees*** |
INDEPENDENT TRUSTEES - concluded | | | |
Sandra G. Sponem (1958) | Trustee and Chair of the Audit Committee | Since 2019
(Trustee) Since 2020 (Chair of the Audit Committee) | Current: Retired. Former: Senior Vice President and Chief Financial Officer, M.A. Mortenson-Companies, Inc. (2007-2017). | 156 | Current: SPDR Series Trust (81) (2018-present); SPDR Index Shares Funds (30) (2018-present); SSGA Active Trust (14) (2018-present). Former: SSGA Master Trust (1) (2018-2020). |
Ronald E. Toupin, Jr. (1958) | Trustee, Chair of the Board and Chair of the Executive Committee | Since 2014 | Current: Portfolio Consultant (2010-present); Member, Governing Council, Independent Directors Council (2013-present); Governor, Board of Governors, Investment Company Institute (2018-present).
Former: Member, Executive Committee, Independent Directors Council (2016-2018); Vice President, Manager and Portfolio Manager, Nuveen Asset Management (1998-1999); Vice President, Nuveen Investment Advisory Corp. (1992-1999); Vice President and Manager, Nuveen Unit Investment Trusts (1991-1999); and Assistant Vice President and Portfolio Manager, Nuveen Unit Investment Trusts (1988-1999), each of John Nuveen & Co., Inc. (1982-1999). | 156 | Former: Western Asset Inflation-Linked Opportunities & Income Fund (2004-2020); Western Asset Inflation-Linked Income Fund (2003-2020); Managed Duration Investment Grade Municipal Fund (2003-2016). |
176 THE GUGGENHEIM FUNDS SEMI-ANNUAL REPORT | |
INFORMATION ON BOARD OF TRUSTEES AND OFFICERS (Unaudited)(continued) |
Name, Address*
and Year of Birth | Position(s)
Held with
Trust | Term of Office
and Length of
Time Served** | Principal Occupation(s)
During Past Five Years | Number of
Portfolios
in Fund
Complex
Overseen | Other
Directorships Held
by Trustees*** |
INTERESTED TRUSTEE | | | | |
Amy J. Lee**** (1961) | Trustee, Vice President and Chief Legal Officer | Since 2018 (Trustee) Since 2014
(Chief Legal Officer) Since 2007
(Vice President) | Current: Interested Trustee, certain other funds in the Fund Complex (2018-present); Chief Legal Officer, certain other funds in the Fund Complex (2014-present); Vice President, certain other funds in the Fund Complex (2007-present); Senior Managing Director, Guggenheim Investments (2012-present).
Former: President and Chief Executive Officer, certain other funds in the Fund Complex (2017-2019); Vice President, Associate General Counsel and Assistant Secretary, Security Benefit Life Insurance Company and Security Benefit Corporation (2004-2012). | 157 | None. |
* | The business address of each Trustee is c/o Guggenheim Investments, 227 West Monroe Street, Chicago, Illinois 60606. |
** | Each Trustee serves an indefinite term, until his or her successor is elected and qualified. |
*** | Each Trustee also serves on the Boards of Trustees of Guggenheim Funds Trust, Guggenheim Variable Funds Trust, Guggenheim Strategy Funds Trust, Fiduciary/Claymore Energy Infrastructure Fund, Guggenheim Taxable Municipal Bond & Investment Grade Debt Trust, Guggenheim Strategic Opportunities Fund, Guggenheim Enhanced Equity Income Fund, Guggenheim Energy & Income Fund, Guggenheim Credit Allocation Fund, Rydex Series Funds, Rydex Dynamic Funds, Rydex Variable Trust and Transparent Value Trust. Messrs. Barnes and Nyberg also serve on the Board of Trustees of Advent Convertible & Income Fund. |
**** | This Trustee is deemed to be an “interested person” of the Fund under the 1940 Act by reason of her position with the Fund’s Investment Manager and/or the parent of the Investment Manager. |
| | THE GUGGENHEIM FUNDS SEMI-ANNUAL REPORT | 177 |
INFORMATION ON BOARD OF TRUSTEES AND OFFICERS (Unaudited)(continued) |
Name, Address*
and Year of Birth | Position(s)
Held with
Trust | Term of Office
and Length of
Time Served** | Principal Occupation(s)
During Past Five Years |
OFFICERS | | | |
Brian E. Binder (1972) | President and Chief Executive Officer | Since 2018 | Current: President and Chief Executive Officer, certain other funds in the Fund Complex (2018-present); President, Chief Executive Officer and Chairman of the Board of Managers, Guggenheim Funds Investment Advisors, LLC (2018-present); President and Chief Executive Officer, Security Investors, LLC (2018-present); Board Member of Guggenheim Partners Fund Management (Europe) Limited (2018-present); Senior Managing Director and Chief Administrative Officer, Guggenheim Investments (2018-present).
Former: Managing Director and President, Deutsche Funds, and Head of US Product, Trading and Fund Administration, Deutsche Asset Management (2013-2018); Managing Director, Head of Business Management and Consulting, Invesco Ltd. (2010-2012). |
James M. Howley (1972) | Assistant Treasurer | Since 2014 | Current: Managing Director, Guggenheim Investments (2004-present); Assistant Treasurer, certain other funds in the Fund Complex (2006-present).
Former: Manager, Mutual Fund Administration of Van Kampen Investments, Inc. (1996-2004). |
Mark E. Mathiasen (1978) | Secretary | Since 2014 | Current: Secretary, certain other funds in the Fund Complex (2007-present); Managing Director, Guggenheim Investments (2007-present). |
Glenn McWhinnie (1969) | Assistant Treasurer | Since 2016 | Current: Vice President, Guggenheim Investments (2009-present); Assistant Treasurer, certain other funds in the Fund Complex (2016-present). |
Michael P. Megaris (1984) | Assistant Secretary | Since 2014 | Current: Assistant Secretary, certain other funds in the Fund Complex (2014-present); Director, Guggenheim Investments (2012-present). |
Elisabeth Miller (1968) | Chief Compliance Officer | Since 2012 | Current: Chief Compliance Officer, certain other funds in the Fund Complex (2012-present); Senior Managing Director, Guggenheim Investments (2012-present). Vice President, Guggenheim Funds Distributors, LLC (2014-present). Former: Chief Compliance Officer, Security Investors, LLC and Guggenheim Funds Investment Advisors, LLC (2012-2018); Chief Compliance Officer, Guggenheim Distributors, LLC (2009-2014); Senior Manager, Security Investors, LLC (2004-2014); Senior Manager, Guggenheim Distributors, LLC (2004-2014). |
Margaux Misantone (1978) | AML Officer | Since 2017 | Current: Chief Compliance Officer, Security Investors, LLC and Guggenheim Funds Investment Advisors, LLC (2018-present); AML Officer, Security Investors, LLC and certain other funds in the Fund Complex (2017-present); Managing Director, Guggenheim Investments (2015-present).
Former: Assistant Chief Compliance Officer, Security Investors, LLC and Guggenheim Funds Investments Advisors, LLC (2015-2018). |
178 THE GUGGENHEIM FUNDS SEMI-ANNUAL REPORT | |
INFORMATION ON BOARD OF TRUSTEES AND OFFICERS (Unaudited)(concluded) |
Name, Address*
and Year of Birth | Position(s)
Held with
Trust | Term of Office
and Length of
Time Served** | Principal Occupation(s)
During Past Five Years |
OFFICERS - concluded | |
Kimberly J. Scott (1974) | Assistant Treasurer | Since 2014 | Current: Director, Guggenheim Investments (2012-present); Assistant Treasurer, certain other funds in the Fund Complex (2012-present).
Former: Financial Reporting Manager, Invesco, Ltd. (2010-2011); Vice President/Assistant Treasurer, Mutual Fund Administration for Van Kampen Investments, Inc./Morgan Stanley Investment Management (2009-2010); Manager of Mutual Fund Administration, Van Kampen Investments, Inc./Morgan Stanley Investment Management (2005-2009). |
Bryan Stone (1979) | Vice President | Since 2014 | Current: Vice President, certain other funds in the Fund Complex (2014-present); Managing Director, Guggenheim Investments (2013-present).
Former: Senior Vice President, Neuberger Berman Group LLC (2009-2013); Vice President, Morgan Stanley (2002-2009). |
John L. Sullivan (1955) | Chief Financial Officer, Chief Accounting Officer and Treasurer | Since 2014 | Current: Chief Financial Officer, Chief Accounting Officer and Treasurer, certain other funds in the Fund Complex (2010-present); Senior Managing Director, Guggenheim Investments (2010-present).
Former: Managing Director and Chief Compliance Officer, each of the funds in the Van Kampen Investments fund complex (2004-2010); Managing Director and Head of Fund Accounting and Administration, Morgan Stanley Investment Management (2002-2004); Chief Financial Officer and Treasurer, Van Kampen Funds (1996-2004). |
Jon Szafran (1989) | Assistant Treasurer | Since 2017 | Current: Vice President, Guggenheim Investments (2017-present); Assistant Treasurer, certain other funds in the Fund Complex (2017-present).
Former: Assistant Treasurer of Henderson Global Funds and Manager of US Fund Administration, Henderson Global Investors (North America) Inc. (“HGINA”), (2017); Senior Analyst of US Fund Administration, HGINA (2014–2017); Senior Associate of Fund Administration, Cortland Capital Market Services, LLC (2013-2014); Experienced Associate, PricewaterhouseCoopers LLP (2012-2013). |
* | The business address of each officer is c/o Guggenheim Investments, 227 West Monroe Street, Chicago, Illinois 60606. |
** | Each officer serves an indefinite term, until his or her successor is duly elected and qualified. |
| | THE GUGGENHEIM FUNDS SEMI-ANNUAL REPORT | 179 |
GUGGENHEIM INVESTMENTS PRIVACY NOTICE (Unaudited) |
Who We Are
This Privacy Notice describes the data protection practices of Guggenheim Investments. Guggenheim Investments as used herein refers to the affiliated investment management businesses of Guggenheim Partners, LLC: Guggenheim Funds Investment Advisors, LLC, Guggenheim Partners Investment Management, LLC, Guggenheim Funds Distributors, LLC, Security Investors, LLC, Guggenheim Investment Advisors (Europe) Limited, Guggenheim Real Estate, LLC, GS Gamma Advisors, LLC, Guggenheim Partners India Management, LLC, Guggenheim Partners Europe Limited, as well as the funds in the Guggenheim Funds complex (the “Funds”) (“Guggenheim Investments,” “we,” “us,” or “our”).
Guggenheim Partners Investment Management Holdings, LLC, located at 330 Madison Avenue, New York, New York 10017 is the data controller for your information. The affiliates who are also controllers of certain of your information are: Guggenheim Investment Advisors (Europe) Limited, Guggenheim Partners Europe Limited, Guggenheim Partners, LLC, Guggenheim Funds Investment Advisors, LLC, Guggenheim Partners Investment Management, LLC, Guggenheim Funds Distributors, LLC and Security Investors, LLC, as well as the Funds.
Our Commitment to You
Guggenheim Investments considers your privacy our utmost concern. When you become our client or investor, you entrust us with not only your hard-earned money but also with your personal and financial information. Because we have access to your private information, we hold ourselves to the highest standards in its safekeeping and use. We strictly limit how we share your information with others, whether you are a current or former Guggenheim Investments client or investor.
The Information We Collect About You
We collect certain nonpublic personal information about you from information you provide on applications, other forms, our website, and/or from third parties including investment advisors. This information includes Social Security or other tax identification number, assets, income, tax information, retirement and estate plan information, transaction history, account balance, payment history, bank account information, marital status, family relationships, information that we collect on our website through the use of “cookies,” and other personal information that you or others provide to us. We may also collect such information through your inquiries by mail, e-mail or telephone. We may also collect customer due diligence information, as required by applicable law and regulation, through third party service providers.
How We Handle Your Personal Information
The legal basis for using your information as set out in this Privacy Notice is as follows: (a) use of your personal data is necessary to perform our obligations under any contract with you (such as a contract for us to provide financial services to you); or (b) where use of your personal data is not necessary for performance of a contract, use of your personal data is necessary for our legitimate interests or the legitimate interests of others (for example, to enforce the legal terms governing our services, operate and market our website and other services we offer, ensure safe environments for our personnel and others, make and receive payments, prevent fraud and to know the customer to whom we are providing the services). Some processing is done to comply with applicable law.
In addition to the specific uses described above, we also use your information in the following manner:
| | ● | We use your information in connection with servicing your accounts. |
| | ● | We use information to respond to your requests or questions. For example, we might use your information to respond to your customer feedback. |
| | ● | We use information to improve our products and services. We may use your information to make our website and products better. We may use your information to customize your experience with us. |
| | ● | We use information for security purposes. We may use your information to protect our company and our customers. |
| | ● | We use information to communicate with you. For example, we will communicate with you about your account or our relationship. We may contact you about your feedback. We might also contact you about this Privacy Notice. We may also enroll you in our email newsletter. |
180 THE GUGGENHEIM FUNDS SEMI-ANNUAL REPORT | |
GUGGENHEIM INVESTMENTS PRIVACY NOTICE (Unaudited)(continued) |
| | ● | We use information as otherwise permitted by law, as we may notify you. |
| | ● | Aggregate/Anonymous Data. We may aggregate and/or anonymize any information collected through the website so that such information can no longer be linked to you or your device (“Aggregate/Anonymous Information”). We may use Aggregate/Anonymous Information for any purpose, including without limitation for research and marketing purposes, and may also share such data with any third parties, including advertisers, promotional partners, and sponsors. |
We do not sell information about current or former clients or their accounts to third parties. Nor do we share this information, except when necessary to complete transactions at your request, to make you aware of investment products and services that we or our affiliates offer, or as permitted or required by law.
We provide information about you to companies and individuals not affiliated with Guggenheim Investments to complete certain transactions or account changes, or to perform services for us related to your account. For example, if you ask to transfer assets from another financial institution to Guggenheim Investments, we must provide certain information about you to that company to complete the transaction. We provide the third party with only the information necessary to carry out its responsibilities and only for that purpose. And we require these third parties to treat your private information with the same high degree of confidentiality that we do. To alert you to other Guggenheim Investments products and services, we share your information within our family of affiliated companies. You may limit our sharing with affiliated companies as set out below. We may also share information with any successor to all or part of our business, or in connection with steps leading up to a merger or acquisition. For example, if part of our business was sold we may give customer information as part of that transaction. We may also share information about you with your consent.
We will release information about you if you direct us to do so, if we are compelled by law to do so, or in other circumstances as permitted by law (for example, to protect your account from fraud).
If you close your account(s) or become an inactive client or investor, we will continue to adhere to the privacy policies and practices described in this notice.
Opt-Out Provisions and Your Data Choices
The law allows you to “opt out” of certain kinds of information sharing with third parties. We do not share personal information about you with any third parties that triggers this opt-out right. This means YOU ARE ALREADY OPTED OUT.
When you are no longer our client or investor, we continue to share your information as described in this notice, and you may contact us at any time to limit our sharing by sending an email to CorporateDataPrivacy@GuggenheimPartners.com.
European Union Data Subjects and certain others: In addition to the choices set forth above, residents of the European Union and certain other jurisdictions have certain rights to (1) request access to or rectification or deletion of information we collect about them, (2) request a restriction on the processing of their information, (3) object to the processing of their information, or (4) request the portability of certain information. To exercise these or other rights, please contact us using the contact information below. We will consider all requests and provide our response within the time period stated by applicable law. Please note, however, that certain information may be exempt from such requests in some circumstances, which may include if we need to keep processing your information for our legitimate interests or to comply with a legal obligation. We may request you provide us with information necessary to confirm your identity before responding to your request.
Residents of France and certain other jurisdictions may also provide us with instructions regarding the manner in which we may continue to store, erase and share your information after your death, and where applicable, the person you have designated to exercise these rights after your death.
How We Protect Privacy Online
We take steps to protect your privacy when you use our web site – www.guggenheiminvestments.com – by using secure forms of online communication, including encryption technology, Secure Socket Layer (SSL) protocol, firewalls and user names and passwords. These safeguards vary based on the sensitivity of the information that we collect and store. However, we cannot and do not guarantee that these measures will prevent every unauthorized attempt to access, use, or disclose your information since despite our efforts, no Internet and/or other
| | THE GUGGENHEIM FUNDS SEMI-ANNUAL REPORT | 181 |
GUGGENHEIM INVESTMENTS PRIVACY NOTICE (Unaudited)(concluded) |
electronic transmissions can be completely secure. Our web site uses “http cookies”—tiny pieces of information that we ask your browser to store. We use cookies for session management and security features on the Guggenheim Investments web site. We do not use them to pull data from your hard drive, to learn your e-mail address, or to view data in cookies created by other web sites. We will not share the information in our cookies or give others access to it. See the legal information area on our web site for more details about web site security and privacy features.
How We Safeguard Your Personal Information and Data Retention
We restrict access to nonpublic personal information about you to our employees and in some cases to third parties (for example, the service providers described above) as permitted by law. We maintain strict physical, electronic and procedural safeguards that comply with federal standards to guard your nonpublic personal information.
We keep your information for no longer than necessary for the purposes for which it is processed. The length of time for which we retain information depends on the purposes for which we collected and use it and/or as required to comply with applicable laws. Information may persist in copies made for backup and business continuity purposes for additional time.
International Visitors
If you are not a resident of the United States, please be aware that your information may be transferred to, stored and processed in the United States where our servers are located and our databases are operated. The data protection and other laws of the United States and other countries might not be as comprehensive as those in your country.
In such cases, we ensure that a legal basis for such a transfer exists and that adequate protection is provided as required by applicable law, for example, by using standard contractual clauses or by transferring your data to a jurisdiction that has obtained an adequacy finding. Individuals whose data may be transferred on the basis of standard contractual clauses may contact us as described below.
We’ll Keep You Informed
If you have any questions or concerns about how we treat your personal data, we encourage you to consult with us first. You may also contact the relevant supervisory authority.
We reserve the right to modify this policy at any time and will inform you promptly of material changes. You may access our privacy policy from our web site at www.guggenheiminvestments.com. Should you have any questions regarding our privacy policy, contact us by email at CorporateDataPrivacy@GuggenheimPartners.com.
182 THE GUGGENHEIM FUNDS SEMI-ANNUAL REPORT | |
LIQUIDITY RISK MANAGEMENT PROGRAM (Unaudited) |
In compliance with SEC Rule 22e-4 under the U.S. Investment Company Act of 1940 (the “Liquidity Rule”), Guggenheim Variable Funds Trust (the “Trust”) has adopted and implemented a written liquidity risk management program (the “Program”) for each series of the Trust (each, a “Fund” and, collectively, the “Funds”). The Trust’s Board of Trustees (the “Board”) has also designated a Program administrator (the “Administrator”).
The Liquidity Rule requires that the Program be reasonably designed to assess and manage each Fund’s liquidity risk. A Fund’s “liquidity risk” is the risk that the Fund could not meet requests to redeem shares issued by the Fund without significant dilution of the remaining investors’ interests in the Fund. The Program includes a number of elements that support the assessment, management and review of liquidity risk. In accordance with the Program, each Fund’s liquidity risk is assessed no less frequently than annually taking into consideration a variety of factors, including, as applicable, the Fund’s investment strategy and liquidity of portfolio investments, cash flow projections, and holdings of cash and cash equivalents, as well as borrowing arrangements and other funding sources. Certain factors are considered under both normal and reasonably foreseeable stressed conditions. There is no guarantee that the Program will achieve its objective under all circumstances.
Under the Program, each Fund portfolio investment is classified into one of four liquidity categories based on a determination of the number of days it is reasonably expected to take to convert the investment to cash, or sell or dispose of the investment, in current market conditions without significantly changing the investment’s market value. The Program is reasonably designed to meet Liquidity Rule requirements relating to “highly liquid investment minimums” (i.e., the minimum amount of Fund net assets to be invested in highly liquid investments that are assets) and to monitor compliance with the Liquidity Rule’s limitations on a Fund’s investments in illiquid investments. Under the Liquidity Rule, a Fund is prohibited from acquiring any illiquid investment if, immediately after the acquisition, the Fund would have invested more than 15% of its net assets in illiquid investments that are assets.
During the period covered by this shareholder report, the Board received a written report (the “Report”) prepared by the Administrator addressing the Program’s operation and assessing the adequacy and effectiveness of its implementation for the period from March 31, 2020, to March 31, 2021. The Report concluded that the Program operated effectively, the Program had been and continued to be reasonably designed to assess and manage each Fund’s liquidity risk, and the Program has been adequately and effectively implemented to monitor and respond to the Funds’ liquidity developments, as applicable. The Report further concluded that the Program operated effectively during recent market conditions arising from COVID-19.
Please refer to your Fund’s prospectus for more information regarding the Fund’s exposure to liquidity risk and other risks to which an investment in the Fund may be subject.
| | THE GUGGENHEIM FUNDS SEMI-ANNUAL REPORT | 183 |
This page intentionally left blank.
This page intentionally left blank.
This page intentionally left blank.
This page intentionally left blank.
This page intentionally left blank.
This page intentionally left blank.
| Item 2. | Code of Ethics. |
| | |
| | Not required at this time. |
| | |
| Item 3. | Audit Committee Financial Expert. |
| | |
| | Not required at this time. |
| | |
| Item 4. | Principal Accountant Fees and Services. |
| | |
| | Not required at this time. |
| | |
| Item 5. | Audit Committee of Listed Registrants. |
| | |
| | Not applicable. |
| | |
| Item 6. | Investments. |
| | |
| | Schedule of Investments is included as part of the report to shareholders filed under Item 1 of this form. |
| | |
| Item 7. | Disclosure of Proxy Voting Policies and Procedures for Closed-End Management Investment Companies. |
| | |
| | Not applicable. |
| | |
| Item 8. | Portfolio Mangers of Closed-end Management Investment Companies |
| | |
| | Not applicable |
| | |
| Item 9. | Purchases of Equity Securities by Closed-End Management Investment Company and Affiliated Purchasers. |
| | |
| | Not applicable. |
| | |
| Item 10. | Submission of Matters to a Vote of Security Holders. |
| | |
| | The registrant does not currently have in place procedures by which shareholders may recommend nominees to the registrant’s board. |
| | |
| | There have been no changes to the procedures by which shareholders may recommend nominees to the registrant’s board. |
| Item 11. | Controls and Procedures. |
(a) The registrant’s President (principal executive officer) and Treasurer (principal financial officer) have evaluated the registrant’s disclosure controls and procedures (as defined in Rule 30a-3(c) under the Investment Company Act) as of a date within 90 days of this filing and have concluded that based on such evaluation as required by Rule 30a-3(b) under the Investment Company Act, that the registrant’s disclosure controls and procedures were effective as of that date in ensuring that information required to be disclosed by the registrant in this Form N-CSR was recorded, processed, summarized, and reported within the time periods specified in the Securities and Exchange Commission’s rules and forms.
(b) The registrant’s principal executive officer and principal financial officer are aware of no change in the registrant’s internal control over financial reporting that occurred during the period covered by this report that has materially affected, or is reasonably likely to materially affect, the registrant’s internal control over financial reporting.
| Item 12. | Disclosure of Securities Lending Activities for Closed End Management Investment Companies. |
| | |
| | Not Applicable |
| | |
| Item 13. | Exhibits. |
(a)(1) Not applicable.
(a)(2) Separate certifications by the President (principal executive officer) and Treasurer (principal financial officer) of the registrant as required by Rule 30a-2(a) under the Act (17 CFR 270.30a-2(a)) are attached.
(b) A certification by the registrant’s President (principal executive officer) and Treasurer (principal financial officer) as required by Rule 30a-2(b) under the Act (17 CFR 270.30a-2(b)) is attached.
SIGNATURES
Pursuant to the requirements of the Securities Exchange Act of 1934 and the Investment Company Act of 1940, the registrant has duly caused this report to be signed on its behalf by the undersigned, thereunto duly authorized.
| (Registrant) | Guggenheim Variable Funds Trust | |
| | | |
| By (Signature and Title)* | /s/ Brian Binder | |
| | Brian Binder, President and Chief Executive Officer | |
| | | |
| Date | September 8, 2021 | |
| | | |
| Pursuant to the requirements of the Securities Exchange Act of 1934 and the Investment Company Act of 1940, this report has been signed below by the following persons on behalf of the registrant and in the capacities and on the dates indicated. |
| | | |
| By (Signature and Title)* | /s/ Brian Binder | |
| | Brian Binder, President and Chief Executive Officer | |
| | | |
| Date | September 8, 2021 | |
| | | |
| By (Signature and Title)* | /s/ John L. Sullivan | |
| | John L. Sullivan, Chief Financial Officer and Treasurer | |
| | | |
| Date | September 8, 2021 | |
| * | Print the name and title of each signing officer under his or her signature. |
