UNITED STATES
SECURITIES AND EXCHANGE COMMISSION
Washington, D.C. 20549
FORM N-CSR
CERTIFIED SHAREHOLDER REPORT OF REGISTERED MANAGEMENT
INVESTMENT COMPANIES
Investment Company Act file number 811- 02753
Guggenheim Variable Funds Trust
(Exact name of registrant as specified in charter)
702 King Farm Boulevard, Suite 200
Rockville, Maryland 20850
(Address of principal executive offices) (Zip code)
Amy J. Lee
Guggenheim Variable Funds Trust
702 King Farm Boulevard, Suite 200
Rockville, Maryland 20850
(Name and address of agent for service)
Registrant's telephone number, including area code: (301) 296-5100
Date of fiscal year end: December 31
Date of reporting period: January 1, 2023 – June 30, 2023
| Item 1. | Reports to Stockholders. |
The registrant’s semi-annual report transmitted to shareholders pursuant to Rule 30e-1 under the Investment Company Act of 1940, as amended (the “Investment Company Act”), is as follows:
6.30.2023
Guggenheim Variable Funds Trust Semi-Annual Report
Series |
Series A | (StylePlus—Large Core Series) | |
Series B | (Large Cap Value Series) | �� |
Series D | (World Equity Income Series) | |
Series E | (Total Return Bond Series) | |
Series F | (Floating Rate Strategies Series) | |
Series J | (StylePlus—Mid Growth Series) | |
Series N | (Managed Asset Allocation Series) | |
Series O | (All Cap Value Series) | |
Series P | (High Yield Series) | |
Series Q | (Small Cap Value Series) | |
Series V | (SMid Cap Value Series) | |
Series X | (StylePlus—Small Growth Series) | |
Series Y | (StylePlus—Large Growth Series) | |
Series Z | (Alpha Opportunity Series) | |
GuggenheimInvestments.com | GVFT-SEMI-2-0623x1223 |
| | |
DEAR SHAREHOLDER | 2 |
ECONOMIC AND MARKET OVERVIEW | 5 |
ABOUT SHAREHOLDERS’ FUND EXPENSES | 7 |
SERIES A (STYLEPLUS—LARGE CORE SERIES) | 9 |
SERIES B (LARGE CAP VALUE SERIES) | 16 |
SERIES D (WORLD EQUITY INCOME SERIES) | 22 |
SERIES E (TOTAL RETURN BOND SERIES) | 29 |
SERIES F (FLOATING RATE STRATEGIES SERIES) | 50 |
SERIES J (STYLEPLUS—MID GROWTH SERIES) | 64 |
SERIES N (MANAGED ASSET ALLOCATION SERIES) | 72 |
SERIES O (ALL CAP VALUE SERIES) | 79 |
SERIES P (HIGH YIELD SERIES) | 86 |
SERIES Q (SMALL CAP VALUE SERIES) | 100 |
SERIES V (SMID CAP VALUE SERIES) | 107 |
SERIES X (STYLEPLUS—SMALL GROWTH SERIES) | 114 |
SERIES Y (STYLEPLUS—LARGE GROWTH SERIES) | 122 |
SERIES Z (ALPHA OPPORTUNITY SERIES) | 129 |
NOTES TO FINANCIAL STATEMENTS | 144 |
OTHER INFORMATION | 165 |
INFORMATION ON BOARD OF TRUSTEES AND OFFICERS | 171 |
GUGGENHEIM INVESTMENTS PRIVACY NOTICE | 177 |
LIQUIDITY RISK MANAGEMENT | 180 |
| | THE GUGGENHEIM FUNDS SEMI-ANNUAL REPORT | 1 |
Dear Shareholder:
Security Investors, LLC (“SI”) and Guggenheim Partners Investment Management, LLC (“GPIM”, and together with SI, the “Investment Advisers”) are pleased to present the semi-annual shareholder report for funds that are part of the Guggenheim Variable Funds Trust (the “Funds”). This report covers performance of the Funds for the semi-annual period ended June 30, 2023 (the “Reporting Period”).
The Investment Advisers are part of Guggenheim Investments, which represents the investment management businesses of Guggenheim Partners, LLC (“Guggenheim”), a global, diversified financial services firm.
Guggenheim Funds Distributors, LLC is the distributor of the Funds. Guggenheim Funds Distributors, LLC is affiliated with Guggenheim and the Investment Advisers.
We encourage you to read the Economic and Market Overview section of the report, which follows this letter.
We are committed to providing innovative investment solutions and appreciate the trust you place in us.
Sincerely,
Security Investors, LLC
Guggenheim Partners Investment Management, LLC
July 31, 2023
Read a Fund’s prospectus and summary prospectus (if available) carefully before investing in the Fund. It contains the Fund’s investment objectives, risks, charges, expenses and other information, which should be considered carefully before investing. Obtain a prospectus and summary prospectus (if available) at guggenheiminvestments.com or call 800.820.0888.
This material is not intended as a recommendation or as investment advice of any kind, including in connection with rollovers, transfers, and distributions. Such material is not provided in a fiduciary capacity, may not be relied upon for or in connection with the making of investment decisions, and does not constitute a solicitation of an offer to buy or sell securities. All content has been provided for informational or educational purposes only and is not intended to be and should not be construed as legal or tax advice and/or a legal opinion. Always consult a financial, tax and/or legal professional regarding your specific situation.
The Series StylePlus Funds are subject to a number of risks and may not be suitable for all investors. Investments in large capitalization stocks may underperform other segments of the equity market or the equity market as a whole. ● Investments in small-sized company securities may present additional risks such as less predictable earnings, higher volatility and less liquidity than larger, more established companies. ● Growth stocks may be more volatile than other stocks because they are more sensitive to investor perceptions regarding the growth potential of the issuing companies. ● The Funds may invest in derivative instruments, which may be more volatile and less liquid, increasing the risk of loss when compared to traditional securities. Certain of the derivative instruments are also subject to the risks of counterparty default and adverse tax treatment. ● The Funds’ use of leverage, through borrowings or instruments such as derivatives, may cause the Funds to be more volatile than if they had not been leveraged. ● The Funds’ investments in other investment vehicles subject the Funds to those risks and expenses affecting the investment vehicle. ● The Funds may invest in foreign securities which carry additional risks when compared to U.S. securities, due to the impact of diplomatic, political or economic developments in the country in question (investments in emerging markets securities are generally subject to an even greater level of risks). ● The Funds may invest in fixed income securities whose market value will change in response to interest rate changes and market conditions among other factors. In general, bond prices rise when interest rates fall and vice versa. ● The Funds’ exposure to high yield securities may subject the Funds to greater volatility. ● The Funds may invest in bank loans and asset-backed securities, including mortgage backed, which involve special types of risks. ● The Funds may invest in restricted securities which may involve financial and liquidity risk. ● The Funds are subject to active trading risks that may increase volatility and impact their ability to achieve their investment objective. ● You may have a gain or loss when you sell your shares. ● It is important to note that the Funds are not guaranteed by the U.S. government. ● Please read the prospectus for more detailed information regarding these and other risks.
The Series Value Funds are subject to a number of risks and may not be suitable for all investors. ● An investment in the Funds will fluctuate and is subject to investment risks, which means investors could lose money. The intrinsic value of the underlying stocks may never be realized or the stocks may decline in value. Investments in large capitalization stocks may underperform other segments of the equity market or the equity market as a whole. Investments in small- and/or mid-sized company securities may present additional risks such as less predictable earnings, higher volatility and less liquidity than larger, more established companies. ● You may have a gain or loss when you sell your shares. The Funds are subject to active trading risks that may increase volatility and impact their ability to achieve their investment objective. ● Please read the prospectus for more detailed information regarding these and other risks.
The Series D (World Equity Income Series) is subject to a number of risks and may not be suitable for all investors. ● Investments in securities in general are subject to market risks that may cause their prices to fluctuate over time. ●The Fund’s investments in foreign securities carry additional risks when compared to U.S. securities, due to the impact of diplomatic, political or economic developments in the country in question (investments in emerging markets are generally subject to an even greater level of risks). Additionally, the Fund’s exposure to foreign currencies subjects the Fund to the risk that those currencies will decline in value relative to the U.S. Dollar. ● The Fund’s investments in derivatives may pose risks in addition to those associated with investing directly in securities or other investments, including illiquidity of
2 | THE GUGGENHEIM FUNDS SEMI-ANNUAL REPORT | |
the derivatives, imperfect correlations with underlying investments or the Fund’s other portfolio holdings, lack of availability and counterparty risk. ●The Fund’s use of leverage, through instruments such as derivatives, may cause the Fund to be more volatile than if it had not been leveraged. ●The Fund’s investments in other investment vehicles subject the Fund to those risks and expenses affecting the investment vehicle. ●The Fund may have significant exposure to securities in a particular capitalization range e.g., large-, mid- or small-cap securities. As a result, the Fund may be subject to the risk that the predominant capitalization range may underperform other segments of the equity market or the equity market as a whole. ● Dividend-paying stocks may underperform non-dividend paying stocks (and the stock market as a whole) over any period of time. In addition, issuers of dividend-paying stocks may have discretion to defer or stop paying dividends for a stated period of time. If the dividend-paying stocks held by the Fund reduce or stop paying dividends, the Fund’s ability to generate income may be adversely affected. ● You may have a gain or loss when you sell your shares. ● The Fund is subject to active trading risks that may increase volatility and impact its ability to achieve its investment objective.● Please read the prospectus for more detailed information regarding these and other risks.
The Series E (Total Return Bond Series) is subject to a number of risks and may not be suitable for all investors. ● The Fund’s market value will change in response to interest rate changes and market conditions among other factors. In general, bond prices rise when interest rates fall and vice versa. ● The Fund’s exposure to high yield securities may subject the Fund to greater volatility. ● When market conditions are deemed appropriate, the Fund may use leverage to the full extent permitted by its investment policies and restrictions and applicable law. Leveraging will exaggerate the effect on net asset value of any increase or decrease in the market value of the Fund’s portfolio. ● The Fund may invest in derivative instruments, which may be more volatile and less liquid, increasing the risk of loss when compared to traditional securities. Certain of the derivative instruments are also subject to the risks of counterparty default and adverse tax treatment. ● Instruments and strategies (such as borrowing transactions and reverse repurchase agreements) may provide leveraged exposure to a particular investment, which will magnify any gains or losses on those investments. ● Investments in reverse repurchase agreements expose the Fund to many of the same risks as investments in derivatives. ● The Fund’s investments in other investment vehicles subject the Fund to those risks and expenses affecting the investment vehicle. ● The Fund’s investments in foreign securities carry additional risks when compared to U.S. securities, due to the impact of diplomatic, political, or economic developments in the country in question (investments in emerging markets securities are generally subject to an even greater level of risk). ● Investments in syndicated bank loans generally offer a floating interest rate and involve special types of risks. ● The Fund’s investments in municipal securities can be affected by events that affect the municipal bond market. ● The Fund’s investments in real estate securities subject the Fund to the same risks as direct investments in real estate, which is particularly sensitive to economic downturns. ● The Fund’s investments in restricted securities may involve financial and liquidity risk. ● The Fund is subject to active trading risks that may increase volatility and impact its ability to achieve its investment objective.● You may have a gain or loss when you sell your shares. ● It is important to note that the Fund is not guaranteed by the U.S. government. ● Please read the prospectus for more detailed information regarding these and other risks.
The Series F (Floating Rate Strategies Series) is subject to a number of risks and may not be suitable for all investors. ● Investments in floating rate senior secured syndicated bank loans and other floating rate securities involve special types of risks, including credit rate risk, interest rate risk, liquidity risk and prepayment risk. ● The Fund’s market value will change in response to interest rate changes and market conditions among other factors. In general, bond prices rise when interest rates fall and vice versa. ● The Fund’s exposure to high yield securities may subject the Fund to greater volatility. ● When market conditions are deemed appropriate, the Fund may use leverage to the full extent permitted by its investment policies and restrictions and applicable law. Leveraging will exaggerate the effect on net asset value of any increase or decrease in the market value of the Fund’s portfolio. ● The Fund may invest in derivative instruments, which may be more volatile and less liquid, increasing the risk of loss when compared to traditional securities. Certain of the derivative instruments are also subject to the risks of counterparty default and adverse tax treatment. ● Instruments and strategies (such as borrowing transactions and reverse repurchase agreements) may provide leveraged exposure to a particular investment, which will magnify any gains or losses on those investments. ● Investments in reverse repurchase agreements and synthetic instruments (such as synthetic collateralized debt obligations) expose the Fund to many of the same risks as investments in derivatives. ● The Fund’s investments in other investment vehicles subject the Fund to those risks and expenses affecting the investment vehicle. ● The Fund’s investments in foreign securities carry additional risks when compared to U.S. securities, due to the impact of diplomatic, political or economic developments in the country in question (investments in emerging markets securities are generally subject to an even greater level of risk). ● The Fund’s investments in real estate securities subject the Fund to the same risks as direct investments in real estate, which is particularly sensitive to economic downturns. ● The Fund’s investments in restricted securities may involve financial and liquidity risk. ● The Fund is subject to active trading risks that may increase volatility and impact its ability to achieve its investment objective. ● You may have a gain or loss when you sell your shares. ● It is important to note that the Fund is not guaranteed by the U.S. government.● Please read the prospectus for more detailed information regarding these and other risks.
The Series N (Managed Asset Allocation Series) is subject to a number of risks and may not be suitable for all investors. ● The value of an investment in the Fund will fluctuate and is subject to investment risks, which means investors could lose money. The Fund could lose money if the issuer of a bond or a counterparty to a derivatives transaction or other transaction is unable to repay interest and principal on time or defaults. The issuer of a bond could also suffer a decrease in quality rating, which would affect the volatility and liquidity of the bond. Derivatives may pose risks in addition to those associated with investing directly in securities or other investments, including the risk that the Fund will be unable to sell, unwind or value the derivative because of an illiquid market, the risk that the derivative is not well correlated with underlying investments or the Fund’s other portfolio holdings, and the risk that the counterparty is unwilling or unable to meet its obligation. The use of derivatives by the Fund to hedge risk may reduce the opportunity for gain by offsetting the positive effect of favorable price movements. Furthermore, if the Investment Manager is incorrect about its expectations of market conditions, the use of derivatives could result in a loss, which in some cases may be unlimited. Foreign securities carry additional risks when compared to U.S. securities, including currency fluctuations, adverse political and economic developments, unreliable or untimely information, less liquidity, limited legal recourse and higher transactional costs. The Investment Manager may not be able to cause certain of the underlying funds’ performance to match or correlate to that of the underlying funds’ respective underlying index or benchmark, either on a daily or aggregate basis. Factors such as underlying fund expenses, imperfect correlation between an underlying fund’s investments and those of its underlying index or underlying benchmark, rounding of share prices, changes to the composition of the underlying index or underlying benchmark, regulatory policies, high portfolio turnover rate, and the use of leverage all contribute to tracking error. Tracking error may cause an underlying fund’s and, thus the Fund’s, performance to be less than you expect. ● The Fund is subject to active trading risks that may increase volatility and impact its ability to achieve its investment objective. ● You may have a gain or loss when you sell your shares.● Please read the prospectus for more detailed information regarding these and other risks.
The Series P (High Yield Series) is subject to a number of risks and may not be suitable for all investors. ● The Fund’s market value will change in response to interest rate changes and market conditions among other factors. In general, bond prices rise when interest rates fall and vice versa. ● The Fund’s exposure to high yield securities may subject the Fund to greater volatility. ● The Fund may invest in derivative instruments, which may be more volatile and less liquid, increasing the risk of loss when compared to traditional securities. Certain of the derivative instruments are also subject to the risks of counterparty default and adverse tax treatment. ●The Fund’s use of leverage, through borrowings or instruments such as derivatives, may cause the Fund to be more volatile than if it had not been leveraged. ● Instruments and strategies (such as borrowing transactions and reverse repurchase agreements) may provide leveraged exposure to a particular investment, which will magnify any gains or losses
| | THE GUGGENHEIM FUNDS SEMI-ANNUAL REPORT | 3 |
on those investments. ● The Fund may invest in foreign securities which carry additional risks when compared to U.S. securities, due to the impact of diplomatic, political or economic developments in the country in question (investments in emerging markets securities are generally subject to an even greater level of risks). ● Investments in syndicated bank loans generally offer a floating interest rate and involve special types of risks. ● The Fund’s investments in other investment vehicles subject the Fund to those risks and expenses affecting the investment vehicle. ● The Fund’s investments in restricted securities may involve financial and liquidity risk. ● The Fund is subject to active trading risks that may increase volatility and impact its ability to achieve its investment objective. ● You may have a gain or loss when you sell your shares. ● It is important to note that the Fund is not guaranteed by the U.S. government. ● Please read the prospectus for more detailed information regarding these and other risks.
The Series Z (Alpha Opportunity Series) is subject to a number of risks and may not be suitable for all investors. ● Investments in securities and derivatives, in general, are subject to market risks that may cause their prices to fluctuate over time. The intrinsic value of the underlying stocks may never be realized or the stocks may decline in value. An investment in the Fund may lose money. There can be no guarantee the Fund will achieve it investment objective. ●The Fund’s use of derivatives such as futures, options and swap agreements may expose the Fund to additional risks that it would not be subject to if it invested directly in the securities underlying those derivatives. ● Certain of the derivative instruments, such as swaps and structured notes, are also subject to the risks of counterparty default and adverse tax treatment. ●The more the Fund invests in leveraged instruments, the more the leverage will magnify any gains or losses on those investments. ● The Fund’s use of short selling involves increased risk and costs, including paying more for a security than it received from its sale and the risk of unlimited losses. ●In certain circumstances the Fund may be subject to liquidity risk and it may be difficult for the Fund to purchase and sell particular investments within a reasonable time at a fair price. ●The Fund’s fixed income investments will change in value in response to interest rate changes and other factors. ● The Fund is subject to active trading risks that may increase volatility and impact its ability to achieve its investment objective. ● You may have a gain or loss when you sell your shares. ● Please read the prospectus for more detailed information regarding these and other risks.
4 | THE GUGGENHEIM FUNDS SEMI-ANNUAL REPORT | |
ECONOMIC AND MARKET OVERVIEW (Unaudited) | June 30, 2023 |
The fundamental backdrop we see for the economy is that inflation, while making some progress, continues to run well above target while the labor market appears overheated. As a result, the U.S. Federal Reserve (the “Fed”) is employing a deliberate and forceful strategy which has the effect of weakening the economy. The Fed believes this strategy is required to meaningfully reduce inflation. We expect Fed policymakers to deliver an additional rate hike in September 2023 as they try to limit an undue easing of financial conditions that could risk a resurgence in inflation. Quantitative tightening appears likely to continue at least into early 2024.
Despite the abrupt tightening of Fed policy seen over recent quarters, growth of real gross domestic product has been resilient, aided by a significant fiscal expansion and easing inflation pressures that have boosted real personal consumption. Indeed, headline personal consumption expenditures inflation has slowed to 2.5% on an annualized basis in the three months ended May 2023, down from 7.3% in the corresponding period a year earlier, helping to lift real income growth and support consumer spending.
Notwithstanding recent stronger-than-expected economic activity, we continue to believe the Fed’s policy measures will likely result in a higher unemployment rate and may ultimately lead to a recession. A range of leading indicators, including a low unemployment rate, an inverted yield curve, a declining leading economic index, and falling consumer confidence, suggest a downturn may be approaching.
While a recession understandably provokes fear among investors, in this environment it is arguably not the worst outcome from a medium-term perspective, as we see signs a recession could be moderate in its severity. Moreover, we expect inflation to be brought under control as spending and demand for labor cool, in turn allowing the Fed to start to ease its monetary policy stance as we progress through 2024.
For the Reporting Period, the S&P 500® Index* returned 16.89%. The MSCI Europe-Australasia-Far East (“EAFE”) Index* returned 11.67%. The return of the MSCI Emerging Markets Index* was 4.89%.
In the bond market, the Bloomberg U.S. Aggregate Bond Index* posted a 2.09% return for the Reporting Period, while the Bloomberg U.S. Corporate High Yield Index* returned 5.38%. The return of the ICE Bank of America (“BofA”) 3-Month U.S. Treasury Bill Index* was 2.27% for the Reporting Period.
The opinions and forecasts expressed may not actually come to pass. This information is subject to change at any time, based on market and other conditions, and should not be construed as a recommendation of any specific security or strategy.
*Index Definitions:
The following indices are referenced throughout this report. Indices are unmanaged and not available for direct investment. Index performance does not reflect transaction costs, fees, or expenses.
Bloomberg U.S. Aggregate Bond Index is a broad-based flagship benchmark that measures the investment grade, U.S. dollar-denominated, fixed-rate taxable bond market, including U.S. Treasuries, government-related and corporate securities, mortgage-backed securities or “MBS” (agency fixed-rate and hybrid adjustable-rate mortgage, or “ARM”, pass-throughs), asset-backed securities (“ABS”), and commercial mortgage-backed securities (“CMBS”) (agency and non-agency).
Bloomberg U.S. Corporate High Yield Index measures the U.S. dollar-denominated, high yield, fixed-rate corporate bond market. Securities are classified as high yield if the middle rating of Moody’s, Fitch, and S&P is Ba1/BB +/BB + or below.
Credit Suisse Leveraged Loan Index is designed to mirror the investable universe of the U.S. dollar-denominated leveraged loan market.
ICE BofA 3-Month U.S. Treasury Bill Index is an unmanaged market index of U.S. Treasury securities maturing in 90 days that assumes reinvestment of all income.
MSCI EAFE Index is a free float-adjusted market capitalization index that is designed to measure the equity market performance of developed markets, excluding the U.S. & Canada.
MSCI Emerging Markets Index is a free float-adjusted market capitalization weighted index that is designed to measure equity market performance in the global emerging markets.
MSCI World (Net) Index is calculated with net dividends reinvested. It is a free float-adjusted market capitalization weighted index that is designed to measure the equity market performance of developed markets.
Morningstar Long/Short Equity Category Average represents long-short portfolios which hold sizable stakes in both long and short positions in equities and related derivatives. Some funds that fall into this category will shift their exposure to long and short positions depending on their macro outlook or the opportunities they uncover through bottom-up research. Some funds may simply hedge long stock positions through exchange traded funds or derivatives. At least 75% of the assets are in equity securities or derivatives.
| | THE GUGGENHEIM FUNDS SEMI-ANNUAL REPORT | 5 |
ECONOMIC AND MARKET OVERVIEW (Unaudited)(concluded) | June 30, 2023 |
Russell 3000® Value Index measures the performance of the broad value segment of the U.S. equity value universe. It includes those Russell 3000 companies with lower price-to-book ratios and lower forecasted growth values.
Russell 2500® Value Index measures the performance of the small- to mid-cap value segment of the U.S. equity universe. It includes those Russell 2500 companies with lower price-to-book ratios and lower forecasted growth values.
Russell 2000® Growth Index measures the performance of the small-cap growth segment of the U.S. equity universe. It includes those Russell 2000 companies with higher price-to-book ratios and higher forecasted growth values.
Russell 2000® Value Index measures the performance of the small-cap value segment of the U.S. equity universe. It includes those Russell 2000 companies with lower price-to-book ratios and lower forecasted growth values.
Russell 1000® Growth Index measures the performance of the large-cap growth segment of the U.S. equity universe. It includes those Russell 1000 companies with higher price-to-book ratios and higher forecasted growth value.
Russell 1000® Value Index measures the performance of the large-cap value segment of the U.S. equity universe. It includes those Russell 1000 companies with lower price-to-book ratios and lower expected growth values.
Russell Midcap® Growth Index measures the performance of the mid-cap growth segment of the U.S. equity universe. It includes those Russell Midcap Index companies with higher price-to-book ratios and higher forecasted growth values.
S&P 500® Index is a broad-based index, the performance of which is based on the performance of 500 widely held common stocks chosen for market size, liquidity, and industry group representation.
6 | THE GUGGENHEIM FUNDS SEMI-ANNUAL REPORT | |
ABOUT SHAREHOLDERS’ FUND EXPENSES (Unaudited) | |
All mutual funds have operating expenses, and it is important for our shareholders to understand the impact of costs on their investments. Shareholders of a fund incur two types of costs: (i) transaction costs, including sales charges (loads) on purchase payments, reinvested dividends, other distributions, and exchange fees, and (ii) ongoing costs, including management fees, administrative services, and shareholder reports, among others. These ongoing costs, or operating expenses, are deducted from a fund’s gross income and reduce the investment return of the fund.
A fund’s expenses are expressed as a percentage of its average net assets, which is known as the expense ratio. The following examples are intended to help investors understand the ongoing costs (in dollars) of investing in a fund and to compare these costs with the ongoing costs of investing in other mutual funds.
The examples are based on an investment of $1,000 made at the beginning of the period and held for the entire six-month period beginning December 31, 2022 and ending June 30, 2023.
The following tables illustrate the Funds’ costs in two ways:
Table 1. Based on actual Fund return: This section helps investors estimate the actual expenses paid over the period. The “Ending Account Value” shown is derived from the Fund’s actual return, and the fifth column shows the dollar amount that would have been paid by an investor who started with $1,000 in the Fund. Investors may use the information here, together with the amount invested, to estimate the expenses paid over the period. Simply divide the Fund’s account value by $1,000 (for example, an $8,600 account value divided by $1,000 = 8.6), then multiply the result by the number provided under the heading “Expenses Paid During Period.”
Table 2. Based on hypothetical 5% return: This section is intended to help investors compare a fund’s cost with those of other mutual funds. The table provides information about hypothetical account values and hypothetical expenses based on the Fund’s actual expense ratio and an assumed rate of return of 5% per year before expenses, which is not the Fund’s actual return. The hypothetical account values and expenses may not be used to estimate the actual ending account balance or expenses paid during the period. The example is useful in making comparisons because the U.S. Securities and Exchange Commission (the “SEC”) requires all mutual funds to calculate expenses based on the 5% return. Investors can assess a fund’s costs by comparing this hypothetical example with the hypothetical examples that appear in shareholder reports of other funds.
The calculations illustrated above assume no shares were bought or sold during the period. Actual costs may have been higher or lower, depending on the amount of investment and the timing of any purchases or redemptions.
Please note that the expenses shown in the table are meant to highlight your ongoing costs only and do not reflect any transactional costs, such as sales charges (loads) on purchase payments, and contingent deferred sales charges (“CDSC”) on redemptions, if any. Therefore, the second table is useful in comparing ongoing costs only, and will not help you determine the relative total costs of owning different funds. In addition, if these transactional costs were included, your costs would have been higher.
More information about the Funds’ expenses, including annual expense ratios for periods up to five years (subject to the Fund’s inception date), can be found in the Financial Highlights section of this report. For additional information on operating expenses and other shareholder costs, please refer to the appropriate Fund prospectus.
| | THE GUGGENHEIM FUNDS SEMI-ANNUAL REPORT | 7 |
ABOUT SHAREHOLDERS’ FUND EXPENSES (Unaudited)(concluded) | |
| Expense
Ratio1 | Fund
Return | Beginning
Account Value
December 31, 2022 | Ending
Account Value
June 30, 2023 | Expenses
Paid During
Period2 |
Table 1. Based on actual Fund return3 | | | | | |
Series A (StylePlus—Large Core Series) | 1.09% | 16.93% | $ 1,000.00 | $ 1,169.30 | $ 5.86 |
Series B (Large Cap Value Series) | 0.77% | 4.39% | 1,000.00 | 1,043.90 | 3.90 |
Series D (World Equity Income Series) | 0.87% | 5.42% | 1,000.00 | 1,054.20 | 4.43 |
Series E (Total Return Bond Series) | 0.81% | 3.01% | 1,000.00 | 1,030.10 | 4.08 |
Series F (Floating Rate Strategies Series) | 1.15% | 5.63% | 1,000.00 | 1,056.30 | 5.86 |
Series J (StylePlus—Mid Growth Series) | 1.19% | 16.30% | 1,000.00 | 1,163.00 | 6.38 |
Series N (Managed Asset Allocation Series) | 0.96% | 8.28% | 1,000.00 | 1,082.80 | 4.96 |
Series O (All Cap Value Series) | 0.85% | 3.82% | 1,000.00 | 1,038.20 | 4.30 |
Series P (High Yield Series) | 1.08% | 4.52% | 1,000.00 | 1,045.20 | 5.48 |
Series Q (Small Cap Value Series) | 1.11% | 1.44% | 1,000.00 | 1,014.40 | 5.54 |
Series V (SMid Cap Value Series) | 0.88% | 3.75% | 1,000.00 | 1,037.50 | 4.45 |
Series X (StylePlus—Small Growth Series) | 1.28% | 13.99% | 1,000.00 | 1,139.90 | 6.79 |
Series Y (StylePlus—Large Growth Series) | 1.34% | 26.96% | 1,000.00 | 1,269.60 | 7.54 |
Series Z (Alpha Opportunity Series) | 1.99% | 4.78% | 1,000.00 | 1,047.80 | 10.10 |
|
Table 2. Based on hypothetical 5% return (before expenses) | | | | |
Series A (StylePlus—Large Core Series) | 1.09% | 5.00% | $ 1,000.00 | $ 1,019.39 | $ 5.46 |
Series B (Large Cap Value Series) | 0.77% | 5.00% | 1,000.00 | 1,020.98 | 3.86 |
Series D (World Equity Income Series) | 0.87% | 5.00% | 1,000.00 | 1,020.48 | 4.36 |
Series E (Total Return Bond Series) | 0.81% | 5.00% | 1,000.00 | 1,020.78 | 4.06 |
Series F (Floating Rate Strategies Series) | 1.15% | 5.00% | 1,000.00 | 1,019.09 | 5.76 |
Series J (StylePlus—Mid Growth Series) | 1.19% | 5.00% | 1,000.00 | 1,018.89 | 5.96 |
Series N (Managed Asset Allocation Series) | 0.96% | 5.00% | 1,000.00 | 1,020.03 | 4.81 |
Series O (All Cap Value Series) | 0.85% | 5.00% | 1,000.00 | 1,020.58 | 4.26 |
Series P (High Yield Series) | 1.08% | 5.00% | 1,000.00 | 1,019.44 | 5.41 |
Series Q (Small Cap Value Series) | 1.11% | 5.00% | 1,000.00 | 1,019.29 | 5.56 |
Series V (SMid Cap Value Series) | 0.88% | 5.00% | 1,000.00 | 1,020.43 | 4.41 |
Series X (StylePlus—Small Growth Series) | 1.28% | 5.00% | 1,000.00 | 1,018.45 | 6.41 |
Series Y (StylePlus—Large Growth Series) | 1.34% | 5.00% | 1,000.00 | 1,018.15 | 6.71 |
Series Z (Alpha Opportunity Series) | 1.99% | 5.00% | 1,000.00 | 1,014.93 | 9.94 |
1 | Annualized and excludes expenses of the underlying funds in which the Funds invest, if any. This ratio represents net expenses, which may include expenses that are excluded from the expense limitation agreement and affiliated waivers. Excluding these expenses, the net expense ratios for the period would be: |
| | Fund | 6/30/23 |
| | Series A (StylePlus—Large Core Series) | 0.85% |
| | Series B (Large Cap Value Series) | 0.77% |
| | Series D (World Equity Income Series) | 0.87% |
| | Series E (Total Return Bond Series) | 0.76% |
| | Series F (Floating Rate Strategies Series) | 1.13% |
| | Series J (StylePlus—Mid Growth Series) | 0.92% |
| | Series O (All Cap Value Series) | 0.85% |
| | Series P (High Yield Series) | 1.05% |
| | Series Q (Small Cap Value Series) | 1.11% |
| | Series V (SMid Cap Value Series) | 0.88% |
| | Series X (StylePlus—Small Growth Series) | 1.04% |
| | Series Y (StylePlus—Large Growth Series) | 0.88% |
| | Series Z (Alpha Opportunity Series) | 1.99% |
2 | Expenses are equal to the Fund’s annualized expense ratio, net of any applicable fee waivers, multiplied by the average account value over the period, multiplied by 181/365 (to reflect the one-half year period). Expenses shown do not include fees charged by insurance companies. |
3 | Actual cumulative return at net asset value for the period December 31, 2022 to June 30, 2023. |
8 | THE GUGGENHEIM FUNDS SEMI-ANNUAL REPORT | |
PERFORMANCE REPORT AND FUND PROFILE (Unaudited) | June 30, 2023 |
SERIES A (STYLEPLUS—LARGE CORE SERIES)
OBJECTIVE: Seeks long-term growth of capital.
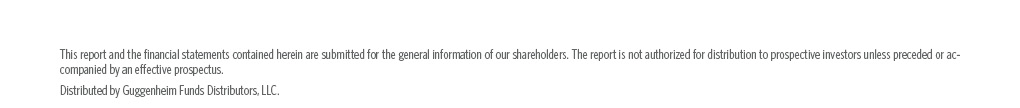
Holdings Diversification (Market Exposure as % of Net Assets)

“Holdings Diversification (Market Exposure as % of Net Assets)” excludes any temporary cash investments, investments in Guggenheim Strategy Funds Trust mutual funds, or investments in Guggenheim Ultra Short Duration Fund.
Inception Date: May 1, 1979 |
Ten Largest Holdings | % of Total Net Assets |
Guggenheim Strategy Fund III | 25.9% |
Guggenheim Variable Insurance Strategy Fund III | 25.2% |
Guggenheim Ultra Short Duration Fund — Institutional Class | 12.3% |
Guggenheim Strategy Fund II | 12.0% |
Apple, Inc. | 1.6% |
Microsoft Corp. | 1.4% |
Alphabet, Inc. — Class C | 0.7% |
Amazon.com, Inc. | 0.5% |
Exxon Mobil Corp. | 0.4% |
Merck & Company, Inc. | 0.4% |
Top Ten Total | 80.4% |
| | |
“Ten Largest Holdings” excludes any temporary cash or derivative investments. |
Average Annual Returns*,†
Periods Ended June 30, 2023
| 6 Month‡ | 1 Year | 5 Year | 10 Year |
Series A (StylePlus—Large Core Series) | 16.93% | 18.83% | 11.09% | 12.54% |
S&P 500 Index | 16.89% | 19.59% | 12.31% | 12.86% |
* | The performance data above represents past performance that is not predictive of future results. The investment return and principal value of an investment in the Fund will fluctuate so that an investor’s shares, when redeemed, may be worth more or less than their original cost. Returns are historical and include changes in principal and reinvested dividends and capital gains and do not reflect the effect of taxes. The S&P 500 Index is an unmanaged index and, unlike the Fund, has no management fees or operating expenses to reduce its reported return. |
† | Performance figures do not reflect fees and expenses associated with an investment in variable insurance products. If returns had taken into account these fees and expenses, performance would have been lower. Shares of a series of Guggenheim Variable Funds Trust are available only through the purchase of such products. |
‡ | 6 month returns are not annualized. |
| | THE GUGGENHEIM FUNDS SEMI-ANNUAL REPORT | 9 |
SCHEDULE OF INVESTMENTS (Unaudited) | June 30, 2023 |
SERIES A (STYLEPLUS—LARGE CORE SERIES) | |
| | Shares | | | Value | |
COMMON STOCKS† - 20.5% |
| | | | | | | | | |
Technology - 6.3% |
Apple, Inc. | | | 18,654 | | | $ | 3,618,316 | |
Microsoft Corp. | | | 9,162 | | | | 3,120,027 | |
NVIDIA Corp. | | | 1,866 | | | | 789,355 | |
QUALCOMM, Inc. | | | 5,241 | | | | 623,889 | |
Microchip Technology, Inc. | | | 6,528 | | | | 584,844 | |
Texas Instruments, Inc. | | | 3,218 | | | | 579,304 | |
NXP Semiconductor N.V. | | | 2,802 | | | | 573,513 | |
Applied Materials, Inc. | | | 3,680 | | | | 531,907 | |
NetApp, Inc. | | | 6,504 | | | | 496,906 | |
Cognizant Technology Solutions Corp. — Class A | | | 7,338 | | | | 479,025 | |
KLA Corp. | | | 938 | | | | 454,949 | |
Broadcom, Inc. | | | 478 | | | | 414,632 | |
Skyworks Solutions, Inc. | | | 3,610 | | | | 399,591 | |
HP, Inc. | | | 8,495 | | | | 260,881 | |
Akamai Technologies, Inc.* | | | 2,725 | | | | 244,896 | |
Teradyne, Inc. | | | 1,547 | | | | 172,227 | |
Adobe, Inc.* | | | 304 | | | | 148,653 | |
Workday, Inc. — Class A* | | | 621 | | | | 140,278 | |
Intuit, Inc. | | | 303 | | | | 138,832 | |
Total Technology | | | | | | | 13,772,025 | |
| | | | | | | | | |
Consumer, Non-cyclical - 4.2% |
Merck & Company, Inc. | | | 7,007 | | | | 808,538 | |
Pfizer, Inc. | | | 18,314 | | | | 671,758 | |
Bristol-Myers Squibb Co. | | | 9,259 | | | | 592,113 | |
Amgen, Inc. | | | 2,657 | | | | 589,907 | |
Gilead Sciences, Inc. | | | 7,236 | | | | 557,679 | |
Vertex Pharmaceuticals, Inc.* | | | 1,368 | | | | 481,413 | |
Viatris, Inc. | | | 47,334 | | | | 472,393 | |
Kimberly-Clark Corp. | | | 3,288 | | | | 453,941 | |
Incyte Corp.* | | | 7,257 | | | | 451,748 | |
Altria Group, Inc. | | | 9,033 | | | | 409,195 | |
Campbell Soup Co. | | | 8,420 | | | | 384,878 | |
Cardinal Health, Inc. | | | 3,759 | | | | 355,489 | |
Molina Healthcare, Inc.* | | | 1,128 | | | | 339,799 | |
Humana, Inc. | | | 742 | | | | 331,770 | |
HCA Healthcare, Inc. | | | 1,036 | | | | 314,405 | |
United Rentals, Inc. | | | 612 | | | | 272,567 | |
Quest Diagnostics, Inc. | | | 1,637 | | | | 230,097 | |
Regeneron Pharmaceuticals, Inc.* | | | 303 | | | | 217,718 | |
AbbVie, Inc. | | | 1,595 | | | | 214,894 | |
UnitedHealth Group, Inc. | | | 442 | | | | 212,443 | |
Organon & Co. | | | 7,541 | | | | 156,928 | |
Eli Lilly & Co. | | | 297 | | | | 139,287 | |
Johnson & Johnson | | | 839 | | | | 138,871 | |
Procter & Gamble Co. | | | 903 | | | | 137,021 | |
PepsiCo, Inc. | | | 714 | | | | 132,247 | |
Moderna, Inc.* | | | 1,030 | | | | 125,145 | |
Total Consumer, Non-cyclical | | | | | | | 9,192,244 | |
| | | | | | | | | |
Communications - 2.9% |
Alphabet, Inc. — Class C* | | | 13,539 | | | | 1,637,813 | |
Amazon.com, Inc.* | | | 7,987 | | | | 1,041,185 | |
Cisco Systems, Inc. | | | 13,857 | | | | 716,961 | |
Meta Platforms, Inc. — Class A* | | | 2,020 | | | | 579,699 | |
VeriSign, Inc.* | | | 2,062 | | | | 465,950 | |
Juniper Networks, Inc. | | | 14,822 | | | | 464,373 | |
F5, Inc.* | | | 3,010 | | | | 440,243 | |
eBay, Inc. | | | 7,519 | | | | 336,024 | |
Motorola Solutions, Inc. | | | 985 | | | | 288,881 | |
Booking Holdings, Inc.* | | | 87 | | | | 234,929 | |
Gen Digital, Inc. | | | 8,527 | | | | 158,176 | |
Total Communications | | | | | | | 6,364,234 | |
| | | | | | | | | |
Industrial - 2.6% |
Caterpillar, Inc. | | | 2,277 | | | | 560,256 | |
Masco Corp. | | | 8,877 | | | | 509,362 | |
3M Co. | | | 5,081 | | | | 508,557 | |
Dover Corp. | | | 3,351 | | | | 494,775 | |
Textron, Inc. | | | 7,185 | | | | 485,922 | |
Keysight Technologies, Inc.* | | | 2,788 | | | | 466,850 | |
Snap-on, Inc. | | | 1,595 | | | | 459,663 | |
Fortive Corp. | | | 5,530 | | | | 413,478 | |
Allegion plc | | | 2,985 | | | | 358,260 | |
Garmin Ltd. | | | 3,089 | | | | 322,152 | |
Expeditors International of Washington, Inc. | | | 2,366 | | | | 286,594 | |
Lockheed Martin Corp. | | | 550 | | | | 253,209 | |
Packaging Corporation of America | | | 1,846 | | | | 243,968 | |
Illinois Tool Works, Inc. | | | 876 | | | | 219,140 | |
Nordson Corp. | | | 584 | | | | 144,937 | |
Total Industrial | | | | | | | 5,727,123 | |
| | | | | | | | | |
Consumer, Cyclical - 2.2% |
PACCAR, Inc. | | | 6,670 | | | | 557,946 | |
Lowe’s Companies, Inc. | | | 2,429 | | | | 548,225 | |
Cummins, Inc. | | | 2,207 | | | | 541,068 | |
Yum! Brands, Inc. | | | 3,615 | | | | 500,858 | |
Home Depot, Inc. | | | 1,545 | | | | 479,939 | |
Lennar Corp. — Class A | | | 3,050 | | | | 382,195 | |
DR Horton, Inc. | | | 3,137 | | | | 381,742 | |
NVR, Inc.* | | | 58 | | | | 368,336 | |
PulteGroup, Inc. | | | 4,723 | | | | 366,883 | |
Tesla, Inc.* | | | 1,196 | | | | 313,077 | |
BorgWarner, Inc. | | | 4,807 | | | | 235,110 | |
Total Consumer, Cyclical | | | | | | | 4,675,379 | |
| | | | | | | | | |
Energy - 1.2% |
Exxon Mobil Corp. | | | 9,214 | | | | 988,202 | |
Valero Energy Corp. | | | 4,608 | | | | 540,518 | |
Marathon Petroleum Corp. | | | 4,622 | | | | 538,925 | |
Chevron Corp. | | | 1,549 | | | | 243,735 | |
Occidental Petroleum Corp. | | | 3,125 | | | | 183,750 | |
Phillips 66 | | | 1,381 | | | | 131,720 | |
Total Energy | | | | | | | 2,626,850 | |
| | | | | | | | | |
Financial - 0.7% |
Goldman Sachs Group, Inc. | | | 1,792 | | | | 577,992 | |
Berkshire Hathaway, Inc. — Class B* | | | 1,280 | | | | 436,480 | |
JPMorgan Chase & Co. | | | 1,641 | | | | 238,667 | |
10 | THE GUGGENHEIM FUNDS SEMI-ANNUAL REPORT | SEE NOTES TO FINANCIAL STATEMENTS. |
SCHEDULE OF INVESTMENTS (Unaudited)(continued) | June 30, 2023 |
SERIES A (STYLEPLUS—LARGE CORE SERIES) | |
| | Shares | | | Value | |
Visa, Inc. — Class A | | | 971 | | | $ | 230,593 | |
Mastercard, Inc. — Class A | | | 238 | | | | 93,605 | |
Total Financial | | | | | | | 1,577,337 | |
| | | | | | | | | |
Basic Materials - 0.2% |
CF Industries Holdings, Inc. | | | 4,087 | | | | 283,719 | |
Mosaic Co. | | | 5,236 | | | | 183,260 | |
Total Basic Materials | | | | | | | 466,979 | |
| | | | | | | | | |
Utilities - 0.2% |
Atmos Energy Corp. | | | 2,893 | | | | 336,572 | |
| | | | | | | | | |
Total Common Stocks | | | | |
(Cost $40,180,699) | | | | | | | 44,738,743 | |
| | | | | | | | | |
MUTUAL FUNDS† - 75.4% |
Guggenheim Strategy Fund III1 | | | 2,335,720 | | | | 56,641,218 | |
Guggenheim Variable Insurance Strategy Fund III1 | | | 2,276,951 | | | | 55,193,299 | |
Guggenheim Ultra Short Duration Fund — Institutional Class1 | | | 2,758,602 | | | | 26,841,198 | |
Guggenheim Strategy Fund II1 | | | 1,089,535 | | | | 26,388,542 | |
Total Mutual Funds | | | | |
(Cost $169,020,099) | | | | | | | 165,064,257 | |
| | | | | | | | | |
MONEY MARKET FUND† - 3.3% |
Dreyfus Treasury Securities Cash Management Fund — Institutional Shares, 4.96%2 | | | 7,227,129 | | | | 7,227,129 | |
Total Money Market Fund | | | | |
(Cost $7,227,129) | | | | | | | 7,227,129 | |
| | | | | | | | | |
Total Investments - 99.2% | | | | |
(Cost $216,427,927) | | $ | 217,030,129 | |
Other Assets & Liabilities, net - 0.8% | | | 1,819,885 | |
Total Net Assets - 100.0% | | $ | 218,850,014 | |
Futures Contracts |
Description | | Number of
Contracts | | | Expiration
Date | | | Notional
Amount | | | Value and
Unrealized
Appreciation** | |
Equity Futures Contracts Purchased† |
S&P 500 Index Mini Futures Contracts | | | 48 | | | | Sep 2023 | | | $ | 10,767,600 | | | $ | 13,315 | |
Total Return Swap Agreements |
Counterparty | Index | Type | Financing
Rate | | Payment
Frequency | | | Maturity
Date | | | Units | | | Notional
Amount | | | Value and
Unrealized
Appreciation | |
OTC Equity Index Swap Agreements†† |
Wells Fargo Bank, N.A. | S&P 500 Total Return Index | Pay | 5.55% (Federal Funds Rate + 0.47%) | | | At Maturity | | | | 09/29/23 | | | | 17,034 | | | $ | 162,839,419 | | | $ | — | |
* | Non-income producing security. |
** | Includes cumulative appreciation (depreciation). Variation margin is reported within the Statement of Assets and Liabilities. |
† | Value determined based on Level 1 inputs — See Note 4. |
†† | Value determined based on Level 2 inputs — See Note 4. |
1 | Affiliated issuer. |
2 | Rate indicated is the 7-day yield as of June 30, 2023. |
| | plc — Public Limited Company |
| | |
| | See Sector Classification in Other Information section. |
SEE NOTES TO FINANCIAL STATEMENTS. | THE GUGGENHEIM FUNDS SEMI-ANNUAL REPORT | 11 |
SCHEDULE OF INVESTMENTS (Unaudited)(concluded) | June 30, 2023 |
SERIES A (STYLEPLUS—LARGE CORE SERIES) | |
The following table summarizes the inputs used to value the Fund’s investments at June 30, 2023 (See Note 4 in the Notes to Financial Statements):
Investments in Securities (Assets) | | Level 1
Quoted
Prices | | | Level 2
Significant
Observable
Inputs | | | Level 3
Significant
Unobservable
Inputs | | | Total | |
Common Stocks | | $ | 44,738,743 | | | $ | — | | | $ | — | | | $ | 44,738,743 | |
Mutual Funds | | | 165,064,257 | | | | — | | | | — | | | | 165,064,257 | |
Money Market Fund | | | 7,227,129 | | | | — | | | | — | | | | 7,227,129 | |
Equity Futures Contracts** | | | 13,315 | | | | — | | | | — | | | | 13,315 | |
Equity Index Swap Agreements** | | | — | | | | — | * | | | — | | | | — | |
Total Assets | | $ | 217,043,444 | | | $ | — | | | $ | — | | | $ | 217,043,444 | |
* | Security has a market value of $0. |
** | This derivative is reported as unrealized appreciation/depreciation at period end. |
Affiliated Transactions
Investments representing 5% or more of the outstanding voting shares of a company, or control of or by, or common control under Guggenheim Investments (“GI”), result in that company being considered an affiliated issuer, as defined in the 1940 Act.
The Fund may invest in certain of the underlying series of Guggenheim Strategy Funds Trust, including Guggenheim Strategy Fund II, Guggenheim Strategy Fund III, and Guggenheim Variable Insurance Strategy Fund III, (collectively, the “Short Term Investment Vehicles”), each of which are open-end management investment companies managed by GI. The Short Term Investment Vehicles, which launched on March 11, 2014, are offered as short term investment options only to mutual funds, trusts, and other accounts managed by GI and/or its affiliates, and are not available to the public. The Short Term Investment Vehicles pay no investment management fees. The Short Term Investment Vehicles’ annual report on Form N-CSR dated September 30, 2022, is available publicly or upon request. This information is available from the EDGAR database on the SEC’s website at https://www.sec.gov/Archives/edgar/data/1601445/000182126822000340/gug84768.htm. The Fund may invest in certain of the underlying series of Guggenheim Funds Trust, which are open-end management investment companies managed by GI, are available to the public and whose most recent annual report on Form N-CSR is available publicly or upon request.
Transactions during the period ended June 30, 2023, in which the company is an affiliated issuer, were as follows:
Security Name | | Value
12/31/22 | | | Additions | | | Reductions | | | Realized
Gain (Loss) | | | Change in
Unrealized
Appreciation
(Depreciation) | | | Value
06/30/23 | | | Shares
06/30/23 | | | Investment
Income | |
Mutual Funds | | | | | | | | | | | | | | | | | | | | | | | | | | | | | | | | |
Guggenheim Strategy Fund II | | $ | 21,079,040 | | | $ | 10,767,192 | | | $ | (5,622,140 | ) | | $ | (17,513 | ) | | $ | 181,963 | | | $ | 26,388,542 | | | | 1,089,535 | | | $ | 493,914 | |
Guggenheim Strategy Fund III | | | 54,778,133 | | | | 1,431,070 | | | | — | | | | — | | | | 432,015 | | | | 56,641,218 | | | | 2,335,720 | | | | 1,427,918 | |
Guggenheim Ultra Short Duration Fund — Institutional Class | | | 25,924,450 | | | | 674,561 | | | | — | | | | — | | | | 242,187 | | | | 26,841,198 | | | | 2,758,602 | | | | 673,088 | |
Guggenheim Variable Insurance Strategy Fund III | | | 53,430,927 | | | | 1,385,751 | | | | — | | | | — | | | | 376,621 | | | | 55,193,299 | | | | 2,276,951 | | | | 1,382,395 | |
| | | $ | 155,212,550 | | | $ | 14,258,574 | | | $ | (5,622,140 | ) | | $ | (17,513 | ) | | $ | 1,232,786 | | | $ | 165,064,257 | | | | | | | $ | 3,977,315 | |
12 | THE GUGGENHEIM FUNDS SEMI-ANNUAL REPORT | SEE NOTES TO FINANCIAL STATEMENTS. |
SERIES A (STYLEPLUS—LARGE CORE SERIES) | |
STATEMENT OF ASSETS AND LIABILITIES (Unaudited) |
June 30, 2023 |
Assets: |
Investments in unaffiliated issuers, at value (cost $47,407,828) | | $ | 51,965,872 | |
Investments in affiliated issuers, at value (cost $169,020,099) | | | 165,064,257 | |
Segregated cash with broker | | | 53,000 | |
Prepaid expenses | | | 9,801 | |
Receivables: |
Swap settlement | | | 23,604,891 | |
Dividends | | | 757,921 | |
Interest | | | 23,491 | |
Variation margin on futures contracts | | | 9,485 | |
Total assets | | | 241,488,718 | |
| | | | | |
Liabilities: |
Overdraft due to custodian bank | | | 5,302 | |
Segregated cash due to broker | | | 21,490,000 | |
Payable for: |
Securities purchased | | | 778,382 | |
Fund shares redeemed | | | 129,783 | |
Management fees | | | 80,943 | |
Distribution and service fees | | | 42,409 | |
Fund accounting/administration fees | | | 2,427 | |
Trustees’ fees* | | | 2,324 | |
Transfer agent/maintenance fees | | | 2,064 | |
Miscellaneous | | | 105,070 | |
Total liabilities | | | 22,638,704 | |
Net assets | | $ | 218,850,014 | |
| | | | | |
Net assets consist of: |
Paid in capital | | $ | 213,435,666 | |
Total distributable earnings (loss) | | | 5,414,348 | |
Net assets | | $ | 218,850,014 | |
Capital shares outstanding | | | 5,739,823 | |
Net asset value per share | | $ | 38.13 | |
STATEMENT OF OPERATIONS (Unaudited) |
Six Months Ended June 30, 2023 |
Investment Income: |
Dividends from securities of unaffiliated issuers (net of foreign withholding tax of $814) | | $ | 382,055 | |
Dividends from securities of affiliated issuers | | | 3,977,315 | |
Interest | | | 176,770 | |
Total investment income | | | 4,536,140 | |
| | | | | |
Expenses: |
Management fees | | | 764,296 | |
Distribution and service fees | | | 253,210 | |
Transfer agent/maintenance fees | | | 12,407 | |
Interest expense | | | 242,639 | |
Fund accounting/administration fees | | | 46,195 | |
Custodian fees | | | 15,986 | |
Professional fees | | | 9,178 | |
Trustees’ fees* | | | 7,517 | |
Line of credit fees | | | 3,341 | |
Miscellaneous | | | 5,216 | |
Total expenses | | | 1,359,985 | |
Less: |
Expenses reimbursed by Adviser | | | (3,544 | ) |
Expenses waived by Adviser | | | (249,019 | ) |
Earnings credits applied | | | (6,523 | ) |
Total waived/reimbursed expenses | | | (259,086 | ) |
Net expenses | | | 1,100,899 | |
Net investment income | | | 3,435,241 | |
| | | | | |
Net Realized and Unrealized Gain (Loss): |
Net realized gain (loss) on: |
Investments in unaffiliated issuers | | | 683,718 | |
Investments in affiliated issuers | | | (17,513 | ) |
Swap agreements | | | 23,641,953 | |
Futures contracts | | | 516,547 | |
Net realized loss | | | 24,824,705 | |
Net change in unrealized appreciation (depreciation) on: |
Investments in unaffiliated issuers | | | 4,889,905 | |
Investments in affiliated issuers | | | 1,232,786 | |
Swap agreements | | | (2,201,633 | ) |
Futures contracts | | | 106,195 | |
Net change in unrealized appreciation (depreciation) | | | 4,027,253 | |
Net realized and unrealized gain | | | 28,851,958 | |
Net increase in net assets resulting from operations | | $ | 32,287,199 | |
* | Relates to Trustees not deemed “interested persons” within the meaning of Section 2(a)(19) of the 1940 Act. |
SEE NOTES TO FINANCIAL STATEMENTS. | THE GUGGENHEIM FUNDS SEMI-ANNUAL REPORT | 13 |
SERIES A (STYLEPLUS—LARGE CORE SERIES) | |
STATEMENTS OF CHANGES IN NET ASSETS |
| | Six Months Ended
June 30, 2023
(Unaudited) | | | Year Ended
December 31,
2022 | |
Increase (Decrease) in Net Assets from Operations: | | | | | | | | |
Net investment income | | $ | 3,435,241 | | | $ | 3,382,560 | |
Net realized loss on investments | | | 24,824,705 | | | | (26,632,209 | ) |
Net change in unrealized appreciation (depreciation) on investments | | | 4,027,253 | | | | (31,208,128 | ) |
Net increase (decrease) in net assets resulting from operations | | | 32,287,199 | | | | (54,457,777 | ) |
| | | | | | | | | |
Distributions to shareholders | | | — | | | | (58,728,698 | ) |
| | | | | | | | | |
Capital share transactions: | | | | | | | | |
Proceeds from sale of shares | | | 2,261,643 | | | | 3,989,714 | |
Distributions reinvested | | | — | | | | 58,728,698 | |
Cost of shares redeemed | | | (11,813,312 | ) | | | (23,388,008 | ) |
Net increase (decrease) from capital share transactions | | | (9,551,669 | ) | | | 39,330,404 | |
Net increase (decrease) in net assets | | | 22,735,530 | | | | (73,856,071 | ) |
| | | | | | | | | |
Net assets: | | | | | | | | |
Beginning of period | | | 196,114,484 | | | | 269,970,555 | |
End of period | | $ | 218,850,014 | | | $ | 196,114,484 | |
| | | | | | | | | |
Capital share activity: | | | | | | | | |
Shares sold | | | 58,959 | | | | 85,664 | |
Shares issued from reinvestment of distributions | | | — | | | | 1,731,388 | |
Shares redeemed | | | (332,977 | ) | | | (556,929 | ) |
Net increase (decrease) in shares | | | (274,018 | ) | | | 1,260,123 | |
14 | THE GUGGENHEIM FUNDS SEMI-ANNUAL REPORT | SEE NOTES TO FINANCIAL STATEMENTS. |
SERIES A (STYLEPLUS—LARGE CORE SERIES) | |
This table is presented to show selected data for a share outstanding throughout each period and to assist shareholders in evaluating a Fund’s performance for the periods presented.
| | Six Months Ended
June 30, 2023a | | | Year Ended
December 31,
2022 | | | Year Ended
December 31,
2021 | | | Year Ended
December 31,
2020 | | | Year Ended
December 31,
2019 | | | Year Ended
December 31,
2018 | |
Per Share Data |
Net asset value, beginning of period | | $ | 32.61 | | | $ | 56.79 | | | $ | 49.39 | | | $ | 44.24 | | | $ | 36.80 | | | $ | 45.50 | |
Income (loss) from investment operations: |
Net investment income (loss)b | | | .59 | | | | .64 | | | | .26 | | | | .38 | | | | .68 | | | | .83 | |
Net gain (loss) on investments (realized and unrealized) | | | 4.93 | | | | (11.88 | ) | | | 13.22 | | | | 7.46 | | | | 10.06 | | | | (3.10 | ) |
Total from investment operations | | | 5.52 | | | | (11.24 | ) | | | 13.48 | | | | 7.84 | | | | 10.74 | | | | (2.27 | ) |
Less distributions from: |
Net investment income | | | — | | | | (.27 | ) | | | (.41 | ) | | | (.74 | ) | | | (.91 | ) | | | (.75 | ) |
Net realized gains | | | — | | | | (12.67 | ) | | | (5.67 | ) | | | (1.95 | ) | | | (2.39 | ) | | | (5.68 | ) |
Total distributions | | | — | | | | (12.94 | ) | | | (6.08 | ) | | | (2.69 | ) | | | (3.30 | ) | | | (6.43 | ) |
Net asset value, end of period | | $ | 38.13 | | | $ | 32.61 | | | $ | 56.79 | | | $ | 49.39 | | | $ | 44.24 | | | $ | 36.80 | |
|
Total Returnc | | | 16.93 | % | | | (20.67 | %) | | | 28.48 | % | | | 18.78 | % | | | 29.97 | % | | | (6.56 | %) |
Ratios/Supplemental Data |
Net assets, end of period (in thousands) | | $ | 218,850 | | | $ | 196,114 | | | $ | 269,971 | | | $ | 230,088 | | | $ | 218,082 | | | $ | 190,644 | |
Ratios to average net assets: |
Net investment income (loss) | | | 3.37 | % | | | 1.54 | % | | | 0.49 | % | | | 0.88 | % | | | 1.65 | % | | | 1.89 | % |
Total expensesd | | | 1.33 | % | | | 1.18 | % | | | 1.14 | % | | | 1.22 | % | | | 1.27 | % | | | 1.26 | % |
Net expensese,f,g | | | 1.09 | % | | | 0.92 | % | | | 0.85 | % | | | 0.89 | % | | | 0.95 | % | | | 0.97 | % |
Portfolio turnover rate | | | 24 | % | | | 63 | % | | | 34 | % | | | 63 | % | | | 41 | % | | | 45 | % |
a | Unaudited figures for the period ended June 30, 2023. Percentage amounts for the period, except total return and portfolio turnover rate, have been annualized. |
b | Net investment income (loss) per share was computed using average shares outstanding throughout the period. |
c | Total return does not take into account any of the expenses associated with an investment in variable insurance products. If total return had taken into account these expenses, performance would have been lower. Shares of a series of Guggenheim Variable Funds Trust are available only through the purchase of such products. |
d | Does not include expenses of the underlying funds in which the Fund invests. |
e | Net expense information reflects the expense ratios after expense waivers and reimbursements, as applicable. |
f | The portion of the ratios of net expenses to average net assets attributable to recoupments of prior fee reductions or expense reimbursements for the years presented was as follows: |
| | 06/30/23a | 12/31/22 | 12/31/21 | 12/31/20 | 12/31/19 | 12/31/18 |
| | — | — | — | — | — | 0.02% |
g | Net expenses may include expenses that are excluded from the expense limitation agreement. Excluding these expenses, the net expense ratios for the years presented would be: |
| | 06/30/23a | 12/31/22 | 12/31/21 | 12/31/20 | 12/31/19 | 12/31/18 |
| | 0.85% | 0.87% | 0.84% | 0.87% | 0.89% | 0.91% |
SEE NOTES TO FINANCIAL STATEMENTS. | THE GUGGENHEIM FUNDS SEMI-ANNUAL REPORT | 15 |
PERFORMANCE REPORT AND FUND PROFILE (Unaudited) | June 30, 2023 |
SERIES B (LARGE CAP VALUE SERIES)
OBJECTIVE: Seeks long-term growth of capital.
Holdings Diversification (Market Exposure as % of Net Assets)
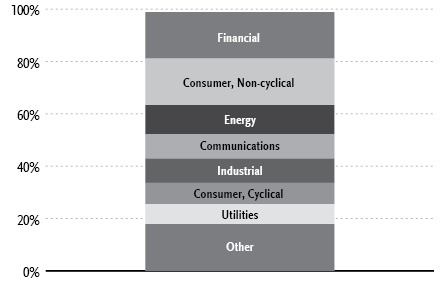
“Holdings Diversification (Market Exposure as % of Net Assets)” excludes any temporary cash investments.
Inception Date: May 1, 1979 |
Ten Largest Holdings | % of Total Net Assets |
iShares Russell 1000 Value ETF | 3.3% |
Chevron Corp. | 2.6% |
Johnson & Johnson | 2.5% |
Verizon Communications, Inc. | 2.4% |
Berkshire Hathaway, Inc. — Class B | 2.3% |
JPMorgan Chase & Co. | 2.3% |
ConocoPhillips | 2.2% |
Bank of America Corp. | 2.1% |
Curtiss-Wright Corp. | 1.9% |
OGE Energy Corp. | 1.9% |
Top Ten Total | 23.5% |
| | |
“Ten Largest Holdings” excludes any temporary cash investments. |
Average Annual Returns*,†
Periods Ended June 30, 2023
| 6 Month‡ | 1 Year | 5 Year | 10 Year |
Series B (Large Cap Value Series) | 4.39% | 11.80% | 8.28% | 9.42% |
Russell 1000 Value Index | 5.12% | 11.54% | 8.11% | 9.22% |
* | The performance data above represents past performance that is not predictive of future results. The investment return and principal value of an investment in the Fund will fluctuate so that an investor’s shares, when redeemed, may be worth more or less than their original cost. Returns are historical and include changes in principal and reinvested dividends and capital gains and do not reflect the effect of taxes. The Russell 1000 Value Index is an unmanaged index and, unlike the Fund, has no management fees or operating expenses to reduce its reported return. |
† | Performance figures do not reflect fees and expenses associated with an investment in variable insurance products. If returns had taken into account these fees and expenses, performance would have been lower. Shares of a series of Guggenheim Variable Funds Trust are available only through the purchase of such products. |
‡ | 6 month returns are not annualized. |
16 | THE GUGGENHEIM FUNDS SEMI-ANNUAL REPORT | |
SCHEDULE OF INVESTMENTS (Unaudited) | June 30, 2023 |
SERIES B (LARGE CAP VALUE SERIES) | |
| | Shares | | | Value | |
COMMON STOCKS† - 95.5% |
| | | | | | | | | |
Financial - 17.8% |
Berkshire Hathaway, Inc. — Class B* | | | 13,678 | | | $ | 4,664,198 | |
JPMorgan Chase & Co. | | | 31,888 | | | | 4,637,791 | |
Bank of America Corp. | | | 147,817 | | | | 4,240,870 | |
Mastercard, Inc. — Class A | | | 7,053 | | | | 2,773,945 | |
Jefferies Financial Group, Inc. | | | 66,119 | | | | 2,193,167 | |
American Tower Corp. — Class A REIT | | | 10,953 | | | | 2,124,225 | |
Ventas, Inc. REIT | | | 44,132 | | | | 2,086,120 | |
Charles Schwab Corp. | | | 34,239 | | | | 1,940,667 | |
Unum Group | | | 39,083 | | | | 1,864,259 | |
Goldman Sachs Group, Inc. | | | 5,570 | | | | 1,796,548 | |
Wells Fargo & Co. | | | 39,933 | | | | 1,704,340 | |
Synovus Financial Corp. | | | 51,898 | | | | 1,569,914 | |
First Horizon Corp. | | | 136,163 | | | | 1,534,557 | |
STAG Industrial, Inc. REIT | | | 34,679 | | | | 1,244,282 | |
Markel Group, Inc.* | | | 780 | | | | 1,078,881 | |
T. Rowe Price Group, Inc. | | | 8,571 | | | | 960,123 | |
Total Financial | | | | | | | 36,413,887 | |
| | | | | | | | | |
Consumer, Non-cyclical - 17.8% |
Johnson & Johnson | | | 30,481 | | | | 5,045,215 | |
Ingredion, Inc. | | | 31,921 | | | | 3,382,030 | |
Quest Diagnostics, Inc. | | | 23,274 | | | | 3,271,393 | |
Tyson Foods, Inc. — Class A | | | 60,213 | | | | 3,073,271 | |
Medtronic plc | | | 34,609 | | | | 3,049,053 | |
Archer-Daniels-Midland Co. | | | 33,763 | | | | 2,551,132 | |
Henry Schein, Inc.* | | | 29,932 | | | | 2,427,485 | |
Humana, Inc. | | | 4,978 | | | | 2,225,813 | |
Encompass Health Corp. | | | 31,362 | | | | 2,123,521 | |
Merck & Company, Inc. | | | 18,090 | | | | 2,087,405 | |
HCA Healthcare, Inc. | | | 6,743 | | | | 2,046,366 | |
Bunge Ltd. | | | 16,341 | | | | 1,541,774 | |
Euronet Worldwide, Inc.* | | | 12,016 | | | | 1,410,318 | |
Moderna, Inc.* | | | 8,817 | | | | 1,071,265 | |
Pfizer, Inc. | | | 26,058 | | | | 955,808 | |
Total Consumer, Non-cyclical | | | | | | | 36,261,849 | |
| | | | | | | | | |
Energy - 11.0% |
Chevron Corp. | | | 34,320 | | | | 5,400,252 | |
ConocoPhillips | | | 44,111 | | | | 4,570,341 | |
Diamondback Energy, Inc. | | | 22,484 | | | | 2,953,498 | |
Coterra Energy, Inc. — Class A | | | 91,049 | | | | 2,303,540 | |
Equities Corp. | | | 50,365 | | | | 2,071,513 | |
Pioneer Natural Resources Co. | | | 9,045 | | | | 1,873,943 | |
Kinder Morgan, Inc. | | | 95,042 | | | | 1,636,623 | |
Marathon Oil Corp. | | | 69,368 | | | | 1,596,851 | |
Total Energy | | | | | | | 22,406,561 | |
| | | | | | | | | |
Communications - 9.4% |
Verizon Communications, Inc. | | | 132,534 | | | | 4,928,939 | |
Alphabet, Inc. — Class A* | | | 24,718 | | | | 2,958,745 | |
Comcast Corp. — Class A | | | 66,547 | | | | 2,765,028 | |
Cisco Systems, Inc. | | | 46,985 | | | | 2,431,004 | |
Walt Disney Co.* | | | 22,077 | | | | 1,971,034 | |
Fox Corp. — Class B | | | 51,667 | | | | 1,647,661 | |
Juniper Networks, Inc. | | | 43,590 | | | | 1,365,675 | |
T-Mobile US, Inc.* | | | 7,508 | | | | 1,042,861 | |
Total Communications | | | | | | | 19,110,947 | |
| | | | | | | | | |
Industrial - 9.3% |
Curtiss-Wright Corp. | | | 20,865 | | | | 3,832,066 | |
Johnson Controls International plc | | | 48,216 | | | | 3,285,438 | |
Knight-Swift Transportation Holdings, Inc. | | | 52,061 | | | | 2,892,509 | |
Advanced Energy Industries, Inc. | | | 23,086 | | | | 2,572,935 | |
Eagle Materials, Inc. | | | 13,566 | | | | 2,528,974 | |
L3Harris Technologies, Inc. | | | 11,920 | | | | 2,333,578 | |
Teledyne Technologies, Inc.* | | | 3,621 | | | | 1,488,629 | |
Total Industrial | | | | | | | 18,934,129 | |
| | | | | | | | | |
Consumer, Cyclical - 8.0% |
Walmart, Inc. | | | 23,914 | | | | 3,758,802 | |
Ferguson plc | | | 19,086 | | | | 3,002,419 | |
Delta Air Lines, Inc. | | | 62,440 | | | | 2,968,398 | |
Lear Corp. | | | 15,549 | | | | 2,232,059 | |
Whirlpool Corp. | | | 11,825 | | | | 1,759,442 | |
Southwest Airlines Co. | | | 47,188 | | | | 1,708,677 | |
MSC Industrial Direct Company, Inc. — Class A | | | 10,556 | | | | 1,005,776 | |
Total Consumer, Cyclical | | | | | | | 16,435,573 | |
| | | | | | | | | |
Utilities - 7.6% |
OGE Energy Corp. | | | 106,476 | | | | 3,823,553 | |
Edison International | | | 42,789 | | | | 2,971,696 | |
Pinnacle West Capital Corp. | | | 34,050 | | | | 2,773,713 | |
Exelon Corp. | | | 61,531 | | | | 2,506,773 | |
Duke Energy Corp. | | | 19,722 | | | | 1,769,852 | |
Black Hills Corp. | | | 26,749 | | | | 1,611,895 | |
Total Utilities | | | | | | | 15,457,482 | |
| | | | | | | | | |
Basic Materials - 7.5% |
Westlake Corp. | | | 30,967 | | | | 3,699,628 | |
Reliance Steel & Aluminum Co. | | | 10,519 | | | | 2,856,855 | |
Huntsman Corp. | | | 105,501 | | | | 2,850,637 | |
Nucor Corp. | | | 14,162 | | | | 2,322,285 | |
Freeport-McMoRan, Inc. | | | 52,034 | | | | 2,081,360 | |
DuPont de Nemours, Inc. | | | 21,889 | | | | 1,563,750 | |
Total Basic Materials | | | | | | | 15,374,515 | |
| | | | | | | | | |
Technology - 7.1% |
KLA Corp. | | | 6,419 | | | | 3,113,343 | |
Microsoft Corp. | | | 7,429 | | | | 2,529,872 | |
Teradyne, Inc. | | | 22,246 | | | | 2,476,647 | |
Fiserv, Inc.* | | | 17,379 | | | | 2,192,361 | |
Leidos Holdings, Inc. | | | 23,089 | | | | 2,042,915 | |
Amdocs Ltd. | | | 15,609 | | | | 1,542,949 | |
MACOM Technology Solutions Holdings, Inc.* | | | 9,152 | | | | 599,731 | |
Total Technology | | | | | | | 14,497,818 | |
| | | | | | | | | |
Total Common Stocks | | | | |
(Cost $159,374,237) | | | | | | | 194,892,761 | |
| | | | | | | | | |
SEE NOTES TO FINANCIAL STATEMENTS. | THE GUGGENHEIM FUNDS SEMI-ANNUAL REPORT | 17 |
SCHEDULE OF INVESTMENTS (Unaudited)(concluded) | June 30, 2023 |
SERIES B (LARGE CAP VALUE SERIES) | |
| | Shares | | | Value | |
EXCHANGE-TRADED FUNDS† - 3.3% |
iShares Russell 1000 Value ETF | | | 42,314 | | | $ | 6,678,418 | |
Total Exchange-Traded Funds | | | | |
(Cost $6,435,560) | | | | | | | 6,678,418 | |
| | | | | | | | | |
MONEY MARKET FUND† - 1.2% |
Dreyfus Treasury Securities Cash Management Fund — Institutional Shares, 4.96%1 | | | 2,526,977 | | | | 2,526,977 | |
Total Money Market Fund | | | | |
(Cost $2,526,977) | | | | | | | 2,526,977 | |
| | | | | | | | | |
Total Investments - 100.0% | | | | |
(Cost $168,336,774) | | $ | 204,098,156 | |
Other Assets & Liabilities, net - (0.0)% | | | (64,981 | ) |
Total Net Assets - 100.0% | | $ | 204,033,175 | |
* | Non-income producing security. |
† | Value determined based on Level 1 inputs — See Note 4. |
1 | Rate indicated is the 7-day yield as of June 30, 2023. |
| | plc — Public Limited Company |
| | REIT — Real Estate Investment Trust |
| | |
| | See Sector Classification in Other Information section. |
The following table summarizes the inputs used to value the Fund’s investments at June 30, 2023 (See Note 4 in the Notes to Financial Statements):
Investments in Securities (Assets) | | Level 1
Quoted
Prices | | | Level 2
Significant
Observable
Inputs | | | Level 3
Significant
Unobservable
Inputs | | | Total | |
Common Stocks | | $ | 194,892,761 | | | $ | — | | | $ | — | | | $ | 194,892,761 | |
Exchange-Traded Funds | | | 6,678,418 | | | | — | | | | — | | | | 6,678,418 | |
Money Market Fund | | | 2,526,977 | | | | — | | | | — | | | | 2,526,977 | |
Total Assets | | $ | 204,098,156 | | | $ | — | | | $ | — | | | $ | 204,098,156 | |
18 | THE GUGGENHEIM FUNDS SEMI-ANNUAL REPORT | SEE NOTES TO FINANCIAL STATEMENTS. |
SERIES B (LARGE CAP VALUE SERIES) | |
STATEMENT OF ASSETS AND LIABILITIES (Unaudited) |
June 30, 2023 |
Assets: |
Investments, at value (cost $168,336,774) | | $ | 204,098,156 | |
Prepaid expenses | | | 894 | |
Receivables: |
Dividends | | | 230,189 | |
Interest | | | 12,834 | |
Fund shares sold | | | 80 | |
Total assets | | | 204,342,153 | |
| | | | | |
Liabilities: |
Payable for: |
Fund shares redeemed | | | 137,656 | |
Management fees | | | 75,551 | |
Distribution and service fees | | | 41,686 | |
Professional fees | | | 29,165 | |
Fund accounting/administration fees | | | 2,330 | |
Transfer agent/maintenance fees | | | 2,062 | |
Trustees’ fees* | | | 133 | |
Miscellaneous | | | 20,395 | |
Total liabilities | | | 308,978 | |
Net assets | | $ | 204,033,175 | |
| | | | | |
Net assets consist of: |
Paid in capital | | $ | 132,194,173 | |
Total distributable earnings (loss) | | | 71,839,002 | |
Net assets | | $ | 204,033,175 | |
Capital shares outstanding | | | 4,739,293 | |
Net asset value per share | | $ | 43.05 | |
STATEMENT OF OPERATIONS (Unaudited) |
Six Months Ended June 30, 2023 |
Investment Income: |
Dividends | | $ | 2,438,322 | |
Interest | | | 133,917 | |
Total investment income | | | 2,572,239 | |
| | | | | |
Expenses: |
Management fees | | | 669,472 | |
Distribution and service fees | | | 257,489 | |
Transfer agent/maintenance fees | | | 12,458 | |
Fund accounting/administration fees | | | 46,664 | |
Professional fees | | | 34,084 | |
Trustees’ fees* | | | 8,190 | |
Line of credit fees | | | 3,508 | |
Custodian fees | | | 3,075 | |
Miscellaneous | | | 15,654 | |
Total expenses | | | 1,050,594 | |
Less: |
Expenses waived by Adviser | | | (255,049 | ) |
Net expenses | | | 795,545 | |
Net investment income | | | 1,776,694 | |
| | | | | |
Net Realized and Unrealized Gain (Loss): |
Net realized gain (loss) on: |
Investments | | | 11,073,874 | |
Net realized gain | | | 11,073,874 | |
Net change in unrealized appreciation (depreciation) on: |
Investments | | | (3,999,779 | ) |
Net change in unrealized appreciation (depreciation) | | | (3,999,779 | ) |
Net realized and unrealized gain | | | 7,074,095 | |
Net increase in net assets resulting from operations | | $ | 8,850,789 | |
* | Relates to Trustees not deemed “interested persons” within the meaning of Section 2(a)(19) of the 1940 Act. |
SEE NOTES TO FINANCIAL STATEMENTS. | THE GUGGENHEIM FUNDS SEMI-ANNUAL REPORT | 19 |
SERIES B (LARGE CAP VALUE SERIES) | |
STATEMENTS OF CHANGES IN NET ASSETS |
| | Six Months Ended
June 30, 2023
(Unaudited) | | | Year Ended
December 31,
2022 | |
Increase (Decrease) in Net Assets from Operations: | | | | | | | | |
Net investment income | | $ | 1,776,694 | | | $ | 3,395,583 | |
Net realized gain on investments | | | 11,073,874 | | | | 22,517,356 | |
Net change in unrealized appreciation (depreciation) on investments | | | (3,999,779 | ) | | | (29,032,822 | ) |
Net increase (decrease) in net assets resulting from operations | | | 8,850,789 | | | | (3,119,883 | ) |
| | | | | | | | | |
Distributions to shareholders | | | — | | | | (22,853,023 | ) |
| | | | | | | | | |
Capital share transactions: | | | | | | | | |
Proceeds from sale of shares | | | 752,959 | | | | 4,727,951 | |
Distributions reinvested | | | — | | | | 22,853,023 | |
Cost of shares redeemed | | | (17,908,068 | ) | | | (26,087,637 | ) |
Net increase (decrease) from capital share transactions | | | (17,155,109 | ) | | | 1,493,337 | |
Net decrease in net assets | | | (8,304,320 | ) | | | (24,479,569 | ) |
| | | | | | | | | |
Net assets: | | | | | | | | |
Beginning of period | | | 212,337,495 | | | | 236,817,064 | |
End of period | | $ | 204,033,175 | | | $ | 212,337,495 | |
| | | | | | | | | |
Capital share activity: | | | | | | | | |
Shares sold | | | 18,037 | | | | 112,131 | |
Shares issued from reinvestment of distributions | | | — | | | | 575,788 | |
Shares redeemed | | | (427,690 | ) | | | (598,577 | ) |
Net increase (decrease) in shares | | | (409,653 | ) | | | 89,342 | |
20 | THE GUGGENHEIM FUNDS SEMI-ANNUAL REPORT | SEE NOTES TO FINANCIAL STATEMENTS. |
SERIES B (LARGE CAP VALUE SERIES) | |
This table is presented to show selected data for a share outstanding throughout each period and to assist shareholders in evaluating a Fund’s performance for the periods presented.
| | Six Months Ended
June 30, 2023a | | | Year Ended
December 31,
2022 | | | Year Ended
December 31,
2021 | | | Year Ended
December 31,
2020 | | | Year Ended
December 31,
2019 | | | Year Ended
December 31,
2018 | |
Per Share Data |
Net asset value, beginning of period | | $ | 41.24 | | | $ | 46.81 | | | $ | 37.61 | | | $ | 40.55 | | | $ | 36.14 | | | $ | 43.36 | |
Income (loss) from investment operations: |
Net investment income (loss)b | | | .36 | | | | .67 | | | | .52 | | | | .82 | | | | .72 | | | | .65 | |
Net gain (loss) on investments (realized and unrealized) | | | 1.45 | | | | (1.48 | ) | | | 9.58 | | | | (.51 | ) | | | 6.93 | | | | (4.42 | ) |
Total from investment operations | | | 1.81 | | | | (.81 | ) | | | 10.10 | | | | .31 | | | | 7.65 | | | | (3.77 | ) |
Less distributions from: |
Net investment income | | | — | | | | (.60 | ) | | | (.90 | ) | | | (.74 | ) | | | (.72 | ) | | | (.58 | ) |
Net realized gains | | | — | | | | (4.16 | ) | | | — | g | | | (2.51 | ) | | | (2.52 | ) | | | (2.87 | ) |
Total distributions | | | — | | | | (4.76 | ) | | | (.90 | ) | | | (3.25 | ) | | | (3.24 | ) | | | (3.45 | ) |
Net asset value, end of period | | $ | 43.05 | | | $ | 41.24 | | | $ | 46.81 | | | $ | 37.61 | | | $ | 40.55 | | | $ | 36.14 | |
|
Total Returnc | | | 4.39 | % | | | (1.32 | %) | | | 27.03 | % | | | 2.21 | % | | | 21.82 | % | | | (9.53 | %) |
Ratios/Supplemental Data |
Net assets, end of period (in thousands) | | $ | 204,033 | | | $ | 212,337 | | | $ | 236,817 | | | $ | 208,548 | | | $ | 226,968 | | | $ | 207,167 | |
Ratios to average net assets: |
Net investment income (loss) | | | 1.73 | % | | | 1.53 | % | | | 1.20 | % | | | 2.40 | % | | | 1.86 | % | | | 1.54 | % |
Total expensesd | | | 1.02 | % | | | 1.02 | % | | | 1.03 | % | | | 1.09 | % | | | 1.07 | % | | | 1.07 | % |
Net expensese,f | | | 0.77 | % | | | 0.78 | % | | | 0.79 | % | | | 0.79 | % | | | 0.80 | % | | | 0.80 | % |
Portfolio turnover rate | | | 14 | % | | | 25 | % | | | 22 | % | | | 19 | % | | | 32 | % | | | 21 | % |
a | Unaudited figures for the period ended June 30, 2023. Percentage amounts for the period, except total return and portfolio turnover rate, have been annualized. |
b | Net investment income (loss) per share was computed using average shares outstanding throughout the period. |
c | Total return does not take into account any of the expenses associated with an investment in variable insurance products. If total return had taken into account these expenses, performance would have been lower. Shares of a series of Guggenheim Variable Funds Trust are available only through the purchase of such products. |
d | Does not include expenses of the underlying funds in which the Fund invests. |
e | Net expense information reflects the expense ratios after expense waivers and reimbursements, as applicable. |
f | Net expenses may include expenses that are excluded from the expense limitation agreement. Excluding these expenses, the net expense ratios for the years presented would be: |
| | 06/30/23a | 12/31/22 | 12/31/21 | 12/31/20 | 12/31/19 | 12/31/18 |
| | 0.77% | 0.78% | 0.79% | 0.79% | 0.80% | 0.80% |
g | Distributions from realized gains are less than $0.01 per share. |
SEE NOTES TO FINANCIAL STATEMENTS. | THE GUGGENHEIM FUNDS SEMI-ANNUAL REPORT | 21 |
PERFORMANCE REPORT AND FUND PROFILE (Unaudited) | June 30, 2023 |
SERIES D (WORLD EQUITY INCOME SERIES)
OBJECTIVE: Seeks to provide total return, comprised of capital appreciation and income.
Holdings Diversification (Market Exposure as % of Net Assets)
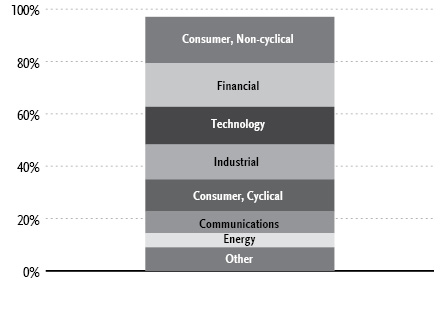
“Holdings Diversification (Market Exposure as % of Net Assets)” excludes any temporary cash investments.
COUNTRY DIVERSIFICATION
Country | | % of Long-Term
Investments | |
United States | | | 64.7 | % |
Japan | | | 7.3 | % |
Canada | | | 5.2 | % |
Australia | | | 5.0 | % |
United Kingdom | | | 3.3 | % |
Israel | | | 1.8 | % |
Ireland | | | 1.5 | % |
Other | | | 11.2 | % |
Total Long-Term Investments | | | 100.0 | % |
Inception Date: April 19, 1984 |
Ten Largest Holdings | % of Total Net Assets |
Apple, Inc. | 3.1% |
Microsoft Corp. | 3.0% |
Alphabet, Inc. — Class C | 1.8% |
UnitedHealth Group, Inc. | 1.6% |
Amazon.com, Inc. | 1.6% |
Johnson & Johnson | 1.5% |
Berkshire Hathaway, Inc. — Class B | 1.4% |
Home Depot, Inc. | 1.4% |
McDonald’s Corp. | 1.2% |
Texas Instruments, Inc. | 1.2% |
Top Ten Total | 17.8% |
| | |
“Ten Largest Holdings” excludes any temporary cash or derivative investments. |
Average Annual Returns*,†
Periods Ended June 30, 2023
| 6 Month‡ | 1 Year | 5 Year | 10 Year |
Series D (World Equity Income Series) | 5.42% | 9.58% | 6.76% | 7.67% |
MSCI World (Net) Index | 15.09% | 18.51% | 9.07% | 9.50% |
* | The performance data above represents past performance that is not predictive of future results. The investment return and principal value of an investment in the Fund will fluctuate so that an investor’s shares, when redeemed, may be worth more or less than their original cost. Returns are historical and include changes in principal and reinvested dividends and capital gains and do not reflect the effect of taxes. The MSCI World (Net) Index is an unmanaged index and, unlike the Fund, has no management fees or operating expenses to reduce its reported return. |
† | Performance figures do not reflect fees and expenses associated with an investment in variable insurance products. If returns had taken into account these fees and expenses, performance would have been lower. Shares of a series of Guggenheim Variable Funds Trust are available only through the purchase of such products. |
‡ | 6 month returns are not annualized. |
22 | THE GUGGENHEIM FUNDS SEMI-ANNUAL REPORT | |
SCHEDULE OF INVESTMENTS (Unaudited) | June 30, 2023 |
SERIES D (WORLD EQUITY INCOME SERIES) | |
| | Shares | | | Value | |
COMMON STOCKS† - 97.1% |
| | | | | | | | | |
Consumer, Non-cyclical - 17.8% |
UnitedHealth Group, Inc. | | | 3,724 | | | $ | 1,789,903 | |
Johnson & Johnson | | | 10,121 | | | | 1,675,228 | |
PepsiCo, Inc. | | | 5,923 | | | | 1,097,058 | |
Amgen, Inc. | | | 4,664 | | | | 1,035,501 | |
Unilever plc | | | 18,110 | | | | 942,403 | |
British American Tobacco plc | | | 28,040 | | | | 928,542 | |
Becton Dickinson and Co. | | | 3,381 | | | | 892,618 | |
SGS S.A. | | | 9,110 | | | | 860,861 | |
McKesson Corp. | | | 2,006 | | | | 857,184 | |
Colgate-Palmolive Co. | | | 11,039 | | | | 850,444 | |
Cintas Corp. | | | 1,680 | | | | 835,094 | |
Seagen, Inc.* | | | 4,180 | | | | 804,483 | |
CSL Ltd. | | | 4,270 | | | | 788,977 | |
Moody’s Corp. | | | 2,210 | | | | 768,461 | |
Imperial Brands plc | | | 33,250 | | | | 733,906 | |
Sysco Corp. | | | 9,460 | | | | 701,932 | |
Cochlear Ltd. | | | 4,260 | | | | 650,039 | |
AmerisourceBergen Corp. — Class A | | | 3,068 | | | | 590,375 | |
Hershey Co. | | | 2,110 | | | | 526,867 | |
Japan Tobacco, Inc. | | | 23,300 | | | | 509,200 | |
Thermo Fisher Scientific, Inc. | | | 970 | | | | 506,098 | |
Abbott Laboratories | | | 3,670 | | | | 400,103 | |
Kellogg Co. | | | 5,564 | | | | 375,014 | |
Laboratory Corporation of America Holdings | | | 1,450 | | | | 349,929 | |
S&P Global, Inc. | | | 730 | | | | 292,650 | |
Kimberly-Clark Corp. | | | 910 | | | | 125,635 | |
Total Consumer, Non-cyclical | | | | | | | 19,888,505 | |
| | | | | | | | | |
Financial - 16.6% |
Berkshire Hathaway, Inc. — Class B* | | | 4,690 | | | | 1,599,290 | |
National Australia Bank Ltd. | | | 54,110 | | | | 950,493 | |
Marsh & McLennan Companies, Inc. | | | 4,917 | | | | 924,789 | |
Aon plc — Class A | | | 2,606 | | | | 899,591 | |
ORIX Corp. | | | 48,310 | | | | 874,787 | |
Credit Agricole S.A. | | | 69,350 | | | | 822,935 | |
Gaming and Leisure Properties, Inc. REIT | | | 16,560 | | | | 802,498 | |
Public Storage REIT | | | 2,650 | | | | 773,482 | |
Banco Santander S.A. | | | 209,300 | | | | 773,281 | |
Willis Towers Watson plc | | | 3,260 | | | | 767,730 | |
ANZ Group Holdings Ltd. | | | 48,210 | | | | 761,430 | |
AvalonBay Communities, Inc. REIT | | | 3,786 | | | | 716,576 | |
Banco Bilbao Vizcaya Argentaria S.A. | | | 92,970 | | | | 713,562 | |
Westpac Banking Corp. | | | 49,350 | | | | 701,525 | |
Cboe Global Markets, Inc. | | | 5,070 | | | | 699,711 | |
Mediobanca Banca di Credito Finanziario SpA | | | 47,040 | | | | 562,714 | |
DBS Group Holdings Ltd. | | | 23,974 | | | | 558,760 | |
Legal & General Group plc | | | 181,610 | | | | 524,019 | |
Amundi S.A.1 | | | 8,810 | | | | 519,734 | |
T. Rowe Price Group, Inc. | | | 4,610 | | | | 516,412 | |
Goldman Sachs Group, Inc. | | | 1,540 | | | | 496,712 | |
United Overseas Bank Ltd. | | | 18,833 | | | | 390,044 | |
Swiss Life Holding AG | | | 660 | | | | 385,741 | |
Simon Property Group, Inc. REIT | | | 3,140 | | | | 362,607 | |
Chubb Ltd. | | | 1,604 | | | | 308,866 | |
BNP Paribas S.A. | | | 4,830 | | | | 304,287 | |
Citigroup, Inc. | | | 6,530 | | | | 300,641 | |
Allianz AG | | | 1,210 | | | | 281,567 | |
Progressive Corp. | | | 1,950 | | | | 258,122 | |
Total Financial | | | | | | | 18,551,906 | |
| | | | | | | | | |
Technology - 14.5% |
Apple, Inc. | | | 18,135 | | | | 3,517,646 | |
Microsoft Corp. | | | 9,716 | | | | 3,308,687 | |
Texas Instruments, Inc. | | | 7,350 | | | | 1,323,147 | |
NVIDIA Corp. | | | 3,080 | | | | 1,302,902 | |
Intel Corp. | | | 36,364 | | | | 1,216,012 | |
Broadcom, Inc. | | | 1,336 | | | | 1,158,886 | |
Intuit, Inc. | | | 2,200 | | | | 1,008,018 | |
Check Point Software Technologies Ltd.* | | | 6,080 | | | | 763,770 | |
Seiko Epson Corp. | | | 28,050 | | | | 435,307 | |
Tower Semiconductor Ltd.* | | | 9,870 | | | | 364,420 | |
Ricoh Company Ltd. | | | 42,890 | | | | 363,424 | |
Cadence Design Systems, Inc.* | | | 1,410 | | | | 330,673 | |
Workday, Inc. — Class A* | | | 1,210 | | | | 273,327 | |
Electronic Arts, Inc. | | | 2,000 | | | | 259,400 | |
MSCI, Inc. — Class A | | | 490 | | | | 229,952 | |
ServiceNow, Inc.* | | | 370 | | | | 207,929 | |
QUALCOMM, Inc. | | | 1,580 | | | | 188,083 | |
Total Technology | | | | | | | 16,251,583 | |
| | | | | | | | | |
Industrial - 13.2% |
United Parcel Service, Inc. — Class B | | | 5,790 | | | | 1,037,858 | |
AP Moller - Maersk A/S — Class B | | | 550 | | | | 965,365 | |
Illinois Tool Works, Inc. | | | 3,735 | | | | 934,347 | |
Canadian National Railway Co. | | | 7,620 | | | | 923,033 | |
Nordson Corp. | | | 3,638 | | | | 902,879 | |
3M Co. | | | 8,520 | | | | 852,767 | |
Snap-on, Inc. | | | 2,646 | | | | 762,551 | |
J.B. Hunt Transport Services, Inc. | | | 3,940 | | | | 713,258 | |
Packaging Corporation of America | | | 5,388 | | | | 712,078 | |
Mitsui OSK Lines Ltd. | | | 29,600 | | | | 709,046 | |
Lockheed Martin Corp. | | | 1,498 | | | | 689,649 | |
Brother Industries Ltd. | | | 38,620 | | | | 562,001 | |
Nippon Yusen K.K. | | | 24,540 | | | | 542,593 | |
Amphenol Corp. — Class A | | | 5,990 | | | | 508,850 | |
CCL Industries, Inc. — Class B | | | 10,050 | | | | 494,179 | |
Arrow Electronics, Inc.* | | | 3,340 | | | | 478,388 | |
Venture Corporation Ltd. | | | 37,080 | | | | 403,449 | |
West Fraser Timber Company Ltd. | | | 3,970 | | | | 341,173 | |
Waste Connections, Inc. | | | 2,190 | | | | 313,017 | |
WSP Global, Inc. | | | 2,210 | | | | 292,068 | |
Aurizon Holdings Ltd. | | | 107,470 | | | | 280,630 | |
Old Dominion Freight Line, Inc. | | | 750 | | | | 277,313 | |
Poste Italiane SpA1 | | | 22,010 | | | | 238,213 | |
Amcor plc | | | 22,970 | | | | 229,241 | |
General Dynamics Corp. | | | 1,059 | | | | 227,844 | |
AGC, Inc. | | | 5,800 | | | | 207,558 | |
Republic Services, Inc. — Class A | | | 960 | | | | 147,043 | |
Total Industrial | | | | | | | 14,746,391 | |
SEE NOTES TO FINANCIAL STATEMENTS. | THE GUGGENHEIM FUNDS SEMI-ANNUAL REPORT | 23 |
SCHEDULE OF INVESTMENTS (Unaudited)(continued) | June 30, 2023 |
SERIES D (WORLD EQUITY INCOME SERIES) | |
| | Shares | | | Value | |
Consumer, Cyclical - 12.4% |
Home Depot, Inc. | | | 5,025 | | | $ | 1,560,966 | |
McDonald’s Corp. | | | 4,518 | | | | 1,348,216 | |
Walmart, Inc. | | | 7,260 | | | | 1,141,127 | |
Lowe’s Companies, Inc. | | | 4,653 | | | | 1,050,182 | |
WW Grainger, Inc. | | | 1,170 | | | | 922,651 | |
Sumitomo Corp. | | | 43,170 | | | | 909,929 | |
Bayerische Motoren Werke AG | | | 5,830 | | | | 715,992 | |
Aisin Corp. | | | 22,430 | | | | 688,252 | |
Sekisui House Ltd. | | | 33,180 | | | | 668,200 | |
Mercedes-Benz Group AG — Class D | | | 7,820 | | | | 628,792 | |
Fastenal Co. | | | 8,980 | | | | 529,730 | |
Lear Corp. | | | 3,673 | | | | 527,259 | |
Persimmon plc | | | 38,570 | | | | 502,324 | |
Toromont Industries Ltd. | | | 5,830 | | | | 479,094 | |
Tesla, Inc.* | | | 1,690 | | | | 442,391 | |
Canadian Tire Corporation Ltd. — Class A | | | 3,110 | | | | 425,334 | |
Honda Motor Co., Ltd. | | | 12,200 | | | | 367,078 | |
Dollarama, Inc. | | | 4,920 | | | | 333,318 | |
Gildan Activewear, Inc. | | | 8,530 | | | | 275,095 | |
Costco Wholesale Corp. | | | 350 | | | | 188,433 | |
Sumitomo Electric Industries Ltd. | | | 10,810 | | | | 131,646 | |
Total Consumer, Cyclical | | | | | | | 13,836,009 | |
| | | | | | | | | |
Communications - 8.2% |
Alphabet, Inc. — Class C* | | | 16,436 | | | | 1,988,263 | |
Amazon.com, Inc.* | | | 13,528 | | | | 1,763,510 | |
Verizon Communications, Inc. | | | 31,780 | | | | 1,181,898 | |
Nice Ltd.* | | | 3,980 | | | | 813,759 | |
FactSet Research Systems, Inc. | | | 1,950 | | | | 781,267 | |
Motorola Solutions, Inc. | | | 2,276 | | | | 667,505 | |
Zillow Group, Inc. — Class C* | | | 12,470 | | | | 626,742 | |
Meta Platforms, Inc. — Class A* | | | 1,460 | | | | 418,991 | |
WPP plc | | | 32,970 | | | | 344,770 | |
HKT Trust & HKT Ltd. | | | 257,630 | | | | 299,531 | |
SoftBank Corp. | | | 22,600 | | | | 241,234 | |
Total Communications | | | | | | | 9,127,470 | |
| | | | | | | | | |
Energy - 5.4% |
Woodside Energy Group Ltd. | | | 35,470 | | | | 813,740 | |
SolarEdge Technologies, Inc.* | | | 2,940 | | | | 791,007 | |
Marathon Petroleum Corp. | | | 5,970 | | | | 696,102 | |
Valero Energy Corp. | | | 5,730 | | | | 672,129 | |
Phillips 66 | | | 6,480 | | | | 618,062 | |
Ampol Ltd. | | | 24,470 | | | | 488,031 | |
Chevron Corp. | | | 2,880 | | | | 453,168 | |
Eni SpA | | | 29,070 | | | | 418,250 | |
ONEOK, Inc. | | | 4,830 | | | | 298,108 | |
Kinder Morgan, Inc. | | | 16,670 | | | | 287,057 | |
Exxon Mobil Corp. | | | 2,500 | | | | 268,125 | |
HF Sinclair Corp. | | | 5,960 | | | | 265,876 | |
Total Energy | | | | | | | 6,069,655 | |
| | | | | | | | | |
Utilities - 4.6% |
Duke Energy Corp. | | | 10,500 | | | | 942,270 | |
DTE Energy Co. | | | 7,240 | | | | 796,545 | |
Consolidated Edison, Inc. | | | 7,440 | | | | 672,576 | |
Mercury NZ Ltd. | | | 154,020 | | | | 614,567 | |
Southern Co. | | | 5,840 | | | | 410,260 | |
Canadian Utilities Ltd. — Class A | | | 14,600 | | | | 378,249 | |
Emera, Inc. | | | 8,450 | | | | 348,125 | |
Fortis, Inc. | | | 6,760 | | | | 291,414 | |
Sempra Energy | | | 1,940 | | | | 282,444 | |
Xcel Energy, Inc. | | | 3,940 | | | | 244,950 | |
Exelon Corp. | | | 4,870 | | | | 198,404 | |
Total Utilities | | | | | | | 5,179,804 | |
| | | | | | | | | |
Basic Materials - 4.4% |
Ecolab, Inc. | | | 5,910 | | | | 1,103,338 | |
LyondellBasell Industries N.V. — Class A | | | 11,960 | | | | 1,098,287 | |
Nutrien Ltd. | | | 15,180 | | | | 896,474 | |
International Paper Co. | | | 20,943 | | | | 666,197 | |
Mitsubishi Chemical Group Corp. | | | 81,050 | | | | 484,924 | |
Nippon Steel Corp. | | | 19,390 | | | | 403,726 | |
Reliance Steel & Aluminum Co. | | | 650 | | | | 176,533 | |
South32 Ltd. | | | 36,970 | | | | 92,597 | |
Total Basic Materials | | | | | | | 4,922,076 | |
| | | | | | | | | |
Total Common Stocks | | | | |
(Cost $105,123,908) | | | | | | | 108,573,399 | |
| | | | | | | | | |
EXCHANGE-TRADED FUNDS† - 2.0% |
SPDR S&P 500 ETF Trust | | | 2,566 | | | | 1,137,456 | |
iShares MSCI EAFE ETF | | | 15,383 | | | | 1,115,268 | |
Total Exchange-Traded Funds | | | | |
(Cost $2,202,183) | | | | | | | 2,252,724 | |
| | | | | | | | | |
MONEY MARKET FUND† - 0.4% |
Goldman Sachs Financial Square Treasury Instruments Fund — Institutional Shares, 4.98%2 | | | 485,217 | | | | 485,217 | |
Total Money Market Fund | | | | |
(Cost $485,217) | | | | | | | 485,217 | |
| | | | | | | | | |
Total Investments - 99.5% | | | | |
(Cost $107,811,308) | | $ | 111,311,340 | |
Other Assets & Liabilities, net - 0.5% | | | 576,727 | |
Total Net Assets - 100.0% | | $ | 111,888,067 | |
Futures Contracts |
Description | | Number of
Contracts | | | Expiration Date | | | Notional
Amount | | | Value and
Unrealized
Appreciation** | |
Currency Futures Contracts Sold Short† |
Japanese Yen Futures Contracts | | | 89 | | | | Sep 2023 | | | $ | 7,802,519 | | | $ | 303,129 | |
24 | THE GUGGENHEIM FUNDS SEMI-ANNUAL REPORT | SEE NOTES TO FINANCIAL STATEMENTS. |
SCHEDULE OF INVESTMENTS (Unaudited)(concluded) | June 30, 2023 |
SERIES D (WORLD EQUITY INCOME SERIES) | |
* | Non-income producing security. |
** | Includes cumulative appreciation (depreciation). Variation margin is reported within the Statement of Assets and Liabilities. |
† | Value determined based on Level 1 inputs — See Note 4. |
1 | Security is a 144A or Section 4(a)(2) security. These securities have been determined to be liquid under guidelines established by the Board of Trustees. The total market value of 144A or Section 4(a)(2) securities is $757,947 (cost $792,819), or 0.7% of total net assets. |
2 | Rate indicated is the 7-day yield as of June 30, 2023. |
| | plc — Public Limited Company |
| | REIT — Real Estate Investment Trust |
| | |
| | See Sector Classification in Other Information section. |
The following table summarizes the inputs used to value the Fund’s investments at June 30, 2023 (See Note 4 in the Notes to Financial Statements):
Investments in Securities (Assets) | | Level 1
Quoted
Prices | | | Level 2
Significant
Observable
Inputs | | | Level 3
Significant
Unobservable
Inputs | | | Total | |
Common Stocks | | $ | 108,573,399 | | | $ | — | | | $ | — | | | $ | 108,573,399 | |
Exchange-Traded Funds | | | 2,252,724 | | | | — | | | | — | | | | 2,252,724 | |
Money Market Fund | | | 485,217 | | | | — | | | | — | | | | 485,217 | |
Currency Futures Contracts** | | | 303,129 | | | | — | | | | — | | | | 303,129 | |
Total Assets | | $ | 111,614,469 | | | $ | — | | | $ | — | | | $ | 111,614,469 | |
** | This derivative is reported as unrealized appreciation/depreciation at period end. |
SEE NOTES TO FINANCIAL STATEMENTS. | THE GUGGENHEIM FUNDS SEMI-ANNUAL REPORT | 25 |
SERIES D (WORLD EQUITY INCOME SERIES) | |
STATEMENT OF ASSETS AND LIABILITIES (Unaudited) |
June 30, 2023 |
Assets: |
Investments, at value (cost $107,811,308) | | $ | 111,311,340 | |
Foreign currency, at value (cost 19,968) | | | 19,998 | |
Cash | | | 8,804 | |
Segregated cash with broker | | | 335,000 | |
Prepaid expenses | | | 352 | |
Receivables: |
Foreign tax reclaims | | | 225,029 | |
Dividends | | | 136,085 | |
Interest | | | 2,110 | |
Fund shares sold | | | 304 | |
Total assets | | | 112,039,022 | |
| | | | | |
Liabilities: |
Payable for: |
Management fees | | | 42,538 | |
Variation margin on futures contracts | | | 30,594 | |
Fund shares redeemed | | | 23,542 | |
Distribution and service fees | | | 22,574 | |
Professional fees | | | 14,800 | |
Transfer agent/maintenance fees | | | 2,062 | |
Trustees’ fees* | | | 1,970 | |
Fund accounting/administration fees | | | 1,625 | |
Miscellaneous | | | 11,250 | |
Total liabilities | | | 150,955 | |
Net assets | | $ | 111,888,067 | |
| | | | | |
Net assets consist of: |
Paid in capital | | $ | 103,889,448 | |
Total distributable earnings (loss) | | | 7,998,619 | |
Net assets | | $ | 111,888,067 | |
Capital shares outstanding | | | 8,578,185 | |
Net asset value per share | | $ | 13.04 | |
STATEMENT OF OPERATIONS (Unaudited) |
Six Months Ended June 30, 2023 |
Investment Income: |
Dividends (net of foreign withholding tax of $192,412) | | $ | 1,974,298 | |
Interest | | | 10,658 | |
Total investment income | | | 1,984,956 | |
| | | | | |
Expenses: |
Management fees | | | 386,244 | |
Distribution and service fees | | | 137,944 | |
Transfer agent/maintenance fees | | | 12,553 | |
Fund accounting/administration fees | | | 27,069 | |
Professional fees | | | 23,108 | |
Trustees’ fees* | | | 7,051 | |
Custodian fees | | | 6,941 | |
Line of credit fees | | | 1,879 | |
Miscellaneous | | | 8,148 | |
Total expenses | | | 610,937 | |
Less: |
Expenses waived by Adviser | | | (129,565 | ) |
Net expenses | | | 481,372 | |
Net investment income | | | 1,503,584 | |
| | | | | |
Net Realized and Unrealized Gain (Loss): |
Net realized gain (loss) on: |
Investments | | | 2,566,087 | |
Futures contracts | | | (190,565 | ) |
Foreign currency transactions | | | (101,347 | ) |
Net realized gain | | | 2,274,175 | |
Net change in unrealized appreciation (depreciation) on: |
Investments | | | 1,757,976 | |
Futures contracts | | | 303,129 | |
Foreign currency translations | | | 7,665 | |
Net change in unrealized appreciation (depreciation) | | | 2,068,770 | |
Net realized and unrealized gain | | | 4,342,945 | |
Net increase in net assets resulting from operations | | $ | 5,846,529 | |
* | Relates to Trustees not deemed “interested persons” within the meaning of Section 2(a)(19) of the 1940 Act. |
26 | THE GUGGENHEIM FUNDS SEMI-ANNUAL REPORT | SEE NOTES TO FINANCIAL STATEMENTS. |
SERIES D (WORLD EQUITY INCOME SERIES) | |
STATEMENTS OF CHANGES IN NET ASSETS |
| | Six Months Ended
June 30, 2023
(Unaudited) | | | Year Ended
December 31,
2022 | |
Increase (Decrease) in Net Assets from Operations: | | | | | | | | |
Net investment income | | $ | 1,503,584 | | | $ | 2,727,960 | |
Net realized gain (loss) on investments | | | 2,274,175 | | | | (2,183,291 | ) |
Net change in unrealized appreciation (depreciation) on investments | | | 2,068,770 | | | | (12,971,794 | ) |
Net increase (decrease) in net assets resulting from operations | | | 5,846,529 | | | | (12,427,125 | ) |
| | | | | | | | | |
Distributions to shareholders | | | — | | | | (27,160,274 | ) |
| | | | | | | | | |
Capital share transactions: | | | | | | | | |
Proceeds from sale of shares | | | 814,401 | | | | 5,871,691 | |
Distributions reinvested | | | — | | | | 27,160,274 | |
Cost of shares redeemed | | | (8,107,283 | ) | | | (18,303,370 | ) |
Net increase (decrease) from capital share transactions | | | (7,292,882 | ) | | | 14,728,595 | |
Net decrease in net assets | | | (1,446,353 | ) | | | (24,858,804 | ) |
| | | | | | | | | |
Net assets: | | | | | | | | |
Beginning of period | | | 113,334,420 | | | | 138,193,224 | |
End of period | | $ | 111,888,067 | | | $ | 113,334,420 | |
| | | | | | | | | |
Capital share activity: | | | | | | | | |
Shares sold | | | 64,359 | | | | 430,664 | |
Shares issued from reinvestment of distributions | | | — | | | | 2,239,099 | |
Shares redeemed | | | (647,160 | ) | | | (1,299,295 | ) |
Net increase (decrease) in shares | | | (582,801 | ) | | | 1,370,468 | |
SEE NOTES TO FINANCIAL STATEMENTS. | THE GUGGENHEIM FUNDS SEMI-ANNUAL REPORT | 27 |
SERIES D (WORLD EQUITY INCOME SERIES) | |
This table is presented to show selected data for a share outstanding throughout each period and to assist shareholders in evaluating a Fund’s performance for the periods presented.
| | Six Months Ended
June 30, 2023a | | | Year Ended
December 31,
2022 | | | Year Ended
December 31,
2021 | | | Year Ended
December 31,
2020 | | | Year Ended
December 31,
2019 | | | Year Ended
December 31,
2018 | |
Per Share Data |
Net asset value, beginning of period | | $ | 12.37 | | | $ | 17.74 | | | $ | 14.79 | | | $ | 14.45 | | | $ | 12.96 | | | $ | 14.52 | |
Income (loss) from investment operations: |
Net investment income (loss)b | | | .17 | | | | .32 | | | | .34 | | | | .22 | | | | .33 | | | | .33 | |
Net gain (loss) on investments (realized and unrealized) | | | .50 | | | | (2.01 | ) | | | 2.86 | | | | .66 | | | | 2.36 | | | | (1.47 | ) |
Total from investment operations | | | .67 | | | | (1.69 | ) | | | 3.20 | | | | .88 | | | | 2.69 | | | | (1.14 | ) |
Less distributions from: |
Net investment income | | | — | | | | (.36 | ) | | | (.25 | ) | | | (.40 | ) | | | (.40 | ) | | | (.42 | ) |
Net realized gains | | | — | | | | (3.32 | ) | | | — | | | | (.14 | ) | | | (.80 | ) | | | — | |
Total distributions | | | — | | | | (3.68 | ) | | | (.25 | ) | | | (.54 | ) | | | (1.20 | ) | | | (.42 | ) |
Net asset value, end of period | | $ | 13.04 | | | $ | 12.37 | | | $ | 17.74 | | | $ | 14.79 | | | $ | 14.45 | | | $ | 12.96 | |
|
Total Returnc | | | 5.42 | % | | | (9.12 | %) | | | 21.74 | % | | | 6.65 | % | | | 21.40 | % | | | (8.17 | %) |
Ratios/Supplemental Data |
Net assets, end of period (in thousands) | | $ | 111,888 | | | $ | 113,334 | | | $ | 138,193 | | | $ | 126,007 | | | $ | 133,758 | | | $ | 125,312 | |
Ratios to average net assets: |
Net investment income (loss) | | | 2.72 | % | | | 2.25 | % | | | 2.02 | % | | | 1.70 | % | | | 2.37 | % | | | 2.29 | % |
Total expensesd | | | 1.11 | % | | | 1.10 | % | �� | | 1.15 | % | | | 1.20 | % | | | 1.19 | % | | | 1.17 | % |
Net expensese,f | | | 0.87 | % | | | 0.88 | % | | | 0.89 | % | | | 0.89 | % | | | 0.90 | % | | | 0.90 | % |
Portfolio turnover rate | | | 101 | % | | | 140 | % | | | 185 | % | | | 196 | % | | | 139 | % | | | 134 | % |
a | Unaudited figures for the period ended June 30, 2023. Percentage amounts for the period, except total return and portfolio turnover rate, have been annualized. |
b | Net investment income (loss) per share was computed using average shares outstanding throughout the period. |
c | Total return does not take into account any of the expenses associated with an investment in variable insurance products. If total return had taken into account these expenses, performance would have been lower. Shares of a series of Guggenheim Variable Funds Trust are available only through the purchase of such products. |
d | Does not include expenses of the underlying funds in which the Fund invests. |
e | Net expense information reflects the expense ratios after expense waivers and reimbursements, as applicable. |
f | Net expenses may include expenses that are excluded from the expense limitation agreement. Excluding these expenses, the net expense ratios for the years presented would be: |
| | 06/30/23a | 12/31/22 | 12/31/21 | 12/31/20 | 12/31/19 | 12/31/18 |
| | 0.87% | 0.88% | 0.89% | 0.89% | 0.90% | 0.90% |
28 | THE GUGGENHEIM FUNDS SEMI-ANNUAL REPORT | SEE NOTES TO FINANCIAL STATEMENTS. |
PERFORMANCE REPORT AND FUND PROFILE (Unaudited) | June 30, 2023 |
SERIES E (TOTAL RETURN BOND SERIES)
OBJECTIVE: Seeks to provide total return, comprised of current income and capital appreciation.
Holdings Diversification (Market Exposure as % of Net Assets)

“Holdings Diversification (Market Exposure as % of Net Assets)” excludes any temporary cash investments.
Inception Date: April 26, 1985 |
Ten Largest Holdings | % of Total Net Assets |
Guggenheim Total Return Bond Fund — R6-Class | 4.3% |
U.S. Treasury Notes, 3.50% — 01/31/28 | 4.2% |
U.S. Treasury Notes, 3.50% — 02/15/33 | 2.8% |
U.S. Treasury Bonds — 05/15/53 | 2.7% |
U.S. Treasury Notes, 4.13% — 11/15/32 | 2.6% |
Fannie Mae, 5.00% | 1.8% |
Freddie Mac, 5.00% | 1.8% |
U.S. Treasury Notes, 3.38% — 05/15/33 | 1.8% |
U.S. Treasury Notes, 3.63% — 03/31/28 | 1.5% |
U.S. Treasury Notes, 4.00% — 02/29/28 | 1.4% |
Top Ten Total | 24.9% |
| | |
“Ten Largest Holdings” excludes any temporary cash or derivative investments. |
| | THE GUGGENHEIM FUNDS SEMI-ANNUAL REPORT | 29 |
PERFORMANCE REPORT AND FUND PROFILE (Unaudited)(concluded) | June 30, 2023 |
Average Annual Returns*,†
Periods Ended June 30, 2023
| 6 Month‡ | 1 Year | 5 Year | 10 Year |
Series E (Total Return Bond Series) | 3.01% | (0.05%) | 0.64% | 2.85% |
Bloomberg U.S. Aggregate Bond Index | 2.09% | (0.94%) | 0.77% | 1.52% |
Portfolio Composition by Quality Rating1 |
Rating | % of Total
Investments |
Fixed Income Instruments | |
AAA | 41.9% |
AA | 7.0% |
A | 11.8% |
BBB | 16.2% |
BB | 4.2% |
B | 1.8% |
CCC | 0.4% |
CC | 1.8% |
C | 0.2% |
NR2 | 4.9% |
Other Instruments | 9.8% |
Total Investments | 100.0% |
* | The performance data above represents past performance that is not predictive of future results. The investment return and principal value of an investment in the Fund will fluctuate so that an investor’s shares, when redeemed, may be worth more or less than their original cost. Returns are historical and include changes in principal and reinvested dividends and capital gains and do not reflect the effect of taxes. The Bloomberg U.S. Aggregate Bond Index is an unmanaged index and, unlike the Fund, has no management fees or operating expenses to reduce its reported return. |
† | Performance figures do not reflect fees and expenses associated with an investment in variable insurance products. If returns had taken into account these fees and expenses, performance would have been lower. Shares of a series of Guggenheim Variable Funds Trust are available only through the purchase of such products. |
‡ | 6 month returns are not annualized. |
1 | Source: BlackRock Solutions. Credit quality ratings are measured on a scale that generally ranges from AAA (highest) to D (lowest). All securities except for those labeled “NR” have been rated by Moody’s, Standard & Poor’s (“S&P”), or Fitch, each of which is a Nationally Recognized Statistical Rating Organization (“NRSRO”). For purposes of this presentation, when ratings are available from more than one agency, the highest rating is used. Guggenheim Investments has converted ratings to the equivalent S&P rating. Security ratings are determined at the time of purchase and may change thereafter. |
2 | NR (not rated) securities do not necessarily indicate low credit quality. |
30 | THE GUGGENHEIM FUNDS SEMI-ANNUAL REPORT | |
SCHEDULE OF INVESTMENTS (Unaudited) | June 30, 2023 |
SERIES E (TOTAL RETURN BOND SERIES) | |
| | | Shares | | | Value | |
COMMON STOCKS† - 0.1% |
| | | | | | | |
| Financial - 0.1% |
AfterNext HealthTech Acquisition Corp. — Class A*,1 | | | 4,100 | | | $ | 42,477 | |
Conyers Park III Acquisition Corp. — Class A*,1 | | | 3,800 | | | | 38,798 | |
Waverley Capital Acquisition Corp. 1 — Class A*,1 | | | 3,000 | | | | 31,110 | |
Blue Whale Acquisition Corp. I — Class A*,1 | | | 2,200 | | | | 22,330 | |
Pershing Square Tontine Holdings, Ltd. — Class A*,†††,1 | | | 76,590 | | | | 7 | |
| Total Financial | | | | | | | 134,722 | |
| | | | | | | | | |
| Communications - 0.0% |
| Vacasa, Inc. — Class A* | | | 3,356 | | | | 2,277 | |
| | | | | | | | | |
| Total Common Stocks | | | | | | | | |
| (Cost $158,895) | | | | | | | 136,999 | |
| | | | | | | | | |
| PREFERRED STOCKS†† - 2.6% |
| Financial - 2.6% |
| Equitable Holdings, Inc. |
| 4.95%* | | | 550,000 | | | | 510,786 | |
| 4.30% | | | 8,625 | | | | 139,035 | |
| Wells Fargo & Co. |
| 3.90%* | | | 450,000 | | | | 396,180 | |
| MetLife, Inc. |
| 3.85% | | | 400,000 | | | | 369,592 | |
| Markel Group, Inc. |
| 6.00%* | | | 379,000 | | | | 365,725 | |
| Charles Schwab Corp. |
| 4.00%* | | | 500,000 | | | | 364,875 | |
| Citigroup, Inc. |
| 4.00%* | | | 200,000 | | | | 170,750 | |
| 3.88%* | | | 200,000 | | | | 167,500 | |
| Bank of New York Mellon Corp. |
| 3.75%* | | | 400,000 | | | | 328,500 | |
| JPMorgan Chase & Co. |
| 3.65%* | | | 250,000 | | | | 220,037 | |
| Bank of America Corp. |
| 6.13%* | | | 100,000 | | | | 97,715 | |
| 4.38%* | | | 100,000 | | | | 85,275 | |
| Goldman Sachs Group, Inc. |
| 3.80%* | | | 150,000 | | | | 120,037 | |
| Kuvare US Holdings, Inc. |
7.00% due 02/17/51*,3 | | | 100,000 | | | | 102,000 | |
| CNO Financial Group, Inc. |
| 5.13% due 11/25/60 | | | 6,000 | | | | 96,000 | |
| Assurant, Inc. |
| 5.25% due 01/15/61 | | | 4,000 | | | | 75,440 | |
| Selective Insurance Group, Inc. |
| 4.60% | | | 4,000 | | | | 65,480 | |
| American Financial Group, Inc. |
| 4.50% due 09/15/60 | | | 3,417 | | | | 61,779 | |
| First Republic Bank |
| 4.25% | | | 16,525 | | | | 197 | |
| 4.50% | | | 675 | | | | 9 | |
| Total Financial | | | | | | | 3,736,912 | |
| | | | | | | | | |
| Total Preferred Stocks | | | | | | | | |
| (Cost $4,856,780) | | | | | | | 3,736,912 | |
| | | | | | | | | |
| WARRANTS† - 0.0% |
| Ginkgo Bioworks Holdings, Inc. | | | | | | | | |
| Expiring 08/01/26 | | | 684 | | | | 181 | |
| AfterNext HealthTech Acquisition Corp. | | | | | | | | |
Expiring 07/09/231 | | | 1,366 | | | | 118 | |
| Acropolis Infrastructure Acquisition Corp. | | | | | | | | |
Expiring 03/31/261 | | | 900 | | | | 78 | |
| Conyers Park III Acquisition Corp. | | | | | | | | |
Expiring 08/12/28*,1 | | | 1,266 | | | | 63 | |
| Blue Whale Acquisition Corp. | | | | | | | | |
Expiring 07/09/23*,1 | | | 550 | | | | 44 | |
| Waverley Capital Acquisition Corp. | | | | | | | | |
Expiring 04/30/27*,1 | | | 1,000 | | | | 36 | |
| Pershing Square Tontine Holdings, Ltd. | | | | | | | | |
Expiring 07/24/25*,†††,1 | | | 8,510 | | | | — | |
| Total Warrants | | | | | | | | |
| (Cost $7,879) | | | | | | | 520 | |
| | | | | | | | | |
| MUTUAL FUNDS† - 4.3% |
Guggenheim Total Return Bond Fund — R6-Class4 | | | 259,022 | | | | 6,079,257 | |
| Total Mutual Funds | | | | | | | | |
| (Cost $6,860,942) | | | | | | | 6,079,257 | |
| | | | | | | | | |
| MONEY MARKET FUND† - 3.4% |
Dreyfus Treasury Securities Cash Management Fund — Institutional Shares, 4.96%5 | | | 3,801,247 | | | | 3,801,247 | |
Dreyfus Treasury Obligations Cash Management Fund — Institutional Shares, 5.00%5 | | | 1,027,573 | | | | 1,027,573 | |
| Total Money Market Fund | | | | | | | | |
| (Cost $4,828,820) | | | | | | | 4,828,820 | |
| | | | | | | | | |
| | | | Face
Amount~ | | | | | |
| CORPORATE BONDS†† - 25.4% |
| Financial - 12.7% | | | | | | | | |
| Pershing Square Holdings Ltd. | | | | | | | | |
3.25% due 11/15/303 | | | 1,000,000 | | | | 774,020 | |
| 3.25% due 10/01/31 | | | 1,000,000 | | | | 760,380 | |
| Bank of America Corp. | | | | | | | | |
2.59% due 04/29/312 | | | 890,000 | | | | 747,188 | |
| Reliance Standard Life Global Funding II | | | | | | | | |
2.75% due 05/07/253 | | | 800,000 | | | | 746,229 | |
SEE NOTES TO FINANCIAL STATEMENTS. | THE GUGGENHEIM FUNDS SEMI-ANNUAL REPORT | 31 |
SCHEDULE OF INVESTMENTS (Unaudited)(continued) | June 30, 2023 |
SERIES E (TOTAL RETURN BOND SERIES) | |
| | Face
Amount~ | | | Value | |
JPMorgan Chase & Co. | | | | | | | | |
5.72% due 09/14/332 | | | 300,000 | | | $ | 304,348 | |
4.49% due 03/24/312 | | | 200,000 | | | | 192,254 | |
2.96% due 05/13/312 | | | 135,000 | | | | 115,756 | |
Wilton RE Ltd. | | | | | | | | |
6.00% 2,3,6 | | | 682,000 | | | | 608,849 | |
GLP Capital Limited Partnership / GLP Financing II, Inc. | | | | | | | | |
5.30% due 01/15/29 | | | 300,000 | | | | 285,646 | |
4.00% due 01/15/31 | | | 290,000 | | | | 250,722 | |
Liberty Mutual Group, Inc. | | | | | | | | |
4.30% due 02/01/613 | | | 554,000 | | | | 348,501 | |
3.95% due 05/15/603 | | | 220,000 | | | | 155,602 | |
Citigroup, Inc. | | | | | | | | |
2.57% due 06/03/312 | | | 590,000 | | | | 492,247 | |
Nippon Life Insurance Co. | | | | | | | | |
2.75% due 01/21/512,3 | | | 350,000 | | | | 287,830 | |
2.90% due 09/16/512,3 | | | 200,000 | | | | 163,325 | |
Fort Benning Family Communities LLC | | | | | | | | |
6.09% due 01/15/513 | | | 463,573 | | | | 445,179 | |
Host Hotels & Resorts, LP | | | | | | | | |
3.50% due 09/15/30 | | | 435,000 | | | | 368,492 | |
2.90% due 12/15/31 | | | 50,000 | | | | 39,308 | |
Assurant, Inc. | | | | | | | | |
6.10% due 02/27/26 | | | 200,000 | | | | 200,667 | |
2.65% due 01/15/32 | | | 250,000 | | | | 187,036 | |
FS KKR Capital Corp. | | | | | | | | |
2.63% due 01/15/27 | | | 250,000 | | | | 213,109 | |
3.25% due 07/15/27 | | | 200,000 | | | | 171,492 | |
Macquarie Group Ltd. | | | | | | | | |
2.87% due 01/14/332,3 | | | 250,000 | | | | 199,663 | |
2.69% due 06/23/322,3 | | | 200,000 | | | | 157,609 | |
Nationwide Mutual Insurance Co. | | | | | | | | |
4.35% due 04/30/503 | | | 467,000 | | | | 354,309 | |
Maple Grove Funding Trust I | | | | | | | | |
4.16% due 08/15/513 | | | 500,000 | | | | 349,320 | |
Safehold GL Holdings LLC | | | | | | | | |
2.85% due 01/15/32 | | | 271,000 | | | | 207,702 | |
2.80% due 06/15/31 | | | 180,000 | | | | 139,615 | |
Ares Finance Company II LLC | | | | | | | | |
3.25% due 06/15/303 | | | 410,000 | | | | 344,715 | |
Fidelity National Financial, Inc. | | | | | | | | |
3.40% due 06/15/30 | | | 255,000 | | | | 222,661 | |
2.45% due 03/15/31 | | | 150,000 | | | | 117,489 | |
Iron Mountain, Inc. | | | | | | | | |
4.50% due 02/15/313 | | | 261,000 | | | | 224,259 | |
5.63% due 07/15/323 | | | 125,000 | | | | 111,822 | |
Global Atlantic Finance Co. | | | | | | | | |
4.70% due 10/15/512,3 | | | 250,000 | | | | 177,200 | |
3.13% due 06/15/313 | | | 195,000 | | | | 146,803 | |
Standard Chartered plc | | | | | | | | |
4.64% due 04/01/312,3 | | | 350,000 | | | | 322,817 | |
United Wholesale Mortgage LLC | | | | | | | | |
5.50% due 04/15/293 | | | 300,000 | | | | 257,250 | |
5.50% due 11/15/253 | | | 63,000 | | | | 59,945 | |
First American Financial Corp. | | | | | | | | |
4.00% due 05/15/30 | | | 360,000 | | | | 315,148 | |
Jefferies Financial Group, Inc. | | | | | | | | |
2.75% due 10/15/32 | | | 300,000 | | | | 230,403 | |
2.63% due 10/15/31 | | | 100,000 | | | | 77,528 | |
Fairfax Financial Holdings Ltd. | | | | | | | | |
3.38% due 03/03/31 | | | 250,000 | | | | 211,011 | |
5.63% due 08/16/32 | | | 100,000 | | | | 96,598 | |
Reinsurance Group of America, Inc. | | | | | | | | |
3.15% due 06/15/30 | | | 356,000 | | | | 305,095 | |
OneAmerica Financial Partners, Inc. | | | | | | | | |
4.25% due 10/15/503 | | | 410,000 | | | | 296,868 | |
Rocket Mortgage LLC / Rocket Mortgage Company-Issuer, Inc. | | | | | | | | |
3.88% due 03/01/313 | | | 350,000 | | | | 283,800 | |
ABN AMRO Bank N.V. | | | | | | | | |
2.47% due 12/13/292,3 | | | 300,000 | | | | 251,120 | |
Mizuho Financial Group, Inc. | | | | | | | | |
5.67% due 05/27/292 | | | 250,000 | | | | 249,435 | |
Belrose Funding Trust | | | | | | | | |
2.33% due 08/15/303 | | | 320,000 | | | | 245,093 | |
Macquarie Bank Ltd. | | | | | | | | |
3.62% due 06/03/303 | | | 290,000 | | | | 243,879 | |
UBS Group AG | | | | | | | | |
2.10% due 02/11/322,3 | | | 300,000 | | | | 227,213 | |
Brookfield Finance, Inc. | | | | | | | | |
3.50% due 03/30/51 | | | 280,000 | | | | 185,205 | |
4.70% due 09/20/47 | | | 50,000 | | | | 41,801 | |
Corebridge Financial, Inc. | | | | | | | | |
4.35% due 04/05/42 | | | 150,000 | | | | 121,036 | |
6.88% due 12/15/522 | | | 100,000 | | | | 95,849 | |
SBA Communications Corp. | | | | | | | | |
3.13% due 02/01/29 | | | 250,000 | | | | 211,914 | |
Jefferies Finance LLC / JFIN Company-Issuer Corp. | | | | | | | | |
5.00% due 08/15/283 | | | 250,000 | | | | 204,954 | |
Mitsubishi UFJ Financial Group, Inc. | | | | | | | | |
5.44% due 02/22/342 | | | 200,000 | | | | 199,249 | |
Societe Generale S.A. | | | | | | | | |
2.89% due 06/09/322,3 | | | 250,000 | | | | 195,864 | |
Stewart Information Services Corp. | | | | | | | | |
3.60% due 11/15/31 | | | 250,000 | | | | 191,946 | |
Westpac Banking Corp. | | | | | | | | |
3.02% due 11/18/362 | | | 150,000 | | | | 115,055 | |
2.96% due 11/16/40 | | | 73,000 | | | | 48,938 | |
2.67% due 11/15/352 | | | 27,000 | | | | 20,719 | |
Trustage Financial Group, Inc. | | | | | | | | |
4.63% due 04/15/323 | | | 200,000 | | | | 173,335 | |
Hunt Companies, Inc. | | | | | | | | |
5.25% due 04/15/293 | | | 200,000 | | | | 158,806 | |
Americo Life, Inc. | | | | | | | | |
3.45% due 04/15/313 | | | 200,000 | | | | 153,468 | |
LPL Holdings, Inc. | | | | | | | | |
4.00% due 03/15/293 | | | 174,000 | | | | 152,654 | |
AmFam Holdings, Inc. | | | | | | | | |
2.81% due 03/11/313 | | | 200,000 | | | | 149,330 | |
Capital One Financial Corp. | | | | | | | | |
6.38% due 06/08/342 | | | 150,000 | | | | 148,925 | |
32 | THE GUGGENHEIM FUNDS SEMI-ANNUAL REPORT | SEE NOTES TO FINANCIAL STATEMENTS. |
SCHEDULE OF INVESTMENTS (Unaudited)(continued) | June 30, 2023 |
SERIES E (TOTAL RETURN BOND SERIES) | |
| | | Face
Amount~ | | | Value | |
| KKR Group Finance Company VIII LLC | | | | | | | | |
3.50% due 08/25/503 | | | 190,000 | | | $ | 129,395 | |
| Prudential Financial, Inc. | | | | | | | | |
3.70% due 10/01/502 | | | 130,000 | | | | 109,646 | |
| Lincoln National Corp. | | | | | | | | |
| 4.38% due 06/15/50 | | | 150,000 | | | | 105,526 | |
| PartnerRe Finance B LLC | | | | | | | | |
4.50% due 10/01/502 | | | 110,000 | | | | 91,850 | |
| Kennedy-Wilson, Inc. | | | | | | | | |
| 4.75% due 03/01/29 | | | 109,000 | | | | 86,181 | |
| Apollo Management Holdings, LP | | | | | | | | |
2.65% due 06/05/303 | | | 90,000 | | | | 73,393 | |
| Brown & Brown, Inc. | | | | | | | | |
| 2.38% due 03/15/31 | | | 90,000 | | | | 72,546 | |
| Assured Guaranty US Holdings, Inc. | | | | | | | | |
| 3.60% due 09/15/51 | | | 100,000 | | | | 68,303 | |
| Penn Mutual Life Insurance Co. | | | | | | | | |
3.80% due 04/29/613 | | | 100,000 | | | | 67,438 | |
| Western & Southern Life Insurance Co. | | | | | | | | |
3.75% due 04/28/613 | | | 100,000 | | | | 66,921 | |
| American Equity Investment Life Holding Co. | | | | | | | | |
| 5.00% due 06/15/27 | | | 69,000 | | | | 66,558 | |
| Everest Reinsurance Holdings, Inc. | | | | | | | | |
| 3.50% due 10/15/50 | | | 86,000 | | | | 60,987 | |
| Kemper Corp. | | | | | | | | |
| 2.40% due 09/30/30 | | | 76,000 | | | | 59,368 | |
| CNO Financial Group, Inc. | | | | | | | | |
| 5.25% due 05/30/29 | | | 50,000 | | | | 47,299 | |
| NFP Corp. | | | | | | | | |
6.88% due 08/15/283 | | | 52,000 | | | | 45,137 | |
| Home Point Capital, Inc. | | | | | | | | |
5.00% due 02/01/263 | | | 50,000 | | | | 44,829 | |
| Brookfield Finance LLC / Brookfield Finance, Inc. | | | | | | | | |
| 3.45% due 04/15/50 | | | 50,000 | | | | 33,056 | |
| Cushman & Wakefield US Borrower LLC | | | | | | | | |
6.75% due 05/15/283 | | | 35,000 | | | | 31,675 | |
| Total Financial | | | | | | | 18,113,706 | |
| | | | | | | | | |
| Consumer, Non-cyclical - 2.9% | | | | | | | | |
| Altria Group, Inc. | | | | | | | | |
| 3.70% due 02/04/51 | | | 350,000 | | | | 234,376 | |
| 3.40% due 05/06/30 | | | 170,000 | | | | 150,013 | |
| 4.45% due 05/06/50 | | | 50,000 | | | | 36,762 | |
| CoStar Group, Inc. | | | | | | | | |
2.80% due 07/15/303 | | | 430,000 | | | | 354,665 | |
| Johns Hopkins University | | | | | | | | |
| 2.81% due 01/01/60 | | | 500,000 | | | | 328,561 | |
| Children’s Hospital Corp. | | | | | | | | |
| 2.59% due 02/01/50 | | | 500,000 | | | | 320,372 | |
| BAT Capital Corp. | | | | | | | | |
| 3.98% due 09/25/50 | | | 300,000 | | | | 202,156 | |
| 4.70% due 04/02/27 | | | 98,000 | | | | 94,886 | |
| Global Payments, Inc. | | | | | | | | |
| 2.90% due 05/15/30 | | | 210,000 | | | | 177,991 | |
| 2.90% due 11/15/31 | | | 140,000 | | | | 113,892 | |
| Smithfield Foods, Inc. | | | | | | | | |
2.63% due 09/13/313 | | | 250,000 | | | | 184,743 | |
3.00% due 10/15/303 | | | 110,000 | | | | 86,246 | |
| JBS USA LUX S.A. / JBS USA Food Company / JBS USA Finance, Inc. | | | | | | | | |
3.00% due 05/15/323 | | | 200,000 | | | | 153,490 | |
4.38% due 02/02/523 | | | 100,000 | | | | 70,139 | |
| Royalty Pharma plc | | | | | | | | |
| 3.55% due 09/02/50 | | | 310,000 | | | | 209,322 | |
| Quanta Services, Inc. | | | | | | | | |
| 2.90% due 10/01/30 | | | 210,000 | | | | 178,402 | |
| Kimberly-Clark de Mexico SAB de CV | | | | | | | | |
2.43% due 07/01/313 | | | 200,000 | | | | 169,670 | |
| Triton Container International Ltd. | | | | | | | | |
3.15% due 06/15/313 | | | 200,000 | | | | 153,878 | |
| California Institute of Technology | | | | | | | | |
| 3.65% due 09/01/19 | | | 225,000 | | | | 153,435 | |
| Spectrum Brands, Inc. | | | | | | | | |
| 5.75% due 07/15/25 | | | 150,000 | | | | 149,907 | |
| Transurban Finance Company Pty Ltd. | | | | | | | | |
2.45% due 03/16/313 | | | 150,000 | | | | 122,785 | |
| Universal Health Services, Inc. | | | | | | | | |
| 2.65% due 10/15/30 | | | 150,000 | | | | 122,512 | |
| Triton Container International Limited / TAL International Container Corp. | | | | | | | | |
| 3.25% due 03/15/32 | | | 100,000 | | | | 78,272 | |
| Tenet Healthcare Corp. | | | | | | | | |
| 4.63% due 06/15/28 | | | 75,000 | | | | 70,049 | |
| US Foods, Inc. | | | | | | | | |
6.25% due 04/15/253 | | | 59,000 | | | | 58,976 | |
| Pfizer Investment Enterprises Pte Ltd. | | | | | | | | |
| 5.30% due 05/19/53 | | | 50,000 | | | | 51,984 | |
| Catalent Pharma Solutions, Inc. | | | | | | | | |
3.13% due 02/15/293 | | | 43,000 | | | | 34,962 | |
| Central Garden & Pet Co. | | | | | | | | |
4.13% due 04/30/313 | | | 42,000 | | | | 34,627 | |
| Total Consumer, Non-cyclical | | | | | | | 4,097,073 | |
| | | | | | | | | |
| Industrial - 2.0% | | | | | | | | |
| Amsted Industries, Inc. | | | | | | | | |
4.63% due 05/15/303 | | | 470,000 | | | | 419,226 | |
| Crown Americas LLC / Crown Americas Capital Corporation VI | | | | | | | | |
| 4.75% due 02/01/26 | | | 400,000 | | | | 387,666 | |
| Stadco LA, LLC | | | | | | | | |
3.75% due 05/15/56††† | | | 500,000 | | | | 346,814 | |
| Flowserve Corp. | | | | | | | | |
| 3.50% due 10/01/30 | | | 270,000 | | | | 230,389 | |
| 2.80% due 01/15/32 | | | 100,000 | | | | 79,683 | |
| Owens Corning | | | | | | | | |
| 3.88% due 06/01/30 | | | 320,000 | | | | 292,352 | |
| TD SYNNEX Corp. | | | | | | | | |
| 2.65% due 08/09/31 | | | 210,000 | | | | 161,016 | |
| 2.38% due 08/09/28 | | | 150,000 | | | | 122,916 | |
| Vontier Corp. | | | | | | | | |
| 2.95% due 04/01/31 | | | 350,000 | | | | 279,813 | |
SEE NOTES TO FINANCIAL STATEMENTS. | THE GUGGENHEIM FUNDS SEMI-ANNUAL REPORT | 33 |
SCHEDULE OF INVESTMENTS (Unaudited)(continued) | June 30, 2023 |
SERIES E (TOTAL RETURN BOND SERIES) | |
| | Face
Amount~ | | | Value | |
Cellnex Finance Company S.A. | | | | | | | | |
3.88% due 07/07/413 | | | 250,000 | | | $ | 183,175 | |
Weir Group plc | | | | | | | | |
2.20% due 05/13/263 | | | 200,000 | | | | 179,135 | |
GATX Corp. | | | | | | | | |
3.50% due 03/15/28 | | | 50,000 | | | | 45,438 | |
Berry Global, Inc. | | | | | | | | |
1.57% due 01/15/26 | | | 50,000 | | | | 45,087 | |
Norfolk Southern Corp. | | | | | | | | |
4.10% due 05/15/21 | | | 50,000 | | | | 35,249 | |
Total Industrial | | | 2,807,959 | |
| | | | | | | | | |
Consumer, Cyclical - 1.9% |
Warnermedia Holdings, Inc. | | | | | | | | |
4.28% due 03/15/32 | | | 400,000 | | | | 354,750 | |
5.14% due 03/15/52 | | | 200,000 | | | | 162,850 | |
Hyatt Hotels Corp. | | | | | | | | |
5.38% due 04/23/25 | | | 220,000 | | | | 217,665 | |
6.00% due 04/23/30 | | | 190,000 | | | | 190,094 | |
Delta Air Lines, Inc. | | | | | | | | |
7.00% due 05/01/253 | | | 367,000 | | | | 374,814 | |
Choice Hotels International, Inc. | | | | | | | | |
3.70% due 01/15/31 | | | 360,000 | | | | 304,264 | |
Mileage Plus Holdings LLC / Mileage Plus Intellectual Property Assets Ltd. | | | | | | | | |
6.50% due 06/20/273 | | | 280,000 | | | | 280,699 | |
Delta Air Lines Inc. / SkyMiles IP Ltd. | | | | | | | | |
4.50% due 10/20/253 | | | 248,000 | | | | 242,591 | |
Ferguson Finance plc | | | | | | | | |
4.65% due 04/20/323 | | | 200,000 | | | | 188,607 | |
United Airlines, Inc. | | | | | | | | |
4.38% due 04/15/263 | | | 150,000 | | | | 142,516 | |
Marriott International, Inc. | | | | | | | | |
2.85% due 04/15/31 | | | 138,000 | | | | 116,030 | |
British Airways Class A Pass Through Trust | | | | | | | | |
2.90% due 03/15/353 | | | 95,476 | | | | 78,665 | |
Walgreens Boots Alliance, Inc. | | | | | | | | |
4.10% due 04/15/50 | | | 98,000 | | | | 69,795 | |
Total Consumer, Cyclical | | | 2,723,340 | |
| | | | | | | | | |
Communications - 1.8% |
British Telecommunications plc | | | | | | | | |
4.88% due 11/23/812,3 | | | 350,000 | | | | 284,491 | |
9.63% due 12/15/30 | | | 100,000 | | | | 123,037 | |
Level 3 Financing, Inc. | | | | | | | | |
3.63% due 01/15/293 | | | 330,000 | | | | 197,919 | |
3.75% due 07/15/293 | | | 100,000 | | | | 60,238 | |
Virgin Media Secured Finance plc | | | | | | | | |
4.50% due 08/15/303 | | | 300,000 | | | | 251,496 | |
Paramount Global | | | | | | | | |
4.95% due 05/19/50 | | | 320,000 | | | | 240,182 | |
Cable One, Inc. | | | | | | | | |
4.00% due 11/15/303 | | | 300,000 | | | | 234,375 | |
Vodafone Group plc | | | | | | | | |
4.13% due 06/04/812 | | | 250,000 | | | | 198,375 | |
Virgin Media Vendor Financing Notes IV DAC | | | | | | | | |
5.00% due 07/15/283 | | | 200,000 | | | | 174,947 | |
Rogers Communications, Inc. | | | | | | | | |
4.55% due 03/15/523 | | | 200,000 | | | | 160,844 | |
Sirius XM Radio, Inc. | | | | | | | | |
4.13% due 07/01/303 | | | 180,000 | | | | 146,980 | |
Altice France S.A. | | | | | | | | |
5.13% due 07/15/293 | | | 200,000 | | | | 141,975 | |
CSC Holdings LLC | | | | | | | | |
4.13% due 12/01/303 | | | 200,000 | | | | 139,905 | |
Go Daddy Operating Company LLC / GD Finance Co., Inc. | | | | | | | | |
3.50% due 03/01/293 | | | 55,000 | | | | 47,127 | |
Radiate Holdco LLC / Radiate Finance, Inc. | | | | | | | | |
4.50% due 09/15/263 | | | 56,000 | | | | 44,647 | |
Charter Communications Operating LLC / Charter Communications Operating Capital | | | | | | | | |
3.90% due 06/01/52 | | | 50,000 | | | | 32,718 | |
McGraw-Hill Education, Inc. | | | | | | | | |
5.75% due 08/01/283 | | | 16,000 | | | | 13,864 | |
Total Communications | | | 2,493,120 | |
| | | | | | | | | |
Technology - 1.4% |
Broadcom, Inc. | | | | | | | | |
4.93% due 05/15/373 | | | 277,000 | | | | 250,686 | |
2.45% due 02/15/313 | | | 300,000 | | | | 243,990 | |
4.15% due 11/15/30 | | | 206,000 | | | | 189,530 | |
3.19% due 11/15/363 | | | 26,000 | | | | 19,650 | |
Oracle Corp. | | | | | | | | |
5.55% due 02/06/53 | | | 180,000 | | | | 174,302 | |
3.95% due 03/25/51 | | | 217,000 | | | | 164,078 | |
CDW LLC / CDW Finance Corp. | | | | | | | | |
3.57% due 12/01/31 | | | 250,000 | | | | 210,955 | |
Foundry JV Holdco LLC | | | | | | | | |
5.88% due 01/25/343 | | | 200,000 | | | | 199,209 | |
Leidos, Inc. | | | | | | | | |
2.30% due 02/15/31 | | | 250,000 | | | | 196,987 | |
Qorvo, Inc. | | | | | | | | |
4.38% due 10/15/29 | | | 119,000 | | | | 107,481 | |
3.38% due 04/01/313 | | | 100,000 | | | | 80,619 | |
MSCI, Inc. | | | | | | | | |
3.63% due 11/01/313 | | | 150,000 | | | | 128,051 | |
Twilio, Inc. | | | | | | | | |
3.63% due 03/15/29 | | | 38,000 | | | | 32,329 | |
Total Technology | | | 1,997,867 | |
| | | | | | | | | |
Energy - 1.3% |
BP Capital Markets plc | | | | | | | | |
4.88% 2,6 | | | 760,000 | | | | 690,840 | |
Galaxy Pipeline Assets Bidco Ltd. | | | | | | | | |
3.25% due 09/30/403 | | | 328,000 | | | | 253,939 | |
ITT Holdings LLC | | | | | | | | |
6.50% due 08/01/293 | | | 248,000 | | | | 208,935 | |
Greensaif Pipelines Bidco SARL | | | | | | | | |
6.13% due 02/23/383 | | | 200,000 | | | | 204,284 | |
Kinder Morgan, Inc. | | | | | | | | |
5.20% due 06/01/33 | | | 150,000 | | | | 145,362 | |
34 | THE GUGGENHEIM FUNDS SEMI-ANNUAL REPORT | SEE NOTES TO FINANCIAL STATEMENTS. |
SCHEDULE OF INVESTMENTS (Unaudited)(continued) | June 30, 2023 |
SERIES E (TOTAL RETURN BOND SERIES) | |
| | Face
Amount~ | | | Value | |
Midwest Connector Capital Company LLC | | | | | | | | |
4.63% due 04/01/293 | | | 110,000 | | | $ | 100,513 | |
TransCanada PipeLines Ltd. | | | | | | | | |
6.20% due 03/09/26 | | | 100,000 | | | | 100,070 | |
NuStar Logistics, LP | | | | | | | | |
5.63% due 04/28/27 | | | 100,000 | | | | 96,090 | |
Parkland Corp. | | | | | | | | |
4.63% due 05/01/303 | | | 100,000 | | | | 86,705 | |
Total Energy | | | 1,886,738 | |
| | | | | | | | | |
Basic Materials - 1.0% |
Anglo American Capital plc | | | | | | | | |
5.63% due 04/01/303 | | | 200,000 | | | | 199,086 | |
2.63% due 09/10/303 | | | 200,000 | | | | 164,976 | |
Newcrest Finance Pty Ltd. | | | | | | | | |
3.25% due 05/13/303 | | | 362,000 | | | | 319,242 | |
Alcoa Nederland Holding BV | | | | | | | | |
5.50% due 12/15/273 | | | 200,000 | | | | 193,424 | |
Minerals Technologies, Inc. | | | | | | | | |
5.00% due 07/01/283 | | | 190,000 | | | | 172,900 | |
INEOS Quattro Finance 2 plc | | | | | | | | |
3.38% due 01/15/263 | | | 150,000 | | | | 136,882 | |
Yamana Gold, Inc. | | | | | | | | |
2.63% due 08/15/31 | | | 150,000 | | | | 116,842 | |
Reliance Steel & Aluminum Co. | | | | | | | | |
2.15% due 08/15/30 | | | 100,000 | | | | 81,481 | |
Valvoline, Inc. | | | | | | | | |
4.25% due 02/15/303 | | | 50,000 | | | | 49,095 | |
Total Basic Materials | | | 1,433,928 | |
| | | | | | | | | |
Utilities - 0.4% |
AES Corp. | | | | | | | | |
3.95% due 07/15/303 | | | 220,000 | | | | 197,234 | |
Enel Finance International N.V. | | | | | | | | |
5.00% due 06/15/323 | | | 200,000 | | | | 189,059 | |
NRG Energy, Inc. | | | | | | | | |
2.45% due 12/02/273 | | | 200,000 | | | | 168,542 | |
Total Utilities | | | 554,835 | |
| | | | | | | | | |
Total Corporate Bonds |
(Cost $43,640,582) | | | 36,108,566 | |
| | | | | |
COLLATERALIZED MORTGAGE OBLIGATIONS†† - 24.2% |
Government Agency - 13.7% |
Fannie Mae | | | | | | | | |
5.00% due 06/01/53 | | | 7,425,585 | | | | 7,285,203 | |
4.00% due 07/01/52 | | | 897,235 | | | | 846,819 | |
3.83% due 05/01/49 | | | 1,000,000 | | | | 843,386 | |
due 05/01/53 | | | 744,965 | | | | 741,572 | |
2.41% due 12/01/41 | | | 1,000,000 | | | | 685,912 | |
Freddie Mac | | | | | | | | |
5.00% due 06/01/53 | | | 4,501,580 | | | | 4,412,933 | |
5.50% due 05/01/53 | | | 3,211,462 | | | | 3,197,111 | |
4.00% due 02/01/53 | | | 981,034 | | | | 930,225 | |
4.00% due 04/01/52 | | | 229,798 | | | | 217,122 | |
Fannie Mae-Aces | | | | | | | | |
1.59% (WAC) due 03/25/35◊,7 | | | 2,546,861 | | | | 263,638 | |
Total Government Agency | | | 19,423,921 | |
| | | | | | | | | |
Residential Mortgage-Backed Securities - 8.0% |
PRPM LLC | | | | | | | | |
2022-1, 3.72% due 02/25/273,8 | | | 736,790 | | | | 697,955 | |
2021-5, 1.79% due 06/25/263,8 | | | 386,692 | | | | 350,897 | |
2023-1, 6.88% (WAC) due 02/25/28◊,3 | | | 143,679 | | | | 142,769 | |
FKRT | | | | | | | | |
2.21% due 11/30/58†††,9 | | | 750,000 | | | | 738,149 | |
Legacy Mortgage Asset Trust | | | | | | | | |
2021-GS3, 1.75% due 07/25/613,8 | | | 392,339 | | | | 367,008 | |
2021-GS5, 2.25% due 07/25/673,8 | | | 390,559 | | | | 360,966 | |
Starwood Mortgage Residential Trust | | | | | | | | |
2020-1, 2.41% (WAC) due 02/25/50◊,3 | | | 782,645 | | | | 719,843 | |
JP Morgan Mortgage Acquisition Trust | | | | | | | | |
2006-WMC4, 5.27% (1 Month USD LIBOR + 0.12%, Rate Floor: 0.12%) due 12/25/36◊ | | | 1,211,193 | | | | 628,325 | |
Ameriquest Mortgage Securities Trust | | | | | | | | |
2006-M3, 5.31% (1 Month USD LIBOR + 0.16%, Rate Floor: 0.16%) due 10/25/36◊ | | | 2,047,167 | | | | 605,592 | |
LSTAR Securities Investment Ltd. | | | | | | | | |
2023-1, 8.58% (SOFR + 3.50%, Rate Floor: 0.00%) due 01/01/28◊,3 | | | 380,784 | | | | 377,649 | |
2021-1, 7.97% (1 Month USD LIBOR + 2.80%, Rate Floor: 1.80%) due 02/01/26◊,9 | | | 224,945 | | | | 222,231 | |
Securitized Asset-Backed Receivables LLC Trust | | | | | | | | |
2007-BR2, 5.33% (1 Month USD LIBOR + 0.18%, Rate Floor: 0.18%) due 02/25/37◊,3 | | | 620,411 | | | | 522,041 | |
Towd Point Revolving Trust | | | | | | | | |
4.83% due 09/25/649 | | | 500,000 | | | | 484,500 | |
Home Equity Loan Trust | | | | | | | | |
2007-FRE1, 5.34% (1 Month USD LIBOR + 0.19%, Rate Floor: 0.19%) due 04/25/37◊ | | | 511,679 | | | | 475,753 | |
CSMC Trust | | | | | | | | |
2020-RPL5, 3.02% (WAC) due 08/25/60◊,3 | | | 450,935 | | | | 438,547 | |
BRAVO Residential Funding Trust | | | | | | | | |
2022-R1, 3.13% due 01/29/703,8 | | | 477,207 | | | | 424,879 | |
Credit Suisse Mortgage Capital Certificates | | | | | | | | |
2021-RPL9, 2.44% (WAC) due 02/25/61◊,3 | | | 421,452 | | | | 388,639 | |
OSAT Trust | | | | | | | | |
2021-RPL1, 2.12% due 05/25/653,8 | | | 411,661 | | | | 383,627 | |
First Franklin Mortgage Loan Trust | | | | | | | | |
2006-FF16, 5.57% (1 Month USD LIBOR + 0.42%, Rate Floor: 0.42%) due 12/25/36◊ | | | 880,573 | | | | 369,283 | |
Master Asset-Backed Securities Trust | | | | | | | | |
2006-WMC4, 5.30% (1 Month USD LIBOR + 0.15%, Rate Floor: 0.15%) due 10/25/36◊ | | | 1,117,061 | | | | 358,173 | |
SEE NOTES TO FINANCIAL STATEMENTS. | THE GUGGENHEIM FUNDS SEMI-ANNUAL REPORT | 35 |
SCHEDULE OF INVESTMENTS (Unaudited)(continued) | June 30, 2023 |
SERIES E (TOTAL RETURN BOND SERIES) | |
| | | Face
Amount~ | | | Value | |
| NovaStar Mortgage Funding Trust Series | | | | | | | | |
2007-2, 5.35% (1 Month USD LIBOR + 0.20%, Rate Cap/Floor: 11.00%/0.20%) due 09/25/37◊ | | | 361,512 | | | $ | 349,224 | |
| NYMT Loan Trust | | | | | | | | |
2022-SP1, 5.25% due 07/25/623,8 | | | 326,976 | | | | 313,652 | |
| HarborView Mortgage Loan Trust | | | | | | | | |
2006-14, 5.46% (1 Month USD LIBOR + 0.30%, Rate Floor: 0.30%) due 01/25/47◊ | | | 330,399 | | | | 297,859 | |
| OBX 2023-NQM1 Trust | | | | | | | | |
2022-NQM1, 6.50% (WAC) due 11/25/62◊,3 | | | 235,975 | | | | 232,529 | |
| American Home Mortgage Investment Trust | | | | | | | | |
2007-1, 2.08% due 05/25/477 | | | 1,710,920 | | | | 227,082 | |
| BRAVO Residential Funding Trust 2023-NQM2 | | | | | | | | |
2023-NQM2, 4.50% due 05/25/623,8 | | | 243,069 | | | | 222,152 | |
| Angel Oak Mortgage Trust 2023-1 | | | | | | | | |
2023-1, 4.75% due 09/26/673,8 | | | 195,165 | | | | 180,530 | |
| Washington Mutual Mortgage Pass-Through Certificates WMALT Series Trust | | | | | | | | |
2006-AR9, 4.82% (1 Year CMT Rate + 0.84%, Rate Floor: 0.84%) due 11/25/46◊ | | | 196,168 | | | | 163,620 | |
| Imperial Fund Mortgage Trust | | | | | | | | |
2022-NQM2, 4.20% (WAC) due 03/25/67◊,3 | | | 180,161 | | | | 158,619 | |
| OBX Trust | | | | | | | | |
2022-NQM9, 6.45% due 09/25/623,8 | | | 93,873 | | | | 93,743 | |
| Morgan Stanley Re-REMIC Trust | | | | | | | | |
2010-R5, 2.67% due 06/26/363 | | | 35,474 | | | | 31,402 | |
| UCFC Manufactured Housing Contract | | | | | | | | |
| 1997-2, 7.38% due 10/15/28 | | | 26,497 | | | | 26,106 | |
| Total Residential Mortgage-Backed Securities | | | | | | | 11,353,344 | |
| | | | | | | | | |
| Commercial Mortgage-Backed Securities - 1.3% | | | | | | | | |
| BX Commercial Mortgage Trust | | | | | | | | |
2022-LP2, 7.11% (1 Month Term SOFR + 1.96%, Rate Floor: 1.96%) due 02/15/39◊,3 | | | 464,195 | | | | 441,263 | |
2021-VOLT, 7.19% (1 Month USD LIBOR + 2.00%, Rate Floor: 2.00%) due 09/15/36◊,3 | | | 350,000 | | | | 330,240 | |
| GS Mortgage Securities Trust | | | | | | | | |
2020-GC45, 0.78% (WAC) due 02/13/53◊,7 | | | 9,890,069 | | | | 300,887 | |
| Extended Stay America Trust | | | | | | | | |
2021-ESH, 7.44% (1 Month USD LIBOR + 2.25%, Rate Floor: 2.25%) due 07/15/38◊,3 | | | 240,934 | | | | 234,131 | |
| Life Mortgage Trust | | | | | | | | |
2021-BMR, 7.61% (1 Month Term SOFR + 2.46%, Rate Floor: 2.35%) due 03/15/38◊,3 | | | 245,743 | | | | 232,630 | |
| CFCRE Commercial Mortgage Trust | | | | | | | | |
2016-C3, 1.14% (WAC) due 01/10/48◊,7 | | | 5,313,796 | | | | 106,316 | |
| Wells Fargo Commercial Mortgage Trust | | | | | | | | |
2016-NXS5, 1.57% (WAC) due 01/15/59◊,7 | | | 3,276,036 | | | | 94,886 | |
| 2015-NXS1, 2.63% due 05/15/48 | | | 5,823 | | | | 5,807 | |
| Citigroup Commercial Mortgage Trust | | | | | | | | |
2016-GC37, 1.82% (WAC) due 04/10/49◊,7 | | | 2,827,993 | | | | 95,846 | |
| COMM Mortgage Trust | | | | | | | | |
2015-CR26, 1.05% (WAC) due 10/10/48◊,7 | | | 5,654,631 | | | | 85,788 | |
| Total Commercial Mortgage-Backed Securities | | | | | | | 1,927,794 | |
| | | | | | | | | |
| Military Housing - 1.2% | | | | | | | | |
| GMAC Commercial Mortgage Asset Corp. | | | | | | | | |
2007-HCKM, 6.11% due 08/10/52†††,3 | | | 918,044 | | | | 906,087 | |
| Freddie Mac Military Housing Bonds Resecuritization Trust Certificates | | | | | | | | |
2015-R1, 4.49% (WAC) due 11/25/55◊,3 | | | 909,112 | | | | 740,577 | |
| Total Military Housing | | | | | | | 1,646,664 | |
| | | | | | | | | |
| Total Collateralized Mortgage Obligations | | | | | | | | |
| (Cost $37,182,719) | | | | | | | 34,351,723 | |
| | | | | | | | | |
ASSET-BACKED SECURITIES†† - 20.9% | | | | | | | | |
| Collateralized Loan Obligations - 12.2% | | | | | | | | |
| Octagon Investment Partners 49 Ltd. | | | | | | | | |
2021-5A B, 6.81% (3 Month USD LIBOR + 1.55%, Rate Floor: 1.55%) due 01/15/33◊,3 | | | 1,750,000 | | | | 1,711,388 | |
| BXMT Ltd. | | | | | | | | |
2020-FL2 AS, 6.37% (1 Month Term SOFR + 1.26%, Rate Floor: 1.26%) due 02/15/38◊,3 | | | 1,000,000 | | | | 916,854 | |
2020-FL3 C, 7.77% (1 Month Term SOFR + 2.66%, Rate Floor: 2.66%) due 11/15/37◊,3 | | | 250,000 | | | | 230,887 | |
| Woodmont Trust | | | | | | | | |
2020-7A A1A, 7.16% (3 Month USD LIBOR + 1.90%, Rate Floor: 1.90%) due 01/15/32◊,3 | | | 1,000,000 | | | | 996,755 | |
| Cerberus Loan Funding XXX, LP | | | | | | | | |
2020-3A A, 7.11% (3 Month USD LIBOR + 1.85%, Rate Floor: 1.85%) due 01/15/33◊,3 | | | 1,000,000 | | | | 992,229 | |
| ABPCI Direct Lending Fund CLO II LLC | | | | | | | | |
2021-1A A1R, 6.85% (3 Month USD LIBOR + 1.60%, Rate Floor: 1.60%) due 04/20/32◊,3 | | | 1,000,000 | | | | 987,500 | |
| Palmer Square Loan Funding Ltd. | | | | | | | | |
2022-1A A2, 6.59% (3 Month Term SOFR + 1.60%, Rate Floor: 1.60%) due 04/15/30◊,3 | | | 1,000,000 | | | | 979,431 | |
| LCCM Trust | | | | | | | | |
2021-FL3 A, 6.71% (1 Month Term SOFR + 1.56%, Rate Floor: 1.56%) due 11/15/38◊,3 | | | 600,000 | | | | 582,818 | |
2021-FL3 AS, 7.06% (1 Month Term SOFR + 1.91%, Rate Floor: 1.91%) due 11/15/38◊,3 | | | 400,000 | | | | 376,693 | |
| Golub Capital Partners CLO 36M Ltd. | | | | | | | | |
2018-36A A, 6.63% (3 Month USD LIBOR + 1.30%, Rate Floor: 0.00%) due 02/05/31◊,3 | | | 791,692 | | | | 783,187 | |
36 | THE GUGGENHEIM FUNDS SEMI-ANNUAL REPORT | SEE NOTES TO FINANCIAL STATEMENTS. |
SCHEDULE OF INVESTMENTS (Unaudited)(continued) | June 30, 2023 |
SERIES E (TOTAL RETURN BOND SERIES) | |
| | Face
Amount~ | | | Value | |
LoanCore Issuer Ltd. | | | | | | | | |
2021-CRE6 C, 7.49% (1 Month USD LIBOR + 2.30%, Rate Floor: 2.30%) due 11/15/38◊,3 | | | 500,000 | | | $ | 466,799 | |
2019-CRE2 AS, 6.69% (1 Month USD LIBOR + 1.50%, Rate Floor: 1.50%) due 05/15/36◊,3 | | | 314,888 | | | | 313,617 | |
Fortress Credit Opportunities XI CLO Ltd. | | | | | | | | |
2018-11A A1T, 6.56% (3 Month USD LIBOR + 1.30%, Rate Floor: 0.00%) due 04/15/31◊,3 | | | 750,000 | | | | 743,175 | |
Dryden 37 Senior Loan Fund | | | | | | | | |
2015-37A Q, due 01/15/313,10 | | | 1,000,000 | | | | 736,948 | |
STWD Ltd. | | | | | | | | |
2019-FL1 B, 6.82% (1 Month Term SOFR + 1.71%, Rate Floor: 1.60%) due 07/15/38◊,3 | | | 750,000 | | | | 721,812 | |
Golub Capital Partners CLO 33M Ltd. | | | | | | | | |
2021-33A AR2, 7.26% (3 Month USD LIBOR + 1.86%, Rate Floor: 1.86%) due 08/25/33◊,3 | | | 750,000 | | | | 717,700 | |
Cerberus Loan Funding XL LLC | | | | | | | | |
2023-1A A, 7.19% (3 Month Term SOFR + 2.40%, Rate Floor: 2.40%) due 03/22/35◊,3 | | | 500,000 | | | | 499,966 | |
ABPCI Direct Lending Fund CLO V Ltd. | | | | | | | | |
2021-5A A1R, 6.75% (3 Month USD LIBOR + 1.50%, Rate Floor: 1.50%) due 04/20/31◊,3 | | | 500,000 | | | | 493,282 | |
Golub Capital Partners CLO 16 Ltd. | | | | | | | | |
2021-16A A1R2, 6.87% (3 Month USD LIBOR + 1.61%, Rate Floor: 1.61%) due 07/25/33◊,3 | | | 500,000 | | | | 492,991 | |
THL Credit Lake Shore MM CLO I Ltd. | | | | | | | | |
2021-1A A1R, 6.96% (3 Month USD LIBOR + 1.70%, Rate Floor: 1.70%) due 04/15/33◊,3 | | | 500,000 | | | | 492,569 | |
ABPCI Direct Lending Fund CLO I LLC | | | | | | | | |
2021-1A A1A2, 6.95% (3 Month USD LIBOR + 1.70%, Rate Floor: 1.70%) due 07/20/33◊,3 | | | 500,000 | | | | 486,768 | |
Golub Capital Partners CLO 54M L.P | | | | | | | | |
2021-54A C, 7.98% (3 Month USD LIBOR + 2.65%, Rate Floor: 2.65%) due 08/05/33◊,3 | | | 500,000 | | | | 477,409 | |
Cerberus Loan Funding XXXIII, LP | | | | | | | | |
2021-3A B, 7.11% (3 Month USD LIBOR + 1.85%, Rate Floor: 1.85%) due 07/23/33◊,3 | | | 500,000 | | | | 476,652 | |
CHCP Ltd. | | | | | | | | |
2021-FL1 C, 7.32% (1 Month Term SOFR + 2.21%, Rate Floor: 2.10%) due 02/15/38◊,3 | | | 500,000 | | | | 475,172 | |
HERA Commercial Mortgage Ltd. | | | | | | | | |
2021-FL1 B, 6.76% (1 Month Term SOFR + 1.71%, Rate Floor: 1.60%) due 02/18/38◊,3 | | | 500,000 | | | | 474,860 | |
KREF | | | | | | | | |
2021-FL2 C, 7.16% (1 Month USD LIBOR + 2.00%, Rate Floor: 2.00%) due 02/15/39◊,3 | | | 500,000 | | | | 464,844 | |
Golub Capital Partners CLO 17 Ltd. | | | | | | | | |
2017-17A A1R, 6.91% (3 Month USD LIBOR + 1.65%, Rate Floor: 0.00%) due 10/25/30◊,3 | | | 221,948 | | | | 220,896 | |
Cerberus Loan Funding XXXVI, LP | | | | | | | | |
2021-6A A, 6.66% (3 Month USD LIBOR + 1.40%, Rate Floor: 1.40%) due 11/22/33◊,3 | | | 98,818 | | | | 98,467 | |
Treman Park CLO Ltd. | | | | | | | | |
2015-1A COM, due 10/20/283,10 | | | 162,950 | | | | 4,171 | |
Copper River CLO Ltd. | | | | | | | | |
2007-1A INC, due 01/20/219,10 | | | 600,000 | | | | 60 | |
Total Collateralized Loan Obligations | | | 17,415,900 | |
| | | | | | | | | |
Transport-Aircraft - 1.9% |
Navigator Aircraft ABS Ltd. | | | | | | | | |
2021-1, 2.77% due 11/15/463,8 | | | 444,941 | | | | 386,404 | |
Lunar Structured Aircraft Portfolio Notes | | | | | | | | |
2021-1, 2.64% due 10/15/463 | | | 418,584 | | | | 363,758 | |
AASET Trust | | | | | | | | |
2021-1A, 2.95% due 11/16/413 | | | 385,219 | | | | 331,870 | |
WAVE LLC | | | | | | | | |
2019-1, 3.60% due 09/15/443 | | | 376,862 | | | | 308,687 | |
JOL Air Ltd. | | | | | | | | |
2019-1, 3.97% due 04/15/443 | | | 346,586 | | | | 306,760 | |
Sapphire Aviation Finance II Ltd. | | | | | | | | |
2020-1A, 3.23% due 03/15/403 | | | 355,013 | | | | 298,453 | |
Castlelake Aircraft Structured Trust | | | | | | | | |
2021-1A, 3.47% due 01/15/463 | | | 281,720 | | | | 257,492 | |
Raspro Trust | | | | | | | | |
2005-1A, 6.18% (3 Month USD LIBOR + 0.93%, Rate Floor: 0.93%) due 03/23/24◊,3 | | | 196,989 | | | | 195,222 | |
Sprite Ltd. | | | | | | | | |
2021-1, 3.75% due 11/15/463 | | | 200,257 | | | | 179,295 | |
Falcon Aerospace Ltd. | | | | | | | | |
2017-1, 4.58% due 02/15/423 | | | 103,057 | | | | 97,105 | |
Total Transport-Aircraft | | | 2,725,046 | |
| | | | | | | | | |
Net Lease - 1.9% |
STORE Master Funding I-VII | | | | | | | | |
2016-1A, 3.96% due 10/20/463 | | | 1,085,192 | | | | 1,003,072 | |
CF Hippolyta Issuer LLC | | | | | | | | |
2022-1A, 6.11% due 08/15/623 | | | 244,283 | | | | 236,813 | |
2020-1, 2.28% due 07/15/603 | | | 224,863 | | | | 200,831 | |
Capital Automotive REIT | | | | | | | | |
2021-1A, 2.76% due 08/15/513 | | | 498,646 | | | | 372,343 | |
SVC ABS LLC | | | | | | | | |
2023-1A, 5.15% due 02/20/533 | | | 349,417 | | | | 333,833 | |
CMFT Net Lease Master Issuer LLC | | | | | | | | |
2021-1, 3.44% due 07/20/513 | | | 400,000 | | | | 299,147 | |
SEE NOTES TO FINANCIAL STATEMENTS. | THE GUGGENHEIM FUNDS SEMI-ANNUAL REPORT | 37 |
SCHEDULE OF INVESTMENTS (Unaudited)(continued) | June 30, 2023 |
SERIES E (TOTAL RETURN BOND SERIES) | |
| | Face
Amount~ | | | Value | |
CARS-DB4, LP | | | | | | | | |
2020-1A, 3.81% due 02/15/503 | | | 247,448 | | | $ | 202,927 | |
Total Net Lease | | | 2,648,966 | |
| | | | | | | | | |
Whole Business - 1.8% |
Arbys Funding LLC | | | | | | | | |
2020-1A, 3.24% due 07/30/503 | | | 972,500 | | | | 856,828 | |
Applebee’s Funding LLC / IHOP Funding LLC | | | | | | | | |
2019-1A, 4.72% due 06/05/493 | | | 495,000 | | | | 455,619 | |
SERVPRO Master Issuer LLC | | | | | | | | |
2021-1A, 2.39% due 04/25/513 | | | 490,000 | | | | 402,298 | |
Taco Bell Funding LLC | | | | | | | | |
2016-1A, 4.97% due 05/25/463 | | | 329,000 | | | | 316,093 | |
Wingstop Funding LLC | | | | | | | | |
2022-1A, 3.73% due 03/05/523 | | | 347,375 | | | | 305,212 | |
ServiceMaster Funding LLC | | | | | | | | |
2020-1, 3.34% due 01/30/513 | | | 238,226 | | | | 187,186 | |
Total Whole Business | | | 2,523,236 | |
| | | | | | | | | |
Financial - 1.0% |
KKR Core Holding Company LLC | | | | | | | | |
4.00% due 08/12/31††† | | | 536,679 | | | | 467,356 | |
Madison Avenue Secured Funding Trust | | | | | | | | |
2023-1, 7.09% (1 Month Term SOFR + 2.00%, Rate Floor: 2.00%) due 03/04/24◊,†††,3 | | | 350,000 | | | | 350,000 | |
Oxford Finance Funding | | | | | | | | |
2020-1A, 3.10% due 02/15/283 | | | 179,995 | | | | 178,248 | |
Lightning A | | | | | | | | |
5.50% due 03/01/37††† | | | 180,209 | | | | 169,221 | |
Thunderbird A | | | | | | | | |
5.50% due 03/01/37††† | | | 179,373 | | | | 168,435 | |
Nassau LLC | | | | | | | | |
2019-1, 3.98% due 08/15/343 | | | 137,585 | | | | 130,377 | |
Total Financial | | | 1,463,637 | |
| | | | | | | | | |
Single Family Residence - 0.6% |
FirstKey Homes 2021-SFR1 Trust | | | | | | | | |
2021-SFR1, 1.79% due 08/17/383 | | | 600,000 | | | | 521,937 | |
FirstKey Homes Trust | | | | | | | | |
2020-SFR2, 4.50% due 10/19/373 | | | 150,000 | | | | 138,081 | |
2020-SFR2, 4.00% due 10/19/373 | | | 150,000 | | | | 137,243 | |
2020-SFR2, 3.37% due 10/19/373 | | | 100,000 | | | | 90,649 | |
Total Single Family Residence | | | 887,910 | |
| | | | | | | | | |
Infrastructure - 0.5% |
Stack Infrastructure Issuer LLC | | | | | | | | |
2023-1A, 5.90% due 03/25/483 | | | 500,000 | | | | 484,254 | |
VB-S1 Issuer LLC - VBTEL | | | | | | | | |
2022-1A, 4.29% due 02/15/523 | | | 250,000 | | | | 223,461 | |
Total Infrastructure | | | 707,715 | |
| | | | | | | | | |
Transport-Container - 0.5% |
CLI Funding VIII LLC | | | | | | | | |
2021-1A, 1.64% due 02/18/463 | | | 379,726 | | | | 323,553 | |
Textainer Marine Containers Ltd. | | | | | | | | |
2021-3A, 1.94% due 08/20/463 | | | 256,000 | | | | 210,761 | |
Textainer Marine Containers VII Ltd. | | | | | | | | |
2020-1A, 2.73% due 08/21/453 | | | 171,582 | | | | 155,760 | |
Total Transport-Container | | | 690,074 | |
| | | | | | | | | |
Collateralized Debt Obligations - 0.5% |
Anchorage Credit Funding 4 Ltd. | | | | | | | | |
2021-4A AR, 2.72% due 04/27/393 | | | 750,000 | | | | 663,685 | |
Total Asset-Backed Securities |
(Cost $31,590,342) | | | 29,726,169 | |
| | | | | |
U.S. GOVERNMENT SECURITIES†† - 20.9% |
U.S. Treasury Notes |
3.50% due 01/31/2811 | | | 6,111,000 | | | | 5,934,115 | |
3.50% due 02/15/3311 | | | 4,100,000 | | | | 3,993,656 | |
4.13% due 11/15/32 | | | 3,575,000 | | | | 3,653,203 | |
3.38% due 05/15/3311 | | | 2,590,000 | | | | 2,497,731 | |
3.63% due 03/31/28 | | | 2,200,000 | | | | 2,148,781 | |
4.00% due 02/29/28 | | | 2,060,000 | | | | 2,044,792 | |
2.75% due 02/15/28 | | | 650,000 | | | | 610,873 | |
3.75% due 06/30/30 | | | 520,000 | | | | 513,094 | |
U.S. Treasury Bonds |
due 05/15/5312,13 | | | 11,480,000 | | | | 3,850,487 | |
due 11/15/5212,13 | | | 3,400,000 | | | | 1,168,451 | |
due 02/15/5212,13 | | | 3,180,000 | | | | 1,092,194 | |
due 02/15/4612,13 | | | 2,455,000 | | | | 989,492 | |
due 05/15/4412,13 | | | 2,145,000 | | | | 924,058 | |
due 11/15/4412,13 | | | 490,000 | | | | 206,277 | |
Total U.S. Government Securities |
(Cost $30,400,462) | | | | | | | 29,627,204 | |
| | | | | | | | | |
SENIOR FLOATING RATE INTERESTS††,◊ - 2.3% |
Consumer, Cyclical - 1.0% |
MB2 Dental Solutions LLC | | | | | | | | |
11.20% (1 Month Term SOFR + 6.00%, Rate Floor: 7.00%) due 01/29/27††† | | | 561,186 | | | | 552,351 | |
First Brands Group LLC | | | | | | | | |
10.25% (6 Month Term SOFR + 5.00%, Rate Floor: 6.00%) due 03/30/27††† | | | 348,250 | | | | 339,979 | |
Zephyr Bidco Ltd. | | | | | | | | |
9.21% (1 Month GBP SONIA + 4.75%, Rate Floor: 4.75%) due 07/23/25 | | GBP | 200,000 | | | | 245,834 | |
SP PF Buyer LLC | | | | | | | | |
9.72% (1 Month Term SOFR + 4.50%, Rate Floor: 4.50%) due 12/22/25 | | | 146,183 | | | | 105,252 | |
Pacific Bells LLC | | | | | | | | |
10.00% (3 Month Term SOFR + 4.50%, Rate Floor: 5.00%) due 11/10/28 | | | 90,494 | | | | 88,543 | |
New Trojan Parent, Inc. | | | | | | | | |
8.46% (1 Month Term SOFR + 3.25%, Rate Floor: 3.25%) due 01/06/28 | | | 98,000 | | | | 53,777 | |
Total Consumer, Cyclical | | | 1,385,736 | |
| | | | | | | | | |
Technology - 0.4% |
Datix Bidco Ltd. | | | | | | | | |
8.68% (6 Month GBP SONIA + 4.50%, Rate Floor: 4.50%) due 04/28/25††† | | GBP | 300,000 | | | | 373,300 | |
38 | THE GUGGENHEIM FUNDS SEMI-ANNUAL REPORT | SEE NOTES TO FINANCIAL STATEMENTS. |
SCHEDULE OF INVESTMENTS (Unaudited)(continued) | June 30, 2023 |
SERIES E (TOTAL RETURN BOND SERIES) | |
| | Face
Amount~ | | | Value | |
RLDatix | | | | | | | | |
9.53% (6 Month Term SOFR + 4.50%, Rate Floor: 4.50%) due 04/28/25††† | | | 129,574 | | | $ | 126,956 | |
Dun & Bradstreet | | | | | | | | |
8.43% (1 Month Term SOFR + 3.25%, Rate Floor: 3.25%) due 02/06/26 | | | 94,594 | | | | 94,617 | |
Total Technology | | | 594,873 | |
| | | | | | | | | |
Financial - 0.4% |
Higginbotham Insurance Agency, Inc. | | | | | | | | |
10.45% (1 Month Term SOFR + 5.25%, Rate Floor: 5.25%) due 11/25/26††† | | | 289,500 | | | | 286,257 | |
Jane Street Group LLC | | | | | | | | |
7.97% (1 Month Term SOFR + 2.75%, Rate Floor: 2.75%) due 01/26/28 | | | 125,533 | | | | 125,130 | |
HighTower Holding LLC | | | | | | | | |
9.15% (1 Month USD LIBOR + 4.00%, Rate Floor: 4.75%) due 04/21/28 | | | 55,463 | | | | 53,868 | |
Total Financial | | | 465,255 | |
| | | | | | | | | |
Consumer, Non-cyclical - 0.3% |
Mission Veterinary Partners | | | | | | | | |
9.19% (1 Month USD LIBOR + 4.00%, Rate Floor: 5.15%) due 04/27/28 | | | 147,375 | | | | 143,138 | |
Quirch Foods Holdings LLC | | | | | | | | |
9.99% (1 Month Term SOFR + 4.75%, Rate Floor: 4.75%) due 10/27/27 | | | 147,242 | | | | 140,064 | |
Southern Veterinary Partners LLC | | | | | | | | |
9.22% (1 Month Term SOFR + 4.00%, Rate Floor: 4.00%) due 10/05/27 | | | 105,993 | | | | 104,005 | |
HAH Group Holding Co. LLC | | | | | | | | |
10.21% (1 Month Term SOFR + 5.00%, Rate Floor: 5.00%) due 10/29/27 | | | 34,173 | | | | 33,147 | |
Elanco Animal Health, Inc. | | | | | | | | |
7.01% (1 Month Term SOFR + 1.75%, Rate Floor: 1.75%) due 08/02/27 | | | 24,441 | | | | 23,976 | |
Total Consumer, Non-cyclical | | | 444,330 | |
| | | | | | | | | |
Industrial - 0.2% |
Mileage Plus Holdings LLC | | | | | | | | |
10.76% (3 Month USD LIBOR + 5.25%, Rate Floor: 6.25%) due 06/21/27 | | | 200,000 | | | | 207,542 | |
American Bath Group LLC | | | | | | | | |
8.95% (1 Month Term SOFR + 3.75%, Rate Floor: 3.75%) due 11/23/27 | | | 66,017 | | | | 61,990 | |
Air Canada | | | | | | | | |
8.84% (3 Month USD LIBOR + 3.50%, Rate Floor: 4.25%) due 08/11/28 | | | 49,543 | | | | 49,472 | |
Total Industrial | | | 319,004 | |
| | | | | | | | | |
Utilities - 0.0% |
Hamilton Projects Acquiror LLC | | | | | | | | |
9.72% (1 Month Term SOFR + 4.50%, Rate Floor: 4.50%) due 06/17/27 | | | 8,606 | | | | 8,509 | |
Total Senior Floating Rate Interests |
(Cost $3,370,583) | | | 3,217,707 | |
FEDERAL AGENCY BONDS†† - 1.3% |
Tennessee Valley Authority |
4.25% due 09/15/65 | | | 1,000,000 | | | | 910,497 | |
5.38% due 04/01/56 | | | 750,000 | | | | 825,772 | |
Tennessee Valley Authority Principal Strips |
due 01/15/4812,13 | | | 500,000 | | | | 152,752 | |
Total Federal Agency Bonds |
(Cost $2,556,730) | | | | | | | 1,889,021 | |
| | | | | | | | | |
MUNICIPAL BONDS†† - 0.4% |
Illinois - 0.2% |
State of Illinois General Obligation Unlimited | | | | | | | | |
5.65% due 12/01/38 | | | 355,556 | | | | 354,313 | |
| |
New York - 0.2% |
Westchester County Local Development Corp. Revenue Bonds | | | | | | | | |
3.85% due 11/01/50 | | | 300,000 | | | | 214,998 | |
Total Municipal Bonds |
(Cost $661,432) | | | 569,311 | |
| | | | | | | | | |
| | | Contracts/
Notional Value | | | | | |
OTC OPTIONS PURCHASED†† - 0.0% |
Call Options on: |
Interest Rate Options |
Morgan Stanley Capital Services LLC 10Y-2Y SOFR CMS CAP Expiring June 2024 with strike price of $0.10 | | USD | 3,900,000 | | | $ | 6,494 | |
Barclays Bank plc 10Y-2Y SOFR CMS CAP Expiring June 2024 with strike price of $0.10 | | USD | 3,850,000 | | | | 6,410 | |
Morgan Stanley Capital Services LLC 10Y-2Y SOFR CMS CAP Expiring December 2023 with strike price of $0.10 | | USD | 3,900,000 | | | | 3,153 | |
Barclays Bank plc 10Y-2Y SOFR CMS CAP Expiring December 2023 with strike price of $0.20 | | USD | 3,900,000 | | | | 3,153 | |
Bank of America, N.A. 10Y-2Y SOFR CMS CAP Expiring June 2024 with strike price of $0.10 | | USD | 1,950,000 | | | | 3,247 | |
Goldman Sachs International 10Y-2Y SOFR CMS CAP Expiring June 2024 with strike price of $0.10 | | | USD 1,600,000 | | | | 2,664 | |
Bank of America, N.A. 10Y-2Y SOFR CMS CAP Expiring December 2023 with strike price of $0.20 | | USD | 1,900,000 | | | | 1,536 | |
Goldman Sachs International 10Y-2Y SOFR CMS CAP Expiring December 2023 with strike price of $0.20 | | USD | 1,600,000 | | | | 1,294 | |
Total OTC Options Purchased |
(Cost $96,418) | | | | | | | 27,951 | |
| | | | | | | | | |
SEE NOTES TO FINANCIAL STATEMENTS. | THE GUGGENHEIM FUNDS SEMI-ANNUAL REPORT | 39 |
SCHEDULE OF INVESTMENTS (Unaudited)(continued) | June 30, 2023 |
SERIES E (TOTAL RETURN BOND SERIES) | |
| | | Contracts/
Notional Value | | | Value | |
| OTC CREDIT DEFAULT SWAPTIONS PURCHASED††,14 - 0.0% |
| Put Swaptions on: | | | | | | | | |
| Credit Swaptions | | | | | | | | |
| Barclays Bank plc 5-Year Credit Default Swap Expiring September 2023 with exercise rate of 0.90% | | | USD 3,700,000 | | | $ | 2,123 | |
| Total OTC Credit Default Swaptions Purchased | | | | | | | | |
| (Cost $5,587) | | | | | | | 2,123 | |
| | | | | | | | | |
| Total Investments - 105.8% | | | | | | | | |
| (Cost $166,218,171) | | | | | | $ | 150,302,283 | |
| | | | | | | | | |
| OTC INTEREST RATE SWAPTIONS WRITTEN††,14 - (0.01)% |
| Put Swaptions on: | | | | | | | | |
| Interest Rate Swaptions | | | | | | | | |
| BNP Paribas 5-Year Interest Rate Swap Expiring July 2023 with exercise rate of 3.51% | | | USD 2,470,000 | | | $ | (43,510 | ) |
| BNP Paribas 5-Year Interest Rate Swap Expiring July 2023 with exercise rate of 3.35% | | | USD 2,490,000 | | | | (61,042 | ) |
| Total OTC Interest Rate Swaptions Written | | | | | | | | |
| (Premiums received $37,338) | | | | | | | (104,552 | ) |
| Other Assets & Liabilities, net - (5.7)% | | | | | | | (8,177,817 | ) |
| Total Net Assets - 100.0% | | | | | | $ | 142,019,914 | |
Centrally Cleared Credit Default Swap Agreements Protection Purchased†† |
Counterparty | Exchange | Index | Protection
Premium Rate | | Payment
Frequency | | | Maturity
Date | | | Notional
Amount ~ | | | Value | | | Upfront
Premiums
Paid(Received) | | | Unrealized
Depreciation** | |
BofA Securities, Inc. | ICE | ITRAXX.EUR.38.V1 | 1.00% | Quarterly | 12/20/27 | EUR 1,600,000 | | $ | (22,885 | ) | | $ | (12,744 | ) | | $ | (10,141 | ) |
BofA Securities, Inc. | ICE | CDX.NA.HY.40.V1 | 5.00% | Quarterly | 06/20/28 | | | 1,400,000 | | | | (39,102 | ) | | | 6,674 | | | | (45,776 | ) |
| | | | | | | | | | | | | | | | | | $ | (61,987 | ) | | $ | (6,070 | ) | | $ | (55,917 | ) |
Centrally Cleared Interest Rate Swap Agreements†† |
Counterparty | Exchange | Floating
Rate
Type | Floating
Rate Index | | Fixed
Rate | | | Payment
Frequency | | | Maturity
Date | | | Notional
Amount | | | Value | | | Upfront
Premiums
Paid | | | Unrealized
Depreciation** | |
BofA Securities, Inc. | CME | Pay | U.S. Secured Overnight Financing Rate | 3.40% | Annually | 04/04/28 | | $ | 5,000,000 | | | $ | (118,532 | ) | | $ | 307 | | | $ | (118,839 | ) |
BofA Securities, Inc. | CME | Pay | U.S. Secured Overnight Financing Rate | 2.78% | Annually | 07/18/27 | | | 5,000,000 | | | | (239,785 | ) | | | 103 | | | | (239,888 | ) |
| | | | | | | | | | | | | | | | | | | | | | $ | (358,317 | ) | | $ | 410 | | | $ | (358,727 | ) |
40 | THE GUGGENHEIM FUNDS SEMI-ANNUAL REPORT | SEE NOTES TO FINANCIAL STATEMENTS. |
SCHEDULE OF INVESTMENTS (Unaudited)(continued) | June 30, 2023 |
SERIES E (TOTAL RETURN BOND SERIES) | |
Forward Foreign Currency Exchange Contracts†† |
Counterparty | | Currency | | | Type | | | Quantity | | | Contract
Amount | | | Settlement
Date | | | Unrealized
Depreciation | |
Barclays Bank plc | | | GBP | | | | Sell | | | | 495,000 | | | | 624,030 USD | | | | 07/14/23 | | | $ | (4,660 | ) |
OTC Interest Rate Swaptions Written |
| |
Counterparty/Description | Floating
Rate Type | Floating
Rate Index | Payment
Frequency | | Fixed
Rate | | | Expiration
Date | | | Exercise
Rate | | | Swaption
Notional
Amount | | | Swaption
Value | |
Put | | | | | | | | | | | | | | | | | | | | | | | |
BNP Paribas 5-Year Interest Rate Swap | Pay | SOFR | Annual | | | 3.51 | % | | | 07/14/23 | | | | 3.51 | % | | $ | 2,470,000 | | | $ | (43,510 | ) |
BNP Paribas 5-Year Interest Rate Swap | Pay | SOFR | Annual | | | 3.35 | % | | | 07/07/23 | | | | 3.35 | % | | | 2,490,000 | | | | (61,042 | ) |
| | | | | | | | | | | | | | | | | | | | | | $ | (104,552 | ) |
OTC Credit Default Swaptions Purchased |
| |
Counterparty/Description | Index | Buy/Sell
Protection | Payment
Frequency | | Protection
Premium
Rate | | | Expiration
Date | | | Exercise
Rate | | | Swaption
Notional
Amount | | | Swaption
Value | |
Put | | | | | | | | | | | | | | | | | | | | | | | |
Barclays Bank plc 5-Year Credit Default Swap | CDX.NA.IG.40.V1 | Buy | Quarterly | | | 1.00 | % | | | 09/20/23 | | | | 0.90 | % | | $ | 3,700,000 | | | $ | 2,123 | |
SEE NOTES TO FINANCIAL STATEMENTS. | THE GUGGENHEIM FUNDS SEMI-ANNUAL REPORT | 41 |
SCHEDULE OF INVESTMENTS (Unaudited)(continued) | June 30, 2023 |
SERIES E (TOTAL RETURN BOND SERIES) | |
~ | The face amount is denominated in U.S. dollars unless otherwise indicated. |
* | Non-income producing security. |
** | Includes cumulative appreciation (depreciation). Variation margin is reported within the Statement of Assets and Liabilities. |
† | Value determined based on Level 1 inputs, unless otherwise noted — See Note 4. |
†† | Value determined based on Level 2 inputs, unless otherwise noted — See Note 4. |
††† | Value determined based on Level 3 inputs — See Note 4. |
◊ | Variable rate security. Rate indicated is the rate effective at June 30, 2023. In some instances, the effective rate is limited by a minimum rate floor or a maximum rate cap established by the issuer. The settlement status of a position may also impact the effective rate indicated. In some cases, a position may be unsettled at period end and may not have a stated effective rate. In instances where multiple underlying reference rates and spread amounts are shown, the effective rate is based on a weighted average. |
1 | Special Purpose Acquisition Company (SPAC). |
2 | Security has a fixed rate coupon which will convert to a floating or variable rate coupon on a future date. |
3 | Security is a 144A or Section 4(a)(2) security. These securities have been determined to be liquid under guidelines established by the Board of Trustees. The total market value of 144A or Section 4(a)(2) securities is $56,725,328 (cost $63,124,006), or 39.9% of total net assets. |
4 | Affiliated issuer. |
5 | Rate indicated is the 7-day yield as of June 30, 2023. |
6 | Perpetual maturity. |
7 | Security is an interest-only strip. |
8 | Security is a step up/down bond. The coupon increases or decreases at regular intervals until the bond reaches full maturity. Rate indicated is the rate at June 30, 2023. See table below for additional step information for each security. |
9 | Security is a 144A or Section 4(a)(2) security. These securities have been determined to be illiquid and restricted under guidelines established by the Board of Trustees. The total market value of 144A or Section 4(a)(2) illiquid and restricted securities is $1,444,940 (cost $1,474,942), or 1.0% of total net assets — See Note 9. |
10 | Security has no stated coupon. However, it is expected to receive residual cash flow payments on defined deal dates. |
11 | All or a portion of this security has been physically segregated or earmarked in connection with reverse repurchase agreements. At June 30, 2023, the total market value of segregated or earmarked securities was $12,425,502 — See Note 11. |
12 | Security is a principal-only strip. |
13 | Zero coupon rate security. |
14 | Swaptions — See additional disclosure in the swaptions table above for more information on swaptions. |
| | BofA — Bank of America |
| | CDX.NA.HY.40.V1 — Credit Default Swap North American High Yield Series 40 Index Version 1 |
| | CDX.NA.IG.40.V1 — Credit Default Swap North American Investment Grade Series 40 Index Version 1 |
| | CME — Chicago Mercantile Exchange |
| | CMS — Constant Maturity Swap |
| | CMT — Constant Maturity Treasury |
| | EUR — Euro |
| | GBP — British Pound |
| | ICE — Intercontinental Exchange |
| | ITRAXX.EUR.38.V1 — iTraxx Europe Series 38 Index Version 1 |
| | LIBOR — London Interbank Offered Rate |
| | plc — Public Limited Company |
| | REMIC — Real Estate Mortgage Investment Conduit |
| | REIT — Real Estate Investment Trust |
| | SARL — Société à Responsabilité Limitée |
| | SOFR — Secured Overnight Financing Rate |
| | SONIA — Sterling Overnight Index Average |
| | WAC — Weighted Average Coupon |
| | |
| | See Sector Classification in Other Information section. |
42 | THE GUGGENHEIM FUNDS SEMI-ANNUAL REPORT | SEE NOTES TO FINANCIAL STATEMENTS. |
SCHEDULE OF INVESTMENTS (Unaudited)(continued) | June 30, 2023 |
SERIES E (TOTAL RETURN BOND SERIES) | |
The following table summarizes the inputs used to value the Fund’s investments at June 30, 2023 (See Note 4 in the Notes to Financial Statements):
Investments in Securities (Assets) | | Level 1
Quoted
Prices | | | Level 2
Significant
Observable
Inputs | | | Level 3
Significant
Unobservable
Inputs | | | Total | |
Common Stocks | | $ | 136,992 | | | $ | — | | | $ | 7 | | | $ | 136,999 | |
Preferred Stocks | | | — | | | | 3,736,912 | | | | — | | | | 3,736,912 | |
Warrants | | | 520 | | | | — | | | | — | * | | | 520 | |
Mutual Funds | | | 6,079,257 | | | | — | | | | — | | | | 6,079,257 | |
Money Market Fund | | | 4,828,820 | | | | — | | | | — | | | | 4,828,820 | |
Corporate Bonds | | | — | | | | 35,761,752 | | | | 346,814 | | | | 36,108,566 | |
Collateralized Mortgage Obligations | | | — | | | | 32,707,487 | | | | 1,644,236 | | | | 34,351,723 | |
Asset-Backed Securities | | | — | | | | 28,571,157 | | | | 1,155,012 | | | | 29,726,169 | |
U.S. Government Securities | | | — | | | | 29,627,204 | | | | — | | | | 29,627,204 | |
Senior Floating Rate Interests | | | — | | | | 1,538,864 | | | | 1,678,843 | | | | 3,217,707 | |
Federal Agency Bonds | | | — | | | | 1,889,021 | | | | — | | | | 1,889,021 | |
Municipal Bonds | | | — | | | | 569,311 | | | | — | | | | 569,311 | |
Options Purchased | | | — | | | | 27,951 | | | | — | | | | 27,951 | |
Credit Default Swaptions Purchased | | | — | | | | 2,123 | | | | — | | | | 2,123 | |
Total Assets | | $ | 11,045,589 | | | $ | 134,431,782 | | | $ | 4,824,912 | | | $ | 150,302,283 | |
Investments in Securities (Liabilities) | | Level 1
Quoted
Prices | | | Level 2
Significant
Observable
Inputs | | | Level 3
Significant
Unobservable
Inputs | | | Total | |
Interest Rate Swaptions Written | | $ | — | | | $ | 104,552 | | | $ | — | | | $ | 104,552 | |
Credit Default Swap Agreements** | | | — | | | | 55,917 | | | | — | | | | 55,917 | |
Interest Rate Swap Agreements** | | | — | | | | 358,727 | | | | — | | | | 358,727 | |
Forward Foreign Currency Exchange Contracts** | | | — | | | | 4,660 | | | | — | | | | 4,660 | |
Total Liabilities | | $ | — | | | $ | 523,856 | | | $ | — | | | $ | 523,856 | |
* | Includes securities with a market value of $0. |
** | This derivative is reported as unrealized appreciation/depreciation at period end. |
The Fund may hold assets and/or liabilities in which the fair value approximates the carrying amount for financial statement purposes. As of the period end, reverse repurchase agreements of $9,198,364 are categorized as Level 2 within the disclosure hierarchy — See Note 11.
SEE NOTES TO FINANCIAL STATEMENTS. | THE GUGGENHEIM FUNDS SEMI-ANNUAL REPORT | 43 |
SCHEDULE OF INVESTMENTS (Unaudited)(continued) | June 30, 2023 |
SERIES E (TOTAL RETURN BOND SERIES) | |
The following is a summary of significant unobservable inputs used in the fair valuation of assets and liabilities categorized within Level 3 of the fair value hierarchy:
Category | | Ending Balance at
June 30, 2023 | | | Valuation Technique | | | Unobservable Inputs | | | Input Range | | | Weighted Average* | |
Assets: | | | | | | | | | | | | | | | | | | | | |
Asset-Backed Securities | | $ | 805,012 | | Yield Analysis | Yield | 6.4%-6.9% | 6.6% |
Asset-Backed Securities | | | 350,000 | | Option adjusted spread off prior month end broker quote | Broker Quote | — | — |
Collateralized Mortgage Obligations | | | 906,087 | | Option adjusted spread off prior month end broker quote | Broker Quote | — | — |
Collateralized Mortgage Obligations | | | 738,149 | | Model Price | Market Comparable Yields | 7.9% | — |
Common Stocks | | | 7 | | Model Price | Liquidation Value | — | — |
Corporate Bonds | | | 346,814 | | Option adjusted spread off prior month end broker quote | Broker Quote | — | — |
Senior Floating Rate Interests | | | 1,338,864 | | Yield Analysis | Yield | 11.0%-11.7% | 11.4% |
Senior Floating Rate Interests | | | 339,979 | | Third Party Pricing | Broker Quote | — | — |
Total Assets | | $ | 4,824,912 | | | | | |
* | Inputs are weighted by the fair value of the instruments. |
Significant changes in a quote, yield, market comparable yields or liquidation value would generally result in significant changes in the fair value of the security. Any remaining Level 3 securities held by the Fund and excluded from the table above, were not considered material to the Fund.
The Fund’s fair valuation leveling guidelines classify a single daily broker quote, or a vendor price based on a single daily or monthly broker quote, as Level 3, if such a quote or price cannot be supported with other available market information.
Transfers between Level 2 and Level 3 may occur as markets fluctuate and/or the availability of data used in an investment’s valuation changes. For the period ended June 30, 2023, the Fund had securities with a total value of $283,262 transfer out of Level 3 into Level 2 due to the availability of current and reliable market-based data provided by a third-party pricing service which utilizes significant observable inputs.
44 | THE GUGGENHEIM FUNDS SEMI-ANNUAL REPORT | SEE NOTES TO FINANCIAL STATEMENTS. |
SCHEDULE OF INVESTMENTS (Unaudited)(continued) | June 30, 2023 |
SERIES E (TOTAL RETURN BOND SERIES) | |
Summary of Fair Value Level 3 Activity
Following is a reconciliation of Level 3 assets for which significant unobservable inputs were used to determine fair value for the period ended June 30, 2023:
| | | Assets | | | | | | | Liabilities | |
| | Asset-Backed
Securities | | | Collateralized
Mortgage
Obligations | | | Corporate
Bonds | | | Senior
Floating Rate
Interests | | | Common
Stocks | | | Total Assets | | | Unfunded
Loan
Commitments | |
Beginning Balance | | $ | 1,198,541 | | | $ | 1,634,137 | | | $ | 344,600 | | | $ | 1,576,324 | | | $ | 7 | | | $ | 4,753,609 | | | $ | (1,569 | ) |
Purchases/(Receipts) | | | 412,744 | | | | — | | | | — | | | | 390,423 | | | | — | | | | 803,167 | | | | — | |
(Sales, maturities and paydowns)/Fundings | | | (453,770 | ) | | | (5,483 | ) | | | — | | | | (53,825 | ) | | | — | | | | (513,078 | ) | | | 809 | |
Amortization of premiums/discounts | | | — | | | | (1,732 | ) | | | — | | | | 3,213 | | | | — | | | | 1,481 | | | | — | |
Total realized gains (losses) included in earnings | | | — | | | | — | | | | — | | | | (3,012 | ) | | | — | | | | (3,012 | ) | | | — | |
Total change in unrealized appreciation (depreciation) included in earnings | | | (2,443 | ) | | | 17,314 | | | | 2,214 | | | | 48,922 | | | | — | | | | 66,007 | | | | 760 | |
Transfers into Level 3 | | | — | | | | — | | | | — | | | | — | | | | — | | | | — | | | | — | |
Transfers out of Level 3 | | | (60 | ) | | | — | | | | — | | | | (283,202 | ) | | | — | | | | (283,262 | ) | | | — | |
Ending Balance | | $ | 1,155,012 | | | $ | 1,644,236 | | | $ | 346,814 | | | $ | 1,678,843 | | | $ | 7 | | | $ | 4,824,912 | | | $ | — | |
Net change in unrealized appreciation (depreciation) for investments in Level 3 securities still held at June 30, 2023 | | $ | (2,268 | ) | | $ | 17,314 | | | $ | 2,214 | | | $ | 26,588 | | | $ | — | | | $ | 43,848 | | | $ | — | |
Step Coupon Bonds
The following table discloses additional information related to step coupon bonds held by the Fund. Certain securities are subject to multiple rate changes prior to maturity. For those securities, a range of rates and corresponding dates have been provided. Rates for all step coupon bonds held by the Fund are scheduled to increase, none are scheduled to decrease.
Name | | Coupon Rate at
Next Reset Date | | | Next Rate Reset Date | | | Future Reset Rate | | | Future Reset Date | |
Angel Oak Mortgage Trust 2023-1 2023-1, 4.75% due 09/26/67 | | | 5.75 | % | | | 01/01/27 | | | | — | | | | — | |
BRAVO Residential Funding Trust 2022-R1, 3.13% due 01/29/70 | | | 6.13 | % | | | 01/30/25 | | | | — | | | | — | |
BRAVO Residential Funding Trust 2023-NQM2 2023-NQM2, 4.50% due 05/25/62 | | | 5.50 | % | | | 02/01/27 | | | | — | | | | — | |
Legacy Mortgage Asset Trust 2021-GS3, 1.75% due 07/25/61 | | | 4.75 | % | | | 05/26/24 | | | | 5.75 | % | | | 05/26/25 | |
Legacy Mortgage Asset Trust 2021-GS5, 2.25% due 07/25/67 | | | 5.25 | % | | | 11/26/24 | | | | 6.25 | % | | | 11/26/25 | |
NYMT Loan Trust 2022-SP1, 5.25% due 07/25/62 | | | 8.25 | % | | | 07/01/25 | | | | 9.25 | % | | | 07/01/26 | |
OBX Trust 2022-NQM9, 6.45% due 09/25/62 | | | 7.45 | % | | | 11/01/26 | | | | — | | | | — | |
OSAT Trust 2021-RPL1, 2.12% due 05/25/65 | | | 5.12 | % | | | 06/26/24 | | | | 6.12 | % | | | 06/26/25 | |
PRPM LLC 2022-1, 3.72% due 02/25/27 | | | 6.72 | % | | | 02/25/25 | | | | 7.72 | % | | | 02/25/26 | |
PRPM LLC 2021-5, 1.79% due 06/25/26 | | | 4.79 | % | | | 06/26/24 | | | | 5.79 | % | | | 06/26/25 | |
SEE NOTES TO FINANCIAL STATEMENTS. | THE GUGGENHEIM FUNDS SEMI-ANNUAL REPORT | 45 |
SCHEDULE OF INVESTMENTS (Unaudited)(concluded) | June 30, 2023 |
SERIES E (TOTAL RETURN BOND SERIES) | |
Affiliated Transactions
Investments representing 5% or more of the outstanding voting shares of a company, or control of or by, or common control under Guggenheim Investments, result in that company being considered an affiliated issuer, as defined in the 1940 Act.
Transactions during the period ended June 30, 2023, in which the company is an affiliated issuer, were as follows:
Security Name | | Value
12/31/22 | | | Additions | | | Reductions | | | Realized
Gain (Loss) | | | Change in
Unrealized
Appreciation
(Depreciation) | | | Value
06/30/23 | | | Shares
06/30/23 | | | Investment
Income | |
Mutual Funds | | | | | | | | | | | | | | | | | | | | | | | | | | | | | | | | |
Guggenheim Total Return Bond Fund — R6-Class | | $ | 5,884,003 | | | $ | 130,828 | | | $ | — | | | $ | — | | | $ | 64,426 | | | $ | 6,079,257 | | | | 259,022 | | | $ | 130,316 | |
46 | THE GUGGENHEIM FUNDS SEMI-ANNUAL REPORT | SEE NOTES TO FINANCIAL STATEMENTS. |
SERIES E (TOTAL RETURN BOND SERIES) | |
STATEMENT OF ASSETS AND LIABILITIES (Unaudited) |
June 30, 2023 |
Assets: |
Investments in unaffiliated issuers, at value (cost $159,357,229) | | $ | 144,223,026 | |
Investments in affiliated issuers, at value (cost $6,860,942) | | | 6,079,257 | |
Segregated cash with broker | | | 84,151 | |
Unamortized upfront premiums paid on credit default swap agreements | | | 6,674 | |
Unamortized upfront premiums paid on interest rate swap agreements | | | 410 | |
Prepaid expenses | | | 795 | |
Receivables: |
Securities sold | | | 5,094,713 | |
Interest | | | 1,097,518 | |
Fund shares sold | | | 93,193 | |
Dividends | | | 23,776 | |
Foreign tax reclaims | | | 1,517 | |
Total assets | | | 156,705,030 | |
| | | | | |
Liabilities: |
Reverse repurchase agreements | | | 9,198,364 | |
Options written, at value (premiums received $37,338) | | | 104,552 | |
Overdraft due to custodian bank | | | 66,524 | |
Foreign currency, at value (proceeds $23) | | | 23 | |
Unamortized upfront premiums received on credit default swap agreements | | | 12,744 | |
Unrealized depreciation on forward foreign currency exchange contracts | | | 4,660 | |
Payable for: |
Securities purchased | | | 4,987,853 | |
Variation margin on interest rate swap agreements | | | 75,244 | |
Fund shares redeemed | | | 60,011 | |
Management fees | | | 40,420 | |
Distribution and service fees | | | 30,211 | |
Variation margin on credit default swap agreements | | | 12,188 | |
Fund accounting/administration fees | | | 3,382 | |
Protection fees on credit default swap agreements | | | 2,673 | |
Transfer agent/maintenance fees | | | 2,057 | |
Trustees’ fees* | | | 680 | |
Miscellaneous | | | 83,530 | |
Total liabilities | | | 14,685,116 | |
Net assets | | $ | 142,019,914 | |
| | | | | |
Net assets consist of: |
Paid in capital | | $ | 162,575,690 | |
Total distributable earnings (loss) | | | (20,555,776 | ) |
Net assets | | $ | 142,019,914 | |
Capital shares outstanding | | | 9,868,649 | |
Net asset value per share | | $ | 14.39 | |
STATEMENT OF OPERATIONS (Unaudited) |
Six Months Ended June 30, 2023 |
Investment Income: |
Dividends from securities of unaffiliated issuers | | $ | 34,810 | |
Dividends from securities of affiliated issuers | | | 130,316 | |
Interest (net of foreign withholding tax of $161) | | | 3,336,858 | |
Total investment income | | | 3,501,984 | |
| | | | | |
Expenses: |
Management fees | | | 270,304 | |
Distribution and service fees | | | 174,214 | |
Transfer agent/maintenance fees | | | 12,554 | |
Professional fees | | | 44,218 | |
Fund accounting/administration fees | | | 32,848 | |
Interest expense | | | 30,021 | |
Custodian fees | | | 15,765 | |
Trustees’ fees* | | | 8,077 | |
Line of credit fees | | | 4,549 | |
Miscellaneous | �� | | 11,582 | |
Total expenses | | | 604,132 | |
Less: |
Expenses reimbursed by Adviser | | | (267 | ) |
Expenses waived by Adviser | | | (43,201 | ) |
Earnings credits applied | | | (2,409 | ) |
Total waived/reimbursed expenses | | | (45,877 | ) |
Net expenses | | | 558,255 | |
Net investment income | | | 2,943,729 | |
| | | | | |
Net Realized and Unrealized Gain (Loss): |
Net realized gain (loss) on: |
Investments in unaffiliated issuers | | | (4,768,026 | ) |
Swap agreements | | | (76,244 | ) |
Futures contracts | | | 50,435 | |
Options purchased | | | (38,120 | ) |
Options written | | | 2,299 | |
Forward foreign currency exchange contracts | | | (8,842 | ) |
Foreign currency transactions | | | 710 | |
Net realized loss | | | (4,837,788 | ) |
Net change in unrealized appreciation (depreciation) on: |
Investments in unaffiliated issuers | | | 6,022,614 | |
Investments in affiliated issuers | | | 64,426 | |
Swap agreements | | | (21,493 | ) |
Futures contracts | | | 22,377 | |
Options purchased | | | (66,484 | ) |
Options written | | | (67,214 | ) |
Forward foreign currency exchange contracts | | | (18,595 | ) |
Foreign currency translations | | | 160 | |
Net change in unrealized appreciation (depreciation) | | | 5,935,791 | |
Net realized and unrealized gain | | | 1,098,003 | |
Net increase in net assets resulting from operations | | $ | 4,041,732 | |
* | Relates to Trustees not deemed “interested persons” within the meaning of Section 2(a)(19) of the 1940 Act. |
SEE NOTES TO FINANCIAL STATEMENTS. | THE GUGGENHEIM FUNDS SEMI-ANNUAL REPORT | 47 |
SERIES E (TOTAL RETURN BOND SERIES) | |
STATEMENTS OF CHANGES IN NET ASSETS |
| | Six Months Ended
June 30, 2023
(Unaudited) | | | Year Ended
December 31,
2022 | |
Increase (Decrease) in Net Assets from Operations: | | | | | | | | |
Net investment income | | $ | 2,943,729 | | | $ | 5,266,149 | |
Net realized loss on investments | | | (4,837,788 | ) | | | (6,503,282 | ) |
Net change in unrealized appreciation (depreciation) on investments | | | 5,935,791 | | | | (26,542,165 | ) |
Net increase (decrease) in net assets resulting from operations | | | 4,041,732 | | | | (27,779,298 | ) |
| | | | | | | | | |
Distributions to shareholders | | | — | | | | (4,733,547 | ) |
| | | | | | | | | |
Capital share transactions: | | | | | | | | |
Proceeds from sale of shares | | | 18,625,868 | | | | 30,323,241 | |
Distributions reinvested | | | — | | | | 4,733,547 | |
Cost of shares redeemed | | | (15,713,921 | ) | | | (41,680,379 | ) |
Net increase (decrease) from capital share transactions | | | 2,911,947 | | | | (6,623,591 | ) |
Net increase (decrease) in net assets | | | 6,953,679 | | | | (39,136,436 | ) |
| | | | | | | | | |
Net assets: | | | | | | | | |
Beginning of period | | | 135,066,235 | | | | 174,202,671 | |
End of period | | $ | 142,019,914 | | | $ | 135,066,235 | |
| | | | | | | | | |
Capital share activity: | | | | | | | | |
Shares sold | | | 1,290,333 | | | | 1,979,951 | |
Shares issued from reinvestment of distributions | | | — | | | | 323,330 | |
Shares redeemed | | | (1,093,421 | ) | | | (2,743,296 | ) |
Net increase (decrease) in shares | | | 196,912 | | | | (440,015 | ) |
48 | THE GUGGENHEIM FUNDS SEMI-ANNUAL REPORT | SEE NOTES TO FINANCIAL STATEMENTS. |
SERIES E (TOTAL RETURN BOND SERIES) | |
This table is presented to show selected data for a share outstanding throughout each period and to assist shareholders in evaluating a Fund’s performance for the periods presented.
| | Six Months Ended
June 30, 2023a | | | Year Ended
December 31,
2022 | | | Year Ended
December 31,
2021 | | | Year Ended
December 31,
2020 | | | Year Ended
December 31,
2019 | | | Year Ended
December 31,
2018 | |
Per Share Data |
Net asset value, beginning of period | | $ | 13.97 | | | $ | 17.23 | | | $ | 18.09 | | | $ | 16.13 | | | $ | 15.85 | | | $ | 16.40 | |
Income (loss) from investment operations: |
Net investment income (loss)b | | | .30 | | | | .53 | | | | .44 | | | | .39 | | | | .38 | | | | .46 | |
Net gain (loss) on investments (realized and unrealized) | | | .12 | | | | (3.29 | ) | | | (.51 | ) | | | 1.88 | | | | .34 | | | | (.29 | ) |
Total from investment operations | | | .42 | | | | (2.76 | ) | | | (.07 | ) | | | 2.27 | | | | .72 | | | | .17 | |
Less distributions from: |
Net investment income | | | — | | | | (.46 | ) | | | (.30 | ) | | | (.31 | ) | | | (.44 | ) | | | (.72 | ) |
Net realized gains | | | — | | | | (.04 | ) | | | (.49 | ) | | | — | | | | — | | | | — | |
Total distributions | | | — | | | | (.50 | ) | | | (.79 | ) | | | (.31 | ) | | | (.44 | ) | | | (.72 | ) |
Net asset value, end of period | | $ | 14.39 | | | $ | 13.97 | | | $ | 17.23 | | | $ | 18.09 | | | $ | 16.13 | | | $ | 15.85 | |
|
Total Returnc | | | 3.01 | % | | | (16.15 | %) | | | (0.43 | %) | | | 14.21 | % | | | 4.49 | % | | | 1.14 | % |
Ratios/Supplemental Data |
Net assets, end of period (in thousands) | | $ | 142,020 | | | $ | 135,066 | | | $ | 174,203 | | | $ | 177,103 | | | $ | 128,209 | | | $ | 122,850 | |
Ratios to average net assets: |
Net investment income (loss) | | | 4.25 | % | | | 3.54 | % | | | 2.51 | % | | | 2.27 | % | | | 2.33 | % | | | 2.85 | % |
Total expensesd | | | 0.87 | % | | | 0.90 | % | | | 0.85 | % | | | 0.88 | % | | | 0.94 | % | | | 0.92 | % |
Net expensese,f,g | | | 0.81 | % | | | 0.85 | % | | | 0.78 | % | | | 0.78 | % | | | 0.78 | % | | | 0.78 | % |
Portfolio turnover rate | | | 62 | % | | | 51 | % | | | 84 | % | | | 123 | % | | | 54 | % | | | 30 | % |
a | Unaudited figures for the period ended June 30, 2023. Percentage amounts for the period, except total return and portfolio turnover rate, have been annualized. |
b | Net investment income (loss) per share was computed using average shares outstanding throughout the period. |
c | Total return does not take into account any of the expenses associated with an investment in variable insurance products. If total return had taken into account these expenses, performance would have been lower. Shares of a series of Guggenheim Variable Funds Trust are available only through the purchase of such products. |
d | Does not include expenses of the underlying funds in which the Fund invests. |
e | Net expense information reflects the expense ratios after expense waivers and reimbursements, as applicable. |
f | The portion of the ratios of net expenses to average net assets attributable to recoupments of prior fee reductions or expense reimbursements for the years presented was as follows: |
| | 06/30/23a | 12/31/22 | 12/31/21 | 12/31/20 | 12/31/19 | 12/31/18 |
| | — | — | — | — | — | 0.00%* |
g | Net expenses may include expenses that are excluded from the expense limitation agreement. Excluding these expenses, the net expense ratios for the years presented would be: |
| | 06/30/23a | 12/31/22 | 12/31/21 | 12/31/20 | 12/31/19 | 12/31/18 |
| | 0.76% | 0.76% | 0.78% | 0.77% | 0.77% | 0.77% |
SEE NOTES TO FINANCIAL STATEMENTS. | THE GUGGENHEIM FUNDS SEMI-ANNUAL REPORT | 49 |
PERFORMANCE REPORT AND FUND PROFILE (Unaudited) | June 30, 2023 |
SERIES F (FLOATING RATE STRATEGIES SERIES)
OBJECTIVE: Seeks to provide a high level of current income while maximizing total return.
Holdings Diversification (Market Exposure as % of Net Assets)
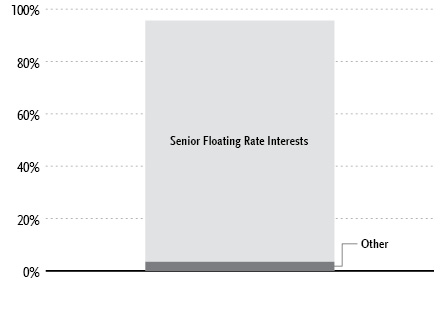
“Holdings Diversification (Market Exposure as % of Net Assets)” excludes any temporary cash investments.
Inception Date: April 24, 2013 |
Ten Largest Holdings | % of Total Net Assets |
SPDR Blackstone Senior Loan ETF | 3.2% |
Indicor LLC, 9.74% | 1.4% |
CSC Holdings LLC, 9.65% | 1.2% |
Belron Finance US LLC, 7.83% | 0.9% |
Caesars Entertainment, Inc., 8.45% | 0.9% |
Agiliti, 8.16% | 0.9% |
Mauser Packaging Solutions Holding Co., 9.16% | 0.9% |
Guardian US HoldCo LLC, 9.05% | 0.9% |
Alliant Holdings Intermediate LLC, 8.65% | 0.9% |
Diamond BC BV, 8.06% | 0.9% |
Top Ten Total | 12.1% |
| | |
“Ten Largest Holdings” excludes any temporary cash or derivative investments. |
50 | THE GUGGENHEIM FUNDS SEMI-ANNUAL REPORT | |
PERFORMANCE REPORT AND FUND PROFILE (Unaudited)(concluded) | June 30, 2023 |
Average Annual Returns*,†
Periods Ended June 30, 2023
| 6 Month‡ | 1 Year | 5 Year | 10 Year |
Series F (Floating Rate Strategies Series) | 5.63% | 10.24% | 2.55% | 3.19% |
Credit Suisse Leveraged Loan Index | 6.33% | 10.10% | 4.02% | 4.13% |
Portfolio Composition by Quality Rating1 |
Rating | % of Total
Investments |
Fixed Income Instruments | |
BBB | 5.8% |
BB | 29.7% |
B | 51.1% |
CCC | 1.7% |
NR2 | 0.1% |
Other Instruments | 11.6% |
Total Investments | 100.0% |
* | The performance data above represents past performance that is not predictive of future results. The investment return and principal value of an investment in the Fund will fluctuate so that an investor’s shares, when redeemed, may be worth more or less than their original cost. Returns are historical and include changes in principal and reinvested dividends and capital gains and do not reflect the effect of taxes. The Credit Suisse Leveraged Loan Index is an unmanaged index and, unlike the Fund, has no management fees or operating expenses to reduce its reported return. |
† | Performance figures do not reflect fees and expenses associated with an investment in variable insurance products. If returns had taken into account these fees and expenses, performance would have been lower. Shares of a series of Guggenheim Variable Funds Trust are available only through the purchase of such products. |
‡ | 6 month returns are not annualized. |
1 | Source: BlackRock Solutions. Credit quality ratings are measured on a scale that generally ranges from AAA (highest) to D (lowest). All securities except for those labeled “NR” have been rated by Moody’s, Standard & Poor’s (“S&P”), or Fitch, each of which is a Nationally Recognized Statistical Rating Organization (“NRSRO”). For purposes of this presentation, when ratings are available from more than one agency, the highest rating is used. Guggenheim Investments has converted ratings to the equivalent S&P rating. Security ratings are determined at the time of purchase and may change thereafter. |
2 | NR (not rated) securities do not necessarily indicate low credit quality. |
| | THE GUGGENHEIM FUNDS SEMI-ANNUAL REPORT | 51 |
SCHEDULE OF INVESTMENTS (Unaudited) | | | June 30, 2023 | |
| SERIES F (FLOATING RATE STRATEGIES SERIES) | | | | |
| | | Shares | | | | Value | |
COMMON STOCKS††† - 0.0% | |
| | | | | | | | | |
Industrial - 0.0% | |
BP Holdco LLC*,1 | | | 11,609 | | | | $ 14,912 | |
Vector Phoenix Holdings, LP* | | | 11,609 | | | | 2,774 | |
API Heat Transfer Parent LLC* | | | 292,731 | | | | 29 | |
Total Industrial | | | | | | | 17,715 | |
| | | | | | | | | |
Financial - 0.0% | |
Tensor Ltd.*,†† | | | 9,240 | | | | 1 | |
| | | | | | | | | |
Total Common Stocks | | | | | |
(Cost $88,565) | | | | | | | 17,716 | |
| | | | | | | | | |
PREFERRED STOCKS††† - 0.0% | |
Industrial - 0.0% | |
API Heat Transfer Intermediate* | | | 36 | | | | 91 | |
| | | | | | | | | |
Total Preferred Stocks | | | | | |
(Cost $28,949) | | | | | | | 91 | |
| | | | | | | | | |
EXCHANGE-TRADED FUNDS† - 3.2% | |
SPDR Blackstone Senior Loan ETF | | | 41,700 | | | | 1,745,979 | |
Total Exchange-Traded Funds | | | | | |
(Cost $1,760,867) | | | | | | | 1,745,979 | |
| | | | | | | | | |
MONEY MARKET FUND† - 8.9% | |
Federated Hermes U.S. Treasury Cash Reserves Fund — Institutional Shares, 5.00%2 | | | 4,902,456 | | | | 4,902,456 | |
Total Money Market Fund | | | | | |
(Cost $4,902,456) | | | | | | | 4,902,456 | |
| | | | | | | | | |
| | | | Face
Amount~ | | | | | |
SENIOR FLOATING RATE INTERESTS††,◊ - 92.2% | |
Consumer, Non-cyclical - 19.0% | | | | | | | | |
Agiliti | | | | | | | | |
8.16% (1 Month Term SOFR + 3.00%, Rate Floor: 3.00%) due 05/01/30 | | | 500,000 | | | | 497,190 | |
Medline Borrower LP | | | | | | | | |
8.47% (1 Month USD LIBOR + 3.25%, Rate Floor: 3.75%) due 10/23/28 | | | 493,750 | | | | 487,731 | |
KDC US Holdings, Inc. | | | | | | | | |
8.94% (1 Month USD LIBOR + 3.75%, Rate Floor: 3.75%) due 12/22/25 | | | 492,288 | | | | 478,381 | |
VC GB Holdings I Corp. | | | | | | | | |
8.48% (3 Month USD LIBOR + 3.00%, Rate Floor: 3.50%) due 07/21/28 | | | 492,500 | | | | 477,518 | |
Bombardier Recreational Products, Inc. | | | | | | | | |
7.20% (1 Month Term SOFR + 2.00%, Rate Floor: 2.00%) due 05/24/27 | | | 474,569 | | | | 470,269 | |
Medical Solutions Parent Holdings, Inc. | | | | | | | | |
8.61% (3 Month Term SOFR + 3.25%, Rate Floor: 3.25%) due 11/01/28 | | | 494,141 | | | | 463,134 | |
| | Face
Amount~ | | | Value | |
Grifols Worldwide Operations USA, Inc. | | | | | | | | |
7.46% (3 Month Term SOFR + 2.00%, Rate Floor: 2.00%) due 11/15/27 | | | 465,476 | | | $ | 457,525 | |
Hostess Brands LLC | | | | | | | | |
due 06/21/30 | | | 450,706 | | | | 449,205 | |
Elanco Animal Health, Inc. | | | | | | | | |
7.01% (1 Month Term SOFR + 1.75%, Rate Floor: 1.75%) due 08/02/27 | | | 451,393 | | | | 442,789 | |
Dermatology Intermediate Holdings III, Inc. | | | | | | | | |
9.30% (3 Month Term SOFR + 4.25%, Rate Floor: 4.25%) due 04/02/29 | | | 389,217 | | | | 384,158 | |
9.30% (3 Month Term SOFR + 4.25%, Rate Floor: 4.25%) due 03/30/29 | | | 36,622 | | | | 36,146 | |
Froneri US, Inc. | | | | | | | | |
7.45% (1 Month Term SOFR + 2.25%, Rate Floor: 2.25%) due 01/29/27 | | | 394,988 | | | | 392,321 | |
Resonetics LLC | | | | | | | | |
9.10% (6 Month USD LIBOR + 4.00%, Rate Floor: 4.00%) due 04/28/28 | | | 394,975 | | | | 382,632 | |
Triton Water Holdings, Inc. | | | | | | | | |
8.49% (3 Month USD LIBOR + 3.50%, Rate Floor: 4.00%) due 03/31/28 | | | 392,001 | | | | 378,344 | |
National Mentor Holdings, Inc. | | | | | | | | |
8.98% (1 Month Term SOFR + 3.75%, Rate Floor: 3.75%) due 03/02/28 | | | 424,216 | | | | 318,959 | |
9.09% (3 Month Term SOFR + 3.75%, Rate Floor: 3.75%) due 03/02/28 | | | 17,906 | | | | 13,463 | |
Hearthside Group Holdings LLC | | | | | | | | |
9.27% (3 Month USD LIBOR + 3.69%, Rate Floor: 3.69%) due 05/23/25 | | | 376,346 | | | | 329,984 | |
Fortrea Holdings, Inc. | | | | | | | | |
due 06/12/30 | | | 270,000 | | | | 269,865 | |
Aramark Services, Inc. | | | | | | | | |
7.72% (1 Month Term SOFR + 2.50%, Rate Floor: 2.50%) due 06/13/30 | | | 250,000 | | | | 249,688 | |
Topgolf Callaway Brands Corp. | | | | | | | | |
8.70% (1 Month Term SOFR + 3.50%, Rate Floor: 3.50%) due 03/15/30 | | | 249,375 | | | | 248,959 | |
Heritage Grocers Group LLC | | | | | | | | |
due 08/01/29 | | | 250,000 | | | | 247,135 | |
Mamba Purchaser, Inc. | | | | | | | | |
8.72% (1 Month Term SOFR + 3.50%, Rate Floor: 4.00%) due 10/16/28 | | | 248,116 | | | | 244,937 | |
Del Monte Foods, Inc. | | | | | | | | |
9.44% (1 Month Term SOFR + 4.25%, Rate Floor: 4.25%) due 05/16/29 | | | 248,750 | | | | 240,355 | |
HAH Group Holding Co. LLC | | | | | | | | |
10.21% (1 Month Term SOFR + 5.00%, Rate Floor: 5.00%) due 10/29/27 | | | 247,469 | | | | 240,045 | |
Kronos Acquisition Holdings, Inc. | | | | | | | | |
9.25% (1 Month USD LIBOR + 3.75%, Rate Floor: 4.25%) due 12/22/26 | | | 245,235 | | | | 238,567 | |
Mission Veterinary Partners | | | | | | | | |
9.19% (1 Month USD LIBOR + 4.00%, Rate Floor: 5.15%) due 04/27/28 | | | 245,625 | | | | 238,563 | |
52 | THE GUGGENHEIM FUNDS SEMI-ANNUAL REPORT | SEE NOTES TO FINANCIAL STATEMENTS. |
SCHEDULE OF INVESTMENTS (Unaudited)(continued) | June 30, 2023 |
SERIES F (FLOATING RATE STRATEGIES SERIES) | |
| | Face
Amount~ | | | Value | |
Sigma Holding BV (Flora Food) | | | | | | | | |
7.47% (6 Month USD LIBOR + 3.00%, Rate Floor: 3.00%) due 07/02/25 | | | 237,500 | | | $ | 235,322 | |
Reynolds Consumer Products LLC | | | | | | | | |
6.95% (1 Month Term SOFR + 1.75%, Rate Floor: 1.75%) due 02/04/27 | | | 219,173 | | | | 218,875 | |
Weber-Stephen Products LLC | | | | | | | | |
8.47% (1 Month Term SOFR + 3.25%, Rate Floor: 3.25%) due 10/29/27 | | | 246,909 | | | | 216,221 | |
Energizer Holdings, Inc. | | | | | | | | |
7.44% (1 Month Term SOFR + 2.25%, Rate Floor: 2.25%) due 12/22/27 | | | 210,426 | | | | 208,980 | |
Chefs’ Warehouse, Inc. | | | | | | | | |
9.95% (1 Month Term SOFR + 4.75%, Rate Floor: 4.75%) due 08/23/29 | | | 198,500 | | | | 197,672 | |
Osmosis Holdings Australia II Pty Ltd. | | | | | | | | |
8.90% (1 Month Term SOFR + 3.75%, Rate Floor: 3.75%) due 07/30/28 | | | 198,267 | | | | 194,401 | |
Pearl Intermediate Parent LLC | | | | | | | | |
8.69% (1 Month USD LIBOR + 3.50%, Rate Floor: 4.25%) due 02/14/25 | | | 147,321 | | | | 143,970 | |
Cambrex Corp. | | | | | | | | |
8.70% (1 Month USD LIBOR + 3.50%, Rate Floor: 3.50%) due 12/04/26 | | | 134,981 | | | | 133,575 | |
TGP Holdings LLC | | | | | | | | |
8.45% (1 Month Term SOFR + 3.25%, Rate Floor: 4.00%) due 06/29/28 | | | 114,177 | | | | 95,026 | |
Endo Luxembourg Finance Company I SARL | | | | | | | | |
14.25% (Commercial Prime Lending Rate + 6.00%, Rate Floor: 7.75%) due 03/27/28 | | | 98,750 | | | | 74,260 | |
Total Consumer, Non-cyclical | | | 10,396,165 | |
| | | | | | | | | |
Industrial - 18.5% |
Mauser Packaging Solutions Holding Co. | | | | | | | | |
9.16% (1 Month Term SOFR + 4.00%, Rate Floor: 4.00%) due 08/14/26 | | | 498,750 | | | | 496,740 | |
Berry Global, Inc. | | | | | | | | |
6.97% (1 Month USD LIBOR + 1.75%, Rate Floor: 1.75%) due 07/01/26 | | | 485,252 | | | | 484,510 | |
TricorBraun Holdings, Inc. | | | | | | | | |
8.47% (1 Month Term SOFR + 3.25%, Rate Floor: 3.25%) due 03/03/28 | | | 491,537 | | | | 477,852 | |
American Bath Group LLC | | | | | | | | |
8.95% (1 Month Term SOFR + 3.75%, Rate Floor: 3.75%) due 11/23/27 | | | 495,461 | | | | 465,238 | |
Arcline FM Holdings LLC | | | | | | | | |
10.25% (3 Month USD LIBOR + 4.75%, Rate Floor: 5.50%) due 06/23/28 | | | 476,513 | | | | 463,408 | |
Anchor Packaging LLC | | | | | | | | |
8.70% (1 Month Term SOFR + 3.50%, Rate Floor: 3.50%) due 07/18/26 | | | 446,512 | | | | 433,398 | |
Park River Holdings, Inc. | | | | | | | | |
8.52% (3 Month USD LIBOR + 3.25%, Rate Floor: 3.25%) due 12/28/27 | | | 443,212 | | | | 424,123 | |
Hunter Douglas, Inc. | | | | | | | | |
8.67% (3 Month Term SOFR + 3.50%, Rate Floor: 3.50%) due 02/26/29 | | | 445,500 | | | | 421,416 | |
PECF USS Intermediate Holding III Corp. | | | | | | | | |
9.52% (3 Month USD LIBOR + 4.25%, Rate Floor: 4.75%) due 12/15/28 | | | 463,728 | | | | 377,938 | |
LTI Holdings, Inc. | | | | | | | | |
8.72% (1 Month USD LIBOR + 3.50%, Rate Floor: 3.50%) due 09/08/25 | | | 385,898 | | | | 370,188 | |
FCG Acquisitions, Inc | | | | | | | | |
8.91% (3 Month USD LIBOR + 3.75%, Rate Floor: 4.25%) due 03/31/28 | | | 342,380 | | | | 336,388 | |
WP CPP Holdings LLC | | | | | | | | |
9.03% (3 Month USD LIBOR + 3.75%, Rate Floor: 4.75%) due 04/30/25 | | | 367,913 | | | | 332,501 | |
STS Operating, Inc. (SunSource) | | | | | | | | |
9.45% (1 Month Term SOFR + 4.25%, Rate Floor: 4.25%) due 12/11/24 | | | 295,570 | | | | 293,814 | |
EMRLD Borrower LP | | | | | | | | |
8.26% (3 Month Term SOFR + 3.00%, Rate Floor: 3.00%) due 05/31/30 | | | 284,822 | | | | 284,554 | |
Fugue Finance LLC | | | | | | | | |
9.76% (3 Month Term SOFR + 4.50%, Rate Floor: 4.50%) due 01/31/28 | | | 279,300 | | | | 278,253 | |
Charter Next Generation, Inc. | | | | | | | | |
8.97% (1 Month Term SOFR + 3.75%, Rate Floor: 3.75%) due 12/01/27 | | | 278,046 | | | | 275,614 | |
Atlantic Aviation | | | | | | | | |
7.97% (1 Month Term SOFR + 2.75%, Rate Floor: 2.75%) due 09/22/28 | | | 274,856 | | | | 272,206 | |
GYP Holdings III Corp. | | | | | | | | |
8.10% (1 Month Term SOFR + 3.00%, Rate Floor: 3.00%) due 05/12/30 | | | 250,000 | | | | 249,923 | |
Brown Group Holding LLC | | | | | | | | |
due 07/02/29 | | | 249,372 | | | | 248,704 | |
Service Logic Acquisition, Inc. | | | | | | | | |
9.27% (3 Month USD LIBOR + 4.00%, Rate Floor: 4.75%) due 10/29/27 | | | 249,362 | | | | 246,869 | |
Harsco Corporation | | | | | | | | |
7.47% (1 Month Term SOFR + 2.25%, Rate Floor: 2.75%) due 03/10/28 | | | 248,731 | | | | 244,172 | |
Aegion Corp. | | | | | | | | |
9.97% (1 Month Term SOFR + 4.75%, Rate Floor: 5.50%) due 05/17/28 | | | 246,859 | | | | 239,068 | |
USIC Holding, Inc. | | | | | | | | |
8.69% (1 Month USD LIBOR + 3.50%, Rate Floor: 4.25%) due 05/12/28 | | | 247,114 | | | | 233,522 | |
Pelican Products, Inc. | | | | | | | | |
9.64% (3 Month USD LIBOR + 4.25%, Rate Floor: 4.75%) due 12/29/28 | | | 244,743 | | | | 221,186 | |
API Heat Transfer | | | | | | | | |
16.54% (3 Month USD LIBOR) (In-Kind rate was 16.54%) due 01/01/24†††,3 | | | 247,974 | | | | 165,692 | |
16.54% (3 Month USD LIBOR) (in-kind rate was 16.54%) due 10/02/23†††,3 | | | 44,241 | | | | 44,241 | |
SEE NOTES TO FINANCIAL STATEMENTS. | THE GUGGENHEIM FUNDS SEMI-ANNUAL REPORT | 53 |
SCHEDULE OF INVESTMENTS (Unaudited)(continued) | June 30, 2023 |
SERIES F (FLOATING RATE STRATEGIES SERIES) | |
| | Face
Amount~ | | | Value | |
Gates Global LLC | | | | | | | | |
8.60% (1 Month Term SOFR + 3.50%, Rate Floor: 3.50%) due 11/16/29 | | | 208,425 | | | $ | 208,208 | |
Pro Mach Group, Inc. | | | | | | | | |
9.19% (1 Month USD LIBOR + 4.00%, Rate Floor: 5.00%) due 08/31/28 | | | 197,056 | | | | 196,406 | |
DG Investment Intermediate Holdings 2, Inc. | | | | | | | | |
8.97% (1 Month Term SOFR + 3.75%, Rate Floor: 3.75%) due 03/31/28 | | | 196,007 | | | | 192,037 | |
Titan Acquisition Ltd. (Husky) | | | | | | | | |
8.73% (3 Month USD LIBOR + 3.00%, Rate Floor: 3.00%) due 03/28/25 | | | 189,499 | | | | 184,682 | |
Berlin Packaging LLC | | | | | | | | |
8.95% ((1 Month USD LIBOR + 3.75%) and (3 Month USD LIBOR + 3.75%), Rate Floor: 4.25%) due 03/13/28 | | | 147,375 | | | | 144,705 | |
Mileage Plus Holdings LLC | | | | | | | | |
10.76% (3 Month USD LIBOR + 5.25%, Rate Floor: 6.25%) due 06/21/27 | | | 120,400 | | | | 124,940 | |
DXP Enterprises, Inc. | | | | | | | | |
10.44% (6 Month Term SOFR + 5.25%, Rate Floor: 5.25%) due 12/23/27 | | | 99,237 | | | | 99,443 | |
Air Canada | | | | | | | | |
8.84% (3 Month USD LIBOR + 3.50%, Rate Floor: 4.25%) due 08/11/28 | | | 99,000 | | | | 98,858 | |
CPG International LLC | | | | | | | | |
7.70% (1 Month Term SOFR + 2.50%, Rate Floor: 2.50%) due 04/28/29 | | | 99,250 | | | | 98,712 | |
TK Elevator Midco GmbH | | | | | | | | |
8.60% (6 Month USD LIBOR + 3.50%, Rate Floor: 4.00%) due 07/30/27 | | | 97,528 | | | | 96,565 | |
Protective Industrial Products, Inc. | | | | | | | | |
9.22% (1 Month Term SOFR + 4.00%, Rate Floor: 4.75%) due 12/29/27 | | | 98,740 | | | | 93,803 | |
Cushman & Wakefield US Borrower LLC | | | | | | | | |
8.45% (1 Month Term SOFR + 3.25%, Rate Floor: 3.25%) due 01/31/30 | | | 42,723 | | | | 41,334 | |
7.97% (1 Month Term SOFR + 2.75%, Rate Floor: 2.75%) due 08/21/25 | | | 33,871 | | | | 33,532 | |
Osmose Utility Services, Inc. | | | | | | | | |
8.47% (1 Month Term SOFR + 3.25%, Rate Floor: 3.75%) due 06/23/28 | | | 72,830 | | | | 71,264 | |
United Airlines, Inc. | | | | | | | | |
9.29% (3 Month USD LIBOR + 3.75%, Rate Floor: 4.50%) due 04/21/28 | | | 63,202 | | | | 63,079 | |
Total Industrial | | | 10,129,086 | |
| | | | | | | | | |
Consumer, Cyclical - 15.8% |
Belron Finance US LLC | | | | | | | | |
7.83% (3 Month Term SOFR + 2.75%, Rate Floor: 2.75%) due 04/18/29 | | | 500,000 | | | | 499,690 | |
Caesars Entertainment, Inc. | | | | | | | | |
8.45% (1 Month Term SOFR + 3.25%, Rate Floor: 3.25%) due 02/06/30 | | | 498,750 | | | | 498,296 | |
Guardian US HoldCo LLC | | | | | | | | |
9.05% (3 Month Term SOFR + 4.00%, Rate Floor: 4.00%) due 01/31/30 | | | 500,000 | | | | 496,095 | |
Fertitta Entertainment LLC | | | | | | | | |
9.10% (1 Month Term SOFR + 4.00%, Rate Floor: 4.00%) due 01/29/29 | | | 494,987 | | | | 487,875 | |
Stars Group (Amaya) | | | | | | | | |
7.75% (3 Month USD LIBOR + 2.25%, Rate Floor: 2.25%) due 07/21/26 | | | 442,125 | | | | 441,740 | |
First Brands Group LLC | | | | | | | | |
10.25% (3 Month Term SOFR + 5.00%, Rate Floor: 6.00%) due 03/30/27 | | | 440,121 | | | | 429,945 | |
American Tire Distributors, Inc. | | | | | | | | |
11.49% (3 Month Term SOFR + 6.25%, Rate Floor: 6.25%) due 10/20/28 | | | 444,375 | | | | 384,282 | |
1011778 BC Unlimited Liability Co. | | | | | | | | |
6.94% (1 Month USD LIBOR + 1.75%, Rate Floor: 1.75%) due 11/19/26 | | | 361,802 | | | | 358,936 | |
PetSmart LLC | | | | | | | | |
8.95% (1 Month Term SOFR + 3.75%, Rate Floor: 3.75%) due 02/11/28 | | | 343,875 | | | | 342,730 | |
PCI Gaming Authority, Inc. | | | | | | | | |
7.72% (1 Month Term SOFR + 2.50%, Rate Floor: 2.50%) due 05/29/26 | | | 250,000 | | | | 250,045 | |
Wyndham Hotels & Resorts, Inc. | | | | | | | | |
7.45% (1 Month Term SOFR + 2.25%, Rate Floor: 2.25%) due 05/24/30 | | | 250,000 | | | | 249,865 | |
BCPE Empire Holdings, Inc. | | | | | | | | |
due 12/11/28 | | | 250,000 | | | | 249,103 | |
Thevelia US LLC | | | | | | | | |
9.39% (3 Month Term SOFR + 4.00%, Rate Floor: 4.00%) due 06/18/29 | | | 247,500 | | | | 246,263 | |
Scientific Games Holdings, LP | | | | | | | | |
8.42% (3 Month Term SOFR + 3.50%, Rate Floor: 3.50%) due 04/04/29 | | | 248,125 | | | | 244,837 | |
Petco Health And Wellness Company, Inc. | | | | | | | | |
8.75% (3 Month Term SOFR + 3.25%, Rate Floor: 3.25%) due 03/03/28 | | | 245,216 | | | | 243,181 | |
Congruex Group LLC | | | | | | | | |
10.95% (3 Month Term SOFR + 5.75%, Rate Floor: 5.75%) due 05/03/29††† | | | 247,500 | | | | 239,456 | |
CCRR Parent, Inc. | | | | | | | | |
8.97% (1 Month Term SOFR + 3.75%, Rate Floor: 4.50%) due 03/06/28 | | | 248,096 | | | | 238,173 | |
Rent-A-Center, Inc. | | | | | | | | |
8.56% (3 Month USD LIBOR + 3.25%, Rate Floor: 3.75%) due 02/17/28 | | | 234,943 | | | | 234,649 | |
Entain Holdings (Gibraltar) Ltd. | | | | | | | | |
8.44% (6 Month Term SOFR + 3.50%, Rate Floor: 3.50%) due 10/31/29 | | | 234,500 | | | | 233,386 | |
Galaxy US Opco, Inc. | | | | | | | | |
9.85% (1 Month Term SOFR + 4.75%, Rate Floor: 4.75%) due 04/30/29††† | | | 248,125 | | | | 232,617 | |
Sweetwater Sound | | | | | | | | |
9.47% (1 Month Term SOFR + 4.25%, Rate Floor: 4.25%) due 08/05/28††† | | | 245,722 | | | | 232,207 | |
54 | THE GUGGENHEIM FUNDS SEMI-ANNUAL REPORT | SEE NOTES TO FINANCIAL STATEMENTS. |
SCHEDULE OF INVESTMENTS (Unaudited)(continued) | June 30, 2023 |
SERIES F (FLOATING RATE STRATEGIES SERIES) | |
| | Face
Amount~ | | | Value | |
Eyemart Express LLC | | | | | | | | |
8.19% (1 Month USD LIBOR + 3.00%, Rate Floor: 4.00%) due 08/31/27 | | | 247,180 | | | $ | 228,641 | |
Eagle Parent Corp. | | | | | | | | |
9.49% (3 Month Term SOFR + 4.25%, Rate Floor: 4.25%) due 04/02/29 | | | 222,188 | | | | 216,262 | |
BGIS (BIFM CA Buyer, Inc.) | | | | | | | | |
8.72% (1 Month Term SOFR + 3.50%, Rate Floor: 3.50%) due 06/01/26 | | | 199,994 | | | | 198,744 | |
Packers Holdings LLC | | | | | | | | |
8.44% (1 Month Term SOFR + 3.25%, Rate Floor: 3.25%) due 03/09/28 | | | 247,510 | | | | 170,720 | |
Mavis Tire Express Services TopCo Corp. | | | | | | | | |
9.22% (1 Month Term SOFR + 4.00%, Rate Floor: 4.00%) due 05/04/28 | | | 147,000 | | | | 145,530 | |
WIRB - Copernicus Group, Inc. | | | | | | | | |
9.22% (1 Month Term SOFR + 4.00%, Rate Floor: 4.00%) due 01/08/27 | | | 145,657 | | | | 142,744 | |
Michaels Stores, Inc. | | | | | | | | |
9.75% (3 Month Term SOFR + 4.25%, Rate Floor: 5.00%) due 04/15/28 | | | 160,216 | | | | 141,510 | |
TMF Sapphire Bidco BV | | | | | | | | |
due 05/03/28 | | | 136,648 | | | | 136,477 | |
New Trojan Parent, Inc. | | | | | | | | |
8.46% (1 Month Term SOFR + 3.25%, Rate Floor: 3.25%) due 01/06/28 | | | 247,475 | | | | 135,802 | |
Clarios Global LP | | | | | | | | |
8.85% (1 Month Term SOFR + 3.75%, Rate Floor: 3.75%) due 05/06/30 | | | 132,434 | | | | 131,979 | |
Hanesbrands, Inc. | | | | | | | | |
8.85% (1 Month Term SOFR + 3.75%, Rate Floor: 3.75%) due 03/08/30††† | | | 99,750 | | | | 99,999 | |
WW International, Inc. | | | | | | | | |
8.72% (1 Month Term SOFR + 3.50%, Rate Floor: 4.00%) due 04/13/28 | | | 94,500 | | | | 60,795 | |
EG Finco Ltd. | | | | | | | | |
9.16% (3 Month USD LIBOR + 4.00%, Rate Floor: 4.00%) due 02/07/25 | | | 37,087 | | | | 36,407 | |
Total Consumer, Cyclical | | | 8,678,981 | |
| | | | | | | | | |
Financial - 11.1% |
Alliant Holdings Intermediate LLC | | | | | | | | |
8.65% (1 Month Term SOFR + 3.50%, Rate Floor: 3.50%) due 11/05/27 | | | 497,500 | | | | 493,978 | |
AmWINS Group, Inc. | | | | | | | | |
7.44% (1 Month USD LIBOR + 2.25%, Rate Floor: 3.00%) due 02/21/28 | | | 488,242 | | | | 483,301 | |
Trans Union LLC | | | | | | | | |
7.47% (1 Month Term SOFR + 2.25%, Rate Floor: 2.25%) due 12/01/28 | | | 482,661 | | | | 481,102 | |
NFP Corp. | | | | | | | | |
8.47% (1 Month Term SOFR + 3.25%, Rate Floor: 3.25%) due 02/15/27 | | | 478,030 | | | | 467,614 | |
Virtu Financial | | | | | | | | |
8.19% (1 Month Term SOFR + 3.00%, Rate Floor: 3.00%) due 01/12/29 | | | 396,000 | | | | 393,897 | |
HUB International Ltd. | | | | | | | | |
9.34% (1 Month Term SOFR + 4.25%, Rate Floor: 4.25%) due 06/08/30 | | | 388,894 | | | | 389,598 | |
FleetCor Technologies Operating Company LLC | | | | | | | | |
6.95% (1 Month Term SOFR + 1.75%, Rate Floor: 1.75%) due 04/28/28 | | | 392,989 | | | | 389,551 | |
Jane Street Group LLC | | | | | | | | |
7.97% (1 Month Term SOFR + 2.75%, Rate Floor: 2.75%) due 01/26/28 | | | 276,854 | | | | 275,966 | |
HarbourVest Partners, LP | | | | | | | | |
8.24% (3 Month Term SOFR + 3.00%, Rate Floor: 3.00%) due 04/20/30 | | | 250,000 | | | | 249,375 | |
Teneo Holdings LLC | | | | | | | | |
10.45% (1 Month Term SOFR + 5.25%, Rate Floor: 5.25%) due 07/11/25 | | | 248,708 | | | | 248,086 | |
Focus Financial Partners, LLC | | | | | | | | |
8.35% (1 Month Term SOFR + 3.25%, Rate Floor: 3.25%) due 06/30/28 | | | 248,125 | | | | 245,919 | |
Citadel Securities, LP | | | | | | | | |
7.72% (1 Month Term SOFR + 2.50%, Rate Floor: 2.50%) due 02/02/28 | | | 244,375 | | | | 243,879 | |
Aretec Group, Inc. | | | | | | | | |
due 03/07/30 | | | 240,000 | | | | 239,251 | |
Claros Mortgage Trust, Inc. | | | | | | | | |
9.69% (1 Month Term SOFR + 4.50%, Rate Floor: 4.50%) due 08/10/26††† | | | 247,469 | | | | 232,620 | |
Asurion LLC | | | | | | | | |
9.45% (1 Month Term SOFR + 4.25%, Rate Floor: 4.25%) due 08/20/28 | | | 244,388 | | | | 232,017 | |
USI, Inc. | | | | | | | | |
8.99% (3 Month Term SOFR + 3.75%, Rate Floor: 3.75%) due 11/22/29 | | | 208,372 | | | | 207,851 | |
Apex Group Treasury LLC | | | | | | | | |
9.99% (3 Month Term SOFR + 5.00%, Rate Floor: 5.00%) due 07/27/28††† | | | 199,000 | | | | 197,756 | |
Franchise Group, Inc. | | | | | | | | |
9.97% (3 Month Term SOFR + 4.75%, Rate Floor: 4.75%) due 03/10/26 | | | 199,776 | | | | 182,795 | |
Apollo Commercial Real Estate Finance, Inc. | | | | | | | | |
7.97% (1 Month Term SOFR + 2.75%, Rate Floor: 2.75%) due 05/15/26 | | | 135,461 | | | | 126,995 | |
Starwood Property Mortgage LLC | | | | | | | | |
8.35% (1 Month Term SOFR + 3.25%, Rate Floor: 3.25%) due 11/18/27 | | | 122,385 | | | | 119,019 | |
Capstone Borrower, Inc. | | | | | | | | |
9.00% (3 Month Term SOFR + 3.75%, Rate Floor: 3.75%) due 06/17/30 | | | 105,972 | | | | 103,587 | |
Duff & Phelps | | | | | | | | |
8.99% (3 Month Term SOFR + 3.75%, Rate Floor: 3.75%) due 04/09/27 | | | 98,728 | | | | 95,625 | |
Total Financial | | | 6,099,782 | |
| | | | | | | | | |
SEE NOTES TO FINANCIAL STATEMENTS. | THE GUGGENHEIM FUNDS SEMI-ANNUAL REPORT | 55 |
SCHEDULE OF INVESTMENTS (Unaudited)(continued) | June 30, 2023 |
SERIES F (FLOATING RATE STRATEGIES SERIES) | |
| | Face
Amount~ | | | Value | |
Technology - 10.5% |
Indicor LLC | | | | | | | | |
9.74% (3 Month Term SOFR + 4.50%, Rate Floor: 4.50%) due 11/22/29 | | | 747,625 | | | $ | 743,887 | |
Emerald TopCo, Inc. (Press Ganey) | | | | | | | | |
8.72% (1 Month USD LIBOR + 3.50%, Rate Floor: 3.50%) due 07/24/26 | | | 497,946 | | | | 483,132 | |
Boxer Parent Company, Inc. | | | | | | | | |
8.97% (1 Month Term SOFR + 3.75%, Rate Floor: 3.75%) due 10/02/25 | | | 460,720 | | | | 456,555 | |
Athenahealth Group, Inc. | | | | | | | | |
8.59% (1 Month Term SOFR + 3.50%, Rate Floor: 3.50%) due 02/15/29 | | | 441,286 | | | | 424,186 | |
Imprivata, Inc. | | | | | | | | |
9.35% (1 Month Term SOFR + 4.25%, Rate Floor: 4.25%) due 12/01/27 | | | 247,500 | | | | 243,664 | |
8.97% (1 Month USD LIBOR + 3.75%, Rate Floor: 4.25%) due 12/01/27 | | | 89,770 | | | | 87,818 | |
Conair Holdings LLC | | | | | | | | |
9.29% (3 Month USD LIBOR + 3.75%, Rate Floor: 4.25%) due 05/17/28 | | | 325,114 | | | | 305,708 | |
WEX, Inc. | | | | | | | | |
7.47% (1 Month Term SOFR + 2.25%, Rate Floor: 2.25%) due 03/31/28 | | | 299,235 | | | | 298,720 | |
Polaris Newco LLC | | | | | | | | |
9.54% (3 Month USD LIBOR + 4.00%, Rate Floor: 4.50%) due 06/02/28 | | | 320,327 | | | | 294,166 | |
Peraton Corp. | | | | | | | | |
8.95% (1 Month Term SOFR + 3.75%, Rate Floor: 3.75%) due 02/01/28 | | | 287,884 | | | | 282,282 | |
Atlas CC Acquisition Corp. | | | | | | | | |
9.78% (3 Month Term SOFR + 4.25%, Rate Floor: 4.25%) due 05/25/28 | | | 288,037 | | | | 249,377 | |
World Wide Technology Holding Co. LLC | | | | | | | | |
8.52% (1 Month Term SOFR + 3.25%, Rate Floor: 3.25%) due 03/01/30 | | | 249,375 | | | | 249,063 | |
Navicure, Inc. | | | | | | | | |
9.22% (1 Month USD LIBOR + 4.00%, Rate Floor: 4.00%) due 10/22/26 | | | 248,077 | | | | 247,147 | |
CoreLogic, Inc. | | | | | | | | |
8.75% (1 Month USD LIBOR + 3.50%, Rate Floor: 4.00%) due 06/02/28 | | | 271,168 | | | | 244,458 | |
Ascend Learning LLC | | | | | | | | |
8.70% (1 Month Term SOFR + 3.50%, Rate Floor: 3.50%) due 12/11/28 | | | 246,250 | | | | 230,975 | |
Cloud Software Group, Inc. | | | | | | | | |
9.84% (3 Month Term SOFR + 4.60%, Rate Floor: 4.60%) due 09/29/28 | | | 244,919 | | | | 228,693 | |
Project Ruby Ultimate Parent Corp. | | | | | | | | |
8.47% (1 Month Term SOFR + 3.25%, Rate Floor: 3.25%) due 03/10/28 | | | 195,500 | | | | 190,857 | |
Sabre GLBL, Inc. | | | | | | | | |
8.72% (1 Month USD LIBOR + 3.50%, Rate Floor: 4.00%) due 12/17/27 | | | 144,990 | | | | 112,874 | |
10.20% (1 Month Term SOFR + 5.00%, Rate Floor: 5.00%) due 06/30/28 | | | 87,599 | | | | 69,379 | |
Park Place Technologies, LLC | | | | | | | | |
10.20% (1 Month Term SOFR + 5.00%, Rate Floor: 6.00%) due 11/10/27 | | | 173,228 | | | | 167,977 | |
CDK Global, Inc. | | | | | | | | |
9.49% (3 Month Term SOFR + 4.25%, Rate Floor: 4.25%) due 07/06/29 | | | 99,500 | | | | 99,156 | |
DCert Buyer, Inc. | | | | | | | | |
9.26% (3 Month Term SOFR + 4.00%, Rate Floor: 4.00%) due 10/16/26 | | | 29,769 | | | | 29,462 | |
Total Technology | | | 5,739,536 | |
| | | | | | | | | |
Communications - 9.9% |
CSC Holdings LLC | | | | | | | | |
9.65% (1 Month Term SOFR + 4.50%, Rate Floor: 4.50%) due 01/17/28 | | | 689,849 | | | | 634,661 | |
WMG Acquisition Corp. | | | | | | | | |
7.33% (3 Month Term SOFR + 2.13%, Rate Floor: 2.13%) due 01/20/28 | | | 450,000 | | | | 448,394 | |
Playtika Holding Corp. | | | | | | | | |
7.94% (1 Month USD LIBOR + 2.75%, Rate Floor: 2.75%) due 03/13/28 | | | 440,977 | | | | 438,830 | |
Altice France SA | | | | | | | | |
10.49% (3 Month Term SOFR + 5.50%, Rate Floor: 5.50%) due 08/15/28 | | | 470,197 | | | | 416,909 | |
Ziggo Financing Partnership | | | | | | | | |
7.69% (1 Month USD LIBOR + 2.50%, Rate Floor: 2.50%) due 04/28/28 | | | 400,000 | | | | 393,428 | |
Telenet Financing USD LLC | | | | | | | | |
7.19% (1 Month USD LIBOR + 2.00%, Rate Floor: 2.00%) due 04/28/28 | | | 400,000 | | | | 392,144 | |
Level 3 Financing, Inc. | | | | | | | | |
6.97% (1 Month Term SOFR + 1.75%, Rate Floor: 1.75%) due 03/01/27 | | | 387,478 | | | | 360,114 | |
McGraw Hill LLC | | | | | | | | |
9.97% ((6 Month USD LIBOR + 4.75%) and (1 Month Term SOFR + 4.75%), Rate Floor: 5.25%) due 07/28/28 | | | 343,875 | | | | 321,523 | |
Zayo Group Holdings, Inc. | | | | | | | | |
8.22% (1 Month Term SOFR + 3.00%, Rate Floor: 3.00%) due 03/09/27 | | | 401,527 | | | | 314,263 | |
Cengage Learning Acquisitions, Inc. | | | | | | | | |
9.88% (3 Month USD LIBOR + 4.75%, Rate Floor: 5.75%) due 07/14/26 | | | 254,782 | | | | 249,304 | |
Virgin Media Bristol LLC | | | | | | | | |
7.69% (1 Month USD LIBOR + 2.50%, Rate Floor: 2.50%) due 01/31/28 | | | 250,406 | | | | 247,964 | |
Xplornet Communications, Inc. | | | | | | | | |
9.22% (1 Month Term SOFR + 4.00%, Rate Floor: 4.00%) due 10/02/28 | | | 294,750 | | | | 239,361 | |
Cincinnati Bell, Inc. | | | | | | | | |
8.45% (1 Month Term SOFR + 3.25%, Rate Floor: 3.25%) due 11/22/28 | | | 249,367 | | | | 238,250 | |
Flight Bidco, Inc. | | | | | | | | |
8.72% (1 Month Term SOFR + 3.50%, Rate Floor: 3.50%) due 07/23/25 | | | 248,052 | | | | 231,361 | |
56 | THE GUGGENHEIM FUNDS SEMI-ANNUAL REPORT | SEE NOTES TO FINANCIAL STATEMENTS. |
SCHEDULE OF INVESTMENTS (Unaudited)(continued) | June 30, 2023 |
SERIES F (FLOATING RATE STRATEGIES SERIES) | |
| | Face
Amount~ | | | Value | |
Authentic Brands | | | | | | | | |
9.20% (1 Month Term SOFR + 4.00%, Rate Floor: 4.00%) due 12/21/28 | | | 225,926 | | | $ | 225,022 | |
Radiate Holdco LLC | | | | | | | | |
8.48% (1 Month Term SOFR + 3.25%, Rate Floor: 3.25%) due 09/25/26 | | | 247,487 | | | | 205,828 | |
Internet Brands, Inc. | | | | | | | | |
8.97% (1 Month USD LIBOR + 3.75%, Rate Floor: 3.75%) due 09/13/24 | | | 69,953 | | | | 69,877 | |
Total Communications | | | 5,427,233 | |
| | | | | | | | | |
Basic Materials - 3.6% |
Diamond BC BV | | | | | | | | |
8.06% (3 Month Term SOFR + 2.75%, Rate Floor: 2.75%) due 09/29/28 | | | 492,500 | | | | 491,707 | |
CTEC III GmbH | | | | | | | | |
7.23% (3 Month EURIBOR + 3.75%, Rate Floor: 3.75%) due 03/16/29 | | | EUR 400,000 | | | | 421,471 | |
Nouryon USA LLC | | | | | | | | |
8.99% (3 Month Term SOFR + 4.00%, Rate Floor: 4.00%) due 04/03/28 | | | 245,000 | | | | 242,447 | |
9.32% (3 Month Term SOFR + 4.00%, Rate Floor: 4.00%) due 04/03/28 | | | 90,895 | | | | 89,901 | |
Trinseo Materials Operating S.C.A. | | | | | | | | |
7.54% (3 Month USD LIBOR + 2.00%, Rate Floor: 2.00%) due 09/06/24 | | | 248,688 | | | | 238,852 | |
INEOS Ltd. | | | | | | | | |
7.97% (1 Month Term SOFR + 2.75%, Rate Floor: 2.75%) due 01/29/26 | | | 147,000 | | | | 146,522 | |
Vantage Specialty Chemicals, Inc. | | | | | | | | |
9.90% (1 Month Term SOFR + 4.75%, Rate Floor: 4.75%) due 10/26/26 | | | 104,475 | | | | 101,289 | |
W.R. Grace Holdings LLC | | | | | | | | |
9.31% (3 Month USD LIBOR + 3.75%, Rate Floor: 4.25%) due 09/22/28 | | | 98,500 | | | | 97,691 | |
Ascend Performance Materials Operations LLC | | | | | | | | |
9.71% (6 Month Term SOFR + 4.75%, Rate Floor: 4.75%) due 08/27/26 | | | 89,242 | | | | 87,304 | |
Ineos US Finance LLC | | | | | | | | |
8.70% (1 Month Term SOFR + 3.50%, Rate Floor: 3.50%) due 02/18/30 | | | 75,000 | | | | 74,504 | |
Total Basic Materials | | | 1,991,688 | |
| | | | | | | | | |
Energy - 2.5% |
Traverse Midstream Partners LLC | | | | | | | | |
8.94% (1 Month Term SOFR + 3.75%, Rate Floor: 3.75%) due 02/16/28 | | | 486,328 | | | | 481,465 | |
TransMontaigne Operating Company LP | | | | | | | | |
8.71% (1 Month Term SOFR + 3.50%, Rate Floor: 3.50%) due 11/17/28 | | | 270,144 | | | | 265,514 | |
UGI Energy Services LLC | | | | | | | | |
8.45% (1 Month Term SOFR + 3.25%, Rate Floor: 3.25%) due 02/22/30 | | | 248,493 | | | | 246,289 | |
AL GCX Holdings LLC | | | | | | | | |
8.55% (3 Month Term SOFR + 3.50%, Rate Floor: 3.50%) due 05/17/29 | | | 247,256 | | | | 245,401 | |
Par Petroleum LLC | | | | | | | | |
9.61% (3 Month Term SOFR + 4.25%, Rate Floor: 4.25%) due 02/28/30 | | | 149,625 | | | | 146,882 | |
Total Energy | | | 1,385,551 | |
| | | | | | | | | |
Bank Loans - 0.7% |
Gen Digital, Inc. | | | | | | | | |
due 09/12/29 | | | 360,000 | | | | 357,750 | |
| | | | | | | | | |
Utilities - 0.6% |
TerraForm Power Operating LLC | | | | | | | | |
7.84% (3 Month Term SOFR + 2.50%, Rate Floor: 2.50%) due 05/21/29 | | | 249,370 | | | | 246,253 | |
Granite Generation LLC | | | | | | | | |
8.94% (1 Month USD LIBOR + 3.75%, Rate Floor: 4.75%) due 11/09/26 | | | 106,631 | | | | 104,682 | |
Total Utilities | | | 350,935 | |
| | | | | | | | | |
Total Senior Floating Rate Interests |
(Cost $51,936,751) | | | 50,556,707 | |
| | | | | | | | | |
CORPORATE BONDS†† - 0.2% |
Industrial - 0.2% |
GrafTech Global Enterprises, Inc. | | | | | | | | |
9.88% due 12/15/284 | | | 90,000 | | | | 89,325 | |
Total Corporate Bonds |
(Cost $87,715) | | | 89,325 | |
| | | | | | | | | |
Total Investments - 104.5% |
(Cost $58,805,303) | | $ | 57,312,274 | |
Other Assets & Liabilities, net - (4.5)% | | | (2,485,310 | ) |
Total Net Assets - 100.0% | | $ | 54,826,964 | |
Forward Foreign Currency Exchange Contracts†† |
Counterparty | | Currency | | | Type | | | Quantity | | | Contract
Amount | | | Settlement
Date | | | Unrealized
Depreciation | |
Bank of America, N.A. | | | EUR | | | | Sell | | | | 414,000 | | | | 447,190 USD | | | | 07/14/23 | | | $ | (4,897 | ) |
SEE NOTES TO FINANCIAL STATEMENTS. | THE GUGGENHEIM FUNDS SEMI-ANNUAL REPORT | 57 |
SCHEDULE OF INVESTMENTS (Unaudited)(continued) | June 30, 2023 |
SERIES F (FLOATING RATE STRATEGIES SERIES) | |
~ | The face amount is denominated in U.S. dollars unless otherwise indicated. |
* | Non-income producing security. |
† | Value determined based on Level 1 inputs — See Note 4. |
†† | Value determined based on Level 2 inputs, unless otherwise noted — See Note 4. |
††† | Value determined based on Level 3 inputs, unless otherwise noted — See Note 4. |
◊ | Variable rate security. Rate indicated is the rate effective at June 30, 2023. In some instances, the effective rate is limited by a minimum rate floor or a maximum rate cap established by the issuer. The settlement status of a position may also impact the effective rate indicated. In some cases, a position may be unsettled at period end and may not have a stated effective rate. In instances where multiple underlying reference rates and spread amounts are shown, the effective rate is based on a weighted average. |
1 | Affiliated issuer. |
2 | Rate indicated is the 7-day yield as of June 30, 2023. |
3 | Payment-in-kind security. |
4 | Security is a 144A or Section 4(a)(2) security. These securities have been determined to be liquid under guidelines established by the Board of Trustees. The total market value of 144A or Section 4(a)(2) securities is $89,325 (cost $87,715), or 0.2% of total net assets. |
| | EUR — Euro |
| | EURIBOR — European Interbank Offered Rate |
| | LIBOR — London Interbank Offered Rate |
| | SARL — Société à Responsabilité Limitée |
| | SOFR — Secured Overnight Financing Rate |
| | |
| | See Sector Classification in Other Information section. |
The following table summarizes the inputs used to value the Fund’s investments at June 30, 2023 (See Note 4 in the Notes to Financial Statements):
Investments in Securities (Assets) | | Level 1
Quoted
Prices | | | Level 2
Significant
Observable
Inputs | | | Level 3
Significant
Unobservable
Inputs | | | Total | |
Common Stocks | | $ | — | | | $ | 1 | | | $ | 17,715 | | | $ | 17,716 | |
Preferred Stocks | | | — | | | | — | | | | 91 | | | | 91 | |
Exchange-Traded Funds | | | 1,745,979 | | | | — | | | | — | | | | 1,745,979 | |
Money Market Fund | | | 4,902,456 | | | | — | | | | — | | | | 4,902,456 | |
Senior Floating Rate Interests | | | — | | | | 49,112,119 | | | | 1,444,588 | | | | 50,556,707 | |
Corporate Bonds | | | — | | | | 89,325 | | | | — | | | | 89,325 | |
Total Assets | | $ | 6,648,435 | | | $ | 49,201,445 | | | $ | 1,462,394 | | | $ | 57,312,274 | |
Investments in Securities (Liabilities) | | Level 1
Quoted
Prices | | | Level 2
Significant
Observable
Inputs | | | Level 3
Significant
Unobservable
Inputs | | | Total | |
Forward Foreign Currency Exchange Contracts** | | $ | — | | | $ | 4,897 | | | $ | — | | | $ | 4,897 | |
Unfunded Loan Commitments (Note 8) | | | — | | | | — | | | | 2,874 | | | | 2,874 | |
Total Liabilities | | $ | — | | | $ | 4,897 | | | $ | 2,874 | | | $ | 7,771 | |
** | This derivative is reported as unrealized appreciation/depreciation at period end. |
58 | THE GUGGENHEIM FUNDS SEMI-ANNUAL REPORT | SEE NOTES TO FINANCIAL STATEMENTS. |
SCHEDULE OF INVESTMENTS (Unaudited)(continued) | June 30, 2023 |
SERIES F (FLOATING RATE STRATEGIES SERIES) | |
The following is a summary of significant unobservable inputs used in the fair valuations of assets and liabilities categorized within Level 3 of the fair value hierarchy:
Category | | Ending Balance at
June 30, 2023 | | | Valuation Technique | | | Unobservable Inputs | | | Input Range | | | Weighted Average* | |
Assets: | | | | | | | | | | | | | | | | | | | | |
Common Stocks | | $ | 17,686 | | Enterprise Value | Valuation Multiple | 2.7x-9.5x | 3.8x |
Common Stocks | | | 29 | | Model Price | Liquidation Value | — | — |
Preferred Stocks | | | 91 | | Model Price | Liquidation Value | — | — |
Senior Floating Rate Interests | | | 1,234,655 | | Third Party Pricing | Broker Quote | — | — |
Senior Floating Rate Interests | | | 209,933 | | Model Price | Purchase Price | — | — |
Total Assets | | $ | 1,462,394 | | | | | |
Liabilities: | | | | | | | | | | | | | | | | | | | | |
Unfunded Loan Commitments | | $ | 2,874 | | Model Price | Purchase Price | — | — |
* | Inputs are weighted by the fair value of the instruments. |
Significant changes in a quote, liquidation value or valuation multiple would generally result in significant changes in the fair value of the security. Any remaining Level 3 securities held by the Fund and excluded from the table above, were not considered material to the Fund.
The Fund’s fair valuation leveling guidelines classify a single daily broker quote, or a vendor price based on a single daily or monthly broker quote, as Level 3, if such a quote or price cannot be supported with other available market information.
Transfers between Level 2 and Level 3 may occur as markets fluctuate and/or the availability of data used in an investment’s valuation changes. For the period ended June 30, 2023, the Fund had securities with a total value of $902,449 transfer into Level 3 from Level 2 due to a lack of observable inputs and had securities with a total value of $658,867 transfer out of Level 3 into Level 2 due to the availability of current and reliable market-based data provided by a third-party pricing service which utilizes significant observable inputs.
Summary of Fair Value Level 3 Activity
Following is a reconciliation of Level 3 assets for which significant unobservable inputs were used to determine fair value for the period ended June 30, 2023:
| | | Assets | | | | | | | Liabilities | |
| | Senior Floating
Rate Interests | | | Common Stocks | | | Preferred Stocks | | | Total Assets | | | Unfunded Loan
Commitments | |
Beginning Balance | | $ | 696,906 | | | $ | 9,843 | | | $ | — | * | | $ | 706,749 | | | $ | (7,934 | ) |
Purchases/(Receipts) | | | 549,704 | | | | — | | | | — | | | | 549,704 | | | | (1,342 | ) |
(Sales, maturities and paydowns)/Fundings | | | (99,102 | ) | | | — | | | | — | | | | (99,102 | ) | | | 104 | |
Amortization of premiums/discounts | | | 1,462 | | | | — | | | | — | | | | 1,462 | | | | 1,108 | |
Total realized gains (losses) included in earnings | | | (7,089 | ) | | | — | | | | — | | | | (7,089 | ) | | | 1,562 | |
Total change in unrealized appreciation (depreciation) included in earnings | | | 59,125 | | | | 7,872 | | | | 91 | | | | 67,088 | | | | 3,628 | |
Transfers into Level 3 | | | 902,449 | | | | — | | | | — | | | | 902,449 | | | | — | |
Transfers out of Level 3 | | | (658,867 | ) | | | — | | | | — | | | | (658,867 | ) | | | — | |
Ending Balance | | $ | 1,444,588 | | | $ | 17,715 | | | $ | 91 | | | $ | 1,462,394 | | | $ | (2,874 | ) |
Net change in unrealized appreciation (depreciation) for investments in Level 3 securities still held at June 30, 2023 | | $ | 34,989 | | | $ | 7,872 | | | $ | 91 | | | $ | 42,952 | | | $ | 3,145 | |
* | Security has a market value of $0. |
SEE NOTES TO FINANCIAL STATEMENTS. | THE GUGGENHEIM FUNDS SEMI-ANNUAL REPORT | 59 |
SCHEDULE OF INVESTMENTS (Unaudited)(concluded) | June 30, 2023 |
SERIES F (FLOATING RATE STRATEGIES SERIES) | |
Affiliated Transactions
Investments representing 5% or more of the outstanding voting shares of a company, or control of or by, or common control under Guggenheim Investments, result in that company being considered an affiliated issuer, as defined in the 1940 Act.
Transactions during the period ended June 30, 2023, in which the company is an affiliated issuer, were as follows:
Security Name | | Value
12/31/22 | | | Additions | | | Reductions | | | Realized
Gain (Loss) | | | Change in
Unrealized
Appreciation
(Depreciation) | | | Value
06/30/23 | | | Shares
06/30/23 | |
Common Stocks | | | | | | | | | | | | | | | | | | | | | | | | | | | | |
BP Holdco LLC* | | $ | 7,040 | | | $ | — | | | $ | — | | | $ | — | | | $ | 7,872 | | | $ | 14,912 | | | | 11,609 | |
* | Non-income producing security. |
60 | THE GUGGENHEIM FUNDS SEMI-ANNUAL REPORT | SEE NOTES TO FINANCIAL STATEMENTS. |
SERIES F (FLOATING RATE STRATEGIES SERIES) | |
STATEMENT OF ASSETS AND LIABILITIES (Unaudited) |
June 30, 2023 |
Assets: |
Investments in unaffiliated issuers, at value (cost $58,801,204) | | $ | 57,297,362 | |
Investments in affiliated issuers, at value (cost $4,099) | | | 14,912 | |
Foreign currency, at value (cost 22,167) | | | 22,112 | |
Cash | | | 165,089 | |
Prepaid expenses | | | 659 | |
Receivables: |
Securities sold | | | 443,107 | |
Fund shares sold | | | 407,536 | |
Interest | | | 273,726 | |
Total assets | | | 58,624,503 | |
| | | | | |
Liabilities: |
Unfunded loan commitments, at value (Note 8) (commitment fees received $488) | | | 2,874 | |
Unrealized depreciation on forward foreign currency exchange contracts | | | 4,897 | |
Payable for: |
Securities purchased | | | 3,693,502 | |
Fund shares redeemed | | | 25,053 | |
Management fees | | | 24,498 | |
Distribution and service fees | | | 10,918 | |
Transfer agent/maintenance fees | | | 2,062 | |
Trustees’ fees* | | | 1,771 | |
Fund accounting/administration fees | | | 1,219 | |
Miscellaneous | | | 30,745 | |
Total liabilities | | | 3,797,539 | |
Net assets | | $ | 54,826,964 | |
| | | | | |
Net assets consist of: |
Paid in capital | | $ | 56,768,939 | |
Total distributable earnings (loss) | | | (1,941,975 | ) |
Net assets | | $ | 54,826,964 | |
Capital shares outstanding | | | 2,197,992 | |
Net asset value per share | | $ | 24.94 | |
STATEMENT OF OPERATIONS (Unaudited) |
Six Months Ended June 30, 2023 |
Investment Income: |
Dividends | | $ | 55,878 | |
Interest from securities of unaffiliated issuers | | | 2,203,036 | |
Total investment income | | | 2,258,914 | |
| | | | | |
Expenses: |
Management fees | | | 161,200 | |
Distribution and service fees | | | 62,328 | |
Transfer agent/maintenance fees | | | 12,481 | |
Professional fees | | | 32,077 | |
Fund accounting/administration fees | | | 14,622 | |
Trustees’ fees* | | | 7,034 | |
Custodian fees | | | 6,058 | |
Line of credit fees | | | 5,124 | |
Interest expense | | | 7 | |
Miscellaneous | | | 7,070 | |
Total expenses | | | 308,001 | |
Less: |
Expenses waived by Adviser | | | (23,143 | ) |
Earnings credits applied | | | (223 | ) |
Total waived expenses | | | (23,366 | ) |
Net expenses | | | 284,635 | |
Net investment income | | | 1,974,279 | |
| | | | | |
Net Realized and Unrealized Gain (Loss): |
Net realized gain (loss) on: |
Investments in unaffiliated issuers | | | (137,457 | ) |
Forward foreign currency exchange contracts | | | (1,151 | ) |
Foreign currency transactions | | | 485 | |
Net realized loss | | | (138,123 | ) |
Net change in unrealized appreciation (depreciation) on: |
Investments in unaffiliated issuers | | | 880,065 | |
Investments in affiliated issuers | | | 7,872 | |
Forward foreign currency exchange contracts | | | (2,301 | ) |
Foreign currency translations | | | (152 | ) |
Net change in unrealized appreciation (depreciation) | | | 885,484 | |
Net realized and unrealized gain | | | 747,361 | |
Net increase in net assets resulting from operations | | $ | 2,721,640 | |
* | Relates to Trustees not deemed “interested persons” within the meaning of Section 2(a)(19) of the 1940 Act. |
SEE NOTES TO FINANCIAL STATEMENTS. | THE GUGGENHEIM FUNDS SEMI-ANNUAL REPORT | 61 |
SERIES F (FLOATING RATE STRATEGIES SERIES) | |
STATEMENTS OF CHANGES IN NET ASSETS |
| | Six Months Ended
June 30, 2023
(Unaudited) | | | Year Ended
December 31,
2022 | |
Increase (Decrease) in Net Assets from Operations: | | | | | | | | |
Net investment income | | $ | 1,974,279 | | | $ | 1,893,774 | |
Net realized loss on investments | | | (138,123 | ) | | | (429,312 | ) |
Net change in unrealized appreciation (depreciation) on investments | | | 885,484 | | | | (2,017,712 | ) |
Net increase (decrease) in net assets resulting from operations | | | 2,721,640 | | | | (553,250 | ) |
| | | | | | | | | |
Distributions to shareholders | | | — | | | | (1,070,948 | ) |
| | | | | | | | | |
Capital share transactions: | | | | | | | | |
Proceeds from sale of shares | | | 22,096,451 | | | | 41,718,376 | |
Distributions reinvested | | | — | | | | 1,070,948 | |
Cost of shares redeemed | | | (18,329,945 | ) | | | (43,594,800 | ) |
Net increase (decrease) from capital share transactions | | | 3,766,506 | | | | (805,476 | ) |
Net increase (decrease) in net assets | | | 6,488,146 | | | | (2,429,674 | ) |
| | | | | | | | | |
Net assets: | | | | | | | | |
Beginning of period | | | 48,338,818 | | | | 50,768,492 | |
End of period | | $ | 54,826,964 | | | $ | 48,338,818 | |
| | | | | | | | | |
Capital share activity: | | | | | | | | |
Shares sold | | | 908,591 | | | | 1,752,818 | |
Shares issued from reinvestment of distributions | | | — | | | | 46,402 | |
Shares redeemed | | | (757,983 | ) | | | (1,832,795 | ) |
Net increase (decrease) in shares | | | 150,608 | | | | (33,575 | ) |
62 | THE GUGGENHEIM FUNDS SEMI-ANNUAL REPORT | SEE NOTES TO FINANCIAL STATEMENTS. |
SERIES F (FLOATING RATE STRATEGIES SERIES) | |
This table is presented to show selected data for a share outstanding throughout each period and to assist shareholders in evaluating a Fund’s performance for the periods presented.
| | Six Months Ended
June 30, 2023a | | | Year Ended
December 31,
2022 | | | Year Ended
December 31,
2021 | | | Year Ended
December 31,
2020 | | | Year Ended
December 31,
2019 | | | Year Ended
December 31,
2018 | |
Per Share Data |
Net asset value, beginning of period | | $ | 23.61 | | | $ | 24.40 | | | $ | 24.41 | | | $ | 25.96 | | | $ | 25.30 | | | $ | 26.26 | |
Income (loss) from investment operations: |
Net investment income (loss)b | | | .96 | | | | .95 | | | | .58 | | | | .68 | | | | 1.06 | | | | 1.01 | |
Net gain (loss) on investments (realized and unrealized) | | | .37 | | | | (1.18 | ) | | | .02 | | | | (.74 | ) | | | .85 | | | | (1.21 | ) |
Total from investment operations | | | 1.33 | | | | (.23 | ) | | | .60 | | | | (.06 | ) | | | 1.91 | | | | (.20 | ) |
Less distributions from: |
Net investment income | | | — | | | | (.56 | ) | | | (.61 | ) | | | (1.49 | ) | | | (1.25 | ) | | | (.76 | ) |
Total distributions | | | — | | | | (.56 | ) | | | (.61 | ) | | | (1.49 | ) | | | (1.25 | ) | | | (.76 | ) |
Net asset value, end of period | | $ | 24.94 | | | $ | 23.61 | | | $ | 24.40 | | | $ | 24.41 | | | $ | 25.96 | | | $ | 25.30 | |
|
Total Returnc | | | 5.63 | % | | | (0.85 | %) | | | 2.50 | % | | | 0.01 | % | | | 7.60 | % | | | (0.84 | %) |
Ratios/Supplemental Data |
Net assets, end of period (in thousands) | | $ | 54,827 | | | $ | 48,339 | | | $ | 50,768 | | | $ | 41,004 | | | $ | 46,047 | | | $ | 58,798 | |
Ratios to average net assets: |
Net investment income (loss) | | | 7.96 | % | | | 4.01 | % | | | 2.36 | % | | | 2.81 | % | | | 4.10 | % | | | 3.85 | % |
Total expenses | | | 1.24 | % | | | 1.27 | % | | | 1.34 | % | | | 1.47 | % | | | 1.38 | % | | | 1.26 | % |
Net expensesd,e,f | | | 1.15 | % | | | 1.16 | % | | | 1.17 | % | | | 1.23 | % | | | 1.21 | % | | | 1.16 | % |
Portfolio turnover rate | | | 26 | % | | | 68 | % | | | 56 | % | | | 60 | % | | | 28 | % | | | 80 | % |
a | Unaudited figures for the period ended June 30, 2023. Percentage amounts for the period, except total return and portfolio turnover rate, have been annualized. |
b | Net investment income (loss) per share was computed using average shares outstanding throughout the period. |
c | Total return does not take into account any of the expenses associated with an investment in variable insurance products. If total return had taken into account these expenses, performance would have been lower. Shares of a series of Guggenheim Variable Funds Trust are available only through the purchase of such products. |
d | Net expense information reflects the expense ratios after expense waivers and reimbursements, as applicable. |
e | The portion of the ratios of net expenses to average net assets attributable to recoupments of prior fee reductions or expense reimbursements for the years presented was as follows: |
| | 06/30/23a | 12/31/22 | 12/31/21 | 12/31/20 | 12/31/19 | 12/31/18 |
| | — | — | — | — | — | 0.00%* |
f | Net expenses may include expenses that are excluded from the expense limitation agreement. Excluding these expenses, the net expense ratios for the years presented would be: |
| | 06/30/23a | 12/31/22 | 12/31/21 | 12/31/20 | 12/31/19 | 12/31/18 |
| | 1.13% | 1.14% | 1.14% | 1.15% | 1.15% | 1.15% |
SEE NOTES TO FINANCIAL STATEMENTS. | THE GUGGENHEIM FUNDS SEMI-ANNUAL REPORT | 63 |
PERFORMANCE REPORT AND FUND PROFILE (Unaudited) | June 30, 2023 |
SERIES J (STYLEPLUS—MID GROWTH SERIES)
OBJECTIVE: Seeks long-term growth of capital.
Holdings Diversification (Market Exposure as % of Net Assets)

“Holdings Diversification (Market Exposure as % of Net Assets)” excludes any temporary cash investments, investments in Guggenheim Strategy Funds Trust mutual funds, or investments in Guggenheim Ultra Short Duration Fund.
Inception Date: October 1, 1992 |
Ten Largest Holdings | % of Total Net Assets |
Guggenheim Strategy Fund III | 31.7% |
Guggenheim Variable Insurance Strategy Fund III | 25.1% |
Guggenheim Strategy Fund II | 16.9% |
Guggenheim Ultra Short Duration Fund — Institutional Class | 1.7% |
Builders FirstSource, Inc. | 0.5% |
United Therapeutics Corp. | 0.4% |
Owens Corning | 0.3% |
Curtiss-Wright Corp. | 0.3% |
Toro Co. | 0.3% |
UFP Industries, Inc. | 0.3% |
Top Ten Total | 77.5% |
| | |
“Ten Largest Holdings” excludes any temporary cash or derivative investments. |
Average Annual Returns*,†
Periods Ended June 30, 2023
| 6 Month‡ | 1 Year | 5 Year | 10 Year |
Series J (StylePlus—Mid Growth Series) | 16.30% | 22.96% | 8.34% | 11.00% |
Russell Midcap Growth Index | 15.94% | 23.13% | 9.71% | 11.53% |
* | The performance data above represents past performance that is not predictive of future results. The investment return and principal value of an investment in the Fund will fluctuate so that an investor’s shares, when redeemed, may be worth more or less than their original cost. Returns are historical and include changes in principal and reinvested dividends and capital gains and do not reflect the effect of taxes. The Russell Midcap Growth Index is an unmanaged index and, unlike the Fund, has no management fees or operating expenses to reduce its reported return. |
† | Performance figures do not reflect fees and expenses associated with an investment in variable insurance products. If returns had taken into account these fees and expenses, performance would have been lower. Shares of a series of Guggenheim Variable Funds Trust are available only through the purchase of such products. |
‡ | 6 month returns are not annualized. |
64 | THE GUGGENHEIM FUNDS SEMI-ANNUAL REPORT | |
SCHEDULE OF INVESTMENTS (Unaudited) | June 30, 2023 |
SERIES J (STYLEPLUS—MID GROWTH SERIES) | |
| | Shares | | | Value | |
COMMON STOCKS† - 20.0% |
| | | | | | | | | |
Industrial - 6.2% |
Builders FirstSource, Inc.* | | | 6,494 | | | $ | 883,088 | |
Owens Corning | | | 3,780 | | | | 493,290 | |
Curtiss-Wright Corp. | | | 2,648 | | | | 486,332 | |
Toro Co. | | | 4,764 | | | | 484,261 | |
UFP Industries, Inc. | | | 4,958 | | | | 481,174 | |
Eagle Materials, Inc. | | | 2,555 | | | | 476,303 | |
Lincoln Electric Holdings, Inc. | | | 2,290 | | | | 454,863 | |
Carlisle Companies, Inc. | | | 1,751 | | | | 449,184 | |
Donaldson Company, Inc. | | | 7,132 | | | | 445,821 | |
Belden, Inc. | | | 4,430 | | | | 423,730 | |
ITT, Inc. | | | 4,484 | | | | 417,954 | |
Simpson Manufacturing Company, Inc. | | | 2,975 | | | | 412,037 | |
Hubbell, Inc. | | | 1,236 | | | | 409,808 | |
Timken Co. | | | 4,055 | | | | 371,154 | |
Watts Water Technologies, Inc. — Class A | | | 1,943 | | | | 356,987 | |
Landstar System, Inc. | | | 1,790 | | | | 344,647 | |
Mueller Industries, Inc. | | | 3,566 | | | | 311,241 | |
Acuity Brands, Inc. | | | 1,835 | | | | 299,252 | |
Louisiana-Pacific Corp. | | | 3,728 | | | | 279,525 | |
Snap-on, Inc. | | | 963 | | | | 277,527 | |
EMCOR Group, Inc. | | | 1,477 | | | | 272,920 | |
Valmont Industries, Inc. | | | 789 | | | | 229,638 | |
AGCO Corp. | | | 1,677 | | | | 220,391 | |
Littelfuse, Inc. | | | 682 | | | | 198,673 | |
Keysight Technologies, Inc.* | | | 1,176 | | | | 196,921 | |
Masco Corp. | | | 3,199 | | | | 183,559 | |
Advanced Drainage Systems, Inc. | | | 1,510 | | | | 171,808 | |
Universal Display Corp. | | | 876 | | | | 126,258 | |
Total Industrial | | | | | | | 10,158,346 | |
| | | | | | | | | |
Consumer, Non-cyclical - 3.6% |
United Therapeutics Corp.* | | | 2,670 | | | | 589,402 | |
Jazz Pharmaceuticals plc* | | | 3,765 | | | | 466,747 | |
Exelixis, Inc.* | | | 24,007 | | | | 458,774 | |
Neurocrine Biosciences, Inc.* | | | 4,742 | | | | 447,171 | |
H&R Block, Inc. | | | 13,994 | | | | 445,989 | |
Quest Diagnostics, Inc. | | | 2,230 | | | | 313,449 | |
Incyte Corp.* | | | 4,973 | | | | 309,569 | |
Hologic, Inc.* | | | 3,753 | | | | 303,880 | |
Shockwave Medical, Inc.* | | | 1,010 | | | | 288,264 | |
Grand Canyon Education, Inc.* | | | 2,791 | | | | 288,059 | |
Lantheus Holdings, Inc.* | | | 2,501 | | | | 209,884 | |
Medpace Holdings, Inc.* | | | 842 | | | | 202,223 | |
Humana, Inc. | | | 423 | | | | 189,136 | |
Molina Healthcare, Inc.* | | | 603 | | | | 181,648 | |
Bruker Corp. | | | 2,336 | | | | 172,677 | |
Encompass Health Corp. | | | 2,534 | | | | 171,577 | |
Option Care Health, Inc.* | | | 4,502 | | | | 146,270 | |
Halozyme Therapeutics, Inc.* | | | 4,001 | | | | 144,316 | |
Globus Medical, Inc. — Class A* | | | 2,275 | | | | 135,454 | |
Campbell Soup Co. | | | 2,520 | | | | 115,189 | |
AMN Healthcare Services, Inc.* | | | 1,032 | | | | 112,612 | |
Service Corporation International | | | 1,461 | | | | 94,366 | |
Darling Ingredients, Inc.* | | | 1,479 | | | | 94,345 | |
Total Consumer, Non-cyclical | | | | | | | 5,881,001 | |
| | | | | | | | | |
Consumer, Cyclical - 3.4% |
Gentex Corp. | | | 13,543 | | | | 396,268 | |
Boyd Gaming Corp. | | | 5,641 | | | | 391,316 | |
Deckers Outdoor Corp.* | | | 720 | | | | 379,915 | |
Brunswick Corp. | | | 4,377 | | | | 379,223 | |
MSC Industrial Direct Company, Inc. — Class A | | | 3,711 | | | | 353,584 | |
Polaris, Inc. | | | 2,848 | | | | 344,409 | |
Yum! Brands, Inc. | | | 2,319 | | | | 321,297 | |
Murphy USA, Inc. | | | 1,004 | | | | 312,354 | |
Watsco, Inc. | | | 809 | | | | 308,609 | |
DR Horton, Inc. | | | 2,473 | | | | 300,939 | |
AutoNation, Inc.* | | | 1,614 | | | | 265,681 | |
Cummins, Inc. | | | 971 | | | | 238,050 | |
Churchill Downs, Inc. | | | 1,708 | | | | 237,702 | |
Casey’s General Stores, Inc. | | | 910 | | | | 221,931 | |
Crocs, Inc.* | | | 1,908 | | | | 214,536 | |
Visteon Corp.* | | | 1,329 | | | | 190,858 | |
Williams-Sonoma, Inc. | | | 1,411 | | | | 176,573 | |
Dick’s Sporting Goods, Inc. | | | 1,226 | | | | 162,065 | |
Wingstop, Inc. | | | 799 | | | | 159,928 | |
Harley-Davidson, Inc. | | | 4,117 | | | | 144,960 | |
Tempur Sealy International, Inc. | | | 3,295 | | | | 132,031 | |
Total Consumer, Cyclical | | | | | | | 5,632,229 | |
| | | | | | | | | |
Technology - 2.6% |
Lattice Semiconductor Corp.* | | | 4,895 | | | | 470,263 | |
Cirrus Logic, Inc.* | | | 5,216 | | | | 422,548 | |
Manhattan Associates, Inc.* | | | 1,523 | | | | 304,417 | |
Power Integrations, Inc. | | | 2,953 | | | | 279,561 | |
Super Micro Computer, Inc.* | | | 1,120 | | | | 279,160 | |
Teradata Corp.* | | | 5,192 | | | | 277,305 | |
Microchip Technology, Inc. | | | 3,078 | | | | 275,758 | |
Diodes, Inc.* | | | 2,974 | | | | 275,065 | |
KLA Corp. | | | 544 | | | | 263,851 | |
Amkor Technology, Inc. | | | 7,625 | | | | 226,844 | |
MACOM Technology Solutions Holdings, Inc.* | | | 3,249 | | | | 212,907 | |
Qualys, Inc.* | | | 1,631 | | | | 210,676 | |
NXP Semiconductor N.V. | | | 927 | | | | 189,738 | |
Dynatrace, Inc.* | | | 3,083 | | | | 158,682 | |
CommVault Systems, Inc.* | | | 2,093 | | | | 151,994 | |
Silicon Laboratories, Inc.* | | | 810 | | | | 127,769 | |
Teradyne, Inc. | | | 1,132 | | | | 126,026 | |
Cadence Design Systems, Inc.* | | | 403 | | | | 94,511 | |
Total Technology | | | | | | | 4,347,075 | |
| | | | | | | | | |
Energy - 1.6% |
Chord Energy Corp. | | | 2,499 | | | | 384,346 | |
Matador Resources Co. | | | 6,807 | | | | 356,142 | |
Marathon Petroleum Corp. | | | 2,879 | | | | 335,692 | |
PBF Energy, Inc. — Class A | | | 7,067 | | | | 289,323 | |
Southwestern Energy Co.* | | | 47,537 | | | | 285,697 | |
Range Resources Corp. | | | 8,266 | | | | 243,020 | |
Antero Resources Corp.* | | | 8,446 | | | | 194,511 | |
Murphy Oil Corp. | | | 4,762 | | | | 182,385 | |
Civitas Resources, Inc. | | | 2,623 | | | | 181,958 | |
SEE NOTES TO FINANCIAL STATEMENTS. | THE GUGGENHEIM FUNDS SEMI-ANNUAL REPORT | 65 |
SCHEDULE OF INVESTMENTS (Unaudited)(continued) | June 30, 2023 |
SERIES J (STYLEPLUS—MID GROWTH SERIES) | |
| | Shares | | | Value | |
Occidental Petroleum Corp. | | | 1,566 | | | $ | 92,081 | |
Total Energy | | | | | | | 2,545,155 | |
| | | | | | | | | |
Financial - 1.1% |
SouthState Corp. | | | 5,939 | | | | 390,786 | |
International Bancshares Corp. | | | 7,834 | | | | 346,263 | |
Cathay General Bancorp | | | 9,039 | | | | 290,966 | |
Evercore, Inc. — Class A | | | 1,734 | | | | 214,305 | |
Affiliated Managers Group, Inc. | | | 1,265 | | | | 189,611 | |
SEI Investments Co. | | | 2,670 | | | | 159,185 | |
RenaissanceRe Holdings Ltd. | | | 820 | | | | 152,946 | |
Total Financial | | | | | | | 1,744,062 | |
| | | | | | | | | |
Basic Materials - 0.7% |
Olin Corp. | | | 6,607 | | | | 339,534 | |
NewMarket Corp. | | | 659 | | | | 264,997 | |
Reliance Steel & Aluminum Co. | | | 814 | | | | 221,074 | |
Westlake Corp. | | | 1,633 | | | | 195,094 | |
Ingevity Corp.* | | | 2,782 | | | | 161,801 | |
Total Basic Materials | | | | | | | 1,182,500 | |
| | | | | | | | | |
Communications - 0.6% |
VeriSign, Inc.* | | | 1,378 | | | | 311,387 | |
Nexstar Media Group, Inc. — Class A | | | 1,769 | | | | 294,627 | |
Motorola Solutions, Inc. | | | 837 | | | | 245,475 | |
Gen Digital, Inc. | | | 5,156 | | | | 95,644 | |
Total Communications | | | | | | | 947,133 | |
| | | | | | | | | |
Utilities - 0.2% |
OGE Energy Corp. | | | 4,876 | | | | 175,097 | |
Atmos Energy Corp. | | | 1,159 | | | | 134,838 | |
ONE Gas, Inc. | | | 1,162 | | | | 89,253 | |
Total Utilities | | | | | | | 399,188 | |
| | | | | | | | | |
Total Common Stocks | | | | |
(Cost $29,509,170) | | | | | | | 32,836,689 | |
MUTUAL FUNDS† - 75.4% |
Guggenheim Strategy Fund III1 | | | 2,144,491 | | | | 52,003,897 | |
Guggenheim Variable Insurance Strategy Fund III1 | | | 1,696,259 | | | | 41,117,309 | |
Guggenheim Strategy Fund II1 | | | 1,143,361 | | | | 27,692,214 | |
Guggenheim Ultra Short Duration Fund — Institutional Class1 | | | 287,854 | | | | 2,800,819 | |
Total Mutual Funds | | | | |
(Cost $125,989,364) | | | | | | | 123,614,239 | |
| | | | | | | | | |
MONEY MARKET FUND† - 3.7% |
Dreyfus Treasury Securities Cash Management Fund — Institutional Shares, 4.96%2 | | | 6,048,262 | | | | 6,048,262 | |
Total Money Market Fund | | | | |
(Cost $6,048,262) | | | | | | | 6,048,262 | |
| | | | | | | | | |
Total Investments - 99.1% | | | | |
(Cost $161,546,796) | | $ | 162,499,190 | |
Other Assets & Liabilities, net - 0.9% | | | 1,470,986 | |
Total Net Assets - 100.0% | | $ | 163,970,176 | |
Futures Contracts |
Description | | Number of
Contracts | | | Expiration Date | | | Notional
Amount | | | Value and
Unrealized
Appreciation** | |
Equity Futures Contracts Purchased† |
S&P MidCap 400 Index Mini Futures Contracts | | | 18 | | | | Sep 2023 | | | $ | 4,759,200 | | | $ | 20,705 | |
S&P 500 Index Mini Futures Contracts | | | 6 | | | | Sep 2023 | | | | 1,345,950 | | | | 6,929 | |
NASDAQ-100 Index Mini Futures Contracts | | | 4 | | | | Sep 2023 | | | | 1,226,500 | | | | 4,570 | |
| | | | | | | | | | | $ | 7,331,650 | | | $ | 32,204 | |
Total Return Swap Agreements |
Counterparty | Index | Type | Financing
Rate | | Payment
Frequency | | | Maturity Date | | | Units | | | Notional
Amount | | | Value and
Unrealized
Appreciation | |
OTC Equity Index Swap Agreements†† |
Wells Fargo Bank, N.A. | Russell MidCap Growth Index | Pay | 5.53% (Federal Funds Rate + 0.45%) | | | At Maturity | | | | 09/29/23 | | | | 26,717 | | | $ | 126,836,820 | | | $ | — | |
66 | THE GUGGENHEIM FUNDS SEMI-ANNUAL REPORT | SEE NOTES TO FINANCIAL STATEMENTS. |
SCHEDULE OF INVESTMENTS (Unaudited)(continued) | June 30, 2023 |
SERIES J (STYLEPLUS—MID GROWTH SERIES) | |
* | Non-income producing security. |
** | Includes cumulative appreciation (depreciation). Variation margin is reported within the Statement of Assets and Liabilities. |
† | Value determined based on Level 1 inputs — See Note 4. |
†† | Value determined based on Level 2 inputs — See Note 4. |
1 | Affiliated issuer. |
2 | Rate indicated is the 7-day yield as of June 30, 2023. |
| | plc — Public Limited Company |
| | |
| | See Sector Classification in Other Information section. |
The following table summarizes the inputs used to value the Fund’s investments at June 30, 2023 (See Note 4 in the Notes to Financial Statements):
Investments in Securities (Assets) | | Level 1
Quoted
Prices | | | Level 2
Significant
Observable
Inputs | | | Level 3
Significant
Unobservable
Inputs | | | Total | |
Common Stocks | | $ | 32,836,689 | | | $ | — | | | $ | — | | | $ | 32,836,689 | |
Mutual Funds | | | 123,614,239 | | | | — | | | | — | | | | 123,614,239 | |
Money Market Fund | | | 6,048,262 | | | | — | | | | — | | | | 6,048,262 | |
Equity Futures Contracts** | | | 32,204 | | | | — | | | | — | | | | 32,204 | |
Equity Index Swap Agreements** | | | — | | | | — | * | | | — | | | | — | |
Total Assets | | $ | 162,531,394 | | | $ | — | | | $ | — | | | $ | 162,531,394 | |
* | Security has a market value of $0. |
** | This derivative is reported as unrealized appreciation/depreciation at period end. |
SEE NOTES TO FINANCIAL STATEMENTS. | THE GUGGENHEIM FUNDS SEMI-ANNUAL REPORT | 67 |
SCHEDULE OF INVESTMENTS (Unaudited)(concluded) | June 30, 2023 |
SERIES J (STYLEPLUS—MID GROWTH SERIES) | |
Affiliated Transactions
Investments representing 5% or more of the outstanding voting shares of a company, or control of or by, or common control under Guggenheim Investments (“GI”), result in that company being considered an affiliated issuer, as defined in the 1940 Act.
The Fund may invest in certain of the underlying series of Guggenheim Strategy Funds Trust, including Guggenheim Strategy Fund II, Guggenheim Strategy Fund III, and Guggenheim Variable Insurance Strategy Fund III, (collectively, the “Short Term Investment Vehicles”), each of which are open-end management investment companies managed by GI. The Short Term Investment Vehicles, which launched on March 11, 2014, are offered as short term investment options only to mutual funds, trusts, and other accounts managed by GI and/or its affiliates, and are not available to the public. The Short Term Investment Vehicles pay no investment management fees. The Short Term Investment Vehicles’ annual report on Form N-CSR dated September 30, 2022, is available publicly or upon request. This information is available from the EDGAR database on the SEC’s website at https://www.sec.gov/Archives/edgar/data/1601445/000182126822000340/gug84768.htm. The Fund may invest in certain of the underlying series of Guggenheim Funds Trust, which are open-end management investment companies managed by GI, are available to the public and whose most recent annual report on Form N-CSR is available publicly or upon request.
Transactions during the period ended June 30, 2023, in which the company is an affiliated issuer, were as follows:
Security Name | | Value
12/31/22 | | | Additions | | | Reductions | | | Realized
Gain (Loss) | | | Change in
Unrealized
Appreciation
(Depreciation) | | | Value
06/30/23 | | | Shares
06/30/23 | | | Investment
Income | |
Mutual Funds | | | | | | | | | | | | | | | | | | | | | | | | | | | | | | | | |
Guggenheim Strategy Fund II | | $ | 26,262,849 | | | $ | 8,500,474 | | | $ | (7,269,700 | ) | | $ | 16,159 | | | $ | 182,432 | | | $ | 27,692,214 | | | | 1,143,361 | | | $ | 646,492 | |
Guggenheim Strategy Fund III | | | 43,164,347 | | | | 8,503,914 | | | | — | | | | — | | | | 335,636 | | | | 52,003,897 | | | | 2,144,491 | | | | 1,283,389 | |
Guggenheim Ultra Short Duration Fund — Institutional Class | | | 2,705,158 | | | | 70,389 | | | | — | | | | — | | | | 25,272 | | | | 2,800,819 | | | | 287,854 | | | | 70,421 | |
Guggenheim Variable Insurance Strategy Fund III | | | 39,804,396 | | | | 1,032,342 | | | | — | | | | — | | | | 280,571 | | | | 41,117,309 | | | | 1,696,259 | | | | 1,029,969 | |
| | | $ | 111,936,750 | | | $ | 18,107,119 | | | $ | (7,269,700 | ) | | $ | 16,159 | | | $ | 823,911 | | | $ | 123,614,239 | | | | | | | $ | 3,030,271 | |
68 | THE GUGGENHEIM FUNDS SEMI-ANNUAL REPORT | SEE NOTES TO FINANCIAL STATEMENTS. |
SERIES J (STYLEPLUS—MID GROWTH SERIES) | |
STATEMENT OF ASSETS AND LIABILITIES (Unaudited) |
June 30, 2023 |
Assets: |
Investments in unaffiliated issuers, at value (cost $35,557,432) | | $ | 38,884,951 | |
Investments in affiliated issuers, at value (cost $125,989,364) | | | 123,614,239 | |
Cash | | | 4 | |
Segregated cash with broker | | | 138,800 | |
Prepaid expenses | | | 649 | |
Receivables: |
Swap settlement | | | 17,466,460 | |
Dividends | | | 560,897 | |
Interest | | | 26,879 | |
Variation margin on futures contracts | | | 19,743 | |
Investment Adviser | | | 109 | |
Total assets | | | 180,712,731 | |
| | | | | |
Liabilities: |
Segregated cash due to broker | | | 15,960,000 | |
Payable for: |
Securities purchased | | | 583,699 | |
Management fees | | | 70,651 | |
Distribution and service fees | | | 33,638 | |
Fund shares redeemed | | | 19,385 | |
Transfer agent/maintenance fees | | | 2,062 | |
Fund accounting/administration fees | | | 1,995 | |
Trustees’ fees* | | | 482 | |
Miscellaneous | | | 70,643 | |
Total liabilities | | | 16,742,555 | |
Net assets | | $ | 163,970,176 | |
| | | | | |
Net assets consist of: |
Paid in capital | | $ | 189,214,491 | |
Total distributable earnings (loss) | | | (25,244,315 | ) |
Net assets | | $ | 163,970,176 | |
Capital shares outstanding | | | 3,829,289 | |
Net asset value per share | | $ | 42.82 | |
STATEMENT OF OPERATIONS (Unaudited) |
Six Months Ended June 30, 2023 |
Investment Income: |
Dividends from securities of unaffiliated issuers (net of foreign withholding tax of $343) | | $ | 216,402 | |
Dividends from securities of affiliated issuers | | | 3,030,271 | |
Interest | | | 114,835 | |
Other income | | | 109 | |
Total investment income | | | 3,361,617 | |
| | | | | |
Expenses: |
Management fees | | | 573,604 | |
Distribution and service fees | | | 192,195 | |
Transfer agent/maintenance fees | | | 12,548 | |
Interest expense | | | 203,301 | |
Fund accounting/administration fees | | | 35,787 | |
Professional fees | | | 23,837 | |
Custodian fees | | | 11,134 | |
Trustees’ fees* | | | 6,113 | |
Line of credit fees | | | 2,516 | |
Miscellaneous | | | 9,330 | |
Total expenses | | | 1,070,365 | |
Less: |
Expenses waived by Adviser | | | (161,134 | ) |
Earnings credits applied | | | (5,699 | ) |
Total waived expenses | | | (166,833 | ) |
Net expenses | | | 903,532 | |
Net investment income | | | 2,458,085 | |
| | | | | |
Net Realized and Unrealized Gain (Loss): |
Net realized gain (loss) on: |
Investments in unaffiliated issuers | | | 838,502 | |
Investments in affiliated issuers | | | 16,159 | |
Swap agreements | | | 17,494,645 | |
Futures contracts | | | 233,333 | |
Net realized gain | | | 18,582,639 | |
Net change in unrealized appreciation (depreciation) on: |
Investments in unaffiliated issuers | | | 3,351,090 | |
Investments in affiliated issuers | | | 823,911 | |
Swap agreements | | | (2,109,057 | ) |
Futures contracts | | | 188,294 | |
Net change in unrealized appreciation (depreciation) | | | 2,254,238 | |
Net realized and unrealized gain | | | 20,836,877 | |
Net increase in net assets resulting from operations | | $ | 23,294,962 | |
* | Relates to Trustees not deemed “interested persons” within the meaning of Section 2(a)(19) of the 1940 Act. |
SEE NOTES TO FINANCIAL STATEMENTS. | THE GUGGENHEIM FUNDS SEMI-ANNUAL REPORT | 69 |
SERIES J (STYLEPLUS—MID GROWTH SERIES) | |
STATEMENTS OF CHANGES IN NET ASSETS |
| | Six Months Ended
June 30, 2023
(Unaudited) | | | Year Ended
December 31,
2022 | |
Increase (Decrease) in Net Assets from Operations: | | | | | | | | |
Net investment income | | $ | 2,458,085 | | | $ | 2,272,753 | |
Net realized gain (loss) on investments | | | 18,582,639 | | | | (49,405,358 | ) |
Net change in unrealized appreciation (depreciation) on investments | | | 2,254,238 | | | | (9,054,433 | ) |
Net increase (decrease) in net assets resulting from operations | | | 23,294,962 | | | | (56,187,038 | ) |
| | | | | | | | | |
Distributions to shareholders | | | — | | | | (43,841,105 | ) |
| | | | | | | | | |
Capital share transactions: | | | | | | | | |
Proceeds from sale of shares | | | 1,971,132 | | | | 16,227,294 | |
Distributions reinvested | | | — | | | | 43,841,105 | |
Cost of shares redeemed | | | (6,468,990 | ) | | | (13,494,617 | ) |
Net increase (decrease) from capital share transactions | | | (4,497,858 | ) | | | 46,573,782 | |
Net increase (decrease) in net assets | | | 18,797,104 | | | | (53,454,361 | ) |
| | | | | | | | | |
Net assets: | | | | | | | | |
Beginning of period | | | 145,173,072 | | | | 198,627,433 | |
End of period | | $ | 163,970,176 | | | $ | 145,173,072 | |
| | | | | | | | | |
Capital share activity: | | | | | | | | |
Shares sold | | | 49,509 | | | | 285,794 | |
Shares issued from reinvestment of distributions | | | — | | | | 1,157,674 | |
Shares redeemed | | | (162,813 | ) | | | (291,950 | ) |
Net increase (decrease) in shares | | | (113,304 | ) | | | 1,151,518 | |
70 | THE GUGGENHEIM FUNDS SEMI-ANNUAL REPORT | SEE NOTES TO FINANCIAL STATEMENTS. |
SERIES J (STYLEPLUS—MID GROWTH SERIES) | |
This table is presented to show selected data for a share outstanding throughout each period and to assist shareholders in evaluating a Fund’s performance for the periods presented.
| | Six Months Ended
June 30, 2023a | | | Year Ended
December 31,
2022 | | | Year Ended
December 31,
2021 | | | Year Ended
December 31,
2020 | | | Year Ended
December 31,
2019 | | | Year Ended
December 31,
2018 | |
Per Share Data |
Net asset value, beginning of period | | $ | 36.82 | | | $ | 71.17 | | | $ | 72.46 | | | $ | 58.49 | | | $ | 48.75 | | | $ | 59.82 | |
Income (loss) from investment operations: |
Net investment income (loss)b | | | .63 | | | | .66 | | | | .22 | | | | .39 | | | | .79 | | | | .97 | |
Net gain (loss) on investments (realized and unrealized) | | | 5.37 | | | | (20.02 | ) | | | 9.44 | | | | 17.43 | | | | 14.90 | | | | (4.08 | ) |
Total from investment operations | | | 6.00 | | | | (19.36 | ) | | | 9.66 | | | | 17.82 | | | | 15.69 | | | | (3.11 | ) |
Less distributions from: |
Net investment income | | | — | | | | (.20 | ) | | | (.40 | ) | | | (.84 | ) | | | (.49 | ) | | | (.83 | ) |
Net realized gains | | | — | | | | (14.79 | ) | | | (10.55 | ) | | | (3.01 | ) | | | (5.46 | ) | | | (7.13 | ) |
Total distributions | | | — | | | | (14.99 | ) | | | (10.95 | ) | | | (3.85 | ) | | | (5.95 | ) | | | (7.96 | ) |
Net asset value, end of period | | $ | 42.82 | | | $ | 36.82 | | | $ | 71.17 | | | $ | 72.46 | | | $ | 58.49 | | | $ | 48.75 | |
|
Total Returnc | | | 16.30 | % | | | (27.78 | %) | | | 13.69 | % | | | 32.10 | % | | | 32.70 | % | | | (7.10 | %) |
Ratios/Supplemental Data |
Net assets, end of period (in thousands) | | $ | 163,970 | | | $ | 145,173 | | | $ | 198,627 | | | $ | 190,920 | | | $ | 157,675 | | | $ | 137,116 | |
Ratios to average net assets: |
Net investment income (loss) | | | 3.21 | % | | | 1.42 | % | | | 0.30 | % | | | 0.66 | % | | | 1.39 | % | | | 1.64 | % |
Total expensesd | | | 1.40 | % | | | 1.18 | % | | | 1.16 | % | | | 1.22 | % | | | 1.30 | % | | | 1.28 | % |
Net expensese,f | | | 1.19 | % | | | 0.96 | % | | | 0.89 | % | | | 0.89 | % | | | 1.00 | % | | | 1.01 | % |
Portfolio turnover rate | | | 25 | % | | | 87 | % | | | 60 | % | | | 71 | % | | | 57 | % | | | 66 | % |
a | Unaudited figures for the period ended June 30, 2023. Percentage amounts for the period, except total return and portfolio turnover rate, have been annualized. |
b | Net investment income (loss) per share was computed using average shares outstanding throughout the period. |
c | Total return does not take into account any of the expenses associated with an investment in variable insurance products. If total return had taken into account these expenses, performance would have been lower. Shares of a series of Guggenheim Variable Funds Trust are available only through the purchase of such products. |
d | Does not include expenses of the underlying funds in which the Fund invests. |
e | Net expense information reflects the expense ratios after expense waivers and reimbursements, as applicable. |
f | Net expenses may include expenses that are excluded from the expense limitation agreement. Excluding these expenses, the net expense ratios for the years presented would be: |
| | 06/30/23a | 12/31/22 | 12/31/21 | 12/31/20 | 12/31/19 | 12/31/18 |
| | 0.92% | 0.91% | 0.87% | 0.88% | 0.92% | 0.94% |
SEE NOTES TO FINANCIAL STATEMENTS. | THE GUGGENHEIM FUNDS SEMI-ANNUAL REPORT | 71 |
PERFORMANCE REPORT AND FUND PROFILE (Unaudited) | June 30, 2023 |
SERIES N (MANAGED ASSET ALLOCATION SERIES)
OBJECTIVE: Seeks to provide growth of capital and, secondarily, preservation of capital.
Holdings Diversification (Market Exposure as % of Net Assets)
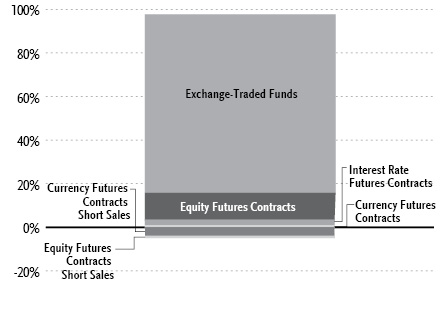
“Holdings Diversification (Market Exposure as % of Net Assets)” excludes any temporary cash investments, investments in Guggenheim Strategy Funds Trust mutual funds, or investments in Guggenheim Ultra Short Duration Fund.
Inception Date: June 1, 1995 |
Ten Largest Holdings | % of Total Net Assets |
Vanguard S&P 500 ETF | 22.3% |
Schwab U.S. Aggregate Bond ETF | 14.6% |
SPDR S&P 500 ETF Trust | 12.5% |
iShares MSCI EAFE ETF | 6.6% |
iShares Core S&P Mid-Cap ETF | 6.4% |
iShares iBoxx $ Investment Grade Corporate Bond ETF | 6.2% |
iShares 7-10 Year Treasury Bond ETF | 5.4% |
iShares 1-3 Year Treasury Bond ETF | 4.7% |
Guggenheim Strategy Fund II | 4.2% |
Guggenheim Variable Insurance Strategy Fund III | 3.0% |
Top Ten Total | 85.9% |
| | |
“Ten Largest Holdings” excludes any temporary cash or derivative investments. |
Average Annual Returns*,†
Periods Ended June 30, 2023
| 6 Month‡ | 1 Year | 5 Year | 10 Year |
Series N (Managed Asset Allocation Series) | 8.28% | 9.37% | 5.31% | 6.54% |
S&P 500 Index | 16.89% | 19.59% | 12.31% | 12.86% |
Blended Index** | 10.81% | 11.24% | 7.94% | 8.45% |
Bloomberg U.S. Aggregate Bond Index | 2.09% | (0.94%) | 0.77% | 1.52% |
* | The performance data above represents past performance that is not predictive of future results. The investment return and principal value of an investment in the Fund will fluctuate so that an investor’s shares, when redeemed, may be worth more or less than their original cost. Returns are historical and include changes in principal and reinvested dividends and capital gains and do not reflect the effect of taxes. The S&P 500 Index and the Bloomberg U.S. Aggregate Bond Index are unmanaged indices and, unlike the Fund, has no management fees or operating expenses to reduce their reported returns |
** | Blended index is 60% S&P 500 Index and 40% Bloomberg U.S. Aggregate Bond Index. |
† | Performance figures do not reflect fees and expenses associated with an investment in variable insurance products. If returns had taken into account these fees and expenses, performance would have been lower. Shares of a series of Guggenheim Variable Funds Trust are available only through the purchase of such products. |
‡ | 6 month returns are not annualized. |
72 | THE GUGGENHEIM FUNDS SEMI-ANNUAL REPORT | |
SCHEDULE OF INVESTMENTS (Unaudited) | June 30, 2023 |
SERIES N (MANAGED ASSET ALLOCATION SERIES) | |
| | Shares | | | Value | |
EXCHANGE-TRADED FUNDS† - 81.9% |
Vanguard S&P 500 ETF | | | 20,416 | | | $ | 8,315,028 | |
Schwab U.S. Aggregate Bond ETF | | | 117,462 | | | | 5,422,046 | |
SPDR S&P 500 ETF Trust | | | 10,501 | | | | 4,654,883 | |
iShares MSCI EAFE ETF | | | 33,872 | | | | 2,455,720 | |
iShares Core S&P Mid-Cap ETF | | | 9,114 | | | | 2,383,129 | |
iShares iBoxx $ Investment Grade Corporate Bond ETF | | | 21,221 | | | | 2,294,839 | |
iShares 7-10 Year Treasury Bond ETF | | | 20,726 | | | | 2,002,132 | |
iShares 1-3 Year Treasury Bond ETF | | | 21,409 | | | | 1,735,842 | |
iShares iBoxx High Yield Corporate Bond ETF | | | 5,736 | | | | 430,602 | |
iShares TIPS Bond ETF | | | 3,987 | | | | 429,081 | |
iShares Russell 1000 Value ETF | | | 2,176 | | | | 343,438 | |
iShares Core S&P 500 ETF | | | 2 | | | | 891 | |
Total Exchange-Traded Funds | | | | |
(Cost $23,746,222) | | | | | | | 30,467,631 | |
| | | | | | | | | |
MUTUAL FUNDS† - 12.7% |
Guggenheim Strategy Fund II1 | | | 63,901 | | | | 1,547,687 | |
Guggenheim Variable Insurance Strategy Fund III1 | | | 45,729 | | | | 1,108,460 | |
Guggenheim Strategy Fund III1 | | | 42,900 | | | | 1,040,314 | |
Guggenheim Ultra Short Duration Fund — Institutional Class1 | | | 105,191 | | | | 1,023,511 | |
Total Mutual Funds | | | | |
(Cost $4,857,790) | | | | | | | 4,719,972 | |
| | | | | | | | | |
MONEY MARKET FUND† - 4.6% |
Dreyfus Treasury Securities Cash Management Fund — Institutional Shares, 4.96%2 | | | 1,705,620 | | | | 1,705,620 | |
Total Money Market Fund | | | | |
(Cost $1,705,620) | | | | | | | 1,705,620 | |
| | | | | | | | | |
| | | Face
Amount | | | | | |
U.S. TREASURY BILLS†† - 0.7% |
U.S. Treasury Bills |
5.11% due 07/18/233,4 | | $ | 268,000 | | | | 267,439 | |
Total U.S. Treasury Bills | | | | |
(Cost $267,342) | | | | | | | 267,439 | |
| | | | | | | | | |
Total Investments - 99.9% | | | | |
(Cost $30,576,974) | | $ | 37,160,662 | |
Other Assets & Liabilities, net - 0.1% | | | 50,279 | |
Total Net Assets - 100.0% | | $ | 37,210,941 | |
Futures Contracts |
Description | | Number of
Contracts | | | Expiration
Date | | | Notional
Amount | | | Value and
Unrealized
Appreciation
(Depreciation)** | |
Equity Futures Contracts Purchased† |
MSCI EAFE Index Futures Contracts | | | 28 | | | | Sep 2023 | | | $ | 3,016,300 | | | $ | 20,674 | |
Russell 2000 Index Mini Futures Contracts | | | 15 | | | | Sep 2023 | | | | 1,427,325 | | | | 12,303 | |
S&P/TSX 60 IX Index Futures Contracts | | | 1 | | | | Sep 2023 | | | | 183,957 | | | | 2,323 | |
CAC 40 10 Euro Index Futures Contracts | | | 1 | | | | Jul 2023 | | | | 81,140 | | | | 1,722 | |
| | | | | | | | | | | $ | 4,708,722 | | | $ | 37,022 | |
Currency Futures Contracts Purchased† |
Australian Dollar Futures Contracts | | | 5 | | | | Sep 2023 | | | $ | 333,700 | | | $ | (4,838 | ) |
Interest Rate Futures Contracts Purchased† |
U.S. Treasury 2 Year Note Futures Contracts | | | 2 | | | | Sep 2023 | | | $ | 406,766 | | | $ | (5,831 | ) |
U.S. Treasury 10 Year Note Futures Contracts | | | 5 | | | | Sep 2023 | | | | 561,562 | | | | (9,657 | ) |
| | | | | | | | | | | $ | 968,328 | | | $ | (15,488 | ) |
Currency Futures Contracts Sold Short† |
Canadian Dollar Futures Contracts | | | 4 | | | | Sep 2023 | | | $ | 302,320 | | | $ | 2,170 | |
Japanese Yen Futures Contracts | | | 1 | | | | Sep 2023 | | | | 87,669 | | | | (3 | ) |
| | | | | | | | | | | $ | 389,989 | | | $ | 2,167 | |
Equity Futures Contracts Sold Short† |
SPI 200 Index Futures Contracts | | | 1 | | | | Sep 2023 | | | $ | 119,738 | | | $ | (69 | ) |
DAX Index Futures Contracts | | | 1 | | | | Sep 2023 | | | | 444,990 | | | | (1,962 | ) |
Nikkei 225 (CME) Index Futures Contracts | | | 1 | | | | Sep 2023 | | | | 167,475 | | | | (6,628 | ) |
S&P 500 Index Mini Futures Contracts | | | 3 | | | | Sep 2023 | | | | 672,975 | | | | (20,608 | ) |
| | | | | | | | | | | $ | 1,405,178 | | | $ | (29,267 | ) |
SEE NOTES TO FINANCIAL STATEMENTS. | THE GUGGENHEIM FUNDS SEMI-ANNUAL REPORT | 73 |
SCHEDULE OF INVESTMENTS (Unaudited)(continued) | June 30, 2023 |
SERIES N (MANAGED ASSET ALLOCATION SERIES) | |
** | Includes cumulative appreciation (depreciation). Variation margin is reported within the Statement of Assets and Liabilities. |
† | Value determined based on Level 1 inputs — See Note 4. |
†† | Value determined based on Level 2 inputs — See Note 4. |
1 | Affiliated issuer. |
2 | Rate indicated is the 7-day yield as of June 30, 2023. |
3 | All or a portion of this security is pledged as futures collateral at June 30, 2023. |
4 | Rate indicated is the effective yield at the time of purchase. |
| | CME — Chicago Mercantile Exchange |
| | |
| | See Sector Classification in Other Information section. |
The following table summarizes the inputs used to value the Fund’s investments at June 30, 2023 (See Note 4 in the Notes to Financial Statements):
Investments in Securities (Assets) | | Level 1
Quoted
Prices | | | Level 2
Significant
Observable
Inputs | | | Level 3
Significant
Unobservable
Inputs | | | Total | |
Exchange-Traded Funds | | $ | 30,467,631 | | | $ | — | | | $ | — | | | $ | 30,467,631 | |
Mutual Funds | | | 4,719,972 | | | | — | | | | — | | | | 4,719,972 | |
Money Market Fund | | | 1,705,620 | | | | — | | | | — | | | | 1,705,620 | |
U.S. Treasury Bills | | | — | | | | 267,439 | | | | — | | | | 267,439 | |
Equity Futures Contracts** | | | 37,022 | | | | — | | | | — | | | | 37,022 | |
Currency Futures Contracts** | | | 2,170 | | | | — | | | | — | | | | 2,170 | |
Total Assets | | $ | 36,932,415 | | | $ | 267,439 | | | $ | — | | | $ | 37,199,854 | |
Investments in Securities (Liabilities) | | Level 1
Quoted
Prices | | | Level 2
Significant
Observable
Inputs | | | Level 3
Significant
Unobservable
Inputs | | | Total | |
Equity Futures Contracts** | | $ | 29,267 | | | $ | — | | | $ | — | | | $ | 29,267 | |
Interest Rate Futures Contracts** | | | 15,488 | | | | — | | | | — | | | | 15,488 | |
Currency Futures Contracts** | | | 4,841 | | | | — | | | | — | | | | 4,841 | |
Total Liabilities | | $ | 49,596 | | | $ | — | | | $ | — | | | $ | 49,596 | |
** | This derivative is reported as unrealized appreciation/depreciation at period end. |
74 | THE GUGGENHEIM FUNDS SEMI-ANNUAL REPORT | SEE NOTES TO FINANCIAL STATEMENTS. |
SCHEDULE OF INVESTMENTS (Unaudited)(concluded) | June 30, 2023 |
SERIES N (MANAGED ASSET ALLOCATION SERIES) | |
Affiliated Transactions
Investments representing 5% or more of the outstanding voting shares of a company, or control of or by, or common control under Guggenheim Investments (“GI”), result in that company being considered an affiliated issuer, as defined in the 1940 Act.
The Fund may invest in certain of the underlying series of Guggenheim Strategy Funds Trust, including Guggenheim Strategy Fund II, Guggenheim Strategy Fund III, and Guggenheim Variable Insurance Strategy Fund III, (collectively, the “Short Term Investment Vehicles”), each of which are open-end management investment companies managed by GI. The Short Term Investment Vehicles, which launched on March 11, 2014, are offered as short term investment options only to mutual funds, trusts, and other accounts managed by GI and/or its affiliates, and are not available to the public. The Short Term Investment Vehicles pay no investment management fees. The Short Term Investment Vehicles’ annual report on Form N-CSR dated September 30, 2022, is available publicly or upon request. This information is available from the EDGAR database on the SEC’s website at https://www.sec.gov/Archives/edgar/data/1601445/000182126822000340/gug84768.htm. The Fund may invest in certain of the underlying series of Guggenheim Funds Trust, which are open-end management investment companies managed by GI, are available to the public and whose most recent annual report on Form N-CSR is available publicly or upon request.
Transactions during the period ended June 30, 2023, in which the company is an affiliated issuer, were as follows:
Security Name | | Value
12/31/22 | | | Additions | | | Reductions | | | Realized
Gain (Loss) | | | Change in
Unrealized
Appreciation
(Depreciation) | | | Value
06/30/23 | | | Shares
06/30/23 | | | Investment
Income | |
Mutual Funds | | | | | | | | | | | | | | | | | | | | | | | | | | | | | | | | |
Guggenheim Strategy Fund II | | $ | 1,536,185 | | | $ | — | | | $ | — | | | $ | — | | | $ | 11,502 | | | $ | 1,547,687 | | | | 63,901 | | | $ | 40,187 | |
Guggenheim Strategy Fund III | | | 1,032,163 | | | | — | | | | — | | | | — | | | | 8,151 | | | | 1,040,314 | | | | 42,900 | | | | 26,627 | |
Guggenheim Ultra Short Duration Fund — Institutional Class | | | 1,014,044 | | | | — | | | | — | | | | — | | | | 9,467 | | | | 1,023,511 | | | | 105,191 | | | | 26,057 | |
Guggenheim Variable Insurance Strategy Fund III | | | 1,100,686 | | | | — | | | | — | | | | — | | | | 7,774 | | | | 1,108,460 | | | | 45,729 | | | | 28,185 | |
| | | $ | 4,683,078 | | | $ | — | | | $ | — | | | $ | — | | | $ | 36,894 | | | $ | 4,719,972 | | | | | | | $ | 121,056 | |
SEE NOTES TO FINANCIAL STATEMENTS. | THE GUGGENHEIM FUNDS SEMI-ANNUAL REPORT | 75 |
SERIES N (MANAGED ASSET ALLOCATION SERIES) | |
STATEMENT OF ASSETS AND LIABILITIES (Unaudited) |
June 30, 2023 |
Assets: |
Investments in unaffiliated issuers, at value (cost $25,719,184) | | $ | 32,440,690 | |
Investments in affiliated issuers, at value (cost $4,857,790) | | | 4,719,972 | |
Cash | | | 4,686 | |
Prepaid expenses | | | 80 | |
Receivables: |
Dividends | | | 70,899 | |
Variation margin on futures contracts | | | 28,636 | |
Interest | | | 6,918 | |
Fund shares sold | | | 37 | |
Total assets | | | 37,271,918 | |
| | | | | |
Liabilities: |
Payable for: |
Professional fees | | | 19,545 | |
Fund shares redeemed | | | 13,274 | |
Management fees | | | 11,919 | |
Distribution and service fees | | | 7,580 | |
Transfer agent/maintenance fees | | | 2,062 | |
Fund accounting/administration fees | | | 2,010 | |
Trustees’ fees* | | | 908 | |
Miscellaneous | | | 3,679 | |
Total liabilities | | | 60,977 | |
Net assets | | $ | 37,210,941 | |
| | | | | |
Net assets consist of: |
Paid in capital | | $ | 28,892,802 | |
Total distributable earnings (loss) | | | 8,318,139 | |
Net assets | | $ | 37,210,941 | |
Capital shares outstanding | | | 1,322,924 | |
Net asset value per share | | $ | 28.13 | |
STATEMENT OF OPERATIONS (Unaudited) |
Six Months Ended June 30, 2023 |
Investment Income: |
Dividends from securities of unaffiliated issuers | | $ | 327,044 | |
Dividends from securities of affiliated issuers | | | 121,056 | |
Interest | | | 40,310 | |
Total investment income | | | 488,410 | |
| | | | | |
Expenses: |
Management fees | | | 72,774 | |
Distribution and service fees | | | 45,484 | |
Transfer agent/maintenance fees | | | 12,517 | |
Professional fees | | | 18,750 | |
Fund accounting/administration fees | | | 11,916 | |
Trustees’ fees* | | | 6,746 | |
Custodian fees | | | 951 | |
Line of credit fees | | | 604 | |
Miscellaneous | | | 5,487 | |
Total expenses | | | 175,229 | |
Less: |
Expenses waived by Adviser | | | (1,268 | ) |
Earnings credits applied | | | (86 | ) |
Total waived expenses | | | (1,354 | ) |
Net expenses | | | 173,875 | |
Net investment income | | | 314,535 | |
| | | | | |
Net Realized and Unrealized Gain (Loss): |
Net realized gain (loss) on: |
Investments in unaffiliated issuers | | | 568,822 | |
Futures contracts | | | 98,381 | |
Foreign currency transactions | | | (211 | ) |
Net realized gain | | | 666,992 | |
Net change in unrealized appreciation (depreciation) on: |
Investments in unaffiliated issuers | | | 1,842,325 | |
Investments in affiliated issuers | | | 36,894 | |
Futures contracts | | | 50,809 | |
Foreign currency translations | | | (3 | ) |
Net change in unrealized appreciation (depreciation) | | | 1,930,025 | |
Net realized and unrealized gain | | | 2,597,017 | |
Net increase in net assets resulting from operations | | $ | 2,911,552 | |
* | Relates to Trustees not deemed “interested persons” within the meaning of Section 2(a)(19) of the 1940 Act. |
76 | THE GUGGENHEIM FUNDS SEMI-ANNUAL REPORT | SEE NOTES TO FINANCIAL STATEMENTS. |
SERIES N (MANAGED ASSET ALLOCATION SERIES) | |
STATEMENTS OF CHANGES IN NET ASSETS |
| | Six Months Ended
June 30, 2023
(Unaudited) | | | Year Ended
December 31,
2022 | |
Increase (Decrease) in Net Assets from Operations: | | | | | | | | |
Net investment income | | $ | 314,535 | | | $ | 455,175 | |
Net realized gain on investments | | | 666,992 | | | | 638,700 | |
Net change in unrealized appreciation (depreciation) on investments | | | 1,930,025 | | | | (8,719,480 | ) |
Net increase (decrease) in net assets resulting from operations | | | 2,911,552 | | | | (7,625,605 | ) |
| | | | | | | | | |
Distributions to shareholders | | | — | | | | (4,049,453 | ) |
| | | | | | | | | |
Capital share transactions: | | | | | | | | |
Proceeds from sale of shares | | | 408,091 | | | | 612,413 | |
Distributions reinvested | | | — | | | | 4,049,453 | |
Cost of shares redeemed | | | (2,078,039 | ) | | | (4,025,591 | ) |
Net increase (decrease) from capital share transactions | | | (1,669,948 | ) | | | 636,275 | |
Net increase (decrease) in net assets | | | 1,241,604 | | | | (11,038,783 | ) |
| | | | | | | | | |
Net assets: | | | | | | | | |
Beginning of period | | | 35,969,337 | | | | 47,008,120 | |
End of period | | $ | 37,210,941 | | | $ | 35,969,337 | |
| | | | | | | | | |
Capital share activity: | | | | | | | | |
Shares sold | | | 14,905 | | | | 20,795 | |
Shares issued from reinvestment of distributions | | | — | | | | 152,178 | |
Shares redeemed | | | (76,656 | ) | | | (138,118 | ) |
Net increase (decrease) in shares | | | (61,751 | ) | | | 34,855 | |
SEE NOTES TO FINANCIAL STATEMENTS. | THE GUGGENHEIM FUNDS SEMI-ANNUAL REPORT | 77 |
SERIES N (MANAGED ASSET ALLOCATION SERIES) | |
This table is presented to show selected data for a share outstanding throughout each period and to assist shareholders in evaluating a Fund’s performance for the periods presented.
| | Six Months Ended
June 30, 2023a | | | Year Ended
December 31,
2022 | | | Year Ended
December 31,
2021 | | | Year Ended
December 31,
2020 | | | Year Ended
December 31,
2019 | | | Year Ended
December 31,
2018 | |
Per Share Data |
Net asset value, beginning of period | | $ | 25.98 | | | $ | 34.83 | | | $ | 33.41 | | | $ | 32.05 | | | $ | 27.34 | | | $ | 31.68 | |
Income (loss) from investment operations: |
Net investment income (loss)b | | | .23 | | | | .33 | | | | .24 | | | | .24 | | | | .44 | | | | .47 | |
Net gain (loss) on investments (realized and unrealized) | | | 1.92 | | | | (6.03 | ) | | | 3.83 | | | | 3.52 | | | | 5.02 | | | | (2.08 | ) |
Total from investment operations | | | 2.15 | | | | (5.70 | ) | | | 4.07 | | | | 3.76 | | | | 5.46 | | | | (1.61 | ) |
Less distributions from: |
Net investment income | | | — | | | | (.25 | ) | | | (.25 | ) | | | (.49 | ) | | | (.51 | ) | | | (.44 | ) |
Net realized gains | | | — | | | | (2.90 | ) | | | (2.40 | ) | | | (1.91 | ) | | | (.24 | ) | | | (2.29 | ) |
Total distributions | | | — | | | | (3.15 | ) | | | (2.65 | ) | | | (2.40 | ) | | | (.75 | ) | | | (2.73 | ) |
Net asset value, end of period | | $ | 28.13 | | | $ | 25.98 | | | $ | 34.83 | | | $ | 33.41 | | | $ | 32.05 | | | $ | 27.34 | |
|
Total Returnc | | | 8.28 | % | | | (16.57 | %) | | | 12.47 | % | | | 12.59 | % | | | 20.11 | % | | | (5.73 | %) |
Ratios/Supplemental Data |
Net assets, end of period (in thousands) | | $ | 37,211 | | | $ | 35,969 | | | $ | 47,008 | | | $ | 45,673 | | | $ | 46,219 | | | $ | 42,636 | |
Ratios to average net assets: |
Net investment income (loss) | | | 1.73 | % | | | 1.15 | % | | | 0.68 | % | | | 0.77 | % | | | 1.45 | % | | | 1.53 | % |
Total expensesd | | | 0.96 | % | | | 0.96 | % | | | 0.94 | % | | | 1.01 | % | | | 1.01 | % | | | 0.99 | % |
Net expensese | | | 0.96 | % | | | 0.95 | % | | | 0.94 | % | | | 1.00 | % | | | 1.00 | % | | | 0.99 | % |
Portfolio turnover rate | | | — | | | | 1 | % | | | 26 | % | | | 6 | % | | | 14 | % | | | 4 | % |
a | Unaudited figures for the period ended June 30, 2023. Percentage amounts for the period, except total return and portfolio turnover rate, have been annualized. |
b | Net investment income (loss) per share was computed using average shares outstanding throughout the period. |
c | Total return does not take into account any of the expenses associated with an investment in variable insurance products. If total return had taken into account these expenses, performance would have been lower. Shares of a series of Guggenheim Variable Funds Trust are available only through the purchase of such products. |
d | Does not include expenses of the underlying funds in which the Fund invests. |
e | Net expense information reflects the expense ratios after expense waivers and reimbursements, as applicable. |
78 | THE GUGGENHEIM FUNDS SEMI-ANNUAL REPORT | SEE NOTES TO FINANCIAL STATEMENTS. |
PERFORMANCE REPORT AND FUND PROFILE (Unaudited) | June 30, 2023 |
SERIES O (ALL CAP VALUE SERIES)
OBJECTIVE: Seeks long-term growth of capital.
Holdings Diversification (Market Exposure as % of Net Assets)
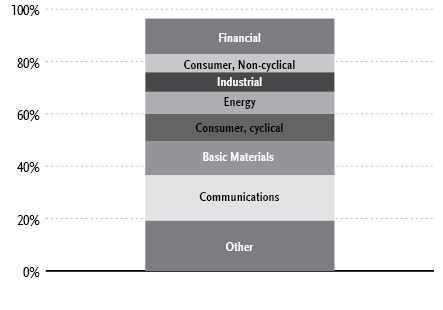
“Holdings Diversification (Market Exposure as % of Net Assets)” excludes any temporary cash investments.
Inception Date: June 1, 1995 |
Ten Largest Holdings | % of Total Net Assets |
Chevron Corp. | 2.4% |
JPMorgan Chase & Co. | 1.8% |
Pioneer Natural Resources Co. | 1.8% |
Johnson & Johnson | 1.8% |
Westlake Corp. | 1.8% |
Ingredion, Inc. | 1.8% |
OGE Energy Corp. | 1.7% |
Berkshire Hathaway, Inc. — Class B | 1.7% |
Verizon Communications, Inc. | 1.6% |
Euronet Worldwide, Inc. | 1.6% |
Top Ten Total | 18.0% |
| | |
“Ten Largest Holdings” excludes any temporary cash investments. |
Average Annual Returns*,†
Periods Ended June 30, 2023
| 6 Month‡ | 1 Year | 5 Year | 10 Year |
Series O (All Cap Value Series) | 3.82% | 11.52% | 7.81% | 9.31% |
Russell 3000 Value Index | 4.98% | 11.22% | 7.79% | 9.09% |
* | The performance data above represents past performance that is not predictive of future results. The investment return and principal value of an investment in the Fund will fluctuate so that an investor’s shares, when redeemed, may be worth more or less than their original cost. Returns are historical and include changes in principal and reinvested dividends and capital gains and do not reflect the effect of taxes. The Russell 3000 Value Index is an unmanaged index and, unlike the Fund, has no management fees or operating expenses to reduce its reported return. |
† | Performance figures do not reflect fees and expenses associated with an investment in variable insurance products. If returns had taken into account these fees and expenses, performance would have been lower. Shares of a series of Guggenheim Variable Funds Trust are available only through the purchase of such products. |
‡ | 6 month returns are not annualized. |
| | THE GUGGENHEIM FUNDS SEMI-ANNUAL REPORT | 79 |
SCHEDULE OF INVESTMENTS (Unaudited) | June 30, 2023 |
SERIES O (ALL CAP VALUE SERIES) | |
| | Shares | | | Value | |
COMMON STOCKS† - 96.4% |
| | | | | | | | | |
Financial - 19.1% |
JPMorgan Chase & Co. | | | 11,762 | | | $ | 1,710,665 | |
Berkshire Hathaway, Inc. — Class B* | | | 4,561 | | | | 1,555,301 | |
Unum Group | | | 29,223 | | | | 1,393,937 | |
Bank of America Corp. | | | 45,454 | | | | 1,304,075 | |
Jefferies Financial Group, Inc. | | | 29,463 | | | | 977,288 | |
Ventas, Inc. REIT | | | 18,188 | | | | 859,747 | |
Mastercard, Inc. — Class A | | | 2,031 | | | | 798,792 | |
Wells Fargo & Co. | | | 17,301 | | | | 738,407 | |
Synovus Financial Corp. | | | 23,249 | | | | 703,282 | |
American Tower Corp. — Class A REIT | | | 3,046 | | | | 590,741 | |
Charles Schwab Corp. | | | 10,274 | | | | 582,330 | |
Prosperity Bancshares, Inc. | | | 9,109 | | | | 514,476 | |
Goldman Sachs Group, Inc. | | | 1,527 | | | | 492,519 | |
First Horizon Corp. | | | 40,664 | | | | 458,283 | |
Stifel Financial Corp. | | | 6,684 | | | | 398,834 | |
STAG Industrial, Inc. REIT | | | 11,015 | | | | 395,218 | |
First Merchants Corp. | | | 13,604 | | | | 384,041 | |
Old Republic International Corp. | | | 14,148 | | | | 356,105 | |
Gaming and Leisure Properties, Inc. REIT | | | 7,190 | | | | 348,428 | |
Texas Capital Bancshares, Inc.* | | | 6,699 | | | | 344,999 | |
Physicians Realty Trust REIT | | | 21,367 | | | | 298,924 | |
Axis Capital Holdings Ltd. | | | 5,505 | | | | 296,334 | |
T. Rowe Price Group, Inc. | | | 2,640 | | | | 295,733 | |
Sun Communities, Inc. REIT | | | 2,052 | | | | 267,704 | |
First American Financial Corp. | | | 4,603 | | | | 262,463 | |
Alexandria Real Estate Equities, Inc. REIT | | | 2,133 | | | | 242,074 | |
Markel Group, Inc.* | | | 175 | | | | 242,056 | |
Hancock Whitney Corp. | | | 6,119 | | | | 234,847 | |
Apple Hospitality REIT, Inc. | | | 15,426 | | | | 233,087 | |
UMB Financial Corp. | | | 2,821 | | | | 171,799 | |
Stewart Information Services Corp. | | | 4,147 | | | | 170,608 | |
United Bankshares, Inc. | | | 4,125 | | | | 122,389 | |
Heritage Insurance Holdings, Inc.* | | | 6,962 | | | | 26,804 | |
Total Financial | | | | | | | 17,772,290 | |
| | | | | | | | | |
Consumer, Non-cyclical - 17.5% |
Johnson & Johnson | | | 10,119 | | | | 1,674,897 | |
Ingredion, Inc. | | | 15,668 | | | | 1,660,025 | |
Euronet Worldwide, Inc.* | | | 12,325 | | | | 1,446,585 | |
Quest Diagnostics, Inc. | | | 8,541 | | | | 1,200,523 | |
Henry Schein, Inc.* | | | 13,673 | | | | 1,108,880 | |
Bunge Ltd. | | | 11,472 | | | | 1,082,383 | |
Encompass Health Corp. | | | 13,794 | | | | 933,992 | |
Medtronic plc | | | 9,686 | | | | 853,337 | |
Tyson Foods, Inc. — Class A | | | 16,562 | | | | 845,324 | |
Archer-Daniels-Midland Co. | | | 10,876 | | | | 821,791 | |
Humana, Inc. | | | 1,823 | | | | 815,118 | |
Merck & Company, Inc. | | | 6,065 | | | | 699,841 | |
HCA Healthcare, Inc. | | | 1,707 | | | | 518,040 | |
Integer Holdings Corp.* | | | 4,278 | | | | 379,073 | |
Moderna, Inc.* | | | 3,118 | | | | 378,837 | |
Enovis Corp.* | | | 5,089 | | | | 326,307 | |
Pfizer, Inc. | | | 7,912 | | | | 290,212 | |
Central Garden & Pet Co. — Class A* | | | 7,922 | | | | 288,836 | |
LivaNova plc* | | | 5,153 | | | | 265,019 | |
ICF International, Inc. | | | 1,592 | | | | 198,029 | |
Certara, Inc.* | | | 8,687 | | | | 158,190 | |
Azenta, Inc.* | | | 2,750 | | | | 128,370 | |
Pacira BioSciences, Inc.* | | | 2,272 | | | | 91,039 | |
Ironwood Pharmaceuticals, Inc. — Class A* | | | 8,172 | | | | 86,950 | |
Jazz Pharmaceuticals plc* | | | 640 | | | | 79,341 | |
Total Consumer, Non-cyclical | | | | | | | 16,330,939 | |
| | | | | | | | | |
Industrial - 12.8% |
Johnson Controls International plc | | | 19,318 | | | | 1,316,329 | |
Knight-Swift Transportation Holdings, Inc. | | | 21,358 | | | | 1,186,650 | |
Advanced Energy Industries, Inc. | | | 10,350 | | | | 1,153,507 | |
Eagle Materials, Inc. | | | 4,555 | | | | 849,143 | |
Teledyne Technologies, Inc.* | | | 2,007 | | | | 825,098 | |
Kirby Corp.* | | | 6,945 | | | | 534,418 | |
Graphic Packaging Holding Co. | | | 20,768 | | | | 499,055 | |
L3Harris Technologies, Inc. | | | 2,536 | | | | 496,473 | |
Littelfuse, Inc. | | | 1,560 | | | | 454,444 | |
Curtiss-Wright Corp. | | | 2,348 | | | | 431,234 | |
Summit Materials, Inc. — Class A* | | | 11,199 | | | | 423,882 | |
PGT Innovations, Inc.* | | | 12,485 | | | | 363,938 | |
Arcosa, Inc. | | | 4,432 | | | | 335,813 | |
Daseke, Inc.* | | | 45,933 | | | | 327,502 | |
Coherent Corp.* | | | 5,658 | | | | 288,445 | |
GATX Corp. | | | 2,150 | | | | 276,791 | |
MDU Resources Group, Inc. | | | 13,111 | | | | 274,544 | |
Terex Corp. | | | 4,370 | | | | 261,457 | |
EnerSys | | | 2,114 | | | | 229,411 | |
Esab Corp. | | | 3,380 | | | | 224,905 | |
Park Aerospace Corp. | | | 14,655 | | | | 202,239 | |
AZEK Company, Inc.* | | | 6,215 | | | | 188,252 | |
Plexus Corp.* | | | 1,806 | | | | 177,421 | |
Sonoco Products Co. | | | 2,930 | | | | 172,929 | |
Mercury Systems, Inc.* | | | 4,933 | | | | 170,632 | |
Knife River Corp.* | | | 3,277 | | | | 142,550 | |
Stoneridge, Inc.* | | | 6,430 | | | | 121,206 | |
Total Industrial | | | | | | | 11,928,268 | |
| | | | | | | | | |
Energy - 10.5% |
Chevron Corp. | | | 14,038 | | | | 2,208,879 | |
Pioneer Natural Resources Co. | | | 8,092 | | | | 1,676,500 | |
ConocoPhillips | | | 13,815 | | | | 1,431,372 | |
Diamondback Energy, Inc. | | | 9,793 | | | | 1,286,408 | |
Equities Corp. | | | 19,806 | | | | 814,621 | |
Coterra Energy, Inc. — Class A | | | 29,092 | | | | 736,028 | |
Kinder Morgan, Inc. | | | 36,763 | | | | 633,059 | |
Marathon Oil Corp. | | | 24,310 | | | | 559,616 | |
Patterson-UTI Energy, Inc. | | | 21,280 | | | | 254,722 | |
Murphy Oil Corp. | | | 4,349 | | | | 166,567 | |
Total Energy | | | | | | | 9,767,772 | |
| | | | | | | | | |
Consumer, Cyclical - 8.5% |
Walmart, Inc. | | | 8,159 | | | | 1,282,432 | |
MSC Industrial Direct Company, Inc. — Class A | | | 11,818 | | | | 1,126,019 | |
80 | THE GUGGENHEIM FUNDS SEMI-ANNUAL REPORT | SEE NOTES TO FINANCIAL STATEMENTS. |
SCHEDULE OF INVESTMENTS (Unaudited)(continued) | June 30, 2023 |
SERIES O (ALL CAP VALUE SERIES) | |
| | Shares | | | Value | |
Ferguson plc | | | 6,573 | | | $ | 1,033,998 | |
Whirlpool Corp. | | | 5,975 | | | | 889,020 | |
Delta Air Lines, Inc. | | | 17,521 | | | | 832,948 | |
Lear Corp. | | | 4,900 | | | | 703,395 | |
H&E Equipment Services, Inc. | | | 11,692 | | | | 534,909 | |
Southwest Airlines Co. | | | 14,749 | | | | 534,061 | |
Alaska Air Group, Inc.* | | | 5,933 | | | | 315,517 | |
Methode Electronics, Inc. | | | 5,456 | | | | 182,885 | |
Meritage Homes Corp. | | | 1,010 | | | | 143,693 | |
Leggett & Platt, Inc. | | | 4,193 | | | | 124,197 | |
Newell Brands, Inc. | | | 11,444 | | | | 99,563 | |
Lakeland Industries, Inc. | | | 6,577 | | | | 94,643 | |
Total Consumer, Cyclical | | | | | | | 7,897,280 | |
| | | | | | | | | |
Basic Materials - 7.5% |
Westlake Corp. | | | 13,907 | | | | 1,661,469 | |
Reliance Steel & Aluminum Co. | | | 5,239 | | | | 1,422,860 | |
Huntsman Corp. | | | 45,965 | | | | 1,241,975 | |
Nucor Corp. | | | 5,980 | | | | 980,600 | |
Freeport-McMoRan, Inc. | | | 15,267 | | | | 610,680 | |
DuPont de Nemours, Inc. | | | 6,536 | | | | 466,932 | |
Avient Corp. | | | 8,639 | | | | 353,335 | |
Ashland, Inc. | | | 2,721 | | | | 236,482 | |
Total Basic Materials | | | | | | | 6,974,333 | |
| | | | | | | | | |
Communications - 6.9% |
Verizon Communications, Inc. | | | 39,044 | | | | 1,452,046 | |
Comcast Corp. — Class A | | | 22,453 | | | | 932,922 | |
Alphabet, Inc. — Class A* | | | 7,377 | | | | 883,027 | |
Fox Corp. — Class B | | | 24,211 | | | | 772,089 | |
Cisco Systems, Inc. | | | 14,121 | | | | 730,621 | |
Walt Disney Co.* | | | 6,367 | | | | 568,445 | |
Juniper Networks, Inc. | | | 13,304 | | | | 416,814 | |
T-Mobile US, Inc.* | | | 2,640 | | | | 366,696 | |
Ciena Corp.* | | | 7,281 | | | | 309,370 | |
Total Communications | | | | | | | 6,432,030 | |
| | | | | | | | | |
Utilities - 6.8% |
OGE Energy Corp. | | | 44,999 | | | | 1,615,914 | |
Pinnacle West Capital Corp. | | | 16,818 | | | | 1,369,994 | |
Edison International | | | 15,015 | | | | 1,042,792 | |
Exelon Corp. | | | 20,760 | | | | 845,762 | |
Black Hills Corp. | | | 12,525 | | | | 754,757 | |
Duke Energy Corp. | | | 5,623 | | | | 504,608 | |
NiSource, Inc. | | | 8,451 | | | | 231,135 | |
Total Utilities | | | | | | | 6,364,962 | |
| | | | | | | | | |
Technology - 6.8% |
Teradyne, Inc. | | | 11,150 | | | | 1,241,330 | |
Leidos Holdings, Inc. | | | 10,336 | | | | 914,529 | |
KLA Corp. | | | 1,826 | | | | 885,647 | |
Microsoft Corp. | | | 2,329 | | | | 793,118 | |
Fiserv, Inc.* | | | 5,115 | | | | 645,257 | |
Evolent Health, Inc. — Class A* | | | 17,216 | | | | 521,645 | |
Amdocs Ltd. | | | 4,891 | | | | 483,475 | |
Science Applications International Corp. | | | 4,099 | | | | 461,056 | |
MACOM Technology Solutions Holdings, Inc.* | | | 4,023 | | | | 263,627 | |
Silicon Laboratories, Inc.* | | | 929 | | | | 146,540 | |
Total Technology | | | | | | | 6,356,224 | |
| | | | | | | | | |
Total Common Stocks | | | | |
(Cost $73,614,439) | | | | | | | 89,824,098 | |
| | | | | | | | | |
RIGHTS† - 0.0% |
Basic Materials - 0.0% |
Pan American Silver Corp.* | | | 40,146 | | | | 20,478 | |
Total Rights | | | | |
(Cost $—) | | | | | | | 20,478 | |
| | | | | | | | | |
MONEY MARKET FUND† - 3.4% |
Dreyfus Treasury Securities Cash Management Fund — Institutional Shares, 4.96%1 | | | 3,204,518 | | | | 3,204,518 | |
Total Money Market Fund | | | | |
(Cost $3,204,518) | | | | | | | 3,204,518 | |
| | | | | | | | | |
Total Investments - 99.8% | | | | |
(Cost $76,818,957) | | $ | 93,049,094 | |
Other Assets & Liabilities, net - 0.2% | | | 156,628 | |
Total Net Assets - 100.0% | | $ | 93,205,722 | |
* | Non-income producing security. |
† | Value determined based on Level 1 inputs — See Note 4. |
1 | Rate indicated is the 7-day yield as of June 30, 2023. |
| | plc — Public Limited Company |
| | REIT — Real Estate Investment Trust |
| | |
| | See Sector Classification in Other Information section. |
SEE NOTES TO FINANCIAL STATEMENTS. | THE GUGGENHEIM FUNDS SEMI-ANNUAL REPORT | 81 |
SCHEDULE OF INVESTMENTS (Unaudited)(concluded) | June 30, 2023 |
SERIES O (ALL CAP VALUE SERIES) | |
The following table summarizes the inputs used to value the Fund’s investments at June 30, 2023 (See Note 4 in the Notes to Financial Statements):
Investments in Securities (Assets) | | Level 1
Quoted
Prices | | | Level 2
Significant
Observable
Inputs | | | Level 3
Significant
Unobservable
Inputs | | | Total | |
Common Stocks | | $ | 89,824,098 | | | $ | — | | | $ | — | | | $ | 89,824,098 | |
Rights | | | 20,478 | | | | — | | | | — | | | | 20,478 | |
Money Market Fund | | | 3,204,518 | | | | — | | | | — | | | | 3,204,518 | |
Total Assets | | $ | 93,049,094 | | | $ | — | | | $ | — | | | $ | 93,049,094 | |
82 | THE GUGGENHEIM FUNDS SEMI-ANNUAL REPORT | SEE NOTES TO FINANCIAL STATEMENTS. |
SERIES O (ALL CAP VALUE SERIES) | |
STATEMENT OF ASSETS AND LIABILITIES (Unaudited) |
June 30, 2023 |
Assets: |
Investments, at value (cost $76,818,957) | | $ | 93,049,094 | |
Prepaid expenses | | | 414 | |
Receivables: |
Securities sold | | | 130,633 | |
Dividends | | | 108,140 | |
Interest | | | 11,631 | |
Fund shares sold | | | 4,738 | |
Total assets | | | 93,304,650 | |
| | | | | |
Liabilities: |
Overdraft due to custodian bank | | | 23 | |
Payable for: |
Management fees | | | 31,263 | |
Fund shares redeemed | | | 22,115 | |
Distribution and service fees | | | 18,675 | |
Professional fees | | | 17,094 | |
Transfer agent/maintenance fees | | | 2,063 | |
Fund accounting/administration fees | | | 1,473 | |
Trustees’ fees* | | | 827 | |
Miscellaneous | | | 5,395 | |
Total liabilities | | | 98,928 | |
Net assets | | $ | 93,205,722 | |
| | | | | |
Net assets consist of: |
Paid in capital | | $ | 63,686,255 | |
Total distributable earnings (loss) | | | 29,519,467 | |
Net assets | | $ | 93,205,722 | |
Capital shares outstanding | | | 2,681,870 | |
Net asset value per share | | $ | 34.75 | |
STATEMENT OF OPERATIONS (Unaudited) |
Six Months Ended June 30, 2023 |
Investment Income: |
Dividends | | $ | 1,072,968 | |
Interest | | | 93,283 | |
Total investment income | | | 1,166,251 | |
| | | | | |
Expenses: |
Management fees | | | 323,342 | |
Distribution and service fees | | | 115,479 | |
Transfer agent/maintenance fees | | | 12,485 | |
Fund accounting/administration fees | | | 23,390 | |
Professional fees | | | 22,781 | |
Trustees’ fees* | | | 8,537 | |
Custodian fees | | | 1,817 | |
Line of credit fees | | | 1,531 | |
Miscellaneous | | | 7,675 | |
Total expenses | | | 517,037 | |
Less: |
Expenses reimbursed by Adviser | | | (1,065 | ) |
Expenses waived by Adviser | | | (122,274 | ) |
Total reimbursed/waived expenses | | | (123,339 | ) |
Net expenses | | | 393,698 | |
Net investment income | | | 772,553 | |
| | | | | |
Net Realized and Unrealized Gain (Loss): |
Net realized gain (loss) on: |
Investments | | | 3,373,888 | |
Net realized gain | | | 3,373,888 | |
Net change in unrealized appreciation (depreciation) on: |
Investments | | | (718,154 | ) |
Net change in unrealized appreciation (depreciation) | | | (718,154 | ) |
Net realized and unrealized gain | | | 2,655,734 | |
Net increase in net assets resulting from operations | | $ | 3,428,287 | |
* | Relates to Trustees not deemed “interested persons” within the meaning of Section 2(a)(19) of the 1940 Act. |
SEE NOTES TO FINANCIAL STATEMENTS. | THE GUGGENHEIM FUNDS SEMI-ANNUAL REPORT | 83 |
SERIES O (ALL CAP VALUE SERIES) | |
STATEMENTS OF CHANGES IN NET ASSETS |
| | Six Months Ended
June 30, 2023
(Unaudited) | | | Year Ended
December 31,
2022 | |
Increase (Decrease) in Net Assets from Operations: | | | | | | | | |
Net investment income | | $ | 772,553 | | | $ | 1,420,372 | |
Net realized gain on investments | | | 3,373,888 | | | | 8,505,286 | |
Net change in unrealized appreciation (depreciation) on investments | | | (718,154 | ) | | | (11,219,630 | ) |
Net increase (decrease) in net assets resulting from operations | | | 3,428,287 | | | | (1,293,972 | ) |
| | | | | | | | | |
Distributions to shareholders | | | — | | | | (11,376,268 | ) |
| | | | | | | | | |
Capital share transactions: | | | | | | | | |
Proceeds from sale of shares | | | 2,145,459 | | | | 3,180,810 | |
Distributions reinvested | | | — | | | | 11,376,268 | |
Cost of shares redeemed | | | (6,280,030 | ) | | | (11,109,259 | ) |
Net increase (decrease) from capital share transactions | | | (4,134,571 | ) | | | 3,447,819 | |
Net decrease in net assets | | | (706,284 | ) | | | (9,222,421 | ) |
| | | | | | | | | |
Net assets: | | | | | | | | |
Beginning of period | | | 93,912,006 | | | | 103,134,427 | |
End of period | | $ | 93,205,722 | | | $ | 93,912,006 | |
| | | | | | | | | |
Capital share activity: | | | | | | | | |
Shares sold | | | 62,244 | | | | 87,562 | |
Shares issued from reinvestment of distributions | | | — | | | | 353,740 | |
Shares redeemed | | | (186,423 | ) | | | (312,170 | ) |
Net increase (decrease) in shares | | | (124,179 | ) | | | 129,132 | |
84 | THE GUGGENHEIM FUNDS SEMI-ANNUAL REPORT | SEE NOTES TO FINANCIAL STATEMENTS. |
SERIES O (ALL CAP VALUE SERIES) | |
This table is presented to show selected data for a share outstanding throughout each period and to assist shareholders in evaluating a Fund’s performance for the periods presented.
| | Six Months Ended
June 30, 2023a | | | Year Ended
December 31,
2022 | | | Year Ended
December 31,
2021 | | | Year Ended
December 31,
2020 | | | Year Ended
December 31,
2019 | | | Year Ended
December 31,
2018 | |
Per Share Data |
Net asset value, beginning of period | | $ | 33.47 | | | $ | 38.53 | | | $ | 31.06 | | | $ | 32.89 | | | $ | 29.31 | | | $ | 35.97 | |
Income (loss) from investment operations: |
Net investment income (loss)b | | | .28 | | | | .52 | | | | .38 | | | | .56 | | | | .51 | | | | .43 | |
Net gain (loss) on investments (realized and unrealized) | | | 1.00 | | | | (1.15 | ) | | | 7.93 | | | | (.33 | ) | | | 6.19 | | | | (3.83 | ) |
Total from investment operations | | | 1.28 | | | | (.63 | ) | | | 8.31 | | | | .23 | | | | 6.70 | | | | (3.40 | ) |
Less distributions from: |
Net investment income | | | — | | | | (.43 | ) | | | (.65 | ) | | | (.52 | ) | | | (.49 | ) | | | (.40 | ) |
Net realized gains | | | — | | | | (4.00 | ) | | | (.19 | ) | | | (1.54 | ) | | | (2.63 | ) | | | (2.86 | ) |
Total distributions | | | — | | | | (4.43 | ) | | | (.84 | ) | | | (2.06 | ) | | | (3.12 | ) | | | (3.26 | ) |
Net asset value, end of period | | $ | 34.75 | | | $ | 33.47 | | | $ | 38.53 | | | $ | 31.06 | | | $ | 32.89 | | | $ | 29.31 | |
|
Total Returnc | | | 3.82 | % | | | (1.17 | %) | | | 26.95 | % | | | 1.88 | % | | | 23.74 | % | | | (10.62 | %) |
Ratios/Supplemental Data |
Net assets, end of period (in thousands) | | $ | 93,206 | | | $ | 93,912 | | | $ | 103,134 | | | $ | 91,661 | | | $ | 107,634 | | | $ | 100,916 | |
Ratios to average net assets: |
Net investment income (loss) | | | 1.67 | % | | | 1.45 | % | | | 1.06 | % | | | 2.03 | % | | | 1.62 | % | | | 1.23 | % |
Total expensesd | | | 1.12 | % | | | 1.11 | % | | | 1.13 | % | | | 1.21 | % | | | 1.18 | % | | | 1.17 | % |
Net expensese,f | | | 0.85 | % | | | 0.86 | % | | | 0.87 | % | | | 0.87 | % | | | 0.88 | % | | | 0.88 | % |
Portfolio turnover rate | | | 13 | % | | | 30 | % | | | 26 | % | | | 22 | % | | | 33 | % | | | 36 | % |
a | Unaudited figures for the period ended June 30, 2023. Percentage amounts for the period, except total return and portfolio turnover rate, have been annualized. |
b | Net investment income (loss) per share was computed using average shares outstanding throughout the period. |
c | Total return does not take into account any of the expenses associated with an investment in variable insurance products. If total return had taken into account these expenses, performance would have been lower. Shares of a series of Guggenheim Variable Funds Trust are available only through the purchase of such products. |
d | Does not include expenses of the underlying funds in which the Fund invests. |
e | Net expense information reflects the expense ratios after expense waivers and reimbursements, as applicable. |
f | Net expenses may include expenses that are excluded from the expense limitation agreement. Excluding these expenses, the net expense ratios for the years presented would be: |
| | 06/30/23a | 12/31/22 | 12/31/21 | 12/31/20 | 12/31/19 | 12/31/18 |
| | 0.85% | 0.86% | 0.87% | 0.87% | 0.88% | 0.88% |
SEE NOTES TO FINANCIAL STATEMENTS. | THE GUGGENHEIM FUNDS SEMI-ANNUAL REPORT | 85 |
PERFORMANCE REPORT AND FUND PROFILE (Unaudited) | June 30, 2023 |
SERIES P (HIGH YIELD SERIES)
OBJECTIVE: Seeks high current income. Capital appreciation is a secondary objective.
Holdings Diversification (Market Exposure as % of Net Assets)

“Holdings Diversification (Market Exposure as % of Net Assets)” excludes any temporary cash investments.
Inception Date: August 5, 1996 |
Ten Largest Holdings | % of Total Net Assets |
Terraform Global Operating, LP, 6.13% | 1.3% |
FAGE International S.A. / FAGE USA Dairy Industry, Inc., 5.63% | 1.2% |
Jefferies Finance LLC / JFIN Company-Issuer Corp., 5.00% | 1.2% |
Artera Services LLC, 9.03% | 1.1% |
GrafTech Finance, Inc., 4.63% | 1.1% |
Cheplapharm Arzneimittel GmbH, 5.50% | 1.1% |
CPI CG, Inc., 8.63% | 1.1% |
Upbound Group, Inc., 6.38% | 1.1% |
VZ Secured Financing BV, 5.00% | 1.0% |
CVR Energy, Inc., 5.75% | 0.9% |
Top Ten Total | 11.1% |
| | |
“Ten Largest Holdings” excludes any temporary cash or derivative investments. |
86 | THE GUGGENHEIM FUNDS SEMI-ANNUAL REPORT | |
PERFORMANCE REPORT AND FUND PROFILE (Unaudited)(concluded) | June 30, 2023 |
Average Annual Returns*,†
Periods Ended June 30, 2023
| 6 Month‡ | 1 Year | 5 Year | 10 Year |
Series P (High Yield Series) | 4.52% | 8.12% | 2.37% | 3.66% |
Bloomberg U.S. Corporate High Yield Index | 5.38% | 9.06% | 3.36% | 4.43% |
Portfolio Composition by Quality Rating1 |
Rating | % of Total
Investments |
Fixed Income Instruments | |
BBB | 4.6% |
BB | 44.1% |
B | 37.1% |
CCC | 5.9% |
NR2 | 1.9% |
Other Instruments | 6.4% |
Total Investments | 100.0% |
* | The performance data above represents past performance that is not predictive of future results. The investment return and principal value of an investment in the Fund will fluctuate so that an investor’s shares, when redeemed, may be worth more or less than their original cost. Returns are historical and include changes in principal and reinvested dividends and capital gains and do not reflect the effect of taxes. The Bloomberg U.S. Corporate High Yield Index is an unmanaged index and, unlike the Fund, has no management fees or operating expenses to reduce its reported return. |
† | Performance figures do not reflect fees and expenses associated with an investment in variable insurance products. If returns had taken into account these fees and expenses, performance would have been lower. Shares of a series of Guggenheim Variable Funds Trust are available only through the purchase of such products. |
‡ | 6 month returns are not annualized. |
1 | Source: BlackRock Solutions. Credit quality ratings are measured on a scale that generally ranges from AAA (highest) to D (lowest). All securities except for those labeled “NR” have been rated by Moody’s, Standard & Poor’s (“S&P”), or Fitch, each of which is a Nationally Recognized Statistical Rating Organization (“NRSRO”). For purposes of this presentation, when ratings are available from more than one agency, the highest rating is used. Guggenheim Investments has converted ratings to the equivalent S&P rating. Security ratings are determined at the time of purchase and may change thereafter. |
2 | NR (not rated) securities do not necessarily indicate low credit quality. |
| | THE GUGGENHEIM FUNDS SEMI-ANNUAL REPORT | 87 |
SCHEDULE OF INVESTMENTS (Unaudited) | June 30, 2023 |
SERIES P (HIGH YIELD SERIES) | |
| | | Shares | | | Value | |
COMMON STOCKS†† - 0.8% |
| | | | | | | |
| Utilities - 0.7% |
| TexGen Power LLC* | | | 7,929 | | | $ | 210,118 | |
| | | | | | | | | |
| Consumer, Non-cyclical - 0.1% | | | | | | | | |
| Cengage Learning Holdings II, Inc.* | | | 2,107 | | | | 23,177 | |
MEDIQ, Inc.*,††† | | | 92 | | | | — | |
| Total Consumer, Non-cyclical | | | | | | | 23,177 | |
| | | | | | | | | |
| Energy - 0.0% | | | | | | | | |
Legacy Reserves, Inc.*,††† | | | 1,969 | | | | 15,752 | |
Permian Production Partners LLC*,††† | | | 9,124 | | | | 469 | |
Bruin E&P Partnership Units*,††† | | | 6,071 | | | | 136 | |
| Total Energy | | | | | | | 16,357 | |
| | | | | | | | | |
| Industrial - 0.0% | | | | | | | | |
BP Holdco LLC*,†††,1 | | | 523 | | | | 672 | |
Vector Phoenix Holdings, LP*,††† | | | 523 | | | | 125 | |
YAK BLOCKER 2 LLC*,††† | | | 914 | | | | 9 | |
YAK BLOCKER 2 LLC*,††† | | | 844 | | | | 8 | |
| Total Industrial | | | | | | | 814 | |
| | | | | | | | | |
| Financial - 0.0% | | | | | | | | |
| Tensor Ltd.* | | | 25,733 | | | | 3 | |
| | | | | | | | | |
| Total Common Stocks | | | | | | | | |
| (Cost $201,767) | | | | | | | 250,469 | |
| | | | | | | | | |
PREFERRED STOCKS†† - 0.8% | | | | | | | | |
| Financial - 0.8% | | | | | | | | |
| American Equity Investment Life Holding Co. | | | | | | | | |
| 5.95% | | | 6,000 | | | | 127,800 | |
| Charles Schwab Corp. | | | | | | | | |
| 4.00% | | | 150,000 | | | | 109,463 | |
| Total Financial | | | | | | | 237,263 | |
| | | | | | | | | |
| Industrial - 0.0% | | | | | | | | |
YAK BLOCKER 2 LLC *,††† | | | 50,189 | | | | 11,845 | |
U.S. Shipping Corp.*,††† | | | 24,529 | | | | 2 | |
| Total Industrial | | | | | | | 11,847 | |
| | | | | | | | | |
| Total Preferred Stocks | | | | | | | | |
| (Cost $1,058,427) | | | | | | | 249,110 | |
| | | | | | | | | |
WARRANTS† - 0.0% | | | | | | | | |
| Acropolis Infrastructure Acquisition Corp. | | | | | | | | |
Expiring 03/31/263 | | | 1,632 | | | | 142 | |
| Total Warrants | | | | | | | | |
| (Cost $1,347) | | | | | | | 142 | |
| | | | | | | | | |
MONEY MARKET FUND† - 4.8% | | | | | | | | |
Dreyfus Treasury Securities Cash Management Fund — Institutional Shares, 4.96%4 | | | 1,486,404 | | | | 1,486,404 | |
| Total Money Market Fund | | | | | | | | |
| (Cost $1,486,404) | | | | | | | 1,486,404 | |
| | | | | | | | | |
| | Face
Amount~ | | | Value | |
CORPORATE BONDS†† - 80.7% |
Consumer, Non-cyclical - 14.4% | | | | | | | | |
FAGE International S.A. / FAGE USA Dairy Industry, Inc. | | | | | | | | |
5.63% due 08/15/265 | | | 410,000 | | | $ | 386,085 | |
Cheplapharm Arzneimittel GmbH | | | | | | | | |
5.50% due 01/15/285 | | | 375,000 | | | | 339,375 | |
CPI CG, Inc. | | | | | | | | |
8.63% due 03/15/265 | | | 351,000 | | | | 337,835 | |
Upbound Group, Inc. | | | | | | | | |
6.38% due 02/15/295,6 | | | 375,000 | | | | 332,813 | |
Tenet Healthcare Corp. | | | | | | | | |
6.13% due 06/15/30 | | | 125,000 | | | | 123,212 | |
6.75% due 05/15/315 | | | 75,000 | | | | 75,183 | |
Legends Hospitality Holding Company LLC / Legends Hospitality Co-Issuer, Inc. | | | | | | | | |
5.00% due 02/01/265 | | | 200,000 | | | | 180,000 | |
KeHE Distributors LLC / KeHE Finance Corp. | | | | | | | | |
8.63% due 10/15/265 | | | 179,000 | | | | 179,224 | |
Prime Security Services Borrower LLC / Prime Finance, Inc. | | | | | | | | |
3.38% due 08/31/275 | | | 200,000 | | | | 176,395 | |
Grifols Escrow Issuer S.A. | | | | | | | | |
4.75% due 10/15/285 | | | 200,000 | | | | 173,576 | |
DaVita, Inc. | | | | | | | | |
4.63% due 06/01/305 | | | 200,000 | | | | 171,696 | |
Par Pharmaceutical, Inc. | | | | | | | | |
due 04/01/275,7 | | | 225,000 | | | | 166,282 | |
Post Holdings, Inc. | | | | | | | | |
5.50% due 12/15/295 | | | 75,000 | | | | 69,208 | |
4.63% due 04/15/305 | | | 75,000 | | | | 65,727 | |
5.63% due 01/15/285 | | | 25,000 | | | | 24,021 | |
Sotheby’s/Bidfair Holdings, Inc. | | | | | | | | |
5.88% due 06/01/295 | | | 200,000 | | | | 155,500 | |
Carriage Services, Inc. | | | | | | | | |
4.25% due 05/15/295 | | | 175,000 | | | | 150,623 | |
WW International, Inc. | | | | | | | | |
4.50% due 04/15/295 | | | 250,000 | | | | 147,757 | |
Kronos Acquisition Holdings, Inc. / KIK Custom Products, Inc. | | | | | | | | |
7.00% due 12/31/275 | | | 107,000 | | | | 94,720 | |
5.00% due 12/31/265 | | | 50,000 | | | | 45,750 | |
Bausch Health Companies, Inc. | | | | | | | | |
4.88% due 06/01/285 | | | 225,000 | | | | 133,920 | |
Castor S.p.A. | | | | | | | | |
8.78% (3 Month EURIBOR + 5.25%, Rate Floor: 5.25%) due 02/15/29◊,5 | | | EUR 125,000 | | | | 126,883 | |
BCP V Modular Services Finance II plc | | | | | | | | |
4.75% due 10/30/285 | | | EUR 125,000 | | | | 115,934 | |
ADT Security Corp. | | | | | | | | |
4.13% due 08/01/295 | | | 125,000 | | | | 107,969 | |
Albertsons Companies Incorporated / Safeway Inc / New Albertsons Limited Partnership / Albertsons LLC | | | | | | | | |
5.88% due 02/15/285 | | | 100,000 | | | | 97,174 | |
88 | THE GUGGENHEIM FUNDS SEMI-ANNUAL REPORT | SEE NOTES TO FINANCIAL STATEMENTS. |
SCHEDULE OF INVESTMENTS (Unaudited)(continued) | June 30, 2023 |
SERIES P (HIGH YIELD SERIES) | |
| | Face
Amount~ | | | Value | |
Endo Luxembourg Finance Company I SARL / Endo US, Inc. | | | | | | | | |
due 04/01/295,7 | | | 125,000 | | | $ | 92,500 | |
Medline Borrower, LP | | | | | | | | |
5.25% due 10/01/295 | | | 100,000 | | | | 86,770 | |
Service Corporation International | | | | | | | | |
3.38% due 08/15/30 | | | 100,000 | | | | 83,630 | |
Central Garden & Pet Co. | | | | | | | | |
4.13% due 04/30/315 | | | 75,000 | | | | 61,834 | |
GXO Logistics, Inc. | | | | | | | | |
2.65% due 07/15/31 | | | 50,000 | | | | 38,882 | |
1.65% due 07/15/26 | | | 25,000 | | | | 21,738 | |
Nathan’s Famous, Inc. | | | | | | | | |
6.63% due 11/01/255 | | | 38,000 | | | | 37,836 | |
Sabre GLBL, Inc. | | | | | | | | |
7.38% due 09/01/255 | | | 35,000 | | | | 31,066 | |
9.25% due 04/15/255 | | | 7,000 | | | | 6,528 | |
Ingles Markets, Inc. | | | | | | | | |
4.00% due 06/15/315 | | | 25,000 | | | | 20,876 | |
Total Consumer, Non-cyclical | | | | | | | 4,458,522 | |
| | | | | | | | | |
Communications - 12.7% | | | | | | | | |
CCO Holdings LLC / CCO Holdings Capital Corp. | | | | | | | | |
6.38% due 09/01/295 | | | 250,000 | | | | 235,540 | |
4.25% due 02/01/315 | | | 150,000 | | | | 121,345 | |
4.50% due 06/01/335 | | | 125,000 | | | | 98,161 | |
4.25% due 01/15/345 | | | 100,000 | | | | 75,577 | |
Level 3 Financing, Inc. | | | | | | | | |
4.25% due 07/01/285 | | | 300,000 | | | | 193,160 | |
3.63% due 01/15/295 | | | 300,000 | | | | 179,926 | |
Altice France S.A. | | | | | | | | |
5.50% due 10/15/295 | | | 325,000 | | | | 232,421 | |
5.13% due 07/15/295 | | | 175,000 | | | | 124,228 | |
McGraw-Hill Education, Inc. | | | | | | | | |
5.75% due 08/01/285 | | | 275,000 | | | | 238,285 | |
8.00% due 08/01/295 | | | 100,000 | | | | 85,351 | |
VZ Secured Financing BV | | | | | | | | |
5.00% due 01/15/325 | | | 375,000 | | | | 302,012 | |
CSC Holdings LLC | | | | | | | | |
4.13% due 12/01/305 | | | 200,000 | | | | 139,905 | |
4.63% due 12/01/305 | | | 200,000 | | | | 88,987 | |
3.38% due 02/15/315 | | | 75,000 | | | | 50,767 | |
LCPR Senior Secured Financing DAC | | | | | | | | |
6.75% due 10/15/275 | | | 270,000 | | | | 253,058 | |
Telenet Finance Luxembourg Notes SARL | | | | | | | | |
5.50% due 03/01/28 | | | 200,000 | | | | 183,400 | |
Sirius XM Radio, Inc. | | | | | | | | |
3.88% due 09/01/315 | | | 125,000 | | | | 96,662 | |
4.13% due 07/01/305 | | | 100,000 | | | | 81,655 | |
Cogent Communications Group, Inc. | | | | | | | | |
7.00% due 06/15/275 | | | 175,000 | | | | 169,312 | |
UPC Broadband Finco BV | | | | | | | | |
4.88% due 07/15/315 | | | 200,000 | | | | 164,618 | |
Vmed O2 UK Financing I plc | | | | | | | | |
4.25% due 01/31/315 | | | 200,000 | | | | 161,712 | |
AMC Networks, Inc. | | | | | | | | |
4.25% due 02/15/29 | | | 300,000 | | | | 161,270 | |
TripAdvisor, Inc. | | | | | | | | |
7.00% due 07/15/255 | | | 125,000 | | | | 125,000 | |
Match Group Holdings II LLC | | | | | | | | |
3.63% due 10/01/315 | | | 150,000 | | | | 123,291 | |
Outfront Media Capital LLC / Outfront Media Capital Corp. | | | | | | | | |
4.25% due 01/15/295 | | | 100,000 | | | | 84,036 | |
Go Daddy Operating Company LLC / GD Finance Co., Inc. | | | | | | | | |
3.50% due 03/01/295 | | | 75,000 | | | | 64,263 | |
Cable One, Inc. | | | | | | | | |
4.00% due 11/15/305 | | | 75,000 | | | | 58,594 | |
Cengage Learning, Inc. | | | | | | | | |
9.50% due 06/15/245 | | | 16,000 | | | | 16,041 | |
Total Communications | | | | | | | 3,908,577 | |
| | | | | | | | | |
Consumer, Cyclical - 12.2% | | | | | | | | |
Hawaiian Brand Intellectual Property Ltd. / HawaiianMiles Loyalty Ltd. | | | | | | | | |
5.75% due 01/20/265 | | | 265,000 | | | | 250,833 | |
JB Poindexter & Company, Inc. | | | | | | | | |
7.13% due 04/15/265 | | | 250,000 | | | | 244,433 | |
Suburban Propane Partners Limited Partnership/Suburban Energy Finance Corp. | | | | | | | | |
5.00% due 06/01/315 | | | 250,000 | | | | 209,287 | |
Aramark Services, Inc. | | | | | | | | |
5.00% due 02/01/285 | | | 200,000 | | | | 188,508 | |
Wolverine World Wide, Inc. | | | | | | | | |
4.00% due 08/15/295 | | | 225,000 | | | | 179,156 | |
Allison Transmission, Inc. | | | | | | | | |
3.75% due 01/30/315 | | | 200,000 | | | | 168,954 | |
Station Casinos LLC | | | | | | | | |
4.63% due 12/01/315 | | | 200,000 | | | | 168,500 | |
Penn Entertainment, Inc. | | | | | | | | |
4.13% due 07/01/295 | | | 200,000 | | | | 164,140 | |
CD&R Smokey Buyer, Inc. | | | | | | | | |
6.75% due 07/15/255 | | | 175,000 | | | | 161,995 | |
Scotts Miracle-Gro Co. | | | | | | | | |
4.38% due 02/01/32 | | | 200,000 | | | | 157,477 | |
Scientific Games Holdings Limited Partnership/Scientific Games US FinCo, Inc. | | | | | | | | |
6.63% due 03/01/305 | | | 175,000 | | | | 154,000 | |
Crocs, Inc. | | | | | | | | |
4.25% due 03/15/295 | | | 175,000 | | | | 148,785 | |
Newell Brands, Inc. | | | | | | | | |
4.70% due 04/01/26 | | | 150,000 | | | | 140,902 | |
Ferrellgas Limited Partnership / Ferrellgas Finance Corp. | | | | | | | | |
5.38% due 04/01/265 | | | 150,000 | | | | 139,514 | |
Allwyn Entertainment Financing UK plc | | | | | | | | |
7.88% due 04/30/295 | | | 125,000 | | | | 126,439 | |
Tempur Sealy International, Inc. | | | | | | | | |
3.88% due 10/15/315 | | | 150,000 | | | | 122,198 | |
SEE NOTES TO FINANCIAL STATEMENTS. | THE GUGGENHEIM FUNDS SEMI-ANNUAL REPORT | 89 |
SCHEDULE OF INVESTMENTS (Unaudited)(continued) | June 30, 2023 |
SERIES P (HIGH YIELD SERIES) | |
| | Face
Amount~ | | | Value | |
United Airlines, Inc. | | | | | | | | |
4.63% due 04/15/295 | | | 125,000 | | | $ | 113,896 | |
Wabash National Corp. | | | | | | | | |
4.50% due 10/15/285 | | | 125,000 | | | | 108,390 | |
Ritchie Bros Holdings, Inc. | | | | | | | | |
7.75% due 03/15/315 | | | 50,000 | | | | 51,871 | |
6.75% due 03/15/285 | | | 50,000 | | | | 50,396 | |
Hanesbrands, Inc. | | | | | | | | |
4.88% due 05/15/265 | | | 100,000 | | | | 93,354 | |
Air Canada | | | | | | | | |
3.88% due 08/15/265 | | | 100,000 | | | | 92,685 | |
Michaels Companies, Inc. | | | | | | | | |
5.25% due 05/01/285 | | | 100,000 | | | | 80,794 | |
Evergreen Acqco 1 Limited Partnership / TVI, Inc. | | | | | | | | |
9.75% due 04/26/285 | | | 75,000 | | | | 77,560 | |
Clarios Global, LP / Clarios US Finance Co. | | | | | | | | |
8.50% due 05/15/275 | | | 75,000 | | | | 75,123 | |
Fertitta Entertainment LLC / Fertitta Entertainment Finance Company, Inc. | | | | | | | | |
4.63% due 01/15/295 | | | 75,000 | | | | 65,813 | |
Asbury Automotive Group, Inc. | | | | | | | | |
5.00% due 02/15/325 | | | 75,000 | | | | 65,302 | |
Superior Plus, LP | | | | | | | | |
4.25% due 05/18/285 | | | CAD 75,000 | | | | 50,296 | |
Clarios Global Limited Partnership / Clarios US Finance Co. | | | | | | | | |
6.75% due 05/15/285 | | | 50,000 | | | | 49,825 | |
Papa John’s International, Inc. | | | | | | | | |
3.88% due 09/15/295 | | | 50,000 | | | | 42,325 | |
Park River Holdings, Inc. | | | | | | | | |
5.63% due 02/01/295 | | | 50,000 | | | | 38,750 | |
Total Consumer, Cyclical | | | | | | | 3,781,501 | |
| | | | | | | | | |
Industrial - 11.8% | | | | | | | | |
New Enterprise Stone & Lime Company, Inc. | | | | | | | | |
9.75% due 07/15/285 | | | 275,000 | | | | 265,287 | |
5.25% due 07/15/285 | | | 150,000 | | | | 136,504 | |
Artera Services LLC | | | | | | | | |
9.03% due 12/04/255 | | | 400,000 | | | | 350,000 | |
GrafTech Finance, Inc. | | | | | | | | |
4.63% due 12/15/285 | | | 430,000 | | | | 349,385 | |
Mauser Packaging Solutions Holding Co. | | | | | | | | |
7.88% due 08/15/265 | | | 175,000 | | | | 173,864 | |
9.25% due 04/15/275 | | | 100,000 | | | | 92,300 | |
Brundage-Bone Concrete Pumping Holdings, Inc. | | | | | | | | |
6.00% due 02/01/265 | | | 275,000 | | | | 260,402 | |
Great Lakes Dredge & Dock Corp. | | | | | | | | |
5.25% due 06/01/295 | | | 275,000 | | | | 229,689 | |
Enviri Corp. | | | | | | | | |
5.75% due 07/31/275 | | | 225,000 | | | | 195,828 | |
Trinity Industries, Inc. | | | | | | | | |
7.75% due 07/15/285 | | | 175,000 | | | | 176,094 | |
Masonite International Corp. | | | | | | | | |
5.38% due 02/01/285 | | | 175,000 | | | | 166,813 | |
Amsted Industries, Inc. | | | | | | | | |
4.63% due 05/15/305 | | | 175,000 | | | | 156,095 | |
Clearwater Paper Corp. | | | | | | | | |
4.75% due 08/15/285 | | | 175,000 | | | | 154,028 | |
Builders FirstSource, Inc. | | | | | | | | |
6.38% due 06/15/325 | | | 125,000 | | | | 124,188 | |
4.25% due 02/01/325 | | | 25,000 | | | | 21,754 | |
Standard Industries, Inc. | | | | | | | | |
4.38% due 07/15/305 | | | 150,000 | | | | 129,915 | |
Ball Corp. | | | | | | | | |
3.13% due 09/15/31 | | | 125,000 | | | | 102,821 | |
6.00% due 06/15/29 | | | 25,000 | | | | 24,813 | |
Advanced Drainage Systems, Inc. | | | | | | | | |
6.38% due 06/15/305 | | | 125,000 | | | | 123,659 | |
EnerSys | | | | | | | | |
4.38% due 12/15/275 | | | 100,000 | | | | 92,049 | |
Howmet Aerospace, Inc. | | | | | | | | |
5.95% due 02/01/37 | | | 75,000 | | | | 76,353 | |
Arcosa, Inc. | | | | | | | | |
4.38% due 04/15/295 | | | 75,000 | | | | 67,200 | |
Emerald Debt Merger Sub LLC | | | | | | | | |
6.63% due 12/15/305 | | | 50,000 | | | | 49,562 | |
Stericycle, Inc. | | | | | | | | |
5.38% due 07/15/245 | | | 50,000 | | | | 49,354 | |
Hillenbrand, Inc. | | | | | | | | |
3.75% due 03/01/31 | | | 50,000 | | | | 42,000 | |
MIWD Holdco II LLC / MIWD Finance Corp. | | | | | | | | |
5.50% due 02/01/305 | | | 25,000 | | | | 20,625 | |
Total Industrial | | | | | | | 3,630,582 | |
| | | | | | | | | |
Financial - 10.4% | | | | | | | | |
United Wholesale Mortgage LLC | | | | | | | | |
5.50% due 04/15/295 | | | 225,000 | | | | 192,938 | |
5.75% due 06/15/275 | | | 200,000 | | | | 182,592 | |
Jefferies Finance LLC / JFIN Company-Issuer Corp. | | | | | | | | |
5.00% due 08/15/285 | | | 450,000 | | | | 368,916 | |
Iron Mountain, Inc. | | | | | | | | |
5.63% due 07/15/325 | | | 275,000 | | | | 246,010 | |
5.25% due 07/15/305 | | | 75,000 | | | | 67,579 | |
Hunt Companies, Inc. | | | | | | | | |
5.25% due 04/15/295 | | | 358,000 | | | | 284,263 | |
OneMain Finance Corp. | | | | | | | | |
3.88% due 09/15/28 | | | 225,000 | | | | 183,937 | |
4.00% due 09/15/30 | | | 75,000 | | | | 57,750 | |
NFP Corp. | | | | | | | | |
6.88% due 08/15/285 | | | 250,000 | | | | 217,005 | |
USI, Inc. | | | | | | | | |
6.88% due 05/01/255 | | | 175,000 | | | | 173,688 | |
Rocket Mortgage LLC / Rocket Mortgage Company-Issuer, Inc. | | | | | | | | |
3.88% due 03/01/315 | | | 200,000 | | | | 162,172 | |
HUB International Ltd. | | | | | | | | |
7.00% due 05/01/265 | | | 100,000 | | | | 99,735 | |
5.63% due 12/01/295 | | | 50,000 | | | | 44,854 | |
Assurant, Inc. | | | | | | | | |
7.00% due 03/27/482 | | | 150,000 | | | | 143,965 | |
90 | THE GUGGENHEIM FUNDS SEMI-ANNUAL REPORT | SEE NOTES TO FINANCIAL STATEMENTS. |
SCHEDULE OF INVESTMENTS (Unaudited)(continued) | June 30, 2023 |
SERIES P (HIGH YIELD SERIES) | |
| | Face
Amount~ | | | Value | |
SLM Corp. | | | | | | | | |
3.13% due 11/02/26 | | | 150,000 | | | $ | 129,750 | |
Jane Street Group / JSG Finance, Inc. | | | | | | | | |
4.50% due 11/15/295 | | | 150,000 | | | | 129,070 | |
Jones Deslauriers Insurance Management, Inc. | | | | | | | | |
10.50% due 12/15/305 | | | 125,000 | | | | 125,385 | |
AmWINS Group, Inc. | | | | | | | | |
4.88% due 06/30/295 | | | 100,000 | | | | 90,298 | |
GLP Capital Limited Partnership / GLP Financing II, Inc. | | | | | | | | |
4.00% due 01/15/31 | | | 100,000 | | | | 86,456 | |
Kennedy-Wilson, Inc. | | | | | | | | |
4.75% due 03/01/29 | | | 100,000 | | | | 79,065 | |
Starwood Property Trust, Inc. | | | | | | | | |
4.38% due 01/15/275 | | | 85,000 | | | | 73,206 | |
Liberty Mutual Group, Inc. | | | | | | | | |
4.30% due 02/01/615 | | | 100,000 | | | | 62,906 | |
Total Financial | | | | | | | 3,201,540 | |
| | | | | | | | | |
Basic Materials - 7.9% | | | | | | | | |
Carpenter Technology Corp. | | | | | | | | |
6.38% due 07/15/28 | | | 225,000 | | | | 220,500 | |
7.63% due 03/15/30 | | | 125,000 | | | | 126,413 | |
SCIL IV LLC / SCIL USA Holdings LLC | | | | | | | | |
5.38% due 11/01/265 | | | 275,000 | | | | 250,701 | |
Minerals Technologies, Inc. | | | | | | | | |
5.00% due 07/01/285 | | | 275,000 | | | | 250,250 | |
Compass Minerals International, Inc. | | | | | | | | |
6.75% due 12/01/275 | | | 200,000 | | | | 192,820 | |
INEOS Finance plc | | | | | | | | |
6.75% due 05/15/285 | | | 200,000 | | | | 192,116 | |
Ingevity Corp. | | | | | | | | |
3.88% due 11/01/285 | | | 225,000 | | | | 192,098 | |
WR Grace Holdings LLC | | | | | | | | |
4.88% due 06/15/275 | | | 200,000 | | | | 185,486 | |
SK Invictus Intermediate II SARL | | | | | | | | |
5.00% due 10/30/295 | | | 225,000 | | | | 178,792 | |
Kaiser Aluminum Corp. | | | | | | | | |
4.63% due 03/01/285 | | | 110,000 | | | | 96,202 | |
4.50% due 06/01/315 | | | 75,000 | | | | 59,788 | |
Diamond BC BV | | | | | | | | |
4.63% due 10/01/295 | | | 150,000 | | | | 151,314 | |
Valvoline, Inc. | | | | | | | | |
3.63% due 06/15/315 | | | 125,000 | | | | 101,605 | |
4.25% due 02/15/305 | | | 25,000 | | | | 24,548 | |
Novelis Corp. | | | | | | | | |
4.75% due 01/30/305 | | | 125,000 | | | | 111,088 | |
Illuminate Buyer LLC / Illuminate Holdings IV, Inc. | | | | | | | | |
9.00% due 07/01/285 | | | 100,000 | | | | 87,136 | |
Mirabela Nickel Ltd. | | | | | | | | |
due 06/24/19†††,7,8 | | | 390,085 | | | | 18,529 | |
Total Basic Materials | | | | | | | 2,439,386 | |
| | | | | | | | | |
Energy - 7.3% | | | | | | | | |
Parkland Corp. | | | | | | | | |
4.63% due 05/01/305 | | | 250,000 | | | | 216,764 | |
4.50% due 10/01/295 | | | 225,000 | | | | 195,188 | |
CVR Energy, Inc. | | | | | | | | |
5.75% due 02/15/285 | | | 325,000 | | | | 286,000 | |
ITT Holdings LLC | | | | | | | | |
6.50% due 08/01/295 | | | 325,000 | | | | 273,806 | |
NuStar Logistics, LP | | | | | | | | |
5.63% due 04/28/27 | | | 200,000 | | | | 192,180 | |
6.00% due 06/01/26 | | | 75,000 | | | | 73,058 | |
Global Partners Limited Partnership / GLP Finance Corp. | | | | | | | | |
7.00% due 08/01/27 | | | 225,000 | | | | 218,324 | |
6.88% due 01/15/29 | | | 50,000 | | | | 46,437 | |
Holly Energy Partners Limited Partnership / Holly Energy Finance Corp. | | | | | | | | |
6.38% due 04/15/275 | | | 200,000 | | | | 197,565 | |
Crestwood Midstream Partners Limited Partnership / Crestwood Midstream Finance Corp. | | | | | | | | |
5.63% due 05/01/275 | | | 175,000 | | | | 165,900 | |
EnLink Midstream LLC | | | | | | | | |
5.38% due 06/01/29 | | | 150,000 | | | | 142,907 | |
TransMontaigne Partners Limited Partnership / TLP Finance Corp. | | | | | | | | |
6.13% due 02/15/26 | | | 150,000 | | | | 129,700 | |
Kinetik Holdings, LP | | | | | | | | |
5.88% due 06/15/305 | | | 75,000 | | | | 71,287 | |
Southwestern Energy Co. | | | | | | | | |
5.38% due 02/01/29 | | | 50,000 | | | | 47,083 | |
Basic Energy Services, Inc. | | | | | | | | |
due 10/15/237 | | | 168,000 | | | | 840 | |
Total Energy | | | | | | | 2,257,039 | |
| | | | | | | | | |
Technology - 2.2% | | | | | | | | |
Boxer Parent Company, Inc. | | | | | | | | |
7.13% due 10/02/255 | | | 200,000 | | | | 200,177 | |
Central Parent Incorporated / CDK Global Inc | | | | | | | | |
7.25% due 06/15/295 | | | 200,000 | | | | 197,758 | |
Capstone Borrower, Inc. | | | | | | | | |
8.00% due 06/15/305 | | | 150,000 | | | | 148,127 | |
Entegris Escrow Corp. | | | | | | | | |
4.75% due 04/15/295 | | | 100,000 | | | | 92,832 | |
CDW LLC / CDW Finance Corp. | | | | | | | | |
3.57% due 12/01/31 | | | 50,000 | | | | 42,191 | |
Total Technology | | | | | | | 681,085 | |
| | | | | | | | | |
Utilities - 1.8% | | | | | | | | |
Terraform Global Operating, LP | | | | | | | | |
6.13% due 03/01/265 | | | 420,000 | | | | 408,975 | |
AmeriGas Partners Limited Partnership / AmeriGas Finance Corp. | | | | | | | | |
5.50% due 05/20/25 | | | 75,000 | | | | 72,390 | |
SEE NOTES TO FINANCIAL STATEMENTS. | THE GUGGENHEIM FUNDS SEMI-ANNUAL REPORT | 91 |
SCHEDULE OF INVESTMENTS (Unaudited)(continued) | June 30, 2023 |
SERIES P (HIGH YIELD SERIES) | |
| | Face
Amount~ | | | Value | |
Clearway Energy Operating LLC | | | | | | | | |
4.75% due 03/15/285 | | | 75,000 | | | $ | 69,197 | |
Total Utilities | | | | | | | 550,562 | |
| | | | | | | | | |
Total Corporate Bonds | | | | |
(Cost $28,425,208) | | | 24,908,794 | |
| | | | | | | | | |
SENIOR FLOATING RATE INTERESTS††,◊ - 12.6% |
Consumer, Cyclical - 3.0% | | | | | | | | |
American Tire Distributors, Inc. | | | | | | | | |
11.49% (3 Month Term SOFR + 6.25%, Rate Floor: 6.25%) due 10/20/28 | | | 172,813 | | | | 149,443 | |
PetSmart LLC | | | | | | | | |
8.95% (1 Month Term SOFR + 3.75%, Rate Floor: 3.75%) due 02/11/28 | | | 147,375 | | | | 146,884 | |
ScribeAmerica Intermediate Holdco LLC (Healthchannels) | | | | | | | | |
9.72% (1 Month Term SOFR + 4.50%, Rate Floor: 4.50%) due 04/03/25 | | | 184,642 | | | | 131,557 | |
First Brands Group LLC | | | | | | | | |
10.25% (3 Month Term SOFR + 5.00%, Rate Floor: 6.00%) due 03/30/27 | | | 112,486 | | | | 109,886 | |
Apro LLC | | | | | | | | |
9.25% (3 Month USD LIBOR + 3.75%, Rate Floor: 4.50%) due 11/16/26 | | | 97,750 | | | | 96,919 | |
CCRR Parent, Inc. | | | | | | | | |
8.97% (1 Month Term SOFR + 3.75%, Rate Floor: 4.50%) due 03/06/28 | | | 98,249 | | | | 94,319 | |
Holding SOCOTEC | | | | | | | | |
9.31% (3 Month Term SOFR + 4.00%, Rate Floor: 4.75%) due 06/02/28 | | | 73,500 | | | | 71,356 | |
Flutter Financing B.V. | | | | | | | | |
8.75% (3 Month Term SOFR + 3.25%, Rate Floor: 3.25%) due 07/24/28 | | | 49,625 | | | | 49,659 | |
Rent-A-Center, Inc. | | | | | | | | |
8.56% (3 Month USD LIBOR + 3.25%, Rate Floor: 3.75%) due 02/17/28 | | | 46,492 | | | | 46,434 | |
Sweetwater Sound | | | | | | | | |
9.47% (1 Month Term SOFR + 4.25%, Rate Floor: 4.25%) due 08/05/28††† | | | 47,915 | | | | 45,279 | |
Total Consumer, Cyclical | | | | | | | 941,736 | |
| | | | | | | | | |
Industrial - 2.3% | | | | | | | | |
Arcline FM Holdings LLC | | | | | | | | |
10.25% (3 Month USD LIBOR + 4.75%, Rate Floor: 5.50%) due 06/23/28 | | | 171,938 | | | | 167,209 | |
Dispatch Terra Acquisition LLC | | | | | | | | |
9.64% (3 Month Term SOFR + 4.25%, Rate Floor: 4.25%) due 03/27/28 | | | 147,123 | | | | 130,572 | |
Pelican Products, Inc. | | | | | | | | |
9.64% (3 Month USD LIBOR + 4.25%, Rate Floor: 4.75%) due 12/29/28 | | | 90,176 | | | | 81,290 | |
Michael Baker International LLC | | | | | | | | |
10.19% (1 Month USD LIBOR + 5.00%, Rate Floor: 5.75%) due 12/01/28††† | | | 73,875 | | | | 73,413 | |
Aegion Corp. | | | | | | | | |
9.97% (1 Month Term SOFR + 4.75%, Rate Floor: 5.50%) due 05/17/28 | | | 73,687 | | | | 71,362 | |
PECF USS Intermediate Holding III Corp. | | | | | | | | |
9.52% (3 Month USD LIBOR + 4.25%, Rate Floor: 4.75%) due 12/15/28 | | | 73,999 | | | | 60,309 | |
Air Canada | | | | | | | | |
8.84% (3 Month USD LIBOR + 3.50%, Rate Floor: 4.25%) due 08/11/28 | | | 49,500 | | | | 49,429 | |
Osmose Utility Services, Inc. | | | | | | | | |
8.47% (1 Month Term SOFR + 3.25%, Rate Floor: 3.75%) due 06/23/28 | | | 49,496 | | | | 48,432 | |
EMRLD Borrower LP | | | | | | | | |
8.26% (3 Month Term SOFR + 3.00%, Rate Floor: 3.00%) due 05/31/30 | | | 17,396 | | | | 17,380 | |
Total Industrial | | | | | | | 699,396 | |
| | | | | | | | | |
Consumer, Non-cyclical - 2.1% | | | | | | | | |
Quirch Foods Holdings LLC | | | | | | | | |
9.99% (1 Month Term SOFR + 4.75%, Rate Floor: 4.75%) due 10/27/27 | | | 97,500 | | | | 92,747 | |
Gibson Brands, Inc. | | | | | | | | |
10.25% (3 Month Term SOFR + 5.00%, Rate Floor: 5.75%) due 08/11/28 | | | 96,038 | | | | 76,830 | |
Osmosis Holdings Australia II Pty Ltd. | | | | | | | | |
8.90% (1 Month Term SOFR + 3.75%, Rate Floor: 3.75%) due 07/30/28 | | | 74,450 | | | | 72,999 | |
National Mentor Holdings, Inc. | | | | | | | | |
8.98% (1 Month Term SOFR + 3.75%, Rate Floor: 3.75%) due 03/02/28 | | | 93,662 | | | | 70,422 | |
Confluent Health LLC | | | | | | | | |
9.22% (1 Month Term SOFR + 4.00%, Rate Floor: 4.50%) due 11/30/28 | | | 74,145 | | | | 66,978 | |
Blue Ribbon LLC | | | | | | | | |
11.17% (1 Month USD LIBOR + 6.00%, Rate Floor: 6.75%) due 05/08/28 | | | 91,250 | | | | 63,601 | |
Women’s Care Holdings, Inc. | | | | | | | | |
9.65% (3 Month Term SOFR + 4.50%, Rate Floor: 4.50%) due 01/17/28 | | | 62,702 | | | | 55,178 | |
Hostess Brands LLC | | | | | | | | |
due 06/21/30 | | | 50,000 | | | | 49,833 | |
Balrog Acquisition, Inc. | | | | | | | | |
9.69% (1 Month Term SOFR + 4.50%, Rate Floor: 5.00%) due 09/05/28 | | | 50,000 | | | | 49,625 | |
Kronos Acquisition Holdings, Inc. | | | | | | | | |
11.38% (3 Month Term SOFR + 6.00%, Rate Floor: 6.00%) due 12/22/26 | | | 24,688 | | | | 24,163 | |
TGP Holdings LLC | | | | | | | | |
8.45% (1 Month Term SOFR + 3.25%, Rate Floor: 4.00%) due 06/29/28 | | | 23,529 | | | | 19,583 | |
Total Consumer, Non-cyclical | | | | | | | 641,959 | |
| | | | | | | | | |
Technology - 1.8% | | | | | | | | |
Datix Bidco Ltd. | | | | | | | | |
8.68% (6 Month GBP SONIA + 4.50%, Rate Floor: 4.50%) due 04/28/25††† | | | GBP 150,000 | | | | 186,650 | |
11.93% (6 Month GBP SONIA + 7.75%, Rate Floor: 7.75%) due 04/27/26††† | | | GBP 75,000 | | | | 93,296 | |
92 | THE GUGGENHEIM FUNDS SEMI-ANNUAL REPORT | SEE NOTES TO FINANCIAL STATEMENTS. |
SCHEDULE OF INVESTMENTS (Unaudited)(continued) | June 30, 2023 |
SERIES P (HIGH YIELD SERIES) | |
| | Face
Amount~ | | | Value | |
Peraton Corp. | | | | | | | | |
8.95% (1 Month Term SOFR + 3.75%, Rate Floor: 3.75%) due 02/01/28 | | | 119,929 | | | $ | 117,595 | |
Cloud Software Group, Inc. | | | | | | | | |
9.84% (3 Month Term SOFR + 4.60%, Rate Floor: 4.60%) due 09/29/28 | | | 99,720 | | | | 93,113 | |
Atlas CC Acquisition Corp. | | | | | | | | |
9.78% (3 Month Term SOFR + 4.25%, Rate Floor: 4.25%) due 05/25/28 | | | 73,500 | | | | 63,635 | |
Total Technology | | | | | | | 554,289 | |
| | | | | | | | | |
Communications - 1.6% | | | | | | | | |
Cengage Learning Acquisitions, Inc. | | | | | | | | |
9.88% (3 Month USD LIBOR + 4.75%, Rate Floor: 5.75%) due 07/14/26 | | | 148,497 | | | | 145,304 | |
Cincinnati Bell, Inc. | | | | | | | | |
8.45% (1 Month Term SOFR + 3.25%, Rate Floor: 3.25%) due 11/22/28 | | | 124,684 | | | | 119,125 | |
Xplornet Communications, Inc. | | | | | | | | |
9.22% (1 Month Term SOFR + 4.00%, Rate Floor: 4.00%) due 10/02/28 | | | 122,813 | | | | 99,734 | |
Playtika Holding Corp. | | | | | | | | |
7.94% (1 Month USD LIBOR + 2.75%, Rate Floor: 2.75%) due 03/13/28 | | | 97,750 | | | | 97,274 | |
Flight Bidco, Inc. | | | | | | | | |
8.72% (1 Month Term SOFR + 3.50%, Rate Floor: 3.50%) due 07/23/25 | | | 49,610 | | | | 46,272 | |
Total Communications | | | | | | | 507,709 | |
| | | | | | | | | |
Financial - 1.0% | | | | | | | | |
Citadel Securities, LP | | | | | | | | |
8.22% (1 Month Term SOFR + 3.00%, Rate Floor: 3.00%) due 02/02/28 | | | 94,288 | | | | 94,204 | |
Franchise Group, Inc. | | | | | | | | |
9.97% (3 Month Term SOFR + 4.75%, Rate Floor: 4.75%) due 03/10/26 | | | 99,888 | | | | 91,397 | |
Claros Mortgage Trust, Inc. | | | | | | | | |
9.69% (1 Month Term SOFR + 4.50%, Rate Floor: 4.50%) due 08/10/26††† | | | 90,613 | | | | 85,176 | |
Eisner Advisory Group | | | | | | | | |
10.47% (1 Month Term SOFR + 5.25%, Rate Floor: 5.25%) due 07/28/28 | | | 49,125 | | | | 49,003 | |
Total Financial | | | | | | | 319,780 | |
| | | | | | | | | |
Basic Materials - 0.7% | | | | | | | | |
LTI Holdings, Inc. | | | | | | | | |
9.97% (1 Month USD LIBOR + 4.75%, Rate Floor: 4.75%) due 07/24/26 | | | 98,855 | | | | 96,094 | |
NIC Acquisition Corp. | | | | | | | | |
9.25% (3 Month Term SOFR + 3.75%, Rate Floor: 3.75%) due 12/29/27 | | | 87,154 | | | | 65,758 | |
Nouryon USA LLC | | | | | | | | |
9.32% (3 Month Term SOFR + 4.00%, Rate Floor: 4.00%) due 04/03/28 | | | 48,958 | | | | 48,423 | |
Total Basic Materials | | | | | | | 210,275 | |
| | | | | | | | | |
Energy - 0.1% | | | | | | | | |
Permian Production Partners LLC | | | | | | | | |
11.22% (1 Month Term SOFR + 6.00%, Rate Floor: 7.00%) (in-kind rate was 2.00%) due 11/24/25†††,9 | | | 18,614 | | | | 18,521 | |
Total Senior Floating Rate Interests | | | | |
(Cost $4,179,899) | | | 3,893,665 | |
| | | | | | | | | |
Total Investments - 99.7% | | | | |
(Cost $35,353,052) | | $ | 30,788,584 | |
Other Assets & Liabilities, net - 0.3% | | | 106,948 | |
Total Net Assets - 100.0% | | $ | 30,895,532 | |
Forward Foreign Currency Exchange Contracts†† |
Counterparty | | Currency | | | Type | | | Quantity | | | Contract
Amount | | | Settlement Date | | | Unrealized
Depreciation | |
Goldman Sachs International | | | CAD | | | | Sell | | | | 67,000 | | | | 50,384 USD | | | | 07/14/23 | | | $ | (215 | ) |
Barclays Bank plc | | | GBP | | | | Sell | | | | 224,000 | | | | 282,390 USD | | | | 07/14/23 | | | | (2,109 | ) |
Bank of America, N.A. | | | EUR | | | | Sell | | | | 227,000 | | | | 245,198 USD | | | | 07/14/23 | | | | (2,685 | ) |
| | | | | | | | | | | | | | | | | | | | | | | $ | (5,009 | ) |
SEE NOTES TO FINANCIAL STATEMENTS. | THE GUGGENHEIM FUNDS SEMI-ANNUAL REPORT | 93 |
SCHEDULE OF INVESTMENTS (Unaudited)(continued) | June 30, 2023 |
SERIES P (HIGH YIELD SERIES) | |
~ | The face amount is denominated in U.S. dollars unless otherwise indicated. |
* | Non-income producing security. |
† | Value determined based on Level 1 inputs — See Note 4. |
†† | Value determined based on Level 2 inputs, unless otherwise noted — See Note 4. |
††† | Value determined based on Level 3 inputs — See Note 4. |
◊ | Variable rate security. Rate indicated is the rate effective at June 30, 2023. In some instances, the effective rate is limited by a minimum rate floor or a maximum rate cap established by the issuer. The settlement status of a position may also impact the effective rate indicated. In some cases, a position may be unsettled at period end and may not have a stated effective rate. In instances where multiple underlying reference rates and spread amounts are shown, the effective rate is based on a weighted average. |
1 | Affiliated issuer. |
2 | Security has a fixed rate coupon which will convert to a floating or variable rate coupon on a future date. |
3 | Special Purpose Acquisition Company (SPAC). |
4 | Rate indicated is the 7-day yield as of June 30, 2023. |
5 | Security is a 144A or Section 4(a)(2) security. These securities have been determined to be liquid under guidelines established by the Board of Trustees. The total market value of 144A or Section 4(a)(2) securities is $21,740,821 (cost $24,437,787), or 70.4% of total net assets. |
6 | All or a portion of this has been physically segregated or earmarked in connection with reverse repurchase agreements. At June 30, 2023, the total market value of segregated or earmarked security was $332,813— See Note 11. |
7 | Security is in default of interest and/or principal obligations. |
8 | Security is a 144A or Section 4(a)(2) security. These securities have been determined to be illiquid and restricted under guidelines established by the Board of Trustees. The total market value of 144A or Section 4(a)(2) illiquid and restricted securities is $18,529 (cost $353,909), or 0.1% of total net assets — See Note 9. |
9 | Payment-in-kind security. |
| | CAD — Canadian Dollar |
| | EUR — Euro |
| | EURIBOR — European Interbank Offered Rate |
| | GBP — British Pound |
| | LIBOR — London Interbank Offered Rate |
| | plc — Public Limited Company |
| | SARL — Société à Responsabilité Limitée |
| | SOFR — Secured Overnight Financing Rate |
| | SONIA — Sterling Overnight Index Average |
| | |
| | See Sector Classification in Other Information section. |
94 | THE GUGGENHEIM FUNDS SEMI-ANNUAL REPORT | SEE NOTES TO FINANCIAL STATEMENTS. |
SCHEDULE OF INVESTMENTS (Unaudited)(continued) | June 30, 2023 |
SERIES P (HIGH YIELD SERIES) | |
The following table summarizes the inputs used to value the Fund’s investments at June 30, 2023 (See Note 4 in the Notes to Financial Statements):
Investments in Securities (Assets) | | Level 1
Quoted
Prices | | | Level 2
Significant
Observable
Inputs | | | Level 3
Significant
Unobservable
Inputs | | | Total | |
Common Stocks | | $ | — | | | $ | 233,298 | | | $ | 17,171 | | | $ | 250,469 | |
Preferred Stocks | | | — | | | | 237,263 | | | | 11,847 | | | | 249,110 | |
Warrants | | | 142 | | | | — | | | | — | | | | 142 | |
Money Market Fund | | | 1,486,404 | | | | — | | | | — | | | | 1,486,404 | |
Corporate Bonds | | | — | | | | 24,890,265 | | | | 18,529 | | | | 24,908,794 | |
Senior Floating Rate Interests | | | — | | | | 3,391,330 | | | | 502,335 | | | | 3,893,665 | |
Total Assets | | $ | 1,486,546 | | | $ | 28,752,156 | | | $ | 549,882 | | | $ | 30,788,584 | |
Investments in Securities (Liabilities) | | Level 1
Quoted
Prices | | | Level 2
Significant
Observable
Inputs | | | Level 3
Significant
Unobservable
Inputs | | | Total | |
Forward Foreign Currency Exchange Contracts** | | $ | — | | | $ | 5,009 | | | $ | — | | | $ | 5,009 | |
** | This derivative is reported as unrealized appreciation/depreciation at period end. |
The Fund may hold assets and/or liabilities in which the fair value approximates the carrying amount for financial statement purposes. As of the period end, reverse repurchase agreements of $241,369 are categorized as Level 2 within the disclosure hierarchy — See Note 11.
The following is a summary of significant unobservable inputs used in the fair valuation of assets and liabilities categorized within Level 3 of the fair value hierarchy:
Category | | Ending Balance at
June 30, 2023 | | | Valuation Technique | | | Unobservable Inputs | | | Input Range | | | Weighted Average* | |
Assets: | | | | | | | | | | | | | | | | | | | | |
Common Stocks | | $ | 17,035 | | Enterprise Value | Valuation Multiple | 2.7x-9.5x | 2.9x |
Common Stocks | | | 136 | | Model Price | Liquidation Value | — | — |
Corporate Bonds | | | 18,529 | | Third Party Pricing | Broker Quote | — | — |
Preferred Stocks | | | 11,845 | | Enterprise Value | Valuation Multiple | 4.9x | — |
Preferred Stocks | | | 2 | | Model Price | Purchase Price | — | — |
Senior Floating Rate Interests | | | 279,946 | | Yield Analysis | Yield | 11.0%-14.2% | 12.1% |
Senior Floating Rate Interests | | | 222,389 | | Third Party Pricing | Broker Quote | — | — |
Total Assets | | $ | 549,882 | | | | | |
* | Inputs are weighted by the fair value of the instruments. |
Significant changes in a quote, yield, liquidation value or valuation multiple would generally result in significant changes in the fair value of the security.
The Fund’s fair valuation leveling guidelines classify a single daily broker quote, or a vendor price based on a single daily or monthly broker quote, as Level 3, if such a quote or price cannot be supported with other available market information.
Transfers between Level 2 and Level 3 may occur as markets fluctuate and/or the availability of data used in an investment’s valuation changes. For the period ended June 30, 2023, the Fund had securities with a total value of $130,455 transfer into Level 3 from Level 2 due to a lack of observable inputs and had securities with a total value of $259,404 transfer out of Level 3 into Level 2 due to the availability of current and reliable market-based data provided by a third-party pricing service which utilizes significant observable inputs.
SEE NOTES TO FINANCIAL STATEMENTS. | THE GUGGENHEIM FUNDS SEMI-ANNUAL REPORT | 95 |
SCHEDULE OF INVESTMENTS (Unaudited)(concluded) | June 30, 2023 |
SERIES P (HIGH YIELD SERIES) | |
Following is a reconciliation of Level 3 assets for which significant unobservable inputs were used to determine fair value for the period ended June 30, 2023:
| | | Assets | | | | | | | Liabilities | |
| | Corporate Bonds | | | Senior Floating
Rate Interests | | | Common Stocks | | | Preferred Stocks | | | Total Assets | | | Unfunded Loan
Commitments | |
Beginning Balance | | $ | 120,477 | | | $ | 559,713 | | | $ | 25,289 | | | $ | 2 | | | $ | 705,481 | | | $ | (1,511 | ) |
Purchases/(Receipts) | | | — | | | | 186 | | | | — | | | | — | | | | 186 | | | | — | |
(Sales, maturities and paydowns)/Fundings | | | — | | | | (45,279 | ) | | | — | | | | — | | | | (45,279 | ) | | | 70 | |
Amortization of premiums/discounts | | | (281 | ) | | | 1,952 | | | | — | | | | — | | | | 1,671 | | | | — | |
Corporate actions | | | — | | | | — | | | | 17 | | | | 11,845 | | | | 11,862 | | | | | |
Total realized gains (losses) included in earnings | | | — | | | | (5,119 | ) | | | — | | | | — | | | | (5,119 | ) | | | 283 | |
Total change in unrealized appreciation (depreciation) included in earnings | | | (11,840 | ) | | | 30,004 | | | | (8,135 | ) | | | — | | | | 10,029 | | | | 1,158 | |
Transfers into Level 3 | | | — | | | | 130,455 | | | | — | | | | — | | | | 130,455 | | | | — | |
Transfers out of Level 3 | | | (89,827 | ) | | | (169,577 | ) | | | — | | | | — | | | | (259,404 | ) | | | — | |
Ending Balance | | $ | 18,529 | | | $ | 502,335 | | | $ | 17,171 | | | $ | 11,847 | | | $ | 549,882 | | | $ | — | |
Net change in unrealized appreciation (depreciation) for investments in Level 3 securities still held at June 30, 2023 | | $ | 10,727 | | | $ | 14,437 | | | $ | (8,135 | ) | | $ | — | | | $ | 17,029 | | | $ | — | |
Affiliated Transactions
Investments representing 5% or more of the outstanding voting shares of a company, or control of or by, or common control under Guggenheim Investments, result in that company being considered an affiliated issuer, as defined in the 1940 Act.
Transactions during the period ended June 30, 2023, in which the company is an affiliated issuer, were as follows:
Security Name | | Value
12/31/22 | | | Additions | | | Reductions | | | Realized
Gain (Loss) | | | Change in
Unrealized
Appreciation
(Depreciation) | | | Value
06/30/23 | | | Shares
06/30/23 | |
Common Stocks | | | | | | | | | | | | | | | | | | | | | | | | | | | | |
BP Holdco LLC* | | $ | 317 | | | $ | — | | | $ | — | | | $ | — | | | $ | 355 | | | $ | 672 | | | | 523 | |
* | Non-income producing security. |
96 | THE GUGGENHEIM FUNDS SEMI-ANNUAL REPORT | SEE NOTES TO FINANCIAL STATEMENTS. |
SERIES P (HIGH YIELD SERIES) | |
STATEMENT OF ASSETS AND LIABILITIES (Unaudited) |
June 30, 2023 |
Assets: |
Investments in unaffiliated issuers, at value (cost $35,352,867) | | $ | 30,787,912 | |
Investments in affiliated issuers, at value (cost $185) | | | 672 | |
Cash | | | 851 | |
Prepaid expenses | | | 141 | |
Receivables: |
Interest | | | 468,637 | |
Securities sold | | | 92,747 | |
Foreign tax reclaims | | | 1,215 | |
Fund shares sold | | | 508 | |
Total assets | | | 31,352,683 | |
| | | | | |
Liabilities: |
Reverse repurchase agreements | | | 241,369 | |
Unrealized depreciation on forward foreign currency exchange contracts | | | 5,009 | |
Payable for: |
Securities purchased | | | 143,156 | |
Professional fees | | | 29,651 | |
Distribution and service fees | | | 6,399 | |
Management fees | | | 5,485 | |
Fund shares redeemed | | | 4,139 | |
Transfer agent/maintenance fees | | | 2,095 | |
Fund accounting/administration fees | | | 1,019 | |
Trustees’ fees* | | | 544 | |
Miscellaneous | | | 18,285 | |
Total liabilities | | | 457,151 | |
Net assets | | $ | 30,895,532 | |
| | | | | |
Net assets consist of: |
Paid in capital | | $ | 41,929,465 | |
Total distributable earnings (loss) | | | (11,033,933 | ) |
Net assets | | $ | 30,895,532 | |
Capital shares outstanding | | | 1,273,471 | |
Net asset value per share | | $ | 24.26 | |
STATEMENT OF OPERATIONS (Unaudited) |
Six Months Ended June 30, 2023 |
Investment Income: |
Dividends from unaffiliated issuers | | $ | 6,589 | |
Interest from unaffiliated issuers | | | 1,070,518 | |
Total investment income | | | 1,077,107 | |
| | | | | |
Expenses: |
Management fees | | | 92,249 | |
Distribution and service fees | | | 38,661 | |
Transfer agent/maintenance fees | | | 12,542 | |
Professional fees | | | 32,902 | |
Fund accounting /administration fees | | | 10,763 | |
Trustees’ fees* | | | 6,291 | |
Custodian fees | | | 5,107 | |
Interest expense | | | 4,148 | |
Line of credit fees | | | 1,106 | |
Miscellaneous | | | 5,619 | |
Total expenses | | | 209,388 | |
Less: |
Expenses reimbursed by Adviser | | | (2,315 | ) |
Expenses waived by Adviser | | | (40,799 | ) |
Earnings credits applied | | | (496 | ) |
Total waived/reimbursed expenses | | | (43,610 | ) |
Net expenses | | | 165,778 | |
Net investment income | | | 911,329 | |
| | | | | |
Net Realized and Unrealized Gain (Loss): |
Net realized gain (loss) on: |
Investments in unaffiliated issuers | | | (321,551 | ) |
Forward foreign currency exchange contracts | | | (5,475 | ) |
Foreign currency transactions | | | 281 | |
Net realized loss | | | (326,745 | ) |
Net change in unrealized appreciation (depreciation) on: |
Investments in unaffiliated issuers | | | 811,876 | |
Investments in affiliated issuers | | | 355 | |
Forward foreign currency exchange contracts | | | (10,070 | ) |
Foreign currency translations | | | 52 | |
Net change in unrealized appreciation (depreciation) | | | 802,213 | |
Net realized and unrealized gain | | | 475,468 | |
Net increase in net assets resulting from operations | | $ | 1,386,797 | |
* | Relates to Trustees not deemed “interested persons” within the meaning of Section 2(a)(19) of the 1940 Act. |
SEE NOTES TO FINANCIAL STATEMENTS. | THE GUGGENHEIM FUNDS SEMI-ANNUAL REPORT | 97 |
SERIES P (HIGH YIELD SERIES) | |
STATEMENTS OF CHANGES IN NET ASSETS |
| | Six Months Ended
June 30, 2023
(Unaudited) | | | Year Ended
December 31,
2022 | |
Increase (Decrease) in Net Assets from Operations: | | | | | | | | |
Net investment income | | $ | 911,329 | | | $ | 1,826,267 | |
Net realized loss on investments | | | (326,745 | ) | | | (1,015,877 | ) |
Net change in unrealized appreciation (depreciation) on investments | | | 802,213 | | | | (4,766,138 | ) |
Net increase (decrease) in net assets resulting from operations | | | 1,386,797 | | | | (3,955,748 | ) |
| | | | | | | | | |
Distributions to shareholders | | | — | | | | (2,232,635 | ) |
| | | | | | | | | |
Capital share transactions: | | | | | | | | |
Proceeds from sale of shares | | | 3,551,683 | | | | 9,470,895 | |
Distributions reinvested | | | — | | | | 2,232,635 | |
Cost of shares redeemed | | | (6,361,062 | ) | | | (17,788,963 | ) |
Net decrease from capital share transactions | | | (2,809,379 | ) | | | (6,085,433 | ) |
Net decrease in net assets | | | (1,422,582 | ) | | | (12,273,816 | ) |
| | | | | | | | | |
Net assets: | | | | | | | | |
Beginning of period | | | 32,318,114 | | | | 44,591,930 | |
End of period | | $ | 30,895,532 | | | $ | 32,318,114 | |
| | | | | | | | | |
Capital share activity: | | | | | | | | |
Shares sold | | | 148,451 | | | | 390,216 | |
Shares issued from reinvestment of distributions | | | — | | | | 95,986 | |
Shares redeemed | | | (267,433 | ) | | | (712,105 | ) |
Net decrease in shares | | | (118,982 | ) | | | (225,903 | ) |
98 | THE GUGGENHEIM FUNDS SEMI-ANNUAL REPORT | SEE NOTES TO FINANCIAL STATEMENTS. |
SERIES P (HIGH YIELD SERIES) | |
This table is presented to show selected data for a share outstanding throughout each period and to assist shareholders in evaluating a Fund’s performance for the periods presented.
| | Six Months Ended
June 30, 2023a | | | Year Ended
December 31,
2022 | | | Year Ended
December 31,
2021 | | | Year Ended
December 31,
2020 | | | Year Ended
December 31,
2019 | | | Year Ended
December 31,
2018 | |
Per Share Data |
Net asset value, beginning of period | | $ | 23.21 | | | $ | 27.55 | | | $ | 27.49 | | | $ | 28.39 | | | $ | 27.51 | | | $ | 31.13 | |
Income (loss) from investment operations: |
Net investment income (loss)b | | | .70 | | | | 1.28 | | | | 1.30 | | | | 1.37 | | | | 1.68 | | | | 1.79 | |
Net gain (loss) on investments (realized and unrealized) | | | .35 | | | | (3.95 | ) | | | .18 | | | | (.21 | ) | | | 1.45 | | | | (2.99 | ) |
Total from investment operations | | | 1.05 | | | | (2.67 | ) | | | 1.48 | | | | 1.16 | | | | 3.13 | | | | (1.20 | ) |
Less distributions from: |
Net investment income | | | — | | | | (1.67 | ) | | | (1.42 | ) | | | (2.06 | ) | | | (2.25 | ) | | | (2.42 | ) |
Total distributions | | | — | | | | (1.67 | ) | | | (1.42 | ) | | | (2.06 | ) | | | (2.25 | ) | | | (2.42 | ) |
Net asset value, end of period | | $ | 24.26 | | | $ | 23.21 | | | $ | 27.55 | | | $ | 27.49 | | | $ | 28.39 | | | $ | 27.51 | |
|
Total Returnc | | | 4.52 | % | | | (9.70 | %) | | | 5.41 | % | | | 4.64 | % | | | 11.59 | % | | | (4.16 | %) |
Ratios/Supplemental Data |
Net assets, end of period (in thousands) | | $ | 30,896 | | | $ | 32,318 | | | $ | 44,592 | | | $ | 45,153 | | | $ | 54,288 | | | $ | 52,504 | |
Ratios to average net assets: |
Net investment income (loss) | | | 5.93 | % | | | 5.19 | % | | | 4.70 | % | | | 5.13 | % | | | 5.89 | % | | | 5.98 | % |
Total expensesd | | | 1.36 | % | | | 1.28 | % | | | 1.28 | % | | | 1.38 | % | | | 1.31 | % | | | 1.42 | % |
Net expensese,f,g | | | 1.08 | % | | | 1.07 | % | | | 1.08 | % | | | 1.12 | % | | | 1.10 | % | | | 1.26 | % |
Portfolio turnover rate | | | 12 | % | | | 33 | % | | | 76 | % | | | 84 | % | | | 58 | % | | | 51 | % |
a | Unaudited figures for the period ended June 30, 2023. Percentage amounts for the period, except total return and portfolio turnover rate, have been annualized. |
b | Net investment income (loss) per share was computed using average shares outstanding throughout the period. |
c | Total return does not take into account any of the expenses associated with an investment in variable insurance products. If total return had taken into account these expenses, performance would have been lower. Shares of a series of Guggenheim Variable Funds Trust are available only through the purchase of such products. |
d | Does not include expenses of the underlying funds in which the Fund invests. |
e | Net expense information reflects the expense ratios after expense waivers and reimbursements, as applicable. |
f | The portion of the ratios of net expenses to average net assets attributable to recoupments of prior fee reductions or expense reimbursements for the years presented was as follows: |
| | 06/30/23a | 12/31/22 | 12/31/21 | 12/31/20 | 12/31/19 | 12/31/18 |
| | — | — | — | — | — | 0.00%* |
g | Net expenses may include expenses that are excluded from the expense limitation agreement. Excluding these expenses, the net expense ratios for the years presented would be: |
| | 06/30/23a | 12/31/22 | 12/31/21 | 12/31/20 | 12/31/19 | 12/31/18 |
| | 1.05% | 1.05% | 1.06% | 1.07% | 1.07% | 1.07% |
SEE NOTES TO FINANCIAL STATEMENTS. | THE GUGGENHEIM FUNDS SEMI-ANNUAL REPORT | 99 |
PERFORMANCE REPORT AND FUND PROFILE (Unaudited) | June 30, 2023 |
SERIES Q (SMALL CAP VALUE SERIES)
OBJECTIVE: Seeks long-term capital appreciation.
Holdings Diversification (Market Exposure as % of Net Assets)

“Holdings Diversification (Market Exposure as % of Net Assets)” excludes any temporary cash investments.
Inception Date: May 1, 2000 |
Ten Largest Holdings | % of Total Net Assets |
Pioneer Natural Resources Co. | 3.2% |
iShares Russell 2000 Value ETF | 2.6% |
SPDR S&P Biotech ETF | 2.6% |
Euronet Worldwide, Inc. | 2.2% |
Rush Enterprises, Inc. — Class A | 1.9% |
H&E Equipment Services, Inc. | 1.8% |
OGE Energy Corp. | 1.8% |
MSC Industrial Direct Company, Inc. — Class A | 1.8% |
Encompass Health Corp. | 1.7% |
GATX Corp. | 1.6% |
Top Ten Total | 21.2% |
| | |
“Ten Largest Holdings” excludes any temporary cash investments. |
Average Annual Returns*,†
Periods Ended June 30, 2023
| 6 Month‡ | 1 Year | 5 Year | 10 Year |
Series Q (Small Cap Value Series) | 1.44% | 10.31% | 4.76% | 6.50% |
Russell 2000 Value Index | 2.50% | 6.01% | 3.54% | 7.29% |
* | The performance data above represents past performance that is not predictive of future results. The investment return and principal value of an investment in the Fund will fluctuate so that an investor’s shares, when redeemed, may be worth more or less than their original cost. Returns are historical and include changes in principal and reinvested dividends and capital gains and do not reflect the effect of taxes. The Russell 2000 Value Index is an unmanaged index and, unlike the Fund, has no management fees or operating expenses to reduce its reported return. |
† | Performance figures do not reflect fees and expenses associated with an investment in variable insurance products. If returns had taken into account these fees and expenses, performance would have been lower. Shares of a series of Guggenheim Variable Funds Trust are available only through the purchase of such products. |
‡ | 6 month returns are not annualized. |
100 | THE GUGGENHEIM FUNDS SEMI-ANNUAL REPORT | |
SCHEDULE OF INVESTMENTS (Unaudited) | June 30, 2023 |
SERIES Q (SMALL CAP VALUE SERIES) | |
| | Shares | | | Value | |
COMMON STOCKS† - 93.3% |
| | | | | | | | | |
Financial - 24.5% |
Hancock Whitney Corp. | | | 25,432 | | | $ | 976,080 | |
STAG Industrial, Inc. REIT | | | 22,618 | | | | 811,534 | |
Stifel Financial Corp. | | | 13,103 | | | | 781,856 | |
Physicians Realty Trust REIT | | | 54,266 | | | | 759,181 | |
Old National Bancorp | | | 54,441 | | | | 758,908 | |
Unum Group | | | 15,874 | | | | 757,190 | |
Texas Capital Bancshares, Inc.* | | | 13,731 | | | | 707,146 | |
Banc of California, Inc. | | | 59,918 | | | | 693,851 | |
Cathay General Bancorp | | | 21,370 | | | | 687,900 | |
LXP Industrial Trust REIT | | | 67,059 | | | | 653,825 | |
Axis Capital Holdings Ltd. | | | 12,130 | | | | 652,958 | |
MGIC Investment Corp. | | | 39,769 | | | | 627,952 | |
First Merchants Corp. | | | 21,923 | | | | 618,886 | |
First American Financial Corp. | | | 9,429 | | | | 537,642 | |
Hanmi Financial Corp. | | | 35,569 | | | | 531,045 | |
Prosperity Bancshares, Inc. | | | 8,912 | | | | 503,350 | |
Stewart Information Services Corp. | | | 11,745 | | | | 483,189 | |
Apple Hospitality REIT, Inc. | | | 30,185 | | | | 456,096 | |
Simmons First National Corp. — Class A | | | 23,197 | | | | 400,148 | |
Sunstone Hotel Investors, Inc. REIT | | | 35,434 | | | | 358,592 | |
Old Republic International Corp. | | | 13,251 | | | | 333,528 | |
UMB Financial Corp. | | | 5,372 | | | | 327,155 | |
Synovus Financial Corp. | | | 9,959 | | | | 301,260 | |
Independent Bank Group, Inc. | | | 7,348 | | | | 253,726 | |
United Bankshares, Inc. | | | 8,031 | | | | 238,280 | |
First Hawaiian, Inc. | | | 12,966 | | | | 233,518 | |
United Community Banks, Inc. | | | 8,606 | | | | 215,064 | |
RMR Group, Inc. — Class A | | | 7,220 | | | | 167,287 | |
Piedmont Office Realty Trust, Inc. — Class A REIT | | | 22,755 | | | | 165,429 | |
Heritage Insurance Holdings, Inc.* | | | 24,180 | | | | 93,093 | |
Total Financial | | | | | | | 15,085,669 | |
| | | | | | | | | |
Industrial - 23.3% |
GATX Corp. | | | 7,873 | | | | 1,013,570 | |
Kirby Corp.* | | | 12,130 | | | | 933,404 | |
Arcosa, Inc. | | | 11,657 | | | | 883,251 | |
Summit Materials, Inc. — Class A* | | | 22,256 | | | | 842,390 | |
Knight-Swift Transportation Holdings, Inc. | | | 13,527 | | | | 751,560 | |
Advanced Energy Industries, Inc. | | | 6,700 | | | | 746,715 | |
Daseke, Inc.* | | | 94,908 | | | | 676,694 | |
Moog, Inc. — Class A | | | 6,196 | | | | 671,832 | |
Mercury Systems, Inc.* | | | 18,276 | | | | 632,167 | |
Sonoco Products Co. | | | 10,651 | | | | 628,622 | |
PGT Innovations, Inc.* | | | 21,399 | | | | 623,781 | |
Coherent Corp.* | | | 11,749 | | | | 598,964 | |
Belden, Inc. | | | 5,787 | | | | 553,527 | |
MDU Resources Group, Inc. | | | 26,414 | | | | 553,109 | |
Terex Corp. | | | 9,210 | | | | 551,034 | |
Curtiss-Wright Corp. | | | 2,816 | | | | 517,187 | |
Littelfuse, Inc. | | | 1,753 | | | | 510,666 | |
EnerSys | | | 4,571 | | | | 496,045 | |
Graphic Packaging Holding Co. | | | 19,212 | | | | 461,664 | |
Esab Corp. | | | 6,348 | | | | 422,396 | |
Park Aerospace Corp. | | | 28,528 | | | | 393,686 | |
AZEK Company, Inc.* | | | 11,646 | | | | 352,757 | |
Knife River Corp.* | | | 6,603 | | | | 287,230 | |
Stoneridge, Inc.* | | | 13,470 | | | | 253,910 | |
Total Industrial | | | | | | | 14,356,161 | |
| | | | | | | | | |
Consumer, Cyclical - 11.6% |
Rush Enterprises, Inc. — Class A | | | 19,655 | | | | 1,193,845 | |
H&E Equipment Services, Inc. | | | 24,579 | | | | 1,124,489 | |
MSC Industrial Direct Company, Inc. — Class A | | | 11,510 | | | | 1,096,673 | |
Alaska Air Group, Inc.* | | | 18,927 | | | | 1,006,538 | |
Meritage Homes Corp. | | | 2,973 | | | | 422,969 | |
Methode Electronics, Inc. | | | 10,734 | | | | 359,804 | |
Hawaiian Holdings, Inc.* | | | 31,086 | | | | 334,796 | |
MarineMax, Inc.* | | | 9,293 | | | | 317,449 | |
Lakeland Industries, Inc. | | | 21,184 | | | | 304,838 | |
Whirlpool Corp. | | | 1,956 | | | | 291,033 | |
Leggett & Platt, Inc. | | | 8,870 | | | | 262,729 | |
Macy’s, Inc. | | | 13,170 | | | | 211,378 | |
Newell Brands, Inc. | | | 22,864 | | | | 198,917 | |
Total Consumer, Cyclical | | | | | | | 7,125,458 | |
| | | | | | | | | |
Consumer, Non-cyclical - 11.4% |
Euronet Worldwide, Inc.* | | | 11,618 | | | | 1,363,605 | |
Encompass Health Corp. | | | 15,794 | | | | 1,069,412 | |
Enovis Corp.* | | | 9,240 | | | | 592,469 | |
Central Garden & Pet Co. — Class A* | | | 15,598 | | | | 568,703 | |
Certara, Inc.* | | | 29,643 | | | | 539,799 | |
LivaNova plc* | | | 10,351 | | | | 532,352 | |
Ingredion, Inc. | | | 4,743 | | | | 502,521 | |
ICF International, Inc. | | | 3,175 | | | | 394,938 | |
Addus HomeCare Corp.* | | | 3,305 | | | | 306,373 | |
Integer Holdings Corp.* | | | 2,929 | | | | 259,539 | |
Azenta, Inc.* | | | 5,523 | | | | 257,813 | |
Perdoceo Education Corp.* | | | 20,801 | | | | 255,228 | |
Ironwood Pharmaceuticals, Inc. — Class A* | | | 16,911 | | | | 179,933 | |
Pacira BioSciences, Inc.* | | | 4,408 | | | | 176,629 | |
Total Consumer, Non-cyclical | | | | | | | 6,999,314 | |
| | | | | | | | | |
Energy - 6.7% |
Pioneer Natural Resources Co. | | | 9,473 | | | | 1,962,616 | |
CNX Resources Corp.* | | | 40,226 | | | | 712,805 | |
Murphy Oil Corp. | | | 16,018 | | | | 613,489 | |
Baytex Energy Corp.* | | | 109,016 | | | | 355,392 | |
Diamondback Energy, Inc. | | | 2,120 | | | | 278,483 | |
Patterson-UTI Energy, Inc. | | | 19,446 | | | | 232,769 | |
Total Energy | | | | | | | 4,155,554 | |
| | | | | | | | | |
Technology - 5.2% |
Science Applications International Corp. | | | 7,631 | | | | 858,335 | |
Amkor Technology, Inc. | | | 25,193 | | | | 749,492 | |
MACOM Technology Solutions Holdings, Inc.* | | | 8,201 | | | | 537,411 | |
Power Integrations, Inc. | | | 4,139 | | | | 391,839 | |
Silicon Laboratories, Inc.* | | | 2,327 | | | | 367,061 | |
SEE NOTES TO FINANCIAL STATEMENTS. | THE GUGGENHEIM FUNDS SEMI-ANNUAL REPORT | 101 |
SCHEDULE OF INVESTMENTS (Unaudited)(continued) | June 30, 2023 |
SERIES Q (SMALL CAP VALUE SERIES) | |
| | Shares | | | Value | |
Conduent, Inc.* | | | 95,977 | | | $ | 326,322 | |
Total Technology | | | | | | | 3,230,460 | |
| | | | | | | | | |
Utilities - 5.1% |
OGE Energy Corp. | | | 30,576 | | | | 1,097,984 | |
Black Hills Corp. | | | 14,699 | | | | 885,762 | |
Spire, Inc. | | | 7,249 | | | | 459,877 | |
Avista Corp. | | | 9,559 | | | | 375,382 | |
ALLETE, Inc. | | | 5,769 | | | | 334,429 | |
Total Utilities | | | | | | | 3,153,434 | |
| | | | | | | | | |
Basic Materials - 4.0% |
Huntsman Corp. | | | 28,622 | | | | 773,366 | |
Avient Corp. | | | 17,177 | | | | 702,539 | |
Ashland, Inc. | | | 6,259 | | | | 543,970 | |
Commercial Metals Co. | | | 8,977 | | | | 472,729 | |
Total Basic Materials | | | | | | | 2,492,604 | |
| | | | | | | | | |
Communications - 1.5% |
Ciena Corp.* | | | 9,083 | | | | 385,937 | |
TEGNA, Inc. | | | 19,791 | | | | 321,406 | |
Gray Television, Inc. | | | 25,944 | | | | 204,438 | |
Total Communications | | | | | | | 911,781 | |
| | | | | | | | | |
Total Common Stocks | | | | |
(Cost $54,282,921) | | | | | | | 57,510,435 | |
| | | | | | | | | |
CONVERTIBLE PREFERRED STOCKS††† - 0.0% |
Industrial - 0.0% |
Thermoenergy Corp.*,1 | | | 116,667 | | | | — | |
| | | | | | | | | |
Total Convertible Preferred Stocks | | | | |
(Cost $111,410) | | | | | | | — | |
| | | | | | | | | |
RIGHTS† - 0.0% |
Basic Materials - 0.0% |
Pan American Silver Corp.* | | | 81,258 | | | | 41,450 | |
Total Rights | | | | |
(Cost $—) | | | | | | | 41,450 | |
| | | | | | | | | |
EXCHANGE-TRADED FUNDS† - 5.2% |
iShares Russell 2000 Value ETF | | | 11,483 | | | | 1,616,806 | |
SPDR S&P Biotech ETF | | | 18,880 | | | | 1,570,816 | |
Total Exchange-Traded Funds | | | | |
(Cost $2,835,621) | | | | | | | 3,187,622 | |
| | | | | | | | | |
MONEY MARKET FUND† - 2.7% |
Dreyfus Treasury Securities Cash Management Fund — Institutional Shares, 4.96%2 | | | 1,660,236 | | | | 1,660,236 | |
Total Money Market Fund | | | | |
(Cost $1,660,236) | | | | | | | 1,660,236 | |
| | | | | | | | | |
Total Investments - 101.2% | | | | |
(Cost $58,890,188) | | $ | 62,399,743 | |
Other Assets & Liabilities, net - (1.2)% | | | (760,368 | ) |
Total Net Assets - 100.0% | | $ | 61,639,375 | |
* | Non-income producing security. |
† | Value determined based on Level 1 inputs — See Note 4. |
††† | Value determined based on Level 3 inputs — See Note 4. |
1 | PIPE (Private Investment in Public Equity) — Stock issued by a company in the secondary market as a means of raising capital more quickly and less expensively than through registration of a secondary public offering. |
2 | Rate indicated is the 7-day yield as of June 30, 2023. |
| | plc — Public Limited Company |
| | REIT — Real Estate Investment Trust |
| | |
| | See Sector Classification in Other Information section. |
102 | THE GUGGENHEIM FUNDS SEMI-ANNUAL REPORT | SEE NOTES TO FINANCIAL STATEMENTS. |
SCHEDULE OF INVESTMENTS (Unaudited)(concluded) | June 30, 2023 |
SERIES Q (SMALL CAP VALUE SERIES) | |
The following table summarizes the inputs used to value the Fund’s investments at June 30, 2023 (See Note 4 in the Notes to Financial Statements):
Investments in Securities (Assets) | | Level 1
Quoted
Prices | | | Level 2
Significant
Observable
Inputs | | | Level 3
Significant
Unobservable
Inputs | | | Total | |
Common Stocks | | $ | 57,510,435 | | | $ | — | | | $ | — | | | $ | 57,510,435 | |
Convertible Preferred Stocks | | | — | | | | — | | | | — | * | | | — | |
Rights | | | 41,450 | | | | — | | | | — | | | | 41,450 | |
Exchange-Traded Funds | | | 3,187,622 | | | | — | | | | — | | | | 3,187,622 | |
Money Market Fund | | | 1,660,236 | | | | — | | | | — | | | | 1,660,236 | |
Total Assets | | $ | 62,399,743 | | | $ | — | | | $ | — | | | $ | 62,399,743 | |
* | Security has a market value of $0. |
SEE NOTES TO FINANCIAL STATEMENTS. | THE GUGGENHEIM FUNDS SEMI-ANNUAL REPORT | 103 |
SERIES Q (SMALL CAP VALUE SERIES) | |
STATEMENT OF ASSETS AND LIABILITIES (Unaudited) |
June 30, 2023 |
Assets: |
Investments, at value (cost $58,890,188) | | $ | 62,399,743 | |
Prepaid expenses | | | 135 | |
Receivables: |
Securities sold | | | 279,486 | |
Dividends | | | 83,978 | |
Interest | | | 6,477 | |
Total assets | | | 62,769,819 | |
| | | | | |
Liabilities: |
Payable for: |
Securities purchased | | | 933,963 | |
Fund shares redeemed | | | 122,083 | |
Management fees | | | 33,914 | |
Distribution and service fees | | | 12,475 | |
Transfer agent/maintenance fees | | | 2,063 | |
Fund accounting/administration fees | | | 1,519 | |
Trustees’ fees* | | | 1,351 | |
Miscellaneous | | | 23,076 | |
Total liabilities | | | 1,130,444 | |
Net assets | | $ | 61,639,375 | |
| | | | | |
Net assets consist of: |
Paid in capital | | $ | 50,238,347 | |
Total distributable earnings (loss) | | | 11,401,028 | |
Net assets | | $ | 61,639,375 | |
Capital shares outstanding | | | 1,436,769 | |
Net asset value per share | | $ | 42.90 | |
STATEMENT OF OPERATIONS (Unaudited) |
Six Months Ended June 30, 2023 |
Investment Income: |
Dividends | | $ | 698,566 | |
Interest | | | 39,747 | |
Total investment income | | | 738,313 | |
| | | | | |
Expenses: |
Management fees | | | 232,909 | |
Distribution and service fees | | | 77,636 | |
Transfer agent/maintenance fees | | | 12,562 | |
Professional fees | | | 20,134 | |
Fund accounting/administration fees | | | 17,190 | |
Trustees’ fees* | | | 7,032 | |
Custodian fees | | | 1,822 | |
Line of credit fees | | | 1,048 | |
Miscellaneous | | | 6,624 | |
Total expenses | | | 376,957 | |
Less: |
Expenses waived by Adviser | | | (31,514 | ) |
Net expenses | | | 345,443 | |
Net investment income | | | 392,870 | |
| | | | | |
Net Realized and Unrealized Gain (Loss): |
Net realized gain (loss) on: |
Investments | | | 2,806,204 | |
Net realized gain | | | 2,806,204 | |
Net change in unrealized appreciation (depreciation) on: |
Investments | | | (2,288,324 | ) |
Net change in unrealized appreciation (depreciation) | | | (2,288,324 | ) |
Net realized and unrealized gain | | | 517,880 | |
Net increase in net assets resulting from operations | | $ | 910,750 | |
* | Relates to Trustees not deemed “interested persons” within the meaning of Section 2(a)(19) of the 1940 Act. |
104 | THE GUGGENHEIM FUNDS SEMI-ANNUAL REPORT | SEE NOTES TO FINANCIAL STATEMENTS. |
SERIES Q (SMALL CAP VALUE SERIES) | |
STATEMENTS OF CHANGES IN NET ASSETS |
| | Six Months Ended
June 30, 2023
(Unaudited) | | | Year Ended
December 31,
2022 | |
Increase (Decrease) in Net Assets from Operations: | | | | | | | | |
Net investment income | | $ | 392,870 | | | $ | 789,210 | |
Net realized gain on investments | | | 2,806,204 | | | | 4,703,199 | |
Net change in unrealized appreciation (depreciation) on investments | | | (2,288,324 | ) | | | (8,393,736 | ) |
Net increase (decrease) in net assets resulting from operations | | | 910,750 | | | | (2,901,327 | ) |
| | | | | | | | | |
Distributions to shareholders | | | — | | | | (3,785,119 | ) |
| | | | | | | | | |
Capital share transactions: | | | | | | | | |
Proceeds from sale of shares | | | 1,836,585 | | | | 5,461,906 | |
Distributions reinvested | | | — | | | | 3,785,119 | |
Cost of shares redeemed | | | (5,491,736 | ) | | | (12,013,440 | ) |
Net decrease from capital share transactions | | | (3,655,151 | ) | | | (2,766,415 | ) |
Net decrease in net assets | | | (2,744,401 | ) | | | (9,452,861 | ) |
| | | | | | | | | |
Net assets: | | | | | | | | |
Beginning of period | | | 64,383,776 | | | | 73,836,637 | |
End of period | | $ | 61,639,375 | | | $ | 64,383,776 | |
| | | | | | | | | |
Capital share activity: | | | | | | | | |
Shares sold | | | 43,301 | | | | 124,259 | |
Shares issued from reinvestment of distributions | | | — | | | | 93,460 | |
Shares redeemed | | | (129,089 | ) | | | (276,335 | ) |
Net decrease in shares | | | (85,788 | ) | | | (58,616 | ) |
SEE NOTES TO FINANCIAL STATEMENTS. | THE GUGGENHEIM FUNDS SEMI-ANNUAL REPORT | 105 |
SERIES Q (SMALL CAP VALUE SERIES) | |
This table is presented to show selected data for a share outstanding throughout each period and to assist shareholders in evaluating a Fund’s performance for the periods presented.
| | Six Months Ended
June 30, 2023a | | | Year Ended
December 31,
2022 | | | Year Ended
December 31,
2021 | | | Year Ended
December 31,
2020 | | | Year Ended
December 31,
2019 | | | Year Ended
December 31,
2018 | |
Per Share Data |
Net asset value, beginning of period | | $ | 42.29 | | | $ | 46.70 | | | $ | 37.30 | | | $ | 41.39 | | | $ | 36.18 | | | $ | 45.89 | |
Income (loss) from investment operations: |
Net investment income (loss)b | | | .27 | | | | .51 | | | | .27 | | | | .32 | | | | .32 | | | | .30 | |
Net gain (loss) on investments (realized and unrealized) | | | .34 | | | | (2.37 | ) | | | 9.47 | | | | (1.36 | ) | | | 7.62 | | | | (5.28 | ) |
Total from investment operations | | | .61 | | | | (1.86 | ) | | | 9.74 | | | | (1.04 | ) | | | 7.94 | | | | (4.98 | ) |
Less distributions from: |
Net investment income | | | — | | | | (.31 | ) | | | (.34 | ) | | | (.37 | ) | | | (.33 | ) | | | (.16 | ) |
Net realized gains | | | — | | | | (2.24 | ) | | | — | | | | (2.68 | ) | | | (2.40 | ) | | | (4.57 | ) |
Total distributions | | | — | | | | (2.55 | ) | | | (.34 | ) | | | (3.05 | ) | | | (2.73 | ) | | | (4.73 | ) |
Net asset value, end of period | | $ | 42.90 | | | $ | 42.29 | | | $ | 46.70 | | | $ | 37.30 | | | $ | 41.39 | | | $ | 36.18 | |
|
Total Returnc | | | 1.44 | % | | | (3.74 | %) | | | 26.18 | % | | | (0.97 | %) | | | 22.58 | % | | | (12.66 | %) |
Ratios/Supplemental Data |
Net assets, end of period (in thousands) | | $ | 61,639 | | | $ | 64,384 | | | $ | 73,837 | | | $ | 64,418 | | | $ | 74,015 | | | $ | 68,349 | |
Ratios to average net assets: |
Net investment income (loss) | | | 1.27 | % | | | 1.17 | % | | | 0.61 | % | | | 0.97 | % | | | 0.80 | % | | | 0.68 | % |
Total expensesd | | | 1.21 | % | | | 1.21 | % | | | 1.21 | % | | | 1.29 | % | | | 1.29 | % | | | 1.26 | % |
Net expensese,f | | | 1.11 | % | | | 1.12 | % | | | 1.13 | % | | | 1.14 | % | | | 1.14 | % | | | 1.14 | % |
Portfolio turnover rate | | | 14 | % | | | 38 | % | | | 32 | % | | | 32 | % | | | 54 | % | | | 37 | % |
a | Unaudited figures for the period ended June 30, 2023. Percentage amounts for the period, except total return and portfolio turnover rate, have been annualized. |
b | Net investment income (loss) per share was computed using average shares outstanding throughout the period. |
c | Total return does not take into account any of the expenses associated with an investment in variable insurance products. If total return had taken into account these expenses, performance would have been lower. Shares of a series of Guggenheim Variable Funds Trust are available only through the purchase of such products. |
d | Does not include expenses of the underlying funds in which the Fund invests. |
e | Net expense information reflects the expense ratios after expense waivers and reimbursements, as applicable. |
f | Net expenses may include expenses that are excluded from the expense limitation agreement. Excluding these expenses, the net expense ratios for the years presented would be: |
| | 06/30/23a | 12/31/22 | 12/31/21 | 12/31/20 | 12/31/19 | 12/31/18 |
| | 1.11% | 1.12% | 1.13% | 1.13% | 1.14% | 1.14% |
106 | THE GUGGENHEIM FUNDS SEMI-ANNUAL REPORT | SEE NOTES TO FINANCIAL STATEMENTS. |
PERFORMANCE REPORT AND FUND PROFILE (Unaudited) | June 30, 2023 |
SERIES V (SMID CAP VALUE SERIES)
OBJECTIVE: Seeks long-term growth of capital.
Holdings Diversification (Market Exposure as % of Net Assets)
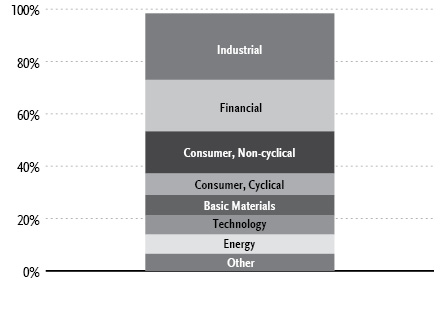
“Holdings Diversification (Market Exposure as % of Net Assets)” excludes any temporary cash investments.
Inception Date: May 1, 1997 |
Ten Largest Holdings | % of Total Net Assets |
Pioneer Natural Resources Co. | 4.0% |
Unum Group | 2.8% |
Ingredion, Inc. | 2.4% |
Euronet Worldwide, Inc. | 2.0% |
Bunge Ltd. | 2.0% |
MSC Industrial Direct Company, Inc. — Class A | 1.9% |
Pinnacle West Capital Corp. | 1.8% |
Kirby Corp. | 1.8% |
Teradyne, Inc. | 1.7% |
OGE Energy Corp. | 1.7% |
Top Ten Total | 22.1% |
| | |
“Ten Largest Holdings” excludes any temporary cash investments. |
Average Annual Returns*,†
Periods Ended June 30, 2023
| 6 Month‡ | 1 Year | 5 Year | 10 Year |
Series V (SMid Cap Value Series) | 3.75% | 12.93% | 6.79% | 8.53% |
Russell 2500 Value Index | 5.83% | 10.37% | 5.32% | 8.02% |
* | The performance data above represents past performance that is not predictive of future results. The investment return and principal value of an investment in the Fund will fluctuate so that an investor’s shares, when redeemed, may be worth more or less than their original cost. Returns are historical and include changes in principal and reinvested dividends and capital gains and do not reflect the effect of taxes. The Russell 2500 Value Index is an unmanaged index and, unlike the Fund, has no management fees or operating expenses to reduce its reported return. |
† | Performance figures do not reflect fees and expenses associated with an investment in variable insurance products. If returns had taken into account these fees and expenses, performance would have been lower. Shares of a series of Guggenheim Variable Funds Trust are available only through the purchase of such products. |
‡ | 6 month returns are not annualized. |
| | THE GUGGENHEIM FUNDS SEMI-ANNUAL REPORT | 107 |
SCHEDULE OF INVESTMENTS (Unaudited) | June 30, 2023 |
SERIES V (SMID CAP VALUE SERIES) | |
| | Shares | | | Value | |
COMMON STOCKS† - 98.4% |
| | | | | | | | | |
Industrial - 25.4% |
Kirby Corp.* | | | 37,063 | | | $ | 2,851,998 | |
Curtiss-Wright Corp. | | | 15,343 | | | | 2,817,895 | |
Graphic Packaging Holding Co. | | | 113,754 | | | | 2,733,508 | |
Knight-Swift Transportation Holdings, Inc. | | | 42,599 | | | | 2,366,800 | |
Littelfuse, Inc. | | | 8,066 | | | | 2,349,707 | |
Summit Materials, Inc. — Class A* | | | 58,969 | | | | 2,231,977 | |
Johnson Controls International plc | | | 31,250 | | | | 2,129,375 | |
PGT Innovations, Inc.* | | | 68,573 | | | | 1,998,903 | |
Advanced Energy Industries, Inc. | | | 17,827 | | | | 1,986,819 | |
Teledyne Technologies, Inc.* | | | 4,806 | | | | 1,975,794 | |
Daseke, Inc.* | | | 244,873 | | | | 1,745,945 | |
Arcosa, Inc. | | | 23,028 | | | | 1,744,832 | |
Coherent Corp.* | | | 30,351 | | | | 1,547,294 | |
MDU Resources Group, Inc. | | | 67,949 | | | | 1,422,852 | |
GATX Corp. | | | 11,044 | | | | 1,421,805 | |
Terex Corp. | | | 23,685 | | | | 1,417,074 | |
EnerSys | | | 11,333 | | | | 1,229,857 | |
Esab Corp. | | | 17,760 | | | | 1,181,750 | |
Park Aerospace Corp. | | | 73,696 | | | | 1,017,005 | |
Plexus Corp.* | | | 9,638 | | | | 946,837 | |
AZEK Company, Inc.* | | | 30,856 | | | | 934,628 | |
Mercury Systems, Inc.* | | | 26,161 | | | | 904,909 | |
Sonoco Products Co. | | | 14,545 | | | | 858,446 | |
Knife River Corp.* | | | 16,987 | | | | 738,934 | |
Stoneridge, Inc.* | | | 34,863 | | | | 657,168 | |
Total Industrial | | | | | | | 41,212,112 | |
| | | | | | | | | |
Financial - 19.7% |
Unum Group | | | 94,220 | | | | 4,494,294 | |
Prosperity Bancshares, Inc. | | | 44,851 | | | | 2,533,184 | |
Stifel Financial Corp. | | | 34,421 | | | | 2,053,901 | |
Old Republic International Corp. | | | 75,587 | | | | 1,902,525 | |
Texas Capital Bancshares, Inc.* | | | 35,000 | | | | 1,802,500 | |
Jefferies Financial Group, Inc. | | | 50,911 | | | | 1,688,718 | |
Axis Capital Holdings Ltd. | | | 29,809 | | | | 1,604,619 | |
First Merchants Corp. | | | 56,292 | | | | 1,589,123 | |
Physicians Realty Trust REIT | | | 112,327 | | | | 1,571,455 | |
Sun Communities, Inc. REIT | | | 10,576 | | | | 1,379,745 | |
First American Financial Corp. | | | 24,171 | | | | 1,378,230 | |
Alexandria Real Estate Equities, Inc. REIT | | | 11,382 | | | | 1,291,743 | |
Markel Group, Inc.* | | | 907 | | | | 1,254,544 | |
Apple Hospitality REIT, Inc. | | | 82,613 | | | | 1,248,282 | |
Ventas, Inc. REIT | | | 25,543 | | | | 1,207,418 | |
Gaming and Leisure Properties, Inc. REIT | | | 19,571 | | | | 948,411 | |
UMB Financial Corp. | | | 14,293 | | | | 870,444 | |
Stewart Information Services Corp. | | | 20,658 | | | | 849,870 | |
Synovus Financial Corp. | | | 25,840 | | | | 781,660 | |
Hancock Whitney Corp. | | | 18,175 | | | | 697,556 | |
United Bankshares, Inc. | | | 20,753 | | | | 615,742 | |
Heritage Insurance Holdings, Inc.* | | | 61,534 | | | | 236,906 | |
Total Financial | | | | | | | 32,000,870 | |
| | | | | | | | | |
Consumer, Non-cyclical - 16.1% |
Ingredion, Inc. | | | 36,948 | | | | 3,914,641 | |
Euronet Worldwide, Inc.* | | | 28,040 | | | | 3,291,055 | |
Bunge Ltd. | | | 34,152 | | | | 3,222,241 | |
Encompass Health Corp. | | | 40,473 | | | | 2,740,427 | |
Henry Schein, Inc.* | | | 25,168 | | | | 2,041,125 | |
Integer Holdings Corp.* | | | 22,585 | | | | 2,001,257 | |
Enovis Corp.* | | | 27,084 | | | | 1,736,626 | |
Central Garden & Pet Co. — Class A* | | | 43,114 | | | | 1,571,936 | |
ICF International, Inc. | | | 8,167 | | | | 1,015,893 | |
Quest Diagnostics, Inc. | | | 6,475 | | | | 910,126 | |
LivaNova plc* | | | 16,420 | | | | 844,480 | |
Certara, Inc.* | | | 45,799 | | | | 834,000 | |
Azenta, Inc.* | | | 14,247 | | | | 665,050 | |
Ironwood Pharmaceuticals, Inc. — Class A* | | | 42,997 | | | | 457,488 | |
Pacira BioSciences, Inc.* | | | 11,211 | | | | 449,225 | |
Jazz Pharmaceuticals plc* | | | 3,354 | | | | 415,795 | |
Total Consumer, Non-cyclical | | | | | | | 26,111,365 | |
| | | | | | | | | |
Consumer, Cyclical - 8.3% |
MSC Industrial Direct Company, Inc. — Class A | | | 32,069 | | | | 3,055,534 | |
H&E Equipment Services, Inc. | | | 58,057 | | | | 2,656,108 | |
Whirlpool Corp. | | | 11,994 | | | | 1,784,587 | |
Alaska Air Group, Inc.* | | | 32,117 | | | | 1,707,982 | |
Methode Electronics, Inc. | | | 28,441 | | | | 953,342 | |
Lear Corp. | | | 6,168 | | | | 885,417 | |
Meritage Homes Corp. | | | 5,181 | | | | 737,101 | |
Leggett & Platt, Inc. | | | 22,402 | | | | 663,547 | |
Lakeland Industries, Inc. | | | 35,963 | | | | 517,508 | |
Newell Brands, Inc. | | | 59,067 | | | | 513,883 | |
Total Consumer, Cyclical | | | | | | | 13,475,009 | |
| | | | | | | | | |
Basic Materials - 7.8% |
Westlake Corp. | | | 23,085 | | | | 2,757,965 | |
Reliance Steel & Aluminum Co. | | | 9,335 | | | | 2,535,293 | |
Huntsman Corp. | | | 80,652 | | | | 2,179,217 | |
Avient Corp. | | | 46,496 | | | | 1,901,686 | |
Nucor Corp. | | | 10,390 | | | | 1,703,752 | |
Ashland, Inc. | | | 17,628 | | | | 1,532,050 | |
Total Basic Materials | | | | | | | 12,609,963 | |
| | | | | | | | | |
Technology - 7.3% |
Teradyne, Inc. | | | 25,467 | | | | 2,835,241 | |
Evolent Health, Inc. — Class A* | | | 88,522 | | | | 2,682,217 | |
Science Applications International Corp. | | | 22,524 | | | | 2,533,500 | |
Leidos Holdings, Inc. | | | 19,309 | | | | 1,708,460 | |
MACOM Technology Solutions Holdings, Inc.* | | | 21,155 | | | | 1,386,287 | |
Silicon Laboratories, Inc.* | | | 4,715 | | | | 743,744 | |
Total Technology | | | | | | | 11,889,449 | |
| | | | | | | | | |
Energy - 7.3% |
Pioneer Natural Resources Co. | | | 30,929 | | | | 6,407,870 | |
Diamondback Energy, Inc. | | | 16,878 | | | | 2,217,094 | |
Equities Corp. | | | 22,223 | | | | 914,032 | |
108 | THE GUGGENHEIM FUNDS SEMI-ANNUAL REPORT | SEE NOTES TO FINANCIAL STATEMENTS. |
SCHEDULE OF INVESTMENTS (Unaudited)(continued) | June 30, 2023 |
SERIES V (SMID CAP VALUE SERIES) | |
| | Shares | | | Value | |
Murphy Oil Corp. | | | 21,592 | | | $ | 826,974 | |
Kinder Morgan, Inc. | | | 47,986 | | | | 826,319 | |
Patterson-UTI Energy, Inc. | | | 49,799 | | | | 596,094 | |
HydroGen Corp.*,†††,1 | | | 672,346 | | | | 1 | |
Total Energy | | | | | | | 11,788,384 | |
| | | | | | | | | |
Utilities - 4.4% |
Pinnacle West Capital Corp. | | | 35,510 | | | | 2,892,643 | |
OGE Energy Corp. | | | 78,870 | | | | 2,832,222 | |
Black Hills Corp. | | | 22,184 | | | | 1,336,808 | |
Total Utilities | | | | | | | 7,061,673 | |
| | | | | | | | | |
Communications - 2.1% |
Fox Corp. — Class B | | | 53,446 | | | | 1,704,393 | |
Ciena Corp.* | | | 38,843 | | | | 1,650,439 | |
Total Communications | | | | | | | 3,354,832 | |
| | | | | | | | | |
Total Common Stocks | | | | |
(Cost $137,297,115) | | | | | | | 159,503,657 | |
| | | | | | | | | |
CONVERTIBLE PREFERRED STOCKS††† - 0.0% |
Industrial - 0.0% |
Thermoenergy Corp.*,2 | | | 308,333 | | | | 1 | |
| | | | | | | | | |
Total Convertible Preferred Stocks | | | | |
(Cost $294,439) | | | | | | | 1 | |
| | | | | | | | | |
RIGHTS† - 0.1% |
Basic Materials - 0.1% |
Pan American Silver Corp.* | | | 220,317 | | | $ | 112,384 | |
Total Rights | | | | |
(Cost $—) | | | | | | | 112,384 | |
| | | | | | | | | |
MONEY MARKET FUND† - 1.1% |
Dreyfus Treasury Securities Cash Management Fund — Institutional Shares, 4.96%3 | | | 1,708,487 | | | | 1,708,487 | |
Total Money Market Fund | | | | |
(Cost $1,708,487) | | | | | | | 1,708,487 | |
| | | | | | | | | |
Total Investments - 99.6% | | | | |
(Cost $139,300,041) | | $ | 161,324,529 | |
Other Assets & Liabilities, net - 0.4% | | | 697,725 | |
Total Net Assets - 100.0% | | $ | 162,022,254 | |
* | Non-income producing security. |
† | Value determined based on Level 1 inputs, unless otherwise noted — See Note 4. |
††† | Value determined based on Level 3 inputs — See Note 4. |
1 | Affiliated issuer. |
2 | PIPE (Private Investment in Public Equity) — Stock issued by a company in the secondary market as a means of raising capital more quickly and less expensively than through registration of a secondary public offering. |
3 | Rate indicated is the 7-day yield as of June 30, 2023. |
| | plc — Public Limited Company |
| | REIT — Real Estate Investment Trust |
| | |
| | See Sector Classification in Other Information section. |
SEE NOTES TO FINANCIAL STATEMENTS. | THE GUGGENHEIM FUNDS SEMI-ANNUAL REPORT | 109 |
SCHEDULE OF INVESTMENTS (Unaudited)(concluded) | June 30, 2023 |
SERIES V (SMID CAP VALUE SERIES) | |
The following table summarizes the inputs used to value the Fund’s investments at June 30, 2023 (See Note 4 in the Notes to Financial Statements):
Investments in Securities (Assets) | | Level 1
Quoted
Prices | | | Level 2
Significant
Observable
Inputs | | | Level 3
Significant
Unobservable
Inputs | | | Total | |
Common Stocks | | $ | 159,503,656 | | | $ | — | | | $ | 1 | | | $ | 159,503,657 | |
Convertible Preferred Stocks | | | — | | | | — | | | | 1 | | | | 1 | |
Rights | | | 112,384 | | | | — | | | | — | | | | 112,384 | |
Money Market Fund | | | 1,708,487 | | | | — | | | | — | | | | 1,708,487 | |
Total Assets | | $ | 161,324,527 | | | $ | — | | | $ | 2 | | | $ | 161,324,529 | |
Affiliated Transactions
Investments representing 5% or more of the outstanding voting shares of a company, or control of or by, or common control under Guggenheim Investments, result in that company being considered an affiliated issuer, as defined in the 1940 Act.
Transactions during the period ended June 30, 2023, in which the company is an affiliated issuer, were as follows:
Security Name | | Value
12/31/22 | | | Additions | | | Reductions | | | Realized
Gain (Loss) | | | Change in
Unrealized
Appreciation
(Depreciation) | | | Value
06/30/23 | | | Shares
06/30/23 | | | Investment
Income | |
Common Stocks | | | | | | | | | | | | | | | | | | | | | | | | | | | | | | | | |
HydroGen Corp. * | | $ | 1 | | | $ | — | | | $ | — | | | $ | — | | | $ | — | | | $ | 1 | | | | 672,346 | | | $ | — | |
* | Non-income producing security. |
110 | THE GUGGENHEIM FUNDS SEMI-ANNUAL REPORT | SEE NOTES TO FINANCIAL STATEMENTS. |
SERIES V (SMID CAP VALUE SERIES) | |
STATEMENT OF ASSETS AND LIABILITIES (Unaudited) |
June 30, 2023 |
Assets: |
Investments in unaffiliated issuers,at value (cost $136,728,466) | | $ | 161,324,528 | |
Investments in affiliated issuers, at value (cost $2,571,575) | | | 1 | |
Prepaid expenses | | | 596 | |
Receivables: |
Securities sold | | | 701,256 | |
Dividends | | | 212,567 | |
Interest | | | 3,103 | |
Fund shares sold | | | 124 | |
Total assets | | | 162,242,175 | |
| | | | | |
Liabilities: |
Overdraft due to custodian bank | | | 124 | |
Payable for: |
Fund shares redeemed | | | 95,532 | |
Management fees | | | 63,628 | |
Distribution and service fees | | | 32,425 | |
Professional fees | | | 12,123 | |
Transfer agent/maintenance fees | | | 2,365 | |
Fund accounting/administration fees | | | 1,989 | |
Trustees’ fees* | | | 1,126 | |
Miscellaneous | | | 10,609 | |
Total liabilities | | | 219,921 | |
Net assets | | $ | 162,022,254 | |
| | | | | |
Net assets consist of: |
Paid in capital | | $ | 123,066,396 | |
Total distributable earnings (loss) | | | 38,955,858 | |
Net assets | | $ | 162,022,254 | |
Capital shares outstanding | | | 2,179,136 | |
Net asset value per share | | $ | 74.35 | |
STATEMENT OF OPERATIONS (Unaudited) |
Six Months Ended June 30, 2023 |
Investment Income: |
Dividends from securities of unaffiliated issuers | | $ | 1,832,197 | |
Interest | | | 59,791 | |
Total investment income | | | 1,891,988 | |
| | | | | |
Expenses: |
Management fees | | | 607,184 | |
Distribution and service fees | | | 202,395 | |
Transfer agent/maintenance fees | | | 12,401 | |
Fund accounting/administration fees | | | 37,639 | |
Professional fees | | | 23,464 | |
Trustees’ fees* | | | 8,977 | |
Line of credit fees | | | 2,691 | |
Custodian fees | | | 1,736 | |
Miscellaneous | | | 9,882 | |
Total expenses | | | 906,369 | |
Less: |
Expenses reimbursed by Adviser | | | (853 | ) |
Expenses waived by Adviser | | | (191,203 | ) |
Total waived/reimbursed expenses | | | (192,056 | ) |
Net expenses | | | 714,313 | |
Net investment income | | | 1,177,675 | |
| | | | | |
Net Realized and Unrealized Gain (Loss): |
Net realized gain (loss) on: |
Investments in unaffiliated issuers | | | 2,127,109 | |
Net realized gain | | | 2,127,109 | |
Net change in unrealized appreciation (depreciation) on: |
Investments in unaffiliated issuers | | | 2,713,004 | |
Net change in unrealized appreciation (depreciation) | | | 2,713,004 | |
Net realized and unrealized gain | | | 4,840,113 | |
Net increase in net assets resulting from operations | | $ | 6,017,788 | |
* | Relates to Trustees not deemed “interested persons” within the meaning of Section 2(a)(19) of the 1940 Act. |
SEE NOTES TO FINANCIAL STATEMENTS. | THE GUGGENHEIM FUNDS SEMI-ANNUAL REPORT | 111 |
SERIES V (SMID CAP VALUE SERIES) | |
STATEMENTS OF CHANGES IN NET ASSETS |
| | Six Months Ended
June 30, 2023
(Unaudited) | | | Year Ended
December 31,
2022 | |
Increase (Decrease) in Net Assets from Operations: | | | | | | | | |
Net investment income | | $ | 1,177,675 | | | $ | 2,330,277 | |
Net realized gain on investments | | | 2,127,109 | | | | 13,613,515 | |
Net change in unrealized appreciation (depreciation) on investments | | | 2,713,004 | | | | (19,694,434 | ) |
Net increase (decrease) in net assets resulting from operations | | | 6,017,788 | | | | (3,750,642 | ) |
| | | | | | | | | |
Distributions to shareholders | | | — | | | | (20,034,393 | ) |
| | | | | | | | | |
Capital share transactions: | | | | | | | | |
Proceeds from sale of shares | | | 1,827,887 | | | | 3,018,349 | |
Distributions reinvested | | | — | | | | 20,034,393 | |
Cost of shares redeemed | | | (10,891,586 | ) | | | (21,572,513 | ) |
Net increase (decrease) from capital share transactions | | | (9,063,699 | ) | | | 1,480,229 | |
Net decrease in net assets | | | (3,045,911 | ) | | | (22,304,806 | ) |
| | | | | | | | | |
Net assets: | | | | | | | | |
Beginning of period | | | 165,068,165 | | | | 187,372,971 | |
End of period | | $ | 162,022,254 | | | $ | 165,068,165 | |
| | | | | | | | | |
Capital share activity: | | | | | | | | |
Shares sold | | | 24,929 | | | | 39,400 | |
Shares issued from reinvestment of distributions | | | — | | | | 293,201 | |
Shares redeemed | | | (149,320 | ) | | | (283,522 | ) |
Net increase (decrease) in shares | | | (124,391 | ) | | | 49,079 | |
112 | THE GUGGENHEIM FUNDS SEMI-ANNUAL REPORT | SEE NOTES TO FINANCIAL STATEMENTS. |
SERIES V (SMID CAP VALUE SERIES) | |
This table is presented to show selected data for a share outstanding throughout each period and to assist shareholders in evaluating a Fund’s performance for the periods presented.
| | Six Months Ended
June 30, 2023a | | | Year Ended
December 31,
2022 | | | Year Ended
December 31,
2021 | | | Year Ended
December 31,
2020 | | | Year Ended
December 31,
2019 | | | Year Ended
December 31,
2018 | |
Per Share Data |
Net asset value, beginning of period | | $ | 71.66 | | | $ | 83.11 | | | $ | 68.31 | | | $ | 69.18 | | | $ | 61.70 | | | $ | 82.36 | |
Income (loss) from investment operations: |
Net investment income (loss)b | | | .53 | | | | 1.03 | | | | .61 | | | | 1.21 | | | | .68 | | | | .53 | |
Net gain (loss) on investments (realized and unrealized) | | | 2.16 | | | | (3.04 | ) | | | 15.53 | | | | 1.10 | g | | | 15.01 | | | | (9.07 | ) |
Total from investment operations | | | 2.69 | | | | (2.01 | ) | | | 16.14 | | | | 2.31 | | | | 15.69 | | | | (8.54 | ) |
Less distributions from: |
Net investment income | | | — | | | | (.70 | ) | | | (1.34 | ) | | | (.77 | ) | | | (.64 | ) | | | (.49 | ) |
Net realized gains | | | — | | | | (8.74 | ) | | | — | | | | (2.41 | ) | | | (7.57 | ) | | | (11.63 | ) |
Total distributions | | | — | | | | (9.44 | ) | | | (1.34 | ) | | | (3.18 | ) | | | (8.21 | ) | | | (12.12 | ) |
Net asset value, end of period | | $ | 74.35 | | | $ | 71.66 | | | $ | 83.11 | | | $ | 68.31 | | | $ | 69.18 | | | $ | 61.70 | |
|
Total Returnc | | | 3.75 | % | | | (1.86 | %) | | | 23.75 | % | | | 4.30 | % | | | 26.70 | % | | | (12.97 | %) |
Ratios/Supplemental Data |
Net assets, end of period (in thousands) | | $ | 162,022 | | | $ | 165,068 | | | $ | 187,373 | | | $ | 172,440 | | | $ | 195,207 | | | $ | 176,113 | |
Ratios to average net assets: |
Net investment income (loss) | | | 1.45 | % | | | 1.36 | % | | | 0.76 | % | | | 2.05 | % | | | 1.01 | % | | | 0.68 | % |
Total expensesd | | | 1.12 | % | | | 1.13 | % | | | 1.14 | % | | | 1.22 | % | | | 1.19 | % | | | 1.19 | % |
Net expensese,f | | | 0.88 | % | | | 0.89 | % | | | 0.90 | % | | | 0.90 | % | | | 0.91 | % | | | 0.91 | % |
Portfolio turnover rate | | | 13 | % | | | 40 | % | | | 34 | % | | | 38 | % | | | 41 | % | | | 65 | % |
a | Unaudited figures for the period ended June 30, 2023. Percentage amounts for the period, except total return and portfolio turnover rate, have been annualized. |
b | Net investment income (loss) per share was computed using average shares outstanding throughout the period. |
c | Total return does not take into account any of the expenses associated with an investment in variable insurance products. If total return had taken into account these expenses, performance would have been lower. Shares of a series of Guggenheim Variable Funds Trust are available only through the purchase of such products. |
d | Does not include expenses of the underlying funds in which the Fund invests. |
e | Net expense information reflects the expense ratios after expense waivers and reimbursements, as applicable. |
f | Net expenses may include expenses that are excluded from the expense limitation agreement. Excluding these expenses, the net expense ratios for the years presented would be: |
| | 06/30/23a | 12/31/22 | 12/31/21 | 12/31/20 | 12/31/19 | 12/31/18 |
| | 0.88% | 0.89% | 0.90% | 0.90% | 0.91% | 0.91% |
g | The amount shown for a share outstanding throughout the period does not agree with the aggregate net loss on investments for the period because of the sales and repurchases of fund shares in relation to fluctuating market value of the investments of the Fund. |
SEE NOTES TO FINANCIAL STATEMENTS. | THE GUGGENHEIM FUNDS SEMI-ANNUAL REPORT | 113 |
PERFORMANCE REPORT AND FUND PROFILE (Unaudited) | June 30, 2023 |
SERIES X (STYLEPLUS—SMALL GROWTH SERIES)
OBJECTIVE: Seeks long-term growth of capital.
Holdings Diversification (Market Exposure as % of Net Assets)

“Holdings Diversification (Market Exposure as % of Net Assets)” excludes any temporary cash investments, investments in Guggenheim Strategy Funds Trust mutual funds, or investments in Guggenheim Ultra Short Duration Fund.
Inception Date: October 15, 1997 |
Ten Largest Holdings | % of Total Net Assets |
Guggenheim Strategy Fund III | 30.8% |
Guggenheim Variable Insurance Strategy Fund III | 26.4% |
Guggenheim Strategy Fund II | 11.8% |
Guggenheim Ultra Short Duration Fund — Institutional Class | 1.1% |
Rambus, Inc. | 0.4% |
Mueller Industries, Inc. | 0.4% |
Diodes, Inc. | 0.4% |
Advanced Energy Industries, Inc. | 0.4% |
Kulicke & Soffa Industries, Inc. | 0.4% |
Onto Innovation, Inc. | 0.4% |
Top Ten Total | 72.5% |
| | |
“Ten Largest Holdings” excludes any temporary cash or derivative investments. |
Average Annual Returns*,†
Periods Ended June 30, 2023
| 6 Month‡ | 1 Year | 5 Year | 10 Year |
Series X (StylePlus—Small Growth Series) | 13.99% | 18.46% | 4.01% | 9.23% |
Russell 2000 Growth Index | 13.55% | 18.53% | 4.22% | 8.83% |
* | The performance data above represents past performance that is not predictive of future results. The investment return and principal value of an investment in the Fund will fluctuate so that an investor’s shares, when redeemed, may be worth more or less than their original cost. Returns are historical and include changes in principal and reinvested dividends and capital gains and do not reflect the effect of taxes. The Russell 2000 Growth Index is an unmanaged index and, unlike the Fund, has no management fees or operating expenses to reduce its reported return. |
† | Performance figures do not reflect fees and expenses associated with an investment in variable insurance products. If returns had taken into account these fees and expenses, performance would have been lower. Shares of a series of Guggenheim Variable Funds Trust are available only through the purchase of such products. |
‡ | 6 month returns are not annualized. |
114 | THE GUGGENHEIM FUNDS SEMI-ANNUAL REPORT | |
SCHEDULE OF INVESTMENTS (Unaudited) | June 30, 2023 |
SERIES X (STYLEPLUS—SMALL GROWTH SERIES) | |
| | Shares | | | Value | |
COMMON STOCKS† - 25.8% |
| | | | | | | | | |
Industrial - 7.4% |
Mueller Industries, Inc. | | | 1,334 | | | $ | 116,432 | |
Advanced Energy Industries, Inc. | | | 957 | | | | 106,658 | |
Boise Cascade Co. | | | 1,087 | | | | 98,210 | |
Applied Industrial Technologies, Inc. | | | 645 | | | | 93,415 | |
Apogee Enterprises, Inc. | | | 1,839 | | | | 87,297 | |
Fabrinet* | | | 614 | | | | 79,746 | |
Standex International Corp. | | | 554 | | | | 78,374 | |
EnPro Industries, Inc. | | | 567 | | | | 75,712 | |
Encore Wire Corp. | | | 387 | | | | 71,955 | |
PGT Innovations, Inc.* | | | 2,327 | | | | 67,832 | |
ITT, Inc. | | | 721 | | | | 67,204 | |
Comfort Systems USA, Inc. | | | 378 | | | | 62,068 | |
Badger Meter, Inc. | | | 396 | | | | 58,434 | |
Albany International Corp. — Class A | | | 622 | | | | 58,020 | |
Donaldson Company, Inc. | | | 919 | | | | 57,447 | |
UFP Industries, Inc. | | | 573 | | | | 55,610 | |
Timken Co. | | | 577 | | | | 52,813 | |
Matson, Inc. | | | 679 | | | | 52,779 | |
AAON, Inc. | | | 546 | | | | 51,766 | |
Lindsay Corp. | | | 422 | | | | 50,362 | |
Curtiss-Wright Corp. | | | 251 | | | | 46,099 | |
Eagle Materials, Inc. | | | 239 | | | | 44,554 | |
Belden, Inc. | | | 461 | | | | 44,094 | |
Sturm Ruger & Company, Inc. | | | 803 | | | | 42,527 | |
Acuity Brands, Inc. | | | 259 | | | | 42,238 | |
Dorian LPG Ltd. | | | 1,599 | | | | 41,014 | |
Alamo Group, Inc. | | | 212 | | | | 38,989 | |
CTS Corp. | | | 914 | | | | 38,964 | |
Louisiana-Pacific Corp. | | | 477 | | | | 35,766 | |
Insteel Industries, Inc. | | | 1,117 | | | | 34,761 | |
Simpson Manufacturing Company, Inc. | | | 248 | | | | 34,348 | |
Watts Water Technologies, Inc. — Class A | | | 173 | | | | 31,785 | |
OSI Systems, Inc.* | | | 262 | | | | 30,871 | |
Hillenbrand, Inc. | | | 398 | | | | 20,409 | |
Total Industrial | | | | | | | 1,968,553 | |
| | | | | | | | | |
Technology - 5.2% |
Rambus, Inc.* | | | 1,831 | | | | 117,434 | |
Diodes, Inc.* | | | 1,223 | | | | 113,115 | |
Kulicke & Soffa Industries, Inc. | | | 1,713 | | | | 101,838 | |
Onto Innovation, Inc.* | | | 848 | | | | 98,767 | |
SPS Commerce, Inc.* | | | 508 | | | | 97,566 | |
Axcelis Technologies, Inc.* | | | 519 | | | | 95,148 | |
Progress Software Corp. | | | 1,215 | | | | 70,592 | |
NetScout Systems, Inc.* | | | 2,194 | | | | 67,904 | |
Cohu, Inc.* | | | 1,425 | | | | 59,223 | |
Photronics, Inc.* | | | 2,038 | | | | 52,560 | |
Veradigm, Inc.* | | | 3,848 | | | | 48,485 | |
Veeco Instruments, Inc.* | | | 1,827 | | | | 46,917 | |
Digi International, Inc.* | | | 1,074 | | | | 42,305 | |
Power Integrations, Inc. | | | 430 | | | | 40,708 | |
MaxLinear, Inc. — Class A* | | | 1,123 | | | | 35,442 | |
CEVA, Inc.* | | | 1,348 | | | | 34,441 | |
PDF Solutions, Inc.* | | | 758 | | | | 34,186 | |
Crane NXT Co. | | | 578 | | | | 32,622 | |
NextGen Healthcare, Inc.* | | | 1,838 | | | | 29,812 | |
Cirrus Logic, Inc.* | | | 352 | | | | 28,516 | |
Computer Programs and Systems, Inc.* | | | 1,129 | | | | 27,875 | |
Agilysys, Inc.* | | | 395 | | | | 27,113 | |
Teradata Corp.* | | | 428 | | | | 22,859 | |
Qualys, Inc.* | | | 158 | | | | 20,409 | |
CommVault Systems, Inc.* | | | 279 | | | | 20,261 | |
Consensus Cloud Solutions, Inc.* | | | 635 | | | | 19,685 | |
Total Technology | | | | | | | 1,385,783 | |
| | | | | | | | | |
Consumer, Non-cyclical - 4.7% |
AMN Healthcare Services, Inc.* | | | 839 | | | | 91,552 | |
Prestige Consumer Healthcare, Inc.* | | | 1,384 | | | | 82,251 | |
elf Beauty, Inc.* | | | 711 | | | | 81,217 | |
Innoviva, Inc.* | | | 5,262 | | | | 66,985 | |
Alarm.com Holdings, Inc.* | | | 1,250 | | | | 64,600 | |
Dynavax Technologies Corp.* | | | 4,259 | | | | 55,026 | |
Merit Medical Systems, Inc.* | | | 644 | | | | 53,864 | |
Vector Group Ltd. | | | 4,112 | | | | 52,675 | |
Ensign Group, Inc. | | | 545 | | | | 52,026 | |
H&R Block, Inc. | | | 1,595 | | | | 50,833 | |
Supernus Pharmaceuticals, Inc.* | | | 1,649 | | | | 49,569 | |
Amphastar Pharmaceuticals, Inc.* | | | 840 | | | | 48,275 | |
Quanex Building Products Corp. | | | 1,760 | | | | 47,256 | |
Vir Biotechnology, Inc.* | | | 1,860 | | | | 45,626 | |
Corcept Therapeutics, Inc.* | | | 2,042 | | | | 45,434 | |
Cytokinetics, Inc.* | | | 1,264 | | | | 41,232 | |
Perdoceo Education Corp.* | | | 3,172 | | | | 38,920 | |
Jazz Pharmaceuticals plc* | | | 301 | | | | 37,315 | |
Collegium Pharmaceutical, Inc.* | | | 1,679 | | | | 36,082 | |
Cross Country Healthcare, Inc.* | | | 1,010 | | | | 28,361 | |
Ligand Pharmaceuticals, Inc. — Class B* | | | 391 | | | | 28,191 | |
Cal-Maine Foods, Inc. | | | 589 | | | | 26,505 | |
Catalyst Pharmaceuticals, Inc.* | | | 1,912 | | | | 25,697 | |
Exelixis, Inc.* | | | 1,339 | | | | 25,588 | |
Harmony Biosciences Holdings, Inc.* | | | 711 | | | | 25,020 | |
Grand Canyon Education, Inc.* | | | 207 | | | | 21,364 | |
CorVel Corp.* | | | 101 | | | | 19,544 | |
Embecta Corp. | | | 850 | | | | 18,360 | |
Ligand Pharmaceuticals, Inc.*,†† | | | 89 | | | | — | |
Ligand Pharmaceuticals, Inc.*,†† | | | 89 | | | | — | |
Total Consumer, Non-cyclical | | | | | | | 1,259,368 | |
| | | | | | | | | |
Consumer, Cyclical - 2.7% |
Cavco Industries, Inc.* | | | 227 | | | | 66,965 | |
MSC Industrial Direct Company, Inc. — Class A | | | 637 | | | | 60,693 | |
Installed Building Products, Inc. | | | 419 | | | | 58,727 | |
Brunswick Corp. | | | 664 | | | | 57,529 | |
Gentex Corp. | | | 1,714 | | | | 50,152 | |
Wabash National Corp. | | | 1,808 | | | | 46,357 | |
Monarch Casino & Resort, Inc. | | | 625 | | | | 44,031 | |
Green Brick Partners, Inc.* | | | 727 | | | | 41,294 | |
Academy Sports & Outdoors, Inc. | | | 714 | | | | 38,592 | |
Boyd Gaming Corp. | | | 546 | | | | 37,876 | |
Oxford Industries, Inc. | | | 335 | | | | 32,971 | |
SEE NOTES TO FINANCIAL STATEMENTS. | THE GUGGENHEIM FUNDS SEMI-ANNUAL REPORT | 115 |
SCHEDULE OF INVESTMENTS (Unaudited)(continued) | June 30, 2023 |
SERIES X (STYLEPLUS—SMALL GROWTH SERIES) | |
| | Shares | | | Value | |
Haverty Furniture Companies, Inc. | | | 953 | | | $ | 28,800 | |
Buckle, Inc. | | | 824 | | | | 28,510 | |
Polaris, Inc. | | | 222 | | | | 26,846 | |
Winnebago Industries, Inc. | | | 401 | | | | 26,743 | |
Methode Electronics, Inc. | | | 795 | | | | 26,648 | |
Ethan Allen Interiors, Inc. | | | 879 | | | | 24,858 | |
Vista Outdoor, Inc.* | | | 801 | | | | 22,164 | |
Total Consumer, Cyclical | | | | | | | 719,756 | |
| | | | | | | | | |
Financial - 2.3% |
Mr Cooper Group, Inc.* | | | 1,673 | | | | 84,721 | |
Preferred Bank/Los Angeles CA | | | 1,511 | | | | 83,090 | |
SouthState Corp. | | | 982 | | | | 64,616 | |
Westamerica BanCorp | | | 1,468 | | | | 56,224 | |
FB Financial Corp. | | | 1,995 | | | | 55,960 | |
TrustCo Bank Corporation NY | | | 1,790 | | | | 51,212 | |
Heritage Financial Corp. | | | 3,120 | | | | 50,450 | |
Hanmi Financial Corp. | | | 3,147 | | | | 46,985 | |
Ameris Bancorp | | | 1,331 | | | | 45,533 | |
International Bancshares Corp. | | | 824 | | | | 36,421 | |
American Equity Investment Life Holding Co. | | | 640 | | | | 33,350 | |
Total Financial | | | | | | | 608,562 | |
| | | | | | | | | |
Energy - 1.6% |
SM Energy Co. | | | 3,115 | | | | 98,528 | |
Civitas Resources, Inc. | | | 1,093 | | | | 75,821 | |
Northern Oil and Gas, Inc. | | | 1,566 | | | | 53,745 | |
Vital Energy, Inc.* | | | 1,141 | | | | 51,516 | |
CONSOL Energy, Inc. | | | 522 | | | | 35,397 | |
Matador Resources Co. | | | 673 | | | | 35,211 | |
CVR Energy, Inc. | | | 1,094 | | | | 32,776 | |
Antero Midstream Corp. | | | 1,931 | | | | 22,400 | |
PBF Energy, Inc. — Class A | | | 543 | | | | 22,231 | |
Total Energy | | | | | | | 427,625 | |
| | | | | | | | | |
Communications - 1.3% |
Extreme Networks, Inc.* | | | 2,893 | | | | 75,363 | |
InterDigital, Inc. | | | 732 | | | | 70,674 | |
A10 Networks, Inc. | | | 3,549 | | | | 51,780 | |
Viavi Solutions, Inc.* | | | 3,766 | | | | 42,669 | |
HealthStream, Inc. | | | 1,542 | | | | 37,872 | |
Harmonic, Inc.* | | | 2,336 | | | | 37,773 | |
Yelp, Inc. — Class A* | | | 959 | | | | 34,917 | |
Total Communications | | | | | | | 351,048 | |
| | | | | | | | | |
Basic Materials - 0.6% |
Livent Corp.* | | | 2,475 | | | | 67,889 | |
Olin Corp. | | | 740 | | | | 38,029 | |
NewMarket Corp. | | | 70 | | | | 28,148 | |
Sylvamo Corp. | | | 679 | | | | 27,466 | |
Total Basic Materials | | | | | | | 161,532 | |
| | | | | | | | | |
Total Common Stocks | | | | |
(Cost $6,202,322) | | | | | | | 6,882,227 | |
| | | | | | | | | |
MUTUAL FUNDS† - 70.1% |
Guggenheim Strategy Fund III1 | | | 339,154 | | | | 8,224,492 | |
Guggenheim Variable Insurance Strategy Fund III1 | | | 290,980 | | | | 7,053,347 | |
Guggenheim Strategy Fund II1 | | | 130,833 | | | | 3,168,771 | |
Guggenheim Ultra Short Duration Fund — Institutional Class1 | | | 30,697 | | | | 298,682 | |
Total Mutual Funds | | | | |
(Cost $19,126,227) | | | | | | | 18,745,292 | |
| | | | | | | | | |
MONEY MARKET FUND† - 2.8% |
Dreyfus Treasury Securities Cash Management Fund — Institutional Shares, 4.96%2 | | | 756,038 | | | | 756,038 | |
Total Money Market Fund | | | | |
(Cost $756,038) | | | | | | | 756,038 | |
| | | | | | | | | |
Total Investments - 98.7% | | | | |
(Cost $26,084,587) | | $ | 26,383,557 | |
Other Assets & Liabilities, net - 1.3% | | | 346,366 | |
Total Net Assets - 100.0% | | $ | 26,729,923 | |
Futures Contracts |
Description | | Number of
Contracts | | | Expiration Date | | | Notional
Amount | | | Value and
Unrealized
Appreciation
(Depreciation)** | |
Equity Futures Contracts Purchased† |
S&P MidCap 400 Index Mini Futures Contracts | | | 3 | | | | Sep 2023 | | | $ | 793,200 | | | $ | 80 | |
Russell 2000 Index Mini Futures Contracts | | | 6 | | | | Sep 2023 | | | | 570,930 | | | | (1,325 | ) |
| | | | | | | | | | | $ | 1,364,130 | | | $ | (1,245 | ) |
116 | THE GUGGENHEIM FUNDS SEMI-ANNUAL REPORT | SEE NOTES TO FINANCIAL STATEMENTS. |
SCHEDULE OF INVESTMENTS (Unaudited)(continued) | June 30, 2023 |
SERIES X (STYLEPLUS—SMALL GROWTH SERIES) | |
Total Return Swap Agreements |
Counterparty | Index | Type | Financing
Rate | | Payment
Frequency | | | Maturity Date | | | Units | | | Notional
Amount | | | Value and
Unrealized
Appreciation | |
OTC Equity Index Swap Agreements†† |
Wells Fargo Bank, N.A. | Russell 2000 Growth Index | Pay | 5.20% (Federal Funds Rate +0.12%) | | | At Maturity | | | | 09/29/23 | | | | 2,131 | | | $ | 19,102,582 | | | $ | — | |
* | Non-income producing security. |
** | Includes cumulative appreciation (depreciation). Variation margin is reported within the Statement of Assets and Liabilities. |
† | Value determined based on Level 1 inputs, unless otherwise noted — See Note 4. |
†† | Value determined based on Level 2 inputs — See Note 4. |
1 | Affiliated issuer. |
2 | Rate indicated is the 7-day yield as of June 30, 2023. |
| | plc — Public Limited Company |
| | |
| | See Sector Classification in Other Information section. |
The following table summarizes the inputs used to value the Fund’s investments at June 30, 2023 (See Note 4 in the Notes to Financial Statements):
Investments in Securities (Assets) | | Level 1
Quoted
Prices | | | Level 2
Significant
Observable
Inputs | | | Level 3
Significant
Unobservable
Inputs | | | Total | |
Common Stocks | | $ | 6,882,227 | | | $ | — | * | | $ | — | | | $ | 6,882,227 | |
Mutual Funds | | | 18,745,292 | | | | — | | | | — | | | | 18,745,292 | |
Money Market Fund | | | 756,038 | | | | — | | | | — | | | | 756,038 | |
Equity Futures Contracts** | | | 80 | | | | — | | | | — | | | | 80 | |
Equity Index Swap Agreements** | | | — | | | | — | * | | | — | | | | — | |
Total Assets | | $ | 26,383,637 | | | $ | — | | | $ | — | | | $ | 26,383,637 | |
Investments in Securities (Liabilities) | | Level 1
Quoted
Prices | | | Level 2
Significant
Observable
Inputs | | | Level 3
Significant
Unobservable
Inputs | | | Total | |
Equity Futures Contracts** | | $ | 1,325 | | | $ | — | | | $ | — | | | $ | 1,325 | |
* | Includes securities with a market value of $0. |
** | This derivative is reported as unrealized appreciation/depreciation at period end. |
SEE NOTES TO FINANCIAL STATEMENTS. | THE GUGGENHEIM FUNDS SEMI-ANNUAL REPORT | 117 |
SCHEDULE OF INVESTMENTS (Unaudited)(concluded) | June 30, 2023 |
SERIES X (STYLEPLUS—SMALL GROWTH SERIES) | |
Affiliated Transactions
Investments representing 5% or more of the outstanding voting shares of a company, or control of or by, or common control under Guggenheim Investments (“GI”), result in that company being considered an affiliated issuer, as defined in the 1940 Act.
The Fund may invest in certain of the underlying series of Guggenheim Strategy Funds Trust, including Guggenheim Strategy Fund II, Guggenheim Strategy Fund III, and Guggenheim Variable Insurance Strategy Fund III, (collectively, the “Short Term Investment Vehicles”), each of which are open-end management investment companies managed by GI. The Short Term Investment Vehicles, which launched on March 11, 2014, are offered as short term investment options only to mutual funds, trusts, and other accounts managed by GI and/or its affiliates, and are not available to the public. The Short Term Investment Vehicles pay no investment management fees. The Short Term Investment Vehicles’ annual report on Form N-CSR dated September 30, 2022, is available publicly or upon request. This information is available from the EDGAR database on the SEC’s website at https://www.sec.gov/Archives/edgar/data/1601445/000182126822000340/gug84768.htm. The Fund may invest in certain of the underlying series of Guggenheim Funds Trust, which are open-end management investment companies managed by GI, are available to the public and whose most recent annual report on Form N-CSR is available publicly or upon request.
Transactions during the period ended June 30, 2023, in which the company is an affiliated issuer, were as follows:
Security Name | | Value
12/31/22 | | | Additions | | | Reductions | | | Realized
Gain (Loss) | | | Change in
Unrealized
Appreciation
(Depreciation) | | | Value
06/30/23 | | | Shares
06/30/23 | | | Investment
Income | |
Mutual Funds | | | | | | | | | | | | | | | | | | | | | | | | | | | | | | | | |
Guggenheim Strategy Fund II | | $ | 2,587,860 | | | $ | 2,325,703 | | | $ | (1,769,275 | ) | | $ | 4,684 | | | $ | 19,799 | | | $ | 3,168,771 | | | | 130,833 | | | $ | 79,408 | |
Guggenheim Strategy Fund III | | | 7,474,966 | | | | 691,577 | | | | — | | | | — | | | | 57,949 | | | | 8,224,492 | | | | 339,154 | | | | 205,198 | |
Guggenheim Ultra Short Duration Fund — Institutional Class | | | 288,481 | | | | 7,507 | | | | — | | | | — | | | | 2,694 | | | | 298,682 | | | | 30,697 | | | | 7,490 | |
Guggenheim Variable Insurance Strategy Fund III | | | 6,828,127 | | | | 177,090 | | | | — | | | | — | | | | 48,130 | | | | 7,053,347 | | | | 290,980 | | | | 176,661 | |
| | | $ | 17,179,434 | | | $ | 3,201,877 | | | $ | (1,769,275 | ) | | $ | 4,684 | | | $ | 128,572 | | | $ | 18,745,292 | | | | | | | $ | 468,757 | |
118 | THE GUGGENHEIM FUNDS SEMI-ANNUAL REPORT | SEE NOTES TO FINANCIAL STATEMENTS. |
SERIES X (STYLEPLUS—SMALL GROWTH SERIES) | |
STATEMENT OF ASSETS AND LIABILITIES (Unaudited) |
June 30, 2023 |
Assets: |
Investments in unaffiliated issuers, at value (cost $6,958,360) | | $ | 7,638,265 | |
Investments in affiliated issuers, at value (cost $19,126,227) | | | 18,745,292 | |
Cash | | | 72 | |
Segregated cash with broker | | | 14,000 | |
Prepaid expenses | | | 55 | |
Receivables: |
Swap settlement | | | 2,473,033 | |
Dividends | | | 85,748 | |
Interest | | | 4,385 | |
Variation margin on futures contracts | | | 610 | |
Total assets | | | 28,961,460 | |
| | | | | |
Liabilities: |
Segregated cash due to broker | | | 2,100,000 | |
Payable for: |
Securities purchased | | | 88,550 | |
Distribution and service fees | | | 5,519 | |
Management fees | | | 5,190 | |
Transfer agent/maintenance fees | | | 2,088 | |
Fund accounting/administration fees | | | 989 | |
Fund shares redeemed | | | 774 | |
Trustees’ fees* | | | 651 | |
Miscellaneous | | | 27,776 | |
Total liabilities | | | 2,231,537 | |
Net assets | | $ | 26,729,923 | |
| | | | | |
Net assets consist of: |
Paid in capital | | $ | 32,278,920 | |
Total distributable earnings (loss) | | | (5,548,997 | ) |
Net assets | | $ | 26,729,923 | |
Capital shares outstanding | | | 1,047,848 | |
Net asset value per share | | $ | 25.51 | |
STATEMENT OF OPERATIONS (Unaudited) |
Six Months Ended June 30, 2023 |
Investment Income: |
Dividends from securities of unaffiliated issuers (net of foreign withholding tax of $76) | | $ | 55,617 | |
Dividends from securities of affiliated issuers | | | 468,757 | |
Interest | | | 15,624 | |
Total investment income | | | 539,998 | |
| | | | | |
Expenses: |
Management fees | | | 94,688 | |
Distribution and service fees | | | 31,729 | |
Transfer agent/maintenance fees | | | 12,518 | |
Interest expense | | | 30,231 | |
Professional fees | | | 16,210 | |
Fund accounting/administration fees | | | 9,635 | |
Trustees’ fees* | | | 7,143 | |
Custodian fees | | | 5,602 | |
Line of credit fees | | | 429 | |
Miscellaneous | | | 5,123 | |
Total expenses | | | 213,308 | |
Less: |
Expenses reimbursed by Adviser | | | (1,555 | ) |
Expenses waived by Adviser | | | (50,283 | ) |
Earnings credits applied | | | (331 | ) |
Total waived/reimbursed expenses | | | (52,169 | ) |
Net expenses | | | 161,139 | |
Net investment income | | | 378,859 | |
| | | | | |
Net Realized and Unrealized Gain (Loss): |
Net realized gain (loss) on: |
Investments in unaffiliated issuers | | | (100,525 | ) |
Investments in affiliated issuers | | | 4,684 | |
Swap agreements | | | 2,477,226 | |
Futures contracts | | | 4,919 | |
Net realized gain | | | 2,386,304 | |
Net change in unrealized appreciation (depreciation) on: |
Investments in unaffiliated issuers | | | 859,584 | |
Investments in affiliated issuers | | | 128,572 | |
Swap agreements | | | (455,885 | ) |
Futures contracts | | | 25,718 | |
Net change in unrealized appreciation (depreciation) | | | 557,989 | |
Net realized and unrealized gain | | | 2,944,293 | |
Net increase in net assets resulting from operations | | $ | 3,323,152 | |
* | Relates to Trustees not deemed “interested persons” within the meaning of Section 2(a)(19) of the 1940 Act. |
SEE NOTES TO FINANCIAL STATEMENTS. | THE GUGGENHEIM FUNDS SEMI-ANNUAL REPORT | 119 |
SERIES X (STYLEPLUS—SMALL GROWTH SERIES) | |
STATEMENTS OF CHANGES IN NET ASSETS |
| | Six Months Ended
June 30, 2023
(Unaudited) | | | Year Ended
December 31,
2022 | |
Increase (Decrease) in Net Assets from Operations: | | | | | | | | |
Net investment income | | $ | 378,859 | | | $ | 358,406 | |
Net realized gain (loss) on investments | | | 2,386,304 | | | | (8,924,685 | ) |
Net change in unrealized appreciation (depreciation) on investments | | | 557,989 | | | | (1,124,827 | ) |
Net increase (decrease) in net assets resulting from operations | | | 3,323,152 | | | | (9,691,106 | ) |
| | | | | | | | | |
Distributions to shareholders | | | — | | | | (8,952,911 | ) |
| | | | | | | | | |
Capital share transactions: | | | | | | | | |
Proceeds from sale of shares | | | 531,316 | | | | 613,968 | |
Distributions reinvested | | | — | | | | 8,952,911 | |
Cost of shares redeemed | | | (1,417,276 | ) | | | (3,640,657 | ) |
Net increase (decrease) from capital share transactions | | | (885,960 | ) | | | 5,926,222 | |
Net increase (decrease) in net assets | | | 2,437,192 | | | | (12,717,795 | ) |
| | | | | | | | | |
Net assets: | | | | | | | | |
Beginning of period | | | 24,292,731 | | | | 37,010,526 | |
End of period | | $ | 26,729,923 | | | $ | 24,292,731 | |
| | | | | | | | | |
Capital share activity: | | | | | | | | |
Shares sold | | | 21,999 | | | | 21,194 | |
Shares issued from reinvestment of distributions | | | — | | | | 382,440 | |
Shares redeemed | | | (59,457 | ) | | | (122,777 | ) |
Net increase (decrease) in shares | | | (37,458 | ) | | | 280,857 | |
120 | THE GUGGENHEIM FUNDS SEMI-ANNUAL REPORT | SEE NOTES TO FINANCIAL STATEMENTS. |
SERIES X (STYLEPLUS—SMALL GROWTH SERIES) | |
This table is presented to show selected data for a share outstanding throughout each period and to assist shareholders in evaluating a Fund’s performance for the periods presented.
| | Six Months Ended
June 30, 2023a | | | Year Ended
December 31,
2022 | | | Year Ended
December 31,
2021 | | | Year Ended
December 31,
2020 | | | Year Ended
December 31,
2019 | | | Year Ended
December 31,
2018 | |
Per Share Data |
Net asset value, beginning of period | | $ | 22.38 | | | $ | 46.01 | | | $ | 44.91 | | | $ | 34.53 | | | $ | 30.87 | | | $ | 40.19 | |
Income (loss) from investment operations: |
Net investment income (loss)b | | | .36 | | | | .38 | | | | .10 | | | | .17 | | | | .42 | | | | .56 | |
Net gain (loss) on investments (realized and unrealized) | | | 2.77 | | | | (12.10 | ) | | | 2.82 | | | | 10.65 | | | | 7.28 | | | | (3.33 | ) |
Total from investment operations | | | 3.13 | | | | (11.72 | ) | | | 2.92 | | | | 10.82 | | | | 7.70 | | | | (2.77 | ) |
Less distributions from: |
Net investment income | | | — | | | | (.11 | ) | | | (.19 | ) | | | (.44 | ) | | | (.22 | ) | | | (.43 | ) |
Net realized gains | | | — | | | | (11.80 | ) | | | (1.63 | ) | | | — | | | | (3.82 | ) | | | (6.12 | ) |
Total distributions | | | — | | | | (11.91 | ) | | | (1.82 | ) | | | (.44 | ) | | | (4.04 | ) | | | (6.55 | ) |
Net asset value, end of period | | $ | 25.51 | | | $ | 22.38 | | | $ | 46.01 | | | $ | 44.91 | | | $ | 34.53 | | | $ | 30.87 | |
|
Total Returnc | | | 13.99 | % | | | (26.61 | %) | | | 6.54 | % | | | 31.82 | % | | | 25.68 | % | | | (10.30 | %) |
Ratios/Supplemental Data |
Net assets, end of period (in thousands) | | $ | 26,729 | | | $ | 24,293 | | | $ | 37,011 | | | $ | 37,989 | | | $ | 33,036 | | | $ | 28,644 | |
Ratios to average net assets: |
Net investment income (loss) | | | 3.00 | % | | | 1.29 | % | | | 0.22 | % | | | 0.49 | % | | | 1.24 | % | | | 1.42 | % |
Total expensesd | | | 1.69 | % | | | 1.43 | % | | | 1.39 | % | | | 1.50 | % | | | 1.62 | % | | | 1.47 | % |
Net expensese,f,g | | | 1.28 | % | | | 1.05 | % | | | 1.00 | % | | | 1.02 | % | | | 1.11 | % | | | 1.12 | % |
Portfolio turnover rate | | | 31 | % | | | 73 | % | | | 64 | % | | | 86 | % | | | 59 | % | | | 65 | % |
a | Unaudited figures for the period ended June 30, 2023. Percentage amounts for the period, except total return and portfolio turnover rate, have been annualized. |
b | Net investment income (loss) per share was computed using average shares outstanding throughout the period. |
c | Total return does not take into account any of the expenses associated with an investment in variable insurance products. If total return had taken into account these expenses, performance would have been lower. Shares of a series of Guggenheim Variable Funds Trust are available only through the purchase of such products. |
d | Does not include expenses of the underlying funds in which the Fund invests. |
e | Net expense information reflects the expense ratios after expense waivers and reimbursements, as applicable. |
f | The portion of the ratios of net expenses to average net assets attributable to recoupments of prior fee reductions or expense reimbursements for the years presented was as follows: |
| | 06/30/23a | 12/31/22 | 12/31/21 | 12/31/20 | 12/31/19 | 12/31/18 |
| | — | — | — | — | — | 0.00%* |
g | Net expenses may include expenses that are excluded from the expense limitation agreement. Excluding these expenses, the net expense ratios for the years presented would be: |
| | 06/30/23a | 12/31/22 | 12/31/21 | 12/31/20 | 12/31/19 | 12/31/18 |
| | 1.04% | 1.04% | 1.00% | 1.01% | 1.03% | 1.06% |
SEE NOTES TO FINANCIAL STATEMENTS. | THE GUGGENHEIM FUNDS SEMI-ANNUAL REPORT | 121 |
PERFORMANCE REPORT AND FUND PROFILE (Unaudited) | June 30, 2023 |
SERIES Y (STYLEPLUS—LARGE GROWTH SERIES)
OBJECTIVE: Seeks long-term growth of capital.
Holdings Diversification (Market Exposure as % of Net Assets)

“Holdings Diversification (Market Exposure as % of Net Assets)” excludes any temporary cash investments, investments in Guggenheim Strategy Funds Trust mutual funds, or investments in Guggenheim Ultra Short Duration Fund.
Inception Date: May 3, 1999 |
Ten Largest Holdings | % of Total Net Assets |
Guggenheim Strategy Fund II | 22.4% |
Guggenheim Variable Insurance Strategy Fund III | 22.4% |
Guggenheim Strategy Fund III | 21.1% |
Guggenheim Ultra Short Duration Fund — Institutional Class | 8.5% |
Apple, Inc. | 3.0% |
Microsoft Corp. | 1.5% |
Alphabet, Inc. — Class C | 1.4% |
NVIDIA Corp. | 0.8% |
Exxon Mobil Corp. | 0.6% |
Merck & Company, Inc. | 0.5% |
Top Ten Total | 82.2% |
| | |
“Ten Largest Holdings” excludes any temporary cash or derivative investments. |
Average Annual Returns*,†
Periods Ended June 30, 2023
| 6 Month‡ | 1 Year | 5 Year | 10 Year |
Series Y (StylePlus—Large Growth Series) | 26.96% | 24.74% | 13.51% | 15.20% |
Russell 1000 Growth Index | 29.02% | 27.11% | 15.14% | 15.74% |
* | The performance data above represents past performance that is not predictive of future results. The investment return and principal value of an investment in the Fund will fluctuate so that an investor’s shares, when redeemed, may be worth more or less than their original cost. Returns are historical and include changes in principal and reinvested dividends and capital gains and do not reflect the effect of taxes. The Russell 1000 Growth Index is an unmanaged index and, unlike the Fund, has no management fees or operating expenses to reduce its reported return. |
† | Performance figures do not reflect fees and expenses associated with an investment in variable insurance products. If returns had taken into account these fees and expenses, performance would have been lower. Shares of a series of Guggenheim Variable Funds Trust are available only through the purchase of such products. |
‡ | 6 month returns are not annualized. |
122 | THE GUGGENHEIM FUNDS SEMI-ANNUAL REPORT | |
SCHEDULE OF INVESTMENTS (Unaudited) | June 30, 2023 |
SERIES Y (STYLEPLUS—LARGE GROWTH SERIES) | |
| | Shares | | | Value | |
COMMON STOCKS† - 20.3% |
| | | | | | | | | |
Technology - 8.5% |
Apple, Inc. | | | 7,017 | | | $ | 1,361,087 | |
Microsoft Corp. | | | 2,027 | | | | 690,275 | |
NVIDIA Corp. | | | 902 | | | | 381,564 | |
QUALCOMM, Inc. | | | 1,320 | | | | 157,133 | |
Applied Materials, Inc. | | | 940 | | | | 135,868 | |
Texas Instruments, Inc. | | | 701 | | | | 126,194 | |
NXP Semiconductor N.V. | | | 532 | | | | 108,890 | |
ON Semiconductor Corp.* | | | 1,151 | | | | 108,862 | |
Microchip Technology, Inc. | | | 1,209 | | | | 108,314 | |
KLA Corp. | | | 222 | | | | 107,674 | |
Analog Devices, Inc. | | | 528 | | | | 102,860 | |
Lam Research Corp. | | | 154 | | | | 99,000 | |
Broadcom, Inc. | | | 110 | | | | 95,417 | |
Teradyne, Inc. | | | 834 | | | | 92,849 | |
Autodesk, Inc.* | | | 437 | | | | 89,415 | |
Adobe, Inc.* | | | 63 | | | | 30,806 | |
Workday, Inc. — Class A* | | | 128 | | | | 28,914 | |
Intuit, Inc. | | | 62 | | | | 28,408 | |
ServiceNow, Inc.* | | | 49 | | | | 27,536 | |
Total Technology | | | | | | | 3,881,066 | |
| | | | | | | | | |
Consumer, Non-cyclical - 4.3% |
Merck & Company, Inc. | | | 1,982 | | | | 228,703 | |
Pfizer, Inc. | | | 4,972 | | | | 182,373 | |
Bristol-Myers Squibb Co. | | | 2,357 | | | | 150,730 | |
Amgen, Inc. | | | 663 | | | | 147,199 | |
UnitedHealth Group, Inc. | | | 289 | | | | 138,905 | |
Gilead Sciences, Inc. | | | 1,759 | | | | 135,566 | |
Vertex Pharmaceuticals, Inc.* | | | 336 | | | | 118,242 | |
AbbVie, Inc. | | | 716 | | | | 96,467 | |
Incyte Corp.* | | | 1,532 | | | | 95,367 | |
Altria Group, Inc. | | | 1,839 | | | | 83,307 | |
Moderna, Inc.* | | | 637 | | | | 77,395 | |
Eli Lilly & Co. | | | 160 | | | | 75,037 | |
Molina Healthcare, Inc.* | | | 244 | | | | 73,503 | |
Humana, Inc. | | | 158 | | | | 70,646 | |
PepsiCo, Inc. | | | 306 | | | | 56,677 | |
Archer-Daniels-Midland Co. | | | 677 | | | | 51,154 | |
Johnson & Johnson | | | 303 | | | | 50,152 | |
Quest Diagnostics, Inc. | | | 337 | | | | 47,369 | |
Regeneron Pharmaceuticals, Inc.* | | | 55 | | | | 39,520 | |
Thermo Fisher Scientific, Inc. | | | 53 | | | | 27,653 | |
Kimberly-Clark Corp. | | | 198 | | | | 27,336 | |
Total Consumer, Non-cyclical | | | | | | | 1,973,301 | |
| | | | | | | | | |
Communications - 2.4% |
Alphabet, Inc. — Class C* | | | 5,133 | | | | 620,939 | |
Amazon.com, Inc.* | | | 1,305 | | | | 170,120 | |
Motorola Solutions, Inc. | | | 363 | | | | 106,461 | |
VeriSign, Inc.* | | | 422 | | | | 95,359 | |
Gen Digital, Inc. | | | 5,136 | | | | 95,273 | |
Total Communications | | | | | | | 1,088,152 | |
| | | | | | | | | |
Industrial - 1.7% |
Caterpillar, Inc. | | | 547 | | | | 134,589 | |
Lockheed Martin Corp. | | | 274 | | | | 126,144 | |
Deere & Co. | | | 273 | | | | 110,617 | |
Masco Corp. | | | 1,843 | | | | 105,751 | |
Keysight Technologies, Inc.* | | | 604 | | | | 101,140 | |
Snap-on, Inc. | | | 329 | | | | 94,815 | |
Expeditors International of Washington, Inc. | | | 686 | | | | 83,095 | |
Total Industrial | | | | | | | 756,151 | |
| | | | | | | | | |
Energy - 1.4% |
Exxon Mobil Corp. | | | 2,768 | | | | 296,868 | |
Marathon Petroleum Corp. | | | 938 | | | | 109,371 | |
Occidental Petroleum Corp. | | | 1,853 | | | | 108,956 | |
Coterra Energy, Inc. — Class A | | | 3,486 | | | | 88,196 | |
Chevron Corp. | | | 241 | | | | 37,921 | |
Total Energy | | | | | | | 641,312 | |
| | | | | | | | | |
Consumer, Cyclical - 1.2% |
Tesla, Inc.* | | | 785 | | | | 205,490 | |
Lowe’s Companies, Inc. | | | 531 | | | | 119,847 | |
Cummins, Inc. | | | 452 | | | | 110,812 | |
DR Horton, Inc. | | | 639 | | | | 77,760 | |
Home Depot, Inc. | | | 154 | | | | 47,838 | |
Total Consumer, Cyclical | | | | | | | 561,747 | |
| | | | | | | | | |
Basic Materials - 0.4% |
CF Industries Holdings, Inc. | | | 1,497 | | | | 103,922 | |
Mosaic Co. | | | 2,876 | | | | 100,660 | |
Total Basic Materials | | | | | | | 204,582 | |
| | | | | | | | | |
Financial - 0.4% |
Visa, Inc. — Class A | | | 477 | | | | 113,278 | |
Mastercard, Inc. — Class A | | | 201 | | | | 79,053 | |
Total Financial | | | | | | | 192,331 | |
| | | | | | | | | |
Total Common Stocks | | | | |
(Cost $8,386,746) | | | | | | | 9,298,642 | |
| | | | | | | | | |
MUTUAL FUNDS† - 74.4% |
Guggenheim Strategy Fund II1 | | | 424,416 | | | | 10,279,365 | |
Guggenheim Variable Insurance Strategy Fund III1 | | | 423,213 | | | | 10,258,690 | |
Guggenheim Strategy Fund III1 | | | 399,496 | | | | 9,687,770 | |
Guggenheim Ultra Short Duration Fund — Institutional Class1 | | | 398,227 | | | | 3,874,752 | |
Total Mutual Funds | | | | |
(Cost $34,735,863) | | | | | | | 34,100,577 | |
| | | | | | | | | |
MONEY MARKET FUND† - 3.9% |
Dreyfus Treasury Securities Cash Management Fund — Institutional Shares, 4.96%2 | | | 1,808,862 | | | | 1,808,862 | |
Total Money Market Fund | | | | |
(Cost $1,808,862) | | | | | | | 1,808,862 | |
| | | | | | | | | |
Total Investments - 98.6% | | | | |
(Cost $44,931,471) | | $ | 45,208,081 | |
Other Assets & Liabilities, net - 1.4% | | | 644,160 | |
Total Net Assets - 100.0% | | $ | 45,852,241 | |
SEE NOTES TO FINANCIAL STATEMENTS. | THE GUGGENHEIM FUNDS SEMI-ANNUAL REPORT | 123 |
SCHEDULE OF INVESTMENTS (Unaudited)(continued) | June 30, 2023 |
SERIES Y (STYLEPLUS—LARGE GROWTH SERIES) | |
Futures Contracts |
Description | | Number of
Contracts | | | Expiration Date | | | Notional
Amount | | | Value and
Unrealized
Appreciation** | |
Equity Futures Contracts Purchased† |
S&P 500 Index Mini Futures Contracts | | | 7 | | | | Sep 2023 | | | $ | 1,570,275 | | | $ | 11,889 | |
NASDAQ-100 Index Mini Futures Contracts | | | 2 | | | | Sep 2023 | | | | 613,250 | | | | 6,630 | |
| | | | | | | | | | | $ | 2,183,525 | | | $ | 18,519 | |
Total Return Swap Agreements |
Counterparty | Index | Type | Financing
Rate | | Payment
Frequency | | | Maturity
Date | | | Units | | | Notional
Amount | | | Value and
Unrealized
Appreciation | |
OTC Equity Index Swap Agreements†† |
Wells Fargo Bank, N.A. | Russell 1000 Growth Index | Pay | 5.55% (Federal Funds Rate + 0.47%) | | | At Maturity | | | | 09/29/23 | | | | 12,313 | | | $ | 34,810,205 | | | $ | — | |
* | Non-income producing security. |
** | Includes cumulative appreciation (depreciation). Variation margin is reported within the Statement of Assets and Liabilities. |
† | Value determined based on Level 1 inputs — See Note 4. |
†† | Value determined based on Level 2 inputs — See Note 4. |
1 | Affiliated issuer. |
2 | Rate indicated is the 7-day yield as of June 30, 2023. |
| | |
| | See Sector Classification in Other Information section. |
The following table summarizes the inputs used to value the Fund’s investments at June 30, 2023 (See Note 4 in the Notes to Financial Statements):
Investments in Securities (Assets) | | Level 1
Quoted
Prices | | | Level 2
Significant
Observable
Inputs | | | Level 3
Significant
Unobservable
Inputs | | | Total | |
Common Stocks | | $ | 9,298,642 | | | $ | — | | | $ | — | | | $ | 9,298,642 | |
Mutual Funds | | | 34,100,577 | | | | — | | | | — | | | | 34,100,577 | |
Money Market Fund | | | 1,808,862 | | | | — | | | | — | | | | 1,808,862 | |
Equity Futures Contracts** | | | 18,519 | | | | — | | | | — | | | | 18,519 | |
Equity Index Swap Agreements** | | | — | | | | — | * | | | — | | | | — | |
Total Assets | | $ | 45,226,600 | | | $ | — | | | $ | — | | | $ | 45,226,600 | |
* | Security has a market value of $0. |
** | This derivative is reported as unrealized appreciation/depreciation at period end. |
124 | THE GUGGENHEIM FUNDS SEMI-ANNUAL REPORT | SEE NOTES TO FINANCIAL STATEMENTS. |
SCHEDULE OF INVESTMENTS (Unaudited)(concluded) | June 30, 2023 |
SERIES Y (STYLEPLUS—LARGE GROWTH SERIES) | |
Affiliated Transactions
Investments representing 5% or more of the outstanding voting shares of a company, or control of or by, or common control under Guggenheim Investments (“GI”), result in that company being considered an affiliated issuer, as defined in the 1940 Act.
The Fund may invest in certain of the underlying series of Guggenheim Strategy Funds Trust, including Guggenheim Strategy Fund II, Guggenheim Strategy Fund III, and Guggenheim Variable Insurance Strategy Fund III, (collectively, the “Short Term Investment Vehicles”), each of which are open-end management investment companies managed by GI. The Short Term Investment Vehicles, which launched on March 11, 2014, are offered as short term investment options only to mutual funds, trusts, and other accounts managed by GI and/or its affiliates, and are not available to the public. The Short Term Investment Vehicles pay no investment management fees. The Short Term Investment Vehicles’ annual report on Form N-CSR dated September 30, 2022, is available publicly or upon request. This information is available from the EDGAR database on the SEC’s website at https://www.sec.gov/Archives/edgar/data/1601445/000182126822000340/gug84768.htm. The Fund may invest in certain of the underlying series of Guggenheim Funds Trust, which are open-end management investment companies managed by GI, are available to the public and whose most recent annual report on Form N-CSR is available publicly or upon request.
Transactions during the period ended June 30, 2023, in which the company is an affiliated issuer, were as follows:
Security Name | | Value
12/31/22 | | | Additions | | | Reductions | | | Realized
Gain (Loss) | | | Change in
Unrealized
Appreciation
(Depreciation) | | | Value
06/30/23 | | | Shares
06/30/23 | | | Investment
Income | |
Mutual Funds | | | | | | | | | | | | | | | | | | | | | | | | | | | | | | | | |
Guggenheim Strategy Fund II | | $ | 4,651,513 | | | $ | 6,878,914 | | | $ | (1,284,400 | ) | | $ | 1,661 | | | $ | 31,677 | | | $ | 10,279,365 | | | | 424,416 | | | $ | 177,321 | |
Guggenheim Strategy Fund III | | | 10,279,629 | | | | 245,508 | | | | (913,902 | ) | | | (33,835 | ) | | | 110,370 | | | | 9,687,770 | | | | 399,496 | | | | 245,170 | |
Guggenheim Ultra Short Duration Fund — Institutional Class | | | 3,742,412 | | | | 97,379 | | | | — | | | | — | | | | 34,961 | | | | 3,874,752 | | | | 398,227 | | | | 97,155 | |
Guggenheim Variable Insurance Strategy Fund III | | | 9,931,120 | | | | 257,567 | | | | — | | | | — | | | | 70,003 | | | | 10,258,690 | | | | 423,213 | | | | 256,916 | |
| | | $ | 28,604,674 | | | $ | 7,479,368 | | | $ | (2,198,302 | ) | | $ | (32,174 | ) | | $ | 247,011 | | | $ | 34,100,577 | | | | | | | $ | 776,562 | |
SEE NOTES TO FINANCIAL STATEMENTS. | THE GUGGENHEIM FUNDS SEMI-ANNUAL REPORT | 125 |
SERIES Y (STYLEPLUS—LARGE GROWTH SERIES) | |
STATEMENT OF ASSETS AND LIABILITIES (Unaudited) |
June 30, 2023 |
Assets: |
Investments in unaffiliated issuers, at value (cost $10,195,608) | | $ | 11,107,504 | |
Investments in affiliated issuers, at value (cost $34,735,863) | | | 34,100,577 | |
Segregated cash with broker | | | 58,000 | |
Prepaid expenses | | | 168 | |
Receivables: |
Swap settlement | | | 7,956,614 | |
Dividends | | | 155,134 | |
Fund shares sold | | | 19,450 | |
Variation margin on futures contracts | | | 12,155 | |
Interest | | | 8,853 | |
Total assets | | | 53,418,455 | |
| | | | | |
Liabilities: |
Overdraft due to custodian bank | | | 278 | |
Segregated cash due to broker | | | 7,330,000 | |
Payable for: |
Securities purchased | | | 160,619 | |
Distribution and service fees | | | 9,399 | |
Management fees | | | 9,058 | |
Transfer agent/maintenance fees | | | 2,206 | |
Fund accounting/administration fees | | | 1,128 | |
Trustees’ fees* | | | 886 | |
Fund shares redeemed | | | 857 | |
Miscellaneous | | | 51,783 | |
Total liabilities | | | 7,566,214 | |
Net assets | | $ | 45,852,241 | |
| | | | | |
Net assets consist of: |
Paid in capital | | $ | 46,088,062 | |
Total distributable earnings (loss) | | | (235,821 | ) |
Net assets | | $ | 45,852,241 | |
Capital shares outstanding | | | 2,624,327 | |
Net asset value per share | | $ | 17.47 | |
STATEMENT OF OPERATIONS (Unaudited) |
Six Months Ended June 30, 2023 |
Investment Income: |
Dividends from securities of unaffiliated issuers (net of foreign withholding tax of $148) | | $ | 64,073 | |
Dividends from securities of affiliated issuers | | | 776,562 | |
Interest | | | 39,357 | |
Total investment income | | | 879,992 | |
| | | | | |
Expenses: |
Management fees | | | 130,959 | |
Distribution and service fees | | | 50,623 | |
Transfer agent/maintenance fees | | | 12,528 | |
Interest expense | | | 90,248 | |
Professional fees | | | 19,157 | |
Fund accounting/administration fees | | | 12,711 | |
Trustees’ fees* | | | 7,472 | |
Custodian fees | | | 3,676 | |
Line of credit fees | | | 699 | |
Miscellaneous | | | 5,377 | |
Total expenses | | | 333,450 | |
Less: |
Expenses reimbursed by Adviser | | | (2,061 | ) |
Expenses waived by Adviser | | | (62,210 | ) |
Earnings credits applied | | | (580 | ) |
Total waived/reimbursed expenses | | | (64,851 | ) |
Net expenses | | | 268,599 | |
Net investment income | | | 611,393 | |
| | | | | |
Net Realized and Unrealized Gain (Loss): |
Net realized gain (loss) on: |
Investments in unaffiliated issuers | | | 103,347 | |
Investments in affiliated issuers | | | (32,174 | ) |
Swap agreements | | | 7,963,030 | |
Futures contracts | | | 71,740 | |
Net realized gain | | | 8,105,943 | |
Net change in unrealized appreciation (depreciation) on: |
Investments in unaffiliated issuers | | | 1,238,179 | |
Investments in affiliated issuers | | | 247,011 | |
Swap agreements | | | (532,587 | ) |
Futures contracts | | | 83,510 | |
Net change in unrealized appreciation (depreciation) | | | 1,036,113 | |
Net realized and unrealized gain | | | 9,142,056 | |
Net increase in net assets resulting from operations | | $ | 9,753,449 | |
* | Relates to Trustees not deemed “interested persons” within the meaning of Section 2(a)(19) of the 1940 Act. |
126 | THE GUGGENHEIM FUNDS SEMI-ANNUAL REPORT | SEE NOTES TO FINANCIAL STATEMENTS. |
SERIES Y (STYLEPLUS—LARGE GROWTH SERIES) | |
STATEMENTS OF CHANGES IN NET ASSETS |
| | Six Months Ended
June 30, 2023
(Unaudited) | | | Year Ended
December 31,
2022 | |
Increase (Decrease) in Net Assets from Operations: | | | | | | | | |
Net investment income | | $ | 611,393 | | | $ | 588,298 | |
Net realized gain (loss) on investments | | | 8,105,943 | | | | (9,758,413 | ) |
Net change in unrealized appreciation (depreciation) on investments | | | 1,036,113 | | | | (8,117,879 | ) |
Net increase (decrease) in net assets resulting from operations | | | 9,753,449 | | | | (17,287,994 | ) |
| | | | | | | | | |
Distributions to shareholders | | | — | | | | (10,472,266 | ) |
| | | | | | | | | |
Capital share transactions: | | | | | | | | |
Proceeds from sale of shares | | | 1,824,837 | | | | 2,650,703 | |
Distributions reinvested | | | — | | | | 10,472,266 | |
Cost of shares redeemed | | | (2,787,021 | ) | | | (6,278,669 | ) |
Net increase (decrease) from capital share transactions | | | (962,184 | ) | | | 6,844,300 | |
Net increase (decrease) in net assets | | | 8,791,265 | | | | (20,915,960 | ) |
| | | | | | | | | |
Net assets: | | | | | | | | |
Beginning of period | | | 37,060,976 | | | | 57,976,936 | |
End of period | | $ | 45,852,241 | | | $ | 37,060,976 | |
| | | | | | | | | |
Capital share activity: | | | | | | | | |
Shares sold | | | 112,242 | | | | 134,492 | |
Shares issued from reinvestment of distributions | | | — | | | | 690,327 | |
Shares redeemed | | | (180,931 | ) | | | (329,923 | ) |
Net increase (decrease) in shares | | | (68,689 | ) | | | 494,896 | |
SEE NOTES TO FINANCIAL STATEMENTS. | THE GUGGENHEIM FUNDS SEMI-ANNUAL REPORT | 127 |
SERIES Y (STYLEPLUS—LARGE GROWTH SERIES) | |
This table is presented to show selected data for a share outstanding throughout each period and to assist shareholders in evaluating a Fund’s performance for the periods presented.
| | Six Months Ended
June 30, 2023a | | | Year Ended
December 31,
2022 | | | Year Ended
December 31,
2021 | | | Year Ended
December 31,
2020 | | | Year Ended
December 31,
2019 | | | Year Ended
December 31,
2018 | |
Per Share Data |
Net asset value, beginning of period | | $ | 13.76 | | | $ | 26.38 | | | $ | 25.79 | | | $ | 19.82 | | | $ | 16.47 | | | $ | 20.30 | |
Income (loss) from investment operations: |
Net investment income (loss)b | | | .23 | | | | .24 | | | | .09 | | | | .16 | | | | .28 | | | | .34 | |
Net gain (loss) on investments (realized and unrealized) | | | 3.48 | | | | (7.87 | ) | | | 6.51 | | | | 7.07 | | | | 5.13 | | | | (.63 | ) |
Total from investment operations | | | 3.71 | | | | (7.63 | ) | | | 6.60 | | | | 7.23 | | | | 5.41 | | | | (.29 | ) |
Less distributions from: |
Net investment income | | | — | | | | (.09 | ) | | | (.17 | ) | | | (.28 | ) | | | (.38 | ) | | | (.34 | ) |
Net realized gains | | | — | | | | (4.90 | ) | | | (5.84 | ) | | | (.98 | ) | | | (1.68 | ) | | | (3.20 | ) |
Total distributions | | | — | | | | (4.99 | ) | | | (6.01 | ) | | | (1.26 | ) | | | (2.06 | ) | | | (3.54 | ) |
Net asset value, end of period | | $ | 17.47 | | | $ | 13.76 | | | $ | 26.38 | | | $ | 25.79 | | | $ | 19.82 | | | $ | 16.47 | |
|
Total Returnc | | | 26.96 | % | | | (30.69 | %) | | | 27.77 | % | | | 37.87 | % | | | 33.92 | % | | | (3.68 | %) |
Ratios/Supplemental Data |
Net assets, end of period (in thousands) | | $ | 45,852 | | | $ | 37,061 | | | $ | 57,977 | | | $ | 49,478 | | | $ | 40,187 | | | $ | 31,737 | |
Ratios to average net assets: |
Net investment income (loss) | | | 3.03 | % | | | 1.34 | % | | | 0.34 | % | | | 0.73 | % | | | 1.51 | % | | | 1.70 | % |
Total expensesd | | | 1.66 | % | | | 1.21 | % | | | 1.20 | % | | | 1.29 | % | | | 1.44 | % | | | 1.38 | % |
Net expensese,f,g | | | 1.34 | % | | | 0.92 | % | | | 0.88 | % | | | 0.88 | % | | | 0.97 | % | | | 1.02 | % |
Portfolio turnover rate | | | 27 | % | | | 65 | % | | | 40 | % | | | 66 | % | | | 47 | % | | | 59 | % |
a | Unaudited figures for the period ended June 30, 2023. Percentage amounts for the period, except total return and portfolio turnover rate, have been annualized. |
b | Net investment income (loss) per share was computed using average shares outstanding throughout the period. |
c | Total return does not take into account any of the expenses associated with an investment in variable insurance products. If total return had taken into account these expenses, performance would have been lower. Shares of a series of Guggenheim Variable Funds Trust are available only through the purchase of such products. |
d | Does not include expenses of the underlying funds in which the Fund invests. |
e | Net expense information reflects the expense ratios after expense waivers and reimbursements, as applicable. |
f | The portion of the ratios of net expenses to average net assets attributable to recoupments of prior fee reductions or expense reimbursements for the years presented was as follows: |
| | 06/30/23a | 12/31/22 | 12/31/21 | 12/31/20 | 12/31/19 | 12/31/18 |
| | — | — | — | — | — | 0.00%* |
g | Net expenses may include expenses that are excluded from the expense limitation agreement. Excluding these expenses, the net expense ratios for the years presented would be: |
| | 06/30/23a | 12/31/22 | 12/31/21 | 12/31/20 | 12/31/19 | 12/31/18 |
| | 0.88% | 0.89% | 0.87% | 0.88% | 0.90% | 0.93% |
128 | THE GUGGENHEIM FUNDS SEMI-ANNUAL REPORT | SEE NOTES TO FINANCIAL STATEMENTS. |
PERFORMANCE REPORT AND FUND PROFILE (Unaudited) | June 30, 2023 |
SERIES Z (ALPHA OPPORTUNITY SERIES)
OBJECTIVE: Seeks long-term growth of capital.
Holdings Diversification (Market Exposure as % of Net Assets)
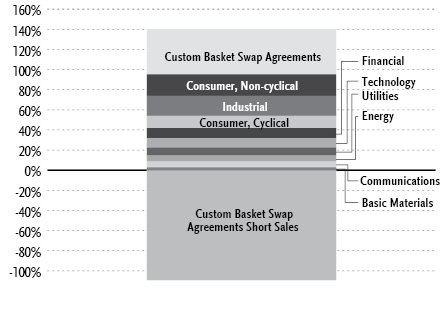
“Holdings Diversification (Market Exposure as % of Net Assets)” excludes any temporary cash investments.
Inception Date: July 7, 2003 |
Ten Largest Holdings | % of Total Net Assets |
ITT, Inc. | 1.1% |
Fortive Corp. | 1.1% |
Snap-on, Inc. | 1.1% |
Marathon Petroleum Corp. | 1.1% |
Viatris, Inc. | 1.1% |
Abbott Laboratories | 1.0% |
H&R Block, Inc. | 1.0% |
SEI Investments Co. | 1.0% |
MSC Industrial Direct Company, Inc. — Class A | 1.0% |
Cisco Systems, Inc. | 1.0% |
Top Ten Total | 10.5% |
| | |
“Ten Largest Holdings” excludes any temporary cash or derivative investments. |
Average Annual Returns*,†
Periods Ended June 30, 2023
| 6 Month‡ | 1 Year | 5 Year | 10 Year |
Series Z (Alpha Opportunity Series) | 4.78% | 3.50% | 0.76% | 3.29% |
Morningstar Long/Short Equity Category Average | 3.92% | 5.54% | 3.00% | 3.57% |
ICE BofA 3-Month U.S. Treasury Bill Index | 2.27% | 3.62% | 1.56% | 0.99% |
* | The performance data above represents past performance that is not predictive of future results. The investment return and principal value of an investment in the Fund will fluctuate so that an investor’s shares, when redeemed, may be worth more or less than their original cost. Returns are historical and include changes in principal and reinvested dividends and capital gains and do not reflect the effect of taxes. The ICE BofA 3-Month U.S. Treasury Bill Index and Morningstar Long/Short Equity Category Average are unmanaged indices and, unlike the Fund, have no management fees or operating expenses to reduce their reported returns. |
† | Performance figures do not reflect fees and expenses associated with an investment in variable insurance products. If returns had taken into account these fees and expenses, performance would have been lower. Shares of a series of Guggenheim Variable Funds Trust are available only through the purchase of such products. |
‡ | 6 month returns are not annualized. |
| | THE GUGGENHEIM FUNDS SEMI-ANNUAL REPORT | 129 |
SCHEDULE OF INVESTMENTS (Unaudited) | June 30, 2023 |
SERIES Z (ALPHA OPPORTUNITY SERIES) | |
| | Shares | | | Value | |
COMMON STOCKS† - 95.3% |
| | | | | | | | | |
Consumer, Non-cyclical - 21.4% |
Viatris, Inc. | | | 3,815 | | | $ | 38,074 | |
Abbott Laboratories1 | | | 345 | | | | 37,612 | |
H&R Block, Inc. | | | 1,163 | | | | 37,065 | |
Merck & Company, Inc.1 | | | 317 | | | | 36,579 | |
Kimberly-Clark Corp. | | | 262 | | | | 36,172 | |
Amgen, Inc.1 | | | 162 | | | | 35,967 | |
Bristol-Myers Squibb Co.1 | | | 542 | | | | 34,661 | |
Hershey Co. | | | 138 | | | | 34,458 | |
Incyte Corp.*,1 | | | 542 | | | | 33,740 | |
Innoviva, Inc.* | | | 2,165 | | | | 27,560 | |
Perdoceo Education Corp.* | | | 2,152 | | | | 26,405 | |
United Therapeutics Corp.*,1 | | | 119 | | | | 26,269 | |
Gilead Sciences, Inc.1 | | | 339 | | | | 26,127 | |
Vector Group Ltd. | | | 1,849 | | | | 23,686 | |
Royalty Pharma plc — Class A | | | 685 | | | | 21,057 | |
Exelixis, Inc.*,1 | | | 1,001 | | | | 19,129 | |
Hackett Group, Inc. | | | 830 | | | | 18,550 | |
USANA Health Sciences, Inc.* | | | 274 | | | | 17,273 | |
John B Sanfilippo & Son, Inc. | | | 147 | | | | 17,239 | |
Vertex Pharmaceuticals, Inc.*,1 | | | 46 | | | | 16,188 | |
Dynavax Technologies Corp.* | | | 1,234 | | | | 15,943 | |
Grand Canyon Education, Inc.* | | | 153 | | | | 15,791 | |
Quanex Building Products Corp. | | | 570 | | | | 15,304 | |
Humana, Inc. | | | 34 | | | | 15,202 | |
Neurocrine Biosciences, Inc.*,1 | | | 148 | | | | 13,956 | |
Altria Group, Inc. | | | 297 | | | | 13,454 | |
Campbell Soup Co.1 | | | 282 | | | | 12,890 | |
AMN Healthcare Services, Inc.*,1 | | | 113 | | | | 12,331 | |
Johnson & Johnson | | | 70 | | | | 11,586 | |
Premier, Inc. — Class A | | | 415 | | | | 11,479 | |
Edwards Lifesciences Corp.*,1 | | | 112 | | | | 10,565 | |
Vir Biotechnology, Inc.* | | | 364 | | | | 8,929 | |
Supernus Pharmaceuticals, Inc.* | | | 294 | | | | 8,838 | |
Eagle Pharmaceuticals, Inc.*,1 | | | 410 | | | | 7,970 | |
Molina Healthcare, Inc.* | | | 25 | | | | 7,531 | |
Quest Diagnostics, Inc. | | | 53 | | | | 7,450 | |
Perrigo Company plc | | | 218 | | | | 7,401 | |
Moderna, Inc.* | | | 60 | | | | 7,290 | |
QIAGEN N.V.* | | | 157 | | | | 7,070 | |
Total Consumer, Non-cyclical | | | | | | | 774,791 | |
| | | | | | | | | |
Industrial - 19.9% |
ITT, Inc. | | | 438 | | | | 40,826 | |
Fortive Corp. | | | 536 | | | | 40,077 | |
Snap-on, Inc.1 | | | 138 | | | | 39,770 | |
3M Co.1 | | | 361 | | | | 36,133 | |
Builders FirstSource, Inc.*,1 | | | 262 | | | | 35,632 | |
UFP Industries, Inc. | | | 355 | | | | 34,453 | |
Mueller Industries, Inc. | | | 374 | | | | 32,643 | |
Dover Corp.1 | | | 218 | | | | 32,188 | |
Boise Cascade Co. | | | 341 | | | | 30,809 | |
Standex International Corp. | | | 212 | | | | 29,991 | |
Eagle Materials, Inc.1 | | | 146 | | | | 27,217 | |
Donaldson Company, Inc.1 | | | 426 | | | | 26,629 | |
Vishay Intertechnology, Inc.1 | | | 825 | | | | 24,255 | |
Acuity Brands, Inc.1 | | | 148 | | | | 24,136 | |
Simpson Manufacturing Company, Inc.1 | | | 170 | | | | 23,545 | |
Sturm Ruger & Company, Inc. | | | 443 | | | | 23,461 | |
Landstar System, Inc. | | | 118 | | | | 22,720 | |
Armstrong World Industries, Inc.1 | | | 291 | | | | 21,377 | |
Louisiana-Pacific Corp. | | | 284 | | | | 21,294 | |
Masco Corp. | | | 309 | | | | 17,731 | |
Golar LNG Ltd. | | | 759 | | | | 15,309 | |
Expeditors International of Washington, Inc. | | | 113 | | | | 13,688 | |
Toro Co. | | | 126 | | | | 12,808 | |
Argan, Inc.1 | | | 317 | | | | 12,493 | |
Garmin Ltd. | | | 113 | | | | 11,785 | |
Ardmore Shipping Corp. | | | 936 | | | | 11,559 | |
Scorpio Tankers, Inc. | | | 243 | | | | 11,477 | |
Keysight Technologies, Inc.* | | | 63 | | | | 10,549 | |
International Seaways, Inc. | | | 265 | | | | 10,134 | |
Dorian LPG Ltd. | | | 330 | | | | 8,464 | |
GrafTech International Ltd. | | | 1,589 | | | | 8,009 | |
Lindsay Corp. | | | 63 | | | | 7,518 | |
Total Industrial | | | | | | | 718,680 | |
| | | | | | | | | |
Consumer, Cyclical - 12.3% |
MSC Industrial Direct Company, Inc. — Class A | | | 387 | | | | 36,874 | |
Allison Transmission Holdings, Inc.1 | | | 599 | | | | 33,819 | |
Gentex Corp.1 | | | 1,153 | | | | 33,737 | |
PulteGroup, Inc. | | | 414 | | | | 32,160 | |
MDC Holdings, Inc.1 | | | 659 | | | | 30,821 | |
Tri Pointe Homes, Inc.* | | | 928 | | | | 30,494 | |
Brunswick Corp.1 | | | 303 | | | | 26,252 | |
DR Horton, Inc.1 | | | 207 | | | | 25,190 | |
Dolby Laboratories, Inc. — Class A | | | 301 | | | | 25,188 | |
Boyd Gaming Corp.1 | | | 301 | | | | 20,880 | |
Patrick Industries, Inc. | | | 249 | | | | 19,920 | |
PetMed Express, Inc. | | | 1,399 | | | | 19,292 | |
Taylor Morrison Home Corp. — Class A* | | | 351 | | | | 17,118 | |
Monarch Casino & Resort, Inc. | | | 231 | | | | 16,274 | |
Meritage Homes Corp. | | | 99 | | | | 14,085 | |
Cavco Industries, Inc.* | | | 45 | | | | 13,275 | |
Buckle, Inc.1 | | | 372 | | | | 12,871 | |
NVR, Inc.* | | | 2 | | | | 12,701 | |
Green Brick Partners, Inc.* | | | 145 | | | | 8,236 | |
Academy Sports & Outdoors, Inc. | | | 145 | | | | 7,837 | |
Home Depot, Inc. | | | 24 | | | | 7,456 | |
Total Consumer, Cyclical | | | | | | | 444,480 | |
| | | | | | | | | |
Financial - 10.0% |
SEI Investments Co. | | | 620 | | | | 36,957 | |
MGIC Investment Corp.1 | | | 2,331 | | | | 36,807 | |
SouthState Corp. | | | 543 | | | | 35,729 | |
Equity Commonwealth REIT | | | 1,746 | | | | 35,374 | |
Weyerhaeuser Co. REIT | | | 853 | | | | 28,584 | |
Essent Group Ltd. | | | 593 | | | | 27,752 | |
Preferred Bank/Los Angeles CA | | | 477 | | | | 26,230 | |
Mr Cooper Group, Inc.* | | | 374 | | | | 18,939 | |
130 | THE GUGGENHEIM FUNDS SEMI-ANNUAL REPORT | SEE NOTES TO FINANCIAL STATEMENTS. |
SCHEDULE OF INVESTMENTS (Unaudited)(continued) | June 30, 2023 |
SERIES Z (ALPHA OPPORTUNITY SERIES) | |
| | Shares | | | Value | |
Radian Group, Inc.1 | | | 713 | | | $ | 18,025 | |
NMI Holdings, Inc. — Class A*,1 | | | 623 | | | | 16,086 | |
Evercore, Inc. — Class A1 | | | 128 | | | | 15,819 | |
FB Financial Corp. | | | 474 | | | | 13,296 | |
S&T Bancorp, Inc. | | | 395 | | | | 10,740 | |
Renasant Corp.1 | | | 409 | | | | 10,687 | |
International Bancshares Corp. | | | 172 | | | | 7,602 | |
Hilltop Holdings, Inc. | | | 240 | | | | 7,551 | |
Travelers Companies, Inc. | | | 41 | | | | 7,120 | |
Allstate Corp. | | | 65 | | | | 7,088 | |
Total Financial | | | | | | | 360,386 | |
| | | | | | | | | |
Technology - 9.3% |
NetApp, Inc.1 | | | 441 | | | | 33,692 | |
Dropbox, Inc. — Class A*,1 | | | 1,230 | | | | 32,804 | |
Kulicke & Soffa Industries, Inc. | | | 498 | | | | 29,606 | |
Applied Materials, Inc. | | | 183 | | | | 26,451 | |
KLA Corp. | | | 54 | | | | 26,191 | |
Apple, Inc. | | | 115 | | | | 22,307 | |
NetScout Systems, Inc.* | | | 668 | | | | 20,675 | |
Microsoft Corp. | | | 57 | | | | 19,411 | |
Diodes, Inc.*,1 | | | 192 | | | | 17,758 | |
Cognizant Technology Solutions Corp. — Class A1 | | | 269 | | | | 17,560 | |
Akamai Technologies, Inc.* | | | 185 | | | | 16,626 | |
Teradyne, Inc. | | | 139 | | | | 15,475 | |
Photronics, Inc.* | | | 512 | | | | 13,204 | |
Cirrus Logic, Inc.*,1 | | | 147 | | | | 11,908 | |
Veradigm, Inc.*,1 | | | 870 | | | | 10,962 | |
Teradata Corp.* | | | 154 | | | | 8,225 | |
QUALCOMM, Inc. | | | 63 | | | | 7,500 | |
Qualys, Inc.* | | | 57 | | | | 7,363 | |
Total Technology | | | | | | | 337,718 | |
| | | | | | | | | |
Utilities - 8.0% |
Atmos Energy Corp. | | | 311 | | | | 36,182 | |
OGE Energy Corp.1 | | | 1,006 | | | | 36,125 | |
Ameren Corp. | | | 438 | | | | 35,771 | |
MGE Energy, Inc.1 | | | 445 | | | | 35,204 | |
Black Hills Corp. | | | 579 | | | | 34,891 | |
ONE Gas, Inc.1 | | | 389 | | | | 29,879 | |
Consolidated Edison, Inc. | | | 254 | | | | 22,962 | |
Clearway Energy, Inc. — Class C1 | | | 734 | | | | 20,963 | |
National Fuel Gas Co.1 | | | 392 | | | | 20,133 | |
Chesapeake Utilities Corp.1 | | | 136 | | | | 16,184 | |
Total Utilities | | | | | | | 288,294 | |
| | | | | | | | | |
Energy - 5.8% |
Marathon Petroleum Corp.1 | | | 331 | | | | 38,595 | |
Valero Energy Corp.1 | | | 314 | | | | 36,832 | |
Exxon Mobil Corp.1 | | | 340 | | | | 36,465 | |
Cheniere Energy, Inc. | | | 148 | | | | 22,549 | |
Phillips 66 | | | 171 | | | | 16,310 | |
California Resources Corp. | | | 317 | | | | 14,357 | |
PBF Energy, Inc. — Class A | | | 314 | | | | 12,855 | |
REX American Resources Corp.* | | | 361 | | | | 12,567 | |
Occidental Petroleum Corp. | | | 180 | | | | 10,584 | |
SM Energy Co. | | | 316 | | | | 9,995 | |
Total Energy | | | | | | | 211,109 | |
| | | | | | | | | |
Communications - 5.8% |
Cisco Systems, Inc.1 | | | 712 | | | | 36,839 | |
VeriSign, Inc.* | | | 159 | | | | 35,929 | |
Yelp, Inc. — Class A* | | | 726 | | | | 26,434 | |
Nexstar Media Group, Inc. — Class A | | | 114 | | | | 18,987 | |
A10 Networks, Inc.1 | | | 1,241 | | | | 18,106 | |
InterDigital, Inc. | | | 167 | | | | 16,124 | |
Verizon Communications, Inc. | | | 342 | | | | 12,719 | |
T-Mobile US, Inc.*,1 | | | 90 | | | | 12,501 | |
TEGNA, Inc. | | | 760 | | | | 12,342 | |
Motorola Solutions, Inc. | | | 35 | | | | 10,264 | |
Extreme Networks, Inc.* | | | 358 | | | | 9,326 | |
Total Communications | | | | | | | 209,571 | |
| | | | | | | | | |
Basic Materials - 2.8% |
NewMarket Corp.1 | | | 63 | | | | 25,334 | |
Westlake Corp. | | | 199 | | | | 23,774 | |
Olin Corp.1 | | | 343 | | | | 17,627 | |
LyondellBasell Industries N.V. — Class A | | | 142 | | | | 13,040 | |
CF Industries Holdings, Inc.1 | | | 168 | | | | 11,662 | |
AdvanSix, Inc.1 | | | 248 | | | | 8,675 | |
Total Basic Materials | | | | | | | 100,112 | |
| | | | | | | | | |
Total Common Stocks | | | | |
(Cost $3,273,629) | | | | | | | 3,445,141 | |
| | | | | | | | | |
MONEY MARKET FUND† - 3.6% |
Goldman Sachs Financial Square Treasury Instruments Fund — Institutional Shares, 4.98%2 | | | 131,443 | | | | 131,443 | |
Total Money Market Fund | | | | |
(Cost $131,443) | | | | | | | 131,443 | |
| | | | | | | | | |
Total Investments - 98.9% | | | | |
(Cost $3,405,072) | | $ | 3,576,584 | |
Other Assets & Liabilities, net - 1.1% | | | 39,248 | |
Total Net Assets - 100.0% | | $ | 3,615,832 | |
SEE NOTES TO FINANCIAL STATEMENTS. | THE GUGGENHEIM FUNDS SEMI-ANNUAL REPORT | 131 |
SCHEDULE OF INVESTMENTS (Unaudited)(continued) | June 30, 2023 |
SERIES Z (ALPHA OPPORTUNITY SERIES) | |
Custom Basket Swap Agreements |
Counterparty | Reference Obligation | Type | Financing
Rate | | Payment
Frequency | | | Maturity
Date | | | Notional
Amount | | | Value and
Unrealized
Appreciation
(Depreciation) | |
OTC Custom Basket Swap Agreements†† |
Goldman Sachs International | GS Equity Custom Basket | Pay | 5.52% (Federal Funds Rate + 0.45%) | | | At Maturity | | | | 05/06/24 | | | $ | 808,393 | | | $ | 52,861 | |
Morgan Stanley Capital Services LLC | MS Equity Custom Basket | Pay | 5.47% (Federal Funds Rate + 0.40%) | | | At Maturity | | | | 02/01/24 | | | | 808,391 | | | | 52,397 | |
| | | | | | | | | | | | | | $ | 1,616,784 | | | $ | 105,258 | |
OTC Custom Basket Swap Agreements Sold Short†† |
Goldman Sachs International | GS Equity Custom Basket | Receive | 4.86% (Federal Funds Rate - 0.21%) | | | At Maturity | | | | 05/06/24 | | | $ | 1,810,906 | | | $ | (56,857 | ) |
Morgan Stanley Capital Services LLC | MS Equity Custom Basket | Receive | 4.77% (Federal Funds Rate - 0.30%) | | | At Maturity | | | | 02/01/24 | | | | 1,831,150 | | | | (57,101 | ) |
| | | | | | | | | | | | | | $ | 3,642,056 | | | $ | (113,958 | ) |
| | Shares | | | Percentage
Notional
Amount | | | Value and
Unrealized
Appreciation
(Depreciation) | |
MS EQUITY LONG CUSTOM BASKET |
Consumer, Non-cyclical |
Vertex Pharmaceuticals, Inc. | | | 11 | | | | 0.50 | % | | $ | 1,693 | |
John B Sanfilippo & Son, Inc. | | | 34 | | | | 0.49 | % | | | 1,456 | |
Perdoceo Education Corp. | | | 506 | | | | 0.77 | % | | | 808 | |
Kimberly-Clark Corp. | | | 62 | | | | 1.06 | % | | | 645 | |
Quanex Building Products Corp. | | | 134 | | | | 0.45 | % | | | 623 | |
AMN Healthcare Services, Inc. | | | 27 | | | | 0.36 | % | | | 620 | |
Hackett Group, Inc. | | | 195 | | | | 0.54 | % | | | 603 | |
Viatris, Inc. | | | 898 | | | | 1.11 | % | | | 575 | |
Exelixis, Inc. | | | 236 | | | | 0.56 | % | | | 400 | |
Dynavax Technologies Corp. | | | 290 | | | | 0.46 | % | | | 395 | |
Edwards Lifesciences Corp. | | | 26 | | | | 0.30 | % | | | 273 | |
Vector Group Ltd. | | | 435 | | | | 0.69 | % | | | 270 | |
Innoviva, Inc. | | | 509 | | | | 0.80 | % | | | 234 | |
Johnson & Johnson | | | 17 | | | | 0.35 | % | | | 207 | |
H&R Block, Inc. | | | 274 | | | | 1.08 | % | | | 206 | |
Merck & Company, Inc. | | | 75 | | | | 1.07 | % | | | 177 | |
USANA Health Sciences, Inc. | | | 65 | | | | 0.51 | % | | | 128 | |
Molina Healthcare, Inc. | | | 6 | | | | 0.22 | % | | | 54 | |
Quest Diagnostics, Inc. | | | 13 | | | | 0.23 | % | | | 52 | |
Perrigo Company plc | | | 51 | | | | 0.21 | % | | | 44 | |
Altria Group, Inc. | | | 70 | | | | 0.39 | % | | | 37 | |
Bristol-Myers Squibb Co. | | | 127 | | | | 1.00 | % | | | 5 | |
Abbott Laboratories | | | 81 | | | | 1.09 | % | | | 4 | |
United Therapeutics Corp. | | | 28 | | | | 0.76 | % | | | (13 | ) |
QIAGEN N.V. | | | 37 | | | | 0.21 | % | | | (34 | ) |
Moderna, Inc. | | | 14 | | | | 0.21 | % | | | (115 | ) |
Vir Biotechnology, Inc. | | | 86 | | | | 0.26 | % | | | (192 | ) |
Supernus Pharmaceuticals, Inc. | | | 69 | | | | 0.26 | % | | | (250 | ) |
Hershey Co. | | | 32 | | | | 0.99 | % | | | (262 | ) |
Neurocrine Biosciences, Inc. | | | 35 | | | | 0.41 | % | | | (267 | ) |
Premier, Inc. — Class A | | | 98 | | | | 0.34 | % | | | (357 | ) |
Amgen, Inc. | | | 38 | | | | 1.04 | % | | | (377 | ) |
Grand Canyon Education, Inc. | | | 36 | | | | 0.46 | % | | | (391 | ) |
Campbell Soup Co. | | | 66 | | | | 0.37 | % | | | (594 | ) |
Humana, Inc. | | | 8 | | | | 0.44 | % | | | (622 | ) |
Gilead Sciences, Inc. | | | 80 | | | | 0.76 | % | | | (625 | ) |
Incyte Corp. | | | 127 | | | | 0.98 | % | | | (1,237 | ) |
Eagle Pharmaceuticals, Inc. | | | 96 | | | | 0.23 | % | | | (1,435 | ) |
Royalty Pharma plc — Class A | | | 161 | | | | 0.61 | % | | | (1,830 | ) |
Total Consumer, Non-cyclical | | | 908 | |
| | | | | | | | | | | | | |
Communications |
Yelp, Inc. — Class A | | | 171 | | | | 0.77 | % | | | 1,424 | |
Cisco Systems, Inc. | | | 168 | | | | 1.08 | % | | | 723 | |
Extreme Networks, Inc. | | | 84 | | | | 0.27 | % | | | 584 | |
InterDigital, Inc. | | | 39 | | | | 0.47 | % | | | 472 | |
Nexstar Media Group, Inc. — Class A | | | 27 | | | | 0.56 | % | | | 263 | |
Motorola Solutions, Inc. | | | 8 | | | | 0.29 | % | | | 62 | |
T-Mobile US, Inc. | | | 21 | | | | 0.36 | % | | | 36 | |
VeriSign, Inc. | | | 37 | | | | 1.03 | % | | | 18 | |
TEGNA, Inc. | | | 179 | | | | 0.36 | % | | | 2 | |
Verizon Communications, Inc. | | | 81 | | | | 0.37 | % | | | (49 | ) |
A10 Networks, Inc. | | | 292 | | | | 0.53 | % | | | (92 | ) |
Total Communications | | | 3,443 | |
| | | | | | | | | | | | | |
132 | THE GUGGENHEIM FUNDS SEMI-ANNUAL REPORT | SEE NOTES TO FINANCIAL STATEMENTS. |
SCHEDULE OF INVESTMENTS (Unaudited)(continued) | June 30, 2023 |
SERIES Z (ALPHA OPPORTUNITY SERIES) | |
| | Shares | | | Percentage
Notional
Amount | | | Value and
Unrealized
Appreciation
(Depreciation) | |
Consumer, Cyclical |
Allison Transmission Holdings, Inc. | | | 141 | | | | 0.98 | % | | $ | 2,692 | |
PulteGroup, Inc. | | | 97 | | | | 0.93 | % | | | 1,978 | |
DR Horton, Inc. | | | 49 | | | | 0.74 | % | | | 1,425 | |
MDC Holdings, Inc. | | | 155 | | | | 0.90 | % | | | 1,310 | |
Taylor Morrison Home Corp. — Class A | | | 83 | | | | 0.50 | % | | | 1,013 | |
Boyd Gaming Corp. | | | 71 | | | | 0.61 | % | | | 999 | |
Brunswick Corp. | | | 71 | | | | 0.76 | % | | | 918 | |
MSC Industrial Direct Company, Inc. — Class A | | | 91 | | | | 1.07 | % | | | 815 | |
Patrick Industries, Inc. | | | 59 | | | | 0.58 | % | | | 791 | |
Tri Pointe Homes, Inc. | | | 218 | | | | 0.89 | % | | | 777 | |
Meritage Homes Corp. | | | 23 | | | | 0.40 | % | | | 478 | |
Cavco Industries, Inc. | | | 11 | | | | 0.40 | % | | | 299 | |
Academy Sports & Outdoors, Inc. | | | 34 | | | | 0.23 | % | | | 189 | |
Green Brick Partners, Inc. | | | 34 | | | | 0.24 | % | | | 172 | |
Gentex Corp. | | | 271 | | | | 0.98 | % | | | 163 | |
Monarch Casino & Resort, Inc. | | | 54 | | | | 0.47 | % | | | 137 | |
Home Depot, Inc. | | | 6 | | | | 0.23 | % | | | 125 | |
Dolby Laboratories, Inc. — Class A | | | 71 | | | | 0.73 | % | | | 67 | |
Buckle, Inc. | | | 88 | | | | 0.38 | % | | | (164 | ) |
PetMed Express, Inc. | | | 329 | | | | 0.56 | % | | | (304 | ) |
Total Consumer, Cyclical | | | 13,880 | |
| | | | | | | | | | | | | |
Industrial |
Standex International Corp. | | | 50 | | | | 0.90 | % | | | 2,826 | |
Snap-on, Inc. | | | 33 | | | | 1.18 | % | | | 2,511 | |
Eagle Materials, Inc. | | | 34 | | | | 0.78 | % | | | 2,142 | |
Vishay Intertechnology, Inc. | | | 194 | | | | 0.71 | % | | | 1,970 | |
Mueller Industries, Inc. | | | 88 | | | | 0.95 | % | | | 1,906 | |
Louisiana-Pacific Corp. | | | 67 | | | | 0.62 | % | | | 1,480 | |
Builders FirstSource, Inc. | | | 62 | | | | 1.04 | % | | | 1,288 | |
Boise Cascade Co. | | | 80 | | | | 0.89 | % | | | 1,278 | |
Fortive Corp. | | | 126 | | | | 1.17 | % | | | 1,230 | |
Simpson Manufacturing Company, Inc. | | | 40 | | | | 0.69 | % | | | 1,097 | |
UFP Industries, Inc. | | | 84 | | | | 1.01 | % | | | 1,081 | |
Dorian LPG Ltd. | | | 78 | | | | 0.25 | % | | | 1,017 | |
ITT, Inc. | | | 103 | | | | 1.19 | % | | | 665 | |
Masco Corp. | | | 73 | | | | 0.52 | % | | | 442 | |
Donaldson Company, Inc. | | | 100 | | | | 0.77 | % | | | 422 | |
Landstar System, Inc. | | | 28 | | | | 0.67 | % | | | 408 | |
Armstrong World Industries, Inc. | | | 68 | | | | 0.62 | % | | | 376 | |
Dover Corp. | | | 51 | | | | 0.93 | % | | | 269 | |
Expeditors International of Washington, Inc. | | | 27 | | | | 0.40 | % | | | 184 | |
Keysight Technologies, Inc. | | | 15 | | | | 0.31 | % | | | 159 | |
International Seaways, Inc. | | | 62 | | | | 0.29 | % | | | 128 | |
Ardmore Shipping Corp. | | | 220 | | | | 0.34 | % | | | 66 | |
Scorpio Tankers, Inc. | | | 57 | | | | 0.33 | % | | | 47 | |
GrafTech International Ltd. | | | 374 | | | | 0.23 | % | | | 40 | |
Toro Co. | | | 30 | | | | 0.38 | % | | | 8 | |
Garmin Ltd. | | | 26 | | | | 0.34 | % | | | (31 | ) |
Argan, Inc. | | | 75 | | | | 0.37 | % | | | (105 | ) |
Golar LNG Ltd. | | | 179 | | | | 0.45 | % | | | (237 | ) |
Acuity Brands, Inc. | | | 35 | | | | 0.71 | % | | | (381 | ) |
Lindsay Corp. | | | 15 | | | | 0.22 | % | | | (447 | ) |
3M Co. | | | 85 | | | | 1.05 | % | | | (733 | ) |
Sturm Ruger & Company, Inc. | | | 104 | | | | 0.68 | % | | | (771 | ) |
Total Industrial | | | 20,335 | |
| | | | | | | | | | | | | |
Basic Materials |
NewMarket Corp. | | | 15 | | | | 0.75 | % | | | 1,242 | |
CF Industries Holdings, Inc. | | | 40 | | | | 0.34 | % | | | (27 | ) |
LyondellBasell Industries N.V. — Class A | | | 33 | | | | 0.37 | % | | | (62 | ) |
Westlake Corp. | | | 47 | | | | 0.69 | % | | | (118 | ) |
AdvanSix, Inc. | | | 58 | | | | 0.25 | % | | | (303 | ) |
Olin Corp. | | | 81 | | | | 0.51 | % | | | (317 | ) |
Total Basic Materials | | | 415 | |
| | | | | | | | | | | | | |
Technology |
Dropbox, Inc. — Class A | | | 289 | | | | 0.95 | % | | | 1,272 | |
Kulicke & Soffa Industries, Inc. | | | 117 | | | | 0.86 | % | | | 1,088 | |
KLA Corp. | | | 13 | | | | 0.78 | % | | | 856 | |
NetApp, Inc. | | | 104 | | | | 0.98 | % | | | 846 | |
Microsoft Corp. | | | 13 | | | | 0.55 | % | | | 737 | |
Diodes, Inc. | | | 45 | | | | 0.51 | % | | | 697 | |
Teradata Corp. | | | 36 | | | | 0.24 | % | | | 696 | |
Teradyne, Inc. | | | 33 | | | | 0.45 | % | | | 625 | |
Photronics, Inc. | | | 120 | | | | 0.38 | % | | | 515 | |
Applied Materials, Inc. | | | 43 | | | | 0.77 | % | | | 474 | |
Cirrus Logic, Inc. | | | 35 | | | | 0.35 | % | | | 431 | |
Apple, Inc. | | | 27 | | | | 0.65 | % | | | 353 | |
Cognizant Technology Solutions Corp. — Class A | | | 63 | | | | 0.51 | % | | | 228 | |
QUALCOMM, Inc. | | | 15 | | | | 0.22 | % | | | 212 | |
Qualys, Inc. | | | 14 | | | | 0.22 | % | | | 109 | |
NetScout Systems, Inc. | | | 157 | | | | 0.60 | % | | | 105 | |
Veradigm, Inc. | | | 205 | | | | 0.32 | % | | | 0 | |
Akamai Technologies, Inc. | | | 44 | | | | 0.49 | % | | | (180 | ) |
Total Technology | | | 9,064 | |
| | | | | | | | | | | | | |
SEE NOTES TO FINANCIAL STATEMENTS. | THE GUGGENHEIM FUNDS SEMI-ANNUAL REPORT | 133 |
SCHEDULE OF INVESTMENTS (Unaudited)(continued) | June 30, 2023 |
SERIES Z (ALPHA OPPORTUNITY SERIES) | |
| | Shares | | | Percentage
Notional
Amount | | | Value and
Unrealized
Appreciation
(Depreciation) | |
Financial |
MGIC Investment Corp. | | | 549 | | | | 1.07 | % | | $ | 891 | |
Essent Group Ltd. | | | 140 | | | | 0.81 | % | | | 821 | |
Weyerhaeuser Co. | | | 201 | | | | 0.83 | % | | | 772 | |
NMI Holdings, Inc. — Class A | | | 147 | | | | 0.47 | % | | | 714 | |
Radian Group, Inc. | | | 168 | | | | 0.53 | % | | | 562 | |
Evercore, Inc. — Class A | | | 30 | | | | 0.46 | % | | | 553 | |
Mr Cooper Group, Inc. | | | 88 | | | | 0.55 | % | | | 329 | |
Hilltop Holdings, Inc. | | | 57 | | | | 0.22 | % | | | 185 | |
Preferred Bank/Los Angeles CA | | | 112 | | | | 0.76 | % | | | 94 | |
SouthState Corp. | | | 128 | | | | 1.04 | % | | | 39 | |
SEI Investments Co. | | | 146 | | | | 1.08 | % | | | 27 | |
International Bancshares Corp. | | | 40 | | | | 0.22 | % | | | 17 | |
Allstate Corp. | | | 15 | | | | 0.20 | % | | | (10 | ) |
Travelers Companies, Inc. | | | 10 | | | | 0.21 | % | | | (12 | ) |
S&T Bancorp, Inc. | | | 93 | | | | 0.31 | % | | | (84 | ) |
Equity Commonwealth | | | 411 | | | | 1.03 | % | | | (153 | ) |
Renasant Corp. | | | 96 | | | | 0.31 | % | | | (653 | ) |
FB Financial Corp. | | | 111 | | | | 0.39 | % | | | (997 | ) |
Total Financial | | | 3,095 | |
| | | | | | | | | | | | | |
Utilities |
MGE Energy, Inc. | | | 105 | | | | 1.04 | % | | | 607 | |
Atmos Energy Corp. | | | 73 | | | | 1.05 | % | | | 117 | |
ONE Gas, Inc. | | | 92 | | | | 0.87 | % | | | 100 | |
Chesapeake Utilities Corp. | | | 32 | | | | 0.47 | % | | | 52 | |
Ameren Corp. | | | 103 | | | | 1.04 | % | | | (27 | ) |
Consolidated Edison, Inc. | | | 60 | | | | 0.67 | % | | | (152 | ) |
Black Hills Corp. | | | 136 | | | | 1.01 | % | | | (227 | ) |
OGE Energy Corp. | | | 237 | | | | 1.05 | % | | | (741 | ) |
National Fuel Gas Co. | | | 92 | | | | 0.58 | % | | | (784 | ) |
Clearway Energy, Inc. — Class C | | | 173 | | | | 0.61 | % | | | (829 | ) |
Total Utilities | | | (1,884 | ) |
| | | | | | | | | | | | | |
Energy |
Marathon Petroleum Corp. | | | 78 | | | | 1.13 | % | | | 1,047 | |
Exxon Mobil Corp. | | | 80 | | | | 1.06 | % | | | 691 | |
REX American Resources Corp. | | | 85 | | | | 0.37 | % | | | 485 | |
California Resources Corp. | | | 75 | | | | 0.42 | % | | | 365 | |
SM Energy Co. | | | 74 | | | | 0.29 | % | | | 352 | |
PBF Energy, Inc. — Class A | | | 74 | | | | 0.37 | % | | | 327 | |
Cheniere Energy, Inc. | | | 35 | | | | 0.66 | % | | | 298 | |
Phillips 66 | | | 40 | | | | 0.47 | % | | | (36 | ) |
Valero Energy Corp. | | | 74 | | | | 1.07 | % | | | (156 | ) |
Occidental Petroleum Corp. | | | 42 | | | | 0.31 | % | | | (232 | ) |
Total Energy | | | 3,141 | |
Total MS Equity Long Custom Basket | | | 52,397 | |
| | | | | | | | | |
MS EQUITY SHORT CUSTOM BASKET |
Consumer, Non-cyclical |
Driven Brands Holdings, Inc. | | | 834 | | | | (1.23 | )% | | | 1,826 | |
Equifax, Inc. | | | 102 | | | | (1.31 | )% | | | 1,331 | |
Clarivate plc | | | 791 | | | | (0.41 | )% | | | 1,088 | |
Global Payments, Inc. | | | 178 | | | | (0.96 | )% | | | 896 | |
ABM Industries, Inc. | | | 491 | | | | (1.14 | )% | | | 632 | |
Utz Brands, Inc. | | | 509 | | | | (0.45 | )% | | | 405 | |
TreeHouse Foods, Inc. | | | 281 | | | | (0.77 | )% | | | (796 | ) |
FTI Consulting, Inc. | | | 82 | | | | (0.85 | )% | | | (960 | ) |
Estee Lauder Companies, Inc. — Class A | | | 83 | | | | (0.89 | )% | | | (1,221 | ) |
Quanta Services, Inc. | | | 93 | | | | (1.00 | )% | | | (1,643 | ) |
Booz Allen Hamilton Holding Corp. | | | 94 | | | | (0.57 | )% | | | (1,792 | ) |
ICF International, Inc. | | | 158 | | | | (1.07 | )% | | | (3,283 | ) |
CoStar Group, Inc. | | | 274 | | | | (1.33 | )% | | | (3,587 | ) |
TransUnion | | | 311 | | | | (1.33 | )% | | | (4,565 | ) |
GXO Logistics, Inc. | | | 284 | | | | (0.97 | )% | | | (4,626 | ) |
Neogen Corp. | | | 1,134 | | | | (1.35 | )% | | | (4,876 | ) |
Total Consumer, Non-cyclical | | | (21,171 | ) |
| | | | | | | | | | | | | |
Financial |
Sun Communities, Inc. | | | 174 | | | | (1.25 | )% | | | 7,371 | |
Rexford Industrial Realty, Inc. | | | 428 | | | | (1.22 | )% | | | 3,793 | |
American Tower Corp. — Class A | | | 139 | | | | (1.47 | )% | | | 3,431 | |
Howard Hughes Corp. | | | 230 | | | | (0.99 | )% | | | 2,459 | |
Outfront Media, Inc. | | | 777 | | | | (0.67 | )% | | | 2,225 | |
Equitable Holdings, Inc. | | | 942 | | | | (1.40 | )% | | | 1,934 | |
Healthcare Realty Trust, Inc. | | | 927 | | | | (0.95 | )% | | | 1,917 | |
Kemper Corp. | | | 270 | | | | (0.71 | )% | | | 1,915 | |
Kennedy-Wilson Holdings, Inc. | | | 1,420 | | | | (1.27 | )% | | | 1,872 | |
Raymond James Financial, Inc. | | | 280 | | | | (1.59 | )% | | | 1,636 | |
Americold Realty Trust, Inc. | | | 712 | | | | (1.26 | )% | | | 1,263 | |
TFS Financial Corp. | | | 702 | | | | (0.48 | )% | | | 807 | |
Prologis, Inc. | | | 169 | | | | (1.13 | )% | | | 739 | |
Assured Guaranty Ltd. | | | 359 | | | | (1.09 | )% | | | 719 | |
Equinix, Inc. | | | 30 | | | | (1.28 | )% | | | 258 | |
Progressive Corp. | | | 135 | | | | (0.98 | )% | | | 221 | |
Stellar Bancorp, Inc. | | | 507 | | | | (0.63 | )% | | | 169 | |
Rayonier, Inc. | | | 724 | | | | (1.24 | )% | | | 118 | |
Popular, Inc. | | | 143 | | | | (0.47 | )% | | | 98 | |
Northern Trust Corp. | | | 205 | | | | (0.83 | )% | | | 64 | |
KKR & Company, Inc. — Class A | | | 422 | | | | (1.29 | )% | | | 19 | |
Hanover Insurance Group, Inc. | | | 106 | | | | (0.65 | )% | | | (6 | ) |
134 | THE GUGGENHEIM FUNDS SEMI-ANNUAL REPORT | SEE NOTES TO FINANCIAL STATEMENTS. |
SCHEDULE OF INVESTMENTS (Unaudited)(continued) | June 30, 2023 |
SERIES Z (ALPHA OPPORTUNITY SERIES) | |
| | Shares | | | Percentage
Notional
Amount | | | Value and
Unrealized
Appreciation
(Depreciation) | |
Crown Castle, Inc. | | | 55 | | | | (0.34 | )% | | $ | (41 | ) |
Voya Financial, Inc. | | | 93 | | | | (0.36 | )% | | | (72 | ) |
Annaly Capital Management, Inc. | | | 591 | | | | (0.65 | )% | | | (272 | ) |
State Street Corp. | | | 202 | | | | (0.81 | )% | | | (309 | ) |
Omega Healthcare Investors, Inc. | | | 295 | | | | (0.49 | )% | | | (422 | ) |
Boston Properties, Inc. | | | 105 | | | | (0.33 | )% | | | (669 | ) |
Medical Properties Trust, Inc. | | | 1,043 | | | | (0.53 | )% | | | (735 | ) |
AGNC Investment Corp. | | | 1,100 | | | | (0.61 | )% | | | (744 | ) |
UDR, Inc. | | | 553 | | | | (1.30 | )% | | | (962 | ) |
Jones Lang LaSalle, Inc. | | | 83 | | | | (0.71 | )% | | | (1,030 | ) |
Brighthouse Financial, Inc. | | | 609 | | | | (1.57 | )% | | | (1,034 | ) |
UMH Properties, Inc. | | | 1,126 | | | | (0.98 | )% | | | (1,102 | ) |
Ellington Financial, Inc. | | | 1,160 | | | | (0.87 | )% | | | (1,172 | ) |
Welltower, Inc. | | | 231 | | | | (1.02 | )% | | | (1,345 | ) |
PennyMac Mortgage Investment Trust | | | 1,117 | | | | (0.82 | )% | | | (1,402 | ) |
Carlyle Group, Inc. | | | 309 | | | | (0.54 | )% | | | (1,563 | ) |
Apollo Global Management, Inc. | | | 161 | | | | (0.68 | )% | | | (1,801 | ) |
PennyMac Financial Services, Inc. | | | 334 | | | | (1.28 | )% | | | (2,489 | ) |
Iron Mountain, Inc. | | | 449 | | | | (1.39 | )% | | | (2,501 | ) |
Ares Management Corp. — Class A | | | 229 | | | | (1.20 | )% | | | (3,379 | ) |
Digital Realty Trust, Inc. | | | 218 | | | | (1.36 | )% | | | (4,180 | ) |
Total Financial | | | 5,798 | |
| | | | | | | | | | | | | |
Utilities |
Avista Corp. | | | 512 | | | | (1.10 | )% | | | 2,175 | |
Spire, Inc. | | | 297 | | | | (1.03 | )% | | | 1,999 | |
Dominion Energy, Inc. | | | 405 | | | | (1.15 | )% | | | 1,559 | |
Sempra Energy | | | 179 | | | | (1.42 | )% | | | 1,135 | |
UGI Corp. | | | 555 | | | | (0.82 | )% | | | 317 | |
CMS Energy Corp. | | | 359 | | | | (1.15 | )% | | | 291 | |
PG&E Corp. | | | 1,250 | | | | (1.18 | )% | | | 51 | |
American Electric Power Company, Inc. | | | 314 | | | | (1.44 | )% | | | (113 | ) |
Alliant Energy Corp. | | | 403 | | | | (1.15 | )% | | | (113 | ) |
DTE Energy Co. | | | 161 | | | | (0.97 | )% | | | (127 | ) |
Exelon Corp. | | | 360 | | | | (0.80 | )% | | | (310 | ) |
Edison International | | | 313 | | | | (1.19 | )% | | | (853 | ) |
Total Utilities | | | 6,011 | |
| | | | | | | | | | | | | |
Technology |
Evolent Health, Inc. — Class A | | | 371 | | | | (0.61 | )% | | | 1,008 | |
Procore Technologies, Inc. | | | 161 | | | | (0.57 | )% | | | (71 | ) |
KBR, Inc. | | | 149 | | | | (0.53 | )% | | | (514 | ) |
Guidewire Software, Inc. | | | 123 | | | | (0.51 | )% | | | (549 | ) |
Alteryx, Inc. — Class A | | | 179 | | | | (0.44 | )% | | | (654 | ) |
Paycor HCM, Inc. | | | 587 | | | | (0.76 | )% | | | (872 | ) |
Privia Health Group, Inc. | | | 776 | | | | (1.11 | )% | | | (1,495 | ) |
Ceridian HCM Holding, Inc. | | | 325 | | | | (1.19 | )% | | | (2,463 | ) |
Total Technology | | | (5,610 | ) |
| | | | | | | | | | | | | |
Industrial |
Waste Management, Inc. | | | 62 | | | | (0.60 | )% | | | (3 | ) |
Boeing Co. | | | 79 | | | | (0.91 | )% | | | (911 | ) |
Vulcan Materials Co. | | | 43 | | | | (0.53 | )% | | | (984 | ) |
Kirby Corp. | | | 146 | | | | (0.61 | )% | | | (1,265 | ) |
Tetra Tech, Inc. | | | 48 | | | | (0.43 | )% | | | (1,483 | ) |
Clean Harbors, Inc. | | | 55 | | | | (0.49 | )% | | | (1,679 | ) |
NV5 Global, Inc. | | | 116 | | | | (0.70 | )% | | | (1,831 | ) |
MasTec, Inc. | | | 90 | | | | (0.58 | )% | | | (2,746 | ) |
Casella Waste Systems, Inc. — Class A | | | 174 | | | | (0.86 | )% | | | (4,346 | ) |
MSA Safety, Inc. | | | 124 | | | | (1.18 | )% | | | (5,831 | ) |
Total Industrial | | | (21,079 | ) |
| | | | | | | | | | | | | |
Consumer, Cyclical |
UniFirst Corp. | | | 103 | | | | (0.88 | )% | | | 4,642 | |
Ollie’s Bargain Outlet Holdings, Inc. | | | 91 | | | | (0.29 | )% | | | 66 | |
Newell Brands, Inc. | | | 1,957 | | | | (0.93 | )% | | | (20 | ) |
OPENLANE, Inc. | | | 1,223 | | | | (1.02 | )% | | | (117 | ) |
Burlington Stores, Inc. | | | 53 | | | | (0.46 | )% | | | (438 | ) |
Five Below, Inc. | | | 48 | | | | (0.52 | )% | | | (576 | ) |
Shake Shack, Inc. — Class A | | | 139 | | | | (0.59 | )% | | | (1,263 | ) |
VF Corp. | | | 1,113 | | | | (1.16 | )% | | | (1,384 | ) |
Tesla, Inc. | | | 40 | | | | (0.57 | )% | | | (2,783 | ) |
Floor & Decor Holdings, Inc. — Class A | | | 148 | | | | (0.84 | )% | | | (3,579 | ) |
Copart, Inc. | | | 238 | | | | (1.19 | )% | | | (6,219 | ) |
Total Consumer, Cyclical | | | (11,671 | ) |
| | | | | | | | | | | | | |
Basic Materials |
Hecla Mining Co. | | | 1,993 | | | | (0.57 | )% | | | 1,803 | |
Royal Gold, Inc. | | | 93 | | | | (0.58 | )% | | | 967 | |
Piedmont Lithium, Inc. | | | 153 | | | | (0.48 | )% | | | 564 | |
Carpenter Technology Corp. | | | 236 | | | | (0.72 | )% | | | (4,150 | ) |
Total Basic Materials | | | (816 | ) |
| | | | | | | | | | | | | |
Communications |
Robinhood Markets, Inc. — Class A | | | 484 | | | | (0.27 | )% | | | (154 | ) |
Palo Alto Networks, Inc. | | | 22 | | | | (0.31 | )% | | | (197 | ) |
Chewy, Inc. — Class A | | | 218 | | | | (0.47 | )% | | | (751 | ) |
DoorDash, Inc. — Class A | | | 166 | | | | (0.69 | )% | | | (1,800 | ) |
Uber Technologies, Inc. | | | 151 | | | | (0.36 | )% | | | (2,281 | ) |
Total Communications | | | (5,183 | ) |
| | | | | | | | | | | | | |
Energy |
NOV, Inc. | | | 949 | | | | (0.83 | )% | | | 4,488 | |
Hess Corp. | | | 201 | | | | (1.49 | )% | | | (1,071 | ) |
SEE NOTES TO FINANCIAL STATEMENTS. | THE GUGGENHEIM FUNDS SEMI-ANNUAL REPORT | 135 |
SCHEDULE OF INVESTMENTS (Unaudited)(continued) | June 30, 2023 |
SERIES Z (ALPHA OPPORTUNITY SERIES) | |
| | Shares | | | Percentage
Notional
Amount | | | Value and
Unrealized
Appreciation
(Depreciation) | |
Valaris Ltd. | | | 152 | | | | (0.52 | )% | | $ | (1,487 | ) |
Tidewater, Inc. | | | 212 | | | | (0.64 | )% | | | (2,591 | ) |
Schlumberger N.V. | | | 480 | | | | (1.29 | )% | | | (2,719 | ) |
Total Energy | | | (3,380 | ) |
Total MS Equity Short Custom Basket | | | (57,101 | ) |
| | | | | | | | | |
GS EQUITY LONG CUSTOM BASKET |
Consumer, Non-cyclical |
Vertex Pharmaceuticals, Inc. | | | 11 | | | | 0.53 | % | | | 1,687 | |
John B Sanfilippo & Son, Inc. | | | 34 | | | | 0.49 | % | | | 1,454 | |
Perdoceo Education Corp. | | | 506 | | | | 0.77 | % | | | 807 | |
Kimberly-Clark Corp. | | | 62 | | | | 1.06 | % | | | 648 | |
AMN Healthcare Services, Inc. | | | 27 | | | | 0.36 | % | | | 625 | |
Quanex Building Products Corp. | | | 134 | | | | 0.45 | % | | | 621 | |
Hackett Group, Inc. | | | 195 | | | | 0.54 | % | | | 601 | |
Viatris, Inc. | | | 898 | | | | 1.11 | % | | | 570 | |
Exelixis, Inc. | | | 236 | | | | 0.56 | % | | | 409 | |
Dynavax Technologies Corp. | | | 290 | | | | 0.46 | % | | | 399 | |
Edwards Lifesciences Corp. | | | 26 | | | | 0.30 | % | | | 276 | |
Vector Group Ltd. | | | 435 | | | | 0.69 | % | | | 274 | |
Innoviva, Inc. | | | 509 | | | | 0.80 | % | | | 240 | |
Johnson & Johnson | | | 17 | | | | 0.35 | % | | | 206 | |
H&R Block, Inc. | | | 274 | | | | 1.08 | % | | | 181 | |
Merck & Company, Inc. | | | 75 | | | | 1.07 | % | | | 179 | |
USANA Health Sciences, Inc. | | | 65 | | | | 0.51 | % | | | 122 | |
Quest Diagnostics, Inc. | | | 13 | | | | 0.23 | % | | | 54 | |
Molina Healthcare, Inc. | | | 6 | | | | 0.22 | % | | | 50 | |
Perrigo Company plc | | | 51 | | | | 0.21 | % | | | 43 | |
Altria Group, Inc. | | | 70 | | | | 0.39 | % | | | 32 | |
Bristol-Myers Squibb Co. | | | 127 | | | | 1.00 | % | | | 9 | |
Abbott Laboratories | | | 81 | | | | 1.09 | % | | | 5 | |
United Therapeutics Corp. | | | 28 | | | | 0.76 | % | | | (13 | ) |
QIAGEN N.V. | | | 37 | | | | 0.21 | % | | | (36 | ) |
Moderna, Inc. | | | 14 | | | | 0.21 | % | | | (117 | ) |
Vir Biotechnology, Inc. | | | 86 | | | | 0.26 | % | | | (199 | ) |
Supernus Pharmaceuticals, Inc. | | | 69 | | | | 0.26 | % | | | (246 | ) |
Neurocrine Biosciences, Inc. | | | 35 | | | | 0.41 | % | | | (271 | ) |
Hershey Co. | | | 32 | | | | 0.99 | % | | | (271 | ) |
Amgen, Inc. | | | 38 | | | | 1.04 | % | | | (342 | ) |
Premier, Inc. — Class A | | | 98 | | | | 0.34 | % | | | (358 | ) |
Grand Canyon Education, Inc. | | | 36 | | | | 0.46 | % | | | (395 | ) |
Campbell Soup Co. | | | 66 | | | | 0.37 | % | | | (591 | ) |
Gilead Sciences, Inc. | | | 80 | | | | 0.76 | % | | | (617 | ) |
Humana, Inc. | | | 8 | | | | 0.44 | % | | | (620 | ) |
Incyte Corp. | | | 127 | | | | 0.98 | % | | | (1,209 | ) |
Eagle Pharmaceuticals, Inc. | | | 96 | | | | 0.23 | % | | | (1,461 | ) |
Royalty Pharma plc — Class A | | | 161 | | | | 0.61 | % | | | (1,811 | ) |
Total Consumer, Non-cyclical | | | 935 | |
| | | | | | | | | | | | | |
Communications |
Yelp, Inc. — Class A | | | 171 | | | | 0.77 | % | | | 1,435 | |
Cisco Systems, Inc. | | | 168 | | | | 1.08 | % | | | 726 | |
Extreme Networks, Inc. | | | 84 | | | | 0.27 | % | | | 584 | |
InterDigital, Inc. | | | 39 | | | | 0.47 | % | | | 478 | |
Nexstar Media Group, Inc. — Class A | | | 27 | | | | 0.56 | % | | | 264 | |
Motorola Solutions, Inc. | | | 8 | | | | 0.29 | % | | | 62 | |
T-Mobile US, Inc. | | | 21 | | | | 0.36 | % | | | 39 | |
VeriSign, Inc. | | | 37 | | | | 1.03 | % | | | 17 | |
TEGNA, Inc. | | | 179 | | | | 0.36 | % | | | 3 | |
Verizon Communications, Inc. | | | 81 | | | | 0.37 | % | | | (52 | ) |
A10 Networks, Inc. | | | 292 | | | | 0.53 | % | | | (101 | ) |
Total Communications | | | 3,455 | |
| | | | | | | | | | | | | |
Consumer, Cyclical |
Allison Transmission Holdings, Inc. | | | 141 | | | | 0.98 | % | | | 2,683 | |
PulteGroup, Inc. | | | 97 | | | | 0.93 | % | | | 1,984 | |
DR Horton, Inc. | | | 49 | | | | 0.74 | % | | | 1,431 | |
MDC Holdings, Inc. | | | 155 | | | | 0.90 | % | | | 1,311 | |
Taylor Morrison Home Corp. — Class A | | | 83 | | | | 0.50 | % | | | 1,017 | |
Boyd Gaming Corp. | | | 71 | | | | 0.61 | % | | | 1,007 | |
Brunswick Corp. | | | 71 | | | | 0.76 | % | | | 927 | |
MSC Industrial Direct Company, Inc. — Class A | | | 91 | | | | 1.07 | % | | | 813 | |
Patrick Industries, Inc. | | | 59 | | | | 0.58 | % | | | 793 | |
Tri Pointe Homes, Inc. | | | 218 | | | | 0.89 | % | | | 792 | |
Meritage Homes Corp. | | | 23 | | | | 0.40 | % | | | 481 | |
Cavco Industries, Inc. | | | 11 | | | | 0.40 | % | | | 298 | |
Academy Sports & Outdoors, Inc. | | | 34 | | | | 0.23 | % | | | 192 | |
Green Brick Partners, Inc. | | | 34 | | | | 0.24 | % | | | 174 | |
Gentex Corp. | | | 271 | | | | 0.98 | % | | | 162 | |
Monarch Casino & Resort, Inc. | | | 54 | | | | 0.47 | % | | | 133 | |
Home Depot, Inc. | | | 6 | | | | 0.23 | % | | | 124 | |
Dolby Laboratories, Inc. — Class A | | | 71 | | | | 0.73 | % | | | 69 | |
Buckle, Inc. | | | 88 | | | | 0.38 | % | | | (161 | ) |
PetMed Express, Inc. | | | 329 | | | | 0.56 | % | | | (304 | ) |
Total Consumer, Cyclical | | | 13,926 | |
| | | | | | | | | | | | | |
Industrial |
Standex International Corp. | | | 50 | | | | 0.87 | % | | | 2,816 | |
136 | THE GUGGENHEIM FUNDS SEMI-ANNUAL REPORT | SEE NOTES TO FINANCIAL STATEMENTS. |
SCHEDULE OF INVESTMENTS (Unaudited)(continued) | June 30, 2023 |
SERIES Z (ALPHA OPPORTUNITY SERIES) | |
| | Shares | | | Percentage
Notional
Amount | | | Value and
Unrealized
Appreciation
(Depreciation) | |
Snap-on, Inc. | | | 33 | | | | 1.18 | % | | $ | 2,510 | |
Eagle Materials, Inc. | | | 34 | | | | 0.78 | % | | | 2,143 | |
Vishay Intertechnology, Inc. | | | 194 | | | | 0.71 | % | | | 1,972 | |
Mueller Industries, Inc. | | | 88 | | | | 0.95 | % | | | 1,906 | |
Louisiana-Pacific Corp. | | | 67 | | | | 0.62 | % | | | 1,511 | |
Builders FirstSource, Inc. | | | 62 | | | | 1.04 | % | | | 1,303 | |
Boise Cascade Co. | | | 80 | | | | 0.89 | % | | | 1,283 | |
Fortive Corp. | | | 126 | | | | 1.17 | % | | | 1,230 | |
Simpson Manufacturing Company, Inc. | | | 40 | | | | 0.69 | % | | | 1,100 | |
UFP Industries, Inc. | | | 84 | | | | 1.01 | % | | | 1,080 | |
Dorian LPG Ltd. | | | 78 | | | | 0.25 | % | | | 1,016 | |
ITT, Inc. | | | 103 | | | | 1.19 | % | | | 692 | |
Masco Corp. | | | 73 | | | | 0.52 | % | | | 438 | |
Donaldson Company, Inc. | | | 100 | | | | 0.77 | % | | | 429 | |
Landstar System, Inc. | | | 28 | | | | 0.67 | % | | | 402 | |
Armstrong World Industries, Inc. | | | 68 | | | | 0.62 | % | | | 381 | |
Dover Corp. | | | 51 | | | | 0.93 | % | | | 274 | |
Expeditors International of Washington, Inc. | | | 27 | | | | 0.40 | % | | | 184 | |
Keysight Technologies, Inc. | | | 15 | | | | 0.31 | % | | | 158 | |
International Seaways, Inc. | | | 62 | | | | 0.29 | % | | | 126 | |
Ardmore Shipping Corp. | | | 220 | | | | 0.34 | % | | | 58 | |
Scorpio Tankers, Inc. | | | 57 | | | | 0.33 | % | | | 48 | |
GrafTech International Ltd. | | | 374 | | | | 0.23 | % | | | 40 | |
Toro Co. | | | 30 | | | | 0.38 | % | | | 18 | |
Garmin Ltd. | | | 26 | | | | 0.34 | % | | | (32 | ) |
Argan, Inc. | | | 75 | | | | 0.37 | % | | | (92 | ) |
Golar LNG Ltd. | | | 179 | | | | 0.45 | % | | | (238 | ) |
Acuity Brands, Inc. | | | 35 | | | | 0.71 | % | | | (368 | ) |
Lindsay Corp. | | | 15 | | | | 0.22 | % | | | (444 | ) |
3M Co. | | | 85 | | | | 1.05 | % | | | (713 | ) |
Sturm Ruger & Company, Inc. | | | 104 | | | | 0.68 | % | | | (778 | ) |
Total Industrial | | | 20,453 | |
| | | | | | | | | | | | | |
Basic Materials |
NewMarket Corp. | | | 15 | | | | 0.75 | % | | | 1,250 | |
CF Industries Holdings, Inc. | | | 40 | | | | 0.34 | % | | | (14 | ) |
LyondellBasell Industries N.V. — Class A | | | 33 | | | | 0.37 | % | | | (49 | ) |
Westlake Corp. | | | 47 | | | | 0.69 | % | | | (123 | ) |
AdvanSix, Inc. | | | 58 | | | | 0.25 | % | | | (305 | ) |
Olin Corp. | | | 81 | | | | 0.51 | % | | | (312 | ) |
Total Basic Materials | | | 447 | |
| | | | | | | | | | | | | |
Technology |
Dropbox, Inc. — Class A | | | 289 | | | | 0.95 | % | | | 1,264 | |
Kulicke & Soffa Industries, Inc. | | | 117 | | | | 0.86 | % | | | 1,092 | |
KLA Corp. | | | 13 | | | | 0.78 | % | | | 869 | |
NetApp, Inc. | | | 104 | | | | 0.98 | % | | | 845 | |
Microsoft Corp. | | | 13 | | | | 0.55 | % | | | 740 | |
Diodes, Inc. | | | 45 | | | | 0.51 | % | | | 699 | |
Teradata Corp. | | | 36 | | | | 0.24 | % | | | 695 | |
Teradyne, Inc. | | | 33 | | | | 0.45 | % | | | 641 | |
Photronics, Inc. | | | 120 | | | | 0.38 | % | | | 519 | |
Applied Materials, Inc. | | | 43 | | | | 0.77 | % | | | 467 | |
Cirrus Logic, Inc. | | | 35 | | | | 0.35 | % | | | 437 | |
Apple, Inc. | | | 27 | | | | 0.65 | % | | | 307 | |
Cognizant Technology Solutions Corp. — Class A | | | 63 | | | | 0.51 | % | | | 230 | |
QUALCOMM, Inc. | | | 15 | | | | 0.22 | % | | | 214 | |
NetScout Systems, Inc. | | | 157 | | | | 0.60 | % | | | 110 | |
Qualys, Inc. | | | 14 | | | | 0.22 | % | | | 105 | |
Veradigm, Inc. | | | 205 | | | | 0.32 | % | | | (3 | ) |
Akamai Technologies, Inc. | | | 44 | | | | 0.49 | % | | | (181 | ) |
Total Technology | | | 9,050 | |
| | | | | | | | | | | | | |
Financial |
MGIC Investment Corp. | | | 549 | | | | 1.07 | % | | | 892 | |
Essent Group Ltd. | | | 140 | | | | 0.81 | % | | | 822 | |
Weyerhaeuser Co. | | | 201 | | | | 0.83 | % | | | 793 | |
NMI Holdings, Inc. — Class A | | | 147 | | | | 0.47 | % | | | 717 | |
Evercore, Inc. — Class A | | | 30 | | | | 0.46 | % | | | 582 | |
Radian Group, Inc. | | | 168 | | | | 0.53 | % | | | 554 | |
Mr Cooper Group, Inc. | | | 88 | | | | 0.55 | % | | | 340 | |
Hilltop Holdings, Inc. | | | 57 | | | | 0.22 | % | | | 186 | |
Preferred Bank/Los Angeles CA | | | 112 | | | | 0.76 | % | | | 103 | |
SouthState Corp. | | | 128 | | | | 1.04 | % | | | 93 | |
SEI Investments Co. | | | 146 | | | | 1.08 | % | | | 42 | |
International Bancshares Corp. | | | 40 | | | | 0.22 | % | | | 18 | |
Douglas Elliman, Inc. | | | 1 | | | | 0.00 | % | | | (2 | ) |
Allstate Corp. | | | 15 | | | | 0.20 | % | | | (10 | ) |
Travelers Companies, Inc. | | | 10 | | | | 0.21 | % | | | (13 | ) |
S&T Bancorp, Inc. | | | 93 | | | | 0.31 | % | | | (84 | ) |
Equity Commonwealth | | | 411 | | | | 1.03 | % | | | (156 | ) |
Renasant Corp. | | | 96 | | | | 0.31 | % | | | (653 | ) |
FB Financial Corp. | | | 111 | | | | 0.39 | % | | | (996 | ) |
Total Financial | | | 3,228 | |
| | | | | | | | | | | | | |
Utilities |
MGE Energy, Inc. | | | 105 | | | | 1.04 | % | | | 604 | |
Atmos Energy Corp. | | | 73 | | | | 1.05 | % | | | 129 | |
ONE Gas, Inc. | | | 92 | | | | 0.87 | % | | | 114 | |
Chesapeake Utilities Corp. | | | 32 | | | | 0.47 | % | | | 46 | |
Ameren Corp. | | | 103 | | | | 1.04 | % | | | (14 | ) |
Consolidated Edison, Inc. | | | 60 | | | | 0.67 | % | | | (146 | ) |
Black Hills Corp. | | | 136 | | | | 1.01 | % | | | (220 | ) |
OGE Energy Corp. | | | 237 | | | | 1.05 | % | | | (722 | ) |
National Fuel Gas Co. | | | 92 | | | | 0.58 | % | | | (780 | ) |
SEE NOTES TO FINANCIAL STATEMENTS. | THE GUGGENHEIM FUNDS SEMI-ANNUAL REPORT | 137 |
SCHEDULE OF INVESTMENTS (Unaudited)(continued) | June 30, 2023 |
SERIES Z (ALPHA OPPORTUNITY SERIES) | |
| | Shares | | | Percentage
Notional
Amount | | | Value and
Unrealized
Appreciation
(Depreciation) | |
Clearway Energy, Inc. — Class C | | | 173 | | | | 0.61 | % | | $ | (827 | ) |
Total Utilities | | | (1,816 | ) |
| | | | | | | | | | | | | |
Energy |
Marathon Petroleum Corp. | | | 78 | | | | 1.13 | % | | | 1,052 | |
Exxon Mobil Corp. | | | 80 | | | | 1.06 | % | | | 716 | |
REX American Resources Corp. | | | 85 | | | | 0.37 | % | | | 500 | |
California Resources Corp. | | | 75 | | | | 0.42 | % | | | 362 | |
SM Energy Co. | | | 74 | | | | 0.29 | % | | | 358 | |
PBF Energy, Inc. — Class A | | | 74 | | | | 0.37 | % | | | 315 | |
Cheniere Energy, Inc. | | | 35 | | | | 0.66 | % | | | 287 | |
Phillips 66 | | | 40 | | | | 0.47 | % | | | (39 | ) |
Valero Energy Corp. | | | 74 | | | | 1.07 | % | | | (141 | ) |
Occidental Petroleum Corp. | | | 42 | | | | 0.31 | % | | | (227 | ) |
Total Energy | | | 3,183 | |
Total GS Equity Long Custom Basket | | | 52,861 | |
| | | | | | | | | |
GS EQUITY SHORT CUSTOM BASKET |
Consumer, Non-cyclical |
Driven Brands Holdings, Inc. | | | 834 | | | | (1.25 | )% | | | 1,869 | |
Equifax, Inc. | | | 102 | | | | (1.33 | )% | | | 1,311 | |
Clarivate plc | | | 791 | | | | (0.42 | )% | | | 1,082 | |
Global Payments, Inc. | | | 178 | | | | (0.97 | )% | | | 906 | |
ABM Industries, Inc. | | | 491 | | | | (1.16 | )% | | | 626 | |
Utz Brands, Inc. | | | 509 | | | | (0.46 | )% | | | 418 | |
TreeHouse Foods, Inc. | | | 281 | | | | (0.78 | )% | | | (828 | ) |
FTI Consulting, Inc. | | | 82 | | | | (0.86 | )% | | | (877 | ) |
Estee Lauder Companies, Inc. — Class A | | | 83 | | | | (0.90 | )% | | | (1,204 | ) |
Quanta Services, Inc. | | | 93 | | | | (1.01 | )% | | | (1,669 | ) |
Booz Allen Hamilton Holding Corp. | | | 94 | | | | (0.58 | )% | | | (1,813 | ) |
ICF International, Inc. | | | 158 | | | | (1.09 | )% | | | (3,286 | ) |
CoStar Group, Inc. | | | 274 | | | | (1.35 | )% | | | (3,619 | ) |
TransUnion | | | 311 | | | | (1.35 | )% | | | (4,597 | ) |
GXO Logistics, Inc. | | | 284 | | | | (0.99 | )% | | | (4,631 | ) |
Neogen Corp. | | | 1,134 | | | | (1.36 | )% | | | (4,890 | ) |
Total Consumer, Non-cyclical | | | (21,202 | ) |
| | | | | | | | | | | | | |
Financial |
Sun Communities, Inc. | | | 174 | | | | (1.25 | )% | | | 7,338 | |
Rexford Industrial Realty, Inc. | | | 428 | | | | (1.23 | )% | | | 3,756 | |
American Tower Corp. — Class A | | | 139 | | | | (1.49 | )% | | | 3,449 | |
Howard Hughes Corp. | | | 230 | | | | (1.00 | )% | | | 2,455 | |
Outfront Media, Inc. | | | 777 | | | | (0.67 | )% | | | 2,256 | |
Healthcare Realty Trust, Inc. | | | 927 | | | | (0.97 | )% | | | 1,934 | |
Kemper Corp. | | | 270 | | | | (0.72 | )% | | | 1,930 | |
Equitable Holdings, Inc. | | | 942 | | | | (1.41 | )% | | | 1,896 | |
Kennedy-Wilson Holdings, Inc. | | | 1,420 | | | | (1.28 | )% | | | 1,818 | |
Raymond James Financial, Inc. | | | 280 | | | | (1.60 | )% | | | 1,595 | |
Americold Realty Trust, Inc. | | | 712 | | | | (1.27 | )% | | | 1,215 | |
TFS Financial Corp. | | | 702 | | | | (0.49 | )% | | | 811 | |
Assured Guaranty Ltd. | | | 359 | | | | (1.11 | )% | | | 701 | |
Prologis, Inc. | | | 169 | | | | (1.14 | )% | | | 635 | |
Equinix, Inc. | | | 30 | | | | (1.30 | )% | | | 233 | |
Progressive Corp. | | | 135 | | | | (0.99 | )% | | | 230 | |
Stellar Bancorp, Inc. | | | 507 | | | | (0.64 | )% | | | 176 | |
Rayonier, Inc. | | | 724 | | | | (1.26 | )% | | | 151 | |
Popular, Inc. | | | 143 | | | | (0.48 | )% | | | 94 | |
Northern Trust Corp. | | | 205 | | | | (0.84 | )% | | | 72 | |
KKR & Company, Inc. — Class A | | | 422 | | | | (1.30 | )% | | | 11 | |
Hanover Insurance Group, Inc. | | | 106 | | | | (0.66 | )% | | | (17 | ) |
Crown Castle, Inc. | | | 55 | | | | (0.35 | )% | | | (36 | ) |
Voya Financial, Inc. | | | 93 | | | | (0.37 | )% | | | (60 | ) |
Annaly Capital Management, Inc. | | | 591 | | | | (0.65 | )% | | | (270 | ) |
State Street Corp. | | | 202 | | | | (0.82 | )% | | | (313 | ) |
Omega Healthcare Investors, Inc. | | | 295 | | | | (0.50 | )% | | | (439 | ) |
Boston Properties, Inc. | | | 105 | | | | (0.33 | )% | | | (687 | ) |
Medical Properties Trust, Inc. | | | 1,043 | | | | (0.53 | )% | | | (748 | ) |
AGNC Investment Corp. | | | 1,100 | | | | (0.62 | )% | | | (802 | ) |
UDR, Inc. | | | 553 | | | | (1.31 | )% | | | (941 | ) |
Jones Lang LaSalle, Inc. | | | 83 | | | | (0.71 | )% | | | (1,043 | ) |
Brighthouse Financial, Inc. | | | 609 | | | | (1.59 | )% | | | (1,068 | ) |
UMH Properties, Inc. | | | 1,126 | | | | (0.99 | )% | | | (1,092 | ) |
Ellington Financial, Inc. | | | 1,160 | | | | (0.88 | )% | | | (1,171 | ) |
Welltower, Inc. | | | 231 | | | | (1.03 | )% | | | (1,377 | ) |
PennyMac Mortgage Investment Trust | | | 1,117 | | | | (0.83 | )% | | | (1,414 | ) |
Carlyle Group, Inc. | | | 309 | | | | (0.55 | )% | | | (1,630 | ) |
Apollo Global Management, Inc. | | | 161 | | | | (0.68 | )% | | | (1,835 | ) |
Iron Mountain, Inc. | | | 449 | | | | (1.41 | )% | | | (2,499 | ) |
PennyMac Financial Services, Inc. | | | 334 | | | | (1.30 | )% | | | (2,506 | ) |
Ares Management Corp. — Class A | | | 229 | | | | (1.22 | )% | | | (3,492 | ) |
Digital Realty Trust, Inc. | | | 218 | | | | (1.37 | )% | | | (4,221 | ) |
Total Financial | | | 5,095 | |
| | | | | | | | | | | | | |
Utilities |
Avista Corp. | | | 512 | | | | (1.10 | )% | | | 2,156 | |
Spire, Inc. | | | 297 | | | | (1.04 | )% | | | 1,972 | |
Dominion Energy, Inc. | | | 405 | | | | (1.16 | )% | | | 1,479 | |
138 | THE GUGGENHEIM FUNDS SEMI-ANNUAL REPORT | SEE NOTES TO FINANCIAL STATEMENTS. |
SCHEDULE OF INVESTMENTS (Unaudited)(continued) | June 30, 2023 |
SERIES Z (ALPHA OPPORTUNITY SERIES) | |
| | Shares | | | Percentage
Notional
Amount | | | Value and
Unrealized
Appreciation
(Depreciation) | |
Sempra Energy | | | 179 | | | | (1.44 | )% | | $ | 1,174 | |
UGI Corp. | | | 555 | | | | (0.83 | )% | | | 297 | |
CMS Energy Corp. | | | 359 | | | | (1.16 | )% | | | 218 | |
PG&E Corp. | | | 1,250 | | | | (1.19 | )% | | | 75 | |
American Electric Power Company, Inc. | | | 314 | | | | (1.46 | )% | | | (126 | ) |
Alliant Energy Corp. | | | 403 | | | | (1.17 | )% | | | (141 | ) |
DTE Energy Co. | | | 161 | | | | (0.98 | )% | | | (144 | ) |
Exelon Corp. | | | 360 | | | | (0.81 | )% | | | (311 | ) |
Edison International | | | 313 | | | | (1.20 | )% | | | (879 | ) |
Total Utilities | | | 5,770 | |
| | | | | | | | | | | | | |
Technology |
Evolent Health, Inc. — Class A | | | 371 | | | | (0.61 | )% | | | 946 | |
Procore Technologies, Inc. | | | 161 | | | | (0.58 | )% | | | (87 | ) |
KBR, Inc. | | | 149 | | | | (0.54 | )% | | | (523 | ) |
Guidewire Software, Inc. | | | 123 | | | | (0.52 | )% | | | (547 | ) |
Alteryx, Inc. — Class A | | | 179 | | | | (0.45 | )% | | | (633 | ) |
Paycor HCM, Inc. | | | 587 | | | | (0.77 | )% | | | (888 | ) |
Ceridian HCM Holding, Inc. | | | 325 | | | | (1.20 | )% | | | (2,549 | ) |
Total Technology | | | (4,281 | ) |
| | | | | | | | | | | | | |
Industrial |
Waste Management, Inc. | | | 62 | | | | (0.59 | )% | | | (30 | ) |
Boeing Co. | | | 79 | | | | (0.92 | )% | | | (946 | ) |
Vulcan Materials Co. | | | 43 | | | | (0.54 | )% | | | (977 | ) |
Kirby Corp. | | | 146 | | | | (0.62 | )% | | | (1,226 | ) |
Tetra Tech, Inc. | | | 48 | | | | (0.43 | )% | | | (1,492 | ) |
Clean Harbors, Inc. | | | 55 | | | | (0.50 | )% | | | (1,691 | ) |
NV5 Global, Inc. | | | 116 | | | | (0.71 | )% | | | (1,831 | ) |
MasTec, Inc. | | | 90 | | | | (0.59 | )% | | | (2,775 | ) |
Casella Waste Systems, Inc. — Class A | | | 174 | | | | (0.87 | )% | | | (4,346 | ) |
MSA Safety, Inc. | | | 124 | | | | (1.19 | )% | | | (5,830 | ) |
Total Industrial | | | (21,144 | ) |
| | | | | | | | | | | | | |
Consumer, Cyclical |
UniFirst Corp. | | | 103 | | | | (0.87 | )% | | | 4,661 | |
Newell Brands, Inc. | | | 1,957 | | | | (0.94 | )% | | | 63 | |
Ollie’s Bargain Outlet Holdings, Inc. | | | 91 | | | | (0.29 | )% | | | 53 | |
OPENLANE, Inc. | | | 1,223 | | | | (1.03 | )% | | | (116 | ) |
Burlington Stores, Inc. | | | 53 | | | | (0.46 | )% | | | (434 | ) |
Five Below, Inc. | | | 48 | | | | (0.52 | )% | | | (587 | ) |
Shake Shack, Inc. — Class A | | | 139 | | | | (0.60 | )% | | | (1,276 | ) |
VF Corp. | | | 1,113 | | | | (1.17 | )% | | | (1,370 | ) |
Tesla, Inc. | | | 40 | | | | (0.58 | )% | | | (2,798 | ) |
Floor & Decor Holdings, Inc. — Class A | | | 148 | | | | (0.85 | )% | | | (3,587 | ) |
Copart, Inc. | | | 238 | | | | (1.20 | )% | | | (6,257 | ) |
Total Consumer, Cyclical | | | (11,648 | ) |
| | | | | | | | | | | | | |
Basic Materials |
Hecla Mining Co. | | | 1,993 | | | | (0.57 | )% | | | 1,814 | |
Royal Gold, Inc. | | | 93 | | | | (0.59 | )% | | | 969 | |
Piedmont Lithium, Inc. | | | 153 | | | | (0.49 | )% | | | 534 | |
Carpenter Technology Corp. | | | 236 | | | | (0.73 | )% | | | (4,144 | ) |
Total Basic Materials | | | (827 | ) |
| | | | | | | | | | | | | |
Communications |
Robinhood Markets, Inc. — Class A | | | 484 | | | | (0.26 | )% | | | (171 | ) |
Palo Alto Networks, Inc. | | | 22 | | | | (0.31 | )% | | | (197 | ) |
Chewy, Inc. — Class A | | | 218 | | | | (0.48 | )% | | | (772 | ) |
DoorDash, Inc. — Class A | | | 166 | | | | (0.70 | )% | | | (1,830 | ) |
Uber Technologies, Inc. | | | 151 | | | | (0.36 | )% | | | (2,275 | ) |
Total Communications | | | (5,245 | ) |
| | | | | | | | | | | | | |
Energy |
NOV, Inc. | | | 949 | | | | (0.84 | )% | | | 4,519 | |
Hess Corp. | | | 201 | | | | (1.51 | )% | | | (1,042 | ) |
Valaris Ltd. | | | 152 | | | | (0.53 | )% | | | (1,510 | ) |
Tidewater, Inc. | | | 212 | | | | (0.65 | )% | | | (2,607 | ) |
Schlumberger N.V. | | | 480 | | | | (1.30 | )% | | | (2,735 | ) |
Total Energy | | | (3,375 | ) |
Total GS Equity Short Custom Basket | | $ | (56,857 | ) |
* | Non-income producing security. |
† | Value determined based on Level 1 inputs — See Note 4. |
†† | Value determined based on Level 2 inputs — See Note 4. |
1 | All or a portion of this security is pledged as equity index swap collateral at June 30, 2023. |
2 | Rate indicated is the 7-day yield as of June 30, 2023. |
| | GS — Goldman Sachs International |
| | MS — Morgan Stanley Capital Services LLC |
| | plc — Public Limited Company |
| | REIT — Real Estate Investment Trust |
| | |
| | See Sector Classification in Other Information section. |
SEE NOTES TO FINANCIAL STATEMENTS. | THE GUGGENHEIM FUNDS SEMI-ANNUAL REPORT | 139 |
SCHEDULE OF INVESTMENTS (Unaudited)(concluded) | June 30, 2023 |
SERIES Z (ALPHA OPPORTUNITY SERIES) | |
The following table summarizes the inputs used to value the Fund’s investments at June 30, 2023 (See Note 4 in the Notes to Financial Statements):
Investments in Securities (Assets) | | Level 1
Quoted
Prices | | | Level 2
Significant
Observable
Inputs | | | Level 3
Significant
Unobservable
Inputs | | | Total | |
Common Stocks | | $ | 3,445,141 | | | $ | — | | | $ | — | | | $ | 3,445,141 | |
Money Market Fund | | | 131,443 | | | | — | | | | — | | | | 131,443 | |
Equity Custom Basket Swap Agreements** | | | — | | | | 105,258 | | | | — | | | | 105,258 | |
Total Assets | | $ | 3,576,584 | | | $ | 105,258 | | | $ | — | | | $ | 3,681,842 | |
Investments in Securities (Liabilities) | | Level 1
Quoted
Prices | | | Level 2
Significant
Observable
Inputs | | | Level 3
Significant
Unobservable
Inputs | | | Total | |
Equity Custom Basket Swap Agreements** | | $ | — | | | $ | 113,958 | | | $ | — | | | $ | 113,958 | |
** | This derivative is reported as unrealized appreciation/depreciation at period end. |
140 | THE GUGGENHEIM FUNDS SEMI-ANNUAL REPORT | SEE NOTES TO FINANCIAL STATEMENTS. |
SERIES Z (ALPHA OPPORTUNITY SERIES) | |
STATEMENT OF ASSETS AND LIABILITIES (Unaudited) |
June 30, 2023 |
Assets: |
Investments, at value (cost $3,405,072) | | $ | 3,576,584 | |
Unrealized appreciation on OTC swap agreements | | | 105,258 | |
Prepaid expenses | | | 8 | |
Receivables: |
Swap settlement | | | 56,563 | |
Investment Adviser | | | 13,004 | |
Dividends | | | 2,313 | |
Interest | | | 297 | |
Total assets | | | 3,754,027 | |
| | | | | |
Liabilities: |
Overdraft due to custodian bank | | | 1,057 | |
Unrealized depreciation on OTC swap agreements | | | 113,958 | |
Payable for: |
Professional fees | | | 15,507 | |
Transfer agent/maintenance fees | | | 2,080 | |
Trustees’ fees* | | | 829 | |
Distribution and service fees | | | 763 | |
Fund accounting/administration fees | | | 753 | |
Fund shares redeemed | | | 101 | |
Miscellaneous | | | 3,147 | |
Total liabilities | | | 138,195 | |
Net assets | | $ | 3,615,832 | |
| | | | | |
Net assets consist of: |
Paid in capital | | $ | 4,819,020 | |
Total distributable earnings (loss) | | | (1,203,188 | ) |
Net assets | | $ | 3,615,832 | |
Capital shares outstanding | | | 226,022 | |
Net asset value per share | | $ | 16.00 | |
STATEMENT OF OPERATIONS (Unaudited) |
Six Months Ended June 30, 2023 |
Investment Income: |
Dividends | | $ | 37,938 | |
Interest | | | 2,541 | |
Total investment income | | | 40,479 | |
| | | | | |
Expenses: |
Management fees | | | 16,148 | |
Distribution and service fees | | | 4,511 | |
Transfer agent /maintenance fees | | | 12,523 | |
Professional fees | | | 19,159 | |
Trustees’ fees* | | | 6,762 | |
Custodian fees | | | 5,264 | |
Fund accounting/administration fees | | | 5,198 | |
Line of credit fees | | | 62 | |
Miscellaneous | | | 6,099 | |
Total expenses | | | 75,726 | |
Less: |
Expenses reimbursed by Adviser | | | (23,549 | ) |
Expenses waived by Adviser | | | (16,499 | ) |
Total waived/reimbursed expenses | | | (40,048 | ) |
Net expenses | | | 35,678 | |
Net investment income | | | 4,801 | |
| | | | | |
Net Realized and Unrealized Gain (Loss): |
Net realized gain (loss) on: |
Investments | | | 19,769 | |
Swap agreements | | | 143,632 | |
Net realized gain | | | 163,401 | |
Net change in unrealized appreciation (depreciation) on: |
Investments | | | 202,995 | |
Swap agreements | | | (203,667 | ) |
Net change in unrealized appreciation (depreciation) | | | (672 | ) |
Net realized and unrealized gain | | | 162,729 | |
Net increase in net assets resulting from operations | | $ | 167,530 | |
* | Relates to Trustees not deemed “interested persons” within the meaning of Section 2(a)(19) of the 1940 Act. |
SEE NOTES TO FINANCIAL STATEMENTS. | THE GUGGENHEIM FUNDS SEMI-ANNUAL REPORT | 141 |
SERIES Z (ALPHA OPPORTUNITY SERIES) | |
STATEMENTS OF CHANGES IN NET ASSETS |
| | Six Months Ended
June 30, 2023
(Unaudited) | | | Year Ended
December 31,
2022 | |
Increase (Decrease) in Net Assets from Operations: | | | | | | | | |
Net investment income | | $ | 4,801 | | | $ | 4,641 | |
Net realized gain (loss) on investments | | | 163,401 | | | | (198,326 | ) |
Net change in unrealized appreciation (depreciation) on investments | | | (672 | ) | | | (181,809 | ) |
Net increase (decrease) in net assets resulting from operations | | | 167,530 | | | | (375,494 | ) |
| | | | | | | | | |
Distributions to shareholders | | | — | | | | (15,376 | ) |
| | | | | | | | | |
Capital share transactions: | | | | | | | | |
Proceeds from sale of shares | | | 46,441 | | | | 107,955 | |
Distributions reinvested | | | — | | | | 15,376 | |
Cost of shares redeemed | | | (249,305 | ) | | | (576,477 | ) |
Net decrease from capital share transactions | | | (202,864 | ) | | | (453,146 | ) |
Net decrease in net assets | | | (35,334 | ) | | | (844,016 | ) |
| | | | | | | | | |
Net assets: | | | | | | | | |
Beginning of period | | | 3,651,166 | | | | 4,495,182 | |
End of period | | $ | 3,615,832 | | | $ | 3,651,166 | |
| | | | | | | | | |
Capital share activity: | | | | | | | | |
Shares sold | | | 3,007 | | | | 6,933 | |
Shares issued from reinvestment of distributions | | | — | | | | 988 | |
Shares redeemed | | | (16,019 | ) | | | (37,088 | ) |
Net decrease in shares | | | (13,012 | ) | | | (29,167 | ) |
142 | THE GUGGENHEIM FUNDS SEMI-ANNUAL REPORT | SEE NOTES TO FINANCIAL STATEMENTS. |
SERIES Z (ALPHA OPPORTUNITY SERIES) | |
This table is presented to show selected data for a share outstanding throughout each period and to assist shareholders in evaluating a Fund’s performance for the periods presented.
| | Six Months Ended
June 30, 2023a | | | Year Ended
December 31,
2022 | | | Year Ended
December 31,
2021 | | | Year Ended
December 31,
2020 | | | Year Ended
December 31,
2019 | | | Year Ended
December 31,
2018 | |
Per Share Data |
Net asset value, beginning of period | | $ | 15.27 | | | $ | 16.76 | | | $ | 14.83 | | | $ | 14.87 | | | $ | 15.27 | | | $ | 20.05 | |
Income (loss) from investment operations: |
Net investment income (loss)b | | | .02 | | | | .02 | | | | .06 | | | | .06 | | | | .07 | | | | .04 | |
Net gain (loss) on investments (realized and unrealized) | | | .71 | | | | (1.45 | ) | | | 1.97 | | | | (.01 | ) | | | (.45 | ) | | | (2.28 | ) |
Total from investment operations | | | .73 | | | | (1.43 | ) | | | 2.03 | | | | .05 | | | | (.38 | ) | | | (2.24 | ) |
Less distributions from: |
Net investment income | | | — | | | | (.06 | ) | | | (.10 | ) | | | (.09 | ) | | | (.02 | ) | | | — | |
Net realized gains | | | — | | | | — | | | | — | | | | — | | | | — | | | | (2.54 | ) |
Total distributions | | | — | | | | (.06 | ) | | | (.10 | ) | | | (.09 | ) | | | (.02 | ) | | | (2.54 | ) |
Net asset value, end of period | | $ | 16.00 | | | $ | 15.27 | | | $ | 16.76 | | | $ | 14.83 | | | $ | 14.87 | | | $ | 15.27 | |
|
Total Returnc | | | 4.78 | % | | | (8.53 | %) | | | 13.81 | % | | | 0.27 | % | | | (2.45 | %) | | | (11.57 | %) |
Ratios/Supplemental Data |
Net assets, end of period (in thousands) | | $ | 3,616 | | | $ | 3,651 | | | $ | 4,495 | | | $ | 4,535 | | | $ | 6,229 | | | $ | 8,056 | |
Ratios to average net assets: |
Net investment income (loss) | | | 0.27 | % | | | 0.12 | % | | | 0.35 | % | | | 0.41 | % | | | 0.44 | % | | | 0.22 | % |
Total expensesd | | | 4.22 | % | | | 4.43 | % | | | 4.58 | % | | | 3.98 | % | | | 3.52 | % | | | 2.47 | % |
Net expensese,f | | | 1.99 | % | | | 1.99 | % | | | 2.01 | % | | | 2.01 | % | | | 2.00 | % | | | 1.99 | % |
Portfolio turnover rate | | | 145 | % | | | 294 | % | | | 204 | % | | | 171 | % | | | 172 | % | | | 219 | % |
a | Unaudited figures for the period ended June 30, 2023. Percentage amounts for the period, except total return and portfolio turnover rate, have been annualized. |
b | Net investment income (loss) per share was computed using average shares outstanding throughout the period. |
c | Total return does not take into account any of the expenses associated with an investment in variable insurance products. If total return had taken into account these expenses, performance would have been lower. Shares of a series of Guggenheim Variable Funds Trust are available only through the purchase of such products. |
d | Does not include expenses of the underlying funds in which the Fund invests. |
e | Net expense information reflects the expense ratios after expense waivers and reimbursements, as applicable. |
f | Net expenses may include expenses that are excluded from the expense limitation agreement. Excluding these expenses, the net expense ratios for the years presented would be: |
| | 06/30/23a | 12/31/22 | 12/31/21 | 12/31/20 | 12/31/19 | 12/31/18 |
| | 1.99% | 1.99% | 2.00% | 2.00% | 2.00% | 1.99% |
SEE NOTES TO FINANCIAL STATEMENTS. | THE GUGGENHEIM FUNDS SEMI-ANNUAL REPORT | 143 |
NOTES TO FINANCIAL STATEMENTS (Unaudited) |
Note 1 – Organization and Significant Accounting Policies
Organization
Guggenheim Variable Funds Trust (the “Trust”), a Delaware statutory trust, is registered with the U.S. Securities and Exchange Commission (the “SEC”) under the Investment Company Act of 1940 (the “1940 Act”), as an open-ended investment company of the series type. Each series, in effect, is representing a separate fund (each, a “Fund”). The Trust may issue an unlimited number of authorized shares. The Trust accounts for the assets of each Fund separately. At June 30, 2023, the Trust consisted of fourteen funds.The Trust offers shares of the funds to insurance companies for their variable annunity and variable life insurance contracts.
This report covers the following funds (collectively, the “Funds”):
Fund Name | Investment
Company Type |
Series A (StylePlus—Large Core Series) | Diversified |
Series B (Large Cap Value Series) | Diversified |
Series D (World Equity Income Series) | Diversified |
Series E (Total Return Bond Series) | Diversified |
Series F (Floating Rate Strategies Series) | Diversified |
Series J (StylePlus—Mid Growth Series) | Diversified |
Series N (Managed Asset Allocation Series) | Diversified |
Series O (All Cap Value Series) | Diversified |
Series P (High Yield Series) | Diversified |
Series Q (Small Cap Value Series) | Diversified |
Series V (SMid Cap Value Series) | Diversified |
Series X (StylePlus—Small Growth Series) | Diversified |
Series Y (StylePlus—Large Growth Series) | Diversified |
Series Z (Alpha Opportunity Series) | Diversified |
Security Investors, LLC (“SI” or the “Adviser”) and Guggenheim Partners Investment Management, LLC (“GPIM” or the “Adviser”), which operates under the name Guggenheim Investments (“GI”), provides advisory services. GPIM provides advisory services to Series F (Floating Rate Strategies Series) and SI provides advisory services to the remaining Funds covered in this report.Guggenheim Funds Distributors, LLC (“GFD”) acts as principal underwriter for the Trust. GI and GFD are affiliated entities.
Pursuant to an investment Sub-Advisory Agreement between Security Investors, LLC (“SI”) and Guggenheim Partners Advisors,LLC (“GPA”), that was in effect during a portion of the Reporting Period, GPA was engaged to provide investment subadvisory services to Series E (Total Return Bond Series) (“Series E”) and Series P (High Yield Series) (“Series P”). Pursuant to an investment Sub-Advisory Agreement between GPIM and GPA that was in effect during a portion of the Reporting Period, GPA was engaged to provide investment sub-advisory services to Series F (Floating Rate Strategies Series) (“Series F”). GPA operated as an investment sub-advisor to these Funds from April 29, 2022 to December 22, 2022.
GPA, under the oversight of the Board, SI and GPIM, assisted SI and GPIM, as applicable, in the supervision and direction of the investment strategies of Series E, Series F and Series P in accordance with their investment policies. As compensation for its services, SI and GPIM, as applicable, paid GPA a fee, payable monthly, in an amount equal to 0.005% of the average daily net assets of Series E, Series F and Series P.
Significant Accounting Policies
The Funds operate as investment companies and, accordingly, follow the investment company accounting and reporting guidance of the Financial Accounting Standards Board (“FASB”) Accounting Standards Codification Topic 946 Financial Services – Investment Companies.
The following significant accounting policies are in conformity with U.S. generally accepted accounting principles (“U.S. GAAP”) and are consistently followed by the Trust. This requires management to make estimates and assumptions that affect the reported amount of assets and liabilities, contingent assets and liabilities at the date of the financial statements, and the reported amounts of revenues and expenses during the reporting period. Actual results could differ from these estimates. All time references are based on Eastern Time.
The net asset value per share (“NAV”) of a Fund is calculated by dividing the market value of a Fund’s securities and other assets, less all liabilities, by the number of outstanding shares of that Fund.
(a) Valuation of Investments
The Board of Trustees of the Funds (the “Board”) has adopted policies and procedures for the valuation of the Funds’ investments (the “Fund Valuation Procedures”). The SEC adopted Rule 2a-5 under the 1940 Act (“Rule 2a-5”) which establishes requirements for determining fair value in good faith. Rule 2a-5 also defines “readily available market quotations” for purposes of the 1940 Act and establishes requirements for determining whether a fund must fair value a security in good faith.
Pursuant to Rule 2a-5, the Board has designated the Adviser as the valuation designee to perform fair valuation determinations for the Funds with respect to all Fund investments and other assets. As the Funds’ valuation designee pursuant to Rule 2a-5, the Adviser has adopted separate procedures (the “Valuation Designee Procedures” and collectively with the Fund Valuation Procedures, the “Valuation Procedures”) reasonably designed to prevent violations of the requirements of Rule 2a-5 and Rule 31a-4. The Adviser, in its role as valuation designee, utilizes the assistance of a valuation committee, consisting of representatives from Guggenheim’s investment management, fund administration,
144 | THE GUGGENHEIM FUNDS SEMI-ANNUAL REPORT | |
NOTES TO FINANCIAL STATEMENTS (Unaudited)(continued) |
legal and compliance departments (the “Valuation Committee”), in determining the fair value of the Funds’ securities and other assets.
Valuations of the Funds’ securities and other assets are supplied primarily by pricing service providers appointed pursuant to the processes set forth in the Valuation Procedures. The Adviser, with the assistance of the Valuation Committee, convenes monthly, or more frequently as needed, to review the valuation of all assets which have been fair valued. The Adviser, consistent with the monitoring and review responsibilities set forth in the Valuation Procedures, regularly reviews the appropriateness of the inputs, methods, models and assumptions employed by the pricing service provider.
If the pricing service provider cannot or does not provide a valuation for a particular investment or such valuation is deemed unreliable, such investment is fair valued by the Adviser.
Equity securities listed or traded on a recognized U.S. securities exchange or the National Association of Securities Dealers Automated Quotations (“NASDAQ”) National Market System will generally be valued on the basis of the last sale price on the primary U.S. exchange or market on which the security is listed or traded; provided, however, that securities listed on NASDAQ will be valued at the NASDAQ official closing price, which may not necessarily represent the last sale price.
Generally, trading in foreign securities markets is substantially completed each day at various times prior to the close of the New York Stock Exchange (“NYSE”). The values of foreign securities are determined as of the close of such foreign markets or the close of the NYSE, if earlier. All investments quoted in foreign currencies are valued in U.S. dollars on the basis of the foreign currency exchange rates prevailing at the close of U.S. business at 4:00 p.m. Investments in foreign securities may involve risks not present in domestic investments. The Adviser will determine the current value of such foreign securities by taking into consideration certain factors which may include the following factors, among others: the value of the securities traded on other foreign markets, American Depositary Receipts (“ADR”) trading, closed-end fund trading, foreign currency exchange activity, and the trading prices of financial products that are tied to foreign securities. In addition, under the Valuation Procedures, the Adviser is authorized to use prices and other information supplied by a pricing service provider in valuing foreign securities.
Open-end investment companies are valued at their NAV as of the close of business, on the valuation date. Exchange-traded funds and closed-end investment companies are generally valued at the last quoted sale price.
U.S. Government securities are valued by pricing service providers, the last traded fill price, or at the reported bid price at the close of business.
Commercial paper and discount notes with a maturity of greater than 60 days at acquisition are valued at prices that reflect broker-dealer supplied valuations or are obtained from pricing service providers, which may consider the trade activity, treasury spreads, yields or price of bonds of comparable quality, coupon, maturity, and type, as well as prices quoted by dealers who make markets in such securities. Commercial paper and discount notes with a maturity of 60 days or less at acquisition are valued at amortized cost, unless the Adviser concludes that amortized cost does not represent the fair value of the applicable asset in which case it will be valued using an independent pricing service.
Repurchase agreements are generally valued at amortized cost, provided such amounts approximate market value.
CLOs, CDOs, MBS, ABS, and other structured finance securities are generally valued using a pricing service provider.
Typically, loans are valued using information provided by a pricing service provider which uses broker quotes, among other inputs. If the pricing service provider cannot or does not provide a valuation for a particular loan, or such valuation is deemed unreliable, such investment is valued based on a quote from a broker-dealer or is fair valued by the Adviser.
Exchange-traded options are valued at the mean of the bid and ask prices on the principal exchange on which they are traded. Over-the-counter (“OTC”) options are valued using a price provided by a pricing service.
Futures contracts are valued on the basis of the last sale price at the 4:00 p.m. price on the valuation date. In the event that the exchange for a specific futures contract closes earlier than 4:00 p.m., the futures contract is valued at the official settlement price of the exchange. However, the underlying securities from which the futures contract value is derived are monitored until 4:00 p.m. to determine if fair valuation would provide a more accurate valuation.
Interest rate swap agreements entered into by a Fund are valued on the basis of the last sale price on the primary exchange on which the swap is traded.
The value of other swap agreements entered into by a Fund will generally be valued using an evaluated price provided by a pricing service provider.
Forward foreign currency exchange contracts are valued daily based on the applicable exchange rate of the underlying currency.
Investments for which market quotations are not readily available are fair valued as determined in good faith by the Adviser. Valuations in accordance with these methods are intended to reflect each security’s (or asset’s or liability’s) “fair value”. Each such determination is based on a consideration of all relevant factors, which are likely to vary from one pricing context to another.
| | THE GUGGENHEIM FUNDS SEMI-ANNUAL REPORT | 145 |
NOTES TO FINANCIAL STATEMENTS (Unaudited)(continued) |
Examples of such factors may include, but are not limited to market prices; sale prices; broker quotes; and models which derive prices based on inputs such as anticipated cash flows or collateral, spread over U.S. Treasury securities, and other information analysis. In connection with futures contracts and other derivative investments, such factors may include obtaining information as to how (a) these contracts and other derivative investments trade in the futures or other derivative markets, respectively, and (b) the securities underlying these contracts and other derivative investments trade in the cash market.
(b) U.S. Government and Agency Obligations
Certain U.S. Government and Agency Obligations are traded on a discount basis; the interest rates shown on the Schedules of Investments reflect the effective rates paid at the time of purchase by the Funds. Other securities bear interest at the rates shown, payable at fixed dates through maturity.
(c) Senior Floating Rate Interests and Loan Investments
Senior floating rate interests in which the Trust invests generally pay interest rates which are periodically adjusted by reference to a base short-term floating rate, plus a premium. These base lending rates are generally (i) the lending rate offered by one or more major European banks, (ii) the prime rate offered by one or more major United States banks, or (iii) the bank’s certificate of deposit rate. Senior floating rate interests often require prepayments from excess cash flows or permit the borrower to repay at its election. The rate at which the borrower repays cannot be predicted with accuracy. As a result, the actual remaining maturity may be substantially less than the stated maturities disclosed in the Funds’ Schedules of Investments.
The Funds invest in loans and other similar debt obligations (“obligations”). A portion of the Funds’ investments in these obligations is sometimes referred to as “covenant lite” loans or obligations (“covenant lite obligations”), which are obligations that lack covenants or possess fewer or less restrictive covenants or constraints on borrowers than certain other types of obligations. The Funds may also obtain exposure to covenant lite obligations through investment in securitization vehicles and other structured products. Recently, many new or reissued obligations have not featured traditional covenants, which are intended to protect lenders and investors by (i) imposing certain restrictions or other limitations on a borrower’s operations or assets or (ii) providing certain rights to lenders. The Funds may have fewer rights with respect to covenant lite obligations, including fewer protections against the possibility of default and fewer remedies in the event of default. As a result, investments in (or exposure to) covenant lite obligations are subject to more risk than investments in (or exposure to) certain other types of obligations. The Funds are subject to other risks associated with investments in (or exposure to) obligations, including that obligations may not be considered “securities” and, as a result, the Funds may not be entitled to rely on the anti-fraud protections under the federal securities laws and instead may have to resort to state law and direct claims.
(d) Interest on When-Issued Securities
The Funds may purchase and sell interests in securities on a when-issued and delayed delivery basis, with payment and delivery scheduled for a future date. No income accrues to the Funds on such interests or securities in connection with such transactions prior to the date the Funds actually take delivery of such interests or securities. These transactions are subject to market fluctuations and are subject to the risk that the value at delivery may be more or less than the trade date purchase price. Although the Funds will generally purchase these securities with the intention of acquiring such securities, they may sell such securities before the settlement date.
(e) Short Sales
When a Fund engages in a short sale of a security, an amount equal to the proceeds is reflected as an asset and an equivalent liability. The amount of the liability is subsequently marked-to-market to reflect the market value of the short sale.
Fees, if any, paid to brokers to borrow securities in connection with short sales are recorded as interest expense. In addition, the Fund must pay out the dividend rate of the equity or coupon rate of the obligation to the lender and record this as an expense. Short dividend or interest expense is a cost associated with the investment objective of short sales transactions, rather than an operational cost associated with the day-to-day management of any mutual fund. The Fund may also receive rebate income from the broker resulting from the investment of the proceeds from securities sold short.
(f) Options
Upon the purchase of an option, the premium paid is recorded as an investment, the value of which is marked-to-market daily. If a purchased option expires, the Fund realizes a loss in the amount of the cost of the option. When the Fund enters into a closing sale transaction, it realizes a gain or loss depending on whether the proceeds from the closing sale transaction are greater or less than the cost of the option. If the Fund exercises a put option, it realizes a gain or loss from the sale of the underlying security and the proceeds from such sale will be decreased by the premium originally paid. When the Fund exercises a call option, the cost of the security purchased by the Fund upon exercise increases by the premium originally paid.
When the Fund writes (sells) an option, an amount equal to the premium received is entered in that Fund’s accounting records as an asset and equivalent liability. The amount of the liability is
146 | THE GUGGENHEIM FUNDS SEMI-ANNUAL REPORT | |
NOTES TO FINANCIAL STATEMENTS (Unaudited)(continued) |
subsequently marked-to-market to reflect the current value of the option written. When a written option expires, or if the Fund enters into a closing purchase transaction, it realizes a gain (or loss if the cost of a closing purchase transaction exceeds the premium received when the option was sold).
The Fund may purchase and write options on swaps (“swaptions”) primarily to preserve a return or spread on a particular investment or portion of the Funds’ holdings, as a duration management technique or to protect against an increase in the price of securities it anticipates purchasing at a later date. The purchaser and writer of a swaption is buying or granting the right to enter into a previously agreed upon interest rate swap agreement at any time before the expiration of the options. The swaptions are forward premium swaptions which have extended settlement dates.
(g) Futures Contracts
Upon entering into a futures contract, a Fund deposits and maintains as collateral such initial margin as required by the exchange on which the transaction is affected. Pursuant to the contract, the Fund agrees to receive from or pay to the broker an amount of cash equal to the daily fluctuation in value of the contract. Such receipts or payments are known as variation margin and are recorded by the Fund as unrealized appreciation or depreciation. When the contract is closed, the Fund records a realized gain or loss equal to the difference between the value of the contract at the time it was opened and the value at the time it was closed.
(h) Swap Agreements
Swap agreements are marked-to-market daily and the change, if any, is recorded as unrealized appreciation or depreciation. Payments received or made as a result of an agreement or termination of an agreement are recognized as realized gains or losses.
Upon entering into certain centrally-cleared swap transactions, a Fund is required to deposit with its clearing broker an amount of cash or securities as an initial margin. Subsequent variation margin receipts or payments are received or made by the Fund depending on fluctuations in the fair value of the reference entity and are recorded by the Fund as unrealized appreciation or depreciation. When the contract is closed, the Fund records a realized gain or loss equal to the difference between the value of the contract at the time it was opened and the value at the time it was closed.
Upfront payments received or made by a Fund on credit default swap agreements and interest rate swap agreements are amortized over the expected life of the agreement. Periodic payments received or paid by a Fund are recorded as realized gains or losses. Payments received or made as a result of a credit event or termination of the contract are recognized, net of a proportional amount of the upfront payment, as realized gains or losses.
(i) Forward Foreign Currency Exchange Contracts
The change in value of a forward foreign currency exchange contract is recorded as unrealized appreciation or depreciation until the contract is closed. When the contract is closed, the Funds record a realized gain or loss equal to the difference between the value at the time the contract was opened and the value at the time it was closed.
(j) Currency Translations
The accounting records of the Funds are maintained in U.S. dollars. All assets and liabilities initially expressed in foreign currencies are converted into U.S. dollars at prevailing exchange rates. Purchases and sales of investment securities, dividend and interest income, and certain expenses are translated at the rates of exchange prevailing on the respective dates of such transactions. Changes in the relationship of these foreign currencies to the U.S. dollar can significantly affect the value of the investments and earnings of the Funds. Foreign investments may also subject the Funds to foreign government exchange restrictions, expropriation, taxation, or other political, social, geopolitical or economic developments, all of which could affect the market and/or credit risk of the investments.
The Funds do not isolate that portion of the results of operations resulting from changes in the foreign exchange rates on investments from the fluctuations arising from changes in the market prices of securities held. Such fluctuations are included with the net realized gain or loss and unrealized appreciation or depreciation on investments.
Reported net realized foreign exchange gains and losses arise from sales of foreign currencies and currency gains or losses realized between the trade and settlement dates on investment transactions. Net unrealized appreciation and depreciation arise from changes in the fair values of assets and liabilities other than investments in securities at the fiscal period end, resulting from changes in exchange rates.
(k) Foreign Taxes
The Funds may be subject to foreign taxes (a portion of which may be reclaimable) on income, stock dividends, capital gains on investments or certain foreign currency transactions. All foreign taxes are recorded in accordance with the applicable foreign tax regulations and rates that exist in the foreign jurisdictions in which the Funds invest. These foreign taxes, if any, are paid by the Funds and reflected in their Statements of Operations as follows: foreign taxes withheld at source are presented as a reduction of income and foreign taxes on capital gains from sales of investments are included
| | THE GUGGENHEIM FUNDS SEMI-ANNUAL REPORT | 147 |
NOTES TO FINANCIAL STATEMENTS (Unaudited)(continued) |
with the net realized gain (loss) on investments. Foreign taxes payable or deferred as of June 30, 2023, if any, are disclosed in the Funds’ Statements of Assets and Liabilities.
(i) Security Transactions
Security transactions are recorded on the trade date for financial reporting purposes. Realized gains and losses from securities transactions are recorded using the identified cost basis. Proceeds from lawsuits related to investment holdings are recorded as a reduction to cost if the securities are still held and as realized gains if no longer held in the respective Fund. Dividend income is recorded on the ex-dividend date, net of applicable taxes withheld by foreign countries, if any. Taxable non-cash dividends are recorded as dividend income. Interest income, including amortization of premiums and accretion of discounts, is accrued on a daily basis. Interest income also includes paydown gains and losses on mortgage-backed and asset-backed securities and senior and subordinated loans. Amendment fees are earned as compensation for evaluating and accepting changes to the original loan agreement and are recognized when received. Dividend income from Real Estate Investment Trusts (“REITs”) is recorded based on the income included in the distributions received from the REIT investments using published REIT classifications, including some management estimates when actual amounts are not available. Distributions received in excess of this estimated amount are recorded as a reduction of the cost of investments or reclassified to realized gains. The actual amounts of income, return of capital, and realized gains are only determined by each REIT after its fiscal year-end, and may differ from the estimated amounts.
Income from residual collateralized loan obligations is recognized using the effective interest method. At the time of purchase, management estimates the future expected cash flows and determines the effective yield and estimated maturity date based on the estimated cash flows. Subsequent to the purchase, the estimated cash flows are updated periodically and a revised yield is calculated prospectively.
Certain Funds may receive other income from investments in senior loan interests including amendment fees, consent fees and commitment fees. For funded loans, these fees are recorded as income when received by the Funds and included in interest income on the Statements of Operations. For unfunded loans, commitment fees are included in realized gain on investments on the Statement of Operations at the end of the commitment period.
(m) Distributions
Distributions of net investment income and net realized gains, if any, are declared and paid at least annually. Normally, all distributions of a Fund will automatically be reinvested without charge in additional shares of the same Fund. Distributions are recorded on the ex-dividend date and are determined in accordance with U.S. federal income tax regulations which may differ from U.S. GAAP.
(n) Expenses
Expenses directly attributable to a Fund are charged directly to the Fund. Other expenses common to various funds within the fund complex are generally allocated amongst such funds on the basis of average net assets.
(o) Earnings Credits
Under the fee arrangement with the custodian, the Funds may earn credits based on overnight custody cash balances. These credits are utilized to reduce related custodial expenses. The custodian fees disclosed in the Statements of Operations are before the reduction in expense from the related earnings credits, if any. Earnings credits for the period ended June 30, 2023, are disclosed in the Statements of Operations.
(p) Cash
The Funds may leave cash overnight in their cash account with the custodian. Periodically, a Fund may have cash due to the custodian bank as an overdraft balance. A fee is incurred on this overdraft, calculated by multiplying the overdraft by a rate based on the federal funds rate, which was 5.08% at June 30, 2023.
(q) Indemnifications
Under the Funds’ organizational documents, the Trustees and Officers are indemnified against certain liabilities arising out of the performance of their duties to the Trust. In addition, throughout the normal course of business, the Funds enter into contracts that contain a variety of representations and warranties which provide general indemnifications. The Funds’ maximum exposure under these arrangements is unknown, as this would involve future claims that may be made against the Funds and/or their affiliates that have not yet occurred. However, based on experience, the Funds expect the risk of loss to be remote.
(r) Special Purpose Acquisition Companies
The Funds may acquire an interest in a special purpose acquisition company (“SPAC”) in an initial public offering or a secondary market transaction. SPAC investments carry many of the same risks as investments in initial public offering securities, such as erratic price movements, greater risk of loss, lack of information about the issuer, limited operating and little public or no trading history, and higher transaction costs. An investment in a SPAC is typically subject to a higher risk of dilution by additional later offerings of interests in the SPAC or by other investors exercising existing rights to purchase shares of the SPAC and interests in SPACs may be illiquid and/or be subject to restrictions on resale. A SPAC is a publicly traded company
148 | THE GUGGENHEIM FUNDS SEMI-ANNUAL REPORT | |
NOTES TO FINANCIAL STATEMENTS (Unaudited)(continued) |
that raises investment capital for the purpose of acquiring the equity securities of one or more existing companies (or interests therein) via merger, combination, acquisition or other similar transactions. Unless and until an acquisition is completed, a SPAC generally invests its assets (less a portion retained to cover expenses) in U.S. government securities, money market securities and cash and does not typically pay dividends in respect of its common stock. SPAC investments are also subject to the risk that a significant portion of the funds raised by the SPAC may be expended during the search for a target acquisition or merger and that the SPAC may have limited time in which to conduct due diligence on potential business combination targets. Because SPACs are in essence blank check companies without operating history or ongoing business other than seeking acquisitions, the value of their securities is particularly dependent on the ability of the entity’s management to identify and complete a profitable acquisition. Among other conflicts of interest, the economic interests of the management, directors, officers and related parties of a SPAC can differ from the economic interests of public shareholders, which may lead to conflicts as they evaluate, negotiate and recommend business combination transactions to shareholders. This risk may become more acute as the deadline for the completion of a business combination nears. There is no guarantee that the SPACs in which the Funds invest will complete an acquisition or that any acquisitions that are completed will be profitable.
Note 2 – Financial Instruments and Derivatives
As part of their investment strategies, the Funds may utilize short sales and a variety of derivative instruments. These investments involve, to varying degrees, elements of market risk and risks in excess of amounts recognized on the Statements of Assets and Liabilities. Valuation and accounting treatment of these instruments can be found under Significant Accounting Policies in Note 1 of these Notes to Financial Statements.
Short Sales
A short sale is a transaction in which a Fund sells a security it does not own. If the security sold short decreases in price between the time the Fund sells the security and closes its short position, the Fund will realize a gain on the transaction. Conversely, if the security increases in price during the period, the Fund will realize a loss on the transaction. The risk of such price increases is the principal risk of engaging in short sales.
Derivatives
Derivatives are instruments whose values depend on, or are derived from, in whole or in part, the value of one or more other assets, such as securities, currencies, commodities or indices. Derivative instruments may be used to increase investment flexibility (including to maintain cash reserves while maintaining exposure to certain other assets), for risk management (hedging) purposes, to facilitate trading, to reduce transaction costs and to pursue higher investment returns. Derivative instruments may also be used to mitigate certain investment risks, such as foreign currency exchange rate risk, interest rate risk and credit risk. U.S. GAAP requires disclosures to enable investors to better understand how and why a Fund uses derivative instruments, how these derivative instruments are accounted for and their effects on the Fund’s financial position and results of operations.
The Funds may utilize derivatives for the following purposes:
Duration: the use of an instrument to manage the interest rate risk of a portfolio.
Hedge: an investment made in order to reduce the risk of adverse price movements in a security, by taking an offsetting position to protect against broad market moves.
Income: the use of any instrument that distributes cash flows typically based upon some rate of interest.
Index Exposure: the use of an instrument to obtain exposure to a listed or other type of index.
Leverage: gaining total exposure to equities or other assets on the long and short sides at greater than 100% of invested capital.
Speculation: the use of an instrument to express macro-economic and other investment views.
For any Fund whose investment strategy consistently involves applying leverage, the value of the Fund’s shares will tend to increase or decrease more than the value of any increase or decrease in the underlying index or other asset. In addition, because an investment in derivative instruments generally requires a small investment relative to the amount of investment exposure assumed, an opportunity for increased net income is created; but, at the same time, leverage risk will increase. The Fund’s use of leverage, through borrowings or instruments such as derivatives, may cause the Fund to be more volatile and riskier than if they had not been leveraged.
Options Purchased and Written
A call option on a security gives the purchaser of the option the right to buy, and the writer of a call option the obligation to sell, the underlying security. The purchaser of a put option has the right to sell, and the writer of the put option the obligation to buy, the underlying security at any time during the option period. The risk associated with purchasing options is limited to the premium originally paid.
| | THE GUGGENHEIM FUNDS SEMI-ANNUAL REPORT | 149 |
NOTES TO FINANCIAL STATEMENTS (Unaudited)(continued) |
The following table represents the Funds’ use and volume of call/put options purchased on a monthly basis:
| | | | Average Notional Amount | |
Fund | Use | | Call | | | Put | |
Series E (Total Return Bond Series) | Duration, Hedge | | $ | 22,600,000 | | | $ | 1,609,204 | |
The risk in writing a call option is that a Fund may incur a loss if the market price of the underlying security increases and the option is exercised. The risk in writing a put option is that a Fund may incur a loss if the market price of the underlying security decreases and the option is exercised. In addition, there may be an imperfect correlation between the movement in prices of options and the underlying securities where a Fund may not be able to enter into a closing transaction because of an illiquid secondary market; or, for OTC options, a Fund may be at risk because of the counterparty’s inability to perform.
The following table represents the Funds’ use and volume of call/put options written on a monthly basis:
| | | | Average Notional Amount | |
Fund | Use | | Call | | | Put | |
Series E (Total Return Bond Series) | Hedge, Income | | $ | — | | | $ | 3,700,000 | |
Futures Contracts
A futures contract is an agreement to purchase (long) or sell (short) an agreed amount of securities or other instruments at a set price for delivery at a future date. There are significant risks associated with a Fund’s use of futures contracts, including (i) there may be an imperfect or no correlation between the changes in market value of the underlying asset and the prices of futures contracts; (ii) there may not be a liquid secondary market for a futures contract; (iii) trading restrictions or limitations may be imposed by an exchange; and (iv) government regulations may restrict trading in futures contracts. When investing in futures, there is minimal counterparty credit risk to a Fund because futures are exchange-traded and the exchange’s clearinghouse, as counterparty to all exchange-traded futures, guarantees against default. Cash deposits are shown as segregated cash with broker on the Statements of Assets and Liabilities; securities held as collateral are noted on the Schedules of Investments.
The following table represents the Funds’ use and volume of futures on a monthly basis:
| | | | Average Notional Amount | |
Fund | Use | | Long | | | Short | |
Series A (StylePlus—Large Core Series) | Index exposure | | $ | 6,608,438 | | | $ | — | |
Series D (World Equity Income Series) | Hedge | | | — | | | | 3,980,930 | |
Series E (Total Return Bond Series) | Duration, Hedge | | | 2,776,010 | | | | — | |
Series J (StylePlus—Mid Growth Series) | Index exposure | | | 5,035,128 | | | | — | |
Series N (Managed Asset Allocation Series) | Index exposure, Speculation | | | 5,916,056 | | | | 1,493,028 | |
Series X (StylePlus—Small Growth Series) | Index exposure | | | 733,476 | | | | — | |
Series Y (StylePlus—Large Growth Series) | Index exposure | | | 1,160,916 | | | | — | |
Swap Agreements
A swap is an agreement that obligates two parties to exchange a series of cash flows at specified intervals based upon or calculated by reference to changes in specified prices or rates for a specified amount of an underlying asset. When utilizing OTC swaps, a Fund bears the risk of loss of the amount expected to be received under a swap agreement in the event of the default or bankruptcy of a swap agreement counterparty or if the underlying asset declines in value. Certain standardized swaps are subject to mandatory central clearing and are executed on a multi-lateral or other trade facility platform, such as a registered exchange. There is limited counterparty credit risk with respect to centrally-cleared swaps as the transaction is facilitated through a central clearinghouse, much like exchange-traded futures contracts. For a Fund utilizing centrally-cleared swaps, the exchange bears the risk of loss resulting from a counterparty not being able to pay. There is no guarantee that a Fund or an underlying fund could eliminate its exposure under an outstanding swap agreement by entering into an offsetting swap agreement with the same or another party.
150 | THE GUGGENHEIM FUNDS SEMI-ANNUAL REPORT | |
NOTES TO FINANCIAL STATEMENTS (Unaudited)(continued) |
Total return and custom basket swaps involve commitments where single or multiple cash flows are exchanged based on the price of an underlying reference asset (such as an index or custom basket of securities) for a fixed or variable interest rate. Total return and custom basket swaps will usually be computed based on the current value of the reference asset as of the close of regular trading on the NYSE or other exchange, with the swap value being adjusted to include dividends accrued, financing charges and/or interest associated with the swap agreement. When utilizing total return or custom basket swaps, a Fund bears the risk of loss of the amount expected to be received under a swap agreement in the event of the default or bankruptcy of a swap agreement counterparty or if the underlying reference asset declines in value.
The following table represents the Funds’ use and volume of total return swaps on a monthly basis:
| | | | Average Notional Amount | |
Fund | Use | | Long | | | Short | |
Series A (StylePlus—Large Core Series) | Index exposure | | $ | 159,864,791 | | | $ | — | |
Series J (StylePlus—Mid Growth Series) | Index exposure | | | 123,779,239 | | | | — | |
Series X (StylePlus—Small Growth Series) | Index exposure | | | 19,187,860 | | | | — | |
Series Y (StylePlus—Large Growth Series) | Index exposure | | | 32,182,694 | | | | — | |
The following table represents the Funds’ use and volume of custom basket swaps on a monthly basis:
| | | | Average Notional Amount | |
Fund | Use | | Long | | | Short | |
Series Z (Alpha Opportunity Series) | Hedge, Leverage | | $ | 1,706,648 | | | $ | 3,538,644 | |
Interest rate swaps involve the exchange by the Funds with another party for their respective commitment to pay or receive a fixed or variable interest rate on a notional amount of principal. Interest rate swaps are generally centrally-cleared, but central clearing does not make interest rate swap transactions risk free.
The following table represents the Funds’ use and volume of interest rate swaps on a monthly basis:
| | | | Average Notional Amount | |
Fund | Use | | Pay Floating Rate | | | Receive Floating Rate | |
Series E (Total Return Bond Series) | Duration, Hedge, Income | | $ | 7,933,333 | | | $ | — | |
Credit default swaps are instruments which allow for the full or partial transfer of third party credit risk, with respect to a particular entity or entities, from one counterparty to the other. A fund enters into credit default swaps as a “seller” or “buyer” of protection primarily to gain or reduce exposure to the investment grade and/or high yield bond market. A seller of credit default swaps is selling credit protection or assuming credit risk with respect to the underlying entity or entities. The buyer in a credit default swap is obligated to pay the seller a periodic stream of payments over the term of the contract provided that no event of default on an underlying reference obligation has occurred. If a credit event occurs, as defined under the terms of the swap agreement, the seller will either (i) pay to the buyer of protection an amount equal to the notional amount of the swap and take delivery of the referenced obligation or underlying securities comprising the referenced index or (ii) pay a net settlement amount in the form of cash or securities equal to the notional amount of the swap less the recovery value of the referenced obligation or underlying securities comprising the referenced index. The notional amount reflects the maximum potential amount the seller of credit protection could be required to pay to the buyer if a credit event occurs. The seller of protection receives periodic premium payments from the buyer and may also receive or pay an upfront premium adjustment to the stated periodic payments. In the event a credit default occurs on a credit default swap referencing an index, a factor adjustment will take place and the buyer of protection will receive a payment reflecting the par less the default recovery rate of the defaulted index component based on its weighting in the index. If no default occurs, the counterparty will pay the stream of payments and have no further obligations to the fund selling the credit protection. For a fund utilizing centrally cleared credit default swaps, the exchange bears the risk of loss resulting from a counterparty not being able to pay. For OTC credit default swaps, a fund bears the risk of loss of the amount expected to be received under a swap agreement in the event of the default or bankruptcy of a swap agreement counterparty, or in the case of a credit default swap in which a fund is selling credit protection, the default of a third party issuer.
| | THE GUGGENHEIM FUNDS SEMI-ANNUAL REPORT | 151 |
NOTES TO FINANCIAL STATEMENTS (Unaudited)(continued) |
The quoted market prices and resulting market values for credit default swap agreements on securities and credit indices serve as an indicator of the current status of the payment/performance risk and represent the likelihood of an expected liability (or profit) for the credit derivative had the notional amount of the swap agreement been closed/sold as of the period end. Increasing market values, in absolute terms when compared to the notional amount of the swap, represent a deterioration of the referenced entity’s credit soundness and a greater likelihood or risk of default or other credit event occurring as defined under the terms of the agreement.
The following table represents the Funds’ use and volume of credit default swaps on a monthly basis:
| | | | Average Notional Amount | |
Fund | Use | | Protection Sold | | | Protection Purchased | |
Series E (Total Return Bond Series) | Hedge, Index exposure | | $ | — | | | $ | 2,533,333 | |
Forward Foreign Currency Exchange Contracts
A forward foreign currency exchange contract is an agreement between two parties to exchange two designated currencies at a specific time in the future. Certain types of contracts may be cash settled, in an amount equal to the change in exchange rates during the term of the contract. The contracts can be used to hedge or manage exposure to foreign currency risks with portfolio investments or to gain exposure to foreign currencies.
The market value of a forward foreign currency exchange contract changes with fluctuations in foreign currency exchange rates. Furthermore, the Funds may be exposed to risk if the counterparties cannot meet the contract terms or if the currency value changes unfavorably as compared to the U.S. dollar.
The following table represents the Funds’ use and volume of forward foreign currency exchange contracts on a monthly basis:
| | | | Average Value | |
Fund | Use | | Purchased | | | Sold | |
Series E (Total Return Bond Series) | Hedge | | $ | — | | | $ | 605,348 | |
Series F (Floating Rate Strategies Series) | Hedge | | | — | | | | 436,271 | |
Series P (High Yield Series) | Hedge | | | — | | | | 578,020 | |
Derivative Investment Holdings Categorized by Risk Exposure
The following is a summary of the location of derivative investments on the Funds’ Statements of Assets and Liabilities as of June 30, 2023:
Derivative Investment Type | Asset Derivatives | Liability Derivatives |
Currency/Equity/Interest rate futures contracts | Variation margin on futures contracts | Variation margin on futures contracts |
Currency forward contracts | — | Unrealized depreciation on forward foreign currency exchange contracts |
Credit/Equity/Interest rate swap contracts | Unamortized upfront premiums paid on credit default swap agreements Unrealized appreciation on OTC swap agreements Unamortized upfront premiums paid on interest rate swap agreements | Unamortized upfront premiums received on credit default swap agreements Unrealized depreciation on OTC swap agreements Variation margin on credit default swap agreements Variation margin on interest rate swap agreements |
Credit/Interest rate option contracts | Investments in unaffiliated issuers, at value | Options written, at value |
152 | THE GUGGENHEIM FUNDS SEMI-ANNUAL REPORT | |
NOTES TO FINANCIAL STATEMENTS (Unaudited)(continued) |
The following tables set forth the fair value of the Funds’ derivative investments categorized by primary risk exposure at June 30, 2023:
Asset Derivative Investments Value |
Fund | | Futures
Equity
Risk* | | | Swaps
Equity
Risk | | | Futures
Foreign
Currency
Exchange
Risk* | | | Futures
Interest
Rate
Risk* | | | Swaps
Interest
Rate
Risk* | | | Swaps
Credit
Risk* | | | Forward
Foreign
Currency
Exchange
Risk | | | Options
Purchased
Interest
Rate Risk | | | Options
Purchased
Credit
Risk | | | Total
Value at
June 30,
2023 | |
Series A (StylePlus—Large Core Series) | | $ | 13,315 | | | $ | — | | | $ | — | | | $ | — | | | $ | — | | | $ | — | | | $ | — | | | $ | — | | | $ | — | | | $ | 13,315 | |
Series D (World Equity Income Series) | | | — | | | | — | | | | 303,129 | | | | — | | | | — | | | | — | | | | — | | | | — | | | | — | | | | 303,129 | |
Series E (Total Return Bond Series) | | | — | | | | — | | | | — | | | | — | | | | — | | | | — | | | | — | | | | 27,951 | | | | 2,123 | | | | 30,074 | |
Series J (StylePlus—Mid Growth Series) | | | 32,204 | | | | — | | | | — | | | | — | | | | — | | | | — | | | | — | | | | — | | | | — | | | | 32,204 | |
Series N (Managed Asset Allocation Series) | | | 37,022 | | | | — | | | | 2,170 | | | | — | | | | — | | | | — | | | | — | | | | — | | | | — | | | | 39,192 | |
Series X (StylePlus—Small Growth Series) | | | 80 | | | | — | | | | — | | | | — | | | | — | | | | — | | | | — | | | | — | | | | — | | | | 80 | |
Series Y (StylePlus—Large Growth Series) | | | 18,519 | | | | — | | | | — | | | | — | | | | — | | | | — | | | | — | | | | — | | | | — | | | | 18,519 | |
Series Z (Alpha Opportunity Series) | | | — | | | | 105,258 | | | | — | | | | — | | | | — | | | | — | | | | — | | | | — | | | | — | | | | 105,258 | |
Liability Derivative Investments Value |
Fund | | Futures
Equity
Risk* | | | Swaps
Equity
Risk | | | Futures
Foreign
Currency
Exchange
Risk* | | | Futures
Interest
Rate
Risk* | | | Swaps
Credit
Risk* | | | Swaps
Interest
Rate
Risk* | | | Forward
Foreign
Currency
Exchange
Risk | | | Options
Written
Interest
Rate Risk | | | Options
Written
Credit
Risk | | | Total
Value at
June 30,
2023 | |
Series E (Total Return Bond Series) | | $ | — | | | $ | — | | | $ | — | | | $ | — | | | $ | 55,917 | | | $ | 358,727 | | | | 4,660 | | | $ | 104,552 | | | $ | — | | | $ | 523,856 | |
Series F (Floating Rate Strategies Series) | | | — | | | | — | | | | — | | | | — | | | | — | | | | — | | | | 4,897 | | | | — | | | | — | | | | 4,897 | |
Series N (Managed Asset Allocation Series) | | | 29,267 | | | | — | | | | 4,841 | | | | 15,488 | | | | — | | | | — | | | | — | | | | — | | | | — | | | | 49,596 | |
Series P (High Yield Series) | | | — | | | | — | | | | — | | | | — | | | | — | | | | — | | | | 5,009 | | | | — | | | | — | | | | 5,009 | |
Series X (StylePlus—Small Growth Series) | | | 1,325 | | | | — | | | | — | | | | — | | | | — | | | | — | | | | — | | | | — | | | | — | | | | 1,325 | |
Series Z (Alpha Opportunity Series) | | | — | | | | 113,958 | | | | — | | | | — | | | | — | | | | — | | | | — | | | | — | | | | — | | | | 113,958 | |
* | Includes cumulative appreciation (depreciation) of exchange-traded, OTC and centrally-cleared derivatives contracts as reported on the Schedules of Investments. For exchange-traded and centrally-cleared derivatives, variation margin is reported within the Statements of Assets and Liabilities. |
| | THE GUGGENHEIM FUNDS SEMI-ANNUAL REPORT | 153 |
NOTES TO FINANCIAL STATEMENTS (Unaudited)(continued) |
The following is a summary of the location of derivative investments on the Funds’ Statements of Operations for the period ended June 30, 2023:
Derivative Investment Type | Location of Gain (Loss) on Derivatives |
Currency/Equity/Interest rate futures contracts | Net realized gain (loss) on futures contracts Net change in unrealized appreciation (depreciation) on futures contracts |
Currency forward contracts | Net realized gain (loss) on forward foreign currency exchange contracts Net change in unrealized appreciation (depreciation) on forward foreign currency exchange contracts |
Equity/Interest rate option contracts | Net realized gain (loss) on options purchased Net change in unrealized appreciation (depreciation) on options purchased Net realized gain (loss) on options written Net change in unrealized appreciation (depreciation) on options written |
Credit/Equity/Interest rate swap contracts | Net realized gain (loss) on swap agreements Net change in unrealized appreciation (depreciation) on swap agreements |
The following is a summary of the Funds’ realized gain (loss) and change in unrealized appreciation (depreciation) on derivative investments recognized on the Funds’ Statements of Operations categorized by primary risk exposure for the period ended June 30, 2023:
Realized Gain (Loss) on Derivative Investments Recognized on the Statements of Operations |
Fund | | Futures
Equity
Risk | | | Swaps
Equity
Risk | | | Futures
Foreign
Currency
Exchange
Risk | | | Futures
Interest
Rate Risk | | | Swaps
Interest
Rate Risk | | | Swaps
Credit Risk | | | Options
Written
Equity
Risk | | | Options
Purchased
Equity
Risk | | | Forward
Foreign
Currency
Exchange
Risk | | | Options
Written
Interest
Rate Risk | | | Total | |
Series A (StylePlus—Large Core Series) | | $ | 516,547 | | | $ | 23,641,953 | | | $ | — | | | $ | — | | | $ | — | | | $ | — | | | $ | — | | | $ | — | | | $ | — | | | $ | — | | | $ | 24,158,500 | |
Series D (World Equity Income Series) | | | — | | | | — | | | | (190,565 | ) | | | — | | | | — | | | | — | | | | — | | | | — | | | | — | | | | — | | | | (190,565 | ) |
Series E (Total Return Bond Series) | | | — | | | | — | | | | — | | | | 50,435 | | | | (50,737 | ) | | | (25,507 | ) | | | 17,500 | | | | (38,120 | ) | | | (8,842 | ) | | | (15,201 | ) | | | (70,472 | ) |
Series F (Floating Rate Strategies Series) | | | — | | | | — | | | | — | | | | — | | | | — | | | | — | | | | — | | | | — | | | | (1,151 | ) | | | — | | | | (1,151 | ) |
Series J (StylePlus—Mid Growth Series) | | | 233,333 | | | | 17,494,645 | | | | — | | | | — | | | | — | | | | — | | | | — | | | | — | | | | — | | | | — | | | | 17,727,978 | |
Series N (Managed Asset Allocation Series) | | | 65,544 | | | | — | | | | 29,015 | | | | 3,822 | | | | — | | | | — | | | | — | | | | — | | | | — | | | | — | | | | 98,381 | |
Series P (High Yield Series) | | | — | | | | — | | | | — | | | | — | | | | — | | | | — | | | | — | | | | — | | | | (5,475 | ) | | | — | | | | (5,475 | ) |
Series X (StylePlus—Small Growth Series) | | | 4,919 | | | | 2,477,226 | | | | — | | | | — | | | | — | | | | — | | | | — | | | | — | | | | — | | | | — | | | | 2,482,145 | |
Series Y (StylePlus—Large Growth Series) | | | 71,740 | | | | 7,963,030 | | | | — | | | | — | | | | — | | | | — | | | | — | | | | — | | | | — | | | | — | | | | 8,034,770 | |
Series Z (Alpha Opportunity Series) | | | — | | | | 143,632 | | | | — | | | | — | | | | — | | | | — | | | | — | | | | — | | | | — | | | | — | | | | 143,632 | |
154 | THE GUGGENHEIM FUNDS SEMI-ANNUAL REPORT | |
NOTES TO FINANCIAL STATEMENTS (Unaudited)(continued) |
Change in Unrealized Appreciation (Depreciation) on Derivative Investments Recognized on the Statements of Operations |
Fund | | Futures
Equity
Risk | | | Swaps
Equity
Risk | | | Futures
Foreign
Currency
Exchange
Risk | | | Futures
Interest
Rate Risk | | | Swaps
Interest
Rate Risk | | | Swaps
Credit Risk | | | Options
Purchased
Credit
Risk | | | Forward
Foreign
Currency
Exchange
Risk | | | Options
Purchased
Interest
Rate Risk | | | Options
Written
Interest
Rate Risk | | | Total | |
Series A (StylePlus—Large Core Series) | | $ | 106,195 | | | $ | (2,201,633 | ) | | $ | — | | | $ | — | | | $ | — | | | $ | — | | | $ | — | | | $ | — | | | $ | — | | | $ | — | | | $ | (2,095,438 | ) |
Series D (World Equity Income Series) | | | — | | | | — | | | | 303,129 | | | | — | | | | — | | | | — | | | | — | | | | — | | | | — | | | | — | | | | 303,129 | |
Series E (Total Return Bond Series) | | | — | | | | — | | | | — | | | | 22,377 | | | | 34,424 | | | | (55,917 | ) | | | (3,464 | ) | | | (18,595 | ) | | | (63,020 | ) | | | (67,214 | ) | | | (151,409 | ) |
Series F (Floating Rate Strategies Series) | | | — | | | | — | | | | — | | | | — | | | | — | | | | — | | | | — | | | | (2,301 | ) | | | — | | | | — | | | | (2,301 | ) |
Series J (StylePlus—Mid Growth Series) | | | 188,294 | | | | (2,109,057 | ) | | | — | | | | — | | | | — | | | | — | | | | — | | | | — | | | | — | | | | — | | | | (1,920,763 | ) |
Series N (Managed Asset Allocation Series) | | | 60,320 | | | | — | | | | 3,056 | | | | (12,567 | ) | | | — | | | | — | | | | — | | | | — | | | | — | | | | — | | | | 50,809 | |
Series P (High Yield Series) | | | — | | | | — | | | | — | | | | — | | | | — | | | | — | | | | — | | | | (10,070 | ) | | | — | | | | — | | | | (10,070 | ) |
Series X (StylePlus—Small Growth Series) | | | 25,718 | | | | (455,885 | ) | | | — | | | | — | | | | — | | | | — | | | | — | | | | — | | | | — | | | | — | | | | (430,167 | ) |
Series Y (StylePlus—Large Growth Series) | | | 83,510 | | | | (532,587 | ) | | | — | | | | — | | | | — | | | | — | | | | — | | | | — | | | | — | | | | — | | | | (449,077 | ) |
Series Z (Alpha Opportunity Series) | | | — | | | | (203,667 | ) | | | — | | | | — | | | | — | | | | — | | | | — | | | | — | | | | — | | | | — | | | | (203,667 | ) |
In conjunction with short sales and the use of derivative instruments, the Funds are required to maintain collateral in various forms. Depending on the financial instrument utilized and the broker involved, the Funds use margin deposits at the broker, cash and/or securities segregated at the custodian bank, discount notes or repurchase agreements allocated to the Funds as collateral.
The Trust has established counterparty credit guidelines and enters into transactions only with financial institutions of investment grade or better. The Trust monitors the counterparty credit risk associated with each such financial institution.
Foreign Investments
There are several risks associated with exposure to foreign currencies, foreign issuers and emerging markets. A fund’s indirect and direct exposure to foreign currencies subjects the Fund to the risk that those currencies will decline in value relative to the U.S. dollar, or in the case of short positions, that the U.S. dollar will decline in value relative to the currency being hedged. Currency rates in foreign countries may fluctuate significantly over short periods of time for a number of reasons, including changes in interest rates and the imposition of currency controls or other political developments in the U.S. or abroad. In addition, the Funds may incur transaction costs in connection with conversions between various currencies. The Funds may, but is not obligated to, engage in currency hedging transactions, which generally involve buying currency forward, options or futures contracts. However, not all currency risks may be effectively hedged, and in some cases the costs of hedging techniques may outweigh expected benefits. In such instances, the value of securities denominated in foreign currencies can change significantly when foreign currencies strengthen or weaken relative to the U.S. dollar.
The Funds may invest in securities of foreign companies directly, or in financial instruments, such as ADRs and exchange-traded funds, which are indirectly linked to the performance of foreign issuers. Foreign markets can be more volatile than the U.S. market due to increased risks of adverse issuer, political, regulatory, market, or economic developments and can perform differently from the U.S. market. Investing in securities of foreign companies directly, or in financial instruments that are indirectly linked to the performance of foreign issuers, may involve risks not typically associated with investing in U.S. issuers. The value of securities denominated in foreign currencies, and of dividends from such securities, can change significantly when foreign currencies strengthen or weaken relative to the U.S. dollar. Foreign securities markets generally have less trading volume and less liquidity than U.S. markets, and prices in some foreign markets may fluctuate more than those of securities traded on U.S. markets. Many foreign countries lack accounting and disclosure standards comparable to those that apply to U.S. companies, and it may be more difficult to obtain reliable information regarding a foreign issuer’s financial condition and operations. Transaction costs and costs associated with custody services are generally higher for foreign securities than they are for U.S. securities. Some foreign governments levy withholding taxes against dividend and interest income. Although in some countries portions of these taxes are recoverable, the non-recovered portion will reduce the income received by the Funds.
| | THE GUGGENHEIM FUNDS SEMI-ANNUAL REPORT | 155 |
NOTES TO FINANCIAL STATEMENTS (Unaudited)(continued) |
Note 3 – Offsetting
In the normal course of business, the Funds enter into transactions subject to enforceable master netting arrangements or other similar arrangements. Generally, the right to offset in those agreements allows the Funds to counteract the exposure to a specific counterparty with collateral received from or delivered to that counterparty based on the terms of the arrangements. These arrangements provide for the right to liquidate upon the occurrence of an event of default, credit event upon merger or additional termination event.
In order to better define their contractual rights and to secure rights that will help the Funds mitigate their counterparty risk, the Funds may enter into an International Swaps and Derivatives Association, Inc. Master Agreement (“ISDA Master Agreement”) or similar agreement with their derivative contract counterparties. An ISDA Master Agreement is a bilateral agreement between a fund and a counterparty that governs OTC derivatives, including foreign exchange contracts, and typically contains, among other things, collateral posting terms and netting provisions in the event of a default and/or termination event. The provisions of the ISDA Master Agreement typically permit a single net payment in the event of a default (close-out netting) or similar event, including the bankruptcy or insolvency of the counterparty.
For derivatives traded under an ISDA Master Agreement, the collateral requirements are typically calculated by netting the mark-to-market amount for each transaction under such agreement and comparing that amount to the value of any collateral currently pledged by the Funds and the counterparty. For financial reporting purposes, cash collateral that has been pledged to cover obligations of the Funds and cash collateral received from the counterparty, if any, are reported separately on the Funds’ Statements of Assets and Liabilities as segregated cash with broker/receivable for variation margin, or payable for swap settlement/variation margin. Cash and/or securities pledged or received as collateral by the Funds in connection with an OTC derivative subject to an ISDA Master Agreement generally may not be invested, sold or rehypothecated by the counterparty or the Funds, as applicable, absent an event of default under such agreement, in which case such collateral generally may be applied towards obligations due to and payable by such counterparty or the Funds, as applicable. Generally, the amount of collateral due from or to a counterparty must exceed a minimum transfer amount threshold (e.g., $300,000) before a transfer is required to be made. To the extent amounts due to the Funds from their counterparties are not fully collateralized, contractually or otherwise, the Funds bear the risk of loss from counterparty nonperformance. The Funds attempt to mitigate counterparty risk by only entering into agreements with counterparties that they believe to be of good standing and by monitoring the financial stability of those counterparties.
For financial reporting purposes, the Funds do not offset derivative assets and derivative liabilities that are subject to netting arrangements in the Funds’ Statements of Assets and Liabilities.
The following tables present derivative financial instruments and secured financing transactions that are subject to enforceable netting arrangements:
| | | | | | | | | | | | | | | | Gross Amounts Not Offset
in the Statements of
Assets and Liabilities | | | | | |
Fund | Instrument | | Gross
Amounts of
Recognized
Assets1 | | | Gross
Amounts
Offset in the
Statements
of Assets and
Liabilities | | | Net Amount
of Assets
Presented on
the Statements
of Assets and
Liabilities | | | Financial
Instruments | | | Cash
Collateral
Received | | | Net
Amount | |
Series A (StylePlus—Large Core Series) | Swap equity contracts | | $ | — | * | | $ | — | | | $ | — | * | | $ | — | | | $ | — | | | $ | — | |
Series E (Total Return Bond Series) | Options purchased | | | 30,074 | | | | — | | | | 30,074 | | | | (4,660 | ) | | | — | | | | 25,414 | |
Series J (StylePlus—Mid Growth Series) | Swap equity contracts | | | — | * | | | — | | | | — | * | | | — | | | | — | | | | — | |
Series X (StylePlus—Small Growth Series) | Swap equity contracts | | | — | * | | | — | | | | — | * | | | — | | | | — | | | | — | |
Series Y (StylePlus—Large Growth Series) | Swap equity contracts | | | — | * | | | — | | | | — | * | | | — | | | | — | | | | — | |
Series Z (Alpha Opportunity Series) | Custom basket swap agreements | | | 105,258 | | | | — | | | | 105,258 | | | | (105,258 | ) | | | — | | | | — | |
156 | THE GUGGENHEIM FUNDS SEMI-ANNUAL REPORT | |
NOTES TO FINANCIAL STATEMENTS (Unaudited)(continued) |
| | | | | | | | | | | | | | | | Gross Amounts Not Offset
in the Statements of
Assets and Liabilities | | | | | |
Fund | Instrument | | Gross
Amounts of
Recognized
Liabilities1 | | | Gross
Amounts
Offset in the
Statements
of Assets and
Liabilities | | | Net Amount
of Liabilities
Presented on
the Statements
of Assets and
Liabilities | | | Financial
Instruments | | | Cash
Collateral
Pledged | | | Net
Amount | |
Series E (Total Return Bond Series) | Forward foreign currency exchange contracts | | $ | 4,660 | | | $ | — | | | $ | 4,660 | | | $ | (4,660 | ) | | $ | — | | | $ | — | |
Series E (Total Return Bond Series) | Options written | | | 104,552 | | | | — | | | | 104,552 | | | | — | | | | — | | | | 104,552 | |
Series F (Floating Rate Strategies Series) | Forward foreign currency exchange contracts | | | 4,897 | | | | — | | | | 4,897 | | | | — | | | | — | | | | 4,897 | |
Series P (High Yield Series) | Forward foreign currency exchange contracts | | | 5,009 | | | | — | | | | 5,009 | | | | — | | | | — | | | | 5,009 | |
Series Z (Alpha Opportunity Series) | Custom basket swap agreements | | | 113,958 | | | | — | | | | 113,958 | | | | (105,258 | ) | | | — | | | | 8,700 | |
1 | Exchange-traded or centrally-cleared derivatives are excluded from these reported amounts. |
* | Security has a market value of $0. |
The Funds have the right to offset deposits against any related derivative liabilities outstanding with each counterparty with the exception of exchange-traded or centrally-cleared derivatives. The following table presents deposits held by others in connection with derivative investments as of June 30, 2023.
Fund | Counterparty | Asset Type | | Cash Pledged | | | Cash Received | |
Series A (StylePlus—Large Core Series) | Morgan Stanley Capital Services LLC | Futures contracts | | $ | 53,000 | | | $ | — | |
| Wells Fargo Bank, N.A. | Total return swap agreements | | | — | | | | 21,490,000 | |
Series A (StylePlus—Large Core Series) Total | | | | | 53,000 | | | | 21,490,000 | |
Series D (World Equity Income Series) | BofA Securities, Inc. | Futures contracts | | | 335,000 | | | | — | |
Series E (Total Return Bond Series) | BofA Securities, Inc. | Credit default swap agreements | | | 52,618 | | | | — | |
| BofA Securities, Inc. | Interest rate swap agreements | | | 31,533 | | | | — | |
Series E (Total Return Bond Series) Total | | | | | 84,151 | | | | | |
Series J (StylePlus—Mid Growth Series) | Morgan Stanley Capital Services LLC | Futures contracts | | | 138,800 | | | | — | |
| Wells Fargo Bank, N.A. | Total return swap agreements | | | — | | | | 15,960,000 | |
Series J (StylePlus—Mid Growth Series) Total | | | | | 138,800 | | | | 15,960,000 | |
Series X (StylePlus—Small Growth Series) | Morgan Stanley Capital Services LLC | Futures contracts | | | 14,000 | | | | — | |
| Wells Fargo Bank, N.A. | Total return swap agreements | | | — | | | | 2,100,000 | |
Series X (StylePlus—Small Growth Series) Total | | | | | 14,000 | | | | 2,100,000 | |
Series Y (StylePlus—Large Growth Series) | Morgan Stanley Capital Services LLC | Futures contracts | | | 58,000 | | | | — | |
| Wells Fargo Bank, N.A. | Total return swap agreements | | | — | | | | 7,330,000 | |
Series Y (StylePlus—Large Growth Series) Total | | | | | 58,000 | | | | 7,330,000 | |
| | THE GUGGENHEIM FUNDS SEMI-ANNUAL REPORT | 157 |
NOTES TO FINANCIAL STATEMENTS (Unaudited)(continued) |
Note 4 – Fair Value Measurement
In accordance with U.S. GAAP, fair value is defined as the price that the Funds would receive to sell an investment or pay to transfer a liability in an orderly transaction between market participants at the measurement date. U.S. GAAP establishes a three-tier fair value hierarchy based on the types of inputs used to value assets and liabilities and requires corresponding disclosure. The hierarchy and the corresponding inputs are summarized below:
Level 1 — | unadjusted quoted prices in active markets for identical assets or liabilities. |
Level 2 — | significant other observable inputs (for example quoted prices for securities that are similar based on characteristics such as interest rates, prepayment speeds, credit risk, etc.). |
Level 3 — | significant unobservable inputs based on the best information available under the circumstances, to the extent observable inputs are not available, which may include assumptions. |
Rule 2a-5 sets forth a definition of “readily available market quotations,” which is consistent with the definition of a Level 1 input under U.S. GAAP. Rule 2a-5 provides that “a market quotation is readily available only when that quotation is a quoted price (unadjusted) in active markets for identical investments that the fund can access at the measurement date, provided that a quotation will not be readily available if it is not reliable.”
Securities for which market quotations are not readily available must be valued at fair value as determined in good faith. Accordingly, any security priced using inputs other than Level 1 inputs will be subject to fair value requirements. The types of inputs available depend on a variety of factors, such as the type of security and the characteristics of the markets in which it trades, if any. Fair valuation determinations that rely on fewer or no observable inputs require greater judgment. Accordingly, fair value determinations for Level 3 securities require the greatest amount of judgment.
Pricing service providers are used to value a majority of the Funds’ investments. When values are not available from a pricing service provider, they will be determined using a variety of sources and techniques, including: market prices; broker quotes; and models which derive prices based on inputs such as prices of securities with comparable maturities and characteristics or based on inputs such as anticipated cash flows or collateral, spread over U.S. Treasury securities, and other information and analysis. A significant portion of the Funds’ assets and liabilities are categorized as Level 2, as indicated in this report.
Quotes from broker-dealers, adjusted for fluctuations in criteria such as credit spreads and interest rates, may also be used to value the Funds’ assets and liabilities, i.e. prices provided by a broker-dealer or other market participant who has not committed to trade at that price. Although quotes are typically received from established market participants, the Funds may not have the transparency to view the underlying inputs which support the market quotations. Significant changes in a quote would generally result in significant changes in the fair value of the security.
Certain fixed income securities are valued by obtaining a monthly quote from a broker-dealer, adjusted for fluctuations in criteria such as credit spreads and interest rates. Certain loans and other securities are valued using a single daily broker quote or a price from a pricing service provider based on a single daily or monthly broker quote.
The inputs or methodologies selected and applied for valuing securities or other assets are not necessarily an indication of the risk associated with investing in those securities. The suitability, appropriateness and accuracy of the techniques, methodologies and sources employed to determine fair valuation are periodically reviewed and subject to change.
158 | THE GUGGENHEIM FUNDS SEMI-ANNUAL REPORT | |
NOTES TO FINANCIAL STATEMENTS (Unaudited)(continued) |
Note 5 – Investment Advisory Agreement and Other Agreements
Under the terms of an investment advisory contract, the Funds pay GI investment advisory fees calculated at the annualized rates below, based on the average daily net assets of the Funds:
Fund | | Management Fees
(as a % of Net Assets) | |
Series A (StylePlus—Large Core Series) | | | 0.75 | % |
Series B (Large Cap Value Series) | | | 0.65 | % |
Series D (World Equity Income Series) | | | 0.70 | % |
Series E (Total Return Bond Series) | | | 0.39 | % |
Series F (Floating Rate Strategies Series) | | | 0.65 | %1 |
Series J (StylePlus—Mid Growth Series) | | | 0.75 | % |
Series N (Managed Asset Allocation Series) | | | 0.40 | % |
Series O (All Cap Value Series) | | | 0.70 | % |
Series P (High Yield Series) | | | 0.60 | % |
Series Q (Small Cap Value Series) | | | 0.75 | % |
Series V (SMid Cap Value Series) | | | 0.75 | % |
Series X (StylePlus—Small Growth Series) | | | 0.75 | % |
Series Y (StylePlus—Large Growth Series) | | | 0.65 | % |
Series Z (Alpha Opportunity Series) | | | 0.90 | % |
1 | The Series F management fee is subject to a 0.05% reduction on assets over $5 billion. |
GI pays operating expenses on behalf of the Trust, such as audit and accounting related services, legal services, custody, printing and mailing, among others, on a pass-through basis. Such expenses are allocated to various Funds within the complex based on relative net assets.
The Board has adopted separate Distribution and Shareholder Services Plans pursuant to Rule 12b-1 under the 1940 Act that allows those Funds to pay distribution and shareholder services fees to GFD. The Funds will pay distribution and shareholder services fees to GFD at an annual rate not to exceed 0.25% of average daily net assets. GFD may, in turn, pay all or a portion of the proceeds from the distribution and shareholder services fees to insurance companies or their affiliates and qualified plan administrators (“intermediaries”) for services they provide on behalf of the Funds to current and prospective variable contract owners and qualified plan participants that invest in the Funds through the intermediaries.
Contractual expense limitation agreements for the following Funds provide that the total expenses be limited to a percentage of average net assets for the Funds, exclusive of brokerage costs, dividends or interest on securities sold short, expenses of other investment companies in which a Fund invests, interest, taxes, litigation, indemnification and extraordinary expenses. The limits are listed below:
| | Limit | | | Effective
Date | | | Contract
End Date | |
Series A (StylePlus—Large Core Series) | | | 0.91 | % | | | 05/01/17 | | | | 05/01/24 | |
Series B (Large Cap Value Series) | | | 0.80 | % | | | 05/01/17 | | | | 05/01/24 | |
Series D (World Equity Income Series) | | | 0.90 | % | | | 05/01/17 | | | | 05/01/24 | |
Series E (Total Return Bond Series) | | | 0.81 | % | | | 11/30/12 | | | | 05/01/24 | |
Series F (Floating Rate Strategies Series) | | | 1.15 | % | | | 04/22/13 | | | | 05/01/24 | |
Series J (StylePlus—Mid Growth Series) | | | 0.94 | % | | | 05/01/17 | | | | 05/01/24 | |
Series O (All Cap Value Series) | | | 0.88 | % | | | 05/01/17 | | | | 05/01/24 | |
Series P (High Yield Series) | | | 1.07 | % | | | 10/20/14 | | | | 05/01/24 | |
Series Q (Small Cap Value Series) | | | 1.14 | % | | | 05/01/17 | | | | 05/01/24 | |
Series V (Mid Cap Value Series) | | | 0.91 | % | | | 05/01/17 | | | | 05/01/24 | |
Series X (StylePlus—Small Growth Series) | | | 1.06 | % | | | 05/01/17 | | | | 05/01/24 | |
Series Y (StylePlus—Large Growth Series) | | | 0.93 | % | | | 05/01/17 | | | | 05/01/24 | |
Series Z (Alpha Opportunity Series) | | | 2.00 | % | | | 05/31/17 | | | | 05/01/24 | |
| | THE GUGGENHEIM FUNDS SEMI-ANNUAL REPORT | 159 |
NOTES TO FINANCIAL STATEMENTS (Unaudited)(continued) |
GI is entitled to reimbursement by the Funds for fees waived or expenses reimbursed during any of the previous 36 months, beginning on the date of the expense limitation agreement, if on any day the estimated operating expenses are less than the indicated percentages. For purposes of this arrangement, GI is entitled to recoupment of previously waived fees or reimbursed expenses for 36 months from the date of the waiver or reimbursement by GI. At June 30, 2023, the amount of fees waived or expenses reimbursed that are subject to recoupment and will expire during the years ended December 31, are presented in the following table:
Fund | | 2023 | | | 2024 | | | 2025 | | | 2026 | | | Total | |
Series A (StylePlus - Large Core Series) | | $ | 328,576 | | | $ | 578,663 | | | $ | 468,020 | | | $ | 188,239 | | | $ | 1,563,498 | |
Series B (Large Cap Value Series) | | | 290,558 | | | | 555,924 | | | | 510,071 | | | | 223,120 | | | | 1,579,673 | |
Series D (World Equity Income Series) | | | 183,904 | | | | 347,403 | | | | 248,699 | | | | 112,460 | | | | 892,466 | |
Series E (Total Return Bond Series) | | | 47,555 | | | | 72,779 | | | | 23,524 | | | | 6,927 | | | | 150,785 | |
Series F (Floating Rate Strategies Series) | | | 53,773 | | | | 76,984 | | | | 45,284 | | | | 15,455 | | | | 191,496 | |
Series J (StylePlus—Mid Growth Series) | | | 242,877 | | | | 434,128 | | | | 323,149 | | | | 134,009 | | | | 1,134,163 | |
Series O (All Cap Value Series) | | | 143,417 | | | | 268,200 | | | | 231,664 | | | | 109,020 | | | | 752,301 | |
Series P (High Yield Series) | | | 57,793 | | | | 90,246 | | | | 69,351 | | | | 38,348 | | | | 255,738 | |
Series Q (Small Cap Value Series) | | | 43,909 | | | | 58,292 | | | | 49,991 | | | | 21,887 | | | | 174,079 | |
Series V (SMid Cap Value Series) | | | 253,015 | | | | 452,499 | | | | 380,378 | | | | 166,959 | | | | 1,252,851 | |
Series X (StylePlus - Small Growth Series) | | | 65,720 | | | | 130,621 | | | | 101,526 | | | | 47,560 | | | | 345,427 | |
Series Y (StylePlus - Large Growth Series) | | | 78,372 | | | | 141,551 | | | | 112,263 | | | | 53,300 | | | | 385,486 | |
Series Z (Alpha Opportunity Series) | | | 77,006 | | | | 116,608 | | | | 94,632 | | | | 39,492 | | | | 327,738 | |
For the period ended June 30, 2023, no amounts were recouped by GI.
If a Fund invests in a fund that is advised by the same adviser or an affiliated adviser, the investing Fund’s adviser has agreed to waive fees at the investing fund level to the extent necessary to offset the proportionate share of any management fee paid by each Fund with respect to its investment in such affiliated fund. Fee waivers will be calculated at the investing Fund level without regard to any expense cap in effect for the investing Fund. Fees waived under this arrangement are not subject to reimbursement to GI. For the period ended June 30, 2023, the following Funds waived fees related to investments in affiliated funds:
Fund | | Amount Waived | |
Series A (StylePlus—Large Core Series) | | $ | 32,733 | |
Series E (Total Return Bond Series) | | | 15,055 | |
Series J (StylePlus—Mid Growth Series) | | | 3,416 | |
Series N (Managed Asset Allocation Series) | | | 1,268 | |
Series X (StylePlus—Small Growth Series) | | | 364 | |
Series Y (StylePlus—Large Growth Series) | | | 4,725 | |
Certain trustees and officers of the Trust are also officers of GI and/or GFD. The Trust does not compensate its officers or trustees who are officers, directors and/or employees of GI or GFD.
MUFG Investor Services (US), LLC (“MUIS”) acts as the Funds’ administrator, transfer agent and accounting agent. As administrator, transfer agent and accounting agent, MUIS maintains the books and records of the Funds’ securities and cash. The Bank of New York Mellon Corp. (“BNY”) acts as the Funds’ custodian. As custodian, BNY is responsible for the custody of the Funds’ assets. For providing the aforementioned administrative and accounting services, MUIS is entitled to receive a monthly fee equal to a percentage of the Funds’ average daily net assets and out of pocket expenses. For providing the aforementioned transfer agent and custodian services, MUIS and BNY are entitled to receive a monthly fee based on the number of transactions during the month and the number of accounts under management, subject to certain minimum monthly fees, and out of pocket expenses.
160 | THE GUGGENHEIM FUNDS SEMI-ANNUAL REPORT | |
NOTES TO FINANCIAL STATEMENTS (Unaudited)(continued) |
Note 6 – Federal Income Tax Information
The Funds intend to comply with the provisions of Subchapter M of the Internal Revenue Code of 1986, as amended (the “Internal Revenue Code”), applicable to regulated investment companies and will distribute substantially all taxable net investment income and capital gains sufficient to relieve the Funds from all, or substantially all, federal income, excise and state income taxes. Therefore, no provision for federal or state income tax or federal excise tax is required.
Tax positions taken or expected to be taken in the course of preparing the Funds’ tax returns are evaluated to determine whether the tax positions are “more-likely-than-not” of being sustained by the applicable tax authority. Tax positions not deemed to meet the more-likely-than-not threshold would be recorded as a tax benefit or expense in the current year. Management has analyzed the Funds’ tax positions taken, or to be taken, on U.S. federal income tax returns for all open tax years, and has concluded that no provision for income tax is required in the Funds’ financial statements. The Funds’ U.S. federal income tax returns are subject to examination by the Internal Revenue Service for a period of three years after they are filed.
At June 30, 2023, the cost of investments for U.S. federal income tax purposes, the aggregate gross unrealized appreciation for all investments for which there was an excess of value over tax cost, and the aggregate gross unrealized depreciation for all investments for which there was an excess of tax cost over value, were as follows:
Fund | | Tax
Cost | | | Tax
Unrealized
Appreciation | | | Tax
Unrealized
Depreciation | | | Net Tax
Unrealized
Appreciation
(Depreciation) | |
Series A (StylePlus—Large Core Series) | | $ | 216,822,998 | | | $ | 5,236,732 | | | $ | (5,016,286 | ) | | $ | 220,446 | |
Series B (Large Cap Value Series) | | | 168,342,411 | | | | 41,847,551 | | | | (6,091,806 | ) | | | 35,755,745 | |
Series D (World Equity Income Series) | | | 108,424,749 | | | | 8,272,659 | | | | (5,082,939 | ) | | | 3,189,720 | |
Series E (Total Return Bond Series) | | | 166,188,014 | | | | 182,579 | | | | (16,592,166 | ) | | | (16,409,587 | ) |
Series F (Floating Rate Strategies Series) | | | 58,883,827 | | | | 168,270 | | | | (1,744,720 | ) | | | (1,576,450 | ) |
Series J (StylePlus—Mid Growth Series) | | | 162,347,091 | | | | 3,722,856 | | | | (3,538,553 | ) | | | 184,303 | |
Series N (Managed Asset Allocation Series) | | | 30,607,863 | | | | 8,481,000 | | | | (1,938,605 | ) | | | 6,542,395 | |
Series O (All Cap Value Series) | | | 76,825,667 | | | | 19,234,067 | | | | (3,010,640 | ) | | | 16,223,427 | |
Series P (High Yield Series) | | | 35,407,520 | | | | 174,957 | | | | (4,798,902 | ) | | | (4,623,945 | ) |
Series Q (Small Cap Value Series) | | | 58,905,994 | | | | 9,986,080 | | | | (6,492,331 | ) | | | 3,493,749 | |
Series V (SMid Cap Value Series) | | | 139,328,372 | | | | 31,990,909 | | | | (9,994,752 | ) | | | 21,996,157 | |
Series X (StylePlus—Small Growth Series) | | | 26,164,095 | | | | 897,015 | | | | (678,798 | ) | | | 218,217 | |
Series Y (StylePlus—Large Growth Series) | | | 45,091,843 | | | | 1,108,701 | | | | (973,944 | ) | | | 134,757 | |
Series Z (Alpha Opportunity Series) | | | 3,420,365 | | | | 351,554 | | | | (204,035 | ) | | | 147,519 | |
Note 7 – Securities Transactions
For the period ended June 30, 2023, the cost of purchases and proceeds from sales of investment securities, excluding government securities, short-term investments and derivatives, were as follows:
Fund | | Purchases | | | Sales | |
Series A (StylePlus—Large Core Series) | | $ | 55,786,582 | | | $ | 46,765,049 | |
Series B (Large Cap Value Series) | | | 27,894,627 | | | | 40,041,020 | |
Series D (World Equity Income Series) | | | 111,855,018 | | | | 118,073,038 | |
Series E (Total Return Bond Series) | | | 60,183,286 | | | | 51,914,418 | |
Series F (Floating Rate Strategies Series) | | | 17,247,383 | | | | 12,566,235 | |
Series J (StylePlus—Mid Growth Series) | | | 48,150,122 | | | | 37,063,550 | |
Series N (Managed Asset Allocation Series) | | | — | | | | 1,251,486 | |
Series O (All Cap Value Series) | | | 11,764,147 | | | | 16,304,399 | |
Series P (High Yield Series) | | | 3,363,291 | | | | 5,773,443 | |
Series Q (Small Cap Value Series) | | | 8,435,825 | | | | 11,342,715 | |
Series V (SMid Cap Value Series) | | | 21,028,101 | | | | 28,559,713 | |
Series X (StylePlus—Small Growth Series) | | | 9,202,570 | | | | 7,712,781 | |
Series Y (StylePlus—Large Growth Series) | | | 15,875,770 | | | | 10,524,418 | |
Series Z (Alpha Opportunity Series) | | | 4,880,272 | | | | 5,085,251 | |
| | THE GUGGENHEIM FUNDS SEMI-ANNUAL REPORT | 161 |
NOTES TO FINANCIAL STATEMENTS (Unaudited)(continued) |
For the period ended June 30, 2023, the cost of purchases and proceeds from sales of government securities were as follows:
Fund | | Purchases | | | Sales | |
Series E (Total Return Bond Series) | | $ | 39,504,846 | | | $ | 30,184,029 | |
The Funds are permitted to purchase or sell securities from or to certain affiliated funds under specified conditions outlined in procedures adopted by the Board. The procedures have been designed to ensure that any purchase or sale of securities by a Fund from or to another fund or portfolio that is or could be considered an affiliate by virtue of having a common investment adviser (or affiliated investment advisers), common trustees and/or common officers complies with Rule 17a-7 of the 1940 Act. Further, as defined under these procedures, each transaction is effected at the current market price to save costs, where permissible. For the period ended June 30, 2023, the Funds did not engage in purchases and sales of securities, pursuant to Rule 17a-7 of the 1940 Act.
Note 8 – Unfunded Loan Commitments
Pursuant to the terms of certain loan agreements, certain Funds held unfunded loan commitments as of June 30, 2023. The Funds are obligated to fund these loan commitments at the borrower’s discretion.
The unfunded loan commitments as of June 30, 2023, were as follows:
Fund | Borrower | | Maturity Date | | | Face Amount | | | Value | |
Series E (Total Return Bond Series) | | | | | | | | | | | | |
| | Lightning A | | | 03/01/37 | | | $ | 219,791 | | | $ | — | |
| | Thunderbird A | | | 03/01/37 | | | | 220,627 | | | | — | |
| | | | | | | | $ | 440,418 | | | $ | — | |
Series F (Floating Rate Strategies Series) | | | | | | | | | | | | |
| | Athenahealth Group, Inc. | | | 02/15/29 | | | | 54,348 | | | | 2,106 | |
| | Authentic Brands | | | 12/21/28 | | | | 74,074 | | | | 296 | |
| | Dermatology Intermediate Holdings III, Inc. | | | 03/30/29 | | | | 36,268 | | | | 472 | |
| | | | | | | | $ | 164,690 | | | $ | 2,874 | |
Note 9 – Restricted Securities
The securities below are considered illiquid and restricted under guidelines established by the Board:
Fund | Restricted Securities | | Acquisition Date | | | Cost | | | Value | |
Series E (Total Return Bond Series) | | | | | | | | | | | | | |
| | Copper River CLO Ltd. | | | | | | | | | | | | |
| | 2007-1A INC, due 01/20/211 | | | 05/09/14 | | | $ | — | | | $ | 60 | |
| | FKRT | | | | | | | | | | | | |
| | 2.21% due 11/30/58 | | | 09/24/21 | | | | 749,999 | | | | 738,149 | |
| | LSTAR Securities Investment Ltd. | | | | | | | | | | | | |
| | 2021-1 7.97% (1 Month USD LIBOR + 2.80%, Rate Floor: 1.80%) due 02/01/262 | | | 02/04/21 | | | | 224,946 | | | | 222,231 | |
| | Towd Point Revolving Trust | | | | | | | | | | | | |
| | 4.83% due 09/25/64 | | | 03/17/22 | | | | 499,997 | | | | 484,500 | |
| | | | | | | | $ | 1,474,942 | | | $ | 1,444,940 | |
Series P (High Yield Series) | | | | | | | | | | | | | |
| | Mirabela Nickel Ltd. | | | | | | | | | | | | |
| | due 06/24/193 | | | 12/31/13 | | | | 353,909 | | | | 18,529 | |
| | | | | | | | $ | 353,909 | | | $ | 18,529 | |
1 | Security has no stated coupon. However, it is expected to receive residual cash flow payments on defined deal dates. |
2 | Variable rate security. Rate indicated is the rate effective at June 30, 2023. In some instances, the effective rate is limited by a minimum rate floor or a maximum rate cap established by the issuer. The settlement status of a position may also impact the effective rate indicated. In some cases, a position may be unsettled at period end and may not have a stated effective rate. In instances where multiple underlying reference rates and spread amounts are shown, the effective rate is based on a weighted average. |
3 | Security is in default of interest and/or principal obligations. |
162 | THE GUGGENHEIM FUNDS SEMI-ANNUAL REPORT | |
NOTES TO FINANCIAL STATEMENTS (Unaudited)(continued) |
Note 10 – Line of Credit
The Trust, along with other affiliated trusts, secured a 364-day committed, $1,230,000,000 line of credit from Citibank, N.A., which was in place through September 30, 2022, at which time a new line of credit was entered into in the amount of $1,150,000,000. A Fund may draw (borrow) from the line of credit as a temporary measure for emergency purposes, to facilitate redemption requests, or for other short-term liquidity purposes consistent with the Fund’s investment objective and program. For example, it may be advantageous for the Fund to borrow money rather than sell existing portfolio positions to meet redemption requests. Fees related to borrowings, if any, vary under this arrangement between the greater of Citibank’s “base rate”, SOFR plus 1%, or the federal funds rate plus 1/2 of 1%.
The commitment fee that may be paid by the Funds is at an annualized rate of 0.15% of the average daily amount of their allocated unused commitment amount. The commitment fee amount is allocated to the individual Funds based on the respective net assets of each participating Fund and is referenced in the Statement of Operations under “Line of credit fees”. The Funds did not have any borrowings under this agreement as of and for the period ended June 30, 2023.
Note 11 – Reverse Repurchase Agreements
Each of the Funds may enter into reverse repurchase agreements. Under a reverse repurchase agreement, a Fund sells securities and agrees to repurchase them at a particular price at a future date. In the event the buyer of securities under a reverse repurchase agreement files for bankruptcy or becomes insolvent, such buyer or its trustee or receiver may receive an extension of time to determine whether to enforce the Fund’s obligation to repurchase the securities, and the Fund’s use of the proceeds of the reverse repurchase agreement may effectively be restricted pending such decision.
For the period ended June 30, 2023, the following Funds entered into reverse repurchase agreements:
Fund | | Number of Days
Outstanding | | | Balance at
June 30, 2023 | | | Average Balance
Outstanding | | | Average Interest Rate | |
Series E (Total Return Bond Series) | | | 29 | | | $ | 9,198,364 | | | $ | 8,465,267 | | | | 4.46 | % |
Series P (High Yield Series) | | | 181 | | | | 241,369 | | | | 279,245 | | | | 3.00 | % |
The following table presents reverse repurchase agreements that are subject to netting arrangements and offset in the Statements of Assets of Liabilities in conformity with U.S. GAAP:
| | | | | | | | | | | | | | | | Gross Amounts Not Offset
in the Statements of
Assets and Liabilities | | | | | |
Fund | Instrument | | Gross
Amounts of
Recognized
Liabilities | | | Gross
Amounts
Offset in the
Statements
of Assets and
Liabilities | | | Net Amount
of Liabilities
Presented on
the Statements
of Assets and
Liabilities | | | Financial
Instruments | | | Cash
Collateral
Pledged | | | Net
Amount | |
Series E (Total Return Bond Series) | Reverse repurchase agreements | | $ | 9,198,364 | | | $ | — | | | $ | 9,198,364 | | | $ | (9,198,364 | ) | | $ | — | | | $ | — | |
Series P (High Yield Series) | Reverse repurchase agreements | | | 241,369 | | | | — | | | | 241,369 | | | | (241,369 | ) | | | — | | | | — | |
As of June 30, 2023, the Series E (Total Return Bond Series) Fund and Series P (High Yield Series) Fund had $9,198,364 and $241,369, respectively, in reverse repurchase agreements outstanding with various counterparties. Details of the reverse repurchase agreements by counterparty are as follows:
Fund | Counterparty | Interest Rate(s) | | Maturity Date | | | Face Value | |
Series E (Total Return Bond Series) | J.P. Morgan Securities LLC | 5.08% - 5.19%* | Open Maturity | | $ | 9,198,364 | |
Series P (High Yield Series) | Goldman Sachs & Co. LLC | 3.00%* | Open Maturity | | | 241,369 | |
* | The rate is adjusted periodically by the counterparty, subject to approval by the Adviser, and is not based upon a set of reference rate and spread. Rate indicated is the rate effective at June 30, 2023. |
| | THE GUGGENHEIM FUNDS SEMI-ANNUAL REPORT | 163 |
NOTES TO FINANCIAL STATEMENTS (Unaudited)(concluded) |
The following is a summary of the remaining contractual maturities of the reverse repurchase agreements outstanding as of period-end, aggregated by asset class of the related collateral pledged by the Funds:
Fund | | Asset Type | | | Up to 30 days | | | Overnight and
continuous | | | Total | |
Series E (Total Return Bond Series) | Federal Agency Notes | | $ | — | | | $ | 9,198,364 | | | $ | 9,198,364 | |
Gross amount of recognized liabilities for reverse repurchase agreements | | | | $ | 9,198,364 | | | $ | 9,198,364 | |
Series P (High Yield Series) | Corporate Bonds | | $ | — | | | $ | 241,369 | | | $ | 241,369 | |
Gross amount of recognized liabilities for reverse repurchase agreements | | | $ | — | | | $ | 241,369 | | | $ | 241,369 | |
Note 12 – Market Risks
The value of, or income generated by, the investments held by the Funds are subject to the possibility of rapid and unpredictable fluctuation, and loss that may result from various factors. These factors include, among others, developments affecting individual companies, or from broader influences, including real or perceived changes in prevailing interest rates (which have since risen and may continue to rise), changes in inflation rates or expectations about inflation rates (which are currently elevated relative to normal conditions), adverse investor confidence or sentiment, changing economic, political (including geopolitical), social or financial market conditions, increased instability or general uncertainty, environmental disasters, governmental actions, public health emergencies (such as the spread of infectious diseases, pandemics and epidemics), debt crises, actual or threatened wars or other armed conflicts (such as the current Russia-Ukraine conflict and its risk of expansion or collateral economic and other effects) or ratings downgrades, and other similar events, each of which may be temporary or last for extended periods. Moreover, changing economic, political, geopolitical, social, financial market or other conditions in one country or geographic region could adversely affect the value, yield and return of the investments held by the Funds in a different country or geographic region, economy, and market because of the increasingly interconnected global economies and financial markets. The duration and extent of the foregoing types of factors or conditions are highly uncertain and difficult to predict and have in the past, and may in the future, cause volatility and distress in economies and financial markets or other adverse circumstances, which may negatively affect the value of the Funds’ investments and performance of the Funds.
Note 13 – Subsequent Events
The Funds evaluated subsequent events through the date the financial statements are issued and determined there were no material events that would require adjustment to or disclosure in the Funds’ financial statements.
164 | THE GUGGENHEIM FUNDS SEMI-ANNUAL REPORT | |
OTHER INFORMATION (Unaudited) |
Delivery of Shareholder Reports
Paper copies of the Funds’ annual and semi-annual shareholder reports are not sent by mail, unless you specifically request paper copies of the reports from the insurance company that offers your contract or from your financial intermediary. Instead, the reports are made available on a website, and you are notified by mail each time a report is posted and provided with a website address to access the report. You may elect to receive paper copies of all future shareholder reports free of charge. You can inform the insurance company that you wish to receive paper copies of reports by following the instructions provided by the insurance company. Your election to receive reports in paper may apply to all portfolio companies available under your contract.
Proxy Voting Information
A description of the policies and procedures that the Trust uses to determine how to vote proxies relating to securities held in the Funds’ portfolios is available, without charge and upon request, by calling 800.820.0888. This information is also available from the EDGAR database on the SEC’s website at https://www.sec.gov.
Information regarding how the Funds’ voted proxies relating to portfolio securities during the most recent 12-month period ended June 30 is available without charge, upon request, by calling 800.820.0888. This information is also available from the EDGAR database on the SEC’s website at https://www.sec.gov.
Sector Classification
Information in the “Schedule of Investments” is categorized by sectors using sector-level Classifications defined by the Bloomberg Industry Classification System, a widely recognized industry classification system provider. Each Fund’s registration statement has investment policies relating to concentration in specific sectors/industries. For purposes of these investment policies, the Funds usually classify sectors/industries based on industry-level Classifications used by widely recognized industry classification system providers such as Bloomberg Industry Classification System, Global Industry Classification Standards and Barclays Global Classification Scheme.
Quarterly Portfolio Schedules Information
The Trust files its complete schedule of portfolio holdings with the SEC for the first and third quarters of each fiscal year as an exhibit to its reports on Form N-PORT, and for reporting periods ended prior to March 31, 2019, filed such information on Form N-Q. The Funds’ Forms N-PORT and N-Q are available on the SEC’s website at https://www.sec.gov. Copies of the portfolio holdings are also available to shareholders, without charge and upon request, by calling 800.820.0888.
Report of the Guggenheim Variable Funds Trust Board of Trustees
The Board of Trustees of Guggenheim Variable Funds Trust (the “Trust”), including the Independent Trustees, unanimously approved the renewal of the investment management agreements (as applicable to a specific Fund, the “Advisory Agreement” and collectively, the “Advisory Agreements”) with Security Investors, LLC (“Security Investors”) and Guggenheim Partners Investment Management, LLC (“GPIM”) on behalf of the applicable series of the Trust listed below (each a “Fund” and collectively, the “Funds”):
● Series A (StylePlus—Large Core Series) (“Series A”)* | ● Series B (Large Cap Value Series) (“Series B”)* |
● Series D (World Equity Income Series) (“Series D”)* | ● Series E (Total Return Bond Series) (“Series E”)* |
● Series F (Floating Rate Strategies Series) (“Series F”)** | ● Series J (StylePlus—Mid Growth Series) (“Series J”)* |
● Series N (Managed Asset Allocation Series) (“Series N”)* | ● Series O (All Cap Value Series) (“Series O”)* |
● Series P (High Yield Series) (“Series P”)* | ● Series Q (Small Cap Value Series) (“Series Q”)* |
● Series V (SMid Cap Value Series) (“Series V”)* | ● Series X (StylePlus—Small Growth Series) (“Series X”)* |
● Series Y (StylePlus—Large Growth Series) (“Series Y”)* | ● Series Z (Alpha Opportunity Series) (“Series Z”)* |
* | Security Investors serves as investment adviser to the Fund. |
** | GPIM serves as investment adviser to the Fund. Unless the context indicates otherwise, GPIM and Security Investors, with respect to their service as investment adviser to the applicable Funds, are each referred to herein as an “Adviser” and together, the “Advisers.” |
| | THE GUGGENHEIM FUNDS SEMI-ANNUAL REPORT | 165 |
OTHER INFORMATION (Unaudited)(continued) |
Security Investors and GPIM are each an indirect subsidiary of Guggenheim Partners, LLC, a privately-held, global investment and advisory firm (“Guggenheim Partners”). Guggenheim Partners, Security Investors, GPIM and their affiliates may be referred to herein collectively as “Guggenheim.” Security Investors and GPIM are also known as “Guggenheim Investments,” the global asset management and investment advisory division of Guggenheim Partners that includes other affiliated investment management businesses.
At meetings held in person on April 17-18, 2023 (the “April Meeting”) and meetings held by videoconference on May 15, 2023 and in person on May 24, 2023 (the “May Meeting”), the Contracts Review Committee of the Board (the “Committee”), consisting solely of the Independent Trustees, met separately from Guggenheim to consider the proposed renewal of the Advisory Agreements. As part of its review process, the Committee was represented by independent legal counsel to the Independent Trustees (“Independent Legal Counsel”), from whom the Independent Trustees received separate legal advice and with whom they met separately. Independent Legal Counsel reviewed and discussed with the Committee various key aspects of the Trustees’ legal responsibilities relating to the proposed renewal of the Advisory Agreements and other principal contracts. The Committee took into account various materials received from Guggenheim and Independent Legal Counsel. The Committee also considered the variety of written materials, reports and oral presentations the Board received throughout the year regarding performance and operating results of the Funds, and other information relevant to its evaluation of the Advisory Agreements.
In connection with the contract review process, FUSE Research Network LLC (“FUSE”), an independent, third-party research provider, was engaged to prepare advisory contract renewal reports designed specifically to help the Board fulfill its advisory contract renewal responsibilities. The objective of the FUSE reports is to present the subject funds’ relative position regarding fees, expenses and total return performance, with peer group and universe comparisons. The Committee assessed the data provided in the FUSE reports as well as commentary presented by Guggenheim. The Committee noted that although FUSE’s process typically results in the identification for each Fund of a universe of similar funds for performance comparisons and a narrower group of similar funds from the universe based on asset levels for comparative fee and expense data evaluation (i.e., the peer group), the peer group constituent funds identified by FUSE for Series F were the same as the performance universe constituent funds due to the Fund’s investment strategy and pricing.
In addition, Guggenheim provided materials and data in response to formal requests for information sent by Independent Legal Counsel on behalf of the Committee. Guggenheim also made a presentation at the April Meeting. Throughout the process, the Committee asked questions of management and requested certain additional information, which Guggenheim provided (collectively with the foregoing reports and materials, the “Contract Review Materials”). The Committee considered the Contract Review Materials in the context of its accumulated experience governing the Trust and other Guggenheim funds and weighed the factors and standards discussed with Independent Legal Counsel.
Following an analysis and discussion of relevant factors, including those identified below, and in the exercise of its business judgment, the Committee concluded that it was in the best interest of each Fund to recommend that the Board approve the renewal of the applicable Advisory Agreement for an additional annual term. Following its review of the Committee’s recommendation, the Board approved the renewal of the applicable Advisory Agreement for each Fund for a one-year period ending August 1, 2024 at a meeting held on May 23-24, 2023 (the “May Board Meeting” and together with the May Meeting, the “May Meetings”) and determined to adopt the Committee’s considerations and conclusions, which follow.
Advisory Agreements
Nature, Extent and Quality of Services Provided by Each Adviser: With respect to the nature, extent and quality of services currently provided by each Adviser, the Committee considered the qualifications, experience and skills of key personnel performing services for the Funds, including those personnel providing compliance and risk oversight, as well as the supervisors and reporting lines for such personnel. The Committee also considered other information, including Guggenheim’s resources and related efforts to retain, attract and motivate capable personnel to serve the Funds. In evaluating Guggenheim’s resources and capabilities, the Committee considered Guggenheim’s commitment to focusing on, and investing resources in support of, funds in the Guggenheim fund complex, including the Funds. The Committee also considered the acceptability of the terms of each Advisory Agreement, including the scope of services required to be performed by each Adviser.
The Committee’s review of the services provided by Guggenheim to the Funds included consideration of Guggenheim’s investment processes and resulting performance, portfolio oversight and risk management, and the related regular quarterly reports and presentations received by the Board. The Committee took into account the risks borne by Guggenheim in sponsoring and providing services to the Funds, including regulatory, operational, legal and entrepreneurial risks. The Committee considered the resources dedicated by Guggenheim to compliance functions and the reporting made to the Board by Guggenheim compliance personnel regarding Guggenheim’s adherence to regulatory requirements. The Committee also considered the regular reports the Board receives from the Trust’s Chief Compliance Officer regarding compliance policies and
166 | THE GUGGENHEIM FUNDS SEMI-ANNUAL REPORT | |
OTHER INFORMATION (Unaudited)(continued) |
procedures established pursuant to Rule 38a-1 under the Investment Company Act of 1940, as amended. In connection with the Committee’s evaluation of the overall package of services provided by Guggenheim, the Committee considered Guggenheim’s administrative services, including its role in supervising, monitoring, coordinating and evaluating the various services provided by the fund administrator, transfer agent, distributor, custodian and other service providers to the Funds. The Committee evaluated the Office of Chief Financial Officer (the “OCFO”), established to oversee the fund administration, accounting and transfer agency services provided to the Funds and other Guggenheim funds, including the OCFO’s resources, personnel and services provided.
With respect to Guggenheim’s resources and the ability of each Adviser to carry out its responsibilities under the applicable Advisory Agreement, the Chief Financial Officer of Guggenheim Investments reviewed with the Committee financial information concerning the holding company for Guggenheim Investments, Guggenheim Partners Investment Management Holdings, LLC (“GPIMH”), and the various entities comprising Guggenheim Investments, and provided the audited consolidated financial statements of GPIMH. (Thereafter, the Committee received the audited consolidated financial statements of GPIM.)
Based on the foregoing, and based on other information received (both oral and written) at the April Meeting and the May Meetings, as well as other considerations, including the Committee’s knowledge of how each Adviser performs its duties obtained through Board meetings, discussions and reports throughout the year, the Committee concluded that each Adviser and its personnel were qualified to serve the Funds in such capacity and may reasonably be expected to continue to provide a high quality of services under each Advisory Agreement with respect to the Funds.
Investment Performance: The Committee received, for each Fund, investment returns for the since-inception, ten-year, five-year, three-year, one-year and three-month periods ended December 31, 2022, as applicable. In addition, the Committee received a comparison of each Fund’s performance to the performance of a benchmark, a universe of funds and a narrower peer group of similar funds based on asset levels as identified by FUSE (except as noted above with respect to Series F), in each case for the same periods, as applicable. The Committee also received from FUSE a description of the methodology for identifying each Fund’s peer group and universe for performance and expense comparisons. The Committee also received certain performance information as of March 31, 2023. In assessing each Fund’s performance, the Committee considered that the Board receives regular reporting from Guggenheim regarding performance and evaluates performance throughout the year.
In seeking to evaluate Fund performance over a full market cycle, the Committee focused its attention on five-year and three-year performance rankings as compared to the relevant universe of funds. Except as to the individual Funds discussed below, the Committee observed that the returns of each Fund ranked in the third quartile or better of such Fund’s performance universe for each of the relevant periods considered. In addition, the Committee made the following observations:
Series F (Floating Rate Strategies Series): The Fund’s returns ranked in the 86th percentile of its performance universe for each of the five-year and three-year periods ended December 31, 2022. The Committee considered management’s statement indicating that given the Fund’s relatively small size and frequent inflow and outflows, the Fund is positioned conservatively and with a strong liquidity profile, noting management’s explanation that the primary contributors to the Fund’s relative underperformance over these time periods were the Fund’s cash position and overweight to BB-rated credits to allow for maximum liquidity. The Committee also noted management’s statement that although this portfolio construction creates a very liquid portfolio compared to the Fund’s peers, it does sacrifice some of the return that is generally attributed to lower quality, smaller and less liquid credits. The Committee considered management’s statement that the Fund’s conservative positioning and liquidity profile contributed to the Fund’s relative outperformance in 2022, noting that Fund’s returns ranked in the 14th percentile of its performance universe for the one-year period ended December 31, 2022.
Series J (StylePlus—Mid Growth Series): The Fund’s returns ranked in the 80th and 73rd percentiles of its performance universe for the five-year and three-year periods ended December 31, 2022, respectively. The Committee noted management’s explanation that the Fund’s relative underperformance over the five-year time period can be attributed to the more conservative positioning of the underlying funds in which the Fund invests, resulting in yields insufficient to offset fund fees and other costs, as well as the strategy’s tilt to value-oriented, lower-growth names within the mid-cap growth segment as growth outperformed value securities from 2018 through 2020. The Committee also noted management’s statement that as a result of the more recent comeback of value-oriented, lower-growth names, the Fund experienced performance rankings that compare more favorably relative to its performance universe for the three-year and one-year periods ended December 31, 2022.
| | THE GUGGENHEIM FUNDS SEMI-ANNUAL REPORT | 167 |
OTHER INFORMATION (Unaudited)(continued) |
Series P (High Yield Series): The Fund’s returns ranked in the 77th and 30th percentiles of its performance universe for the five-year and three-year periods ended December 31, 2022, respectively. The Committee noted management’s explanation that the Fund’s relative underperformance over the five-year time period was concentrated in 2019 and 2020. The Committee considered management’s statement that in 2019 the Fund was negatively impacted by its energy exposure and its allocation to bank loans which underperformed high yield bonds. The Committee also considered management’s statement that although the Fund experienced strong downside protection in the first quarter of 2020 with respect to the COVID-19 pandemic, the Fund maintained high cash balances to shore up liquidity during the market rebound in early April 2020 resulting in a large cash drag and maintained lower exposure to the most speculative names for the remainder of 2020 which outperformed during that period. The Committee considered the Fund’s relative outperformance in more recent periods, noting that the Fund’s returns ranked in the 30th and 17th percentiles of its performance universe for the three-year and one-year periods ended December 31, 2022, respectively.
Series X (StylePlus–Small Growth Series): The Fund’s returns ranked in the 97th and 91st percentiles of its performance universe for the five-year and three-year periods ended December 31, 2022, respectively. The Committee noted management’s explanation that the Fund’s relative underperformance over these time periods was attributable to the more conservative positioning of the underlying funds in which the Fund invests, resulting in yields insufficient to offset fund fees and other costs, as well as the strategy’s tilt to value-oriented, lower-growth names within the small-cap growth segment as growth outperformed value securities from 2018 through 2020. The Committee also noted management’s statement that as a result of the more recent comeback of value-oriented, lower-growth names, the Fund experienced a performance ranking that compares more favorably relative to its performance universe for the one-year period ended December 31, 2022.
Series Z (Alpha Opportunity Series): The Fund’s returns ranked in the 97th and 75th percentiles of its performance universe for the five-year and three-year periods ended December 31, 2022, respectively. The Committee noted management’s explanation that the Fund’s relative underperformance over the five-year time period was primarily due to the Fund’s beta profile and fundamental factor tilts. The Committee noted management’s statement that the Fund’s lower beta profile to broad market U.S. equities relative to its peers and long exposure to value and short exposure to growth have detracted from investment performance. The Committee also noted management’s statement that as a result of an update in 2021 to the quantitative investment methodology that the Fund employs, as well as the more recent comeback of value-oriented, higher quality names, the Fund experienced performance rankings that compare more favorably relative to its performance universe for the three-year and one-year periods ended December 31, 2022.
Based on the foregoing, and based on other information received (both oral and written) at the April Meeting and the May Meetings, as well as other considerations, the Committee concluded that: (i) each Fund’s performance was acceptable; or (ii) it was satisfied with Guggenheim’s responses and/or efforts to improve investment performance.
Comparative Fees, Costs of Services Provided and the Benefits Realized by Each Adviser from Its Relationship with the Funds: The Committee compared each Fund’s contractual advisory fee, net effective management fee1 and total net expense ratio to the applicable peer group. The Committee also reviewed the median advisory fees and expense ratios, including expense ratio components (e.g., transfer agency fees, administration fees, other operating expenses, distribution fees and fee waivers/reimbursements), of the peer group of funds. In addition, the Committee considered information regarding Guggenheim’s process for evaluating the competitiveness of each Fund’s fees and expenses, noting Guggenheim’s statement that evaluations seek to incorporate a variety of factors with a general focus on ensuring fees and expenses: (i) are competitive; (ii) give consideration to resource support requirements; and (iii) ensure Funds are able to deliver on shareholder return expectations. The Committee also considered Guggenheim’s discussion of information regarding fee and expense trends across the open-end fund industry and its response to those trends with respect to the funds in the Guggenheim fund complex, including the Funds.
As part of its evaluation of each Fund’s advisory fee, the Committee considered how such fees compared to the advisory fee charged by Guggenheim to one or more other clients that it manages pursuant to similar investment strategies, to the extent applicable, noting that, in certain instances, Guggenheim charges a lower advisory fee to such other clients. In this connection, the Committee considered, among other things, Guggenheim’s representations about the significant differences between managing mutual funds as compared to other types of accounts. The Committee also considered Guggenheim’s explanation that lower fees are charged in certain instances due to various other factors, including the scope of contract, type of investors, fee structure, applicable legal, governance and capital structures, tax status and historical pricing reasons. In addition, the Committee took into account Guggenheim’s discussion of the regulatory, operational, legal and entrepreneurial risks involved with the Funds as compared to other types of accounts. The Committee concluded that the information it received
1 | The “net effective management fee” for each Fund represents the combined effective advisory fee and administration fee as a percentage of average net assets for the latest fiscal year, after any waivers and/or reimbursements. |
168 | THE GUGGENHEIM FUNDS SEMI-ANNUAL REPORT | |
OTHER INFORMATION (Unaudited)(continued) |
demonstrated that the aggregate services provided to, or the specific circumstances of, each Fund were sufficiently different from the services provided to, or the specific circumstances of, other clients with similar investment strategies and/or that the risks borne by Guggenheim were sufficiently greater than those associated with managing other clients with similar investment strategies to support the difference in fees.
In further considering the comparative fee and expense data presented in the Contract Review Materials and addressed by Guggenheim, the Committee took into account those Funds with currently effective expense limitation agreements with the Adviser. Except as to the individual Funds discussed below, the Committee observed that each Fund’s contractual advisory fee, net effective management fee and total net expense ratio each rank in the third quartile or better of such Fund’s peer group. In addition, the Committee made the following observations:
Series A (StylePlus—Large Core Series): The Fund’s contractual advisory fee ranks in the fourth quartile (87th percentile) of its peer group. The Committee considered that the Fund’s net effective management fee ranks in the first quartile (20th percentile) of its peer group and the Fund’s total net expense ratio ranks in the second quartile (27th percentile) of its peer group. The Committee took into account the Fund’s currently effective expense limitation agreement with the Adviser.
Series F (Floating Rate Strategies Series): The Fund’s contractual advisory fee ranks in the third quartile (71st percentile) of its peer group. The Fund’s net effective management fee and total net expense ratio each rank in the fourth quartile (both in the 100th percentile) of its peer group, which the Committee noted was largely driven by the small size of the Fund and the higher other operating expense ratio in comparison to its peers. The Committee considered the Adviser’s statement explaining the higher fees and expenses that performance is driven by a unique investment approach that requires significant resources. The Committee also took into account the Fund’s currently effective expense limitation agreement with the Adviser.
Series N (Managed Asset Allocation Series): The Fund’s contractual advisory fee ranks in the second quartile (43rd percentile) of its peer group. The Fund’s net effective management fee and total net expense ratio each rank in the fourth quartile (79th and 93rd percentiles, respectively) of its peer group, which the Committee noted was largely driven by the small size of the Fund and the higher other operating expense ratio in comparison to its peers.
Series O (All Cap Value Series): The Fund’s contractual advisory fee ranks in the fourth quartile (77th percentile) of its peer group. The Committee considered that the Fund’s net effective management fee and total net expense ratio each rank in the first quartile (both in the 23rd percentile) of its peer group. The Committee took into account the Fund’s currently effective expense limitation agreement with the Adviser.
With respect to the costs of services provided and benefits realized by Guggenheim Investments from its relationship with the Funds, the Committee reviewed a profitability analysis and data from management for each Fund setting forth the average assets under management for the twelve months ended December 31, 2022, gross revenues received, and expenses incurred directly or through allocations, by Guggenheim Investments, expense waivers (as applicable), earnings and the operating margin/profitability rate, including variance information relative to the foregoing amounts as of December 31, 2021. In addition, the Chief Financial Officer of Guggenheim Investments reviewed with, and addressed questions from, the Committee concerning the expense allocation methodology employed in producing the profitability analysis. In the course of its review of Guggenheim Investments’ profitability, the Committee took into account the methods used by Guggenheim Investments to determine expenses and profit and the representation by the Chief Financial Officer of Guggenheim Investments that such methods provided a reasonable basis for determining the profitability of the applicable Adviser with respect to each Fund. The Committee considered all of the foregoing, among other things, in evaluating the costs of services provided, the profitability to Guggenheim Investments and the profitability rates presented.
The Committee also considered other benefits available to each Adviser because of its relationship with the Funds and noted Guggenheim’s statement that it does not believe the Advisers derive any such “fall-out” benefits. In this regard, the Committee noted Guggenheim’s statement that, although it does not consider such benefits to be fall-out benefits, the Advisers may benefit from certain economies of scale and synergies, such as enhanced visibility of the Advisers, enhanced leverage in fee negotiations and other synergies arising from offering a broad spectrum of products, including the Funds.
Based on the foregoing, and based on other information received (both oral and written) at the April Meeting and the May Meetings, as well as other considerations, the Committee concluded that the comparative fees and the benefits realized by each Adviser from its relationship with the Funds were appropriate and that each Adviser’s profitability from its relationship with the Funds was not unreasonable.
| | THE GUGGENHEIM FUNDS SEMI-ANNUAL REPORT | 169 |
OTHER INFORMATION (Unaudited)(concluded) |
Economies of Scale: The Committee received and considered information regarding whether there have been economies of scale with respect to the management of the Funds as Fund assets grow, whether the Funds have appropriately benefited from any economies of scale, and whether there is potential for realization of any further economies of scale. The Committee considered whether economies of scale in the provision of services to the Funds were being passed along to and shared with the shareholders. The Committee considered that Guggenheim believes it is appropriately sharing potential economies of scale and that Guggenheim’s decrease in 2022 in overall expenses was attributable to decreased product costs driven by lower average assets under management and lower non-recurring costs related to closed-end fund matters as well as a decrease in compensation and benefits. The Committee also considered that although expenses related to investment resources decreased in 2022, Guggenheim’s shared services expenses and certain other expenses increased in 2022.
The Committee also noted the process employed by the Adviser to evaluate whether it would be appropriate to institute a new breakpoint for a Fund, with consideration given to, among other things: (i) the Fund’s size and trends in asset levels over recent years; (ii) the competitiveness of the expense levels; (iii) whether expense waivers are in place; (iv) changes and trends in revenue and expenses; (v) whether there are any anticipated expenditures that may benefit the Fund in the future; (vi) Fund profit level margins; (vii) relative Fund performance; (viii) the nature, extent and quality of services management provides to the Fund; and (ix) the complexity of the Fund’s investment strategy and the resources required to support the Fund.
As part of its assessment of economies of scale, the Committee took into account Guggenheim’s representation that it seeks to share economies of scale through a number of means, including advisory fees set at competitive rates pre-assuming future asset growth, expense waivers and limitations, and investments in personnel, operations and infrastructure to support the fund business. The Committee also received information regarding amounts that had been shared with shareholders through such expense waivers and limitations. Thus, the Committee considered the size of the Funds and the competitiveness of and/or other determinations made regarding the current advisory fee for each Fund, as well as whether a Fund is subject to an expense limitation.
Based on the foregoing, and based on other information received (both oral and written) at the April Meeting and the May Meetings, as well as other considerations, the Committee concluded that the advisory fee for each Fund was reasonable.
Overall Conclusions
The Committee concluded that the investment advisory fees are fair and reasonable in light of the extent and quality of the services provided and other benefits received and that the renewal of the applicable Advisory Agreement is in the best interest of each Fund. In reaching this conclusion, no single factor was determinative or conclusive and each Committee member, in the exercise of his or her informed business judgment, may afford different weights to different factors.
Following its review of the Committee’s analysis and determinations, the Board adopted the considerations and conclusions of the Committee and determined to approve the renewal of the Advisory Agreements.
170 | THE GUGGENHEIM FUNDS SEMI-ANNUAL REPORT | |
INFORMATION ON BOARD OF TRUSTEES AND OFFICERS (Unaudited) |
A Board of Trustees oversees the Trust, as well as other trusts of GI, in which its members have no stated term of service, and continue to serve after election until resignation. The Statement of Additional Information includes further information about Fund Trustees and Officers, and can be obtained without charge by visiting guggenheiminvestments.com or by calling 800.820.0888.
Name, Address*
and Year of Birth | Position(s)
Held with
Trust | Term of Office
and Length of
Time Served** | Principal Occupation(s)
During Past Five Years | Number of
Portfolios
in Fund
Complex
Overseen | Other
Directorships Held
by Trustees*** |
INDEPENDENT TRUSTEES | | | |
Randall C. Barnes (1951) | Trustee and Chair of the Valuation Oversight Committee | Since 2014 (Trustee)
Since 2020 (Chair of the Valuation Oversight Committee) | Current: Private Investor (2001-present).
Former: Senior Vice President and Treasurer, PepsiCo, Inc. (1993-1997); President, Pizza Hut International (1991-1993); Senior Vice President, Strategic Planning and New Business Development, PepsiCo, Inc. (1987-1990). | 155 | Current: Advent Convertible and Income Fund (2005-present); Purpose Investments Funds (2013-present). Former: Fiduciary/Claymore Energy Infrastructure Fund (2004-2022); Guggenheim Enhanced Equity Income Fund (2005-2021); Guggenheim Credit Allocation Fund (2013-2021). |
Angela Brock-Kyle (1959) | Trustee | Since 2019 | Current: Founder and Chief Executive Officer, B.O.A.R.D.S. (2013-present); Director, Mutual Fund Directors Forum (2022-present).
Former: Senior Leader, TIAA (financial services firm) (1987-2012). | 154 | Current: Bowhead Insurance GP, LLC (2020-present); Hunt Companies, Inc. (2019-present).
Former: Fiduciary/Claymore Energy Infrastructure Fund (2019-2022); Guggenheim Enhanced Equity Income Fund (2019-2021); Guggenheim Credit Allocation Fund (2019-2021); Infinity Property & Casualty Corp. (2014-2018). |
| | THE GUGGENHEIM FUNDS SEMI-ANNUAL REPORT | 171 |
INFORMATION ON BOARD OF TRUSTEES AND OFFICERS (Unaudited)(continued) |
Name, Address*
and Year of Birth | Position(s)
Held with
Trust | Term of Office
and Length of
Time Served** | Principal Occupation(s)
During Past Five Years | Number of
Portfolios
in Fund
Complex
Overseen | Other
Directorships Held
by Trustees*** |
INDEPENDENT TRUSTEES - continued | | | | |
Thomas F. Lydon, Jr. (1960) | Trustee and Chair of the Contracts Review Committee | Since 2019 (Trustee)
Since 2020 (Chair of the Contracts Review Committee) | Current: President, Global Trends Investments (registered investment adviser) (1996-present); CEO, ETF Flows, LLC (financial advisor education and research provider) (2019-present); CEO, Lydon Media (2016-present). Director, GDX Index Partners, LLC (index provider) (2021-present); Vice Chairman, VettaFi (financial advisor content, research and digital distribution provider) (2022-present). | 154 | Current: US Global Investors, Inc. (GROW) (1995-present).
Former: Fiduciary/Claymore Energy Infrastructure Fund (2019-2022); Guggenheim Enhanced Equity Income Fund (2019-2021); Guggenheim Credit Allocation Fund (2019-2021); Harvest Volatility Edge Trust (3) (2017-2019). |
Ronald A. Nyberg (1953) | Trustee and Chair of the Nominating and Governance Committee | Since 2014 | Current: Of Counsel, Momkus LLP (law firm) (2016-present).
Former: Partner, Nyberg & Cassioppi, LLC (law firm) (2000-2016); Executive Vice President, General Counsel, and Corporate Secretary, Van Kampen Investments (1982-1999). | 155 | Current: Advent Convertible and Income Fund (2003-present); PPM Funds (2) (2018-present); NorthShore-Edward-Elmhurst Health (2012-present).
Former: Fiduciary/Claymore Energy Infrastructure Fund (2004-2022); Guggenheim Enhanced Equity Income Fund (2005-2021); Guggenheim Credit Allocation Fund (2013-2021); Western Asset Inflation-Linked Opportunities & Income Fund (2004-2020); Western Asset Inflation-Linked Income Fund (2003-2020). |
172 | THE GUGGENHEIM FUNDS SEMI-ANNUAL REPORT | |
INFORMATION ON BOARD OF TRUSTEES AND OFFICERS (Unaudited)(continued) |
Name, Address*
and Year of Birth | Position(s)
Held with
Trust | Term of Office
and Length of
Time Served** | Principal Occupation(s)
During Past Five Years | Number of
Portfolios
in Fund
Complex
Overseen | Other
Directorships Held
by Trustees*** |
INDEPENDENT TRUSTEES - concluded | | |
Sandra G. Sponem (1958) | Trustee and Chair of the Audit Committee | Since 2019 (Trustee)
Since 2020 (Chair of the Audit Committee) | Current: Retired.
Former: Senior Vice President and Chief Financial Officer, M.A. Mortenson-Companies, Inc. (construction and real estate development company) (2007-2017). | 154 | Current: SPDR Series Trust (81) (2018-present); SPDR Index Shares Funds (30) (2018-present); SSGA Active Trust (14) (2018-present).
Former: Fiduciary/Claymore Energy Infrastructure Fund (2019-2022); Guggenheim Enhanced Equity Income Fund (2019-2021); Guggenheim Credit Allocation Fund (2019-2021); SSGA Master Trust (1) (2018-2020). |
Ronald E. Toupin, Jr. (1958) | Trustee, Chair of the Board and Chair of the Executive Committee | Since 2014 | Current: Portfolio Consultant (2010-present); Member, Governing Council, Independent Directors Council (2013-present); Governor, Board of Governors, Investment Company Institute (2018-present).
Former: Member, Executive Committee, Independent Directors Council (2016-2018); Vice President, Manager and Portfolio Manager, Nuveen Asset Management (1998-1999); Vice President, Nuveen Investment Advisory Corp. (1992-1999); Vice President and Manager, Nuveen Unit Investment Trusts (1991-1999); and Assistant Vice President and Portfolio Manager, Nuveen Unit Investment Trusts (1988-1999), each of John Nuveen & Co., Inc. (registered broker dealer) (1982-1999). | 154 | Former: Fiduciary/Claymore Energy Infrastructure Fund (2004-2022); Guggenheim Enhanced Equity Income Fund (2005-2021); Guggenheim Credit Allocation Fund (2013-2021); Western Asset Inflation-Linked Opportunities & Income Fund (2004-2020); Western Asset Inflation-Linked Income Fund (2003-2020). |
| | THE GUGGENHEIM FUNDS SEMI-ANNUAL REPORT | 173 |
INFORMATION ON BOARD OF TRUSTEES AND OFFICERS (Unaudited)(continued) |
Name, Address*
and Year of Birth | Position(s)
Held with
Trust | Term of Office
and Length of
Time Served** | Principal Occupation(s)
During Past Five Years | Number of
Portfolios
in Fund
Complex
Overseen | Other
Directorships Held
by Trustees*** |
INTERESTED TRUSTEE | | | | |
Amy J. Lee**** (1961) | Trustee, Vice President and Chief Legal Officer | Since 2018 (Trustee)
Since 2014 (Chief Legal Officer)
Since 2007 (Vice President) | Current: Interested Trustee, certain other funds in the Fund Complex (2018-present); Chief Legal Officer, certain other funds in the Fund Complex (2014-present); Vice President, certain other funds in the Fund Complex (2007-present); Senior Managing Director, Guggenheim Investments (2012-present).
Former: President and Chief Executive Officer, certain other funds in the Fund Complex (2017-2019); Vice President, Associate General Counsel and Assistant Secretary, Security Benefit Life Insurance Company and Security Benefit Corporation (2004-2012). | 154 | Former: Fiduciary/Claymore Energy Infrastructure Fund (2018-2022); Guggenheim Enhanced Equity Income Fund (2018-2021); Guggenheim Credit Allocation Fund (2018-2021). |
* | The business address of each Trustee is c/o Guggenheim Investments, 227 West Monroe Street, Chicago, Illinois 60606. |
** | Each Trustee serves an indefinite term, until his or her successor is elected and qualified. |
*** | Each Trustee also serves on the Boards of Trustees of Guggenheim Funds Trust, Guggenheim Variable Funds Trust, Guggenheim Strategy Funds Trust, Guggenheim Taxable Municipal Bond & Investment Grade Debt Trust, Guggenheim Strategic Opportunities Fund, Guggenheim Energy & Income Fund, Guggenheim Active Allocation Fund, Rydex Series Funds, Rydex Dynamic Funds, Rydex Variable Trust and Transparent Value Trust. Messrs. Barnes and Nyberg also serve on the Board of Trustees of Advent Convertible & Income Fund. |
**** | This Trustee is deemed to be an “interested person” of the Funds under the 1940 Act by reason of her position with the Funds’ Investment Manager and/or the parent of the Investment Manager. |
174 | THE GUGGENHEIM FUNDS SEMI-ANNUAL REPORT | |
INFORMATION ON BOARD OF TRUSTEES AND OFFICERS (Unaudited)(continued) |
Name, Address*
and Year of Birth | Position(s)
Held with
Trust | Term of Office
and Length of
Time Served** | Principal Occupation(s)
During Past Five Years |
OFFICERS | | | |
Brian E. Binder (1972) | President and Chief Executive Officer | Since 2018 | Current: President, Mutual Funds Boards, Guggenheim Investments (2022-present); President and Chief Executive Officer, certain other funds in the Fund Complex (2018-present); President, Mutual Funds Boards, Guggenheim Funds Investment Advisors, LLC and Security Investors, LLC (2018-present); Board Member, Guggenheim Partners Investments Funds plc (2022-present); Board Member, Guggenheim Global Investments plc (2022-present); Board Member, Guggenheim Partners Fund Management (Europe) Limited (2018-present).
Former: Senior Managing Director and Chief Administrative Officer, Guggenheim Investments (2018-2022); Managing Director and President, Deutsche Funds, and Head of US Product, Trading and Fund Administration, Deutsche Asset Management (2013-2018); Managing Director, Chairman of North American Executive Committee and Head of Business Management and Consulting, Invesco Ltd. (2010-2012). |
James Howley (1972) | Chief Financial Officer, Chief Accounting Officer and Treasurer | Since 2022 | Current: Managing Director, Guggenheim Investments (2004-present); Chief Financial Officer, Chief Accounting Officer, and Treasurer, certain other funds in the Fund Complex (2022-present).
Former: Assistant Treasurer, certain other funds in the Fund Complex (2006-2022); Manager, Mutual Fund Administration of Van Kampen Investments, Inc. (1996-2004). |
Mark E. Mathiasen (1978) | Secretary | Since 2014 | Current: Secretary, certain other funds in the Fund Complex (2007-present); Managing Director, Guggenheim Investments (2007-present). |
Glenn McWhinnie (1969) | Assistant Treasurer | Since 2016 | Current: Vice President, Guggenheim Investments (2009-present); Assistant Treasurer, certain other funds in the Fund Complex (2016-present). |
Michael P. Megaris (1984) | Assistant Secretary | Since 2014 | Current: Assistant Secretary, certain other funds in the Fund Complex (2014-present); Managing Director, Guggenheim Investments (2012-present). |
Elisabeth Miller (1968) | Chief Compliance Officer | Since 2012 | Current: Chief Compliance Officer, certain other funds in the Fund Complex (2012-present); Senior Managing Director, Guggenheim Investments (2012-present); Senior Managing Director, Guggenheim Funds Distributors, LLC (2014-present).
Former: Chief Compliance Officer, Security Investors, LLC and Guggenheim Funds Investment Advisors, LLC (2012-2018); Chief Compliance Officer, Guggenheim Distributors, LLC (2009-2014); Senior Manager, Security Investors, LLC (2004-2014); Senior Manager, Guggenheim Distributors, LLC (2004-2014). |
Margaux Misantone (1978) | AML Officer | Since 2017 | Current: Chief Compliance Officer, Security Investors, LLC and Guggenheim Funds Investment Advisors, LLC (2018-present); AML Officer, Security Investors, LLC and certain other funds in the Fund Complex (2017-present); Managing Director, Guggenheim Investments (2015-present).
Former: Assistant Chief Compliance Officer, Security Investors, LLC and Guggenheim Funds Investments Advisors, LLC (2015-2018). |
| | THE GUGGENHEIM FUNDS SEMI-ANNUAL REPORT | 175 |
INFORMATION ON BOARD OF TRUSTEES AND OFFICERS (Unaudited)(concluded) |
Name, Address*
and Year of Birth | Position(s)
Held with
Trust | Term of Office
and Length of
Time Served** | Principal Occupation(s)
During Past Five Years |
OFFICERS - concluded | |
Kimberly J. Scott (1974) | Assistant Treasurer | Since 2014 | Current: Director, Guggenheim Investments (2012-present); Assistant Treasurer, certain other funds in the Fund Complex (2012-present).
Former: Financial Reporting Manager, Invesco, Ltd. (2010-2011); Vice President/Assistant Treasurer, Mutual Fund Administration for Van Kampen Investments, Inc./Morgan Stanley Investment Management (2009-2010); Manager of Mutual Fund Administration, Van Kampen Investments, Inc./Morgan Stanley Investment Management (2005-2009). |
Bryan Stone (1979) | Vice President | Since 2014 | Current: Vice President, certain other funds in the Fund Complex (2014-present); Managing Director, Guggenheim Investments (2013-present).
Former: Senior Vice President, Neuberger Berman Group LLC (2009-2013); Vice President, Morgan Stanley (2002-2009). |
Jon Szafran (1989) | Assistant Treasurer | Since 2017 | Current: Director, Guggenheim Investments (2017-present); Assistant Treasurer, certain other funds in the Fund Complex (2017-present).
Former: Assistant Treasurer of Henderson Global Funds and Manager of US Fund Administration, Henderson Global Investors (North America) Inc. (“HGINA”), (2017); Senior Analyst of US Fund Administration, HGINA (2014-2017); Senior Associate of Fund Administration, Cortland Capital Market Services, LLC (2013-2014); Experienced Associate, PricewaterhouseCoopers LLP (2012-2013). |
* | The business address of each officer is c/o Guggenheim Investments, 227 West Monroe Street, Chicago, Illinois 60606. |
** | Each officer serves an indefinite term, until his or her successor is duly elected and qualified. |
176 | THE GUGGENHEIM FUNDS SEMI-ANNUAL REPORT | |
GUGGENHEIM INVESTMENTS PRIVACY NOTICE (Unaudited) |
Who We Are
This Privacy Notice describes the data protection practices of Guggenheim Investments. Guggenheim Investments as used herein refers to the affiliated investment management businesses of Guggenheim Partners, LLC: Guggenheim Funds Investment Advisors, LLC, Guggenheim Partners Investment Management, LLC, Guggenheim Funds Distributors, LLC, Security Investors, LLC, Guggenheim Investment Advisors (Europe) Limited, Guggenheim Real Estate, LLC, GS Gamma Advisors, LLC, Guggenheim Partners India Management, LLC, Guggenheim Partners Europe Limited, as well as the funds in the Guggenheim Funds complex (the “Funds”) (“Guggenheim Investments,” “we,” “us,” or “our”).
Guggenheim Partners Investment Management Holdings, LLC, located at 330 Madison Avenue, New York, New York, 10017 is the data controller for your information. The affiliates who are also controllers of certain of your information are: Guggenheim Investment Advisors (Europe) Limited, Guggenheim Partners Europe Limited, Guggenheim Partners, LLC, Guggenheim Funds Investment Advisors, LLC, Guggenheim Partners Investment Management, LLC, Guggenheim Funds Distributors, LLC and Security Investors, LLC, as well as the Funds.
Our Commitment to You
Guggenheim Investments considers your privacy our utmost concern. When you become our client or investor, you entrust us with not only your hard-earned money but also with your personal and financial information. Because we have access to your private information, we hold ourselves to the highest standards in its safekeeping and use. We strictly limit how we share your information with others, whether you are a current or former Guggenheim Investments client or investor.
The Information We Collect About You
We collect certain nonpublic personal information about you from information you provide on applications, other forms, our website, and/or from third parties including investment advisors. This information includes Social Security or other tax identification number, assets, income, tax information, retirement and estate plan information, transaction history, account balance, payment history, bank account information, marital status, family relationships, information that we collect on our website through the use of “cookies,” and other personal information that you or others provide to us. We may also collect such information through your inquiries by mail, e-mail or telephone. We may also collect customer due diligence information, as required by applicable law and regulation, through third party service providers.
How We Handle Your Personal Information
The legal basis for using your information as set out in this Privacy Notice is as follows: (a) use of your personal data is necessary to perform our obligations under any contract with you (such as a contract for us to provide financial services to you); or (b) where use of your personal data is not necessary for performance of a contract, use of your personal data is necessary for our legitimate interests or the legitimate interests of others (for example, to enforce the legal terms governing our services, operate and market our website and other services we offer, ensure safe environments for our personnel and others, make and receive payments, prevent fraud and to know the customer to whom we are providing the services). Some processing is done to comply with applicable law.
In addition to the specific uses described above, we also use your information in the following manner:
| | ● | We use your information in connection with servicing your accounts. |
| | ● | We use information to respond to your requests or questions. For example, we might use your information to respond to your customer feedback. |
| | ● | We use information to improve our products and services. We may use your information to make our website and products better. We may use your information to customize your experience with us. |
| | ● | We use information for security purposes. We may use your information to protect our company and our customers. |
| | ● | We use information to communicate with you. For example, we will communicate with you about your account or our relationship. We may contact you about your feedback. We might also contact you about this Privacy Notice. We may also enroll you in our email newsletter. |
| | THE GUGGENHEIM FUNDS SEMI-ANNUAL REPORT | 177 |
GUGGENHEIM INVESTMENTS PRIVACY NOTICE (Unaudited)(continued) |
| | ● | We use information as otherwise permitted by law, as we may notify you. |
| | ● | Aggregate/Anonymous Data. We may aggregate and/or anonymize any information collected through the website so that such information can no longer be linked to you or your device (“Aggregate/Anonymous Information”). We may use Aggregate/Anonymous Information for any purpose, including without limitation for research and marketing purposes, and may also share such data with any third parties, including advertisers, promotional partners, and sponsors. |
We do not sell information about current or former clients or their accounts to third parties. Nor do we share this information, except when necessary to complete transactions at your request, to make you aware of investment products and services that we or our affiliates offer, or as permitted or required by law.
We provide information about you to companies and individuals not affiliated with Guggenheim Investments to complete certain transactions or account changes, or to perform services for us related to your account. For example, if you ask to transfer assets from another financial institution to Guggenheim Investments, we must provide certain information about you to that company to complete the transaction. We provide the third party with only the information necessary to carry out its responsibilities and only for that purpose. And we require these third parties to treat your private information with the same high degree of confidentiality that we do. To alert you to other Guggenheim Investments products and services, we share your information within our family of affiliated companies. You may limit our sharing with affiliated companies as set out below. We may also share information with any successor to all or part of our business, or in connection with steps leading up to a merger or acquisition. For example, if part of our business was sold we may give customer information as part of that transaction. We may also share information about you with your consent.
We will release information about you if you direct us to do so, if we are compelled by law to do so, or in other circumstances as permitted by law (for example, to protect your account from fraud).
If you close your account(s) or become an inactive client or investor, we will continue to adhere to the privacy policies and practices described in this notice.
Opt-Out Provisions and Your Data Choices
The law allows you to “opt out” of certain kinds of information sharing with third parties. We do not share personal information about you with any third parties that triggers this opt-out right. This means YOU ARE ALREADY OPTED OUT.
When you are no longer our client or investor, we continue to share your information as described in this notice, and you may contact us at any time to limit our sharing by sending an email to CorporateDataPrivacy@GuggenheimPartners.com.
European Union Data Subjects and certain others: In addition to the choices set forth above, residents of the European Union and certain other jurisdictions have certain rights to (1) request access to or rectification or deletion of information we collect about them, (2) request a restriction on the processing of their information, (3) object to the processing of their information, or (4) request the portability of certain information. To exercise these or other rights, please contact us using the contact information below. We will consider all requests and provide our response within the time period stated by applicable law. Please note, however, that certain information may be exempt from such requests in some circumstances, which may include if we need to keep processing your information for our legitimate interests or to comply with a legal obligation. We may request you provide us with information necessary to confirm your identity before responding to your request.
Residents of France and certain other jurisdictions may also provide us with instructions regarding the manner in which we may continue to store, erase and share your information after your death, and where applicable, the person you have designated to exercise these rights after your death.
178 | THE GUGGENHEIM FUNDS SEMI-ANNUAL REPORT | |
GUGGENHEIM INVESTMENTS PRIVACY NOTICE (Unaudited)(concluded) |
How We Protect Privacy Online
We take steps to protect your privacy when you use our web site – www.guggenheiminvestments.com – by using secure forms of online communication, including encryption technology, Secure Socket Layer (SSL) protocol, firewalls and user names and passwords. These safeguards vary based on the sensitivity of the information that we collect and store. However, we cannot and do not guarantee that these measures will prevent every unauthorized attempt to access, use, or disclose your information since despite our efforts, no Internet and/or other electronic transmissions can be completely secure. Our web site uses “http cookies”—tiny pieces of information that we ask your browser to store. We use cookies for session management and security features on the Guggenheim Investments web site. We do not use them to pull data from your hard drive, to learn your e-mail address, or to view data in cookies created by other web sites. We will not share the information in our cookies or give others access to it. See the legal information area on our web site for more details about web site security and privacy features.
How We Safeguard Your Personal Information and Data Retention
We restrict access to nonpublic personal information about you to our employees and in some cases to third parties (for example, the service providers described above) as permitted by law. We maintain strict physical, electronic and procedural safeguards that comply with federal standards to guard your nonpublic personal information.
We keep your information for no longer than necessary for the purposes for which it is processed. The length of time for which we retain information depends on the purposes for which we collected and use it and/or as required to comply with applicable laws. Information may persist in copies made for backup and business continuity purposes for additional time.
International Visitors
If you are not a resident of the United States, please be aware that your information may be transferred to, stored and processed in the United States where our servers are located and our databases are operated. The data protection and other laws of the United States and other countries might not be as comprehensive as those in your country.
In such cases, we ensure that a legal basis for such a transfer exists and that adequate protection is provided as required by applicable law, for example, by using standard contractual clauses or by transferring your data to a jurisdiction that has obtained an adequacy finding. Individuals whose data may be transferred on the basis of standard contractual clauses may contact us as described below.
We’ll Keep You Informed
If you have any questions or concerns about how we treat your personal data, we encourage you to consult with us first. You may also contact the relevant supervisory authority.
We reserve the right to modify this policy at any time and will inform you promptly of material changes. You may access our privacy policy from our web site at www.guggenheiminvestments.com. Should you have any questions regarding our privacy policy, contact us by email at CorporateDataPrivacy@GuggenheimPartners.com.
| | THE GUGGENHEIM FUNDS SEMI-ANNUAL REPORT | 179 |
LIQUIDITY RISK MANAGEMENT (Unaudited) |
In compliance with SEC Rule 22e-4 under the U.S. Investment Company Act of 1940 (the “Liquidity Rule”), the Guggenheim Variable Funds Trust (the “Trust”) has adopted and implemented a written liquidity risk management program (the “Program”) for each series of the Trust (each, a “Fund” and, collectively, the “Funds”). The Trust’s Board of Trustees (the “Board”) has also designated a Program administrator (the “Administrator”).
The Liquidity Rule requires that the Program be reasonably designed to assess and manage each Fund’s liquidity risk. A Fund’s “liquidity risk” (as defined in the Liquidity Rule) is the risk that the Fund could not meet requests to redeem shares issued by the Fund without significant dilution of the remaining investors’ interests in the Fund. The Program includes a number of elements that support the assessment, management and periodic review of liquidity risk. In accordance with the Program, each Fund’s liquidity risk is assessed, managed, and periodically reviewed no less frequently than annually taking into consideration a variety of factors, including, as applicable, the Fund’s investment strategy and liquidity of portfolio investments, short-term and long-term cash flow projections, and holdings of cash and cash equivalents, as well as borrowing arrangements and other funding sources. Certain factors are considered under both normal and reasonably foreseeable stressed conditions. There is no guarantee that the Program will achieve its objective under all circumstances.
Under the Program, each Fund portfolio investment is classified into one of four liquidity categories. The classification is based on a determination of the number of days a Fund reasonably expects to take to convert the investment into cash, or sell or dispose of the investment, in current market conditions without significantly changing the investment’s market value. The Program is reasonably designed to meet Liquidity Rule requirements relating to “highly liquid investment minimums” (i.e., the minimum amount of a Fund’s net assets to be invested in highly liquid investments that are assets) and to monitor compliance with the Liquidity Rule’s limitations on a Fund’s investments in “illiquid investments” (as defined in the Liquidity Rule). Under the Liquidity Rule, a Fund is prohibited from acquiring any illiquid investment if, immediately after the acquisition, the Fund would have invested more than 15% of its net assets in illiquid investments that are assets.
During the period covered by this shareholder report, the Board received a written report (the “Report”) prepared by the Administrator addressing the Program’s operation and assessing the adequacy and effectiveness of its implementation for the period from March 31, 2022, to March 31, 2023. The Report summarized the Administrator’s assessment of the Program’s implementation and concluded that the Program operated effectively, the Program had been and continued to be reasonably designed to assess and manage each Fund’s liquidity risk, and the Program has been adequately and effectively implemented to monitor and respond to the Funds’ liquidity developments, as applicable.
Please refer to the Fund’s prospectus for more information regarding the Fund’s exposure to liquidity risk and other risks to which an investment in the Fund may be subject.
180 | THE GUGGENHEIM FUNDS SEMI-ANNUAL REPORT | |
This page intentionally left blank.
Not required at this time.
| Item 3. | Audit Committee Financial Expert. |
Not required at this time.
| Item 4. | Principal Accountant Fees and Services. |
Not required at this time.
| Item 5. | Audit Committee of Listed Registrants. |
Not applicable.
(a) The Schedule of Investments is included under Item 1 of this Form.
(b) Not applicable.
| Item 7. | Disclosure of Proxy Voting Policies and Procedures for Closed-End Management Investment Companies. |
Not applicable.
Item 8. Portfolio Managers of Closed-end Management Investment Companies
Not applicable
| Item 9. | Purchases of Equity Securities by Closed-End Management Investment Company and Affiliated Purchasers. |
Not applicable.
| Item 10. | Submission of Matters to a Vote of Security Holders. |
The registrant does not currently have in place procedures by which shareholders may recommend nominees to the registrant’s board.
There have been no changes to the procedures by which shareholders may recommend nominees to the registrant’s board.
| Item 11. | Controls and Procedures. |
(a) The registrant’s President (principal executive officer) and Treasurer (principal financial officer) have evaluated the registrant’s disclosure controls and procedures (as defined in Rule 30a-3(c) under the Investment Company Act) as of a date within 90 days of this filing and have concluded that based on such evaluation as required by Rule 30a-3(b) under the Investment Company Act, that the registrant’s disclosure controls and procedures were effective as of that date in ensuring that information required to be disclosed by the registrant in this Form N-CSR was recorded, processed, summarized, and reported within the time periods specified in the Securities and Exchange Commission’s rules and forms.
(b) There were no changes in the registrant’s internal control over financial reporting (as defined in Rule 30a-3(d) under the Investment Company Act) that occurred during the period covered by this report that have materially affected, or are reasonably likely to materially affect, the registrant’s internal control over financial reporting.
| Item 12. | Disclosure of Securities Lending Activities for Closed-End Management Investment Companies. |
Not Applicable
(a)(1) Not applicable.
(a)(2) Separate certifications by the President (principal executive officer) and Treasurer (principal financial officer) of the registrant as required by Rule 30a-2(a) under the Investment Company Act (17 CFR 270.30a-2(a)) are attached.
(a)(3) Not applicable.
(a)(4) Not applicable.
(b) A certification by the registrant’s President (principal executive officer) and Treasurer (principal financial officer) as required by Rule 30a-2(b) under the Investment Company Act Act (17 CFR 270.30a-2(b)) is attached.
SIGNATURES
Pursuant to the requirements of the Securities Exchange Act of 1934 and the Investment Company Act of 1940, the registrant has duly caused this report to be signed on its behalf by the undersigned, thereunto duly authorized.
(Registrant) | Guggenheim Variable Funds Trust | |
| | | |
| By (Signature and Title)* | /s/ Brian E. Binder | |
| | Brian E. Binder, President and Chief Executive Officer | |
| | | |
| Date | September 1, 2023 | |
Pursuant to the requirements of the Securities Exchange Act of 1934 and the Investment Company Act of 1940, this report has been signed below by the following persons on behalf of the registrant and in the capacities and on the dates indicated.
| By (Signature and Title)* | /s/ Brian E. Binder | |
| | Brian E. Binder, President and Chief Executive Officer | |
| | | |
| Date | September 1, 2023 | |
| | | |
| By (Signature and Title)* | /s/ James Howley | |
| | James Howley, Chief Financial Officer, Chief Accounting Officer and Treasurer | |
| | | |
| Date | September 1, 2023 | |
| * | Print the name and title of each signing officer under his or her signature. |
