0000217087 gvft:SeriesJStylePlus8212MidGrowthSeriesVariableAnnuitySampP500IndexMember 2016-12-31 0000217087 gvft:SeriesXStylePlus8212SmallGrowthSeriesVariableAnnuitySampP500IndexMember 2018-06-30
UNITED STATES
SECURITIES AND EXCHANGE COMMISSION
Washington, D.C. 20549
FORM N-CSR
CERTIFIED SHAREHOLDER REPORT OF REGISTERED MANAGEMENT
INVESTMENT COMPANIES
Investment Company Act file number 811- 02753
Guggenheim Variable Funds Trust
(Exact name of registrant as specified in charter)
702 King Farm Boulevard, Suite 200
Rockville, Maryland 20850
(Address of principal executive offices) (Zip code)
Amy J. Lee
Guggenheim Variable Funds Trust
702 King Farm Boulevard, Suite 200
Rockville, Maryland 20850
(Name and address of agent for service)
Registrant's telephone number, including area code: (301) 296-5100
Date of fiscal year end: December 31
Date of reporting period: January 1, 2024 – June 30, 2024
| Item 1. | Reports to Stockholders. |
| (a) | The registrant’s semi-annual report transmitted to shareholders pursuant to Rule 30e-1 under the Investment Company Act of 1940, as amended (the “Investment Company Act”), is as follows: |

Semi-Annual Shareholder Report | June 30, 2024
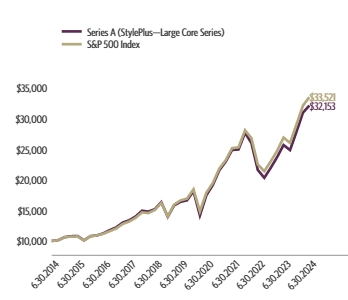
This semi-annual shareholder report contains important information about the Series A (StylePlus—Large Core Series) for the period of January 1, 2024 to June 30, 2024. You can find additional information about the fund at GuggenheimInvestments.com/variable-insurance-funds. You can also request this information by contacting 800 820 0888 or GuggenheimClientServices@mufg-is.com.
For the period of January 1, 2024 to June 30, 2024, the fund returned 15.31%, outperforming the fund's benchmark, the S&P 500 Index, which returned 15.29% for the same period.
What factors materially affected the fund's performance over the last six months?
The equity sleeve was allocated 15%-25% to actively managed equity and 75%-85% to passive equity. Relative to the fund's benchmark, the active equity sleeve contributed to performance. The passive equity component, which accounted for most of the fund's exposure to the broad equity market, consisted of equity index swaps and equity index futures, and generated performance roughly in line with fund's benchmark (before costs associated with derivatives); the active fixed income sleeve generated excess returns over the costs of equity index derivatives.
Cumulative performance* for the fund's most recently completed 10 years, assuming a $10,000 initial investment.
| 06/30/2014 | 10000 | 10000 |
| 09/30/2014 | 10130 | 10113 |
| 12/31/2014 | 10629 | 10612 |
| 03/31/2015 | 10773 | 10712 |
| 06/30/2015 | 10816 | 10742 |
| 09/30/2015 | 10094 | 10051 |
| 12/31/2015 | 10788 | 10758 |
| 03/31/2016 | 10911 | 10903 |
| 06/30/2016 | 11238 | 11171 |
| 09/30/2016 | 11767 | 11602 |
| 12/31/2016 | 12228 | 12045 |
| 03/31/2017 | 12996 | 12776 |
| 06/30/2017 | 13371 | 13170 |
| 09/30/2017 | 13986 | 13760 |
| 12/31/2017 | 14945 | 14675 |
| 03/31/2018 | 14804 | 14563 |
| 06/30/2018 | 15188 | 15064 |
| 09/30/2018 | 16344 | 16225 |
| 12/31/2018 | 13964 | 14031 |
| 03/31/2019 | 15813 | 15946 |
| 06/30/2019 | 16401 | 16633 |
| 09/30/2019 | 16643 | 16915 |
| 12/31/2019 | 18149 | 18449 |
| 03/31/2020 | 14178 | 14834 |
| 06/30/2020 | 17464 | 17881 |
| 09/30/2020 | 19156 | 19478 |
| 12/31/2020 | 21557 | 21844 |
| 03/31/2021 | 22967 | 23193 |
| 06/30/2021 | 24884 | 25175 |
| 09/30/2021 | 24966 | 25322 |
| 12/31/2021 | 27697 | 28114 |
| 03/31/2022 | 26034 | 26821 |
| 06/30/2022 | 21620 | 22503 |
| 09/30/2022 | 20328 | 21404 |
| 12/31/2022 | 21972 | 23023 |
| 03/31/2023 | 23717 | 24749 |
| 06/30/2023 | 25691 | 26912 |
| 09/30/2023 | 24866 | 26031 |
| 12/31/2023 | 27883 | 29075 |
| 03/31/2024 | 30976 | 32144 |
| 06/30/2024 | 32153 | 33521 |
| Series A (StylePlus—Large Core Series) | 15.31% | 25.15% | 14.41% | 12.39% |
| S&P 500 Index | 15.29% | 24.56% | 15.05% | 12.86% |
The fund's past performance is not a good predictor of the fund's future performance.
| Net Assets | $249,083,822 |
| Number of Portfolio Holdings | 85 |
| Portfolio Turnover Rate | 26% |
| S&P 500 Index Swap Agreements | 76.2% |
| Technology | 8.1% |
| Consumer, Non-cyclical | 3.6% |
| Communications | 2.8% |
| Industrial | 2.7% |
| Financial | 2.5% |
| Consumer, Cyclical | 2.0% |
| Other | 2.4% |

| Guggenheim Strategy Fund III | 24.5% |
| Guggenheim Variable Insurance Strategy Fund III | 23.8% |
| Guggenheim Strategy Fund II | 14.2% |
| Guggenheim Ultra Short Duration Fund — Institutional Class | 11.6% |
| Microsoft Corp. | 1.9% |
| Apple, Inc. | 1.7% |
| NVIDIA Corp. | 1.3% |
| Alphabet, Inc. — Class C | 0.7% |
| Amazon.com, Inc. | 0.7% |
| Broadcom, Inc. | 0.5% |
| Top 10 Total | 80.9% |
| |
1 | "Holdings Diversification (Market Exposure as % of Net Assets)" excludes any temporary cash investments, investments in Guggenheim Strategy Funds Trust mutual funds, or investments in Guggenheim Ultra Short Duration Fund. |
| |
2 | "10 Largest Holdings" excludes any temporary cash or derivative investments. |
There were no changes in or disagreements with fund accountants for the period.
| |  | For additional information, including the fund's prospectus, financial information, holdings and proxy voting information, go to GuggenheimInvestments.com/variable-insurance-funds or, call 800 820 0888. |
SAR-C000027852-063024
Semi-Annual Shareholder Report | June 30, 2024
This semi-annual shareholder report contains important information about the Series B (Large Cap Value Series) for the period of January 1, 2024 to June 30, 2024. You can find additional information about the fund at GuggenheimInvestments.com/variable-insurance-funds. You can also request this information by contacting 800 820 0888 or GuggenheimClientServices@mufg-is.com.
For the period of January 1, 2024 to June 30, 2024, the fund returned 8.72%, underperforming the fund's benchmark, the S&P 500 Index, which returned 15.29% for the same period and outperforming the fund's secondary index, the Russell 1000 Value Index, which returned 6.62% for the same period.
The fund's broad-based securities market index was changed from the Russell 1000 Value Index to the S&P 500 Index to comply with the regulation that requires the fund's broad-based securities market index to represent the overall applicable market.
What factors materially affected the fund's performance over the last six months?
The fund's stock selection was the most significant contributor to outperformance relative to the Russell 1000 Value Index for the reporting period, due to the AI-driven Technology holdings in Alphabet, Inc.- Class A, Qualcomm Inc, KLA Corp, Teradyne Inc., and Applied Materials. Positions in Diamondback Energy and Leidos Holdings in the Energy and Professional Services sectors also contributed meaningfully.
Cumulative performance* for the fund's most recently completed 10 years, assuming a $10,000 initial investment.
| 06/30/2014 | 10000 | 10000 | 10000 |
| 09/30/2014 | 9907 | 10113 | 9981 |
| 12/31/2014 | 10122 | 10612 | 10478 |
| 03/31/2015 | 10154 | 10712 | 10402 |
| 06/30/2015 | 10093 | 10742 | 10413 |
| 09/30/2015 | 9223 | 10051 | 9539 |
| 12/31/2015 | 9608 | 10758 | 10077 |
| 03/31/2016 | 9778 | 10903 | 10242 |
| 06/30/2016 | 10239 | 11171 | 10711 |
| 09/30/2016 | 10694 | 11602 | 11084 |
| 12/31/2016 | 11664 | 12045 | 11824 |
| 03/31/2017 | 12088 | 12776 | 12211 |
| 06/30/2017 | 12166 | 13170 | 12375 |
| 09/30/2017 | 12639 | 13760 | 12760 |
| 12/31/2017 | 13508 | 14675 | 13440 |
| 03/31/2018 | 13125 | 14563 | 13059 |
| 06/30/2018 | 13374 | 15064 | 13212 |
| 09/30/2018 | 14088 | 16225 | 13966 |
| 12/31/2018 | 12221 | 14031 | 12329 |
| 03/31/2019 | 13578 | 15946 | 13800 |
| 06/30/2019 | 13703 | 16633 | 14331 |
| 09/30/2019 | 13647 | 16915 | 14525 |
| 12/31/2019 | 14888 | 18449 | 15601 |
| 03/31/2020 | 10658 | 14834 | 11431 |
| 06/30/2020 | 12237 | 17881 | 13064 |
| 09/30/2020 | 12833 | 19478 | 13795 |
| 12/31/2020 | 15216 | 21844 | 16037 |
| 03/31/2021 | 17349 | 23193 | 17842 |
| 06/30/2021 | 18004 | 25175 | 18771 |
| 09/30/2021 | 17979 | 25322 | 18625 |
| 12/31/2021 | 19330 | 28114 | 20072 |
| 03/31/2022 | 20065 | 26821 | 19924 |
| 06/30/2022 | 17810 | 22503 | 17491 |
| 09/30/2022 | 16854 | 21404 | 16508 |
| 12/31/2022 | 19074 | 23023 | 18559 |
| 03/31/2023 | 19098 | 24749 | 18746 |
| 06/30/2023 | 19912 | 26912 | 19509 |
| 09/30/2023 | 19337 | 26031 | 18892 |
| 12/31/2023 | 20842 | 29075 | 20686 |
| 03/31/2024 | 22764 | 32144 | 22545 |
| 06/30/2024 | 22660 | 33521 | 22057 |
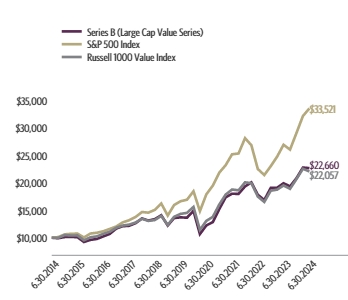
| Series B (Large Cap Value Series) | 8.72% | 13.80% | 10.58% | 8.52% |
| S&P 500 Index | 15.29% | 24.56% | 15.05% | 12.86% |
| Russell 1000 Value Index | 6.62% | 13.06% | 9.01% | 8.23% |
The fund's past performance is not a good predictor of the fund's future performance.
| Net Assets | $203,542,452 |
| Number of Portfolio Holdings | 83 |
| Portfolio Turnover Rate | 8% |
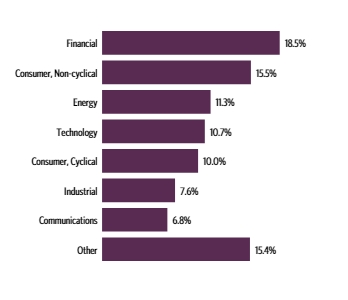
| Financial | 18.5% |
| Consumer, Non-cyclical | 15.5% |
| Energy | 11.3% |
| Technology | 10.7% |
| Consumer, Cyclical | 10.0% |
| Industrial | 7.6% |
| Communications | 6.8% |
| Other | 15.4% |
| iShares Russell 1000 Value ETF | 3.6% |
| Bank of America Corp. | 2.7% |
| Berkshire Hathaway, Inc. — Class B | 2.6% |
| Chevron Corp. | 2.6% |
| Verizon Communications, Inc. | 2.5% |
| Walmart, Inc. | 2.3% |
| Alphabet, Inc. — Class A | 2.1% |
| ConocoPhillips | 2.1% |
| Diamondback Energy, Inc. | 1.9% |
| JPMorgan Chase & Co. | 1.8% |
| Top 10 Total | 24.2% |
| |
1 | "Holdings Diversification (Market Exposure as % of Net Assets)" excludes any temporary cash investments, investments in Guggenheim Strategy Funds Trust mutual funds, or investments in Guggenheim Ultra Short Duration Fund. |
| |
2 | "10 Largest Holdings" excludes any temporary cash or derivative investments. |
There were no changes in or disagreements with fund accountants for the period.
| | | For additional information, including the fund's prospectus, financial information, holdings and proxy voting information, go to GuggenheimInvestments.com/variable-insurance-funds or, call 800 820 0888. |
SAR-C000027862-063024
Semi-Annual Shareholder Report | June 30, 2024
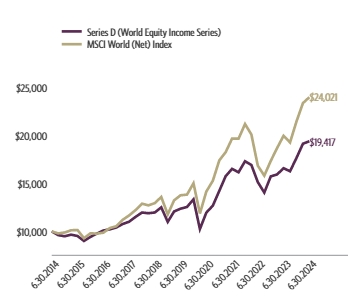
This semi-annual shareholder report contains important information about the Series D (World Equity Income Series) for the period of January 1, 2024 to June 30, 2024. You can find additional information about the fund at GuggenheimInvestments.com/variable-insurance-funds. You can also request this information by contacting 800 820 0888 or GuggenheimClientServices@mufg-is.com.
For the period of January 1, 2024 to June 30, 2024, the fund returned 9.83%, underperforming the fund's benchmark, the MSCI World (Net) Index, which returned 11.75% for the same period.
What factors materially affected the fund's performance over the last six months?
An underweight in the Health Care sector and good selection in Financials were the largest positive contributors to the fund's return. The leading overall detractor from return was allocation, with the Information Technology and Communication Services sectors responsible for most of the relative underperformance. The fund was also most underweight relative to the Benchmark in the Information Technology sector, which exacerbated the underperformance. From a country perspective, Security selection in Australia was a large positive contributor to return. Europe as a whole contributed to return, with the largest relative contributions from Italy, France, and Sweden. The U.S. was the single largest relative detractor from return. The UK and Germany were the other leading detractors from return on a relative basis. The top relative individual contributor to the fund was Dell Technologies, Inc. The biggest detractor was an underweight in Nvidia Corp.
Cumulative performance* for the fund's most recently completed 10 years, assuming a $10,000 initial investment.
| 06/30/2014 | 10000 | 10000 |
| 09/30/2014 | 9608 | 9784 |
| 12/31/2014 | 9488 | 9883 |
| 03/31/2015 | 9654 | 10112 |
| 06/30/2015 | 9518 | 10143 |
| 09/30/2015 | 8997 | 9286 |
| 12/31/2015 | 9425 | 9797 |
| 03/31/2016 | 9767 | 9763 |
| 06/30/2016 | 10086 | 9861 |
| 09/30/2016 | 10211 | 10341 |
| 12/31/2016 | 10403 | 10533 |
| 03/31/2017 | 10764 | 11204 |
| 06/30/2017 | 11004 | 11655 |
| 09/30/2017 | 11508 | 12219 |
| 12/31/2017 | 11969 | 12892 |
| 03/31/2018 | 11895 | 12719 |
| 06/30/2018 | 11969 | 12948 |
| 09/30/2018 | 12510 | 13592 |
| 12/31/2018 | 10992 | 11769 |
| 03/31/2019 | 12077 | 13238 |
| 06/30/2019 | 12366 | 13767 |
| 09/30/2019 | 12550 | 13841 |
| 12/31/2019 | 13344 | 15025 |
| 03/31/2020 | 10241 | 11862 |
| 06/30/2020 | 11959 | 14159 |
| 09/30/2020 | 12682 | 15281 |
| 12/31/2020 | 14231 | 17415 |
| 03/31/2021 | 15761 | 18272 |
| 06/30/2021 | 16531 | 19687 |
| 09/30/2021 | 16173 | 19685 |
| 12/31/2021 | 17325 | 21214 |
| 03/31/2022 | 16934 | 20121 |
| 06/30/2022 | 15147 | 16864 |
| 09/30/2022 | 14052 | 15821 |
| 12/31/2022 | 15745 | 17366 |
| 03/31/2023 | 15949 | 18708 |
| 06/30/2023 | 16598 | 19986 |
| 09/30/2023 | 16281 | 19294 |
| 12/31/2023 | 17679 | 21496 |
| 03/31/2024 | 19155 | 23399 |
| 06/30/2024 | 19417 | 24021 |
| Series D (World Equity Income Series) | 9.83% | 16.98% | 9.44% | 6.86% |
| MSCI World (Net) Index | 11.75% | 20.19% | 11.78% | 9.16% |
The fund's past performance is not a good predictor of the fund's future performance.
| Net Assets | $115,943,933 |
| Number of Portfolio Holdings | 146 |
| Portfolio Turnover Rate | 56% |
| Financial | 22.8% |
| Technology | 20.4% |
| Consumer, Non-cyclical | 14.5% |
| Consumer, Cyclical | 9.4% |
| Communications | 8.7% |
| Industrial | 6.5% |
| Utilities | 6.5% |
| Other | 9.9% |

| United States | 69.5% |
| Japan | 3.6% |
| Netherlands | 3.6% |
| Denmark | 2.7% |
| Australia | 2.2% |
| France | 2.2% |
| Canada | 2.1% |
| Other | 14.1% |
| Total Investments | 100.0% |
| NVIDIA Corp. | 3.4% |
| Apple, Inc. | 3.4% |
| Microsoft Corp. | 3.3% |
| Alphabet, Inc. — Class C | 2.4% |
| Amazon.com, Inc. | 2.0% |
| Novo Nordisk A/S — Class B | 1.5% |
| Walmart, Inc. | 1.3% |
| Johnson & Johnson | 1.2% |
| Berkshire Hathaway, Inc. — Class B | 1.2% |
| UnitedHealth Group, Inc. | 1.1% |
| Top 10 Total | 20.8% |
| |
1 | "Holdings Diversification (Market Exposure as % of Net Assets)" excludes any temporary cash investments, investments in Guggenheim Strategy Funds Trust mutual funds, or investments in Guggenheim Ultra Short Duration Fund. |
| |
2 | "10 Largest Holdings" excludes any temporary cash or derivative investments. |
There were no changes in or disagreements with fund accountants for the period.
| | | For additional information, including the fund's prospectus, financial information, holdings and proxy voting information, go to GuggenheimInvestments.com/variable-insurance-funds or, call 800 820 0888. |
SAR-C000027864-063024
Semi-Annual Shareholder Report | June 30, 2024
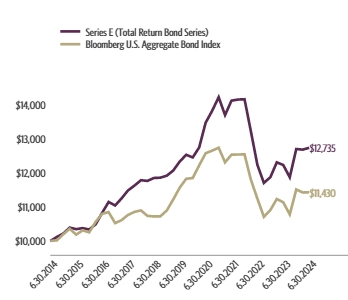
This semi-annual shareholder report contains important information about the Series E (Total Return Bond Series) for the period of January 1, 2024 to June 30, 2024. You can find additional information about the fund at GuggenheimInvestments.com/variable-insurance-funds. You can also request this information by contacting 800 820 0888 or GuggenheimClientServices@mufg-is.com.
For the period of January 1, 2024 to June 30, 2024, the fund returned 0.21%, outperforming the fund's benchmark, the Bloomberg U.S. Aggregate Bond Index, which returned (0.71%) for the same period.
What factors materially affected the fund's performance over the last six months?
The fund's relative outperformance to the Benchmark was primarily driven by security selection, sector allocation and the fund's carry advantage over the benchmark. Carry is the difference between the cost of financing an asset and the interest received on that asset. Duration was a detractor from absolute returns as interest rates rose roughly 50 basis points over the performance period but only a modest detractor in relative terms. The fund benefited from an overweight allocation to asset-backed securities, as securitized credit spreads broadly outperformed corporate credit spreads. Security selection within agency residential mortgage-backed securities, investment grade corporates, and high yield corporates were key contributors to relative performance.
Cumulative performance* for the fund's most recently completed 10 years, assuming a $10,000 initial investment.
| 06/30/2014 | 10000 | 10000 |
| 09/30/2014 | 10116 | 10017 |
| 12/31/2014 | 10219 | 10196 |
| 03/31/2015 | 10392 | 10360 |
| 06/30/2015 | 10347 | 10186 |
| 09/30/2015 | 10376 | 10311 |
| 12/31/2015 | 10336 | 10252 |
| 03/31/2016 | 10488 | 10563 |
| 06/30/2016 | 10824 | 10797 |
| 09/30/2016 | 11145 | 10847 |
| 12/31/2016 | 11042 | 10524 |
| 03/31/2017 | 11248 | 10610 |
| 06/30/2017 | 11482 | 10763 |
| 09/30/2017 | 11626 | 10854 |
| 12/31/2017 | 11784 | 10897 |
| 03/31/2018 | 11763 | 10737 |
| 06/30/2018 | 11849 | 10720 |
| 09/30/2018 | 11858 | 10722 |
| 12/31/2018 | 11918 | 10898 |
| 03/31/2019 | 12068 | 11219 |
| 06/30/2019 | 12331 | 11564 |
| 09/30/2019 | 12530 | 11826 |
| 12/31/2019 | 12453 | 11848 |
| 03/31/2020 | 12746 | 12221 |
| 06/30/2020 | 13472 | 12575 |
| 09/30/2020 | 13821 | 12652 |
| 12/31/2020 | 14222 | 12737 |
| 03/31/2021 | 13696 | 12308 |
| 06/30/2021 | 14120 | 12533 |
| 09/30/2021 | 14152 | 12539 |
| 12/31/2021 | 14161 | 12541 |
| 03/31/2022 | 13215 | 11797 |
| 06/30/2022 | 12237 | 11243 |
| 09/30/2022 | 11704 | 10709 |
| 12/31/2022 | 11874 | 10909 |
| 03/31/2023 | 12308 | 11232 |
| 06/30/2023 | 12231 | 11137 |
| 09/30/2023 | 11870 | 10778 |
| 12/31/2023 | 12700 | 11512 |
| 03/31/2024 | 12682 | 11423 |
| 06/30/2024 | 12735 | 11430 |
| Series E (Total Return Bond Series) | 0.21% | 4.12% | 0.65% | 2.45% |
| Bloomberg U.S. Aggregate Bond Index | -0.71% | 2.63% | -0.23% | 1.35% |
The fund's past performance is not a good predictor of the fund's future performance.
| Net Assets | $160,389,829 |
| Number of Portfolio Holdings | 538 |
| Portfolio Turnover Rate | 41% |
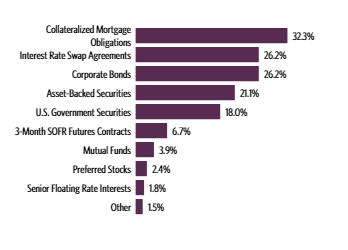
| Collateralized Mortgage Obligations | 32.3% |
| Interest Rate Swap Agreements | 26.2% |
| Corporate Bonds | 26.2% |
| Asset-Backed Securities | 21.1% |
| U.S. Government Securities | 18.0% |
| 3-Month SOFR Futures Contracts | 6.7% |
| Mutual Funds | 3.9% |
| Preferred Stocks | 2.4% |
| Senior Floating Rate Interests | 1.8% |
| Other | 1.5% |
| AAA | 46.1% |
| AA | 6.2% |
| A | 13.6% |
| BBB | 14.6% |
| BB | 5.4% |
| B | 1.3% |
| CCC | 0.3% |
| CC | 1.4% |
| C | 0.1% |
| NR3 | 3.2% |
| Other Instruments | 7.8% |
| Guggenheim Total Return Bond Fund — R6-Class | 3.9% |
| U.S. Treasury Notes, 4.13% due 03/31/31 | 2.7% |
| Uniform MBS 30 Year due 09/01/24 | 2.7% |
| Uniform MBS 30 Year due 09/01/24 | 2.6% |
| U.S. Treasury Bonds due 05/15/53 | 2.2% |
| U.S. Treasury Notes, 4.00% due 02/15/34 | 2.1% |
| U.S. Treasury Notes, 4.50% due 05/31/29 | 2.0% |
| U.S. Treasury Notes, 4.63% due 04/30/31 | 1.6% |
| Uniform MBS 15 Year due 08/01/24 | 1.3% |
| Freddie Mac, 5.00% due 06/01/53 | 1.1% |
| Top 10 Total | 22.2% |
| |
1 | "Holdings Diversification (Market Exposure as % of Net Assets)" excludes any temporary cash investments, investments in Guggenheim Strategy Funds Trust mutual funds, or investments in Guggenheim Ultra Short Duration Fund. |
| |
2 | Source: BlackRock Solutions. Credit quality ratings are measured on a scale that generally ranges from AAA (highest) to D (lowest). All securities except for those labeled "NR" have been rated by Moody's, Standard & Poor's ("S&P"), or Fitch, each of which is a Nationally Recognized Statistical Rating Organization ("NRSRO"). For purposes of this presentation, when ratings are available from more than one agency, the highest rating is used. Guggenheim Investments has converted ratings to the equivalent S&P rating. Security ratings are determined at the time of purchase and may change thereafter. |
3 | NR (not rated) securities do not necessarily indicate low credit quality. |
| |
4 | "10 Largest Holdings" excludes any temporary cash or derivative investments. |
There were no changes in or disagreements with fund accountants for the period.
| | | For additional information, including the fund's prospectus, financial information, holdings and proxy voting information, go to GuggenheimInvestments.com/variable-insurance-funds or, call 800 820 0888. |
SAR-C000027865-063024
Semi-Annual Shareholder Report | June 30, 2024
This semi-annual shareholder report contains important information about the Series F (Floating Rate Strategies Series) for the period of January 1, 2024 to June 30, 2024. You can find additional information about the fund at GuggenheimInvestments.com/variable-insurance-funds. You can also request this information by contacting 800 820 0888 or GuggenheimClientServices@mufg-is.com.
For the period of January 1, 2024 to June 30, 2024, the fund returned 3.12%, outperforming the fund's benchmark, the Bloomberg U.S. Aggregate Bond Index, which returned (0.71%) for the same period and underperforming the fund's secondary index, the Credit Suisse Leveraged Loan Index, which returned 4.44% for the same period.
The fund's broad-based securities market index was changed from the Credit Suisse Leveraged Loan Index to the Bloomberg U.S. Aggregate Index to comply with the regulation that requires the fund's broad-based securities market index to represent the overall applicable market.
What factors materially affected the fund's performance over the last six months?
Above-average returns for both the fund and the Credit Suisse Leveraged Loan Index (the "Index") continued to be driven by high all-in coupon. Interest return accounted for over 100% of overall return for both the fund and the benchmark during the first half of the year (more than offsetting a negative return from price movement). From a supply/demand perspective, record collateralized loan obligation issuance pushed the supply deficit to all-time highs as robust primary activity remained primarily opportunistic (refinancings/repricings). Comparing the fund to the Index, credit issues in the consumer and communications sectors were the primary detractors to performance during the reporting period. Relative performance benefited from an overweight to the consumer non-cyclicals sector and from the fund's small high yield bond allocation.
Cumulative performance* for the fund's most recently completed 10 years, assuming a $10,000 initial investment.
| 06/30/2014 | 10000 | 10000 | 10000 |
| 07/31/2014 | 10000 | 9975 | 9996 |
| 08/31/2014 | 10027 | 10085 | 10019 |
| 09/30/2014 | 10015 | 10017 | 9967 |
| 10/31/2014 | 10038 | 10115 | 9996 |
| 11/30/2014 | 10080 | 10187 | 10041 |
| 12/31/2014 | 10004 | 10196 | 9930 |
| 01/31/2015 | 10023 | 10410 | 9956 |
| 02/28/2015 | 10133 | 10312 | 10096 |
| 03/31/2015 | 10179 | 10360 | 10136 |
| 04/30/2015 | 10252 | 10323 | 10227 |
| 05/31/2015 | 10294 | 10298 | 10247 |
| 06/30/2015 | 10282 | 10186 | 10215 |
| 07/31/2015 | 10324 | 10257 | 10224 |
| 08/31/2015 | 10277 | 10242 | 10158 |
| 09/30/2015 | 10241 | 10311 | 10090 |
| 10/31/2015 | 10226 | 10313 | 10076 |
| 11/30/2015 | 10163 | 10286 | 9987 |
| 12/31/2015 | 10077 | 10252 | 9892 |
| 01/31/2016 | 10049 | 10393 | 9820 |
| 02/29/2016 | 9936 | 10467 | 9766 |
| 03/31/2016 | 10190 | 10563 | 10023 |
| 04/30/2016 | 10363 | 10604 | 10214 |
| 05/31/2016 | 10445 | 10607 | 10307 |
| 06/30/2016 | 10425 | 10797 | 10310 |
| 07/31/2016 | 10577 | 10865 | 10455 |
| 08/31/2016 | 10647 | 10853 | 10538 |
| 09/30/2016 | 10739 | 10847 | 10630 |
| 10/31/2016 | 10814 | 10764 | 10711 |
| 11/30/2016 | 10852 | 10509 | 10746 |
| 12/31/2016 | 10940 | 10524 | 10869 |
| 01/31/2017 | 10969 | 10544 | 10927 |
| 02/28/2017 | 11019 | 10615 | 10991 |
| 03/31/2017 | 11040 | 10610 | 11000 |
| 04/30/2017 | 11061 | 10692 | 11048 |
| 05/31/2017 | 11094 | 10774 | 11090 |
| 06/30/2017 | 11098 | 10763 | 11083 |
| 07/31/2017 | 11167 | 10809 | 11169 |
| 08/31/2017 | 11163 | 10906 | 11154 |
| 09/30/2017 | 11206 | 10854 | 11200 |
| 10/31/2017 | 11279 | 10861 | 11274 |
| 11/30/2017 | 11297 | 10847 | 11287 |
| 12/31/2017 | 11318 | 10897 | 11331 |
| 01/31/2018 | 11404 | 10771 | 11453 |
| 02/28/2018 | 11404 | 10669 | 11473 |
| 03/31/2018 | 11443 | 10737 | 11510 |
| 04/30/2018 | 11456 | 10658 | 11566 |
| 05/31/2018 | 11461 | 10734 | 11588 |
| 06/30/2018 | 11435 | 10720 | 11600 |
| 07/31/2018 | 11516 | 10723 | 11696 |
| 08/31/2018 | 11551 | 10792 | 11744 |
| 09/30/2018 | 11626 | 10722 | 11824 |
| 10/31/2018 | 11618 | 10638 | 11825 |
| 11/30/2018 | 11524 | 10701 | 11729 |
| 12/31/2018 | 11227 | 10898 | 11460 |
| 01/31/2019 | 11471 | 11014 | 11724 |
| 02/28/2019 | 11658 | 11007 | 11908 |
| 03/31/2019 | 11591 | 11219 | 11893 |
| 04/30/2019 | 11791 | 11221 | 12082 |
| 05/31/2019 | 11724 | 11421 | 12055 |
| 06/30/2019 | 11755 | 11564 | 12081 |
| 07/31/2019 | 11853 | 11589 | 12176 |
| 08/31/2019 | 11825 | 11890 | 12141 |
| 09/30/2019 | 11876 | 11826 | 12193 |
| 10/31/2019 | 11811 | 11862 | 12133 |
| 11/30/2019 | 11904 | 11856 | 12200 |
| 12/31/2019 | 12081 | 11848 | 12397 |
| 01/31/2020 | 12123 | 12076 | 12463 |
| 02/29/2020 | 11918 | 12293 | 12294 |
| 03/31/2020 | 10643 | 12221 | 10762 |
| 04/30/2020 | 11001 | 12438 | 11224 |
| 05/31/2020 | 11388 | 12496 | 11650 |
| 06/30/2020 | 11415 | 12575 | 11807 |
| 07/31/2020 | 11607 | 12762 | 12029 |
| 08/31/2020 | 11730 | 12659 | 12210 |
| 09/30/2020 | 11760 | 12652 | 12294 |
| 10/31/2020 | 11780 | 12596 | 12316 |
| 11/30/2020 | 11938 | 12720 | 12578 |
| 12/31/2020 | 12082 | 12737 | 12741 |
| 01/31/2021 | 12141 | 12646 | 12903 |
| 02/28/2021 | 12176 | 12463 | 12990 |
| 03/31/2021 | 12156 | 12308 | 12997 |
| 04/30/2021 | 12191 | 12405 | 13063 |
| 05/31/2021 | 12235 | 12445 | 13131 |
| 06/30/2021 | 12255 | 12533 | 13185 |
| 07/31/2021 | 12227 | 12673 | 13184 |
| 08/31/2021 | 12267 | 12649 | 13249 |
| 09/30/2021 | 12348 | 12539 | 13334 |
| 10/31/2021 | 12343 | 12536 | 13366 |
| 11/30/2021 | 12308 | 12573 | 13345 |
| 12/31/2021 | 12384 | 12541 | 13429 |
| 01/31/2022 | 12409 | 12271 | 13477 |
| 02/28/2022 | 12328 | 12134 | 13411 |
| 03/31/2022 | 12328 | 11797 | 13416 |
| 04/30/2022 | 12328 | 11349 | 13439 |
| 05/31/2022 | 12034 | 11422 | 13102 |
| 06/30/2022 | 11765 | 11243 | 12832 |
| 07/31/2022 | 12050 | 11518 | 13072 |
| 08/31/2022 | 12211 | 11192 | 13272 |
| 09/30/2022 | 11925 | 10709 | 12985 |
| 10/31/2022 | 12065 | 10570 | 13095 |
| 11/30/2022 | 12216 | 10959 | 13240 |
| 12/31/2022 | 12278 | 10909 | 13287 |
| 01/31/2023 | 12590 | 11245 | 13628 |
| 02/28/2023 | 12637 | 10954 | 13714 |
| 03/31/2023 | 12637 | 11232 | 13701 |
| 04/30/2023 | 12705 | 11300 | 13831 |
| 05/31/2023 | 12658 | 11177 | 13819 |
| 06/30/2023 | 12970 | 11137 | 14128 |
| 07/31/2023 | 13116 | 11130 | 14312 |
| 08/31/2023 | 13267 | 11059 | 14477 |
| 09/30/2023 | 13348 | 10778 | 14604 |
| 10/31/2023 | 13326 | 10607 | 14609 |
| 11/30/2023 | 13477 | 11088 | 14783 |
| 12/31/2023 | 13644 | 11512 | 15021 |
| 01/31/2024 | 13693 | 11481 | 15138 |
| 02/29/2024 | 13800 | 11318 | 15273 |
| 03/31/2024 | 13908 | 11423 | 15400 |
| 04/30/2024 | 13962 | 11134 | 15504 |
| 05/31/2024 | 14070 | 11323 | 15645 |
| 06/30/2024 | 14070 | 11430 | 15688 |

| Series F (Floating Rate Strategies Series) | 3.12% | 8.48% | 3.66% | 3.47% |
| Bloomberg U.S. Aggregate Bond Index | -0.71% | 2.63% | -0.23% | 1.35% |
| Credit Suisse Leveraged Loan Index | 4.44% | 11.04% | 5.36% | 4.61% |
The fund's past performance is not a good predictor of the fund's future performance.
| Net Assets | $56,876,119 |
| Number of Portfolio Holdings | 235 |
| Portfolio Turnover Rate | 31% |
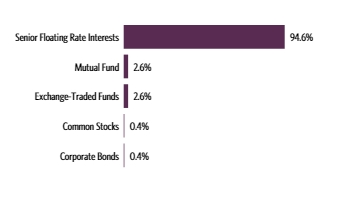
| Senior Floating Rate Interests | 94.6% |
| Mutual Fund | 2.6% |
| Exchange-Traded Funds | 2.6% |
| Common Stocks | 0.4% |
| Corporate Bonds | 0.4% |
| BBB | 6.7% |
| BB | 35.3% |
| B | 46.5% |
| CCC | 3.0% |
| CC | 0.1% |
| NR3 | 0.2% |
| Other Instruments | 8.2% |
| Guggenheim Floating Rate Strategies Fund — Class R6 | 2.6% |
| SPDR Blackstone Senior Loan ETF | 2.6% |
| Arsenal AIC Parent LLC, 9.10% | 0.9% |
| Planview Parent, Inc., 9.08% | 0.9% |
| Restaurant Brands, 7.09% | 0.9% |
| WMG Acquisition Corp. | 0.9% |
| McGraw Hill LLC, 10.20% | 0.9% |
| American Builders & Contractors Supply Co., Inc., 7.34% | |
| Summit Behavioral Healthcare LLC, 9.60% | 0.9% |
| Beacon Roofing Supply, Inc., 7.34% | 0.9% |
| Top 10 Total | 12.4% |
| |
1 | "Holdings Diversification (Market Exposure as % of Net Assets)" excludes any temporary cash investments, investments in Guggenheim Strategy Funds Trust mutual funds, or investments in Guggenheim Ultra Short Duration Fund. |
| |
2 | Source: BlackRock Solutions. Credit quality ratings are measured on a scale that generally ranges from AAA (highest) to D (lowest). All securities except for those labeled "NR" have been rated by Moody's, Standard & Poor's ("S&P"), or Fitch, each of which is a Nationally Recognized Statistical Rating Organization ("NRSRO"). For purposes of this presentation, when ratings are available from more than one agency, the highest rating is used. Guggenheim Investments has converted ratings to the equivalent S&P rating. Security ratings are determined at the time of purchase and may change thereafter. |
3 | NR (not rated) securities do not necessarily indicate low credit quality. |
| |
4 | "10 Largest Holdings" excludes any temporary cash or derivative investments. |
There were no changes in or disagreements with fund accountants for the period.
| | | For additional information, including the fund's prospectus, financial information, holdings and proxy voting information, go to GuggenheimInvestments.com/variable-insurance-funds or, call 800 820 0888. |
SAR-C000125779-063024
Semi-Annual Shareholder Report | June 30, 2024
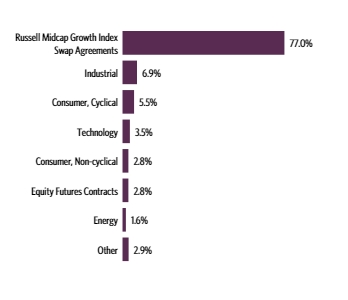
This semi-annual shareholder report contains important information about the Series J (StylePlus—Mid Growth Series) for the period of January 1, 2024 to June 30, 2024. You can find additional information about the fund at GuggenheimInvestments.com/variable-insurance-funds. You can also request this information by contacting 800 820 0888 or GuggenheimClientServices@mufg-is.com.
For the period of January 1, 2024 to June 30, 2024, the fund returned 7.60%, underperforming the fund's benchmark, the S&P 500 Index, which returned 15.29% for the same period and outperforming the fund's secondary index, the Russell Midcap Growth Index, which returned 5.98% for the same period.
The fund's broad-based securities market index was changed from the Russell Midcap Growth Index to the S&P 500 Index to comply with the regulation that requires the fund's broad-based securities market index to represent the overall applicable market.
What factors materially affected the fund's performance over the last six months?
The fund outperformed the Russell Midcap Growth Index (the "Index") for the reporting period. The equity sleeve was allocated 15%-25% to actively managed equity and 75%-85% to passive equity. Relative to the Index, the active equity sleeve contributed to performance. The passive equity component, which accounted for most of the fund's exposure to the broad equity market, consisted of equity index swaps and equity index futures, and generated performance roughly in line with the Index (before costs associated with derivatives); the active fixed income sleeve generated excess returns over the costs of equity index derivatives.
Cumulative performance* for the fund's most recently completed 10 years, assuming a $10,000 initial investment.
| 06/30/2014 | 10000 | 10000 | 10000 |
| 09/30/2014 | 9912 | 10113 | 9927 |
| 12/31/2014 | 10502 | 10612 | 10507 |
| 03/31/2015 | 11080 | 10712 | 11072 |
| 06/30/2015 | 10958 | 10742 | 10945 |
| 09/30/2015 | 10080 | 10051 | 10071 |
| 12/31/2015 | 10494 | 10758 | 10486 |
| 03/31/2016 | 10538 | 10903 | 10546 |
| 06/30/2016 | 10759 | 11171 | 10711 |
| 09/30/2016 | 11322 | 11602 | 11203 |
| 12/31/2016 | 11402 | 12045 | 11254 |
| 03/31/2017 | 12217 | 12776 | 12030 |
| 06/30/2017 | 12695 | 13170 | 12537 |
| 09/30/2017 | 13340 | 13760 | 13199 |
| 12/31/2017 | 14215 | 14675 | 14098 |
| 03/31/2018 | 14457 | 14563 | 14404 |
| 06/30/2018 | 14811 | 15064 | 14859 |
| 09/30/2018 | 15849 | 16225 | 15985 |
| 12/31/2018 | 13205 | 14031 | 13428 |
| 03/31/2019 | 15657 | 15946 | 16063 |
| 06/30/2019 | 16385 | 16633 | 16930 |
| 09/30/2019 | 16247 | 16915 | 16816 |
| 12/31/2019 | 17524 | 18449 | 18191 |
| 03/31/2020 | 13335 | 14834 | 14545 |
| 06/30/2020 | 17617 | 17881 | 18947 |
| 09/30/2020 | 19319 | 19478 | 20723 |
| 12/31/2020 | 23150 | 21844 | 24664 |
| 03/31/2021 | 23444 | 23193 | 24525 |
| 06/30/2021 | 25709 | 25175 | 27240 |
| 09/30/2021 | 25419 | 25322 | 27033 |
| 12/31/2021 | 26318 | 28114 | 27804 |
| 03/31/2022 | 22867 | 26821 | 24306 |
| 06/30/2022 | 17978 | 22503 | 19184 |
| 09/30/2022 | 17593 | 21404 | 19059 |
| 12/31/2022 | 19008 | 23023 | 20374 |
| 03/31/2023 | 20758 | 24749 | 22236 |
| 06/30/2023 | 22105 | 26912 | 23622 |
| 09/30/2023 | 21050 | 26031 | 22388 |
| 12/31/2023 | 24027 | 29075 | 25644 |
| 03/31/2024 | 26769 | 32144 | 28080 |
| 06/30/2024 | 25848 | 33521 | 27178 |
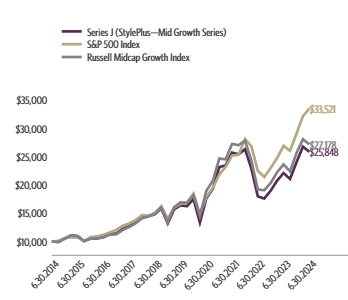
| Series J (StylePlus—Mid Growth Series) | 7.60% | 16.93% | 9.55% | 9.96% |
| S&P 500 Index | 15.29% | 24.56% | 15.05% | 12.86% |
| Russell Midcap Growth Index | 5.98% | 15.05% | 9.93% | 10.51% |
The fund's past performance is not a good predictor of the fund's future performance.
| Net Assets | $173,487,396 |
| Number of Portfolio Holdings | 150 |
| Portfolio Turnover Rate | 34% |
| Russell Midcap Growth Index Swap Agreements | 77.0% |
| Industrial | 6.9% |
| Consumer, Cyclical | 5.5% |
| Technology | 3.5% |
| Consumer, Non-cyclical | 2.8% |
| Equity Futures Contracts | 2.8% |
| Energy | 1.6% |
| Other | 2.9% |
| Guggenheim Variable Insurance Strategy Fund III | 26.8% |
| Guggenheim Strategy Fund III | 26.5% |
| Guggenheim Strategy Fund II | 20.2% |
| Guggenheim Ultra Short Duration Fund — Institutional Class | 1.7% |
| Owens Corning | 0.5% |
| Neurocrine Biosciences, Inc. | 0.5% |
| Pure Storage, Inc. — Class A | 0.4% |
| Lennox International, Inc. | 0.4% |
| Toll Brothers, Inc. | 0.4% |
| United Therapeutics Corp. | 0.4% |
| Top 10 Total | 77.8% |
| |
1 | "Holdings Diversification (Market Exposure as % of Net Assets)" excludes any temporary cash investments, investments in Guggenheim Strategy Funds Trust mutual funds, or investments in Guggenheim Ultra Short Duration Fund. |
| |
2 | "10 Largest Holdings" excludes any temporary cash or derivative investments. |
There were no changes in or disagreements with fund accountants for the period.
| | | For additional information, including the fund's prospectus, financial information, holdings and proxy voting information, go to GuggenheimInvestments.com/variable-insurance-funds or, call 800 820 0888. |
SAR-C000027868-063024
Semi-Annual Shareholder Report | June 30, 2024
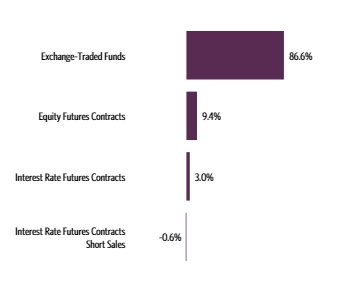
This semi-annual shareholder report contains important information about the Series N (Managed Asset Allocation Series) for the period of January 1, 2024 to June 30, 2024. You can find additional information about the fund at GuggenheimInvestments.com/variable-insurance-funds. You can also request this information by contacting 800 820 0888 or GuggenheimClientServices@mufg-is.com.
For the period of January 1, 2024 to June 30, 2024, the fund returned 5.88%, outperforming the fund's benchmark, the Bloomberg U.S. Aggregate Bond Index, which returned (0.71%) for the same period and underperforming the fund's secondary index, the S&P 500 Index, which returned 15.29% for the same period.
What factors materially affected the fund's performance over the last six months?
Strong earnings growth in large cap technology stocks propelled the equity market, more particularly the U.S. large cap equity market, to historical records multiple times during the reporting period. Smaller U.S. stocks and international equity markets performed less strongly. Bond markets have struggled with the oscillating outlook on whether or how frequently the Federal Reserve might cut interest rates this year. Treasury and high quality bonds, in general, declined. S&P 500 futures and ETFs, the S&P Mid Cap ETF, and MSCI EAFE Index futures and ETFs were the biggest contributors to the fund's return, while the biggest detractors were the Bloomberg U.S. Aggregate Bond ETF, iShares iBoxx Investment Grade Bond ETF, and the 10-year U.S. Treasury ETF and related futures.
Cumulative performance* for the fund's most recently completed 10 years, assuming a $10,000 initial investment.
| 06/30/2014 | 10000 | 10000 | 10000 |
| 09/30/2014 | 9864 | 10017 | 10113 |
| 12/31/2014 | 10136 | 10196 | 10612 |
| 03/31/2015 | 10410 | 10360 | 10712 |
| 06/30/2015 | 10326 | 10186 | 10742 |
| 09/30/2015 | 9876 | 10311 | 10051 |
| 12/31/2015 | 10146 | 10252 | 10758 |
| 03/31/2016 | 10320 | 10563 | 10903 |
| 06/30/2016 | 10572 | 10797 | 11171 |
| 09/30/2016 | 10921 | 10847 | 11602 |
| 12/31/2016 | 10960 | 10524 | 12045 |
| 03/31/2017 | 11410 | 10610 | 12776 |
| 06/30/2017 | 11737 | 10763 | 13170 |
| 09/30/2017 | 12101 | 10854 | 13760 |
| 12/31/2017 | 12536 | 10897 | 14675 |
| 03/31/2018 | 12370 | 10737 | 14563 |
| 06/30/2018 | 12536 | 10720 | 15064 |
| 09/30/2018 | 12959 | 10722 | 16225 |
| 12/31/2018 | 11818 | 10898 | 14031 |
| 03/31/2019 | 12882 | 11219 | 15946 |
| 06/30/2019 | 13357 | 11564 | 16633 |
| 09/30/2019 | 13522 | 11826 | 16915 |
| 12/31/2019 | 14195 | 11848 | 18449 |
| 03/31/2020 | 12233 | 12221 | 14834 |
| 06/30/2020 | 13885 | 12575 | 17881 |
| 09/30/2020 | 14561 | 12652 | 19478 |
| 12/31/2020 | 15981 | 12737 | 21844 |
| 03/31/2021 | 16388 | 12308 | 23193 |
| 06/30/2021 | 17196 | 12533 | 25175 |
| 09/30/2021 | 17112 | 12539 | 25322 |
| 12/31/2021 | 17974 | 12541 | 28114 |
| 03/31/2022 | 16895 | 11797 | 26821 |
| 06/30/2022 | 14846 | 11243 | 22503 |
| 09/30/2022 | 14054 | 10709 | 21404 |
| 12/31/2022 | 14995 | 10909 | 23023 |
| 03/31/2023 | 15734 | 11232 | 24749 |
| 06/30/2023 | 16236 | 11137 | 26912 |
| 09/30/2023 | 15640 | 10778 | 26031 |
| 12/31/2023 | 17112 | 11512 | 29075 |
| 03/31/2024 | 17930 | 11423 | 32144 |
| 06/30/2024 | 18119 | 11430 | 33521 |

| Series N (Managed Asset Allocation Series) | 5.88% | 11.59% | 6.29% | 6.12% |
| Bloomberg U.S. Aggregate Bond Index | -0.71% | 2.63% | -0.23% | 1.35% |
| S&P 500 Index | 15.29% | 24.56% | 15.05% | 12.86% |
The fund's past performance is not a good predictor of the fund's future performance.
| Net Assets | $35,573,951 |
| Number of Portfolio Holdings | 23 |
| Portfolio Turnover Rate | 1% |
| Exchange-Traded Funds | 86.6% |
| Equity Futures Contracts | 9.4% |
| Interest Rate Futures Contracts | 3.0% |
| Interest Rate Futures Contracts Short Sales | -0.6% |
| Vanguard S&P 500 ETF | 23.3% |
| Schwab U.S. Aggregate Bond ETF | 14.5% |
| SPDR S&P 500 ETF Trust | 12.5% |
| iShares MSCI EAFE ETF | 8.6% |
| iShares 7-10 Year Treasury Bond ETF | 7.8% |
| iShares iBoxx $ Investment Grade Corporate Bond ETF | 7.1% |
| iShares 1-3 Year Treasury Bond ETF | 6.6% |
| iShares Core S&P Mid-Cap ETF | 6.2% |
| Guggenheim Variable Insurance Strategy Fund III | 3.1% |
| Guggenheim Strategy Fund II | 3.0% |
| Top 10 Total | 92.7% |
| |
1 | "Holdings Diversification (Market Exposure as % of Net Assets)" excludes any temporary cash investments, investments in Guggenheim Strategy Funds Trust mutual funds, or investments in Guggenheim Ultra Short Duration Fund. |
| |
2 | "10 Largest Holdings" excludes any temporary cash or derivative investments. |
There were no changes in or disagreements with fund accountants for the period.
| | | For additional information, including the fund's prospectus, financial information, holdings and proxy voting information, go to GuggenheimInvestments.com/variable-insurance-funds or, call 800 820 0888. |
SAR-C000027869-063024
Semi-Annual Shareholder Report | June 30, 2024
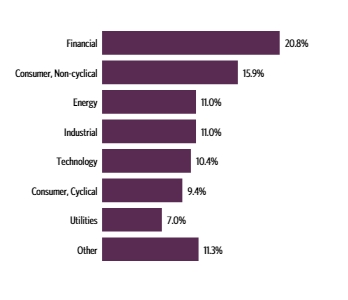
This semi-annual shareholder report contains important information about the Series O (All Cap Value Series) for the period of January 1, 2024 to June 30, 2024. You can find additional information about the fund at GuggenheimInvestments.com/variable-insurance-funds. You can also request this information by contacting 800 820 0888 or GuggenheimClientServices@mufg-is.com.
For the period of January 1, 2024 to June 30, 2024, the fund returned 6.52%, underperforming the fund's benchmark, the S&P 500 Index, which returned 15.29% for the same period and outperforming the fund's secondary index, the Russell 3000 Value Index, which returned 6.18% for the same period.
The fund's broad-based securities market index was changed from the Russell 3000 Value Index to the S&P 500 Index to comply with the regulation that requires the fund's broad-based securities market index to represent the overall applicable market.
What factors materially affected the fund's performance over the last six months?
The fund slightly outperformed the Russell 3000 Value Index for the reporting period. It benefited from its underweight to the Health Care and REITs sectors. Its overweight to smaller-market-cap companies detracted from performance as the larger, mega-cap companies in the market performed best. The fund's stock selection was the most significant contributor to outperformance due to the AI-driven technology holdings in Alphabet, KLA Corp, Teradyne, and Qualcomm as well as holdings in Diamondback Energy, Jefferies Financial, Leidos, and Encompass Health.
Cumulative performance* for the fund's most recently completed 10 years, assuming a $10,000 initial investment.
| 06/30/2014 | 10000 | 10000 | 10000 |
| 09/30/2014 | 9675 | 10113 | 9913 |
| 12/31/2014 | 9989 | 10612 | 10439 |
| 03/31/2015 | 10054 | 10712 | 10386 |
| 06/30/2015 | 10003 | 10742 | 10386 |
| 09/30/2015 | 9168 | 10051 | 9494 |
| 12/31/2015 | 9519 | 10758 | 10008 |
| 03/31/2016 | 9769 | 10903 | 10173 |
| 06/30/2016 | 10159 | 11171 | 10637 |
| 09/30/2016 | 10635 | 11602 | 11049 |
| 12/31/2016 | 11681 | 12045 | 11850 |
| 03/31/2017 | 12028 | 12776 | 12204 |
| 06/30/2017 | 12100 | 13170 | 12361 |
| 09/30/2017 | 12647 | 13760 | 12765 |
| 12/31/2017 | 13407 | 14675 | 13413 |
| 03/31/2018 | 13072 | 14563 | 13035 |
| 06/30/2018 | 13512 | 15064 | 13258 |
| 09/30/2018 | 14056 | 16225 | 13972 |
| 12/31/2018 | 11983 | 14031 | 12263 |
| 03/31/2019 | 13352 | 15946 | 13726 |
| 06/30/2019 | 13541 | 16633 | 14231 |
| 09/30/2019 | 13660 | 16915 | 14405 |
| 12/31/2019 | 14827 | 18449 | 15482 |
| 03/31/2020 | 10387 | 14834 | 11252 |
| 06/30/2020 | 12050 | 17881 | 12890 |
| 09/30/2020 | 12557 | 19478 | 13588 |
| 12/31/2020 | 15106 | 21844 | 15927 |
| 03/31/2021 | 17508 | 23193 | 17821 |
| 06/30/2021 | 18111 | 25175 | 18742 |
| 09/30/2021 | 17928 | 25322 | 18568 |
| 12/31/2021 | 19177 | 28114 | 19968 |
| 03/31/2022 | 19914 | 26821 | 19799 |
| 06/30/2022 | 17644 | 22503 | 17343 |
| 09/30/2022 | 16789 | 21404 | 16379 |
| 12/31/2022 | 18952 | 23023 | 18375 |
| 03/31/2023 | 18992 | 24749 | 18543 |
| 06/30/2023 | 19677 | 26912 | 19289 |
| 09/30/2023 | 19057 | 26031 | 18681 |
| 12/31/2023 | 20568 | 29075 | 20516 |
| 03/31/2024 | 22241 | 32144 | 22285 |
| 06/30/2024 | 21909 | 33521 | 21784 |
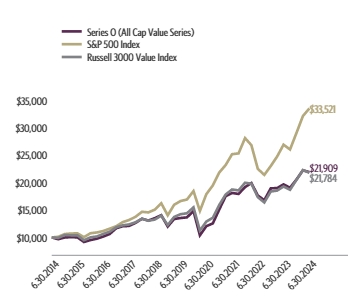
| Series O (All Cap Value Series) | 6.52% | 11.34% | 10.10% | 8.16% |
| S&P 500 Index | 15.29% | 24.56% | 15.05% | 12.86% |
| Russell 3000 Value Index | 6.18% | 12.93% | 8.89% | 8.10% |
The fund's past performance is not a good predictor of the fund's future performance.
| Net Assets | $93,533,140 |
| Number of Portfolio Holdings | 141 |
| Portfolio Turnover Rate | 12% |
| Financial | 20.8% |
| Consumer, Non-cyclical | 15.9% |
| Energy | 11.0% |
| Industrial | 11.0% |
| Technology | 10.4% |
| Consumer, Cyclical | 9.4% |
| Utilities | 7.0% |
| Other | 11.3% |
| Jefferies Financial Group, Inc. | 2.4% |
| Chevron Corp. | 2.3% |
| Diamondback Energy, Inc. | 2.1% |
| Berkshire Hathaway, Inc. — Class B | 2.0% |
| JPMorgan Chase & Co. | 2.0% |
| Bank of America Corp. | 1.9% |
| OGE Energy Corp. | 1.9% |
| Walmart, Inc. | 1.8% |
| Verizon Communications, Inc. | 1.7% |
| Pinnacle West Capital Corp. | 1.7% |
| Top 10 Total | 19.8% |
| |
1 | "Holdings Diversification (Market Exposure as % of Net Assets)" excludes any temporary cash investments, investments in Guggenheim Strategy Funds Trust mutual funds, or investments in Guggenheim Ultra Short Duration Fund. |
| |
2 | "10 Largest Holdings" excludes any temporary cash or derivative investments. |
There were no changes in or disagreements with fund accountants for the period.
| | | For additional information, including the fund's prospectus, financial information, holdings and proxy voting information, go to GuggenheimInvestments.com/variable-insurance-funds or, call 800 820 0888. |
SAR-C000027853-063024
Semi-Annual Shareholder Report | June 30, 2024
This semi-annual shareholder report contains important information about the Series P (High Yield Series) for the period of January 1, 2024 to June 30, 2024. You can find additional information about the fund at GuggenheimInvestments.com/variable-insurance-funds. You can also request this information by contacting 800 820 0888 or GuggenheimClientServices@mufg-is.com.
For the period of January 1, 2024 to June 30, 2024, the fund returned 2.49%, outperforming the fund's benchmark, the Bloomberg U.S. Aggregate Bond Index, which returned (0.71%) for the same period and underperforming the fund's secondary index, the Bloomberg U.S. Corporate High Yield Index, which returned 2.58% for the same period.
The fund's broad-based securities market index was changed from the Bloomberg U.S. Corporate High Yield Index to the Bloomberg U.S. Aggregate Bond Index to comply with the regulation that requires the fund's broad-based securities market index to represent the overall applicable market.
What factors materially affected the fund's performance over the last six months?
Overall, lower financing costs and borrower sentiment spurred heavy new issuance volume while strong market conditions kept spreads tight. The primary contributors to the fund's performance were exposure to higher quality credit and a restructured equity position, and the primary detractor was weaker performance from consumer cyclical holdings.
Cumulative performance* for the fund's most recently completed 10 years, assuming a $10,000 initial investment.
| 06/30/2014 | 10000 | 10000 | 10000 |
| 09/30/2014 | 9889 | 10017 | 9813 |
| 12/31/2014 | 9677 | 10196 | 9715 |
| 03/31/2015 | 9909 | 10360 | 9960 |
| 06/30/2015 | 10037 | 10186 | 9960 |
| 09/30/2015 | 9557 | 10311 | 9476 |
| 12/31/2015 | 9295 | 10252 | 9281 |
| 03/31/2016 | 9382 | 10563 | 9592 |
| 06/30/2016 | 10018 | 10797 | 10121 |
| 09/30/2016 | 10579 | 10847 | 10683 |
| 12/31/2016 | 10923 | 10524 | 10871 |
| 03/31/2017 | 11149 | 10610 | 11164 |
| 06/30/2017 | 11327 | 10763 | 11407 |
| 09/30/2017 | 11514 | 10854 | 11632 |
| 12/31/2017 | 11604 | 10897 | 11686 |
| 03/31/2018 | 11462 | 10737 | 11586 |
| 06/30/2018 | 11507 | 10720 | 11705 |
| 09/30/2018 | 11695 | 10722 | 11986 |
| 12/31/2018 | 11125 | 10898 | 11443 |
| 03/31/2019 | 11687 | 11219 | 12274 |
| 06/30/2019 | 12023 | 11564 | 12580 |
| 09/30/2019 | 12188 | 11826 | 12748 |
| 12/31/2019 | 12428 | 11848 | 13082 |
| 03/31/2020 | 10692 | 12221 | 11422 |
| 06/30/2020 | 11698 | 12575 | 12585 |
| 09/30/2020 | 12239 | 12652 | 13163 |
| 12/31/2020 | 13005 | 12737 | 14012 |
| 03/31/2021 | 13062 | 12308 | 14131 |
| 06/30/2021 | 13449 | 12533 | 14519 |
| 09/30/2021 | 13633 | 12539 | 14647 |
| 12/31/2021 | 13708 | 12541 | 14752 |
| 03/31/2022 | 13106 | 11797 | 14038 |
| 06/30/2022 | 11967 | 11243 | 12658 |
| 09/30/2022 | 11904 | 10709 | 12576 |
| 12/31/2022 | 12379 | 10909 | 13101 |
| 03/31/2023 | 12741 | 11232 | 13569 |
| 06/30/2023 | 12938 | 11137 | 13806 |
| 09/30/2023 | 13076 | 10778 | 13869 |
| 12/31/2023 | 13867 | 11512 | 14863 |
| 03/31/2024 | 14082 | 11423 | 15082 |
| 06/30/2024 | 14212 | 11430 | 15247 |
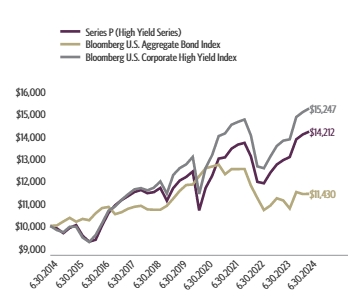
| Series P (High Yield Series) | 2.49% | 9.84% | 3.40% | 3.58% |
| Bloomberg U.S. Aggregate Bond Index | -0.71% | 2.63% | -0.23% | 1.35% |
| Bloomberg U.S. Corporate High Yield Index | 2.58% | 10.44% | 3.92% | 4.31% |
The fund's past performance is not a good predictor of the fund's future performance.
| Net Assets | $32,004,941 |
| Number of Portfolio Holdings | 273 |
| Portfolio Turnover Rate | 24% |
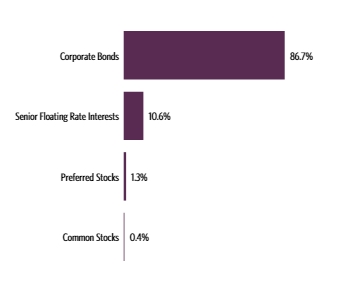
| Corporate Bonds | 86.7% |
| Senior Floating Rate Interests | 10.6% |
| Preferred Stocks | 1.3% |
| Common Stocks | 0.4% |
| BBB | 3.1% |
| BB | 46.7% |
| B | 39.3% |
| CCC | 6.5% |
| CC | 0.1% |
| NR3 | 0.1% |
| Other Instruments | 4.2% |
| Terraform Global Operating, LP, 6.13% | 1.3% |
| CPI CG, Inc., 8.63% | 1.1% |
| Cheplapharm Arzneimittel GmbH, 5.50% | 1.1% |
| Enviri Corp., 5.75% | 1.0% |
| CVR Energy, Inc., 5.75% | 1.0% |
| ITT Holdings LLC, 6.50% | 0.9% |
| VZ Secured Financing BV, 5.00% | 0.9% |
| CPI CG, Inc., 10.00% | 0.9% |
| Trinity Industries, Inc., 7.75% | 0.9% |
| GrafTech Finance, Inc., 4.63% | 0.8% |
| Top 10 Total | 9.9% |
| |
1 | "Holdings Diversification (Market Exposure as % of Net Assets)" excludes any temporary cash investments, investments in Guggenheim Strategy Funds Trust mutual funds, or investments in Guggenheim Ultra Short Duration Fund. |
| |
2 | Source: BlackRock Solutions. Credit quality ratings are measured on a scale that generally ranges from AAA (highest) to D (lowest). All securities except for those labeled "NR" have been rated by Moody's, Standard & Poor's ("S&P"), or Fitch, each of which is a Nationally Recognized Statistical Rating Organization ("NRSRO"). For purposes of this presentation, when ratings are available from more than one agency, the highest rating is used. Guggenheim Investments has converted ratings to the equivalent S&P rating. Security ratings are determined at the time of purchase and may change thereafter. |
3 | NR (not rated) securities do not necessarily indicate low credit quality. |
| |
4 | "10 Largest Holdings" excludes any temporary cash or derivative investments. |
There were no changes in or disagreements with fund accountants for the period.
| | | For additional information, including the fund's prospectus, financial information, holdings and proxy voting information, go to GuggenheimInvestments.com/variable-insurance-funds or, call 800 820 0888. |
SAR-C000027854-063024
Semi-Annual Shareholder Report | June 30, 2024
This semi-annual shareholder report contains important information about the Series Q (Small Cap Value Series) for the period of January 1, 2024 to June 30, 2024. You can find additional information about the fund at GuggenheimInvestments.com/variable-insurance-funds. You can also request this information by contacting 800 820 0888 or GuggenheimClientServices@mufg-is.com.
For the period of January 1, 2024 to June 30, 2024, the fund returned 0.32%, underperforming the fund's benchmark, the S&P 500 Index, which returned 15.29% for the same period and outperforming the fund's secondary index, the Russell 2000 Value Index, which returned (0.85%) for the same period.
The fund's broad-based securities market index was changed from the Russell 2000 Value Index to the S&P 500 Index to comply with the regulation that requires the fund's broad-based securities market index to represent the overall applicable market.
What factors materially affected the fund's performance over the last six months?
The fund outperformed the Russell 2000 Value Index for the reporting period. However, the return was subdued relative to many other equity benchmarks, as the AI-driven large cap technology growth stocks drove many indices much higher. The fund benefited from its underweight to banks, REITs, and consumer discretionary sectors. There was meaningful contribution from holdings in Kirby Corp, Pioneer Natural Resources, Encompass Health, Stifel Financial, Crocs, and Radnet.
Cumulative performance* for the fund's most recently completed 10 years, assuming a $10,000 initial investment.
| 06/30/2014 | 10000 | 10000 | 10000 |
| 09/30/2014 | 8969 | 10113 | 9142 |
| 12/31/2014 | 9505 | 10612 | 10001 |
| 03/31/2015 | 9670 | 10712 | 10200 |
| 06/30/2015 | 9536 | 10742 | 10078 |
| 09/30/2015 | 8534 | 10051 | 8996 |
| 12/31/2015 | 8876 | 10758 | 9254 |
| 03/31/2016 | 9231 | 10903 | 9412 |
| 06/30/2016 | 9397 | 11171 | 9817 |
| 09/30/2016 | 9872 | 11602 | 10688 |
| 12/31/2016 | 11237 | 12045 | 12192 |
| 03/31/2017 | 11235 | 12776 | 12176 |
| 06/30/2017 | 11213 | 13170 | 12258 |
| 09/30/2017 | 11559 | 13760 | 12884 |
| 12/31/2017 | 11653 | 14675 | 13148 |
| 03/31/2018 | 11496 | 14563 | 12800 |
| 06/30/2018 | 12069 | 15064 | 13863 |
| 09/30/2018 | 12295 | 16225 | 14086 |
| 12/31/2018 | 10177 | 14031 | 11456 |
| 03/31/2019 | 11198 | 15946 | 12823 |
| 06/30/2019 | 11395 | 16633 | 12999 |
| 09/30/2019 | 11562 | 16915 | 12924 |
| 12/31/2019 | 12475 | 18449 | 14022 |
| 03/31/2020 | 8237 | 14834 | 9022 |
| 06/30/2020 | 9786 | 17881 | 10727 |
| 09/30/2020 | 9747 | 19478 | 11001 |
| 12/31/2020 | 12354 | 21844 | 14672 |
| 03/31/2021 | 14842 | 23193 | 17777 |
| 06/30/2021 | 15236 | 25175 | 18588 |
| 09/30/2021 | 14910 | 25322 | 18034 |
| 12/31/2021 | 15588 | 28114 | 18819 |
| 03/31/2022 | 15825 | 26821 | 18368 |
| 06/30/2022 | 13802 | 22503 | 15562 |
| 09/30/2022 | 13235 | 21404 | 14844 |
| 12/31/2022 | 15006 | 23023 | 16094 |
| 03/31/2023 | 14857 | 24749 | 15988 |
| 06/30/2023 | 15226 | 26912 | 16497 |
| 09/30/2023 | 14755 | 26031 | 16008 |
| 12/31/2023 | 16549 | 29075 | 18451 |
| 03/31/2024 | 17300 | 32144 | 18986 |
| 06/30/2024 | 16603 | 33521 | 18294 |

| Series Q (Small Cap Value Series) | 0.32% | 9.04% | 7.82% | 5.20% |
| S&P 500 Index | 15.29% | 24.56% | 15.05% | 12.86% |
| Russell 2000 Value Index | -0.85% | 10.90% | 7.07% | 6.23% |
The fund's past performance is not a good predictor of the fund's future performance.
| Net Assets | $57,391,967 |
| Number of Portfolio Holdings | 103 |
| Portfolio Turnover Rate | 13% |
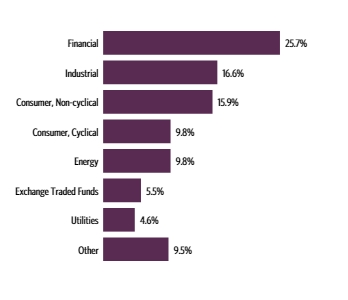
| Financial | 25.7% |
| Industrial | 16.6% |
| Consumer, Non-cyclical | 15.9% |
| Consumer, Cyclical | 9.8% |
| Energy | 9.8% |
| Exchange Traded Funds | 5.5% |
| Utilities | 4.6% |
| Other | 9.5% |
| SPDR S&P Biotech ETF | 3.1% |
| iShares Russell 2000 Value ETF | 2.5% |
| Encompass Health Corp. | 2.4% |
| Stifel Financial Corp. | 2.2% |
| Liberty Energy, Inc. — Class A | 2.0% |
| MGP Ingredients, Inc. | 2.0% |
| Murphy Oil Corp. | 2.0% |
| Rush Enterprises, Inc. — Class A | 2.0% |
| Kirby Corp. | 2.0% |
| OGE Energy Corp. | 1.9% |
| Top 10 Total | 22.1% |
| |
1 | "Holdings Diversification (Market Exposure as % of Net Assets)" excludes any temporary cash investments, investments in Guggenheim Strategy Funds Trust mutual funds, or investments in Guggenheim Ultra Short Duration Fund. |
| |
2 | "10 Largest Holdings" excludes any temporary cash or derivative investments. |
There were no changes in or disagreements with fund accountants for the period.
| | | For additional information, including the fund's prospectus, financial information, holdings and proxy voting information, go to GuggenheimInvestments.com/variable-insurance-funds or, call 800 820 0888. |
SAR-C000027855-063024
Semi-Annual Shareholder Report | June 30, 2024
This semi-annual shareholder report contains important information about the Series V (SMid Cap Value Series) for the period of January 1, 2024 to June 30, 2024. You can find additional information about the fund at GuggenheimInvestments.com/variable-insurance-funds. You can also request this information by contacting 800 820 0888 or GuggenheimClientServices@mufg-is.com.
For the period of January 1, 2024 to June 30, 2024, the fund returned 2.98%, underperforming the fund's benchmark, the S&P 500 Index, which returned 15.29% for the same period and outperforming the fund's secondary index, the Russell 2500 Value Index, which returned 1.50% for the same period.
The fund's broad-based securities market index was changed from the Russell 2500 Value Index to the S&P 500 Index to comply with the regulation that requires the fund's broad-based securities market index to represent the overall applicable market.
What factors materially affected the fund's performance over the last six months?
The fund outperformed the Russell 2500 Value Index for the reporting period. However, the return was subdued relative to many other equity benchmarks, as the AI-driven large cap technology growth stocks drove many indices much higher. The fund benefited from its industry allocations (overweight in Utilities and Technology while underweight in Consumer Discretionary and REITs) as well as strong individual stock performance from Jefferies Financial, Stifel Financial, Leidos and Crocs.
Cumulative performance* for the fund's most recently completed 10 years, assuming a $10,000 initial investment.
| 06/30/2014 | 10000 | 10000 | 10000 |
| 09/30/2014 | 9230 | 9360 | 10113 |
| 12/31/2014 | 9439 | 9930 | 10612 |
| 03/31/2015 | 9611 | 10229 | 10712 |
| 06/30/2015 | 9418 | 10099 | 10742 |
| 09/30/2015 | 8669 | 9131 | 10051 |
| 12/31/2015 | 8798 | 9385 | 10758 |
| 03/31/2016 | 9257 | 9698 | 10903 |
| 06/30/2016 | 9554 | 10121 | 11171 |
| 09/30/2016 | 10052 | 10746 | 11602 |
| 12/31/2016 | 11151 | 11750 | 12045 |
| 03/31/2017 | 11430 | 11941 | 12776 |
| 06/30/2017 | 11501 | 11979 | 13170 |
| 09/30/2017 | 12119 | 12438 | 13760 |
| 12/31/2017 | 12680 | 12967 | 14675 |
| 03/31/2018 | 12455 | 12623 | 14563 |
| 06/30/2018 | 13228 | 13356 | 15064 |
| 09/30/2018 | 13378 | 13713 | 16225 |
| 12/31/2018 | 11035 | 11365 | 14031 |
| 03/31/2019 | 12347 | 12855 | 15946 |
| 06/30/2019 | 12671 | 13099 | 16633 |
| 09/30/2019 | 13027 | 13116 | 16915 |
| 12/31/2019 | 13981 | 14043 | 18449 |
| 03/31/2020 | 9648 | 9178 | 14834 |
| 06/30/2020 | 11459 | 11069 | 17881 |
| 09/30/2020 | 11773 | 11461 | 19478 |
| 12/31/2020 | 14582 | 14728 | 21844 |
| 03/31/2021 | 17140 | 17206 | 23193 |
| 06/30/2021 | 17537 | 18067 | 25175 |
| 09/30/2021 | 17062 | 17694 | 25322 |
| 12/31/2021 | 18045 | 18819 | 28114 |
| 03/31/2022 | 18425 | 18537 | 26821 |
| 06/30/2022 | 16271 | 15684 | 22503 |
| 09/30/2022 | 15651 | 14977 | 21404 |
| 12/31/2022 | 17710 | 16357 | 23023 |
| 03/31/2023 | 17855 | 16585 | 24749 |
| 06/30/2023 | 18374 | 17310 | 26912 |
| 09/30/2023 | 17693 | 16676 | 26031 |
| 12/31/2023 | 19433 | 18971 | 29075 |
| 03/31/2024 | 20739 | 20122 | 32144 |
| 06/30/2024 | 20012 | 19256 | 33521 |
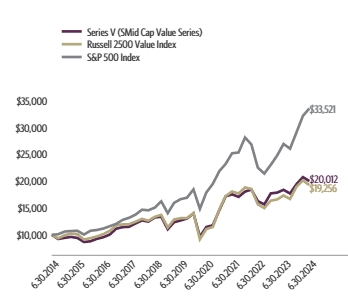
| Series V (SMid Cap Value Series) | 2.98% | 8.91% | 9.57% | 7.18% |
| S&P 500 Index | 15.29% | 24.56% | 15.05% | 12.86% |
| Russell 2500 Value Index | 1.50% | 11.24% | 8.01% | 6.77% |
The fund's past performance is not a good predictor of the fund's future performance.
| Net Assets | $155,845,824 |
| Number of Portfolio Holdings | 91 |
| Portfolio Turnover Rate | 17% |
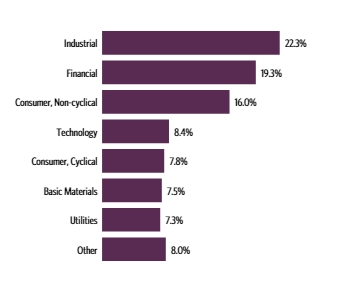
| Industrial | 22.3% |
| Financial | 19.3% |
| Consumer, Non-cyclical | 16.0% |
| Technology | 8.4% |
| Consumer, Cyclical | 7.8% |
| Basic Materials | 7.5% |
| Utilities | 7.3% |
| Other | 8.0% |
| Unum Group | 2.8% |
| Jefferies Financial Group, Inc. | 2.5% |
| Teradyne, Inc. | 2.4% |
| Stifel Financial Corp. | 2.4% |
| Pinnacle West Capital Corp. | 2.4% |
| OGE Energy Corp. | 2.3% |
| Teledyne Technologies, Inc. | 2.3% |
| Old Republic International Corp. | 2.2% |
| Evergy, Inc. | 2.2% |
| Diamondback Energy, Inc. | 2.2% |
| Top 10 Total | 23.7% |
| |
1 | "Holdings Diversification (Market Exposure as % of Net Assets)" excludes any temporary cash investments, investments in Guggenheim Strategy Funds Trust mutual funds, or investments in Guggenheim Ultra Short Duration Fund. |
| |
2 | "10 Largest Holdings" excludes any temporary cash or derivative investments. |
There were no changes in or disagreements with fund accountants for the period.
| | | For additional information, including the fund's prospectus, financial information, holdings and proxy voting information, go to GuggenheimInvestments.com/variable-insurance-funds or, call 800 820 0888. |
SAR-C000027857-063024
Semi-Annual Shareholder Report | June 30, 2024
This semi-annual shareholder report contains important information about the Series X (StylePlus—Small Growth Series) for the period of January 1, 2024 to June 30, 2024. You can find additional information about the fund at GuggenheimInvestments.com/variable-insurance-funds. You can also request this information by contacting 800 820 0888 or GuggenheimClientServices@mufg-is.com.
For the period of January 1, 2024 to June 30, 2024, the fund returned 3.93%, underperforming the fund's benchmark, the S&P 500 Index, which returned 15.29% for the same period and underperforming the fund's secondary index, the Russell 2000 Growth Index, which returned 4.44% for the same period.
The fund's broad-based securities market index was changed from the Russell 2000 Growth Index to the S&P 500 Index to comply with the regulation that requires the fund's broad-based securities market index to represent the overall applicable market.
What factors materially affected the fund's performance over the last six months?
The fund underperformed the Russell 2000 Growth Index (the "Index") for the reporting period. The equity sleeve was allocated 20%-30% to actively managed equity and 70%-80% to passive equity. Relative to the Index, the active equity sleeve detracted from performance. The passive equity component, which accounted for most of the fund's exposure to the broad equity market, consisted of equity index swaps and equity index futures, and generated performance roughly in line with the Index (before costs associated with derivatives); the active fixed income sleeve generated excess returns over the costs of equity index derivatives.
Cumulative performance* for the fund's most recently completed 10 years, assuming a $10,000 initial investment.
| 06/30/2014 | 10000 | 10000 | 10000 |
| 09/30/2014 | 9437 | 9387 | 10113 |
| 12/31/2014 | 10403 | 10331 | 10612 |
| 03/31/2015 | 11100 | 11016 | 10712 |
| 06/30/2015 | 11346 | 11234 | 10742 |
| 09/30/2015 | 9881 | 9767 | 10051 |
| 12/31/2015 | 10268 | 10189 | 10758 |
| 03/31/2016 | 9821 | 9711 | 10903 |
| 06/30/2016 | 10172 | 10026 | 11171 |
| 09/30/2016 | 11150 | 10951 | 11602 |
| 12/31/2016 | 11650 | 11342 | 12045 |
| 03/31/2017 | 12287 | 11948 | 12776 |
| 06/30/2017 | 12791 | 12473 | 13170 |
| 09/30/2017 | 13604 | 13248 | 13760 |
| 12/31/2017 | 14257 | 13856 | 14675 |
| 03/31/2018 | 14470 | 14174 | 14563 |
| 06/30/2018 | 15509 | 15200 | 15064 |
| 09/30/2018 | 16359 | 16039 | 16225 |
| 12/31/2018 | 12788 | 12566 | 14031 |
| 03/31/2019 | 14830 | 14721 | 15946 |
| 06/30/2019 | 15207 | 15125 | 16633 |
| 09/30/2019 | 14563 | 14494 | 16915 |
| 12/31/2019 | 16072 | 16145 | 18449 |
| 03/31/2020 | 11477 | 11986 | 14834 |
| 06/30/2020 | 15173 | 15651 | 17881 |
| 09/30/2020 | 16304 | 16771 | 19478 |
| 12/31/2020 | 21186 | 21737 | 21844 |
| 03/31/2021 | 22460 | 22797 | 23193 |
| 06/30/2021 | 23361 | 23690 | 25175 |
| 09/30/2021 | 22243 | 22351 | 25322 |
| 12/31/2021 | 22572 | 22353 | 28114 |
| 03/31/2022 | 19712 | 19530 | 26821 |
| 06/30/2022 | 15939 | 15770 | 22503 |
| 09/30/2022 | 15684 | 15808 | 21404 |
| 12/31/2022 | 16565 | 16461 | 23023 |
| 03/31/2023 | 17579 | 17461 | 24749 |
| 06/30/2023 | 18882 | 18692 | 26912 |
| 09/30/2023 | 17669 | 17324 | 26031 |
| 12/31/2023 | 20046 | 19533 | 29075 |
| 03/31/2024 | 21531 | 21014 | 32144 |
| 06/30/2024 | 20833 | 20400 | 33521 |
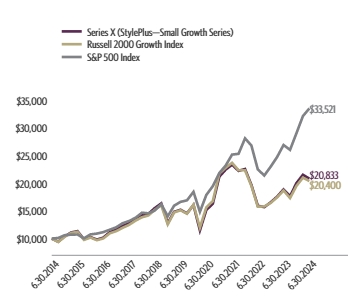
| Series X (StylePlus—Small Growth Series) | 3.93% | 10.34% | 6.50% | 7.62% |
| S&P 500 Index | 15.29% | 24.56% | 15.05% | 12.86% |
| Russell 2000 Growth Index | 4.44% | 9.14% | 6.17% | 7.39% |
The fund's past performance is not a good predictor of the fund's future performance.
| Net Assets | $26,201,956 |
| Number of Portfolio Holdings | 137 |
| Portfolio Turnover Rate | 40% |
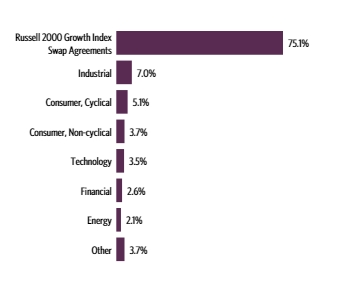
| Russell 2000 Growth Index Swap Agreements | 75.1% |
| Industrial | 7.0% |
| Consumer, Cyclical | 5.1% |
| Consumer, Non-cyclical | 3.7% |
| Technology | 3.5% |
| Financial | 2.6% |
| Energy | 2.1% |
| Other | 3.7% |
| Guggenheim Variable Insurance Strategy Fund III | 27.3% |
| Guggenheim Strategy Fund III | 26.2% |
| Guggenheim Strategy Fund II | 16.5% |
| Guggenheim Ultra Short Duration Fund — Institutional Class | 1.2% |
| Mueller Industries, Inc. | 0.6% |
| Boise Cascade Co. | 0.4% |
| Meritage Homes Corp. | 0.4% |
| Abercrombie & Fitch Co. — Class A | 0.4% |
| Fabrinet | 0.4% |
| InterDigital, Inc. | 0.4% |
| Top 10 Total | 73.8% |
| |
1 | "Holdings Diversification (Market Exposure as % of Net Assets)" excludes any temporary cash investments, investments in Guggenheim Strategy Funds Trust mutual funds, or investments in Guggenheim Ultra Short Duration Fund. |
| |
2 | "10 Largest Holdings" excludes any temporary cash or derivative investments. |
There were no changes in or disagreements with fund accountants for the period.
| | | For additional information, including the fund's prospectus, financial information, holdings and proxy voting information, go to GuggenheimInvestments.com/variable-insurance-funds or, call 800 820 0888. |
SAR-C000027859-063024
Semi-Annual Shareholder Report | June 30, 2024
This semi-annual shareholder report contains important information about the Series Y (StylePlus—Large Growth Series) for the period of January 1, 2024 to June 30, 2024. You can find additional information about the fund at GuggenheimInvestments.com/variable-insurance-funds. You can also request this information by contacting 800 820 0888 or GuggenheimClientServices@mufg-is.com.
For the period of January 1, 2024 to June 30, 2024, the fund returned 20.67%, outperforming the fund's benchmark, the S&P 500 Index, which returned 15.29% for the same period and underperforming the fund's secondary index, the Russell 1000 Growth Index, which returned 20.70% for the same period.
The fund's broad-based securities market index was changed from the Russell 1000 Growth Index to the S&P 500 Index to comply with the regulation that requires the fund's broad-based securities market index to represent the overall applicable market.
What factors materially affected the fund's performance over the last six months?
The fund slightly underperformed the Russell 1000 Growth Index (the "Index") for the reporting period. The equity sleeve was allocated 15%-25% to actively managed equity and 75%-85% to passive equity. Relative to the Index, the active equity sleeve returns were roughly in line. The passive equity component, which accounted for most of the fund's exposure to the broad equity market, consisted of equity index swaps and equity index futures, and generated performance roughly in line with the Index (before costs associated with derivatives); the active fixed income sleeve generated excess returns over the costs of equity index derivatives.
Cumulative performance* for the fund's most recently completed 10 years, assuming a $10,000 initial investment.
| 06/30/2014 | 10000 | 10000 | 10000 |
| 09/30/2014 | 10164 | 10113 | 10149 |
| 12/31/2014 | 10679 | 10612 | 10634 |
| 03/31/2015 | 11097 | 10712 | 11042 |
| 06/30/2015 | 11117 | 10742 | 11056 |
| 09/30/2015 | 10519 | 10051 | 10471 |
| 12/31/2015 | 11265 | 10758 | 11237 |
| 03/31/2016 | 11324 | 10903 | 11320 |
| 06/30/2016 | 11466 | 11171 | 11390 |
| 09/30/2016 | 12084 | 11602 | 11912 |
| 12/31/2016 | 12247 | 12045 | 12032 |
| 03/31/2017 | 13351 | 12776 | 13104 |
| 06/30/2017 | 13935 | 13170 | 13716 |
| 09/30/2017 | 14788 | 13760 | 14525 |
| 12/31/2017 | 15934 | 14675 | 15667 |
| 03/31/2018 | 16099 | 14563 | 15889 |
| 06/30/2018 | 16916 | 15064 | 16804 |
| 09/30/2018 | 18460 | 16225 | 18345 |
| 12/31/2018 | 15355 | 14031 | 15430 |
| 03/31/2019 | 17723 | 15946 | 17915 |
| 06/30/2019 | 18469 | 16633 | 18746 |
| 09/30/2019 | 18675 | 16915 | 19025 |
| 12/31/2019 | 20564 | 18449 | 21045 |
| 03/31/2020 | 17119 | 14834 | 18078 |
| 06/30/2020 | 22265 | 17881 | 23110 |
| 09/30/2020 | 25296 | 19478 | 26165 |
| 12/31/2020 | 28352 | 21844 | 29146 |
| 03/31/2021 | 28791 | 23193 | 29421 |
| 06/30/2021 | 32144 | 25175 | 32932 |
| 09/30/2021 | 32395 | 25322 | 33313 |
| 12/31/2021 | 36226 | 28114 | 37189 |
| 03/31/2022 | 32642 | 26821 | 33827 |
| 06/30/2022 | 25556 | 22503 | 26749 |
| 09/30/2022 | 24451 | 21404 | 25787 |
| 12/31/2022 | 25108 | 23023 | 26353 |
| 03/31/2023 | 28520 | 24749 | 30139 |
| 06/30/2023 | 31878 | 26912 | 34000 |
| 09/30/2023 | 30842 | 26031 | 32936 |
| 12/31/2023 | 35130 | 29075 | 37601 |
| 03/31/2024 | 39361 | 32144 | 41893 |
| 06/30/2024 | 42392 | 33521 | 45384 |

| Series Y (StylePlus—Large Growth Series) | 20.67% | 32.98% | 18.08% | 15.54% |
| S&P 500 Index | 15.29% | 24.56% | 15.05% | 12.86% |
| Russell 1000 Growth Index | 20.70% | 33.48% | 19.34% | 16.33% |
The fund's past performance is not a good predictor of the fund's future performance.
| Net Assets | $55,059,332 |
| Number of Portfolio Holdings | 63 |
| Portfolio Turnover Rate | 21% |
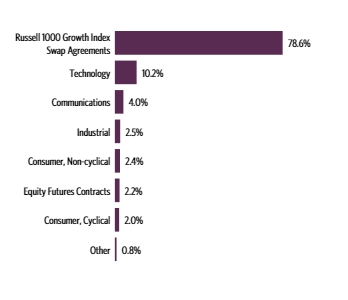
| Russell 1000 Growth Index Swap Agreements | 78.6% |
| Technology | 10.2% |
| Communications | 4.0% |
| Industrial | 2.5% |
| Consumer, Non-cyclical | 2.4% |
| Equity Futures Contracts | 2.2% |
| Consumer, Cyclical | 2.0% |
| Other | 0.8% |
| Guggenheim Strategy Fund III | 25.9% |
| Guggenheim Variable Insurance Strategy Fund III | 23.0% |
| Guggenheim Strategy Fund II | 19.4% |
| Guggenheim Ultra Short Duration Fund — Institutional Class | 7.6% |
| Microsoft Corp. | 2.6% |
| Apple, Inc. | 2.4% |
| NVIDIA Corp. | 2.2% |
| Alphabet, Inc. — Class C | 1.5% |
| Amazon.com, Inc. | 1.3% |
| Meta Platforms, Inc. — Class A | 0.7% |
| Top 10 Total | 86.6% |
| |
1 | "Holdings Diversification (Market Exposure as % of Net Assets)" excludes any temporary cash investments, investments in Guggenheim Strategy Funds Trust mutual funds, or investments in Guggenheim Ultra Short Duration Fund. |
| |
2 | "10 Largest Holdings" excludes any temporary cash or derivative investments. |
There were no changes in or disagreements with fund accountants for the period.
| | | For additional information, including the fund's prospectus, financial information, holdings and proxy voting information, go to GuggenheimInvestments.com/variable-insurance-funds or, call 800 820 0888. |
SAR-C000027860-063024
Semi-Annual Shareholder Report | June 30, 2024
This semi-annual shareholder report contains important information about the Series Z (Alpha Opportunity Series) for the period of January 1, 2024 to June 30, 2024. You can find additional information about the fund at GuggenheimInvestments.com/variable-insurance-funds. You can also request this information by contacting 800 820 0888 or GuggenheimClientServices@mufg-is.com.
| Variable Annuity | $102 | 1.97% |
For the period of January 1, 2024 to June 30, 2024, the fund returned 9.07%, underperforming the fund's benchmark, the S&P 500 Index, which returned 15.29% for the same period and outperforming the fund's secondary index, the ICE BofA 3-Month U.S. Treasury Bill Index, which returned 2.65% for the same period.
The fund's broad-based securities market index was changed from the ICE BofA 3-Month U.S. Treasury Bill Index to the S&P 500 Index to comply with the regulation that requires the fund's broad-based securities market index to represent the overall applicable market.
What factors materially affected the fund's performance over the last six months?
The global growth outlook remained modestly bullish and steady during the reporting period, while inflation seemed to be finally tamed, which could foreshadow interest rate cuts in the second half of 2024. This optimism helped the S&P 500 Index to gain more than 15% during the reporting period. The fund significantly outperformed the ICE BofA 3-Month U.S. Treasury Bill Index. Among the fundamental factors, the fund's exposure in higher profitability, lower volatility, and higher momentum names paid off well. The overall contribution of the industry tilts (overweights/underweights) was moderate whereas security selection was quite strong during the reporting period.
Cumulative performance* for the fund's most recently completed 10 years, assuming a $10,000 initial investment.
| 06/30/2014 | 10000 | 10000 | 10000 |
| 09/30/2014 | 9747 | 10113 | 10001 |
| 12/31/2014 | 10337 | 10612 | 10001 |
| 03/31/2015 | 10102 | 10712 | 10002 |
| 06/30/2015 | 9981 | 10742 | 10002 |
| 09/30/2015 | 9965 | 10051 | 10003 |
| 12/31/2015 | 9852 | 10758 | 10007 |
| 03/31/2016 | 10535 | 10903 | 10014 |
| 06/30/2016 | 10178 | 11171 | 10021 |
| 09/30/2016 | 10291 | 11602 | 10031 |
| 12/31/2016 | 11111 | 12045 | 10039 |
| 03/31/2017 | 11414 | 12776 | 10050 |
| 06/30/2017 | 11153 | 13170 | 10070 |
| 09/30/2017 | 11414 | 13760 | 10097 |
| 12/31/2017 | 11913 | 14675 | 10125 |
| 03/31/2018 | 11361 | 14563 | 10161 |
| 06/30/2018 | 10820 | 15064 | 10207 |
| 09/30/2018 | 11025 | 16225 | 10257 |
| 12/31/2018 | 10535 | 14031 | 10315 |
| 03/31/2019 | 10528 | 15946 | 10377 |
| 06/30/2019 | 10149 | 16633 | 10443 |
| 09/30/2019 | 10138 | 16915 | 10502 |
| 12/31/2019 | 10277 | 18449 | 10550 |
| 03/31/2020 | 9427 | 14834 | 10611 |
| 06/30/2020 | 9869 | 17881 | 10613 |
| 09/30/2020 | 9950 | 19478 | 10617 |
| 12/31/2020 | 10305 | 21844 | 10621 |
| 03/31/2021 | 11153 | 23193 | 10623 |
| 06/30/2021 | 10958 | 25175 | 10623 |
| 09/30/2021 | 10706 | 25322 | 10625 |
| 12/31/2021 | 11728 | 28114 | 10626 |
| 03/31/2022 | 10832 | 26821 | 10630 |
| 06/30/2022 | 10860 | 22503 | 10641 |
| 09/30/2022 | 10018 | 21404 | 10691 |
| 12/31/2022 | 10727 | 23023 | 10782 |
| 03/31/2023 | 11057 | 24749 | 10899 |
| 06/30/2023 | 11240 | 26912 | 11027 |
| 09/30/2023 | 11619 | 26031 | 11173 |
| 12/31/2023 | 11626 | 29075 | 11326 |
| 03/31/2024 | 13011 | 32144 | 11473 |
| 06/30/2024 | 12688 | 33521 | 11626 |
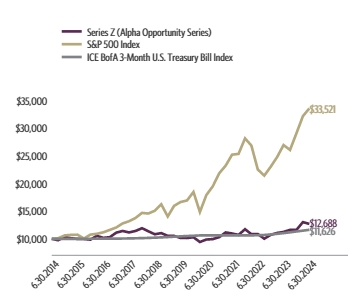
| Series Z (Alpha Opportunity Series) | 9.07% | 12.88% | 4.57% | 2.41% |
| S&P 500 Index | 15.29% | 24.56% | 15.05% | 12.86% |
| ICE BofA 3-Month U.S. Treasury Bill Index | 2.65% | 5.43% | 2.17% | 1.52% |
The fund's past performance is not a good predictor of the fund's future performance.
| Net Assets | $3,621,693 |
| Number of Portfolio Holdings | 162 |
| Portfolio Turnover Rate | 153% |
| Custom Basket Swap Agreements | 57.3% |
| Industrial | 17.7% |
| Consumer, Cyclical | 16.7% |
| Consumer, Non-cyclical | 16.6% |
| Financial | 12.1% |
| Communications | 10.8% |
| Technology | 7.0% |
| Utilities | 6.2% |
| Energy | 4.9% |
| Basic Materials | 0.8% |
| Government | 0.6% |
| Custom Basket Swap Agreements Short Sales | -100.9% |
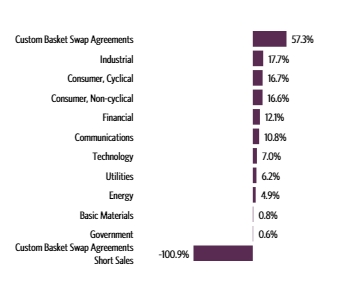
| United Therapeutics Corp. | 1.1% |
| Gilead Sciences, Inc. | 1.0% |
| AT&T, Inc. | 1.0% |
| Dropbox, Inc. — Class A | 1.0% |
| Cisco Systems, Inc. | 1.0% |
| Yelp, Inc. — Class A | 1.0% |
| General Motors Co. | 1.0% |
| Amdocs Ltd. | 1.0% |
| ONE Gas, Inc. | 1.0% |
| Innoviva, Inc. | 1.0% |
| Top 10 Total | 10.1% |
| |
1 | "Holdings Diversification (Market Exposure as % of Net Assets)" excludes any temporary cash investments, investments in Guggenheim Strategy Funds Trust mutual funds, or investments in Guggenheim Ultra Short Duration Fund. |
| |
2 | "10 Largest Holdings" excludes any temporary cash or derivative investments. |
There were no changes in or disagreements with fund accountants for the period.
| | | For additional information, including the fund's prospectus, financial information, holdings and proxy voting information, go to GuggenheimInvestments.com/variable-insurance-funds or, call 800 820 0888. |
SAR-C000027861-063024
Not required at this time.
| Item 3. | Audit Committee Financial Expert. |
Not required at this time.
| Item 4. | Principal Accountant Fees and Services. |
Not required at this time.
| Item 5. | Audit Committee of Listed Registrants. |
| (a) | Not applicable to this registrant. |
| (b) | Not applicable to this registrant. |
(a) The Schedule of Investments is included under Item 7 of this Form.
(b) Not applicable.
| Item 7. | Financial Statements and Financial Highlights for Open-End Management Investment Companies. |
6.30.2024
Guggenheim Variable Funds Trust Semi-Annual
Financial Report
Series |
Series A | (StylePlus—Large Core Series) | |
Series B | (Large Cap Value Series) | |
Series D | (World Equity Income Series) | |
Series E | (Total Return Bond Series) | |
Series F | (Floating Rate Strategies Series) | |
Series J | (StylePlus—Mid Growth Series) | |
Series N | (Managed Asset Allocation Series) | |
Series O | (All Cap Value Series) | |
Series P | (High Yield Series) | |
Series Q | (Small Cap Value Series) | |
Series V | (SMid Cap Value Series) | |
Series X | (StylePlus—Small Growth Series) | |
Series Y | (StylePlus—Large Growth Series) | |
Series Z | (Alpha Opportunity Series) | |
GuggenheimInvestments.com | GVFT-SEMI-0624x1224 |
| | |
Item 7: Financial Statements and Financial Highlights for Open-End Management Investment Companies (Semi-Annual Financial Report) | |
SERIES A (STYLEPLUS—LARGE CORE SERIES) | 2 |
SERIES B (LARGE CAP VALUE SERIES) | 8 |
SERIES D (WORLD EQUITY INCOME SERIES) | 13 |
SERIES E (TOTAL RETURN BOND SERIES) | 19 |
SERIES F (FLOATING RATE STRATEGIES SERIES) | 41 |
SERIES J (STYLEPLUS—MID GROWTH SERIES) | 53 |
SERIES N (MANAGED ASSET ALLOCATION SERIES) | 60 |
SERIES O (ALL CAP VALUE SERIES) | 66 |
SERIES P (HIGH YIELD SERIES) | 72 |
SERIES Q (SMALL CAP VALUE SERIES) | 83 |
SERIES V (SMID CAP VALUE SERIES) | 89 |
SERIES X (STYLEPLUS—SMALL GROWTH SERIES) | 95 |
SERIES Y (STYLEPLUS—LARGE GROWTH SERIES) | 102 |
SERIES Z (ALPHA OPPORTUNITY SERIES) | 108 |
NOTES TO FINANCIAL STATEMENTS | 121 |
OTHER INFORMATION | 143 |
Item 8: Changes in and Disagreements with Accountants for Open-End Management Investment Companies | 144 |
Item 9: Proxy Disclosures for Open-End Management Investment Companies | 145 |
Item 10: Renumeration Paid to Directors, Officers, and others of Open-End Management Investment Companies | 146 |
Item 11: Statement Regarding Basis for Approval of Investment Advisory Contract | 147 |
| | THE GUGGENHEIM FUNDS SEMI-ANNUAL FINANCIAL REPORT | 1 |
SCHEDULE OF INVESTMENTS (Unaudited) | June 30, 2024 |
SERIES A (STYLEPLUS—LARGE CORE SERIES) | |
| | Shares | | | Value | |
COMMON STOCKS† - 22.6% |
| | | | | | | | | |
Technology - 8.1% |
Microsoft Corp. | | | 10,414 | | | $ | 4,654,538 | |
Apple, Inc. | | | 20,505 | | | | 4,318,763 | |
NVIDIA Corp. | | | 26,610 | | | | 3,287,399 | |
Broadcom, Inc. | | | 841 | | | | 1,350,251 | |
Applied Materials, Inc. | | | 3,469 | | | | 818,649 | |
QUALCOMM, Inc. | | | 3,953 | | | | 787,359 | |
International Business Machines Corp. | | | 4,440 | | | | 767,898 | |
KLA Corp. | | | 872 | | | | 718,973 | |
Skyworks Solutions, Inc. | | | 6,245 | | | | 665,592 | |
Qorvo, Inc.* | | | 5,702 | | | | 661,660 | |
NXP Semiconductor N.V. | | | 2,337 | | | | 628,863 | |
NetApp, Inc. | | | 4,767 | | | | 613,990 | |
Fair Isaac Corp.* | | | 288 | | | | 428,734 | |
HP, Inc. | | | 9,948 | | | | 348,379 | |
Akamai Technologies, Inc.* | | | 2,152 | | | | 193,852 | |
Total Technology | | | | | | | 20,244,900 | |
| | | | | | | | | |
Consumer, Non-cyclical - 3.6% |
Merck & Company, Inc. | | | 7,297 | | | | 903,368 | |
AbbVie, Inc. | | | 5,188 | | | | 889,846 | |
Amgen, Inc. | | | 2,435 | | | | 760,816 | |
Philip Morris International, Inc. | | | 7,187 | | | | 728,259 | |
Regeneron Pharmaceuticals, Inc.* | | | 672 | | | | 706,292 | |
Gilead Sciences, Inc. | | | 10,125 | | | | 694,676 | |
Vertex Pharmaceuticals, Inc.* | | | 1,448 | | | | 678,707 | |
Bristol-Myers Squibb Co. | | | 15,864 | | | | 658,832 | |
Altria Group, Inc. | | | 13,968 | | | | 636,242 | |
United Rentals, Inc. | | | 949 | | | | 613,747 | |
Molina Healthcare, Inc.* | | | 1,857 | | | | 552,086 | |
DaVita, Inc.* | | | 3,334 | | | | 461,992 | |
HCA Healthcare, Inc. | | | 1,011 | | | | 324,814 | |
Eli Lilly & Co. | | | 314 | | | | 284,289 | |
UnitedHealth Group, Inc. | | | 329 | | | | 167,547 | |
Total Consumer, Non-cyclical | | | | | | | 9,061,513 | |
| | | | | | | | | |
Communications - 2.8% |
Alphabet, Inc. — Class C | | | 10,053 | | | | 1,843,921 | |
Amazon.com, Inc.* | | | 8,645 | | | | 1,670,646 | |
Cisco Systems, Inc. | | | 17,133 | | | | 813,989 | |
Meta Platforms, Inc. — Class A | | | 1,482 | | | | 747,254 | |
Motorola Solutions, Inc. | | | 1,704 | | | | 657,829 | |
eBay, Inc. | | | 10,976 | | | | 589,631 | |
F5, Inc.* | | | 3,372 | | | | 580,760 | |
Total Communications | | | | | | | 6,904,030 | |
| | | | | | | | | |
Industrial - 2.7% |
Caterpillar, Inc. | | | 2,330 | | | | 776,123 | |
Deere & Co. | | | 1,817 | | | | 678,886 | |
Lockheed Martin Corp. | | | 1,449 | | | | 676,828 | |
Dover Corp. | | | 3,236 | | | | 583,936 | |
Allegion plc | | | 4,779 | | | | 564,639 | |
Masco Corp. | | | 8,464 | | | | 564,295 | |
A O Smith Corp. | | | 6,872 | | | | 561,992 | |
Snap-on, Inc. | | | 2,116 | | | | 553,101 | |
Builders FirstSource, Inc.* | | | 3,861 | | | | 534,401 | |
Illinois Tool Works, Inc. | | | 2,244 | | | | 531,738 | |
Keysight Technologies, Inc.* | | | 1,799 | | | | 246,013 | |
Garmin Ltd. | | | 1,116 | | | | 181,819 | |
TransDigm Group, Inc. | | | 123 | | | | 157,146 | |
Total Industrial | | | | | | | 6,610,917 | |
| | | | | | | | | |
Financial - 2.5% |
Synchrony Financial | | | 13,309 | | | | 628,052 | |
MetLife, Inc. | | | 8,628 | | | | 605,599 | |
Prudential Financial, Inc. | | | 5,167 | | | | 605,521 | |
Travelers Companies, Inc. | | | 2,922 | | | | 594,160 | |
Hartford Financial Services Group, Inc. | | | 5,857 | | | | 588,863 | |
Fifth Third Bancorp | | | 16,002 | | | | 583,913 | |
Everest Group Ltd. | | | 1,501 | | | | 571,911 | |
Loews Corp. | | | 7,551 | | | | 564,362 | |
Berkshire Hathaway, Inc. — Class B* | | | 945 | | | | 384,426 | |
American Express Co. | | | 1,388 | | | | 321,391 | |
Arch Capital Group Ltd.* | | | 2,869 | | | | 289,453 | |
American International Group, Inc. | | | 3,789 | | | | 281,295 | |
JPMorgan Chase & Co. | | | 892 | | | | 180,416 | |
Total Financial | | | | | | | 6,199,362 | |
| | | | | | | | | |
Consumer, Cyclical - 2.0% |
General Motors Co. | | | 13,593 | | | | 631,531 | |
WW Grainger, Inc. | | | 672 | | | | 606,305 | |
Cummins, Inc. | | | 2,140 | | | | 592,630 | |
DR Horton, Inc. | | | 4,183 | | | | 589,510 | |
PACCAR, Inc. | | | 5,678 | | | | 584,493 | |
Domino’s Pizza, Inc. | | | 1,103 | | | | 569,512 | |
Lennar Corp. — Class A | | | 3,799 | | | | 569,356 | |
PulteGroup, Inc. | | | 5,119 | | | | 563,602 | |
BorgWarner, Inc. | | | 6,662 | | | | 214,783 | |
Tesla, Inc.* | | | 945 | | | | 186,997 | |
Total Consumer, Cyclical | | | | | | | 5,108,719 | |
| | | | | | | | | |
Energy - 0.6% |
Valero Energy Corp. | | | 4,015 | | | | 629,391 | |
Marathon Petroleum Corp. | | | 3,610 | | | | 626,263 | |
Exxon Mobil Corp. | | | 1,473 | | | | 169,572 | |
Total Energy | | | | | | | 1,425,226 | |
| | | | | | | | | |
Basic Materials - 0.2% |
CF Industries Holdings, Inc. | | | 7,434 | | | | 551,008 | |
| | | | | | | | | |
Utilities - 0.1% |
NRG Energy, Inc. | | | 3,327 | | | | 259,040 | |
| | | | | | | | | |
Total Common Stocks | | | | |
(Cost $46,681,697) | | | | | | | 56,364,715 | |
| | | | | | | | | |
2 | THE GUGGENHEIM FUNDS SEMI-ANNUAL FINANCIAL REPORT | SEE NOTES TO FINANCIAL STATEMENTS. |
SCHEDULE OF INVESTMENTS (Unaudited)(continued) | June 30, 2024 |
SERIES A (STYLEPLUS—LARGE CORE SERIES) | |
| | Shares | | | Value | |
MUTUAL FUNDS† - 74.1% |
Guggenheim Strategy Fund III1 | | | 2,467,337 | | | $ | 61,017,234 | |
Guggenheim Variable Insurance Strategy Fund III1 | | | 2,394,514 | | | | 59,168,442 | |
Guggenheim Strategy Fund II1 | | | 1,433,991 | | | | 35,347,871 | |
Guggenheim Ultra Short Duration Fund — Institutional Class1 | | | 2,910,363 | | | | 28,929,009 | |
Total Mutual Funds | | | | |
(Cost $185,158,078) | | | | | | | 184,462,556 | |
| | | | | | | | | |
MONEY MARKET FUND***,† - 3.5% |
Dreyfus Treasury Securities Cash Management Fund — Institutional Shares, 5.18%2 | | | 8,825,316 | | | | 8,825,316 | |
Total Money Market Fund | | | | |
(Cost $8,825,316) | | | | | | | 8,825,316 | |
| | | | | | | | | |
Total Investments - 100.2% | | | | |
(Cost $240,665,091) | | $ | 249,652,587 | |
Other Assets & Liabilities, net - (0.2)% | | | (568,765 | ) |
Total Net Assets - 100.0% | | $ | 249,083,822 | |
Futures Contracts |
Description | | Number of
Contracts | | | Expiration
Date | | | Notional
Amount | | | Value and
Unrealized
Depreciation** | |
Equity Futures Contracts Purchased† |
S&P 500 Index Mini Futures Contracts | | | 14 | | | | Sep 2024 | | | $ | 3,866,450 | | | $ | (16,696 | ) |
Total Return Swap Agreements |
Counterparty | Index | Type | Financing
Rate | | Payment
Frequency | | | Maturity
Date | | | Units | | | Notional
Amount | | | Value and
Unrealized
Appreciation | |
OTC Equity Index Swap Agreements†† |
Wells Fargo Bank, N.A. | S&P 500 Index | Pay | 6.12% (Federal Funds Rate + 0.79%) | | | At Maturity | | | | 9/30/24 | | | | 15,934 | | | $ | 189,728,528 | | | $ | — | |
* | Non-income producing security. |
** | Includes cumulative appreciation (depreciation). Variation margin is reported within the Statement of Assets and Liabilities. |
*** | A copy of each underlying unaffiliated fund’s financial statements is available at the SEC’s website at www.sec.gov. |
† | Value determined based on Level 1 inputs — See Note 4. |
†† | Value determined based on Level 2 inputs — See Note 4. |
1 | Affiliated issuer. |
2 | Rate indicated is the 7-day yield as of June 30, 2024. |
| | plc — Public Limited Company |
| | |
| | See Sector Classification in Other Information section. |
SEE NOTES TO FINANCIAL STATEMENTS. | THE GUGGENHEIM FUNDS SEMI-ANNUAL FINANCIAL REPORT | 3 |
SCHEDULE OF INVESTMENTS (Unaudited)(concluded) | June 30, 2024 |
SERIES A (STYLEPLUS—LARGE CORE SERIES) | |
The following table summarizes the inputs used to value the Fund’s investments at June 30, 2024 (See Note 4 in the Notes to Financial Statements):
Investments in Securities (Assets) | | Level 1
Quoted
Prices | | | Level 2
Significant
Observable
Inputs | | | Level 3
Significant
Unobservable
Inputs | | | Total | |
Common Stocks | | $ | 56,364,715 | | | $ | — | | | $ | — | | | $ | 56,364,715 | |
Mutual Funds | | | 184,462,556 | | | | — | | | | — | | | | 184,462,556 | |
Money Market Fund | | | 8,825,316 | | | | — | | | | — | | | | 8,825,316 | |
Equity Index Swap Agreements** | | | — | | | | — | * | | | — | | | | — | |
Total Assets | | $ | 249,652,587 | | | $ | — | | | $ | — | | | $ | 249,652,587 | |
Investments in Securities (Liabilities) | | Level 1
Quoted
Prices | | | Level 2
Significant
Observable
Inputs | | | Level 3
Significant
Unobservable
Inputs | | | Total | |
Equity Futures Contracts** | | $ | 16,696 | | | $ | — | | | $ | — | | | $ | 16,696 | |
* | Security has a market value of $0. |
** | This derivative is reported as unrealized appreciation/depreciation at period end. |
Affiliated Transactions
Investments representing 5% or more of the outstanding voting shares of a company, or control of or by, or common control under Guggenheim Investments (“GI”), result in that company being considered an affiliated issuer, as defined in the 1940 Act.
The Fund may invest in certain of the underlying series of Guggenheim Strategy Funds Trust, including Guggenheim Strategy Fund II, Guggenheim Strategy Fund III and Guggenheim Variable Insurance Strategy Fund III (collectively, the “Guggenheim Strategy Funds”), each of which are open-end management investment companies managed by GI. The Guggenheim Strategy Funds, which launched on March 11, 2014, are offered as short term investment options only to mutual funds, trusts, and other accounts managed by GI and/or its affiliates, and are not available to the public. The Guggenheim Strategy Funds pay no investment management fees. The Guggenheim Strategy Funds’ annual report on Form N-CSR dated September 30, 2023 is available publicly or upon request. This information is available from the EDGAR database on the SEC’s website at https://www.sec.gov/Archives/edgar/data/1601445/000182126823000217/gug86449-ncsr.htm. The Fund may invest in certain of the underlying series of Guggenheim Funds Trust, which are open-end management investment companies managed by GI, are available to the public and whose most recent annual report on Form N-CSR is available publicly or upon request.
Transactions during the period ended June 30, 2024, in which the company is an affiliated issuer, were as follows:
Security Name | | Value
12/31/23 | | | Additions | | | Reductions | | | Realized
Gain (Loss) | | | Change in
Unrealized
Appreciation
(Depreciation) | | | Value
06/30/24 | | | Shares
06/30/24 | | | Investment
Income | |
Mutual Funds | | | | | | | | | | | | | | | | | | | | | | | | | | | | | | | | |
Guggenheim Strategy Fund II | | $ | 33,013,461 | | | $ | 10,949,374 | | | $ | (8,796,179 | ) | | $ | 172,515 | | | $ | 8,700 | | | $ | 35,347,871 | | | | 1,433,991 | | | $ | 952,966 | |
Guggenheim Strategy Fund III | | | 55,350,435 | | | | 5,245,612 | | | | — | | | | — | | | | 421,187 | | | | 61,017,234 | | | | 2,467,337 | | | | 1,559,210 | |
Guggenheim Ultra Short Duration Fund — Institutional Class | | | 27,939,102 | | | | 732,150 | | | | — | | | | — | | | | 257,757 | | | | 28,929,009 | | | | 2,910,363 | | | | 737,155 | |
Guggenheim Variable Insurance Strategy Fund III | | | 52,343,502 | | | | 6,424,440 | | | | — | | | | — | | | | 400,500 | | | | 59,168,442 | | | | 2,394,514 | | | | 1,509,205 | |
| | | $ | 168,646,500 | | | $ | 23,351,576 | | | $ | (8,796,179 | ) | | $ | 172,515 | | | $ | 1,088,144 | | | $ | 184,462,556 | | | | | | | $ | 4,758,536 | |
4 | THE GUGGENHEIM FUNDS SEMI-ANNUAL FINANCIAL REPORT | SEE NOTES TO FINANCIAL STATEMENTS. |
SERIES A (STYLEPLUS—LARGE CORE SERIES) | |
STATEMENT OF ASSETS AND LIABILITIES (Unaudited) |
June 30, 2024 |
Assets: |
Investments in unaffiliated issuers, at value (cost $55,507,013) | | $ | 65,190,031 | |
Investments in affiliated issuers, at value (cost $185,158,078) | | | 184,462,556 | |
Cash | | | 5 | |
Segregated cash with broker | | | 421,000 | |
Prepaid expenses | | | 13,506 | |
Receivables: |
Swap settlement | | | 5,448,479 | |
Dividends | | | 813,744 | |
Interest | | | 31,556 | |
Fund shares sold | | | 22,233 | |
Total assets | | | 256,403,110 | |
| | | | | |
Liabilities: |
Segregated cash due to broker | | | 6,150,000 | |
Payable for: |
Securities purchased | | | 763,454 | |
Fund shares redeemed | | | 164,256 | |
Management fees | | | 103,964 | |
Distribution and service fees | | | 47,489 | |
Variation margin on futures contracts | | | 15,750 | |
Transfer agent/maintenance fees | | | 2,140 | |
Fund accounting/administration fees | | | 1,760 | |
Trustees’ fees* | | | 1,475 | |
Miscellaneous | | | 69,000 | |
Total liabilities | | | 7,319,288 | |
Net assets | | $ | 249,083,822 | |
| | | | | |
Net assets consist of: |
Paid in capital | | $ | 194,983,484 | |
Total distributable earnings (loss) | | | 54,100,338 | |
Net assets | | $ | 249,083,822 | |
Capital shares outstanding | | | 5,300,395 | |
Net asset value per share | | $ | 46.99 | |
STATEMENT OF OPERATIONS (Unaudited) |
Six Months Ended June 30, 2024 |
Investment Income: |
Dividends from securities of unaffiliated issuers (net of foreign withholding tax of $724) | | $ | 395,064 | |
Dividends from securities of affiliated issuers | | | 4,758,536 | |
Interest | | | 234,435 | |
Total investment income | | | 5,388,035 | |
| | | | | |
Expenses: |
Management fees | | | 891,526 | |
Distribution and service fees | | | 297,175 | |
Transfer agent/maintenance fees | | | 12,595 | |
Interest expense | | | 339,930 | |
Fund accounting/administration fees | | | 50,034 | |
Professional fees | | | 15,073 | |
Trustees’ fees* | | | 8,010 | |
Custodian fees | | | 4,002 | |
Line of credit fees | | | 2,438 | |
Miscellaneous | | | 9,677 | |
Total expenses | | | 1,630,460 | |
Less: |
Expenses reimbursed by Adviser | | | (8 | ) |
Expenses waived by Adviser | | | (275,787 | ) |
Earnings credits applied | | | (1,738 | ) |
Total waived/reimbursed expenses | | | (277,533 | ) |
Net expenses | | | 1,352,927 | |
Net investment income | | | 4,035,108 | |
| | | | | |
Net Realized and Unrealized Gain (Loss): |
Net realized gain (loss) on: |
Investments in unaffiliated issuers | | | 4,201,802 | |
Investments in affiliated issuers | | | 172,515 | |
Swap agreements | | | 39,630,379 | |
Futures contracts | | | 305,367 | |
Net realized gain | | | 44,310,063 | |
Net change in unrealized appreciation (depreciation) on: |
Investments in unaffiliated issuers | | | 3,108,172 | |
Investments in affiliated issuers | | | 1,088,144 | |
Swap agreements | | | (18,411,216 | ) |
Futures contracts | | | (158,294 | ) |
Net change in unrealized appreciation (depreciation) | | | (14,373,194 | ) |
Net realized and unrealized gain | | | 29,936,869 | |
Net increase in net assets resulting from operations | | $ | 33,971,977 | |
* | Relates to Trustees not deemed “interested persons” within the meaning of Section 2(a)(19) of the 1940 Act. |
SEE NOTES TO FINANCIAL STATEMENTS. | THE GUGGENHEIM FUNDS SEMI-ANNUAL FINANCIAL REPORT | 5 |
SERIES A (STYLEPLUS—LARGE CORE SERIES) | |
STATEMENTS OF CHANGES IN NET ASSETS |
| | Six Months Ended
June 30, 2024
(Unaudited) | | | Year Ended
December 31,
2023 | |
Increase (Decrease) in Net Assets from Operations: | | | | | | | | |
Net investment income | | $ | 4,035,108 | | | $ | 7,520,223 | |
Net realized gain on investments | | | 44,310,063 | | | | 16,107,826 | |
Net change in unrealized appreciation (depreciation) on investments | | | (14,373,194 | ) | | | 26,755,730 | |
Net increase in net assets resulting from operations | | | 33,971,977 | | | | 50,383,779 | |
| | | | | | | | | |
Distributions to shareholders | | | — | | | | (3,382,567 | ) |
| | | | | | | | | |
Capital share transactions: | | | | | | | | |
Proceeds from sale of shares | | | 2,327,779 | | | | 4,913,388 | |
Distributions reinvested | | | — | | | | 3,382,567 | |
Cost of shares redeemed | | | (14,719,785 | ) | | | (23,907,800 | ) |
Net decrease from capital share transactions | | | (12,392,006 | ) | | | (15,611,845 | ) |
Net increase in net assets | | | 21,579,971 | | | | 31,389,367 | |
| | | | | | | | | |
Net assets: | | | | | | | | |
Beginning of period | | | 227,503,851 | | | | 196,114,484 | |
End of period | | $ | 249,083,822 | | | $ | 227,503,851 | |
| | | | | | | | | |
Capital share activity: | | | | | | | | |
Shares sold | | | 53,645 | | | | 134,474 | |
Shares issued from reinvestment of distributions | | | — | | | | 88,758 | |
Shares redeemed | | | (336,160 | ) | | | (654,163 | ) |
Net decrease in shares | | | (282,515 | ) | | | (430,931 | ) |
6 | THE GUGGENHEIM FUNDS SEMI-ANNUAL FINANCIAL REPORT | SEE NOTES TO FINANCIAL STATEMENTS. |
SERIES A (STYLEPLUS—LARGE CORE SERIES) | |
This table is presented to show selected data for a share outstanding throughout each period and to assist shareholders in evaluating a Fund’s performance for the periods presented.
| | Six Months Ended
June 30, 2024a | | | Year Ended
December 31,
2023 | | | Year Ended
December 31,
2022 | | | Year Ended
December 31,
2021 | | | Year Ended
December 31,
2020 | | | Year Ended
December 31,
2019 | |
Per Share Data |
Net asset value, beginning of period | | $ | 40.75 | | | $ | 32.61 | | | $ | 56.79 | | | $ | 49.39 | | | $ | 44.24 | | | $ | 36.80 | |
Income (loss) from investment operations: |
Net investment income (loss)b | | | .74 | | | | 1.30 | | | | .64 | | | | .26 | | | | .38 | | | | .68 | |
Net gain (loss) on investments (realized and unrealized) | | | 5.50 | | | | 7.43 | | | | (11.88 | ) | | | 13.22 | | | | 7.46 | | | | 10.06 | |
Total from investment operations | | | 6.24 | | | | 8.73 | | | | (11.24 | ) | | | 13.48 | | | | 7.84 | | | | 10.74 | |
Less distributions from: |
Net investment income | | | — | | | | (.59 | ) | | | (.27 | ) | | | (.41 | ) | | | (.74 | ) | | | (.91 | ) |
Net realized gains | | | — | | | | — | | | | (12.67 | ) | | | (5.67 | ) | | | (1.95 | ) | | | (2.39 | ) |
Total distributions | | | — | | | | (.59 | ) | | | (12.94 | ) | | | (6.08 | ) | | | (2.69 | ) | | | (3.30 | ) |
Net asset value, end of period | | $ | 46.99 | | | $ | 40.75 | | | $ | 32.61 | | | $ | 56.79 | | | $ | 49.39 | | | $ | 44.24 | |
|
Total Returnc | | | 15.31 | % | | | 26.90 | % | | | (20.67 | %) | | | 28.48 | % | | | 18.78 | % | | | 29.97 | % |
Ratios/Supplemental Data |
Net assets, end of period (in thousands) | | $ | 249,084 | | | $ | 227,504 | | | $ | 196,114 | | | $ | 269,971 | | | $ | 230,088 | | | $ | 218,082 | |
Ratios to average net assets: |
Net investment income (loss) | | | 3.39 | % | | | 3.58 | % | | | 1.54 | % | | | 0.49 | % | | | 0.88 | % | | | 1.65 | % |
Total expensesd | | | 1.37 | % | | | 1.31 | % | | | 1.18 | % | | | 1.14 | % | | | 1.22 | % | | | 1.27 | % |
Net expensese,f | | | 1.14 | % | | | 1.03 | % | | | 0.92 | % | | | 0.85 | % | | | 0.89 | % | | | 0.95 | % |
Portfolio turnover rate | | | 26 | % | | | 52 | % | | | 63 | % | | | 34 | % | | | 63 | % | | | 41 | % |
a | Unaudited figures for the period ended June 30, 2024. Percentage amounts for the period, except total return and portfolio turnover rate, have been annualized. |
b | Net investment income (loss) per share was computed using average shares outstanding throughout the period. |
c | Total return does not take into account any of the expenses associated with an investment in variable insurance products. If total return had taken into account these expenses, performance would have been lower. Shares of a series of Guggenheim Variable Funds Trust are available only through the purchase of such products. |
d | Does not include expenses of the underlying funds in which the Fund invests. |
e | Net expense information reflects the expense ratios after expense waivers and reimbursements, as applicable. |
f | Net expenses may include expenses that are excluded from the expense limitation agreement. Excluding these expenses, the net expense ratios for the years presented would be: |
| | 6/30/24a | 12/31/23 | 12/31/22 | 12/31/21 | 12/31/20 | 12/31/19 |
| | 0.85% | 0.84% | 0.87% | 0.84% | 0.87% | 0.89% |
SEE NOTES TO FINANCIAL STATEMENTS. | THE GUGGENHEIM FUNDS SEMI-ANNUAL FINANCIAL REPORT | 7 |
SCHEDULE OF INVESTMENTS (Unaudited) | June 30, 2024 |
SERIES B (LARGE CAP VALUE SERIES) | |
| | Shares | | | Value | |
COMMON STOCKS† - 92.2% |
| | | | | | | | | |
Financial - 18.5% |
Bank of America Corp. | | | 138,250 | | | $ | 5,498,202 | |
Berkshire Hathaway, Inc. — Class B* | | | 12,951 | | | | 5,268,467 | |
JPMorgan Chase & Co. | | | 18,035 | | | | 3,647,759 | |
First Horizon Corp. | | | 224,284 | | | | 3,536,959 | |
Jefferies Financial Group, Inc. | | | 66,119 | | | | 3,290,081 | |
American Tower Corp. — Class A REIT | | | 14,076 | | | | 2,736,093 | |
Charles Schwab Corp. | | | 34,239 | | | | 2,523,072 | |
Wells Fargo & Co. | | | 39,933 | | | | 2,371,621 | |
Synovus Financial Corp. | | | 51,898 | | | | 2,085,781 | |
Unum Group | | | 39,083 | | | | 1,997,532 | |
Mastercard, Inc. — Class A | | | 4,281 | | | | 1,888,606 | |
Goldman Sachs Group, Inc. | | | 3,383 | | | | 1,530,198 | |
STAG Industrial, Inc. REIT | | | 34,679 | | | | 1,250,525 | |
Total Financial | | | | | | | 37,624,896 | |
| | | | | | | | | |
Consumer, Non-cyclical - 15.5% |
Johnson & Johnson | | | 21,775 | | | | 3,182,634 | |
Tyson Foods, Inc. — Class A | | | 55,425 | | | | 3,166,985 | |
Medtronic plc | | | 34,609 | | | | 2,724,074 | |
Humana, Inc. | | | 7,086 | | | | 2,647,684 | |
Encompass Health Corp. | | | 28,767 | | | | 2,467,921 | |
PayPal Holdings, Inc.* | | | 39,093 | | | | 2,268,567 | |
Merck & Company, Inc. | | | 18,090 | | | | 2,239,542 | |
Coca-Cola Co. | | | 33,195 | | | | 2,112,862 | |
Ingredion, Inc. | | | 17,910 | | | | 2,054,277 | |
Archer-Daniels-Midland Co. | | | 33,763 | | | | 2,040,973 | |
HCA Healthcare, Inc. | | | 6,126 | | | | 1,968,161 | |
Bunge Global S.A. | | | 16,341 | | | | 1,744,729 | |
Euronet Worldwide, Inc.* | | | 12,016 | | | | 1,243,656 | |
MGP Ingredients, Inc. | | | 12,554 | | | | 934,017 | |
Pfizer, Inc. | | | 26,058 | | | | 729,103 | |
Total Consumer, Non-cyclical | | | | | | | 31,525,185 | |
| | | | | | | | | |
Energy - 11.3% |
Chevron Corp. | | | 33,255 | | | | 5,201,747 | |
ConocoPhillips | | | 37,877 | | | | 4,332,371 | |
Diamondback Energy, Inc. | | | 19,179 | | | | 3,839,444 | |
Coterra Energy, Inc. — Class A | | | 84,827 | | | | 2,262,336 | |
Equities Corp. | | | 50,365 | | | | 1,862,498 | |
Marathon Oil Corp. | | | 62,440 | | | | 1,790,155 | |
Kinder Morgan, Inc. | | | 82,457 | | | | 1,638,421 | |
Exxon Mobil Corp. | | | 8,886 | | | | 1,022,956 | |
Range Resources Corp. | | | 29,996 | | | | 1,005,766 | |
Total Energy | | | | | | | 22,955,694 | |
| | | | | | | | | |
Technology - 10.7% |
Microsoft Corp. | | | 7,429 | | | | 3,320,392 | |
Leidos Holdings, Inc. | | | 21,429 | | | | 3,126,063 | |
Fiserv, Inc.* | | | 15,738 | | | | 2,345,591 | |
Fortinet, Inc.* | | | 38,345 | | | | 2,311,053 | |
Applied Materials, Inc. | | | 9,397 | | | | 2,217,598 | |
Teradyne, Inc. | | | 14,622 | | | | 2,168,296 | |
QUALCOMM, Inc. | | | 10,495 | | | | 2,090,394 | |
KLA Corp. | | | 2,414 | | | | 1,990,367 | |
NXP Semiconductor N.V. | | | 6,849 | | | | 1,842,998 | |
Intel Corp. | | | 12,988 | | | | 402,238 | |
Total Technology | | | | | | | 21,814,990 | |
| | | | | | | | | |
Consumer, Cyclical - 10.0% |
Walmart, Inc. | | | 69,112 | | | | 4,679,573 | |
Levi Strauss & Co. — Class A | | | 116,809 | | | | 2,252,078 | |
Ferguson plc | | | 10,801 | | | | 2,091,614 | |
Las Vegas Sands Corp. | | | 44,138 | | | | 1,953,107 | |
Crocs, Inc.* | | | 12,308 | | | | 1,796,229 | |
Lear Corp. | | | 15,549 | | | | 1,775,851 | |
Delta Air Lines, Inc. | | | 36,325 | | | | 1,723,258 | |
Southwest Airlines Co. | | | 47,188 | | | | 1,350,049 | |
H&E Equipment Services, Inc. | | | 21,423 | | | | 946,254 | |
BorgWarner, Inc. | | | 27,517 | | | | 887,148 | |
Advance Auto Parts, Inc. | | | 13,809 | | | | 874,524 | |
Total Consumer, Cyclical | | | | | | | 20,329,685 | |
| | | | | | | | | |
Industrial - 7.6% |
Curtiss-Wright Corp. | | | 12,698 | | | | 3,440,904 | |
Knight-Swift Transportation Holdings, Inc. | | | 52,061 | | | | 2,598,885 | |
Advanced Energy Industries, Inc. | | | 23,086 | | | | 2,510,833 | |
L3Harris Technologies, Inc. | | | 10,925 | | | | 2,453,537 | |
Teledyne Technologies, Inc.* | | | 4,553 | | | | 1,766,473 | |
Eagle Materials, Inc. | | | 7,586 | | | | 1,649,651 | |
Johnson Controls International plc | | | 15,821 | | | | 1,051,622 | |
Total Industrial | | | | | | | 15,471,905 | |
| | | | | | | | | |
Communications - 6.8% |
Verizon Communications, Inc. | | | 124,002 | | | | 5,113,843 | |
Alphabet, Inc. — Class A | | | 23,889 | | | | 4,351,382 | |
AT&T, Inc. | | | 117,235 | | | | 2,240,361 | |
T-Mobile US, Inc. | | | 7,508 | | | | 1,322,759 | |
Walt Disney Co. | | | 8,839 | | | | 877,624 | |
Total Communications | | | | | | | 13,905,969 | |
| | | | | | | | | |
Utilities - 6.3% |
OGE Energy Corp. | | | 99,731 | | | | 3,560,396 | |
Edison International | | | 39,837 | | | | 2,860,695 | |
Pinnacle West Capital Corp. | | | 30,934 | | | | 2,362,739 | |
Exelon Corp. | | | 61,531 | | | | 2,129,588 | |
Duke Energy Corp. | | | 18,730 | | | | 1,877,308 | |
Total Utilities | | | | | | | 12,790,726 | |
| | | | | | | | | |
Basic Materials - 5.5% |
Freeport-McMoRan, Inc. | | | 48,972 | | | | 2,380,039 | |
Westlake Corp. | | | 15,443 | | | | 2,236,455 | |
Nucor Corp. | | | 13,164 | | | | 2,080,965 | |
DuPont de Nemours, Inc. | | | 21,889 | | | | 1,761,846 | |
Reliance, Inc. | | | 5,518 | | | | 1,575,941 | |
Huntsman Corp. | | | 48,718 | | | | 1,109,309 | |
Total Basic Materials | | | | | | | 11,144,555 | |
| | | | | | | | | |
Total Common Stocks | | | | |
(Cost $143,330,206) | | | | | | | 187,563,605 | |
| | | | | | | | | |
8 | THE GUGGENHEIM FUNDS SEMI-ANNUAL FINANCIAL REPORT | SEE NOTES TO FINANCIAL STATEMENTS. |
SCHEDULE OF INVESTMENTS (Unaudited)(concluded) | June 30, 2024 |
SERIES B (LARGE CAP VALUE SERIES) | |
| | Shares | | | Value | |
EXCHANGE-TRADED FUND**,† - 3.6% |
iShares Russell 1000 Value ETF | | | 42,314 | | | $ | 7,382,523 | |
Total Exchange-Traded Fund | | | | |
(Cost $6,435,561) | | | | | | | 7,382,523 | |
| | | | | | | | | |
MONEY MARKET FUND**,† - 4.3% |
Dreyfus Treasury Securities Cash Management Fund — Institutional Shares, 5.18%1 | | | 8,758,486 | | | | 8,758,486 | |
Total Money Market Fund | | | | |
(Cost $8,758,486) | | | | | | | 8,758,486 | |
| | | | | | | | | |
Total Investments - 100.1% | | | | |
(Cost $158,524,253) | | $ | 203,704,614 | |
Other Assets & Liabilities, net - (0.1)% | | | (162,162 | ) |
Total Net Assets - 100.0% | | $ | 203,542,452 | |
* | Non-income producing security. |
** | A copy of each underlying unaffiliated fund’s financial statements is available at the SEC’s website at www.sec.gov. |
† | Value determined based on Level 1 inputs — See Note 4. |
1 | Rate indicated is the 7-day yield as of June 30, 2024. |
| | plc — Public Limited Company |
| | REIT — Real Estate Investment Trust |
| | |
| | See Sector Classification in Other Information section. |
The following table summarizes the inputs used to value the Fund’s investments at June 30, 2024 (See Note 4 in the Notes to Financial Statements):
Investments in Securities (Assets) | | Level 1
Quoted
Prices | | | Level 2
Significant
Observable
Inputs | | | Level 3
Significant
Unobservable
Inputs | | | Total | |
Common Stocks | | $ | 187,563,605 | | | $ | — | | | $ | — | | | $ | 187,563,605 | |
Exchange-Traded Fund | | | 7,382,523 | | | | — | | | | — | | | | 7,382,523 | |
Money Market Fund | | | 8,758,486 | | | | — | | | | — | | | | 8,758,486 | |
Total Assets | | $ | 203,704,614 | | | $ | — | | | $ | — | | | $ | 203,704,614 | |
SEE NOTES TO FINANCIAL STATEMENTS. | THE GUGGENHEIM FUNDS SEMI-ANNUAL FINANCIAL REPORT | 9 |
SERIES B (LARGE CAP VALUE SERIES) | |
STATEMENT OF ASSETS AND LIABILITIES (Unaudited) |
June 30, 2024 |
Assets: |
Investments, at value (cost $158,524,253) | | $ | 203,704,614 | |
Prepaid expenses | | | 823 | |
Receivables: |
Dividends | | | 182,906 | |
Fund shares sold | | | 31,083 | |
Interest | | | 24,872 | |
Total assets | | | 203,944,298 | |
| | | | | |
Liabilities: |
Payable for: |
Fund shares redeemed | | | 274,047 | |
Management fees | | | 63,664 | |
Distribution and service fees | | | 39,178 | |
Transfer agent/maintenance fees | | | 1,952 | |
Fund accounting/administration fees | | | 1,568 | |
Trustees’ fees* | | | 375 | |
Due to Investment Adviser | | | 110 | |
Miscellaneous | | | 20,952 | |
Total liabilities | | | 401,846 | |
Net assets | | $ | 203,542,452 | |
| | | | | |
Net assets consist of: |
Paid in capital | | $ | 132,536,890 | |
Total distributable earnings (loss) | | | 71,005,562 | |
Net assets | | $ | 203,542,452 | |
Capital shares outstanding | | | 4,678,542 | |
Net asset value per share | | $ | 43.51 | |
STATEMENT OF OPERATIONS (Unaudited) |
Six Months Ended June 30, 2024 |
Investment Income: |
Dividends (net of foreign withholding tax of $2,557) | | $ | 2,222,758 | |
Interest | | | 74,677 | |
Total investment income | | | 2,297,435 | |
| | | | | |
Expenses: |
Management fees | | | 656,391 | |
Distribution and service fees | | | 252,458 | |
Transfer agent/maintenance fees | | | 12,423 | |
Fund accounting/administration fees | | | 43,184 | |
Professional fees | | | 23,786 | |
Trustees’ fees* | | | 7,100 | |
Custodian fees | | | 3,092 | |
Line of credit fees | | | 2,761 | |
Miscellaneous | | | 5,169 | |
Recoupment of previously waived fees | | | 587 | |
Total expenses | | | 1,006,951 | |
Less: |
Expenses reimbursed by Adviser | | | (3,965 | ) |
Expenses waived by Adviser | | | (222,918 | ) |
Total waived/reimbursed expenses | | | (226,883 | ) |
Net expenses | | | 780,068 | |
Net investment income | | | 1,517,367 | |
| | | | | |
Net Realized and Unrealized Gain (Loss): |
Net realized gain (loss) on: |
Investments | | | 6,404,955 | |
Net realized gain | | | 6,404,955 | |
Net change in unrealized appreciation (depreciation) on: |
Investments | | | 8,962,205 | |
Net change in unrealized appreciation (depreciation) | | | 8,962,205 | |
Net realized and unrealized gain | | | 15,367,160 | |
Net increase in net assets resulting from operations | | $ | 16,884,527 | |
* | Relates to Trustees not deemed “interested persons” within the meaning of Section 2(a)(19) of the 1940 Act. |
10 | THE GUGGENHEIM FUNDS SEMI-ANNUAL FINANCIAL REPORT | SEE NOTES TO FINANCIAL STATEMENTS. |
SERIES B (LARGE CAP VALUE SERIES) | |
STATEMENTS OF CHANGES IN NET ASSETS |
| | Six Months Ended
June 30, 2024
(Unaudited) | | | Year Ended
December 31,
2023 | |
Increase (Decrease) in Net Assets from Operations: | | | | | | | | |
Net investment income | | $ | 1,517,367 | | | $ | 3,474,246 | |
Net realized gain on investments | | | 6,404,955 | | | | 17,795,975 | |
Net change in unrealized appreciation (depreciation) on investments | | | 8,962,205 | | | | (3,543,005 | ) |
Net increase in net assets resulting from operations | | | 16,884,527 | | | | 17,727,216 | |
| | | | | | | | | |
Distributions to shareholders | | | — | | | | (23,233,407 | ) |
| | | | | | | | | |
Capital share transactions: | | | | | | | | |
Proceeds from sale of shares | | | 1,576,554 | | | | 1,355,855 | |
Distributions reinvested | | | — | | | | 23,233,407 | |
Cost of shares redeemed | | | (14,493,651 | ) | | | (31,845,544 | ) |
Net decrease from capital share transactions | | | (12,917,097 | ) | | | (7,256,282 | ) |
Net increase (decrease) in net assets | | | 3,967,430 | | | | (12,762,473 | ) |
| | | | | | | | | |
Net assets: | | | | | | | | |
Beginning of period | | | 199,575,022 | | | | 212,337,495 | |
End of period | | $ | 203,542,452 | | | $ | 199,575,022 | |
| | | | | | | | | |
Capital share activity: | | | | | | | | |
Shares sold | | | 37,334 | | | | 33,854 | |
Shares issued from reinvestment of distributions | | | — | | | | 595,576 | |
Shares redeemed | | | (345,129 | ) | | | (792,039 | ) |
Net decrease in shares | | | (307,795 | ) | | | (162,609 | ) |
SEE NOTES TO FINANCIAL STATEMENTS. | THE GUGGENHEIM FUNDS SEMI-ANNUAL FINANCIAL REPORT | 11 |
SERIES B (LARGE CAP VALUE SERIES) | |
This table is presented to show selected data for a share outstanding throughout each period and to assist shareholders in evaluating a Fund’s performance for the periods presented.
| | Six Months Ended
June 30, 2024a | | | Year Ended
December 31,
2023 | | | Year Ended
December 31,
2022 | | | Year Ended
December 31,
2021 | | | Year Ended
December 31,
2020 | | | Year Ended
December 31,
2019 | |
Per Share Data |
Net asset value, beginning of period | | $ | 40.02 | | | $ | 41.24 | | | $ | 46.81 | | | $ | 37.61 | | | $ | 40.55 | | | $ | 36.14 | |
Income (loss) from investment operations: |
Net investment income (loss)b | | | .31 | | | | .69 | | | | .67 | | | | .52 | | | | .82 | | | | .72 | |
Net gain (loss) on investments (realized and unrealized) | | | 3.18 | | | | 3.00 | | | | (1.48 | ) | | | 9.58 | | | | (.51 | ) | | | 6.93 | |
Total from investment operations | | | 3.49 | | | | 3.69 | | | | (.81 | ) | | | 10.10 | | | | .31 | | | | 7.65 | |
Less distributions from: |
Net investment income | | | — | | | | (.71 | ) | | | (.60 | ) | | | (.90 | ) | | | (.74 | ) | | | (.72 | ) |
Net realized gains | | | — | | | | (4.20 | ) | | | (4.16 | ) | | | — | c | | | (2.51 | ) | | | (2.52 | ) |
Total distributions | | | — | | | | (4.91 | ) | | | (4.76 | ) | | | (.90 | ) | | | (3.25 | ) | | | (3.24 | ) |
Net asset value, end of period | | $ | 43.51 | | | $ | 40.02 | | | $ | 41.24 | | | $ | 46.81 | | | $ | 37.61 | | | $ | 40.55 | |
|
Total Returnd | | | 8.72 | % | | | 9.27 | % | | | (1.32 | %) | | | 27.03 | % | | | 2.21 | % | | | 21.82 | % |
Ratios/Supplemental Data |
Net assets, end of period (in thousands) | | $ | 203,542 | | | $ | 199,575 | | | $ | 212,337 | | | $ | 236,817 | | | $ | 208,548 | | | $ | 226,968 | |
Ratios to average net assets: |
Net investment income (loss) | | | 1.50 | % | | | 1.72 | % | | | 1.53 | % | | | 1.20 | % | | | 2.40 | % | | | 1.86 | % |
Total expensese | | | 1.00 | % | | | 1.02 | % | | | 1.02 | % | | | 1.03 | % | | | 1.09 | % | | | 1.07 | % |
Net expensesf,g,h | | | 0.77 | % | | | 0.77 | % | | | 0.78 | % | | | 0.79 | % | | | 0.79 | % | | | 0.80 | % |
Portfolio turnover rate | | | 8 | % | | | 22 | % | | | 25 | % | | | 22 | % | | | 19 | % | | | 32 | % |
a | Unaudited figures for the period ended June 30, 2024. Percentage amounts for the period, except total return and portfolio turnover rate, have been annualized. |
b | Net investment income (loss) per share was computed using average shares outstanding throughout the period. |
c | Distributions from realized gains are less than $0.01 per share. |
d | Total return does not take into account any of the expenses associated with an investment in variable insurance products. If total return had taken into account these expenses, performance would have been lower. Shares of a series of Guggenheim Variable Funds Trust are available only through the purchase of such products. |
e | Does not include expenses of the underlying funds in which the Fund invests. |
f | Net expense information reflects the expense ratios after expense waivers and reimbursements, as applicable. |
g | The portion of the ratios of net expenses to average net assets attributable to recoupments of prior fee reductions of expense reimbursements for the years presented was as follows: |
| | 06/30/24a | 12/31/23 | 12/31/22 | 12/31/21 | 12/31/20 | 12/31/19 |
| | 0.00%* | — | — | — | — | — |
h | Net expenses may include expenses that are excluded from the expense limitation agreement. Excluding these expenses, the net expense ratios for the years presented would be: |
| | 06/30/24a | 12/31/23 | 12/31/22 | 12/31/21 | 12/31/20 | 12/31/19 |
| | 0.77% | 0.77% | 0.78% | 0.79% | 0.79% | 0.80% |
12 | THE GUGGENHEIM FUNDS SEMI-ANNUAL FINANCIAL REPORT | SEE NOTES TO FINANCIAL STATEMENTS. |
SCHEDULE OF INVESTMENTS (Unaudited) | June 30, 2024 |
SERIES D (WORLD EQUITY INCOME SERIES) | |
| | Shares | | | Value | |
COMMON STOCKS† - 97.3% |
| | | | | | | | | |
Financial - 22.8% |
Berkshire Hathaway, Inc. — Class B* | | | 3,330 | | | $ | 1,354,644 | |
Goldman Sachs Group, Inc. | | | 2,740 | | | | 1,239,357 | |
Westpac Banking Corp. | | | 59,330 | | | | 1,074,316 | |
ING Groep N.V. | | | 62,100 | | | | 1,067,558 | |
AvalonBay Communities, Inc. REIT | | | 4,736 | | | | 979,831 | |
Simon Property Group, Inc. REIT | | | 6,440 | | | | 977,592 | |
National Australia Bank Ltd. | | | 39,210 | | | | 945,575 | |
AXA S.A. | | | 28,600 | | | | 937,710 | |
Public Storage REIT | | | 3,250 | | | | 934,863 | |
United Overseas Bank Ltd. | | | 40,500 | | | | 934,503 | |
Allianz AG | | | 3,330 | | | | 925,290 | |
Intesa Sanpaolo SpA | | | 242,800 | | | | 902,781 | |
Synchrony Financial | | | 19,100 | | | | 901,329 | |
Aon plc — Class A | | | 2,890 | | | | 848,446 | |
BNP Paribas S.A. | | | 12,900 | | | | 825,380 | |
Skandinaviska Enskilda Banken AB — Class A | | | 55,500 | | | | 820,867 | |
VICI Properties, Inc. REIT | | | 28,600 | | | | 819,104 | |
Capital One Financial Corp. | | | 5,900 | | | | 816,855 | |
Banco Bilbao Vizcaya Argentaria S.A. | | | 80,370 | | | | 807,183 | |
Swedbank AB — Class A | | | 38,200 | | | | 787,158 | |
Svenska Handelsbanken AB — Class A | | | 80,800 | | | | 772,435 | |
Danske Bank A/S | | | 24,100 | | | | 718,938 | |
Aviva plc | | | 116,400 | | | | 700,989 | |
Tryg A/S | | | 28,700 | | | | 627,170 | |
Generali | | | 23,900 | | | | 595,253 | |
American International Group, Inc. | | | 7,900 | | | | 586,496 | |
Banco Santander S.A. | | | 104,500 | | | | 486,449 | |
NN Group N.V. | | | 9,600 | | | | 446,409 | |
Swiss Life Holding AG | | | 590 | | | | 433,155 | |
Mediobanca Banca di Credito Finanziario SpA | | | 28,840 | | | | 422,365 | |
Allstate Corp. | | | 2,600 | | | | 415,116 | |
UniCredit SpA | | | 9,600 | | | | 355,429 | |
FirstService Corp. | | | 1,900 | | | | 289,207 | |
Societe Generale S.A. | | | 11,900 | | | | 279,917 | |
Gaming and Leisure Properties, Inc. REIT | | | 4,800 | | | | 217,008 | |
Sampo Oyj — Class A | | | 4,800 | | | | 207,096 | |
Total Financial | | | | | | | 26,453,774 | |
| | | | | | | | | |
Technology - 20.4% |
NVIDIA Corp. | | | 32,070 | | | | 3,961,928 | |
Apple, Inc. | | | 18,435 | | | | 3,882,780 | |
Microsoft Corp. | | | 8,566 | | | | 3,828,574 | |
Broadcom, Inc. | | | 723 | | | | 1,160,798 | |
International Business Machines Corp. | | | 6,400 | | | | 1,106,880 | |
NXP Semiconductor N.V. | | | 4,060 | | | | 1,092,505 | |
Texas Instruments, Inc. | | | 5,450 | | | | 1,060,189 | |
Dell Technologies, Inc. — Class C | | | 6,960 | | | | 959,854 | |
Skyworks Solutions, Inc. | | | 8,600 | | | | 916,588 | |
Cognizant Technology Solutions Corp. — Class A | | | 12,400 | | | | 843,200 | |
CGI, Inc.* | | | 8,390 | | | | 837,583 | |
Constellation Software, Inc. | | | 260 | | | | 749,292 | |
Workday, Inc. — Class A* | | | 3,340 | | | | 746,690 | |
Crowdstrike Holdings, Inc. — Class A* | | | 1,910 | | | | 731,893 | |
Super Micro Computer, Inc.* | | | 710 | | | | 581,738 | |
QUALCOMM, Inc. | | | 2,140 | | | | 426,245 | |
Descartes Systems Group, Inc.* | | | 2,900 | | | | 281,029 | |
Applied Materials, Inc. | | | 1,190 | | | | 280,828 | |
Lam Research Corp. | | | 240 | | | | 255,564 | |
Total Technology | | | | | | | 23,704,158 | |
| | | | | | | | | |
Consumer, Non-cyclical - 14.5% |
Novo Nordisk A/S — Class B | | | 12,300 | | | | 1,760,265 | |
Johnson & Johnson | | | 9,487 | | | | 1,386,620 | |
UnitedHealth Group, Inc. | | | 2,554 | | | | 1,300,650 | |
PepsiCo, Inc. | | | 7,523 | | | | 1,240,768 | |
Colgate-Palmolive Co. | | | 10,739 | | | | 1,042,113 | |
Elevance Health, Inc. | | | 1,910 | | | | 1,034,952 | |
McKesson Corp. | | | 1,756 | | | | 1,025,574 | |
Altria Group, Inc. | | | 21,500 | | | | 979,325 | |
CVS Health Corp. | | | 15,000 | | | | 885,900 | |
Bunge Global S.A. | | | 8,100 | | | | 864,837 | |
Kraft Heinz Co. | | | 26,100 | | | | 840,942 | |
Amgen, Inc. | | | 2,374 | | | | 741,756 | |
CK Hutchison Holdings Ltd. | | | 149,232 | | | | 711,887 | |
Sysco Corp. | | | 8,950 | | | | 638,941 | |
Royalty Pharma plc — Class A | | | 16,600 | | | | 437,742 | |
Eli Lilly & Co. | | | 480 | | | | 434,582 | |
Japan Tobacco, Inc. | | | 14,000 | | | | 379,174 | |
Cencora, Inc. — Class A | | | 1,660 | | | | 373,998 | |
United Rentals, Inc. | | | 480 | | | | 310,430 | |
Cigna Group | | | 720 | | | | 238,011 | |
HCA Healthcare, Inc. | | | 720 | | | | 231,322 | |
Total Consumer, Non-cyclical | | | | | | | 16,859,789 | |
| | | | | | | | | |
Consumer, Cyclical - 8.8% |
Walmart, Inc. | | | 22,080 | | | | 1,495,037 | |
General Motors Co. | | | 23,880 | | | | 1,109,464 | |
PACCAR, Inc. | | | 8,800 | | | | 905,872 | |
Sumitomo Corp. | | | 33,170 | | | | 833,429 | |
Home Depot, Inc. | | | 2,415 | | | | 831,339 | |
Sekisui House Ltd. | | | 34,480 | | | | 766,449 | |
Stellantis N.V. | | | 38,200 | | | | 755,529 | |
Bayerische Motoren Werke AG | | | 7,900 | | | | 747,633 | |
Aptiv plc* | | | 9,600 | | | | 676,032 | |
WW Grainger, Inc. | | | 670 | | | | 604,501 | |
Isuzu Motors Ltd. | | | 39,300 | | | | 522,557 | |
Singapore Airlines Ltd. | | | 68,900 | | | | 350,198 | |
Ford Motor Co. | | | 23,800 | | | | 298,452 | |
Target Corp. | | | 1,900 | | | | 281,276 | |
Total Consumer, Cyclical | | | | | | | 10,177,768 | |
| | | | | | | | | |
Communications - 8.7% |
Alphabet, Inc. — Class C | | | 15,416 | | | | 2,827,603 | |
Amazon.com, Inc.* | | | 11,828 | | | | 2,285,761 | |
Cisco Systems, Inc. | | | 23,200 | | | | 1,102,232 | |
Meta Platforms, Inc. — Class A | | | 2,140 | | | | 1,079,031 | |
Verizon Communications, Inc. | | | 20,180 | | | | 832,223 | |
HKT Trust & HKT Ltd. | | | 505,000 | | | | 566,462 | |
SEE NOTES TO FINANCIAL STATEMENTS. | THE GUGGENHEIM FUNDS SEMI-ANNUAL FINANCIAL REPORT | 13 |
SCHEDULE OF INVESTMENTS (Unaudited)(continued) | June 30, 2024 |
SERIES D (WORLD EQUITY INCOME SERIES) | |
| | Shares | | | Value | |
Arista Networks, Inc.* | | | 1,430 | | | $ | 501,186 | |
T-Mobile US, Inc. | | | 2,100 | | | | 369,978 | |
Motorola Solutions, Inc. | | | 720 | | | | 277,956 | |
eBay, Inc. | | | 4,500 | | | | 241,740 | |
Total Communications | | | | | | | 10,084,172 | |
| | | | | | | | | |
Industrial - 6.5% |
Lockheed Martin Corp. | | | 2,388 | | | | 1,115,435 | |
General Dynamics Corp. | | | 2,850 | | | | 826,899 | |
Snap-on, Inc. | | | 2,746 | | | | 717,777 | |
Westrock Co. | | | 14,100 | | | | 708,666 | |
Mitsui OSK Lines Ltd. | | | 23,100 | | | | 694,652 | |
Martin Marietta Materials, Inc. | | | 1,190 | | | | 644,742 | |
Parker-Hannifin Corp. | | | 1,200 | | | | 606,972 | |
Bouygues S.A. | | | 14,300 | | | | 459,887 | |
Amphenol Corp. — Class A | | | 6,580 | | | | 443,294 | |
Aena SME S.A.1 | | | 2,100 | | | | 425,449 | |
Caterpillar, Inc. | | | 960 | | | | 319,776 | |
TransDigm Group, Inc. | | | 238 | | | | 304,071 | |
FedEx Corp. | | | 950 | | | | 284,848 | |
Total Industrial | | | | | | | 7,552,468 | |
| | | | | | | | | |
Utilities - 6.5% |
Southern Co. | | | 14,140 | | | | 1,096,840 | |
Duke Energy Corp. | | | 10,700 | | | | 1,072,461 | |
Entergy Corp. | | | 8,400 | | | | 898,800 | |
Consolidated Edison, Inc. | | | 9,940 | | | | 888,835 | |
DTE Energy Co. | | | 7,210 | | | | 800,382 | |
Exelon Corp. | | | 21,550 | | | | 745,845 | |
NRG Energy, Inc. | | | 8,900 | | | | 692,954 | |
American Electric Power Company, Inc. | | | 4,800 | | | | 421,152 | |
Public Service Enterprise Group, Inc. | | | 4,100 | | | | 302,170 | |
Chubu Electric Power Company, Inc. | | | 23,800 | | | | 281,203 | |
FirstEnergy Corp. | | | 7,200 | | | | 275,544 | |
Total Utilities | | | | | | | 7,476,186 | |
| | | | | | | | | |
Energy - 5.3% |
Phillips 66 | | | 7,380 | | | | 1,041,835 | |
Marathon Petroleum Corp. | | | 5,870 | | | | 1,018,328 | |
Valero Energy Corp. | | | 6,430 | | | | 1,007,967 | |
Idemitsu Kosan Company Ltd. | | | 101,300 | | | | 658,512 | |
Aker BP ASA | | | 21,400 | | | | 546,895 | |
Ampol Ltd. | | | 25,270 | | | | 543,529 | |
HF Sinclair Corp. | | | 10,130 | | | | 540,334 | |
Cheniere Energy, Inc. | | | 1,700 | | | | 297,211 | |
Pembina Pipeline Corp. | | | 7,100 | | | | 263,484 | |
DCC plc | | | 2,600 | | | | 181,465 | |
Total Energy | | | | | | | 6,099,560 | |
| | | | | | | | | |
Basic Materials - 3.8% |
Nucor Corp. | | | 5,500 | | | | 869,440 | |
Dow, Inc. | | | 15,500 | | | | 822,275 | |
Reliance, Inc. | | | 2,870 | | | | 819,672 | |
LyondellBasell Industries N.V. — Class A | | | 8,060 | | | | 771,020 | |
Yara International ASA | | | 19,000 | | | | 547,609 | |
Celanese Corp. — Class A | | | 2,600 | | | | 350,714 | |
Rio Tinto plc | | | 2,600 | | | | 170,581 | |
Total Basic Materials | | | | | | | 4,351,311 | |
| | | | | | | | | |
Total Common Stocks | | | | |
(Cost $96,546,929) | | | | | | | 112,759,186 | |
| | | | | | | | | |
PREFERRED STOCK† - 0.6% |
Consumer, Cyclical - 0.6% |
Volkswagen AG | | | 6,500 | | | | 734,295 | |
Total Preferred Stock | | | | |
(Cost $838,707) | | | | | | | 734,295 | |
| | | | | | | | | |
EXCHANGE-TRADED FUNDS***,† - 0.8% |
iShares MSCI EAFE ETF | | | 6,225 | | | | 487,604 | |
SPDR S&P 500 ETF Trust | | | 895 | | | | 487,077 | |
Total Exchange-Traded Funds | | | | |
(Cost $988,766) | | | | | | | 974,681 | |
| | | | | | | | | |
MONEY MARKET FUND***,† - 0.1% |
Goldman Sachs Financial Square Treasury Instruments Fund — Institutional Shares,5.16%2 | | | 76,324 | | | | 76,324 | |
Total Money Market Fund | | | | |
(Cost $76,324) | | | | | | | 76,324 | |
| | | | | | | | | |
Total Investments - 98.8% | | | | |
(Cost $98,450,726) | | $ | 114,544,486 | |
Other Assets & Liabilities, net - 1.2% | | | 1,399,447 | |
Total Net Assets - 100.0% | | $ | 115,943,933 | |
Futures Contracts |
Description | | Number of
Contracts | | | Expiration
Date | | | Notional
Amount | | | Value and
Unrealized
Appreciation** | |
Currency Futures Contracts Sold Short† |
Japanese Yen Futures Contracts | | | 53 | | | | Sep 2024 | | | $ | 4,167,456 | | | $ | 63,189 | |
14 | THE GUGGENHEIM FUNDS SEMI-ANNUAL FINANCIAL REPORT | SEE NOTES TO FINANCIAL STATEMENTS. |
SCHEDULE OF INVESTMENTS (Unaudited)(concluded) | June 30, 2024 |
SERIES D (WORLD EQUITY INCOME SERIES) | |
* | Non-income producing security. |
** | Includes cumulative appreciation (depreciation). Variation margin is reported within the Statement of Assets and Liabilities. |
*** | A copy of each underlying unaffiliated fund’s financial statements is available at the SEC’s website at www.sec.gov. |
† | Value determined based on Level 1 inputs — See Note 4. |
1 | Security is a 144A or Section 4(a)(2) security. These securities have been determined to be liquid under guidelines established by the Board of Trustees. The total market value of 144A or Section 4(a)(2) securities is $425,449 (cost $412,277), or 0.4% of total net assets. |
2 | Rate indicated is the 7-day yield as of June 30, 2024. |
| | plc — Public Limited Company |
| | REIT — Real Estate Investment Trust |
| | |
| | See Sector Classification in Other Information section. |
The following table summarizes the inputs used to value the Fund’s investments at June 30, 2024 (See Note 4 in the Notes to Financial Statements):
Investments in Securities (Assets) | | Level 1
Quoted
Prices | | | Level 2
Significant
Observable
Inputs | | | Level 3
Significant
Unobservable
Inputs | | | Total | |
Common Stocks | | $ | 112,759,186 | | | $ | — | | | $ | — | | | $ | 112,759,186 | |
Preferred Stock | | | 734,295 | | | | — | | | | — | | | | 734,295 | |
Exchange-Traded Funds | | | 974,681 | | | | — | | | | — | | | | 974,681 | |
Money Market Fund | | | 76,324 | | | | — | | | | — | | | | 76,324 | |
Currency Futures Contracts** | | | 63,189 | | | | — | | | | — | | | | 63,189 | |
Total Assets | | $ | 114,607,675 | | | $ | — | | | $ | — | | | $ | 114,607,675 | |
** | This derivative is reported as unrealized appreciation/depreciation at period end. |
SEE NOTES TO FINANCIAL STATEMENTS. | THE GUGGENHEIM FUNDS SEMI-ANNUAL FINANCIAL REPORT | 15 |
SERIES D (WORLD EQUITY INCOME SERIES) | |
STATEMENT OF ASSETS AND LIABILITIES (Unaudited) |
June 30, 2024 |
Assets: |
Investments, at value (cost $98,450,726) | | $ | 114,544,486 | |
Foreign currency, at value (cost 34,113) | | | 34,115 | |
Cash | | | 6,102 | |
Segregated cash with broker | | | 170,000 | |
Prepaid expenses | | | 412 | |
Receivables: |
Securities sold | | | 1,034,438 | |
Foreign tax reclaims | | | 155,399 | |
Dividends | | | 106,795 | |
Fund shares sold | | | 16,999 | |
Variation margin on futures contracts | | | 2,650 | |
Interest | | | 1,348 | |
Total assets | | | 116,072,744 | |
| | | | | |
Liabilities: |
Payable for: |
Management fees | | | 44,003 | |
Fund shares redeemed | | | 24,063 | |
Distribution and service fees | | | 22,232 | |
Professional fees | | | 16,323 | |
Custodian fees | | | 7,891 | |
Transfer agent/maintenance fees | | | 2,071 | |
Trustees’ fees* | | | 1,735 | |
Fund accounting /administration fees | | | 1,244 | |
Due to Investment Adviser | | | 71 | |
Miscellaneous | | | 9,178 | |
Total liabilities | | | 128,811 | |
Net assets | | $ | 115,943,933 | |
| | | | | |
Net assets consist of: |
Paid in capital | | $ | 93,243,285 | |
Total distributable earnings (loss) | | | 22,700,648 | |
Net assets | | $ | 115,943,933 | |
Capital shares outstanding | | | 7,804,392 | |
Net asset value per share | | $ | 14.86 | |
STATEMENT OF OPERATIONS (Unaudited) |
Six Months Ended June 30, 2024 |
Investment Income: |
Dividends (net of foreign withholding tax of $178,990) | | $ | 1,876,581 | |
Interest | | | 12,344 | |
Total investment income | | | 1,888,925 | |
| | | | | |
Expenses: |
Management fees | | | 400,617 | |
Distribution and service fees | | | 143,077 | |
Transfer agent/maintenance fees | | | 12,534 | |
Fund accounting /administration fees | | | 26,419 | |
Professional fees | | | 16,043 | |
Custodian fees | | | 10,937 | |
Trustees’ fees* | | | 7,599 | |
Line of credit fees | | | 1,612 | |
Miscellaneous | | | 7,685 | |
Recoupment of previously waived fees | | | 374 | |
Total expenses | | | 626,897 | |
Less: |
Expenses waived by Adviser | | | (127,791 | ) |
Earnings credits applied | | | (80 | ) |
Total waived expenses | | | (127,871 | ) |
Net expenses | | | 499,026 | |
Net investment income | | | 1,389,899 | |
| | | | | |
Net Realized and Unrealized Gain (Loss): |
Net realized gain (loss) on: |
Investments | | | 4,143,790 | |
Futures contracts | | | (166,729 | ) |
Foreign currency transactions | | | (15,147 | ) |
Net realized gain | | | 3,961,914 | |
Net change in unrealized appreciation (depreciation) on: |
Investments | | | 5,289,981 | |
Futures contracts | | | 63,189 | |
Foreign currency translations | | | (2,815 | ) |
Net change in unrealized appreciation (depreciation) | | | 5,350,355 | |
Net realized and unrealized gain | | | 9,312,269 | |
Net increase in net assets resulting from operations | | $ | 10,702,168 | |
* | Relates to Trustees not deemed “interested persons” within the meaning of Section 2(a)(19) of the 1940 Act. |
16 | THE GUGGENHEIM FUNDS SEMI-ANNUAL FINANCIAL REPORT | SEE NOTES TO FINANCIAL STATEMENTS. |
SERIES D (WORLD EQUITY INCOME SERIES) | |
STATEMENTS OF CHANGES IN NET ASSETS |
| | Six Months Ended
June 30, 2024
(Unaudited) | | | Year Ended
December 31,
2023 | |
Increase (Decrease) in Net Assets from Operations: | | | | | | | | |
Net investment income | | $ | 1,389,899 | | | $ | 2,453,661 | |
Net realized gain on investments | | | 3,961,914 | | | | 1,242,126 | |
Net change in unrealized appreciation (depreciation) on investments | | | 5,350,355 | | | | 9,073,987 | |
Net increase in net assets resulting from operations | | | 10,702,168 | | | | 12,769,774 | |
| | | | | | | | | |
Distributions to shareholders | | | — | | | | (2,923,384 | ) |
| | | | | | | | | |
Capital share transactions: | | | | | | | | |
Proceeds from sale of shares | | | 812,081 | | | | 1,311,195 | |
Distributions reinvested | | | — | | | | 2,923,384 | |
Cost of shares redeemed | | | (8,456,799 | ) | | | (14,528,906 | ) |
Net decrease from capital share transactions | | | (7,644,718 | ) | | | (10,294,327 | ) |
Net increase (decrease) in net assets | | | 3,057,450 | | | | (447,937 | ) |
| | | | | | | | | |
Net assets: | | | | | | | | |
Beginning of period | | | 112,886,483 | | | | 113,334,420 | |
End of period | | $ | 115,943,933 | | | $ | 112,886,483 | |
| | | | | | | | | |
Capital share activity: | | | | | | | | |
Shares sold | | | 56,534 | | | | 102,968 | |
Shares issued from reinvestment of distributions | | | — | | | | 226,795 | |
Shares redeemed | | | (592,779 | ) | | | (1,150,112 | ) |
Net decrease in shares | | | (536,245 | ) | | | (820,349 | ) |
SEE NOTES TO FINANCIAL STATEMENTS. | THE GUGGENHEIM FUNDS SEMI-ANNUAL FINANCIAL REPORT | 17 |
SERIES D (WORLD EQUITY INCOME SERIES) | |
This table is presented to show selected data for a share outstanding throughout each period and to assist shareholders in evaluating a Fund’s performance for the periods presented.
| | Six Months Ended
June 30, 2024a | | | Year Ended
December 31,
2023 | | | Year Ended
December 31,
2022 | | | Year Ended
December 31,
2021 | | | Year Ended
December 31,
2020 | | | Year Ended
December 31,
2019 | |
Per Share Data |
Net asset value, beginning of period | | $ | 13.53 | | | $ | 12.37 | | | $ | 17.74 | | | $ | 14.79 | | | $ | 14.45 | | | $ | 12.96 | |
Income (loss) from investment operations: |
Net investment income (loss)b | | | .17 | | | | .28 | | | | .32 | | | | .34 | | | | .22 | | | | .33 | |
Net gain (loss) on investments (realized and unrealized) | | | 1.16 | | | | 1.22 | | | | (2.01 | ) | | | 2.86 | | | | .66 | | | | 2.36 | |
Total from investment operations | | | 1.33 | | | | 1.50 | | | | (1.69 | ) | | | 3.20 | | | | .88 | | | | 2.69 | |
Less distributions from: |
Net investment income | | | — | | | | (.34 | ) | | | (.36 | ) | | | (.25 | ) | | | (.40 | ) | | | (.40 | ) |
Net realized gains | | | — | | | | — | | | | (3.32 | ) | | | — | | | | (.14 | ) | | | (.80 | ) |
Total distributions | | | — | | | | (.34 | ) | | | (3.68 | ) | | | (.25 | ) | | | (.54 | ) | | | (1.20 | ) |
Net asset value, end of period | | $ | 14.86 | | | $ | 13.53 | | | $ | 12.37 | | | $ | 17.74 | | | $ | 14.79 | | | $ | 14.45 | |
|
Total Returnc | | | 9.83 | % | | | 12.28 | % | | | (9.12 | %) | | | 21.74 | % | | | 6.65 | % | | | 21.40 | % |
Ratios/Supplemental Data |
Net assets, end of period (in thousands) | | $ | 115,944 | | | $ | 112,886 | | | $ | 113,334 | | | $ | 138,193 | | | $ | 126,007 | | | $ | 133,758 | |
Ratios to average net assets: |
Net investment income (loss) | | | 2.43 | % | | | 2.22 | % | | | 2.25 | % | | | 2.02 | % | | | 1.70 | % | | | 2.37 | % |
Total expensesd | | | 1.10 | % | | | 1.14 | % | | | 1.10 | % | | | 1.15 | % | | | 1.20 | % | | | 1.19 | % |
Net expensese,f,g | | | 0.87 | % | | | 0.87 | % | | | 0.88 | % | | | 0.89 | % | | | 0.89 | % | | | 0.90 | % |
Portfolio turnover rate | | | 56 | % | | | 177 | % | | | 140 | % | | | 185 | % | | | 196 | % | | | 139 | % |
a | Unaudited figures for the period ended June 30, 2024. Percentage amounts for the period, except total return and portfolio turnover rate, have been annualized. |
b | Net investment income (loss) per share was computed using average shares outstanding throughout the period. |
c | Total return does not take into account any of the expenses associated with an investment in variable insurance products. If total return had taken into account these expenses, performance would have been lower. Shares of a series of Guggenheim Variable Funds Trust are available only through the purchase of such products. |
d | Does not include expenses of the underlying funds in which the Fund invests. |
e | Net expense information reflects the expense ratios after expense waivers and reimbursements, as applicable. |
f | The portion of the ratios of net expenses to average net assets attributable to recoupments of prior fee reductions or expense reimbursements for the years presented was as follows: |
| | 06/30/24a | 12/31/23 | 12/31/22 | 12/31/21 | 12/31/20 | 12/31/19 |
| | 0.00* | — | — | — | — | — |
g | Net expenses may include expenses that are excluded from the expense limitation agreement. Excluding these expenses, the net expense ratios for the years presented would be: |
| | 06/30/24a | 12/31/23 | 12/31/22 | 12/31/21 | 12/31/20 | 12/31/19 |
| | 0.86% | 0.87% | 0.88% | 0.89% | 0.89% | 0.90% |
18 | THE GUGGENHEIM FUNDS SEMI-ANNUAL FINANCIAL REPORT | SEE NOTES TO FINANCIAL STATEMENTS. |
SCHEDULE OF INVESTMENTS (Unaudited) | June 30, 2024 |
SERIES E (TOTAL RETURN BOND SERIES) | |
| | Shares | | | Value | |
COMMON STOCKS† - 0.0% |
| | | | | | | | | |
Communications - 0.0% |
Vacasa, Inc. — Class A* | | | 167 | | | $ | 813 | |
| | | | | | | | | |
Financial - 0.0% |
Pershing Square Tontine Holdings, Ltd. — Class A*,†††,1 | | | 76,590 | | | | 8 | |
| | | | | | | | | |
Total Common Stocks | | | | |
(Cost $33,288) | | | | | | | 821 | |
| | | | | | | | | |
PREFERRED STOCKS†† - 2.4% |
Financial - 2.4% |
Equitable Holdings, Inc. |
4.95% | | | 550,000 | | | | 541,436 | |
Citigroup, Inc. |
4.00% | | | 200,000 | | | | 191,535 | |
3.88% | | | 200,000 | | | | 189,282 | |
7.63%2 | | | 100,000 | | | | 104,118 | |
Wells Fargo & Co. |
3.90% | | | 500,000 | | | | 478,463 | |
Charles Schwab Corp. |
4.00% | | | 500,000 | | | | 427,007 | |
MetLife, Inc. |
3.85% | | | 400,000 | | | | 387,144 | |
Bank of New York Mellon Corp. |
3.75% | | | 400,000 | | | | 369,115 | |
Markel Group, Inc. |
6.00% | | | 360,000 | | | | 357,505 | |
JPMorgan Chase & Co. |
3.65% | | | 250,000 | | | | 236,465 | |
Goldman Sachs Group, Inc. |
3.80%2 | | | 150,000 | | | | 141,372 | |
CNO Financial Group, Inc. |
5.13% due 11/25/60 | | | 6,000 | | | | 116,400 | |
Kuvare US Holdings, Inc. |
7.00% due 02/17/513 | | | 100,000 | | | | 99,500 | |
Bank of America Corp. |
4.38% | | | 100,000 | | | | 94,573 | |
Selective Insurance Group, Inc. |
4.60% | | | 4,000 | | | | 72,600 | |
Assurant, Inc. |
5.25% due 01/15/61 | | | 75 | | | | 1,569 | |
First Republic Bank |
4.25%* | | | 16,525 | | | | 331 | |
4.50%* | | | 675 | | | | 14 | |
Total Financial | | | | | | | 3,808,429 | |
| | | | | | | | | |
Total Preferred Stocks | | | | |
(Cost $4,481,558) | | | | | | | 3,808,429 | |
| | | | | | | | | |
WARRANTS† - 0.0% |
Ginkgo Bioworks Holdings, Inc. | | | | | | | | |
Expiring 09/16/26 | | | 684 | | | | 19 | |
Pershing Square SPARC Holdings, Ltd. | | | | | | | | |
Expiring 12/31/49*,†††,1 | | | 23,402 | | | | 3 | |
Pershing Square Tontine Holdings, Ltd. | | | | | | | | |
Expiring 07/24/25*,†††,1 | | | 8,510 | | | | — | |
Total Warrants | | | | |
(Cost $1,584) | | | | | | | 22 | |
| | | | | | | | | |
MUTUAL FUNDS† - 3.9% |
Guggenheim Total Return Bond Fund — R6-Class4 | | | 271,603 | | | | 6,347,351 | |
Total Mutual Funds | | | | |
(Cost $7,152,446) | | | | | | | 6,347,351 | |
| | | | | | | | | |
MONEY MARKET FUNDS***,† - 1.7% |
Dreyfus Treasury Securities Cash Management Fund — Institutional Shares, 5.18%5 | | | 2,142,426 | | | | 2,142,426 | |
Dreyfus Treasury Obligations Cash Management Fund — Institutional Shares, 5.18%5 | | | 663,940 | | | | 663,940 | |
Total Money Market Funds | | | | |
(Cost $2,806,366) | | | | | | | 2,806,366 | |
| | | | | | | | | |
| | | Face
Amount~ | | | | | |
COLLATERALIZED MORTGAGE OBLIGATIONS†† - 32.3% |
Government Agency - 21.5% | | | | | | | | |
Uniform MBS 30 Year | | | | | | | | |
due 09/01/2416 | | | 4,300,735 | | | | 4,311,444 | |
due 09/01/2416 | | | 4,840,000 | | | | 4,119,256 | |
due 08/01/2416 | | | 1,669,920 | | | | 1,674,312 | |
due 09/01/2416 | | | 1,200,000 | | | | 983,859 | |
due 09/01/2416 | | | 1,210,000 | | | | 947,206 | |
due 09/01/2416 | | | 801,027 | | | | 791,358 | |
Fannie Mae | | | | | | | | |
5.00% due 05/01/53 | | | 2,655,164 | | | | 2,576,000 | |
5.00% due 04/01/53 | | | 1,438,058 | | | | 1,391,717 | |
3.00% due 05/01/52 | | | 1,419,365 | | | | 1,208,890 | |
5.00% due 06/01/53 | | | 994,364 | | | | 961,259 | |
5.50% due 05/01/53 | | | 705,140 | | | | 697,120 | |
5.00% due 12/01/53 | | | 660,644 | | | | 638,571 | |
5.00% due 08/01/53 | | | 537,512 | | | | 520,155 | |
5.50% due 06/01/54 | | | 411,933 | | | | 406,352 | |
5.00% due 01/01/54 | | | 202,168 | | | | 195,413 | |
5.00% due 09/01/52 | | | 195,788 | | | | 189,614 | |
Freddie Mac | | | | | | | | |
5.00% due 06/01/53 | | | 1,864,541 | | | | 1,802,182 | |
5.50% due 06/01/54 | | | 1,417,127 | | | | 1,397,927 | |
5.00% due 04/01/53 | | | 1,409,218 | | | | 1,363,372 | |
5.50% due 06/01/53 | | | 1,168,337 | | | | 1,155,339 | |
5.50% due 09/01/53 | | | 1,016,879 | | | | 1,014,139 | |
5.50% due 05/01/53 | | | 806,630 | | | | 795,966 | |
5.00% due 09/01/52 | | | 520,815 | | | | 504,631 | |
5.00% due 03/01/53 | | | 462,307 | | | | 447,483 | |
5.00% due 01/01/54 | | | 210,076 | | | | 203,047 | |
Uniform MBS 15 Year | | | | | | | | |
due 08/01/2416 | | | 2,137,500 | | | | 2,118,878 | |
due 09/01/2416 | | | 362,500 | | | | 359,215 | |
SEE NOTES TO FINANCIAL STATEMENTS. | THE GUGGENHEIM FUNDS SEMI-ANNUAL FINANCIAL REPORT | 19 |
SCHEDULE OF INVESTMENTS (Unaudited)(continued) | June 30, 2024 |
SERIES E (TOTAL RETURN BOND SERIES) | |
| | Face
Amount~ | | | Value | |
Ginnie Mae | | | | | | | | |
due 08/01/2416 | | | 526,257 | | | $ | 528,415 | |
due 08/01/2416 | | | 498,939 | | | | 495,039 | |
due 09/01/2416 | | | 263,088 | | | | 264,004 | |
due 09/01/2416 | | | 249,431 | | | | 247,374 | |
Fannie Mae-Aces | | | | | | | | |
1.59% (WAC) due 03/25/35◊,6 | | | 2,532,654 | | | | 237,442 | |
Total Government Agency | | | | | | | 34,546,979 | |
| | | | | | | | | |
Residential Mortgage-Backed Securities - 8.6% | | | | | | | | |
OBX Trust | | | | | | | | |
2024-NQM3, 6.43% due 12/25/637 | | | 466,063 | | | | 465,117 | |
2024-NQM5, 6.29% due 12/01/643,7 | | | 238,741 | | | | 238,615 | |
2024-NQM2, 6.18% due 12/25/633,7 | | | 234,245 | | | | 232,888 | |
2022-NQM1, 6.50% (WAC) due 11/25/62◊,3 | | | 200,476 | | | | 199,559 | |
2024-NQM6, 6.85% due 02/25/643,7 | | | 146,977 | | | | 148,114 | |
2024-NQM9, 6.44% due 01/25/643,7 | | | 100,000 | | | | 99,669 | |
2024-NQM8, 6.59% due 05/25/643,7 | | | 99,188 | | | | 99,549 | |
2022-NQM9, 6.45% due 09/25/623,7 | | | 85,117 | | | | 85,099 | |
PRPM LLC | | | | | | | | |
2022-1, 3.72% due 02/25/273,7 | | | 648,068 | | | | 636,795 | |
2021-5, 4.79% due 06/25/263,7 | | | 337,894 | | | | 335,194 | |
2023-1, 6.88% (WAC) due 02/25/28◊,3 | | | 126,024 | | | | 126,476 | |
BRAVO Residential Funding Trust | | | | | | | | |
2022-R1, 3.13% due 01/29/703,7 | | | 468,561 | | | | 440,879 | |
2024-NQM1, 6.40% due 12/01/633,7 | | | 229,992 | | | | 230,037 | |
2023-NQM2, 4.50% due 05/25/627 | | | 222,723 | | | | 213,727 | |
JP Morgan Mortgage Trust | | | | | | | | |
2021-12, 2.50% (WAC) due 02/25/52◊,3 | | | 639,295 | | | | 577,902 | |
2021-13, 2.50% (WAC) due 04/25/52◊,3 | | | 282,081 | | | | 254,182 | |
CSMC Trust | | | | | | | | |
2020-RPL5, 4.71% (WAC) due 08/25/60◊,3 | | | 391,788 | | | | 389,988 | |
2021-RPL4, 4.04% (WAC) due 12/27/60◊,3 | | | 337,257 | | | | 330,689 | |
Legacy Mortgage Asset Trust | | | | | | | | |
2021-GS3, 4.75% due 07/25/613,7 | | | 348,384 | | | | 339,013 | |
2021-GS5, 2.25% due 07/25/673,7 | | | 347,466 | | | | 338,180 | |
Angel Oak Mortgage Trust | | | | | | | | |
2024-2, 6.25% due 01/25/693,7 | | | 474,834 | | | | 471,485 | |
2023-1, 4.75% due 09/26/673,7 | | | 178,110 | | | | 170,586 | |
Starwood Mortgage Residential Trust | | | | | | | | |
2020-1, 2.41% (WAC) due 02/25/50◊,3 | | | 666,581 | | | | 623,787 | |
JP Morgan Mortgage Acquisition Trust | | | | | | | | |
2006-WMC4, 5.58% (1 Month Term SOFR + 0.23%, Rate Floor: 0.12%) due 12/25/36◊ | | | 1,145,290 | | | | 597,001 | |
Ameriquest Mortgage Securities Trust | | | | | | | | |
2006-M3, 5.62% (1 Month Term SOFR + 0.27%, Rate Floor: 0.16%) due 10/25/36◊ | | | 1,985,733 | | | | 570,268 | |
Securitized Asset-Backed Receivables LLC Trust | | | | | | | | |
2007-BR2, 5.82% (1 Month Term SOFR + 0.47%, Rate Floor: 0.36%) due 02/25/37◊,3 | | | 565,508 | | | | 465,838 | |
GCAT Trust | | | | | | | | |
2023-NQM3, 6.89% due 08/25/683,7 | | | 441,778 | | | | 447,264 | |
Home Equity Loan Trust | | | | | | | | |
2007-FRE1, 5.65% (1 Month Term SOFR + 0.30%, Rate Floor: 0.19%) due 04/25/37◊ | | | 454,013 | | | | 422,462 | |
NYMT Loan Trust | | | | | | | | |
2022-SP1, 5.25% due 07/25/623,7 | | | 424,925 | | | | 416,249 | |
Credit Suisse Mortgage Capital Certificates | | | | | | | | |
2021-RPL9, 2.44% (WAC) due 02/25/61◊,3 | | | 380,041 | | | | 377,516 | |
OSAT Trust | | | | | | | | |
2021-RPL1, 5.12% due 05/25/653,7 | | | 365,463 | | | | 363,996 | |
Master Asset-Backed Securities Trust | | | | | | | | |
2006-WMC4, 5.76% (1 Month Term SOFR + 0.41%, Rate Floor: 0.30%) due 10/25/36◊ | | | 1,084,899 | | | | 352,963 | |
FIGRE Trust | | | | | | | | |
2024-HE2, 6.38% (WAC) due 05/25/54◊,3 | | | 243,861 | | | | 245,880 | |
2024-HE1, 6.17% (WAC) due 03/25/54◊,3 | | | 94,597 | | | | 94,578 | |
First Franklin Mortgage Loan Trust | | | | | | | | |
2006-FF16, 5.88% (1 Month Term SOFR + 0.53%, Rate Floor: 0.42%) due 12/25/36◊ | | | 831,886 | | | | 336,032 | |
Top Pressure Recovery Turbines | | | | | | | | |
7.51% due 11/01/69 | | | 300,000 | | | | 300,150 | |
NovaStar Mortgage Funding Trust Series | | | | | | | | |
2007-2, 5.66% (1 Month Term SOFR + 0.31%, Rate Cap/Floor: 11.00%/0.20%) due 09/25/37◊ | | | 307,268 | | | | 295,349 | |
HarborView Mortgage Loan Trust | | | | | | | | |
2006-14, 5.75% (1 Month Term SOFR + 0.41%, Rate Floor: 0.30%) due 01/25/47◊ | | | 295,651 | | | | 260,381 | |
American Home Mortgage Investment Trust | | | | | | | | |
2007-1, 2.08% due 05/25/476 | | | 1,655,867 | | | | 234,754 | |
RCKT Mortgage Trust | | | | | | | | |
2024-CES4, 6.15% due 06/25/443,7 | | | 198,643 | | | | 199,895 | |
Imperial Fund Mortgage Trust | | | | | | | | |
2022-NQM2, 4.20% (WAC) due 03/25/67◊,3 | | | 166,491 | | | | 153,181 | |
Sequoia Mortgage Trust | | | | | | | | |
2024-5, 6.00% (WAC) due 06/25/54◊,3 | | | 148,040 | | | | 147,595 | |
Washington Mutual Mortgage Pass-Through Certificates WMALT Series Trust | | | | | | | | |
2006-AR9, 5.99% (1 Year CMT Rate + 0.84%, Rate Floor: 0.84%) due 11/25/46◊ | | | 184,420 | | | | 144,959 | |
Saluda Grade Alternative Mortgage Trust | | | | | | | | |
2023-FIG4, 6.72% (WAC) due 11/25/53◊,3 | | | 136,242 | | | | 137,903 | |
LSTAR Securities Investment Ltd. | | | | | | | | |
2024-1, 8.43% (30 Day Average SOFR + 3.10%, Rate Floor: 3.10%) due 01/01/29◊,3 | | | 88,360 | | | | 87,789 | |
Morgan Stanley Re-REMIC Trust | | | | | | | | |
2010-R5, 5.75% due 06/26/36 | | | 28,478 | | | | 25,114 | |
UCFC Manufactured Housing Contract | | | | | | | | |
1997-2, 7.38% due 10/15/28 | | | 7,424 | | | | 7,388 | |
Total Residential Mortgage-Backed Securities | | | | | | | 13,732,035 | |
| | | | | | | | | |
20 | THE GUGGENHEIM FUNDS SEMI-ANNUAL FINANCIAL REPORT | SEE NOTES TO FINANCIAL STATEMENTS. |
SCHEDULE OF INVESTMENTS (Unaudited)(continued) | June 30, 2024 |
SERIES E (TOTAL RETURN BOND SERIES) | |
| | Face
Amount~ | | | Value | |
Commercial Mortgage-Backed Securities - 1.2% | | | | | | | | |
BX Commercial Mortgage Trust | | | | | | | | |
2022-LP2, 7.29% (1 Month Term SOFR + 1.96%, Rate Floor: 1.96%) due 02/15/39◊,3 | | | 395,365 | | | $ | 389,437 | |
2021-VOLT, 7.44% (1 Month Term SOFR + 2.11%, Rate Floor: 2.00%) due 09/15/36◊,3 | | | 350,000 | | | | 345,406 | |
GS Mortgage Securities Trust | | | | | | | | |
2020-GC45, 0.77% (WAC) due 02/13/53◊,6 | | | 9,821,557 | | | | 264,542 | |
BX Trust | | | | | | | | |
2024-VLT4, 7.46% (1 Month Term SOFR + 2.14%, Rate Floor: 2.14%) due 07/15/29◊,3 | | | 150,000 | | | | 149,297 | |
2024-VLT4, 7.26% (1 Month Term SOFR + 1.94%, Rate Floor: 1.94%) due 07/15/29◊,3 | | | 100,000 | | | | 99,571 | |
Life Mortgage Trust | | | | | | | | |
2021-BMR, 7.79% (1 Month Term SOFR + 2.46%, Rate Floor: 2.35%) due 03/15/38◊,3 | | | 245,743 | | | | 235,617 | |
Extended Stay America Trust | | | | | | | | |
2021-ESH, 7.69% (1 Month Term SOFR + 2.36%, Rate Floor: 2.25%) due 07/15/38◊,3 | | | 226,949 | | | | 226,807 | |
CFCRE Commercial Mortgage Trust | | | | | | | | |
2016-C3, 1.14% (WAC) due 01/10/48◊,6 | | | 5,211,071 | | | | 56,651 | |
Citigroup Commercial Mortgage Trust | | | | | | | | |
2016-GC37, 1.81% (WAC) due 04/10/49◊,6 | | | 2,761,080 | | | | 53,898 | |
Wells Fargo Commercial Mortgage Trust | | | | | | | | |
2016-NXS5, 1.56% (WAC) due 01/15/59◊,6 | | | 3,183,410 | | | | 53,382 | |
COMM Mortgage Trust | | | | | | | | |
2015-CR26, 1.04% (WAC) due 10/10/48◊,6 | | | 5,499,806 | | | | 36,150 | |
Total Commercial Mortgage-Backed Securities | | | | | | | 1,910,758 | |
| | | | | | | | | |
Military Housing - 1.0% | | | | | | | | |
GMAC Commercial Mortgage Asset Corp. | | | | | | | | |
2007-HCKM, 6.11% due 08/10/52†††,3 | | | 906,553 | | | | 871,937 | |
Freddie Mac Military Housing Bonds Resecuritization Trust Certificates | | | | | | | | |
2015-R1, 4.49% (WAC) due 11/25/55◊,3 | | | 893,957 | | | | 780,208 | |
Total Military Housing | | | | | | | 1,652,145 | |
| | | | | | | | | |
Total Collateralized Mortgage Obligations | | | | |
(Cost $54,060,020) | | | 51,841,917 | |
| |
CORPORATE BONDS†† - 26.2% |
Financial - 13.1% | | | | | | | | |
Pershing Square Holdings Ltd. | | | | | | | | |
3.25% due 10/01/313 | | | 1,000,000 | | | | 814,194 | |
Reliance Standard Life Global Funding II | | | | | | | | |
5.24% due 02/02/263 | | | 800,000 | | | | 791,434 | |
Wilton RE Ltd. | | | | | | | | |
6.00% †††,2,3,8 | | | 682,000 | | | | 620,580 | |
Citigroup, Inc. | | | | | | | | |
2.57% due 06/03/312 | | | 590,000 | | | | 506,411 | |
GLP Capital Limited Partnership / GLP Financing II, Inc. | | | | | | | | |
4.00% due 01/15/31 | | | 290,000 | | | | 259,998 | |
5.30% due 01/15/29 | | | 250,000 | | | | 246,318 | |
Nippon Life Insurance Co. | | | | | | | | |
2.75% due 01/21/512,3 | | | 350,000 | | | | 291,695 | |
2.90% due 09/16/512,3 | | | 200,000 | | | | 164,919 | |
Host Hotels & Resorts, LP | | | | | | | | |
3.50% due 09/15/30 | | | 435,000 | | | | 384,397 | |
2.90% due 12/15/31 | | | 50,000 | | | | 41,770 | |
JPMorgan Chase & Co. | | | | | | | | |
5.35% due 06/01/342 | | | 305,000 | | | | 303,648 | |
2.96% due 05/13/312 | | | 135,000 | | | | 118,317 | |
Jefferies Financial Group, Inc. | | | | | | | | |
2.75% due 10/15/32 | | | 300,000 | | | | 239,700 | |
6.20% due 04/14/34 | | | 100,000 | | | | 101,282 | |
2.63% due 10/15/31 | | | 100,000 | | | | 80,700 | |
Fort Moore Family Communities LLC | | | | | | | | |
6.09% due 01/15/513 | | | 457,003 | | | | 414,742 | |
Assurant, Inc. | | | | | | | | |
2.65% due 01/15/32 | | | 250,000 | | | | 206,144 | |
6.10% due 02/27/26 | | | 200,000 | | | | 202,209 | |
FS KKR Capital Corp. | | | | | | | | |
2.63% due 01/15/27 | | | 250,000 | | | | 225,673 | |
3.25% due 07/15/27 | | | 200,000 | | | | 181,140 | |
Global Atlantic Finance Co. | | | | | | | | |
4.70% due 10/15/512,3 | | | 250,000 | | | | 232,172 | |
3.13% due 06/15/313 | | | 195,000 | | | | 161,280 | |
Morgan Stanley | | | | | | | | |
6.63% due 11/01/342 | | | 220,000 | | | | 237,601 | |
5.94% due 02/07/392 | | | 150,000 | | | | 148,349 | |
Safehold GL Holdings LLC | | | | | | | | |
2.80% due 06/15/31 | | | 180,000 | | | | 150,517 | |
2.85% due 01/15/32 | | | 151,000 | | | | 124,059 | |
6.10% due 04/01/34 | | | 100,000 | | | | 98,783 | |
Macquarie Group Ltd. | | | | | | | | |
2.87% due 01/14/332,3 | | | 250,000 | | | | 206,601 | |
2.69% due 06/23/322,3 | | | 200,000 | | | | 165,785 | |
Ares Finance Company II LLC | | | | | | | | |
3.25% due 06/15/303 | | | 410,000 | | | | 365,431 | |
CoStar Group, Inc. | | | | | | | | |
2.80% due 07/15/303 | | | 430,000 | | | | 363,615 | |
Blue Owl Capital GP LLC | | | | | | | | |
7.21% due 08/22/43††† | | | 350,000 | | | | 358,514 | |
OneMain Finance Corp. | | | | | | | | |
7.13% due 03/15/26 | | | 350,000 | | | | 355,654 | |
Iron Mountain, Inc. | | | | | | | | |
4.50% due 02/15/313 | | | 261,000 | | | | 235,599 | |
5.63% due 07/15/323 | | | 125,000 | | | | 118,695 | |
Fidelity National Financial, Inc. | | | | | | | | |
3.40% due 06/15/30 | | | 255,000 | | | | 226,163 | |
2.45% due 03/15/31 | | | 150,000 | | | | 122,219 | |
Liberty Mutual Group, Inc. | | | | | | | | |
4.30% due 02/01/613 | | | 554,000 | | | | 344,893 | |
SEE NOTES TO FINANCIAL STATEMENTS. | THE GUGGENHEIM FUNDS SEMI-ANNUAL FINANCIAL REPORT | 21 |
SCHEDULE OF INVESTMENTS (Unaudited)(continued) | June 30, 2024 |
SERIES E (TOTAL RETURN BOND SERIES) | |
| | Face
Amount~ | | | Value | |
Maple Grove Funding Trust I | | | | | | | | |
4.16% due 08/15/513 | | | 500,000 | | | $ | 337,866 | |
Brookfield Finance, Inc. | | | | | | | | |
3.50% due 03/30/51 | | | 280,000 | | | | 193,643 | |
5.68% due 01/15/35 | | | 100,000 | | | | 98,930 | |
4.70% due 09/20/47 | | | 50,000 | | | | 42,345 | |
United Wholesale Mortgage LLC | | | | | | | | |
5.50% due 04/15/293 | | | 300,000 | | | | 285,018 | |
5.50% due 11/15/253 | | | 50,000 | | | | 49,638 | |
Standard Chartered plc | | | | | | | | |
4.64% due 04/01/312,3 | | | 350,000 | | | | 333,235 | |
First American Financial Corp. | | | | | | | | |
4.00% due 05/15/30 | | | 360,000 | | | | 323,317 | |
LPL Holdings, Inc. | | | | | | | | |
4.00% due 03/15/293 | | | 174,000 | | | | 162,197 | |
6.00% due 05/20/34 | | | 160,000 | | | | 159,760 | |
Fairfax Financial Holdings Ltd. | | | | | | | | |
3.38% due 03/03/31 | | | 250,000 | | | | 217,121 | |
5.63% due 08/16/32 | | | 100,000 | | | | 98,575 | |
Rocket Mortgage LLC / Rocket Mortgage Company-Issuer, Inc. | | | | | | | | |
3.88% due 03/01/313 | | | 350,000 | | | | 305,019 | |
Nationwide Mutual Insurance Co. | | | | | | | | |
4.35% due 04/30/503 | | | 370,000 | | | | 284,112 | |
Reinsurance Group of America, Inc. | | | | | | | | |
3.15% due 06/15/30 | | | 203,000 | | | | 180,567 | |
5.75% due 09/15/34 | | | 100,000 | | | | 99,637 | |
OneAmerica Financial Partners, Inc. | | | | | | | | |
4.25% due 10/15/503 | | | 410,000 | | | | 276,219 | |
BPCE S.A. | | | | | | | | |
7.00% due 10/19/342,3 | | | 250,000 | | | | 267,253 | |
Prudential Financial, Inc. | | | | | | | | |
6.50% due 03/15/542 | | | 150,000 | | | | 151,422 | |
3.70% due 10/01/502 | | | 130,000 | | | | 113,080 | |
ABN AMRO Bank N.V. | | | | | | | | |
2.47% due 12/13/292,3 | | | 300,000 | | | | 263,905 | |
Belrose Funding Trust | | | | | | | | |
2.33% due 08/15/303 | | | 320,000 | | | | 260,664 | |
Macquarie Bank Ltd. | | | | | | | | |
3.62% due 06/03/303 | | | 290,000 | | | | 258,100 | |
Lazard Group LLC | | | | | | | | |
6.00% due 03/15/31 | | | 250,000 | | | | 252,658 | |
Corebridge Financial, Inc. | | | | | | | | |
6.88% due 12/15/522 | | | 250,000 | | | | 252,263 | |
Credit Agricole S.A. | | | | | | | | |
5.34% due 01/10/302,3 | | | 250,000 | | | | 247,331 | |
UBS Group AG | | | | | | | | |
2.10% due 02/11/322,3 | | | 300,000 | | | | 241,068 | |
Jefferies Finance LLC / JFIN Company-Issuer Corp. | | | | | | | | |
5.00% due 08/15/283 | | | 250,000 | | | | 230,617 | |
SBA Communications Corp. | | | | | | | | |
3.13% due 02/01/29 | | | 250,000 | | | | 222,887 | |
CNO Financial Group, Inc. | | | | | | | | |
6.45% due 06/15/34 | | | 170,000 | | | | 169,837 | |
5.25% due 05/30/29 | | | 50,000 | | | | 48,512 | |
Stewart Information Services Corp. | | | | | | | | |
3.60% due 11/15/31 | | | 250,000 | | | | 206,681 | |
Societe Generale S.A. | | | | | | | | |
2.89% due 06/09/322,3 | | | 250,000 | | | | 203,949 | |
TPG Operating Group II, LP | | | | | | | | |
5.88% due 03/05/34 | | | 200,000 | | | | 200,751 | |
Lloyds Banking Group plc | | | | | | | | |
5.46% due 01/05/282 | | | 200,000 | | | | 199,575 | |
BNP Paribas S.A. | | | | | | | | |
5.50% due 05/20/302,3 | | | 200,000 | | | | 199,205 | |
Westpac Banking Corp. | | | | | | | | |
3.02% due 11/18/362 | | | 150,000 | | | | 123,061 | |
2.96% due 11/16/40 | | | 73,000 | | | | 51,151 | |
2.67% due 11/15/352 | | | 27,000 | | | | 22,311 | |
Hunt Companies, Inc. | | | | | | | | |
5.25% due 04/15/293 | | | 200,000 | | | | 181,762 | |
Trustage Financial Group, Inc. | | | | | | | | |
4.63% due 04/15/323 | | | 200,000 | | | | 175,538 | |
Brown & Brown, Inc. | | | | | | | | |
5.65% due 06/11/34 | | | 100,000 | | | | 99,358 | |
2.38% due 03/15/31 | | | 90,000 | | | | 74,316 | |
Bank of America Corp. | | | | | | | | |
2.59% due 04/29/312 | | | 190,000 | | | | 164,277 | |
Jane Street Group / JSG Finance, Inc. | | | | | | | | |
7.13% due 04/30/313 | | | 160,000 | | | | 164,076 | |
Americo Life, Inc. | | | | | | | | |
3.45% due 04/15/313 | | | 200,000 | | | | 159,479 | |
Capital One Financial Corp. | | | | | | | | |
6.38% due 06/08/342 | | | 150,000 | | | | 153,894 | |
AmFam Holdings, Inc. | | | | | | | | |
2.81% due 03/11/313 | | | 200,000 | | | | 152,867 | |
Equinix Europe 2 Financing Corporation LLC | | | | | | | | |
5.50% due 06/15/34 | | | 150,000 | | | | 149,756 | |
Pacific Beacon LLC | | | | | | | | |
5.51% due 07/15/363 | | | 150,000 | | | | 142,658 | |
KKR Group Finance Company VIII LLC | | | | | | | | |
3.50% due 08/25/503 | | | 190,000 | | | | 131,300 | |
Dyal Capital Partners III (B) LP | | | | | | | | |
6.55% due 06/15/44††† | | | 132,000 | | | | 129,743 | |
PartnerRe Finance B LLC | | | | | | | | |
4.50% due 10/01/502 | | | 140,000 | | | | 127,097 | |
RGA Global Funding | | | | | | | | |
5.50% due 01/11/313 | | | 120,000 | | | | 119,824 | |
Aretec Group, Inc. | | | | | | | | |
10.00% due 08/15/303 | | | 100,000 | | | | 108,759 | |
VFH Parent LLC / Valor Company-Issuer, Inc. | | | | | | | | |
7.50% due 06/15/313 | | | 100,000 | | | | 100,480 | |
Pine Street Trust III | | | | | | | | |
6.22% due 05/15/543 | | | 100,000 | | | | 99,904 | |
Kennedy-Wilson, Inc. | | | | | | | | |
4.75% due 03/01/29 | | | 109,000 | | | | 93,258 | |
Apollo Management Holdings, LP | | | | | | | | |
2.65% due 06/05/303 | | | 90,000 | | | | 78,620 | |
Assured Guaranty US Holdings, Inc. | | | | | | | | |
3.60% due 09/15/51 | | | 100,000 | | | | 69,089 | |
American National Group, Inc. | | | | | | | | |
5.00% due 06/15/27 | | | 69,000 | | | | 67,416 | |
22 | THE GUGGENHEIM FUNDS SEMI-ANNUAL FINANCIAL REPORT | SEE NOTES TO FINANCIAL STATEMENTS. |
SCHEDULE OF INVESTMENTS (Unaudited)(continued) | June 30, 2024 |
SERIES E (TOTAL RETURN BOND SERIES) | |
| | Face
Amount~ | | | Value | |
Western & Southern Life Insurance Co. | | | | | | | | |
3.75% due 04/28/613 | | | 100,000 | | | $ | 65,640 | |
Penn Mutual Life Insurance Co. | | | | | | | | |
3.80% due 04/29/613 | | | 100,000 | | | | 64,053 | |
Kemper Corp. | | | | | | | | |
2.40% due 09/30/30 | | | 76,000 | | | | 62,148 | |
Mutual of Omaha Insurance Co. | | | | | | | | |
6.14% due 01/16/642,3 | | | 50,000 | | | | 49,412 | |
Nationstar Mortgage Holdings, Inc. | | | | | | | | |
5.00% due 02/01/263 | | | 50,000 | | | | 48,938 | |
Cushman & Wakefield US Borrower LLC | | | | | | | | |
6.75% due 05/15/283 | | | 35,000 | | | | 34,742 | |
Brookfield Finance LLC / Brookfield Finance, Inc. | | | | | | | | |
3.45% due 04/15/50 | | | 50,000 | | | | 34,392 | |
Lincoln National Corp. | | | | | | | | |
5.85% due 03/15/34 | | | 30,000 | | | | 29,957 | |
Total Financial | | | | | | | 20,977,434[ | |
| | | | | | | | | |
Industrial - 2.7% | | | | | | | | |
AP Grange Holdings | | | | | | | | |
6.50% due 03/20/45 | | | 900,000 | | | | 900,000 | |
5.00% due 03/20/45 | | | 200,000 | | | | 200,000 | |
Amsted Industries, Inc. | | | | | | | | |
4.63% due 05/15/303 | | | 470,000 | | | | 431,227 | |
TD SYNNEX Corp. | | | | | | | | |
2.65% due 08/09/31 | | | 210,000 | | | | 172,764 | |
2.38% due 08/09/28 | | | 150,000 | | | | 133,604 | |
6.10% due 04/12/34 | | | 100,000 | | | | 100,278 | |
Crown Americas LLC / Crown Americas Capital Corporation VI | | | | | | | | |
4.75% due 02/01/26 | | | 400,000 | | | | 393,115 | |
Stadco LA LLC | | | | | | | | |
3.75% due 05/15/56††† | | | 500,000 | | | | 336,591 | |
Flowserve Corp. | | | | | | | | |
3.50% due 10/01/30 | | | 270,000 | | | | 240,272 | |
2.80% due 01/15/32 | | | 100,000 | | | | 82,068 | |
Vontier Corp. | | | | | | | | |
2.95% due 04/01/31 | | | 350,000 | | | | 291,081 | |
Berry Global, Inc. | | | | | | | | |
5.80% due 06/15/313 | | | 150,000 | | | | 149,781 | |
1.57% due 01/15/26 | | | 50,000 | | | | 46,976 | |
Weir Group plc | | | | | | | | |
2.20% due 05/13/263 | | | 200,000 | | | | 187,712 | |
Dyal Capital Partners III (A) LP | | | | | | | | |
6.55% due 06/15/44††† | | | 168,000 | | | | 165,127 | |
Boeing Co. | | | | | | | | |
6.86% due 05/01/543 | | | 100,000 | | | | 102,617 | |
6.53% due 05/01/343 | | | 50,000 | | | | 51,195 | |
Owens Corning | | | | | | | | |
5.95% due 06/15/54 | | | 110,000 | | | | 110,879 | |
Westinghouse Air Brake Technologies Corp. | | | | | | | | |
5.61% due 03/11/34 | | | 100,000 | | | | 100,550 | |
Sealed Air Corp. | | | | | | | | |
6.50% due 07/15/323 | | | 100,000 | | | | 99,439 | |
Norfolk Southern Corp. | | | | | | | | |
4.10% due 05/15/21 | | | 50,000 | | | | 35,280 | |
Total Industrial | | | | | | | 4,330,556 | |
| | | | | | | | | |
Consumer, Cyclical - 2.2% | | | | | | | | |
Warnermedia Holdings, Inc. | | | | | | | | |
4.28% due 03/15/32 | | | 400,000 | | | | 349,131 | |
5.14% due 03/15/52 | | | 196,000 | | | | 152,607 | |
Hyatt Hotels Corp. | | | | | | | | |
5.38% due 04/23/25 | | | 220,000 | | | | 219,107 | |
5.75% due 04/23/30 | | | 190,000 | | | | 193,224 | |
Delta Air Lines, Inc. | | | | | | | | |
7.00% due 05/01/253 | | | 367,000 | | | | 369,776 | |
Choice Hotels International, Inc. | | | | | | | | |
3.70% due 01/15/31 | | | 360,000 | | | | 317,609 | |
5.85% due 08/01/34 | | | 30,000 | | | | 29,568 | |
International Game Technology plc | | | | | | | | |
4.13% due 04/15/263 | | | 230,000 | | | | 223,906 | |
Mileage Plus Holdings LLC / Mileage Plus Intellectual Property Assets Ltd. | | | | | | | | |
6.50% due 06/20/273 | | | 210,000 | | | | 210,419 | |
Flutter Treasury Designated Activity Co. | | | | | | | | |
6.38% due 04/29/293 | | | 200,000 | | | | 201,267 | |
LG Energy Solution Ltd. | | | | | | | | |
5.50% due 07/02/343 | | | 200,000 | | | | 195,111 | |
Ferguson Finance plc | | | | | | | | |
4.65% due 04/20/323 | | | 200,000 | | | | 189,287 | |
Walgreens Boots Alliance, Inc. | | | | | | | | |
3.45% due 06/01/26 | | | 100,000 | | | | 94,088 | |
4.10% due 04/15/50 | | | 98,000 | | | | 67,303 | |
Hasbro, Inc. | | | | | | | | |
6.05% due 05/14/34 | | | 150,000 | | | | 149,761 | |
Delta Air Lines, Inc. / SkyMiles IP Ltd. | | | | | | | | |
4.50% due 10/20/253 | | | 150,000 | | | | 148,183 | |
United Airlines, Inc. | | | | | | | | |
4.38% due 04/15/263 | | | 150,000 | | | | 144,901 | |
Air Canada | | | | | | | | |
3.88% due 08/15/263 | | | 150,000 | | | | 142,679 | |
Beacon Roofing Supply, Inc. | | | | | | | | |
4.50% due 11/15/263 | | | 100,000 | | | | 97,193 | |
British Airways Class A Pass Through Trust | | | | | | | | |
2.90% due 03/15/353 | | | 89,431 | | | | 77,199 | |
Total Consumer, Cyclical | | | | | | | 3,572,319 | |
| | | | | | | | | |
Consumer, Non-cyclical - 2.2% | | | | | | | | |
JBS USA LUX S.A. / JBS USA Food Company / JBS USA Finance, Inc. | | | | | | | | |
3.00% due 05/15/32 | | | 200,000 | | | | 164,645 | |
5.50% due 01/15/30 | | | 100,000 | | | | 98,476 | |
4.38% due 02/02/52 | | | 100,000 | | | | 74,736 | |
Smithfield Foods, Inc. | | | | | | | | |
2.63% due 09/13/313 | | | 300,000 | | | | 240,011 | |
3.00% due 10/15/303 | | | 110,000 | | | | 93,393 | |
Global Payments, Inc. | | | | | | | | |
2.90% due 05/15/30 | | | 195,000 | | | | 169,758 | |
2.90% due 11/15/31 | | | 140,000 | | | | 117,225 | |
3.20% due 08/15/29 | | | 15,000 | | | | 13,476 | |
SEE NOTES TO FINANCIAL STATEMENTS. | THE GUGGENHEIM FUNDS SEMI-ANNUAL FINANCIAL REPORT | 23 |
SCHEDULE OF INVESTMENTS (Unaudited)(continued) | June 30, 2024 |
SERIES E (TOTAL RETURN BOND SERIES) | |
| | Face
Amount~ | | | Value | |
Altria Group, Inc. | | | | | | | | |
3.70% due 02/04/51 | | | 350,000 | | | $ | 236,561 | |
4.45% due 05/06/50 | | | 50,000 | | | | 38,397 | |
Medline Borrower Limited Partnership/Medline Company-Issuer, Inc. | | | | | | | | |
6.25% due 04/01/293 | | | 250,000 | | | | 252,829 | |
Brink’s Co. | | | | | | | | |
6.75% due 06/15/323 | | | 150,000 | | | | 151,101 | |
6.50% due 06/15/293 | | | 100,000 | | | | 101,048 | |
Royalty Pharma plc | | | | | | | | |
3.55% due 09/02/50 | | | 310,000 | | | | 208,080 | |
GXO Logistics, Inc. | | | | | | | | |
6.25% due 05/06/29 | | | 100,000 | | | | 101,720 | |
6.50% due 05/06/34 | | | 100,000 | | | | 101,481 | |
IQVIA, Inc. | | | | | | | | |
5.00% due 05/15/273 | | | 200,000 | | | | 195,141 | |
Triton Container International Ltd. | | | | | | | | |
3.15% due 06/15/313 | | | 200,000 | | | | 166,230 | |
CVS Health Corp. | | | | | | | | |
5.70% due 06/01/34 | | | 150,000 | | | | 149,595 | |
Graham Holdings Co. | | | | | | | | |
5.75% due 06/01/263 | | | 150,000 | | | | 148,850 | |
Albertsons Companies Incorporated / Safeway Inc / New Albertsons Limited Partnership / Albertsons LLC | | | | | | | | |
3.25% due 03/15/263 | | | 150,000 | | | | 144,090 | |
Universal Health Services, Inc. | | | | | | | | |
2.65% due 10/15/30 | | | 150,000 | | | | 128,062 | |
Transurban Finance Company Pty Ltd. | | | | | | | | |
2.45% due 03/16/313 | | | 150,000 | | | | 125,349 | |
AZ Battery Property LLC | | | | | | | | |
6.73% due 02/20/46††† | | | 100,000 | | | | 100,670 | |
Triton Container International Limited / TAL International Container Corp. | | | | | | | | |
3.25% due 03/15/32 | | | 100,000 | | | | 82,003 | |
Tenet Healthcare Corp. | | | | | | | | |
4.63% due 06/15/28 | | | 75,000 | | | | 71,325 | |
Catalent Pharma Solutions, Inc. | | | | | | | | |
3.13% due 02/15/293 | | | 43,000 | | | | 41,154 | |
Central Garden & Pet Co. | | | | | | | | |
4.13% due 04/30/313 | | | 42,000 | | | | 37,014 | |
Total Consumer, Non-cyclical | | | | | | | 3,552,420 | |
| | | | | | | | | |
Energy - 2.0% | | | | | | | | |
BP Capital Markets plc | | | | | | | | |
4.88% 2,8 | | | 516,000 | | | | 486,465 | |
Venture Global LNG, Inc. | | | | | | | | |
9.50% due 02/01/293 | | | 200,000 | | | | 219,019 | |
9.88% due 02/01/323 | | | 100,000 | | | | 108,842 | |
Galaxy Pipeline Assets Bidco Ltd. | | | | | | | | |
3.25% due 09/30/403 | | | 328,000 | | | | 248,387 | |
Plains All American Pipeline Limited Partnership / PAA Finance Corp. | | | | | | | | |
5.70% due 09/15/34 | | | 250,000 | | | | 247,704 | |
ITT Holdings LLC | | | | | | | | |
6.50% due 08/01/293 | | | 248,000 | | | | 224,689 | |
Greensaif Pipelines Bidco SARL | | | | | | | | |
6.13% due 02/23/383 | | | 200,000 | | | | 203,263 | |
Hess Midstream Operations, LP | | | | | | | | |
5.63% due 02/15/263 | | | 200,000 | | | | 198,492 | |
Venture Global Calcasieu Pass LLC | | | | | | | | |
4.13% due 08/15/313 | | | 200,000 | | | | 179,473 | |
Cheniere Energy Partners, LP | | | | | | | | |
5.75% due 08/15/343 | | | 150,000 | | | | 150,598 | |
Kinder Morgan, Inc. | | | | | | | | |
5.20% due 06/01/33 | | | 150,000 | | | | 145,549 | |
Midwest Connector Capital Company LLC | | | | | | | | |
4.63% due 04/01/293 | | | 110,000 | | | | 106,775 | |
Viper Energy, Inc. | | | | | | | | |
7.38% due 11/01/313 | | | 100,000 | | | | 103,569 | |
Sunoco, LP | | | | | | | | |
7.25% due 05/01/323 | | | 100,000 | | | | 103,436 | |
TransCanada PipeLines Ltd. | | | | | | | | |
6.20% due 03/09/26 | | | 100,000 | | | | 100,049 | |
NuStar Logistics, LP | | | | | | | | |
5.63% due 04/28/27 | | | 100,000 | | | | 99,158 | |
Parkland Corp. | | | | | | | | |
4.63% due 05/01/303 | | | 100,000 | | | | 91,204 | |
Targa Resources Corp. | | | | | | | | |
6.50% due 03/30/34 | | | 63,000 | | | | 66,713 | |
Energy Transfer, LP | | | | | | | | |
7.38% due 02/01/313 | | | 50,000 | | | | 52,174 | |
Targa Resources Partners Limited Partnership / Targa Resources Partners Finance Corp. | | | | | | | | |
5.50% due 03/01/30 | | | 37,000 | | | | 36,773 | |
Total Energy | | | | | | | 3,172,332 | |
| | | | | | | | | |
Communications - 1.5% | | | | | | | | |
British Telecommunications plc | | | | | | | | |
4.88% due 11/23/812,3 | | | 350,000 | | | | 313,897 | |
9.63% due 12/15/30 | | | 100,000 | | | | 122,101 | |
Level 3 Financing, Inc. | | | | | | | | |
3.88% due 10/15/303 | | | 330,000 | | | | 172,939 | |
11.00% due 11/15/293 | | | 71,086 | | | | 72,743 | |
4.00% due 04/15/313 | | | 100,000 | | | | 52,250 | |
Virgin Media Secured Finance plc | | | | | | | | |
4.50% due 08/15/303 | | | 300,000 | | | | 254,381 | |
Paramount Global | | | | | | | | |
4.90% due 08/15/44 | | | 132,000 | | | | 91,804 | |
5.90% due 10/15/40 | | | 86,000 | | | | 68,970 | |
5.25% due 04/01/44 | | | 46,000 | | | | 33,501 | |
4.85% due 07/01/42 | | | 35,000 | | | | 25,068 | |
4.60% due 01/15/45 | | | 20,000 | | | | 13,354 | |
Cable One, Inc. | | | | | | | | |
4.00% due 11/15/303 | | | 300,000 | | | | 223,905 | |
Vodafone Group plc | | | | | | | | |
4.13% due 06/04/812 | | | 250,000 | | | | 212,912 | |
Rogers Communications, Inc. | | | | | | | | |
4.55% due 03/15/52 | | | 200,000 | | | | 163,277 | |
Sirius XM Radio, Inc. | | | | | | | | |
4.13% due 07/01/303 | | | 180,000 | | | | 153,741 | |
24 | THE GUGGENHEIM FUNDS SEMI-ANNUAL FINANCIAL REPORT | SEE NOTES TO FINANCIAL STATEMENTS. |
SCHEDULE OF INVESTMENTS (Unaudited)(continued) | June 30, 2024 |
SERIES E (TOTAL RETURN BOND SERIES) | |
| | Face
Amount~ | | | Value | |
Altice France S.A. | | | | | | | | |
5.13% due 07/15/293 | | | 200,000 | | | $ | 131,520 | |
CSC Holdings LLC | | | | | | | | |
4.13% due 12/01/303 | | | 200,000 | | | | 129,269 | |
Go Daddy Operating Company LLC / GD Finance Co., Inc. | | | | | | | | |
3.50% due 03/01/293 | | | 55,000 | | | | 49,668 | |
Charter Communications Operating LLC / Charter Communications Operating Capital | | | | | | | | |
3.90% due 06/01/52 | | | 50,000 | | | | 31,354 | |
McGraw-Hill Education, Inc. | | | | | | | | |
5.75% due 08/01/283 | | | 16,000 | | | | 15,429 | |
Total Communications | | | | | | | 2,332,083 | |
| | | | | | | | | |
Technology - 1.2% | | | | | | | | |
ACI Worldwide, Inc. | | | | | | | | |
5.75% due 08/15/263 | | | 400,000 | | | | 397,808 | |
Broadcom, Inc. | | | | | | | | |
4.93% due 05/15/373 | | | 277,000 | | | | 260,522 | |
3.19% due 11/15/363 | | | 26,000 | | | | 20,575 | |
Leidos, Inc. | | | | | | | | |
2.30% due 02/15/31 | | | 250,000 | | | | 205,979 | |
Foundry JV Holdco LLC | | | | | | | | |
5.88% due 01/25/343 | | | 200,000 | | | | 198,290 | |
Qorvo, Inc. | | | | | | | | |
4.38% due 10/15/29 | | | 119,000 | | | | 112,392 | |
3.38% due 04/01/313 | | | 100,000 | | | | 85,719 | |
Oracle Corp. | | | | | | | | |
3.95% due 03/25/51 | | | 217,000 | | | | 160,444 | |
MSCI, Inc. | | | | | | | | |
3.63% due 11/01/313 | | | 150,000 | | | | 131,611 | |
Booz Allen Hamilton, Inc. | | | | | | | | |
5.95% due 08/04/33 | | | 100,000 | | | | 103,142 | |
Constellation Software, Inc. | | | | | | | | |
5.46% due 02/16/343 | | | 100,000 | | | | 100,012 | |
Atlassian Corp. | | | | | | | | |
5.50% due 05/15/34 | | | 100,000 | | | | 99,085 | |
Fiserv, Inc. | | | | | | | | |
5.35% due 03/15/31 | | | 50,000 | | | | 49,971 | |
Twilio, Inc. | | | | | | | | |
3.63% due 03/15/29 | | | 38,000 | | | | 34,181 | |
Total Technology | | | | | | | 1,959,731 | |
| | | | | | | | | |
Basic Materials - 0.7% | | | | | | | | |
Anglo American Capital plc | | | | | | | | |
5.63% due 04/01/303 | | | 200,000 | | | | 201,294 | |
2.63% due 09/10/303 | | | 200,000 | | | | 170,641 | |
Alcoa Nederland Holding BV | | | | | | | | |
5.50% due 12/15/273 | | | 200,000 | | | | 196,940 | |
Minerals Technologies, Inc. | | | | | | | | |
5.00% due 07/01/283 | | | 190,000 | | | | 180,331 | |
International Flavors & Fragrances, Inc. | | | | | | | | |
1.23% due 10/01/253 | | | 170,000 | | | | 160,786 | |
Yamana Gold, Inc. | | | | | | | | |
2.63% due 08/15/31 | | | 150,000 | | | | 124,654 | |
Arsenal AIC Parent LLC | | | | | | | | |
8.00% due 10/01/303 | | | 100,000 | | | | 104,940 | |
Total Basic Materials | | | | | | | 1,139,586 | |
| | | | | | | | | |
Utilities - 0.5% | | | | | | | | |
NRG Energy, Inc. | | | | | | | | |
2.45% due 12/02/273 | | | 200,000 | | | | 180,494 | |
7.00% due 03/15/333 | | | 100,000 | | | | 105,560 | |
AES Corp. | | | | | | | | |
3.95% due 07/15/303 | | | 220,000 | | | | 201,153 | |
Enel Finance International N.V. | | | | | | | | |
5.00% due 06/15/323 | | | 200,000 | | | | 190,018 | |
AmeriGas Partners Limited Partnership / AmeriGas Finance Corp. | | | | | | | | |
5.88% due 08/20/26 | | | 100,000 | | | | 96,898 | |
Total Utilities | | | | | | | 774,123 | |
| | | | | | | | | |
Transportation - 0.1% | | | | | | | | |
Stolthaven Houston, Inc. | | | | | | | | |
5.98% due 07/17/34 | | | 200,000 | | | | 197,750 | |
Total Corporate Bonds | | | | |
(Cost $46,789,312) | | | 42,008,334 | |
| |
ASSET-BACKED SECURITIES†† - 21.1% |
Collateralized Loan Obligations - 11.7% | | | | | | | | |
Octagon Investment Partners 49 Ltd. | | | | | | | | |
2024-5A BR, 7.24% (3 Month Term SOFR + 1.95%, Rate Floor: 1.95%) due 04/15/37◊,3 | | | 1,750,000 | | | | 1,756,770 | |
BXMT Ltd. | | | | | | | | |
2020-FL2 AS, 6.59% (1 Month Term SOFR + 1.26%, Rate Floor: 1.26%) due 02/15/38◊,3 | | | 1,000,000 | | | | 955,702 | |
2020-FL3 C, 7.99% (1 Month Term SOFR + 2.66%, Rate Floor: 2.66%) due 11/15/37◊,3 | | | 250,000 | | | | 212,695 | |
Cerberus Loan Funding XXXIII, LP | | | | | | | | |
2021-3A A, 7.15% (3 Month Term SOFR + 1.82%, Rate Floor: 1.56%) due 07/23/33◊,3 | | | 500,000 | | | | 500,949 | |
2021-3A B, 7.44% (3 Month Term SOFR + 2.11%, Rate Floor: 1.85%) due 07/23/33◊,3 | | | 500,000 | | | | 500,001 | |
ABPCI Direct Lending Fund CLO II LLC | | | | | | | | |
2021-1A A1R, 7.19% (3 Month Term SOFR + 1.86%, Rate Floor: 1.60%) due 04/20/32◊,3 | | | 1,000,000 | | | | 999,936 | |
Palmer Square Loan Funding Ltd. | | | | | | | | |
2022-1A A2, 6.93% (3 Month Term SOFR + 1.60%, Rate Floor: 1.60%) due 04/15/30◊,3 | | | 1,000,000 | | | | 998,966 | |
Cerberus Loan Funding XLIV LLC | | | | | | | | |
2024-5A A, 7.45% (3 Month Term SOFR + 2.35%, Rate Floor: 2.35%) due 01/15/36◊,3 | | | 700,000 | | | | 708,211 | |
SEE NOTES TO FINANCIAL STATEMENTS. | THE GUGGENHEIM FUNDS SEMI-ANNUAL FINANCIAL REPORT | 25 |
SCHEDULE OF INVESTMENTS (Unaudited)(continued) | June 30, 2024 |
SERIES E (TOTAL RETURN BOND SERIES) | |
| | Face
Amount~ | | | Value | |
2024-5A B, 8.30% (3 Month Term SOFR + 3.20%, Rate Floor: 3.20%) due 01/15/36◊,3 | | | 250,000 | | | $ | 253,665 | |
LCCM Trust | | | | | | | | |
2021-FL3 A, 6.89% (1 Month Term SOFR + 1.56%, Rate Floor: 1.56%) due 11/15/38◊,3 | | | 536,089 | | | | 530,392 | |
2021-FL3 AS, 7.24% (1 Month Term SOFR + 1.91%, Rate Floor: 1.91%) due 11/15/38◊,3 | | | 400,000 | | | | 387,138 | |
Woodmont Trust | | | | | | | | |
2020-7A A1A, 7.49% (3 Month Term SOFR + 2.16%, Rate Floor: 1.90%) due 01/15/32◊,3 | | | 871,261 | | | | 871,261 | |
Golub Capital Partners CLO 33M Ltd. | | | | | | | | |
2021-33A AR2, 7.46% (3 Month Term SOFR + 2.12%, Rate Floor: 1.86%) due 08/25/33◊,3 | | | 750,000 | | | | 745,840 | |
STWD Ltd. | | | | | | | | |
2019-FL1 B, 7.04% (1 Month Term SOFR + 1.71%, Rate Floor: 1.71%) due 07/15/38◊,3 | | | 750,000 | | | | 738,893 | |
Dryden 37 Senior Loan Fund | | | | | | | | |
2015-37A Q, due 01/15/313,9 | | | 1,000,000 | | | | 693,871 | |
KREF Ltd. | | | | | | | | |
2021-FL2 C, 7.44% (1 Month Term SOFR + 2.11%, Rate Floor: 2.00%) due 02/15/39◊,3 | | | 500,000 | | | | 467,251 | |
2021-FL2 AS, 6.74% (1 Month Term SOFR + 1.41%, Rate Floor: 1.30%) due 02/15/39◊,3 | | | 150,000 | | | | 145,430 | |
Golub Capital Partners CLO 36M Ltd. | | | | | | | | |
2018-36A A, 6.90% (3 Month Term SOFR + 1.56%, Rate Floor: 0.00%) due 02/05/31◊,3 | | | 583,480 | | | | 582,817 | |
Cerberus Loan Funding XL LLC | | | | | | | | |
2023-1A A, 7.73% (3 Month Term SOFR + 2.40%, Rate Floor: 2.40%) due 03/22/35◊,3 | | | 500,000 | | | | 504,744 | |
Cerberus Loan Funding XLII LLC | | | | | | | | |
2023-3A A1, 7.81% (3 Month Term SOFR + 2.48%, Rate Floor: 2.48%) due 09/13/35◊,3 | | | 500,000 | | | | 503,249 | |
Golub Capital Partners CLO 16 Ltd. | | | | | | | | |
2021-16A A1R2, 7.20% (3 Month Term SOFR + 1.87%, Rate Floor: 1.61%) due 07/25/33◊,3 | | | 500,000 | | | | 502,751 | |
Owl Rock CLO XVI | | | | | | | | |
2024-16A A, 7.32% (3 Month Term SOFR + 2.00%, Rate Floor: 2.00%) due 04/20/36◊,3 | | | 500,000 | | | | 502,172 | |
ABPCI Direct Lending Fund CLO I LLC | | | | | | | | |
2021-1A A1A2, 7.29% (3 Month Term SOFR + 1.96%, Rate Floor: 1.96%) due 07/20/33◊,3 | | | 500,000 | | | | 501,245 | |
THL Credit Lake Shore MM CLO I Ltd. | | | | | | | | |
2021-1A A1R, 7.29% (3 Month Term SOFR + 1.96%, Rate Floor: 1.70%) due 04/15/33◊,3 | | | 500,000 | | | | 499,876 | |
Golub Capital Partners CLO 54M L.P | | | | | | | | |
2021-54A C, 8.25% (3 Month Term SOFR + 2.91%, Rate Floor: 2.65%) due 08/05/33◊,3 | | | 500,000 | | | | 498,444 | |
HERA Commercial Mortgage Ltd. | | | | | | | | |
2021-FL1 B, 7.05% (1 Month Term SOFR + 1.71%, Rate Floor: 1.60%) due 02/18/38◊,3 | | | 500,000 | | | | 483,546 | |
LoanCore Issuer Ltd. | | | | | | | | |
2021-CRE6 C, 7.74% (1 Month Term SOFR + 2.41%, Rate Floor: 2.30%) due 11/15/38◊,3 | | | 500,000 | | | | 469,633 | |
Fortress Credit Opportunities XI CLO Ltd. | | | | | | | | |
2018-11A A1T, 6.89% (3 Month Term SOFR + 1.56%, Rate Floor: 0.00%) due 04/15/31◊,3 | | | 341,539 | | | | 340,845 | |
Fortress Credit BSL XV Ltd. | | | | | | | | |
2024-2A BR, 7.33% (3 Month Term SOFR + 2.00%, Rate Floor: 2.00%) due 10/18/33◊,3 | | | 300,000 | | | | 300,000 | |
Cerberus Loan Funding XLVII LLC | | | | | | | | |
2024-3A B, 7.35% (3 Month Term SOFR + 1.95%, Rate Floor: 1.95%) due 07/15/36◊,3 | | | 300,000 | | | | 300,000 | |
Owl Rock CLO IV Ltd. | | | | | | | | |
2021-4A A1R, 7.18% (3 Month Term SOFR + 1.86%, Rate Floor: 1.60%) due 08/20/33◊,3 | | | 250,000 | | | | 250,796 | |
CIFC Funding 2017-II Ltd. | | | | | | | | |
2021-2A CR, 7.44% (3 Month Term SOFR + 2.11%, Rate Floor: 1.85%) due 04/20/30◊,3 | | | 250,000 | | | | 250,462 | |
Owl Rock CLO XVII LLC | | | | | | | | |
2024-17A B, due 07/15/36◊,3 | | | 250,000 | | | | 250,000 | |
Ares Direct Lending CLO 1 LLC | | | | | | | | |
2024-1A B, 7.59% (3 Month Term SOFR + 2.20%, Rate Floor: 2.20%) due 04/25/36◊,3 | | | 250,000 | | | | 249,956 | |
Owl Rock CLO III Ltd. | | | | | | | | |
2024-3A AR, 7.23% (3 Month Term SOFR + 1.85%, Rate Floor: 1.85%) due 04/20/36◊,3 | | | 250,000 | | | | 249,950 | |
Golub Capital Partners CLO 17 Ltd. | | | | | | | | |
2017-17A A1R, 7.24% (3 Month Term SOFR + 1.91%, Rate Floor: 0.00%) due 10/25/30◊,3 | | | 141,149 | | | | 141,254 | |
Treman Park CLO Ltd. | | | | | | | | |
2015-1A COM, due 10/20/283,9 | | | 162,950 | | | | 544 | |
Copper River CLO Ltd. | | | | | | | | |
2007-1A INC, due 01/20/219,10 | | | 600,000 | | | | 60 | |
Total Collateralized Loan Obligations | | | | | | | 18,849,315 | |
| | | | | | | | | |
26 | THE GUGGENHEIM FUNDS SEMI-ANNUAL FINANCIAL REPORT | SEE NOTES TO FINANCIAL STATEMENTS. |
SCHEDULE OF INVESTMENTS (Unaudited)(continued) | June 30, 2024 |
SERIES E (TOTAL RETURN BOND SERIES) | |
| | Face
Amount~ | | | Value | |
Financial - 1.7% | | | | | | | | |
Station Place Securitization Trust | | | | | | | | |
due 08/11/25◊ | | | 325,000 | | | $ | 325,000 | |
due 07/11/26◊ | | | 325,000 | | | | 325,000 | |
KKR Core Holding Company LLC | | | | | | | | |
4.00% due 08/12/31††† | | | 520,311 | | | | 466,107 | |
Project Onyx I | | | | | | | | |
8.45% (3 Month Term SOFR + 3.15%, Rate Floor: 3.15%) due 01/26/27◊,††† | | | 412,131 | | | | 411,341 | |
LVNV Funding LLC | | | | | | | | |
7.80% due 11/05/28††† | | | 250,000 | | | | 254,730 | |
Thunderbird A | | | | | | | | |
5.50% due 03/01/37††† | | | 260,000 | | | | 238,588 | |
Lightning A | | | | | | | | |
5.50% due 03/01/37††† | | | 260,000 | | | | 238,589 | |
Project Onyx II | | | | | | | | |
8.45% (3 Month Term SOFR + 3.15%, Rate Floor: 3.15%) due 01/26/27◊,††† | | | 124,470 | | | | 123,652 | |
Nassau LLC | | | | | | | | |
2019-1, 3.98% due 08/15/343 | | | 115,488 | | | | 110,519 | |
LVNV Funding LLC | | | | | | | | |
6.84% due 06/12/29 | | | 100,000 | | | | 100,000 | |
Oxford Finance Funding | | | | | | | | |
2020-1A, 3.10% due 02/15/283 | | | 92,585 | | | | 91,377 | |
Total Financial | | | | | | | 2,684,903 | |
| | | | | | | | | |
Net Lease - 1.6% | | | | | | | | |
STORE Master Funding I-VII | | | | | | | | |
2016-1A, 3.96% due 10/20/463 | | | 845,172 | | | | 801,039 | |
CF Hippolyta Issuer LLC | | | | | | | | |
2022-1A, 6.11% due 08/15/623 | | | 244,283 | | | | 239,686 | |
2020-1, 2.28% due 07/15/603 | | | 224,888 | | | | 210,111 | |
Capital Automotive REIT | | | | | | | | |
2021-1A, 2.76% due 08/15/513 | | | 496,354 | | | | 392,233 | |
SVC ABS LLC | | | | | | | | |
2023-1A, 5.15% due 02/20/533 | | | 347,667 | | | | 334,147 | |
CMFT Net Lease Master Issuer LLC | | | | | | | | |
2021-1, 3.44% due 07/20/513 | | | 400,000 | | | | 317,208 | |
CARS-DB4, LP | | | | | | | | |
2020-1A, 3.81% due 02/15/503 | | | 246,198 | | | | 213,842 | |
Total Net Lease | | | | | | | 2,508,266 | |
| | | | | | | | | |
Transport-Aircraft - 1.6% | | | | | | | | |
AASET Trust | | | | | | | | |
2021-1A, 2.95% due 11/16/413 | | | 332,723 | | | | 306,647 | |
2024-1A, 6.26% due 05/16/4910 | | | 250,000 | | | | 250,207 | |
Navigator Aircraft ABS Ltd. | | | | | | | | |
2021-1, 2.77% due 11/15/463 | | | 408,496 | | | | 367,242 | |
Lunar Structured Aircraft Portfolio Notes | | | | | | | | |
2021-1, 2.64% due 10/15/463 | | | 388,804 | | | | 347,521 | |
WAVE LLC | | | | | | | | |
2019-1, 3.60% due 09/15/443 | | | 330,895 | | | | 299,460 | |
JOL Air Ltd. | | | | | | | | |
2019-1, 3.97% due 04/15/443 | | | 310,886 | | | | 289,146 | |
Sapphire Aviation Finance II Ltd. | | | | | | | | |
2020-1A, 3.23% due 03/15/403 | | | 306,654 | | | | 281,398 | |
Castlelake Aircraft Structured Trust | | | | | | | | |
2021-1A, 3.47% due 01/15/463 | | | 165,776 | | | | 155,935 | |
Sprite Ltd. | | | | | | | | |
2021-1, 3.75% due 11/15/463 | | | 157,532 | | | | 147,452 | |
Falcon Aerospace Ltd. | | | | | | | | |
2017-1, 4.58% due 02/15/423 | | | 55,376 | | | | 53,161 | |
Total Transport-Aircraft | | | | | | | 2,498,169 | |
| | | | | | | | | |
Whole Business - 1.6% | | | | | | | | |
Arbys Funding LLC | | | | | | | | |
2020-1A, 3.24% due 07/30/503 | | | 770,000 | | | | 714,038 | |
Applebee’s Funding LLC / IHOP Funding LLC | | | | | | | | |
2019-1A, 4.72% due 06/05/493 | | | 495,000 | | | | 477,022 | |
SERVPRO Master Issuer LLC | | | | | | | | |
2021-1A, 2.39% due 04/25/513 | | | 485,000 | | | | 427,514 | |
Taco Bell Funding LLC | | | | | | | | |
2016-1A, 4.97% due 05/25/463 | | | 328,125 | | | | 321,793 | |
Subway Funding LLC | | | | | | | | |
2024-1A, 6.27% due 07/30/543 | | | 200,000 | | | | 202,636 | |
2024-1A, 6.51% due 07/30/543 | | | 100,000 | | | | 101,793 | |
ServiceMaster Funding LLC | | | | | | | | |
2020-1, 3.34% due 01/30/513 | | | 235,726 | | | | 198,503 | |
DB Master Finance LLC | | | | | | | | |
2019-1A, due 05/20/493,16 | | | 95,250 | | | | 92,199 | |
Total Whole Business | | | | | | | 2,535,498 | |
| | | | | | | | | |
Infrastructure - 1.1% | | | | | | | | |
Stack Infrastructure Issuer LLC | | | | | | | | |
2023-1A, 5.90% due 03/25/483 | | | 500,000 | | | | 498,352 | |
Switch ABS Issuer LLC | | | | | | | | |
2024-2A, 5.44% due 06/25/543 | | | 300,000 | | | | 291,116 | |
2024-1A, 6.28% due 03/25/543 | | | 100,000 | | | | 100,326 | |
Hotwire Funding LLC | | | | | | | | |
2021-1, 2.31% due 11/20/513 | | | 250,000 | | | | 230,495 | |
2024-1A, 5.89% due 06/20/543 | | | 150,000 | | | | 151,844 | |
VB-S1 Issuer LLC - VBTEL | | | | | | | | |
2022-1A, 4.29% due 02/15/523 | | | 250,000 | | | | 232,924 | |
Aligned Data Centers Issuer LLC | | | | | | | | |
2021-1A, 1.94% due 08/15/463 | | | 250,000 | | | | 230,252 | |
Total Infrastructure | | | | | | | 1,735,309 | |
| | | | | | | | | |
Single Family Residence - 0.8% | | | | | | | | |
FirstKey Homes Trust | | | | | | | | |
2021-SFR1, 1.79% due 08/17/383 | | | 600,000 | | | | 551,019 | |
2020-SFR2, 4.50% due 10/19/373 | | | 150,000 | | | | 143,532 | |
2020-SFR2, 4.00% due 10/19/373 | | | 150,000 | | | | 143,234 | |
2020-SFR2, 3.37% due 10/19/373 | | | 100,000 | | | | 94,995 | |
Tricon Residential Trust | | | | | | | | |
2023-SFR2, 5.00% due 12/17/403 | | | 250,000 | | | | 240,467 | |
2024-SFR2, 5.70% due 06/17/283 | | | 100,000 | | | | 99,176 | |
Total Single Family Residence | | | | | | | 1,272,423 | |
| | | | | | | | | |
Transport-Container - 0.4% | | | | | | | | |
CLI Funding VIII LLC | | | | | | | | |
2021-1A, 1.64% due 02/18/463 | | | 325,155 | | | | 288,913 | |
Textainer Marine Containers Ltd. | | | | | | | | |
2021-3A, 1.94% due 08/20/463 | | | 232,000 | | | | 199,477 | |
SEE NOTES TO FINANCIAL STATEMENTS. | THE GUGGENHEIM FUNDS SEMI-ANNUAL FINANCIAL REPORT | 27 |
SCHEDULE OF INVESTMENTS (Unaudited)(continued) | June 30, 2024 |
SERIES E (TOTAL RETURN BOND SERIES) | |
| | Face
Amount~ | | | Value | |
Textainer Marine Containers VII Ltd. | | | | | | | | |
2020-1A, 2.73% due 08/21/453 | | | 143,797 | | | $ | 134,657 | |
TIF Funding III LLC | | | | | | | | |
2024-1A, 5.48% due 04/20/493 | | | 98,125 | | | | 97,613 | |
Total Transport-Container | | | | | | | 720,660 | |
| | | | | | | | | |
Collateralized Debt Obligations - 0.4% | | | | | | | | |
Anchorage Credit Funding 4 Ltd. | | | | | | | | |
2021-4A AR, 2.72% due 04/27/393 | | | 750,000 | | | | 678,859 | |
| | | | | | | | | |
Insurance - 0.1% | | | | | | | | |
Obra Longevity | | | | | | | | |
8.48% due 06/30/39 | | | 180,000 | | | | 180,000 | |
due 06/30/39 | | | 270,000 | | | | — | |
Total Insurance | | | | | | | 180,000 | |
| | | | | | | | | |
Unsecured Consumer Loans - 0.1% | | | | | | | | |
Service Experts Issuer LLC | | | | | | | | |
2024-1A, 6.39% due 11/20/353 | | | 150,000 | | | | 150,882 | |
Total Asset-Backed Securities | | | | |
(Cost $34,814,760) | | | 33,814,284 | |
| | | | | |
U.S. GOVERNMENT SECURITIES†† - 18.0% |
U.S. Treasury Notes |
4.13% due 03/31/31 | | | 4,430,100 | | | | 4,371,782 | |
4.00% due 02/15/34 | | | 3,540,000 | | | | 3,436,013 | |
4.50% due 05/31/29 | | | 3,200,000 | | | | 3,221,750 | |
4.63% due 04/30/31 | | | 2,500,000 | | | | 2,540,234 | |
4.13% due 03/31/29 | | | 1,660,000 | | | | 1,643,076 | |
4.00% due 02/29/28 | | | 560,000 | | | | 551,469 | |
U.S. Treasury Bonds |
due 05/15/5311,12 | | | 12,650,000 | | | | 3,540,144 | |
4.38% due 11/15/39 | | | 1,690,000 | | | | 1,670,922 | |
due 11/15/5211,12 | | | 3,400,000 | | | | 973,353 | |
due 02/15/466,11 | | | 2,550,000 | | | | 903,402 | |
due 05/15/446,11 | | | 2,230,000 | | | | 855,351 | |
due 02/15/5211,12 | | | 2,180,000 | | | | 633,254 | |
due 02/15/5411,12 | | | 1,200,000 | | | | 328,733 | |
due 11/15/446,11 | | | 500,000 | | | | 187,323 | |
United States Treasury Inflation Indexed Bonds |
0.13% due 10/15/25 | | | 1,449,912 | | | | 1,402,013 | |
0.13% due 04/15/25 | | | 1,432,201 | | | | 1,393,170 | |
0.13% due 04/15/27 | | | 666,216 | | | | 564,520 | |
0.38% due 01/15/27 | | | 623,054 | | | | 456,244 | |
1.38% due 07/15/33 | | | 196,131 | | | | 185,191 | |
Total U.S. Government Securities | | | | |
(Cost $30,572,778) | | | | | | | 28,857,944 | |
| | | | | | | | | |
SENIOR FLOATING RATE INTERESTS††,◊ - 1.8% |
Financial - 0.9% | | | | | | | | |
Higginbotham Insurance Agency, Inc. | | | | | | | | |
10.94% (1 Month Term SOFR + 5.50%, Rate Floor: 6.50%) due 11/24/28††† | | | 413,942 | | | | 410,480 | |
Worldpay | | | | | | | | |
due 01/31/31 | | | 250,000 | | | | 249,965 | |
Jane Street Group LLC | | | | | | | | |
7.96% (3 Month Term SOFR + 2.61%, Rate Floor: 2.61%) due 01/26/28 | | | 224,309 | | | | 224,002 | |
Citadel Securities, LP | | | | | | | | |
7.59% (1 Month Term SOFR + 2.25%, Rate Floor: 2.25%) due 07/29/30 | | | 199,017 | | | | 199,515 | |
CPI Holdco B LLC | | | | | | | | |
7.34% (1 Month Term SOFR + 2.00%, Rate Floor: 2.00%) due 05/10/31 | | | 150,000 | | | | 149,766 | |
Eisner Advisory Group | | | | | | | | |
9.34% (3 Month Term SOFR + 4.00%, Rate Floor: 4.50%) due 02/22/31 | | | 100,000 | | | | 100,792 | |
HighTower Holding LLC | | | | | | | | |
9.59% (3 Month Term SOFR + 4.00%, Rate Floor: 4.75%) due 04/21/28 | | | 54,898 | | | | 54,950 | |
Total Financial | | | | | | | 1,389,470 | |
| | | | | | | | | |
Consumer, Cyclical - 0.3% | | | | | | | | |
First Brands Group LLC | | | | | | | | |
10.59% (3 Month Term SOFR + 5.00%, Rate Floor: 6.00%) due 03/30/27 | | | 344,879 | | | | 342,186 | |
MB2 Dental Solutions, LLC | | | | | | | | |
11.33% (1 Month Term SOFR + 6.00%, Rate Floor: 6.75%) due 01/29/31††† | | | 134,796 | | | | 134,536 | |
13.50% (Commercial Prime Lending Rate + 5.00%, Rate Floor: 5.75%) due 01/29/31††† | | | 2,200 | | | | 1,940 | |
Pacific Bells LLC | | | | | | | | |
10.10% (3 Month Term SOFR + 4.50%, Rate Floor: 5.00%) due 11/10/28 | | | 89,575 | | | | 89,463 | |
Total Consumer, Cyclical | | | | | | | 568,125 | |
| | | | | | | | | |
Consumer, Non-cyclical - 0.3% | | | | | | | | |
Midwest Veterinary Partners LLC | | | | | | | | |
9.08% (1 Month Term SOFR + 3.75%, Rate Floor: 4.50%) due 04/28/28 | | | 146,250 | | | | 146,177 | |
Quirch Foods Holdings LLC | | | | | | | | |
10.64% (3 Month Term SOFR + 5.00%, Rate Floor: 6.00%) due 10/27/27 | | | 145,732 | | | | 141,542 | |
Southern Veterinary Partners LLC | | | | | | | | |
9.09% (1 Month Term SOFR + 3.75%, Rate Floor: 4.75%) due 10/05/27 | | | 105,177 | | | | 105,244 | |
HAH Group Holding Co. LLC | | | | | | | | |
10.45% (1 Month Term SOFR + 5.00%, Rate Floor: 6.00%) due 10/29/27 | | | 33,823 | | | | 33,865 | |
Elanco Animal Health, Inc. | | | | | | | | |
7.18% (1 Month Term SOFR + 1.75%, Rate Floor: 1.75%) due 08/02/27 | | | 24,238 | | | | 24,137 | |
Total Consumer, Non-cyclical | | | | | | | 450,965 | |
| | | | | | | | | |
Industrial - 0.2% | | | | | | | | |
EMRLD Borrower, LP | | | | | | | | |
due 06/18/31 | | | 100,000 | | | | 99,875 | |
7.84% (1 Month Term SOFR + 2.50%, Rate Floor: 2.50%) due 05/31/30 | | | 99,500 | | | | 99,397 | |
28 | THE GUGGENHEIM FUNDS SEMI-ANNUAL FINANCIAL REPORT | SEE NOTES TO FINANCIAL STATEMENTS. |
SCHEDULE OF INVESTMENTS (Unaudited)(continued) | June 30, 2024 |
SERIES E (TOTAL RETURN BOND SERIES) | |
| | Face
Amount~ | | | Value | |
Mileage Plus Holdings LLC | | | | | | | | |
10.74% (3 Month Term SOFR + 5.25%, Rate Floor: 6.25%) due 06/21/27 | | | 150,000 | | | $ | 152,914 | |
Total Industrial | | | | | | | 352,186 | |
| | | | | | | | | |
Technology - 0.1% | | | | | | | | |
Datix Bidco Ltd. | | | | | | | | |
10.70% (1 Month GBP SONIA + 5.50%, Rate Floor: 5.50%) due 04/30/31††† | | GBP | 71,200 | | | | 88,248 | |
10.82% (1 Month Term SOFR + 5.50%, Rate Floor: 6.00%) due 04/30/31††† | | | 20,000 | | | | 19,609 | |
Total Technology | | | | | | | 107,857 | |
| | | | | | | | | |
Total Senior Floating Rate Interests | | | | |
(Cost $2,855,806) | | | 2,868,603 | |
| | | | | |
FEDERAL AGENCY BONDS†† - 1.1% |
Tennessee Valley Authority |
4.25% due 09/15/65 | | | 1,000,000 | | | | 848,293 | |
5.38% due 04/01/56 | | | 750,000 | | | | 777,476 | |
Tennessee Valley Authority Principal Strips |
due 01/15/4811,12 | | | 500,000 | | | | 149,025 | |
Total Federal Agency Bonds | | | | |
(Cost $2,556,214) | | | | | | | 1,774,794 | |
| | | | | | | | | |
MUNICIPAL BONDS†† - 0.2% |
Illinois - 0.2% | | | | | | | | |
State of Illinois General Obligation Unlimited | | | | | | | | |
5.65% due 12/01/38 | | | 333,333 | | | | 339,058 | |
Total Municipal Bonds | | | | |
(Cost $338,608) | | | 339,058 | |
| |
U.S. TREASURY BILLS†† - 0.2% |
U.S. Treasury Bills |
5.21% due 07/05/2413 | | | 300,000 | | | | 299,824 | |
Total U.S. Treasury Bills | | | | |
(Cost $299,826) | | | | | | | 299,824 | |
| | | | | | | | | |
REPURCHASE AGREEMENTS††,14 - 0.3% |
J.P. Morgan Securities LLC |
issued 06/28/24 at 5.41% due 07/01/24 | | | 138,280 | | | | 138,280 | |
BofA Securities, Inc. |
issued 06/28/24 at 5.39% due 07/01/24 | | | 138,279 | | | | 138,279 | |
BNP Paribas |
issued 06/28/24 at 5.40% due 07/01/24 | | | 124,451 | | | | 124,451 | |
Bank of Montreal |
issued 06/28/24 at 5.39% due 07/01/24 | | | 43,995 | | | | 43,995 | |
Total Repurchase Agreements | | | | |
(Cost $445,005) | | | | | | | 445,005 | |
| | Notional
Value | | | | |
OTC INTEREST RATE SWAPTIONS PURCHASED††,15 - 0.0% |
Call Swaptions on: | | | | | | | | |
Interest Rate Swaptions | | | | | | | | |
Morgan Stanley Capital Services LLC 6-Month/2-Year Interest Rate Swap Expiring December 2024 with exercise rate of 2.92% (Notional Value $5,754,226) | | EUR | 5,369,000 | | | | 24,191 | |
Morgan Stanley Capital Services LLC 6-Month/10-Year Interest Rate Swap Expiring December 2024 with exercise rate of 2.21% (Notional Value $1,264,665) | | EUR | 1,180,000 | | | | 5,892 | |
Total OTC Interest Rate Swaptions Purchased | | | | |
(Cost $33,697) | | | | | | | 30,083 | |
| | | | | | | | | |
Total Investments - 109.2% | | | | |
(Cost $187,241,268) | | $ | 175,242,835 | |
| | | | | | | | | |
OTC INTEREST RATE SWAPTIONS WRITTEN††,15 - (0.0)% |
Call Swaptions on: | | | | | | | | |
Interest Rate Swaptions | | | | | | | | |
Morgan Stanley Capital Services LLC 6-Month/2-Year Interest Rate Swap Expiring December 2024 with exercise rate of 2.36% (Notional Value $5,754,226) | | EUR | 5,369,000 | | | | (7,236 | ) |
Morgan Stanley Capital Services LLC 6-Month/10-Year Interest Rate Swap Expiring December 2024 with exercise rate of 2.71% (Notional Value $1,264,665) | | EUR | 1,180,000 | | | | (21,541 | ) |
Total OTC Interest Rate Swaptions Written | | | | |
(Premiums received $33,697) | | | | | | | (28,777 | ) |
Other Assets & Liabilities, net - (9.2)% | | | (14,824,229 | ) |
Total Net Assets - 100.0% | | $ | 160,389,829 | |
SEE NOTES TO FINANCIAL STATEMENTS. | THE GUGGENHEIM FUNDS SEMI-ANNUAL FINANCIAL REPORT | 29 |
SCHEDULE OF INVESTMENTS (Unaudited)(continued) | June 30, 2024 |
SERIES E (TOTAL RETURN BOND SERIES) | |
Futures Contracts |
Description | | Number of
Contracts | | | Expiration
Date | | | Notional
Amount | | | Value and
Unrealized
Appreciation
(Depreciation)** | |
Interest Rate Futures Contracts Purchased† |
3-Month SOFR Futures Contracts | | | 15 | | | | Mar 2026 | | | $ | 3,600,938 | | | $ | 2,413 | |
3-Month SOFR Futures Contracts | | | 15 | | | | Dec 2025 | | | | 3,595,500 | | | | 913 | |
3-Month SOFR Futures Contracts | | | 15 | | | | Sep 2025 | | | | 3,588,375 | | | | (586 | ) |
| | | | | | | | | | | $ | 10,784,813 | | | $ | 2,740 | |
Centrally Cleared Credit Default Swap Agreements Protection Purchased†† |
Counterparty | Exchange | Index | Protection
Premium Rate | | Payment
Frequency | | | Maturity
Date | | | Notional
Amount~ | | | Value | | | Upfront
Premiums
Received | | | Unrealized
Appreciation** | |
BofA Securities, Inc. | ICE | ITRAXX.EUR.41.V1 | 1.00% | Quarterly | 06/20/29 | | EUR | 360,000 | | | $ | (6,861 | ) | | $ | (8,080 | ) | | $ | 1,219 | |
Centrally Cleared Interest Rate Swap Agreements†† |
Counterparty | Exchange | Floating
Rate
Type | Floating
Rate Index | | Fixed
Rate | | | Payment
Frequency | | | Maturity
Date | | | Notional
Amount | | | Value | | | Upfront
Premiums
Paid | | | Unrealized
Appreciation
(Depreciation)** | |
BofA Securities, Inc. | CME | Pay | U.S. Secured Overnight Financing Rate | 4.48% | Annually | 11/02/33 | | $ | 2,380,000 | | | $ | 101,445 | | | $ | 106 | | | $ | 101,339 | |
BofA Securities, Inc. | CME | Pay | U.S. Secured Overnight Financing Rate | 3.94% | Annually | 06/05/30 | | | 12,200,000 | | | | 56,050 | | | | 1,734 | | | | 54,316 | |
BofA Securities, Inc. | CME | Pay | U.S. Secured Overnight Financing Rate | 4.50% | Annually | 11/02/30 | | | 462,000 | | | | 12,919 | | | | 274 | | | | 12,645 | |
BofA Securities, Inc. | CME | Pay | U.S. Secured Overnight Financing Rate | 4.99% | Annually | 10/11/25 | | | 9,089,000 | | | | 8,332 | | | | 206 | | | | 8,126 | |
BofA Securities, Inc. | CME | Pay | U.S. Secured Overnight Financing Rate | 3.96% | Annually | 04/03/34 | | | 180,000 | | | | 382 | | | | 294 | | | | 88 | |
BofA Securities, Inc. | CME | Pay | U.S. Secured Overnight Financing Rate | 4.27% | Annually | 06/27/27 | | | 4,500,000 | | | | (5,690 | ) | | | 310 | | | | (6,000 | ) |
BofA Securities, Inc. | CME | Pay | U.S. Secured Overnight Financing Rate | 3.69% | Annually | 02/06/34 | | | 300,000 | | | | (5,745 | ) | | | 290 | | | | (6,035 | ) |
BofA Securities, Inc. | CME | Pay | U.S. Secured Overnight Financing Rate | 3.76% | Annually | 02/06/29 | | | 3,000,000 | | | | (41,874 | ) | | | 288 | | | | (42,162 | ) |
30 | THE GUGGENHEIM FUNDS SEMI-ANNUAL FINANCIAL REPORT | SEE NOTES TO FINANCIAL STATEMENTS. |
SCHEDULE OF INVESTMENTS (Unaudited)(continued) | June 30, 2024 |
SERIES E (TOTAL RETURN BOND SERIES) | |
Centrally Cleared Interest Rate Swap Agreements†† |
Counterparty | Exchange | Floating
Rate
Type | Floating
Rate Index | | Fixed
Rate | | | Payment
Frequency | | | Maturity
Date | | | Notional
Amount | | | Value | | | Upfront
Premiums
Paid | | | Unrealized
Appreciation
(Depreciation)** | |
BofA Securities, Inc. | CME | Pay | U.S. Secured Overnight Financing Rate | 3.40% | Annually | 04/04/28 | | $ | 5,000,000 | | | $ | (135,941 | ) | | $ | 242 | | | $ | (136,183 | ) |
BofA Securities, Inc. | CME | Pay | U.S. Secured Overnight Financing Rate | 2.78% | Annually | 07/18/27 | | | 5,000,000 | | | | (215,691 | ) | | | 78 | | | | (215,769 | ) |
| | | | | | | | | | | | | | | | | | | | | | $ | (225,813 | ) | | $ | 3,822 | | | $ | (229,635 | ) |
Forward Foreign Currency Exchange Contracts†† |
Counterparty | | Currency | | | Type | | | Quantity | | | Contract
Amount | | | Settlement
Date | | | Unrealized
Appreciation
(Depreciation) | |
Goldman Sachs International | | | GBP | | | | Sell | | | | 71,000 | | | | 90,442 USD | | | | 07/16/24 | | | $ | 680 | |
Barclays Bank plc | | | EUR | | | | Buy | | | | 43,000 | | | | 46,261 USD | | | | 07/16/24 | | | | (157 | ) |
| | | | | | | | | | | | | | | | | | | | | | | $ | 523 | |
OTC Interest Rate Swaptions Purchased |
Counterparty/
Description | Floating
Rate Type | Floating
Rate Index | Payment
Frequency | | Fixed
Rate | | | Expiration
Date | | | Exercise
Rate | | | Swaption
Notional
Amount | | | Swaption
Value | |
Call |
Morgan Stanley Capital Services LLC 6-Month/2-Year Interest Rate Swap | Pay | 6 Month EURIBOR | Semi-annual | | | 2.92 | % | | | 12/20/24 | | | | 2.92 | % | | $ | 5,754,226 | | | $ | 24,191 | |
Morgan Stanley Capital Services LLC 6-Month/10-Year Interest Rate Swap | Pay | 6 Month EURIBOR | Semi-annual | | | 2.21 | % | | | 12/20/24 | | | | 2.21 | % | | | 1,264,665 | | | | 5,892 | |
| | | | | | | | | | | | | | | | | | | | | | $ | 30,083 | |
OTC Interest Rate Swaptions Written |
Counterparty/
Description | Floating
Rate Type | Floating
Rate Index | Payment
Frequency | | Fixed
Rate | | | Expiration
Date | | | Exercise
Rate | | | Swaption
Notional
Amount | | | Swaption
Value | |
Call |
Morgan Stanley Capital Services LLC 6-Month/2-Year Interest Rate Swap | Receive | 6 Month EURIBOR | Semi-annual | | | 2.36 | % | | | 12/20/24 | | | | 2.36 | % | | $ | 5,754,226 | | | $ | (7,236 | ) |
Morgan Stanley Capital Services LLC 6-Month/10-Year Interest Rate Swap | Receive | 6 Month EURIBOR | Semi-annual | | | 2.71 | % | | | 12/20/24 | | | | 2.71 | % | | | 1,264,665 | | | | (21,541 | ) |
| | | | | | | | | | | | | | | | | | | | | | $ | (28,777 | ) |
SEE NOTES TO FINANCIAL STATEMENTS. | THE GUGGENHEIM FUNDS SEMI-ANNUAL FINANCIAL REPORT | 31 |
SCHEDULE OF INVESTMENTS (Unaudited)(continued) | June 30, 2024 |
SERIES E (TOTAL RETURN BOND SERIES) | |
~ | The face amount is denominated in U.S. dollars unless otherwise indicated. |
* | Non-income producing security. |
** | Includes cumulative appreciation (depreciation). Variation margin is reported within the Statement of Assets and Liabilities. |
*** | A copy of each underlying unaffiliated fund’s financial statements is available at the SEC’s website at www.sec.gov. |
† | Value determined based on Level 1 inputs, unless otherwise noted — See Note 4. |
†† | Value determined based on Level 2 inputs, unless otherwise noted — See Note 4. |
††† | Value determined based on Level 3 inputs — See Note 4. |
◊ | Variable rate security. Rate indicated is the rate effective at June 30, 2024. In some instances, the effective rate is limited by a minimum rate floor or a maximum rate cap established by the issuer. The settlement status of a position may also impact the effective rate indicated. In some cases, a position may be unsettled at period end and may not have a stated effective rate. In instances where multiple underlying reference rates and spread amounts are shown, the effective rate is based on a weighted average. |
1 | Special Purpose Acquisition Company (SPAC). |
2 | Security has a fixed rate coupon which will convert to a floating or variable rate coupon on a future date. |
3 | Security is a 144A or Section 4(a)(2) security. These securities have been determined to be liquid under guidelines established by the Board of Trustees. The total market value of 144A or Section 4(a)(2) securities is $66,144,702 (cost $70,332,882), or 41.2% of total net assets. |
4 | Affiliated issuer. |
5 | Rate indicated is the 7-day yield as of June 30, 2024. |
6 | Security is an interest-only strip. |
7 | Security is a step up/down bond. The coupon increases or decreases at regular intervals until the bond reaches full maturity. Rate indicated is the rate at June 30, 2024. See table below for additional step information for each security. |
8 | Perpetual maturity. |
9 | Security has no stated coupon. However, it is expected to receive residual cash flow payments on defined deal dates. |
10 | Security is a 144A or Section 4(a)(2) security. These securities have been determined to be illiquid and restricted under guidelines established by the Board of Trustees. The total market value of 144A or Section 4(a)(2) illiquid and restricted securities is $250,267 (cost $249,992), or 0.2% of total net assets — See Note 9. |
11 | Zero coupon rate security. |
12 | Security is a principal-only strip. |
13 | Rate indicated is the effective yield at the time of purchase. |
14 | Repurchase Agreements - The interest rate on repurchase agreements is market driven and based on the underlying collateral obtained. See additional disclosure in the repurchase agreements table below for more information on repurchase agreements. |
15 | Swaptions — See additional disclosure in the swaptions table above for more information on swaptions. |
16 | Security is unsettled at period end and does not have a stated effective rate. |
| | BofA — Bank of America |
| | CME — Chicago Mercantile Exchange |
| | CMT — Constant Maturity Treasury |
| | EUR — Euro |
| | GBP — British Pound |
| | ICE — Intercontinental Exchange |
| | ITRAXX.EUR.41.V1 — iTraxx Europe Series 41 Index Version 1 |
| | plc — Public Limited Company |
| | REMIC — Real Estate Mortgage Investment Conduit |
| | REIT — Real Estate Investment Trust |
| | SARL — Société à Responsabilité Limitée |
| | SOFR — Secured Overnight Financing Rate |
| | SONIA — Sterling Overnight Index Average |
| | WAC — Weighted Average Coupon |
| | |
| | See Sector Classification in Other Information section. |
32 | THE GUGGENHEIM FUNDS SEMI-ANNUAL FINANCIAL REPORT | SEE NOTES TO FINANCIAL STATEMENTS. |
SCHEDULE OF INVESTMENTS (Unaudited)(continued) | June 30, 2024 |
SERIES E (TOTAL RETURN BOND SERIES) | |
The following table summarizes the inputs used to value the Fund’s investments at June 30, 2024 (See Note 4 in the Notes to Financial Statements):
Investments in Securities (Assets) | | Level 1
Quoted
Prices | | | Level 2
Significant
Observable
Inputs | | | Level 3
Significant
Unobservable
Inputs | | | Total | |
Common Stocks | | $ | 813 | | | $ | — | | | $ | 8 | | | $ | 821 | |
Preferred Stocks | | | — | | | | 3,808,429 | | | | — | | | | 3,808,429 | |
Warrants | | | 19 | | | | — | | | | 3 | | | | 22 | |
Mutual Funds | | | 6,347,351 | | | | — | | | | — | | | | 6,347,351 | |
Money Market Fund | | | 2,806,366 | | | | — | | | | — | | | | 2,806,366 | |
Collateralized Mortgage Obligations | | | — | | | | 50,969,980 | | | | 871,937 | | | | 51,841,917 | |
Corporate Bonds | | | — | | | | 40,297,109 | | | | 1,711,225 | | | | 42,008,334 | |
Asset-Backed Securities | | | — | | | | 32,081,277 | | | | 1,733,007 | | | | 33,814,284 | |
U.S. Government Securities | | | — | | | | 28,857,944 | | | | — | | | | 28,857,944 | |
Senior Floating Rate Interests | | | — | | | | 2,213,790 | | | | 654,813 | | | | 2,868,603 | |
Federal Agency Bonds | | | — | | | | 1,774,794 | | | | — | | | | 1,774,794 | |
Municipal Bonds | | | — | | | | 339,058 | | | | — | | | | 339,058 | |
U.S. Treasury Bills | | | — | | | | 299,824 | | | | — | | | | 299,824 | |
Repurchase Agreements | | | — | | | | 445,005 | | | | — | | | | 445,005 | |
Interest Rate Swaptions Purchased | | | — | | | | 30,083 | | | | — | | | | 30,083 | |
Interest Rate Futures Contracts** | | | 3,326 | | | | — | | | | — | | | | 3,326 | |
Credit Default Swap Agreements** | | | — | | | | 1,219 | | | | — | | | | 1,219 | |
Interest Rate Swap Agreements** | | | — | | | | 176,514 | | | | — | | | | 176,514 | |
Forward Foreign Currency Exchange Contracts** | | | — | | | | 680 | | | | — | | | | 680 | |
Total Assets | | $ | 9,157,875 | | | $ | 161,295,706 | | | $ | 4,970,993 | | | $ | 175,424,574 | |
Investments in Securities (Liabilities) | | Level 1
Quoted
Prices | | | Level 2
Significant
Observable
Inputs | | | Level 3
Significant
Unobservable
Inputs | | | Total | |
Interest Rate Swaptions Written | | $ | — | | | $ | 28,777 | | | $ | — | | | $ | 28,777 | |
Interest Rate Futures Contracts** | | | 586 | | | | — | | | | — | | | | 586 | |
Interest Rate Swap Agreements** | | | — | | | | 406,149 | | | | — | | | | 406,149 | |
Forward Foreign Currency Exchange Contracts** | | | — | | | | 157 | | | | — | | | | 157 | |
Unfunded Loan Commitments (Note 9) | | | — | | | | — | | | | 2,004 | | | | 2,004 | |
Total Liabilities | | $ | 586 | | | $ | 435,083 | | | $ | 2,004 | | | $ | 437,673 | |
** | This derivative is reported as unrealized appreciation/depreciation at period end. |
SEE NOTES TO FINANCIAL STATEMENTS. | THE GUGGENHEIM FUNDS SEMI-ANNUAL FINANCIAL REPORT | 33 |
SCHEDULE OF INVESTMENTS (Unaudited)(continued) | June 30, 2024 |
SERIES E (TOTAL RETURN BOND SERIES) | |
The following is a summary of significant unobservable inputs used in the fair valuation of assets and liabilities categorized within Level 3 of the fair value hierarchy:
Category | | Ending Balance at
June 30, 2024 | | | Valuation Technique | | | Unobservable Inputs | | | Input Range | | | Weighted Average* | |
Assets: | | | | | | | | | | | | | | | | | | | | |
Asset-Backed Securities | | $ | 1,198,014 | | Yield Analysis | Yield | 6.5%-7.4% | 7.0% |
Asset-Backed Securities | | | 534,993 | | Option adjusted spread off prior month end broker quote | Broker Quote | — | — |
Collateralized Mortgage Obligations | | | 871,937 | | Option adjusted spread off prior month end broker quote | Broker Quote | — | — |
Common Stocks | | | 8 | | Model Price | Liquidation Value | — | — |
Corporate Bonds | | | 1,090,645 | | Option adjusted spread off prior month end broker quote | Broker Quote | — | — |
Corporate Bonds | | | 620,580 | | Third Party Pricing | Vendor Price | — | — |
Senior Floating Rate Interests | | | 518,337 | | Yield Analysis | Yield | 9.9%-11.0% | 10.1% |
Senior Floating Rate Interests | | | 136,476 | | Model Price | Purchase Price | — | — |
Warrants | | | 3 | | Model Price | Liquidation Value | — | — |
Total Assets | | $ | 4,970,993 | | | | | |
Liabilities: | | | | | | | | | | | | | | | | | | | | |
Unfunded Loan Commitments | | $ | 2,004 | | Model Price | Purchase Price | — | — |
* | Inputs are weighted by the fair value of the instruments. |
Significant changes in a quote, yield or liquidation value would generally result in significant changes in the fair value of the security. Any remaining Level 3 securities held by the Fund and excluded from the table above, were not considered material to the Fund.
The Fund’s fair valuation leveling guidelines classify a single daily broker quote, or a vendor price based on a single daily or monthly broker quote, as Level 3, if such a quote or price cannot be supported with other available market information.
Transfers between Level 2 and Level 3 may occur as markets fluctuate and/or the availability of data used in an investment’s valuation changes. For the period ended June 30, 2024, the Fund had securities with a total value of $620,580 transfer into Level 3 from Level 2 due to a lack of observable inputs and did not have any securities to transfer out of Level 3 into Level 2.
34 | THE GUGGENHEIM FUNDS SEMI-ANNUAL FINANCIAL REPORT | SEE NOTES TO FINANCIAL STATEMENTS. |
SCHEDULE OF INVESTMENTS (Unaudited)(continued) | June 30, 2024 |
SERIES E (TOTAL RETURN BOND SERIES) | |
Summary of Fair Value Level 3 Activity
Following is a reconciliation of Level 3 assets for which significant unobservable inputs were used to determine fair value for the period ended June 30, 2024:
| | | Assets | | | | | | | Liabilities | |
| | Asset-
Backed
Securities | | | Collateralized
Mortgage
Obligations | | | Corporate
Bonds | | | Senior
Floating
Rate
Interests | | | Warrants | | | Common
Stocks | | | Total Assets | | | Unfunded
Loan
Commitments | |
Beginning Balance | | $ | 2,091,143 | | | $ | 908,966 | | | $ | 707,677 | | | $ | 1,296,906 | | | $ | — | | | $ | 8 | | | $ | 5,004,700 | | | $ | (399 | ) |
Purchases/(Receipts) | | | 74,667 | | | | — | | | | 400,000 | | | | 287,050 | | | | — | | | | — | | | | 761,717 | | | | (4,634 | ) |
(Sales, maturities and paydowns)/Fundings | | | (407,997 | ) | | | (5,833 | ) | | | — | | | | (929,013 | ) | | | — | | | | — | | | | (1,342,843 | ) | | | 703 | |
Amortization of premiums/discounts | | | — | | | | (1,810 | ) | | | — | | | | 8,583 | | | | — | | | | — | | | | 6,773 | | | | 68 | |
Total realized gains (losses) included in earnings | | | — | | | | — | | | | — | | | | (36,613 | ) | | | — | | | | — | | | | (36,613 | ) | | | (406 | ) |
Total change in unrealized appreciation (depreciation) included in earnings | | | (24,806 | ) | | | (29,386 | ) | | | (17,032 | ) | | | 27,900 | | | | 3 | | | | — | | | | (43,321 | ) | | | 2,664 | |
Transfers into Level 3 | | | — | | | | — | | | | 620,580 | | | | — | | | | — | | | | — | | | | 620,580 | | | | — | |
Transfers out of Level 3 | | | — | | | | — | | | | — | | | | — | | | | — | | | | — | | | | — | | | | — | |
Ending Balance | | $ | 1,733,007 | | | $ | 871,937 | | | $ | 1,711,225 | | | $ | 654,813 | | | $ | 3 | | | $ | 8 | | | $ | 4,970,993 | | | $ | (2,004 | ) |
Net change in unrealized appreciation (depreciation) for investments in Level 3 securities still held at June 30, 2024 | | $ | (24,992 | ) | | $ | (29,386 | ) | | $ | (17,032 | ) | | $ | 123 | | | $ | 3 | | | $ | — | | | $ | (71,284 | ) | | $ | 2,265 | |
Step Coupon Bonds
The following table discloses additional information related to step coupon bonds held by the Fund. Certain securities are subject to multiple rate changes prior to maturity. For those securities, a range of rates and corresponding dates have been provided. Rates for all step coupon bonds held by the Fund are scheduled to increase, none are scheduled to decrease.
Name | | Coupon Rate at
Next Reset Date | | | Next Rate Reset Date | | | Future Reset Rate | | | Future Reset Date | |
Angel Oak Mortgage Trust 2023-1, 4.75% due 09/26/67 | | | 5.75 | % | | | 01/01/27 | | | | — | | | | — | |
Angel Oak Mortgage Trust 2024-2, 6.25% due 01/25/69 | | | 7.25 | % | | | 01/01/28 | | | | — | | | | — | |
BRAVO Residential Funding Trust 2022-R1, 3.13% due 01/29/70 | | | 6.13 | % | | | 01/30/25 | | | | — | | | | — | |
BRAVO Residential Funding Trust 2024-NQM1, 6.40% due 12/01/63 | | | 7.40 | % | | | 01/01/28 | | | | — | | | | — | |
BRAVO Residential Funding Trust 2023-NQM2, 4.50% due 05/25/62 | | | 5.50 | % | | | 02/01/27 | | | | — | | | | — | |
GCAT Trust 2023-NQM3, 6.89% due 08/25/68 | | | 7.89 | % | | | 09/01/27 | | | | — | | | | — | |
Legacy Mortgage Asset Trust 2021-GS3, 4.75% due 07/25/61 | | | 5.75 | % | | | 05/25/25 | | | | — | | | | — | |
Legacy Mortgage Asset Trust 2021-GS5, 2.25% due 07/25/67 | | | 5.25 | % | | | 11/25/24 | | | | 6.25 | % | | | 11/25/25 | |
NYMT Loan Trust 2022-SP1, 5.25% due 07/25/62 | | | 8.25 | % | | | 07/01/25 | | | | 9.25 | % | | | 07/01/26 | |
OBX Trust 2024-NQM5, 6.29% due 12/01/64 | | | 7.29 | % | | | 03/01/28 | | | | — | | | | — | |
OBX Trust 2024-NQM2, 6.18% due 12/25/63 | | | 7.18 | % | | | 01/01/28 | | | | — | | | | — | |
OBX Trust 2024-NQM3, 6.43% due 12/25/63 | | | 7.43 | % | | | 02/01/28 | | | | — | | | | — | |
OBX Trust 2022-NQM9, 6.45% due 09/25/62 | | | 7.45 | % | | | 11/01/26 | | | | — | | | | — | |
OBX Trust 2024-NQM6, 6.85% due 02/25/64 | | | 7.85 | % | | | 04/01/28 | | | | — | | | | — | |
OBX Trust 2024-NQM8, 6.59% due 05/25/64 | | | 7.59 | % | | | 05/01/28 | | | | — | | | | — | |
SEE NOTES TO FINANCIAL STATEMENTS. | THE GUGGENHEIM FUNDS SEMI-ANNUAL FINANCIAL REPORT | 35 |
SCHEDULE OF INVESTMENTS (Unaudited)(continued) | June 30, 2024 |
SERIES E (TOTAL RETURN BOND SERIES) | |
Name | | Coupon Rate at
Next Reset Date | | | Next Rate Reset Date | | | Future Reset Rate | | | Future Reset Date | |
OBX Trust 2024-NQM9, 6.44% due 01/25/64 | | | 7.66 | % | | | 06/01/28 | | | | — | | | | — | |
OSAT Trust 2021-RPL1, 5.12% due 05/25/65 | | | 6.12 | % | | | 06/25/25 | | | | — | | | | — | |
PRPM LLC 2022-1, 3.72% due 02/25/27 | | | 6.72 | % | | | 02/25/25 | | | | 7.72 | % | | | 02/25/26 | |
PRPM LLC 2021-5, 4.79% due 06/25/26 | | | 5.79 | % | | | 06/25/25 | | | | — | | | | — | |
RCKT Mortgage Trust 2024-CES4, 6.15% due 06/25/44 | | | 7.15 | % | | | 05/01/28 | | | | — | | | | — | |
Repurchase Agreements
The Fund may engage in repurchase agreements. Repurchase agreements are fixed income securities in the form of agreements backed by collateral. These agreements typically involve the acquisition by the Fund of securities from the selling institution coupled with the agreement that the selling institution will repurchase the underlying securities at a specified price and at a fixed time in the future. The Fund may accept a wide variety of underlying securities as collateral for the repurchase agreements entered into by the Fund. Any such securities serving as collateral are marked-to-market daily in order to maintain full collateralization. Securities purchased under repurchase agreements are reflected as an asset on the Fund’s Statement of Assets and Liabilities. Interest earned is recorded as a component of interest income on the Fund’s Statement of Operations. In the event that the Fund terminates a repurchase agreement prior to the contractually agreed upon repurchase date, the Fund is charged a breakage fee by the counterparty to compensate for the early termination. Such fees are recorded as repurchase agreement breakage fees on the Fund’s Statement of Operations.
In connection with transactions in repurchase agreements, it is the Fund’s policy that its custodian take possession of the underlying collateral. The collateral is in the possession of the Fund’s custodian and is evaluated to ensure that its market value exceeds, at a minimum, 102% of the original face amount of the repurchase agreements.
The use of repurchase agreements involves certain risks. For example, if the selling institution defaults on its obligation to repurchase the underlying securities at a time when the value of securities has declined, the Fund may incur a loss upon disposition of them. In the event of an insolvency or bankruptcy by the selling institution, the Fund’s right to control the collateral could be affected and result in certain costs and delays. In addition, the Fund could incur a loss if the value of the underlying collateral falls below the agreed upon repurchase price.
Counterparty and Terms of Agreement | | Face Value | | | Repurchase Price | | Collateral | | Par Value | | | Fair Value | |
J.P. Morgan Securities LLC | | | | | | | | | U.S. Treasury Inflation Indexed Bonds | | | | | | | | |
5.41% | | | | | | | | | 0.13% - 1.63% | | | | | | | | |
07/01/24 | | $ | 138,280 | | | $ | 138,342 | | Due 04/15/25 - 04/15/28 | | $ | 84,202 | | | $ | 81,597 | |
| | | | | | | | | | U.S. Treasury Notes | | | | | | | | |
| | | | | | | | | | 2.88% - 4.63% | | | | | | | | |
| | | | | | | | | | Due 04/30/25 - 12/31/30 | | | 34,200 | | | | 33,840 | |
| | | | | | | | | | U.S. Treasury Strips | | | | | | | | |
| | | | | | | | | | 0.00% | | | | | | | | |
| | | | | | | | | | Due 02/15/27 - 05/15/49 | | | 22,046 | | | | 19,645 | |
| | | | | | | | | | U.S. Treasury Bonds | | | | | | | | |
| | | | | | | | | | 3.63% -6.88% | | | | | | | | |
| | | | | | | | | | Due 08/15/25 - 05/15/53 | | | 6,600 | | | | 6,026 | |
| | | | | | | | | | | | | 147,048 | | | | 141,108 | |
| | | | | | | | | | | | | | | | | | |
BofA Securities, Inc. | | | | | | | | | U.S. Treasury Strips | | | | | | | | |
5.39% | | | | | | | | | 0.00% | | | | | | | | |
Due 07/01/24 | | | 138,279 | | | | 138,341 | | Due 5/15/29 | | | 174,287 | | | | 141,046 | |
| | | | | | | | | | | | | | | | | | |
BNP Paribas | | | | | | | | | U.S. Treasury Strips | | | | | | | | |
5.40% | | | | | | | | | 0.00% | | | | | | | | |
Due 07/01/24 | | | 124,451 | | | | 124,507 | | Due 8/15/44 | | | 321,100 | | | | 127,019 | |
| | | | | | | | | | | | | | | | | | |
Bank of Montreal | | | | | | | | | | | | | | | | | |
5.39% | | | | | | | | | | | | | | | | | |
Due 07/01/24 | | | 43,995 | | | | 44,015 | | U.S. Treasury Note | | | | | | | | |
| | | | | | | | | | 2.88% | | | | | | | | |
| | | | | | | | | | Due 5/15/32 | | | 49,600 | | | | 44,944 | |
36 | THE GUGGENHEIM FUNDS SEMI-ANNUAL FINANCIAL REPORT | SEE NOTES TO FINANCIAL STATEMENTS. |
SCHEDULE OF INVESTMENTS (Unaudited)(concluded) | June 30, 2024 |
SERIES E (TOTAL RETURN BOND SERIES) | |
Affiliated Transactions
Investments representing 5% or more of the outstanding voting shares of a company, or control of or by, or common control under Guggenheim Investments, result in that company being considered an affiliated issuer, as defined in the 1940 Act. The Fund may invest in certain of the underlying series of Guggenheim Funds Trust, which are open-end management investment companies managed by GI, are available to the public and whose most recent annual report on Form N-CSR is available publicly or upon request.
Transactions during the period ended June 30, 2024, in which the company is an affiliated issuer, were as follows:
Security Name | | Value
12/31/23 | | | Additions | | | Reductions | | | Realized
Gain (Loss) | | | Change in
Unrealized
Appreciation
(Depreciation) | | | Value
06/30/24 | | | Shares
06/30/24 | | | Investment
Income | |
Mutual Funds | | | | | | | | | | | | | | | | | | | | | | | | | | | | | | | | |
Guggenheim Total Return Bond Fund — R6-Class | | $ | 6,323,894 | | | $ | 145,436 | | | $ | — | | | $ | — | | | $ | (121,979 | ) | | $ | 6,347,351 | | | | 271,603 | | | $ | 146,219 | |
SEE NOTES TO FINANCIAL STATEMENTS. | THE GUGGENHEIM FUNDS SEMI-ANNUAL FINANCIAL REPORT | 37 |
SERIES E (TOTAL RETURN BOND SERIES) | |
STATEMENT OF ASSETS AND LIABILITIES (Unaudited) |
June 30, 2024 |
Assets: |
Investments in unaffiliated issuers, at value (cost $179,643,817) | | $ | 168,450,479 | |
Investments in affiliated issuers, at value (cost $7,152,446) | | | 6,347,351 | |
Repurchase agreements, at value (cost $445,005) | | | 445,005 | |
Cash | | | 380,458 | |
Segregated cash with broker | | | 515,470 | |
Unamortized upfront premiums paid on interest rate swap agreements | | | 3,822 | |
Unrealized appreciation on forward foreign currency exchange contracts | | | 680 | |
Prepaid expenses | | | 904 | |
Receivables: |
Securities sold | | | 18,546,393 | |
Interest | | | 1,287,641 | |
Fund shares sold | | | 605,540 | |
Dividends | | | 28,211 | |
Variation margin on futures contracts | | | 562 | |
Total assets | | | 196,612,516 | |
| | | | | |
Liabilities: |
Unfunded loan commitments, at value (Note 8) (commitment fees received $4,270) | | | 2,004 | |
Options written, at value (premiums received $33,697) | | | 28,777 | |
Unamortized upfront premiums received on credit default swap agreements | | | 8,080 | |
Unrealized depreciation on forward foreign currency exchange contracts | | | 157 | |
Payable for: |
Securities purchased | | | 35,698,742 | |
Variation margin on interest rate swap agreements | | | 215,354 | |
Due to Investment Adviser | | | 41,129 | |
Management fees | | | 38,284 | |
Distribution and service fees | | | 30,046 | |
Fund shares redeemed | | | 4,985 | |
Fund accounting/administration fees | | | 2,904 | |
Transfer agent/maintenance fees | | | 2,112 | |
Trustees’ fees* | | | 2,020 | |
Protection fees on credit default swap agreements | | | 118 | |
Swap settlement | | | 82 | |
Variation margin on credit default swap agreements | | | 4 | |
Miscellaneous | | | 147,889 | |
Total liabilities | | | 36,222,687 | |
Net assets | | $ | 160,389,829 | |
| | | | | |
Net assets consist of: |
Paid in capital | | $ | 180,356,940 | |
Total distributable earnings (loss) | | | (19,967,111 | ) |
Net assets | | $ | 160,389,829 | |
Capital shares outstanding | | | 11,119,758 | |
Net asset value per share | | $ | 14.42 | |
STATEMENT OF OPERATIONS (Unaudited) |
Six Months Ended June 30, 2024 |
Investment Income: |
Dividends from securities of unaffiliated issuers | | $ | 8,235 | |
Dividends from securities of affiliated issuers | | | 146,219 | |
Interest (net of foreign withholding tax of $277) | | | 4,178,048 | |
Total investment income | | | 4,332,502 | |
| | | | | |
Expenses: |
Management fees | | | 294,212 | |
Distribution and service fees | | | 188,598 | |
Transfer agent/maintenance fees | | | 12,608 | |
Interest expense | | | 77,201 | |
Professional fees | | | 34,126 | |
Fund accounting/administration fees | | | 33,398 | |
Trustees’ fees* | | | 8,190 | |
Custodian fees | | | 4,619 | |
Line of credit fees | | | 4,209 | |
Miscellaneous | | | 6,475 | |
Recoupment of previously waived fees | | | 41,129 | |
Total expenses | | | 704,765 | |
Less: |
Expenses reimbursed by Adviser | | | (4,410 | ) |
Expenses waived by Adviser | | | (40,767 | ) |
Earnings credits applied | | | (69 | ) |
Total waived/reimbursed expenses | | | (45,246 | ) |
Net expenses | | | 659,519 | |
Net investment income | | | 3,672,983 | |
| | | | | |
Net Realized and Unrealized Gain (Loss): |
Net realized gain (loss) on: |
Investments in unaffiliated issuers | | | (1,150,217 | ) |
Swap agreements | | | (138,601 | ) |
Futures contracts | | | (50,953 | ) |
Options purchased | | | (51,002 | ) |
Forward foreign currency exchange contracts | | | (1,246 | ) |
Foreign currency transactions | | | 590 | |
Net realized loss | | | (1,391,429 | ) |
Net change in unrealized appreciation (depreciation) on: |
Investments in unaffiliated issuers | | | (733,377 | ) |
Investments in affiliated issuers | | | (121,979 | ) |
Swap agreements | | | (985,778 | ) |
Futures contracts | | | (106,889 | ) |
Options purchased | | | 30,822 | |
Options written | | | 4,920 | |
Forward foreign currency exchange contracts | | | 6,103 | |
Foreign currency translations | | | 325 | |
Net change in unrealized appreciation (depreciation) | | | (1,905,853 | ) |
Net realized and unrealized loss | | | (3,297,282 | ) |
Net increase in net assets resulting from operations | | $ | 375,701 | |
* | Relates to Trustees not deemed “interested persons” within the meaning of Section 2(a)(19) of the 1940 Act. |
38 | THE GUGGENHEIM FUNDS SEMI-ANNUAL FINANCIAL REPORT | SEE NOTES TO FINANCIAL STATEMENTS. |
SERIES E (TOTAL RETURN BOND SERIES) | |
STATEMENTS OF CHANGES IN NET ASSETS |
| | Six Months Ended
June 30, 2024
(Unaudited) | | | Year Ended
December 31,
2023 | |
Increase (Decrease) in Net Assets from Operations: | | | | | | | | |
Net investment income | | $ | 3,672,983 | | | $ | 6,281,614 | |
Net realized loss on investments | | | (1,391,429 | ) | | | (8,779,709 | ) |
Net change in unrealized appreciation (depreciation) on investments | | | (1,905,853 | ) | | | 12,027,856 | |
Net increase in net assets resulting from operations | | | 375,701 | | | | 9,529,761 | |
| | | | | | | | | |
Distributions to shareholders | | | — | | | | (5,275,065 | ) |
| | | | | | | | | |
Capital share transactions: | | | | | | | | |
Proceeds from sale of shares | | | 21,268,860 | | | | 33,336,930 | |
Distributions reinvested | | | — | | | | 5,275,065 | |
Cost of shares redeemed | | | (11,537,262 | ) | | | (27,650,396 | ) |
Net increase from capital share transactions | | | 9,731,598 | | | | 10,961,599 | |
Net increase in net assets | | | 10,107,299 | | | | 15,216,295 | |
| | | | | | | | | |
Net assets: | | | | | | | | |
Beginning of period | | | 150,282,530 | | | | 135,066,235 | |
End of period | | $ | 160,389,829 | | | $ | 150,282,530 | |
| | | | | | | | | |
Capital share activity: | | | | | | | | |
Shares sold | | | 1,486,625 | | | | 2,359,120 | |
Shares issued from reinvestment of distributions | | | — | | | | 378,412 | |
Shares redeemed | | | (808,439 | ) | | | (1,967,697 | ) |
Net increase in shares | | | 678,186 | | | | 769,835 | |
SEE NOTES TO FINANCIAL STATEMENTS. | THE GUGGENHEIM FUNDS SEMI-ANNUAL FINANCIAL REPORT | 39 |
SERIES E (TOTAL RETURN BOND SERIES) | |
This table is presented to show selected data for a share outstanding throughout each period and to assist shareholders in evaluating a Fund’s performance for the periods presented.
| | Six Months Ended
June 30, 2024a | | | Year Ended
December 31,
2023 | | | Year Ended
December 31,
2022 | | | Year Ended
December 31,
2021 | | | Year Ended
December 31,
2020 | | | Year Ended
December 31,
2019 | |
Per Share Data |
Net asset value, beginning of period | | $ | 14.39 | | | $ | 13.97 | | | $ | 17.23 | | | $ | 18.09 | | | $ | 16.13 | | | $ | 15.85 | |
Income (loss) from investment operations: |
Net investment income (loss)b | | | .35 | | | | .62 | | | | .53 | | | | .44 | | | | .39 | | | | .38 | |
Net gain (loss) on investments (realized and unrealized) | | | (.32 | ) | | | .33 | | | | (3.29 | ) | | | (.51 | ) | | | 1.88 | | | | .34 | |
Total from investment operations | | | .03 | | | | .95 | | | | (2.76 | ) | | | (.07 | ) | | | 2.27 | | | | .72 | |
Less distributions from: |
Net investment income | | | — | | | | (.53 | ) | | | (.46 | ) | | | (.30 | ) | | | (.31 | ) | | | (.44 | ) |
Net realized gains | | | — | | | | — | | | | (.04 | ) | | | (.49 | ) | | | — | | | | — | |
Total distributions | | | — | | | | (.53 | ) | | | (.50 | ) | | | (.79 | ) | | | (.31 | ) | | | (.44 | ) |
Net asset value, end of period | | $ | 14.42 | | | $ | 14.39 | | | $ | 13.97 | | | $ | 17.23 | | | $ | 18.09 | | | $ | 16.13 | |
|
Total Returnc | | | 0.21 | % | | | 6.95 | % | | | (16.15 | %) | | | (0.43 | %) | | | 14.21 | % | | | 4.49 | % |
Ratios/Supplemental Data |
Net assets, end of period (in thousands) | | $ | 160,390 | | | $ | 150,283 | | | $ | 135,066 | | | $ | 174,203 | | | $ | 177,103 | | | $ | 128,209 | |
Ratios to average net assets: |
Net investment income (loss) | | | 4.87 | % | | | 4.44 | % | | | 3.54 | % | | | 2.51 | % | | | 2.27 | % | | | 2.33 | % |
Total expensesd | | | 0.93 | % | | | 1.02 | % | | | 0.90 | % | | | 0.85 | % | | | 0.88 | % | | | 0.94 | % |
Net expensese,f,g | | | 0.87 | % | | | 0.95 | % | | | 0.85 | % | | | 0.78 | % | | | 0.78 | % | | | 0.78 | % |
Portfolio turnover rate | | | 41 | % | | | 91 | % | | | 51 | % | | | 84 | % | | | 123 | % | | | 54 | % |
a | Unaudited figures for the period ended June 30, 2024. Percentage amounts for the period, except total return and portfolio turnover rate, have been annualized. |
b | Net investment income (loss) per share was computed using average shares outstanding throughout the period. |
c | Total return does not take into account any of the expenses associated with an investment in variable insurance products. If total return had taken into account these expenses, performance would have been lower. Shares of a series of Guggenheim Variable Funds Trust are available only through the purchase of such products. |
d | Does not include expenses of the underlying funds in which the Fund invests. |
e | Net expense information reflects the expense ratios after expense waivers and reimbursements, as applicable. |
f | The portion of the ratios of net expenses to average net assets attributable to recoupments of prior fee reductions or expense reimbursements for the years presented was as follows: |
| | 06/30/24a | 12/31/23 | 12/31/22 | 12/31/21 | 12/31/20 | 12/31/19 |
| | 0.05% | — | — | — | — | — |
g | Net expenses may include expenses that are excluded from the expense limitation agreement. Excluding these expenses, the net expense ratios for the years presented would be: |
| | 06/30/24a | 12/31/23 | 12/31/22 | 12/31/21 | 12/31/20 | 12/31/19 |
| | 0.77% | 0.76% | 0.76% | 0.78% | 0.77% | 0.77% |
40 | THE GUGGENHEIM FUNDS SEMI-ANNUAL FINANCIAL REPORT | SEE NOTES TO FINANCIAL STATEMENTS. |
SCHEDULE OF INVESTMENTS (Unaudited) | June 30, 2024 |
SERIES F (FLOATING RATE STRATEGIES SERIES) | |
| | Shares | | | Value | |
COMMON STOCKS† - 0.4% |
| | | | | | | | | |
Industrial - 0.3% |
API Heat Transfer Intermediate*,††† | | | 123 | | | $ | 184,167 | |
BP Holdco LLC*,†††,1 | | | 11,609 | | | | 14,072 | |
Vector Phoenix Holdings, LP*,††† | | | 11,609 | | | | 245 | |
Total Industrial | | | | | | | 198,484 | |
| | | | | | | | | |
Consumer, Non-cyclical - 0.1% |
Endo, Inc.* | | | 1,026 | | | | 28,985 | |
Endo, Inc.*,††,2 | | | 20 | | | | 552 | |
Total Consumer, Non-cyclical | | | | | | | 29,537 | |
| | | | | | | | | |
Total Common Stocks | | | | |
(Cost $226,670) | | | | | | | 228,021 | |
| | | | | | | | | |
EXCHANGE-TRADED FUNDS**,† - 2.6% |
SPDR Blackstone Senior Loan ETF | | | 35,740 | | | | 1,493,932 | |
Total Exchange-Traded Funds | | | | |
(Cost $1,494,953) | | | | | | | 1,493,932 | |
| | | | | | | | | |
MUTUAL FUND† - 2.6% |
Guggenheim Floating Rate Strategies Fund — Class R61 | | | 61,829 | | | | 1,503,689 | |
Total Mutual Fund | | | | |
(Cost $1,516,579) | | | | | | | 1,503,689 | |
| | | | | | | | | |
MONEY MARKET FUND**,† - 2.8% |
Federated Hermes U.S. Treasury Cash Reserves Fund — Institutional Shares, 5.17%3 | | | 1,601,440 | | | | 1,601,440 | |
Total Money Market Fund | | | | |
(Cost $1,601,440) | | | | | | | 1,601,440 | |
| | | | | | | | | |
| | | Face
Amount~ | | | | | |
SENIOR FLOATING RATE INTERESTS††,◊ - 94.6% |
Consumer, Cyclical - 19.5% | | | | | | | | |
Alterra Mountain Co. | | | | | | | | |
8.59% (1 Month Term SOFR + 3.25%, Rate Floor: 3.25%) due 08/17/28 | | | 300,000 | | | | 300,501 | |
due 05/31/30 | | | 200,000 | | | | 200,876 | |
Restaurant Brands | | | | | | | | |
7.09% (1 Month Term SOFR + 1.75%, Rate Floor: 1.75%) due 09/20/30 | | | 502,045 | | | | 500,243 | |
Dealer Tire LLC | | | | | | | | |
due 06/24/31 | | | 500,000 | | | | 498,750 | |
PetSmart LLC | | | | | | | | |
9.19% (1 Month Term SOFR + 3.75%, Rate Floor: 4.50%) due 02/11/28 | | | 499,557 | | | | 497,473 | |
Hanesbrands, Inc. | | | | | | | | |
9.09% (1 Month Term SOFR + 3.75%, Rate Floor: 4.25%) due 03/08/30 | | | 495,735 | | | | 496,563 | |
Truck Hero, Inc. | | | | | | | | |
8.96% (1 Month Term SOFR + 3.50%, Rate Floor: 4.25%) due 01/31/28 | | | 498,711 | | | | 496,323 | |
WIRB - Copernicus Group, Inc. | | | | | | | | |
9.44% (1 Month Term SOFR + 4.11%, Rate Floor: 5.11%) due 01/08/27††† | | | 491,443 | | | | 493,131 | |
First Brands Group LLC | | | | | | | | |
10.59% (3 Month Term SOFR + 5.00%, Rate Floor: 6.00%) due 03/30/27 | | | 497,429 | | | | 493,544 | |
Petco Health And Wellness Company, Inc. | | | | | | | | |
8.85% (3 Month Term SOFR + 3.25%, Rate Floor: 4.00%) due 03/03/28 | | | 476,931 | | | | 438,710 | |
Flutter Financing B.V. | | | | | | | | |
7.58% (3 Month Term SOFR + 2.25%, Rate Floor: 2.75%) due 11/18/30 | | | 437,800 | | | | 437,529 | |
Clarios Global, LP | | | | | | | | |
due 05/06/30 | | | 400,000 | | | | 400,500 | |
American Tire Distributors, Inc. | | | | | | | | |
11.84% (3 Month Term SOFR + 6.25%, Rate Floor: 7.00%) due 10/20/28 | | | 439,875 | | | | 317,123 | |
Thevelia US LLC | | | | | | | | |
9.48% (3 Month Term SOFR + 4.00%, Rate Floor: 4.50%) due 06/18/29 | | | 245,000 | | | | 246,455 | |
9.08% (3 Month Term SOFR + 3.75%, Rate Floor: 4.25%) due 06/01/29 | | | 39,800 | | | | 39,974 | |
Fertitta Entertainment LLC | | | | | | | | |
9.08% (1 Month Term SOFR + 3.75%, Rate Floor: 4.25%) due 01/29/29 | | | 251,196 | | | | 251,355 | |
PCI Gaming Authority, Inc. | | | | | | | | |
7.96% (1 Month Term SOFR + 2.50%, Rate Floor: 2.50%) due 05/29/26 | | | 250,000 | | | | 249,375 | |
BCPE Empire Holdings, Inc. | | | | | | | | |
9.34% (1 Month Term SOFR + 4.00%, Rate Floor: 4.50%) due 12/11/28 | | | 248,750 | | | | 248,626 | |
Belron Finance US LLC | | | | | | | | |
7.68% (3 Month Term SOFR + 2.25%, Rate Floor: 2.75%) due 04/13/29 | | | 248,125 | | | | 248,435 | |
Sweetwater Sound | | | | | | | | |
9.71% (1 Month Term SOFR + 4.25%, Rate Floor: 5.00%) due 08/07/28 | | | 245,134 | | | | 245,609 | |
Caesars Entertainment, Inc. | | | | | | | | |
8.10% (3 Month Term SOFR + 2.75%, Rate Floor: 3.25%) due 02/06/30 | | | 235,085 | | | | 234,832 | |
Eyemart Express LLC | | | | | | | | |
8.46% (3 Month Term SOFR + 3.11%, Rate Floor: 4.11%) due 08/31/27 | | | 245,790 | | | | 244,254 | |
CCRR Parent, Inc. | | | | | | | | |
9.71% (1 Month Term SOFR + 4.25%, Rate Floor: 5.00%) due 03/06/28 | | | 286,733 | | | | 242,470 | |
Entain Holdings (Gibraltar) Ltd. | | | | | | | | |
8.01% (6 Month Term SOFR + 2.75%, Rate Floor: 3.25%) due 10/31/29 | | | 232,734 | | | | 232,942 | |
Rent-A-Center, Inc. | | | | | | | | |
8.09% (1 Month Term SOFR + 2.75%, Rate Floor: 3.25%) due 02/17/28 | | | 232,422 | | | | 232,810 | |
Go Daddy Operating Company LLC | | | | | | | | |
7.34% (1 Month Term SOFR + 2.00%, Rate Floor: 2.00%) due 11/09/29 | | | 228,939 | | | | 229,163 | |
SEE NOTES TO FINANCIAL STATEMENTS. | THE GUGGENHEIM FUNDS SEMI-ANNUAL FINANCIAL REPORT | 41 |
SCHEDULE OF INVESTMENTS (Unaudited)(continued) | June 30, 2024 |
SERIES F (FLOATING RATE STRATEGIES SERIES) | |
| | Face
Amount~ | | | Value | |
Ontario Gaming GTA, LP | | | | | | | | |
9.58% (3 Month Term SOFR + 4.25%, Rate Floor: 4.75%) due 08/01/30 | | | 219,421 | | | $ | 220,209 | |
Eagle Parent Corp. | | | | | | | | |
9.58% (3 Month Term SOFR + 4.25%, Rate Floor: 4.75%) due 04/02/29 | | | 219,938 | | | | 213,458 | |
Grant Thornton Advisors LLC | | | | | | | | |
8.60% (3 Month Term SOFR + 3.25%, Rate Floor: 3.25%) due 05/01/31 | | | 211,536 | | | | 212,067 | |
Galaxy US Opco, Inc. | | | | | | | | |
10.08% (3 Month Term SOFR + 4.75%, Rate Floor: 5.25%) due 04/30/29 | | | 246,250 | | | | 198,847 | |
Scientific Games Corp. | | | | | | | | |
8.31% (1 Month Term SOFR + 3.00%, Rate Floor: 3.50%) due 04/04/29 | | | 198,514 | | | | 198,017 | |
Peer Holding III BV | | | | | | | | |
due 06/21/31 | | | 190,000 | | | | 190,080 | |
BIFM CA Buyer, Inc. | | | | | | | | |
9.59% (1 Month Term SOFR + 4.25%, Rate Floor: 4.75%) due 05/31/28 | | | 188,316 | | | | 189,022 | |
Congruex Group LLC | | | | | | | | |
11.23% (3 Month Term SOFR + 5.75%, Rate Floor: 6.50%) due 05/03/29 | | | 245,000 | | | | 187,425 | |
Guardian US HoldCo LLC | | | | | | | | |
8.83% (3 Month Term SOFR + 3.50%, Rate Floor: 4.00%) due 01/31/30 | | | 160,389 | | | | 159,186 | |
Apro LLC | | | | | | | | |
due 06/26/31 | | | 150,000 | | | | 149,813 | |
Michaels Stores, Inc. | | | | | | | | |
9.85% (3 Month Term SOFR + 4.51%, Rate Floor: 5.26%) due 04/15/28 | | | 158,581 | | | | 142,068 | |
TMF Sapphire Bidco BV | | | | | | | | |
9.31% (3 Month Term SOFR + 4.00%, Rate Floor: 4.00%) due 05/03/28 | | | 136,307 | | | | 136,392 | |
Packers Holdings LLC | | | | | | | | |
8.69% (1 Month Term SOFR + 3.25%, Rate Floor: 4.00%) due 03/09/28 | | | 245,019 | | | | 132,433 | |
Crash Champions Inc. | | | | | | | | |
10.08% (3 Month Term SOFR + 4.75%, Rate Floor: 4.75%) due 02/06/29 | | | 130,000 | | | | 130,488 | |
Bulldog Purchaser, Inc. | | | | | | | | |
due 06/12/31 | | | 67,436 | | | | 67,689 | |
WW International, Inc. | | | | | | | | |
8.96% (1 Month Term SOFR + 3.50%, Rate Floor: 4.00%) due 04/13/28 | | | 94,500 | | | | 34,965 | |
EG Finco Ltd. | | | | | | | | |
11.07% (6 Month Term SOFR + 5.93%, Rate Floor: 5.93%) due 02/07/28 | | | 22,027 | | | | 21,706 | |
Total Consumer, Cyclical | | | | | | | 11,101,431 | |
| | | | | | | | | |
Industrial - 18.7% | | | | | | | | |
American Builders & Contractors Supply Co., Inc. | | | | | | | | |
7.34% (1 Month Term SOFR + 2.00%, Rate Floor: 2.00%) due 01/25/31 | | | 498,754 | | | | 499,442 | |
Beacon Roofing Supply, Inc. | | | | | | | | |
7.34% (1 Month Term SOFR + 2.00%, Rate Floor: 2.00%) due 05/19/28 | | | 497,500 | | | | 498,789 | |
LTI Holdings, Inc. | | | | | | | | |
8.96% (1 Month Term SOFR + 3.50%, Rate Floor: 3.50%) due 09/08/25 | | | 496,715 | | | | 488,644 | |
American Bath Group LLC | | | | | | | | |
9.19% (1 Month Term SOFR + 3.75%, Rate Floor: 4.25%) due 11/23/27 | | | 490,527 | | | | 477,818 | |
Arcline FM Holdings LLC | | | | | | | | |
10.35% (3 Month Term SOFR + 4.75%, Rate Floor: 5.50%) due 06/23/28 | | | 471,663 | | | | 472,030 | |
Hunter Douglas, Inc. | | | | | | | | |
8.84% (3 Month Term SOFR + 3.50%, Rate Floor: 4.00%) due 02/26/29 | | | 442,125 | | | | 437,863 | |
Park River Holdings, Inc. | | | | | | | | |
8.81% (3 Month Term SOFR + 3.25%, Rate Floor: 4.00%) due 12/28/27 | | | 438,686 | | | | 428,206 | |
LBM Acquisition LLC | | | | | | | | |
9.18% (1 Month Term SOFR + 3.75%, Rate Floor: 4.50%) due 05/29/31 | | | 416,015 | | | | 408,618 | |
FCG Acquisitions, Inc | | | | | | | | |
9.35% (3 Month Term SOFR + 4.01%, Rate Floor: 4.51%) due 04/03/28 | | | 338,886 | | | | 338,629 | |
Aegion Corp. | | | | | | | | |
9.59% (1 Month Term SOFR + 4.25%, Rate Floor: 5.00%) due 05/17/28 | | | 299,245 | | | | 300,101 | |
Michael Baker International LLC | | | | | | | | |
10.09% (1 Month Term SOFR + 4.75%, Rate Floor: 5.50%) due 12/01/28††† | | | 283,287 | | | | 283,641 | |
Fugue Finance LLC | | | | | | | | |
9.35% (3 Month Term SOFR + 4.00%, Rate Floor: 4.50%) due 01/31/28 | | | 276,505 | | | | 278,233 | |
TricorBraun Holdings, Inc. | | | | | | | | |
8.71% (1 Month Term SOFR + 3.25%, Rate Floor: 3.75%) due 03/03/28 | | | 268,363 | | | | 267,665 | |
Quikrete Holdings, Inc. | | | | | | | | |
7.84% (1 Month Term SOFR + 2.50%, Rate Floor: 2.50%) due 04/14/31 | | | 141,313 | | | | 141,533 | |
7.59% (1 Month Term SOFR + 2.25%, Rate Floor: 2.25%) due 03/19/29 | | | 108,063 | | | | 108,063 | |
Core & Main LP | | | | | | | | |
7.59% (3 Month Term SOFR + 2.25%, Rate Floor: 2.25%) due 02/05/31 | | | 249,375 | | | | 249,532 | |
GYP Holdings III Corp. | | | | | | | | |
7.59% (1 Month Term SOFR + 2.25%, Rate Floor: 2.25%) due 05/13/30 | | | 248,752 | | | | 249,219 | |
Barnes Group, Inc. | | | | | | | | |
7.84% (1 Month Term SOFR + 2.50%, Rate Floor: 2.50%) due 08/31/30 | | | 248,454 | | | | 248,764 | |
EMRLD Borrower, LP | | | | | | | | |
7.84% (1 Month Term SOFR + 2.50%, Rate Floor: 2.50%) due 05/31/30 | | | 248,750 | | | | 248,491 | |
Service Logic Acquisition, Inc. | | | | | | | | |
9.59% (3 Month Term SOFR + 4.00%, Rate Floor: 4.75%) due 10/29/27 | | | 247,449 | | | | 248,068 | |
42 | THE GUGGENHEIM FUNDS SEMI-ANNUAL FINANCIAL REPORT | SEE NOTES TO FINANCIAL STATEMENTS. |
SCHEDULE OF INVESTMENTS (Unaudited)(continued) | June 30, 2024 |
SERIES F (FLOATING RATE STRATEGIES SERIES) | |
| | Face
Amount~ | | | Value | |
Harsco Corporation | | | | | | | | |
7.71% (1 Month Term SOFR + 2.25%, Rate Floor: 2.75%) due 03/10/28 | | | 246,193 | | | $ | 245,526 | |
United Airlines Inc. | | | | | | | | |
8.09% (1 Month Term SOFR + 2.75%, Rate Floor: 2.75%) due 02/24/31 | | | 240,000 | | | | 240,214 | |
USIC Holding, Inc. | | | | | | | | |
9.08% ((1 Month Term SOFR + 3.50%) and (3 Month Term SOFR + 3.50%), Rate Floor: 4.25%) due 05/12/28 | | | 245,227 | | | | 236,593 | |
Installed Building Products, Inc. | | | | | | | | |
7.34% (1 Month Term SOFR + 2.00%, Rate Floor: 2.00%) due 03/21/31 | | | 229,425 | | | | 230,643 | |
DXP Enterprises, Inc. | | | | | | | | |
10.16% (6 Month Term SOFR + 4.75%, Rate Floor: 5.75%) due 10/05/30 | | | 223,313 | | | | 224,429 | |
Pelican Products, Inc. | | | | | | | | |
9.85% (3 Month Term SOFR + 4.25%, Rate Floor: 4.75%) due 12/29/28 | | | 241,645 | | | | 222,141 | |
Ravago Holdings America, Inc. | | | | | | | | |
10.00% (Commercial Prime Lending Rate + 1.50%, Rate Floor: 2.50%) due 03/06/28 | | | 215,371 | | | | 215,011 | |
TransDigm, Inc. | | | | | | | | |
7.84% (3 Month Term SOFR + 3.25%, Rate Floor: 3.25%) due 02/28/31 | | | 196,258 | | | | 196,651 | |
DG Investment Intermediate Holdings 2, Inc. | | | | | | | | |
9.21% (1 Month Term SOFR + 3.75%, Rate Floor: 4.50%) due 03/31/28 | | | 194,006 | | | | 193,279 | |
Protective Industrial Products, Inc. | | | | | | | | |
9.46% (1 Month Term SOFR + 4.00%, Rate Floor: 4.75%) due 12/29/27 | | | 162,733 | | | | 161,716 | |
APi Group DE, Inc. | | | | | | | | |
7.34% (1 Month Term SOFR + 2.00%, Rate Floor: 2.00%) due 01/03/29 | | | 160,000 | | | | 159,814 | |
Genesee & Wyoming, Inc. | | | | | | | | |
7.33% (3 Month Term SOFR + 2.00%, Rate Floor: 2.00%) due 04/05/31 | | | 155,000 | | | | 154,786 | |
Berlin Packaging LLC | | | | | | | | |
9.14% (1 Month Term SOFR + 3.75%, Rate Floor: 3.75%) due 05/09/31 | | | 152,006 | | | | 152,300 | |
Foundation Building Materials Holding Company LLC | | | | | | | | |
9.33% (3 Month Term SOFR + 4.00%, Rate Floor: 4.00%) due 01/29/31 | | | 150,000 | | | | 149,125 | |
Spring Education Group, Inc. | | | | | | | | |
9.33% (3 Month Term SOFR + 4.00%, Rate Floor: 4.00%) due 10/04/30 | | | 145,341 | | | | 145,855 | |
API Heat Transfer | | | | | | | | |
13.61% (3 Month Term SOFR + 8.00%, Rate Floor: 11.00%) due 11/10/27††† | | | 80,863 | | | | 80,863 | |
10.61% (3 Month Term SOFR + 5.00%, Rate Floor: 8.00%) due 11/10/27††† | | | 46,920 | | | | 46,920 | |
STS Operating, Inc. | | | | | | | | |
9.44% (3 Month Term SOFR + 4.10%, Rate Floor: 4.10%) due 03/15/31 | | | 117,000 | | | | 117,183 | |
Artera Services LLC | | | | | | | | |
9.83% (3 Month Term SOFR + 4.50%, Rate Floor: 4.50%) due 02/06/31 | | | 114,713 | | | | 115,122 | |
ASP Dream Acquisiton Co. LLC | | | | | | | | |
9.69% (1 Month Term SOFR + 4.35%, Rate Floor: 5.10%) due 12/15/28 | | | 100,882 | | | | 100,882 | |
XPO, Inc. | | | | | | | | |
7.33% (1 Month Term SOFR + 2.00%, Rate Floor: 2.00%) due 02/03/31 | | | 100,000 | | | | 100,188 | |
Air Canada | | | | | | | | |
7.85% (3 Month Term SOFR + 2.50%, Rate Floor: 2.50%) due 03/21/31 | | | 100,000 | | | | 100,031 | |
CPM Holdings, Inc. | | | | | | | | |
9.83% (1 Month Term SOFR + 4.50%, Rate Floor: 5.00%) due 09/22/28 | | | 99,877 | | | | 99,024 | |
Mileage Plus Holdings LLC | | | | | | | | |
10.74% (3 Month Term SOFR + 5.25%, Rate Floor: 6.25%) due 06/21/27 | | | 90,300 | | | | 92,055 | |
GFL Environmental, Inc. | | | | | | | | |
due 06/27/31 | | | 70,000 | | | | 70,000 | |
MI Windows And Doors LLC | | | | | | | | |
8.84% (1 Month Term SOFR + 3.50%, Rate Floor: 3.50%) due 03/20/31 | | | 50,000 | | | | 50,260 | |
Bleriot US Bidco LLC | | | | | | | | |
due 10/31/28 | | | 45,000 | | | | 45,180 | |
Total Industrial | | | | | | | 10,619,140 | |
| | | | | | | | | |
Consumer, Non-cyclical - 17.4% | | | | | | | | |
Summit Behavioral Healthcare LLC | | | | | | | | |
9.60% (3 Month Term SOFR + 4.25%, Rate Floor: 5.00%) due 11/24/28 | | | 497,462 | | | | 499,118 | |
Triton Water Holdings, Inc. | | | | | | | | |
8.85% (3 Month Term SOFR + 3.51%, Rate Floor: 4.01%) due 03/31/28 | | | 487,234 | | | | 487,234 | |
VC GB Holdings I Corp. | | | | | | | | |
8.33% (3 Month Term SOFR + 3.00%, Rate Floor: 3.50%) due 07/21/28 | | | 487,500 | | | | 485,443 | |
Topgolf Callaway Brands Corp. | | | | | | | | |
8.34% (1 Month Term SOFR + 3.00%, Rate Floor: 3.00%) due 03/15/30 | | | 474,940 | | | | 475,790 | |
Bombardier Recreational Products, Inc. | | | | | | | | |
8.09% (1 Month Term SOFR + 2.75%, Rate Floor: 2.75%) due 01/22/31 | | | 469,755 | | | | 469,389 | |
Grifols Worldwide Operations USA, Inc. | | | | | | | | |
7.44% (1 Month Term SOFR + 2.00%, Rate Floor: 3.00%) due 11/15/27 | | | 461,849 | | | | 453,692 | |
Dermatology Intermediate Holdings III, Inc. | | | | | | | | |
9.58% (3 Month Term SOFR + 4.25%, Rate Floor: 4.75%) due 04/02/29 | | | 457,441 | | | | 442,478 | |
National Mentor Holdings, Inc. | | | | | | | | |
9.19% ((1 Month Term SOFR + 3.75%) and (3 Month Term SOFR + 3.75%), Rate Floor: 4.50%) due 03/02/28 | | | 418,805 | | | | 394,514 | |
9.18% (3 Month Term SOFR + 3.75%, Rate Floor: 4.50%) due 03/02/28 | | | 17,906 | | | | 16,868 | |
SEE NOTES TO FINANCIAL STATEMENTS. | THE GUGGENHEIM FUNDS SEMI-ANNUAL FINANCIAL REPORT | 43 |
SCHEDULE OF INVESTMENTS (Unaudited)(continued) | June 30, 2024 |
SERIES F (FLOATING RATE STRATEGIES SERIES) | |
| | Face
Amount~ | | | Value | |
Froneri US, Inc. | | | | | | | | |
7.69% (1 Month Term SOFR + 2.25%, Rate Floor: 2.25%) due 01/29/27 | | | 390,916 | | | $ | 390,505 | |
Medline Borrower LP | | | | | | | | |
8.09% (1 Month Term SOFR + 2.75%, Rate Floor: 3.25%) due 10/23/28 | | | 389,974 | | | | 390,497 | |
CHG PPC Parent LLC | | | | | | | | |
8.46% (1 Month Term SOFR + 3.00%, Rate Floor: 3.50%) due 12/08/28 | | | 377,962 | | | | 378,200 | |
Medical Solutions Parent Holdings, Inc. | | | | | | | | |
8.69% (1 Month Term SOFR + 3.25%, Rate Floor: 3.75%) due 11/01/28 | | | 489,162 | | | | 367,219 | |
Cambrex Corp. | | | | | | | | |
8.94% (1 Month Term SOFR + 3.50%, Rate Floor: 4.25%) due 12/04/26 | | | 299,236 | | | | 294,562 | |
Nomad Foods Limited | | | | | | | | |
7.81% (3 Month Term SOFR + 2.50%, Rate Floor: 3.00%) due 11/08/29 | | | 264,991 | | | | 264,991 | |
PlayCore | | | | | | | | |
9.84% (1 Month Term SOFR + 4.50%, Rate Floor: 5.50%) due 02/14/30 | | | 250,000 | | | | 251,355 | |
Southern Veterinary Partners LLC | | | | | | | | |
9.09% (1 Month Term SOFR + 3.75%, Rate Floor: 4.75%) due 10/05/27 | | | 250,558 | | | | 250,716 | |
Aramark Services, Inc. | | | | | | | | |
7.34% (1 Month Term SOFR + 2.00%, Rate Floor: 2.00%) due 06/24/30 | | | 247,500 | | | | 247,624 | |
Heritage Grocers Group LLC | | | | | | | | |
12.18% (3 Month Term SOFR + 6.75%, Rate Floor: 7.50%) due 08/01/29 | | | 246,859 | | | | 246,654 | |
HAH Group Holding Co. LLC | | | | | | | | |
10.45% (1 Month Term SOFR + 5.00%, Rate Floor: 6.00%) due 10/29/27 | | | 244,938 | | | | 245,244 | |
Midwest Veterinary Partners LLC | | | | | | | | |
9.08% (1 Month Term SOFR + 3.75%, Rate Floor: 4.50%) due 04/28/28 | | | 243,750 | | | | 243,628 | |
Kronos Acquisition Holdings, Inc. | | | | | | | | �� |
9.35% (3 Month Term SOFR + 4.01%, Rate Floor: 4.51%) due 12/22/26 | | | 243,348 | | | | 242,923 | |
Resonetics LLC | | | | | | | | |
9.08% (1 Month Term SOFR + 3.75%, Rate Floor: 4.50%) due 06/06/31 | | | 227,376 | | | | 227,660 | |
Weber-Stephen Products LLC | | | | | | | | |
8.71% (1 Month Term SOFR + 3.25%, Rate Floor: 4.00%) due 10/29/27 | | | 243,819 | | | | 226,006 | |
DaVita, Inc. | | | | | | | | |
7.21% (1 Month Term SOFR + 1.75%, Rate Floor: 1.75%) due 04/12/31 | | | 225,118 | | | | 224,922 | |
Outcomes Group Holdings, Inc. | | | | | | | | |
9.59% (3 Month Term SOFR + 4.25%, Rate Floor: 4.25%) due 04/01/31 | | | 220,152 | | | | 220,598 | |
TGP Holdings LLC | | | | | | | | |
8.69% (1 Month Term SOFR + 3.25%, Rate Floor: 4.00%) due 06/29/28 | | | 191,325 | | | | 180,955 | |
Chefs’ Warehouse, Inc. | | | | | | | | |
9.34% (1 Month Term SOFR + 4.00%, Rate Floor: 4.50%) due 08/23/29 | | | 177,833 | | | | 177,945 | |
Energizer Holdings, Inc. | | | | | | | | |
7.34% (1 Month Term SOFR + 2.00%, Rate Floor: 2.00%) due 12/22/27 | | | 173,857 | | | | 173,967 | |
Osmosis Holdings Australia II Pty Ltd. | | | | | | | | |
9.33% (1 Month Term SOFR + 4.00%, Rate Floor: 4.50%) due 07/30/28 | | | 173,034 | | | | 173,240 | |
Surgery Center Holdings, Inc. | | | | | | | | |
8.09% (1 Month Term SOFR + 2.75%, Rate Floor: 2.75%) due 12/19/30 | | | 170,000 | | | | 170,255 | |
Hayward Industries, Inc. | | | | | | | | |
8.21% (1 Month Term SOFR + 2.75%, Rate Floor: 3.25%) due 05/30/28 | | | 132,294 | | | | 132,067 | |
Del Monte Foods, Inc. | | | | | | | | |
9.74% (3 Month Term SOFR + 4.25%, Rate Floor: 4.75%) due 05/16/29 | | | 160,444 | | | | 122,428 | |
Endo Finance Holdings, Inc. | | | | | | | | |
9.83% (3 Month Term SOFR + 4.50%, Rate Floor: 5.00%) due 04/23/31 | | | 120,000 | | | | 119,776 | |
Pacific Dental Services LLC | | | | | | | | |
8.58% (1 Month Term SOFR + 3.25%, Rate Floor: 3.25%) due 03/07/31 | | | 110,000 | | | | 110,069 | |
Concentra Health Services, Inc. | | | | | | | | |
due 06/26/31 | | | 85,000 | | | | 85,213 | |
Midwest Physician Administrative Services | | | | | | | | |
due 03/12/28 | | | 40,165 | | | | 34,981 | |
Total Consumer, Non-cyclical | | | | | | | 9,918,726 | |
| | | | | | | | | |
Technology - 11.1% | | | | | | | | |
Planview Parent, Inc. | | | | | | | | |
9.08% (3 Month Term SOFR + 4.26%, Rate Floor: 5.01%) due 12/17/27 | | | 502,360 | | | | 501,104 | |
DCert Buyer, Inc. | | | | | | | | |
9.34% (1 Month Term SOFR + 4.00%, Rate Floor: 4.00%) due 10/16/26 | | | 498,698 | | | | 485,502 | |
Conair Holdings LLC | | | | | | | | |
9.21% (1 Month Term SOFR + 3.75%, Rate Floor: 4.25%) due 05/17/28 | | | 471,420 | | | | 468,417 | |
Athenahealth Group, Inc. | | | | | | | | |
8.59% (1 Month Term SOFR + 3.25%, Rate Floor: 3.75%) due 02/15/29 | | | 436,828 | | | | 434,919 | |
Waystar Technologies, Inc. | | | | | | | | |
due 10/22/29 | | | 400,769 | | | | 400,769 | |
Polaris Newco LLC | | | | | | | | |
9.59% (3 Month Term SOFR + 4.00%, Rate Floor: 4.50%) due 06/02/28 | | | 317,068 | | | | 316,760 | |
Peraton Corp. | | | | | | | | |
9.19% (1 Month Term SOFR + 3.75%, Rate Floor: 4.50%) due 02/01/28 | | | 284,053 | | | | 283,934 | |
Xerox Corp. | | | | | | | | |
9.34% (1 Month Term SOFR + 4.00%, Rate Floor: 4.50%) due 11/19/29 | | | 274,004 | | | | 273,404 | |
CoreLogic, Inc. | | | | | | | | |
8.96% (1 Month Term SOFR + 3.50%, Rate Floor: 4.00%) due 06/02/28 | | | 268,408 | | | | 263,997 | |
Boxer Parent Co., Inc. | | | | | | | | |
9.34% (1 Month Term SOFR + 4.00%, Rate Floor: 4.00%) due 12/29/28 | | | 248,750 | | | | 248,971 | |
44 | THE GUGGENHEIM FUNDS SEMI-ANNUAL FINANCIAL REPORT | SEE NOTES TO FINANCIAL STATEMENTS. |
SCHEDULE OF INVESTMENTS (Unaudited)(continued) | June 30, 2024 |
SERIES F (FLOATING RATE STRATEGIES SERIES) | |
| | Face
Amount~ | | | Value | |
Ascend Learning LLC | | | | | | | | |
8.94% (1 Month Term SOFR + 3.50%, Rate Floor: 4.00%) due 12/11/28 | | | 243,750 | | | $ | 243,401 | |
Cloud Software Group, Inc. | | | | | | | | |
9.33% (3 Month Term SOFR + 4.00%, Rate Floor: 4.50%) due 03/30/29 | | | 242,853 | | | | 42,489 | |
Wrench Group LLC | | | | | | | | |
9.60% (3 Month Term SOFR + 4.00%, Rate Floor: 5.00%) due 10/30/28 | | | 224,438 | | | | 224,438 | |
Sabre GLBL, Inc. | | | | | | | | |
8.96% (1 Month Term SOFR + 3.50%, Rate Floor: 4.00%) due 12/17/27 | | | 144,680 | | | | 129,643 | |
10.44% (1 Month Term SOFR + 5.00%, Rate Floor: 5.50%) due 06/30/28 | | | 87,599 | | | | 79,880 | |
Atlas CC Acquisition Corp. | | | | | | | | |
9.86% (3 Month Term SOFR + 4.25%, Rate Floor: 5.00%) due 05/25/28 | | | 285,833 | | | | 207,864 | |
Gen Digital, Inc. | | | | | | | | |
7.33% (3 Month Term SOFR + 1.75%, Rate Floor: 2.25%) due 09/12/29††† | | | 189,839 | | | | 189,543 | |
Iron Mountain Information Management Services, Inc. | | | | | | | | |
7.59% (1 Month Term SOFR + 2.25%, Rate Floor: 2.25%) due 01/31/31 | | | 189,050 | | | | 188,025 | |
Instructure Holdings, Inc. | | | | | | | | |
8.35% (3 Month Term SOFR + 2.75%, Rate Floor: 3.25%) due 10/30/28 | | | 175,065 | | | | 174,773 | |
Blackhawk Network Holdings, Inc. | | | | | | | | |
10.34% (1 Month Term SOFR + 5.00%, Rate Floor: 6.00%) due 02/23/29 | | | 145,000 | | | | 145,273 | |
Modena Buyer LLC | | | | | | | | |
due 04/17/31 | | | 147,465 | | | | 143,733 | |
DS Admiral Bidco LLC | | | | | | | | |
due 06/05/31 | | | 130,000 | | | | 128,700 | |
SS&C Technologies, Inc. | | | | | | | | |
7.34% (1 Month Term SOFR + 2.00%, Rate Floor: 2.00%) due 05/09/31 | | | 121,193 | | | | 121,329 | |
Waystar Technologies Inc. | | | | | | | | |
9.35% (1 Month Term SOFR + 4.00%, Rate Floor: 4.00%) due 10/22/29 | | | 99,231 | | | | 99,231 | |
Epicor Software | | | | | | | | |
8.59% (1 Month Term SOFR + 3.25%, Rate Floor: 3.25%) due 05/22/31 | | | 95,601 | | | | 95,947 | |
isolved, Inc. | | | | | | | | |
8.84% (1 Month Term SOFR + 3.50%, Rate Floor: 3.50%) due 10/15/30 | | | 85,286 | | | | 85,366 | |
Dye & Durham Corp. | | | | | | | | |
9.68% (3 Month Term SOFR + 4.35%, Rate Floor: 5.35%) due 04/04/31 | | | 85,000 | | | | 85,213 | |
VS Buyer LLC | | | | | | | | |
8.58% (1 Month Term SOFR + 3.25%, Rate Floor: 3.25%) due 04/04/31 | | | 75,000 | | | | 75,094 | |
Total Technology | | | | | | | 6,337,719 | |
| | | | | | | | | |
Communications - 10.1% | | | | | | | | |
WMG Acquisition Corp. | | | | | | | | |
due 01/24/31 | | | 500,000 | | | | 500,235 | |
McGraw Hill LLC | | | | | | | | |
10.20% (3 Month Term SOFR + 4.75%, Rate Floor: 5.25%) due 07/28/28 | | | 499,151 | | | | 499,704 | |
UPC Broadband Holding BV | | | | | | | | |
8.44% (1 Month Term SOFR + 3.00%, Rate Floor: 3.00%) due 01/31/29 | | | 500,000 | | | | 496,735 | |
Playtika Holding Corp. | | | | | | | | |
8.21% (1 Month Term SOFR + 2.75%, Rate Floor: 3.75%) due 03/13/28 | | | 487,210 | | | | 486,908 | |
Virgin Media Bristol LLC | | | | | | | | |
7.94% (1 Month Term SOFR + 2.50%, Rate Floor: 2.50%) due 01/31/28 | | | 500,406 | | | | 477,772 | |
CSC Holdings LLC | | | | | | | | |
9.83% (1 Month Term SOFR + 4.50%, Rate Floor: 4.50%) due 01/18/28 | | | 483,941 | | | | 464,240 | |
Ziggo Financing Partnership | | | | | | | | |
7.94% (1 Month Term SOFR + 2.50%, Rate Floor: 2.50%) due 04/28/28 | | | 400,000 | | | | 386,224 | |
Telenet Financing USD LLC | | | | | | | | |
7.44% (1 Month Term SOFR + 2.00%, Rate Floor: 2.00%) due 04/28/28 | | | 400,000 | | | | 379,916 | |
Level 3 Financing, Inc. | | | | | | | | |
11.90% (1 Month Term SOFR + 6.56%, Rate Floor: 6.56%) due 04/15/30 | | | 194,447 | | | | 189,100 | |
11.90% (1 Month Term SOFR + 6.56%, Rate Floor: 6.56%) due 04/16/29 | | | 193,031 | | | | 188,718 | |
Zayo Group Holdings, Inc. | | | | | | | | |
8.46% (1 Month Term SOFR + 3.00%, Rate Floor: 3.00%) due 03/09/27 | | | 401,527 | | | | 348,493 | |
Altice France SA | | | | | | | | |
10.83% (3 Month Term SOFR + 5.50%, Rate Floor: 5.50%) due 08/15/28 | | | 465,495 | | | | 340,589 | |
LCPR Loan Financing LLC | | | | | | | | |
9.19% (1 Month Term SOFR + 3.75%, Rate Floor: 4.75%) due 10/16/28 | | | 286,866 | | | | 276,037 | |
Cengage Learning, Inc. | | | | | | | | |
9.54% (6 Month Term SOFR + 4.25%, Rate Floor: 5.25%) due 03/24/31 | | | 235,000 | | | | 235,442 | |
Charter Communications Operating LLC | | | | | | | | |
7.30% (3 Month Term SOFR + 2.00%, Rate Floor: 2.00%) due 12/09/30 | | | 189,050 | | | | 186,734 | |
Simon & Schuster | | | | | | | | |
9.33% (3 Month Term SOFR + 4.00%, Rate Floor: 4.00%) due 10/30/30 | | | 129,276 | | | | 129,276 | |
Titan AcquisitionCo New Zealand Ltd. (Trade Me) | | | | | | | | |
9.60% (3 Month Term SOFR + 4.00%, Rate Floor: 4.50%) due 10/18/28 | | | 85,111 | | | | 85,165 | |
Xplornet Communications, Inc. | | | | | | | | |
9.57% (3 Month Term SOFR + 4.26%, Rate Floor: 4.76%) due 10/02/28 | | | 292,500 | | | | 44,282 | |
Total Communications | | | | | | | 5,715,570 | |
| | | | | | | | | |
Financial - 9.4% | | | | | | | | |
USI, Inc. | | | | | | | | |
8.08% (3 Month Term SOFR + 3.25%, Rate Floor: 3.25%) due 09/27/30 | | | 298,500 | | | | 298,375 | |
SEE NOTES TO FINANCIAL STATEMENTS. | THE GUGGENHEIM FUNDS SEMI-ANNUAL FINANCIAL REPORT | 45 |
SCHEDULE OF INVESTMENTS (Unaudited)(continued) | June 30, 2024 |
SERIES F (FLOATING RATE STRATEGIES SERIES) | |
| | Face
Amount~ | | | Value | |
8.33% (3 Month Term SOFR + 3.00%, Rate Floor: 3.00%) due 11/22/29 | | | 206,807 | | | $ | 206,679 | |
Citadel Securities, LP | | | | | | | | |
7.59% (1 Month Term SOFR + 2.25%, Rate Floor: 2.25%) due 07/29/30 | | | 355,551 | | | | 356,440 | |
Cobham Ultra SeniorCo SARL | | | | | | | | |
9.01% (6 Month Term SOFR + 3.50%, Rate Floor: 4.00%) due 08/06/29 | | | 323,500 | | | | 313,148 | |
Trans Union LLC | | | | | | | | |
7.09% (1 Month Term SOFR + 1.75%, Rate Floor: 1.75%) due 06/05/31 | | | 300,000 | | | | 299,175 | |
Jane Street Group LLC | | | | | | | | |
7.96% (3 Month Term SOFR + 2.61%, Rate Floor: 2.61%) due 01/26/28 | | | 274,725 | | | | 274,348 | |
AmWINS Group, Inc. | | | | | | | | |
7.71% (1 Month Term SOFR + 2.25%, Rate Floor: 3.00%) due 02/22/28 | | | 250,049 | | | | 249,719 | |
Focus Financial Partners, LLC | | | | | | | | |
8.09% (1 Month Term SOFR + 2.75%, Rate Floor: 3.25%) due 06/30/28 | | | 245,641 | | | | 245,240 | |
Asurion LLC | | | | | | | | |
9.69% (1 Month Term SOFR + 4.25%, Rate Floor: 4.25%) due 08/20/28 | | | 241,938 | | | | 239,854 | |
HarbourVest Partners, LP | | | | | | | | |
7.83% (3 Month Term SOFR + 2.50%, Rate Floor: 2.50%) due 04/19/30††† | | | 238,537 | | | | 238,537 | |
Aretec Group, Inc. | | | | | | | | |
9.34% (1 Month Term SOFR + 4.00%, Rate Floor: 4.00%) due 08/09/30 | | | 237,605 | | | | 238,348 | |
Worldpay | | | | | | | | |
due 01/31/31 | | | 235,000 | | | | 234,967 | |
Ardonagh Group Finco Pty Ltd. | | | | | | | | |
due 02/27/31 | | | 231,314 | | | | 230,157 | |
Nexus Buyer LLC | | | | | | | | |
9.84% (3 Month Term SOFR + 4.50%, Rate Floor: 4.50%) due 12/13/28 | | | 220,000 | | | | 219,945 | |
Capstone Borrower, Inc. | | | | | | | | |
8.58% (3 Month Term SOFR + 3.25%, Rate Floor: 3.25%) due 06/17/30 | | | 217,186 | | | | 217,549 | |
Apex Group Treasury LLC | | | | | | | | |
10.32% (3 Month Term SOFR + 5.00%, Rate Floor: 5.50%) due 07/27/28††† | | | 197,000 | | | | 197,492 | |
Virtu Financial | | | | | | | | |
8.09% (1 Month Term SOFR + 2.75%, Rate Floor: 2.75%) due 06/23/31 | | | 175,000 | | | | 174,563 | |
Zodiac Pool Solutions LLC | | | | | | | | |
7.37% (1 Month Term SOFR + 1.93%, Rate Floor: 2.43%) due 01/29/29 | | | 163,188 | | | | 162,780 | |
Assetmark Financial Holdings, Inc. | | | | | | | | |
due 06/03/31 | | | 155,000 | | | | 155,000 | |
Franchise Group, Inc. | | | | | | | | |
10.36% (6 Month Term SOFR + 4.75%, Rate Floor: 5.50%) due 03/10/26 | | | 199,776 | | | | 150,331 | |
Tegra118 Wealth Solutions, Inc. | | | | | | | | |
9.33% (3 Month Term SOFR + 4.00%, Rate Floor: 4.00%) due 02/18/27 | | | 149,611 | | | | 142,973 | |
Eisner Advisory Group | | | | | | | | |
9.34% (3 Month Term SOFR + 4.00%, Rate Floor: 4.50%) due 02/22/31 | | | 139,300 | | | | 140,402 | |
Alter Domus | | | | | | | | |
due 05/13/31 | | | 101,494 | | | | 101,812 | |
GIP Pilot Acquisition Partners, LP | | | | | | | | |
7.83% (1 Month Term SOFR + 2.50%, Rate Floor: 2.50%) due 10/04/30 | | | 101,176 | | | | 101,176 | |
Osaic Holdings, Inc. | | | | | | | | |
9.34% (1 Month Term SOFR + 4.00%, Rate Floor: 4.00%) due 08/17/28 | | | 94,763 | | | | 95,012 | |
CPI Holdco B LLC | | | | | | | | |
7.34% (1 Month Term SOFR + 2.00%, Rate Floor: 2.00%) due 05/10/31 | | | 90,000 | | | | 89,860 | |
Total Financial | | | | | | | 5,373,882 | |
| | | | | | | | | |
Basic Materials - 4.5% | | | | | | | | |
Arsenal AIC Parent LLC | | | | | | | | |
9.10% (1 Month Term SOFR + 3.75%, Rate Floor: 3.75%) due 08/19/30 | | | 525,994 | | | | 528,493 | |
Illuminate Buyer LLC | | | | | | | | |
8.96% (1 Month Term SOFR + 3.50%, Rate Floor: 3.50%) due 12/31/29 | | | 452,936 | | | | 454,390 | |
CTEC III GmbH | | | | | | | | |
7.29% (3 Month EURIBOR + 3.50%, Rate Floor: 3.50%) due 03/16/29 | | EUR | 400,000 | | | | 424,794 | |
LSF11 A5 HoldCo LLC | | | | | | | | |
8.96% (3 Month Term SOFR + 4.35%, Rate Floor: 4.85%) due 10/15/28††† | | | 358,968 | | | | 359,716 | |
HB Fuller Co. | | | | | | | | |
7.34% (1 Month Term SOFR + 2.00%, Rate Floor: 2.50%) due 02/15/30 | | | 299,250 | | | | 299,065 | |
Platform Specialty Products | | | | | | | | |
7.34% (1 Month Term SOFR + 2.00%, Rate Floor: 2.00%) due 12/18/30 | | | 147,231 | | | | 147,369 | |
Vantage Specialty Chemicals, Inc. | | | | | | | | |
10.08% (3 Month Term SOFR + 4.75%, Rate Floor: 5.25%) due 10/26/26 | | | 103,688 | | | | 102,230 | |
W.R. Grace Holdings LLC | | | | | | | | |
8.59% (1 Month Term SOFR + 3.25%, Rate Floor: 3.75%) due 09/22/28 | | | 97,500 | | | | 97,796 | |
Nouryon USA LLC | | | | | | | | |
8.83% (3 Month Term SOFR + 3.50%, Rate Floor: 3.50%) due 04/03/28 | | | 90,213 | | | | 90,348 | |
INEOS Ltd. | | | | | | | | |
8.21% (1 Month Term SOFR + 2.75%, Rate Floor: 3.25%) due 01/29/26 | | | 26,846 | | | | 26,804 | |
Total Basic Materials | | | | | | | 2,531,005 | |
| | | | | | | | | |
Energy - 2.1% | | | | | | | | |
UGI Energy Services LLC | | | | | | | | |
7.94% (1 Month Term SOFR + 2.60%, Rate Floor: 3.10%) due 02/22/30 | | | 245,995 | | | | 246,129 | |
AL GCX Holdings LLC | | | | | | | | |
8.58% (1 Month Term SOFR + 3.25%, Rate Floor: 3.75%) due 05/17/29 | | | 242,436 | | | | 241,830 | |
46 | THE GUGGENHEIM FUNDS SEMI-ANNUAL FINANCIAL REPORT | SEE NOTES TO FINANCIAL STATEMENTS. |
SCHEDULE OF INVESTMENTS (Unaudited)(continued) | June 30, 2024 |
SERIES F (FLOATING RATE STRATEGIES SERIES) | |
| | Face
Amount~ | | | Value | |
BANGL LLC | | | | | | | | |
9.80% (3 Month Term SOFR + 4.50%, Rate Floor: 4.50%) due 02/01/29 | | | 230,660 | | | $ | 232,102 | |
Par Petroleum LLC | | | | | | | | |
9.05% (3 Month Term SOFR + 3.75%, Rate Floor: 4.25%) due 02/28/30 | | | 148,500 | | | | 148,840 | |
ITT Holdings LLC | | | | | | | | |
8.44% (1 Month Term SOFR + 3.00%, Rate Floor: 3.50%) due 10/11/30 | | | 114,139 | | | | 114,174 | |
WhiteWater DBR HoldCo LLC | | | | | | | | |
8.08% (3 Month Term SOFR + 2.75%, Rate Floor: 2.75%) due 02/16/31 | | | 110,000 | | | | 110,069 | |
Bip PipeCo Holdings LLC | | | | | | | | |
7.81% (3 Month Term SOFR + 2.50%, Rate Floor: 2.50%) due 12/06/30 | | | 100,000 | | | | 100,094 | |
TransMontaigne Operating Company, LP | | | | | | | | |
8.96% (1 Month Term SOFR + 3.50%, Rate Floor: 4.00%) due 11/17/28 | | | 264 | | | | 264 | |
Total Energy | | | | | | | 1,193,502 | |
| | | | | | | | | |
Utilities - 1.8% | | | | | | | | |
Calpine Construction Finance Company, LP | | | | | | | | |
7.34% (1 Month Term SOFR + 2.00%, Rate Floor: 2.00%) due 07/31/30 | | | 497,500 | | | | 495,689 | |
NRG Energy, Inc. | | | | | | | | |
7.34% (1 Month Term SOFR + 2.00%, Rate Floor: 2.00%) due 04/16/31 | | | 270,640 | | | | 270,504 | |
TerraForm Power Operating LLC | | | | | | | | |
7.93% (3 Month Term SOFR + 2.50%, Rate Floor: 3.00%) due 05/21/29 | | | 226,700 | | | | 227,197 | |
UGI Energy Services LLC | | | | | | | | |
due 02/22/30 | | | 35,000 | | | | 35,019 | |
Total Utilities | | | | | | | 1,028,409 | |
| | | | | | | | | |
Total Senior Floating Rate Interests | | | | |
(Cost $54,900,443) | | | 53,819,384 | |
| |
CORPORATE BONDS†† - 0.4% |
Communications - 0.3% | | | | | | | | |
Level 3 Financing, Inc. | | | | | | | | |
11.00% due 11/15/294 | | | 134,610 | | | | 137,747 | |
| | | | | | | | | |
Industrial - 0.1% | | | | | | | | |
GrafTech Global Enterprises, Inc. | | | | | | | | |
9.88% due 12/15/284 | | | 90,000 | | | | 66,336 | |
Total Corporate Bonds | | | | |
(Cost $216,476) | | | 204,083 | |
| | | | | | | | | |
Total Investments - 103.5% | | | | |
(Cost $59,956,561) | | $ | 58,850,549 | |
Other Assets & Liabilities, net - (3.5)% | | | (1,974,430 | ) |
Total Net Assets - 100.0% | | $ | 56,876,119 | |
Forward Foreign Currency Exchange Contracts†† |
Counterparty | | Currency | | | Type | | | Quantity | | | Contract
Amount | | | Settlement
Date | | | Unrealized
Appreciation | |
Barclays Bank plc | | | EUR | | | | Sell | | | | 403,000 | | | | 433,568 USD | | | | 07/16/24 | | | $ | 1,471 | |
~ | The face amount is denominated in U.S. dollars unless otherwise indicated. |
* | Non-income producing security. |
** | A copy of each underlying unaffiliated fund’s financial statements is available at the SEC’s website at www.sec.gov. |
† | Value determined based on Level 1 inputs, unless otherwise noted — See Note 4. |
†† | Value determined based on Level 2 inputs, unless otherwise noted — See Note 4. |
††† | Value determined based on Level 3 inputs — See Note 4. |
◊ | Variable rate security. Rate indicated is the rate effective at June 30, 2024. In some instances, the effective rate is limited by a minimum rate floor or a maximum rate cap established by the issuer. The settlement status of a position may also impact the effective rate indicated. In some cases, a position may be unsettled at period end and may not have a stated effective rate. In instances where multiple underlying reference rates and spread amounts are shown, the effective rate is based on a weighted average. |
1 | Affiliated issuer. |
2 | Security is a 144A or Section 4(a)(2) security. These securities have been determined to be illiquid and restricted under guidelines established by the Board of Trustees. The total market value of 144A or Section 4(a)(2) illiquid and restricted securities is $552 (cost $255), or 0.0% of total net assets — See Note 9. |
3 | Rate indicated is the 7-day yield as of June 30, 2024. |
4 | Security is a 144A or Section 4(a)(2) security. These securities have been determined to be liquid under guidelines established by the Board of Trustees. The total market value of 144A or Section 4(a)(2) securities is $204,083 (cost $216,476), or 0.4% of total net assets. |
| | EUR — Euro |
| | EURIBOR — European Interbank Offered Rate |
| | plc — Public Limited Company |
| | SARL — Société à Responsabilité Limitée |
| | SOFR — Secured Overnight Financing Rate |
| | |
| | See Sector Classification in Other Information section. |
SEE NOTES TO FINANCIAL STATEMENTS. | THE GUGGENHEIM FUNDS SEMI-ANNUAL FINANCIAL REPORT | 47 |
SCHEDULE OF INVESTMENTS (Unaudited)(continued) | June 30, 2024 |
SERIES F (FLOATING RATE STRATEGIES SERIES) | |
The following table summarizes the inputs used to value the Fund’s investments at June 30, 2024 (See Note 4 in the Notes to Financial Statements):
Investments in Securities (Assets) | | Level 1
Quoted
Prices | | | Level 2
Significant
Observable
Inputs | | | Level 3
Significant
Unobservable
Inputs | | | Total | |
Common Stocks | | $ | 28,985 | | | $ | 552 | | | $ | 198,484 | | | $ | 228,021 | |
Exchange-Traded Funds | | | 1,493,932 | | | | — | | | | — | | | | 1,493,932 | |
Mutual Fund | | | 1,503,689 | | | | — | | | | — | | | | 1,503,689 | |
Money Market Fund | | | 1,601,440 | | | | — | | | | — | | | | 1,601,440 | |
Senior Floating Rate Interests | | | — | | | | 51,929,541 | | | | 1,889,843 | | | | 53,819,384 | |
Corporate Bonds | | | — | | | | 204,083 | | | | — | | | | 204,083 | |
Forward Foreign Currency Exchange Contracts** | | | — | | | | 1,471 | | | | — | | | | 1,471 | |
Total Assets | | $ | 4,628,046 | | | $ | 52,135,647 | | | $ | 2,088,327 | | | $ | 58,852,020 | |
** | This derivative is reported as unrealized appreciation/depreciation at period end. |
The following is a summary of significant unobservable inputs used in the fair valuation of assets and liabilities categorized within Level 3 of the fair value hierarchy:
Category | | Ending Balance at
June 30, 2024 | | | Valuation Technique | | | Unobservable Inputs | | | Input Range | | | Weighted Average* | |
Assets: | | | | | | | | | | | | | | | | | | | | |
Common Stocks | | $ | 198,484 | | Enterprise Value | Valuation Multiple | 2.9x-9.3x | 4.9x |
Senior Floating Rate Interests | | | 1,042,390 | | Third Party Pricing | Vendor Price | — | — |
Senior Floating Rate Interests | | | 719,670 | | Third Party Pricing | Broker Quote | — | — |
Senior Floating Rate Interests | | | 127,783 | | Model Price | Purchase Price | — | — |
Total Assets | | $ | 2,088,327 | | | | | |
* | Inputs are weighted by the fair value of the instruments. |
Significant changes in a quote or valuation multiple would generally result in significant changes in the fair value of the security. Any remaining Level 3 securities held by the Fund and excluded from the table above, were not considered material to the Fund.
The Fund’s fair valuation leveling guidelines classify a single daily broker quote, or a vendor price based on a single daily or monthly broker quote, as Level 3, if such a quote or price cannot be supported with other available market information.
Transfers between Level 2 and Level 3 may occur as markets fluctuate and/or the availability of data used in an investment’s valuation changes. For the period ended June 30, 2024, the Fund had securities with a total value of $1,042,390 transfer into Level 3 from Level 2 due to a lack of observable inputs and had securities with a total value of $1,150,617 transfer out of Level 3 into Level 2 due to the availability of current and reliable market-based data provided by a third-party pricing service which utilizes significant observable inputs.
48 | THE GUGGENHEIM FUNDS SEMI-ANNUAL FINANCIAL REPORT | SEE NOTES TO FINANCIAL STATEMENTS. |
SCHEDULE OF INVESTMENTS (Unaudited)(concluded) | June 30, 2024 |
SERIES F (FLOATING RATE STRATEGIES SERIES) | |
Summary of Fair Value Level 3 Activity
Following is a reconciliation of Level 3 assets for which significant unobservable inputs were used to determine fair value for the period ended June 30, 2024:
| | | Assets | | | | | | | Liabilities | |
| | Senior Floating
Rate Interests | | | Common Stocks | | | Total Assets | | | Unfunded Loan
Commitments | |
Beginning Balance | | $ | 2,007,344 | | | $ | 186,293 | | | $ | 2,193,637 | | | $ | — | |
Purchases/(Receipts) | | | 124,540 | | | | — | | | | 124,540 | | | | — | |
(Sales, maturities and paydowns)/Fundings | | | (88,277 | ) | | | — | | | | (88,277 | ) | | | — | |
Amortization of premiums/discounts | | | 1,893 | | | | — | | | | 1,893 | | | | — | |
Total realized gains (losses) included in earnings | | | (14 | ) | | | — | | | | (14 | ) | | | — | |
Total change in unrealized appreciation (depreciation) included in earnings | | | (47,416 | ) | | | 12,191 | | | | (35,225 | ) | | | — | |
Transfers into Level 3 | | | 1,042,390 | | | | — | | | | 1,042,390 | | | | — | |
Transfers out of Level 3 | | | (1,150,617 | ) | | | — | | | | (1,150,617 | ) | | | — | |
Ending Balance | | $ | 1,889,843 | | | $ | 198,484 | | | $ | 2,088,327 | | | $ | — | |
Net change in unrealized appreciation (depreciation) for investments in Level 3 securities still held at June 30, 2024 | | $ | (2,127 | ) | | $ | 12,191 | | | $ | 10,064 | | | $ | — | |
Affiliated Transactions
Investments representing 5% or more of the outstanding voting shares of a company, or control of or by, or common control under Guggenheim Investments, result in that company being considered an affiliated issuer, as defined in the 1940 Act. The Fund may invest in certain of the underlying series of Guggenheim Funds Trust, which are open-end management investment companies managed by GI, are available to the public and whose most recent annual report on Form N-CSR is available publicly or upon request.
Transactions during the period ended June 30, 2024, in which the company is an affiliated issuer, were as follows:
Security Name | | Value
12/31/23 | | | Additions | | | Reductions | | | Realized
Gain (Loss) | | | Change in
Unrealized
Appreciation
(Depreciation) | | | Value
06/30/24 | | | Shares
06/30/24 | | | Investment
Income | |
Common Stocks | | | | | | | | | | | | | | | | | | | | | | | | | | | | | | | | |
BP Holdco LLC * | | $ | 14,072 | | | $ | — | | | $ | — | | | $ | — | | | $ | — | | | $ | 14,072 | | | | 11,609 | | | $ | — | |
Mutual Funds | | | | | | | | | | | | | | | | | | | | | | | | | | | | | | | | |
Guggenheim Floating Rate Strategies Fund — Class R6 | | | — | | | | 1,516,579 | | | | — | | | | — | | | | (12,890 | ) | | | 1,503,689 | | | | 61,829 | | | | 16,579 | |
| | | $ | 14,072 | | | $ | 1,516,579 | | | $ | — | | | $ | — | | | $ | (12,890 | ) | | $ | 1,517,761 | | | | | | | $ | 16,579 | |
* | Non-income producing security. |
SEE NOTES TO FINANCIAL STATEMENTS. | THE GUGGENHEIM FUNDS SEMI-ANNUAL FINANCIAL REPORT | 49 |
SERIES F (FLOATING RATE STRATEGIES SERIES) | |
STATEMENT OF ASSETS AND LIABILITIES (Unaudited) |
June 30, 2024 |
Assets: |
Investments in unaffiliated issuers, at value (cost $58,435,883) | | $ | 57,332,788 | |
Investments in affiliated issuers, at value (cost $1,520,678) | | | 1,517,761 | |
Cash | | | 198,595 | |
Unrealized appreciation on forward foreign currency exchange contracts | | | 1,471 | |
Prepaid expenses | | | 1,110 | |
Receivables: |
Securities sold | | | 2,979,980 | |
Interest | | | 247,362 | |
Dividends | | | 9,585 | |
Total assets | | | 62,288,652 | |
| | | | | |
Liabilities: |
Payable for: |
Securities purchased | | | 4,121,419 | |
Fund shares redeemed | | | 1,210,934 | |
Management fees | | | 26,666 | |
Distribution and service fees | | | 11,266 | |
Transfer agent/maintenance fees | | | 1,909 | |
Trustees’ fees* | | | 1,508 | |
Fund accounting/administration fees | | | 1,063 | |
Miscellaneous | | | 37,768 | |
Total liabilities | | | 5,412,533 | |
Net assets | | $ | 56,876,119 | |
| | | | | |
Net assets consist of: |
Paid in capital | | $ | 55,947,045 | |
Total distributable earnings (loss) | | | 929,074 | |
Net assets | | $ | 56,876,119 | |
Capital shares outstanding | | | 2,176,972 | |
Net asset value per share | | $ | 26.13 | |
STATEMENT OF OPERATIONS (Unaudited) |
Six Months Ended June 30, 2024 |
Investment Income: |
Dividends from securities of unaffiliated issuers | | $ | 62,330 | |
Dividends from securities of affiliated issuers | | | 16,579 | |
Interest | | | 2,666,773 | |
Total investment income | | | 2,745,682 | |
| | | | | |
Expenses: |
Management fees | | | 190,446 | |
Distribution and service fees | | | 73,248 | |
Transfer agent/maintenance fees | | | 12,440 | |
Professional fees | | | 34,885 | |
Fund accounting/administration fees | | | 15,718 | |
Custodian fees | | | 11,536 | |
Trustees’ fees* | | | 7,072 | |
Line of credit fees | | | 5,310 | |
Miscellaneous | | | 8,019 | |
Total expenses | | | 358,674 | |
Less: |
Expenses waived by Adviser | | | (23,688 | ) |
Earnings credits applied | | | (1,415 | ) |
Total waived/reimbursed expenses | | | (25,103 | ) |
Net expenses | | | 333,571 | |
Net investment income | | | 2,412,111 | |
| | | | | |
Net Realized and Unrealized Gain (Loss): |
Net realized gain (loss) on: |
Investments in unaffiliated issuers | | | (315,058 | ) |
Forward foreign currency exchange contracts | | | 5,434 | |
Foreign currency transactions | | | (313 | ) |
Net realized loss | | | (309,937 | ) |
Net change in unrealized appreciation (depreciation) on: |
Investments in unaffiliated issuers | | | (292,544 | ) |
Investments in affiliated issuers | | | (12,890 | ) |
Forward foreign currency exchange contracts | | | 11,759 | |
Foreign currency translations | | | (477 | ) |
Net change in unrealized appreciation (depreciation) | | | (294,152 | ) |
Net realized and unrealized loss | | | (604,089 | ) |
Net increase in net assets resulting from operations | | $ | 1,808,022 | |
* | Relates to Trustees not deemed “interested persons” within the meaning of Section 2(a)(19) of the 1940 Act. |
50 | THE GUGGENHEIM FUNDS SEMI-ANNUAL FINANCIAL REPORT | SEE NOTES TO FINANCIAL STATEMENTS. |
SERIES F (FLOATING RATE STRATEGIES SERIES) | |
STATEMENTS OF CHANGES IN NET ASSETS |
| | Six Months Ended
June 30, 2024
(Unaudited) | | | Year Ended
December 31,
2023 | |
Increase (Decrease) in Net Assets from Operations: | | | | | | | | |
Net investment income | | $ | 2,412,111 | | | $ | 4,458,367 | |
Net realized loss on investments | | | (309,937 | ) | | | (323,367 | ) |
Net change in unrealized appreciation (depreciation) on investments | | | (294,152 | ) | | | 1,575,433 | |
Net increase in net assets resulting from operations | | | 1,808,022 | | | | 5,710,433 | |
| | | | | | | | | |
Distributions to shareholders | | | — | | | | (1,925,766 | ) |
| | | | | | | | | |
Capital share transactions: | | | | | | | | |
Proceeds from sale of shares | | | 9,439,458 | | | | 50,185,730 | |
Distributions reinvested | | | — | | | | 1,925,766 | |
Cost of shares redeemed | | | (13,541,174 | ) | | | (45,065,168 | ) |
Net increase (decrease) from capital share transactions | | | (4,101,716 | ) | | | 7,046,328 | |
Net increase (decrease) in net assets | | | (2,293,694 | ) | | | 10,830,995 | |
| | | | | | | | | |
Net assets: | | | | | | | | |
Beginning of period | | | 59,169,813 | | | | 48,338,818 | |
End of period | | $ | 56,876,119 | | | $ | 59,169,813 | |
| | | | | | | | | |
Capital share activity: | | | | | | | | |
Shares sold | | | 365,535 | | | | 2,041,325 | |
Shares issued from reinvestment of distributions | | | — | | | | 79,184 | |
Shares redeemed | | | (523,976 | ) | | | (1,832,480 | ) |
Net increase (decrease) in shares | | | (158,441 | ) | | | 288,029 | |
SEE NOTES TO FINANCIAL STATEMENTS. | THE GUGGENHEIM FUNDS SEMI-ANNUAL FINANCIAL REPORT | 51 |
SERIES F (FLOATING RATE STRATEGIES SERIES) | |
This table is presented to show selected data for a share outstanding throughout each period and to assist shareholders in evaluating a Fund’s performance for the periods presented.
| | Six Months Ended
June 30, 2024a | | | Year Ended
December 31,
2023 | | | Year Ended
December 31,
2022 | | | Year Ended
December 31,
2021 | | | Year Ended
December 31,
2020 | | | Year Ended
December 31,
2019 | |
Per Share Data |
Net asset value, beginning of period | | $ | 25.34 | | | $ | 23.61 | | | $ | 24.40 | | | $ | 24.41 | | | $ | 25.96 | | | $ | 25.30 | |
Income (loss) from investment operations: |
Net investment income (loss)b | | | 1.06 | | | | 1.99 | | | | .95 | | | | .58 | | | | .68 | | | | 1.06 | |
Net gain (loss) on investments (realized and unrealized) | | | (.27 | ) | | | .61 | | | | (1.18 | ) | | | .02 | | | | (.74 | ) | | | .85 | |
Total from investment operations | | | .79 | | | | 2.60 | | | | (.23 | ) | | | .60 | | | | (.06 | ) | | | 1.91 | |
Less distributions from: |
Net investment income | | | — | | | | (.87 | ) | | | (.56 | ) | | | (.61 | ) | | | (1.49 | ) | | | (1.25 | ) |
Total distributions | | | — | | | | (.87 | ) | | | (.56 | ) | | | (.61 | ) | | | (1.49 | ) | | | (1.25 | ) |
Net asset value, end of period | | $ | 26.13 | | | $ | 25.34 | | | $ | 23.61 | | | $ | 24.40 | | | $ | 24.41 | | | $ | 25.96 | |
|
Total Returnc | | | 3.12 | % | | | 11.12 | % | | | (0.85 | %) | | | 2.50 | % | | | 0.01 | % | | | 7.60 | % |
Ratios/Supplemental Data |
Net assets, end of period (in thousands) | | $ | 56,876 | | | $ | 59,170 | | | $ | 48,339 | | | $ | 50,768 | | | $ | 41,004 | | | $ | 46,047 | |
Ratios to average net assets: |
Net investment income (loss) | | | 8.23 | % | | | 8.10 | % | | | 4.01 | % | | | 2.36 | % | | | 2.81 | % | | | 4.10 | % |
Total expenses | | | 1.22 | % | | | 1.25 | % | | | 1.27 | % | | | 1.34 | % | | | 1.47 | % | | | 1.38 | % |
Net expensesd,e | | | 1.14 | % | | | 1.16 | % | | | 1.16 | % | | | 1.17 | % | | | 1.23 | % | | | 1.21 | % |
Portfolio turnover rate | | | 31 | % | | | 66 | % | | | 68 | % | | | 56 | % | | | 60 | % | | | 28 | % |
a | Unaudited figures for the period ended June 30, 2024. Percentage amounts for the period, except total return and portfolio turnover rate, have been annualized. |
b | Net investment income (loss) per share was computed using average shares outstanding throughout the period. |
c | Total return does not take into account any of the expenses associated with an investment in variable insurance products. If total return had taken into account these expenses, performance would have been lower. Shares of a series of Guggenheim Variable Funds Trust are available only through the purchase of such products. |
d | Net expense information reflects the expense ratios after expense waivers and reimbursements, as applicable. |
e | Net expenses may include expenses that are excluded from the expense limitation agreement. Excluding these expenses, the net expense ratios for the years presented would be: |
| | 06/30/24a | 12/31/23 | 12/31/22 | 12/31/21 | 12/31/20 | 12/31/19 |
| | 1.13% | 1.13% | 1.14% | 1.14% | 1.15% | 1.15% |
52 | THE GUGGENHEIM FUNDS SEMI-ANNUAL FINANCIAL REPORT | SEE NOTES TO FINANCIAL STATEMENTS. |
SCHEDULE OF INVESTMENTS (Unaudited) | June 30, 2024 |
SERIES J (STYLEPLUS—MID GROWTH SERIES) | |
| | Shares | | | Value | |
COMMON STOCKS† - 23.2% |
| | | | | | | | | |
Industrial - 6.9% |
Owens Corning | | | 4,884 | | | $ | 848,448 | |
Lennox International, Inc. | | | 1,401 | | | | 749,507 | |
Applied Industrial Technologies, Inc. | | | 3,255 | | | | 631,470 | |
UFP Industries, Inc. | | | 5,336 | | | | 597,632 | |
Lincoln Electric Holdings, Inc. | | | 3,125 | | | | 589,500 | |
Carlisle Companies, Inc. | | | 1,445 | | | | 585,529 | |
Advanced Drainage Systems, Inc. | | | 3,633 | | | | 582,697 | |
Vontier Corp. | | | 14,729 | | | | 562,648 | |
Acuity Brands, Inc. | | | 2,060 | | | | 497,367 | |
Terex Corp. | | | 8,261 | | | | 453,033 | |
Timken Co. | | | 5,516 | | | | 441,997 | |
Mueller Industries, Inc. | | | 7,105 | | | | 404,559 | |
Allegion plc | | | 3,407 | | | | 402,537 | |
Masco Corp. | | | 5,973 | | | | 398,220 | |
Snap-on, Inc. | | | 1,405 | | | | 367,253 | |
Boise Cascade Co. | | | 3,049 | | | | 363,502 | |
Simpson Manufacturing Company, Inc. | | | 2,028 | | | | 341,779 | |
Builders FirstSource, Inc.* | | | 2,449 | | | | 338,966 | |
Donaldson Company, Inc. | | | 4,672 | | | | 334,328 | |
Fortune Brands Innovations, Inc. | | | 3,709 | | | | 240,862 | |
Mettler-Toledo International, Inc.* | | | 172 | | | | 240,386 | |
Watts Water Technologies, Inc. — Class A | | | 1,123 | | | | 205,924 | |
Illinois Tool Works, Inc. | | | 728 | | | | 172,507 | |
Armstrong World Industries, Inc. | | | 1,420 | | | | 160,801 | |
AAON, Inc. | | | 1,638 | | | | 142,899 | |
Universal Display Corp. | | | 669 | | | | 140,657 | |
EMCOR Group, Inc. | | | 339 | | | | 123,762 | |
A O Smith Corp. | | | 1,472 | | | | 120,380 | |
Garmin Ltd. | | | 733 | | | | 119,420 | |
Esab Corp. | | | 1,255 | | | | 118,510 | |
Chart Industries, Inc.* | | | 819 | | | | 118,214 | |
Comfort Systems USA, Inc. | | | 387 | | | | 117,694 | |
Jabil, Inc. | | | 1,053 | | | | 114,556 | |
TopBuild Corp.* | | | 295 | | | | 113,655 | |
Crown Holdings, Inc. | | | 1,466 | | | | 109,056 | |
Trex Company, Inc.* | | | 1,448 | | | | 107,326 | |
NEXTracker, Inc. — Class A* | | | 1,497 | | | | 70,179 | |
Total Industrial | | | | | | | 12,027,760 | |
| | | | | | | | | |
Consumer, Cyclical - 5.5% |
Toll Brothers, Inc. | | | 6,008 | | | | 692,001 | |
Wingstop, Inc. | | | 1,354 | | | | 572,282 | |
Core & Main, Inc. — Class A* | | | 11,460 | | | | 560,853 | |
KB Home | | | 6,877 | | | | 482,628 | |
Travel + Leisure Co. | | | 9,782 | | | | 439,995 | |
MSC Industrial Direct Company, Inc. — Class A | | | 5,419 | | | | 429,781 | |
Murphy USA, Inc. | | | 873 | | | | 409,839 | |
Williams-Sonoma, Inc. | | | 1,451 | | | | 409,719 | |
Domino’s Pizza, Inc. | | | 774 | | | | 399,639 | |
Light & Wonder, Inc. — Class A* | | | 3,808 | | | | 399,383 | |
PulteGroup, Inc. | | | 3,538 | | | | 389,534 | |
Lennar Corp. — Class A | | | 2,546 | | | | 381,569 | |
PACCAR, Inc. | | | 3,678 | | | | 378,613 | |
Meritage Homes Corp. | | | 2,304 | | | | 372,902 | |
Yum! Brands, Inc. | | | 2,183 | | | | 289,160 | |
Skechers USA, Inc. — Class A* | | | 3,863 | | | | 267,011 | |
Tempur Sealy International, Inc. | | | 5,098 | | | | 241,339 | |
Crocs, Inc.* | | | 1,648 | | | | 240,509 | |
Watsco, Inc. | | | 436 | | | | 201,973 | |
Visteon Corp.* | | | 1,878 | | | | 200,383 | |
Autoliv, Inc. | | | 1,836 | | | | 196,434 | |
Mattel, Inc.* | | | 9,778 | | | | 158,990 | |
Dick’s Sporting Goods, Inc. | | | 621 | | | | 133,422 | |
AutoZone, Inc.* | | | 43 | | | | 127,456 | |
Boyd Gaming Corp. | | | 2,253 | | | | 124,140 | |
Royal Caribbean Cruises Ltd.* | | | 772 | | | | 123,080 | |
Las Vegas Sands Corp. | | | 2,771 | | | | 122,617 | |
WW Grainger, Inc. | | | 135 | | | | 121,802 | |
Gentex Corp. | | | 3,492 | | | | 117,715 | |
DR Horton, Inc. | | | 833 | | | | 117,395 | |
Wynn Resorts Ltd. | | | 1,296 | | | | 115,992 | |
Brunswick Corp. | | | 1,551 | | | | 112,866 | |
YETI Holdings, Inc.* | | | 2,806 | | | | 107,049 | |
Casey’s General Stores, Inc. | | | 274 | | | | 104,547 | |
Total Consumer, Cyclical | | | | | | | 9,542,618 | |
| | | | | | | | | |
Technology - 3.5% |
Pure Storage, Inc. — Class A* | | | 11,823 | | | | 759,155 | |
Dropbox, Inc. — Class A* | | | 26,265 | | | | 590,180 | |
Qualys, Inc.* | | | 4,076 | | | | 581,237 | |
Cirrus Logic, Inc.* | | | 4,343 | | | | 554,427 | |
NetApp, Inc. | | | 3,296 | | | | 424,525 | |
KLA Corp. | | | 497 | | | | 409,781 | |
NXP Semiconductor N.V. | | | 1,473 | | | | 396,370 | |
Teradata Corp.* | | | 9,531 | | | | 329,391 | |
CommVault Systems, Inc.* | | | 1,658 | | | | 201,563 | |
Appfolio, Inc. — Class A* | | | 758 | | | | 185,384 | |
Fair Isaac Corp.* | | | 123 | | | | 183,105 | |
Duolingo, Inc.* | | | 692 | | | | 144,400 | |
Autodesk, Inc.* | | | 557 | | | | 137,830 | |
Monolithic Power Systems, Inc. | | | 164 | | | | 134,756 | |
Manhattan Associates, Inc.* | | | 545 | | | | 134,441 | |
MACOM Technology Solutions Holdings, Inc.* | | | 1,199 | | | | 133,653 | |
Rambus, Inc.* | | | 2,157 | | | | 126,745 | |
Onto Innovation, Inc.* | | | 554 | | | | 121,636 | |
IPG Photonics Corp.* | | | 1,408 | | | | 118,821 | |
Microchip Technology, Inc. | | | 1,276 | | | | 116,754 | |
ON Semiconductor Corp.* | | | 1,658 | | | | 113,656 | |
Lattice Semiconductor Corp.* | | | 1,909 | | | | 110,703 | |
Total Technology | | | | | | | 6,008,513 | |
| | | | | | | | | |
Consumer, Non-cyclical - 2.8% |
Neurocrine Biosciences, Inc.* | | | 5,840 | | | | 803,993 | |
United Therapeutics Corp.* | | | 2,037 | | | | 648,886 | |
H&R Block, Inc. | | | 11,848 | | | | 642,517 | |
Halozyme Therapeutics, Inc.* | | | 9,580 | | | | 501,609 | |
Jazz Pharmaceuticals plc* | | | 4,484 | | | | 478,577 | |
United Rentals, Inc. | | | 629 | | | | 406,793 | |
Molina Healthcare, Inc.* | | | 792 | | | | 235,461 | |
SEE NOTES TO FINANCIAL STATEMENTS. | THE GUGGENHEIM FUNDS SEMI-ANNUAL FINANCIAL REPORT | 53 |
SCHEDULE OF INVESTMENTS (Unaudited)(continued) | June 30, 2024 |
SERIES J (STYLEPLUS—MID GROWTH SERIES) | |
| | Shares | | | Value | |
Exelixis, Inc.* | | | 7,831 | | | $ | 175,963 | |
Coca-Cola Consolidated, Inc. | | | 135 | | | | 146,475 | |
elf Beauty, Inc.* | | | 652 | | | | 137,389 | |
Lantheus Holdings, Inc.* | | | 1,665 | | | | 133,683 | |
Celsius Holdings, Inc.* | | | 2,083 | | | | 118,919 | |
WEX, Inc.* | | | 664 | | | | 117,621 | |
Sarepta Therapeutics, Inc.* | | | 739 | | | | 116,762 | |
DaVita, Inc.* | | | 838 | | | | 116,122 | |
BioMarin Pharmaceutical, Inc.* | | | 967 | | | | 79,613 | |
Total Consumer, Non-cyclical | | | | | | | 4,860,383 | |
| | | | | | | | | |
Energy - 1.6% |
Marathon Petroleum Corp. | | | 2,298 | | | | 398,657 | |
Chord Energy Corp. | | | 1,937 | | | | 324,796 | |
CNX Resources Corp.* | | | 10,969 | | | | 266,547 | |
Permian Resources Corp. | | | 15,907 | | | | 256,898 | |
Antero Midstream Corp. | | | 16,915 | | | | 249,327 | |
Targa Resources Corp. | | | 1,933 | | | | 248,932 | |
SM Energy Co. | | | 4,729 | | | | 204,434 | |
Civitas Resources, Inc. | | | 2,895 | | | | 199,755 | |
Ovintiv, Inc. | | | 3,987 | | | | 186,871 | |
Weatherford International plc* | | | 1,082 | | | | 132,491 | |
Matador Resources Co. | | | 2,073 | | | | 123,551 | |
Texas Pacific Land Corp. | | | 109 | | | | 80,035 | |
Total Energy | | | | | | | 2,672,294 | |
| | | | | | | | | |
Financial - 1.4% |
Interactive Brokers Group, Inc. — Class A | | | 4,297 | | | | 526,812 | |
MGIC Investment Corp. | | | 21,797 | | | | 469,746 | |
International Bancshares Corp. | | | 6,394 | | | | 365,801 | |
RenaissanceRe Holdings Ltd. | | | 1,419 | | | | 317,160 | |
East West Bancorp, Inc. | | | 2,281 | | | | 167,038 | |
Kinsale Capital Group, Inc. | | | 399 | | | | 153,727 | |
Evercore, Inc. — Class A | | | 609 | | | | 126,934 | |
Cullen/Frost Bankers, Inc. | | | 1,207 | | | | 122,667 | |
Carlyle Group, Inc. | | | 3,048 | | | | 122,377 | |
Erie Indemnity Co. — Class A | | | 335 | | | | 121,404 | |
Total Financial | | | | | | | 2,493,666 | |
| | | | | | | | | |
Communications - 0.8% |
Ciena Corp.* | | | 7,619 | | | | 367,083 | |
GoDaddy, Inc. — Class A* | | | 2,592 | | | | 362,128 | |
Motorola Solutions, Inc. | | | 927 | | | | 357,868 | |
Arista Networks, Inc.* | | | 403 | | | | 141,244 | |
VeriSign, Inc.* | | | 668 | | | | 118,771 | |
Etsy, Inc.* | | | 1,855 | | | | 109,408 | |
Total Communications | | | | | | | 1,456,502 | |
| | | | | | | | | |
Basic Materials - 0.7% |
NewMarket Corp. | | | 943 | | | | 486,183 | |
Cabot Corp. | | | 4,873 | | | | 447,780 | |
CF Industries Holdings, Inc. | | | 2,278 | | | | 168,845 | |
Reliance, Inc. | | | 414 | | | | 118,238 | |
Total Basic Materials | | | | | | | 1,221,046 | |
| | | | | | | | | |
Total Common Stocks | | | | |
(Cost $37,197,503) | | | | | | | 40,282,782 | |
| | | | | | | | | |
MUTUAL FUNDS† - 75.2% |
Guggenheim Variable Insurance Strategy Fund III1 | | | 1,883,504 | | | | 46,541,391 | |
Guggenheim Strategy Fund III1 | | | 1,856,609 | | | | 45,913,942 | |
Guggenheim Strategy Fund II1 | | | 1,419,479 | | | | 34,990,163 | |
Guggenheim Ultra Short Duration Fund — Institutional Class1 | | | 303,690 | | | | 3,018,677 | |
Total Mutual Funds | | | | |
(Cost $130,419,560) | | | | | | | 130,464,173 | |
| | | | | | | | | |
MONEY MARKET FUND***,† - 1.6% |
Dreyfus Treasury Securities Cash Management Fund — Institutional Shares, 5.18%2 | | | 2,810,097 | | | | 2,810,097 | |
Total Money Market Fund | | | | |
(Cost $2,810,097) | | | | | | | 2,810,097 | |
| | | | | | | | | |
Total Investments - 100.0% | | | | |
(Cost $170,427,160) | | $ | 173,557,052 | |
Other Assets & Liabilities, net - 0.0% | | | (69,656 | ) |
Total Net Assets - 100.0% | | $ | 173,487,396 | |
Futures Contracts |
Description | | Number of
Contracts | | | Expiration
Date | | | Notional
Amount | | | Value and
Unrealized
Appreciation
(Depreciation)** | |
Equity Futures Contracts Purchased† |
S&P MidCap 400 Index Mini Futures Contracts | | | 5 | | | | Sep 2024 | | | $ | 1,479,550 | | | $ | 434 | |
S&P 500 Index Mini Futures Contracts | | | 5 | | | | Sep 2024 | | | | 1,380,875 | | | | (5,963 | ) |
NASDAQ-100 Index Mini Futures Contracts | | | 5 | | | | Sep 2024 | | | | 1,993,250 | | | | (26,463 | ) |
| | | | | | | | | | | $ | 4,853,675 | | | $ | (31,992 | ) |
54 | THE GUGGENHEIM FUNDS SEMI-ANNUAL FINANCIAL REPORT | SEE NOTES TO FINANCIAL STATEMENTS. |
SCHEDULE OF INVESTMENTS (Unaudited)(continued) | June 30, 2024 |
SERIES J (STYLEPLUS—MID GROWTH SERIES) | |
Total Return Swap Agreements |
Counterparty | Index | Type | Financing
Rate | | Payment
Frequency | | | Maturity
Date | | | Units | | | Notional
Amount | | | Value and
Unrealized
Appreciation
(Depreciation) | |
OTC Equity Index Swap Agreements†† |
Wells Fargo Bank, N.A. | Russell MidCap Growth Index | Pay | 6.05% (Federal Funds Rate + 0.72%) | | | At Maturity | | | | 09/30/24 | | | | 24,467 | | | $ | 133,638,876 | | | $ | — | |
* | Non-income producing security. |
** | Includes cumulative appreciation (depreciation). Variation margin is reported within the Statement of Assets and Liabilities. |
*** | A copy of each underlying unaffiliated fund’s financial statements is available at the SEC’s website at www.sec.gov. |
† | Value determined based on Level 1 inputs — See Note 4. |
†† | Value determined based on Level 2 inputs — See Note 4. |
1 | Affiliated issuer. |
2 | Rate indicated is the 7-day yield as of June 30, 2024. |
| | plc — Public Limited Company |
| | |
| | See Sector Classification in Other Information section. |
The following table summarizes the inputs used to value the Fund’s investments at June 30, 2024 (See Note 4 in the Notes to Financial Statements):
Investments in Securities (Assets) | | Level 1
Quoted
Prices | | | Level 2
Significant
Observable
Inputs | | | Level 3
Significant
Unobservable
Inputs | | | Total | |
Common Stocks | | $ | 40,282,782 | | | $ | — | | | $ | — | | | $ | 40,282,782 | |
Mutual Funds | | | 130,464,173 | | | | — | | | | — | | | | 130,464,173 | |
Money Market Fund | | | 2,810,097 | | | | — | | | | — | | | | 2,810,097 | |
Equity Futures Contracts** | | | 434 | | | | — | | | | — | | | | 434 | |
Equity Index Swap Agreements** | | | — | | | | — | * | | | — | | | | — | |
Total Assets | | $ | 173,557,486 | | | $ | — | | | $ | — | | | $ | 173,557,486 | |
Investments in Securities (Liabilities) | | Level 1
Quoted
Prices | | | Level 2
Significant
Observable
Inputs | | | Level 3
Significant
Unobservable
Inputs | | | Total | |
Equity Futures Contracts** | | $ | 32,426 | | | $ | — | | | $ | — | | | $ | 32,426 | |
* | Security has a market value of $0. |
** | This derivative is reported as unrealized appreciation/depreciation at period end. |
SEE NOTES TO FINANCIAL STATEMENTS. | THE GUGGENHEIM FUNDS SEMI-ANNUAL FINANCIAL REPORT | 55 |
SCHEDULE OF INVESTMENTS (Unaudited)(concluded) | June 30, 2024 |
SERIES J (STYLEPLUS—MID GROWTH SERIES) | |
Affiliated Transactions
Investments representing 5% or more of the outstanding voting shares of a company, or control of or by, or common control under Guggenheim Investments (“GI”), result in that company being considered an affiliated issuer, as defined in the 1940 Act.
The Fund may invest in certain of the underlying series of Guggenheim Strategy Funds Trust, including Guggenheim Strategy Fund II, Guggenheim Strategy Fund III and Guggenheim Variable Insurance Strategy Fund III (collectively, the “Guggenheim Strategy Funds”), each of which are open-end management investment companies managed by GI. The Guggenheim Strategy Funds, which launched on March 11, 2014, are offered as short term investment options only to mutual funds, trusts, and other accounts managed by GI and/or its affiliates, and are not available to the public. The Guggenheim Strategy Funds pay no investment management fees. The Guggenheim Strategy Funds’ annual report on Form N-CSR dated September 30, 2023 is available publicly or upon request. This information is available from the EDGAR database on the SEC’s website at https://www.sec.gov/Archives/edgar/data/1601445/000182126823000217/gug86449-ncsr.htm. The Fund may invest in certain of the underlying series of Guggenheim Funds Trust, which are open-end management investment companies managed by GI, are available to the public and whose most recent annual report on Form N-CSR is available publicly or upon request.
Transactions during the period ended June 30, 2024, in which the company is an affiliated issuer, were as follows:
Security Name | | Value
12/31/23 | | | Additions | | | Reductions | | | Realized
Gain (Loss) | | | Change in
Unrealized
Appreciation
(Depreciation) | | | Value
06/30/24 | | | Shares
06/30/24 | | | Investment
Income | |
Mutual Funds | | | | | | | | | | | | | | | | | | | | | | | | | | | | | | | | |
Guggenheim Strategy Fund II | | $ | 40,526,245 | | | $ | 1,068,042 | | | $ | (6,821,240 | ) | | $ | 116,399 | | | $ | 100,717 | | | $ | 34,990,163 | | | | 1,419,479 | | | $ | 1,075,750 | |
Guggenheim Strategy Fund III | | | 46,148,406 | | | | 1,227,817 | | | | (1,795,800 | ) | | | (29,918 | ) | | | 363,437 | | | | 45,913,942 | | | | 1,856,609 | | | | 1,235,820 | |
Guggenheim Ultra Short Duration Fund — Institutional Class | | | 2,915,383 | | | | 76,398 | | | | — | | | | — | | | | 26,896 | | | | 3,018,677 | | | | 303,690 | | | | 76,920 | |
Guggenheim Variable Insurance Strategy Fund III | | | 40,139,678 | | | | 6,091,756 | | | | — | | | | — | | | | 309,957 | | | | 46,541,391 | | | | 1,883,504 | | | | 1,174,477 | |
| | | $ | 129,729,712 | | | $ | 8,464,013 | | | $ | (8,617,040 | ) | | $ | 86,481 | | | $ | 801,007 | | | $ | 130,464,173 | | | | | | | $ | 3,562,967 | |
56 | THE GUGGENHEIM FUNDS SEMI-ANNUAL FINANCIAL REPORT | SEE NOTES TO FINANCIAL STATEMENTS. |
SERIES J (STYLEPLUS—MID GROWTH SERIES) | |
STATEMENT OF ASSETS AND LIABILITIES (Unaudited) |
June 30, 2024 |
Assets: |
Investments in unaffiliated issuers, at value (cost $40,007,600) | | $ | 43,092,879 | |
Investments in affiliated issuers, at value (cost $130,419,560) | | | 130,464,173 | |
Segregated cash with broker | | | 5,690,000 | |
Prepaid expenses | | | 590 | |
Receivables: |
Dividends | | | 569,183 | |
Interest | | | 11,217 | |
Fund shares sold | | | 4,531 | |
Total assets | | | 179,832,573 | |
| | | | | |
Liabilities: |
Overdraft due to custodian bank | | | 6,198 | |
Payable for: |
Swap settlement | | | 5,566,194 | |
Securities purchased | | | 554,421 | |
Management fees | | | 71,880 | |
Fund shares redeemed | | | 60,903 | |
Distribution and service fees | | | 33,198 | |
Variation margin on futures contracts | | | 14,125 | |
Transfer agent/maintenance fees | | | 1,934 | |
Fund accounting/administration fees | | | 1,446 | |
Trustees’ fees* | | | 419 | |
Miscellaneous | | | 34,459 | |
Total liabilities | | | 6,345,177 | |
Net assets | | $ | 173,487,396 | |
| | | | | |
Net assets consist of: |
Paid in capital | | $ | 173,539,639 | |
Total distributable earnings (loss) | | | (52,243 | ) |
Net assets | | $ | 173,487,396 | |
Capital shares outstanding | | | 3,511,478 | |
Net asset value per share | | $ | 49.41 | |
STATEMENT OF OPERATIONS (Unaudited) |
Six Months Ended June 30, 2024 |
Investment Income: |
Dividends from securities of unaffiliated issuers (net of foreign withholding tax of $466) | | $ | 210,746 | |
Dividends from securities of affiliated issuers | | | 3,562,967 | |
Interest | | | 135,261 | |
Total investment income | | | 3,908,974 | |
| | | | | |
Expenses: |
Management fees | | | 654,547 | |
Distribution and service fees | | | 218,183 | |
Transfer agent/maintenance fees | | | 12,444 | |
Interest expense | | | 277,993 | |
Fund accounting/administration fees | | | 37,932 | |
Professional fees | | | 19,491 | |
Custodian fees | | | 9,787 | |
Trustees’ fees* | | | 7,826 | |
Line of credit fees | | | 1,963 | |
Miscellaneous | | | 8,625 | |
Total expenses | | | 1,248,791 | |
Less: |
Expenses reimbursed by Adviser | | | (1,703 | ) |
Expenses waived by Adviser | | | (174,609 | ) |
Earnings credits applied | | | (2,157 | ) |
Total waived/reimbursed expenses | | | (178,469 | ) |
Net expenses | | | 1,070,322 | |
Net investment income | | | 2,838,652 | |
| | | | | |
Net Realized and Unrealized Gain (Loss): |
Net realized gain (loss) on: |
Investments in unaffiliated issuers | | | 5,479,380 | |
Investments in affiliated issuers | | | 86,481 | |
Swap agreements | | | 21,717,640 | |
Futures contracts | | | 468,000 | |
Net realized gain | | | 27,751,501 | |
Net change in unrealized appreciation (depreciation) on: |
Investments in unaffiliated issuers | | | (955,352 | ) |
Investments in affiliated issuers | | | 801,007 | |
Swap agreements | | | (17,377,099 | ) |
Futures contracts | | | (252,771 | ) |
Net change in unrealized appreciation (depreciation) | | | (17,784,215 | ) |
Net realized and unrealized gain | | | 9,967,286 | |
Net increase in net assets resulting from operations | | $ | 12,805,938 | |
* | Relates to Trustees not deemed “interested persons” within the meaning of Section 2(a)(19) of the 1940 Act. |
SEE NOTES TO FINANCIAL STATEMENTS. | THE GUGGENHEIM FUNDS SEMI-ANNUAL FINANCIAL REPORT | 57 |
SERIES J (STYLEPLUS—MID GROWTH SERIES) | |
STATEMENTS OF CHANGES IN NET ASSETS |
| | Six Months Ended
June 30, 2024
(Unaudited) | | | Year Ended
December 31,
2023 | |
Increase (Decrease) in Net Assets from Operations: | | | | | | | | |
Net investment income | | $ | 2,838,652 | | | $ | 5,185,453 | |
Net realized gain on investments | | | 27,751,501 | | | | 10,598,484 | |
Net change in unrealized appreciation (depreciation) on investments | | | (17,784,215 | ) | | | 22,151,755 | |
Net increase in net assets resulting from operations | | | 12,805,938 | | | | 37,935,692 | |
| | | | | | | | | |
Distributions to shareholders | | | — | | | | (2,254,596 | ) |
| | | | | | | | | |
Capital share transactions: | | | | | | | | |
Proceeds from sale of shares | | | 1,645,015 | | | | 13,775,845 | |
Distributions reinvested | | | — | | | | 2,254,596 | |
Cost of shares redeemed | | | (14,293,069 | ) | | | (23,555,097 | ) |
Net decrease from capital share transactions | | | (12,648,054 | ) | | | (7,524,656 | ) |
Net increase in net assets | | | 157,884 | | | | 28,156,440 | |
| | | | | | | | | |
Net assets: | | | | | | | | |
Beginning of period | | | 173,329,512 | | | | 145,173,072 | |
End of period | | $ | 173,487,396 | | | $ | 173,329,512 | |
| | | | | | | | | |
Capital share activity: | | | | | | | | |
Shares sold | | | 33,576 | | | | 351,330 | |
Shares issued from reinvestment of distributions | | | — | | | | 51,806 | |
Shares redeemed | | | (296,667 | ) | | | (571,160 | ) |
Net decrease in shares | | | (263,091 | ) | | | (168,024 | ) |
58 | THE GUGGENHEIM FUNDS SEMI-ANNUAL FINANCIAL REPORT | SEE NOTES TO FINANCIAL STATEMENTS. |
SERIES J (STYLEPLUS—MID GROWTH SERIES) | |
This table is presented to show selected data for a share outstanding throughout each period and to assist shareholders in evaluating a Fund’s performance for the periods presented.
| | Six Months Ended
June 30, 2024a | | | Year Ended
December 31,
2023 | | | Year Ended
December 31,
2022 | | | Year Ended
December 31,
2021 | | | Year Ended
December 31,
2020 | | | Year Ended
December 31,
2019 | |
Per Share Data |
Net asset value, beginning of period | | $ | 45.92 | | | $ | 36.82 | | | $ | 71.17 | | | $ | 72.46 | | | $ | 58.49 | | | $ | 48.75 | |
Income (loss) from investment operations: |
Net investment income (loss)b | | | .78 | | | | 1.37 | | | | .66 | | | | .22 | | | | .39 | | | | .79 | |
Net gain (loss) on investments (realized and unrealized) | | | 2.71 | | | | 8.32 | | | | (20.02 | ) | | | 9.44 | | | | 17.43 | | | | 14.90 | |
Total from investment operations | | | 3.49 | | | | 9.69 | | | | (19.36 | ) | | | 9.66 | | | | 17.82 | | | | 15.69 | |
Less distributions from: |
Net investment income | | | — | | | | (.59 | ) | | | (.20 | ) | | | (.40 | ) | | | (.84 | ) | | | (.49 | ) |
Net realized gains | | | — | | | | — | | | | (14.79 | ) | | | (10.55 | ) | | | (3.01 | ) | | | (5.46 | ) |
Total distributions | | | — | | | | (.59 | ) | | | (14.99 | ) | | | (10.95 | ) | | | (3.85 | ) | | | (5.95 | ) |
Net asset value, end of period | | $ | 49.41 | | | $ | 45.92 | | | $ | 36.82 | | | $ | 71.17 | | | $ | 72.46 | | | $ | 58.49 | |
|
Total Returnc | | | 7.60 | % | | | 26.41 | % | | | (27.78 | %) | | | 13.69 | % | | | 32.10 | % | | | 32.70 | % |
Ratios/Supplemental Data |
Net assets, end of period (in thousands) | | $ | 173,487 | | | $ | 173,330 | | | $ | 145,173 | | | $ | 198,627 | | | $ | 190,920 | | | $ | 157,675 | |
Ratios to average net assets: |
Net investment income (loss) | | | 3.25 | % | | | 3.35 | % | | | 1.42 | % | | | 0.30 | % | | | 0.66 | % | | | 1.39 | % |
Total expensesd | | | 1.43 | % | | | 1.35 | % | | | 1.18 | % | | | 1.16 | % | | | 1.22 | % | | | 1.30 | % |
Net expensese,f | | | 1.23 | % | | | 1.11 | % | | | 0.96 | % | | | 0.89 | % | | | 0.89 | % | | | 1.00 | % |
Portfolio turnover rate | | | 34 | % | | | 67 | % | | | 87 | % | | | 60 | % | | | 71 | % | | | 57 | % |
a | Unaudited figures for the period ended June 30, 2024. Percentage amounts for the period, except total return and portfolio turnover rate, have been annualized. |
b | Net investment income (loss) per share was computed using average shares outstanding throughout the period. |
c | Total return does not take into account any of the expenses associated with an investment in variable insurance products. If total return had taken into account these expenses, performance would have been lower. Shares of a series of Guggenheim Variable Funds Trust are available only through the purchase of such products. |
d | Does not include expenses of the underlying funds in which the Fund invests. |
e | Net expense information reflects the expense ratios after expense waivers and reimbursements, as applicable. |
f | Net expenses may include expenses that are excluded from the expense limitation agreement. Excluding these expenses, the net expense ratios for the years presented would be: |
| | 6/30/24a | 12/31/23 | 12/31/22 | 12/31/21 | 12/31/20 | 12/31/19 |
| | 0.91% | 0.91% | 0.91% | 0.87% | 0.88% | 0.92% |
SEE NOTES TO FINANCIAL STATEMENTS. | THE GUGGENHEIM FUNDS SEMI-ANNUAL FINANCIAL REPORT | 59 |
SCHEDULE OF INVESTMENTS (Unaudited) | June 30, 2024 |
SERIES N (MANAGED ASSET ALLOCATION SERIES) | |
| | Shares | | | Value | |
EXCHANGE-TRADED FUNDS†,*** - 86.6% |
Vanguard S&P 500 ETF | | | 16,598 | | | $ | 8,301,158 | |
Schwab U.S. Aggregate Bond ETF | | | 113,005 | | | | 5,150,768 | |
SPDR S&P 500 ETF Trust | | | 8,172 | | | | 4,447,366 | |
iShares MSCI EAFE ETF | | | 39,233 | | | | 3,073,121 | |
iShares 7-10 Year Treasury Bond ETF | | | 29,604 | | | | 2,772,415 | |
iShares iBoxx $ Investment Grade Corporate Bond ETF | | | 23,455 | | | | 2,512,500 | |
iShares 1-3 Year Treasury Bond ETF | | | 28,819 | | | | 2,353,071 | |
iShares Core S&P Mid-Cap ETF | | | 37,326 | | | | 2,184,317 | |
iShares iBoxx High Yield Corporate Bond ETF | | | 79 | | | | 6,094 | |
iShares Russell 1000 Value ETF | | | 20 | | | | 3,489 | |
iShares TIPS Bond ETF | | | 29 | | | | 3,097 | |
iShares Core S&P 500 ETF | | | 2 | | | | 1,094 | |
Total Exchange-Traded Funds | | | | |
(Cost $23,296,039) | | | | | | | 30,808,490 | |
| | | | | | | | | |
MUTUAL FUNDS† - 11.2% |
Guggenheim Variable Insurance Strategy Fund III1 | | | 45,729 | | | | 1,129,953 | |
Guggenheim Strategy Fund II1 | | | 43,300 | | | | 1,067,336 | |
Guggenheim Strategy Fund III1 | | | 42,900 | | | | 1,060,905 | |
Guggenheim Ultra Short Duration Fund — Institutional Class1 | | | 74,390 | | | | 739,442 | |
Total Mutual Funds | | | | |
(Cost $4,035,721) | | | | | | | 3,997,636 | |
| | | | | | | | | |
MONEY MARKET FUND†,*** - 1.6% |
Dreyfus Treasury Securities Cash Management Fund — Institutional Shares, 5.18%2 | | | 580,235 | | | | 580,235 | |
Total Money Market Fund | | | | |
(Cost $580,235) | | | | | | | 580,235 | |
| | | | | | | | | |
| | | Face
Amount | | | | | |
U.S. TREASURY BILLS†† - 0.7% |
U.S. Treasury Bills |
5.18% due 07/09/243,4 | | $ | 241,000 | | | | 240,720 | |
Total U.S. Treasury Bills | | | | |
(Cost $240,718) | | | | | | | 240,720 | |
| | | | | | | | | |
Total Investments - 100.1% | | | | |
(Cost $28,152,713) | | $ | 35,627,081 | |
Other Assets & Liabilities, net - (0.1)% | | | (53,130 | ) |
Total Net Assets - 100.0% | | $ | 35,573,951 | |
Futures Contracts |
Description | | Number of
Contracts | | | Expiration
Date | | | Notional
Amount | | | Value and
Unrealized
Appreciation
(Depreciation)** | |
Interest Rate Futures Contracts Purchased† |
U.S. Treasury 10 Year Note Futures Contracts | | | 6 | | | | Sep 2024 | | | $ | 659,156 | | | $ | 3,607 | |
U.S. Treasury 2 Year Note Futures Contracts | | | 2 | | | | Sep 2024 | | | | 408,438 | | | | 591 | |
| | | | | | | | | | | $ | 1,067,594 | | | $ | 4,198 | |
Equity Futures Contracts Purchased† |
MSCI EAFE Index Futures Contracts | | | 18 | | | | Sep 2024 | | | $ | 2,109,960 | | | $ | 11,940 | |
Russell 2000 Index Mini Futures Contracts | | | 12 | | | | Sep 2024 | | | | 1,239,840 | | | | (10,100 | ) |
| | | | | | | | | | | $ | 3,349,800 | | | $ | 1,840 | |
Interest Rate Futures Contracts Sold Short† |
U.S. Treasury 5 Year Note Futures Contracts | | | 2 | | | | Sep 2024 | | | $ | 213,047 | | | $ | (816 | ) |
60 | THE GUGGENHEIM FUNDS SEMI-ANNUAL FINANCIAL REPORT | SEE NOTES TO FINANCIAL STATEMENTS. |
SCHEDULE OF INVESTMENTS (Unaudited)(continued) | June 30, 2024 |
SERIES N (MANAGED ASSET ALLOCATION SERIES) | |
** | Includes cumulative appreciation (depreciation). Variation margin is reported within the Statement of Assets and Liabilities. |
*** | A copy of each underlying unaffiliated fund’s financial statements is available at the SEC’s website at www.sec.gov. |
† | Value determined based on Level 1 inputs — See Note 4. |
†† | Value determined based on Level 2 inputs — See Note 4. |
1 | Affiliated issuer. |
2 | Rate indicated is the 7-day yield as of June 30, 2024. |
3 | All or a portion of this security is pledged as futures collateral at June 30, 2024. |
4 | Rate indicated is the effective yield at the time of purchase. |
| | |
| | See Sector Classification in Other Information section. |
The following table summarizes the inputs used to value the Fund’s investments at June 30, 2024 (See Note 4 in the Notes to Financial Statements):
Investments in Securities (Assets) | | Level 1
Quoted
Prices | | | Level 2
Significant
Observable
Inputs | | | Level 3
Significant
Unobservable
Inputs | | | Total | |
Exchange-Traded Funds | | $ | 30,808,490 | | | $ | — | | | $ | — | | | $ | 30,808,490 | |
Mutual Funds | | | 3,997,636 | | | | — | | | | — | | | | 3,997,636 | |
Money Market Fund | | | 580,235 | | | | — | | | | — | | | | 580,235 | |
U.S. Treasury Bills | | | — | | | | 240,720 | | | | — | | | | 240,720 | |
Equity Futures Contracts** | | | 11,940 | | | | — | | | | — | | | | 11,940 | |
Interest Rate Futures Contracts** | | | 4,198 | | | | — | | | | — | | | | 4,198 | |
Total Assets | | $ | 35,402,499 | | | $ | 240,720 | | | $ | — | | | $ | 35,643,219 | |
Investments in Securities (Liabilities) | | Level 1
Quoted
Prices | | | Level 2
Significant
Observable
Inputs | | | Level 3
Significant
Unobservable
Inputs | | | Total | |
Equity Futures Contracts** | | $ | 10,100 | | | $ | — | | | $ | — | | | $ | 10,100 | |
Interest Rate Futures Contracts** | | | 816 | | | | — | | | | — | | | | 816 | |
Total Liabilities | | $ | 10,916 | | | $ | — | | | $ | — | | | $ | 10,916 | |
** | This derivative is reported as unrealized appreciation/depreciation at period end. |
SEE NOTES TO FINANCIAL STATEMENTS. | THE GUGGENHEIM FUNDS SEMI-ANNUAL FINANCIAL REPORT | 61 |
SCHEDULE OF INVESTMENTS (Unaudited)(concluded) | June 30, 2024 |
SERIES N (MANAGED ASSET ALLOCATION SERIES) | |
Affiliated Transactions
Investments representing 5% or more of the outstanding voting shares of a company, or control of or by, or common control under Guggenheim Investments (“GI”), result in that company being considered an affiliated issuer, as defined in the 1940 Act.
The Fund may invest in certain of the underlying series of Guggenheim Strategy Funds Trust, including Guggenheim Strategy Fund II, Guggenheim Strategy Fund III and Guggenheim Variable Insurance Strategy Fund III (collectively, the “Guggenheim Strategy Funds”), each of which are open-end management investment companies managed by GI. The Guggenheim Strategy Funds, which launched on March 11, 2014, are offered as short term investment options only to mutual funds, trusts, and other accounts managed by GI and/or its affiliates, and are not available to the public. The Guggenheim Strategy Funds pay no investment management fees. The Guggenheim Strategy Funds’ annual report on Form N-CSR dated September 30, 2023 is available publicly or upon request. This information is available from the EDGAR database on the SEC’s website at https://www.sec.gov/Archives/edgar/data/1601445/000182126823000217/gug86449-ncsr.htm. The Fund may invest in certain of the underlying series of Guggenheim Funds Trust, which are open-end management investment companies managed by GI, are available to the public and whose most recent annual report on Form N-CSR is available publicly or upon request.
Transactions during the period ended June 30, 2024, in which the company is an affiliated issuer, were as follows:
Security Name | | Value
12/31/23 | | | Additions | | | Reductions | | | Realized
Gain (Loss) | | | Change in
Unrealized
Appreciation
(Depreciation) | | | Value
06/30/24 | | | Shares
06/30/24 | | | Investment
Income | |
Mutual Funds | | | | | | | | | | | | | | | | | | | | | | | | | | | | | | | | |
Guggenheim Strategy Fund II | | $ | 1,060,841 | | | $ | — | | | $ | — | | | $ | — | | | $ | 6,495 | | | $ | 1,067,336 | | | | 43,300 | | | $ | 29,900 | |
Guggenheim Strategy Fund III | | | 1,053,183 | | | | — | | | | — | | | | — | | | | 7,722 | | | | 1,060,905 | | | | 42,900 | | | | 28,309 | |
Guggenheim Ultra Short Duration Fund — Institutional Class | | | 732,746 | | | | — | | | | — | | | | — | | | | 6,696 | | | | 739,442 | | | | 74,390 | | | | 19,128 | |
Guggenheim Variable Insurance Strategy Fund III | | | 1,121,722 | | | | — | | | | — | | | | — | | | | 8,231 | | | | 1,129,953 | | | | 45,729 | | | | 30,427 | |
| | | $ | 3,968,492 | | | $ | — | | | $ | — | | | $ | — | | | $ | 29,144 | | | $ | 3,997,636 | | | | | | | $ | 107,764 | |
62 | THE GUGGENHEIM FUNDS SEMI-ANNUAL FINANCIAL REPORT | SEE NOTES TO FINANCIAL STATEMENTS. |
SERIES N (MANAGED ASSET ALLOCATION SERIES) | |
STATEMENT OF ASSETS AND LIABILITIES (Unaudited) |
June 30, 2024 |
Assets: |
Investments in unaffiliated issuers, at value (cost $24,116,992) | | $ | 31,629,445 | |
Investments in affiliated issuers, at value (cost $4,035,721) | | | 3,997,636 | |
Cash | | | 1,912 | |
Prepaid expenses | | | 114 | |
Receivables: |
Dividends | | | 60,955 | |
Interest | | | 2,395 | |
Variation margin on futures contracts | | | 1,442 | |
Fund shares sold | | | 198 | |
Total assets | | | 35,694,097 | |
| | | | | |
Liabilities: |
Payable for: |
Fund shares redeemed | | | 78,454 | |
Professional fees | | | 14,619 | |
Management fees | | | 10,810 | |
Distribution and service fees | | | 6,844 | |
Transfer agent/maintenance fees | | | 1,926 | |
Fund accounting /administration fees | | | 1,795 | |
Trustees’ fees* | | | 1,187 | |
Miscellaneous | | | 4,511 | |
Total liabilities | | | 120,146 | |
Net assets | | $ | 35,573,951 | |
| | | | | |
Net assets consist of: |
Paid in capital | | $ | 24,360,690 | |
Total distributable earnings (loss) | | | 11,213,261 | |
Net assets | | $ | 35,573,951 | |
Capital shares outstanding | | | 1,155,874 | |
Net asset value per share | | $ | 30.78 | |
STATEMENT OF OPERATIONS (Unaudited) |
Six Months Ended June 30, 2024 |
Investment Income: |
Dividends from securities of unaffiliated issuers | | $ | 360,779 | |
Dividends from securities of affiliated issuers | | | 107,764 | |
Interest | | | 20,484 | |
Total investment income | | | 489,027 | |
| | | | | |
Expenses: |
Management fees | | | 70,795 | |
Distribution and service fees | | | 44,247 | |
Transfer agent fees | | | 12,413 | |
Professional fees | | | 19,894 | |
Fund accounting /administration fees | | | 11,271 | |
Trustees’ fees* | | | 7,031 | |
Custodian fees | | | 1,746 | |
Line of credit fees | | | 519 | |
Miscellaneous | | | 6,075 | |
Total expenses | | | 173,991 | |
Less: |
Expenses waived by Adviser | | | (915 | ) |
Earnings credits applied | | | (54 | ) |
Total waived expenses | | | (969 | ) |
Net expenses | | | 173,022 | |
Net investment income | | | 316,005 | |
| | | | | |
Net Realized and Unrealized Gain (Loss): |
Net realized gain (loss) on: |
Investments | | | 1,126,043 | |
Futures contracts | | | 241,988 | |
Foreign currency transactions | | | (86 | ) |
Net realized gain | | | 1,367,945 | |
Net change in unrealized appreciation (depreciation) on: |
Investments in unaffiliated issuers | | | 544,230 | |
Investments in affiliated issuers | | | 29,144 | |
Futures contracts | | | (225,949 | ) |
Foreign currency translations | | | 14 | |
Net change in unrealized appreciation (depreciation) | | | 347,439 | |
Net realized and unrealized gain | | | 1,715,384 | |
Net increase in net assets resulting from operations | | $ | 2,031,389 | |
* | Relates to Trustees not deemed “interested persons” within the meaning of Section 2(a)(19) of the 1940 Act. |
SEE NOTES TO FINANCIAL STATEMENTS. | THE GUGGENHEIM FUNDS SEMI-ANNUAL FINANCIAL REPORT | 63 |
SERIES N (MANAGED ASSET ALLOCATION SERIES) | |
STATEMENTS OF CHANGES IN NET ASSETS |
| | Six Months Ended
June 30, 2024
(Unaudited) | | | Year Ended
December 31,
2023 | |
Increase (Decrease) in Net Assets from Operations: | | | | | | | | |
Net investment income | | $ | 316,005 | | | $ | 698,989 | |
Net realized gain on investments | | | 1,367,945 | | | | 1,508,972 | |
Net change in unrealized appreciation (depreciation) on investments | | | 347,439 | | | | 2,488,892 | |
Net increase in net assets resulting from operations | | | 2,031,389 | | | | 4,696,853 | |
| | | | | | | | | |
Distributions to shareholders | | | — | | | | (733,004 | ) |
| | | | | | | | | |
Capital share transactions: | | | | | | | | |
Proceeds from sale of shares | | | 382,927 | | | | 536,127 | |
Distributions reinvested | | | — | | | | 733,004 | |
Cost of shares redeemed | | | (2,423,741 | ) | | | (5,618,941 | ) |
Net decrease from capital share transactions | | | (2,040,814 | ) | | | (4,349,810 | ) |
Net decrease in net assets | | | (9,425 | ) | | | (385,961 | ) |
| | | | | | | | | |
Net assets: | | | | | | | | |
Beginning of period | | | 35,583,376 | | | | 35,969,337 | |
End of period | | $ | 35,573,951 | | | $ | 35,583,376 | |
| | | | | | | | | |
Capital share activity: | | | | | | | | |
Shares sold | | | 12,849 | | | | 19,560 | |
Shares issued from reinvestment of distributions | | | — | | | | 26,207 | |
Shares redeemed | | | (81,084 | ) | | | (206,333 | ) |
Net decrease in shares | | | (68,235 | ) | | | (160,566 | ) |
64 | THE GUGGENHEIM FUNDS SEMI-ANNUAL FINANCIAL REPORT | SEE NOTES TO FINANCIAL STATEMENTS. |
SERIES N (MANAGED ASSET ALLOCATION SERIES) | |
This table is presented to show selected data for a share outstanding throughout each period and to assist shareholders in evaluating a Fund’s performance for the periods presented.
| | Six Months Ended
June 30, 2024a | | | Year Ended
December 31,
2023 | | | Year Ended
December 31,
2022 | | | Year Ended
December 31,
2021 | | | Year Ended
December 31,
2020 | | | Year Ended
December 31,
2019 | |
Per Share Data |
Net asset value, beginning of period | | $ | 29.07 | | | $ | 25.98 | | | $ | 34.83 | | | $ | 33.41 | | | $ | 32.05 | | | $ | 27.34 | |
Income (loss) from investment operations: |
Net investment income (loss)b | | | .27 | | | | .53 | | | | .33 | | | | .24 | | | | .24 | | | | .44 | |
Net gain (loss) on investments (realized and unrealized) | | | 1.44 | | | | 3.11 | | | | (6.03 | ) | | | 3.83 | | | | 3.52 | | | | 5.02 | |
Total from investment operations | | | 1.71 | | | | 3.64 | | | | (5.70 | ) | | | 4.07 | | | | 3.76 | | | | 5.46 | |
Less distributions from: |
Net investment income | | | — | | | | (.34 | ) | | | (.25 | ) | | | (.25 | ) | | | (.49 | ) | | | (.51 | ) |
Net realized gains | | | — | | | | (.21 | ) | | | (2.90 | ) | | | (2.40 | ) | | | (1.91 | ) | | | (.24 | ) |
Total distributions | | | — | | | | (.55 | ) | | | (3.15 | ) | | | (2.65 | ) | | | (2.40 | ) | | | (.75 | ) |
Net asset value, end of period | | $ | 30.78 | | | $ | 29.07 | | | $ | 25.98 | | | $ | 34.83 | | | $ | 33.41 | | | $ | 32.05 | |
|
Total Returnc | | | 5.88 | % | | | 14.12 | % | | | (16.57 | %) | | | 12.47 | % | | | 12.59 | % | | | 20.11 | % |
Ratios/Supplemental Data |
Net assets, end of period (in thousands) | | $ | 35,574 | | | $ | 35,583 | | | $ | 35,969 | | | $ | 47,008 | | | $ | 45,673 | | | $ | 46,219 | |
Ratios to average net assets: |
Net investment income (loss) | | | 1.79 | % | | | 1.95 | % | | | 1.15 | % | | | 0.68 | % | | | 0.77 | % | | | 1.45 | % |
Total expensesd | | | 0.98 | % | | | 0.97 | % | | | 0.96 | % | | | 0.94 | % | | | 1.01 | % | | | 1.01 | % |
Net expensese | | | 0.98 | % | | | 0.97 | % | | | 0.95 | % | | | 0.94 | % | | | 1.00 | % | | | 1.00 | % |
Portfolio turnover rate | | | 1 | % | | | 7 | % | | | 1 | % | | | 26 | % | | | 6 | % | | | 14 | % |
a | Unaudited figures for the period ended June 30, 2024. Percentage amounts for the period, except total return and portfolio turnover rate, have been annualized. |
b | Net investment income (loss) per share was computed using average shares outstanding throughout the period. |
c | Total return does not take into account any of the expenses associated with an investment in variable insurance products. If total return had taken into account these expenses, performance would have been lower. Shares of a series of Guggenheim Variable Funds Trust are available only through the purchase of such products. |
d | Does not include expenses of the underlying funds in which the Fund invests. |
e | Net expense information reflects the expense ratios after expense waivers and reimbursements, as applicable. |
SEE NOTES TO FINANCIAL STATEMENTS. | THE GUGGENHEIM FUNDS SEMI-ANNUAL FINANCIAL REPORT | 65 |
SCHEDULE OF INVESTMENTS (Unaudited) | June 30, 2024 |
SERIES O (ALL CAP VALUE SERIES) | |
| | Shares | | | Value | |
COMMON STOCKS† - 96.8% |
| | | | | | | | | |
Financial - 20.8% |
Jefferies Financial Group, Inc. | | | 44,831 | | | $ | 2,230,791 | |
Berkshire Hathaway, Inc. — Class B* | | | 4,561 | | | | 1,855,415 | |
JPMorgan Chase & Co. | | | 9,089 | | | | 1,838,341 | |
Bank of America Corp. | | | 45,454 | | | | 1,807,706 | |
Unum Group | | | 29,223 | | | | 1,493,587 | |
First Horizon Corp. | | | 94,243 | | | | 1,486,212 | |
Wells Fargo & Co. | | | 17,301 | | | | 1,027,506 | |
American Tower Corp. — Class A REIT | | | 4,981 | | | | 968,207 | |
Charles Schwab Corp. | | | 10,274 | | | | 757,091 | |
Stifel Financial Corp. | | | 8,449 | | | | 710,983 | |
Mastercard, Inc. — Class A | | | 1,587 | | | | 700,121 | |
Old Republic International Corp. | | | 21,612 | | | | 667,811 | |
Synovus Financial Corp. | | | 15,065 | | | | 605,462 | |
Goldman Sachs Group, Inc. | | | 1,040 | | | | 470,413 | |
Alexandria Real Estate Equities, Inc. REIT | | | 3,802 | | | | 444,720 | |
STAG Industrial, Inc. REIT | | | 11,015 | | | | 397,201 | |
Prosperity Bancshares, Inc. | | | 6,089 | | | | 372,282 | |
Jones Lang LaSalle, Inc.* | | | 1,706 | | | | 350,208 | |
First Merchants Corp. | | | 9,742 | | | | 324,311 | |
Stewart Information Services Corp. | | | 4,147 | | | | 257,446 | |
WisdomTree, Inc. | | | 24,428 | | | | 242,081 | |
Apple Hospitality REIT, Inc. | | | 15,426 | | | | 224,294 | |
Axos Financial, Inc.* | | | 3,511 | | | | 200,653 | |
Total Financial | | | | | | | 19,432,842 | |
| | | | | | | | | |
Consumer, Non-cyclical - 15.9% |
Euronet Worldwide, Inc.* | | | 12,325 | | | | 1,275,637 | |
Ingredion, Inc. | | | 11,115 | | | | 1,274,890 | |
Encompass Health Corp. | | | 13,794 | | | | 1,183,387 | |
Johnson & Johnson | | | 7,769 | | | | 1,135,517 | |
Humana, Inc. | | | 2,596 | | | | 969,996 | |
Tyson Foods, Inc. — Class A | | | 16,562 | | | | 946,353 | |
MGP Ingredients, Inc. | | | 11,571 | | | | 860,882 | |
Medtronic plc | | | 9,686 | | | | 762,385 | |
Merck & Company, Inc. | | | 6,065 | | | | 750,847 | |
PayPal Holdings, Inc.* | | | 12,789 | | | | 742,146 | |
Archer-Daniels-Midland Co. | | | 10,876 | | | | 657,454 | |
Coca-Cola Co. | | | 10,011 | | | | 637,200 | |
Bunge Global S.A. | | | 5,146 | | | | 549,439 | |
HCA Healthcare, Inc. | | | 1,707 | | | | 548,425 | |
Integer Holdings Corp.* | | | 4,278 | | | | 495,350 | |
Enovis Corp.* | | | 8,793 | | | | 397,444 | |
RadNet, Inc.* | | | 5,546 | | | | 326,770 | |
Central Garden & Pet Co. — Class A* | | | 8,961 | | | | 295,990 | |
LivaNova plc* | | | 5,153 | | | | 282,487 | |
ICF International, Inc. | | | 1,592 | | | | 236,348 | |
Pfizer, Inc. | | | 7,912 | | | | 221,378 | |
Azenta, Inc.* | | | 2,750 | | | | 144,705 | |
Certara, Inc.* | | | 8,687 | | | | 120,315 | |
Conagra Brands, Inc. | | | 2,538 | | | | 72,130 | |
Total Consumer, Non-cyclical | | | | | | | 14,887,475 | |
| | | | | | | | | |
Energy - 11.0% |
Chevron Corp. | | | 14,038 | | | | 2,195,824 | |
Diamondback Energy, Inc. | | | 9,793 | | | | 1,960,461 | |
ConocoPhillips | | | 12,704 | | | | 1,453,083 | |
Equities Corp. | | | 21,249 | | | | 785,788 | |
Coterra Energy, Inc. — Class A | | | 29,092 | | | | 775,884 | |
Kinder Morgan, Inc. | | | 36,763 | | | | 730,481 | |
Marathon Oil Corp. | | | 24,310 | | | | 696,968 | |
Range Resources Corp. | | | 9,703 | | | | 325,341 | |
Murphy Oil Corp. | | | 7,759 | | | | 319,981 | |
Talos Energy, Inc.* | | | 23,296 | | | | 283,046 | |
Liberty Energy, Inc. — Class A | | | 12,812 | | | | 267,643 | |
Exxon Mobil Corp. | | | 2,256 | | | | 259,711 | |
Patterson-UTI Energy, Inc. | | | 21,280 | | | | 220,461 | |
Total Energy | | | | | | | 10,274,672 | |
| | | | | | | | | |
Industrial - 11.0% |
Teledyne Technologies, Inc.* | | | 3,077 | | | | 1,193,815 | |
Advanced Energy Industries, Inc. | | | 10,350 | | | | 1,125,666 | |
Knight-Swift Transportation Holdings, Inc. | | | 21,358 | | | | 1,066,191 | |
Johnson Controls International plc | | | 10,937 | | | | 726,982 | |
Curtiss-Wright Corp. | | | 2,348 | | | | 636,261 | |
Kirby Corp.* | | | 5,294 | | | | 633,851 | |
L3Harris Technologies, Inc. | | | 2,536 | | | | 569,535 | |
Eagle Materials, Inc. | | | 2,603 | | | | 566,048 | |
Graphic Packaging Holding Co. | | | 20,768 | | | | 544,329 | |
Summit Materials, Inc. — Class A* | | | 11,199 | | | | 409,996 | |
Coherent Corp.* | | | 5,564 | | | | 403,167 | |
Arcosa, Inc. | | | 4,432 | | | | 369,673 | |
MDU Resources Group, Inc. | | | 13,111 | | | | 329,086 | |
Esab Corp. | | | 3,380 | | | | 319,173 | |
A O Smith Corp. | | | 2,819 | | | | 230,538 | |
Littelfuse, Inc. | | | 798 | | | | 203,961 | |
Park Aerospace Corp. | | | 14,655 | | | | 200,480 | |
Timken Co. | | | 2,101 | | | | 168,353 | |
Sonoco Products Co. | | | 2,930 | | | | 148,610 | |
Gates Industrial Corporation plc* | | | 8,806 | | | | 139,223 | |
GATX Corp. | | | 687 | | | | 90,931 | |
NVE Corp. | | | 958 | | | | 71,553 | |
Regal Rexnord Corp. | | | 459 | | | | 62,066 | |
Stoneridge, Inc.* | | | 3,534 | | | | 56,403 | |
Total Industrial | | | | | | | 10,265,891 | |
| | | | | | | | | |
Technology - 10.4% |
Leidos Holdings, Inc. | | | 10,336 | | | | 1,507,816 | |
Teradyne, Inc. | | | 10,089 | | | | 1,496,098 | |
Microsoft Corp. | | | 2,329 | | | | 1,040,946 | |
Fortinet, Inc.* | | | 14,265 | | | | 859,751 | |
Applied Materials, Inc. | | | 3,278 | | | | 773,575 | |
Fiserv, Inc.* | | | 5,115 | | | | 762,340 | |
QUALCOMM, Inc. | | | 3,378 | | | | 672,830 | |
NXP Semiconductor N.V. | | | 2,451 | | | | 659,540 | |
KLA Corp. | | | 740 | | | | 610,137 | |
MACOM Technology Solutions Holdings, Inc.* | | | 4,023 | | | | 448,444 | |
Science Applications International Corp. | | | 3,543 | | | | 416,480 | |
Amkor Technology, Inc. | | | 9,678 | | | | 387,314 | |
66 | THE GUGGENHEIM FUNDS SEMI-ANNUAL FINANCIAL REPORT | SEE NOTES TO FINANCIAL STATEMENTS. |
SCHEDULE OF INVESTMENTS (Unaudited)(continued) | June 30, 2024 |
SERIES O (ALL CAP VALUE SERIES) | |
| | Shares | | | Value | |
Intel Corp. | | | 4,787 | | | $ | 148,253 | |
Total Technology | | | | | | | 9,783,524 | |
| | | | | | | | | |
Consumer, Cyclical - 9.4% |
Walmart, Inc. | | | 24,477 | | | | 1,657,338 | |
H&E Equipment Services, Inc. | | | 19,746 | | | | 872,181 | |
Crocs, Inc.* | | | 5,758 | | | | 840,323 | |
Levi Strauss & Co. — Class A | | | 40,614 | | | | 783,038 | |
Ferguson plc | | | 3,519 | | | | 681,454 | |
Las Vegas Sands Corp. | | | 14,239 | | | | 630,076 | |
Lear Corp. | | | 4,900 | | | | 559,629 | |
Delta Air Lines, Inc. | | | 11,133 | | | | 528,149 | |
Advance Auto Parts, Inc. | | | 7,007 | | | | 443,753 | |
Southwest Airlines Co. | | | 14,749 | | | | 421,969 | |
MSC Industrial Direct Company, Inc. — Class A | | | 4,360 | | | | 345,791 | |
BorgWarner, Inc. | | | 8,877 | | | | 286,194 | |
Sonic Automotive, Inc. — Class A | | | 4,555 | | | | 248,111 | |
AutoNation, Inc.* | | | 1,136 | | | | 181,056 | |
Lakeland Industries, Inc. | | | 6,577 | | | | 150,876 | |
Century Communities, Inc. | | | 912 | | | | 74,474 | |
Newell Brands, Inc. | | | 11,444 | | | | 73,356 | |
Methode Electronics, Inc. | | | 5,456 | | | | 56,470 | |
Total Consumer, Cyclical | | | | | | | 8,834,238 | |
| | | | | | | | | |
Utilities - 7.0% |
OGE Energy Corp. | | | 49,487 | | | | 1,766,686 | |
Pinnacle West Capital Corp. | | | 20,436 | | | | 1,560,902 | |
Edison International | | | 15,015 | | | | 1,078,227 | |
Exelon Corp. | | | 20,760 | | | | 718,504 | |
Evergy, Inc. | | | 12,690 | | | | 672,189 | |
Duke Energy Corp. | | | 5,623 | | | | 563,593 | |
Black Hills Corp. | | | 3,016 | | | | 164,010 | |
Total Utilities | | | | | | | 6,524,111 | |
| | | | | | | | | |
Basic Materials - 6.1% |
Westlake Corp. | | | 7,103 | | | | 1,028,657 | |
Reliance, Inc. | | | 3,354 | | | | 957,902 | |
Nucor Corp. | | | 5,896 | | | | 932,040 | |
Freeport-McMoRan, Inc. | | | 15,267 | | | | 741,976 | |
Huntsman Corp. | | | 30,083 | | | | 684,990 | |
DuPont de Nemours, Inc. | | | 6,536 | | | | 526,083 | |
Avient Corp. | | | 8,639 | | | | 377,092 | |
Ashland, Inc. | | | 2,721 | | | | 257,107 | |
MP Materials Corp.* | | | 13,889 | | | | 176,807 | |
Total Basic Materials | | | | | | | 5,682,654 | |
| | | | | | | | | |
Communications - 5.2% |
Verizon Communications, Inc. | | | 39,044 | | | | 1,610,175 | |
Alphabet, Inc. — Class A | | | 7,377 | | | | 1,343,721 | |
AT&T, Inc. | | | 37,750 | | | | 721,402 | |
T-Mobile US, Inc. | | | 2,640 | | | | 465,115 | |
Walt Disney Co. | | | 2,851 | | | | 283,076 | |
Ciena Corp.* | | | 3,971 | | | | 191,323 | |
Calix, Inc.* | | | 5,358 | | | | 189,834 | |
Luna Innovations, Inc.* | | | 23,147 | | | | 74,070 | |
Total Communications | | | | | | | 4,878,716 | |
| | | | | | | | | |
Total Common Stocks | | | | |
(Cost $70,052,043) | | | | | | | 90,564,123 | |
| | | | | | | | | |
RIGHTS† - 0.0% |
Basic Materials - 0.0% |
Pan American Silver Corp.* | | | 40,146 | | | | 18,572 | |
Total Rights | | | | |
(Cost $—) | | | | | | | 18,572 | |
| | | | | | | | | |
MONEY MARKET FUND**,† - 3.2% |
Dreyfus Treasury Securities Cash Management Fund — Institutional Shares, 5.18%1 | | | 2,982,926 | | | | 2,982,926 | |
Total Money Market Fund | | | | |
(Cost $2,982,926) | | | | | | | 2,982,926 | |
| | | | | | | | | |
Total Investments - 100.0% | | | | |
(Cost $73,034,969) | | $ | 93,565,621 | |
Other Assets & Liabilities, net - 0.0% | | | (32,481 | ) |
Total Net Assets - 100.0% | | $ | 93,533,140 | |
* | Non-income producing security. |
** | A copy of each underlying unaffiliated fund’s financial statements is available at the SEC’s website at www.sec.gov. |
† | Value determined based on Level 1 inputs — See Note 4. |
1 | Rate indicated is the 7-day yield as of June 30, 2024. |
| | plc — Public Limited Company |
| | REIT — Real Estate Investment Trust |
| | |
| | See Sector Classification in Other Information section. |
SEE NOTES TO FINANCIAL STATEMENTS. | THE GUGGENHEIM FUNDS SEMI-ANNUAL FINANCIAL REPORT | 67 |
SCHEDULE OF INVESTMENTS (Unaudited)(concluded) | June 30, 2024 |
SERIES O (ALL CAP VALUE SERIES) | |
The following table summarizes the inputs used to value the Fund’s investments at June 30, 2024 (See Note 4 in the Notes to Financial Statements):
Investments in Securities (Assets) | | Level 1
Quoted
Prices | | | Level 2
Significant
Observable
Inputs | | | Level 3
Significant
Unobservable
Inputs | | | Total | |
Common Stocks | | $ | 90,564,123 | | | $ | — | | | $ | — | | | $ | 90,564,123 | |
Rights | | | 18,572 | | | | — | | | | — | | | | 18,572 | |
Money Market Fund | | | 2,982,926 | | | | — | | | | — | | | | 2,982,926 | |
Total Assets | | $ | 93,565,621 | | | $ | — | | | $ | — | | | $ | 93,565,621 | |
68 | THE GUGGENHEIM FUNDS SEMI-ANNUAL FINANCIAL REPORT | SEE NOTES TO FINANCIAL STATEMENTS. |
SERIES O (ALL CAP VALUE SERIES) | |
STATEMENT OF ASSETS AND LIABILITIES (Unaudited) |
June 30, 2024 |
Assets: |
Investments, at value (cost $73,034,969) | | $ | 93,565,621 | |
Cash | | | 399 | |
Prepaid expenses | | | 377 | |
Receivables: |
Dividends | | | 81,833 | |
Interest | | | 9,710 | |
Fund shares sold | | | 2,491 | |
Total assets | | | 93,660,431 | |
| | | | | |
Liabilities: |
Payable for: |
Fund shares redeemed | | | 53,179 | |
Management fees | | | 33,656 | |
Distribution and service fees | | | 17,951 | |
Professional fees | | | 11,461 | |
Transfer agent/maintenance fees | | | 1,957 | |
Trustees’ fees* | | | 1,869 | |
Fund accounting/administration fees | | | 1,151 | |
Due to Investment Adviser | | | 56 | |
Miscellaneous | | | 6,011 | |
Total liabilities | | | 127,291 | |
Net assets | | $ | 93,533,140 | |
| | | | | |
Net assets consist of: |
Paid in capital | | $ | 64,245,837 | |
Total distributable earnings (loss) | | | 29,287,303 | |
Net assets | | $ | 93,533,140 | |
Capital shares outstanding | | | 2,675,411 | |
Net asset value per share | | $ | 34.96 | |
STATEMENT OF OPERATIONS (Unaudited) |
Six Months Ended June 30, 2024 |
Investment Income: |
Dividends (net of foreign withholding tax of $863) | | $ | 968,433 | |
Interest | | | 54,412 | |
Total investment income | | | 1,022,845 | |
| | | | | |
Expenses: |
Management fees | | | 326,769 | |
Distribution and service fees | | | 116,703 | |
Transfer agent/maintenance fees | | | 12,452 | |
Fund accounting/administration fees | | | 22,377 | |
Professional fees | | | 17,586 | |
Trustees’ fees* | | | 7,442 | |
Custodian fees | | | 2,335 | |
Line of credit fees | | | 1,205 | |
Miscellaneous | | | 7,476 | |
Recoupment of previously waived fees | | | 298 | |
Total expenses | | | 514,643 | |
Less: |
Expenses waived by Adviser | | | (116,734 | ) |
Net expenses | | | 397,909 | |
Net investment income | | | 624,936 | |
| | | | | |
Net Realized and Unrealized Gain (Loss): |
Net realized gain (loss) on: |
Investments | | | 1,848,876 | |
Net realized gain | | | 1,848,876 | |
Net change in unrealized appreciation (depreciation) on: |
Investments | | | 3,447,592 | |
Net change in unrealized appreciation (depreciation) | | | 3,447,592 | |
Net realized and unrealized gain | | | 5,296,468 | |
Net increase in net assets resulting from operations | | $ | 5,921,404 | |
* | Relates to Trustees not deemed “interested persons” within the meaning of Section 2(a)(19) of the 1940 Act. |
SEE NOTES TO FINANCIAL STATEMENTS. | THE GUGGENHEIM FUNDS SEMI-ANNUAL FINANCIAL REPORT | 69 |
SERIES O (ALL CAP VALUE SERIES) | |
STATEMENTS OF CHANGES IN NET ASSETS |
| | Six Months Ended
June 30, 2024
(Unaudited) | | | Year Ended
December 31,
2023 | |
Increase (Decrease) in Net Assets from Operations: | | | | | | | | |
Net investment income | | $ | 624,936 | | | $ | 1,502,249 | |
Net realized gain on investments | | | 1,848,876 | | | | 5,803,307 | |
Net change in unrealized appreciation (depreciation) on investments | | | 3,447,592 | | | | 134,769 | |
Net increase in net assets resulting from operations | | | 5,921,404 | | | | 7,440,325 | |
| | | | | | | | | |
Distributions to shareholders | | | — | | | | (9,149,598 | ) |
| | | | | | | | | |
Capital share transactions: | | | | | | | | |
Proceeds from sale of shares | | | 846,341 | | | | 4,025,157 | |
Distributions reinvested | | | — | | | | 9,149,598 | |
Cost of shares redeemed | | | (6,599,281 | ) | | | (12,012,812 | ) |
Net increase (decrease) from capital share transactions | | | (5,752,940 | ) | | | 1,161,943 | |
Net increase (decrease) in net assets | | | 168,464 | | | | (547,330 | ) |
| | | | | | | | | |
Net assets: | | | | | | | | |
Beginning of period | | | 93,364,676 | | | | 93,912,006 | |
End of period | | $ | 93,533,140 | | | $ | 93,364,676 | |
| | | | | | | | | |
Capital share activity: | | | | | | | | |
Shares sold | | | 24,407 | | | | 122,486 | |
Shares issued from reinvestment of distributions | | | — | | | | 285,212 | |
Shares redeemed | | | (193,507 | ) | | | (369,236 | ) |
Net increase (decrease) in shares | | | (169,100 | ) | | | 38,462 | |
70 | THE GUGGENHEIM FUNDS SEMI-ANNUAL FINANCIAL REPORT | SEE NOTES TO FINANCIAL STATEMENTS. |
SERIES O (ALL CAP VALUE SERIES) | |
This table is presented to show selected data for a share outstanding throughout each period and to assist shareholders in evaluating a Fund’s performance for the periods presented.
| | Six Months Ended
June 30, 2024a | | | Year Ended
December 31,
2023 | | | Year Ended
December 31,
2022 | | | Year Ended
December 31,
2021 | | | Year Ended
December 31,
2020 | | | Year Ended
December 31,
2019 | |
Per Share Data |
Net asset value, beginning of period | | $ | 32.82 | | | $ | 33.47 | | | $ | 38.53 | | | $ | 31.06 | | | $ | 32.89 | | | $ | 29.31 | |
Income (loss) from investment operations: |
Net investment income (loss)b | | | .23 | | | | .53 | | | | .52 | | | | .38 | | | | .56 | | | | .51 | |
Net gain (loss) on investments (realized and unrealized) | | | 1.91 | | | | 2.24 | | | | (1.15 | ) | | | 7.93 | | | | (.33 | ) | | | 6.19 | |
Total from investment operations | | | 2.14 | | | | 2.77 | | | | (.63 | ) | | | 8.31 | | | | .23 | | | | 6.70 | |
Less distributions from: |
Net investment income | | | — | | | | (.53 | ) | | | (.43 | ) | | | (.65 | ) | | | (.52 | ) | | | (.49 | ) |
Net realized gains | | | — | | | | (2.89 | ) | | | (4.00 | ) | | | (.19 | ) | | | (1.54 | ) | | | (2.63 | ) |
Total distributions | | | — | | | | (3.42 | ) | | | (4.43 | ) | | | (.84 | ) | | | (2.06 | ) | | | (3.12 | ) |
Net asset value, end of period | | $ | 34.96 | | | $ | 32.82 | | | $ | 33.47 | | | $ | 38.53 | | | $ | 31.06 | | | $ | 32.89 | |
|
Total Returnc | | | 6.52 | % | | | 8.52 | % | | | (1.17 | %) | | | 26.95 | % | | | 1.88 | % | | | 23.74 | % |
Ratios/Supplemental Data |
Net assets, end of period (in thousands) | | $ | 93,533 | | | $ | 93,365 | | | $ | 93,912 | | | $ | 103,134 | | | $ | 91,661 | | | $ | 107,634 | |
Ratios to average net assets: |
Net investment income (loss) | | | 1.34 | % | | | 1.63 | % | | | 1.45 | % | | | 1.06 | % | | | 2.03 | % | | | 1.62 | % |
Total expensesd | | | 1.10 | % | | | 1.14 | % | | | 1.11 | % | | | 1.13 | % | | | 1.21 | % | | | 1.18 | % |
Net expensese,f,g | | | 0.85 | % | | | 0.85 | % | | | 0.86 | % | | | 0.87 | % | | | 0.87 | % | | | 0.88 | % |
Portfolio turnover rate | | | 12 | % | | | 25 | % | | | 30 | % | | | 26 | % | | | 22 | % | | | 33 | % |
a | Unaudited figures for the period ended June 30, 2024. Percentage amounts for the period, except total return and portfolio turnover rate, have been annualized. |
b | Net investment income (loss) per share was computed using average shares outstanding throughout the period. |
c | Total return does not take into account any of the expenses associated with an investment in variable insurance products. If total return had taken into account these expenses, performance would have been lower. Shares of a series of Guggenheim Variable Funds Trust are available only through the purchase of such products. |
d | Does not include expenses of the underlying funds in which the Fund invests. |
e | Net expense information reflects the expense ratios after expense waivers and reimbursements, as applicable. |
f | The portion of the ratios of net expenses to average net assets attributable to recoupments of prior fee reductions or expense reimbursements for the years presented was as follows: |
| | 06/30/24a | 12/31/23 | 12/31/22 | 12/31/21 | 12/31/20 | 12/31/19 |
| | 0.00%* | — | — | — | — | — |
g | Net expenses may include expenses that are excluded from the expense limitation agreement. Excluding these expenses, the net expense ratios for the years presented would be: |
| | 06/30/24a | 12/31/23 | 12/31/22 | 12/31/21 | 12/31/20 | 12/31/19 |
| | 0.85% | 0.85% | 0.86% | 0.87% | 0.87% | 0.88% |
SEE NOTES TO FINANCIAL STATEMENTS. | THE GUGGENHEIM FUNDS SEMI-ANNUAL FINANCIAL REPORT | 71 |
SCHEDULE OF INVESTMENTS (Unaudited) | June 30, 2024 |
SERIES P (HIGH YIELD SERIES) | |
| | Shares | | | Value | |
COMMON STOCKS† - 0.4% |
| | | | | | | | | |
Consumer, Non-cyclical - 0.3% |
Endo, Inc.* | | | 3,591 | | | $ | 101,446 | |
Endo, Inc.*,†† | | | 60 | | | | 1,657 | |
MEDIQ, Inc.*,††† | | | 92 | | | | — | |
Total Consumer, Non-cyclical | | | | | | | 103,103 | |
| | | | | | | | | |
Energy - 0.1% |
Legacy Reserves, Inc.††† | | | 1,969 | | | | 7,876 | |
Permian Production Partners LLC*,††† | | | 9,124 | | | | 428 | |
Total Energy | | | | | | | 8,304 | |
| | | | | | | | | |
Utilities - 0.0% |
Mountain Creek Power LLC*,†† | | | 7,929 | | | | 7,929 | |
| | | | | | | | | |
Industrial - 0.0% |
YAK BLOCKER 2 LLC*,††† | | | 914 | | | | 1,773 | |
YAK BLOCKER 2 LLC*,††† | | | 844 | | | | 1,638 | |
BP Holdco LLC*,†††,1 | | | 523 | | | | 634 | |
Vector Phoenix Holdings, LP*,††† | | | 523 | | | | 11 | |
Total Industrial | | | | | | | 4,056 | |
| | | | | | | | | |
Financial - 0.0% |
Endo Luxembourg Finance Co I SARL / Endo US, Inc.*,†††,2 | | | 225,000 | | | | 1,726 | |
Endo Luxembourg Finance Co I SARL / Endo US, Inc.*,†††,2 | | | 125,000 | | | | 959 | |
Total Financial | | | | | | | 2,685 | |
| | | | | | | | | |
Total Common Stocks | | | | |
(Cost $146,302) | | | | | | | 126,077 | |
| | | | | | | | | |
PREFERRED STOCKS†† - 1.3% |
Financial - 1.3% |
Citigroup, Inc. |
7.63% | | | 125,000 | | | | 130,147 | |
Charles Schwab Corp. |
4.00% | | | 150,000 | | | | 128,102 | |
American National Group, Inc. |
5.95% | | | 3,500 | | | | 84,945 | |
Goldman Sachs Group, Inc. |
7.50% | | | 75,000 | | | | 78,579 | |
Total Financial | | | | | | | 421,773 | |
| | | | | | | | | |
Industrial - 0.0% |
U.S. Shipping Corp.*,††† | | | 24,529 | | | | 3 | |
Total Preferred Stocks | | | | |
(Cost $1,062,500) | | | | | | | 421,776 | |
| | | | | | | | | |
MONEY MARKET FUND**,† - 2.6% |
Dreyfus Treasury Securities Cash Management Fund — Institutional Shares, 5.18%4 | | | 835,481 | | | | 835,481 | |
Total Money Market Fund | | | | |
(Cost $835,481) | | | | | | | 835,481 | |
| | Face
Amount~ | | | | |
CORPORATE BONDS†† - 86.7% |
Consumer, Cyclical - 16.0% | | | | | | | | |
United Airlines, Inc. | | | | | | | | |
4.38% due 04/15/265 | | | 150,000 | | | | 144,901 | |
4.63% due 04/15/295 | | | 125,000 | | | | 116,414 | |
CD&R Smokey Buyer, Inc. | | | | | | | | |
6.75% due 07/15/255 | | | 250,000 | | | | 248,413 | |
Suburban Propane Partners Limited Partnership/Suburban Energy Finance Corp. | | | | | | | | |
5.00% due 06/01/315 | | | 250,000 | | | | 225,135 | |
Allwyn Entertainment Financing UK plc | | | | | | | | |
7.88% due 04/30/295 | | | 200,000 | | | | 206,675 | |
Vail Resorts, Inc. | | | | | | | | |
6.50% due 05/15/325 | | | 200,000 | | | | 202,392 | |
Station Casinos LLC | | | | | | | | |
4.63% due 12/01/315 | | | 225,000 | | | | 200,543 | |
Wolverine World Wide, Inc. | | | | | | | | |
4.00% due 08/15/295 | | | 225,000 | | | | 188,354 | |
Caesars Entertainment, Inc. | | | | | | | | |
8.13% due 07/01/275 | | | 150,000 | | | | 153,050 | |
6.50% due 02/15/325 | | | 25,000 | | | | 25,122 | |
Allison Transmission, Inc. | | | | | | | | |
3.75% due 01/30/315 | | | 200,000 | | | | 175,347 | |
Scotts Miracle-Gro Co. | | | | | | | | |
4.38% due 02/01/32 | | | 200,000 | | | | 172,297 | |
Penn Entertainment, Inc. | | | | | | | | |
4.13% due 07/01/295 | | | 200,000 | | | | 171,533 | |
Ferrellgas Limited Partnership / Ferrellgas Finance Corp. | | | | | | | | |
5.38% due 04/01/265 | | | 175,000 | | | | 171,200 | |
Scientific Games Holdings Limited Partnership/Scientific Games US FinCo, Inc. | | | | | | | | |
6.63% due 03/01/305 | | | 175,000 | | | | 170,593 | |
Air Canada | | | | | | | | |
3.88% due 08/15/265 | | | 175,000 | | | | 166,458 | |
Crocs, Inc. | | | | | | | | |
4.25% due 03/15/295 | | | 175,000 | | | | 159,509 | |
Hawaiian Brand Intellectual Property Ltd. / HawaiianMiles Loyalty Ltd. | | | | | | | | |
5.75% due 01/20/265 | | | 165,000 | | | | 156,991 | |
Ritchie Bros Holdings, Inc. | | | | | | | | |
7.75% due 03/15/315 | | | 150,000 | | | | 156,653 | |
Ontario Gaming GTA, LP | | | | | | | | |
8.00% due 08/01/305 | | | 150,000 | | | | 153,937 | |
Newell Brands, Inc. | | | | | | | | |
5.20% due 04/01/26 | | | 150,000 | | | | 148,156 | |
Hanesbrands, Inc. | | | | | | | | |
4.88% due 05/15/265 | | | 150,000 | | | | 146,745 | |
Wabash National Corp. | | | | | | | | |
4.50% due 10/15/285 | | | 150,000 | | | | 134,973 | |
Clarios Global Limited Partnership / Clarios US Finance Co. | | | | | | | | |
8.50% due 05/15/275 | | | 75,000 | | | | 75,423 | |
6.75% due 05/15/285 | | | 50,000 | | | | 50,603 | |
72 | THE GUGGENHEIM FUNDS SEMI-ANNUAL FINANCIAL REPORT | SEE NOTES TO FINANCIAL STATEMENTS. |
SCHEDULE OF INVESTMENTS (Unaudited)(continued) | June 30, 2024 |
SERIES P (HIGH YIELD SERIES) | |
| | Face
Amount~ | | | Value | |
Tempur Sealy International, Inc. | | | | | | | | |
3.88% due 10/15/315 | | | 150,000 | | | $ | 125,385 | |
ONE Hotels GmbH | | | | | | | | |
7.75% due 04/02/315 | | EUR | 100,000 | | | | 111,738 | |
Amer Sports Co. | | | | | | | | |
6.75% due 02/16/315 | | | 100,000 | | | | 99,734 | |
1011778 BC ULC / New Red Finance, Inc. | | | | | | | | |
4.00% due 10/15/305 | | | 100,000 | | | | 88,030 | |
Michaels Companies, Inc. | | | | | | | | |
5.25% due 05/01/285 | | | 100,000 | | | | 80,000 | |
Park River Holdings, Inc. | | | | | | | | |
5.63% due 02/01/295 | | | 100,000 | | | | 79,063 | |
JB Poindexter & Company, Inc. | | | | | | | | |
8.75% due 12/15/315 | | | 75,000 | | | | 77,699 | |
Hilton Domestic Operating Company, Inc. | | | | | | | | |
6.13% due 04/01/325 | | | 75,000 | | | | 75,364 | |
Clarios Global, LP | | | | | | | | |
6.75% due 05/15/255 | | | 75,000 | | | | 74,977 | |
Fertitta Entertainment LLC / Fertitta Entertainment Finance Company, Inc. | | | | | | | | |
4.63% due 01/15/295 | | | 75,000 | | | | 68,299 | |
Asbury Automotive Group, Inc. | | | | | | | | |
5.00% due 02/15/325 | | | 75,000 | | | | 67,951 | |
Evergreen Acqco 1 Limited Partnership / TVI, Inc. | | | | | | | | |
9.75% due 04/26/285 | | | 61,000 | | | | 65,096 | |
Superior Plus, LP | | | | | | | | |
4.25% due 05/18/285 | | CAD | 75,000 | | | | 51,337 | |
Advance Auto Parts, Inc. | | | | | | | | |
5.90% due 03/09/26 | | | 50,000 | | | | 50,006 | |
Papa John’s International, Inc. | | | | | | | | |
3.88% due 09/15/295 | | | 50,000 | | | | 44,254 | |
Sabre GLBL, Inc. | | | | | | | | |
7.38% due 09/01/252 | | | 35,000 | | | | 33,583 | |
9.25% due 04/15/252 | | | 7,000 | | | | 6,872 | |
Total Consumer, Cyclical | | | | | | | 5,120,805 | |
| | | | | | | | | |
Consumer, Non-cyclical - 14.7% | | | | | | | | |
CPI CG, Inc. | | | | | | | | |
8.63% due 03/15/265 | | | 351,000 | | | | 358,489 | |
10.00% due 07/15/295 | | | 275,000 | | | | 285,312 | |
Cheplapharm Arzneimittel GmbH | | | | | | | | |
5.50% due 01/15/285 | | | 375,000 | | | | 346,909 | |
Boost Newco Borrower LLC | | | | | | | | |
7.50% due 01/15/315 | | | 200,000 | | | | 208,530 | |
Tenet Healthcare Corp. | | | | | | | | |
6.13% due 06/15/30 | | | 125,000 | | | | 124,156 | |
6.75% due 05/15/31 | | | 75,000 | | | | 76,126 | |
Upbound Group, Inc. | | | | | | | | |
6.38% due 02/15/295 | | | 205,000 | | | | 196,655 | |
IQVIA, Inc. | | | | | | | | |
5.00% due 10/15/265 | | | 200,000 | | | | 196,234 | |
Champions Financing, Inc. | | | | | | | | |
8.75% due 02/15/295 | | | 175,000 | | | | 179,458 | |
TriNet Group, Inc. | | | | | | | | |
7.13% due 08/15/315 | | | 175,000 | | | | 177,763 | |
Grifols S.A. | | | | | | | | |
4.75% due 10/15/285 | | | 200,000 | | | | 172,595 | |
Bausch Health Companies, Inc. | | | | | | | | |
4.88% due 06/01/285 | | | 225,000 | | | | 168,381 | |
Post Holdings, Inc. | | | | | | | | |
5.50% due 12/15/295 | | | 75,000 | | | | 72,369 | |
4.63% due 04/15/305 | | | 75,000 | | | | 68,919 | |
5.63% due 01/15/285 | | | 25,000 | | | | 24,612 | |
Kronos Acquisition Holdings, Inc. / KIK Custom Products, Inc. | | | | | | | | |
7.00% due 12/31/275 | | | 107,000 | | | | 110,660 | |
5.00% due 12/31/265 | | | 50,000 | | | | 51,172 | |
Carriage Services, Inc. | | | | | | | | |
4.25% due 05/15/295 | | | 175,000 | | | | 156,355 | |
Brink’s Co. | | | | | | | | |
6.75% due 06/15/325 | | | 150,000 | | | | 151,101 | |
Sotheby’s/Bidfair Holdings, Inc. | | | | | | | | |
5.88% due 06/01/295 | | | 200,000 | | | | 148,835 | |
Darling Ingredients, Inc. | | | | | | | | |
6.00% due 06/15/305 | | | 150,000 | | | | 147,490 | |
Albertsons Companies Incorporated / Safeway Inc / New Albertsons Limited Partnership / Albertsons LLC | | | | | | | | |
3.25% due 03/15/265 | | | 150,000 | | | | 144,090 | |
Castor S.p.A. | | | | | | | | |
8.97% (3 Month EURIBOR + 5.25%, Rate Floor: 5.25%) due 02/15/29◊,5 | | EUR | 125,000 | | | | 131,456 | |
US Foods, Inc. | | | | | | | | |
7.25% due 01/15/325 | | | 125,000 | | | | 129,724 | |
Williams Scotsman, Inc. | | | | | | | | |
7.38% due 10/01/315 | | | 125,000 | | | | 128,638 | |
BCP V Modular Services Finance II plc | | | | | | | | |
4.75% due 10/30/285 | | EUR | 125,000 | | | | 124,571 | |
AMN Healthcare, Inc. | | | | | | | | |
4.63% due 10/01/275 | | | 125,000 | | | | 119,073 | |
Medline Borrower, LP | | | | | | | | |
5.25% due 10/01/295 | | | 100,000 | | | | 95,433 | |
DaVita, Inc. | | | | | | | | |
4.63% due 06/01/305 | | | 100,000 | | | | 90,363 | |
Service Corporation International | | | | | | | | |
3.38% due 08/15/30 | | | 100,000 | | | | 87,030 | |
WW International, Inc. | | | | | | | | |
4.50% due 04/15/295 | | | 205,000 | | | | 79,246 | |
Medline Borrower Limited Partnership/Medline Company-Issuer, Inc. | | | | | | | | |
6.25% due 04/01/295 | | | 75,000 | | | | 75,849 | |
Central Garden & Pet Co. | | | | | | | | |
4.13% due 04/30/315 | | | 75,000 | | | | 66,097 | |
Endo Finance Holdings, Inc. | | | | | | | | |
8.50% due 04/15/315 | | | 25,000 | | | | 25,800 | |
Total Consumer, Non-cyclical | | | | | | | 4,719,491 | |
| | | | | | | | | |
Industrial - 13.7% | | | | | | | | |
New Enterprise Stone & Lime Company, Inc. | | | | | | | | |
9.75% due 07/15/285 | | | 200,000 | | | | 203,331 | |
5.25% due 07/15/285 | | | 150,000 | | | | 141,618 | |
SEE NOTES TO FINANCIAL STATEMENTS. | THE GUGGENHEIM FUNDS SEMI-ANNUAL FINANCIAL REPORT | 73 |
SCHEDULE OF INVESTMENTS (Unaudited)(continued) | June 30, 2024 |
SERIES P (HIGH YIELD SERIES) | |
| | Face
Amount~ | | | Value | |
Enviri Corp. | | | | | | | | |
5.75% due 07/31/275 | | | 325,000 | | | $ | 308,924 | |
Trinity Industries, Inc. | | | | | | | | |
7.75% due 07/15/285 | | | 275,000 | | | | 284,681 | |
Mauser Packaging Solutions Holding Co. | | | | | | | | |
7.88% due 04/15/275 | | | 175,000 | | | | 178,498 | |
9.25% due 04/15/275 | | | 100,000 | | | | 100,064 | |
GrafTech Finance, Inc. | | | | | | | | |
4.63% due 12/15/285 | | | 430,000 | | | | 272,572 | |
Brundage-Bone Concrete Pumping Holdings, Inc. | | | | | | | | |
6.00% due 02/01/265 | | | 275,000 | | | | 271,933 | |
Great Lakes Dredge & Dock Corp. | | | | | | | | |
5.25% due 06/01/295 | | | 275,000 | | | | 245,386 | |
EMRLD Borrower Limited Partnership / Emerald Company-Issuer, Inc. | | | | | | | | |
6.63% due 12/15/305 | | | 225,000 | | | | 226,756 | |
Builders FirstSource, Inc. | | | | | | | | |
6.38% due 06/15/325 | | | 125,000 | | | | 125,180 | |
6.38% due 03/01/345 | | | 45,000 | | | | 44,551 | |
4.25% due 02/01/325 | | | 25,000 | | | | 22,098 | |
TransDigm, Inc. | | | | | | | | |
6.88% due 12/15/305 | | | 175,000 | | | | 178,649 | |
EnerSys | | | | | | | | |
6.63% due 01/15/325 | | | 175,000 | | | | 177,876 | |
Clearwater Paper Corp. | | | | | | | | |
4.75% due 08/15/285 | | | 175,000 | | | | 161,768 | |
Amsted Industries, Inc. | | | | | | | | |
4.63% due 05/15/305 | | | 175,000 | | | | 160,564 | |
Clean Harbors, Inc. | | | | | | | | |
6.38% due 02/01/315 | | | 150,000 | | | | 150,391 | |
Wrangler Holdco Corp. | | | | | | | | |
6.63% due 04/01/325 | | | 150,000 | | | | 149,337 | |
Standard Industries, Inc. | | | | | | | | |
4.38% due 07/15/305 | | | 150,000 | | | | 135,528 | |
Artera Services LLC | | | | | | | | |
8.50% due 02/15/315 | | | 125,000 | | | | 128,687 | |
Advanced Drainage Systems, Inc. | | | | | | | | |
6.38% due 06/15/305 | | | 125,000 | | | | 125,452 | |
Hillenbrand, Inc. | | | | | | | | |
6.25% due 02/15/29 | | | 75,000 | | | | 75,360 | |
3.75% due 03/01/31 | | | 50,000 | | | | 43,436 | |
Summit Materials LLC / Summit Materials Finance Corp. | | | | | | | | |
7.25% due 01/15/315 | | | 100,000 | | | | 103,565 | |
Sealed Air Corporation/Sealed Air Corp US | | | | | | | | |
7.25% due 02/15/315 | | | 100,000 | | | | 102,960 | |
Calderys Financing LLC | | | | | | | | |
11.25% due 06/01/285 | | | 75,000 | | | | 79,335 | |
Arcosa, Inc. | | | | | | | | |
4.38% due 04/15/295 | | | 75,000 | | | | 69,647 | |
AmeriTex HoldCo Intermediate LLC | | | | | | | | |
10.25% due 10/15/285 | | | 50,000 | | | | 52,654 | |
Miter Brands Acquisition Holdco Incorporated / MIWD Borrower LLC | | | | | | | | |
6.75% due 04/01/325 | | | 25,000 | | | | 25,178 | |
Ball Corp. | | | | | | | | |
6.00% due 06/15/29 | | | 25,000 | | | | 25,134 | |
MIWD Holdco II LLC / MIWD Finance Corp. | | | | | | | | |
5.50% due 02/01/305 | | | 25,000 | | | | 23,072 | |
Total Industrial | | | | | | | 4,394,185 | |
| | | | | | | | | |
Communications - 13.4% | | | | | | | | |
CCO Holdings LLC / CCO Holdings Capital Corp. | | | | | | | | |
6.38% due 09/01/295 | | | 250,000 | | | | 237,632 | |
4.25% due 02/01/315 | | | 225,000 | | | | 183,699 | |
4.50% due 06/01/335 | | | 125,000 | | | | 98,391 | |
4.25% due 01/15/345 | | | 100,000 | | | | 75,906 | |
Level 3 Financing, Inc. | | | | | | | | |
4.50% due 04/01/305 | | | 300,000 | | | | 163,059 | |
3.88% due 10/15/305 | | | 300,000 | | | | 157,218 | |
11.00% due 11/15/295 | | | 99,190 | | | | 101,501 | |
McGraw-Hill Education, Inc. | | | | | | | | |
5.75% due 08/01/285 | | | 275,000 | | | | 265,182 | |
8.00% due 08/01/295 | | | 100,000 | | | | 97,241 | |
Vmed O2 UK Financing I plc | | | | | | | | |
7.75% due 04/15/325 | | | 200,000 | | | | 195,088 | |
4.25% due 01/31/315 | | | 200,000 | | | | 165,976 | |
Altice France S.A. | | | | | | | | |
5.50% due 10/15/295 | | | 325,000 | | | | 214,203 | |
5.13% due 07/15/295 | | | 175,000 | | | | 115,080 | |
VZ Secured Financing BV | | | | | | | | |
5.00% due 01/15/325 | | | 339,000 | | | | 289,055 | |
LCPR Senior Secured Financing DAC | | | | | | | | |
6.75% due 10/15/275 | | | 270,000 | | | | 252,864 | |
CSC Holdings LLC | | | | | | | | |
4.13% due 12/01/305 | | | 200,000 | | | | 129,269 | |
4.63% due 12/01/305 | | | 200,000 | | | | 72,840 | |
3.38% due 02/15/315 | | | 75,000 | | | | 46,807 | |
Cogent Communications Group Incorporated / Cogent Communications Finance Inc | | | | | | | | |
7.00% due 06/15/275 | | | 225,000 | | | | 222,649 | |
AMC Networks, Inc. | | | | | | | | |
4.25% due 02/15/29 | | | 300,000 | | | | 202,386 | |
Telenet Finance Luxembourg Notes SARL | | | | | | | | |
5.50% due 03/01/28 | | | 200,000 | | | | 189,434 | |
Sirius XM Radio, Inc. | | | | | | | | |
3.88% due 09/01/315 | | | 125,000 | | | | 102,042 | |
4.13% due 07/01/305 | | | 100,000 | | | | 85,412 | |
Sunrise FinCo I BV | | | | | | | | |
4.88% due 07/15/315 | | | 200,000 | | | | 181,603 | |
Match Group Holdings II LLC | | | | | | | | |
3.63% due 10/01/315 | | | 150,000 | | | | 127,054 | |
Outfront Media Capital LLC / Outfront Media Capital Corp. | | | | | | | | |
4.25% due 01/15/295 | | | 100,000 | | | | 91,182 | |
7.38% due 02/15/315 | | | 25,000 | | | | 26,018 | |
Go Daddy Operating Company LLC / GD Finance Co., Inc. | | | | | | | | |
3.50% due 03/01/295 | | | 75,000 | | | | 67,729 | |
74 | THE GUGGENHEIM FUNDS SEMI-ANNUAL FINANCIAL REPORT | SEE NOTES TO FINANCIAL STATEMENTS. |
SCHEDULE OF INVESTMENTS (Unaudited)(continued) | June 30, 2024 |
SERIES P (HIGH YIELD SERIES) | |
| | Face
Amount~ | | | Value | |
TripAdvisor, Inc. | | | | | | | | |
7.00% due 07/15/255 | | | 65,000 | | | $ | 65,183 | |
Cable One, Inc. | | | | | | | | |
4.00% due 11/15/305 | | | 75,000 | | | | 55,976 | |
Total Communications | | | | | | | 4,277,679 | |
| | | | | | | | | |
Financial - 9.5% | | | | | | | | |
SLM Corp. | | | | | | | | |
3.13% due 11/02/26 | | | 250,000 | | | | 232,868 | |
Jefferies Finance LLC / JFIN Company-Issuer Corp. | | | | | | | | |
5.00% due 08/15/285 | | | 250,000 | | | | 230,617 | |
Jane Street Group / JSG Finance, Inc. | | | | | | | | |
4.50% due 11/15/295 | | | 150,000 | | | | 140,711 | |
7.13% due 04/30/315 | | | 75,000 | | | | 76,910 | |
Ardonagh Finco Ltd. | | | | | | | | |
7.75% due 02/15/315 | | | 200,000 | | | | 197,713 | |
Hunt Companies, Inc. | | | | | | | | |
5.25% due 04/15/295 | | | 200,000 | | | | 181,762 | |
Rocket Mortgage LLC / Rocket Mortgage Company-Issuer, Inc. | | | | | | | | |
3.88% due 03/01/315 | | | 200,000 | | | | 174,297 | |
United Wholesale Mortgage LLC | | | | | | | | |
5.75% due 06/15/275 | | | 125,000 | | | | 122,031 | |
5.50% due 04/15/295 | | | 50,000 | | | | 47,503 | |
Starwood Property Trust, Inc. | | | | | | | | |
4.38% due 01/15/275 | | | 85,000 | | | | 80,476 | |
7.25% due 04/01/295 | | | 75,000 | | | | 75,804 | |
OneMain Finance Corp. | | | | | | | | |
3.88% due 09/15/28 | | | 100,000 | | | | 89,662 | |
4.00% due 09/15/30 | | | 75,000 | | | | 64,368 | |
Alliant Holdings Intermediate LLC / Alliant Holdings Company-Issuer | | | | | | | | |
7.00% due 01/15/315 | | | 150,000 | | | | 151,534 | |
Assurant, Inc. | | | | | | | | |
7.00% due 03/27/483 | | | 150,000 | | | | 150,597 | |
HUB International Ltd. | | | | | | | | |
7.38% due 01/31/325 | | | 100,000 | | | | 101,408 | |
5.63% due 12/01/295 | | | 50,000 | | | | 47,285 | |
Jones Deslauriers Insurance Management, Inc. | | | | | | | | |
10.50% due 12/15/305 | | | 125,000 | | | | 134,231 | |
VFH Parent LLC / Valor Company-Issuer, Inc. | | | | | | | | |
7.50% due 06/15/315 | | | 125,000 | | | | 125,600 | |
Iron Mountain, Inc. | | | | | | | | |
5.63% due 07/15/325 | | | 125,000 | | | | 118,695 | |
Aretec Group, Inc. | | | | | | | | |
10.00% due 08/15/305 | | | 100,000 | | | | 108,759 | |
PennyMac Financial Services, Inc. | | | | | | | | |
7.88% due 12/15/295 | | | 100,000 | | | | 103,118 | |
AmWINS Group, Inc. | | | | | | | | |
4.88% due 06/30/295 | | | 100,000 | | | | 93,027 | |
Kennedy-Wilson, Inc. | | | | | | | | |
4.75% due 03/01/29 | | | 100,000 | | | | 85,558 | |
Liberty Mutual Group, Inc. | | | | | | | | |
4.30% due 02/01/615 | | | 100,000 | | | | 62,255 | |
USI, Inc. | | | | | | | | |
7.50% due 01/15/325 | | | 50,000 | | | | 50,782 | |
Total Financial | | | | | | | 3,047,571 | |
| | | | | | | | | |
Energy - 7.2% | | | | | | | | |
CVR Energy, Inc. | | | | | | | | |
5.75% due 02/15/285 | | | 325,000 | | | | 301,360 | |
8.50% due 01/15/295 | | | 75,000 | | | | 75,309 | |
Global Partners Limited Partnership / GLP Finance Corp. | | | | | | | | |
7.00% due 08/01/27 | | | 225,000 | | | | 225,906 | |
8.25% due 01/15/325 | | | 100,000 | | | | 102,783 | |
ITT Holdings LLC | | | | | | | | |
6.50% due 08/01/295 | | | 325,000 | | | | 294,452 | |
TransMontaigne Partners Limited Partnership / TLP Finance Corp. | | | | | | | | |
6.13% due 02/15/26 | | | 250,000 | | | | 242,072 | |
NuStar Logistics, LP | | | | | | | | |
5.63% due 04/28/27 | | | 125,000 | | | | 123,947 | |
6.00% due 06/01/26 | | | 75,000 | | | | 74,884 | |
Buckeye Partners, LP | | | | | | | | |
3.95% due 12/01/26 | | | 125,000 | | | | 118,646 | |
6.88% due 07/01/295 | | | 75,000 | | | | 75,280 | |
Venture Global Calcasieu Pass LLC | | | | | | | | |
6.25% due 01/15/305 | | | 150,000 | | | | 152,234 | |
Parkland Corp. | | | | | | | | |
4.50% due 10/01/295 | | | 125,000 | | | | 114,413 | |
Viper Energy, Inc. | | | | | | | | |
7.38% due 11/01/315 | | | 100,000 | | | | 103,569 | |
Venture Global LNG, Inc. | | | | | | | | |
9.50% due 02/01/295 | | | 75,000 | | | | 82,132 | |
Sunoco, LP | | | | | | | | |
7.25% due 05/01/325 | | | 75,000 | | | | 77,577 | |
Kinetik Holdings, LP | | | | | | | | |
5.88% due 06/15/305 | | | 75,000 | | | | 73,906 | |
Southwestern Energy Co. | | | | | | | | |
5.38% due 02/01/29 | | | 50,000 | | | | 48,600 | |
Basic Energy Services, Inc. | | | | | | | | |
due 10/15/236 | | | 168,000 | | | | 840 | |
Total Energy | | | | | | | 2,287,910 | |
| | | | | | | | | |
Basic Materials - 6.5% | | | | | | | | |
SCIL IV LLC / SCIL USA Holdings LLC | | | | | | | | |
5.38% due 11/01/265 | | | 275,000 | | | | 265,909 | |
Carpenter Technology Corp. | | | | | | | | |
7.63% due 03/15/30 | | | 125,000 | | | | 128,690 | |
6.38% due 07/15/28 | | | 100,000 | | | | 99,979 | |
Ingevity Corp. | | | | | | | | |
3.88% due 11/01/285 | | | 225,000 | | | | 204,142 | |
SK Invictus Intermediate II SARL | | | | | | | | |
5.00% due 10/30/295 | | | 225,000 | | | | 203,763 | |
INEOS Finance plc | | | | | | | | |
6.75% due 05/15/285 | | | 200,000 | | | | 200,273 | |
Compass Minerals International, Inc. | | | | | | | | |
6.75% due 12/01/275 | | | 200,000 | | | | 191,128 | |
Novelis Corp. | | | | | | | | |
4.75% due 01/30/305 | | | 200,000 | | | | 185,541 | |
SEE NOTES TO FINANCIAL STATEMENTS. | THE GUGGENHEIM FUNDS SEMI-ANNUAL FINANCIAL REPORT | 75 |
SCHEDULE OF INVESTMENTS (Unaudited)(continued) | June 30, 2024 |
SERIES P (HIGH YIELD SERIES) | |
| | Face
Amount~ | | | Value | |
Kaiser Aluminum Corp. | | | | | | | | |
4.63% due 03/01/285 | | | 110,000 | | | $ | 102,923 | |
4.50% due 06/01/315 | | | 75,000 | | | | 66,416 | |
Minerals Technologies, Inc. | | | | | | | | |
5.00% due 07/01/285 | | | 175,000 | | | | 166,095 | |
Arsenal AIC Parent LLC | | | | | | | | |
8.00% due 10/01/305 | | | 100,000 | | | | 104,939 | |
Illuminate Buyer LLC / Illuminate Holdings IV, Inc. | | | | | | | | |
9.00% due 07/01/285 | | | 100,000 | | | | 100,792 | |
WR Grace Holdings LLC | | | | | | | | |
4.88% due 06/15/275 | | | 75,000 | | | | 72,325 | |
Mirabela Nickel Ltd. | | | | | | | | |
due 06/24/19†††,2,6 | | | 390,085 | | | | 1,950 | |
Total Basic Materials | | | | | | | 2,094,865 | |
| | | | | | | | | |
Technology - 4.2% | | | | | | | | |
Central Parent Incorporated / CDK Global, Inc. | | | | | | | | |
7.25% due 06/15/295 | | | 225,000 | | | | 223,888 | |
Dye & Durham Ltd. | | | | | | | | |
8.63% due 04/15/295 | | | 200,000 | | | | 202,884 | |
Boxer Parent Company, Inc. | | | | | | | | |
7.13% due 10/02/255 | | | 200,000 | | | | 200,151 | |
NCR Voyix Corp. | | | | | | | | |
5.13% due 04/15/295 | | | 200,000 | | | | 188,351 | |
Capstone Borrower, Inc. | | | | | | | | |
8.00% due 06/15/305 | | | 150,000 | | | | 154,905 | |
SS&C Technologies, Inc. | | | | | | | | |
5.50% due 09/30/275 | | | 100,000 | | | | 98,470 | |
Entegris, Inc. | | | | | | | | |
4.75% due 04/15/295 | | | 100,000 | | | | 95,676 | |
Dun & Bradstreet Corp. | | | | | | | | |
5.00% due 12/15/295 | | | 100,000 | | | | 92,883 | |
Cloud Software Group, Inc. | | | | | | | | |
6.50% due 03/31/295 | | | 75,000 | | | | 72,024 | |
Total Technology | | | | | | | 1,329,232 | |
| | | | | | | | | |
Utilities - 1.5% | | | | | | | | |
Terraform Global Operating, LP | | | | | | | | |
6.13% due 03/01/265 | | | 420,000 | | | | 414,701 | |
Clearway Energy Operating LLC | | | | | | | | |
4.75% due 03/15/285 | | | 75,000 | | | | 71,664 | |
Total Utilities | | | | | | | 486,365 | |
| | | | | | | | | |
Total Corporate Bonds | | | | |
(Cost $29,971,743) | | | 27,758,103 | |
| | | | | |
SENIOR FLOATING RATE INTERESTS††,◊ - 10.6% |
Consumer, Non-cyclical - 2.8% | | | | | | | | |
Outcomes Group Holdings, Inc. | | | | | | | | |
9.59% (3 Month Term SOFR + 4.25%, Rate Floor: 4.25%) due 04/01/31 | | | 100,000 | | | | 100,203 | |
Resonetics LLC | | | | | | | | |
9.08% (1 Month Term SOFR + 3.75%, Rate Floor: 4.50%) due 06/06/31 | | | 100,000 | | | | 100,125 | |
Gibson Brands, Inc. | | | | | | | | |
10.58% (3 Month Term SOFR + 5.00%, Rate Floor: 5.75%) due 08/11/28 | | | 95,063 | | | | 89,042 | |
National Mentor Holdings, Inc. | | | | | | | | |
9.19% ((1 Month Term SOFR + 3.75%) and (3 Month Term SOFR + 3.75%), Rate Floor: 4.50%) due 03/02/28 | | | 92,467 | | | | 87,104 | |
PlayCore | | | | | | | | |
9.84% (1 Month Term SOFR + 4.50%, Rate Floor: 5.50%) due 02/14/30 | | | 75,000 | | | | 75,406 | |
Confluent Health LLC | | | | | | | | |
9.46% (1 Month Term SOFR + 4.00%, Rate Floor: 4.50%) due 11/30/28††† | | | 73,372 | | | | 70,988 | |
IVI America LLC | | | | | | | | |
due 03/15/31 | | | 70,000 | | | | 70,394 | |
Blue Ribbon LLC | | | | | | | | |
11.57% (3 Month Term SOFR + 6.00%, Rate Floor: 6.75%) due 05/08/28 | | | 86,250 | | | | 65,119 | |
Women’s Care Holdings, Inc. | | | | | | | | |
9.93% (3 Month Term SOFR + 4.50%, Rate Floor: 5.25%) due 01/17/28 | | | 62,062 | | | | 57,439 | |
Endo Finance Holdings, Inc. | | | | | | | | |
9.83% (3 Month Term SOFR + 4.50%, Rate Floor: 5.00%) due 04/23/31 | | | 50,000 | | | | 49,907 | |
Balrog Acquisition, Inc. | | | | | | | | |
9.96% (1 Month Term SOFR + 4.50%, Rate Floor: 5.25%) due 09/05/28††† | | | 49,500 | | | | 49,500 | |
TGP Holdings LLC | | | | | | | | |
8.69% (1 Month Term SOFR + 3.25%, Rate Floor: 4.00%) due 06/29/28 | | | 48,515 | | | | 45,885 | |
Kronos Acquisition Holdings, Inc. | | | | | | | | |
11.49% (3 Month Term SOFR + 6.00%, Rate Floor: 7.00%) due 12/22/26 | | | 24,438 | | | | 24,437 | |
Total Consumer, Non-cyclical | | | | | | | 885,549 | |
| | | | | | | | | |
Consumer, Cyclical - 2.4% | | | | | | | | |
PetSmart LLC | | | | | | | | |
9.19% (1 Month Term SOFR + 3.75%, Rate Floor: 4.50%) due 02/11/28 | | | 145,875 | | | | 145,267 | |
ScribeAmerica Intermediate Holdco LLC (Healthchannels) | | | | | | | | |
9.96% (1 Month Term SOFR + 4.50%, Rate Floor: 5.50%) due 04/03/25 | | | 182,348 | | | | 126,427 | |
CCRR Parent, Inc. | | | | | | | | |
9.71% (1 Month Term SOFR + 4.25%, Rate Floor: 5.00%) due 03/06/28 | | | 146,859 | | | | 124,188 | |
American Tire Distributors, Inc. | | | | | | | | |
11.84% (3 Month Term SOFR + 6.25%, Rate Floor: 7.00%) due 10/20/28 | | | 171,500 | | | | 123,641 | |
Apro LLC | | | | | | | | |
due 06/26/31 | | | 75,000 | | | | 74,906 | |
Holding SOCOTEC | | | | | | | | |
9.57% (6 Month Term SOFR + 4.00%, Rate Floor: 4.75%) due 06/30/28 | | | 72,750 | | | | 72,599 | |
76 | THE GUGGENHEIM FUNDS SEMI-ANNUAL FINANCIAL REPORT | SEE NOTES TO FINANCIAL STATEMENTS. |
SCHEDULE OF INVESTMENTS (Unaudited)(continued) | June 30, 2024 |
SERIES P (HIGH YIELD SERIES) | |
| | Face
Amount~ | | | Value | |
First Brands Group LLC | | | | | | | | |
10.59% (3 Month Term SOFR + 5.00%, Rate Floor: 6.00%) due 03/30/27 | | | 49,391 | | | $ | 49,006 | |
Rent-A-Center, Inc. | | | | | | | | |
8.09% (1 Month Term SOFR + 2.75%, Rate Floor: 3.25%) due 02/17/28 | | | 45,993 | | | | 46,070 | |
WW International, Inc. | | | | | | | | |
8.96% (1 Month Term SOFR + 3.50%, Rate Floor: 4.00%) due 04/13/28 | | | 45,000 | | | | 16,650 | |
Total Consumer, Cyclical | | | | | | | 778,754 | |
| | | | | | | | | |
Industrial - 2.3% | | | | | | | | |
Arcline FM Holdings LLC | | | | | | | | |
10.35% (3 Month Term SOFR + 4.75%, Rate Floor: 5.50%) due 06/23/28 | | | 170,188 | | | | 170,320 | |
Gulfside Supply, Inc. | | | | | | | | |
due 05/29/31 | | | 125,000 | | | | 125,000 | |
Dispatch Terra Acquisition LLC | | | | | | | | |
9.73% (3 Month Term SOFR + 4.25%, Rate Floor: 5.00%) due 03/27/28 | | | 145,622 | | | | 124,324 | |
Pelican Products, Inc. | | | | | | | | |
9.85% (3 Month Term SOFR + 4.25%, Rate Floor: 4.75%) due 12/29/28 | | | 89,034 | | | | 81,849 | |
Michael Baker International LLC | | | | | | | | |
10.09% (1 Month Term SOFR + 4.75%, Rate Floor: 5.50%) due 12/01/28††† | | | 73,313 | | | | 73,404 | |
Aegion Corp. | | | | | | | | |
9.59% (1 Month Term SOFR + 4.25%, Rate Floor: 5.00%) due 05/17/28 | | | 72,989 | | | | 73,198 | |
STS Operating, Inc. | | | | | | | | |
9.44% (3 Month Term SOFR + 4.10%, Rate Floor: 4.10%) due 03/15/31 | | | 50,000 | | | | 50,078 | |
Patriot Container Corp. (Wastequip) | | | | | | | | |
9.19% (1 Month Term SOFR + 3.75%, Rate Floor: 4.75%) due 03/20/25 | | | 24,802 | | | | 24,098 | |
Total Industrial | | | | | | | 722,271 | |
| | | | | | | | | |
Technology - 1.3% | | | | | | | | |
Cloud Software Group, Inc. | | | | | | | | |
9.33% (3 Month Term SOFR + 4.00%, Rate Floor: 4.50%) due 03/30/29 | | | 98,878 | | | | 98,730 | |
Blackhawk Network Holdings, Inc. | | | | | | | | |
10.34% (1 Month Term SOFR + 5.00%, Rate Floor: 6.00%) due 02/23/29 | | | 75,000 | | | | 75,141 | |
DS Admiral Bidco LLC | | | | | | | | |
due 06/05/31 | | | 75,000 | | | | 74,250 | |
Modena Buyer LLC | | | | | | | | |
due 04/17/31 | | | 75,000 | | | | 73,101 | |
Planview Parent, Inc. | | | | | | | | |
due 12/17/27 | | | 55,000 | | | | 54,863 | |
Atlas CC Acquisition Corp. | | | | | | | | |
9.86% (3 Month Term SOFR + 4.25%, Rate Floor: 5.00%) due 05/25/28 | | | 72,938 | | | | 53,042 | |
Total Technology | | | | | | | 429,127 | |
| | | | | | | | | |
Financial - 0.7% | | | | | | | | |
Asurion LLC | | | | | | | | |
due 08/20/28 | | | 79,798 | | | | 79,111 | |
Eisner Advisory Group | | | | | | | | |
9.34% (3 Month Term SOFR + 4.00%, Rate Floor: 4.50%) due 02/22/31 | | | 75,000 | | | | 75,594 | |
Franchise Group, Inc. | | | | | | | | |
10.36% (6 Month Term SOFR + 4.75%, Rate Floor: 5.50%) due 03/10/26 | | | 99,888 | | | | 75,165 | |
Total Financial | | | | | | | 229,870 | |
| | | | | | | | | |
Basic Materials - 0.5% | | | | | | | | |
LTI Holdings, Inc. | | | | | | | | |
10.21% (1 Month Term SOFR + 4.75%, Rate Floor: 4.75%) due 07/24/26 | | | 97,828 | | | | 96,601 | |
NIC Acquisition Corp. | | | | | | | | |
9.35% (3 Month Term SOFR + 3.75%, Rate Floor: 4.50%) due 12/29/27 | | | 87,154 | | | | 72,447 | |
Total Basic Materials | | | | | | | 169,048 | |
| | | | | | | | | |
Communications - 0.5% | | | | | | | | |
Cengage Learning, Inc. | | | | | | | | |
9.54% (6 Month Term SOFR + 4.25%, Rate Floor: 5.25%) due 03/24/31 | | | 125,000 | | | | 125,235 | |
Xplornet Communications, Inc. | | | | | | | | |
9.57% (3 Month Term SOFR + 4.26%, Rate Floor: 4.76%) due 10/02/28 | | | 121,875 | | | | 18,451 | |
Total Communications | | | | | | | 143,686 | |
| | | | | | | | | |
Energy - 0.1% | | | | | | | | |
Permian Production Partners LLC | | | | | | | | |
13.46% (1 Month Term SOFR + 6.00%, Rate Floor: 7.00%) (in-kind rate was 2.00%) due 11/24/25†††,7 | | | 15,774 | | | | 15,616 | |
Total Senior Floating Rate Interests | | | | |
(Cost $3,716,552) | | | 3,373,921 | |
| | | | | | | | | |
Total Investments - 101.6% | | | | |
(Cost $35,732,578) | | $ | 32,515,358 | |
Other Assets & Liabilities, net - (1.6)% | | | (510,417 | ) |
Total Net Assets - 100.0% | | $ | 32,004,941 | |
SEE NOTES TO FINANCIAL STATEMENTS. | THE GUGGENHEIM FUNDS SEMI-ANNUAL FINANCIAL REPORT | 77 |
SCHEDULE OF INVESTMENTS (Unaudited)(continued) | June 30, 2024 |
SERIES P (HIGH YIELD SERIES) | |
Forward Foreign Currency Exchange Contracts†† |
Counterparty | | Currency | | | Type | | | Quantity | | | Contract
Amount | | | Settlement
Date | | | Unrealized
Appreciation
(Depreciation) | |
Barclays Bank plc | | | EUR | | | | Sell | | | | 348,000 | | | | 374,396 USD | | | | 07/16/24 | | | $ | 1,270 | |
Morgan Stanley Capital Services LLC | | | CAD | | | | Sell | | | | 72,000 | | | | 52,390 USD | | | | 07/16/24 | | | | (267 | ) |
| | | | | | | | | | | | | | | | | | | | | | | $ | 1,003 | |
~ | The face amount is denominated in U.S. dollars unless otherwise indicated. |
* | Non-income producing security. |
** | A copy of each underlying unaffiliated fund’s financial statements is available at the SEC’s website at www.sec.gov |
† | Value determined based on Level 1 inputs, unless otherwise noted — See Note 4. |
†† | Value determined based on Level 2 inputs, unless otherwise noted — See Note 4. |
††† | Value determined based on Level 3 inputs — See Note 4. |
◊ | Variable rate security. Rate indicated is the rate effective at June 30, 2024. In some instances, the effective rate is limited by a minimum rate floor or a maximum rate cap established by the issuer. The settlement status of a position may also impact the effective rate indicated. In some cases, a position may be unsettled at period end and may not have a stated effective rate. In instances where multiple underlying reference rates and spread amounts are shown, the effective rate is based on a weighted average. |
1 | Affiliated issuer. |
2 | Security is a 144A or Section 4(a)(2) security. These securities have been determined to be illiquid and restricted under guidelines established by the Board of Trustees. The total market value of 144A or Section 4(a)(2) illiquid and restricted securities is $45,090 (cost $398,471), or 0.1% of total net assets — See Note 9. |
3 | Security has a fixed rate coupon which will convert to a floating or variable rate coupon on a future date. |
4 | Rate indicated is the 7-day yield as of June 30, 2024. |
5 | Security is a 144A or Section 4(a)(2) security. These securities have been determined to be liquid under guidelines established by the Board of Trustees. The total market value of 144A or Section 4(a)(2) securities is $24,835,560 (cost $26,405,228), or 77.6% of total net assets. |
6 | Security is in default of interest and/or principal obligations. |
7 | Payment-in-kind security. |
| | CAD — Canadian Dollar |
| | EUR — Euro |
| | EURIBOR — European Interbank Offered Rate |
| | plc — Public Limited Company |
| | SARL — Société à Responsabilité Limitée |
| | SOFR — Secured Overnight Financing Rate |
| | |
| | See Sector Classification in Other Information section. |
78 | THE GUGGENHEIM FUNDS SEMI-ANNUAL FINANCIAL REPORT | SEE NOTES TO FINANCIAL STATEMENTS. |
SCHEDULE OF INVESTMENTS (Unaudited)(concluded) | June 30, 2024 |
SERIES P (HIGH YIELD SERIES) | |
The following table summarizes the inputs used to value the Fund’s investments at June 30, 2024 (See Note 4 in the Notes to Financial Statements):
Investments in Securities (Assets) | | Level 1
Quoted
Prices | | | Level 2
Significant
Observable
Inputs | | | Level 3
Significant
Unobservable
Inputs | | | Total | |
Common Stocks | | $ | 101,446 | | | $ | 9,586 | | | $ | 15,045 | | | $ | 126,077 | |
Preferred Stocks | | | — | | | | 421,773 | | | | 3 | | | | 421,776 | |
Money Market Fund | | | 835,481 | | | | — | | | | — | | | | 835,481 | |
Corporate Bonds | | | — | | | | 27,756,153 | | | | 1,950 | | | | 27,758,103 | |
Senior Floating Rate Interests | | | — | | | | 3,164,413 | | | | 209,508 | | | | 3,373,921 | |
Forward Foreign Currency Exchange Contracts** | | | — | | | | 1,270 | | | | — | | | | 1,270 | |
Total Assets | | $ | 936,927 | | | $ | 31,353,195 | | | $ | 226,506 | | | $ | 32,516,628 | |
Investments in Securities (Liabilities) | | Level 1
Quoted
Prices | | | Level 2
Significant
Observable
Inputs | | | Level 3
Significant
Unobservable
Inputs | | | Total | |
Forward Foreign Currency Exchange Contracts** | | $ | — | | | $ | 267 | | | $ | — | | | $ | 267 | |
** | This derivative is reported as unrealized appreciation/depreciation at period end. |
Affiliated Transactions
Investments representing 5% or more of the outstanding voting shares of a company, or control of or by, or common control under Guggenheim Investments, result in that company being considered an affiliated issuer, as defined in the 1940 Act.
Transactions during the period ended June 30, 2024, in which the company is an affiliated issuer, were as follows:
Security Name | | Value
12/31/23 | | | Additions | | | Reductions | | | Realized
Gain (Loss) | | | Change in
Unrealized
Appreciation
(Depreciation) | | | Value
06/30/24 | | | Shares
06/30/24 | | | Investment
Income | |
Common Stocks | | | | | | | | | | | | | | | | | | | | | | | | | | | | | | | | |
BP Holdco LLC * | | $ | 634 | | | $ | — | | | $ | — | | | $ | — | | | $ | — | | | $ | 634 | | | | 523 | | | $ | — | |
* | Non-income producing security. |
SEE NOTES TO FINANCIAL STATEMENTS. | THE GUGGENHEIM FUNDS SEMI-ANNUAL FINANCIAL REPORT | 79 |
SERIES P (HIGH YIELD SERIES) | |
STATEMENT OF ASSETS AND LIABILITIES (Unaudited) |
June 30, 2024 |
Assets: |
Investments in unaffiliated issuers, at value (cost $35,732,393) | | $ | 32,514,724 | |
Investments in affiliated issuers, at value (cost $185) | | | 634 | |
Cash | | | 10,018 | |
Unrealized appreciation on forward foreign currency exchange contracts | | | 1,270 | |
Prepaid expenses | | | 184 | |
Receivables: |
Interest | | | 518,665 | |
Foreign tax reclaims | | | 1,215 | |
Securities sold | | | 202 | |
Total assets | | | 33,046,912 | |
| | | | | |
Liabilities: |
Unrealized depreciation on forward foreign currency exchange contracts | | | 267 | |
Payable for: |
Securities purchased | | | 850,331 | |
Fund shares redeemed | | | 134,046 | |
Management fees | | | 9,707 | |
Distribution and service fees | | | 6,141 | |
Transfer agent and maintenance fees | | | 2,247 | |
Trustees’ fees* | | | 955 | |
Fund accounting/administration fees | | | 930 | |
Miscellaneous | | | 37,347 | |
Total liabilities | | | 1,041,971 | |
Net assets | | $ | 32,004,941 | |
| | | | | |
Net assets consist of: |
Paid in capital | | $ | 41,779,878 | |
Total distributable earnings (loss) | | | (9,774,937 | ) |
Net assets | | $ | 32,004,941 | |
Capital shares outstanding | | | 1,272,951 | |
Net asset value per share | | $ | 25.14 | |
STATEMENT OF OPERATIONS (Unaudited) |
Six Months Ended June 30, 2024 |
Investment Income: |
Dividends from securities of unaffiliated issuers | | $ | 14,430 | |
Interest | | | 1,170,734 | |
Total investment income | | | 1,185,164 | |
| | | | | |
Expenses: |
Management fees | | | 96,455 | |
Distribution and service fees | | | 40,189 | |
Transfer agent and maintenance fees | | | 12,741 | |
Professional fees | | | 20,496 | |
Fund accounting/administration fees | | | 10,650 | |
Custodian fees | | | 7,251 | |
Trustees’ fees* | | | 7,003 | |
Interest expense | | | 3,938 | |
Line of credit fees | | | 957 | |
Miscellaneous | | | 7,819 | |
Total expenses | | | 207,499 | |
Less: |
Expenses waived by Adviser | | | (34,900 | ) |
Net expenses | | | 172,599 | |
Net investment income | | | 1,012,565 | |
| | | | | |
Net Realized and Unrealized Gain (Loss): |
Net realized gain (loss) on: |
Investments in unaffiliated issuers | | | (148,605 | ) |
Forward foreign currency exchange contracts | | | 5,210 | |
Foreign currency transactions | | | 648 | |
Net realized loss | | | (142,747 | ) |
Net change in unrealized appreciation (depreciation) on: |
Investments in unaffiliated issuers | | | (92,981 | ) |
Forward foreign currency exchange contracts | | | 12,151 | |
Foreign currency translations | | | (106 | ) |
Net change in unrealized appreciation (depreciation) | | | (80,936 | ) |
Net realized and unrealized loss | | | (223,683 | ) |
Net increase in net assets resulting from operations | | $ | 788,882 | |
* | Relates to Trustees not deemed “interested persons” within the meaning of Section 2(a)(19) of the 1940 Act. |
80 | THE GUGGENHEIM FUNDS SEMI-ANNUAL FINANCIAL REPORT | SEE NOTES TO FINANCIAL STATEMENTS. |
SERIES P (HIGH YIELD SERIES) | |
STATEMENTS OF CHANGES IN NET ASSETS |
| | Six Months Ended
June 30, 2024
(Unaudited) | | | Year Ended
December 31,
2023 | |
Increase (Decrease) in Net Assets from Operations: | | | | | | | | |
Net investment income | | $ | 1,012,565 | | | $ | 1,936,311 | |
Net realized loss on investments | | | (142,747 | ) | | | (532,773 | ) |
Net change in unrealized appreciation (depreciation) on investments | | | (80,936 | ) | | | 2,236,322 | |
Net increase in net assets resulting from operations | | | 788,882 | | | | 3,639,860 | |
| | | | | | | | | |
Distributions to shareholders | | | — | | | | (1,782,949 | ) |
| | | | | | | | | |
Capital share transactions: | | | | | | | | |
Proceeds from sale of shares | | | 2,327,046 | | | | 22,499,533 | |
Distributions reinvested | | | — | | | | 1,782,949 | |
Cost of shares redeemed | | | (4,296,766 | ) | | | (25,271,728 | ) |
Net decrease from capital share transactions | | | (1,969,720 | ) | | | (989,246 | ) |
Net increase (decrease) in net assets | | | (1,180,838 | ) | | | 867,665 | |
| | | | | | | | | |
Net assets: | | | | | | | | |
Beginning of period | | | 33,185,779 | | | | 32,318,114 | |
End of period | | $ | 32,004,941 | | | $ | 33,185,779 | |
| | | | | | | | | |
Capital share activity: | | | | | | | | |
Shares sold | | | 94,030 | | | | 952,750 | |
Shares issued from reinvestment of distributions | | | — | | | | 76,951 | |
Shares redeemed | | | (174,164 | ) | | | (1,069,069 | ) |
Net decrease in shares | | | (80,134 | ) | | | (39,368 | ) |
SEE NOTES TO FINANCIAL STATEMENTS. | THE GUGGENHEIM FUNDS SEMI-ANNUAL FINANCIAL REPORT | 81 |
SERIES P (HIGH YIELD SERIES) | |
This table is presented to show selected data for a share outstanding throughout each period and to assist shareholders in evaluating a Fund’s performance for the periods presented.
| | Six Months Ended
June 30, 2024a | | | Year Ended
December 31,
2023 | | | Year Ended
December 31,
2022 | | | Year Ended
December 31,
2021 | | | Year Ended
December 31,
2020 | | | Year Ended
December 31,
2019 | |
Per Share Data |
Net asset value, beginning of period | | $ | 24.53 | | | $ | 23.21 | | | $ | 27.55 | | | $ | 27.49 | | | $ | 28.39 | | | $ | 27.51 | |
Income (loss) from investment operations: |
Net investment income (loss)b | | | .78 | | | | 1.47 | | | | 1.28 | | | | 1.30 | | | | 1.37 | | | | 1.68 | |
Net gain (loss) on investments (realized and unrealized) | | | (.17 | ) | | | 1.25 | | | | (3.95 | ) | | | .18 | | | | (.21 | ) | | | 1.45 | |
Total from investment operations | | | .61 | | | | 2.72 | | | | (2.67 | ) | | | 1.48 | | | | 1.16 | | | | 3.13 | |
Less distributions from: |
Net investment income | | | — | | | | (1.40 | ) | | | (1.67 | ) | | | (1.42 | ) | | | (2.06 | ) | | | (2.25 | ) |
Total distributions | | | — | | | | (1.40 | ) | | | (1.67 | ) | | | (1.42 | ) | | | (2.06 | ) | | | (2.25 | ) |
Net asset value, end of period | | $ | 25.14 | | | $ | 24.53 | | | $ | 23.21 | | | $ | 27.55 | | | $ | 27.49 | | | $ | 28.39 | |
|
Total Returnc | | | 2.49 | % | | | 12.02 | % | | | (9.70 | %) | | | 5.41 | % | | | 4.64 | % | | | 11.59 | % |
Ratios/Supplemental Data |
Net assets, end of period (in thousands) | | $ | 32,005 | | | $ | 33,186 | | | $ | 32,318 | | | $ | 44,592 | | | $ | 45,153 | | | $ | 54,288 | |
Ratios to average net assets: |
Net investment income (loss) | | | 6.30 | % | | | 6.23 | % | | | 5.19 | % | | | 4.70 | % | | | 5.13 | % | | | 5.89 | % |
Total expensesd | | | 1.29 | % | | | 1.34 | % | | | 1.28 | % | | | 1.28 | % | | | 1.38 | % | | | 1.31 | % |
Net expensese,f | | | 1.07 | % | | | 1.08 | % | | | 1.07 | % | | | 1.08 | % | | | 1.12 | % | | | 1.10 | % |
Portfolio turnover rate | | | 24 | % | | | 39 | % | | | 33 | % | | | 76 | % | | | 84 | % | | | 58 | % |
a | Unaudited figures for the period ended June 30, 2024. Percentage amounts for the period, except total return and portfolio turnover rate, have been annualized. |
b | Net investment income (loss) per share was computed using average shares outstanding throughout the period. |
c | Total return does not take into account any of the expenses associated with an investment in variable insurance products. If total return had taken into account these expenses, performance would have been lower. Shares of a series of Guggenheim Variable Funds Trust are available only through the purchase of such products. |
d | Does not include expenses of the underlying funds in which the Fund invests. |
e | Net expense information reflects the expense ratios after expense waivers and reimbursements, as applicable. |
f | Net expenses may include expenses that are excluded from the expense limitation agreement. Excluding these expenses, the net expense ratios for the years presented would be: |
| | 06/30/24a | 12/31/23 | 12/31/22 | 12/31/21 | 12/31/20 | 12/31/19 |
| | 1.04% | 1.05% | 1.05% | 1.06% | 1.07% | 1.07% |
82 | THE GUGGENHEIM FUNDS SEMI-ANNUAL FINANCIAL REPORT | SEE NOTES TO FINANCIAL STATEMENTS. |
SCHEDULE OF INVESTMENTS (Unaudited) | June 30, 2024 |
SERIES Q (SMALL CAP VALUE SERIES) | |
| | Shares | | | Value | |
COMMON STOCKS† - 91.9% |
| | | | | | | | | |
Financial - 25.7% |
Stifel Financial Corp. | | | 14,822 | | | $ | 1,247,271 | |
Old National Bancorp | | | 54,441 | | | | 935,841 | |
STAG Industrial, Inc. REIT | | | 22,618 | | | | 815,605 | |
Unum Group | | | 15,874 | | | | 811,320 | |
Cathay General Bancorp | | | 21,370 | | | | 806,076 | |
First Horizon Corp. | | | 50,408 | | | | 794,934 | |
Healthpeak Properties, Inc. REIT | | | 36,575 | | | | 716,875 | |
Old Republic International Corp. | | | 21,100 | | | | 651,990 | |
First Merchants Corp. | | | 18,547 | | | | 617,430 | |
LXP Industrial Trust REIT | | | 67,059 | | | | 611,578 | |
Hanmi Financial Corp. | | | 35,569 | | | | 594,714 | |
Hancock Whitney Corp. | | | 12,214 | | | | 584,195 | |
Jefferies Financial Group, Inc. | | | 10,997 | | | | 547,211 | |
Prosperity Bancshares, Inc. | | | 8,912 | | | | 544,880 | |
First American Financial Corp. | | | 9,429 | | | | 508,694 | |
WisdomTree, Inc. | | | 46,292 | | | | 458,754 | |
Apple Hospitality REIT, Inc. | | | 30,185 | | | | 438,890 | |
Synovus Financial Corp. | | | 9,959 | | | | 400,252 | |
Sunstone Hotel Investors, Inc. REIT | | | 35,434 | | | | 370,640 | |
Jones Lang LaSalle, Inc.* | | | 1,697 | | | | 348,360 | |
Independent Bank Group, Inc. | | | 7,348 | | | | 334,481 | |
Stewart Information Services Corp. | | | 5,311 | | | | 329,707 | |
First Hawaiian, Inc. | | | 12,966 | | | | 269,174 | |
United Bankshares, Inc. | | | 8,031 | | | | 260,526 | |
United Community Banks, Inc. | | | 8,606 | | | | 219,109 | |
BOK Financial Corp. | | | 2,380 | | | | 218,103 | |
Piedmont Office Realty Trust, Inc. — Class A REIT | | | 22,755 | | | | 164,974 | |
RMR Group, Inc. — Class A | | | 7,220 | | | | 163,172 | |
Total Financial | | | | | | | 14,764,756 | |
| | | | | | | | | |
Industrial - 16.6% |
Kirby Corp.* | | | 9,394 | | | | 1,124,743 | |
Arcosa, Inc. | | | 11,657 | | | | 972,310 | |
Summit Materials, Inc. — Class A* | | | 22,256 | | | | 814,792 | |
Curtiss-Wright Corp. | | | 2,816 | | | | 763,080 | |
Advanced Energy Industries, Inc. | | | 6,700 | | | | 728,692 | |
Moog, Inc. — Class A | | | 4,241 | | | | 709,519 | |
Knight-Swift Transportation Holdings, Inc. | | | 13,527 | | | | 675,268 | |
MDU Resources Group, Inc. | | | 26,414 | | | | 662,992 | |
Sonoco Products Co. | | | 10,651 | | | | 540,219 | |
Esab Corp. | | | 5,652 | | | | 533,719 | |
Graphic Packaging Holding Co. | | | 19,212 | | | | 503,546 | |
Littelfuse, Inc. | | | 1,586 | | | | 405,366 | |
Park Aerospace Corp. | | | 28,528 | | | | 390,263 | |
Gates Industrial Corporation plc* | | | 17,793 | | | | 281,307 | |
Timken Co. | | | 1,977 | | | | 158,417 | |
NVE Corp. | | | 1,852 | | | | 138,326 | |
Stoneridge, Inc.* | | | 6,684 | | | | 106,677 | |
Total Industrial | | | | | | | 9,509,236 | |
| | | | | | | | | |
Consumer, Non-cyclical - 15.9% |
Encompass Health Corp. | | | 15,794 | | | | 1,354,967 | |
MGP Ingredients, Inc. | | | 15,614 | | | | 1,161,682 | |
Euronet Worldwide, Inc.* | | | 9,664 | | | | 1,000,224 | |
Enovis Corp.* | | | 17,412 | | | | 787,022 | |
Central Garden & Pet Co. — Class A* | | | 19,498 | | | | 644,002 | |
RadNet, Inc.* | | | 10,595 | | | | 624,258 | |
Addus HomeCare Corp.* | | | 5,048 | | | | 586,123 | |
LivaNova plc* | | | 10,351 | | | | 567,442 | |
Ingredion, Inc. | | | 4,743 | | | | 544,022 | |
ICF International, Inc. | | | 3,175 | | | | 471,361 | |
Perdoceo Education Corp. | | | 20,801 | | | | 445,557 | |
Integer Holdings Corp.* | | | 2,929 | | | | 339,149 | |
Certara, Inc.* | | | 24,453 | | | | 338,674 | |
Azenta, Inc.* | | | 5,523 | | | | 290,620 | |
Total Consumer, Non-cyclical | | | | | | | 9,155,103 | |
| | | | | | | | | |
Consumer, Cyclical - 9.8% |
Rush Enterprises, Inc. — Class A | | | 26,989 | | | | 1,130,030 | |
H&E Equipment Services, Inc. | | | 18,636 | | | | 823,152 | |
Crocs, Inc.* | | | 5,169 | | | | 754,364 | |
Sonic Automotive, Inc. — Class A | | | 8,945 | | | | 487,234 | |
Alaska Air Group, Inc.* | | | 11,992 | | | | 484,477 | |
MSC Industrial Direct Company, Inc. — Class A | | | 4,531 | | | | 359,354 | |
AutoNation, Inc.* | | | 2,124 | | | | 338,523 | |
MarineMax, Inc.* | | | 9,293 | | | | 300,814 | |
Advance Auto Parts, Inc. | | | 4,642 | | | | 293,978 | |
Macy’s, Inc. | | | 13,170 | | | | 252,864 | |
Newell Brands, Inc. | | | 22,864 | | | | 146,558 | |
Century Communities, Inc. | | | 1,740 | | | | 142,088 | |
Methode Electronics, Inc. | | | 10,734 | | | | 111,097 | |
Total Consumer, Cyclical | | | | | | | 5,624,533 | |
| | | | | | | | | |
Energy - 9.8% |
Liberty Energy, Inc. — Class A | | | 56,221 | | | | 1,174,457 | |
Murphy Oil Corp. | | | 27,505 | | | | 1,134,306 | |
CNX Resources Corp.* | | | 40,226 | | | | 977,492 | |
Patterson-UTI Energy, Inc. | | | 55,761 | | | | 577,684 | |
Diamondback Energy, Inc. | | | 2,120 | | | | 424,403 | |
Baytex Energy Corp. | | | 109,016 | | | | 379,375 | |
Talos Energy, Inc.* | | | 29,247 | | | | 355,351 | |
Range Resources Corp. | | | 8,907 | | | | 298,652 | |
ProPetro Holding Corp.* | | | 32,309 | | | | 280,119 | |
Total Energy | | | | | | | 5,601,839 | |
| | | | | | | | | |
Utilities - 4.6% |
OGE Energy Corp. | | | 30,576 | | | | 1,091,563 | |
Spire, Inc. | | | 7,249 | | | | 440,232 | |
Black Hills Corp. | | | 7,403 | | | | 402,575 | |
ALLETE, Inc. | | | 5,769 | | | | 359,697 | |
Avista Corp. | | | 9,559 | | | | 330,837 | |
Total Utilities | | | | | | | 2,624,904 | |
| | | | | | | | | |
Basic Materials - 4.2% |
Avient Corp. | | | 15,796 | | | | 689,496 | |
Ashland, Inc. | | | 6,259 | | | | 591,413 | |
Commercial Metals Co. | | | 8,977 | | | | 493,645 | |
MP Materials Corp.* | | | 26,853 | | | | 341,839 | |
SEE NOTES TO FINANCIAL STATEMENTS. | THE GUGGENHEIM FUNDS SEMI-ANNUAL FINANCIAL REPORT | 83 |
SCHEDULE OF INVESTMENTS (Unaudited)(continued) | June 30, 2024 |
SERIES Q (SMALL CAP VALUE SERIES) | |
| | Shares | | | Value | |
Huntsman Corp. | | | 14,242 | | | $ | 324,290 | |
Total Basic Materials | | | | | | | 2,440,683 | |
| | | | | | | | | |
Technology - 2.9% |
Science Applications International Corp. | | | 7,631 | | | | 897,024 | |
Amkor Technology, Inc. | | | 18,498 | | | | 740,290 | |
Total Technology | | | | | | | 1,637,314 | |
| | | | | | | | | |
Communications - 2.4% |
Ciena Corp.* | | | 9,083 | | | | 437,619 | |
Calix, Inc.* | | | 10,580 | | | | 374,850 | |
TEGNA, Inc. | | | 19,791 | | | | 275,886 | |
Luna Innovations, Inc.* | | | 44,775 | | | | 143,280 | |
Gray Television, Inc. | | | 25,944 | | | | 134,909 | |
Total Communications | | | | | | | 1,366,544 | |
| | | | | | | | | |
Total Common Stocks | | | | |
(Cost $47,198,166) | | | | | | | 52,724,912 | |
| | | | | | | | | |
CONVERTIBLE PREFERRED STOCKS††† - 0.0% |
Industrial - 0.0% |
Thermoenergy Corp.*,1 | | | 116,667 | | | | 34 | |
Total Convertible Preferred Stocks | | | | |
(Cost $111,409) | | | | | | | 34 | |
| | | | | | | | | |
RIGHTS† - 0.1% |
Basic Materials - 0.1% |
Pan American Silver Corp.* |
Expires 02/22/29 | | | 81,258 | | | | 37,590 | |
Total Rights | | | | |
(Cost $—) | | | | | | | 37,590 | |
| | | | | | | | | |
EXCHANGE-TRADED FUNDS**,† - 5.5% |
SPDR S&P Biotech ETF | | | 18,880 | | | | 1,750,365 | |
iShares Russell 2000 Value ETF | | | 9,455 | | | | 1,439,996 | |
Total Exchange-Traded Funds | | | | |
(Cost $2,513,307) | | | | | | | 3,190,361 | |
| | | | | | | | | |
MONEY MARKET FUND**,† - 2.5% |
Dreyfus Treasury Securities Cash Management Fund — Institutional Shares, 5.18%2 | | | 1,443,626 | | | | 1,443,626 | |
Total Money Market Fund | | | | |
(Cost $1,443,626) | | | | | | | 1,443,626 | |
| | | | | | | | | |
Total Investments - 100.0% | | | | |
(Cost $51,266,508) | | $ | 57,396,523 | |
Other Assets & Liabilities, net - 0.0% | | | (4,556 | ) |
Total Net Assets - 100.0% | | $ | 57,391,967 | |
* | Non-income producing security. |
** | A copy of each underlying unaffiliated fund’s financial statements is available at the SEC’s website at www.sec.gov. |
† | Value determined based on Level 1 inputs — See Note 4. |
††† | Value determined based on Level 3 inputs — See Note 4. |
1 | PIPE (Private Investment in Public Equity) - Stock issued by a company in the secondary market as a means of raising capital more quickly and less expensively than through registration of a secondary public offering. |
2 | Rate indicated is the 7-day yield as of June 30, 2024. |
| | plc — Public Limited Company |
| | REIT — Real Estate Investment Trust |
| | |
| | See Sector Classification in Other Information section. |
84 | THE GUGGENHEIM FUNDS SEMI-ANNUAL FINANCIAL REPORT | SEE NOTES TO FINANCIAL STATEMENTS. |
SCHEDULE OF INVESTMENTS (Unaudited)(concluded) | June 30, 2024 |
SERIES Q (SMALL CAP VALUE SERIES) | |
The following table summarizes the inputs used to value the Fund’s investments at June 30, 2024 (See Note 4 in the Notes to Financial Statements):
Investments in Securities (Assets) | | Level 1
Quoted
Prices | | | Level 2
Significant
Observable
Inputs | | | Level 3
Significant
Unobservable
Inputs | | | Total | |
Common Stocks | | $ | 52,724,912 | | | $ | — | | | $ | — | | | $ | 52,724,912 | |
Convertible Preferred Stocks | | | — | | | | — | | | | 34 | | | | 34 | |
Rights | | | 37,590 | | | | — | | | | — | | | | 37,590 | |
Exchange-Traded Funds | | | 3,190,361 | | | | — | | | | — | | | | 3,190,361 | |
Money Market Fund | | | 1,443,626 | | | | — | | | | — | | | | 1,443,626 | |
Total Assets | | $ | 57,396,489 | | | $ | — | | | $ | 34 | | | $ | 57,396,523 | |
SEE NOTES TO FINANCIAL STATEMENTS. | THE GUGGENHEIM FUNDS SEMI-ANNUAL FINANCIAL REPORT | 85 |
SERIES Q (SMALL CAP VALUE SERIES) | |
STATEMENT OF ASSETS AND LIABILITIES (Unaudited) |
June 30, 2024 |
Assets: |
Investments, at value (cost $51,266,508) | | $ | 57,396,523 | |
Prepaid expenses | | | 121 | |
Receivables: |
Dividends | | | 63,964 | |
Interest | | | 8,611 | |
Fund shares sold | | | 340 | |
Total assets | | | 57,469,559 | |
| | | | | |
Liabilities: |
Payable for: |
Management fees | | | 30,308 | |
Professional fees | | | 12,000 | |
Distribution and service fees | | | 11,263 | |
Fund shares redeemed | | | 10,232 | |
Transfer agent/maintenance fees | | | 4,478 | |
Fund accounting/administration fees | | | 1,293 | |
Trustees’ fees* | | | 1,041 | |
Due to Investment Adviser | | | 57 | |
Miscellaneous | | | 6,920 | |
Total liabilities | | | 77,592 | |
Net assets | | $ | 57,391,967 | |
| | | | | |
Net assets consist of: |
Paid in capital | | $ | 46,395,219 | |
Total distributable earnings (loss) | | | 10,996,748 | |
Net assets | | $ | 57,391,967 | |
Capital shares outstanding | | | 1,325,077 | |
Net asset value per share | | $ | 43.31 | |
STATEMENT OF OPERATIONS (Unaudited) |
Six Months Ended June 30, 2024 |
Investment Income: |
Dividends (net of foreign withholding tax of $540) | | $ | 555,008 | |
Interest | | | 30,882 | |
Total investment income | | | 585,890 | |
| | | | | |
Expenses: |
Management fees | | | 226,118 | |
Distribution and service fees | | | 75,373 | |
Transfer agent/maintenance fees | | | 14,435 | |
Professional fees | | | 17,610 | |
Fund accounting/administration fees | | | 16,043 | |
Trustees’ fees* | | | 7,071 | |
Custodian fees | | | 1,212 | |
Line of credit fees | | | 832 | |
Miscellaneous | | | 6,046 | |
Recoupment of previously waived fees | | | 260 | |
Total expenses | | | 365,000 | |
Less: |
Expenses waived by Adviser | | | (29,496 | ) |
Net expenses | | | 335,504 | |
Net investment income | | | 250,386 | |
| | | | | |
Net Realized and Unrealized Gain (Loss): |
Net realized gain (loss) on: |
Investments | | | 1,357,681 | |
Net realized gain | | | 1,357,681 | |
Net change in unrealized appreciation (depreciation) on: |
Investments | | | (1,431,029 | ) |
Net change in unrealized appreciation (depreciation) | | | (1,431,029 | ) |
Net realized and unrealized loss | | | (73,348 | ) |
Net increase in net assets resulting from operations | | $ | 177,038 | |
* | Relates to Trustees not deemed “interested persons” within the meaning of Section 2(a)(19) of the 1940 Act. |
86 | THE GUGGENHEIM FUNDS SEMI-ANNUAL FINANCIAL REPORT | SEE NOTES TO FINANCIAL STATEMENTS. |
SERIES Q (SMALL CAP VALUE SERIES) | |
STATEMENTS OF CHANGES IN NET ASSETS |
| | Six Months Ended
June 30, 2024
(Unaudited) | | | Year Ended
December 31,
2023 | |
Increase (Decrease) in Net Assets from Operations: | | | | | | | | |
Net investment income | | $ | 250,386 | | | $ | 699,173 | |
Net realized gain on investments | | | 1,357,681 | | | | 3,429,041 | |
Net change in unrealized appreciation (depreciation) on investments | | | (1,431,029 | ) | | | 1,763,165 | |
Net increase in net assets resulting from operations | | | 177,038 | | | | 5,891,379 | |
| | | | | | | | | |
Distributions to shareholders | | | — | | | | (4,697,915 | ) |
| | | | | | | | | |
Capital share transactions: | | | | | | | | |
Proceeds from sale of shares | | | 1,458,730 | | | | 3,300,157 | |
Distributions reinvested | | | — | | | | 4,697,915 | |
Cost of shares redeemed | | | (6,463,056 | ) | | | (11,356,057 | ) |
Net decrease from capital share transactions | | | (5,004,326 | ) | | | (3,357,985 | ) |
Net decrease in net assets | | | (4,827,288 | ) | | | (2,164,521 | ) |
| | | | | | | | | |
Net assets: | | | | | | | | |
Beginning of period | | | 62,219,255 | | | | 64,383,776 | |
End of period | | $ | 57,391,967 | | | $ | 62,219,255 | |
| | | | | | | | | |
Capital share activity: | | | | | | | | |
Shares sold | | | 33,359 | | | | 79,965 | |
Shares issued from reinvestment of distributions | | | — | | | | 114,948 | |
Shares redeemed | | | (149,398 | ) | | | (276,354 | ) |
Net decrease in shares | | | (116,039 | ) | | | (81,441 | ) |
SEE NOTES TO FINANCIAL STATEMENTS. | THE GUGGENHEIM FUNDS SEMI-ANNUAL FINANCIAL REPORT | 87 |
SERIES Q (SMALL CAP VALUE SERIES) | |
This table is presented to show selected data for a share outstanding throughout each period and to assist shareholders in evaluating a Fund’s performance for the periods presented.
| | Six Months Ended
June 30, 2024a | | | Year Ended
December 31,
2023 | | | Year Ended
December 31,
2022 | | | Year Ended
December 31,
2021 | | | Year Ended
December 31,
2020 | | | Year Ended
December 31,
2019 | |
Per Share Data |
Net asset value, beginning of period | | $ | 43.17 | | | $ | 42.29 | | | $ | 46.70 | | | $ | 37.30 | | | $ | 41.39 | | | $ | 36.18 | |
Income (loss) from investment operations: |
Net investment income (loss)b | | | .18 | | | | .47 | | | | .51 | | | | .27 | | | | .32 | | | | .32 | |
Net gain (loss) on investments (realized and unrealized) | | | (.04 | ) | | | 3.68 | | | | (2.37 | ) | | | 9.47 | | | | (1.36 | ) | | | 7.62 | |
Total from investment operations | | | .14 | | | | 4.15 | | | | (1.86 | ) | | | 9.74 | | | | (1.04 | ) | | | 7.94 | |
Less distributions from: |
Net investment income | | | — | | | | (.56 | ) | | | (.31 | ) | | | (.34 | ) | | | (.37 | ) | | | (.33 | ) |
Net realized gains | | | — | | | | (2.71 | ) | | | (2.24 | ) | | | — | | | | (2.68 | ) | | | (2.40 | ) |
Total distributions | | | — | | | | (3.27 | ) | | | (2.55 | ) | | | (.34 | ) | | | (3.05 | ) | | | (2.73 | ) |
Net asset value, end of period | | $ | 43.31 | | | $ | 43.17 | | | $ | 42.29 | | | $ | 46.70 | | | $ | 37.30 | | | $ | 41.39 | |
|
Total Returnc | | | 0.32 | % | | | 10.29 | % | | | (3.74 | %) | | | 26.18 | % | | | (0.97 | %) | | | 22.58 | % |
Ratios/Supplemental Data |
Net assets, end of period (in thousands) | | $ | 57,392 | | | $ | 62,219 | | | $ | 64,384 | | | $ | 73,837 | | | $ | 64,418 | | | $ | 74,015 | |
Ratios to average net assets: |
Net investment income (loss) | | | 0.83 | % | | | 1.15 | % | | | 1.17 | % | | | 0.61 | % | | | 0.97 | % | | | 0.80 | % |
Total expensesd | | | 1.21 | % | | | 1.23 | % | | | 1.21 | % | | | 1.21 | % | | | 1.29 | % | | | 1.29 | % |
Net expensese,f,g | | | 1.11 | % | | | 1.11 | % | | | 1.12 | % | | | 1.13 | % | | | 1.14 | % | | | 1.14 | % |
Portfolio turnover rate | | | 13 | % | | | 25 | % | | | 38 | % | | | 32 | % | | | 32 | % | | | 54 | % |
a | Unaudited figures for the period ended June 30, 2024. Percentage amounts for the period, except total return and portfolio turnover rate, have been annualized. |
b | Net investment income (loss) per share was computed using average shares outstanding throughout the period. |
c | Total return does not take into account any of the expenses associated with an investment in variable insurance products. If total return had taken into account these expenses, performance would have been lower. Shares of a series of Guggenheim Variable Funds Trust are available only through the purchase of such products. |
d | Does not include expenses of the underlying funds in which the Fund invests. |
e | Net expense information reflects the expense ratios after expense waivers and reimbursements, as applicable. |
f | The portion of the ratios of net expenses to average net assets attributable to recoupments of prior fee reductions or expense reimbursements for the years presented was as follows: |
| | 06/30/24a | 12/31/23 | 12/31/22 | 12/31/21 | 12/31/20 | 12/31/19 |
| | 0.00%* | — | — | — | — | — |
g | Net expenses may include expenses that are excluded from the expense limitation agreement. Excluding these expenses, the net expense ratios for the years presented would be: |
| | 06/30/24a | 12/31/23 | 12/31/22 | 12/31/21 | 12/31/20 | 12/31/19 |
| | 1.11% | 1.11% | 1.12% | 1.13% | 1.13% | 1.14% |
88 | THE GUGGENHEIM FUNDS SEMI-ANNUAL FINANCIAL REPORT | SEE NOTES TO FINANCIAL STATEMENTS. |
SCHEDULE OF INVESTMENTS (Unaudited) | June 30, 2024 |
SERIES V (SMID CAP VALUE SERIES) | |
| | Shares | | | Value | |
COMMON STOCKS† - 96.6% |
| | | | | | | | | |
Industrial - 22.3% |
Teledyne Technologies, Inc.* | | | 9,091 | | | $ | 3,527,126 | |
Curtiss-Wright Corp. | | | 11,638 | | | | 3,153,665 | |
Graphic Packaging Holding Co. | | | 113,754 | | | | 2,981,492 | |
Kirby Corp.* | | | 24,724 | | | | 2,960,205 | |
Summit Materials, Inc. — Class A* | | | 58,969 | | | | 2,158,855 | |
Knight-Swift Transportation Holdings, Inc. | | | 42,599 | | | | 2,126,542 | |
Coherent Corp.* | | | 28,208 | | | | 2,043,952 | |
Advanced Energy Industries, Inc. | | | 17,827 | | | | 1,938,865 | |
Arcosa, Inc. | | | 23,028 | | | | 1,920,766 | |
MDU Resources Group, Inc. | | | 67,949 | | | | 1,705,520 | |
Esab Corp. | | | 17,760 | | | | 1,677,077 | |
Johnson Controls International plc | | | 24,207 | | | | 1,609,039 | |
A O Smith Corp. | | | 14,111 | | | | 1,153,998 | |
Littelfuse, Inc. | | | 4,153 | | | | 1,061,465 | |
Park Aerospace Corp. | | | 73,696 | | | | 1,008,161 | |
Timken Co. | | | 10,309 | | | | 826,060 | |
Gates Industrial Corporation plc* | | | 46,827 | | | | 740,335 | |
Sonoco Products Co. | | | 14,545 | | | | 737,723 | |
GATX Corp. | | | 3,418 | | | | 452,406 | |
NVE Corp. | | | 4,870 | | | | 363,740 | |
Regal Rexnord Corp. | | | 2,296 | | | | 310,465 | |
Stoneridge, Inc.* | | | 17,339 | | | | 276,730 | |
Total Industrial | | | | | | | 34,734,187 | |
| | | | | | | | | |
Financial - 19.3% |
Unum Group | | | 85,948 | | | | 4,392,802 | |
Jefferies Financial Group, Inc. | | | 78,073 | | | | 3,884,912 | |
Stifel Financial Corp. | | | 43,924 | | | | 3,696,205 | |
Old Republic International Corp. | | | 112,351 | | | | 3,471,646 | |
First Horizon Corp. | | | 157,270 | | | | 2,480,148 | |
Alexandria Real Estate Equities, Inc. REIT | | | 19,006 | | | | 2,223,132 | |
Prosperity Bancshares, Inc. | | | 31,653 | | | | 1,935,264 | |
Jones Lang LaSalle, Inc.* | | | 8,839 | | | | 1,814,470 | |
First Merchants Corp. | | | 48,927 | | | | 1,628,780 | |
Stewart Information Services Corp. | | | 20,658 | | | | 1,282,449 | |
WisdomTree, Inc. | | | 119,831 | | | | 1,187,525 | |
Apple Hospitality REIT, Inc. | | | 76,398 | | | | 1,110,827 | |
Axos Financial, Inc.* | | | 17,465 | | | | 998,125 | |
Total Financial | | | | | | | 30,106,285 | |
| | | | | | | | | |
Consumer, Non-cyclical - 16.0% |
Encompass Health Corp. | | | 39,104 | | | | 3,354,732 | |
Ingredion, Inc. | | | 27,991 | | | | 3,210,568 | |
MGP Ingredients, Inc. | | | 41,461 | | | | 3,084,698 | |
Euronet Worldwide, Inc.* | | | 28,040 | | | | 2,902,140 | |
Integer Holdings Corp.* | | | 22,296 | | | | 2,581,654 | |
Enovis Corp.* | | | 44,942 | | | | 2,031,379 | |
RadNet, Inc.* | | | 27,947 | | | | 1,646,637 | |
Central Garden & Pet Co. — Class A* | | | 46,224 | | | | 1,526,770 | |
ICF International, Inc. | | | 8,167 | | | | 1,212,473 | |
LivaNova plc* | | | 16,420 | | | | 900,144 | |
Quest Diagnostics, Inc. | | | 6,021 | | | | 824,155 | |
Azenta, Inc.* | | | 14,247 | | | | 749,677 | |
Certara, Inc.* | | | 45,799 | | | | 634,316 | |
Conagra Brands, Inc. | | | 12,582 | | | | 357,580 | |
Total Consumer, Non-cyclical | | | | | | | 25,016,923 | |
| | | | | | | | | |
Technology - 8.4% |
Teradyne, Inc. | | | 25,467 | | | | 3,776,502 | |
Leidos Holdings, Inc. | | | 19,309 | | | | 2,816,797 | |
MACOM Technology Solutions Holdings, Inc.* | | | 21,155 | | | | 2,358,148 | |
Science Applications International Corp. | | | 18,106 | | | | 2,128,360 | |
Amkor Technology, Inc. | | | 49,612 | | | | 1,985,472 | |
Total Technology | | | | | | | 13,065,279 | |
| | | | | | | | | |
Consumer, Cyclical - 7.8% |
H&E Equipment Services, Inc. | | | 48,553 | | | | 2,144,586 | |
MSC Industrial Direct Company, Inc. — Class A | | | 22,183 | | | | 1,759,334 | |
Crocs, Inc.* | | | 11,874 | | | | 1,732,892 | |
Sonic Automotive, Inc. — Class A | | | 23,754 | | | | 1,293,881 | |
Ralph Lauren Corp. — Class A | | | 5,538 | | | | 969,482 | |
AutoNation, Inc.* | | | 5,640 | | | | 898,903 | |
Lakeland Industries, Inc. | | | 35,963 | | | | 824,991 | |
Advance Auto Parts, Inc. | | | 12,098 | | | | 766,166 | |
Lear Corp. | | | 6,168 | | | | 704,447 | |
Century Communities, Inc. | | | 4,653 | | | | 379,964 | |
Newell Brands, Inc. | | | 59,067 | | | | 378,619 | |
Methode Electronics, Inc. | | | 28,441 | | | | 294,365 | |
Total Consumer, Cyclical | | | | | | | 12,147,630 | |
| | | | | | | | | |
Basic Materials - 7.5% |
Reliance, Inc. | | | 8,565 | | | | 2,446,164 | |
Avient Corp. | | | 45,219 | | | | 1,973,809 | |
Westlake Corp. | | | 12,969 | | | | 1,878,171 | |
Ashland, Inc. | | | 17,088 | | | | 1,614,645 | |
Huntsman Corp. | | | 64,045 | | | | 1,458,305 | |
Nucor Corp. | | | 9,033 | | | | 1,427,937 | |
MP Materials Corp.* | | | 70,831 | | | | 901,678 | |
Total Basic Materials | | | | | | | 11,700,709 | |
| | | | | | | | | |
Utilities - 7.3% |
Pinnacle West Capital Corp. | | | 47,971 | | | | 3,664,025 | |
OGE Energy Corp. | | | 98,854 | | | | 3,529,088 | |
Evergy, Inc. | | | 65,193 | | | | 3,453,273 | |
Black Hills Corp. | | | 14,897 | | | | 810,099 | |
Total Utilities | | | | | | | 11,456,485 | |
| | | | | | | | | |
Energy - 6.5% |
Diamondback Energy, Inc. | | | 16,878 | | | | 3,378,807 | |
Murphy Oil Corp. | | | 41,143 | | | | 1,696,737 | |
Liberty Energy, Inc. — Class A | | | 68,891 | | | | 1,439,133 | |
Equities Corp. | | | 30,561 | | | | 1,130,146 | |
Kinder Morgan, Inc. | | | 47,986 | | | | 953,482 | |
Talos Energy, Inc.* | | | 77,945 | | | | 947,032 | |
Patterson-UTI Energy, Inc. | | | 49,799 | | | | 515,917 | |
HydroGen Corp.*,†††,1 | | | 672,346 | | | | 1 | |
Total Energy | | | | | | | 10,061,255 | |
| | | | | | | | | |
SEE NOTES TO FINANCIAL STATEMENTS. | THE GUGGENHEIM FUNDS SEMI-ANNUAL FINANCIAL REPORT | 89 |
SCHEDULE OF INVESTMENTS (Unaudited)(continued) | June 30, 2024 |
SERIES V (SMID CAP VALUE SERIES) | |
| | Shares | | | Value | |
Communications - 1.5% |
Calix, Inc.* | | | 27,564 | | | $ | 976,592 | |
Ciena Corp.* | | | 19,837 | | | | 955,747 | |
Luna Innovations, Inc.* | | | 116,725 | | | | 373,520 | |
Total Communications | | | | | | | 2,305,859 | |
| | | | | | | | | |
Total Common Stocks | | | | |
(Cost $124,460,591) | | | | | | | 150,594,612 | |
| | | | | | | | | |
CONVERTIBLE PREFERRED STOCKS††† - 0.0% |
Industrial - 0.0% |
Thermoenergy Corp.*,2 | | | 308,333 | | | | 90 | |
Total Convertible Preferred Stocks | | | | |
(Cost $294,438) | | | | | | | 90 | |
| | | | | | | | | |
RIGHTS† - 0.1% |
Basic Materials - 0.1% |
Pan American Silver Corp.* | | | 220,317 | | | | 101,919 | |
Total Rights | | | | |
(Cost $—) | | | | | | | 101,919 | |
| | | | | | | | | |
MONEY MARKET FUND†,** - 3.3% |
Dreyfus Treasury Securities Cash Management Fund — Institutional Shares, 5.18%3 | | | 5,170,480 | | | | 5,170,480 | |
Total Money Market Fund | | | | |
(Cost $5,170,480) | | | | | | | 5,170,480 | |
| | | | | | | | | |
Total Investments - 100.0% | | | | |
(Cost $129,925,509) | | $ | 155,867,101 | |
Other Assets & Liabilities, net - 0.0% | | | (21,277 | ) |
Total Net Assets - 100.0% | | $ | 155,845,824 | |
* | Non-income producing security. |
** | A copy of each underlying unaffiliated fund’s financial statements is available at the SEC’s website at www.sec.gov. |
† | Value determined based on Level 1 inputs, unless otherwise noted — See Note 4. |
††† | Value determined based on Level 3 inputs — See Note 4. |
1 | Affiliated issuer. |
2 | PIPE (Private Investment in Public Equity) - Stock issued by a company in the secondary market as a means of raising capital more quickly and less expensively than through registration of a secondary public offering. |
3 | Rate indicated is the 7-day yield as of June 30, 2024. |
| | plc — Public Limited Company |
| | REIT — Real Estate Investment Trust |
| | |
| | See Sector Classification in Other Information section. |
90 | THE GUGGENHEIM FUNDS SEMI-ANNUAL FINANCIAL REPORT | SEE NOTES TO FINANCIAL STATEMENTS. |
SCHEDULE OF INVESTMENTS (Unaudited)(concluded) | June 30, 2024 |
SERIES V (SMID CAP VALUE SERIES) | |
The following table summarizes the inputs used to value the Fund’s investments at June 30, 2024 (See Note 4 in the Notes to Financial Statements):
Investments in Securities (Assets) | | Level 1
Quoted
Prices | | | Level 2
Significant
Observable
Inputs | | | Level 3
Significant
Unobservable
Inputs | | | Total | |
Common Stocks | | $ | 150,594,611 | | | $ | — | | | $ | 1 | | | $ | 150,594,612 | |
Convertible Preferred Stocks | | | — | | | | — | | | | 90 | | | | 90 | |
Rights | | | 101,919 | | | | — | | | | — | | | | 101,919 | |
Money Market Fund | | | 5,170,480 | | | | — | | | | — | | | | 5,170,480 | |
Total Assets | | $ | 155,867,010 | | | $ | — | | | $ | 91 | | | $ | 155,867,101 | |
Affiliated Transactions
Investments representing 5% or more of the outstanding voting shares of a company, or control of or by, or common control under Guggenheim Investments, result in that company being considered an affiliated issuer, as defined in the 1940 Act.
Transactions during the period ended June 30, 2024, in which the company is an affiliated issuer, were as follows:
Security Name | | Value
12/31/23 | | | Additions | | | Reductions | | | Realized
Gain (Loss) | | | Change in
Unrealized
Appreciation
(Depreciation) | | | Value
06/30/24 | | | Shares
06/30/24 | | | Investment
Income | |
Common Stocks | | | | | | | | | | | | | | | | | | | | | | | | | | | | | | | | |
HydroGen Corp. * | | $ | 1 | | | $ | — | | | $ | — | | | $ | — | | | $ | — | | | $ | 1 | | | | 672,346 | | | $ | — | |
* | Non-income producing security. |
SEE NOTES TO FINANCIAL STATEMENTS. | THE GUGGENHEIM FUNDS SEMI-ANNUAL FINANCIAL REPORT | 91 |
SERIES V (SMID CAP VALUE SERIES) | |
STATEMENT OF ASSETS AND LIABILITIES (Unaudited) |
June 30, 2024 |
Assets: |
Investments in unaffiliated issuers, at value (cost $127,353,934) | | $ | 155,867,100 | |
Investments in affiliated issuers, at value (cost $2,571,575) | | | 1 | |
Cash | | | 1,981 | |
Prepaid expenses | | | 625 | |
Receivables: |
Dividends | | | 134,990 | |
Interest | | | 12,448 | |
Fund shares sold | | | 9,698 | |
Total assets | | | 156,026,843 | |
| | | | | |
Liabilities: |
Payable for: |
Management fees | | | 61,451 | |
Fund shares redeemed | | | 52,633 | |
Distribution and service fees | | | 29,829 | |
Printing fees | | | 10,655 | |
Professional fees | | | 9,199 | |
Trustees’ fees* | | | 2,654 | |
Transfer agent/maintenance fees | | | 1,966 | |
Fund accounting/administration fees | | | 1,378 | |
Due to Investment Adviser | | | 95 | |
Miscellaneous | | | 11,159 | |
Total liabilities | | | 181,019 | |
Net assets | | $ | 155,845,824 | |
| | | | | |
Net assets consist of: |
Paid in capital | | $ | 118,446,006 | |
Total distributable earnings (loss) | | | 37,399,818 | |
Net assets | | $ | 155,845,824 | |
Capital shares outstanding | | | 2,097,475 | |
Net asset value per share | | $ | 74.30 | |
STATEMENT OF OPERATIONS (Unaudited) |
Six Months Ended June 30, 2024 |
Investment Income: |
Dividends from securities of unaffiliated issuers | | $ | 1,374,506 | |
Interest | | | 64,279 | |
Total investment income | | | 1,438,785 | |
| | | | | |
Expenses: |
Management fees | | | 595,775 | |
Distribution and service fees | | | 198,591 | |
Transfer agent/maintenance fees | | | 12,299 | |
Fund accounting/administration fees | | | 34,932 | |
Professional fees | | | 16,645 | |
Trustees’ fees* | | | 7,666 | |
Custodian fees | | | 3,563 | |
Line of credit fees | | | 2,123 | |
Miscellaneous | | | 8,759 | |
Recoupment of previously waived fees | | | 524 | |
Total expenses | | | 880,877 | |
Less: |
Expenses reimbursed by Adviser | | | (1,955 | ) |
Expenses waived by Adviser | | | (177,882 | ) |
Total waived/reimbursed expenses | | | (179,837 | ) |
Net expenses | | | 701,040 | |
Net investment income | | | 737,745 | |
| | | | | |
Net Realized and Unrealized Gain (Loss): |
Net realized gain (loss) on: |
Investments in unaffiliated issuers | | | 4,507,608 | |
Net realized gain | | | 4,507,608 | |
Net change in unrealized appreciation (depreciation) on: |
Investments in unaffiliated issuers | | | (446,140 | ) |
Net change in unrealized appreciation (depreciation) | | | (446,140 | ) |
Net realized and unrealized gain | | | 4,061,468 | |
Net increase in net assets resulting from operations | | $ | 4,799,213 | |
* | Relates to Trustees not deemed “interested persons” within the meaning of Section 2(a)(19) of the 1940 Act. |
92 | THE GUGGENHEIM FUNDS SEMI-ANNUAL FINANCIAL REPORT | SEE NOTES TO FINANCIAL STATEMENTS. |
SERIES V (SMID CAP VALUE SERIES) | |
STATEMENTS OF CHANGES IN NET ASSETS |
| | Six Months Ended
June 30, 2024
(Unaudited) | | | Year Ended
December 31,
2023 | |
Increase (Decrease) in Net Assets from Operations: | | | | | | | | |
Net investment income | | $ | 737,745 | | | $ | 2,072,415 | |
Net realized gain on investments | | | 4,507,608 | | | | 5,467,881 | |
Net change in unrealized appreciation (depreciation) on investments | | | (446,140 | ) | | | 7,076,248 | |
Net increase in net assets resulting from operations | | | 4,799,213 | | | | 14,616,544 | |
| | | | | | | | | |
Distributions to shareholders | | | — | | | | (13,654,917 | ) |
| | | | | | | | | |
Capital share transactions: | | | | | | | | |
Proceeds from sale of shares | | | 2,655,846 | | | | 2,665,048 | |
Distributions reinvested | | | — | | | | 13,654,917 | |
Cost of shares redeemed | | | (12,165,052 | ) | | | (21,793,940 | ) |
Net decrease from capital share transactions | | | (9,509,206 | ) | | | (5,473,975 | ) |
Net decrease in net assets | | | (4,709,993 | ) | | | (4,512,348 | ) |
| | | | | | | | | |
Net assets: | | | | | | | | |
Beginning of period | | | 160,555,817 | | | | 165,068,165 | |
End of period | | $ | 155,845,824 | | | $ | 160,555,817 | |
| | | | | | | | | |
Capital share activity: | | | | | | | | |
Shares sold | | | 36,979 | | | | 37,002 | |
Shares issued from reinvestment of distributions | | | — | | | | 195,433 | |
Shares redeemed | | | (164,739 | ) | | | (310,727 | ) |
Net decrease in shares | | | (127,760 | ) | | | (78,292 | ) |
SEE NOTES TO FINANCIAL STATEMENTS. | THE GUGGENHEIM FUNDS SEMI-ANNUAL FINANCIAL REPORT | 93 |
SERIES V (SMID CAP VALUE SERIES) | |
This table is presented to show selected data for a share outstanding throughout each period and to assist shareholders in evaluating a Fund’s performance for the periods presented.
| | Six Months Ended
June 30, 2024a | | | Year Ended
December 31,
2023 | | | Year Ended
December 31,
2022 | | | Year Ended
December 31,
2021 | | | Year Ended
December 31,
2020 | | | Year Ended
December 31,
2019 | |
Per Share Data |
Net asset value, beginning of period | | $ | 72.15 | | | $ | 71.66 | | | $ | 83.11 | | | $ | 68.31 | | | $ | 69.18 | | | $ | 61.70 | |
Income (loss) from investment operations: |
Net investment income (loss)b | | | .34 | | | | .91 | | | | 1.03 | | | | .61 | | | | 1.21 | | | | .68 | |
Net gain (loss) on investments (realized and unrealized) | | | 1.81 | | | | 5.86 | | | | (3.04 | ) | | | 15.53 | | | | 1.10 | h | | | 15.01 | |
Total from investment operations | | | 2.15 | | | | 6.77 | | | | (2.01 | ) | | | 16.14 | | | | 2.31 | | | | 15.69 | |
Less distributions from: |
Net investment income | | | — | | | | (1.10 | ) | | | (.70 | ) | | | (1.34 | ) | | | (.77 | ) | | | (.64 | ) |
Net realized gains | | | — | | | | (5.18 | ) | | | (8.74 | ) | | | — | | | | (2.41 | ) | | | (7.57 | ) |
Total distributions | | | — | | | | (6.28 | ) | | | (9.44 | ) | | | (1.34 | ) | | | (3.18 | ) | | | (8.21 | ) |
Net asset value, end of period | | $ | 74.30 | | | $ | 72.15 | | | $ | 71.66 | | | $ | 83.11 | | | $ | 68.31 | | | $ | 69.18 | |
|
Total Returnc | | | 2.98 | % | | | 9.73 | % | | | (1.86 | %) | | | 23.75 | % | | | 4.30 | % | | | 26.70 | % |
Ratios/Supplemental Data |
Net assets, end of period (in thousands) | | $ | 155,846 | | | $ | 160,556 | | | $ | 165,068 | | | $ | 187,373 | | | $ | 172,440 | | | $ | 195,207 | |
Ratios to average net assets: |
Net investment income (loss) | | | 0.93 | % | | | 1.30 | % | | | 1.36 | % | | | 0.76 | % | | | 2.05 | % | | | 1.01 | % |
Total expensesd | | | 1.11 | % | | | 1.15 | % | | | 1.13 | % | | | 1.14 | % | | | 1.22 | % | | | 1.19 | % |
Net expensese,f,g | | | 0.88 | % | | | 0.88 | % | | | 0.89 | % | | | 0.90 | % | | | 0.90 | % | | | 0.91 | % |
Portfolio turnover rate | | | 17 | % | | | 28 | % | | | 40 | % | | | 34 | % | | | 38 | % | | | 41 | % |
a | Unaudited figures for the period ended June 30, 2024. Percentage amounts for the period, except total return and portfolio turnover rate, have been annualized. |
b | Net investment income (loss) per share was computed using average shares outstanding throughout the period. |
c | Total return does not take into account any of the expenses associated with an investment in variable insurance products. If total return had taken into account these expenses, performance would have been lower. Shares of a series of Guggenheim Variable Funds Trust are available only through the purchase of such products. |
d | Does not include expenses of the underlying funds in which the Fund invests. |
e | Net expense information reflects the expense ratios after expense waivers and reimbursements, as applicable. |
f | The portion of the ratios of net expenses to average net assets attributable to recoupments of prior fee reductions or expense reimbursements for the years presented was as follows: |
| | 06/30/24a | 12/31/23 | 12/31/22 | 12/31/21 | 12/31/20 | 12/31/19 |
| | 0.00%* | — | — | — | — | — |
g | Net expenses may include expenses that are excluded from the expense limitation agreement. Excluding these expenses, the net expense ratios for the years presented would be: |
| | 06/30/24a | 12/31/23 | 12/31/22 | 12/31/21 | 12/31/20 | 12/31/19 |
| | 0.88% | 0.88% | 0.89% | 0.90% | 0.90% | 0.91% |
h | The amount shown for a share outstanding throughout the period does not agree with the aggregate net loss on investments for the period because of the sales and repurchases of fund shares in relation to fluctuating market value of the investments of the Fund. |
94 | THE GUGGENHEIM FUNDS SEMI-ANNUAL FINANCIAL REPORT | SEE NOTES TO FINANCIAL STATEMENTS. |
SCHEDULE OF INVESTMENTS (Unaudited) | June 30, 2024 |
SERIES X (STYLEPLUS—SMALL GROWTH SERIES) | |
| | Shares | | | Value | |
COMMON STOCKS† - 25.8% |
| | | | | | | | | |
Industrial - 7.0% |
Mueller Industries, Inc. | | | 2,546 | | | $ | 144,969 | |
Boise Cascade Co. | | | 985 | | | | 117,432 | |
Fabrinet* | | | 418 | | | | 102,322 | |
AZZ, Inc. | | | 1,223 | | | | 94,477 | |
Armstrong World Industries, Inc. | | | 827 | | | | 93,650 | |
Griffon Corp. | | | 1,308 | | | | 83,529 | |
Apogee Enterprises, Inc. | | | 1,217 | | | | 76,470 | |
Tennant Co. | | | 753 | | | | 74,125 | |
Applied Industrial Technologies, Inc. | | | 360 | | | | 69,840 | |
UFP Industries, Inc. | | | 592 | | | | 66,304 | |
Vontier Corp. | | | 1,733 | | | | 66,201 | |
Acuity Brands, Inc. | | | 271 | | | | 65,430 | |
Timken Co. | | | 809 | | | | 64,825 | |
Terex Corp. | | | 1,176 | | | | 64,492 | |
Watts Water Technologies, Inc. — Class A | | | 319 | | | | 58,495 | |
Dorian LPG Ltd. | | | 1,301 | | | | 54,590 | |
Lindsay Corp. | | | 430 | | | | 52,839 | |
American Woodmark Corp.* | | | 649 | | | | 51,011 | |
Badger Meter, Inc. | | | 267 | | | | 49,755 | |
AeroVironment, Inc.* | | | 267 | | | | 48,636 | |
Frontdoor, Inc.* | | | 1,325 | | | | 44,772 | |
Worthington Enterprises, Inc. | | | 845 | | | | 39,994 | |
Simpson Manufacturing Company, Inc. | | | 215 | | | | 36,234 | |
Itron, Inc.* | | | 357 | | | | 35,329 | |
Enerpac Tool Group Corp. | | | 908 | | | | 34,667 | |
SPX Technologies, Inc.* | | | 241 | | | | 34,256 | |
Fortune Brands Innovations, Inc. | | | 527 | | | | 34,223 | |
Donaldson Company, Inc. | | | 474 | | | | 33,920 | |
Powell Industries, Inc. | | | 194 | | | | 27,820 | |
John Bean Technologies Corp. | | | 220 | | | | 20,893 | |
Total Industrial | | | | | | | 1,841,500 | |
| | | | | | | | | |
Consumer, Cyclical - 5.1% |
Meritage Homes Corp. | | | 649 | | | | 105,041 | |
Abercrombie & Fitch Co. — Class A* | | | 581 | | | | 103,325 | |
GMS, Inc.* | | | 1,224 | | | | 98,667 | |
Steven Madden Ltd. | | | 2,221 | | | | 93,948 | |
Group 1 Automotive, Inc. | | | 292 | | | | 86,806 | |
M/I Homes, Inc.* | | | 588 | | | | 71,818 | |
Patrick Industries, Inc. | | | 613 | | | | 66,541 | |
Installed Building Products, Inc. | | | 298 | | | | 61,293 | |
MSC Industrial Direct Company, Inc. — Class A | | | 765 | | | | 60,672 | |
Buckle, Inc. | | | 1,470 | | | | 54,302 | |
Kontoor Brands, Inc. | | | 820 | | | | 54,243 | |
Boot Barn Holdings, Inc.* | | | 389 | | | | 50,154 | |
Golden Entertainment, Inc. | | | 1,543 | | | | 48,003 | |
Signet Jewelers Ltd. | | | 518 | | | | 46,402 | |
Tri Pointe Homes, Inc.* | | | 1,079 | | | | 40,193 | |
Green Brick Partners, Inc.* | | | 665 | | | | 38,064 | |
Wingstop, Inc. | | | 89 | | | | 37,617 | |
Travel + Leisure Co. | | | 835 | | | | 37,558 | |
KB Home | | | 513 | | | | 36,002 | |
Dine Brands Global, Inc. | | | 939 | | | | 33,992 | |
Light & Wonder, Inc. — Class A* | | | 293 | | | | 30,730 | |
Vista Outdoor, Inc.* | | | 801 | | | | 30,158 | |
Dave & Buster’s Entertainment, Inc.* | | | 606 | | | | 24,125 | |
Murphy USA, Inc. | | | 47 | | | | 22,064 | |
Total Consumer, Cyclical | | | | | | | 1,331,718 | |
| | | | | | | | | |
Consumer, Non-cyclical - 3.7% |
Innoviva, Inc.* | | | 4,572 | | | | 74,981 | |
Alarm.com Holdings, Inc.* | | | 1,159 | | | | 73,643 | |
Collegium Pharmaceutical, Inc.* | | | 2,204 | | | | 70,969 | |
Catalyst Pharmaceuticals, Inc.* | | | 4,553 | | | | 70,526 | |
Jazz Pharmaceuticals plc* | | | 615 | | | | 65,639 | |
Alkermes plc* | | | 2,546 | | | | 61,358 | |
Stride, Inc.* | | | 789 | | | | 55,624 | |
LiveRamp Holdings, Inc.* | | | 1,556 | | | | 48,143 | |
Halozyme Therapeutics, Inc.* | | | 885 | | | | 46,339 | |
Amphastar Pharmaceuticals, Inc.* | | | 1,137 | | | | 45,480 | |
Upbound Group, Inc. | | | 1,357 | | | | 41,660 | |
Adtalem Global Education, Inc.* | | | 545 | | | | 37,174 | |
H&R Block, Inc. | | | 621 | | | | 33,677 | |
ANI Pharmaceuticals, Inc.* | | | 517 | | | | 32,922 | |
Perdoceo Education Corp. | | | 1,420 | | | | 30,416 | |
Xencor, Inc.* | | | 1,545 | | | | 29,247 | |
Corcept Therapeutics, Inc.* | | | 859 | | | | 27,909 | |
PROG Holdings, Inc. | | | 763 | | | | 26,461 | |
Harmony Biosciences Holdings, Inc.* | | | 844 | | | | 25,463 | |
Ironwood Pharmaceuticals, Inc. — Class A* | | | 3,488 | | | | 22,742 | |
Ensign Group, Inc. | | | 168 | | | | 20,780 | |
OraSure Technologies, Inc.* | | | 4,823 | | | | 20,546 | |
OmniAb, Inc.* | | | 1 | | | | 2 | |
Ligand Pharmaceuticals, Inc.*,†† | | | 89 | | | | — | |
Ligand Pharmaceuticals, Inc.*,†† | | | 89 | | | | — | |
Total Consumer, Non-cyclical | | | | | | | 961,701 | |
| | | | | | | | | |
Technology - 3.5% |
Axcelis Technologies, Inc.* | | | 669 | | | | 95,125 | |
Progress Software Corp. | | | 1,364 | | | | 74,011 | |
Dropbox, Inc. — Class A* | | | 3,153 | | | | 70,848 | |
FormFactor, Inc.* | | | 1,075 | | | | 65,070 | |
Qualys, Inc.* | | | 434 | | | | 61,889 | |
SPS Commerce, Inc.* | | | 326 | | | | 61,340 | |
Box, Inc. — Class A* | | | 2,067 | | | | 54,651 | |
ACI Worldwide, Inc.* | | | 1,343 | | | | 53,169 | |
Cirrus Logic, Inc.* | | | 397 | | | | 50,681 | |
Photronics, Inc.* | | | 1,770 | | | | 43,666 | |
Insight Enterprises, Inc.* | | | 212 | | | | 42,052 | |
CommVault Systems, Inc.* | | | 333 | | | | 40,483 | |
Teradata Corp.* | | | 1,157 | | | | 39,986 | |
MACOM Technology Solutions Holdings, Inc.* | | | 346 | | | | 38,568 | |
Adeia, Inc. | | | 3,437 | | | | 38,443 | |
BlackLine, Inc.* | | | 750 | | | | 36,338 | |
DoubleVerify Holdings, Inc.* | | | 1,831 | | | | 35,650 | |
Appfolio, Inc. — Class A* | | | 97 | | | | 23,723 | |
Total Technology | | | | | | | 925,693 | |
| | | | | | | | | |
SEE NOTES TO FINANCIAL STATEMENTS. | THE GUGGENHEIM FUNDS SEMI-ANNUAL FINANCIAL REPORT | 95 |
SCHEDULE OF INVESTMENTS (Unaudited)(continued) | June 30, 2024 |
SERIES X (STYLEPLUS—SMALL GROWTH SERIES) | |
| | Shares | | | Value | |
Financial - 2.6% |
First BanCorp | | | 5,402 | | | $ | 98,803 | |
OFG Bancorp | | | 2,430 | | | | 91,003 | |
Preferred Bank/Los Angeles CA | | | 1,073 | | | | 81,001 | |
Pathward Financial, Inc. | | | 1,211 | | | | 68,506 | |
Westamerica BanCorp | | | 1,195 | | | | 57,993 | |
Marathon Digital Holdings, Inc.* | | | 2,624 | | | | 52,087 | |
BancFirst Corp. | | | 578 | | | | 50,691 | |
Bancorp, Inc.* | | | 1,295 | | | | 48,899 | |
NMI Holdings, Inc. — Class A* | | | 1,073 | | | | 36,525 | |
MGIC Investment Corp. | | | 1,680 | | | | 36,204 | |
SiriusPoint Ltd.* | | | 2,183 | | | | 26,632 | |
Palomar Holdings, Inc.* | | | 271 | | | | 21,992 | |
HCI Group, Inc. | | | 212 | | | | 19,540 | |
Total Financial | | | | | | | 689,876 | |
| | | | | | | | | |
Energy - 2.1% |
Liberty Energy, Inc. — Class A | | | 4,260 | | | | 88,991 | |
CVR Energy, Inc. | | | 2,717 | | | | 72,734 | |
SM Energy Co. | | | 1,628 | | | | 70,378 | |
Magnolia Oil & Gas Corp. — Class A | | | 2,544 | | | | 64,465 | |
Northern Oil and Gas, Inc. | | | 1,700 | | | | 63,189 | |
Alpha Metallurgical Resources, Inc. | | | 156 | | | | 43,763 | |
Par Pacific Holdings, Inc.* | | | 1,694 | | | | 42,774 | |
Warrior Met Coal, Inc. | | | 654 | | | | 41,052 | |
CONSOL Energy, Inc.* | | | 372 | | | | 37,955 | |
REX American Resources Corp.* | | | 525 | | | | 23,935 | |
Total Energy | | | | | | | 549,236 | |
| | | | | | | | | |
Communications - 1.1% |
InterDigital, Inc. | | | 873 | | | | 101,757 | |
Yelp, Inc. — Class A* | | | 2,185 | | | | 80,736 | |
Extreme Networks, Inc.* | | | 2,865 | | | | 38,534 | |
Ciena Corp.* | | | 697 | | | | 33,581 | |
A10 Networks, Inc. | | | 2,070 | | | | 28,670 | |
Total Communications | | | | | | | 283,278 | |
| | | | | | | | | |
Basic Materials - 0.5% |
ATI, Inc.* | | | 1,458 | | | | 80,846 | |
Cabot Corp. | | | 315 | | | | 28,945 | |
NewMarket Corp. | | | 38 | | | | 19,592 | |
Total Basic Materials | | | | | | | 129,383 | |
| | | | | | | | | |
Utilities - 0.2% |
Otter Tail Corp. | | | 542 | | | | 47,474 | |
| | | | | | | | | |
Total Common Stocks | | | | |
(Cost $6,416,309) | | | | | | | 6,759,859 | |
| | | | | | | | | |
MUTUAL FUNDS† - 71.2% |
Guggenheim Variable Insurance Strategy Fund III1 | | | 289,529 | | | | 7,154,266 | |
Guggenheim Strategy Fund III1 | | | 277,665 | | | | 6,866,648 | |
Guggenheim Strategy Fund II1 | | | 175,054 | | | | 4,315,070 | |
Guggenheim Ultra Short Duration Fund — Institutional Class1 | | | 32,386 | | | | 321,915 | |
Total Mutual Funds | | | | |
(Cost $18,688,296) | | | | | | | 18,657,899 | |
| | | | | | | | | |
MONEY MARKET FUND***,† - 2.6% |
Dreyfus Treasury Securities Cash Management Fund — Institutional Shares, 5.18%2 | | | 692,291 | | | | 692,291 | |
Total Money Market Fund | | | | |
(Cost $692,291) | | | | | | | 692,291 | |
| | | | | | | | | |
Total Investments - 99.6% | | | | |
(Cost $25,796,896) | | $ | 26,110,049 | |
Other Assets & Liabilities, net - 0.4% | | | 91,907 | |
Total Net Assets - 100.0% | | $ | 26,201,956 | |
Futures Contracts |
Description | | Number of
Contracts | | | Expiration
Date | | | Notional
Amount | | | Value and
Unrealized
Appreciation
(Depreciation)** | |
Equity Futures Contracts Purchased† |
Russell 2000 Index Mini Futures Contracts | | | 1 | | | | Sep 2024 | | | $ | 103,320 | | | $ | 975 | |
NASDAQ-100 Index Mini Futures Contracts | | | 1 | | | | Sep 2024 | | | | 398,650 | | | | (5,293 | ) |
| | | | | | | | | | | $ | 501,970 | | | $ | (4,318 | ) |
96 | THE GUGGENHEIM FUNDS SEMI-ANNUAL FINANCIAL REPORT | SEE NOTES TO FINANCIAL STATEMENTS. |
SCHEDULE OF INVESTMENTS (Unaudited)(continued) | June 30, 2024 |
SERIES X (STYLEPLUS—SMALL GROWTH SERIES) | |
Total Return Swap Agreements |
Counterparty | Index | Type | Financing
Rate | | Payment
Frequency | | | Maturity
Date | | | Units | | | Notional
Amount | | | Value and
Unrealized
Depreciation | |
OTC Equity Index Swap Agreements†† |
Wells Fargo Bank, N.A. | Russell 2000 Growth Index | Pay | 5.79% (Federal Funds Rate + 0.46%) | | | At Maturity | | | | 09/30/24 | | | | 2,010 | | | $ | 19,664,150 | | | $ | — | |
* | Non-income producing security. |
** | Includes cumulative appreciation (depreciation). Variation margin is reported within the Statement of Assets and Liabilities. |
*** | A copy of each underlying unaffiliated fund’s financial statements is available at the SEC’s website at www.sec.gov. |
† | Value determined based on Level 1 inputs, unless otherwise noted — See Note 4. |
†† | Value determined based on Level 2 inputs — See Note 4. |
1 | Affiliated issuer. |
2 | Rate indicated is the 7-day yield as of June 30, 2024. |
| | plc — Public Limited Company |
| | |
| | See Sector Classification in Other Information section. |
The following table summarizes the inputs used to value the Fund’s investments at June 30, 2024 (See Note 4 in the Notes to Financial Statements):
Investments in Securities (Assets) | | Level 1
Quoted
Prices | | | Level 2
Significant
Observable
Inputs | | | Level 3
Significant
Unobservable
Inputs | | | Total | |
Common Stocks | | $ | 6,759,859 | | | $ | — | * | | $ | — | | | $ | 6,759,859 | |
Mutual Funds | | | 18,657,899 | | | | — | | | | — | | | | 18,657,899 | |
Money Market Fund | | | 692,291 | | | | — | | | | — | | | | 692,291 | |
Equity Futures Contracts** | | | 975 | | | | — | | | | — | | | | 975 | |
Equity Index Swap Agreements** | | | — | | | | — | * | | | — | | | | — | |
Total Assets | | $ | 26,111,024 | | | $ | — | | | $ | — | | | $ | 26,111,024 | |
Investments in Securities (Liabilities) | | Level 1
Quoted
Prices | | | Level 2
Significant
Observable
Inputs | | | Level 3
Significant
Unobservable
Inputs | | | Total | |
Equity Futures Contracts** | | $ | 5,293 | | | $ | — | | | $ | — | | | $ | 5,293 | |
* | Security has a market value of $0. |
** | This derivative is reported as unrealized appreciation/depreciation at period end. |
SEE NOTES TO FINANCIAL STATEMENTS. | THE GUGGENHEIM FUNDS SEMI-ANNUAL FINANCIAL REPORT | 97 |
SCHEDULE OF INVESTMENTS (Unaudited)(concluded) | June 30, 2024 |
SERIES X (STYLEPLUS—SMALL GROWTH SERIES) | |
Affiliated Transactions
Investments representing 5% or more of the outstanding voting shares of a company, or control of or by, or common control under Guggenheim Investments (“GI”), result in that company being considered an affiliated issuer, as defined in the 1940 Act.
The Fund may invest in certain of the underlying series of Guggenheim Strategy Funds Trust, including Guggenheim Strategy Fund II, Guggenheim Strategy Fund III and Guggenheim Variable Insurance Strategy Fund III (collectively, the “Guggenheim Strategy Funds”), each of which are open-end management investment companies managed by GI. The Guggenheim Strategy Funds, which launched on March 11, 2014, are offered as short term investment options only to mutual funds, trusts, and other accounts managed by GI and/or its affiliates, and are not available to the public. The Guggenheim Strategy Funds pay no investment management fees. The Guggenheim Strategy Funds’ annual report on Form N-CSR dated September 30, 2023 is available publicly or upon request. This information is available from the EDGAR database on the SEC’s website at https://www.sec.gov/Archives/edgar/data/1601445/000182126823000217/gug86449-ncsr.htm. The Fund may invest in certain of the underlying series of Guggenheim Funds Trust, which are open-end management investment companies managed by GI, are available to the public and whose most recent annual report on Form N-CSR is available publicly or upon request.
Transactions during the period ended June 30, 2024, in which the company is an affiliated issuer, were as follows:
Security Name | | Value
12/31/23 | | | Additions | | | Reductions | | | Realized
Gain (Loss) | | | Change in
Unrealized
Appreciation
(Depreciation) | | | Value
06/30/24 | | | Shares
06/30/24 | | | Investment
Income | |
Mutual Funds | | | | | | | | | | | | | | | | | | | | | | | | | | | | | | | | |
Guggenheim Strategy Fund II | | $ | 3,891,748 | | | $ | 1,600,489 | | | $ | (1,202,110 | ) | | $ | 15,281 | | | $ | 9,662 | | | $ | 4,315,070 | | | | 175,054 | | | $ | 128,773 | |
Guggenheim Strategy Fund III | | | 6,638,163 | | | | 179,247 | | | | — | | | | — | | | | 49,238 | | | | 6,866,648 | | | | 277,665 | | | | 180,398 | |
Guggenheim Ultra Short Duration Fund — Institutional Class | | | 310,899 | | | | 8,147 | | | | — | | | | — | | | | 2,869 | | | | 321,915 | | | | 32,386 | | | | 8,203 | |
Guggenheim Variable Insurance Strategy Fund III | | | 6,914,473 | | | | 188,493 | | | | — | | | | — | | | | 51,300 | | | | 7,154,266 | | | | 289,529 | | | | 189,651 | |
| | | $ | 17,755,283 | | | $ | 1,976,376 | | | $ | (1,202,110 | ) | | $ | 15,281 | | | $ | 113,069 | | | $ | 18,657,899 | | | | | | | $ | 507,025 | |
98 | THE GUGGENHEIM FUNDS SEMI-ANNUAL FINANCIAL REPORT | SEE NOTES TO FINANCIAL STATEMENTS. |
SERIES X (STYLEPLUS—SMALL GROWTH SERIES) | |
STATEMENT OF ASSETS AND LIABILITIES (Unaudited) |
June 30, 2024 |
Assets: |
Investments in unaffiliated issuers, at value (cost $7,108,600) | | $ | 7,452,150 | |
Investments in affiliated issuers, at value (cost $18,688,296) | | | 18,657,899 | |
Cash | | | 177 | |
Segregated cash with broker | | | 845,000 | |
Prepaid expenses | | | 51 | |
Receivables: |
Dividends | | | 82,398 | |
Fund shares sold | | | 6,766 | |
Interest | | | 3,472 | |
Total assets | | | 27,047,913 | |
| | | | | |
Liabilities: |
Payable for: |
Swap settlement | | | 725,736 | |
Securities purchased | | | 79,168 | |
Management fees | | | 6,685 | |
Distribution and service fees | | | 5,018 | |
Transfer agent/maintenance fees | | | 1,953 | |
Variation margin on futures contracts | | | 1,825 | |
Trustees’ fees* | | | 1,270 | |
Fund accounting/administration fees | | | 911 | |
Miscellaneous | | | 23,391 | |
Total liabilities | | | 845,957 | |
Net assets | | $ | 26,201,956 | |
| | | | | |
Net assets consist of: |
Paid in capital | | $ | 29,571,692 | |
Total distributable earnings (loss) | | | (3,369,736 | ) |
Net assets | | $ | 26,201,956 | |
Capital shares outstanding | | | 943,270 | |
Net asset value per share | | $ | 27.78 | |
STATEMENT OF OPERATIONS (Unaudited) |
Six Months Ended June 30, 2024 |
Investment Income: |
Dividends from securities of unaffiliated issuers (net of foreign withholding tax of $308) | | $ | 39,489 | |
Dividends from securities of affiliated issuers | | | 507,025 | |
Interest | | | 27,634 | |
Total investment income | | | 574,148 | |
| | | | | |
Expenses: |
Management fees | | | 98,831 | |
Distribution and service fees | | | 32,944 | |
Transfer agent/maintenance fees | | | 12,412 | |
Interest expense | | | 29,709 | |
Professional fees | | | 16,894 | |
Fund accounting/administration fees | | | 9,538 | |
Custodian fees | | | 7,957 | |
Trustees’ fees* | | | 6,961 | |
Line of credit fees | | | 376 | |
Miscellaneous | | | 5,509 | |
Total expenses | | | 221,131 | |
Less: |
Expenses reimbursed by Adviser | | | (69 | ) |
Expenses waived by Adviser | | | (55,648 | ) |
Total waived/reimbursed expenses | | | (55,717 | ) |
Net expenses | | | 165,414 | |
Net investment income | | | 408,734 | |
| | | | | |
Net Realized and Unrealized Gain (Loss): |
Net realized gain (loss) on: |
Investments in unaffiliated issuers | | | 675,540 | |
Investments in affiliated issuers | | | 15,281 | |
Swap agreements | | | 2,500,446 | |
Futures contracts | | | 55,420 | |
Net realized gain | | | 3,246,687 | |
Net change in unrealized appreciation (depreciation) on: |
Investments in unaffiliated issuers | | | (563,599 | ) |
Investments in affiliated issuers | | | 113,069 | |
Swap agreements | | | (2,133,893 | ) |
Futures contracts | | | (53,060 | ) |
Net change in unrealized appreciation (depreciation) | | | (2,637,483 | ) |
Net realized and unrealized gain | | | 609,204 | |
Net increase in net assets resulting from operations | | $ | 1,017,938 | |
* | Relates to Trustees not deemed “interested persons” within the meaning of Section 2(a)(19) of the 1940 Act. |
SEE NOTES TO FINANCIAL STATEMENTS. | THE GUGGENHEIM FUNDS SEMI-ANNUAL FINANCIAL REPORT | 99 |
SERIES X (STYLEPLUS—SMALL GROWTH SERIES) | |
STATEMENTS OF CHANGES IN NET ASSETS |
| | Six Months Ended
June 30, 2024
(Unaudited) | | | Year Ended
December 31,
2023 | |
Increase (Decrease) in Net Assets from Operations: | | | | | | | | |
Net investment income | | $ | 408,734 | | | $ | 784,872 | |
Net realized gain on investments | | | 3,246,687 | | | | 849,271 | |
Net change in unrealized appreciation (depreciation) on investments | | | (2,637,483 | ) | | | 3,206,582 | |
Net increase in net assets resulting from operations | | | 1,017,938 | | | | 4,840,725 | |
| | | | | | | | | |
Distributions to shareholders | | | — | | | | (356,250 | ) |
| | | | | | | | | |
Capital share transactions: | | | | | | | | |
Proceeds from sale of shares | | | 212,421 | | | | 1,135,100 | |
Distributions reinvested | | | — | | | | 356,250 | |
Cost of shares redeemed | | | (1,657,970 | ) | | | (3,638,989 | ) |
Net decrease from capital share transactions | | | (1,445,549 | ) | | | (2,147,639 | ) |
Net increase (decrease) in net assets | | | (427,611 | ) | | | 2,336,836 | |
| | | | | | | | | |
Net assets: | | | | | | | | |
Beginning of period | | | 26,629,567 | | | | 24,292,731 | |
End of period | | $ | 26,201,956 | | | $ | 26,629,567 | |
| | | | | | | | | |
Capital share activity: | | | | | | | | |
Shares sold | | | 7,755 | | | | 46,743 | |
Shares issued from reinvestment of distributions | | | — | | | | 13,755 | |
Shares redeemed | | | (60,571 | ) | | | (149,718 | ) |
Net decrease in shares | | | (52,816 | ) | | | (89,220 | ) |
100 | THE GUGGENHEIM FUNDS SEMI-ANNUAL FINANCIAL REPORT | SEE NOTES TO FINANCIAL STATEMENTS. |
SERIES X (STYLEPLUS—SMALL GROWTH SERIES) | |
This table is presented to show selected data for a share outstanding throughout each period and to assist shareholders in evaluating a Fund’s performance for the periods presented.
| | Six Months Ended
June 30, 2024a | | | Year Ended
December 31,
2023 | | | Year Ended
December 31,
2022 | | | Year Ended
December 31,
2021 | | | Year Ended
December 31,
2020 | | | Year Ended
December 31,
2019 | |
Per Share Data |
Net asset value, beginning of period | | $ | 26.73 | | | $ | 22.38 | | | $ | 46.01 | | | $ | 44.91 | | | $ | 34.53 | | | $ | 30.87 | |
Income (loss) from investment operations: |
Net investment income (loss)b | | | .42 | | | | .75 | | | | .38 | | | | .10 | | | | .17 | | | | .42 | |
Net gain (loss) on investments (realized and unrealized) | | | .63 | | | | 3.94 | | | | (12.10 | ) | | | 2.82 | | | | 10.65 | | | | 7.28 | |
Total from investment operations | | | 1.05 | | | | 4.69 | | | | (11.72 | ) | | | 2.92 | | | | 10.82 | | | | 7.70 | |
Less distributions from: |
Net investment income | | | — | | | | (.34 | ) | | | (.11 | ) | | | (.19 | ) | | | (.44 | ) | | | (.22 | ) |
Net realized gains | | | — | | | | — | | | | (11.80 | ) | | | (1.63 | ) | | | — | | | | (3.82 | ) |
Total distributions | | | — | | | | (.34 | ) | | | (11.91 | ) | | | (1.82 | ) | | | (.44 | ) | | | (4.04 | ) |
Net asset value, end of period | | $ | 27.78 | | | $ | 26.73 | | | $ | 22.38 | | | $ | 46.01 | | | $ | 44.91 | | | $ | 34.53 | |
|
Total Returnc | | | 3.93 | % | | | 21.01 | % | | | (26.61 | %) | | | 6.54 | % | | | 31.82 | % | | | 25.68 | % |
Ratios/Supplemental Data |
Net assets, end of period (in thousands) | | $ | 26,202 | | | $ | 26,630 | | | $ | 24,293 | | | $ | 37,011 | | | $ | 37,989 | | | $ | 33,036 | |
Ratios to average net assets: |
Net investment income (loss) | | | 3.10 | % | | | 3.11 | % | | | 1.29 | % | | | 0.22 | % | | | 0.49 | % | | | 1.24 | % |
Total expensesd | | | 1.68 | % | | | 1.65 | % | | | 1.43 | % | | | 1.39 | % | | | 1.50 | % | | | 1.62 | % |
Net expensese,f | | | 1.26 | % | | | 1.19 | % | | | 1.05 | % | | | 1.00 | % | | | 1.02 | % | | | 1.11 | % |
Portfolio turnover rate | | | 40 | % | | | 80 | % | | | 73 | % | | | 64 | % | | | 86 | % | | | 59 | % |
a | Unaudited figures for the period ended June 30, 2024. Percentage amounts for the period, except total return and portfolio turnover rate, have been annualized. |
b | Net investment income (loss) per share was computed using average shares outstanding throughout the period. |
c | Total return does not take into account any of the expenses associated with an investment in variable insurance products. If total return had taken into account these expenses, performance would have been lower. Shares of a series of Guggenheim Variable Funds Trust are available only through the purchase of such products. |
d | Does not include expenses of the underlying funds in which the Fund invests. |
e | Net expense information reflects the expense ratios after expense waivers and reimbursements, as applicable. |
f | Net expenses may include expenses that are excluded from the expense limitation agreement. Excluding these expenses, the net expense ratios for the years presented would be: |
| | 06/30/24a | 12/31/23 | 12/31/22 | 12/31/21 | 12/31/20 | 12/31/19 |
| | 1.03% | 1.03% | 1.04% | 1.00% | 1.01% | 1.03% |
SEE NOTES TO FINANCIAL STATEMENTS. | THE GUGGENHEIM FUNDS SEMI-ANNUAL FINANCIAL REPORT | 101 |
SCHEDULE OF INVESTMENTS (Unaudited) | June 30, 2024 |
SERIES Y (STYLEPLUS—LARGE GROWTH SERIES) | |
| | Shares | | | Value | |
COMMON STOCKS† - 21.9% |
| | | | | | | | | |
Technology - 10.2% |
Microsoft Corp. | | | 3,213 | | | $ | 1,436,049 | |
Apple, Inc. | | | 6,187 | | | | 1,303,106 | |
NVIDIA Corp. | | | 9,760 | | | | 1,205,750 | |
Oracle Corp. | | | 1,693 | | | | 239,052 | |
Applied Materials, Inc. | | | 909 | | | | 214,515 | |
Broadcom, Inc. | | | 117 | | | | 187,847 | |
KLA Corp. | | | 214 | | | | 176,445 | |
QUALCOMM, Inc. | | | 824 | | | | 164,124 | |
NXP Semiconductor N.V. | | | 522 | | | | 140,465 | |
NetApp, Inc. | | | 997 | | | | 128,413 | |
Microchip Technology, Inc. | | | 1,397 | | | | 127,826 | |
Akamai Technologies, Inc.* | | | 1,320 | | | | 118,906 | |
ON Semiconductor Corp.* | | | 1,702 | | | | 116,672 | |
Synopsys, Inc.* | | | 71 | | | | 42,249 | |
Advanced Micro Devices, Inc.* | | | 212 | | | | 34,389 | |
Total Technology | | | | | | | 5,635,808 | |
| | | | | | | | | |
Communications - 4.0% |
Alphabet, Inc. — Class C | | | 4,385 | | | | 804,297 | |
Amazon.com, Inc.* | | | 3,604 | | | | 696,473 | |
Meta Platforms, Inc. — Class A | | | 760 | | | | 383,207 | |
Motorola Solutions, Inc. | | | 365 | | | | 140,908 | |
Expedia Group, Inc.* | | | 1,076 | | | | 135,565 | |
Netflix, Inc.* | | | 55 | | | | 37,119 | |
Total Communications | | | | | | | 2,197,569 | |
| | | | | | | | | |
Industrial - 2.5% |
Caterpillar, Inc. | | | 502 | | | | 167,216 | |
Deere & Co. | | | 389 | | | | 145,342 | |
Fortive Corp. | | | 1,763 | | | | 130,638 | |
TE Connectivity Ltd. | | | 844 | | | | 126,963 | |
Masco Corp. | | | 1,801 | | | | 120,073 | |
A O Smith Corp. | | | 1,468 | | | | 120,053 | |
Allegion plc | | | 1,010 | | | | 119,332 | |
Builders FirstSource, Inc.* | | | 850 | | | | 117,648 | |
Snap-on, Inc. | | | 448 | | | | 117,103 | |
Jabil, Inc. | | | 1,057 | | | | 114,991 | |
Generac Holdings, Inc.* | | | 543 | | | | 71,795 | |
Total Industrial | | | | | | | 1,351,154 | |
| | | | | | | | | |
Consumer, Non-cyclical - 2.4% |
Eli Lilly & Co. | | | 233 | | | | 210,953 | |
AbbVie, Inc. | | | 1,013 | | | | 173,750 | |
Merck & Company, Inc. | | | 1,372 | | | | 169,854 | |
Regeneron Pharmaceuticals, Inc.* | | | 145 | | | | 152,400 | |
United Rentals, Inc. | | | 217 | | | | 140,340 | |
HCA Healthcare, Inc. | | | 395 | | | | 126,906 | |
Molina Healthcare, Inc.* | | | 397 | | | | 118,028 | |
DaVita, Inc.* | | | 829 | | | | 114,874 | |
Vertex Pharmaceuticals, Inc.* | | | 196 | | | | 91,869 | |
Total Consumer, Non-cyclical | | | | | | | 1,298,974 | |
| | | | | | | | | |
Consumer, Cyclical - 2.0% |
DR Horton, Inc. | | | 956 | | | | 134,729 | |
Tesla, Inc.* | | | 675 | | | | 133,569 | |
PACCAR, Inc. | | | 1,252 | | | | 128,881 | |
PulteGroup, Inc. | | | 1,137 | | | | 125,184 | |
Las Vegas Sands Corp. | | | 2,804 | | | | 124,077 | |
Lennar Corp. — Class A | | | 810 | | | | 121,394 | |
Domino’s Pizza, Inc. | | | 232 | | | | 119,789 | |
Delta Air Lines, Inc. | | | 2,517 | | | | 119,406 | |
Wynn Resorts Ltd. | | | 1,306 | | | | 116,887 | |
Total Consumer, Cyclical | | | | | | | 1,123,916 | |
| | | | | | | | | |
Financial - 0.4% |
Arch Capital Group Ltd.* | | | 1,358 | | | | 137,009 | |
Mastercard, Inc. — Class A | | | 79 | | | | 34,852 | |
Visa, Inc. — Class A | | | 128 | | | | 33,596 | |
Total Financial | | | | | | | 205,457 | |
| | | | | | | | | |
Energy - 0.2% |
Marathon Petroleum Corp. | | | 768 | | | | 133,233 | |
| | | | | | | | | |
Basic Materials - 0.2% |
CF Industries Holdings, Inc. | | | 1,582 | | | | 117,258 | |
| | | | | | | | | |
Total Common Stocks | | | | |
(Cost $9,274,956) | | | | | | | 12,063,369 | |
| | | | | | | | | |
MUTUAL FUNDS† - 75.9% |
Guggenheim Strategy Fund III1 | | | 576,175 | | | | 14,248,812 | |
Guggenheim Variable Insurance Strategy Fund III1 | | | 512,713 | | | | 12,669,140 | |
Guggenheim Strategy Fund II1 | | | 432,911 | | | | 10,671,258 | |
Guggenheim Ultra Short Duration Fund — Institutional Class1 | | | 420,135 | | | | 4,176,145 | |
Total Mutual Funds | | | | |
(Cost $41,765,871) | | | | | | | 41,765,355 | |
| | | | | | | | | |
MONEY MARKET FUND***,† - 3.9% |
Dreyfus Treasury Securities Cash Management Fund — Institutional Shares, 5.18%2 | | | 2,170,323 | | | | 2,170,323 | |
Total Money Market Fund | | | | |
(Cost $2,170,323) | | | | | | | 2,170,323 | |
| | | | | | | | | |
Total Investments - 101.7% | | | | |
(Cost $53,211,150) | | $ | 55,999,047 | |
Other Assets & Liabilities, net - (1.7)% | | | (939,715 | ) |
Total Net Assets - 100.0% | | $ | 55,059,332 | |
102 | THE GUGGENHEIM FUNDS SEMI-ANNUAL FINANCIAL REPORT | SEE NOTES TO FINANCIAL STATEMENTS. |
SCHEDULE OF INVESTMENTS (Unaudited)(continued) | June 30, 2024 |
SERIES Y (STYLEPLUS—LARGE GROWTH SERIES) | |
Futures Contracts |
Description | | Number of
Contracts | | | Expiration
Date | | | Notional
Amount | | | Value and
Unrealized
Depreciation** | |
Equity Futures Contracts Purchased† |
S&P 500 Index Mini Futures Contracts | | | 3 | | | | Sep 2024 | | | $ | 828,525 | | | $ | (3,578 | ) |
NASDAQ-100 Index Mini Futures Contracts | | | 1 | | | | Sep 2024 | | | | 398,650 | | | | (5,292 | ) |
| | | | | | | | | | | $ | 1,227,175 | | | $ | (8,870 | ) |
Total Return Swap Agreements |
Counterparty | Index | Type | Financing
Rate | | Payment
Frequency | | | Maturity
Date | | | Units | | | Notional
Amount | | | Value and
Unrealized
Appreciation | |
OTC Equity Index Swap Agreements†† |
Wells Fargo Bank, N.A. | Russell 1000 Growth Index | Pay | 6.13% (Federal Funds Rate + 0.80%) | | | At Maturity | | | | 09/30/24 | | | | 11,463 | | | $ | 43,257,705 | | | $ | — | |
* | Non-income producing security. |
** | Includes cumulative appreciation (depreciation). Variation margin is reported within the Statement of Assets and Liabilities. |
*** | A copy of each underlying unaffiliated fund’s financial statements is available at the SEC’s website at www.sec.gov. |
† | Value determined based on Level 1 inputs — See Note 4. |
†† | Value determined based on Level 2 inputs — See Note 4. |
1 | Affiliated issuer. |
2 | Rate indicated is the 7-day yield as of June 30, 2024. |
| | plc — Public Limited Company |
| | |
| | See Sector Classification in Other Information section. |
The following table summarizes the inputs used to value the Fund’s investments at June 30, 2024 (See Note 4 in the Notes to Financial Statements):
Investments in Securities (Assets) | | Level 1
Quoted
Prices | | | Level 2
Significant
Observable
Inputs | | | Level 3
Significant
Unobservable
Inputs | | | Total | |
Common Stocks | | $ | 12,063,369 | | | $ | — | | | $ | — | | | $ | 12,063,369 | |
Mutual Funds | | | 41,765,355 | | | | — | | | | — | | | | 41,765,355 | |
Money Market Fund | | | 2,170,323 | | | | — | | | | — | | | | 2,170,323 | |
Equity Index Swap Agreements** | | | — | | | | — | * | | | — | | | | — | |
Total Assets | | $ | 55,999,047 | | | $ | — | | | $ | — | | | $ | 55,999,047 | |
Investments in Securities (Liabilities) | | Level 1
Quoted
Prices | | | Level 2
Significant
Observable
Inputs | | | Level 3
Significant
Unobservable
Inputs | | | Total | |
Equity Futures Contracts** | | $ | 8,870 | | | $ | — | | | $ | — | | | $ | 8,870 | |
* | Security has a market value of $0. |
** | This derivative is reported as unrealized appreciation/depreciation at period end. |
SEE NOTES TO FINANCIAL STATEMENTS. | THE GUGGENHEIM FUNDS SEMI-ANNUAL FINANCIAL REPORT | 103 |
SCHEDULE OF INVESTMENTS (Unaudited)(concluded) | June 30, 2024 |
SERIES Y (STYLEPLUS—LARGE GROWTH SERIES) | |
Affiliated Transactions
Investments representing 5% or more of the outstanding voting shares of a company, or control of or by, or common control under Guggenheim Investments (“GI”), result in that company being considered an affiliated issuer, as defined in the 1940 Act.
The Fund may invest in certain of the underlying series of Guggenheim Strategy Funds Trust, including Guggenheim Strategy Fund II, Guggenheim Strategy Fund III and Guggenheim Variable Insurance Strategy Fund III (collectively, the “Guggenheim Strategy Funds”), each of which are open-end management investment companies managed by GI. The Guggenheim Strategy Funds, which launched on March 11, 2014, are offered as short term investment options only to mutual funds, trusts, and other accounts managed by GI and/or its affiliates, and are not available to the public. The Guggenheim Strategy Funds pay no investment management fees. The Guggenheim Strategy Funds’ annual report on Form N-CSR dated September 30, 2023 is available publicly or upon request. This information is available from the EDGAR database on the SEC’s website at https://www.sec.gov/Archives/edgar/data/1601445/000182126823000217/gug86449-ncsr.htm. The Fund may invest in certain of the underlying series of Guggenheim Funds Trust, which are open-end management investment companies managed by GI, are available to the public and whose most recent annual report on Form N-CSR is available publicly or upon request.
Transactions during the period ended June 30, 2024, in which the company is an affiliated issuer, were as follows:
Security Name | | Value
12/31/23 | | | Additions | | | Reductions | | | Realized
Gain (Loss) | | | Change in
Unrealized
Appreciation
(Depreciation) | | | Value
06/30/24 | | | Shares
06/30/24 | | | Investment
Income | |
Mutual Funds | | | | | | | | | | | | | | | | | | | | | | | | | | | | | | | | |
Guggenheim Strategy Fund II | | $ | 10,652,769 | | | $ | 2,293,552 | | | $ | (2,328,740 | ) | | $ | 26,837 | | | $ | 26,840 | | | $ | 10,671,258 | | | | 432,911 | | | $ | 280,648 | |
Guggenheim Strategy Fund III | | | 10,621,790 | | | | 3,529,351 | | | | – | | | | – | | | | 97,671 | | | | 14,248,812 | | | | 576,175 | | | | 360,503 | |
Guggenheim Ultra Short Duration Fund — Institutional Class | | | 4,033,244 | | | | 105,692 | | | | – | | | | – | | | | 37,209 | | | | 4,176,145 | | | | 420,135 | | | | 106,415 | |
Guggenheim Variable Insurance Strategy Fund III | | | 10,670,930 | | | | 1,915,091 | | | | – | | | | – | | | | 83,119 | | | | 12,669,140 | | | | 512,713 | | | | 316,578 | |
| | | $ | 35,978,733 | | | $ | 7,843,686 | | | $ | (2,328,740 | ) | | $ | 26,837 | | | $ | 244,839 | | | $ | 41,765,355 | | | | | | | $ | 1,064,144 | |
104 | THE GUGGENHEIM FUNDS SEMI-ANNUAL FINANCIAL REPORT | SEE NOTES TO FINANCIAL STATEMENTS. |
SERIES Y (STYLEPLUS—LARGE GROWTH SERIES) | |
STATEMENT OF ASSETS AND LIABILITIES (Unaudited) |
June 30, 2024 |
Assets: |
Investments in unaffiliated issuers, at value (cost $11,445,279) | | $ | 14,233,692 | |
Investments in affiliated issuers, at value (cost $41,765,871) | | | 41,765,355 | |
Segregated cash with broker | | | 145,000 | |
Prepaid expenses | | | 173 | |
Receivables: |
Swap settlement | | | 2,751,546 | |
Dividends | | | 173,909 | |
Interest | | | 10,475 | |
Fund shares sold | | | 886 | |
Total assets | | | 59,081,036 | |
| | | | | |
Liabilities: |
Segregated cash due to broker | | | 3,080,000 | |
Payable for: |
Fund shares redeemed | | | 700,690 | |
Securities purchased | | | 171,245 | |
Management fees | | | 17,952 | |
Distribution and service fees | | | 10,544 | |
Variation margin on futures contracts | | | 5,515 | |
Transfer agent/maintenance fees | | | 1,918 | |
Trustees’ fees* | | | 1,101 | |
Fund accounting/administration fees | | | 1,026 | |
Miscellaneous | | | 31,713 | |
Total liabilities | | | 4,021,704 | |
Net assets | | $ | 55,059,332 | |
| | | | | |
Net assets consist of: |
Paid in capital | | $ | 41,517,798 | |
Total distributable earnings (loss) | | | 13,541,534 | |
Net assets | | $ | 55,059,332 | |
Capital shares outstanding | | | 2,400,014 | |
Net asset value per share | | $ | 22.94 | |
STATEMENT OF OPERATIONS (Unaudited) |
Six Months Ended June 30, 2024 |
Investment Income: |
Dividends from securities of unaffiliated issuers (net of foreign withholding tax of $159) | | $ | 42,421 | |
Dividends from securities of affiliated issuers | | | 1,064,144 | |
Interest | | | 54,473 | |
Total investment income | | | 1,161,038 | |
| | | | | |
Expenses: |
Management fees | | | 169,652 | |
Distribution and service fees | | | 65,251 | |
Transfer agent/maintenance fees | | | 12,300 | |
Interest expense | | | 98,698 | |
Professional fees | | | 18,270 | |
Fund accounting/administration fees | | | 14,488 | |
Trustees’ fees* | | | 7,069 | |
Custodian fees | | | 5,129 | |
Line of credit fees | | | 630 | |
Miscellaneous | | | 5,526 | |
Total expenses | | | 397,013 | |
Less: |
Expenses waived by Adviser | | | (67,917 | ) |
Net expenses | | | 329,096 | |
Net investment income | | | 831,942 | |
| | | | | |
Net Realized and Unrealized Gain (Loss): |
Net realized gain (loss) on: |
Investments in unaffiliated issuers | | | 655,501 | |
Investments in affiliated issuers | | | 26,837 | |
Swap agreements | | | 11,382,393 | |
Futures contracts | | | 129,705 | |
Net realized gain | | | 12,194,436 | |
Net change in unrealized appreciation (depreciation) on: |
Investments in unaffiliated issuers | | | 1,396,684 | |
Investments in affiliated issuers | | | 244,839 | |
Swap agreements | | | (4,776,102 | ) |
Futures contracts | | | (23,030 | ) |
Net change in unrealized appreciation (depreciation) | | | (3,157,609 | ) |
Net realized and unrealized gain | | | 9,036,827 | |
Net increase in net assets resulting from operations | | $ | 9,868,769 | |
* | Relates to Trustees not deemed “interested persons” within the meaning of Section 2(a)(19) of the 1940 Act. |
SEE NOTES TO FINANCIAL STATEMENTS. | THE GUGGENHEIM FUNDS SEMI-ANNUAL FINANCIAL REPORT | 105 |
SERIES Y (STYLEPLUS—LARGE GROWTH SERIES) | |
STATEMENTS OF CHANGES IN NET ASSETS |
| | Six Months Ended
June 30, 2024
(Unaudited) | | | Year Ended
December 31,
2023 | |
Increase (Decrease) in Net Assets from Operations: | | | | | | | | |
Net investment income | | $ | 831,942 | | | $ | 1,441,067 | |
Net realized gain on investments | | | 12,194,436 | | | | 6,130,097 | |
Net change in unrealized appreciation (depreciation) on investments | | | (3,157,609 | ) | | | 6,677,620 | |
Net increase in net assets resulting from operations | | | 9,868,769 | | | | 14,248,784 | |
| | | | | | | | | |
Distributions to shareholders | | | — | | | | (586,749 | ) |
| | | | | | | | | |
Capital share transactions: | | | | | | | | |
Proceeds from sale of shares | | | 1,704,405 | | | | 3,844,874 | |
Distributions reinvested | | | — | | | | 586,749 | |
Cost of shares redeemed | | | (5,243,246 | ) | | | (6,425,230 | ) |
Net decrease from capital share transactions | | | (3,538,841 | ) | | | (1,993,607 | ) |
Net increase in net assets | | | 6,329,928 | | | | 11,668,428 | |
| | | | | | | | | |
Net assets: | | | | | | | | |
Beginning of period | | | 48,729,404 | | | | 37,060,976 | |
End of period | | $ | 55,059,332 | | | $ | 48,729,404 | |
| | | | | | | | | |
Capital share activity: | | | | | | | | |
Shares sold | | | 82,628 | | | | 226,502 | |
Shares issued from reinvestment of distributions | | | — | | | | 33,414 | |
Shares redeemed | | | (246,211 | ) | | | (389,335 | ) |
Net decrease in shares | | | (163,583 | ) | | | (129,419 | ) |
106 | THE GUGGENHEIM FUNDS SEMI-ANNUAL FINANCIAL REPORT | SEE NOTES TO FINANCIAL STATEMENTS. |
SERIES Y (STYLEPLUS—LARGE GROWTH SERIES) | |
This table is presented to show selected data for a share outstanding throughout each period and to assist shareholders in evaluating a Fund’s performance for the periods presented.
| | Six Months Ended
June 30, 2024a | | | Year Ended
December 31,
2023 | | | Year Ended
December 31,
2022 | | | Year Ended
December 31,
2021 | | | Year Ended
December 31,
2020 | | | Year Ended
December 31,
2019 | |
Per Share Data |
Net asset value, beginning of period | | $ | 19.01 | | | $ | 13.76 | | | $ | 26.38 | | | $ | 25.79 | | | $ | 19.82 | | | $ | 16.47 | |
Income (loss) from investment operations: |
Net investment income (loss)b | | | .33 | | | | .55 | | | | .24 | | | | .09 | | | | .16 | | | | .28 | |
Net gain (loss) on investments (realized and unrealized) | | | 3.60 | | | | 4.92 | | | | (7.87 | ) | | | 6.51 | | | | 7.07 | | | | 5.13 | |
Total from investment operations | | | 3.93 | | | | 5.47 | | | | (7.63 | ) | | | 6.60 | | | | 7.23 | | | | 5.41 | |
Less distributions from: |
Net investment income | | | — | | | | (.22 | ) | | | (.09 | ) | | | (.17 | ) | | | (.28 | ) | | | (.38 | ) |
Net realized gains | | | — | | | | — | | | | (4.90 | ) | | | (5.84 | ) | | | (.98 | ) | | | (1.68 | ) |
Total distributions | | | — | | | | (.22 | ) | | | (4.99 | ) | | | (6.01 | ) | | | (1.26 | ) | | | (2.06 | ) |
Net asset value, end of period | | $ | 22.94 | | | $ | 19.01 | | | $ | 13.76 | | | $ | 26.38 | | | $ | 25.79 | | | $ | 19.82 | |
|
Total Returnc | | | 20.67 | % | | | 39.91 | % | | | (30.69 | %) | | | 27.77 | % | | | 37.87 | % | | | 33.92 | % |
Ratios/Supplemental Data |
Net assets, end of period (in thousands) | | $ | 55,059 | | | $ | 48,729 | | | $ | 37,061 | | | $ | 57,977 | | | $ | 49,478 | | | $ | 40,187 | |
Ratios to average net assets: |
Net investment income (loss) | | | 3.19 | % | | | 3.35 | % | | | 1.34 | % | | | 0.34 | % | | | 0.73 | % | | | 1.51 | % |
Total expensesd | | | 1.52 | % | | | 1.51 | % | | | 1.21 | % | | | 1.20 | % | | | 1.29 | % | | | 1.44 | % |
Net expensese,f | | | 1.26 | % | | | 1.18 | % | | | 0.92 | % | | | 0.88 | % | | | 0.88 | % | | | 0.97 | % |
Portfolio turnover rate | | | 21 | % | | | 57 | % | | | 65 | % | | | 40 | % | | | 66 | % | | | 47 | % |
a | Unaudited figures for the period ended June 30, 2024. Percentage amounts for the period, except total return and portfolio turnover rate, have been annualized. |
b | Net investment income (loss) per share was computed using average shares outstanding throughout the period. |
c | Total return does not take into account any of the expenses associated with an investment in variable insurance products. If total return had taken into account these expenses, performance would have been lower. Shares of a series of Guggenheim Variable Funds Trust are available only through the purchase of such products. |
d | Does not include expenses of the underlying funds in which the Fund invests. |
e | Net expense information reflects the expense ratios after expense waivers and reimbursements, as applicable. |
f | Net expenses may include expenses that are excluded from the expense limitation agreement. Excluding these expenses, the net expense ratios for the years presented would be: |
| | 06/30/24a | 12/31/23 | 12/31/22 | 12/31/21 | 12/31/20 | 12/31/19 |
| | 0.88% | 0.88% | 0.89% | 0.87% | 0.88% | 0.90% |
SEE NOTES TO FINANCIAL STATEMENTS. | THE GUGGENHEIM FUNDS SEMI-ANNUAL FINANCIAL REPORT | 107 |
SCHEDULE OF INVESTMENTS (Unaudited) | June 30, 2024 |
SERIES Z (ALPHA OPPORTUNITY SERIES) | |
| | Shares | | | Value | |
COMMON STOCKS† - 93.4% |
| | | | | | | | | |
Industrial - 17.7% |
Apogee Enterprises, Inc.1 | | | 552 | | | $ | 34,685 | |
Mueller Industries, Inc.1 | | | 598 | | | | 34,050 | |
Vontier Corp. | | | 870 | | | | 33,234 | |
Vishay Intertechnology, Inc. | | | 1,484 | | | | 33,093 | |
Avnet, Inc. | | | 637 | | | | 32,799 | |
International Seaways, Inc. | | | 544 | | | | 32,167 | |
Teekay Corp.* | | | 3,502 | | | | 31,413 | |
TD SYNNEX Corp.1 | | | 266 | | | | 30,696 | |
Caterpillar, Inc. | | | 89 | | | | 29,646 | |
Teekay Tankers Ltd. — Class A | | | 426 | | | | 29,313 | |
Acuity Brands, Inc. | | | 121 | | | | 29,214 | |
Sonoco Products Co. | | | 561 | | | | 28,454 | |
Boise Cascade Co.1 | | | 232 | | | | 27,659 | |
Scorpio Tankers, Inc. | | | 312 | | | | 25,362 | |
UFP Industries, Inc.1 | | | 226 | | | | 25,312 | |
Snap-on, Inc. | | | 95 | | | | 24,832 | |
Owens Corning | | | 133 | | | | 23,105 | |
Atkore, Inc. | | | 130 | | | | 17,541 | |
Terex Corp.1 | | | 316 | | | | 17,330 | |
Griffon Corp. | | | 256 | | | | 16,348 | |
AGCO Corp. | | | 127 | | | | 12,431 | |
Dorian LPG Ltd. | | | 262 | | | | 10,994 | |
AZZ, Inc. | | | 141 | | | | 10,893 | |
Lindsay Corp. | | | 81 | | | | 9,953 | |
Argan, Inc.1 | | | 133 | | | | 9,730 | |
Ardmore Shipping Corp. | | | 400 | | | | 9,012 | |
Mettler-Toledo International, Inc.*,1 | | | 6 | | | | 8,386 | |
Masterbrand, Inc.* | | | 477 | | | | 7,002 | |
Kennametal, Inc. | | | 295 | | | | 6,944 | |
Total Industrial | | | | | | | 641,598 | |
| | | | | | | | | |
Consumer, Cyclical - 16.7% |
General Motors Co.1 | | | 758 | | | | 35,217 | |
Allison Transmission Holdings, Inc.1 | | | 457 | | | | 34,686 | |
Cummins, Inc. | | | 123 | | | | 34,062 | |
Lennar Corp. — Class A1 | | | 217 | | | | 32,522 | |
PACCAR, Inc.1 | | | 314 | | | | 32,323 | |
Lear Corp. | | | 281 | | | | 32,093 | |
MSC Industrial Direct Company, Inc. — Class A | | | 404 | | | | 32,041 | |
GMS, Inc.* | | | 379 | | | | 30,551 | |
KB Home | | | 410 | | | | 28,774 | |
Monarch Casino & Resort, Inc.1 | | | 421 | | | | 28,683 | |
BorgWarner, Inc. | | | 871 | | | | 28,081 | |
Polaris, Inc. | | | 356 | | | | 27,878 | |
Buckle, Inc. | | | 669 | | | | 24,713 | |
M/I Homes, Inc.* | | | 167 | | | | 20,397 | |
Meritage Homes Corp. | | | 120 | | | | 19,422 | |
Carter’s, Inc. | | | 312 | | | | 19,335 | |
Visteon Corp.* | | | 165 | | | | 17,606 | |
Movado Group, Inc. | | | 681 | | | | 16,930 | |
MasterCraft Boat Holdings, Inc.* | | | 787 | | | | 14,859 | |
Wabash National Corp. | | | 663 | | | | 14,480 | |
Mattel, Inc.* | | | 831 | | | | 13,512 | |
Dillard’s, Inc. — Class A | | | 29 | | | | 12,771 | |
Toll Brothers, Inc. | | | 108 | | | | 12,440 | |
Build-A-Bear Workshop, Inc. — Class A1 | | | 426 | | | | 10,765 | |
Ethan Allen Interiors, Inc. | | | 379 | | | | 10,570 | |
Golden Entertainment, Inc.1 | | | 314 | | | | 9,768 | |
Sonos, Inc.* | | | 655 | | | | 9,668 | |
Total Consumer, Cyclical | | | | | | | 604,147 | |
| | | | | | | | | |
Consumer, Non-cyclical - 16.6% |
United Therapeutics Corp.*,1 | | | 122 | | | | 38,863 | |
Gilead Sciences, Inc.1 | | | 534 | | | | 36,638 | |
Innoviva, Inc.*,1 | | | 2,137 | | | | 35,047 | |
Neurocrine Biosciences, Inc.* | | | 253 | | | | 34,830 | |
Bristol-Myers Squibb Co.1 | | | 832 | | | | 34,553 | |
Johnson & Johnson1 | | | 233 | | | | 34,055 | |
Jazz Pharmaceuticals plc* | | | 318 | | | | 33,940 | |
Merck & Company, Inc.1 | | | 265 | | | | 32,807 | |
Molina Healthcare, Inc.* | | | 93 | | | | 27,649 | |
Collegium Pharmaceutical, Inc.* | | | 790 | | | | 25,438 | |
Royalty Pharma plc — Class A | | | 952 | | | | 25,104 | |
United Rentals, Inc. | | | 33 | | | | 21,342 | |
Catalyst Pharmaceuticals, Inc.* | | | 1,246 | | | | 19,300 | |
Cal-Maine Foods, Inc. | | | 238 | | | | 14,544 | |
Perdoceo Education Corp.1 | | | 646 | | | | 13,837 | |
Alkermes plc* | | | 537 | | | | 12,942 | |
Upbound Group, Inc. | | | 394 | | | | 12,096 | |
USANA Health Sciences, Inc.* | | | 265 | | | | 11,989 | |
Pacira BioSciences, Inc.* | | | 415 | | | | 11,873 | |
Stride, Inc.* | | | 166 | | | | 11,703 | |
Zimmer Biomet Holdings, Inc. | | | 90 | | | | 9,768 | |
Organon & Co.1 | | | 468 | | | | 9,688 | |
Centene Corp.*,1 | | | 134 | | | | 8,884 | |
Inmode Ltd.* | | | 468 | | | | 8,536 | |
ZipRecruiter, Inc. — Class A* | | | 903 | | | | 8,208 | |
Alarm.com Holdings, Inc.* | | | 121 | | | | 7,689 | |
Amgen, Inc. | | | 24 | | | | 7,499 | |
Biogen, Inc.* | | | 32 | | | | 7,418 | |
Exelixis, Inc.* | | | 315 | | | | 7,078 | |
Harmony Biosciences Holdings, Inc.* | | | 230 | | | | 6,939 | |
Becton Dickinson & Co. | | | 29 | | | | 6,778 | |
LiveRamp Holdings, Inc.* | | | 217 | | | | 6,714 | |
Amphastar Pharmaceuticals, Inc.* | | | 163 | | | | 6,520 | |
OraSure Technologies, Inc.* | | | 1,449 | | | | 6,173 | |
Xencor, Inc.* | | | 292 | | | | 5,528 | |
Total Consumer, Non-cyclical | | | | | | | 601,970 | |
| | | | | | | | | |
Financial - 12.1% |
MGIC Investment Corp.1 | | | 1,608 | | | | 34,652 | |
Equity Commonwealth REIT* | | | 1,776 | | | | 34,497 | |
Enact Holdings, Inc.1 | | | 1,124 | | | | 34,462 | |
MetLife, Inc.1 | | | 489 | | | | 34,323 | |
Essent Group Ltd. | | | 600 | | | | 33,714 | |
Synchrony Financial1 | | | 677 | | | | 31,948 | |
Janus Henderson Group plc | | | 944 | | | | 31,822 | |
Preferred Bank/Los Angeles CA | | | 368 | | | | 27,780 | |
Everest Group Ltd. | | | 55 | | | | 20,956 | |
Hilltop Holdings, Inc. | | | 624 | | | | 19,519 | |
108 | THE GUGGENHEIM FUNDS SEMI-ANNUAL FINANCIAL REPORT | SEE NOTES TO FINANCIAL STATEMENTS. |
SCHEDULE OF INVESTMENTS (Unaudited)(continued) | June 30, 2024 |
SERIES Z (ALPHA OPPORTUNITY SERIES) | |
| | Shares | | | Value | |
Jackson Financial, Inc. — Class A | | | 254 | | | $ | 18,862 | |
OneMain Holdings, Inc. | | | 372 | | | | 18,038 | |
NMI Holdings, Inc. — Class A*,1 | | | 521 | | | | 17,735 | |
Western Union Co. | | | 1,297 | | | | 15,850 | |
Enova International, Inc.* | | | 237 | | | | 14,753 | |
Ally Financial, Inc. | | | 354 | | | | 14,043 | |
Central Pacific Financial Corp. | | | 601 | | | | 12,741 | |
SiriusPoint Ltd.* | | | 894 | | | | 10,907 | |
International Bancshares Corp. | | | 188 | | | | 10,755 | |
Total Financial | | | | | | | 437,357 | |
| | | | | | | | | |
Communications - 10.8% |
AT&T, Inc.1 | | | 1,876 | | | | 35,850 | |
Cisco Systems, Inc.1 | | | 748 | | | | 35,537 | |
Yelp, Inc. — Class A* | | | 957 | | | | 35,361 | |
InterDigital, Inc. | | | 295 | | | | 34,385 | |
Verizon Communications, Inc.1 | | | 825 | | | | 34,023 | |
Fox Corp. — Class B1 | | | 1,061 | | | | 33,973 | |
T-Mobile US, Inc.1 | | | 190 | | | | 33,474 | |
eBay, Inc.1 | | | 584 | | | | 31,372 | |
TEGNA, Inc. | | | 1,971 | | | | 27,476 | |
IDT Corp. — Class B1 | | | 723 | | | | 25,970 | |
Ooma, Inc.*,1 | | | 1,764 | | | | 17,517 | |
Spok Holdings, Inc. | | | 1,107 | | | | 16,395 | |
Ciena Corp.* | | | 332 | | | | 15,996 | |
Gogo, Inc.*,1 | | | 1,317 | | | | 12,670 | |
Total Communications | | | | | | | 389,999 | |
| | | | | | | | | |
Technology - 7.0% |
Dropbox, Inc. — Class A*,1 | | | 1,583 | | | | 35,570 | |
Amdocs Ltd. | | | 445 | | | | 35,119 | |
Zoom Video Communications, Inc. — Class A* | | | 551 | | | | 32,613 | |
Immersion Corp.1 | | | 2,191 | | | | 20,617 | |
NetApp, Inc.1 | | | 151 | | | | 19,449 | |
Qualys, Inc.* | | | 120 | | | | 17,112 | |
Amkor Technology, Inc. | | | 418 | | | | 16,728 | |
Clear Secure, Inc. — Class A | | | 870 | | | | 16,278 | |
Cirrus Logic, Inc.* | | | 112 | | | | 14,298 | |
IPG Photonics Corp.* | | | 125 | | | | 10,549 | |
Photronics, Inc.* | | | 407 | | | | 10,041 | |
Adeia, Inc.1 | | | 859 | | | | 9,608 | |
Teradata Corp.* | | | 262 | | | | 9,055 | |
Playtika Holding Corp.1 | | | 1,114 | | | | 8,767 | |
Total Technology | | | | | | | 255,804 | |
| | | | | | | | | |
Utilities - 6.2% |
ONE Gas, Inc. | | | 549 | | | | 35,054 | |
OGE Energy Corp.1 | | | 949 | | | | 33,879 | |
Black Hills Corp. | | | 618 | | | | 33,607 | |
WEC Energy Group, Inc. | | | 420 | | | | 32,953 | |
National Fuel Gas Co.1 | | | 606 | | | | 32,839 | |
CMS Energy Corp.1 | | | 550 | | | | 32,742 | |
Otter Tail Corp. | | | 275 | | | | 24,087 | |
Total Utilities | | | | | | | 225,161 | |
| | | | | | | | | |
Energy - 4.9% |
PBF Energy, Inc. — Class A | | | 755 | | | | 34,745 | |
CVR Energy, Inc.1 | | | 1,270 | | | | 33,998 | |
Cheniere Energy, Inc. | | | 131 | | | | 22,903 | |
HF Sinclair Corp. | | | 421 | | | | 22,456 | |
Valero Energy Corp.1 | | | 137 | | | | 21,476 | |
Marathon Petroleum Corp.1 | | | 87 | | | | 15,093 | |
SandRidge Energy, Inc.1 | | | 900 | | | | 11,637 | |
Liberty Energy, Inc. — Class A | | | 336 | | | | 7,019 | |
Par Pacific Holdings, Inc.* | | | 274 | | | | 6,918 | |
Total Energy | | | | | | | 176,245 | |
| | | | | | | | | |
Basic Materials - 0.8% |
CF Industries Holdings, Inc.1 | | | 238 | | | | 17,641 | |
Sylvamo Corp. | | | 164 | | | | 11,250 | |
Total Basic Materials | | | | | | | 28,891 | |
| | | | | | | | | |
Government - 0.6% |
Banco Latinoamericano de Comercio Exterior S.A. — Class E | | | 806 | | | | 23,914 | |
| | | | | | | | | |
Total Common Stocks | | | | |
(Cost $3,306,763) | | | | | | | 3,385,086 | |
| | | | | | | | | |
MONEY MARKET FUND**,† - 2.1% |
Goldman Sachs Financial Square Treasury Instruments Fund — Institutional Shares, 5.16%2 | | | 74,797 | | | | 74,797 | |
Total Money Market Fund | | | | |
(Cost $74,797) | | | | | | | 74,797 | |
| | | | | | | | | |
Total Investments - 95.5% | | | | |
(Cost $3,381,560) | | $ | 3,459,883 | |
Other Assets & Liabilities, net - 4.5% | | | 161,810 | |
Total Net Assets - 100.0% | | $ | 3,621,693 | |
SEE NOTES TO FINANCIAL STATEMENTS. | THE GUGGENHEIM FUNDS SEMI-ANNUAL FINANCIAL REPORT | 109 |
SCHEDULE OF INVESTMENTS (Unaudited)(continued) | June 30, 2024 |
SERIES Z (ALPHA OPPORTUNITY SERIES) | |
Custom Basket Swap Agreements |
Counterparty | Reference Obligation | Type | Financing
Rate | | Payment
Frequency | | | Maturity
Date | | | Notional
Amount | | | Value and
Unrealized
Appreciation | |
OTC Custom Basket Swap Agreements†† |
Morgan Stanley Capital Services LLC | MS Equity Custom Basket | Pay | 5.73% (Federal Funds Rate + 0.40%) | | | At Maturity | | | | 11/01/24 | | | $ | 1,037,416 | | | $ | 45,976 | |
Goldman Sachs International | GS Equity Custom Basket | Pay | 5.78% (Federal Funds Rate + 0.45%) | | | At Maturity | | | | 05/16/28 | | | | 1,037,417 | | | | 30,253 | |
| | | | | | | | | | | | | | $ | 2,074,833 | | | $ | 76,229 | |
OTC Custom Basket Swap Agreements Sold Short†† |
Morgan Stanley Capital Services LLC | MS Equity Custom Basket | Receive | 5.02% (Federal Funds Rate - 0.31%) | | | At Maturity | | | | 11/01/24 | | | $ | 1,840,500 | | | $ | 73,054 | |
Goldman Sachs International | GS Equity Custom Basket | Receive | 5.12% (Federal Funds Rate - 0.21%) | | | At Maturity | | | | 05/16/28 | | | | 1,814,632 | | | | 57,809 | |
| | | | | | | | | | | | | | $ | 3,655,132 | | | $ | 130,863 | |
| | Shares | | | Percentage
Notional
Amount | | | Value and
Unrealized
Appreciation
(Depreciation) | |
MS EQUITY LONG CUSTOM BASKET | | | | | | | | |
Industrial | | | | | | | | | | | | |
Mueller Industries, Inc. | | | 183 | | | | 1.01 | % | | $ | 3,821 | |
International Seaways, Inc. | | | 167 | | | | 0.95 | % | | | 2,730 | |
Apogee Enterprises, Inc. | | | 169 | | | | 1.02 | % | | | 2,506 | |
Teekay Tankers Ltd. — Class A | | | 131 | | | | 0.87 | % | | | 2,313 | |
Teekay Corp. | | | 1,073 | | | | 0.93 | % | | | 2,284 | |
Scorpio Tankers, Inc. | | | 96 | | | | 0.75 | % | | | 2,155 | |
Owens Corning | | | 41 | | | | 0.69 | % | | | 1,797 | |
Boise Cascade Co. | | | 71 | | | | 0.82 | % | | | 1,642 | |
Argan, Inc. | | | 41 | | | | 0.29 | % | | | 1,321 | |
Ardmore Shipping Corp. | | | 122 | | | | 0.26 | % | | | 1,278 | |
TD SYNNEX Corp. | | | 82 | | | | 0.91 | % | | | 977 | |
Snap-on, Inc. | | | 29 | | | | 0.73 | % | | | 516 | |
UFP Industries, Inc. | | | 69 | | | | 0.74 | % | | | 335 | |
Lindsay Corp. | | | 25 | | | | 0.30 | % | | | 220 | |
Caterpillar, Inc. | | | 27 | | | | 0.87 | % | | | 121 | |
AZZ, Inc. | | | 43 | | | | 0.32 | % | | | 80 | |
Mettler-Toledo International, Inc. | | | 2 | | | | 0.27 | % | | | (78 | ) |
Terex Corp. | | | 97 | | | | 0.51 | % | | | (80 | ) |
Kennametal, Inc. | | | 90 | | | | 0.20 | % | | | (154 | ) |
Vishay Intertechnology, Inc. | | | 455 | | | | 0.98 | % | | | (198 | ) |
Masterbrand, Inc. | | | 146 | | | | 0.21 | % | | | (357 | ) |
Vontier Corp. | | | 267 | | | | 0.98 | % | | | (388 | ) |
Griffon Corp. | | | 78 | | | | 0.48 | % | | | (389 | ) |
Atkore, Inc. | | | 40 | | | | 0.52 | % | | | (474 | ) |
Acuity Brands, Inc. | | | 37 | | | | 0.86 | % | | | (474 | ) |
Avnet, Inc. | | | 195 | | | | 0.97 | % | | | (530 | ) |
AGCO Corp. | | | 39 | | | | 0.37 | % | | | (636 | ) |
Dorian LPG Ltd. | | | 80 | | | | 0.32 | % | | | (649 | ) |
Sonoco Products Co. | | | 172 | | | | 0.85 | % | | | (1,005 | ) |
Total Industrial | | | | | | | | | | | 18,684 | |
| | | | | | | | | | | | | |
Communications | | | | | | | | | | | | |
InterDigital, Inc. | | | 90 | | | | 1.02 | % | | | 3,040 | |
AT&T, Inc. | | | 575 | | | | 1.06 | % | | | 2,029 | |
eBay, Inc. | | | 179 | | | | 0.93 | % | | | 1,997 | |
IDT Corp. — Class B | | | 222 | | | | 0.77 | % | | | 1,836 | |
Verizon Communications, Inc. | | | 253 | | | | 1.01 | % | | | 1,352 | |
T-Mobile US, Inc. | | | 58 | | | | 0.98 | % | | | 1,222 | |
Gogo, Inc. | | | 404 | | | | 0.37 | % | | | 269 | |
Yelp, Inc. — Class A | | | 293 | | | | 1.04 | % | | | 220 | |
Ciena Corp. | | | 102 | | | | 0.47 | % | | | (43 | ) |
Fox Corp. — Class B | | | 325 | | | | 1.00 | % | | | (74 | ) |
Cisco Systems, Inc. | | | 229 | | | | 1.05 | % | | | (170 | ) |
TEGNA, Inc. | | | 604 | | | | 0.81 | % | | | (244 | ) |
Spok Holdings, Inc. | | | 339 | | | | 0.48 | % | | | (248 | ) |
Ooma, Inc. | | | 541 | | | | 0.53 | % | | | (361 | ) |
Total Communications | | | | | | | | | | | 10,825 | |
| | | | | | | | | | | | | |
Technology | | | | | | | | | | | | |
Immersion Corp. | | | 671 | | | | 0.62 | % | | | 1,737 | |
Cirrus Logic, Inc. | | | 34 | | | | 0.42 | % | | | 1,310 | |
NetApp, Inc. | | | 46 | | | | 0.57 | % | | | 1,123 | |
Amkor Technology, Inc. | | | 128 | | | | 0.49 | % | | | 944 | |
Clear Secure, Inc. — Class A | | | 267 | | | | 0.48 | % | | | 356 | |
Playtika Holding Corp. | | | 342 | | | | 0.26 | % | | | 330 | |
Qualys, Inc. | | | 37 | | | | 0.51 | % | | | 246 | |
Adeia, Inc. | | | 263 | | | | 0.28 | % | | | 167 | |
110 | THE GUGGENHEIM FUNDS SEMI-ANNUAL FINANCIAL REPORT | SEE NOTES TO FINANCIAL STATEMENTS. |
SCHEDULE OF INVESTMENTS (Unaudited)(continued) | June 30, 2024 |
SERIES Z (ALPHA OPPORTUNITY SERIES) | |
| | Shares | | | Percentage
Notional
Amount | | | Value and
Unrealized
Appreciation
(Depreciation) | |
IPG Photonics Corp. | | | 38 | | | | 0.31 | % | | $ | (91 | ) |
Teradata Corp. | | | 80 | | | | 0.27 | % | | | (151 | ) |
Photronics, Inc. | | | 125 | | | | 0.30 | % | | | (398 | ) |
Dropbox, Inc. — Class A | | | 485 | | | | 1.05 | % | | | (508 | ) |
Zoom Video Communications, Inc. — Class A | | | 169 | | | | 0.96 | % | | | (749 | ) |
Amdocs Ltd. | | | 136 | | | | 1.04 | % | | | (841 | ) |
Total Technology | | | | | | | | | | | 3,475 | |
| | | | | | | | | | | | | |
Consumer, Non-cyclical | | | | | | | | | | | | |
United Therapeutics Corp. | | | 38 | | | | 1.17 | % | | | 3,694 | |
Perdoceo Education Corp. | | | 198 | | | | 0.41 | % | | | 2,173 | |
Innoviva, Inc. | | | 655 | | | | 1.04 | % | | | 1,903 | |
Merck & Company, Inc. | | | 81 | | | | 0.97 | % | | | 1,313 | |
Organon & Co. | | | 144 | | | | 0.29 | % | | | 423 | |
Cal-Maine Foods, Inc. | | | 73 | | | | 0.43 | % | | | 269 | |
Amgen, Inc. | | | 7 | | | | 0.21 | % | | | 247 | |
Alarm.com Holdings, Inc. | | | 37 | | | | 0.23 | % | | | 199 | |
Neurocrine Biosciences, Inc. | | | 77 | | | | 1.02 | % | | | 198 | |
Exelixis, Inc. | | | 97 | | | | 0.21 | % | | | 57 | |
Stride, Inc. | | | 51 | | | | 0.35 | % | | | 54 | |
Gilead Sciences, Inc. | | | 164 | | | | 1.08 | % | | | 18 | |
Pacira BioSciences, Inc. | | | 127 | | | | 0.35 | % | | | 10 | |
Becton Dickinson & Co. | | | 9 | | | | 0.20 | % | | | (21 | ) |
LiveRamp Holdings, Inc. | | | 66 | | | | 0.20 | % | | | (40 | ) |
Biogen, Inc. | | | 10 | | | | 0.22 | % | | | (42 | ) |
Catalyst Pharmaceuticals, Inc. | | | 382 | | | | 0.57 | % | | | (72 | ) |
Zimmer Biomet Holdings, Inc. | | | 27 | | | | 0.28 | % | | | (113 | ) |
Amphastar Pharmaceuticals, Inc. | | | 50 | | | | 0.19 | % | | | (122 | ) |
Centene Corp. | | | 41 | | | | 0.26 | % | | | (138 | ) |
Harmony Biosciences Holdings, Inc. | | | 71 | | | | 0.21 | % | | | (166 | ) |
ZipRecruiter, Inc. — Class A | | | 277 | | | | 0.24 | % | | | (196 | ) |
United Rentals, Inc. | | | 10 | | | | 0.62 | % | | | (221 | ) |
Xencor, Inc. | | | 90 | | | | 0.16 | % | | | (240 | ) |
OraSure Technologies, Inc. | | | 444 | | | | 0.18 | % | | | (261 | ) |
USANA Health Sciences, Inc. | | | 81 | | | | 0.35 | % | | | (281 | ) |
Inmode Ltd. | | | 143 | | | | 0.25 | % | | | (324 | ) |
Alkermes plc | | | 165 | | | | 0.38 | % | | | (326 | ) |
Upbound Group, Inc. | | | 121 | | | | 0.36 | % | | | (329 | ) |
Johnson & Johnson | | | 71 | | | | 1.00 | % | | | (504 | ) |
Royalty Pharma plc — Class A | | | 292 | | | | 0.74 | % | | | (623 | ) |
Collegium Pharmaceutical, Inc. | | | 242 | | | | 0.75 | % | | | (683 | ) |
Molina Healthcare, Inc. | | | 28 | | | | 0.80 | % | | | (932 | ) |
Jazz Pharmaceuticals plc | | | 97 | | | | 1.00 | % | | | (1,080 | ) |
Bristol-Myers Squibb Co. | | | 255 | | | | 1.03 | % | | | (3,088 | ) |
Total Consumer, Non-cyclical | | | | | | | | | | | 756 | |
| | | | | | | | | | | | | |
Consumer, Cyclical | | | | | | | | | | | | |
Allison Transmission Holdings, Inc. | | | 140 | | | | 1.02 | % | | | 3,846 | |
KB Home | | | 126 | | | | 0.85 | % | | | 1,497 | |
M/I Homes, Inc. | | | 51 | | | | 0.60 | % | | | 1,485 | |
Lennar Corp. — Class A | | | 67 | | | | 0.97 | % | | | 984 | |
General Motors Co. | | | 232 | | | | 1.04 | % | | | 319 | |
Monarch Casino & Resort, Inc. | | | 129 | | | | 0.85 | % | | | 267 | |
Build-A-Bear Workshop, Inc. — Class A | | | 130 | | | | 0.32 | % | | | 88 | |
Dillard’s, Inc. — Class A | | | 9 | | | | 0.38 | % | | | 43 | |
Cummins, Inc. | | | 38 | | | | 1.01 | % | | | (76 | ) |
Toll Brothers, Inc. | | | 33 | | | | 0.37 | % | | | (122 | ) |
Ethan Allen Interiors, Inc. | | | 116 | | | | 0.31 | % | | | (139 | ) |
PACCAR, Inc. | | | 96 | | | | 0.95 | % | | | (153 | ) |
Buckle, Inc. | | | 205 | | | | 0.73 | % | | | (238 | ) |
Sonos, Inc. | | | 201 | | | | 0.29 | % | | | (249 | ) |
Golden Entertainment, Inc. | | | 96 | | | | 0.29 | % | | | (264 | ) |
Movado Group, Inc. | | | 209 | | | | 0.50 | % | | | (281 | ) |
Visteon Corp. | | | 50 | | | | 0.51 | % | | | (281 | ) |
Mattel, Inc. | | | 255 | | | | 0.40 | % | | | (322 | ) |
BorgWarner, Inc. | | | 267 | | | | 0.83 | % | | | (416 | ) |
Meritage Homes Corp. | | | 37 | | | | 0.58 | % | | | (540 | ) |
Carter’s, Inc. | | | 96 | | | | 0.57 | % | | | (563 | ) |
MSC Industrial Direct Company, Inc. — Class A | | | 124 | | | | 0.95 | % | | | (927 | ) |
MasterCraft Boat Holdings, Inc. | | | 241 | | | | 0.44 | % | | | (944 | ) |
GMS, Inc. | | | 116 | | | | 0.90 | % | | | (965 | ) |
Wabash National Corp. | | | 203 | | | | 0.43 | % | | | (1,043 | ) |
Lear Corp. | | | 86 | | | | 0.95 | % | | | (1,068 | ) |
Polaris, Inc. | | | 109 | | | | 0.82 | % | | | (1,710 | ) |
Total Consumer, Cyclical | | | | | | | | | | | (1,772 | ) |
| | | | | | | | | | | | | |
Financial | | | | | | | | | | | | |
MGIC Investment Corp. | | | 493 | | | | 1.02 | % | | | 3,414 | |
Essent Group Ltd. | | | 184 | | | | 1.00 | % | | | 2,141 | |
Synchrony Financial | | | 207 | | | | 0.94 | % | | | 1,773 | |
Preferred Bank/Los Angeles CA | | | 113 | | | | 0.82 | % | | | 833 | |
Enact Holdings, Inc. | | | 345 | | | | 1.02 | % | | | 788 | |
International Bancshares Corp. | | | 58 | | | | 0.32 | % | | | 765 | |
NMI Holdings, Inc. — Class A | | | 160 | | | | 0.52 | % | | | 712 | |
Janus Henderson Group plc | | | 289 | | | | 0.94 | % | | | 453 | |
Everest Group Ltd. | | | 17 | | | | 0.62 | % | | | 156 | |
Central Pacific Financial Corp. | | | 184 | | | | 0.38 | % | | | 101 | |
SEE NOTES TO FINANCIAL STATEMENTS. | THE GUGGENHEIM FUNDS SEMI-ANNUAL FINANCIAL REPORT | 111 |
SCHEDULE OF INVESTMENTS (Unaudited)(continued) | June 30, 2024 |
SERIES Z (ALPHA OPPORTUNITY SERIES) | |
| | Shares | | | Percentage
Notional
Amount | | | Value and
Unrealized
Appreciation
(Depreciation) | |
OneMain Holdings, Inc. | | | 114 | | | | 0.53 | % | | $ | 86 | |
Ally Financial, Inc. | | | 109 | | | | 0.42 | % | | | 60 | |
Enova International, Inc. | | | 73 | | | | 0.44 | % | | | 45 | |
Hilltop Holdings, Inc. | | | 191 | | | | 0.58 | % | | | 34 | |
Equity Commonwealth | | | 544 | | | | 1.02 | % | | | 19 | |
MetLife, Inc. | | | 150 | | | | 1.01 | % | | | 9 | |
Jackson Financial, Inc. — Class A | | | 78 | | | | 0.56 | % | | | 3 | |
SiriusPoint Ltd. | | | 274 | | | | 0.32 | % | | | (16 | ) |
Western Union Co. | | | 397 | | | | 0.47 | % | | | (305 | ) |
Total Financial | | | | | | | | | | | 11,071 | |
| | | | | | | | | | | | | |
Utilities | | | | | | | | | | | | |
National Fuel Gas Co. | | | 186 | | | | 0.97 | % | | | 660 | |
OGE Energy Corp. | | | 291 | | | | 1.00 | % | | | 592 | |
Black Hills Corp. | | | 190 | | | | 1.00 | % | | | 331 | |
Otter Tail Corp. | | | 84 | | | | 0.71 | % | | | (169 | ) |
ONE Gas, Inc. | | | 168 | | | | 1.03 | % | | | (186 | ) |
WEC Energy Group, Inc. | | | 129 | | | | 0.98 | % | | | (343 | ) |
CMS Energy Corp. | | | 168 | | | | 0.96 | % | | | (412 | ) |
Total Utilities | | | | | | | | | | | 473 | |
| | | | | | | | | | | | | |
Basic Materials | | | | | | | | | | | | |
Sylvamo Corp. | | | 50 | | | | 0.33 | % | | | (131 | ) |
CF Industries Holdings, Inc. | | | 73 | | | | 0.52 | % | | | (289 | ) |
Total Basic Materials | | | | | | | | | | | (420 | ) |
| | | | | | | | | | | | | |
Energy | | | | | | | | | | | | |
Marathon Petroleum Corp. | | | 27 | | | | 0.45 | % | | | 1,856 | |
Cheniere Energy, Inc. | | | 40 | | | | 0.67 | % | | | 1,007 | |
PBF Energy, Inc. — Class A | | | 231 | | | | 1.02 | % | | | 281 | |
Valero Energy Corp. | | | 42 | | | | 0.63 | % | | | 125 | |
SandRidge Energy, Inc. | | | 276 | | | | 0.34 | % | | | (18 | ) |
HF Sinclair Corp. | | | 129 | | | | 0.66 | % | | | (46 | ) |
Liberty Energy, Inc. — Class A | | | 103 | | | | 0.21 | % | | | (80 | ) |
Par Pacific Holdings, Inc. | | | 84 | | | | 0.20 | % | | | (475 | ) |
CVR Energy, Inc. | | | 389 | | | | 1.01 | % | | | (1,561 | ) |
Total Energy | | | | | | | | | | | 1,089 | |
| | | | | | | | | | | | | |
Government | | | | | | | | | | | | |
Banco Latinoamericano de Comercio Exterior S.A. — Class E | | | 247 | | | | 0.71 | % | | | 1,795 | |
Total MS Equity Long Custom Basket | | | | | | $ | 45,976 | |
| | | | | | | | | |
MS EQUITY SHORT CUSTOM BASKET | | | | | | | | |
| | | | | | | | | | | | | |
Technology | | | | | | | | | | | | |
Paycor HCM, Inc. | | | 1,647 | | | | (1.13 | )% | | $ | 13,436 | |
Dayforce, Inc. | | | 558 | | | | (1.50 | )% | | | 6,861 | |
Privia Health Group, Inc. | | | 1,490 | | | | (1.41 | )% | | | 4,768 | |
Braze, Inc. — Class A | | | 492 | | | | (1.04 | )% | | | 3,822 | |
Take-Two Interactive Software, Inc. | | | 166 | | | | (1.40 | )% | | | 91 | |
ACV Auctions, Inc. — Class A | | | 1,444 | | | | (1.43 | )% | | | (1,077 | ) |
KBR, Inc. | | | 441 | | | | (1.54 | )% | | | (1,252 | ) |
SiTime Corp. | | | 86 | | | | (0.58 | )% | | | (2,768 | ) |
Parsons Corp. | | | 370 | | | | (1.64 | )% | | | (3,063 | ) |
Total Technology | | | | | | | | | | | 20,818 | |
| | | | | | | | | | | | | |
Utilities | | | | | | | | | | | | |
AES Corp. | | | 1,317 | | | | (1.26 | )% | | | 4,626 | |
Middlesex Water Co. | | | 509 | | | | (1.45 | )% | | | 1,765 | |
PNM Resources, Inc. | | | 717 | | | | (1.44 | )% | | | (14 | ) |
Total Utilities | | | | | | | | | | | 6,377 | |
| | | | | | | | | | | | | |
Consumer, Cyclical | | | | | | | | | | | | |
Walgreens Boots Alliance, Inc. | | | 1,531 | | | | (1.01 | )% | | | 14,207 | |
Floor & Decor Holdings, Inc. — Class A | | | 147 | | | | (0.79 | )% | | | 2,822 | |
Camping World Holdings, Inc. — Class A | | | 722 | | | | (0.70 | )% | | | 1,544 | |
Allegiant Travel Co. — Class A | | | 357 | | | | (0.97 | )% | | | 1,190 | |
DraftKings, Inc. — Class A | | | 258 | | | | (0.54 | )% | | | 571 | |
Copart, Inc. | | | 433 | | | | (1.27 | )% | | | (103 | ) |
VSE Corp. | | | 116 | | | | (0.56 | )% | | | (407 | ) |
CarMax, Inc. | | | 275 | | | | (1.10 | )% | | | (845 | ) |
JetBlue Airways Corp. | | | 3,413 | | | | (1.13 | )% | | | (1,655 | ) |
Freshpet, Inc. | | | 144 | | | | (1.00 | )% | | | (2,847 | ) |
Total Consumer, Cyclical | | | | | | | | | | | 14,477 | |
| | | | | | | | | | | | | |
Consumer, Non-cyclical | | | | | | | | | | | | |
Avis Budget Group, Inc. | | | 127 | | | | (0.72 | )% | | | 1,841 | |
Hertz Global Holdings, Inc. | | | 2,866 | | | | (0.55 | )% | | | 1,811 | |
U-Haul Holding Co. | | | 316 | | | | (1.06 | )% | | | 721 | |
NeoGenomics, Inc. | | | 969 | | | | (0.73 | )% | | | 693 | |
CBIZ, Inc. | | | 361 | | | | (1.45 | )% | | | 670 | |
RB Global, Inc. | | | 234 | | | | (0.97 | )% | | | (691 | ) |
GXO Logistics, Inc. | | | 542 | | | | (1.49 | )% | | | (977 | ) |
Equifax, Inc. | | | 116 | | | | (1.53 | )% | | | (1,181 | ) |
TransUnion | | | 256 | | | | (1.03 | )% | | | (1,505 | ) |
Spectrum Brands Holdings, Inc. | | | 315 | | | | (1.47 | )% | | | (2,410 | ) |
RxSight, Inc. | | | 179 | | | | (0.59 | )% | | | (3,840 | ) |
Total Consumer, Non-cyclical | | | | | | | | | | | (4,868 | ) |
| | | | | | | | | | | | | |
Financial | | | | | | | | | | | | |
Kennedy-Wilson Holdings, Inc. | | | 2,663 | | | | (1.41 | )% | | | 13,609 | |
Sun Communities, Inc. | | | 233 | | | | (1.52 | )% | | | 9,120 | |
New York Mortgage Trust, Inc. | | | 3,988 | | | | (1.27 | )% | | | 7,146 | |
Americold Realty Trust, Inc. | | | 1,006 | | | | (1.40 | )% | | | 6,711 | |
112 | THE GUGGENHEIM FUNDS SEMI-ANNUAL FINANCIAL REPORT | SEE NOTES TO FINANCIAL STATEMENTS. |
SCHEDULE OF INVESTMENTS (Unaudited)(continued) | June 30, 2024 |
SERIES Z (ALPHA OPPORTUNITY SERIES) | |
| | Shares | | | Percentage
Notional
Amount | | | Value and
Unrealized
Appreciation
(Depreciation) | |
PotlatchDeltic Corp. | | | 642 | | | | (1.37 | )% | | $ | 3,905 | |
Marcus & Millichap, Inc. | | | 888 | | | | (1.52 | )% | | | 3,880 | |
Cannae Holdings, Inc. | | | 1,360 | | | | (1.34 | )% | | | 3,479 | |
Howard Hughes Holdings, Inc. | | | 415 | | | | (1.46 | )% | | | 1,981 | |
Equinix, Inc. | | | 27 | | | | (1.11 | )% | | | 1,638 | |
TFS Financial Corp. | | | 2,132 | | | | (1.46 | )% | | | 884 | |
Terreno Realty Corp. | | | 189 | | | | (0.61 | )% | | | 851 | |
Northern Trust Corp. | | | 304 | | | | (1.39 | )% | | | 2 | |
American Tower Corp. — Class A | | | 28 | | | | (0.30 | )% | | | (27 | ) |
State Street Corp. | | | 370 | | | | (1.49 | )% | | | (180 | ) |
Rexford Industrial Realty, Inc. | | | 619 | | | | (1.50 | )% | | | (208 | ) |
Capitol Federal Financial, Inc. | | | 3,472 | | | | (1.04 | )% | | | (276 | ) |
Veris Residential, Inc. | | | 1,344 | | | | (1.10 | )% | | | (283 | ) |
Ventas, Inc. | | | 226 | | | | (0.63 | )% | | | (320 | ) |
Digital Realty Trust, Inc. | | | 68 | | | | (0.56 | )% | | | (368 | ) |
CBRE Group, Inc. — Class A | | | 155 | | | | (0.75 | )% | | | (417 | ) |
Prologis, Inc. | | | 134 | | | | (0.82 | )% | | | (764 | ) |
Redwood Trust, Inc. | | | 4,253 | | | | (1.50 | )% | | | (1,169 | ) |
Bank of New York Mellon Corp. | | | 470 | | | | (1.53 | )% | | | (1,285 | ) |
Iron Mountain, Inc. | | | 160 | | | | (0.78 | )% | | | (1,736 | ) |
Apartment Investment and Management Co. — Class A | | | 3,443 | | | | (1.55 | )% | | | (2,045 | ) |
Elme Communities | | | 1,793 | | | | (1.55 | )% | | | (3,111 | ) |
Welltower, Inc. | | | 263 | | | | (1.49 | )% | | | (5,817 | ) |
FTAI Infrastructure, Inc. | | | 2,958 | | | | (1.39 | )% | | | (9,010 | ) |
Total Financial | | | | | | | | | | | 26,190 | |
| | | | | | | | | | | | | |
Energy | | | | | | | | | | | | |
Dril-Quip, Inc. | | | 1,147 | | | | (1.16 | )% | | | 3,075 | |
NOV, Inc. | | | 1,579 | | | | (1.63 | )% | | | 744 | |
Oceaneering International, Inc. | | | 996 | | | | (1.28 | )% | | | (1,252 | ) |
Valaris Ltd. | | | 383 | | | | (1.55 | )% | | | (2,424 | ) |
Antero Resources Corp. | | | 809 | | | | (1.43 | )% | | | (4,057 | ) |
Archrock, Inc. | | | 964 | | | | (1.06 | )% | | | (6,478 | ) |
TechnipFMC plc | | | 1,135 | | | | (1.61 | )% | | | (6,830 | ) |
Total Energy | | | | | | | | | | | (17,222 | ) |
| | | | | | | | | | | | | |
Industrial | | | | | | | | | | | | |
Norfolk Southern Corp. | | | 125 | | | | (1.46 | )% | | | 3,247 | |
Old Dominion Freight Line, Inc. | | | 114 | | | | (1.09 | )% | | | 2,917 | |
XPO, Inc. | | | 108 | | | | (0.62 | )% | | | 1,869 | |
Knight-Swift Transportation Holdings, Inc. | | | 584 | | | | (1.58 | )% | | | 1,323 | |
Boeing Co. | | | 111 | | | | (1.10 | )% | | | 1,183 | |
Xylem, Inc. | | | 199 | | | | (1.47 | )% | | | 719 | |
Saia, Inc. | | | 25 | | | | (0.64 | )% | | | 484 | |
Montrose Environmental Group, Inc. | | | 151 | | | | (0.37 | )% | | | 327 | |
GATX Corp. | | | 207 | | | | (1.49 | )% | | | (939 | ) |
RXO, Inc. | | | 1,336 | | | | (1.90 | )% | | | (5,804 | ) |
Casella Waste Systems, Inc. — Class A | | | 281 | | | | (1.51 | )% | | | (5,989 | ) |
Total Industrial | | | | | | | | | | | (663 | ) |
| | | | | | | | | | | | | |
Communications | | | | | | | | | | | | |
Boston Omaha Corp. — Class A | | | 1,106 | | | | (0.81 | )% | | | 1,703 | |
Uber Technologies, Inc. | | | 344 | | | | (1.36 | )% | | | (2,326 | ) |
Total Communications | | | | | | | | | | | (623 | ) |
| | | | | | | | | | | | | |
Basic Materials | | | | | | | | | | | | |
Piedmont Lithium, Inc. | | | 721 | | | | (0.39 | )% | | | 19,215 | |
Compass Minerals International, Inc. | | | 647 | | | | (0.36 | )% | | | 7,534 | |
Novagold Resources, Inc. | | | 3,816 | | | | (0.72 | )% | | | 2,349 | |
Hecla Mining Co. | | | 1,673 | | | | (0.44 | )% | | | 2,105 | |
MP Materials Corp. | | | 512 | | | | (0.35 | )% | | | 1,451 | |
Ivanhoe Electric Incorporated / US | | | 1,764 | | | | (0.90 | )% | | | 807 | |
Newmont Corp. | | | 183 | | | | (0.42 | )% | | | (197 | ) |
Kronos Worldwide, Inc. | | | 1,442 | | | | (0.98 | )% | | | (4,696 | ) |
Total Basic Materials | | | | | | | | | | | 28,568 | |
Total MS Equity Short Custom Basket | | | | | | $ | 73,054 | |
GS EQUITY LONG CUSTOM BASKET | | | | | | | | |
Industrial | | | | | | | | | | | | |
Apogee Enterprises, Inc. | | | 169 | | | | 1.03 | % | | $ | 2,504 | |
Teekay Tankers Ltd. — Class A | | | 131 | | | | 0.87 | % | | | 2,307 | |
Teekay Corp. | | | 1,073 | | | | 0.93 | % | | | 2,277 | |
International Seaways, Inc. | | | 167 | | | | 0.95 | % | | | 2,249 | |
Owens Corning | | | 41 | | | | 0.69 | % | | | 1,805 | |
Mueller Industries, Inc. | | | 183 | | | | 1.00 | % | | | 1,638 | |
Ardmore Shipping Corp. | | | 122 | | | | 0.26 | % | | | 1,274 | |
Argan, Inc. | | | 41 | | | | 0.29 | % | | | 1,016 | |
TD SYNNEX Corp. | | | 82 | | | | 0.91 | % | | | 1,002 | |
Scorpio Tankers, Inc. | | | 96 | | | | 0.75 | % | | | 977 | |
UFP Industries, Inc. | | | 69 | | | | 0.74 | % | | | 303 | |
Lindsay Corp. | | | 25 | | | | 0.30 | % | | | 220 | |
Caterpillar, Inc. | | | 27 | | | | 0.87 | % | | | 122 | |
AZZ, Inc. | | | 43 | | | | 0.32 | % | | | 60 | |
Terex Corp. | | | 97 | | | | 0.51 | % | | | (68 | ) |
Mettler-Toledo International, Inc. | | | 2 | | | | 0.27 | % | | | (76 | ) |
Kennametal, Inc. | | | 90 | | | | 0.20 | % | | | (150 | ) |
Vishay Intertechnology, Inc. | | | 455 | | | | 0.98 | % | | | (189 | ) |
Snap-on, Inc. | | | 29 | | | | 0.73 | % | | | (196 | ) |
SEE NOTES TO FINANCIAL STATEMENTS. | THE GUGGENHEIM FUNDS SEMI-ANNUAL FINANCIAL REPORT | 113 |
SCHEDULE OF INVESTMENTS (Unaudited)(continued) | June 30, 2024 |
SERIES Z (ALPHA OPPORTUNITY SERIES) | |
| | Shares | | | Percentage
Notional
Amount | | | Value and
Unrealized
Appreciation
(Depreciation) | |
Masterbrand, Inc. | | | 146 | | | | 0.21 | % | | $ | (356 | ) |
Griffon Corp. | | | 78 | | | | 0.48 | % | | | (360 | ) |
Vontier Corp. | | | 267 | | | | 0.98 | % | | | (393 | ) |
Atkore, Inc. | | | 40 | | | | 0.52 | % | | | (468 | ) |
Acuity Brands, Inc. | | | 37 | | | | 0.86 | % | | | (472 | ) |
Avnet, Inc. | | | 195 | | | | 0.97 | % | | | (503 | ) |
Dorian LPG Ltd. | | | 80 | | | | 0.32 | % | | | (631 | ) |
AGCO Corp. | | | 39 | | | | 0.37 | % | | | (633 | ) |
Sonoco Products Co. | | | 172 | | | | 0.84 | % | | | (999 | ) |
Boise Cascade Co. | | | 71 | | | | 0.83 | % | | | (1,120 | ) |
Total Industrial | | | | | | | | | | | 11,140 | |
| | | | | | | | | | | | | |
Communications | | | | | | | | | | | | |
InterDigital, Inc. | | | 90 | | | | 1.02 | % | | | 3,047 | |
AT&T, Inc. | | | 575 | | | | 1.06 | % | | | 2,025 | |
eBay, Inc. | | | 179 | | | | 0.93 | % | | | 1,991 | |
IDT Corp. — Class B | | | 222 | | | | 0.77 | % | | | 1,833 | |
Verizon Communications, Inc. | | | 253 | | | | 1.01 | % | | | 1,339 | |
T-Mobile US, Inc. | | | 58 | | | | 0.98 | % | | | 1,216 | |
Gogo, Inc. | | | 404 | | | | 0.37 | % | | | 221 | |
Yelp, Inc. — Class A | | | 293 | | | | 1.04 | % | | | 221 | |
Cisco Systems, Inc. | | | 229 | | | | 1.05 | % | | | 79 | |
Ciena Corp. | | | 102 | | | | 0.47 | % | | | (43 | ) |
Fox Corp. — Class B | | | 325 | | | | 1.00 | % | | | (69 | ) |
TEGNA, Inc. | | | 604 | | | | 0.81 | % | | | (260 | ) |
Spok Holdings, Inc. | | | 339 | | | | 0.48 | % | | | (261 | ) |
Ooma, Inc. | | | 541 | | | | 0.52 | % | | | (355 | ) |
Total Communications | | | | | | | | | | | 10,984 | |
| | | | | | | | | | | | | |
Technology | | | | | | | | | | | | |
Immersion Corp. | | | 671 | | | | 0.62 | % | | | 1,729 | |
Cirrus Logic, Inc. | | | 34 | | | | 0.42 | % | | | 1,314 | |
NetApp, Inc. | | | 46 | | | | 0.57 | % | | | 1,132 | |
Amkor Technology, Inc. | | | 128 | | | | 0.49 | % | | | 944 | |
Playtika Holding Corp. | | | 342 | | | | 0.26 | % | | | 337 | |
Clear Secure, Inc. — Class A | | | 267 | | | | 0.48 | % | | | 331 | |
Qualys, Inc. | | | 37 | | | | 0.51 | % | | | 251 | |
Adeia, Inc. | | | 263 | | | | 0.28 | % | | | 169 | |
IPG Photonics Corp. | | | 38 | | | | 0.31 | % | | | (90 | ) |
Teradata Corp. | | | 80 | | | | 0.27 | % | | | (150 | ) |
Photronics, Inc. | | | 125 | | | | 0.30 | % | | | (383 | ) |
Dropbox, Inc. — Class A | | | 485 | | | | 1.05 | % | | | (515 | ) |
Zoom Video Communications, Inc. — Class A | | | 169 | | | | 0.96 | % | | | (763 | ) |
Amdocs Ltd. | | | 136 | | | | 1.03 | % | | | (846 | ) |
Total Technology | | | | | | | | | | | 3,460 | |
| | | | | | | | | | | | | |
Consumer, Non-cyclical | | | | | | | | | | | | |
United Therapeutics Corp. | | | 38 | | | | 1.18 | % | | | 3,704 | |
Innoviva, Inc. | | | 655 | | | | 1.04 | % | | | 1,785 | |
Merck & Company, Inc. | | | 81 | | | | 0.97 | % | | | 1,317 | |
Organon & Co. | | | 144 | | | | 0.29 | % | | | 412 | |
Amgen, Inc. | | | 7 | | | | 0.21 | % | | | 246 | |
Cal-Maine Foods, Inc. | | | 73 | | | | 0.43 | % | | | 211 | |
Alarm.com Holdings, Inc. | | | 37 | | | | 0.23 | % | | | 204 | |
Neurocrine Biosciences, Inc. | | | 77 | | | | 1.02 | % | | | 156 | |
Stride, Inc. | | | 51 | | | | 0.35 | % | | | 58 | |
Exelixis, Inc. | | | 97 | | | | 0.21 | % | | | 52 | |
Gilead Sciences, Inc. | | | 164 | | | | 1.08 | % | | | 13 | |
Pacira BioSciences, Inc. | | | 127 | | | | 0.35 | % | | | 2 | |
Perdoceo Education Corp. | | | 198 | | | | 0.41 | % | | | (10 | ) |
Becton Dickinson & Co. | | | 9 | | | | 0.20 | % | | | (24 | ) |
Biogen, Inc. | | | 10 | | | | 0.22 | % | | | (43 | ) |
LiveRamp Holdings, Inc. | | | 66 | | | | 0.20 | % | | | (47 | ) |
Catalyst Pharmaceuticals, Inc. | | | 382 | | | | 0.57 | % | | | (85 | ) |
Zimmer Biomet Holdings, Inc. | | | 27 | | | | 0.28 | % | | | (113 | ) |
Amphastar Pharmaceuticals, Inc. | | | 50 | | | | 0.19 | % | | | (126 | ) |
Centene Corp. | | | 41 | | | | 0.26 | % | | | (142 | ) |
Harmony Biosciences Holdings, Inc. | | | 71 | | | | 0.21 | % | | | (170 | ) |
ZipRecruiter, Inc. — Class A | | | 277 | | | | 0.24 | % | | | (214 | ) |
United Rentals, Inc. | | | 10 | | | | 0.62 | % | | | (223 | ) |
OraSure Technologies, Inc. | | | 444 | | | | 0.18 | % | | | (247 | ) |
Xencor, Inc. | | | 90 | | | | 0.16 | % | | | (252 | ) |
USANA Health Sciences, Inc. | | | 81 | | | | 0.35 | % | | | (290 | ) |
Inmode Ltd. | | | 143 | | | | 0.25 | % | | | (325 | ) |
Alkermes plc | | | 165 | | | | 0.38 | % | | | (328 | ) |
Upbound Group, Inc. | | | 121 | | | | 0.36 | % | | | (329 | ) |
Johnson & Johnson | | | 71 | | | | 1.00 | % | | | (515 | ) |
Royalty Pharma plc — Class A | | | 292 | | | | 0.74 | % | | | (623 | ) |
Collegium Pharmaceutical, Inc. | | | 242 | | | | 0.75 | % | | | (689 | ) |
Molina Healthcare, Inc. | | | 28 | | | | 0.80 | % | | | (924 | ) |
Jazz Pharmaceuticals plc | | | 97 | | | | 1.00 | % | | | (1,079 | ) |
Bristol-Myers Squibb Co. | | | 255 | | | | 1.02 | % | | | (1,635 | ) |
Total Consumer, Non-cyclical | | | | | | | | | | | (273 | ) |
| | | | | | | | | | | | | |
Consumer, Cyclical | | | | | | | | | | | | |
Allison Transmission Holdings, Inc. | | | 140 | | | | 1.03 | % | | | 1,583 | |
M/I Homes, Inc. | | | 51 | | | | 0.60 | % | | | 1,493 | |
KB Home | | | 126 | | | | 0.85 | % | | | 1,492 | |
Lennar Corp. — Class A | | | 67 | | | | 0.97 | % | | | 991 | |
General Motors Co. | | | 232 | | | | 1.04 | % | | | 314 | |
Monarch Casino & Resort, Inc. | | | 129 | | | | 0.85 | % | | | 252 | |
Build-A-Bear Workshop, Inc. — Class A | | | 130 | | | | 0.32 | % | | | 93 | |
Dillard’s, Inc. — Class A | | | 9 | | | | 0.38 | % | | | 58 | |
114 | THE GUGGENHEIM FUNDS SEMI-ANNUAL FINANCIAL REPORT | SEE NOTES TO FINANCIAL STATEMENTS. |
SCHEDULE OF INVESTMENTS (Unaudited)(continued) | June 30, 2024 |
SERIES Z (ALPHA OPPORTUNITY SERIES) | |
| | Shares | | | Percentage
Notional
Amount | | | Value and
Unrealized
Appreciation
(Depreciation) | |
Cummins, Inc. | | | 38 | | | | 1.01 | % | | $ | (69 | ) |
Toll Brothers, Inc. | | | 33 | | | | 0.37 | % | | | (118 | ) |
Ethan Allen Interiors, Inc. | | | 116 | | | | 0.31 | % | | | (140 | ) |
PACCAR, Inc. | | | 96 | | | | 0.95 | % | | | (151 | ) |
Buckle, Inc. | | | 205 | | | | 0.73 | % | | | (222 | ) |
Sonos, Inc. | | | 201 | | | | 0.29 | % | | | (240 | ) |
Movado Group, Inc. | | | 209 | | | | 0.50 | % | | | (249 | ) |
Golden Entertainment, Inc. | | | 96 | | | | 0.29 | % | | | (259 | ) |
Visteon Corp. | | | 50 | | | | 0.51 | % | | | (281 | ) |
Mattel, Inc. | | | 255 | | | | 0.40 | % | | | (314 | ) |
BorgWarner, Inc. | | | 267 | | | | 0.83 | % | | | (402 | ) |
Meritage Homes Corp. | | | 37 | | | | 0.58 | % | | | (533 | ) |
Carter’s, Inc. | | | 96 | | | | 0.57 | % | | | (572 | ) |
MasterCraft Boat Holdings, Inc. | | | 241 | | | | 0.44 | % | | | (948 | ) |
GMS, Inc. | | | 116 | | | | 0.90 | % | | | (973 | ) |
Wabash National Corp. | | | 203 | | | | 0.43 | % | | | (1,041 | ) |
Lear Corp. | | | 86 | | | | 0.95 | % | | | (1,062 | ) |
MSC Industrial Direct Company, Inc. — Class A | | | 124 | | | | 0.95 | % | | | (1,129 | ) |
Polaris, Inc. | | | 109 | | | | 0.82 | % | | | (1,712 | ) |
Total Consumer, Cyclical | | | | | | | | | | | (4,139 | ) |
| | | | | | | | | | | | | |
Financial | | | | | | | | | | | | |
Synchrony Financial | | | 207 | | | | 0.95 | % | | | 1,785 | |
Essent Group Ltd. | | | 184 | | | | 1.00 | % | | | 1,624 | |
Enact Holdings, Inc. | | | 345 | | | | 1.02 | % | | | 793 | |
MGIC Investment Corp. | | | 493 | | | | 1.02 | % | | | 731 | |
Preferred Bank/Los Angeles CA | | | 113 | | | | 0.82 | % | | | 722 | |
NMI Holdings, Inc. — Class A | | | 160 | | | | 0.52 | % | | | 692 | |
International Bancshares Corp. | | | 58 | | | | 0.32 | % | | | 488 | |
Janus Henderson Group plc | | | 289 | | | | 0.94 | % | | | 436 | |
Everest Group Ltd. | | | 17 | | | | 0.62 | % | | | 153 | |
Central Pacific Financial Corp. | | | 184 | | | | 0.38 | % | | | 99 | |
OneMain Holdings, Inc. | | | 114 | | | | 0.53 | % | | | 78 | |
Ally Financial, Inc. | | | 109 | | | | 0.42 | % | | | 57 | |
Enova International, Inc. | | | 73 | | | | 0.44 | % | | | 42 | |
MetLife, Inc. | | | 150 | | | | 1.01 | % | | | 39 | |
Hilltop Holdings, Inc. | | | 191 | | | | 0.58 | % | | | 34 | |
Jackson Financial, Inc. — Class A | | | 78 | | | | 0.56 | % | | | 22 | |
Equity Commonwealth | | | 544 | | | | 1.02 | % | | | 21 | |
SiriusPoint Ltd. | | | 274 | | | | 0.32 | % | | | 10 | |
Douglas Elliman, Inc. | | | 1 | | | | 0.00 | % | | | (2 | ) |
Western Union Co. | | | 397 | | | | 0.47 | % | | | (290 | ) |
Total Financial | | | | | | | | | | | 7,534 | |
| | | | | | | | | | | | | |
Utilities | | | | | | | | | | | | |
National Fuel Gas Co. | | | 186 | | | | 0.98 | % | | | 693 | |
OGE Energy Corp. | | | 291 | | | | 1.00 | % | | | 567 | |
Black Hills Corp. | | | 190 | | | | 1.00 | % | | | 299 | |
Otter Tail Corp. | | | 84 | | | | 0.71 | % | | | (173 | ) |
ONE Gas, Inc. | | | 168 | | | | 1.03 | % | | | (192 | ) |
WEC Energy Group, Inc. | | | 129 | | | | 0.98 | % | | | (330 | ) |
CMS Energy Corp. | | | 168 | | | | 0.96 | % | | | (418 | ) |
Total Utilities | | | | | | | | | | | 446 | |
| | | | | | | | | | | | | |
Basic Materials | | | | | | | | | | | | |
Sylvamo Corp. | | | 50 | | | | 0.33 | % | | | (131 | ) |
CF Industries Holdings, Inc. | | | 73 | | | | 0.52 | % | | | (291 | ) |
Total Basic Materials | | | | | | | | | | | (422 | ) |
| | | | | | | | | | | | | |
Energy | | | | | | | | | | | | |
Marathon Petroleum Corp. | | | 27 | | | | 0.45 | % | | | 1,024 | |
Cheniere Energy, Inc. | | | 40 | | | | 0.67 | % | | | 1,001 | |
Valero Energy Corp. | | | 42 | | | | 0.63 | % | | | 135 | |
SandRidge Energy, Inc. | | | 276 | | | | 0.34 | % | | | (25 | ) |
HF Sinclair Corp. | | | 129 | | | | 0.66 | % | | | (34 | ) |
Liberty Energy, Inc. — Class A | | | 103 | | | | 0.21 | % | | | (90 | ) |
PBF Energy, Inc. — Class A | | | 231 | | | | 1.02 | % | | | (208 | ) |
Par Pacific Holdings, Inc. | | | 84 | | | | 0.20 | % | | | (480 | ) |
CVR Energy, Inc. | | | 389 | | | | 1.00 | % | | | (1,581 | ) |
Total Energy | | | | | | | | | | | (258 | ) |
| | | | | | | | | | | | | |
Government | | | | | | | | | | | | |
Banco Latinoamericano de Comercio Exterior S.A. — Class E | | | 247 | | | | 0.71 | % | | | 1,781 | |
Total GS Equity Long Custom Basket | | | | | | $ | 30,253 | |
| | | | | | | | | |
GS EQUITY SHORT CUSTOM BASKET | | | | | | | | |
| | | | | | | | | | | | | |
Technology | | | | | | | | | | | | |
Paycor HCM, Inc. | | | 1,647 | | | | (1.14 | )% | | $ | 12,066 | |
Dayforce, Inc. | | | 558 | | | | (1.53 | )% | | | 6,812 | |
Braze, Inc. — Class A | | | 492 | | | | (1.05 | )% | | | 3,854 | |
Take-Two Interactive Software, Inc. | | | 166 | | | | (1.42 | )% | | | 94 | |
ACV Auctions, Inc. — Class A | | | 1,444 | | | | (1.45 | )% | | | (1,046 | ) |
KBR, Inc. | | | 441 | | | | (1.56 | )% | | | (1,253 | ) |
SiTime Corp. | | | 86 | | | | (0.59 | )% | | | (2,761 | ) |
Parsons Corp. | | | 370 | | | | (1.67 | )% | | | (3,093 | ) |
Total Technology | | | | | | | | | | | 14,673 | |
| | | | | | | | | | | | | |
Utilities | | | | | | | | | | | | |
AES Corp. | | | 1,317 | | | | (1.28 | )% | | | 4,787 | |
Middlesex Water Co. | | | 509 | | | | (1.47 | )% | | | 1,764 | |
PNM Resources, Inc. | | | 717 | | | | (1.46 | )% | | | 21 | |
Total Utilities | | | | | | | | | | | 6,572 | |
| | | | | | | | | | | | | |
SEE NOTES TO FINANCIAL STATEMENTS. | THE GUGGENHEIM FUNDS SEMI-ANNUAL FINANCIAL REPORT | 115 |
SCHEDULE OF INVESTMENTS (Unaudited)(continued) | June 30, 2024 |
SERIES Z (ALPHA OPPORTUNITY SERIES) | |
| | Shares | | | Percentage
Notional
Amount | | | Value and
Unrealized
Appreciation
(Depreciation) | |
Consumer, Cyclical | | | | | | | | | | | | |
Walgreens Boots Alliance, Inc. | | | 1,531 | | | | (1.02 | )% | | $ | 14,249 | |
Floor & Decor Holdings, Inc. — Class A | | | 147 | | | | (0.81 | )% | | | 2,723 | |
Camping World Holdings, Inc. — Class A | | | 722 | | | | (0.71 | )% | | | 1,507 | |
Allegiant Travel Co. — Class A | | | 357 | | | | (0.99 | )% | | | 1,163 | |
DraftKings, Inc. — Class A | | | 258 | | | | (0.54 | )% | | | 578 | |
Copart, Inc. | | | 433 | | | | (1.29 | )% | | | (127 | ) |
VSE Corp. | | | 116 | | | | (0.56 | )% | | | (402 | ) |
CarMax, Inc. | | | 275 | | | | (1.11 | )% | | | (847 | ) |
JetBlue Airways Corp. | | | 3,413 | | | | (1.15 | )% | | | (1,678 | ) |
Freshpet, Inc. | | | 144 | | | | (1.03 | )% | | | (2,790 | ) |
Total Consumer, Cyclical | | | | | | | | | | | 14,376 | |
| | | | | | | | | | | | | |
Consumer, Non-cyclical | | | | | | | | | | | | |
Hertz Global Holdings, Inc. | | | 2,866 | | | | (0.56 | )% | | | 1,811 | |
Avis Budget Group, Inc. | | | 127 | | | | (0.73 | )% | | | 1,806 | |
U-Haul Holding Co. | | | 316 | | | | (1.07 | )% | | | 757 | |
CBIZ, Inc. | | | 361 | | | | (1.47 | )% | | | 709 | |
NeoGenomics, Inc. | | | 969 | | | | (0.74 | )% | | | 657 | |
RB Global, Inc. | | | 234 | | | | (0.98 | )% | | | (726 | ) |
GXO Logistics, Inc. | | | 542 | | | | (1.51 | )% | | | (785 | ) |
Equifax, Inc. | | | 116 | | | | (1.55 | )% | | | (1,189 | ) |
TransUnion | | | 256 | | | | (1.05 | )% | | | (1,527 | ) |
Spectrum Brands Holdings, Inc. | | | 315 | | | | (1.49 | )% | | | (2,449 | ) |
RxSight, Inc. | | | 179 | | | | (0.59 | )% | | | (3,792 | ) |
Total Consumer, Non-cyclical | | | | | | | | | | | (4,728 | ) |
| | | | | | | | | | | | | |
Financial | | | | | | | | | | | | |
Kennedy-Wilson Holdings, Inc. | | | 2,663 | | | | (1.43 | )% | | | 12,169 | |
New York Mortgage Trust, Inc. | | | 3,988 | | | | (1.28 | )% | | | 7,113 | |
Americold Realty Trust, Inc. | | | 1,006 | | | | (1.42 | )% | | | 4,514 | |
PotlatchDeltic Corp. | | | 642 | | | | (1.39 | )% | | | 3,922 | |
Marcus & Millichap, Inc. | | | 888 | | | | (1.54 | )% | | | 3,861 | |
Cannae Holdings, Inc. | | | 1,360 | | | | (1.36 | )% | | | 3,468 | |
Howard Hughes Holdings, Inc. | | | 415 | | | | (1.48 | )% | | | 1,964 | |
Sun Communities, Inc. | | | 233 | | | | (1.55 | )% | | | 1,256 | |
TFS Financial Corp. | | | 2,132 | | | | (1.48 | )% | | | 1,252 | |
Terreno Realty Corp. | | | 189 | | | | (0.62 | )% | | | 925 | |
Northern Trust Corp. | | | 304 | | | | (1.41 | )% | | | (7 | ) |
American Tower Corp. — Class A | | | 28 | | | | (0.30 | )% | | | (24 | ) |
State Street Corp. | | | 370 | | | | (1.51 | )% | | | (178 | ) |
Capitol Federal Financial, Inc. | | | 3,472 | | | | (1.05 | )% | | | (239 | ) |
Veris Residential, Inc. | | | 1,344 | | | | (1.11 | )% | | | (281 | ) |
Rexford Industrial Realty, Inc. | | | 619 | | | | (1.52 | )% | | | (282 | ) |
Ventas, Inc. | | | 226 | | | | (0.64 | )% | | | (291 | ) |
Digital Realty Trust, Inc. | | | 68 | | | | (0.57 | )% | | | (365 | ) |
CBRE Group, Inc. — Class A | | | 155 | | | | (0.76 | )% | | | (456 | ) |
Equinix, Inc. | | | 27 | | | | (1.13 | )% | | | (515 | ) |
Prologis, Inc. | | | 134 | | | | (0.83 | )% | | | (750 | ) |
Redwood Trust, Inc. | | | 4,253 | | | | (1.52 | )% | | | (1,179 | ) |
Bank of New York Mellon Corp. | | | 470 | | | | (1.55 | )% | | | (1,300 | ) |
Iron Mountain, Inc. | | | 160 | | | | (0.79 | )% | | | (1,724 | ) |
Apartment Investment and Management Co. — Class A | | | 3,443 | | | | (1.57 | )% | | | (2,062 | ) |
Elme Communities | | | 1,793 | | | | (1.57 | )% | | | (3,115 | ) |
Welltower, Inc. | | | 263 | | | | (1.51 | )% | | | (3,612 | ) |
FTAI Infrastructure, Inc. | | | 2,958 | | | | (1.41 | )% | | | (9,037 | ) |
Total Financial | | | | | | | | | | | 15,027 | |
| | | | | | | | | | | | | |
Energy | | | | | | | | | | | | |
Dril-Quip, Inc. | | | 1,147 | | | | (1.18 | )% | | | 3,037 | |
NOV, Inc. | | | 1,579 | | | | (1.65 | )% | | | 1,523 | |
Oceaneering International, Inc. | | | 996 | | | | (1.30 | )% | | | (1,243 | ) |
Valaris Ltd. | | | 383 | | | | (1.57 | )% | | | (2,321 | ) |
Antero Resources Corp. | | | 809 | | | | (1.45 | )% | | | (4,088 | ) |
Archrock, Inc. | | | 964 | | | | (1.07 | )% | | | (6,505 | ) |
TechnipFMC plc | | | 1,135 | | | | (1.64 | )% | | | (6,831 | ) |
Total Energy | | | | | | | | | | | (16,428 | ) |
| | | | | | | | | | | | | |
Industrial | | | | | | | | | | | | |
Norfolk Southern Corp. | | | 125 | | | | (1.48 | )% | | | 3,221 | |
Old Dominion Freight Line, Inc. | | | 114 | | | | (1.11 | )% | | | 2,945 | |
XPO, Inc. | | | 108 | | | | (0.63 | )% | | | 1,958 | |
Knight-Swift Transportation Holdings, Inc. | | | 584 | | | | (1.61 | )% | | | 1,326 | |
Boeing Co. | | | 111 | | | | (1.11 | )% | | | 1,186 | |
Xylem, Inc. | | | 199 | | | | (1.49 | )% | | | 669 | |
Saia, Inc. | | | 25 | | | | (0.65 | )% | | | 479 | |
Montrose Environmental Group, Inc. | | | 151 | | | | (0.37 | )% | | | 282 | |
GE Vernova, Inc. | | | 0 | | | | 0.00 | % | | | (3 | ) |
General Electric Co. | | | 0 | | | | 0.00 | % | | | (12 | ) |
GATX Corp. | | | 207 | | | | (1.51 | )% | | | (951 | ) |
Casella Waste Systems, Inc. — Class A | | | 281 | | | | (1.54 | )% | | | (3,213 | ) |
RXO, Inc. | | | 1,336 | | | | (1.93 | )% | | | (5,880 | ) |
Total Industrial | | | | | | | | | | | 2,007 | |
| | | | | | | | | | | | | |
116 | THE GUGGENHEIM FUNDS SEMI-ANNUAL FINANCIAL REPORT | SEE NOTES TO FINANCIAL STATEMENTS. |
SCHEDULE OF INVESTMENTS (Unaudited)(concluded) | June 30, 2024 |
SERIES Z (ALPHA OPPORTUNITY SERIES) | |
| | Shares | | | Percentage
Notional
Amount | | | Value and
Unrealized
Appreciation
(Depreciation) | |
Communications | | | | | | | | | | | | |
Boston Omaha Corp. — Class A | | | 1,106 | | | | (0.82 | )% | | $ | 1,657 | |
Uber Technologies, Inc. | | | 344 | | | | (1.38 | )% | | | (2,311 | ) |
Total Communications | | | | | | | | | | | (654 | ) |
| | | | | | | | | | | | | |
Basic Materials | | | | | | | | | | | | |
Piedmont Lithium, Inc. | | | 721 | | | | (0.40 | )% | | | 19,157 | |
Compass Minerals International, Inc. | | | 647 | | | | (0.37 | )% | | | 7,487 | |
Novagold Resources, Inc. | | | 3,816 | | | | (0.73 | )% | | | 2,342 | |
MP Materials Corp. | | | 512 | | | | (0.36 | )% | | | 1,571 | |
Ivanhoe Electric Incorporated / US | | | 1,764 | | | | (0.91 | )% | | | 851 | |
Hecla Mining Co. | | | 1,673 | | | | (0.45 | )% | | | 476 | |
Newmont Corp. | | | 183 | | | | (0.42 | )% | | | (189 | ) |
Kronos Worldwide, Inc. | | | 1,442 | | | | (1.00 | )% | | | (4,731 | ) |
Total Basic Materials | | | | | | | | | | | 26,964 | |
Total GS Equity Short Custom Basket | | | | | | $ | 57,809 | |
* | Non-income producing security. |
** | A copy of each underlying unaffiliated fund’s financial statements is available at the SEC’s website at www.sec.gov. |
† | Value determined based on Level 1 inputs — See Note 4. |
†† | Value determined based on Level 2 inputs — See Note 4. |
1 | All or a portion of this security is pledged as equity custom basket swap collateral at June 30, 2024. |
2 | Rate indicated is the 7-day yield as of June 30, 2024. |
| | GS — Goldman Sachs International |
| | MS — Morgan Stanley Capital Services LLC |
| | plc — Public Limited Company |
| | REIT — Real Estate Investment Trust |
| | |
| | See Sector Classification in Other Information section. |
The following table summarizes the inputs used to value the Fund’s investments at June 30, 2024 (See Note 4 in the Notes to Financial Statements):
Investments in Securities (Assets) | | Level 1
Quoted
Prices | | | Level 2
Significant
Observable
Inputs | | | Level 3
Significant
Unobservable
Inputs | | | Total | |
Common Stocks | | $ | 3,385,086 | | | $ | — | | | $ | — | | | $ | 3,385,086 | |
Money Market Fund | | | 74,797 | | | | — | | | | — | | | | 74,797 | |
Equity Custom Basket Swap Agreements** | | | — | | | | 207,092 | | | | — | | | | 207,092 | |
Total Assets | | $ | 3,459,883 | | | $ | 207,092 | | | $ | — | | | $ | 3,666,975 | |
** | This derivative is reported as unrealized appreciation/depreciation at period end. |
SEE NOTES TO FINANCIAL STATEMENTS. | THE GUGGENHEIM FUNDS SEMI-ANNUAL FINANCIAL REPORT | 117 |
SERIES Z (ALPHA OPPORTUNITY SERIES) | |
STATEMENT OF ASSETS AND LIABILITIES (Unaudited) |
June 30, 2024 |
Assets: |
Investments, at value (cost $3,381,560) | | $ | 3,459,883 | |
Cash | | | 261 | |
Unrealized appreciation on OTC swap agreements | | | 207,092 | |
Prepaid expenses | | | 8 | |
Receivables: |
Investment Adviser | | | 4,747 | |
Dividends | | | 1,593 | |
Interest | | | 461 | |
Total assets | | | 3,674,045 | |
| | | | | |
Liabilities: |
Payable for: |
Swap settlement | | | 28,185 | |
Professional fees | | | 15,731 | |
Transfer agent/maintenance fees | | | 1,996 | |
Fund accounting/administration fees | | | 851 | |
Trustees’ fees* | | | 770 | |
Distribution and service fees | | | 705 | |
Fund shares redeemed | | | 527 | |
Miscellaneous | | | 3,587 | |
Total liabilities | | | 52,352 | |
Net assets | | $ | 3,621,693 | |
| | | | | |
Net assets consist of: |
Paid in capital | | $ | 4,385,598 | |
Total distributable earnings (loss) | | | (763,905 | ) |
Net assets | | $ | 3,621,693 | |
Capital shares outstanding | | | 200,773 | |
Net asset value per share | | $ | 18.04 | |
STATEMENT OF OPERATIONS (Unaudited) |
Six Months Ended June 30, 2024 |
Investment Income: |
Dividends | | $ | 37,742 | |
Interest | | | 3,700 | |
Total investment income | | | 41,442 | |
| | | | | |
Expenses: |
Management fees | | | 16,796 | |
Distribution and service fees | | | 4,666 | |
Transfer agent/maintenance fees | | | 12,424 | |
Professional fees | | | 19,954 | |
Custodian fees | | | 6,918 | |
Trustees’ fees* | | | 6,800 | |
Fund accounting/administration fees | | | 5,203 | |
Line of credit fees | | | 49 | |
Miscellaneous | | | 6,663 | |
Total expenses | | | 79,473 | |
Less: |
Expenses reimbursed by Adviser | | | (25,269 | ) |
Expenses waived by Adviser | | | (17,375 | ) |
Total waived/reimbursed expenses | | | (42,644 | ) |
Net expenses | | | 36,829 | |
Net investment income | | | 4,613 | |
| | | | | |
Net Realized and Unrealized Gain (Loss): |
Net realized gain (loss) on: |
Investments | | | 389,197 | |
Swap agreements | | | (137,375 | ) |
Net realized gain | | | 251,822 | |
Net change in unrealized appreciation (depreciation) on: |
Investments | | | (220,298 | ) |
Swap agreements | | | 283,131 | |
Net change in unrealized appreciation (depreciation) | | | 62,833 | |
Net realized and unrealized gain | | | 314,655 | |
Net increase in net assets resulting from operations | | $ | 319,268 | |
* | Relates to Trustees not deemed “interested persons” within the meaning of Section 2(a)(19) of the 1940 Act. |
118 | THE GUGGENHEIM FUNDS SEMI-ANNUAL FINANCIAL REPORT | SEE NOTES TO FINANCIAL STATEMENTS. |
SERIES Z (ALPHA OPPORTUNITY SERIES) | |
STATEMENTS OF CHANGES IN NET ASSETS |
| | Six Months Ended
June 30, 2024
(Unaudited) | | | Year Ended
December 31,
2023 | |
Increase (Decrease) in Net Assets from Operations: | | | | | | | | |
Net investment income | | $ | 4,613 | | | $ | 4,918 | |
Net realized gain on investments | | | 251,822 | | | | 227,712 | |
Net change in unrealized appreciation (depreciation) on investments | | | 62,833 | | | | 59,098 | |
Net increase in net assets resulting from operations | | | 319,268 | | | | 291,728 | |
| | | | | | | | | |
Distributions to shareholders | | | — | | | | (4,183 | ) |
| | | | | | | | | |
Capital share transactions: | | | | | | | | |
Proceeds from sale of shares | | | 250,074 | | | | 68,066 | |
Distributions reinvested | | | — | | | | 4,183 | |
Cost of shares redeemed | | | (437,330 | ) | | | (521,279 | ) |
Net decrease from capital share transactions | | | (187,256 | ) | | | (449,030 | ) |
Net increase (decrease) in net assets | | | 132,012 | | | | (161,485 | ) |
| | | | | | | | | |
Net assets: | | | | | | | | |
Beginning of period | | | 3,489,681 | | | | 3,651,166 | |
End of period | | $ | 3,621,693 | | | $ | 3,489,681 | |
| | | | | | | | | |
Capital share activity: | | | | | | | | |
Shares sold | | | 14,112 | | | | 4,319 | |
Shares issued from reinvestment of distributions | | | — | | | | 264 | |
Shares redeemed | | | (24,357 | ) | | | (32,599 | ) |
Net decrease in shares | | | (10,245 | ) | | | (28,016 | ) |
SEE NOTES TO FINANCIAL STATEMENTS. | THE GUGGENHEIM FUNDS SEMI-ANNUAL FINANCIAL REPORT | 119 |
SERIES Z (ALPHA OPPORTUNITY SERIES) | |
This table is presented to show selected data for a share outstanding throughout each period and to assist shareholders in evaluating a Fund’s performance for the periods presented.
| | Six Months Ended
June 30, 2024a | | | Year Ended
December 31,
2023 | | | Year Ended
December 31,
2022 | | | Year Ended
December 31,
2021 | | | Year Ended
December 31,
2020 | | | Year Ended
December 31,
2019 | |
Per Share Data |
Net asset value, beginning of period | | $ | 16.54 | | | $ | 15.27 | | | $ | 16.76 | | | $ | 14.83 | | | $ | 14.87 | | | $ | 15.27 | |
Income (loss) from investment operations: |
Net investment income (loss)b | | | .02 | | | | .02 | | | | .02 | | | | .06 | | | | .06 | | | | .07 | |
Net gain (loss) on investments (realized and unrealized) | | | 1.48 | | | | 1.27 | | | | (1.45 | ) | | | 1.97 | | | | (.01 | ) | | | (.45 | ) |
Total from investment operations | | | 1.50 | | | | 1.29 | | | | (1.43 | ) | | | 2.03 | | | | .05 | | | | (.38 | ) |
Less distributions from: |
Net investment income | | | — | | | | (.02 | ) | | | (.06 | ) | | | (.10 | ) | | | (.09 | ) | | | (.02 | ) |
Total distributions | | | — | | | | (.02 | ) | | | (.06 | ) | | | (.10 | ) | | | (.09 | ) | | | (.02 | ) |
Net asset value, end of period | | $ | 18.04 | | | $ | 16.54 | | | $ | 15.27 | | | $ | 16.76 | | | $ | 14.83 | | | $ | 14.87 | |
|
Total Returnc | | | 9.07 | % | | | 8.38 | % | | | (8.53 | %) | | | 13.81 | % | | | 0.27 | % | | | (2.45 | %) |
Ratios/Supplemental Data |
Net assets, end of period (in thousands) | | $ | 3,622 | | | $ | 3,490 | | | $ | 3,651 | | | $ | 4,495 | | | $ | 4,535 | | | $ | 6,229 | |
Ratios to average net assets: |
Net investment income (loss) | | | 0.25 | % | | | 0.14 | % | | | 0.12 | % | | | 0.35 | % | | | 0.41 | % | | | 0.44 | % |
Total expensesd | | | 4.26 | % | | | 4.44 | % | | | 4.43 | % | | | 4.58 | % | | | 3.98 | % | | | 3.52 | % |
Net expensese,f | | | 1.97 | % | | | 1.98 | % | | | 1.99 | % | | | 2.01 | % | | | 2.01 | % | | | 2.00 | % |
Portfolio turnover rate | | | 153 | % | | | 319 | % | | | 294 | % | | | 204 | % | | | 171 | % | | | 172 | % |
a | Unaudited figures for the period ended June 30, 2024. Percentage amounts for the period, except total return and portfolio turnover rate, have been annualized. |
b | Net investment income (loss) per share was computed using average shares outstanding throughout the period. |
c | Total return does not take into account any of the expenses associated with an investment in variable insurance products. If total return had taken into account these expenses, performance would have been lower. Shares of a series of Guggenheim Variable Funds Trust are available only through the purchase of such products. |
d | Does not include expenses of the underlying funds in which the Fund invests. |
e | Net expense information reflects the expense ratios after expense waivers and reimbursements, as applicable. |
f | Net expenses may include expenses that are excluded from the expense limitation agreement. Excluding these expenses, the net expense ratios for the years presented would be: |
| | 6/30/24a | 12/31/23 | 12/31/22 | 12/31/21 | 12/31/20 | 12/31/19 |
| | 1.97% | 1.98% | 1.99% | 2.00% | 2.00% | 2.00% |
120 | THE GUGGENHEIM FUNDS SEMI-ANNUAL FINANCIAL REPORT | SEE NOTES TO FINANCIAL STATEMENTS. |
NOTES TO FINANCIAL STATEMENTS (Unaudited) |
Note 1 – Organization and Significant Accounting Policies
Organization
Guggenheim Variable Funds Trust (the “Trust”), a Delaware statutory trust, is registered with the U.S. Securities and Exchange Commission (the “SEC”) under the Investment Company Act of 1940 (the “1940 Act”), as an open-ended investment company of the series type. Each series, in effect, is representing a separate fund (each, a “Fund”). The Trust may issue an unlimited number of authorized shares. The Trust accounts for the assets of each Fund separately. At June 30, 2024, the Trust consisted of fourteen funds. The Trust offers shares of the funds to insurance companies for their variable annuity and variable life insurance contracts.
This report covers the following funds (collectively, the “Funds”):
Fund Name | Investment
Company Type |
Series A (StylePlus—Large Core Series) | Diversified |
Series B (Large Cap Value Series) | Diversified |
Series D (World Equity Income Series) | Diversified |
Series E (Total Return Bond Series) | Diversified |
Series F (Floating Rate Strategies Series) | Diversified |
Series J (StylePlus—Mid Growth Series) | Diversified |
Series N (Managed Asset Allocation Series) | Diversified |
Series O (All Cap Value Series) | Diversified |
Series P (High Yield Series) | Diversified |
Series Q (Small Cap Value Series) | Diversified |
Series V (SMid Cap Value Series) | Diversified |
Series X (StylePlus—Small Growth Series) | Diversified |
Series Y (StylePlus—Large Growth Series) | Diversified |
Series Z (Alpha Opportunity Series) | Diversified |
Security Investors, LLC (“SI” or the “Adviser”) and Guggenheim Partners Investment Management, LLC (“GPIM” or the “Adviser”), which operates under the name Guggenheim Investments (“GI”), provide advisory services. GPIM provides advisory services to Series F (Floating Rate Strategies Series) and SI provides advisory services to the remaining Funds covered in this report. Guggenheim Funds Distributors, LLC (“GFD”) serves as the distributor for the Trust. GI and GFD are affiliated entities.
Significant Accounting Policies
The Funds operate as investment companies and, accordingly, follow the investment company accounting and reporting guidance of the Financial Accounting Standards Board (“FASB”) Accounting Standards Codification Topic 946 Financial Services – Investment Companies.
The following significant accounting policies are in conformity with U.S. generally accepted accounting principles (“U.S. GAAP”) and are consistently followed by the Trust. This requires management to make estimates and assumptions that affect the reported amount of assets and liabilities, contingent assets and liabilities at the date of the financial statements, and the reported amounts of revenues and expenses during the reporting period. Actual results could differ from these estimates. All time references are based on Eastern Time.
The net asset value per share (“NAV”) of a fund is calculated by dividing the market value of a fund’s securities and other assets, less all liabilities, by the number of outstanding shares of that fund.
(a) Valuation of Investments
The Board of Trustees of the Funds (the “Board”) adopted policies and procedures for the valuation of the Funds’ investments (the “Fund Valuation Procedures”).
Pursuant to Rule 2a-5, the Board designated the Adviser as the valuation designee to perform fair valuation determinations for the Funds with respect to all Fund investments and/or other assets. As the Funds’ valuation designee pursuant to Rule 2a-5, the Adviser has adopted separate procedures (the “Valuation Designee Procedures” and collectively with the Fund Valuation Procedures, the “Valuation Procedures”) reasonably designed to prevent violations of the requirements of Rule 2a-5 and Rule 31a-4 under the 1940 Act. The Adviser, in its role as valuation designee, utilizes the assistance of a valuation committee, consisting of representatives from Guggenheim’s investment management, fund administration, legal and compliance departments (the “Valuation Committee”), in determining the fair value of the Funds’ securities and/or other assets. The Valuation Procedures permit the Funds to use a variety of valuation methodologies in connection with valuing the Funds’ investments. The methodology used for a specific type of investment may vary based on available market data or other relevant considerations. As a general matter, valuing securities and assets accurately is difficult and can be based on inputs and assumptions, which may not always be accurate.
In general, portfolio securities and assets of a Fund will be valued on the basis of readily available market quotations at their current market value. With respect to portfolio securities and assets of a Fund for which market quotations are not readily available, or deemed unreliable by the Adviser, the Fund will fair value those securities and assets in good faith in accordance with the Valuation Procedures. Valuations in accordance with these methods are intended to reflect each security’s (or asset’s or liability’s) “fair value.” Fair value represents a good faith approximation of the value of a security. Fair value determinations may be based on limited inputs and involve the consideration of a number of subjective factors, an analysis of applicable facts and circumstances, and the exercise of judgment. Each such determination is based on a consideration of all relevant factors, which are likely to vary from one pricing context to another. Examples of such factors may include, but are not limited to
| | THE GUGGENHEIM FUNDS SEMI-ANNUAL FINANCIAL REPORT | 121 |
NOTES TO FINANCIAL STATEMENTS (Unaudited)(continued) |
market prices; sale prices; broker quotes; and models which derive prices based on inputs such as prices of securities with comparable maturities and characteristics, or based on inputs such as anticipated cash flows or collateral, spread over U.S. Treasury securities, and other information analysis. As a result, it is possible that the fair value for a security determined in good faith in accordance with the Valuation Procedures may differ from valuations for the same security determined by other funds using their own valuation procedures. Although the Valuation Procedures are designed to value a portfolio security or asset at the price a Fund may reasonably expect to receive upon its sale in an orderly transaction, there can be no assurance that any fair value determination thereunder would, in fact, approximate the amount that a Fund could reasonably expect to receive upon the sale of the portfolio security or asset.
U.S. Government securities are valued by independent third-party pricing services, using the last traded fill price, or at the reported bid price at the close of business on the valuation date.
Commercial paper and discount notes with a maturity of greater than 60 days at acquisition are valued at prices that are obtained from independent third-party pricing services, which may consider the trade activity, treasury spreads, yields or price of bonds of comparable quality, coupon, maturity, and type, as well as prices quoted by dealers who make markets in such securities. Commercial paper and discount notes with a maturity of 60 days or less at acquisition are valued at amortized cost, unless the Adviser concludes that amortized cost does not represent the fair value of the applicable asset in which case it will be valued using independent third-party pricing services.
CLOs, CDOs, MBS, ABS, and other structured finance securities are generally valued using an independent third party pricing service.
Repurchase agreements are generally valued at amortized cost, provided such amounts approximate market value.
Equity securities listed or traded on a recognized U.S. securities exchange or the National Association of Securities Dealers Automated Quotations (“NASDAQ”) will generally be valued on the basis of the last sale price on the primary U.S. exchange or market on which the security is listed or traded; provided, however, that securities listed on NASDAQ will be valued at the NASDAQ official closing price, which may not necessarily represent the last sale price.
Open-end investment companies are valued at their NAV as of the close of business, on the valuation date. Exchange-traded funds and end investment companies are generally valued at the last quoted sale price.
Exchange-traded options are valued at the mean of the bid and ask prices on the principal exchange on which they are traded.
Forward foreign currency exchange contracts are valued daily based on the applicable exchange rate of the underlying currency.
Futures contracts are valued on the basis of the last sale price as of 4:00 p.m. on the valuation date. In the event that the exchange for a specific futures contract closes earlier than 4:00 p.m., the futures contract is valued at the official settlement price of the exchange. However, the underlying securities from which the futures contract value is derived are monitored until 4:00 p.m. to determine if fair valuation would provide a more accurate valuation.
The value of interest rate swap agreements entered into by a Fund is valued on the basis of the last sale price on the primary exchange on which the swap is traded. The values of other swap agreements entered into by a Fund are generally valued using an evaluated price provided by an independent third party pricing service.
Typically, loans are valued using information provided by independent third-party pricing services which use broker quotes, among other inputs. If the independent third-party pricing services cannot or do not provide a valuation for a particular loan, or such valuation is deemed unreliable, such investment is valued based on a quote from a broker-dealer or is fair valued by the Adviser.
Generally, trading in foreign securities markets is substantially completed each day at various times prior to the close of the New York Stock Exchange (“NYSE”). The values of foreign securities are determined as of the close of such foreign markets or the close of the NYSE, if earlier. All investments quoted in foreign currencies are valued in U.S. dollars on the basis of the foreign currency exchange rates prevailing at the close of U.S. business at 4:00 p.m. E.T. Investments in foreign securities may involve risks not present in domestic investments. The Adviser will determine the current value of such foreign securities by taking into consideration certain factors which may include those discussed above, as well as the following factors, among others: the value of the securities traded on other foreign markets, American Depositary Receipts (“ADR”) trading, closed-end fund trading, foreign currency exchange activity, and the trading prices of financial products that are tied to foreign securities. In addition, under the Valuation Procedures and Valuation Designee Procedures, the Adviser is authorized to use prices and other information supplied by a third-party pricing vendor in valuing foreign securities.
A Fund may also fair value securities and assets when a significant event is deemed to have occurred after the time of a market quotation including for securities and assets traded on foreign markets and securities and assets for which market quotations are provided by independent third party pricing services as of a
122 | THE GUGGENHEIM FUNDS SEMI-ANNUAL FINANCIAL REPORT | |
NOTES TO FINANCIAL STATEMENTS (Unaudited)(continued) |
time that is prior to the time when the Funds determine their NAV. There can be no assurance in each case that significant events will be identified.
Valuations of the Funds’ securities and other assets are supplied primarily by independent third party pricing services pursuant to the processes set forth in the Valuation Designee Procedures. Valuations provided by the independent third party pricing services are generally based on methods designed to approximate the amount that a Fund could reasonably expect to receive upon the sale of the portfolio security or asset. When providing valuations to the Funds, independent third party pricing services use various inputs, methods, models and assumptions, which may include information provided by broker-dealers and other market makers. Independent third party pricing services face the same challenges as the Funds in valuing securities and assets and may rely on limited available information. If the independent third party pricing service cannot or does not provide a valuation for a particular investment, or such valuation is deemed unreliable, such investment is fair valued by the Adviser. A Fund may also use third party service providers to model certain securities to determine fair market value. While a Fund’s use of fair valuation is intended to result in calculation of NAV that fairly reflects values of the Fund’s portfolio securities as of the time of pricing, a Fund cannot guarantee that any fair valuation will, in fact, approximate the amount the Fund would actually realize upon the sale of the securities in question.
Quotes from broker-dealers (i.e., prices provided by a broker-dealer or other market participant, which may or may not be committed to trade at that price), adjusted for fluctuations in criteria such as credit spreads and interest rates, may also be used to value a Fund’s securities and assets. Quotes from broker-dealers and vendor prices based on broker quotes can vary in terms of depth (e.g., provided by a single broker-dealer) and frequency (e.g., provided on a daily, weekly, or monthly basis, or any other regular or irregular interval). Although quotes from broker-dealers and vendor prices based on broker quotes are typically received from established market participants, a Fund may not have the transparency to view the underlying inputs which support such quotes. Significant changes in a quote from a broker-dealer would generally result in significant changes in the fair value of the security.
(b) U.S. Government and Agency Obligations
Certain U.S. Government and Agency Obligations are traded on a discount basis; the interest rates shown on the Schedules of Investments reflect the effective rates paid at the time of purchase by the Funds. Other securities bear interest at the rates shown, payable at fixed dates through maturity.
Inflation-Indexed bonds are fixed-income securities whose principal value is periodically adjusted to the rate of inflation. The interest rate on these securities is generally fixed at issuance at a rate lower than bonds which are not inflation-indexed. Over the life of an inflation-indexed bond however, interest will be paid based on a principal value which is adjusted for inflation. Any increase in the principal amount of an inflation-indexed bond is recognized as a component of Interest on the Funds’ Statements of Operations, even though principal is not received until maturity.
(c) Senior Floating Rate Interests and Loan Investments
Senior floating rate interests in which the Trust invests generally pay interest rates which are periodically adjusted by reference to a base short-term floating rate, plus a premium. These base lending rates are generally (i) the lending rate offered by one or more major European banks, (ii) the prime rate offered by one or more major United States banks, or (iii) the bank’s certificate of deposit rate. Senior floating rate interests often require prepayments from excess cash flows or permit the borrower to repay at its election. The rate at which the borrower repays cannot be predicted with accuracy. As a result, the actual remaining maturity may be substantially less than the stated maturities disclosed in the Funds’ Schedules of Investments.
The Funds invest in loans and other similar debt obligations (“obligations”). A portion of the Funds’ investments in these obligations is sometimes referred to as “covenant lite” loans or obligations (“covenant lite obligations”), which are obligations that lack financial maintenance covenants or possess fewer or contingent financial maintenance covenants and other financial protections for lenders and investors. The Funds may also obtain exposure to covenant lite obligations through investment in securitization vehicles and other structured products. Many new, restructured or reissued obligations have not featured traditional covenants, which are intended to protect lenders and investors by (i) imposing certain restrictions or other limitations on a borrower’s operations or assets or (ii) providing certain rights to lenders. The Funds may have fewer rights with respect to covenant lite obligations, including fewer protections against the possibility of default and fewer remedies in the event of default. As a result, investments in (or exposure to) covenant lite obligations are subject to more risk than investments in (or exposure to) certain other types of obligations. The Funds are subject to other risks associated with investments in (or exposure to) obligations, including that obligations may not be considered “securities” and, as a result, the Funds may not be entitled to rely on the anti-fraud protections under the federal securities laws and instead may have to resort to state law and direct claims.
| | THE GUGGENHEIM FUNDS SEMI-ANNUAL FINANCIAL REPORT | 123 |
NOTES TO FINANCIAL STATEMENTS (Unaudited)(continued) |
(d) Interest on When-Issued Securities
The Funds may purchase and sell interests in securities on a when-issued and delayed delivery basis, with payment and delivery scheduled for a future date. No income accrues to the Funds on such interests or securities in connection with such transactions prior to the date the Funds actually take delivery of such interests or securities. These transactions are subject to market fluctuations and are subject to the risk that the value at delivery may be more or less than the trade date purchase price. Although the Funds will generally purchase these securities with the intention of acquiring such securities, they may sell such securities before the settlement date.
(e) Options
Upon the purchase of an option, the premium paid is recorded as an investment, the value of which is marked-to-market daily. If a purchased option expires, the Fund realizes a loss in the amount of the cost of the option. When the Fund enters into a closing sale transaction, it realizes a gain or loss depending on whether the proceeds from the closing sale transaction are greater or less than the cost of the option. If the Fund exercises a put option, it realizes a gain or loss from the sale of the underlying security and the proceeds from such sale will be decreased by the premium originally paid. When the Fund exercises a call option, the cost of the security purchased by the Fund upon exercise increases by the premium originally paid.
When the Fund writes (sells) an option, an amount equal to the premium received is entered in that Fund’s accounting records as an asset and equivalent liability. The amount of the liability is subsequently marked-to-market to reflect the current value of the option written. When a written option expires, or if the Fund enters into a closing purchase transaction, it realizes a gain (or loss if the cost of a closing purchase transaction exceeds the premium received when the option was sold).
The Fund may purchase and write swaptions primarily to preserve a return or spread on a particular investment or portion of the Funds’ holdings, as a duration management technique or to protect against an increase in the price of securities it anticipates purchasing at a later date. The purchaser and writer of a swaption is buying or granting the right to enter into a previously agreed upon interest rate swap agreement at any time before the expiration of the options. The swaptions are forward premium swaptions which have extended settlement dates.
(f) Futures Contracts
Upon entering into a futures contract, a Fund deposits and maintains as collateral such initial margin as required by the exchange on which the transaction is affected. Pursuant to the contract, the Fund agrees to receive from or pay to the broker an amount of cash equal to the daily fluctuation in value of the contract. Such receipts or payments are known as variation margin and are recorded by the Fund as unrealized appreciation or depreciation. When the contract is closed, the Fund records a realized gain or loss equal to the difference between the value of the contract at the time it was opened and the value at the time it was closed.
(g) Swap Agreements
Swap agreements are marked-to-market daily and the change, if any, is recorded as unrealized appreciation or depreciation. Payments received or made as a result of an agreement or termination of an agreement are recognized as realized gains or losses.
Upon entering into certain centrally-cleared swap transactions, a Fund is required to deposit with its clearing broker an amount of cash or securities as an initial margin. Subsequent variation margin receipts or payments are received or made by the Fund depending on fluctuations in the fair value of the reference entity and are recorded by the Fund as unrealized appreciation or depreciation. When the contract is closed, the Fund records a realized gain or loss equal to the difference between the value of the contract at the time it was opened and the value at the time it was closed.
Upfront payments received or made by a Fund on credit default swap agreements and interest rate swap agreements are amortized over the expected life of the agreement. Periodic payments received or paid by a Fund are recorded as realized gains or losses. Payments received or made as a result of a credit event or termination of the contract are recognized, net of a proportional amount of the upfront payment, as realized gains or losses.
(h) Forward Foreign Currency Exchange Contracts
The change in value of a forward foreign currency exchange contract is recorded as unrealized appreciation or depreciation until the contract is closed. When the contract is closed, the Funds record a realized gain or loss equal to the difference between the value at the time the contract was opened and the value at the time it was closed.
(i) Currency Translations
The accounting records of the Funds are maintained in U.S. dollars. All assets and liabilities initially expressed in foreign currencies are converted into U.S. dollars at prevailing exchange rates. Purchases and sales of investment securities, dividend and interest income, and certain expenses are translated at the rates of exchange prevailing on the respective dates of such transactions. Changes in the relationship of these foreign currencies to the U.S. dollar can significantly affect the value of the investments and
124 | THE GUGGENHEIM FUNDS SEMI-ANNUAL FINANCIAL REPORT | |
NOTES TO FINANCIAL STATEMENTS (Unaudited)(continued) |
earnings of the Funds. Foreign investments may also subject the Funds to foreign government exchange restrictions, expropriation, taxation, or other political, social, geopolitical or economic developments, all of which could affect the market and/or credit risk of the investments.
The Funds do not isolate that portion of the results of operations resulting from changes in the foreign exchange rates on investments from the fluctuations arising from changes in the market prices of securities held. Such fluctuations are included with the net realized gain or loss and unrealized appreciation or depreciation on investments.
Reported net realized foreign exchange gains and losses arise from sales of foreign currencies and currency gains or losses realized between the trade and settlement dates on investment transactions. Net unrealized appreciation and depreciation arise from changes in the fair values of assets and liabilities other than investments in securities at the fiscal period end, resulting from changes in exchange rates.
(j) Foreign Taxes
The Funds may be subject to foreign taxes (a portion of which may be reclaimable) on income, stock dividends, capital gains on investments or certain foreign currency transactions. All foreign taxes are recorded in accordance with the applicable foreign tax regulations and rates that exist in the foreign jurisdictions in which the Funds invest. These foreign taxes, if any, are paid by the Funds and reflected in their Statements of Operations as follows: foreign taxes withheld at source are presented as a reduction of income and foreign taxes on capital gains from sales of investments are included with the net realized gain (loss) on investments. Foreign taxes payable or deferred as of June 30, 2024, if any, are disclosed in the Funds’ Statements of Assets and Liabilities.
(k) Security Transactions
Security transactions are recorded on the trade date for financial reporting purposes. Realized gains and losses from securities transactions are recorded using the identified cost basis. Proceeds from lawsuits related to investment holdings are recorded as a reduction to cost if the securities are still held and as realized gains if no longer held in the respective Fund. Dividend income is recorded on the ex-dividend date, net of applicable taxes withheld by foreign countries, if any. Taxable non-cash dividends are recorded as dividend income. Interest income, including amortization of premiums and accretion of discounts, is accrued on a daily basis. Interest income also includes paydown gains and losses on mortgage-backed and asset-backed securities and senior and subordinated loans. Amendment fees are earned as compensation for evaluating and accepting changes to the original loan agreement and are recognized when received. Dividend income from Real Estate Investment Trusts (“REITs”) is recorded based on the income included in the distributions received from the REIT investments using published REIT classifications, including some management estimates when actual amounts are not available. Distributions received in excess of this estimated amount are recorded as a reduction of the cost of investments or reclassified to realized gains. The actual amounts of income, return of capital, and realized gains are only determined by each REIT after its fiscal year-end, and may differ from the estimated amounts.
Income from residual collateralized loan obligations is recognized using the effective interest method. At the time of purchase, management estimates the future expected cash flows and determines the effective yield and estimated maturity date based on the estimated cash flows. Subsequent to the purchase, the estimated cash flows are updated periodically and a revised yield is calculated prospectively.
The Funds may receive other income from investments in senior loan interests including amendment fees, consent fees and commitment fees. For funded loans, these fees are recorded as income when received by the Funds and included in interest income on the Funds’ Statements of Operations. For unfunded loans, commitment fees are included in realized gain on investments on the Funds’ Statements of Operations at the end of the commitment period.
(l) Distributions
Distributions of net investment income and net realized gains, if any, are declared and paid at least annually. Normally, all distributions of a Fund will automatically be reinvested without charge in additional shares of the same Fund. Distributions are recorded on the ex-dividend date and are determined in accordance with U.S. federal income tax regulations which may differ from U.S. GAAP.
(m) Expenses
Expenses directly attributable to a Fund are charged directly to the Fund. Other expenses common to various funds within the fund complex are generally allocated amongst such funds on the basis of average net assets.
(n) Earnings Credits
Under the fee arrangement with the custodian, the Funds may earn credits based on overnight custody cash balances. These credits are utilized to reduce related custodial expenses. The custodian fees disclosed in the Funds’ Statements of Operations are before the reduction in expense from the related earnings credits, if any. Earnings credits for the period ended June 30, 2024, are disclosed in the Funds’ Statements of Operations.
| | THE GUGGENHEIM FUNDS SEMI-ANNUAL FINANCIAL REPORT | 125 |
NOTES TO FINANCIAL STATEMENTS (Unaudited)(continued) |
(o) Cash
The Funds may leave cash overnight in their cash account with the custodian. Periodically, a Fund may have cash due to the custodian bank as an overdraft balance. A fee is incurred on this overdraft, calculated by multiplying the overdraft by a rate based on the federal funds rate, which was 5.33% at June 30, 2024.
(p) Indemnifications
Under the Funds’ organizational documents, the Trustees and Officers are indemnified against certain liabilities arising out of the performance of their duties to the Trust. In addition, throughout the normal course of business, the Funds enter into contracts that contain a variety of representations and warranties which provide general indemnifications. The Funds’ maximum exposure under these arrangements is unknown, as this would involve future claims that may be made against the Funds and/or their affiliates that have not yet occurred. However, based on experience, the Funds expect the risk of loss to be remote.
(q) Special Purpose Acquisition Companies
The Funds may acquire an interest in a special purpose acquisition company (“SPAC”) in an initial public offering or a secondary market transaction. SPAC investments carry many of the same risks as investments in initial public offering securities, such as erratic price movements, greater risk of loss, lack of information about the issuer, limited operating and little public or no trading history, and higher transaction costs. An investment in a SPAC is typically subject to a higher risk of dilution by additional later offerings of interests in the SPAC or by other investors exercising existing rights to purchase shares of the SPAC and interests in SPACs may be illiquid and/or be subject to restrictions on resale. A SPAC is a publicly traded company that raises investment capital for the purpose of acquiring the equity securities of one or more existing companies (or interests therein) via merger, combination, acquisition or other similar transactions. Unless and until an acquisition is completed, a SPAC generally invests its assets (less a portion retained to cover expenses) in U.S. government securities, money market securities and cash and does not typically pay dividends in respect of its common stock. SPAC investments are also subject to the risk that a significant portion of the funds raised by the SPAC may be expended during the search for a target acquisition or merger and that the SPAC may have limited time in which to conduct due diligence on potential business combination targets. Because SPACs are in essence blank check companies without operating history or ongoing business other than seeking acquisitions, the value of their securities is particularly dependent on the ability of the entity’s management to identify and complete a profitable acquisition. Among other conflicts of interest, the economic interests of the management, directors, officers and related parties of a SPAC can differ from the economic interests of public shareholders, which may lead to conflicts as they evaluate, negotiate and recommend business combination transactions to shareholders. This risk may become more acute as the deadline for the completion of a business combination nears. There is no guarantee that the SPACs in which the Funds invest will complete an acquisition or that any acquisitions that are completed will be profitable.
Note 2 – Financial Instruments and Derivatives
As part of their investment strategies, the Funds may utilize a variety of derivative instruments. These investments involve, to varying degrees, elements of market risk and risks in excess of amounts recognized on the Funds’ Statements of Assets and Liabilities. Valuation and accounting treatment of these instruments can be found under Significant Accounting Policies in Note 1 of these Notes to Financial Statements.
Derivatives
Derivatives are instruments whose values depend on, or are derived from, in whole or in part, the value of one or more other assets, such as securities, currencies, commodities or indices. Derivative instruments may be used for investment purposes (including to maintain cash reserves while maintaining exposure to certain other assets), for risk management (hedging) purposes, to facilitate trading, to reduce transaction costs and to pursue higher investment returns. Derivative instruments may also be used to seek to mitigate certain investment risks, such as foreign currency exchange rate risk, interest rate risk and credit risk. U.S. GAAP requires disclosures to enable investors to better understand how and why a Fund uses derivative instruments, how these derivative instruments are accounted for and their effects on the Fund’s financial position and results of operations.
The Funds may utilize derivatives for the following purposes:
Duration: the use of an instrument to manage the interest rate risk of a portfolio.
Hedge: an investment made in order to reduce the risk of adverse price movements in a security, by taking an offsetting position to protect against broad market moves.
Income: the use of any instrument that distributes cash flows typically based upon some rate of interest.
Index Exposure: the use of an instrument to obtain exposure to a listed or other type of index.
Leverage: gaining total exposure to equities or other assets on the long and short sides at greater than 100% of invested capital.
Speculation: the use of an instrument to express macro-economic and other investment views.
126 | THE GUGGENHEIM FUNDS SEMI-ANNUAL FINANCIAL REPORT | |
NOTES TO FINANCIAL STATEMENTS (Unaudited)(continued) |
For any Fund whose investment strategy consistently involves applying leverage, the value of the Fund’s shares will tend to increase or decrease more than the value of any increase or decrease in the underlying index or other asset. In addition, because an investment in derivative instruments generally requires a small investment relative to the amount of investment exposure assumed, an opportunity for increased net income is created; but, at the same time, leverage risk will increase. The Fund’s use of leverage, through borrowings or instruments such as derivatives, may cause the Fund to be more volatile and riskier than if they had not been leveraged.
Options Purchased and Written
A call option on a security gives the purchaser of the option the right to buy, and the writer of a call option the obligation to sell, the underlying security. The purchaser of a put option has the right to sell, and the writer of the put option the obligation to buy, the underlying security at any time during the option period. The risk associated with purchasing options is limited to the premium originally paid.
The following table represents the Funds’ use and volume of call/put options purchased on a monthly basis:
| | | | Average Notional Amount | |
Fund | Use | | Call | | | Put | |
Series E (Total Return Bond Series) | Duration, Hedge, Income | | $ | 10,586,482 | | | $ | — | |
The risk in writing a call option is that a Fund may incur a loss if the market price of the underlying security increases and the option is exercised. The risk in writing a put option is that a Fund may incur a loss if the market price of the underlying security decreases and the option is exercised. In addition, there may be an imperfect correlation between the movement in prices of options and the underlying securities where a Fund may not be able to enter into a closing transaction because of an illiquid secondary market; or, for over-the-counter (“OTC”) options, a Fund may be at risk because of the counterparty’s inability to perform.
The following table represents the Funds’ use and volume of call/put options written on a monthly basis:
| | | | Average Notional Amount | |
Fund | Use | | Call | | | Put | |
Series E (Total Return Bond Series) | Hedge, Income | | $ | 1,169,815 | | | $ | — | |
Futures Contracts
A futures contract is an agreement to purchase (long) or sell (short) an agreed amount of securities or other instruments at a set price for delivery at a future date. There are significant risks associated with a Fund’s use of futures contracts, including (i) there may be an imperfect or no correlation between the changes in market value of the underlying asset and the prices of futures contracts; (ii) there may not be a liquid secondary market for a futures contract; (iii) trading restrictions or limitations may be imposed by an exchange; and (iv) government regulations may restrict trading in futures contracts. When investing in futures, there is minimal counterparty credit risk to a Fund because futures are exchange-traded and the exchange’s clearinghouse, as counterparty to all exchange-traded futures, guarantees against default. Cash deposits are shown as segregated cash with broker on the Funds’ Statements of Assets and Liabilities; securities held as collateral are noted on the Funds’ Schedules of Investments.
The following table represents the Funds’ use and volume of futures on a monthly basis:
| | | | Average Notional Amount | |
Fund | Use | | Long | | | Short | |
Series A (StylePlus—Large Core Series) | Index exposure | | $ | 3,502,765 | | | $ | — | |
Series D (World Equity Income Series) | Hedge | | | — | | | | 7,628,660 | |
Series E (Total Return Bond Series) | Duration, Hedge | | | 13,174,344 | | | | — | |
Series J (StylePlus—Mid Growth Series) | Index exposure | | | 4,817,061 | | | | — | |
Series N (Managed Asset Allocation Series) | Index exposure, Speculation | | | 5,250,063 | | | | 718,316 | |
Series X (StylePlus—Small Growth Series) | Index exposure | | | 727,445 | | | | — | |
Series Y (StylePlus—Large Growth Series) | Index exposure | | | 1,150,440 | | | | — | |
| | THE GUGGENHEIM FUNDS SEMI-ANNUAL FINANCIAL REPORT | 127 |
NOTES TO FINANCIAL STATEMENTS (Unaudited)(continued) |
Swap Agreements
A swap is an agreement that obligates two parties to exchange a series of cash flows at specified intervals based upon or calculated by reference to changes in specified prices or rates for a specified amount of an underlying asset. When utilizing OTC swaps, a Fund bears the risk of loss of the amount expected to be received under a swap agreement in the event of the default or bankruptcy of a swap agreement counterparty or if the underlying asset declines in value. Certain standardized swaps are subject to mandatory central clearing and are executed on a multi-lateral or other trade facility platform, such as a registered exchange. There is limited counterparty credit risk with respect to centrally-cleared swaps as the transaction is facilitated through a central clearinghouse, much like exchange-traded futures contracts. For a Fund utilizing centrally-cleared swaps, the exchange bears the risk of loss resulting from a counterparty not being able to pay. There is no guarantee that a Fund or an underlying fund could eliminate its exposure under an outstanding swap agreement by entering into an offsetting swap agreement with the same or another party.
Total return and custom basket swaps involve commitments where single or multiple cash flows are exchanged based on the price of an underlying reference asset (such as an index or custom basket of securities) for a fixed or variable interest rate. Total return and custom basket swaps will usually be computed based on the current value of the reference asset as of the close of regular trading on the NYSE or other exchange, with the swap value being adjusted to include dividends accrued, financing charges and/or interest associated with the swap agreement. When utilizing total return or custom basket swaps, a Fund bears the risk of loss of the amount expected to be received under a swap agreement in the event of the default or bankruptcy of a swap agreement counterparty or if the underlying reference asset declines in value.
The following table represents the Funds’ use and volume of total return swaps on a monthly basis:
| | | | Average Notional Amount | |
Fund | Use | | Long | | | Short | |
Series A (StylePlus—Large Core Series) | Index exposure | | $ | 184,852,274 | | | $ | — | |
Series E (Total Return Bond Series) | Hedge, Index exposure | | | 127,693 | | | | 71,339 | |
Series J (StylePlus—Mid Growth Series) | Index exposure | | | 135,579,903 | | | | — | |
Series X (StylePlus—Small Growth Series) | Index exposure | | | 19,831,168 | | | | — | |
Series Y (StylePlus—Large Growth Series) | Index exposure | | | 41,084,785 | | | | — | |
The following table represents the Funds’ use and volume of custom basket swaps on a monthly basis:
| | | | Average Notional Amount | |
Fund | Use | | Long | | | Short | |
Series Z (Alpha Opportunity Series) | Hedge, Leverage | | $ | 1,993,870 | | | $ | 3,898,459 | |
Interest rate swaps involve the exchange by the Funds with another party for their respective commitment to pay or receive a fixed or variable interest rate on a notional amount of principal. Interest rate swaps are generally centrally-cleared, but central clearing does not make interest rate swap transactions risk free.
The following table represents the Funds’ use and volume of interest rate swaps on a monthly basis:
| | | | Average Notional Amount | |
Fund | Use | | Pay Floating Rate | | | Receive Floating Rate | |
Series E (Total Return Bond Series) | Duration, Hedge, Income | | $ | 38,797,667 | | | $ | — | |
Credit default swaps are instruments which allow for the full or partial transfer of third party credit risk, with respect to a particular entity or entities, from one counterparty to the other. A fund enters into credit default swaps as a “seller” or “buyer” of protection primarily to gain or reduce exposure to the investment grade and/or high yield bond market. A seller of credit default swaps is selling credit protection or assuming credit risk with respect to the underlying entity or entities. The buyer in a credit default swap is obligated to pay the seller a periodic stream of payments over the term of the contract provided that no event of default on an underlying reference obligation has occurred. If a credit event occurs, as defined under the terms of the swap agreement, the seller will either (i) pay to the buyer of protection an amount equal to the notional amount of the swap and take delivery of the referenced obligation or underlying securities comprising the referenced index or (ii) pay
128 | THE GUGGENHEIM FUNDS SEMI-ANNUAL FINANCIAL REPORT | |
NOTES TO FINANCIAL STATEMENTS (Unaudited)(continued) |
a net settlement amount in the form of cash or securities equal to the notional amount of the swap less the recovery value of the referenced obligation or underlying securities comprising the referenced index. The notional amount reflects the maximum potential amount the seller of credit protection could be required to pay to the buyer if a credit event occurs. The seller of protection receives periodic premium payments from the buyer and may also receive or pay an upfront premium adjustment to the stated periodic payments. In the event a credit default occurs on a credit default swap referencing an index, a factor adjustment will take place and the buyer of protection will receive a payment reflecting the par less the default recovery rate of the defaulted index component based on its weighting in the index. If no default occurs, the counterparty will pay the stream of payments and have no further obligations to the fund selling the credit protection. For a fund utilizing centrally cleared credit default swaps, the exchange bears the risk of loss resulting from a counterparty not being able to pay. For OTC credit default swaps, a fund bears the risk of loss of the amount expected to be received under a swap agreement in the event of the default or bankruptcy of a swap agreement counterparty, or in the case of a credit default swap in which a fund is selling credit protection, the default of a third party issuer.
The quoted market prices and resulting market values for credit default swap agreements on securities and credit indices serve as an indicator of the current status of the payment/performance risk and represent the likelihood of an expected liability (or profit) for the credit derivative had the notional amount of the swap agreement been closed/sold as of the period end. Increasing market values, in absolute terms when compared to the notional amount of the swap, represent a deterioration of the referenced entity’s credit soundness and a greater likelihood or risk of default or other credit event occurring as defined under the terms of the agreement.
The following table represents the Funds’ use and volume of credit default swaps on a monthly basis:
| | | | Average Notional Amount | |
Fund | Use | | Protection Sold | | | Protection Purchased | |
Series E (Total Return Bond Series) | Hedge, Index exposure | | $ | — | | | $ | 1,296,667 | |
Forward Foreign Currency Exchange Contracts
A forward foreign currency exchange contract is an agreement between two parties to exchange two designated currencies at a specific time in the future. Certain types of contracts may be cash settled, in an amount equal to the change in exchange rates during the term of the contract. The contracts can be used to hedge or manage exposure to foreign currency risks with portfolio investments or to gain exposure to foreign currencies.
The market value of a forward foreign currency exchange contract changes with fluctuations in foreign currency exchange rates. Furthermore, the Funds may be exposed to risk if the counterparties cannot meet the contract terms or if the currency value changes unfavorably as compared to the U.S. dollar.
The following table represents the Funds’ use and volume of forward foreign currency exchange contracts on a monthly basis:
| | | | Average Value | |
Fund | Use | | Purchased | | | Sold | |
Series E (Total Return Bond Series) | Hedge | | $ | 43,296 | | | $ | 305,528 | |
Series F (Floating Rate Strategies Series) | Hedge | | | 6,670 | | | | 447,472 | |
Series P (High Yield Series) | Hedge | | | — | | | | 546,456 | |
| | THE GUGGENHEIM FUNDS SEMI-ANNUAL FINANCIAL REPORT | 129 |
NOTES TO FINANCIAL STATEMENTS (Unaudited)(continued) |
Derivative Investment Holdings Categorized by Risk Exposure
The following is a summary of the location of derivative investments on the Funds’ Statements of Assets and Liabilities as of June 30, 2024:
Derivative Investment Type | Asset Derivatives | Liability Derivatives |
Currency/Equity/Interest rate futures contracts | Variation margin on futures contracts | Variation margin on futures contracts |
Currency forward contracts | Unrealized appreciation on forward foreign currency exchange contracts | Unrealized depreciation on forward foreign currency exchange contracts |
Credit/Equity/Interest rate swap agreements | Unrealized appreciation on OTC swap agreements Unamortized upfront premiums paid on interest rate swap agreements | Unamortized upfront premiums received on credit default swap agreements Variation margin on interest rate swap agreements Variation margin on credit default swap agreements |
Interest rate option contracts | Investments in unaffiliated issuers, at value | Options written, at value |
The following tables set forth the fair value of the Funds’ derivative investments categorized by primary risk exposure at June 30, 2024:
Asset Derivative Investments Value |
Fund | | Futures
Equity
Risk* | | | Swaps
Equity
Risk | | | Futures
Foreign
Currency
Exchange
Risk* | | | Futures
Interest
Rate Risk* | | | Swaps
Interest
Rate Risk* | | | Swaps
Credit
Risk* | | | Forward
Foreign
Currency
Exchange
Risk | | | Options
Purchased
Interest
Rate Risk | | | Total
Value at
June 30,
2024 | |
Series D (World Equity Income Series) | | $ | — | | | $ | — | | | $ | 63,189 | | | $ | — | | | $ | — | | | $ | — | | | $ | — | | | $ | — | | | $ | 63,189 | |
Series E (Total Return Bond Series) | | | — | | | | — | | | | — | | | | 3,326 | | | | 176,514 | | | | 1,219 | | | | 680 | | | | 30,083 | | | | 211,822 | |
Series F (Floating Rate Strategies Series) | | | — | | | | — | | | | — | | | | — | | | | — | | | | — | | | | 1,471 | | | | — | | | | 1,471 | |
Series J (StylePlus—Mid Growth Series) | | | 434 | | | | — | | | | — | | | | — | | | | — | | | | — | | | | — | | | | — | | | | 434 | |
Series N (Managed Asset Allocation Series) | | | 11,940 | | | | — | | | | — | | | | 4,198 | | | | — | | | | — | | | | — | | | | — | | | | 16,138 | |
Series P (High Yield Series) | | | — | | | | — | | | | — | | | | — | | | | — | | | | — | | | | 1,270 | | | | — | | | | 1,270 | |
Series X (StylePlus—Small Growth Series) | | | 975 | | | | — | | | | — | | | | — | | | | — | | | | — | | | | — | | | | — | | | | 975 | |
Series Z (Alpha Opportunity Series) | | | — | | | | 207,092 | | | | — | | | | — | | | | — | | | | — | | | | — | | | | — | | | | 207,092 | |
130 | THE GUGGENHEIM FUNDS SEMI-ANNUAL FINANCIAL REPORT | |
NOTES TO FINANCIAL STATEMENTS (Unaudited)(continued) |
Liability Derivative Investments Value |
Fund | | Futures
Equity
Risk* | | | Swaps
Equity Risk | | | Futures
Foreign
Currency
Exchange
Risk* | | | Futures
Interest
Rate Risk* | | | Swaps
Interest
Rate Risk* | | | Swaps
Credit
Risk* | | | Forward
Foreign
Currency
Exchange
Risk | | | Options
Written
Interest
Rate Risk | | | Total
Value at
June 30,
2024 | |
Series A (StylePlus—Large Core Series) | | $ | 16,696 | | | $ | — | | | $ | — | | | $ | — | | | $ | — | | | $ | — | | | $ | — | | | $ | — | | | $ | 16,696 | |
Series E (Total Return Bond Series) | | | — | | | | — | | | | — | | | | 586 | | | | 406,149 | | | | — | | | | 157 | | | | 28,777 | | | | 435,669 | |
Series J (StylePlus—Mid Growth Series) | | | 32,426 | | | | — | | | | — | | | | — | | | | — | | | | — | | | | — | | | | — | | | | 32,426 | |
Series N (Managed Asset Allocation Series) | | | 10,100 | | | | — | | | | — | | | | 816 | | | | — | | | | — | | | | — | | | | — | | | | 10,916 | |
Series P (High Yield Series) | | | — | | | | — | | | | — | | | | — | | | | — | | | | — | | | | 267 | | | | — | | | | 267 | |
Series X (StylePlus—Small Growth Series) | | | 5,293 | | | | — | | | | — | | | | — | | | | — | | | | — | | | | — | | | | — | | | | 5,293 | |
Series Y (StylePlus—Large Growth Series) | | | 8,870 | | | | — | | | | — | | | | — | | | | — | | | | — | | | | — | | | | — | | | | 8,870 | |
* | Includes cumulative appreciation (depreciation) of exchange-traded, OTC and centrally-cleared derivatives contracts as reported on the Schedules of Investments. For exchange-traded and centrally-cleared derivatives, variation margin is reported within the Funds’ Statements of Assets and Liabilities. |
The following is a summary of the location of derivative investments on the Funds’ Statements of Operations for the period ended June 30, 2024:
Derivative Investment Type | Location of Gain (Loss) on Derivatives |
Currency/Equity/Interest rate futures contracts | Net realized gain (loss) on futures contracts Net change in unrealized appreciation (depreciation) on futures contracts |
Currency forward contracts | Net realized gain (loss) on forward foreign currency exchange contracts Net change in unrealized appreciation (depreciation) on forward foreign currency exchange contracts |
Interest rate option contracts | Net realized gain (loss) on options purchased Net change in unrealized appreciation (depreciation) on options purchased Net change in unrealized appreciation (depreciation) on options written |
Credit/Equity/Interest rate swap agreements | Net realized gain (loss) on swap agreements Net change in unrealized appreciation (depreciation) on swap agreements |
| | THE GUGGENHEIM FUNDS SEMI-ANNUAL FINANCIAL REPORT | 131 |
NOTES TO FINANCIAL STATEMENTS (Unaudited)(continued) |
The following is a summary of the Funds’ realized gain (loss) and change in unrealized appreciation (depreciation) on derivative investments recognized on the Funds’ Statements of Operations categorized by primary risk exposure for the period ended June 30, 2024:
Realized Gain (Loss) on Derivative Investments Recognized on the Statements of Operations |
Fund | | Futures
Equity
Risk | | | Swaps
Equity
Risk | | | Futures
Foreign
Currency
Exchange
Risk | | | Futures
Interest
Rate Risk | | | Swaps
Interest
Rate Risk | | | Swaps
Credit
Risk | | | Forward
Foreign
Currency
Exchange
Risk | | | Options
Purchased
Interest
Rate Risk | | | Options
Written
Interest
Rate Risk | | | Total | |
Series A (StylePlus—Large Core Series) | | $ | 305,367 | | | $ | 39,630,379 | | | $ | — | | | $ | — | | | $ | — | | | $ | — | | | $ | — | | | $ | — | | | $ | — | | | $ | 39,935,746 | |
Series D (World Equity Income Series) | | | — | | | | — | | | | (166,729 | ) | | | — | | | | — | | | | — | | | | — | | | | — | | | | — | | | | (166,729 | ) |
Series E (Total Return Bond Series) | | | — | | | | 1,144 | | | | — | | | | (50,953 | ) | | | (23,283 | ) | | | (116,462 | ) | | | (1,246 | ) | | | (51,002 | ) | | | — | | | | (241,802 | ) |
Series F (Floating Rate Strategies Series) | | | — | | | | — | | | | — | | | | — | | | | — | | | | — | | | | 5,434 | | | | — | | | | — | | | | 5,434 | |
Series J (StylePlus—Mid Growth Series) | | | 468,000 | | | | 21,717,640 | | | | — | | | | — | | | | — | | | | — | | | | — | | | | — | | | | — | | | | 22,185,640 | |
Series N (Managed Asset Allocation Series) | | | 245,472 | | | | — | | | | (7,277 | ) | | | 3,793 | | | | — | | | | — | | | | — | | | | — | | | | — | | | | 241,988 | |
Series P (High Yield Series) | | | — | | | | — | | | | — | | | | — | | | | — | | | | — | | | | 5,210 | | | | — | | | | — | | | | 5,210 | |
Series X (StylePlus—Small Growth Series) | | | 55,420 | | | | 2,500,446 | | | | — | | | | — | | | | — | | | | — | | | | — | | | | — | | | | — | | | | 2,555,866 | |
Series Y (StylePlus—Large Growth Series) | | | 129,705 | | | | 11,382,393 | | | | — | | | | — | | | | — | | | | — | | | | — | | | | — | | | | — | | | | 11,512,098 | |
Series Z (Alpha Opportunity Series) | | | — | | | | (137,375 | ) | | | — | | | | — | | | | — | | | | — | | | | — | | | | — | | | | — | | | | (137,375 | ) |
Change in Unrealized Appreciation (Depreciation) on Derivative Investments Recognized on the Statements of Operations |
Fund | | Futures
Equity
Risk | | | Swaps
Equity
Risk | | | Futures
Foreign
Currency
Exchange
Risk | | | Futures
Interest
Rate
Risk | | | Swaps
Interest
Rate
Risk | | | Swaps
Credit
Risk | | | Forward
Foreign
Currency
Exchange
Risk | | | Options
Purchased
Interest
Rate Risk | | | Options
Written
Interest
Rate Risk | | | Total | |
Series A (StylePlus—Large Core Series) | | $ | (158,294 | ) | | $ | (18,411,216 | ) | | $ | — | | | $ | — | | | $ | — | | | $ | — | | | $ | — | | | $ | — | | | $ | — | | | $ | (18,569,510 | ) |
Series D (World Equity Income Series) | | | — | | | | — | | | | 63,189 | | | | — | | | | — | | | | — | | | | — | | | | — | | | | — | | | | 63,189 | |
Series E (Total Return Bond Series) | | | — | | | | (8,652 | ) | | | — | | | | (106,889 | ) | | | (1,072,867 | ) | | | 95,741 | | | | 6,103 | | | | 30,822 | | | | 4,920 | | | | (1,050,822 | ) |
Series F (Floating Rate Strategies Series) | | | — | | | | — | | | | — | | | | — | | | | — | | | | — | | | | 11,759 | | | | — | | | | — | | | | 11,759 | |
Series J (StylePlus—Mid Growth Series) | | | (252,771 | ) | | | (17,377,099 | ) | | | — | | | | — | | | | — | | | | — | | | | — | | | | — | | | | — | | | | (17,629,870 | ) |
Series N (Managed Asset Allocation Series) | | | (196,402 | ) | | | — | | | | 3,086 | | | | (32,633 | ) | | | — | | | | — | | | | — | | | | — | | | | — | | | | (225,949 | ) |
Series P (High Yield Series) | | | — | | | | — | | | | — | | | | — | | | | — | | | | — | | | | 12,151 | | | | — | | | | — | | | | 12,151 | |
Series X (StylePlus—Small Growth Series) | | | (53,060 | ) | | | (2,133,893 | ) | | | — | | | | — | | | | — | | | | — | | | | — | | | | — | | | | — | | | | (2,186,953 | ) |
Series Y (StylePlus—Large Growth Series) | | | (23,030 | ) | | | (4,776,102 | ) | | | — | | | | — | | | | — | | | | — | | | | — | | | | — | | | | — | | | | (4,799,132 | ) |
Series Z (Alpha Opportunity Series) | | | — | | | | 283,131 | | | | — | | | | — | | | | — | | | | — | | | | — | | | | — | | | | — | | | | 283,131 | |
In conjunction with short sales and the use of derivative instruments, the Funds are required to maintain collateral in various forms. Depending on the financial instrument utilized and the broker involved, the Funds use margin deposits at the broker, cash and/or securities segregated at the custodian bank, discount notes or repurchase agreements allocated to the Funds as collateral.
132 | THE GUGGENHEIM FUNDS SEMI-ANNUAL FINANCIAL REPORT | |
NOTES TO FINANCIAL STATEMENTS (Unaudited)(continued) |
The Trust has established counterparty credit guidelines and enters into transactions only with financial institutions rated/identified as investment grade or better. The Trust monitors the counterparty credit risk associated with each such financial institution.
Foreign Investments
There are several risks associated with exposure to foreign currencies, foreign issuers and emerging markets. A fund’s indirect and direct exposure to foreign currencies subjects the Fund to the risk that those currencies will decline in value relative to the U.S. dollar, or in the case of short positions, that the U.S. dollar will decline in value relative to the currency being hedged. Currency rates in foreign countries may fluctuate significantly over short periods of time for a number of reasons, including changes in interest rates and the imposition of currency controls or other political developments in the U.S. or abroad. In addition, the Funds may incur transaction costs in connection with conversions between various currencies. The Funds may, but is not obligated to, engage in currency hedging transactions, which generally involve buying currency forward, options or futures contracts. However, not all currency risks may be effectively hedged, and in some cases the costs of hedging techniques may outweigh expected benefits. In such instances, the value of securities denominated in foreign currencies can change significantly when foreign currencies strengthen or weaken relative to the U.S. dollar.
The Funds may invest in securities of foreign companies directly, or in financial instruments, such as ADRs and exchange-traded funds, which are indirectly linked to the performance of foreign issuers. Foreign markets can be more volatile than the U.S. market due to increased risks of adverse issuer, political, regulatory, market, or economic developments and can perform differently from the U.S. market. Investing in securities of foreign companies directly, or in financial instruments that are indirectly linked to the performance of foreign issuers, may involve risks not typically associated with investing in U.S. issuers. The value of securities denominated in foreign currencies, and of dividends from such securities, can change significantly when foreign currencies strengthen or weaken relative to the U.S. dollar. Foreign securities markets generally have less trading volume and less liquidity than U.S. markets, and prices in some foreign markets may fluctuate more than those of securities traded on U.S. markets. Many foreign countries lack accounting and disclosure standards comparable to those that apply to U.S. companies, and it may be more difficult to obtain reliable information regarding a foreign issuer’s financial condition and operations. Transaction costs and costs associated with custody services are generally higher for foreign securities than they are for U.S. securities. Some foreign governments levy withholding taxes against dividend and interest income. Although in some countries portions of these taxes are recoverable, the non-recovered portion will reduce the income received by the Funds.
Note 3 – Offsetting
In the normal course of business, the Funds enter into transactions subject to enforceable master netting arrangements or other similar arrangements. Generally, the right to offset in those agreements allows the Funds to counteract the exposure to a specific counterparty with collateral received from or delivered to that counterparty based on the terms of the arrangements. These arrangements provide for the right to liquidate upon the occurrence of an event of default, credit event upon merger or additional termination event.
In order to better define their contractual rights and to secure rights that will help the Funds mitigate their counterparty risk, the Funds may enter into an International Swaps and Derivatives Association, Inc. Master Agreement (“ISDA Master Agreement”) or similar agreement with their derivative contract counterparties. An ISDA Master Agreement is a bilateral agreement between a fund and a counterparty that governs OTC derivatives, including foreign exchange contracts, and typically contains, among other things, collateral posting terms and netting provisions in the event of a default and/or termination event. The provisions of the ISDA Master Agreement typically permit a single net payment in the event of a default (close-out netting) or similar event, including the bankruptcy or insolvency of the counterparty.
For derivatives traded under an ISDA Master Agreement, the collateral requirements are typically calculated by netting the mark-to-market amount for each transaction under such agreement and comparing that amount to the value of any collateral currently pledged by the Funds and the counterparty. For financial reporting purposes, cash collateral that has been pledged to cover obligations of the Funds and cash collateral received from the counterparty, if any, are reported separately on the Funds’ Statements of Assets and Liabilities as segregated cash with broker/receivable for variation margin, or payable for swap settlement/variation margin. Cash and/or securities pledged or received as collateral by the Funds in connection with an OTC derivative subject to an ISDA Master Agreement generally may not be invested, sold or rehypothecated by the counterparty or the Funds, as applicable, absent an event of default under such agreement, in which case such collateral generally may be applied towards obligations due to and payable by such counterparty or the Funds, as applicable. Generally, the amount of collateral due from or to a counterparty must exceed a minimum transfer amount threshold (e.g., $300,000) before a transfer is required to be made. To the extent amounts due to the Funds from their counterparties are not fully collateralized, contractually or otherwise, the Funds bear the risk of loss from counterparty nonperformance. The Funds attempt to mitigate counterparty risk by only entering into agreements with counterparties that they believe to be of good standing and by monitoring the financial stability of those counterparties.
| | THE GUGGENHEIM FUNDS SEMI-ANNUAL FINANCIAL REPORT | 133 |
NOTES TO FINANCIAL STATEMENTS (Unaudited)(continued) |
For financial reporting purposes, the Funds do not offset derivative assets and derivative liabilities that are subject to netting arrangements in the Funds’ Statements of Assets and Liabilities.
The following tables present derivative financial instruments and secured financing transactions that are subject to enforceable netting arrangements:
| | | | | | | | | | | | | | | | Gross Amounts Not Offset
in the Statements of
Assets and Liabilities | | | | | |
Fund | Instrument* | | Gross
Amounts of
Recognized
Assets1 | | | Gross
Amounts
Offset in the
Statements
of Assets and
Liabilities | | | Net Amounts
of Assets
Presented on
the Statements
of Assets and
Liabilities | | | Financial
Instruments | | | Cash
Collateral
Received | | | Net
Amount | |
Series E (Total Return Bond Series) | Forward foreign currency exchange contracts | | $ | 680 | | | $ | — | | | $ | 680 | | | $ | — | | | $ | — | | | $ | 680 | |
| | Options purchased | | | 30,083 | | | | — | | | | 30,083 | | | | (28,777 | ) | | | — | | | | 1,306 | |
Series F (Floating Rate Strategies Series) | Forward foreign currency exchange contracts | | | 1,471 | | | | — | | | | 1,471 | | | | — | | | | — | | | | 1,471 | |
Series P (High Yield Series) | Forward foreign currency exchange contracts | | | 1,270 | | | | — | | | | 1,270 | | | | — | | | | — | | | | 1,270 | |
Series Z (Alpha Opportunity Series) | Custom basket swap agreements | | | 207,092 | | | | — | | | | 207,092 | | | | — | | | | — | | | | 207,092 | |
| | | | | | | | | | | | | | | | Gross Amounts Not Offset
in the Statements of
Assets and Liabilities | | | | | |
Fund | Instrument* | | Gross
Amounts of
Recognized
Liabilities1 | | | Gross
Amounts
Offset in the
Statements
of Assets and
Liabilities | | | Net Amounts
of Liabilities
Presented on
the Statements
of Assets and
Liabilities | | | Financial
Instruments | | | Cash
Collateral
Pledged | | | Net
Amount | |
Series E (Total Return Bond Series) | Forward foreign currency exchange contracts | | $ | 157 | | | $ | — | | | $ | 157 | | | $ | — | | | $ | — | | | $ | 157 | |
| | Options written | | | 28,777 | | | | — | | | | 28,777 | | | | (28,777 | ) | | | — | | | | — | |
Series P (High Yield Series) | Forward foreign currency exchange contracts | | | 267 | | | | — | | | | 267 | | | | — | | | | — | | | | 267 | |
* | Series A (StylePlus - Large Core Series), Series J (StylePlus - Mid Growth Series), Series X (StylePlus - Small Growth Series) and Series Y (StylePlus - Large Growth Series) held OTC total return swap agreements entered into at period end which had a $0 value and unrealized appreciation. Accordingly, these positions are excluded from netting arrangements at June 30, 2024. |
1 | Exchange-traded or centrally-cleared derivatives are excluded from these reported amounts. |
134 | THE GUGGENHEIM FUNDS SEMI-ANNUAL FINANCIAL REPORT | |
NOTES TO FINANCIAL STATEMENTS (Unaudited)(continued) |
The Funds have the right to offset deposits against any related derivative liabilities outstanding with each counterparty with the exception of exchange-traded or centrally-cleared derivatives. The following table presents deposits held by others in connection with derivative investments as of June 30, 2024.
Fund | Counterparty | Asset Type | | Cash Pledged | | | Cash Received | |
Series A (StylePlus—Large Core Series) | Morgan Stanley Capital Services LLC | Futures contracts | | $ | 421,000 | | | $ | — | |
| Wells Fargo Bank, N.A. | Total return swap agreements | | | — | | | | 6,150,000 | |
Series A (StylePlus --Large Core Series) Total | | | | | 421,000 | | | | 6,150,000 | |
Series D (World Equity Income Series) | BofA Securities, Inc. | Futures contracts | | | 170,000 | | | | — | |
Series E (Total Return Bond Series) | BofA Securities, Inc. | Credit default swap agreements | | | 5,013 | | | | — | |
| | BofA Securities, Inc. | Futures contracts | | | 42,000 | | | | — | |
| BofA Securities, Inc. | Interest rate swap agreements | | | 468,457 | | | | — | |
Series E (Total Return Bond Series) Total | | | | | 515,470 | | | | — | |
Series J (StylePlus—Mid Growth Series) | Morgan Stanley Capital Services LLC | Futures contracts | | | 400,000 | | | | — | |
| Wells Fargo Bank, N.A. | Total return swap agreements | | | 5,290,000 | | | | — | |
Series J (StylePlus --Mid Growth Series) Total | | | | | 5,690,000 | | | | — | |
Series X (StylePlus—Small Growth Series) | Morgan Stanley Capital Services LLC | Futures contracts | | | 85,000 | | | | — | |
| Wells Fargo Bank, N.A. | Total return swap agreements | | | 760,000 | | | | — | |
Series X (StylePlus --Small Growth Series) Total | | | | | 845,000 | | | | — | |
Series Y (StylePlus—Large Growth Series) | Morgan Stanley Capital Services LLC | Futures contracts | | | 145,000 | | | | — | |
| Wells Fargo Bank, N.A. | Total return swap agreements | | | — | | | | 3,080,000 | |
Series Y (StylePlus --Large Growth Series) Total | | | | | 145,000 | | | | 3,080,000 | |
Note 4 – Fair Value Measurement
In accordance with U.S. GAAP, fair value is defined as the price that the Funds would receive to sell an investment or pay to transfer a liability in an orderly transaction between market participants at the measurement date. U.S. GAAP establishes a three-tier fair value hierarchy based on the types of inputs used to value assets and liabilities and requires corresponding disclosure. The hierarchy and the corresponding inputs are summarized below:
Level 1 — | unadjusted quoted prices in active markets for identical assets or liabilities. |
Level 2 — | significant other observable inputs (for example quoted prices for securities that are similar based on characteristics such as interest rates, prepayment speeds, credit risk, etc.). |
Level 3 — | significant unobservable inputs based on the best information available under the circumstances, to the extent observable inputs are not available, which may include assumptions. |
Rule 2a-5 sets forth a definition of “readily available market quotations,” which is consistent with the definition of a Level 1 input under U.S. GAAP. Rule 2a-5 provides that “a market quotation is readily available only when that quotation is a quoted price (unadjusted) in active markets for identical investments that the fund can access at the measurement date, provided that a quotation will not be readily available if it is not reliable.”
Securities for which market quotations are not readily available must be valued at fair value as determined in good faith. Accordingly, any security priced using inputs other than Level 1 inputs will be subject to fair value requirements. The types of inputs available depend on a variety of factors, such as the type of security and the characteristics of the markets in which it trades, if any. Fair valuation determinations that rely on fewer or no observable inputs require greater judgment. Accordingly, fair value determinations for Level 3 securities require the greatest amount of judgment.
| | THE GUGGENHEIM FUNDS SEMI-ANNUAL FINANCIAL REPORT | 135 |
NOTES TO FINANCIAL STATEMENTS (Unaudited)(continued) |
Pricing service providers are used to value a majority of the Funds’ investments. When values are not available from a pricing service provider, they will be determined using a variety of sources and techniques, including: market prices; broker quotes; and models which derive prices based on inputs such as prices of securities with comparable maturities and characteristics or based on inputs such as anticipated cash flows or collateral, spread over U.S. Treasury securities, and other information and analysis. A significant portion of the Funds’ assets and liabilities are categorized as Level 2, as indicated in this report.
Quotes from broker-dealers, adjusted for fluctuations in criteria such as credit spreads and interest rates, may also be used to value the Funds’ assets and liabilities, i.e. prices provided by a broker-dealer or other market participant who has not committed to trade at that price. Although quotes are typically received from established market participants, the Funds may not have the transparency to view the underlying inputs which support the market quotations. Significant changes in a quote would generally result in significant changes in the fair value of the security.
Certain fixed income securities are valued by obtaining a monthly quote from a broker-dealer, adjusted for fluctuations in criteria such as credit spreads and interest rates.
Certain loans and other securities are valued using a single daily broker quote or a price from a pricing service provider based on a single daily or monthly broker quote.
The inputs or methodologies selected and applied for valuing securities or other assets are not necessarily an indication of the risk associated with investing in those securities. The suitability, appropriateness and accuracy of the techniques, methodologies and sources employed to determine fair valuation are periodically reviewed and subject to change.
Note 5 – Investment Advisory Agreement and Other Agreements
Under the terms of an investment advisory contract, the Funds pay GI investment advisory fees on a monthly basis calculated daily at the annualized rates below, based on the average daily net assets of the Funds:
Fund | | Management Fees
(as a % of Net Assets) | |
Series A (StylePlus—Large Core Series) | | | 0.75 | % |
Series B (Large Cap Value Series) | | | 0.65 | % |
Series D (World Equity Income Series) | | | 0.70 | % |
Series E (Total Return Bond Series) | | | 0.39 | % |
Series F (Floating Rate Strategies Series) | | | 0.65 | %1 |
Series J (StylePlus—Mid Growth Series) | | | 0.75 | % |
Series N (Managed Asset Allocation Series) | | | 0.40 | % |
Series O (All Cap Value Series) | | | 0.70 | % |
Series P (High Yield Series) | | | 0.60 | % |
Series Q (Small Cap Value Series) | | | 0.75 | % |
Series V (SMid Cap Value Series) | | | 0.75 | % |
Series X (StylePlus—Small Growth Series) | | | 0.75 | % |
Series Y (StylePlus—Large Growth Series) | | | 0.65 | % |
Series Z (Alpha Opportunity Series) | | | 0.90 | % |
1 | The Series F management fee is subject to a 0.05% reduction on assets over $5 billion. |
GI pays operating expenses on behalf of the Trust, such as audit and accounting related services, legal services, custody, printing and mailing, among others, on a pass-through basis. Such expenses are allocated to various Funds within the complex based on relative net assets.
The Board has adopted a separate Distribution and Shareholder Services Plan pursuant to Rule 12b-1 under the 1940 Act that allows those Funds to pay distribution and shareholder services fees to GFD. The Funds will pay distribution and shareholder services fees to GFD at an annual rate not to exceed 0.25% of average daily net assets. GFD may, in turn, pay all or a portion of the proceeds from the distribution and shareholder services fees to insurance companies or their affiliates and qualified plan administrators (“intermediaries”) for services they provide on behalf of the Funds to current and prospective variable contract owners and qualified plan participants that invest in the Funds through the intermediaries.
136 | THE GUGGENHEIM FUNDS SEMI-ANNUAL FINANCIAL REPORT | |
NOTES TO FINANCIAL STATEMENTS (Unaudited)(continued) |
Contractual expense limitation agreements for the following Funds provide that the total expenses be limited to a percentage of average net assets for the Funds, exclusive of brokerage costs, dividends or interest on securities sold short, expenses of other investment companies in which a Fund invests, interest, taxes, litigation, indemnification and extraordinary expenses. The limits are listed below:
| | Limit | | | Effective
Date | | | Contract
End Date | |
Series A (StylePlus—Large Core Series) | | | 0.91 | % | | | 05/01/17 | | | | 05/01/25 | |
Series B (Large Cap Value Series) | | | 0.80 | % | | | 05/01/17 | | | | 05/01/25 | |
Series D (World Equity Income Series) | | | 0.90 | % | | | 05/01/17 | | | | 05/01/25 | |
Series E (Total Return Bond Series) | | | 0.81 | % | | | 11/30/12 | | | | 05/01/25 | |
Series F (Floating Rate Strategies Series) | | | 1.15 | % | | | 04/22/13 | | | | 05/01/25 | |
Series J (StylePlus—Mid Growth Series) | | | 0.94 | % | | | 05/01/17 | | | | 05/01/25 | |
Series O (All Cap Value Series) | | | 0.88 | % | | | 05/01/17 | | | | 05/01/25 | |
Series P (High Yield Series) | | | 1.07 | % | | | 10/20/14 | | | | 05/01/25 | |
Series Q (Small Cap Value Series) | | | 1.14 | % | | | 05/01/17 | | | | 05/01/25 | |
Series V (Mid Cap Value Series) | | | 0.91 | % | | | 05/01/17 | | | | 05/01/25 | |
Series X (StylePlus—Small Growth Series) | | | 1.06 | % | | | 05/01/17 | | | | 05/01/25 | |
Series Y (StylePlus—Large Growth Series) | | | 0.93 | % | | | 05/01/17 | | | | 05/01/25 | |
Series Z (Alpha Opportunity Series) | | | 2.00 | % | | | 05/31/17 | | | | 05/01/25 | |
GI is entitled to reimbursement by the Funds for fees waived or expenses reimbursed during any of the previous 36 months, beginning on the date of the expense limitation agreement, if on any day the estimated operating expenses are less than the indicated percentages. For purposes of this arrangement, GI is entitled to recoupment of previously waived fees or reimbursed expenses for 36 months from the date of the waiver or reimbursement by GI. At June 30, 2024, the amount of fees waived or expenses reimbursed that are subject to recoupment and will expire during the years ended December 31, are presented in the following table:
Fund | | 2024 | | | 2025 | | | 2026 | | | 2027 | | | Total | |
Series A (StylePlus - Large Core Series) | | $ | 315,054 | | | $ | 468,020 | | | $ | 454,885 | | | $ | 203,638 | | | $ | 1,441,597 | |
Series B (Large Cap Value Series) | | | 299,663 | | | | 510,071 | | | | 442,921 | | | | 195,572 | | | | 1,448,227 | |
Series D (World Equity Income Series) | | | 197,596 | | | | 248,699 | | | | 266,381 | | | | 110,046 | | | | 822,722 | |
Series E (Total Return Bond Series) | | | 16,130 | | | | 23,524 | | | | 21,638 | | | | — | | | | 61,292 | |
Series F (Floating Rate Strategies Series) | | | 44,065 | | | | 45,284 | | | | 36,293 | | | | 13,319 | | | | 138,961 | |
Series J (StylePlus—Mid Growth Series) | | | 236,132 | | | | 323,149 | | | | 320,330 | | | | 145,552 | | | | 1,025,163 | |
Series O (All Cap Value Series) | | | 142,110 | | | | 231,664 | | | | 231,701 | | | | 102,260 | | | | 707,735 | |
Series P (High Yield Series) | | | 46,963 | | | | 69,351 | | | | 72,179 | | | | 29,912 | | | | 218,405 | |
Series Q (Small Cap Value Series) | | | 29,735 | | | | 49,991 | | | | 52,236 | | | | 20,148 | | | | 152,110 | |
Series V (SMid Cap Value Series) | | | 229,272 | | | | 380,378 | | | | 377,732 | | | | 155,206 | | | | 1,142,588 | |
Series X (StylePlus - Small Growth Series) | | | 70,499 | | | | 101,526 | | | | 106,422 | | | | 51,236 | | | | 329,683 | |
Series Y (StylePlus - Large Growth Series) | | | 75,884 | | | | 112,263 | | | | 117,237 | | | | 54,727 | | | | 360,111 | |
Series Z (Alpha Opportunity Series) | | | 95,963 | | | | 94,632 | | | | 87,340 | | | | 42,065 | | | | 320,000 | |
For the period ended June 30, 2024, GI recouped amounts from the Funds as follows:
Series B (Large Cap Value Series) | | $ | 587 | |
Series D (World Equity Income Series) | | | 374 | |
Series E ( Total Return Bond Series) | | | 41,129 | |
Series O (All Cap Value Series) | | | 298 | |
Series Q (Small Cap Value Series) | | | 260 | |
Series V (SMid Cap Value Series) | | | 524 | |
| | THE GUGGENHEIM FUNDS SEMI-ANNUAL FINANCIAL REPORT | 137 |
NOTES TO FINANCIAL STATEMENTS (Unaudited)(continued) |
If a Fund invests in a fund that is advised by the same adviser or an affiliated adviser, the investing Fund’s adviser has agreed to waive fees at the investing fund level to the extent necessary to offset the proportionate share of any management fee paid by each Fund with respect to its investment in such affiliated fund. Fee waivers will be calculated at the investing fund level without regard to any expense cap in effect for the investing fund. Fees waived under this arrangement are not subject to reimbursement to GI. For the period ended June 30, 2024, the following Funds waived fees related to investments in affiliated funds:
Fund | | Amount Waived | |
Series A (StylePlus—Large Core Series) | | $ | 35,273 | |
Series E (Total Return Bond Series) | | | 15,575 | |
Series F (Floating Rate Strategies Series) | | | 1,278 | |
Series J (StylePlus—Mid Growth Series) | | | 3,681 | |
Series N (Managed Asset Allocation Series) | | | 915 | |
Series X (StylePlus—Small Growth Series) | | | 393 | |
Series Y (StylePlus—Large Growth Series) | | | 5,092 | |
Certain trustees and officers of the Trust are also officers of GI and/or GFD. The Trust does not compensate its officers or trustees who are officers, directors and/or employees of GI or GFD.
MUFG Investor Services (US), LLC (“MUIS”) acts as the Funds’ administrator, transfer agent and accounting agent. As administrator, transfer agent and accounting agent, MUIS maintains the books and records of the Funds’ securities and cash. The Bank of New York Mellon Corp. (“BNY”) acts as the Funds’ custodian. As custodian, BNY is responsible for the custody of the Funds’ assets. For providing the aforementioned administrative and accounting services, MUIS is entitled to receive a monthly fee equal to a percentage of the Funds’ average daily net assets and out of pocket expenses. For providing the aforementioned transfer agent and custodian services, MUIS and BNY are entitled to receive a monthly fee based on the number of transactions during the month and the number of accounts under management, subject to certain minimum monthly fees, and out of pocket expenses.
Note 6 – Federal Income Tax Information
The Funds intend to comply with the provisions of Subchapter M of the Internal Revenue Code of 1986, as amended (the “Internal Revenue Code”), applicable to regulated investment companies and will distribute substantially all taxable net investment income and capital gains sufficient to relieve the Funds from all, or substantially all, federal income, excise and state income taxes. Therefore, no provision for federal or state income tax or federal excise tax is required.
Tax positions taken or expected to be taken in the course of preparing the Funds’ tax returns are evaluated to determine whether the tax positions are “more-likely-than-not” of being sustained by the applicable tax authority. Tax positions not deemed to meet the “more-likely-than-not” threshold would be recorded as a tax benefit or expense in the current year. Management has analyzed the Funds’ tax positions taken, or to be taken, on U.S. federal income tax returns for all open tax years, and has concluded that no provision for income tax is required in the Funds’ financial statements. The Funds’ U.S. federal income tax returns are subject to examination by the Internal Revenue Service (“IRS”) for a period of three years after they are filed.
138 | THE GUGGENHEIM FUNDS SEMI-ANNUAL FINANCIAL REPORT | |
NOTES TO FINANCIAL STATEMENTS (Unaudited)(continued) |
At June 30, 2024, the cost of investments for U.S. federal income tax purposes, the aggregate gross unrealized appreciation for all investments for which there was an excess of value over tax cost and the aggregate gross unrealized depreciation for all investments for which there was an excess of tax cost over value, were as follows:
Fund | | Tax
Cost | | | Tax
Unrealized
Appreciation | | | Tax
Unrealized
Depreciation | | | Net Tax
Unrealized
Appreciation
(Depreciation) | |
Series A (StylePlus—Large Core Series) | | $ | 241,010,443 | | | $ | 10,434,739 | | | $ | (1,809,291 | ) | | $ | 8,625,448 | |
Series B (Large Cap Value Series) | | | 158,529,890 | | | | 50,423,715 | | | | (5,248,991 | ) | | | 45,174,724 | |
Series D (World Equity Income Series) | | | 98,745,256 | | | | 18,248,307 | | | | (2,385,888 | ) | | | 15,862,419 | |
Series E (Total Return Bond Series) | | | 187,438,372 | | | | 663,250 | | | | (13,112,717 | ) | | | (12,449,467 | ) |
Series F (Floating Rate Strategies Series) | | | 60,027,409 | | | | 325,435 | | | | (1,500,824 | ) | | | (1,175,389 | ) |
Series J (StylePlus—Mid Growth Series) | | | 170,830,096 | | | | 4,244,680 | | | | (1,549,716 | ) | | | 2,694,964 | |
Series N (Managed Asset Allocation Series) | | | 28,183,602 | | | | 9,180,408 | | | | (1,731,707 | ) | | | 7,448,701 | |
Series O (All Cap Value Series) | | | 73,041,678 | | | | 23,414,461 | | | | (2,890,518 | ) | | | 20,523,943 | |
Series P (High Yield Series) | | | 35,769,722 | | | | 357,546 | | | | (3,610,907 | ) | | | (3,253,361 | ) |
Series Q (Small Cap Value Series) | | | 51,282,314 | | | | 10,532,351 | | | | (4,418,142 | ) | | | 6,114,209 | |
Series V (SMid Cap Value Series) | | | 129,954,074 | | | | 35,035,193 | | | | (9,122,166 | ) | | | 25,913,027 | |
Series X (StylePlus—Small Growth Series) | | | 25,838,435 | | | | 607,751 | | | | (340,455 | ) | | | 267,296 | |
Series Y (StylePlus—Large Growth Series) | | | 53,336,284 | | | | 2,927,568 | | | | (273,675 | ) | | | 2,653,893 | |
Series Z (Alpha Opportunity Series) | | | 3,393,834 | | | | 401,755 | | | | (128,614 | ) | | | 273,141 | |
Note 7 – Securities Transactions
For the period ended June 30, 2024, the cost of purchases and proceeds from sales of investment securities, excluding government securities, short-term investments and derivatives, were as follows:
Fund | | Purchases | | | Sales | |
Series A (StylePlus—Large Core Series) | | $ | 74,937,822 | | | $ | 59,997,754 | |
Series B (Large Cap Value Series) | | | 15,621,404 | | | | 34,782,743 | |
Series D (World Equity Income Series) | | | 63,577,819 | | | | 70,632,734 | |
Series E (Total Return Bond Series) | | | 29,041,347 | | | | 21,958,542 | |
Series F (Floating Rate Strategies Series) | | | 18,136,546 | | | | 17,749,479 | |
Series J (StylePlus—Mid Growth Series) | | | 57,120,547 | | | | 57,042,252 | |
Series N (Managed Asset Allocation Series) | | | 200,126 | | | | 1,647,274 | |
Series O (All Cap Value Series) | | | 10,888,584 | | | | 16,013,359 | |
Series P (High Yield Series) | | | 7,922,464 | | | | 7,502,186 | |
Series Q (Small Cap Value Series) | | | 7,521,523 | | | | 13,116,133 | |
Series V (SMid Cap Value Series) | | | 26,628,968 | | | | 39,711,267 | |
Series X (StylePlus—Small Growth Series) | | | 10,040,181 | | | | 10,174,619 | |
Series Y (StylePlus—Large Growth Series) | | | 16,230,893 | | | | 10,664,973 | |
Series Z (Alpha Opportunity Series) | | | 5,350,307 | | | | 5,653,143 | |
For the period ended June 30, 2024, the cost of purchases and proceeds from sales of government securities were as follows:
Fund | | Purchases | | | Sales | |
Series E (Total Return Bond Series) | | $ | 36,596,275 | | | $ | 39,307,096 | |
The Funds are permitted to purchase or sell securities from or to certain affiliated funds under specified conditions outlined in procedures adopted by the Board. The procedures have been designed to ensure that any purchase or sale of securities by a Fund from or to another fund or portfolio that is or could be considered an affiliate by virtue of having a common investment adviser (or affiliated investment advisers), common
| | THE GUGGENHEIM FUNDS SEMI-ANNUAL FINANCIAL REPORT | 139 |
NOTES TO FINANCIAL STATEMENTS (Unaudited)(continued) |
trustees and/or common officers complies with Rule 17a-7 of the 1940 Act. Further, as defined under these procedures, each transaction is effected at the current market price. For the period ended June 30, 2024, the Funds did not engage in purchases and sales of securities, pursuant to Rule 17a-7 of the 1940 Act.
Note 8 – Unfunded Loan Commitments
Pursuant to the terms of certain loan agreements, certain Funds held unfunded loan commitments as of June 30, 2024. The Funds are obligated to fund these loan commitments at the borrower’s discretion.
The unfunded loan commitments as of June 30, 2024, were as follows:
Fund | Borrower | | Maturity Date | | | Face Amount | | | Value | |
Series E (Total Return Bond Series) | | | | | | | | | | | | |
| | Authentic Brands | | | 12/21/28 | | | $ | 300,000 | | | $ | — | |
| | Datix Bidco Ltd. | | | 04/30/31 | | | | 22,000 | | | | — | |
| | Lightning A | | | 03/01/37 | | | | 140,000 | | | | — | |
| | MB2 Dental Solutions, LLC | | | 01/29/31 | | | | 82,666 | | | | 2,004 | |
| | RLDatix | | | 04/30/30 | | | | 18,050 | | | | — | |
| | Thunderbird A | | | 03/01/37 | | | | 140,000 | | | | — | |
| | | | | | | | $ | 702,716 | | | $ | 2,004 | |
Series F (Floating Rate Strategies Series) | | | | | | | | | | | | |
| | Alter Domus | | | 05/14/31 | | | $ | 7,506 | | | $ | — | |
| | Epicor Software | | | 05/22/31 | | | | 11,217 | | | | — | |
| | | | | | | | $ | 18,723 | | | $ | — | |
Note 9 – Restricted Securities
The securities below are considered illiquid and restricted under guidelines established by the Board:
Fund | Restricted Securities | | Acquisition Date | | | Cost | | | Value | |
Series E (Total Return Bond Series) | | | | | | | | | | | | | |
| | AASET Trust | | | | | | | | | | | | |
| | 2024-1A 6.26% due 05/16/49 | | | 06/06/24 | | | $ | 249,992 | | | $ | 250,207 | |
| | Copper River CLO Ltd. | | | | | | | | | | | | |
| 2007-1A INC, due 01/20/211 | | | 05/09/14 | | | | — | | | | 60 | |
| | | | | | | | $ | 249,992 | | | $ | 250,267 | |
Series F (Floating Rate Strategies Series) | | | | | | | | | | | | | |
| | Endo, Inc.* | | | 04/23/24 | | | $ | 255 | | | $ | 552 | |
Series P (High Yield Series) | | | | | | | | | | | | | |
| | Endo Luxembourg Finance Co I SARL / Endo US, Inc.* | | | 04/23/24 | | | $ | 1,343 | | | $ | 1,726 | |
| | Endo Luxembourg Finance Co. I SARL / Endo US, Inc.* | | | 04/23/24 | | | | 746 | | | | 959 | |
| | Mirabela Nickel Ltd. | | | | | | | | | | | | |
| | due 06/24/192 | | | 12/31/13 | | | | 353,909 | | | | 1,950 | |
| | Sabre GLBL, Inc. | | | | | | | | | | | | |
| | 7.38% due 09/01/25 | | | 04/27/22 | | | | 35,246 | | | | 33,583 | |
| | Sabre GLBL, Inc. | | | | | | | | | | | | |
| 9.25% due 04/15/25 | | | 01/05/22 | | | | 7,227 | | | | 6,872 | |
| | | | | | | | $ | 398,471 | | | $ | 45,090 | |
* | Non-income producing security. |
1 | Security has no stated coupon. However, it is expected to receive residual cash flow payments on defined deal dates. |
2 | Security is in default of interest and/or principal obligations. |
140 | THE GUGGENHEIM FUNDS SEMI-ANNUAL FINANCIAL REPORT | |
NOTES TO FINANCIAL STATEMENTS (Unaudited)(continued) |
Note 10 – Line of Credit
The Trust, along with other affiliated trusts, secured a 364-day committed, $1,150,000,000 line of credit from a syndicated bank group led by Citibank, N.A., which was in place through September 29, 2023, at which time a new line of credit was entered into in the amount of $1,165,000,000. The Fund may draw (borrow) from the line of credit as a temporary measure for emergency purposes, to facilitate redemption requests, or for other short-term liquidity purposes consistent with the Fund’s investment objective and program. For example, it may be advantageous for the Fund to borrow money rather than sell existing portfolio positions to meet redemption requests. Fees related to borrowings, if any, vary under this arrangement between the greater of Citibank’s “base rate”, SOFR plus 1%, or the federal funds rate plus 1/2 of 1%.
The commitment fee that may be paid by the Funds is at an annualized rate of 0.15% of the average daily amount of their allocated unused commitment amount. The commitment fee amount is allocated to the individual Funds based on the respective net assets of each participating Fund and is referenced in the Funds’ Statements of Operations under “Line of credit fees”. The Funds did not have any borrowings under this agreement as of and for the period ended June 30, 2024.
Note 11 – Reverse Repurchase Agreements
Each of the Funds may enter into reverse repurchase agreements. Under a reverse repurchase agreement, a Fund sells securities and agrees to repurchase them at a particular price at a future date. In the event the buyer of securities under a reverse repurchase agreement files for bankruptcy or becomes insolvent, such buyer or its trustee or receiver may receive an extension of time to determine whether to enforce the Fund’s obligation to repurchase the securities, and the Fund’s use of the proceeds of the reverse repurchase agreement may effectively be restricted pending such decision.
For the period ended June 30, 2024, the following Funds entered into reverse repurchase agreements as follows:
Fund | | Number of Days
Outstanding | | | Balance at
June 30, 2024 | | | Average Balance
Outstanding | | | Average Interest Rate | |
Series E (Total Return Bond Series) | | | 112 | | | $ | — | * | | $ | 4,625,620 | | | | 5.49 | % |
Series P (High Yield Series) | | | 177 | | | | — | * | | | 245,587 | | | | 3.32 | % |
* | As of June 30, 2024, the Funds had no open reverse repurchase agreements. |
Note 12 – Market Risks
The value of, or income generated by, the investments held by the Funds are subject to the possibility of rapid and unpredictable fluctuation, and loss that may result from various factors. These factors include, among others, developments affecting individual companies, or issuers or particular industries, or from broader influences, including real or perceived changes in prevailing interest rates (which may change at any time based on changes in monetary policies and various market and other economic conditions), changes in inflation rates or expectations about inflation rates, adverse investor confidence or sentiment, changing economic, political (including geopolitical), social or financial market conditions, increased instability or general uncertainty, extreme weather, natural/environmental or man made disasters, governmental actions, public health emergencies (such as the spread of infectious diseases, pandemics and epidemics), debt crises, actual or threatened wars or other armed conflicts (such as the escalated conflict in the Middle East and the ongoing Russia-Ukraine conflict and its collateral economic and other effects, including, but not limited to, sanctions and other international trade barriers) or ratings downgrades, and other similar events, each of which may be temporary or last for extended periods. Different sectors, industries and security types may react differently to such developments. Moreover, changing economic, political, geopolitical, social, financial market or other conditions in one country, geographic region or industry could adversely affect the value, yield and return of the investments held by the Funds in a different country, geographic region, economy, industry or market because of the increasingly interconnected global economies and financial markets. The duration and extent of the foregoing types of factors or conditions are highly uncertain and difficult to predict and have in the past, and may in the future, cause volatility and distress in economies and financial markets or other adverse circumstances, which may negatively affect the value of the Funds’ investments and performance of the Funds.
| | THE GUGGENHEIM FUNDS SEMI-ANNUAL FINANCIAL REPORT | 141 |
NOTES TO FINANCIAL STATEMENTS (Unaudited)(concluded) |
Note 13 – Subsequent Events
On May 24, 2024, the Board approved Agreements and Plans of Reorganization (the “Plans of Reorganization”) providing for the reorganization of each series (fund) of Guggenheim Variable Funds Trust identified below, into the series of New Age Alpha Variable Funds Trust identified below (each, an “Acquiring Fund” and collectively, the “Acquiring Funds”) (each, a “Reorganization” and collectively, the “Reorganizations”), subject to shareholder approval. Upon completion of a Reorganization, shareholders of the Acquired Fund will become shareholders of the Acquiring Fund and will own shares of the Acquiring Fund equal in value to the shares of the Acquired Fund immediately prior to the Reorganization.
Acquired Fund | Acquiring Fund |
Series A (StylePlus—Large Core Series) | NAA Large Core Series |
Series B (Large Cap Value Series) | NAA Large Cap Value Series |
Series D (World Equity Income Series) | NAA World Equity Income Series |
Series J (StylePlus—Mid Growth Series) | NAA Mid Growth Series |
Series O (All Cap Value Series) | NAA All Cap Value Series |
Series Q (Small Cap Value Series) | NAA Small Cap Value Series |
Series V (Smid-Cap Value Series) | NAA Smid-Cap Value Series |
Series X (StylePlus—Small Growth Series) | NAA Small Growth Series |
Series Y (StylePlus—Large Growth Series) | NAA Large Growth Series |
If approved by shareholders, each proposed Reorganization is expected to occur on or about October 25, 2024, or any such other date as the parties may agree.
On May 24, 2024, the Board approved a proposal to close and liquidate Series N (Managed Asset Allocation Series) and Series Z (Alpha Opportunity Series) each pursuant to the terms of a Plan of Liquidation (collectively, the “Liquidations”), subject to shareholder approval. On July 22, 2024, shareholders approved the Liquidations, which were completed on August 16, 2024.
The Funds evaluated subsequent events through the date the financial statements are issued and determined there were no additional material events that would require adjustment to or disclosure in the Funds’ financial statements.
142 | THE GUGGENHEIM FUNDS SEMI-ANNUAL FINANCIAL REPORT | |
OTHER INFORMATION (Unaudited) |
Sector Classification
Information in the Schedule of Investments is categorized by sectors using sector-level Classifications defined by the Bloomberg Industry Classification System, a widely recognized industry classification system provider. Each Fund’s registration statement has investment policies relating to concentration in specific sectors/industries. For purposes of these investment policies, the Funds usually classify sectors/industries based on industry-level Classifications used by widely recognized industry classification system providers such as Bloomberg Industry Classification System, Global Industry Classification Standards and Barclays Global Classification Scheme.
Quarterly Portfolio Schedules Information
The Trust files its complete schedule of portfolio holdings with the SEC for the first and third quarters of each fiscal year as an exhibit to its reports on Form N-PORT, and for reporting periods ended prior to March 31, 2019, filed such information on Form N-Q. The Funds’ Forms N-PORT and N-Q are available on the SEC’s website at https://www.sec.gov. Copies of the portfolio holdings are also available to shareholders, without charge and upon request, by calling 800.820.0888.
| | THE GUGGENHEIM FUNDS SEMI-ANNUAL FINANCIAL REPORT | 143 |
Item 8: Changes in and Disagreements with Accountants for Open-End Management Investment Companies |
Note: This is not applicable for any fund included in this document.
144 | THE GUGGENHEIM FUNDS SEMI-ANNUAL FINANCIAL REPORT | |
Item 9: Proxy Disclosures for Open-End Management Investment Companies |
Note: This is not applicable for any fund included in this document.
| | THE GUGGENHEIM FUNDS SEMI-ANNUAL FINANCIAL REPORT | 145 |
Item 10: Renumeration Paid to Directors, Officers, and others of Open-End Management Investment Companies
The remuneration paid to directors, officers, and others, if applicable, are included as part of the financial statements included under Item 7 of this Form.
146 | THE GUGGENHEIM FUNDS SEMI-ANNUAL FINANCIAL REPORT | |
Item 11: Statement Regarding Basis for Approval of Investment Advisory Contract
Report of the Guggenheim Variable Funds Trust Board of Trustees
The Board of Trustees of Guggenheim Variable Funds Trust (the “Trust”), including the Independent Trustees, approved the renewal of the investment management agreements (as applicable to a specific Fund, the “Advisory Agreement” and collectively, the “Advisory Agreements”) with Security Investors, LLC (“Security Investors”) and Guggenheim Partners Investment Management, LLC (“GPIM”) on behalf of the applicable series of the Trust listed below (each a “Fund” and collectively, the “Funds”):
● Series A (StylePlus—Large Core Series) (“Series A”)* | ● Series B (Large Cap Value Series) (“Series B”)* |
● Series D (World Equity Income Series) (“Series D”)* | ● Series E (Total Return Bond Series) (“Series E”)* |
● Series F (Floating Rate Strategies Series) (“Series F”)** | ● Series J (StylePlus—Mid Growth Series) (“Series J”)* |
● Series N (Managed Asset Allocation Series) (“Series N”)* | ● Series O (All Cap Value Series) (“Series O”)* |
● Series P (High Yield Series) (“Series P”)* | ● Series Q (Small Cap Value Series) (“Series Q”)* |
● Series V (SMid Cap Value Series) (“Series V”)* | ● Series X (StylePlus—Small Growth Series) (“Series X”)* |
● Series Y (StylePlus—Large Growth Series) (“Series Y”)* | ● Series Z (Alpha Opportunity Series) (“Series Z”)* |
* | Security Investors serves as investment adviser to the Fund. |
** | GPIM serves as investment adviser to the Fund. Unless the context indicates otherwise, GPIM and Security Investors, with respect to their service as investment adviser to the applicable Funds, are each referred to herein as an “Adviser” and together, the “Advisers.” |
Security Investors and GPIM are each an indirect subsidiary of Guggenheim Partners, LLC, a privately-held, global investment and advisory firm (“Guggenheim Partners”). Guggenheim Partners, Security Investors, GPIM and their affiliates may be referred to herein collectively as “Guggenheim.” Security Investors and GPIM are also known as “Guggenheim Investments,” the global asset management and investment advisory division of Guggenheim Partners that includes other affiliated investment management businesses.
At meetings held in person on April 16, 2024 (the “April Meeting”) and on May 20-21, 2024 (the “May Meeting”), the Contracts Review Committee of the Board (the “Committee”), consisting solely of the Independent Trustees, met separately from Guggenheim to consider the proposed renewal of the Advisory Agreements. As part of its review process, the Committee was represented by independent legal counsel to the Independent Trustees (“Independent Legal Counsel”), from whom the Independent Trustees received separate legal advice and with whom they met separately. Independent Legal Counsel reviewed and discussed with the Committee various key aspects of the Trustees’ legal responsibilities relating to the proposed renewal of the Advisory Agreements and other principal contracts. The Committee took into account various materials received from Guggenheim and Independent Legal Counsel. The Committee also considered the variety of written materials, reports and oral presentations the Board received throughout the year regarding performance and operating results of the Funds, and other information relevant to its evaluation of the Advisory Agreements.
In connection with the contract review process, FUSE Research Network LLC (“FUSE”), an independent, third-party research provider, was engaged to prepare advisory contract renewal reports designed specifically to help the Board fulfill its advisory contract renewal responsibilities. The objective of the FUSE reports is to present the subject fund’s relative position regarding fees, expenses and total return performance, with peer group and universe comparisons. The Committee assessed the data provided in the FUSE reports as well as commentary presented by Guggenheim. The Committee noted that although FUSE’s process typically results in the identification for each Fund of a universe of similar funds for performance comparisons and a narrower group of similar funds from the universe based on asset levels for comparative fee and expense data evaluation (i.e., the peer group), the peer group constituent funds identified by FUSE for each of Series D and Series F were the same as the performance universe constituent funds due to each Fund’s investment strategy and pricing.
In addition, Guggenheim provided materials and data in response to formal requests for information sent by Independent Legal Counsel on behalf of the Committee. Guggenheim also made a presentation at the April Meeting. Throughout the process, the Committee asked questions of management and requested certain additional information, which Guggenheim provided (collectively with the foregoing reports and materials, the “Contract Review Materials”). The Committee considered the Contract Review Materials in the context of its accumulated experience governing the Trust and other funds in the Guggenheim fund complex and weighed the factors and standards discussed with Independent Legal Counsel.
| | THE GUGGENHEIM FUNDS SEMI-ANNUAL FINANCIAL REPORT | 147 |
Item 11: Statement Regarding Basis for Approval of Investment Advisory Contract (Continued)
As a part of its analysis, the Committee considered that Guggenheim had engaged in a strategic review of the Guggenheim fund line-up beginning in 2023, which resulted in recommendations to the Board in 2024 for certain Funds1 to be reorganized into new funds sponsored by a third-party manager (the “Proposed Reorganizations”) and for certain Funds2 to be liquidated and terminated (the “Proposed Liquidations”). The Committee noted that the Board was engaged in an extensive due diligence process to evaluate the Proposed Reorganizations and the Proposed Liquidations, which was ongoing at the time of the May Board Meeting (defined below), at which meeting the Advisory Agreements were being considered for renewal. The Committee considered the potential timing of the Proposed Reorganizations and the Proposed Liquidations and that the continuation of the applicable Advisory Agreements for the applicable Funds would allow such Funds to operate until the completion of the Proposed Reorganizations or the Proposed Liquidations, if approved by the Board and by shareholders, and would provide for the operation of such Funds to continue in the event the Board or shareholders do not approve the Proposed Reorganizations or the Proposed Liquidations.
Following an analysis and discussion of relevant factors, including those identified below, and in the exercise of its business judgment, the Committee concluded that it was in the best interest of each Fund to recommend that the Board approve the renewal of the applicable Advisory Agreement for an additional annual term. Following its review of the Committee’s recommendation, the Board approved the renewal of the applicable Advisory Agreement for each Fund for a one-year period ending August 1, 2025 at a meeting held on May 20-21, 2024 (the “May Board Meeting” and together with the May Meeting, the “May Meetings”) and determined to adopt the Committee’s considerations and conclusions, which follow.
Advisory Agreements
Nature, Extent and Quality of Services Provided by Each Adviser: With respect to the nature, extent and quality of services currently provided by each Adviser, the Committee considered the qualifications, experience and skills of key personnel performing services for the Funds, including those personnel providing compliance and risk oversight, as well as the supervisors and reporting lines for such personnel. The Committee also considered other information, including Guggenheim’s resources and related efforts to retain, attract and motivate capable personnel to serve the Funds. In evaluating Guggenheim’s resources and capabilities, the Committee considered Guggenheim’s commitment to focusing on, and investing resources in support of, funds in the Guggenheim fund complex. The Committee also considered Guggenheim’s discussions with the Committee and the Board regarding the Proposed Reorganizations and the Proposed Liquidations, including at the April Meeting and the May Meetings. In this regard, the Committee considered Guggenheim’s representation that it continues to manage each Fund included in the Proposed Reorganizations or the Proposed Liquidations in the best interest of such Fund and its shareholders and will continue to do so for so long as it serves as investment adviser to such Fund, including until the Proposed Reorganizations and the Proposed Liquidations, if approved by the Board and by shareholders, are completed. In addition, the Committee considered the acceptability of the terms of each Advisory Agreement, including the scope of services required to be performed by each Adviser.
The Committee’s review of the services provided by Guggenheim to the Funds included consideration of Guggenheim’s investment processes and resulting performance, portfolio oversight and risk management, and the related regular quarterly reports and presentations received by the Board. The Committee took into account the risks borne by Guggenheim in sponsoring and providing services to the Funds, including regulatory, operational, legal and entrepreneurial risks. The Committee considered the resources dedicated by Guggenheim to compliance functions and the reporting made to the Board by Guggenheim compliance personnel regarding Guggenheim’s adherence to regulatory requirements. The Committee also considered the regular reports the Board receives from the Trust’s Chief Compliance Officer regarding compliance policies and procedures established pursuant to Rule 38a-1 under the Investment Company Act of 1940, as amended. In connection with the Committee’s evaluation of the overall package of services provided by Guggenheim, the Committee considered Guggenheim’s administrative services, including its role in supervising, monitoring, coordinating and evaluating the various services provided by the fund administrator, transfer agent, distributor, custodian and other service providers to the Funds. The Committee evaluated the Office of Chief Financial Officer (the “OCFO”), which oversees the fund administration, accounting and transfer agency services provided to the Funds and other funds in the Guggenheim fund complex, including the OCFO’s resources, personnel and services provided.
1 | Series A, Series B, Series D, Series J, Series O, Series Q, Series V, Series X and Series Y. |
2 | Series N and Series Z. |
148 | THE GUGGENHEIM FUNDS SEMI-ANNUAL FINANCIAL REPORT | |
Item 11: Statement Regarding Basis for Approval of Investment Advisory Contract (Continued)
With respect to Guggenheim’s resources and the ability of each Adviser to carry out its responsibilities under the applicable Advisory Agreement, the Chief Financial Officer of Guggenheim Investments reviewed with the Committee financial information concerning the holding company for Guggenheim Investments, Guggenheim Partners Investment Management Holdings, LLC (“GPIMH”), and the various entities comprising Guggenheim Investments, and provided the audited consolidated financial statements of GPIMH. (Thereafter, the Committee received the audited consolidated financial statements of GPIM.)
Based on the foregoing, and based on other information received (both oral and written) at the April Meeting and the May Meetings, as well as other considerations, including the Committee’s knowledge of how each Adviser performs its duties obtained through Board meetings, discussions and reports throughout the year, the Committee concluded that each Adviser and its personnel were qualified to serve the Funds in such capacity and may reasonably be expected to continue to provide a high quality of services under each Advisory Agreement with respect to the Funds.
Investment Performance: The Committee received, for each Fund, investment returns for the since-inception, ten-year, five-year, three-year, one-year and three-month periods ended December 31, 2023, as applicable. In addition, the Committee received a comparison of each Fund’s performance to the performance of a benchmark, a universe of funds and a narrower peer group of similar funds based on asset levels as identified by FUSE (except as noted above with respect to Series D and Series F), in each case for the same periods, as applicable. The Committee also received from FUSE a description of the methodology for identifying each Fund’s peer group and universe for performance and expense comparisons. The Committee also received certain performance information as of March 31, 2024. In assessing each Fund’s performance, the Committee considered that the Board receives regular reporting from Guggenheim regarding performance and evaluates performance throughout the year.
In seeking to evaluate Fund performance over a full market cycle, the Committee focused its attention on five-year and three-year performance rankings as compared to the relevant universe of funds. Except as to the individual Funds discussed below, the Committee observed that the returns of each Fund ranked in the third quartile or better of such Fund’s performance universe for each of the five-year and three-year periods considered. In addition, the Committee made the following observations:
Series F (Floating Rate Strategies Series): The Fund’s returns ranked in the 100th and 57th percentiles of its performance universe for each of the five-year and three-year periods ended December 31, 2023, respectively. The Committee considered management’s statement indicating that given the Fund’s relatively small size and frequent inflow and outflows, the Fund is positioned conservatively and with a strong liquidity profile. The Committee noted management’s statement that although this portfolio construction creates a very liquid portfolio compared to the Fund’s peers, it does sacrifice some of the return that is generally attributed to lower quality, smaller and less liquid credits and it contributed to the Fund’s relative underperformance in 2023. The Committee also noted that the Fund’s performance was also impacted by several idiosyncratic credit situations in the consumer cyclical sector in 2023, which were offset by positive credit selection in the capital goods sector. The Committee further considered management’s statement that the Fund’s conservative positioning and liquidity profile contributed to the Fund’s relative outperformance in 2022.
Series Z (Alpha Opportunity Series): The Fund’s returns ranked in the 90th and 47th percentiles of its performance universe for the five-year and three-year periods ended December 31, 2023, respectively. The Committee noted management’s explanation that the Fund’s relative underperformance over the five-year time period was primarily due to the Fund’s beta profile and fundamental factor tilts. The Committee noted management’s statement that the Fund’s lower beta profile to broad market U.S. equities relative to its peers and long exposure to value and short exposure to growth have detracted from investment performance. The Committee also noted management’s statement that as a result of an update in 2021 to the quantitative investment methodology that the Fund employs, the Fund experienced performance rankings that compare more favorably relative to its performance universe for the three-year and one-year periods ended December 31, 2023.
Based on the foregoing, and based on other information received (both oral and written) at the April Meeting and the May Meetings, as well as other considerations, the Committee concluded that: (i) each Fund’s performance was acceptable; or (ii) it was satisfied with Guggenheim’s responses and/or efforts to improve investment performance.
Comparative Fees, Costs of Services Provided and the Benefits Realized by Each Adviser from Its Relationship with the Funds: The Committee compared each Fund’s contractual advisory fee, net effective management fee3 and total net expense ratio to the applicable peer group. The Committee also reviewed the median advisory fees and expense ratios, including expense ratio components (e.g., transfer agency fees,
3 | The “net effective management fee” for each Fund represents the combined effective advisory fee and administration fee as a percentage of average net assets for the latest fiscal year, after any waivers and/or reimbursements. |
| | THE GUGGENHEIM FUNDS SEMI-ANNUAL FINANCIAL REPORT | 149 |
Item 11: Statement Regarding Basis for Approval of Investment Advisory Contract (Continued)
administration fees, other operating expenses, distribution fees and fee waivers/reimbursements), of the peer group. In addition, the Committee considered information regarding Guggenheim’s process for evaluating the competitiveness of each Fund’s fees and expenses, noting Guggenheim’s statement that evaluations seek to incorporate a variety of factors with a general focus on ensuring fees and expenses: (i) are competitive; (ii) give consideration to resource support requirements; and (iii) ensure Funds are able to deliver on shareholder return expectations.
As part of its evaluation of each Fund’s advisory fee, the Committee considered how such fees compared to the advisory fee charged by Guggenheim to one or more other clients that it manages pursuant to similar investment strategies, to the extent applicable, noting that, in certain instances, Guggenheim charges a lower advisory fee to such other clients. In this connection, the Committee considered, among other things, Guggenheim’s representations about the significant differences between managing mutual funds as compared to other types of accounts. The Committee also considered Guggenheim’s explanation that lower fees are charged in certain instances due to various other factors, including the scope of contract, type of investors, fee structure, applicable legal, governance and capital structures, tax status and historical pricing reasons. In addition, the Committee took into account Guggenheim’s discussion of the regulatory, operational, legal and entrepreneurial risks involved with the Funds as compared to other types of accounts. The Committee concluded that the information it received demonstrated that the aggregate services provided to, or the specific circumstances of, each Fund were sufficiently different from the services provided to, or the specific circumstances of, other clients with similar investment strategies and/or that the risks borne by Guggenheim were sufficiently greater than those associated with managing other clients with similar investment strategies to support the difference in fees.
In further considering the comparative fee and expense data presented in the Contract Review Materials and addressed by Guggenheim, the Committee took into account those Funds with currently effective expense limitation agreements with the Adviser. Except as to the individual Funds discussed below, the Committee observed that each Fund’s contractual advisory fee, net effective management fee and total net expense ratio each rank in the third quartile or better of such Fund’s peer group. In addition, the Committee made the following observations:
Series A (StylePlus—Large Core Series): The Fund’s contractual advisory fee ranks in the fourth quartile (79th percentile) of its peer group. The Committee considered that the Fund’s net effective management fee ranks in the first quartile (14th percentile) of its peer group and the Fund’s total net expense ratio ranks in the first quartile (1st percentile) of its peer group. The Committee took into account the Fund’s currently effective expense limitation agreement with the Adviser.
Series F (Floating Rate Strategies Series): The Fund’s contractual advisory fee ranks in the third quartile (71st percentile) of its peer group. The Fund’s net effective management fee and total net expense ratio each rank in the fourth quartile (both in the 86th percentile) of its peer group, which the Committee noted was largely driven by the small size of the Fund and the higher other operating expense ratio in comparison to its peers. The Committee considered the Adviser’s statement explaining the higher fees and expenses that performance is driven by a unique investment approach that requires significant resources. The Committee also took into account the Fund’s currently effective expense limitation agreement with the Adviser.
Series N (Managed Asset Allocation Series): The Fund’s contractual advisory fee ranks in the second quartile (50th percentile) of its peer group. The Fund’s net effective management fee ranks in the third quartile (58th percentile) of its peer group. The Fund’s total net expense ratio ranks in the fourth quartile (83rd percentile) of its peer group, which the Committee noted was largely driven by the small size of the Fund and the higher other operating expense ratio in comparison to its peers.
With respect to the costs of services provided and benefits realized by Guggenheim Investments from its relationship with the Funds, the Committee reviewed a profitability analysis and data from management for each Fund setting forth the average assets under management for the twelve months ended December 31, 2023, gross revenues received, and expenses incurred directly or through allocations, by Guggenheim Investments, expense waivers (as applicable), earnings and the operating margin/profitability rate, including variance information relative to the foregoing amounts as of December 31, 2022 and December 31, 2021. In addition, the Chief Financial Officer of Guggenheim Investments reviewed with, and addressed questions from, the Committee concerning the expense allocation methodology employed in producing the profitability analysis. In the course of its review of Guggenheim Investments’ profitability, the Committee took into account the methods used by Guggenheim Investments to determine expenses and profit and the representation by the Chief Financial Officer of Guggenheim Investments that such methods provided a reasonable basis for determining the profitability of the applicable Adviser with respect to each Fund. The Committee considered all of the foregoing, among other things, in evaluating the costs of services provided, the profitability to Guggenheim Investments and the profitability rates presented.
150 | THE GUGGENHEIM FUNDS SEMI-ANNUAL FINANCIAL REPORT | |
Item 11: Statement Regarding Basis for Approval of Investment Advisory Contract (Concluded)
The Committee also considered other benefits available to each Adviser because of its relationship with the Funds and noted Guggenheim’s statement that it does not believe the Advisers derive any such “fall-out” benefits. In this regard, the Committee noted Guggenheim’s statement that, although it does not consider such benefits to be fall-out benefits, the Advisers may benefit from certain economies of scale and synergies, such as enhanced visibility of the Advisers, enhanced leverage in fee negotiations and other synergies arising from offering a broad spectrum of products, including the Funds.
Based on the foregoing, and based on other information received (both oral and written) at the April Meeting and the May Meetings, as well as other considerations, the Committee concluded that the comparative fees and the benefits realized by each Adviser from its relationship with the Funds were appropriate and that each Adviser’s profitability from its relationship with the Funds was not unreasonable.
Economies of Scale: The Committee received and considered information regarding whether there have been economies of scale with respect to the management of the Funds as Fund assets grow, whether the Funds have appropriately benefited from any economies of scale, and whether there is potential for realization of any further economies of scale. The Committee considered whether economies of scale in the provision of services to the Funds were being passed along to and shared with the shareholders. The Committee considered that Guggenheim believes it is appropriately sharing potential economies of scale and that Guggenheim’s decrease in overall expenses in 2023 was attributable to decreased product and distribution related costs driven by lower average assets under management (which also resulted in decreased revenue from the funds in the Guggenheim fund complex), decreased expense waivers and reimbursements, and decreased expenses associated with non-recurring items.
The Committee also noted the process employed by the Adviser to evaluate whether it would be appropriate to institute a new breakpoint for a Fund, with consideration given to, among other things: (i) the Fund’s size and trends in asset levels over recent years; (ii) the competitiveness of the expense levels; (iii) whether expense waivers are in place; (iv) changes and trends in revenue and expenses; (v) whether there are any anticipated expenditures that may benefit the Fund in the future; (vi) Fund profit level margins; (vii) relative Fund performance; (viii) the nature, extent and quality of services management provides to the Fund; and (ix) the complexity of the Fund’s investment strategy and the resources required to support the Fund.
As part of its assessment of economies of scale, the Committee took into account Guggenheim’s representation that it seeks to share economies of scale through a number of means, including advisory fees set at competitive rates pre-assuming future asset growth, expense waivers and limitations, and investments in personnel, operations and infrastructure to support the fund business. The Committee also received information regarding amounts that had been shared with shareholders through such expense waivers and limitations. Thus, the Committee considered the size of the Funds and the competitiveness of and/or other determinations made regarding the current advisory fee for each Fund, as well as whether a Fund is subject to an expense limitation.
Based on the foregoing, and based on other information received (both oral and written) at the April Meeting and the May Meetings, as well as other considerations, the Committee concluded that the advisory fee for each Fund was reasonable.
Overall Conclusions
The Committee concluded that the investment advisory fees are fair and reasonable in light of the extent and quality of the services provided and other benefits received and that the renewal of the applicable Advisory Agreement is in the best interest of each Fund. In reaching this conclusion, no single factor was determinative or conclusive and each Committee member, in the exercise of their informed business judgment, may afford different weights to different factors.
Following its review of the Committee’s analysis and determinations, the Board adopted the considerations and conclusions of the Committee and determined to approve the renewal of the Advisory Agreements. As a part of its considerations, the Board noted its ongoing evaluation of the Proposed Reorganizations and the Proposed Liquidations for certain Funds and determined that the renewal of the applicable Advisory Agreements for such Funds would allow such Funds to operate until the completion of the Proposed Reorganizations or the Proposed Liquidations, if approved by the Board and by shareholders, and would provide for the operation of such Funds to continue in the event the Board or shareholders do not approve the Proposed Reorganizations or the Proposed Liquidations. (Following the May Board Meeting, the Board approved the Proposed Reorganizations and the Proposed Liquidations, subject to shareholder approval, at a reconvening of the May Board Meeting held by videoconference on May 24, 2024.)
| | THE GUGGENHEIM FUNDS SEMI-ANNUAL FINANCIAL REPORT | 151 |
This page intentionally left blank.
This page intentionally left blank.
This page intentionally left blank.
This page intentionally left blank.
This page intentionally left blank.
This page intentionally left blank.
| Item 8. | Changes in and Disagreements with Accountants for Open-End Management Investment Companies. |
See Item 7.
| Item 9. | Proxy Disclosures for Open-End Management Investment Companies. |
See Item 7.
| Item 10. | Remuneration Paid to Directors, Officers, and Others of Open-End Management Investment Companies. |
See Item 7.
| Item 11. | Statement Regarding Basis for Approval of Investment Advisory Contract. |
See Item 7.
| Item 12. | Disclosure of Proxy Voting Policies and Procedures for Closed-End Management Investment Companies. |
Not applicable to this registrant.
| Item 13. | Portfolio Managers of Closed-End Management Investment Companies. |
Not applicable to this registrant.
| Item 14. | Purchases of Equity Securities by Closed-End Management Investment Company and Affiliated Purchases. |
Not applicable to this registrant.
| Item 15. | Submission of Matters to a Vote of Security Holders. |
The registrant does not currently have in place procedures by which shareholders may
recommend nominees to the registrant’s board.
There have been no changes to the procedures by which shareholders may
recommend nominees to the registrant’s board.
| Item 16. | Controls and Procedures. |
(a) The registrant’s President (principal executive officer) and Treasurer (principal financial officer) have evaluated the registrant’s disclosure controls and procedures (as defined in Rule 30a-3(c) under the Investment Company Act) as of a date within 90 days of this filing and have concluded that based on such evaluation as required by Rule 30a-3(b) under the Investment Company Act, that the registrant’s disclosure controls and procedures were effective as of that date in ensuring that information required to be disclosed by the registrant in this Form N-CSR was recorded, processed, summarized, and reported within the time periods specified in the Securities and Exchange Commission’s rules and forms.
(b) There were no changes in the registrant’s internal control over financial reporting (as defined in Rule 30a-3(d) under the Investment Company Act) that occurred during the period covered by this report that the officers listed above believe to have materially affected, or to be reasonably likely to materially affect, the registrant’s internal control over financial reporting.
| Item 17. | Disclosure of Securities Lending Activities for Closed-End Management Investment Companies. |
Not applicable to this registrant.
| Item 18. | Recovery of Erroneously Awarded Compensation. |
(a)(1) Not applicable.
(a)(2) Separate certifications by the President (principal executive officer) and Treasurer (principal financial officer) of the registrant as required by Rule 30a-2(a) under the Investment Company Act (17 CFR 270.30a-2(a)) are attached.
(a)(3) Not applicable.
(a)(4) Not applicable.
(b) A certification by the registrant’s President (principal executive officer) and Treasurer (principal financial officer) as required by Rule 30a-2(b) under the Investment Company Act (17 CFR 270.30a-2(b)) is attached.
SIGNATURES
Pursuant to the requirements of the Securities Exchange Act of 1934 and the Investment Company Act of 1940, the registrant has duly caused this report to be signed on its behalf by the undersigned, thereunto duly authorized.
(Registrant) | Guggenheim Variable Funds Trust | |
| | | |
| By (Signature and Title)* | /s/ Brian Binder | |
| | Brian Binder, President and Chief Executive Officer | |
| | | |
| Date | August 29, 2024 | |
Pursuant to the requirements of the Securities Exchange Act of 1934 and the Investment Company Act of 1940, this report has been signed below by the following persons on behalf of the registrant and in the capacities and on the dates indicated.
| By (Signature and Title)* | /s/ Brian Binder | |
| | Brian Binder, President and Chief Executive Officer | |
| | | |
| Date | August 29, 2024 | |
| | | |
| By (Signature and Title)* | /s/ James Howley | |
| | James Howley, Chief Financial Officer, Chief Accounting Officer and Treasurer | |
| | | |
| Date | August 29, 2024 | |
| * | Print the name and title of each signing officer under his or her signature. |
Variable Annuity
Variable Annuity
Variable Annuity
Variable Annuity
Variable Annuity
Variable Annuity
Variable Annuity
Variable Annuity
Variable Annuity
Variable Annuity
Variable Annuity
Variable Annuity
Variable Annuity
Variable Annuity
S&P 500 Index
S&P 500 Index
S&P 500 Index
S&P 500 Index
S&P 500 Index
S&P 500 Index
S&P 500 Index
S&P 500 Index
S&P 500 Index
S&P 500 Index
Bloomberg U.S. Aggregate Bond Index
Bloomberg U.S. Aggregate Bond Index
Bloomberg U.S. Aggregate Bond Index
Bloomberg U.S. Aggregate Bond Index