UNITED STATES
SECURITIES AND EXCHANGE COMMISSION
Washington, D.C. 20549
FORM N-CSR
CERTIFIED SHAREHOLDER REPORT OF
REGISTERED MANAGEMENT INVESTMENT COMPANIES
Investment Company Act file number 811- 02753
Guggenheim Variable Funds Trust
(Exact name of registrant as specified in charter)
702 King Farm Boulevard, Suite 200
Rockville, Maryland 20850
(Address of principal executive offices) (Zip code)
Amy J. Lee
Guggenheim Variable Funds Trust
702 King Farm Boulevard, Suite 200
Rockville, Maryland 20850
(Name and address of agent for service)
Registrant's telephone number, including area code: 1-301-296-5100
Date of fiscal year end: December 31
Date of reporting period: January 1, 2020 - December 31, 2020
Form N-CSR is to be used by management investment companies to file reports with the Commission not later than 10 days after the transmission to stockholders of any report that is required to be transmitted to stockholders under Rule 30e-1 under the Investment Company Act of 1940 (17 CFR 270.30e-1). The Commission may use the information provided on Form N-CSR in its regulatory, disclosure review, inspection, and policymaking roles.
A registrant is required to disclose the information specified by Form N-CSR, and the Commission will make this information public. A registrant is not required to respond to the collection of information contained in Form N-CSR unless the Form displays a currently valid Office of Management and Budget (“OMB”) control number. Please direct comments concerning the accuracy of the information collection burden estimate and any suggestions for reducing the burden to Secretary, Securities and Exchange Commission, 450 Fifth Street, NW, Washington, DC 20549-0609. The OMB has reviewed this collection of information under the clearance requirements of 44 U.S.C. §3507.
| Item 1. | Reports to Stockholders. |
12.31.2020
Guggenheim Variable Funds Trust Annual Report
Series |
Series A | (StylePlus—Large Core Series) | | |
Series B | (Large Cap Value Series) | | |
Series D | (World Equity Income Series) | | |
Series E | (Total Return Bond Series) | | |
Series F | (Floating Rate Strategies Series) | | |
Series J | (StylePlus—Mid Growth Series) | | |
Series N | (Managed Asset Allocation Series) | | |
Series O | (All Cap Value Series) | | |
Series P | (High Yield Series) | | |
Series Q | (Small Cap Value Series) | | |
Series V | (SMid Cap Value Series) | | |
Series X | (StylePlus—Small Growth Series) | | |
Series Y | (StylePlus—Large Growth Series) | | |
Series Z | (Alpha Opportunity Series) | | |
GuggenheimInvestments.com | GVFT-ANN-2-1220x1221 |

| | |
DEAR SHAREHOLDER | 2 |
ECONOMIC AND MARKET OVERVIEW | 5 |
ABOUT SHAREHOLDERS’ FUND EXPENSES | 7 |
SERIES A (STYLEPLUS—LARGE CORE SERIES) | 9 |
SERIES B (LARGE CAP VALUE SERIES) | 18 |
SERIES D (WORLD EQUITY INCOME SERIES) | 27 |
SERIES E (TOTAL RETURN BOND SERIES) | 36 |
SERIES F (FLOATING RATE STRATEGIES SERIES) | 58 |
SERIES J (STYLEPLUS—MID GROWTH SERIES) | 71 |
SERIES N (MANAGED ASSET ALLOCATION SERIES) | 81 |
SERIES O (ALL CAP VALUE SERIES) | 90 |
SERIES P (HIGH YIELD SERIES) | 100 |
SERIES Q (SMALL CAP VALUE SERIES) | 114 |
SERIES V (SMID CAP VALUE SERIES) | 123 |
SERIES X (STYLEPLUS—SMALL GROWTH SERIES) | 133 |
SERIES Y (STYLEPLUS—LARGE GROWTH SERIES) | 143 |
SERIES Z (ALPHA OPPORTUNITY SERIES) | 152 |
NOTES TO FINANCIAL STATEMENTS | 171 |
REPORT OF INDEPENDENT REGISTERED PUBLIC ACCOUNTING FIRM | 195 |
OTHER INFORMATION | 196 |
INFORMATION ON BOARD OF TRUSTEES AND OFFICERS | 198 |
GUGGENHEIM INVESTMENTS PRIVACY NOTICE | 203 |
LIQUIDITY RISK MANAGEMENT PROGRAM | 206 |
| | THE GUGGENHEIM FUNDS ANNUAL REPORT | 1 |
Dear Shareholder:
Security Investors, LLC and Guggenheim Partners Investment Management, LLC (the “Investment Advisers”) are pleased to present the annual shareholder report for funds that are part of the Guggenheim Variable Funds Trust (the “Funds”). This report covers performance of the Funds for the annual period ended December 31, 2020.
The Investment Advisers are part of Guggenheim Investments, which represents the investment management businesses of Guggenheim Partners, LLC (“Guggenheim”), a global, diversified financial services firm.
Guggenheim Funds Distributors, LLC is the distributor of the Funds. Guggenheim Funds Distributors, LLC is affiliated with Guggenheim and the Investment Advisers.
We encourage you to read the Economic and Market Overview section of the report, which follows this letter, and then the Managers’ Commentary for each Fund.
We are committed to providing innovative investment solutions and appreciate the trust you place in us.
Sincerely,
Security Investors, LLC
Guggenheim Partners Investment Management, LLC
January 31, 2021
Read a prospectus and summary prospectus (if available) carefully before investing. It contains the investment objectives, risks, charges, expenses and other information, which should be considered carefully before investing. Obtain a prospectus and summary prospectus (if available) at guggenheiminvestments.com or call 800.820.0888.
This material is not intended as a recommendation or as investment advice of any kind, including in connection with rollovers, transfers, and distributions. Such material is not provided in a fiduciary capacity, may not be relied upon for or in connection with the making of investment decisions, and does not constitute a solicitation of an offer to buy or sell securities. All content has been provided for informational or educational purposes only and is not intended to be and should not be construed as legal or tax advice and/or a legal opinion. Always consult a financial, tax and/or legal professional regarding your specific situation.
The global ongoing crisis caused by the outbreak of COVID-19 is causing materially reduced consumer demand and economic output, disrupting supply chains, resulting in market closures, travel restrictions and quarantines, and adversely impacting local and global economies. Investors should be aware that in light of the current uncertainty, volatility and distress in economies, financial markets, and labor and health conditions all over the world, the Funds’ investments and a shareholder’s investment in a Fund are subject to sudden and substantial losses, increased volatility and other adverse events. Firms through which investors invest with the Funds, the Funds, their service providers, the markets in which they invest and market intermediaries are also impacted by quarantines and similar measures intended to contain the ongoing pandemic, which can obstruct their functioning and subject them to heightened operational risks.
2 | THE GUGGENHEIM FUNDS ANNUAL REPORT | |
The Series StylePlus Funds may not be suitable for all investors. Investments in large capitalization stocks may underperform other segments of the equity market or the equity market as a whole. ● Investments in small-sized company securities may present additional risks such as less predictable earnings, higher volatility and less liquidity than larger, more established companies. ● Growth stocks may be more volatile than other stocks because they are more sensitive to investor perceptions regarding the growth potential of the issuing companies. ● The Funds may invest in derivative instruments, which may be more volatile and less liquid, increasing the risk of loss when compared to traditional securities. Certain of the derivative instruments are also subject to the risks of counterparty default and adverse tax treatment. ● The Funds’ use of leverage, through borrowings or instruments such as derivatives, may cause the Funds to be more volatile than if they had not been leveraged. ● The Funds’ investments in other investment vehicles subject the Funds to those risks and expenses affecting the investment vehicle. ● The Funds may invest in foreign securities which carry additional risks when compared to U.S. securities, due to the impact of diplomatic, political or economic developments in the country in question (investments in emerging markets securities are generally subject to an even greater level of risks). ● The Funds may invest in fixed income securities whose market value will change in response to interest rate changes and market conditions among other factors. In general, bond prices rise when interest rates fall and vice versa. ● The Funds’ exposure to high yield securities may subject the Funds to greater volatility. ● The Funds may invest in bank loans and asset-backed securities, including mortgage backed, which involve special types of risks. ● The Funds may invest in restricted securities which may involve financial and liquidity risk. ● You may have a gain or loss when you sell your shares. ● It is important to note that the Funds are not guaranteed by the U.S. government. ● Please read the prospectus for more detailed information regarding these and other risks.
The Series Value Funds may not be suitable for all investors. ● An investment in the Funds will fluctuate and is subject to investment risks, which means investors could lose money. The intrinsic value of the underlying stocks may never be realized or the stocks may decline in value. Investments in small- and/or mid-sized company securities may present additional risks such as less predictable earnings, higher volatility and less liquidity than larger, more established companies. ● Please read the prospectus for more detailed information regarding these and other risks.
The Series D (World Equity Income Series) may not be suitable for all investors. ● Investments in securities in general are subject to market risks that may cause their prices to fluctuate over time. ● The Fund’s investments in foreign securities carry additional risks when compared to U.S. securities, due to the impact of diplomatic, political or economic developments in the country in question (investments in emerging markets are generally subject to an even greater level of risks). Additionally, the Fund’s exposure to foreign currencies subjects the Fund to the risk that those currencies will decline in value relative to the U.S. Dollar. ● The Fund’s investments in derivatives may pose risks in addition to those associated with investing directly in securities or other investments, including illiquidity of the derivatives, imperfect correlations with underlying investments or the Fund’s other portfolio holdings, lack of availability and counterparty risk. ● The Fund’s use of leverage, through instruments such as derivatives, may cause the Fund to be more volatile than if it had not been leveraged. ● The Fund’s investments in other investment vehicles subject the Fund to those risks and expenses affecting the investment vehicle. ● The Fund may have significant exposure to securities in a particular capitalization range e.g., large-, mid- or small-cap securities. As a result, the Fund may be subject to the risk that the pre-denominate capitalization range may underperform other segments of the equity market or the equity market as a whole. ● Please read the prospectus for more detailed information regarding these and other risks.
The Series E (Total Return Bond Series) may not be suitable for all investors. ● The Fund’s market value will change in response to interest rate changes and market conditions among other factors. In general, bond prices rise when interest rates fall and vice versa. ● The Fund’s exposure to high yield securities may subject the Fund to greater volatility. ● When market conditions are deemed appropriate, the Fund will leverage to the full extent permitted by its investment policies and restrictions and applicable law. Leveraging will exaggerate the effect on net asset value of any increase or decrease in the market value of the Fund’s portfolio. ● The Fund may invest in derivative instruments, which may be more volatile and less liquid, increasing the risk of loss when compared to traditional securities. Certain of the derivative instruments are also subject to the risks of counterparty default and adverse tax treatment. ● Instruments and strategies (such as borrowing transactions and reverse repurchase agreements) may provide leveraged exposure to a particular investment, which will magnify any gains or losses on those investments. ● Investments in reverse repurchase agreements expose the Fund to many of the same risks as investments in derivatives. ● The Fund’s investments in other investment vehicles subject the Fund to those risks and expenses affecting the investment vehicle. ● The Fund’s investments in foreign securities carry additional risks when compared to U.S. securities, due to the impact of diplomatic, political, or economic developments in the country in question (investments in emerging markets securities are generally subject to an even greater level of risk). ● Investments in syndicated bank loans generally offer a floating interest rate and involve special types of risks. ● The Fund’s investments in municipal securities can be affected by events that affect the municipal bond market. ● The Fund’s investments in real estate securities subject the Fund to the same risks as direct investments in real estate, which is particularly sensitive to economic downturns. ● The Fund’s investments in restricted securities may involve financial and liquidity risk. ● You may have a gain or loss when you sell your shares. ● It is important to note that the Fund is not guaranteed by the U.S. government. ● Please read the prospectus for more detailed information regarding these and other risks.
The Series F (Floating Rate Strategies Series) may not be suitable for all investors. ● Investments in floating rate senior secured syndicated bank loans and other floating rate securities involve special types of risks, including credit rate risk, interest rate risk, liquidity risk and prepayment risk. ● The Fund’s market value will change in response to interest rate changes and market conditions among other factors. In general, bond prices rise when interest rates fall and vice versa. ● The Fund’s exposure to high yield securities may subject the Fund to greater volatility. ● When market conditions are deemed appropriate, the Fund may use leverage to the full extent permitted by its investment policies and restrictions and applicable law. Leveraging will exaggerate the effect on net asset value of any increase or decrease in the market value of the Fund’s portfolio. ● The Fund may invest in derivative instruments, which may be more volatile and less liquid, increasing the risk of loss when compared to traditional securities. Certain of the derivative instruments are also subject to the risks of counterparty default and adverse tax treatment. ● Instruments and strategies (such as borrowing transactions and reverse repurchase agreements) may provide leveraged exposure to a particular investment, which will magnify any gains or losses on those investments. ● Investments in reverse repurchase agreements and synthetic instruments (such as synthetic collateralized debt obligations) expose the Fund to many of the same risks as investments in derivatives. ● The Fund’s investments in other investment vehicles subject the Fund to those risks and expenses affecting the investment vehicle. ● The Fund’s investments in foreign securities carry additional risks when compared to U.S. securities, due to the impact of diplomatic, political or economic developments in the country in question (investments in emerging markets securities are generally subject to an even greater level of risk). ● The Fund’s investments in real estate securities subject the Fund to the same risks as direct investments in real estate, which is particularly sensitive to economic downturns. ● The Fund’s investments in restricted securities may involve financial and liquidity risk. ● The Fund is subject to active trading risks that may increase volatility and impact its ability to achieve its investment objective. ● You may have a gain or loss when you sell your shares. ● It is important to note that the Fund is not guaranteed by the U.S. government. ● Please read the prospectus for more detailed information regarding these and other risks.
The Series N (Managed Asset Allocation Series) may not be suitable for all investors. ● The value of an investment in the Fund will fluctuate and is subject to investment risks, which means investors could lose money. The Fund could lose money if the issuer of a bond or a counterparty to a derivatives transaction or other transaction is unable to repay interest and principal on time or defaults. The issuer of a bond could also suffer a decrease in quality rating, which would affect the volatility and liquidity
| | THE GUGGENHEIM FUNDS ANNUAL REPORT | 3 |
of the bond. Derivatives may pose risks in addition to those associated with investing directly in securities or other investments, including the risk that the Fund will be unable to sell, unwind or value the derivative because of an illiquid market, the risk that the derivative is not well correlated with underlying investments or the Fund’s other portfolio holdings, and the risk that the counterparty is unwilling or unable to meet its obligation. The use of derivatives by the Fund to hedge risk may reduce the opportunity for gain by offsetting the positive effect of favorable price movements. Furthermore, if the Investment Manager is incorrect about its expectations of market conditions, the use of derivatives could result in a loss, which in some cases may be unlimited. Foreign securities carry additional risks when compared to U.S. securities, including currency fluctuations, adverse political and economic developments, unreliable or untimely information, less liquidity, limited legal recourse and higher transactional costs. The Investment Manager may not be able to cause certain of the underlying funds’ performance to match or correlate to that of the underlying funds’ respective underlying index or benchmark, either on a daily or aggregate basis. Factors such as underlying fund expenses, imperfect correlation between an underlying fund’s investments and those of its underlying index or underlying benchmark, rounding of share prices, changes to the composition of the underlying index or underlying benchmark, regulatory policies, high portfolio turnover rate, and the use of leverage all contribute to tracking error. Tracking error may cause an underlying fund’s and, thus the Fund’s, performance to be less than you expect. ● Please read the prospectus for more detailed information regarding these and other risks.
The Series P (High Yield Series) may not be suitable for all investors. ● The Fund’s market value will change in response to interest rate changes and market conditions among other factors. In general, bond prices rise when interest rates fall and vice versa. ● The Fund’s exposure to high yield securities may subject the Fund to greater volatility. ● The Fund may invest in derivative instruments, which may be more volatile and less liquid, increasing the risk of loss when compared to traditional securities. Certain of the derivative instruments are also subject to the risks of counterparty default and adverse tax treatment. ● The Fund’s use of leverage, through borrowings or instruments such as derivatives, may cause the Fund to be more volatile than if it had not been leveraged. ● Instruments and strategies (such as borrowing transactions and reverse repurchase agreements) may provide leveraged exposure to a particular investment, which will magnify any gains or losses on those investments. ● The Fund may invest in foreign securities which carry additional risks when compared to U.S. securities, due to the impact of diplomatic, political or economic developments in the country in question (investments in emerging markets securities are generally subject to an even greater level of risks). ● Investments in syndicated bank loans generally offer a floating interest rate and involve special types of risks. ● The Fund’s investments in other investment vehicles subject the Fund to those risks and expenses affecting the investment vehicle. ● The Fund’s investments in restricted securities may involve financial and liquidity risk. ● You may have a gain or loss when you sell your shares. ● It is important to note that the Fund is not guaranteed by the U.S. government. ● Please read the prospectus for more detailed information regarding these and other risks.
The Series Z (Alpha Opportunity Series) may not be suitable for all investors. ● Investments in securities and derivatives, in general, are subject to market risks that may cause their prices to fluctuate over time. An investment in the Fund may lose money. There can be no guarantee the Fund will achieve it investment objective. ● The Fund’s use of derivatives such as futures, options and swap agreements may expose the Fund to additional risks that it would not be subject to if it invested directly in the securities underlying those derivatives. ● Certain of the derivative instruments, such as swaps and structured notes, are also subject to the risks of counterparty default and adverse tax treatment. ● The more the Fund invests in leveraged instruments, the more the leverage will magnify any gains or losses on those investments. ● The Fund’s use of short selling involves increased risk and costs, including paying more for a security than it received from its sale and the risk of unlimited losses. ● In certain circumstances the Fund may be subject to liquidity risk and it may be difficult for the Fund to purchase and sell particular investments within a reasonable time at a fair price. ● In certain circumstances, it may be difficult for the Fund to purchase and sell particular investments within a reasonable time at a fair price. ● The Fund’s fixed income investments will change in value in response to interest rate changes and other factors. ● Please read the prospectus for more detailed information regarding these and other risks.
4 | THE GUGGENHEIM FUNDS ANNUAL REPORT | |
ECONOMIC AND MARKET OVERVIEW (Unaudited) | December 31, 2020 |
In what could have been one of the worst years on record for equity investors due to the devastating human and economic cost of the COVID-19 pandemic combined with political unrest in the U.S., the 12-month period ended December 31, 2020, witnessed the Standard & Poor’s 500® (“S&P 500®”) Index reach a record high of 3,756.07 from 3,234.85 at the start of the year. This was despite plummeting to 2,237.40 on March 23, 2020 as the effects of the pandemic caused the U.S. economy to stall. This dramatic change in fortune for equity markets was due in large part by a swift, sweeping response to the economic shutdown in March 2020 by the U.S. Federal Reserve (the “Fed”), which has continued to signal its intention to use ultra-accommodative monetary policy to strive toward full employment and 2% inflation via unprecedented measures. The central bank’s commitment to keeping interest rates near zero and its bond-buying program to lessen the risk of corporate defaults resulted in bountiful debt issuance by corporate borrowers and a growing confidence among equity investors that the investment environment would remain benign for the foreseeable future.
As such, our economic outlook for the coming year is positive, owing to another round of COVID-19 relief and more planned by the new administration, plus the expectation for a successful vaccine distribution. The new package, titled the Coronavirus Response and Relief Supplemental Appropriations Act, delivers a $900 billion injection into the economy, bringing total COVID-related aid to over $3.5 trillion including the 2020 bill, or roughly 8.5% of 2020–2021 gross domestic product (“GDP”). On this measure, it is already 3.5x more than the stimulus delivered in the five years following the financial crisis.
The latest round of fiscal stimulus should cause a surge in personal income during the first quarter, and a significant percentage of the population should be vaccinated or immune from prior infection by mid-2021. It is likely that local governments will be able to begin to relax restrictions even before herd immunity is reached since hospitalizations should fall once the elderly are vaccinated. As we move through the year, consumer spending growth should start to accelerate, spurred on by elevated personal savings and strong gains in household net worth. Elsewhere, the housing market will continue to benefit from tight supply and low interest rates, and business investment should rebound as corporations look to put to work record levels of precautionary cash. As a result, we expect real GDP growth to be well above potential for the year.
If the unemployment rate continues to fall at its recent pace and inflation picks up with its usual six-quarter lag behind economic activity, the experience of prior cycles would suggest that the Fed could start its hiking cycle as early as late-2022. However, the change in the Fed’s playbook will keep it sidelined for years as it looks to make up for shortfalls related to its 2% inflation target and no longer worries about an overly tight labor market.
This means the Fed is likely to keep rates at zero for several years beyond the late-2023 liftoff currently priced into the bond market. Similarly, the odds are low of a tapering of the Fed’s bond purchases in 2021. While we believe the government response to the pandemic was necessary and appropriate, investors are already paying some price with more elevated valuations due in part to the Fed’s aggressive relaunch of quantitative easing. Under these circumstances, investors will likely continue to take on more risk as long as more fiscal support is underway and while the Fed remains willing to backstop credit markets to support financial conditions.
For the 12-month period ended December 31, 2020, the S&P 500® Index* returned 18.40%. The MSCI Europe-Australasia-Far East (“EAFE”) Index* returned 7.82%. The return of the MSCI Emerging Markets Index* was 15.84%.
In the bond market, the Bloomberg Barclays U.S. Aggregate Bond Index* posted a 7.51% return for the 12-month period, while the Bloomberg Barclays U.S. Corporate High Yield Index* returned 7.11%. The return of the ICE Bank of America (“BofA”) Merrill Lynch 3-Month U.S. Treasury Bill Index* was 0.67% for the 12-month period.
The opinions and forecasts expressed may not actually come to pass. This information is subject to change at any time, based on market and other conditions, and should not be construed as a recommendation of any specific security or strategy.
*Index Definitions:
The following indices are referenced throughout this report. Indices are unmanaged and not available for direct investment. Index performance does not reflect transaction costs, fees, or expenses.
Bloomberg Barclays U.S. Aggregate Bond Index is a broad-based flagship benchmark that measures the investment grade, U.S. dollar-denominated, fixed-rate taxable bond market, including U.S. Treasuries, government-related and corporate securities, mortgage-backed securities or “MBS” (agency fixed-rate and hybrid adjustable-rate mortgage, or “ARM”, pass-throughs), asset-backed securities (“ABS”), and commercial mortgage-backed securities (“CMBS”) (agency and non-agency).
Bloomberg Barclays U.S. Corporate High Yield Index measures the U.S. dollar-denominated, high yield, fixed-rate corporate bond market. Securities are classified as high yield if the middle rating of Moody’s, Fitch, and S&P is Ba1/BB +/BB + or below.
| | THE GUGGENHEIM FUNDS ANNUAL REPORT | 5 |
ECONOMIC AND MARKET OVERVIEW (Unaudited)(concluded) | December 31, 2020 |
Credit Suisse Leveraged Loan Index is designed to mirror the investable universe of the U.S. dollar-denominated leveraged loan market.
ICE BofA Merrill Lynch 3-Month U.S. Treasury Bill Index is an unmanaged market index of U.S. Treasury securities maturing in 90 days that assumes reinvestment of all income.
MSCI EAFE Index is a free float-adjusted market capitalization index that is designed to measure the equity market performance of developed markets, excluding the U.S. & Canada.
MSCI Emerging Markets Index is a free float-adjusted market capitalization weighted index that is designed to measure equity market performance in the global emerging markets.
MSCI World Index is calculated with net dividends reinvested. It is a free float-adjusted market capitalization weighted index that is designed to measure the equity market performance of developed markets.
Morningstar Long/Short Equity Category Average represents long-short portfolios which hold sizable stakes in both long and short positions in equities and related derivatives. Some funds that fall into this category will shift their exposure to long and short positions depending on their macro outlook or the opportunities they uncover through bottom-up research. Some funds may simply hedge long stock positions through exchange traded funds or derivatives. At least 75% of the assets are in equity securities or derivatives.
Russell 1000® Growth Index measures the performance of the large-cap growth segment of the U.S. equity universe. It includes those Russell 1000 companies with higher price-to-book ratios and higher forecasted growth value.
Russell 1000® Value Index measures the performance of the large-cap value segment of the U.S. equity universe. It includes those Russell 1000 companies with lower price-to-book ratios and lower expected growth values.
Russell 2000® Growth Index measures the performance of the small-cap growth segment of the U.S. equity universe. It includes those Russell 2000 companies with higher price-to-book ratios and higher forecasted growth values.
Russell 2000® Value Index measures the performance of the small-cap value segment of the U.S. equity universe. It includes those Russell 2000 companies with lower price-to-book ratios and lower forecasted growth values.
Russell 2500® Value Index measures the performance of the small- to mid-cap value segment of the U.S. equity universe. It includes those Russell 2500 companies with lower price-to-book ratios and lower forecasted growth values.
Russell 3000® Index measures the performance of the largest 3,000 U.S. companies, representing approximately 98% of the investable U.S. equity market.
Russell 3000® Value Index measures the performance of the broad value segment of the U.S. equity value universe. It includes those Russell 3000 companies with lower price-to-book ratios and lower forecasted growth values.
Russell Midcap® Growth Index measures the performance of the mid-cap growth segment of the U.S. equity universe. It includes those Russell Midcap Index companies with higher price-to-book ratios and higher forecasted growth values.
S&P 500® is a broad-based index, the performance of which is based on the performance of 500 widely held common stocks chosen for market size, liquidity, and industry group representation.
6 | THE GUGGENHEIM FUNDS ANNUAL REPORT | |
ABOUT SHAREHOLDERS’ FUND EXPENSES (Unaudited) | |
All mutual funds have operating expenses, and it is important for our shareholders to understand the impact of costs on their investments. Shareholders of a fund incur two types of costs: (i) transaction costs, including sales charges (loads) on purchase payments, reinvested dividends, other distributions, and exchange fees, and (ii) ongoing costs, including management fees, administrative services, and shareholder reports, among others. These ongoing costs, or operating expenses, are deducted from a fund’s gross income and reduce the investment return of the fund.
A fund’s expenses are expressed as a percentage of its average net assets, which is known as the expense ratio. The following examples are intended to help investors understand the ongoing costs (in dollars) of investing in a fund and to compare these costs with the ongoing costs of investing in other mutual funds.
The examples are based on an investment of $1,000 made at the beginning of the period and held for the entire six-month period beginning June 30, 2020 and ending December 31, 2020.
The following tables illustrate the Funds’ costs in two ways:
Table 1. Based on actual Fund return: This section helps investors estimate the actual expenses paid over the period. The “Ending Account Value” shown is derived from the Fund’s actual return, and the fifth column shows the dollar amount that would have been paid by an investor who started with $1,000 in the Fund. Investors may use the information here, together with the amount invested, to estimate the expenses paid over the period. Simply divide the Fund’s account value by $1,000 (for example, an $8,600 account value divided by $1,000 = 8.6), then multiply the result by the number provided under the heading “Expenses Paid During Period.”
Table 2. Based on hypothetical 5% return: This section is intended to help investors compare a fund’s cost with those of other mutual funds. The table provides information about hypothetical account values and hypothetical expenses based on the Fund’s actual expense ratio and an assumed rate of return of 5% per year before expenses, which is not the Fund’s actual return. The hypothetical account values and expenses may not be used to estimate the actual ending account balance or expenses paid during the period. The example is useful in making comparisons because the U.S. Securities and Exchange Commission (the “SEC”) requires all mutual funds to calculate expenses based on the 5% return. Investors can assess a fund’s costs by comparing this hypothetical example with the hypothetical examples that appear in shareholder reports of other funds.
The calculations illustrated above assume no shares were bought or sold during the period. Actual costs may have been higher or lower, depending on the amount of investment and the timing of any purchases or redemptions.
Please note that the expenses shown in the table are meant to highlight your ongoing costs only and do not reflect any transactional costs, such as sales charges (loads) on purchase payments, and contingent deferred sales charges (“CDSC”) on redemptions, if any. Therefore, the second table is useful in comparing ongoing costs only, and will not help you determine the relative total costs of owning different funds. In addition, if these transactional costs were included, your costs would have been higher.
More information about the Funds’ expenses, including annual expense ratios for periods up to five years (subject to the Fund’s inception date), can be found in the Financial Highlights section of this report. For additional information on operating expenses and other shareholder costs, please refer to the appropriate Fund prospectus.
| | THE GUGGENHEIM FUNDS ANNUAL REPORT | 7 |
ABOUT SHAREHOLDERS’ FUND EXPENSES (Unaudited)(concluded) | |
| Expense
Ratio1 | Fund
Return | Beginning
Account Value
June 30, 2020 | Ending
Account Value
December 31, 2020 | Expenses
Paid During
Period2 |
Table 1. Based on actual Fund return3 | | | | | |
Series A (StylePlus—Large Core Series) | 0.87% | 23.44% | $ 1,000.00 | $ 1,234.40 | $ 4.90 |
Series B (Large Cap Value Series) | 0.79% | 24.35% | 1,000.00 | 1,243.50 | 4.47 |
Series D (World Equity Income Series) | 0.89% | 19.00% | 1,000.00 | 1,190.00 | 4.91 |
Series E (Total Return Bond Series) | 0.78% | 5.57% | 1,000.00 | 1,055.70 | 4.04 |
Series F (Floating Rate Strategies Series) | 1.23% | 5.84% | 1,000.00 | 1,058.40 | 6.38 |
Series J (StylePlus—Mid Growth Series) | 0.87% | 31.41% | 1,000.00 | 1,314.10 | 5.07 |
Series N (Managed Asset Allocation Series) | 0.98% | 15.10% | 1,000.00 | 1,151.00 | 5.31 |
Series O (All Cap Value Series) | 0.87% | 25.35% | 1,000.00 | 1,253.50 | 4.94 |
Series P (High Yield Series) | 1.08% | 11.17% | 1,000.00 | 1,111.70 | 5.75 |
Series Q (Small Cap Value Series) | 1.13% | 26.24% | 1,000.00 | 1,262.40 | 6.44 |
Series V (SMid Cap Value Series) | 0.90% | 27.26% | 1,000.00 | 1,272.60 | 5.16 |
Series X (StylePlus—Small Growth Series) | 0.98% | 39.63% | 1,000.00 | 1,396.30 | 5.92 |
Series Y (StylePlus—Large Growth Series) | 2.47% | 27.34% | 1,000.00 | 1,273.40 | 14.15 |
Series Z (Alpha Opportunity Series) | 2.00% | 4.42% | 1,000.00 | 1,044.20 | 10.31 |
|
Table 2. Based on hypothetical 5% return (before expenses) | | | | |
Series A (StylePlus—Large Core Series) | 0.87% | 5.00% | $ 1,000.00 | $ 1,020.82 | $ 4.43 |
Series B (Large Cap Value Series) | 0.79% | 5.00% | 1,000.00 | 1,021.22 | 4.02 |
Series D (World Equity Income Series) | 0.89% | 5.00% | 1,000.00 | 1,020.72 | 4.53 |
Series E (Total Return Bond Series) | 0.78% | 5.00% | 1,000.00 | 1,021.27 | 3.97 |
Series F (Floating Rate Strategies Series) | 1.23% | 5.00% | 1,000.00 | 1,019.00 | 6.26 |
Series J (StylePlus—Mid Growth Series) | 0.87% | 5.00% | 1,000.00 | 1,020.82 | 4.43 |
Series N (Managed Asset Allocation Series) | 0.98% | 5.00% | 1,000.00 | 1,020.27 | 4.99 |
Series O (All Cap Value Series) | 0.87% | 5.00% | 1,000.00 | 1,020.82 | 4.43 |
Series P (High Yield Series) | 1.08% | 5.00% | 1,000.00 | 1,019.76 | 5.50 |
Series Q (Small Cap Value Series) | 1.13% | 5.00% | 1,000.00 | 1,019.51 | 5.75 |
Series V (SMid Cap Value Series) | 0.90% | 5.00% | 1,000.00 | 1,020.67 | 4.58 |
Series X (StylePlus—Small Growth Series) | 0.98% | 5.00% | 1,000.00 | 1,020.27 | 4.99 |
Series Y (StylePlus—Large Growth Series) | 2.47% | 5.00% | 1,000.00 | 1,012.75 | 12.53 |
Series Z (Alpha Opportunity Series) | 2.00% | 5.00% | 1,000.00 | 1,015.12 | 10.16 |
1 | Annualized and excludes expenses of the underlying funds in which the Funds invest, if any. This ratio represents net expenses, which may include expenses that are excluded from the expense limitation agreement and affiliated waivers. Excluding these expenses, the net expense ratios for the period would be: |
| | Fund | 12/31/20 |
| | Series A (StylePlus—Large Core Series) | 0.85% |
| | Series B (Large Cap Value Series) | 0.79% |
| | Series D (World Equity Income Series) | 0.89% |
| | Series E (Total Return Bond Series) | 0.77% |
| | Series F (Floating Rate Strategies Series) | 1.14% |
| | Series J (StylePlus—Mid Growth Series) | 0.87% |
| | Series O (All Cap Value Series) | 0.87% |
| | Series P (High Yield Series) | 1.06% |
| | Series Q (Small Cap Value Series) | 1.13% |
| | Series V (SMid Cap Value Series) | 0.90% |
| | Series X (StylePlus—Small Growth Series) | 1.00% |
| | Series Y (StylePlus—Large Growth Series) | 0.87% |
| | Series Z (Alpha Opportunity Series) | 2.00% |
2 | Expenses are equal to the Fund’s annualized expense ratio, net of any applicable fee waivers, multiplied by the average account value over the period, multiplied by 184/365 (to reflect the one-half year period). Expenses shown do not include fees charged by insurance companies. |
3 | Actual cumulative return at net asset value for the period June 30, 2020 to December 31, 2020. |
8 | THE GUGGENHEIM FUNDS ANNUAL REPORT | |
MANAGERS’ COMMENTARY (Unaudited) | December 31, 2020 |
To Our Shareholders:
The Series A (StylePlus TM—Large Core Series) (the “Fund”) is managed by a team of seasoned professionals, including Farhan Sharaff, Senior Managing Director and Assistant Chief Investment Officer, Equities; Qi Yan, Managing Director and Portfolio Manager; and Adam J. Bloch, Managing Director and Portfolio Manager. In the following paragraphs, the investment team discusses performance of the Fund for the fiscal year ended December 31, 2020.
For the year ended December 31, 2020, Series A (StylePlus—Large Core Series) returned 18.78%, compared with the 18.40% return of its benchmark, the S&P 500® Index.
Investment Approach
Through a combination of actively managed individual equity, passive equity, and actively managed fixed income, the Fund seeks to exceed the total return of the S&P 500 Index. The actively managed equity and fixed income components seek to provide multiple sources of outperformance and take advantage of Guggenheim’s competencies in both fixed income and systematic stock selection.
The active and passive allocation decisions seek to add value by tactically allocating to actively managed equity through quantitative selection models when stock picking opportunities are high. During periods when Guggenheim views these opportunities to be less attractive, the Fund seeks to increase its passive exposure to equities and the allocation to fixed-income securities. The prospective return during such periods is the equity index plus an “alpha” component coming from the yield of the fixed-income overlay.
Performance Review
Over the period, from 15-25% of the total equity position was allocated to actively managed equity and 75-85% to passive equity. Remaining Fund assets were invested in the Guggenheim Strategy Funds, short-term fixed-income investment companies advised by Guggenheim Investments, and the Guggenheim Ultra Short Duration Fund whose objective is to seek a high level of income consistent with the preservation of capital.
The Fund outperformed the S&P 500 Index for the fiscal year ended December 31, 2020 by 38 basis points net of fees. The fixed income sleeve contributed to total return, as positions in the Guggenheim Ultra Short Duration Fund and the Guggenheim Strategy Funds, net of the investment income earned by these positions, were positive for the period. The actively managed equity sleeve detracted from performance on a relative basis. The passive equity position, maintained through swap agreements and futures contracts, had an insignificant impact on relative performance for the period.
Performance displayed represents past performance which is no guarantee of future results.
The opinions and forecast expressed may not actually come to pass. This information is subject to change at any time, based on market and other conditions, and should not be construed as a recommendation of any specific security or strategy.
| | THE GUGGENHEIM FUNDS ANNUAL REPORT | 9 |
PERFORMANCE REPORT AND FUND PROFILE (Unaudited) | December 31, 2020 |
SERIES A (STYLEPLUS—LARGE CORE SERIES)
OBJECTIVE: Seeks long-term growth of capital.
Holdings Diversification (Market Exposure as % of Net Assets)

“Holdings Diversification (Market Exposure as % of Net Assets)” excludes any temporary cash investments, investments in Guggenheim Strategy Funds Trust mutual funds, or investments in Guggenheim Ultra Short Duration Fund.
Inception Date: May 1, 1979 |
Ten Largest Holdings (% of Total Net Assets) |
Guggenheim Strategy Fund III | 25.0% |
Guggenheim Variable Insurance Strategy Fund III | 24.9% |
Guggenheim Ultra Short Duration Fund — Institutional Class | 20.5% |
Guggenheim Strategy Fund II | 7.2% |
Apple, Inc. | 1.0% |
Microsoft Corp. | 0.8% |
Amazon.com, Inc. | 0.6% |
Alphabet, Inc. — Class C | 0.5% |
Johnson & Johnson | 0.4% |
Verizon Communications, Inc. | 0.3% |
Top Ten Total | 81.2% |
| | |
“Ten Largest Holdings” excludes any temporary cash or derivative investments. |
10 | THE GUGGENHEIM FUNDS ANNUAL REPORT | |
PERFORMANCE REPORT AND FUND PROFILE (Unaudited)(concluded) | December 31, 2020 |
Cumulative Fund Performance*,†
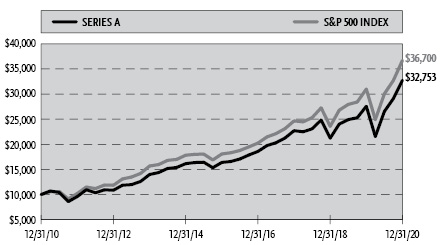
Average Annual Returns*,†
Periods Ended December 31, 2020
| 1 Year | 5 Year | 10 Year |
Series A (StylePlus—Large Core Series) | 18.78% | 14.85% | 12.60% |
S&P 500 Index | 18.40% | 15.22% | 13.88% |
* | The performance data above represents past performance that is not predictive of future results. The investment return and principal value of an investment in the Fund will fluctuate so that an investor’s shares, when redeemed, may be worth more or less than their original cost. Returns are historical and include changes in principal and reinvested dividends and capital gains and do not reflect the effect of taxes. The S&P 500 Index is an unmanaged index and, unlike the Fund, has no management fees or operating expenses to reduce its reported return. |
† | Performance figures do not reflect fees and expenses associated with an investment in variable insurance products. If returns had taken into account these fees and expenses, performance would have been lower. Shares of a series of Guggenheim Variable Funds Trust are available only through the purchase of such products. |
| | THE GUGGENHEIM FUNDS ANNUAL REPORT | 11 |
SCHEDULE OF INVESTMENTS | December 31, 2020 |
SERIES A (STYLEPLUS—LARGE CORE SERIES) | |
| | Shares | | | Value | |
COMMON STOCKS† - 15.5% |
| | | | | | | | | |
Consumer, Non-cyclical - 5.0% |
Johnson & Johnson | | | 5,526 | | | $ | 869,682 | |
Merck & Company, Inc. | | | 7,190 | | | | 588,142 | |
UnitedHealth Group, Inc. | | | 1,477 | | | | 517,954 | |
Bristol-Myers Squibb Co. | | | 8,236 | | | | 510,879 | |
Amgen, Inc. | | | 2,214 | | | | 509,043 | |
Pfizer, Inc. | | | 12,851 | | | | 473,045 | |
AbbVie, Inc. | | | 4,031 | | | | 431,922 | |
Philip Morris International, Inc. | | | 4,924 | | | | 407,658 | |
Altria Group, Inc. | | | 8,312 | | | | 340,792 | |
Procter & Gamble Co. | | | 2,403 | | | | 334,354 | |
Eli Lilly & Co. | | | 1,968 | | | | 332,277 | |
Kraft Heinz Co. | | | 8,786 | | | | 304,523 | |
Molson Coors Beverage Co. — Class B | | | 6,477 | | | | 292,695 | |
Gilead Sciences, Inc. | | | 5,013 | | | | 292,057 | |
CVS Health Corp. | | | 4,219 | | | | 288,158 | |
United Rentals, Inc.* | | | 1,205 | | | | 279,452 | |
McKesson Corp. | | | 1,572 | | | | 273,402 | |
AmerisourceBergen Corp. — Class A | | | 2,796 | | | | 273,337 | |
Anthem, Inc. | | | 819 | | | | 262,973 | |
Quanta Services, Inc. | | | 3,639 | | | | 262,081 | |
General Mills, Inc. | | | 4,431 | | | | 260,543 | |
Cigna Corp. | | | 1,126 | | | | 234,411 | |
Humana, Inc. | | | 571 | | | | 234,264 | |
Alexion Pharmaceuticals, Inc.* | | | 1,488 | | | | 232,485 | |
DaVita, Inc.* | | | 1,878 | | | | 220,477 | |
HCA Healthcare, Inc. | | | 1,286 | | | | 211,496 | |
PayPal Holdings, Inc.* | | | 857 | | | | 200,709 | |
Laboratory Corporation of America Holdings* | | | 922 | | | | 187,673 | |
Vertex Pharmaceuticals, Inc.* | | | 708 | | | | 167,329 | |
Tyson Foods, Inc. — Class A | | | 2,398 | | | | 154,527 | |
Cardinal Health, Inc. | | | 2,868 | | | | 153,610 | |
Becton Dickinson and Co. | | | 589 | | | | 147,379 | |
Kroger Co. | | | 4,568 | | | | 145,080 | |
Kimberly-Clark Corp. | | | 1,062 | | | | 143,189 | |
Universal Health Services, Inc. — Class B | | | 964 | | | | 132,550 | |
Biogen, Inc.* | | | 532 | | | | 130,266 | |
J M Smucker Co. | | | 1,102 | | | | 127,391 | |
Regeneron Pharmaceuticals, Inc.* | | | 259 | | | | 125,125 | |
Colgate-Palmolive Co. | | | 1,432 | | | | 122,450 | |
Conagra Brands, Inc. | | | 3,240 | | | | 117,482 | |
Campbell Soup Co. | | | 2,223 | | | | 107,482 | |
Quest Diagnostics, Inc. | | | 862 | | | | 102,725 | |
Total Consumer, Non-cyclical | | | | | | | 11,503,069 | |
| | | | | | | | | |
Technology - 4.0% |
Apple, Inc. | | | 17,061 | | | | 2,263,824 | |
Microsoft Corp. | | | 8,059 | | | | 1,792,483 | |
Intel Corp. | | | 10,123 | | | | 504,328 | |
International Business Machines Corp. | | | 3,898 | | | | 490,680 | |
Broadcom, Inc. | | | 1,062 | | | | 464,997 | |
Oracle Corp. | | | 6,385 | | | | 413,045 | |
Cerner Corp. | | | 5,014 | | | | 393,499 | |
Texas Instruments, Inc. | | | 2,391 | | | | 392,435 | |
Seagate Technology plc | | | 5,584 | | | | 347,102 | |
HP, Inc. | | | 12,188 | | | | 299,703 | |
NetApp, Inc. | | | 4,363 | | | | 289,005 | |
Applied Materials, Inc. | | | 2,456 | | | | 211,953 | |
Accenture plc — Class A | | | 764 | | | | 199,564 | |
QUALCOMM, Inc. | | | 1,270 | | | | 193,472 | |
NVIDIA Corp. | | | 326 | | | | 170,237 | |
KLA Corp. | | | 634 | | | | 164,149 | |
Cognizant Technology Solutions Corp. — Class A | | | 1,925 | | | | 157,754 | |
Micron Technology, Inc.* | | | 2,070 | | | | 155,622 | |
Microchip Technology, Inc. | | | 906 | | | | 125,127 | |
Advanced Micro Devices, Inc.* | | | 763 | | | | 69,975 | |
Total Technology | | | | | | | 9,098,954 | |
| | | | | | | | | |
Communications - 2.8% |
Amazon.com, Inc.* | | | 444 | | | | 1,446,077 | |
Alphabet, Inc. — Class C* | | | 675 | | | | 1,182,519 | |
Verizon Communications, Inc. | | | 10,647 | | | | 625,511 | |
Facebook, Inc. — Class A* | | | 2,244 | | | | 612,971 | |
Cisco Systems, Inc. | | | 13,335 | | | | 596,741 | |
Comcast Corp. — Class A | | | 6,049 | | | | 316,968 | |
AT&T, Inc. | | | 10,820 | | | | 311,183 | |
T-Mobile US, Inc.* | | | 2,068 | | | | 278,870 | |
Juniper Networks, Inc. | | | 11,295 | | | | 254,251 | |
Motorola Solutions, Inc. | | | 1,085 | | | | 184,515 | |
Walt Disney Co.* | | | 954 | | | | 172,846 | |
Corning, Inc. | | | 3,846 | | | | 138,456 | |
Omnicom Group, Inc. | | | 2,219 | | | | 138,399 | |
eBay, Inc. | | | 2,525 | | | | 126,881 | |
Total Communications | | | | | | | 6,386,188 | |
| | | | | | | | | |
Financial - 1.5% |
Berkshire Hathaway, Inc. — Class B* | | | 2,502 | | | | 580,139 | |
JPMorgan Chase & Co. | | | 3,606 | | | | 458,215 | |
Bank of America Corp. | | | 13,585 | | | | 411,761 | |
MetLife, Inc. | | | 8,105 | | | | 380,530 | |
Allstate Corp. | | | 2,748 | | | | 302,087 | |
Visa, Inc. — Class A | | | 1,309 | | | | 286,318 | |
Travelers Companies, Inc. | | | 1,460 | | | | 204,940 | |
Western Union Co. | | | 9,150 | | | | 200,751 | |
Mastercard, Inc. — Class A | | | 494 | | | | 176,328 | |
Ameriprise Financial, Inc. | | | 811 | | | | 157,602 | |
Hartford Financial Services Group, Inc. | | | 2,924 | | | | 143,217 | |
Aflac, Inc. | | | 2,410 | | | | 107,173 | |
Total Financial | | | | | | | 3,409,061 | |
| | | | | | | | | |
Consumer, Cyclical - 1.0% |
Lowe’s Companies, Inc. | | | 2,638 | | | | 423,425 | |
Best Buy Company, Inc. | | | 2,533 | | | | 252,768 | |
AutoZone, Inc.* | | | 206 | | | | 244,201 | |
Walmart, Inc. | | | 1,666 | | | | 240,154 | |
Genuine Parts Co. | | | 2,311 | | | | 232,094 | |
PACCAR, Inc. | | | 2,025 | | | | 174,717 | |
Lennar Corp. — Class A | | | 2,061 | | | | 157,110 | |
PulteGroup, Inc. | | | 3,540 | | | | 152,645 | |
Cummins, Inc. | | | 560 | | | | 127,176 | |
12 | THE GUGGENHEIM FUNDS ANNUAL REPORT | SEE NOTES TO FINANCIAL STATEMENTS. |
SCHEDULE OF INVESTMENTS (continued) | December 31, 2020 |
SERIES A (STYLEPLUS—LARGE CORE SERIES) | |
| | Shares | | | Value | |
LKQ Corp.* | | | 3,282 | | | $ | 115,657 | |
General Motors Co. | | | 2,492 | | | | 103,767 | |
Whirlpool Corp. | | | 568 | | | | 102,518 | |
Total Consumer, Cyclical | | | | | | | 2,326,232 | |
| | | | | | | | | |
Industrial - 0.9% |
TE Connectivity Ltd. | | | 3,126 | | | | 378,465 | |
Caterpillar, Inc. | | | 1,282 | | | | 233,350 | |
Lockheed Martin Corp. | | | 638 | | | | 226,477 | |
3M Co. | | | 1,284 | | | | 224,430 | |
General Dynamics Corp. | | | 1,437 | | | | 213,855 | |
Snap-on, Inc. | | | 1,237 | | | | 211,700 | |
Textron, Inc. | | | 3,492 | | | | 168,768 | |
General Electric Co. | | | 13,933 | | | | 150,477 | |
Waters Corp.* | | | 603 | | | | 149,194 | |
Northrop Grumman Corp. | | | 415 | | | | 126,459 | |
Huntington Ingalls Industries, Inc. | | | 640 | | | | 109,107 | |
Total Industrial | | | | | | | 2,192,282 | |
| | | | | | | | | |
Utilities - 0.3% |
Evergy, Inc. | | | 5,349 | | | | 296,923 | |
Public Service Enterprise Group, Inc. | | | 3,550 | | | | 206,965 | |
PPL Corp. | | | 5,082 | | | | 143,312 | |
Exelon Corp. | | | 2,948 | | | | 124,465 | |
Total Utilities | | | | | | | 771,665 | |
| | | | | | | | | |
Total Common Stocks | | | | |
(Cost $29,784,065) | | | | | | | 35,687,451 | |
| | | | | | | | | |
MUTUAL FUNDS† - 77.6% |
Guggenheim Strategy Fund III1 | | | 2,291,485 | | | | 57,516,275 | |
Guggenheim Variable Insurance Strategy Fund III1 | | | 2,290,586 | | | | 57,356,264 | |
Guggenheim Ultra Short Duration Fund — Institutional Class1 | | | 4,727,161 | | | | 47,177,063 | |
Guggenheim Strategy Fund II1 | | | 665,081 | | | | 16,600,429 | |
Total Mutual Funds | | | | |
(Cost $177,551,558) | | | | | | | 178,650,031 | |
| | | | | | | | | |
MONEY MARKET FUND† - 6.3% |
Dreyfus Treasury Securities Cash Management Fund — Institutional Shares, 0.01%2 | | | 14,478,785 | | | | 14,478,785 | |
Total Money Market Fund | | | | |
(Cost $14,478,785) | | | | | | | 14,478,785 | |
| | | | | | | | | |
Total Investments - 99.4% | | | | |
(Cost $221,814,408) | | $ | 228,816,267 | |
Other Assets & Liabilities, net - 0.6% | | | 1,271,473 | |
Total Net Assets - 100.0% | | $ | 230,087,740 | |
Futures Contracts |
Description | | Number of
Contracts | | | Expiration
Date | | | Notional
Amount | | | Value and
Unrealized
Appreciation** | |
Equity Futures Contracts Purchased† |
S&P 500 Index Mini Futures Contracts | | | 11 | | | | Mar 2021 | | | $ | 2,059,338 | | | $ | 31,340 | |
Total Return Swap Agreements |
Counterparty | Index | Financing
Rate Pay | Payment
Frequency | | Maturity Date | | | Units | | | Notional
Amount | | | Value and
Unrealized
Appreciation | |
OTC Equity Index Swap Agreements†† |
Wells Fargo Bank, N.A. | S&P 500 Total Return Index | 0.41% (3 Month USD LIBOR + 0.18%) | At Maturity | | | 04/07/21 | | | | 24,965 | | | $ | 193,689,455 | | | $ | 21,689,692 | |
* | Non-income producing security. |
** | Includes cumulative appreciation (depreciation). Variation margin is reported within the Statement of Assets and Liabilities. |
† | Value determined based on Level 1 inputs — See Note 4. |
†† | Value determined based on Level 2 inputs — See Note 4. |
1 | Affiliated issuer. |
2 | Rate indicated is the 7-day yield as of December 31, 2020. |
| | LIBOR — London Interbank Offered Rate |
| | plc — Public Limited Company |
| | |
| | See Sector Classification in Other Information section. |
SEE NOTES TO FINANCIAL STATEMENTS. | THE GUGGENHEIM FUNDS ANNUAL REPORT | 13 |
SCHEDULE OF INVESTMENTS (concluded) | December 31, 2020 |
SERIES A (STYLEPLUS—LARGE CORE SERIES) | |
The following table summarizes the inputs used to value the Fund’s investments at December 31, 2020 (See Note 4 in the Notes to Financial Statements):
Investments in Securities (Assets) | | Level 1
Quoted
Prices | | | Level 2
Significant
Observable
Inputs | | | Level 3
Significant
Unobservable
Inputs | | | Total | |
Common Stocks | | $ | 35,687,451 | | | $ | — | | | $ | — | | | $ | 35,687,451 | |
Mutual Funds | | | 178,650,031 | | | | — | | | | — | | | | 178,650,031 | |
Money Market Fund | | | 14,478,785 | | | | — | | | | — | | | | 14,478,785 | |
Equity Futures Contracts** | | | 31,340 | | | | — | | | | — | | | | 31,340 | |
Equity Index Swap Agreements** | | | — | | | | 21,689,692 | | | | — | | | | 21,689,692 | |
Total Assets | | $ | 228,847,607 | | | $ | 21,689,692 | | | $ | — | | | $ | 250,537,299 | |
** | This derivative is reported as unrealized appreciation/depreciation at period end. |
Affiliated Transactions
Investments representing 5% or more of the outstanding voting shares of a company, or control of or by, or common control under Guggenheim Investments (“GI”), result in that company being considered an affiliated issuer, as defined in the 1940 Act.
The Fund may invest in certain of the underlying series of Guggenheim Strategy Funds Trust, including Guggenheim Strategy Fund II, Guggenheim Strategy Fund III, and Guggenheim Variable Insurance Strategy Fund III, (collectively, the “Short Term Investment Vehicles”), each of which are open-end management investment companies managed by GI. The Short Term Investment Vehicles, which launched on March 11, 2014, are offered as short term investment options only to mutual funds, trusts, and other accounts managed by GI and/or its affiliates, and are not available to the public. The Short Term Investment Vehicles pay no investment management fees. The Short Term Investment Vehicles’ annual report on Form N-CSR dated September 30, 2020, is available publicly or upon request. This information is available from the EDGAR database on the SEC’s website at https://www.sec.gov/Archives/edgar/data/1601445/000182126820000133/gug81042-ncsr.htm.
Transactions during the year ended December 31, 2020, in which the company is an affiliated issuer, were as follows:
Security Name | | Value
12/31/19 | | | Additions | | | Reductions | | | Realized
Gain (Loss) | | | Change in
Unrealized
Appreciation
(Depreciation) | | | Value
12/31/20 | | | Shares
12/31/20 | | | Investment
Income | |
Mutual Funds | | | | | | | | | | | | | | | | | | | | | | | | | | | | | | | | |
Guggenheim Strategy Fund II | | $ | 12,015,307 | | | $ | 14,544,441 | | | $ | (10,080,012 | ) | | $ | (11,823 | ) | | $ | 132,516 | | | $ | 16,600,429 | | | | 665,081 | | | $ | 187,525 | |
Guggenheim Strategy Fund III | | | 61,933,211 | | | | 1,102,018 | | | | (6,330,471 | ) | | | (93,034 | ) | | | 904,551 | | | | 57,516,275 | | | | 2,291,485 | | | | 1,098,471 | |
Guggenheim Ultra Short Duration Fund — Institutional Class | | | 17,010,235 | | | | 54,270,487 | | | | (24,876,972 | ) | | | 208,461 | | | | 564,852 | | | | 47,177,063 | | | | 4,727,161 | | | | 426,910 | |
Guggenheim Variable Insurance Strategy Fund III | | | 69,062,402 | | | | 1,083,539 | | | | (13,356,679 | ) | | | (197,053 | ) | | | 764,055 | | | | 57,356,264 | | | | 2,290,586 | | | | 1,081,281 | |
| | | $ | 160,021,155 | | | $ | 71,000,485 | | | $ | (54,644,134 | ) | | $ | (93,449 | ) | | $ | 2,365,974 | | | $ | 178,650,031 | | | | | | | $ | 2,794,187 | |
14 | THE GUGGENHEIM FUNDS ANNUAL REPORT | SEE NOTES TO FINANCIAL STATEMENTS. |
SERIES A (STYLEPLUS—LARGE CORE SERIES) | |
STATEMENT OF ASSETS AND LIABILITIES |
December 31, 2020 |
Assets: |
Investments in unaffiliated issuers, at value (cost $44,262,850) | | $ | 50,166,236 | |
Investments in affiliated issuers, at value (cost $177,551,558) | | | 178,650,031 | |
Segregated cash with broker | | | 121,000 | |
Unrealized appreciation on OTC swap agreements | | | 21,689,692 | |
Prepaid expenses | | | 13,199 | |
Receivables: |
Fund shares sold | | | 276,035 | |
Dividends | | | 258,993 | |
Variation margin on futures contracts | | | 11,027 | |
Interest | | | 104 | |
Total assets | | | 251,186,317 | |
| | | | | |
Liabilities: |
Overdraft due to custodian bank | | | 692 | |
Segregated cash due to broker | | | 20,290,000 | |
Payable for: |
Securities purchased | | | 229,846 | |
Swap settlement | | | 171,897 | |
Fund shares redeemed | | | 124,499 | |
Management fees | | | 71,837 | |
Distribution and service fees | | | 47,829 | |
Trustees’ fees* | | | 18,077 | |
Fund accounting/administration fees | | | 16,196 | |
Transfer agent/maintenance fees | | | 2,261 | |
Miscellaneous | | | 125,443 | |
Total liabilities | | | 21,098,577 | |
Commitments and contingent liabilities (Note 13) | | | — | |
Net assets | | $ | 230,087,740 | |
| | | | | |
Net assets consist of: |
Paid in capital | | $ | 174,948,483 | |
Total distributable earnings (loss) | | | 55,139,257 | |
Net assets | | $ | 230,087,740 | |
Capital shares outstanding | | | 4,659,032 | |
Net asset value per share | | $ | 49.39 | |
STATEMENT OF OPERATIONS |
Year Ended December 31, 2020 |
Investment Income: |
Dividends from securities of unaffiliated issuers | | $ | 760,633 | |
Dividends from securities of affiliated issuers | | | 2,794,187 | |
Interest | | | 33,046 | |
Total investment income | | | 3,587,866 | |
| | | | | |
Expenses: |
Management fees | | | 1,525,571 | |
Distribution and service fees | | | 508,524 | |
Transfer agent/maintenance fees | | | 25,242 | |
Fund accounting/administration fees | | | 154,865 | |
Professional fees | | | 82,102 | |
Interest expense | | | 24,064 | |
Trustees’ fees* | | | 21,814 | |
Custodian fees | | | 18,466 | |
Line of credit fees | | | 5,513 | |
Miscellaneous | | | 112,423 | |
Total expenses | | | 2,478,584 | |
Less: |
Expenses reimbursed by Adviser | | | (7,431 | ) |
Expenses waived by Adviser | | | (685,598 | ) |
Earnings credits applied | | | (1,837 | ) |
Total waived/reimbursed expenses | | | (694,866 | ) |
Net expenses | | | 1,783,718 | |
Net investment income | | | 1,804,148 | |
| | | | | |
Net Realized and Unrealized Gain (Loss): |
Net realized gain (loss) on: |
Investments in unaffiliated issuers | | | (133,158 | ) |
Investments in affiliated issuers | | | (93,449 | ) |
Swap agreements | | | 25,117,473 | |
Futures contracts | | | 2,478,294 | |
Net realized gain | | | 27,369,160 | |
Net change in unrealized appreciation (depreciation) on: |
Investments in unaffiliated issuers | | | 671,240 | |
Investments in affiliated issuers | | | 2,365,974 | |
Swap agreements | | | 3,792,004 | |
Futures contracts | | | 15,523 | |
Net change in unrealized appreciation (depreciation) | | | 6,844,741 | |
Net realized and unrealized gain | | | 34,213,901 | |
Net increase in net assets resulting from operations | | $ | 36,018,049 | |
* | Relates to Trustees not deemed “interested persons” within the meaning of Section 2(a)(19) of the 1940 Act. |
SEE NOTES TO FINANCIAL STATEMENTS. | THE GUGGENHEIM FUNDS ANNUAL REPORT | 15 |
SERIES A (STYLEPLUS—LARGE CORE SERIES) | |
STATEMENTS OF CHANGES IN NET ASSETS |
| | Year Ended
December 31,
2020 | | | Year Ended
December 31,
2019 | |
Increase (Decrease) in Net Assets from Operations: | | | | | | | | |
Net investment income | | $ | 1,804,148 | | | $ | 3,421,328 | |
Net realized gain on investments | | | 27,369,160 | | | | 10,837,317 | |
Net change in unrealized appreciation (depreciation) on investments | | | 6,844,741 | | | | 39,670,957 | |
Net increase in net assets resulting from operations | | | 36,018,049 | | �� | | 53,929,602 | |
| | | | | | | | | |
Distributions to shareholders | | | (12,350,787 | ) | | | (15,823,058 | ) |
| | | | | | | | | |
Capital share transactions: | | | | | | | | |
Proceeds from sale of shares | | | 4,825,074 | | | | 2,928,839 | |
Distributions reinvested | | | 12,350,787 | | | | 15,823,058 | |
Cost of shares redeemed | | | (28,837,836 | ) | | | (29,420,471 | ) |
Net decrease from capital share transactions | | | (11,661,975 | ) | | | (10,668,574 | ) |
Net increase in net assets | | | 12,005,287 | | | | 27,437,970 | |
| | | | | | | | | |
Net assets: | | | | | | | | |
Beginning of year | | | 218,082,453 | | | | 190,644,483 | |
End of year | | $ | 230,087,740 | | | $ | 218,082,453 | |
| | | | | | | | | |
Capital share activity: | | | | | | | | |
Shares sold | | | 113,612 | | | | 70,822 | |
Shares issued from reinvestment of distributions | | | 294,839 | | | | 387,345 | |
Shares redeemed | | | (678,666 | ) | | | (709,256 | ) |
Net decrease in shares | | | (270,215 | ) | | | (251,089 | ) |
16 | THE GUGGENHEIM FUNDS ANNUAL REPORT | SEE NOTES TO FINANCIAL STATEMENTS. |
SERIES A (STYLEPLUS—LARGE CORE SERIES) | |
This table is presented to show selected data for a share outstanding throughout each period and to assist shareholders in evaluating a Fund’s performance for the periods presented.
| | Year Ended
December 31,
2020 | | | Year Ended
December 31,
2019 | | | Year Ended
December 31,
2018 | | | Year Ended
December 31,
2017 | | | Year Ended
December 31,
2016 | |
Per Share Data |
Net asset value, beginning of period | | $ | 44.24 | | | $ | 36.80 | | | $ | 45.50 | | | $ | 38.20 | | | $ | 34.34 | |
Income (loss) from investment operations: |
Net investment income (loss)a | | | .38 | | | | .68 | | | | .83 | | | | .62 | | | | .46 | |
Net gain (loss) on investments (realized and unrealized) | | | 7.46 | | | | 10.06 | | | | (3.10 | ) | | | 7.76 | | | | 4.09 | |
Total from investment operations | | | 7.84 | | | | 10.74 | | | | (2.27 | ) | | | 8.38 | | | | 4.55 | |
Less distributions from: |
Net investment income | | | (.74 | ) | | | (.91 | ) | | | (.75 | ) | | | (.50 | ) | | | (.32 | ) |
Net realized gains | | | (1.95 | ) | | | (2.39 | ) | | | (5.68 | ) | | | (.58 | ) | | | (.37 | ) |
Total distributions | | | (2.69 | ) | | | (3.30 | ) | | | (6.43 | ) | | | (1.08 | ) | | | (.69 | ) |
Net asset value, end of period | | $ | 49.39 | | | $ | 44.24 | | | $ | 36.80 | | | $ | 45.50 | | | $ | 38.20 | |
|
Total Returnb | | | 18.78 | % | | | 29.97 | % | | | (6.56 | %) | | | 22.22 | % | | | 13.34 | % |
Ratios/Supplemental Data |
Net assets, end of period (in thousands) | | $ | 230,088 | | | $ | 218,082 | | | $ | 190,644 | | | $ | 251,795 | | | $ | 223,705 | |
Ratios to average net assets: |
Net investment income (loss) | | | 0.88 | % | | | 1.65 | % | | | 1.89 | % | | | 1.48 | % | | | 1.31 | % |
Total expensesc | | | 1.22 | % | | | 1.27 | % | | | 1.26 | % | | | 1.12 | % | | | 0.93 | % |
Net expensesd,e,f | | | 0.89 | % | | | 0.95 | % | | | 0.97 | % | | | 0.91 | % | | | 0.93 | % |
Portfolio turnover rate | | | 63 | % | | | 41 | % | | | 45 | % | | | 44 | % | | | 43 | % |
a | Net investment income (loss) per share was computed using average shares outstanding throughout the period. |
b | Total return does not take into account any of the expenses associated with an investment in variable insurance products. If total return had taken into account these expenses, performance would have been lower. Shares of a series of Guggenheim Variable Funds Trust are available only through the purchase of such products. |
c | Does not include expenses of the underlying funds in which the Fund invests. |
d | Net expense information reflects the expense ratios after expense waivers and reimbursements, as applicable. |
e | Net expenses may include expenses that are excluded from the expense limitation agreement. Excluding these expenses, the net expense ratios for the years presented would be: |
| | 12/31/20 | 12/31/19 | 12/31/18 | 12/31/17 | 12/31/16 |
| | 0.87% | 0.89% | 0.91% | 0.90% | 0.93% |
f | The portion of the ratios of net expenses to average net assets attributable to recoupments of prior fee reductions or expense reimbursements for the periods presented was as follows: |
| | 12/31/20 | 12/31/19 | 12/31/18 | 12/31/17 | 12/31/16 |
| | — | — | 0.02% | — | — |
SEE NOTES TO FINANCIAL STATEMENTS. | THE GUGGENHEIM FUNDS ANNUAL REPORT | 17 |
MANAGERS’ COMMENTARY (Unaudited) | December 31, 2020 |
To Our Shareholders:
The Series B (Large Cap Value Series) is managed by a team of seasoned professionals led by David Toussaint, CFA, CPA, Managing Director and Portfolio Manager; James Schier, CFA, Senior Managing Director and Portfolio Manager; Farhan Sharaff, Senior Managing Director, Assistant Chief Investment Officer, Equities, and Portfolio Manager; Gregg Strohkorb, CFA, Director and Portfolio Manager; and Burak Hurmeydan, Ph.D., Director and Portfolio Manager. In the following paragraphs, the team discusses performance of the Fund for the fiscal year ended December 31, 2020.
For the year ended December 31, 2020, Series B (Large Cap Value Series) returned 2.21%, compared with the Russell 1000® Value Index, which returned 2.80%.
Strategy and Market Overview
Our investment approach focuses on understanding how companies make money and how easily companies can improve returns, maintain existing high levels of profitability, or benefit from change that occurs within the industries in which they operate. In today’s rapidly changing environment marked by very sharp and quick, but constrained volatility, our long-term orientation and discipline are a competitive advantage. This should become especially critical when the environment of indiscriminant valuation expansion subsides, and fundamentals once again become a more dominant factor in the market.
Performance Review
Dominating the market for the period was the strong outperformance of growth versus value stocks, despite occasional signs that the situation might be ready to turn. Significant monetary and fiscal stimulus and the low-rate environment helped multiples of growth stocks expand more than those of value stocks, leading to stocks with extreme valuations to experience continued multiple expansion.
The Information Technology sector was the bright spot for the Fund for the period, along with lesser contributions from Materials and Health Care. Performance was aided by relative contributions from Energy, where the Fund’s holdings—despite a negative return overall—strongly outperformed those in the benchmark. Information Technology benefited from an overweight, the Fund’s largest relative to the benchmark, and strong selection, especially in Apple Computer, Micron Technology, and Intel. Top individual contributors included Olin Corp. and Westlake Chemical Corp. in the Materials space and Alexion Pharmaceuticals in Health Care.
The Energy sector in the Fund relatively outperformed that in the benchmark, but its slightly larger allocation detracted from performance. Leading individual contributors were Range Resources and Cabot Oil & Gas, which benefited from firming in natural gas prices. Marathon Oil was a major sector detractor.
Sectors detracting from performance included Financials and Utilities. The Fund’s Financials holdings underperformed those in the benchmark, and the impact was magnified by the sector’s large weighting, the largest in both the Fund and the benchmark. Major banks such as Wells Fargo and Citigroup were large detractors due to perceived weaker economic activity as a result of COVID, and the Fed’s lowering of interest rates in reaction to the pandemic. In Utilities, the Fund was hurt by having little exposure to the better-performing renewables space, which also had higher valuations and thus did not possess value characteristics sought by the Fund.
A large individual detractor was Staples company Tyson Foods, which fell as thousands of its employees tested positive for COVID during the summer.
Portfolio Positioning
While this strategy is balanced relative to the benchmark, the size of companies it owns is typically smaller, given their often-better growth opportunities.
At the end of the period, the Fund’s largest sector overweights on average relative to the benchmark were in Tech and Health Care. The Fund’s largest sector underweights were in Industrials and Consumer Staples.
18 | THE GUGGENHEIM FUNDS ANNUAL REPORT | |
MANAGERS’ COMMENTARY (Unaudited)(concluded) | December 31, 2020 |
Portfolio and Market Outlook
The market outlook is indeed murkier than usual. The expectation of a government and a Federal Reserve willing to do whatever is necessary to help the economy and the markets will need to meet the growing limitations that an increasingly indebted nation must eventually face. However, near term benefits of stimulus money and a Federal Reserve willing to commit to near zero interest rates for an indefinite period suggest a buoyant near-term outlook.
Performance displayed represents past performance which is no guarantee of future results.
The opinions and forecast expressed may not actually come to pass. This information is subject to change at any time, based on market and other conditions, and should not be construed as a recommendation of any specific security or strategy.
| | THE GUGGENHEIM FUNDS ANNUAL REPORT | 19 |
PERFORMANCE REPORT AND FUND PROFILE (Unaudited) | December 31, 2020 |
SERIES B (LARGE CAP VALUE SERIES)
OBJECTIVE: Seeks long-term growth of capital.
Holdings Diversification (Market Exposure as % of Net Assets)

“Holdings Diversification (Market Exposure as % of Net Assets)” excludes any temporary cash investments.
Inception Date: May 1, 1979 |
Ten Largest Holdings (% of Total Net Assets) |
Verizon Communications, Inc. | 2.8% |
Micron Technology, Inc. | 2.6% |
JPMorgan Chase & Co. | 2.5% |
Citigroup, Inc. | 2.3% |
Berkshire Hathaway, Inc. — Class B | 2.2% |
Johnson & Johnson | 2.2% |
Comcast Corp. — Class A | 2.1% |
Pfizer, Inc. | 2.1% |
Walmart, Inc. | 1.8% |
Exelon Corp. | 1.7% |
Top Ten Total | 22.3% |
| | |
“Ten Largest Holdings” excludes any temporary cash investments. |
20 | THE GUGGENHEIM FUNDS ANNUAL REPORT | |
PERFORMANCE REPORT AND FUND PROFILE (Unaudited)(concluded) | December 31, 2020 |
Cumulative Fund Performance*,†
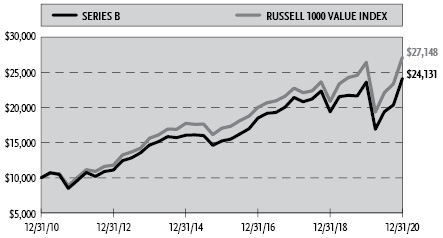
Average Annual Returns*,†
Periods Ended December 31, 2020
| 1 Year | 5 Year | 10 Year |
Series B (Large Cap Value Series) | 2.21% | 9.63% | 9.21% |
Russell 1000 Value Index | 2.80% | 9.74% | 10.50% |
* | The performance data above represents past performance that is not predictive of future results. The investment return and principal value of an investment in the Fund will fluctuate so that an investor’s shares, when redeemed, may be worth more or less than their original cost. Returns are historical and include changes in principal and reinvested dividends and capital gains and do not reflect the effect of taxes. The Russell 1000 Value Index is an unmanaged index and, unlike the Fund, has no management fees or operating expenses to reduce its reported return. |
† | Performance figures do not reflect fees and expenses associated with an investment in variable insurance products. If returns had taken into account these fees and expenses, performance would have been lower. Shares of a series of Guggenheim Variable Funds Trust are available only through the purchase of such products. |
| | THE GUGGENHEIM FUNDS ANNUAL REPORT | 21 |
SCHEDULE OF INVESTMENTS | December 31, 2020 |
SERIES B (LARGE CAP VALUE SERIES) | |
| | Shares | | | Value | |
COMMON STOCKS† - 96.8% |
| | | | | | | | | |
Financial - 24.1% |
JPMorgan Chase & Co. | | | 40,704 | | | $ | 5,172,257 | |
Citigroup, Inc. | | | 78,919 | | | | 4,866,146 | |
Berkshire Hathaway, Inc. — Class B* | | | 20,208 | | | | 4,685,629 | |
Bank of America Corp. | | | 112,828 | | | | 3,419,817 | |
Allstate Corp. | | | 23,741 | | | | 2,609,848 | |
Wells Fargo & Co. | | | 78,884 | | | | 2,380,719 | |
Morgan Stanley | | | 34,665 | | | | 2,375,592 | |
Voya Financial, Inc. | | | 38,150 | | | | 2,243,602 | |
MetLife, Inc. | | | 45,139 | | | | 2,119,276 | |
Prudential Financial, Inc. | | | 25,393 | | | | 1,982,432 | |
Principal Financial Group, Inc. | | | 37,840 | | | | 1,877,242 | |
Synovus Financial Corp. | | | 54,552 | | | | 1,765,848 | |
Hartford Financial Services Group, Inc. | | | 34,287 | | | | 1,679,377 | |
Loews Corp. | | | 36,285 | | | | 1,633,551 | |
Zions Bancorp North America | | | 36,234 | | | | 1,574,005 | |
Charles Schwab Corp. | | | 27,103 | | | | 1,437,543 | |
Medical Properties Trust, Inc. REIT | | | 65,452 | | | | 1,426,199 | |
Mastercard, Inc. — Class A | | | 3,197 | | | | 1,141,137 | |
Regions Financial Corp. | | | 70,117 | | | | 1,130,286 | |
Park Hotels & Resorts, Inc. REIT | | | 64,125 | | | | 1,099,744 | |
KeyCorp | | | 64,668 | | | | 1,061,202 | |
Jones Lang LaSalle, Inc.* | | | 4,866 | | | | 721,968 | |
American International Group, Inc. | | | 18,813 | | | | 712,260 | |
BOK Financial Corp. | | | 9,366 | | | | 641,384 | |
Gaming and Leisure Properties, Inc. REIT | | | 12,532 | | | | 531,357 | |
Total Financial | | | | | | | 50,288,421 | |
| | | | | | | | | |
Consumer, Non-cyclical - 18.7% |
Johnson & Johnson | | | 28,659 | | | | 4,510,353 | |
Pfizer, Inc. | | | 116,819 | | | | 4,300,107 | |
HCA Healthcare, Inc. | | | 18,846 | | | | 3,099,413 | |
McKesson Corp. | | | 16,663 | | | | 2,898,029 | |
Humana, Inc. | | | 6,970 | | | | 2,859,582 | |
Quest Diagnostics, Inc. | | | 22,092 | | | | 2,632,703 | |
Archer-Daniels-Midland Co. | | | 52,046 | | | | 2,623,639 | |
Medtronic plc | | | 21,543 | | | | 2,523,547 | |
Tyson Foods, Inc. — Class A | | | 34,884 | | | | 2,247,925 | |
Zimmer Biomet Holdings, Inc. | | | 13,693 | | | | 2,109,954 | |
Encompass Health Corp. | | | 25,501 | | | | 2,108,678 | |
Bunge Ltd. | | | 25,800 | | | | 1,691,964 | |
Merck & Company, Inc. | | | 20,657 | | | | 1,689,743 | |
Amgen, Inc. | | | 6,861 | | | | 1,577,481 | |
Alexion Pharmaceuticals, Inc.* | | | 6,589 | | | | 1,029,466 | |
Ingredion, Inc. | | | 13,001 | | | | 1,022,789 | |
Total Consumer, Non-cyclical | | | | | | | 38,925,373 | |
| | | | | | | | | |
Communications - 9.8% |
Verizon Communications, Inc. | | | 99,873 | | | | 5,867,539 | |
Comcast Corp. — Class A | | | 82,304 | | | | 4,312,730 | |
F5 Networks, Inc.* | | | 12,607 | | | | 2,218,075 | |
Cisco Systems, Inc. | | | 46,985 | | | | 2,102,579 | |
Alphabet, Inc. — Class A* | | | 859 | | | | 1,505,518 | |
Walt Disney Co.* | | | 8,284 | | | | 1,500,895 | |
T-Mobile US, Inc.* | | | 8,893 | | | | 1,199,221 | |
Juniper Networks, Inc. | | | 43,590 | | | | 981,211 | |
AT&T, Inc. | | | 24,582 | | | | 706,978 | |
Total Communications | | | | | | | 20,394,746 | |
| | | | | | | | | |
Consumer, Cyclical - 9.7% |
Walmart, Inc. | | | 26,728 | | | | 3,852,841 | |
Southwest Airlines Co. | | | 47,188 | | | | 2,199,433 | |
Lear Corp. | | | 12,115 | | | | 1,926,648 | |
LKQ Corp.* | | | 49,954 | | | | 1,760,379 | |
DR Horton, Inc. | | | 25,375 | | | | 1,748,845 | |
PACCAR, Inc. | | | 20,253 | | | | 1,747,429 | |
Home Depot, Inc. | | | 5,978 | | | | 1,587,876 | |
Penske Automotive Group, Inc. | | | 24,754 | | | | 1,470,140 | |
PVH Corp. | | | 14,248 | | | | 1,337,745 | |
Kohl’s Corp. | | | 32,758 | | | | 1,332,923 | |
Ralph Lauren Corp. — Class A | | | 11,569 | | | | 1,200,168 | |
Total Consumer, Cyclical | | | | | | | 20,164,427 | |
| | | | | | | | | |
Industrial - 8.0% |
Honeywell International, Inc. | | | 16,613 | | | | 3,533,585 | |
Owens Corning | | | 30,831 | | | | 2,335,756 | |
Johnson Controls International plc | | | 46,562 | | | | 2,169,324 | |
Knight-Swift Transportation Holdings, Inc. | | | 46,371 | | | | 1,939,235 | |
Curtiss-Wright Corp. | | | 14,040 | | | | 1,633,554 | |
FedEx Corp. | | | 6,009 | | | | 1,560,057 | |
Valmont Industries, Inc. | | | 7,628 | | | | 1,334,366 | |
General Electric Co. | | | 97,873 | | | | 1,057,028 | |
L3Harris Technologies, Inc. | | | 5,536 | | | | 1,046,415 | |
Total Industrial | | | | | | | 16,609,320 | |
| | | | | | | | | |
Technology - 7.7% |
Micron Technology, Inc.* | | | 72,631 | | | | 5,460,399 | |
Skyworks Solutions, Inc. | | | 19,813 | | | | 3,029,011 | |
Qorvo, Inc.* | | | 13,783 | | | | 2,291,699 | |
Apple, Inc. | | | 16,014 | | | | 2,124,898 | |
Intel Corp. | | | 22,852 | | | | 1,138,487 | |
Amdocs Ltd. | | | 15,609 | | | | 1,107,146 | |
Cerner Corp. | | | 12,890 | | | | 1,011,607 | |
Total Technology | | | | | | | 16,163,247 | |
| | | | | | | | | |
Utilities - 7.6% |
Exelon Corp. | | | 84,432 | | | | 3,564,719 | |
Public Service Enterprise Group, Inc. | | | 56,473 | | | | 3,292,376 | |
Edison International | | | 48,175 | | | | 3,026,354 | |
Duke Energy Corp. | | | 21,954 | | | | 2,010,108 | |
Pinnacle West Capital Corp. | | | 23,291 | | | | 1,862,116 | |
NiSource, Inc. | | | 51,045 | | | | 1,170,972 | |
PPL Corp. | | | 33,862 | | | | 954,908 | |
Total Utilities | | | | | | | 15,881,553 | |
| | | | | | | | | |
Basic Materials - 6.2% |
Huntsman Corp. | | | 123,085 | | | | 3,094,357 | |
Westlake Chemical Corp. | | | 30,967 | | | | 2,526,907 | |
Olin Corp. | | | 90,597 | | | | 2,225,062 | |
Nucor Corp. | | | 38,756 | | | | 2,061,432 | |
DuPont de Nemours, Inc. | | | 18,012 | | | | 1,280,833 | |
Reliance Steel & Aluminum Co. | | | 10,519 | | | | 1,259,650 | |
22 | THE GUGGENHEIM FUNDS ANNUAL REPORT | SEE NOTES TO FINANCIAL STATEMENTS. |
SCHEDULE OF INVESTMENTS (concluded) | December 31, 2020 |
SERIES B (LARGE CAP VALUE SERIES) | |
| | Shares | | | Value | |
Dow, Inc. | | | 9,877 | | | $ | 548,174 | |
Total Basic Materials | | | | | | | 12,996,415 | |
| | | | | | | | | |
Energy - 5.0% |
Chevron Corp. | | | 36,592 | | | | 3,090,194 | |
ConocoPhillips | | | 55,659 | | | | 2,225,804 | |
Cabot Oil & Gas Corp. — Class A | | | 91,049 | | | | 1,482,278 | |
Exxon Mobil Corp. | | | 26,250 | | | | 1,082,025 | |
Marathon Oil Corp. | | | 158,094 | | | | 1,054,487 | |
Parsley Energy, Inc. — Class A | | | 56,789 | | | | 806,404 | |
Range Resources Corp.* | | | 107,163 | | | | 717,992 | |
Total Energy | | | | | | | 10,459,184 | |
| | | | | | | | | |
Total Common Stocks | | | | |
(Cost $162,905,367) | | | | | | | 201,882,686 | |
| | | | | | | | | |
EXCHANGE-TRADED FUNDS† - 1.1% |
iShares Russell 1000 Value ETF | | | 16,114 | | | | 2,203,267 | |
Total Exchange-Traded Funds | | | | |
(Cost $2,092,872) | | | | | | | 2,203,267 | |
| |
MONEY MARKET FUND† - 1.8% |
Dreyfus Treasury Securities Cash Management Fund — Institutional Shares, 0.01%1 | | | 3,824,344 | | | | 3,824,344 | |
Total Money Market Fund | | | | |
(Cost $3,824,344) | | | | | | | 3,824,344 | |
| | | | | | | | | |
Total Investments - 99.7% | | | | |
(Cost $168,822,583) | | $ | 207,910,297 | |
Other Assets & Liabilities, net - 0.3% | | | 637,400 | |
Total Net Assets - 100.0% | | $ | 208,547,697 | |
* | Non-income producing security. |
† | Value determined based on Level 1 inputs — See Note 4. |
1 | Rate indicated is the 7-day yield as of December 31, 2020. |
| | plc — Public Limited Company |
| | REIT — Real Estate Investment Trust |
| | |
| | See Sector Classification in Other Information section. |
The following table summarizes the inputs used to value the Fund’s investments at December 31, 2020 (See Note 4 in the Notes to Financial Statements):
Investments in Securities (Assets) | | Level 1
Quoted
Prices | | | Level 2
Significant
Observable
Inputs | | | Level 3
Significant
Unobservable
Inputs | | | Total | |
Common Stocks | | $ | 201,882,686 | | | $ | — | | | $ | — | | | $ | 201,882,686 | |
Exchange-Traded Funds | | | 2,203,267 | | | | — | | | | — | | | | 2,203,267 | |
Money Market Fund | | | 3,824,344 | | | | — | | | | — | | | | 3,824,344 | |
Total Assets | | $ | 207,910,297 | | | $ | — | | | $ | — | | | $ | 207,910,297 | |
SEE NOTES TO FINANCIAL STATEMENTS. | THE GUGGENHEIM FUNDS ANNUAL REPORT | 23 |
SERIES B (LARGE CAP VALUE SERIES) | |
STATEMENT OF ASSETS AND LIABILITIES |
December 31, 2020 |
Assets: |
Investments, at value (cost $168,822,583) | | $ | 207,910,297 | |
Prepaid expenses | | | 6,014 | |
Receivables: |
Securities sold | | | 1,199,458 | |
Dividends | | | 241,270 | |
Interest | | | 24 | |
Fund shares sold | | | 8 | |
Total assets | | | 209,357,071 | |
| | | | | |
Liabilities: |
Payable for: |
Securities purchased | | | 456,073 | |
Fund shares redeemed | | | 149,880 | |
Management fees | | | 71,210 | |
Distribution and service fees | | | 43,821 | |
Fund accounting/administration fees | | | 14,615 | |
Trustees’ fees* | | | 5,815 | |
Transfer agent/maintenance fees | | | 2,273 | |
Miscellaneous | | | 65,687 | |
Total liabilities | | | 809,374 | |
Commitments and contingent liabilities (Note 13) | | | — | |
Net assets | | $ | 208,547,697 | |
| | | | | |
Net assets consist of: |
Paid in capital | | $ | 164,746,610 | |
Total distributable earnings (loss) | | | 43,801,087 | |
Net assets | | $ | 208,547,697 | |
Capital shares outstanding | | | 5,544,347 | |
Net asset value per share | | $ | 37.61 | |
STATEMENT OF OPERATIONS |
Year Ended December 31, 2020 |
Investment Income: |
Dividends | | $ | 6,061,440 | |
Interest | | | 13,902 | |
Total investment income | | | 6,075,342 | |
| | | | | |
Expenses: |
Management fees | | | 1,237,745 | |
Distribution and service fees | | | 476,055 | |
Transfer agent/maintenance fees | | | 25,234 | |
Fund accounting/administration fees | | | 145,741 | |
Professional fees | | | 74,455 | |
Trustees’ fees* | | | 22,224 | |
Custodian fees | | | 6,190 | |
Line of credit fees | | | 5,109 | |
Miscellaneous | | | 89,313 | |
Total expenses | | | 2,082,066 | |
Less: |
Expenses waived by Adviser | | | (569,190 | ) |
Net expenses | | | 1,512,876 | |
Net investment income | | | 4,562,466 | |
| | | | | |
Net Realized and Unrealized Gain (Loss): |
Net realized gain (loss) on: |
Investments | | | 1,794,553 | |
Net realized gain | | | 1,794,553 | |
Net change in unrealized appreciation (depreciation) on: |
Investments | | | (5,308,681 | ) |
Net change in unrealized appreciation (depreciation) | | | (5,308,681 | ) |
Net realized and unrealized loss | | | (3,514,128 | ) |
Net increase in net assets resulting from operations | | $ | 1,048,338 | |
* | Relates to Trustees not deemed “interested persons” within the meaning of Section 2(a)(19) of the 1940 Act. |
24 | THE GUGGENHEIM FUNDS ANNUAL REPORT | SEE NOTES TO FINANCIAL STATEMENTS. |
SERIES B (LARGE CAP VALUE SERIES) | |
STATEMENTS OF CHANGES IN NET ASSETS |
| | Year Ended
December 31,
2020 | | | Year Ended
December 31,
2019 | |
Increase (Decrease) in Net Assets from Operations: | | | | | | | | |
Net investment income | | $ | 4,562,466 | | | $ | 4,036,022 | |
Net realized gain on investments | | | 1,794,553 | | | | 15,885,112 | |
Net change in unrealized appreciation (depreciation) on investments | | | (5,308,681 | ) | | | 23,033,020 | |
Net increase in net assets resulting from operations | | | 1,048,338 | | | | 42,954,154 | |
| | | | | | | | | |
Distributions to shareholders | | | (17,232,283 | ) | | | (17,179,352 | ) |
| | | | | | | | | |
Capital share transactions: | | | | | | | | |
Proceeds from sale of shares | | | 11,205,807 | | | | 10,450,047 | |
Distributions reinvested | | | 17,232,283 | | | | 17,179,352 | |
Cost of shares redeemed | | | (30,674,259 | ) | | | (33,603,539 | ) |
Net decrease from capital share transactions | | | (2,236,169 | ) | | | (5,974,140 | ) |
Net increase (decrease) in net assets | | | (18,420,114 | ) | | | 19,800,662 | |
| | | | | | | | | |
Net assets: | | | | | | | | |
Beginning of year | | | 226,967,811 | | | | 207,167,149 | |
End of year | | $ | 208,547,697 | | | $ | 226,967,811 | |
| | | | | | | | | |
Capital share activity: | | | | | | | | |
Shares sold | | | 310,192 | | | | 272,332 | |
Shares issued from reinvestment of distributions | | | 540,197 | | | | 454,721 | |
Shares redeemed | | | (902,732 | ) | | | (863,141 | ) |
Net decrease in shares | | | (52,343 | ) | | | (136,088 | ) |
SEE NOTES TO FINANCIAL STATEMENTS. | THE GUGGENHEIM FUNDS ANNUAL REPORT | 25 |
SERIES B (LARGE CAP VALUE SERIES) | |
This table is presented to show selected data for a share outstanding throughout each period and to assist shareholders in evaluating a Fund’s performance for the periods presented.
| | Year Ended
December 31,
2020 | | | Year Ended
December 31,
2019 | | | Year Ended
December 31,
2018 | | | Year Ended
December 31,
2017 | | | Year Ended
December 31,
2016 | |
Per Share Data |
Net asset value, beginning of period | | $ | 40.55 | | | $ | 36.14 | | | $ | 43.36 | | | $ | 39.08 | | | $ | 33.20 | |
Income (loss) from investment operations: |
Net investment income (loss)a | | | .82 | | | | .72 | | | | .65 | | | | .48 | | | | .50 | |
Net gain (loss) on investments (realized and unrealized) | | | (.51 | ) | | | 6.93 | | | | (4.42 | ) | | | 5.52 | | | | 6.48 | |
Total from investment operations | | | .31 | | | | 7.65 | | | | (3.77 | ) | | | 6.00 | | | | 6.98 | |
Less distributions from: |
Net investment income | | | (.74 | ) | | | (.72 | ) | | | (.58 | ) | | | (.53 | ) | | | (.61 | ) |
Net realized gains | | | (2.51 | ) | | | (2.52 | ) | | | (2.87 | ) | | | (1.19 | ) | | | (.49 | ) |
Total distributions | | | (3.25 | ) | | | (3.24 | ) | | | (3.45 | ) | | | (1.72 | ) | | | (1.10 | ) |
Net asset value, end of period | | $ | 37.61 | | | $ | 40.55 | | | $ | 36.14 | | | $ | 43.36 | | | $ | 39.08 | |
|
Total Returnb | | | 2.21 | % | | | 21.82 | % | | | (9.53 | %) | | | 15.81 | % | | | 21.41 | % |
Ratios/Supplemental Data |
Net assets, end of period (in thousands) | | $ | 208,548 | | | $ | 226,968 | | | $ | 207,167 | | | $ | 269,258 | | | $ | 260,692 | |
Ratios to average net assets: |
Net investment income (loss) | | | 2.40 | % | | | 1.86 | % | | | 1.54 | % | | | 1.17 | % | | | 1.44 | % |
Total expensesc | | | 1.09 | % | | | 1.07 | % | | | 1.07 | % | | | 1.02 | % | | | 0.82 | % |
Net expensesd,e | | | 0.79 | % | | | 0.80 | % | | | 0.80 | % | | | 0.81 | % | | | 0.82 | % |
Portfolio turnover rate | | | 19 | % | | | 32 | % | | | 21 | % | | | 27 | % | | | 44 | % |
a | Net investment income (loss) per share was computed using average shares outstanding throughout the period. |
b | Total return does not take into account any of the expenses associated with an investment in variable insurance products. If total return had taken into account these expenses, performance would have been lower. Shares of a series of Guggenheim Variable Funds Trust are available only through the purchase of such products. |
c | Does not include expenses of the underlying funds in which the Fund invests. |
d | Net expense information reflects the expense ratios after expense waivers and reimbursements, as applicable. |
e | Net expenses may include expenses that are excluded from the expense limitation agreement. Excluding these expenses, the net expense ratios for the years presented would be: |
| | 12/31/20 | 12/31/19 | 12/31/18 | 12/31/17 | 12/31/16 |
| | 0.79% | 0.80% | 0.80% | 0.79% | 0.82% |
26 | THE GUGGENHEIM FUNDS ANNUAL REPORT | SEE NOTES TO FINANCIAL STATEMENTS. |
MANAGERS’ COMMENTARY (Unaudited) | December 31, 2020 |
To Our Shareholders:
The Series D (World Equity Income Series) is managed by a team of seasoned professionals, including Farhan Sharaff, Senior Managing Director and Assistant Chief Investment Officer, Equities, and Portfolio Manager; Evan Einstein, Director and Portfolio Manager; and Douglas Makin, Director and Portfolio Manager. In the following paragraphs, the investment team discusses performance for the fiscal year ended December 31, 2020.
For the one-year period ended December 31, 2020, Series D (World Equity Income Series) returned 6.65%, compared with the 15.90% return of its benchmark, the MSCI World Index.
Performance Review
The Fund underperformed the Index but delivered on its mandate to provide current equity income while providing a stable long-term total return. During the year, the Fund balanced generating income while doing so with lower risk than the benchmark. The Fund tends to underperform in times of strong market gains.
The trailing twelve month income distribution yield of the Fund was 2.72%* as of the end of the period. Besides helping investors navigate the declining rate environment; being cognizant of companies with unsustainable dividends is one of the primary drivers for the Fund’s track record relative to peers.
The tactical currency hedge, which helps to reduce volatility and is achieved via currency futures contracts, contributed to performance this year, as the dollar was strong during the first half of the year despite some choppy periods for key exchange rates.
The Fund had negative selection attribution but positive allocation. Information Technology made the biggest contribution to selection performance as growth names led the market for much of the period. Leading detractors in selection were Consumer Discretionary and Consumer Staples.
From a complete sector attribution standpoint, the contribution from Energy led overall relative performance. And the fund’s largest weighted sector, Information Technology, had the largest absolute portfolio contribution. The biggest relative detractor was Consumer Discretionary, the largest relative underweight.
From a country perspective, the Fund benefited most from its underweight in France and Germany and from its overweight in Denmark and Switzerland. The lower weight and lower performance of the Fund’s U.S. holdings as compared with the benchmark was a significant detractor, as were the Fund’s Japan and Canada holdings.
The panic spawned by COVID-19 earlier in the year seemed to be less of a concern at period end, as central banks worked to prop up the markets. Relief set in over the summer, and growth companies, especially in Technology, propelled markets higher, as did Consumer Discretionary, Telecommunication Services, and Materials. The Fund leaned into this shift, and these sectors were the top-returning ones in the Fund for the year. The top individual holdings for the year were Apple Computer and Amazon.com. The leading detractors from return were Sysco and Exxon Mobil, hurt by an overall downturn in energy.
Portfolio Positioning
Although lagging the MSCI World Index in each quarter, the Fund delivered positive performance for three of four quarters. Compared with the Index, the Fund is positioned more cautiously, as we question whether the recent ascent will continue for much longer. The fund also continued to invest more in positions with higher yields than the benchmark. Over the year, on average, the weight in Telecommunications Services increased the most, while Health Care decreased the most.
We believe global equities remain a critical allocation in investors’ portfolios. To prepare for the future and the uncertainty it brings, investors often benefit from seeking out dividend yield, but should avoid reaching for yield that may be excessive or unsustainable.
* | Calculated by taking the most recent annual income distribution and dividing by the NAV per share as of 12/31/2020. This rate does not represent the total return of a fund. |
Performance displayed represents past performance which is no guarantee of future results.
The opinions and forecast expressed may not actually come to pass. This information is subject to change at any time, based on market and other conditions, and should not be construed as a recommendation of any specific security or strategy.
| | THE GUGGENHEIM FUNDS ANNUAL REPORT | 27 |
PERFORMANCE REPORT AND FUND PROFILE (Unaudited) | December 31, 2020 |
SERIES D (WORLD EQUITY INCOME SERIES)
OBJECTIVE: Seeks to provide total return, comprised of capital appreciation and income.
Holdings Diversification (Market Exposure as % of Net Assets)
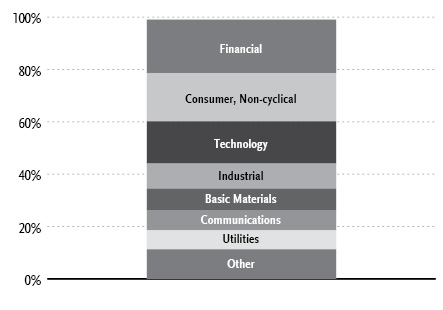
“Holdings Diversification (Market Exposure as % of Net Assets)” excludes any temporary cash investments.
COUNTRY DIVERSIFICATION
At December 31, 2020, the investment diversification of the Fund by Country was as follows:
Country | % of Long-Term
Investments |
United States | 61.7% |
Japan | 4.9% |
United Kingdom | 4.0% |
Sweden | 4.0% |
Denmark | 3.6% |
Switzerland | 3.0% |
Netherlands | 3.0% |
Other | 15.8% |
Total Long-Term Investments | 100.0% |
Inception Date: April 19, 1984 |
Ten Largest Holdings (% of Total Net Assets) |
Apple, Inc. | 3.1% |
Amazon.com, Inc. | 2.8% |
Microsoft Corp. | 2.6% |
Alphabet, Inc. — Class C | 1.5% |
Mastercard, Inc. — Class A | 1.4% |
ASML Holding N.V. | 1.3% |
Rio Tinto plc | 1.2% |
Costco Wholesale Corp. | 1.1% |
PepsiCo, Inc. | 1.1% |
Merck & Company, Inc. | 1.1% |
Top Ten Total | 17.2% |
| | |
“Ten Largest Holdings” excludes any temporary cash investments. |
28 | THE GUGGENHEIM FUNDS ANNUAL REPORT | |
PERFORMANCE REPORT AND FUND PROFILE (Unaudited)(concluded) | December 31, 2020 |
Cumulative Fund Performance*,†

Average Annual Returns*,†
Periods Ended December 31, 2020
| 1 Year | 5 Year | 10 Year |
Series D (World Equity Income Series) | 6.65% | 8.59% | 6.31% |
MSCI World Index | 15.90% | 12.19% | 9.87% |
* | The performance data above represents past performance that is not predictive of future results. The investment return and principal value of an investment in the Fund will fluctuate so that an investor’s shares, when redeemed, may be worth more or less than their original cost. Returns are historical and include changes in principal and reinvested dividends and capital gains and do not reflect the effect of taxes. The MSCI World Index is an unmanaged index and, unlike the Fund, has no management fees or operating expenses to reduce its reported return. |
† | Performance figures do not reflect fees and expenses associated with an investment in variable insurance products. If returns had taken into account these fees and expenses, performance would have been lower. Shares of a series of Guggenheim Variable Funds Trust are available only through the purchase of such products. |
| | THE GUGGENHEIM FUNDS ANNUAL REPORT | 29 |
SCHEDULE OF INVESTMENTS | December 31, 2020 |
SERIES D (WORLD EQUITY INCOME SERIES) | |
| | Shares | | | Value | |
COMMON STOCKS† - 96.7% |
| | | | | | | | | |
Financial - 20.6% |
Mastercard, Inc. — Class A | | | 4,800 | | | $ | 1,713,312 | |
Citigroup, Inc. | | | 21,000 | | | | 1,294,860 | |
Wells Fargo & Co. | | | 42,100 | | | | 1,270,578 | |
DBS Group Holdings Ltd.†† | | | 61,700 | | | | 1,170,349 | |
Legal & General Group plc†† | | | 308,600 | | | | 1,124,292 | |
Oversea-Chinese Banking Corporation Ltd.†† | | | 142,200 | | | | 1,084,644 | |
Prudential Financial, Inc. | | | 12,300 | | | | 960,261 | |
Simon Property Group, Inc. REIT | | | 11,200 | | | | 955,136 | |
United Overseas Bank Ltd.†† | | | 53,700 | | | | 916,138 | |
Sumitomo Mitsui Financial Group, Inc.†† | | | 29,400 | | | | 911,337 | |
Medical Properties Trust, Inc. REIT | | | 39,700 | | | | 865,063 | |
Annaly Capital Management, Inc. REIT | | | 99,600 | | | | 841,620 | |
BOC Hong Kong Holdings Ltd.†† | | | 261,200 | | | | 791,794 | |
Zurich Insurance Group AG†† | | | 1,800 | | | | 758,687 | |
Daiwa House REIT Investment Corp.†† | | | 300 | | | | 742,153 | |
Admiral Group plc†† | | | 18,400 | | | | 727,351 | |
AGNC Investment Corp. REIT | | | 45,500 | | | | 709,800 | |
VEREIT, Inc. | | | 18,780 | | | | 709,696 | |
Mitsubishi UFJ Financial Group, Inc.†† | | | 158,600 | | | | 702,214 | |
Synchrony Financial | | | 18,700 | | | | 649,077 | |
Banque Cantonale Vaudoise†† | | | 5,900 | | | | 642,316 | |
AvalonBay Communities, Inc. REIT | | | 4,000 | | | | 641,720 | |
Vornado Realty Trust REIT | | | 16,400 | | | | 612,376 | |
Citizens Financial Group, Inc. | | | 16,000 | | | | 572,160 | |
Goldman Sachs Group, Inc. | | | 2,100 | | | | 553,791 | |
Hang Seng Bank Ltd.†† | | | 29,300 | | | | 505,685 | |
Equity Residential REIT | | | 8,500 | | | | 503,880 | |
NN Group N.V.†† | | | 10,700 | | | | 462,657 | |
KeyCorp | | | 26,700 | | | | 438,147 | |
Capital One Financial Corp. | | | 3,500 | | | | 345,975 | |
New World Development Company Ltd.†† | | | 73,300 | | | | 341,038 | |
Tryg A/S†† | | | 10,700 | | | | 336,549 | |
Bank of America Corp. | | | 10,700 | | | | 324,317 | |
AXA S.A.†† | | | 13,300 | | | | 319,029 | |
Public Storage REIT | | | 1,100 | | | | 254,023 | |
Allstate Corp. | | | 1,800 | | | | 197,874 | |
Total Financial | | | | | | | 25,949,899 | |
| | | | | | | | | |
Consumer, Non-cyclical - 18.3% |
PepsiCo, Inc. | | | 9,400 | | | | 1,394,020 | |
Merck & Company, Inc. | | | 16,700 | | | | 1,366,060 | |
Philip Morris International, Inc. | | | 15,400 | | | | 1,274,966 | |
Genmab A/S*,†† | | | 2,700 | | | | 1,094,903 | |
AbbVie, Inc. | | | 10,100 | | | | 1,082,215 | |
Roche Holding AG†† | | | 3,100 | | | | 1,079,908 | |
DexCom, Inc.* | | | 2,900 | | | | 1,072,188 | |
Square, Inc. — Class A* | | | 4,800 | | | | 1,044,672 | |
Vertex Pharmaceuticals, Inc.* | | | 3,700 | | | | 874,458 | |
Tyson Foods, Inc. — Class A | | | 12,500 | | | | 805,500 | |
Recruit Holdings Company Ltd.†† | | | 19,100 | | | | 802,249 | |
Kimberly-Clark Corp. | | | 5,800 | | | | 782,014 | |
Procter & Gamble Co. | | | 5,600 | | | | 779,184 | |
Sysco Corp. | | | 10,400 | | | | 772,304 | |
Kraft Heinz Co. | | | 21,400 | | | | 741,724 | |
Johnson & Johnson | | | 4,300 | | | | 676,734 | |
Boston Scientific Corp.* | | | 18,700 | | | | 672,265 | |
Novo Nordisk A/S — Class B†† | | | 9,500 | | | | 662,755 | |
WH Group Ltd.††,2 | | | 787,100 | | | | 660,056 | |
Colgate-Palmolive Co. | | | 7,700 | | | | 658,427 | |
CVS Health Corp. | | | 9,600 | | | | 655,680 | |
CoStar Group, Inc.* | | | 600 | | | | 554,568 | |
Jazz Pharmaceuticals plc* | | | 3,200 | | | | 528,160 | |
ABIOMED, Inc.* | | | 1,600 | | | | 518,720 | |
Humana, Inc. | | | 1,100 | | | | 451,297 | |
Archer-Daniels-Midland Co. | | | 8,500 | | | | 428,485 | |
Kellogg Co. | | | 5,800 | | | | 360,934 | |
Bristol-Myers Squibb Co. | | | 5,100 | | | | 316,353 | |
HCA Healthcare, Inc. | | | 1,600 | | | | 263,136 | |
Baxter International, Inc. | | | 3,200 | | | | 256,768 | |
Incyte Corp.* | | | 2,700 | | | | 234,846 | |
S&P Global, Inc. | | | 600 | | | | 197,238 | |
Total Consumer, Non-cyclical | | | | | | | 23,062,787 | |
| | | | | | | | | |
Technology - 16.2% |
Apple, Inc. | | | 29,800 | | | | 3,954,162 | |
Microsoft Corp. | | | 14,800 | | | | 3,291,816 | |
ASML Holding N.V.†† | | | 3,400 | | | | 1,646,534 | |
Texas Instruments, Inc. | | | 6,700 | | | | 1,099,671 | |
NVIDIA Corp. | | | 2,100 | | | | 1,096,620 | |
Micron Technology, Inc.* | | | 14,100 | | | | 1,060,038 | |
Advanced Micro Devices, Inc.* | | | 11,300 | | | | 1,036,323 | |
Twilio, Inc. — Class A* | | | 2,900 | | | | 981,650 | |
Seagate Technology plc | | | 15,600 | | | | 969,696 | |
ASM Pacific Technology Ltd.†† | | | 59,300 | | | | 783,193 | |
International Business Machines Corp. | | | 5,900 | | | | 742,692 | |
salesforce.com, Inc.* | | | 3,200 | | | | 712,096 | |
Western Digital Corp. | | | 11,200 | | | | 620,368 | |
Lam Research Corp. | | | 1,300 | | | | 613,951 | |
SAP AG†† | | | 3,700 | | | | 479,316 | |
Oracle Corporation Japan†† | | | 2,900 | | | | 378,025 | |
Hewlett Packard Enterprise Co. | | | 26,700 | | | | 316,395 | |
Tokyo Electron Ltd.†† | | | 800 | | | | 298,848 | |
Square Enix Holdings Company Ltd.†† | | | 4,600 | | | | 278,898 | |
Total Technology | | | | | | | 20,360,292 | |
| | | | | | | | | |
Industrial - 9.6% |
3M Co. | | | 7,100 | | | | 1,241,009 | |
Atlas Copco AB — Class A†† | | | 21,100 | | | | 1,084,831 | |
DSV PANALPINA A/S†† | | | 6,100 | | | | 1,025,243 | |
Lockheed Martin Corp. | | | 2,700 | | | | 958,446 | |
Kone Oyj — Class B†† | | | 11,200 | | | | 912,762 | |
Northrop Grumman Corp. | | | 2,600 | | | | 792,272 | |
Husqvarna AB — Class B†† | | | 56,100 | | | | 728,308 | |
Illinois Tool Works, Inc. | | | 3,000 | | | | 611,640 | |
Investment AB Latour — Class B†† | | | 23,700 | | | | 574,272 | |
CRH plc ADR†† | | | 13,300 | | | | 565,718 | |
Venture Corporation Ltd.†† | | | 35,000 | | | | 515,113 | |
Keyence Corp.†† | | | 900 | | | | 506,260 | |
Deutsche Post AG†† | | | 10,100 | | | | 500,412 | |
Waste Management, Inc. | | | 3,900 | | | | 459,927 | |
30 | THE GUGGENHEIM FUNDS ANNUAL REPORT | SEE NOTES TO FINANCIAL STATEMENTS. |
SCHEDULE OF INVESTMENTS (continued) | December 31, 2020 |
SERIES D (WORLD EQUITY INCOME SERIES) | |
| | Shares | | | Value | |
Packaging Corporation of America | | | 3,000 | | | $ | 413,730 | |
Komatsu Ltd.†† | | | 13,100 | | | | 361,534 | |
Siemens AG†† | | | 2,100 | | | | 302,559 | |
ROCKWOOL International A/S — Class B†† | | | 800 | | | | 299,424 | |
SKF AB — Class B†† | | | 10,700 | | | | 278,500 | |
Total Industrial | | | | | | | 12,131,960 | |
| | | | | | | | | |
Basic Materials - 8.1% |
Rio Tinto plc†† | | | 20,300 | | | | 1,527,830 | |
Givaudan S.A.†† | | | 300 | | | | 1,269,462 | |
LyondellBasell Industries N.V. — Class A | | | 12,800 | | | | 1,173,248 | |
FMC Corp. | | | 7,700 | | | | 884,961 | |
UPM-Kymmene Oyj†† | | | 22,600 | | | | 842,961 | |
Nucor Corp. | | | 15,700 | | | | 835,083 | |
Boliden AB†† | | | 21,400 | | | | 759,472 | |
Steel Dynamics, Inc. | | | 18,600 | | | | 685,782 | |
Fortescue Metals Group Ltd.†† | | | 35,300 | | | | 637,751 | |
Koninklijke DSM N.V.†† | | | 2,400 | | | | 412,814 | |
Arkema S.A.†† | | | 2,700 | | | | 309,002 | |
Covestro AG††,2 | | | 4,800 | | | | 295,804 | |
Novozymes A/S — Class B†† | | | 5,000 | | | | 284,818 | |
Johnson Matthey plc†† | | | 8,000 | | | | 264,947 | |
Total Basic Materials | | | | | | | 10,183,935 | |
| | | | | | | | | |
Communications - 7.8% |
Amazon.com, Inc.* | | | 1,100 | | | | 3,582,623 | |
Alphabet, Inc. — Class C* | | | 1,081 | | | | 1,893,782 | |
ViacomCBS, Inc. — Class B | | | 23,000 | | | | 856,980 | |
Facebook, Inc. — Class A* | | | 3,035 | | | | 829,041 | |
Lumen Technologies, Inc. | | | 59,100 | | | | 576,225 | |
Kakaku.com, Inc.†† | | | 21,000 | | | | 574,835 | |
ZOZO, Inc.†† | | | 20,700 | | | | 509,925 | |
HKT Trust & HKT Ltd.†† | | | 336,700 | | | | 436,697 | |
Twitter, Inc.* | | | 5,300 | | | | 286,995 | |
Netflix, Inc.* | | | 500 | | | | 270,365 | |
Total Communications | | | | | | | 9,817,468 | |
| | | | | | | | | |
Utilities - 7.2% |
Southern Co. | | | 17,200 | | | | 1,056,596 | |
FirstEnergy Corp. | | | 33,100 | | | | 1,013,191 | |
PPL Corp. | | | 32,200 | | | | 908,040 | |
Exelon Corp. | | | 18,600 | | | | 785,292 | |
Orsted A/S††,2 | | | 3,700 | | | | 757,088 | |
Duke Energy Corp. | | | 7,400 | | | | 677,544 | |
Sempra Energy | | | 5,300 | | | | 675,273 | |
Vistra Corp. | | | 33,700 | | | | 662,542 | |
Fortum Oyj†† | | | 26,500 | | | | 640,373 | |
UGI Corp. | | | 16,000 | | | | 559,360 | |
NRG Energy, Inc. | | | 13,300 | | | | 499,415 | |
CLP Holdings Ltd.†† | | | 51,800 | | | | 478,999 | |
Enagas S.A.†† | | | 16,300 | | | | 358,668 | |
Total Utilities | | | | | | | 9,072,381 | |
| | | | | | | | | |
Consumer, Cyclical - 5.6% |
Costco Wholesale Corp. | | | 3,700 | | | | 1,394,086 | |
Evolution Gaming Group AB††,2 | | | 10,400 | | | | 1,045,913 | |
Walgreens Boots Alliance, Inc. | | | 20,600 | | | | 821,528 | |
Carnival Corp. | | | 32,000 | | | | 693,120 | |
Berkeley Group Holdings plc†† | | | 10,400 | | | | 672,638 | |
Autoliv, Inc. | | | 6,700 | | | | 617,070 | |
Home Depot, Inc. | | | 2,100 | | | | 557,802 | |
Electrolux AB†† | | | 21,400 | | | | 498,081 | |
Persimmon plc†† | | | 8,000 | | | | 301,846 | |
Tesla, Inc.* | | | 300 | | | | 211,701 | |
Cie Generale des Etablissements Michelin SCA — Class B†† | | | 1,600 | | | | 206,052 | |
Total Consumer, Cyclical | | | | | | | 7,019,837 | |
| | | | | | | | | |
Energy - 2.6% |
Schlumberger N.V. | | | 50,900 | | | | 1,111,147 | |
Marathon Petroleum Corp. | | | 26,500 | | | | 1,096,040 | |
Valero Energy Corp. | | | 13,500 | | | | 763,695 | |
BP plc†† | | | 106,800 | | | | 368,483 | |
Total Energy | | | | | | | 3,339,365 | |
| | | | | | | | | |
Diversified - 0.7% |
CK Hutchison Holdings Ltd.†† | | | 132,300 | | | | 923,741 | |
| | | | | | | | | |
Total Common Stocks | | | | |
(Cost $100,451,084) | | | | | | | 121,861,665 | |
| | | | | | | | | |
PREFERRED STOCKS† - 1.3% |
Consumer, Cyclical - 1.3% |
Porsche Automobil Holding SE | | | 11,600 | | | | 801,453 | |
Volkswagen AG †† | | | 4,200 | | | | 785,071 | |
Total Consumer, Cyclical | | | | | | | 1,586,524 | |
| | | | | | | | | |
Total Preferred Stocks | | | | |
(Cost $1,524,306) | | | | | | | 1,586,524 | |
| | | | | | | | | |
EXCHANGE-TRADED FUNDS† - 1.1% |
SPDR S&P 500 ETF Trust | | | 1,788 | | | | 668,498 | |
iShares MSCI EAFE ETF | | | 9,041 | | | | 659,631 | |
Total Exchange-Traded Funds | | | | |
(Cost $1,307,057) | | | | | | | 1,328,129 | |
| | | | | | | | | |
MONEY MARKET FUND† - 0.5% |
Goldman Sachs Financial Square Treasury Instruments Fund — Institutional Shares, 0.01%1 | | | 682,839 | | | | 682,839 | |
Total Money Market Fund | | | | |
(Cost $682,839) | | | | | | | 682,839 | |
| | | | | | | | | |
Total Investments - 99.6% | | | | |
(Cost $103,965,286) | | $ | 125,459,157 | |
Other Assets & Liabilities, net - 0.4% | | | 547,526 | |
Total Net Assets - 100.0% | | $ | 126,006,683 | |
SEE NOTES TO FINANCIAL STATEMENTS. | THE GUGGENHEIM FUNDS ANNUAL REPORT | 31 |
SCHEDULE OF INVESTMENTS (concluded) | December 31, 2020 |
SERIES D (WORLD EQUITY INCOME SERIES) | |
* | Non-income producing security. |
† | Value determined based on Level 1 inputs, unless otherwise noted — See Note 4. |
†† | Value determined based on Level 2 inputs — See Note 4. |
1 | Rate indicated is the 7-day yield as of December 31, 2020. |
2 | Security is a 144A or Section 4(a)(2) security. These securities have been determined to be liquid under guidelines established by the Board of Trustees. The total market value of 144A or Section 4(a)(2) securities is $2,758,861 (cost $2,085,685), or 2.2% of total net assets. |
| | ADR — American Depositary Receipt |
| | plc — Public Limited Company |
| | REIT — Real Estate Investment Trust |
| | |
| | See Sector Classification in Other Information section. |
The following table summarizes the inputs used to value the Fund’s investments at December 31, 2020 (See Note 4 in the Notes to Financial Statements):
Investments in Securities (Assets) | | Level 1
Quoted
Prices | | | Level 2
Significant
Observable
Inputs | | | Level 3
Significant
Unobservable
Inputs | | | Total | |
Common Stocks | | $ | 80,127,611 | | | $ | 41,734,054 | | | $ | — | | | $ | 121,861,665 | |
Preferred Stocks | | | 801,453 | | | | 785,071 | | | | — | | | | 1,586,524 | |
Exchange-Traded Funds | | | 1,328,129 | | | | — | | | | — | | | | 1,328,129 | |
Money Market Fund | | | 682,839 | | | | — | | | | — | | | | 682,839 | |
Total Assets | | $ | 82,940,032 | | | $ | 42,519,125 | | | $ | — | | | $ | 125,459,157 | |
32 | THE GUGGENHEIM FUNDS ANNUAL REPORT | SEE NOTES TO FINANCIAL STATEMENTS. |
SERIES D (WORLD EQUITY INCOME SERIES) | |
STATEMENT OF ASSETS AND LIABILITIES |
December 31, 2020 |
Assets: |
Investments, at value (cost $103,965,286) | | $ | 125,459,157 | |
Cash | | | 426 | |
Prepaid expenses | | | 4,400 | |
Receivables: |
Fund shares sold | | | 296,382 | |
Foreign tax reclaims | | | 215,015 | |
Dividends | | | 208,651 | |
Interest | | | 3 | |
Total assets | | | 126,184,034 | |
| | | | | |
Liabilities: |
Payable for: |
Management fees | | | 42,859 | |
Professional fees | | | 31,267 | |
Distribution and service fees | | | 26,230 | |
Printing fees | | | 23,447 | |
Fund shares redeemed | | | 19,866 | |
Fund accounting/administration fees | | | 9,847 | |
Pricing fees | | | 9,337 | |
Trustees’ fees* | | | 3,769 | |
Transfer agent/maintenance fees | | | 2,418 | |
Miscellaneous | | | 8,311 | |
Total liabilities | | | 177,351 | |
Commitments and contingent liabilities (Note 13) | | | — | |
Net assets | | $ | 126,006,683 | |
| | | | | |
Net assets consist of: |
Paid in capital | | $ | 106,384,815 | |
Total distributable earnings (loss) | | | 19,621,868 | |
Net assets | | $ | 126,006,683 | |
Capital shares outstanding | | | 8,520,916 | |
Net asset value per share | | $ | 14.79 | |
STATEMENT OF OPERATIONS |
Year Ended December 31, 2020 |
Investment Income: |
Dividends (net of foreign withholding tax of $266,240) | | $ | 3,028,935 | |
Interest | | | 2,797 | |
Total investment income | | | 3,031,732 | |
| | | | | |
Expenses: |
Management fees | | | 819,092 | |
Distribution and service fees | | | 292,533 | |
Transfer agent/maintenance fees | | | 25,317 | |
Fund accounting/administration fees | | | 93,028 | |
Professional fees | | | 64,867 | |
Trustees’ fees* | | | 20,126 | |
Custodian fees | | | 18,978 | |
Line of credit fees | | | 3,214 | |
Miscellaneous | | | 68,047 | |
Total expenses | | | 1,405,202 | |
Less: |
Expenses reimbursed by Adviser | | | (1,765 | ) |
Expenses waived by Adviser | | | (356,705 | ) |
Total waived/reimbursed expenses | | | (358,470 | ) |
Net expenses | | | 1,046,732 | |
Net investment income | | | 1,985,000 | |
| | | | | |
Net Realized and Unrealized Gain (Loss): |
Net realized gain (loss) on: |
Investments | | | (3,846,003 | ) |
Futures contracts | | | 242,617 | |
Foreign currency transactions | | | 36,511 | |
Net realized loss | | | (3,566,875 | ) |
Net change in unrealized appreciation (depreciation) on: |
Investments | | | 8,215,243 | |
Futures contracts | | | 452 | |
Foreign currency translations | | | 16,107 | |
Net change in unrealized appreciation (depreciation) | | | 8,231,802 | |
Net realized and unrealized gain | | | 4,664,927 | |
Net increase in net assets resulting from operations | | $ | 6,649,927 | |
* | Relates to Trustees not deemed “interested persons” within the meaning of Section 2(a)(19) of the 1940 Act. |
SEE NOTES TO FINANCIAL STATEMENTS. | THE GUGGENHEIM FUNDS ANNUAL REPORT | 33 |
SERIES D (WORLD EQUITY INCOME SERIES) | |
STATEMENTS OF CHANGES IN NET ASSETS |
| | Year Ended
December 31,
2020 | | | Year Ended
December 31,
2019 | |
Increase (Decrease) in Net Assets from Operations: | | | | | | | | |
Net investment income | | $ | 1,985,000 | | | $ | 3,090,907 | |
Net realized gain (loss) on investments | | | (3,566,875 | ) | | | 1,990,953 | |
Net change in unrealized appreciation (depreciation) on investments | | | 8,231,802 | | | | 20,186,786 | |
Net increase in net assets resulting from operations | | | 6,649,927 | | | | 25,268,646 | |
| | | | | | | | | |
Distributions to shareholders | | | (4,694,939 | ) | | | (10,799,071 | ) |
| | | | | | | | | |
Capital share transactions: | | | | | | | | |
Proceeds from sale of shares | | | 2,006,847 | | | | 1,377,569 | |
Distributions reinvested | | | 4,694,939 | | | | 10,799,071 | |
Cost of shares redeemed | | | (16,408,213 | ) | | | (18,200,016 | ) |
Net decrease from capital share transactions | | | (9,706,427 | ) | | | (6,023,376 | ) |
Net increase (decrease) in net assets | | | (7,751,439 | ) | | | 8,446,199 | |
| | | | | | | | | |
Net assets: | | | | | | | | |
Beginning of year | | | 133,758,122 | | | | 125,311,923 | |
End of year | | $ | 126,006,683 | | | $ | 133,758,122 | |
| | | | | | | | | |
Capital share activity: | | | | | | | | |
Shares sold | | | 149,287 | | | | 99,244 | |
Shares issued from reinvestment of distributions | | | 362,544 | | | | 796,979 | |
Shares redeemed | | | (1,246,184 | ) | | | (1,309,109 | ) |
Net decrease in shares | | | (734,353 | ) | | | (412,886 | ) |
34 | THE GUGGENHEIM FUNDS ANNUAL REPORT | SEE NOTES TO FINANCIAL STATEMENTS. |
SERIES D (WORLD EQUITY INCOME SERIES) | |
This table is presented to show selected data for a share outstanding throughout each period and to assist shareholders in evaluating a Fund’s performance for the periods presented.
| | Year Ended
December 31,
2020 | | | Year Ended
December 31,
2019 | | | Year Ended
December 31,
2018 | | | Year Ended
December 31,
2017 | | | Year Ended
December 31,
2016 | |
Per Share Data |
Net asset value, beginning of period | | $ | 14.45 | | | $ | 12.96 | | | $ | 14.52 | | | $ | 12.98 | | | $ | 12.12 | |
Income (loss) from investment operations: |
Net investment income (loss)a | | | .22 | | | | .33 | | | | .33 | | | | .33 | | | | .37 | |
Net gain (loss) on investments (realized and unrealized) | | | .66 | | | | 2.36 | | | | (1.47 | ) | | | 1.60 | | | | .88 | |
Total from investment operations | | | .88 | | | | 2.69 | | | | (1.14 | ) | | | 1.93 | | | | 1.25 | |
Less distributions from: |
Net investment income | | | (.40 | ) | | | (.40 | ) | | | (.42 | ) | | | (.39 | ) | | | (.39 | ) |
Net realized gains | | | (.14 | ) | | | (.80 | ) | | | — | | | | — | | | | — | |
Total distributions | | | (.54 | ) | | | (1.20 | ) | | | (.42 | ) | | | (.39 | ) | | | (.39 | ) |
Net asset value, end of period | | $ | 14.79 | | | $ | 14.45 | | | $ | 12.96 | | | $ | 14.52 | | | $ | 12.98 | |
|
Total Returnb | | | 6.65 | % | | | 21.40 | % | | | (8.17 | %) | | | 15.06 | % | | | 10.37 | % |
Ratios/Supplemental Data |
Net assets, end of period (in thousands) | | $ | 126,007 | | | $ | 133,758 | | | $ | 125,312 | | | $ | 161,111 | | | $ | 159,978 | |
Ratios to average net assets: |
Net investment income (loss) | | | 1.70 | % | | | 2.37 | % | | | 2.29 | % | | | 2.38 | % | | | 2.92 | % |
Total expensesc | | | 1.20 | % | | | 1.19 | % | | | 1.17 | % | | | 1.12 | % | | | 0.91 | % |
Net expensesd,e | | | 0.89 | % | | | 0.90 | % | | | 0.90 | % | | | 0.90 | % | | | 0.91 | % |
Portfolio turnover rate | | | 196 | % | | | 139 | % | | | 134 | % | | | 112 | % | | | 43 | % |
a | Net investment income (loss) per share was computed using average shares outstanding throughout the period. |
b | Total return does not take into account any of the expenses associated with an investment in variable insurance products. If total return had taken into account these expenses, performance would have been lower. Shares of a series of Guggenheim Variable Funds Trust are available only through the purchase of such products. |
c | Does not include expenses of the underlying funds in which the Fund invests. |
d | Net expense information reflects the expense ratios after expense waivers and reimbursements, as applicable. |
e | Net expenses may include expenses that are excluded from the expense limitation agreement. Excluding these expenses, the net expense ratios for the years presented would be: |
| | 12/31/20 | 12/31/19 | 12/31/18 | 12/31/17 |
| | 0.89% | 0.90% | 0.90% | 0.88% |
SEE NOTES TO FINANCIAL STATEMENTS. | THE GUGGENHEIM FUNDS ANNUAL REPORT | 35 |
MANAGERS’ COMMENTARY (Unaudited) | December 31, 2020 |
To Our Shareholders:
The Series E (Total Return Bond Series) is managed by a team of seasoned professionals, including B. Scott Minerd, Chairman of Investments and Global Chief Investment Officer; Anne B. Walsh, Senior Managing Director and Chief Investment Officer, Fixed Income; Steven H. Brown, CFA, Senior Managing Director and Portfolio Manager; and Adam J. Bloch, Managing Director and Portfolio Manager. In the following paragraphs, the investment team discusses the market environment and the Fund’s performance for the fiscal year ended December 31, 2020.
For the one-year period ended December 31, 2020, Total Return Bond Series E returned 14.21%, compared with the 7.51% return of its benchmark, the Bloomberg Barclays U.S. Aggregate Bond Index.
The Fund seeks to provide total return, comprised of current income and capital appreciation. The Fund pursues its investment objective by investing primarily in high-quality, investment-grade fixed-income securities across multiple sectors. The Fund employs a relative-value sector allocation strategy, offering the opportunity to capitalize on total return potential created by changing market conditions.
The portfolio was defensively positioned coming into 2020 because we viewed the risk versus reward trade-off of owning corporate credit as unattractive, as economic momentum was stalling as we reached the later innings of the credit cycle. The Fund maintained a significant liquidity buffer and limited exposure to higher-risk asset classes. As spreads swung from cycle tights to near historically wide levels, the Fund profitably unwound credit protection credit default swap index hedges and took advantage of dislocations across corporate credit markets by adding both investment-grade and high-yield corporate exposure.
The resetting of valuations across most asset classes presented opportunities and prompted us to meaningfully increase the Fund’s credit beta. Beginning in mid-March, credit spreads reached levels that had rarely been wider, which completely changed the value proposition and upside/ downside risk of investing in credit. The most attractive categories of focus have been new issue investment-grade corporates, select opportunities in the high-yield and loan sectors, and secondary market opportunities in structured credit. Even as credit spreads retraced from their mid-March wides, they still presented attractive long-term value.
Over the 12-month period, investment-grade corporate credit was the largest contributor to Fund performance. Scale, revenue diversity, and several liquidity levers at their disposal continue to help investment-grade-rated companies weather the pandemic, and makes the sector an attractive place to allocate capital. Investment-grade companies have bolstered their balance sheets by terming out debt maturities at historically low interest rates. After a robust record supply in 2020, totaling roughly $1.8 trillion, street estimates for 2021 predict about $1.2 trillion in issuance, which should support a favorable technical backdrop for credit investors. The global search for yield remains strong and greater dollar liquidity has helped keep the cost of currency hedging for foreign investors low, so we continue to see robust overseas demand for U.S. credit. Headlines on election concerns, stimulus rhetoric, and increased COVID-19 cases all contributed to short term volatility. However, we believe the investment-grade corporate bond market will see buyers step in at wider levels and we anticipate spreads will trade relatively range bound into the new year.
Structured credit, which totaled a quarter of the Fund’s allocation at period end, added to performance. Improving sentiment toward broader market risk continued to flow into the structured credit markets. We continued to favor senior tranches, as subordinated positions may encounter further credit losses that are not yet priced in should the economic impact of COVID-19, coupled with a lack of a fiscal stimulus bill, persist. With that said, we see opportunities in whole-business asset-backed securities (“ABS”) financing for market-leading quick-service restaurant concepts, digital infrastructure securitizations, and select esoteric ABS that offer compelling yields with strong credit fundamentals.
Since the initial increase of borrowers in forbearance in April 2020, residential mortgage-backed securities’ credit performance stabilized, and spreads tightened. New-home starts accelerated past expectations during the third quarter of 2020, leading to more confidence within the sector. Mortgage credit performance will continue to be dependent on the broader economy, but most of the positions in the Fund are not reliant on a sustained recovery given that the exposure is significantly seasoned.
Since March 2020, the Fund added high-yield exposure in the higher quality portion of the market in particular, including in fallen angels. The U.S. Federal Reserve’s (the “Fed’s”) SMCCF program remained in place and continued to support the market mostly via the supportive sentiment it engenders as opposed to the total purchase volumes. The facility has not used the vast majority of its buying power and would likely step in if
36 | THE GUGGENHEIM FUNDS ANNUAL REPORT | |
MANAGERS’ COMMENTARY (Unaudited)(concluded) | December 31, 2020 |
credit volatility resurfaces. While new-issue supply has set all-time highs in 2020, as $400 billion has been issued in high yield, compared to $275 billion last year, investor demand has remained very strong. We opportunistically sourced high yield bonds for the portfolio, especially via the primary market, given the attractive relative yield pickup versus other sectors.
Overall duration ended the period at 7.5 years versus the benchmark’s duration of 6.1 years, and the positioning serves as a risk ballast to the strategy’s credit allocation. This is also consistent with our view that the Fed will be able to keep rates inside 10 years from rising substantially and the possibility of negative rates at some point. Past economic cycles, such as 2001 and 2009, have shown that it takes several years for U.S. Treasury yields to bottom.
The Fund used the following derivative types during the period: options, futures contracts, swap agreements, and forward foreign currency exchange contracts. Synthetic, over-the-counter instruments, tracking spreads on the 2Y-10Y constant maturity swap and presented as call options, were used for hedging purposes. Futures contracts were used to manage portfolio duration, for income, and for hedging purposes. Total return swap agreements were used for income. Interest rate swap agreements were used to manage portfolio duration and for hedging. Credit default swap agreements were used for hedging as well as to achieve index exposure to the broader investment grade and high yield credit markets. Forward foreign currency exchange contracts were used for income and hedging purposes. Derivatives used for hedging performed as expected. The use of derivatives contributed to Fund performance.
The Fund may invest in certain of the underlying series of Guggenheim Funds Trust and Guggenheim Strategy Funds Trust, including Guggenheim Ultra Short Duration, Guggenheim Strategy Fund II, Guggenheim Strategy Fund III, and Guggenheim Variable Insurance Strategy Fund III, (collectively, the “Short-Term Investment Vehicles”), each of which are open-end management investment companies managed by Guggenheim Investments. The Short Term Investment Vehicles, which launched on March 11, 2014, are offered as short term investment options only to mutual funds, trusts, and other accounts managed by Guggenheim Investments and/or its affiliates, and are not available to the public, with the exception of Guggenheim Ultra Short Duration Fund, which is available to the public. Guggenheim Strategy Fund II, Guggenheim Strategy Fund III, and Guggenheim Variable Insurance Strategy Fund III do not charge an investment management fee. Guggenheim Ultra Short Duration Fund charges an investment management fee, but the Fund’s adviser has agreed to waive fees to the extent necessary to offset the proportionate share of any management fee paid by the Fund with respect to its investment in such affiliated fund. For the one-year period ended December 31, 2020, investment in the Short-Term Investment Vehicles benefited Fund performance.
Performance displayed represents past performance which is no guarantee of future results.
The opinions and forecast expressed may not actually come to pass. This information is subject to change at any time, based on market and other conditions, and should not be construed as a recommendation of any specific security or strategy.
| | THE GUGGENHEIM FUNDS ANNUAL REPORT | 37 |
PERFORMANCE REPORT AND FUND PROFILE (Unaudited) | December 31, 2020 |
SERIES E (TOTAL RETURN BOND SERIES)
OBJECTIVE: Seeks to provide total return, comprised of current income and capital appreciation.
Holdings Diversification (Market Exposure as % of Net Assets)

“Holdings Diversification (Market Exposure as % of Net Assets)” excludes any temporary cash investments, investments in Guggenheim Strategy Funds Trust mutual funds, or investments in Guggenheim Ultra Short Duration Fund.
Inception Date: April 26, 1985 |
Ten Largest Holdings (% of Total Net Assets) |
Guggenheim Total Return Bond Fund — R6-Class | 3.9% |
Guggenheim Strategy Fund II | 2.9% |
iShares iBoxx $ Investment Grade Corporate Bond ETF | 2.7% |
U.S. Treasury Strips due 2/15/50 | 1.8% |
Pershing Square Tontine Holdings, Ltd. — Class A | 1.2% |
Guggenheim Ultra Short Duration Fund — Institutional Class | 1.2% |
iShares iBoxx High Yield Corporate Bond ETF | 1.0% |
Octagon Investment Partners 49 Ltd. | 1.0% |
Station Place Securitization Trust Series 2020-16, 1.14% | 0.8% |
SBA Tower Trust, 2.33% | 0.7% |
Top Ten Total | 17.2% |
| | |
“Ten Largest Holdings” excludes any temporary cash or derivative investments. |
38 | THE GUGGENHEIM FUNDS ANNUAL REPORT | |
PERFORMANCE REPORT AND FUND PROFILE (Unaudited)(concluded) | December 31, 2020 |
Cumulative Fund Performance*,†

Average Annual Returns*,†
Periods Ended December 31, 2020
| 1 Year | 5 Year | 10 Year |
Series E (Total Return Bond Series) | 14.21% | 6.59% | 5.47% |
Bloomberg Barclays U.S. Aggregate Bond Index | 7.51% | 4.44% | 3.84% |
Portfolio Composition by Quality Rating1 |
Rating | % of Total
Investments |
Fixed Income Instruments | |
AAA | 22.4% |
AA | 8.3% |
A | 11.6% |
BBB | 26.7% |
BB | 7.2% |
B | 4.9% |
CCC | 0.5% |
CC | 0.7% |
C | 0.2% |
NR2 | 2.1% |
Other Instruments | 15.4% |
Total Investments | 100.0% |
* | The performance data above represents past performance that is not predictive of future results. The investment return and principal value of an investment in the Fund will fluctuate so that an investor’s shares, when redeemed, may be worth more or less than their original cost. Returns are historical and include changes in principal and reinvested dividends and capital gains and do not reflect the effect of taxes. The Bloomberg Barclays U.S. Aggregate Bond Index is an unmanaged index and, unlike the Fund, has no management fees or operating expenses to reduce its reported return. |
† | Performance figures do not reflect fees and expenses associated with an investment in variable insurance products. If returns had taken into account these fees and expenses, performance would have been lower. Shares of a series of Guggenheim Variable Funds Trust are available only through the purchase of such products. |
1 | Source: BlackRock Solutions. Credit quality ratings are measured on a scale that generally ranges from AAA (highest) to D (lowest). All securities except for those labeled “NR” have been rated by Moody’s, Standard & Poor’s (“S&P”), or Fitch, each of which is a Nationally Recognized Statistical Rating Organization (“NRSRO”). For purposes of this presentation, when ratings are available from more than one agency, the highest rating is used. Guggenheim Investments has converted ratings to the equivalent S&P rating. Security ratings are determined at the time of purchase and may change thereafter. |
2 | NR (not rated) securities do not necessarily indicate low credit quality. |
| | THE GUGGENHEIM FUNDS ANNUAL REPORT | 39 |
SCHEDULE OF INVESTMENTS | December 31, 2020 |
SERIES E (TOTAL RETURN BOND SERIES) | |
| | Shares | | | Value | |
COMMON STOCKS† - 1.2% |
| | | | | | | | | |
Diversified - 1.2% |
Pershing Square Tontine Holdings, Ltd. — Class A* | | | 76,590 | | | $ | 2,123,075 | |
| | | | | | | | | |
Total Common Stocks | | | | |
(Cost $1,483,472) | | | | | | | 2,123,075 | |
| | | | | | | | | |
PREFERRED STOCKS†† - 1.2% |
Financial - 1.2% |
Wells Fargo & Co., 4.70% | | | 16,000 | | | | 422,080 | |
Public Storage, 4.63% | | | 14,400 | | | | 390,816 | |
Bank of America Corp., 4.38%* | | | 12,000 | | | | 318,600 | |
American Financial Group, Inc., 4.50% due 09/15/60 | | | 10,000 | | | | 278,700 | |
First Republic Bank, 4.13% | | | 6,000 | | | | 158,640 | |
CNO Financial Group, Inc., 5.13% due 11/25/60* | | | 6,000 | | | | 157,620 | |
Assurant, Inc., 5.25% due 01/15/61* | | | 4,000 | | | | 109,440 | |
W R Berkley Corp., 4.25% due 09/30/60 | | | 4,000 | | | | 105,120 | |
Selective Insurance Group, Inc., 4.60%* | | | 4,000 | | | | 103,360 | |
Public Storage, 4.13% | | | 3,200 | | | | 86,816 | |
Total Financial | | | | | | | 2,131,192 | |
| | | | | | | | | |
Total Preferred Stocks | | | | |
(Cost $1,990,000) | | | | | | | 2,131,192 | |
| | | | | | | | | |
WARRANTS† - 0.0% |
Pershing Square Tontine Holdings, Ltd. | | | | | | | | |
$23.00, 07/24/25 | | | 8,510 | | | | 81,696 | |
Total Warrants | | | | |
(Cost $48,328) | | | | | | | 81,696 | |
| | | | | | | | | |
EXCHANGE-TRADED FUNDS† - 3.6% |
iShares iBoxx $ Investment Grade Corporate Bond ETF | | | 34,090 | | | | 4,708,852 | |
iShares iBoxx High Yield Corporate Bond ETF | | | 20,120 | | | | 1,756,476 | |
Total Exchange-Traded Funds | | | | |
(Cost $5,891,665) | | | | | | | 6,465,328 | |
| | | | | | | | | |
MUTUAL FUNDS† - 8.0% |
Guggenheim Total Return Bond Fund — R6-Class2 | | | 234,783 | | | | 6,977,737 | |
Guggenheim Strategy Fund II2 | | | 204,222 | | | | 5,097,370 | |
Guggenheim Ultra Short Duration Fund — Institutional Class2 | | | 208,818 | | | | 2,084,004 | |
Total Mutual Funds | | | | |
(Cost $13,359,086) | | | | | | | 14,159,111 | |
| | | | | | | | | |
MONEY MARKET FUND† - 1.2% |
Dreyfus Treasury Securities Cash Management Fund — Institutional Shares, 0.01%3 | | | 2,111,910 | | | | 2,111,910 | |
Total Money Market Fund | | | | |
(Cost $2,111,910) | | | | | | | 2,111,910 | |
| | | | | | | | | |
| | Face
Amount | | | | |
CORPORATE BONDS†† - 40.3% |
Financial - 16.0% | | | | | | | | |
American International Group, Inc. | | | | | | | | |
3.40% due 06/30/30 | | $ | 660,000 | | | | 756,262 | |
4.38% due 06/30/50 | | | 550,000 | | | | 720,152 | |
Wells Fargo & Co. | | | | | | | | |
3.07% due 04/30/414 | | | 1,100,000 | | | | 1,196,579 | |
2.57% due 02/11/314 | | | 150,000 | | | | 159,160 | |
Citizens Financial Group, Inc. | | | | | | | | |
3.25% due 04/30/30 | | | 1,110,000 | | | | 1,250,858 | |
Nationwide Mutual Insurance Co. | | | | | | | | |
4.35% due 04/30/505 | | | 950,000 | | | | 1,115,986 | |
Pershing Square Holdings Ltd. | | | | | | | | |
3.25% due 11/15/305 | | | 1,000,000 | | | | 1,012,950 | |
Charles Schwab Corp. | | | | | | | | |
4.00%1,4 | | | 500,000 | | | | 526,250 | |
5.38%1,4 | | | 400,000 | | | | 445,500 | |
Bank of America Corp. | | | | | | | | |
2.59% due 04/29/314 | | | 890,000 | | | | 953,865 | |
Reliance Standard Life Global Funding II | | | | | | | | |
2.75% due 05/07/255 | | | 800,000 | | | | 848,553 | |
Citigroup, Inc. | | | | | | | | |
2.57% due 06/03/314 | | | 590,000 | | | | 628,857 | |
4.00%1,4 | | | 200,000 | | | | 205,250 | |
Reinsurance Group of America, Inc. | | | | | | | | |
3.15% due 06/15/30 | | | 750,000 | | | | 820,063 | |
Arch Capital Group Ltd. | | | | | | | | |
3.64% due 06/30/50 | | | 700,000 | | | | 814,640 | |
Markel Corp. | | | | | | | | |
6.00%1,4 | | | 660,000 | | | | 730,125 | |
Wilton RE Ltd. | | | | | | | | |
6.00%†††,1,4,5 | | | 700,000 | | | | 725,221 | |
JPMorgan Chase & Co. | | | | | | | | |
2.96% due 05/13/314 | | | 230,000 | | | | 252,216 | |
4.49% due 03/24/314 | | | 200,000 | | | | 246,026 | |
3.11% due 04/22/414 | | | 200,000 | | | | 223,553 | |
GLP Capital Limited Partnership / GLP Financing II, Inc. | | | | | | | | |
5.30% due 01/15/29 | | | 300,000 | | | | 347,085 | |
4.00% due 01/15/31 | | | 290,000 | | | | 316,454 | |
Lincoln National Corp. | | | | | | | | |
3.40% due 01/15/31 | | | 370,000 | | | | 423,993 | |
4.38% due 06/15/50 | | | 150,000 | | | | 193,319 | |
Intercontinental Exchange, Inc. | | | | | | | | |
2.65% due 09/15/40 | | | 600,000 | | | | 615,795 | |
Equitable Holdings, Inc. | | | | | | | | |
4.95%1,4 | | | 550,000 | | | | 585,062 | |
Fidelity National Financial, Inc. | | | | | | | | |
3.40% due 06/15/30 | | | 300,000 | | | | 329,452 | |
2.45% due 03/15/31 | | | 230,000 | | | | 233,938 | |
Deloitte LLP | | | | | | | | |
3.56% due 05/07/30††† | | | 500,000 | | | | 526,617 | |
Iron Mountain, Inc. | | | | | | | | |
5.25% due 07/15/305 | | | 250,000 | | | | 270,000 | |
5.63% due 07/15/325 | | | 125,000 | | | | 137,813 | |
4.50% due 02/15/315 | | | 100,000 | | | | 104,750 | |
40 | THE GUGGENHEIM FUNDS ANNUAL REPORT | SEE NOTES TO FINANCIAL STATEMENTS. |
SCHEDULE OF INVESTMENTS (continued) | December 31, 2020 |
SERIES E (TOTAL RETURN BOND SERIES) | |
| | Face
Amount | | | Value | |
Host Hotels & Resorts, LP | | | | | | | | |
3.50% due 09/15/30 | | $ | 435,000 | | | $ | 458,291 | |
KKR Group Finance Company VI LLC | | | | | | | | |
3.75% due 07/01/295 | | | 390,000 | | | | 453,806 | |
OneAmerica Financial Partners, Inc. | | | | | | | | |
4.25% due 10/15/505 | | | 410,000 | | | | 442,532 | |
Ares Finance Company II LLC | | | | | | | | |
3.25% due 06/15/305 | | | 410,000 | | | | 434,035 | |
NFP Corp. | | | | | | | | |
7.00% due 05/15/255 | | | 200,000 | | | | 215,000 | |
6.88% due 08/15/285 | | | 200,000 | | | | 213,536 | |
Standard Chartered plc | | | | | | | | |
4.64% due 04/01/314,5 | | | 350,000 | | | | 423,395 | |
MetLife, Inc. | | | | | | | | |
3.85%1,4 | | | 400,000 | | | | 422,000 | |
Alleghany Corp. | | | | | | | | |
3.63% due 05/15/30 | | | 370,000 | | | | 416,237 | |
Bank of New York Mellon Corp. | | | | | | | | |
3.70%1,4 | | | 250,000 | | | | 258,662 | |
4.70%1,4 | | | 140,000 | | | | 154,392 | |
First American Financial Corp. | | | | | | | | |
4.00% due 05/15/30 | | | 360,000 | | | | 412,658 | |
Quicken Loans LLC / Quicken Loans Company-Issuer, Inc. | | | | | | | | |
3.88% due 03/01/315 | | | 350,000 | | | | 363,125 | |
Prudential plc | | | | | | | | |
3.13% due 04/14/30 | | | 300,000 | | | | 340,120 | |
Liberty Mutual Group, Inc. | | | | | | | | |
3.95% due 05/15/605 | | | 280,000 | | | | 334,208 | |
Goldman Sachs Group, Inc. | | | | | | | | |
3.50% due 04/01/25 | | | 300,000 | | | | 333,297 | |
Belrose Funding Trust | | | | | | | | |
2.33% due 08/15/305 | | | 320,000 | | | | 329,332 | |
KKR Group Finance Company VIII LLC | | | | | | | | |
3.50% due 08/25/505 | | | 290,000 | | | | 321,843 | |
Everest Reinsurance Holdings, Inc. | | | | | | | | |
3.50% due 10/15/50 | | | 280,000 | | | | 317,618 | |
Macquarie Bank Ltd. | | | | | | | | |
3.62% due 06/03/305 | | | 290,000 | | | | 317,482 | |
Jefferies Group LLC | | | | | | | | |
2.75% due 10/15/32 | | | 300,000 | | | | 314,848 | |
Credit Suisse Group AG | | | | | | | | |
4.19% due 04/01/314,5 | | | 250,000 | | | | 294,243 | |
Cushman & Wakefield US Borrower LLC | | | | | | | | |
6.75% due 05/15/286 | | | 250,000 | | | | 275,625 | |
Brookfield Finance, Inc. | | | | | | | | |
3.50% due 03/30/51 | | | 240,000 | | | | 256,310 | |
Crown Castle International Corp. | | | | | | | | |
3.30% due 07/01/30 | | | 201,000 | | | | 224,975 | |
Loews Corp. | | | | | | | | |
3.20% due 05/15/30 | | | 190,000 | | | | 215,843 | |
Allianz SE | | | | | | | | |
3.50%1,4,5 | | | 200,000 | | | | 203,750 | |
Alexandria Real Estate Equities, Inc. | | | | | | | | |
4.90% due 12/15/30 | | | 150,000 | | | | 190,886 | |
Kemper Corp. | | | | | | | | |
2.40% due 09/30/30 | | | 170,000 | | | | 173,070 | |
Australia & New Zealand Banking Group Ltd. | | | | | | | | |
2.57% due 11/25/354,5 | | | 150,000 | | | | 153,026 | |
Prudential Financial, Inc. | | | | | | | | |
3.70% due 10/01/504 | | | 130,000 | | | | 137,511 | |
Nasdaq, Inc. | | | | | | | | |
3.25% due 04/28/50 | | | 110,000 | | | | 120,870 | |
PartnerRe Finance B LLC | | | | | | | | |
4.50% due 10/01/504 | | | 110,000 | | | | 115,242 | |
Westpac Banking Corp. | | | | | | | | |
2.96% due 11/16/40 | | | 100,000 | | | | 106,487 | |
CIT Group, Inc. | | | | | | | | |
3.93% due 06/19/244 | | | 100,000 | | | | 105,750 | |
United Shore Financial Services LLC | | | | | | | | |
5.50% due 11/15/255 | | | 100,000 | | | | 105,500 | |
Ameriprise Financial, Inc. | | | | | | | | |
3.00% due 04/02/25 | | | 90,000 | | | | 97,980 | |
Brown & Brown, Inc. | | | | | | | | |
2.38% due 03/15/31 | | | 90,000 | | | | 94,195 | |
Apollo Management Holdings, LP | | | | | | | | |
2.65% due 06/05/305 | | | 90,000 | | | | 91,992 | |
Aflac, Inc. | | | | | | | | |
3.60% due 04/01/30 | | | 70,000 | | | | 82,392 | |
American Equity Investment Life Holding Co. | | | | | | | | |
5.00% due 06/15/27 | | | 69,000 | | | | 77,933 | |
Assurant, Inc. | | | | | | | | |
1.50% (3 Month USD LIBOR + 1.25%) due 03/26/217 | | | 62,000 | | | | 62,001 | |
SBA Communications Corp. | | | | | | | | |
3.88% due 02/15/275 | | | 50,000 | | | | 52,515 | |
Weyerhaeuser Co. | | | | | | | | |
4.00% due 04/15/30 | | | 43,000 | | | | 50,922 | |
Total Financial | | | | | | | 28,281,779 | |
| | | | | | | | | |
Consumer, Non-cyclical - 6.5% | | | | | | | | |
Sysco Corp. | | | | | | | | |
5.95% due 04/01/30 | | | 920,000 | | | | 1,208,922 | |
CoStar Group, Inc. | | | | | | | | |
2.80% due 07/15/305 | | | 740,000 | | | | 768,887 | |
DaVita, Inc. | | | | | | | | |
4.63% due 06/01/305 | | | 377,000 | | | | 400,091 | |
3.75% due 02/15/315 | | | 303,000 | | | | 307,654 | |
Constellation Brands, Inc. | | | | | | | | |
2.88% due 05/01/30 | | | 500,000 | | | | 547,890 | |
3.75% due 05/01/50 | | | 120,000 | | | | 141,294 | |
Quanta Services, Inc. | | | | | | | | |
2.90% due 10/01/30 | | | 530,000 | | | | 568,243 | |
BAT Capital Corp. | | | | | | | | |
3.98% due 09/25/50 | | | 300,000 | | | | 313,062 | |
4.70% due 04/02/27 | | | 190,000 | | | | 223,416 | |
Johns Hopkins University | | | | | | | | |
2.81% due 01/01/60 | | | 500,000 | | | | 527,271 | |
Children’s Hospital Corp. | | | | | | | | |
2.59% due 02/01/50 | | | 500,000 | | | | 499,893 | |
Royalty Pharma plc | | | | | | | | |
3.55% due 09/02/505 | | | 310,000 | | | | 330,290 | |
2.20% due 09/02/305 | | | 160,000 | | | | 164,307 | |
SEE NOTES TO FINANCIAL STATEMENTS. | THE GUGGENHEIM FUNDS ANNUAL REPORT | 41 |
SCHEDULE OF INVESTMENTS (continued) | December 31, 2020 |
SERIES E (TOTAL RETURN BOND SERIES) | |
| | Face
Amount | | | Value | |
Kraft Heinz Foods Co. | | | | | | | | |
4.38% due 06/01/46 | | $ | 180,000 | | | $ | 194,750 | |
4.88% due 10/01/495 | | | 75,000 | | | | 87,497 | |
4.25% due 03/01/315 | | | 75,000 | | | | 83,629 | |
5.50% due 06/01/505 | | | 50,000 | | | | 62,988 | |
5.00% due 06/04/42 | | | 50,000 | | | | 58,664 | |
Altria Group, Inc. | | | | | | | | |
3.40% due 05/06/30 | | | 170,000 | | | | 190,739 | |
2.35% due 05/06/25 | | | 150,000 | | | | 159,373 | |
4.45% due 05/06/50 | | | 50,000 | | | | 59,111 | |
Anheuser-Busch InBev Worldwide, Inc. | | | | | | | | |
3.50% due 06/01/30 | | | 295,000 | | | | 341,717 | |
Nielsen Finance LLC / Nielsen Finance Co. | | | | | | | | |
5.63% due 10/01/285 | | | 300,000 | | | | 325,965 | |
McCormick & Company, Inc. | | | | | | | | |
2.50% due 04/15/30 | | | 300,000 | | | | 321,255 | |
Zimmer Biomet Holdings, Inc. | | | | | | | | |
3.55% due 03/20/30 | | | 283,000 | | | | 320,464 | |
Centene Corp. | | | | | | | | |
3.00% due 10/15/30 | | | 300,000 | | | | 317,970 | |
California Institute of Technology | | | | | | | | |
3.65% due 09/01/19 | | | 225,000 | | | | 255,494 | |
Global Payments, Inc. | | | | | | | | |
2.90% due 05/15/30 | | | 210,000 | | | | 228,663 | |
US Foods, Inc. | | | | | | | | |
6.25% due 04/15/255 | | | 200,000 | | | | 213,750 | |
Kimberly-Clark de Mexico SAB de CV | | | | | | | | |
2.43% due 07/01/315 | | | 200,000 | | | | 206,604 | |
Keurig Dr Pepper, Inc. | | | | | | | | |
3.20% due 05/01/30 | | | 179,000 | | | | 202,668 | |
WEX, Inc. | | | | | | | | |
4.75% due 02/01/235 | | | 200,000 | | | | 200,250 | |
Thermo Fisher Scientific, Inc. | | | | | | | | |
4.50% due 03/25/30 | | | 150,000 | | | | 187,466 | |
Transurban Finance Company Pty Ltd. | | | | | | | | |
2.45% due 03/16/315 | | | 150,000 | | | | 157,355 | |
Universal Health Services, Inc. | | | | | | | | |
2.65% due 10/15/305 | | | 150,000 | | | | 155,717 | |
Spectrum Brands, Inc. | | | | | | | | |
5.75% due 07/15/25 | | | 150,000 | | | | 154,890 | |
Hologic, Inc. | | | | | | | | |
3.25% due 02/15/295 | | | 150,000 | | | | 152,625 | |
Avantor Funding, Inc. | | | | | | | | |
4.63% due 07/15/285 | | | 125,000 | | | | 132,187 | |
Smithfield Foods, Inc. | | | | | | | | |
3.00% due 10/15/305 | | | 110,000 | | | | 116,388 | |
Gartner, Inc. | | | | | | | | |
3.75% due 10/01/305 | | | 100,000 | | | | 105,376 | |
Service Corporation International | | | | | | | | |
3.38% due 08/15/30 | | | 100,000 | | | | 104,021 | |
Syneos Health, Inc. | | | | | | | | |
3.63% due 01/15/295 | | | 100,000 | | | | 100,276 | |
Prime Security Services Borrower LLC / Prime Finance, Inc. | | | | | | | | |
3.38% due 08/31/275 | | | 100,000 | | | | 99,250 | |
Tenet Healthcare Corp. | | | | | | | | |
4.63% due 06/15/285 | | | 75,000 | | | | 78,563 | |
Central Garden & Pet Co. | | | | | | | | |
4.13% due 10/15/30 | | | 75,000 | | | | 78,188 | |
Jaguar Holding Company II / PPD Development, LP | | | | | | | | |
4.63% due 06/15/255 | | | 50,000 | | | | 52,731 | |
Kronos Acquisition Holdings, Inc. / KIK Custom Products, Inc. | | | | | | | | |
5.00% due 12/31/265 | | | 50,000 | | | | 52,160 | |
Total Consumer, Non-cyclical | | | | | | | 11,559,964 | |
| | | | | | | | | |
Industrial - 5.0% | | | | | | | | |
Boeing Co. | | | | | | | | |
5.15% due 05/01/30 | | | 970,000 | | | | 1,173,944 | |
5.81% due 05/01/50 | | | 490,000 | | | | 675,291 | |
5.71% due 05/01/40 | | | 490,000 | | | | 635,883 | |
FedEx Corp. | | | | | | | | |
4.25% due 05/15/30 | | | 602,000 | | | | 731,438 | |
WRKCo, Inc. | | | | | | | | |
3.00% due 06/15/33 | | | 660,000 | | | | 725,120 | |
Amsted Industries, Inc. | | | | | | | | |
4.63% due 05/15/305 | | | 470,000 | | | | 492,325 | |
BAE Systems plc | | | | | | | | |
3.40% due 04/15/305 | | | 400,000 | | | | 453,150 | |
Crown Americas LLC / Crown Americas Capital Corporation VI | | | | | | | | |
4.75% due 02/01/26 | | | 400,000 | | | | 415,000 | |
Owens Corning | | | | | | | | |
3.88% due 06/01/30 | | | 320,000 | | | | 369,109 | |
Howmet Aerospace, Inc. | | | | | | | | |
6.75% due 01/15/28 | | | 300,000 | | | | 366,852 | |
Textron, Inc. | | | | | | | | |
2.45% due 03/15/31 | | | 350,000 | | | | 360,340 | |
Acuity Brands Lighting, Inc. | | | | | | | | |
2.15% due 12/15/30 | | | 350,000 | | | | 355,086 | |
Ardagh Packaging Finance plc / Ardagh Holdings USA, Inc. | | | | | | | | |
4.13% due 08/15/265 | | | 250,000 | | | | 261,250 | |
Standard Industries, Inc. | | | | | | | | |
4.38% due 07/15/305 | | | 125,000 | | | | 133,716 | |
3.38% due 01/15/315 | | | 125,000 | | | | 125,625 | |
Ball Corp. | | | | | | | | |
2.88% due 08/15/30 | | | 240,000 | | | | 239,400 | |
GATX Corp. | | | | | | | | |
4.00% due 06/30/30 | | | 140,000 | | | | 165,452 | |
3.50% due 03/15/28 | | | 50,000 | | | | 56,225 | |
Vulcan Materials Co. | | | | | | | | |
3.50% due 06/01/30 | | | 190,000 | | | | 218,236 | |
FLIR Systems, Inc. | | | | | | | | |
2.50% due 08/01/30 | | | 170,000 | | | | 178,434 | |
Ryder System, Inc. | | | | | | | | |
3.35% due 09/01/25 | | | 160,000 | | | | 177,852 | |
Xylem, Inc. | | | | | | | | |
2.25% due 01/30/31 | | | 150,000 | | | | 157,977 | |
Flowserve Corp. | | | | | | | | |
3.50% due 10/01/30 | | | 120,000 | | | | 128,093 | |
Graphic Packaging International LLC | | | | | | | | |
3.50% due 03/01/295 | | | 125,000 | | | | 127,813 | |
42 | THE GUGGENHEIM FUNDS ANNUAL REPORT | SEE NOTES TO FINANCIAL STATEMENTS. |
SCHEDULE OF INVESTMENTS (continued) | December 31, 2020 |
SERIES E (TOTAL RETURN BOND SERIES) | |
| | Face
Amount | | | Value | |
Oshkosh Corp. | | | | | | | | |
3.10% due 03/01/30 | | $ | 50,000 | | | $ | 54,532 | |
Berry Global, Inc. | | | | | | | | |
1.57% due 01/15/265 | | | 50,000 | | | | 50,452 | |
Total Industrial | | | | | | | 8,828,595 | |
| | | | | | | | | |
Consumer, Cyclical - 4.2% | | | | | | | | |
Delta Air Lines, Inc. | | | | | | | | |
7.00% due 05/01/255 | | | 1,070,000 | | | | 1,235,371 | |
Marriott International, Inc. | | | | | | | | |
4.63% due 06/15/30 | | | 340,000 | | | | 398,983 | |
3.50% due 10/15/32 | | | 330,000 | | | | 360,883 | |
5.75% due 05/01/25 | | | 250,000 | | | | 292,425 | |
Walgreens Boots Alliance, Inc. | | | | | | | | |
4.10% due 04/15/50 | | | 577,000 | | | | 610,743 | |
3.20% due 04/15/30 | | | 173,000 | | | | 187,931 | |
Starbucks Corp. | | | | | | | | |
2.55% due 11/15/30 | | | 600,000 | | | | 648,897 | |
Hyatt Hotels Corp. | | | | | | | | |
5.38% due 04/23/25 | | | 220,000 | | | | 248,626 | |
5.75% due 04/23/30 | | | 190,000 | | | | 233,565 | |
VF Corp. | | | | | | | | |
2.95% due 04/23/30 | | | 380,000 | | | | 420,452 | |
Hilton Domestic Operating Company, Inc. | | | | | | | | |
3.75% due 05/01/295 | | | 400,000 | | | | 417,076 | |
Choice Hotels International, Inc. | | | | | | | | |
3.70% due 01/15/31 | | | 360,000 | | | | 398,707 | |
1011778 BC ULC / New Red Finance, Inc. | | | | | | | | |
4.00% due 10/15/305 | | | 300,000 | | | | 304,029 | |
3.88% due 01/15/285 | | | 75,000 | | | | 76,183 | |
Mileage Plus Holdings LLC / Mileage Plus Intellectual Property Assets Ltd. | | | | | | | | |
6.50% due 06/20/275 | | | 350,000 | | | | 376,250 | |
Delta Air Lines Inc. / SkyMiles IP Ltd. | | | | | | | | |
4.50% due 10/20/255 | | | 300,000 | | | | 320,658 | |
Lowe’s Companies, Inc. | | | | | | | | |
4.50% due 04/15/30 | | | 250,000 | | | | 311,192 | |
Aramark Services, Inc. | | | | | | | | |
6.38% due 05/01/255 | | | 200,000 | | | | 213,750 | |
5.00% due 02/01/285 | | | 10,000 | | | | 10,538 | |
WMG Acquisition Corp. | | | | | | | | |
3.00% due 02/15/315 | | | 75,000 | | | | 73,500 | |
3.88% due 07/15/305 | | | 50,000 | | | | 53,139 | |
Dollar General Corp. | | | | | | | | |
3.50% due 04/03/30 | | | 100,000 | | | | 114,797 | |
Allison Transmission, Inc. | | | | | | | | |
3.75% due 01/30/315 | | | 100,000 | | | | 102,312 | |
Hanesbrands, Inc. | | | | | | | | |
5.38% due 05/15/255 | | | 55,000 | | | | 58,191 | |
Performance Food Group, Inc. | | | | | | | | |
6.88% due 05/01/255 | | | 50,000 | | | | 53,500 | |
Total Consumer, Cyclical | | | | | | | 7,521,698 | |
| | | | | | | | | |
Communications - 3.5% | | | | | | | | |
ViacomCBS, Inc. | | | | | | | | |
4.95% due 01/15/31 | | | 617,000 | | | | 774,414 | |
4.95% due 05/19/50 | | | 320,000 | | | | 414,503 | |
Level 3 Financing, Inc. | | | | | | | | |
4.25% due 07/01/285 | | | 350,000 | | | | 359,625 | |
3.63% due 01/15/295 | | | 350,000 | | | | 349,125 | |
Charter Communications Operating LLC / Charter Communications Operating Capital | | | | | | | | |
2.80% due 04/01/31 | | | 625,000 | | | | 661,050 | |
AT&T, Inc. | | | | | | | | |
2.75% due 06/01/31 | | | 410,000 | | | | 438,135 | |
Booking Holdings, Inc. | | | | | | | | |
4.63% due 04/13/30 | | | 350,000 | | | | 434,903 | |
CSC Holdings LLC | | | | | | | | |
4.13% due 12/01/305 | | | 200,000 | | | | 209,120 | |
3.38% due 02/15/315 | | | 200,000 | | | | 196,250 | |
T-Mobile USA, Inc. | | | | | | | | |
3.88% due 04/15/305 | | | 335,000 | | | | 387,997 | |
Virgin Media Secured Finance plc | | | | | | | | |
4.50% due 08/15/305 | | | 300,000 | | | | 313,500 | |
Cable One, Inc. | | | | | | | | |
4.00% due 11/15/305 | | | 300,000 | | | | 311,625 | |
Virgin Media Vendor Financing Notes IV DAC | | | | | | | | |
5.00% due 07/15/285 | | | 200,000 | | | | 208,000 | |
Sirius XM Radio, Inc. | | | | | | | | |
4.13% due 07/01/305 | | | 180,000 | | | | 191,587 | |
Verizon Communications, Inc. | | | | | | | | |
3.15% due 03/22/30 | | | 150,000 | | | | 168,212 | |
CCO Holdings LLC / CCO Holdings Capital Corp. | | | | | | | | |
4.50% due 05/01/325 | | | 100,000 | | | | 106,772 | |
4.25% due 02/01/315 | | | 50,000 | | | | 52,693 | |
Radiate Holdco LLC / Radiate Finance, Inc. | | | | | | | | |
4.50% due 09/15/265 | | | 150,000 | | | | 154,688 | |
QualityTech Limited Partnership / QTS Finance Corp. | | | | | | | | |
3.88% due 10/01/285 | | | 150,000 | | | | 153,000 | |
Fox Corp. | | | | | | | | |
3.05% due 04/07/25 | | | 60,000 | | | | 65,472 | |
3.50% due 04/08/30 | | | 50,000 | | | | 56,795 | |
Altice France S.A. | | | | | | | | |
7.38% due 05/01/265 | | | 100,000 | | | | 105,250 | |
Switch Ltd. | | | | | | | | |
3.75% due 09/15/285 | | | 50,000 | | | | 50,750 | |
Total Communications | | | | | | | 6,163,466 | |
| | | | | | | | | |
Energy - 1.6% | | | | | | | | |
BP Capital Markets plc | | | | | | | | |
4.88%1,4 | | | 880,000 | | | | 981,816 | |
Galaxy Pipeline Assets Bidco Ltd. | | | | | | | | |
3.25% due 09/30/405 | | | 700,000 | | | | 738,584 | |
Sabine Pass Liquefaction LLC | | | | | | | | |
4.50% due 05/15/305 | | | 400,000 | | | | 474,111 | |
Magellan Midstream Partners, LP | | | | | | | | |
3.25% due 06/01/30 | | | 190,000 | | | | 214,703 | |
Equinor ASA | | | | | | | | |
2.38% due 05/22/30 | | | 160,000 | | | | 171,256 | |
Valero Energy Corp. | | | | | | | | |
2.15% due 09/15/27 | | | 140,000 | | | | 143,047 | |
SEE NOTES TO FINANCIAL STATEMENTS. | THE GUGGENHEIM FUNDS ANNUAL REPORT | 43 |
SCHEDULE OF INVESTMENTS (continued) | December 31, 2020 |
SERIES E (TOTAL RETURN BOND SERIES) | |
| | Face
Amount | | | Value | |
Midwest Connector Capital Company LLC | | | | | | | | |
4.63% due 04/01/295 | | $ | 100,000 | | | $ | 104,826 | |
Baker Hughes a GE Company LLC / Baker Hughes Co-Obligor, Inc. | | | | | | | | |
4.49% due 05/01/30 | | | 50,000 | | | | 60,083 | |
Total Energy | | | | | | | 2,888,426 | |
| | | | | | | | | |
Technology - 1.6% | | | | | | | | |
NetApp, Inc. | | | | | | | | |
2.70% due 06/22/30 | | | 950,000 | | | | 1,020,758 | |
Broadcom, Inc. | | | | | | | | |
4.15% due 11/15/30 | | | 510,000 | | | | 590,459 | |
Qorvo, Inc. | | | | | | | | |
4.38% due 10/15/29 | | | 170,000 | | | | 187,037 | |
3.38% due 04/01/315 | | | 100,000 | | | | 103,250 | |
MSCI, Inc. | | | | | | | | |
3.88% due 02/15/315 | | | 250,000 | | | | 264,375 | |
NCR Corp. | | | | | | | | |
5.00% due 10/01/285 | | | 250,000 | | | | 263,750 | |
Leidos, Inc. | | | | | | | | |
2.30% due 02/15/315 | | | 250,000 | | | | 254,550 | |
Boxer Parent Company, Inc. | | | | | | | | |
7.13% due 10/02/255 | | | 100,000 | | | | 108,545 | |
Total Technology | | | | | | | 2,792,724 | |
| | | | | | | | | |
Basic Materials - 1.2% | | | | | | | | |
Newcrest Finance Pty Ltd. | | | | | | | | |
3.25% due 05/13/305 | | | 460,000 | | | | 508,098 | |
4.20% due 05/13/505 | | | 220,000 | | | | 268,913 | |
Anglo American Capital plc | | | | | | | | |
5.63% due 04/01/305 | | | 200,000 | | | | 254,126 | |
2.63% due 09/10/305 | | | 200,000 | | | | 209,138 | |
Alcoa Nederland Holding BV | | | | | | | | |
5.50% due 12/15/275 | | | 200,000 | | | | 218,854 | |
Minerals Technologies, Inc. | | | | | | | | |
5.00% due 07/01/285 | | | 200,000 | | | | 209,280 | |
Ingevity Corp. | | | | | | | | |
3.88% due 11/01/285 | | | 150,000 | | | | 151,125 | |
Reliance Steel & Aluminum Co. | | | | | | | | |
2.15% due 08/15/30 | | | 100,000 | | | | 102,742 | |
Steel Dynamics, Inc. | | | | | | | | |
3.25% due 01/15/31 | | | 60,000 | | | | 67,095 | |
Valvoline, Inc. | | | | | | | | |
4.25% due 02/15/305 | | | 50,000 | | | | 53,000 | |
Total Basic Materials | | | | | | | 2,042,371 | |
| | | | | | | | | |
Utilities - 0.7% | | | | | | | | |
Cheniere Corpus Christi Holdings LLC | | | | | | | | |
3.52% due 12/31/39††† | | | 800,000 | | | | 793,100 | |
AES Corp. | | | | | | | | |
3.95% due 07/15/305 | | | 220,000 | | | | 248,690 | |
NRG Energy, Inc. | | | | | | | | |
2.45% due 12/02/275 | | | 200,000 | | | | 210,565 | |
Total Utilities | | | | | | | 1,252,355 | |
| | | | | | | | | |
Total Corporate Bonds | | | | |
(Cost $65,119,970) | | | 71,331,378 | |
| |
ASSET-BACKED SECURITIES†† - 20.1% |
Collateralized Loan Obligations - 11.9% | | | | | | | | |
Octagon Investment Partners 49 Ltd. | | | | | | | | |
due 01/15/335,7 | | | 1,750,000 | | | | 1,750,000 | |
LoanCore Issuer Ltd. | | | | | | | | |
2019-CRE2, 1.66% (1 Month USD LIBOR + 1.50%, Rate Floor: 1.50%) due 05/15/365,7 | | | 550,000 | | | | 547,873 | |
2018-CRE1, 1.66% (1 Month USD LIBOR + 1.50%, Rate Floor: 1.50%) due 05/15/285,7 | | | 500,000 | | | | 498,810 | |
FDF II Ltd. | | | | | | | | |
2016-2A, 4.29% due 05/12/315 | | | 1,000,000 | | | | 1,009,541 | |
Whitebox CLO II Ltd. | | | | | | | | |
2020-2A, 1.99% (3 Month USD LIBOR + 1.75%, Rate Floor: 1.75%) due 10/24/315,7 | | | 1,000,000 | | | | 1,000,171 | |
Cerberus Loan Funding XXX, LP | | | | | | | | |
2020-3A, 2.07% (3 Month USD LIBOR + 1.85%, Rate Floor: 1.85%) due 01/15/335,7 | | | 1,000,000 | | | | 1,000,000 | |
Woodmont 2020-7 Trust | | | | | | | | |
2020-7A, 2.13% (3 Month USD LIBOR + 1.90%, Rate Floor: 0.00%) due 01/15/325,7 | | | 1,000,000 | | | | 1,000,000 | |
Parliament Funding II Ltd. | | | | | | | | |
2020-1A, 2.76% (3 Month USD LIBOR + 2.45%, Rate Floor: 2.45%) due 08/12/305,7 | | | 1,000,000 | | | | 999,983 | |
GoldenTree Loan Management US CLO 1 Ltd. | | | | | | | | |
2020-1A, 1.17% (3 Month USD LIBOR + 0.95%, Rate Floor: 0.95%) due 04/20/295,7 | | | 1,000,000 | | | | 998,023 | |
MidOcean Credit CLO VII | | | | | | | | |
2017-7A, 1.69% (3 Month USD LIBOR + 1.45%, Rate Floor: 0.00%) due 07/15/295,7 | | | 1,000,000 | | | | 997,560 | |
Marathon CLO VII Ltd. | | | | | | | | |
2014-7A, 1.87% (3 Month USD LIBOR + 1.65%, Rate Floor: 0.00%) due 10/28/255,7 | | | 1,000,000 | | | | 997,490 | |
NXT Capital CLO LLC | | | | | | | | |
2017-1A, 1.92% (3 Month USD LIBOR + 1.70%, Rate Floor: 0.00%) due 04/20/295,7 | | | 1,000,000 | | | | 995,356 | |
BXMT Ltd. | | | | | | | | |
2020-FL2, 1.30% (1 Month USD LIBOR + 1.15%, Rate Floor: 1.15%) due 02/16/375,7 | | | 1,000,000 | | | | 986,211 | |
MP CLO VIII Ltd. | | | | | | | | |
2018-2A, 1.13% (3 Month USD LIBOR + 0.91%, Rate Floor: 0.00%) due 10/28/275,7 | | | 876,040 | | | | 870,953 | |
Dryden 37 Senior Loan Fund | | | | | | | | |
2015-37A, due 01/15/315,8 | | | 1,000,000 | | | | 857,450 | |
44 | THE GUGGENHEIM FUNDS ANNUAL REPORT | SEE NOTES TO FINANCIAL STATEMENTS. |
SCHEDULE OF INVESTMENTS (continued) | December 31, 2020 |
SERIES E (TOTAL RETURN BOND SERIES) | |
| | Face
Amount | | | Value | |
Golub Capital Partners CLO Ltd. | | | | | | | | |
2018-36A, 1.53% (3 Month USD LIBOR + 1.30%, Rate Floor: 0.00%) due 02/05/315,7 | | $ | 850,000 | | | $ | 840,228 | |
Dryden 33 Senior Loan Fund | | | | | | | | |
2020-33A, 1.64% (3 Month USD LIBOR + 1.40%, Rate Floor: 1.40%) due 04/15/295,7 | | | 750,000 | | | | 750,000 | |
Fortress Credit Opportunities XI CLO Ltd. | | | | | | | | |
2018-11A, 1.54% (3 Month USD LIBOR + 1.30%, Rate Floor: 0.00%) due 04/15/315,7 | | | 750,000 | | | | 741,300 | |
STWD Ltd. | | | | | | | | |
2019-FL1, 1.76% (1 Month USD LIBOR + 1.60%, Rate Floor: 1.60%) due 07/15/385,7 | | | 750,000 | | | | 741,294 | |
Halcyon Loan Advisors Funding Ltd. | | | | | | | | |
2017-3A, 1.12% (3 Month USD LIBOR + 0.90%, Rate Floor: 0.00%) due 10/18/275,7 | | | 557,005 | | | | 554,410 | |
ABPCI Direct Lending Fund IX LLC | | | | | | | | |
2020-9A, 2.19% (3 Month USD LIBOR + 1.95%, Rate Floor: 1.95%) due 11/18/315,7 | | | 500,000 | | | | 500,921 | |
Wellfleet CLO Ltd. | | | | | | | | |
2020-2A, 1.28% (3 Month USD LIBOR + 1.06%, Rate Floor: 0.00%) due 10/20/295,7 | | | 500,000 | | | | 497,045 | |
GPMT Ltd. | | | | | | | | |
2019-FL2, 2.05% (1 Month USD LIBOR + 1.90%, Rate Floor: 1.90%) due 02/22/365,7 | | | 500,000 | | | | 494,270 | |
Treman Park CLO Ltd. | | | | | | | | |
2015-1A, due 10/20/285,8 | | | 500,000 | | | | 400,709 | |
NewStar Clarendon Fund CLO LLC | | | | | | | | |
2019-1A, 1.52% (3 Month USD LIBOR + 1.30%, Rate Floor: 0.00%) due 01/25/275,7 | | | 336,231 | | | | 335,903 | |
BXMT 2020-FL3 Ltd. | | | | | | | | |
2020-FL3, 2.70% (1 Month USD LIBOR + 2.55%, Rate Floor: 2.55%) due 03/15/375,7 | | | 250,000 | | | | 250,363 | |
Golub Capital Partners CLO 17 Ltd. | | | | | | | | |
2017-17A, 1.87% (3 Month USD LIBOR + 1.65%, Rate Floor: 0.00%) due 10/25/305,7 | | | 250,000 | | | | 249,154 | |
Fortress Credit Opportunities IX CLO Ltd. | | | | | | | | |
2017-9A, 1.77% (3 Month USD LIBOR + 1.55%, Rate Floor: 0.00%) due 11/15/295,7 | | | 109,000 | | | | 108,581 | |
THL Credit Wind River CLO Ltd. | | | | | | | | |
2019-1A, 1.12% (3 Month USD LIBOR + 0.88%, Rate Floor: 0.00%) due 01/15/265,7 | | | 68,633 | | | | 68,618 | |
Copper River CLO Ltd. | | | | | | | | |
2006-1A, due 01/20/216,8 | | | 600,000 | | | | 17,640 | |
Total Collateralized Loan Obligations | | | | | | | 21,059,857 | |
| | | | | | | | | |
Financial - 1.9% | | | | | | | | |
Station Place Securitization Trust Series 2020-16 | | | | | | | | |
2020-16, 1.14% (1 Month USD LIBOR + 1.00%, Rate Floor: 1.00%) due 12/22/215,7 | | | 1,500,000 | | | | 1,500,000 | |
Station Place Securitization Trust Series 2020-17 | | | | | | | | |
2020-17, 1.14% (1 Month USD LIBOR + 1.00%, Rate Floor: 1.00%) due 03/24/215,7 | | | 900,000 | | | | 900,000 | |
Oxford Finance Funding | | | | | | | | |
2020-1A, 3.10% due 02/15/285 | | | 500,000 | | | | 511,750 | |
Madison Avenue Secured Funding Trust Series 2020-1 | | | | | | | | |
2020-1, 1.77% (1 Month USD LIBOR + 1.63%, Rate Floor: 0.00%) due 12/13/21†††,5,7 | | | 250,000 | | | | 250,000 | |
Nassau LLC | | | | | | | | |
2019-1, 3.98% due 08/15/345 | | | 215,333 | | | | 219,176 | |
Total Financial | | | | | | | 3,380,926 | |
| | | | | | | | | |
Transport-Aircraft - 1.5% | | | | | | | | |
Castlelake Aircraft Securitization Trust | | | | | | | | |
2017-1, 3.97% due 07/15/42 | | | 595,779 | | | | 557,922 | |
WAVE LLC | | | | | | | | |
2019-1, 3.60% due 09/15/445 | | | 467,879 | | | | 456,256 | |
Sapphire Aviation Finance II Ltd. | | | | | | | | |
2020-1A, 3.23% due 03/15/405 | | | 450,929 | | | | 436,549 | |
Raspro Trust | | | | | | | | |
2005-1A, 1.14% (3 Month USD LIBOR + 0.93%, Rate Floor: 0.93%) due 03/23/245,7 | | | 405,814 | | | | 395,274 | |
AIM Aviation Finance Ltd. | | | | | | | | |
2015-1A, 4.21% due 02/15/405 | | | 448,695 | | | | 348,029 | |
Turbine Engines Securitization Ltd. | | | | | | | | |
2013-1A, 5.13% due 12/13/486 | | | 422,684 | | | | 342,404 | |
Falcon Aerospace Ltd. | | | | | | | | |
2017-1, 4.58% due 02/15/425 | | | 218,194 | | | | 209,023 | |
Total Transport-Aircraft | | | | | | | 2,745,457 | |
| | | | | | | | | |
Whole Business - 1.1% | | | | | | | | |
Arbys Funding LLC | | | | | | | | |
2020-1A, 3.24% due 07/30/505 | | | 997,500 | | | | 1,019,256 | |
Domino’s Pizza Master Issuer LLC | | | | | | | | |
2017-1A, 1.47% (3 Month USD LIBOR + 1.25%, Rate Floor: 0.00%) due 07/25/475,7 | | | 485,000 | | | | 485,475 | |
ServiceMaster Funding LLC | | | | | | | | |
2020-1, 3.34% due 01/30/515 | | | 250,000 | | | | 254,260 | |
Taco Bell Funding LLC | | | | | | | | |
2016-1A, 4.97% due 05/25/465 | | | 96,500 | | | | 104,075 | |
SEE NOTES TO FINANCIAL STATEMENTS. | THE GUGGENHEIM FUNDS ANNUAL REPORT | 45 |
SCHEDULE OF INVESTMENTS (continued) | December 31, 2020 |
SERIES E (TOTAL RETURN BOND SERIES) | |
| | Face
Amount | | | Value | |
Wendy’s Funding LLC | | | | | | | | |
2015-1A, 4.50% due 06/15/455 | | $ | 94,750 | | | $ | 96,136 | |
Total Whole Business | | | | | | | 1,959,202 | |
| | | | | | | | | |
Net Lease - 1.0% | | | | | | | | |
Store Master Funding I-VII | | | | | | | | |
2016-1A, 3.96% due 10/20/465 | | | 1,152,187 | | | | 1,183,751 | |
Capital Automotive REIT | | | | | | | | |
2020-1A, 3.81% due 02/15/505 | | | 249,896 | | | | 261,374 | |
CF Hippolyta LLC | | | | | | | | |
2020-1, 2.28% due 07/15/605 | | | 238,595 | | | | 242,286 | |
Total Net Lease | | | | | | | 1,687,411 | |
| | | | | | | | | |
Transport-Container - 0.9% | | | | | | | | |
CAL Funding IV Ltd. | | | | | | | | |
2020-1A, 2.22% due 09/25/455 | | | 489,375 | | | | 495,597 | |
Textainer Marine Containers VIII Ltd. | | | | | | | | |
2020-2A, 2.10% due 09/20/455 | | | 488,361 | | | | 495,183 | |
Global SC Finance II SRL | | | | | | | | |
2014-1A, 3.19% due 07/17/295 | | | 358,333 | | | | 358,338 | |
Textainer Marine Containers VII Ltd. | | | | | | | | |
2020-1A, 2.73% due 08/21/455 | | | 241,271 | | | | 248,178 | |
Total Transport-Container | | | | | | | 1,597,296 | |
| | | | | | | | | |
Collateralized Debt Obligations - 0.9% | | | | | | | | |
Anchorage Credit Funding Ltd. | | | | | | | | |
2016-4A, 3.50% due 02/15/355 | | | 1,000,000 | | | | 1,004,185 | |
Anchorage Credit Funding 3 Ltd. | | | | | | | | |
2021-3A, 2.87% due 01/28/395 | | | 500,000 | | | | 500,541 | |
Putnam Structured Product Funding Ltd. | | | | | | | | |
2003-1A, 1.18% (1 Month USD LIBOR + 1.00%, Rate Floor: 0.00%) due 10/15/386,7 | | | 77,680 | | | | 77,432 | |
Total Collateralized Debt Obligations | | | | | | | 1,582,158 | |
| | | | | | | | | |
Infrastructure - 0.7% | | | | | | | | |
SBA Tower Trust | | | | | | | | |
2.33% due 01/15/285 | | | 1,250,000 | | | | 1,259,897 | |
Insurance - 0.2% | | | | | | | | |
Chesterfield Financial Holdings LLC | | | | | | | | |
2014-1A, 4.50% due 12/15/345 | | | 357,750 | | | | 367,862 | |
Total Asset-Backed Securities | | | | |
(Cost $35,741,607) | | | 35,640,066 | |
| | | | | | | | | |
COLLATERALIZED MORTGAGE OBLIGATIONS†† - 13.5% |
Residential Mortgage-Backed Securities - 6.0% | | | | | | | | |
CSMC Trust | | | | | | | | |
2020-RPL5, 3.02% due 08/25/605 | | | 735,175 | | | | 737,269 | |
2018-RPL9, 3.85% (WAC) due 09/25/575,7 | | | 628,572 | | | | 672,200 | |
Starwood Mortgage Residential Trust | | | | | | | | |
2020-1, 2.41% (WAC) due 02/25/505,7 | | | 924,890 | | | | 944,734 | |
2019-1, 2.94% (WAC) due 06/25/495,7 | | | 181,161 | | | | 183,754 | |
JP Morgan Mortgage Acquisition Trust | | | | | | | | |
2006-WMC4, 0.27% (1 Month USD LIBOR + 0.12%, Rate Floor: 0.12%) due 12/25/367 | | | 1,458,686 | | | | 934,647 | |
FKRT | | | | | | | | |
2020-C2A, 3.25% due 12/30/236 | | | 810,000 | | | | 810,540 | |
Home Equity Loan Trust | | | | | | | | |
2007-FRE1, 0.34% (1 Month USD LIBOR + 0.19%, Rate Floor: 0.19%) due 04/25/377 | | | 816,197 | | | | 764,325 | |
Soundview Home Loan Trust | | | | | | | | |
2006-OPT5, 0.29% (1 Month USD LIBOR + 0.14%, Rate Floor: 0.14%) due 07/25/367 | | | 772,269 | | | | 750,780 | |
NovaStar Mortgage Funding Trust Series | | | | | | | | |
2007-2, 0.35% (1 Month USD LIBOR + 0.20%, Rate Cap/Floor: 11.00%/0.20%) due 09/25/377 | | | 680,126 | | | | 651,614 | |
Homeward Opportunities Fund I Trust | | | | | | | | |
2019-2, 2.70% (WAC) due 09/25/595,7 | | | 532,311 | | | | 538,172 | |
Deephaven Residential Mortgage Trust | | | | | | | | |
2019-3A, 2.96% (WAC) due 07/25/595,7 | | | 506,003 | | | | 511,200 | |
Wachovia Asset Securitization Issuance II LLC Trust | | | | | | | | |
2007-HE2A, 0.28% (1 Month USD LIBOR + 0.13%, Rate Floor: 0.13%) due 07/25/375,7 | | | 513,929 | | | | 479,718 | |
CIM Trust | | | | | | | | |
2018-R2, 3.69% (WAC) due 08/25/575,7 | | | 478,269 | | | | 478,643 | |
HarborView Mortgage Loan Trust | | | | | | | | |
2006-14, 0.30% (1 Month USD LIBOR + 0.15%, Rate Floor: 0.15%) due 01/25/477 | | | 489,541 | | | | 446,364 | |
BRAVO Residential Funding Trust | | | | | | | | |
2019-NQM1, 2.67% (WAC) due 07/25/595,7 | | | 400,826 | | | | 410,246 | |
American Home Mortgage Investment Trust | | | | | | | | |
2007-1, 2.08% due 05/25/479 | | | 2,251,915 | | | | 376,418 | |
CSMC Series | | | | | | | | |
2015-12R, 0.65% (WAC) due 11/30/375,7 | | | 376,804 | | | | 375,575 | |
Washington Mutual Mortgage Pass-Through Certificates WMALT Series Trust | | | | | | | | |
2006-AR9, 1.45% (1 Year CMT Rate + 0.84%, Rate Floor: 0.84%) due 11/25/467 | | | 285,139 | | | | 238,996 | |
CIT Mortgage Loan Trust | | | | | | | | |
2007-1, 1.50% (1 Month USD LIBOR + 1.35%, Rate Floor: 1.35%) due 10/25/375,7 | | | 131,153 | | | | 131,778 | |
UCFC Manufactured Housing Contract | | | | | | | | |
1997-2, 7.38% due 10/15/28 | | | 82,476 | | | | 86,401 | |
Morgan Stanley Re-REMIC Trust | | | | | | | | |
2010-R5, 1.57% due 06/26/365 | | | 59,959 | | | | 53,941 | |
Total Residential Mortgage-Backed Securities | | | | | | | 10,577,315 | |
| | | | | | | | | |
Government Agency - 5.4% | | | | | | | | |
Fannie Mae | | | | | | | | |
3.83% due 05/01/49 | | | 1,000,000 | | | | 1,175,397 | |
3.33% due 04/01/30 | | | 958,145 | | | | 1,094,866 | |
2.99% due 09/01/29 | | | 500,000 | | | | 563,001 | |
2.96% due 11/01/29 | | | 500,000 | | | | 561,390 | |
46 | THE GUGGENHEIM FUNDS ANNUAL REPORT | SEE NOTES TO FINANCIAL STATEMENTS. |
SCHEDULE OF INVESTMENTS (continued) | December 31, 2020 |
SERIES E (TOTAL RETURN BOND SERIES) | |
| | Face
Amount | | | Value | |
3.11% due 10/01/29 | | $ | 500,000 | | | $ | 560,921 | |
2.90% due 11/01/29 | | | 500,000 | | | | 559,477 | |
Freddie Mac Multifamily Structured Pass Through Certificates | | | | | | | | |
2017-KW03, 3.02% due 06/25/27 | | | 1,050,000 | | | | 1,173,872 | |
2018-K074, 3.60% due 02/25/28 | | | 1,000,000 | | | | 1,167,605 | |
2019-1513, 2.80% due 08/25/34 | | | 650,000 | | | | 741,997 | |
Fannie Mae-Aces | | | | | | | | |
2017-M11, 2.98% due 08/25/29 | | | 900,000 | | | | 1,022,178 | |
2020-M23, 1.50% (WAC) due 03/25/357,9 | | | 3,795,457 | | | | 521,926 | |
2020-M23, 1.74% due 03/25/35 | | | 395,000 | | | | 405,114 | |
Total Government Agency | | | | | | | 9,547,744 | |
| | | | | | | | | |
Military Housing - 1.2% | | | | | | | | |
Freddie Mac Military Housing Bonds Resecuritization Trust Certificates | | | | | | | | |
2015-R1, 1.93% (WAC) due 11/25/555,7 | | | 943,108 | | | | 1,128,390 | |
GMAC Commercial Mortgage Asset Corp. | | | | | | | | |
2007-HCKM, 6.11% due 08/10/525 | | | 943,832 | | | | 1,075,521 | |
Total Military Housing | | | | | | | 2,203,911 | |
| | | | | | | | | |
Commercial Mortgage-Backed Securities - 0.9% | | | | | | | | |
GS Mortgage Securities Trust | | | | | | | | |
2020-GC45, 0.67% (WAC) due 02/13/537,9 | | | 9,989,180 | | | | 496,182 | |
Wells Fargo Commercial Mortgage Trust | | | | | | | | |
2016-NXS5, 1.46% (WAC) due 01/15/597,9 | | | 3,879,523 | | | | 224,046 | |
2015-NXS1, 2.63% due 05/15/48 | | | 61,601 | | | | 61,577 | |
CFCRE Commercial Mortgage Trust | | | | | | | | |
2016-C3, 1.00% (WAC) due 01/10/487,9 | | | 5,678,426 | | | | 244,958 | |
Citigroup Commercial Mortgage Trust | | | | | | | | |
2016-GC37, 1.70% (WAC) due 04/10/497,9 | | | 3,438,866 | | | | 244,662 | |
COMM Mortgage Trust | | | | | | | | |
2015-CR26, 0.93% (WAC) due 10/10/487,9 | | | 6,262,685 | | | | 227,631 | |
Total Commercial Mortgage Backed Securities | | | | | | | 1,499,056 | |
| | | | | | | | | |
Total Collateralized Mortgage Obligations | | | | |
(Cost $22,612,593) | | | 23,828,026 | |
| | | | | | | | | |
SENIOR FLOATING RATE INTERESTS††,7 - 5.6% |
Consumer, Non-cyclical - 1.4% | | | | | | | | |
Bombardier Recreational Products, Inc. | | | | | | | | |
6.00% (3 Month USD LIBOR + 5.00%, Rate Floor: 6.00%) due 05/24/27 | | | 448,875 | | | | 456,955 | |
US Foods, Inc. | | | | | | | | |
4.25% (1 Month USD LIBOR + 3.25%, Rate Floor: 4.25%) due 04/24/25††† | | | 441,563 | | | | 432,731 | |
Energizer Holdings, Inc. | | | | | | | | |
due 12/16/27 | | | 250,000 | | | | 249,532 | |
B&G Foods, Inc. | | | | | | | | |
2.65% (1 Month USD LIBOR + 2.50%, Rate Floor: 2.50%) due 10/12/26 | | | 250,000 | | | | 249,285 | |
Packaging Coordinators Midco, Inc. | | | | | | | | |
4.50% (6 Month USD LIBOR + 3.75%, Rate Floor: 4.50%) due 11/30/27 | | | 200,000 | | | | 200,000 | |
Avantor Funding, Inc. | | | | | | | | |
3.50% (1 Month USD LIBOR + 2.50%, Rate Floor: 3.50%) due 11/08/27 | | | 150,000 | | | | 150,095 | |
Southern Veterinary Partners LLC | | | | | | | | |
5.00% (3 Month USD LIBOR + 4.00%, Rate Floor: 5.00%) due 10/05/27††† | | | 131,818 | | | | 131,159 | |
HAH Group Holding Co LLC | | | | | | | | |
6.00% (3 Month USD LIBOR + 5.00%, Rate Floor: 6.00%) due 10/29/27 | | | 130,000 | | | | 128,863 | |
Weber-Stephen Products LLC | | | | | | | | |
4.00% (1 Month USD LIBOR + 3.25%, Rate Floor: 4.00%) due 10/29/27 | | | 100,000 | | | | 100,050 | |
WellSky Corp. | | | | | | | | |
due 02/09/24††† | | | 100,000 | | | | 99,750 | |
Sunshine Investments B.V. | | | | | | | | |
3.47% (3 Month USD LIBOR + 3.25%, Rate Floor: 3.25%) due 03/28/25 | | | 100,000 | | | | 99,125 | |
Elanco Animal Health, Inc. | | | | | | | | |
1.90% (1 Month USD LIBOR + 1.75%, Rate Floor: 1.75%) due 08/02/27 | | | 97,411 | | | | 96,457 | |
National Mentor Holdings, Inc. | | | | | | | | |
due 03/09/26 | | | 87,400 | | | | 87,200 | |
Civitas Solutions, Inc. | | | | | | | | |
4.43% (1 Month USD LIBOR + 4.25%, Rate Floor: 4.25%) due 03/09/26 | | | 12,062 | | | | 12,034 | |
4.51% (1 Month USD LIBOR + 4.25%, Rate Floor: 4.25%) due 03/09/26 | | | 538 | | | | 537 | |
Total Consumer, Non-cyclical | | | | | | | 2,493,773 | |
| | | | | | | | | |
Industrial - 1.3% | | | | | | | | |
Berlin Packaging LLC | | | | | | | | |
3.16% (1 Month USD LIBOR + 3.00% and 3 Month USD LIBOR + 3.00%, Rate Floor: 3.00%) due 11/07/25 | | | 476,731 | | | | 468,331 | |
Charter Nex US Holdings, Inc. | | | | | | | | |
5.00% (1 Month USD LIBOR + 4.25%, Rate Floor: 5.00%) due 12/01/27 | | | 400,000 | | | | 401,600 | |
Mileage Plus Holdings LLC | | | | | | | | |
6.25% (3 Month USD LIBOR + 5.25%, Rate Floor: 6.25%) due 06/21/27 | | | 250,000 | | | | 259,845 | |
American Bath Group LLC | | | | | | | | |
5.25% (3 Month USD LIBOR + 4.50%, Rate Floor: 5.25%) due 11/23/27 | | | 250,000 | | | | 250,312 | |
Vertical (TK Elevator) | | | | | | | | |
4.57% (3 Month USD LIBOR + 4.25%, Rate Floor: 4.25%) due 07/30/27 | | | 199,500 | | | | 200,176 | |
TransDigm, Inc. | | | | | | | | |
2.40% (1 Month USD LIBOR + 2.25%, Rate Floor: 2.25%) due 12/09/25 | | | 129,347 | | | | 126,585 | |
Delta Air Lines, Inc. | | | | | | | | |
5.75% (3 Month USD LIBOR + 4.75%, Rate Floor: 5.75%) due 05/01/23 | | | 99,500 | | | | 100,904 | |
American Residential Services LLC | | | | | | | | |
4.25% (3 Month USD LIBOR + 3.50%, Rate Floor: 4.25%) due 10/15/27 | | | 100,000 | | | | 99,750 | |
SEE NOTES TO FINANCIAL STATEMENTS. | THE GUGGENHEIM FUNDS ANNUAL REPORT | 47 |
SCHEDULE OF INVESTMENTS (continued) | December 31, 2020 |
SERIES E (TOTAL RETURN BOND SERIES) | |
| | Face
Amount | | | Value | |
Anchor Packaging LLC | | | | | | | | |
4.15% (1 Month USD LIBOR + 4.00%, Rate Floor: 4.00%) due 07/20/26 | | $ | 99,747 | | | $ | 99,498 | |
Pelican Products, Inc. | | | | | | | | |
4.50% (3 Month USD LIBOR + 3.50%, Rate Floor: 4.50%) due 05/01/25 | | | 100,000 | | | | 97,833 | |
Service Logic Acquisition, Inc. | | | | | | | | |
4.75% (3 Month USD LIBOR + 4.00%, Rate Floor: 4.75%) due 10/29/27 | | | 78,806 | | | | 78,707 | |
Total Industrial | | | | | | | 2,183,541 | |
| | | | | | | | | |
Communications - 0.7% | | | | | | | | |
UPC Financing Partnership | | | | | | | | |
3.68% (3 Month USD LIBOR + 3.50%, Rate Floor: 3.50%) due 01/31/29 | | | 175,000 | | | | 175,087 | |
3.67% (3 Month USD LIBOR + 3.50%, Rate Floor: 3.50%) due 01/31/29 | | | 175,000 | | | | 175,088 | |
Nielsen Finance LLC | | | | | | | | |
2.15% (1 Month USD LIBOR + 2.00%, Rate Floor: 2.00%) due 10/04/23 | | | 350,000 | | | | 348,590 | |
Syndigo LLC | | | | | | | | |
5.25% (6 Month USD LIBOR + 4.50%, Rate Floor: 5.25%) due 12/10/27 | | | 200,000 | | | | 198,500 | |
Xplornet Communications Inc. | | | | | | | | |
4.90% (1 Month USD LIBOR + 4.75%, Rate Floor: 4.75%) due 06/10/27 | | | 149,625 | | | | 149,662 | |
ProQuest, LLC | | | | | | | | |
3.65% (1 Month USD LIBOR + 3.50%, Rate Floor: 3.50%) due 10/23/26 | | | 150,000 | | | | 149,625 | |
Alchemy Copyrights LLC | | | | | | | | |
4.00% (1 Month USD LIBOR + 3.25%, Rate Floor: 4.00%) due 08/16/27††† | | | 100,000 | | | | 100,250 | |
Total Communications | | | | | | | 1,296,802 | |
| | | | | | | | | |
Consumer, Cyclical - 0.7% | | | | | | | | |
BGIS (BIFM CA Buyer, Inc.) | | | | | | | | |
3.65% (1 Month USD LIBOR + 3.50%, Rate Floor: 3.50%) due 06/01/26 | | | 297,858 | | | | 296,741 | |
Samsonite IP Holdings SARL | | | | | | | | |
5.50% (1 Month USD LIBOR + 4.50%, Rate Floor: 5.50%) due 04/25/25 | | | 298,500 | | | | 296,449 | |
CHG Healthcare Services, Inc. | | | | | | | | |
4.00% (3 Month USD LIBOR + 3.00%, Rate Floor: 4.00%) due 06/07/23 | | | 278,301 | | | | 276,259 | |
CNT Holdings I Corp. | | | | | | | | |
4.50% (6 Month USD LIBOR + 3.75%, Rate Floor: 4.50%) due 11/08/27 | | | 200,000 | | | | 199,656 | |
Intrawest Resorts Holdings, Inc. | | | | | | | | |
2.90% (1 Month USD LIBOR + 2.75%, Rate Floor: 2.75%) due 07/31/24 | | | 199,486 | | | | 196,410 | |
Total Consumer, Cyclical | | | | | | | 1,265,515 | |
| | | | | | | | | |
Technology - 0.5% | | | | | | | | |
Ascend Learning LLC | | | | | | | | |
4.75% (1 Month USD LIBOR + 3.75%, Rate Floor: 4.75%) due 07/12/24 | | | 399,000 | | | | 399,666 | |
Planview Parent, Inc. | | | | | | | | |
4.75% (3 Month USD LIBOR + 4.00%, Rate Floor: 4.75%) due 12/10/27 | | | 120,000 | | | | 119,700 | |
due 12/10/27 | | | 100,000 | | | | 99,000 | |
Sabre GLBL, Inc. | | | | | | | | |
due 12/10/27 | | | 100,000 | | | | 100,125 | |
Dun & Bradstreet | | | | | | | | |
3.90% (1 Month USD LIBOR + 3.75%, Rate Floor: 3.75%) due 02/06/26 | | | 99,749 | | | | 99,707 | |
E2open LLC | | | | | | | | |
4.00% (1 Month USD LIBOR + 3.50%, Rate Floor: 4.00%) due 10/29/27 | | | 100,000 | | | | 99,688 | |
Total Technology | | | | | | | 917,886 | |
| | | | | | | | | |
Financial - 0.5% | | | | | | | | |
Citadel Securities LP | | | | | | | | |
2.90% (1 Month USD LIBOR + 2.75%, Rate Floor: 2.75%) due 02/27/26 | | | 339,144 | | | | 339,001 | |
Higginbotham | | | | | | | | |
6.50% (1 Month USD LIBOR + 5.75%, Rate Floor: 6.50%) due 11/25/26 | | | 156,069 | | | | 153,728 | |
Jefferies Finance LLC | | | | | | | | |
4.50% (1 Month USD LIBOR + 3.75%, Rate Floor: 4.50%) due 09/30/27 | | | 149,625 | | | | 149,251 | |
USI, Inc. | | | | | | | | |
4.50% (3 Month USD LIBOR + 4.00%, Rate Floor: 4.50%) due 12/02/26 | | | 149,625 | | | | 149,158 | |
Duff & Phelps | | | | | | | | |
4.75% (1 Month USD LIBOR + 3.75%, Rate Floor: 4.75%) due 04/09/27 | | | 99,749 | | | | 99,766 | |
Total Financial | | | | | | | 890,904 | |
| | | | | | | | | |
Basic Materials - 0.3% | | | | | | | | |
Illuminate Buyer LLC | | | | | | | | |
4.15% (1 Month USD LIBOR + 4.00%, Rate Floor: 4.00%) due 06/30/27 | | | 250,000 | | | | 249,895 | |
GrafTech Finance, Inc. | | | | | | | | |
4.50% (1 Month USD LIBOR + 3.50%, Rate Floor: 4.50%) due 02/12/25 | | | 142,942 | | | | 142,645 | |
PQ Corp. | | | | | | | | |
4.00% (3 Month USD LIBOR + 3.00%, Rate Floor: 4.00%) due 02/08/27 | | | 77,274 | | | | 77,193 | |
Total Basic Materials | | | | | | | 469,733 | |
| | | | | | | | | |
Utilities - 0.2% | | | | | | | | |
Hamilton Projects Acquiror LLC | | | | | | | | |
5.75% (3 Month USD LIBOR + 4.75%, Rate Floor: 5.75%) due 06/17/27 | | | 389,023 | | | | 389,268 | |
Total Senior Floating Rate Interests | | | | |
(Cost $9,767,956) | | | 9,907,422 | |
| | | | | | | | | |
FEDERAL AGENCY BONDS†† - 2.8% |
Fannie Mae Principal Strips |
due 07/15/3710,11 | | | 2,500,000 | | | | 1,829,607 | |
Freddie Mac Principal Strips |
due 07/15/3210 | | | 1,950,000 | | | | 1,651,682 | |
48 | THE GUGGENHEIM FUNDS ANNUAL REPORT | SEE NOTES TO FINANCIAL STATEMENTS. |
SCHEDULE OF INVESTMENTS (continued) | December 31, 2020 |
SERIES E (TOTAL RETURN BOND SERIES) | |
| | Face
Amount | | | Value | |
Tennessee Valley Authority |
5.38% due 04/01/56 | | $ | 750,000 | | | $ | 1,290,135 | |
Tennessee Valley Authority Principal Strips |
due 01/15/4810,11 | | | 500,000 | | | | 252,677 | |
Total Federal Agency Bonds | | | | |
(Cost $3,870,172) | | | | | | | 5,024,101 | |
| | | | | | | | | |
U.S. GOVERNMENT SECURITIES†† - 2.5% |
U.S. Treasury Strips |
due 02/15/5010,11 | | | 5,120,000 | | | | 3,125,706 | |
U.S. Treasury Bonds |
due 08/15/5010,11 | | | 2,050,000 | | | | 1,238,051 | |
Total U.S. Government Securities | | | | |
(Cost $4,440,316) | | | | | | | 4,363,757 | |
| | | | | | | | | |
MUNICIPAL BONDS†† - 1.5% |
California - 0.7% | | | | | | | | |
Cypress School District General Obligation Unlimited | | | | | | | | |
due 08/01/4810 | | | 1,000,000 | | | | 417,970 | |
State of California General Obligation Unlimited | | | | | | | | |
7.55% due 04/01/39 | | | 100,000 | | | | 175,580 | |
7.35% due 11/01/39 | | | 100,000 | | | | 166,094 | |
Newport Mesa Unified School District General Obligation Unlimited | | | | | | | | |
due 08/01/4610 | | | 700,000 | | | | 289,555 | |
San Dieguito Union High School District General Obligation Unlimited | | | | | | | | |
2.68% due 08/01/36 | | | 250,000 | | | | 261,692 | |
Total California | | | | | | | 1,310,891 | |
| | | | | | | | | |
Texas - 0.3% | | | | | | | | |
City of San Antonio Texas Electric & Gas Systems Revenue Revenue Bonds | | | | | | | | |
2.91% due 02/01/48 | | | 500,000 | | | | 526,965 | |
Illinois - 0.3% | | | | | | | | |
State of Illinois General Obligation Unlimited | | | | | | | | |
5.65% due 12/01/38 | | | 400,000 | | | | 475,720 | |
New York - 0.2% | | | | | | | | |
Westchester County Local Development Corp. Revenue Bonds | | | | | | | | |
3.85% due 11/01/50 | | | 300,000 | | | | 313,566 | |
Total Municipal Bonds | | | | |
(Cost $2,346,360) | | | 2,627,142 | |
| | | | | | | |
| | Notional
Value | | | | |
OTC OPTIONS PURCHASED†† - 0.4% |
Call options on: | | | | | | | | |
BofA Merrill Lynch, N.A. 2Y-10 CMS CAP Expiring July 2022 with strike price of $0.40 | | $ | 50,900,000 | | | | 256,536 | |
Morgan Stanley Capital Services LLC 2Y-10 CMS CAP Expiring July 2022 with strike price of $0.40 | | | 41,800,000 | | | | 210,672 | |
Goldman Sachs International 2Y-10 CMS CAP Expiring July 2022 with strike price of $0.61 | | | 29,500,000 | | | | 103,840 | |
Goldman Sachs International 2Y-10 CMS CAP Expiring July 2022 with strike price of $0.40 | | | 9,300,000 | | | | 46,872 | |
BofA Merrill Lynch, N.A. 2Y-10 CMS CAP Expiring July 2022 with strike price of $0.61 | | | 4,500,000 | | | | 15,840 | |
Total Call options | | | | | | | 633,760 | |
Total OTC Options Purchased | | | | |
(Cost $288,851) | | | | | | | 633,760 | |
| | | | | | | | | |
Total Investments - 101.9% | | | | |
(Cost $169,072,286) | | $ | 180,427,964 | |
Other Assets & Liabilities, net - (1.9)% | | | (3,324,547 | ) |
Total Net Assets - 100.0% | | $ | 177,103,417 | |
Centrally Cleared Credit Default Swap Agreements Protection Sold†† |
| |
Counterparty | Exchange | Index | | Protection
Premium
Rate | | Payment
Frequency | | Maturity
Date | | | Notional
Amount | | | Value | | | Upfront
Premiums
Paid | | | Unrealized
Appreciation** | |
BofA Securities, Inc. | ICE | CDX.NA.HY.35.V1 | | | 5.00 | % | Quarterly | 12/20/25 | | $ | 980,000 | | | $ | 91,405 | | | $ | 41,178 | | | $ | 50,227 | |
SEE NOTES TO FINANCIAL STATEMENTS. | THE GUGGENHEIM FUNDS ANNUAL REPORT | 49 |
SCHEDULE OF INVESTMENTS (continued) | December 31, 2020 |
SERIES E (TOTAL RETURN BOND SERIES) | |
Centrally Cleared Interest Rate Swap Agreements†† |
| |
Counterparty | Exchange | Floating
Rate
Type | Floating
Rate Index | | Fixed
Rate | | Payment
Frequency | | Maturity
Date | | | Notional
Amount | | | Value | | | Upfront
Premiums
Paid | | | Unrealized
Appreciation
(Depreciation)** | |
BofA Securities, Inc. | CME | Pay | Federal Funds Rate | 0.76% | Annually | 01/05/31 | | $ | 3,600,000 | | | $ | 31 | | | $ | 329 | | | $ | (298 | ) |
BofA Securities, Inc. | CME | Pay | Federal Funds Rate | 0.78% | Annually | 12/23/30 | | | 4,000,000 | | | | (1,471 | ) | | | 331 | | | | (1,802 | ) |
BofA Securities, Inc. | CME | Pay | Federal Funds Rate | 0.77% | Annually | 11/12/30 | | | 4,500,000 | | | | (4,050 | ) | | | 331 | | | | (4,381 | ) |
BofA Securities, Inc. | CME | Pay | Federal Funds Rate | 0.14% | Annually | 05/28/25 | | | 5,000,000 | | | | (14,373 | ) | | | 284 | | | | (14,657 | ) |
BofA Securities, Inc. | CME | Pay | Federal Funds Rate | 0.68% | Annually | 12/02/30 | | | 3,200,000 | | | | (32,925 | ) | | | 323 | | | | (33,248 | ) |
| | | | | | | | | | | | | | | | | | | $ | (52,788 | ) | | $ | 1,598 | | | $ | (54,386 | ) |
Forward Foreign Currency Exchange Contracts†† |
Counterparty | | Contracts
to Sell | | | Currency | | | Settlement Date | | | Settlement
Value | | | Value at
December
31, 2020 | | | Unrealized
Appreciation
(Depreciation) | |
Citibank N.A., New York | | | 4,780,000 | | | | BRL | | | | 07/01/21 | | | $ | 1,134,050 | | | $ | 917,193 | | | $ | 216,857 | |
Goldman Sachs International | | | 1,300,000 | | | | BRL | | | | 07/01/21 | | | | 304,557 | | | | 249,446 | | | | 55,111 | |
JPMorgan Chase Bank, N.A. | | | 900,000 | | | | BRL | | | | 07/01/21 | | | | 213,802 | | | | 172,693 | | | | 41,109 | |
Bank of America, N.A. | | | 176,088,000 | | | | JPY | | | | 08/02/21 | | | | 1,737,682 | | | | 1,710,051 | | | | 27,631 | |
Morgan Stanley Capital Services LLC | | | 88,044,000 | | | | JPY | | | | 08/02/21 | | | | 864,109 | | | | 855,026 | | | | 9,083 | |
Goldman Sachs International | | | 45,222,600 | | | | JPY | | | | 12/20/21 | | | | 446,820 | | | | 440,139 | | | | 6,681 | |
Citibank N.A., New York | | | 88,044,000 | | | | JPY | | | | 05/06/21 | | | | 858,631 | | | | 853,974 | | | | 4,657 | |
Barclays Bank plc | | | 35,017,500 | | | | JPY | | | | 06/01/21 | | | | 342,771 | | | | 339,765 | | | | 3,006 | |
Bank of America, N.A. | | | 88,000 | | | | JPY | | | | 02/01/21 | | | | 860 | | | | 853 | | | | 7 | |
Goldman Sachs International | | | 22,600 | | | | JPY | | | | 06/21/21 | | | | 221 | | | | 219 | | | | 2 | |
Morgan Stanley Capital Services LLC | | | 44,000 | | | | JPY | | | | 02/01/21 | | | | 427 | | | | 426 | | | | 1 | |
Citibank N.A., New York | | | 92 | | | | ILS | | | | 02/01/21 | | | | 26 | | | | 29 | | | | (3 | ) |
Bank of America, N.A. | | | 33,550 | | | | ILS | | | | 02/01/21 | | | | 9,803 | | | | 10,459 | | | | (656 | ) |
Bank of America, N.A. | | | 353,500 | | | | ILS | | | | 04/30/21 | | | | 102,806 | | | | 110,430 | | | | (7,624 | ) |
Bank of America, N.A. | | | 643,550 | | | | ILS | | | | 01/31/22 | | | | 190,795 | | | | 202,342 | | | | (11,547 | ) |
Citibank N.A., New York | | | 676,700 | | | | ILS | | | | 04/30/21 | | | | 197,663 | | | | 211,395 | | | | (13,732 | ) |
Goldman Sachs International | | | 1,107,750 | | | | ILS | | | | 01/31/22 | | | | 327,439 | | | | 348,292 | | | | (20,853 | ) |
Goldman Sachs International | | | 1,103,122 | | | | ILS | | | | 02/01/21 | | | | 321,286 | | | | 343,897 | | | | (22,611 | ) |
Goldman Sachs International | | | 1,148,550 | | | | EUR | | | | 07/30/21 | | | | 1,334,184 | | | | 1,410,063 | | | | (75,879 | ) |
Goldman Sachs International | | | 4,191,500 | | | | ILS | | | | 04/30/21 | | | | 1,227,341 | | | | 1,309,389 | | | | (82,048 | ) |
| | | | | | | | | | | | | | | | | | | | | | | $ | 129,192 | |
| | | | | | | | | | | | | | | | | | | |
Counterparty | | Contracts
to Buy | | | Currency | | | Settlement Date | | | Settlement
Value | | | Value at
December
31, 2020 | | | Unrealized
Appreciation
(Depreciation) | |
Goldman Sachs International | | | 1,148,550 | | | | EUR | | | | 07/30/21 | | | $ | 1,317,961 | | | $ | 1,410,063 | | | $ | 92,102 | |
Goldman Sachs International | | | 2,610,850 | | | | ILS | | | | 04/30/21 | | | | 728,189 | | | | 815,607 | | | | 87,418 | |
JPMorgan Chase Bank, N.A. | | | 2,610,850 | | | | ILS | | | | 04/30/21 | | | | 735,658 | | | | 815,608 | | | | 79,950 | |
Goldman Sachs International | | | 1,751,300 | | | | ILS | | | | 01/31/22 | | | | 477,073 | | | | 550,634 | | | | 73,561 | |
JPMorgan Chase Bank, N.A. | | | 264,132,000 | | | | JPY | | | | 08/02/21 | | | | 2,500,540 | | | | 2,565,077 | | | | 64,537 | |
Goldman Sachs International | | | 1,136,764 | | | | ILS | | | | 02/01/21 | | | | 317,854 | | | | 354,385 | | | | 36,531 | |
Goldman Sachs International | | | 88,044,000 | | | | JPY | | | | 05/06/21 | | | | 825,309 | | | | 853,973 | | | | 28,664 | |
JPMorgan Chase Bank, N.A. | | | 35,017,500 | | | | JPY | | | | 06/01/21 | | | | 328,648 | | | | 339,764 | | | | 11,116 | |
Barclays Bank plc | | | 45,222,600 | | | | JPY | | | | 12/20/21 | | | | 431,061 | | | | 440,139 | | | | 9,078 | |
50 | THE GUGGENHEIM FUNDS ANNUAL REPORT | SEE NOTES TO FINANCIAL STATEMENTS. |
SCHEDULE OF INVESTMENTS (continued) | December 31, 2020 |
SERIES E (TOTAL RETURN BOND SERIES) | |
Counterparty | | Contracts
to Buy | | | Currency | | | Settlement Date | | | Settlement
Value | | | Value at
December
31, 2020 | | | Unrealized
Appreciation
(Depreciation) | |
Citibank N.A., New York | | | 4,641,000 | | | | BRL | | | | 07/01/21 | | | $ | 890,026 | | | $ | 890,522 | | | $ | 496 | |
JPMorgan Chase Bank, N.A. | | | 132,000 | | | | JPY | | | | 02/01/21 | | | | 1,244 | | | | 1,279 | | | | 35 | |
Barclays Bank plc | | | 22,600 | | | | JPY | | | | 06/21/21 | | | | 214 | | | | 219 | | | | 5 | |
JPMorgan Chase Bank, N.A. | | | 2,339,000 | | | | BRL | | | | 07/01/21 | | | | 453,294 | | | | 448,810 | | | | (4,484 | ) |
| | | | | | | | | | | | | | | | | | | | | | | $ | 479,009 | |
* | Non-income producing security. |
** | Includes cumulative appreciation (depreciation). Variation margin is reported within the Statement of Assets and Liabilities. |
† | Value determined based on Level 1 inputs — See Note 4. |
†† | Value determined based on Level 2 inputs, unless otherwise noted — See Note 4. |
††† | Value determined based on Level 3 inputs — See Note 4. |
1 | Perpetual maturity. |
2 | Affiliated issuer. |
3 | Rate indicated is the 7-day yield as of December 31, 2020. |
4 | Security has a fixed rate coupon which will convert to a floating or variable rate coupon on a future date. |
5 | Security is a 144A or Section 4(a)(2) security. These securities have been determined to be liquid under guidelines established by the Board of Trustees. The total market value of 144A or Section 4(a)(2) securities is $68,417,532 (cost $66,494,421), or 38.6% of total net assets. |
6 | Security is a 144A or Section 4(a)(2) security. These securities have been determined to be illiquid and restricted under guidelines established by the Board of Trustees. The total market value of 144A or Section 4(a)(2) illiquid and restricted securities is $1,523,641 (cost $2,255,064), or 0.9% of total net assets — See Note 9. |
7 | Variable rate security. Rate indicated is the rate effective at December 31, 2020. In some instances, the effective rate is limited by a minimum rate floor or a maximum rate cap established by the issuer. The settlement status of a position may also impact the effective rate indicated. In some cases, a position may be unsettled at period end and may not have a stated effective rate. In instances where multiple underlying reference rates and spread amounts are shown, the effective rate is based on a weighted average. |
8 | Security has no stated coupon. However, it is expected to receive residual cash flow payments on defined deal dates. |
9 | Security is an interest-only strip. |
10 | Zero coupon rate security. |
11 | Security is a principal-only strip. |
| | BofA — Bank of America |
| | BRL — Brazilian Real |
| | CDX.NA.HY.35.V1 — Credit Default Swap North American High Yield Series 35 Index Version 1. |
| | CME — Chicago Mercantile Exchange |
| | CMS — Constant Maturity Swap |
| | CMT — Constant Maturity Treasury |
| | EUR — Euro |
| | ICE — Intercontinental Exchange |
| | ILS — Israeli New Shekel |
| | JPY — Japanese Yen |
| | LIBOR — London Interbank Offered Rate |
| | plc — Public Limited Company |
| | REIT — Real Estate Investment Trust |
| | REMIC — Real Estate Mortgage Investment Conduit |
| | SARL — Société à Responsabilité Limitée |
| | WAC — Weighted Average Coupon |
| | |
| | See Sector Classification in Other Information section. |
SEE NOTES TO FINANCIAL STATEMENTS. | THE GUGGENHEIM FUNDS ANNUAL REPORT | 51 |
SCHEDULE OF INVESTMENTS (continued) | December 31, 2020 |
SERIES E (TOTAL RETURN BOND SERIES) | |
The following table summarizes the inputs used to value the Fund’s investments at December 31, 2020 (See Note 4 in the Notes to Financial Statements):
Investments in Securities (Assets) | | Level 1
Quoted
Prices | | | Level 2
Significant
Observable
Inputs | | | Level 3
Significant
Unobservable
Inputs | | | Total | |
Common Stocks | | $ | 2,123,075 | | | $ | — | | | $ | — | | | $ | 2,123,075 | |
Preferred Stocks | | | — | | | | 2,131,192 | | | | — | | | | 2,131,192 | |
Warrants | | | 81,696 | | | | — | | | | — | | | | 81,696 | |
Exchange-Traded Funds | | | 6,465,328 | | | | — | | | | — | | | | 6,465,328 | |
Mutual Funds | | | 14,159,111 | | | | — | | | | — | | | | 14,159,111 | |
Money Market Fund | | | 2,111,910 | | | | — | | | | — | | | | 2,111,910 | |
Corporate Bonds | | | — | | | | 69,286,440 | | | | 2,044,938 | | | | 71,331,378 | |
Asset-Backed Securities | | | — | | | | 35,390,066 | | | | 250,000 | | | | 35,640,066 | |
Collateralized Mortgage Obligations | | | — | | | | 23,828,026 | | | | — | | | | 23,828,026 | |
Senior Floating Rate Interests | | | — | | | | 9,143,532 | | | | 763,890 | | | | 9,907,422 | |
Federal Agency Bonds | | | — | | | | 5,024,101 | | | | — | | | | 5,024,101 | |
U.S. Government Securities | | | — | | | | 4,363,757 | | | | — | | | | 4,363,757 | |
Municipal Bonds | | | — | | | | 2,627,142 | | | | — | | | | 2,627,142 | |
Options Purchased | | | — | | | | 633,760 | | | | — | | | | 633,760 | |
Credit Default Swap Agreements** | | | — | | | | 50,227 | | | | — | | | | 50,227 | |
Forward Foreign Currency Exchange Contracts** | | | — | | | | 847,638 | | | | — | | | | 847,638 | |
Total Assets | | $ | 24,941,120 | | | $ | 153,325,881 | | | $ | 3,058,828 | | | $ | 181,325,829 | |
Investments in Securities (Liabilities) | | Level 1
Quoted
Prices | | | Level 2
Significant
Observable
Inputs | | | Level 3
Significant
Unobservable
Inputs | | | Total | |
Interest Rate Swap Agreements** | | $ | — | | | $ | 54,386 | | | $ | — | | | $ | 54,386 | |
Forward Foreign Currency Exchange Contracts** | | | — | | | | 239,437 | | | | — | | | | 239,437 | |
Unfunded Loan Commitments (Note 8) | | | — | | | | — | | | | 1,282 | | | | 1,282 | |
Total Liabilities | | $ | — | | | $ | 293,823 | | | $ | 1,282 | | | $ | 295,105 | |
** | This derivative is reported as unrealized appreciation/depreciation at period end. |
The following is a summary of significant unobservable inputs used in the fair valuation of assets and liabilities categorized within Level 3 of the fair value hierarchy:
Category | | Ending Balance at
December 31, 2020 | | | Valuation Technique | | | Unobservable Inputs | | | Input Range | | | Weighted Average | |
Assets: | | | | | | | | | | | | | | | | | | | | |
Asset-Backed Securities | | $ | 250,000 | | Model Price | Purchase Price | | | — | | | | — | |
Corporate Bonds | | | 2,044,938 | | Option Adjusted Spread off the prior month end broker quote | Broker Quote | | | — | | | | — | |
Senior Floating Rate Interests | | | 763,890 | | Third Party Pricing | Broker Quote | | | | | | | | |
Total Assets | | $ | 3,058,828 | | | | | | | | | — | | | | — | |
Liabilities: | | | | | | | | | | | | | | | | | | | | |
Unfunded Loan Commitments | | $ | 1,282 | | Model | Purchase Price | | | — | | | | — | |
Significant changes in a quote would generally result in significant changes in the fair value of the security.
The Fund’s fair valuation leveling guidelines classify a single daily broker quote, or a vendor price based on a single daily or monthly broker quote, as Level 3, if such a quote or price cannot be supported with other available market information.
52 | THE GUGGENHEIM FUNDS ANNUAL REPORT | SEE NOTES TO FINANCIAL STATEMENTS. |
SCHEDULE OF INVESTMENTS (continued) | December 31, 2020 |
SERIES E (TOTAL RETURN BOND SERIES) | |
Summary of Fair Value Level 3 Activity
Following is a reconciliation of Level 3 assets for which significant unobservable inputs were used to determine fair value for the year ended December 31, 2020:
| | | Assets | | | | | | | Liabilities | |
| | Asset-Backed
Securities | | | Corporate
Bonds | | | Senior Floating
Rate Interests | | | Total Assets | | | Unfunded Loan
Commitments | |
Beginning Balance | | $ | 1,050,000 | | | $ | — | | | $ | — | | | $ | 1,050,000 | | | $ | — | |
Purchases/(Receipts) | | | 250,000 | | | | 2,000,000 | | | | 746,750 | | | | 2,996,750 | | | | (1,335 | ) |
(Sales, maturities and paydowns)/Fundings | | | (1,050,000 | ) | | | — | | | | (8,438 | ) | | | (1,058,438 | ) | | | 12 | |
Amortization of premiums/discounts | | | — | | | | — | | | | 4,629 | | | | 4,629 | | | | — | |
Total change in unrealized appreciation (depreciation) included in earnings | | | — | | | | 44,938 | | | | 20,949 | | | | 65,887 | | | | 41 | |
Ending Balance | | $ | 250,000 | | | $ | 2,044,938 | | | $ | 763,890 | | | $ | 3,058,828 | | | $ | (1,282 | ) |
Net change in unrealized appreciation (depreciation) for investments in Level 3 securities still held at December 31, 2020 | | $ | — | | | $ | 44,938 | | | $ | 20,949 | | | $ | 65,887 | | | $ | 41 | |
SEE NOTES TO FINANCIAL STATEMENTS. | THE GUGGENHEIM FUNDS ANNUAL REPORT | 53 |
SCHEDULE OF INVESTMENTS (concluded) | December 31, 2020 |
SERIES E (TOTAL RETURN BOND SERIES) | |
Affiliated Transactions
Investments representing 5% or more of the outstanding voting shares of a company, or control of or by, or common control under Guggenheim Investments (“GI”), result in that company being considered an affiliated issuer, as defined in the 1940 Act.
The Fund may invest in certain of the underlying series of Guggenheim Strategy Funds Trust, including Guggenheim Strategy Fund II, Guggenheim Strategy Fund III, and Guggenheim Variable Insurance Strategy Fund III, (collectively, the “Short Term Investment Vehicles”), each of which are open-end management investment companies managed by GI. The Short Term Investment Vehicles, which launched on March 11, 2014, are offered as short term investment options only to mutual funds, trusts, and other accounts managed by GI and/or its affiliates, and are not available to the public. The Short Term Investment Vehicles pay no investment management fees. The Short Term Investment Vehicles’ annual report on Form N-CSR dated September 30, 2020, is available publicly or upon request. This information is available from the EDGAR database on the SEC’s website at https://www.sec.gov/Archives/edgar/data/1601445/000182126820000133/gug81042-ncsr.htm.
Transactions during the year ended December 31, 2020, in which the company is an affiliated issuer, were as follows:
Security Name | | Value
12/31/19 | | | Additions | | | Reductions | | | Realized
Gain (Loss) | | | Change in
Unrealized
Appreciation
(Depreciation) | | | Value
12/31/20 | | | Shares
12/31/20 | | | Investment
Income | | | Capital Gain
Distributions | |
Mutual Funds | | | | | | | | | | | | | | | | | | | | | | | | | | | | | | | | | | | | |
Guggenheim Limited Duration Fund — R6-Class | | $ | 3,032,782 | | | $ | 20,807 | | | $ | (3,064,730 | ) | | $ | (9,448 | ) | | $ | 20,589 | | | $ | — | | | | — | | | $ | 20,941 | | | $ | — | |
Guggenheim Strategy Fund II | | | — | | | | 7,697,589 | | | | (2,650,000 | ) | | | 3,211 | | | | 46,570 | | | | 5,097,370 | | | | 204,222 | | | | 47,095 | | | | — | |
Guggenheim Total Return Bond Fund — R6-Class | | | 6,055,444 | | | | 342,336 | | | | — | | | | — | | | | 579,957 | | | | 6,977,737 | | | | 234,783 | | | | 174,464 | | | | 166,818 | |
Guggenheim Ultra Short Duration Fund — Institutional Class | | | 2,048,198 | | | | 29,458 | | | | — | | | | — | | | | 6,348 | | | | 2,084,004 | | | | 208,818 | | | | 29,443 | | | | — | |
| | | $ | 11,136,424 | | | $ | 8,090,190 | | | $ | (5,714,730 | ) | | $ | (6,237 | ) | | $ | 653,464 | | | $ | 14,159,111 | | | | | | | $ | 271,943 | | | $ | 166,818 | |
54 | THE GUGGENHEIM FUNDS ANNUAL REPORT | SEE NOTES TO FINANCIAL STATEMENTS. |
SERIES E (TOTAL RETURN BOND SERIES) | |
STATEMENT OF ASSETS AND LIABILITIES |
December 31, 2020 |
Assets: |
Investments in unaffiliated issuers, at value (cost $155,713,200) | | $ | 166,268,853 | |
Investments in affiliated issuers, at value (cost $13,359,086) | | | 14,159,111 | |
Cash | | | 17,254 | |
Unamortized upfront premiums paid on credit default swap agreements | | | 41,178 | |
Unamortized upfront premiums paid on interest rate swap agreements | | | 1,598 | |
Unrealized appreciation on forward foreign currency exchange contracts | | | 847,638 | |
Prepaid expenses | | | 9,008 | |
Receivables: |
Interest | | | 740,082 | |
Fund shares sold | | | 109,079 | |
Dividends | | | 25,404 | |
Variation margin on interest rate swap agreements | | | 12,661 | |
Foreign tax reclaims | | | 1,845 | |
Protection fees on credit default swap agreements | | | 1,633 | |
Variation margin on credit default swap agreements | | | 1,268 | |
Securities sold | | | 182 | |
Total assets | | | 182,236,794 | |
| | | | | |
Liabilities: |
Unfunded loan commitments, at value (Note 8) (commitment fees received $1,323) | | | 1,282 | |
Segregated cash due to broker | | | 854,402 | |
Unrealized depreciation on forward foreign currency exchange contracts | | | 239,437 | |
Payable for: |
Securities purchased | | | 3,838,792 | |
Management fees | | | 42,913 | |
Distribution and service fees | | | 36,748 | |
Fund shares redeemed | | | 19,429 | |
Fund accounting/administration fees | | | 14,448 | |
Transfer agent/maintenance fees | | | 2,151 | |
Trustees’ fees* | | | 1,636 | |
Swap settlement | | | 329 | |
Miscellaneous | | | 81,810 | |
Total liabilities | | | 5,133,377 | |
Commitments and contingent liabilities (Note 13) | | | — | |
Net assets | | $ | 177,103,417 | |
| | | | | |
Net assets consist of: |
Paid in capital | | $ | 158,965,773 | |
Total distributable earnings (loss) | | | 18,137,644 | |
Net assets | | $ | 177,103,417 | |
Capital shares outstanding | | | 9,788,689 | |
Net asset value per share | | $ | 18.09 | |
STATEMENT OF OPERATIONS |
Year Ended December 31, 2020 |
Investment Income: |
Dividends from securities of unaffiliated issuers | | $ | 244,529 | |
Dividends from securities of affiliated issuers | | | 271,943 | |
Interest (net of foreign withholding tax of $327) | | | 3,935,526 | |
Total investment income | | | 4,451,998 | |
| | | | | |
Expenses: |
Management fees | | | 569,094 | |
Distribution and service fees | | | 364,805 | |
Transfer agent/maintenance fees | | | 25,185 | |
Fund accounting/administration fees | | | 113,452 | |
Professional fees | | | 87,235 | |
Printing fees | | | 44,200 | |
Custodian fees | | | 21,378 | |
Trustees’ fees* | | | 19,874 | |
Line of credit fees | | | 13,401 | |
Interest expense | | | 910 | |
Miscellaneous | | | 28,755 | |
Total expenses | | | 1,288,289 | |
Less: |
Expenses reimbursed by Adviser | | | (7,603 | ) |
Expenses waived by Adviser | | | (136,616 | ) |
Earnings credits applied | | | (769 | ) |
Total waived/reimbursed expenses | | | (144,988 | ) |
Net expenses | | | 1,143,301 | |
Net investment income | | | 3,308,697 | |
| | | | | |
Net Realized and Unrealized Gain (Loss): |
Net realized gain (loss) on: |
Investments in unaffiliated issuers | | | 3,518,920 | |
Investments in affiliated issuers | | | (6,237 | ) |
Distributions received from affiliated investment companies | | | 166,818 | |
Swap agreements | | | 1,700,742 | |
Futures contracts | | | 72,641 | |
Forward foreign currency exchange contracts | | | 253,680 | |
Foreign currency transactions | | | 20,982 | |
Net realized gain | | | 5,727,546 | |
Net change in unrealized appreciation (depreciation) on: |
Investments in unaffiliated issuers | | | 7,804,354 | |
Investments in affiliated issuers | | | 653,464 | |
Swap agreements | | | 576,587 | |
Options purchased | | | 417,520 | |
Forward foreign currency exchange contracts | | | 480,809 | |
Foreign currency translations | | | (2,609 | ) |
Net change in unrealized appreciation (depreciation) | | | 9,930,125 | |
Net realized and unrealized gain | | | 15,657,671 | |
Net increase in net assets resulting from operations | | $ | 18,966,368 | |
* | Relates to Trustees not deemed “interested persons” within the meaning of Section 2(a)(19) of the 1940 Act. |
SEE NOTES TO FINANCIAL STATEMENTS. | THE GUGGENHEIM FUNDS ANNUAL REPORT | 55 |
SERIES E (TOTAL RETURN BOND SERIES) | |
STATEMENTS OF CHANGES IN NET ASSETS |
| | Year Ended
December 31,
2020 | | | Year Ended
December 31,
2019 | |
Increase (Decrease) in Net Assets from Operations: | | | | | | | | |
Net investment income | | $ | 3,308,697 | | | $ | 3,083,801 | |
Net realized gain (loss) on investments | | | 5,727,546 | | | | (711,371 | ) |
Net change in unrealized appreciation (depreciation) on investments | | | 9,930,125 | | | | 3,523,292 | |
Net increase in net assets resulting from operations | | | 18,966,368 | | | | 5,895,722 | |
| | | | | | | | | |
Distributions to shareholders | | | (2,739,180 | ) | | | (3,605,920 | ) |
| | | | | | | | | |
Capital share transactions: | | | | | | | | |
Proceeds from sale of shares | | | 76,319,538 | | | | 33,497,118 | |
Distributions reinvested | | | 2,739,180 | | | | 3,605,920 | |
Cost of shares redeemed | | | (46,391,432 | ) | | | (34,034,071 | ) |
Net increase from capital share transactions | | | 32,667,286 | | | | 3,068,967 | |
Net increase in net assets | | | 48,894,474 | | | | 5,358,769 | |
| | | | | | | | | |
Net assets: | | | | | | | | |
Beginning of year | | | 128,208,943 | | | | 122,850,174 | |
End of year | | $ | 177,103,417 | | | $ | 128,208,943 | |
| | | | | | | | | |
Capital share activity: | | | | | | | | |
Shares sold | | | 4,405,043 | | | | 2,083,694 | |
Shares issued from reinvestment of distributions | | | 156,346 | | | | 225,935 | |
Shares redeemed | | | (2,723,087 | ) | | | (2,107,651 | ) |
Net increase in shares | | | 1,838,302 | | | | 201,978 | |
56 | THE GUGGENHEIM FUNDS ANNUAL REPORT | SEE NOTES TO FINANCIAL STATEMENTS. |
SERIES E (TOTAL RETURN BOND SERIES) | |
This table is presented to show selected data for a share outstanding throughout each period and to assist shareholders in evaluating a Fund’s performance for the periods presented.
| | Year Ended
December 31,
2020 | | | Year Ended
December 31,
2019 | | | Year Ended
December 31,
2018 | | | Year Ended
December 31,
2017 | | | Year Ended
December 31,
2016 | |
Per Share Data |
Net asset value, beginning of period | | $ | 16.13 | | | $ | 15.85 | | | $ | 16.40 | | | $ | 16.05 | | | $ | 15.68 | |
Income (loss) from investment operations: |
Net investment income (loss)a | | | .39 | | | | .38 | | | | .46 | | | | .61 | | | | .66 | |
Net gain (loss) on investments (realized and unrealized) | | | 1.88 | | | | .34 | | | | (.29 | ) | | | .45 | | | | .41 | |
Total from investment operations | | | 2.27 | | | | .72 | | | | .17 | | | | 1.06 | | | | 1.07 | |
Less distributions from: |
Net investment income | | | (.31 | ) | | | (.44 | ) | | | (.72 | ) | | | (.71 | ) | | | (.70 | ) |
Total distributions | | | (.31 | ) | | | (.44 | ) | | | (.72 | ) | | | (.71 | ) | | | (.70 | ) |
Net asset value, end of period | | $ | 18.09 | | | $ | 16.13 | | | $ | 15.85 | | | $ | 16.40 | | | $ | 16.05 | |
|
Total Returnb | | | 14.21 | % | | | 4.49 | % | | | 1.14 | % | | | 6.72 | % | | | 6.83 | % |
Ratios/Supplemental Data |
Net assets, end of period (in thousands) | | $ | 177,103 | | | $ | 128,209 | | | $ | 122,850 | | | $ | 130,499 | | | $ | 114,043 | |
Ratios to average net assets: |
Net investment income (loss) | | | 2.27 | % | | | 2.33 | % | | | 2.85 | % | | | 3.76 | % | | | 4.13 | % |
Total expensesc | | | 0.88 | % | | | 0.94 | % | | | 0.92 | % | | | 0.99 | % | | | 1.02 | % |
Net expensesd,e,f | | | 0.78 | % | | | 0.78 | % | | | 0.78 | % | | | 0.81 | % | | | 0.83 | % |
Portfolio turnover rate | | | 123 | % | | | 54 | % | | | 30 | % | | | 76 | % | | | 88 | % |
a | Net investment income (loss) per share was computed using average shares outstanding throughout the period. |
b | Total return does not take into account any of the expenses associated with an investment in variable insurance products. If total return had taken into account these expenses, performance would have been lower. Shares of a series of Guggenheim Variable Funds Trust are available only through the purchase of such products. |
c | Does not include expenses of the underlying funds in which the Fund invests. |
d | Net expense information reflects the expense ratios after expense waivers and reimbursements, as applicable. |
e | Net expense may include expenses that are excluded from the expense limitation agreement. Excluding these expenses, the net expense ratios for the years would be: |
| | 12/31/20 | 12/31/19 | 12/31/18 | 12/31/17 | 12/31/16 |
| | 0.77% | 0.77% | 0.77% | 0.77% | 0.78% |
f | The portion of the ratios of net expenses to average net assets attributable to recoupments of prior fee reductions or expense reimbursements for the years was as follows: |
| | 12/31/20 | 12/31/19 | 12/31/18 | 12/31/17 | 12/31/16 |
| | — | — | 0.00%* | — | — |
SEE NOTES TO FINANCIAL STATEMENTS. | THE GUGGENHEIM FUNDS ANNUAL REPORT | 57 |
MANAGERS’ COMMENTARY (Unaudited) | December 31, 2020 |
To Our Shareholders:
The Series F (Floating Rate Series) is managed by a team of seasoned professionals, including B. Scott Minerd, Chairman of Investments and Global Chief Investment Officer; Anne B. Walsh, Senior Managing Director and Chief Investment Officer, Fixed Income; Kevin H. Gundersen, Senior Managing Director and Portfolio Manager; Thomas J. Hauser, Senior Managing Director and Portfolio Manager. In the following paragraphs, the investment team discusses the market environment and Series performance for the fiscal year ended December 31, 2020.
For the year ended December 31, 2020, Series F (Floating Rate Series) returned 0.01% net of fees, compared with 2.78% for its benchmark, the Credit Suisse Leveraged Loan Index.
Performance Overview
Underperformance in recent quarters has been driven by similar factors, in which relative returns were impacted by owning fewer top performers as opposed to owning an outsized portion of bottom performers. In March and the second quarter of 2020 we took steps to realign the portfolio to endure the pandemic and an associated protracted downturn: increasing quality, selling a number of distressed positions and swapping into credits with better liquidity positions and forward-looking business prospects. While we added many names at notable discounts to par, the names which we purchased were generally higher in price than those we sold.
We have generally seen a rally in weaker issuers, with CCCs returning ~10% in the fourth quarter and 5.4% in 2020. Our underweight to CCCs and underweight to stressed issuers both contributed to underperformance.
Market Overview
The leveraged credit sector has delivered stellar performance since the COVID-driven lows in March. Prices have recovered to over 90% of par, and spreads have tightened to historical average levels. While the recovery from the initial economic shock from COVID-19 has been faster than expected, it has been helped by improved consumer confidence measures and personal income growth due to massive fiscal support. The U.S. Federal Reserve and Treasury’s continued support for corporate borrowers has addressed market functioning, providing indirect support of the leveraged loan markets.
The fourth quarter witnessed a continuation of the rally that started in mid-March following vaccine optimism and potential for additional fiscal stimulus, with only a brief pause in October driven by election uncertainty. The Credit Suisse Leveraged Loan Index returned 2.8%, but despite the favorable outcome, loans trailed the Bank of America High Yield Index (+6.2%) and the S&P 500 (+18.4%).
Virus-sensitive names rallied in the fourth quarter, with Aerospace (+7.3%), Energy (+6.6%), Gaming/Leisure (+6.2%) and Metals (5.9%) leading. CCCs outperformed in both the fourth quarter and 2020, returning 9.5% and 5.4%, respectively. Although counterintuitive to see in a year when loan prices declined in aggregate, many loan issuers were downgraded earlier in the year only to subsequently rally sharply. According to Credit Suisse, the portion of the market bid above par has reached 8.9% compared to 44.8% at year-end 2019. The market value of the market priced below 80 ended the year only 4.4% after spiking to 28.4% at March 31.
Institutional loan volume in the fourth quarter of $81 billion was 9% above third quarter levels, 10% above the fourth quarter of 2019, and was driven by a continued rebound in M&A and LBO activity. M&A activity was primarily driven by sponsor-backed companies with corporate M&A very light at $5.1 billion (the lowest since 2012, per S&P LCD). Despite the pandemic, 2020 issuance in total was down only 7% from 2019, and dividend deals were up 25% YoY to $34 billion. Refinancing activity was unsurprisingly down in 2020 as wider secondary market spreads made many potential refinancings and repricings uneconomical.
Demand technicals continued improving during the fourth quarter. CLO issuance accelerated to $31 billion, an annualized pace of ~$96 billion which would be on par with activity seen in 2017, albeit still well below annualized levels seen in 2018-2019. CLOs continued to be the primary buyer with mutual fund flows flat, though fund flows did turn slightly positive during the latter portion of the quarter as the yield curve steepened. Healthy bond-for-loan takeout volume continued as well, providing an additional boost to the demand technical picture.
58 | THE GUGGENHEIM FUNDS ANNUAL REPORT | |
MANAGERS’ COMMENTARY (Unaudited)(concluded) | December 31, 2020 |
Indicators of fundamentals continued stabilizing across the loan market as the year carried on. The distressed rate ended December at 7%, as compared to 11% in September and 23% in March. At the same time, the decline in the downgrade-to-upgrade ratio has been even more pronounced, reaching 1x in December versus a high of 43x in May. The default rate has also improved and ticked lower to 3.8%, down from 4.2% over the last quarter. Ongoing spread contraction indicates that fundamentals may continue to improve, although it is likely that defaults will remain elevated for much of 2021.
Market Outlook and Positioning:
Heading into 2021, the outlook for the U.S. economy and leveraged loan asset class is materially improved, driven by prospects for vaccine distribution to boost economic normalization and for a Democratic government to provide further fiscal stimulus. We believe it is likely that as the elderly are vaccinated, fatality and hospitalization rates will fall, allowing for more economic activity to resume. This will likely benefit those portions of the loan market that are still most depressed, such as the leisure sector, although certain secularly challenged industries such as movie theatres and retailers will likely continue to face ongoing challenges.
We expect default rates to continue to rise slightly through the middle of 2021 as residual stresses continue to move through the market, particularly in energy and retail, where average prices are still $79 and $86, respectively, according to Credit Suisse. As earnings improve, we expect to see deleveraging, but in a bifurcated and uneven manner throughout the year. An environment of stabilization and spread compression should drive returns in the 5% area, driven by average coupons of 4.1% and residual price upside.
Most recently, our buying has been tilted towards better rated credits in the triple-B to high single-B area. Opportunities have ranged from higher-quality, well-structured transactions benefitting companies in pandemic-related sectors, to mid-tier credit but less risky industries such as technology and communications. Of late, we have focused purchases primarily in the primary market, where attractive new issue spreads accompany firms with credit fundamentals that should continue to perform well.
Performance displayed represents past performance which is no guarantee of future results.
The opinions and forecast expressed may not actually come to pass. This information is subject to change at any time, based on market and other conditions, and should not be construed as a recommendation of any specific security or strategy.
| | THE GUGGENHEIM FUNDS ANNUAL REPORT | 59 |
PERFORMANCE REPORT AND FUND PROFILE (Unaudited) | December 31, 2020 |
SERIES F (FLOATING RATE STRATEGIES SERIES)
OBJECTIVE: Seeks to provide a high level of current income while maximizing total return.
Holdings Diversification (Market Exposure as % of Net Assets)
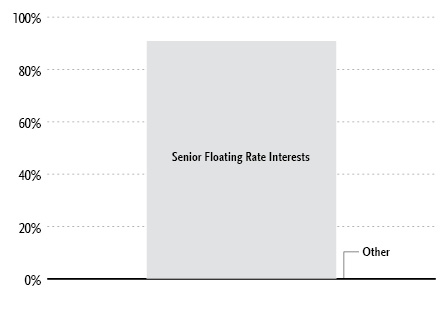
“Holdings Diversification (Market Exposure as % of Net Assets)” excludes any temporary cash investments.
Inception Date: April 24, 2013 |
Ten Largest Holdings (% of Total Net Assets) |
WP CPP Holdings LLC, 4.75% | 1.4% |
Navistar Inc., 3.66% | 1.4% |
Power Solutions (Panther), 3.65% | 1.4% |
NFP Corp., 3.40% | 1.3% |
Hearthside Group Holdings LLC, 3.83% | 1.3% |
Endo Luxembourg Finance Co., 5.00% | 1.3% |
Delta Air Lines, Inc., 5.75% | 1.2% |
CSC Holdings, LLC, 2.41% | 1.2% |
Asplundh Tree Expert LLC, 2.65% | 1.2% |
Altra Industrial Motion Corp., 2.15% | 1.2% |
Top Ten Total | 12.9% |
| | |
“Ten Largest Holdings” excludes any temporary cash or derivative investments. |
60 | THE GUGGENHEIM FUNDS ANNUAL REPORT | |
PERFORMANCE REPORT AND FUND PROFILE (Unaudited)(concluded) | December 31, 2020 |
Cumulative Fund Performance*,†
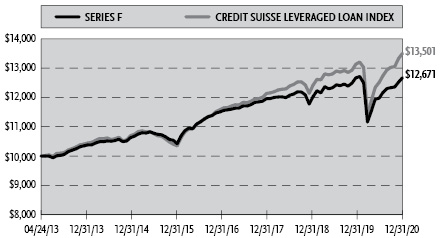
Average Annual Returns*,†
Periods Ended December 31, 2020
| 1 Year | 5 Year | Since
Inception
(04/24/13) |
Series F (Floating Rate Strategies Series) | 0.01% | 3.70% | 3.13% |
Credit Suisse Leveraged Loan Index | 2.78% | 5.19% | 3.98% |
Portfolio Composition by Quality Rating1 |
Rating | % of Total
Investments |
Fixed Income Instruments | |
BBB | 12.7% |
BB | 33.3% |
B | 36.8% |
CCC | 3.6% |
NR2 | 0.2% |
Other Instruments | 13.4% |
Total Investments | 100.0% |
* | The performance data above represents past performance that is not predictive of future results. The investment return and principal value of an investment in the Fund will fluctuate so that an investor’s shares, when redeemed, may be worth more or less than their original cost. Returns are historical and include changes in principal and reinvested dividends and capital gains and do not reflect the effect of taxes. The Credit Suisse Leveraged Loan Index is an unmanaged index and, unlike the Fund, has no management fees or operating expenses to reduce its reported return. |
† | Performance figures do not reflect fees and expenses associated with an investment in variable insurance products. If returns had taken into account these fees and expenses, performance would have been lower. Shares of a series of Guggenheim Variable Funds Trust are available only through the purchase of such products. |
1 | Source: BlackRock Solutions. Credit quality ratings are measured on a scale that generally ranges from AAA (highest) to D (lowest). All securities except for those labeled “NR” have been rated by Moody’s, Standard & Poor’s (“S&P”), or Fitch, each of which is a Nationally Recognized Statistical Rating Organization (“NRSRO”). For purposes of this presentation, when ratings are available from more than one agency, the highest rating is used. Guggenheim Investments has converted ratings to the equivalent S&P rating. Security ratings are determined at the time of purchase and may change thereafter. |
2 | NR (not rated) securities do not necessarily indicate low credit quality. |
| | THE GUGGENHEIM FUNDS ANNUAL REPORT | 61 |
SCHEDULE OF INVESTMENTS | December 31, 2020 |
SERIES F (FLOATING RATE STRATEGIES SERIES) | |
| | Shares | | | Value | |
COMMON STOCKS††† - 0.1% |
| | | | | | | | | |
Industrial - 0.1% |
API Heat Transfer Parent LLC* | | | 170,114 | | | $ | 13,202 | |
BP Holdco LLC*,1 | | | 11,609 | | | | 4,093 | |
Vector Phoenix Holdings, LP* | | | 11,609 | | | | 1,127 | |
Total Industrial | | | | | | | 18,422 | |
| | | | | | | | | |
Consumer, Non-cyclical - 0.0% |
Chef Holdings, Inc.* | | | 20 | | | | 1,692 | |
| | | | | | | | | |
Total Common Stocks | | | | |
(Cost $90,943) | | | | | | | 20,114 | |
| | | | | | | | | |
PREFERRED STOCKS††† - 0.0% |
Industrial - 0.0% |
API Heat Transfer Intermediate* | | | 36 | | | | 18,500 | |
Total Preferred Stocks | | | | |
(Cost $28,949) | | | | | | | 18,500 | |
| | | | | | | | | |
MONEY MARKET FUND† - 14.0% |
Federated Hermes U.S. Treasury Cash Reserves Fund — Institutional Shares, 0.01%2 | | | 5,749,415 | | | | 5,749,415 | |
Total Money Market Fund | | | | |
(Cost $5,749,415) | | | | | | | 5,749,415 | |
| | | | | | | | | |
| | | Face
Amount | | | | | |
SENIOR FLOATING RATE INTERESTS††,3 - 90.8% |
Industrial - 20.8% | | | | | | | | |
WP CPP Holdings LLC | | | | | | | | |
4.75% (3 Month USD LIBOR + 3.75%, Rate Floor: 4.75%) due 04/30/25 | | $ | 627,132 | | | | 584,575 | |
Delta Air Lines, Inc. | | | | | | | | |
5.75% (3 Month USD LIBOR + 4.75%, Rate Floor: 5.75%) due 05/01/23 | | | 497,500 | | | | 504,520 | |
Altra Industrial Motion Corp. | | | | | | | | |
2.15% (1 Month USD LIBOR + 2.00%, Rate Floor: 2.00%) due 10/01/25 | | | 499,627 | | | | 498,378 | |
Reynolds Group Holdings, Inc. | | | | | | | | |
3.40% (1 Month USD LIBOR + 3.25%, Rate Floor: 3.25%) due 02/05/26 | | | 500,000 | | | | 495,625 | |
Gardner Denver, Inc. | | | | | | | | |
1.90% (1 Month USD LIBOR + 1.75%, Rate Floor: 1.75%) due 03/01/27 | | | 496,250 | | | | 489,178 | |
Reece Ltd. | | | | | | | | |
2.26% (3 Month USD LIBOR + 2.00%, Rate Floor: 2.00%) due 01/04/27 | | | 495,681 | | | | 487,626 | |
USIC Holding, Inc. | | | | | | | | |
4.00% (1 Month USD LIBOR + 3.00%, Rate Floor: 4.00%) due 12/08/23 | | | 485,325 | | | | 484,718 | |
TransDigm, Inc. | | | | | | | | |
2.40% (1 Month USD LIBOR + 2.25%, Rate Floor: 2.25%) due 05/30/25 | | | 493,744 | | | | 483,252 | |
Alliance Laundry Systems LLC | | | | | | | | |
4.25% (3 Month USD LIBOR + 3.50%, Rate Floor: 4.25%) due 10/08/27 | | | 450,000 | | | | 449,437 | |
Cushman & Wakefield US Borrower LLC | | | | | | | | |
2.90% (1 Month USD LIBOR + 2.75%, Rate Floor: 2.75%) due 08/21/25 | | | 448,869 | | | | 440,116 | |
American Builders & Contractors Supply Co., Inc. | | | | | | | | |
2.15% (1 Month USD LIBOR + 2.00%, Rate Floor: 2.00%) due 01/15/27 | | | 444,375 | | | | 439,771 | |
Berry Global, Inc. | | | | | | | | |
2.15% (1 Month USD LIBOR + 2.00%, Rate Floor: 2.00%) due 07/01/26 | | | 417,275 | | | | 414,826 | |
Genesee & Wyoming, Inc. | | | | | | | | |
2.25% (3 Month USD LIBOR + 2.00%, Rate Floor: 2.00%) due 12/30/26 | | | 397,995 | | | | 396,813 | |
LTI Holdings, Inc. | | | | | | | | |
3.65% (1 Month USD LIBOR + 3.50%, Rate Floor: 3.50%) due 09/06/25 | | | 394,990 | | | | 382,860 | |
Mileage Plus Holdings LLC | | | | | | | | |
6.25% (3 Month USD LIBOR + 5.25%, Rate Floor: 6.25%) due 06/21/27 | | | 250,000 | | | | 259,845 | |
Charter Nex US Holdings, Inc. | | | | | | | | |
5.00% (1 Month USD LIBOR + 4.25%, Rate Floor: 5.00%) due 12/01/27 | | | 250,000 | | | | 251,000 | |
BWAY Holding Co. | | | | | | | | |
3.48% (3 Month USD LIBOR + 3.25%, Rate Floor: 3.25%) due 04/03/24 | | | 256,096 | | | | 246,813 | |
VC GB Holdings, Inc. | | | | | | | | |
4.00% (1 Month USD LIBOR + 3.00%, Rate Floor: 4.00%) due 02/28/24††† | | | 233,741 | | | | 233,157 | |
CPG International LLC | | | | | | | | |
4.75% (3 Month USD LIBOR + 3.75%, Rate Floor: 4.75%) due 05/06/24 | | | 199,652 | | | | 199,352 | |
Titan Acquisition Ltd. (Husky) | | | | | | | | |
3.27% (3 Month USD LIBOR + 3.00%, Rate Floor: 3.00%) due 03/28/25 | | | 194,499 | | | | 189,262 | |
API Heat Transfer | | | | | | | | |
12.00% (3 Month USD LIBOR + 0.00%, Rate Floor: 1.00%) (in-kind rate was 11.00%) due 01/01/24†††,4 | | | 178,621 | | | | 159,419 | |
12.00% (3 Month USD LIBOR + 0.00%, Rate Floor: 1.00%) (in-kind rate was 11.00%) due 10/02/23†††,4 | | | 31,868 | | | | 29,000 | |
Filtration Group Corp. | | | | | | | | |
3.15% (1 Month USD LIBOR + 3.00%, Rate Floor: 3.00%) due 03/31/25 | | | 185,512 | | | | 183,342 | |
Berlin Packaging LLC | | | | | | | | |
3.16% (1 Month USD LIBOR + 3.00% and 3 Month USD LIBOR + 3.00%, Rate Floor: 3.00%) due 11/07/25 | | | 148,855 | | | | 146,232 | |
Vertical (TK Elevator) | | | | | | | | |
4.57% (3 Month USD LIBOR + 4.25%, Rate Floor: 4.25%) due 07/30/27 | | | 99,750 | | | | 100,088 | |
Total Industrial | | | | | | | 8,549,205 | |
62 | THE GUGGENHEIM FUNDS ANNUAL REPORT | SEE NOTES TO FINANCIAL STATEMENTS. |
SCHEDULE OF INVESTMENTS (continued) | December 31, 2020 |
SERIES F (FLOATING RATE STRATEGIES SERIES) | |
| | Face
Amount | | | Value | |
Consumer, Non-cyclical - 19.4% | | | | | | | | |
Hearthside Group Holdings LLC | | | | | | | | |
3.83% (1 Month USD LIBOR + 3.69%, Rate Floor: 3.69%) due 05/23/25 | | $ | 537,625 | | | $ | 527,545 | |
Endo Luxembourg Finance Co. | | | | | | | | |
5.00% (3 Month USD LIBOR + 4.25%, Rate Floor: 5.00%) due 04/29/24 | | | 533,543 | | | | 524,206 | |
Aramark Services, Inc. | | | | | | | | |
1.90% (1 Month USD LIBOR + 1.75%, Rate Floor: 1.75%) due 03/11/25 | | | 500,000 | | | | 492,625 | |
Froneri US, Inc. | | | | | | | | |
2.40% (1 Month USD LIBOR + 2.25%, Rate Floor: 2.25%) due 01/29/27 | | | 497,500 | | | | 492,027 | |
DaVita, Inc. | | | | | | | | |
1.90% (1 Month USD LIBOR + 1.75%, Rate Floor: 1.75%) due 08/12/26 | | | 496,241 | | | | 491,502 | |
Elanco Animal Health, Inc. | | | | | | | | |
1.90% (1 Month USD LIBOR + 1.75%, Rate Floor: 1.75%) due 08/02/27 | | | 487,054 | | | | 482,286 | |
Bombardier Recreational Products, Inc. | | | | | | | | |
2.15% (1 Month USD LIBOR + 2.00%, Rate Floor: 2.00%) due 05/24/27 | | | 486,831 | | | | 480,444 | |
JBS USA Lux SA | | | | | | | | |
2.15% (1 Month USD LIBOR + 2.00%, Rate Floor: 2.00%) due 05/01/26 | | | 468,578 | | | | 464,478 | |
Cambrex Corp. | | | | | | | | |
5.50% (1 Month USD LIBOR + 4.50%, Rate Floor: 5.50%) due 12/04/26 | | | 450,000 | | | | 453,375 | |
Weber-Stephen Products LLC | | | | | | | | |
4.00% (1 Month USD LIBOR + 3.25%, Rate Floor: 4.00%) due 10/29/27 | | | 450,000 | | | | 450,225 | |
US Foods, Inc. | | | | | | | | |
2.15% (1 Month USD LIBOR + 2.00%, Rate Floor: 2.00%) due 09/14/26 | | | 444,375 | | | | 436,461 | |
Grifols Worldwide Operations USA, Inc. | | | | | | | | |
2.10% (1 Week USD LIBOR + 2.00%, Rate Floor: 2.00%) due 11/15/27 | | | 397,122 | | | | 393,401 | |
Valeant Pharmaceuticals International, Inc. | | | | | | | | |
2.90% (1 Month USD LIBOR + 2.75%, Rate Floor: 2.75%) due 11/27/25 | | | 375,000 | | | | 371,115 | |
Packaging Coordinators Midco, Inc. | | | | | | | | |
4.50% (6 Month USD LIBOR + 3.75%, Rate Floor: 4.50%) due 11/30/27 | | | 290,566 | | | | 290,566 | |
Diamond (BC) BV | | | | | | | | |
3.21% (3 Month USD LIBOR + 3.00%, Rate Floor: 3.00%) due 09/06/24 | | | 291,000 | | | | 286,393 | |
Syneos Health, Inc. | | | | | | | | |
1.90% (1 Month USD LIBOR + 1.75%, Rate Floor: 1.75%) due 08/01/24 | | | 267,846 | | | | 265,302 | |
Sigma Holding BV (Flora Food) | | | | | | | | |
3.37% (6 Month USD LIBOR + 3.00%, Rate Floor: 3.00%) due 07/02/25 | | | 243,750 | | | | 241,388 | |
Springs Window Fashions | | | | | | | | |
4.40% (1 Month USD LIBOR + 4.25%, Rate Floor: 4.25%) due 06/16/25 | | | 107,672 | | | | 106,640 | |
8.65% (1 Month USD LIBOR + 8.50%, Rate Floor: 8.50%) due 06/15/26 | | | 100,000 | | | | 95,188 | |
BCPE Eagle Buyer LLC | | | | | | | | |
5.25% (1 Month USD LIBOR + 4.25%, Rate Floor: 5.25%) due 03/18/24 | | | 193,467 | | | | 188,066 | |
Kronos Acquisition Holdings, Inc. | | | | | | | | |
5.25% (3 Month USD LIBOR + 4.50%, Rate Floor: 5.25%) due 12/22/26 | | | 150,000 | | | | 149,813 | |
Energizer Holdings, Inc. | | | | | | | | |
due 12/16/27 | | | 150,000 | | | | 149,719 | |
Hayward Industries, Inc. | | | | | | | | |
3.65% (1 Month USD LIBOR + 3.50%, Rate Floor: 3.50%) due 08/05/24 | | | 105,634 | | | | 104,269 | |
CTI Foods Holding Co. LLC | | | | | | | | |
8.00% (3 Month USD LIBOR + 4.00%, Rate Floor: 5.00%) (in-kind rate was 3.00%) due 05/03/24†††,4 | | | 11,282 | | | | 10,605 | |
Total Consumer, Non-cyclical | | | | | | | 7,947,639 | |
| | | | | | | | | |
Communications - 16.1% | | | | | | | | |
CSC Holdings, LLC | | | | | | | | |
2.41% (1 Month USD LIBOR + 2.25%, Rate Floor: 2.25%) due 07/17/25 | | | 509,641 | | | | 501,267 | |
GTT Communications, Inc. | | | | | | | | |
3.00% (3 Month USD LIBOR + 2.75%, Rate Floor: 2.75%) due 05/31/25 | | | 633,750 | | | | 493,324 | |
SFR Group S.A. | | | | | | | | |
3.85% (1 Month USD LIBOR + 3.69%, Rate Floor: 3.69%) due 01/31/26 | | | 481,363 | | | | 475,798 | |
McGraw-Hill Global Education Holdings LLC | | | | | | | | |
5.00% (3 Month USD LIBOR + 4.00%, Rate Floor: 5.00%) due 05/04/22 | | | 462,636 | | | | 449,964 | |
Cengage Learning Acquisitions, Inc. | | | | | | | | |
5.25% (3 Month USD LIBOR + 4.25%, Rate Floor: 5.25%) due 06/07/23 | | | 432,902 | | | | 414,257 | |
Virgin Media Bristol LLC | | | | | | | | |
2.66% (1 Month USD LIBOR + 2.50%, Rate Floor: 2.50%) due 01/31/28 | | | 415,406 | | | | 411,177 | |
Radiate Holdco, LLC | | | | | | | | |
4.25% (1 Month USD LIBOR + 3.50%, Rate Floor: 4.25%) due 09/25/26 | | | 400,000 | | | | 400,188 | |
Zayo Group Holdings, Inc. | | | | | | | | |
3.15% (1 Month USD LIBOR + 3.00%, Rate Floor: 3.00%) due 03/09/27 | | | 401,527 | | | | 398,515 | |
Ziggo Financing Partnership | | | | | | | | |
due 04/28/28 | | | 400,000 | | | | 397,124 | |
Nielsen Finance LLC | | | | | | | | |
2.15% (1 Month USD LIBOR + 2.00%, Rate Floor: 2.00%) due 10/04/23 | | | 379,018 | | | | 377,491 | |
UPC Financing Partnership | | | | | | | | |
3.67% (3 Month USD LIBOR + 3.50%, Rate Floor: 3.50%) due 01/31/29 | | | 175,000 | | | | 175,088 | |
3.68% (3 Month USD LIBOR + 3.50%, Rate Floor: 3.50%) due 01/31/29 | | | 175,000 | | | | 175,088 | |
ProQuest, LLC | | | | | | | | |
3.65% (1 Month USD LIBOR + 3.50%, Rate Floor: 3.50%) due 10/23/26 | | | 283,083 | | | | 282,375 | |
SEE NOTES TO FINANCIAL STATEMENTS. | THE GUGGENHEIM FUNDS ANNUAL REPORT | 63 |
SCHEDULE OF INVESTMENTS (continued) | December 31, 2020 |
SERIES F (FLOATING RATE STRATEGIES SERIES) | |
| | Face
Amount | | | Value | |
Xplornet Communications Inc. | | | | | | | | |
4.90% (1 Month USD LIBOR + 4.75%, Rate Floor: 4.75%) due 06/10/27 | | $ | 249,375 | | | $ | 249,437 | |
WMG Acquisition Corp. | | | | | | | | |
2.27% (1 Month USD LIBOR + 2.13%, Rate Floor: 2.13%) due 11/01/23 | | | 247,365 | | | | 246,707 | |
Internet Brands, Inc. | | | | | | | | |
3.65% (1 Month USD LIBOR + 3.50%, Rate Floor: 3.50%) due 09/13/24 | | | 247,331 | | | | 243,715 | |
Telenet Financing USD LLC | | | | | | | | |
due 04/28/28 | | | 200,000 | | | | 197,126 | |
Altice US Finance I Corp. | | | | | | | | |
2.41% (1 Month USD LIBOR + 2.25%, Rate Floor: 2.25%) due 01/15/26 | | | 196,500 | | | | 193,258 | |
Market Track LLC | | | | | | | | |
5.25% (3 Month USD LIBOR + 4.25%, Rate Floor: 5.25%) due 06/05/24 | | | 193,500 | | | | 178,987 | |
Authentic Brands | | | | | | | | |
4.50% (3 Month USD LIBOR + 3.50%, Rate Floor: 4.50%) due 09/27/24 | | | 168,270 | | | | 166,828 | |
Liberty Cablevision of Puerto Rico LLC | | | | | | | | |
5.16% (1 Month USD LIBOR + 5.00%, Rate Floor: 5.00%) due 10/15/26 | | | 100,000 | | | | 100,271 | |
GTT Communications BV | | | | | | | | |
due 12/31/21 | | | 74,854 | | | | 68,491 | |
Total Communications | | | | | | | 6,596,476 | |
| | | | | | | | | |
Consumer, Cyclical - 13.1% | | | | | | | | |
Navistar Inc. | | | | | | | | |
3.66% (1 Month USD LIBOR + 3.50%, Rate Floor: 3.50%) due 11/06/24 | | | 585,347 | | | | 584,029 | |
Power Solutions (Panther) | | | | | | | | |
3.65% (1 Month USD LIBOR + 3.50%, Rate Floor: 3.50%) due 04/30/26 | | | 557,545 | | | | 554,640 | |
American Tire Distributors, Inc. | | | | | | | | |
8.50% (1 Month USD LIBOR + 7.50% and 3 Month USD LIBOR + 7.50%, Rate Floor: 8.50%) due 09/02/24 | | | 512,563 | | | | 487,191 | |
7.00% (3 Month USD LIBOR + 6.00%, Rate Floor: 7.00%) due 09/01/23 | | | 57,427 | | | | 55,475 | |
Samsonite IP Holdings SARL | | | | | | | | |
1.90% (1 Month USD LIBOR + 1.75%, Rate Floor: 1.75%) due 04/25/25 | | | 499,359 | | | | 488,622 | |
Whatabrands, LLC | | | | | | | | |
2.90% (1 Month USD LIBOR + 2.75%, Rate Floor: 2.75%) due 07/31/26 | | | 479,805 | | | | 474,930 | |
Mavis Tire Express Services Corp. | | | | | | | | |
3.50% (3 Month USD LIBOR + 3.25%, Rate Floor: 3.25%) due 03/20/25 | | | 438,493 | | | | 429,942 | |
Go Daddy Operating Company LLC | | | | | | | | |
due 02/15/24 | | | 398,623 | | | | 398,125 | |
CHG Healthcare Services, Inc. | | | | | | | | |
4.00% (3 Month USD LIBOR + 3.00%, Rate Floor: 4.00%) due 06/07/23 | | | 391,954 | | | | 389,077 | |
Intrawest Resorts Holdings, Inc. | | | | | | | | |
2.90% (1 Month USD LIBOR + 2.75%, Rate Floor: 2.75%) due 07/31/24 | | | 358,614 | | | | 353,084 | |
1011778 BC Unlimited Liability Co. | | | | | | | | |
1.90% (1 Month USD LIBOR + 1.75%, Rate Floor: 1.75%) due 11/19/26 | | | 346,500 | | | | 341,195 | |
IBC Capital Ltd. | | | | | | | | |
3.99% (3 Month USD LIBOR + 3.75%, Rate Floor: 3.75%) due 09/11/23 | | | 339,403 | | | | 334,312 | |
Wyndham Hotels & Resorts, Inc. | | | | | | | | |
1.90% (1 Month USD LIBOR + 1.75%, Rate Floor: 1.75%) due 05/30/25 | | | 146,625 | | | | 145,452 | |
Prime Security Services Borrower LLC (ADT) | | | | | | | | |
4.25% (1 Month USD LIBOR + 3.25% and 3 Month USD LIBOR + 3.25% and 12 Month USD LIBOR + 3.25%, Rate Floor: 4.25%) due 09/23/26 | | | 134,031 | | | | 134,366 | |
Playtika Holding Corp. | | | | | | | | |
7.00% (3 Month USD LIBOR + 6.00%, Rate Floor: 7.00%) due 12/09/24 | | | 96,331 | | | | 96,802 | |
CPI Acquisition, Inc. | | | | | | | | |
5.50% (3 Month USD LIBOR + 4.50%, Rate Floor: 5.50%) due 08/17/22 | | | 41,839 | | | | 38,161 | |
EG Finco Ltd. | | | | | | | | |
4.25% (3 Month USD LIBOR + 4.00%, Rate Floor: 4.00%) due 02/07/25 | | | 37,964 | | | | 37,466 | |
Belk, Inc. | | | | | | | | |
7.75% (3 Month USD LIBOR + 6.75%, Rate Floor: 7.75%) due 07/31/25 | | | 67,356 | | | | 23,503 | |
Total Consumer, Cyclical | | | | | | | 5,366,372 | |
| | | | | | | | | |
Financial - 10.7% | | | | | | | | |
NFP Corp. | | | | | | | | |
3.40% (1 Month USD LIBOR + 3.25%, Rate Floor: 3.25%) due 02/15/27 | | | 564,620 | | | | 552,018 | |
Ryan Specialty Group LLC | | | | | | | | |
4.00% (1 Month USD LIBOR + 3.25%, Rate Floor: 4.00%) due 09/01/27 | | | 498,750 | | | | 496,880 | |
Delos Finance SARL (International Lease Finance) | | | | | | | | |
2.00% (3 Month USD LIBOR + 1.75%, Rate Floor: 1.75%) due 10/06/23 | | | 490,000 | | | | 489,182 | |
HUB International Ltd. | | | | | | | | |
2.96% (3 Month USD LIBOR + 2.75%, Rate Floor: 2.75%) due 04/25/25 | | | 493,687 | | | | 484,277 | |
Trans Union LLC | | | | | | | | |
1.90% (1 Month USD LIBOR + 1.75%, Rate Floor: 1.75%) due 11/16/26 | | | 466,349 | | | | 464,115 | |
Virtu Financial, Inc. | | | | | | | | |
3.15% (1 Month USD LIBOR + 3.00%, Rate Floor: 3.00%) due 03/01/26 | | | 430,000 | | | | 428,835 | |
Citadel Securities LP | | | | | | | | |
2.90% (1 Month USD LIBOR + 2.75%, Rate Floor: 2.75%) due 02/27/26 | | | 396,992 | | | | 396,826 | |
Focus Financial Partners, LLC | | | | | | | | |
due 07/03/24 | | | 398,977 | | | | 395,817 | |
LPL Holdings, Inc. | | | | | | | | |
1.90% (1 Month USD LIBOR + 1.75%, Rate Floor: 1.75%) due 11/12/26 | | | 353,107 | | | | 351,782 | |
64 | THE GUGGENHEIM FUNDS ANNUAL REPORT | SEE NOTES TO FINANCIAL STATEMENTS. |
SCHEDULE OF INVESTMENTS (continued) | December 31, 2020 |
SERIES F (FLOATING RATE STRATEGIES SERIES) | |
| | Face
Amount | | | Value | |
Aretec Group, Inc. | | | | | | | | |
4.40% (1 Month USD LIBOR + 4.25%, Rate Floor: 4.25%) due 10/01/25 | | $ | 245,000 | | | $ | 239,181 | |
Jane Street Group LLC | | | | | | | | |
3.23% (3 Month USD LIBOR + 3.00%, Rate Floor: 3.00%) due 01/31/25 | | | 80,391 | | | | 80,170 | |
Total Financial | | | | | | | 4,379,083 | |
| | | | | | | | | |
Technology - 5.7% | | | | | | | | |
Dun & Bradstreet | | | | | | | | |
due 02/06/26 | | | 450,000 | | | | 449,811 | |
Informatica LLC | | | | | | | | |
3.40% (1 Month USD LIBOR + 3.25%, Rate Floor: 3.25%) due 02/25/27 | | | 357,300 | | | | 353,952 | |
Aspect Software, Inc. | | | | | | | | |
6.00% (3 Month USD LIBOR + 5.00%, Rate Floor: 6.00%) due 01/15/24 | | | 211,785 | | | | 203,667 | |
Tech Data Corp. | | | | | | | | |
3.65% (1 Month USD LIBOR + 3.50%, Rate Floor: 3.50%) due 06/30/25 | | | 200,000 | | | | 201,062 | |
Boxer Parent Co., Inc. | | | | | | | | |
4.40% (1 Month USD LIBOR + 4.25%, Rate Floor: 4.25%) due 10/02/25 | | | 192,527 | | | | 191,508 | |
Solera LLC | | | | | | | | |
2.90% (1 Month USD LIBOR + 2.75%, Rate Floor: 2.75%) due 03/03/23 | | | 172,653 | | | | 171,142 | |
EIG Investors Corp. | | | | | | | | |
4.75% (3 Month USD LIBOR + 3.75%, Rate Floor: 4.75%) due 02/09/23 | | | 149,459 | | | | 149,273 | |
Emerald TopCo, Inc. (Press Ganey) | | | | | | | | |
3.71% (3 Month USD LIBOR + 3.50%, Rate Floor: 3.50%) due 07/24/26 | | | 148,125 | | | | 146,088 | |
TIBCO Software, Inc. | | | | | | | | |
3.90% (1 Month USD LIBOR + 3.75%, Rate Floor: 3.75%) due 06/30/26 | | | 137,310 | | | | 134,435 | |
Epicor Software | | | | | | | | |
5.25% (1 Month USD LIBOR + 4.25%, Rate Floor: 5.25%) due 07/30/27 | | | 125,798 | | | | 126,401 | |
Neustar, Inc. | | | | | | | | |
4.50% (3 Month USD LIBOR + 3.50%, Rate Floor: 4.50%) due 08/08/24 | | | 116,399 | | | | 112,544 | |
Brave Parent Holdings, Inc. | | | | | | | | |
4.15% (1 Month USD LIBOR + 4.00%, Rate Floor: 4.00%) due 04/18/25 | | | 97,744 | | | | 97,134 | |
Total Technology | | | | | | | 2,337,017 | |
| | | | | | | | | |
Basic Materials - 3.6% | | | | | | | | |
Asplundh Tree Expert LLC | | | | | | | | |
2.65% (1 Month USD LIBOR + 2.50%, Rate Floor: 2.50%) due 09/06/27 | | | 498,750 | | | | 499,688 | |
Messer Industries USA, Inc. | | | | | | | | |
due 03/02/26 | | | 398,985 | | | | 395,545 | |
PQ Corp. | | | | | | | | |
2.46% (3 Month USD LIBOR + 2.25%, Rate Floor: 2.25%) due 02/08/27 | | | 330,947 | | | | 327,948 | |
GrafTech Finance, Inc. | | | | | | | | |
4.50% (1 Month USD LIBOR + 3.50%, Rate Floor: 4.50%) due 02/12/25 | | | 254,544 | | | | 254,015 | |
Total Basic Materials | | | | | | | 1,477,196 | |
| | | | | | | | | |
Energy - 1.0% | | | | | | | | |
Buckeye Partners LP | | | | | | | | |
2.90% (1 Month USD LIBOR + 2.75%, Rate Floor: 2.75%) due 11/02/26 | | | 397,995 | | | | 397,187 | |
| | | | | | | | | |
Utilities - 0.4% | | | | | | | | |
Hamilton Projects Acquiror LLC | | | | | | | | |
5.75% (3 Month USD LIBOR + 4.75%, Rate Floor: 5.75%) due 06/17/27 | | | 179,100 | | | | 179,213 | |
Total Senior Floating Rate Interests | | | | |
(Cost $37,533,685) | | | 37,229,388 | |
| | | | | | | | | |
Total Investments - 104.9% | | | | |
(Cost $43,402,992) | | $ | 43,017,417 | |
Other Assets & Liabilities, net - (4.9)% | | | (2,013,706 | ) |
Total Net Assets - 100.0% | | $ | 41,003,711 | |
* | Non-income producing security. |
† | Value determined based on Level 1 inputs — See Note 4. |
†† | Value determined based on Level 2 inputs, unless otherwise noted — See Note 4. |
††† | Value determined based on Level 3 inputs — See Note 4. |
1 | Affiliated issuer. |
2 | Rate indicated is the 7-day yield as of December 31, 2020. |
3 | Variable rate security. Rate indicated is the rate effective at December 31, 2020. In some instances, the effective rate is limited by a minimum rate floor or a maximum rate cap established by the issuer. The settlement status of a position may also impact the effective rate indicated. In some cases, a position may be unsettled at period end and may not have a stated effective rate. In instances where multiple underlying reference rates and spread amounts are shown, the effective rate is based on a weighted average. |
4 | Payment-in-kind security. |
| | LIBOR — London Interbank Offered Rate |
| | SARL — Société à Responsabilité Limitée |
| | |
| | See Sector Classification in Other Information section. |
SEE NOTES TO FINANCIAL STATEMENTS. | THE GUGGENHEIM FUNDS ANNUAL REPORT | 65 |
SCHEDULE OF INVESTMENTS (continued) | December 31, 2020 |
SERIES F (FLOATING RATE STRATEGIES SERIES) | |
The following table summarizes the inputs used to value the Fund’s investments at December 31, 2020 (See Note 4 in the Notes to Financial Statements):
Investments in Securities (Assets) | | Level 1
Quoted
Prices | | | Level 2
Significant
Observable
Inputs | | | Level 3
Significant
Unobservable
Inputs | | | Total | |
Common Stocks | | $ | — | | | $ | — | | | $ | 20,114 | | | $ | 20,114 | |
Preferred Stocks | | | — | | | | — | | | | 18,500 | | | | 18,500 | |
Money Market Fund | | | 5,749,415 | | | | — | | | | — | | | | 5,749,415 | |
Senior Floating Rate Interests | | | — | | | | 36,797,207 | | | | 432,181 | | | | 37,229,388 | |
Total Assets | | $ | 5,749,415 | | | $ | 36,797,207 | | | $ | 470,795 | | | $ | 43,017,417 | |
Investments in Securities (Liabilities) | | Level 1
Quoted
Prices | | | Level 2
Significant
Observable
Inputs | | | Level 3
Significant
Unobservable
Inputs | | | Total | |
Unfunded Loan Commitments (Note 8) | | $ | — | | | $ | — | | | $ | 383 | | | $ | 383 | |
The following is a summary of significant unobservable inputs used in the fair valuations of assets and liabilities categorized within Level 3 of the fair value hierarchy:
Category | | Ending Balance at
December 31, 2020 | | | Valuation Technique | | | Unobservable Inputs | | | Input Range | | | Weighted Average* | |
Assets: | | | | | | | | | | | | | | | | | | | | |
Common Stocks | | $ | 20,114 | | Enterprise Value | Valuation Multiple | | | 3.5x-19.2x | | | | 14.7x | |
Preferred Stocks | | | 18,500 | | Yield Analysis | Yield | | | 18.2 | % | | | — | |
Senior Floating Rate Interests | | | 233,157 | | Third Party Pricing | Broker Quote | | | — | | | | — | |
Senior Floating Rate Interests | | | 199,024 | | Enterprise Value | Valuation Multiple | | | 9.4x-19.2x | | | | 18.7x | |
Total Assets | | $ | 470,795 | | | | | | | | | | | | | | |
Liabilities: | | | | | | | | | | | | | | | | | | | | |
Unfunded Loan Commitments | | $ | 383 | | | | Model Price | | | | Purchase Price | | | | — | | | | — | |
* | Inputs are weighted by the fair value of the instruments. |
Significant changes in a quote, yield or valuation multiple would generally result in significant changes in the fair value of the security.
The Fund’s fair valuation leveling guidelines classify a single daily broker quote, or a vendor price based on a single daily or monthly broker quote, as Level 3, if such a quote or price cannot be supported with other available market information.
Transfers between Level 2 and Level 3 may occur as markets fluctuate and/or the availability of data used in an investment’s valuation changes. For the year ended December 31, 2020, the Fund had securities with a total value of $264,859 transfer into Level 3 from Level 2 due to lack of observable inputs and had securities with a total market value of $666,613 transfer out of Level 3 to Level 2 due to the availability of current and reliable market-based data provided by a third-party pricing service which utilizes significant observable inputs.
66 | THE GUGGENHEIM FUNDS ANNUAL REPORT | SEE NOTES TO FINANCIAL STATEMENTS. |
SCHEDULE OF INVESTMENTS (concluded) | December 31, 2020 |
SERIES F (FLOATING RATE STRATEGIES SERIES) | |
Summary of Fair Value Level 3 Activity
Following is a reconciliation of Level 3 assets for which significant unobservable inputs were used to determine fair value for the year ended December 31, 2020:
| | | Assets | | | | | | | Liabilities | |
| | Senior Floating
Rate Interests | | | Common
Stocks | | | Preferred
Stocks | | | Total Assets | | | Unfunded Loan
Commitments | |
Beginning Balance | | $ | 442,260 | | | $ | 7,408 | | | $ | — | | | $ | 449,668 | | | $ | (1,634 | ) |
Purchases/(Receipts) | | | 420,727 | | | | — | | | | — | | | | 420,727 | | | | (287 | ) |
(Sales, maturities and paydowns)/Fundings | | | (6,154 | ) | | | — | | | | — | | | | (6,154 | ) | | | 481 | |
Amortization of premiums/discounts | | | 574 | | | | — | | | | — | | | | 574 | | | | — | |
Total change in unrealized appreciation (depreciation) included in earnings | | | 8,230 | | | | (496 | ) | | | — | | | | 7,734 | | | | 1,057 | |
Transfers into Level 3 | | | 233,157 | | | | 13,202 | | | | 18,500 | | | | 264,859 | | | | — | |
Transfers out of Level 3 | | | (666,613 | ) | | | — | | | | — | | | | (666,613 | ) | | | — | |
Ending Balance | | $ | 432,181 | | | $ | 20,114 | | | $ | 18,500 | | | $ | 470,795 | | | $ | (383 | ) |
Net change in unrealized appreciation (depreciation) for investments in Level 3 securities still held at December 31, 2020 | | $ | 6,031 | | | $ | (496 | ) | | $ | — | | | $ | 5,535 | | | $ | 151 | |
Affiliated Transactions
Investments representing 5% or more of the outstanding voting shares of a company, or control of or by, or common control under Guggenheim Investments, result in that company being considered an affiliated issuer, as defined in the 1940 Act.
Transactions during the year ended December 31, 2020, in which the company is an affiliated issuer, were as follows:
Security Name | | Value
12/31/19 | | | Additions | | | Reductions | | | Realized
Gain (Loss) | | | Change in
Unrealized
Appreciation
(Depreciation) | | | Value
12/31/20 | | | Shares
12/31/20 | |
Common Stock | | | | | | | | | | | | | | | | | | | | | | | | | | | | |
BP Holdco LLC* | | $ | 4,099 | | | $ | — | | | $ | — | | | $ | — | | | $ | (6 | ) | | $ | 4,093 | | | | 11,609 | |
* | Non-income producing security. |
SEE NOTES TO FINANCIAL STATEMENTS. | THE GUGGENHEIM FUNDS ANNUAL REPORT | 67 |
SERIES F (FLOATING RATE STRATEGIES SERIES) | |
STATEMENT OF ASSETS AND LIABILITIES |
December 31, 2020 |
Assets: |
Investments in unaffiliated issuers, at value (cost $43,398,893) | | $ | 43,013,324 | |
Investments in affiliated issuers, at value (cost $4,099) | | | 4,093 | |
Cash | | | 151,489 | |
Prepaid expenses | | | 9,084 | |
Receivables: |
Securities sold | | | 697,062 | |
Interest | | | 53,449 | |
Fund shares sold | | | 14 | |
Total assets | | | 43,928,515 | |
| | | | | |
Liabilities: |
Unfunded loan commitments, at value (Note 8) (commitment fees received $669) | | | 383 | |
Payable for: |
Securities purchased | | | 2,810,700 | |
Fund shares redeemed | | | 22,455 | |
Management fees | | | 10,150 | |
Distribution and service fees | | | 8,565 | |
Fund accounting/administration fees | | | 6,432 | |
Transfer agent/maintenance fees | | | 2,168 | |
Trustees’ fees* | | | 1,677 | |
Miscellaneous | | | 62,274 | |
Total liabilities | | | 2,924,804 | |
Commitments and contingent liabilities (Note 13) | | | — | |
Net assets | | $ | 41,003,711 | |
| | | | | |
Net assets consist of: |
Paid in capital | | $ | 44,016,342 | |
Total distributable earnings (loss) | | | (3,012,631 | ) |
Net assets | | $ | 41,003,711 | |
Capital shares outstanding | | | 1,680,092 | |
Net asset value per share | | $ | 24.41 | |
STATEMENT OF OPERATIONS |
Year Ended December 31, 2020 |
Investment Income: |
Interest from securities of unaffiliated issuers | | $ | 1,587,520 | |
Total investment income | | | 1,587,520 | |
| | | | | |
Expenses: |
Management fees | | | 255,579 | |
Distribution and service fees | | | 98,299 | |
Transfer agent/maintenance fees | | | 25,228 | |
Professional fees | | | 73,379 | |
Fund accounting/administration fees | | | 37,273 | |
Line of credit fees | | | 29,661 | |
Trustees’ fees* | | | 18,582 | |
Custodian fees | | | 12,578 | |
Miscellaneous | | | 29,241 | |
Total expenses | | | 579,820 | |
Less: |
Expenses reimbursed by Adviser | | | (4,814 | ) |
Expenses waived by Adviser | | | (92,894 | ) |
Earnings credits applied | | | (813 | ) |
Total waived/reimbursed expenses | | | (98,521 | ) |
Net expenses | | | 481,299 | |
Net investment income | | | 1,106,221 | |
| | | | | |
Net Realized and Unrealized Gain (Loss): |
Net realized gain (loss) on: |
Investments in unaffiliated issuers | | | (2,206,068 | ) |
Net realized loss | | | (2,206,068 | ) |
Net change in unrealized appreciation (depreciation) on: |
Investments in unaffiliated issuers | | | 396,923 | |
Investments in affiliated issuers | | | (6 | ) |
Net change in unrealized appreciation (depreciation) | | | 396,917 | |
Net realized and unrealized loss | | | (1,809,151 | ) |
Net decrease in net assets resulting from operations | | $ | (702,930 | ) |
* | Relates to Trustees not deemed “interested persons” within the meaning of Section 2(a)(19) of the 1940 Act. |
68 | THE GUGGENHEIM FUNDS ANNUAL REPORT | SEE NOTES TO FINANCIAL STATEMENTS. |
SERIES F (FLOATING RATE STRATEGIES SERIES) | |
STATEMENTS OF CHANGES IN NET ASSETS |
| | Year Ended
December 31,
2020 | | | Year Ended
December 31,
2019 | |
Increase (Decrease) in Net Assets from Operations: | | | | | | | | |
Net investment income | | $ | 1,106,221 | | | $ | 2,229,067 | |
Net realized loss on investments | | | (2,206,068 | ) | | | (671,944 | ) |
Net change in unrealized appreciation (depreciation) on investments | | | 396,917 | | | | 2,378,952 | |
Net increase (decrease) in net assets resulting from operations | | | (702,930 | ) | | | 3,936,075 | |
| | | | | | | | | |
Distributions to shareholders | | | (2,229,065 | ) | | | (2,678,923 | ) |
| | | | | | | | | |
Capital share transactions: | | | | | | | | |
Proceeds from sale of shares | | | 25,343,213 | | | | 16,078,068 | |
Distributions reinvested | | | 2,229,065 | | | | 2,678,923 | |
Cost of shares redeemed | | | (29,683,817 | ) | | | (32,764,760 | ) |
Net decrease from capital share transactions | | | (2,111,539 | ) | | | (14,007,769 | ) |
Net decrease in net assets | | | (5,043,534 | ) | | | (12,750,617 | ) |
| | | | | | | | | |
Net assets: | | | | | | | | |
Beginning of year | | | 46,047,245 | | | | 58,797,862 | |
End of year | | $ | 41,003,711 | | | $ | 46,047,245 | |
| | | | | | | | | |
Capital share activity: | | | | | | | | |
Shares sold | | | 1,049,495 | | | | 615,568 | |
Shares issued from reinvestment of distributions | | | 94,854 | | | | 105,511 | |
Shares redeemed | | | (1,237,868 | ) | | | (1,271,092 | ) |
Net decrease in shares | | | (93,519 | ) | | | (550,013 | ) |
SEE NOTES TO FINANCIAL STATEMENTS. | THE GUGGENHEIM FUNDS ANNUAL REPORT | 69 |
SERIES F (FLOATING RATE STRATEGIES SERIES) | |
This table is presented to show selected data for a share outstanding throughout each period and to assist shareholders in evaluating a Fund’s performance for the periods presented.
| | Year Ended
December 31,
2020 | | | Year Ended
December 31,
2019 | | | Year Ended
December 31,
2018 | | | Year Ended
December 31,
2017 | | | Year Ended
December 31,
2016 | |
Per Share Data |
Net asset value, beginning of period | | $ | 25.96 | | | $ | 25.30 | | | $ | 26.26 | | | $ | 26.22 | | | $ | 25.72 | |
Income (loss) from investment operations: |
Net investment income (loss)a | | | .68 | | | | 1.06 | | | | 1.01 | | | | .91 | | | | 1.05 | |
Net gain (loss) on investments (realized and unrealized) | | | (.74 | ) | | | .85 | | | | (1.21 | ) | | | (.02 | ) | | | 1.09 | |
Total from investment operations | | | (.06 | ) | | | 1.91 | | | | (.20 | ) | | | .89 | | | | 2.14 | |
Less distributions from: |
Net investment income | | | (1.49 | ) | | | (1.25 | ) | | | (.76 | ) | | | (.85 | ) | | | (1.56 | ) |
Net realized gains | | | — | | | | — | | | | — | | | | — | | | | (.08 | ) |
Total distributions | | | (1.49 | ) | | | (1.25 | ) | | | (.76 | ) | | | (.85 | ) | | | (1.64 | ) |
Net asset value, end of period | | $ | 24.41 | | | $ | 25.96 | | | $ | 25.30 | | | $ | 26.26 | | | $ | 26.22 | |
|
Total Returnb | | | 0.01 | % | | | 7.60 | % | | | (0.84 | %) | | | 3.46 | % | | | 8.56 | % |
Ratios/Supplemental Data |
Net assets, end of period (in thousands) | | $ | 41,004 | | | $ | 46,047 | | | $ | 58,798 | | | $ | 51,038 | | | $ | 53,245 | |
Ratios to average net assets: |
Net investment income (loss) | | | 2.81 | % | | | 4.10 | % | | | 3.85 | % | | | 3.44 | % | | | 4.06 | % |
Total expenses | | | 1.47 | % | | | 1.38 | % | | | 1.26 | % | | | 1.28 | % | | | 1.22 | % |
Net expensesc,d,e | | | 1.23 | % | | | 1.21 | % | | | 1.16 | % | | | 1.18 | % | | | 1.18 | % |
Portfolio turnover rate | | | 60 | % | | | 28 | % | | | 80 | % | | | 57 | % | | | 71 | % |
a | Net investment income (loss) per share was computed using average shares outstanding throughout the period. |
b | Total return does not take into account any of the expenses associated with an investment in variable insurance products. If total return had taken into account these expenses, performance would have been lower. Shares of a series of Guggenheim Variable Funds Trust are available only through the purchase of such products. |
c | Net expense information reflects the expense ratios after expense waivers and reimbursements, as applicable. |
d | Net expenses may include expenses that are excluded from the expense limitation agreement. Excluding these expenses, the net expense ratios for the years presented would be: |
| | 12/31/20 | 12/31/19 | 12/31/18 | 12/31/17 | 12/31/16 |
| | 1.15% | 1.15% | 1.15% | 1.15% | 1.15% |
e | The portion of the ratios of net expenses to average net assets attributable to recoupments of prior fee reductions or expense reimbursements for the years was as follows: |
| | 12/31/20 | 12/31/19 | 12/31/18 | 12/31/17 | 12/31/16 |
| | — | — | 0.00%* | 0.01% | — |
70 | THE GUGGENHEIM FUNDS ANNUAL REPORT | SEE NOTES TO FINANCIAL STATEMENTS. |
MANAGERS’ COMMENTARY (Unaudited) | December 31, 2020 |
To Our Shareholders:
The Series J (StylePlusTM—Mid Growth Series) (the “Fund”) is managed by a team of seasoned professionals, including Farhan Sharaff, Senior Managing Director and Assistant Chief Investment Officer, Equities; Qi Yan, Managing Director and Portfolio Manager; and Adam J. Bloch, Managing Director and Portfolio Manager. In the following paragraphs, the investment team discusses performance of the Fund for the fiscal year ended December 31, 2020.
For the year ended December 31, 2020, Series J (StylePlus—Mid Growth Series) returned 32.10%, compared with the 35.59% return of its benchmark, the Russell Midcap® Growth Index.
Investment Approach
Through a combination of actively managed individual equity, passive equity, and actively managed fixed income, the Fund seeks to exceed the total return of the Russell Midcap Growth Index. The actively managed equity and fixed income components seek to provide multiple sources of outperformance and take advantage of Guggenheim’s competencies in both fixed income and systematic stock selection.
The active and passive decisions seek to add value by tactically allocating to actively managed equity through quantitative selection models when stock picking opportunities are high. During periods when Guggenheim views these opportunities to be less attractive, the Fund seeks to increase its passive exposure to equities and the allocation to fixed income securities. The prospective return during such periods is the equity index plus an “alpha” component coming from the yield of the fixed income overlay.
Performance Review
Over the period, from 15-25% of the total equity position was allocated to actively managed equity and 75-85% to passive equity. Remaining Fund assets were invested in the Guggenheim Strategy Funds, short-term fixed income investment companies advised by Guggenheim Investments, and the Guggenheim Ultra Short Duration Fund, whose objective is to seek a high level of income consistent with the preservation of capital.
The Fund underperformed the Russell Midcap Growth Index for the fiscal year ended December 31, 2020 by 349 basis points net of fees. The fixed income sleeve contributed to total return, as positions in the Guggenheim Ultra Short Duration Fund and the Guggenheim Strategy Funds, net of the investment income earned by these positions, were positive for the period. The actively managed equity sleeve detracted from performance on a relative basis. The passive equity position, maintained through swap agreements and futures contracts, had an insignificant impact on relative performance for the period.
Performance displayed represents past performance which is no guarantee of future results.
The opinions and forecast expressed may not actually come to pass. This information is subject to change at any time, based on market and other conditions, and should not be construed as a recommendation of any specific security or strategy.
| | THE GUGGENHEIM FUNDS ANNUAL REPORT | 71 |
PERFORMANCE REPORT AND FUND PROFILE (Unaudited) | December 31, 2020 |
SERIES J (STYLEPLUS—MID GROWTH SERIES)
OBJECTIVE: Seeks long-term growth of capital.
Holdings Diversification (Market Exposure as % of Net Assets)

“Holdings Diversification (Market Exposure as % of Net Assets)” excludes any temporary cash investments, investments in Guggenheim Strategy Funds Trust mutual funds, or investments in Guggenheim Ultra Short Duration Fund.
Inception Date: October 1, 1992 |
Ten Largest Holdings (% of Total Net Assets) |
Guggenheim Ultra Short Duration Fund — Institutional Class | 28.0% |
Guggenheim Strategy Fund III | 21.2% |
Guggenheim Variable Insurance Strategy Fund III | 21.2% |
Guggenheim Strategy Fund II | 10.3% |
Chemed Corp. | 0.3% |
Enphase Energy, Inc. | 0.2% |
Trimble, Inc. | 0.2% |
Jazz Pharmaceuticals plc | 0.2% |
SolarEdge Technologies, Inc. | 0.2% |
Charles River Laboratories International, Inc. | 0.2% |
Top Ten Total | 82.0% |
| | |
“Ten Largest Holdings” excludes any temporary cash or derivative investments. |
72 | THE GUGGENHEIM FUNDS ANNUAL REPORT | |
PERFORMANCE REPORT AND FUND PROFILE (Unaudited)(concluded) | December 31, 2020 |
Cumulative Fund Performance*,†
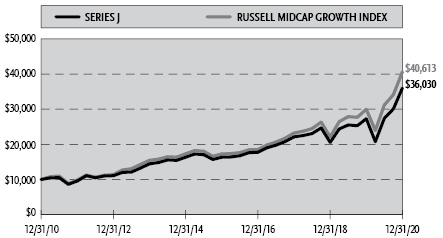
Average Annual Returns*,†
Periods Ended December 31, 2020
| 1 Year | 5 Year | 10 Year |
Series J (StylePlus—Mid Growth Series) | 32.10% | 17.14% | 13.68% |
Russell Midcap Growth Index | 35.59% | 18.66% | 15.04% |
* | The performance data above represents past performance that is not predictive of future results. The investment return and principal value of an investment in the Fund will fluctuate so that an investor’s shares, when redeemed, may be worth more or less than their original cost. Returns are historical and include changes in principal and reinvested dividends and capital gains and do not reflect the effect of taxes. The Russell Midcap Growth Index is an unmanaged index and, unlike the Fund, has no management fees or operating expenses to reduce its reported return. |
† | Performance figures do not reflect fees and expenses associated with an investment in variable insurance products. If returns had taken into account these fees and expenses, performance would have been lower. Shares of a series of Guggenheim Variable Funds Trust are available only through the purchase of such products. |
| | THE GUGGENHEIM FUNDS ANNUAL REPORT | 73 |
SCHEDULE OF INVESTMENTS | December 31, 2020 |
SERIES J (STYLEPLUS—MID GROWTH SERIES) | |
| | Shares | | | Value | |
COMMON STOCKS† - 15.2% |
| | | | | | | | | |
Consumer, Non-cyclical - 4.4% |
Chemed Corp. | | | 974 | | | $ | 518,762 | |
Jazz Pharmaceuticals plc* | | | 2,380 | | | | 392,819 | |
Charles River Laboratories International, Inc.* | | | 1,540 | | | | 384,784 | |
Encompass Health Corp. | | | 4,340 | | | | 358,874 | |
Bio-Techne Corp. | | | 977 | | | | 310,246 | |
PRA Health Sciences, Inc.* | | | 2,394 | | | | 300,303 | |
Masimo Corp.* | | | 1,106 | | | | 296,828 | |
Amedisys, Inc.* | | | 905 | | | | 265,464 | |
Exelixis, Inc.* | | | 12,342 | | | | 247,704 | |
Integra LifeSciences Holdings Corp.* | | | 3,548 | | | | 230,336 | |
Repligen Corp.* | | | 1,133 | | | | 217,117 | |
Hill-Rom Holdings, Inc. | | | 2,143 | | | | 209,950 | |
LHC Group, Inc.* | | | 966 | | | | 206,067 | |
STERIS plc | | | 1,062 | | | | 201,292 | |
Syneos Health, Inc.* | | | 2,928 | | | | 199,485 | |
Post Holdings, Inc.* | | | 1,921 | | | | 194,040 | |
Quanta Services, Inc. | | | 2,685 | | | | 193,374 | |
Arrowhead Pharmaceuticals, Inc.* | | | 2,463 | | | | 188,986 | |
ICU Medical, Inc.* | | | 868 | | | | 186,177 | |
United Rentals, Inc.* | | | 791 | | | | 183,441 | |
Quidel Corp.* | | | 1,012 | | | | 181,806 | |
Globus Medical, Inc. — Class A* | | | 2,773 | | | | 180,855 | |
Boston Beer Company, Inc. — Class A* | | | 178 | | | | 176,984 | |
Kimberly-Clark Corp. | | | 1,125 | | | | 151,684 | |
WEX, Inc.* | | | 742 | | | | 151,019 | |
Darling Ingredients, Inc.* | | | 2,575 | | | | 148,526 | |
Emergent BioSolutions, Inc.* | | | 1,547 | | | | 138,611 | |
Service Corporation International | | | 2,652 | | | | 130,213 | |
Tyson Foods, Inc. — Class A | | | 2,004 | | | | 129,138 | |
Vertex Pharmaceuticals, Inc.* | | | 523 | | | | 123,606 | |
HealthEquity, Inc.* | | | 1,739 | | | | 121,226 | |
Dentsply Sirona, Inc. | | | 2,300 | | | | 120,428 | |
Campbell Soup Co. | | | 2,414 | | | | 116,717 | |
Haemonetics Corp.* | | | 966 | | | | 114,713 | |
Hologic, Inc.* | | | 1,552 | | | | 113,032 | |
LivaNova plc* | | | 1,702 | | | | 112,689 | |
Baxter International, Inc. | | | 1,351 | | | | 108,404 | |
McKesson Corp. | | | 603 | | | | 104,874 | |
Ligand Pharmaceuticals, Inc. — Class B* | | | 1,051 | | | | 104,522 | |
Molina Healthcare, Inc.* | | | 425 | | | | 90,389 | |
CoreLogic, Inc. | | | 1,094 | | | | 84,588 | |
Incyte Corp.* | | | 967 | | | | 84,110 | |
Cardinal Health, Inc. | | | 1,512 | | | | 80,983 | |
United Therapeutics Corp.* | | | 486 | | | | 73,770 | |
Regeneron Pharmaceuticals, Inc.* | | | 151 | | | | 72,949 | |
Helen of Troy Ltd.* | | | 324 | | | | 71,989 | |
Total Consumer, Non-cyclical | | | | | | | 8,373,874 | |
| | | | | | | | | |
Industrial - 3.6% |
Trimble, Inc.* | | | 5,895 | | | | 393,609 | |
Hubbell, Inc. | | | 2,158 | | | | 338,353 | |
AGCO Corp. | | | 3,072 | | | | 316,693 | |
Timken Co. | | | 4,064 | | | | 314,391 | |
ITT, Inc. | | | 3,741 | | | | 288,132 | |
Carlisle Companies, Inc. | | | 1,794 | | | | 280,187 | |
Lincoln Electric Holdings, Inc. | | | 2,277 | | | | 264,701 | |
Cognex Corp. | | | 3,127 | | | | 251,051 | |
Generac Holdings, Inc.* | | | 1,053 | | | | 239,463 | |
TE Connectivity Ltd. | | | 1,827 | | | | 221,195 | |
EMCOR Group, Inc. | | | 2,126 | | | | 194,444 | |
Waters Corp.* | | | 757 | | | | 187,297 | |
Knight-Swift Transportation Holdings, Inc. | | | 4,413 | | | | 184,552 | |
Trex Company, Inc.* | | | 2,009 | | | | 168,193 | |
PerkinElmer, Inc. | | | 1,164 | | | | 167,034 | |
Oshkosh Corp. | | | 1,929 | | | | 166,029 | |
Lennox International, Inc. | | | 597 | | | | 163,560 | |
Curtiss-Wright Corp. | | | 1,403 | | | | 163,239 | |
TopBuild Corp.* | | | 861 | | | | 158,493 | |
Woodward, Inc. | | | 1,304 | | | | 158,475 | |
Axon Enterprise, Inc.* | | | 1,253 | | | | 153,530 | |
II-VI, Inc.* | | | 1,967 | | | | 149,413 | |
Energizer Holdings, Inc. | | | 3,531 | | | | 148,938 | |
Owens Corning | | | 1,828 | | | | 138,489 | |
Jabil, Inc. | | | 2,864 | | | | 121,806 | |
Huntington Ingalls Industries, Inc. | | | 708 | | | | 120,700 | |
National Instruments Corp. | | | 2,731 | | | | 120,000 | |
Masco Corp. | | | 2,148 | | | | 117,990 | |
Clean Harbors, Inc.* | | | 1,518 | | | | 115,520 | |
Graco, Inc. | | | 1,567 | | | | 113,373 | |
Valmont Industries, Inc. | | | 630 | | | | 110,206 | |
MasTec, Inc.* | | | 1,520 | | | | 103,633 | |
Werner Enterprises, Inc. | | | 2,344 | | | | 91,932 | |
XPO Logistics, Inc.* | | | 726 | | | | 86,539 | |
Northrop Grumman Corp. | | | 256 | | | | 78,008 | |
Littelfuse, Inc. | | | 287 | | | | 73,087 | |
MSA Safety, Inc. | | | 478 | | | | 71,409 | |
Nordson Corp. | | | 351 | | | | 70,533 | |
Universal Display Corp. | | | 298 | | | | 68,480 | |
Eagle Materials, Inc. | | | 577 | | | | 58,479 | |
Toro Co. | | | 586 | | | | 55,576 | |
Total Industrial | | | | | | | 6,786,732 | |
| | | | | | | | | |
Technology - 2.3% |
Fair Isaac Corp.* | | | 600 | | | | 306,624 | |
Cerner Corp. | | | 3,539 | | | | 277,741 | |
Monolithic Power Systems, Inc. | | | 730 | | | | 267,348 | |
MKS Instruments, Inc. | | | 1,758 | | | | 264,491 | |
Lumentum Holdings, Inc.* | | | 2,755 | | | | 261,174 | |
CDK Global, Inc. | | | 4,741 | | | | 245,726 | |
Cree, Inc.* | | | 2,258 | | | | 239,122 | |
Seagate Technology plc | | | 3,552 | | | | 220,792 | |
J2 Global, Inc.* | | | 2,156 | | | | 210,619 | |
CACI International, Inc. — Class A* | | | 831 | | | | 207,193 | |
PTC, Inc.* | | | 1,705 | | | | 203,935 | |
NetApp, Inc. | | | 3,008 | | | | 199,250 | |
ACI Worldwide, Inc.* | | | 5,018 | | | | 192,842 | |
Cirrus Logic, Inc.* | | | 2,343 | | | | 192,595 | |
Perspecta, Inc. | | | 7,070 | | | | 170,246 | |
Teradata Corp.* | | | 7,288 | | | | 163,761 | |
Silicon Laboratories, Inc.* | | | 1,253 | | | | 159,557 | |
74 | THE GUGGENHEIM FUNDS ANNUAL REPORT | SEE NOTES TO FINANCIAL STATEMENTS. |
SCHEDULE OF INVESTMENTS (continued) | December 31, 2020 |
SERIES J (STYLEPLUS—MID GROWTH SERIES) | |
| | Shares | | | Value | |
Manhattan Associates, Inc.* | | | 1,259 | | | $ | 132,421 | |
Synaptics, Inc.* | | | 1,260 | | | | 121,464 | |
NCR Corp.* | | | 3,200 | | | | 120,224 | |
Blackbaud, Inc. | | | 2,028 | | | | 116,732 | |
Semtech Corp.* | | | 1,002 | | | | 72,234 | |
Ceridian HCM Holding, Inc.* | | | 553 | | | | 58,928 | |
Total Technology | | | | | | | 4,405,019 | |
| | | | | | | | | |
Consumer, Cyclical - 2.0% |
Gentex Corp. | | | 10,631 | | | | 360,710 | |
AutoZone, Inc.* | | | 235 | | | | 278,578 | |
Polaris, Inc. | | | 2,470 | | | | 235,342 | |
Deckers Outdoor Corp.* | | | 819 | | | | 234,873 | |
Williams-Sonoma, Inc. | | | 2,140 | | | | 217,938 | |
Caesars Entertainment, Inc.* | | | 2,880 | | | | 213,898 | |
Lithia Motors, Inc. — Class A | | | 697 | | | | 203,991 | |
Brunswick Corp. | | | 2,456 | | | | 187,245 | |
RH* | | | 391 | | | | 174,980 | |
Visteon Corp.* | | | 1,332 | | | | 167,192 | |
Tempur Sealy International, Inc.* | | | 6,098 | | | | 164,646 | |
PACCAR, Inc. | | | 1,765 | | | | 152,284 | |
Wyndham Hotels & Resorts, Inc. | | | 2,456 | | | | 145,985 | |
PulteGroup, Inc. | | | 2,788 | | | | 120,219 | |
O’Reilly Automotive, Inc.* | | | 252 | | | | 114,048 | |
LKQ Corp.* | | | 3,008 | | | | 106,002 | |
Leggett & Platt, Inc. | | | 2,111 | | | | 93,517 | |
IAA, Inc.* | | | 1,335 | | | | 86,748 | |
Scotts Miracle-Gro Co. — Class A | | | 433 | | | | 86,228 | |
Mattel, Inc.* | | | 4,824 | | | | 84,179 | |
Penn National Gaming, Inc.* | | | 946 | | | | 81,706 | |
Five Below, Inc.* | | | 441 | | | | 77,166 | |
Carter’s, Inc. | | | 802 | | | | 75,444 | |
KB Home | | | 2,183 | | | | 73,174 | |
Texas Roadhouse, Inc. — Class A | | | 881 | | | | 68,859 | |
Total Consumer, Cyclical | | | | | | | 3,804,952 | |
| | | | | | | | | |
Financial - 1.2% |
Stifel Financial Corp. | | | 4,692 | | | | 236,733 | |
RenaissanceRe Holdings Ltd. | | | 1,388 | | | | 230,158 | |
Evercore, Inc. — Class A | | | 1,826 | | | | 200,203 | |
Primerica, Inc. | | | 1,401 | | | | 187,636 | |
Western Union Co. | | | 7,305 | | | | 160,272 | |
Brown & Brown, Inc. | | | 3,066 | | | | 145,359 | |
Ameriprise Financial, Inc. | | | 713 | | | | 138,557 | |
Medical Properties Trust, Inc. REIT | | | 5,462 | | | | 119,017 | |
CyrusOne, Inc. REIT | | | 1,619 | | | | 118,430 | |
PROG Holdings, Inc. | | | 1,927 | | | | 103,807 | |
Brighthouse Financial, Inc.* | | | 2,492 | | | | 90,223 | |
Interactive Brokers Group, Inc. — Class A | | | 1,439 | | | | 87,664 | |
SLM Corp. | | | 5,812 | | | | 72,011 | |
Essent Group Ltd. | | | 1,582 | | | | 68,343 | |
EastGroup Properties, Inc. REIT | | | 414 | | | | 57,157 | |
American Campus Communities, Inc. REIT | | | 1,325 | | | | 56,670 | |
STORE Capital Corp. REIT | | | 1,598 | | | | 54,300 | |
Commerce Bancshares, Inc. | | | 813 | | | | 53,394 | |
Camden Property Trust REIT | | | 521 | | | | 52,058 | |
Total Financial | | | | | | | 2,231,992 | |
| |
Communications - 0.7% |
Ciena Corp.* | | | 5,232 | | | | 276,511 | |
FactSet Research Systems, Inc. | | | 727 | | | | 241,728 | |
Cable One, Inc. | | | 81 | | | | 180,445 | |
Corning, Inc. | | | 3,038 | | | | 109,368 | |
Yelp, Inc. — Class A* | | | 3,112 | | | | 101,669 | |
Motorola Solutions, Inc. | | | 575 | | | | 97,785 | |
GrubHub, Inc.* | | | 1,218 | | | | 90,461 | |
New York Times Co. — Class A | | | 1,737 | | | | 89,924 | |
Interpublic Group of Companies, Inc. | | | 3,580 | | | | 84,202 | |
eBay, Inc. | | | 1,573 | | | | 79,043 | |
Omnicom Group, Inc. | | | 1,262 | | | | 78,711 | |
Total Communications | | | | | | | 1,429,847 | |
| | | | | | | | | |
Energy - 0.7% |
Enphase Energy, Inc.* | | | 2,653 | | | | 465,522 | |
SolarEdge Technologies, Inc.* | | | 1,219 | | | | 389,007 | |
Sunrun, Inc.* | | | 3,412 | | | | 236,725 | |
First Solar, Inc.* | | | 1,563 | | | | 154,612 | |
Murphy USA, Inc. | | | 545 | | | | 71,324 | |
Total Energy | | | | | | | 1,317,190 | |
| | | | | | | | | |
Utilities - 0.3% |
ONE Gas, Inc. | | | 2,402 | | | | 184,402 | |
Hawaiian Electric Industries, Inc. | | | 4,687 | | | | 165,873 | |
IDACORP, Inc. | | | 1,652 | | | | 158,641 | |
Total Utilities | | | | | | | 508,916 | |
| | | | | | | | | |
Basic Materials - 0.0% |
RPM International, Inc. | | | 968 | | | | 87,875 | |
| | | | | | | | | |
Total Common Stocks | | | | |
(Cost $23,887,796) | | | | | | | 28,946,397 | |
| | | | | | | | | |
MUTUAL FUNDS† - 80.7% |
Guggenheim Ultra Short Duration Fund — Institutional Class1 | | | 5,366,525 | | | | 53,557,922 | |
Guggenheim Strategy Fund III1 | | | 1,614,095 | | | | 40,513,796 | |
Guggenheim Variable Insurance Strategy Fund III1 | | | 1,614,311 | | | | 40,422,360 | |
Guggenheim Strategy Fund II1 | | | 786,089 | | | | 19,620,773 | |
Total Mutual Funds | | | | |
(Cost $153,156,934) | | | | | | | 154,114,851 | |
| | | | | | | | | |
MONEY MARKET FUND† - 4.1% |
Dreyfus Treasury Securities Cash Management Fund — Institutional Shares, 0.01%2 | | | 7,811,894 | | | | 7,811,894 | |
Total Money Market Fund | | | | |
(Cost $7,811,894) | | | | | | | 7,811,894 | |
| | | | | | | | | |
Total Investments - 100.0% | | | | |
(Cost $184,856,624) | | $ | 190,873,142 | |
Other Assets & Liabilities, net - 0.0% | | | 46,858 | |
Total Net Assets - 100.0% | | $ | 190,920,000 | |
SEE NOTES TO FINANCIAL STATEMENTS. | THE GUGGENHEIM FUNDS ANNUAL REPORT | 75 |
SCHEDULE OF INVESTMENTS (continued) | December 31, 2020 |
SERIES J (STYLEPLUS—MID GROWTH SERIES) | |
Futures Contracts |
Description | | Number of
Contracts | | | Expiration Date | | | Notional
Amount | | | Value and
Unrealized
Appreciation** | |
Equity Futures Contracts Purchased† |
S&P 500 Index Mini Futures Contracts | | | 2 | | | | Mar 2021 | | | $ | 374,425 | | | $ | 5,698 | |
NASDAQ-100 Index Mini Futures Contracts | | | 1 | | | | Mar 2021 | | | | 257,385 | | | | 5,495 | |
S&P MidCap 400 Index Mini Futures Contracts | | | 3 | | | | Mar 2021 | | | | 690,780 | | | | 5,480 | |
| | | | | | | | | | | $ | 1,322,590 | | | $ | 16,673 | |
Total Return Swap Agreements |
Counterparty | Index | Financing
Rate Pay | Payment
Frequency | | Maturity Date | | | Units | | | Notional
Amount | | | Value and
Unrealized
Appreciation | |
OTC Equity Index Swap Agreements†† |
Citibank N.A., New York | Russell MidCap Growth Index Total Return | 0.25% (3 Month USD LIBOR + 0.02%) | At Maturity | | | 04/07/21 | | | | 32,505 | | | $ | 161,115,583 | | | $ | 25,114,016 | |
* | Non-income producing security. |
** | Includes cumulative appreciation (depreciation). Variation margin is reported within the Statement of Assets and Liabilities. |
† | Value determined based on Level 1 inputs — See Note 4. |
†† | Value determined based on Level 2 inputs — See Note 4. |
1 | Affiliated issuer. |
2 | Rate indicated is the 7-day yield as of December 31, 2020. |
| | LIBOR — London Interbank Offered Rate |
| | plc — Public Limited Company |
| | REIT — Real Estate Investment Trust |
| | |
| | See Sector Classification in Other Information section. |
76 | THE GUGGENHEIM FUNDS ANNUAL REPORT | SEE NOTES TO FINANCIAL STATEMENTS. |
SCHEDULE OF INVESTMENTS (concluded) | December 31, 2020 |
SERIES J (STYLEPLUS—MID GROWTH SERIES) | |
The following table summarizes the inputs used to value the Fund’s investments at December 31, 2020 (See Note 4 in the Notes to Financial Statements):
Investments in Securities (Assets) | | Level 1
Quoted
Prices | | | Level 2
Significant
Observable
Inputs | | | Level 3
Significant
Unobservable
Inputs | | | Total | |
Common Stocks | | $ | 28,946,397 | | | $ | — | | | $ | — | | | $ | 28,946,397 | |
Mutual Funds | | | 154,114,851 | | | | — | | | | — | | | | 154,114,851 | |
Money Market Fund | | | 7,811,894 | | | | — | | | | — | | | | 7,811,894 | |
Equity Futures Contracts** | | | 16,673 | | | | — | | | | — | | | | 16,673 | |
Equity Index Swap Agreements** | | | — | | | | 25,114,016 | | | | — | | | | 25,114,016 | |
Total Assets | | $ | 190,889,815 | | | $ | 25,114,016 | | | $ | — | | | $ | 216,003,831 | |
** | This derivative is reported as unrealized appreciation/depreciation at period end. |
Affiliated Transactions
Investments representing 5% or more of the outstanding voting shares of a company, or control of or by, or common control under Guggenheim Investments (“GI”), result in that company being considered an affiliated issuer, as defined in the 1940 Act.
The Fund may invest in certain of the underlying series of Guggenheim Strategy Funds Trust, including Guggenheim Strategy Fund II, Guggenheim Strategy Fund III, and Guggenheim Variable Insurance Strategy Fund III, (collectively, the “Short Term Investment Vehicles”), each of which are open-end management investment companies managed by GI. The Short Term Investment Vehicles, which launched on March 11, 2014, are offered as short term investment options only to mutual funds, trusts, and other accounts managed by GI and/or its affiliates, and are not available to the public. The Short Term Investment Vehicles pay no investment management fees. The Short Term Investment Vehicles’ annual report on Form N-CSR dated September 30, 2020, is available publicly or upon request. This information is available from the EDGAR database on the SEC’s website at https://www.sec.gov/Archives/edgar/data/1601445/000182126820000133/gug81042-ncsr.htm.
Transactions during the year ended December 31, 2020, in which the company is an affiliated issuer, were as follows:
Security Name | | Value
12/31/19 | | | Additions | | | Reductions | | | Realized
Gain (Loss) | | | Change in
Unrealized
Appreciation
(Depreciation) | | | Value
12/31/20 | | | Shares
12/31/20 | | | Investment
Income | |
Mutual Funds | | | | | | | | | | | | | | | | | | | | | | | | | | | | | | | | |
Guggenheim Strategy Fund II | | $ | 10,442,989 | | | $ | 17,149,839 | | | $ | (8,041,964 | ) | | $ | (73,734 | ) | | $ | 143,643 | | | $ | 19,620,773 | | | | 786,089 | | | $ | 189,614 | |
Guggenheim Strategy Fund III | | | 40,848,416 | | | | 764,932 | | | | (1,655,987 | ) | | | (65,898 | ) | | | 622,333 | | | | 40,513,796 | | | | 1,614,095 | | | | 762,296 | |
Guggenheim Ultra Short Duration Fund — Institutional Class | | | 15,131,682 | | | | 63,587,836 | | | | (25,957,961 | ) | | | 266,092 | | | | 530,273 | | | | 53,557,922 | | | | 5,366,525 | | | | 401,849 | |
Guggenheim Variable Insurance Strategy Fund III | | | 50,233,799 | | | | 770,576 | | | | (10,963,294 | ) | | | (168,723 | ) | | | 550,002 | | | | 40,422,360 | | | | 1,614,311 | | | | 769,073 | |
| | | $ | 116,656,886 | | | $ | 82,273,183 | | | $ | (46,619,206 | ) | | $ | (42,263 | ) | | $ | 1,846,251 | | | $ | 154,114,851 | | | | | | | $ | 2,122,832 | |
SEE NOTES TO FINANCIAL STATEMENTS. | THE GUGGENHEIM FUNDS ANNUAL REPORT | 77 |
SERIES J (STYLEPLUS—MID GROWTH SERIES) | |
STATEMENT OF ASSETS AND LIABILITIES |
December 31, 2020 |
Assets: |
Investments in unaffiliated issuers, at value (cost $31,699,690) | | $ | 36,758,291 | |
Investments in affiliated issuers, at value (cost $153,156,934) | | | 154,114,851 | |
Segregated cash with broker | | | 78,500 | |
Unrealized appreciation on OTC swap agreements | | | 25,114,016 | |
Prepaid expenses | | | 5,464 | |
Receivables: |
Fund shares sold | | | 310,647 | |
Dividends | | | 188,690 | |
Variation margin on futures contracts | | | 3,520 | |
Interest | | | 88 | |
Total assets | | | 216,574,067 | |
| | | | | |
Liabilities: |
Segregated cash due to broker | | | 25,160,000 | |
Payable for: |
Securities purchased | | | 184,792 | |
Swap settlement | | | 81,403 | |
Management fees | | | 59,157 | |
Distribution and service fees | | | 39,805 | |
Fund shares redeemed | | | 17,859 | |
Fund accounting/administration fees | | | 13,526 | |
Trustees’ fees* | | | 2,147 | |
Transfer agent/maintenance fees | | | 2,135 | |
Miscellaneous | | | 93,243 | |
Total liabilities | | | 25,654,067 | |
Commitments and contingent liabilities (Note 13) | | | — | |
Net assets | | $ | 190,920,000 | |
| | | | | |
Net assets consist of: |
Paid in capital | | $ | 132,385,343 | |
Total distributable earnings (loss) | | | 58,534,657 | |
Net assets | | $ | 190,920,000 | |
Capital shares outstanding | | | 2,634,689 | |
Net asset value per share | | $ | 72.46 | |
STATEMENT OF OPERATIONS |
Year Ended December 31, 2020 |
Investment Income: |
Dividends from securities of unaffiliated issuers | | $ | 284,755 | |
Dividends from securities of affiliated issuers | | | 2,122,832 | |
Interest | | | 22,378 | |
Total investment income | | | 2,429,965 | |
| | | | | |
Expenses: |
Management fees | | | 1,168,216 | |
Distribution and service fees | | | 389,405 | |
Transfer agent/maintenance fees | | | 25,253 | |
Fund accounting/administration fees | | | 120,560 | |
Professional fees | | | 67,959 | |
Interest expense | | | 21,816 | |
Trustees’ fees* | | | 20,587 | |
Custodian fees | | | 17,104 | |
Line of credit fees | | | 4,176 | |
Miscellaneous | | | 91,815 | |
Total expenses | | | 1,926,891 | |
Less: |
Expenses reimbursed by Adviser | | | (6,488 | ) |
Expenses waived by Adviser | | | (517,801 | ) |
Earnings credits applied | | | (1,617 | ) |
Total waived/reimbursed expenses | | | (525,906 | ) |
Net expenses | | | 1,400,985 | |
Net investment income | | | 1,028,980 | |
| | | | | |
Net Realized and Unrealized Gain (Loss): |
Net realized gain (loss) on: |
Investments in unaffiliated issuers | | | (1,206,739 | ) |
Investments in affiliated issuers | | | (42,263 | ) |
Swap agreements | | | 27,839,730 | |
Futures contracts | | | 1,621,468 | |
Net realized gain | | | 28,212,196 | |
Net change in unrealized appreciation (depreciation) on: |
Investments in unaffiliated issuers | | | 2,429,204 | |
Investments in affiliated issuers | | | 1,846,251 | |
Swap agreements | | | 13,111,432 | |
Futures contracts | | | (3,440 | ) |
Net change in unrealized appreciation (depreciation) | | | 17,383,447 | |
Net realized and unrealized gain | | | 45,595,643 | |
Net increase in net assets resulting from operations | | $ | 46,624,623 | |
* | Relates to Trustees not deemed “interested persons” within the meaning of Section 2(a)(19) of the 1940 Act. |
78 | THE GUGGENHEIM FUNDS ANNUAL REPORT | SEE NOTES TO FINANCIAL STATEMENTS. |
SERIES J (STYLEPLUS—MID GROWTH SERIES) | |
STATEMENTS OF CHANGES IN NET ASSETS |
| | Year Ended
December 31,
2020 | | | Year Ended
December 31,
2019 | |
Increase (Decrease) in Net Assets from Operations: | | | | | | | | |
Net investment income | | $ | 1,028,980 | | | $ | 2,136,044 | |
Net realized gain on investments | | | 28,212,196 | | | | 10,018,654 | |
Net change in unrealized appreciation (depreciation) on investments | | | 17,383,447 | | | | 30,693,392 | |
Net increase in net assets resulting from operations | | | 46,624,623 | | | | 42,848,090 | |
| | | | | | | | | |
Distributions to shareholders | | | (9,832,328 | ) | | | (15,157,609 | ) |
| | | | | | | | | |
Capital share transactions: | | | | | | | | |
Proceeds from sale of shares | | | 4,851,242 | | | | 2,722,984 | |
Distributions reinvested | | | 9,832,328 | | | | 15,157,609 | |
Cost of shares redeemed | | | (18,230,591 | ) | | | (25,012,530 | ) |
Net decrease from capital share transactions | | | (3,547,021 | ) | | | (7,131,937 | ) |
Net increase in net assets | | | 33,245,274 | | | | 20,558,544 | |
| | | | | | | | | |
Net assets: | | | | | | | | |
Beginning of year | | | 157,674,726 | | | | 137,116,182 | |
End of year | | $ | 190,920,000 | | | $ | 157,674,726 | |
| | | | | | | | | |
Capital share activity: | | | | | | | | |
Shares sold | | | 80,991 | | | | 48,009 | |
Shares issued from reinvestment of distributions | | | 169,086 | | | | 270,623 | |
Shares redeemed | | | (311,264 | ) | | | (435,155 | ) |
Net decrease in shares | | | (61,187 | ) | | | (116,523 | ) |
SEE NOTES TO FINANCIAL STATEMENTS. | THE GUGGENHEIM FUNDS ANNUAL REPORT | 79 |
SERIES J (STYLEPLUS—MID GROWTH SERIES) | |
This table is presented to show selected data for a share outstanding throughout each period and to assist shareholders in evaluating a Fund’s performance for the periods presented.
| | Year Ended
December 31,
2020 | | | Year Ended
December 31,
2019 | | | Year Ended
December 31,
2018 | | | Year Ended
December 31,
2017 | | | Year Ended
December 31,
2016 | |
Per Share Data |
Net asset value, beginning of period | | $ | 58.49 | | | $ | 48.75 | | | $ | 59.82 | | | $ | 48.43 | | | $ | 45.15 | |
Income (loss) from investment operations: |
Net investment income (loss)a | | | .39 | | | | .79 | | | | .97 | | | | .67 | | | | .52 | |
Net gain (loss) on investments (realized and unrealized) | | | 17.43 | | | | 14.90 | | | | (4.08 | ) | | | 11.22 | | | | 3.37 | |
Total from investment operations | | | 17.82 | | | | 15.69 | | | | (3.11 | ) | | | 11.89 | | | | 3.89 | |
Less distributions from: |
Net investment income | | | (.84 | ) | | | (.49 | ) | | | (.83 | ) | | | (.50 | ) | | | (.33 | ) |
Net realized gains | | | (3.01 | ) | | | (5.46 | ) | | | (7.13 | ) | | | — | | | | (.28 | ) |
Total distributions | | | (3.85 | ) | | | (5.95 | ) | | | (7.96 | ) | | | (.50 | ) | | | (.61 | ) |
Net asset value, end of period | | $ | 72.46 | | | $ | 58.49 | | | $ | 48.75 | | | $ | 59.82 | | | $ | 48.43 | |
|
Total Returnb | | | 32.10 | % | | | 32.70 | % | | | (7.10 | %) | | | 24.67 | % | | | 8.65 | % |
Ratios/Supplemental Data |
Net assets, end of period (in thousands) | | $ | 190,920 | | | $ | 157,675 | | | $ | 137,116 | | | $ | 187,897 | | | $ | 166,814 | |
Ratios to average net assets: |
Net investment income (loss) | | | 0.66 | % | | | 1.39 | % | | | 1.64 | % | | | 1.25 | % | | | 1.14 | % |
Total expensesc | | | 1.22 | % | | | 1.30 | % | | | 1.28 | % | | | 1.14 | % | | | 0.95 | % |
Net expensesd,e | | | 0.89 | % | | | 1.00 | % | | | 1.01 | % | | | 0.94 | % | | | 0.95 | % |
Portfolio turnover rate | | | 71 | % | | | 57 | % | | | 66 | % | | | 49 | % | | | 57 | % |
a | Net investment income (loss) per share was computed using average shares outstanding throughout the period. |
b | Total return does not take into account any of the expenses associated with an investment in variable insurance products. If total return had taken into account these expenses, performance would have been lower. Shares of a series of Guggenheim Variable Funds Trust are available only through the purchase of such products. |
c | Does not include expenses of the underlying funds in which the Fund invests. |
d | Net expense information reflects the expense ratios after expense waivers and reimbursements, as applicable. |
e | Net expense may include expenses that are excluded from the expense limitation agreement. Excluding these expenses, the net expense ratios for the years presented would be: |
| | 12/31/20 | 12/31/19 | 12/31/18 | 12/31/17 | 12/31/16 | 12/31/15 |
| | 0.88% | 0.92% | 0.94% | 0.92% | 0.95% | 0.97% |
80 | THE GUGGENHEIM FUNDS ANNUAL REPORT | SEE NOTES TO FINANCIAL STATEMENTS. |
MANAGERS’ COMMENTARY (Unaudited) | December 31, 2020 |
To Our Shareholders:
The Series N (Managed Asset Allocation Series) is managed by a team of seasoned professionals, including Michael P. Byrum, CFA, Portfolio Manager; Ryan Harder, CFA, Portfolio Manager; and Matthew Wu, Ph.D., CFA, Portfolio Manager. In the following paragraphs, the team discusses performance of the Series for the fiscal year ended December 31, 2020.
For the year ended December 31, 2020, Series N (Managed Asset Allocation Series) returned 12.59%, compared with its weighted benchmark that is 60% S&P 500® Index and 40% Barclays U.S. Aggregate Bond Index, which returned 14.73%. The S&P 500 Index returned 18.40% over the year and the Bloomberg Barclays U.S. Aggregate Bond Index returned 7.51%.
The year 2020 was unusually volatile, beginning with a pandemic that forced a rapid fall in the market. The U.S. Federal Reserve quickly cut rates and announced aggressive bond purchase plans, while a large relief act was passed by Congress, prompting the market to strongly rebound. Helped by announcements of the successful development of vaccines, the stock market built on its gains and turned in one of the strongest ever months in November.
Despite the volatility, all the Fund’s core holdings delivered positive returns. ETFs and futures contracts on the Russell 2000 Index became the largest winner. The best performer of the prior few years—ETFs and futures on S&P 500—was the second-best performer, followed by S&P MidCap 400 Index. Similar to 2019, bonds underperformed U.S. equity, with the 2-year Treasury bill the least, followed by iShares Core US Aggregate Bond ETF. However, the 10-year treasury still managed to outperform iShares MSCI EAFE ETF.
Performance displayed represents past performance which is no guarantee of future results.
The opinions and forecast expressed may not actually come to pass. This information is subject to change at any time, based on market and other conditions, and should not be construed as a recommendation of any specific security or strategy.
| | THE GUGGENHEIM FUNDS ANNUAL REPORT | 81 |
PERFORMANCE REPORT AND FUND PROFILE (Unaudited) | December 31, 2020 |
SERIES N (MANAGED ASSET ALLOCATION SERIES)
OBJECTIVE: Seeks to provide growth of capital and, secondarily, preservation of capital.
Holdings Diversification (Market Exposure as % of Net Assets)
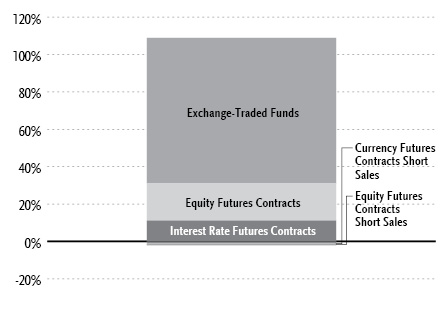
“Holdings Diversification (Market Exposure as % of Net Assets)” excludes any temporary cash investments, investments in Guggenheim Strategy Funds Trust mutual funds, or investments in Guggenheim Ultra Short Duration Fund.
Inception Date: June 1, 1995 |
Ten Largest Holdings (% of Total Net Assets) |
Vanguard S&P 500 ETF | 17.5% |
SPDR S&P 500 ETF Trust | 16.6% |
iShares Core U.S. Aggregate Bond ETF | 15.8% |
iShares iBoxx $ Investment Grade Corporate Bond ETF | 8.1% |
iShares MSCI EAFE ETF | 5.6% |
iShares Core S&P Mid-Cap ETF | 5.3% |
Guggenheim Variable Insurance Strategy Fund III | 5.1% |
Guggenheim Strategy Fund III | 4.9% |
iShares 7-10 Year Treasury Bond ETF | 4.9% |
Guggenheim Strategy Fund II | 4.1% |
Top Ten Total | 87.9% |
| | |
“Ten Largest Holdings” excludes any temporary cash or derivative investments. |
82 | THE GUGGENHEIM FUNDS ANNUAL REPORT | |
PERFORMANCE REPORT AND FUND PROFILE (Unaudited)(concluded) | December 31, 2020 |
Cumulative Fund Performance*,†

Average Annual Returns*,†
Periods Ended December 31, 2020
| 1 Year | 5 Year | 10 Year |
Series N (Managed Asset Allocation Series) | 12.59% | 9.51% | 8.17% |
Blended Index** | 14.73% | 11.10% | 10.02% |
Bloomberg Barclays U.S. Aggregate Bond Index | 7.51% | 4.44% | 3.84% |
S&P 500 Index | 18.40% | 15.22% | 13.88% |
* | The performance data above represents past performance that is not predictive of future results. The investment return and principal value of an investment in the Fund will fluctuate so that an investor’s shares, when redeemed, may be worth more or less than their original cost. Returns are historical and include changes in principal and reinvested dividends and capital gains and do not reflect the effect of taxes. The S&P 500 Index and the Bloomberg Barclays U.S. Aggregate Bond Index are unmanaged indices and, unlike the Fund, have no management fees or operating expenses to reduce their reported returns. |
** | Blended index is 60% S&P 500 Index and 40% Bloomberg Barclays U.S. Aggregate Bond Index. |
† | Performance figures do not reflect fees and expenses associated with an investment in variable insurance products. If returns had taken into account these fees and expenses, performance would have been lower. Shares of a series of Guggenheim Variable Funds Trust are available only through the purchase of such products. |
| | THE GUGGENHEIM FUNDS ANNUAL REPORT | 83 |
SCHEDULE OF INVESTMENTS | December 31, 2020 |
SERIES N (MANAGED ASSET ALLOCATION SERIES) | |
| | Shares | | | Value | |
EXCHANGE-TRADED FUNDS† - 77.9% |
Vanguard S&P 500 ETF | | | 23,258 | | | $ | 7,993,542 | |
SPDR S&P 500 ETF Trust | | | 20,224 | | | | 7,561,349 | |
iShares Core U.S. Aggregate Bond ETF | | | 60,955 | | | | 7,204,272 | |
iShares iBoxx $ Investment Grade Corporate Bond ETF | | | 26,879 | | | | 3,712,796 | |
iShares MSCI EAFE ETF | | | 35,190 | | | | 2,567,462 | |
iShares Core S&P Mid-Cap ETF | | | 10,538 | | | | 2,421,948 | |
iShares 7-10 Year Treasury Bond ETF | | | 18,601 | | | | 2,231,190 | |
iShares 1-3 Year Treasury Bond ETF | | | 21,644 | | | | 1,869,609 | |
iShares Core S&P 500 ETF | | | 2 | | | | 751 | |
Total Exchange-Traded Funds | | | | |
(Cost $23,351,743) | | | | | | | 35,562,919 | |
| | | | | | | | | |
MUTUAL FUNDS† - 16.4% |
Guggenheim Variable Insurance Strategy Fund III1 | | | 92,960 | | | | 2,327,726 | |
Guggenheim Strategy Fund III1 | | | 89,908 | | | | 2,256,685 | |
Guggenheim Strategy Fund II1 | | | 74,980 | | | | 1,871,503 | |
Guggenheim Ultra Short Duration Fund — Institutional Class1 | | | 104,244 | | | | 1,040,355 | |
Total Mutual Funds | | | | |
(Cost $7,475,031) | | | | | | | 7,496,269 | |
| | | | | | | | | |
MONEY MARKET FUND† - 4.9% |
Dreyfus Treasury Securities Cash Management Fund — Institutional Shares, 0.01%2 | | | 2,251,577 | | | | 2,251,577 | |
Total Money Market Fund | | | | |
(Cost $2,251,577) | | | | | | | 2,251,577 | |
| | | | | | | | | |
| | | Face
Amount | | | | | |
U.S. TREASURY BILLS†† - 1.5% |
U.S. Treasury Bills |
0.08% due 01/28/213,4 | | $ | 689,000 | | | | 688,974 | |
Total U.S. Treasury Bills | | | | |
(Cost $688,960) | | | | | | | 688,974 | |
| | | | | | | | | |
Total Investments - 100.7% | | | | |
(Cost $33,767,311) | | $ | 45,999,739 | |
Other Assets & Liabilities, net - (0.7)% | | | (326,854 | ) |
Total Net Assets - 100.0% | | $ | 45,672,885 | |
Futures Contracts |
Description | | Number of
Contracts | | | Expiration
Date | | | Notional
Amount | | | Value and
Unrealized
Appreciation
(Depreciation)** | |
Equity Futures Contracts Purchased† |
MSCI EAFE Index Futures Contracts | | | 43 | | | | Mar 2021 | | | $ | 4,580,575 | | | $ | 102,637 | |
Russell 2000 Index Mini Futures Contracts | | | 20 | | | | Mar 2021 | | | | 1,974,200 | | | | 54,322 | |
S&P 500 Index Mini Futures Contracts | | | 8 | | | | Mar 2021 | | | | 1,497,700 | | | | 33,429 | |
S&P MidCap 400 Index Mini Futures Contracts | | | 2 | | | | Mar 2021 | | | | 460,520 | | | | 12,107 | |
NASDAQ-100 Index Mini Futures Contracts | | | 1 | | | | Mar 2021 | | | | 257,385 | | | | 9,362 | |
CAC 40 10 Euro Index Futures Contracts†† | | | 3 | | | | Jan 2021 | | | | 204,829 | | | | 3,233 | |
Dow Jones Industrial Average Index Mini Futures Contracts | | | 1 | | | | Mar 2021 | | | | 152,340 | | | | 2,768 | |
| | | | | | | | | | | $ | 9,127,549 | | | $ | 217,858 | |
Interest Rate Futures Contracts Purchased† |
U.S. Treasury 2 Year Note Futures Contracts | | | 6 | | | | Mar 2021 | | | | 1,325,765 | | | | 1,300 | |
U.S. Treasury 10 Year Note Futures Contracts | | | 27 | | | | Mar 2021 | | | | 3,726,422 | | | | 1,009 | |
| | | | | | | | | | | $ | 5,052,187 | | | $ | 2,309 | |
Currency Futures Contracts Sold Short† |
Japanese Yen Futures Contracts | | | 1 | | | | Mar 2021 | | | $ | 121,156 | | | $ | (865 | ) |
| | | | | | | | | | | | | | | | | |
Equity Futures Contracts Sold Short† |
FTSE 100 Index Futures Contracts†† | | | 2 | | | | Mar 2021 | | | | 177,586 | | | | 298 | |
Nikkei 225 (CME) Index Futures Contracts | | | 1 | | | | Mar 2021 | | | | 137,625 | | | | (4,853 | ) |
DAX Index Futures Contracts†† | | | 1 | | | | Mar 2021 | | | | 419,336 | | | | (19,476 | ) |
| | | | | | | | | | | $ | 734,547 | | | $ | (24,031 | ) |
84 | THE GUGGENHEIM FUNDS ANNUAL REPORT | SEE NOTES TO FINANCIAL STATEMENTS. |
SCHEDULE OF INVESTMENTS (continued) | December 31, 2020 |
SERIES N (MANAGED ASSET ALLOCATION SERIES) | |
** | Includes cumulative appreciation (depreciation). Variation margin is reported within the Statement of Assets and Liabilities. |
† | Value determined based on Level 1 inputs, unless otherwise noted — See Note 4. |
†† | Value determined based on Level 2 inputs — See Note 4. |
1 | Affiliated issuer. |
2 | Rate indicated is the 7-day yield as of December 31, 2020. |
3 | All or a portion of this security is pledged as futures collateral at December 31, 2020. |
4 | Rate indicated is the effective yield at the time of purchase. |
| | CME — Chicago Mercantile Exchange |
| | |
| | See Sector Classification in Other Information section. |
The following table summarizes the inputs used to value the Fund’s investments at December 31, 2020 (See Note 4 in the Notes to Financial Statements):
Investments in Securities (Assets) | | Level 1
Quoted
Prices | | | Level 2
Significant
Observable
Inputs | | | Level 3
Significant
Unobservable
Inputs | | | Total | |
Exchange-Traded Funds | | $ | 35,562,919 | | | $ | — | | | $ | — | | | $ | 35,562,919 | |
Mutual Funds | | | 7,496,269 | | | | — | | | | — | | | | 7,496,269 | |
Money Market Fund | | | 2,251,577 | | | | — | | | | — | | | | 2,251,577 | |
U.S. Treasury Bills | | | — | | | | 688,974 | | | | — | | | | 688,974 | |
Equity Futures Contracts** | | | 214,625 | | | | 3,531 | | | | — | | | | 218,156 | |
Interest Rate Futures Contracts** | | | 2,309 | | | | — | | | | — | | | | 2,309 | |
Total Assets | | $ | 45,527,699 | | | $ | 692,505 | | | $ | — | | | $ | 46,220,204 | |
Investments in Securities (Liabilities) | | Level 1
Quoted
Prices | | | Level 2
Significant
Observable
Inputs | | | Level 3
Significant
Unobservable
Inputs | | | Total | |
Equity Futures Contracts** | | $ | 4,853 | | | $ | 19,476 | | | $ | — | | | $ | 24,329 | |
Currency Futures Contracts** | | | 865 | | | | — | | | | — | | | | 865 | |
Total Liabilities | | $ | 5,718 | | | $ | 19,476 | | | $ | — | | | $ | 25,194 | |
** | This derivative is reported as unrealized appreciation/depreciation at period end. |
SEE NOTES TO FINANCIAL STATEMENTS. | THE GUGGENHEIM FUNDS ANNUAL REPORT | 85 |
SCHEDULE OF INVESTMENTS (concluded) | December 31, 2020 |
SERIES N (MANAGED ASSET ALLOCATION SERIES) | |
Affiliated Transactions
Investments representing 5% or more of the outstanding voting shares of a company, or control of or by, or common control under Guggenheim Investments (“GI”), result in that company being considered an affiliated issuer, as defined in the 1940 Act.
The Fund may invest in certain of the underlying series of Guggenheim Strategy Funds Trust, including Guggenheim Strategy Fund II, Guggenheim Strategy Fund III, and Guggenheim Variable Insurance Strategy Fund III, (collectively, the “Short Term Investment Vehicles”), each of which are open-end management investment companies managed by GI. The Short Term Investment Vehicles, which launched on March 11, 2014, are offered as short term investment options only to mutual funds, trusts, and other accounts managed by GI and/or its affiliates, and are not available to the public. The Short Term Investment Vehicles pay no investment management fees. The Short Term Investment Vehicles’ annual report on Form N-CSR dated September 30, 2020, is available publicly or upon request. This information is available from the EDGAR database on the SEC’s website at https://www.sec.gov/Archives/edgar/data/1601445/000182126820000133/gug81042-ncsr.htm.
Transactions during the year ended December 31, 2020, in which the company is an affiliated issuer, were as follows:
Security Name | | Value
12/31/19 | | | Additions | | | Reductions | | | Realized
Gain (Loss) | | | Change in
Unrealized
Appreciation
(Depreciation) | | | Value
12/31/20 | | | Shares
12/31/20 | | | Investment
Income | |
Mutual Funds | | | | | | | | | | | | | | | | | | | | | | | | | | | | | | | | |
Guggenheim Strategy Fund II | | $ | 1,819,612 | | | $ | 35,390 | | | $ | — | | | $ | — | | | $ | 16,501 | | | $ | 1,871,503 | | | | 74,980 | | | $ | 35,311 | |
Guggenheim Strategy Fund III | | | 3,384,297 | | | | 46,185 | | | | (1,200,000 | ) | | | (11,759 | ) | | | 37,962 | | | | 2,256,685 | | | | 89,908 | | | | 46,094 | |
Guggenheim Ultra Short Duration Fund — Institutional Class | | | 1,022,480 | | | | 14,706 | | | | — | | | | — | | | | 3,169 | | | | 1,040,355 | | | | 104,244 | | | | 14,698 | |
Guggenheim Variable Insurance Strategy Fund III | | | 2,964,889 | | | | 44,735 | | | | (700,000 | ) | | | (14,276 | ) | | | 32,378 | | | | 2,327,726 | | | | 92,960 | | | | 44,653 | |
| | | $ | 9,191,278 | | | $ | 141,016 | | | $ | (1,900,000 | ) | | $ | (26,035 | ) | | $ | 90,010 | | | $ | 7,496,269 | | | | | | | $ | 140,756 | |
86 | THE GUGGENHEIM FUNDS ANNUAL REPORT | SEE NOTES TO FINANCIAL STATEMENTS. |
SERIES N (MANAGED ASSET ALLOCATION SERIES) | |
STATEMENT OF ASSETS AND LIABILITIES |
December 31, 2020 |
Assets: |
Investments in unaffiliated issuers, at value (cost $26,292,280) | | $ | 38,503,470 | |
Investments in affiliated issuers, at value (cost $7,475,031) | | | 7,496,269 | |
Cash | | | 7 | |
Segregated cash with broker | | | 798 | |
Prepaid expenses | | | 2,664 | |
Receivables: |
Securities sold | | | 149,584 | |
Dividends | | | 41,768 | |
Fund shares sold | | | 275 | |
Interest | | | 16 | |
Total assets | | | 46,194,851 | |
| | | | | |
Liabilities: |
Payable for: |
Securities purchased | | | 410,219 | |
Variation margin on futures contracts | | | 29,900 | |
Professional fees | | | 29,403 | |
Management fees | | | 15,112 | |
Distribution and service fees | | | 9,584 | |
Fund accounting/administration fees | | | 5,335 | |
Fund shares redeemed | | | 3,770 | |
Transfer agent/maintenance fees | | | 2,210 | |
Trustees’ fees* | | | 1,202 | |
Miscellaneous | | | 15,231 | |
Total liabilities | | | 521,966 | |
Commitments and contingent liabilities (Note 13) | | | — | |
Net assets | | $ | 45,672,885 | |
| | | | | |
Net assets consist of: |
Paid in capital | | $ | 29,999,719 | |
Total distributable earnings (loss) | | | 15,673,166 | |
Net assets | | $ | 45,672,885 | |
Capital shares outstanding | | | 1,366,926 | |
Net asset value per share | | $ | 33.41 | |
STATEMENT OF OPERATIONS |
Year Ended December 31, 2020 |
Investment Income: |
Dividends from securities of unaffiliated issuers | | $ | 619,324 | |
Dividends from securities of affiliated issuers | | | 140,756 | |
Interest | | | 4,419 | |
Total investment income | | | 764,499 | |
| | | | | |
Expenses: |
Management fees | | | 172,176 | |
Distribution and service fees | | | 107,610 | |
Transfer agent/maintenance fees | | | 25,256 | |
Professional fees | | | 41,283 | |
Fund accounting/administration fees | | | 39,923 | |
Trustees’ fees* | | | 18,121 | |
Custodian fees | | | 3,720 | |
Line of credit fees | | | 1,192 | |
Miscellaneous | | | 25,090 | |
Total expenses | | | 434,371 | |
Less: |
Expenses waived by Adviser | | | (2,572 | ) |
Net expenses | | | 431,799 | |
Net investment income | | | 332,700 | |
| | | | | |
Net Realized and Unrealized Gain (Loss): |
Net realized gain (loss) on: |
Investments in unaffiliated issuers | | | 1,990,393 | |
Investments in affiliated issuers | | | (26,035 | ) |
Futures contracts | | | 1,363,225 | |
Foreign currency transactions | | | (3,414 | ) |
Net realized gain | | | 3,324,169 | |
Net change in unrealized appreciation (depreciation) on: |
Investments in unaffiliated issuers | | | 1,143,642 | |
Investments in affiliated issuers | | | 90,010 | |
Futures contracts | | | 154,398 | |
Foreign currency translations | | | 4 | |
Net change in unrealized appreciation (depreciation) | | | 1,388,054 | |
Net realized and unrealized gain | | | 4,712,223 | |
Net increase in net assets resulting from operations | | $ | 5,044,923 | |
* | Relates to Trustees not deemed “interested persons” within the meaning of Section 2(a)(19) of the 1940 Act. |
SEE NOTES TO FINANCIAL STATEMENTS. | THE GUGGENHEIM FUNDS ANNUAL REPORT | 87 |
SERIES N (MANAGED ASSET ALLOCATION SERIES) | |
STATEMENTS OF CHANGES IN NET ASSETS |
| | Year Ended
December 31,
2020 | | | Year Ended
December 31,
2019 | |
Increase (Decrease) in Net Assets from Operations: | | | | | | | | |
Net investment income | | $ | 332,700 | | | $ | 658,539 | |
Net realized gain on investments | | | 3,324,169 | | | | 2,663,361 | |
Net change in unrealized appreciation (depreciation) on investments | | | 1,388,054 | | | | 4,897,820 | |
Net increase in net assets resulting from operations | | | 5,044,923 | | | | 8,219,720 | |
| | | | | | | | | |
Distributions to shareholders | | | (3,200,030 | ) | | | (1,105,138 | ) |
| | | | | | | | | |
Capital share transactions: | | | | | | | | |
Proceeds from sale of shares | | | 1,360,017 | | | | 1,782,394 | |
Distributions reinvested | | | 3,200,030 | | | | 1,105,138 | |
Cost of shares redeemed | | | (6,950,594 | ) | | | (6,419,274 | ) |
Net decrease from capital share transactions | | | (2,390,547 | ) | | | (3,531,742 | ) |
Net increase (decrease) in net assets | | | (545,654 | ) | | | 3,582,840 | |
| | | | | | | | | |
Net assets: | | | | | | | | |
Beginning of year | | | 46,218,539 | | | | 42,635,699 | |
End of year | | $ | 45,672,885 | | | $ | 46,218,539 | |
| | | | | | | | | |
Capital share activity: | | | | | | | | |
Shares sold | | | 43,430 | | | | 59,756 | |
Shares issued from reinvestment of distributions | | | 106,597 | | | | 36,365 | |
Shares redeemed | | | (225,315 | ) | | | (213,259 | ) |
Net decrease in shares | | | (75,288 | ) | | | (117,138 | ) |
88 | THE GUGGENHEIM FUNDS ANNUAL REPORT | SEE NOTES TO FINANCIAL STATEMENTS. |
SERIES N (MANAGED ASSET ALLOCATION SERIES) | |
This table is presented to show selected data for a share outstanding throughout each period and to assist shareholders in evaluating a Fund’s performance for the periods presented.
| | Year Ended
December 31,
2020 | | | Year Ended
December 31,
2019 | | | Year Ended
December 31,
2018 | | | Year Ended
December 31,
2017 | | | Year Ended
December 31,
2016 | |
Per Share Data |
Net asset value, beginning of period | | $ | 32.05 | | | $ | 27.34 | | | $ | 31.68 | | | $ | 28.74 | | | $ | 27.43 | |
Income (loss) from investment operations: |
Net investment income (loss)a | | | .24 | | | | .44 | | | | .47 | | | | .39 | | | | .40 | |
Net gain (loss) on investments (realized and unrealized) | | | 3.52 | | | | 5.02 | | | | (2.08 | ) | | | 3.68 | | | | 1.78 | |
Total from investment operations | | | 3.76 | | | | 5.46 | | | | (1.61 | ) | | | 4.07 | | | | 2.18 | |
Less distributions from: |
Net investment income | | | (.49 | ) | | | (.51 | ) | | | (.44 | ) | | | (.46 | ) | | | (.33 | ) |
Net realized gains | | | (1.91 | ) | | | (.24 | ) | | | (2.29 | ) | | | (.67 | ) | | | (.54 | ) |
Total distributions | | | (2.40 | ) | | | (.75 | ) | | | (2.73 | ) | | | (1.13 | ) | | | (.87 | ) |
Net asset value, end of period | | $ | 33.41 | | | $ | 32.05 | | | $ | 27.34 | | | $ | 31.68 | | | $ | 28.74 | |
|
Total Returnb | | | 12.59 | % | | | 20.11 | % | | | (5.73 | %) | | | 14.39 | % | | | 8.01 | % |
Ratios/Supplemental Data |
Net assets, end of period (in thousands) | | $ | 45,673 | | | $ | 46,219 | | | $ | 42,636 | | | $ | 51,080 | | | $ | 52,840 | |
Ratios to average net assets: |
Net investment income (loss) | | | 0.77 | % | | | 1.45 | % | | | 1.53 | % | | | 1.29 | % | | | 1.42 | % |
Total expensesc | | | 1.01 | % | | | 1.01 | % | | | 0.99 | % | | | 0.98 | % | | | 0.92 | % |
Net expensesd | | | 1.00 | % | | | 1.00 | % | | | 0.99 | % | | | 0.98 | % | | | 0.92 | % |
Portfolio turnover rate | | | 6 | % | | | 14 | % | | | 4 | % | | | 1 | % | | | 6 | % |
a | Net investment income (loss) per share was computed using average shares outstanding throughout the period. |
b | Total return does not take into account any of the expenses associated with an investment in variable insurance products. If total return had taken into account these expenses, performance would have been lower. Shares of a series of Guggenheim Variable Funds Trust are available only through the purchase of such products. |
c | Does not include expenses of the underlying funds in which the Fund invests. |
d | Net expense information reflects the expense ratios after expense waivers and reimbursements, as applicable. |
SEE NOTES TO FINANCIAL STATEMENTS. | THE GUGGENHEIM FUNDS ANNUAL REPORT | 89 |
MANAGERS’ COMMENTARY (Unaudited) | December 31, 2020 |
To Our Shareholders:
The Series O (All Cap Value Series) is managed by a team of seasoned professionals led by James Schier, CFA, Senior Managing Director and Portfolio Manager; David Toussaint, CFA, CPA, Managing Director and Portfolio Manager; Farhan Sharaff, Senior Managing Director, Assistant Chief Investment Officer, Equities, and Portfolio Manager; Gregg Strohkorb, CFA, Director Portfolio Manager; and Burak Hurmeydan, Ph.D., Director and Portfolio Manager. In the following paragraphs, the team discusses performance of the Fund for the fiscal year ended December 31, 2020.
For the year ended December 31, 2020, Series O (All Cap Value Series) returned 1.88%, compared with the Russell 3000® Value Index, which returned 2.87%.
Strategy and Market Overview
Our investment approach focuses on understanding how companies make money and how easily companies can improve returns, maintain existing high levels of profitability, or benefit from change that occurs within the industries in which they operate. In today’s rapidly changing environment marked by very sharp and quick, but constrained volatility, our long-term orientation and discipline are a competitive advantage. This should become especially critical when the environment of indiscriminant valuation expansion subsides, and fundamentals once again become a more dominant factor in the market.
Performance Review
Dominating the market for the period was the strong outperformance of growth versus value stocks, despite occasional signs that the situation might be ready to turn. Significant monetary and fiscal stimulus and the low-rate environment helped multiples of growth stocks expand more than those of value stocks, leading to stocks with extreme valuations to experience continued multiple expansion.
The Information Technology sector was the bright spot for the Fund for the period, along with lesser contributions from Health Care and Materials. Performance was aided by relative contributions from Real Estate and Energy, where the Fund’s holdings—despite a negative return overall—strongly outperformed those in the benchmark. Information Technology benefited from an overweight, the Fund’s largest relative to the benchmark, and strong selection, especially in Apple Computer and Micron Technology. Top individual contributors included Olin Corp. and Westlake Chemical Corp. in the Materials space and Alexion Pharmaceuticals in Health Care.
The Energy sector in the Fund relatively outperformed that in the benchmark, but its slightly larger allocation detracted from performance. Leading individual contributors were Range Resources, which benefited from firming in natural gas prices. Chevron and Marathon Oil were major sector detractors. Office REIT Equity Commonwealth was the main contributors, while commercial REIT Howard Hughes Corp. was the main detractor.
Sectors detracting from performance included Financials and Utilities. The Fund’s Financial holdings underperformed those in the benchmark, and the impact was magnified by the sector’s large weighting, the largest in both the Fund and the benchmark. Major banks such as Wells Fargo and Citigroup were large detractors due to perceived weaker economic activity as a result of COVID, and the Fed’s lowering of interest rates in reaction to the pandemic. In Utilities, the Fund was hurt by having no exposure to the better-performing renewables space, which also had higher valuations and thus did not possess value characteristics sought by the Fund.
A large individual detractor was Consumer Staples company Tyson Foods, which fell as thousands of its employees tested positive for COVID during the summer. The contribution from Consumer Discretionary, slightly negative, was not as bad as it could have been through an overweight to homebuilder D. R. Horton, which returned more than 30% over the period.
Portfolio Positioning
While this strategy is balanced relative to the benchmark, the size of companies it owns is typically smaller, given their often-better growth opportunities.
Over the period, the Fund’s largest sector overweights on average relative to the benchmark were in Tech and Financials. The Fund’s largest sector underweights were in Health Care and Communication Services.
90 | THE GUGGENHEIM FUNDS ANNUAL REPORT | |
MANAGERS’ COMMENTARY (Unaudited)(concluded) | December 31, 2020 |
Portfolio and Market Outlook
The market outlook is indeed murkier than usual. The expectation of a government and a Federal Reserve willing to do whatever is necessary to help the economy and the markets will need to meet the growing limitations that an increasingly indebted nation must eventually face. However, near term benefits of stimulus money and a Federal Reserve willing to commit to near zero interest rates for an indefinite period suggest a buoyant near-term outlook.
Performance displayed represents past performance which is no guarantee of future results.
The opinions and forecast expressed may not actually come to pass. This information is subject to change at any time, based on market and other conditions, and should not be construed as a recommendation of any specific security or strategy.
| | THE GUGGENHEIM FUNDS ANNUAL REPORT | 91 |
PERFORMANCE REPORT AND FUND PROFILE (Unaudited) | December 31, 2020 |
SERIES O (ALL CAP VALUE SERIES)
OBJECTIVE: Seeks long-term growth of capital.
Holdings Diversification (Market Exposure as % of Net Assets)
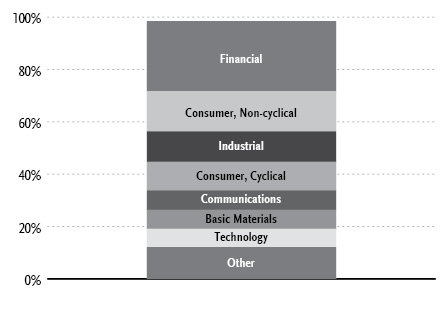
“Holdings Diversification (Market Exposure as % of Net Assets)” excludes any temporary cash investments.
Inception Date: June 1, 1995 |
Ten Largest Holdings (% of Total Net Assets) |
Micron Technology, Inc. | 1.9% |
Verizon Communications, Inc. | 1.8% |
Chevron Corp. | 1.8% |
JPMorgan Chase & Co. | 1.7% |
Citigroup, Inc. | 1.6% |
Voya Financial, Inc. | 1.6% |
Berkshire Hathaway, Inc. — Class B | 1.5% |
Huntsman Corp. | 1.5% |
Johnson & Johnson | 1.5% |
Skyworks Solutions, Inc. | 1.5% |
Top Ten Total | 16.4% |
| | |
“Ten Largest Holdings” excludes any temporary cash investments. |
92 | THE GUGGENHEIM FUNDS ANNUAL REPORT | |
PERFORMANCE REPORT AND FUND PROFILE (Unaudited)(concluded) | December 31, 2020 |
Cumulative Fund Performance*,†

Average Annual Returns*,†
Periods Ended December 31, 2020
| 1 Year | 5 Year | 10 Year |
Series O (All Cap Value Series) | 1.88% | 9.67% | 9.13% |
Russell 3000 Value Index | 2.87% | 9.74% | 10.36% |
* | The performance data above represents past performance that is not predictive of future results. The investment return and principal value of an investment in the Fund will fluctuate so that an investor’s shares, when redeemed, may be worth more or less than their original cost. Returns are historical and include changes in principal and reinvested dividends and capital gains and do not reflect the effect of taxes. The Russell 3000 Value Index is an unmanaged index and, unlike the Fund, has no management fees or operating expenses to reduce its reported return. |
† | Performance figures do not reflect fees and expenses associated with an investment in variable insurance products. If returns had taken into account these fees and expenses, performance would have been lower. Shares of a series of Guggenheim Variable Funds Trust are available only through the purchase of such products. |
| | THE GUGGENHEIM FUNDS ANNUAL REPORT | 93 |
SCHEDULE OF INVESTMENTS | December 31, 2020 |
SERIES O (ALL CAP VALUE SERIES) | |
| | Shares | | | Value | |
COMMON STOCKS† - 98.5% |
| | | | | | | | | |
Financial - 26.8% |
JPMorgan Chase & Co. | | | 12,026 | | | $ | 1,528,144 | |
Citigroup, Inc. | | | 23,857 | | | | 1,471,023 | |
Voya Financial, Inc. | | | 24,286 | | | | 1,428,260 | |
Berkshire Hathaway, Inc. — Class B* | | | 6,100 | | | | 1,414,407 | |
Bank of America Corp. | | | 41,246 | | | | 1,250,166 | |
Synovus Financial Corp. | | | 31,962 | | | | 1,034,610 | |
Zions Bancorp North America | | | 21,169 | | | | 919,581 | |
Morgan Stanley | | | 13,028 | | | | 892,809 | |
KeyCorp | | | 49,889 | | | | 818,678 | |
Allstate Corp. | | | 7,125 | | | | 783,251 | |
Alleghany Corp. | | | 1,206 | | | | 728,050 | |
Wells Fargo & Co. | | | 23,964 | | | | 723,233 | |
MetLife, Inc. | | | 15,334 | | | | 719,931 | |
Medical Properties Trust, Inc. REIT | | | 30,988 | | | | 675,228 | |
Prudential Financial, Inc. | | | 7,716 | | | | 602,388 | |
Principal Financial Group, Inc. | | | 11,835 | | | | 587,134 | |
First Horizon National Corp. | | | 44,618 | | | | 569,326 | |
Pinnacle Financial Partners, Inc. | | | 8,768 | | | | 564,659 | |
Physicians Realty Trust REIT | | | 29,711 | | | | 528,856 | |
BOK Financial Corp. | | | 7,672 | | | | 525,379 | |
Hartford Financial Services Group, Inc. | | | 10,480 | | | | 513,310 | |
Radian Group, Inc. | | | 24,321 | | | | 492,500 | |
Gaming and Leisure Properties, Inc. REIT | | | 11,540 | | | | 489,296 | |
Park Hotels & Resorts, Inc. REIT | | | 28,247 | | | | 484,436 | |
Alexandria Real Estate Equities, Inc. REIT | | | 2,595 | | | | 462,481 | |
Loews Corp. | | | 10,075 | | | | 453,577 | |
Axis Capital Holdings Ltd. | | | 8,833 | | | | 445,095 | |
Charles Schwab Corp. | | | 8,169 | | | | 433,284 | |
Regions Financial Corp. | | | 22,189 | | | | 357,687 | |
VICI Properties, Inc. REIT | | | 13,634 | | | | 347,667 | |
Sun Communities, Inc. REIT | | | 2,052 | | | | 311,801 | |
Hilltop Holdings, Inc. | | | 10,087 | | | | 277,493 | |
Stifel Financial Corp. | | | 5,273 | | | | 266,050 | |
Mastercard, Inc. — Class A | | | 715 | | | | 255,212 | |
American International Group, Inc. | | | 6,394 | | | | 242,077 | |
Heritage Insurance Holdings, Inc. | | | 23,153 | | | | 234,540 | |
WSFS Financial Corp. | | | 4,887 | | | | 219,329 | |
Apple Hospitality REIT, Inc. | | | 15,426 | | | | 199,150 | |
Old Republic International Corp. | | | 9,140 | | | | 180,150 | |
Heartland Financial USA, Inc. | | | 3,967 | | | | 160,148 | |
Total Financial | | | | | | | 24,590,396 | |
| | | | | | | | | |
Consumer, Non-cyclical - 15.3% |
Johnson & Johnson | | | 8,556 | | | | 1,346,543 | |
Pfizer, Inc. | | | 35,686 | | | | 1,313,602 | |
Bunge Ltd. | | | 18,787 | | | | 1,232,051 | |
HCA Healthcare, Inc. | | | 6,217 | | | | 1,022,448 | |
Archer-Daniels-Midland Co. | | | 16,063 | | | | 809,736 | |
Medtronic plc | | | 6,276 | | | | 735,171 | |
Encompass Health Corp. | | | 8,850 | | | | 731,806 | |
Quest Diagnostics, Inc. | | | 5,569 | | | | 663,658 | |
Ingredion, Inc. | | | 8,169 | | | | 642,655 | |
Zimmer Biomet Holdings, Inc. | | | 4,163 | | | | 641,477 | |
Tyson Foods, Inc. — Class A | | | 9,842 | | | | 634,219 | |
McKesson Corp. | | | 3,206 | | | | 557,587 | |
Merck & Company, Inc. | | | 6,587 | | | | 538,817 | |
Humana, Inc. | | | 1,232 | | | | 505,453 | |
Alexion Pharmaceuticals, Inc.* | | | 2,906 | | | | 454,033 | |
Emergent BioSolutions, Inc.* | | | 4,318 | | | | 386,893 | |
Amgen, Inc. | | | 1,636 | | | | 376,149 | |
Sabre Corp. | | | 27,673 | | | | 332,630 | |
Central Garden & Pet Co. — Class A* | | | 7,922 | | | | 287,806 | |
US Foods Holding Corp.* | | | 8,453 | | | | 281,569 | |
Integer Holdings Corp.* | | | 3,227 | | | | 262,000 | |
MGP Ingredients, Inc. | | | 5,140 | | | | 241,888 | |
Total Consumer, Non-cyclical | | | | | | | 13,998,191 | |
| | | | | | | | | |
Industrial - 11.7% |
Honeywell International, Inc. | | | 5,354 | | | | 1,138,796 | |
Owens Corning | | | 14,831 | | | | 1,123,596 | |
Johnson Controls International plc | | | 19,318 | | | | 900,026 | |
Knight-Swift Transportation Holdings, Inc. | | | 21,358 | | | | 893,191 | |
Valmont Industries, Inc. | | | 4,528 | | | | 792,083 | |
MDU Resources Group, Inc. | | | 19,696 | | | | 518,793 | |
FedEx Corp. | | | 1,764 | | | | 457,970 | |
Plexus Corp.* | | | 5,474 | | | | 428,121 | |
Jacobs Engineering Group, Inc. | | | 3,679 | | | | 400,864 | |
Graphic Packaging Holding Co. | | | 20,768 | | | | 351,810 | |
General Electric Co. | | | 30,573 | | | | 330,189 | |
Rexnord Corp. | | | 8,337 | | | | 329,228 | |
PGT Innovations, Inc.* | | | 15,978 | | | | 324,992 | |
L3Harris Technologies, Inc. | | | 1,706 | | | | 322,468 | |
EnerSys | | | 3,666 | | | | 304,498 | |
Aerojet Rocketdyne Holdings, Inc.* | | | 5,469 | | | | 289,037 | |
Colfax Corp.* | | | 6,293 | | | | 240,644 | |
Curtiss-Wright Corp. | | | 2,055 | | | | 239,099 | |
Kennametal, Inc. | | | 5,690 | | | | 206,206 | |
Kirby Corp.* | | | 3,954 | | | | 204,936 | |
Altra Industrial Motion Corp. | | | 3,570 | | | | 197,885 | |
GATX Corp. | | | 2,150 | | | | 178,837 | |
Terex Corp. | | | 4,648 | | | | 162,169 | |
Park Aerospace Corp. | | | 11,271 | | | | 151,144 | |
Schneider National, Inc. — Class B | | | 5,577 | | | | 115,444 | |
Crane Co. | | | 1,331 | | | | 103,366 | |
Total Industrial | | | | | | | 10,705,392 | |
| | | | | | | | | |
Consumer, Cyclical - 10.9% |
Walmart, Inc. | | | 8,159 | | | | 1,176,120 | |
Lear Corp. | | | 5,073 | | | | 806,759 | |
PVH Corp. | | | 8,459 | | | | 794,215 | |
DR Horton, Inc. | | | 11,089 | | | | 764,254 | |
Southwest Airlines Co. | | | 14,749 | | | | 687,451 | |
Penske Automotive Group, Inc. | | | 11,376 | | | | 675,621 | |
Kohl’s Corp. | | | 14,436 | | | | 587,401 | |
Ralph Lauren Corp. — Class A | | | 5,600 | | | | 580,944 | |
PACCAR, Inc. | | | 5,968 | | | | 514,919 | |
LKQ Corp.* | | | 13,820 | | | | 487,017 | |
Home Depot, Inc. | | | 1,752 | | | | 465,366 | |
MSC Industrial Direct Company, Inc. — Class A | | | 4,351 | | | | 367,181 | |
Alaska Air Group, Inc. | | | 5,933 | | | | 308,516 | |
94 | THE GUGGENHEIM FUNDS ANNUAL REPORT | SEE NOTES TO FINANCIAL STATEMENTS. |
SCHEDULE OF INVESTMENTS (continued) | December 31, 2020 |
SERIES O (ALL CAP VALUE SERIES) | |
| | Shares | | | Value | |
UniFirst Corp. | | | 1,425 | | | $ | 301,658 | |
Tapestry, Inc. | | | 8,289 | | | | 257,622 | |
Methode Electronics, Inc. | | | 5,202 | | | | 199,133 | |
BorgWarner, Inc. | | | 5,015 | | | | 193,780 | |
Dick’s Sporting Goods, Inc. | | | 3,056 | | | | 171,778 | |
Skechers USA, Inc. — Class A* | | | 4,730 | | | | 169,996 | |
Urban Outfitters, Inc.* | | | 6,291 | | | | 161,050 | |
Movado Group, Inc.* | | | 6,583 | | | | 109,409 | |
Meritage Homes Corp.* | | | 1,270 | | | | 105,181 | |
Dana, Inc. | | | 5,083 | | | | 99,220 | |
Total Consumer, Cyclical | | | | | | | 9,984,591 | |
| | | | | | | | | |
Communications - 7.4% |
Verizon Communications, Inc. | | | 27,789 | | | | 1,632,604 | |
Comcast Corp. — Class A | | | 25,395 | | | | 1,330,698 | |
Infinera Corp.* | | | 77,869 | | | | 816,067 | |
F5 Networks, Inc.* | | | 4,041 | | | | 710,974 | |
Cisco Systems, Inc. | | | 14,121 | | | | 631,915 | |
Alphabet, Inc. — Class A* | | | 263 | | | | 460,944 | |
T-Mobile US, Inc.* | | | 2,842 | | | | 383,244 | |
Viavi Solutions, Inc.* | | | 22,862 | | | | 342,358 | |
Juniper Networks, Inc. | | | 13,304 | | | | 299,473 | |
Ciena Corp.* | | | 3,527 | | | | 186,402 | |
Total Communications | | | | | | | 6,794,679 | |
| | | | | | | | | |
Basic Materials - 7.3% |
Huntsman Corp. | | | 54,063 | | | | 1,359,144 | |
Westlake Chemical Corp. | | | 14,254 | | | | 1,163,126 | |
Olin Corp. | | | 39,150 | | | | 961,524 | |
Nucor Corp. | | | 15,903 | | | | 845,881 | |
Reliance Steel & Aluminum Co. | | | 6,554 | | | | 784,841 | |
Ashland Global Holdings, Inc. | | | 4,903 | | | | 388,318 | |
DuPont de Nemours, Inc. | | | 5,258 | | | | 373,896 | |
Commercial Metals Co. | | | 11,660 | | | | 239,496 | |
Element Solutions, Inc. | | | 13,397 | | | | 237,529 | |
Dow, Inc. | | | 3,272 | | | | 181,596 | |
Kraton Corp.* | | | 5,854 | | | | 162,683 | |
Total Basic Materials | | | | | | | 6,698,034 | |
| | | | | | | | | |
Technology - 7.0% |
Micron Technology, Inc.* | | | 22,842 | | | | 1,717,261 | |
Skyworks Solutions, Inc. | | | 8,767 | | | | 1,340,299 | |
Qorvo, Inc.* | | | 6,411 | | | | 1,065,957 | |
Apple, Inc. | | | 4,958 | | | | 657,877 | |
Evolent Health, Inc. — Class A* | | | 30,098 | | | | 482,471 | |
Intel Corp. | | | 7,045 | | | | 350,982 | |
Amdocs Ltd. | | | 4,891 | | | | 346,919 | |
Science Applications International Corp. | | | 2,581 | | | | 244,266 | |
Cerner Corp. | | | 2,940 | | | | 230,731 | |
Total Technology | | | | | | | 6,436,763 | |
| | | | | | | | | |
Utilities - 6.5% |
Edison International | | | 17,606 | | | | 1,106,009 | |
Exelon Corp. | | | 23,741 | | | | 1,002,345 | |
Public Service Enterprise Group, Inc. | | | 16,529 | | | | 963,641 | |
Pinnacle West Capital Corp. | | | 10,663 | | | | 852,507 | |
Duke Energy Corp. | | | 6,950 | | | | 636,342 | |
NiSource, Inc. | | | 16,523 | | | | 379,038 | |
PPL Corp. | | | 9,865 | | | | 278,193 | |
Avista Corp. | | | 6,144 | | | | 246,620 | |
Spire, Inc. | | | 3,738 | | | | 239,381 | |
Southwest Gas Holdings, Inc. | | | 3,787 | | | | 230,060 | |
Total Utilities | | | | | | | 5,934,136 | |
| | | | | | | | | |
Energy - 5.6% |
Chevron Corp. | | | 19,271 | | | | 1,627,436 | |
Parsley Energy, Inc. — Class A | | | 64,634 | | | | 917,803 | |
ConocoPhillips | | | 20,031 | | | | 801,039 | |
Cabot Oil & Gas Corp. — Class A | | | 29,092 | | | | 473,618 | |
Range Resources Corp.* | | | 70,480 | | | | 472,216 | |
Marathon Oil Corp. | | | 51,739 | | | | 345,099 | |
Exxon Mobil Corp. | | | 6,914 | | | | 284,995 | |
Patterson-UTI Energy, Inc. | | | 33,553 | | | | 176,489 | |
Total Energy | | | | | | | 5,098,695 | |
| | | | | | | | | |
Total Common Stocks | | | | |
(Cost $73,321,912) | | | | | | | 90,240,877 | |
| | | | | | | | | |
RIGHTS† - 0.0% |
Basic Materials - 0.0% |
Pan American Silver Corp.* | | | 40,146 | | | | 33,120 | |
Total Rights | | | | |
(Cost $—) | | | | | | | 33,120 | |
| | | | | | | | | |
MONEY MARKET FUND† - 1.3% |
Dreyfus Treasury Securities Cash Management Fund — Institutional Shares, 0.01%1 | | | 1,191,468 | | | | 1,191,468 | |
Total Money Market Fund | | | | |
(Cost $1,191,468) | | | | | | | 1,191,468 | |
| | | | | | | | | |
Total Investments - 99.8% | | | | |
(Cost $74,513,380) | | $ | 91,465,465 | |
Other Assets & Liabilities, net - 0.2% | | | 195,589 | |
Total Net Assets - 100.0% | | $ | 91,661,054 | |
SEE NOTES TO FINANCIAL STATEMENTS. | THE GUGGENHEIM FUNDS ANNUAL REPORT | 95 |
SCHEDULE OF INVESTMENTS (concluded) | December 31, 2020 |
SERIES O (ALL CAP VALUE SERIES) | |
* | Non-income producing security. |
† | Value determined based on Level 1 inputs — See Note 4. |
1 | Rate indicated is the 7-day yield as of December 31, 2020. |
| | plc — Public Limited Company |
| | REIT — Real Estate Investment Trust |
| | |
| | See Sector Classification in Other Information section. |
The following table summarizes the inputs used to value the Fund’s investments at December 31, 2020 (See Note 4 in the Notes to Financial Statements):
Investments in Securities (Assets) | | Level 1
Quoted
Prices | | | Level 2
Significant
Observable
Inputs | | | Level 3
Significant
Unobservable
Inputs | | | Total | |
Common Stocks | | $ | 90,240,877 | | | $ | — | | | $ | — | | | $ | 90,240,877 | |
Rights | | | 33,120 | | | | — | | | | — | | | | 33,120 | |
Money Market Fund | | | 1,191,468 | | | | — | | | | — | | | | 1,191,468 | |
Total Assets | | $ | 91,465,465 | | | $ | — | | | $ | — | | | $ | 91,465,465 | |
96 | THE GUGGENHEIM FUNDS ANNUAL REPORT | SEE NOTES TO FINANCIAL STATEMENTS. |
SERIES O (ALL CAP VALUE SERIES) | |
STATEMENT OF ASSETS AND LIABILITIES |
December 31, 2020 |
Assets: |
Investments, at value (cost $74,513,380) | | $ | 91,465,465 | |
Prepaid expenses | | | 3,545 | |
Receivables: |
Securities sold | | | 393,337 | |
Dividends | | | 119,721 | |
Fund shares sold | | | 183 | |
Interest | | | 9 | |
Total assets | | | 91,982,260 | |
| | | | | |
Liabilities: |
Payable for: |
Securities purchased | | | 150,274 | |
Fund shares redeemed | | | 49,073 | |
Management fees | | | 32,932 | |
Printing fees | | | 31,113 | |
Professional fees | | | 22,971 | |
Distribution and service fees | | | 19,265 | |
Fund accounting/administration fees | | | 7,959 | |
Transfer agent/maintenance fees | | | 2,249 | |
Trustees’ fees* | | | 2,162 | |
Miscellaneous | | | 3,208 | |
Total liabilities | | | 321,206 | |
Commitments and contingent liabilities (Note 13) | | | — | |
Net assets | | $ | 91,661,054 | |
| | | | | |
Net assets consist of: |
Paid in capital | | $ | 72,379,727 | |
Total distributable earnings (loss) | | | 19,281,327 | |
Net assets | | $ | 91,661,054 | |
Capital shares outstanding | | | 2,951,181 | |
Net asset value per share | | $ | 31.06 | |
STATEMENT OF OPERATIONS |
Year Ended December 31, 2020 |
Investment Income: |
Dividends | | $ | 2,500,880 | |
Interest | | | 2,994 | |
Total investment income | | | 2,503,874 | |
| | | | | |
Expenses: |
Management fees | | | 603,413 | |
Distribution and service fees | | | 215,504 | |
Transfer agent/maintenance fees | | | 25,367 | |
Fund accounting/administration fees | | | 70,950 | |
Professional fees | | | 49,169 | |
Trustees’ fees* | | | 19,570 | |
Custodian fees | | | 3,894 | |
Line of credit fees | | | 2,343 | |
Miscellaneous | | | 52,270 | |
Total expenses | | | 1,042,480 | |
Less: |
Expenses waived by Adviser | | | (288,584 | ) |
Earnings credits applied | | | (8 | ) |
Total waived expenses | | | (288,592 | ) |
Net expenses | | | 753,888 | |
Net investment income | | | 1,749,986 | |
| | | | | |
Net Realized and Unrealized Gain (Loss): |
Net realized gain (loss) on: |
Investments | | | 1,258,735 | |
Net realized gain | | | 1,258,735 | |
Net change in unrealized appreciation (depreciation) on: |
Investments | | | (3,137,740 | ) |
Net change in unrealized appreciation (depreciation) | | | (3,137,740 | ) |
Net realized and unrealized loss | | | (1,879,005 | ) |
Net decrease in net assets resulting from operations | | $ | (129,019 | ) |
* | Relates to Trustees not deemed “interested persons” within the meaning of Section 2(a)(19) of the 1940 Act. |
SEE NOTES TO FINANCIAL STATEMENTS. | THE GUGGENHEIM FUNDS ANNUAL REPORT | 97 |
SERIES O (ALL CAP VALUE SERIES) | |
STATEMENTS OF CHANGES IN NET ASSETS |
| | Year Ended
December 31,
2020 | | | Year Ended
December 31,
2019 | |
Increase (Decrease) in Net Assets from Operations: | | | | | | | | |
Net investment income | | $ | 1,749,986 | | | $ | 1,685,159 | |
Net realized gain on investments | | | 1,258,735 | | | | 6,063,349 | |
Net change in unrealized appreciation (depreciation) on investments | | | (3,137,740 | ) | | | 14,405,167 | |
Net increase (decrease) in net assets resulting from operations | | | (129,019 | ) | | | 22,153,675 | |
| | | | | | | | | |
Distributions to shareholders | | | (6,300,999 | ) | | | (9,601,509 | ) |
| | | | | | | | | |
Capital share transactions: | | | | | | | | |
Proceeds from sale of shares | | | 2,686,231 | | | | 4,011,293 | |
Distributions reinvested | | | 6,300,999 | | | | 9,601,509 | |
Cost of shares redeemed | | | (18,530,135 | ) | | | (19,446,850 | ) |
Net decrease from capital share transactions | | | (9,542,905 | ) | | | (5,834,048 | ) |
Net increase (decrease) in net assets | | | (15,972,923 | ) | | | 6,718,118 | |
| | | | | | | | | |
Net assets: | | | | | | | | |
Beginning of year | | | 107,633,977 | | | | 100,915,859 | |
End of year | | $ | 91,661,054 | | | $ | 107,633,977 | |
| | | | | | | | | |
Capital share activity: | | | | | | | | |
Shares sold | | | 103,876 | | | | 130,063 | |
Shares issued from reinvestment of distributions | | | 241,418 | | | | 315,943 | |
Shares redeemed | | | (666,704 | ) | | | (616,888 | ) |
Net decrease in shares | | | (321,410 | ) | | | (170,882 | ) |
98 | THE GUGGENHEIM FUNDS ANNUAL REPORT | SEE NOTES TO FINANCIAL STATEMENTS. |
SERIES O (ALL CAP VALUE SERIES) | |
This table is presented to show selected data for a share outstanding throughout each period and to assist shareholders in evaluating a Fund’s performance for the periods presented.
| | Year Ended
December 31,
2020 | | | Year Ended
December 31,
2019 | | | Year Ended
December 31,
2018 | | | Year Ended
December 31,
2017 | | | Year Ended
December 31,
2016 | |
Per Share Data |
Net asset value, beginning of period | | $ | 32.89 | | | $ | 29.31 | | | $ | 35.97 | | | $ | 34.05 | | | $ | 29.30 | |
Income (loss) from investment operations: |
Net investment income (loss)a | | | .56 | | | | .51 | | | | .43 | | | | .24 | | | | .45 | |
Net gain (loss) on investments (realized and unrealized) | | | (.33 | ) | | | 6.19 | | | | (3.83 | ) | | | 4.51 | | | | 6.01 | |
Total from investment operations | | | .23 | | | | 6.70 | | | | (3.40 | ) | | | 4.75 | | | | 6.46 | |
Less distributions from: |
Net investment income | | | (.52 | ) | | | (.49 | ) | | | (.40 | ) | | | (.38 | ) | | | (.48 | ) |
Net realized gains | | | (1.54 | ) | | | (2.63 | ) | | | (2.86 | ) | | | (2.45 | ) | | | (1.23 | ) |
Total distributions | | | (2.06 | ) | | | (3.12 | ) | | | (3.26 | ) | | | (2.83 | ) | | | (1.71 | ) |
Net asset value, end of period | | $ | 31.06 | | | $ | 32.89 | | | $ | 29.31 | | | $ | 35.97 | | | $ | 34.05 | |
|
Total Returnb | | | 1.88 | % | | | 23.74 | % | | | (10.62 | %) | | | 14.77 | % | | | 22.71 | % |
Ratios/Supplemental Data |
Net assets, end of period (in thousands) | | $ | 91,661 | | | $ | 107,634 | | | $ | 100,916 | | | $ | 132,771 | | | $ | 128,367 | |
Ratios to average net assets: |
Net investment income (loss) | | | 2.03 | % | | | 1.62 | % | | | 1.23 | % | | | 0.69 | % | | | 1.48 | % |
Total expensesc | | | 1.21 | % | | | 1.18 | % | | | 1.17 | % | | | 1.11 | % | | | 0.90 | % |
Net expensesd,e,f | | | 0.87 | % | | | 0.88 | % | | | 0.88 | % | | | 0.89 | % | | | 0.90 | % |
Portfolio turnover rate | | | 22 | % | | | 33 | % | | | 36 | % | | | 33 | % | | | 47 | % |
a | Net investment income (loss) per share was computed using average shares outstanding throughout the period. |
b | Total return does not take into account any of the expenses associated with an investment in variable insurance products. If total return had taken into account these expenses, performance would have been lower. Shares of a series of Guggenheim Variable Funds Trust are available only through the purchase of such products. |
c | Does not include expenses of the underlying funds in which the Fund invests. |
d | Net expense information reflects the expense ratios after expense waivers and reimbursements, as applicable. |
e | Net expenses may include expenses that are excluded from the expense limitation agreement. Excluding these expenses, the net expense ratios for the years presented would be: |
| | 12/31/20 | 12/31/19 | 12/31/18 | 12/31/17 | 12/31/16 |
| | 0.87% | 0.88% | 0.88% | 0.88% | 0.90% |
f | The portion of the ratios of net expenses to average net assets attributable to recoupments of prior fee reductions or expense reimbursements for the years was as follows: |
| | 12/31/20 | 12/31/19 | 12/31/18 | 12/31/17 | 12/31/16 |
| | — | — | — | 0.00%* | — |
SEE NOTES TO FINANCIAL STATEMENTS. | THE GUGGENHEIM FUNDS ANNUAL REPORT | 99 |
MANAGERS’ COMMENTARY (Unaudited) | December 31, 2020 |
To Our Shareholders
The Series P (High Yield Series) is managed by a team of seasoned professionals, including B. Scott Minerd, Chairman of Investments and Global Chief Investment Officer; Kevin H. Gundersen, Senior Managing Director and Portfolio Manager; Thomas J. Hauser, Senior Managing Director and Portfolio Manager; and Richard de Wet, Director and Portfolio Manager. In the following paragraphs, the investment team discusses the market environment and the Fund’s performance for the fiscal year ended December 31, 2020.
For the year ended December 31, 2020, Series P (High Yield Series) returned 4.64%, compared to 7.11% return of its benchmark, the Bloomberg Barclays U.S. Corporate High Yield Index.
The high yield market started the year with high bond prices and spreads near historic lows, but rapidly changed with the onset of the Coronavirus in March. Lower quality credit sold off and the new issue market was effectively shut for three weeks. Overall, the high yield market returned -12.7% in the first quarter and was the weakest quarter since fourth quarter of 2008 during the Global Financial Crisis. The Coronavirus outbreak dramatically halted large portions of the U.S. economy to which the U.S. Federal Reserve (the “Fed”) responded quickly. The Federal Open Market Committee cut rates by 125 basis points and implemented a series of liquidity programs to support commercial loans, mortgages, corporations, and municipalities. The Fed also agreed to buy bonds from recent fallen angels, adding a strong technical tailwind to the high yield market.
The combination of the monetary and fiscal support helped to jumpstart the high yield market. The new issue market reopened, and issuance has remained robust since. The second and third quarters of 2020 alone saw $276 billion in issuance, which nearly equaled full-year 2019 levels. Over the period, the market experienced sizeable demand, with high-yield fund flows surging $53 billion during the last three quarters of the year. Overall, the market was up 10.2%, 4.6%, and 6.5% in the year’s final three quarters, respectively. With the market rally, most sectors exhibited positive performance for the full year period even with the sell-off in the first quarter. At the end of the year, the average high yield corporate bond yield was 4.18% which compares favorably to considerably lower global yields.
The Fund invests in non-U.S. dollar denominated assets when the risk-return profile is favorable. The Fund entered into forward foreign currency exchange contracts to hedge exchange rate risk for non-U.S. dollar denominated positions which had a negligible impact to performance. Non-U.S. dollar denominated assets comprise less than 1% of the Fund. The Fund added high yield credit default swap exposure which contributed to performance.
Fund performance over the period was driven by the exposure to high yield bonds with strong credit selection in Consumer Non-Cyclicals, Communications, and CCC-rated credit. A small exposure to select investment-grade credit contributed to performance as well, along with increased exposure to longer dated maturities. The Fund was underweight Fallen Angels which generally were BB-rated and performed well following their inclusion into high yield indexes. In addition, the Fund increased its cash position at the end of the first quarter with the onset of market volatility and as a result was negatively impacted by the rapid market rally in second quarter. The Fund was also underweight energy by 270 basis points on average which detracted as energy was a top performing sector following the first quarter.
We expect a continued hunt for yield in light of global stimulus and low prevailing yields. We also expect this will mean relaxing credit underwriting standards for many investors, potentially leaving some exposed to credits with weak underlying fundamentals. As primary new issuance has remained robust, we have increased diversification across issuers, and participated in the refinancing of existing holdings when priced attractively.
While the level of distressed assets in the market has come down markedly, we still believe avoiding defaults will be key to achieving performance going forward. We continue to avoid highly levered industries and companies with heavy capital expenditure needs that can impair cash flow. Companies with recurring revenue streams, strong cash flows, and high-quality margins remain the focus in this challenging economic environment.
Performance displayed represents past performance which is no guarantee of future results.
The opinions and forecast expressed may not actually come to pass. This information is subject to change at any time, based on market and other conditions, and should not be construed as a recommendation of any specific security or strategy.
100 | THE GUGGENHEIM FUNDS ANNUAL REPORT | |
PERFORMANCE REPORT AND FUND PROFILE (Unaudited) | December 31, 2020 |
SERIES P (HIGH YIELD SERIES)
OBJECTIVE: Seeks high current income. Capital appreciation is a secondary objective.
Holdings Diversification (Market Exposure as % of Net Assets)
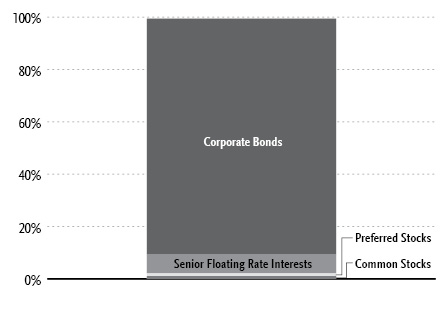
“Holdings Diversification (Market Exposure as % of Net Assets)�� excludes any temporary cash investments.
Inception Date: August 5, 1996 |
Ten Largest Holdings (% of Total Net Assets) |
Terraform Global Operating LLC, 6.13% | 1.6% |
EIG Investors Corp., 10.88% | 1.5% |
LBC Tank Terminals Holding Netherlands BV, 6.88% | 1.4% |
CCO Holdings LLC / CCO Holdings Capital Corp., 4.50% | 1.4% |
Hunt Companies, Inc., 6.25% | 1.2% |
NFP Corp., 6.88% | 1.2% |
Iron Mountain, Inc., 5.63% | 1.1% |
Great Lakes Dredge & Dock Corp., 8.00% | 1.1% |
Indigo Natural Resources LLC, 6.88% | 1.0% |
Vector Group Ltd., 6.13% | 1.0% |
Top Ten Total | 12.5% |
| | |
“Ten Largest Holdings” excludes any temporary cash or derivative investments. |
| | THE GUGGENHEIM FUNDS ANNUAL REPORT | 101 |
PERFORMANCE REPORT AND FUND PROFILE (Unaudited)(concluded) | December 31, 2020 |
Cumulative Fund Performance*,†

Average Annual Returns*,†
Periods Ended December 31, 2020
| 1 Year | 5 Year | 10 Year |
Series P (High Yield Series) | 4.64% | 6.95% | 5.44% |
Bloomberg Barclays U.S. Corporate High Yield Index | 7.11% | 8.59% | 6.80% |
Portfolio Composition by Quality Rating1 |
Rating | % of Total
Investments |
Fixed Income Instruments | |
A | 0.6% |
BBB | 11.8% |
BB | 49.4% |
B | 24.3% |
CCC | 8.8% |
NR2 | 0.6% |
Other Instruments | 4.5% |
Total Investments | 100.0% |
* | The performance data above represents past performance that is not predictive of future results. The investment return and principal value of an investment in the Fund will fluctuate so that an investor’s shares, when redeemed, may be worth more or less than their original cost. Returns are historical and include changes in principal and reinvested dividends and capital gains and do not reflect the effect of taxes. The Bloomberg Barclays U.S. Corporate High Yield Index is an unmanaged index and, unlike the Fund, has no management fees or operating expenses to reduce its reported return. |
† | Performance figures do not reflect fees and expenses associated with an investment in variable insurance products. If returns had taken into account these fees and expenses, performance would have been lower. Shares of a series of Guggenheim Variable Funds Trust are available only through the purchase of such products. |
1 | Source: BlackRock Solutions. Credit quality ratings are measured on a scale that generally ranges from AAA (highest) to D (lowest). All securities except for those labeled “NR” have been rated by Moody’s, Standard & Poor’s (“S&P”), or Fitch, each of which is a Nationally Recognized Statistical Rating Organization (“NRSRO”). For purposes of this presentation, when ratings are available from more than one agency, the highest rating is used. Guggenheim Investments has converted ratings to the equivalent S&P rating. Security ratings are determined at the time of purchase and may change thereafter. |
2 | NR (not rated) securities do not necessarily indicate low credit quality. |
102 | THE GUGGENHEIM FUNDS ANNUAL REPORT | |
SCHEDULE OF INVESTMENTS | December 31, 2020 |
SERIES P (HIGH YIELD SERIES) | |
| | Shares | | | Value | |
COMMON STOCKS† - 1.0% |
| | | | | | | | | |
Utilities - 0.6% |
TexGen Power LLC†† | | | 7,929 | | | $ | 268,262 | |
| | | | | | | | | |
Energy - 0.2% |
Unit Corp.*,††† | | | 10,559 | | | | 100,310 | |
Legacy Reserves, Inc.*,††† | | | 1,969 | | | | 1,969 | |
Permian Production Partners LLC*,††† | | | 9,124 | | | | — | |
Total Energy | | | | | | | 102,279 | |
| | | | | | | | | |
Consumer, Non-cyclical - 0.2% |
ATD New Holdings, Inc.*,†† | | | 3,166 | | | | 73,873 | |
Cengage Learning Holdings II, Inc.*,†† | | | 2,107 | | | | 16,329 | |
Chef Holdings, Inc.*,††† | | | 75 | | | | 6,344 | |
Spectrum Brands Holdings, Inc. | | | 6 | | | | 474 | |
Crimson Wine Group Ltd.* | | | 24 | | | | 128 | |
MEDIQ, Inc.*,††† | | | 92 | | | | — | |
Total Consumer, Non-cyclical | | | | | | | 97,148 | |
| | | | | | | | | |
Financial - 0.0% |
Jefferies Financial Group, Inc. | | | 247 | | | | 6,076 | |
| | | | | | | | | |
Industrial - 0.0% |
BP Holdco LLC*,†††,1 | | | 523 | | | | 184 | |
Vector Phoenix Holdings, LP*,††† | | | 523 | | | | 51 | |
Total Industrial | | | | | | | 235 | |
| | | | | | | | | |
Consumer, Cyclical - 0.0% |
Delta Air Lines, Inc. | | | 1 | | | | 40 | |
Chorus Aviation, Inc. | | | 3 | | | | 9 | |
Total Consumer, Cyclical | | | | �� | | | 49 | |
| | | | | | | | | |
Total Common Stocks | | | | |
(Cost $639,163) | | | | | | | 474,049 | |
| | | | | | | | | |
PREFERRED STOCKS†† - 1.1% |
Financial - 1.1% |
Bank of America Corp., 4.38%* | | | 6,000 | | | | 159,300 | |
First Republic Bank, 4.13% | | | 6,000 | | | | 158,640 | |
American Equity Investment Life Holding Co., 5.95% | | | 6,000 | | | | 156,120 | |
Total Financial | | | | | | | 474,060 | |
| | | | | | | | | |
Industrial - 0.0% |
U.S. Shipping Corp.*,††† | | | 24,529 | | | | — | |
Total Preferred Stocks | | | | |
(Cost $1,075,000) | | | | | | | 474,060 | |
| | | | | | | | | |
MONEY MARKET FUND† - 1.7% |
Dreyfus Treasury Securities Cash Management Fund — Institutional Shares, 0.01%2 | | | 770,412 | | | | 770,412 | |
Total Money Market Fund | | | | |
(Cost $770,412) | | | | | | | 770,412 | |
| | | | | | | | | |
| | Face
Amount | | | | |
CORPORATE BONDS†† - 90.1% |
Communications - 15.5% | | | | | | | | |
CSC Holdings LLC | | | | | | | | |
4.13% due 12/01/303 | | $ | 225,000 | | | | 235,260 | |
4.63% due 12/01/303 | | | 200,000 | | | | 208,750 | |
3.38% due 02/15/313 | | | 200,000 | | | | 196,250 | |
6.50% due 02/01/293 | | | 150,000 | | | | 169,357 | |
CCO Holdings LLC / CCO Holdings Capital Corp. | | | | | | | | |
4.50% due 05/01/323 | | | 600,000 | | | | 640,632 | |
4.25% due 02/01/313 | | | 100,000 | | | | 105,386 | |
Altice France S.A. | | | | | | | | |
7.38% due 05/01/263 | | | 250,000 | | | | 263,125 | |
8.13% due 02/01/273 | | | 200,000 | | | | 220,502 | |
5.13% due 01/15/293 | | | 200,000 | | | | 207,000 | |
EIG Investors Corp. | | | | | | | | |
10.88% due 02/01/24 | | | 635,000 | | | | 656,907 | |
Level 3 Financing, Inc. | | | | | | | | |
4.25% due 07/01/283 | | | 300,000 | | | | 308,250 | |
3.63% due 01/15/293 | | | 300,000 | | | | 299,250 | |
Virgin Media Secured Finance plc | | | | | | | | |
4.50% due 08/15/303 | | | 300,000 | | | | 313,500 | |
5.50% due 05/15/293 | | | 100,000 | | | | 108,375 | |
Cengage Learning, Inc. | | | | | | | | |
9.50% due 06/15/243 | | | 440,000 | | | | 411,400 | |
Sirius XM Radio, Inc. | | | | | | | | |
4.13% due 07/01/303 | | | 200,000 | | | | 212,875 | |
5.50% due 07/01/293 | | | 125,000 | | | | 137,539 | |
Virgin Media Finance plc | | | | | | | | |
5.00% due 07/15/303 | | | 275,000 | | | | 285,313 | |
McGraw-Hill Global Education Holdings LLC / McGraw-Hill Global Education Finance | | | | | | | | |
7.88% due 05/15/243 | | | 293,000 | | | | 266,630 | |
Telenet Finance Luxembourg Note | | | | | | | | |
5.50% due 03/01/28 | | | 200,000 | | | | 213,300 | |
Lamar Media Corp. | | | | | | | | |
4.88% due 01/15/29 | | | 100,000 | | | | 106,250 | |
3.75% due 02/15/28 | | | 100,000 | | | | 102,770 | |
Vmed O2 UK Financing I plc | | | | | | | | |
4.25% due 01/31/313 | | | 200,000 | | | | 204,000 | |
Houghton Mifflin Harcourt Publishers, Inc. | | | | | | | | |
9.00% due 02/15/253 | | | 200,000 | | | | 203,500 | |
LCPR Senior Secured Financing DAC | | | | | | | | |
6.75% due 10/15/273 | | | 175,000 | | | | 188,344 | |
Radiate Holdco LLC / Radiate Finance, Inc. | | | | | | | | |
4.50% due 09/15/263 | | | 150,000 | | | | 154,687 | |
T-Mobile USA, Inc. | | | | | | | | |
3.30% due 02/15/513 | | | 150,000 | | | | 154,325 | |
QualityTech Limited Partnership / QTS Finance Corp. | | | | | | | | |
3.88% due 10/01/283 | | | 150,000 | | | | 153,000 | |
Match Group Holdings II LLC | | | | | | | | |
4.63% due 06/01/283 | | | 100,000 | | | | 104,813 | |
Zayo Group Holdings, Inc. | | | | | | | | |
4.00% due 03/01/273 | | | 100,000 | | | | 100,250 | |
SEE NOTES TO FINANCIAL STATEMENTS. | THE GUGGENHEIM FUNDS ANNUAL REPORT | 103 |
SCHEDULE OF INVESTMENTS (continued) | December 31, 2020 |
SERIES P (HIGH YIELD SERIES) | |
| | Face
Amount | | | Value | |
TripAdvisor, Inc. | | | | | | | | |
7.00% due 07/15/253 | | $ | 50,000 | | | $ | 54,000 | |
Total Communications | | | | | | | 6,985,540 | |
| | | | | | | | | |
Financial - 15.0% | | | | | | | | |
Iron Mountain, Inc. | | | | | | | | |
5.63% due 07/15/323 | | | 475,000 | | | | 523,687 | |
4.88% due 09/15/293 | | | 120,000 | | | | 126,600 | |
5.25% due 07/15/303 | | | 75,000 | | | | 81,000 | |
Hunt Companies, Inc. | | | | | | | | |
6.25% due 02/15/263 | | | 525,000 | | | | 538,125 | |
NFP Corp. | | | | | | | | |
6.88% due 08/15/283 | | | 500,000 | | | | 533,840 | |
OneMain Finance Corp. | | | | | | | | |
7.13% due 03/15/26 | | | 150,000 | | | | 177,375 | |
4.00% due 09/15/30 | | | 150,000 | | | | 155,641 | |
6.63% due 01/15/28 | | | 50,000 | | | | 59,375 | |
8.88% due 06/01/25 | | | 50,000 | | | | 56,563 | |
Newmark Group, Inc. | | | | | | | | |
6.13% due 11/15/23 | | | 400,000 | | | | 434,583 | |
Fidelity & Guaranty Life Holdings, Inc. | | | | | | | | |
5.50% due 05/01/253,4 | | | 350,000 | | | | 408,450 | |
Quicken Loans LLC / Quicken Loans Company-Issuer, Inc. | | | | | | | | |
3.88% due 03/01/313 | | | 350,000 | | | | 363,125 | |
Jefferies Finance LLC / JFIN Company-Issuer Corp. | | | | | | | | |
6.25% due 06/03/263 | | | 325,000 | | | | 336,477 | |
United Shore Financial Services LLC | | | | | | | | |
5.50% due 11/15/253 | | | 300,000 | | | | 316,500 | |
Cushman & Wakefield US Borrower LLC | | | | | | | | |
6.75% due 05/15/285 | | | 250,000 | | | | 275,625 | |
SLM Corp. | | | | | | | | |
4.20% due 10/29/25 | | | 225,000 | | | | 237,656 | |
American Equity Investment Life Holding Co. | | | | | | | | |
5.00% due 06/15/274 | | | 210,000 | | | | 237,187 | |
Assurant, Inc. | | | | | | | | |
7.00% due 03/27/486 | | | 200,000 | | | | 225,000 | |
AmWINS Group, Inc. | | | | | | | | |
7.75% due 07/01/263 | | | 200,000 | | | | 214,780 | |
USI, Inc. | | | | | | | | |
6.88% due 05/01/253 | | | 175,000 | | | | 179,375 | |
Charles Schwab Corp. | | | | | | | | |
4.00% 6,7 | | | 150,000 | | | | 157,875 | |
Wilton Re Finance LLC | | | | | | | | |
5.88% due 03/30/333,6 | | | 150,000 | | | | 157,245 | |
Greystar Real Estate Partners LLC | | | | | | | | |
5.75% due 12/01/253 | | | 150,000 | | | | 152,850 | |
CIT Group, Inc. | | | | | | | | |
3.93% due 06/19/246 | | | 125,000 | | | | 132,188 | |
Bank of New York Mellon Corp. | | | | | | | | |
3.70%6,7 | | | 125,000 | | | | 129,331 | |
CNO Financial Group, Inc. | | | | | | | | |
5.25% due 05/30/29 | | | 100,000 | | | | 120,725 | |
Goldman Sachs Group, Inc. | | | | | | | | |
5.30%6,7 | | | 100,000 | | | | 109,222 | |
HUB International Ltd. | | | | | | | | |
7.00% due 05/01/263 | | | 100,000 | | | | 104,579 | |
Quicken Loans LLC | | | | | | | | |
5.25% due 01/15/283 | | | 75,000 | | | | 80,063 | |
LPL Holdings, Inc. | | | | | | | | |
4.63% due 11/15/273 | | | 75,000 | | | | 77,625 | |
Alliant Holdings Intermediate LLC / Alliant Holdings Company-Issuer | | | | | | | | |
4.25% due 10/15/273 | | | 75,000 | | | | 76,687 | |
Total Financial | | | | | | | 6,779,354 | |
| | | | | | | | | |
Consumer, Non-cyclical - 14.6% | | | | | | | | |
Kraft Heinz Foods Co. | | | | | | | | |
5.00% due 06/04/42 | | | 375,000 | | | | 439,978 | |
4.88% due 10/01/493 | | | 200,000 | | | | 233,325 | |
4.38% due 06/01/46 | | | 100,000 | | | | 108,194 | |
5.50% due 06/01/503 | | | 25,000 | | | | 31,494 | |
5.20% due 07/15/45 | | | 25,000 | | | | 29,726 | |
Vector Group Ltd. | | | | | | | | |
6.13% due 02/01/253 | | | 435,000 | | | | 442,295 | |
Sabre GLBL, Inc. | | | | | | | | |
9.25% due 04/15/253 | | | 175,000 | | | | 208,250 | |
7.38% due 09/01/253 | | | 175,000 | | | | 189,875 | |
FAGE International S.A. / FAGE USA Dairy Industry, Inc. | | | | | | | | |
5.63% due 08/15/263 | | | 385,000 | | | | 394,625 | |
Centene Corp. | | | | | | | | |
3.00% due 10/15/30 | | | 200,000 | | | | 211,980 | |
4.25% due 12/15/27 | | | 125,000 | | | | 132,500 | |
Cheplapharm Arzneimittel GmbH | | | | | | | | |
5.50% due 01/15/283 | | | 325,000 | | | | 339,625 | |
Kronos Acquisition Holdings, Inc. / KIK Custom Products, Inc. | | | | | | | | |
7.00% due 12/31/273 | | | 250,000 | | | | 261,755 | |
5.00% due 12/31/263 | | | 50,000 | | | | 52,160 | |
AMN Healthcare, Inc. | | | | | | | | |
4.63% due 10/01/273 | | | 200,000 | | | | 209,514 | |
4.00% due 04/15/293 | | | 100,000 | | | | 102,250 | |
Nielsen Finance LLC / Nielsen Finance Co. | | | | | | | | |
5.88% due 10/01/303 | | | 275,000 | | | | 311,094 | |
DaVita, Inc. | | | | | | | | |
3.75% due 02/15/313 | | | 300,000 | | | | 304,608 | |
Tenet Healthcare Corp. | | | | | | | | |
7.50% due 04/01/253 | | | 200,000 | | | | 218,500 | |
5.13% due 11/01/273 | | | 75,000 | | | | 79,406 | |
US Foods, Inc. | | | | | | | | |
6.25% due 04/15/253 | | | 275,000 | | | | 293,906 | |
KeHE Distributors LLC / KeHE Finance Corp. | | | | | | | | |
8.63% due 10/15/263 | | | 225,000 | | | | 252,562 | |
Molina Healthcare, Inc. | | | | | | | | |
5.38% due 11/15/22 | | | 150,000 | | | | 158,812 | |
3.88% due 11/15/303 | | | 75,000 | | | | 80,438 | |
Carriage Services, Inc. | | | | | | | | |
6.63% due 06/01/263 | | | 200,000 | | | | 213,750 | |
Prime Security Services Borrower LLC / Prime Finance, Inc. | | | | | | | | |
3.38% due 08/31/273 | | | 200,000 | | | | 198,500 | |
104 | THE GUGGENHEIM FUNDS ANNUAL REPORT | SEE NOTES TO FINANCIAL STATEMENTS. |
SCHEDULE OF INVESTMENTS (continued) | December 31, 2020 |
SERIES P (HIGH YIELD SERIES) | |
| | Face
Amount | | | Value | |
Par Pharmaceutical, Inc. | | | | | | | | |
7.50% due 04/01/273 | | $ | 175,000 | | | $ | 189,875 | |
Nathan’s Famous, Inc. | | | | | | | | |
6.63% due 11/01/253 | | | 175,000 | | | | 179,594 | |
Sotheby’s | | | | | | | | |
7.38% due 10/15/273 | | | 150,000 | | | | 160,687 | |
Central Garden & Pet Co. | | | | | | | | |
4.13% due 10/15/30 | | | 125,000 | | | | 130,313 | |
Syneos Health, Inc. | | | | | | | | |
3.63% due 01/15/293 | | | 125,000 | | | | 125,346 | |
WEX, Inc. | | | | | | | | |
4.75% due 02/01/233 | | | 100,000 | | | | 100,125 | |
Gartner, Inc. | | | | | | | | |
4.50% due 07/01/283 | | | 75,000 | | | | 79,125 | |
TreeHouse Foods, Inc. | | | | | | | | |
4.00% due 09/01/28 | | | 75,000 | | | | 77,578 | |
Lamb Weston Holdings, Inc. | | | | | | | | |
4.88% due 05/15/283 | | | 50,000 | | | | 55,813 | |
Total Consumer, Non-cyclical | | | | | | | 6,597,578 | |
| | | | | | | | | |
Consumer, Cyclical - 14.0% | | | | | | | | |
LBC Tank Terminals Holding Netherlands BV | | | | | | | | |
6.88% due 05/15/233 | | | 650,000 | | | | 650,000 | |
Suburban Propane Partners Limited Partnership/Suburban Energy Finance Corp. | | | | | | | | |
5.88% due 03/01/27 | | | 275,000 | | | | 287,375 | |
5.75% due 03/01/25 | | | 200,000 | | | | 204,000 | |
JB Poindexter & Company, Inc. | | | | | | | | |
7.13% due 04/15/263 | | | 350,000 | | | | 370,125 | |
1011778 BC ULC / New Red Finance, Inc. | | | | | | | | |
4.00% due 10/15/303 | | | 225,000 | | | | 228,022 | |
3.50% due 02/15/293 | | | 125,000 | | | | 124,844 | |
Hilton Domestic Operating Company, Inc. | | | | | | | | |
4.00% due 05/01/313 | | | 250,000 | | | | 263,777 | |
5.75% due 05/01/283 | | | 50,000 | | | | 54,375 | |
Live Nation Entertainment, Inc. | | | | | | | | |
6.50% due 05/15/273 | | | 175,000 | | | | 195,741 | |
3.75% due 01/15/283 | | | 100,000 | | | | 101,040 | |
Boyd Gaming Corp. | | | | | | | | |
8.63% due 06/01/253 | | | 250,000 | | | | 278,047 | |
Wabash National Corp. | | | | | | | | |
5.50% due 10/01/253 | | | 255,000 | | | | 260,100 | |
Boyne USA, Inc. | | | | | | | | |
7.25% due 05/01/253 | | | 247,000 | | | | 259,041 | |
Clarios Global, LP | | | | | | | | |
6.75% due 05/15/253 | | | 225,000 | | | | 242,437 | |
Aramark Services, Inc. | | | | | | | | |
6.38% due 05/01/253 | | | 225,000 | | | | 240,469 | |
Wolverine World Wide, Inc. | | | | | | | | |
6.38% due 05/15/253 | | | 200,000 | | | | 213,000 | |
Hanesbrands, Inc. | | | | | | | | |
5.38% due 05/15/253 | | | 200,000 | | | | 211,604 | |
Titan International, Inc. | | | | | | | | |
6.50% due 11/30/23 | | | 225,000 | | | | 208,125 | |
Delta Air Lines, Inc. | | | | | | | | |
7.00% due 05/01/253 | | | 175,000 | | | | 202,047 | |
Superior Plus Limited Partnership / Superior General Partner, Inc. | | | | | | | | |
7.00% due 07/15/263 | | | 175,000 | | | | 187,031 | |
Cedar Fair, LP / Canada’s Wonderland Co. / Magnum Management Corp. / Millennium Operations LLC | | | | | | | | |
5.50% due 05/01/253 | | | 175,000 | | | | 182,437 | |
Williams Scotsman International, Inc. | | | | | | | | |
4.63% due 08/15/283 | | | 175,000 | | | | 181,125 | |
Allison Transmission, Inc. | | | | | | | | |
3.75% due 01/30/313 | | | 175,000 | | | | 179,047 | |
Performance Food Group, Inc. | | | | | | | | |
6.88% due 05/01/253 | | | 125,000 | | | | 133,750 | |
CD&R Smokey Buyer, Inc. | | | | | | | | |
6.75% due 07/15/253 | | | 125,000 | | | | 133,594 | |
Clarios Global Limited Partnership / Clarios US Finance Co. | | | | | | | | |
8.50% due 05/15/273 | | | 100,000 | | | | 108,641 | |
Mileage Plus Holdings LLC / Mileage Plus Intellectual Property Assets Ltd. | | | | | | | | |
6.50% due 06/20/273 | | | 100,000 | | | | 107,500 | |
Vail Resorts, Inc. | | | | | | | | |
6.25% due 05/15/253 | | | 100,000 | | | | 106,750 | |
Burlington Coat Factory Warehouse Corp. | | | | | | | | |
6.25% due 04/15/253 | | | 100,000 | | | | 106,250 | |
Yum! Brands, Inc. | | | | | | | | |
3.63% due 03/15/31 | | | 100,000 | | | | 101,083 | |
Six Flags Theme Parks, Inc. | | | | | | | | |
7.00% due 07/01/253 | | | 75,000 | | | | 81,000 | |
Powdr Corp. | | | | | | | | |
6.00% due 08/01/253 | | | 75,000 | | | | 78,938 | |
Wyndham Hotels & Resorts, Inc. | | | | | | | | |
4.38% due 08/15/283 | | | 50,000 | | | | 51,953 | |
Total Consumer, Cyclical | | | | | | | 6,333,268 | |
| | | | | | | | | |
Industrial - 13.1% | | | | | | | | |
Great Lakes Dredge & Dock Corp. | | | | | | | | |
8.00% due 05/15/22 | | | 476,000 | | | | 488,176 | |
Grinding Media Inc. / MC Grinding Media Canada Inc. | | | | | | | | |
7.38% due 12/15/233 | | | 425,000 | | | | 431,375 | |
PowerTeam Services LLC | | | | | | | | |
9.03% due 12/04/253 | | | 375,000 | | | | 417,229 | |
TransDigm, Inc. | | | | | | | | |
6.25% due 03/15/263 | | | 275,000 | | | | 292,875 | |
8.00% due 12/15/253 | | | 100,000 | | | | 110,530 | |
Harsco Corp. | | | | | | | | |
5.75% due 07/31/273 | | | 377,000 | | | | 398,677 | |
New Enterprise Stone & Lime Company, Inc. | | | | | | | | |
6.25% due 03/15/263 | | | 200,000 | | | | 205,000 | |
9.75% due 07/15/283 | | | 175,000 | | | | 191,625 | |
Cleaver-Brooks, Inc. | | | | | | | | |
7.88% due 03/01/233 | | | 400,000 | | | | 395,000 | |
Howmet Aerospace, Inc. | | | | | | | | |
5.95% due 02/01/37 | | | 275,000 | | | | 331,375 | |
6.75% due 01/15/28 | | | 50,000 | | | | 61,142 | |
SEE NOTES TO FINANCIAL STATEMENTS. | THE GUGGENHEIM FUNDS ANNUAL REPORT | 105 |
SCHEDULE OF INVESTMENTS (continued) | December 31, 2020 |
SERIES P (HIGH YIELD SERIES) | |
| | Face
Amount | | | Value | |
Masonite International Corp. | | | | | | | | |
5.38% due 02/01/283 | | $ | 175,000 | | | $ | 187,906 | |
5.75% due 09/15/263 | | | 150,000 | | | | 156,750 | |
Standard Industries, Inc. | | | | | | | | |
3.38% due 01/15/313 | | | 175,000 | | | | 175,875 | |
4.38% due 07/15/303 | | | 100,000 | | | | 106,973 | |
5.00% due 02/15/273 | | | 50,000 | | | | 52,250 | |
Signature Aviation US Holdings, Inc. | | | | | | | | |
4.00% due 03/01/283 | | | 300,000 | | | | 301,995 | |
EnerSys | | | | | | | | |
4.38% due 12/15/273 | | | 250,000 | | | | 264,375 | |
Trinity Industries, Inc. | | | | | | | | |
4.55% due 10/01/24 | | | 200,000 | | | | 208,766 | |
GrafTech Finance, Inc. | | | | | | | | |
4.63% due 12/15/283 | | | 200,000 | | | | 202,250 | |
JELD-WEN, Inc. | | | | | | | | |
6.25% due 05/15/253 | | | 175,000 | | | | 189,000 | |
EnPro Industries, Inc. | | | | | | | | |
5.75% due 10/15/26 | | | 170,000 | | | | 180,625 | |
American Woodmark Corp. | | | | | | | | |
4.88% due 03/15/263 | | | 156,000 | | | | 159,900 | |
Summit Materials LLC / Summit Materials Finance Corp. | | | | | | | | |
6.50% due 03/15/273 | | | 75,000 | | | | 79,688 | |
5.25% due 01/15/293 | | | 75,000 | | | | 78,750 | |
Amsted Industries, Inc. | | | | | | | | |
4.63% due 05/15/303 | | | 150,000 | | | | 157,125 | |
Hillenbrand, Inc. | | | | | | | | |
5.75% due 06/15/25 | | | 100,000 | | | | 108,000 | |
Total Industrial | | | | | | | 5,933,232 | |
| | | | | | | | | |
Energy - 6.4% | | | | | | | | |
NuStar Logistics, LP | | | | | | | | |
6.38% due 10/01/30 | | | 200,000 | | | | 226,560 | |
5.63% due 04/28/27 | | | 200,000 | | | | 213,000 | |
6.00% due 06/01/26 | | | 75,000 | | | | 81,113 | |
Indigo Natural Resources LLC | | | | | | | | |
6.88% due 02/15/263 | | | 450,000 | | | | 460,125 | |
American Midstream Partners Limited Partnership / American Midstream Finance Corp. | | | | | | | | |
9.50% due 12/15/213 | | | 405,000 | | | | 401,962 | |
Exterran Energy Solutions Limited Partnership / EES Finance Corp. | | | | | | | | |
8.13% due 05/01/25 | | | 325,000 | | | | 271,375 | |
PDC Energy, Inc. | | | | | | | | |
6.13% due 09/15/24 | | | 250,000 | | | | 256,903 | |
Global Partners Limited Partnership / GLP Finance Corp. | | | | | | | | |
7.00% due 08/01/27 | | | 200,000 | | | | 214,000 | |
6.88% due 01/15/293 | | | 25,000 | | | | 27,063 | |
CVR Energy, Inc. | | | | | | | | |
5.75% due 02/15/283 | | | 175,000 | | | | 165,812 | |
Crestwood Midstream Partners Limited Partnership / Crestwood Midstream Finance Corp. | | | | | | | | |
5.63% due 05/01/273 | | | 150,000 | | | | 148,500 | |
Parkland Corp. | | | | | | | | |
6.00% due 04/01/263 | | | 125,000 | | | | 131,250 | |
Range Resources Corp. | | | | | | | | |
5.00% due 03/15/23 | | | 120,000 | | | | 117,000 | |
Rattler Midstream, LP | | | | | | | | |
5.63% due 07/15/253 | | | 75,000 | | | | 79,219 | |
TransMontaigne Partners Limited Partnership / TLP Finance Corp. | | | | | | | | |
6.13% due 02/15/26 | | | 50,000 | | | | 50,250 | |
Basic Energy Services, Inc. | | | | | | | | |
10.75% due 10/15/235 | | | 175,000 | | | | 31,500 | |
Total Energy | | | | | | | 2,875,632 | |
| | | | | | | | | |
Basic Materials - 6.3% | | | | | | | | |
Carpenter Technology Corp. | | | | | | | | |
6.38% due 07/15/284 | | | 400,000 | | | | 441,418 | |
4.45% due 03/01/23 | | | 75,000 | | | | 78,541 | |
Alcoa Nederland Holding BV | | | | | | | | |
7.00% due 09/30/263 | | | 200,000 | | | | 213,000 | |
6.75% due 09/30/243 | | | 200,000 | | | | 208,310 | |
United States Steel Corp. | | | | | | | | |
12.00% due 06/01/253 | | | 225,000 | | | | 259,875 | |
6.88% due 08/15/25 | | | 100,000 | | | | 95,500 | |
Kaiser Aluminum Corp. | | | | | | | | |
4.63% due 03/01/283 | | | 235,000 | | | | 243,812 | |
6.50% due 05/01/253 | | | 50,000 | | | | 53,500 | |
Minerals Technologies, Inc. | | | | | | | | |
5.00% due 07/01/283 | | | 275,000 | | | | 287,760 | |
Valvoline, Inc. | | | | | | | | |
3.63% due 06/15/313 | | | 250,000 | | | | 256,563 | |
4.25% due 02/15/303 | | | 25,000 | | | | 26,500 | |
Arconic Corp. | | | | | | | | |
6.00% due 05/15/253 | | | 200,000 | | | | 213,500 | |
Ingevity Corp. | | | | | | | | |
4.50% due 02/01/263 | | | 100,000 | | | | 101,875 | |
3.88% due 11/01/283 | | | 100,000 | | | | 100,750 | |
WR Grace & Company-Conn | | | | | | | | |
4.88% due 06/15/273 | | | 125,000 | | | | 132,565 | |
Clearwater Paper Corp. | | | | | | | | |
4.75% due 08/15/283 | | | 50,000 | | | | 51,750 | |
HB Fuller Co. | | | | | | | | |
4.25% due 10/15/28 | | | 50,000 | | | | 51,250 | |
Mirabela Nickel Ltd. | | | | | | | | |
due 06/24/195,8 | | | 390,085 | | | | 19,504 | |
Total Basic Materials | | | | | | | 2,835,973 | |
| | | | | | | | | |
Technology - 3.2% | | | | | | | | |
NCR Corp. | | | | | | | | |
8.13% due 04/15/253 | | | 300,000 | | | | 334,092 | |
6.13% due 09/01/293 | | | 250,000 | | | | 276,875 | |
5.25% due 10/01/303 | | | 200,000 | | | | 214,500 | |
Boxer Parent Company, Inc. | | | | | | | | |
7.13% due 10/02/253 | | | 250,000 | | | | 271,362 | |
Open Text Holdings, Inc. | | | | | | | | |
4.13% due 02/15/303 | | | 100,000 | | | | 106,380 | |
Qorvo, Inc. | | | | | | | | |
3.38% due 04/01/313 | | | 100,000 | | | | 103,250 | |
106 | THE GUGGENHEIM FUNDS ANNUAL REPORT | SEE NOTES TO FINANCIAL STATEMENTS. |
SCHEDULE OF INVESTMENTS (continued) | December 31, 2020 |
SERIES P (HIGH YIELD SERIES) | |
| | Face
Amount | | | Value | |
CDK Global, Inc. | | | | | | | | |
5.25% due 05/15/293 | | $ | 50,000 | | | $ | 55,396 | |
Presidio Holdings, Inc. | | | | | | | | |
4.88% due 02/01/273 | | | 50,000 | | | | 53,039 | |
PTC, Inc. | | | | | | | | |
4.00% due 02/15/283 | | | 50,000 | | | | 52,406 | |
Total Technology | | | | | | | 1,467,300 | |
| | | | | | | | | |
Utilities - 2.0% | | | | | | | | |
Terraform Global Operating LLC | | | | | | | | |
6.13% due 03/01/263 | | | 695,000 | | | | 710,638 | |
Clearway Energy Operating LLC | | | | | | | | |
5.75% due 10/15/25 | | | 175,000 | | | | 184,187 | |
Bruce Mansfield | | | | | | | | |
due 08/01/23†††,5,8 | | | 139,000 | | | | 70 | |
Total Utilities | | | | | | | 894,895 | |
| | | | | | | | | |
Total Corporate Bonds | | | | |
(Cost $39,465,614) | | | 40,702,772 | |
| | | | | | | | | |
SENIOR FLOATING RATE INTERESTS††,10 - 7.3% |
Communications - 2.1% | | | | | | | | |
Cengage Learning Acquisitions, Inc. | | | | | | | | |
5.25% (3 Month USD LIBOR + 4.25%, Rate Floor: 5.25%) due 06/07/23 | | | 347,094 | | | | 332,145 | |
McGraw-Hill Global Education Holdings LLC | | | | | | | | |
5.00% (3 Month USD LIBOR + 4.00%, Rate Floor: 5.00%) due 05/04/22 | | | 232,599 | | | | 226,228 | |
Resource Label Group LLC | | | | | | | | |
9.50% (3 Month USD LIBOR + 8.50%, Rate Floor: 9.50%) due 11/26/23††† | | | 250,000 | | | | 220,000 | |
GTT Communications, Inc. | | | | | | | | |
3.00% (3 Month USD LIBOR + 2.75%, Rate Floor: 2.75%) due 05/31/25 | | | 195,000 | | | | 151,792 | |
GTT Communications BV | | | | | | | | |
due 12/31/21 | | | 22,991 | | | | 21,037 | |
Total Communications | | | | | | | 951,202 | |
| | | | | | | | | |
Consumer, Non-cyclical - 2.1% | | | | | | | | |
Endo Luxembourg Finance Co. | | | | | | | | |
5.00% (3 Month USD LIBOR + 4.25%, Rate Floor: 5.00%) due 04/29/24 | | | 321,034 | | | | 315,416 | |
Diamond (BC) BV | | | | | | | | |
3.21% (3 Month USD LIBOR + 3.00%, Rate Floor: 3.00%) due 09/06/24 | | | 146,970 | | | | 144,643 | |
Springs Window Fashions | | | | | | | | |
8.65% (1 Month USD LIBOR + 8.50%, Rate Floor: 8.50%) due 06/15/26 | | | 150,000 | | | | 142,782 | |
HAH Group Holding Co LLC | | | | | | | | |
6.00% (3 Month USD LIBOR + 5.00%, Rate Floor: 6.00%) due 10/29/27 | | | 130,000 | | | | 128,862 | |
Quirch Foods Holdings LLC | | | | | | | | |
6.25% (3 Month USD LIBOR + 5.25% and 6 Month USD LIBOR + 5.25%, Rate Floor: 6.25%) due 10/27/27 | | | 100,000 | | | | 99,250 | |
Kronos Acquisition Holdings, Inc. | | | | | | | | |
5.25% (3 Month USD LIBOR + 4.50%, Rate Floor: 5.25%) due 12/22/26 | | | 75,000 | | | | 74,906 | |
CTI Foods Holding Co. LLC | | | | | | | | |
8.00% (3 Month USD LIBOR + 4.00%, Rate Floor: 5.00%) (in-kind rate was 3.00%) due 05/03/24†††,9 | | | 42,306 | | | | 39,768 | |
Total Consumer, Non-cyclical | | | | | | | 945,627 | |
| | | | | | | | | |
Consumer, Cyclical - 1.8% | | | | | | | | |
ScribeAmerica Intermediate Holdco LLC (Healthchannels) | | | | | | | | |
4.65% (1 Month USD LIBOR + 4.50%, Rate Floor: 4.50%) due 04/03/25 | | | 194,744 | | | | 185,494 | |
BBB Industries, LLC | | | | | | | | |
4.65% (1 Month USD LIBOR + 4.50%, Rate Floor: 4.50%) due 08/01/25 | | | 156,425 | | | | 150,950 | |
Blue Nile, Inc. | | | | | | | | |
7.50% (3 Month USD LIBOR + 6.50%, Rate Floor: 7.50%) due 02/17/23 | | | 185,625 | | | | 132,722 | |
Playtika Holding Corp. | | | | | | | | |
7.00% (3 Month USD LIBOR + 6.00%, Rate Floor: 7.00%) due 12/09/24 | | | 96,203 | | | | 96,673 | |
PT Intermediate Holdings III LLC | | | | | | | | |
6.50% (3 Month USD LIBOR + 5.50%, Rate Floor: 6.50%) due 10/15/25 | | | 99,000 | | | | 92,070 | |
Sotheby’s | | | | | | | | |
6.50% (1 Month USD LIBOR + 5.50%, Rate Floor: 6.50%) due 01/15/27 | | | 52,679 | | | | 52,811 | |
American Tire Distributors, Inc. | | | | | | | | |
7.00% (3 Month USD LIBOR + 6.00%, Rate Floor: 7.00%) due 09/01/23 | | | 29,221 | | | | 28,227 | |
8.50% (1 Month USD LIBOR + 7.50% and 3 Month USD LIBOR + 7.50%, Rate Floor: 8.50%) due 09/02/24 | | | 19,093 | | | | 18,147 | |
Belk, Inc. | | | | | | | | |
7.75% (3 Month USD LIBOR + 6.75%, Rate Floor: 7.75%) due 07/31/25 | | | 107,896 | | | | 37,648 | |
Total Consumer, Cyclical | | | | | | | 794,742 | |
| | | | | | | | | |
Industrial - 0.8% | | | | | | | | |
Diversitech Holdings, Inc. | | | | | | | | |
8.50% (3 Month USD LIBOR + 7.50%, Rate Floor: 8.50%) due 06/02/25††† | | | 200,000 | | | | 197,500 | |
JetBlue Airways Corp. | | | | | | | | |
6.25% (3 Month USD LIBOR + 5.25%, Rate Floor: 6.25%) due 06/17/24 | | | 97,500 | | | | 100,075 | |
YAK MAT (YAK ACCESS LLC) | | | | | | | | |
10.24% (3 Month USD LIBOR + 10.00%, Rate Floor: 10.00%) due 07/10/26 | | | 125,000 | | | | 87,500 | |
Total Industrial | | | | | | | 385,075 | |
| | | | | | | | | |
Financial - 0.2% | | | | | | | | |
Jefferies Finance LLC | | | | | | | | |
4.50% (1 Month USD LIBOR + 3.75%, Rate Floor: 4.50%) due 09/30/27 | | | 74,813 | | | | 74,625 | |
| | | | | | | | | |
SEE NOTES TO FINANCIAL STATEMENTS. | THE GUGGENHEIM FUNDS ANNUAL REPORT | 107 |
SCHEDULE OF INVESTMENTS (continued) | December 31, 2020 |
SERIES P (HIGH YIELD SERIES) | |
| | Face
Amount | | | Value | |
Utilities - 0.2% | | | | | | | | |
RS Ivy Holdco, Inc. | | | | | | | | |
6.50% (3 Month USD LIBOR + 5.50%, Rate Floor: 6.50%) due 12/23/27 | | $ | 75,000 | | | $ | 74,250 | |
| | | | | | | | | |
Technology - 0.1% | | | | | | | | |
Planview Parent, Inc. | | | | | | | | |
4.75% (3 Month USD LIBOR + 4.00%, Rate Floor: 4.75%) due 12/10/27 | | | 40,000 | | | | 39,900 | |
| | | | | | | | | |
Energy - 0.0% | | | | | | | | |
Permian Production Partners LLC | | | | | | | | |
9.00% (1 Month USD LIBOR + 6.00%, Rate Floor: 7.00%) (in-kind rate was 2.00%) due 11/23/25†††,9 | | | 60,100 | | | | 9,015 | |
Total Senior Floating Rate Interests | | | | |
(Cost $3,528,407) | | | 3,274,436 | |
| |
U.S. TREASURY BILLS†† - 0.8% |
U.S. Treasury Bills |
0.10% due 03/04/2111 | | | 350,000 | | | | 349,960 | |
Total U.S. Treasury Bills | | | | |
(Cost $349,940) | | | | | | | 349,960 | |
| | | | | | | | | |
Total Investments - 102.0% | | | | |
(Cost $45,828,536) | | $ | 46,045,689 | |
Other Assets & Liabilities, net - (2.0)% | | | (892,715 | ) |
Total Net Assets - 100.0% | | $ | 45,152,974 | |
Centrally Cleared Credit Default Swap Agreements Protection Sold†† |
| |
Counterparty | Exchange | Index | | Protection
Premium
Rate | Payment
Frequency | Maturity
Date | | | Notional
Amount | | Value | | | Upfront
Premiums
Paid | | | Unrealized
Appreciation** | |
BofA Securities, Inc. | ICE | CDX.NA.HY.35.V1 | | | 5.00 | % | Quarterly | 12/20/25 | | $ | 2,800,000 | | | $ | 261,158 | | | $ | 105,319 | | | $ | 155,839 | |
* | Non-income producing security. |
** | Includes cumulative appreciation (depreciation). Variation margin is reported within the Statement of Assets and Liabilities. |
† | Value determined based on Level 1 inputs, unless otherwise noted — See Note 4. |
†† | Value determined based on Level 2 inputs, unless otherwise noted — See Note 4. |
††† | Value determined based on Level 3 inputs — See Note 4. |
1 | Affiliated issuer. |
2 | Rate indicated is the 7-day yield as of December 31, 2020. |
3 | Security is a 144A or Section 4(a)(2) security. These securities have been determined to be liquid under guidelines established by the Board of Trustees. The total market value of 144A or Section 4(a)(2) securities is $31,315,280 (cost $29,937,762), or 69.4% of total net assets. |
4 | All or a portion of this security has been physically segregated or earmarked in connection with reverse repurchase agreements. At December 31, 2020, the total market value of segregated or earmarked security was $1,087,055 — See Note 12 |
5 | Security is a 144A or Section 4(a)(2) security. These securities have been determined to be illiquid and restricted under guidelines established by the Board of Trustees. The total market value of 144A or Section 4(a)(2) illiquid and restricted securities is $326,699 (cost $917,409), or 0.7% of total net assets — See Note 9. |
6 | Security has a fixed rate coupon which will convert to a floating or variable rate coupon on a future date. |
7 | Perpetual maturity. |
8 | Security is in default of interest and/or principal obligations. |
9 | Payment-in-kind security. |
10 | Variable rate security. Rate indicated is the rate effective at December 31, 2020. In some instances, the effective rate is limited by a minimum rate floor or a maximum rate cap established by the issuer. The settlement status of a position may also impact the effective rate indicated. In some cases, a position may be unsettled at period end and may not have a stated effective rate. In instances where multiple underlying reference rates and spread amounts are shown, the effective rate is based on a weighted average. |
11 | Rate indicated is the effective yield at the time of purchase. |
| | BofA — Bank of America |
| | CDX.NA.HY.35.V1 — Credit Default Swap North American High Yield Series 35 Index Version 1 |
| | ICE — Intercontinental Exchange |
| | LIBOR — London Interbank Offered Rate |
| | plc — Public Limited Company |
| | |
| | See Sector Classification in Other Information section. |
108 | THE GUGGENHEIM FUNDS ANNUAL REPORT | SEE NOTES TO FINANCIAL STATEMENTS. |
SCHEDULE OF INVESTMENTS (continued) | December 31, 2020 |
SERIES P (HIGH YIELD SERIES) | |
The following table summarizes the inputs used to value the Fund’s investments at December 31, 2020 (See Note 4 in the Notes to Financial Statements):
Investments in Securities (Assets) | | Level 1
Quoted
Prices | | | Level 2
Significant
Observable
Inputs | | | Level 3
Significant
Unobservable
Inputs | | | Total | |
Common Stocks | | $ | 6,727 | | | $ | 358,464 | | | $ | 108,858 | | | $ | 474,049 | |
Preferred Stocks | | | — | | | | 474,060 | | | | — | * | | | 474,060 | |
Money Market Fund | | | 770,412 | | | | — | | | | — | | | | 770,412 | |
Corporate Bonds | | | — | | | | 40,702,702 | | | | 70 | | | | 40,702,772 | |
Senior Floating Rate Interests | | | — | | | | 2,808,153 | | | | 466,283 | | | | 3,274,436 | |
U.S. Treasury Bills | | | — | | | | 349,960 | | | | — | | | | 349,960 | |
Credit Default Swap Agreements** | | | — | | | | 155,839 | | | | — | | | | 155,839 | |
Total Assets | | $ | 777,139 | | | $ | 44,849,178 | | | $ | 575,211 | | | $ | 46,201,528 | |
Investments in Securities (Liabilities) | | Level 1
Quoted
Prices | | | Level 2
Significant
Observable
Inputs | | | Level 3
Significant
Unobservable
Inputs | | | Total | |
Unfunded Loan Commitments (Note 8) | | $ | — | | | $ | — | | | $ | 408 | | | $ | 408 | |
* | Security has a market value of $0. |
** | This derivative is reported as unrealized appreciation/depreciation at period end. |
The Fund may hold assets and/or liabilities in which the fair value approximates the carrying amount for financial statement purposes. As of the period end, reverse repurchase agreements of $988,490 are categorized as Level 2 within the disclosure hierarchy — See Note 12.
The following is a summary of significant unobservable inputs used in the fair valuations of assets and liabilities categorized within Level 3 of the fair value hierarchy:
Category | | Ending Balance at
December 31, 2020 | | | Valuation Technique | | | Unobservable Inputs | | | Input Range | | | Weighted Average* | |
Assets: | | | | | | | | | | | | | | | | | | | | |
Common Stocks | | $ | 100,310 | | Option Adjusted Spread off the prior month end broker quote | Broker Quote | | | — | | | | — | |
Common Stocks | | | 8,548 | | Enterprise Value | Valuation Multiple | | | 2.9x-11.5x | | | | 7.8x | |
Corporate Bonds | | | 70 | | Option Adjusted Spread off the prior month end broker quote | Broker Quote | | | — | | | | — | |
Senior Floating Rate Interests | | | 426,515 | | Third Party Pricing | Broker Quote | | | — | | | | — | |
Senior Floating Rate Interests | | | 39,768 | | Enterprise Value | Valuation Multiple | | | 9.4x | | | | — | |
Total Assets | | $ | 575,211 | | | | | | | | | | | | | | |
Liabilities: | | | | | | | | | | | | | | | | | | | | |
Unfunded Loan Commitments | | $ | 408 | | Model Price | Purchase Price | | | — | | | | — | |
* | Inputs are weighted by the fair value of the instruments. |
Significant changes in a quote or valuation multiple would generally result in significant changes in the fair value of the security. Any remaining Level 3 securities held by the Fund and excluded from the table above, were not considered material to the Fund.
The Fund’s fair valuation leveling guidelines classify a single daily broker quote, or a vendor price based on a single daily or monthly broker quote, as Level 3, if such a quote or price cannot be supported with other available market information.
SEE NOTES TO FINANCIAL STATEMENTS. | THE GUGGENHEIM FUNDS ANNUAL REPORT | 109 |
SCHEDULE OF INVESTMENTS (concluded) | December 31, 2020 |
SERIES P (HIGH YIELD SERIES) | |
Transfers between Level 2 and Level 3 may occur as markets fluctuate and/or the availability of data used in an investment’s valuation changes. For the year ended December 31, 2020, the Fund had securities with a total value of $70 transfer into Level 3 from Level 2 due to lack of observable inputs and had securities with a total market value of $224,792 transfer out of Level 3 to Level 2 due to the availability of current and reliable market-based data provided by a third-party pricing service which utilizes significant observable inputs.
Summary of Fair Value Level 3 Activity
Following is a reconciliation of Level 3 assets for which significant unobservable inputs were used to determine fair value for the year ended December 31, 2020:
| | | Assets | | | | | | | Liabilities | |
| | Senior Floating
Rate Interests | | | Corporate
Bonds | | | Common
Stocks | | | Total Assets | | | Unfunded Loan
Commitments | |
Beginning Balance | | $ | 1,301,383 | | | $ | — | | | $ | 8,995 | | | $ | 1,310,378 | | | $ | (6,310 | ) |
Purchases/(Receipts) | | | 38,440 | | | | — | | | | 107,530 | | | | 145,970 | | | | (412 | ) |
(Sales, maturities and paydowns)/Fundings | | | (635,059 | ) | | | — | | | | — | | | | (635,059 | ) | | | 1,138 | |
Amortization of premiums/discounts | | | 3,073 | | | | — | | | | — | | | | 3,073 | | | | — | |
Total realized gains (losses) included in earnings | | | (160,691 | ) | | | — | | | | (735 | ) | | | (161,426 | ) | | | 74,222 | |
Total change in unrealized appreciation (depreciation) included in earnings | | | 143,929 | | | | — | | | | (6,932 | ) | | | 136,997 | | | | (69,046 | ) |
Transfers into Level 3 | | | — | | | | 70 | | | | — | | | | 70 | | | | — | |
Transfers out of Level 3 | | | (224,792 | ) | | | — | | | | — | | | | (224,792 | ) | | | — | |
Ending Balance | | $ | 466,283 | | | $ | 70 | | | $ | 108,858 | | | $ | 575,211 | | | $ | (408 | ) |
Net change in unrealized appreciation (depreciation) for investments in Level 3 securities still held at December 31, 2020 | | $ | (6,745 | ) | | $ | — | | | $ | (7,667 | ) | | $ | (14,412 | ) | | $ | 16 | |
Affiliated Transactions
Investments representing 5% or more of the outstanding voting shares of a company, or control of or by, or common control under Guggenheim Investments, result in that company being considered an affiliated issuer, as defined in the 1940 Act.
Transactions during the year ended December 31, 2020, in which the company is an affiliated issuer, were as follows:
Security Name | | Value
12/31/19 | | | Additions | | | Reductions | | | Realized
Gain (Loss) | | | Change in
Unrealized
Appreciation
(Depreciation) | | | Value
12/31/20 | | | Shares
12/31/20 | |
Common Stock | | | | | | | | | | | | | | | | | | | | | | | | | | | | |
BP Holdco LLC* | | $ | 185 | | | $ | — | | | $ | — | | | $ | — | | | $ | (1 | ) | | $ | 184 | | | | 523 | |
* | Non-income producing security. |
110 | THE GUGGENHEIM FUNDS ANNUAL REPORT | SEE NOTES TO FINANCIAL STATEMENTS. |
SERIES P (HIGH YIELD SERIES) | |
STATEMENT OF ASSETS AND LIABILITIES |
December 31, 2020 |
Assets: |
Investments in unaffiliated issuers, at value (cost $45,828,351) | | $ | 46,045,505 | |
Investments in affiliated issuers, at value (cost $185) | | | 184 | |
Cash | | | 17,019 | |
Unamortized upfront premiums paid on credit default swap agreements | | | 105,319 | |
Prepaid expenses | | | 3,495 | |
Receivables: |
Interest | | | 598,568 | |
Securities sold | | | 26,800 | |
Protection fees on credit default swap agreements | | | 4,667 | |
Variation margin on credit default swap agreements | | | 3,617 | |
Fund shares sold | | | 3,330 | |
Total assets | | | 46,808,504 | |
| | | | | |
Liabilities: |
Unfunded loan commitments, at value (Note 8) (commitment fees received $430) | | | 408 | |
Reverse repurchase agreements (Note 12) | | | 988,490 | |
Segregated cash due to broker | | | 108,800 | |
Payable for: |
Securities purchased | | | 350,000 | |
Fund shares redeemed | | | 116,451 | |
Management fees | | | 12,804 | |
Distribution and service fees | | | 9,522 | |
Fund accounting/administration fees | | | 5,318 | |
Transfer agent/maintenance fees | | | 2,164 | |
Trustees’ fees* | | | 1,605 | |
Miscellaneous | | | 59,968 | |
Total liabilities | | | 1,655,530 | |
Commitments and contingent liabilities (Note 13) | | | — | |
Net assets | | $ | 45,152,974 | |
| | | | | |
Net assets consist of: |
Paid in capital | | $ | 51,658,017 | |
Total distributable earnings (loss) | | | (6,505,043 | ) |
Net assets | | $ | 45,152,974 | |
Capital shares outstanding | | | 1,642,261 | |
Net asset value per share | | $ | 27.49 | |
STATEMENT OF OPERATIONS |
Year Ended December 31, 2020 |
Investment Income: |
Dividends from securities of unaffiliated issuers | | $ | 37,306 | |
Interest from securities of unaffiliated issuers | | | 2,656,554 | |
Total investment income | | | 2,693,860 | |
| | | | | |
Expenses: |
Management fees | | | 258,875 | |
Distribution and service fees | | | 107,865 | |
Transfer agent/maintenance fees | | | 25,317 | |
Professional fees | | | 56,931 | |
Fund accounting/administration fees | | | 40,025 | |
Printing fees | | | 24,092 | |
Trustees’ fees* | | | 18,366 | |
Interest expense | | | 17,726 | |
Custodian fees | | | 11,427 | |
Line of credit fees | | | 3,997 | |
Miscellaneous | | | 28,831 | |
Total expenses | | | 593,452 | |
Less: |
Expenses reimbursed by Adviser | | | (1,241 | ) |
Expenses waived by Adviser | | | (110,602 | ) |
Earnings credits applied | | | (352 | ) |
Total waived/reimbursed expenses | | | (112,195 | ) |
Net expenses | | | 481,257 | |
Net investment income | | | 2,212,603 | |
| | | | | |
Net Realized and Unrealized Gain (Loss): |
Net realized gain (loss) on: |
Investments in unaffiliated issuers | | | (3,524,211 | ) |
Swap agreements | | | 146,268 | |
Forward foreign currency exchange contracts | | | 7,301 | |
Foreign currency transactions | | | 497 | |
Net realized loss | | | (3,370,145 | ) |
Net change in unrealized appreciation (depreciation) on: |
Investments in unaffiliated issuers | | | 2,647,411 | |
Investments in affiliated issuers | | | (1 | ) |
Swap agreements | | | 155,839 | |
Forward foreign currency exchange contracts | | | 2,168 | |
Foreign currency translations | | | (40 | ) |
Net change in unrealized appreciation (depreciation) | | | 2,805,377 | |
Net realized and unrealized loss | | | (564,768 | ) |
Net increase in net assets resulting from operations | | $ | 1,647,835 | |
* | Relates to Trustees not deemed “interested persons” within the meaning of Section 2(a)(19) of the 1940 Act. |
SEE NOTES TO FINANCIAL STATEMENTS. | THE GUGGENHEIM FUNDS ANNUAL REPORT | 111 |
SERIES P (HIGH YIELD SERIES) | |
STATEMENTS OF CHANGES IN NET ASSETS |
| | Year Ended
December 31,
2020 | | | Year Ended
December 31,
2019 | |
Increase (Decrease) in Net Assets from Operations: | | | | | | | | |
Net investment income | | $ | 2,212,603 | | | $ | 3,156,330 | |
Net realized loss on investments | | | (3,370,145 | ) | | | (2,468,727 | ) |
Net change in unrealized appreciation (depreciation) on investments | | | 2,805,377 | | | | 5,143,083 | |
Net increase in net assets resulting from operations | | | 1,647,835 | | | | 5,830,686 | |
| | | | | | | | | |
Distributions to shareholders | | | (3,157,421 | ) | | | (4,081,160 | ) |
| | | | | | | | | |
Capital share transactions: | | | | | | | | |
Proceeds from sale of shares | | | 17,515,926 | | | | 15,085,511 | |
Distributions reinvested | | | 3,157,421 | | | | 4,081,160 | |
Cost of shares redeemed | | | (28,298,902 | ) | | | (19,132,137 | ) |
Net increase (decrease) from capital share transactions | | | (7,625,555 | ) | | | 34,534 | |
Net increase (decrease) in net assets | | | (9,135,141 | ) | | | 1,784,060 | |
| | | | | | | | | |
Net assets: | | | | | | | | |
Beginning of year | | | 54,288,115 | | | | 52,504,055 | |
End of year | | $ | 45,152,974 | | | $ | 54,288,115 | |
| | | | | | | | | |
Capital share activity: | | | | | | | | |
Shares sold | | | 669,412 | | | | 529,015 | |
Shares issued from reinvestment of distributions | | | 123,918 | | | | 148,244 | |
Shares redeemed | | | (1,063,235 | ) | | | (673,296 | ) |
Net increase (decrease) in shares | | | (269,905 | ) | | | 3,963 | |
112 | THE GUGGENHEIM FUNDS ANNUAL REPORT | SEE NOTES TO FINANCIAL STATEMENTS. |
SERIES P (HIGH YIELD SERIES) | |
This table is presented to show selected data for a share outstanding throughout each period and to assist shareholders in evaluating a Fund’s performance for the periods presented.
| | Year Ended
December 31,
2020 | | | Year Ended
December 31,
2019 | | | Year Ended
December 31,
2018 | | | Year Ended
December 31,
2017 | | | Year Ended
December 31,
2016 | |
Per Share Data |
Net asset value, beginning of period | | $ | 28.39 | | | $ | 27.51 | | | $ | 31.13 | | | $ | 30.82 | | | $ | 28.63 | |
Income (loss) from investment operations: |
Net investment income (loss)a | | | 1.37 | | | | 1.68 | | | | 1.79 | | | | 1.81 | | | | 1.91 | |
Net gain (loss) on investments (realized and unrealized) | | | (.21 | ) | | | 1.45 | | | | (2.99 | ) | | | .09 | | | | 2.93 | |
Total from investment operations | | | 1.16 | | | | 3.13 | | | | (1.20 | ) | | | 1.90 | | | | 4.84 | |
Less distributions from: |
Net investment income | | | (2.06 | ) | | | (2.25 | ) | | | (2.42 | ) | | | (1.59 | ) | | | (2.65 | ) |
Total distributions | | | (2.06 | ) | | | (2.25 | ) | | | (2.42 | ) | | | (1.59 | ) | | | (2.65 | ) |
Net asset value, end of period | | $ | 27.49 | | | $ | 28.39 | | | $ | 27.51 | | | $ | 31.13 | | | $ | 30.82 | |
|
Total Returnb | | | 4.64 | % | | | 11.59 | % | | | (4.16 | %) | | | 6.23 | % | | | 17.52 | % |
Ratios/Supplemental Data |
Net assets, end of period (in thousands) | | $ | 45,153 | | | $ | 54,288 | | | $ | 52,504 | | | $ | 79,272 | | | $ | 95,760 | |
Ratios to average net assets: |
Net investment income (loss) | | | 5.13 | % | | | 5.89 | % | | | 5.98 | % | | | 5.79 | % | | | 6.46 | % |
Total expensesc | | | 1.38 | % | | | 1.31 | % | | | 1.42 | % | | | 1.40 | % | | | 1.17 | % |
Net expensesd,e,f | | | 1.12 | % | | | 1.10 | % | | | 1.26 | % | | | 1.33 | % | | | 1.13 | % |
Portfolio turnover rate | | | 84 | % | | | 58 | % | | | 51 | % | | | 76 | % | | | 84 | % |
a | Net investment income (loss) per share was computed using average shares outstanding throughout the period. |
b | Total return does not take into account any of the expenses associated with an investment in variable insurance products. If total return had taken into account these expenses, performance would have been lower. Shares of a series of Guggenheim Variable Funds Trust are available only through the purchase of such products. |
c | Does not include expenses of the underlying funds in which the Fund invests, if any. |
d | Net expense information reflects the expense ratios after expense waivers and reimbursements, as applicable. |
e | Net expenses may include expenses that are excluded from the expense limitation agreement. Excluding these expenses, the net expense ratios for the years presented would be: |
| | 12/31/20 | 12/31/19 | 12/31/18 | 12/31/17 | 12/31/16 |
| | 1.07% | 1.07% | 1.07% | 1.07% | 1.07% |
f | The portion of the ratios of net expenses to average net assets attributable to recoupments of prior fee reductions or expense reimbursements for the years was as follows: |
| | 12/31/20 | 12/31/19 | 12/31/18 | 12/31/17 | 12/31/16 |
| | — | — | 0.00%* | 0.02% | — |
SEE NOTES TO FINANCIAL STATEMENTS. | THE GUGGENHEIM FUNDS ANNUAL REPORT | 113 |
MANAGERS’ COMMENTARY (Unaudited) | December 31, 2020 |
To Our Shareholders:
The Series Q (Small Cap Value Series) is managed by a team of seasoned professionals led by David Toussaint, CFA, CPA, Managing Director and Portfolio Manager; James Schier, CFA, Senior Managing Director and Portfolio Manager; Farhan Sharaff, Senior Managing Director, Assistant Chief Investment Officer, Equities, and Portfolio Manager; Gregg Strohkorb, CFA, Director and Portfolio Manager; and Burak Hurmeydan, Ph.D., Director and Portfolio Manager. In the following paragraphs, the team discusses performance of the Fund for the fiscal year ended December 31, 2020.
For the year ended December 31, 2020, Series Q (Small Cap Value Series) returned -0.97%, compared with the Russell 2000® Value Index, which returned 4.63%.
Strategy and Market Overview
Our investment approach focuses on understanding how companies make money and how easily companies can improve returns, maintain existing high levels of profitability, or benefit from change that occurs within the industries in which they operate. In today’s rapidly changing environment marked by very sharp and quick, but constrained volatility, our long-term orientation and discipline are a competitive advantage. This should become especially critical when the environment of indiscriminant valuation expansion subsides, and fundamentals once again become a more dominant factor in the market.
Performance Review
Dominating the market for the period was the strong outperformance of growth versus value stocks, despite occasional signs that the situation might be ready to turn. Significant monetary and fiscal stimulus and the low-rate environment helped multiples of growth stocks expand more than those of value stocks, leading to stocks with extreme valuations to experience continued multiple expansion.
Information Technology and Industrials were the bright spots for the Fund for the period, aided by a relative contribution from Energy and Real Estate, where the Fund’s holdings—despite a negative return overall—strongly outperformed or was flat versus the benchmark. The Information Technology companies benefiting performance included those poised for the coming roll-out of 5G networks and the resultant capital expenditures needed to improve the storage and flow of ever-increasing data. Among them were MACOM Technology Solutions and Infinera Corp.
Overweighting healthcare and office REITS and underweighting retail and hotel/resort REITs was responsible for the positive relative showing in the Real Estate sector. Office REIT Equity Commonwealth was the main contributor, as was Lexington Realty Trust, a single-tenant industrial REIT, while commercial REIT Howard Hughes Corp. and mortgage REIT Redwood Trust were the main detractors. The Fund’s Energy holdings were also a relative contributor to performance, helped by the Fund’s position in Range Resources, which benefited from firming in natural gas prices, and not owning many exploration and production companies in the benchmark.
Stock selection also contributed in the Health Care sector, although allocation was a detriment. Emergent Biosolutions, Inc. was a key individual contributor, benefiting from its business model in supplying the government vaccines and securing production agreements with many of the companies at the forefront in the development of COVID vaccines.
Financials and Utilities were major drags on performance, made worse by a negative relative contribution from Materials, Consumer Discretionary, and Consumer Staples, where the Fund’s holdings—despite a positive return overall—significantly underperformed those in the benchmark.
The strategy focused on higher quality companies in the Materials and Industrials sectors as compared with the benchmark, which contained many highly levered or highly economically sensitive companies that gained during the latter months of the period. Fund laggards for the year in those sectors included U.S. Concrete, Hawaiian Holdings and Kirby, a diesel engine and marine products company, which fell on concerns of muted economic activity due to COVID.
The Fund’s Financials holdings underperformed those in the benchmark, and the impact was magnified by the sector’s large weighting, the largest in both the Fund and the benchmark. Insurers were among large detractors, including mortgage insurer Radian Group.
114 | THE GUGGENHEIM FUNDS ANNUAL REPORT | |
MANAGERS’ COMMENTARY (Unaudited)(concluded) | December 31, 2020 |
In Utilities, the Fund was hurt by having no exposure to the better-performing renewables space, which also had higher valuations and thus did not possess value characteristics sought by the Fund. Among the electric utilities it did own, Avista Corp. and Portland General Electric were the largest detractors, in part due to perceived lower economic activity resulting from COVID and, particularly in the case of Portland, concerns of liabilities arising from the forest fires in their service area.
Portfolio Positioning
While this strategy is balanced relative to the benchmark, it does possess defensive characteristics in virtue of emphasizing relatively larger companies found in the benchmark as well as an overweight in Utilities. It also has a bias to larger companies within the benchmark and a deeper value bias.
At the end of the period, the Fund’s largest sector overweights relative to the benchmark were Information Technology and Utilities. The Fund’s largest sector underweights were in Consumer Discretionary and Financials.
Portfolio and Market Outlook
The market outlook is indeed murkier than usual. The expectation of a government and a Federal Reserve willing to do whatever is necessary to help the economy and the markets will need to meet the growing limitations that an increasingly indebted nation must eventually face. However, near term benefits of stimulus money and a Federal Reserve willing to commit to near zero interest rates for an indefinite period suggest a buoyant near-term outlook.
Performance displayed represents past performance which is no guarantee of future results.
The opinions and forecast expressed may not actually come to pass. This information is subject to change at any time, based on market and other conditions, and should not be construed as a recommendation of any specific security or strategy.
| | THE GUGGENHEIM FUNDS ANNUAL REPORT | 115 |
PERFORMANCE REPORT AND FUND PROFILE (Unaudited) | December 31, 2020 |
SERIES Q (SMALL CAP VALUE SERIES)
OBJECTIVE: Seeks long-term capital appreciation.
Holdings Diversification (Market Exposure as % of Net Assets)
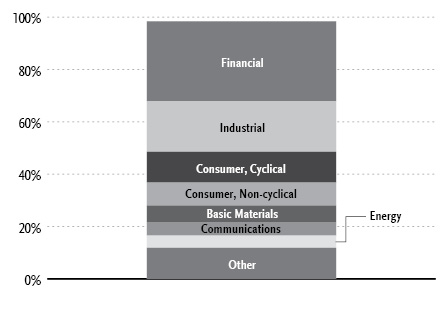
“Holdings Diversification (Market Exposure as % of Net Assets)” excludes any temporary cash investments.
Inception Date: May 1, 2000 |
Ten Largest Holdings (% of Total Net Assets) |
iShares Russell 2000 Value ETF | 3.7% |
Parsley Energy, Inc. — Class A | 2.1% |
Encompass Health Corp. | 1.8% |
Pinnacle Financial Partners, Inc. | 1.8% |
First Horizon National Corp. | 1.8% |
Physicians Realty Trust | 1.7% |
Infinera Corp. | 1.7% |
MDU Resources Group, Inc. | 1.6% |
Evolent Health, Inc. — Class A | 1.6% |
Synovus Financial Corp. | 1.6% |
Top Ten Total | 19.4% |
| | |
“Ten Largest Holdings” excludes any temporary cash investments. |
116 | THE GUGGENHEIM FUNDS ANNUAL REPORT | |
PERFORMANCE REPORT AND FUND PROFILE (Unaudited)(concluded) | December 31, 2020 |
Cumulative Fund Performance*,†

Average Annual Returns*,†
Periods Ended December 31, 2020
| 1 Year | 5 Year | 10 Year |
Series Q (Small Cap Value Series) | (0.97%) | 6.84% | 7.17% |
Russell 2000 Value Index | 4.63% | 9.65% | 8.66% |
* | The performance data above represents past performance that is not predictive of future results. The investment return and principal value of an investment in the Fund will fluctuate so that an investor’s shares, when redeemed, may be worth more or less than their original cost. Returns are historical and include changes in principal and reinvested dividends and capital gains and do not reflect the effect of taxes. The Russell 2000 Value Index is an unmanaged index and, unlike the Fund, has no management fees or operating expenses to reduce its reported return. |
† | Performance figures do not reflect fees and expenses associated with an investment in variable insurance products. If returns had taken into account these fees and expenses, performance would have been lower. Shares of a series of Guggenheim Variable Funds Trust are available only through the purchase of such products. |
| | THE GUGGENHEIM FUNDS ANNUAL REPORT | 117 |
SCHEDULE OF INVESTMENTS | December 31, 2020 |
SERIES Q (SMALL CAP VALUE SERIES) | |
| | Shares | | | Value | |
COMMON STOCKS† - 94.7% |
| | | | | | | | | |
Financial - 30.5% |
Pinnacle Financial Partners, Inc. | | | 17,993 | | | $ | 1,158,749 | |
First Horizon National Corp. | | | 89,171 | | | | 1,137,822 | |
Physicians Realty Trust REIT | | | 62,421 | | | | 1,111,094 | |
Synovus Financial Corp. | | | 30,892 | | | | 999,974 | |
Radian Group, Inc. | | | 46,284 | | | | 937,251 | |
CNO Financial Group, Inc. | | | 40,859 | | | | 908,296 | |
Axis Capital Holdings Ltd. | | | 17,543 | | | | 883,992 | |
Lexington Realty Trust REIT | | | 81,504 | | | | 865,573 | |
Zions Bancorp North America | | | 18,784 | | | | 815,977 | |
Investors Bancorp, Inc. | | | 71,084 | | | | 750,647 | |
Hilltop Holdings, Inc. | | | 26,270 | | | | 722,688 | |
Cathay General Bancorp | | | 21,370 | | | | 687,900 | |
BOK Financial Corp. | | | 9,723 | | | | 665,831 | |
Simmons First National Corp. — Class A | | | 28,200 | | | | 608,838 | |
MGIC Investment Corp. | | | 47,910 | | | | 601,270 | |
Heritage Insurance Holdings, Inc. | | | 58,346 | | | | 591,045 | |
Stifel Financial Corp. | | | 10,985 | | | | 554,278 | |
Flagstar Bancorp, Inc. | | | 12,439 | | | | 507,014 | |
Hancock Whitney Corp. | | | 13,170 | | | | 448,043 | |
Independent Bank Group, Inc. | | | 6,785 | | | | 424,198 | |
WSFS Financial Corp. | | | 9,290 | | | | 416,935 | |
Hanmi Financial Corp. | | | 35,569 | | | | 403,353 | |
Sunstone Hotel Investors, Inc. REIT | | | 35,434 | | | | 401,467 | |
Apple Hospitality REIT, Inc. | | | 30,185 | | | | 389,688 | |
Kennedy-Wilson Holdings, Inc. | | | 20,793 | | | | 371,987 | |
Piedmont Office Realty Trust, Inc. — Class A REIT | | | 22,755 | | | | 369,314 | |
Berkshire Hills Bancorp, Inc. | | | 21,325 | | | | 365,084 | |
Old Republic International Corp. | | | 17,213 | | | | 339,268 | |
Park Hotels & Resorts, Inc. REIT | | | 19,249 | | | | 330,120 | |
Heartland Financial USA, Inc. | | | 7,689 | | | | 310,405 | |
American National Group, Inc. | | | 3,134 | | | | 301,240 | |
RMR Group, Inc. — Class A | | | 7,220 | | | | 278,836 | |
Total Financial | | | | | | | 19,658,177 | |
| | | | | | | | | |
Industrial - 19.4% |
MDU Resources Group, Inc. | | | 39,144 | | | | 1,031,053 | |
Valmont Industries, Inc. | | | 4,900 | | | | 857,157 | |
Plexus Corp.* | | | 10,407 | | | | 813,932 | |
GATX Corp. | | | 9,649 | | | | 802,604 | |
Owens Corning | | | 10,556 | | | | 799,722 | |
Knight-Swift Transportation Holdings, Inc. | | | 18,935 | | | | 791,862 | |
Sanmina Corp.* | | | 21,718 | | | | 692,587 | |
PGT Innovations, Inc.* | | | 33,402 | | | | 679,397 | |
Graphic Packaging Holding Co. | | | 39,961 | | | | 676,939 | |
Rexnord Corp. | | | 17,141 | | | | 676,898 | |
Aerojet Rocketdyne Holdings, Inc.* | | | 11,589 | | | | 612,479 | |
EnerSys | | | 6,949 | | | | 577,184 | |
Colfax Corp.* | | | 12,415 | | | | 474,749 | |
Curtiss-Wright Corp. | | | 4,017 | | | | 467,378 | |
Kennametal, Inc. | | | 11,020 | | | | 399,365 | |
Kirby Corp.* | | | 7,657 | | | | 396,862 | |
Altra Industrial Motion Corp. | | | 6,646 | | | | 368,388 | |
Terex Corp. | | | 9,227 | | | | 321,930 | |
Encore Wire Corp. | | | 5,174 | | | | 313,389 | |
Park Aerospace Corp. | | | 22,473 | | | | 301,363 | |
Crane Co. | | | 2,835 | | | | 220,166 | |
Schneider National, Inc. — Class B | | | 10,354 | | | | 214,328 | |
Total Industrial | | | | | | | 12,489,732 | |
| | | | | | | | | |
Consumer, Cyclical - 11.7% |
MSC Industrial Direct Company, Inc. — Class A | | | 8,379 | | | | 707,104 | |
Abercrombie & Fitch Co. — Class A | | | 31,931 | | | | 650,115 | |
Alaska Air Group, Inc. | | | 12,258 | | | | 637,416 | |
UniFirst Corp. | | | 2,863 | | | | 606,069 | |
MDC Holdings, Inc. | | | 11,533 | | | | 560,504 | |
Hawaiian Holdings, Inc. | | | 31,086 | | | | 550,222 | |
Meritage Homes Corp.* | | | 5,862 | | | | 485,491 | |
Tapestry, Inc.* | | | 15,303 | | | | 475,617 | |
Penske Automotive Group, Inc. | | | 7,343 | | | | 436,101 | |
Wabash National Corp. | | | 25,239 | | | | 434,868 | |
International Game Technology plc | | | 23,298 | | | | 394,668 | |
Methode Electronics, Inc. | | | 9,889 | | | | 378,551 | |
Dick’s Sporting Goods, Inc. | | | 5,840 | | | | 328,266 | |
Urban Outfitters, Inc.* | | | 11,467 | | | | 293,555 | |
Movado Group, Inc.* | | | 12,832 | | | | 213,268 | |
Dana, Inc. | | | 9,714 | | | | 189,617 | |
Tenneco, Inc. — Class A* | | | 17,087 | | | | 181,122 | |
Total Consumer, Cyclical | | | | | | | 7,522,554 | |
| | | | | | | | | |
Consumer, Non-cyclical - 8.8% |
Encompass Health Corp. | | | 14,281 | | | | 1,180,896 | |
Ingredion, Inc. | | | 8,743 | | | | 687,812 | |
Sabre Corp.* | | | 57,177 | | | | 687,267 | |
Emergent BioSolutions, Inc.* | | | 7,378 | | | | 661,069 | |
Central Garden & Pet Co. — Class A* | | | 16,553 | | | | 601,370 | |
US Foods Holding Corp.* | | | 16,542 | | | | 551,014 | |
Integer Holdings Corp.* | | | 6,366 | | | | 516,856 | |
MGP Ingredients, Inc. | | | 10,713 | | | | 504,154 | |
Perdoceo Education Corp.* | | | 20,801 | | | | 262,717 | |
Total Consumer, Non-cyclical | | | | | | | 5,653,155 | |
| | | | | | | | | |
Basic Materials - 6.5% |
Huntsman Corp. | | | 34,999 | | | | 879,875 | |
Ashland Global Holdings, Inc. | | | 10,472 | | | | 829,382 | |
Olin Corp. | | | 25,310 | | | | 621,614 | |
Reliance Steel & Aluminum Co. | | | 3,874 | | | | 463,912 | |
Commercial Metals Co. | | | 21,704 | | | | 445,800 | |
Element Solutions, Inc. | | | 24,781 | | | | 439,367 | |
Kraton Corp.* | | | 11,022 | | | | 306,301 | |
Verso Corp. — Class A | | | 19,294 | | | | 231,914 | |
Total Basic Materials | | | | | | | 4,218,165 | |
| | | | | | | | | |
Communications - 5.0% |
Infinera Corp.* | | | 102,982 | | | | 1,079,251 | |
Viavi Solutions, Inc.* | | | 58,785 | | | | 880,305 | |
Gray Television, Inc.* | | | 25,944 | | | | 464,138 | |
Ciena Corp.* | | | 7,015 | | | | 370,743 | |
Tribune Publishing Co. | | | 18,952 | | | | 259,642 | |
118 | THE GUGGENHEIM FUNDS ANNUAL REPORT | SEE NOTES TO FINANCIAL STATEMENTS. |
SCHEDULE OF INVESTMENTS (concluded) | December 31, 2020 |
SERIES Q (SMALL CAP VALUE SERIES) | |
| | Shares | | | Value | |
Entercom Communications Corp. — Class A | | | 57,603 | | | $ | 142,280 | |
Total Communications | | | | | | | 3,196,359 | |
| | | | | | | | | |
Energy - 4.7% |
Parsley Energy, Inc. — Class A | | | 93,594 | | | | 1,329,035 | |
Range Resources Corp.* | | | 118,684 | | | | 795,183 | |
CNX Resources Corp.* | | | 40,226 | | | | 434,441 | |
Patterson-UTI Energy, Inc. | | | 66,332 | | | | 348,906 | |
Oil States International, Inc.* | | | 30,739 | | | | 154,310 | |
Total Energy | | | | | | | 3,061,875 | |
| | | | | | | | | |
Utilities - 4.4% |
Black Hills Corp. | | | 12,958 | | | | 796,269 | |
Avista Corp. | | | 16,495 | | | | 662,109 | |
Southwest Gas Holdings, Inc. | | | 8,470 | | | | 514,553 | |
Spire, Inc. | | | 7,249 | | | | 464,226 | |
ALLETE, Inc. | | | 6,868 | | | | 425,404 | |
Total Utilities | | | | | | | 2,862,561 | |
| | | | | | | | | |
Technology - 3.7% |
Evolent Health, Inc. — Class A* | | | 63,776 | | | | 1,022,329 | |
Conduent, Inc.* | | | 109,019 | | | | 523,291 | |
Science Applications International Corp. | | | 5,005 | | | | 473,673 | |
Axcelis Technologies, Inc.* | | | 11,822 | | | | 344,257 | |
Total Technology | | | | | | | 2,363,550 | |
| | | | | | | | | |
Total Common Stocks | | | | |
(Cost $55,099,574) | | | | | | | 61,026,128 | |
| | | | | | | | | |
CONVERTIBLE PREFERRED STOCKS††† - 0.0% |
Industrial - 0.0% |
Thermoenergy Corp.*,1 | | | 116,667 | | | | 7 | |
Total Convertible Preferred Stocks | | | | |
(Cost $111,409) | | | | | | | 7 | |
| | | | | | | | | |
RIGHTS† - 0.1% |
Basic Materials - 0.1% |
Pan American Silver Corp.* | | | 81,258 | | | | 67,038 | |
Total Rights | | | | |
(Cost $—) | | | | | | | 67,038 | |
| | | | | | | | | |
EXCHANGE-TRADED FUNDS† - 3.7% |
iShares Russell 2000 Value ETF | | | 18,253 | | | | 2,404,833 | |
Total Exchange-Traded Funds | | | | |
(Cost $2,116,029) | | | | | | | 2,404,833 | |
| | | | | | | | | |
MONEY MARKET FUND† - 1.5% |
Dreyfus Treasury Securities Cash Management Fund — Institutional Shares, 0.01%2 | | | 938,730 | | | | 938,730 | |
Total Money Market Fund | | | | |
(Cost $938,730) | | | | | | | 938,730 | |
| | | | | | | | | |
Total Investments - 100.0% | | | | |
(Cost $58,265,742) | | $ | 64,436,736 | |
Other Assets & Liabilities, net - 0.0% | | | (18,497 | ) |
Total Net Assets - 100.0% | | $ | 64,418,239 | |
* | Non-income producing security. |
† | Value determined based on Level 1 inputs — See Note 4. |
††† | Value determined based on Level 3 inputs — See Note 4. |
1 | PIPE (Private Investment in Public Equity) — Stock issued by a company in the secondary market as a means of raising capital more quickly and less expensively than through registration of a secondary public offering. |
2 | Rate indicated is the 7-day yield as of December 31, 2020. |
| | plc — Public Limited Company |
| | REIT — Real Estate Investment Trust |
| | |
| | See Sector Classification in Other Information section. |
The following table summarizes the inputs used to value the Fund’s investments at December 31, 2020 (See Note 4 in the Notes to Financial Statements):
Investments in Securities (Assets) | | Level 1
Quoted
Prices | | | Level 2
Significant
Observable
Inputs | | | Level 3
Significant
Unobservable
Inputs | | | Total | |
Common Stocks | | $ | 61,026,128 | | | $ | — | | | $ | — | | | $ | 61,026,128 | |
Convertible Preferred Stocks | | | — | | | | — | | | | 7 | | | | 7 | |
Rights | | | 67,038 | | | | — | | | | — | | | | 67,038 | |
Exchange-Traded Funds | | | 2,404,833 | | | | — | | | | — | | | | 2,404,833 | |
Money Market Fund | | | 938,730 | | | | — | | | | — | | | | 938,730 | |
Total Assets | | $ | 64,436,729 | | | $ | — | | | $ | 7 | | | $ | 64,436,736 | |
SEE NOTES TO FINANCIAL STATEMENTS. | THE GUGGENHEIM FUNDS ANNUAL REPORT | 119 |
SERIES Q (SMALL CAP VALUE SERIES) | |
STATEMENT OF ASSETS AND LIABILITIES |
December 31, 2020 |
Assets: |
Investments, at value (cost $58,265,742) | | $ | 64,436,736 | |
Prepaid expenses | | | 2,857 | |
Receivables: |
Dividends | | | 89,312 | |
Interest | | | 13 | |
Total assets | | | 64,528,918 | |
| | | | | |
Liabilities: |
Payable for: |
Management fees | | | 30,600 | |
Professional fees | | | 25,821 | |
Distribution and service fees | | | 13,506 | |
Fund shares redeemed | | | 13,040 | |
Printing fees | | | 12,365 | |
Fund accounting/administration fees | | | 6,397 | |
Trustees’ fees* | | | 2,470 | |
Transfer agent/maintenance fees | | | 2,074 | |
Miscellaneous | | | 4,406 | |
Total liabilities | | | 110,679 | |
Commitments and contingent liabilities (Note 13) | | | — | |
Net assets | | $ | 64,418,239 | |
| | | | | |
Net assets consist of: |
Paid in capital | | $ | 62,049,515 | |
Total distributable earnings (loss) | | | 2,368,724 | |
Net assets | | $ | 64,418,239 | |
Capital shares outstanding | | | 1,727,203 | |
Net asset value per share | | $ | 37.30 | |
STATEMENT OF OPERATIONS |
Year Ended December 31, 2020 |
Investment Income: |
Dividends | | $ | 1,193,294 | |
Interest | | | 5,881 | |
Total investment income | | | 1,199,175 | |
| | | | | |
Expenses: |
Management fees | | | 427,646 | |
Distribution and service fees | | | 142,549 | |
Transfer agent/maintenance fees | | | 29,177 | |
Fund accounting/administration fees | | | 49,971 | |
Professional fees | | | 40,002 | |
Trustees’ fees* | | | 18,856 | |
Custodian fees | | | 3,904 | |
Line of credit fees | | | 1,541 | |
Miscellaneous | | | 23,074 | |
Total expenses | | | 736,720 | |
Less: |
Expenses reimbursed by Adviser: | | | (5,108 | ) |
Expenses waived by Adviser | | | (84,648 | ) |
Earnings credits applied | | | (65 | ) |
Total waived/reimbursed expenses | | | (89,821 | ) |
Net expenses | | | 646,899 | |
Net investment income | | | 552,276 | |
| | | | | |
Net Realized and Unrealized Gain (Loss): |
Net realized gain (loss) on: |
Investments | | | (4,256,850 | ) |
Net realized loss | | | (4,256,850 | ) |
Net change in unrealized appreciation (depreciation) on: |
Investments | | | 1,558,527 | |
Net change in unrealized appreciation (depreciation) | | | 1,558,527 | |
Net realized and unrealized loss | | | (2,698,323 | ) |
Net decrease in net assets resulting from operations | | $ | (2,146,047 | ) |
* | Relates to Trustees not deemed “interested persons” within the meaning of Section 2(a)(19) of the 1940 Act. |
120 | THE GUGGENHEIM FUNDS ANNUAL REPORT | SEE NOTES TO FINANCIAL STATEMENTS. |
SERIES Q (SMALL CAP VALUE SERIES) | |
STATEMENTS OF CHANGES IN NET ASSETS |
| | Year Ended
December 31,
2020 | | | Year Ended
December 31,
2019 | |
Increase (Decrease) in Net Assets from Operations: | | | | | | | | |
Net investment income | | $ | 552,276 | | | $ | 579,635 | |
Net realized gain (loss) on investments | | | (4,256,850 | ) | | | 5,213,071 | |
Net change in unrealized appreciation (depreciation) on investments | | | 1,558,527 | | | | 8,752,696 | |
Net increase (decrease) in net assets resulting from operations | | | (2,146,047 | ) | | | 14,545,402 | |
| | | | | | | | | |
Distributions to shareholders | | | (4,948,061 | ) | | | (4,786,908 | ) |
| | | | | | | | | |
Capital share transactions: | | | | | | | | |
Proceeds from sale of shares | | | 3,971,913 | | | | 3,757,305 | |
Distributions reinvested | | | 4,948,061 | | | | 4,786,908 | |
Cost of shares redeemed | | | (11,422,980 | ) | | | (12,636,580 | ) |
Net decrease from capital share transactions | | | (2,503,006 | ) | | | (4,092,367 | ) |
Net increase (decrease) in net assets | | | (9,597,114 | ) | | | 5,666,127 | |
| | | | | | | | | |
Net assets: | | | | | | | | |
Beginning of year | | | 74,015,353 | | | | 68,349,226 | |
End of year | | $ | 64,418,239 | | | $ | 74,015,353 | |
| | | | | | | | | |
Capital share activity: | | | | | | | | |
Shares sold | | | 120,097 | | | | 93,527 | |
Shares issued from reinvestment of distributions | | | 161,070 | | | | 125,410 | |
Shares redeemed | | | (342,024 | ) | | | (319,855 | ) |
Net decrease in shares | | | (60,857 | ) | | | (100,918 | ) |
SEE NOTES TO FINANCIAL STATEMENTS. | THE GUGGENHEIM FUNDS ANNUAL REPORT | 121 |
SERIES Q (SMALL CAP VALUE SERIES) | |
This table is presented to show selected data for a share outstanding throughout each period and to assist shareholders in evaluating a Fund’s performance for the periods presented.
| | Year Ended
December 31,
2020 | | | Year Ended
December 31,
2019 | | | Year Ended
December 31,
2018 | | | Year Ended
December 31,
2017 | | | Year Ended
December 31,
2016 | |
Per Share Data |
Net asset value, beginning of period | | $ | 41.39 | | | $ | 36.18 | | | $ | 45.89 | | | $ | 46.02 | | | $ | 39.71 | |
Income (loss) from investment operations: |
Net investment income (loss)a | | | .32 | | | | .32 | | | | .30 | | | | .05 | | | | .21 | |
Net gain (loss) on investments (realized and unrealized) | | | (1.36 | ) | | | 7.62 | | | | (5.28 | ) | | | 1.58 | | | | 9.76 | |
Total from investment operations | | | (1.04 | ) | | | 7.94 | | | | (4.98 | ) | | | 1.63 | | | | 9.97 | |
Less distributions from: |
Net investment income | | | (.37 | ) | | | (.33 | ) | | | (.16 | ) | | | (.17 | ) | | | (.05 | ) |
Net realized gains | | | (2.68 | ) | | | (2.40 | ) | | | (4.57 | ) | | | (1.59 | ) | | | (3.61 | ) |
Total distributions | | | (3.05 | ) | | | (2.73 | ) | | | (4.73 | ) | | | (1.76 | ) | | | (3.66 | ) |
Net asset value, end of period | | $ | 37.30 | | | $ | 41.39 | | | $ | 36.18 | | | $ | 45.89 | | | $ | 46.02 | |
|
Total Returnb | | | (0.97 | %) | | | 22.58 | % | | | (12.66 | %) | | | 3.70 | % | | | 26.60 | % |
Ratios/Supplemental Data |
Net assets, end of period (in thousands) | | $ | 64,418 | | | $ | 74,015 | | | $ | 68,349 | | | $ | 98,726 | | | $ | 106,304 | |
Ratios to average net assets: |
Net investment income (loss) | | | 0.97 | % | | | 0.80 | % | | | 0.68 | % | | | 0.11 | % | | | 0.52 | % |
Total expensesc | | | 1.29 | % | | | 1.29 | % | | | 1.26 | % | | | 1.23 | % | | | 1.16 | % |
Net expensesd,e,f | | | 1.14 | % | | | 1.14 | % | | | 1.14 | % | | | 1.14 | % | | | 1.16 | % |
Portfolio turnover rate | | | 32 | % | | | 54 | % | | | 37 | % | | | 32 | % | | | 68 | % |
a | Net investment income (loss) per share was computed using average shares outstanding throughout the period. |
b | Total return does not take into account any of the expenses associated with an investment in variable insurance products. If total return had taken into account these expenses, performance would have been lower. Shares of a series of Guggenheim Variable Funds Trust are available only through the purchase of such products. |
c | Does not include expenses of the underlying funds in which the Fund invests. |
d | Net expense information reflects the expense ratios after expense waivers and reimbursements, as applicable. |
e | Net expense may include expenses that are excluded from the expense limitation agreement. Excluding these expenses, the net expense ratios for the years would be: |
| | 12/31/20 | 12/31/19 | 12/31/18 | 12/31/17 | 12/31/16 |
| | 1.13% | 1.14% | 1.14% | 1.12% | 1.16% |
f | The portion of the ratios of net expenses to average net assets attributable to recoupments of prior fee reductions or expense reimbursements for the years was a follows: |
| | 12/31/20 | 12/31/19 | 12/31/18 | 12/31/17 | 12/31/16 |
| | — | — | — | 0.00%* | — |
122 | THE GUGGENHEIM FUNDS ANNUAL REPORT | SEE NOTES TO FINANCIAL STATEMENTS. |
MANAGERS’ COMMENTARY (Unaudited) | December 31, 2020 |
To Our Shareholders:
The Series V (SMid Cap Value Series) is managed by a team of seasoned professionals led by James Schier, CFA, Senior Managing Director and Portfolio Manager; David Toussaint, CFA, CPA, Managing Director and Portfolio Manager; Farhan Sharaff, Senior Managing Director, Assistant Chief Investment Officer, Equities, and Portfolio Manager; Gregg Strohkorb, CFA, Director Portfolio Manager; and Burak Hurmeydan, Ph.D., Director and Portfolio Manager. In the following paragraphs, the team discusses performance of the Fund for the fiscal year ended December 31, 2020.
For the year ended December 31, 2020, Series V (SMid Cap Value Series) returned 4.30%, compared with the Russell 2500® Value Index, which returned 4.88%.
Strategy and Market Overview
Our investment approach focuses on understanding how companies make money and how easily companies can improve returns, maintain existing high levels of profitability, or benefit from change that occurs within the industries in which they operate. In today’s rapidly changing environment marked by very sharp and quick, but constrained volatility, our long-term orientation and discipline are a competitive advantage. This should become especially critical when the environment of indiscriminant valuation expansion subsides, and fundamentals once again become a more dominant factor in the market.
Performance Review
Dominating the market for the period was the strong outperformance of growth versus value stocks, despite occasional signs that the situation might be ready to turn. Significant monetary and fiscal stimulus and the low-rate environment helped multiples of growth stocks expand more than those of value stocks, leading to stocks with extreme valuations to experience continued multiple expansion.
The Information Technology sector was the bright spot for the Fund for the period, aided by relative contributions from Real Estate and Energy, where the Fund’s holdings—despite a negative return overall—strongly outperformed those in the benchmark. The Information Technology companies benefiting performance included those poised for the coming roll-out of 5G networks and the resultant capital expenditures needed to improve the storage and flow of ever-increasing data. Among them were MACOM Technology Solutions and Infinera Corp.
Overweighting healthcare and office REITS and underweighting retail and hotel/resort REITs was responsible for the positive relative showing in the Real Estate sector. Office REITs Alexandria Real Estate Equities, Inc., and Equity Commonwealth were the main contributors, while commercial REIT Howard Hughes Corp. and mortgage REIT Redwood Trust were the main detractors. The Fund’s Energy holdings were also a relative contributor to performance, helped by the Fund’s position in Range Resources, which benefited from firming in natural gas prices, and not owning many exploration and production companies in the benchmark.
Stock selection also contributed in the Health Care sector, although allocation was a detriment. Emergent Biosolutions, Inc. was a key individual contributor, benefiting from its business model in supplying the government vaccines and securing production agreements with many of the companies at the forefront in the development of COVID vaccines.
Utilities and Financials were major drags on performance, made worse by negative relative contributions from Consumer Discretionary, where the Fund’s holdings—despite a positive return overall—significantly underperformed those in the benchmark. The strategy also focused on higher quality companies in the Materials and Industrials sectors as compared with the benchmark, which contained many highly levered or highly economically sensitive companies that gained during the latter months of the period. Fund laggards for the year in those sectors included U.S. Concrete, Alaska Air and Kirby, a diesel engine and marine products company, which fell on concerns of muted economic activity due to COVID.
In Utilities, the Fund was hurt by having no exposure to the better-performing renewables space, which also had higher valuations and thus did not possess value characteristics sought by the Fund. Among the electric utilities it did own, Avista Corp. and Portland General Electric were among the largest detractors, in part due to perceived lower economic activity resulting from COVID and, particularly in the case of Portland, concerns of liabilities arising from the forest fires in their service area.
The Fund’s Financials holdings slightly underperformed those in the benchmark, and the impact was magnified by the sector’s large weighting, the largest in both the Fund and the benchmark. Insurers were among large detractors, including Radian Group, Inc. and Alleghany Corp.
| | THE GUGGENHEIM FUNDS ANNUAL REPORT | 123 |
MANAGERS’ COMMENTARY (Unaudited)(concluded) | December 31, 2020 |
Portfolio Positioning
While this strategy is balanced relative to the benchmark, it does possess defensive characteristics in virtue of emphasizing relatively larger companies found in the benchmark as well as an overweight in Utilities.
Over the period, the Fund’s largest sector overweights on average relative to the benchmark were in Information Technology and Utilities. The Fund’s largest sector underweights were in Consumer Discretionary and Real Estate.
Portfolio and Market Outlook
The market outlook is indeed murkier than usual. The expectation of a government and a Federal Reserve willing to do whatever is necessary to help the economy and the markets will need to meet the growing limitations that an increasingly indebted nation must eventually face. However, near term benefits of stimulus money and a Federal Reserve willing to commit to near zero interest rates for an indefinite period suggest a buoyant near-term outlook.
Performance displayed represents past performance which is no guarantee of future results.
The opinions and forecast expressed may not actually come to pass. This information is subject to change at any time, based on market and other conditions, and should not be construed as a recommendation of any specific security or strategy.
124 | THE GUGGENHEIM FUNDS ANNUAL REPORT | |
PERFORMANCE REPORT AND FUND PROFILE (Unaudited) | December 31, 2020 |
SERIES V (SMID CAP VALUE SERIES)
OBJECTIVE: Seeks long-term growth of capital.
Holdings Diversification (Market Exposure as % of Net Assets)
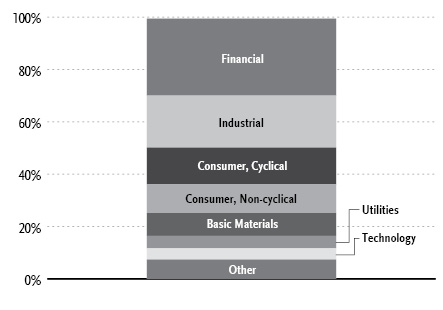
“Holdings Diversification (Market Exposure as % of Net Assets)” excludes any temporary cash investments.
Inception Date: May 1, 1997 |
Ten Largest Holdings (% of Total Net Assets) |
Alleghany Corp. | 2.5% |
Voya Financial, Inc. | 2.4% |
Infinera Corp. | 2.3% |
Bunge Ltd. | 2.2% |
Parsley Energy, Inc. — Class A | 2.0% |
First Horizon National Corp. | 1.9% |
Encompass Health Corp. | 1.9% |
Pinnacle Financial Partners, Inc. | 1.8% |
Physicians Realty Trust | 1.7% |
MDU Resources Group, Inc. | 1.7% |
Top Ten Total | 20.4% |
| | |
“Ten Largest Holdings” excludes any temporary cash investments. |
| | THE GUGGENHEIM FUNDS ANNUAL REPORT | 125 |
PERFORMANCE REPORT AND FUND PROFILE (Unaudited)(concluded) | December 31, 2020 |
Cumulative Fund Performance*,†
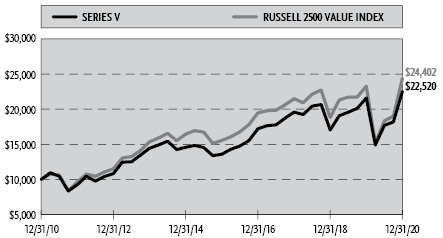
Average Annual Returns*,†
Periods Ended December 31, 2020
| 1 Year | 5 Year | 10 Year |
Series V (SMid Cap Value Series) | 4.30% | 10.64% | 8.46% |
Russell 2500 Value Index | 4.88% | 9.43% | 9.33% |
* | The performance data above represents past performance that is not predictive of future results. The investment return and principal value of an investment in the Fund will fluctuate so that an investor’s shares, when redeemed, may be worth more or less than their original cost. Returns are historical and include changes in principal and reinvested dividends and capital gains and do not reflect the effect of taxes. The Russell 2500 Value Index is an unmanaged index and, unlike the Fund, has no management fees or operating expenses to reduce its reported return. |
† | Performance figures do not reflect fees and expenses associated with an investment in variable insurance products. If returns had taken into account these fees and expenses, performance would have been lower. Shares of a series of Guggenheim Variable Funds Trust are available only through the purchase of such products. |
126 | THE GUGGENHEIM FUNDS ANNUAL REPORT | |
SCHEDULE OF INVESTMENTS | December 31, 2020 |
SERIES V (SMID CAP VALUE SERIES) | |
| | Shares | | | Value | |
COMMON STOCKS† - 99.5% |
| | | | | | | | | |
Financial - 29.5% |
Alleghany Corp. | | | 7,036 | | | $ | 4,247,563 | |
Voya Financial, Inc. | | | 69,329 | | | | 4,077,239 | |
First Horizon National Corp. | | | 254,627 | | | | 3,249,041 | |
Pinnacle Financial Partners, Inc. | | | 48,251 | | | | 3,107,364 | |
Physicians Realty Trust REIT | | | 169,330 | | | | 3,014,074 | |
Synovus Financial Corp. | | | 88,068 | | | | 2,850,761 | |
KeyCorp | | | 163,290 | | | | 2,679,589 | |
Alexandria Real Estate Equities, Inc. REIT | | | 14,789 | | | | 2,635,695 | |
Radian Group, Inc. | | | 130,124 | | | | 2,635,011 | |
Zions Bancorp North America | | | 58,413 | | | | 2,537,461 | |
Axis Capital Holdings Ltd. | | | 47,582 | | | | 2,397,657 | |
BOK Financial Corp. | | | 27,656 | | | | 1,893,883 | |
VICI Properties, Inc. REIT | | | 73,769 | | | | 1,881,109 | |
Sun Communities, Inc. REIT | | | 10,925 | | | | 1,660,054 | |
Hilltop Holdings, Inc. | | | 50,937 | | | | 1,401,277 | |
Stifel Financial Corp. | | | 27,105 | | | | 1,367,718 | |
Heritage Insurance Holdings, Inc. | | | 124,542 | | | | 1,261,610 | |
Medical Properties Trust, Inc. REIT | | | 55,511 | | | | 1,209,585 | |
WSFS Financial Corp. | | | 26,426 | | | | 1,185,999 | |
Apple Hospitality REIT, Inc. | | | 86,689 | | | | 1,119,155 | |
Old Republic International Corp. | | | 48,986 | | | | 965,514 | |
Park Hotels & Resorts, Inc. REIT | | | 53,247 | | | | 913,186 | |
Gaming and Leisure Properties, Inc. REIT | | | 20,577 | | | | 872,465 | |
Heartland Financial USA, Inc. | | | 21,485 | | | | 867,349 | |
American National Group, Inc. | | | 8,206 | | | | 788,761 | |
Total Financial | | | | | | | 50,819,120 | |
| | | | | | | | | |
Industrial - 19.8% |
MDU Resources Group, Inc. | | | 111,700 | | | | 2,942,178 | |
Plexus Corp.* | | | 28,833 | | | | 2,255,029 | |
Jacobs Engineering Group, Inc. | | | 20,265 | | | | 2,208,074 | |
Owens Corning | | | 28,675 | | | | 2,172,418 | |
Valmont Industries, Inc. | | | 12,390 | | | | 2,167,383 | |
Knight-Swift Transportation Holdings, Inc. | | | 50,395 | | | | 2,107,519 | |
Graphic Packaging Holding Co. | | | 123,176 | | | | 2,086,601 | |
PGT Innovations, Inc.* | | | 90,732 | | | | 1,845,489 | |
Rexnord Corp. | | | 45,107 | | | | 1,781,275 | |
Aerojet Rocketdyne Holdings, Inc.* | | | 31,164 | | | | 1,647,018 | |
EnerSys | | | 19,326 | | | | 1,605,218 | |
Johnson Controls International plc | | | 33,962 | | | | 1,582,289 | |
Colfax Corp.* | | | 35,142 | | | | 1,343,830 | |
Curtiss-Wright Corp. | | | 11,482 | | | | 1,335,931 | |
Kennametal, Inc. | | | 29,722 | | | | 1,077,125 | |
Altra Industrial Motion Corp. | | | 18,998 | | | | 1,053,059 | |
GATX Corp. | | | 12,173 | | | | 1,012,550 | |
Kirby Corp.* | | | 18,358 | | | | 951,495 | |
Terex Corp. | | | 25,021 | | | | 872,983 | |
Park Aerospace Corp. | | | 63,025 | | | | 845,165 | |
Schneider National, Inc. — Class B | | | 29,495 | | | | 610,547 | |
Crane Co. | | | 7,842 | | | | 609,010 | |
Total Industrial | | | | | | | 34,112,186 | |
| | | | | | | | | |
Consumer, Cyclical - 14.1% |
LKQ Corp.* | | | 75,146 | | | | 2,648,145 | |
MSC Industrial Direct Company, Inc. — Class A | | | 23,281 | | | | 1,964,684 | |
PVH Corp. | | | 19,068 | | | | 1,790,295 | |
Alaska Air Group, Inc. | | | 33,919 | | | | 1,763,788 | |
UniFirst Corp. | | | 8,142 | | | | 1,723,580 | |
Ralph Lauren Corp. — Class A | | | 14,306 | | | | 1,484,104 | |
DR Horton, Inc. | | | 20,862 | | | | 1,437,809 | |
Tapestry, Inc. | | | 43,938 | | | | 1,365,593 | |
Lear Corp. | | | 7,697 | | | | 1,224,054 | |
Penske Automotive Group, Inc. | | | 20,311 | | | | 1,206,270 | |
Kohl’s Corp. | | | 27,232 | | | | 1,108,070 | |
Methode Electronics, Inc. | | | 28,128 | | | | 1,076,740 | |
BorgWarner, Inc. | | | 26,067 | | | | 1,007,229 | |
Dick’s Sporting Goods, Inc. | | | 16,603 | | | | 933,255 | |
Skechers USA, Inc. — Class A* | | | 24,575 | | | | 883,226 | |
Urban Outfitters, Inc.* | | | 33,724 | | | | 863,334 | |
Meritage Homes Corp.* | | | 8,595 | | | | 711,838 | |
Movado Group, Inc.* | | | 36,499 | | | | 606,613 | |
Dana, Inc. | | | 27,674 | | | | 540,196 | |
Total Consumer, Cyclical | | | | | | | 24,338,823 | |
| | | | | | | | | |
Consumer, Non-cyclical - 11.0% |
Bunge Ltd. | | | 58,010 | | | | 3,804,296 | |
Encompass Health Corp. | | | 38,936 | | | | 3,219,618 | |
Emergent BioSolutions, Inc.* | | | 23,994 | | | | 2,149,862 | |
Sabre Corp. | | | 158,207 | | | | 1,901,648 | |
Ingredion, Inc. | | | 23,621 | | | | 1,858,264 | |
Central Garden & Pet Co. — Class A* | | | 44,954 | | | | 1,633,179 | |
US Foods Holding Corp.* | | | 47,507 | | | | 1,582,458 | |
Integer Holdings Corp.* | | | 18,179 | | | | 1,475,953 | |
MGP Ingredients, Inc. | | | 29,051 | | | | 1,367,140 | |
Total Consumer, Non-cyclical | | | | | | | 18,992,418 | |
| | | | | | | | | |
Basic Materials - 8.7% |
Huntsman Corp. | | | 100,649 | | | | 2,530,316 | |
Ashland Global Holdings, Inc. | | | 28,424 | | | | 2,251,181 | |
Westlake Chemical Corp. | | | 26,532 | | | | 2,165,011 | |
Reliance Steel & Aluminum Co. | | | 16,380 | | | | 1,961,505 | |
Olin Corp. | | | 69,749 | | | | 1,713,035 | |
Commercial Metals Co. | | | 61,757 | | | | 1,268,489 | |
Element Solutions, Inc. | | | 71,264 | | | | 1,263,511 | |
Nucor Corp. | | | 17,518 | | | | 931,782 | |
Kraton Corp.* | | | 31,543 | | | | 876,580 | |
Total Basic Materials | | | | | | | 14,961,410 | |
| | | | | | | | | |
Utilities - 4.8% |
Pinnacle West Capital Corp. | | | 18,823 | | | | 1,504,899 | |
Black Hills Corp. | | | 24,313 | | | | 1,494,034 | |
Avista Corp. | | | 35,237 | | | | 1,414,413 | |
Southwest Gas Holdings, Inc. | | | 22,265 | | | | 1,352,599 | |
Edison International | | | 19,855 | | | | 1,247,291 | |
Spire, Inc. | | | 18,832 | | | | 1,206,001 | |
Total Utilities | | | | | | | 8,219,237 | |
| | | | | | | | | |
SEE NOTES TO FINANCIAL STATEMENTS. | THE GUGGENHEIM FUNDS ANNUAL REPORT | 127 |
SCHEDULE OF INVESTMENTS (continued) | December 31, 2020 |
SERIES V (SMID CAP VALUE SERIES) | |
| | Shares | | | Value | |
Technology - 4.3% |
Evolent Health, Inc. — Class A* | | | 171,481 | | | $ | 2,748,841 | |
Qorvo, Inc.* | | | 12,626 | | | | 2,099,325 | |
Science Applications International Corp. | | | 14,238 | | | | 1,347,484 | |
Skyworks Solutions, Inc. | | | 8,550 | | | | 1,307,124 | |
Total Technology | | | | | | | 7,502,774 | |
| | | | | | | | | |
Communications - 4.0% |
Infinera Corp.* | | | 385,933 | | | | 4,044,578 | |
Viavi Solutions, Inc.* | | | 126,644 | | | | 1,896,494 | |
Ciena Corp.* | | | 19,511 | | | | 1,031,156 | |
Total Communications | | | | | | | 6,972,228 | |
| | | | | | | | | |
Energy - 3.3% |
Parsley Energy, Inc. — Class A | | | 247,044 | | | | 3,508,025 | |
Range Resources Corp.* | | | 184,618 | | | | 1,236,941 | |
Patterson-UTI Energy, Inc. | | | 179,975 | | | | 946,668 | |
HydroGen Corp.*,†††,1 | | | 672,346 | | | | 1 | |
Total Energy | | | | | | | 5,691,635 | |
| | | | | | | | | |
Total Common Stocks | | | | |
(Cost $147,319,260) | | | | | | | 171,609,831 | |
| | | | | | | | | |
CONVERTIBLE PREFERRED STOCKS††† - 0.0% |
Industrial - 0.0% |
Thermoenergy Corp.*,2 | | | 308,333 | | | | 20 | |
Total Convertible Preferred Stocks | | | | |
(Cost $294,438) | | | | | | | 20 | |
| | | | | | | | | |
RIGHTS† - 0.1% |
Basic Materials - 0.1% |
Pan American Silver Corp.* | | | 220,317 | | | | 181,761 | |
Total Rights | | | | |
(Cost $—) | | | | | | | 181,761 | |
| | | | | | | | | |
MONEY MARKET FUND† - 0.4% |
Dreyfus Treasury Securities Cash Management Fund — Institutional Shares, 0.01%3 | | | 684,981 | | | | 684,981 | |
Total Money Market Fund | | | | |
(Cost $684,981) | | | | | | | 684,981 | |
| | | | | | | | | |
Total Investments - 100.0% | | | | |
(Cost $148,298,679) | | $ | 172,476,593 | |
Other Assets & Liabilities, net - 0.0% | | | (36,418 | ) |
Total Net Assets - 100.0% | | $ | 172,440,175 | |
* | Non-income producing security. |
† | Value determined based on Level 1 inputs, unless otherwise noted — See Note 4. |
††† | Value determined based on Level 3 inputs — See Note 4. |
1 | Affiliated issuer. |
2 | PIPE (Private Investment in Public Equity) — Stock issued by a company in the secondary market as a means of raising capital more quickly and less expensively than through registration of a secondary public offering. |
3 | Rate indicated is the 7-day yield as of December 31, 2020. |
| | plc — Public Limited Company |
| | REIT — Real Estate Investment Trust |
| | |
| | See Sector Classification in Other Information section. |
The following table summarizes the inputs used to value the Fund’s investments at December 31, 2020 (See Note 4 in the Notes to Financial Statements):
Investments in Securities (Assets) | | Level 1
Quoted
Prices | | | Level 2
Significant
Observable
Inputs | | | Level 3
Significant
Unobservable
Inputs | | | Total | |
Common Stocks | | $ | 171,609,830 | | | $ | — | | | $ | 1 | | | $ | 171,609,831 | |
Convertible Preferred Stocks | | | — | | | | — | | | | 20 | | | | 20 | |
Rights | | | 181,761 | | | | — | | | | — | | | | 181,761 | |
Money Market Fund | | | 684,981 | | | | — | | | | — | | | | 684,981 | |
Total Assets | | $ | 172,476,572 | | | $ | — | | | $ | 21 | | | $ | 172,476,593 | |
128 | THE GUGGENHEIM FUNDS ANNUAL REPORT | SEE NOTES TO FINANCIAL STATEMENTS. |
SCHEDULE OF INVESTMENTS (concluded) | December 31, 2020 |
SERIES V (SMID CAP VALUE SERIES) | |
Affiliated Transactions
Investments representing 5% or more of the outstanding voting shares of a company, or control of or by, or common control under Guggenheim Investments, result in that company being considered an affiliated issuer, as defined in the 1940 Act.
Transactions during the year ended December 31, 2020, in which the company is an affiliated issuer, were as follows:
Security Name | | Value
12/31/19 | | | Additions | | | Reductions | | | Realized
Gain (Loss) | | | Change in
Unrealized
Appreciation
(Depreciation) | | | Value
12/31/20 | | | Shares
12/31/20 | |
Common Stock | | | | | | | | | | | | | | | | | | | | | | | | | | | | |
HydroGen Corp.* | | $ | 1 | | | $ | — | | | $ | — | | | $ | — | | | $ | — | | | $ | 1 | | | | 672,346 | |
* | Non-income producing security. |
SEE NOTES TO FINANCIAL STATEMENTS. | THE GUGGENHEIM FUNDS ANNUAL REPORT | 129 |
SERIES V (SMID CAP VALUE SERIES) | |
STATEMENT OF ASSETS AND LIABILITIES |
December 31, 2020 |
Assets: |
Investments in unaffiliated issuers, at value (cost $145,727,104) | | $ | 172,476,592 | |
Investments in affiliated issuers, at value (cost $2,571,575) | | | 1 | |
Prepaid expenses | | | 5,189 | |
Receivables: |
Dividends | | | 277,242 | |
Interest | | | 5 | |
Total assets | | | 172,759,029 | |
| | | | | |
Liabilities: |
Payable for: |
Fund shares redeemed | | | 118,318 | |
Management fees | | | 69,533 | |
Professional fees | | | 36,976 | |
Distribution and service fees | | | 36,435 | |
Printing fees | | | 30,195 | |
Fund accounting/administration fees | | | 12,613 | |
Trustees’ fees* | �� | | 3,238 | |
Transfer agent/maintenance fees | | | 3,190 | |
Miscellaneous (Note 11) | | | 8,356 | |
Total liabilities | | | 318,854 | |
Commitments and contingent liabilities (Note 13) | | | — | |
Net assets | | $ | 172,440,175 | |
| | | | | |
Net assets consist of: |
Paid in capital | | $ | 148,271,904 | |
Total distributable earnings (loss) | | | 24,168,271 | |
Net assets | | $ | 172,440,175 | |
Capital shares outstanding | | | 2,524,259 | |
Net asset value per share | | $ | 68.31 | |
STATEMENT OF OPERATIONS |
Year Ended December 31, 2020 |
Investment Income: |
Dividends from securities of unaffiliated issuers (net of foreign withholding tax of $149) | | $ | 4,651,706 | |
Interest | | | 19,798 | |
Total investment income | | | 4,671,504 | |
| | | | | |
Expenses: |
Management fees | | | 1,186,622 | |
Distribution and service fees | | | 395,541 | |
Transfer agent/maintenance fees | | | 25,259 | |
Fund accounting/administration fees | | | 122,614 | |
Professional fees | | | 75,811 | |
Trustees’ fees* | | | 21,594 | |
Custodian fees | | | 7,976 | |
Line of credit fees | | | 4,265 | |
Miscellaneous | | | 84,567 | |
Total expenses | | | 1,924,249 | |
Less: |
Expenses waived by Adviser | | | (493,187 | ) |
Net expenses | | | 1,431,062 | |
Net investment income | | | 3,240,442 | |
| | | | | |
Net Realized and Unrealized Gain (Loss): |
Net realized gain (loss) on: |
Investments in unaffiliated issuers | | | (3,032,217 | ) |
Net realized loss | | | (3,032,217 | ) |
Net change in unrealized appreciation (depreciation) on: |
Investments in unaffiliated issuers | | | 2,945,264 | |
Net change in unrealized appreciation (depreciation) | | | 2,945,264 | |
Net realized and unrealized loss | | | (86,953 | ) |
Net increase in net assets resulting from operations | | $ | 3,153,489 | |
* | Relates to Trustees not deemed “interested persons” within the meaning of Section 2(a)(19) of the 1940 Act. |
130 | THE GUGGENHEIM FUNDS ANNUAL REPORT | SEE NOTES TO FINANCIAL STATEMENTS. |
SERIES V (SMID CAP VALUE SERIES) | |
STATEMENTS OF CHANGES IN NET ASSETS |
| | Year Ended
December 31,
2020 | | | Year Ended
December 31,
2019 | |
Increase (Decrease) in Net Assets from Operations: | | | | | | | | |
Net investment income | | $ | 3,240,442 | | | $ | 1,903,230 | |
Net realized gain (loss) on investments | | | (3,032,217 | ) | | | 8,101,780 | |
Net change in unrealized appreciation (depreciation) on investments | | | 2,945,264 | | | | 34,429,097 | |
Net increase in net assets resulting from operations | | | 3,153,489 | | | | 44,434,107 | |
| | | | | | | | | |
Distributions to shareholders | | | (8,192,481 | ) | | | (21,621,842 | ) |
| | | | | | | | | |
Capital share transactions: | | | | | | | | |
Proceeds from sale of shares | | | 3,673,402 | | | | 5,292,322 | |
Distributions reinvested | | | 8,192,481 | | | | 21,621,842 | |
Cost of shares redeemed | | | (29,593,956 | ) | | | (30,631,827 | ) |
Net decrease from capital share transactions | | | (17,728,073 | ) | | | (3,717,663 | ) |
Net increase (decrease) in net assets | | | (22,767,065 | ) | | | 19,094,602 | |
| | | | | | | | | |
Net assets: | | | | | | | | |
Beginning of year | | | 195,207,240 | | | | 176,112,638 | |
End of year | | $ | 172,440,175 | | | $ | 195,207,240 | |
| | | | | | | | | |
Capital share activity: | | | | | | | | |
Shares sold | | | 65,752 | | | | 81,079 | |
Shares issued from reinvestment of distributions | | | 145,257 | | | | 342,497 | |
Shares redeemed | | | (508,289 | ) | | | (456,487 | ) |
Net decrease in shares | | | (297,280 | ) | | | (32,911 | ) |
SEE NOTES TO FINANCIAL STATEMENTS. | THE GUGGENHEIM FUNDS ANNUAL REPORT | 131 |
SERIES V (SMID CAP VALUE SERIES) | |
This table is presented to show selected data for a share outstanding throughout each period and to assist shareholders in evaluating a Fund’s performance for the periods presented.
| | Year Ended
December 31,
2020 | | | Year Ended
December 31,
2019 | | | Year Ended
December 31,
2018 | | | Year Ended
December 31,
2017 | | | Year Ended
December 31,
2016 | |
Per Share Data |
Net asset value, beginning of period | | $ | 69.18 | | | $ | 61.70 | | | $ | 82.36 | | | $ | 74.35 | | | $ | 65.74 | |
Income (loss) from investment operations: |
Net investment income (loss)a | | | 1.21 | | | | .68 | | | | .53 | | | | (.16 | ) | | | .99 | |
Net gain (loss) on investments (realized and unrealized) | | | 1.10 | e | | | 15.01 | | | | (9.07 | ) | | | 10.16 | | | | 15.50 | |
Total from investment operations | | | 2.31 | | | | 15.69 | | | | (8.54 | ) | | | 10.00 | | | | 16.49 | |
Less distributions from: |
Net investment income | | | (.77 | ) | | | (.64 | ) | | | (.49 | ) | | | (.52 | ) | | | (.68 | ) |
Net realized gains | | | (2.41 | ) | | | (7.57 | ) | | | (11.63 | ) | | | (1.47 | ) | | | (7.20 | ) |
Total distributions | | | (3.18 | ) | | | (8.21 | ) | | | (12.12 | ) | | | (1.99 | ) | | | (7.88 | ) |
Net asset value, end of period | | $ | 68.31 | | | $ | 69.18 | | | $ | 61.70 | | | $ | 82.36 | | | $ | 74.35 | |
|
Total Returnb | | | 4.30 | % | | | 26.70 | % | | | (12.97 | %) | | | 13.71 | % | | | 26.75 | % |
Ratios/Supplemental Data |
Net assets, end of period (in thousands) | | $ | 172,440 | | | $ | 195,207 | | | $ | 176,113 | | | $ | 242,217 | | | $ | 248,062 | |
Ratios to average net assets: |
Net investment income (loss) | | | 2.05 | % | | | 1.01 | % | | | 0.68 | % | | | (0.21 | %) | | | 1.46 | % |
Total expenses | | | 1.22 | % | | | 1.19 | % | | | 1.19 | % | | | 1.10 | % | | | 0.93 | % |
Net expensesc,d | | | 0.90 | % | | | 0.91 | % | | | 0.91 | % | | | 0.91 | % | | | 0.93 | % |
Portfolio turnover rate | | | 38 | % | | | 41 | % | | | 65 | % | | | 54 | % | | | 60 | % |
a | Net investment income (loss) per share was computed using average shares outstanding throughout the period. |
b | Total return does not take into account any of the expenses associated with an investment in variable insurance products. If total return had taken into account these expenses, performance would have been lower. Shares of a series of Guggenheim Variable Funds Trust are available only through the purchase of such products. |
c | Net expense information reflects the expense ratios after expense waivers and reimbursements, as applicable. |
d | Net expenses may include expenses that are excluded from the expense limitation agreement. Excluding these expenses, the net expense ratios for the years presented would be: |
| | 12/31/20 | 12/31/19 | 12/31/18 | 12/31/17 | 12/31/16 |
| | 0.90% | 0.91% | 0.91% | 0.89% | 0.93% |
e | The amount shown for a share outstanding throughout the period does not agree with the aggregate net loss on investments for the period because of the sales and repurchases of fund shares in relation to fluctuating market value of the investments of the Fund. |
132 | THE GUGGENHEIM FUNDS ANNUAL REPORT | SEE NOTES TO FINANCIAL STATEMENTS. |
MANAGERS’ COMMENTARY (Unaudited) | December 31, 2020 |
To Our Shareholders:
The Series X (StylePlusTM—Small Growth Series) is managed by a team of seasoned professionals, including Farhan Sharaff, Senior Managing Director and Assistant Chief Investment Officer, Equities; Qi Yan, Managing Director and Portfolio Manager; and Adam J. Bloch, Managing Director and Portfolio Manager. In the following paragraphs, the investment team discusses performance of the Fund for the fiscal year ended December 31, 2020.
For the year ended December 31, 2020, Series X (StylePlus—Small Growth Series) returned 31.82%, compared with the 34.63% return of its benchmark, the Russell 2000® Growth Index.
Investment Approach
Through a combination of actively managed individual equity, passive equity, and actively managed fixed income, the Fund seeks to exceed the total return of the Russell 2000 Growth Index. The actively managed equity and fixed income components seek to provide multiple sources of outperformance and take advantage of Guggenheim’s competencies in both fixed income and systematic stock selection.
The active and passive decisions seek to add value by tactically allocating to actively managed equity through quantitative selection models when stock picking opportunities are high. During periods when Guggenheim views these opportunities to be less attractive, the Fund seeks to increase its passive exposure to equities and the allocation to fixed income securities. The prospective return during such periods is the equity index plus an “alpha” component coming from the yield of the fixed income overlay.
Performance Review
Over the period, from 15-25% of the total equity position was allocated to actively managed equity and 75-85% to passive equity. Remaining Fund assets were invested in the Guggenheim Strategy Funds, short-term fixed income investment companies advised by Guggenheim Investments, and the Guggenheim Ultra Short Duration Fund, whose objective is to seek a high level of income consistent with the preservation of capital.
The Fund underperformed the Russell 2000 Growth Index for the fiscal year ended December 31, 2020 by 281 basis points net of fees. The fixed income sleeve contributed to total return, as positions in the Guggenheim Ultra Short Duration Fund and the Guggenheim Strategy Funds, net of the investment income earned by these positions, were positive for the period. The actively managed equity sleeve detracted from performance on a relative basis. The passive equity position, maintained through swap agreements and futures contracts, had an insignificant impact on relative performance for the period.
Performance displayed represents past performance which is no guarantee of future results.
The opinions and forecast expressed may not actually come to pass. This information is subject to change at any time, based on market and other conditions, and should not be construed as a recommendation of any specific security or strategy.
| | THE GUGGENHEIM FUNDS ANNUAL REPORT | 133 |
PERFORMANCE REPORT AND FUND PROFILE (Unaudited) | December 31, 2020 |
SERIES X (STYLEPLUS—SMALL GROWTH SERIES)
OBJECTIVE: Seeks long-term growth of capital.
Holdings Diversification (Market Exposure as % of Net Assets)
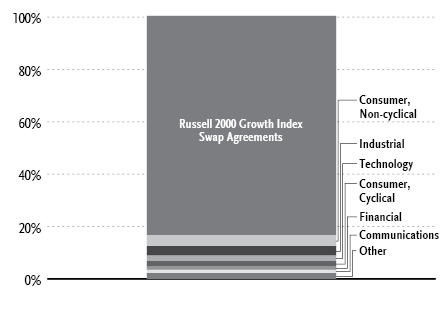
“Holdings Diversification (Market Exposure as % of Net Assets)” excludes any temporary cash investments, investments in Guggenheim Strategy Funds Trust mutual funds, or investments in Guggenheim Ultra Short Duration Fund.
Inception Date: October 15, 1997 |
Ten Largest Holdings (% of Total Net Assets) |
Guggenheim Ultra Short Duration Fund — Institutional Class | 28.4% |
Guggenheim Strategy Fund III | 20.7% |
Guggenheim Variable Insurance Strategy Fund III | 20.7% |
Guggenheim Strategy Fund II | 11.2% |
Viavi Solutions, Inc. | 0.3% |
UFP Industries, Inc. | 0.2% |
NeoGenomics, Inc. | 0.2% |
Gentherm, Inc. | 0.2% |
La-Z-Boy, Inc. | 0.2% |
Omnicell, Inc. | 0.2% |
Top Ten Total | 82.3% |
| | |
“Ten Largest Holdings” excludes any temporary cash or derivative investments. |
134 | THE GUGGENHEIM FUNDS ANNUAL REPORT | |
PERFORMANCE REPORT AND FUND PROFILE (Unaudited)(concluded) | December 31, 2020 |
Cumulative Fund Performance*,†

Average Annual Returns*,†
Periods Ended December 31, 2020
| 1 Year | 5 Year | 10 Year |
Series X (StylePlus—Small Growth Series) | 31.82% | 15.59% | 13.10% |
Russell 2000 Growth Index | 34.63% | 16.36% | 13.48% |
* | The performance data above represents past performance that is not predictive of future results. The investment return and principal value of an investment in the Fund will fluctuate so that an investor’s shares, when redeemed, may be worth more or less than their original cost. Returns are historical and include changes in principal and reinvested dividends and capital gains and do not reflect the effect of taxes. The Russell 2000 Growth Index is an unmanaged index and, unlike the Fund, has no management fees or operating expenses to reduce its reported return. |
† | Performance figures do not reflect fees and expenses associated with an investment in variable insurance products. If returns had taken into account these fees and expenses, performance would have been lower. Shares of a series of Guggenheim Variable Funds Trust are available only through the purchase of such products. |
| | THE GUGGENHEIM FUNDS ANNUAL REPORT | 135 |
SCHEDULE OF INVESTMENTS | December 31, 2020 |
SERIES X (STYLEPLUS—SMALL GROWTH SERIES) | |
| | Shares | | | Value | |
COMMON STOCKS† - 14.8% |
| | | | | | | | | |
Consumer, Non-cyclical - 4.1% |
NeoGenomics, Inc.* | | | 1,252 | | | $ | 67,408 | |
Omnicell, Inc.* | | | 480 | | | | 57,610 | |
Post Holdings, Inc.* | | | 551 | | | | 55,656 | |
Alarm.com Holdings, Inc.* | | | 483 | | | | 49,966 | |
R1 RCM, Inc.* | | | 1,997 | | | | 47,968 | |
Select Medical Holdings Corp.* | | | 1,604 | | | | 44,367 | |
Ensign Group, Inc. | | | 584 | | | | 42,585 | |
Vector Group Ltd. | | | 3,455 | | | | 40,251 | |
Innoviva, Inc.* | | | 3,235 | | | | 40,082 | |
Rent-A-Center, Inc. | | | 1,026 | | | | 39,286 | |
Corcept Therapeutics, Inc.* | | | 1,480 | | | | 38,717 | |
CONMED Corp. | | | 338 | | | | 37,856 | |
Integra LifeSciences Holdings Corp.* | | | 579 | | | | 37,589 | |
Coca-Cola Consolidated, Inc. | | | 138 | | | | 36,745 | |
Amphastar Pharmaceuticals, Inc.* | | | 1,764 | | | | 35,474 | |
EVERTEC, Inc. | | | 846 | | | | 33,265 | |
Eagle Pharmaceuticals, Inc.* | | | 702 | | | | 32,692 | |
Orthofix Medical, Inc.* | | | 742 | | | | 31,891 | |
Enanta Pharmaceuticals, Inc.* | | | 747 | | | | 31,449 | |
AMN Healthcare Services, Inc.* | | | 456 | | | | 31,122 | |
Medifast, Inc. | | | 147 | | | | 28,862 | |
CorVel Corp.* | | | 272 | | | | 28,832 | |
US Physical Therapy, Inc. | | | 238 | | | | 28,619 | |
Merit Medical Systems, Inc.* | | | 510 | | | | 28,310 | |
Vanda Pharmaceuticals, Inc.* | | | 2,141 | | | | 28,133 | |
Green Dot Corp. — Class A* | | | 496 | | | | 27,677 | |
Addus HomeCare Corp.* | | | 233 | | | | 27,282 | |
Surmodics, Inc.* | | | 625 | | | | 27,200 | |
MEDNAX, Inc.* | | | 1,104 | | | | 27,092 | |
Supernus Pharmaceuticals, Inc.* | | | 1,036 | | | | 26,066 | |
Coherus Biosciences, Inc.* | | | 1,449 | | | | 25,184 | |
Hill-Rom Holdings, Inc. | | | 247 | | | | 24,198 | |
Anika Therapeutics, Inc.* | | | 511 | | | | 23,128 | |
Glaukos Corp.* | | | 299 | | | | 22,503 | |
ICU Medical, Inc.* | | | 98 | | | | 21,020 | |
Perdoceo Education Corp.* | | | 1,652 | | | | 20,865 | |
Syneos Health, Inc.* | | | 293 | | | | 19,962 | |
Deluxe Corp. | | | 650 | | | | 18,980 | |
HMS Holdings Corp.* | | | 514 | | | | 18,889 | |
Varex Imaging Corp.* | | | 1,096 | | | | 18,281 | |
RadNet, Inc.* | | | 931 | | | | 18,220 | |
Exelixis, Inc.* | | | 894 | | | | 17,942 | |
Covetrus, Inc.* | | | 606 | | | | 17,416 | |
Ligand Pharmaceuticals, Inc. — Class B* | | | 174 | | | | 17,304 | |
Emergent BioSolutions, Inc.* | | | 193 | | | | 17,293 | |
Providence Service Corp.* | | | 124 | | | | 17,190 | |
Pacira BioSciences, Inc.* | | | 281 | | | | 16,815 | |
Xencor, Inc.* | | | 383 | | | | 16,710 | |
John B Sanfilippo & Son, Inc. | | | 210 | | | | 16,561 | |
B&G Foods, Inc. | | | 575 | | | | 15,945 | |
Natus Medical, Inc.* | | | 725 | | | | 14,529 | |
WD-40 Co. | | | 43 | | | | 11,424 | |
Cytokinetics, Inc.* | | | 535 | | | | 11,117 | |
Owens & Minor, Inc. | | | 401 | | | | 10,847 | |
Total Consumer, Non-cyclical | | | | | | | 1,542,375 | |
| | | | | | | | | |
Industrial - 3.6% |
UFP Industries, Inc. | | | 1,328 | | | | 73,770 | |
Brady Corp. — Class A | | | 1,086 | | | | 57,362 | |
Advanced Energy Industries, Inc.* | | | 558 | | | | 54,109 | |
Applied Industrial Technologies, Inc. | | | 610 | | | | 47,574 | |
Mueller Industries, Inc. | | | 1,339 | | | | 47,012 | |
Saia, Inc.* | | | 259 | | | | 46,827 | |
Chart Industries, Inc.* | | | 393 | | | | 46,292 | |
Watts Water Technologies, Inc. — Class A | | | 376 | | | | 45,759 | |
Franklin Electric Company, Inc. | | | 626 | | | | 43,326 | |
Exponent, Inc. | | | 462 | | | | 41,594 | |
Itron, Inc.* | | | 433 | | | | 41,525 | |
Fabrinet* | | | 527 | | | | 40,890 | |
OSI Systems, Inc.* | | | 426 | | | | 39,712 | |
Aerojet Rocketdyne Holdings, Inc.* | | | 741 | | | | 39,162 | |
SPX Corp.* | | | 717 | | | | 39,105 | |
John Bean Technologies Corp. | | | 333 | | | | 37,919 | |
AGCO Corp. | | | 359 | | | | 37,009 | |
Plexus Corp.* | | | 467 | | | | 36,524 | |
Jabil, Inc. | | | 826 | | | | 35,130 | |
Comfort Systems USA, Inc. | | | 644 | | | | 33,913 | |
Tennant Co. | | | 444 | | | | 31,156 | |
Moog, Inc. — Class A | | | 381 | | | | 30,213 | |
SPX FLOW, Inc.* | | | 517 | | | | 29,965 | |
Federal Signal Corp. | | | 836 | | | | 27,730 | |
Oshkosh Corp. | | | 318 | | | | 27,370 | |
EMCOR Group, Inc. | | | 299 | | | | 27,346 | |
Matson, Inc. | | | 475 | | | | 27,061 | |
Timken Co. | | | 347 | | | | 26,844 | |
Patrick Industries, Inc. | | | 359 | | | | 24,538 | |
Apogee Enterprises, Inc. | | | 719 | | | | 22,778 | |
Proto Labs, Inc.* | | | 143 | | | | 21,936 | |
MasTec, Inc.* | | | 320 | | | | 21,817 | |
American Woodmark Corp.* | | | 218 | | | | 20,459 | |
Energizer Holdings, Inc. | | | 457 | | | | 19,276 | |
KBR, Inc. | | | 620 | | | | 19,177 | |
MYR Group, Inc.* | | | 307 | | | | 18,451 | |
Hillenbrand, Inc. | | | 453 | | | | 18,029 | |
Encore Wire Corp. | | | 287 | | | | 17,384 | |
Comtech Telecommunications Corp. | | | 813 | | | | 16,821 | |
Knowles Corp.* | | | 881 | | | | 16,237 | |
Barnes Group, Inc. | | | 315 | | | | 15,968 | |
Badger Meter, Inc. | | | 126 | | | | 11,851 | |
Total Industrial | | | | | | | 1,376,921 | |
| | | | | | | | | |
Technology - 2.1% |
Brooks Automation, Inc. | | | 780 | | | | 52,923 | |
Power Integrations, Inc. | | | 630 | | | | 51,572 | |
Progress Software Corp. | | | 1,111 | | | | 50,206 | |
FormFactor, Inc.* | | | 1,086 | | | | 46,720 | |
LivePerson, Inc.* | | | 743 | | | | 46,237 | |
ExlService Holdings, Inc.* | | | 525 | | | | 44,693 | |
Diodes, Inc.* | | | 620 | | | | 43,710 | |
136 | THE GUGGENHEIM FUNDS ANNUAL REPORT | SEE NOTES TO FINANCIAL STATEMENTS. |
SCHEDULE OF INVESTMENTS (continued) | December 31, 2020 |
SERIES X (STYLEPLUS—SMALL GROWTH SERIES) | |
| | Shares | | | Value | |
8x8, Inc.* | | | 1,190 | | | $ | 41,019 | |
Rambus, Inc.* | | | 2,163 | | | | 37,766 | |
CSG Systems International, Inc. | | | 830 | | | | 37,408 | |
ManTech International Corp. — Class A | | | 397 | | | | 35,309 | |
Xperi Holding Corp. | | | 1,569 | | | | 32,792 | |
Kulicke & Soffa Industries, Inc. | | | 914 | | | | 29,074 | |
Allscripts Healthcare Solutions, Inc.* | | | 1,975 | | | | 28,519 | |
CDK Global, Inc. | | | 485 | | | | 25,138 | |
Teradata Corp.* | | | 1,098 | | | | 24,672 | |
Insight Enterprises, Inc.* | | | 308 | | | | 23,436 | |
Veeco Instruments, Inc.* | | | 1,269 | | | | 22,030 | |
Cirrus Logic, Inc.* | | | 241 | | | | 19,810 | |
Perspecta, Inc. | | | 761 | | | | 18,325 | |
Synaptics, Inc.* | | | 185 | | | | 17,834 | |
Axcelis Technologies, Inc.* | | | 603 | | | | 17,559 | |
J2 Global, Inc.* | | | 176 | | | | 17,193 | |
NextGen Healthcare, Inc.* | | | 912 | | | | 16,635 | |
Sykes Enterprises, Inc.* | | | 393 | | | | 14,804 | |
MaxLinear, Inc. — Class A* | | | 339 | | | | 12,947 | |
Total Technology | | | | | | | 808,331 | |
| | | | | | | | | |
Consumer, Cyclical - 2.1% |
Gentherm, Inc.* | | | 984 | | | | 64,176 | |
La-Z-Boy, Inc. | | | 1,593 | | | | 63,465 | |
YETI Holdings, Inc.* | | | 841 | | | | 57,583 | |
Crocs, Inc.* | | | 778 | | | | 48,749 | |
Meritage Homes Corp.* | | | 573 | | | | 47,456 | |
LCI Industries | | | 344 | | | | 44,610 | |
Methode Electronics, Inc. | | | 1,013 | | | | 38,778 | |
MDC Holdings, Inc. | | | 746 | | | | 36,256 | |
Sleep Number Corp.* | | | 433 | | | | 35,446 | |
LGI Homes, Inc.* | | | 316 | | | | 33,449 | |
Albany International Corp. — Class A | | | 406 | | | | 29,808 | |
Callaway Golf Co. | | | 1,142 | | | | 27,420 | |
Installed Building Products, Inc.* | | | 266 | | | | 27,113 | |
Steven Madden Ltd. | | | 744 | | | | 26,278 | |
GMS, Inc.* | | | 802 | | | | 24,445 | |
iRobot Corp.* | | | 255 | | | | 20,474 | |
Winnebago Industries, Inc. | | | 328 | | | | 19,660 | |
Universal Electronics, Inc.* | | | 355 | | | | 18,623 | |
Brunswick Corp. | | | 241 | | | | 18,374 | |
Polaris, Inc. | | | 187 | | | | 17,817 | |
Dorman Products, Inc.* | | | 179 | | | | 15,541 | |
Meritor, Inc.* | | | 552 | | | | 15,406 | |
M/I Homes, Inc.* | | | 347 | | | | 15,369 | |
Century Communities, Inc.* | | | 339 | | | | 14,841 | |
Shake Shack, Inc. — Class A* | | | 130 | | | | 11,022 | |
Big Lots, Inc. | | | 240 | | | | 10,303 | |
UniFirst Corp. | | | 26 | | | | 5,504 | |
Total Consumer, Cyclical | | | | | | | 787,966 | |
| | | | | | | | | |
Financial - 1.2% |
Axos Financial, Inc.* | | | 1,373 | | | | 51,528 | |
Stifel Financial Corp. | | | 977 | | | | 49,300 | |
Trupanion, Inc.* | | | 389 | | | | 46,567 | |
ServisFirst Bancshares, Inc. | | | 857 | | | | 34,529 | |
NMI Holdings, Inc. — Class A* | | | 1,373 | | | | 31,099 | |
AMERISAFE, Inc. | | | 477 | | | | 27,394 | |
TrustCo Bank Corp. NY | | | 3,656 | | | | 24,385 | |
James River Group Holdings Ltd. | | | 474 | | | | 23,297 | |
eHealth, Inc.* | | | 302 | | | | 21,324 | |
Safety Insurance Group, Inc. | | | 260 | | | | 20,254 | |
Preferred Bank/Los Angeles CA | | | 359 | | | | 18,119 | |
National Storage Affiliates Trust REIT | | | 477 | | | | 17,186 | |
Innovative Industrial Properties, Inc. REIT | | | 90 | | | | 16,482 | |
Independent Bank Corp. | | | 218 | | | | 15,923 | |
Uniti Group, Inc. REIT | | | 1,207 | | | | 14,158 | |
Mr Cooper Group, Inc.* | | | 376 | | | | 11,667 | |
PRA Group, Inc.* | | | 294 | | | | 11,660 | |
Virtus Investment Partners, Inc. | | | 53 | | | | 11,501 | |
Walker & Dunlop, Inc. | | | 123 | | | | 11,318 | |
Community Bank System, Inc. | | | 154 | | | | 9,596 | |
Essential Properties Realty Trust, Inc. REIT | | | 267 | | | | 5,660 | |
Agree Realty Corp. REIT | | | 60 | | | | 3,995 | |
Total Financial | | | | | | | 476,942 | |
| | | | | | | | | |
Communications - 0.9% |
Viavi Solutions, Inc.* | | | 6,457 | | | | 96,694 | |
HealthStream, Inc.* | | | 1,894 | | | | 41,365 | |
Vonage Holdings Corp.* | | | 2,982 | | | | 38,393 | |
Cogent Communications Holdings, Inc. | | | 625 | | | | 37,419 | |
Stamps.com, Inc.* | | | 180 | | | | 35,314 | |
Iridium Communications, Inc.* | | | 692 | | | | 27,213 | |
Ciena Corp.* | | | 420 | | | | 22,197 | |
Shutterstock, Inc. | | | 298 | | | | 21,367 | |
Shenandoah Telecommunications Co. | | | 342 | | | | 14,791 | |
Total Communications | | | | | | | 334,753 | |
| | | | | | | | | |
Basic Materials - 0.4% |
Cleveland-Cliffs, Inc. | | | 3,807 | | | | 55,430 | |
Quaker Chemical Corp. | | | 134 | | | | 33,954 | |
Livent Corp.* | | | 1,681 | | | | 31,670 | |
Rogers Corp.* | | | 175 | | | | 27,176 | |
Balchem Corp. | | | 149 | | | | 17,168 | |
Total Basic Materials | | | | | | | 165,398 | |
| | | | | | | | | |
Utilities - 0.3% |
IDACORP, Inc. | | | 383 | | | | 36,779 | |
ONE Gas, Inc. | | | 340 | | | | 26,102 | |
Hawaiian Electric Industries, Inc. | | | 561 | | | | 19,854 | |
American States Water Co. | | | 197 | | | | 15,664 | |
Total Utilities | | | | | | | 98,399 | |
| | | | | | | | | |
Energy - 0.1% |
Renewable Energy Group, Inc.* | | | 308 | | | | 21,813 | |
| | | | | | | | | |
Total Common Stocks | | | | |
(Cost $4,663,829) | | | | | | | 5,612,898 | |
| | | | | | | | | |
SEE NOTES TO FINANCIAL STATEMENTS. | THE GUGGENHEIM FUNDS ANNUAL REPORT | 137 |
SCHEDULE OF INVESTMENTS (continued) | December 31, 2020 |
SERIES X (STYLEPLUS—SMALL GROWTH SERIES) | |
| | Shares | | | Value | |
MUTUAL FUNDS† - 81.0% |
Guggenheim Ultra Short Duration Fund — Institutional Class1 | | | 1,080,910 | | | $ | 10,787,486 | |
Guggenheim Strategy Fund III1 | | | 314,015 | | | | 7,881,769 | |
Guggenheim Variable Insurance Strategy Fund III1 | | | 314,336 | | | | 7,870,976 | |
Guggenheim Strategy Fund II1 | | | 169,740 | | | | 4,236,714 | |
Total Mutual Funds | | | | |
(Cost $30,616,601) | | | | | | | 30,776,945 | |
| | | | | | | | | |
MONEY MARKET FUND† - 4.6% |
Dreyfus Treasury Securities Cash Management Fund — Institutional Shares, 0.01%2 | | | 1,749,876 | | | | 1,749,876 | |
Total Money Market Fund | | | | |
(Cost $1,749,876) | | | | | | | 1,749,876 | |
| | | | | | | | | |
Total Investments - 100.4% | | | | |
(Cost $37,030,306) | | $ | 38,139,719 | |
Other Assets & Liabilities, net - (0.4)% | | | (150,888 | ) |
Total Net Assets - 100.0% | | $ | 37,988,831 | |
Futures Contracts |
Description | | Number of
Contracts | | | Expiration
Date | | | Notional
Amount | | | Value and
Unrealized
Appreciation** | |
Equity Futures Contracts Purchased† |
Russell 2000 Index Mini Futures Contracts | | | 3 | | | | Mar 2021 | | | $ | 296,130 | | | $ | 2,180 | |
S&P MidCap 400 Index Mini Futures Contracts | | | 1 | | | | Mar 2021 | | | | 230,260 | | | | 1,827 | |
| | | | | | | | | | | $ | 526,390 | | | $ | 4,007 | |
Total Return Swap Agreements |
Counterparty | Index | Financing
Rate Pay | Payment
Frequency | | Maturity
Date | | | Units | | | Notional
Amount | | | Value and
Unrealized
Appreciation | |
OTC Equity Index Swap Agreements†† |
Wells Fargo Bank, N.A. | Russell 2000 Growth Index | 0.23% (3 Month USD LIBOR) | At Maturity | | | 04/07/21 | | | | 21,909 | | | $ | 31,883,050 | | | $ | 6,983,538 | |
* | Non-income producing security. |
** | Includes cumulative appreciation (depreciation). Variation margin is reported within the Statement of Assets and Liabilities. |
† | Value determined based on Level 1 inputs — See Note 4. |
†† | Value determined based on Level 2 inputs — See Note 4. |
1 | Affiliated issuer. |
2 | Rate indicated is the 7-day yield as of December 31, 2020. |
| | LIBOR — London Interbank Offered Rate |
| | REIT — Real Estate Investment Trust |
| | |
| | See Sector Classification in Other Information section. |
138 | THE GUGGENHEIM FUNDS ANNUAL REPORT | SEE NOTES TO FINANCIAL STATEMENTS. |
SCHEDULE OF INVESTMENTS (concluded) | December 31, 2020 |
SERIES X (STYLEPLUS—SMALL GROWTH SERIES) | |
The following table summarizes the inputs used to value the Fund’s investments at December 31, 2020 (See Note 4 in the Notes to Financial Statements):
Investments in Securities (Assets) | | Level 1
Quoted
Prices | | | Level 2
Significant
Observable
Inputs | | | Level 3
Significant
Unobservable
Inputs | | | Total | |
Common Stocks | | $ | 5,612,898 | | | $ | — | | | $ | — | | | $ | 5,612,898 | |
Mutual Funds | | | 30,776,945 | | | | — | | | | — | | | | 30,776,945 | |
Money Market Fund | | | 1,749,876 | | | | — | | | | — | | | | 1,749,876 | |
Equity Futures Contracts** | | | 4,007 | | | | — | | | | — | | | | 4,007 | |
Equity Index Swap Agreements** | | | — | | | | 6,983,538 | | | | — | | | | 6,983,538 | |
Total Assets | | $ | 38,143,726 | | | $ | 6,983,538 | | | $ | — | | | $ | 45,127,264 | |
** | This derivative is reported as unrealized appreciation/depreciation at period end. |
Affiliated Transactions
Investments representing 5% or more of the outstanding voting shares of a company, or control of or by, or common control under Guggenheim Investments (“GI”), result in that company being considered an affiliated issuer, as defined in the 1940 Act.
The Fund may invest in certain of the underlying series of Guggenheim Strategy Funds Trust, including Guggenheim Strategy Fund II, Guggenheim Strategy Fund III, and Guggenheim Variable Insurance Strategy Fund III, (collectively, the “Short Term Investment Vehicles”), each of which are open-end management investment companies managed by GI. The Short Term Investment Vehicles, which launched on March 11, 2014, are offered as short term investment options only to mutual funds, trusts, and other accounts managed by GI and/or its affiliates, and are not available to the public. The Short Term Investment Vehicles pay no investment management fees. The Short Term Investment Vehicles’ annual report on Form N-CSR dated September 30, 2020, is available publicly or upon request. This information is available from the EDGAR database on the SEC’s website at https://www.sec.gov/Archives/edgar/data/1601445/000182126820000133/gug81042-ncsr.htm.
Transactions during the year ended December 31, 2020, in which the company is an affiliated issuer, were as follows:
Security Name | | Value
12/31/19 | | | Additions | | | Reductions | | | Realized
Gain (Loss) | | | Change in
Unrealized
Appreciation
(Depreciation) | | | Value
12/31/20 | | | Shares
12/31/20 | | | Investment
Income | |
Mutual Funds | | | | | | | | | | | | | | | | | | | | | | | | | | | | | | | | |
Guggenheim Strategy Fund II | | $ | 1,459,343 | | | $ | 3,557,665 | | | $ | (799,996 | ) | | $ | (5,157 | ) | | $ | 24,859 | | | $ | 4,236,714 | | | | 169,740 | | | $ | 37,459 | |
Guggenheim Strategy Fund III | | | 9,080,856 | | | | 153,495 | | | | (1,466,980 | ) | | | (18,053 | ) | | | 132,451 | | | | 7,881,769 | | | | 314,015 | | | | 153,038 | |
Guggenheim Ultra Short Duration Fund — Institutional Class | | | 3,975,718 | | | | 14,030,053 | | | | (7,362,964 | ) | | | 75,211 | | | | 69,468 | | | | 10,787,486 | | | | 1,080,910 | | | | 74,991 | |
Guggenheim Variable Insurance Strategy Fund III | | | 10,222,838 | | | | 151,625 | | | | (2,589,259 | ) | | | (25,452 | ) | | | 111,224 | | | | 7,870,976 | | | | 314,336 | | | | 151,357 | |
| | | $ | 24,738,755 | | | $ | 17,892,838 | | | $ | (12,219,199 | ) | | $ | 26,549 | | | $ | 338,002 | | | $ | 30,776,945 | | | | | | | $ | 416,845 | |
SEE NOTES TO FINANCIAL STATEMENTS. | THE GUGGENHEIM FUNDS ANNUAL REPORT | 139 |
SERIES X (STYLEPLUS—SMALL GROWTH SERIES) | |
STATEMENT OF ASSETS AND LIABILITIES |
December 31, 2020 |
Assets: |
Investments in unaffiliated issuers, at value (cost $6,413,705) | | $ | 7,362,774 | |
Investments in affiliated issuers, at value (cost $30,616,601) | | | 30,776,945 | |
Segregated cash with broker | | | 31,500 | |
Unrealized appreciation on OTC swap agreements | | | 6,983,538 | |
Prepaid expenses | | | 2,332 | |
Receivables: |
Fund shares sold | | | 40,898 | |
Dividends | | | 35,772 | |
Swap settlement | | | 17,493 | |
Interest | | | 19 | |
Total assets | | | 45,251,271 | |
| | | | | |
Liabilities: |
Segregated cash due to broker | | | 7,150,000 | |
Payable for: |
Securities purchased | | | 36,323 | |
Fund shares redeemed | | | 10,280 | |
Management fees | | | 9,935 | |
Distribution and service fees | | | 7,861 | |
Fund accounting/administration fees | | | 4,896 | |
Trustees’ fees* | | | 2,309 | |
Transfer agent/maintenance fees | | | 2,207 | |
Variation margin on futures contracts | | | 25 | |
Miscellaneous | | | 38,604 | |
Total liabilities | | | 7,262,440 | |
Commitments and contingent liabilities (Note 13) | | | — | |
Net assets | | $ | 37,988,831 | |
| | | | | |
Net assets consist of: |
Paid in capital | | $ | 28,504,724 | |
Total distributable earnings (loss) | | | 9,484,107 | |
Net assets | | $ | 37,988,831 | |
Capital shares outstanding | | | 845,884 | |
Net asset value per share | | $ | 44.91 | |
STATEMENT OF OPERATIONS |
Year Ended December 31, 2020 |
Investment Income: |
Dividends from securities of unaffiliated issuers (net of foreign withholding tax of $9) | | $ | 40,621 | |
Dividends from securities of affiliated issuers | | | 416,845 | |
Interest | | | 4,548 | |
Total investment income | | | 462,014 | |
| | | | | |
Expenses: |
Management fees | | | 226,585 | |
Distribution and service fees | | | 75,528 | |
Transfer agent/maintenance fees | | | 25,282 | |
Professional fees | | | 35,696 | |
Fund accounting/administration fees | | | 33,839 | |
Trustees’ fees* | | | 17,839 | |
Custodian fees | | | 12,570 | |
Interest expense | | | 5,681 | |
Line of credit fees | | | 806 | |
Miscellaneous | | | 23,970 | |
Total expenses | | | 457,796 | |
Less: |
Expenses reimbursed by Adviser | | | (2,389 | ) |
Expenses waived by Adviser | | | (142,449 | ) |
Total waived/reimbursed expenses | | | (144,838 | ) |
Net expenses | | | 312,958 | |
Net investment income | | | 149,056 | |
| | | | | |
Net Realized and Unrealized Gain (Loss): |
Net realized gain (loss) on: |
Investments in unaffiliated issuers | | | (535,399 | ) |
Investments in affiliated issuers | | | 26,549 | |
Swap agreements | | | 4,256,235 | |
Futures contracts | | | 418,018 | |
Net realized gain | | | 4,165,403 | |
Net change in unrealized appreciation (depreciation) on: |
Investments in unaffiliated issuers | | | 635,025 | |
Investments in affiliated issuers | | | 338,002 | |
Swap agreements | | | 3,728,811 | |
Futures contracts | | | (1,101 | ) |
Net change in unrealized appreciation (depreciation) | | | 4,700,737 | |
Net realized and unrealized gain | | | 8,866,140 | |
Net increase in net assets resulting from operations | | $ | 9,015,196 | |
* | Relates to Trustees not deemed “interested persons” within the meaning of Section 2(a)(19) of the 1940 Act. |
140 | THE GUGGENHEIM FUNDS ANNUAL REPORT | SEE NOTES TO FINANCIAL STATEMENTS. |
SERIES X (STYLEPLUS—SMALL GROWTH SERIES) | |
STATEMENTS OF CHANGES IN NET ASSETS |
| | Year Ended
December 31,
2020 | | | Year Ended
December 31,
2019 | |
Increase (Decrease) in Net Assets from Operations: | | | | | | | | |
Net investment income | | $ | 149,056 | | | $ | 396,214 | |
Net realized gain (loss) on investments | | | 4,165,403 | | | | (2,600,657 | ) |
Net change in unrealized appreciation (depreciation) on investments | | | 4,700,737 | | | | 9,373,826 | |
Net increase in net assets resulting from operations | | | 9,015,196 | | | | 7,169,383 | |
| | | | | | | | | |
Distributions to shareholders | | | (390,463 | ) | | | (3,561,318 | ) |
| | | | | | | | | |
Capital share transactions: | | | | | | | | |
Proceeds from sale of shares | | | 951,691 | | | | 1,854,292 | |
Distributions reinvested | | | 390,463 | | | | 3,561,318 | |
Cost of shares redeemed | | | (5,013,878 | ) | | | (4,632,150 | ) |
Net increase (decrease) from capital share transactions | | | (3,671,724 | ) | | | 783,460 | |
Net increase in net assets | | | 4,953,009 | | | | 4,391,525 | |
| | | | | | | | | |
Net assets: | | | | | | | | |
Beginning of year | | | 33,035,822 | | | | 28,644,297 | |
End of year | | $ | 37,988,831 | | | $ | 33,035,822 | |
| | | | | | | | | |
Capital share activity: | | | | | | | | |
Shares sold | | | 29,544 | | | | 55,734 | |
Shares issued from reinvestment of distributions | | | 11,666 | | | | 109,109 | |
Shares redeemed | | | (152,191 | ) | | | (135,747 | ) |
Net increase (decrease) in shares | | | (110,981 | ) | | | 29,096 | |
SEE NOTES TO FINANCIAL STATEMENTS. | THE GUGGENHEIM FUNDS ANNUAL REPORT | 141 |
SERIES X (STYLEPLUS—SMALL GROWTH SERIES) | |
This table is presented to show selected data for a share outstanding throughout each period and to assist shareholders in evaluating a Fund’s performance for the periods presented.
| | Year Ended
December 31,
2020 | | | Year Ended
December 31,
2019 | | | Year Ended
December 31,
2018 | | | Year Ended
December 31,
2017 | | | Year Ended
December 31,
2016 | |
Per Share Data |
Net asset value, beginning of period | | $ | 34.53 | | | $ | 30.87 | | | $ | 40.19 | | | $ | 33.08 | | | $ | 31.03 | |
Income (loss) from investment operations: |
Net investment income (loss)a | | | .17 | | | | .42 | | | | .56 | | | | .36 | | | | .25 | |
Net gain (loss) on investments (realized and unrealized) | | | 10.65 | | | | 7.28 | | | | (3.33 | ) | | | 7.02 | | | | 3.74 | |
Total from investment operations | | | 10.82 | | | | 7.70 | | | | (2.77 | ) | | | 7.38 | | | | 3.99 | |
Less distributions from: |
Net investment income | | | (.44 | ) | | | (.22 | ) | | | (.43 | ) | | | (.27 | ) | | | (.13 | ) |
Net realized gains | | | — | | | | (3.82 | ) | | | (6.12 | ) | | | — | | | | (1.81 | ) |
Total distributions | | | (.44 | ) | | | (4.04 | ) | | | (6.55 | ) | | | (.27 | ) | | | (1.94 | ) |
Net asset value, end of period | | $ | 44.91 | | | $ | 34.53 | | | $ | 30.87 | | | $ | 40.19 | | | $ | 33.08 | |
|
Total Returnb | | | 31.82 | % | | | 25.68 | % | | | (10.30 | %) | | | 22.38 | % | | | 13.45 | % |
Ratios/Supplemental Data |
Net assets, end of period (in thousands) | | $ | 37,989 | | | $ | 33,036 | | | $ | 28,644 | | | $ | 39,560 | | | $ | 34,216 | |
Ratios to average net assets: |
Net investment income (loss) | | | 0.49 | % | | | 1.24 | % | | | 1.42 | % | | | 0.99 | % | | | 0.83 | % |
Total expensesc | | | 1.50 | % | | | 1.62 | % | | | 1.47 | % | | | 1.37 | % | | | 1.23 | % |
Net expensesd,e | | | 1.02 | % | | | 1.11 | % | | | 1.12 | % | | | 1.10 | % | | | 1.23 | % |
Portfolio turnover rate | | | 86 | % | | | 59 | % | | | 65 | % | | | 50 | % | | | 76 | % |
a | Net investment income (loss) per share was computed using average shares outstanding throughout the period. |
b | Total return does not take into account any of the expenses associated with an investment in variable insurance products. If total return had taken into account these expenses, performance would have been lower. Shares of a series of Guggenheim Variable Funds Trust are available only through the purchase of such products. |
c | Does not include expenses of the underlying funds in which the Fund invests. |
d | Net expenses may include expenses that are excluded from the expense limitation agreement. Excluding these expenses, the net expense ratios for the years presented would be: |
| | 12/31/20 | 12/31/19 | 12/31/18 | 12/31/17 | 12/31/16 |
| | 1.01% | 1.03% | 1.06% | 1.09% | 1.23% |
e | The portion of the ratios of net expenses to average net assets attributable to recoupment of prior fee reductions or expenses reimbursements for the years presented was as follows: |
| | 12/31/20 | 12/31/19 | 12/31/18 | 12/31/17 | 12/31/16 |
| | — | — | 0.00%* | — | — |
142 | THE GUGGENHEIM FUNDS ANNUAL REPORT | SEE NOTES TO FINANCIAL STATEMENTS. |
MANAGERS’ COMMENTARY (Unaudited) | December 31, 2020 |
To Our Shareholders:
The Series Y (StylePlus TM—Large Growth Series) is managed by a team of seasoned professionals, including Farhan Sharaff, Senior Managing Director and Assistant Chief Investment Officer, Equities; Qi Yan, Managing Director and Portfolio Manager; and Adam J. Bloch, Managing Director and Portfolio Manager. In the following paragraphs, the investment team discusses performance of the Fund for the fiscal year ended December 31, 2020.
For the year ended December 31, 2020, Series Y (StylePlus—Large Growth Series) returned 37.87%, compared with the 38.49% return of its benchmark, the Russell 1000® Growth Index.
Investment Approach
Through a combination of actively managed individual equity, passive equity, and actively managed fixed income, the Fund seeks to exceed the total return of the Russell 1000 Growth Index. The actively managed equity and fixed income components seek to provide multiple sources of outperformance and take advantage of Guggenheim’s competencies in both fixed income and systematic stock selection.
The active and passive decisions seek to add value by tactically allocating to actively managed equity through quantitative selection models when stock picking opportunities are high. During periods when Guggenheim views these opportunities to be less attractive, the Fund seeks to increase its passive exposure to equities and the allocation to fixed income securities. The prospective return during such periods is the equity index plus an “alpha” component coming from the yield of the fixed income overlay.
Performance Review
Over the period, from 15-25% of the total equity position was allocated to actively managed equity and 75-85% to passive equity. Remaining Fund assets were invested in the Guggenheim Strategy Funds, short-term fixed income investment companies advised by Guggenheim Investments, and the Guggenheim Ultra Short Duration Fund, whose objective is to seek a high level of income consistent with the preservation of capital.
The Fund underperformed the Russell 1000 Growth Index for the fiscal year ended December 31, 2020 by 62 basis points net of fees. The fixed income sleeve contributed to total return, as positions in the Guggenheim Ultra Short Duration Fund and the Guggenheim Strategy Funds, net of the investment income earned by these positions, were positive for the period. The actively managed equity sleeve detracted from performance on a relative basis. The passive equity position, maintained through swap agreements and futures contracts, had an insignificant impact on relative performance for the period.
Performance displayed represents past performance which is no guarantee of future results.
The opinions and forecast expressed may not actually come to pass. This information is subject to change at any time, based on market and other conditions, and should not be construed as a recommendation of any specific security or strategy.
| | THE GUGGENHEIM FUNDS ANNUAL REPORT | 143 |
PERFORMANCE REPORT AND FUND PROFILE (Unaudited) | December 31, 2020 |
SERIES Y (STYLEPLUS—LARGE GROWTH SERIES)
OBJECTIVE: Seeks long-term growth of capital.
Holdings Diversification (Market Exposure as % of Net Assets)

“Holdings Diversification (Market Exposure as % of Net Assets)” excludes any temporary cash investments, investments in Guggenheim Strategy Funds Trust mutual funds, or investments in Guggenheim Ultra Short Duration Fund.
Inception Date: May 3, 1999 |
Ten Largest Holdings (% of Total Net Assets) |
Guggenheim Variable Insurance Strategy Fund III | 23.5% |
Guggenheim Strategy Fund III | 21.3% |
Guggenheim Ultra Short Duration Fund — Institutional Class | 18.2% |
Guggenheim Strategy Fund II | 14.4% |
Apple, Inc. | 1.9% |
Microsoft Corp. | 1.5% |
Amazon.com, Inc. | 1.2% |
Alphabet, Inc. — Class C | 1.0% |
Facebook, Inc. — Class A | 0.6% |
Johnson & Johnson | 0.3% |
Top Ten Total | 83.9% |
| | |
“Ten Largest Holdings” excludes any temporary cash or derivative investments. |
144 | THE GUGGENHEIM FUNDS ANNUAL REPORT | |
PERFORMANCE REPORT AND FUND PROFILE (Unaudited)(concluded) | December 31, 2020 |
Cumulative Fund Performance*,†
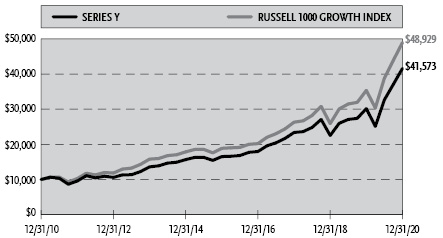
Average Annual Returns*,†
Periods Ended December 31, 2020
| 1 Year | 5 Year | 10 Year |
Series Y (StylePlus—Large Growth Series) | 37.87% | 20.27% | 15.31% |
Russell 1000 Growth Index | 38.49% | 21.00% | 17.21% |
* | The performance data above represents past performance that is not predictive of future results. The investment return and principal value of an investment in the Fund will fluctuate so that an investor’s shares, when redeemed, may be worth more or less than their original cost. Returns are historical and include changes in principal and reinvested dividends and capital gains and do not reflect the effect of taxes. The Russell 1000 Growth Index is an unmanaged index and, unlike the Fund, has no management fees or operating expenses to reduce its reported return. |
† | Performance figures do not reflect fees and expenses associated with an investment in variable insurance products. If returns had taken into account these fees and expenses, performance would have been lower. Shares of a series of Guggenheim Variable Funds Trust are available only through the purchase of such products. |
| | THE GUGGENHEIM FUNDS ANNUAL REPORT | 145 |
SCHEDULE OF INVESTMENTS | December 31, 2020 |
SERIES Y (STYLEPLUS—LARGE GROWTH SERIES) | |
| | Shares | | | Value | |
COMMON STOCKS† - 15.8% |
| | | | | | | | | |
Technology - 5.6% |
Apple, Inc. | | | 7,074 | | | $ | 938,649 | |
Microsoft Corp. | | | 3,405 | | | | 757,340 | |
Oracle Corp. | | | 1,768 | | | | 114,372 | |
Broadcom, Inc. | | | 245 | | | | 107,273 | |
NVIDIA Corp. | | | 186 | | | | 97,129 | |
Texas Instruments, Inc. | | | 477 | | | | 78,290 | |
Applied Materials, Inc. | | | 813 | | | | 70,162 | |
Adobe, Inc.* | | | 139 | | | | 69,517 | |
QUALCOMM, Inc. | | | 450 | | | | 68,553 | |
Cerner Corp. | | | 868 | | | | 68,120 | |
NetApp, Inc. | | | 1,015 | | | | 67,234 | |
Seagate Technology plc | | | 945 | | | | 58,741 | |
KLA Corp. | | | 203 | | | | 52,559 | |
Intel Corp. | | | 943 | | | | 46,980 | |
salesforce.com, Inc.* | | | 175 | | | | 38,943 | |
Skyworks Solutions, Inc. | | | 244 | | | | 37,303 | |
Microchip Technology, Inc. | | | 222 | | | | 30,661 | |
Advanced Micro Devices, Inc.* | | | 306 | | | | 28,063 | |
Citrix Systems, Inc. | | | 181 | | | | 23,548 | |
Cognizant Technology Solutions Corp. — Class A | | | 239 | | | | 19,586 | |
Total Technology | | | | | | | 2,773,023 | |
| | | | | | | | | |
Consumer, Non-cyclical - 4.0% |
Johnson & Johnson | | | 865 | | | | 136,134 | |
Procter & Gamble Co. | | | 964 | | | | 134,131 | |
PayPal Holdings, Inc.* | | | 495 | | | | 115,929 | |
Merck & Company, Inc. | | | 1,295 | | | | 105,931 | |
Eli Lilly & Co. | | | 587 | | | | 99,109 | |
AbbVie, Inc. | | | 876 | | | | 93,863 | |
Amgen, Inc. | | | 403 | | | | 92,658 | |
Bristol-Myers Squibb Co. | | | 1,444 | | | | 89,571 | |
Vertex Pharmaceuticals, Inc.* | | | 351 | | | | 82,955 | |
UnitedHealth Group, Inc. | | | 236 | | | | 82,760 | |
United Rentals, Inc.* | | | 350 | | | | 81,169 | |
Kimberly-Clark Corp. | | | 591 | | | | 79,684 | |
Quanta Services, Inc. | | | 1,063 | | | | 76,557 | |
Abbott Laboratories | | | 693 | | | | 75,877 | |
Colgate-Palmolive Co. | | | 885 | | | | 75,676 | |
Thermo Fisher Scientific, Inc. | | | 154 | | | | 71,730 | |
Tyson Foods, Inc. — Class A | | | 1,077 | | | | 69,402 | |
Regeneron Pharmaceuticals, Inc.* | | | 116 | | | | 56,041 | |
Campbell Soup Co. | | | 1,085 | | | | 52,460 | |
Dentsply Sirona, Inc. | | | 966 | | | | 50,580 | |
Hologic, Inc.* | | | 656 | | | | 47,776 | |
McKesson Corp. | | | 251 | | | | 43,654 | |
Altria Group, Inc. | | | 1,047 | | | | 42,927 | |
Incyte Corp.* | | | 396 | | | | 34,444 | |
Philip Morris International, Inc. | | | 364 | | | | 30,136 | |
Stryker Corp. | | | 110 | | | | 26,954 | |
Baxter International, Inc. | | | 290 | | | | 23,270 | |
Cardinal Health, Inc. | | | 417 | | | | 22,335 | |
Total Consumer, Non-cyclical | | | | | | | 1,993,713 | |
| | | | | | | | | |
Communications - 3.5% |
Amazon.com, Inc.* | | | 187 | | | | 609,046 | |
Alphabet, Inc. — Class C* | | | 278 | | | | 487,023 | |
Facebook, Inc. — Class A* | | | 1,019 | | | | 278,350 | |
Comcast Corp. — Class A | | | 1,759 | | | | 92,171 | |
Netflix, Inc.* | | | 118 | | | | 63,806 | |
Motorola Solutions, Inc. | | | 327 | | | | 55,610 | |
Corning, Inc. | | | 1,486 | | | | 53,496 | |
eBay, Inc. | | | 916 | | | | 46,029 | |
T-Mobile US, Inc.* | | | 180 | | | | 24,273 | |
Total Communications | | | | | | | 1,709,804 | |
| | | | | | | | | |
Consumer, Cyclical - 1.1% |
Lowe’s Companies, Inc. | | | 672 | | | | 107,863 | |
AutoZone, Inc.* | | | 74 | | | | 87,722 | |
Tesla, Inc.* | | | 119 | | | | 83,975 | |
Home Depot, Inc. | | | 237 | | | | 62,952 | |
PulteGroup, Inc. | | | 1,309 | | | | 56,444 | |
Cummins, Inc. | | | 153 | | | | 34,746 | |
PACCAR, Inc. | | | 303 | | | | 26,143 | |
Target Corp. | | | 127 | | | | 22,419 | |
LKQ Corp.* | | | 619 | | | | 21,814 | |
DR Horton, Inc. | | | 282 | | | | 19,435 | |
NIKE, Inc. — Class B | | | 108 | | | | 15,279 | |
Total Consumer, Cyclical | | | | | | | 538,792 | |
| | | | | | | | | |
Industrial - 0.9% |
TE Connectivity Ltd. | | | 710 | | | | 85,960 | |
Waters Corp.* | | | 278 | | | | 68,783 | |
PerkinElmer, Inc. | | | 465 | | | | 66,727 | |
Lockheed Martin Corp. | | | 177 | | | | 62,831 | |
Garmin Ltd. | | | 427 | | | | 51,095 | |
Caterpillar, Inc. | | | 279 | | | | 50,784 | |
Huntington Ingalls Industries, Inc. | | | 129 | | | | 21,992 | |
United Parcel Service, Inc. — Class B | | | 112 | | | | 18,861 | |
FedEx Corp. | | | 66 | | | | 17,135 | |
Total Industrial | | | | | | | 444,168 | |
| | | | | | | | | |
Financial - 0.7% |
Visa, Inc. — Class A | | | 411 | | | | 89,898 | |
Western Union Co. | | | 3,202 | | | | 70,252 | |
Ameriprise Financial, Inc. | | | 320 | | | | 62,185 | |
Mastercard, Inc. — Class A | | | 153 | | | | 54,612 | |
JPMorgan Chase & Co. | | | 228 | | | | 28,972 | |
Berkshire Hathaway, Inc. — Class B* | | | 95 | | | | 22,028 | |
BlackRock, Inc. — Class A | | | 17 | | | | 12,266 | |
Total Financial | | | | | | | 340,213 | |
| | | | | | | | | |
Total Common Stocks | | | | |
(Cost $6,054,024) | | | | | | | 7,799,713 | |
146 | THE GUGGENHEIM FUNDS ANNUAL REPORT | SEE NOTES TO FINANCIAL STATEMENTS. |
SCHEDULE OF INVESTMENTS (continued) | December 31, 2020 |
SERIES Y (STYLEPLUS—LARGE GROWTH SERIES) | |
| | Shares | | | Value | |
MUTUAL FUNDS† - 77.4% |
Guggenheim Variable Insurance Strategy Fund III1 | | | 463,320 | | | $ | 11,601,522 | |
Guggenheim Strategy Fund III1 | | | 419,660 | | | | 10,533,474 | |
Guggenheim Ultra Short Duration Fund — Institutional Class1 | | | 904,440 | | | | 9,026,315 | |
Guggenheim Strategy Fund II1 | | | 285,773 | | | | 7,132,904 | |
Total Mutual Funds | | | | |
(Cost $38,093,877) | | | | | | | 38,294,215 | |
| | | | | | | | | |
MONEY MARKET FUND† - 6.7% |
Dreyfus Treasury Securities Cash Management Fund — Institutional Shares, 0.01%2 | | | 3,327,792 | | | | 3,327,792 | |
Total Money Market Fund | | | | |
(Cost $3,327,792) | | | | | | | 3,327,792 | |
| | | | | | | | | |
Total Investments - 99.9% | | | | |
(Cost $47,475,693) | | $ | 49,421,720 | |
Other Assets & Liabilities, net - 0.1% | | | 55,782 | |
Total Net Assets - 100.0% | | $ | 49,477,502 | |
Futures Contracts |
Description | | Number of
Contracts | | | Expiration Date | | | Notional
Amount | | | Value and
Unrealized
Appreciation** | |
Equity Futures Contracts Purchased† |
NASDAQ-100 Index Mini Futures Contracts | | | 2 | | | | Mar 2021 | | | $ | 514,770 | | | $ | 5,161 | |
S&P 500 Index Mini Futures Contracts | | | 2 | | | | Mar 2021 | | | | 374,425 | | | | 2,895 | |
| | | | | | | | | | | $ | 889,195 | | | $ | 8,056 | |
Total Return Swap Agreements |
Counterparty | Index | Financing
Rate Pay | Payment
Frequency | | Maturity Date | | | Units | | | Notional
Amount | | | Value and
Unrealized
Appreciation | |
OTC Equity Index Swap Agreements†† |
Wells Fargo Bank, N.A. | Russell 1000 Growth Index | 0.41% (3 Month USD LIBOR + 0.18%) | At Maturity | | | 04/07/21 | | | | 16,764 | | | $ | 40,699,052 | | | $ | 4,398,136 | |
* | Non-income producing security. |
** | Includes cumulative appreciation (depreciation). Variation margin is reported within the Statement of Assets and Liabilities. |
† | Value determined based on Level 1 inputs — See Note 4. |
†† | Value determined based on Level 2 inputs — See Note 4. |
1 | Affiliated issuer. |
2 | Rate indicated is the 7-day yield as of December 31, 2020. |
| | LIBOR — London Interbank Offered Rate |
| | plc — Public Limited Company |
| | |
| | See Sector Classification in Other Information section. |
SEE NOTES TO FINANCIAL STATEMENTS. | THE GUGGENHEIM FUNDS ANNUAL REPORT | 147 |
SCHEDULE OF INVESTMENTS (concluded) | December 31, 2020 |
SERIES Y (STYLEPLUS—LARGE GROWTH SERIES) | |
The following table summarizes the inputs used to value the Fund’s investments at December 31, 2020 (See Note 4 in the Notes to Financial Statements):
Investments in Securities (Assets) | | Level 1
Quoted
Prices | | | Level 2
Significant
Observable
Inputs | | | Level 3
Significant
Unobservable
Inputs | | | Total | |
Common Stocks | | $ | 7,799,713 | | | $ | — | | | $ | — | | | $ | 7,799,713 | |
Mutual Funds | | | 38,294,215 | | | | — | | | | — | | | | 38,294,215 | |
Money Market Fund | | | 3,327,792 | | | | — | | | | — | | | | 3,327,792 | |
Equity Futures Contracts** | | | 8,056 | | | | — | | | | — | | | | 8,056 | |
Equity Index Swap Agreements** | | | — | | | | 4,398,136 | | | | — | | | | 4,398,136 | |
Total Assets | | $ | 49,429,776 | | | $ | 4,398,136 | | | $ | — | | | $ | 53,827,912 | |
** | This derivative is reported as unrealized appreciation/depreciation at period end. |
Affiliated Transactions
Investments representing 5% or more of the outstanding voting shares of a company, or control of or by, or common control under Guggenheim Investments (“GI”), result in that company being considered an affiliated issuer, as defined in the 1940 Act.
The Fund may invest in certain of the underlying series of Guggenheim Strategy Funds Trust, including Guggenheim Strategy Fund II, Guggenheim Strategy Fund III, and Guggenheim Variable Insurance Strategy Fund III, (collectively, the “Short Term Investment Vehicles”), each of which are open-end management investment companies managed by GI. The Short Term Investment Vehicles, which launched on March 11, 2014, are offered as short term investment options only to mutual funds, trusts, and other accounts managed by GI and/or its affiliates, and are not available to the public. The Short Term Investment Vehicles pay no investment management fees. The Short Term Investment Vehicles’ annual report on Form N-CSR dated September 30, 2020, is available publicly or upon request. This information is available from the EDGAR database on the SEC’s website at https://www.sec.gov/Archives/edgar/data/1601445/000182126820000133/gug81042-ncsr.htm.
Transactions during the year ended December 31, 2020, in which the company is an affiliated issuer, were as follows:
Security Name | | Value
12/31/19 | | | Additions | | | Reductions | | | Realized
Gain (Loss) | | | Change in
Unrealized
Appreciation
(Depreciation) | | | Value
12/31/20 | | | Shares
12/31/20 | | | Investment
Income | |
Mutual Funds | | | | | | | | | | | | | | | | | | | | | | | | | | | | | | | | |
Guggenheim Strategy Fund II | | $ | 3,464,697 | | | $ | 6,856,359 | | | $ | (3,219,977 | ) | | $ | (18,159 | ) | | $ | 49,984 | | | $ | 7,132,904 | | | | 285,773 | | | $ | 79,968 | |
Guggenheim Strategy Fund III | | | 10,177,783 | | | | 196,778 | | | | — | | | | — | | | | 158,913 | | | | 10,533,474 | | | | 419,660 | | | | 196,071 | |
Guggenheim Ultra Short Duration Fund — Institutional Class | | | 4,788,517 | | | | 13,582,229 | | | | (9,505,948 | ) | | | 71,945 | | | | 89,572 | | | | 9,026,315 | | | | 904,440 | | | | 101,116 | |
Guggenheim Variable Insurance Strategy Fund III | | | 11,437,229 | | | | 208,427 | | | | (167,970 | ) | | | (7,664 | ) | | | 131,500 | | | | 11,601,522 | | | | 463,320 | | | | 207,827 | |
| | | $ | 29,868,226 | | | $ | 20,843,793 | | | $ | (12,893,895 | ) | | $ | 46,122 | | | $ | 429,969 | | | $ | 38,294,215 | | | | | | | $ | 584,982 | |
148 | THE GUGGENHEIM FUNDS ANNUAL REPORT | SEE NOTES TO FINANCIAL STATEMENTS. |
SERIES Y (STYLEPLUS—LARGE GROWTH SERIES) | |
STATEMENT OF ASSETS AND LIABILITIES |
December 31, 2020 |
Assets: |
Investments in unaffiliated issuers, at value (cost $9,381,816) | | $ | 11,127,505 | |
Investments in affiliated issuers, at value (cost $38,093,877) | | | 38,294,215 | |
Cash | | | 260 | |
Segregated cash with broker | | | 54,000 | |
Unrealized appreciation on OTC swap agreements | | | 4,398,136 | |
Prepaid expenses | | | 2,674 | |
Receivables: |
Dividends | | | 51,629 | |
Swap settlement | | | 48,939 | |
Variation margin on futures contracts | | | 3,115 | |
Fund shares sold | | | 268 | |
Interest | | | 21 | |
Total assets | | | 53,980,762 | |
| | | | | |
Liabilities: |
Segregated cash due to broker | | | 4,370,000 | |
Payable for: |
Securities purchased | | | 49,266 | |
Management fees | | | 12,878 | |
Distribution and service fees | | | 10,175 | |
Fund accounting/administration fees | | | 5,495 | |
Transfer agent/maintenance fees | | | 2,260 | |
Trustees’ fees* | | | 1,606 | |
Fund shares redeemed | | | 925 | |
Miscellaneous | | | 50,655 | |
Total liabilities | | | 4,503,260 | |
Commitments and contingent liabilities (Note 13) | | | — | |
Net assets | | $ | 49,477,502 | |
| | | | | |
Net assets consist of: |
Paid in capital | | $ | 32,197,243 | |
Total distributable earnings (loss) | | | 17,280,259 | |
Net assets | | $ | 49,477,502 | |
Capital shares outstanding | | | 1,918,609 | |
Net asset value per share | | $ | 25.79 | |
STATEMENT OF OPERATIONS |
Year Ended December 31, 2020 |
Investment Income: |
Dividends from securities of unaffiliated issuers | | $ | 100,569 | |
Dividends from securities of affiliated issuers | | | 584,982 | |
Interest | | | 6,640 | |
Total investment income | | | 692,191 | |
| | | | | |
Expenses: |
Management fees | | | 275,463 | |
Distribution and service fees | | | 105,947 | |
Transfer agent/maintenance fees | | | 25,220 | |
Fund accounting/administration fees | | | 39,465 | |
Professional fees | | | 38,835 | |
Trustees’ fees* | | | 17,901 | |
Custodian fees | | | 13,873 | |
Interest Expense | | | 8,075 | |
Line of credit fees | | | 1,140 | |
Miscellaneous | | | 28,233 | |
Total expenses | | | 554,152 | |
Less: |
Expenses reimbursed by Adviser | | | (14 | ) |
Expenses waived by Adviser | | | (172,265 | ) |
Earnings credits applied | | | (386 | ) |
Total waived/reimbursed expenses | | | (172,665 | ) |
Net expenses | | | 381,487 | |
Net investment income | | | 310,704 | |
| | | | | |
Net Realized and Unrealized Gain (Loss): |
Net realized gain (loss) on: |
Investments in unaffiliated issuers | | | 703,890 | |
Investments in affiliated issuers | | | 46,122 | |
Swap agreements | | | 10,530,636 | |
Futures contracts | | | 742,384 | |
Net realized gain | | | 12,023,032 | |
Net change in unrealized appreciation (depreciation) on: |
Investments in unaffiliated issuers | | | 671,132 | |
Investments in affiliated issuers | | | 429,969 | |
Swap agreements | | | 691,341 | |
Futures contracts | | | (2,380 | ) |
Net change in unrealized appreciation (depreciation) | | | 1,790,062 | |
Net realized and unrealized gain | | | 13,813,094 | |
Net increase in net assets resulting from operations | | $ | 14,123,798 | |
* | Relates to Trustees not deemed “interested persons” within the meaning of Section 2(a)(19) of the 1940 Act. |
SEE NOTES TO FINANCIAL STATEMENTS. | THE GUGGENHEIM FUNDS ANNUAL REPORT | 149 |
SERIES Y (STYLEPLUS—LARGE GROWTH SERIES) | |
STATEMENTS OF CHANGES IN NET ASSETS |
| | Year Ended
December 31,
2020 | | | Year Ended
December 31,
2019 | |
Increase (Decrease) in Net Assets from Operations: | | | | | | | | |
Net investment income | | $ | 310,704 | | | $ | 559,187 | |
Net realized gain on investments | | | 12,023,032 | | | | 2,353,082 | |
Net change in unrealized appreciation (depreciation) on investments | | | 1,790,062 | | | | 7,660,875 | |
Net increase in net assets resulting from operations | | | 14,123,798 | | | | 10,573,144 | |
| | | | | | | | | |
Distributions to shareholders | | | (2,463,223 | ) | | | (3,884,327 | ) |
| | | | | | | | | |
Capital share transactions: | | | | | | | | |
Proceeds from sale of shares | | | 5,759,960 | | | | 3,347,793 | |
Distributions reinvested | | | 2,463,223 | | | | 3,884,327 | |
Cost of shares redeemed | | | (10,593,308 | ) | | | (5,470,930 | ) |
Net increase (decrease) from capital share transactions | | | (2,370,125 | ) | | | 1,761,190 | |
Net increase in net assets | | | 9,290,450 | | | | 8,450,007 | |
| | | | | | | | | |
Net assets: | | | | | | | | |
Beginning of year | | | 40,187,052 | | | | 31,737,045 | |
End of year | | $ | 49,477,502 | | | $ | 40,187,052 | |
| | | | | | | | | |
Capital share activity: | | | | | | | | |
Shares sold | | | 280,129 | | | | 179,743 | |
Shares issued from reinvestment of distributions | | | 116,354 | | | | 212,374 | |
Shares redeemed | | | (504,964 | ) | | | (292,350 | ) |
Net increase (decrease) in shares | | | (108,481 | ) | | | 99,767 | |
150 | THE GUGGENHEIM FUNDS ANNUAL REPORT | SEE NOTES TO FINANCIAL STATEMENTS. |
SERIES Y (STYLEPLUS—LARGE GROWTH SERIES) | |
This table is presented to show selected data for a share outstanding throughout each period and to assist shareholders in evaluating a Fund’s performance for the periods presented.
| | Year Ended
December 31,
2020 | | | Year Ended
December 31,
2019 | | | Year Ended
December 31,
2018 | | | Year Ended
December 31,
2017 | | | Year Ended
December 31,
2016 | |
Per Share Data |
Net asset value, beginning of period | | $ | 19.82 | | | $ | 16.47 | | | $ | 20.30 | | | $ | 15.75 | | | $ | 15.11 | |
Income (loss) from investment operations: |
Net investment income (loss)a | | | .16 | | | | .28 | | | | .34 | | | | .25 | | | | .17 | |
Net gain (loss) on investments (realized and unrealized) | | | 7.07 | | | | 5.13 | | | | (.63 | ) | | | 4.48 | | | | 1.13 | |
Total from investment operations | | | 7.23 | | | | 5.41 | | | | (.29 | ) | | | 4.73 | | | | 1.30 | |
Less distributions from: |
Net investment income | | | (.28 | ) | | | (.38 | ) | | | (.34 | ) | | | (.18 | ) | | | (.08 | ) |
Net realized gains | | | (.98 | ) | | | (1.68 | ) | | | (3.20 | ) | | | — | | | | (.58 | ) |
Total distributions | | | (1.26 | ) | | | (2.06 | ) | | | (3.54 | ) | | | (.18 | ) | | | (.66 | ) |
Net asset value, end of period | | $ | 25.79 | | | $ | 19.82 | | | $ | 16.47 | | | $ | 20.30 | | | $ | 15.75 | |
|
Total Returnb | | | 37.87 | % | | | 33.92 | % | | | (3.68 | %) | | | 30.11 | % | | | 8.72 | % |
Ratios/Supplemental Data |
Net assets, end of period (in thousands) | | $ | 49,478 | | | $ | 40,187 | | | $ | 31,737 | | | $ | 48,173 | | | $ | 38,565 | |
Ratios to average net assets: |
Net investment income (loss) | | | 0.73 | % | | | 1.51 | % | | | 1.70 | % | | | 1.36 | % | | | 1.14 | % |
Total expensesc | | | 1.29 | % | | | 1.44 | % | | | 1.38 | % | | | 1.20 | % | | | 1.04 | % |
Net expensesd,e,f | | | 0.88 | % | | | 0.97 | % | | | 1.02 | % | | | 0.97 | % | | | 1.04 | % |
Portfolio turnover rate | | | 66 | % | | | 47 | % | | | 59 | % | | | 43 | % | | | 42 | % |
a | Net investment income (loss) per share was computed using average shares outstanding throughout the period. |
b | Total return does not take into account any of the expenses associated with an investment in variable insurance products. If total return had taken into account these expenses, performance would have been lower. Shares of a series of Guggenheim Variable Funds Trust are available only through the purchase of such products. |
c | Does not include expenses of the underlying funds in which the Fund invests. |
d | Net expense information reflects the expense ratios after expense waivers and reimbursements, as applicable. |
e | Net expenses may include expenses that are excluded from the expense limitation agreement. Excluding these expenses, the net expense ratios for the years presented would be: |
| | 12/31/20 | 12/31/19 | 12/31/18 | 12/31/17 | 12/31/16 |
| | 0.88% | 0.90% | 0.93% | 0.97% | 1.04% |
f | The portion of the ratios of net expenses to average net assets attributable to recoupments of prior fee reductions of expense reimbursements for the periods presented was as follows: |
| | 12/31/20 | 12/31/19 | 12/31/18 | 12/31/17 | 12/31/16 |
| | — | — | 0.00%* | — | — |
SEE NOTES TO FINANCIAL STATEMENTS. | THE GUGGENHEIM FUNDS ANNUAL REPORT | 151 |
MANAGERS’ COMMENTARY (Unaudited) | December 31, 2020 |
Dear Shareholder:
Guggenheim Series Z (Alpha Opportunity Fund) (the “Fund”) is managed by a team of seasoned professionals, including Farhan Sharaff, Senior Managing Director and Assistant Chief Investment Officer, Equities, and Portfolio Manager; Samir Sanghani, CFA, Managing Director and Portfolio Manager; and Burak Hurmeydan, Ph.D., Director and Portfolio Manager. In the paragraphs below, the team discusses the performance of the Fund for the fiscal year period ended December 31, 2020.
For the year ended December 31, 2020, Series Z (Alpha Opportunity Series) returned 0.27%, compared with the 0.67% return of its benchmark, the ICE BofA Merrill Lynch 3-Month U.S. Treasury Bill Index.
Investment Approach
The Fund is managed as an opportunistic long/short strategy, looking to invest in areas of the market where stock prices look priced at a discount vis-à-vis their company fundamentals and risks, while shorting areas of the market that look overpriced or are not compensating for risks appropriately. The strategy philosophy is founded in part on the academic view that markets are primarily efficient – investors require higher compensation for characteristics that increase the riskiness of future cash flows (such as being very small, or having lots of economic sensitivity in the business). Academics have noted that companies exhibiting certain risk factors have on average outperformed safer firms as the ‘risk premium’ leads to better performance. However, unlike most academic research in this field, the Fund’s managers do not believe that those historic risk premia are constant. We believe that investors’ perceptions of what is risky can change a lot over time. They can harbor new fears about avoiding the latest economic crisis, or alternatively become over-excited about some new hot technology and completely forget about the risks involved.
The Fund’s strategy is to quantitatively compute what forward looking compensation level is embedded in a large universe of stocks – and ascertain what broad risk factors are being overvalued or undervalued. The Fund’s portfolio is adaptive to changing market dynamics and aims to buy a highly diversified set of names with undervalued risk factors, and short a highly diversified set of stocks with overvalued characteristics.
The Fund will ordinarily hold simultaneous long and short positions in equity securities or securities markets that provide exposure up to a level equal to 150% of the Fund’s net assets for both the long and short positions. The Fund intends to maintain a low overall net exposure (the difference between the notional value of long positions and the notional value of short positions), typically varying between 50% net long and 30% net short, in order to maintain low correlation to traditional equity markets and lower-than-market volatility, and seek to provide consistent absolute return. The overall net exposure will change as market opportunities change, and may, based on the Fund’s view of current market conditions, be outside this range.
Derivatives in the Fund are used to take short positions as well as long exposure above 100% of NAV (that is, to take leverage).
Performance Review
The Fund’s flat return for the year belies the incredible historic volatility endured in 2020. In what seems like an eon ago, the year started with strong returns in assets of all kinds as several political and macro uncertainties had begun to clear up. The U.S. Federal Reserve (the “Fed”) was cutting short-term rates in a “midcycle adjustment” policy. A “Phase 1” trade deal was signed with China that deescalated the trade war, and the UK helped consolidate power for the Prime Minister which clarified the Brexit path forward.
The Coronavirus Pandemic halted global economies in quick fashion during the first quarter, and as a result market returns cratered in the worst showing since the 2008 Global Financial Crisis. Industries most impacted by global stay-at-home orders were hit the hardest, including airlines, hotels, cruise lines, and brick-and-mortar apparel retailers. Within the energy sector, on top of a big drop in oil demand due to shutdowns, a price war broke out between Russia and Saudi Arabia when they could not agree on the extent of OPEC supply cuts. This led to a collapse in oil prices and even a short stint of negative pricing in the oil futures market. Banks also suffered as investors foresaw big write-offs on loan books due to companies and individuals that were most impacted.
Congress took unusually quick action, passing the CARES act, which provided direct payment to certain U.S. citizens, funding for extended unemployment, and small business relief to prevent layoffs. The Fed was also busy announcing an emergency rate cut with a zero lower bound, and massive quantitative easing and emergency lending facilities. These quick actions helped stabilize the markets and provided a backstop to
152 | THE GUGGENHEIM FUNDS ANNUAL REPORT | |
MANAGERS’ COMMENTARY (Unaudited)(continued) | December 31, 2020 |
liquidity and credit flow, massively shrinking the “risk premium” across all sorts of fixed income asset classes. That low risk premium spilled into the stock market as investors were ready to invest at ever higher valuations driven by low rates, low credit spreads, the promise of further stimulus, and positive news on vaccines.
The Presidential and Congressional election results led to a manic bullish environment to end the year. Despite the Democratic party win, typically considered the more unfriendly party for businesses, this year’s removal of erratic and unorthodox leadership seemed to stoke a collective sigh of relief. Further, a strong emphasis on Covid control and heavy stimulus on the Democratic platform fed the rally in many of the remaining beaten down industries most impacted by the pandemic. When all was said and done, the broad market (S&P 500 index) surged 18.4%. And even the riskiest corner of the market, small cap value names, achieved a positive benchmark return.
At period end, the Fund held about 122% of assets in long securities, and 77% short, for a net-dollar exposure of 45%. The net exposure averaged 40% during the year (ranging between a low of 30% at the start of the calendar year and a high of 49% in the months right before the election). While the positive net market exposure resulted in contribution to returns simply from the market exposure, the Fund is generally less exposed to the broad market returns than most long/short equity managers. The realized net beta (sensitivity of daily Fund returns to the S&P 500 index) averaged around 0.20 during the year. The beta is lower than the net dollar exposure because the shorts selected exhibit higher beta versus the market than the more-defensive long positions.
Fund long positions (on a standalone unlevered basis) averaged a return of 4.7% for the year, while short positions returned 6.8% on a stand-alone basis. Short positions outperformed the long names— opposite of our ideal outcome. However, the Fund ended with a slight positive return for the year since the total weight invested in longs was higher.
Digging deeper into the attribution for the year, the Fund’s net long bias added about 8.3% of attributable return. Sector positioning had a positive impact of about 7.3%, with key contributors being a net short in Real Estate as well as a large net long position in Healthcare. The Fund’s fundamental style tilts did poorly, detracting by about 5.5%. The Fund’s tilts towards value and away from high-growth companies both underperformed; however, a net long position in higher-profitable companies benefitted from the flight-to-quality trade and offset the drag from the value bias.
Stock selection–after controlling for the style and sector tilts described above–was detracted by 8.0%. The selection within REITs was the largest example. While our factor positioning correctly led to a net negative exposure to the sector with the ‘right’ fundamental style tilts, our short names did not all participate in the sector returns evenly. A number of ‘Covid-resistant’ real estate businesses dramatically outperformed during the period (data centers, warehouses, mobile home parks, biotech offices, etc). The selection effect in that sector alone wiped out about 5% of the otherwise positive factor attribution in the sector.
The portfolio managers are keeping a close eye on the ‘Covid risk’ inherent in certain narrow industries that most directly suffer or benefit from the pandemic. This is what we call a transient factor, a little more difficult for traditional quant techniques to identify due to the uniqueness of the risk factor and lack of historic precedent. Our goal is to at least understand the risks of both shutdowns and reopenings, and make sure the portfolio is not inadvertently or overly exposed to this unpredictable risk. This approach helped the Fund considerably at the outset of the pandemic crash. During the couple of weeks when markets were moving 5% plus in a day, a number of our shorts in the most vulnerable industries had massive down moves. As the extent of the shutdowns became clear and the Fed and Congress began to react, we quickly closed many of those profitable shorts to avoid the volatility risk, with concurrent sells on the long side of defensive name winners to maintain the low net exposure. That reaction–mainly driven from a risk management perspective–helped avoid losses during the strong reversal rally in April and avoid the fate of treating that price action as any other typical momentum.
Positioning
The Fund maintains its style bias towards cheaper valuation names, while maintaining a quality bias including higher free cash flow names and stronger profitability bias. However, due to the quite-expensive valuations afforded high growth names, we remain net short growth.
From an industry perspective, the Fund remains net long several defensive sectors with relatively well-priced stocks, including Healthcare, Staples, and Utilities. After being short the Financials sector for a few years, the Fund has closed that out and now remains close to neutral in that sector. The largest net short exposures currently are Materials and Real Estate.
| | THE GUGGENHEIM FUNDS ANNUAL REPORT | 153 |
MANAGERS’ COMMENTARY (Unaudited)(concluded) | December 31, 2020 |
Looking forward, we are starting to see some positive indicators for our valuation disciplined approach. The Democratic presidential and Congressional victories will certainly lead to some stock market positives (bigger stimulus, more traditional international dealings) as well as some corporate negatives (higher corporate taxes, more regulations on certain industries). The interest rate markets have started pricing this in with higher yields and a steeper yield curve. Underneath the equity market surface, the recent political and medical developments have spurred a long-awaited recovery in ‘Value Stocks’. These are generally the companies that need a robust economic environment to deliver earnings increases. Meanwhile, strong secular growth companies within each industry have had solid fundamentals in recent years, but their prices have already incorporated much of the longer-term growth. If long-term rates rise, the discounting of far-off profitability will hurt them more, as it helped that group as rates fell. The Fund’s style positioning would likely benefit from a steady return to economic growth, higher interest rates, and some of the extreme valuation disparities starting to converge.
Performance displayed represents past performance which is no guarantee of future results.
The opinions and forecast expressed may not actually come to pass. This information is subject to change at any time, based on market and other conditions, and should not be construed as a recommendation of any specific security or strategy.
154 | THE GUGGENHEIM FUNDS ANNUAL REPORT | |
PERFORMANCE REPORT AND FUND PROFILE (Unaudited) | December 31, 2020 |
SERIES Z (ALPHA OPPORTUNITY SERIES)
OBJECTIVE: Seeks long-term growth of capital.
Holdings Diversification (Market Exposure as % of Net Assets)
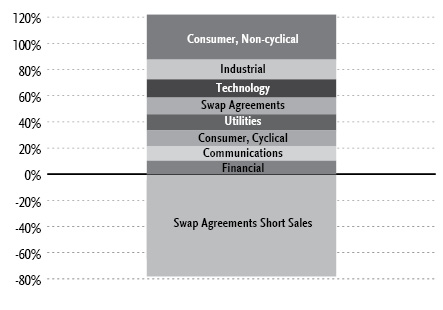
“Holdings Diversification (Market Exposure as % of Net Assets)” excludes any temporary cash investments.
Inception Date: July 7, 2003 |
Ten Largest Holdings (% of Total Net Assets) |
Cisco Systems, Inc. | 1.4% |
Allstate Corp. | 1.4% |
International Business Machines Corp. | 1.4% |
MetLife, Inc. | 1.3% |
Verizon Communications, Inc. | 1.3% |
Molson Coors Beverage Co. — Class B | 1.3% |
Gentex Corp. | 1.3% |
Philip Morris International, Inc. | 1.2% |
Cerner Corp. | 1.2% |
Amgen, Inc. | 1.2% |
Top Ten Total | 13.0% |
| | |
“Ten Largest Holdings” excludes any temporary cash or derivative investments. |
| | THE GUGGENHEIM FUNDS ANNUAL REPORT | 155 |
PERFORMANCE REPORT AND FUND PROFILE (Unaudited)(concluded) | December 31, 2020 |
Cumulative Fund Performance*,†
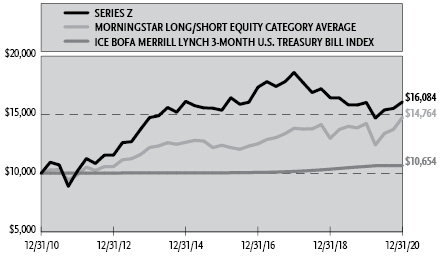
Average Annual Returns*,†
Periods Ended December 31, 2020
| 1 Year | 5 Year | 10 Year |
Series Z (Alpha Opportunity Series) | 0.27% | 0.90% | 4.87% |
ICE BofA Merrill Lynch 3-Month U.S. Treasury Bill Index | 0.67% | 1.20% | 0.64% |
Morningstar Long/Short Equity Category Average | 3.62% | 3.57% | 3.97% |
* | The performance data above represents past performance that is not predictive of future results. The investment return and principal value of an investment in the Fund will fluctuate so that an investor’s shares, when redeemed, may be worth more or less than their original cost. Returns are historical and include changes in principal and reinvested dividends and capital gains and do not reflect the effect of taxes. The ICE BofA Merrill Lynch 3-Month U.S. Treasury Bill Index and Morningstar Long/Short Equity Category Average are unmanaged indices and, unlike the Fund, have no management fees or operating expenses to reduce their reported returns. |
† | Performance figures do not reflect fees and expenses associated with an investment in variable insurance products. If returns had taken into account these fees and expenses, performance would have been lower. Shares of a series of Guggenheim Variable Funds Trust are available only through the purchase of such products. |
156 | THE GUGGENHEIM FUNDS ANNUAL REPORT | |
SCHEDULE OF INVESTMENTS | December 31, 2020 |
SERIES Z (ALPHA OPPORTUNITY SERIES) | |
| | Shares | | | Value | |
COMMON STOCKS† - 109.1% |
| | | | | | | | | |
Consumer, Non-cyclical - 34.4% |
Molson Coors Beverage Co. — Class B1 | | | 1,298 | | | $ | 58,656 | |
Philip Morris International, Inc.1 | | | 676 | | | | 55,966 | |
Amgen, Inc.1 | | | 238 | | | | 54,721 | |
Merck & Company, Inc. | | | 652 | | | | 53,334 | |
General Mills, Inc.1 | | | 854 | | | | 50,215 | |
Colgate-Palmolive Co.1 | | | 572 | | | | 48,912 | |
Johnson & Johnson1 | | | 308 | | | | 48,473 | |
Kraft Heinz Co. | | | 1,377 | | | | 47,727 | |
Kimberly-Clark Corp.1 | | | 333 | | | | 44,899 | |
McKesson Corp.1 | | | 254 | | | | 44,176 | |
Procter & Gamble Co.1 | | | 307 | | | | 42,716 | |
DaVita, Inc.* | | | 361 | | | | 42,382 | |
Cardinal Health, Inc.1 | | | 756 | | | | 40,491 | |
Altria Group, Inc. | | | 982 | | | | 40,262 | |
Campbell Soup Co.1 | | | 807 | | | | 39,018 | |
J M Smucker Co.1 | | | 326 | | | | 37,686 | |
UnitedHealth Group, Inc. | | | 107 | | | | 37,523 | |
United Rentals, Inc.* | | | 156 | | | | 36,178 | |
United Therapeutics Corp.* | | | 217 | | | | 32,938 | |
Quanta Services, Inc. | | | 421 | | | | 30,321 | |
Ingredion, Inc.1 | | | 369 | | | | 29,029 | |
Conagra Brands, Inc. | | | 780 | | | | 28,283 | |
Laboratory Corporation of America Holdings* | | | 131 | | | | 26,665 | |
Jazz Pharmaceuticals plc* | | | 159 | | | | 26,243 | |
Tyson Foods, Inc. — Class A | | | 402 | | | | 25,905 | |
CVS Health Corp. | | | 375 | | | | 25,612 | |
Post Holdings, Inc.* | | | 249 | | | | 25,152 | |
Pfizer, Inc.1 | | | 674 | | | | 24,810 | |
Gilead Sciences, Inc.1 | | | 400 | | | | 23,304 | |
Rent-A-Center, Inc. | | | 594 | | | | 22,744 | |
John B Sanfilippo & Son, Inc. | | | 278 | | | | 21,923 | |
Humana, Inc. | | | 53 | | | | 21,744 | |
Anthem, Inc. | | | 67 | | | | 21,513 | |
Mondelez International, Inc. — Class A | | | 356 | | | | 20,815 | |
Eli Lilly & Co.1 | | | 120 | | | | 20,261 | |
Sprouts Farmers Market, Inc.* | | | 980 | | | | 19,698 | |
Cigna Corp. | | | 93 | | | | 19,361 | |
TreeHouse Foods, Inc.* | | | 448 | | | | 19,036 | |
Constellation Brands, Inc. — Class A | | | 78 | | | | 17,086 | |
Encompass Health Corp. | | | 200 | | | | 16,538 | |
Bristol-Myers Squibb Co. | | | 261 | | | | 16,190 | |
Vector Group Ltd. | | | 1,389 | | | | 16,182 | |
Alexion Pharmaceuticals, Inc.* | | | 101 | | | | 15,780 | |
Molina Healthcare, Inc.* | | | 74 | | | | 15,738 | |
Innoviva, Inc.* | | | 1,222 | | | | 15,141 | |
Ionis Pharmaceuticals, Inc.* | | | 241 | | | | 13,626 | |
Alkermes plc* | | | 671 | | | | 13,386 | |
Chemed Corp. | | | 25 | | | | 13,315 | |
Hill-Rom Holdings, Inc. | | | 133 | | | | 13,030 | |
Hologic, Inc.* | | | 175 | | | | 12,745 | |
AbbVie, Inc. | | | 116 | | | | 12,429 | |
Medtronic plc | | | 105 | | | | 12,300 | |
USANA Health Sciences, Inc.* | | | 158 | | | | 12,182 | |
Clorox Co. | | | 60 | | | | 12,115 | |
Kellogg Co.1 | | | 192 | | | | 11,948 | |
Prestige Consumer Healthcare, Inc.* | | | 331 | | | | 11,542 | |
Viatris, Inc.* | | | 1 | | | | 14 | |
Total Consumer, Non-cyclical | | | | | | | 1,559,979 | |
| | | | | | | | | |
Industrial - 15.1% |
Hubbell, Inc.1 | | | 282 | | | | 44,215 | |
TE Connectivity Ltd. | | | 326 | | | | 39,469 | |
AGCO Corp.1 | | | 376 | | | | 38,762 | |
Snap-on, Inc.1 | | | 220 | | | | 37,651 | |
Vishay Intertechnology, Inc. | | | 1,727 | | | | 35,766 | |
Masco Corp. | | | 561 | | | | 30,816 | |
Oshkosh Corp. | | | 313 | | | | 26,940 | |
Timken Co. | | | 343 | | | | 26,535 | |
Arrow Electronics, Inc.* | | | 271 | | | | 26,368 | |
Caterpillar, Inc.1 | | | 141 | | | | 25,665 | |
Waters Corp.*,1 | | | 99 | | | | 24,495 | |
3M Co. | | | 140 | | | | 24,471 | |
General Dynamics Corp. | | | 163 | | | | 24,257 | |
Lincoln Electric Holdings, Inc. | | | 199 | | | | 23,134 | |
Garmin Ltd. | | | 193 | | | | 23,094 | |
Lockheed Martin Corp. | | | 62 | | | | 22,009 | |
Regal Beloit Corp.1 | | | 170 | | | | 20,877 | |
Keysight Technologies, Inc.* | | | 157 | | | | 20,738 | |
Terex Corp. | | | 511 | | | | 17,829 | |
Owens Corning | | | 232 | | | | 17,576 | |
Acuity Brands, Inc. | | | 134 | | | | 16,226 | |
Energizer Holdings, Inc. | | | 374 | | | | 15,775 | |
Eaton Corporation plc | | | 131 | | | | 15,738 | |
National Instruments Corp. | | | 324 | | | | 14,237 | |
Pentair plc | | | 260 | | | | 13,803 | |
PerkinElmer, Inc. | | | 94 | | | | 13,489 | |
Dover Corp. | | | 98 | | | | 12,372 | |
A O Smith Corp. | | | 223 | | | | 12,225 | |
Trane Technologies plc | | | 81 | | | | 11,758 | |
Lennox International, Inc. | | | 39 | | | | 10,685 | |
Total Industrial | | | | | | | 686,975 | |
| | | | | | | | | |
Technology - 13.8% |
International Business Machines Corp.1 | | | 490 | | | | 61,681 | |
Cerner Corp.1 | | | 702 | | | | 55,093 | |
SS&C Technologies Holdings, Inc.1 | | | 752 | | | | 54,708 | |
Seagate Technology plc | | | 795 | | | | 49,417 | |
NetApp, Inc. | | | 645 | | | | 42,725 | |
Texas Instruments, Inc. | | | 254 | | | | 41,689 | |
Intel Corp. | | | 835 | | | | 41,600 | |
Oracle Corp.1 | | | 576 | | | | 37,261 | |
HP, Inc. | | | 1,336 | | | | 32,852 | |
CDK Global, Inc. | | | 576 | | | | 29,854 | |
KLA Corp. | | | 108 | | | | 27,962 | |
Apple, Inc. | | | 185 | | | | 24,548 | |
Skyworks Solutions, Inc. | | | 138 | | | | 21,097 | |
Dell Technologies, Inc. — Class C* | | | 276 | | | | 20,228 | |
Cirrus Logic, Inc.* | | | 235 | | | | 19,317 | |
Applied Materials, Inc. | | | 206 | | | | 17,778 | |
Paychex, Inc. | | | 172 | | | | 16,027 | |
SEE NOTES TO FINANCIAL STATEMENTS. | THE GUGGENHEIM FUNDS ANNUAL REPORT | 157 |
SCHEDULE OF INVESTMENTS (continued) | December 31, 2020 |
SERIES Z (ALPHA OPPORTUNITY SERIES) | |
| | Shares | | | Value | |
Kulicke & Soffa Industries, Inc. | | | 491 | | | $ | 15,619 | |
Microchip Technology, Inc. | | | 107 | | | | 14,778 | |
Total Technology | | | | | | | 624,234 | |
| | | | | | | | | |
Utilities - 12.4% |
IDACORP, Inc. | | | 524 | | | | 50,320 | |
Evergy, Inc.1 | | | 872 | | | | 48,405 | |
Public Service Enterprise Group, Inc.1 | | | 815 | | | | 47,514 | |
Ameren Corp. | | | 569 | | | | 44,416 | |
Exelon Corp.1 | | | 1,020 | | | | 43,064 | |
PPL Corp.1 | | | 1,491 | | | | 42,046 | |
Duke Energy Corp. | | | 429 | | | | 39,279 | |
Southern Co.1 | | | 502 | | | | 30,838 | |
OGE Energy Corp. | | | 865 | | | | 27,559 | |
UGI Corp. | | | 745 | | | | 26,045 | |
NiSource, Inc. | | | 991 | | | | 22,733 | |
Consolidated Edison, Inc.1 | | | 311 | | | | 22,476 | |
ONE Gas, Inc. | | | 279 | | | | 21,419 | |
Southwest Gas Holdings, Inc. | | | 324 | | | | 19,683 | |
CenterPoint Energy, Inc. | | | 894 | | | | 19,346 | |
National Fuel Gas Co.1 | | | 405 | | | | 16,658 | |
NorthWestern Corp. | | | 241 | | | | 14,053 | |
Avista Corp. | | | 327 | | | | 13,126 | |
Portland General Electric Co.1 | | | 279 | | | | 11,933 | |
Total Utilities | | | | | | | 560,913 | |
| | | | | | | | | |
Consumer, Cyclical - 11.9% |
Gentex Corp.1 | | | 1,696 | | | | 57,545 | |
Best Buy Company, Inc.1 | | | 478 | | | | 47,700 | |
Gentherm, Inc.* | | | 708 | | | | 46,176 | |
Allison Transmission Holdings, Inc.1 | | | 930 | | | | 40,111 | |
Genuine Parts Co. | | | 384 | | | | 38,565 | |
Autoliv, Inc. | | | 392 | | | | 36,103 | |
Lowe’s Companies, Inc. | | | 204 | | | | 32,744 | |
PACCAR, Inc. | | | 329 | | | | 28,386 | |
AutoZone, Inc.* | | | 23 | | | | 27,265 | |
Lear Corp.1 | | | 164 | | | | 26,081 | |
AutoNation, Inc.* | | | 320 | | | | 22,333 | |
PulteGroup, Inc. | | | 483 | | | | 20,827 | |
Brunswick Corp. | | | 270 | | | | 20,585 | |
Lennar Corp. — Class A | | | 269 | | | | 20,506 | |
Cummins, Inc.1 | | | 88 | | | | 19,985 | |
Meritage Homes Corp.* | | | 183 | | | | 15,156 | |
MSC Industrial Direct Company, Inc. — Class A | | | 178 | | | | 15,021 | |
Dolby Laboratories, Inc. — Class A | | | 133 | | | | 12,918 | |
Hanesbrands, Inc. | | | 860 | | | | 12,539 | |
Total Consumer, Cyclical | | | | | | | 540,546 | |
| | | | | | | | | |
Communications - 11.3% |
Cisco Systems, Inc.1 | | | 1,434 | | | | 64,172 | |
Verizon Communications, Inc.1 | | | 1,001 | | | | 58,809 | |
Viavi Solutions, Inc.*,1 | | | 3,303 | | | | 49,462 | |
T-Mobile US, Inc.* | | | 346 | | | | 46,658 | |
Juniper Networks, Inc.1 | | | 1,794 | | | | 40,383 | |
Sirius XM Holdings, Inc. | | | 6,053 | | | | 38,558 | |
AT&T, Inc.1 | | | 1,132 | | | | 32,556 | |
Cogent Communications Holdings, Inc. | | | 531 | | | | 31,791 | |
Omnicom Group, Inc.1 | | | 468 | | | | 29,189 | |
Motorola Solutions, Inc. | | | 150 | | | | 25,509 | |
VeriSign, Inc.* | | | 112 | | | | 24,237 | |
Ciena Corp.* | | | 414 | | | | 21,880 | |
eBay, Inc. | | | 428 | | | | 21,507 | |
Discovery, Inc. — Class A* | | | 575 | | | | 17,302 | |
Alphabet, Inc. — Class C* | | | 6 | | | | 10,511 | |
Total Communications | | | | | | | 512,524 | |
| | | | | | | | | |
Financial - 10.2% |
Allstate Corp.1 | | | 581 | | | | 63,869 | |
MetLife, Inc.1 | | | 1,257 | | | | 59,016 | |
Highwoods Properties, Inc. REIT1 | | | 1,028 | | | | 40,740 | |
Berkshire Hathaway, Inc. — Class B* | | | 172 | | | | 39,882 | |
Equity Residential REIT1 | | | 577 | | | | 34,204 | |
Travelers Companies, Inc. | | | 234 | | | | 32,846 | |
Piedmont Office Realty Trust, Inc. — Class A REIT | | | 1,743 | | | | 28,289 | |
Western Union Co. | | | 1,252 | | | | 27,469 | |
Hartford Financial Services Group, Inc. | | | 470 | | | | 23,021 | |
Ameriprise Financial, Inc. | | | 110 | | | | 21,377 | |
Aflac, Inc. | | | 470 | | | | 20,901 | |
Synchrony Financial | | | 544 | | | | 18,882 | |
SEI Investments Co. | | | 268 | | | | 15,402 | |
Bank of America Corp. | | | 425 | | | | 12,882 | |
JPMorgan Chase & Co. | | | 99 | | | | 12,580 | |
M&T Bank Corp. | | | 98 | | | | 12,475 | |
Total Financial | | | | | | | 463,835 | |
| | | | | | | | | |
Total Common Stocks | | | | |
(Cost $4,486,502) | | | | | | | 4,949,006 | |
| | | | | | | | | |
MONEY MARKET FUND† - 2.4% |
Goldman Sachs Financial Square Treasury Instruments Fund — Institutional Shares, 0.01%2 | | | 108,662 | | | | 108,662 | |
Total Money Market Fund | | | | |
(Cost $108,662) | | | | | | | 108,662 | |
| | | | | | | | | |
Total Investments - 111.5% | | | | |
(Cost $4,595,164) | | $ | 5,057,668 | |
Other Assets & Liabilities, net - (11.5)% | | | (522,284 | ) |
Total Net Assets - 100.0% | | $ | 4,535,384 | |
158 | THE GUGGENHEIM FUNDS ANNUAL REPORT | SEE NOTES TO FINANCIAL STATEMENTS. |
SCHEDULE OF INVESTMENTS (continued) | December 31, 2020 |
SERIES Z (ALPHA OPPORTUNITY SERIES) | |
Custom Basket Swap Agreements |
Counterparty | Reference Obligation | Financing Rate
Pay (Receive) | Payment
Frequency | | Maturity Date | | | Notional
Amount | | | Value and
Unrealized
Appreciation
(Depreciation) | |
OTC Custom Basket Swap Agreements †† |
Morgan Stanley Capital Services LLC | MS Equity Custom Basket | 0.49% (Federal Funds Rate + 0.40%) | At Maturity | | | 02/01/24 | | | $ | 291,475 | | | $ | 37,466 | |
Goldman Sachs International | GS Equity Custom Basket | 0.54% (Federal Funds Rate + 0.45%) | At Maturity | | | 05/06/24 | | | | 291,594 | | | | 37,324 | |
| | | | | | | | | | $ | 583,069 | | | $ | 74,790 | |
OTC Custom Basket Swap Agreements Sold Short †† |
Goldman Sachs International | GS Equity Custom Basket | (0.11)% (Federal Funds Rate - 0.20%) | At Maturity | | | 05/06/24 | | | $ | 1,775,291 | | | $ | (259,365 | ) |
Morgan Stanley Capital Services LLC | MS Equity Custom Basket | (0.21)% (Federal Funds Rate - 0.30%) | At Maturity | | | 02/01/24 | | | | 1,775,291 | | | | (264,321 | ) |
| | | | | | | | | | $ | 3,550,582 | | | $ | (523,686 | ) |
| | Shares | | | Percentage
Notional
Amount | | |
Value and
Unrealized
Appreciation
| |
MS EQUITY LONG CUSTOM BASKET | | | | | | | | |
Consumer, Non-cyclical | | | | | | | | | | | | |
United Rentals, Inc. | | | 9 | | | | 0.73 | % | | $ | 1,034 | |
McKesson Corp. | | | 15 | | | | 0.90 | % | | | 873 | |
Rent-A-Center, Inc. | | | 35 | | | | 0.46 | % | | | 714 | |
DaVita, Inc. | | | 21 | | | | 0.85 | % | | | 697 | |
Molson Coors Beverage Co. — Class B | | | 78 | | | | 1.21 | % | | | 684 | |
United Therapeutics Corp. | | | 13 | | | | 0.68 | % | | | 563 | |
Quanta Services, Inc. | | | 25 | | | | 0.62 | % | | | 494 | |
Cardinal Health, Inc. | | | 45 | | | | 0.83 | % | | | 489 | |
Johnson & Johnson | | | 18 | | | | 0.97 | % | | | 465 | |
Eli Lilly & Co. | | | 7 | | | | 0.41 | % | | | 436 | |
Colgate-Palmolive Co. | | | 34 | | | | 1.00 | % | | | 410 | |
Amgen, Inc. | | | 14 | | | | 1.10 | % | | | 399 | |
UnitedHealth Group, Inc. | | | 6 | | | | 0.72 | % | | | 334 | |
Jazz Pharmaceuticals plc | | | 9 | | | | 0.51 | % | | | 332 | |
Alexion Pharmaceuticals, Inc. | | | 6 | | | | 0.32 | % | | | 325 | |
Procter & Gamble Co. | | | 18 | | | | 0.86 | % | | | 322 | |
Kraft Heinz Co. | | | 83 | | | | 0.99 | % | | | 304 | |
Anthem, Inc. | | | 4 | | | | 0.44 | % | | | 282 | |
Philip Morris International, Inc. | | | 40 | | | | 1.14 | % | | | 278 | |
Cigna Corp. | | | 5 | | | | 0.36 | % | | | 224 | |
Medtronic plc | | | 6 | | | | 0.24 | % | | | 161 | |
Post Holdings, Inc. | | | 15 | | | | 0.52 | % | | | 152 | |
Molina Healthcare, Inc. | | | 4 | | | | 0.29 | % | | | 145 | |
Pfizer, Inc. | | | 40 | | | | 0.51 | % | | | 135 | |
| | Shares | | | Percentage
Notional
Amount | | | Value and
Unrealized
Appreciation
(Depreciation) | |
Constellation Brands, Inc. — Class A | | | 4 | | | | 0.30 | % | | $ | 123 | |
Tyson Foods, Inc. — Class A | | | 24 | | | | 0.53 | % | | | 120 | |
Mondelez International, Inc. — Class A | | | 21 | | | | 0.42 | % | | | 115 | |
J M Smucker Co. | | | 31 | | | | 1.23 | % | | | 77 | |
Conagra Brands, Inc. | | | 47 | | | | 0.58 | % | | | 75 | |
Hill-Rom Holdings, Inc. | | | 8 | | | | 0.27 | % | | | 74 | |
Altria Group, Inc. | | | 59 | | | | 0.83 | % | | | 72 | |
Kellogg Co. | | | 11 | | | | 0.24 | % | | | 66 | |
Chemed Corp. | | | 1 | | | | 0.18 | % | | | 63 | |
Hologic, Inc. | | | 10 | | | | 0.25 | % | | | 59 | |
Alkermes plc | | | 40 | | | | 0.27 | % | | | 54 | |
Ionis Pharmaceuticals, Inc. | | | 14 | | | | 0.27 | % | | | 45 | |
Merck & Company, Inc. | | | 39 | | | | 1.09 | % | | | 42 | |
Innoviva, Inc. | | | 73 | | | | 0.31 | % | | | 34 | |
Laboratory Corporation of America Holdings | | | 7 | | | | 0.49 | % | | | 30 | |
Campbell Soup Co. | | | 48 | | | | 0.80 | % | | | 23 | |
USANA Health Sciences, Inc. | | | 9 | | | | 0.24 | % | | | 21 | |
AbbVie, Inc. | | | 7 | | | | 0.26 | % | | | 21 | |
Bristol-Myers Squibb Co. | | | 15 | | | | 0.32 | % | | | 13 | |
Encompass Health Corp. | | | 12 | | | | 0.34 | % | | | 10 | |
Clorox Co. | | | 3 | | | | 0.21 | % | | | 5 | |
TreeHouse Foods, Inc. | | | 27 | | | | 0.39 | % | | | 4 | |
Prestige Consumer Healthcare, Inc. | | | 20 | | | | 0.24 | % | | | (3 | ) |
CVS Health Corp. | | | 22 | | | | 0.52 | % | | | (4 | ) |
SEE NOTES TO FINANCIAL STATEMENTS. | THE GUGGENHEIM FUNDS ANNUAL REPORT | 159 |
SCHEDULE OF INVESTMENTS (continued) | December 31, 2020 |
SERIES Z (ALPHA OPPORTUNITY SERIES) | |
| | Shares | | | Percentage
Notional
Amount | | | Value and
Unrealized
Appreciation
(Depreciation) | |
Vector Group Ltd. | | | 84 | | | | 0.34 | % | | $ | (5 | ) |
Humana, Inc. | | | 3 | | | | 0.42 | % | | | (12 | ) |
General Mills, Inc. | | | 51 | | | | 1.03 | % | | | (30 | ) |
John B Sanfilippo & Son, Inc. | | | 16 | | | | 0.43 | % | | | (49 | ) |
Sprouts Farmers Market, Inc. | | | 59 | | | | 0.41 | % | | | (55 | ) |
Kimberly-Clark Corp. | | | 20 | | | | 0.93 | % | | | (86 | ) |
Ingredion, Inc. | | | 22 | | | | 0.59 | % | | | (184 | ) |
Gilead Sciences, Inc. | | | 24 | | | | 0.48 | % | | | (284 | ) |
Total Consumer, Non-cyclical | | | | | | | | | | | 10,686 | |
| | | | | | | | | | | | | |
Financial | | | | | | | | | | | | |
MetLife, Inc. | | | 77 | | | | 1.23 | % | | | 671 | |
Allstate Corp. | | | 35 | | | | 1.32 | % | | | 505 | |
Travelers Companies, Inc. | | | 14 | | | | 0.67 | % | | | 383 | |
Hartford Financial Services Group, Inc. | | | 28 | | | | 0.47 | % | | | 356 | |
Synchrony Financial | | | 32 | | | | 0.38 | % | | | 294 | |
Aflac, Inc. | | | 28 | | | | 0.43 | % | | | 234 | |
Ameriprise Financial, Inc. | | | 6 | | | | 0.40 | % | | | 221 | |
Equity Residential | | | 34 | | | | 0.69 | % | | | 199 | |
JPMorgan Chase & Co. | | | 6 | | | | 0.26 | % | | | 191 | |
Western Union Co. | | | 75 | | | | 0.56 | % | | | 166 | |
Berkshire Hathaway, Inc. — Class B | | | 10 | | | | 0.80 | % | | | 151 | |
Highwoods Properties, Inc. | | | 62 | | | | 0.84 | % | | | 115 | |
M&T Bank Corp. | | | 5 | | | | 0.22 | % | | | 111 | |
Bank of America Corp. | | | 25 | | | | 0.26 | % | | | 104 | |
SEI Investments Co. | | | 16 | | | | 0.32 | % | | | 12 | |
Piedmont Office Realty Trust, Inc. — Class A | | | 105 | | | | 0.58 | % | | | (24 | ) |
Total Financial | | | | | | | | | | | 3,689 | |
| | | | | | | | | | | | | |
Consumer, Cyclical | | | | | | | | | | | | |
Gentherm, Inc. | | | 42 | | | | 0.94 | % | | | 1,267 | |
Autoliv, Inc. | | | 23 | | | | 0.73 | % | | | 832 | |
Gentex Corp. | | | 102 | | | | 1.19 | % | | | 810 | |
Lear Corp. | | | 9 | | | | 0.49 | % | | | 645 | |
Cummins, Inc. | | | 5 | | | | 0.39 | % | | | 392 | |
Brunswick Corp. | | | 16 | | | | 0.42 | % | | | 298 | |
Allison Transmission Holdings, Inc. | | | 56 | | | | 0.83 | % | | | 296 | |
Hanesbrands, Inc. | | | 52 | | | | 0.26 | % | | | 278 | |
Dolby Laboratories, Inc. — Class A | | | 8 | | | | 0.27 | % | | | 250 | |
MSC Industrial Direct Company, Inc. — Class A | | | 10 | | | | 0.29 | % | | | 193 | |
Genuine Parts Co. | | | 23 | | | | 0.79 | % | | | 110 | |
PACCAR, Inc. | | | 19 | | | | 0.56 | % | | | 92 | |
AutoNation, Inc. | | | 19 | | | | 0.45 | % | | | 92 | |
Lowe’s Companies, Inc. | | | 12 | | | | 0.66 | % | | | 61 | |
AutoZone, Inc. | | | 1 | | | | 0.41 | % | | | 39 | |
Lennar Corp. — Class A | | | 16 | | | | 0.42 | % | | | (15 | ) |
PulteGroup, Inc. | | | 29 | | | | 0.43 | % | | | (27 | ) |
Meritage Homes Corp. | | | 11 | | | | 0.31 | % | | | (86 | ) |
Best Buy Company, Inc. | | | 28 | | | | 0.96 | % | | | (246 | ) |
Total Consumer, Cyclical | | | | | | | | | | | 5,281 | |
| | | | | | | | | | | | | |
Communications | | | | | | | | | | | | |
Viavi Solutions, Inc. | | | 199 | | | | 1.02 | % | | | 665 | |
T-Mobile US, Inc. | | | 20 | | | | 0.93 | % | | | 491 | |
Cisco Systems, Inc. | | | 86 | | | | 1.32 | % | | | 394 | |
Ciena Corp. | | | 25 | | | | 0.45 | % | | | 333 | |
Omnicom Group, Inc. | | | 28 | | | | 0.60 | % | | | 296 | |
Motorola Solutions, Inc. | | | 9 | | | | 0.53 | % | | | 133 | |
Discovery, Inc. — Class A | | | 34 | | | | 0.35 | % | | | 99 | |
VeriSign, Inc. | | | 6 | | | | 0.45 | % | | | 89 | |
Verizon Communications, Inc. | | | 60 | | | | 1.21 | % | | | 88 | |
Cogent Communications Holdings, Inc. | | | 32 | | | | 0.66 | % | | | 82 | |
Sirius XM Holdings, Inc. | | | 366 | | | | 0.80 | % | | | 46 | |
Juniper Networks, Inc. | | | 108 | | | | 0.83 | % | | | 22 | |
eBay, Inc. | | | 25 | | | | 0.43 | % | | | (25 | ) |
AT&T, Inc. | | | 68 | | | | 0.67 | % | | | (564 | ) |
Total Communications | | | | | | | | | | | 2,149 | |
| | | | | | | | | | | | | |
Technology | | | | | | | | | | | | |
NetApp, Inc. | | | 39 | | | | 0.89 | % | | | 946 | |
Texas Instruments, Inc. | | | 15 | | | | 0.84 | % | | | 740 | |
HP, Inc. | | | 80 | | | | 0.67 | % | | | 589 | |
CDK Global, Inc. | | | 34 | | | | 0.60 | % | | | 566 | |
Seagate Technology plc | | | 48 | | | | 1.02 | % | | | 554 | |
SS&C Technologies Holdings, Inc. | | | 45 | | | | 1.12 | % | | | 541 | |
KLA Corp. | | | 6 | | | | 0.53 | % | | | 446 | |
Applied Materials, Inc. | | | 12 | | | | 0.36 | % | | | 402 | |
Oracle Corp. | | | 34 | | | | 0.75 | % | | | 391 | |
Cerner Corp. | | | 42 | | | | 1.13 | % | | | 388 | |
Cirrus Logic, Inc. | | | 14 | | | | 0.39 | % | | | 268 | |
Microchip Technology, Inc. | | | 6 | | | | 0.28 | % | | | 232 | |
Kulicke & Soffa Industries, Inc. | | | 29 | | | | 0.32 | % | | | 228 | |
Apple, Inc. | | | 11 | | | | 0.50 | % | | | 194 | |
Skyworks Solutions, Inc. | | | 8 | | | | 0.42 | % | | | 110 | |
International Business Machines Corp. | | | 29 | | | | 1.25 | % | | | 105 | |
Dell Technologies, Inc. — Class C | | | 16 | | | | 0.40 | % | | | 48 | |
Paychex, Inc. | | | 10 | | | | 0.32 | % | | | (3 | ) |
Intel Corp. | | | 50 | | | | 0.85 | % | | | (231 | ) |
Total Technology | | | | | | | | | | | 6,514 | |
| | | | | | | | | | | | | |
Utilities | | | | | | | | | | | | |
Exelon Corp. | | | 61 | | | | 0.88 | % | | | 240 | |
160 | THE GUGGENHEIM FUNDS ANNUAL REPORT | SEE NOTES TO FINANCIAL STATEMENTS. |
SCHEDULE OF INVESTMENTS (continued) | December 31, 2020 |
SERIES Z (ALPHA OPPORTUNITY SERIES) | |
| | Shares | | | Percentage
Notional
Amount | | | Value and
Unrealized
Appreciation
(Depreciation) | |
Southern Co. | | | 30 | | | | 0.63 | % | | $ | 224 | |
Public Service Enterprise Group, Inc. | | | 49 | | | | 0.98 | % | | | 186 | |
CenterPoint Energy, Inc. | | | 54 | | | | 0.40 | % | | | 156 | |
IDACORP, Inc. | | | 31 | | | | 1.02 | % | | | 150 | |
NorthWestern Corp. | | | 14 | | | | 0.28 | % | | | 135 | |
UGI Corp. | | | 45 | | | | 0.54 | % | | | 121 | |
Evergy, Inc. | | | 52 | | | | 0.99 | % | | | 117 | |
OGE Energy Corp. | | | 52 | | | | 0.57 | % | | | 70 | |
Ameren Corp. | | | 34 | | | | 0.91 | % | | | 40 | |
Avista Corp. | | | 19 | | | | 0.26 | % | | | 24 | |
ONE Gas, Inc. | | | 16 | | | | 0.42 | % | | | 15 | |
PPL Corp. | | | 90 | | | | 0.87 | % | | | (6 | ) |
Portland General Electric Co. | | | 16 | | | | 0.23 | % | | | (19 | ) |
NiSource, Inc. | | | 59 | | | | 0.46 | % | | | (43 | ) |
Consolidated Edison, Inc. | | | 18 | | | | 0.45 | % | | | (78 | ) |
National Fuel Gas Co. | | | 24 | | | | 0.34 | % | | | (95 | ) |
Duke Energy Corp. | | | 25 | | | | 0.79 | % | | | (110 | ) |
Southwest Gas Holdings, Inc. | | | 19 | | | | 0.40 | % | | | (250 | ) |
Total Utilities | | | | | | | | | | | 877 | |
| | | | | | | | | | | | | |
Industrial | | | | | | | | | | | | |
TE Connectivity Ltd. | | | 19 | | | | 0.79 | % | | | 771 | |
Snap-on, Inc. | | | 13 | | | | 0.76 | % | | | 704 | |
AGCO Corp. | | | 22 | | | | 0.78 | % | | | 692 | |
Vishay Intertechnology, Inc. | | | 104 | | | | 0.74 | % | | | 581 | |
Timken Co. | | | 20 | | | | 0.53 | % | | | 579 | |
Caterpillar, Inc. | | | 8 | | | | 0.50 | % | | | 535 | |
Regal Beloit Corp. | | | 10 | | | | 0.42 | % | | | 533 | |
Owens Corning | | | 14 | | | | 0.36 | % | | | 501 | |
Garmin Ltd. | | | 11 | | | | 0.45 | % | | | 407 | |
Lincoln Electric Holdings, Inc. | | | 12 | | | | 0.48 | % | | | 403 | |
Hubbell, Inc. | | | 17 | | | | 0.91 | % | | | 381 | |
Terex Corp. | | | 30 | | | | 0.36 | % | | | 368 | |
Arrow Electronics, Inc. | | | 16 | | | | 0.53 | % | | | 303 | |
Waters Corp. | | | 6 | | | | 0.51 | % | | | 283 | |
Oshkosh Corp. | | | 18 | | | | 0.53 | % | | | 245 | |
Eaton Corporation plc | | | 7 | | | | 0.29 | % | | | 176 | |
Acuity Brands, Inc. | | | 8 | | | | 0.33 | % | | | 172 | |
National Instruments Corp. | | | 19 | | | | 0.29 | % | | | 146 | |
Keysight Technologies, Inc. | | | 9 | | | | 0.41 | % | | | 124 | |
Pentair plc | | | 15 | | | | 0.27 | % | | | 109 | |
Trane Technologies plc | | | 4 | | | | 0.20 | % | | | 97 | |
Dover Corp. | | | 5 | | | | 0.22 | % | | | 88 | |
PerkinElmer, Inc. | | | 5 | | | | 0.25 | % | | | 82 | |
A O Smith Corp. | | | 13 | | | | 0.24 | % | | | 81 | |
Energizer Holdings, Inc. | | | 22 | | | | 0.32 | % | | | 58 | |
Lennox International, Inc. | | | 2 | | | | 0.19 | % | | | 15 | |
3M Co. | | | 8 | | | | 0.48 | % | | | (11 | ) |
Masco Corp. | | | 33 | | | | 0.62 | % | | | (29 | ) |
General Dynamics Corp. | | | 9 | | | | 0.46 | % | | | (37 | ) |
Lockheed Martin Corp. | | | 3 | | | | 0.37 | % | | | (87 | ) |
Total Industrial | | | | | | | | | | | 8,270 | |
Total MS Equity Long Custom Basket | | | | | | $ | 37,466 | |
| | | | | | | | | |
MS EQUITY SHORT CUSTOM BASKET | | | | | | | | |
| | | | | | | | | | | | | |
Utilities | | | | | | | | | | | | |
American States Water Co. | | | 89 | | | | (0.37 | )% | | $ | 754 | |
California Water Service Group | | | 278 | | | | (0.83 | )% | | | (508 | ) |
Total Utilities | | | | | | | | | | | 246 | |
| | | | | | | | | | | | | |
Industrial | | | | | | | | | | | | |
Raytheon Technologies Corp. | | | 244 | | | | (0.98 | )% | | | 742 | |
US Ecology, Inc. | | | 199 | | | | (0.41 | )% | | | 238 | |
Boeing Co. | | | 21 | | | | (0.25 | )% | | | 119 | |
AMETEK, Inc. | | | 70 | | | | (0.48 | )% | | | (44 | ) |
TransDigm Group, Inc. | | | 19 | | | | (0.66 | )% | | | (1,582 | ) |
HEICO Corp. | | | 53 | | | | (0.40 | )% | | | (1,714 | ) |
Eagle Materials, Inc. | | | 69 | | | | (0.39 | )% | | | (1,849 | ) |
Martin Marietta Materials, Inc. | | | 26 | | | | (0.42 | )% | | | (2,005 | ) |
Ingersoll Rand, Inc. | | | 452 | | | | (1.16 | )% | | | (2,496 | ) |
Crown Holdings, Inc. | | | 109 | | | | (0.62 | )% | | | (3,050 | ) |
AptarGroup, Inc. | | | 268 | | | | (2.07 | )% | | | (3,476 | ) |
Casella Waste Systems, Inc. — Class A | | | 234 | | | | (0.82 | )% | | | (3,677 | ) |
Vulcan Materials Co. | | | 103 | | | | (0.86 | )% | | | (3,747 | ) |
Ball Corp. | | | 264 | | | | (1.39 | )% | | | (5,041 | ) |
Tetra Tech, Inc. | | | 184 | | | | (1.20 | )% | | | (5,213 | ) |
Total Industrial | | | | | | | | | | | (32,795 | ) |
| | | | | | | | | | | | | |
Communications | | | | | | | | | | | | |
Anaplan, Inc. | | | 68 | | | | (0.28 | )% | | | (2,070 | ) |
Okta, Inc. | | | 30 | | | | (0.43 | )% | | | (2,970 | ) |
Zendesk, Inc. | | | 110 | | | | (0.89 | )% | | | (4,349 | ) |
Liberty Broadband Corp. — Class C | | | 214 | | | | (1.91 | )% | | | (4,611 | ) |
Q2 Holdings, Inc. | | | 124 | | | | (0.88 | )% | | | (6,085 | ) |
Total Communications | | | | | | | | | | | (20,085 | ) |
| | | | | | | | | | | | | |
Basic Materials | | | | | | | | | | | | |
Huntsman Corp. | | | 625 | | | | (0.89 | )% | | | 598 | |
Newmont Corp. | | | 139 | | | | (0.47 | )% | | | 214 | |
Sherwin-Williams Co. | | | 13 | | | | (0.54 | )% | | | 27 | |
Ecolab, Inc. | | | 32 | | | | (0.39 | )% | | | (1,280 | ) |
Ashland Global Holdings, Inc. | | | 239 | | | | (1.07 | )% | | | (1,285 | ) |
DuPont de Nemours, Inc. | | | 344 | | | | (1.38 | )% | | | (1,725 | ) |
Axalta Coating Systems Ltd. | | | 413 | | | | (0.66 | )% | | | (1,741 | ) |
PPG Industries, Inc. | | | 72 | | | | (0.58 | )% | | | (2,231 | ) |
SEE NOTES TO FINANCIAL STATEMENTS. | THE GUGGENHEIM FUNDS ANNUAL REPORT | 161 |
SCHEDULE OF INVESTMENTS (continued) | December 31, 2020 |
SERIES Z (ALPHA OPPORTUNITY SERIES) | |
| | Shares | | | Percentage
Notional
Amount | | | Value and
Unrealized
Appreciation
(Depreciation) | |
Air Products and Chemicals, Inc. | | | 121 | | | | (1.86 | )% | | $ | (3,169 | ) |
Celanese Corp. — Class A | | | 134 | | | | (0.98 | )% | | | (3,991 | ) |
Freeport-McMoRan, Inc. | | | 297 | | | | (0.44 | )% | | | (4,542 | ) |
Balchem Corp. | | | 245 | | | | (1.59 | )% | | | (5,797 | ) |
Linde plc | | | 133 | | | | (1.97 | )% | | | (6,601 | ) |
RPM International, Inc. | | | 294 | | | | (1.50 | )% | | | (6,965 | ) |
Albemarle Corp. | | | 132 | | | | (1.10 | )% | | | (10,442 | ) |
Quaker Chemical Corp. | | | 91 | | | | (1.30 | )% | | | (10,758 | ) |
United States Steel Corp. | | | 1,247 | | | | (1.18 | )% | | | (11,813 | ) |
Total Basic Materials | | | | | | | | | | | (71,501 | ) |
| | | | | | | | | | | | | |
Consumer, Cyclical | | | | | | | | | | | | |
United Airlines Holdings, Inc. | | | 210 | | | | (0.51 | )% | | | 183 | |
Alaska Air Group, Inc. | | | 294 | | | | (0.86 | )% | | | 69 | |
JetBlue Airways Corp. | | | 779 | | | | (0.64 | )% | | | (2,050 | ) |
Five Below, Inc. | | | 51 | | | | (0.50 | )% | | | (2,338 | ) |
Delta Air Lines, Inc. | | | 430 | | | | (0.97 | )% | | | (2,735 | ) |
Live Nation Entertainment, Inc. | | | 140 | | | | (0.58 | )% | | | (3,005 | ) |
Southwest Airlines Co. | | | 420 | | | | (1.10 | )% | | | (3,123 | ) |
Hilton Worldwide Holdings, Inc. | | | 170 | | | | (1.07 | )% | | | (3,413 | ) |
TJX Companies, Inc. | | | 278 | | | | (1.07 | )% | | | (3,579 | ) |
Copart, Inc. | | | 162 | | | | (1.16 | )% | | | (4,756 | ) |
Burlington Stores, Inc. | | | 79 | | | | (1.16 | )% | | | (4,866 | ) |
NIKE, Inc. — Class B | | | 177 | | | | (1.41 | )% | | | (5,487 | ) |
Scotts Miracle-Gro Co. — Class A | | | 71 | | | | (0.80 | )% | | | (5,506 | ) |
Starbucks Corp. | | | 278 | | | | (1.68 | )% | | | (8,521 | ) |
Total Consumer, Cyclical | | | | | | | | | | | (49,127 | ) |
| | | | | | | | | | | | | |
Energy | | | | | | | | | | | | |
Williams Companies, Inc. | | | 444 | | | | (0.50 | )% | | | 201 | |
Cheniere Energy, Inc. | | | 176 | | | | (0.60 | )% | | | (213 | ) |
Phillips 66 | | | 337 | | | | (1.33 | )% | | | (809 | ) |
Ovintiv, Inc. | | | 843 | | | | (0.68 | )% | | | (827 | ) |
NOV, Inc. | | | 491 | | | | (0.38 | )% | | | (1,130 | ) |
ChampionX Corp. | | | 819 | | | | (0.71 | )% | | | (1,203 | ) |
Hess Corp. | | | 261 | | | | (0.78 | )% | | | (1,575 | ) |
Schlumberger N.V. | | | 1,030 | | | | (1.27 | )% | | | (3,072 | ) |
Total Energy | | | | | | | | | | | (8,628 | ) |
| | | | | | | | | | | | | |
Technology | | | | | | | | | | | | |
Splunk, Inc. | | | 66 | | | | (0.63 | )% | | | 922 | |
NVIDIA Corp. | | | 14 | | | | (0.41 | )% | | | (858 | ) |
salesforce.com, Inc. | | | 43 | | | | (0.54 | )% | | | (894 | ) |
Appfolio, Inc. — Class A | | | 32 | | | | (0.32 | )% | | | (1,077 | ) |
Clarivate plc | | | 375 | | | | (0.63 | )% | | | (1,099 | ) |
Pegasystems, Inc. | | | 106 | | | | (0.80 | )% | | | (1,351 | ) |
Tyler Technologies, Inc. | | | 21 | | | | (0.52 | )% | | | (1,669 | ) |
Atlassian Corporation plc — Class A | | | 33 | | | | (0.43 | )% | | | (1,930 | ) |
ANSYS, Inc. | | | 44 | | | | (0.90 | )% | | | (1,953 | ) |
Rapid7, Inc. | | | 122 | | | | (0.62 | )% | | | (2,145 | ) |
Smartsheet, Inc. — Class A | | | 89 | | | | (0.35 | )% | | | (2,249 | ) |
Coupa Software, Inc. | | | 19 | | | | (0.36 | )% | | | (2,263 | ) |
Workiva, Inc. | | | 62 | | | | (0.32 | )% | | | (3,129 | ) |
Zscaler, Inc. | | | 33 | | | | (0.37 | )% | | | (4,050 | ) |
HubSpot, Inc. | | | 23 | | | | (0.51 | )% | | | (5,124 | ) |
Varonis Systems, Inc. | | | 112 | | | | (1.03 | )% | | | (5,382 | ) |
Total Technology | | | | | | | | | | | (34,251 | ) |
| | | | | | | | | | | | | |
Financial | | | | | | | | | | | | |
UDR, Inc. | | | 297 | | | | (0.64 | )% | | | 2,615 | |
Realty Income Corp. | | | 436 | | | | (1.53 | )% | | | 2,527 | |
Kilroy Realty Corp. | | | 292 | | | | (0.94 | )% | | | 2,495 | |
Global Net Lease, Inc. | | | 547 | | | | (0.53 | )% | | | 1,399 | |
JBG SMITH Properties | | | 446 | | | | (0.79 | )% | | | 931 | |
Douglas Emmett, Inc. | | | 204 | | | | (0.34 | )% | | | 844 | |
QTS Realty Trust, Inc. — Class A | | | 151 | | | | (0.53 | )% | | | 418 | |
Truist Financial Corp. | | | 142 | | | | (0.38 | )% | | | 99 | |
First Industrial Realty Trust, Inc. | | | 301 | | | | (0.71 | )% | | | 98 | |
Americold Realty Trust | | | 261 | | | | (0.55 | )% | | | 89 | |
Host Hotels & Resorts, Inc. | | | 454 | | | | (0.37 | )% | | | 67 | |
Agree Realty Corp. | | | 410 | | | | (1.54 | )% | | | 41 | |
American Tower Corp. — Class A | | | 25 | | | | (0.32 | )% | | | (17 | ) |
Camden Property Trust | | | 126 | | | | (0.71 | )% | | | (20 | ) |
Crown Castle International Corp. | | | 34 | | | | (0.30 | )% | | | (23 | ) |
Fulton Financial Corp. | | | 519 | | | | (0.37 | )% | | | (257 | ) |
Prologis, Inc. | | | 179 | | | | (1.00 | )% | | | (295 | ) |
CyrusOne, Inc. | | | 161 | | | | (0.66 | )% | | | (295 | ) |
First Midwest Bancorp, Inc. | | | 611 | | | | (0.55 | )% | | | (331 | ) |
Southside Bancshares, Inc. | | | 355 | | | | (0.62 | )% | | | (387 | ) |
Duke Realty Corp. | | | 279 | | | | (0.63 | )% | | | (476 | ) |
Howard Hughes Corp. | | | 120 | | | | (0.53 | )% | | | (478 | ) |
Healthpeak Properties, Inc. | | | 432 | | | | (0.74 | )% | | | (601 | ) |
TFS Financial Corp. | | | 511 | | | | (0.51 | )% | | | (709 | ) |
STAG Industrial, Inc. | | | 228 | | | | (0.40 | )% | | | (1,183 | ) |
Rayonier, Inc. | | | 423 | | | | (0.70 | )% | | | (1,213 | ) |
First Financial Bankshares, Inc. | | | 372 | | | | (0.76 | )% | | | (1,230 | ) |
Healthcare Trust of America, Inc. — Class A | | | 478 | | | | (0.74 | )% | | | (1,309 | ) |
Alleghany Corp. | | | 37 | | | | (1.26 | )% | | | (1,388 | ) |
Medical Properties Trust, Inc. | | | 781 | | | | (0.96 | )% | | | (1,398 | ) |
Intercontinental Exchange, Inc. | | | 126 | | | | (0.82 | )% | | | (1,498 | ) |
SBA Communications Corp. | | | 20 | | | | (0.32 | )% | | | (1,519 | ) |
Loews Corp. | | | 241 | | | | (0.61 | )% | | | (1,586 | ) |
162 | THE GUGGENHEIM FUNDS ANNUAL REPORT | SEE NOTES TO FINANCIAL STATEMENTS. |
SCHEDULE OF INVESTMENTS (continued) | December 31, 2020 |
SERIES Z (ALPHA OPPORTUNITY SERIES) | |
| | Shares | | | Percentage
Notional
Amount | | | Value and
Unrealized
Appreciation
(Depreciation) | |
Brookline Bancorp, Inc. | | | 1,103 | | | | (0.75 | )% | | $ | (1,654 | ) |
EastGroup Properties, Inc. | | | 99 | | | | (0.77 | )% | | | (2,053 | ) |
Alexandria Real Estate Equities, Inc. | | | 95 | | | | (0.95 | )% | | | (2,300 | ) |
Equinix, Inc. | | | 19 | | | | (0.76 | )% | | | (2,642 | ) |
Terreno Realty Corp. | | | 197 | | | | (0.65 | )% | | | (3,456 | ) |
Sun Communities, Inc. | | | 132 | | | | (1.13 | )% | | | (4,288 | ) |
Rexford Industrial Realty, Inc. | | | 443 | | | | (1.23 | )% | | | (5,799 | ) |
First Republic Bank | | | 162 | | | | (1.34 | )% | | | (6,844 | ) |
Total Financial | | | | | | | | | | | (33,626 | ) |
| | | | | | | | | | | | | |
Consumer, Non-cyclical | | | | | | | | | | | | |
Nevro Corp. | | | 100 | | | | (0.98 | )% | | | (255 | ) |
Moody’s Corp. | | | 51 | | | | (0.83 | )% | | | (938 | ) |
Verisk Analytics, Inc. — Class A | | | 62 | | | | (0.73 | )% | | | (1,138 | ) |
WD-40 Co. | | | 36 | | | | (0.54 | )% | | | (1,530 | ) |
CoStar Group, Inc. | | | 17 | | | | (0.89 | )% | | | (1,569 | ) |
Equifax, Inc. | | | 98 | | | | (1.06 | )% | | | (2,767 | ) |
Avalara, Inc. | | | 35 | | | | (0.33 | )% | | | (3,155 | ) |
Avery Dennison Corp. | | | 69 | | | | (0.60 | )% | | | (3,202 | ) |
Total Consumer, Non-cyclical | | | | | | | | | | | (14,554 | ) |
Total MS Equity Short Custom Basket | | | | | | $ | (264,321 | ) |
| | | | | | | | | |
GS EQUITY LONG CUSTOM BASKET | | | | | | | | |
Financial | | | | | | | | | | | | |
MetLife, Inc. | | | 77 | | | | 1.26 | % | | $ | 675 | |
Allstate Corp. | | | 35 | | | | 1.32 | % | | | 508 | |
Travelers Companies, Inc. | | | 14 | | | | 0.67 | % | | | 379 | |
Hartford Financial Services Group, Inc. | | | 28 | | | | 0.47 | % | | | 357 | |
Synchrony Financial | | | 32 | | | | 0.38 | % | | | 293 | |
Aflac, Inc. | | | 28 | | | | 0.43 | % | | | 232 | |
Ameriprise Financial, Inc. | | | 6 | | | | 0.40 | % | | | 220 | |
Equity Residential | | | 34 | | | | 0.69 | % | | | 203 | |
JPMorgan Chase & Co. | | | 6 | | | | 0.26 | % | | | 190 | |
Western Union Co. | | | 75 | | | | 0.56 | % | | | 166 | |
Berkshire Hathaway, Inc. — Class B | | | 10 | | | | 0.80 | % | | | 151 | |
Highwoods Properties, Inc. | | | 62 | | | | 0.84 | % | | | 116 | |
M&T Bank Corp. | | | 5 | | | | 0.22 | % | | | 114 | |
Bank of America Corp. | | | 25 | | | | 0.26 | % | | | 102 | |
SEI Investments Co. | | | 16 | | | | 0.32 | % | | | 11 | |
Piedmont Office Realty Trust, Inc. — Class A | | | 105 | | | | 0.58 | % | | | (17 | ) |
Total Financial | | | | | | | | | | | 3,700 | |
| | | | | | | | | | | | | |
Industrial | | | | | | | | | | | | |
TE Connectivity Ltd. | | | 20 | | | | 0.82 | % | | | 820 | |
Snap-on, Inc. | | | 13 | | | | 0.76 | % | | | 698 | |
AGCO Corp. | | | 22 | | | | 0.78 | % | | | 692 | |
Timken Co. | | | 20 | | | | 0.53 | % | | | 579 | |
Vishay Intertechnology, Inc. | | | 104 | | | | 0.74 | % | | | 577 | |
Caterpillar, Inc. | | | 8 | | | | 0.50 | % | | | 536 | |
Regal Beloit Corp. | | | 10 | | | | 0.42 | % | | | 528 | |
Owens Corning | | | 14 | | | | 0.36 | % | | | 502 | |
Garmin Ltd. | | | 11 | | | | 0.45 | % | | | 405 | |
Lincoln Electric Holdings, Inc. | | | 12 | | | | 0.48 | % | | | 399 | |
Hubbell, Inc. | | | 17 | | | | 0.91 | % | | | 380 | |
Terex Corp. | | | 30 | | | | 0.36 | % | | | 370 | |
Arrow Electronics, Inc. | | | 16 | | | | 0.53 | % | | | 298 | |
Waters Corp. | | | 6 | | | | 0.51 | % | | | 296 | |
Oshkosh Corp. | | | 18 | | | | 0.53 | % | | | 196 | |
Eaton Corporation plc | | | 7 | | | | 0.29 | % | | | 176 | |
Acuity Brands, Inc. | | | 8 | | | | 0.33 | % | | | 174 | |
National Instruments Corp. | | | 19 | | | | 0.29 | % | | | 146 | |
Keysight Technologies, Inc. | | | 9 | | | | 0.41 | % | | | 124 | |
Pentair plc | | | 15 | | | | 0.27 | % | | | 110 | |
Trane Technologies plc | | | 4 | | | | 0.20 | % | | | 98 | |
Dover Corp. | | | 5 | | | | 0.22 | % | | | 89 | |
PerkinElmer, Inc. | | | 5 | | | | 0.25 | % | | | 82 | |
A O Smith Corp. | | | 13 | | | | 0.24 | % | | | 80 | |
Energizer Holdings, Inc. | | | 22 | | | | 0.32 | % | | | 58 | |
Lennox International, Inc. | | | 2 | | | | 0.19 | % | | | 16 | |
3M Co. | | | 8 | | | | 0.48 | % | | | (10 | ) |
Masco Corp. | | | 33 | | | | 0.62 | % | | | (30 | ) |
General Dynamics Corp. | | | 9 | | | | 0.46 | % | | | (37 | ) |
Lockheed Martin Corp. | | | 3 | | | | 0.37 | % | | | (90 | ) |
Total Industrial | | | | | | | | | | | 8,262 | |
| | | | | | | | | | | | | |
Consumer, Non-cyclical | | | | | | | | | | | | |
United Rentals, Inc. | | | 9 | | | | 0.72 | % | | | 1,036 | |
Rent-A-Center, Inc. | | | 35 | | | | 0.46 | % | | | 716 | |
DaVita, Inc. | | | 21 | | | | 0.85 | % | | | 701 | |
Molson Coors Beverage Co. — Class B | | | 78 | | | | 1.21 | % | | | 681 | |
McKesson Corp. | | | 15 | | | | 0.89 | % | | | 620 | |
United Therapeutics Corp. | | | 13 | | | | 0.68 | % | | | 570 | |
Amgen, Inc. | | | 14 | | | | 1.10 | % | | | 503 | |
Cardinal Health, Inc. | | | 45 | | | | 0.83 | % | | | 492 | |
Quanta Services, Inc. | | | 25 | | | | 0.62 | % | | | 491 | |
Johnson & Johnson | | | 18 | | | | 0.97 | % | | | 460 | |
Eli Lilly & Co. | | | 7 | | | | 0.41 | % | | | 432 | |
Colgate-Palmolive Co. | | | 34 | | | | 1.00 | % | | | 405 | |
Jazz Pharmaceuticals plc | | | 9 | | | | 0.51 | % | | | 337 | |
UnitedHealth Group, Inc. | | | 6 | | | | 0.72 | % | | | 334 | |
Alexion Pharmaceuticals, Inc. | | | 6 | | | | 0.32 | % | | | 324 | |
Procter & Gamble Co. | | | 18 | | | | 0.86 | % | | | 324 | |
Kraft Heinz Co. | | | 83 | | | | 0.99 | % | | | 299 | |
Anthem, Inc. | | | 4 | | | | 0.44 | % | | | 284 | |
SEE NOTES TO FINANCIAL STATEMENTS. | THE GUGGENHEIM FUNDS ANNUAL REPORT | 163 |
SCHEDULE OF INVESTMENTS (continued) | December 31, 2020 |
SERIES Z (ALPHA OPPORTUNITY SERIES) | |
| | Shares | | | Percentage
Notional
Amount | | | Value and
Unrealized
Appreciation
(Depreciation) | |
Philip Morris International, Inc. | | | 40 | | | | 1.14 | % | | $ | 234 | |
Cigna Corp. | | | 5 | | | | 0.36 | % | | | 229 | |
Post Holdings, Inc. | | | 15 | | | | 0.52 | % | | | 149 | |
Molina Healthcare, Inc. | | | 4 | | | | 0.29 | % | | | 145 | |
Constellation Brands, Inc. — Class A | | | 4 | | | | 0.30 | % | | | 123 | |
Tyson Foods, Inc. — Class A | | | 24 | | | | 0.53 | % | | | 118 | |
Medtronic plc | | | 6 | | | | 0.24 | % | | | 117 | |
Mondelez International, Inc. — Class A | | | 21 | | | | 0.42 | % | | | 114 | |
Pfizer, Inc. | | | 40 | | | | 0.50 | % | | | 87 | |
Conagra Brands, Inc. | | | 47 | | | | 0.58 | % | | | 75 | |
J M Smucker Co. | | | 31 | | | | 1.23 | % | | | 75 | |
Hill-Rom Holdings, Inc. | | | 8 | | | | 0.27 | % | | | 72 | |
Altria Group, Inc. | | | 59 | | | | 0.83 | % | | | 70 | |
Chemed Corp. | | | 1 | | | | 0.18 | % | | | 61 | |
Hologic, Inc. | | | 10 | | | | 0.25 | % | | | 61 | |
Kellogg Co. | | | 11 | | | | 0.23 | % | | | 59 | |
Alkermes plc | | | 40 | | | | 0.27 | % | | | 55 | |
Ionis Pharmaceuticals, Inc. | | | 14 | | | | 0.27 | % | | | 48 | |
Merck & Company, Inc. | | | 39 | | | | 1.09 | % | | | 42 | |
Laboratory Corporation of America Holdings | | | 7 | | | | 0.49 | % | | | 30 | |
Innoviva, Inc. | | | 73 | | | | 0.31 | % | | | 28 | |
Campbell Soup Co. | | | 48 | | | | 0.80 | % | | | 22 | |
AbbVie, Inc. | | | 7 | | | | 0.26 | % | | | 22 | |
USANA Health Sciences, Inc. | | | 9 | | | | 0.24 | % | | | 21 | |
Bristol-Myers Squibb Co. | | | 15 | | | | 0.32 | % | | | 16 | |
Encompass Health Corp. | | | 12 | | | | 0.34 | % | | | 10 | |
Clorox Co. | | | 3 | | | | 0.21 | % | | | 5 | |
TreeHouse Foods, Inc. | | | 27 | | | | 0.39 | % | | | 5 | |
Prestige Consumer Healthcare, Inc. | | | 20 | | | | 0.24 | % | | | (4 | ) |
CVS Health Corp. | | | 22 | | | | 0.52 | % | | | (4 | ) |
Vector Group Ltd. | | | 84 | | | | 0.34 | % | | | (6 | ) |
Humana, Inc. | | | 3 | | | | 0.42 | % | | | (9 | ) |
General Mills, Inc. | | | 51 | | | | 1.03 | % | | | (33 | ) |
Ingredion, Inc. | | | 22 | | | | 0.59 | % | | | (34 | ) |
John B Sanfilippo & Son, Inc. | | | 16 | | | | 0.43 | % | | | (43 | ) |
Sprouts Farmers Market, Inc. | | | 59 | | | | 0.41 | % | | | (58 | ) |
Kimberly-Clark Corp. | | | 20 | | | | 0.92 | % | | | (85 | ) |
Gilead Sciences, Inc. | | | 24 | | | | 0.48 | % | | | (285 | ) |
Total Consumer, Non-cyclical | | | | | | | | | | | 10,541 | |
| | | | | | | | | | | | | |
Consumer, Cyclical | | | | | | | | | | | | |
Gentherm, Inc. | | | 42 | | | | 0.94 | % | | | 1,270 | |
Autoliv, Inc. | | | 23 | | | | 0.73 | % | | | 836 | |
Gentex Corp. | | | 102 | | | | 1.19 | % | | | 811 | |
Lear Corp. | | | 9 | | | | 0.49 | % | | | 646 | |
Cummins, Inc. | | | 5 | | | | 0.39 | % | | | 393 | |
Allison Transmission Holdings, Inc. | | | 56 | | | | 0.83 | % | | | 309 | |
Brunswick Corp. | | | 16 | | | | 0.42 | % | | | 296 | |
Hanesbrands, Inc. | | | 52 | | | | 0.26 | % | | | 276 | |
Dolby Laboratories, Inc. — Class A | | | 8 | | | | 0.27 | % | | | 250 | |
MSC Industrial Direct Company, Inc. — Class A | | | 10 | | | | 0.29 | % | | | 193 | |
Genuine Parts Co. | | | 23 | | | | 0.79 | % | | | 113 | |
PACCAR, Inc. | | | 19 | | | | 0.56 | % | | | 91 | |
AutoNation, Inc. | | | 19 | | | | 0.45 | % | | | 89 | |
Lowe’s Companies, Inc. | | | 12 | | | | 0.66 | % | | | 61 | |
AutoZone, Inc. | | | 1 | | | | 0.41 | % | | | 41 | |
Lennar Corp. — Class A | | | 16 | | | | 0.42 | % | | | (16 | ) |
PulteGroup, Inc. | | | 29 | | | | 0.43 | % | | | (26 | ) |
Meritage Homes Corp. | | | 11 | | | | 0.31 | % | | | (91 | ) |
Best Buy Company, Inc. | | | 28 | | | | 0.96 | % | | | (249 | ) |
Total Consumer, Cyclical | | | | | | | | | | | 5,293 | |
| | | | | | | | | | | | | |
Technology | | | | | | | | | | | | |
NetApp, Inc. | | | 39 | | | | 0.89 | % | | | 947 | |
Texas Instruments, Inc. | | | 15 | | | | 0.84 | % | | | 741 | |
HP, Inc. | | | 80 | | | | 0.67 | % | | | 591 | |
CDK Global, Inc. | | | 34 | | | | 0.60 | % | | | 565 | |
Seagate Technology plc | | | 48 | | | | 1.02 | % | | | 556 | |
SS&C Technologies Holdings, Inc. | | | 45 | | | | 1.12 | % | | | 541 | |
KLA Corp. | | | 6 | | | | 0.53 | % | | | 444 | |
Applied Materials, Inc. | | | 12 | | | | 0.36 | % | | | 403 | |
Cerner Corp. | | | 42 | | | | 1.13 | % | | | 390 | |
Oracle Corp. | | | 34 | | | | 0.75 | % | | | 366 | |
Cirrus Logic, Inc. | | | 14 | | | | 0.39 | % | | | 273 | |
Microchip Technology, Inc. | | | 6 | | | | 0.28 | % | | | 232 | |
Kulicke & Soffa Industries, Inc. | | | 29 | | | | 0.32 | % | | | 231 | |
Apple, Inc. | | | 11 | | | | 0.50 | % | | | 194 | |
Skyworks Solutions, Inc. | | | 8 | | | | 0.42 | % | | | 111 | |
International Business Machines Corp. | | | 29 | | | | 1.25 | % | | | 98 | |
Dell Technologies, Inc. — Class C | | | 16 | | | | 0.40 | % | | | 48 | |
Paychex, Inc. | | | 10 | | | | 0.32 | % | | | (3 | ) |
Intel Corp. | | | 50 | | | | 0.85 | % | | | (230 | ) |
Total Technology | | | | | | | | | | | 6,498 | |
| | | | | | | | | | | | | |
Communications | | | | | | | | | | | | |
Viavi Solutions, Inc. | | | 199 | | | | 1.02 | % | | | 642 | |
T-Mobile US, Inc. | | | 20 | | | | 0.92 | % | | | 493 | |
Cisco Systems, Inc. | | | 86 | | | | 1.32 | % | | | 394 | |
Ciena Corp. | | | 25 | | | | 0.45 | % | | | 337 | |
Omnicom Group, Inc. | | | 28 | | | | 0.60 | % | | | 297 | |
Motorola Solutions, Inc. | | | 9 | | | | 0.53 | % | | | 135 | |
164 | THE GUGGENHEIM FUNDS ANNUAL REPORT | SEE NOTES TO FINANCIAL STATEMENTS. |
SCHEDULE OF INVESTMENTS (continued) | December 31, 2020 |
SERIES Z (ALPHA OPPORTUNITY SERIES) | |
| | Shares | | | Percentage
Notional
Amount | | | Value and
Unrealized
Appreciation
(Depreciation) | |
Verizon Communications, Inc. | | | 60 | | | | 1.21 | % | | $ | 115 | |
Discovery, Inc. — Class A | | | 34 | | | | 0.35 | % | | | 99 | |
Cogent Communications Holdings, Inc. | | | 32 | | | | 0.66 | % | | | 90 | |
VeriSign, Inc. | | | 6 | | | | 0.45 | % | | | 90 | |
Sirius XM Holdings, Inc. | | | 366 | | | | 0.80 | % | | | 43 | |
Juniper Networks, Inc. | | | 108 | | | | 0.83 | % | | | 30 | |
eBay, Inc. | | | 25 | | | | 0.43 | % | | | (29 | ) |
AT&T, Inc. | | | 68 | | | | 0.67 | % | | | (569 | ) |
Total Communications | | | | | | | | | | | 2,167 | |
| | | | | | | | | | | | | |
Utilities | | | | | | | | | | | | |
Exelon Corp. | | | 62 | | | | 0.89 | % | | | 244 | |
Southern Co. | | | 30 | | | | 0.63 | % | | | 206 | |
Public Service Enterprise Group, Inc. | | | 49 | | | | 0.98 | % | | | 187 | |
CenterPoint Energy, Inc. | | | 54 | | | | 0.40 | % | | | 158 | |
IDACORP, Inc. | | | 31 | | | | 1.02 | % | | | 152 | |
NorthWestern Corp. | | | 14 | | | | 0.28 | % | | | 136 | |
UGI Corp. | | | 45 | | | | 0.54 | % | | | 121 | |
Evergy, Inc. | | | 52 | | | | 0.99 | % | | | 120 | |
OGE Energy Corp. | | | 52 | | | | 0.57 | % | | | 68 | |
Ameren Corp. | | | 34 | | | | 0.91 | % | | | 40 | |
Avista Corp. | | | 19 | | | | 0.26 | % | | | 25 | |
ONE Gas, Inc. | | | 16 | | | | 0.42 | % | | | 20 | |
PPL Corp. | | | 90 | | | | 0.87 | % | | | 8 | |
NiSource, Inc. | | | 59 | | | | 0.46 | % | | | (43 | ) |
Portland General Electric Co. | | | 16 | | | | 0.23 | % | | | (48 | ) |
Consolidated Edison, Inc. | | | 18 | | | | 0.45 | % | | | (80 | ) |
National Fuel Gas Co. | | | 24 | | | | 0.34 | % | | | (93 | ) |
Duke Energy Corp. | | | 25 | | | | 0.78 | % | | | (111 | ) |
Southwest Gas Holdings, Inc. | | | 19 | | | | 0.40 | % | | | (247 | ) |
Total Utilities | | | | | | | | | | | 863 | |
Total GS Equity Long Custom Basket | | | | | | $ | 37,324 | |
| | | | | | | | | |
GS EQUITY SHORT CUSTOM BASKET | | | | | | | | |
| | | | | | | | | | | | | |
Financial | | | | | | | | | | | | |
UDR, Inc. | | | 297 | | | | (0.62 | )% | | $ | 2,647 | |
Kilroy Realty Corp. | | | 292 | | | | (0.91 | )% | | | 2,463 | |
Realty Income Corp. | | | 436 | | | | (1.53 | )% | | | 2,213 | |
Global Net Lease, Inc. | | | 547 | | | | (0.53 | )% | | | 1,395 | |
JBG SMITH Properties | | | 446 | | | | (0.79 | )% | | | 930 | |
Douglas Emmett, Inc. | | | 204 | | | | (0.34 | )% | | | 841 | |
Truist Financial Corp. | | | 142 | | | | (0.38 | )% | | | 114 | |
First Industrial Realty Trust, Inc. | | | 301 | | | | (0.71 | )% | | | 107 | |
Agree Realty Corp. | | | 410 | | | | (1.54 | )% | | | 84 | |
Host Hotels & Resorts, Inc. | | | 454 | | | | (0.37 | )% | | | 79 | |
American Tower Corp. — Class A | | | 25 | | | | (0.32 | )% | | | (12 | ) |
Crown Castle International Corp. | | | 34 | | | | (0.30 | )% | | | (15 | ) |
Camden Property Trust | | | 126 | | | | (0.71 | )% | | | (19 | ) |
Prologis, Inc. | | | 179 | | | | (1.00 | )% | | | (265 | ) |
Fulton Financial Corp. | | | 519 | | | | (0.37 | )% | | | (283 | ) |
First Midwest Bancorp, Inc. | | | 611 | | | | (0.55 | )% | | | (298 | ) |
CyrusOne, Inc. | | | 161 | | | | (0.66 | )% | | | (319 | ) |
Southside Bancshares, Inc. | | | 355 | | | | (0.62 | )% | | | (423 | ) |
Howard Hughes Corp. | | | 120 | | | | (0.53 | )% | | | (445 | ) |
Duke Realty Corp. | | | 279 | | | | (0.63 | )% | | | (459 | ) |
Healthpeak Properties, Inc. | | | 432 | | | | (0.74 | )% | | | (601 | ) |
TFS Financial Corp. | | | 511 | | | | (0.51 | )% | | | (716 | ) |
Americold Realty Trust | | | 261 | | | | (0.55 | )% | | | (1,019 | ) |
QTS Realty Trust, Inc. — Class A | | | 151 | | | | (0.53 | )% | | | (1,106 | ) |
SBA Communications Corp. | | | 20 | | | | (0.32 | )% | | | (1,177 | ) |
Rayonier, Inc. | | | 423 | | | | (0.70 | )% | | | (1,196 | ) |
STAG Industrial, Inc. | | | 228 | | | | (0.40 | )% | | | (1,205 | ) |
First Financial Bankshares, Inc. | | | 372 | | | | (0.76 | )% | | | (1,228 | ) |
Alleghany Corp. | | | 37 | | | | (1.26 | )% | | | (1,321 | ) |
Healthcare Trust of America, Inc. — Class A | | | 478 | | | | (0.74 | )% | | | (1,324 | ) |
Medical Properties Trust, Inc. | | | 781 | | | | (0.96 | )% | | | (1,399 | ) |
Intercontinental Exchange, Inc. | | | 126 | | | | (0.82 | )% | | | (1,497 | ) |
Loews Corp. | | | 241 | | | | (0.61 | )% | | | (1,582 | ) |
Brookline Bancorp, Inc. | | | 1,103 | | | | (0.75 | )% | | | (1,661 | ) |
EastGroup Properties, Inc. | | | 99 | | | | (0.77 | )% | | | (1,899 | ) |
Equinix, Inc. | | | 19 | | | | (0.76 | )% | | | (2,092 | ) |
Terreno Realty Corp. | | | 197 | | | | (0.65 | )% | | | (2,254 | ) |
Alexandria Real Estate Equities, Inc. | | | 95 | | | | (0.95 | )% | | | (2,280 | ) |
Sun Communities, Inc. | | | 132 | | | | (1.13 | )% | | | (3,078 | ) |
Rexford Industrial Realty, Inc. | | | 443 | | | | (1.23 | )% | | | (4,157 | ) |
First Republic Bank | | | 162 | | | | (1.34 | )% | | | (6,800 | ) |
Total Financial | | | | | | | | | | | (31,257 | ) |
| | | | | | | | | | | | | |
Basic Materials | | | | | | | | | | | | |
Huntsman Corp. | | | 625 | | | | (0.89 | )% | | | 613 | |
Newmont Corp. | | | 139 | | | | (0.47 | )% | | | 220 | |
Sherwin-Williams Co. | | | 13 | | | | (0.54 | )% | | | 25 | |
Ashland Global Holdings, Inc. | | | 239 | | | | (1.07 | )% | | | (1,255 | ) |
Ecolab, Inc. | | | 32 | | | | (0.39 | )% | | | (1,311 | ) |
DuPont de Nemours, Inc. | | | 344 | | | | (1.38 | )% | | | (1,720 | ) |
SEE NOTES TO FINANCIAL STATEMENTS. | THE GUGGENHEIM FUNDS ANNUAL REPORT | 165 |
SCHEDULE OF INVESTMENTS (continued) | December 31, 2020 |
SERIES Z (ALPHA OPPORTUNITY SERIES) | |
| | Shares | | | Percentage
Notional
Amount | | | Value and
Unrealized
Appreciation
(Depreciation) | |
Axalta Coating Systems Ltd. | | | 413 | | | | (0.66 | )% | | $ | (1,724 | ) |
PPG Industries, Inc. | | | 72 | | | | (0.58 | )% | | | (1,971 | ) |
Air Products and Chemicals, Inc. | | | 121 | | | | (1.86 | )% | | | (3,181 | ) |
Celanese Corp. — Class A | | | 134 | | | | (0.98 | )% | | | (4,000 | ) |
Freeport-McMoRan, Inc. | | | 297 | | | | (0.44 | )% | | | (4,541 | ) |
Balchem Corp. | | | 245 | | | | (1.59 | )% | | | (4,558 | ) |
Linde plc | | | 133 | | | | (1.97 | )% | | | (6,564 | ) |
RPM International, Inc. | | | 294 | | | | (1.50 | )% | | | (7,328 | ) |
Albemarle Corp. | | | 132 | | | | (1.10 | )% | | | (10,467 | ) |
Quaker Chemical Corp. | | | 91 | | | | (1.30 | )% | | | (10,808 | ) |
United States Steel Corp. | | | 1,247 | | | | (1.18 | )% | | | (11,819 | ) |
Total Basic Materials | | | | | | | | | | | (70,389 | ) |
| | | | | | | | | | | | | |
Industrial | | | | | | | | | | | | |
Raytheon Technologies Corp. | | | 244 | | | | (0.98 | )% | | | 767 | |
US Ecology, Inc. | | | 199 | | | | (0.41 | )% | | | 234 | |
Boeing Co. | | | 21 | | | | (0.25 | )% | | | 115 | |
AMETEK, Inc. | | | 70 | | | | (0.48 | )% | | | (43 | ) |
TransDigm Group, Inc. | | | 19 | | | | (0.66 | )% | | | (1,590 | ) |
HEICO Corp. | | | 53 | | | | (0.40 | )% | | | (1,701 | ) |
Eagle Materials, Inc. | | | 69 | | | | (0.39 | )% | | | (1,847 | ) |
Martin Marietta Materials, Inc. | | | 26 | | | | (0.42 | )% | | | (2,008 | ) |
Ingersoll Rand, Inc. | | | 452 | | | | (1.16 | )% | | | (2,497 | ) |
Crown Holdings, Inc. | | | 109 | | | | (0.62 | )% | | | (3,054 | ) |
AptarGroup, Inc. | | | 268 | | | | (2.07 | )% | | | (3,458 | ) |
Casella Waste Systems, Inc. — Class A | | | 234 | | | | (0.82 | )% | | | (3,689 | ) |
Vulcan Materials Co. | | | 103 | | | | (0.86 | )% | | | (3,763 | ) |
Ball Corp. | | | 264 | | | | (1.39 | )% | | | (4,788 | ) |
Tetra Tech, Inc. | | | 184 | | | | (1.20 | )% | | | (5,229 | ) |
Total Industrial | | | | | | | | | | | (32,551 | ) |
| | | | | | | | | | | | | |
Consumer, Non-cyclical | | | | | | | | | | | | |
Nevro Corp. | | | 100 | | | | (0.98 | )% | | | (162 | ) |
Moody’s Corp. | | | 51 | | | | (0.83 | )% | | | (946 | ) |
Verisk Analytics, Inc. — Class A | | | 62 | | | | (0.73 | )% | | | (1,137 | ) |
WD-40 Co. | | | 36 | | | | (0.54 | )% | | | (1,540 | ) |
CoStar Group, Inc. | | | 17 | | | | (0.89 | )% | | | (1,590 | ) |
Equifax, Inc. | | | 98 | | | | (1.06 | )% | | | (2,783 | ) |
Avalara, Inc. | | | 35 | | | | (0.33 | )% | | | (2,814 | ) |
Avery Dennison Corp. | | | 69 | | | | (0.60 | )% | | | (3,218 | ) |
Total Consumer, Non-cyclical | | | | | | | | | | | (14,190 | ) |
| | | | | | | | | | | | | |
Technology | | | | | | | | | | | | |
Splunk, Inc. | | | 66 | | | | (0.63 | )% | | | 922 | |
NVIDIA Corp. | | | 14 | | | | (0.41 | )% | | | (895 | ) |
salesforce.com, Inc. | | | 43 | | | | (0.54 | )% | | | (930 | ) |
Appfolio, Inc. — Class A | | | 32 | | | | (0.32 | )% | | | (1,078 | ) |
Clarivate plc | | | 375 | | | | (0.63 | )% | | | (1,104 | ) |
Pegasystems, Inc. | | | 106 | | | | (0.80 | )% | | | (1,349 | ) |
Tyler Technologies, Inc. | | | 21 | | | | (0.52 | )% | | | (1,663 | ) |
Atlassian Corporation plc — Class A | | | 33 | | | | (0.43 | )% | | | (1,953 | ) |
ANSYS, Inc. | | | 44 | | | | (0.90 | )% | | | (1,966 | ) |
Rapid7, Inc. | | | 122 | | | | (0.62 | )% | | | (2,087 | ) |
Smartsheet, Inc. — Class A | | | 89 | | | | (0.35 | )% | | | (2,249 | ) |
Coupa Software, Inc. | | | 19 | | | | (0.36 | )% | | | (2,260 | ) |
Workiva, Inc. | | | 62 | | | | (0.32 | )% | | | (3,136 | ) |
Zscaler, Inc. | | | 33 | | | | (0.37 | )% | | | (4,051 | ) |
HubSpot, Inc. | | | 23 | | | | (0.51 | )% | | | (4,898 | ) |
Varonis Systems, Inc. | | | 112 | | | | (1.03 | )% | | | (5,336 | ) |
Total Technology | | | | | | | | | | | (34,033 | ) |
| | | | | | | | | | | | | |
Consumer, Cyclical | | | | | | | | | | | | |
United Airlines Holdings, Inc. | | | 210 | | | | (0.51 | )% | | | 172 | |
Alaska Air Group, Inc. | | | 294 | | | | (0.86 | )% | | | 5 | |
JetBlue Airways Corp. | | | 779 | | | | (0.64 | )% | | | (2,020 | ) |
Five Below, Inc. | | | 51 | | | | (0.50 | )% | | | (2,335 | ) |
Delta Air Lines, Inc. | | | 430 | | | | (0.97 | )% | | | (2,708 | ) |
Live Nation Entertainment, Inc. | | | 140 | | | | (0.58 | )% | | | (2,992 | ) |
Southwest Airlines Co. | | | 420 | | | | (1.10 | )% | | | (3,122 | ) |
Hilton Worldwide Holdings, Inc. | | | 170 | | | | (1.07 | )% | | | (3,392 | ) |
TJX Companies, Inc. | | | 278 | | | | (1.07 | )% | | | (3,566 | ) |
Copart, Inc. | | | 162 | | | | (1.16 | )% | | | (4,762 | ) |
Burlington Stores, Inc. | | | 79 | | | | (1.16 | )% | | | (4,926 | ) |
NIKE, Inc. — Class B | | | 177 | | | | (1.41 | )% | | | (5,495 | ) |
Scotts Miracle-Gro Co. — Class A | | | 71 | | | | (0.80 | )% | | | (5,503 | ) |
Starbucks Corp. | | | 278 | | | | (1.68 | )% | | | (8,533 | ) |
Total Consumer, Cyclical | | | | | | | | | | | (49,177 | ) |
| | | | | | | | | | | | | |
Energy | | | | | | | | | | | | |
Williams Companies, Inc. | | | 444 | | | | (0.50 | )% | | | 197 | |
Cheniere Energy, Inc. | | | 176 | | | | (0.60 | )% | | | (194 | ) |
Ovintiv, Inc. | | | 843 | | | | (0.68 | )% | | | (715 | ) |
Phillips 66 | | | 337 | | | | (1.33 | )% | | | (821 | ) |
ChampionX Corp. | | | 819 | | | | (0.71 | )% | | | (1,077 | ) |
NOV, Inc. | | | 491 | | | | (0.38 | )% | | | (1,133 | ) |
Hess Corp. | | | 261 | | | | (0.78 | )% | | | (1,574 | ) |
Schlumberger N.V. | | | 1,030 | | | | (1.27 | )% | | | (3,007 | ) |
Total Energy | | | | | | | | | | | (8,324 | ) |
| | | | | | | | | | | | | |
Utilities | | | | | | | | | | | | |
American States Water Co. | | | 89 | | | | (0.40 | )% | | | 750 | |
California Water Service Group | | | 278 | | | | (0.85 | )% | | | (496 | ) |
Total Utilities | | | | | | | | | | | 254 | |
| | | | | | | | | | | | | |
166 | THE GUGGENHEIM FUNDS ANNUAL REPORT | SEE NOTES TO FINANCIAL STATEMENTS. |
SCHEDULE OF INVESTMENTS (continued) | December 31, 2020 |
SERIES Z (ALPHA OPPORTUNITY SERIES) | |
| | Shares | | | Percentage
Notional
Amount | | |
Value and
Unrealized
Depreciation
| |
Communications | | | | | | | | | | | | |
Anaplan, Inc. | | | 68 | | | | (0.28 | )% | | $ | (2,077 | ) |
Okta, Inc. | | | 30 | | | | (0.43 | )% | | | (2,901 | ) |
Zendesk, Inc. | | | 110 | | | | (0.89 | )% | | | (4,326 | ) |
Liberty Broadband Corp. — Class C | | | 214 | | | | (1.91 | )% | | | (4,596 | ) |
Q2 Holdings, Inc. | | | 124 | | | | (0.88 | )% | | | (5,798 | ) |
Total Communications | | | | | | | | | | | (19,698 | ) |
Total GS Equity Short Custom Basket | | | | | | $ | (259,365 | ) |
* | Non-income producing security. |
† | Value determined based on Level 1 inputs — See Note 4. |
†† | Value determined based on Level 2 inputs — See Note 4. |
1 | All or a portion of this security is pledged as custom basket swap collateral at December 31, 2020. |
2 | Rate indicated is the 7-day yield as of December 31, 2020. |
| | GS — Goldman Sachs International |
| | MS — Morgan Stanley Capital Services LLC |
| | plc — Public Limited Company |
| | REIT — Real Estate Investment Trust |
| | |
| | See Sector Classification in Other Information section. |
The following table summarizes the inputs used to value the Fund’s investments at December 31, 2020 (See Note 4 in the Notes to Financial Statements):
Investments in Securities (Assets) | | Level 1
Quoted
Prices | | | Level 2
Significant
Observable
Inputs | | | Level 3
Significant
Unobservable
Inputs | | | Total | |
Common Stocks | | $ | 4,949,006 | | | $ | — | | | $ | — | | | $ | 4,949,006 | |
Money Market Fund | | | 108,662 | | | | — | | | | — | | | | 108,662 | |
Equity Custom Basket Swap Agreements** | | | — | | | | 74,790 | | | | — | | | | 74,790 | |
Total Assets | | $ | 5,057,668 | | | $ | 74,790 | | | $ | — | | | $ | 5,132,458 | |
Investments in Securities (Liabilities) | | Level 1
Quoted
Prices | | | Level 2
Significant
Observable
Inputs | | | Level 3
Significant
Unobservable
Inputs | | | Total | |
Equity Custom Basket Swap Agreements** | | $ | — | | | $ | 523,686 | | | $ | — | | | $ | 523,686 | �� |
** | This derivative is reported as unrealized appreciation/depreciation at period end. |
SEE NOTES TO FINANCIAL STATEMENTS. | THE GUGGENHEIM FUNDS ANNUAL REPORT | 167 |
SERIES Z (ALPHA OPPORTUNITY SERIES) | |
STATEMENT OF ASSETS AND LIABILITIES |
December 31, 2020 |
Assets: |
Investments, at value (cost $4,595,164) | | $ | 5,057,668 | |
Unrealized appreciation on OTC swap agreements | | | 74,790 | |
Prepaid expenses | | | 1,727 | |
Receivables: |
Investment Adviser | | | 9,690 | |
Dividends | | | 8,730 | |
Total assets | | | 5,152,605 | |
| | | | | |
Liabilities: |
Overdraft due to custodian bank | | | 433 | |
Unrealized depreciation on OTC swap agreements | | | 523,686 | |
Payable for: |
Swap settlement | | | 32,277 | |
Fund shares redeemed | | | 17,521 | |
Fund accounting/administration fees | | | 5,638 | |
Transfer agent/maintenance fees | | | 2,157 | |
Trustees’ fees* | | | 1,020 | |
Distribution and service fees | | | 973 | |
Miscellaneous | | | 33,516 | |
Total liabilities | | | 617,221 | |
Commitments and contingent liabilities (Note 13) | | | — | |
Net assets | | $ | 4,535,384 | |
| | | | | |
Net assets consist of: |
Paid in capital | | $ | 6,063,246 | |
Total distributable earnings (loss) | | | (1,527,862 | ) |
Net assets | | $ | 4,535,384 | |
Capital shares outstanding | | | 305,883 | |
Net asset value per share | | $ | 14.83 | |
STATEMENT OF OPERATIONS |
Year Ended December 31, 2020 |
Investment Income: |
Dividends | | $ | 123,238 | |
Interest | | | 1,202 | |
Total investment income | | | 124,440 | |
| | | | | |
Expenses: |
Management fees | | | 46,355 | |
Distribution and service fees | | | 12,876 | |
Transfer agent/maintenance fees | | | 25,132 | |
Professional fees | | | 42,630 | |
Fund accounting/administration fees | | | 34,044 | |
Trustees’ fees* | | | 17,268 | |
Custodian fees | | | 9,625 | |
Line of credit fees | | | 147 | |
Miscellaneous | | | 16,745 | |
Total expenses | | | 204,822 | |
Less: |
Expenses reimbursed by Adviser | | | (55,199 | ) |
Expenses waived by Adviser | | | (46,317 | ) |
Earnings credits applied | | | (31 | ) |
Total waived/reimbursed expenses | | | (101,547 | ) |
Net expenses | | | 103,275 | |
Net investment income | | | 21,165 | |
| | | | | |
Net Realized and Unrealized Gain (Loss): |
Net realized gain (loss) on: |
Investments | | | 221,663 | |
Swap agreements | | | (229,633 | ) |
Net realized loss | | | (7,970 | ) |
Net change in unrealized appreciation (depreciation) on: |
Investments | | | 50,462 | |
Swap agreements | | | (113,734 | ) |
Net change in unrealized appreciation (depreciation) | | | (63,272 | ) |
Net realized and unrealized loss | | | (71,242 | ) |
Net decrease in net assets resulting from operations | | $ | (50,077 | ) |
* | Relates to Trustees not deemed “interested persons” within the meaning of Section 2(a)(19) of the 1940 Act. |
168 | THE GUGGENHEIM FUNDS ANNUAL REPORT | SEE NOTES TO FINANCIAL STATEMENTS. |
SERIES Z (ALPHA OPPORTUNITY SERIES) | |
STATEMENTS OF CHANGES IN NET ASSETS |
| | Year Ended
December 31,
2020 | | | Year Ended
December 31,
2019 | |
Increase (Decrease) in Net Assets from Operations: | | | | | | | | |
Net investment income | | $ | 21,165 | | | $ | 31,524 | |
Net realized loss on investments | | | (7,970 | ) | | | (936,944 | ) |
Net change in unrealized appreciation (depreciation) on investments | | | (63,272 | ) | | | 695,655 | |
Net decrease in net assets resulting from operations | | | (50,077 | ) | | | (209,765 | ) |
| | | | | | | | | |
Distributions to shareholders | | | (31,639 | ) | | | (11,658 | ) |
| | | | | | | | | |
Capital share transactions: | | | | | | | | |
Proceeds from sale of shares | | | 78,547 | | | | 182,878 | |
Distributions reinvested | | | 31,639 | | | | 11,658 | |
Cost of shares redeemed | | | (1,722,128 | ) | | | (1,800,412 | ) |
Net decrease from capital share transactions | | | (1,611,942 | ) | | | (1,605,876 | ) |
Net decrease in net assets | | | (1,693,658 | ) | | | (1,827,299 | ) |
| | | | | | | | | |
Net assets: | | | | | | | | |
Beginning of year | | | 6,229,042 | | | | 8,056,341 | |
End of year | | $ | 4,535,384 | | | $ | 6,229,042 | |
| | | | | | | | | |
Capital share activity: | | | | | | | | |
Shares sold | | | 5,512 | | | | 12,241 | |
Shares issued from reinvestment of distributions | | | 2,180 | | | | 804 | |
Shares redeemed | | | (120,777 | ) | | | (121,599 | ) |
Net decrease in shares | | | (113,085 | ) | | | (108,554 | ) |
SEE NOTES TO FINANCIAL STATEMENTS. | THE GUGGENHEIM FUNDS ANNUAL REPORT | 169 |
SERIES Z (ALPHA OPPORTUNITY SERIES) | |
This table is presented to show selected data for a share outstanding throughout each period and to assist shareholders in evaluating a Fund’s performance for the periods presented.
| | Year Ended
December 31,
2020 | | | Year Ended
December 31,
2019 | | | Year Ended
December 31,
2018 | | | Year Ended
December 31,
2017 | | | Year Ended
December 31,
2016 | |
Per Share Data |
Net asset value, beginning of period | | $ | 14.87 | | | $ | 15.27 | | | $ | 20.05 | | | $ | 18.70 | | | $ | 16.59 | |
Income (loss) from investment operations: |
Net investment income (loss)a | | | .06 | | | | .07 | | | | .04 | | | | (.04 | ) | | | (.21 | ) |
Net gain (loss) on investments (realized and unrealized) | | | (.01 | ) | | | (.45 | ) | | | (2.28 | ) | | | 1.39 | | | | 2.32 | |
Total from investment operations | | | .05 | | | | (.38 | ) | | | (2.24 | ) | | | 1.35 | | | | 2.11 | |
Less distributions from: |
Net investment income | | | (.09 | ) | | | (.02 | ) | | | — | | | | — | | | | — | |
Net realized gains | | | — | | | | — | | | | (2.54 | ) | | | — | | | | — | |
Total distributions | | | (.09 | ) | | | (.02 | ) | | | (2.54 | ) | | | — | | | | — | |
Net asset value, end of period | | $ | 14.83 | | | $ | 14.87 | | | $ | 15.27 | | | $ | 20.05 | | | $ | 18.70 | |
|
Total Returnb | | | 0.27 | % | | | (2.45 | %) | | | (11.57 | %) | | | 7.22 | % | | | 12.79 | % |
Ratios/Supplemental Data |
Net assets, end of period (in thousands) | | $ | 4,535 | | | $ | 6,229 | | | $ | 8,056 | | | $ | 12,317 | | | $ | 13,192 | |
Ratios to average net assets: |
Net investment income (loss) | | | 0.41 | % | | | 0.44 | % | | | 0.22 | % | | | (0.23 | %) | | | (1.18 | %) |
Total expenses | | | 3.98 | % | | | 3.52 | % | | | 2.47 | % | | | 2.48 | % | | | 2.92 | % |
Net expensesc,d,e | | | 2.01 | % | | | 2.00 | % | | | 1.99 | % | | | 2.22 | % | | | 2.92 | % |
Portfolio turnover rate | | | 171 | % | | | 172 | % | | | 219 | % | | | 182 | % | | | 198 | % |
a | Net investment income (loss) per share was computed using average shares outstanding throughout the period. |
b | Total return does not take into account any of the expenses associated with an investment in variable insurance products. If total return had taken into account these expenses, performance would have been lower. Shares of a series of Guggenheim Variable Funds Trust are available only through the purchase of such products. |
c | Net expense information reflects the expense ratios after expense waivers and reimbursements, as applicable. |
d | Net expenses may include expenses that are excluded from the expense limitation agreement. Excluding these expenses, the net expense ratios for the years presented would be: |
| | 12/31/20 | 12/31/19 | 12/31/18 | 12/31/17 | 12/31/16 |
| | 2.00% | 2.00% | 1.99% | 2.13% | 2.35% |
e | The portion of the ratios of net expenses to average net assets attributable to recoupments of prior fee reductions or expense reimbursements for the years presented was as follows: |
| | 12/31/20 | 12/31/19 | 12/31/18 | 12/31/17 | 12/31/16 |
| | — | — | — | 0.15% | — |
170 | THE GUGGENHEIM FUNDS ANNUAL REPORT | SEE NOTES TO FINANCIAL STATEMENTS. |
NOTES TO FINANCIAL STATEMENTS |
Note 1 – Organization and Significant Accounting Policies
Organization
Guggenheim Variable Funds Trust (the “Trust”), a Delaware statutory trust, is registered with the SEC under the Investment Company Act of 1940 (“1940 Act”), as an open-ended investment company of the series type. Each series, in effect, is representing a separate fund (each, a “Fund”). The Trust may issue an unlimited number of authorized shares. The Trust accounts for the assets of each Fund separately. At December 31, 2020, the Trust consisted of fourteen funds. The Trust offers shares of the funds to insurance companies for their variable annuity and variable life insurance contracts.
This report covers the following funds (collectively, the “Funds”):
Fund Name | Investment
Company Type |
Series A (StylePlus—Large Core Series) | Diversified |
Series B (Large Cap Value Series) | Diversified |
Series D (World Equity Income Series) | Diversified |
Series E (Total Return Bond Series) | Diversified |
Series F (Floating Rate Strategies Series) | Diversified |
Series J (StylePlus—Mid Growth Series) | Diversified |
Series N (Managed Asset Allocation Series) | Diversified |
Series O (All Cap Value Series) | Diversified |
Series P (High Yield Series) | Diversified |
Series Q (Small Cap Value Series) | Diversified |
Series V (SMid Cap Value Series) | Diversified |
Series X (StylePlus—Small Growth Series) | Diversified |
Series Y (StylePlus—Large Growth Series) | Diversified |
Series Z (Alpha Opportunity Series) | Diversified |
Security Investors, LLC and Guggenheim Partners Investment Management, LLC (“GPIM”), which operates under the name Guggenheim Investments (“GI”), provides advisory services. GPIM provides advisory services to Series F (Floating Rate Strategies Series) and Security Investors, LLC provides advisory services to the remaining Funds covered in this report. Guggenheim Funds Distributors, LLC (“GFD”) acts as principal underwriter for the Trust. GI and GFD are affiliated entities.
Significant Accounting Policies
The Funds operate as investment companies and, accordingly, follow the investment company accounting and reporting guidance of the Financial Accounting Standards Board (“FASB”) Accounting Standards Codification Topic 946 Financial Services – Investment Companies.
The following significant accounting policies are in conformity with U.S. generally accepted accounting principles (“U.S. GAAP”) and are consistently followed by the Trust. This requires management to make estimates and assumptions that affect the reported amount of assets and liabilities, contingent assets and liabilities at the date of the financial statements, and the reported amounts of revenues and expenses during the reporting period. Actual results could differ from these estimates. All time references are based on Eastern Time.
The net asset value per share (“NAV”) of a fund is calculated by dividing the market value of a fund’s securities and other assets, less all liabilities, by the number of outstanding shares of that fund.
(a) Valuation of Investments
The Board of Trustees of the Funds (the “Board”) has adopted policies and procedures for the valuation of the Funds’ investments (the “Valuation Procedures”). Pursuant to the Valuation Procedures, the Board has delegated to a valuation committee, consisting of representatives from Guggenheim’s investment management, fund administration, legal and compliance departments (the “Valuation Committee”), the day-to-day responsibility for implementing the Valuation Procedures, including, under most circumstances, the responsibility for determining the fair value of the Funds’ securities and/or other assets.
Valuations of the Funds’ securities and other assets are supplied primarily by pricing services appointed pursuant to the processes set forth in the Valuation Procedures. The Valuation Committee convenes monthly, or more frequently as needed, to review the valuation of all assets which have been fair valued for reasonableness. The Funds’ officers, through the Valuation Committee and consistent with the monitoring and review responsibilities set forth in the Valuation Procedures, regularly review procedures used and valuations provided by the pricing services.
If the pricing service cannot or does not provide a valuation for a particular investment or such valuation is deemed unreliable, such investment is fair valued by the Valuation Committee.
Equity securities listed or traded on a recognized U.S. securities exchange or the National Association of Securities Dealers Automated Quotations (“NASDAQ”) National Market System shall generally be valued on the basis of the last sale price on the primary U.S. exchange or market on which the security is listed or traded; provided, however, that securities listed on NASDAQ will be valued at the NASDAQ Official Closing Price, which may not necessarily represent the last sale price. If there is no sale on the valuation date, exchange-traded U.S. equity securities will be valued on the basis of the last bid price.
Generally, trading in foreign securities markets is substantially completed each day at various times prior to the close of the New York Stock Exchange (“NYSE”). The values of foreign securities are
| | THE GUGGENHEIM FUNDS ANNUAL REPORT | 171 |
NOTES TO FINANCIAL STATEMENTS (continued) |
determined as of the close of such foreign markets or the close of the NYSE, if earlier. All investments quoted in foreign currencies are valued in U.S. dollars on the basis of the foreign currency exchange rates prevailing at the close of U.S. business at 4:00 p.m. Investments in foreign securities may involve risks not present in domestic investments. The Valuation Committee will determine the current value of such foreign securities by taking into consideration certain factors which may include those discussed above, as well as the following factors, among others: the value of the securities traded on other foreign markets, ADR trading, closed-end fund trading, foreign currency exchange activity, and the trading prices of financial products that are tied to foreign securities. In addition, under the Valuation Procedures, the Valuation Committee and Guggenheim Funds Investment Advisors, LLC (“GFIA” or the “Adviser”) are authorized to use prices and other information supplied by a third party pricing vendor in valuing foreign securities.
Open-end investment companies are valued at their NAV as of the close of business, on the valuation date. Exchange-traded funds and closed-end investment companies are valued at the last quoted sale price.
U.S. Government securities are valued by independent pricing services, the last traded fill price, or at the reported bid price at the close of business.
Repurchase agreements are generally valued at amortized cost, provided such amounts approximate market value.
Debt securities with a maturity of greater than 60 days at acquisition are valued at prices that reflect broker-dealer supplied valuations or are obtained from independent pricing services, which may consider the trade activity, treasury spreads, yields or price of bonds of comparable quality, coupon, maturity, and type, as well as prices quoted by dealers who make markets in such securities. Short-term debt securities with a maturity of 60 days or less at acquisition are valued at amortized cost, provided such amount approximates market value.
Typically, loans are valued using information provided by an independent third party pricing service that uses broker quotes, among other inputs. If the pricing service cannot or does not provide a valuation for a particular loan or such valuation is deemed unreliable, such investment is valued based on a quote from a broker-dealer or is fair valued by the Valuation Committee.
Exchange-traded options are valued at the mean of the bid and ask prices on the principal exchange on which they are traded. Over-the-counter (“OTC”) options are valued using a price provided by a pricing service.
The value of futures contracts is accounted for using the unrealized appreciation or depreciation on the contracts that is determined by marking the contracts to their current realized settlement prices. Financial futures contracts are valued at the 4:00 p.m. price on the valuation date. In the event that the exchange for a specific futures contract closes earlier than 4:00 p.m., the futures contract is valued at the official settlement price of the exchange. However, the underlying securities from which the futures contract value is derived are monitored until 4:00 p.m. to determine if fair valuation would provide a more accurate valuation.
The value of interest rate swap agreements entered into by a fund is accounted for using the unrealized appreciation or depreciation on the agreements that is determined using the previous day’s Chicago Mercantile Exchange close price, adjusted for the current day’s spreads.
The values of other swap agreements entered into by a fund are accounted for using the unrealized appreciation or depreciation on the agreements that are determined by marking the agreements to the last quoted value of the index or other underlying position that the swaps pertain to at the close of the NYSE.
Forward foreign currency exchange contracts are valued daily based on the applicable exchange rate of the underlying currency.
Investments for which market quotations are not readily available are fair-valued as determined in good faith by GI, subject to review and approval by the Valuation Committee, pursuant to methods established or ratified by the Board. Valuations in accordance with these methods are intended to reflect each security’s (or asset’s or liability’s) “fair value”. Each such determination is based on a consideration of all relevant factors, which are likely to vary from one pricing context to another. Examples of such factors may include, but are not limited to market prices; sale prices; broker quotes; and models which derive prices based on inputs such as prices of securities with comparable maturities and characteristics, or based on inputs such as anticipated cash flows or collateral, spread over U.S. Treasury securities, and other information analysis. In connection with futures contracts and other derivative investments, such factors may include obtaining information as to how (a) these contracts and other derivative investments trade in the futures or other derivative markets, respectively, and (b) the securities underlying these contracts and other derivative investments trade in the cash market.
(b) U.S. Government and Agency Obligations
Certain U.S. Government and Agency Obligations are traded on a discount basis; the interest rates shown on the Schedules of Investments reflect the effective rates paid at the time of purchase by the Funds. Other securities bear interest at the rates shown, payable at fixed dates through maturity.
172 | THE GUGGENHEIM FUNDS ANNUAL REPORT | |
NOTES TO FINANCIAL STATEMENTS (continued) |
(c) Senior Floating Rate Interests and Loan Investments
Senior floating rate interests in which the Trust invests generally pay interest rates which are periodically adjusted by reference to a base short-term floating rate, plus a premium. These base lending rates are generally (i) the lending rate offered by one or more major European banks, such as the one-month or three-month London Inter-Bank Offered Rate (“LIBOR”), (ii) the prime rate offered by one or more major United States banks, or (iii) the bank’s certificate of deposit rate. Senior floating rate interests often require prepayments from excess cash flows or permit the borrower to repay at its election. The rate at which the borrower repays cannot be predicted with accuracy. As a result, the actual remaining maturity may be substantially less than the stated maturities disclosed in the Funds’ Schedules of Investments.
The Funds invest in loans and other similar debt obligations (“obligations”). A portion of the Funds’ investments in these obligations is sometimes referred to as “covenant lite” loans or obligations (“covenant lite obligations”), which are obligations that lack covenants or possess fewer or less restrictive covenants or constraints on borrowers than certain other types of obligations. The Funds may also obtain exposure to covenant lite obligations through investment in securitization vehicles and other structured products. In recent market conditions, many new or reissued obligations have not featured traditional covenants, which are intended to protect lenders and investors by (i) imposing certain restrictions or other limitations on a borrower’s operations or assets or (ii) providing certain rights to lenders. The Funds may have fewer rights with respect to covenant lite obligations, including fewer protections against the possibility of default and fewer remedies in the event of default. As a result, investments in (or exposure to) covenant lite obligations are subject to more risk than investments in (or exposure to) certain other types of obligations. The Funds are subject to other risks associated with investments in (or exposure to) obligations, including that obligations may not be considered “securities” and, as a result, the Funds may not be entitled to rely on the anti-fraud protections under the federal securities laws and instead may have to resort to state law and direct claims.
(d) Interest on When-Issued Securities
The Funds may purchase and sell interests in securities on a when-issued and delayed delivery basis, with payment and delivery scheduled for a future date. No income accrues to the Funds on such interests or securities in connection with such transactions prior to the date the Funds actually take delivery of such interests or securities. These transactions are subject to market fluctuations and are subject to the risk that the value at delivery may be more or less than the trade date purchase price. Although the Funds will generally purchase these securities with the intention of acquiring such securities, they may sell such securities before the settlement date.
(e) Options
Upon the purchase of an option, the premium paid is recorded as an investment, the value of which is marked-to-market daily. If a purchased option expires, the Fund realizes a loss in the amount of the cost of the option. When the Fund enters into a closing sale transaction, it realizes a gain or loss depending on whether the proceeds from the closing sale transaction are greater or less than the cost of the option. If the Fund exercises a put option, it realizes a gain or loss from the sale of the underlying security and the proceeds from such sale will be decreased by the premium originally paid. When the Fund exercises a call option, the cost of the security purchased by the Fund upon exercise increases by the premium originally paid.
When the Fund writes (sells) an option, an amount equal to the premium received is entered in that Fund’s accounting records as an asset and equivalent liability. The amount of the liability is subsequently marked-to-market to reflect the current value of the option written. When a written option expires, or if the Fund enters into a closing purchase transaction, it realizes a gain (or loss if the cost of a closing purchase transaction exceeds the premium received when the option was sold).
(f) Futures Contracts
Upon entering into a futures contract, a Fund deposits and maintains as collateral such initial margin as required by the exchange on which the transaction is affected. Pursuant to the contract, the Fund agrees to receive from or pay to the broker an amount of cash equal to the daily fluctuation in value of the contract. Such receipts or payments are known as variation margin and are recorded by the Fund as unrealized appreciation or depreciation. When the contract is closed, the Fund records a realized gain or loss equal to the difference between the value of the contract at the time it was opened and the value at the time it was closed.
(g) Swap Agreements
Swap agreements are marked-to-market daily and the change, if any, is recorded as unrealized appreciation or depreciation. Payments received or made as a result of an agreement or termination of an agreement are recognized as realized gains or losses.
Upon entering into certain centrally-cleared swap transactions, a Fund is required to deposit with its clearing broker an amount of cash or securities as an initial margin. Subsequent variation margin receipts or payments are received or made by the Fund depending on fluctuations in the fair value of the reference entity and are recorded by the Fund as unrealized appreciation or depreciation. When the contract is closed, the Fund records a
| | THE GUGGENHEIM FUNDS ANNUAL REPORT | 173 |
NOTES TO FINANCIAL STATEMENTS (continued) |
realized gain or loss equal to the difference between the value of the contract at the time it was opened and the value at the time it was closed.
Upfront payments received or made by a Fund on credit default swap agreements and interest rate swap agreements are amortized over the expected life of the agreement. Periodic payments received or paid by a Fund are recorded as realized gains or losses. Payments received or made as a result of a credit event or termination of the contract are recognized, net of a proportional amount of the upfront payment, as realized gains or losses.
(h) Forward Foreign Currency Exchange Contracts
The change in value of a forward foreign currency exchange contract is recorded as unrealized appreciation or depreciation until the contract is closed. When the contract is closed, the Funds record a realized gain or loss equal to the difference between the value at the time the contract was opened and the value at the time it was closed.
(i) Currency Translations
The accounting records of the Funds are maintained in U.S. dollars. All assets and liabilities initially expressed in foreign currencies are converted into U.S. dollars at prevailing exchange rates. Purchases and sales of investment securities, dividend and interest income, and certain expenses are translated at the rates of exchange prevailing on the respective dates of such transactions. Changes in the relationship of these foreign currencies to the U.S. dollar can significantly affect the value of the investments and earnings of the Funds. Foreign investments may also subject the Funds to foreign government exchange restrictions, expropriation, taxation, or other political, social or economic developments, all of which could affect the market and/or credit risk of the investments.
The Funds do not isolate that portion of the results of operations resulting from changes in the foreign exchange rates on investments from the fluctuations arising from changes in the market prices of securities held. Such fluctuations are included with the net realized gain or loss and unrealized appreciation or depreciation on investments.
Reported net realized foreign exchange gains and losses arise from sales of foreign currencies and currency gains or losses realized between the trade and settlement dates on investment transactions. Net unrealized appreciation and depreciation arise from changes in the fair values of assets and liabilities other than investments in securities at the fiscal year end, resulting from changes in exchange rates.
(j) Foreign Taxes
The Funds may be subject to foreign taxes (a portion of which may be reclaimable) on income, stock dividends, capital gains on investments or certain foreign currency transactions. All foreign taxes are recorded in accordance with the applicable foreign tax regulations and rates that exist in the foreign jurisdictions in which the Funds invest. These foreign taxes, if any, are paid by the Funds and reflected in their Statements of Operations as follows: foreign taxes withheld at source are presented as a reduction of income and foreign taxes on capital gains from sales of investments are included with the net realized gain (loss) on investments. Foreign taxes payable or deferred as of December 31, 2020, if any, are disclosed in the Funds’ Statements of Assets and Liabilities.
(k) Security Transactions
Security transactions are recorded on the trade date for financial reporting purposes. Realized gains and losses from securities transactions are recorded using the identified cost basis. Proceeds from lawsuits related to investment holdings are recorded as a reduction to cost if the securities are still held and as realized gains if no longer held in the respective Fund. Dividend income is recorded on the ex-dividend date, net of applicable taxes withheld by foreign countries, if any. Taxable non-cash dividends are recorded as dividend income. Interest income, including amortization of premiums and accretion of discounts, is accrued on a daily basis. Interest income also includes paydown gains and losses on mortgage-backed and asset-backed securities and senior and subordinated loans. Amendment fees are earned as compensation for evaluating and accepting changes to the original loan agreement and are recognized when received. Dividend income from Real Estate Investment Trusts (“REITs”) is recorded based on the income included in the distributions received from the REIT investments using published REIT classifications, including some management estimates when actual amounts are not available. Distributions received in excess of this estimated amount are recorded as a reduction of the cost of investments or reclassified to realized gains. The actual amounts of income, return of capital, and realized gains are only determined by each REIT after its fiscal year-end, and may differ from the estimated amounts.
Income from residual collateralized loan obligations is recognized using the effective interest method. At the time of purchase, management estimates the future expected cash flows and determines the effective yield and estimated maturity date based on the estimated cash flows. Subsequent to the purchase, the estimated cash flows are updated periodically and a revised yield is calculated prospectively.
Certain Funds may receive other income from investments in senior loan interests including amendment fees, consent fees and commitment fees. For funded loans, these fees are recorded as
174 | THE GUGGENHEIM FUNDS ANNUAL REPORT | |
NOTES TO FINANCIAL STATEMENTS (continued) |
income when received by the Funds and included in interest income on the Statements of Operations. For unfunded loans, commitment fees are included in realized gain on investments on the Statement of Operations at the end of the commitment period.
(l) Distributions
Distributions of net investment income and net realized gains, if any, are declared and paid at least annually. Normally, all distributions of a Fund will automatically be reinvested without charge in additional shares of the same Fund. Distributions are recorded on the ex-dividend date and are determined in accordance with U.S. federal income tax regulations which may differ from U.S. GAAP.
(m) Expenses
Expenses directly attributable to a Fund are charged directly to the Fund. Other expenses common to various funds within the fund complex are generally allocated amongst such funds on the basis of average net assets.
(n) Earnings Credits
Under the fee arrangement with the custodian, the Funds may earn credits based on overnight custody cash balances. These credits are utilized to reduce related custodial expenses. The custodian fees disclosed in the Statements of Operations are before the reduction in expense from the related earnings credits, if any. Earnings credits for the year ended December 31, 2020, are disclosed in the Statements of Operations.
(o) Cash
The Funds may leave cash overnight in their cash account with the custodian. Periodically, a Fund may have cash due to the custodian bank as an overdraft balance. A fee is incurred on this overdraft, calculated by multiplying the overdraft by a rate based on the federal funds rate, which was 0.09% at December 31, 2020.
(p) Indemnifications
Under the Funds’ organizational documents, the Trustees and Officers are indemnified against certain liabilities arising out of the performance of their duties to the Trust. In addition, throughout the normal course of business, the Funds enter into contracts that contain a variety of representations and warranties which provide general indemnifications. The Funds’ maximum exposure under these arrangements is unknown, as this would involve future claims that may be made against the Funds and/or their affiliates that have not yet occurred. However, based on experience, the Funds expect the risk of loss to be remote.
Note 2 – Derivatives
As part of their investment strategy, the Funds utilize a variety of derivative instruments. These investments involve, to varying degrees, elements of market risk and risks in excess of amounts recognized on the Statements of Assets and Liabilities. Valuation and accounting treatment of these instruments can be found under Significant Accounting Policies in Note 1 of these Notes to Financial Statements.
Derivatives are instruments whose values depend on, or are derived from, in whole or in part, the value of one or more other assets, such as securities, currencies, commodities or indices. Derivative instruments may be used to increase investment flexibility (including to maintain cash reserves while maintaining exposure to certain other assets), for risk management (hedging) purposes, to facilitate trading, to reduce transaction costs and to pursue higher investment returns. Derivative instruments may also be used to mitigate certain investment risks, such as foreign currency exchange rate risk, interest rate risk and credit risk. U.S. GAAP requires disclosures to enable investors to better understand how and why a Fund uses derivative instruments, how these derivative instruments are accounted for and their effects on the Fund’s financial position and results of operations.
The Funds may utilize derivatives for the following purposes:
Duration: the use of an instrument to manage the interest rate risk of a portfolio.
Hedge: an investment made in order to reduce the risk of adverse price movements in a security, by taking an offsetting position to protect against broad market moves.
Income: the use of any instrument that distributes cash flows typically based upon some rate of interest.
Index Exposure: the use of an instrument to obtain exposure to a listed or other type of index.
Leverage: gaining total exposure to equities or other assets on the long and short sides at greater than 100% of invested capital.
Speculation: the use of an instrument to express macro-economic and other investment views.
For any Fund whose investment strategy consistently involves applying leverage, the value of the Fund’s shares will tend to increase or decrease more than the value of any increase or decrease in the underlying index or other asset. In addition, because an investment in derivative instruments generally requires a small investment relative
| | THE GUGGENHEIM FUNDS ANNUAL REPORT | 175 |
NOTES TO FINANCIAL STATEMENTS (continued) |
to the amount of investment exposure assumed, an opportunity for increased net income is created; but, at the same time, leverage risk will increase. The Fund’s use of leverage, through borrowings or instruments such as derivatives, may cause the Fund to be more volatile and riskier than if they had not been leveraged.
Options Purchased and Written
A call option on a security gives the purchaser of the option the right to buy, and the writer of a call option the obligation to sell, the underlying security. The purchaser of a put option has the right to sell, and the writer of the put option the obligation to buy, the underlying security at any time during the option period. The risk associated with purchasing options is limited to the premium originally paid.
The following table represents the Funds’ use and volume of call/put options purchased on a monthly basis:
| | | | Average Notional Amount | |
Fund | Use | | Call | | | Put | |
Series E (Total Return Bond Series) | Hedge | | $ | 136,000,000 | | | $ | — | |
Futures Contracts
A futures contract is an agreement to purchase (long) or sell (short) an agreed amount of securities or other instruments at a set price for delivery at a future date. There are significant risks associated with a Fund’s use of futures contracts, including (i) there may be an imperfect or no correlation between the changes in market value of the underlying asset and the prices of futures contracts; (ii) there may not be a liquid secondary market for a futures contract; (iii) trading restrictions or limitations may be imposed by an exchange; and (iv) government regulations may restrict trading in futures contracts. When investing in futures, there is minimal counterparty credit risk to a Fund because futures are exchange-traded and the exchange’s clearinghouse, as counterparty to all exchange-traded futures, guarantees against default. Cash deposits are shown as segregated cash with broker on the Statements of Assets and Liabilities; securities held as collateral are noted on the Schedules of Investments.
The following table represents the Funds’ use and volume of futures on a monthly basis:
| | | | Average Notional Amount | |
Fund | Use | | Long | | | Short | |
Series A (StylePlus—Large Core Series) | Index exposure | | $ | 6,503,971 | | | $ | — | |
Series D (World Equity Income Series) | Hedge | | | — | | | | 3,323,970 | |
Series E (Total Return Bond Series) | Duration, Hedge, Income | | | — | | | | 162,003 | |
Series J (StylePlus—Mid Growth Series) | Index exposure | | | 5,513,494 | | | | — | |
Series N (Managed Asset Allocation Series) | Index exposure, Speculation | | | 14,529,579 | | | | 994,915 | |
Series X (StylePlus—Small Growth Series) | Index exposure | | | 1,052,686 | | | | — | |
Series Y (StylePlus—Large Growth Series) | Index exposure | | | 1,912,907 | | | | — | |
Swap Agreements
A swap is an agreement that obligates two parties to exchange a series of cash flows at specified intervals based upon or calculated by reference to changes in specified prices or rates for a specified amount of an underlying asset. When utilizing OTC swaps, a fund bears the risk of loss of the amount expected to be received under a swap agreement in the event of the default or bankruptcy of a swap agreement counterparty or if the underlying asset declines in value. Certain standardized swaps are subject to mandatory central clearing and are executed on a multi-lateral or other trade facility platform, such as a registered exchange. There is limited counterparty credit risk with respect to centrally-cleared swaps as the transaction is facilitated through a central clearinghouse, much like exchange-traded futures contracts. For a fund utilizing centrally-cleared swaps, the exchange bears the risk of loss resulting from a counterparty not being able to pay. There is no guarantee that a fund or an underlying fund could eliminate its exposure under an outstanding swap agreement by entering into an offsetting swap agreement with the same or another party.
176 | THE GUGGENHEIM FUNDS ANNUAL REPORT | |
NOTES TO FINANCIAL STATEMENTS (continued) |
Total return and custom basket swaps involve commitments where single or multiple cash flows are exchanged based on the price of an underlying reference asset (such as an index or custom basket of securities) for a fixed or variable interest rate. Total return and custom basket swaps will usually be computed based on the current value of the reference asset as of the close of regular trading on the NYSE or other exchange, with the swap value being adjusted to include dividends accrued, financing charges and/or interest associated with the swap agreement. When utilizing total return or custom basket swaps, a fund bears the risk of loss of the amount expected to be received under a swap agreement in the event of the default or bankruptcy of a swap agreement counterparty or if the underlying reference asset declines in value.
The following table represents the Funds’ use and volume of total return swaps on a monthly basis:
| | | | Average Notional Amount | |
Fund | Use | | Long | | | Short | |
Series A (StylePlus—Large Core Series) | Index exposure | | $ | 163,165,567 | | | $ | — | |
Series E (Total Return Bond Series) | Index exposure, Income | | | 321,979 | | | | 214,543 | |
Series J (StylePlus—Mid Growth Series) | Index exposure | | | 126,272,386 | | | | — | |
Series X (StylePlus—Small Growth Series) | Index exposure | | | 24,463,428 | | | | — | |
Series Y (StylePlus—Large Growth Series) | Index exposure | | | 33,994,369 | | | | — | |
The following table represents the Funds’ use and volume of custom basket swaps on a monthly basis:
| | | | Average Notional Amount | |
Fund | Use | | Long | | | Short | |
Series Z (Alpha Opportunity Series) | Hedge, Leverage | | $ | 917,590 | | | $ | 3,942,624 | |
Interest rate swaps involve the exchange by the Funds with another party for their respective commitment to pay or receive a fixed or variable interest rate on a notional amount of principal. Interest rate swaps are generally centrally-cleared, but central clearing does not make interest rate swap transactions risk free.
The following table represents the Funds’ use and volume of interest rate swaps on a monthly basis:
| | | | Average Notional Amount | |
Fund | Use | | Pay Floating Rate | | | Receive Floating Rate | |
Series E (Total Return Bond Series) | Duration, Hedge | | $ | 9,582,750 | | | $ | 1,366,667 | |
Credit default swaps are instruments which allow for the full or partial transfer of third party credit risk, with respect to a particular entity or entities, from one counterparty to the other. A fund enters into credit default swaps as a “seller” or “buyer” of protection primarily to gain or reduce exposure to the investment grade and/or high yield bond market. A seller of credit default swaps is selling credit protection or assuming credit risk with respect to the underlying entity or entities. The buyer in a credit default swap is obligated to pay the seller a periodic stream of payments over the term of the contract provided that no event of default on an underlying reference obligation has occurred. If a credit event occurs, as defined under the terms of the swap agreement, the seller will either (i) pay to the buyer of protection an amount equal to the notional amount of the swap and take delivery of the referenced obligation or underlying securities comprising the referenced index or (ii) pay a net settlement amount in the form of cash or securities equal to the notional amount of the swap less the recovery value of the referenced obligation or underlying securities comprising the referenced index. The notional amount reflects the maximum potential amount the seller of credit protection could be required to pay to the buyer if a credit event occurs. The seller of protection receives periodic premium payments from the buyer and may also receive or pay an upfront premium adjustment to the stated periodic payments. In the event a credit default occurs on a credit default swap referencing an index, a factor adjustment will take place and the buyer of protection will receive a payment reflecting the par less the default recovery rate of the defaulted index component based on its weighting in the index. If no default occurs, the counterparty will pay the stream of payments and have no further obligations to the fund selling the credit protection. For a fund utilizing centrally cleared credit default swaps, the exchange bears the risk of loss resulting from a counterparty not being able to pay. For OTC credit default swaps, a fund bears the risk of loss of the amount expected to be received under a swap agreement in the event of the default or bankruptcy of a swap agreement counterparty, or in the case of a credit default swap in which a fund is selling credit protection, the default of a third party issuer.
| | THE GUGGENHEIM FUNDS ANNUAL REPORT | 177 |
NOTES TO FINANCIAL STATEMENTS (continued) |
The quoted market prices and resulting market values for credit default swap agreements on securities and credit indices serve as an indicator of the current status of the payment/performance risk and represent the likelihood of an expected liability (or profit) for the credit derivative had the notional amount of the swap agreement been closed/sold as of the period end. Increasing market values, in absolute terms when compared to the notional amount of the swap, represent a deterioration of the referenced entity’s credit soundness and a greater likelihood or risk of default or other credit event occurring as defined under the terms of the agreement.
The following table represents the Funds’ use and volume of credit default swaps on a monthly basis:
| | | | Average Notional Amount | |
Fund | Use | | Protection Sold | | | Protection Purchased | |
Series E (Total Return Bond Series) | Hedge, Index exposure | | $ | 8,298,333 | | | $ | 4,005,000 | |
Series P (High Yield Series) | Index exposure | | | 2,053,333 | | | | — | |
Forward Foreign Currency Exchange Contracts
A forward foreign currency exchange contract is an agreement between two parties to exchange two designated currencies at a specific time in the future. Certain types of contracts may be cash settled, in an amount equal to the change in exchange rates during the term of the contract. The contracts can be used to hedge or manage exposure to foreign currency risks with portfolio investments or to gain exposure to foreign currencies.
The market value of a forward foreign currency exchange contract changes with fluctuations in foreign currency exchange rates. Furthermore, the Funds may be exposed to risk if the counterparties cannot meet the contract terms or if the currency value changes unfavorably as compared to the U.S. dollar.
The following table represents the Funds’ use and volume of forward foreign currency exchange contracts on a monthly basis:
| | | | Average Value | |
Fund | Use | | Purchased | | | Sold | |
Series E (Total Return Bond Series) | Hedge, Income | | $ | 7,824,981 | | | $ | 9,723,862 | |
Series P (High Yield Series) | Hedge | | | 18,161 | | | | 62,991 | |
Derivative Investment Holdings Categorized by Risk Exposure
The following is a summary of the location of derivative investments on the Funds’ Statements of Assets and Liabilities as of December 31, 2020:
Derivative Investment Type | Asset Derivatives | Liability Derivatives |
Equity contracts | Unrealized appreciation on OTC swap agreements | Unrealized depreciation on OTC swap agreements |
| Variation margin on futures contracts | Variation margin on futures contracts |
Interest Rate contracts | Unamortized upfront premiums paid on interest rate swap agreement | |
| | Variation margin on interest rate swap agreements | |
| | Variation margin on futures contracts | |
| Investments in unaffiliated issuers, at value | |
Currency contracts | Unrealized appreciation on forward foreign currency exchange contracts | Unrealized depreciation on forward foreign currency exchange contracts |
| | Variation margin on futures contracts |
Credit contracts | Unamortized upfront premiums paid on credit default swap agreements | Unamortized upfront premiums received on credit default swap agreements |
| | Variation margin on credit default swap agreements | |
| | Protection fees on credit default swap agreements | |
178 | THE GUGGENHEIM FUNDS ANNUAL REPORT | |
NOTES TO FINANCIAL STATEMENTS (continued) |
The following table sets forth the fair value of the Funds’ derivative investments categorized by primary risk exposure at December 31, 2020:
Asset Derivative Investments Value |
Fund | | Futures
Equity
Risk* | | | Swaps
Equity
Risk | | | Futures
Foreign
Currency
Exchange
Risk* | | | Futures
Interest
Rate
Risk* | | | Swaps
Interest
Rate
Risk* | | | Swaps
Credit
Risk* | | | Options
Purchased
Interest
Rate
Risk | | | Forward
Foreign
Currency
Exchange
Risk | | | Total
Value at
December
31,
2020 | |
Series A (StylePlus—Large Core Series) | | $ | 31,340 | | | $ | 21,689,692 | | | $ | — | | | $ | — | | | $ | — | | | $ | — | | | $ | — | | | $ | — | | | $ | 21,721,032 | |
Series E (Total Return Bond Series) | | | — | | | | — | | | | — | | | | — | | | | — | | | | 50,227 | | | | 633,760 | | | | 847,638 | | | | 1,531,625 | |
Series J (StylePlus—Mid Growth Series) | | | 16,673 | | | | 25,114,016 | | | | — | | | | — | | | | — | | | | — | | | | — | | | | — | | | | 25,130,689 | |
Series N (Managed Asset Allocation Series) | | | 218,156 | | | | — | | | | — | | | | 2,309 | | | | — | | | | — | | | | — | | | | — | | | | 220,465 | |
Series P (High Yield Series) | | | — | | | | — | | | | — | | | | — | | | | — | | | | 155,839 | | | | — | | | | — | | | | 155,839 | |
Series X (StylePlus—Small Growth Series) | | | 4,007 | | | | 6,983,538 | | | | — | | | | — | | | | — | | | | — | | | | — | | | | — | | | | 6,987,545 | |
Series Y (StylePlus—Large Growth Series) | | | 8,056 | | | | 4,398,136 | | | | — | | | | — | | | | — | | | | — | | | | — | | | | — | | | | 4,406,192 | |
Series Z (Alpha Opportunity Series) | | | — | | | | 74,790 | | | | — | | | | — | | | | — | | | | — | | | | — | | | | — | | | | 74,790 | |
Liability Derivative Investments Value |
Fund | | Futures
Equity
Risk* | | | Swaps
Equity
Risk | | | Futures
Foreign
Currency
Exchange
Risk* | | | Futures
Interest
Rate
Risk* | | | Swaps
Interest
Rate
Risk* | | | Swaps
Credit
Risk* | | | Options
Purchased
Interest
Rate
Risk | | | Forward
Foreign
Currency
Exchange
Risk | | | Total
Value at
December
31,
2020 | |
Series E (Total Return Bond Series) | | $ | — | | | $ | — | | | $ | — | | | $ | — | | | $ | 54,386 | | | $ | — | | | $ | — | | | $ | 239,437 | | | $ | 293,823 | |
Series N (Managed Asset Allocation Series) | | | 24,329 | | | | — | | | | 865 | | | | — | | | | — | | | | — | | | | — | | | | — | | | | 25,194 | |
Series Z (Alpha Opportunity Series) | | | — | | | | 523,686 | | | | — | | | | — | | | | — | | | | — | | | | — | | | | — | | | | 523,686 | |
* | Includes cumulative appreciation (depreciation) of exchange-traded, OTC and centrally-cleared derivatives contracts as reported on the Schedules of Investments. For exchange-traded and centrally-cleared derivatives, variation margin is reported within the Statements of Assets and Liabilities. |
The following is a summary of the location of derivative investments on the Funds’ Statements of Operations for the year ended December 31, 2020:
Derivative Investment Type | Location of Gain (Loss) on Derivatives |
Equity/Interest Rate contracts | Net realized gain (loss) on futures contracts |
| | Net change in unrealized appreciation (depreciation) on futures contracts |
| | Net change in unrealized appreciation (depreciation) on options purchased |
| | Net realized gain (loss) on swap agreements |
| Net change in unrealized appreciation (depreciation) on swap agreements |
Currency contracts | Net realized gain (loss) on futures contracts |
| | Net change in unrealized appreciation (depreciation) on futures contracts |
| | Net realized gain (loss) on forward foreign currency exchange contracts |
| Net change in unrealized appreciation (depreciation) on forward foreign currency exchange contracts |
Credit contracts | Net realized gain (loss) on swap agreements |
| | Net change in unrealized appreciation (depreciation) on swap agreements |
| | THE GUGGENHEIM FUNDS ANNUAL REPORT | 179 |
NOTES TO FINANCIAL STATEMENTS (continued) |
The following is a summary of the Funds’ realized gain (loss) and change in unrealized appreciation (depreciation) on derivative investments recognized on the Statements of Operations categorized by primary risk exposure for the year ended December 31, 2020:
Realized Gain (Loss) on Derivative Investments Recognized on the Statements of Operations |
Fund | | Futures
Equity
Risk | | | Swaps
Equity
Risk | | | Futures
Foreign
Currency
Exchange
Risk | | | Futures
Interest
Rate
Risk | | | Swaps
Interest
Rate
Risk | | | Swaps
Credit
Risk | | | Options
Purchased
Interest
Rate
Risk | | | Forward
Foreign
Currency
Exchange
Risk | | | Total | |
Series A (StylePlus—Large Core Series) | | $ | 2,478,294 | | | $ | 25,117,473 | | | $ | — | | | $ | — | | | $ | — | | | $ | — | | | $ | — | | | $ | — | | | $ | 27,595,767 | |
Series D (World Equity Income Series) | | | — | | | | — | | | | 242,617 | | | | — | | | | — | | | | — | | | | — | | | | — | | | | 242,617 | |
Series E (Total Return Bond Series) | | | —— | | | | — | | | | — | | | | 72,641 | | | | 484,005 | | | | 1,216,737 | | | | — | | | | 253,680 | | | | 2,027,063 | |
Series J (StylePlus—Mid Growth Series) | | | 1,621,468 | | | | 27,839,730 | | | | — | | | | — | | | | — | | | | — | | | | — | | | | — | | | | 29,461,198 | |
Series N (Managed Asset Allocation Series) | | | 1,116,523 | | | | — | | | | (26,776 | ) | | | 273,478 | | | | — | | | | — | | | | — | | | | — | | | | 1,363,225 | |
Series P (High Yield Series) | | | — | | | | — | | | | — | | | | — | | | | — | | | | 146,268 | | | | — | | | | 7,301 | | | | 153,569 | |
Series X (StylePlus—Small Growth Series) | | | 418,018 | | | | 4,256,235 | | | | — | | | | — | | | | — | | | | — | | | | — | | | | — | | | | 4,674,253 | |
Series Y (StylePlus—Large Growth Series) | | | 742,384 | | | | 10,530,636 | | | | — | | | | — | | | | — | | | | — | | | | — | | | | — | | | | 11,273,020 | |
Series Z (Alpha Opportunity Series) | | | — | | | | (229,633 | ) | | | — | | | | — | | | | — | | | | — | | | | — | | | | — | | | | (229,633 | ) |
Change in Unrealized Appreciation (Depreciation) on Derivative Investments Recognized on the Statements of Operations |
Fund | | Futures
Equity
Risk | | | Swaps
Equity
Risk | | | Futures
Foreign
Currency
Exchange
Risk | | | Futures
Interest
Rate
Risk | | | Swaps
Interest
Rate
Risk | | | Swaps
Credit
Risk | | | Options
Purchased
Interest
Rate
Risk | | | Forward
Foreign
Currency
Exchange
Risk | | | Total | |
Series A (StylePlus—Large Core Series) | | $ | 15,523 | | | $ | 3,792,004 | | | $ | — | | | $ | — | | | $ | — | | | $ | — | | | $ | — | | | $ | — | | | $ | 3,807,527 | |
Series D (World Equity Income Series) | | | — | | | | — | | | | 452 | | | | — | | | | — | | | | — | | | | — | | | | — | | | | 452 | |
Series E (Total Return Bond Series) | | | — | | | | — | | | | — | | | | — | | | | 104,545 | | | | 472,042 | | | | 417,520 | | | | 480,809 | | | | 1,474,916 | |
Series J (StylePlus—Mid Growth Series) | | | (3,440 | ) | | | 13,111,432 | | | | — | | | | — | | | | — | | | | — | | | | — | | | | — | | | | 13,107,992 | |
Series N (Managed Asset Allocation Series) | | | 105,173 | | | | — | | | | (488 | ) | | | 49,713 | | | | — | | | | — | | | | — | | | | — | | | | 154,398 | |
Series P (High Yield Series) | | | — | | | | — | | | | — | | | | — | | | | — | | | | 155,839 | | | | — | | | | 2,168 | | | | 158,007 | |
Series X (StylePlus—Small Growth Series) | | | (1,101 | ) | | | 3,728,811 | | | | — | | | | — | | | | — | | | | — | | | | — | | | | — | | | | 3,727,710 | |
Series Y (StylePlus—Large Growth Series) | | | (2,380 | ) | | | 691,341 | | | | — | | | | — | | | | — | | | | — | | | | — | | | | — | | | | 688,961 | |
Series Z (Alpha Opportunity Series) | | | — | | | | (113,734 | ) | | | — | | | | — | | | | — | | | | — | | | | — | | | | — | | | | (113,734 | ) |
In conjunction with the use of derivative instruments, the Funds are required to maintain collateral in various forms. Depending on the financial instrument utilized and the broker involved, the Funds use margin deposits at the broker, cash and/or securities segregated at the custodian bank, discount notes or repurchase agreements allocated to the Funds as collateral.
180 | THE GUGGENHEIM FUNDS ANNUAL REPORT | |
NOTES TO FINANCIAL STATEMENTS (continued) |
Foreign Investments
There are several risks associated with exposure to foreign currencies, foreign issuers and emerging markets. A fund’s indirect and direct exposure to foreign currencies subjects the Fund to the risk that those currencies will decline in value relative to the U.S. dollar, or in the case of short positions, that the U.S. dollar will decline in value relative to the currency being hedged. Currency rates in foreign countries may fluctuate significantly over short periods of time for a number of reasons, including changes in interest rates and the imposition of currency controls or other political developments in the U.S. or abroad. In addition, the Funds may incur transaction costs in connection with conversions between various currencies. The Funds may, but is not obligated to, engage in currency hedging transactions, which generally involve buying currency forward, options or futures contracts. However, not all currency risks may be effectively hedged, and in some cases the costs of hedging techniques may outweigh expected benefits. In such instances, the value of securities denominated in foreign currencies can change significantly when foreign currencies strengthen or weaken relative to the U.S. dollar.
The Funds may invest in securities of foreign companies directly, or in financial instruments, such as ADRs and exchange-traded funds, which are indirectly linked to the performance of foreign issuers. Foreign markets can be more volatile than the U.S. market due to increased risks of adverse issuer, political, regulatory, market, or economic developments and can perform differently from the U.S. market. Investing in securities of foreign companies directly, or in financial instruments that are indirectly linked to the performance of foreign issuers, may involve risks not typically associated with investing in U.S. issuers. The value of securities denominated in foreign currencies, and of dividends from such securities, can change significantly when foreign currencies strengthen or weaken relative to the U.S. dollar. Foreign securities markets generally have less trading volume and less liquidity than U.S. markets, and prices in some foreign markets may fluctuate more than those of securities traded on U.S. markets. Many foreign countries lack accounting and disclosure standards comparable to those that apply to U.S. companies, and it may be more difficult to obtain reliable information regarding a foreign issuer’s financial condition and operations. Transaction costs and costs associated with custody services are generally higher for foreign securities than they are for U.S. securities. Some foreign governments levy withholding taxes against dividend and interest income. Although in some countries portions of these taxes are recoverable, the non-recovered portion will reduce the income received by the Funds.
The Trust has established counterparty credit guidelines and enters into transactions only with financial institutions of investment grade or better. The Trust monitors the counterparty credit risk.
Note 3 – Offsetting
In the normal course of business, the Funds enter into transactions subject to enforceable master netting arrangements or other similar arrangements. Generally, the right to offset in those agreements allows the Funds to counteract the exposure to a specific counterparty with collateral received from or delivered to that counterparty based on the terms of the arrangements. These arrangements provide for the right to liquidate upon the occurrence of an event of default, credit event upon merger or additional termination event.
In order to better define their contractual rights and to secure rights that will help the Funds mitigate their counterparty risk, the Funds may enter into an International Swaps and Derivatives Association, Inc. Master Agreement (“ISDA Master Agreement”) or similar agreement with their derivative contract counterparties. An ISDA Master Agreement is a bilateral agreement between a fund and a counterparty that governs OTC derivatives, including foreign exchange contracts, and typically contains, among other things, collateral posting terms and netting provisions in the event of a default and/or termination event. The provisions of the ISDA Master Agreement typically permit a single net payment in the event of a default (close-out netting) or similar event, including the bankruptcy or insolvency of the counterparty.
For derivatives traded under an ISDA Master Agreement, the collateral requirements are typically calculated by netting the mark-to-market amount for each transaction under such agreement and comparing that amount to the value of any collateral currently pledged by the Funds and the counterparty. For financial reporting purposes, cash collateral that has been pledged to cover obligations of the Funds and cash collateral received from the counterparty, if any, are reported separately on the Statements of Assets and Liabilities as segregated cash with broker/receivable for variation margin, or payable for swap settlement/variation margin. Cash and/or securities pledged or received as collateral by the Funds in connection with an OTC derivative subject to an ISDA Master Agreement generally may not be invested, sold or rehypothecated by the counterparty or the Funds, as applicable, absent an event of default under such agreement, in which case such collateral generally may be applied towards obligations due to and payable by such counterparty or the Funds, as applicable. Generally, the amount of collateral due from or to a counterparty must exceed a minimum transfer amount threshold (e.g., $300,000) before a transfer is required to be made. To the extent amounts due to the Funds from their counterparties are not fully collateralized, contractually or otherwise, the Funds bear the risk of loss from counterparty nonperformance. The Funds attempt to mitigate counterparty risk by only entering into agreements with counterparties that they believe to be of good standing and by monitoring the financial stability of those counterparties.
| | THE GUGGENHEIM FUNDS ANNUAL REPORT | 181 |
NOTES TO FINANCIAL STATEMENTS (continued) |
For financial reporting purposes, the Funds do not offset derivative assets and derivative liabilities that are subject to netting arrangements in the Statements of Assets and Liabilities.
The following tables present derivative financial instruments and secured financing transactions that are subject to enforceable netting arrangements:
| | | | | | | | | | | | | | | | Gross Amounts Not Offset
in the Statements of
Assets and Liabilities | | | | | |
Fund | Instrument | | Gross
Amounts of
Recognized
Assets1 | | | Gross
Amounts
Offset in the
Statements
of Assets and
Liabilities | | | Net Amount
of Assets
Presented on
the Statements
of Assets and
Liabilities | | | Financial
Instruments | | | Cash
Collateral
Received | | | Net
Amount | |
Series A (StylePlus—Large Core Series) | Swap equity contracts | | $ | 21,689,692 | | | $ | — | | | $ | 21,689,692 | | | $ | — | | | $ | (20,290,000 | ) | | $ | 1,399,692 | |
Series E (Total Return Bond Series) | Forward foreign currency exchange contracts | | | 847,638 | | | | — | | | | 847,638 | | | | (239,437 | ) | | | (396,038 | ) | | | 212,163 | |
| | Options purchased contracts | | | 633,760 | | | | — | | | | 633,760 | | | | — | | | | (314,481 | ) | | | 319,279 | |
Series J (StylePlus—Mid Growth Series) | Swap equity contracts | | | 25,114,016 | | | | — | | | | 25,114,016 | | | | — | | | | (25,114,016 | ) | | | — | |
Series X (StylePlus—Small Growth Series) | Swap equity contracts | | | 6,983,538 | | | | — | | | | 6,983,538 | | | | — | | | | (6,983,538 | ) | | | — | |
Series Y (StylePlus—Large Growth Series) | Swap equity contracts | | | 4,398,136 | | | | — | | | | 4,398,136 | | | | — | | | | (4,370,000 | ) | | | 28,136 | |
Series Z (Alpha Opportunity Series) | Custom basket swap agreements | | | 74,790 | | | | — | | | | 74,790 | | | | (74,790 | ) | | | — | | | | — | |
| | | | | | | | | | | | | | | | Gross Amounts Not Offset
in the Statements of
Assets and Liabilities | | | | | |
Fund | Instrument | | Gross
Amounts of
Recognized
Liabilities1 | | | Gross
Amounts
Offset in the
Statements
of Assets and
Liabilities | | | Net Amount
of Liabilities
Presented on
the Statements
of Assets and
Liabilities | | | Financial
Instruments | | | Cash
Collateral
Pledged | | | Net
Amount | |
Series E (Total Return Bond Series) | Forward foreign currency exchange contracts | | $ | 239,437 | | | $ | — | | | $ | 239,437 | | | $ | (239,437 | ) | | $ | — | | | $ | — | |
Series Z (Alpha Opportunity Series) | Custom basket swap agreements | | | 523,686 | | | | — | | | | 523,686 | | | | (523,686 | ) | | | — | | | | — | |
1 | Exchange-traded or centrally-cleared derivatives are excluded from these reported amounts. |
182 | THE GUGGENHEIM FUNDS ANNUAL REPORT | |
NOTES TO FINANCIAL STATEMENTS (continued) |
The Funds have the right to offset deposits against any related derivative liabilities outstanding with each counterparty with the exception of exchange-traded or centrally-cleared derivatives. The following table presents deposits held by others in connection with derivative investments as of December 31, 2020.
Fund | Counterparty | Asset Type | | Cash Pledged | | | Cash Received | |
Series A (StylePlus—Large Core Series) | Morgan Stanley Capital Services LLC | Futures contracts | | $ | 121,000 | | | $ | — | |
| Wells Fargo Bank, N.A. | Total return swap agreements | | | — | | | | 20,290,000 | |
Series A (StylePlus—Large Core Series) Total | | | | | 121,000 | | | | 20,290,000 | |
Series E (Total Return Bond Series) | BofA Securities, Inc. | Credit default swap agreements | | | — | | | | 42,399 | |
| | BofA Securities, Inc. | Interest rate swap agreements | | | — | | | | 29,759 | |
| | Citibank N.A., New York | Forward foreign currency exchange contracts | | | — | | | | 280,000 | |
| | Goldman Sachs International | Forward foreign currency exchange contracts, Options | | | — | | | | 290,000 | |
| Morgan Stanley Capital Services LLC | Forward foreign currency exchange contracts, Options | | | — | | | | 212,244 | |
Series E (Total Return Bond Series) Total | | | | | | | | | 854,402 | |
Series J (StylePlus—Mid Growth Series) | Citibank N.A., New York | Total return swap agreements | | | — | | | | 25,160,000 | |
| Morgan Stanley Capital Services LLC | Futures contracts | | | 78,500 | | | | — | |
Series J (StylePlus—Mid Growth Series) Total | | | | | 78,500 | | | | 25,160,000 | |
Series N (Managed Asset Allocation Series) | Goldman Sachs International | Futures contracts | | | 798 | | | | — | |
Series P (High Yield Series) | BofA Securities, Inc. | Credit default swap agreements | | | — | | | | 108,800 | |
Series X (StylePlus—Small Growth Series) | Morgan Stanley Capital Services LLC | Futures contracts | | | 31,500 | | | | — | |
| Wells Fargo Bank, N.A. | Total return swap agreements | | | — | | | | 7,150,000 | |
Series X (StylePlus—Small Growth Series) Total | | | | | 31,500 | | | | 7,150,000 | |
Series Y (StylePlus—Large Growth Series) | Morgan Stanley Capital Services LLC | Futures contracts | | | 54,000 | | | | — | |
| Wells Fargo Bank, N.A. | Total return swap agreements | | | — | | | | 4,370,000 | |
Series Y (StylePlus—Large Growth Series) Total | | | | | 54,000 | | | | 4,370,000 | |
Note 4 – Fair Value Measurement
In accordance with U.S. GAAP, fair value is defined as the price that the Funds would receive to sell an investment or pay to transfer a liability in an orderly transaction with an independent buyer in the principal market, or in the absence of a principal market, the most advantageous market for the investment or liability. U.S. GAAP establishes a three-tier fair value hierarchy based on the types of inputs used to value assets and liabilities and requires corresponding disclosure. The hierarchy and the corresponding inputs are summarized below:
Level 1 — | quoted prices in active markets for identical assets or liabilities. |
Level 2 — | significant other observable inputs (for example quoted prices for securities that are similar based on characteristics such as interest rates, prepayment speeds, credit risk, etc.). |
Level 3 — | significant unobservable inputs based on the best information available under the circumstances, to the extent observable inputs are not available, which may include assumptions. |
The types of inputs available depend on a variety of factors, such as the type of security and the characteristics of the markets in which it trades, if any. Fair valuation determinations that rely on fewer or no observable inputs require greater judgment. Accordingly, fair value determinations for Level 3 securities require the greatest amount of judgment.
| | THE GUGGENHEIM FUNDS ANNUAL REPORT | 183 |
NOTES TO FINANCIAL STATEMENTS (continued) |
Independent pricing services are used to value a majority of the Funds’ investments. When values are not available from a pricing service, they will be determined using a variety of sources and techniques, including: market prices; broker quotes; and models which derive prices based on inputs such as prices of securities with comparable maturities and characteristics or based on inputs such as anticipated cash flows or collateral, spread over U.S. Treasury securities, and other information and analysis. A significant portion of the Funds’ assets and liabilities are categorized as Level 2, as indicated in this report.
Quotes from broker-dealers, adjusted for fluctuations in criteria such as credit spreads and interest rates, may also be used to value the Funds’ assets and liabilities, i.e. prices provided by a broker-dealer or other market participant who has not committed to trade at that price. Although quotes are typically received from established market participants, the Funds may not have the transparency to view the underlying inputs which support the market quotations. Significant changes in a quote would generally result in significant changes in the fair value of the security.
Certain fixed income securities are valued by obtaining a monthly quote from a broker-dealer, adjusted for fluctuations in criteria such as credit spreads and interest rates. Certain loans and other securities are valued using a single daily broker quote or a price from a third party vendor based on a single daily or monthly broker quote.
The inputs or methodologies used for valuing securities are not necessarily an indication of the risk associated with investing in those securities. The suitability of the techniques and sources employed to determine fair valuation are regularly monitored and subject to change.
Note 5 – Investment Advisory Agreement and Other Agreements
Under the terms of an investment advisory contract, the Funds pay GI investment advisory fees calculated at the annualized rates below, based on the average daily net assets of the Funds:
Fund | | Management Fees
(as a % of Net Assets) | |
Series A (StylePlus—Large Core Series) | | | 0.75 | % |
Series B (Large Cap Value Series) | | | 0.65 | % |
Series D (World Equity Income Series) | | | 0.70 | % |
Series E (Total Return Bond Series) | | | 0.39 | % |
Series F (Floating Rate Strategies Series) | | | 0.65 | %1 |
Series J (StylePlus—Mid Growth Series) | | | 0.75 | % |
Series N (Managed Asset Allocation Series) | | | 0.40 | % |
Series O (All Cap Value Series) | | | 0.70 | % |
Series P (High Yield Series) | | | 0.60 | % |
Series Q (Small Cap Value Series) | | | 0.75 | % |
Series V (SMid Cap Value Series) | | | 0.75 | % |
Series X (StylePlus—Small Growth Series) | | | 0.75 | % |
Series Y (StylePlus—Large Growth Series) | | | 0.65 | % |
Series Z (Alpha Opportunity Series) | | | 0.90 | % |
1 | The Series’ management fee is subject to a 0.05% reduction on assets over $5 billion. |
GI pays operating expenses on behalf of the Trust, such as audit and accounting related services, legal services, custody, printing and mailing, among others, on a pass-through basis. Such expenses are allocated to various Funds within the complex based on relative net assets.
The Board has adopted a Distribution and Shareholder Services Plan pursuant to Rule 12b-1 under the 1940 Act that allows those Funds to pay distribution and shareholder services fees to GFD. The Funds will pay distribution and shareholder services fees to GFD at an annual rate not to exceed 0.25% of average daily net assets. GFD may, in turn, pay all or a portion of the proceeds from the distribution and shareholder services fees to insurance companies or their affiliates and qualified plan administrators (“intermediaries”) for services they provide on behalf of the Funds to current and prospective variable contract owners and qualified plan participants that invest in the Funds through the intermediaries.
184 | THE GUGGENHEIM FUNDS ANNUAL REPORT | |
NOTES TO FINANCIAL STATEMENTS (continued) |
Contractual expense limitation agreements for the following Funds provide that the total expenses be limited to a percentage of average net assets for the Funds, exclusive of brokerage costs, dividends or interest on securities sold short, expenses of other investment companies in which a Fund invests, interest, taxes, litigation, indemnification and extraordinary expenses. The limits are listed below:
| | Limit | | | Effective
Date | | | Contract
End Date | |
Series A (StylePlus—Large Core Series) | | | 0.91 | % | | | 05/01/17 | | | | 05/01/22 | |
Series B (Large Cap Value Series) | | | 0.80 | % | | | 05/01/17 | | | | 05/01/22 | |
Series D (World Equity Income Series) | | | 0.90 | % | | | 05/01/17 | | | | 05/01/22 | |
Series E (Total Return Bond Series) | | | 0.81 | % | | | 11/30/12 | | | | 05/01/21 | |
Series F (Floating Rate Strategies Series) | | | 1.15 | % | | | 04/22/13 | | | | 05/01/21 | |
Series J (StylePlus—Mid Growth Series) | | | 0.94 | % | | | 05/01/17 | | | | 05/01/22 | |
Series O (All Cap Value Series) | | | 0.88 | % | | | 05/01/17 | | | | 05/01/22 | |
Series P (High Yield Series) | | | 1.07 | % | | | 10/20/14 | | | | 05/01/21 | |
Series Q (Small Cap Value Series) | | | 1.14 | % | | | 05/01/17 | | | | 05/01/22 | |
Series V (Mid Cap Value Series) | | | 0.91 | % | | | 05/01/17 | | | | 05/01/22 | |
Series X (StylePlus—Small Growth Series) | | | 1.06 | % | | | 05/01/17 | | | | 05/01/22 | |
Series Y (StylePlus—Large Growth Series) | | | 0.93 | % | | | 05/01/17 | | | | 05/01/22 | |
Series Z (Alpha Opportunity Series) | | | 2.00 | % | | | 05/31/17 | | | | 05/01/22 | |
GI is entitled to reimbursement by the Funds for fees waived or expenses reimbursed during any of the previous 36 months, beginning on the date of the expense limitation agreement, if on any day the estimated operating expenses are less than the indicated percentages. For purposes of this arrangement, GI is entitled to recoupment of previously waived fees or reimbursed expenses for 36 months from the date of the waiver or reimbursement by GI. At December 31, 2020, the amount of fees waived or expenses reimbursed that are subject to recoupment and will expire during the years ended December 31, are presented in the following table:
Fund | | 2021 | | | 2022 | | | 2023 | | | Total | |
Series A (StylePlus - Large Core Series) | | $ | 660,760 | | | $ | 627,973 | | | $ | 609,622 | | | $ | 1,898,355 | |
Series B (Large Cap Value Series) | | | 657,291 | | | | 596,531 | | | | 569,190 | | | | 1,823,012 | |
Series D (World Equity Income Series) | | | 403,628 | | | | 384,683 | | | | 358,470 | | | | 1,146,781 | |
Series E (Total Return Bond Series) | | | 130,822 | | | | 159,891 | | | | 102,283 | | | | 392,996 | |
Series F (Floating Rate Strategies Series) | | | 64,413 | | | | 92,992 | | | | 97,708 | | | | 255,113 | |
Series J (StylePlus—Mid Growth Series) | | | 471,165 | | | | 429,212 | | | | 445,780 | | | | 1,346,157 | |
Series O (All Cap Value Series) | | | 349,269 | | | | 319,350 | | | | 288,584 | | | | 957,203 | |
Series P (High Yield Series) | | | 105,313 | | | | 112,110 | | | | 111,843 | | | | 329,266 | |
Series Q (Small Cap Value Series) | | | 102,746 | | | | 107,646 | | | | 89,756 | | | | 300,148 | |
Series V (Mid Cap Value Series) | | | 612,269 | | | | 531,107 | | | | 493,187 | | | | 1,636,563 | |
Series X (StylePlus - Small Growth Series) | | | 132,343 | | | | 151,315 | | | | 130,501 | | | | 414,159 | |
Series Y (StylePlus - Large Growth Series) | | | 153,784 | | | | 163,763 | | | | 153,061 | | | | 470,608 | |
Series Z (Alpha Opportunity Series) | | | 47,889 | | | | 108,215 | | | | 101,516 | | | | 257,620 | |
For the year ended December 31, 2020, no amounts were recouped by GI.
If a Fund invests in a fund that is advised by the same adviser or an affiliated adviser, the investing Fund’s adviser has agreed to waive fees at the investing fund level to the extent necessary to offset the proportionate share of any management fee paid by each Fund with respect to its investment in such affiliated fund. Fee waivers will be calculated at the investing Fund level without regard to any expense cap in effect for the investing Fund. Fees waived under this arrangement are not subject to reimbursement to GI. For the year ended December 31, 2020, the following Funds waived fees related to investments in affiliated funds:
Fund | | Amount Waived | |
Series A (StylePlus—Large Core Series) | | $ | 83,407 | |
Series E (Total Return Bond Series) | | | 41,936 | |
Series J (StylePlus—Mid Growth Series) | | | 78,510 | |
Series N (Managed Asset Allocation Series) | | | 2,572 | |
Series X (StylePlus—Small Growth Series) | | | 14,337 | |
Series Y (StylePlus—Large Growth Series) | | | 19,218 | |
| | THE GUGGENHEIM FUNDS ANNUAL REPORT | 185 |
NOTES TO FINANCIAL STATEMENTS (continued) |
Certain trustees and officers of the Trust are also officers of GI and/or GFD. The Trust does not compensate its officers or trustees who are officers, directors and/or employees of GI or GFD.
MUFG Investor Services (US), LLC (“MUIS”) acts as the Funds’ administrator, transfer agent and accounting agent. As administrator, transfer agent and accounting agent, MUIS maintains the books and records of the Funds’ securities and cash. The Bank of New York Mellon Corp. (“BNY”) acts as the Funds’ custodian. As custodian, BNY is responsible for the custody of the Funds’ assets. For providing the aforementioned administrative and accounting services, MUIS is entitled to receive a monthly fee equal to a percentage of the Funds’ average daily net assets and out of pocket expenses. For providing the aforementioned transfer agent and custodian services, MUIS and BNY are entitled to receive a monthly fee based on the number of transactions during the month and the number of accounts under management, subject to certain minimum monthly fees, and out of pocket expenses.
Note 6 – Federal Income Tax Information
The Funds intend to comply with the provisions of Subchapter M of the Internal Revenue Code applicable to regulated investment companies and will distribute substantially all taxable net investment income and capital gains sufficient to relieve the Funds from all, or substantially all, federal income, excise and state income taxes. Therefore, no provision for federal or state income tax or federal excise tax is required.
Tax positions taken or expected to be taken in the course of preparing the Funds’ tax returns are evaluated to determine whether the tax positions are “more-likely-than-not” of being sustained by the applicable tax authority. Tax positions not deemed to meet the more-likely-than-not threshold would be recorded as a tax benefit or expense in the current year. Management has analyzed the Funds’ tax positions taken, or to be taken, on U.S. federal income tax returns for all open tax years, and has concluded that no provision for income tax is required in the Funds’ financial statements. The Funds’ U.S. federal income tax returns are subject to examination by the Internal Revenue Service (“IRS”) for a period of three years after they are filed.
The tax character of distributions paid during the year ended December 31, 2020 was as follows:
Fund | | Ordinary
Income | | | Long-Term
Capital Gain | | | Total
Distributions | |
Series A (StylePlus—Large Core Series) | | $ | 12,350,787 | | | $ | — | | | $ | 12,350,787 | |
Series B (Large Cap Value Series) | | | 3,913,860 | | | | 13,318,423 | | | | 17,232,283 | |
Series D (World Equity Income Series) | | | 3,479,403 | | | | 1,215,536 | | | | 4,694,939 | |
Series E (Total Return Bond Series) | | | 2,739,180 | | | | — | | | | 2,739,180 | |
Series F (Floating Rate Strategies Series) | | | 2,229,065 | | | | — | | | | 2,229,065 | |
Series J (StylePlus—Mid Growth Series) | | | 9,832,328 | | | | — | | | | 9,832,328 | |
Series N (Managed Asset Allocation Series) | | | 1,463,049 | | | | 1,736,981 | | | | 3,200,030 | |
Series O (All Cap Value Series) | | | 1,587,955 | | | | 4,713,044 | | | | 6,300,999 | |
Series P (High Yield Series) | | | 3,157,421 | | | | — | | | | 3,157,421 | |
Series Q (Small Cap Value Series) | | | 1,453,190 | | | | 3,494,871 | | | | 4,948,061 | |
Series V (SMid Cap Value Series) | | | 1,965,149 | | | | 6,227,332 | | | | 8,192,481 | |
Series X (StylePlus—Small Growth Series) | | | 390,463 | | | | — | | | | 390,463 | |
Series Y (StylePlus—Large Growth Series) | | | 2,418,053 | | | | 45,170 | | | | 2,463,223 | |
Series Z (Alpha Opportunity Series) | | | 31,639 | | | | — | | | | 31,639 | |
186 | THE GUGGENHEIM FUNDS ANNUAL REPORT | |
NOTES TO FINANCIAL STATEMENTS (continued) |
The tax character of distributions paid during the year ended December 31, 2019 was as follows:
Fund | | Ordinary
Income | | | Long-Term
Capital Gain | | | Total
Distributions | |
Series A (StylePlus—Large Core Series) | | $ | 15,823,058 | | | $ | — | | | $ | 15,823,058 | |
Series B (Large Cap Value Series) | | | 4,909,168 | | | | 12,270,184 | | | | 17,179,352 | |
Series D (World Equity Income Series) | | | 5,270,431 | | | | 5,528,640 | | | | 10,799,071 | |
Series E (Total Return Bond Series) | | | 3,605,920 | | | | — | | | | 3,605,920 | |
Series F (Floating Rate Strategies Series) | | | 2,678,923 | | | | — | | | | 2,678,923 | |
Series J (StylePlus—Mid Growth Series) | | | 15,157,609 | | | | — | | | | 15,157,609 | |
Series N (Managed Asset Allocation Series) | | | 745,349 | | | | 359,789 | | | | 1,105,138 | |
Series O (All Cap Value Series) | | | 2,015,279 | | | | 7,586,230 | | | | 9,601,509 | |
Series P (High Yield Series) | | | 4,081,160 | | | | — | | | | 4,081,160 | |
Series Q (Small Cap Value Series) | | | 890,774 | | | | 3,896,134 | | | | 4,786,908 | |
Series V (SMid Cap Value Series) | | | 3,320,862 | | | | 18,300,980 | | | | 21,621,842 | |
Series X (StylePlus—Small Growth Series) | | | 3,561,318 | | | | — | | | | 3,561,318 | |
Series Y (StylePlus—Large Growth Series) | | | 3,884,327 | | | | — | | | | 3,884,327 | |
Series Z (Alpha Opportunity Series) | | | 11,658 | | | | — | | | | 11,658 | |
Note: For U.S. federal income tax purposes, short-term capital gain distributions are treated as ordinary income distributions.
The tax components of distributable earnings/(loss) as of December 31, 2020 were as follows:
Fund | | Undistributed
Ordinary
Income | | | Undistributed
Long-Term
Capital Gain | | | Net Unrealized
Appreciation
(Depreciation) | | | Accumulated
Capital and
Other Losses | | | Total | |
Series A (StylePlus—Large Core Series) | | $ | 26,897,830 | | | $ | — | | | $ | 28,241,427 | | | $ | — | | | $ | 55,139,257 | |
Series B (Large Cap Value Series) | | | 4,719,482 | | | | — | | | | 39,081,605 | | | | — | | | | 43,801,087 | |
Series D (World Equity Income Series) | | | 2,075,008 | | | | — | | | | 20,884,400 | | | | (3,337,540 | ) | | | 19,621,868 | |
Series E (Total Return Bond Series) | | | 5,202,765 | | | | 2,465,765 | | | | 10,517,942 | | | | (48,828 | ) | | | 18,137,644 | |
Series F (Floating Rate Strategies Series) | | | 1,106,221 | | | | — | | | | (455,364 | ) | | | (3,663,488 | ) | | | (3,012,631 | ) |
Series J (StylePlus—Mid Growth Series) | | | 27,834,018 | | | | 501 | | | | 30,700,138 | | | | — | | | | 58,534,657 | |
Series N (Managed Asset Allocation Series) | | | 900,457 | | | | 2,575,357 | | | | 12,197,352 | | | | — | | | | 15,673,166 | |
Series O (All Cap Value Series) | | | 1,837,518 | | | | 504,267 | | | | 16,939,542 | | | | — | | | | 19,281,327 | |
Series P (High Yield Series) | | | 2,204,041 | | | | — | | | | 337,399 | | | | (9,046,483 | ) | | | (6,505,043 | ) |
Series Q (Small Cap Value Series) | | | 586,680 | | | | — | | | | 6,170,994 | | | | (4,388,950 | ) | | | 2,368,724 | |
Series V (SMid Cap Value Series) | | | 3,235,905 | | | | — | | | | 24,045,848 | | | | (3,113,482 | ) | | | 24,168,271 | |
Series X (StylePlus—Small Growth Series) | | | 1,474,404 | | | | — | | | | 8,009,703 | | | | — | | | | 9,484,107 | |
Series Y (StylePlus—Large Growth Series) | | | 11,035,296 | | | | — | | | | 6,244,963 | | | | — | | | | 17,280,259 | |
Series Z (Alpha Opportunity Series) | | | 28,890 | | | | — | | | | (22,807 | ) | | | (1,533,945 | ) | | | (1,527,862 | ) |
For U.S. federal income tax purposes, capital loss carryforwards represent realized losses of the Funds that may be carried forward and applied against future capital gains. The Funds are permitted to carry forward capital losses for an unlimited period and such capital loss carryforwards retain their character as either short-term or long-term capital losses. As of December 31, 2020, capital loss carryforwards for the Funds were as follows:
| | | Unlimited | | | | | |
Fund | | Short-Term | | | Long-Term | | | Total
Capital Loss
Carryforward | |
Series D (World Equity Income Series) | | $ | (3,337,540 | ) | | $ | — | | | $ | (3,337,540 | ) |
Series F (Floating Rate Strategies Series) | | | (486,227 | ) | | | (3,177,261 | ) | | | (3,663,488 | ) |
Series P (High Yield Series) | | | (136,021 | ) | | | (8,910,462 | ) | | | (9,046,483 | ) |
Series Q (Small Cap Value Series) | | | (684,692 | ) | | | (3,704,258 | ) | | | (4,388,950 | ) |
Series V (SMid Cap Value Series) | | | (1,346,789 | ) | | | (1,766,693 | ) | | | (3,113,482 | ) |
Series Z (Alpha Opportunity Series) | | | (1,424,060 | ) | | | (109,885 | ) | | | (1,533,945 | ) |
| | THE GUGGENHEIM FUNDS ANNUAL REPORT | 187 |
NOTES TO FINANCIAL STATEMENTS (continued) |
For the year ended December 31, 2020, the following capital loss carryforward amounts were utilized:
Fund | | Utilized | |
Series E (Total Return Bond Series) | | $ | 877,391 | |
Series X (StylePlus—Small Growth Series) | | | 2,611,213 | |
Series Z (Alpha Opportunity Series) | | | 1,043 | |
Net investment income and net realized gains (losses) may differ for financial statement and tax purposes because of temporary or permanent book/tax differences. These differences are primarily due to investments in real estate investment trusts, foreign currency gains and losses, losses deferred due to wash sales, distributions in connection with redemption of fund shares, return of capital distributions received, income accruals on certain investments, income recharacterization from certain investments, investments in swaps, and the “mark-to-market,” recharacterization, or disposition of certain Passive Foreign Investment Companies (PFICs). Additional differences may result from the tax treatment of bond premium/discount amortization, losses deferred due to straddles, and the “mark-to-market” of certain derivatives. To the extent these differences are permanent and would require a reclassification between Paid in Capital and Total Distributable Earnings (Loss), such reclassifications are made in the period that the differences arise. These reclassifications have no effect on net assets or NAV per share.
The following adjustments were made on the Statements of Assets and Liabilities as of December 31, 2020 for permanent book/tax differences:
Fund | | Paid In
Capital | | | Total
Distributable
Earnings/(Loss) | |
Series A (StylePlus—Large Core Series) | | $ | 2,506,406 | | | $ | (2,506,406 | ) |
Series B (Large Cap Value Series) | | | 1,693,071 | | | | (1,693,071 | ) |
Series D (World Equity Income Series) | | | (1 | ) | | | 1 | |
Series E (Total Return Bond Series) | | | 1,120,577 | | | | (1,120,577 | ) |
Series J (StylePlus—Mid Growth Series) | | | 1,793,982 | | | | (1,793,982 | ) |
Series N (Managed Asset Allocation Series) | | | 338,138 | | | | (338,138 | ) |
Series O (All Cap Value Series) | | | 682,305 | | | | (682,305 | ) |
Series X (StylePlus—Small Growth Series) | | | 307,842 | | | | (307,842 | ) |
Series Y (StylePlus—Large Growth Series) | | | 1,376,833 | | | | (1,376,833 | ) |
At December 31, 2020, the cost of investments for U.S. federal income tax purposes, the aggregate gross unrealized appreciation for all investments for which there was an excess of value over tax cost and the aggregate gross unrealized depreciation for all investments for which there was an excess of tax cost over value, were as follows:
Fund | | Tax
Cost | | | Tax
Unrealized
Appreciation | | | Tax
Unrealized
Depreciation | | | Net Tax
Unrealized
Appreciation/
(Depreciation) | |
Series A (StylePlus—Large Core Series) | | $ | 222,264,532 | | | $ | 28,592,864 | | | $ | (351,437 | ) | | $ | 28,241,427 | |
Series B (Large Cap Value Series) | | | 168,828,692 | | | | 48,865,034 | | | | (9,783,429 | ) | | | 39,081,605 | |
Series D (World Equity Income Series) | | | 104,596,544 | | | | 21,795,532 | | | | (932,919 | ) | | | 20,862,613 | |
Series E (Total Return Bond Series) | | | 169,905,905 | | | | 11,623,337 | | | | (1,105,437 | ) | | | 10,517,900 | |
Series F (Floating Rate Strategies Series) | | | 43,473,067 | | | | 201,491 | | | | (657,141 | ) | | | (455,650 | ) |
Series J (StylePlus—Mid Growth Series) | | | 185,287,020 | | | | 30,886,732 | | | | (186,594 | ) | | | 30,700,138 | |
Series N (Managed Asset Allocation Series) | | | 33,805,628 | | | | 12,242,683 | | | | (45,339 | ) | | | 12,197,344 | |
Series O (All Cap Value Series) | | | 74,525,923 | | | | 21,174,122 | | | | (4,234,580 | ) | | | 16,939,542 | |
Series P (High Yield Series) | | | 45,864,153 | | | | 2,192,258 | | | | (1,854,883 | ) | | | 337,375 | |
Series Q (Small Cap Value Series) | | | 58,265,742 | | | | 11,596,085 | | | | (5,425,091 | ) | | | 6,170,994 | |
Series V (SMid Cap Value Series) | | | 148,430,745 | | | | 33,809,943 | | | | (9,764,095 | ) | | | 24,045,848 | |
Series X (StylePlus—Small Growth Series) | | | 37,113,554 | | | | 8,102,924 | | | | (93,221 | ) | | | 8,009,703 | |
Series Y (StylePlus—Large Growth Series) | | | 47,574,893 | | | | 6,277,362 | | | | (32,399 | ) | | | 6,244,963 | |
Series Z (Alpha Opportunity Series) | | | 4,631,579 | | | | 584,797 | | | | (607,604 | ) | | | (22,807 | ) |
188 | THE GUGGENHEIM FUNDS ANNUAL REPORT | |
NOTES TO FINANCIAL STATEMENTS (continued) |
Note 7 – Securities Transactions
For the year ended December 31, 2020, the cost of purchases and proceeds from sales of investment securities, excluding government securities, short-term investments and derivatives, were as follows:
Fund | | Purchases | | | Sales | |
Series A (StylePlus—Large Core Series) | | $ | 125,737,551 | | | $ | 123,057,416 | |
Series B (Large Cap Value Series) | | | 35,990,405 | | | | 54,258,137 | |
Series D (World Equity Income Series) | | | 227,396,058 | | | | 239,398,976 | |
Series E (Total Return Bond Series) | | | 183,140,127 | | | | 130,539,689 | |
Series F (Floating Rate Strategies Series) | | | 21,794,712 | | | | 24,978,256 | |
Series J (StylePlus—Mid Growth Series) | | | 134,432,842 | | | | 105,990,395 | |
Series N (Managed Asset Allocation Series) | | | 2,491,918 | | | | 7,741,466 | |
Series O (All Cap Value Series) | | | 18,603,234 | | | | 33,369,051 | |
Series P (High Yield Series) | | | 36,257,119 | | | | 44,666,232 | |
Series Q (Small Cap Value Series) | | | 17,994,693 | | | | 23,911,459 | |
Series V (SMid Cap Value Series) | | | 59,026,669 | | | | 76,018,778 | |
Series X (StylePlus—Small Growth Series) | | | 29,343,878 | | | | 25,060,144 | |
Series Y (StylePlus—Large Growth Series) | | | 32,611,966 | | | | 26,492,662 | |
Series Z (Alpha Opportunity Series) | | | 8,889,782 | | | | 10,689,191 | |
For the year ended December 31, 2020, the cost of purchases and proceeds from the sales of government securities were as follows:
Fund | | Purchases | | | Sales | |
Series E (Total Return Bond Series) | | $ | 33,095,912 | | | $ | 42,619,348 | |
The Funds are permitted to purchase or sell securities from or to certain affiliated funds under specified conditions outlined in procedures adopted by the Board. The procedures have been designed to ensure that any purchase or sale of securities by a Fund from or to another fund or portfolio that is or could be considered an affiliate by virtue of having a common investment adviser (or affiliated investment advisers), common trustees and/or common officers complies with Rule 17a-7 of the 1940 Act. Further, as defined under these procedures, each transaction is effected at the current market price to save costs, where permissible. For the year ended December 31, 2020, the Funds engaged in purchases and sales of securities, pursuant to Rule 17a-7 of the 1940 Act, as follows:
Fund | | Purchases | | | Sales | | | Realized
Gain | |
Series E (Total Return Bond Series) | | $ | 1,113,685 | | | $ | 697,535 | | | $ | 19,514 | |
Series P (High Yield Series) | | | 222,316 | | | | 2,272,039 | | | | 51,325 | |
Note 8 – Unfunded Loan Commitments
Pursuant to the terms of certain loan agreements, certain Funds held unfunded loan commitments as of December 31, 2020. The Funds are obligated to fund these loan commitments at the borrower’s discretion.
| | THE GUGGENHEIM FUNDS ANNUAL REPORT | 189 |
NOTES TO FINANCIAL STATEMENTS (continued) |
The unfunded loan commitments as of December 31, 2020, were as follows:
Fund | Borrower | | Maturity Date | | | | | | Face Amount* | | | Value | |
Series E (Total Return Bond Series) | | | | | | | | | | | | | | | | |
| | HAH Group Holding Co LLC | | | 10/29/27 | | | | | | | $ | 20,000 | | | $ | 292 | |
| | Higginbotham | | | 11/25/22 | | | | | | | | 43,931 | | | | 310 | |
| | MB2 Dental Solutions LLC | | | 03/22/21 | | | | | | | | 450,000 | | | | — | |
| | Planview Parent, Inc. | | | 12/10/27 | | | | | | | | 30,000 | | | | 298 | |
| | Service Logic Acquisition, Inc. | | | 10/22/27 | | | | | | | | 21,194 | | | | 206 | |
| | Southern Veterinary Partners LLC | | | 10/05/27 | | | | | | | | 18,182 | | | | 176 | |
| | Zephyr Bidco Ltd. | | | 01/20/21 | | GBP | | | 200,000 | | | | — | |
| | | | | | | | | | | | | | | $ | 1,282 | |
Series F (Floating Rate Strategies Series) | | | | | | | | | | | | | | | | |
| | Aspect Software, Inc. | | | 07/15/23 | | | | | | | $ | 44,625 | | | $ | 383 | |
| | | | | | | | | | | | | | | | | | |
Series P (High Yield Series) | | | | | | | | | | | | | | | | |
| | Aspect Software, Inc. | | | 07/15/23 | | | | | | | $ | 2,009 | | | $ | 17 | |
| | HAH Group Holding Co LLC | | | 10/29/27 | | | | | | | | 20,000 | | | | 292 | |
| | Planview Parent, Inc. | | | 12/10/27 | | | | | | | | 10,000 | | | | 99 | |
| | | | | | | | | | | | $ | 32,009 | | | $ | 408 | |
* | The face amount is denominated in U.S. dollars unless otherwise indicated. |
Note 9 – Restricted Securities
The securities below are considered illiquid and restricted under guidelines established by the Board:
Fund | Restricted Securities | | Acquisition Date | | | Cost | | | Value | |
Series E (Total Return Bond Series) | | | | | | | | | | | | | |
| | Copper River CLO Ltd. | | | | | | | | | | | | |
| | 2006-1A, due 01/20/211 | | | 05/09/14 | | | $ | 702,000 | | | $ | 17,640 | |
| | Cushman & Wakefield US Borrower LLC | | | | | | | | | | | | |
| | 6.75% due 05/15/28 | | | 05/19/20 | | | | 250,000 | | | | 275,625 | |
| | FKRT | | | | | | | | | | | | |
| | 2020-C2A, 3.25% due 12/30/23 | | | 12/03/20 | | | | 810,501 | | | | 810,540 | |
| | Putnam Structured Product Funding Ltd. | | | | | | | | | | | | |
| | 2003-1A, 1.18% (1 Month USD LIBOR + 1.00%, Rate Floor: 0.00%), due 10/15/382 | | | 06/01/16 | | | | 72,037 | | | | 77,432 | |
| | Turbine Engines Securitization Ltd. | | | | | | | | | | | | |
| | 2013-1A, 5.13% due 12/13/48 | | | 11/27/13 | | | | 420,526 | | | | 342,404 | |
| | | | | | | $ | 2,255,064 | | | $ | 1,523,641 | |
Series P (High Yield Series) | | | | | | | | | | | | | |
| | Basic Energy Services, Inc. | | | | | | | | | | | | |
| | 10.75% due 10/15/23 | | | 09/25/18 | | | $ | 173,852 | | | $ | 31,500 | |
| | Bruce Mansfield | | | | | | | | | | | | |
| | due 08/01/233 | | | 11/07/18 | | | | 135,373 | | | | 70 | |
| | Cushman & Wakefield US Borrower LLC | | | | | | | | | | | | |
| | 6.75% due 05/15/28 | | | 05/19/20 | | | | 254,275 | | | | 275,625 | |
| | Mirabela Nickel Ltd. | | | | | | | | | | | | |
| | due 06/24/193 | | | 12/31/13 | | | | 353,909 | | | | 19,504 | |
| | | | | | | | $ | 917,409 | | | $ | 326,699 | |
1 | Security has no stated coupon. However, it is expected to receive residual cash flow payments on defined deal dates. |
2 | Variable rate security. Rate indicated is the rate effective at December 31, 2020. In some instances, the effective rate is limited by a minimum rate floor or a maximum rate cap established by the issuer. The settlement status of a position may also impact the effective rate indicated. In some cases, a position may be unsettled at period end and may not have a stated effective rate. In instances where multiple underlying reference rates and spread amounts are shown, the effective rate is based on a weighted average. |
3 | Security is in default of interest and/or principal obligations. |
190 | THE GUGGENHEIM FUNDS ANNUAL REPORT | |
NOTES TO FINANCIAL STATEMENTS (continued) |
Note 10 – Line of Credit
The Trust, along with other affiliated trusts, secured a 364-day committed, $1,205,000,000 line of credit from Citibank, N.A., which was in place through October 4, 2019, at which time the line of credit was renewed with an increased commitment amount of $1,230,000,000. A Fund may draw (borrow) from the line of credit, with limits subject to applicable regulatory requirements around leverage, as a temporary measure for emergency purposes, to facilitate redemption requests, or for other short-term liquidity purposes consistent with the Fund’s investment objective and program. For example, it may be advantageous for the Fund to borrow money rather than sell existing portfolio positions to meet redemption requests. Fees related to borrowings, if any, vary under this arrangement between the greater of Citibank’s “base rate”, LIBOR plus 1%, or the federal funds rate plus 1/2 of 1%.
The commitment fee that may be paid by the Funds is at an annualized rate of 0.15% of the average daily amount of their allocated unused commitment amount. The commitment fee amount is allocated to the individual Funds based on the respective net assets of each participating Fund and is referenced in the Statement of Operations under “Line of credit fees”. The Funds did not have any borrowings under this agreement as of and for the year ended December 31, 2020.
In addition, Series E (Total Return Bond Series) and Series F (Floating Rate Strategies Series)(the “Funds”) entered into an additional unlimited credit facility agreement with BNP Paribas Prime Brokerage, Inc. (the “counterparty”) whereby the counterparty has agreed to provide secured financing to the Funds and the Funds will provide pledged collateral to the counterparty. Fees related to borrowings, if any, equate to 1 month LIBOR plus 0.90%. The Funds did not have any borrowings under this agreement at or during the year ended December 31, 2020.
Note 11 – Other Liabilities
Series A (StylePlus—Large Core Series) and Series V (SMid Cap Value Series) (the “Funds”) each wrote put option contracts through Lehman Brothers, Inc. (“Lehman”) that were exercised prior to the option contracts expiration and prior to the bankruptcy filing by Lehman, during September 2008. However, these transactions have not settled and the securities have not been delivered to the Funds as of December 31, 2020.
The Funds have recorded a liability on their respective books equal to the difference between the strike price on the put options and the market prices of the underlying security on the exercise date. The amount of liability recorded by the Funds prior to December 31, 2020 was $18,615 for Series A (StylePlus—Large Core Series) and $205,716 for Series V (SMid Cap Value Series) and was included in payable for miscellaneous in the Statements of Assets and Liabilities. On May 15, 2020, the Funds revised the amounts of their liability to $0 after it was determined the Funds have no future obligations related to this matter.
Note 12 – Reverse Repurchase Agreements
Each of the Funds may enter into reverse repurchase agreements. Under a reverse repurchase agreement, a Fund sells securities and agrees to repurchase them at a particular price at a future date. In the event the buyer of securities under a reverse repurchase agreement files for bankruptcy or becomes insolvent, such buyer or its trustee or receiver may receive an extension of time to determine whether to enforce the Fund’s obligation to repurchase the securities, and the Fund’s use of the proceeds of the reverse repurchase agreement may effectively be restricted pending such decision.
For the year ended December 31, 2020, the following Funds entered into reverse repurchase agreements:
Fund | | Number
of Days
Outstanding | | | Balance at
December 31,
2020 | | | Average
Balance
Outstanding | | | Average
Interest
Rate | |
Series E (Total Return Bond Series) | | | 153 | | | $ | — | * | | $ | 1,759,735 | | | | 0.12 | % |
Series P (High Yield Series) | | | 366 | | | | 988,490 | | | | 1,585,208 | | | | 1.12 | % |
* | As of December 31, 2020, Series E (Total Return Bond Series) did not have any open reverse repurchase agreements. |
| | THE GUGGENHEIM FUNDS ANNUAL REPORT | 191 |
NOTES TO FINANCIAL STATEMENTS (continued) |
The following table presents reverse repurchase agreements that are subject to netting arrangements and offset in the Statements of Assets of Liabilities in conformity with U.S. GAAP:
| | | | | | | | | | | | | | | | Gross Amounts Not Offset
in the Statements of
Assets and Liabilities | | | | | |
Fund | Instrument | | Gross
Amounts of
Recognized
Liabilities | | | Gross
Amounts
Offset in the
Statements
of Assets and
Liabilities | | | Net Amount
of Liabilities
Presented on
the Statements
of Assets and
Liabilities | | | Financial
Instruments | | | Cash
Collateral
Pledged | | | Net
Amount | |
Series P (High Yield Series) | Reverse repurchase agreements | | $ | 988,490 | | | $ | — | | | $ | 988,490 | | | $ | (988,490 | ) | | $ | — | | | $ | — | |
As of December 31, 2020, the Series P (High Yield Series) had outstanding reverse repurchase agreements with various counterparties. Details of the reverse repurchase agreements by counterparty are as follows:
Counterparty | Interest Rate(s) | Maturity Date(s) | | Face Value | |
Credit Suisse Securities (USA) LLC | 0.30% - 0.50%* | Open Maturity | | $ | 758,750 | |
RBC Capital Markets LLC | 0.38%* | Open Maturity | | | 229,740 | |
| | | | $ | 988,490 | |
* | The rate is adjusted periodically by the counterparty, subject to approval by the Adviser, and is not based upon a set reference rate and spread. Rate indicated is the rate effective as of December 31, 2020. |
The following is a summary of the remaining contractual maturities of the reverse repurchase agreements outstanding as of year-end, aggregated by asset class of the related collateral pledged by the Fund:
Fund | Asset Type | | Overnight and
Continuous | | | Total | |
Series P (High Yield Series) | Corporate Bonds | | $ | 988,490 | | | $ | 988,490 | |
Gross amount of recognized liabilities for reverse repurchase agreements | | | $ | 988,490 | | | $ | 988,490 | |
Note 13 – Legal Proceedings
Tribune Company
SBL Fund has been named as a defendant and a putative member of the proposed defendant class of shareholders in the case entitled Kirschner v. FitzSimons, No. 12-2652 (S.D.N.Y.) (formerly Official Committee of Unsecured Creditors of Tribune Co. v. FitzSimons, Adv. Pro. No. 10-54010 (Bankr. D. Del.)) (the “FitzSimons action”), as a result of ownership by certain series of the SBL Fund of shares in the Tribune Company (“Tribune”) in 2007, when Tribune effected a leveraged buyout transaction (“LBO”) by which Tribune converted to a privately-held company. In his complaint, the plaintiff has alleged that, in connection with the LBO, Tribune insiders and shareholders were overpaid for their Tribune stock using financing that the insiders knew would, and ultimately did, leave Tribune insolvent. The plaintiff has asserted claims against certain insiders, major shareholders, professional advisers, and others involved in the LBO. The plaintiff is also attempting to obtain from former Tribune shareholders, including the SBL Fund, the proceeds they received in connection with the LBO.
In June 2011, a group of Tribune creditors filed multiple actions against former Tribune shareholders involving state law constructive fraudulent conveyance claims arising out of the 2007 LBO (the “SLCFC actions”). SBL Fund has been named as a defendant in two of the SLCFC actions: Deutsche Bank Trust Co. Americas v. Ohlson Enter., No. 12-0064 (S.D.N.Y.) and Deutsche Bank Trust Co. Americas v. Cantor Fitzgerald & Co., No. 11-4900 (S.D.N.Y.). In those actions, the creditors seek to recover from Tribune’s former shareholders the proceeds received in connection with the 2007 LBO.
192 | THE GUGGENHEIM FUNDS ANNUAL REPORT | |
NOTES TO FINANCIAL STATEMENTS (continued) |
The FitzSimons action and the SLCFC actions have been consolidated with the majority of the other Tribune LBO-related lawsuits in a multidistrict litigation proceeding captioned In re Tribune Company Fraudulent Conveyance Litig., No. 11-md-2296 (S.D.N.Y.) (the “MDL Proceeding”).
On September 23, 2013, the District Court granted the defendants’ omnibus motion to dismiss the SLCFC actions, on the basis that the creditors lacked standing. On September 30, 2013, the creditors filed a notice of appeal of the September 23 order. On October 28, 2013, the defendants filed a joint notice of cross-appeal of that same order. On March 29, 2016, the U.S. Court of Appeals for the Second Circuit issued its opinion on the appeal of the SLCFC actions. The appeals court affirmed the district court’s dismissal of those lawsuits, but on different grounds than the district court. The appeals court held that while the plaintiffs have standing under the U.S. Bankruptcy Code, their claims were preempted by Section 546(e) of the Bankruptcy Code—the statutory safe harbor for settlement payments. On April 12, 2016, the Plaintiffs in the SLCFC actions filed a petition seeking rehearing en banc before the appeals court. On July 22, 2016, the appeals court denied the petition. On September 9, 2016, the plaintiffs filed a petition for writ of certiorari in the U.S. Supreme Court challenging the Second Circuit’s decision that the safe harbor of Section 546(e) applied to their claims. The shareholder defendants, including the Funds, filed a joint brief in opposition to the petition for certiorari on October 24, 2016. On April 3, 2018, Justice Kennedy and Justice Thomas issued a “Statement” related to the petition for certiorari suggesting that the Second Circuit and/or District Court may want to take steps to reexamine the application of the Section 546(e) safe harbor to the previously dismissed state law constructive fraudulent transfer claims based on the Supreme Court’s decision in Merit Management Group LP v. FTI Consulting, Inc. On April 10, 2018, plaintiffs filed in the Second Circuit a motion for that court to recall its mandate, vacate its prior decision, and remand to the district court for further proceedings consistent with Merit Management. On April 20, 2018, the shareholder defendants filed a response to plaintiffs’ motion to recall the mandate. On May 15, 2018, the Second Circuit issued an order recalling the mandate “in anticipation of further panel review.” On December 19, 2019, the Second Circuit issued an amended opinion that again affirmed the district court’s ruling on the basis that plaintiffs’ claims were preempted by Section 546(e) of the Bankruptcy Code. Plaintiffs filed a motion for rehearing and rehearing en banc on January 2, 2020. The Second Circuit denied the petition on February 6, 2020. On July 6, 2020, plaintiffs filed a new petition for a writ of certiorari in the U.S. Supreme Court. In that petition, plaintiffs stated that “[t]o make it more likely that there will be a quorum for this petition,” they have “abandon[ed] the case and let the judgment below stand” with respect to certain defendants. That list did not include SBL Fund. Defendants filed an opposition to the petition for certiorari on August 26, 2020, and plaintiffs filed a reply in support of the petition for certiorari on September 8, 2020.
On May 23, 2014, the defendants filed motions to dismiss the FitzSimons action, including a global motion to dismiss Count I, which is the claim brought against former Tribune shareholders for intentional fraudulent conveyance under U.S. federal law. On January 6, 2017, the United States District Court for the Southern District of New York granted the shareholder defendants’ motion to dismiss the intentional fraudulent conveyance claim in the FitzSimons action. The Court concluded that the plaintiff had failed to allege that Tribune entered the LBO with actual intent to hinder, delay, or defraud its creditors, and therefore the complaint failed to state a claim. In dismissing the intentional fraudulent conveyance claim, the Court denied the plaintiff’s request to amend the complaint. The plaintiff requested that the Court direct entry of a final judgment in order to make the order immediately appealable. On February 23, 2017, the Court issued an order stating that it intended to permit an interlocutory appeal of the dismissal order, but would wait to do so until it has resolved outstanding motions to dismiss filed by other defendants.
On July 18, 2017, the plaintiff submitted a letter to the District Court seeking leave to amend its complaint to add a constructive fraudulent transfer claim. The shareholder defendants opposed that request. On August 24, 2017, the Court denied the plaintiff’s request without prejudice to renewal of the request in the event of an intervening change in the law. On March 8, 2018, the plaintiff renewed his request for leave to file a motion to amend the complaint to assert a constructive fraudulent transfer claim based on the Supreme Court’s ruling in Merit Management Group LP v. FTI Consulting, Inc. The shareholder defendants opposed that request. On June 18, 2018 the District Court ordered that the request would be stayed pending further action by the Second Circuit in the SLCFC actions.
On December 18, 2018, plaintiff filed a letter with the District Court requesting that the stay be dissolved in order to permit briefing on the motion to amend the complaint and indicating plaintiff’s intention to file another motion to amend the complaint to reinstate claims for intentional fraudulent transfer. The shareholder defendants opposed that request. On January 14, 2019, the court held a case management conference, during which the court stated that it would not lift the stay prior to further action from the Second Circuit in the SLCFC actions. The court further stated that it would allow the plaintiff to file a motion to amend to try to reinstate its intentional fraudulent transfer claim. On January 23, 2019, the court ordered the parties still facing pending claims to participate in a mediation, to commence on January 28, 2019. The mediation did not result in a settlement of the claims against the shareholder defendants.
| | THE GUGGENHEIM FUNDS ANNUAL REPORT | 193 |
NOTES TO FINANCIAL STATEMENTS (concluded) |
On April 4, 2019, plaintiff filed a motion to amend the Fifth Amended Complaint to assert a federal constructive fraudulent transfer claim against certain shareholder defendants. On April 10, 2019, the shareholder defendants filed a brief in opposition to plaintiff’s motion to amend. On April 12, 2019, the plaintiff filed a reply brief. On April 23, 2019, the court denied the plaintiff’s motion to amend. On June 13, 2019, the court entered judgment pursuant to Rule 54(b). On July 12, 2019, the Plaintiff filed a notice of appeal with respect to the dismissal of his claims and the District Court’s denial of his motion for leave to amend. Plaintiff filed an appellate brief on January 7, 2020. The shareholder defendants’ brief was filed on April 27, 2020. Plaintiff filed a reply brief on May 18, 2020. The Court held oral argument on August 24, 2020.
None of these lawsuits alleges any wrongdoing on the part of Guggenheim Variable Funds Trust f/k/a SBL Fund. The following series of Guggenheim Variable Funds Trust held shares of Tribune and tendered these shares as part of Tribune’s LBO: Series A (StylePlus—Large Core Series) f/k/a Series H (Enhanced Index Series), Series N (Managed Asset Allocation Series) and Series O (All Cap Value Series) (the “Funds”). The value of the proceeds received by the foregoing Funds was $158,950, $51,000 and $3,774,000, respectively. At this stage of the proceedings, Guggenheim Variable Funds Trust is not able to make a reliable predication as to the outcome of these lawsuits or the effect, if any, on a Fund’s net asset value.
Note 14 – COVID-19 and Recent Developments
The global ongoing crisis caused by the outbreak of COVID-19 is causing materially reduced consumer demand and economic output, disrupting supply chains, resulting in market closures, travel restrictions and quarantines, and adversely impacting local and global economies. Investors should be aware that in light of the current uncertainty, volatility and distress in economies, financial markets, and labor and health conditions all over the world, the Funds’ investments and a shareholder’s investment in the Funds are subject to sudden and substantial losses, increased volatility and other adverse events. Firms through which investors invest with the Funds, the Funds, their service providers, the markets in which they invest and market intermediaries are also impacted by quarantines and similar measures intended to contain the ongoing pandemic, which can obstruct their functioning and subject them to heightened operational risks.
Note 15 – Subsequent Events
The Funds evaluated subsequent events through the date the financial statements were available for issue and determined there were no material events that would require adjustment to or disclosure in the Funds’ financial statements.
194 | THE GUGGENHEIM FUNDS ANNUAL REPORT | |
REPORT OF INDEPENDENT REGISTERED PUBLIC ACCOUNTING FIRM |
To the Shareholders and the Board of Trustees of Guggenheim Variable Funds Trust
Opinion on the Financial Statements
We have audited the accompanying statements of assets and liabilities of Guggenheim Variable Funds Trust (the “Trust”) (comprising Series A (Style Plus—Large Core Series), Series B (Large Cap Value Series), Series D (World Equity Income Series), Series E (Total Return Bond Series), Series F (Floating Rate Strategies Series), Series J (Style Plus—Mid Growth Series), Series N (Managed Asset Allocation Series), Series O (All Cap Value Series), Series P (High Yield Series), Series Q (Small Cap Value Series), Series V (SMid Cap Value Series), Series X (Style Plus—Small Growth Series), Series Y (Style Plus—Large Growth Series) and Series Z (Alpha Opportunity Series) (collectively referred to as the “Funds”)), including the schedules of investments, as of December 31, 2020, and the related statements of operations for the year then ended, the statements of changes in net assets for each of the two years in the period then ended, the financial highlights for each of the five years in the period then ended and the related notes (collectively referred to as the “financial statements”). In our opinion, the financial statements present fairly, in all material respects, the financial position of each of the Funds comprising Guggenheim Variable Funds Trust at December 31, 2020, the results of their operations for the year then ended, the changes in their net assets for each of the two years in the period then ended and their financial highlights for each of the five years in the period then ended, in conformity with U.S. generally accepted accounting principles.
Basis for Opinion
These financial statements are the responsibility of the Trust’s management. Our responsibility is to express an opinion on each of the Funds’ financial statements based on our audits. We are a public accounting firm registered with the Public Company Accounting Oversight Board (United States) (“PCAOB”) and are required to be independent with respect to the Trust in accordance with the U.S. federal securities laws and the applicable rules and regulations of the Securities and Exchange Commission and the PCAOB.
We conducted our audits in accordance with the standards of the PCAOB. Those standards require that we plan and perform the audit to obtain reasonable assurance about whether the financial statements are free of material misstatement, whether due to error or fraud. The Trust is not required to have, nor were we engaged to perform, an audit of the Trust’s internal control over financial reporting. As part of our audits, we are required to obtain an understanding of internal control over financial reporting but not for the purpose of expressing an opinion on the effectiveness of the Trust’s internal control over financial reporting. Accordingly, we express no such opinion.
Our audits included performing procedures to assess the risks of material misstatement of the financial statements, whether due to error or fraud, and performing procedures that respond to those risks. Such procedures included examining, on a test basis, evidence regarding the amounts and disclosures in the financial statements. Our procedures included confirmation of securities owned as of December 31, 2020, by correspondence with the custodian, transfer agent, paying agents and brokers or by other appropriate auditing procedures where replies from paying agents or brokers were not received. Our audits also included evaluating the accounting principles used and significant estimates made by management, as well as evaluating the overall presentation of the financial statements. We believe that our audits provide a reasonable basis for our opinion.

We have served as the auditor of one or more Guggenheim investment companies since 1979.
Tysons, Virginia
February 26, 2021
| | THE GUGGENHEIM FUNDS ANNUAL REPORT | 195 |
OTHER INFORMATION (Unaudited) |
Federal Income Tax Information
This information is being provided as required by the Internal Revenue Code. Amounts shown may differ from those elsewhere in the report because of differences in tax and financial reporting practice.
In January 2021, shareholders will be advised on IRS Form 1099 DIV or substitute 1099 DIV as to the federal tax status of the distributions received by shareholders in the calendar year 2020.
The Funds’ investment income (dividend income plus short-term capital gains, if any) qualifies as follows:
Of the taxable ordinary income distributions paid during the fiscal year ending December 31, 2020, the following Funds had the corresponding percentages qualify for the dividends received deduction for corporations.
Fund | | Dividend
Received
Deduction | |
Series A (StylePlus—Large Core Series) | | | 7.49 | % |
Series B (Large Cap Value Series) | | | 100.00 | % |
Series D (World Equity Income Series) | | | 58.49 | % |
Series J (StylePlus—Mid Growth Series) | | | 3.46 | % |
Series N (Managed Asset Allocation Series) | | | 29.75 | % |
Series O (All Cap Value Series) | | | 100.00 | % |
Series P (High Yield Series) | | | 0.94 | % |
Series Q (Small Cap Value Series) | | | 78.59 | % |
Series V (SMid Cap Value Series) | | | 100.00 | % |
Series X (StylePlus—Small Growth Series) | | | 17.46 | % |
Series Y (StylePlus—Large Growth Series) | | | 4.96 | % |
Series Z (Alpha Opportunity Series) | | | 100.00 | % |
With respect to the taxable year ended December 31, 2020, the Funds hereby designate as capital gain dividends the amounts listed below, or, if subsequently determined to be different, the net capital gain of such year:
Fund | | From long-term
capital gain: | | | From long-term capital
gain, using proceeds
from shareholder
redemptions: | |
Series A (StylePlus—Large Core Series) | | $ | — | | | $ | 2,186,993 | |
Series B (Large Cap Value Series) | | | 13,318,423 | | | | 1,693,071 | |
Series D (World Equity Income Series) | | | 1,215,536 | | | | — | |
Series J (StylePlus—Mid Growth Series) | | | — | | | | 1,152,291 | |
Series N (Managed Asset Allocation Series) | | | 1,736,981 | | | | 338,138 | |
Series O (All Cap Value Series) | | | 4,713,044 | | | | 682,305 | |
Series Q (Small Cap Value Series) | | | 3,494,871 | | | | — | |
Series V (SMid Cap Value Series) | | | 6,227,332 | | | | — | |
Series X (StylePlus—Small Growth Series) | | | — | | | | 123,788 | |
Series Y (StylePlus—Large Growth Series) | | | 45,170 | | | | 822,927 | |
Delivery of Shareholder Reports
Paper copies of the Funds’ annual and semi-annual shareholder reports are not sent by mail, unless you specifically request paper copies of the reports from the insurance company that offers your contract or from your financial intermediary. Instead, the reports are made available on a website, and you are notified by mail each time a report is posted and provided with a website address to access the report.
You may elect to receive paper copies of all future shareholder reports free of charge. You can inform the insurance company that you wish to receive paper copies of reports by following the instructions provided by the insurance company. Your election to receive reports in paper may apply to all portfolio companies available under your contract.
196 | THE GUGGENHEIM FUNDS ANNUAL REPORT | |
OTHER INFORMATION (Unaudited)(concluded) |
Proxy Voting Information
A description of the policies and procedures that the Trust uses to determine how to vote proxies relating to securities held in the Funds’ portfolios is available, without charge and upon request, by calling 800.820.0888. This information is also available from the EDGAR database on the SEC’s website at https://www.sec.gov.
Information regarding how the Funds voted proxies relating to portfolio securities during the most recent 12-month period ended June 30 is available without charge, upon request, by calling 800.820.0888. This information is also available from the EDGAR database on the SEC’s website at https://www.sec.gov.
Sector Classification
Information in the “Schedule of Investments” is categorized by sectors using sector-level Classifications defined by the Bloomberg Industry Classification System, a widely recognized industry classification system provider. Each Fund’s registration statement has investment policies relating to concentration in specific sectors/industries. For purposes of these investment policies, the Funds usually classify sectors/industries based on industry-level Classifications used by widely recognized industry classification system providers such as Bloomberg Industry Classification System, Global Industry Classification Standards and Barclays Global Classification Scheme.
Quarterly Portfolio Schedules Information
The Trust files its complete schedule of portfolio holdings with the SEC for the first and third quarters of each fiscal year as an exhibit to its reports on Form N-PORT, and for reporting periods ended prior to March 31, 2019, filed such information on Form N-Q. The Funds’ Forms N-PORT and N-Q are available on the SEC’s website at https://www.sec.gov. Copies of the portfolio holdings are also available to shareholders, without charge and upon request, by calling 800.820.0888.
| | THE GUGGENHEIM FUNDS ANNUAL REPORT | 197 |
INFORMATION ON BOARD OF TRUSTEES AND OFFICERS (Unaudited) |
A Board of Trustees oversees the Trust, as well as other trusts of GI, in which its members have no stated term of service, and continue to serve after election until resignation. The Statement of Additional Information includes further information about Fund Trustees and Officers, and can be obtained without charge by visiting guggenheiminvestments.com or by calling 800.820.0888.
Name, Address*
and Year of Birth | Position(s)
Held with
Trust | Term of Office
and Length of
Time Served** | Principal Occupation(s)
During Past Five Years | Number of
Portfolios
in Fund
Complex
Overseen | Other
Directorships Held
by Trustees*** |
INDEPENDENT TRUSTEES | | | |
Randall C. Barnes (1951) | Trustee and Chair of the Valuation Oversight Committee | Since 2014 (Trustee) Since 2020 (Chair of the Valuation Oversight Committee) | Current: Private Investor (2001-present).
Former: Senior Vice President and Treasurer, PepsiCo, Inc. (1993-1997); President, Pizza Hut International (1991-1993); Senior Vice President, Strategic Planning and New Business Development, PepsiCo, Inc. (1987-1990). | 157 | Current: Purpose Investments Funds (2013-present).
Former: Managed Duration Investment Grade Municipal Fund (2006-2016). |
Angela Brock-Kyle (1959) | Trustee | Since 2019 | Current: Founder and Chief Executive Officer, B.O.A.R.D.S. (2013-present).
Former: Senior Leader, TIAA (1987-2012). | 156 | Current: Bowhead Insurance GP, LLC (2020-present); Hunt Companies, Inc. (2019-present).
Former: Infinity Property & Casualty Corp. (2014-2018). |
Donald A. Chubb, Jr. (1946)1 | Trustee | Since 1994 | Current: Retired.
Former: Business broker and manager of commercial real estate, Griffith & Blair, Inc. (1997-2017). | 156 | Former: Midland Care, Inc. (2011-2016). |
Jerry B. Farley (1946)1 | Trustee | Since 2005 | Current: President, Washburn University (1997-present). | 156 | Current: CoreFirst Bank & Trust (2000-present).
Former: Westar Energy, Inc. (2004-2018). |
Roman Friedrich III (1946)1 | Trustee | Since 2014 | Current: Founder and Managing Partner, Roman Friedrich & Company (1998-present). | 156 | Former: Zincore Metals, Inc. (2009-2019). |
Thomas F. Lydon, Jr. (1960) | Trustee and Chair of the Contracts Review Committee | Since 2019 (Trustee) Since 2020 (Chair of the Contracts Review Committee) | Current: President, Global Trends Investments (1996-present); Co-Chief Executive Officer, ETF Flows, LLC (2019-present); Chief Executive Officer, Lydon Media (2016-present). | 156 | Current: US Global Investors (GROW) (1995-present).
Former: Harvest Volatility Edge Trust (3) (2017-2019). |
198 | THE GUGGENHEIM FUNDS ANNUAL REPORT | |
INFORMATION ON BOARD OF TRUSTEES AND OFFICERS (Unaudited)(continued) |
Name, Address*
and Year of Birth | Position(s)
Held with
Trust | Term of Office
and Length of
Time Served** | Principal Occupation(s)
During Past Five Years | Number of
Portfolios
in Fund
Complex
Overseen | Other
Directorships Held
by Trustees*** |
INDEPENDENT TRUSTEES - concluded | | |
Ronald A. Nyberg (1953) | Trustee and Chair of the Nominating and Governance Committee | Since 2014 | Current: Of Counsel, Momkus LLP (2016-present).
Former: Partner, Nyberg & Cassioppi, LLC (2000-2016); Executive Vice President, General Counsel, and Corporate Secretary, Van Kampen Investments (1982-1999). | 157 | Current: PPM Funds (3) (2018-present); Edward-Elmhurst Healthcare System (2012-present).
Former: Western Asset Inflation-Linked Opportunities & Income Fund (2004-2020); Western Asset Inflation-Linked Income Fund (2003-2020); Managed Duration Investment Grade Municipal Fund (2003-2016). |
Sandra G. Sponem (1958) | Trustee and Chair of the Audit Committee | Since 2019 (Trustee) Since 2020 (Chair of the Audit Committee) | Current: Retired.
Former: Senior Vice President and Chief Financial Officer, M.A. Mortenson-Companies, Inc. (2007-2017). | 156 | Current: SPDR Series Trust (81) (2018-present); SPDR Index Shares Funds (30) (2018-present); SSGA Active Trust (14) (2018-present).
Former: SSGA Master Trust (1) (2018-2020). |
Ronald E. Toupin, Jr. (1958) | Trustee, Chair of the Board and Chair of the Executive Committee | Since 2014 | Current: Portfolio Consultant (2010-present); Member, Governing Council, Independent Directors Council (2013-present); Governor, Board of Governors, Investment Company Institute (2018-present).
Former: Member, Executive Committee, Independent Directors Council (2016-2018); Vice President, Manager and Portfolio Manager, Nuveen Asset Management (1998-1999); Vice President, Nuveen Investment Advisory Corp. (1992-1999); Vice President and Manager, Nuveen Unit Investment Trusts (1991-1999); and Assistant Vice President and Portfolio Manager, Nuveen Unit Investment Trusts (1988-1999), each of John Nuveen & Co., Inc. (1982-1999). | 156 | Former: Western Asset Inflation-Linked Opportunities & Income Fund (2004-2020); Western Asset Inflation-Linked Income Fund (2003-2020); Managed Duration Investment Grade Municipal Fund (2003-2016). |
| | THE GUGGENHEIM FUNDS ANNUAL REPORT | 199 |
INFORMATION ON BOARD OF TRUSTEES AND OFFICERS (Unaudited)(continued) |
Name, Address*
and Year of Birth | Position(s)
Held with
Trust | Term of Office
and Length of
Time Served** | Principal Occupation(s)
During Past Five Years | Number of
Portfolios
in Fund
Complex
Overseen | Other
Directorships Held
by Trustees*** |
INTERESTED TRUSTEE | | | | |
Amy J. Lee**** (1961) | Trustee, Vice President and Chief Legal Officer | Since 2018 (Trustee) Since 2014 (Chief Legal Officer) Since 2007 (Vice President) | Current: Interested Trustee, certain other funds in the Fund Complex (2018-present); Chief Legal Officer, certain other funds in the Fund Complex (2014-present); Vice President, certain other funds in the Fund Complex (2007-present); Senior Managing Director, Guggenheim Investments (2012-present).
Former: President and Chief Executive Officer, certain other funds in the Fund Complex (2017-2019); Vice President, Associate General Counsel and Assistant Secretary, Security Benefit Life Insurance Company and Security Benefit Corporation (2004-2012). | 156 | None. |
* | The business address of each Trustee is c/o Guggenheim Investments, 227 West Monroe Street, Chicago, Illinois 60606. |
** | Each Trustee serves an indefinite term, until his or her successor is elected and qualified. Time served includes time served in the respective position for the Predecessor Corporation. |
*** | Each Trustee also serves on the Boards of Trustees of Guggenheim Funds Trust, Guggenheim Variable Funds Trust, Guggenheim Strategy Funds Trust, Fiduciary/Claymore Energy Infrastructure Fund, Guggenheim Taxable Municipal Bond & Investment Grade Debt Trust, Guggenheim Strategic Opportunities Fund, Guggenheim Enhanced Equity Income Fund, Guggenheim Energy & Income Fund, Guggenheim Credit Allocation Fund, Rydex Series Funds, Rydex Dynamic Funds, Rydex Variable Trust and Transparent Value Trust. Messrs. Barnes and Nyberg also serve on the Board of Trustees of Advent Convertible & Income Fund. |
**** | This Trustee is deemed to be an “interested person” of the Funds under the 1940 Act by reason of her position with the Funds’ Investment Manager and/or the parent of the Investment Manager. |
1 | Under the Funds’ Independent Trustees Retirement Policy, Messrs. Chubb, Farley and Friedrich are expected to retire in 2021. |
200 | THE GUGGENHEIM FUNDS ANNUAL REPORT | |
INFORMATION ON BOARD OF TRUSTEES AND OFFICERS (Unaudited)(continued) |
Name, Address*
and Year of Birth | Position(s)
Held with
Trust | Term of Office
and Length of
Time Served** | Principal Occupation(s)
During Past Five Years |
OFFICERS | | | |
Brian E. Binder (1972) | President and Chief Executive Officer | Since 2018 | Current: President and Chief Executive Officer, certain other funds in the Fund Complex (2018-present); President, Chief Executive Officer and Chairman of the Board of Managers, Guggenheim Funds Investment Advisors, LLC (2018-present); President and Chief Executive Officer, Security Investors, LLC (2018-present); Board Member of Guggenheim Partners Fund Management (Europe) Limited (2018-present); Senior Managing Director and Chief Administrative Officer, Guggenheim Investments (2018-present).
Former: Managing Director and President, Deutsche Funds, and Head of US Product, Trading and Fund Administration, Deutsche Asset Management (2013-2018); Managing Director, Head of Business Management and Consulting, Invesco Ltd. (2010-2012). |
James M. Howley (1972) | Assistant Treasurer | Since 2014 | Current: Managing Director, Guggenheim Investments (2004-present); Assistant Treasurer, certain other funds in the Fund Complex (2006-present).
Former: Manager, Mutual Fund Administration of Van Kampen Investments, Inc. (1996-2004). |
Mark E. Mathiasen (1978) | Secretary | Since 2014 | Current: Secretary, certain other funds in the Fund Complex (2007-present); Managing Director, Guggenheim Investments (2007-present). |
Glenn McWhinnie (1969) | Assistant Treasurer | Since 2016 | Current: Vice President, Guggenheim Investments (2009-present); Assistant Treasurer, certain other funds in the Fund Complex (2016-present). |
Michael P. Megaris (1984) | Assistant Secretary | Since 2014 | Current: Assistant Secretary, certain other funds in the Fund Complex (2014-present); Director, Guggenheim Investments (2012-present). |
Elisabeth Miller (1968) | Chief Compliance Officer | Since 2012 | Current: Chief Compliance Officer, certain other funds in the Fund Complex (2012-present); Senior Managing Director, Guggenheim Investments (2012-present). Vice President, Guggenheim Funds Distributors, LLC (2014-present).
Former: Chief Compliance Officer, Security Investors, LLC and Guggenheim Funds Investment Advisors, LLC (2012-2018); Chief Compliance Officer, Guggenheim Distributors, LLC (2009-2014); Senior Manager, Security Investors, LLC (2004-2014); Senior Manager, Guggenheim Distributors, LLC (2004-2014). |
Margaux Misantone (1978) | AML Officer | Since 2017 | Current: Chief Compliance Officer, Security Investors, LLC and Guggenheim Funds Investment Advisors, LLC (2018-present); AML Officer, Security Investors, LLC and certain other funds in the Fund Complex (2017-present); Managing Director, Guggenheim Investments (2015-present).
Former: Assistant Chief Compliance Officer, Security Investors, LLC and Guggenheim Funds Investments Advisors, LLC (2015-2018). |
William Rehder (1967) | Assistant Vice President | Since 2018 | Current: Managing Director, Guggenheim Investments (2002-present). |
| | THE GUGGENHEIM FUNDS ANNUAL REPORT | 201 |
INFORMATION ON BOARD OF TRUSTEES AND OFFICERS (Unaudited)(concluded) |
Name, Address*
and Year of Birth | Position(s)
Held with
Trust | Term of Office
and Length of
Time Served** | Principal Occupation(s)
During Past Five Years |
OFFICERS - concluded | | |
Kimberly J. Scott (1974) | Assistant Treasurer | Since 2014 | Current: Director, Guggenheim Investments (2012-present); Assistant Treasurer, certain other funds in the Fund Complex (2012-present).
Former: Financial Reporting Manager, Invesco, Ltd. (2010-2011); Vice President/Assistant Treasurer, Mutual Fund Administration for Van Kampen Investments, Inc./Morgan Stanley Investment Management (2009-2010); Manager of Mutual Fund Administration, Van Kampen Investments, Inc./Morgan Stanley Investment Management (2005-2009). |
Bryan Stone (1979) | Vice President | Since 2014 | Current: Vice President, certain other funds in the Fund Complex (2014-present); Managing Director, Guggenheim Investments (2013-present).
Former: Senior Vice President, Neuberger Berman Group LLC (2009-2013); Vice President, Morgan Stanley (2002-2009). |
John L. Sullivan (1955) | Chief Financial Officer, Chief Accounting Officer and Treasurer | Since 2014 | Current: Chief Financial Officer, Chief Accounting Officer and Treasurer, certain other funds in the Fund Complex (2010-present); Senior Managing Director, Guggenheim Investments (2010-present).
Former: Managing Director and Chief Compliance Officer, each of the funds in the Van Kampen Investments fund complex (2004-2010); Managing Director and Head of Fund Accounting and Administration, Morgan Stanley Investment Management (2002-2004); Chief Financial Officer and Treasurer, Van Kampen Funds (1996-2004). |
Jon Szafran (1989) | Assistant Treasurer | Since 2017 | Current: Vice President, Guggenheim Investments (2017-present); Assistant Treasurer, certain other funds in the Fund Complex (2017-present).
Former: Assistant Treasurer of Henderson Global Funds and Manager of US Fund Administration, Henderson Global Investors (North America) Inc. (“HGINA”), (2017); Senior Analyst of US Fund Administration, HGINA (2014–2017); Senior Associate of Fund Administration, Cortland Capital Market Services, LLC (2013-2014); Experienced Associate, PricewaterhouseCoopers LLP (2012-2013). |
* | The business address of each officer is c/o Guggenheim Investments, 227 West Monroe Street, Chicago, Illinois 60606. |
** | Each officer serves an indefinite term, until his or her successor is duly elected and qualified. |
202 | THE GUGGENHEIM FUNDS ANNUAL REPORT | |
GUGGENHEIM INVESTMENTS PRIVACY NOTICE (Unaudited) |
Who We Are
This Privacy Notice describes the data protection practices of Guggenheim Investments. Guggenheim Investments as used herein refers to the affiliated investment management businesses of Guggenheim Partners, LLC: Guggenheim Funds Investment Advisors, LLC, Guggenheim Partners Investment Management, LLC, Guggenheim Funds Distributors, LLC, Security Investors, LLC, Guggenheim Investment Advisors (Europe) Limited, Guggenheim Real Estate, LLC, GS Gamma Advisors, LLC, Guggenheim Partners India Management, LLC, Guggenheim Partners Europe Limited, as well as the funds in the Guggenheim Funds complex (the “Funds”) (“Guggenheim Investments,” “we,” “us,” or “our”).
Guggenheim Partners Investment Management Holdings, LLC, located at 330 Madison Avenue, New York, New York 10017 is the data controller for your information. The affiliates who are also controllers of certain of your information are: Guggenheim Investment Advisors (Europe) Limited, Guggenheim Partners Europe Limited, Guggenheim Partners, LLC, Guggenheim Funds Investment Advisors, LLC, Guggenheim Partners Investment Management, LLC, Guggenheim Funds Distributors, LLC and Security Investors, LLC, as well as the Funds.
Our Commitment to You
Guggenheim Investments considers your privacy our utmost concern. When you become our client or investor, you entrust us with not only your hard-earned money but also with your personal and financial information. Because we have access to your private information, we hold ourselves to the highest standards in its safekeeping and use. We strictly limit how we share your information with others, whether you are a current or former Guggenheim Investments client or investor.
The Information We Collect About You
We collect certain nonpublic personal information about you from information you provide on applications, other forms, our website, and/or from third parties including investment advisors. This information includes Social Security or other tax identification number, assets, income, tax information, retirement and estate plan information, transaction history, account balance, payment history, bank account information, marital status, family relationships, information that we collect on our website through the use of “cookies,” and other personal information that you or others provide to us. We may also collect such information through your inquiries by mail, e-mail or telephone. We may also collect customer due diligence information, as required by applicable law and regulation, through third party service providers.
How We Handle Your Personal Information
The legal basis for using your information as set out in this Privacy Notice is as follows: (a) use of your personal data is necessary to perform our obligations under any contract with you (such as a contract for us to provide financial services to you); or (b) where use of your personal data is not necessary for performance of a contract, use of your personal data is necessary for our legitimate interests or the legitimate interests of others (for example, to enforce the legal terms governing our services, operate and market our website and other services we offer, ensure safe environments for our personnel and others, make and receive payments, prevent fraud and to know the customer to whom we are providing the services). Some processing is done to comply with applicable law.
In addition to the specific uses described above, we also use your information in the following manner:
| | ● | We use your information in connection with servicing your accounts. |
| | ● | We use information to respond to your requests or questions. For example, we might use your information to respond to your customer feedback. |
| | ● | We use information to improve our products and services. We may use your information to make our website and products better. We may use your information to customize your experience with us. |
| | ● | We use information for security purposes. We may use your information to protect our company and our customers. |
| | ● | We use information to communicate with you. For example, we will communicate with you about your account or our relationship. We may contact you about your feedback. We might also contact you about this Privacy Notice. We may also enroll you in our email newsletter. |
| | THE GUGGENHEIM FUNDS ANNUAL REPORT | 203 |
GUGGENHEIM INVESTMENTS PRIVACY NOTICE (Unaudited)(continued) |
| | ● | We use information as otherwise permitted by law, as we may notify you. |
| | ● | Aggregate/Anonymous Data. We may aggregate and/or anonymize any information collected through the website so that such information can no longer be linked to you or your device (“Aggregate/Anonymous Information”). We may use Aggregate/Anonymous Information for any purpose, including without limitation for research and marketing purposes, and may also share such data with any third parties, including advertisers, promotional partners, and sponsors. |
We do not sell information about current or former clients or their accounts to third parties. Nor do we share this information, except when necessary to complete transactions at your request, to make you aware of investment products and services that we or our affiliates offer, or as permitted or required by law.
We provide information about you to companies and individuals not affiliated with Guggenheim Investments to complete certain transactions or account changes, or to perform services for us related to your account. For example, if you ask to transfer assets from another financial institution to Guggenheim Investments, we must provide certain information about you to that company to complete the transaction. We provide the third party with only the information necessary to carry out its responsibilities and only for that purpose. And we require these third parties to treat your private information with the same high degree of confidentiality that we do. To alert you to other Guggenheim Investments products and services, we share your information within our family of affiliated companies. You may limit our sharing with affiliated companies as set out below. We may also share information with any successor to all or part of our business, or in connection with steps leading up to a merger or acquisition. For example, if part of our business was sold we may give customer information as part of that transaction. We may also share information about you with your consent.
We will release information about you if you direct us to do so, if we are compelled by law to do so, or in other circumstances as permitted by law (for example, to protect your account from fraud).
If you close your account(s) or become an inactive client or investor, we will continue to adhere to the privacy policies and practices described in this notice.
Opt-Out Provisions and Your Data Choices
The law allows you to “opt out” of certain kinds of information sharing with third parties. We do not share personal information about you with any third parties that triggers this opt-out right. This means YOU ARE ALREADY OPTED OUT.
When you are no longer our client or investor, we continue to share your information as described in this notice, and you may contact us at any time to limit our sharing by sending an email to CorporateDataPrivacy@GuggenheimPartners.com.
European Union Data Subjects and certain others: In addition to the choices set forth above, residents of the European Union and certain other jurisdictions have certain rights to (1) request access to or rectification or deletion of information we collect about them, (2) request a restriction on the processing of their information, (3) object to the processing of their information, or (4) request the portability of certain information. To exercise these or other rights, please contact us using the contact information below. We will consider all requests and provide our response within the time period stated by applicable law. Please note, however, that certain information may be exempt from such requests in some circumstances, which may include if we need to keep processing your information for our legitimate interests or to comply with a legal obligation. We may request you provide us with information necessary to confirm your identity before responding to your request.
Residents of France and certain other jurisdictions may also provide us with instructions regarding the manner in which we may continue to store, erase and share your information after your death, and where applicable, the person you have designated to exercise these rights after your death.
How We Protect Privacy Online
We take steps to protect your privacy when you use our web site – www.guggenheiminvestments.com – by using secure forms of online communication, including encryption technology, Secure Socket Layer (SSL) protocol, firewalls and user names and passwords. These safeguards vary based on the sensitivity of the information that we collect and store. However, we cannot and do not guarantee that these measures will prevent every unauthorized attempt to access, use, or disclose your information since despite our efforts, no Internet and/or other
204 | THE GUGGENHEIM FUNDS ANNUAL REPORT | |
GUGGENHEIM INVESTMENTS PRIVACY NOTICE (Unaudited)(concluded) |
electronic transmissions can be completely secure. Our web site uses “http cookies”—tiny pieces of information that we ask your browser to store. We use cookies for session management and security features on the Guggenheim Investments web site. We do not use them to pull data from your hard drive, to learn your e-mail address, or to view data in cookies created by other web sites. We will not share the information in our cookies or give others access to it. See the legal information area on our web site for more details about web site security and privacy features.
How We Safeguard Your Personal Information and Data Retention
We restrict access to nonpublic personal information about you to our employees and in some cases to third parties (for example, the service providers described above) as permitted by law. We maintain strict physical, electronic and procedural safeguards that comply with federal standards to guard your nonpublic personal information.
We keep your information for no longer than necessary for the purposes for which it is processed. The length of time for which we retain information depends on the purposes for which we collected and use it and/or as required to comply with applicable laws. Information may persist in copies made for backup and business continuity purposes for additional time.
International Visitors
If you are not a resident of the United States, please be aware that your information may be transferred to, stored and processed in the United States where our servers are located and our databases are operated. The data protection and other laws of the United States and other countries might not be as comprehensive as those in your country.
In such cases, we ensure that a legal basis for such a transfer exists and that adequate protection is provided as required by applicable law, for example, by using standard contractual clauses or by transferring your data to a jurisdiction that has obtained an adequacy finding. Individuals whose data may be transferred on the basis of standard contractual clauses may contact us as described below.
We’ll Keep You Informed
If you have any questions or concerns about how we treat your personal data, we encourage you to consult with us first. You may also contact the relevant supervisory authority.
We reserve the right to modify this policy at any time and will inform you promptly of material changes. You may access our privacy policy from our web site at www.guggenheiminvestments.com. Should you have any questions regarding our privacy policy, contact us by email at CorporateDataPrivacy@GuggenheimPartners.com.
| | THE GUGGENHEIM FUNDS ANNUAL REPORT | 205 |
LIQUIDITY RISK MANAGEMENT PROGRAM (Unaudited) |
In compliance with SEC Rule 22e-4 under the U.S. Investment Company Act of 1940 (the “Liquidity Rule”), the Guggenheim Variable Funds Trust (the “Trust”) has adopted and implemented a written liquidity risk management program (the “Program”) for each series of the Trust (each, a “Fund” and, collectively, the “Funds”). The Trust’s Board of Trustees (the “Board”) previously approved the designation of a Program administrator (the “Administrator”).
The Liquidity Rule requires that the Program be reasonably designed to assess and manage each Fund’s liquidity risk. A Fund’s “liquidity risk” is the risk that the Fund could not meet requests to redeem shares issued by the Fund without significant dilution of the remaining investors’ interests in the Fund. The Program includes a number of elements that support the assessment, management and review of liquidity risk. In accordance with the Program, each Fund’s liquidity risk is assessed no less frequently than annually taking into consideration a variety of factors, including, as applicable, the Fund’s investment strategy and liquidity of portfolio investments, cash flow projections, and holdings of cash and cash equivalents, as well as borrowing arrangements and other funding sources. Certain factors are considered under both normal and reasonably foreseeable stressed conditions. There is no guarantee that the Program will achieve its objective under all circumstances.
Under the Program, each Fund portfolio investment is classified into one of four liquidity categories based on a determination of the number of days it is reasonably expected to take to convert the investment to cash, or sell or dispose of the investment, in current market conditions without significantly changing the investment’s market value. The Program is reasonably designed to meet Liquidity Rule requirements relating to “highly liquid investment minimums” (i.e., the minimum amount of Fund net assets to be invested in highly liquid investments that are assets) and to monitor compliance with the Liquidity Rule’s limitations on a Fund’s investments in illiquid investments. Under the Liquidity Rule, a Fund is prohibited from acquiring any illiquid investment if, immediately after the acquisition, the Fund would have invested more than 15% of its net assets in illiquid investments that are assets.
During the period covered by this shareholder report, the Board received a written report (the “Report”) prepared by the Administrator addressing the Program’s operation and assessing the adequacy and effectiveness of its implementation for the period from December 1, 2018, through March 31, 2020. The Report concluded that the Program operated effectively, the Program had been and continued to be reasonably designed to assess and manage each Fund’s liquidity risk and the Program has been adequately and effectively implemented to monitor and respond to the Funds’ liquidity developments, as applicable.
Please refer to your Fund’s prospectus for more information regarding the Fund’s exposure to liquidity risk and other risks to which an investment in the Fund may be subject.
206 | THE GUGGENHEIM FUNDS ANNUAL REPORT | |
This page intentionally left blank.
This page intentionally left blank.
This page intentionally left blank.
This page intentionally left blank.
This page intentionally left blank.
This page intentionally left blank.
This page intentionally left blank.
The registrant’s Board of Trustees has adopted a code of ethics that applies to the registrant’s principal executive officer and principal financial officer. No substantive amendments were approved or waivers were granted to the Code during the period covered by this report. The Code is filed as an exhibit to this Form N-CSR.
| Item 3. | Audit Committee Financial Expert. |
The registrant's Board of Trustees has determined that it has at least one audit committee financial expert serving on its audit committee (the “Audit Committee”), Sandra G. Sponem. Ms. Sponem is “independent,” meaning that she is not an “interested person” of the Registrant (as that term is defined in Section 2(a)(19) of the Investment Company Act of 1940, as amended) and she does not accept any consulting, advisory, or other compensatory fee from the Registrant (except in her capacity as a Board or committee member).
(Under applicable securities laws, a person who is determined to be an audit committee financial expert will not be deemed an "expert" for any purpose, including without limitation for the purposes of Section 11 of the Securities Act of 1933, as a result of being designated or identified as an audit committee financial expert. The designation or identification of a person as an audit committee financial expert does not impose on such person any duties, obligations, or liabilities that are greater than the duties, obligations, and liabilities imposed on such person as a member of the audit committee and Board of Trustees in the absence of such designation or identification.)
| Item 4. | Principal Accountant Fees and Services. |
(a) Audit Fees. The aggregate Audit Fees billed by the registrant’s principal accountant for professional services rendered for the audit of the annual financial statements or services that are normally provided by the accountant in connection with statutory and regulatory filings or engagements for the fiscal years ended December 31, 2020 and December 31, 2019 were $335,517, and $327,786, respectively.
(b) Audit-Related Fees. The aggregate Audit-Related Fees billed by the registrant’s principal accountant for assurance and related services that are reasonably related to the performance of the audit of the registrant’s financial statements and are not reported under paragraph (a) of this Item for the fiscal years ended December 31, 2020 and December 31, 2019 were $0 and $0, respectively.
The aggregate fees billed in the Reporting Periods for assurance and related services by the Auditor to the registrant’s investment adviser (not including any sub-investment adviser whose role is primarily portfolio management and is subcontracted with or overseen by another investment adviser), and any entity controlling, controlled by or under common control with the investment adviser that provides ongoing services to the Registrant (“Service Affiliates”) which required pre-approval by the Audit Committee which related to the review of the transfer agent function for the fiscal years ended December 31, 2020 and December 31, 2019 were $x and $0, respectively.
(c) Tax Fees. The aggregate Tax Fees billed by the registrant’s principal accountant for professional services rendered for tax compliance, tax advice, and tax planning, including preparation of tax returns and distribution assistance, for the fiscal years ended December 31, 2020 and December 31, 2019 were $86,584, and $85,600, respectively.
(d) All Other Fees. The aggregate All Other Fees billed by the registrant’s principal accountant for products and services provided by the principal accountant, other than the services reported in paragraphs (a) through (c) of this Item, for the fiscal years ended December 31, 2020 and December 31, 2019 were $0 and $0, respectively.
(e) Audit Committee Pre-Approval Policies and Procedures.
(1) Audit Committee pre-approval policies and procedures:
To fulfill its responsibilities and duties the Audit Committee (the “Committee”) shall:
| 1. | Pre-Approval Policy (Trusts). Pre-approve any engagement of the independent auditors to provide any services, other than “prohibited non-audit services,” to the Trust, including the fees and other compensation to be paid to the independent auditors (unless an exception is available under Rule 2-01 of Regulation S-X). |
| (a) | The categories of services to be reviewed and considered for pre-approval include those services set forth under Section II.A.1. of the Background and Definitions for Audit Committee Charter (collectively, “Identified Services”). |
| (b) | The Committee has pre-approved Identified Services for which the estimated fees are less than $25,000. |
| (c) | For Identified Services with estimated fees of $25,000 or more, but less than $50,000, the Chair or any member of the Committee designated by the Chair is hereby authorized to pre-approve such Identified Services on behalf of the Committee. |
| (d) | For Identified Services with estimated fees of $50,000 or more, such Identified Services require pre-approval by the Committee. |
| (e) | All requests for Identified Services to be provided by the independent auditor that were pre-approved by the Committee shall be submitted to the Principal/Chief Accounting Officer (“CAO”) of the Trust by the independent auditor using the pre-approval request form. The Trust’s CAO will determine whether such services are included within the list of services that have received the general pre-approval of the Committee. |
| (f) | The independent auditors or the CAO of the Trust (or an officer of the Trust who reports to the CAO) shall report to the Committee at each of its regular scheduled meetings all audit, audit-related and permissible non-audit services initiated since the last such report (unless the services were contained in the initial audit plan, as previously presented to, and approved by, the Committee). The report shall include a general description of the services and projected fees, and the means by which such services were approved by the Committee (including the particular category of Identified Services under which pre-approval was obtained). |
| 2. | Pre-Approval Policy (Adviser or Any Control Affiliate). Pre-approve any engagement of the independent auditors, including the fees and other compensation to be paid to the independent auditors, to provide any non-audit services to the Adviser (or any “control affiliate” of the Adviser providing ongoing services to the Trust), if the engagement relates directly to the operations or financial reporting of the Trust (unless an exception is available under Rule 2-01 of Regulation S-X). |
| (a) | The Chair or any member of the Committee designated by the Chair may grant the pre-approval for non-audit services to the Adviser (or any “control affiliate” of the Adviser providing ongoing services to the Trust) relating directly to the operations or financial reporting of the Trust for which the estimated fees are less than $25,000. All such delegated pre-approvals shall be presented to the Committee no later than the next Committee meeting. |
| (b) | For non-audit services to the Adviser (or any “control affiliate” of the Adviser providing ongoing services to the Trust) relating directly to the operations or financial reporting of the Trust for which the estimated fees are $25,000 or more, such services require pre-approval by the Committee. |
| a. | Pre-Approval Requirements |
| i. | Categories of Services to be Reviewed and Considered for Pre-Approval |
| a. | Annual financial statement audits |
| b. | Seed audits (related to new product filings, as required) |
| c. | SEC and regulatory filings and consents |
| a. | Accounting consultations |
| b. | Fund merger/reorganization support services |
| c. | Other accounting related matters |
| d. | Agreed upon procedures reports |
| f. | Other internal control reports |
| a. | Recurring tax services: |
| i. | Preparation of Federal and state income tax returns, including extensions |
| ii. | Preparation of calculations of taxable income, including fiscal year tax designations |
| iii. | Preparation of annual Federal excise tax returns (if applicable) |
| iv. | Preparation of calendar year excise distribution calculations |
| v. | Calculation of tax equalization on an as-needed basis |
| vi. | Preparation of monthly/quarterly estimates of tax undistributed position for closed-end funds |
| vii. | Preparation of the estimated excise distribution calculations on an as-needed basis |
| viii. | Preparation of calendar year shareholder reporting designations on Form 1099 |
| ix. | Preparation of quarterly Federal, state and local and franchise tax estimated tax payments on an as-needed basis |
| x. | Preparation of state apportionment calculations to properly allocate Fund taxable income among the states for state tax filing purposes |
| xi. | Assistance with management’s identification of passive foreign investment companies (PFICs) for tax purposes |
| b. | Permissible non-recurring tax services upon request: |
| i. | Assistance with determining ownership changes which impact a Fund’s utilization of loss carryforwards |
| ii. | Assistance with corporate actions and tax treatment of complex securities and structured products |
| iii. | Assistance with IRS ruling requests and calculation of deficiency dividends |
| iv. | Conduct training sessions for the Adviser’s internal tax resources |
| v. | Assistance with Federal, state, local and international tax planning and advice regarding the tax consequences of proposed or actual transactions |
| vi. | Tax services related to amendments to Federal, state and local returns and sales and use tax compliance |
| vii. | RIC qualification reviews |
| viii. | Tax distribution analysis and planning |
| ix. | Tax authority examination services |
| x. | Tax appeals support services |
| xi. | Tax accounting methods studies |
| xii. | Fund merger, reorganization and liquidation support services |
| xiii. | Tax compliance, planning and advice services and related projects |
| xiv. | Assistance with out of state residency status |
| xv. | Provision of tax compliance services in India for Funds with direct investments in India |
(2) None of the services described in each of Items 4(b) through (d) were approved by the Audit Committee pursuant to paragraph (c)(7)(i)(C) of Rule 2-01 of Regulation S-X.
(f) Not applicable.
(g) Non-Audit Fees. The aggregate non-audit fees billed by the registrant’s accountant for the most recent fiscal year and the preceding fiscal year for services rendered to the registrant, the investment advisor, and any entity controlling, controlled by, or under common control with the advisor that provides ongoing services to the registrant were $86,584, and $85,600, respectively. These aggregate fees were less than the aggregate fees billed for the same periods by the registrant’s principal accountant for audit services rendered to the registrant, the investment advisor, and any entity controlling, controlled by, or under common control with the advisor that provides ongoing services to the registrant.
(h) Auditor Independence. The registrant’s Audit Committee was provided with information relating to the provision of non-audit services by Ernst & Young, LLP to the registrant’s investment adviser (not including any sub adviser whose role is primarily portfolio management and is subcontracted with or overseen by another investment adviser), and any entity controlling, controlled by, or under common control with the investment adviser that provides ongoing services to the registrant that were not pre-approved by the Audit Committee so that a determination could be made whether the provision of such services is compatible with maintaining Ernst & Young, LLP’s independence.
| Item 5. | Audit Committee of Listed Registrants. |
Not applicable.
Schedule of Investments is included as part of the report to shareholders filed under Item 1 of this form
| Item 7. | Disclosure of Proxy Voting Policies and Procedures for Closed-End Management Investment Companies. |
Not applicable.
| Item 8. | Portfolio Mangers of Closed-end Management Investment Companies |
Not applicable
| Item 9. | Purchases of Equity Securities by Closed-End Management Investment Company and Affiliated Purchasers. |
Not applicable.
| Item 10. | Submission of Matters to a Vote of Security Holders. |
The registrant does not currently have in place procedures by which shareholders may recommend nominees to the registrant’s board.
There have been no changes to the procedures by which shareholders may recommend nominees to the registrant’s board.
| Item 11. | Controls and Procedures. |
(a) The registrant’s President (principal executive officer) and Treasurer (principal financial officer) have evaluated the registrant’s disclosure controls and procedures (as defined in Rule 30a-3(c) under the Investment Company Act) as of a date within 90 days of this filing and have concluded that based on such evaluation as required by Rule 30a-3(b) under the Investment Company Act, that the registrant’s disclosure controls and procedures were effective as of that date in ensuring that information required to be disclosed by the registrant in this Form N-CSR was recorded, processed, summarized, and reported within the time periods specified in the Securities and Exchange Commission’s rules and forms.
(b) The registrant’s principal executive officer and principal financial officer are aware of no change in the registrant’s internal control over financial reporting that occurred during the period covered by this report that has materially affected, or is reasonably likely to materially affect, the registrant’s internal control over financial reporting.
| Item 12. | Disclosure of Securities Lending Activities for Closed End Management Investment Companies. |
Not Applicable
(a)(1) The registrant’s code of ethics pursuant to Item 2 of Form N-CSR is attached.
(a)(2) Separate certifications by the President (principal executive officer) and Treasurer (principal financial officer) of the registrant as required by Rule 30a-2(a) under the Act (17 CFR 270.30a-2(a)) are attached.
(b) A certification by the registrant’s President (principal executive officer) and Treasurer (principal financial officer) as required by Rule 30a-2(b) under the Act (17 CFR 270.30a-2(b)) is attached.
SIGNATURES
Pursuant to the requirements of the Securities Exchange Act of 1934 and the Investment Company Act of 1940, the registrant has duly caused this report to be signed on its behalf by the undersigned, thereunto duly authorized.
| (Registrant) | Guggenheim Variable Funds Trust | |
| | | |
| By (Signature and Title)* | /s/ Brian Binder | |
| | Brian Binder, President and Chief Executive Officer | |
| | | |
| Date | March 5, 2021 | |
| | | |
| Pursuant to the requirements of the Securities Exchange Act of 1934 and the Investment Company Act of 1940, this report has been signed below by the following persons on behalf of the registrant and in the capacities and on the dates indicated. |
| | | |
| By (Signature and Title)* | /s/ Brian Binder | |
| | Brian Binder, President and Chief Executive Officer | |
| | | |
| Date | March 5, 2021 | |
| | | |
| By (Signature and Title)* | /s/ John L. Sullivan | |
| | John L. Sullivan, Chief Financial Officer, Chief Accounting Officer and Treasurer | |
| | | |
| Date | March 5, 2021 | |
| | * | Print the name and title of each signing officer under his or her signature. |
