UNITED STATES
SECURITIES AND EXCHANGE COMMISSION
Washington, D.C. 20549
FORM N-CSR
CERTIFIED SHAREHOLDER REPORT OF REGISTERED MANAGEMENT
INVESTMENT COMPANIES
Investment Company Act file number 811- 02753
Guggenheim Variable Funds Trust
(Exact name of registrant as specified in charter)
702 King Farm Boulevard, Suite 200
Rockville, Maryland 20850
(Address of principal executive offices) (Zip code)
Amy J. Lee
Guggenheim Variable Funds Trust
702 King Farm Boulevard, Suite 200
Rockville, Maryland 20850
(Name and address of agent for service)
Registrant's telephone number, including area code: 1-301-296-5100
Date of fiscal year end: December 31
Date of reporting period: January 1, 2022 - December 31, 2022
Form N-CSR is to be used by management investment companies to file reports with the Commission not later than 10 days after the transmission to stockholders of any report that is required to be transmitted to stockholders under Rule 30e-1 under the Investment Company Act of 1940 (17 CFR 270.30e-1). The Commission may use the information provided on Form N-CSR in its regulatory, disclosure review, inspection, and policymaking roles.
A registrant is required to disclose the information specified by Form N-CSR, and the Commission will make this information public. A registrant is not required to respond to the collection of information contained in Form N-CSR unless the Form displays a currently valid Office of Management and Budget ("OMB") control number. Please direct comments concerning the accuracy of the information collection burden estimate and any suggestions for reducing the burden to Secretary, Securities and Exchange Commission, 450 Fifth Street, NW, Washington, DC 20549-0609. The OMB has reviewed this collection of information under the clearance requirements of 44 U.S.C. §3507.
Item 1. Reports to Stockholders.
|

12.31.2022
Guggenheim Variable Funds Trust Annual Report
Series | ||
Series A | (StylePlus—Large Core Series) | |
Series B | (Large Cap Value Series) | |
Series D | (World Equity Income Series) | |
Series E | (Total Return Bond Series) | |
Series F | (Floating Rate Strategies Series) | |
Series J | (StylePlus—Mid Growth Series) | |
Series N | (Managed Asset Allocation Series) | |
Series O | (All Cap Value Series) | |
Series P | (High Yield Series) | |
Series Q | (Small Cap Value Series) | |
Series V | (SMid Cap Value Series) | |
Series X | (StylePlus—Small Growth Series) | |
Series Y | (StylePlus—Large Growth Series) | |
Series Z | (Alpha Opportunity Series) | |
GuggenheimInvestments.com | GVFT-ANN-1222x1223 |
TABLE OF CONTENTS |
DEAR SHAREHOLDER | 2 |
ECONOMIC AND MARKET OVERVIEW | 5 |
ABOUT SHAREHOLDERS’ FUND EXPENSES | 7 |
SERIES A (STYLEPLUS—LARGE CORE SERIES) | 9 |
SERIES B (LARGE CAP VALUE SERIES) | 18 |
SERIES D (WORLD EQUITY INCOME SERIES) | 26 |
SERIES E (TOTAL RETURN BOND SERIES) | 35 |
SERIES F (FLOATING RATE STRATEGIES SERIES) | 57 |
SERIES J (STYLEPLUS—MID GROWTH SERIES) | 72 |
SERIES N (MANAGED ASSET ALLOCATION SERIES) | 82 |
SERIES O (ALL CAP VALUE SERIES) | 91 |
SERIES P (HIGH YIELD SERIES) | 101 |
SERIES Q (SMALL CAP VALUE SERIES) | 116 |
SERIES V (SMID CAP VALUE SERIES) | 125 |
SERIES X (STYLEPLUS—SMALL GROWTH SERIES) | 135 |
SERIES Y (STYLEPLUS—LARGE GROWTH SERIES) | 145 |
SERIES Z (ALPHA OPPORTUNITY SERIES) | 154 |
NOTES TO FINANCIAL STATEMENTS | 172 |
REPORT OF INDEPENDENT REGISTERED PUBLIC ACCOUNTING FIRM | 197 |
OTHER INFORMATION | 198 |
INFORMATION ON BOARD OF TRUSTEES AND OFFICERS | 200 |
GUGGENHEIM INVESTMENTS PRIVACY NOTICE | 205 |
THE GUGGENHEIM FUNDS ANNUAL REPORT | 1 |
| December 31, 2022 |
Dear Shareholder:
Security Investors, LLC and Guggenheim Partners Investment Management, LLC (“SI”, “GPIM”, or the “Investment Advisers”) are pleased to present the annual shareholder report for funds that are part of the Guggenheim Variable Funds Trust (the “Funds”). This report covers performance of the Funds for the annual period ended December 31, 2022 (the “Reporting Period”).
In December 2022, Guggenheim Partners announced the untimely and unexpected death of Scott Minerd, one of Guggenheim’s Managing Partners and its Global Chief Investment Officer. He joined Guggenheim as a Managing Partner shortly after the firm was formed. He was a frequent commentator on markets and investments, both on television and via social media. He also was one of the designers of the organization, systems and processes that make Guggenheim Investments a strong, robust and scalable leader in the asset management business.
Guggenheim has implemented its succession plan, which is designed to deal with unexpected events. There has been and will continue to be no disruption of service to our clients, no change in the daily management of client portfolios and no change in the process of selecting investment assets, all of which continue to be handled by the longstanding committees and long-tenured investment professionals who, every day, implement our investment processes.
Guggenheim Investments continues to be led by its Co-Presidents, Dina DiLorenzo and David Rone, and by Anne B. Walsh, a Managing Partner and Chief Investment Officer of Guggenheim Partners Investment Management. Ms. Walsh will continue her current role leading the team managing client investments and will assume many of Mr. Minerd’s responsibilities on an interim basis.
The Investment Advisers are part of Guggenheim Investments, which represents the investment management businesses of Guggenheim Partners, LLC (“Guggenheim”), a global, diversified financial services firm.
Guggenheim Funds Distributors, LLC is the distributor of the Funds. Guggenheim Funds Distributors, LLC is affiliated with Guggenheim and the Investment Advisers.
We encourage you to read the Economic and Market Overview section of the report, which follows this letter, and then the Performance Report and Fund Profile for each Fund.
We are committed to providing innovative investment solutions and appreciate the trust you place in us.
Sincerely,
Security Investors, LLC
Guggenheim Partners Investment Management, LLC
January 31, 2023
Read a prospectus and summary prospectus (if available) carefully before investing. It contains the investment objectives, risks, charges, expenses and other information, which should be considered carefully before investing. Obtain a prospectus and summary prospectus (if available) at guggenheiminvestments.com or call 800.820.0888.
This material is not intended as a recommendation or as investment advice of any kind, including in connection with rollovers, transfers, and distributions. Such material is not provided in a fiduciary capacity, may not be relied upon for or in connection with the making of investment decisions, and does not constitute a solicitation of an offer to buy or sell securities. All content has been provided for informational or educational purposes only and is not intended to be and should not be construed as legal or tax advice and/or a legal opinion. Always consult a financial, tax and/or legal professional regarding your specific situation.
The Series StylePlus Funds may not be suitable for all investors. Investments in large capitalization stocks may underperform other segments of the equity market or the equity market as a whole. ● Investments in small-sized company securities may present additional risks such as less predictable earnings, higher volatility and less liquidity than larger, more established companies. ● Growth stocks may be more volatile than other stocks because they are more sensitive to investor perceptions regarding the growth potential of the issuing companies. ● The Funds may invest in derivative instruments, which may be more volatile and less liquid, increasing the risk of loss when compared to traditional securities. Certain of the derivative instruments are also subject to the risks of counterparty default and adverse tax treatment. ● The Funds’ use of leverage, through borrowings or instruments such as derivatives, may cause the Funds to be more volatile than if they had not been leveraged. ● The Funds’ investments in other investment vehicles subject the Funds to those risks and expenses affecting the investment vehicle. ● The Funds may invest in foreign securities which carry
2 | THE GUGGENHEIM FUNDS ANNUAL REPORT |
| December 31, 2022 |
additional risks when compared to U.S. securities, due to the impact of diplomatic, political or economic developments in the country in question (investments in emerging markets securities are generally subject to an even greater level of risks). ● The Funds may invest in fixed income securities whose market value will change in response to interest rate changes and market conditions among other factors. In general, bond prices rise when interest rates fall and vice versa. ● The Funds’ exposure to high yield securities may subject the Funds to greater volatility. ● The Funds may invest in bank loans and asset-backed securities, including mortgage backed, which involve special types of risks. ● The Funds may invest in restricted securities which may involve financial and liquidity risk. ● You may have a gain or loss when you sell your shares. ● It is important to note that the Funds are not guaranteed by the U.S. government. ● Please read the prospectus for more detailed information regarding these and other risks.
The Series Value Funds may not be suitable for all investors. ● An investment in the Funds will fluctuate and is subject to investment risks, which means investors could lose money. The intrinsic value of the underlying stocks may never be realized or the stocks may decline in value. Investments in small- and/or mid-sized company securities may present additional risks such as less predictable earnings, higher volatility and less liquidity than larger, more established companies. ● Please read the prospectus for more detailed information regarding these and other risks.
The Series D (World Equity Income Series) may not be suitable for all investors. ● Investments in securities in general are subject to market risks that may cause their prices to fluctuate over time. ●The Fund’s investments in foreign securities carry additional risks when compared to U.S. securities, due to the impact of diplomatic, political or economic developments in the country in question (investments in emerging markets are generally subject to an even greater level of risks). Additionally, the Fund’s exposure to foreign currencies subjects the Fund to the risk that those currencies will decline in value relative to the U.S. Dollar. ● The Fund’s investments in derivatives may pose risks in addition to those associated with investing directly in securities or other investments, including illiquidity of the derivatives, imperfect correlations with underlying investments or the Fund’s other portfolio holdings, lack of availability and counterparty risk. ●The Fund’s use of leverage, through instruments such as derivatives, may cause the Fund to be more volatile than if it had not been leveraged. ●The Fund’s investments in other investment vehicles subject the Fund to those risks and expenses affecting the investment vehicle. ●The Fund may have significant exposure to securities in a particular capitalization range e.g., large-, mid- or small-cap securities. As a result, the Fund may be subject to the risk that the pre-denominate capitalization range may underperform other segments of the equity market or the equity market as a whole. ● Please read the prospectus for more detailed information regarding these and other risks.
The Series E (Total Return Bond Series) may not be suitable for all investors. ● The Fund’s market value will change in response to interest rate changes and market conditions among other factors. In general, bond prices rise when interest rates fall and vice versa. ● The Fund’s exposure to high yield securities may subject the Fund to greater volatility. ● When market conditions are deemed appropriate, the Fund will leverage to the full extent permitted by its investment policies and restrictions and applicable law. Leveraging will exaggerate the effect on net asset value of any increase or decrease in the market value of the Fund’s portfolio. ● The Fund may invest in derivative instruments, which may be more volatile and less liquid, increasing the risk of loss when compared to traditional securities. Certain of the derivative instruments are also subject to the risks of counterparty default and adverse tax treatment. ● Instruments and strategies (such as borrowing transactions and reverse repurchase agreements) may provide leveraged exposure to a particular investment, which will magnify any gains or losses on those investments. ● Investments in reverse repurchase agreements expose the Fund to many of the same risks as investments in derivatives. ● The Fund’s investments in other investment vehicles subject the Fund to those risks and expenses affecting the investment vehicle. ● The Fund’s investments in foreign securities carry additional risks when compared to U.S. securities, due to the impact of diplomatic, political, or economic developments in the country in question (investments in emerging markets securities are generally subject to an even greater level of risk). ● Investments in syndicated bank loans generally offer a floating interest rate and involve special types of risks. ● The Fund’s investments in municipal securities can be affected by events that affect the municipal bond market. ● The Fund’s investments in real estate securities subject the Fund to the same risks as direct investments in real estate, which is particularly sensitive to economic downturns. ● The Fund’s investments in restricted securities may involve financial and liquidity risk. ● You may have a gain or loss when you sell your shares. ● It is important to note that the Fund is not guaranteed by the U.S. government. ● Please read the prospectus for more detailed information regarding these and other risks.
The Series F (Floating Rate Strategies Series) may not be suitable for all investors. ● Investments in floating rate senior secured syndicated bank loans and other floating rate securities involve special types of risks, including credit rate risk, interest rate risk, liquidity risk and prepayment risk. ● The Fund’s market value will change in response to interest rate changes and market conditions among other factors. In general, bond prices rise when interest rates fall and vice versa. ● The Fund’s exposure to high yield securities may subject the Fund to greater volatility. ● When market conditions are deemed appropriate, the Fund may use leverage to the full extent permitted by its investment policies and restrictions and applicable law. Leveraging will exaggerate the effect on net asset value of any increase or decrease in the market value of the Fund’s portfolio. ● The Fund may invest in derivative instruments, which may be more volatile and less liquid, increasing the risk of loss when compared to traditional securities. Certain of the derivative instruments are also subject to the risks of counterparty default and adverse tax treatment. ● Instruments and strategies (such as borrowing transactions and reverse repurchase agreements) may provide leveraged exposure to a particular investment, which will magnify any gains or losses on those investments. ● Investments in reverse repurchase agreements and synthetic instruments (such as synthetic collateralized debt obligations) expose the Fund to many of the same risks as investments in derivatives. ● The Fund’s investments in other investment vehicles subject the Fund to those risks and expenses affecting the investment vehicle. ● The Fund’s investments in foreign securities carry additional risks when compared to U.S. securities, due to the impact of diplomatic, political or economic developments in the country in question (investments in emerging markets securities are generally subject to an even greater level of risk). ● The Fund’s investments in real estate securities subject the Fund to the same risks as direct investments in real estate, which is particularly sensitive to economic downturns. ● The Fund’s investments in restricted securities may involve financial and liquidity risk. ● The Fund is subject to active trading risks that may increase volatility and impact its ability to achieve its investment objective. ● You may have a gain or loss when you sell your shares. ● It is important to note that the Fund is not guaranteed by the U.S. government. ● Please read the prospectus for more detailed information regarding these and other risks.
The Series N (Managed Asset Allocation Series) may not be suitable for all investors. ● The value of an investment in the Fund will fluctuate and is subject to investment risks, which means investors could lose money. The Fund could lose money if the issuer of a bond or a counterparty to a derivatives transaction or other transaction is unable to repay interest and principal on time or defaults. The issuer of a bond could also suffer a decrease in quality rating, which would affect the volatility and liquidity of the bond. Derivatives may pose risks in addition to those associated with investing directly in securities or other investments, including the risk that the Fund will be unable to sell, unwind or value the derivative because of an illiquid market, the risk that the derivative is not well correlated with underlying investments or the Fund’s other portfolio holdings, and the risk that the counterparty is unwilling or unable to meet its obligation. The use of derivatives by the Fund to hedge risk may reduce the opportunity for gain by offsetting the positive effect of favorable price movements. Furthermore, if the Investment Manager is incorrect about its expectations of market conditions, the use of derivatives could result in a loss, which in some cases may be unlimited. Foreign securities carry additional risks when compared to U.S. securities, including currency fluctuations, adverse political and economic developments, unreliable or untimely information, less liquidity, limited legal recourse and higher transactional costs. The Investment Manager may not be able to cause certain of the underlying funds’ performance to match or correlate to that of the underlying funds’
THE GUGGENHEIM FUNDS ANNUAL REPORT | 3 |
| December 31, 2022 |
respective underlying index or benchmark, either on a daily or aggregate basis. Factors such as underlying fund expenses, imperfect correlation between an underlying fund’s investments and those of its underlying index or underlying benchmark, rounding of share prices, changes to the composition of the underlying index or underlying benchmark, regulatory policies, high portfolio turnover rate, and the use of leverage all contribute to tracking error. Tracking error may cause an underlying fund’s and, thus the Fund’s, performance to be less than you expect. ● Please read the prospectus for more detailed information regarding these and other risks.
The Series P (High Yield Series) may not be suitable for all investors. ● The Fund’s market value will change in response to interest rate changes and market conditions among other factors. In general, bond prices rise when interest rates fall and vice versa. ● The Fund’s exposure to high yield securities may subject the Fund to greater volatility. ● The Fund may invest in derivative instruments, which may be more volatile and less liquid, increasing the risk of loss when compared to traditional securities. Certain of the derivative instruments are also subject to the risks of counterparty default and adverse tax treatment. ●The Fund’s use of leverage, through borrowings or instruments such as derivatives, may cause the Fund to be more volatile than if it had not been leveraged. ● Instruments and strategies (such as borrowing transactions and reverse repurchase agreements) may provide leveraged exposure to a particular investment, which will magnify any gains or losses on those investments. ● The Fund may invest in foreign securities which carry additional risks when compared to U.S. securities, due to the impact of diplomatic, political or economic developments in the country in question (investments in emerging markets securities are generally subject to an even greater level of risks). ● Investments in syndicated bank loans generally offer a floating interest rate and involve special types of risks. ● The Fund’s investments in other investment vehicles subject the Fund to those risks and expenses affecting the investment vehicle. ● The Fund’s investments in restricted securities may involve financial and liquidity risk. ● You may have a gain or loss when you sell your shares. ● It is important to note that the Fund is not guaranteed by the U.S. government. ● Please read the prospectus for more detailed information regarding these and other risks.
The Series Z (Alpha Opportunity Series) may not be suitable for all investors. ● Investments in securities and derivatives, in general, are subject to market risks that may cause their prices to fluctuate over time. An investment in the Fund may lose money. There can be no guarantee the Fund will achieve it investment objective. ●The Fund’s use of derivatives such as futures, options and swap agreements may expose the Fund to additional risks that it would not be subject to if it invested directly in the securities underlying those derivatives. ● Certain of the derivative instruments, such as swaps and structured notes, are also subject to the risks of counterparty default and adverse tax treatment. ●The more the Fund invests in leveraged instruments, the more the leverage will magnify any gains or losses on those investments. ● The Fund’s use of short selling involves increased risk and costs, including paying more for a security than it received from its sale and the risk of unlimited losses. ●In certain circumstances the Fund may be subject to liquidity risk and it may be difficult for the Fund to purchase and sell particular investments within a reasonable time at a fair price. ●The Fund’s fixed income investments will change in value in response to interest rate changes and other factors. ● Please read the prospectus for more detailed information regarding these and other risks.
4 | THE GUGGENHEIM FUNDS ANNUAL REPORT |
ECONOMIC AND MARKET OVERVIEW (Unaudited) | December 31, 2022 |
Helped by lower energy prices, real economic growth reaccelerated in the fourth quarter of 2022. Amid this continued strong growth, the Federal Reserve (the “Fed”) is explicitly targeting a weaker labor market, and several leading indicators point to rising unemployment by the middle of the year. Consumption also faces headwinds from dwindling excess savings buffers and a sharply negative wealth shock as financial asset and home prices fall. Business investment also appears to be weakening due to the sharp tightening in financial conditions and more challenging outlook for economic growth. The housing sector could subtract further from gross domestic product (“GDP”) as the spike in mortgage rates has adversely impacted demand.
Because private sector balance sheets are generally healthy in the aggregate and the economy lacks major imbalances, we do not expect a particularly deep recession. But the likelihood of a limited monetary and fiscal policy response means the economic recovery could be weak, and certain highly levered companies may suffer.
Moderation in goods prices as supply chains normalize should bring inflation lower over the next several months, and shelter inflation should roll over by mid-2023. Services inflation outside of shelter is the main concern for the Fed, but a softening labor market and cooling wage growth may keep this category contained. As a result, core inflation could fall below 3 percent by the end of the year.
The Fed’s continued rate hike campaign may cause the front end of the yield curve to remain elevated in the near term. But should the economic cycle roll over later this year, Treasury yields may see a significant decline. Weakening corporate earnings growth and an emerging recession would present downside risk to equity returns later in 2023 but, given corporate fundamentals remain solid, high quality fixed income and carefully selected high yield issuers should provide attractive returns.
For the Reporting Period, the S&P 500® Index* returned -18.11%. The MSCI Europe-Australasia-Far East (“EAFE”) Index* returned -14.45%. The return of the MSCI Emerging Markets Index* was -20.09%.
In the bond market, the Bloomberg U.S. Aggregate Bond Index* posted a -13.01% return for the Reporting Period, while the Bloomberg U.S. Corporate High Yield Index* returned -11.19%. The return of the ICE Bank of America (“BofA”) 3-Month U.S. Treasury Bill Index* was 1.47% for the Reporting Period.
The opinions and forecasts expressed may not actually come to pass. This information is subject to change at any time, based on market and other conditions, and should not be construed as a recommendation of any specific security or strategy.
*Index Definitions:
The following indices are referenced throughout this report. Indices are unmanaged and not available for direct investment. Index performance does not reflect transaction costs, fees, or expenses.
Bloomberg U.S. Aggregate Bond Index is a broad-based flagship benchmark that measures the investment grade, U.S. dollar-denominated, fixed-rate taxable bond market, including U.S. Treasuries, government-related and corporate securities, mortgage-backed securities or “MBS” (agency fixed-rate and hybrid adjustable-rate mortgage, or “ARM”, pass-throughs), asset-backed securities (“ABS”), and commercial mortgage-backed securities (“CMBS”) (agency and non-agency).
Bloomberg U.S. Corporate High Yield Index measures the U.S. dollar-denominated, high yield, fixed-rate corporate bond market. Securities are classified as high yield if the middle rating of Moody’s, Fitch, and S&P is Ba1/BB +/BB + or below.
Credit Suisse Leveraged Loan Index is designed to mirror the investable universe of the U.S. dollar-denominated leveraged loan market.
ICE BofA 3-Month U.S. Treasury Bill Index is an unmanaged market index of U.S. Treasury securities maturing in 90 days that assumes reinvestment of all income.
MSCI EAFE Index is a free float-adjusted market capitalization index that is designed to measure the equity market performance of developed markets, excluding the U.S. & Canada.
MSCI Emerging Markets Index is a free float-adjusted market capitalization weighted index that is designed to measure equity market performance in the global emerging markets.
MSCI World (Net) Index is calculated with net dividends reinvested. It is a free float-adjusted market capitalization weighted index that is designed to measure the equity market performance of developed markets.
THE GUGGENHEIM FUNDS ANNUAL REPORT | 5 |
ECONOMIC AND MARKET OVERVIEW (Unaudited)(concluded) | December 31, 2022 |
Morningstar Long/Short Equity Category Average represents long-short portfolios which hold sizable stakes in both long and short positions in equities and related derivatives. Some funds that fall into this category will shift their exposure to long and short positions depending on their macro outlook or the opportunities they uncover through bottom-up research. Some funds may simply hedge long stock positions through exchange traded funds or derivatives. At least 75% of the assets are in equity securities or derivatives.
Russell 3000® Index measures the performance of the largest 3,000 U.S. companies, representing approximately 98% of the investable U.S. equity market.
Russell 3000® Value Index measures the performance of the broad value segment of the U.S. equity value universe. It includes those Russell 3000 companies with lower price-to-book ratios and lower forecasted growth values.
Russell 2500® Value Index measures the performance of the small- to mid-cap value segment of the U.S. equity universe. It includes those Russell 2500 companies with lower price-to-book ratios and lower forecasted growth values.
Russell 2000® Growth Index measures the performance of the small-cap growth segment of the U.S. equity universe. It includes those Russell 2000 companies with higher price-to-book ratios and higher forecasted growth values.
Russell 2000® Value Index measures the performance of the small-cap value segment of the U.S. equity universe. It includes those Russell 2000 companies with lower price-to-book ratios and lower forecasted growth values.
Russell 1000® Growth Index measures the performance of the large-cap growth segment of the U.S. equity universe. It includes those Russell 1000 companies with higher price-to-book ratios and higher forecasted growth value.
Russell 1000® Value Index: A measure of the performance for the large-cap value segment of the U.S. equity universe. It includes those Russell 1000 companies with lower price-to-book ratios and lower expected growth values.
Russell Midcap® Growth Index measures the performance of the mid-cap growth segment of the U.S. equity universe. It includes those Russell Midcap Index companies with higher price-to-book ratios and higher forecasted growth values.
S&P 500® Index is a broad-based index, the performance of which is based on the performance of 500 widely held common stocks chosen for market size, liquidity, and industry group representation.
6 | THE GUGGENHEIM FUNDS ANNUAL REPORT |
ABOUT SHAREHOLDERS’ FUND EXPENSES (Unaudited) |
|
All mutual funds have operating expenses, and it is important for our shareholders to understand the impact of costs on their investments. Shareholders of a fund incur two types of costs: (i) transaction costs, including sales charges (loads) on purchase payments, reinvested dividends, other distributions, and exchange fees, and (ii) ongoing costs, including management fees, administrative services, and shareholder reports, among others. These ongoing costs, or operating expenses, are deducted from a fund’s gross income and reduce the investment return of the fund.
A fund’s expenses are expressed as a percentage of its average net assets, which is known as the expense ratio. The following examples are intended to help investors understand the ongoing costs (in dollars) of investing in a fund and to compare these costs with the ongoing costs of investing in other mutual funds.
The examples are based on an investment of $1,000 made at the beginning of the period and held for the entire six-month period beginning June 30, 2022 and ending December 31, 2022.
The following tables illustrate the Funds’ costs in two ways:
Table 1. Based on actual Fund return: This section helps investors estimate the actual expenses paid over the period. The “Ending Account Value” shown is derived from the Fund’s actual return, and the fifth column shows the dollar amount that would have been paid by an investor who started with $1,000 in the Fund. Investors may use the information here, together with the amount invested, to estimate the expenses paid over the period. Simply divide the Fund’s account value by $1,000 (for example, an $8,600 account value divided by $1,000 = 8.6), then multiply the result by the number provided under the heading “Expenses Paid During Period.”
Table 2. Based on hypothetical 5% return: This section is intended to help investors compare a fund’s cost with those of other mutual funds. The table provides information about hypothetical account values and hypothetical expenses based on the Fund’s actual expense ratio and an assumed rate of return of 5% per year before expenses, which is not the Fund’s actual return. The hypothetical account values and expenses may not be used to estimate the actual ending account balance or expenses paid during the period. The example is useful in making comparisons because the U.S. Securities and Exchange Commission (the “SEC”) requires all mutual funds to calculate expenses based on the 5% return. Investors can assess a fund’s costs by comparing this hypothetical example with the hypothetical examples that appear in shareholder reports of other funds.
The calculations illustrated above assume no shares were bought or sold during the period. Actual costs may have been higher or lower, depending on the amount of investment and the timing of any purchases or redemptions.
Please note that the expenses shown in the table are meant to highlight your ongoing costs only and do not reflect any transactional costs, such as sales charges (loads) on purchase payments, and contingent deferred sales charges (“CDSC”) on redemptions, if any. Therefore, the second table is useful in comparing ongoing costs only, and will not help you determine the relative total costs of owning different funds. In addition, if these transactional costs were included, your costs would have been higher.
More information about the Funds’ expenses, including annual expense ratios for periods up to five years (subject to the Fund’s inception date), can be found in the Financial Highlights section of this report. For additional information on operating expenses and other shareholder costs, please refer to the appropriate Fund prospectus.
THE GUGGENHEIM FUNDS ANNUAL REPORT | 7 |
ABOUT SHAREHOLDERS’ FUND EXPENSES (Unaudited)(concluded) |
|
| Expense | Fund | Beginning | Ending | Expenses |
Table 1. Based on actual Fund return3 | |||||
Series A (StylePlus—Large Core Series) | 0.97% | 1.63% | $ 1,000.00 | $ 1,016.30 | $ 4.93 |
Series B (Large Cap Value Series) | 0.77% | 7.10% | 1,000.00 | 1,071.00 | 4.02 |
Series D (World Equity Income Series) | 0.87% | 3.95% | 1,000.00 | 1,039.50 | 4.47 |
Series E (Total Return Bond Series) | 0.92% | (2.97%) | 1,000.00 | 970.30 | 4.57 |
Series F (Floating Rate Strategies Series) | 1.15% | 4.37% | 1,000.00 | 1,043.70 | 5.92 |
Series J (StylePlus—Mid Growth Series) | 1.00% | 5.73% | 1,000.00 | 1,057.30 | 5.19 |
Series N (Managed Asset Allocation Series) | 0.97% | 1.01% | 1,000.00 | 1,010.10 | 4.91 |
Series O (All Cap Value Series) | 0.85% | 7.41% | 1,000.00 | 1,074.10 | 4.44 |
Series P (High Yield Series) | 1.05% | 3.44% | 1,000.00 | 1,034.40 | 5.38 |
Series Q (Small Cap Value Series) | 1.11% | 8.72% | 1,000.00 | 1,087.20 | 5.84 |
Series V (SMid Cap Value Series) | 0.88% | 8.84% | 1,000.00 | 1,088.40 | 4.63 |
Series X (StylePlus—Small Growth Series) | 1.03% | 3.93% | 1,000.00 | 1,039.30 | 5.29 |
Series Y (StylePlus—Large Growth Series) | 0.94% | (1.75%) | 1,000.00 | 982.50 | 4.70 |
Series Z (Alpha Opportunity Series) | 1.98% | (1.22%) | 1,000.00 | 987.80 | 9.92 |
| |||||
Table 2. Based on hypothetical 5% return (before expenses) | |||||
Series A (StylePlus—Large Core Series) | 0.97% | 5.00% | $ 1,000.00 | $ 1,020.32 | $ 4.94 |
Series B (Large Cap Value Series) | 0.77% | 5.00% | 1,000.00 | 1,021.32 | 3.92 |
Series D (World Equity Income Series) | 0.87% | 5.00% | 1,000.00 | 1,020.82 | 4.43 |
Series E (Total Return Bond Series) | 0.92% | 5.00% | 1,000.00 | 1,020.57 | 4.69 |
Series F (Floating Rate Strategies Series) | 1.15% | 5.00% | 1,000.00 | 1,019.41 | 5.85 |
Series J (StylePlus—Mid Growth Series) | 1.00% | 5.00% | 1,000.00 | 1,020.16 | 5.09 |
Series N (Managed Asset Allocation Series) | 0.97% | 5.00% | 1,000.00 | 1,020.32 | 4.94 |
Series O (All Cap Value Series) | 0.85% | 5.00% | 1,000.00 | 1,020.92 | 4.33 |
Series P (High Yield Series) | 1.05% | 5.00% | 1,000.00 | 1,019.91 | 5.35 |
Series Q (Small Cap Value Series) | 1.11% | 5.00% | 1,000.00 | 1,019.61 | 5.65 |
Series V (SMid Cap Value Series) | 0.88% | 5.00% | 1,000.00 | 1,020.77 | 4.48 |
Series X (StylePlus—Small Growth Series) | 1.03% | 5.00% | 1,000.00 | 1,020.01 | 5.24 |
Series Y (StylePlus—Large Growth Series) | 0.94% | 5.00% | 1,000.00 | 1,020.47 | 4.79 |
Series Z (Alpha Opportunity Series) | 1.98% | 5.00% | 1,000.00 | 1,015.22 | 10.06 |
1 | Annualized and excludes expenses of the underlying funds in which the Funds invest, if any. This ratio represents net expenses, which may include expenses that are excluded from the expense limitation agreement and affiliated waivers. Excluding these expenses, the net expense ratios for the period would be: |
Fund | 12/31/22 | |
Series A (StylePlus—Large Core Series) | 0.87% | |
Series B (Large Cap Value Series) | 0.77% | |
Series D (World Equity Income Series) | 0.86% | |
Series E (Total Return Bond Series) | 0.76% | |
Series F (Floating Rate Strategies Series) | 1.13% | |
Series J (StylePlus—Mid Growth Series) | 0.91% | |
Series O (All Cap Value Series) | 0.85% | |
Series P (High Yield Series) | 1.05% | |
Series Q (Small Cap Value Series) | 1.11% | |
Series V (SMid Cap Value Series) | 0.88% | |
Series X (StylePlus—Small Growth Series) | 1.03% | |
Series Y (StylePlus—Large Growth Series) | 0.88% | |
Series Z (Alpha Opportunity Series) | 1.98% |
2 | Expenses are equal to the Fund’s annualized expense ratio, net of any applicable fee waivers, multiplied by the average account value over the period, multiplied by 184/365 (to reflect the one-half year period). Expenses shown do not include fees charged by insurance companies. |
3 | Actual cumulative return at net asset value for the period June 30, 2022 to December 31, 2022. |
8 | THE GUGGENHEIM FUNDS ANNUAL REPORT |
MANAGERS’ COMMENTARY (Unaudited) | December 31, 2022 |
To Our Shareholders
The Series A (StylePlusTM—Large Core Series, or the “Fund”) is managed by a team of seasoned professionals, including Farhan Sharaff, Senior Managing Director and Assistant Chief Investment Officer, Equities, and Portfolio Manager; Qi Yan, Managing Director and Portfolio Manager; and Adam J. Bloch, Managing Director and Portfolio Manager. In the subsequent paragraphs, the investment team discusses the Fund’s performance for the 12-month period ended December 31, 2022 (the “Reporting Period”).
For the Reporting Period, the Fund provided a total return of -20.67%, underperforming the S&P 500 Index (“Index”), the Fund’s benchmark, which returned -18.11% for the same period.
What factors contributed or detracted from the Fund’s performance during the Reporting Period?
Over the Reporting Period, 15%-25% of the total equity position was allocated to actively managed equity and 75%-85% to passive equity. Remaining Fund assets were invested in the Guggenheim Strategy Funds, short-term fixed-income investment companies advised by Guggenheim Investments, and the Guggenheim Ultra Short Duration Fund, whose objective is to seek a high level of income consistent with the preservation of capital.
The Fund underperformed the S&P 500 Index for the Reporting Period by 2.6% net of fees. During this Reporting Period, active equity and active fixed income contributed 0.2% and -0.8% to the Fund’s relative return differential, respectively. The remainder resulted from equity index swap cost, implementation shortfall and Fund’s expenses.
How did the Fund use derivatives during the Reporting Period?
The passive equity component, which accounted for 75%-85% of the Fund’s exposure to the broad equity market, consisted of equity index swaps and equity index futures. On average, the equity index futures accounted for 0%-5% of the overall exposure, with the remainder from equity index swaps.
Performance displayed represents past performance which is no guarantee of future results.
The opinions and forecast expressed may not actually come to pass. This information is subject to change at any time, based on market and other conditions, and should not be construed as a recommendation of any specific security or strategy.
THE GUGGENHEIM FUNDS ANNUAL REPORT | 9 |
PERFORMANCE REPORT AND FUND PROFILE (Unaudited) | December 31, 2022 |
SERIES A (STYLEPLUS—LARGE CORE SERIES)
OBJECTIVE: Seeks long-term growth of capital.
Holdings Diversification (Market Exposure as % of Net Assets)
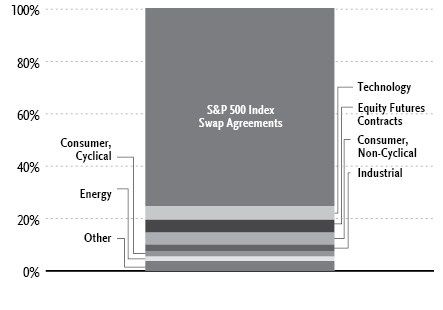
“Holdings Diversification (Market Exposure as % of Net Assets)” excludes any temporary cash investments, investments in Guggenheim Strategy Funds Trust mutual funds, or investments in Guggenheim Ultra Short Duration Fund.
Inception Date: May 1, 1979 |
Ten Largest Holdings | (% of Total Net Assets) |
Guggenheim Strategy Fund III | 27.9% |
Guggenheim Variable Insurance Strategy Fund III | 27.2% |
Guggenheim Ultra Short Duration Fund — Institutional Class | 13.2% |
Guggenheim Strategy Fund II | 10.8% |
Microsoft Corp. | 1.2% |
Apple, Inc. | 1.2% |
Alphabet, Inc. — Class C | 0.6% |
Exxon Mobil Corp. | 0.5% |
Visa, Inc. — Class A | 0.4% |
Home Depot, Inc. | 0.4% |
Top Ten Total | 83.4% |
“Ten Largest Holdings” excludes any temporary cash or derivative investments. | |
10 | THE GUGGENHEIM FUNDS ANNUAL REPORT |
PERFORMANCE REPORT AND FUND PROFILE (Unaudited)(concluded) | December 31, 2022 |
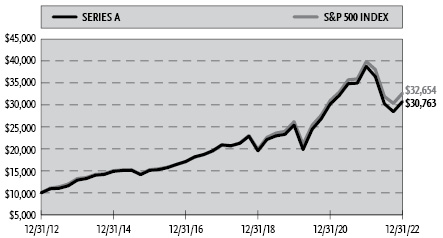
Cumulative Fund Performance*,†
Average Annual Returns*,†
Periods Ended December 31, 2022
| 1 Year | 5 Year | 10 Year |
Series A (StylePlus—Large Core Series) | (20.67%) | 8.01% | 11.89% |
S&P 500 Index | (18.11%) | 9.42% | 12.56% |
* | The performance data above represents past performance that is not predictive of future results. The investment return and principal value of an investment in the Fund will fluctuate so that an investor’s shares, when redeemed, may be worth more or less than their original cost. Returns are historical and include changes in principal and reinvested dividends and capital gains and do not reflect the effect of taxes. The S&P 500 Index is an unmanaged index and, unlike the Fund, has no management fees or operating expenses to reduce its reported return. |
† | Performance figures do not reflect fees and expenses associated with an investment in variable insurance products. If returns had taken into account these fees and expenses, performance would have been lower. Shares of a series of Guggenheim Variable Funds Trust are available only through the purchase of such products. |
THE GUGGENHEIM FUNDS ANNUAL REPORT | 11 |
SCHEDULE OF INVESTMENTS | December 31, 2022 |
SERIES A (STYLEPLUS—LARGE CORE SERIES) |
| Shares | Value | ||||||
COMMON STOCKS† - 19.8% | ||||||||
Technology - 5.2% | ||||||||
Microsoft Corp. | 10,019 | $ | 2,402,757 | |||||
Apple, Inc. | 18,333 | 2,382,007 | ||||||
QUALCOMM, Inc. | 4,079 | 448,445 | ||||||
Applied Materials, Inc. | 3,884 | 378,224 | ||||||
Skyworks Solutions, Inc. | 4,143 | 377,552 | ||||||
NXP Semiconductor N.V. | 2,289 | 361,731 | ||||||
Microchip Technology, Inc. | 5,113 | 359,188 | ||||||
Texas Instruments, Inc. | 2,147 | 354,727 | ||||||
Hewlett Packard Enterprise Co. | 21,387 | 341,337 | ||||||
International Business Machines Corp. | 2,306 | 324,892 | ||||||
KLA Corp. | 846 | 318,967 | ||||||
NetApp, Inc. | 5,274 | 316,756 | ||||||
HP, Inc. | 10,930 | 293,689 | ||||||
Broadcom, Inc. | 498 | 278,447 | ||||||
Seagate Technology Holdings plc | 4,868 | 256,105 | ||||||
Adobe, Inc.* | 704 | 236,917 | ||||||
ON Semiconductor Corp.* | 3,388 | 211,309 | ||||||
Qorvo, Inc.* | 2,279 | 206,569 | ||||||
Micron Technology, Inc. | 3,314 | 165,634 | ||||||
NVIDIA Corp. | 984 | 143,802 | ||||||
Total Technology | 10,159,055 | |||||||
Consumer, Non-cyclical - 4.6% | ||||||||
Philip Morris International, Inc. | 5,778 | 584,792 | ||||||
Bristol-Myers Squibb Co. | 7,681 | 552,648 | ||||||
Gilead Sciences, Inc. | 6,165 | 529,265 | ||||||
Quest Diagnostics, Inc. | 2,903 | 454,145 | ||||||
Hershey Co. | 1,948 | 451,098 | ||||||
Pfizer, Inc. | 8,702 | 445,891 | ||||||
Johnson & Johnson | 2,473 | 436,856 | ||||||
Vertex Pharmaceuticals, Inc.* | 1,490 | 430,282 | ||||||
Hologic, Inc.* | 5,732 | 428,811 | ||||||
Incyte Corp.* | 5,212 | 418,628 | ||||||
Altria Group, Inc. | 9,113 | 416,555 | ||||||
Tyson Foods, Inc. — Class A | 6,035 | 375,679 | ||||||
Organon & Co. | 13,366 | 373,312 | ||||||
Amgen, Inc. | 1,320 | 346,685 | ||||||
Merck & Company, Inc. | 3,071 | 340,727 | ||||||
General Mills, Inc. | 3,500 | 293,475 | ||||||
UnitedHealth Group, Inc. | 538 | 285,237 | ||||||
Regeneron Pharmaceuticals, Inc.* | 394 | 284,267 | ||||||
AbbVie, Inc. | 1,710 | 276,353 | ||||||
United Rentals, Inc.* | 718 | 255,192 | ||||||
FleetCor Technologies, Inc.* | 1,316 | 241,723 | ||||||
Campbell Soup Co. | 3,720 | 211,110 | ||||||
Eli Lilly & Co. | 556 | 203,407 | ||||||
Procter & Gamble Co. | 827 | 125,340 | ||||||
Coca-Cola Co. | 1,937 | 123,212 | ||||||
PepsiCo, Inc. | 671 | 121,223 | ||||||
Total Consumer, Non-cyclical | 9,005,913 | |||||||
Industrial - 2.7% | ||||||||
Lockheed Martin Corp. | 1,116 | 542,923 | ||||||
Emerson Electric Co. | 4,997 | 480,012 | ||||||
3M Co. | 3,937 | 472,125 | ||||||
General Dynamics Corp. | 1,893 | 469,672 | ||||||
Otis Worldwide Corp. | 5,708 | 446,993 | ||||||
Textron, Inc. | 5,908 | 418,287 | ||||||
Snap-on, Inc. | 1,759 | 401,914 | ||||||
Packaging Corporation of America | 3,126 | 399,847 | ||||||
Sealed Air Corp. | 7,939 | 395,997 | ||||||
Keysight Technologies, Inc.* | 2,047 | 350,180 | ||||||
Masco Corp. | 6,800 | 317,356 | ||||||
Allegion plc | 2,562 | 269,676 | ||||||
Fortune Brands Innovations, Inc. | 2,393 | 136,664 | ||||||
A O Smith Corp. | 2,367 | 135,487 | ||||||
Masterbrand, Inc.* | 2,393 | 18,067 | ||||||
Total Industrial | 5,255,200 | |||||||
Consumer, Cyclical - 1.9% | ||||||||
Home Depot, Inc. | 2,243 | 708,474 | ||||||
McDonald’s Corp. | 2,404 | 633,526 | ||||||
Lowe’s Companies, Inc. | 2,700 | 537,948 | ||||||
Yum! Brands, Inc. | 3,545 | 454,044 | ||||||
PACCAR, Inc. | 3,784 | 374,503 | ||||||
NVR, Inc.* | 74 | 341,331 | ||||||
Cummins, Inc. | 1,332 | 322,730 | ||||||
Tesla, Inc.* | 1,302 | 160,380 | ||||||
Bath & Body Works, Inc. | 3,337 | 140,621 | ||||||
Walmart, Inc. | 796 | 112,865 | ||||||
Total Consumer, Cyclical | 3,786,422 | |||||||
Energy - 1.7% | ||||||||
Exxon Mobil Corp. | 8,900 | 981,670 | ||||||
Marathon Petroleum Corp. | 4,137 | 481,506 | ||||||
Valero Energy Corp. | 3,771 | 478,389 | ||||||
Occidental Petroleum Corp. | 7,011 | 441,623 | ||||||
Kinder Morgan, Inc. | 19,253 | 348,094 | ||||||
Phillips 66 | 2,730 | 284,138 | ||||||
Chevron Corp. | 1,581 | 283,774 | ||||||
Total Energy | 3,299,194 | |||||||
Communications - 1.6% | ||||||||
Alphabet, Inc. — Class C* | 13,814 | 1,225,716 | ||||||
Cisco Systems, Inc. | 13,380 | 637,423 | ||||||
Amazon.com, Inc.* | 7,483 | 628,572 | ||||||
VeriSign, Inc.* | 1,913 | 393,007 | ||||||
Meta Platforms, Inc. — Class A* | 2,523 | 303,618 | ||||||
Total Communications | 3,188,336 | |||||||
Financial - 1.3% | ||||||||
Visa, Inc. — Class A | 3,448 | 716,356 | ||||||
Mastercard, Inc. — Class A | 1,257 | 437,097 | ||||||
Goldman Sachs Group, Inc. | 1,094 | 375,658 | ||||||
Berkshire Hathaway, Inc. — Class B* | 1,152 | 355,853 | ||||||
JPMorgan Chase & Co. | 2,560 | 343,296 | ||||||
Bank of New York Mellon Corp. | 5,426 | 246,991 | ||||||
Prologis, Inc. REIT | 1,126 | 126,934 | ||||||
Total Financial | 2,602,185 | |||||||
12 | THE GUGGENHEIM FUNDS ANNUAL REPORT | SEE NOTES TO FINANCIAL STATEMENTS. |
SCHEDULE OF INVESTMENTS (continued) | December 31, 2022 |
SERIES A (STYLEPLUS—LARGE CORE SERIES) |
| Shares | Value | ||||||
Basic Materials - 0.6% | ||||||||
LyondellBasell Industries N.V. — Class A | 4,432 | $ | 367,989 | |||||
Dow, Inc. | 6,830 | 344,164 | ||||||
FMC Corp. | 1,013 | 126,422 | ||||||
Mosaic Co. | 2,527 | 110,859 | ||||||
CF Industries Holdings, Inc. | 1,194 | 101,729 | ||||||
Total Basic Materials | 1,051,163 | |||||||
Utilities - 0.2% | ||||||||
FirstEnergy Corp. | 10,472 | 439,196 | ||||||
Total Common Stocks | ||||||||
(Cost $39,118,525) | 38,786,664 | |||||||
MUTUAL FUNDS† - 79.1% | ||||||||
Guggenheim Strategy Fund III1 | 2,276,730 | 54,778,133 | ||||||
Guggenheim Variable Insurance Strategy Fund III1 | 2,219,814 | 53,430,927 | ||||||
Guggenheim Ultra Short Duration Fund — Institutional Class1 | 2,689,258 | 25,924,450 | ||||||
Guggenheim Strategy Fund II1 | 876,832 | 21,079,040 | ||||||
Total Mutual Funds | ||||||||
(Cost $160,401,178) | 155,212,550 | |||||||
MONEY MARKET FUND† - 0.6% | ||||||||
Dreyfus Treasury Securities Cash Management Fund — Institutional Shares, 3.90%2 | 1,137,805 | 1,137,805 | ||||||
Total Money Market Fund | ||||||||
(Cost $1,137,805) | 1,137,805 | |||||||
Total Investments - 99.5% | ||||||||
(Cost $200,657,508) | $ | 195,137,019 | ||||||
Other Assets & Liabilities, net - 0.5% | 977,465 | |||||||
Total Net Assets - 100.0% | $ | 196,114,484 | ||||||
Futures Contracts | ||||||||||||||||
Description | Number of | Expiration | Notional | Value and | ||||||||||||
Equity Futures Contracts Purchased† | ||||||||||||||||
S&P 500 Index Mini Futures Contracts | 50 | Mar 2023 | $ | 9,653,750 | $ | (92,880 | ) | |||||||||
Total Return Swap Agreements | |||||||||||||||||||||||
Counterparty | Index | Type | Financing | Payment | Maturity | Units | Notional | Value and | |||||||||||||||
OTC Equity Index Swap Agreements†† | |||||||||||||||||||||||
Wells Fargo Bank, N.A. | S&P 500 Total Return Index | Pay | 4.56% (Federal Funds Rate + 0.23%) | At Maturity | 06/28/23 | 18,159 | $ | 148,501,760 | $ | 2,201,633 | |||||||||||||
* | Non-income producing security. |
** | Includes cumulative appreciation (depreciation). Variation margin is reported within the Statement of Assets and Liabilities. |
† | Value determined based on Level 1 inputs — See Note 4. |
†† | Value determined based on Level 2 inputs — See Note 4. |
1 | Affiliated issuer. |
2 | Rate indicated is the 7-day yield as of December 31, 2022. |
plc — Public Limited Company | |
REIT — Real Estate Investment Trust | |
See Sector Classification in Other Information section. |
SEE NOTES TO FINANCIAL STATEMENTS. | THE GUGGENHEIM FUNDS ANNUAL REPORT | 13 |
SCHEDULE OF INVESTMENTS (concluded) | December 31, 2022 |
SERIES A (STYLEPLUS—LARGE CORE SERIES) |
The following table summarizes the inputs used to value the Fund’s investments at December 31, 2022 (See Note 4 in the Notes to Financial Statements):
Investments in Securities (Assets) | Level 1 | Level 2 | Level 3 | Total | ||||||||||||
Common Stocks | $ | 38,786,664 | $ | — | $ | — | $ | 38,786,664 | ||||||||
Mutual Funds | 155,212,550 | — | — | 155,212,550 | ||||||||||||
Money Market Fund | 1,137,805 | — | — | 1,137,805 | ||||||||||||
Equity Index Swap Agreements** | — | 2,201,633 | — | 2,201,633 | ||||||||||||
Total Assets | $ | 195,137,019 | $ | 2,201,633 | $ | — | $ | 197,338,652 | ||||||||
Investments in Securities (Liabilities) | Level 1 | Level 2 | Level 3 | Total | ||||||||||||
Equity Futures Contracts** | $ | 92,880 | $ | — | $ | — | $ | 92,880 | ||||||||
** | This derivative is reported as unrealized appreciation/depreciation at period end. |
Affiliated Transactions
Investments representing 5% or more of the outstanding voting shares of a company, or control of or by, or common control under Guggenheim Investments (“GI”), result in that company being considered an affiliated issuer, as defined in the 1940 Act.
The Fund may invest in certain of the underlying series of Guggenheim Strategy Funds Trust, including Guggenheim Strategy Fund II, Guggenheim Strategy Fund III, and Guggenheim Variable Insurance Strategy Fund III, (collectively, the “Short Term Investment Vehicles”), each of which are open-end management investment companies managed by GI. The Short Term Investment Vehicles, which launched on March 11, 2014, are offered as short term investment options only to mutual funds, trusts, and other accounts managed by GI and/or its affiliates, and are not available to the public. The Short Term Investment Vehicles pay no investment management fees. The Short Term Investment Vehicles’ annual report on Form N-CSR dated September 30, 2022, is available publicly or upon request. This information is available from the EDGAR database on the SEC’s website at https://www.sec.gov/Archives/edgar/data/1601445/000182126822000340/gug84768.htm. The Fund may invest in certain of the underlying series of Guggenheim Funds Trust, which are open-end management investment companies managed by GI, are available to the public and whose most recent annual report on Form N-CSR is available publicly or upon request.
Transactions during the year ended December 31, 2022, in which the company is an affiliated issuer, were as follows:
Security Name | Value | Additions | Reductions | Realized | Change in | Value | Shares | Investment | ||||||||||||||||||||||||
Mutual Funds | ||||||||||||||||||||||||||||||||
Guggenheim Strategy Fund II | $ | 16,780,495 | $ | 31,311,810 | $ | (26,500,000 | ) | $ | (390,779 | ) | $ | (122,486 | ) | $ | 21,079,040 | 876,832 | $ | 497,500 | ||||||||||||||
Guggenheim Strategy Fund III | 81,097,553 | 1,819,737 | (25,363,135 | ) | (449,343 | ) | (2,326,679 | ) | 54,778,133 | 2,276,730 | 1,811,531 | |||||||||||||||||||||
Guggenheim Ultra Short Duration Fund — Institutional Class | 54,253,430 | 653,311 | (28,084,987 | ) | 17,882 | (915,186 | ) | 25,924,450 | 2,689,258 | 649,369 | ||||||||||||||||||||||
Guggenheim Variable Insurance Strategy Fund III | 67,541,303 | 1,550,542 | (13,377,998 | ) | (365,472 | ) | (1,917,448 | ) | 53,430,927 | 2,219,814 | 1,541,894 | |||||||||||||||||||||
| $ | 219,672,781 | $ | 35,335,400 | $ | (93,326,120 | ) | $ | (1,187,712 | ) | $ | (5,281,799 | ) | $ | 155,212,550 | $ | 4,500,294 | ||||||||||||||||
14 | THE GUGGENHEIM FUNDS ANNUAL REPORT | SEE NOTES TO FINANCIAL STATEMENTS. |
SERIES A (STYLEPLUS—LARGE CORE SERIES) |
STATEMENT OF ASSETS AND LIABILITIES |
December 31, 2022 |
Assets: | ||||
Investments in unaffiliated issuers, at value (cost $40,256,330) | $ | 39,924,469 | ||
Investments in affiliated issuers, at value (cost $160,401,178) | 155,212,550 | |||
Cash | 8,777,117 | |||
Segregated cash with broker | 533,000 | |||
Unrealized appreciation on OTC swap agreements | 2,201,633 | |||
Prepaid expenses | 10,513 | |||
Receivables: | ||||
Dividends | 653,067 | |||
Interest | 7,734 | |||
Investment Adviser | 14 | |||
Total assets | 207,320,097 | |||
Liabilities: | ||||
Segregated cash due to broker | 9,910,000 | |||
Payable for: | ||||
Securities purchased | 645,819 | |||
Fund shares redeemed | 339,702 | |||
Management fees | 84,894 | |||
Distribution and service fees | 41,432 | |||
Swap settlement | 37,062 | |||
Variation margin on futures contracts | 25,625 | |||
Trustees’ fees* | 3,255 | |||
Fund accounting/administration fees | 3,086 | |||
Transfer agent/maintenance fees | 2,161 | |||
Miscellaneous | 112,577 | |||
Total liabilities | 11,205,613 | |||
Net assets | $ | 196,114,484 | ||
Net assets consist of: | ||||
Paid in capital | $ | 222,987,335 | ||
Total distributable earnings (loss) | (26,872,851 | ) | ||
Net assets | $ | 196,114,484 | ||
Capital shares outstanding | 6,013,841 | |||
Net asset value per share | $ | 32.61 | ||
STATEMENT OF OPERATIONS |
Year Ended December 31, 2022 |
Investment Income: | ||||
Dividends from securities of unaffiliated issuers (net of foreign withholding tax of $767) | $ | 803,477 | ||
Dividends from securities of affiliated issuers | 4,500,294 | |||
Interest | 98,241 | |||
Total investment income | 5,402,012 | |||
Expenses: | ||||
Management fees | 1,652,040 | |||
Distribution and service fees | 549,346 | |||
Transfer agent/maintenance fees | 25,387 | |||
Fund accounting/administration fees | 128,200 | |||
Interest expense | 101,058 | |||
Professional fees | 79,140 | |||
Custodian fees | 25,496 | |||
Line of credit fees | 7,000 | |||
Trustees’ fees* | 10,838 | |||
Miscellaneous | 22,413 | |||
Total expenses | 2,600,918 | |||
Less: | ||||
Expenses reimbursed by Adviser | (7 | ) | ||
Expenses waived by Adviser | (576,164 | ) | ||
Earnings credits applied | (5,295 | ) | ||
Total waived/reimbursed expenses | (581,466 | ) | ||
Net expenses | 2,019,452 | |||
Net investment income | 3,382,560 | |||
Net Realized and Unrealized Gain (Loss): | ||||
Net realized gain (loss) on: | ||||
Investments in unaffiliated issuers | (824,783 | ) | ||
Investments in affiliated issuers | (1,187,712 | ) | ||
Swap agreements | (25,002,540 | ) | ||
Futures contracts | 382,826 | |||
Net realized loss | (26,632,209 | ) | ||
Net change in unrealized appreciation (depreciation) on: | ||||
Investments in unaffiliated issuers | (7,955,652 | ) | ||
Investments in affiliated issuers | (5,281,799 | ) | ||
Swap agreements | (17,777,522 | ) | ||
Futures contracts | (193,155 | ) | ||
Net change in unrealized appreciation (depreciation) | (31,208,128 | ) | ||
Net realized and unrealized loss | (57,840,337 | ) | ||
Net decrease in net assets resulting from operations | $ | (54,457,777 | ) | |
* | Relates to Trustees not deemed “interested persons” within the meaning of Section 2(a)(19) of the 1940 Act. |
SEE NOTES TO FINANCIAL STATEMENTS. | THE GUGGENHEIM FUNDS ANNUAL REPORT | 15 |
SERIES A (STYLEPLUS—LARGE CORE SERIES) |
STATEMENTS OF CHANGES IN NET ASSETS |
| Year Ended | Year Ended | ||||||
Increase (Decrease) in Net Assets from Operations: | ||||||||
Net investment income | $ | 3,382,560 | $ | 1,220,679 | ||||
Net realized gain (loss) on investments | (26,632,209 | ) | 62,342,705 | |||||
Net change in unrealized appreciation (depreciation) on investments | (31,208,128 | ) | (926,499 | ) | ||||
Net increase (decrease) in net assets resulting from operations | (54,457,777 | ) | 62,636,885 | |||||
Distributions to shareholders | (58,728,698 | ) | (26,897,830 | ) | ||||
Capital share transactions: | ||||||||
Proceeds from sale of shares | 3,989,714 | 2,897,714 | ||||||
Distributions reinvested | 58,728,698 | 26,897,830 | ||||||
Cost of shares redeemed | (23,388,008 | ) | (25,651,784 | ) | ||||
Net increase from capital share transactions | 39,330,404 | 4,143,760 | ||||||
Net increase (decrease) in net assets | (73,856,071 | ) | 39,882,815 | |||||
Net assets: | ||||||||
Beginning of year | 269,970,555 | 230,087,740 | ||||||
End of year | $ | 196,114,484 | $ | 269,970,555 | ||||
Capital share activity: | ||||||||
Shares sold | 85,664 | 54,152 | ||||||
Shares issued from reinvestment of distributions | 1,731,388 | 518,662 | ||||||
Shares redeemed | (556,929 | ) | (478,128 | ) | ||||
Net increase in shares | 1,260,123 | 94,686 | ||||||
16 | THE GUGGENHEIM FUNDS ANNUAL REPORT | SEE NOTES TO FINANCIAL STATEMENTS. |
SERIES A (STYLEPLUS—LARGE CORE SERIES) |
FINANCIAL HIGHLIGHTS |
This table is presented to show selected data for a share outstanding throughout each period and to assist shareholders in evaluating a Fund’s performance for the periods presented.
| Year Ended | Year Ended | Year Ended | Year Ended | Year Ended | |||||||||||||||
Per Share Data | ||||||||||||||||||||
Net asset value, beginning of period | $ | 56.79 | $ | 49.39 | $ | 44.24 | $ | 36.80 | $ | 45.50 | ||||||||||
Income (loss) from investment operations: | ||||||||||||||||||||
Net investment income (loss)a | .64 | .26 | .38 | .68 | .83 | |||||||||||||||
Net gain (loss) on investments (realized and unrealized) | (11.88 | ) | 13.22 | 7.46 | 10.06 | (3.10 | ) | |||||||||||||
Total from investment operations | (11.24 | ) | 13.48 | 7.84 | 10.74 | (2.27 | ) | |||||||||||||
Less distributions from: | ||||||||||||||||||||
Net investment income | (.27 | ) | (.41 | ) | (.74 | ) | (.91 | ) | (.75 | ) | ||||||||||
Net realized gains | (12.67 | ) | (5.67 | ) | (1.95 | ) | (2.39 | ) | (5.68 | ) | ||||||||||
Total distributions | (12.94 | ) | (6.08 | ) | (2.69 | ) | (3.30 | ) | (6.43 | ) | ||||||||||
Net asset value, end of period | $ | 32.61 | $ | 56.79 | $ | 49.39 | $ | 44.24 | $ | 36.80 | ||||||||||
| ||||||||||||||||||||
Total Returnb | (20.67 | %) | 28.48 | % | 18.78 | % | 29.97 | % | (6.56 | %) | ||||||||||
Ratios/Supplemental Data | ||||||||||||||||||||
Net assets, end of period (in thousands) | $ | 196,114 | $ | 269,971 | $ | 230,088 | $ | 218,082 | $ | 190,644 | ||||||||||
Ratios to average net assets: | ||||||||||||||||||||
Net investment income (loss) | 1.54 | % | 0.49 | % | 0.88 | % | 1.65 | % | 1.89 | % | ||||||||||
Total expensesc | 1.18 | % | 1.14 | % | 1.22 | % | 1.27 | % | 1.26 | % | ||||||||||
Net expensesd,e,f | 0.92 | % | 0.85 | % | 0.89 | % | 0.95 | % | 0.97 | % | ||||||||||
Portfolio turnover rate | 63 | % | 34 | % | 63 | % | 41 | % | 45 | % | ||||||||||
a | Net investment income (loss) per share was computed using average shares outstanding throughout the period. |
b | Total return does not take into account any of the expenses associated with an investment in variable insurance products. If total return had taken into account these expenses, performance would have been lower. Shares of a series of Guggenheim Variable Funds Trust are available only through the purchase of such products. |
c | Does not include expenses of the underlying funds in which the Fund invests. |
d | Net expense information reflects the expense ratios after expense waivers and reimbursements, as applicable. |
e | The portion of the ratios of net expenses to average net assets attributable to recoupments of prior fee reductions or expense reimbursements for the years presented was as follows: |
12/31/22 | 12/31/21 | 12/31/20 | 12/31/19 | 12/31/18 | |
— | — | — | — | 0.02% |
f | Net expenses may include expenses that are excluded from the expense limitation agreement. Excluding these expenses, the net expense ratios for the years presented would be: |
12/31/22 | 12/31/21 | 12/31/20 | 12/31/19 | 12/31/18 | |
0.87% | 0.84% | 0.87% | 0.89% | 0.91% |
SEE NOTES TO FINANCIAL STATEMENTS. | THE GUGGENHEIM FUNDS ANNUAL REPORT | 17 |
MANAGERS’ COMMENTARY (Unaudited) | December 31, 2022 |
To Our Shareholders
The Series B (Large Cap Value Series, or the “Fund”) is managed by a team of seasoned professionals, led by David Toussaint, CFA, CPA, Managing Director and Portfolio Manager; James Schier, CFA, Senior Managing Director and Portfolio Manager; Farhan Sharaff, Senior Managing Director, Assistant Chief Investment Officer, Equities, and Portfolio Manager; Gregg Strohkorb, CFA, Director and Portfolio Manager; and Burak Hurmeydan, Ph.D., Director and Portfolio Manager. In the subsequent paragraphs, the investment team discusses the Fund’s performance for the 12-month period ended December 31, 2022 (the “Reporting Period”).
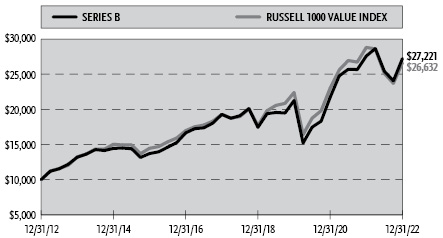
For the Reporting Period, the Fund provided a total return of -1.32%, outperforming the Russell 1000 Value Index (“Index”), the Fund’s benchmark, which returned -7.54% for the same period.
What factors contributed or detracted from the Fund’s performance during the Reporting Period?
After the market reached record highs at the end of 2021, it came under pressure as the Federal Reserve strove to contain inflation by raising rates and, at the same time, the market had to deal with the uncertainty over the Ukraine invasion. The Fund’s general focus towards quality companies (those with better balance sheets than peers) that meet our valuation parameters tended to position the Fund’s holdings well in most sectors. In fact, the Fund produced a very significant positive contribution from its security selection and produced a significant positive contribution from its sector allocation.
The Fund had an overweight relative to its benchmark to the Energy sector throughout the Reporting Period, which contributed the most to the Fund’s outperformance versus its benchmark. The Energy holdings returned over 60% during the Reporting Period, while the overall benchmark returned -7.54%. ConocoPhillips and Marathon Oil, both oil producers, performed extremely well and were up over 65% each, as oil prices improved due to uncertainty stemming from the Russian-Ukraine War and the companies exercised capital discipline throughout 2022. An oil and natural gas service company, Patterson-UTI Energy, was up over 100%, as the company’s oil and natural gas drilling rigs were put to work in the field. Another positive contributor to performance was the Fund’s overweight to the Utilities sector. Constellation Energy, a spin-off from Exelon Corp., fared well, as passage of the Inflation Reduction Act favored companies with nuclear power generation assets. One of the best performers in the Fund was McKesson Corp, within the Health Care sector, as it continued to grow revenue and earnings in its U.S. businesses and divested some of its European businesses.
The Fund’s largest detractor from performance was Micron Technology, one of the largest memory chips makers in the world. The oversupply of memory chips in the market caused prices to fall, hurting the company’s revenue and earnings. Another poor performer for the Fund was Tyson Foods, Inc., a producer and distributor of chicken, beef, and pork. The company has been faced with higher feed, labor, and freight costs that hurt margins and earnings.
How was the Fund positioned at the end of the Reporting Period?
The market outlook is unusually cloudy. In addition to the geopolitical uncertainty that appears to be potentially significant, the market must contend with a hawkish Federal Reserve. Together, this provides a challenging environment for economic growth. All of this, however, does not change our process, which is heavily bottoms up driven.
At the Fund’s year-end, the Fund held an overweight to the Utilities and a similar size underweight to the REITs sector. Both sectors are interest-rate-sensitive, but we favor utilities because of the valuations, profitability, and regulatory nature of their businesses. We are also overweight the Information Technology sector, as we are seeing more attractive opportunities after the sector has significantly underperformed during the past year. We continue to favor the Materials sector, as it trades at attractive valuations, generates free cash flow, and may provide growth opportunities as a result of the government programs and the onshoring of manufacturing. Two sectors the Fund is underweight are the Financials and Health Care sectors. Higher interest rates will benefit the Financials, but a possible looming recession could increase credit costs and depress earnings. Within Health Care, the Fund is primarily underweight Pharmaceuticals, a sector that has performed well but whose earnings and cash flow may disappoint post pandemic.
Performance displayed represents past performance which is no guarantee of future results.
The opinions and forecast expressed may not actually come to pass. This information is subject to change at any time, based on market and other conditions, and should not be construed as a recommendation of any specific security or strategy.
18 | THE GUGGENHEIM FUNDS ANNUAL REPORT |
PERFORMANCE REPORT AND FUND PROFILE (Unaudited) | December 31, 2022 |
SERIES B (LARGE CAP VALUE SERIES)
OBJECTIVE: Seeks long-term growth of capital.
Holdings Diversification (Market Exposure as % of Net Assets)
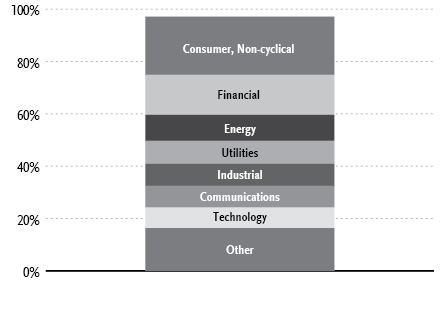
“Holdings Diversification (Market Exposure as % of Net Assets)” excludes any temporary cash investments.
Inception Date: May 1, 1979 |
Ten Largest Holdings | (% of Total Net Assets) |
JPMorgan Chase & Co. | 3.2% |
iShares Russell 1000 Value ETF | 3.0% |
Chevron Corp. | 2.9% |
Berkshire Hathaway, Inc. — Class B | 2.8% |
Johnson & Johnson | 2.5% |
Bank of America Corp. | 2.3% |
Humana, Inc. | 2.2% |
ConocoPhillips | 2.0% |
OGE Energy Corp. | 1.9% |
Verizon Communications, Inc. | 1.8% |
Top Ten Total | 24.6% |
“Ten Largest Holdings” excludes any temporary cash investments. | |
THE GUGGENHEIM FUNDS ANNUAL REPORT | 19 |
PERFORMANCE REPORT AND FUND PROFILE (Unaudited)(concluded) | December 31, 2022 |
Cumulative Fund Performance*,†
Average Annual Returns*,†
Periods Ended December 31, 2022
| 1 Year | 5 Year | 10 Year |
Series B (Large Cap Value Series) | (1.32%) | 7.14% | 10.53% |
Russell 1000 Value Index | (7.54%) | 6.67% | 10.29% |
* | The performance data above represents past performance that is not predictive of future results. The investment return and principal value of an investment in the Fund will fluctuate so that an investor’s shares, when redeemed, may be worth more or less than their original cost. Returns are historical and include changes in principal and reinvested dividends and capital gains and do not reflect the effect of taxes. The Russell 1000 Value Index is an unmanaged index and, unlike the Fund, has no management fees or operating expenses to reduce its reported return. |
† | Performance figures do not reflect fees and expenses associated with an investment in variable insurance products. If returns had taken into account these fees and expenses, performance would have been lower. Shares of a series of Guggenheim Variable Funds Trust are available only through the purchase of such products. |
20 | THE GUGGENHEIM FUNDS ANNUAL REPORT |
SCHEDULE OF INVESTMENTS | December 31, 2022 |
SERIES B (LARGE CAP VALUE SERIES) |
| Shares | Value | ||||||
COMMON STOCKS† - 94.3% | ||||||||
Consumer, Non-cyclical - 22.3% | ||||||||
Johnson & Johnson | 30,481 | $ | 5,384,469 | |||||
Humana, Inc. | 9,178 | 4,700,880 | ||||||
Quest Diagnostics, Inc. | 23,274 | 3,640,985 | ||||||
Tyson Foods, Inc. — Class A | 57,068 | 3,552,483 | ||||||
Merck & Company, Inc. | 29,200 | 3,239,740 | ||||||
Archer-Daniels-Midland Co. | 33,763 | 3,134,895 | ||||||
Ingredion, Inc. | 31,921 | 3,126,024 | ||||||
J M Smucker Co. | 17,762 | 2,814,566 | ||||||
Medtronic plc | 33,173 | 2,578,206 | ||||||
Bunge Ltd. | 24,190 | 2,413,436 | ||||||
Henry Schein, Inc.* | 29,932 | 2,390,669 | ||||||
Encompass Health Corp. | 31,362 | 1,875,761 | ||||||
HCA Healthcare, Inc. | 6,743 | 1,618,050 | ||||||
Moderna, Inc.* | 8,817 | 1,583,709 | ||||||
Pfizer, Inc. | 29,771 | 1,525,466 | ||||||
McKesson Corp. | 4,051 | 1,519,611 | ||||||
Bristol-Myers Squibb Co. | 16,678 | 1,199,982 | ||||||
Euronet Worldwide, Inc.* | 12,016 | 1,134,070 | ||||||
Total Consumer, Non-cyclical | 47,433,002 | |||||||
Financial - 15.4% | ||||||||
JPMorgan Chase & Co. | 50,992 | 6,838,027 | ||||||
Berkshire Hathaway, Inc. — Class B* | 18,930 | 5,847,477 | ||||||
Bank of America Corp. | 147,817 | 4,895,699 | ||||||
Charles Schwab Corp. | 34,239 | 2,850,739 | ||||||
Wells Fargo & Co. | 62,015 | 2,560,599 | ||||||
Mastercard, Inc. — Class A | 6,610 | 2,298,496 | ||||||
Goldman Sachs Group, Inc. | 5,570 | 1,912,627 | ||||||
Voya Financial, Inc. | 27,419 | 1,685,994 | ||||||
STAG Industrial, Inc. REIT | 34,679 | 1,120,479 | ||||||
American Tower Corp. — Class A REIT | 4,618 | 978,369 | ||||||
T. Rowe Price Group, Inc. | 8,571 | 934,753 | ||||||
Gaming and Leisure Properties, Inc. REIT | 12,532 | 652,792 | ||||||
Total Financial | 32,576,051 | |||||||
Energy - 9.9% | ||||||||
Chevron Corp. | 34,320 | 6,160,097 | ||||||
ConocoPhillips | 35,652 | 4,206,936 | ||||||
Coterra Energy, Inc. — Class A | 91,049 | 2,237,074 | ||||||
Pioneer Natural Resources Co. | 9,045 | 2,065,787 | ||||||
Marathon Oil Corp. | 69,368 | 1,877,792 | ||||||
Diamondback Energy, Inc. | 13,241 | 1,811,104 | ||||||
Kinder Morgan, Inc. | 95,042 | 1,718,360 | ||||||
Equities Corp. | 26,222 | 887,090 | ||||||
Total Energy | 20,964,240 | |||||||
Utilities - 8.8% | ||||||||
OGE Energy Corp. | 102,359 | 4,048,298 | ||||||
Edison International | 42,789 | 2,722,236 | ||||||
Exelon Corp. | 61,531 | 2,659,985 | ||||||
Pinnacle West Capital Corp. | 34,050 | 2,589,162 | ||||||
Duke Energy Corp. | 19,722 | 2,031,169 | ||||||
Black Hills Corp. | 26,749 | 1,881,525 | ||||||
NiSource, Inc. | 65,351 | 1,791,924 | ||||||
PPL Corp. | 33,862 | 989,448 | ||||||
Total Utilities | 18,713,747 | |||||||
Industrial - 8.4% | ||||||||
Curtiss-Wright Corp. | 20,865 | 3,484,246 | ||||||
Johnson Controls International plc | 46,562 | 2,979,968 | ||||||
Knight-Swift Transportation Holdings, Inc. | 46,371 | 2,430,304 | ||||||
Valmont Industries, Inc. | 6,927 | 2,290,551 | ||||||
L3Harris Technologies, Inc. | 10,969 | 2,283,856 | ||||||
FedEx Corp. | 10,893 | 1,886,668 | ||||||
Teledyne Technologies, Inc.* | 3,621 | 1,448,074 | ||||||
Advanced Energy Industries, Inc. | 12,693 | 1,088,805 | ||||||
Total Industrial | 17,892,472 | |||||||
Communications - 8.3% | ||||||||
Verizon Communications, Inc. | 94,596 | 3,727,082 | ||||||
Alphabet, Inc. — Class A* | 41,560 | 3,666,839 | ||||||
Comcast Corp. — Class A | 66,547 | 2,327,149 | ||||||
Cisco Systems, Inc. | 46,985 | 2,238,366 | ||||||
Walt Disney Co.* | 20,667 | 1,795,549 | ||||||
Fox Corp. — Class B | 51,667 | 1,469,926 | ||||||
Juniper Networks, Inc. | 43,590 | 1,393,136 | ||||||
T-Mobile US, Inc.* | 7,508 | 1,051,120 | ||||||
Total Communications | 17,669,167 | |||||||
Technology - 7.9% | ||||||||
Micron Technology, Inc. | 69,952 | 3,496,201 | ||||||
Microsoft Corp. | 11,629 | 2,788,867 | ||||||
Leidos Holdings, Inc. | 23,089 | 2,428,732 | ||||||
KLA Corp. | 6,419 | 2,420,156 | ||||||
Teradyne, Inc. | 22,246 | 1,943,188 | ||||||
Fiserv, Inc.* | 17,379 | 1,756,495 | ||||||
Amdocs Ltd. | 15,609 | 1,418,858 | ||||||
MACOM Technology Solutions Holdings, Inc.* | 9,152 | 576,393 | ||||||
Total Technology | 16,828,890 | |||||||
Consumer, Cyclical - 6.8% | ||||||||
Walmart, Inc. | 23,914 | 3,390,766 | ||||||
PACCAR, Inc. | 20,253 | 2,004,439 | ||||||
Delta Air Lines, Inc.* | 57,154 | 1,878,080 | ||||||
Whirlpool Corp. | 11,825 | 1,672,765 | ||||||
Southwest Airlines Co. | 47,188 | 1,588,820 | ||||||
Home Depot, Inc. | 4,980 | 1,572,983 | ||||||
Ralph Lauren Corp. — Class A | 11,569 | 1,222,496 | ||||||
PVH Corp. | 14,248 | 1,005,767 | ||||||
Total Consumer, Cyclical | 14,336,116 | |||||||
Basic Materials - 6.5% | ||||||||
Westlake Corp. | 30,967 | 3,175,356 | ||||||
Huntsman Corp. | 105,501 | 2,899,167 | ||||||
Reliance Steel & Aluminum Co. | 10,519 | 2,129,467 | ||||||
Freeport-McMoRan, Inc. | 52,034 | 1,977,292 | ||||||
SEE NOTES TO FINANCIAL STATEMENTS. | THE GUGGENHEIM FUNDS ANNUAL REPORT | 21 |
SCHEDULE OF INVESTMENTS (concluded) | December 31, 2022 |
SERIES B (LARGE CAP VALUE SERIES) |
| Shares | Value | ||||||
Nucor Corp. | 14,162 | $ | 1,866,693 | |||||
International Flavors & Fragrances, Inc. | 6,793 | 712,178 | ||||||
DuPont de Nemours, Inc. | 8,550 | 586,787 | ||||||
Dow, Inc. | 9,877 | 497,702 | ||||||
Total Basic Materials | 13,844,642 | |||||||
Total Common Stocks | ||||||||
(Cost $160,478,523) | 200,258,327 | |||||||
EXCHANGE-TRADED FUNDS† - 3.0% | ||||||||
iShares Russell 1000 Value ETF | 42,314 | 6,416,918 | ||||||
Total Exchange-Traded Funds | ||||||||
(Cost $6,435,561) | 6,416,918 | |||||||
MONEY MARKET FUND† - 2.7% | ||||||||
Dreyfus Treasury Securities Cash Management Fund — Institutional Shares, 3.90%1 | 5,655,817 | 5,655,817 | ||||||
Total Money Market Fund | ||||||||
(Cost $5,655,817) | 5,655,817 | |||||||
Total Investments - 100.0% | ||||||||
(Cost $172,569,901) | $ | 212,331,062 | ||||||
Other Assets & Liabilities, net - 0.0% | 6,433 | |||||||
Total Net Assets - 100.0% | $ | 212,337,495 | ||||||
* | Non-income producing security. |
† | Value determined based on Level 1 inputs — See Note 4. |
1 | Rate indicated is the 7-day yield as of December 31, 2022. |
plc — Public Limited Company | |
REIT — Real Estate Investment Trust | |
See Sector Classification in Other Information section. |
The following table summarizes the inputs used to value the Fund’s investments at December 31, 2022 (See Note 4 in the Notes to Financial Statements):
Investments in Securities (Assets) | Level 1 | Level 2 | Level 3 | Total | ||||||||||||
Common Stocks | $ | 200,258,327 | $ | — | $ | — | $ | 200,258,327 | ||||||||
Exchange-Traded Funds | 6,416,918 | — | — | 6,416,918 | ||||||||||||
Money Market Fund | 5,655,817 | — | — | 5,655,817 | ||||||||||||
Total Assets | $ | 212,331,062 | $ | — | $ | — | $ | 212,331,062 | ||||||||
22 | THE GUGGENHEIM FUNDS ANNUAL REPORT | SEE NOTES TO FINANCIAL STATEMENTS. |
SERIES B (LARGE CAP VALUE SERIES) |
STATEMENT OF ASSETS AND LIABILITIES |
December 31, 2022 |
Assets: | ||||
Investments, at value (cost $172,569,901) | $ | 212,331,062 | ||
Cash | 26 | |||
Prepaid expenses | 4,482 | |||
Receivables: | ||||
Dividends | 294,558 | |||
Interest | 15,754 | |||
Total assets | 212,645,882 | |||
Liabilities: | ||||
Payable for: | ||||
Fund shares redeemed | 141,314 | |||
Management fees | 77,915 | |||
Distribution and service fees | 45,776 | |||
Professional fees | 26,699 | |||
Fund accounting/administration fees | 3,202 | |||
Transfer agent/maintenance fees | 2,137 | |||
Trustees’ fees* | 395 | |||
Miscellaneous | 10,949 | |||
Total liabilities | 308,387 | |||
Net assets | $ | 212,337,495 | ||
Net assets consist of: | ||||
Paid in capital | $ | 149,349,282 | ||
Total distributable earnings (loss) | 62,988,213 | |||
Net assets | $ | 212,337,495 | ||
Capital shares outstanding | 5,148,946 | |||
Net asset value per share | $ | 41.24 | ||
STATEMENT OF OPERATIONS |
Year Ended December 31, 2022 |
Investment Income: | ||||
Dividends | $ | 5,039,370 | ||
Interest | 94,035 | |||
Total investment income | 5,133,405 | |||
Expenses: | ||||
Management fees | 1,447,126 | |||
Distribution and service fees | 556,587 | |||
Transfer agent/maintenance fees | 25,376 | |||
Fund accounting/administration fees | 128,795 | |||
Professional fees | 75,370 | |||
Trustees’ fees* | 12,219 | |||
Line of credit fees | 6,106 | |||
Custodian fees | 5,318 | |||
Miscellaneous | 24,318 | |||
Total expenses | 2,281,215 | |||
Less: | ||||
Expenses waived by Adviser | (543,337 | ) | ||
Earnings credits applied | (56 | ) | ||
Total waived expenses | (543,393 | ) | ||
Net expenses | 1,737,822 | |||
Net investment income | 3,395,583 | |||
Net Realized and Unrealized Gain (Loss): | ||||
Net realized gain (loss) on: | ||||
Investments | 22,517,356 | |||
Net realized gain | 22,517,356 | |||
Net change in unrealized appreciation (depreciation) on: | ||||
Investments | (29,032,822 | ) | ||
Net change in unrealized appreciation (depreciation) | (29,032,822 | ) | ||
Net realized and unrealized loss | (6,515,466 | ) | ||
Net decrease in net assets resulting from operations | $ | (3,119,883 | ) | |
* | Relates to Trustees not deemed “interested persons” within the meaning of Section 2(a)(19) of the 1940 Act. |
SEE NOTES TO FINANCIAL STATEMENTS. | THE GUGGENHEIM FUNDS ANNUAL REPORT | 23 |
SERIES B (LARGE CAP VALUE SERIES) |
STATEMENTS OF CHANGES IN NET ASSETS |
| Year Ended | Year Ended | ||||||
Increase (Decrease) in Net Assets from Operations: | ||||||||
Net investment income | $ | 3,395,583 | $ | 2,762,327 | ||||
Net realized gain on investments | 22,517,356 | 21,610,319 | ||||||
Net change in unrealized appreciation (depreciation) on investments | (29,032,822 | ) | 29,706,269 | |||||
Net increase (decrease) in net assets resulting from operations | (3,119,883 | ) | 54,078,915 | |||||
Distributions to shareholders | (22,853,023 | ) | (4,639,626 | ) | ||||
Capital share transactions: | ||||||||
Proceeds from sale of shares | 4,727,951 | 5,978,283 | ||||||
Distributions reinvested | 22,853,023 | 4,639,626 | ||||||
Cost of shares redeemed | (26,087,637 | ) | (31,787,831 | ) | ||||
Net increase (decrease) from capital share transactions | 1,493,337 | (21,169,922 | ) | |||||
Net increase (decrease) in net assets | (24,479,569 | ) | 28,269,367 | |||||
Net assets: | ||||||||
Beginning of year | 236,817,064 | 208,547,697 | ||||||
End of year | $ | 212,337,495 | $ | 236,817,064 | ||||
Capital share activity: | ||||||||
Shares sold | 112,131 | 137,180 | ||||||
Shares issued from reinvestment of distributions | 575,788 | 107,473 | ||||||
Shares redeemed | (598,577 | ) | (729,396 | ) | ||||
Net increase (decrease) in shares | 89,342 | (484,743 | ) | |||||
24 | THE GUGGENHEIM FUNDS ANNUAL REPORT | SEE NOTES TO FINANCIAL STATEMENTS. |
SERIES B (LARGE CAP VALUE SERIES) |
FINANCIAL HIGHLIGHTS |
This table is presented to show selected data for a share outstanding throughout each period and to assist shareholders in evaluating a Fund’s performance for the periods presented.
| Year Ended | Year Ended | Year Ended | Year Ended | Year Ended | |||||||||||||||
Per Share Data | ||||||||||||||||||||
Net asset value, beginning of period | $ | 46.81 | $ | 37.61 | $ | 40.55 | $ | 36.14 | $ | 43.36 | ||||||||||
Income (loss) from investment operations: | ||||||||||||||||||||
Net investment income (loss)a | .67 | .52 | .82 | .72 | .65 | |||||||||||||||
Net gain (loss) on investments (realized and unrealized) | (1.48 | ) | 9.58 | (.51 | ) | 6.93 | (4.42 | ) | ||||||||||||
Total from investment operations | (.81 | ) | 10.10 | .31 | 7.65 | (3.77 | ) | |||||||||||||
Less distributions from: | ||||||||||||||||||||
Net investment income | (.60 | ) | (.90 | ) | (.74 | ) | (.72 | ) | (.58 | ) | ||||||||||
Net realized gains | (4.16 | ) | — | b | (2.51 | ) | (2.52 | ) | (2.87 | ) | ||||||||||
Total distributions | (4.76 | ) | (.90 | ) | (3.25 | ) | (3.24 | ) | (3.45 | ) | ||||||||||
Net asset value, end of period | $ | 41.24 | $ | 46.81 | $ | 37.61 | $ | 40.55 | $ | 36.14 | ||||||||||
| ||||||||||||||||||||
Total Returnc | (1.32 | %) | 27.03 | % | 2.21 | % | 21.82 | % | (9.53 | %) | ||||||||||
Ratios/Supplemental Data | ||||||||||||||||||||
Net assets, end of period (in thousands) | $ | 212,337 | $ | 236,817 | $ | 208,548 | $ | 226,968 | $ | 207,167 | ||||||||||
Ratios to average net assets: | ||||||||||||||||||||
Net investment income (loss) | 1.53 | % | 1.20 | % | 2.40 | % | 1.86 | % | 1.54 | % | ||||||||||
Total expensesd | 1.02 | % | 1.03 | % | 1.09 | % | 1.07 | % | 1.07 | % | ||||||||||
Net expensese,f | 0.78 | % | 0.79 | % | 0.79 | % | 0.80 | % | 0.80 | % | ||||||||||
Portfolio turnover rate | 25 | % | 22 | % | 19 | % | 32 | % | 21 | % | ||||||||||
a | Net investment income (loss) per share was computed using average shares outstanding throughout the period. |
b | Distributions from realized gains are less than $0.01 per share. |
c | Total return does not take into account any of the expenses associated with an investment in variable insurance products. If total return had taken into account these expenses, performance would have been lower. Shares of a series of Guggenheim Variable Funds Trust are available only through the purchase of such products. |
d | Does not include expenses of the underlying funds in which the Fund invests. |
e | Net expense information reflects the expense ratios after expense waivers and reimbursements, as applicable. |
f | Net expenses may include expenses that are excluded from the expense limitation agreement. Excluding these expenses, the net expense ratios for the years presented would be: |
12/31/22 | 12/31/21 | 12/31/20 | 12/31/19 | 12/31/18 | |
0.78% | 0.79% | 0.79% | 0.80% | 0.80% |
SEE NOTES TO FINANCIAL STATEMENTS. | THE GUGGENHEIM FUNDS ANNUAL REPORT | 25 |
MANAGERS’ COMMENTARY (Unaudited) | December 31, 2022 |
To Our Shareholders
The Series D (World Equity Income Series, or the “Fund”) is managed by a team of seasoned professionals, including Farhan Sharaff, Senior Managing Director and Assistant Chief Investment Officer, Equities, and Portfolio Manager; Evan Einstein, Managing Director and Portfolio Manager; and Douglas Makin, Director and Portfolio Manager. In the subsequent paragraphs, the investment team discusses the Fund’s performance for the 12-month period ended December 31, 2022 (the “Reporting Period”).
For the Reporting Period, the Fund provided a total return of -9.12%, outperforming by 9.02% the MSCI World (Net) Index (“Index”), the Fund’s benchmark, which returned -18.14% for the same period.
What factors contributed or detracted from the Fund’s performance during the Reporting Period?
The last year was a difficult period for global equity markets. U.S. inflation has been historically high; the Federal Reserve has been increasing interest rates; and war has been destabilizing Europe. The Fund managed to outperform due to its positioning in lower risk and higher relative yield than the benchmark. The Fund’s strategy tends to create a bias toward value-oriented investments, which also tends to contribute to performance in a down market.
The leading contributor to return was security selection, with Health Care and Information Technology sectors leading the outperformance. These sectors were also where the Fund was most underweight relative to the benchmark, which helped in the Technology sector but hurt in the Health Care sector. An overweight in the Energy sector was also a strong positive contributor, but was partially offset by negative selection, a leading drag on return.
From a country perspective, the Fund had its strongest absolute contribution from its holdings in Canada. The holdings in most other countries, including the U.S., were negative for the Reporting Period, ultimately detracting from absolute return. However, the U.S., the largest country weight in the Fund, was the top relative contributor to performance, far outperforming the benchmark. This was also true of other countries, such as Japan and the U.K. where allocations were over 5% and the Fund had positive relative contributions to performance.
The top individual contributors to the Fund were an underweight in Tesla, and overweights in Tourmaline Oil Corp. and defense contractors Northrup Grumman and Lockheed Martin. The biggest detractors were an underweight in UnitedHealth Group, an overweight in Intel Corp, and not owning Eli Lilly.
How did the Fund use derivatives during the Reporting Period?
The Fund uses currency contract futures to hedge non-U.S. dollar equity positions, which helps to reduce volatility. Their contribution to performance in aggregate was positive, as the currency futures were active for much of the Reporting Period and the dollar was strong against other currencies for much of the Reporting Period as well.
How was the Fund positioned at the end of the Reporting Period?
Rising interest rates, the reopening of the economy following the pandemic, and a historically wide valuation gap between growth and value sectors were among the factors that saw value stocks solidly outperform growth stocks over the Reporting Period. Compared with the Index, the Fund is positioned more cautiously, as we anticipate continuing market weakness that defined much of the Reporting Period.
The Fund was most overweight in the Energy, Industrials and Materials sectors at the end of the Reporting Period, and most underweight in the Health Care, Information Technology, and Consumer Staples sectors.
The currency hedge ended the Reporting Period with no active positions as the U.S. dollar’s strengthening has taken a breather.
Performance displayed represents past performance which is no guarantee of future results.
The opinions and forecast expressed may not actually come to pass. This information is subject to change at any time, based on market and other conditions, and should not be construed as a recommendation of any specific security or strategy.
26 | THE GUGGENHEIM FUNDS ANNUAL REPORT | SEE NOTES TO FINANCIAL STATEMENTS. |
PERFORMANCE REPORT AND FUND PROFILE (Unaudited) | December 31, 2022 |
SERIES D (WORLD EQUITY INCOME SERIES)
OBJECTIVE: Seeks to provide total return, comprised of capital appreciation and income.
Holdings Diversification (Market Exposure as % of Net Assets)
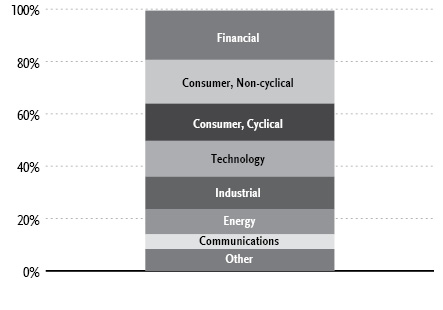
“Holdings Diversification (Market Exposure as % of Net Assets)” excludes any temporary cash investments.
COUNTRY DIVERSIFICATION
At December 31, 2022, the investment diversification of the Fund by Country was as follows:
Country |
| % of Long-Term | |||||
United States | 58.5% | ||||||
Japan | 9.1% | ||||||
Canada | 5.9% | ||||||
Australia | 5.2% | ||||||
United Kingdom | 4.9% | ||||||
Switzerland | 2.9% | ||||||
France | 2.4% | ||||||
Other | 11.1% | ||||||
Total Long-Term Investments | 100.0% | ||||||
Inception Date: April 19, 1984 |
Ten Largest Holdings | (% of Total Net Assets) |
Microsoft Corp. | 2.9% |
Apple, Inc. | 2.8% |
Johnson & Johnson | 1.7% |
Alphabet, Inc. — Class C | 1.5% |
Home Depot, Inc. | 1.4% |
Shell plc | 1.3% |
Novartis AG | 1.2% |
McDonald’s Corp. | 1.2% |
Merck & Company, Inc. | 1.1% |
UnitedHealth Group, Inc. | 1.1% |
Top Ten Total | 16.2% |
“Ten Largest Holdings” excludes any temporary cash investments. | |
THE GUGGENHEIM FUNDS ANNUAL REPORT | 27 |
PERFORMANCE REPORT AND FUND PROFILE (Unaudited)(concluded) | December 31, 2022 |
Cumulative Fund Performance*,†
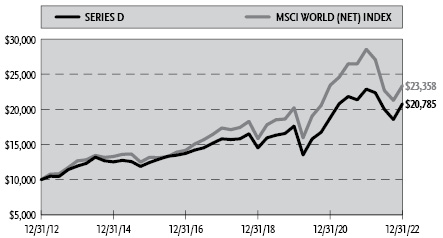
Average Annual Returns*,†
Periods Ended December 31, 2022
| 1 Year | 5 Year | 10 Year |
Series D (World Equity Income Series) | (9.12%) | 5.64% | 7.59% |
MSCI World (Net) Index | (18.14%) | 6.14% | 8.85% |
* | The performance data above represents past performance that is not predictive of future results. The investment return and principal value of an investment in the Fund will fluctuate so that an investor’s shares, when redeemed, may be worth more or less than their original cost. Returns are historical and include changes in principal and reinvested dividends and capital gains and do not reflect the effect of taxes. The MSCI World (Net) Index is an unmanaged index and, unlike the Fund, has no management fees or operating expenses to reduce its reported return. |
† | Performance figures do not reflect fees and expenses associated with an investment in variable insurance products. If returns had taken into account these fees and expenses, performance would have been lower. Shares of a series of Guggenheim Variable Funds Trust are available only through the purchase of such products. |
28 | THE GUGGENHEIM FUNDS ANNUAL REPORT |
SCHEDULE OF INVESTMENTS | December 31, 2022 |
SERIES D (WORLD EQUITY INCOME SERIES) |
| Shares | Value | ||||||
COMMON STOCKS† - 99.4% | ||||||||
Financial - 18.9% | ||||||||
Chubb Ltd. | 4,934 | $ | 1,088,440 | |||||
Travelers Companies, Inc. | 5,478 | 1,027,070 | ||||||
ANZ Group Holdings Ltd.* | 62,600 | 1,008,454 | ||||||
MetLife, Inc. | 13,653 | 988,068 | ||||||
Aon plc — Class A | 3,266 | 980,257 | ||||||
Cboe Global Markets, Inc. | 7,812 | 980,172 | ||||||
Banco Bilbao Vizcaya Argentaria S.A.†† | 160,800 | 969,046 | ||||||
Westpac Banking Corp.†† | 60,300 | 954,674 | ||||||
Principal Financial Group, Inc. | 10,940 | 918,085 | ||||||
AXA S.A.†† | 32,700 | 911,351 | ||||||
Banco Santander S.A.†† | 301,500 | 901,989 | ||||||
National Australia Bank Ltd.†† | 44,300 | 899,482 | ||||||
Japan Real Estate Investment Corp. REIT†† | 200 | 878,332 | ||||||
Prudential Financial, Inc. | 8,200 | 815,572 | ||||||
Nippon Building Fund, Inc. REIT†† | 180 | 804,809 | ||||||
Willis Towers Watson plc | 3,250 | 794,885 | ||||||
Gaming and Leisure Properties, Inc. REIT | 14,800 | 770,932 | ||||||
AvalonBay Communities, Inc. REIT | 4,496 | 726,194 | ||||||
Aflac, Inc. | 9,800 | 705,012 | ||||||
Truist Financial Corp. | 14,800 | 636,844 | ||||||
Intesa Sanpaolo SpA†† | 276,400 | 612,659 | ||||||
DBS Group Holdings Ltd.†† | 17,800 | 450,681 | ||||||
Societe Generale S.A.†† | 15,100 | 378,961 | ||||||
ORIX Corp.†† | 23,100 | 369,700 | ||||||
Mediobanca Banca di Credito Finanziario SpA†† | 35,200 | 338,415 | ||||||
Annaly Capital Management, Inc. REIT | 15,850 | 334,118 | ||||||
Marsh & McLennan Companies, Inc. | 1,727 | 285,784 | ||||||
Western Union Co. | 18,800 | 258,876 | ||||||
SEI Investments Co. | 4,392 | 256,054 | ||||||
Credit Agricole S.A.†† | 20,100 | 211,549 | ||||||
PNC Financial Services Group, Inc. | 1,200 | 189,528 | ||||||
Total Financial | 21,445,993 | |||||||
Consumer, Non-cyclical - 16.7% | ||||||||
Johnson & Johnson | 11,211 | 1,980,423 | ||||||
Novartis AG†† | 14,600 | 1,321,577 | ||||||
Merck & Company, Inc. | 11,198 | 1,242,418 | ||||||
UnitedHealth Group, Inc. | 2,334 | 1,237,440 | ||||||
Amgen, Inc. | 4,054 | 1,064,743 | ||||||
J M Smucker Co. | 6,622 | 1,049,322 | ||||||
Imperial Brands plc†† | 41,800 | 1,040,738 | ||||||
Becton Dickinson and Co. | 3,851 | 979,310 | ||||||
Colgate-Palmolive Co. | 12,169 | 958,795 | ||||||
AbbVie, Inc. | 5,733 | 926,510 | ||||||
Automatic Data Processing, Inc. | 3,751 | 895,964 | ||||||
Kellogg Co. | 11,014 | 784,637 | ||||||
Gilead Sciences, Inc. | 8,700 | 746,895 | ||||||
AmerisourceBergen Corp. — Class A | 4,128 | 684,051 | ||||||
CVS Health Corp. | 6,500 | 605,735 | ||||||
Dai Nippon Printing Company Ltd.†† | 30,100 | 604,608 | ||||||
CSL Ltd.†† | 2,200 | 429,002 | ||||||
Kikkoman Corp.†† | 6,500 | 342,089 | ||||||
WH Group Ltd.††,1 | 553,600 | 322,892 | ||||||
Brambles Ltd.†† | 36,600 | 300,153 | ||||||
McKesson Corp. | 746 | 279,840 | ||||||
Unilever plc†† | 5,500 | 277,638 | ||||||
Abbott Laboratories | 2,500 | 274,475 | ||||||
Hormel Foods Corp. | 4,800 | 218,640 | ||||||
PepsiCo, Inc. | 1,133 | 204,688 | ||||||
General Mills, Inc. | 2,300 | 192,855 | ||||||
Total Consumer, Non-cyclical | 18,965,438 | |||||||
Consumer, Cyclical - 14.2% | ||||||||
Home Depot, Inc. | 5,025 | 1,587,196 | ||||||
McDonald’s Corp. | 4,988 | 1,314,488 | ||||||
Lowe’s Companies, Inc. | 5,393 | �� | 1,074,501 | |||||
O’Reilly Automotive, Inc.* | 1,228 | 1,036,469 | ||||||
Sumitomo Corp.†† | 59,600 | 990,593 | ||||||
Yum! Brands, Inc. | 7,600 | 973,408 | ||||||
Genuine Parts Co. | 5,475 | 949,967 | ||||||
Dollar General Corp. | 3,700 | 911,125 | ||||||
PACCAR, Inc. | 9,033 | 893,996 | ||||||
TJX Companies, Inc. | 11,212 | 892,475 | ||||||
Ferguson plc* | 6,403 | 812,989 | ||||||
Ulta Beauty, Inc.* | 1,500 | 703,605 | ||||||
Aisin Corp.†† | 22,600 | 599,152 | ||||||
Canadian Tire Corporation Ltd. — Class A | 5,300 | 554,062 | ||||||
Toromont Industries Ltd. | 7,100 | 512,534 | ||||||
Lear Corp. | 3,703 | 459,246 | ||||||
Hasbro, Inc. | 5,818 | 354,956 | ||||||
Tesla, Inc.* | 2,502 | 308,197 | ||||||
LKQ Corp. | 4,400 | 235,004 | ||||||
Dollarama, Inc. | 4,000 | 234,022 | ||||||
Tractor Supply Co. | 1,000 | 224,970 | ||||||
Darden Restaurants, Inc. | 1,500 | 207,495 | ||||||
Cummins, Inc. | 849 | 205,704 | ||||||
Total Consumer, Cyclical | 16,036,154 | |||||||
Technology - 13.8% | ||||||||
Microsoft Corp. | 13,726 | 3,291,769 | ||||||
Apple, Inc. | 24,285 | 3,155,350 | ||||||
Texas Instruments, Inc. | 7,290 | 1,204,454 | ||||||
Broadcom, Inc. | 1,716 | 959,467 | ||||||
Intel Corp. | 32,414 | 856,702 | ||||||
Analog Devices, Inc. | 5,127 | 840,982 | ||||||
Dell Technologies, Inc. — Class C | 19,723 | 793,259 | ||||||
Paychex, Inc. | 6,500 | 751,140 | ||||||
Broadridge Financial Solutions, Inc. | 4,891 | 656,030 | ||||||
Seiko Epson Corp.†† | 39,800 | 578,968 | ||||||
Ricoh Company Ltd.†† | 73,600 | 560,099 | ||||||
Hewlett Packard Enterprise Co. | 32,500 | 518,700 | ||||||
SCSK Corp.†† | 29,800 | 451,010 | ||||||
Jack Henry & Associates, Inc. | 2,500 | 438,900 | ||||||
NXP Semiconductor N.V. | 2,125 | 335,813 | ||||||
Electronic Arts, Inc. | 2,000 | 244,360 | ||||||
Total Technology | 15,637,003 | |||||||
SEE NOTES TO FINANCIAL STATEMENTS. | THE GUGGENHEIM FUNDS ANNUAL REPORT | 29 |
SCHEDULE OF INVESTMENTS (continued) | December 31, 2022 |
SERIES D (WORLD EQUITY INCOME SERIES) |
| Shares | Value | ||||||
Industrial - 12.3% | ||||||||
AP Moller - Maersk A/S — Class B†† | 500 | $ | 1,119,528 | |||||
General Dynamics Corp. | 4,039 | 1,002,116 | ||||||
Lockheed Martin Corp. | 1,968 | 957,412 | ||||||
Northrop Grumman Corp. | 1,696 | 925,355 | ||||||
Packaging Corporation of America | 6,968 | 891,277 | ||||||
Waste Connections, Inc. | 6,709 | 889,345 | ||||||
Snap-on, Inc. | 3,746 | 855,924 | ||||||
TE Connectivity Ltd. | 7,395 | 848,946 | ||||||
3M Co. | 6,790 | 814,257 | ||||||
Nippon Yusen K.K.†† | 34,100 | 803,984 | ||||||
Amcor plc | 64,900 | 772,959 | ||||||
Aurizon Holdings Ltd.†† | 272,800 | 691,147 | ||||||
Mitsui OSK Lines Ltd.†† | 24,400 | 609,615 | ||||||
Nordson Corp. | 2,248 | 534,395 | ||||||
United Parcel Service, Inc. — Class B | 2,800 | 486,752 | ||||||
Waste Management, Inc. | 3,100 | 486,328 | ||||||
Canadian National Railway Company | 3,000 | 356,485 | ||||||
CCL Industries, Inc. — Class B | 7,500 | 320,490 | ||||||
Illinois Tool Works, Inc. | 1,345 | 296,303 | ||||||
Brother Industries Ltd.†† | 12,300 | 185,871 | ||||||
Republic Services, Inc. — Class A | 900 | 116,091 | ||||||
Total Industrial | 13,964,580 | |||||||
Energy - 9.7% | ||||||||
Shell plc†† | 51,000 | 1,437,360 | ||||||
TotalEnergies SE†† | 19,500 | 1,224,715 | ||||||
Eni SpA†† | 77,900 | 1,108,274 | ||||||
Repsol S.A.†† | 53,400 | 850,412 | ||||||
Suncor Energy, Inc. | 26,400 | 837,708 | ||||||
Equinor ASA†† | 22,500 | 808,728 | ||||||
Imperial Oil Ltd. | 16,100 | 784,452 | ||||||
ENEOS Holdings, Inc.†† | 197,900 | 673,835 | ||||||
Galp Energia SGPS S.A. — Class B†† | 46,900 | 633,041 | ||||||
Parkland Corp. | 24,900 | 546,547 | ||||||
Keyera Corp. | 24,700 | 539,967 | ||||||
Idemitsu Kosan Company Ltd.†† | 22,600 | 529,025 | ||||||
Ampol Ltd.†† | 24,600 | 472,889 | ||||||
Tourmaline Oil Corp. | 6,100 | 307,896 | ||||||
Exxon Mobil Corp. | 2,500 | 275,750 | ||||||
Total Energy | 11,030,599 | |||||||
Communications - 5.6% | ||||||||
Alphabet, Inc. — Class C* | 18,666 | 1,656,234 | ||||||
Amazon.com, Inc.* | 13,738 | 1,153,992 | ||||||
Verizon Communications, Inc. | 28,580 | 1,126,052 | ||||||
Motorola Solutions, Inc. | 2,886 | 743,751 | ||||||
Liberty Global plc — Class C* | 30,367 | 590,031 | ||||||
Cisco Systems, Inc. | 10,046 | 478,591 | ||||||
Telstra Group Ltd.†† | 124,600 | 336,986 | ||||||
FactSet Research Systems, Inc. | 570 | 228,690 | ||||||
Total Communications | 6,314,327 | |||||||
Basic Materials - 5.2% | ||||||||
Rio Tinto plc†† | 16,600 | 1,168,123 | ||||||
LyondellBasell Industries N.V. — Class A | 9,630 | 799,579 | ||||||
South32 Ltd.†† | 274,800 | 753,427 | ||||||
International Paper Co. | 20,053 | 694,435 | ||||||
Nippon Steel Corp.†† | 39,700 | 688,740 | ||||||
Air Products and Chemicals, Inc. | 2,183 | 672,932 | ||||||
JFE Holdings, Inc.†† | 53,700 | 623,018 | ||||||
Nutrien Ltd. | 6,500 | 474,696 | ||||||
Total Basic Materials | 5,874,950 | |||||||
Utilities - 3.0% | ||||||||
SSE plc†† | 32,700 | 672,313 | ||||||
Duke Energy Corp. | 6,100 | 628,239 | ||||||
EDP - Energias de Portugal S.A.†† | 116,300 | 580,035 | ||||||
Southern Co. | 7,390 | 527,720 | ||||||
National Grid plc†† | 29,100 | 348,514 | ||||||
Fortis, Inc. | 8,500 | 340,239 | ||||||
Consolidated Edison, Inc. | 2,600 | 247,806 | ||||||
Total Utilities | 3,344,866 | |||||||
Total Common Stocks | ||||||||
(Cost $110,865,253) | 112,613,910 | |||||||
EXCHANGE-TRADED FUNDS† - 0.1% | ||||||||
iShares MSCI EAFE ETF | 914 | 59,995 | ||||||
SPDR S&P 500 ETF Trust | 138 | 52,775 | ||||||
Total Exchange-Traded Funds | ||||||||
(Cost $119,371) | 112,770 | |||||||
MONEY MARKET FUND† - 0.2% | ||||||||
Goldman Sachs Financial Square Treasury Instruments Fund — Institutional Shares, 3.93%2 | 249,001 | 249,001 | ||||||
Total Money Market Fund | ||||||||
(Cost $249,001) | 249,001 | |||||||
Total Investments - 99.7% | ||||||||
(Cost $111,233,625) | $ | 112,975,681 | ||||||
Other Assets & Liabilities, net - 0.3% | 358,739 | |||||||
Total Net Assets - 100.0% | $ | 113,334,420 | ||||||
30 | THE GUGGENHEIM FUNDS ANNUAL REPORT | SEE NOTES TO FINANCIAL STATEMENTS. |
SCHEDULE OF INVESTMENTS (concluded) | December 31, 2022 |
SERIES D (WORLD EQUITY INCOME SERIES) |
* | Non-income producing security. |
† | Value determined based on Level 1 inputs — See Note 4. |
†† | Value determined based on Level 2 inputs — See Note 4. |
1 | Security is a 144A or Section 4(a)(2) security. These securities have been determined to be liquid under guidelines established by the Board of Trustees. The total market value of 144A or Section 4(a)(2) securities is $322,892 (cost $325,405), or 0.3% of total net assets. |
2 | Rate indicated is the 7-day yield as of December 31, 2022. |
plc — Public Limited Company | |
REIT — Real Estate Investment Trust | |
See Sector Classification in Other Information section. |
The following table summarizes the inputs used to value the Fund’s investments at December 31, 2022 (See Note 4 in the Notes to Financial Statements):
Investments in Securities (Assets) | Level 1 | Level 2 | Level 3 | Total | ||||||||||||
Common Stocks | $ | 79,794,163 | $ | 32,819,747 | $ | — | $ | 112,613,910 | ||||||||
Exchange-Traded Funds | 112,770 | — | — | 112,770 | ||||||||||||
Money Market Fund | 249,001 | — | — | 249,001 | ||||||||||||
Total Assets | $ | 80,155,934 | $ | 32,819,747 | $ | — | $ | 112,975,681 | ||||||||
SEE NOTES TO FINANCIAL STATEMENTS. | THE GUGGENHEIM FUNDS ANNUAL REPORT | 31 |
SERIES D (WORLD EQUITY INCOME SERIES) |
STATEMENT OF ASSETS AND LIABILITIES |
December 31, 2022 |
Assets: | ||||
Investments, at value (cost $111,233,625) | $ | 112,975,681 | ||
Cash | 21,571 | |||
Prepaid expenses | 3,451 | |||
Receivables: | ||||
Foreign tax reclaims | 202,369 | |||
Dividends | 159,159 | |||
Securities sold | 153,260 | |||
Interest | 1,992 | |||
Total assets | 113,517,483 | |||
Liabilities: | ||||
Payable for: | ||||
Fund shares redeemed | 66,471 | |||
Management fees | 48,409 | |||
Professional fees | 26,279 | |||
Distribution and service fees | 24,685 | |||
Trustees’ fees* | 2,587 | |||
Fund accounting/administration fees | 2,300 | |||
Transfer agent/maintenance fees | 2,066 | |||
Due to Investment Adviser | 357 | |||
Miscellaneous | 9,909 | |||
Total liabilities | 183,063 | |||
Net assets | $ | 113,334,420 | ||
Net assets consist of: | ||||
Paid in capital | $ | 111,182,330 | ||
Total distributable earnings (loss) | 2,152,090 | |||
Net assets | $ | 113,334,420 | ||
Capital shares outstanding | 9,160,986 | |||
Net asset value per share | $ | 12.37 | ||
STATEMENT OF OPERATIONS |
Year Ended December 31, 2022 |
Investment Income: | ||||
Dividends (net of foreign withholding tax of $336,219) | $ | 3,784,661 | ||
Interest | 12,286 | |||
Total investment income | 3,796,947 | |||
Expenses: | ||||
Management fees | 849,725 | |||
Distribution and service fees | 303,472 | |||
Transfer agent/maintenance fees | 25,148 | |||
Fund accounting/administration fees | 74,534 | |||
Professional fees | 44,321 | |||
Trustees’ fees* | 10,693 | |||
Custodian fees | 9,031 | |||
Line of credit fees | 3,494 | |||
Miscellaneous | 14,803 | |||
Recoupment of previously waived fees | 357 | |||
Total expenses | 1,335,578 | |||
Less: | ||||
Expenses waived by Adviser | (266,589 | ) | ||
Earnings credits applied | (2 | ) | ||
Total waived expenses | (266,591 | ) | ||
Net expenses | 1,068,987 | |||
Net investment income | 2,727,960 | |||
Net Realized and Unrealized Gain (Loss): | ||||
Net realized gain (loss) on: | ||||
Investments | (3,536,615 | ) | ||
Futures contracts | 1,352,842 | |||
Foreign currency transactions | 482 | |||
Net realized loss | (2,183,291 | ) | ||
Net change in unrealized appreciation (depreciation) on: | ||||
Investments | (12,953,737 | ) | ||
Foreign currency translations | (18,057 | ) | ||
Net change in unrealized appreciation (depreciation) | (12,971,794 | ) | ||
Net realized and unrealized loss | (15,155,085 | ) | ||
Net decrease in net assets resulting from operations | $ | (12,427,125 | ) | |
* | Relates to Trustees not deemed “interested persons” within the meaning of Section 2(a)(19) of the 1940 Act. |
32 | THE GUGGENHEIM FUNDS ANNUAL REPORT | SEE NOTES TO FINANCIAL STATEMENTS. |
SERIES D (WORLD EQUITY INCOME SERIES) |
STATEMENTS OF CHANGES IN NET ASSETS |
| Year Ended | Year Ended | ||||||
Increase (Decrease) in Net Assets from Operations: | ||||||||
Net investment income | $ | 2,727,960 | $ | 2,736,857 | ||||
Net realized gain (loss) on investments | (2,183,291 | ) | 30,419,122 | |||||
Net change in unrealized appreciation (depreciation) on investments | (12,971,794 | ) | (6,816,541 | ) | ||||
Net increase (decrease) in net assets resulting from operations | (12,427,125 | ) | 26,339,438 | |||||
Distributions to shareholders | (27,160,274 | ) | (2,031,098 | ) | ||||
Capital share transactions: | ||||||||
Proceeds from sale of shares | 5,871,691 | 5,327,206 | ||||||
Distributions reinvested | 27,160,274 | 2,031,098 | ||||||
Cost of shares redeemed | (18,303,370 | ) | (19,480,103 | ) | ||||
Net increase (decrease) from capital share transactions | 14,728,595 | (12,121,799 | ) | |||||
Net increase (decrease) in net assets | (24,858,804 | ) | 12,186,541 | |||||
Net assets: | ||||||||
Beginning of year | 138,193,224 | 126,006,683 | ||||||
End of year | $ | 113,334,420 | $ | 138,193,224 | ||||
Capital share activity: | ||||||||
Shares sold | 430,664 | 320,264 | ||||||
Shares issued from reinvestment of distributions | 2,239,099 | 119,758 | ||||||
Shares redeemed | (1,299,295 | ) | (1,170,420 | ) | ||||
Net increase (decrease) in shares | 1,370,468 | (730,398 | ) | |||||
SEE NOTES TO FINANCIAL STATEMENTS. | THE GUGGENHEIM FUNDS ANNUAL REPORT | 33 |
SERIES D (WORLD EQUITY INCOME SERIES) |
FINANCIAL HIGHLIGHTS |
This table is presented to show selected data for a share outstanding throughout each period and to assist shareholders in evaluating a Fund’s performance for the periods presented.
| Year Ended | Year Ended | Year Ended | Year Ended | Year Ended | |||||||||||||||
Per Share Data | ||||||||||||||||||||
Net asset value, beginning of period | $ | 17.74 | $ | 14.79 | $ | 14.45 | $ | 12.96 | $ | 14.52 | ||||||||||
Income (loss) from investment operations: | ||||||||||||||||||||
Net investment income (loss)a | .32 | .34 | .22 | .33 | .33 | |||||||||||||||
Net gain (loss) on investments (realized and unrealized) | (2.01 | ) | 2.86 | .66 | 2.36 | (1.47 | ) | |||||||||||||
Total from investment operations | (1.69 | ) | 3.20 | .88 | 2.69 | (1.14 | ) | |||||||||||||
Less distributions from: | ||||||||||||||||||||
Net investment income | (.36 | ) | (.25 | ) | (.40 | ) | (.40 | ) | (.42 | ) | ||||||||||
Net realized gains | (3.32 | ) | — | (.14 | ) | (.80 | ) | — | ||||||||||||
Total distributions | (3.68 | ) | (.25 | ) | (.54 | ) | (1.20 | ) | (.42 | ) | ||||||||||
Net asset value, end of period | $ | 12.37 | $ | 17.74 | $ | 14.79 | $ | 14.45 | $ | 12.96 | ||||||||||
| ||||||||||||||||||||
Total Returnb | (9.12 | %) | 21.74 | % | 6.65 | % | 21.40 | % | (8.17 | %) | ||||||||||
Ratios/Supplemental Data | ||||||||||||||||||||
Net assets, end of period (in thousands) | $ | 113,334 | $ | 138,193 | $ | 126,007 | $ | 133,758 | $ | 125,312 | ||||||||||
Ratios to average net assets: | ||||||||||||||||||||
Net investment income (loss) | 2.25 | % | 2.02 | % | 1.70 | % | 2.37 | % | 2.29 | % | ||||||||||
Total expensesc | 1.10 | % | 1.15 | % | 1.20 | % | 1.19 | % | 1.17 | % | ||||||||||
Net expensesd,e | 0.88 | % | 0.89 | % | 0.89 | % | 0.90 | % | 0.90 | % | ||||||||||
Portfolio turnover rate | 140 | % | 185 | % | 196 | % | 139 | % | 134 | % | ||||||||||
a | Net investment income (loss) per share was computed using average shares outstanding throughout the period. |
b | Total return does not take into account any of the expenses associated with an investment in variable insurance products. If total return had taken into account these expenses, performance would have been lower. Shares of a series of Guggenheim Variable Funds Trust are available only through the purchase of such products. |
c | Does not include expenses of the underlying funds in which the Fund invests. |
d | Net expense information reflects the expense ratios after expense waivers and reimbursements, as applicable. |
e | Net expenses may include expenses that are excluded from the expense limitation agreement. Excluding these expenses, the net expense ratios for the years presented would be: |
12/31/22 | 12/31/21 | 12/31/20 | 12/31/19 | 12/31/18 | |
0.88% | 0.89% | 0.89% | 0.90% | 0.90% |
34 | THE GUGGENHEIM FUNDS ANNUAL REPORT | SEE NOTES TO FINANCIAL STATEMENTS. |
MANAGERS’ COMMENTARY (Unaudited) | December 31, 2022 |
To Our Shareholders
The Series E (Total Return Bond Series, or the “Fund”) is managed by a team of seasoned professionals, including Anne B. Walsh, CFA, JD, Managing Partner, Chief Investment Officer of GPIM; Steven H. Brown, CFA, Chief Investment Officer, Total Return and Macro Strategies, and Senior Managing Director of GPIM; Adam J. Bloch, Managing Director and Portfolio Manager of GPIM; and Evan L. Serdensky, Director and Portfolio Manager of GPIM. In the subsequent paragraphs, the investment team discusses the Fund’s performance for the 12-month period ended December 31, 2022 (the “Reporting Period”).
For the Reporting Period, the Fund provided a total return of -16.15%, underperforming the Bloomberg U.S. Aggregate Bond Index (“Index”), the Fund’s benchmark, which returned -13.01% for the same period.
What factors contributed or detracted from the Fund’s performance during the Reporting Period?
Duration was the largest driver of absolute performance, detracting about -14.0%, but contributed about +0.25% to relative performance, primarily from the Fund’s curve positioning The Fund’s bear flattener bias benefited performance, as the rise in front end yields outpaced that of longer maturity yields. Bear flattening refers to the yield curve scenario for bonds in which short-term interest rates rise more rapidly than long-term interest rates.
Performance from spread widening was the largest driver of the Fund’s relative underperformance, detracting roughly -4.00% on a relative basis. The Fund’s overweight allocation to credit drove this underperformance and was broadly distributed across all asset classes. Carry contributed about +4.25% to absolute performance and +1.25% to relative performance.
How did the Fund use derivatives during the Reporting Period?
During the Reporting Period, the Fund used interest rate futures, forwards, options, and swaps to help manage duration positioning and foreign exchange risk. Interest rate swaps, futures, and curve caps detracted from performance, while performance from swaptions was incrementally positive. Options on equities, which functioned as hedges to the Fund’s credit positioning, contributed to performance. In addition, the Fund hedged non-USD exposure with foreign-exchange derivatives, which had a positive impact on performance over the Reporting Period.
How was the Fund positioned at the end of the Reporting Period?
Securitized credit, which comprised 32% of the Fund at the end of the Reporting Period, continues to be a significant and expanding asset class allocation within the Fund, particularly given its lagged performance relative to corporates towards the end of 2022. As tail risks have risen across the market, we have increased our allocation to high grade pockets of securitized credit, upgrading credit quality through capital structure seniority and strong structural protections at attractive spreads versus comparably rated corporate credit. A unique opportunity has emerged in securitized credit in that investors are now able to source investments at steep dollar-price discounts, given both the rise in interest rates and widening in credit spreads that have occurred year-to-date. This dynamic presents a compelling total return opportunity as investors are now able to potentially capture not only the traditional yield advantage offered by the sector in the form of higher coupons relative to similarly rated corporates, but also excess returns, should rates fall or spreads tighten. In more normal market environments, the value proposition of much of securitized credit is typically limited to a carry advantage given that prices for many subsectors rarely trade above par due to call structures. To this end, our buying efforts have been concentrated in the secondary market in subsectors such as AA-rated collateralized loan obligations (“CLOs”). In primary markets, we are finding opportunities in the non-agency residential mortgage-backed securities (“RMBS”) sector in senior tranches of non-qualified mortgaged (“non-QM”) deals, which price at discounts to par and have offered yields and spreads comparable to BB-rated corporate credit.
Corporate credit totaled approximately 39% of the Fund with roughly 28% investment grade rated and 11% below investment grade rated. While fundamental credit metrics, such as leverage and interest coverage, generally still show improving or healthy trends across most sectors, we expect these metrics to gradually deteriorate over the next several quarters and for default rates to pick up accordingly. Credit spread valuations are relatively fairly valued, with spreads in the 50th percentile versus long-term historical ranges. At current valuations, the long-term value across credit assets is compelling, although we expect volatility to remain elevated in the near term. The Fund has taken advantage of dislocations across corporate credit by purchasing high credit quality investment grade corporates at attractive absolute yields, while simultaneously trimming lower grade categories, such as leveraged loans, that performed well on a relative basis over the course of the year and have greater risks going into a potential economic slowdown.
THE GUGGENHEIM FUNDS ANNUAL REPORT | 35 |
MANAGERS’ COMMENTARY (Unaudited) (concluded) | December 31, 2022 |
Duration drifted lower throughout the fourth quarter of 2022 as yields fell significantly amid softer inflation data. While we are confident that the combined effects of decelerating inflation and slowing growth should keep interest rates reasonably capped, we also acknowledge that yields have moved materially off their highs and material moves lower in yields will be more difficult amid a Federal Reserve that seems intent on stamping out inflation. Additionally, the Fund added rate hedges that would benefit, should the yield curve steepen amid either the Federal Reserve cutting rates faster than market expectations or long-term inflation expectations rising if the Federal Reserve pivots too early.
Though we expect to see continued volatility as markets grapple with the rapid tightening of financial conditions, at current valuations we see return distributions for fixed income skewed to the upside over the next year. Importantly, examples of market distress and falling inflation expectations are signaling a more benign path for interest rates and thus some moderation in rate volatility, which should prove to be beneficial tailwinds to fixed-income valuations.
Performance displayed represents past performance which is no guarantee of future results.
The opinions and forecast expressed may not actually come to pass. This information is subject to change at any time, based on market and other conditions, and should not be construed as a recommendation of any specific security or strategy.
36 | THE GUGGENHEIM FUNDS ANNUAL REPORT |
PERFORMANCE REPORT AND FUND PROFILE (Unaudited) | December 31, 2022 |
SERIES E (TOTAL RETURN BOND SERIES)
OBJECTIVE: Seeks to provide total return, comprised of current income and capital appreciation.
Holdings Diversification (Market Exposure as % of Net Assets)
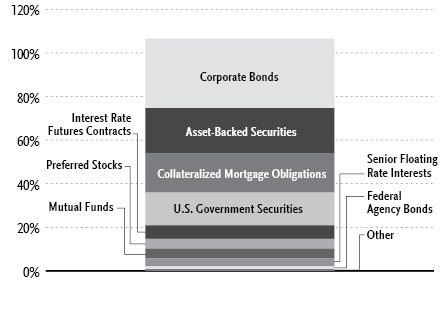
“Holdings Diversification (Market Exposure as % of Net Assets)” excludes any temporary cash investments, investments in Guggenheim Strategy Funds Trust mutual funds, or investments in Guggenheim Ultra Short Duration Fund.
Inception Date: April 26, 1985 |
Ten Largest Holdings (% of Total Net Assets) | |
Uniform MBS 30 Year | 6.0% |
U.S. Treasury Notes, 4.13% | 4.5% |
Guggenheim Total Return Bond Fund — R6-Class | 4.4% |
U.S. Treasury Notes, 3.88% | 3.5% |
U.S. Treasury Bonds, 2.00% | 2.2% |
Octagon Investment Partners 49 Ltd., 5.63% | 1.3% |
U.S. Treasury Notes, 2.63% | 1.2% |
U.S. Treasury Bonds — 11/15/52 | 0.8% |
U.S. Treasury Bonds — 02/15/52 | 0.8% |
STORE Master Funding I-VII, 3.96% | 0.8% |
Top Ten Total | 25.5% |
“Ten Largest Holdings” excludes any temporary cash or derivative investments. | |
THE GUGGENHEIM FUNDS ANNUAL REPORT | 37 |
PERFORMANCE REPORT AND FUND PROFILE (Unaudited)(concluded) | December 31, 2022 |
Cumulative Fund Performance*
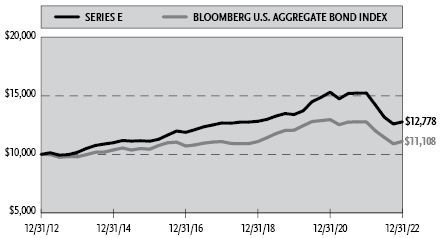
Average Annual Returns*,†
Periods Ended December 31, 2022
| 1 Year | 5 Year | 10 Year |
Series E (Total Return Bond Series) | (16.15%) | 0.15% | 2.48% |
Bloomberg U.S. Aggregate Bond Index | (13.01%) | 0.02% | 1.06% |
Portfolio Composition by Quality Rating1 | |
Rating | % of Total |
Fixed Income Instruments | |
AAA | 31.1% |
AA | 7.2% |
A | 11.6% |
BBB | 22.2% |
BB | 5.2% |
B | 3.6% |
CCC | 0.4% |
CC | 1.9% |
C | 0.1% |
NR2 | 4.8% |
Other Instruments | 11.9% |
Total Investments | 100.0% |
* | The performance data above represents past performance that is not predictive of future results. The investment return and principal value of an investment in the Fund will fluctuate so that an investor’s shares, when redeemed, may be worth more or less than their original cost. Returns are historical and include changes in principal and reinvested dividends and capital gains and do not reflect the effect of taxes. The Bloomberg U.S. Aggregate Bond Index is an unmanaged index and, unlike the Fund, has no management fees or operating expenses to reduce its reported return. |
† | Performance figures do not reflect fees and expenses associated with an investment in variable insurance products. If returns had taken into account these fees and expenses, performance would have been lower. Shares of a series of Guggenheim Variable Funds Trust are available only through the purchase of such products. |
1 | Source: BlackRock Solutions. Credit quality ratings are measured on a scale that generally ranges from AAA (highest) to D (lowest). All securities except for those labeled “NR” have been rated by Moody’s, Standard & Poor’s (“S&P”), or Fitch, each of which is a Nationally Recognized Statistical Rating Organization (“NRSRO”). For purposes of this presentation, when ratings are available from more than one agency, the highest rating is used. Guggenheim Investments has converted ratings to the equivalent S&P rating. Security ratings are determined at the time of purchase and may change thereafter. |
2 | NR (not rated) securities do not necessarily indicate low credit quality. |
38 | THE GUGGENHEIM FUNDS ANNUAL REPORT |
SCHEDULE OF INVESTMENTS | December 31, 2022 |
SERIES E (TOTAL RETURN BOND SERIES) |
| Shares | Value | ||||||
COMMON STOCKS† - 0.2% | ||||||||
Financial - 0.2% | ||||||||
TPG Pace Beneficial II Corp.*,1 | 6,675 | $ | 65,582 | |||||
MSD Acquisition Corp. — Class A*,1 | 4,876 | 49,248 | ||||||
AfterNext HealthTech Acquisition Corp. — Class A*,1 | 4,100 | 41,082 | ||||||
Conyers Park III Acquisition Corp. — Class A*,1 | 3,800 | 37,468 | ||||||
Waverley Capital Acquisition Corp. 1 — Class A*,††,1 | 3,000 | 30,060 | ||||||
Acropolis Infrastructure Acquisition Corp. — Class A*,1 | 2,700 | 26,757 | ||||||
Blue Whale Acquisition Corp. I — Class A*,1 | 2,200 | 21,538 | ||||||
Pershing Square Tontine Holdings, Ltd. — Class A*,†††,1 | 76,590 | 7 | ||||||
Total Financial | 271,742 | |||||||
Communications - 0.0% | ||||||||
Figs, Inc. — Class A* | 1,346 | 9,059 | ||||||
Vacasa, Inc. — Class A* | 3,356 | 4,228 | ||||||
Total Communications | 13,287 | |||||||
Total Common Stocks | ||||||||
(Cost $328,768) | 285,029 | |||||||
PREFERRED STOCKS†† - 4.6% | ||||||||
Financial - 4.6% | ||||||||
Equitable Holdings, Inc. | ||||||||
4.95%* | 550,000 | 518,485 | ||||||
4.30% | 12,000 | 212,280 | ||||||
Wells Fargo & Co. | ||||||||
3.90%* | 450,000 | 393,869 | ||||||
4.70% | 16,000 | 294,240 | ||||||
Citigroup, Inc. | ||||||||
3.88%* | 600,000 | 511,500 | ||||||
4.00%* | 200,000 | 174,224 | ||||||
Markel Corp. | ||||||||
6.00%* | 660,000 | 638,550 | ||||||
First Republic Bank | ||||||||
4.25% | 23,425 | 384,873 | ||||||
4.13% | 5,325 | 85,200 | ||||||
4.50% | 1,925 | 33,225 | ||||||
Charles Schwab Corp. | ||||||||
4.00%* | 500,000 | 398,725 | ||||||
MetLife, Inc. | ||||||||
3.85%* | 400,000 | 371,500 | ||||||
Bank of America Corp. | ||||||||
6.13%* | 100,000 | 98,125 | ||||||
4.38%* | 100,000 | 84,693 | ||||||
4.38% | 4,775 | 83,801 | ||||||
4.13% | 4,050 | 67,635 | ||||||
Bank of New York Mellon Corp. | ||||||||
3.75%* | 400,000 | 322,183 | ||||||
W R Berkley Corp. | ||||||||
4.13% due 03/30/61 | 11,288 | 200,136 | ||||||
4.25% due 09/30/60 | 1,845 | 34,170 | ||||||
JPMorgan Chase & Co. | ||||||||
3.65%* | 250,000 | 214,063 | ||||||
American Financial Group, Inc. | ||||||||
4.50% due 09/15/60 | 8,968 | 166,715 | ||||||
Arch Capital Group Ltd. | ||||||||
4.55% | 9,510 | 164,238 | ||||||
Public Storage | ||||||||
4.63% | 8,522 | 162,855 | ||||||
RenaissanceRe Holdings Ltd. | ||||||||
4.20% | 7,675 | 124,565 | ||||||
Goldman Sachs Group, Inc. | ||||||||
3.80%* | 150,000 | 122,205 | ||||||
CNO Financial Group, Inc. | ||||||||
5.13% due 11/25/60 | 6,000 | 101,460 | ||||||
Kuvare US Holdings, Inc. | ||||||||
7.00% due 02/17/51*,4 | 100,000 | 101,000 | ||||||
Assurant, Inc. | ||||||||
5.25% due 01/15/61 | 4,000 | 80,760 | ||||||
Selective Insurance Group, Inc. | ||||||||
4.60% | 4,000 | 67,000 | ||||||
Total Financial | 6,212,275 | |||||||
Total Preferred Stocks | ||||||||
(Cost $7,689,418) | 6,212,275 | |||||||
WARRANTS† - 0.0% | ||||||||
Conyers Park III Acquisition Corp. | ||||||||
Expiring 08/12/28*,1 | 1,266 | 190 | ||||||
Ginkgo Bioworks Holdings, Inc. | ||||||||
Expiring 08/01/26* | 684 | 137 | ||||||
Acropolis Infrastructure Acquisition Corp. | ||||||||
Expiring 03/31/26*,1 | 900 | 108 | ||||||
AfterNext HealthTech Acquisition Corp. | ||||||||
Expiring 07/09/23*,1 | 1,366 | 102 | ||||||
MSD Acquisition Corp. | ||||||||
Expiring 05/13/23*,1 | 974 | 73 | ||||||
Waverley Capital Acquisition Corp. | ||||||||
Expiring 04/30/27*,††,1 | 1,000 | 40 | ||||||
Blue Whale Acquisition Corp. | ||||||||
Expiring 07/09/23*,1 | 550 | 39 | ||||||
Total Warrants | ||||||||
(Cost $8,824) | 689 | |||||||
MUTUAL FUNDS† - 4.3% | ||||||||
Guggenheim Total Return Bond Fund — R6-Class5 | 253,512 | 5,884,003 | ||||||
Total Mutual Funds | ||||||||
(Cost $6,730,114) | 5,884,003 | |||||||
MONEY MARKET FUND† - 3.4% | ||||||||
Dreyfus Treasury Obligations Cash Management Fund — Institutional Shares, 4.17%6 | 4,537,271 | 4,537,271 | ||||||
Total Money Market Fund | ||||||||
(Cost $4,537,271) | 4,537,271 | |||||||
SEE NOTES TO FINANCIAL STATEMENTS. | THE GUGGENHEIM FUNDS ANNUAL REPORT | 39 |
SCHEDULE OF INVESTMENTS (continued) | December 31, 2022 |
SERIES E (TOTAL RETURN BOND SERIES) |
Face | Value | |||||||
| CORPORATE BONDS†† - 31.8% | ||||||||
| Financial - 14.3% | ||||||||
| Pershing Square Holdings Ltd. | ||||||||
3.25% due 11/15/304 | 1,000,000 | $ | 778,570 | |||||
| 3.25% due 10/01/31 | 1,000,000 | 752,240 | ||||||
| Reliance Standard Life Global Funding II | ||||||||
2.75% due 05/07/254 | 800,000 | 750,911 | ||||||
| Bank of America Corp. | ||||||||
2.59% due 04/29/313 | 890,000 | 724,848 | ||||||
| Nationwide Mutual Insurance Co. | ||||||||
4.35% due 04/30/504 | 950,000 | 709,571 | ||||||
| JPMorgan Chase & Co. | ||||||||
5.72% due 09/14/333 | 300,000 | 292,816 | ||||||
2.96% due 05/13/313 | 230,000 | 189,510 | ||||||
4.49% due 03/24/313 | 200,000 | 186,791 | ||||||
| Liberty Mutual Group, Inc. | ||||||||
4.30% due 02/01/614 | 700,000 | 427,000 | ||||||
3.95% due 05/15/604 | 280,000 | 183,381 | ||||||
| Wilton RE Ltd. | ||||||||
6.00%3,4,7 | 700,000 | 606,109 | ||||||
| Macquarie Bank Ltd. | ||||||||
3.05% due 03/03/363,4 | 450,000 | 325,488 | ||||||
3.62% due 06/03/304 | 290,000 | 234,408 | ||||||
| GLP Capital Limited Partnership / GLP Financing II, Inc. | ||||||||
| 5.30% due 01/15/29 | 300,000 | 283,902 | ||||||
| 4.00% due 01/15/31 | 290,000 | 248,762 | ||||||
| Citigroup, Inc. | ||||||||
2.57% due 06/03/313 | 590,000 | 477,186 | ||||||
| Fairfax Financial Holdings Ltd. | ||||||||
| 3.38% due 03/03/31 | 450,000 | 368,699 | ||||||
5.63% due 08/16/324 | 100,000 | 93,861 | ||||||
| Reinsurance Group of America, Inc. | ||||||||
| 3.15% due 06/15/30 | 529,000 | 449,301 | ||||||
| Nippon Life Insurance Co. | ||||||||
2.75% due 01/21/513,4 | 350,000 | 280,874 | ||||||
2.90% due 09/16/513,4 | 200,000 | 159,966 | ||||||
| Fidelity National Financial, Inc. | ||||||||
| 3.40% due 06/15/30 | 279,000 | 235,498 | ||||||
| 2.45% due 03/15/31 | 230,000 | 175,457 | ||||||
| Host Hotels & Resorts, LP | ||||||||
| 3.50% due 09/15/30 | 435,000 | 358,992 | ||||||
| 2.90% due 12/15/31 | 50,000 | 38,248 | ||||||
| FS KKR Capital Corp. | ||||||||
| 2.63% due 01/15/27 | 250,000 | 208,709 | ||||||
| 3.25% due 07/15/27 | 200,000 | 168,233 | ||||||
| Macquarie Group Ltd. | ||||||||
2.87% due 01/14/333,4 | 250,000 | 191,796 | ||||||
2.69% due 06/23/323,4 | 200,000 | 153,471 | ||||||
| Safehold Operating Partnership, LP | ||||||||
| 2.85% due 01/15/32 | 271,000 | 205,674 | ||||||
| 2.80% due 06/15/31 | 180,000 | 138,142 | ||||||
| Ares Finance Company II LLC | ||||||||
3.25% due 06/15/304 | 410,000 | 338,229 | ||||||
| Global Atlantic Finance Co. | ||||||||
4.70% due 10/15/513,4 | 250,000 | 190,417 | ||||||
3.13% due 06/15/314 | 200,000 | 146,741 | ||||||
| Maple Grove Funding Trust I | ||||||||
4.16% due 08/15/514 | 500,000 | 335,063 | ||||||
| United Wholesale Mortgage LLC | ||||||||
5.50% due 04/15/294 | 300,000 | 238,644 | ||||||
5.50% due 11/15/254 | 100,000 | 90,062 | ||||||
| Iron Mountain, Inc. | ||||||||
4.50% due 02/15/314 | 261,000 | 214,526 | ||||||
5.63% due 07/15/324 | 125,000 | 108,327 | ||||||
| Standard Chartered plc | ||||||||
4.64% due 04/01/313,4 | 350,000 | 314,523 | ||||||
| National Australia Bank Ltd. | ||||||||
2.99% due 05/21/314 | 400,000 | 313,110 | ||||||
| Jefferies Financial Group, Inc. | ||||||||
| 2.75% due 10/15/32 | 300,000 | 225,604 | ||||||
| 2.63% due 10/15/31 | 100,000 | 76,284 | ||||||
| First American Financial Corp. | ||||||||
| 4.00% due 05/15/30 | 360,000 | 301,486 | ||||||
| OneAmerica Financial Partners, Inc. | ||||||||
4.25% due 10/15/504 | 410,000 | 291,728 | ||||||
| Rocket Mortgage LLC / Rocket Mortgage Company-Issuer, Inc. | ||||||||
3.88% due 03/01/314 | 350,000 | 267,146 | ||||||
| ABN AMRO Bank N.V. | ||||||||
2.47% due 12/13/293,4 | 300,000 | 242,588 | ||||||
| Belrose Funding Trust | ||||||||
2.33% due 08/15/304 | 320,000 | 242,332 | ||||||
| UBS Group AG | ||||||||
2.10% due 02/11/323,4 | 300,000 | 225,868 | ||||||
| Brookfield Finance, Inc. | ||||||||
| 3.50% due 03/30/51 | 280,000 | 177,728 | ||||||
| 4.70% due 09/20/47 | 50,000 | 40,184 | ||||||
| Corebridge Financial, Inc. | ||||||||
4.35% due 04/05/424 | 150,000 | 123,052 | ||||||
6.88% due 12/15/523,4 | 100,000 | 92,404 | ||||||
| Toronto-Dominion Bank | ||||||||
8.13% due 10/31/823 | 200,000 | 208,000 | ||||||
| Bank of Nova Scotia | ||||||||
8.63% due 10/27/823 | 200,000 | 207,927 | ||||||
| SBA Communications Corp. | ||||||||
| 3.13% due 02/01/29 | 250,000 | 207,873 | ||||||
| Jefferies Finance LLC / JFIN Company-Issuer Corp. | ||||||||
5.00% due 08/15/284 | 250,000 | 203,933 | ||||||
| Societe Generale S.A. | ||||||||
2.89% due 06/09/323,4 | 250,000 | 192,332 | ||||||
| Stewart Information Services Corp. | ||||||||
| 3.60% due 11/15/31 | 250,000 | 191,582 | ||||||
| Everest Reinsurance Holdings, Inc. | ||||||||
| 3.50% due 10/15/50 | 280,000 | 189,517 | ||||||
| Assurant, Inc. | ||||||||
| 2.65% due 01/15/32 | 250,000 | 184,902 | ||||||
40 | THE GUGGENHEIM FUNDS ANNUAL REPORT | SEE NOTES TO FINANCIAL STATEMENTS. |
SCHEDULE OF INVESTMENTS (continued) | December 31, 2022 |
SERIES E (TOTAL RETURN BOND SERIES) |
Face | Value | |||||||
| Westpac Banking Corp. | ||||||||
3.02% due 11/18/363 | 150,000 | $ | 111,520 | |||||
| 2.96% due 11/16/40 | 100,000 | 66,026 | ||||||
| Intercontinental Exchange, Inc. | ||||||||
| 2.65% due 09/15/40 | 250,000 | 173,385 | ||||||
| Trustage Financial Group, Inc. | ||||||||
4.63% due 04/15/324 | 200,000 | 172,420 | ||||||
| Hunt Companies, Inc. | ||||||||
5.25% due 04/15/294 | 200,000 | 168,102 | ||||||
| Primerica, Inc. | ||||||||
| 2.80% due 11/19/31 | 200,000 | 162,791 | ||||||
| AmFam Holdings, Inc. | ||||||||
2.81% due 03/11/314 | 200,000 | 155,394 | ||||||
| Americo Life, Inc. | ||||||||
3.45% due 04/15/314 | 200,000 | 152,093 | ||||||
| LPL Holdings, Inc. | ||||||||
4.00% due 03/15/294 | 174,000 | 151,397 | ||||||
| Assured Guaranty US Holdings, Inc. | ||||||||
| 3.15% due 06/15/31 | 90,000 | 75,748 | ||||||
| 3.60% due 09/15/51 | 100,000 | 65,066 | ||||||
| NFP Corp. | ||||||||
6.88% due 08/15/284 | 167,000 | 137,655 | ||||||
| KKR Group Finance Company VIII LLC | ||||||||
3.50% due 08/25/504 | 190,000 | 127,018 | ||||||
| Kemper Corp. | ||||||||
| 2.40% due 09/30/30 | 146,000 | 113,511 | ||||||
| Lincoln National Corp. | ||||||||
| 4.38% due 06/15/50 | 150,000 | 111,644 | ||||||
| Prudential Financial, Inc. | ||||||||
3.70% due 10/01/503 | 130,000 | 109,706 | ||||||
| PartnerRe Finance B LLC | ||||||||
4.50% due 10/01/503 | 110,000 | 95,183 | ||||||
| Kennedy-Wilson, Inc. | ||||||||
| 4.75% due 03/01/29 | 112,000 | 88,765 | ||||||
| Apollo Management Holdings, LP | ||||||||
2.65% due 06/05/304 | 90,000 | 73,113 | ||||||
| Brown & Brown, Inc. | ||||||||
| 2.38% due 03/15/31 | 90,000 | 68,475 | ||||||
| Western & Southern Life Insurance Co. | ||||||||
3.75% due 04/28/614 | 100,000 | 66,719 | ||||||
| Penn Mutual Life Insurance Co. | ||||||||
3.80% due 04/29/614 | 100,000 | 65,951 | ||||||
| American Equity Investment Life Holding Co. | ||||||||
| 5.00% due 06/15/27 | 69,000 | 65,336 | ||||||
| CNO Financial Group, Inc. | ||||||||
| 5.25% due 05/30/29 | 50,000 | 47,635 | ||||||
| Home Point Capital, Inc. | ||||||||
5.00% due 02/01/264 | 53,000 | 36,649 | ||||||
| Cushman & Wakefield US Borrower LLC | ||||||||
6.75% due 05/15/284 | 35,000 | 33,403 | ||||||
| Brookfield Finance LLC | ||||||||
| 3.45% due 04/15/50 | 50,000 | 31,580 | ||||||
| Total Financial | 19,306,811 | |||||||
| Consumer, Non-cyclical - 4.1% | ||||||||
| CoStar Group, Inc. | ||||||||
2.80% due 07/15/304 | 740,000 | 604,350 | ||||||
| Altria Group, Inc. | ||||||||
| 3.70% due 02/04/51 | 550,000 | 344,476 | ||||||
| 3.40% due 05/06/30 | 170,000 | 145,308 | ||||||
| 4.45% due 05/06/50 | 50,000 | 35,405 | ||||||
| Quanta Services, Inc. | ||||||||
| 2.90% due 10/01/30 | 467,000 | 383,977 | ||||||
| BAT Capital Corp. | ||||||||
| 3.98% due 09/25/50 | 300,000 | 196,307 | ||||||
| 4.70% due 04/02/27 | 190,000 | 182,132 | ||||||
| DaVita, Inc. | ||||||||
3.75% due 02/15/314 | 297,000 | 221,666 | ||||||
4.63% due 06/01/304 | 113,000 | 90,900 | ||||||
| Johns Hopkins University | ||||||||
| 2.81% due 01/01/60 | 500,000 | 312,193 | ||||||
| Children’s Hospital Corp. | ||||||||
| 2.59% due 02/01/50 | 500,000 | 304,342 | ||||||
| Global Payments, Inc. | ||||||||
| 2.90% due 05/15/30 | 210,000 | 172,067 | ||||||
| 2.90% due 11/15/31 | 140,000 | 110,400 | ||||||
| Smithfield Foods, Inc. | ||||||||
2.63% due 09/13/314 | 250,000 | 178,802 | ||||||
3.00% due 10/15/304 | 110,000 | 83,753 | ||||||
| Medline Borrower, LP | ||||||||
3.88% due 04/01/294 | 296,000 | 238,564 | ||||||
| JBS USA LUX S.A. / JBS USA Food Company / JBS USA Finance, Inc. | ||||||||
3.00% due 05/15/324 | 200,000 | 153,370 | ||||||
4.38% due 02/02/524 | 100,000 | 70,693 | ||||||
| Royalty Pharma plc | ||||||||
| 3.55% due 09/02/50 | 310,000 | 198,107 | ||||||
| Becle, SAB de CV | ||||||||
2.50% due 10/14/314 | 250,000 | 194,250 | ||||||
| Kimberly-Clark de Mexico SAB de CV | ||||||||
2.43% due 07/01/314 | 200,000 | 159,882 | ||||||
| Triton Container International Ltd. | ||||||||
3.15% due 06/15/314 | 200,000 | 155,692 | ||||||
| Spectrum Brands, Inc. | ||||||||
| 5.75% due 07/15/25 | 150,000 | 148,303 | ||||||
| California Institute of Technology | ||||||||
| 3.65% due 09/01/19 | 225,000 | 143,311 | ||||||
| Universal Health Services, Inc. | ||||||||
2.65% due 10/15/304 | 150,000 | 119,381 | ||||||
| Transurban Finance Company Pty Ltd. | ||||||||
2.45% due 03/16/314 | 150,000 | 117,987 | ||||||
| Catalent Pharma Solutions, Inc. | ||||||||
3.13% due 02/15/294 | 127,000 | 101,120 | ||||||
| TriNet Group, Inc. | ||||||||
3.50% due 03/01/294 | 117,000 | 96,197 | ||||||
| Triton Container International Limited/ TAL International Container Corp. | ||||||||
| 3.25% due 03/15/32 | 100,000 | 77,205 | ||||||
SEE NOTES TO FINANCIAL STATEMENTS. | THE GUGGENHEIM FUNDS ANNUAL REPORT | 41 |
SCHEDULE OF INVESTMENTS (continued) | December 31, 2022 |
SERIES E (TOTAL RETURN BOND SERIES) |
Face | Value | |||||||
| Central Garden & Pet Co. | ||||||||
4.13% due 04/30/314 | 84,000 | $ | 69,537 | |||||
| US Foods, Inc. | ||||||||
6.25% due 04/15/254 | 70,000 | 69,267 | ||||||
| Tenet Healthcare Corp. | ||||||||
4.63% due 06/15/284 | 75,000 | 67,106 | ||||||
| Service Corporation International | ||||||||
| 3.38% due 08/15/30 | 60,000 | 48,775 | ||||||
| Total Consumer, Non-cyclical | 5,594,825 | |||||||
| Industrial - 4.0% | ||||||||
| Boeing Co. | ||||||||
| 5.15% due 05/01/30 | 970,000 | 946,370 | ||||||
| 5.71% due 05/01/40 | 490,000 | 467,246 | ||||||
| 5.81% due 05/01/50 | 490,000 | 454,316 | ||||||
| 2.20% due 02/04/26 | 200,000 | 181,712 | ||||||
| Amsted Industries, Inc. | ||||||||
4.63% due 05/15/304 | 470,000 | 400,675 | ||||||
| Crown Americas LLC / Crown Americas Capital Corporation VI | ||||||||
| 4.75% due 02/01/26 | 400,000 | 388,300 | ||||||
| Stadco LA, LLC | ||||||||
3.75% due 05/15/56††† | 500,000 | 344,600 | ||||||
| TD SYNNEX Corp. | ||||||||
| 2.65% due 08/09/31 | 250,000 | 189,359 | ||||||
| 2.38% due 08/09/28 | 150,000 | 121,009 | ||||||
| Cellnex Finance Company S.A. | ||||||||
3.88% due 07/07/414 | 450,000 | 307,800 | ||||||
| Flowserve Corp. | ||||||||
| 3.50% due 10/01/30 | 270,000 | 225,061 | ||||||
| 2.80% due 01/15/32 | 100,000 | 74,905 | ||||||
| Owens Corning | ||||||||
| 3.88% due 06/01/30 | 320,000 | 284,332 | ||||||
| Acuity Brands Lighting, Inc. | ||||||||
| 2.15% due 12/15/30 | 350,000 | 268,782 | ||||||
| Vontier Corp. | ||||||||
| 2.95% due 04/01/31 | 350,000 | 252,899 | ||||||
| Weir Group plc | ||||||||
2.20% due 05/13/264 | 200,000 | 177,369 | ||||||
| GATX Corp. | ||||||||
| 4.00% due 06/30/30 | 140,000 | 124,059 | ||||||
| 3.50% due 03/15/28 | 50,000 | 45,367 | ||||||
| Berry Global, Inc. | ||||||||
| 1.57% due 01/15/26 | 50,000 | 44,541 | ||||||
| Norfolk Southern Corp. | ||||||||
| 4.10% due 05/15/21 | 50,000 | 34,579 | ||||||
| Total Industrial | 5,333,281 | |||||||
| Consumer, Cyclical - 2.9% | ||||||||
| Marriott International, Inc. | ||||||||
| 4.63% due 06/15/30 | 340,000 | 317,259 | ||||||
| 3.50% due 10/15/32 | 204,000 | 169,700 | ||||||
| 2.85% due 04/15/31 | 170,000 | 137,663 | ||||||
| 2.75% due 10/15/33 | 100,000 | 76,291 | ||||||
| Warnermedia Holdings, Inc. | ||||||||
4.28% due 03/15/324 | 400,000 | 329,506 | ||||||
5.14% due 03/15/524 | 200,000 | 145,393 | ||||||
| Hyatt Hotels Corp. | ||||||||
| 5.63% due 04/23/25 | 220,000 | 218,302 | ||||||
| 6.00% due 04/23/30 | 190,000 | 185,863 | ||||||
| Delta Air Lines, Inc. | ||||||||
7.00% due 05/01/254 | 367,000 | 375,052 | ||||||
| Hilton Domestic Operating Company, Inc. | ||||||||
3.75% due 05/01/294 | 393,000 | 339,945 | ||||||
| Mileage Plus Holdings LLC / Mileage Plus Intellectual Property Assets Ltd. | ||||||||
6.50% due 06/20/274 | 315,020 | 313,194 | ||||||
| Choice Hotels International, Inc. | ||||||||
| 3.70% due 01/15/31 | 360,000 | 305,155 | ||||||
| Delta Air Lines Inc. / SkyMiles IP Ltd. | ||||||||
4.50% due 10/20/254 | 300,000 | 292,674 | ||||||
| Ferguson Finance plc | ||||||||
4.65% due 04/20/324 | 200,000 | 182,013 | ||||||
| 1011778 BC ULC / New Red Finance, Inc. | ||||||||
4.00% due 10/15/304 | 143,000 | 115,803 | ||||||
3.88% due 01/15/284 | 55,000 | 49,200 | ||||||
| United Airlines, Inc. | ||||||||
4.38% due 04/15/264 | 150,000 | 139,039 | ||||||
| British Airways Class A Pass Through Trust | ||||||||
2.90% due 03/15/354 | 98,402 | 80,102 | ||||||
| Walgreens Boots Alliance, Inc. | ||||||||
| 4.10% due 04/15/50 | 98,000 | 72,093 | ||||||
| WMG Acquisition Corp. | ||||||||
3.00% due 02/15/314 | 50,000 | 39,955 | ||||||
| Total Consumer, Cyclical | 3,884,202 | |||||||
| Communications - 2.5% | ||||||||
| Charter Communications Operating LLC / Charter Communications Operating Capital | ||||||||
| 2.80% due 04/01/31 | 625,000 | 486,567 | ||||||
| 2.25% due 01/15/29 | 100,000 | 80,488 | ||||||
| 3.90% due 06/01/52 | 50,000 | 31,391 | ||||||
| British Telecommunications plc | ||||||||
4.88% due 11/23/813,4 | 350,000 | 275,343 | ||||||
| 9.63% due 12/15/30 | 100,000 | 119,753 | ||||||
| Level 3 Financing, Inc. | ||||||||
3.63% due 01/15/294 | 330,000 | 241,639 | ||||||
3.75% due 07/15/294 | 100,000 | 71,937 | ||||||
| CSC Holdings LLC | ||||||||
4.13% due 12/01/304 | 200,000 | 141,166 | ||||||
3.38% due 02/15/314 | 200,000 | 130,427 | ||||||
| Virgin Media Secured Finance plc | ||||||||
4.50% due 08/15/304 | 300,000 | 250,627 | ||||||
| Cable One, Inc. | ||||||||
4.00% due 11/15/304 | 300,000 | 235,415 | ||||||
| Paramount Global | ||||||||
| 4.95% due 05/19/50 | 320,000 | 232,774 | ||||||
| Vodafone Group plc | ||||||||
4.13% due 06/04/813 | 250,000 | 185,553 | ||||||
42 | THE GUGGENHEIM FUNDS ANNUAL REPORT | SEE NOTES TO FINANCIAL STATEMENTS. |
SCHEDULE OF INVESTMENTS (continued) | December 31, 2022 |
SERIES E (TOTAL RETURN BOND SERIES) |
Face | Value | |||||||
| Virgin Media Vendor Financing Notes IV DAC | ||||||||
5.00% due 07/15/284 | 200,000 | $ | 174,821 | |||||
| Rogers Communications, Inc. | ||||||||
4.55% due 03/15/524 | 200,000 | 155,057 | ||||||
| Altice France S.A. | ||||||||
5.13% due 07/15/294 | 200,000 | 149,949 | ||||||
| Sirius XM Radio, Inc. | ||||||||
4.13% due 07/01/304 | 180,000 | 148,538 | ||||||
| Go Daddy Operating Company LLC / GD Finance Co., Inc. | ||||||||
3.50% due 03/01/294 | 115,000 | 96,277 | ||||||
| Radiate Holdco LLC / Radiate Finance, Inc. | ||||||||
4.50% due 09/15/264 | 114,000 | 83,756 | ||||||
| McGraw-Hill Education, Inc. | ||||||||
5.75% due 08/01/284 | 72,000 | 60,507 | ||||||
| Lamar Media Corp. | ||||||||
| 3.63% due 01/15/31 | 70,000 | 57,871 | ||||||
| Total Communications | 3,409,856 | |||||||
| Basic Materials - 1.2% | ||||||||
| Newcrest Finance Pty Ltd. | ||||||||
3.25% due 05/13/304 | 460,000 | 383,891 | ||||||
4.20% due 05/13/504 | 220,000 | 155,403 | ||||||
| Anglo American Capital plc | ||||||||
5.63% due 04/01/304 | 200,000 | 198,547 | ||||||
2.63% due 09/10/304 | 200,000 | 162,537 | ||||||
| Alcoa Nederland Holding BV | ||||||||
5.50% due 12/15/274 | 200,000 | 192,732 | ||||||
| Minerals Technologies, Inc. | ||||||||
5.00% due 07/01/284 | 190,000 | 169,214 | ||||||
| INEOS Quattro Finance 2 plc | ||||||||
3.38% due 01/15/264 | 150,000 | 137,813 | ||||||
| Yamana Gold, Inc. | ||||||||
| 2.63% due 08/15/31 | 150,000 | 112,008 | ||||||
| Reliance Steel & Aluminum Co. | ||||||||
| 2.15% due 08/15/30 | 100,000 | 78,746 | ||||||
| Valvoline, Inc. | ||||||||
4.25% due 02/15/304 | 50,000 | 48,506 | ||||||
| Total Basic Materials | 1,639,397 | |||||||
| Energy - 1.2% | ||||||||
| BP Capital Markets plc | ||||||||
4.88% 3,7 | 880,000 | 770,000 | ||||||
| Galaxy Pipeline Assets Bidco Ltd. | ||||||||
3.25% due 09/30/404 | 328,000 | 253,605 | ||||||
2.94% due 09/30/404 | 144,980 | 116,404 | ||||||
| ITT Holdings LLC | ||||||||
6.50% due 08/01/294 | 248,000 | 208,851 | ||||||
| Midwest Connector Capital Company LLC | ||||||||
4.63% due 04/01/294 | 110,000 | 99,373 | ||||||
| NuStar Logistics, LP | ||||||||
| 5.63% due 04/28/27 | 100,000 | 93,506 | ||||||
| Parkland Corp. | ||||||||
4.63% due 05/01/304 | 100,000 | 82,750 | ||||||
| Total Energy | 1,624,489 | |||||||
| Technology - 1.2% | ||||||||
| Broadcom, Inc. | ||||||||
4.93% due 05/15/374 | 277,000 | 241,645 | ||||||
2.45% due 02/15/314 | 300,000 | 236,286 | ||||||
| 4.15% due 11/15/30 | 206,000 | 184,607 | ||||||
3.19% due 11/15/364 | 26,000 | 18,675 | ||||||
| Qorvo, Inc. | ||||||||
| 4.38% due 10/15/29 | 170,000 | 150,321 | ||||||
3.38% due 04/01/314 | 100,000 | 80,344 | ||||||
| CDW LLC / CDW Finance Corp. | ||||||||
| 3.57% due 12/01/31 | 250,000 | 206,009 | ||||||
| Leidos, Inc. | ||||||||
| 2.30% due 02/15/31 | 250,000 | 191,514 | ||||||
| Oracle Corp. | ||||||||
| 3.95% due 03/25/51 | 250,000 | 178,110 | ||||||
| Boxer Parent Company, Inc. | ||||||||
7.13% due 10/02/254 | 100,000 | 97,251 | ||||||
| Twilio, Inc. | ||||||||
| 3.63% due 03/15/29 | 38,000 | 30,871 | ||||||
| Total Technology | 1,615,633 | |||||||
| Utilities - 0.4% | ||||||||
| AES Corp. | ||||||||
3.95% due 07/15/304 | 220,000 | 194,040 | ||||||
| NRG Energy, Inc. | ||||||||
2.45% due 12/02/274 | 200,000 | 165,711 | ||||||
| Enel Finance America LLC | ||||||||
2.88% due 07/12/414 | 200,000 | 119,976 | ||||||
| Xcel Energy, Inc. | ||||||||
| 2.35% due 11/15/31 | 60,000 | 47,933 | ||||||
| Total Utilities | 527,660 | |||||||
| Total Corporate Bonds | ||||||||
| (Cost $53,282,555) | 42,936,154 | |||||||
| ASSET-BACKED SECURITIES†† - 20.9% | ||||||||
| Collateralized Loan Obligations - 13.1% | ||||||||
| Octagon Investment Partners 49 Ltd. | ||||||||
2021-5A B, 5.63% (3 Month USD LIBOR + 1.55%, Rate Floor: 1.55%) due 01/15/33◊,4 | 1,750,000 | 1,685,494 | ||||||
| BXMT Ltd. | ||||||||
2020-FL2 AS, 5.59% (1 Month Term SOFR + 1.26%, Rate Floor: 1.15%) due 02/15/38◊,4 | 1,000,000 | 980,854 | ||||||
2020-FL3 C, 6.47% (30 Day Average SOFR + 2.66%, Rate Floor: 2.55%) due 11/15/37◊,4 | 250,000 | 238,639 | ||||||
| Woodmont Trust | ||||||||
2020-7A A1A, 5.98% (3 Month USD LIBOR + 1.90%, Rate Floor: 1.90%) due 01/15/32◊,4 | 1,000,000 | 990,965 | ||||||
| Cerberus Loan Funding XXX, LP | ||||||||
2020-3A A, 5.93% (3 Month USD LIBOR + 1.85%, Rate Floor: 1.85%) due 01/15/33◊,4 | 1,000,000 | 978,179 | ||||||
SEE NOTES TO FINANCIAL STATEMENTS. | THE GUGGENHEIM FUNDS ANNUAL REPORT | 43 |
SCHEDULE OF INVESTMENTS (continued) | December 31, 2022 |
SERIES E (TOTAL RETURN BOND SERIES) |
Face | Value | |||||||
| ABPCI Direct Lending Fund CLO II LLC | ||||||||
2021-1A A1R, 5.84% (3 Month USD LIBOR + 1.60%, Rate Floor: 1.60%) due 04/20/32◊,4 | 1,000,000 | $ | 963,444 | |||||
| Palmer Square Loan Funding Ltd. | ||||||||
2022-1A A2, 5.46% (3 Month Term SOFR + 1.60%, Rate Floor: 1.60%) due 04/15/30◊,4 | 1,000,000 | 962,139 | ||||||
| LCCM Trust | ||||||||
2021-FL3 A, 5.77% (1 Month USD LIBOR + 1.45%, Rate Floor: 1.45%) due 11/15/38◊,4 | 600,000 | 575,304 | ||||||
2021-FL3 AS, 6.12% (1 Month USD LIBOR + 1.80%, Rate Floor: 1.80%) due 11/15/38◊,4 | 400,000 | 376,988 | ||||||
| LoanCore Issuer Ltd. | ||||||||
2019-CRE2 AS, 5.82% (1 Month USD LIBOR + 1.50%, Rate Floor: 1.50%) due 05/15/36◊,4 | 480,574 | 475,366 | ||||||
2021-CRE6 C, 6.62% (1 Month USD LIBOR + 2.30%, Rate Floor: 2.30%) due 11/15/38◊,4 | 500,000 | 471,654 | ||||||
| Golub Capital Partners CLO 36M Ltd. | ||||||||
2018-36A A, 5.83% (3 Month USD LIBOR + 1.30%, Rate Floor: 0.00%) due 02/05/31◊,4 | 850,000 | 832,412 | ||||||
| Dryden 37 Senior Loan Fund | ||||||||
2015-37A Q, due 01/15/314,8 | 1,000,000 | 777,266 | ||||||
| STWD Ltd. | ||||||||
2019-FL1 B, 6.04% (1 Month Term SOFR + 1.71%, Rate Floor: 1.60%) due 07/15/38◊,4 | 750,000 | 733,269 | ||||||
| Fortress Credit Opportunities XI CLO Ltd. | ||||||||
2018-11A A1T, 5.38% (3 Month USD LIBOR + 1.30%, Rate Floor: 0.00%) due 04/15/31◊,4 | 750,000 | 732,562 | ||||||
| Golub Capital Partners CLO 33M Ltd. | ||||||||
2021-33A AR2, 6.62% (3 Month USD LIBOR + 1.86%, Rate Floor: 1.86%) due 08/25/33◊,4 | 750,000 | 698,640 | ||||||
| Cerberus Loan Funding XXVI, LP | ||||||||
2021-1A AR, 5.58% (3 Month USD LIBOR + 1.50%, Rate Floor: 1.50%) due 04/15/31◊,4 | 500,000 | 492,636 | ||||||
| THL Credit Lake Shore MM CLO I Ltd. | ||||||||
2021-1A A1R, 5.78% (3 Month USD LIBOR + 1.70%, Rate Floor: 1.70%) due 04/15/33◊,4 | 500,000 | 487,845 | ||||||
| ABPCI Direct Lending Fund CLO V Ltd. | ||||||||
2021-5A A1R, 5.74% (3 Month USD LIBOR + 1.50%, Rate Floor: 1.50%) due 04/20/31◊,4 | 500,000 | 486,850 | ||||||
| ABPCI Direct Lending Fund CLO I LLC | ||||||||
2021-1A A1A2, 5.94% (3 Month USD LIBOR + 1.70%, Rate Floor: 1.70%) due 07/20/33◊,4 | 500,000 | 480,723 | ||||||
| Golub Capital Partners CLO 16 Ltd. | ||||||||
2021-16A A1R2, 5.97% (3 Month USD LIBOR + 1.61%, Rate Floor: 1.61%) due 07/25/33◊,4 | 500,000 | 479,016 | ||||||
| KREF | ||||||||
2021-FL2 C, 6.33% (1 Month USD LIBOR + 2.00%, Rate Floor: 2.00%) due 02/15/39◊,4 | 500,000 | 477,810 | ||||||
| HERA Commercial Mortgage Ltd. | ||||||||
2021-FL1 B, 5.94% (1 Month USD LIBOR + 1.60%, Rate Floor: 1.60%) due 02/18/38◊,4 | 500,000 | 465,515 | ||||||
| CHCP Ltd. | ||||||||
2021-FL1 C, 6.54% (1 Month Term SOFR + 2.21%, Rate Floor: 2.10%) due 02/15/38◊,4 | 500,000 | 463,436 | ||||||
| Cerberus Loan Funding XXXIII, LP | ||||||||
2021-3A B, 5.93% (3 Month USD LIBOR + 1.85%, Rate Floor: 1.85%) due 07/23/33◊,4 | 500,000 | 458,029 | ||||||
| Golub Capital Partners CLO 54M L.P | ||||||||
2021-54A C, 7.18% (3 Month USD LIBOR + 2.65%, Rate Floor: 2.65%) due 08/05/33◊,4 | 500,000 | 457,084 | ||||||
| Golub Capital Partners CLO 17 Ltd. | ||||||||
2017-17A A1R, 6.01% (3 Month USD LIBOR + 1.65%, Rate Floor: 0.00%) due 10/25/30◊,4 | 250,000 | 245,948 | ||||||
| Cerberus Loan Funding XXXVI, LP | ||||||||
2021-6A A, 5.48% (3 Month USD LIBOR + 1.40%, Rate Floor: 1.40%) due 11/22/33◊,4 | 187,625 | 186,792 | ||||||
| Treman Park CLO Ltd. | ||||||||
2015-1A COM, due 10/20/284,8 | 162,950 | 9,749 | ||||||
| Copper River CLO Ltd. | ||||||||
2007-1A INC, due 01/20/21†††,8,9 | 600,000 | 235 | ||||||
| Total Collateralized Loan Obligations | 17,664,843 | |||||||
| Transport-Aircraft - 1.9% | ||||||||
| Lunar Structured Aircraft Portfolio Notes | ||||||||
2021-1, 2.64% due 10/15/464 | 437,114 | 350,373 | ||||||
| AASET Trust | ||||||||
2021-1A, 2.95% due 11/16/414 | 410,914 | 328,209 | ||||||
| WAVE LLC | ||||||||
2019-1, 3.60% due 09/15/444 | 405,249 | 306,593 | ||||||
| JOL Air Ltd. | ||||||||
2019-1, 3.97% due 04/15/444 | 371,407 | 303,407 | ||||||
| Sapphire Aviation Finance II Ltd. | ||||||||
2020-1A, 3.23% due 03/15/404 | 373,315 | 282,270 | ||||||
| Castlelake Aircraft Structured Trust | ||||||||
2021-1A, 3.47% due 01/15/464 | 309,520 | 260,009 | ||||||
| Sprite Ltd. | ||||||||
2021-1, 3.75% due 11/15/464 | 225,380 | 195,108 | ||||||
44 | THE GUGGENHEIM FUNDS ANNUAL REPORT | SEE NOTES TO FINANCIAL STATEMENTS. |
SCHEDULE OF INVESTMENTS (continued) | December 31, 2022 |
SERIES E (TOTAL RETURN BOND SERIES) |
Face | Value | |||||||
| Raspro Trust | ||||||||
2005-1A, 5.17% (3 Month USD LIBOR + 0.93%, Rate Floor: 0.93%) due 03/23/24◊,4 | 196,989 | $ | 194,496 | |||||
| Navigator Aircraft ABS Ltd. | ||||||||
2021-1, 2.77% due 11/15/464 | 231,399 | 194,364 | ||||||
| Falcon Aerospace Ltd. | ||||||||
2017-1, 4.58% due 02/15/424 | 128,071 | 116,164 | ||||||
| Total Transport-Aircraft | 2,530,993 | |||||||
| Whole Business - 1.7% | ||||||||
| Arbys Funding LLC | ||||||||
2020-1A, 3.24% due 07/30/504 | 977,500 | 826,150 | ||||||
| Applebee’s Funding LLC / IHOP Funding LLC | ||||||||
2019-1A, 4.72% due 06/05/494 | 495,000 | 451,102 | ||||||
| Wingstop Funding LLC | ||||||||
2022-1A, 3.73% due 03/05/524 | 498,750 | 428,634 | ||||||
| SERVPRO Master Issuer LLC | ||||||||
2021-1A, 2.39% due 04/25/514 | 492,500 | 385,236 | ||||||
| ServiceMaster Funding LLC | ||||||||
2020-1, 3.34% due 01/30/514 | 245,625 | 184,048 | ||||||
| Taco Bell Funding LLC | ||||||||
2016-1A, 4.97% due 05/25/464 | 94,500 | 90,641 | ||||||
| Total Whole Business | 2,365,811 | |||||||
| Net Lease - 1.7% | ||||||||
| STORE Master Funding I-VII | ||||||||
2016-1A, 3.96% due 10/20/464 | 1,099,131 | 1,016,813 | ||||||
| CF Hippolyta Issuer LLC | ||||||||
2022-1A, 6.11% due 08/15/624 | 246,686 | 231,662 | ||||||
2020-1, 2.28% due 07/15/604 | 227,075 | 198,186 | ||||||
| Capital Automotive REIT | ||||||||
2021-1A, 2.76% due 08/15/514 | 499,271 | 369,737 | ||||||
| CMFT Net Lease Master Issuer LLC | ||||||||
2021-1, 3.44% due 07/20/514 | 400,000 | 312,637 | ||||||
| CARS-DB4, LP | ||||||||
2020-1A, 3.81% due 02/15/504 | 248,073 | 203,246 | ||||||
| Total Net Lease | 2,332,281 | |||||||
| Financial - 1.1% | ||||||||
| KKR Core Holding Company LLC | ||||||||
4.00% due 08/12/31††† | 540,449 | 458,890 | ||||||
| Madison Avenue Secured Funding Trust | ||||||||
2021-1, 5.07% (1 Month USD LIBOR + 1.50%, Rate Floor: 1.50%) due 01/17/23◊,†††,4 | 450,000 | 450,000 | ||||||
| Oxford Finance Funding | ||||||||
2020-1A, 3.10% due 02/15/284 | 224,550 | 222,068 | ||||||
| Thunderbird A | ||||||||
5.50% due 03/01/37††† | 150,092 | 146,339 | ||||||
| Nassau LLC | ||||||||
2019-1, 3.98% due 08/15/344 | 150,593 | 143,247 | ||||||
| Lightning A | ||||||||
5.50% due 03/01/37††† | 146,745 | 143,077 | ||||||
| Total Financial | 1,563,621 | |||||||
| Collateralized Debt Obligations - 0.8% | ||||||||
| Anchorage Credit Funding 4 Ltd. | ||||||||
2021-4A AR, 2.72% due 04/27/394 | 750,000 | 639,337 | ||||||
| Anchorage Credit Funding 3 Ltd. | ||||||||
2021-3A A1R, 2.87% due 01/28/394 | 450,000 | 393,408 | ||||||
| Total Collateralized Debt Obligations | 1,032,745 | |||||||
| Single Family Residence - 0.3% | ||||||||
| FirstKey Homes Trust | ||||||||
2020-SFR2, 4.50% due 10/19/374 | 150,000 | 133,120 | ||||||
2020-SFR2, 4.00% due 10/19/374 | 150,000 | 131,664 | ||||||
2020-SFR2, 3.37% due 10/19/374 | 100,000 | 86,649 | ||||||
| Total Single Family Residence | 351,433 | |||||||
| Infrastructure - 0.2% | ||||||||
| VB-S1 Issuer LLC - VBTEL | ||||||||
2022-1A, 4.29% due 02/15/524 | 250,000 | 219,378 | ||||||
| SBA Tower Trust | ||||||||
6.56% due 01/15/284 | 55,000 | 55,086 | ||||||
| Total Infrastructure | 274,464 | |||||||
| Transport-Container - 0.1% | ||||||||
| Textainer Marine Containers VII Ltd. | ||||||||
2020-1A, 2.73% due 08/21/454 | 186,134 | 168,527 | ||||||
| Total Asset-Backed Securities | ||||||||
| (Cost $30,609,050) | 28,284,718 | |||||||
| COLLATERALIZED MORTGAGE OBLIGATIONS†† - 17.9% | ||||||||
| Residential Mortgage-Backed Securities - 7.7% | ||||||||
| Starwood Mortgage Residential Trust | ||||||||
2020-1, 2.41% (WAC) due 02/25/50◊,4 | 862,887 | 824,291 | ||||||
| PRPM LLC | ||||||||
2022-1, 3.72% due 02/25/274,10 | 429,826 | 401,889 | ||||||
2021-5, 1.79% due 06/25/264,10 | 410,181 | 371,410 | ||||||
| Legacy Mortgage Asset Trust | ||||||||
2021-GS3, 1.75% due 07/25/614,10 | 411,360 | 371,826 | ||||||
2021-GS5, 2.25% due 07/25/674,10 | 415,120 | 371,593 | ||||||
| FKRT | ||||||||
2.21% due 11/30/58†††,9 | 750,000 | 719,910 | ||||||
| Ameriquest Mortgage Securities Trust | ||||||||
2006-M3, 4.55% (1 Month USD LIBOR + 0.16%, Rate Floor: 0.16%) due 10/25/36◊ | 2,068,908 | 673,963 | ||||||
| JP Morgan Mortgage Acquisition Trust | ||||||||
2006-WMC4, 4.51% (1 Month USD LIBOR + 0.12%, Rate Floor: 0.12%) due 12/25/36◊ | 1,239,581 | 664,601 | ||||||
| Securitized Asset-Backed Receivables LLC Trust 2007-BR2 | ||||||||
2007-BR2, 4.57% (1 Month USD LIBOR + 0.18%, Rate Floor: 0.18%) due 02/25/37◊,4 | 639,558 | 533,812 | ||||||
SEE NOTES TO FINANCIAL STATEMENTS. | THE GUGGENHEIM FUNDS ANNUAL REPORT | 45 |
SCHEDULE OF INVESTMENTS (continued) | December 31, 2022 |
SERIES E (TOTAL RETURN BOND SERIES) |
Face | Value | |||||||
| Home Equity Loan Trust | ||||||||
2007-FRE1, 4.58% (1 Month USD LIBOR + 0.19%, Rate Floor: 0.19%) due 04/25/37◊ | 544,821 | $ | 508,297 | |||||
| Towd Point Revolving Trust | ||||||||
4.83% due 09/25/649 | 500,000 | 481,300 | ||||||
| CSMC Trust | ||||||||
2020-RPL5, 3.02% (WAC) due 08/25/60◊,4 | 486,194 | 464,560 | ||||||
| BRAVO Residential Funding Trust | ||||||||
2022-R1, 3.13% due 01/29/704,10 | 482,709 | 427,529 | ||||||
| Credit Suisse Mortgage Capital Certificates | ||||||||
2021-RPL9, 2.44% (WAC) due 02/25/61◊,4 | 440,617 | 403,976 | ||||||
| OSAT Trust | ||||||||
2021-RPL1, 2.12% due 05/25/654,10 | 431,644 | 398,417 | ||||||
| First Franklin Mortgage Loan Trust | ||||||||
2006-FF16, 4.81% (1 Month USD LIBOR + 0.42%, Rate Floor: 0.42%) due 12/25/36◊ | 894,723 | 384,153 | ||||||
| NovaStar Mortgage Funding Trust Series | ||||||||
2007-2, 4.59% (1 Month USD LIBOR + 0.20%, Rate Cap/Floor: 11.00%/0.20%) due 09/25/37◊ | 393,010 | 378,237 | ||||||
| LSTAR Securities Investment Ltd. | ||||||||
2021-1, 5.92% (1 Month USD LIBOR + 1.80%, Rate Floor: 1.80%) due 02/01/26◊,9 | 230,243 | 205,305 | ||||||
2021-2, 5.82% (1 Month USD LIBOR + 1.70%, Rate Floor: 1.70%) due 03/02/26◊,9 | 174,797 | 171,819 | ||||||
| Master Asset-Backed Securities Trust | ||||||||
2006-WMC4, 4.54% (1 Month USD LIBOR + 0.15%, Rate Floor: 0.15%) due 10/25/36◊ | 1,129,305 | 362,105 | ||||||
| NYMT Loan Trust | ||||||||
2022-SP1, 5.25% due 07/25/624,10 | 337,479 | 324,912 | ||||||
| HarborView Mortgage Loan Trust | ||||||||
2006-14, 4.64% (1 Month USD LIBOR + 0.30%, Rate Floor: 0.30%) due 01/25/47◊ | 343,081 | 292,460 | ||||||
| American Home Mortgage Investment Trust | ||||||||
2007-1, 2.08% due 05/25/4711 | 1,775,815 | 209,264 | ||||||
| Imperial Fund Mortgage Trust | ||||||||
2022-NQM2, 4.20% (WAC) due 03/25/67◊,4 | 187,301 | 166,075 | ||||||
| Washington Mutual Mortgage Pass-Through Certificates WMALT Series Trust | ||||||||
2006-AR9, 2.89% (1 Year CMT Rate + 0.84%, Rate Floor: 0.84%) due 11/25/46◊ | 205,738 | 162,427 | ||||||
| OBX Trust | ||||||||
2022-NQM9, 6.45% due 09/25/624,10 | 99,042 | 98,558 | ||||||
| UCFC Manufactured Housing Contract | ||||||||
| 1997-2, 7.38% due 10/15/28 | 37,288 | 36,802 | ||||||
| Morgan Stanley Re-REMIC Trust | ||||||||
2010-R5, 2.18% due 06/26/364 | 37,456 | 32,658 | ||||||
| Total Residential Mortgage-Backed Securities | 10,442,149 | |||||||
| Government Agency - 7.4% | ||||||||
| Uniform MBS 30 Year | ||||||||
due 02/01/232 | 8,680,000 | 8,136,424 | ||||||
| Fannie Mae | ||||||||
| 3.83% due 05/01/49 | 1,000,000 | 846,441 | ||||||
| 2.41% due 12/01/41 | 1,000,000 | 681,612 | ||||||
| Fannie Mae-Aces | ||||||||
1.47% (WAC) due 03/25/35◊,11 | 2,664,245 | 277,964 | ||||||
| Total Government Agency | 9,942,441 | |||||||
| Commercial Mortgage-Backed Securities - 1.5% | ||||||||
| BX Commercial Mortgage Trust | ||||||||
2022-LP2, 6.30% (1 Month Term SOFR + 1.96%, Rate Floor: 1.96%) due 02/15/39◊,4 | 464,195 | 432,248 | ||||||
2021-VOLT, 6.32% (1 Month USD LIBOR + 2.00%, Rate Floor: 2.00%) due 09/15/36◊,4 | 350,000 | 325,489 | ||||||
| GS Mortgage Securities Trust | ||||||||
2020-GC45, 0.67% (WAC) due 02/13/53◊,11 | 9,942,807 | 323,486 | ||||||
| Extended Stay America Trust | ||||||||
2021-ESH, 6.57% (1 Month USD LIBOR + 2.25%, Rate Floor: 2.25%) due 07/15/38◊,4 | 244,048 | 233,641 | ||||||
| Life Mortgage Trust | ||||||||
2021-BMR, 6.67% (1 Month USD LIBOR + 2.35%, Rate Floor: 2.35%) due 03/15/38◊,4 | 245,743 | 231,868 | ||||||
| CFCRE Commercial Mortgage Trust | ||||||||
2016-C3, 0.98% (WAC) due 01/10/48◊,11 | 5,363,886 | 130,670 | ||||||
| Wells Fargo Commercial Mortgage Trust | ||||||||
2016-NXS5, 1.42% (WAC) due 01/15/59◊,11 | 3,591,815 | 115,370 | ||||||
| 2015-NXS1, 2.63% due 05/15/48 | 5,823 | 5,810 | ||||||
| Citigroup Commercial Mortgage Trust | ||||||||
2016-GC37, 1.65% (WAC) due 04/10/49◊,11 | 2,858,644 | 116,292 | ||||||
| COMM Mortgage Trust | ||||||||
2015-CR26, 0.90% (WAC) due 10/10/48◊,11 | 5,724,212 | 110,274 | ||||||
| Total Commercial Mortgage-Backed Securities | 2,025,148 | |||||||
| Military Housing - 1.3% | ||||||||
| GMAC Commercial Mortgage Asset Corp. | ||||||||
2007-HCKM, 6.11% due 08/10/52†††,4 | 923,527 | 914,227 | ||||||
| Freddie Mac Military Housing Bonds Resecuritization Trust Certificates | ||||||||
2015-R1, 4.49% (WAC) due 11/25/55◊,4 | 916,364 | 824,103 | ||||||
| Total Military Housing | 1,738,330 | |||||||
| Total Collateralized Mortgage Obligations | ||||||||
| (Cost $26,814,166) | 24,148,068 | |||||||
46 | THE GUGGENHEIM FUNDS ANNUAL REPORT | SEE NOTES TO FINANCIAL STATEMENTS. |
SCHEDULE OF INVESTMENTS (continued) | December 31, 2022 |
SERIES E (TOTAL RETURN BOND SERIES) |
Face | Value | |||||||
U.S. GOVERNMENT SECURITIES†† - 15.0% | ||||||||
| U.S. Treasury Notes | ||||||||
| 4.13% due 11/15/32 | 5,975,000 | $ | 6,097,301 | |||||
| 3.88% due 11/30/27 | 4,800,000 | 4,773,750 | ||||||
| 2.63% due 05/31/27 | 1,710,000 | 1,611,875 | ||||||
| U.S. Treasury Bonds | ||||||||
due 11/15/5212,13 | 3,400,000 | 1,106,433 | ||||||
due 02/15/5212,13 | 3,180,000 | 1,022,082 | ||||||
due 02/15/4612,13 | 2,455,000 | 941,887 | ||||||
due 05/15/4412,13 | 2,145,000 | 880,396 | ||||||
due 11/15/4412,13 | 490,000 | 195,943 | ||||||
2.00% due 08/15/5115 | 4,500,000 | 2,946,445 | ||||||
| 1.88% due 11/15/51 | 1,050,000 | 665,027 | ||||||
| Total U.S. Government Securities | ||||||||
| (Cost $22,968,477) | 20,241,139 | |||||||
| SENIOR FLOATING RATE INTERESTS††,◊ - 3.6% | ||||||||
| Consumer, Cyclical - 1.0% | ||||||||
| MB2 Dental Solutions LLC | ||||||||
10.42% (1 Month Term SOFR + 6.00%, Rate Floor: 7.00%) due 01/29/27††† | 442,442 | 434,505 | ||||||
| Zephyr Bidco Ltd. | ||||||||
| 8.21% (1 Month GBP SONIA + 4.75%, Rate Floor: 5.44%) due 07/23/25 | GBP 200,000 | 197,050 | ||||||
| Pacific Bells LLC | ||||||||
| 9.34% (3 Month Term SOFR + 4.50%, Rate Floor: 5.00%) due 11/10/28 | 139,872 | 131,014 | ||||||
| MB2 Dental Solutions LLC | ||||||||
10.42% (1 Month Term SOFR + 6.00%, Rate Floor: 7.00%) due 01/29/27††† | 121,607 | 119,426 | ||||||
| CNT Holdings I Corp. | ||||||||
| 7.24% (3 Month Term SOFR + 3.50%, Rate Floor: 4.25%) due 11/08/27 | 114,947 | 111,067 | ||||||
| Mavis Tire Express Services TopCo Corp. | ||||||||
| 8.50% (1 Month Term SOFR + 4.00%, Rate Floor: 5.75%) due 05/04/28 | 113,384 | 107,958 | ||||||
| BGIS (BIFM CA Buyer, Inc.) | ||||||||
| 7.88% (1 Month USD LIBOR + 3.50%, Rate Floor: 3.50%) due 06/01/26 | 110,144 | 104,912 | ||||||
| SP PF Buyer LLC | ||||||||
| 8.88% (1 Month USD LIBOR + 4.50%, Rate Floor: 4.50%) due 12/22/25 | 146,947 | 96,021 | ||||||
| New Trojan Parent, Inc. | ||||||||
| 7.55% (1 Month USD LIBOR + 3.25%, Rate Floor: 3.75%) due 01/06/28 | 98,500 | 67,719 | ||||||
| Total Consumer, Cyclical | 1,369,672 | |||||||
| Technology - 0.7% | ||||||||
| Datix Bidco Ltd. | ||||||||
6.69% (6 Month GBP SONIA + 4.50%, Rate Floor: 5.19%) due 04/28/25††† | GBP 300,000 | 354,219 | ||||||
| Planview Parent, Inc. | ||||||||
| 8.73% (3 Month USD LIBOR + 4.00%, Rate Floor: 4.75%) due 12/17/27 | 227,550 | 210,686 | ||||||
| RLDatix | ||||||||
8.95% (6 Month Term SOFR + 4.50%, Rate Floor: 4.50%) due 04/27/25††† | 129,574 | 126,554 | ||||||
| Peraton Corp. | ||||||||
| 8.13% (1 Month USD LIBOR + 3.75%, Rate Floor: 4.50%) due 02/01/28 | 108,735 | 105,994 | ||||||
| Dun & Bradstreet | ||||||||
| 7.64% (1 Month USD LIBOR + 3.25%, Rate Floor: 3.25%) due 02/06/26 | 95,092 | 94,057 | ||||||
| Apttus Corp. | ||||||||
| 8.66% (3 Month USD LIBOR + 4.25%, Rate Floor: 5.00%) due 05/08/28 | 35,572 | 33,171 | ||||||
| Total Technology | 924,681 | |||||||
| Consumer, Non-cyclical - 0.5% | ||||||||
| Quirch Foods Holdings LLC | ||||||||
8.99% (1 Month Term SOFR + 4.50%, Rate Floor: 5.50%) due 10/27/27††† | 197,481 | 179,708 | ||||||
| Mission Veterinary Partners | ||||||||
7.37% (1 Month USD LIBOR + 4.00%, Rate Floor: 4.75%) due 04/27/28††† | 148,125 | 131,831 | ||||||
| Southern Veterinary Partners LLC | ||||||||
| 8.38% (1 Month USD LIBOR + 4.00%, Rate Floor: 5.00%) due 10/05/27 | 123,695 | 118,232 | ||||||
| HAH Group Holding Co. LLC | ||||||||
| 9.43% (1 Month Term SOFR + 5.00%, Rate Floor: 6.00%) due 10/29/27 | 82,332 | 78,318 | ||||||
| National Mentor Holdings, Inc. | ||||||||
| 8.33% ((1 Month USD LIBOR + 3.75%) and (3 Month USD LIBOR + 3.75%), Rate Floor: 4.50%) due 03/02/28 | 93,901 | 65,365 | ||||||
| Del Monte Foods, Inc. | ||||||||
| 8.67% (1 Month Term SOFR + 4.25%, Rate Floor: 4.75%) due 05/16/29 | 66,410 | 64,355 | ||||||
| Elanco Animal Health, Inc. | ||||||||
| 5.87% (1 Month USD LIBOR + 1.75%, Rate Floor: 1.75%) due 08/02/27 | 64,908 | 62,221 | ||||||
| Total Consumer, Non-cyclical | 700,030 | |||||||
| Industrial - 0.5% | ||||||||
| Mileage Plus Holdings LLC | ||||||||
| 10.00% (3 Month USD LIBOR + 5.25%, Rate Floor: 6.25%) due 06/21/27 | 225,000 | 231,131 | ||||||
| American Bath Group LLC | ||||||||
| 7.88% (1 Month USD LIBOR + 3.50%, Rate Floor: 4.00%) due 11/23/27 | 171,874 | 150,081 | ||||||
| TransDigm, Inc. | ||||||||
| 6.98% (3 Month USD LIBOR + 2.25%, Rate Floor: 2.25%) due 12/09/25 | 126,734 | 125,033 | ||||||
| Air Canada | ||||||||
| 8.13% (3 Month USD LIBOR + 3.50%, Rate Floor: 4.25%) due 08/11/28 | 94,479 | 93,180 | ||||||
| Service Logic Acquisition, Inc. | ||||||||
| 8.41% (3 Month USD LIBOR + 4.00%, Rate Floor: 4.75%) due 10/29/27 | 35,750 | 33,783 | ||||||
| Total Industrial | 633,208 | |||||||
SEE NOTES TO FINANCIAL STATEMENTS. | THE GUGGENHEIM FUNDS ANNUAL REPORT | 47 |
SCHEDULE OF INVESTMENTS (continued) | December 31, 2022 |
SERIES E (TOTAL RETURN BOND SERIES) |
Face | Value | |||||||
| Financial - 0.4% | ||||||||
| Higginbotham Insurance Agency, Inc. | ||||||||
9.63% (1 Month USD LIBOR + 5.25%, Rate Floor: 6.00%) due 11/25/26††† | 236,977 | $ | 230,081 | |||||
| Jane Street Group LLC | ||||||||
| 7.13% (1 Month USD LIBOR + 2.75%, Rate Floor: 2.75%) due 01/26/28 | 168,038 | 162,838 | ||||||
| HighTower Holding LLC | ||||||||
| 8.28% (3 Month USD LIBOR + 4.00%, Rate Floor: 4.75%) due 04/21/28 | 148,125 | 135,287 | ||||||
| Trans Union LLC | ||||||||
| 6.63% (1 Month USD LIBOR + 2.25%, Rate Floor: 2.75%) due 12/01/28 | 42,104 | 41,637 | ||||||
| Duff & Phelps | ||||||||
| 8.07% (1 Month Term SOFR + 3.75%, Rate Floor: 3.75%) due 04/09/27 | 32,840 | 30,613 | ||||||
| Total Financial | 600,456 | |||||||
| Communications - 0.2% | ||||||||
| Syndigo LLC | ||||||||
| 8.84% (1 Month USD LIBOR + 4.50%, Rate Floor: 5.25%) due 12/15/27 | 180,853 | 162,768 | ||||||
| Authentic Brands | ||||||||
| 7.92% (1 Month Term SOFR + 3.50%, Rate Floor: 4.00%) due 12/21/28 | 143,508 | 138,665 | ||||||
| Total Communications | 301,433 | |||||||
| Utilities - 0.1% | ||||||||
| Hamilton Projects Acquiror LLC | ||||||||
| 9.23% (3 Month USD LIBOR + 4.50%, Rate Floor: 5.50%) due 06/17/27 | 123,223 | 121,118 | ||||||
| Basic Materials - 0.1% | ||||||||
| Illuminate Buyer LLC | ||||||||
| 7.88% (1 Month USD LIBOR + 3.50%, Rate Floor: 3.50%) due 06/30/27 | 63,448 | 60,650 | ||||||
| GrafTech Finance, Inc. | ||||||||
| 7.38% (1 Month USD LIBOR + 3.00%, Rate Floor: 3.50%) due 02/12/25 | 47,905 | 47,306 | ||||||
| Total Basic Materials | 107,956 | |||||||
| Energy - 0.1% | ||||||||
| ITT Holdings LLC | ||||||||
| 7.13% (1 Month USD LIBOR + 2.75%, Rate Floor: 3.25%) due 07/10/28 | 96,775 | 95,323 | ||||||
| Total Senior Floating Rate Interests | ||||||||
| (Cost $5,238,061) | 4,853,877 | |||||||
| FEDERAL AGENCY BONDS†† - 1.3% | ||||||||
| Tennessee Valley Authority | ||||||||
| 4.25% due 09/15/65 | 1,000,000 | 861,187 | ||||||
| 5.38% due 04/01/56 | 750,000 | 789,681 | ||||||
| Tennessee Valley Authority Principal Strips | ||||||||
due 01/15/4812,13 | 500,000 | 134,171 | ||||||
| Total Federal Agency Bonds | ||||||||
| (Cost $2,556,960) | 1,785,039 | |||||||
| MUNICIPAL BONDS†† - 0.8% | ||||||||
| New York - 0.2% | ||||||||
| Westchester County Local Development Corp. Revenue Bonds | ||||||||
| 3.85% due 11/01/50 | 300,000 | 207,009 | ||||||
| Port Authority of New York & New Jersey Revenue Bonds | ||||||||
| 3.14% due 02/15/51 | 275,000 | 194,565 | ||||||
| Total New York | 401,574 | |||||||
| Texas - 0.3% | ||||||||
| City of San Antonio Texas Electric & Gas Systems Revenue Bonds | ||||||||
| 2.91% due 02/01/48 | 500,000 | 351,917 | ||||||
| Illinois - 0.3% | ||||||||
| State of Illinois General Obligation Unlimited | ||||||||
| 5.65% due 12/01/38 | 355,556 | 348,226 | ||||||
| Total Municipal Bonds | ||||||||
| (Cost $1,436,552) | 1,101,717 | |||||||
| COMMERCIAL PAPER†† - 1.9% | ||||||||
| McKesson Corp. | ||||||||
4.67% due 01/06/234,14 | 1,510,000 | 1,509,021 | ||||||
| McCormick & Co, Inc. | ||||||||
4.25% due 01/03/234,14 | 600,000 | 599,858 | ||||||
| Dollar General Corp. | ||||||||
4.45% due 01/03/234,14 | 430,000 | 429,894 | ||||||
| Total Commercial Paper | ||||||||
| (Cost $2,538,773) | 2,538,773 | |||||||
48 | THE GUGGENHEIM FUNDS ANNUAL REPORT | SEE NOTES TO FINANCIAL STATEMENTS. |
SCHEDULE OF INVESTMENTS (continued) | December 31, 2022 |
SERIES E (TOTAL RETURN BOND SERIES) |
| Contracts/ | Value | ||||||
OTC OPTIONS PURCHASED†† - 0.1% | ||||||||
Call Options on: | ||||||||
Interest Rate Options | ||||||||
Morgan Stanley Capital Services LLC 10Y-2Y SOFR CMS CAP Expiring December 2023 with strike price of $0.10 | USD | 3,900,000 | $ | 14,533 | ||||
Barclays Bank plc 10Y-2Y SOFR CMS CAP Expiring December 2023 with strike price of $0.20 | USD | 3,900,000 | 14,533 | |||||
Morgan Stanley Capital Services LLC 10Y-2Y SOFR CMS CAP Expiring June 2024 with strike price of $0.10 | USD | 3,900,000 | 16,529 | |||||
Barclays Bank plc 10Y-2Y SOFR CMS CAP Expiring June 2024 with strike price of $0.10 | USD | 3,850,000 | 16,317 | |||||
Bank of America, N.A. 10Y-2Y SOFR CMS CAP Expiring June 2024 with strike price of $0.10 | USD | 1,950,000 | 8,264 | |||||
Bank of America, N.A. 10Y-2Y SOFR CMS CAP Expiring December 2023 with strike price of $0.20 | USD | 1,900,000 | 8,052 | |||||
Goldman Sachs International 10Y-2Y SOFR CMS CAP Expiring June 2024 with strike price of $0.10 | USD | 1,600,000 | 6,781 | |||||
Goldman Sachs International 10Y-2Y SOFR CMS CAP Expiring December 2023 with strike price of $0.20 | USD | 1,600,000 | 5,962 | |||||
Total OTC Options Purchased | ||||||||
(Cost $96,418) | 90,971 | |||||||
Total Investments - 105.8% | ||||||||
(Cost $164,835,407) | $ | 142,899,723 | ||||||
Other Assets & Liabilities, net - (5.8)% | (7,833,488 | ) | ||||||
Total Net Assets - 100.0% | $ | 135,066,235 | ||||||
Futures Contracts | ||||||||||||||||
Description | Number of | Expiration | Notional | Value and | ||||||||||||
Interest Rate Futures Contracts Purchased† | ||||||||||||||||
3-Month SOFR Futures Contracts | 35 | Mar 2024 | $ | 8,351,438 | $ | (22,377 | ) | |||||||||
SEE NOTES TO FINANCIAL STATEMENTS. | THE GUGGENHEIM FUNDS ANNUAL REPORT | 49 |
SCHEDULE OF INVESTMENTS (continued) | December 31, 2022 |
SERIES E (TOTAL RETURN BOND SERIES) |
Centrally Cleared Interest Rate Swap Agreements†† | ||||||||||||||||||||||||||||
Counterparty | Exchange | Floating | Floating | Fixed | Payment | Maturity | Notional | Value | Upfront | Unrealized | ||||||||||||||||||
BofA Securities, Inc. | CME | Pay | U.S. Secured Overnight Financing Rate | 3.45% | Annually | 09/26/32 | $ | 1,700,000 | $ | (15,160 | ) | $ | 305 | $ | (15,465 | ) | ||||||||||||
BofA Securities, Inc. | CME | Pay | U.S. Secured Overnight Financing Rate | 2.78% | Annually | 07/18/27 | 9,000,000 | (377,477 | ) | 209 | (377,686 | ) | ||||||||||||||||
| $ | (392,637 | ) | $ | 514 | $ | (393,151 | ) | |||||||||||||||||||||
Forward Foreign Currency Exchange Contracts†† | ||||||||||||||||||||||||
Counterparty | Currency | Type | Quantity | Contract | Settlement | Unrealized | ||||||||||||||||||
Barclays Bank plc | GBP | Sell | 466,000 | 577,495 USD | 01/17/23 | $ | 13,935 | |||||||||||||||||
~ | The face amount is denominated in U.S. dollars unless otherwise indicated. |
* | Non-income producing security. |
** | Includes cumulative appreciation (depreciation). Variation margin is reported within the Statement of Assets and Liabilities. |
† | Value determined based on Level 1 inputs, unless otherwise noted — See Note 4. |
†† | Value determined based on Level 2 inputs, unless otherwise noted — See Note 4. |
††† | Value determined based on Level 3 inputs — See Note 4. |
◊ | Variable rate security. Rate indicated is the rate effective at December 31, 2022. In some instances, the effective rate is limited by a minimum rate floor or a maximum rate cap established by the issuer. The settlement status of a position may also impact the effective rate indicated. In some cases, a position may be unsettled at period end and may not have a stated effective rate. In instances where multiple underlying reference rates and spread amounts are shown, the effective rate is based on a weighted average. |
1 | Special Purpose Acquisition Company (SPAC). |
2 | Security is unsettled and does not have stated effective rate. |
3 | Security has a fixed rate coupon which will convert to a floating or variable rate coupon on a future date. |
4 | Security is a 144A or Section 4(a)(2) security. These securities have been determined to be liquid under guidelines established by the Board of Trustees. The total market value of 144A or Section 4(a)(2) securities is $60,394,627 (cost $68,838,023), or 44.7% of total net assets. |
5 | Affiliated issuer. |
6 | Rate indicated is the 7-day yield as of December 31, 2022. |
7 | Perpetual maturity. |
8 | Security has no stated coupon. However, it is expected to receive residual cash flow payments on defined deal dates. |
9 | Security is a 144A or Section 4(a)(2) security. These securities have been determined to be illiquid and restricted under guidelines established by the Board of Trustees. The total market value of 144A or Section 4(a)(2) illiquid and restricted securities is $1,578,569 (cost $1,655,033), or 1.2% of total net assets — See Note 9. |
10 | Security is a step up/down bond. The coupon increases or decreases at regular intervals until the bond reaches full maturity. Rate indicated is the rate at December 31, 2022. See table below for additional step information for each security. |
11 | Security is an interest-only strip. |
12 | Zero coupon rate security. |
13 | Security is a principal-only strip. |
14 | Rate indicated is the effective yield at the time of purchase. |
15 | All or a portion of this security is pledged as interest rate swap collateral at December 31, 2022. |
BofA — Bank of America | |
CME — Chicago Mercantile Exchange | |
CMS — Constant Maturity Swap | |
CMT — Constant Maturity Treasury | |
GBP — British Pound | |
LIBOR — London Interbank Offered Rate | |
plc — Public Limited Company | |
REMIC — Real Estate Mortgage Investment Conduit | |
REIT — Real Estate Investment Trust | |
SOFR — Secured Overnight Financing Rate | |
SONIA — Sterling Overnight Index Average | |
WAC — Weighted Average Coupon | |
See Sector Classification in Other Information section. |
50 | THE GUGGENHEIM FUNDS ANNUAL REPORT | SEE NOTES TO FINANCIAL STATEMENTS. |
SCHEDULE OF INVESTMENTS (continued) | December 31, 2022 |
SERIES E (TOTAL RETURN BOND SERIES) |
The following table summarizes the inputs used to value the Fund’s investments at December 31, 2022 (See Note 4 in the Notes to Financial Statements):
Investments in Securities (Assets) | Level 1 | Level 2 | Level 3 | Total | ||||||||||||
Common Stocks | $ | 254,962 | $ | 30,060 | $ | 7 | $ | 285,029 | ||||||||
Preferred Stocks | — | 6,212,275 | — | 6,212,275 | ||||||||||||
Warrants | 649 | 40 | — | 689 | ||||||||||||
Mutual Funds | 5,884,003 | — | — | 5,884,003 | ||||||||||||
Money Market Fund | 4,537,271 | — | — | 4,537,271 | ||||||||||||
Corporate Bonds | — | 42,591,554 | 344,600 | 42,936,154 | ||||||||||||
Asset-Backed Securities | — | 27,086,177 | 1,198,541 | 28,284,718 | ||||||||||||
Collateralized Mortgage Obligations | — | 22,513,931 | 1,634,137 | 24,148,068 | ||||||||||||
U.S. Government Securities | — | 20,241,139 | — | 20,241,139 | ||||||||||||
Senior Floating Rate Interests | — | 3,277,553 | 1,576,324 | 4,853,877 | ||||||||||||
Federal Agency Bonds | — | 1,785,039 | — | 1,785,039 | ||||||||||||
Municipal Bonds | — | 1,101,717 | — | 1,101,717 | ||||||||||||
Commercial Paper | — | 2,538,773 | — | 2,538,773 | ||||||||||||
Options Purchased | — | 90,971 | — | 90,971 | ||||||||||||
Forward Foreign Currency Exchange Contracts** | — | 13,935 | — | 13,935 | ||||||||||||
Total Assets | $ | 10,676,885 | $ | 127,483,164 | $ | 4,753,609 | $ | 142,913,658 | ||||||||
Investments in Securities (Liabilities) | Level 1 | Level 2 | Level 3 | Total | ||||||||||||
Interest Rate Futures Contracts** | $ | 22,377 | $ | — | $ | — | $ | 22,377 | ||||||||
Interest Rate Swap Agreements** | — | 393,151 | — | 393,151 | ||||||||||||
Unfunded Loan Commitments (Note 8) | — | — | 1,569 | 1,569 | ||||||||||||
Total Liabilities | $ | 22,377 | $ | 393,151 | $ | 1,569 | $ | 417,097 | ||||||||
** | This derivative is reported as unrealized appreciation/depreciation at period end. |
The following is a summary of significant unobservable inputs used in the fair valuation of assets and liabilities categorized within Level 3 of the fair value hierarchy:
Category | Ending Balance at | Valuation | Unobservable | Input Range | Weighted | |||||||||||||||
Assets: | ||||||||||||||||||||
Asset-Backed Securities | $ | 748,306 | Yield Analysis | Yield | 6.2%-6.8% | 6.6% | ||||||||||||||
Asset-Backed Securities | 450,000 | Third Party Pricing | Broker Quote | — | — | |||||||||||||||
Asset-Backed Securities | 235 | Model Price | Purchase Price | — | — | |||||||||||||||
Collateralized Mortgage Obligations | 914,227 | Option adjusted spread off prior month end broker quote | Broker Quote | — | — | |||||||||||||||
Collateralized Mortgage Obligations | 719,910 | Model Price | Market Comparable Yields | 7.7% | — | |||||||||||||||
Common Stocks | 7 | Model Price | Liquidation Value | — | — | |||||||||||||||
Corporate Bonds | 344,600 | Option adjusted spread off prior month end broker quote | Broker Quote | — | — | |||||||||||||||
Senior Floating Rate Interests | 1,264,785 | Yield Analysis | Yield | 10.2%-10.9% | 10.6% | |||||||||||||||
Senior Floating Rate Interests | 311,539 | Third Party Pricing | Broker Quote | — | — | |||||||||||||||
Total Assets | $ | 4,753,609 |
|
|
|
| ||||||||||||||
Liabilities: | ||||||||||||||||||||
Unfunded Loan Commitments | $ | 1,569 | Model Price | Purchase Price | — | — | ||||||||||||||
* | Inputs are weighted by the fair value of the instruments. |
SEE NOTES TO FINANCIAL STATEMENTS. | THE GUGGENHEIM FUNDS ANNUAL REPORT | 51 |
SCHEDULE OF INVESTMENTS (continued) | December 31, 2022 |
SERIES E (TOTAL RETURN BOND SERIES) |
Significant changes in a quote, yield, liquidation value or market comparable yields would generally result in significant changes in the fair value of the security.
The Fund’s fair valuation leveling guidelines classify a single daily broker quote, or a vendor price based on a single daily or monthly broker quote, as Level 3, if such a quote or price cannot be supported with other available market information.
Transfers between Level 2 and Level 3 may occur as markets fluctuate and/or the availability of data used in an investment’s valuation changes. For the year ended December 31, 2022, the Fund had securities with a total value of $582,073 transfer into Level 3 from Level 2 due to a lack of observable inputs and had securities with a total value of $1,764,142 transfer out of Level 3 into Level 2 due to the availability of current and reliable market-based data provided by a third-party pricing service which utilizes significant observable inputs.
Summary of Fair Value Level 3 Activity
Following is a reconciliation of Level 3 assets for which significant unobservable inputs were used to determine fair value for the year ended December 31, 2022:
Assets | Liabilities | |||||||||||||||||||||||||||
| Asset-Backed | Collateralized | Corporate | Senior | Common | Total Assets | Unfunded | |||||||||||||||||||||
Beginning Balance | $ | 357,878 | $ | 2,953,298 | $ | 2,552,806 | $ | 1,609,782 | $ | — | $ | 7,473,764 | $ | (4,803 | ) | |||||||||||||
Purchases/(Receipts) | 736,837 | — | — | 660,774 | — | 1,397,611 | 4,200 | |||||||||||||||||||||
(Sales, maturities and paydowns)/Fundings | (259,551 | ) | (24,262 | ) | (1,081,161 | ) | (384,973 | ) | — | (1,749,947 | ) | 422 | ||||||||||||||||
Amortization of premiums/discounts | — | (6,486 | ) | — | 2,801 | — | (3,685 | ) | (1,227 | ) | ||||||||||||||||||
Total realized gains (losses) included in earnings | — | — | (218,838 | ) | (10,882 | ) | — | (229,720 | ) | 292 | ||||||||||||||||||
Total change in unrealized appreciation (depreciation) included in earnings | (86,858 | ) | (464,310 | ) | (302,098 | ) | (99,079 | ) | — | (952,345 | ) | (453 | ) | |||||||||||||||
Transfers into Level 3 | 450,235 | — | — | 131,831 | 7 | 582,073 | — | |||||||||||||||||||||
Transfers out of Level 3 | — | (824,103 | ) | (606,109 | ) | (333,930 | ) | — | (1,764,142 | ) | — | |||||||||||||||||
Ending Balance | $ | 1,198,541 | $ | 1,634,137 | $ | 344,600 | $ | 1,576,324 | $ | 7 | $ | 4,753,609 | $ | (1,569 | ) | |||||||||||||
Net change in unrealized appreciation (depreciation) for investments in Level 3 securities still held at December 31, 2022 | $ | (86,712 | ) | $ | (209,459 | ) | $ | (149,727 | ) | $ | (76,459 | ) | $ | — | $ | (522,357 | ) | $ | (760 | ) | ||||||||
Step Coupon Bonds
The following table discloses additional information related to step coupon bonds held by the Fund. Certain securities are subject to multiple rate changes prior to maturity. For those securities, a range of rates and corresponding dates have been provided. Rates for all step coupon bonds held by the Fund are scheduled to increase, none are scheduled to decrease.
Name | Coupon Rate at | Next Rate Reset Date | Future Reset Rate | Future Reset Date | ||||||||||||
BRAVO Residential Funding Trust 2022-R1, 3.13% due 01/29/70 | 6.13 | % | 01/30/25 | — | — | |||||||||||
Legacy Mortgage Asset Trust 2021-GS3, 1.75% due 07/25/61 | 4.75 | % | 05/26/24 | 5.75 | % | 05/26/25 | ||||||||||
Legacy Mortgage Asset Trust 2021-GS5, 2.25% due 07/25/67 | 5.25 | % | 11/26/24 | 6.25 | % | 11/26/25 | ||||||||||
NYMT Loan Trust 2022-SP1, 5.25% due 07/25/62 | 8.25 | % | 07/01/25 | 9.25 | % | 07/01/26 | ||||||||||
OBX Trust 2022-NQM9, 6.45% due 09/25/62 | 7.45 | % | 11/01/26 | — | — | |||||||||||
OSAT Trust 2021-RPL1, 2.12% due 05/25/65 | 5.12 | % | 06/26/24 | 6.12 | % | 06/26/25 | ||||||||||
PRPM LLC 2022-1, 3.72% due 02/25/27 | 6.72 | % | 02/25/25 | 7.72 | % | 02/25/26 | ||||||||||
PRPM LLC 2021-5, 1.79% due 06/25/26 | 4.79 | % | 06/26/24 | 5.79 | % | 06/26/25 | ||||||||||
52 | THE GUGGENHEIM FUNDS ANNUAL REPORT | SEE NOTES TO FINANCIAL STATEMENTS. |
SCHEDULE OF INVESTMENTS (concluded) | December 31, 2022 |
SERIES E (TOTAL RETURN BOND SERIES) |
Affiliated Transactions
Investments representing 5% or more of the outstanding voting shares of a company, or control of or by, or common control under Guggenheim Investments, result in that company being considered an affiliated issuer, as defined in the 1940 Act.
Transactions during the year ended December 31, 2022, in which the company is an affiliated issuer, were as follows:
Security Name | Value | Additions | Reductions | Realized | Change in | Value | Shares | Investment | ||||||||||||||||||||||||
Mutual Funds | ||||||||||||||||||||||||||||||||
Guggenheim Total Return Bond Fund — R6-Class | $ | 6,967,697 | $ | 238,606 | $ | — | $ | — | $ | (1,322,300 | ) | $ | 5,884,003 | 253,512 | $ | 238,084 | ||||||||||||||||
SEE NOTES TO FINANCIAL STATEMENTS. | THE GUGGENHEIM FUNDS ANNUAL REPORT | 53 |
SERIES E (TOTAL RETURN BOND SERIES) |
STATEMENT OF ASSETS AND LIABILITIES |
December 31, 2022 |
Assets: | ||||
Investments in unaffiliated issuers, at value (cost $158,105,293) | $ | 137,015,720 | ||
Investments in affiliated issuers, at value (cost $6,730,114) | 5,884,003 | |||
Cash | 882,773 | |||
Segregated cash with broker | 26,183 | |||
Unamortized upfront premiums paid on interest rate swap agreements | 514 | |||
Unrealized appreciation on forward foreign currency exchange contracts | 13,935 | |||
Prepaid expenses | 4,639 | |||
Receivables: | ||||
Interest | 925,295 | |||
Securities sold | 444,697 | |||
Fund shares sold | 120,346 | |||
Dividends | 25,160 | |||
Foreign tax reclaims | 1,518 | |||
Total assets | 145,344,783 | |||
Liabilities: | ||||
Unfunded loan commitments, at value (Note 8) (commitment fees received $809) | 1,569 | |||
Foreign currency, at value (proceeds $2) | 2 | |||
Payable for: | ||||
Securities purchased | 9,110,592 | |||
Fund shares redeemed | 997,999 | |||
Management fees | 39,178 | |||
Distribution and service fees | 28,291 | |||
Variation margin on interest rate swap agreements | 7,136 | |||
Variation margin on futures contracts | 6,125 | |||
Fund accounting/administration fees | 4,005 | |||
Transfer agent/maintenance fees | 2,084 | |||
Trustees’ fees* | 559 | |||
Miscellaneous | 81,008 | |||
Total liabilities | 10,278,548 | |||
Net assets | $ | 135,066,235 | ||
Net assets consist of: | ||||
Paid in capital | $ | 159,663,743 | ||
Total distributable earnings (loss) | (24,597,508 | ) | ||
Net assets | $ | 135,066,235 | ||
Capital shares outstanding | 9,671,737 | |||
Net asset value per share | $ | 13.97 | ||
STATEMENT OF OPERATIONS |
Year Ended December 31, 2022 |
Investment Income: | ||||
Dividends from securities of unaffiliated issuers | $ | 177,996 | ||
Dividends from securities of affiliated issuers | 238,084 | |||
Interest (net of foreign withholding tax of $2,777) | 6,113,757 | |||
Total investment income | 6,529,837 | |||
Expenses: | ||||
Management fees | 579,896 | |||
Distribution and service fees | 370,787 | |||
Transfer agent/maintenance fees | 25,228 | |||
Interest expense | 127,685 | |||
Fund accounting/administration fees | 89,509 | |||
Professional fees | 84,053 | |||
Custodian fees | 22,444 | |||
Trustees’ fees* | 11,979 | |||
Line of credit fees | 9,613 | |||
Miscellaneous | 20,732 | |||
Total expenses | 1,341,926 | |||
Less: | ||||
Expenses waived by Adviser | (76,067 | ) | ||
Earnings credits applied | (2,171 | ) | ||
Total waived expenses | (78,238 | ) | ||
Net expenses | 1,263,688 | |||
Net investment income | 5,266,149 | |||
Net Realized and Unrealized Gain (Loss): | ||||
Net realized gain (loss) on: | ||||
Investments in unaffiliated issuers | (6,168,757 | ) | ||
Investments sold short | 292 | |||
Swap agreements | (708,205 | ) | ||
Options purchased | 510,118 | |||
Options written | (225,076 | ) | ||
Forward foreign currency exchange contracts | 89,353 | |||
Foreign currency transactions | (1,007 | ) | ||
Net realized loss | (6,503,282 | ) | ||
Net change in unrealized appreciation (depreciation) on: | ||||
Investments in unaffiliated issuers | (24,960,927 | ) | ||
Investments in affiliated issuers | (1,322,300 | ) | ||
Swap agreements | (246,347 | ) | ||
Futures contracts | (22,377 | ) | ||
Options purchased | 24,833 | |||
Options written | (2,596 | ) | ||
Forward foreign currency exchange contracts | (12,437 | ) | ||
Foreign currency translations | (14 | ) | ||
Net change in unrealized appreciation (depreciation) | (26,542,165 | ) | ||
Net realized and unrealized loss | (33,045,447 | ) | ||
Net decrease in net assets resulting from operations | $ | (27,779,298 | ) | |
* | Relates to Trustees not deemed “interested persons” within the meaning of Section 2(a)(19) of the 1940 Act. |
54 | THE GUGGENHEIM FUNDS ANNUAL REPORT | SEE NOTES TO FINANCIAL STATEMENTS. |
SERIES E (TOTAL RETURN BOND SERIES) |
STATEMENTS OF CHANGES IN NET ASSETS |
| Year Ended | Year Ended | ||||||
Increase (Decrease) in Net Assets from Operations: | ||||||||
Net investment income | $ | 5,266,149 | $ | 4,295,792 | ||||
Net realized gain (loss) on investments | (6,503,282 | ) | 2,645,106 | |||||
Net change in unrealized appreciation (depreciation) on investments | (26,542,165 | ) | (7,755,610 | ) | ||||
Net decrease in net assets resulting from operations | (27,779,298 | ) | (814,712 | ) | ||||
Distributions to shareholders | (4,733,547 | ) | (7,668,530 | ) | ||||
Capital share transactions: | ||||||||
Proceeds from sale of shares | 30,323,241 | 44,222,719 | ||||||
Distributions reinvested | 4,733,547 | 7,668,530 | ||||||
Cost of shares redeemed | (41,680,379 | ) | (46,308,753 | ) | ||||
Net increase (decrease) from capital share transactions | (6,623,591 | ) | 5,582,496 | |||||
Net decrease in net assets | (39,136,436 | ) | (2,900,746 | ) | ||||
Net assets: | ||||||||
Beginning of year | 174,202,671 | 177,103,417 | ||||||
End of year | $ | 135,066,235 | $ | 174,202,671 | ||||
Capital share activity: | ||||||||
Shares sold | 1,979,951 | 2,514,664 | ||||||
Shares issued from reinvestment of distributions | 323,330 | 441,990 | ||||||
Shares redeemed | (2,743,296 | ) | (2,633,591 | ) | ||||
Net increase (decrease) in shares | (440,015 | ) | 323,063 | |||||
SEE NOTES TO FINANCIAL STATEMENTS. | THE GUGGENHEIM FUNDS ANNUAL REPORT | 55 |
SERIES E (TOTAL RETURN BOND SERIES) |
FINANCIAL HIGHLIGHTS |
This table is presented to show selected data for a share outstanding throughout each period and to assist shareholders in evaluating a Fund’s performance for the periods presented.
| Year Ended | Year Ended | Year Ended | Year Ended | Year Ended | |||||||||||||||
Per Share Data | ||||||||||||||||||||
Net asset value, beginning of period | $ | 17.23 | $ | 18.09 | $ | 16.13 | $ | 15.85 | $ | 16.40 | ||||||||||
Income (loss) from investment operations: | ||||||||||||||||||||
Net investment income (loss)a | .53 | .44 | .39 | .38 | .46 | |||||||||||||||
Net gain (loss) on investments (realized and unrealized) | (3.29 | ) | (.51 | ) | 1.88 | .34 | (.29 | ) | ||||||||||||
Total from investment operations | (2.76 | ) | (.07 | ) | 2.27 | .72 | .17 | |||||||||||||
Less distributions from: | ||||||||||||||||||||
Net investment income | (.46 | ) | (.30 | ) | (.31 | ) | (.44 | ) | (.72 | ) | ||||||||||
Net realized gains | (.04 | ) | (.49 | ) | — | — | — | |||||||||||||
Total distributions | (.50 | ) | (.79 | ) | (.31 | ) | (.44 | ) | (.72 | ) | ||||||||||
Net asset value, end of period | $ | 13.97 | $ | 17.23 | $ | 18.09 | $ | 16.13 | $ | 15.85 | ||||||||||
| ||||||||||||||||||||
Total Returnb | (16.15 | %) | (0.43 | %) | 14.21 | % | 4.49 | % | 1.14 | % | ||||||||||
Ratios/Supplemental Data | ||||||||||||||||||||
Net assets, end of period (in thousands) | $ | 135,066 | $ | 174,203 | $ | 177,103 | $ | 128,209 | $ | 122,850 | ||||||||||
Ratios to average net assets: | ||||||||||||||||||||
Net investment income (loss) | 3.54 | % | 2.51 | % | 2.27 | % | 2.33 | % | 2.85 | % | ||||||||||
Total expensesc | 0.90 | % | 0.85 | % | 0.88 | % | 0.94 | % | 0.92 | % | ||||||||||
Net expensesd,e,f | 0.85 | % | 0.78 | % | 0.78 | % | 0.78 | % | 0.78 | % | ||||||||||
Portfolio turnover rate | 51 | % | 84 | % | 123 | % | 54 | % | 30 | % | ||||||||||
a | Net investment income (loss) per share was computed using average shares outstanding throughout the period. |
b | Total return does not take into account any of the expenses associated with an investment in variable insurance products. If total return had taken into account these expenses, performance would have been lower. Shares of a series of Guggenheim Variable Funds Trust are available only through the purchase of such products. |
c | Does not include expenses of the underlying funds in which the Fund invests. |
d | Net expense information reflects the expense ratios after expense waivers and reimbursements, as applicable. |
e | The portion of the ratios of net expenses to average net assets attributable to recoupments of prior fee reductions or expense reimbursements for the years presented was as follows: |
12/31/22 | 12/31/21 | 12/31/20 | 12/31/19 | 12/31/18 | |
— | — | — | — | 0.00%* |
* | Less than 0.01%. |
f | Net expenses may include expenses that are excluded from the expense limitation agreement. Excluding these expenses, the net expense ratios for the years presented would be: |
12/31/22 | 12/31/21 | 12/31/20 | 12/31/19 | 12/31/18 | |
0.76% | 0.78% | 0.77% | 0.77% | 0.77% |
56 | THE GUGGENHEIM FUNDS ANNUAL REPORT | SEE NOTES TO FINANCIAL STATEMENTS. |
MANAGERS’ COMMENTARY (Unaudited) | December 31, 2022 |
To Our Shareholders
The Series F (Floating Rate Strategies Series, or the “Fund”) is managed by a team of seasoned professionals, including Anne B. Walsh, CFA, JD, Managing Partner, Chief Investment Officer of GPIM; and Thomas J. Hauser, Senior Managing Director and Portfolio Manager of GPIM. In the subsequent paragraphs, the investment team discusses the Fund’s performance for the 12-month period ended December 31, 2022 (the “Reporting Period”).
For the Reporting Period, the Fund provided a total return of -0.85%, outperforming the Credit Suisse Leveraged Loan Index (“Index”), the Fund’s benchmark, which returned -1.06% for the same period.
What factors contributed or detracted from the Fund’s performance during the Reporting Period?
Leveraged credit finished the Reporting Period with positive returns in the fourth quarter, closing out a choppy and generally negative year for the asset class. The Index significantly outperformed comparable indexes for high-yield and investment-grade bonds, as well as the S&P 500, due to the floating rate coupon of its components providing insulation from rate moves.
For the Reporting Period, loan issuance hit a 12-year low at $226 billion, -63% from 2021’s record levels, as market volatility and rising new issue yields discouraged many prospective issuers from tapping the market. On the demand side, collateralized loan obligations (“CLO”) issuance of $128 billion for the year was robust, in line with 2018 for the second highest year on record besides 2021. Retail flows were down -$13.5 billion for 2022. For the Reporting Period, measurable demand (CLO issuance and net retail flows) exceeded net supply (new issuance less refinancing volume) by $52.2 billion, as CLO issuance outpaced sluggish supply.
The primary driver of relative return for the Reporting Period was credit selection, namely in B and CCC credits (or, said differently, in avoiding of some of the worst-performing names in the benchmark). From a sector point of view, credit selection in the Consumer Non-Cyclicals, Consumer Cyclicals, and Capital Goods sectors were the strongest segments on a relative basis to the benchmark, although an overweight to Consumer Non-Cyclicals slightly detracted from performance. By rating, the Fund had an up-in-quality bias for the Reporting Period, underweight the CCC and defaulted issuer segments, which both also contributed to performance.
How did the Fund use derivatives during the Reporting Period?
The Fund used derivatives in the form of forward foreign currency exchange contracts to hedge currency exposure on foreign-denominated bonds. The hedges had a positive impact on performance for the Reporting Period.
How was the Fund positioned at the end of the Reporting Period?
If defaults continue to rise, loan market spreads will likely widen further from current elevated levels, presenting a market that is oversold relative to the underlying fundamentals. We think this could pose an interesting opportunity to add credits selectively that we view as trading cheap relative to their underlying fundamentals, albeit with continued caution regarding cyclical businesses with higher leverage.
The portfolio remains positioned up in quality, underweight the benchmark in both CCCs and in exposure to distressed issuers (names trading below 80). We remain focused on the secondary given the slow start to primary volume in 2023 but will seek to take advantage of new issues if and when volume picks up.
Performance displayed represents past performance which is no guarantee of future results.
The opinions and forecast expressed may not actually come to pass. This information is subject to change at any time, based on market and other conditions, and should not be construed as a recommendation of any specific security or strategy.
THE GUGGENHEIM FUNDS ANNUAL REPORT | 57 |
PERFORMANCE REPORT AND FUND PROFILE (Unaudited) | December 31, 2022 |
SERIES F (FLOATING RATE STRATEGIES SERIES)
OBJECTIVE: Seeks to provide a high level of current income while maximizing total return.
Holdings Diversification (Market Exposure as % of Net Assets)
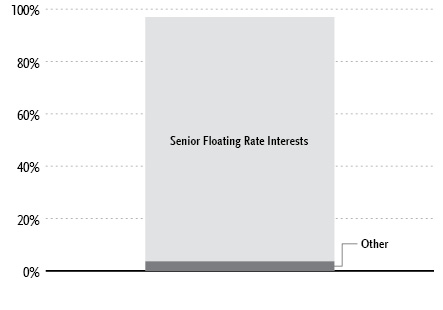
“Holdings Diversification (Market Exposure as % of Net Assets)” excludes any temporary cash investments.
Inception Date: April 24, 2013 |
Ten Largest Holdings | (% of Total Net Assets) |
SPDR Blackstone Senior Loan ETF | 3.6% |
Reynolds Group Holdings, Inc., 7.63% | 1.0% |
Agiliti, 6.88% | 1.0% |
White Cap Supply Holdings LLC, 8.07% | 1.0% |
AmWINS Group, Inc., 6.63% | 1.0% |
Station Casinos LLC, 6.64% | 1.0% |
TransDigm, Inc., 6.98% | 1.0% |
Diamond BC BV, 7.16% | 1.0% |
HUB International Ltd., 7.33% | 1.0% |
KDC US Holdings, Inc., 8.13% | 1.0% |
Top Ten Total | 12.6% |
“Ten Largest Holdings” excludes any temporary cash or derivative investments. | |
58 | THE GUGGENHEIM FUNDS ANNUAL REPORT |
PERFORMANCE REPORT AND FUND PROFILE (Unaudited)(concluded) | December 31, 2022 |
Cumulative Fund Performance*,†
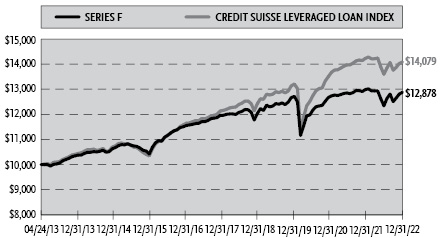
Average Annual Returns*,†
Periods Ended December 31, 2022
| 1 Year | 5 Year | Since |
Series F (Floating Rate Strategies Series) | (0.85%) | 1.64% | 2.64% |
Credit Suisse Leveraged Loan Index | (1.06%) | 3.24% | 3.59% |
Portfolio Composition by Quality Rating1 | |
Rating | % of Total |
Fixed Income Instruments | |
BBB | 8.0% |
BB | 28.0% |
B | 53.0% |
CCC | 1.4% |
NR2 | 0.2% |
Other Instruments | 9.4% |
Total Investments | 100.0% |
* | The performance data above represents past performance that is not predictive of future results. The investment return and principal value of an investment in the Fund will fluctuate so that an investor’s shares, when redeemed, may be worth more or less than their original cost. Returns are historical and include changes in principal and reinvested dividends and capital gains and do not reflect the effect of taxes. The Credit Suisse Leveraged Loan Index is an unmanaged index and, unlike the Fund, has no management fees or operating expenses to reduce its reported return. |
† | Performance figures do not reflect fees and expenses associated with an investment in variable insurance products. If returns had taken into account these fees and expenses, performance would have been lower. Shares of a series of Guggenheim Variable Funds Trust are available only through the purchase of such products. |
1 | Source: BlackRock Solutions. Credit quality ratings are measured on a scale that generally ranges from AAA (highest) to D (lowest). All securities except for those labeled “NR” have been rated by Moody’s, Standard & Poor’s (“S&P”), or Fitch, each of which is a Nationally Recognized Statistical Rating Organization (“NRSRO”). For purposes of this presentation, when ratings are available from more than one agency, the highest rating is used. Guggenheim Investments has converted ratings to the equivalent S&P rating. Security ratings are determined at the time of purchase and may change thereafter. |
2 | NR (not rated) securities do not necessarily indicate low credit quality. |
THE GUGGENHEIM FUNDS ANNUAL REPORT | 59 |
SCHEDULE OF INVESTMENTS | December 31, 2022 |
SERIES F (FLOATING RATE STRATEGIES SERIES) |
| Shares | Value | |||||||
COMMON STOCKS††† - 0.0% | ||||||||
| Industrial - 0.0% | ||||||||
BP Holdco LLC*,1 | 11,609 | $ | 7,040 | |||||
| Vector Phoenix Holdings, LP* | 11,609 | 2,774 | ||||||
| API Heat Transfer Parent LLC* | 292,731 | 29 | ||||||
| Total Industrial | 9,843 | |||||||
| Total Common Stocks | ||||||||
| (Cost $88,564) | 9,843 | |||||||
| PREFERRED STOCKS††† - 0.0% | ||||||||
| Industrial - 0.0% | ||||||||
| API Heat Transfer Intermediate* | 36 | — | ||||||
| Total Preferred Stocks | ||||||||
| (Cost $28,949) | — | |||||||
| EXCHANGE-TRADED FUNDS† - 3.6% | ||||||||
| SPDR Blackstone Senior Loan ETF | 41,700 | 1,705,530 | ||||||
| Total Exchange-Traded Funds | ||||||||
| (Cost $1,760,867) | 1,705,530 | |||||||
| MONEY MARKET FUND† - 6.1% | ||||||||
Federated Hermes U.S. Treasury Cash Reserves Fund — Institutional Shares, 3.82%2 | 2,964,932 | 2,964,932 | ||||||
| Total Money Market Fund | ||||||||
| (Cost $2,964,932) | 2,964,932 | |||||||
Face | ||||||||
SENIOR FLOATING RATE INTERESTS††,◊ - 93.4% | ||||||||
Industrial - 22.5% | ||||||||
Reynolds Group Holdings, Inc. | ||||||||
7.63% (1 Month USD LIBOR + 3.25%, Rate Floor: 3.25%) due 02/05/26 | 490,000 | 483,414 | ||||||
White Cap Supply Holdings LLC | ||||||||
8.07% (1 Month Term SOFR + 3.75%, Rate Floor: 4.25%) due 10/19/27 | 498,744 | 481,467 | ||||||
TransDigm, Inc. | ||||||||
6.98% (3 Month USD LIBOR + 2.25%, Rate Floor: 2.25%) due 05/30/25 | 483,769 | 478,065 | ||||||
Brown Group Holding LLC | ||||||||
6.88% (1 Month USD LIBOR + 2.50%, Rate Floor: 3.00%) due 06/07/28 | 480,363 | 470,823 | ||||||
TricorBraun Holdings, Inc. | ||||||||
7.63% (1 Month USD LIBOR + 3.25%, Rate Floor: 3.75%) due 03/03/28 | 494,045 | 470,321 | ||||||
Arcline FM Holdings LLC | ||||||||
9.48% (3 Month USD LIBOR + 4.75%, Rate Floor: 5.50%) due 06/23/28 | 478,938 | 454,191 | ||||||
Cushman & Wakefield US Borrower LLC | ||||||||
7.13% (1 Month USD LIBOR + 2.75%, Rate Floor: 2.75%) due 08/21/25 | 439,824 | 428,987 | ||||||
Anchor Packaging LLC | ||||||||
8.38% (1 Month USD LIBOR + 4.00%, Rate Floor: 4.00%) due 07/18/26 | 448,837 | 428,078 | ||||||
Atlantic Aviation | ||||||||
7.13% (1 Month USD LIBOR + 2.75%, Rate Floor: 3.25%) due 09/22/28 | 398,992 | 392,944 | ||||||
Hunter Douglas, Inc. | ||||||||
7.86% (3 Month Term SOFR + 3.50%, Rate Floor: 4.00%) due 02/26/29 | 447,750 | 392,180 | ||||||
PECF USS Intermediate Holding III Corp. | ||||||||
8.63% (1 Month USD LIBOR + 4.25%, Rate Floor: 4.75%) due 12/15/28 | 466,082 | 387,300 | ||||||
Park River Holdings, Inc. | ||||||||
6.99% (3 Month USD LIBOR + 3.25%, Rate Floor: 4.00%) due 12/28/27 | 444,343 | 387,134 | ||||||
LTI Holdings, Inc. | ||||||||
7.88% (1 Month USD LIBOR + 3.50%, Rate Floor: 3.50%) due 09/08/25 | 386,908 | 369,617 | ||||||
Engineered Machinery Holdings, Inc. | ||||||||
8.48% (3 Month USD LIBOR + 3.50%, Rate Floor: 4.25%) due 05/19/28 | 346,500 | 334,806 | ||||||
FCG Acquisitions, Inc | ||||||||
8.48% (3 Month USD LIBOR + 3.75%, Rate Floor: 4.25%) due 03/31/28 | 344,127 | 326,490 | ||||||
WP CPP Holdings LLC | ||||||||
8.17% (3 Month USD LIBOR + 3.75%, Rate Floor: 4.75%) due 04/30/25 | 369,756 | 320,368 | ||||||
STS Operating, Inc. (SunSource) | ||||||||
8.63% (1 Month USD LIBOR + 4.25%, Rate Floor: 5.25%) due 12/11/24 | 297,133 | 282,895 | ||||||
Charter Next Generation, Inc. | ||||||||
8.13% (1 Month USD LIBOR + 3.75%, Rate Floor: 4.50%) due 12/01/27 | 280,185 | 271,693 | ||||||
Summit Materials LLC | ||||||||
7.61% (3 Month Term SOFR + 3.00%, Rate Floor: 3.00%) due 12/09/27 | 260,000 | 259,675 | ||||||
Savage Enterprises LLC | ||||||||
due 09/15/28 | 250,000 | 247,500 | ||||||
BWAY Holding Co. | ||||||||
7.37% (1 Month USD LIBOR + 3.25%, Rate Floor: 3.25%) due 04/03/24 | 251,452 | 245,201 | ||||||
USIC Holding, Inc. | ||||||||
7.88% (1 Month USD LIBOR + 3.50%, Rate Floor: 4.25%) due 05/12/28 | 248,371 | 236,618 | ||||||
Aegion Corp. | ||||||||
9.13% (1 Month USD LIBOR + 4.75%, Rate Floor: 5.50%) due 05/17/28 | 248,115 | 230,953 | ||||||
Pelican Products, Inc. | ||||||||
8.71% (3 Month USD LIBOR + 4.25%, Rate Floor: 4.75%) due 12/29/28 | 245,362 | 218,372 | ||||||
American Bath Group LLC | ||||||||
7.88% (1 Month USD LIBOR + 3.50%, Rate Floor: 4.00%) due 11/23/27 | 247,307 | 215,948 | ||||||
Gates Global LLC | ||||||||
7.82% (1 Month Term SOFR + 3.50%, Rate Floor: 4.00%) due 11/16/29 | 209,475 | 207,642 | ||||||
60 | THE GUGGENHEIM FUNDS ANNUAL REPORT | SEE NOTES TO FINANCIAL STATEMENTS. |
SCHEDULE OF INVESTMENTS (continued) | December 31, 2022 |
SERIES F (FLOATING RATE STRATEGIES SERIES) |
| Face | Value | ||||||
Pro Mach Group, Inc. | ||||||||
8.38% (1 Month USD LIBOR + 4.00%, Rate Floor: 5.00%) due 08/31/28 | 198,056 | $ | 192,312 | |||||
DG Investment Intermediate Holdings 2, Inc. | ||||||||
7.82% (1 Month USD LIBOR + 3.75%, Rate Floor: 4.50%) due 03/31/28 | 197,007 | 188,141 | ||||||
Titan Acquisition Ltd. (Husky) | ||||||||
8.15% (3 Month USD LIBOR + 3.00%, Rate Floor: 3.00%) due 03/28/25 | 190,499 | 177,551 | ||||||
API Heat Transfer | ||||||||
14.67% (3 Month USD LIBOR) (in-kind rate was 14.67%) due 01/01/24†††,3 | 229,132 | 116,857 | ||||||
14.67% (3 Month USD LIBOR) (in-kind rate was 14.67%) due 10/02/23†††,3 | 40,880 | 34,748 | ||||||
Berlin Packaging LLC | ||||||||
7.91% (1 Month USD LIBOR + 3.75%, Rate Floor: 4.25%) due 03/13/28 | 148,125 | 142,224 | ||||||
Mileage Plus Holdings LLC | ||||||||
10.00% (3 Month USD LIBOR + 5.25%, Rate Floor: 6.25%) due 06/21/27 | 135,450 | 139,141 | ||||||
US Farathane LLC | ||||||||
8.98% (3 Month USD LIBOR + 4.25%, Rate Floor: 5.25%) due 12/23/24 | 148,206 | 133,386 | ||||||
Griffon Corporation | ||||||||
7.01% ((3 Month Term SOFR + 2.50%) and (Commercial Prime Lending Rate + 1.50%), Rate Floor: 3.00%) due 01/24/29 | 123,500 | 121,108 | ||||||
Air Canada | ||||||||
8.13% (3 Month USD LIBOR + 3.50%, Rate Floor: 4.25%) due 08/11/28 | 99,500 | 98,132 | ||||||
CPG International LLC | ||||||||
6.92% (6 Month Term SOFR + 2.50%, Rate Floor: 2.50%) due 04/28/29 | 100,000 | 97,000 | ||||||
DXP Enterprises, Inc. | ||||||||
9.95% (6 Month Term SOFR + 5.25%, Rate Floor: 6.25%) due 12/23/27 | 99,746 | 94,634 | ||||||
TK Elevator Midco GmbH | ||||||||
6.87% (6 Month USD LIBOR + 3.50%, Rate Floor: 4.00%) due 07/30/27 | 97,772 | 93,923 | ||||||
Protective Industrial Products, Inc. | ||||||||
8.38% (1 Month USD LIBOR + 4.00%, Rate Floor: 4.75%) due 12/29/27 | 99,244 | 90,312 | ||||||
United Airlines, Inc. | ||||||||
8.11% (3 Month USD LIBOR + 3.75%, Rate Floor: 4.50%) due 04/21/28 | 79,814 | 78,661 | ||||||
Osmose Utility Services, Inc. | ||||||||
7.63% (1 Month USD LIBOR + 3.25%, Rate Floor: 3.75%) due 06/23/28 | 73,385 | 69,546 | ||||||
Total Industrial | 10,890,358 | |||||||
Consumer, Non-cyclical - 19.2% | ||||||||
Agiliti | ||||||||
6.88% (1 Month USD LIBOR + 2.75%, Rate Floor: 2.75%) due 01/04/26 | 494,859 | 481,869 | ||||||
KDC US Holdings, Inc. | ||||||||
8.13% (1 Month USD LIBOR + 3.75%, Rate Floor: 3.75%) due 12/22/25 | 494,859 | 476,405 | ||||||
Medline Borrower LP | ||||||||
7.63% (1 Month USD LIBOR + 3.25%, Rate Floor: 3.75%) due 10/23/28 | 496,250 | 470,931 | ||||||
Medical Solutions Parent Holdings, Inc. | ||||||||
7.88% (1 Month USD LIBOR + 3.50%, Rate Floor: 4.00%) due 11/01/28 | 496,630 | 464,245 | ||||||
Bombardier Recreational Products, Inc. | ||||||||
6.38% (1 Month USD LIBOR + 2.00%, Rate Floor: 2.00%) due 05/24/27 | 477,021 | 460,922 | ||||||
Grifols Worldwide Operations USA, Inc. | ||||||||
6.38% (1 Month USD LIBOR + 2.00%, Rate Floor: 2.00%) due 11/15/27 | 465,476 | 449,379 | ||||||
VC GB Holdings I Corp. | ||||||||
7.88% (1 Month USD LIBOR + 3.50%, Rate Floor: 4.00%) due 07/21/28 | 495,000 | 444,881 | ||||||
Elanco Animal Health, Inc. | ||||||||
5.87% (1 Month USD LIBOR + 1.75%, Rate Floor: 1.75%) due 08/02/27 | 453,893 | 435,097 | ||||||
Froneri US, Inc. | ||||||||
6.63% (1 Month USD LIBOR + 2.25%, Rate Floor: 2.25%) due 01/29/27 | 397,024 | 385,720 | ||||||
Resonetics LLC | ||||||||
8.41% (3 Month USD LIBOR + 4.00%, Rate Floor: 4.75%) due 04/28/28 | 396,985 | 377,136 | ||||||
US Foods, Inc. | ||||||||
6.38% (1 Month USD LIBOR + 2.00%, Rate Floor: 2.00%) due 09/14/26 | 375,375 | 371,107 | ||||||
Triton Water Holdings, Inc. | ||||||||
8.23% (3 Month USD LIBOR + 3.50%, Rate Floor: 4.00%) due 03/31/28 | 394,001 | 365,041 | ||||||
Hearthside Group Holdings LLC | ||||||||
8.07% (1 Month USD LIBOR + 3.69%, Rate Floor: 3.69%) due 05/23/25 | 378,327 | 334,630 | ||||||
National Mentor Holdings, Inc. | ||||||||
8.33% ((1 Month USD LIBOR + 3.75%) and (3 Month USD LIBOR + 3.75%), Rate Floor: 4.50%) due 03/02/28 | 425,298 | 296,054 | ||||||
8.48% (3 Month USD LIBOR + 3.75%, Rate Floor: 4.50%) due 03/02/28 | 17,906 | 12,465 | ||||||
IQVIA Holdings, Inc. | ||||||||
6.48% (3 Month USD LIBOR + 1.75%, Rate Floor: 1.75%) due 06/11/25 | 250,000 | 248,595 | ||||||
Perrigo Investments LLC | ||||||||
6.92% (1 Month Term SOFR + 2.50%, Rate Floor: 3.00%) due 04/20/29 | 248,750 | 246,884 | ||||||
Del Monte Foods, Inc. | ||||||||
8.67% (1 Month Term SOFR + 4.25%, Rate Floor: 4.75%) due 05/16/29 | 250,000 | 242,265 | ||||||
Mamba Purchaser, Inc. | ||||||||
7.89% (1 Month USD LIBOR + 3.50%, Rate Floor: 4.00%) due 10/16/28 | 249,372 | 237,631 | ||||||
SEE NOTES TO FINANCIAL STATEMENTS. | THE GUGGENHEIM FUNDS ANNUAL REPORT | 61 |
SCHEDULE OF INVESTMENTS (continued) | December 31, 2022 |
SERIES F (FLOATING RATE STRATEGIES SERIES) |
| Face | Value | ||||||
HAH Group Holding Co. LLC | ||||||||
9.43% (1 Month Term SOFR + 5.00%, Rate Floor: 6.00%) due 10/29/27 | 248,735 | $ | 236,608 | |||||
Energizer Holdings, Inc. | ||||||||
6.63% (1 Month USD LIBOR + 2.25%, Rate Floor: 2.75%) due 12/22/27 | 241,143 | 236,019 | ||||||
Kronos Acquisition Holdings, Inc. | ||||||||
8.48% (3 Month USD LIBOR + 3.75%, Rate Floor: 4.25%) due 12/22/26 | 246,492 | 233,860 | ||||||
Dermatology Intermediate Holdings III, Inc. | ||||||||
8.57% (1 Month Term SOFR + 4.25%, Rate Floor: 4.75%) due 04/02/29††† | 234,777 | 228,321 | ||||||
Mission Veterinary Partners | ||||||||
7.37% (1 Month USD LIBOR + 4.00%, Rate Floor: 4.75%) due 04/27/28††† | 246,875 | 219,719 | ||||||
Reynolds Consumer Products LLC | ||||||||
6.13% (1 Month USD LIBOR + 1.75%, Rate Floor: 1.75%) due 02/04/27 | 220,468 | 218,435 | ||||||
Sigma Holding BV (Flora Food) | ||||||||
5.90% (6 Month USD LIBOR + 3.00%, Rate Floor: 3.00%) due 07/02/25 | 238,750 | 215,443 | ||||||
Weber-Stephen Products LLC | ||||||||
7.63% (1 Month USD LIBOR + 3.25%, Rate Floor: 4.00%) due 10/29/27 | 248,455 | 208,702 | ||||||
Chefs’ Warehouse, Inc. | ||||||||
9.17% (1 Month Term SOFR + 4.75%, Rate Floor: 5.25%) due 08/23/29 | 199,500 | 197,256 | ||||||
Osmosis Holdings Australia II Pty Ltd. | ||||||||
7.97% (1 Month Term SOFR + 3.75%, Rate Floor: 4.25%) due 07/30/28 | 99,500 | 93,572 | ||||||
7.84% (3 Month Term SOFR + 3.75%, Rate Floor: 4.25%) due 07/31/28 | 84,972 | 79,874 | ||||||
8.09% (1 Month Term SOFR + 3.75%, Rate Floor: 3.75%) due 07/31/28 | 7,389 | 6,946 | ||||||
Pearl Intermediate Parent LLC | ||||||||
7.88% (1 Month USD LIBOR + 3.50%, Rate Floor: 4.25%) due 02/14/25 | 148,087 | 138,765 | ||||||
TGP Holdings LLC | ||||||||
7.63% (1 Month USD LIBOR + 3.25%, Rate Floor: 4.00%) due 06/29/28 | 107,195 | 85,220 | ||||||
7.63% (1 Month USD LIBOR + 3.25%, Rate Floor: 4.00%) due 06/29/28 | 6,982 | 5,551 | ||||||
Endo Luxembourg Finance Company I SARL | ||||||||
13.50% (Commercial Prime Lending Rate + 6.00%, Rate Floor: 7.75%) due 03/27/28 | 98,750 | 78,753 | ||||||
Aveanna Healthcare LLC | ||||||||
4.25% (1 Month USD LIBOR + 3.75%, Rate Floor: 3.75%) due 07/17/28 | 11,292 | 8,780 | ||||||
Total Consumer, Non-cyclical | 9,293,081 | |||||||
Consumer, Cyclical - 16.0% | ||||||||
Station Casinos LLC | ||||||||
6.64% (1 Month USD LIBOR + 2.25%, Rate Floor: 2.50%) due 02/08/27 | 493,579 | 480,983 | ||||||
Fertitta Entertainment LLC | ||||||||
8.32% (1 Month Term SOFR + 4.00%, Rate Floor: 4.50%) due 01/27/29 | 497,494 | 472,062 | ||||||
Stars Group (Amaya) | ||||||||
6.98% (3 Month USD LIBOR + 2.25%, Rate Floor: 2.25%) due 07/21/26 | 444,375 | 437,523 | ||||||
Packers Holdings LLC | ||||||||
7.54% (1 Month USD LIBOR + 3.25%, Rate Floor: 4.00%) due 03/09/28 | 497,510 | 433,147 | ||||||
First Brands Group LLC | ||||||||
7.94% (3 Month Term SOFR + 5.00%, Rate Floor: 7.00%) due 03/30/27 | 442,372 | 417,599 | ||||||
Dealer Tire, LLC | ||||||||
8.82% (1 Month Term SOFR + 4.50%, Rate Floor: 0.50%) due 12/14/27 | 415,625 | 409,598 | ||||||
American Tire Distributors, Inc. | ||||||||
10.61% (3 Month USD LIBOR + 6.25%, Rate Floor: 7.00%) due 10/20/28 | 447,750 | 407,452 | ||||||
Power Solutions (Panther) | ||||||||
7.63% (1 Month USD LIBOR + 3.25%, Rate Floor: 3.25%) due 04/30/26 | 400,000 | 391,168 | ||||||
1011778 BC Unlimited Liability Co. | ||||||||
6.14% ((1 Month USD LIBOR + 1.75%) and (3 Month USD LIBOR + 1.75%), Rate Floor: 1.75%) due 11/19/26 | 363,676 | 356,857 | ||||||
PetSmart LLC | ||||||||
8.13% (1 Month USD LIBOR + 3.75%, Rate Floor: 4.50%) due 02/11/28 | 345,625 | 337,524 | ||||||
Hilton Worldwide Finance LLC | ||||||||
6.17% (1 Month Term SOFR + 1.75%, Rate Floor: 2.75%) due 06/22/26 | 250,000 | 249,005 | ||||||
PCI Gaming Authority, Inc. | ||||||||
6.88% (1 Month USD LIBOR + 2.50%, Rate Floor: 2.50%) due 05/29/26 | 250,000 | 248,125 | ||||||
Petco Health And Wellness Company, Inc. | ||||||||
8.09% (3 Month USD LIBOR + 3.25%, Rate Floor: 4.00%) due 03/03/28 | 254,353 | 246,590 | ||||||
Congruex Group LLC | ||||||||
9.99% (3 Month Term SOFR + 5.75%, Rate Floor: 6.50%) due 05/03/29 | 248,750 | 241,288 | ||||||
Thevelia US LLC | ||||||||
8.73% (3 Month Term SOFR + 4.00%, Rate Floor: 4.50%) due 06/18/29 | 248,750 | 240,044 | ||||||
Scientific Games Holdings, LP | ||||||||
7.10% (3 Month Term SOFR + 3.50%, Rate Floor: 4.00%) due 04/04/29 | 249,375 | 237,412 | ||||||
BGIS (BIFM CA Buyer, Inc.) | ||||||||
7.88% (1 Month USD LIBOR + 3.50%, Rate Floor: 3.50%) due 06/01/26 | 248,711 | 236,898 | ||||||
CCRR Parent, Inc. | ||||||||
8.14% (1 Month USD LIBOR + 3.75%, Rate Floor: 4.50%) due 03/06/28 | 249,365 | 236,792 | ||||||
Galaxy US Opco, Inc. | ||||||||
9.07% (1 Month Term SOFR + 4.75%, Rate Floor: 5.25%) due 04/30/29 | 250,000 | 225,625 | ||||||
62 | THE GUGGENHEIM FUNDS ANNUAL REPORT | SEE NOTES TO FINANCIAL STATEMENTS. |
SCHEDULE OF INVESTMENTS (continued) | December 31, 2022 |
SERIES F (FLOATING RATE STRATEGIES SERIES) |
| Face | Value | ||||||
Eagle Parent Corp. | ||||||||
8.83% (3 Month Term SOFR + 4.25%, Rate Floor: 4.75%) due 04/02/29 | 223,313 | $ | 218,846 | |||||
Eyemart Express LLC | ||||||||
5.00% (1 Month USD LIBOR + 3.00%, Rate Floor: 4.00%) due 08/31/27 | 250,000 | 212,500 | ||||||
New Trojan Parent, Inc. | ||||||||
7.55% (1 Month USD LIBOR + 3.25%, Rate Floor: 3.75%) due 01/06/28 | 248,737 | 171,007 | ||||||
Go Daddy Operating Company LLC | ||||||||
7.57% (1 Month Term SOFR + 3.25%, Rate Floor: 3.25%) due 11/09/29 | 150,000 | 149,604 | ||||||
Mavis Tire Express Services TopCo Corp. | ||||||||
8.50% (1 Month Term SOFR + 4.00%, Rate Floor: 5.75%) due 05/04/28 | 147,750 | 140,679 | ||||||
Michaels Stores, Inc. | ||||||||
8.98% (3 Month USD LIBOR + 4.25%, Rate Floor: 5.00%) due 04/14/28 | 161,033 | 138,579 | ||||||
Entain Holdings (Gibraltar) Ltd. | ||||||||
8.18% (3 Month Term SOFR + 3.60%, Rate Floor: 0.50%) due 10/31/29 | 100,000 | 99,417 | ||||||
Rent-A-Center, Inc. | ||||||||
7.69% (3 Month USD LIBOR + 3.25%, Rate Floor: 3.75%) due 02/17/28 | 98,250 | 94,443 | ||||||
WIRB - Copernicus Group, Inc. | ||||||||
8.38% (3 Month USD LIBOR + 4.00%, Rate Floor: 5.00%) due 01/08/27 | 98,734 | 89,354 | ||||||
WW International, Inc. | ||||||||
7.89% (1 Month USD LIBOR + 3.50%, Rate Floor: 4.00%) due 04/13/28 | 94,500 | 53,392 | ||||||
EG Finco Ltd. | ||||||||
8.73% (3 Month USD LIBOR + 4.00%, Rate Floor: 4.00%) due 02/07/25 | 37,184 | 35,023 | ||||||
Total Consumer, Cyclical | 7,708,536 | |||||||
Financial - 11.1% | ||||||||
AmWINS Group, Inc. | ||||||||
6.63% (1 Month USD LIBOR + 2.25%, Rate Floor: 3.00%) due 02/21/28 | 490,745 | 481,391 | ||||||
HUB International Ltd. | ||||||||
7.33% (3 Month USD LIBOR + 3.00%, Rate Floor: 3.15%) due 04/25/25 | 482,323 | 476,497 | ||||||
NFP Corp. | ||||||||
7.63% (1 Month USD LIBOR + 3.25%, Rate Floor: 3.25%) due 02/15/27 | 480,500 | 458,791 | ||||||
Trans Union LLC | ||||||||
6.13% (1 Month USD LIBOR + 1.75%, Rate Floor: 1.75%) due 11/13/26 | 439,150 | 432,484 | ||||||
FleetCor Technologies Operating Company LLC | ||||||||
6.13% (1 Month USD LIBOR + 1.75%, Rate Floor: 1.75%) due 04/28/28 | 394,992 | 390,426 | ||||||
Virtu Financial | ||||||||
7.42% (1 Month Term SOFR + 3.00%, Rate Floor: 3.50%) due 01/13/29 | 400,000 | 388,600 | ||||||
Teneo Holdings LLC | ||||||||
9.67% (1 Month Term SOFR + 5.25%, Rate Floor: 6.25%) due 07/11/25 | 382,038 | 366,757 | ||||||
Jane Street Group LLC | ||||||||
7.13% (1 Month USD LIBOR + 2.75%, Rate Floor: 2.75%) due 01/26/28 | 278,274 | 269,665 | ||||||
Focus Financial Partners, LLC | ||||||||
7.57% (1 Month Term SOFR + 3.25%, Rate Floor: 3.75%) due 06/30/28 | 249,375 | 246,051 | ||||||
Claros Mortgage Trust, Inc. | ||||||||
8.92% (1 Month Term SOFR + 4.50%, Rate Floor: 5.00%) due 08/10/26 | 248,744 | 245,324 | ||||||
Citadel Securities, LP | ||||||||
6.94% (1 Month Term SOFR + 2.50%, Rate Floor: 2.50%) due 02/02/28 | 246,250 | 241,140 | ||||||
Apollo Commercial Real Estate Finance, Inc. | ||||||||
7.13% (1 Month USD LIBOR + 2.75%, Rate Floor: 2.75%) due 05/15/26 | 249,354 | 238,133 | ||||||
Aretec Group, Inc. | ||||||||
8.67% (1 Month Term SOFR + 4.25%, Rate Floor: 5.25%) due 10/01/25 | 240,000 | 234,120 | ||||||
USI, Inc. | ||||||||
8.33% (3 Month Term SOFR + 3.75%, Rate Floor: 4.25%) due 11/22/29 | 209,421 | 207,178 | ||||||
Apex Group Treasury LLC | ||||||||
9.33% (1 Month Term SOFR + 5.00%, Rate Floor: 5.50%) due 07/27/28 | 200,000 | 194,000 | ||||||
Franchise Group, Inc. | ||||||||
8.69% (3 Month USD LIBOR + 4.75%, Rate Floor: 5.50%) due 03/10/26 | 199,776 | 191,785 | ||||||
Starwood Property Mortgage LLC | ||||||||
7.57% (1 Month Term SOFR + 3.25%, Rate Floor: 3.75%) due 11/18/27 | 123,000 | 120,963 | ||||||
Blackstone Mortgage Trust, Inc. | ||||||||
7.82% (1 Month Term SOFR + 3.50%, Rate Floor: 4.00%) due 05/09/29††† | 99,500 | 97,261 | ||||||
Duff & Phelps | ||||||||
8.07% (1 Month Term SOFR + 3.75%, Rate Floor: 3.75%) due 04/09/27 | 99,237 | 92,508 | ||||||
Total Financial | 5,373,074 | |||||||
Communications - 11.0% | ||||||||
| CSC Holdings LLC | ||||||||
due 01/17/28 | 691,578 | 649,406 | ||||||
WMG Acquisition Corp. | ||||||||
6.51% (1 Month USD LIBOR + 2.13%, Rate Floor: 2.13%) due 01/20/28 | 450,000 | 444,186 | ||||||
SFR Group S.A. | ||||||||
7.77% (3 Month USD LIBOR + 3.69%, Rate Floor: 3.69%) due 02/02/26 | 471,438 | 435,688 | ||||||
Playtika Holding Corp. | ||||||||
7.13% (1 Month USD LIBOR + 2.75%, Rate Floor: 2.75%) due 03/13/28 | 444,361 | 423,303 | ||||||
Ziggo Financing Partnership | ||||||||
6.82% (1 Month USD LIBOR + 2.50%, Rate Floor: 2.50%) due 04/28/28 | 400,000 | 389,376 | ||||||
SEE NOTES TO FINANCIAL STATEMENTS. | THE GUGGENHEIM FUNDS ANNUAL REPORT | 63 |
SCHEDULE OF INVESTMENTS (continued) | December 31, 2022 |
SERIES F (FLOATING RATE STRATEGIES SERIES) |
| Face | Value | ||||||
Telenet Financing USD LLC | ||||||||
6.32% (1 Month USD LIBOR + 2.00%, Rate Floor: 2.00%) due 04/28/28 | 400,000 | $ | 388,600 | |||||
Level 3 Financing, Inc. | ||||||||
6.13% (1 Month USD LIBOR + 1.75%, Rate Floor: 1.75%) due 03/01/27 | 387,478 | 370,526 | ||||||
McGraw Hill LLC | ||||||||
8.32% (3 Month USD LIBOR + 4.75%, Rate Floor: 5.25%) due 07/28/28 | 345,625 | 324,563 | ||||||
Zayo Group Holdings, Inc. | ||||||||
7.38% (1 Month USD LIBOR + 3.00%, Rate Floor: 3.00%) due 03/09/27 | 401,527 | 324,116 | ||||||
Virgin Media Bristol LLC | ||||||||
6.82% (1 Month USD LIBOR + 2.50%, Rate Floor: 2.50%) due 01/31/28 | 250,406 | 245,846 | ||||||
SBA Senior Finance II LLC | ||||||||
6.14% (1 Month USD LIBOR + 1.75%, Rate Floor: 1.75%) due 04/11/25 | 245,863 | 244,771 | ||||||
Internet Brands, Inc. | ||||||||
8.13% (1 Month USD LIBOR + 3.75%, Rate Floor: 3.75%) due 09/13/24 | 242,218 | 234,985 | ||||||
Xplornet Communications, Inc. | ||||||||
8.38% (1 Month USD LIBOR + 4.00%, Rate Floor: 4.50%) due 10/02/28 | 296,250 | 229,099 | ||||||
Flight Bidco, Inc. | ||||||||
7.88% (1 Month USD LIBOR + 3.50%, Rate Floor: 3.50%) due 07/23/25 | 248,701 | 228,417 | ||||||
Radiate Holdco LLC | ||||||||
7.63% (1 Month USD LIBOR + 3.25%, Rate Floor: 4.00%) due 09/25/26 | 248,744 | 201,147 | ||||||
Cengage Learning Acquisitions, Inc. | ||||||||
7.81% (3 Month USD LIBOR + 4.75%, Rate Floor: 5.75%) due 07/14/26 | 205,952 | 184,778 | ||||||
Total Communications | 5,318,807 | |||||||
Technology - 9.3% | ||||||||
Emerald TopCo, Inc. (Press Ganey) | ||||||||
7.88% (1 Month USD LIBOR + 3.50%, Rate Floor: 3.50%) due 07/24/26 | 500,533 | 457,362 | ||||||
Boxer Parent Company, Inc. | ||||||||
8.13% (1 Month USD LIBOR + 3.75%, Rate Floor: 3.75%) due 10/02/25 | 463,433 | 442,949 | ||||||
Athenahealth Group, Inc. | ||||||||
7.82% (1 Month Term SOFR + 3.50%, Rate Floor: 4.00%) due 02/15/29 | 425,399 | 383,012 | ||||||
due 02/15/29 | 18,116 | 18,047 | ||||||
Polaris Newco LLC | ||||||||
8.73% (3 Month USD LIBOR + 4.00%, Rate Floor: 4.50%) due 06/02/28 | 321,958 | 293,098 | ||||||
Peraton Corp. | ||||||||
8.13% (1 Month USD LIBOR + 3.75%, Rate Floor: 4.50%) due 02/01/28 | 289,384 | 282,088 | ||||||
Conair Holdings LLC | ||||||||
8.48% (3 Month USD LIBOR + 3.75%, Rate Floor: 4.25%) due 05/17/28 | 326,768 | 273,260 | ||||||
Entegris, Inc. | ||||||||
7.52% ((1 Month Term SOFR + 3.00%) and (3 Month Term SOFR + 3.00%), Rate Floor: 3.00%) due 07/06/29 | 250,000 | 249,062 | ||||||
Navicure, Inc. | ||||||||
8.38% (1 Month USD LIBOR + 4.00%, Rate Floor: 4.00%) due 10/22/26 | 249,359 | 244,579 | ||||||
Atlas CC Acquisition Corp. | ||||||||
8.98% (3 Month USD LIBOR + 4.25%, Rate Floor: 5.00%) due 05/25/28 | 289,507 | 242,566 | ||||||
Imprivata, Inc. | ||||||||
8.57% (1 Month Term SOFR + 4.25%, Rate Floor: 4.75%) due 12/01/27 | 248,750 | 239,345 | ||||||
Ascend Learning LLC | ||||||||
7.88% (1 Month USD LIBOR + 3.50%, Rate Floor: 4.00%) due 12/11/28 | 247,500 | 233,578 | ||||||
CoreLogic, Inc. | ||||||||
7.94% (1 Month USD LIBOR + 3.50%, Rate Floor: 4.00%) due 06/02/28 | 272,548 | 226,555 | ||||||
VT TopCo, Inc. | ||||||||
8.13% (1 Month USD LIBOR + 3.75%, Rate Floor: 4.50%) due 08/01/25 | 233,202 | 225,430 | ||||||
Sabre GLBL, Inc. | ||||||||
7.88% (1 Month USD LIBOR + 3.50%, Rate Floor: 4.00%) due 12/17/27 | 147,750 | 134,084 | ||||||
9.42% (1 Month Term SOFR + 5.00%, Rate Floor: 5.50%) due 06/30/28 | 90,046 | 82,787 | ||||||
Project Ruby Ultimate Parent Corp. | ||||||||
7.63% (1 Month USD LIBOR + 3.25%, Rate Floor: 4.00%) due 03/10/28 | 196,500 | 185,376 | ||||||
Park Place Technologies, LLC | ||||||||
9.42% (1 Month Term SOFR + 5.00%, Rate Floor: 6.00%) due 11/10/27 | 174,114 | 163,594 | ||||||
CDK Global, Inc. | ||||||||
9.08% (3 Month Term SOFR + 4.50%, Rate Floor: 5.00%) due 07/06/29 | 100,000 | 98,977 | ||||||
DCert Buyer, Inc. | ||||||||
8.70% (6 Month Term SOFR + 4.00%, Rate Floor: 4.00%) due 10/16/26 | 29,923 | 28,865 | ||||||
Total Technology | 4,504,614 | |||||||
Basic Materials - 3.4% | ||||||||
Diamond BC BV | ||||||||
7.16% (3 Month USD LIBOR + 2.75%, Rate Floor: 3.25%) due 09/29/28 | 495,000 | 477,675 | ||||||
Messer Industries USA, Inc. | ||||||||
7.23% (3 Month USD LIBOR + 2.50%, Rate Floor: 2.50%) due 03/02/26 | 410,001 | 405,901 | ||||||
CTEC III GmbH | ||||||||
5.70% (3 Month EURIBOR + 3.75%, Rate Floor: 3.75%) due 03/16/29 | EUR 400,000 | 402,031 | ||||||
64 | THE GUGGENHEIM FUNDS ANNUAL REPORT | SEE NOTES TO FINANCIAL STATEMENTS. |
SCHEDULE OF INVESTMENTS (continued) | December 31, 2022 |
SERIES F (FLOATING RATE STRATEGIES SERIES) |
| Face | Value | ||||||
INEOS Ltd. | ||||||||
7.13% (1 Month USD LIBOR + 2.75%, Rate Floor: 3.25%) due 01/29/26 | 147,750 | $ | 144,906 | |||||
Axalta Coating Systems Dutch Holding B B.V. | ||||||||
7.51% (3 Month Term SOFR + 3.00%, Rate Floor: 3.50%) due 12/07/29 | 100,000 | 100,000 | ||||||
W.R. Grace Holdings LLC | ||||||||
8.50% (3 Month USD LIBOR + 3.75%, Rate Floor: 4.25%) due 09/22/28 | 99,000 | 96,958 | ||||||
Total Basic Materials | 1,627,471 | |||||||
Energy - 0.5% | ||||||||
TransMontaigne Operating Company LP | ||||||||
7.87% (1 Month USD LIBOR + 3.50%, Rate Floor: 4.00%) due 11/17/28 | 248,744 | 243,458 | ||||||
Utilities - 0.4% | ||||||||
UGI Energy Services, Inc. | ||||||||
7.88% (1 Month USD LIBOR + 3.50%, Rate Floor: 3.50%) due 08/13/26 | 99,742 | 99,261 | ||||||
Granite Generation LLC | ||||||||
8.13% (1 Month USD LIBOR + 3.75%, Rate Floor: 4.75%) due 11/09/26 | 85,786 | 83,145 | ||||||
Total Utilities | 182,406 | |||||||
Total Senior Floating Rate Interests | ||||||||
(Cost $47,356,137) | 45,141,805 | |||||||
Total Investments - 103.1% | ||||||||
(Cost $52,199,449) | $ | 49,822,110 | ||||||
Other Assets & Liabilities, net - (3.1)% | (1,483,292 | ) | ||||||
Total Net Assets - 100.0% | $ | 48,338,818 | ||||||
Forward Foreign Currency Exchange Contracts†† | ||||||||||||||||||||||||
Counterparty | Currency | Type | Quantity | Contract | Settlement | Unrealized | ||||||||||||||||||
Barclays Bank plc | EUR | Sell | 388,000 | 413,354 USD | 01/17/23 | $ | (2,596 | ) | ||||||||||||||||
SEE NOTES TO FINANCIAL STATEMENTS. | THE GUGGENHEIM FUNDS ANNUAL REPORT | 65 |
SCHEDULE OF INVESTMENTS (continued) | December 31, 2022 |
SERIES F (FLOATING RATE STRATEGIES SERIES) |
~ | The face amount is denominated in U.S. dollars unless otherwise indicated. |
* | Non-income producing security. |
† | Value determined based on Level 1 inputs — See Note 4. |
†† | Value determined based on Level 2 inputs,unless otherwise noted — See Note 4. |
††† | Value determined based on Level 3 inputs — See Note 4. |
◊ | Variable rate security. Rate indicated is the rate effective at December 31, 2022. In some instances, the effective rate is limited by a minimum rate floor or a maximum rate cap established by the issuer. The settlement status of a position may also impact the effective rate indicated. In some cases, a position may be unsettled at period end and may not have a stated effective rate. In instances where multiple underlying reference rates and spread amounts are shown, the effective rate is based on a weighted average. |
1 | Affiliated issuer. |
2 | Rate indicated is the 7-day yield as of December 31, 2022. |
3 | Payment-in-kind security. |
EUR — Euro | |
EURIBOR — European Interbank Offered Rate | |
LIBOR — London Interbank Offered Rate | |
plc — Public Limited Company | |
SARL — Société à Responsabilité Limitée | |
SOFR — Secured Overnight Financing Rate | |
See Sector Classification in Other Information section. |
The following table summarizes the inputs used to value the Fund’s investments at December 31, 2022 (See Note 4 in the Notes to Financial Statements):
Investments in Securities (Assets) | Level 1 | Level 2 | Level 3 | Total | ||||||||||||
Common Stocks | $ | — | $ | — | $ | 9,843 | $ | 9,843 | ||||||||
Preferred Stocks | — | — | — | * | — | |||||||||||
Exchange-Traded Funds | 1,705,530 | — | — | 1,705,530 | ||||||||||||
Money Market Fund | 2,964,932 | — | — | 2,964,932 | ||||||||||||
Senior Floating Rate Interests | — | 44,444,899 | 696,906 | 45,141,805 | ||||||||||||
Total Assets | $ | 4,670,462 | $ | 44,444,899 | $ | 706,749 | $ | 49,822,110 | ||||||||
Investments in Securities (Liabilities) | Level 1 | Level 2 | Level 3 | Total | ||||||||||||
Forward Foreign Currency Exchange Contracts** | $ | — | $ | 2,596 | $ | — | $ | 2,596 | ||||||||
Unfunded Loan Commitments (Note 8) | — | — | 7,934 | 7,934 | ||||||||||||
Total Liabilities | $ | — | $ | 2,596 | $ | 7,934 | $ | 10,530 | ||||||||
* | Security has a market value of $0. |
** | This derivative is reported as unrealized appreciation/depreciation at period end. |
66 | THE GUGGENHEIM FUNDS ANNUAL REPORT | SEE NOTES TO FINANCIAL STATEMENTS. |
SCHEDULE OF INVESTMENTS (continued) | December 31, 2022 |
SERIES F (FLOATING RATE STRATEGIES SERIES) |
The following is a summary of significant unobservable inputs used in the fair valuations of assets and liabilities categorized within Level 3 of the fair value hierarchy:
Category | Ending Balance at | Valuation | Unobservable | Input Range | Weighted | |||||||||||||||
Assets: | ||||||||||||||||||||
Common Stocks | $ | 9,814 | Enterprise Value | Valuation Multiple | 2.7x-11.8x | 5.3x | ||||||||||||||
Common Stocks | 29 | Model Price | Liquidation Value | — | — | |||||||||||||||
Senior Floating Rate Interests | 151,605 | Model Price | Purchase Price | — | — | |||||||||||||||
Senior Floating Rate Interests | 545,301 | Third Party Pricing | Broker Quote | — | — | |||||||||||||||
Total Assets | $ | 706,749 |
|
|
|
| ||||||||||||||
Liabilities: | ||||||||||||||||||||
Unfunded Loan Commitments | $ | 7,934 | Model Price | Purchase Price | — | — | ||||||||||||||
* | Inputs are weighted by the fair value of the instruments. |
Significant changes in a quote, liquidation value or valuation multiple would generally result in significant changes in the fair value of the security. Any remaining Level 3 securities held by the Fund and excluded from the table above, were not considered material to the Fund.
The Fund’s fair valuation leveling guidelines classify a single daily broker quote, or a vendor price based on a single daily or monthly broker quote, as Level 3, if such a quote or price cannot be supported with other available market information.
Summary of Fair Value Level 3 Activity
Following is a reconciliation of Level 3 assets for which significant unobservable inputs were used to determine fair value for the year ended December 31, 2022:
Assets | Liabilities | |||||||||||||||
| Senior Floating | Common | Total Assets | Unfunded Loan | ||||||||||||
Beginning Balance | $ | 88,644 | $ | 11,406 | $ | 100,050 | $ | (1,735 | ) | |||||||
Purchases/(Receipts) | 616,935 | — | 616,935 | (1,257 | ) | |||||||||||
(Sales, maturities and paydowns)/Fundings | (4,636 | ) | — | (4,636 | ) | 1,885 | ||||||||||
Amortization of premiums/discounts | (8,944 | ) | — | (8,944 | ) | 306 | ||||||||||
Total realized gains (losses) included in earnings | 6 | — | 6 | (153 | ) | |||||||||||
Total change in unrealized appreciation (depreciation) included in earnings | 4,901 | (1,563 | ) | 3,338 | (6,980 | ) | ||||||||||
Transfers into Level 3 | — | — | — | — | ||||||||||||
Transfers out of Level 3 | — | — | — | — | ||||||||||||
Ending Balance | $ | 696,906 | $ | 9,843 | $ | 706,749 | $ | (7,934 | ) | |||||||
Net change in unrealized appreciation (depreciation) for investments in Level 3 securities still held at December 31, 2022 | $ | (5,020 | ) | $ | (1,563 | ) | $ | (6,583 | ) | $ | (6,014 | ) | ||||
Affiliated Transactions
Investments representing 5% or more of the outstanding voting shares of a company, or control of or by, or common control under Guggenheim Investments, result in that company being considered an affiliated issuer, as defined in the 1940 Act.
SEE NOTES TO FINANCIAL STATEMENTS. | THE GUGGENHEIM FUNDS ANNUAL REPORT | 67 |
SCHEDULE OF INVESTMENTS (concluded) | December 31, 2022 |
SERIES F (FLOATING RATE STRATEGIES SERIES) |
Transactions during the year ended December 31, 2022, in which the company is an affiliated issuer, were as follows:
Security Name | Value | Additions | Reductions | Realized | Change in | Value | Shares | |||||||||||||||||||||
Common Stocks | ||||||||||||||||||||||||||||
BP Holdco LLC * | $ | 8,184 | $ | — | $ | — | $ | — | $ | (1,144 | ) | $ | 7,040 | 11,609 | ||||||||||||||
* | Non-income producing security. |
68 | THE GUGGENHEIM FUNDS ANNUAL REPORT | SEE NOTES TO FINANCIAL STATEMENTS. |
SERIES F (FLOATING RATE STRATEGIES SERIES) |
STATEMENT OF ASSETS AND LIABILITIES |
December 31, 2022 |
Assets: | ||||
Investments in unaffiliated issuers, at value (cost $52,195,350) | $ | 49,815,070 | ||
Investments in affiliated issuers, at value (cost $4,099) | 7,040 | |||
Foreign currency, at value (cost 8,443) | 8,529 | |||
Cash | 123,745 | |||
Prepaid expenses | 4,153 | |||
Receivables: | ||||
Securities sold | 301,276 | |||
Interest | 161,829 | |||
Fund shares sold | 78,246 | |||
Total assets | 50,499,888 | |||
Liabilities: | ||||
Unfunded loan commitments, at value (Note 8) (commitment fees received $1,921) | 7,934 | |||
Unrealized depreciation on forward foreign currency exchange contracts | 2,596 | |||
Payable for: | ||||
Securities purchased | 2,038,188 | |||
Fund shares redeemed | 25,835 | |||
Management fees | 19,342 | |||
Distribution and service fees | 9,998 | |||
Transfer agent/maintenance fees | 2,146 | |||
Trustees’ fees* | 2,001 | |||
Fund accounting/administration fees | 1,723 | |||
Miscellaneous | 51,307 | |||
Total liabilities | 2,161,070 | |||
Net assets | $ | 48,338,818 | ||
Net assets consist of: | ||||
Paid in capital | $ | 53,002,433 | ||
Total distributable earnings (loss) | (4,663,615 | ) | ||
Net assets | $ | 48,338,818 | ||
Capital shares outstanding | 2,047,384 | |||
Net asset value per share | $ | 23.61 | ||
STATEMENT OF OPERATIONS |
Year Ended December 31, 2022 |
Investment Income: | ||||
Dividends | $ | 64,855 | ||
Interest from securities of unaffiliated issuers | 2,376,199 | |||
Total investment income | 2,441,054 | |||
Expenses: | ||||
Management fees | 307,310 | |||
Distribution and service fees | 117,869 | |||
Transfer agent/maintenance fees | 25,369 | |||
Professional fees | 64,828 | |||
Fund accounting/administration fees | 34,355 | |||
Custodian fees | 14,325 | |||
Trustees’ fees* | 11,543 | |||
Line of credit fees | 10,940 | |||
Miscellaneous | 14,196 | |||
Total expenses | 600,735 | |||
Less: | ||||
Expenses reimbursed by Adviser: | (1,179 | ) | ||
Expenses waived by Adviser | (51,332 | ) | ||
Earnings credits applied | (944 | ) | ||
Total waived expenses | (53,455 | ) | ||
Net expenses | 547,280 | |||
Net investment income | 1,893,774 | |||
Net Realized and Unrealized Gain (Loss): | ||||
Net realized gain (loss) on: | ||||
Investments in unaffiliated issuers | (464,171 | ) | ||
Forward foreign currency exchange contracts | 8,645 | |||
Foreign currency transactions | 26,214 | |||
Net realized loss | (429,312 | ) | ||
Net change in unrealized appreciation (depreciation) on: | ||||
Investments in unaffiliated issuers | (2,014,086 | ) | ||
Investments in affiliated issuers | (1,144 | ) | ||
Forward foreign currency exchange contracts | (2,596 | ) | ||
Foreign currency translations | 114 | |||
Net change in unrealized appreciation (depreciation) | (2,017,712 | ) | ||
Net realized and unrealized loss | (2,447,024 | ) | ||
Net decrease in net assets resulting from operations | $ | (553,250 | ) | |
* | Relates to Trustees not deemed “interested persons” within the meaning of Section 2(a)(19) of the 1940 Act. |
SEE NOTES TO FINANCIAL STATEMENTS. | THE GUGGENHEIM FUNDS ANNUAL REPORT | 69 |
SERIES F (FLOATING RATE STRATEGIES SERIES) |
STATEMENTS OF CHANGES IN NET ASSETS |
| Year Ended | Year Ended | ||||||
Increase (Decrease) in Net Assets from Operations: | ||||||||
Net investment income | $ | 1,893,774 | $ | 1,070,948 | ||||
Net realized loss on investments | (429,312 | ) | (8,680 | ) | ||||
Net change in unrealized appreciation (depreciation) on investments | (2,017,712 | ) | 17,167 | |||||
Net increase (decrease) in net assets resulting from operations | (553,250 | ) | 1,079,435 | |||||
Distributions to shareholders | (1,070,948 | ) | (1,106,221 | ) | ||||
Capital share transactions: | ||||||||
Proceeds from sale of shares | 41,718,376 | 24,874,622 | ||||||
Distributions reinvested | 1,070,948 | 1,106,221 | ||||||
Cost of shares redeemed | (43,594,800 | ) | (16,189,276 | ) | ||||
Net increase (decrease) from capital share transactions | (805,476 | ) | 9,791,567 | |||||
Net increase (decrease) in net assets | (2,429,674 | ) | 9,764,781 | |||||
Net assets: | ||||||||
Beginning of year | 50,768,492 | 41,003,711 | ||||||
End of year | $ | 48,338,818 | $ | 50,768,492 | ||||
Capital share activity: | ||||||||
Shares sold | 1,752,818 | 1,018,724 | ||||||
Shares issued from reinvestment of distributions | 46,402 | 45,844 | ||||||
Shares redeemed | (1,832,795 | ) | (663,701 | ) | ||||
Net increase (decrease) in shares | (33,575 | ) | 400,867 | |||||
70 | THE GUGGENHEIM FUNDS ANNUAL REPORT | SEE NOTES TO FINANCIAL STATEMENTS. |
SERIES F (FLOATING RATE STRATEGIES SERIES) |
FINANCIAL HIGHLIGHTS |
This table is presented to show selected data for a share outstanding throughout each period and to assist shareholders in evaluating a Fund’s performance for the periods presented.
| Year Ended | Year Ended | Year Ended | Year Ended | Year Ended | |||||||||||||||
Per Share Data | ||||||||||||||||||||
Net asset value, beginning of period | $ | 24.40 | $ | 24.41 | $ | 25.96 | $ | 25.30 | $ | 26.26 | ||||||||||
Income (loss) from investment operations: | ||||||||||||||||||||
Net investment income (loss)a | .95 | .58 | .68 | 1.06 | 1.01 | |||||||||||||||
Net gain (loss) on investments (realized and unrealized) | (1.18 | ) | .02 | (.74 | ) | .85 | (1.21 | ) | ||||||||||||
Total from investment operations | (.23 | ) | .60 | (.06 | ) | 1.91 | (.20 | ) | ||||||||||||
Less distributions from: | ||||||||||||||||||||
Net investment income | (.56 | ) | (.61 | ) | (1.49 | ) | (1.25 | ) | (.76 | ) | ||||||||||
Total distributions | (.56 | ) | (.61 | ) | (1.49 | ) | (1.25 | ) | (.76 | ) | ||||||||||
Net asset value, end of period | $ | 23.61 | $ | 24.40 | $ | 24.41 | $ | 25.96 | $ | 25.30 | ||||||||||
| ||||||||||||||||||||
Total Returnb | (0.85 | %) | 2.50 | % | 0.01 | % | 7.60 | % | (0.84 | %) | ||||||||||
Ratios/Supplemental Data | ||||||||||||||||||||
Net assets, end of period (in thousands) | $ | 48,339 | $ | 50,768 | $ | 41,004 | $ | 46,047 | $ | 58,798 | ||||||||||
Ratios to average net assets: | ||||||||||||||||||||
Net investment income (loss) | 4.01 | % | 2.36 | % | 2.81 | % | 4.10 | % | 3.85 | % | ||||||||||
Total expenses | 1.27 | % | 1.34 | % | 1.47 | % | 1.38 | % | 1.26 | % | ||||||||||
Net expensesc,d,e | 1.16 | % | 1.17 | % | 1.23 | % | 1.21 | % | 1.16 | % | ||||||||||
Portfolio turnover rate | 68 | % | 56 | % | 60 | % | 28 | % | 80 | % | ||||||||||
a | Net investment income (loss) per share was computed using average shares outstanding throughout the period. |
b | Total return does not take into account any of the expenses associated with an investment in variable insurance products. If total return had taken into account these expenses, performance would have been lower. Shares of a series of Guggenheim Variable Funds Trust are available only through the purchase of such products. |
c | Net expense information reflects the expense ratios after expense waivers and reimbursements, as applicable. |
d | The portion of the ratios of net expenses to average net assets attributable to recoupments of prior fee reductions or expense reimbursements for the years presented was as follows: |
12/31/22 | 12/31/21 | 12/31/20 | 12/31/19 | 12/31/18 | |
— | — | — | — | 0.00%* |
* | Less than 0.01%. |
e | Net expenses may include expenses that are excluded from the expense limitation agreement. Excluding these expenses, the net expense ratios for the years presented would be: |
12/31/22 | 12/31/21 | 12/31/20 | 12/31/19 | 12/31/18 | |
1.14% | 1.14% | 1.15% | 1.15% | 1.15% |
SEE NOTES TO FINANCIAL STATEMENTS. | THE GUGGENHEIM FUNDS ANNUAL REPORT | 71 |
MANAGERS’ COMMENTARY (Unaudited) | December 31, 2022 |
To Our Shareholders
The Series J (StylePlusTM—Mid Growth Series, or the “Fund”) is managed by a team of seasoned professionals, including Farhan Sharaff, Senior Managing Director and Assistant Chief Investment Officer, Equities, and Portfolio Manager; Qi Yan, Managing Director and Portfolio Manager; and Adam J. Bloch, Managing Director and Portfolio Manager. In the subsequent paragraphs, the investment team discusses the Fund’s performance for the 12-month period ended December 31, 2022 (the “Reporting Period”).
For the Reporting Period, the Fund provided a total return of -27.78%, underperforming the Russell Midcap Growth Index (“Index”), the Fund’s benchmark, which returned -26.72% for the same period.
What factors contributed or detracted from the Fund’s performance during the Reporting Period?
Over the Reporting Period, 15%-25% of the total equity position was allocated to actively managed equity and 75%-85% to passive equity. Remaining Fund assets were invested in the Guggenheim Strategy Funds, short-term fixed-income investment companies advised by Guggenheim Investments, and the Guggenheim Ultra Short Duration Fund, whose objective is to seek a high level of income consistent with the preservation of capital.
For the Reporting Period, the Fund underperformed the Russell Mid Growth Index by 1.1% net of fees. During this Reporting Period, active equity and active fixed income contributed +1.8% and -0.8% to the Fund’s relative return differential, respectively. The remainder resulted from equity index swap cost, implementation shortfall and Fund’s expenses.
How did the Fund use derivatives during the Reporting Period?
The passive equity component, which accounted for 75%-85% of the Fund’s exposure to the broad equity market, consisted of equity index swaps and equity index futures. On average, the equity index futures accounted for 0%-5% of the overall exposure, with the remainder from equity index swaps.
Performance displayed represents past performance which is no guarantee of future results.
The opinions and forecast expressed may not actually come to pass. This information is subject to change at any time, based on market and other conditions, and should not be construed as a recommendation of any specific security or strategy.
72 | THE GUGGENHEIM FUNDS ANNUAL REPORT |
PERFORMANCE REPORT AND FUND PROFILE (Unaudited) | December 31, 2022 |
SERIES J (STYLEPLUS—MID GROWTH SERIES)
OBJECTIVE: Seeks long-term growth of capital.
Holdings Diversification (Market Exposure as % of Net Assets)
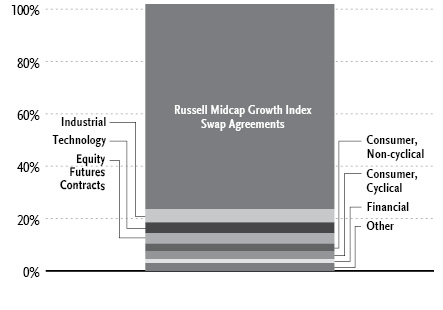
“Holdings Diversification (Market Exposure as % of Net Assets)” excludes any temporary cash investments, investments in Guggenheim Strategy Funds Trust mutual funds, or investments in Guggenheim Ultra Short Duration Fund.
Inception Date: October 1, 1992 |
Ten Largest Holdings | (% of Total Net Assets) |
Guggenheim Strategy Fund III | 29.7% |
Guggenheim Variable Insurance Strategy Fund III | 27.4% |
Guggenheim Strategy Fund II | 18.1% |
Guggenheim Ultra Short Duration Fund — Institutional Class | 1.9% |
Steel Dynamics, Inc. | 0.3% |
United Therapeutics Corp. | 0.3% |
Builders FirstSource, Inc. | 0.3% |
Fair Isaac Corp. | 0.3% |
Olin Corp. | 0.3% |
Lincoln Electric Holdings, Inc. | 0.3% |
Top Ten Total | 78.9% |
“Ten Largest Holdings” excludes any temporary cash or derivative investments. | |
THE GUGGENHEIM FUNDS ANNUAL REPORT | 73 |
PERFORMANCE REPORT AND FUND PROFILE (Unaudited)(concluded) | December 31, 2022 |
Cumulative Fund Performance*,†
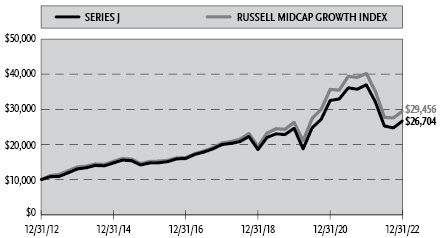
Average Annual Returns*,†
Periods Ended December 31, 2022
| 1 Year | 5 Year | 10 Year |
Series J (StylePlus—Mid Growth Series) | (27.78%) | 5.98% | 10.32% |
Russell Midcap Growth Index | (26.72%) | 7.64% | 11.41% |
* | The performance data above represents past performance that is not predictive of future results. The investment return and principal value of an investment in the Fund will fluctuate so that an investor’s shares, when redeemed, may be worth more or less than their original cost. Returns are historical and include changes in principal and reinvested dividends and capital gains and do not reflect the effect of taxes. The Russell Midcap Growth Index is an unmanaged index and, unlike the Fund, has no management fees or operating expenses to reduce its reported return. |
† | Performance figures do not reflect fees and expenses associated with an investment in variable insurance products. If returns had taken into account these fees and expenses, performance would have been lower. Shares of a series of Guggenheim Variable Funds Trust are available only through the purchase of such products. |
74 | THE GUGGENHEIM FUNDS ANNUAL REPORT |
SCHEDULE OF INVESTMENTS | December 31, 2022 |
SERIES J (STYLEPLUS—MID GROWTH SERIES) |
| Shares | Value | ||||||
COMMON STOCKS† - 19.6% | ||||||||
Industrial - 5.1% | ||||||||
Builders FirstSource, Inc.* | 6,870 | $ | 445,726 | |||||
Lincoln Electric Holdings, Inc. | 2,893 | 418,010 | ||||||
Eagle Materials, Inc. | 3,056 | 405,990 | ||||||
Carlisle Companies, Inc. | 1,715 | 404,140 | ||||||
Donaldson Company, Inc. | 6,568 | 386,658 | ||||||
Louisiana-Pacific Corp. | 6,338 | 375,210 | ||||||
Simpson Manufacturing Company, Inc. | 3,769 | 334,159 | ||||||
Toro Co. | 2,644 | 299,301 | ||||||
Acuity Brands, Inc. | 1,804 | 298,760 | ||||||
Littelfuse, Inc. | 1,219 | 268,424 | ||||||
UFP Industries, Inc. | 3,374 | 267,389 | ||||||
Mueller Industries, Inc. | 4,321 | 254,939 | ||||||
nVent Electric plc | 5,718 | 219,971 | ||||||
Hubbell, Inc. | 907 | 212,855 | ||||||
Axon Enterprise, Inc.* | 1,226 | 203,430 | ||||||
Middleby Corp.* | 1,368 | 183,175 | ||||||
Sealed Air Corp. | 3,644 | 181,763 | ||||||
TopBuild Corp.* | 1,159 | 181,372 | ||||||
Masco Corp. | 3,696 | 172,492 | ||||||
Jabil, Inc. | 2,174 | 148,267 | ||||||
EMCOR Group, Inc. | 987 | 146,184 | ||||||
Trex Company, Inc.* | 3,420 | 144,769 | ||||||
Esab Corp. | 3,070 | 144,044 | ||||||
Universal Display Corp. | 1,288 | 139,156 | ||||||
Lennox International, Inc. | 567 | 135,643 | ||||||
Graco, Inc. | 1,959 | 131,762 | ||||||
Fortune Brands Innovations, Inc. | 2,176 | 124,271 | ||||||
AECOM | 1,376 | 116,864 | ||||||
Curtiss-Wright Corp. | 695 | 116,058 | ||||||
AGCO Corp. | 673 | 93,338 | ||||||
Otis Worldwide Corp. | 1,131 | 88,569 | ||||||
Applied Industrial Technologies, Inc. | 686 | 86,457 | ||||||
Silgan Holdings, Inc. | 1,656 | 85,847 | ||||||
Knight-Swift Transportation Holdings, Inc. | 1,580 | 82,808 | ||||||
Owens Corning | 940 | 80,182 | ||||||
Masterbrand, Inc.* | 2,176 | 16,429 | ||||||
Total Industrial | 7,394,412 | |||||||
Technology - 4.1% | ||||||||
Fair Isaac Corp.* | 718 | 429,798 | ||||||
Cirrus Logic, Inc.* | 4,428 | 329,797 | ||||||
Lattice Semiconductor Corp.* | 4,881 | 316,679 | ||||||
Power Integrations, Inc. | 4,252 | 304,953 | ||||||
CommVault Systems, Inc.* | 4,837 | 303,957 | ||||||
Genpact Ltd. | 6,554 | 303,581 | ||||||
Synaptics, Inc.* | 2,579 | 245,418 | ||||||
ACI Worldwide, Inc.* | 10,356 | 238,188 | ||||||
ExlService Holdings, Inc.* | 1,382 | 234,152 | ||||||
Concentrix Corp. | 1,700 | 226,372 | ||||||
Dynatrace, Inc.* | 5,830 | 223,289 | ||||||
Diodes, Inc.* | 2,904 | 221,111 | ||||||
Maximus, Inc. | 2,806 | 205,764 | ||||||
MACOM Technology Solutions Holdings, Inc.* | 3,203 | 201,725 | ||||||
Lumentum Holdings, Inc.* | 3,588 | 187,186 | ||||||
Qualys, Inc.* | 1,646 | 184,731 | ||||||
Rambus, Inc.* | 4,978 | 178,312 | ||||||
Teradata Corp.* | 5,122 | 172,407 | ||||||
Qorvo, Inc.* | 1,502 | 136,141 | ||||||
NetApp, Inc. | 2,216 | 133,093 | ||||||
Manhattan Associates, Inc.* | 1,076 | 130,626 | ||||||
Microchip Technology, Inc. | 1,728 | 121,392 | ||||||
HP, Inc. | 4,359 | 117,126 | ||||||
SiTime Corp.* | 1,133 | 115,136 | ||||||
Amkor Technology, Inc. | 4,595 | 110,188 | ||||||
Skyworks Solutions, Inc. | 1,205 | 109,812 | ||||||
NXP Semiconductor N.V. | 611 | 96,556 | ||||||
Onto Innovation, Inc.* | 1,353 | 92,126 | ||||||
ON Semiconductor Corp.* | 1,443 | 90,000 | ||||||
Seagate Technology Holdings plc | 1,703 | 89,595 | ||||||
CACI International, Inc. — Class A* | 287 | 86,270 | ||||||
Total Technology | 5,935,481 | |||||||
Consumer, Non-cyclical - 3.1% | ||||||||
United Therapeutics Corp.* | 1,605 | 446,334 | ||||||
Neurocrine Biosciences, Inc.* | 2,947 | 351,990 | ||||||
Halozyme Therapeutics, Inc.* | 6,042 | 343,790 | ||||||
Quest Diagnostics, Inc. | 1,975 | 308,969 | ||||||
Darling Ingredients, Inc.* | 4,804 | 300,682 | ||||||
Hologic, Inc.* | 3,931 | 294,078 | ||||||
Exelixis, Inc.* | 13,698 | 219,716 | ||||||
Shockwave Medical, Inc.* | 1,048 | 215,479 | ||||||
Jazz Pharmaceuticals plc* | 1,317 | 209,811 | ||||||
QuidelOrtho Corp.* | 2,305 | 197,469 | ||||||
Repligen Corp.* | 1,111 | 188,104 | ||||||
Service Corporation International | 2,568 | 177,551 | ||||||
Medpace Holdings, Inc.* | 822 | 174,601 | ||||||
H&R Block, Inc. | 4,691 | 171,268 | ||||||
Globus Medical, Inc. — Class A* | 2,251 | 167,182 | ||||||
Incyte Corp.* | 1,774 | 142,488 | ||||||
Masimo Corp.* | 676 | 100,014 | ||||||
Bruker Corp. | 1,372 | 93,776 | ||||||
LHC Group, Inc.* | 524 | 84,726 | ||||||
Acadia Healthcare Company, Inc.* | 1,017 | 83,719 | ||||||
Lantheus Holdings, Inc.* | 1,590 | 81,027 | ||||||
AMN Healthcare Services, Inc.* | 769 | 79,069 | ||||||
Total Consumer, Non-cyclical | 4,431,843 | |||||||
Consumer, Cyclical - 2.8% | ||||||||
Wyndham Hotels & Resorts, Inc. | 4,759 | 339,364 | ||||||
Brunswick Corp. | 4,387 | 316,215 | ||||||
Boyd Gaming Corp. | 5,537 | 301,933 | ||||||
Yum! Brands, Inc. | 2,112 | 270,505 | ||||||
Crocs, Inc.* | 2,291 | 248,413 | ||||||
Tempur Sealy International, Inc. | 6,897 | 236,774 | ||||||
AutoNation, Inc.* | 2,107 | 226,081 | ||||||
Watsco, Inc. | 884 | 220,470 | ||||||
Williams-Sonoma, Inc. | 1,855 | 213,177 | ||||||
Churchill Downs, Inc. | 945 | 199,801 | ||||||
Deckers Outdoor Corp.* | 474 | 189,202 | ||||||
Academy Sports & Outdoors, Inc. | 3,482 | 182,944 | ||||||
Wingstop, Inc. | 1,280 | 176,154 | ||||||
Casey’s General Stores, Inc. | 714 | 160,186 | ||||||
SEE NOTES TO FINANCIAL STATEMENTS. | THE GUGGENHEIM FUNDS ANNUAL REPORT | 75 |
SCHEDULE OF INVESTMENTS (continued) | December 31, 2022 |
SERIES J (STYLEPLUS—MID GROWTH SERIES) |
| Shares | Value | ||||||
Asbury Automotive Group, Inc.* | 816 | $ | 146,268 | |||||
YETI Holdings, Inc.* | 2,872 | 118,642 | ||||||
Murphy USA, Inc. | 412 | 115,170 | ||||||
Polaris, Inc. | 1,107 | 111,807 | ||||||
Mattel, Inc.* | 6,095 | 108,735 | ||||||
Choice Hotels International, Inc. | 742 | 83,579 | ||||||
BJ’s Wholesale Club Holdings, Inc.* | 1,257 | 83,163 | ||||||
Total Consumer, Cyclical | 4,048,583 | |||||||
Financial - 1.6% | ||||||||
Cathay General Bancorp | 7,107 | 289,883 | ||||||
Evercore, Inc. — Class A | 2,568 | 280,117 | ||||||
Wintrust Financial Corp. | 2,829 | 239,107 | ||||||
Ameris Bancorp | 4,907 | 231,316 | ||||||
Interactive Brokers Group, Inc. — Class A | 3,001 | 217,122 | ||||||
Annaly Capital Management, Inc. REIT | 9,876 | 208,186 | ||||||
United Community Banks, Inc. | 4,792 | 161,970 | ||||||
First Horizon Corp. | 5,893 | 144,378 | ||||||
Kinsale Capital Group, Inc. | 515 | 134,683 | ||||||
Selective Insurance Group, Inc. | 1,003 | 88,876 | ||||||
RenaissanceRe Holdings Ltd. | 480 | 88,430 | ||||||
CubeSmart REIT | 2,075 | 83,519 | ||||||
Jefferies Financial Group, Inc. | 2,391 | 81,964 | ||||||
Rexford Industrial Realty, Inc. REIT | 1,083 | 59,175 | ||||||
Total Financial | 2,308,726 | |||||||
Energy - 1.4% | ||||||||
Antero Midstream Corp. | 35,999 | 388,429 | ||||||
DT Midstream, Inc. | 6,164 | 340,623 | ||||||
PDC Energy, Inc. | 4,946 | 313,972 | ||||||
NOV, Inc. | 9,926 | 207,354 | ||||||
ONEOK, Inc. | 2,914 | 191,450 | ||||||
Targa Resources Corp. | 2,542 | 186,837 | ||||||
Matador Resources Co. | 3,200 | 183,168 | ||||||
Occidental Petroleum Corp. | 2,291 | 144,310 | ||||||
Southwestern Energy Co.* | 21,475 | 125,629 | ||||||
Total Energy | 2,081,772 | |||||||
Basic Materials - 1.1% | ||||||||
Steel Dynamics, Inc. | 4,636 | 452,937 | ||||||
Olin Corp. | 7,924 | 419,497 | ||||||
Reliance Steel & Aluminum Co. | 1,438 | 291,109 | ||||||
Ingevity Corp.* | 3,845 | 270,842 | ||||||
RPM International, Inc. | 1,145 | 111,580 | ||||||
Total Basic Materials | 1,545,965 | |||||||
Utilities - 0.2% | ||||||||
OGE Energy Corp. | 3,690 | 145,939 | ||||||
National Fuel Gas Co. | 1,502 | 95,077 | ||||||
Essential Utilities, Inc. | 1,817 | 86,725 | ||||||
Total Utilities | 327,741 | |||||||
Communications - 0.2% | ||||||||
Calix, Inc.* | 1,714 | 117,289 | ||||||
Nexstar Media Group, Inc. — Class A | 659 | 115,345 | ||||||
VeriSign, Inc.* | 446 | 91,626 | ||||||
Total Communications | 324,260 | |||||||
Total Common Stocks | ||||||||
(Cost $28,422,354) | 28,398,783 | |||||||
MUTUAL FUNDS† - 77.1% | ||||||||
Guggenheim Strategy Fund III1 | 1,794,029 | 43,164,347 | ||||||
Guggenheim Variable Insurance Strategy Fund III1 | 1,653,693 | 39,804,396 | ||||||
Guggenheim Strategy Fund II1 | 1,092,465 | 26,262,849 | ||||||
Guggenheim Ultra Short Duration Fund — Institutional Class1 | 280,618 | 2,705,158 | ||||||
Total Mutual Funds | ||||||||
(Cost $115,135,786) | 111,936,750 | |||||||
MONEY MARKET FUND† - 1.7% | ||||||||
Dreyfus Treasury Securities Cash Management Fund — Institutional Shares, 3.90%2 | 2,498,810 | 2,498,810 | ||||||
Total Money Market Fund | ||||||||
(Cost $2,498,810) | 2,498,810 | |||||||
Total Investments - 98.4% | ||||||||
(Cost $146,056,950) | $ | 142,834,343 | ||||||
Other Assets & Liabilities, net - 1.6% | 2,338,729 | |||||||
Total Net Assets - 100.0% | $ | 145,173,072 | ||||||
76 | THE GUGGENHEIM FUNDS ANNUAL REPORT | SEE NOTES TO FINANCIAL STATEMENTS. |
SCHEDULE OF INVESTMENTS (continued) | December 31, 2022 |
SERIES J (STYLEPLUS—MID GROWTH SERIES) |
Futures Contracts | ||||||||||||||||
Description | Number of | Expiration Date | Notional | Value and | ||||||||||||
Equity Futures Contracts Purchased† | ||||||||||||||||
S&P 500 Index Mini Futures Contracts | 5 | Mar 2023 | $ | 965,375 | $ | (40,819 | ) | |||||||||
S&P MidCap 400 Index Mini Futures Contracts | 16 | Mar 2023 | 3,909,280 | (50,600 | ) | |||||||||||
NASDAQ-100 Index Mini Futures Contracts | 4 | Mar 2023 | 881,840 | (64,671 | ) | |||||||||||
| $ | 5,756,495 | $ | (156,090 | ) | ||||||||||||
Total Return Swap Agreements | |||||||||||||||||||||||
Counterparty | Index | Type | Financing | Payment | Maturity | Units | Notional | Value and | |||||||||||||||
OTC Equity Index Swap Agreements†† | |||||||||||||||||||||||
Wells Fargo Bank, N.A. | Russell MidCap Growth Index | Pay | 4.54% (Federal Funds Rate + 0.21%) | At Maturity | 06/28/23 | 27,817 | $ | 113,894,203 | $ | 2,109,057 | |||||||||||||
* | Non-income producing security. |
** | Includes cumulative appreciation (depreciation). Variation margin is reported within the Statement of Assets and Liabilities. |
† | Value determined based on Level 1 inputs — See Note 4. |
†† | Value determined based on Level 2 inputs — See Note 4. |
1 | Affiliated issuer. |
2 | Rate indicated is the 7-day yield as of December 31, 2022. |
plc — Public Limited Company | |
REIT — Real Estate Investment Trust | |
See Sector Classification in Other Information section. |
The following table summarizes the inputs used to value the Fund’s investments at December 31, 2022 (See Note 4 in the Notes to Financial Statements):
Investments in Securities (Assets) | Level 1 | Level 2 | Level 3 | Total | ||||||||||||
Common Stocks | $ | 28,398,783 | $ | — | $ | — | $ | 28,398,783 | ||||||||
Mutual Funds | 111,936,750 | — | — | 111,936,750 | ||||||||||||
Money Market Fund | 2,498,810 | — | — | 2,498,810 | ||||||||||||
Equity Index Swap Agreements** | — | 2,109,057 | — | 2,109,057 | ||||||||||||
Total Assets | $ | 142,834,343 | $ | 2,109,057 | $ | — | $ | 144,943,400 | ||||||||
Investments in Securities (Liabilities) | Level 1 | Level 2 | Level 3 | Total | ||||||||||||
Equity Futures Contracts** | $ | 156,090 | $ | — | $ | — | $ | 156,090 | ||||||||
** | This derivative is reported as unrealized appreciation/depreciation at period end. |
SEE NOTES TO FINANCIAL STATEMENTS. | THE GUGGENHEIM FUNDS ANNUAL REPORT | 77 |
SCHEDULE OF INVESTMENTS (concluded) | December 31, 2022 |
SERIES J (STYLEPLUS—MID GROWTH SERIES) |
Affiliated Transactions
Investments representing 5% or more of the outstanding voting shares of a company, or control of or by, or common control under Guggenheim Investments (“GI”), result in that company being considered an affiliated issuer, as defined in the 1940 Act.
The Fund may invest in certain of the underlying series of Guggenheim Strategy Funds Trust, including Guggenheim Strategy Fund II, Guggenheim Strategy Fund III, and Guggenheim Variable Insurance Strategy Fund III, (collectively, the “Short Term Investment Vehicles”), each of which are open-end management investment companies managed by GI. The Short Term Investment Vehicles, which launched on March 11, 2014, are offered as short term investment options only to mutual funds, trusts, and other accounts managed by GI and/or its affiliates, and are not available to the public. The Short Term Investment Vehicles pay no investment management fees. The Short Term Investment Vehicles’ annual report on Form N-CSR dated September 30, 2022, is available publicly or upon request. This information is available from the EDGAR database on the SEC’s website at https://www.sec.gov/Archives/edgar/data/1601445/000182126822000340/gug84768.htm. The Fund may invest in certain of the underlying series of Guggenheim Funds Trust, which are open-end management investment companies managed by GI, are available to the public and whose most recent annual report on Form N-CSR is available publicly or upon request.
Transactions during the year ended December 31, 2022, in which the company is an affiliated issuer, were as follows:
Security Name | Value | Additions | Reductions | Realized | Change in | Value | Shares | Investment | ||||||||||||||||||||||||
Mutual Funds | ||||||||||||||||||||||||||||||||
Guggenheim Strategy Fund II | $ | 31,106,522 | $ | 66,542,147 | $ | (70,406,849 | ) | $ | (955,413 | ) | $ | (23,558 | ) | $ | 26,262,849 | 1,092,465 | $ | 793,742 | ||||||||||||||
Guggenheim Strategy Fund III | 58,441,099 | 4,422,133 | (17,531,958 | ) | (466,356 | ) | (1,700,571 | ) | 43,164,347 | 1,794,029 | 1,415,053 | |||||||||||||||||||||
Guggenheim Ultra Short Duration Fund — Institutional Class | 18,802,104 | 66,116 | (16,074,987 | ) | (102,954 | ) | 14,879 | 2,705,158 | 280,618 | 66,355 | ||||||||||||||||||||||
Guggenheim Variable Insurance Strategy Fund III | 45,644,872 | 5,131,003 | (9,382,998 | ) | (219,354 | ) | (1,369,127 | ) | 39,804,396 | 1,653,693 | 1,123,921 | |||||||||||||||||||||
| $ | 153,994,597 | $ | 76,161,399 | $ | (113,396,792 | ) | $ | (1,744,077 | ) | $ | (3,078,377 | ) | $ | 111,936,750 | $ | 3,399,071 | ||||||||||||||||
78 | THE GUGGENHEIM FUNDS ANNUAL REPORT | SEE NOTES TO FINANCIAL STATEMENTS. |
SERIES J (STYLEPLUS—MID GROWTH SERIES) |
STATEMENT OF ASSETS AND LIABILITIES |
December 31, 2022 |
Assets: | ||||
Investments in unaffiliated issuers, at value (cost $30,921,164) | $ | 30,897,593 | ||
Investments in affiliated issuers, at value (cost $115,135,786) | 111,936,750 | |||
Cash | 6,974,505 | |||
Segregated cash with broker | 333,800 | |||
Unrealized appreciation on OTC swap agreements | 2,109,057 | |||
Prepaid expenses | 3,826 | |||
Receivables: | ||||
Dividends | 482,176 | |||
Fund shares sold | 22,398 | |||
Interest | 17,714 | |||
Investment Adviser | 109 | |||
Total assets | 152,777,928 | |||
Liabilities: | ||||
Segregated cash due to broker | 6,870,000 | |||
Payable for: | ||||
Securities purchased | 481,488 | |||
Management fees | 68,443 | |||
Distribution and service fees | 30,707 | |||
Swap settlement | 28,196 | |||
Variation margin on futures contracts | 23,663 | |||
Fund shares redeemed | 15,051 | |||
Fund accounting/administration fees | 2,599 | |||
Trustees’ fees* | 2,560 | |||
Transfer agent/maintenance fees | 2,076 | |||
Miscellaneous | 80,073 | |||
Total liabilities | 7,604,856 | |||
Net assets | $ | 145,173,072 | ||
Net assets consist of: | ||||
Paid in capital | $ | 193,712,349 | ||
Total distributable earnings (loss) | (48,539,277 | ) | ||
Net assets | $ | 145,173,072 | ||
Capital shares outstanding | 3,942,593 | |||
Net asset value per share | $ | 36.82 | ||
STATEMENT OF OPERATIONS |
Year Ended December 31, 2022 |
Investment Income: | ||||
Dividends from securities of unaffiliated issuers (net of foreign withholding tax of $167) | $ | 339,404 | ||
Dividends from securities of affiliated issuers | 3,399,071 | |||
Interest | 70,541 | |||
Total investment income | 3,809,016 | |||
Expenses: | ||||
Management fees | 1,203,500 | |||
Distribution and service fees | 400,174 | |||
Transfer agent/maintenance fees | 25,187 | |||
Fund accounting/administration fees | 95,713 | |||
Interest expense | 67,768 | |||
Professional fees | 47,258 | |||
Custodian fees | 15,059 | |||
Trustees’ fees* | 13,258 | |||
Line of credit fees | 4,854 | |||
Miscellaneous | 22,819 | |||
Total expenses | 1,895,590 | |||
Less: | ||||
Expenses waived by Adviser | (355,014 | ) | ||
Earnings credits applied | (4,313 | ) | ||
Total waived expenses | (359,327 | ) | ||
Net expenses | 1,536,263 | |||
Net investment income | 2,272,753 | |||
Net Realized and Unrealized Gain (Loss): | ||||
Net realized gain (loss) on: | ||||
Investments in unaffiliated issuers | (3,631,367 | ) | ||
Investments in affiliated issuers | (1,744,077 | ) | ||
Swap agreements | (43,923,527 | ) | ||
Futures contracts | (106,387 | ) | ||
Net realized loss | (49,405,358 | ) | ||
Net change in unrealized appreciation (depreciation) on: | ||||
Investments in unaffiliated issuers | (2,808,921 | ) | ||
Investments in affiliated issuers | (3,078,377 | ) | ||
Swap agreements | (2,943,839 | ) | ||
Futures contracts | (223,296 | ) | ||
Net change in unrealized appreciation (depreciation) | (9,054,433 | ) | ||
Net realized and unrealized loss | (58,459,791 | ) | ||
Net decrease in net assets resulting from operations | $ | (56,187,038 | ) | |
* | Relates to Trustees not deemed “interested persons” within the meaning of Section 2(a)(19) of the 1940 Act. |
SEE NOTES TO FINANCIAL STATEMENTS. | THE GUGGENHEIM FUNDS ANNUAL REPORT | 79 |
SERIES J (STYLEPLUS—MID GROWTH SERIES) |
STATEMENTS OF CHANGES IN NET ASSETS |
| Year Ended | Year Ended | ||||||
Increase (Decrease) in Net Assets from Operations: | ||||||||
Net investment income | $ | 2,272,753 | $ | 602,667 | ||||
Net realized gain (loss) on investments | (49,405,358 | ) | 47,983,165 | |||||
Net change in unrealized appreciation (depreciation) on investments | (9,054,433 | ) | (23,362,414 | ) | ||||
Net increase (decrease) in net assets resulting from operations | (56,187,038 | ) | 25,223,418 | |||||
Distributions to shareholders | (43,841,105 | ) | (27,830,332 | ) | ||||
Capital share transactions: | ||||||||
Proceeds from sale of shares | 16,227,294 | 7,094,590 | ||||||
Distributions reinvested | 43,841,105 | 27,830,332 | ||||||
Cost of shares redeemed | (13,494,617 | ) | (24,610,575 | ) | ||||
Net increase from capital share transactions | 46,573,782 | 10,314,347 | ||||||
Net increase (decrease) in net assets | (53,454,361 | ) | 7,707,433 | |||||
Net assets: | ||||||||
Beginning of year | 198,627,433 | 190,920,000 | ||||||
End of year | $ | 145,173,072 | $ | 198,627,433 | ||||
Capital share activity: | ||||||||
Shares sold | 285,794 | 92,701 | ||||||
Shares issued from reinvestment of distributions | 1,157,674 | 400,552 | ||||||
Shares redeemed | (291,950 | ) | (336,867 | ) | ||||
Net increase in shares | 1,151,518 | 156,386 | ||||||
80 | THE GUGGENHEIM FUNDS ANNUAL REPORT | SEE NOTES TO FINANCIAL STATEMENTS. |
SERIES J (STYLEPLUS—MID GROWTH SERIES) |
FINANCIAL HIGHLIGHTS |
This table is presented to show selected data for a share outstanding throughout each period and to assist shareholders in evaluating a Fund’s performance for the periods presented.
| Year Ended | Year Ended | Year Ended | Year Ended | Year Ended | |||||||||||||||
Per Share Data | ||||||||||||||||||||
Net asset value, beginning of period | $ | 71.17 | $ | 72.46 | $ | 58.49 | $ | 48.75 | $ | 59.82 | ||||||||||
Income (loss) from investment operations: | ||||||||||||||||||||
Net investment income (loss)a | .66 | .22 | .39 | .79 | .97 | |||||||||||||||
Net gain (loss) on investments (realized and unrealized) | (20.02 | ) | 9.44 | 17.43 | 14.90 | (4.08 | ) | |||||||||||||
Total from investment operations | (19.36 | ) | 9.66 | 17.82 | 15.69 | (3.11 | ) | |||||||||||||
Less distributions from: | ||||||||||||||||||||
Net investment income | (.20 | ) | (.40 | ) | (.84 | ) | (.49 | ) | (.83 | ) | ||||||||||
Net realized gains | (14.79 | ) | (10.55 | ) | (3.01 | ) | (5.46 | ) | (7.13 | ) | ||||||||||
Total distributions | (14.99 | ) | (10.95 | ) | (3.85 | ) | (5.95 | ) | (7.96 | ) | ||||||||||
Net asset value, end of period | $ | 36.82 | $ | 71.17 | $ | 72.46 | $ | 58.49 | $ | 48.75 | ||||||||||
| ||||||||||||||||||||
Total Returnb | (27.78 | %) | 13.69 | % | 32.10 | % | 32.70 | % | (7.10 | %) | ||||||||||
Ratios/Supplemental Data | ||||||||||||||||||||
Net assets, end of period (in thousands) | $ | 145,173 | $ | 198,627 | $ | 190,920 | $ | 157,675 | $ | 137,116 | ||||||||||
Ratios to average net assets: | ||||||||||||||||||||
Net investment income (loss) | 1.42 | % | 0.30 | % | 0.66 | % | 1.39 | % | 1.64 | % | ||||||||||
Total expensesc | 1.18 | % | 1.16 | % | 1.22 | % | 1.30 | % | 1.28 | % | ||||||||||
Net expensesd,e | 0.96 | % | 0.89 | % | 0.89 | % | 1.00 | % | 1.01 | % | ||||||||||
Portfolio turnover rate | 87 | % | 60 | % | 71 | % | 57 | % | 66 | % | ||||||||||
a | Net investment income (loss) per share was computed using average shares outstanding throughout the period. |
b | Total return does not take into account any of the expenses associated with an investment in variable insurance products. If total return had taken into account these expenses, performance would have been lower. Shares of a series of Guggenheim Variable Funds Trust are available only through the purchase of such products. |
c | Does not include expenses of the underlying funds in which the Fund invests. |
d | Net expense information reflects the expense ratios after expense waivers and reimbursements, as applicable. |
e | Net expenses may include expenses that are excluded from the expense limitation agreement. Excluding these expenses, the net expense ratios for the years presented would be: |
12/31/22 | 12/31/21 | 12/31/20 | 12/31/19 | 12/31/18 | |
0.91% | 0.87% | 0.88% | 0.92% | 0.94% |
SEE NOTES TO FINANCIAL STATEMENTS. | THE GUGGENHEIM FUNDS ANNUAL REPORT | 81 |
MANAGERS’ COMMENTARY (Unaudited) | December 31, 2022 |
To Our Shareholders
The Series N (Managed Asset Allocation Series, or the “Fund”) is managed by a team of seasoned professionals, including Michael P. Byrum, CFA, Senior Managing Director and Portfolio Manager; and Matthew Wu, Ph.D., CFA, Director and Portfolio Manager. In the subsequent paragraphs, the investment team discusses the Fund’s performance for the 12-month period ended December 31, 2022 (the “Reporting Period”).
For the Reporting Period, the Fund provided a total return of -16.57%, underperforming the weighted benchmark that is 60% S&P 500® Index and 40% Bloomberg U.S. Aggregate Bond Index, which returned -15.79%. The S&P 500 Index returned -18.11% over the year and the Bloomberg U.S. Aggregate Bond Index returned -13.01% for the same period.
What factors contributed or detracted from the Fund’s performance during the Reporting Period?
The year 2022 started with high inflation, with CPI year-over-year above 7%. Russia’s invasion into Ukraine made the inflation situation even worse. The Federal Reserve was clearly behind the curve and applied tightening policies in an aggressive way, comparable to what it did in the early 1980s. Essentially, all financial assets fell, with the bond markets seeing their worst performance in decades. Within equity, investors’ risk aversion sentiment punished international markets even more.
Our tactical models correctly overweighted U.S. equity and underweighted international equity for the first ten months in the Reporting Period. Within U.S. equity, we overweighted large cap and underweighted small cap. The models also successfully captured a few short-term opportunities in currency markets.
In the meantime, interest rate increases hurt our cash strategies funds.
In terms of absolute returns, the biggest detractors were iBoxx Investment Grade Corporate Bond ETFs, S&P 500 Index futures and ETFs, and Russell 2000 Index futures and ETFs.
How did the Fund use derivatives during the Reporting Period?
We have used index and bond futures to replicate benchmark exposures and traded them when we found it less expensive than trading ETFs.
How was the Fund positioned at the end of the Reporting Period?
At the end of the Reporting Period, we continued to position the portfolio holdings to closely replicate most of the benchmark’s exposures. The financial markets are not as overvalued as a year ago, while the debate about monetary policy’s direction will continue as the inflation numbers show initial evidence of easing. Also in dispute is the impact of China’s reopening. Therefore, markets are expected to continue to be volatile, which may generate short-term opportunities for our models to capture.
Performance displayed represents past performance which is no guarantee of future results.
The opinions and forecast expressed may not actually come to pass. This information is subject to change at any time, based on market and other conditions, and should not be construed as a recommendation of any specific security or strategy.
82 | THE GUGGENHEIM FUNDS ANNUAL REPORT |
PERFORMANCE REPORT AND FUND PROFILE (Unaudited) | December 31, 2022 |
SERIES N (MANAGED ASSET ALLOCATION SERIES)
OBJECTIVE: Seeks to provide growth of capital and, secondarily, preservation of capital.
Holdings Diversification (Market Exposure as % of Net Assets)
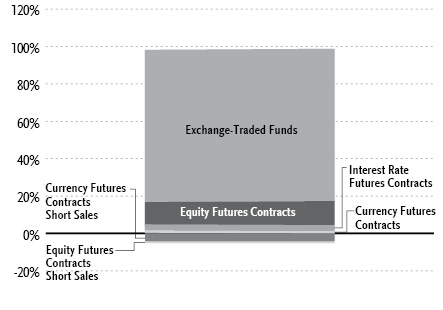
“Holdings Diversification (Market Exposure as % of Net Assets)” excludes any temporary cash investments, investments in Guggenheim Strategy Funds Trust mutual funds, or investments in Guggenheim Ultra Short Duration Fund.
Inception Date: June 1, 1995 |
Ten Largest Holdings | (% of Total Net Assets) |
Vanguard S&P 500 ETF | 22.0% |
Schwab U.S. Aggregate Bond ETF | 14.9% |
SPDR S&P 500 ETF Trust | 11.2% |
iShares MSCI EAFE ETF | 6.5% |
iShares iBoxx $ Investment Grade Corporate Bond ETF | 6.2% |
iShares Core S&P Mid-Cap ETF | 6.1% |
iShares 7-10 Year Treasury Bond ETF | 5.5% |
iShares 1-3 Year Treasury Bond ETF | 4.8% |
Guggenheim Strategy Fund II | 4.3% |
Guggenheim Variable Insurance Strategy Fund III | 3.0% |
Top Ten Total | 84.5% |
“Ten Largest Holdings” excludes any temporary cash or derivative investments. | |
THE GUGGENHEIM FUNDS ANNUAL REPORT | 83 |
PERFORMANCE REPORT AND FUND PROFILE (Unaudited)(concluded) | December 31, 2022 |
Cumulative Fund Performance*,†
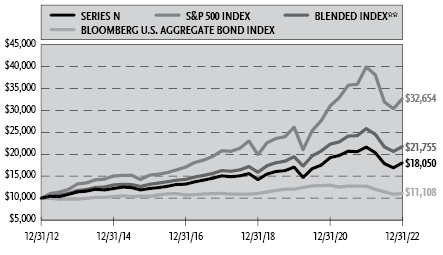
Average Annual Returns*,†
Periods Ended December 31, 2022
| 1 Year | 5 Year | 10 Year |
Series N (Managed Asset Allocation Series) | (16.57%) | 3.65% | 6.08% |
S&P 500 Index | (18.11%) | 9.42% | 12.56% |
Blended Index** | (15.79%) | 5.96% | 8.08% |
Bloomberg U.S. Aggregate Bond Index | (13.01%) | 0.02% | 1.06% |
* | The performance data above represents past performance that is not predictive of future results. The investment return and principal value of an investment in the Fund will fluctuate so that an investor’s shares, when redeemed, may be worth more or less than their original cost. Returns are historical and include changes in principal and reinvested dividends and capital gains and do not reflect the effect of taxes. The S&P 500 Index and the Bloomberg U.S. Aggregate Bond Index are unmanaged indices and, unlike the Fund, have no management fees or operating expenses to reduce their reported returns. |
** | Blended index is 60% S&P 500 Index and 40% Bloomberg U.S. Aggregate Bond Index. |
† | Performance figures do not reflect fees and expenses associated with an investment in variable insurance products. If returns had taken into account these fees and expenses, performance would have been lower. Shares of a series of Guggenheim Variable Funds Trust are available only through the purchase of such products. |
84 | THE GUGGENHEIM FUNDS ANNUAL REPORT |
SCHEDULE OF INVESTMENTS | December 31, 2022 |
SERIES N (MANAGED ASSET ALLOCATION SERIES) |
| Shares | Value | ||||||
EXCHANGE-TRADED FUNDS† - 81.5% | ||||||||
Vanguard S&P 500 ETF | 22,530 | $ | 7,915,690 | |||||
Schwab U.S. Aggregate Bond ETF | 117,462 | 5,362,140 | ||||||
SPDR S&P 500 ETF Trust | 10,501 | 4,015,897 | ||||||
iShares MSCI EAFE ETF | 35,262 | 2,314,598 | ||||||
iShares iBoxx $ Investment Grade Corporate Bond ETF | 21,221 | 2,237,330 | ||||||
iShares Core S&P Mid-Cap ETF | 9,114 | 2,204,586 | ||||||
iShares 7-10 Year Treasury Bond ETF | 20,726 | 1,985,136 | ||||||
iShares 1-3 Year Treasury Bond ETF | 21,409 | 1,737,769 | ||||||
iShares Russell 1000 Value ETF | 4,533 | 687,430 | ||||||
iShares TIPS Bond ETF | 3,987 | 424,376 | ||||||
iShares iBoxx High Yield Corporate Bond ETF | 5,736 | 422,342 | ||||||
iShares Core S&P 500 ETF | 2 | 768 | ||||||
Total Exchange-Traded Funds | ||||||||
(Cost $24,428,980) | 29,308,062 | |||||||
MUTUAL FUNDS† - 13.0% | ||||||||
Guggenheim Strategy Fund II1 | 63,901 | 1,536,185 | ||||||
Guggenheim Variable Insurance Strategy Fund III1 | 45,729 | 1,100,686 | ||||||
Guggenheim Strategy Fund III1 | 42,900 | 1,032,163 | ||||||
Guggenheim Ultra Short Duration Fund — Institutional Class1 | 105,191 | 1,014,044 | ||||||
Total Mutual Funds | ||||||||
(Cost $4,857,790) | 4,683,078 | |||||||
MONEY MARKET FUND† - 4.5% | ||||||||
Dreyfus Treasury Securities Cash Management Fund — Institutional Shares, 3.90%2 | 1,630,605 | 1,630,605 | ||||||
Total Money Market Fund | ||||||||
(Cost $1,630,605) | 1,630,605 | |||||||
Face | ||||||||
U.S. TREASURY BILLS†† - 1.0% | ||||||||
U.S. Treasury Bills | ||||||||
3.79% due 01/17/233,4 | $ | 334,000 | 333,522 | |||||
Total U.S. Treasury Bills | ||||||||
(Cost $333,423) | 333,522 | |||||||
Total Investments - 100.0% | ||||||||
(Cost $31,250,798) | $ | 35,955,267 | ||||||
Other Assets & Liabilities, net - 0.0% | 14,070 | |||||||
Total Net Assets - 100.0% | $ | 35,969,337 | ||||||
Futures Contracts | ||||||||||||||||
Description | Number of | Expiration Date | Notional | Value and | ||||||||||||
Interest Rate Futures Contracts Purchased† | ||||||||||||||||
U.S. Treasury 2 Year Note Futures Contracts | 2 | Mar 2023 | $ | 410,000 | $ | 372 | ||||||||||
U.S. Treasury 10 Year Note Futures Contracts | 7 | Mar 2023 | 784,875 | (3,293 | ) | |||||||||||
| $ | 1,194,875 | $ | (2,921 | ) | ||||||||||||
Currency Futures Contracts Purchased† | ||||||||||||||||
British Pound Futures Contracts | 5 | Mar 2023 | $ | 378,437 | $ | (3,263 | ) | |||||||||
Equity Futures Contracts Purchased† | ||||||||||||||||
Russell 2000 Index Mini Futures Contracts | 17 | Mar 2023 | 1,505,605 | (42,343 | ) | |||||||||||
MSCI EAFE Index Futures Contracts | 32 | Mar 2023 | 3,118,560 | (60,189 | ) | |||||||||||
| $ | 4,624,165 | $ | (102,532 | ) | ||||||||||||
Equity Futures Contracts Sold Short† | ||||||||||||||||
NASDAQ-100 Index Mini Futures Contracts | 2 | Mar 2023 | 440,920 | 29,419 | ||||||||||||
DAX Index Futures Contracts | 1 | Mar 2023 | 372,202 | 13,191 | ||||||||||||
Nikkei 225 (CME) Index Futures Contracts | 1 | Mar 2023 | 128,850 | 9,397 | ||||||||||||
S&P MidCap 400 Index Mini Futures Contracts | 1 | Mar 2023 | 244,330 | 758 | ||||||||||||
FTSE 100 Index Futures Contracts†† | 1 | Mar 2023 | 90,411 | (104 | ) | |||||||||||
S&P 500 Index Mini Futures Contracts | 1 | Mar 2023 | 193,075 | (2,694 | ) | |||||||||||
| $ | 1,469,788 | $ | 49,967 | |||||||||||||
Currency Futures Contracts Sold Short† | ||||||||||||||||
Euro FX Futures Contracts | 3 | Mar 2023 | $ | 403,481 | $ | (2,464 | ) | |||||||||
SEE NOTES TO FINANCIAL STATEMENTS. | THE GUGGENHEIM FUNDS ANNUAL REPORT | 85 |
SCHEDULE OF INVESTMENTS (continued) | December 31, 2022 |
SERIES N (MANAGED ASSET ALLOCATION SERIES) |
** | Includes cumulative appreciation (depreciation). Variation margin is reported within the Statement of Assets and Liabilities. |
† | Value determined based on Level 1 inputs — See Note 4. |
†† | Value determined based on Level 2 inputs — See Note 4. |
1 | Affiliated issuer. |
2 | Rate indicated is the 7-day yield as of December 31, 2022. |
3 | All or a portion of this security is pledged as futures collateral at December 31, 2022. |
4 | Rate indicated is the effective yield at the time of purchase. |
CME — Chicago Mercantile Exchange | |
See Sector Classification in Other Information section. |
The following table summarizes the inputs used to value the Fund’s investments at December 31, 2022 (See Note 4 in the Notes to Financial Statements):
Investments in Securities (Assets) | Level 1 | Level 2 | Level 3 | Total | ||||||||||||
Exchange-Traded Funds | $ | 29,308,062 | $ | — | $ | — | $ | 29,308,062 | ||||||||
Mutual Funds | 4,683,078 | — | — | 4,683,078 | ||||||||||||
Money Market Fund | 1,630,605 | — | — | 1,630,605 | ||||||||||||
U.S. Treasury Bills | — | 333,522 | — | 333,522 | ||||||||||||
Equity Futures Contracts** | 52,765 | — | — | 52,765 | ||||||||||||
Interest Rate Futures Contracts** | 372 | — | — | 372 | ||||||||||||
Total Assets | $ | 35,674,882 | $ | 333,522 | $ | — | $ | 36,008,404 | ||||||||
Investments in Securities (Liabilities) | Level 1 | Level 2 | Level 3 | Total | ||||||||||||
Equity Futures Contracts** | $ | 105,226 | $ | 104 | $ | — | $ | 105,330 | ||||||||
Currency Futures Contracts** | 5,727 | — | — | 5,727 | ||||||||||||
Interest Rate Futures Contracts** | 3,293 | — | — | 3,293 | ||||||||||||
Total Liabilities | $ | 114,246 | $ | 104 | $ | — | $ | 114,350 | ||||||||
** | This derivative is reported as unrealized appreciation/depreciation at period end. |
86 | THE GUGGENHEIM FUNDS ANNUAL REPORT | SEE NOTES TO FINANCIAL STATEMENTS. |
SCHEDULE OF INVESTMENTS (concluded) | December 31, 2022 |
SERIES N (MANAGED ASSET ALLOCATION SERIES) |
Affiliated Transactions
Investments representing 5% or more of the outstanding voting shares of a company, or control of or by, or common control under Guggenheim Investments (“GI”), result in that company being considered an affiliated issuer, as defined in the 1940 Act.
The Fund may invest in certain of the underlying series of Guggenheim Strategy Funds Trust, including Guggenheim Strategy Fund II, Guggenheim Strategy Fund III, and Guggenheim Variable Insurance Strategy Fund III, (collectively, the “Short Term Investment Vehicles”), each of which are open-end management investment companies managed by GI. The Short Term Investment Vehicles, which launched on March 11, 2014, are offered as short term investment options only to mutual funds, trusts, and other accounts managed by GI and/or its affiliates, and are not available to the public. The Short Term Investment Vehicles pay no investment management fees. The Short Term Investment Vehicles’ annual report on Form N-CSR dated September 30, 2022, is available publicly or upon request. This information is available from the EDGAR database on the SEC’s website at https://www.sec.gov/Archives/edgar/data/1601445/000182126822000340/gugg84768.htm. The Fund may invest in certain of the underlying series of Guggenheim Funds Trust, which are open-end management investment companies managed by GI, are available to the public and whose most recent annual report on Form N-CSR is available publicly or upon request.
Transactions during the year ended December 31, 2022, in which the company is an affiliated issuer, were as follows:
Security Name | Value | Additions | Reductions | Realized | Change in | Value | Shares | Investment | ||||||||||||||||||||||||
Mutual Funds | ||||||||||||||||||||||||||||||||
Guggenheim Strategy Fund II | $ | 1,891,803 | $ | — | $ | (300,000 | ) | $ | (3,155 | ) | $ | (52,463 | ) | $ | 1,536,185 | 63,901 | $ | 44,281 | ||||||||||||||
Guggenheim Strategy Fund III | 1,784,985 | — | (700,000 | ) | (10,060 | ) | (42,762 | ) | 1,032,163 | 42,900 | 33,628 | |||||||||||||||||||||
Guggenheim Ultra Short Duration Fund — Institutional Class | 1,043,498 | — | — | — | (29,454 | ) | 1,014,044 | 105,191 | 23,026 | |||||||||||||||||||||||
Guggenheim Variable Insurance Strategy Fund III | 1,853,627 | — | (700,000 | ) | (12,209 | ) | (40,732 | ) | 1,100,686 | 45,729 | 33,306 | |||||||||||||||||||||
| $ | 6,573,913 | $ | — | $ | (1,700,000 | ) | $ | (25,424 | ) | $ | (165,411 | ) | $ | 4,683,078 | $ | 134,241 | ||||||||||||||||
SEE NOTES TO FINANCIAL STATEMENTS. | THE GUGGENHEIM FUNDS ANNUAL REPORT | 87 |
SERIES N (MANAGED ASSET ALLOCATION SERIES) |
STATEMENT OF ASSETS AND LIABILITIES |
December 31, 2022 |
Assets: | ||||
Investments in unaffiliated issuers, at value (cost $26,393,008) | $ | 31,272,189 | ||
Investments in affiliated issuers, at value (cost $4,857,790) | 4,683,078 | |||
Cash | 57,661 | |||
Prepaid expenses | 2,437 | |||
Receivables: | ||||
Dividends | 37,104 | |||
Interest | 5,998 | |||
Fund shares sold | 618 | |||
Total assets | 36,059,085 | |||
Liabilities: | ||||
Payable for: | ||||
Variation margin on futures contracts | 29,432 | |||
Professional fees | 27,359 | |||
Management fees | 12,293 | |||
Distribution and service fees | 7,818 | |||
Fund shares redeemed | 4,106 | |||
Fund accounting/administration fees | 2,547 | |||
Transfer agent/maintenance fees | 2,081 | |||
Trustees’ fees* | 1,258 | |||
Miscellaneous | 2,854 | |||
Total liabilities | 89,748 | |||
Net assets | $ | 35,969,337 | ||
Net assets consist of: | ||||
Paid in capital | $ | 30,562,750 | ||
Total distributable earnings (loss) | 5,406,587 | |||
Net assets | $ | 35,969,337 | ||
Capital shares outstanding | 1,384,675 | |||
Net asset value per share | $ | 25.98 | ||
STATEMENT OF OPERATIONS |
Year Ended December 31, 2022 |
Investment Income: | ||||
Dividends from securities of unaffiliated issuers | $ | 668,886 | ||
Dividends from securities of affiliated issuers | 134,241 | |||
Interest | 26,228 | |||
Total investment income | 829,355 | |||
Expenses: | ||||
Management fees | 157,682 | |||
Distribution and service fees | 98,551 | |||
Transfer agent/maintenance fees | 25,255 | |||
Professional fees | 41,709 | |||
Fund accounting/administration fees | 30,347 | |||
Trustees’ fees* | 9,089 | |||
Custodian fees | 2,595 | |||
Line of credit fees | 1,189 | |||
Miscellaneous | 10,358 | |||
Total expenses | 376,775 | |||
Less: | ||||
Expenses waived by Adviser | (2,555 | ) | ||
Earnings credits applied | (40 | ) | ||
Total waived expenses | (2,595 | ) | ||
Net expenses | 374,180 | |||
Net investment income | 455,175 | |||
Net Realized and Unrealized Gain (Loss): | ||||
Net realized gain (loss) on: | ||||
Investments in unaffiliated issuers | 1,785,242 | |||
Investments in affiliated issuers | (25,424 | ) | ||
Futures contracts | (1,120,296 | ) | ||
Foreign currency transactions | (822 | ) | ||
Net realized gain | 638,700 | |||
Net change in unrealized appreciation (depreciation) on: | ||||
Investments in unaffiliated issuers | (8,372,824 | ) | ||
Investments in affiliated issuers | (165,411 | ) | ||
Futures contracts | (181,268 | ) | ||
Foreign currency translations | 23 | |||
Net change in unrealized appreciation (depreciation) | (8,719,480 | ) | ||
Net realized and unrealized loss | (8,080,780 | ) | ||
Net decrease in net assets resulting from operations | $ | (7,625,605 | ) | |
* | Relates to Trustees not deemed “interested persons” within the meaning of Section 2(a)(19) of the 1940 Act. |
88 | THE GUGGENHEIM FUNDS ANNUAL REPORT | SEE NOTES TO FINANCIAL STATEMENTS. |
SERIES N (MANAGED ASSET ALLOCATION SERIES) |
STATEMENTS OF CHANGES IN NET ASSETS |
| Year Ended | Year Ended | ||||||
Increase (Decrease) in Net Assets from Operations: | ||||||||
Net investment income | $ | 455,175 | $ | 319,709 | ||||
Net realized gain on investments | 638,700 | 4,219,532 | ||||||
Net change in unrealized appreciation (depreciation) on investments | (8,719,480 | ) | 935,032 | |||||
Net increase (decrease) in net assets resulting from operations | (7,625,605 | ) | 5,474,273 | |||||
Distributions to shareholders | (4,049,453 | ) | (3,475,814 | ) | ||||
Capital share transactions: | ||||||||
Proceeds from sale of shares | 612,413 | 1,389,917 | ||||||
Distributions reinvested | 4,049,453 | 3,475,814 | ||||||
Cost of shares redeemed | (4,025,591 | ) | (5,528,955 | ) | ||||
Net increase (decrease) from capital share transactions | 636,275 | (663,224 | ) | |||||
Net increase (decrease) in net assets | (11,038,783 | ) | 1,335,235 | |||||
Net assets: | ||||||||
Beginning of year | 47,008,120 | 45,672,885 | ||||||
End of year | $ | 35,969,337 | $ | 47,008,120 | ||||
Capital share activity: | ||||||||
Shares sold | 20,795 | 40,195 | ||||||
Shares issued from reinvestment of distributions | 152,178 | 103,632 | ||||||
Shares redeemed | (138,118 | ) | (160,933 | ) | ||||
Net increase (decrease) in shares | 34,855 | (17,106 | ) | |||||
SEE NOTES TO FINANCIAL STATEMENTS. | THE GUGGENHEIM FUNDS ANNUAL REPORT | 89 |
SERIES N (MANAGED ASSET ALLOCATION SERIES) |
FINANCIAL HIGHLIGHTS |
This table is presented to show selected data for a share outstanding throughout each period and to assist shareholders in evaluating a Fund’s performance for the periods presented.
| Year Ended | Year Ended | Year Ended | Year Ended | Year Ended | |||||||||||||||
Per Share Data | ||||||||||||||||||||
Net asset value, beginning of period | $ | 34.83 | $ | 33.41 | $ | 32.05 | $ | 27.34 | $ | 31.68 | ||||||||||
Income (loss) from investment operations: | ||||||||||||||||||||
Net investment income (loss)a | .33 | .24 | .24 | .44 | .47 | |||||||||||||||
Net gain (loss) on investments (realized and unrealized) | (6.03 | ) | 3.83 | 3.52 | 5.02 | (2.08 | ) | |||||||||||||
Total from investment operations | (5.70 | ) | 4.07 | 3.76 | 5.46 | (1.61 | ) | |||||||||||||
Less distributions from: | ||||||||||||||||||||
Net investment income | (.25 | ) | (.25 | ) | (.49 | ) | (.51 | ) | (.44 | ) | ||||||||||
Net realized gains | (2.90 | ) | (2.40 | ) | (1.91 | ) | (.24 | ) | (2.29 | ) | ||||||||||
Total distributions | (3.15 | ) | (2.65 | ) | (2.40 | ) | (.75 | ) | (2.73 | ) | ||||||||||
Net asset value, end of period | $ | 25.98 | $ | 34.83 | $ | 33.41 | $ | 32.05 | $ | 27.34 | ||||||||||
| ||||||||||||||||||||
Total Returnb | (16.57 | %) | 12.47 | % | 12.59 | % | 20.11 | % | (5.73 | %) | ||||||||||
Ratios/Supplemental Data | ||||||||||||||||||||
Net assets, end of period (in thousands) | $ | 35,969 | $ | 47,008 | $ | 45,673 | $ | 46,219 | $ | 42,636 | ||||||||||
Ratios to average net assets: | ||||||||||||||||||||
Net investment income (loss) | 1.15 | % | 0.68 | % | 0.77 | % | 1.45 | % | 1.53 | % | ||||||||||
Total expensesc | 0.96 | % | 0.94 | % | 1.01 | % | 1.01 | % | 0.99 | % | ||||||||||
Net expensesd | 0.95 | % | 0.94 | % | 1.00 | % | 1.00 | % | 0.99 | % | ||||||||||
Portfolio turnover rate | 1 | % | 26 | % | 6 | % | 14 | % | 4 | % | ||||||||||
a | Net investment income (loss) per share was computed using average shares outstanding throughout the period. |
b | Total return does not take into account any of the expenses associated with an investment in variable insurance products. If total return had taken into account these expenses, performance would have been lower. Shares of a series of Guggenheim Variable Funds Trust are available only through the purchase of such products. |
c | Does not include expenses of the underlying funds in which the Fund invests. |
d | Net expense information reflects the expense ratios after expense waivers and reimbursements, as applicable. |
90 | THE GUGGENHEIM FUNDS ANNUAL REPORT | SEE NOTES TO FINANCIAL STATEMENTS. |
MANAGERS’ COMMENTARY (Unaudited) | December 31, 2022 |
To Our Shareholders
The Series O (All Cap Value Series, or the “Fund”) is managed by a team of seasoned professionals, led by James Schier, CFA, Senior Managing Director and Portfolio Manager; David Toussaint, CFA, CPA, Managing Director and Portfolio Manager; Farhan Sharaff, Senior Managing Director, Assistant Chief Investment Officer, Equities, and Portfolio Manager; Gregg Strohkorb, CFA, Director and Portfolio Manager; and Burak Hurmeydan, Ph.D., Director and Portfolio Manager. In the subsequent paragraphs, the investment team discusses the Fund’s performance for the 12-month period ended December 31, 2022 (the “Reporting Period”).
For the Reporting Period, the Fund provided a total return of -1.17%, outperforming the Russell 3000 Value Index (“Index”), the Fund’s benchmark, which returned -7.98% for the same period.
What factors contributed or detracted from the Fund’s performance during the Reporting Period?
After the market reached record highs at the end of 2021, it came under pressure as the Federal Reserve (the “Fed”) strove to contain inflation by raising rates and, at the same time, the market had to deal with the uncertainty over the Ukraine invasion. The Fund’s general focus toward quality companies (those with better balance sheets than peers) that meet our valuation parameters tended to position the holdings well in most sectors. In fact, the Fund produced a significant positive contribution from both its security selection and its sector allocation.
The Fund had an overweight to the Energy sector throughout the Reporting Period, which contributed the most to the Fund’s outperformance versus its benchmark. The Energy holdings returned over 62% during the Reporting Period, while the overall benchmark recorded an 8% loss. A focus on oil and gas exploration and development companies was a key to success. EQT Corp., a natural gas producer, was up over 50%, as natural gas prices spiked as a result of the Russian-Ukraine War and Europe’s supply of natural gas being curtailed. ConocoPhillips and Marathon Oil, both oil producers, performed extremely well and were up over 65% each, as oil prices improved due to uncertainty stemming from the Russian-Ukraine War and the companies exercised capital discipline throughout 2022. An oil and natural gas service company, Patterson-UTI Energy, was up over 100%, as the company’s oil and natural gas drilling rigs were put to work in the field.
Stock selection within the Financials sector was equally as significant for the Fund during the year. The Fund’s holdings in this sector dropped 0.2% versus a 10.5% decline in the benchmark. First Horizon (a regional bank based in Memphis) gained 42% after receiving a take-over offer from Toronto-Dominion Bank. Allegheny Corporation (primarily a reinsurance company) received a merger offer from Berkshire Hathaway and gained more than 27%. Another significant contributor, UNUM Group, gained more than 73%. UNUM, a supplemental disability and health insurance company, benefited from lower COVID-related disability claims and strong payroll growth, given the strong employment levels throughout the year. In addition, the reserves set aside for the closed long-term-care book of business benefited from higher interest rates during the year.
Another positive contributor to performance was the Fund’s overweight to the Utilities sector. Constellation Energy, a spin-off from Exelon Corp, fared well and was up over 75%, as passage of the Inflation Reduction Act favored companies with nuclear power generation assets.
Although the Fund was underweight the Health Care sector, the fourth best-performing sector, stock selection was a significant contributor, as the Fund’s holdings were up 8.1%. One of the best performers within this sector was McKesson Corp, up over 50%. The company continued to grow revenue and earnings in its U.S. businesses and divested some of its European businesses. The best overall performer for the Fund this year was in Health Care, as Prothena Corp. gained over 150%. Positive results from a competitor’s Alzeimer’s drug trial portend similar positive results for the company’s own Alzeimer’s drug trial.
The Fund’s largest detractor from performance was Micron Technology, one of the largest memory chips makers in the world. The oversupply of memory chips in the market caused prices to fall, hurting the company’s revenue and earnings. Another poor performer for the Fund was Tyson Foods, Inc., a producer and distributor of chicken, beef, and pork. The company has been faced with higher feed, labor, and freight costs that hurt margins and earnings.
How was the Fund positioned at the end of the Reporting Period?
The market outlook is unusually cloudy. In addition to the geopolitical uncertainty that appears to be potentially significant, the market must contend with a hawkish Federal Reserve. Together, this provides a challenging environment for economic growth. All of this, however, does not change our process, which is heavily bottoms up driven.
THE GUGGENHEIM FUNDS ANNUAL REPORT | 91 |
MANAGERS’ COMMENTARY (Unaudited)(concluded) | December 31, 2022 |
The Fund’s largest overweights are in the Information Technology, Industrials, and Materials sectors. In Information Technology, we see more attractive opportunities after the sector significantly underperformed during 2022. Among the Industrials holdings, opportunities appear abundant especially among construction & engineering companies, truckers, airlines, building products and distributors. In Materials, we can find many self-help situations in the chemical industry (opportunities companies possess to generate earnings growth that are not dependent on general macroeconomic conditions; these opportunities could include cost cutting, asset redeployment, or share repurchases). Many of these companies also benefit from low-cost North American natural gas feedstock costs. The strategy also has an overweighting among steel companies, as they trade at attractive valuations, generate free cash flow, and may provide growth opportunities as a result of government programs and the onshoring of manufacturing.
At the end of the Reporting Period, the Fund held an overweight to the Utilities and a similar size underweight to the REITs sector. Both sectors are interest-rate-sensitive, but we favor utilities because of the valuations, profitability, and regulatory nature of their businesses.
The Fund is underweight Financials, Health Care, and Consumer Discretionary sectors. Higher interest rates will benefit the Financials, but a possible looming recession could increase credit costs and depress earnings. Within Health Care, the Fund is primarily underweight Pharmaceuticals, a sector that has performed well, but whose earnings and cash flow may disappoint post pandemic. Finally, in Consumer Discretionary, many companies appear to be operating at near-peak profitability levels just as consumer spending is nearing an inflection point or plateauing at best.
Performance displayed represents past performance which is no guarantee of future results.
The opinions and forecast expressed may not actually come to pass. This information is subject to change at any time, based on market and other conditions, and should not be construed as a recommendation of any specific security or strategy.
92 | THE GUGGENHEIM FUNDS ANNUAL REPORT |
PERFORMANCE REPORT AND FUND PROFILE (Unaudited) | December 31, 2022 |
SERIES O (ALL CAP VALUE SERIES)
OBJECTIVE: Seeks long-term growth of capital.
Holdings Diversification (Market Exposure as % of Net Assets)
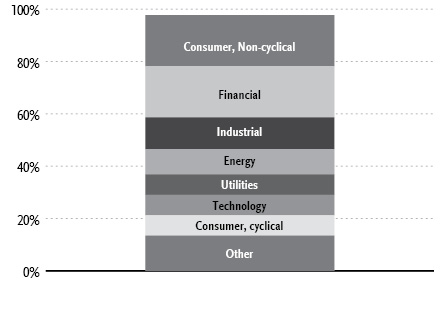
“Holdings Diversification (Market Exposure as % of Net Assets)” excludes any temporary cash investments.
Inception Date: June 1, 1995 |
Ten Largest Holdings (% of Total Net Assets) | |
Chevron Corp. | 2.7% |
JPMorgan Chase & Co. | 2.4% |
Berkshire Hathaway, Inc. — Class B | 2.2% |
Pioneer Natural Resources Co. | 2.0% |
Johnson & Johnson | 1.9% |
OGE Energy Corp. | 1.9% |
Ingredion, Inc. | 1.6% |
Bunge Ltd. | 1.6% |
Bank of America Corp. | 1.6% |
Westlake Corp. | 1.5% |
Top Ten Total | 19.4% |
“Ten Largest Holdings” excludes any temporary cash investments. | |
THE GUGGENHEIM FUNDS ANNUAL REPORT | 93 |
PERFORMANCE REPORT AND FUND PROFILE (Unaudited)(concluded) | December 31, 2022 |
Cumulative Fund Performance*,†
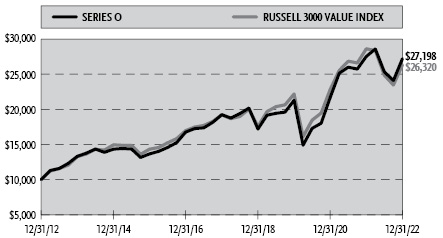
Average Annual Returns*,†
Periods Ended December 31, 2022
| 1 Year | 5 Year | 10 Year |
Series O (All Cap Value Series) | (1.17%) | 7.17% | 10.52% |
Russell 3000 Value Index | (7.98%) | 6.50% | 10.16% |
* | The performance data above represents past performance that is not predictive of future results. The investment return and principal value of an investment in the Fund will fluctuate so that an investor’s shares, when redeemed, may be worth more or less than their original cost. Returns are historical and include changes in principal and reinvested dividends and capital gains and do not reflect the effect of taxes. The Russell 3000 Value Index is an unmanaged index and, unlike the Fund, has no management fees or operating expenses to reduce its reported return. |
† | Performance figures do not reflect fees and expenses associated with an investment in variable insurance products. If returns had taken into account these fees and expenses, performance would have been lower. Shares of a series of Guggenheim Variable Funds Trust are available only through the purchase of such products. |
94 | THE GUGGENHEIM FUNDS ANNUAL REPORT |
SCHEDULE OF INVESTMENTS | December 31, 2022 |
SERIES O (ALL CAP VALUE SERIES) |
| Shares | Value | ||||||
COMMON STOCKS† - 97.7% | ||||||||
Consumer, Non-cyclical - 19.5% | ||||||||
Johnson & Johnson | 10,119 | $ | 1,787,521 | |||||
Ingredion, Inc. | 15,668 | 1,534,367 | ||||||
Bunge Ltd. | 15,296 | 1,526,082 | ||||||
Quest Diagnostics, Inc. | 8,541 | 1,336,154 | ||||||
Euronet Worldwide, Inc.* | 12,325 | 1,163,233 | ||||||
Henry Schein, Inc.* | 13,673 | 1,092,062 | ||||||
Merck & Company, Inc. | 9,829 | 1,090,528 | ||||||
Tyson Foods, Inc. — Class A | 16,562 | 1,030,984 | ||||||
Archer-Daniels-Midland Co. | 10,876 | 1,009,837 | ||||||
Humana, Inc. | 1,823 | 933,722 | ||||||
Encompass Health Corp. | 13,794 | 825,019 | ||||||
J M Smucker Co. | 4,784 | 758,073 | ||||||
Medtronic plc | 9,686 | 752,796 | ||||||
Moderna, Inc.* | 3,118 | 560,055 | ||||||
McKesson Corp. | 1,423 | 533,796 | ||||||
HCA Healthcare, Inc. | 1,707 | 409,612 | ||||||
Pfizer, Inc. | 7,912 | 405,411 | ||||||
Bristol-Myers Squibb Co. | 5,239 | 376,946 | ||||||
Integer Holdings Corp.* | 4,278 | 292,872 | ||||||
Central Garden & Pet Co. — Class A* | 7,922 | 283,608 | ||||||
Azenta, Inc.* | 2,750 | 160,105 | ||||||
ICF International, Inc. | 1,592 | 157,688 | ||||||
Jazz Pharmaceuticals plc* | 640 | 101,958 | ||||||
Ironwood Pharmaceuticals, Inc. — Class A* | 8,172 | 101,251 | ||||||
Pacira BioSciences, Inc.* | 2,272 | 87,722 | ||||||
Total Consumer, Non-cyclical | 18,311,402 | |||||||
Financial - 19.5% | ||||||||
JPMorgan Chase & Co. | 16,798 | 2,252,612 | ||||||
Berkshire Hathaway, Inc. — Class B* | 6,640 | 2,051,096 | ||||||
Bank of America Corp. | 45,454 | 1,505,437 | ||||||
BOK Financial Corp. | 9,094 | 943,866 | ||||||
Charles Schwab Corp. | 10,274 | 855,413 | ||||||
Unum Group | 18,643 | 764,922 | ||||||
Voya Financial, Inc. | 11,903 | 731,916 | ||||||
Wells Fargo & Co. | 17,301 | 714,358 | ||||||
Mastercard, Inc. — Class A | 2,031 | 706,240 | ||||||
Prosperity Bancshares, Inc. | 9,109 | 662,042 | ||||||
First Merchants Corp. | 13,604 | 559,260 | ||||||
Goldman Sachs Group, Inc. | 1,527 | 524,341 | ||||||
STAG Industrial, Inc. REIT | 15,226 | 491,952 | ||||||
Physicians Realty Trust REIT | 29,711 | 429,918 | ||||||
Texas Capital Bancshares, Inc.* | 6,699 | 404,017 | ||||||
Gaming and Leisure Properties, Inc. REIT | 7,190 | 374,527 | ||||||
Old Republic International Corp. | 14,148 | 341,674 | ||||||
Alexandria Real Estate Equities, Inc. REIT | 2,133 | 310,714 | ||||||
American Tower Corp. — Class A REIT | 1,450 | 307,197 | ||||||
Axis Capital Holdings Ltd. | 5,505 | 298,206 | ||||||
Hancock Whitney Corp. | 6,119 | 296,098 | ||||||
Sun Communities, Inc. REIT | 2,052 | 293,436 | ||||||
T. Rowe Price Group, Inc. | 2,640 | 287,918 | ||||||
Stifel Financial Corp. | 4,680 | 273,172 | ||||||
Old National Bancorp | 15,146 | 272,325 | ||||||
Apple Hospitality REIT, Inc. | 15,426 | 243,422 | ||||||
First American Financial Corp. | 4,603 | 240,921 | ||||||
Trustmark Corp. | 5,229 | 182,544 | ||||||
SVB Financial Group* | 775 | 178,359 | ||||||
Wintrust Financial Corp. | 1,986 | 167,857 | ||||||
United Bankshares, Inc. | 4,125 | 167,021 | ||||||
First Hawaiian, Inc. | 6,166 | 160,563 | ||||||
VICI Properties, Inc. REIT | 4,779 | 154,840 | ||||||
United Community Banks, Inc. | 4,420 | 149,396 | ||||||
Heritage Insurance Holdings, Inc.* | 6,962 | 12,532 | ||||||
Total Financial | 18,310,112 | |||||||
Industrial - 12.2% | ||||||||
Johnson Controls International plc | 19,318 | 1,236,352 | ||||||
Valmont Industries, Inc. | 3,396 | 1,122,955 | ||||||
Knight-Swift Transportation Holdings, Inc. | 21,358 | 1,119,373 | ||||||
Teledyne Technologies, Inc.* | 1,590 | 635,857 | ||||||
FedEx Corp. | 3,213 | 556,491 | ||||||
L3Harris Technologies, Inc. | 2,536 | 528,021 | ||||||
Advanced Energy Industries, Inc. | 5,649 | 484,571 | ||||||
Graphic Packaging Holding Co. | 20,768 | 462,088 | ||||||
Kirby Corp.* | 6,945 | 446,911 | ||||||
Littelfuse, Inc. | 1,841 | 405,388 | ||||||
MDU Resources Group, Inc. | 13,111 | 397,788 | ||||||
Curtiss-Wright Corp. | 2,348 | 392,093 | ||||||
Terex Corp. | 8,905 | 380,422 | ||||||
Arcosa, Inc. | 6,519 | 354,243 | ||||||
Altra Industrial Motion Corp. | 5,805 | 346,849 | ||||||
Enovis Corp.* | 5,089 | 272,363 | ||||||
Daseke, Inc.* | 45,933 | 261,359 | ||||||
GATX Corp. | 2,150 | 228,631 | ||||||
PGT Innovations, Inc.* | 12,485 | 224,230 | ||||||
Mercury Systems, Inc.* | 4,933 | 220,702 | ||||||
Park Aerospace Corp. | 14,655 | 196,523 | ||||||
Plexus Corp.* | 1,806 | 185,891 | ||||||
Summit Materials, Inc. — Class A* | 6,366 | 180,731 | ||||||
Sonoco Products Co. | 2,930 | 177,880 | ||||||
Esab Corp. | 3,380 | 158,590 | ||||||
EnerSys | 2,114 | 156,098 | ||||||
Stoneridge, Inc.* | 6,430 | 138,631 | ||||||
Coherent Corp.* | 3,098 | 108,740 | ||||||
AZEK Company, Inc.* | 4,251 | 86,380 | ||||||
Total Industrial | 11,466,151 | |||||||
Energy - 9.6% | ||||||||
Chevron Corp. | 14,038 | 2,519,681 | ||||||
Pioneer Natural Resources Co. | 8,092 | 1,848,132 | ||||||
ConocoPhillips | 12,079 | 1,425,322 | ||||||
Coterra Energy, Inc. — Class A | 29,092 | 714,791 | ||||||
Kinder Morgan, Inc. | 36,763 | 664,675 | ||||||
Marathon Oil Corp. | 24,310 | 658,072 | ||||||
Diamondback Energy, Inc. | 3,889 | 531,937 | ||||||
Patterson-UTI Energy, Inc. | 21,280 | 358,355 | ||||||
Equities Corp. | 9,599 | 324,734 | ||||||
Total Energy | 9,045,699 | |||||||
SEE NOTES TO FINANCIAL STATEMENTS. | THE GUGGENHEIM FUNDS ANNUAL REPORT | 95 |
SCHEDULE OF INVESTMENTS (continued) | December 31, 2022 |
SERIES O (ALL CAP VALUE SERIES) |
| Shares | Value | ||||||
Utilities - 7.9% | ||||||||
OGE Energy Corp. | 44,999 | $ | 1,779,710 | |||||
Pinnacle West Capital Corp. | 16,818 | 1,278,841 | ||||||
Edison International | 15,015 | 955,254 | ||||||
Exelon Corp. | 20,760 | 897,455 | ||||||
Black Hills Corp. | 12,525 | 881,009 | ||||||
Duke Energy Corp. | 5,623 | 579,113 | ||||||
NiSource, Inc. | 18,936 | 519,225 | ||||||
PPL Corp. | 9,865 | 288,255 | ||||||
Spire, Inc. | 3,327 | 229,097 | ||||||
Total Utilities | 7,407,959 | |||||||
Technology - 7.8% | ||||||||
Micron Technology, Inc. | 23,004 | 1,149,740 | ||||||
Leidos Holdings, Inc. | 10,336 | 1,087,244 | ||||||
Teradyne, Inc. | 11,150 | 973,952 | ||||||
Microsoft Corp. | 3,160 | 757,831 | ||||||
KLA Corp. | 1,826 | 688,457 | ||||||
Evolent Health, Inc. — Class A* | 22,593 | 634,412 | ||||||
Fiserv, Inc.* | 5,115 | 516,973 | ||||||
Science Applications International Corp. | 4,099 | 454,702 | ||||||
Amdocs Ltd. | 4,891 | 444,592 | ||||||
MACOM Technology Solutions Holdings, Inc.* | 4,023 | 253,368 | ||||||
Silicon Laboratories, Inc.* | 1,684 | 228,468 | ||||||
Power Integrations, Inc. | 2,155 | 154,557 | ||||||
Total Technology | 7,344,296 | |||||||
Consumer, Cyclical - 7.7% | ||||||||
Walmart, Inc. | 8,159 | 1,156,865 | ||||||
Whirlpool Corp. | 4,317 | 610,683 | ||||||
Ralph Lauren Corp. — Class A | 5,600 | 591,752 | ||||||
PACCAR, Inc. | 5,968 | 590,653 | ||||||
Delta Air Lines, Inc.* | 17,521 | 575,740 | ||||||
H&E Equipment Services, Inc. | 11,692 | 530,817 | ||||||
MSC Industrial Direct Company, Inc. — Class A | 6,117 | 499,759 | ||||||
Southwest Airlines Co. | 14,749 | 496,599 | ||||||
Home Depot, Inc. | 1,560 | 492,741 | ||||||
PVH Corp. | 6,578 | 464,341 | ||||||
Methode Electronics, Inc. | 7,815 | 346,752 | ||||||
Alaska Air Group, Inc.* | 5,933 | 254,763 | ||||||
UniFirst Corp. | 918 | 177,165 | ||||||
Marriott Vacations Worldwide Corp. | 1,054 | 141,858 | ||||||
Leggett & Platt, Inc. | 4,193 | 135,140 | ||||||
Meritage Homes Corp.* | 1,010 | 93,122 | ||||||
Lakeland Industries, Inc.* | 6,577 | 87,474 | ||||||
Total Consumer, Cyclical | 7,246,224 | |||||||
Communications - 7.0% | ||||||||
Alphabet, Inc. — Class A* | 14,120 | 1,245,808 | ||||||
Verizon Communications, Inc. | 27,789 | 1,094,887 | ||||||
Comcast Corp. — Class A | 22,453 | 785,181 | ||||||
Fox Corp. — Class B | 24,211 | 688,803 | ||||||
Cisco Systems, Inc. | 14,121 | 672,724 | ||||||
Walt Disney Co.* | 6,367 | 553,165 | ||||||
Juniper Networks, Inc. | 13,304 | 425,196 | ||||||
Ciena Corp.* | 7,281 | 371,185 | ||||||
T-Mobile US, Inc.* | 2,640 | 369,600 | ||||||
Infinera Corp.* | 49,770 | 335,450 | ||||||
Total Communications | 6,541,999 | |||||||
Basic Materials - 6.5% | ||||||||
Westlake Corp. | 13,907 | 1,426,024 | ||||||
Huntsman Corp. | 45,965 | 1,263,118 | ||||||
Reliance Steel & Aluminum Co. | 5,239 | 1,060,583 | ||||||
Nucor Corp. | 4,515 | 595,122 | ||||||
Freeport-McMoRan, Inc. | 15,267 | 580,146 | ||||||
Ashland, Inc. | 2,721 | 292,589 | ||||||
Avient Corp. | 8,639 | 291,653 | ||||||
International Flavors & Fragrances, Inc. | 1,983 | 207,898 | ||||||
DuPont de Nemours, Inc. | 2,496 | 171,300 | ||||||
Dow, Inc. | 3,272 | 164,876 | ||||||
Total Basic Materials | 6,053,309 | |||||||
Total Common Stocks | ||||||||
(Cost $74,801,783) | 91,727,151 | |||||||
RIGHTS† - 0.0% | ||||||||
Basic Materials - 0.0% | ||||||||
Pan American Silver Corp.* | 40,146 | 22,923 | ||||||
Total Rights | ||||||||
(Cost $—) | 22,923 | |||||||
MONEY MARKET FUND† - 2.3% | ||||||||
Dreyfus Treasury Securities Cash Management Fund — Institutional Shares, 3.90%1 | 2,139,137 | 2,139,137 | ||||||
Total Money Market Fund | ||||||||
(Cost $2,139,137) | 2,139,137 | |||||||
Total Investments - 100.0% | ||||||||
(Cost $76,940,920) | $ | 93,889,211 | ||||||
Other Assets & Liabilities, net - 0.0% | 22,795 | |||||||
Total Net Assets - 100.0% | $ | 93,912,006 | ||||||
* | Non-income producing security. |
† | Value determined based on Level 1 inputs — See Note 4. |
1 | Rate indicated is the 7-day yield as of December 31, 2022. |
plc — Public Limited Company | |
REIT — Real Estate Investment Trust | |
See Sector Classification in Other Information section. |
96 | THE GUGGENHEIM FUNDS ANNUAL REPORT | SEE NOTES TO FINANCIAL STATEMENTS. |
SCHEDULE OF INVESTMENTS (concluded) | December 31, 2022 |
SERIES O (ALL CAP VALUE SERIES) |
The following table summarizes the inputs used to value the Fund’s investments at December 31, 2022 (See Note 4 in the Notes to Financial Statements):
Investments in Securities (Assets) | Level 1 | Level 2 | Level 3 | Total | ||||||||||||
Common Stocks | $ | 91,727,151 | $ | — | $ | — | $ | 91,727,151 | ||||||||
Rights | 22,923 | — | — | 22,923 | ||||||||||||
Money Market Fund | 2,139,137 | — | — | 2,139,137 | ||||||||||||
Total Assets | $ | 93,889,211 | $ | — | $ | — | $ | 93,889,211 | ||||||||
SEE NOTES TO FINANCIAL STATEMENTS. | THE GUGGENHEIM FUNDS ANNUAL REPORT | 97 |
SERIES O (ALL CAP VALUE SERIES) |
STATEMENT OF ASSETS AND LIABILITIES |
December 31, 2022 |
Assets: | ||||
Investments, at value (cost $76,940,920) | $ | 93,889,211 | ||
Cash | 1,175 | |||
Prepaid expenses | 3,172 | |||
Receivables: | ||||
Dividends | 133,132 | |||
Interest | 6,939 | |||
Total assets | 94,033,629 | |||
Liabilities: | ||||
Payable for: | ||||
Management fees | 36,729 | |||
Fund shares redeemed | 33,311 | |||
Professional fees | 23,070 | |||
Distribution and service fees | 20,226 | |||
Transfer agent/maintenance fees | 2,145 | |||
Fund accounting/administration fees | 2,102 | |||
Trustees’ fees* | 255 | |||
Miscellaneous | 3,785 | |||
Total liabilities | 121,623 | |||
Net assets | $ | 93,912,006 | ||
Net assets consist of: | ||||
Paid in capital | $ | 67,820,826 | ||
Total distributable earnings (loss) | 26,091,180 | |||
Net assets | $ | 93,912,006 | ||
Capital shares outstanding | 2,806,049 | |||
Net asset value per share | $ | 33.47 | ||
STATEMENT OF OPERATIONS |
Year Ended December 31, 2022 |
Investment Income: | ||||
Dividends | $ | 2,210,610 | ||
Interest | 50,326 | |||
Total investment income | 2,260,936 | |||
Expenses: | ||||
Management fees | 683,744 | |||
Distribution and service fees | 244,193 | |||
Transfer agent/maintenance fees | 25,458 | |||
Fund accounting/administration fees | 61,571 | |||
Professional fees | 34,531 | |||
Trustees’ fees* | 9,749 | |||
Line of credit fees | 2,678 | |||
Custodian fees | 2,563 | |||
Miscellaneous | 22,431 | |||
Total expenses | 1,086,918 | |||
Less: | ||||
Expenses waived by Adviser | (246,297 | ) | ||
Earnings credits applied | (57 | ) | ||
Total waived expenses | (246,354 | ) | ||
Net expenses | 840,564 | |||
Net investment income | 1,420,372 | |||
Net Realized and Unrealized Gain (Loss): | ||||
Net realized gain (loss) on: | ||||
Investments | 8,505,286 | |||
Net realized gain | 8,505,286 | |||
Net change in unrealized appreciation (depreciation) on: | ||||
Investments | (11,219,630 | ) | ||
Net change in unrealized appreciation (depreciation) | (11,219,630 | ) | ||
Net realized and unrealized loss | (2,714,344 | ) | ||
Net decrease in net assets resulting from operations | $ | (1,293,972 | ) | |
* | Relates to Trustees not deemed “interested persons” within the meaning of Section 2(a)(19) of the 1940 Act. |
98 | THE GUGGENHEIM FUNDS ANNUAL REPORT | SEE NOTES TO FINANCIAL STATEMENTS. |
SERIES O (ALL CAP VALUE SERIES) |
STATEMENTS OF CHANGES IN NET ASSETS |
| Year Ended | Year Ended | ||||||
Increase (Decrease) in Net Assets from Operations: | ||||||||
Net investment income | $ | 1,420,372 | $ | 1,081,242 | ||||
Net realized gain on investments | 8,505,286 | 11,358,520 | ||||||
Net change in unrealized appreciation (depreciation) on investments | (11,219,630 | ) | 11,215,836 | |||||
Net increase (decrease) in net assets resulting from operations | (1,293,972 | ) | 23,655,598 | |||||
Distributions to shareholders | (11,376,268 | ) | (2,332,442 | ) | ||||
Capital share transactions: | ||||||||
Proceeds from sale of shares | 3,180,810 | 3,847,533 | ||||||
Distributions reinvested | 11,376,268 | 2,332,442 | ||||||
Cost of shares redeemed | (11,109,259 | ) | (16,029,758 | ) | ||||
Net increase (decrease) from capital share transactions | 3,447,819 | (9,849,783 | ) | |||||
Net increase (decrease) in net assets | (9,222,421 | ) | 11,473,373 | |||||
Net assets: | ||||||||
Beginning of year | 103,134,427 | 91,661,054 | ||||||
End of year | $ | 93,912,006 | $ | 103,134,427 | ||||
Capital share activity: | ||||||||
Shares sold | 87,562 | 103,312 | ||||||
Shares issued from reinvestment of distributions | 353,740 | 65,298 | ||||||
Shares redeemed | (312,170 | ) | (442,874 | ) | ||||
Net increase (decrease) in shares | 129,132 | (274,264 | ) | |||||
SEE NOTES TO FINANCIAL STATEMENTS. | THE GUGGENHEIM FUNDS ANNUAL REPORT | 99 |
SERIES O (ALL CAP VALUE SERIES) |
FINANCIAL HIGHLIGHTS |
This table is presented to show selected data for a share outstanding throughout each period and to assist shareholders in evaluating a Fund’s performance for the periods presented.
| Year Ended | Year Ended | Year Ended | Year Ended | Year Ended | |||||||||||||||
Per Share Data | ||||||||||||||||||||
Net asset value, beginning of period | $ | 38.53 | $ | 31.06 | $ | 32.89 | $ | 29.31 | $ | 35.97 | ||||||||||
Income (loss) from investment operations: | ||||||||||||||||||||
Net investment income (loss)a | .52 | .38 | .56 | .51 | .43 | |||||||||||||||
Net gain (loss) on investments (realized and unrealized) | (1.15 | ) | 7.93 | (.33 | ) | 6.19 | (3.83 | ) | ||||||||||||
Total from investment operations | (.63 | ) | 8.31 | .23 | 6.70 | (3.40 | ) | |||||||||||||
Less distributions from: | ||||||||||||||||||||
Net investment income | (.43 | ) | (.65 | ) | (.52 | ) | (.49 | ) | (.40 | ) | ||||||||||
Net realized gains | (4.00 | ) | (.19 | ) | (1.54 | ) | (2.63 | ) | (2.86 | ) | ||||||||||
Total distributions | (4.43 | ) | (.84 | ) | (2.06 | ) | (3.12 | ) | (3.26 | ) | ||||||||||
Net asset value, end of period | $ | 33.47 | $ | 38.53 | $ | 31.06 | $ | 32.89 | $ | 29.31 | ||||||||||
| ||||||||||||||||||||
Total Returnb | (1.17 | %) | 26.95 | % | 1.88 | % | 23.74 | % | (10.62 | %) | ||||||||||
Ratios/Supplemental Data | ||||||||||||||||||||
Net assets, end of period (in thousands) | $ | 93,912 | $ | 103,134 | $ | 91,661 | $ | 107,634 | $ | 100,916 | ||||||||||
Ratios to average net assets: | ||||||||||||||||||||
Net investment income (loss) | 1.45 | % | 1.06 | % | 2.03 | % | 1.62 | % | 1.23 | % | ||||||||||
Total expensesc | 1.11 | % | 1.13 | % | 1.21 | % | 1.18 | % | 1.17 | % | ||||||||||
Net expensesd,e | 0.86 | % | 0.87 | % | 0.87 | % | 0.88 | % | 0.88 | % | ||||||||||
Portfolio turnover rate | 30 | % | 26 | % | 22 | % | 33 | % | 36 | % | ||||||||||
a | Net investment income (loss) per share was computed using average shares outstanding throughout the period. |
b | Total return does not take into account any of the expenses associated with an investment in variable insurance products. If total return had taken into account these expenses, performance would have been lower. Shares of a series of Guggenheim Variable Funds Trust are available only through the purchase of such products. |
c | Does not include expenses of the underlying funds in which the Fund invests. |
d | Net expense information reflects the expense ratios after expense waivers and reimbursements, as applicable. |
e | Net expenses may include expenses that are excluded from the expense limitation agreement. Excluding these expenses, the net expense ratios for the years presented would be: |
12/31/22 | 12/31/21 | 12/31/20 | 12/31/19 | 12/31/18 | |
0.86% | 0.87% | 0.87% | 0.88% | 0.88% |
100 | THE GUGGENHEIM FUNDS ANNUAL REPORT | SEE NOTES TO FINANCIAL STATEMENTS. |
MANAGERS’ COMMENTARY (Unaudited) | December 31, 2022 |
To Our Shareholders
The Series P (High Yield Series, or the “Fund”) is managed by a team of seasoned professionals, including Anne B. Walsh, CFA, JD, Managing Partner, Chief Investment Officer of GPIM and Thomas J. Hauser, Senior Managing Director and Portfolio Manager of GPIM. In the subsequent paragraphs, the investment team discusses the Fund’s performance for the 12-month period ended December 31, 2022 (the “Reporting Period”).
For the Reporting Period, the Fund provided a total return of -9.70%, outperforming the Bloomberg U.S. Corporate High Yield Index (“Index”), the Fund’s benchmark, which returned -11.19% for the same period.
What factors contributed or detracted from the Fund’s performance during the Reporting Period?
The Reporting Period was significantly impacted by challenging macroeconomics. The Index returned -11.19% over the year, amid the sharp rise in interest rates, due to the ongoing conflict in Ukraine, elevated inflation, and the potential for recession. The high-yield market experienced outflows from observable sources during the year, which pressured trading levels. All sectors and rating categories generated negative returns, while interest rates continued to climb as the Federal Reserve attempted to rein in inflation.
Bottom-up fundamental credit analysis continues to be the main driver of the Fund’s positioning and performance. The largest contributing sectors to performance were Technology and Consumer Non-Cyclicals, where the Fund benefited from strong security selection relative to the benchmark. An up-in-quality bias for the Reporting Period drove an overweight to single B rated issuers and underweight to CCC rated issuers, which both contributed to outperformance. The Fund’s larger allocation to bank loans was a meaningful contributor to performance due to their insulation from the selloff in interest rates. The Fund’s underweight to Energy, which was the top performing sector, slightly detracted from performance for the Reporting Period.
How did the Fund use derivatives during the Reporting Period?
The Fund invests in non-U.S. dollar denominated assets when the risk-return profile is favorable. The Fund entered forward foreign currency exchange contracts to hedge exchange rate risk for non-U.S. dollar denominated positions which had a positive impact to performance. Non-U.S. dollar denominated assets comprise less than 2% of the Fund.
How was the Fund positioned at the end of the Reporting Period?
The Fund’s largest exposure is to high-yield bonds followed by a meaningful exposure to bank loans. We continue to evaluate the relative value between high yield bonds and bank loans, potentially looking to shift the allocation as the relationship changes.
The Fund remains cautious given heightened risk of default and recession. As such, the Fund continues to avoid highly levered industries and companies with high capital expenditure needs that could impair cash flow, and instead focuses on companies with recurring revenue streams, strong cash flows, and high-quality margins. Even with heightened credit risk and rising risk of recession, we think current yields offer opportunities to find credits that are trading cheap relative to their fundamentals and risk of default/loss.
Performance displayed represents past performance which is no guarantee of future results.
The opinions and forecast expressed may not actually come to pass. This information is subject to change at any time, based on market and other conditions, and should not be construed as a recommendation of any specific security or strategy.
THE GUGGENHEIM FUNDS ANNUAL REPORT | 101 |
PERFORMANCE REPORT AND FUND PROFILE (Unaudited) | December 31, 2022 |
SERIES P (HIGH YIELD SERIES)
OBJECTIVE: Seeks high current income. Capital appreciation is a secondary objective.
Holdings Diversification (Market Exposure as % of Net Assets)
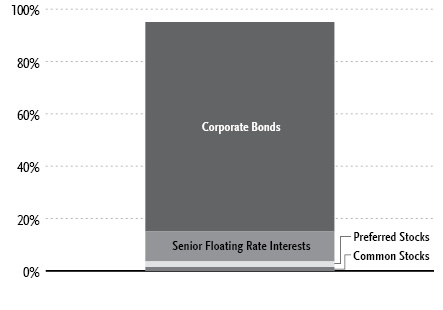
“Holdings Diversification (Market Exposure as % of Net Assets)” excludes any temporary cash investments.
Inception Date: August 5, 1996 |
Ten Largest Holdings | (% of Total Net Assets) |
iShares iBoxx High Yield Corporate Bond ETF | 1.3% |
Terraform Global Operating, LP, 6.13% | 1.2% |
Carpenter Technology Corp., 6.38% | 1.2% |
FAGE International S.A. / FAGE USA Dairy Industry, Inc., 5.63% | 1.2% |
Hunt Companies, Inc., 5.25% | 1.2% |
Jefferies Finance LLC / JFIN Company-Issuer Corp., 5.00% | 1.1% |
GrafTech Finance, Inc., 4.63% | 1.1% |
CPI CG, Inc., 8.63% | 1.1% |
Artera Services LLC, 9.03% | 1.0% |
NFP Corp., 6.88% | 1.0% |
Top Ten Total | 11.4% |
“Ten Largest Holdings” excludes any temporary cash or derivative investments. | |
102 | THE GUGGENHEIM FUNDS ANNUAL REPORT |
PERFORMANCE REPORT AND FUND PROFILE (Unaudited)(concluded) | December 31, 2022 |
Cumulative Fund Performance*,†
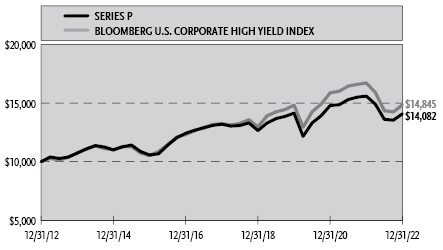
Average Annual Returns*,†
Periods Ended December 31, 2022
| 1 Year | 5 Year | 10 Year |
Series P (High Yield Series) | (9.70%) | 1.30% | 3.48% |
Bloomberg U.S. Corporate High Yield Index | (11.19%) | 2.31% | 4.03% |
Portfolio Composition by Quality Rating1 | |
Rating | % of Total |
Fixed Income Instruments | |
A | 0.5% |
BBB | 4.5% |
BB | 48.3% |
B | 32.9% |
CCC | 5.9% |
NR2 | 1.8% |
Other Instruments | 6.1% |
Total Investments | 100.0% |
* | The performance data above represents past performance that is not predictive of future results. The investment return and principal value of an investment in the Fund will fluctuate so that an investor’s shares, when redeemed, may be worth more or less than their original cost. Returns are historical and include changes in principal and reinvested dividends and capital gains and do not reflect the effect of taxes. The Bloomberg U.S. Corporate High Yield Index is an unmanaged index and, unlike the Fund, has no management fees or operating expenses to reduce its reported return. |
† | Performance figures do not reflect fees and expenses associated with an investment in variable insurance products. If returns had taken into account these fees and expenses, performance would have been lower. Shares of a series of Guggenheim Variable Funds Trust are available only through the purchase of such products. |
1 | Source: BlackRock Solutions. Credit quality ratings are measured on a scale that generally ranges from AAA (highest) to D (lowest). All securities except for those labeled “NR” have been rated by Moody’s, Standard & Poor’s (“S&P”), or Fitch, each of which is a Nationally Recognized Statistical Rating Organization (“NRSRO”). For purposes of this presentation, when ratings are available from more than one agency, the highest rating is used. Guggenheim Investments has converted ratings to the equivalent S&P rating. Security ratings are determined at the time of purchase and may change thereafter. |
2 | NR (not rated) securities do not necessarily indicate low credit quality. |
THE GUGGENHEIM FUNDS ANNUAL REPORT | 103 |
SCHEDULE OF INVESTMENTS | December 31, 2022 |
SERIES P (HIGH YIELD SERIES) |
| Shares | Value | |||||||
| COMMON STOCKS† - 1.1% | ||||||||
| Utilities - 0.6% | ||||||||
TexGen Power LLC*,†† | 7,929 | $ | 206,154 | |||||
| Financial - 0.3% | ||||||||
TPG Pace Beneficial II Corp.*,1 | 5,510 | 54,136 | ||||||
| Acropolis Infrastructure | ||||||||
Acquisition Corp. — Class A*,1 | 4,900 | 48,559 | ||||||
MSD Acquisition Corp. — Class A*,1 | 84 | 848 | ||||||
| Total Diversified | 103,543 | |||||||
| Energy - 0.1% | ||||||||
Legacy Reserves, Inc.*,††† | 1,969 | 17,229 | ||||||
Permian Production Partners LLC††† | 9,124 | 7,482 | ||||||
Bruin E&P Partnership Units*,††† | 6,071 | 136 | ||||||
| Total Energy | 24,847 | |||||||
| Consumer, Non-cyclical - 0.1% | ||||||||
Cengage Learning Holdings II, Inc.*,†† | 2,107 | 23,573 | ||||||
MEDIQ, Inc.*,††† | 92 | — | ||||||
| Total Consumer, Non-cyclical | 23,573 | |||||||
| Industrial - 0.0% | ||||||||
BP Holdco LLC*,†††,2 | 523 | 317 | ||||||
Vector Phoenix Holdings, LP*,††† | 523 | 125 | ||||||
| Total Industrial | 442 | |||||||
| Consumer, Cyclical - 0.0% | ||||||||
| Chorus Aviation, Inc.* | 3 | 7 | ||||||
| Total Common Stocks | ||||||||
| (Cost $305,101) | 358,566 | |||||||
| PREFERRED STOCKS†† - 1.1% | ||||||||
| Financial - 1.1% | ||||||||
| American Equity Investment Life Holding Co. | ||||||||
| 5.95% | 6,000 | 120,660 | ||||||
| Charles Schwab Corp. | ||||||||
| 4.00%* | 150,000 | 119,618 | ||||||
| Arch Capital Group Ltd. | ||||||||
| 4.55% | 6,000 | 103,620 | ||||||
| Total Financial | 343,898 | |||||||
| Industrial - 0.0% | ||||||||
U.S. Shipping Corp.*,††† | 24,529 | 2 | ||||||
| Total Preferred Stocks | ||||||||
| (Cost $1,075,000) | 343,900 | |||||||
| WARRANTS† - 0.0% | ||||||||
| Acropolis Infrastructure Acquisition Corp. | ||||||||
Expiring 03/31/26*,1 | 1,632 | 196 | ||||||
| MSD Acquisition Corp. | ||||||||
Expiring 05/13/23*,1 | 16 | 1 | ||||||
| Total Warrants | ||||||||
| (Cost $1,365) | 197 | |||||||
| EXCHANGE-TRADED FUNDS† - 1.3% | ||||||||
| iShares iBoxx High Yield Corporate Bond ETF | 5,600 | 412,328 | ||||||
| Total Exchange-Traded Funds | ||||||||
| (Cost $417,384) | 412,328 | |||||||
| MONEY MARKET FUND† - 2.5% | ||||||||
Dreyfus Treasury Securities Cash Management Fund — Institutional Shares, 3.90%4 | 811,908 | 811,908 | ||||||
| Total Money Market Fund | ||||||||
| (Cost $811,908) | 811,908 | |||||||
Face | ||||||||
CORPORATE BONDS†† - 80.6% | ||||||||
Communications - 14.6% | ||||||||
Altice France S.A. | ||||||||
5.50% due 10/15/295 | 325,000 | 247,822 | ||||||
8.13% due 02/01/275 | 200,000 | 182,176 | ||||||
5.13% due 07/15/295 | 175,000 | 131,205 | ||||||
CCO Holdings LLC / CCO Holdings Capital Corp. | ||||||||
6.38% due 09/01/295 | 250,000 | 234,935 | ||||||
4.25% due 02/01/315 | 150,000 | 120,317 | ||||||
4.50% due 06/01/335 | 125,000 | 95,904 | ||||||
4.25% due 01/15/345 | 100,000 | 73,804 | ||||||
McGraw-Hill Education, Inc. | ||||||||
5.75% due 08/01/285 | 375,000 | 315,139 | ||||||
8.00% due 08/01/295 | 175,000 | 144,719 | ||||||
Level 3 Financing, Inc. | ||||||||
4.25% due 07/01/285 | 300,000 | 236,310 | ||||||
3.63% due 01/15/295 | 300,000 | 219,673 | ||||||
VZ Secured Financing BV | ||||||||
5.00% due 01/15/325 | 375,000 | 304,733 | ||||||
Cengage Learning, Inc. | ||||||||
9.50% due 06/15/245 | 290,000 | 276,588 | ||||||
LCPR Senior Secured Financing DAC | ||||||||
6.75% due 10/15/275 | 270,000 | 252,450 | ||||||
Virgin Media Finance plc | ||||||||
5.00% due 07/15/305 | 275,000 | 220,567 | ||||||
CSC Holdings LLC | ||||||||
4.13% due 12/01/305 | 200,000 | 141,166 | ||||||
3.38% due 02/15/315 | 75,000 | 48,910 | ||||||
AMC Networks, Inc. | ||||||||
4.25% due 02/15/29 | 300,000 | 186,929 | ||||||
Sirius XM Radio, Inc. | ||||||||
3.88% due 09/01/315 | 125,000 | 97,521 | ||||||
4.13% due 07/01/305 | 100,000 | 82,521 | ||||||
Telenet Finance Luxembourg Notes SARL | ||||||||
5.50% due 03/01/28 | 200,000 | 180,000 | ||||||
UPC Broadband Finco BV | ||||||||
4.88% due 07/15/315 | 200,000 | 166,359 | ||||||
Vmed O2 UK Financing I plc | ||||||||
4.25% due 01/31/315 | 200,000 | 161,903 | ||||||
104 | THE GUGGENHEIM FUNDS ANNUAL REPORT | SEE NOTES TO FINANCIAL STATEMENTS. |
SCHEDULE OF INVESTMENTS (continued) | December 31, 2022 |
SERIES P (HIGH YIELD SERIES) |
| Face | Value | ||||||
TripAdvisor, Inc. | ||||||||
7.00% due 07/15/255 | 125,000 | $ | 123,504 | |||||
Cogent Communications Group, Inc. | ||||||||
7.00% due 06/15/275 | 125,000 | 122,491 | ||||||
Match Group Holdings II LLC | ||||||||
3.63% due 10/01/315 | 150,000 | 115,030 | ||||||
CSC Holdings LLC | ||||||||
4.63% due 12/01/30†††,5 | 200,000 | 107,635 | ||||||
Go Daddy Operating Company LLC / GD Finance Co., Inc. | ||||||||
3.50% due 03/01/295 | 75,000 | 62,789 | ||||||
Cable One, Inc. | ||||||||
4.00% due 11/15/305 | 75,000 | 58,854 | ||||||
Outfront Media Capital LLC / Outfront Media Capital Corp. | ||||||||
4.25% due 01/15/295 | 25,000 | 20,743 | ||||||
Total Communications | 4,732,697 | |||||||
Consumer, Non-cyclical - 14.2% | ||||||||
FAGE International S.A. / FAGE USA Dairy Industry, Inc. | ||||||||
5.63% due 08/15/265 | 410,000 | 380,332 | ||||||
CPI CG, Inc. | ||||||||
8.63% due 03/15/265 | 351,000 | 344,920 | ||||||
Cheplapharm Arzneimittel GmbH | ||||||||
5.50% due 01/15/285 | 375,000 | 313,575 | ||||||
Rent-A-Center, Inc. | ||||||||
6.38% due 02/15/295,6 | 375,000 | 303,356 | ||||||
Tenet Healthcare Corp. | ||||||||
6.13% due 06/15/305 | 250,000 | 238,200 | ||||||
4.38% due 01/15/305 | 75,000 | 64,918 | ||||||
Albertsons Companies Incorporated / Safeway Inc / New Albertsons Limited Partnership / Albertsons LLC | ||||||||
5.88% due 02/15/285 | 225,000 | 213,903 | ||||||
Darling Ingredients, Inc. | ||||||||
6.00% due 06/15/305 | 200,000 | 195,500 | ||||||
Sabre GLBL, Inc. | ||||||||
7.38% due 09/01/255 | 147,000 | 141,273 | ||||||
9.25% due 04/15/255 | 50,000 | 49,806 | ||||||
KeHE Distributors LLC / KeHE Finance Corp. | ||||||||
8.63% due 10/15/265 | 179,000 | 174,972 | ||||||
Grifols Escrow Issuer S.A. | ||||||||
4.75% due 10/15/285 | 200,000 | 172,694 | ||||||
Prime Security Services Borrower LLC / Prime Finance, Inc. | ||||||||
3.38% due 08/31/275 | 200,000 | 172,637 | ||||||
Par Pharmaceutical, Inc. | ||||||||
due 04/01/275,7 | 225,000 | 170,994 | ||||||
Sotheby’s/Bidfair Holdings, Inc. | ||||||||
5.88% due 06/01/295 | 200,000 | 167,940 | ||||||
DaVita, Inc. | ||||||||
4.63% due 06/01/305 | 200,000 | 160,885 | ||||||
Bausch Health Companies, Inc. | ||||||||
4.88% due 06/01/285 | 225,000 | 143,109 | ||||||
Kronos Acquisition Holdings, Inc. / KIK Custom Products, Inc. | ||||||||
7.00% due 12/31/275 | 107,000 | 88,007 | ||||||
5.00% due 12/31/265 | 50,000 | 43,250 | ||||||
Castor S.p.A. | ||||||||
7.30% (3 Month EURIBOR + 5.25%, Rate Floor: 5.25%) due 02/15/29◊,5 | EUR | 125,000 | 129,319 | |||||
WW International, Inc. | ||||||||
4.50% due 04/15/295 | 250,000 | 124,897 | ||||||
BCP V Modular Services Finance II plc | ||||||||
4.75% due 10/30/285 | EUR | 125,000 | 111,786 | |||||
Endo Luxembourg Finance Company I SARL / Endo US, Inc. | ||||||||
due 04/01/295,7 | 125,000 | 94,829 | ||||||
Legends Hospitality Holding Company LLC / Legends Hospitality Co-Issuer, Inc. | ||||||||
5.00% due 02/01/265 | 100,000 | 89,000 | ||||||
Post Holdings, Inc. | ||||||||
4.63% due 04/15/305 | 75,000 | 64,706 | ||||||
5.63% due 01/15/285 | 25,000 | 23,534 | ||||||
Service Corporation International | ||||||||
3.38% due 08/15/30 | 100,000 | 81,291 | ||||||
Medline Borrower, LP | ||||||||
5.25% due 10/01/295 | 100,000 | 79,427 | ||||||
Central Garden & Pet Co. | ||||||||
4.13% due 04/30/315 | 75,000 | 62,087 | ||||||
GXO Logistics, Inc. | ||||||||
2.65% due 07/15/31 | 50,000 | 36,918 | ||||||
1.65% due 07/15/26 | 25,000 | 21,404 | ||||||
Garden Spinco Corp. | ||||||||
8.63% due 07/20/305 | 50,000 | 53,000 | ||||||
Nathan’s Famous, Inc. | ||||||||
6.63% due 11/01/255 | 52,000 | 50,570 | ||||||
Ingles Markets, Inc. | ||||||||
4.00% due 06/15/315 | 25,000 | 21,026 | ||||||
Total Consumer, Non-cyclical | 4,584,065 | |||||||
Financial - 12.9% | ||||||||
Iron Mountain, Inc. | ||||||||
5.63% due 07/15/325 | 275,000 | 238,320 | ||||||
4.88% due 09/15/295 | 120,000 | 104,664 | ||||||
5.25% due 07/15/305 | 75,000 | 65,175 | ||||||
Hunt Companies, Inc. | ||||||||
5.25% due 04/15/295 | 450,000 | 378,231 | ||||||
Jefferies Finance LLC / JFIN Company-Issuer Corp. | ||||||||
5.00% due 08/15/285 | 450,000 | 367,079 | ||||||
United Wholesale Mortgage LLC | ||||||||
5.50% due 04/15/295 | 225,000 | 178,983 | ||||||
5.75% due 06/15/275 | 200,000 | 172,178 | ||||||
NFP Corp. | ||||||||
6.88% due 08/15/285 | 393,000 | 323,942 | ||||||
OneMain Finance Corp. | ||||||||
3.88% due 09/15/28 | 175,000 | 139,164 | ||||||
4.00% due 09/15/30 | 75,000 | 55,960 | ||||||
6.63% due 01/15/28 | 50,000 | 46,042 | ||||||
SEE NOTES TO FINANCIAL STATEMENTS. | THE GUGGENHEIM FUNDS ANNUAL REPORT | 105 |
SCHEDULE OF INVESTMENTS (continued) | December 31, 2022 |
SERIES P (HIGH YIELD SERIES) |
| Face | Value | ||||||
Greystar Real Estate Partners LLC | ||||||||
5.75% due 12/01/255 | 200,000 | $ | 195,450 | |||||
Kennedy-Wilson, Inc. | ||||||||
5.00% due 03/01/31 | 150,000 | 112,911 | ||||||
4.75% due 03/01/29 | 100,000 | 79,255 | ||||||
Cushman & Wakefield US Borrower LLC | ||||||||
6.75% due 05/15/285 | 200,000 | 190,872 | ||||||
USI, Inc. | ||||||||
6.88% due 05/01/255 | 175,000 | 168,585 | ||||||
Iron Mountain Information Management Services, Inc. | ||||||||
5.00% due 07/15/325 | 200,000 | 166,140 | ||||||
Rocket Mortgage LLC / Rocket Mortgage Company-Issuer, Inc. | ||||||||
3.88% due 03/01/315 | 200,000 | 152,655 | ||||||
Wilton Re Finance LLC | ||||||||
5.88% due 03/30/333,5 | 150,000 | 148,425 | ||||||
Assurant, Inc. | ||||||||
7.00% due 03/27/483 | 150,000 | 145,280 | ||||||
HUB International Ltd. | ||||||||
7.00% due 05/01/265 | 100,000 | 97,899 | ||||||
5.63% due 12/01/295 | 50,000 | 43,669 | ||||||
SLM Corp. | ||||||||
3.13% due 11/02/26 | 150,000 | 127,567 | ||||||
Jones Deslauriers Insurance Management, Inc. | ||||||||
10.50% due 12/15/305 | 125,000 | 123,107 | ||||||
Starwood Property Trust, Inc. | ||||||||
4.38% due 01/15/275 | 125,000 | 109,384 | ||||||
GLP Capital Limited Partnership / GLP Financing II, Inc. | ||||||||
4.00% due 01/15/31 | 100,000 | 85,780 | ||||||
AmWINS Group, Inc. | ||||||||
4.88% due 06/30/295 | 100,000 | 84,815 | ||||||
Liberty Mutual Group, Inc. | ||||||||
4.30% due 02/01/615 | 100,000 | 61,000 | ||||||
Home Point Capital, Inc. | ||||||||
5.00% due 02/01/265 | 13,000 | 8,989 | ||||||
Total Financial | 4,171,521 | |||||||
Consumer, Cyclical - 10.2% | ||||||||
Crocs, Inc. | ||||||||
4.25% due 03/15/295 | 300,000 | 254,130 | ||||||
Hawaiian Brand Intellectual Property Ltd. / HawaiianMiles Loyalty Ltd. | ||||||||
5.75% due 01/20/265 | 265,000 | 239,825 | ||||||
Clarios Global Limited Partnership / Clarios US Finance Co. | ||||||||
6.25% due 05/15/265 | 200,000 | 195,501 | ||||||
JB Poindexter & Company, Inc. | ||||||||
7.13% due 04/15/265 | 200,000 | 193,000 | ||||||
Aramark Services, Inc. | ||||||||
5.00% due 02/01/285 | 200,000 | 186,587 | ||||||
Wolverine World Wide, Inc. | ||||||||
4.00% due 08/15/295 | 225,000 | 170,451 | ||||||
Allison Transmission, Inc. | ||||||||
3.75% due 01/30/315 | 200,000 | 164,500 | ||||||
Station Casinos LLC | ||||||||
4.63% due 12/01/315 | 200,000 | 160,435 | ||||||
Penn Entertainment, Inc. | ||||||||
4.13% due 07/01/295 | 200,000 | 158,001 | ||||||
Scotts Miracle-Gro Co. | ||||||||
4.38% due 02/01/32 | 200,000 | 150,740 | ||||||
CD&R Smokey Buyer, Inc. | ||||||||
6.75% due 07/15/255 | 175,000 | 150,171 | ||||||
Newell Brands, Inc. | ||||||||
4.45% due 04/01/26 | 150,000 | 141,119 | ||||||
Yum! Brands, Inc. | ||||||||
4.75% due 01/15/305 | 150,000 | 137,625 | ||||||
Suburban Propane Partners Limited Partnership/Suburban Energy Finance Corp. | ||||||||
5.00% due 06/01/315 | 150,000 | 127,497 | ||||||
Tempur Sealy International, Inc. | ||||||||
3.88% due 10/15/315 | 150,000 | 117,754 | ||||||
United Airlines, Inc. | ||||||||
4.63% due 04/15/295 | 125,000 | 108,837 | ||||||
Wabash National Corp. | ||||||||
4.50% due 10/15/285 | 125,000 | 106,448 | ||||||
Scientific Games Holdings Limited Partnership/Scientific Games US FinCo, Inc. | ||||||||
6.63% due 03/01/305 | 125,000 | 105,587 | ||||||
Hanesbrands, Inc. | ||||||||
4.88% due 05/15/265 | 100,000 | 89,357 | ||||||
Air Canada | ||||||||
3.88% due 08/15/265 | 100,000 | 88,573 | ||||||
Michaels Companies, Inc. | ||||||||
5.25% due 05/01/285 | 100,000 | 80,453 | ||||||
Ferrellgas Limited Partnership / Ferrellgas Finance Corp. | ||||||||
5.38% due 04/01/265 | 75,000 | 68,224 | ||||||
Asbury Automotive Group, Inc. | ||||||||
5.00% due 02/15/325 | 75,000 | 61,702 | ||||||
Superior Plus, LP | ||||||||
4.25% due 05/18/285 | CAD | 75,000 | 48,207 | |||||
Total Consumer, Cyclical | 3,304,724 | |||||||
Industrial - 9.7% | ||||||||
New Enterprise Stone & Lime Company, Inc. | ||||||||
9.75% due 07/15/285 | 350,000 | 323,379 | ||||||
5.25% due 07/15/285 | 150,000 | 133,195 | ||||||
GrafTech Finance, Inc. | ||||||||
4.63% due 12/15/285 | 430,000 | 353,126 | ||||||
Artera Services LLC | ||||||||
9.03% due 12/04/255 | 400,000 | 333,236 | ||||||
Brundage-Bone Concrete Pumping Holdings, Inc. | ||||||||
6.00% due 02/01/265 | 275,000 | 250,703 | ||||||
Mauser Packaging Solutions Holding Co. | ||||||||
5.50% due 04/15/245 | 100,000 | 97,235 | ||||||
7.25% due 04/15/255 | 100,000 | 92,471 | ||||||
8.50% due 04/15/245 | 25,000 | 24,499 | ||||||
106 | THE GUGGENHEIM FUNDS ANNUAL REPORT | SEE NOTES TO FINANCIAL STATEMENTS. |
SCHEDULE OF INVESTMENTS (continued) | December 31, 2022 |
SERIES P (HIGH YIELD SERIES) |
| Face | Value | ||||||
Ball Corp. | ||||||||
3.13% due 09/15/31 | 125,000 | $ | 100,391 | |||||
6.88% due 03/15/28 | 75,000 | 77,038 | ||||||
Great Lakes Dredge & Dock Corp. | ||||||||
5.25% due 06/01/295 | 225,000 | 174,915 | ||||||
Masonite International Corp. | ||||||||
5.38% due 02/01/285 | 175,000 | 161,807 | ||||||
Amsted Industries, Inc. | ||||||||
4.63% due 05/15/305 | 175,000 | 149,188 | ||||||
Builders FirstSource, Inc. | ||||||||
6.38% due 06/15/325 | 125,000 | 117,406 | ||||||
4.25% due 02/01/325 | 25,000 | 20,268 | ||||||
Standard Industries, Inc. | ||||||||
4.38% due 07/15/305 | 150,000 | 122,239 | ||||||
TransDigm, Inc. | ||||||||
8.00% due 12/15/255 | 100,000 | 101,479 | ||||||
EnerSys | ||||||||
4.38% due 12/15/275 | 100,000 | 90,000 | ||||||
Harsco Corp. | ||||||||
5.75% due 07/31/275 | 100,000 | 78,957 | ||||||
Advanced Drainage Systems, Inc. | ||||||||
6.38% due 06/15/305 | 75,000 | 72,874 | ||||||
Howmet Aerospace, Inc. | ||||||||
5.95% due 02/01/37 | 75,000 | 72,806 | ||||||
Arcosa, Inc. | ||||||||
4.38% due 04/15/295 | 75,000 | 65,038 | ||||||
Stericycle, Inc. | ||||||||
5.38% due 07/15/245 | 50,000 | 49,254 | ||||||
Hillenbrand, Inc. | ||||||||
3.75% due 03/01/31 | 50,000 | 41,000 | ||||||
MIWD Holdco II LLC / MIWD Finance Corp. | ||||||||
5.50% due 02/01/305 | 25,000 | 19,904 | ||||||
Total Industrial | 3,122,408 | |||||||
Energy - 7.2% | ||||||||
Parkland Corp. | ||||||||
4.63% due 05/01/305 | 250,000 | 206,875 | ||||||
4.50% due 10/01/295 | 225,000 | 187,485 | ||||||
NuStar Logistics, LP | ||||||||
5.63% due 04/28/27 | 200,000 | 187,012 | ||||||
6.38% due 10/01/30 | 100,000 | 92,466 | ||||||
6.00% due 06/01/26 | 75,000 | 72,218 | ||||||
CVR Energy, Inc. | ||||||||
5.75% due 02/15/285 | 325,000 | 282,912 | ||||||
5.25% due 02/15/255 | 25,000 | 23,000 | ||||||
ITT Holdings LLC | ||||||||
6.50% due 08/01/295 | 325,000 | 273,696 | ||||||
Global Partners Limited Partnership / GLP Finance Corp. | ||||||||
7.00% due 08/01/26 | 225,000 | 213,666 | ||||||
6.88% due 01/15/29 | 50,000 | 45,803 | ||||||
Holly Energy Partners Limited Partnership / Holly Energy Finance Corp. | ||||||||
6.38% due 04/15/275 | 175,000 | 171,936 | ||||||
Crestwood Midstream Partners Limited Partnership / Crestwood Midstream Finance Corp. | ||||||||
5.63% due 05/01/275 | 175,000 | 162,750 | ||||||
EnLink Midstream LLC | ||||||||
6.50% due 09/01/305 | 150,000 | 148,455 | ||||||
TransMontaigne Partners Limited Partnership / TLP Finance Corp. | ||||||||
6.13% due 02/15/26 | 150,000 | 129,000 | ||||||
Kinetik Holdings, LP | ||||||||
5.88% due 06/15/305 | 75,000 | 70,334 | ||||||
Southwestern Energy Co. | ||||||||
5.38% due 02/01/29 | 50,000 | 46,353 | ||||||
Basic Energy Services, Inc. | ||||||||
due 10/15/23†††,7 | 168,000 | 5,040 | ||||||
Total Energy | 2,319,001 | |||||||
Basic Materials - 7.0% | ||||||||
Carpenter Technology Corp. | ||||||||
6.38% due 07/15/28 | 400,000 | �� | 380,412 | |||||
7.63% due 03/15/30 | 125,000 | 125,298 | ||||||
Minerals Technologies, Inc. | ||||||||
5.00% due 07/01/285 | 275,000 | 244,915 | ||||||
SCIL IV LLC / SCIL USA Holdings LLC | ||||||||
5.38% due 11/01/265 | 275,000 | 233,062 | ||||||
Compass Minerals International, Inc. | ||||||||
6.75% due 12/01/275 | 200,000 | 192,000 | ||||||
SK Invictus Intermediate II SARL | ||||||||
5.00% due 10/30/295 | 225,000 | 184,500 | ||||||
WR Grace Holdings LLC | ||||||||
4.88% due 06/15/275 | 200,000 | 177,226 | ||||||
Kaiser Aluminum Corp. | ||||||||
4.63% due 03/01/285 | 110,000 | 95,989 | ||||||
4.50% due 06/01/315 | 75,000 | 60,281 | ||||||
Clearwater Paper Corp. | ||||||||
4.75% due 08/15/285 | 175,000 | 153,768 | ||||||
Valvoline, Inc. | ||||||||
3.63% due 06/15/315 | 125,000 | 102,566 | ||||||
4.25% due 02/15/305 | 25,000 | 24,253 | ||||||
Diamond BC BV | ||||||||
4.63% due 10/01/295 | 150,000 | 120,375 | ||||||
Ingevity Corp. | ||||||||
3.88% due 11/01/285 | 100,000 | 85,987 | ||||||
Illuminate Buyer LLC / Illuminate Holdings IV, Inc. | ||||||||
9.00% due 07/01/285 | 100,000 | 83,723 | ||||||
Mirabela Nickel Ltd. | ||||||||
due 06/24/19†††,7,8 | 390,085 | 7,802 | ||||||
Total Basic Materials | 2,272,157 | |||||||
Technology - 3.2% | ||||||||
Central Parent Incorporated / CDK Global Inc | ||||||||
7.25% due 06/15/295 | 200,000 | 195,624 | ||||||
Boxer Parent Company, Inc. | ||||||||
7.13% due 10/02/255 | 200,000 | 194,502 | ||||||
NCR Corp. | ||||||||
6.13% due 09/01/295 | 200,000 | 187,011 | ||||||
SEE NOTES TO FINANCIAL STATEMENTS. | THE GUGGENHEIM FUNDS ANNUAL REPORT | 107 |
SCHEDULE OF INVESTMENTS (continued) | December 31, 2022 |
SERIES P (HIGH YIELD SERIES) |
| Face | Value | ||||||
Qorvo, Inc. | ||||||||
3.38% due 04/01/315 | 200,000 | $ | 160,688 | |||||
Entegris Escrow Corp. | ||||||||
4.75% due 04/15/295 | 100,000 | 91,194 | ||||||
MSCI, Inc. | ||||||||
3.88% due 02/15/315 | 100,000 | 83,143 | ||||||
Fair Isaac Corp. | ||||||||
4.00% due 06/15/285 | 75,000 | 68,063 | ||||||
CDW LLC / CDW Finance Corp. | ||||||||
3.57% due 12/01/31 | 50,000 | 41,202 | ||||||
Total Technology | 1,021,427 | |||||||
Utilities - 1.6% | ||||||||
Terraform Global Operating, LP | ||||||||
6.13% due 03/01/265 | 420,000 | 393,750 | ||||||
AmeriGas Partners Limited Partnership / AmeriGas Finance Corp. | ||||||||
5.50% due 05/20/25 | 75,000 | 72,062 | ||||||
Clearway Energy Operating LLC | ||||||||
4.75% due 03/15/285 | 75,000 | 69,221 | ||||||
Total Utilities | 535,033 | |||||||
Total Corporate Bonds | ||||||||
(Cost $30,240,304) | 26,063,033 | |||||||
SENIOR FLOATING RATE INTERESTS††,◊ - 12.0% | ||||||||
Consumer, Cyclical - 3.3% | ||||||||
American Tire Distributors, Inc. | ||||||||
10.61% (3 Month USD LIBOR + 6.25%, Rate Floor: 7.00%) due 10/20/28 | 174,125 | 158,454 | ||||||
PetSmart LLC | ||||||||
8.13% (1 Month USD LIBOR + 3.75%, Rate Floor: 4.50%) due 02/11/28 | 148,125 | 144,653 | ||||||
ScribeAmerica Intermediate Holdco LLC (Healthchannels) | ||||||||
8.88% (1 Month USD LIBOR + 4.50%, Rate Floor: 4.50%) due 04/03/25 | 185,680 | 128,584 | ||||||
First Brands Group LLC | ||||||||
7.94% (3 Month Term SOFR + 5.00%, Rate Floor: 7.00%) due 03/30/27 | 113,062 | 106,730 | ||||||
Apro LLC | ||||||||
7.92% (1 Month USD LIBOR + 3.75%, Rate Floor: 4.50%) due 11/16/26 | 98,250 | 95,138 | ||||||
Congruex Group LLC | ||||||||
9.99% (3 Month Term SOFR + 5.75%, Rate Floor: 6.50%) due 05/03/29 | 85,746 | 83,174 | ||||||
CCRR Parent, Inc. | ||||||||
8.14% (1 Month USD LIBOR + 3.75%, Rate Floor: 4.50%) due 03/06/28 | 73,688 | 69,972 | ||||||
Holding SOCOTEC | ||||||||
8.73% (3 Month USD LIBOR + 4.00%, Rate Floor: 4.75%) due 06/30/28 | 74,250 | 69,609 | ||||||
FR Refuel LLC | ||||||||
9.19% (3 Month Term SOFR + 4.50%, Rate Floor: 5.25%) due 11/08/28 | 67,103 | 64,083 | ||||||
Flutter Financing B.V. | ||||||||
8.09% (3 Month Term SOFR + 3.25%, Rate Floor: 3.75%) due 07/24/28 | 49,875 | 49,591 | ||||||
Rent-A-Center, Inc. | ||||||||
7.69% (3 Month USD LIBOR + 3.25%, Rate Floor: 3.75%) due 02/17/28 | 49,125 | 47,221 | ||||||
Sweetwater Sound | ||||||||
8.69% (1 Month USD LIBOR + 4.25%, Rate Floor: 5.00%) due 08/07/28 | 48,749 | 45,093 | ||||||
Fertitta Entertainment LLC | ||||||||
8.32% (1 Month Term SOFR + 4.00%, Rate Floor: 4.50%) due 01/27/29 | 13,697 | 12,997 | ||||||
Total Consumer, Cyclical | 1,075,299 | |||||||
Industrial - 2.5% | ||||||||
Arcline FM Holdings LLC | ||||||||
9.48% (3 Month USD LIBOR + 4.75%, Rate Floor: 5.50%) due 06/23/28 | 172,813 | 163,883 | ||||||
Dispatch Terra Acquisition LLC | ||||||||
8.98% (3 Month USD LIBOR + 4.25%, Rate Floor: 5.00%) due 03/27/28 | 147,873 | 124,214 | ||||||
Pelican Products, Inc. | ||||||||
8.71% (3 Month USD LIBOR + 4.25%, Rate Floor: 4.75%) due 12/29/28 | 114,935 | 102,292 | ||||||
Michael Baker International LLC | ||||||||
9.38% (1 Month USD LIBOR + 5.00%, Rate Floor: 5.75%) due 12/01/28††† | 74,250 | 71,651 | ||||||
Aegion Corp. | ||||||||
9.13% (1 Month USD LIBOR + 4.75%, Rate Floor: 5.50%) due 05/17/28 | 74,062 | 68,939 | ||||||
PECF USS Intermediate Holding III Corp. | ||||||||
8.63% (1 Month USD LIBOR + 4.25%, Rate Floor: 4.75%) due 12/15/28 | 74,374 | 61,803 | ||||||
Air Canada | ||||||||
8.13% (3 Month USD LIBOR + 3.50%, Rate Floor: 4.25%) due 08/11/28 | 49,750 | 49,066 | ||||||
United Airlines, Inc. | ||||||||
8.11% (3 Month USD LIBOR + 3.75%, Rate Floor: 4.50%) due 04/21/28 | 49,125 | 48,416 | ||||||
Osmose Utility Services, Inc. | ||||||||
7.63% (1 Month USD LIBOR + 3.25%, Rate Floor: 3.75%) due 06/23/28 | 49,874 | 47,265 | ||||||
US Farathane LLC | ||||||||
8.98% (3 Month USD LIBOR + 4.25%, Rate Floor: 5.25%) due 12/23/24 | 48,667 | 43,800 | ||||||
YAK MAT (YAK ACCESS LLC) | ||||||||
13.64% (3 Month USD LIBOR + 10.00%, Rate Floor: 10.00%) due 07/10/26 | 150,000 | 15,750 | ||||||
Total Industrial | 797,079 | |||||||
Consumer, Non-cyclical - 1.8% | ||||||||
Women’s Care Holdings, Inc. | ||||||||
7.87% (6 Month USD LIBOR + 4.50%, Rate Floor: 5.25%) due 01/17/28 | 96,902 | 90,422 | ||||||
Quirch Foods Holdings LLC | ||||||||
8.99% (1 Month Term SOFR + 4.50%, Rate Floor: 5.50%) due 10/27/27††† | 98,000 | 89,180 | ||||||
108 | THE GUGGENHEIM FUNDS ANNUAL REPORT | SEE NOTES TO FINANCIAL STATEMENTS. |
SCHEDULE OF INVESTMENTS (continued) | December 31, 2022 |
SERIES P (HIGH YIELD SERIES) |
| Face | Value | ||||||
Gibson Brands, Inc. | ||||||||
9.13% (3 Month Term SOFR + 5.00%, Rate Floor: 5.75%) due 08/11/28††† | 96,525 | $ | 70,463 | |||||
Blue Ribbon LLC | ||||||||
10.12% (1 Month USD LIBOR + 6.00%, Rate Floor: 6.75%) due 05/08/28 | 93,750 | 69,492 | ||||||
National Mentor Holdings, Inc. | ||||||||
8.33% ((1 Month USD LIBOR + 3.75%) and (3 Month USD LIBOR + 3.75%), Rate Floor: 4.50%) due 03/02/28 | 93,901 | 65,365 | ||||||
Osmosis Holdings Australia II Pty Ltd. | ||||||||
7.84% (3 Month Term SOFR + 3.75%, Rate Floor: 4.25%) due 07/31/28 | 63,729 | 59,905 | ||||||
8.09% (1 Month Term SOFR + 3.75%, Rate Floor: 3.75%) due 07/31/28 | 5,542 | 5,209 | ||||||
Confluent Health LLC | ||||||||
8.38% (1 Month USD LIBOR + 4.00%, Rate Floor: 4.50%) due 11/30/28 | 68,801 | 58,252 | ||||||
Mission Veterinary Partners | ||||||||
7.37% (1 Month USD LIBOR + 4.00%, Rate Floor: 4.75%) due 04/27/28††† | 49,623 | 44,165 | ||||||
Kronos Acquisition Holdings, Inc. | ||||||||
10.51% (3 Month Term SOFR + 6.00%, Rate Floor: 7.00%) due 12/22/26 | 24,688 | 23,762 | ||||||
TGP Holdings LLC | ||||||||
7.63% (1 Month USD LIBOR + 3.25%, Rate Floor: 4.00%) due 06/29/28 | 22,080 | 17,554 | ||||||
7.63% (1 Month USD LIBOR + 3.25%, Rate Floor: 4.00%) due 06/29/28 | 1,449 | 1,152 | ||||||
Total Consumer, Non-cyclical | 594,921 | |||||||
Technology - 1.5% | ||||||||
Datix Bidco Ltd. | ||||||||
6.69% (6 Month GBP SONIA + 4.50%, Rate Floor: 5.19%) due 04/28/25††† | GBP | 150,000 | 177,110 | |||||
9.94% (6 Month GBP SONIA + 7.75%, Rate Floor: 8.44%) due 04/27/26††† | GBP | 75,000 | 88,809 | |||||
Peraton Corp. | ||||||||
8.13% (1 Month USD LIBOR + 3.75%, Rate Floor: 4.50%) due 02/01/28 | 176,161 | 171,720 | ||||||
Atlas CC Acquisition Corp. | ||||||||
8.98% (3 Month USD LIBOR + 4.25%, Rate Floor: 5.00%) due 05/25/28 | 73,875 | 61,896 | ||||||
Total Technology | 499,535 | |||||||
Communications - 1.1% | ||||||||
Xplornet Communications, Inc. | ||||||||
8.38% (1 Month USD LIBOR + 4.00%, Rate Floor: 4.50%) due 10/02/28 | 123,438 | 95,458 | ||||||
Playtika Holding Corp. | ||||||||
7.13% (1 Month USD LIBOR + 2.75%, Rate Floor: 2.75%) due 03/13/28 | 98,500 | 93,832 | ||||||
Cengage Learning Acquisitions, Inc. | ||||||||
7.81% (3 Month USD LIBOR + 4.75%, Rate Floor: 5.75%) due 07/14/26 | 74,063 | 66,448 | ||||||
McGraw Hill LLC | ||||||||
8.32% (3 Month USD LIBOR + 4.75%, Rate Floor: 5.25%) due 07/28/28 | 48,863 | 45,886 | ||||||
Flight Bidco, Inc. | ||||||||
7.88% (1 Month USD LIBOR + 3.50%, Rate Floor: 3.50%) due 07/23/25 | 49,740 | 45,683 | ||||||
Total Communications | 347,307 | |||||||
Financial - 1.0% | ||||||||
Franchise Group, Inc. | ||||||||
8.69% (3 Month USD LIBOR + 4.75%, Rate Floor: 5.50%) due 03/10/26 | 99,888 | 95,892 | ||||||
Citadel Securities, LP | ||||||||
7.44% (1 Month Term SOFR + 3.00%, Rate Floor: 3.00%) due 02/02/28 | 95,000 | 93,842 | ||||||
Claros Mortgage Trust, Inc. | ||||||||
8.92% (1 Month Term SOFR + 4.50%, Rate Floor: 5.00%) due 08/10/26 | 91,080 | 89,828 | ||||||
Eisner Advisory Group | ||||||||
9.69% (1 Month Term SOFR + 5.25%, Rate Floor: 6.00%) due 07/28/28 | 49,375 | 46,413 | ||||||
Total Financial | 325,975 | |||||||
Basic Materials - 0.7% | ||||||||
LTI Holdings, Inc. | ||||||||
9.13% (1 Month USD LIBOR + 4.75%, Rate Floor: 4.75%) due 07/24/26 | 99,368 | 94,648 | ||||||
NIC Acquisition Corp. | ||||||||
8.48% (3 Month USD LIBOR + 3.75%, Rate Floor: 4.50%) due 12/29/27 | 98,497 | 70,819 | ||||||
Ascend Performance Materials Operations LLC | ||||||||
8.83% (6 Month Term SOFR + 4.75%, Rate Floor: 5.50%) due 08/27/26 | 49,621 | 46,607 | ||||||
Total Basic Materials | 212,074 | |||||||
Energy - 0.1% | ||||||||
Permian Production Partners LLC | ||||||||
12.39% (1 Month USD LIBOR + 6.00%, Rate Floor: 10.39%) (in-kind rate was 2.00%) due 11/24/25†††,9 | 18,427 | 18,335 | ||||||
Total Senior Floating Rate Interests | ||||||||
(Cost $4,384,936) | 3,870,525 | |||||||
Total Investments - 98.6% | ||||||||
(Cost $37,235,998) | $ | 31,860,457 | ||||||
Other Assets & Liabilities, net - 1.4% | 457,657 | |||||||
Total Net Assets - 100.0% | $ | 32,318,114 | ||||||
SEE NOTES TO FINANCIAL STATEMENTS. | THE GUGGENHEIM FUNDS ANNUAL REPORT | 109 |
SCHEDULE OF INVESTMENTS (continued) | December 31, 2022 |
SERIES P (HIGH YIELD SERIES) |
Forward Foreign Currency Exchange Contracts†† | ||||||||||||||||||||||||
Counterparty | Currency | Type | Quantity | Contract | Settlement | Unrealized | ||||||||||||||||||
Barclays Bank plc | GBP | Sell | 223,000 | 276,355 USD | 01/17/23 | $ | 6,668 | |||||||||||||||||
Bank of America, N.A. | CAD | Sell | 65,000 | 47,957 USD | 01/17/23 | (68 | ) | |||||||||||||||||
Barclays Bank plc | EUR | Sell | 230,000 | 245,029 USD | 01/17/23 | (1,539 | ) | |||||||||||||||||
| $ | 5,061 | |||||||||||||||||||||||
~ | The face amount is denominated in U.S. dollars unless otherwise indicated. |
* | Non-income producing security. |
† | Value determined based on Level 1 inputs, unless otherwise noted — See Note 4. |
†† | Value determined based on Level 2 inputs, unless otherwise noted — See Note 4. |
††† | Value determined based on Level 3 inputs — See Note 4. |
◊ | Variable rate security. Rate indicated is the rate effective at December 31, 2022. In some instances, the effective rate is limited by a minimum rate floor or a maximum rate cap established by the issuer. The settlement status of a position may also impact the effective rate indicated. In some cases, a position may be unsettled at period end and may not have a stated effective rate. In instances where multiple underlying reference rates and spread amounts are shown, the effective rate is based on a weighted average. |
1 | Special Purpose Acquisition Company (SPAC). |
2 | Affiliated issuer. |
3 | Security has a fixed rate coupon which will convert to a floating or variable rate coupon on a future date. |
4 | Rate indicated is the 7-day yield as of December 31, 2022. |
5 | Security is a 144A or Section 4(a)(2) security. These securities have been determined to be liquid under guidelines established by the Board of Trustees. The total market value of 144A or Section 4(a)(2) securities is $22,763,104 (cost $26,036,288), or 70.4% of total net assets. |
6 | All or a portion of this has been physically segregated or earmarked in connection with reverse repurchase agreements. At December 31, 2022, the total market value of segregated or earmarked security was $303,356 — See Note 11. |
7 | Security is in default of interest and/or principal obligations. |
8 | Security is a 144A or Section 4(a)(2) security. These securities have been determined to be illiquid and restricted under guidelines established by the Board of Trustees. The total market value of 144A or Section 4(a)(2) illiquid and restricted securities is $7,802 (cost $353,909), or 0.0% of total net assets — See Note 9. |
9 | Payment-in-kind security. |
CAD — Canadian Dollar | |
EUR — Euro | |
EURIBOR — European Interbank Offered Rate | |
GBP — British Pound | |
LIBOR — London Interbank Offered Rate | |
plc — Public Limited Company | |
SARL — Société à Responsabilité Limitée | |
SOFR — Secured Overnight Financing Rate | |
See Sector Classification in Other Information section. |
110 | THE GUGGENHEIM FUNDS ANNUAL REPORT | SEE NOTES TO FINANCIAL STATEMENTS. |
SCHEDULE OF INVESTMENTS (continued) | December 31, 2022 |
SERIES P (HIGH YIELD SERIES) |
The following table summarizes the inputs used to value the Fund’s investments at December 31, 2022 (See Note 4 in the Notes to Financial Statements):
Investments in Securities (Assets) | Level 1 | Level 2 | Level 3 | Total | ||||||||||||
Common Stocks | $ | 103,550 | $ | 229,727 | $ | 25,289 | $ | 358,566 | ||||||||
Preferred Stocks | — | 343,898 | 2 | 343,900 | ||||||||||||
Warrants | 197 | — | — | 197 | ||||||||||||
Exchange-Traded Funds | 412,328 | — | — | 412,328 | ||||||||||||
Money Market Fund | 811,908 | — | — | 811,908 | ||||||||||||
Corporate Bonds | — | 25,942,556 | 120,477 | 26,063,033 | ||||||||||||
Senior Floating Rate Interests | — | 3,310,812 | 559,713 | 3,870,525 | ||||||||||||
Forward Foreign Currency Exchange Contracts** | — | 6,668 | — | 6,668 | ||||||||||||
Total Assets | $ | 1,327,983 | $ | 29,833,661 | $ | 705,481 | $ | 31,867,125 | ||||||||
Investments in Securities (Liabilities) | Level 1 | Level 2 | Level 3 | Total | ||||||||||||
Forward Foreign Currency Exchange Contracts** | $ | — | $ | 1,607 | $ | — | $ | 1,607 | ||||||||
Unfunded Loan Commitments (Note 8) | — | — | 1,511 | 1,511 | ||||||||||||
Total Liabilities | $ | — | $ | 1,607 | $ | 1,511 | $ | 3,118 | ||||||||
** | This derivative is reported as unrealized appreciation/depreciation at period end. |
The Fund may hold assets and/or liabilities in which the fair value approximates the carrying amount for financial statement purposes. As of the period end, reverse repurchase agreements of $238,240 are categorized as Level 2 within the disclosure hierarchy — See Note 11.
The following is a summary of significant unobservable inputs used in the fair valuation of assets and liabilities categorized within Level 3 of the fair value hierarchy:
Category | Ending Balance at | Valuation Technique | Unobservable Inputs | Input Range | Weighted Average* | |||||||||||||||
Assets: | ||||||||||||||||||||
Common Stocks | $ | 25,153 | Enterprise Value | Valuation Multiple | 2.7x-11.8x | 2.7x | ||||||||||||||
Common Stocks | 136 | Model Price | Liquidation Value | — | — | |||||||||||||||
Corporate Bonds | 107,635 | Third Party Pricing | Vendor Price | — | — | |||||||||||||||
Corporate Bonds | 12,842 | Third Party Pricing | Broker Quote | — | — | |||||||||||||||
Preferred Stocks | 2 | Model Price | Purchase Price | — | — | |||||||||||||||
Senior Floating Rate Interests | 293,794 | Third Party Pricing | Broker Quote | — | — | |||||||||||||||
Senior Floating Rate Interests | 265,919 | Yield Analysis | Yield | 10.2% - 13.3% | 11.2% | |||||||||||||||
Total Assets | $ | 705,481 |
|
|
|
| ||||||||||||||
Liabilities: | ||||||||||||||||||||
Unfunded Loan Commitments | $ | 1,511 | Model Price | Purchase Price | — | — | ||||||||||||||
* | Inputs are weighted by the fair value of the instruments. |
Significant changes in a quote, liquidation value or valuation multiple would generally result in significant changes in the fair value of the security.
SEE NOTES TO FINANCIAL STATEMENTS. | THE GUGGENHEIM FUNDS ANNUAL REPORT | 111 |
SCHEDULE OF INVESTMENTS (concluded) | December 31, 2022 |
SERIES P (HIGH YIELD SERIES) |
The Fund’s fair valuation leveling guidelines classify a single daily broker quote, or a vendor price based on a single daily or monthly broker quote, as Level 3, if such a quote or price cannot be supported with other available market information.
Transfers between Level 2 and Level 3 may occur as markets fluctuate and/or the availability of data used in an investment’s valuation changes. For the year ended December 31, 2022, the Fund had securities with a total value of $186,440 transfer into Level 3 from Level 2 due to a lack of observable inputs and had securities with a total value of $352,865 transfer out of Level 3 into Level 2 due to the availability of current and reliable market-based data provided by a third-party pricing service which utilizes significant observable inputs.
Summary of Fair Value Level 3 Activity
Following is a reconciliation of Level 3 assets for which significant unobservable inputs were used to determine fair value for the year ended December 31, 2022:
Assets | Liabilities | |||||||||||||||||||||||
| Corporate | Senior Floating | Common | Preferred | Total Assets | Unfunded | ||||||||||||||||||
Beginning Balance | $ | — | $ | 673,373 | $ | 209,563 | $ | 2 | $ | 882,938 | $ | (169 | ) | |||||||||||
Purchases/(Receipts) | — | 49,764 | — | — | 49,764 | (534 | ) | |||||||||||||||||
(Sales, maturities and paydowns)/Fundings | — | (26,445 | ) | — | — | (26,445 | ) | 692 | ||||||||||||||||
Amortization of premiums/discounts | — | 6,412 | — | — | 6,412 | 48 | ||||||||||||||||||
Total realized gains (losses) included in earnings | — | (237 | ) | — | — | (237 | ) | (8 | ) | |||||||||||||||
Total change in unrealized appreciation (depreciation) included in earnings | — | (62,406 | ) | 21,880 | — | (40,526 | ) | (1,540 | ) | |||||||||||||||
Transfers into Level 3 | 120,477 | 65,963 | — | — | 186,440 | — | ||||||||||||||||||
Transfers out of Level 3 | — | (146,711 | ) | (206,154 | ) | — | (352,865 | ) | — | |||||||||||||||
Ending Balance | $ | 120,477 | $ | 559,713 | $ | 25,289 | $ | 2 | $ | 705,481 | $ | (1,511 | ) | |||||||||||
Net change in unrealized appreciation (depreciation) for investments in Level 3 securities still held at December 31, 2022 | $ | — | $ | (59,853 | ) | $ | 74 | $ | — | $ | (59,779 | ) | $ | (1,202 | ) | |||||||||
Affiliated Transactions
Investments representing 5% or more of the outstanding voting shares of a company, or control of or by, or common control under Guggenheim Investments, result in that company being considered an affiliated issuer, as defined in the 1940 Act.
Security Name | Value | Additions | Reductions | Realized | Change in | Value | Shares | |||||||||||||||||||||
Common Stocks | ||||||||||||||||||||||||||||
BP Holdco LLC * | $ | 368 | $ | — | $ | — | $ | — | $ | (51 | ) | $ | 317 | 523 | ||||||||||||||
* | Non-income producing security. |
112 | THE GUGGENHEIM FUNDS ANNUAL REPORT | SEE NOTES TO FINANCIAL STATEMENTS. |
SERIES P (HIGH YIELD SERIES) |
STATEMENT OF ASSETS AND LIABILITIES |
December 31, 2022 |
Assets: | ||||
Investments in unaffiliated issuers, at value (cost $37,235,813) | $ | 31,860,140 | ||
Investments in affiliated issuers, at value (cost $185) | 317 | |||
Cash | 27,812 | |||
Unrealized appreciation on forward foreign currency exchange contracts | 6,668 | |||
Prepaid expenses | 2,611 | |||
Receivables: | ||||
Interest | 508,884 | |||
Securities sold | 227,671 | |||
Fund shares sold | 784 | |||
Foreign tax reclaims | 367 | |||
Total assets | 32,635,254 | |||
Liabilities: | ||||
Unfunded loan commitments, at value (Note 8) (commitment fees received $353) | 1,511 | |||
Reverse repurchase agreements (Note 11) | 238,240 | |||
Unrealized depreciation on forward foreign currency exchange contracts | 1,607 | |||
Payable for: | ||||
Professional fees | 39,209 | |||
Distribution and service fees | 6,769 | |||
Management fees | 5,624 | |||
Fund shares redeemed | 4,870 | |||
Transfer agent/maintenance fees | 2,127 | |||
Fund accounting/administration fees | 1,543 | |||
Trustees’ fees* | 1,379 | |||
Securities purchased | 20 | |||
Miscellaneous | 14,241 | |||
Total liabilities | 317,140 | |||
Net assets | $ | 32,318,114 | ||
Net assets consist of: | ||||
Paid in capital | $ | 44,738,844 | ||
Total distributable earnings (loss) | (12,420,730 | ) | ||
Net assets | $ | 32,318,114 | ||
Capital shares outstanding | 1,392,453 | |||
Net asset value per share | $ | 23.21 | ||
STATEMENT OF OPERATIONS |
Year Ended December 31, 2022 |
Investment Income: | ||||
Dividends from unaffiliated issuers | $ | 44,570 | ||
Interest from unaffiliated issuers | 2,157,682 | |||
Total investment income | 2,202,252 | |||
Expenses: | ||||
Management fees | 211,162 | |||
Distribution and service fees | 87,760 | |||
Transfer agent/maintenance fees | 25,380 | |||
Professional fees | 63,392 | |||
Fund accounting/administration fees | 28,430 | |||
Trustees’ fees* | 11,140 | |||
Custodian fees | 8,923 | |||
Interest expense | 3,886 | |||
Line of credit fees | 2,243 | |||
Miscellaneous | 8,880 | |||
Total expenses | 451,196 | |||
Less: | ||||
Expenses reimbursed by Adviser | (2,583 | ) | ||
Expenses waived by Adviser | (71,901 | ) | ||
Earnings credits applied | (727 | ) | ||
Total waived/reimbursed expenses | (75,211 | ) | ||
Net expenses | 375,985 | |||
Net investment income | 1,826,267 | |||
Net Realized and Unrealized Gain (Loss): | ||||
Net realized gain (loss) on: | ||||
Investments in unaffiliated issuers | (1,106,066 | ) | ||
Investments in unaffiliated issuers sold short | (281 | ) | ||
Swap agreements | 39,182 | |||
Forward foreign currency exchange contracts | 53,140 | |||
Foreign currency transactions | (1,852 | ) | ||
Net realized loss | (1,015,877 | ) | ||
Net change in unrealized appreciation (depreciation) on: | ||||
Investments in unaffiliated issuers | (4,783,023 | ) | ||
Investments in affiliated issuers | (51 | ) | ||
Forward foreign currency exchange contracts | 16,944 | |||
Foreign currency translations | (8 | ) | ||
Net change in unrealized appreciation (depreciation) | (4,766,138 | ) | ||
Net realized and unrealized loss | (5,782,015 | ) | ||
Net decrease in net assets resulting from operations | $ | (3,955,748 | ) | |
* | Relates to Trustees not deemed “interested persons” within the meaning of Section 2(a)(19) of the 1940 Act. |
SEE NOTES TO FINANCIAL STATEMENTS. | THE GUGGENHEIM FUNDS ANNUAL REPORT | 113 |
SERIES P (HIGH YIELD SERIES) |
STATEMENTS OF CHANGES IN NET ASSETS |
| Year Ended | Year Ended | ||||||
Increase (Decrease) in Net Assets from Operations: | ||||||||
Net investment income | $ | 1,826,267 | $ | 2,152,479 | ||||
Net realized gain (loss) on investments | (1,015,877 | ) | 1,302,748 | |||||
Net change in unrealized appreciation (depreciation) on investments | (4,766,138 | ) | (978,489 | ) | ||||
Net increase (decrease) in net assets resulting from operations | (3,955,748 | ) | 2,476,738 | |||||
Distributions to shareholders | (2,232,635 | ) | (2,204,042 | ) | ||||
Capital share transactions: | ||||||||
Proceeds from sale of shares | 9,470,895 | 90,239,472 | ||||||
Distributions reinvested | 2,232,635 | 2,204,042 | ||||||
Cost of shares redeemed | (17,788,963 | ) | (93,277,254 | ) | ||||
Net decrease from capital share transactions | (6,085,433 | ) | (833,740 | ) | ||||
Net decrease in net assets | (12,273,816 | ) | (561,044 | ) | ||||
Net assets: | ||||||||
Beginning of year | 44,591,930 | 45,152,974 | ||||||
End of year | $ | 32,318,114 | $ | 44,591,930 | ||||
Capital share activity: | ||||||||
Shares sold | 390,216 | 3,257,017 | ||||||
Shares issued from reinvestment of distributions | 95,986 | 81,180 | ||||||
Shares redeemed | (712,105 | ) | (3,362,102 | ) | ||||
Net decrease in shares | (225,903 | ) | (23,905 | ) | ||||
114 | THE GUGGENHEIM FUNDS ANNUAL REPORT | SEE NOTES TO FINANCIAL STATEMENTS. |
SERIES P (HIGH YIELD SERIES) |
FINANCIAL HIGHLIGHTS |
This table is presented to show selected data for a share outstanding throughout each period and to assist shareholders in evaluating a Fund’s performance for the periods presented.
| Year Ended | Year Ended | Year Ended | Year Ended | Year Ended | |||||||||||||||
Per Share Data | ||||||||||||||||||||
Net asset value, beginning of period | $ | 27.55 | $ | 27.49 | $ | 28.39 | $ | 27.51 | $ | 31.13 | ||||||||||
Income (loss) from investment operations: | ||||||||||||||||||||
Net investment income (loss)a | 1.28 | 1.30 | 1.37 | 1.68 | 1.79 | |||||||||||||||
Net gain (loss) on investments (realized and unrealized) | (3.95 | ) | .18 | (.21 | ) | 1.45 | (2.99 | ) | ||||||||||||
Total from investment operations | (2.67 | ) | 1.48 | 1.16 | 3.13 | (1.20 | ) | |||||||||||||
Less distributions from: | ||||||||||||||||||||
Net investment income | (1.67 | ) | (1.42 | ) | (2.06 | ) | (2.25 | ) | (2.42 | ) | ||||||||||
Total distributions | (1.67 | ) | (1.42 | ) | (2.06 | ) | (2.25 | ) | (2.42 | ) | ||||||||||
Net asset value, end of period | $ | 23.21 | $ | 27.55 | $ | 27.49 | $ | 28.39 | $ | 27.51 | ||||||||||
| ||||||||||||||||||||
Total Returnb | (9.70 | %) | 5.41 | % | 4.64 | % | 11.59 | % | (4.16 | %) | ||||||||||
Ratios/Supplemental Data | ||||||||||||||||||||
Net assets, end of period (in thousands) | $ | 32,318 | $ | 44,592 | $ | 45,153 | $ | 54,288 | $ | 52,504 | ||||||||||
Ratios to average net assets: | ||||||||||||||||||||
Net investment income (loss) | 5.19 | % | 4.70 | % | 5.13 | % | 5.89 | % | 5.98 | % | ||||||||||
Total expensesc | 1.28 | % | 1.28 | % | 1.38 | % | 1.31 | % | 1.42 | % | ||||||||||
Net expensesd,e,f | 1.07 | % | 1.08 | % | 1.12 | % | 1.10 | % | 1.26 | % | ||||||||||
Portfolio turnover rate | 33 | % | 76 | % | 84 | % | 58 | % | 51 | % | ||||||||||
a | Net investment income (loss) per share was computed using average shares outstanding throughout the period. |
b | Total return does not take into account any of the expenses associated with an investment in variable insurance products. If total return had taken into account these expenses, performance would have been lower. Shares of a series of Guggenheim Variable Funds Trust are available only through the purchase of such products. |
c | Does not include expenses of the underlying funds in which the Fund invests. |
d | Net expense information reflects the expense ratios after expense waivers and reimbursements, as applicable. |
e | The portion of the ratios of net expenses to average net assets attributable to recoupments of prior fee reductions or expense reimbursements for the years presented was as follows: |
12/31/22 | 12/31/21 | 12/31/20 | 12/31/19 | 12/31/18 | |
— | — | — | — | 0.00%* |
* | Less than 0.01%. |
f | Net expenses may include expenses that are excluded from the expense limitation agreement. Excluding these expenses, the net expense ratios for the years presented would be: |
12/31/22 | 12/31/21 | 12/31/20 | 12/31/19 | 12/31/18 | |
1.05% | 1.06% | 1.07% | 1.07% | 1.07% |
SEE NOTES TO FINANCIAL STATEMENTS. | THE GUGGENHEIM FUNDS ANNUAL REPORT | 115 |
MANAGERS’ COMMENTARY (Unaudited) | December 31, 2022 |
To Our Shareholders
The Series Q (Small Cap Value Series, or the “Fund”) is managed by a team of seasoned professionals, led by David Toussaint, CFA, CPA, Managing Director and Portfolio Manager; James Schier, CFA, Senior Managing Director and Portfolio Manager; Farhan Sharaff, Senior Managing Director, Assistant Chief Investment Officer, Equities, and Portfolio Manager; Gregg Strohkorb, CFA, Director and Portfolio Manager; and Burak Hurmeydan, Ph.D., Director and Portfolio Manager. In the subsequent paragraphs, the investment team discusses the Fund’s performance and the market environment for the 12-month period ended December 31, 2022 (the “Reporting Period”).
For the Reporting Period, the Fund provided a total return of -3.74%, outperforming the Russell 2000 Value Index (“Index”), the Fund’s benchmark, which returned -14.48% for the same period.
What factors contributed or detracted from the Fund’s performance during the Reporting Period?
After the market reached record highs at the end of 2021, it came under pressure as the Federal Reserve (the “Fed”) strove to contain inflation by raising rates, and at the same time, the market had to deal with the uncertainty over the Ukraine invasion. The Fund’s general focus towards quality companies (those with better balance sheets than peers) that meet our valuation parameters tended to position the holdings well in most sectors. In fact, the Fund produced a very significant positive contribution from its security selection and produced a significant positive contribution from its sector allocation.
Stock selection within the Financials sector was the most significant positive sector during the year. The Fund’s holdings in this sector were down 1.9% versus a 12.1% decline in the benchmark. First Horizon (a regional bank based in Memphis) gained 42% after receiving a take-over offer from Toronto-Dominion Bank. Another significant contributor, UNUM Group, gained more than 70%. UNUM, a supplemental disability and health insurance company, benefited from lower COVID-related disability claims and strong payroll growth given strong employment levels throughout the year. In addition, the reserves set aside for the closed long-term-care book of business benefited from the higher fixed income rates brought about during the year.
During the year, Industrials was the second most significant positive contributor. Valmont Industries, which designs and manufactures poles, towers and structures for lighting, communication, and utility markets, gained more than 30%, as infrastructure spending on these segments helped the company grow revenues and earnings. Science Applications International Corporation returned 35%% for the year. This IT and consulting services provider to the government gained because of increased defense spending by the government due to the Russian-Ukraine war.
The third most significant contributor during the year was within the Information Technology sector. Sanmina Corporation, an electronics contract manufacturer, was up 59% while the sector was down 27%. The company benefited by increased demand in their cloud and communications end markets.
Finally, another strong contributor to the Fund’s performance was in the Energy sector. The slight energy overweighting was magnified by the significant outperformance the sector recorded. Energy was only one of two sectors that posted positive returns during the year and dwarfed the returns elsewhere by advancing 60%. The Fund’s holdings in this sector gained more than 62%. A focus on oil and gas exploration and development companies was a key to success. EQT Corp, a natural gas producer, was up over 65%, as natural gas prices spiked as a result of the Russian-Ukraine War and Europe’s supply of natural gas being curtailed. Pioneer Natural Resources, a Permian oil producer, performed extremely well as oil prices improved and the company exercised capital discipline throughout 2022. Additionally, an oil and natural gas service company, Patterson-UTI Energy, was up over 100% as the company’s oil and natural gas drilling rigs were put to work in the field.
The Fund’s largest detractor from performance was its holding in a Medicare health insurance broker, GoHealth, which was down around 70% for the year. A more intense competitive environment resulted in higher rate of insurance coverage changes and lower retention, which delayed a positive cashflow environment indefinitely. This holding has been sold out of the Fund.
Another negative contributor to the Fund’s performance was Daseke Inc., down around 43% for the year. The trucking company specializes in flatbed trailers, and the market was worried about an economic slowdown hurting demand.
116 | THE GUGGENHEIM FUNDS ANNUAL REPORT |
MANAGERS’ COMMENTARY (Unaudited)(concluded) | December 31, 2022 |
How was the Fund positioned at the end of the Reporting Period?
The market outlook is unusually cloudy. In addition to the geopolitical uncertainty that appears to be potentially significant, the market must contend with a hawkish Federal Reserve. Together, this provides a challenging environment for economic growth. All of this, however, does not change our process which is heavily bottoms up driven.
The Fund’s largest overweights are in the Industrials, Information Technology, and Materials sectors. Among the Industrials holdings, opportunities appear abundant especially among distributors, aerospace & defense, construction, and trucking. Among Information Technology, the strategy has exposure to financial processing companies, semiconductors, communications equipment, and electronic components companies that we believe have ample growth and improving profitability opportunities. In Materials, we can find many self-help situations in the chemical industry (opportunities companies possess to generate earnings growth that are not dependent on general macroeconomic conditions; these opportunities could include cost cutting, asset redeployment, or share repurchases). Many of these companies also benefit from beneficial, low cost North American natural gas feedstock costs. The strategy also has an overweighting among packaging companies.
The strategy’s largest underweighting can be found in Health Care, primarily to the biotechnology and pharmaceuticals sub-industries. Many of these companies do not possess the quality attributes of balance sheet strength and positive earnings and cashflow that we desire. Another larger underweight for the Fund is the Consumer Discretionary sector. Generally, in this sector, many companies appear to be operating at near-peak profitability levels just as consumer spending is nearing an inflection point or plateauing at best. Finally, the Fund is underweight the REITs sector. Among property REITs we are generally leery of overall leverage levels among companies that must roll over debt at ever higher interest rates.
Performance displayed represents past performance which is no guarantee of future results.
The opinions and forecast expressed may not actually come to pass. This information is subject to change at any time, based on market and other conditions, and should not be construed as a recommendation of any specific security or strategy.
THE GUGGENHEIM FUNDS ANNUAL REPORT | 117 |
PERFORMANCE REPORT AND FUND PROFILE (Unaudited) | December 31, 2022 |
SERIES Q (SMALL CAP VALUE SERIES)
OBJECTIVE: Seeks long-term capital appreciation.
Holdings Diversification (Market Exposure as % of Net Assets)
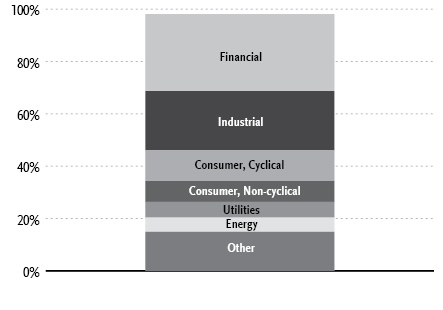
“Holdings Diversification (Market Exposure as % of Net Assets)” excludes any temporary cash investments.
Inception Date: May 1, 2000 |
Ten Largest Holdings | (% of Total Net Assets) |
Pioneer Natural Resources Co. | 3.4% |
iShares Russell 2000 Value ETF | 2.5% |
SPDR S&P Biotech ETF | 1.9% |
Prosperity Bancshares, Inc. | 1.9% |
BOK Financial Corp. | 1.9% |
OGE Energy Corp. | 1.9% |
H&E Equipment Services, Inc. | 1.7% |
Unum Group | 1.6% |
Black Hills Corp. | 1.6% |
Rush Enterprises, Inc. — Class A | 1.6% |
Top Ten Total | 20.0% |
“Ten Largest Holdings” excludes any temporary cash investments. | |
118 | THE GUGGENHEIM FUNDS ANNUAL REPORT |
PERFORMANCE REPORT AND FUND PROFILE (Unaudited)(concluded) | December 31, 2022 |
Cumulative Fund Performance*,†
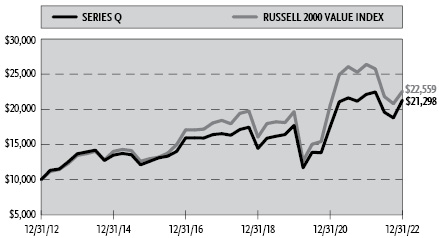
Average Annual Returns*,†
Periods Ended December 31, 2022
| 1 Year | 5 Year | 10 Year |
Series Q (Small Cap Value Series) | (3.74%) | 5.19% | 7.85% |
Russell 2000 Value Index | (14.48%) | 4.13% | 8.48% |
* | The performance data above represents past performance that is not predictive of future results. The investment return and principal value of an investment in the Fund will fluctuate so that an investor’s shares, when redeemed, may be worth more or less than their original cost. Returns are historical and include changes in principal and reinvested dividends and capital gains and do not reflect the effect of taxes. The Russell 2000 Value Index is an unmanaged index and, unlike the Fund, has no management fees or operating expenses to reduce its reported return. |
† | Performance figures do not reflect fees and expenses associated with an investment in variable insurance products. If returns had taken into account these fees and expenses, performance would have been lower. Shares of a series of Guggenheim Variable Funds Trust are available only through the purchase of such products. |
THE GUGGENHEIM FUNDS ANNUAL REPORT | 119 |
SCHEDULE OF INVESTMENTS | December 31, 2022 |
SERIES Q (SMALL CAP VALUE SERIES) |
| Shares | Value | ||||||
COMMON STOCKS† - 93.6% | ||||||||
Financial - 29.4% | ||||||||
Prosperity Bancshares, Inc. | 17,100 | $ | 1,242,828 | |||||
BOK Financial Corp. | 11,964 | 1,241,744 | ||||||
Unum Group | 25,288 | 1,037,567 | ||||||
First Merchants Corp. | 21,923 | 901,254 | ||||||
Hanmi Financial Corp. | 35,569 | 880,333 | ||||||
Cathay General Bancorp | 21,370 | 871,682 | ||||||
Hancock Whitney Corp. | 17,715 | 857,229 | ||||||
Texas Capital Bancshares, Inc.* | 13,731 | 828,117 | ||||||
Physicians Realty Trust REIT | 54,266 | 785,229 | ||||||
CNO Financial Group, Inc. | 31,438 | 718,358 | ||||||
Old Republic International Corp. | 29,318 | 708,030 | ||||||
LXP Industrial Trust REIT | 67,059 | 671,931 | ||||||
Axis Capital Holdings Ltd. | 12,130 | 657,082 | ||||||
Stifel Financial Corp. | 10,167 | 593,448 | ||||||
Banc of California, Inc. | 37,010 | 589,569 | ||||||
Old National Bancorp | 30,698 | 551,950 | ||||||
STAG Industrial, Inc. REIT | 17,048 | 550,821 | ||||||
MGIC Investment Corp. | 39,769 | 516,997 | ||||||
Simmons First National Corp. — Class A | 23,197 | 500,591 | ||||||
First American Financial Corp. | 9,429 | 493,514 | ||||||
Apple Hospitality REIT, Inc. | 30,185 | 476,319 | ||||||
Independent Bank Group, Inc. | 7,348 | 441,468 | ||||||
Trustmark Corp. | 10,996 | 383,870 | ||||||
Sunstone Hotel Investors, Inc. REIT | 35,434 | 342,293 | ||||||
First Hawaiian, Inc. | 12,966 | 337,635 | ||||||
Wintrust Financial Corp. | 3,881 | 328,022 | ||||||
United Bankshares, Inc. | 8,031 | 325,175 | ||||||
Stewart Information Services Corp. | 7,572 | 323,551 | ||||||
United Community Banks, Inc. | 8,606 | 290,883 | ||||||
Piedmont Office Realty Trust, Inc. — Class A REIT | 22,755 | 208,663 | ||||||
RMR Group, Inc. — Class A | 7,220 | 203,965 | ||||||
Heritage Insurance Holdings, Inc.* | 24,180 | 43,524 | ||||||
Total Financial | 18,903,642 | |||||||
Industrial - 22.7% | ||||||||
Curtiss-Wright Corp. | 5,763 | 962,364 | ||||||
Graphic Packaging Holding Co. | 39,961 | 889,132 | ||||||
GATX Corp. | 7,873 | 837,215 | ||||||
Valmont Industries, Inc. | 2,518 | 832,627 | ||||||
Mercury Systems, Inc.* | 18,276 | 817,668 | ||||||
MDU Resources Group, Inc. | 26,414 | 801,401 | ||||||
Kirby Corp.* | 12,130 | 780,565 | ||||||
Altra Industrial Motion Corp. | 12,814 | 765,636 | ||||||
Knight-Swift Transportation Holdings, Inc. | 13,527 | 708,950 | ||||||
Terex Corp. | 16,114 | 688,390 | ||||||
Littelfuse, Inc. | 2,931 | 645,406 | ||||||
Arcosa, Inc. | 11,657 | 633,441 | ||||||
Moog, Inc. — Class A | 6,196 | 543,761 | ||||||
Daseke, Inc.* | 94,908 | 540,027 | ||||||
Enovis Corp.* | 9,240 | 494,525 | ||||||
Belden, Inc. | 5,787 | 416,085 | ||||||
PGT Innovations, Inc.* | 21,399 | 384,326 | ||||||
Park Aerospace Corp. | 28,528 | 382,561 | ||||||
Summit Materials, Inc. — Class A* | 12,916 | 366,685 | ||||||
Sonoco Products Co. | 5,696 | 345,804 | ||||||
EnerSys | 4,571 | 337,523 | ||||||
Esab Corp. | 6,348 | 297,848 | ||||||
Stoneridge, Inc.* | 13,470 | 290,413 | ||||||
Advanced Energy Industries, Inc. | 3,261 | 279,729 | ||||||
Coherent Corp.* | 6,131 | 215,198 | ||||||
Smith-Midland Corp.* | 9,338 | 191,429 | ||||||
AZEK Company, Inc.* | 8,528 | 173,289 | ||||||
Total Industrial | 14,621,998 | |||||||
Consumer, Cyclical - 11.7% | ||||||||
H&E Equipment Services, Inc. | 24,579 | 1,115,887 | ||||||
Rush Enterprises, Inc. — Class A | 19,655 | 1,027,563 | ||||||
MSC Industrial Direct Company, Inc. — Class A | 11,510 | 940,367 | ||||||
Meritage Homes Corp.* | 8,962 | 826,296 | ||||||
Methode Electronics, Inc. | 17,885 | 793,557 | ||||||
Alaska Air Group, Inc.* | 17,426 | 748,273 | ||||||
UniFirst Corp. | 1,795 | 346,417 | ||||||
Hawaiian Holdings, Inc.* | 31,086 | 318,942 | ||||||
Marriott Vacations Worldwide Corp. | 2,255 | 303,501 | ||||||
Leggett & Platt, Inc. | 8,870 | 285,880 | ||||||
Lakeland Industries, Inc.* | 21,184 | 281,747 | ||||||
Whirlpool Corp. | 1,956 | 276,696 | ||||||
Macy’s, Inc. | 13,170 | 271,961 | ||||||
Total Consumer, Cyclical | 7,537,087 | |||||||
Consumer, Non-cyclical - 7.9% | ||||||||
Euronet Worldwide, Inc.* | 10,865 | 1,025,438 | ||||||
Encompass Health Corp. | 15,794 | 944,639 | ||||||
Ingredion, Inc. | 8,376 | 820,262 | ||||||
Central Garden & Pet Co. — Class A* | 15,598 | 558,408 | ||||||
Azenta, Inc.* | 5,523 | 321,549 | ||||||
ICF International, Inc. | 3,175 | 314,484 | ||||||
Perdoceo Education Corp.* | 20,801 | 289,134 | ||||||
Jazz Pharmaceuticals plc* | 1,337 | 212,998 | ||||||
Ironwood Pharmaceuticals, Inc. — Class A* | 16,911 | 209,527 | ||||||
Integer Holdings Corp.* | 2,929 | 200,520 | ||||||
Pacira BioSciences, Inc.* | 4,408 | 170,193 | ||||||
Total Consumer, Non-cyclical | 5,067,152 | |||||||
Utilities - 6.1% | ||||||||
OGE Energy Corp. | 30,576 | 1,209,281 | ||||||
Black Hills Corp. | 14,699 | 1,033,928 | ||||||
Spire, Inc. | 7,249 | 499,166 | ||||||
Avista Corp. | 9,559 | 423,846 | ||||||
ALLETE, Inc. | 5,769 | 372,158 | ||||||
Pinnacle West Capital Corp. | 4,642 | 352,978 | ||||||
Total Utilities | 3,891,357 | |||||||
Energy - 5.4% | ||||||||
Pioneer Natural Resources Co. | 9,473 | 2,163,538 | ||||||
CNX Resources Corp.* | 40,226 | 677,406 | ||||||
Patterson-UTI Energy, Inc. | 19,446 | 327,471 | ||||||
120 | THE GUGGENHEIM FUNDS ANNUAL REPORT | SEE NOTES TO FINANCIAL STATEMENTS. |
SCHEDULE OF INVESTMENTS (concluded) | December 31, 2022 |
SERIES Q (SMALL CAP VALUE SERIES) |
| Shares | Value | ||||||
Ranger Oil Corp. — Class A | 8,056 | $ | 325,704 | |||||
Total Energy | 3,494,119 | |||||||
Technology - 4.1% | ||||||||
Science Applications International Corp. | 7,631 | 846,507 | ||||||
MACOM Technology Solutions Holdings, Inc.* | 8,201 | 516,499 | ||||||
Conduent, Inc.* | 95,977 | 388,707 | ||||||
Silicon Laboratories, Inc.* | 2,327 | 315,704 | ||||||
Power Integrations, Inc. | 4,139 | 296,849 | ||||||
Amkor Technology, Inc. | 12,311 | 295,218 | ||||||
Total Technology | 2,659,484 | |||||||
Basic Materials - 3.8% | ||||||||
Huntsman Corp. | 28,622 | 786,533 | ||||||
Ashland, Inc. | 6,259 | 673,030 | ||||||
Avient Corp. | 17,177 | 579,895 | ||||||
Commercial Metals Co. | 8,977 | 433,589 | ||||||
Total Basic Materials | 2,473,047 | |||||||
Communications - 2.5% | ||||||||
Ciena Corp.* | 15,160 | 772,857 | ||||||
Infinera Corp.* | 80,707 | 543,965 | ||||||
Gray Television, Inc. | 25,944 | 290,313 | ||||||
Total Communications | 1,607,135 | |||||||
Total Common Stocks | ||||||||
(Cost $54,725,313) | 60,255,021 | |||||||
CONVERTIBLE PREFERRED STOCKS††† - 0.0% | ||||||||
Industrial - 0.0% | ||||||||
Thermoenergy Corp.*,1 | 116,667 | — | ||||||
Total Convertible Preferred Stocks | ||||||||
(Cost $111,410) | — | |||||||
RIGHTS† - 0.1% | ||||||||
Basic Materials - 0.1% | ||||||||
Pan American Silver Corp.* | 81,258 | 46,398 | ||||||
Total Rights | ||||||||
(Cost $—) | 46,398 | |||||||
EXCHANGE-TRADED FUNDS† - 4.4% | ||||||||
iShares Russell 2000 Value ETF | 11,483 | 1,592,348 | ||||||
SPDR S&P Biotech ETF* | 15,110 | 1,254,130 | ||||||
Total Exchange-Traded Funds | ||||||||
(Cost $2,513,295) | 2,846,478 | |||||||
MONEY MARKET FUND† - 1.4% | ||||||||
Dreyfus Treasury Securities Cash Management Fund — Institutional Shares, 3.90%2 | 882,865 | 882,865 | ||||||
Total Money Market Fund | ||||||||
(Cost $882,865) | 882,865 | |||||||
Total Investments - 99.5% | ||||||||
(Cost $58,232,883) | $ | 64,030,762 | ||||||
Other Assets & Liabilities, net - 0.5% | 353,014 | |||||||
Total Net Assets - 100.0% | $ | 64,383,776 | ||||||
* | Non-income producing security. |
† | Value determined based on Level 1 inputs — See Note 4. |
†† | Value determined based on Level 2 inputs — See Note 4. |
††† | Value determined based on Level 3 inputs — See Note 4. |
1 | PIPE (Private Investment in Public Equity) - Stock issued by a company in the secondary market as a means of raising capital more quickly and less expensively than through registration of a secondary public offering. |
2 | Rate indicated is the 7-day yield as of December 31, 2022. |
plc — Public Limited Company | |
REIT — Real Estate Investment Trust | |
See Sector Classification in Other Information section. |
The following table summarizes the inputs used to value the Fund’s investments at December 31, 2022 (See Note 4 in the Notes to Financial Statements):
Investments in Securities (Assets) | Level 1 | Level 2 | Level 3 | Total | ||||||||||||
Common Stocks | $ | 60,255,021 | $ | — | $ | — | $ | 60,255,021 | ||||||||
Convertible Preferred Stocks | — | — | — | * | — | |||||||||||
Rights | 46,398 | — | — | 46,398 | ||||||||||||
Exchange-Traded Funds | 2,846,478 | — | — | 2,846,478 | ||||||||||||
Money Market Fund | 882,865 | — | — | 882,865 | ||||||||||||
Total Assets | $ | 64,030,762 | $ | — | $ | — | $ | 64,030,762 | ||||||||
* | Security has a market value of $0. |
SEE NOTES TO FINANCIAL STATEMENTS. | THE GUGGENHEIM FUNDS ANNUAL REPORT | 121 |
SERIES Q (SMALL CAP VALUE SERIES) |
STATEMENT OF ASSETS AND LIABILITIES |
December 31, 2022 |
Assets: | ||||
Investments, at value (cost $58,232,883) | $ | 64,030,762 | ||
Cash | 4,148 | |||
Prepaid expenses | 2,891 | |||
Receivables: | ||||
Securities sold | 351,557 | |||
Dividends | 87,155 | |||
Interest | 4,266 | |||
Fund shares sold | 128 | |||
Total assets | 64,480,907 | |||
Liabilities: | ||||
Payable for: | ||||
Management fees | 33,661 | |||
Professional fees | 19,104 | |||
Fund shares redeemed | 18,186 | |||
Distribution and service fees | 13,788 | |||
Fund accounting/administration fees | 2,101 | |||
Transfer agent/maintenance fees | 2,078 | |||
Trustees’ fees* | 1,629 | |||
Miscellaneous | 6,584 | |||
Total liabilities | 97,131 | |||
Net assets | $ | 64,383,776 | ||
Net assets consist of: | ||||
Paid in capital | $ | 53,893,498 | ||
Total distributable earnings (loss) | 10,490,278 | |||
Net assets | $ | 64,383,776 | ||
Capital shares outstanding | 1,522,557 | |||
Net asset value per share | $ | 42.29 | ||
STATEMENT OF OPERATIONS |
Year Ended December 31, 2022 |
Investment Income: | ||||
Dividends | $ | 1,524,142 | ||
Interest | 20,022 | |||
Total investment income | 1,544,164 | |||
Expenses: | ||||
Management fees | 505,296 | |||
Distribution and service fees | 168,432 | |||
Transfer agent/maintenance fees | 25,229 | |||
Fund accounting/administration fees | 45,627 | |||
Professional fees | 42,262 | |||
Trustees’ fees* | 10,755 | |||
Custodian fees | 4,087 | |||
Line of credit fees | 1,806 | |||
Miscellaneous | 11,459 | |||
Total expenses | 814,953 | |||
Less: | ||||
Expenses reimbursed by Adviser: | (307 | ) | ||
Expenses waived by Adviser | (59,679 | ) | ||
Earnings credits applied | (13 | ) | ||
Total waived/reimbursed expenses | (59,999 | ) | ||
Net expenses | 754,954 | |||
Net investment income | 789,210 | |||
Net Realized and Unrealized Gain (Loss): | ||||
Net realized gain (loss) on: | ||||
Investments | 4,703,199 | |||
Net realized gain | 4,703,199 | |||
Net change in unrealized appreciation (depreciation) on: | ||||
Investments | (8,393,736 | ) | ||
Net change in unrealized appreciation (depreciation) | (8,393,736 | ) | ||
Net realized and unrealized loss | (3,690,537 | ) | ||
Net decrease in net assets resulting from operations | $ | (2,901,327 | ) | |
* | Relates to Trustees not deemed “interested persons” within the meaning of Section 2(a)(19) of the 1940 Act. |
122 | THE GUGGENHEIM FUNDS ANNUAL REPORT | SEE NOTES TO FINANCIAL STATEMENTS. |
SERIES Q (SMALL CAP VALUE SERIES) |
STATEMENTS OF CHANGES IN NET ASSETS |
| Year Ended | Year Ended | ||||||
Increase (Decrease) in Net Assets from Operations: | ||||||||
Net investment income | $ | 789,210 | $ | 454,119 | ||||
Net realized gain on investments | 4,703,199 | 7,938,808 | ||||||
Net change in unrealized appreciation (depreciation) on investments | (8,393,736 | ) | 8,020,621 | |||||
Net increase (decrease) in net assets resulting from operations | (2,901,327 | ) | 16,413,548 | |||||
Distributions to shareholders | (3,785,119 | ) | (557,150 | ) | ||||
Capital share transactions: | ||||||||
Proceeds from sale of shares | 5,461,906 | 8,061,437 | ||||||
Distributions reinvested | 3,785,119 | 557,150 | ||||||
Cost of shares redeemed | (12,013,440 | ) | (15,056,587 | ) | ||||
Net decrease from capital share transactions | (2,766,415 | ) | (6,438,000 | ) | ||||
Net increase (decrease) in net assets | (9,452,861 | ) | 9,418,398 | |||||
Net assets: | ||||||||
Beginning of year | 73,836,637 | 64,418,239 | ||||||
End of year | $ | 64,383,776 | $ | 73,836,637 | ||||
Capital share activity: | �� | |||||||
Shares sold | 124,259 | 179,207 | ||||||
Shares issued from reinvestment of distributions | 93,460 | 12,764 | ||||||
Shares redeemed | (276,335 | ) | (338,001 | ) | ||||
Net decrease in shares | (58,616 | ) | (146,030 | ) | ||||
SEE NOTES TO FINANCIAL STATEMENTS. | THE GUGGENHEIM FUNDS ANNUAL REPORT | 123 |
SERIES Q (SMALL CAP VALUE SERIES) |
FINANCIAL HIGHLIGHTS |
This table is presented to show selected data for a share outstanding throughout each period and to assist shareholders in evaluating a Fund’s performance for the periods presented.
| Year Ended | Year Ended | Year Ended | Year Ended | Year Ended | |||||||||||||||
Per Share Data | ||||||||||||||||||||
Net asset value, beginning of period | $ | 46.70 | $ | 37.30 | $ | 41.39 | $ | 36.18 | $ | 45.89 | ||||||||||
Income (loss) from investment operations: | ||||||||||||||||||||
Net investment income (loss)a | .51 | .27 | .32 | .32 | .30 | |||||||||||||||
Net gain (loss) on investments (realized and unrealized) | (2.37 | ) | 9.47 | (1.36 | ) | 7.62 | (5.28 | ) | ||||||||||||
Total from investment operations | (1.86 | ) | 9.74 | (1.04 | ) | 7.94 | (4.98 | ) | ||||||||||||
Less distributions from: | ||||||||||||||||||||
Net investment income | (.31 | ) | (.34 | ) | (.37 | ) | (.33 | ) | (.16 | ) | ||||||||||
Net realized gains | (2.24 | ) | — | (2.68 | ) | (2.40 | ) | (4.57 | ) | |||||||||||
Total distributions | (2.55 | ) | (.34 | ) | (3.05 | ) | (2.73 | ) | (4.73 | ) | ||||||||||
Net asset value, end of period | $ | 42.29 | $ | 46.70 | $ | 37.30 | $ | 41.39 | $ | 36.18 | ||||||||||
| ||||||||||||||||||||
Total Returnb | (3.74 | %) | 26.18 | % | (0.97 | %) | 22.58 | % | (12.66 | %) | ||||||||||
Ratios/Supplemental Data | ||||||||||||||||||||
Net assets, end of period (in thousands) | $ | 64,384 | $ | 73,837 | $ | 64,418 | $ | 74,015 | $ | 68,349 | ||||||||||
Ratios to average net assets: | ||||||||||||||||||||
Net investment income (loss) | 1.17 | % | 0.61 | % | 0.97 | % | 0.80 | % | 0.68 | % | ||||||||||
Total expensesc | 1.21 | % | 1.21 | % | 1.29 | % | 1.29 | % | 1.26 | % | ||||||||||
Net expensesd,e | 1.12 | % | 1.13 | % | 1.14 | % | 1.14 | % | 1.14 | % | ||||||||||
Portfolio turnover rate | 38 | % | 32 | % | 32 | % | 54 | % | 37 | % | ||||||||||
a | Net investment income (loss) per share was computed using average shares outstanding throughout the period. |
b | Total return does not take into account any of the expenses associated with an investment in variable insurance products. If total return had taken into account these expenses, performance would have been lower. Shares of a series of Guggenheim Variable Funds Trust are available only through the purchase of such products. |
c | Does not include expenses of the underlying funds in which the Fund invests. |
d | Net expense information reflects the expense ratios after expense waivers and reimbursements, as applicable. |
e | Net expenses may include expenses that are excluded from the expense limitation agreement. Excluding these expenses, the net expense ratios for the years presented would be: |
12/31/22 | 12/31/21 | 12/31/20 | 12/31/19 | 12/31/18 | |
1.12% | 1.13% | 1.13% | 1.14% | 1.14% |
124 | THE GUGGENHEIM FUNDS ANNUAL REPORT | SEE NOTES TO FINANCIAL STATEMENTS. |
MANAGERS’ COMMENTARY (Unaudited) | December 31, 2022 |
To Our Shareholders
The Series V (SMid Cap Value Series, or the “Fund”) is managed by a team of seasoned professionals, led by James Schier, CFA, Senior Managing Director and Portfolio Manager; David Toussaint, CFA, CPA, Managing Director and Portfolio Manager; Farhan Sharaff, Senior Managing Director, Assistant Chief Investment Officer, Equities, and Portfolio Manager; Gregg Strohkorb, CFA, Director and Portfolio Manager; and Burak Hurmeydan, Ph.D., Director and Portfolio Manager. In the subsequent paragraphs, the investment team discusses the Fund’s performance and the market environment for the 12-month period ended December 31, 2022 (the “Reporting Period”).
For the Reporting Period, the Fund provided a total return of -1.86%, outperforming the Russell 2500 Value Index (“Index”), the Fund’s benchmark, which returned -13.08% for the same period.
What factors contributed or detracted from the Fund’s performance during the Reporting Period?
After the market reached record highs at the end of 2021, it came under pressure as the Federal Reserve (the “Fed”) strove to contain inflation by raising rates and, at the same time, there was uncertainty over the Ukraine invasion. The Fund’s general focus towards quality companies (those with better balance sheets than peers) that meet our valuation parameters tended to position the holdings well in most sectors. In fact, the Fund produced a very significant positive contribution from its security selection and produced a significant positive contribution from its sector allocation. Stock selection relative to the benchmark was positive in all eleven sectors.
Stock selection within the Financials sector was the most significant positive contributor during the year. The Fund’s holdings in this sector gained 7.9% versus a 10.8% decline in the benchmark. First Horizon (a regional bank based in Memphis) gained 42% after receiving a take-over offer from Toronto-Dominion Bank. Allegheny Corporation (primarily a reinsurance company) received a merger offer from Berkshire Hathaway and gained more than 27%. Another significant contributor, UNUM Group, gained more than 73%. UNUM, a supplemental disability and health insurance company benefitted from lower COVID-related disability claims and strong payroll growth, given strong employment levels throughout the year. In addition, the reserves set aside for the closed long-term-care book of business benefited from higher fixed interest rates during the year.
During the year, Industrials was the second-most significant positive contributor. Valmont Industries, which designs and manufactures poles, towers and structures for lighting, communication, and utility markets, gained more than 30%, as infrastructure spending on these segments helped the company grow revenues and earnings. Science Applications International Corporation returned 35% for the year. This IT and consulting services provider to the government gained because of increased defense spending due to the Russian-Ukraine war.
Health care selection was the third most significant positive development as holdings in this sector increased 3.5% versus down 21.9% in the benchmark. Evolent Health Inc gained more than 2%. Evolent, a software company that develops cost-effective, high quality health care delivery and payment models, has had a successful year in booking new clients. The best performer in this sector for the Fund was Prothena Corp., up over 150%. Positive results from a competitor’s Alzeimer’s drug trial portend similar positive results for the company’s own Alzeimer’s drug trial.
The fourth most significant attribute in the year was the Energy sector. The slight overweighting of around 1% was magnified by the significant outperformance the sector recorded. Energy was the only sector that posted positive returns during the year and dwarfed the returns elsewhere in advancing almost 52%. The Fund’s holdings in this sector gained more than 67%. A focus on oil and gas exploration and development companies was a key to success. EQT Corp., a natural gas producer, was up over 65%, as natural gas prices spiked as a result of the Russian-Ukraine War and Europe’s supply of natural gas being curtailed. Pioneer Natural Resources, a Permian oil producer, performed extremely well as oil prices improved and the company exercised capital discipline throughout 2022. Additionally, an oil and natural gas service company, Patterson-UTI Energy, was up over 100% as the company’s oil and natural gas drilling rigs were put to work in the field.
The Fund’s largest detractor from performance was its holding in a Medicare health insurance broker, GoHealth, which was down around 70% for the year. A more intense competitive environment resulted in higher rate of insurance coverage changes and lower retention, which delayed a positive cashflow environment indefinitely. This holding has been sold out of the Fund.
Another negative contributor to the Fund’s performance was Daseke Inc., down around 43% for the year. The trucking company specializes in flatbed trailers, and the market was worried about an economic slowdown hurting demand.
THE GUGGENHEIM FUNDS ANNUAL REPORT | 125 |
MANAGERS’ COMMENTARY (Unaudited)(concluded) | December 31, 2022 |
How was the Fund positioned at the end of the Reporting Period?
The market outlook is unusually cloudy. In addition to the geopolitical uncertainty that appears to be potentially significant, the market must contend with a hawkish Federal Reserve. Together, this provides a challenging environment for economic growth. All of this, however, does not change our process, which is heavily bottoms up driven.
The Fund’s largest overweightings can be found in the Industrials, Materials and Consumer Staples sectors. Among the Industrials holdings, opportunities appear abundant especially among truckers, building products and distributors. In Materials, we can find many self-help situations in the chemical industry (opportunities companies possess to generate earnings growth that are not dependent on general macroeconomic conditions; these opportunities could include cost cutting, asset redeployment, or share repurchases). Many of these companies also benefit from low cost North American natural gas feedstock costs. The strategy also has an overweighting among packaging companies. Among Consumer Staples, the strategy has a significant presence in agricultural products, with weightings in Bunge and Ingredion.
The strategy’s largest underweighting can be found in Consumer Discretionary (4% versus 11%), Financials (18% versus 22%), and REITS (6% versus 11%). Generally, in Consumer Discretionary, many companies appear to be operating at near-peak profitability levels just as consumer spending is nearing an inflection point or plateauing at best. Among Financials, the strategy’s weighting is among insurance and banks but lacks exposure among more market sensitive sub-industries such as exchanges, asset managers, and mortgage REITs. Among property REITs, we are generally leery of overall leverage levels among companies that must roll over debt at ever higher interest rates.
Performance displayed represents past performance which is no guarantee of future results.
The opinions and forecast expressed may not actually come to pass. This information is subject to change at any time, based on market and other conditions, and should not be construed as a recommendation of any specific security or strategy.
126 | THE GUGGENHEIM FUNDS ANNUAL REPORT |
PERFORMANCE REPORT AND FUND PROFILE (Unaudited) | December 31, 2022 |
SERIES V (SMID CAP VALUE SERIES)
OBJECTIVE: Seeks long-term growth of capital.
Holdings Diversification (Market Exposure as % of Net Assets)

“Holdings Diversification (Market Exposure as % of Net Assets)” excludes any temporary cash investments.
Inception Date: May 1, 1997 |
Ten Largest Holdings | (% of Total Net Assets) |
Pioneer Natural Resources Co. | 4.3% |
Bunge Ltd. | 2.5% |
Unum Group | 2.4% |
Ingredion, Inc. | 2.2% |
Prosperity Bancshares, Inc. | 2.0% |
OGE Energy Corp. | 1.9% |
Evolent Health, Inc. — Class A | 1.8% |
BOK Financial Corp. | 1.7% |
H&E Equipment Services, Inc. | 1.7% |
Pinnacle West Capital Corp. | 1.6% |
Top Ten Total | 22.1% |
“Ten Largest Holdings” excludes any temporary cash investments. | |
THE GUGGENHEIM FUNDS ANNUAL REPORT | 127 |
PERFORMANCE REPORT AND FUND PROFILE (Unaudited)(concluded) | December 31, 2022 |
Cumulative Fund Performance*,†
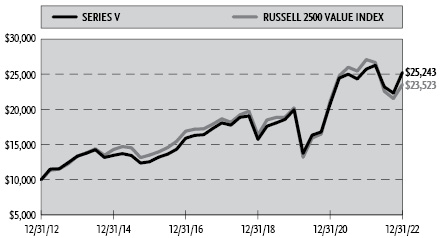
Average Annual Returns*,†
Periods Ended December 31, 2022
| 1 Year | 5 Year | 10 Year |
Series V (SMid Cap Value Series) | (1.86%) | 6.91% | 9.70% |
Russell 2500 Value Index | (13.08%) | 4.75% | 8.93% |
* | The performance data above represents past performance that is not predictive of future results. The investment return and principal value of an investment in the Fund will fluctuate so that an investor’s shares, when redeemed, may be worth more or less than their original cost. Returns are historical and include changes in principal and reinvested dividends and capital gains and do not reflect the effect of taxes. The Russell 2500 Value Index is an unmanaged index and, unlike the Fund, has no management fees or operating expenses to reduce its reported return. |
† | Performance figures do not reflect fees and expenses associated with an investment in variable insurance products. If returns had taken into account these fees and expenses, performance would have been lower. Shares of a series of Guggenheim Variable Funds Trust are available only through the purchase of such products. |
128 | THE GUGGENHEIM FUNDS ANNUAL REPORT |
SCHEDULE OF INVESTMENTS | December 31, 2022 |
SERIES V (SMID CAP VALUE SERIES) |
| Shares | Value | ||||||
COMMON STOCKS† - 98.3% | ||||||||
Financial - 23.8% | ||||||||
Unum Group | 96,805 | $ | 3,971,909 | |||||
Prosperity Bancshares, Inc. | 46,351 | 3,368,791 | ||||||
BOK Financial Corp. | 27,458 | 2,849,866 | ||||||
Physicians Realty Trust REIT | 164,446 | 2,379,534 | ||||||
First Merchants Corp. | 56,292 | 2,314,164 | ||||||
Texas Capital Bancshares, Inc.* | 35,000 | 2,110,850 | ||||||
Old Republic International Corp. | 75,587 | 1,825,426 | ||||||
Alexandria Real Estate Equities, Inc. REIT | 11,382 | 1,658,016 | ||||||
Axis Capital Holdings Ltd. | 29,809 | 1,614,754 | ||||||
Stifel Financial Corp. | 26,146 | 1,526,142 | ||||||
Sun Communities, Inc. REIT | 10,576 | 1,512,368 | ||||||
Old National Bancorp | 79,106 | 1,422,326 | ||||||
Voya Financial, Inc. | 21,525 | 1,323,572 | ||||||
Apple Hospitality REIT, Inc. | 82,613 | 1,303,633 | ||||||
First American Financial Corp. | 24,171 | 1,265,110 | ||||||
Gaming and Leisure Properties, Inc. REIT | 19,571 | 1,019,453 | ||||||
Trustmark Corp. | 27,785 | 969,974 | ||||||
SVB Financial Group* | 3,895 | 896,395 | ||||||
Hancock Whitney Corp. | 18,175 | 879,488 | ||||||
STAG Industrial, Inc. REIT | 26,463 | 855,019 | ||||||
First Hawaiian, Inc. | 32,761 | 853,097 | ||||||
Wintrust Financial Corp. | 10,005 | 845,623 | ||||||
United Bankshares, Inc. | 20,753 | 840,289 | ||||||
VICI Properties, Inc. REIT | 24,514 | 794,254 | ||||||
United Community Banks, Inc. | 22,235 | 751,543 | ||||||
Heritage Insurance Holdings, Inc.* | 61,534 | 110,761 | ||||||
Total Financial | 39,262,357 | |||||||
Industrial - 23.4% | ||||||||
Curtiss-Wright Corp. | 16,040 | 2,678,520 | ||||||
Graphic Packaging Holding Co. | 119,885 | 2,667,441 | ||||||
Kirby Corp.* | 38,649 | 2,487,063 | ||||||
Valmont Industries, Inc. | 7,478 | 2,472,750 | ||||||
Littelfuse, Inc. | 10,214 | 2,249,123 | ||||||
Knight-Swift Transportation Holdings, Inc. | 42,599 | 2,232,614 | ||||||
Johnson Controls International plc | 32,961 | 2,109,504 | ||||||
MDU Resources Group, Inc. | 67,949 | 2,061,573 | ||||||
Terex Corp. | 47,683 | 2,037,018 | ||||||
Arcosa, Inc. | 34,542 | 1,877,012 | ||||||
Enovis Corp.* | 27,084 | 1,449,536 | ||||||
Daseke, Inc.* | 244,873 | 1,393,327 | ||||||
GATX Corp. | 11,670 | 1,240,988 | ||||||
PGT Innovations, Inc.* | 68,573 | 1,231,571 | ||||||
Mercury Systems, Inc.* | 26,161 | 1,170,443 | ||||||
Teledyne Technologies, Inc.* | 2,786 | 1,114,149 | ||||||
Plexus Corp.* | 9,638 | 992,040 | ||||||
Park Aerospace Corp. | 73,696 | 988,263 | ||||||
Altra Industrial Motion Corp. | 14,968 | 894,338 | ||||||
Sonoco Products Co. | 14,545 | 883,027 | ||||||
Advanced Energy Industries, Inc. | 10,258 | 879,931 | ||||||
EnerSys | 11,333 | 836,828 | ||||||
Esab Corp. | 17,760 | 833,299 | ||||||
Stoneridge, Inc.* | 34,863 | 751,646 | ||||||
Coherent Corp.* | 15,702 | 551,140 | ||||||
AZEK Company, Inc.* | 22,006 | 447,162 | ||||||
Total Industrial | 38,530,306 | |||||||
Consumer, Non-cyclical - 13.3% | ||||||||
Bunge Ltd. | 40,835 | 4,074,108 | ||||||
Ingredion, Inc. | 36,948 | 3,618,318 | ||||||
Euronet Worldwide, Inc.* | 28,040 | 2,646,415 | ||||||
Encompass Health Corp. | 40,473 | 2,420,690 | ||||||
Henry Schein, Inc.* | 25,168 | 2,010,168 | ||||||
Integer Holdings Corp.* | 22,585 | 1,546,169 | ||||||
Central Garden & Pet Co. — Class A* | 43,114 | 1,543,481 | ||||||
Quest Diagnostics, Inc. | 6,475 | 1,012,949 | ||||||
Azenta, Inc.* | 14,247 | 829,460 | ||||||
ICF International, Inc. | 8,167 | 808,942 | ||||||
Jazz Pharmaceuticals plc* | 3,354 | 534,326 | ||||||
Ironwood Pharmaceuticals, Inc. — Class A* | 42,997 | 532,733 | ||||||
Pacira BioSciences, Inc.* | 11,211 | 432,856 | ||||||
Total Consumer, Non-cyclical | 22,010,615 | |||||||
Consumer, Cyclical - 9.1% | ||||||||
H&E Equipment Services, Inc. | 61,426 | 2,788,740 | ||||||
MSC Industrial Direct Company, Inc. — Class A | 32,069 | 2,620,037 | ||||||
Methode Electronics, Inc. | 43,794 | 1,943,140 | ||||||
Ralph Lauren Corp. — Class A | 13,536 | 1,430,349 | ||||||
Alaska Air Group, Inc.* | 32,117 | 1,379,104 | ||||||
UniFirst Corp. | 4,638 | 895,088 | ||||||
PVH Corp. | 11,908 | 840,586 | ||||||
Marriott Vacations Worldwide Corp. | 5,658 | 761,510 | ||||||
Leggett & Platt, Inc. | 22,402 | 722,017 | ||||||
Whirlpool Corp. | 5,059 | 715,646 | ||||||
Lakeland Industries, Inc.* | 35,963 | 478,308 | ||||||
Meritage Homes Corp.* | 5,181 | 477,688 | ||||||
Total Consumer, Cyclical | 15,052,213 | |||||||
Technology - 7.9% | ||||||||
Evolent Health, Inc. — Class A* | 104,193 | 2,925,740 | ||||||
Science Applications International Corp. | 23,262 | 2,580,453 | ||||||
Teradyne, Inc. | 25,467 | 2,224,542 | ||||||
Leidos Holdings, Inc. | 19,309 | 2,031,114 | ||||||
MACOM Technology Solutions Holdings, Inc.* | 21,155 | 1,332,342 | ||||||
Silicon Laboratories, Inc.* | 8,862 | 1,202,308 | ||||||
Power Integrations, Inc. | 10,709 | 768,049 | ||||||
Total Technology | 13,064,548 | |||||||
Basic Materials - 6.8% | ||||||||
Westlake Corp. | 23,085 | 2,367,136 | ||||||
Huntsman Corp. | 80,652 | 2,216,317 | ||||||
Reliance Steel & Aluminum Co. | 9,765 | 1,976,826 | ||||||
Ashland, Inc. | 17,628 | 1,895,539 | ||||||
Avient Corp. | 46,496 | 1,569,705 | ||||||
Nucor Corp. | 9,527 | 1,255,754 | ||||||
Total Basic Materials | 11,281,277 | |||||||
SEE NOTES TO FINANCIAL STATEMENTS. | THE GUGGENHEIM FUNDS ANNUAL REPORT | 129 |
SCHEDULE OF INVESTMENTS (continued) | December 31, 2022 |
SERIES V (SMID CAP VALUE SERIES) |
| Shares | Value | ||||||
Energy - 5.9% | ||||||||
Pioneer Natural Resources Co. | 30,929 | $ | 7,063,874 | |||||
Diamondback Energy, Inc. | 6,961 | 952,126 | ||||||
Kinder Morgan, Inc. | 47,986 | 867,587 | ||||||
Patterson-UTI Energy, Inc. | 49,799 | 838,615 | ||||||
HydroGen Corp.*,1,††† | 672,346 | 1 | ||||||
Total Energy | 9,722,203 | |||||||
Utilities - 4.9% | ||||||||
OGE Energy Corp. | 78,870 | 3,119,309 | ||||||
Pinnacle West Capital Corp. | 35,510 | 2,700,180 | ||||||
Black Hills Corp. | 22,184 | 1,560,423 | ||||||
Spire, Inc. | 9,347 | 643,634 | ||||||
Total Utilities | 8,023,546 | |||||||
Communications - 3.2% | ||||||||
Ciena Corp.* | 38,843 | 1,980,216 | ||||||
Infinera Corp.* | 262,869 | 1,771,737 | ||||||
Fox Corp. — Class B | 53,446 | 1,520,539 | ||||||
Total Communications | 5,272,492 | |||||||
Total Common Stocks | ||||||||
(Cost $142,739,437) | 162,219,557 | |||||||
CONVERTIBLE PREFERRED STOCKS††† - 0.0% | ||||||||
Thermoenergy Corp.*,2 | 308,333 | 1 | ||||||
Total Convertible Preferred Stocks | ||||||||
(Cost $294,438) | 1 | |||||||
RIGHTS† - 0.1% | ||||||||
Basic Materials - 0.1% | ||||||||
Pan American Silver Corp.* | 220,317 | 125,801 | ||||||
Total Rights | ||||||||
(Cost $—) | 125,801 | |||||||
MONEY MARKET FUND† - 1.6% | ||||||||
Dreyfus Treasury Securities Cash Management Fund — Institutional Shares, 3.90%3 | 2,671,868 | 2,671,868 | ||||||
Total Money Market Fund | ||||||||
(Cost $2,671,868) | 2,671,868 | |||||||
Total Investments - 100.0% | ||||||||
(Cost $145,705,743) | $ | 165,017,227 | ||||||
Other Assets & Liabilities, net - 0.0% | 50,938 | |||||||
Total Net Assets - 100.0% | $ | 165,068,165 | ||||||
* | Non-income producing security. |
† | Value determined based on Level 1 inputs, unless otherwise noted — See Note 4. |
††† | Value determined based on Level 3 inputs — See Note 4. |
1 | Affiliated issuer. |
2 | PIPE (Private Investment in Public Equity) - Stock issued by a company in the secondary market as a means of raising capital more quickly and less expensively than through registration of a secondary public offering. |
3 | Rate indicated is the 7-day yield as of December 31, 2022. |
plc — Public Limited Company | |
REIT — Real Estate Investment Trust | |
See Sector Classification in Other Information section. |
The following table summarizes the inputs used to value the Fund’s investments at December 31, 2022 (See Note 4 in the Notes to Financial Statements):
Investments in Securities (Assets) | Level 1 | Level 2 | Level 3 | Total | ||||||||||||
Common Stocks | $ | 162,219,556 | $ | — | $ | 1 | $ | 162,219,557 | ||||||||
Convertible Preferred Stocks | — | — | 1 | 1 | ||||||||||||
Rights | 125,801 | — | — | 125,801 | ||||||||||||
Money Market Fund | 2,671,868 | — | — | 2,671,868 | ||||||||||||
Total Assets | $ | 165,017,225 | $ | — | $ | 2 | $ | 165,017,227 | ||||||||
130 | THE GUGGENHEIM FUNDS ANNUAL REPORT | SEE NOTES TO FINANCIAL STATEMENTS. |
SCHEDULE OF INVESTMENTS (concluded) | December 31, 2022 |
SERIES V (SMID CAP VALUE SERIES) |
Affiliated Transactions
Investments representing 5% or more of the outstanding voting shares of a company, or control of or by, or common control under Guggenheim Investments, result in that company being considered an affiliated issuer, as defined in the 1940 Act.
Transactions during the year ended December 31, 2022, in which the company is an affiliated issuer, were as follows:
Security Name | Value | Additions | Reductions | Realized | Change in | Value | Shares | Investment | ||||||||||||||||||||||||
Common Stock | ||||||||||||||||||||||||||||||||
HydroGen Corp.* | $ | 1 | $ | — | $ | — | $ | — | $ | — | $ | 1 | 672,346 | $ | — | |||||||||||||||||
* | Non-income producing security. |
SEE NOTES TO FINANCIAL STATEMENTS. | THE GUGGENHEIM FUNDS ANNUAL REPORT | 131 |
SERIES V (SMID CAP VALUE SERIES) |
STATEMENT OF ASSETS AND LIABILITIES |
December 31, 2022 |
Assets: | ||||
Investments, at value (cost $143,134,168) | $ | 165,017,226 | ||
Investments in affiliated issuers, at value (cost $2,571,575) | 1 | |||
Cash | 6,099 | |||
Prepaid expenses | 4,026 | |||
Receivables: | ||||
Dividends | 226,484 | |||
Interest | 7,519 | |||
Total assets | 165,261,355 | |||
Liabilities: | ||||
Payable for: | ||||
Management fees | 78,152 | |||
Fund shares redeemed | 47,252 | |||
Distribution and service fees | 35,469 | |||
Professional fees | 18,067 | |||
Fund accounting/administration fees | 2,761 | |||
Transfer agent/maintenance fees | 2,526 | |||
Trustees’ fees* | 256 | |||
Due to Investment Adviser | 116 | |||
Miscellaneous | 8,591 | |||
Total liabilities | 193,190 | |||
Net assets | $ | 165,068,165 | ||
Net assets consist of: | ||||
Paid in capital | $ | 132,130,095 | ||
Total distributable earnings (loss) | 32,938,070 | |||
Net assets | $ | 165,068,165 | ||
Capital shares outstanding | 2,303,527 | |||
Net asset value per share | $ | 71.66 | ||
STATEMENT OF OPERATIONS |
Year Ended December 31, 2022 |
Investment Income: | ||||
Dividends from securities of unaffiliated issuers | $ | 3,804,496 | ||
Interest | 55,080 | |||
Total investment income | 3,859,576 | |||
Expenses: | ||||
Management fees | 1,288,014 | |||
Distribution and service fees | 429,338 | |||
Transfer agent/maintenance fees | 24,939 | |||
Fund accounting/administration fees | 101,395 | |||
Professional fees | 62,692 | |||
Trustees’ fees* | 8,807 | |||
Custodian fees | 5,161 | |||
Line of credit fees | 4,605 | |||
Miscellaneous | 10,544 | |||
Recoupment of previously waived fees | 116 | |||
Total expenses | 1,935,611 | |||
Less: | ||||
Expenses waived by Adviser | (406,069 | ) | ||
Earnings credits applied | (243 | ) | ||
Total waived expenses | (406,312 | ) | ||
Net expenses | 1,529,299 | |||
Net investment income | 2,330,277 | |||
Net Realized and Unrealized Gain (Loss): | ||||
Net realized gain (loss) on: | ||||
Investments in unaffiliated issuers | 13,613,515 | |||
Net realized gain | 13,613,515 | |||
Net change in unrealized appreciation (depreciation) on: | ||||
Investments in unaffiliated issuers | (19,694,434 | ) | ||
Net change in unrealized appreciation (depreciation) | (19,694,434 | ) | ||
Net realized and unrealized loss | (6,080,919 | ) | ||
Net decrease in net assets resulting from operations | $ | (3,750,642 | ) | |
* | Relates to Trustees not deemed “interested persons” within the meaning of Section 2(a)(19) of the 1940 Act. |
132 | THE GUGGENHEIM FUNDS ANNUAL REPORT | SEE NOTES TO FINANCIAL STATEMENTS. |
SERIES V (SMID CAP VALUE SERIES) |
STATEMENTS OF CHANGES IN NET ASSETS |
| Year Ended | Year Ended | ||||||
Increase (Decrease) in Net Assets from Operations: | ||||||||
Net investment income | $ | 2,330,277 | $ | 1,441,071 | ||||
Net realized gain on investments | 13,613,515 | 23,340,393 | ||||||
Net change in unrealized appreciation (depreciation) on investments | (19,694,434 | ) | 14,828,004 | |||||
Net increase (decrease) in net assets resulting from operations | (3,750,642 | ) | 39,609,468 | |||||
Distributions to shareholders | (20,034,393 | ) | (3,140,125 | ) | ||||
Capital share transactions: | ||||||||
Proceeds from sale of shares | 3,018,349 | 5,172,278 | ||||||
Distributions reinvested | 20,034,393 | 3,140,125 | ||||||
Cost of shares redeemed | (21,572,513 | ) | (29,848,950 | ) | ||||
Net increase (decrease) from capital share transactions | 1,480,229 | (21,536,547 | ) | |||||
Net increase (decrease) in net assets | (22,304,806 | ) | 14,932,796 | |||||
Net assets: | ||||||||
Beginning of year | 187,372,971 | 172,440,175 | ||||||
End of year | $ | 165,068,165 | $ | 187,372,971 | ||||
Capital share activity: | �� | |||||||
Shares sold | 39,400 | 64,686 | ||||||
Shares issued from reinvestment of distributions | 293,201 | 40,140 | ||||||
Shares redeemed | (283,522 | ) | (374,637 | ) | ||||
Net increase (decrease) in shares | 49,079 | (269,811 | ) | |||||
SEE NOTES TO FINANCIAL STATEMENTS. | THE GUGGENHEIM FUNDS ANNUAL REPORT | 133 |
SERIES V (SMID CAP VALUE SERIES) |
FINANCIAL HIGHLIGHTS |
This table is presented to show selected data for a share outstanding throughout each period and to assist shareholders in evaluating a Fund’s performance for the periods presented.
| Year Ended | Year Ended | Year Ended | Year Ended | Year Ended | |||||||||||||||
Per Share Data | ||||||||||||||||||||
Net asset value, beginning of period | $ | 83.11 | $ | 68.31 | $ | 69.18 | $ | 61.70 | $ | 82.36 | ||||||||||
Income (loss) from investment operations: | ||||||||||||||||||||
Net investment income (loss)a | 1.03 | .61 | 1.21 | .68 | .53 | |||||||||||||||
Net gain (loss) on investments (realized and unrealized) | (3.04 | ) | 15.53 | 1.10 | f | 15.01 | (9.07 | ) | ||||||||||||
Total from investment operations | (2.01 | ) | 16.14 | 2.31 | 15.69 | (8.54 | ) | |||||||||||||
Less distributions from: | ||||||||||||||||||||
Net investment income | (.70 | ) | (1.34 | ) | (.77 | ) | (.64 | ) | (.49 | ) | ||||||||||
Net realized gains | (8.74 | ) | — | (2.41 | ) | (7.57 | ) | (11.63 | ) | |||||||||||
Total distributions | (9.44 | ) | (1.34 | ) | (3.18 | ) | (8.21 | ) | (12.12 | ) | ||||||||||
Net asset value, end of period | $ | 71.66 | $ | 83.11 | $ | 68.31 | $ | 69.18 | $ | 61.70 | ||||||||||
| ||||||||||||||||||||
Total Returnb | (1.86 | %) | 23.75 | % | 4.30 | % | 26.70 | % | (12.97 | %) | ||||||||||
Ratios/Supplemental Data | ||||||||||||||||||||
Net assets, end of period (in thousands) | $ | 165,068 | $ | 187,373 | $ | 172,440 | $ | 195,207 | $ | 176,113 | ||||||||||
Ratios to average net assets: | ||||||||||||||||||||
Net investment income (loss) | 1.36 | % | 0.76 | % | 2.05 | % | 1.01 | % | 0.68 | % | ||||||||||
Total expensesc | 1.13 | % | 1.14 | % | 1.22 | % | 1.19 | % | 1.19 | % | ||||||||||
Net expensesd,e | 0.89 | % | 0.90 | % | 0.90 | % | 0.91 | % | 0.91 | % | ||||||||||
Portfolio turnover rate | 40 | % | 34 | % | 38 | % | 41 | % | 65 | % | ||||||||||
a | Net investment income (loss) per share was computed using average shares outstanding throughout the period. |
b | Total return does not take into account any of the expenses associated with an investment in variable insurance products. If total return had taken into account these expenses, performance would have been lower. Shares of a series of Guggenheim Variable Funds Trust are available only through the purchase of such products. |
c | Does not include expenses of the underlying funds in which the Fund invests. |
d | Net expense information reflects the expense ratios after expense waivers and reimbursements, as applicable. |
e | Net expenses may include expenses that are excluded from the expense limitation agreement. Excluding these expenses, the net expense ratios for the years presented would be: |
12/31/22 | 12/31/21 | 12/31/20 | 12/31/19 | 12/31/18 | |
0.89% | 0.90% | 0.90% | 0.91% | 0.91% |
f | The amount shown for a share outstanding throughout the period does not agree with the aggregate net loss on investments for the period because of the sales and repurchases of fund shares in relation to fluctuating market value of the investments of the Fund. |
134 | THE GUGGENHEIM FUNDS ANNUAL REPORT | SEE NOTES TO FINANCIAL STATEMENTS. |
MANAGERS’ COMMENTARY (Unaudited) | December 31, 2022 |
To Our Shareholders
The Series X (StylePlusTM—Small Growth Series, or the “Fund”) is managed by a team of seasoned professionals, including Farhan Sharaff, Senior Managing Director and Assistant Chief Investment Officer, Equities, and Portfolio Manager; Qi Yan, Managing Director and Portfolio Manager; and Adam J. Bloch, Managing Director and Portfolio Manager. In the subsequent paragraphs, the investment team discusses the Fund’s performance for the 12-month period ended December 31, 2022 (the “Reporting Period”).
For the Reporting Period, the Fund provided a total return of -26.61%, underperforming the Russell 2000 Growth Index (“Index”), the Fund’s benchmark, which returned -26.36% for the same period.
What factors contributed or detracted from the Fund’s performance during the Reporting Period?
Over the Reporting Period, 15%-25% of the total equity position was allocated to actively managed equity and 75%-85% to passive equity. Remaining Fund assets were invested in the Guggenheim Strategy Funds, short-term fixed-income investment companies advised by Guggenheim Investments, and the Guggenheim Ultra Short Duration Fund, whose objective is to seek a high level of income consistent with the preservation of capital.
For the Reporting Period, the Fund underperformed the Russell 2000 Growth Index by 0.3% net of fees. During this Reporting Period, active equity and active fixed income contributed +2.3% and -0.7% to the Fund’s relative return differential, respectively. The remainder resulted from equity index swap cost, implementation shortfall and Fund’s expenses.
How did the Fund use derivatives during the Reporting Period?
The passive equity component, which accounted for 75%-85% of the Fund’s exposure to the broad equity market, consisted of equity index swaps and equity index futures. On average, the equity index futures accounted for 0%-5% of the overall exposure, with the remainder from equity index swaps.
Performance displayed represents past performance which is no guarantee of future results.
The opinions and forecast expressed may not actually come to pass. This information is subject to change at any time, based on market and other conditions, and should not be construed as a recommendation of any specific security or strategy.
SEE NOTES TO FINANCIAL STATEMENTS. | THE GUGGENHEIM FUNDS ANNUAL REPORT | 135 |
PERFORMANCE REPORT AND FUND PROFILE (Unaudited) | December 31, 2022 |
SERIES X (STYLEPLUS—SMALL GROWTH SERIES)
OBJECTIVE: Seeks long-term growth of capital.
Holdings Diversification (Market Exposure as % of Net Assets)
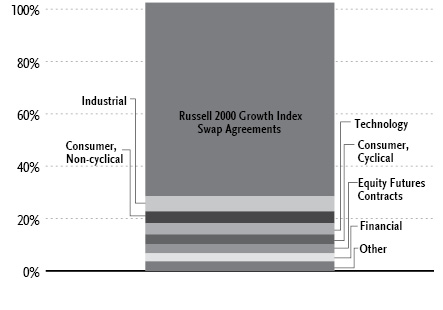
“Holdings Diversification (Market Exposure as % of Net Assets)” excludes any temporary cash investments, investments in Guggenheim Strategy Funds Trust mutual funds, or investments in Guggenheim Ultra Short Duration Fund.
Inception Date: October 15, 1997 |
Ten Largest Holdings (% of Total Net Assets) | |
Guggenheim Strategy Fund III | 30.8% |
Guggenheim Variable Insurance Strategy Fund III | 28.1% |
Guggenheim Strategy Fund II | 10.6% |
Guggenheim Ultra Short Duration Fund — Institutional Class | 1.2% |
UFP Industries, Inc. | 0.4% |
Mueller Industries, Inc. | 0.4% |
Albany International Corp. — Class A | 0.3% |
AMN Healthcare Services, Inc. | 0.3% |
Diodes, Inc. | 0.3% |
Rambus, Inc. | 0.3% |
Top Ten Total | 72.7% |
“Ten Largest Holdings” excludes any temporary cash or derivative investments. | |
136 | THE GUGGENHEIM FUNDS ANNUAL REPORT |
PERFORMANCE REPORT AND FUND PROFILE (Unaudited)(concluded) | December 31, 2022 |
Cumulative Fund Performance*,†
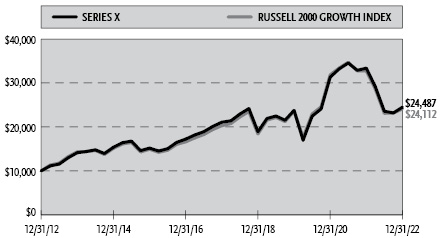
Average Annual Returns*,†
Periods Ended December 31, 2022
| 1 Year | 5 Year | 10 Year |
Series X (StylePlus—Small Growth Series) | (26.61%) | 3.05% | 9.37% |
Russell 2000 Growth Index | (26.36%) | 3.51% | 9.20% |
* | The performance data above represents past performance that is not predictive of future results. The investment return and principal value of an investment in the Fund will fluctuate so that an investor’s shares, when redeemed, may be worth more or less than their original cost. Returns are historical and include changes in principal and reinvested dividends and capital gains and do not reflect the effect of taxes. The Russell 2000 Growth Index is an unmanaged index and, unlike the Fund, has no management fees or operating expenses to reduce its reported return. |
† | Performance figures do not reflect fees and expenses associated with an investment in variable insurance products. If returns had taken into account these fees and expenses, performance would have been lower. Shares of a series of Guggenheim Variable Funds Trust are available only through the purchase of such products. |
THE GUGGENHEIM FUNDS ANNUAL REPORT | 137 |
SCHEDULE OF INVESTMENTS | December 31, 2022 |
SERIES X (STYLEPLUS—SMALL GROWTH SERIES) |
| Shares | Value | ||||||
COMMON STOCKS† - 25.0% | ||||||||
Industrial - 5.8% | ||||||||
UFP Industries, Inc. | 1,332 | $ | 105,484 | |||||
Mueller Industries, Inc. | 1,457 | 85,963 | ||||||
Albany International Corp. — Class A | 816 | 80,449 | ||||||
Advanced Energy Industries, Inc. | 814 | 69,825 | ||||||
Standex International Corp. | 670 | 68,615 | ||||||
Park Aerospace Corp. | 4,570 | 61,284 | ||||||
Hillenbrand, Inc. | 1,372 | 58,543 | ||||||
Fabrinet* | 454 | 58,212 | ||||||
Dorian LPG Ltd. | 3,034 | 57,494 | ||||||
Comfort Systems USA, Inc. | 499 | 57,425 | ||||||
Applied Industrial Technologies, Inc. | 437 | 55,075 | ||||||
Encore Wire Corp. | 377 | 51,860 | ||||||
PGT Innovations, Inc.* | 2,851 | 51,204 | ||||||
Sturm Ruger & Company, Inc. | 1,007 | 50,974 | ||||||
Eagle Materials, Inc. | 375 | 49,819 | ||||||
OSI Systems, Inc.* | 568 | 45,167 | ||||||
Matson, Inc. | 701 | 43,820 | ||||||
Simpson Manufacturing Company, Inc. | 458 | 40,606 | ||||||
Louisiana-Pacific Corp. | 616 | 36,467 | ||||||
Lindsay Corp. | 217 | 35,339 | ||||||
Acuity Brands, Inc. | 213 | 35,275 | ||||||
Boise Cascade Co. | 496 | 34,060 | ||||||
Insteel Industries, Inc. | 1,204 | 33,134 | ||||||
Myers Industries, Inc. | 1,464 | 32,545 | ||||||
CTS Corp. | 683 | 26,924 | ||||||
Griffon Corp. | 529 | �� | 18,933 | |||||
EnPro Industries, Inc. | 173 | 18,803 | ||||||
Arcosa, Inc. | 331 | 17,986 | ||||||
Plexus Corp.* | 174 | 17,910 | ||||||
Total Industrial | 1,399,195 | |||||||
Consumer, Non-cyclical - 4.5% | ||||||||
AMN Healthcare Services, Inc.* | 775 | 79,685 | ||||||
Prestige Consumer Healthcare, Inc.* | 1,189 | 74,431 | ||||||
Cytokinetics, Inc.* | 1,479 | 67,768 | ||||||
EVERTEC, Inc. | 1,974 | 63,918 | ||||||
Ironwood Pharmaceuticals, Inc. — Class A* | 4,667 | 57,824 | ||||||
Alarm.com Holdings, Inc.* | 1,136 | 56,209 | ||||||
Supernus Pharmaceuticals, Inc.* | 1,418 | 50,580 | ||||||
Xencor, Inc.* | 1,705 | 44,398 | ||||||
Innoviva, Inc.* | 3,298 | 43,698 | ||||||
Catalyst Pharmaceuticals, Inc.* | 2,271 | 42,241 | ||||||
USANA Health Sciences, Inc.* | 752 | 40,006 | ||||||
Vir Biotechnology, Inc.* | 1,558 | 39,433 | ||||||
Collegium Pharmaceutical, Inc.* | 1,473 | 34,174 | ||||||
Pacira BioSciences, Inc.* | 885 | 34,170 | ||||||
Varex Imaging Corp.* | 1,590 | 32,277 | ||||||
Medifast, Inc. | 273 | 31,491 | ||||||
Dynavax Technologies Corp.* | 2,775 | 29,526 | ||||||
Corcept Therapeutics, Inc.* | 1,398 | 28,393 | ||||||
Fulgent Genetics, Inc.* | 941 | 28,023 | ||||||
Amphastar Pharmaceuticals, Inc.* | 925 | 25,919 | ||||||
Vanda Pharmaceuticals, Inc.* | 3,326 | 24,579 | ||||||
Eagle Pharmaceuticals, Inc.* | 822 | 24,027 | ||||||
Arcus Biosciences, Inc.* | 1,148 | 23,741 | ||||||
REGENXBIO, Inc.* | 939 | 21,297 | ||||||
Hostess Brands, Inc.* | 916 | 20,555 | ||||||
Ensign Group, Inc. | 193 | 18,260 | ||||||
Exelixis, Inc.* | 1,129 | 18,109 | ||||||
Merit Medical Systems, Inc.* | 255 | 18,008 | ||||||
Cal-Maine Foods, Inc. | 316 | 17,206 | ||||||
Total Consumer, Non-cyclical | 1,089,946 | |||||||
Technology - 4.3% | ||||||||
Diodes, Inc.* | 1,046 | 79,642 | ||||||
Rambus, Inc.* | 2,141 | 76,691 | ||||||
Axcelis Technologies, Inc.* | 803 | 63,726 | ||||||
Kulicke & Soffa Industries, Inc. | 1,403 | 62,097 | ||||||
Progress Software Corp. | 1,212 | 61,145 | ||||||
Onto Innovation, Inc.* | 878 | 59,783 | ||||||
SPS Commerce, Inc.* | 459 | 58,949 | ||||||
Veeco Instruments, Inc.* | 2,518 | 46,784 | ||||||
CSG Systems International, Inc. | 742 | 42,442 | ||||||
MaxLinear, Inc. — Class A* | 1,104 | 37,481 | ||||||
Synaptics, Inc.* | 392 | 37,303 | ||||||
Avid Technology, Inc.* | 1,355 | 36,030 | ||||||
Cohu, Inc.* | 1,110 | 35,576 | ||||||
Ultra Clean Holdings, Inc.* | 1,065 | 35,305 | ||||||
Cirrus Logic, Inc.* | 455 | 33,888 | ||||||
TTEC Holdings, Inc. | 759 | 33,495 | ||||||
Agilysys, Inc.* | 403 | 31,894 | ||||||
SMART Global Holdings, Inc.* | 1,876 | 27,915 | ||||||
Digital Turbine, Inc.* | 1,825 | 27,813 | ||||||
CEVA, Inc.* | 1,012 | 25,887 | ||||||
Veradigm, Inc.* | 1,304 | 23,003 | ||||||
ACI Worldwide, Inc.* | 904 | 20,792 | ||||||
Alpha & Omega Semiconductor Ltd.* | 690 | 19,713 | ||||||
Teradata Corp.* | 564 | 18,984 | ||||||
CommVault Systems, Inc.* | 293 | 18,412 | ||||||
NetScout Systems, Inc.* | 550 | 17,880 | ||||||
Total Technology | 1,032,630 | |||||||
Consumer, Cyclical - 3.7% | ||||||||
Wyndham Hotels & Resorts, Inc. | 895 | 63,823 | ||||||
Methode Electronics, Inc. | 1,101 | 48,851 | ||||||
GMS, Inc.* | 975 | 48,555 | ||||||
Asbury Automotive Group, Inc.* | 251 | 44,992 | ||||||
Oxford Industries, Inc. | 481 | 44,820 | ||||||
Installed Building Products, Inc. | 523 | 44,769 | ||||||
Academy Sports & Outdoors, Inc. | 850 | 44,659 | ||||||
Buckle, Inc. | 895 | 40,588 | ||||||
Patrick Industries, Inc. | 667 | 40,420 | ||||||
Sally Beauty Holdings, Inc.* | 3,224 | 40,365 | ||||||
Cavco Industries, Inc.* | 175 | 39,594 | ||||||
LCI Industries | 398 | 36,795 | ||||||
Winnebago Industries, Inc. | 683 | 35,994 | ||||||
Jack in the Box, Inc. | 481 | 32,819 | ||||||
Dine Brands Global, Inc. | 469 | 30,297 | ||||||
Children’s Place, Inc.* | 830 | 30,229 | ||||||
Movado Group, Inc. | 913 | 29,444 | ||||||
138 | THE GUGGENHEIM FUNDS ANNUAL REPORT | SEE NOTES TO FINANCIAL STATEMENTS. |
SCHEDULE OF INVESTMENTS (continued) | December 31, 2022 |
SERIES X (STYLEPLUS—SMALL GROWTH SERIES) |
| Shares | Value | ||||||
Shoe Carnival, Inc. | 1,199 | $ | 28,668 | |||||
Six Flags Entertainment Corp.* | 1,194 | 27,760 | ||||||
Golden Entertainment, Inc.* | 689 | 25,769 | ||||||
Boyd Gaming Corp. | 446 | 24,320 | ||||||
Steven Madden Ltd. | 737 | 23,554 | ||||||
Sleep Number Corp.* | 808 | 20,992 | ||||||
Vista Outdoor, Inc.* | 801 | 19,520 | ||||||
UniFirst Corp. | 100 | 19,299 | ||||||
AutoNation, Inc.* | 174 | 18,670 | ||||||
Total Consumer, Cyclical | 905,566 | |||||||
Financial - 3.1% | ||||||||
Preferred Bank/Los Angeles CA | 1,011 | 75,441 | ||||||
National Bank Holdings Corp. — Class A | 1,641 | 69,037 | ||||||
Hanmi Financial Corp. | 2,444 | 60,489 | ||||||
Central Pacific Financial Corp. | 2,975 | 60,333 | ||||||
First BanCorp | 4,622 | 58,792 | ||||||
Southside Bancshares, Inc. | 1,591 | 57,260 | ||||||
Brightsphere Investment Group, Inc. | 2,690 | 55,360 | ||||||
FB Financial Corp. | 1,461 | 52,800 | ||||||
Hilltop Holdings, Inc. | 1,320 | 39,613 | ||||||
Ameris Bancorp | 829 | 39,079 | ||||||
Virtus Investment Partners, Inc. | 160 | 30,631 | ||||||
CVB Financial Corp. | 953 | 24,540 | ||||||
Dime Community Bancshares, Inc. | 730 | 23,236 | ||||||
Enova International, Inc.* | 514 | 19,722 | ||||||
First Hawaiian, Inc. | 739 | 19,244 | ||||||
NBT Bancorp, Inc. | 438 | 19,018 | ||||||
Agree Realty Corp. REIT | 259 | 18,371 | ||||||
Mr Cooper Group, Inc.* | 448 | 17,978 | ||||||
Triumph Financial, Inc.* | 345 | 16,860 | ||||||
Total Financial | 757,804 | |||||||
Communications - 1.2% | ||||||||
Extreme Networks, Inc.* | 3,016 | 55,223 | ||||||
HealthStream, Inc.* | 1,728 | 42,923 | ||||||
InterDigital, Inc. | 800 | 39,584 | ||||||
Viavi Solutions, Inc.* | 3,481 | 36,585 | ||||||
A10 Networks, Inc. | 2,090 | 34,757 | ||||||
Harmonic, Inc.* | 2,652 | 34,741 | ||||||
Perficient, Inc.* | 373 | 26,047 | ||||||
ADTRAN Holdings, Inc. | 1,047 | 19,673 | ||||||
Total Communications | 289,533 | |||||||
Energy - 1.2% | ||||||||
SM Energy Co. | 1,960 | 68,267 | ||||||
Antero Midstream Corp. | 5,757 | 62,118 | ||||||
DT Midstream, Inc. | 1,087 | 60,068 | ||||||
Civitas Resources, Inc. | 663 | 38,407 | ||||||
Helmerich & Payne, Inc. | 389 | 19,283 | ||||||
Patterson-UTI Energy, Inc. | 1,108 | 18,659 | ||||||
Laredo Petroleum, Inc.* | 357 | 18,357 | ||||||
Total Energy | 285,159 | |||||||
Basic Materials - 1.0% | ||||||||
HB Fuller Co. | 825 | 59,086 | ||||||
Livent Corp.* | 2,863 | 56,888 | ||||||
Balchem Corp. | 416 | 50,798 | ||||||
Ingevity Corp.* | 502 | 35,361 | ||||||
AdvanSix, Inc. | 877 | 33,344 | ||||||
Innospec, Inc. | 179 | 18,412 | ||||||
Total Basic Materials | 253,889 | |||||||
Utilities - 0.2% | ||||||||
South Jersey Industries, Inc. | 1,036 | 36,809 | ||||||
SJW Group | 237 | 19,242 | ||||||
Total Utilities | 56,051 | |||||||
Health Care - 0.0% | ||||||||
Ligand Pharmaceuticals Inc*,†† | 89 | — | ||||||
Ligand Pharmaceuticals Inc*,†† | 89 | — | ||||||
Total Health Care | — | |||||||
Total Common Stocks | ||||||||
(Cost $6,249,452) | 6,069,773 | |||||||
MUTUAL FUNDS† - 70.7% | ||||||||
Guggenheim Strategy Fund III1 | 310,680 | 7,474,966 | ||||||
Guggenheim Variable Insurance Strategy Fund III1 | 283,678 | 6,828,127 | ||||||
Guggenheim Strategy Fund II1 | 107,648 | 2,587,860 | ||||||
Guggenheim Ultra Short Duration Fund — Institutional Class1 | 29,925 | 288,481 | ||||||
Total Mutual Funds | ||||||||
(Cost $17,688,941) | 17,179,434 | |||||||
MONEY MARKET FUND† - 2.4% | ||||||||
Dreyfus Treasury Securities Cash Management Fund — Institutional Shares, 3.90%2 | 579,212 | 579,212 | ||||||
Total Money Market Fund | ||||||||
(Cost $579,212) | 579,212 | |||||||
Total Investments - 98.1% | ||||||||
(Cost $24,517,605) | $ | 23,828,419 | ||||||
Other Assets & Liabilities, net - 1.9% | 464,312 | |||||||
Total Net Assets - 100.0% | $ | 24,292,731 | ||||||
SEE NOTES TO FINANCIAL STATEMENTS. | THE GUGGENHEIM FUNDS ANNUAL REPORT | 139 |
SCHEDULE OF INVESTMENTS (continued) | December 31, 2022 |
SERIES X (STYLEPLUS—SMALL GROWTH SERIES) |
Futures Contracts | ||||||||||||||||
Description | Number of | Expiration Date | Notional | Value and | ||||||||||||
Equity Futures Contracts Purchased† | ||||||||||||||||
Russell 2000 Index Mini Futures Contracts | 4 | Mar 2023 | $ | 354,260 | $ | (12,605 | ) | |||||||||
S&P MidCap 400 Index Mini Futures Contracts | 2 | Mar 2023 | 488,660 | (14,358 | ) | |||||||||||
| $ | 842,920 | $ | (26,963 | ) | ||||||||||||
Total Return Swap Agreements | |||||||||||||||||||||||
Counterparty | Index | Type | Financing | Payment | Maturity Date | Units | Notional | Value and | |||||||||||||||
OTC Equity Index Swap Agreements†† | |||||||||||||||||||||||
Wells Fargo Bank, N.A. | Russell 2000 Growth Index | Pay | 4.31% (Federal Funds Rate - 0.02%) | At Maturity | 06/28/23 | 2,276 | $ | 17,965,970 | $ | 455,885 | |||||||||||||
* | Non-income producing security. |
** | Includes cumulative appreciation (depreciation). Variation margin is reported within the Statement of Assets and Liabilities. |
† | Value determined based on Level 1 inputs, unless otherwise noted — See Note 4. |
†† | Value determined based on Level 2 inputs — See Note 4. |
1 | Affiliated issuer. |
2 | Rate indicated is the 7-day yield as of December 31, 2022. |
REIT — Real Estate Investment Trust | |
See Sector Classification in Other Information section. |
The following table summarizes the inputs used to value the Fund’s investments at December 31, 2022 (See Note 4 in the Notes to Financial Statements):
Investments in Securities (Assets) | Level 1 | Level 2 | Level 3 | Total | ||||||||||||
Common Stocks | $ | 6,069,773 | $ | — | * | $ | — | $ | 6,069,773 | |||||||
Mutual Funds | 17,179,434 | — | — | 17,179,434 | ||||||||||||
Money Market Fund | 579,212 | — | — | 579,212 | ||||||||||||
Equity Index Swap Agreements** | — | 455,885 | — | 455,885 | ||||||||||||
Total Assets | $ | 23,828,419 | $ | 455,885 | $ | — | $ | 24,284,304 | ||||||||
Investments in Securities (Liabilities) | Level 1 | Level 2 | Level 3 | Total | ||||||||||||
Equity Futures Contracts** | $ | 26,963 | $ | — | $ | — | $ | 26,963 | ||||||||
* | Security has a market value of $0. |
** | This derivative is reported as unrealized appreciation/depreciation at period end. |
140 | THE GUGGENHEIM FUNDS ANNUAL REPORT | SEE NOTES TO FINANCIAL STATEMENTS. |
SCHEDULE OF INVESTMENTS (concluded) | December 31, 2022 |
SERIES X (STYLEPLUS—SMALL GROWTH SERIES) |
Affiliated Transactions
Investments representing 5% or more of the outstanding voting shares of a company, or control of or by, or common control under Guggenheim Investments (“GI”), result in that company being considered an affiliated issuer, as defined in the 1940 Act.
The Fund may invest in certain of the underlying series of Guggenheim Strategy Funds Trust, including Guggenheim Strategy Fund II, Guggenheim Strategy Fund III, and Guggenheim Variable Insurance Strategy Fund III, (collectively, the “Short Term Investment Vehicles”), each of which are open-end management investment companies managed by GI. The Short Term Investment Vehicles, which launched on March 11, 2014, are offered as short term investment options only to mutual funds, trusts, and other accounts managed by GI and/or its affiliates, and are not available to the public. The Short Term Investment Vehicles pay no investment management fees. The Short Term Investment Vehicles’ annual report on Form N-CSR dated September 30, 2022, is available publicly or upon request. This information is available from the EDGAR database on the SEC’s website at https://www.sec.gov/Archives/edgar/data/1601445/000182126822000340/gug84768.htm. The Fund may invest in certain of the underlying series of Guggenheim Funds Trust, which are open-end management investment companies managed by GI, are available to the public and whose most recent annual report on Form N-CSR is available publicly or upon request.
Transactions during the year ended December 31, 2022, in which the company is an affiliated issuer, were as follows:
Security Name | Value | Additions | Reductions | Realized | Change in | Value | Shares | �� | Investment | |||||||||||||||||||||||
Mutual Funds | ||||||||||||||||||||||||||||||||
Guggenheim Strategy Fund II | $ | 6,675,169 | $ | 7,535,898 | $ | (11,487,950 | ) | $ | (138,996 | ) | $ | 3,739 | $ | 2,587,860 | 107,648 | $ | 107,792 | |||||||||||||||
Guggenheim Strategy Fund III | 9,233,350 | 739,610 | (2,146,772 | ) | (65,944 | ) | (285,278 | ) | 7,474,966 | 310,680 | 238,379 | |||||||||||||||||||||
Guggenheim Ultra Short Duration Fund — Institutional Class | 3,333,685 | 7,697 | (3,041,984 | ) | (19,829 | ) | 8,912 | 288,481 | 29,925 | 7,789 | ||||||||||||||||||||||
Guggenheim Variable Insurance Strategy Fund III | 8,963,296 | 948,438 | (2,787,978 | ) | (61,913 | ) | (233,716 | ) | 6,828,127 | 283,678 | 197,355 | |||||||||||||||||||||
| $ | 28,205,500 | $ | 9,231,643 | $ | (19,464,684 | ) | $ | (286,682 | ) | $ | (506,343 | ) | $ | 17,179,434 | $ | 551,315 | ||||||||||||||||
SEE NOTES TO FINANCIAL STATEMENTS. | THE GUGGENHEIM FUNDS ANNUAL REPORT | 141 |
SERIES X (STYLEPLUS—SMALL GROWTH SERIES) |
STATEMENT OF ASSETS AND LIABILITIES |
December 31, 2022 |
Assets: | ||||
Investments in unaffiliated issuers, at value (cost $6,828,664) | $ | 6,648,985 | ||
Investments in affiliated issuers, at value (cost $17,688,941) | 17,179,434 | |||
Cash | 134,271 | |||
Segregated cash with broker | 51,000 | |||
Unrealized appreciation on OTC swap agreements | 455,885 | |||
Prepaid expenses | 2,339 | |||
Receivables: | ||||
Dividends | 79,169 | |||
Fund shares sold | 10,024 | |||
Interest | 2,591 | |||
Total assets | 24,563,698 | |||
Liabilities: | ||||
Segregated cash due to broker | 120,000 | |||
Payable for: | ||||
Securities purchased | 75,458 | |||
Professional fees | 22,749 | |||
Fund shares redeemed | 17,411 | |||
Management fees | 5,573 | |||
Distribution and service fees | 5,140 | |||
Swap settlement | 4,193 | |||
Variation margin on futures contracts | 3,700 | |||
Transfer agent/maintenance fees | 2,075 | |||
Fund accounting/administration fees | 1,471 | |||
Trustees’ fees* | 678 | |||
Miscellaneous | 12,519 | |||
Total liabilities | 270,967 | |||
Net assets | $ | 24,292,731 | ||
Net assets consist of: | ||||
Paid in capital | $ | 33,164,880 | ||
Total distributable earnings (loss) | (8,872,149 | ) | ||
Net assets | $ | 24,292,731 | ||
Capital shares outstanding | 1,085,306 | |||
Net asset value per share | $ | 22.38 | ||
STATEMENT OF OPERATIONS |
Year Ended December 31, 2022 |
Investment Income: | ||||
Dividends from securities of unaffiliated issuers (net of foreign withholding tax of $279) | $ | 94,057 | ||
Dividends from securities of affiliated issuers | 551,315 | |||
Interest | 2,666 | |||
Total investment income | 648,038 | |||
Expenses: | ||||
Management fees | 208,377 | |||
Distribution and service fees | 69,293 | |||
Transfer agent/maintenance fees | 25,209 | |||
Professional fees | 38,332 | |||
Fund accounting/administration fees | 26,717 | |||
Trustees’ fees* | 10,051 | |||
Custodian fees | 9,457 | |||
Line of credit fees | 813 | |||
Miscellaneous | 8,858 | |||
Total expenses | 397,107 | |||
Less: | ||||
Expenses reimbursed by Adviser: | (778 | ) | ||
Expenses waived by Adviser | (105,856 | ) | ||
Earnings credits applied | (841 | ) | ||
Total waived/reimbursed expenses | (107,475 | ) | ||
Net expenses | 289,632 | |||
Net investment income | 358,406 | |||
Net Realized and Unrealized Gain (Loss): | ||||
Net realized gain (loss) on: | ||||
Investments in unaffiliated issuers | (153,306 | ) | ||
Investments in affiliated issuers | (286,682 | ) | ||
Swap agreements | (8,395,894 | ) | ||
Futures contracts | (88,803 | ) | ||
Net realized loss | (8,924,685 | ) | ||
Net change in unrealized appreciation (depreciation) on: | ||||
Investments in unaffiliated issuers | (1,121,138 | ) | ||
Investments in affiliated issuers | (506,343 | ) | ||
Swap agreements | 555,481 | |||
Futures contracts | (52,827 | ) | ||
Net change in unrealized appreciation (depreciation) | (1,124,827 | ) | ||
Net realized and unrealized loss | (10,049,512 | ) | ||
Net decrease in net assets resulting from operations | $ | (9,691,106 | ) | |
* | Relates to Trustees not deemed “interested persons” within the meaning of Section 2(a)(19) of the 1940 Act. |
142 | THE GUGGENHEIM FUNDS ANNUAL REPORT | SEE NOTES TO FINANCIAL STATEMENTS. |
SERIES X (STYLEPLUS—SMALL GROWTH SERIES) |
STATEMENTS OF CHANGES IN NET ASSETS |
| Year Ended | Year Ended | ||||||
Increase (Decrease) in Net Assets from Operations: | ||||||||
Net investment income | $ | 358,406 | $ | 84,462 | ||||
Net realized gain (loss) on investments | (8,924,685 | ) | 9,676,123 | |||||
Net change in unrealized appreciation (depreciation) on investments | (1,124,827 | ) | (7,232,395 | ) | ||||
Net increase (decrease) in net assets resulting from operations | (9,691,106 | ) | 2,528,190 | |||||
Distributions to shareholders | (8,952,911 | ) | (1,474,151 | ) | ||||
Capital share transactions: | ||||||||
Proceeds from sale of shares | 613,968 | 971,520 | ||||||
Distributions reinvested | 8,952,911 | 1,474,151 | ||||||
Cost of shares redeemed | (3,640,657 | ) | (4,478,015 | ) | ||||
Net increase (decrease) from capital share transactions | 5,926,222 | (2,032,344 | ) | |||||
Net decrease in net assets | (12,717,795 | ) | (978,305 | ) | ||||
Net assets: | ||||||||
Beginning of year | 37,010,526 | 37,988,831 | ||||||
End of year | $ | 24,292,731 | $ | 37,010,526 | ||||
Capital share activity: | ||||||||
Shares sold | 21,194 | 20,250 | ||||||
Shares issued from reinvestment of distributions | 382,440 | 32,292 | ||||||
Shares redeemed | (122,777 | ) | (93,977 | ) | ||||
Net increase (decrease) in shares | 280,857 | (41,435 | ) | |||||
SEE NOTES TO FINANCIAL STATEMENTS. | THE GUGGENHEIM FUNDS ANNUAL REPORT | 143 |
SERIES X (STYLEPLUS—SMALL GROWTH SERIES) |
FINANCIAL HIGHLIGHTS |
This table is presented to show selected data for a share outstanding throughout each period and to assist shareholders in evaluating a Fund’s performance for the periods presented.
| Year Ended | Year Ended | Year Ended | Year Ended | Year Ended | |||||||||||||||
Per Share Data | ||||||||||||||||||||
Net asset value, beginning of period | $ | 46.01 | $ | 44.91 | $ | 34.53 | $ | 30.87 | $ | 40.19 | ||||||||||
Income (loss) from investment operations: | ||||||||||||||||||||
Net investment income (loss)a | .38 | .10 | .17 | .42 | .56 | |||||||||||||||
Net gain (loss) on investments (realized and unrealized) | (12.10 | ) | 2.82 | 10.65 | 7.28 | (3.33 | ) | |||||||||||||
Total from investment operations | (11.72 | ) | 2.92 | 10.82 | 7.70 | (2.77 | ) | |||||||||||||
Less distributions from: | ||||||||||||||||||||
Net investment income | (.11 | ) | (.19 | ) | (.44 | ) | (.22 | ) | (.43 | ) | ||||||||||
Net realized gains | (11.80 | ) | (1.63 | ) | — | (3.82 | ) | (6.12 | ) | |||||||||||
Total distributions | (11.91 | ) | (1.82 | ) | (.44 | ) | (4.04 | ) | (6.55 | ) | ||||||||||
Net asset value, end of period | $ | 22.38 | $ | 46.01 | $ | 44.91 | $ | 34.53 | $ | 30.87 | ||||||||||
| ||||||||||||||||||||
Total Returnb | (26.61 | %) | 6.54 | % | 31.82 | % | 25.68 | % | (10.30 | %) | ||||||||||
Ratios/Supplemental Data | ||||||||||||||||||||
Net assets, end of period (in thousands) | $ | 24,293 | $ | 37,011 | $ | 37,989 | $ | 33,036 | $ | 28,644 | ||||||||||
Ratios to average net assets: | ||||||||||||||||||||
Net investment income (loss) | 1.29 | % | 0.22 | % | 0.49 | % | 1.24 | % | 1.42 | % | ||||||||||
Total expensesc | 1.43 | % | 1.39 | % | 1.50 | % | 1.62 | % | 1.47 | % | ||||||||||
Net expensesd,e,f | 1.05 | % | 1.00 | % | 1.02 | % | 1.11 | % | 1.12 | % | ||||||||||
Portfolio turnover rate | 73 | % | 64 | % | 86 | % | 59 | % | 65 | % | ||||||||||
a | Net investment income (loss) per share was computed using average shares outstanding throughout the period. |
b | Total return does not take into account any of the expenses associated with an investment in variable insurance products. If total return had taken into account these expenses, performance would have been lower. Shares of a series of Guggenheim Variable Funds Trust are available only through the purchase of such products. |
c | Does not include expenses of the underlying funds in which the Fund invests. |
d | Net expense information reflects the expense ratios after expense waivers and reimbursements, as applicable. |
e | The portion of the ratios of net expenses to average net assets attributable to recoupments of prior fee reductions or expense reimbursements for the years presented was as follows: |
12/31/22 | 12/31/21 | 12/31/20 | 12/31/19 | 12/31/18 | |
— | — | — | — | 0.00%* |
* | Less than 0.01%. |
f | Net expenses may include expenses that are excluded from the expense limitation agreement. Excluding these expenses, the net expense ratios for the years presented would be: |
12/31/22 | 12/31/21 | 12/31/20 | 12/31/19 | 12/31/18 | |
1.04% | 1.00% | 1.01% | 1.03% | 1.06% |
144 | THE GUGGENHEIM FUNDS ANNUAL REPORT | SEE NOTES TO FINANCIAL STATEMENTS. |
MANAGERS’ COMMENTARY (Unaudited) | December 31, 2022 |
To Our Shareholders
The Series Y (StylePlusTM—Large Growth Series, or the “Fund”) is managed by a team of seasoned professionals, including Farhan Sharaff, Senior Managing Director and Assistant Chief Investment Officer, Equities; Qi Yan, Managing Director and Portfolio Manager; and Adam J. Bloch, Managing Director and Portfolio Manager. In the subsequent paragraphs, the investment team discusses the Fund’s performance for the 12-month period ended December 31, 2022 (the “Reporting Period”).
For the Reporting Period, the Fund provided a total return of -30.69%, underperforming the Russell 1000 Growth Index (“Index”), the Fund’s benchmark, which returned -29.14% for the same period.
What factors contributed or detracted from the Fund’s performance during the Reporting Period?
Over the Reporting Period, 15%-25% of the total equity position was allocated to actively managed equity and 75%-85% to passive equity. Remaining Fund assets were invested in the Guggenheim Strategy Funds, short-term fixed-income investment companies advised by Guggenheim Investments, and the Guggenheim Ultra Short Duration Fund, whose objective is to seek a high level of income consistent with the preservation of capital.
For the Reporting Period, the Fund underperformed the Russell 1000 Growth Index by 1.6% net of fees. During this Reporting Period, active equity and active fixed income contributed +1.2% and -0.8% to the Fund’s relative return differential, respectively. The remainder resulted from equity index swap cost, implementation shortfall and Fund’s expenses.
How did the Fund use derivatives during the Reporting Period?
The passive equity component, which accounted for 75%-85% of the Fund’s exposure to the broad equity market, consisted of equity index swaps and equity index futures. On average, the equity index futures accounted for 0%-5% of the overall exposure, with the remainder from equity index swaps.
Performance displayed represents past performance which is no guarantee of future results.
The opinions and forecast expressed may not actually come to pass. This information is subject to change at any time, based on market and other conditions, and should not be construed as a recommendation of any specific security or strategy.
THE GUGGENHEIM FUNDS ANNUAL REPORT | 145 |
PERFORMANCE REPORT AND FUND PROFILE (Unaudited) | December 31, 2022 |
SERIES Y (STYLEPLUS—LARGE GROWTH SERIES)
OBJECTIVE: Seeks long-term growth of capital.
Holdings Diversification (Market Exposure as % of Net Assets)
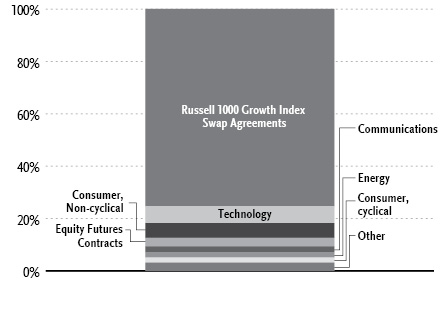
“Holdings Diversification (Market Exposure as % of Net Assets)” excludes any temporary cash investments, investments in Guggenheim Strategy Funds Trust mutual funds, or investments in Guggenheim Ultra Short Duration Fund.
Inception Date: May 3, 1999 |
Ten Largest Holdings | (% of Total Net Assets) |
Guggenheim Strategy Fund III | 27.7% |
Guggenheim Variable Insurance Strategy Fund III | 26.8% |
Guggenheim Strategy Fund II | 12.6% |
Guggenheim Ultra Short Duration Fund — Institutional Class | 10.1% |
Apple, Inc. | 2.3% |
Alphabet, Inc. — Class C | 1.4% |
Microsoft Corp. | 1.1% |
Visa, Inc. — Class A | 0.6% |
Exxon Mobil Corp. | 0.5% |
Pfizer, Inc. | 0.5% |
Top Ten Total | 83.6% |
“Ten Largest Holdings” excludes any temporary cash or derivative investments. | |
146 | THE GUGGENHEIM FUNDS ANNUAL REPORT |
PERFORMANCE REPORT AND FUND PROFILE (Unaudited)(concluded) | December 31, 2022 |
Cumulative Fund Performance*,†
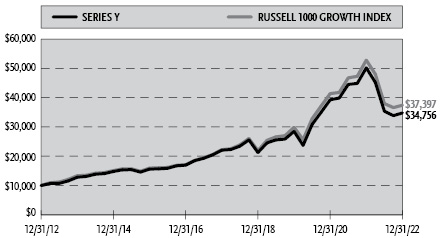
Average Annual Returns*,†
Periods Ended December 31, 2022
| 1 Year | 5 Year | 10 Year |
Series Y (StylePlus—Large Growth Series) | (30.69%) | 9.52% | 13.27% |
Russell 1000 Growth Index | (29.14%) | 10.96% | 14.10% |
* | The performance data above represents past performance that is not predictive of future results. The investment return and principal value of an investment in the Fund will fluctuate so that an investor’s shares, when redeemed, may be worth more or less than their original cost. Returns are historical and include changes in principal and reinvested dividends and capital gains and do not reflect the effect of taxes. The Russell 1000 Growth Index is an unmanaged index and, unlike the Fund, has no management fees or operating expenses to reduce its reported return. |
† | Performance figures do not reflect fees and expenses associated with an investment in variable insurance products. If returns had taken into account these fees and expenses, performance would have been lower. Shares of a series of Guggenheim Variable Funds Trust are available only through the purchase of such products. |
THE GUGGENHEIM FUNDS ANNUAL REPORT | 147 |
SCHEDULE OF INVESTMENTS | December 31, 2022 |
SERIES Y (STYLEPLUS—LARGE GROWTH SERIES) |
| Shares | Value | ||||||
COMMON STOCKS† - 21.3% | ||||||||
Technology - 6.4% | ||||||||
Apple, Inc. | 6,511 | $ | 845,974 | |||||
Microsoft Corp. | 1,689 | 405,056 | ||||||
QUALCOMM, Inc. | 1,273 | 139,953 | ||||||
Applied Materials, Inc. | 1,108 | 107,897 | ||||||
NVIDIA Corp. | 721 | 105,367 | ||||||
KLA Corp. | 226 | 85,209 | ||||||
NXP Semiconductor N.V. | 536 | 84,704 | ||||||
Microchip Technology, Inc. | 1,131 | 79,453 | ||||||
ON Semiconductor Corp.* | 1,224 | 76,341 | ||||||
Qorvo, Inc.* | 812 | 73,600 | ||||||
Skyworks Solutions, Inc. | 794 | 72,357 | ||||||
Seagate Technology Holdings plc | 1,356 | 71,339 | ||||||
Broadcom, Inc. | 124 | 69,332 | ||||||
NetApp, Inc. | 1,105 | 66,367 | ||||||
HP, Inc. | 2,247 | 60,377 | ||||||
Adobe, Inc.* | 74 | 24,903 | ||||||
Total Technology | 2,368,229 | |||||||
Consumer, Non-cyclical - 5.6% | ||||||||
Pfizer, Inc. | 3,548 | 181,799 | ||||||
AbbVie, Inc. | 1,065 | 172,115 | ||||||
UnitedHealth Group, Inc. | 299 | 158,524 | ||||||
Regeneron Pharmaceuticals, Inc.* | 166 | 119,767 | ||||||
Amgen, Inc. | 413 | 108,470 | ||||||
Merck & Company, Inc. | 960 | 106,512 | ||||||
Johnson & Johnson | 593 | 104,753 | ||||||
Vertex Pharmaceuticals, Inc.* | 344 | 99,340 | ||||||
Quest Diagnostics, Inc. | 592 | 92,612 | ||||||
Hershey Co. | 396 | 91,702 | ||||||
Hologic, Inc.* | 1,206 | 90,221 | ||||||
PepsiCo, Inc. | 475 | 85,813 | ||||||
Incyte Corp.* | 1,060 | 85,139 | ||||||
Procter & Gamble Co. | 536 | 81,236 | ||||||
Molina Healthcare, Inc.* | 231 | 76,281 | ||||||
United Rentals, Inc.* | 214 | 76,060 | ||||||
Coca-Cola Co. | 1,170 | 74,424 | ||||||
Eli Lilly & Co. | 186 | 68,046 | ||||||
Elevance Health, Inc. | 111 | 56,940 | ||||||
Gilead Sciences, Inc. | 584 | 50,137 | ||||||
Bristol-Myers Squibb Co. | 648 | 46,624 | ||||||
Thermo Fisher Scientific, Inc. | 55 | 30,288 | ||||||
Danaher Corp. | 90 | 23,888 | ||||||
Total Consumer, Non-cyclical | 2,080,691 | |||||||
Communications - 2.3% | ||||||||
Alphabet, Inc. — Class C* | 6,029 | 534,953 | ||||||
Amazon.com, Inc.* | 1,253 | 105,252 | ||||||
VeriSign, Inc.* | 442 | 90,805 | ||||||
Cisco Systems, Inc. | 1,686 | 80,321 | ||||||
Meta Platforms, Inc. — Class A* | 335 | 40,314 | ||||||
Total Communications | 851,645 | |||||||
Energy - 2.0% | ||||||||
Exxon Mobil Corp. | 1,767 | 194,900 | ||||||
Chevron Corp. | 817 | 146,643 | ||||||
ONEOK, Inc. | 1,363 | 89,549 | ||||||
Occidental Petroleum Corp. | 1,408 | 88,690 | ||||||
APA Corp. | 1,895 | 88,459 | ||||||
Targa Resources Corp. | 1,188 | 87,318 | ||||||
ConocoPhillips | 359 | 42,362 | ||||||
Total Energy | 737,921 | |||||||
Consumer, Cyclical - 1.9% | ||||||||
McDonald’s Corp. | 485 | 127,812 | ||||||
AutoZone, Inc.* | 40 | 98,647 | ||||||
Lowe’s Companies, Inc. | 493 | 98,225 | ||||||
Yum! Brands, Inc. | 724 | 92,730 | ||||||
Tesla, Inc.* | 704 | 86,719 | ||||||
Home Depot, Inc. | 230 | 72,648 | ||||||
NVR, Inc.* | 15 | 69,189 | ||||||
Bath & Body Works, Inc. | 1,430 | 60,260 | ||||||
Total Consumer, Cyclical | 706,230 | |||||||
Industrial - 1.6% | ||||||||
Nordson Corp. | 367 | 87,243 | ||||||
Pentair plc | 1,868 | 84,023 | ||||||
A O Smith Corp. | 1,439 | 82,368 | ||||||
Sealed Air Corp. | 1,627 | 81,155 | ||||||
Otis Worldwide Corp. | 954 | 74,708 | ||||||
Fortune Brands Innovations, Inc. | 1,163 | 66,419 | ||||||
Masco Corp. | 1,390 | 64,871 | ||||||
Caterpillar, Inc. | 105 | 25,154 | ||||||
Lockheed Martin Corp. | 50 | 24,324 | ||||||
Masterbrand, Inc.* | 1,163 | 8,781 | ||||||
Total Industrial | 599,046 | |||||||
Financial - 1.1% | ||||||||
Visa, Inc. — Class A | 1,114 | 231,444 | ||||||
Mastercard, Inc. — Class A | 263 | 91,453 | ||||||
Goldman Sachs Group, Inc. | 110 | 37,772 | ||||||
Prologis, Inc. REIT | 300 | 33,819 | ||||||
Progressive Corp. | 190 | 24,645 | ||||||
Total Financial | 419,133 | |||||||
Basic Materials - 0.4% | ||||||||
CF Industries Holdings, Inc. | 878 | 74,806 | ||||||
Nucor Corp. | 373 | 49,165 | ||||||
Total Basic Materials | 123,971 | |||||||
Total Common Stocks | ||||||||
(Cost $8,213,149) | 7,886,866 | |||||||
148 | THE GUGGENHEIM FUNDS ANNUAL REPORT | SEE NOTES TO FINANCIAL STATEMENTS. |
SCHEDULE OF INVESTMENTS (continued) | December 31, 2022 |
SERIES Y (STYLEPLUS—LARGE GROWTH SERIES) |
| Shares | Value | ||||||
MUTUAL FUNDS† - 77.2% | ||||||||
Guggenheim Strategy Fund III1 | 427,250 | $ | 10,279,629 | |||||
Guggenheim Variable Insurance Strategy Fund III1 | 412,593 | 9,931,120 | ||||||
Guggenheim Strategy Fund II1 | 193,491 | 4,651,513 | ||||||
Guggenheim Ultra Short Duration Fund — Institutional Class1 | 388,217 | 3,742,412 | ||||||
Total Mutual Funds | ||||||||
(Cost $29,486,971) | 28,604,674 | |||||||
Total Investments - 98.5% | ||||||||
(Cost $37,700,120) | $ | 36,491,540 | ||||||
Other Assets & Liabilities, net - 1.5% | 569,436 | |||||||
Total Net Assets - 100.0% | $ | 37,060,976 | ||||||
Futures Contracts | ||||||||||||||||
Description | Number of | Expiration Date | Notional | Value and | ||||||||||||
Equity Futures Contracts Purchased† | ||||||||||||||||
NASDAQ-100 Index Mini Futures Contracts | 2 | Mar 2023 | $ | 440,920 | $ | (32,336 | ) | |||||||||
S&P 500 Index Mini Futures Contracts | 4 | Mar 2023 | 772,300 | (32,655 | ) | |||||||||||
| $ | 1,213,220 | $ | (64,991 | ) | ||||||||||||
Total Return Swap Agreements | |||||||||||||||||||||||
Counterparty | Index | Type | Financing Rate | Payment | Maturity | Units | Notional | Value and | |||||||||||||||
OTC Equity Index Swap Agreements†† | |||||||||||||||||||||||
Wells Fargo Bank, N.A. | Russell 1000 Growth Index | Pay | 4.56% (Federal Funds Rate + 0.23%) | At Maturity | 06/28/23 | 12,763 | $ | 27,966,668 | $ | 532,587 | |||||||||||||
* | Non-income producing security. |
** | Includes cumulative appreciation (depreciation). Variation margin is reported within the Statement of Assets and Liabilities. |
† | Value determined based on Level 1 inputs — See Note 4. |
†† | Value determined based on Level 2 inputs — See Note 4. |
1 | Affiliated issuer. |
plc — Public Limited Company | |
REIT — Real Estate Investment Trust | |
See Sector Classification in Other Information section. |
SEE NOTES TO FINANCIAL STATEMENTS. | THE GUGGENHEIM FUNDS ANNUAL REPORT | 149 |
SCHEDULE OF INVESTMENTS (concluded) | December 31, 2022 |
SERIES Y (STYLEPLUS—LARGE GROWTH SERIES) |
The following table summarizes the inputs used to value the Fund’s investments at December 31, 2022 (See Note 4 in the Notes to Financial Statements):
Investments in Securities (Assets) | Level 1 | Level 2 | Level 3 | Total | ||||||||||||
Common Stocks | $ | 7,886,866 | $ | — | $ | — | $ | 7,886,866 | ||||||||
Mutual Funds | 28,604,674 | — | — | 28,604,674 | ||||||||||||
Equity Index Swap Agreements** | — | 532,587 | — | 532,587 | ||||||||||||
Total Assets | $ | 36,491,540 | $ | 532,587 | $ | — | $ | 37,024,127 | ||||||||
Investments in Securities (Liabilities) | Level 1 | Level 2 | Level 3 | Total | ||||||||||||
Equity Futures Contracts** | $ | 64,991 | $ | — | $ | — | $ | 64,991 | ||||||||
** | This derivative is reported as unrealized appreciation/depreciation at period end. |
Affiliated Transactions
Investments representing 5% or more of the outstanding voting shares of a company, or control of or by, or common control under Guggenheim Investments (“GI”), result in that company being considered an affiliated issuer, as defined in the 1940 Act.
The Fund may invest in certain of the underlying series of Guggenheim Strategy Funds Trust, including Guggenheim Strategy Fund II, Guggenheim Strategy Fund III, and Guggenheim Variable Insurance Strategy Fund III, (collectively, the “Short Term Investment Vehicles”), each of which are open-end management investment companies managed by GI. The Short Term Investment Vehicles, which launched on March 11, 2014, are offered as short term investment options only to mutual funds, trusts, and other accounts managed by GI and/or its affiliates, and are not available to the public. The Short Term Investment Vehicles pay no investment management fees. The Short Term Investment Vehicles’ annual report on Form N-CSR dated September 30, 2022, is available publicly or upon request. This information is available from the EDGAR database on the SEC’s website at https://www.sec.gov/Archives/edgar/data/1601445/000182126822000340/gug84768.htm. The Fund may invest in certain of the underlying series of Guggenheim Funds Trust, which are open-end management investment companies managed by GI, are available to the public and whose most recent annual report on Form N-CSR is available publicly or upon request.
Transactions during the year ended December 31, 2022, in which the company is an affiliated issuer, were as follows:
Security Name | Value | Additions | Reductions | Realized | Change in | Value | Shares | Investment | ||||||||||||||||||||||||
Mutual Funds | ||||||||||||||||||||||||||||||||
Guggenheim Strategy Fund II | $ | 8,709,839 | $ | 11,246,699 | $ | (15,090,906 | ) | $ | (192,372 | ) | $ | (21,747 | ) | $ | 4,651,513 | 193,491 | $ | 155,158 | ||||||||||||||
Guggenheim Strategy Fund III | 14,184,016 | 2,568,946 | (5,930,252 | ) | (165,742 | ) | (377,339 | ) | 10,279,629 | 427,250 | 349,331 | |||||||||||||||||||||
Guggenheim Ultra Short Duration Fund — Institutional Class | 9,222,929 | 87,109 | (5,456,983 | ) | (31,221 | ) | (79,422 | ) | 3,742,412 | 388,217 | 86,649 | |||||||||||||||||||||
Guggenheim Variable Insurance Strategy Fund III | 12,887,874 | 285,221 | (2,821,955 | ) | (63,097 | ) | (356,923 | ) | 9,931,120 | 412,593 | 283,630 | |||||||||||||||||||||
| $ | 45,004,658 | $ | 14,187,975 | $ | (29,300,096 | ) | $ | (452,432 | ) | $ | (835,431 | ) | $ | 28,604,674 | $ | 874,768 | ||||||||||||||||
150 | THE GUGGENHEIM FUNDS ANNUAL REPORT | SEE NOTES TO FINANCIAL STATEMENTS. |
SERIES Y (STYLEPLUS—LARGE GROWTH SERIES) |
STATEMENT OF ASSETS AND LIABILITIES |
December 31, 2022 |
Assets: | ||||
Investments in unaffiliated issuers, at value (cost $8,213,149) | $ | 7,886,866 | ||
Investments in affiliated issuers, at value (cost $29,486,971) | 28,604,674 | |||
Cash | 369,856 | |||
Segregated cash with broker | 78,000 | |||
Unrealized appreciation on OTC swap agreements | 532,587 | |||
Prepaid expenses | 2,465 | |||
Receivables: | ||||
Dividends | 115,007 | |||
Fund shares sold | 11,857 | |||
Interest | 4,989 | |||
Total assets | 37,606,301 | |||
Liabilities: | ||||
Segregated cash due to broker | 350,000 | |||
Payable for: | ||||
Securities purchased | 119,379 | |||
Management fees | 9,992 | |||
Distribution and service fees | 7,881 | |||
Swap settlement | 6,950 | |||
Fund shares redeemed | 3,897 | |||
Variation margin on futures contracts | 2,440 | |||
Transfer agent/maintenance fees | 2,189 | |||
Fund accounting/administration fees | 1,592 | |||
Trustees’ fees* | 590 | |||
Miscellaneous | 40,415 | |||
Total liabilities | 545,325 | |||
Net assets | $ | 37,060,976 | ||
Net assets consist of: | ||||
Paid in capital | $ | 47,050,246 | ||
Total distributable earnings (loss) | (9,989,270 | ) | ||
Net assets | $ | 37,060,976 | ||
Capital shares outstanding | 2,693,016 | |||
Net asset value per share | $ | 13.76 | ||
STATEMENT OF OPERATIONS |
Year Ended December 31, 2022 |
Investment Income: | ||||
Dividends from securities of unaffiliated issuers (net of foreign withholding tax of $251) | $ | 92,995 | ||
Dividends from securities of affiliated issuers | 874,768 | |||
Interest | 19,955 | |||
Total investment income | 987,718 | |||
Expenses: | ||||
Management fees | 284,371 | |||
Distribution and service fees | 109,119 | |||
Transfer agent/maintenance fees | 25,409 | |||
Professional fees | 41,166 | |||
Fund accounting/administration fees | 32,812 | |||
Interest expense | 11,042 | |||
Custodian fees | 8,881 | |||
Trustees’ fees* | 7,393 | |||
Line of credit fees | 1,366 | |||
Miscellaneous | 7,769 | |||
Total expenses | 529,328 | |||
Less: | ||||
Expenses reimbursed by Adviser: | (3 | ) | ||
Expenses waived by Adviser | (128,545 | ) | ||
Earnings credits applied | (1,360 | ) | ||
Total waived/reimbursed expenses | (129,908 | ) | ||
Net expenses | 399,420 | |||
Net investment income | 588,298 | |||
Net Realized and Unrealized Gain (Loss): | ||||
Net realized gain (loss) on: | ||||
Investments in unaffiliated issuers | 364,926 | |||
Investments in affiliated issuers | (452,432 | ) | ||
Swap agreements | (9,485,398 | ) | ||
Futures contracts | (185,509 | ) | ||
Net realized loss | (9,758,413 | ) | ||
Net change in unrealized appreciation (depreciation) on: | ||||
Investments in unaffiliated issuers | (2,982,044 | ) | ||
Investments in affiliated issuers | (835,431 | ) | ||
Swap agreements | (4,210,414 | ) | ||
Futures contracts | (89,990 | ) | ||
Net change in unrealized appreciation (depreciation) | (8,117,879 | ) | ||
Net realized and unrealized loss | (17,876,292 | ) | ||
Net decrease in net assets resulting from operations | $ | (17,287,994 | ) | |
* | Relates to Trustees not deemed “interested persons” within the meaning of Section 2(a)(19) of the 1940 Act. |
SEE NOTES TO FINANCIAL STATEMENTS. | THE GUGGENHEIM FUNDS ANNUAL REPORT | 151 |
SERIES Y (STYLEPLUS—LARGE GROWTH SERIES) |
STATEMENTS OF CHANGES IN NET ASSETS |
| Year Ended | Year Ended | ||||||
Increase (Decrease) in Net Assets from Operations: | ||||||||
Net investment income | $ | 588,298 | $ | 181,755 | ||||
Net realized gain (loss) on investments | (9,758,413 | ) | 11,923,708 | |||||
Net change in unrealized appreciation (depreciation) on investments | (8,117,879 | ) | 1,024,676 | |||||
Net increase (decrease) in net assets resulting from operations | (17,287,994 | ) | 13,130,139 | |||||
Distributions to shareholders | (10,472,266 | ) | (11,035,296 | ) | ||||
Capital share transactions: | ||||||||
Proceeds from sale of shares | 2,650,703 | 3,689,459 | ||||||
Distributions reinvested | 10,472,266 | 11,035,296 | ||||||
Cost of shares redeemed | (6,278,669 | ) | (8,320,164 | ) | ||||
Net increase from capital share transactions | 6,844,300 | 6,404,591 | ||||||
Net increase (decrease) in net assets | (20,915,960 | ) | 8,499,434 | |||||
Net assets: | ||||||||
Beginning of year | 57,976,936 | 49,477,502 | ||||||
End of year | $ | 37,060,976 | $ | 57,976,936 | ||||
Capital share activity: | ||||||||
Shares sold | 134,492 | 141,529 | ||||||
Shares issued from reinvestment of distributions | 690,327 | 457,516 | ||||||
Shares redeemed | (329,923 | ) | (319,534 | ) | ||||
Net increase in shares | 494,896 | 279,511 | ||||||
152 | THE GUGGENHEIM FUNDS ANNUAL REPORT | SEE NOTES TO FINANCIAL STATEMENTS. |
SERIES Y (STYLEPLUS—LARGE GROWTH SERIES) |
FINANCIAL HIGHLIGHTS |
This table is presented to show selected data for a share outstanding throughout each period and to assist shareholders in evaluating a Fund’s performance for the periods presented.
| Year Ended | Year Ended | Year Ended | Year Ended | Year Ended | |||||||||||||||
Per Share Data | ||||||||||||||||||||
Net asset value, beginning of period | $ | 26.38 | $ | 25.79 | $ | 19.82 | $ | 16.47 | $ | 20.30 | ||||||||||
Income (loss) from investment operations: | ||||||||||||||||||||
Net investment income (loss)a | .24 | .09 | .16 | .28 | .34 | |||||||||||||||
Net gain (loss) on investments (realized and unrealized) | (7.87 | ) | 6.51 | 7.07 | 5.13 | (.63 | ) | |||||||||||||
Total from investment operations | (7.63 | ) | 6.60 | 7.23 | 5.41 | (.29 | ) | |||||||||||||
Less distributions from: | ||||||||||||||||||||
Net investment income | (.09 | ) | (.17 | ) | (.28 | ) | (.38 | ) | (.34 | ) | ||||||||||
Net realized gains | (4.90 | ) | (5.84 | ) | (.98 | ) | (1.68 | ) | (3.20 | ) | ||||||||||
Total distributions | (4.99 | ) | (6.01 | ) | (1.26 | ) | (2.06 | ) | (3.54 | ) | ||||||||||
Net asset value, end of period | $ | 13.76 | $ | 26.38 | $ | 25.79 | $ | 19.82 | $ | 16.47 | ||||||||||
| ||||||||||||||||||||
Total Returnb | (30.69 | %) | 27.77 | % | 37.87 | % | 33.92 | % | (3.68 | %) | ||||||||||
Ratios/Supplemental Data | ||||||||||||||||||||
Net assets, end of period (in thousands) | $ | 37,061 | $ | 57,977 | $ | 49,478 | $ | 40,187 | $ | 31,737 | ||||||||||
Ratios to average net assets: | ||||||||||||||||||||
Net investment income (loss) | 1.34 | % | 0.34 | % | 0.73 | % | 1.51 | % | 1.70 | % | ||||||||||
Total expensesc | 1.21 | % | 1.20 | % | 1.29 | % | 1.44 | % | 1.38 | % | ||||||||||
Net expensesd,e,f | 0.92 | % | 0.88 | % | 0.88 | % | 0.97 | % | 1.02 | % | ||||||||||
Portfolio turnover rate | 65 | % | 40 | % | 66 | % | 47 | % | 59 | % | ||||||||||
a | Net investment income (loss) per share was computed using average shares outstanding throughout the period. |
b | Total return does not take into account any of the expenses associated with an investment in variable insurance products. If total return had taken into account these expenses, performance would have been lower. Shares of a series of Guggenheim Variable Funds Trust are available only through the purchase of such products. |
c | Does not include expenses of the underlying funds in which the Fund invests. |
d | Net expense information reflects the expense ratios after expense waivers and reimbursements, as applicable. |
e | The portion of the ratios of net expenses to average net assets attributable to recoupments of prior fee reductions or expense reimbursements for the years presented was as follows: |
12/31/22 | 12/31/21 | 12/31/20 | 12/31/19 | 12/31/18 | |
— | — | — | — | 0.00%* |
* | Less than 0.01%. |
f | Net expenses may include expenses that are excluded from the expense limitation agreement. Excluding these expenses, the net expense ratios for the years presented would be: |
12/31/22 | 12/31/21 | 12/31/20 | 12/31/19 | 12/31/18 | |
0.89% | 0.87% | 0.88% | 0.90% | 0.93% |
SEE NOTES TO FINANCIAL STATEMENTS. | THE GUGGENHEIM FUNDS ANNUAL REPORT | 153 |
MANAGERS’ COMMENTARY (Unaudited) | December 31, 2022 |
To Our Shareholders
The Series Z (Alpha Opportunity Series) is managed by a team of seasoned professionals, including Farhan Sharaff, Senior Managing Director and Assistant Chief Investment Officer, Equities, and Portfolio Manager; Samir Sanghani, CFA, Managing Director and Portfolio Manager; and Burak Hurmeydan, Ph.D., Director and Portfolio Manager. In the subsequent paragraphs, the investment team discusses the Fund’s performance for the 12-month period ended December 31, 2022 (the “Reporting Period”).
For the Reporting Period, the Fund provided a total return of -8.53%, underperforming the ICE BofA 3-Month U.S. Treasury Bill Index (“Index”), the Fund’s benchmark, which returned 1.47% for the same period.
What factors contributed or detracted from the Fund’s performance during the Reporting Period?
For the Reporting Period, the broad market reversed its ‘reopening’ excitement and began a steady bear market. Economic ramifications of the Covid pandemic continued–as supply constraints and worker shortages drove inflation steadily higher. Despite rebounding demand and consumers flush with money, many industries and service companies could not keep enough parts or employees, causing shortages and driving wages higher. Exacerbating the underlying inflation was the sudden war in Ukraine and continued rolling China Covid-related shutdowns. Both were human tragedies in their own rights. And both threw supply chains into more chaos. The Federal Reserve board went completely all in with interest rate increases to halt the inflation at a pace not seen in 40 years. The rapid and steady rise in rates led to a coordinated drop in stocks and bonds. As the year closed out, the lagged effects of rising rates began hitting corporate earnings, led to numerous layoff announcements, and rising fears of an inevitable recession in 2023.
Within equity markets, the most expensive and smaller cap names all suffered more than the broad averages.
The Fund had a return of -8.5%. The overall market decline contributed about -1.2% drag based on our net long exposure. The realized beta (sensitivity of daily returns to broad stock benchmark moves) was about 0.19 for the year, lower than most long/short managers.
Overall fundamental style positioning worked in the Fund’s favor by about +5.7% attribution. Value names had a good year vis-à-vis expensive growth. Our Value style positioning paid off by about +11.5% for the year. With the value of far off and riskier earnings discounted at higher rates, there was more pain for expensive growth. A bias towards High Quality positions did not pay off as expected in a down year. With rate moves a bigger factor than economic drag this year, higher quality names suffered the earnings discount math as much or more than lower-earnings quality companies.
Industry tilts totaled a moderate -1.1% drag for the year. A net short in Energy during the early part of the year caused substantial damage when oil and gas prices spiked during the Ukraine war. On the plus side, the Fund’s net short in Real Estate was a positive contributor, as that sector suffered from both fundamental and rate-related risks.
Security selection (the impact of returns within style and industry groups) was a large drag (-9%) for the Reporting Period. For example, within the Real Estate sector, short names in the hotel group outperformed the sector while a few long positions in the office group underperformed–leading to negative selection.
How did the Fund use derivatives during the Reporting Period?
The Fund uses total return swaps to gain exposure to short positions and to attain some leverage on the long side when surpassing 100% long weights. In total, the derivatives have a net negative market exposure, creating a partial market hedge against assets that are invested in long stocks. The net performance impact of these derivatives was positive for the Reporting Period as the overall market had a large negative return.
How was the Fund positioned at the end of the Reporting Period?
At Reporting Period end, the Fund held about 146% of assets in long securities, and 96% short, for a net-dollar exposure of 49%. Because the long side exposure holds higher quality and more defensive sectors, while the short side focuses on higher risk names, the actual expected net ‘beta’ of the fund is in the 0.15 to 0.25 range.
154 | THE GUGGENHEIM FUNDS ANNUAL REPORT |
MANAGERS’ COMMENTARY (Unaudited)(concluded) | December 31, 2022 |
The Fund maintains its style bias towards cheaper valuation names. Our bias towards higher profitability and low stock volatility remains, but at reduced levels from last year as those factors have paid off significantly and look less underpriced than usual. The Fund’s short position in the Growth names has also shrunk as those names declined rapidly last year; we are now closer to neutral on this factor bias. The Fund remains biased to small cap size, a shift that first began about a year ago. While small caps are generally riskier than their large cap brethren, the additional risk looks to be compensated with a much wider expected return based on fundamentals and valuations.
From an industry perspective, the Fund’s largest net long sectors are Healthcare and IT, with our names mostly focused on cheaper and higher cash flow generating groups within those otherwise growth-oriented sectors. The largest net short exposures are Real Estate, and Commercial Services. Notably, the Fund has flipped to a net long exposure to Energy and Materials, while cutting back on weights in Staples and Utilities. With considerable moves in relative stock prices and changing fundamentals, the dynamic industry weight reallocation was substantial this year.
Performance displayed represents past performance which is no guarantee of future results.
The opinions and forecast expressed may not actually come to pass. This information is subject to change at any time, based on market and other conditions, and should not be construed as a recommendation of any specific security or strategy.
THE GUGGENHEIM FUNDS ANNUAL REPORT | 155 |
PERFORMANCE REPORT AND FUND PROFILE (Unaudited) | December 31, 2022 |
SERIES Z (ALPHA OPPORTUNITY SERIES)
OBJECTIVE: Seeks long-term growth of capital.
Holdings Diversification (Market Exposure as % of Net Assets)
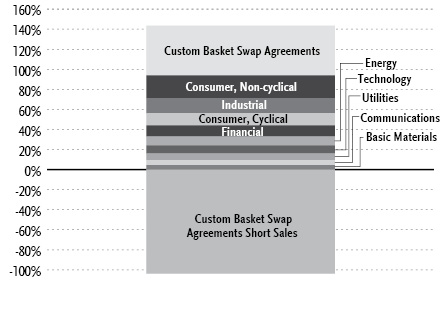
“Holdings Diversification (Market Exposure as % of Net Assets)” excludes any temporary cash investments.
Inception Date: July 7, 2003 |
Ten Largest Holdings | (% of Total Net Assets) |
Quest Diagnostics, Inc. | 1.0% |
Ironwood Pharmaceuticals, Inc. — Class A | 1.0% |
Marathon Petroleum Corp. | 1.0% |
Preferred Bank/Los Angeles CA | 1.0% |
Exxon Mobil Corp. | 1.0% |
FirstEnergy Corp. | 1.0% |
OGE Energy Corp. | 1.0% |
Coca-Cola Co. | 1.0% |
Black Hills Corp. | 1.0% |
Hologic, Inc. | 1.0% |
Top Ten Total | 10.0% |
“Ten Largest Holdings” excludes any temporary cash or derivative investments. | |
156 | THE GUGGENHEIM FUNDS ANNUAL REPORT |
PERFORMANCE REPORT AND FUND PROFILE (Unaudited)(concluded) | December 31, 2022 |
Cumulative Fund Performance*,†
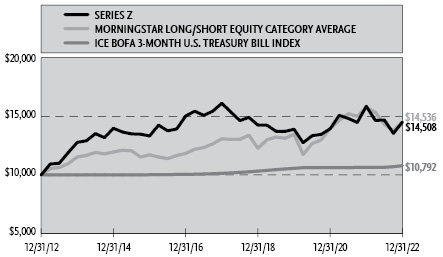
Average Annual Returns*,†
Periods Ended December 31, 2022
| 1 Year | 5 Year | 10 Year |
Series Z (Alpha Opportunity Series) | (8.53%) | (2.08%) | 3.79% |
Morningstar Long/Short Equity Category Average | (7.67%) | 2.13% | 3.81% |
ICE BofA 3-Month U.S. Treasury Bill Index | 1.47% | 1.27% | 0.77% |
* | The performance data above represents past performance that is not predictive of future results. The investment return and principal value of an investment in the Fund will fluctuate so that an investor’s shares, when redeemed, may be worth more or less than their original cost. Returns are historical and include changes in principal and reinvested dividends and capital gains and do not reflect the effect of taxes. The ICE BofA 3-Month U.S. Treasury Bill Index and Morningstar Long/Short Equity Category Average are unmanaged indices and, unlike the Fund, have no management fees or operating expenses to reduce their reported returns. |
† | Performance figures do not reflect fees and expenses associated with an investment in variable insurance products. If returns had taken into account these fees and expenses, performance would have been lower. Shares of a series of Guggenheim Variable Funds Trust are available only through the purchase of such products. |
THE GUGGENHEIM FUNDS ANNUAL REPORT | 157 |
SCHEDULE OF INVESTMENTS | December 31, 2022 |
SERIES Z (ALPHA OPPORTUNITY SERIES) |
| Shares | Value | ||||||
COMMON STOCKS† - 93.9% | ||||||||
Consumer, Non-cyclical - 22.5% | ||||||||
Quest Diagnostics, Inc. | 240 | $ | 37,389 | |||||
Ironwood Pharmaceuticals, Inc. — Class A* | 2,974 | 36,848 | ||||||
Coca-Cola Co. | 563 | 35,813 | ||||||
Hologic, Inc.*,1 | 476 | 35,610 | ||||||
John B Sanfilippo & Son, Inc. | 437 | 35,537 | ||||||
Hershey Co. | 153 | 35,430 | ||||||
Perdoceo Education Corp.*,1 | 2,340 | 32,526 | ||||||
IDEXX Laboratories, Inc.* | 79 | 32,229 | ||||||
Bristol-Myers Squibb Co.1 | 442 | 31,802 | ||||||
Prestige Consumer Healthcare, Inc.* | 469 | 29,359 | ||||||
Danaher Corp. | 105 | 27,869 | ||||||
Altria Group, Inc.1 | 580 | 26,512 | ||||||
USANA Health Sciences, Inc.* | 495 | 26,334 | ||||||
Royalty Pharma plc — Class A | 666 | 26,320 | ||||||
Varex Imaging Corp.* | 1,290 | 26,187 | ||||||
Tyson Foods, Inc. — Class A1 | 417 | 25,958 | ||||||
Post Holdings, Inc.*,1 | 271 | 24,460 | ||||||
Triton International Ltd. | 321 | 22,078 | ||||||
EVERTEC, Inc.1 | 659 | 21,339 | ||||||
Monster Beverage Corp.* | 206 | 20,915 | ||||||
Jazz Pharmaceuticals plc*,1 | 119 | 18,958 | ||||||
United Therapeutics Corp.*,1 | 67 | 18,632 | ||||||
Globus Medical, Inc. — Class A* | 249 | 18,493 | ||||||
Gilead Sciences, Inc. | 212 | 18,200 | ||||||
Supernus Pharmaceuticals, Inc.*,1 | 497 | 17,728 | ||||||
Vertex Pharmaceuticals, Inc.*,1 | 59 | 17,038 | ||||||
Eagle Pharmaceuticals, Inc.* | 540 | 15,784 | ||||||
Incyte Corp.*,1 | 178 | 14,297 | ||||||
Lamb Weston Holdings, Inc.1 | 152 | 13,583 | ||||||
Innoviva, Inc.* | 1,022 | 13,542 | ||||||
Inter Parfums, Inc. | 105 | 10,135 | ||||||
Regeneron Pharmaceuticals, Inc.* | 14 | 10,101 | ||||||
Vanda Pharmaceuticals, Inc.*,1 | 1,320 | 9,755 | ||||||
Quanex Building Products Corp. | 404 | 9,567 | ||||||
Exelixis, Inc.* | 587 | 9,415 | ||||||
Amphastar Pharmaceuticals, Inc.*,1 | 336 | 9,414 | ||||||
Eli Lilly & Co. | 20 | 7,317 | ||||||
Total Consumer, Non-cyclical | 822,474 | |||||||
Industrial - 15.3% | ||||||||
Donaldson Company, Inc. | 599 | 35,263 | ||||||
Textron, Inc.1 | 498 | 35,259 | ||||||
Graco, Inc. | 521 | 35,042 | ||||||
Standex International Corp.1 | 334 | 34,205 | ||||||
Snap-on, Inc.1 | 148 | 33,816 | ||||||
Emerson Electric Co. | 346 | 33,237 | ||||||
Eagle Materials, Inc.1 | 238 | 31,618 | ||||||
Albany International Corp. — Class A1 | 318 | 31,352 | ||||||
Louisiana-Pacific Corp.1 | 491 | 29,067 | ||||||
Vishay Intertechnology, Inc.1 | 1,250 | 26,963 | ||||||
General Dynamics Corp.1 | 108 | 26,796 | ||||||
Lockheed Martin Corp. | 54 | 26,270 | ||||||
Sturm Ruger & Company, Inc.1 | 455 | 23,032 | ||||||
Advanced Energy Industries, Inc.1 | 254 | 21,788 | ||||||
Acuity Brands, Inc.1 | 131 | 21,695 | ||||||
Mueller Industries, Inc.1 | 309 | 18,231 | ||||||
Sealed Air Corp. | 353 | 17,608 | ||||||
Dorian LPG Ltd. | 925 | 17,529 | ||||||
AMETEK, Inc. | 111 | 15,509 | ||||||
3M Co. | 109 | 13,071 | ||||||
Otis Worldwide Corp. | 139 | 10,885 | ||||||
OSI Systems, Inc.* | 131 | 10,417 | ||||||
PGT Innovations, Inc.* | 566 | 10,166 | ||||||
Total Industrial | 558,819 | |||||||
Consumer, Cyclical - 12.0% | ||||||||
Wyndham Hotels & Resorts, Inc. | 495 | 35,299 | ||||||
Columbia Sportswear Co. | 402 | 35,207 | ||||||
Yum! Brands, Inc. | 274 | 35,094 | ||||||
GMS, Inc.*,1 | 589 | 29,332 | ||||||
Home Depot, Inc. | 89 | 28,112 | ||||||
Brunswick Corp.1 | 387 | 27,895 | ||||||
Allison Transmission Holdings, Inc.1 | 645 | 26,832 | ||||||
MSC Industrial Direct Company, Inc. — Class A | 273 | 22,304 | ||||||
Methode Electronics, Inc.1 | 460 | 20,410 | ||||||
Buckle, Inc.1 | 445 | 20,181 | ||||||
Starbucks Corp.1 | 161 | 15,971 | ||||||
Boyd Gaming Corp.1 | 278 | 15,159 | ||||||
Steven Madden Ltd. | 444 | 14,190 | ||||||
Academy Sports & Outdoors, Inc.1 | 268 | 14,081 | ||||||
Haverty Furniture Companies, Inc. | 446 | 13,335 | ||||||
Oxford Industries, Inc. | 137 | 12,766 | ||||||
Lowe’s Companies, Inc. | 62 | 12,353 | ||||||
Patrick Industries, Inc. | 190 | 11,514 | ||||||
Williams-Sonoma, Inc. | 97 | 11,147 | ||||||
Group 1 Automotive, Inc. | 58 | 10,461 | ||||||
Watsco, Inc. | 41 | 10,225 | ||||||
Winnebago Industries, Inc. | 161 | 8,485 | ||||||
Ethan Allen Interiors, Inc. | 302 | 7,979 | ||||||
Total Consumer, Cyclical | 438,332 | |||||||
Financial - 11.3% | ||||||||
Preferred Bank/Los Angeles CA | 488 | 36,467 | ||||||
Heritage Financial Corp. | 1,148 | 35,175 | ||||||
Hope Bancorp, Inc. | 2,710 | 34,715 | ||||||
National Bank Holdings Corp. — Class A1 | 825 | 34,708 | ||||||
S&T Bancorp, Inc. | 1,005 | 34,351 | ||||||
Renasant Corp. | 912 | 34,282 | ||||||
TowneBank | 1,086 | 33,492 | ||||||
Evercore, Inc. — Class A | 198 | 21,598 | ||||||
International Bancshares Corp.1 | 394 | 18,029 | ||||||
Office Properties Income Trust REIT | 1,185 | 15,820 | ||||||
Central Pacific Financial Corp.1 | 721 | 14,622 | ||||||
BankUnited, Inc.1 | 426 | 14,471 | ||||||
Stewart Information Services Corp. | 323 | 13,802 | ||||||
Virtus Investment Partners, Inc. | 61 | 11,678 | ||||||
Hilltop Holdings, Inc. | 369 | 11,074 | ||||||
Marcus & Millichap, Inc. | 318 | 10,955 | ||||||
Bread Financial Holdings, Inc.1 | 269 | 10,131 | ||||||
158 | THE GUGGENHEIM FUNDS ANNUAL REPORT | SEE NOTES TO FINANCIAL STATEMENTS. |
SCHEDULE OF INVESTMENTS (continued) | December 31, 2022 |
SERIES Z (ALPHA OPPORTUNITY SERIES) |
| Shares | Value | ||||||
Visa, Inc. — Class A | 47 | $ | 9,765 | |||||
PennyMac Financial Services, Inc.1 | 161 | 9,122 | ||||||
NMI Holdings, Inc. — Class A*,1 | 367 | 7,670 | ||||||
Total Financial | 411,927 | |||||||
Energy - 8.6% | ||||||||
Marathon Petroleum Corp.1 | 313 | 36,430 | ||||||
Exxon Mobil Corp.1 | 330 | 36,399 | ||||||
Antero Midstream Corp.1 | 3,189 | 34,409 | ||||||
DT Midstream, Inc.1 | 601 | 33,211 | ||||||
Kinder Morgan, Inc.1 | 1,827 | 33,032 | ||||||
Valero Energy Corp. | 181 | 22,962 | ||||||
Williams Companies, Inc.1 | 605 | 19,905 | ||||||
Phillips 66 | 178 | 18,526 | ||||||
CVR Energy, Inc.1 | 555 | 17,394 | ||||||
Occidental Petroleum Corp. | 218 | 13,732 | ||||||
REX American Resources Corp.* | 367 | 11,693 | ||||||
SunCoke Energy, Inc.1 | 1,315 | 11,348 | ||||||
Par Pacific Holdings, Inc.* | 388 | 9,021 | ||||||
Equitrans Midstream Corp.1 | 1,265 | 8,476 | ||||||
ONEOK, Inc.1 | 126 | 8,278 | ||||||
Total Energy | 314,816 | |||||||
Technology - 8.2% | ||||||||
Cirrus Logic, Inc.*,1 | 467 | 34,782 | ||||||
Applied Materials, Inc. | 286 | 27,851 | ||||||
Synopsys, Inc.* | 85 | 27,140 | ||||||
Microsoft Corp. | 94 | 22,543 | ||||||
Dropbox, Inc. — Class A* | 889 | 19,896 | ||||||
Maximus, Inc. | 218 | 15,986 | ||||||
Diodes, Inc.*,1 | 166 | 12,639 | ||||||
Teradata Corp.* | 361 | 12,151 | ||||||
NetScout Systems, Inc.*,1 | 345 | 11,216 | ||||||
Synaptics, Inc.*,1 | 116 | 11,039 | ||||||
Avid Technology, Inc.* | 407 | 10,822 | ||||||
Apple, Inc. | 81 | 10,524 | ||||||
Adobe, Inc.* | 30 | 10,096 | ||||||
QUALCOMM, Inc.1 | 90 | 9,895 | ||||||
Rambus, Inc.*,1 | 261 | 9,349 | ||||||
NetApp, Inc. | 155 | 9,309 | ||||||
Kulicke & Soffa Industries, Inc. | 200 | 8,852 | ||||||
Axcelis Technologies, Inc.*,1 | 111 | 8,809 | ||||||
CSG Systems International, Inc.1 | 147 | 8,408 | ||||||
Veeco Instruments, Inc.* | 442 | 8,212 | ||||||
ACI Worldwide, Inc.*,1 | 345 | 7,935 | ||||||
Total Technology | 297,454 | |||||||
Utilities - 6.9% | ||||||||
FirstEnergy Corp. | 866 | 36,320 | ||||||
OGE Energy Corp. | 906 | 35,832 | ||||||
Black Hills Corp. | 508 | 35,733 | ||||||
UGI Corp.1 | 882 | 32,696 | ||||||
MGE Energy, Inc.1 | 363 | 25,555 | ||||||
Chesapeake Utilities Corp.1 | 186 | 21,981 | ||||||
Clearway Energy, Inc. — Class C | 623 | 19,855 | ||||||
ONE Gas, Inc. | 262 | 19,839 | ||||||
Otter Tail Corp.1 | 257 | 15,089 | ||||||
National Fuel Gas Co.1 | 152 | 9,621 | ||||||
Total Utilities | 252,521 | |||||||
Communications - 4.6% | ||||||||
Verizon Communications, Inc.1 | 832 | 32,781 | ||||||
T-Mobile US, Inc.*,1 | 204 | 28,560 | ||||||
Gogo, Inc.*,1 | 1,732 | 25,564 | ||||||
Meta Platforms, Inc. — Class A*,1 | 194 | 23,346 | ||||||
Cisco Systems, Inc.1 | 396 | 18,866 | ||||||
VeriSign, Inc.* | 72 | 14,792 | ||||||
InterDigital, Inc.1 | 278 | 13,755 | ||||||
Alphabet, Inc. — Class C* | 118 | 10,470 | ||||||
Total Communications | 168,134 | |||||||
Basic Materials - 4.5% | ||||||||
Minerals Technologies, Inc.1 | 402 | 24,409 | ||||||
Balchem Corp.1 | 183 | 22,346 | ||||||
Huntsman Corp.1 | 717 | 19,703 | ||||||
NewMarket Corp.1 | 56 | 17,422 | ||||||
Olin Corp. | 288 | 15,247 | ||||||
LyondellBasell Industries N.V. — Class A1 | 178 | 14,779 | ||||||
FMC Corp.1 | 92 | 11,482 | ||||||
AdvanSix, Inc.1 | 264 | 10,037 | ||||||
Ingevity Corp.* | 142 | 10,003 | ||||||
American Vanguard Corp.1 | 433 | 9,400 | ||||||
Westlake Corp. | 88 | 9,024 | ||||||
Total Basic Materials | 163,852 | |||||||
Total Common Stocks | ||||||||
(Cost $3,459,812) | 3,428,329 | |||||||
MONEY MARKET FUND† - 1.3% | ||||||||
Goldman Sachs Financial Square Treasury Instruments Fund — Institutional Shares, 3.93%2 | 48,920 | 48,920 | ||||||
Total Money Market Fund | ||||||||
(Cost $48,920) | 48,920 | |||||||
Total Investments - 95.2% | ||||||||
(Cost $3,508,732) | $ | 3,477,249 | ||||||
Other Assets & Liabilities, net - 4.8% | 173,917 | |||||||
Total Net Assets - 100.0% | $ | 3,651,166 | ||||||
SEE NOTES TO FINANCIAL STATEMENTS. | THE GUGGENHEIM FUNDS ANNUAL REPORT | 159 |
SCHEDULE OF INVESTMENTS (continued) | December 31, 2022 |
SERIES Z (ALPHA OPPORTUNITY SERIES) |
Custom Basket Swap Agreements | |||||||||||||||||||
Counterparty | Reference Obligation | Type | Financing | Payment | Maturity | Notional | Value and | ||||||||||||
Centrally Cleared Custom Basket Swap Agreements†† | |||||||||||||||||||
Goldman Sachs International | GS Equity Custom Basket | Pay | 4.78% (Federal Funds Rate + 0.45%) | At Maturity | 05/06/24 | $ | 909,207 | $ | 8,712 | ||||||||||
Morgan Stanley Capital Services LLC | MS Equity Custom Basket | Pay | 4.73% (Federal Funds Rate + 0.40%) | At Maturity | 02/01/24 | 907,144 | 7,623 | ||||||||||||
| $ | 1,816,351 | $ | 16,335 | ||||||||||||||||
OTC Custom Basket Swap Agreements Sold Short†† | |||||||||||||||||||
Goldman Sachs International | GS Equity Custom Basket | Receive | 4.13% (Federal Funds Rate - 0.20%) | At Maturity | 05/06/24 | $ | 1,741,111 | $ | 89,689 | ||||||||||
Morgan Stanley Capital Services LLC | MS Equity Custom Basket | Receive | 4.03% (Federal Funds Rate - 0.30%) | At Maturity | 02/01/24 | 1,754,398 | 88,943 | ||||||||||||
| $ | 3,495,509 | $ | 178,632 | ||||||||||||||||
| Shares | Percentage | Value and | |||||||||
MS EQUITY LONG CUSTOM BASKET | ||||||||||||
Consumer, Cyclical | ||||||||||||
Home Depot, Inc. | 23 | 0.80 | % | $ | 863 | |||||||
GMS, Inc. | 156 | 0.86 | % | 783 | ||||||||
Academy Sports & Outdoors, Inc. | 70 | 0.41 | % | 686 | ||||||||
Buckle, Inc. | 117 | 0.58 | % | 629 | ||||||||
Allison Transmission Holdings, Inc. | 170 | 0.78 | % | 623 | ||||||||
Patrick Industries, Inc. | 33 | 0.22 | % | 489 | ||||||||
Methode Electronics, Inc. | 121 | 0.59 | % | 440 | ||||||||
Haverty Furniture Companies, Inc. | 118 | 0.39 | % | 202 | ||||||||
Group 1 Automotive, Inc. | 15 | 0.30 | % | 167 | ||||||||
Starbucks Corp. | 42 | 0.46 | % | 166 | ||||||||
Ethan Allen Interiors, Inc. | 80 | 0.23 | % | (42 | ) | |||||||
Wyndham Hotels & Resorts, Inc. | 131 | 1.03 | % | (83 | ) | |||||||
Watsco, Inc. | 11 | 0.30 | % | (116 | ) | |||||||
Boyd Gaming Corp. | 73 | 0.44 | % | (121 | ) | |||||||
Lowe’s Companies, Inc. | 16 | 0.35 | % | (129 | ) | |||||||
Columbia Sportswear Co. | 106 | 1.02 | % | (176 | ) | |||||||
Yum! Brands, Inc. | 72 | 1.02 | % | (180 | ) | |||||||
Winnebago Industries, Inc. | 42 | 0.24 | % | (187 | ) | |||||||
MSC Industrial Direct Company, Inc. — Class A | 72 | 0.65 | % | (201 | ) | |||||||
Oxford Industries, Inc. | 36 | 0.37 | % | (220 | ) | |||||||
Steven Madden Ltd. | 117 | 0.41 | % | (286 | ) | |||||||
Brunswick Corp. | 102 | 0.81 | % | (311 | ) | |||||||
Williams-Sonoma, Inc. | 25 | 0.32 | % | (338 | ) | |||||||
Total Consumer, Cyclical | 2,658 | |||||||||||
Technology | ||||||||||||
Rambus, Inc. | 69 | 0.27 | % | 1,1001 | ||||||||
Axcelis Technologies, Inc. | 29 | 0.25 | % | 445 | ||||||||
CSG Systems International, Inc. | 39 | 0.25 | % | 416 | ||||||||
Diodes, Inc. | 44 | 0.37 | % | 356 | ||||||||
QUALCOMM, Inc. | 23 | 0.28 | % | 116 | ||||||||
Maximus, Inc. | 57 | 0.46 | % | 45 | ||||||||
Adobe, Inc. | 8 | 0.30 | % | 24 | ||||||||
Dropbox, Inc. — Class A | 235 | 0.58 | % | (37 | ) | |||||||
Teradata Corp. | 95 | 0.35 | % | (41 | ) | |||||||
Apple, Inc. | 21 | 0.30 | % | (106 | ) | |||||||
Veeco Instruments, Inc. | 117 | 0.24 | % | (115 | ) | |||||||
Synaptics, Inc. | 30 | 0.31 | % | (116 | ) | |||||||
Kulicke & Soffa Industries, Inc. | 52 | 0.25 | % | (182 | ) | |||||||
Avid Technology, Inc. | 107 | 0.31 | % | (197 | ) | |||||||
NetScout Systems, Inc. | 91 | 0.33 | % | (206 | ) | |||||||
NetApp, Inc. | 41 | 0.27 | % | (230 | ) | |||||||
Cirrus Logic, Inc. | 123 | 1.01 | % | (237 | ) | |||||||
Microsoft Corp. | 25 | 0.66 | % | (243 | ) | |||||||
Synopsys, Inc. | 22 | 0.77 | % | (294 | ) | |||||||
ACI Worldwide, Inc. | 91 | 0.23 | % | (322 | ) | |||||||
Applied Materials, Inc. | 75 | 0.81 | % | (664 | ) | |||||||
Total Technology | (488 | ) | ||||||||||
Industrial | ||||||||||||
Standex International Corp. | 88 | 0.99 | % | 1,160 | ||||||||
Dorian LPG Ltd. | 245 | 0.51 | % | 1,095 | ||||||||
Snap-on, Inc. | 39 | 0.98 | % | 773 | ||||||||
Louisiana-Pacific Corp. | 130 | 0.85 | % | 681 | ||||||||
Vishay Intertechnology, Inc. | 330 | 0.78 | % | 617 | ||||||||
Albany International Corp. — Class A | 84 | 0.91 | % | 589 | ||||||||
Eagle Materials, Inc. | 63 | 0.92 | % | 559 | ||||||||
Emerson Electric Co. | 91 | 0.96 | % | 503 | ||||||||
Textron, Inc. | 132 | 1.03 | % | 339 | ||||||||
Lockheed Martin Corp. | 14 | 0.75 | % | 132 | ||||||||
160 | THE GUGGENHEIM FUNDS ANNUAL REPORT | SEE NOTES TO FINANCIAL STATEMENTS. |
SCHEDULE OF INVESTMENTS (continued) | December 31, 2022 |
SERIES Z (ALPHA OPPORTUNITY SERIES) |
| Shares | Percentage | Value and | |||||||||
Advanced Energy Industries, Inc. | 67 | 0.63 | % | $ | 125 | |||||||
Donaldson Company, Inc. | 158 | 1.03 | % | 92 | ||||||||
OSI Systems, Inc. | 34 | 0.30 | % | 47 | ||||||||
Otis Worldwide Corp. | 37 | 0.32 | % | (4 | ) | |||||||
General Dynamics Corp. | 28 | 0.77 | % | (13 | ) | |||||||
AMETEK, Inc. | 29 | 0.45 | % | (91 | ) | |||||||
3M Co. | 28 | 0.37 | % | (136 | ) | |||||||
Graco, Inc. | 138 | 1.02 | % | (240 | ) | |||||||
Mueller Industries, Inc. | 82 | 0.53 | % | (269 | ) | |||||||
Sealed Air Corp. | 93 | 0.51 | % | (298 | ) | |||||||
Acuity Brands, Inc. | 34 | 0.62 | % | (522 | ) | |||||||
PGT Innovations, Inc. | 150 | 0.30 | % | (739 | ) | |||||||
Sturm Ruger & Company, Inc. | 120 | 0.67 | % | (1,532 | ) | |||||||
Total Industrial | 2,868 | |||||||||||
Basic Materials | ||||||||||||
FMC Corp. | 24 | 0.33 | % | 310 | ||||||||
Westlake Corp. | 23 | 0.26 | % | 280 | ||||||||
American Vanguard Corp. | 114 | 0.27 | % | 89 | ||||||||
NewMarket Corp. | 14 | 0.48 | % | 66 | ||||||||
Olin Corp. | 76 | 0.44 | % | (167 | ) | |||||||
Ingevity Corp. | 37 | 0.29 | % | (198 | ) | |||||||
LyondellBasell Industries N.V. — Class A | 47 | 0.43 | % | (230 | ) | |||||||
AdvanSix, Inc. | 69 | 0.29 | % | (231 | ) | |||||||
Minerals Technologies, Inc. | 106 | 0.71 | % | (307 | ) | |||||||
Huntsman Corp. | 189 | 0.57 | % | (455 | ) | |||||||
Balchem Corp. | 48 | 0.65 | % | (461 | ) | |||||||
Total Basic Materials | (1,304 | ) | ||||||||||
Financial | ||||||||||||
S&T Bancorp, Inc. | 266 | 1.00 | % | 1,594 | ||||||||
Renasant Corp. | 241 | 1.00 | % | 990 | ||||||||
Preferred Bank/Los Angeles CA | 129 | 1.06 | % | 984 | ||||||||
TowneBank | 287 | 0.98 | % | 880 | ||||||||
Associated Banc-Corp. | 264 | 0.67 | % | 807 | ||||||||
PennyMac Financial Services, Inc. | 42 | 0.26 | % | 392 | ||||||||
Virtus Investment Partners, Inc. | 16 | 0.34 | % | 383 | ||||||||
NMI Holdings, Inc. — Class A | 97 | 0.22 | % | 242 | ||||||||
International Bancshares Corp. | 104 | 0.52 | % | 207 | ||||||||
Evercore, Inc. — Class A | 52 | 0.63 | % | 204 | ||||||||
Bread Financial Holdings, Inc. | 71 | 0.29 | % | 184 | ||||||||
National Bank Holdings Corp. — Class A | 218 | 1.01 | % | 167 | ||||||||
Hilltop Holdings, Inc. | 97 | 0.32 | % | 160 | ||||||||
Visa, Inc. — Class A | 12 | 0.27 | % | (82 | ) | |||||||
Marcus & Millichap, Inc. | 84 | 0.32 | % | (170 | ) | |||||||
Hope Bancorp, Inc. | 717 | 1.01 | % | (383 | ) | |||||||
BankUnited, Inc. | 112 | 0.42 | % | (454 | ) | |||||||
Heritage Financial Corp. | 304 | 1.03 | % | (976 | ) | |||||||
Central Pacific Financial Corp. | 191 | 0.43 | % | (1,051 | ) | |||||||
Stewart Information Services Corp. | 85 | 0.40 | % | (1,164 | ) | |||||||
Office Properties Income Trust | 313 | 0.46 | % | (2,295 | ) | |||||||
Total Financial | 619 | |||||||||||
Communications | ||||||||||||
Cisco Systems, Inc. | 104 | 0.55 | % | 585 | ||||||||
T-Mobile US, Inc. | 54 | 0.83 | % | 317 | ||||||||
VeriSign, Inc. | 19 | 0.43 | % | 155 | ||||||||
Alphabet, Inc. — Class C | 31 | 0.30 | % | (255 | ) | |||||||
Meta Platforms, Inc. — Class A | 51 | 0.68 | % | (683 | ) | |||||||
Gogo, Inc. | 458 | 0.75 | % | (822 | ) | |||||||
InterDigital, Inc. | 73 | 0.40 | % | (1,068 | ) | |||||||
Verizon Communications, Inc. | 220 | 0.96 | % | (1,070 | ) | |||||||
Total Communications | (2,841 | ) | ||||||||||
Consumer, Non-cyclical | ||||||||||||
Perdoceo Education Corp. | 619 | 0.95 | % | 1,981 | ||||||||
Ironwood Pharmaceuticals, Inc. — Class A | 787 | 1.07 | % | 1,168 | ||||||||
Bristol-Myers Squibb Co. | 117 | 0.93 | % | 1,028 | ||||||||
United Therapeutics Corp. | 17 | 0.52 | % | 1,002 | ||||||||
Vertex Pharmaceuticals, Inc. | 15 | 0.48 | % | 937 | ||||||||
Coca-Cola Co. | 149 | 1.04 | % | 718 | ||||||||
Regeneron Pharmaceuticals, Inc. | 3 | 0.24 | % | 714 | ||||||||
Hologic, Inc. | 126 | 1.04 | % | 709 | ||||||||
Amphastar Pharmaceuticals, Inc. | 89 | 0.27 | % | 700 | ||||||||
Jazz Pharmaceuticals plc | 31 | 0.54 | % | 616 | ||||||||
Incyte Corp. | 47 | 0.42 | % | 504 | ||||||||
Quest Diagnostics, Inc. | 63 | 1.09 | % | 467 | ||||||||
Triton International Ltd. | 85 | 0.64 | % | 458 | ||||||||
Supernus Pharmaceuticals, Inc. | 131 | 0.52 | % | 367 | ||||||||
Altria Group, Inc. | 153 | 0.77 | % | 328 | ||||||||
Eli Lilly & Co. | 5 | 0.20 | % | 276 | ||||||||
Post Holdings, Inc. | 71 | 0.71 | % | 255 | ||||||||
Innoviva, Inc. | 270 | 0.39 | % | 207 | ||||||||
Lamb Weston Holdings, Inc. | 40 | 0.39 | % | 154 | ||||||||
Prestige Consumer Healthcare, Inc. | 124 | 0.86 | % | 122 | ||||||||
SEE NOTES TO FINANCIAL STATEMENTS. | THE GUGGENHEIM FUNDS ANNUAL REPORT | 161 |
SCHEDULE OF INVESTMENTS (continued) | December 31, 2022 |
SERIES Z (ALPHA OPPORTUNITY SERIES) |
| Shares | Percentage | Value and | |||||||||
Quanex Building Products Corp. | 107 | 0.28 | % | $ | 115 | |||||||
Globus Medical, Inc. — Class A | 66 | 0.54 | % | 111 | ||||||||
John B Sanfilippo & Son, Inc. | 115 | 1.03 | % | 2 | ||||||||
Monster Beverage Corp. | 54 | 0.60 | % | (31 | ) | |||||||
Hershey Co. | 40 | 1.02 | % | (61 | ) | |||||||
Inter Parfums, Inc. | 28 | 0.30 | % | (67 | ) | |||||||
Danaher Corp. | 28 | 0.82 | % | (79 | ) | |||||||
Gilead Sciences, Inc. | 56 | 0.53 | % | (123 | ) | |||||||
Exelixis, Inc. | 155 | 0.27 | % | (161 | ) | |||||||
IDEXX Laboratories, Inc. | 21 | 0.94 | % | (268 | ) | |||||||
Varex Imaging Corp. | 341 | 0.76 | % | (399 | ) | |||||||
EVERTEC, Inc. | 174 | 0.62 | % | (591 | ) | |||||||
Royalty Pharma plc — Class A | 176 | 0.77 | % | (594 | ) | |||||||
Eagle Pharmaceuticals, Inc. | 142 | 0.46 | % | (1,442 | ) | |||||||
Tyson Foods, Inc. — Class A | 110 | 0.75 | % | (2,414 | ) | |||||||
Vanda Pharmaceuticals, Inc. | 349 | 0.28 | % | (2,469 | ) | |||||||
USANA Health Sciences, Inc. | 131 | 0.77 | % | (2,868 | ) | |||||||
Total Consumer, Non-cyclical | 1,372 | |||||||||||
Energy | ||||||||||||
Marathon Petroleum Corp. | 82 | 1.05 | % | 1,342 | ||||||||
Exxon Mobil Corp. | 87 | 1.06 | % | 1,018 | ||||||||
Phillips 66 | 47 | 0.54 | % | 854 | ||||||||
Valero Energy Corp. | 47 | 0.66 | % | 682 | ||||||||
Antero Midstream Corp. | 844 | 1.00 | % | 559 | ||||||||
Par Pacific Holdings, Inc. | 102 | 0.26 | % | 409 | ||||||||
REX American Resources Corp. | 97 | 0.34 | % | 255 | ||||||||
Kinder Morgan, Inc. | 483 | 0.96 | % | 194 | ||||||||
ONEOK, Inc. | 33 | 0.24 | % | 189 | ||||||||
SunCoke Energy, Inc. | 348 | 0.33 | % | 157 | ||||||||
Equitrans Midstream Corp. | 335 | 0.25 | % | 9 | ||||||||
Williams Companies, Inc. | 160 | 0.58 | % | (58 | ) | |||||||
DT Midstream, Inc. | 159 | 0.97 | % | (168 | ) | |||||||
Occidental Petroleum Corp. | 57 | 0.40 | % | (448 | ) | |||||||
CVR Energy, Inc. | 146 | 0.50 | % | (542 | ) | |||||||
Total Energy | 4,452 | |||||||||||
Utilities | ||||||||||||
FirstEnergy Corp. | 229 | 1.06 | % | 964 | ||||||||
ONE Gas, Inc. | 69 | 0.58 | % | 181 | ||||||||
UGI Corp. | 233 | 0.95 | % | 70 | ||||||||
Black Hills Corp. | 134 | 1.04 | % | 28 | ||||||||
National Fuel Gas Co. | 40 | 0.28 | % | 12 | ||||||||
OGE Energy Corp. | 240 | 1.05 | % | 2 | ||||||||
Chesapeake Utilities Corp. | 49 | 0.64 | % | (8 | ) | |||||||
Otter Tail Corp. | 68 | 0.44 | % | (219 | ) | |||||||
Clearway Energy, Inc. — Class C | 165 | 0.58 | % | (359 | ) | |||||||
MGE Energy, Inc. | 96 | 0.74 | % | (384 | ) | |||||||
Total Utilities | 287 | |||||||||||
Total MS Equity Long Custom Basket | 7,623 | |||||||||||
MS EQUITY SHORT CUSTOM BASKET | ||||||||||||
Consumer, Non-cyclical | ||||||||||||
Viad Corp. | 271 | (0.38 | )% | 5,984 | ||||||||
ASGN, Inc. | 127 | (0.59 | )% | 5,342 | ||||||||
Equifax, Inc. | 135 | (1.50 | )% | 4,716 | ||||||||
Healthcare Services Group, Inc. | 825 | (0.56 | )% | 3,982 | ||||||||
FTI Consulting, Inc. | 109 | (0.99 | )% | 1,932 | ||||||||
CoStar Group, Inc. | 235 | (1.04 | )% | 1,741 | ||||||||
TransUnion | 408 | (1.32 | )% | 1,500 | ||||||||
Driven Brands Holdings, Inc. | 670 | (1.04 | )% | 1,337 | ||||||||
Patterson Companies, Inc. | 268 | (0.43 | )% | 712 | ||||||||
Rollins, Inc. | 215 | (0.45 | )% | 671 | ||||||||
GXO Logistics, Inc. | 172 | (0.42 | )% | 386 | ||||||||
ABM Industries, Inc. | 546 | (1.38 | )% | (312 | ) | |||||||
Quanta Services, Inc. | 67 | (0.54 | )% | (693 | ) | |||||||
Cintas Corp. | 60 | (1.54 | )% | (1,584 | ) | |||||||
ICU Medical, Inc. | 149 | (1.34 | )% | (3,209 | ) | |||||||
Total Consumer, Non-cyclical | 22,505 | |||||||||||
Utilities | ||||||||||||
AES Corp. | 329 | (0.54 | )% | (116 | ) | |||||||
Vistra Corp. | 516 | (0.68 | )% | (190 | ) | |||||||
Public Service Enterprise Group, Inc. | 450 | (1.57 | )% | (736 | ) | |||||||
Exelon Corp. | 613 | (1.51 | )% | (1,025 | ) | |||||||
Edison International | 419 | (1.52 | )% | (2,049 | ) | |||||||
Total Utilities | (4,116 | ) | ||||||||||
Basic Materials | ||||||||||||
Alcoa Corp. | 198 | (0.51 | )% | 367 | ||||||||
Freeport-McMoRan, Inc. | 265 | (0.57 | )% | 252 | ||||||||
ATI, Inc. | 277 | (0.47 | )% | 193 | ||||||||
Total Basic Materials | 812 | |||||||||||
Financial | ||||||||||||
Signature Bank | 76 | (0.50 | )% | 11,153 | ||||||||
Invitation Homes, Inc. | 475 | (0.80 | )% | 6,095 | ||||||||
Welltower, Inc. | 187 | (0.70 | )% | 4,608 | ||||||||
Sun Communities, Inc. | 192 | (1.56 | )% | 4,528 | ||||||||
Equinix, Inc. | 32 | (1.19 | )% | 4,112 | ||||||||
Crown Castle, Inc. | 87 | (0.67 | )% | 4,099 | ||||||||
Americold Realty Trust, Inc. | 489 | (0.79 | )% | 3,613 | ||||||||
Bank of America Corp. | 782 | (1.48 | )% | 3,162 | ||||||||
KKR & Company, Inc. — Class A | 355 | (0.94 | )% | 3,017 | ||||||||
162 | THE GUGGENHEIM FUNDS ANNUAL REPORT | SEE NOTES TO FINANCIAL STATEMENTS. |
SCHEDULE OF INVESTMENTS (continued) | December 31, 2022 |
SERIES Z (ALPHA OPPORTUNITY SERIES) |
| Shares | Percentage | Value and | |||||||||
Ares Management Corp. — Class A | 289 | (1.13 | )% | $ | 2,812 | |||||||
Kennedy-Wilson Holdings, Inc. | 1,161 | (1.04 | )% | 2,222 | ||||||||
Digital Realty Trust, Inc. | 119 | (0.68 | )% | 2,082 | ||||||||
American Tower Corp. — Class A | 125 | (1.51 | )% | 2,031 | ||||||||
Equitable Holdings, Inc. | 876 | (1.43 | )% | 2,020 | ||||||||
Raymond James Financial, Inc. | 236 | (1.44 | )% | 2,015 | ||||||||
Ryman Hospitality Properties, Inc. | 227 | (1.06 | )% | 1,743 | ||||||||
Independence Realty Trust, Inc. | 640 | (0.62 | )% | 1,719 | ||||||||
Assurant, Inc. | 85 | (0.61 | )% | 1,632 | ||||||||
Host Hotels & Resorts, Inc. | 641 | (0.59 | )% | 1,062 | ||||||||
Pebblebrook Hotel Trust | 429 | (0.33 | )% | 933 | ||||||||
Alexandria Real Estate Equities, Inc. | 181 | (1.50 | )% | 886 | ||||||||
Kite Realty Group Trust | 1,019 | (1.22 | )% | 814 | ||||||||
Ventas, Inc. | 244 | (0.63 | )% | 810 | ||||||||
KeyCorp | 1,161 | (1.15 | )% | 809 | ||||||||
Northern Trust Corp. | 305 | (1.54 | )% | 720 | ||||||||
Wells Fargo & Co. | 237 | (0.56 | )% | 717 | ||||||||
UDR, Inc. | 674 | (1.49 | )% | 515 | ||||||||
Principal Financial Group, Inc. | 94 | (0.45 | )% | 484 | ||||||||
Kimco Realty Corp. | 902 | (1.09 | )% | 446 | ||||||||
Iron Mountain, Inc. | 431 | (1.22 | )% | 340 | ||||||||
Howard Hughes Corp. | 408 | (1.78 | )% | 218 | ||||||||
Citigroup, Inc. | 414 | (1.07 | )% | 142 | ||||||||
Cboe Global Markets, Inc. | 82 | (0.59 | )% | 141 | ||||||||
Willis Towers Watson plc | 55 | (0.77 | )% | 122 | ||||||||
Cullen/Frost Bankers, Inc. | 64 | (0.49 | )% | (139 | ) | |||||||
Progressive Corp. | 209 | (1.55 | )% | (204 | ) | |||||||
Cincinnati Financial Corp. | 78 | (0.46 | )% | (251 | ) | |||||||
American International Group, Inc. | 194 | (0.70 | )% | (376 | ) | |||||||
TFS Financial Corp. | 737 | (0.61 | )% | (511 | ) | |||||||
Intercontinental Exchange, Inc. | 162 | (0.95 | )% | (615 | ) | |||||||
BlackRock, Inc. — Class A | 22 | (0.89 | )% | (795 | ) | |||||||
Arthur J Gallagher & Co. | 52 | (0.56 | )% | (1,018 | ) | |||||||
CBRE Group, Inc. — Class A | 180 | (0.79 | )% | (1,180 | ) | |||||||
First Republic Bank | 162 | (1.13 | )% | (1,319 | ) | |||||||
Invesco Ltd. | 969 | (0.99 | )% | (1,405 | ) | |||||||
Allstate Corp. | 172 | (1.33 | )% | (1,548 | ) | |||||||
Apollo Global Management, Inc. | 421 | (1.53 | )% | (2,059 | ) | |||||||
Total Financial | 60,402 | |||||||||||
Consumer, Cyclical | ||||||||||||
MillerKnoll, Inc. | 468 | (0.56 | )% | 7,597 | ||||||||
CarMax, Inc. | 165 | (0.57 | )% | 3,720 | ||||||||
American Airlines Group, Inc. | 690 | (0.50 | )% | 3,619 | ||||||||
Hawaiian Holdings, Inc. | 615 | (0.36 | )% | 2,105 | ||||||||
Live Nation Entertainment, Inc. | 147 | (0.58 | )% | 564 | ||||||||
Floor & Decor Holdings, Inc. — Class A | 93 | (0.37 | )% | 500 | ||||||||
Delta Air Lines, Inc. | 685 | (1.28 | )% | (200 | ) | |||||||
Walgreens Boots Alliance, Inc. | 432 | (0.92 | )% | (202 | ) | |||||||
Copart, Inc. | 414 | (1.44 | )% | (672 | ) | |||||||
Madison Square Garden Sports Corp. — Class A | 61 | (0.64 | )% | (2,542 | ) | |||||||
Total Consumer, Cyclical | 14,489 | |||||||||||
Industrial | ||||||||||||
Stanley Black & Decker, Inc. | 124 | (0.53 | )% | 5,724 | ||||||||
Stericycle, Inc. | 129 | (0.37 | )% | 3,134 | ||||||||
Waste Management, Inc. | 163 | (1.46 | )% | 2,157 | ||||||||
TD SYNNEX Corp. | 277 | (1.50 | )% | 987 | ||||||||
Kirby Corp. | 141 | (0.52 | )% | 574 | ||||||||
Jacobs Solutions, Inc. | 225 | (1.54 | )% | 349 | ||||||||
J.B. Hunt Transport Services, Inc. | 43 | (0.43 | )% | (146 | ) | |||||||
Norfolk Southern Corp. | 39 | (0.55 | )% | (557 | ) | |||||||
TransDigm Group, Inc. | 9 | (0.32 | )% | (754 | ) | |||||||
FedEx Corp. | 52 | (0.51 | )% | (934 | ) | |||||||
Boeing Co. | 49 | (0.53 | )% | (1,223 | ) | |||||||
MSA Safety, Inc. | 156 | (1.28 | )% | (3,475 | ) | |||||||
Casella Waste Systems, Inc. — Class A | 213 | (0.96 | )% | (3,627 | ) | |||||||
Total Industrial | 2,209 | |||||||||||
Energy | ||||||||||||
NOV, Inc. | 501 | (0.60 | )% | 1,124 | ||||||||
Helmerich & Payne, Inc. | 177 | (0.50 | )% | (64 | ) | |||||||
Patterson-UTI Energy, Inc. | 789 | (0.76 | )% | (202 | ) | |||||||
Halliburton Co. | 729 | (1.64 | )% | (793 | ) | |||||||
Liberty Energy, Inc. — Class A | 603 | (0.55 | )% | (1,244 | ) | |||||||
ChampionX Corp. | 185 | (0.31 | )% | (1,311 | ) | |||||||
Hess Corp. | 120 | (0.97 | )% | (1,853 | ) | |||||||
Valaris Ltd. | 198 | (0.76 | )% | (3,268 | ) | |||||||
Schlumberger Ltd. | 248 | (0.76 | )% | (3,786 | ) | |||||||
EOG Resources, Inc. | 194 | (1.43 | )% | (4,325 | ) | |||||||
Total Energy | (15,722 | ) | ||||||||||
SEE NOTES TO FINANCIAL STATEMENTS. | THE GUGGENHEIM FUNDS ANNUAL REPORT | 163 |
SCHEDULE OF INVESTMENTS (continued) | December 31, 2022 |
SERIES Z (ALPHA OPPORTUNITY SERIES) |
| Shares | Percentage | Value and | |||||||||
Communications | ||||||||||||
IAC, Inc. | 288 | (0.73 | )% | $ | 3,364 | |||||||
Walt Disney Co. | 225 | (1.11 | )% | 2,623 | ||||||||
Warner Bros Discovery, Inc. | 927 | (0.50 | )% | 2,200 | ||||||||
Paramount Global — Class B | 576 | (0.55 | )% | 1,532 | ||||||||
Uber Technologies, Inc. | 556 | (0.78 | )% | 628 | ||||||||
Interpublic Group of Companies, Inc. | 561 | (1.07 | )% | (2,153 | ) | |||||||
Total Communications | 8,194 | |||||||||||
Technology | ||||||||||||
Take-Two Interactive Software, Inc. | 169 | (1.00 | )% | 460 | ||||||||
Science Applications International Corp. | 206 | (1.30 | )% | (290 | ) | |||||||
Total Technology | 170 | |||||||||||
Total MS Equity Short Custom Basket | 88,943 | |||||||||||
GS EQUITY LONG CUSTOM BASKET | ||||||||||||
Consumer, Cyclical | ||||||||||||
Patrick Industries, Inc. | 67 | 0.45 | % | 985 | ||||||||
Home Depot, Inc. | 23 | 0.80 | % | 871 | ||||||||
GMS, Inc. | 156 | 0.85 | % | 761 | ||||||||
Academy Sports & Outdoors, Inc. | 70 | 0.40 | % | 693 | ||||||||
Buckle, Inc. | 117 | 0.58 | % | 634 | ||||||||
Allison Transmission Holdings, Inc. | 170 | 0.78 | % | 616 | ||||||||
Methode Electronics, Inc. | 121 | 0.59 | % | 442 | ||||||||
Haverty Furniture Companies, Inc. | 118 | 0.39 | % | 199 | ||||||||
Group 1 Automotive, Inc. | 15 | 0.30 | % | 183 | ||||||||
Starbucks Corp. | 42 | 0.46 | % | 166 | ||||||||
Ethan Allen Interiors, Inc. | 80 | 0.23 | % | (37 | ) | |||||||
Watsco, Inc. | 11 | 0.30 | % | (95 | ) | |||||||
Wyndham Hotels & Resorts, Inc. | 131 | 1.03 | % | (98 | ) | |||||||
Boyd Gaming Corp. | 73 | 0.44 | % | (114 | ) | |||||||
Lowe’s Companies, Inc. | 16 | 0.35 | % | (132 | ) | |||||||
Winnebago Industries, Inc. | 42 | 0.24 | % | (168 | ) | |||||||
Yum! Brands, Inc. | 72 | 1.01 | % | (179 | ) | |||||||
Columbia Sportswear Co. | 106 | 1.02 | % | (186 | ) | |||||||
MSC Industrial Direct Company, Inc. — Class A | 72 | 0.65 | % | (202 | ) | |||||||
Oxford Industries, Inc. | 36 | 0.37 | % | (248 | ) | |||||||
Brunswick Corp. | 102 | 0.81 | % | (291 | ) | |||||||
Steven Madden Ltd. | 117 | 0.41 | % | (294 | ) | |||||||
Williams-Sonoma, Inc. | 25 | 0.32 | % | (317 | ) | |||||||
Total Consumer, Cyclical | 3,189 | |||||||||||
Technology | ||||||||||||
Rambus, Inc. | 69 | 0.27 | % | 1,099 | ||||||||
Axcelis Technologies, Inc. | 29 | 0.25 | % | 454 | ||||||||
CSG Systems International, Inc. | 39 | 0.25 | % | 411 | ||||||||
Diodes, Inc. | 44 | 0.37 | % | 355 | ||||||||
QUALCOMM, Inc. | 23 | 0.28 | % | 119 | ||||||||
Maximus, Inc. | 57 | 0.46 | % | 55 | ||||||||
Adobe, Inc. | 8 | 0.30 | % | 20 | ||||||||
Teradata Corp. | 95 | 0.35 | % | (42 | ) | |||||||
Dropbox, Inc. — Class A | 235 | 0.58 | % | (53 | ) | |||||||
Apple, Inc. | 21 | 0.30 | % | (104 | ) | |||||||
Synaptics, Inc. | 30 | 0.31 | % | (109 | ) | |||||||
Veeco Instruments, Inc. | 117 | 0.24 | % | (113 | ) | |||||||
Kulicke & Soffa Industries, Inc. | 52 | 0.25 | % | (182 | ) | |||||||
NetScout Systems, Inc. | 91 | 0.33 | % | (184 | ) | |||||||
Avid Technology, Inc. | 107 | 0.31 | % | (217 | ) | |||||||
NetApp, Inc. | 41 | 0.27 | % | (231 | ) | |||||||
Cirrus Logic, Inc. | 123 | 1.01 | % | (246 | ) | |||||||
Microsoft Corp. | 25 | 0.66 | % | (247 | ) | |||||||
Synopsys, Inc. | 22 | 0.77 | % | (299 | ) | |||||||
ACI Worldwide, Inc. | 91 | 0.23 | % | (318 | ) | |||||||
Applied Materials, Inc. | 75 | 0.80 | % | (681 | ) | |||||||
Total Technology | (513 | ) | ||||||||||
Industrial | ||||||||||||
Standex International Corp. | 88 | 0.99 | % | 1,146 | ||||||||
Dorian LPG Ltd. | 245 | 0.51 | % | 1,106 | ||||||||
Snap-on, Inc. | 39 | 0.98 | % | 770 | ||||||||
Louisiana-Pacific Corp. | 130 | 0.85 | % | 727 | ||||||||
Vishay Intertechnology, Inc. | 330 | 0.78 | % | 614 | ||||||||
Albany International Corp. — Class A | 84 | 0.91 | % | 590 | ||||||||
Eagle Materials, Inc. | 63 | 0.92 | % | 561 | ||||||||
Emerson Electric Co. | 91 | 0.96 | % | 508 | ||||||||
Textron, Inc. | 132 | 1.03 | % | 414 | ||||||||
Lockheed Martin Corp. | 14 | 0.75 | % | 143 | ||||||||
Advanced Energy Industries, Inc. | 67 | 0.63 | % | 140 | ||||||||
Donaldson Company, Inc. | 158 | 1.02 | % | 102 | ||||||||
OSI Systems, Inc. | 34 | 0.30 | % | 44 | ||||||||
General Dynamics Corp. | 28 | 0.76 | % | 2 | ||||||||
Otis Worldwide Corp. | 37 | 0.32 | % | (5 | ) | |||||||
AMETEK, Inc. | 29 | 0.45 | % | (93 | ) | |||||||
3M Co. | 28 | 0.37 | % | (139 | ) | |||||||
Graco, Inc. | 138 | 1.02 | % | (245 | ) | |||||||
Mueller Industries, Inc. | 82 | 0.53 | % | (271 | ) | |||||||
Sealed Air Corp. | 93 | 0.51 | % | (300 | ) | |||||||
Acuity Brands, Inc. | 34 | 0.62 | % | (510 | ) | |||||||
PGT Innovations, Inc. | 150 | 0.30 | % | (737 | ) | |||||||
164 | THE GUGGENHEIM FUNDS ANNUAL REPORT | SEE NOTES TO FINANCIAL STATEMENTS. |
SCHEDULE OF INVESTMENTS (continued) | December 31, 2022 |
SERIES Z (ALPHA OPPORTUNITY SERIES) |
| Shares | Percentage | Value and | |||||||||
Sturm Ruger & Company, Inc. | 120 | 0.67 | % | $ | (1,581 | ) | ||||||
Total Industrial | 2,986 | |||||||||||
Basic Materials | ||||||||||||
FMC Corp. | 24 | 0.33 | % | 322 | ||||||||
Westlake Corp. | 23 | 0.26 | % | 273 | ||||||||
American Vanguard Corp. | 114 | 0.27 | % | 84 | ||||||||
NewMarket Corp. | 14 | 0.48 | % | 74 | ||||||||
Olin Corp. | 76 | 0.44 | % | (169 | ) | |||||||
Ingevity Corp. | 37 | 0.29 | % | (200 | ) | |||||||
LyondellBasell Industries N.V. — Class A | 47 | 0.43 | % | (229 | ) | |||||||
AdvanSix, Inc. | 69 | 0.29 | % | (234 | ) | |||||||
Minerals Technologies, Inc. | 106 | 0.71 | % | (300 | ) | |||||||
Huntsman Corp. | 189 | 0.57 | % | (463 | ) | |||||||
Balchem Corp. | 48 | 0.64 | % | (465 | ) | |||||||
Total Basic Materials | (1,307 | ) | ||||||||||
Financial | ||||||||||||
S&T Bancorp, Inc. | 266 | 1.00 | % | 1,588 | ||||||||
Renasant Corp. | 241 | 1.00 | % | 987 | ||||||||
Preferred Bank/Los Angeles CA | 129 | 1.06 | % | 984 | ||||||||
TowneBank | 287 | 0.97 | % | 922 | ||||||||
Associated Banc-Corp. | 264 | 0.67 | % | 824 | ||||||||
PennyMac Financial Services, Inc. | 42 | 0.26 | % | 396 | ||||||||
Virtus Investment Partners, Inc. | 16 | 0.34 | % | 377 | ||||||||
Evercore, Inc. — Class A | 52 | 0.62 | % | 254 | ||||||||
NMI Holdings, Inc. — Class A | 97 | 0.22 | % | 246 | ||||||||
International Bancshares Corp. | 104 | 0.52 | % | 208 | ||||||||
Bread Financial Holdings, Inc. | 71 | 0.29 | % | 195 | ||||||||
National Bank Holdings Corp. — Class A | 218 | 1.01 | % | 192 | ||||||||
Hilltop Holdings, Inc. | 97 | 0.32 | % | 161 | ||||||||
Visa, Inc. — Class A | 12 | 0.27 | % | (86 | ) | |||||||
Marcus & Millichap, Inc. | 84 | 0.32 | % | (173 | ) | |||||||
Hope Bancorp, Inc. | 717 | 1.01 | % | (380 | ) | |||||||
BankUnited, Inc. | 112 | 0.42 | % | (450 | ) | |||||||
Heritage Financial Corp. | 304 | 1.02 | % | (988 | ) | |||||||
Central Pacific Financial Corp. | 191 | 0.43 | % | (1,054 | ) | |||||||
Stewart Information Services Corp. | 85 | 0.40 | % | (1,166 | ) | |||||||
Office Properties Income Trust | 313 | 0.46 | % | (2,291 | ) | |||||||
Total Financial | 746 | |||||||||||
Communications | ||||||||||||
Cisco Systems, Inc. | 104 | 0.54 | % | 595 | ||||||||
T-Mobile US, Inc. | 54 | 0.83 | % | 311 | ||||||||
VeriSign, Inc. | 19 | 0.43 | % | 157 | ||||||||
Alphabet, Inc. — Class C | 31 | 0.30 | % | (255 | ) | |||||||
Meta Platforms, Inc. — Class A | 51 | 0.67 | % | (683 | ) | |||||||
Gogo, Inc. | 458 | 0.74 | % | (695 | ) | |||||||
InterDigital, Inc. | 73 | 0.40 | % | (1,070 | ) | |||||||
Verizon Communications, Inc. | 220 | 0.95 | % | (1,081 | ) | |||||||
Total Communications | (2,721 | ) | ||||||||||
Consumer, Non-cyclical | ||||||||||||
Perdoceo Education Corp. | 619 | 0.95 | % | 1,977 | ||||||||
Ironwood Pharmaceuticals, Inc. — Class A | 787 | 1.07 | % | 1,153 | ||||||||
Bristol-Myers Squibb Co. | 117 | 0.93 | % | 1,030 | ||||||||
United Therapeutics Corp. | 17 | 0.52 | % | 1,002 | ||||||||
Vertex Pharmaceuticals, Inc. | 15 | 0.48 | % | 935 | ||||||||
Coca-Cola Co. | 149 | 1.04 | % | 732 | ||||||||
Regeneron Pharmaceuticals, Inc. | 3 | 0.24 | % | 714 | ||||||||
Hologic, Inc. | 126 | 1.04 | % | 711 | ||||||||
Amphastar Pharmaceuticals, Inc. | 89 | 0.27 | % | 700 | ||||||||
Jazz Pharmaceuticals plc | 31 | 0.54 | % | 635 | ||||||||
Incyte Corp. | 47 | 0.42 | % | 521 | ||||||||
Quest Diagnostics, Inc. | 63 | 1.08 | % | 460 | ||||||||
Triton International Ltd. | 85 | 0.64 | % | 459 | ||||||||
Altria Group, Inc. | 153 | 0.77 | % | 327 | ||||||||
Supernus Pharmaceuticals, Inc. | 131 | 0.51 | % | 319 | ||||||||
Eli Lilly & Co. | 5 | 0.20 | % | 276 | ||||||||
Post Holdings, Inc. | 71 | 0.70 | % | 270 | ||||||||
Innoviva, Inc. | 270 | 0.39 | % | 211 | ||||||||
Lamb Weston Holdings, Inc. | 40 | 0.39 | % | 157 | ||||||||
Prestige Consumer Healthcare, Inc. | 124 | 0.85 | % | 121 | ||||||||
Quanex Building Products Corp. | 107 | 0.28 | % | 113 | ||||||||
Globus Medical, Inc. — Class A | 66 | 0.54 | % | 91 | ||||||||
John B Sanfilippo & Son, Inc. | 115 | 1.03 | % | 1 | ||||||||
Monster Beverage Corp. | 54 | 0.60 | % | (38 | ) | |||||||
Hershey Co. | 40 | 1.02 | % | (53 | ) | |||||||
Inter Parfums, Inc. | 28 | 0.30 | % | (62 | ) | |||||||
Danaher Corp. | 28 | 0.82 | % | (93 | ) | |||||||
Gilead Sciences, Inc. | 56 | 0.53 | % | (131 | ) | |||||||
Exelixis, Inc. | 155 | 0.27 | % | (151 | ) | |||||||
SEE NOTES TO FINANCIAL STATEMENTS. | THE GUGGENHEIM FUNDS ANNUAL REPORT | 165 |
SCHEDULE OF INVESTMENTS (continued) | December 31, 2022 |
SERIES Z (ALPHA OPPORTUNITY SERIES) |
| Shares | Percentage | Value and | |||||||||
IDEXX Laboratories, Inc. | 21 | 0.94 | % | $ | (276 | ) | ||||||
Varex Imaging Corp. | 341 | 0.76 | % | (376 | ) | |||||||
Royalty Pharma plc — Class A | 176 | 0.77 | % | (569 | ) | |||||||
EVERTEC, Inc. | 174 | 0.62 | % | (580 | ) | |||||||
Eagle Pharmaceuticals, Inc. | 142 | 0.46 | % | (1,470 | ) | |||||||
Tyson Foods, Inc. — Class A | 110 | 0.75 | % | (2,410 | ) | |||||||
Vanda Pharmaceuticals, Inc. | 349 | 0.28 | % | (2,475 | ) | |||||||
USANA Health Sciences, Inc. | 131 | 0.77 | % | (2,882 | ) | |||||||
Total Consumer, Non-cyclical | 1,349 | |||||||||||
Energy | ||||||||||||
Marathon Petroleum Corp. | 82 | 1.05 | % | 1,361 | ||||||||
Exxon Mobil Corp. | 87 | 1.06 | % | 1,045 | ||||||||
Phillips 66 | 47 | 0.54 | % | 860 | ||||||||
Valero Energy Corp. | 47 | 0.66 | % | 692 | ||||||||
Antero Midstream Corp. | 844 | 1.00 | % | 574 | ||||||||
Par Pacific Holdings, Inc. | 102 | 0.26 | % | 414 | ||||||||
REX American Resources Corp. | 97 | 0.34 | % | 270 | ||||||||
Kinder Morgan, Inc. | 483 | 0.96 | % | 207 | ||||||||
ONEOK, Inc. | 33 | 0.24 | % | 192 | ||||||||
SunCoke Energy, Inc. | 348 | 0.33 | % | 156 | ||||||||
Equitrans Midstream Corp. | 335 | 0.25 | % | 4 | ||||||||
Williams Companies, Inc. | 160 | 0.58 | % | (51 | ) | |||||||
DT Midstream, Inc. | 159 | 0.97 | % | (157 | ) | |||||||
Occidental Petroleum Corp. | 57 | 0.39 | % | (411 | ) | |||||||
CVR Energy, Inc. | 146 | 0.50 | % | (526 | ) | |||||||
Total Energy | 4,630 | |||||||||||
Utilities | ||||||||||||
FirstEnergy Corp. | 229 | 1.06 | % | 1,020 | ||||||||
ONE Gas, Inc. | 69 | 0.57 | % | 189 | ||||||||
UGI Corp. | 233 | 0.95 | % | 86 | ||||||||
OGE Energy Corp. | 240 | 1.04 | % | 22 | ||||||||
National Fuel Gas Co. | 40 | 0.28 | % | 18 | ||||||||
Black Hills Corp. | 134 | 1.04 | % | 11 | ||||||||
Chesapeake Utilities Corp. | 49 | 0.64 | % | (18 | ) | |||||||
Otter Tail Corp. | 68 | 0.44 | % | (224 | ) | |||||||
Clearway Energy, Inc. — Class C | 165 | 0.58 | % | (360 | ) | |||||||
MGE Energy, Inc. | 96 | 0.74 | % | (391 | ) | |||||||
Total Utilities | 353 | |||||||||||
Total GS Equity Long Custom Basket | 8,712 | |||||||||||
GS EQUITY SHORT CUSTOM BASKET | ||||||||||||
Consumer, Non-cyclical | ||||||||||||
Viad Corp. | 271 | (0.38 | )% | 5,987 | ||||||||
ASGN, Inc. | 127 | (0.59 | )% | 5,330 | ||||||||
Equifax, Inc. | 135 | (1.51 | )% | 4,725 | ||||||||
Healthcare Services Group, Inc. | 825 | (0.57 | )% | 4,025 | ||||||||
FTI Consulting, Inc. | 109 | (0.99 | )% | 2,045 | ||||||||
CoStar Group, Inc. | 235 | (1.04 | )% | 1,700 | ||||||||
TransUnion | 408 | (1.33 | )% | 1,432 | ||||||||
Driven Brands Holdings, Inc. | 670 | (1.05 | )% | 1,376 | ||||||||
Patterson Companies, Inc. | 268 | (0.43 | )% | 688 | ||||||||
Rollins, Inc. | 215 | (0.45 | )% | 661 | ||||||||
GXO Logistics, Inc. | 172 | (0.42 | )% | 384 | ||||||||
ABM Industries, Inc. | 546 | (1.39 | )% | (317 | ) | |||||||
Quanta Services, Inc. | 67 | (0.55 | )% | (682 | ) | |||||||
Cintas Corp. | 60 | (1.56 | )% | (1,671 | ) | |||||||
ICU Medical, Inc. | 149 | (1.35 | )% | (3,231 | ) | |||||||
Total Consumer, Non-cyclical | 22,452 | |||||||||||
Utilities | ||||||||||||
AES Corp. | 329 | (0.54 | )% | (99 | ) | |||||||
Vistra Corp. | 516 | (0.69 | )% | (232 | ) | |||||||
Public Service Enterprise Group, Inc. | 450 | (1.58 | )% | (630 | ) | |||||||
Exelon Corp. | 613 | (1.52 | )% | (1,044 | ) | |||||||
Edison International | 419 | (1.53 | )% | (2,197 | ) | |||||||
Total Utilities | (4,202 | ) | ||||||||||
Basic Materials | ||||||||||||
Alcoa Corp. | 198 | (0.52 | )% | 402 | ||||||||
Freeport-McMoRan, Inc. | 265 | (0.58 | )% | 257 | ||||||||
ATI, Inc. | 277 | (0.48 | )% | 223 | ||||||||
Total Basic Materials | 882 | |||||||||||
Financial | ||||||||||||
Signature Bank | 76 | (0.50 | )% | 11,143 | ||||||||
Invitation Homes, Inc. | 475 | (0.81 | )% | 6,089 | ||||||||
Welltower, Inc. | 187 | (0.70 | )% | 4,613 | ||||||||
Sun Communities, Inc. | 192 | (1.58 | )% | 4,512 | ||||||||
Crown Castle, Inc. | 87 | (0.68 | )% | 4,101 | ||||||||
Equinix, Inc. | 32 | (1.20 | )% | 4,082 | ||||||||
Americold Realty Trust, Inc. | 489 | (0.80 | )% | 3,591 | ||||||||
Bank of America Corp. | 782 | (1.49 | )% | 3,156 | ||||||||
KKR & Company, Inc. — Class A | 355 | (0.95 | )% | 3,033 | ||||||||
Howard Hughes Corp. | 234 | (1.03 | )% | 2,863 | ||||||||
Ares Management Corp. — Class A | 289 | (1.14 | )% | 2,813 | ||||||||
Kennedy-Wilson Holdings, Inc. | 1,161 | (1.05 | )% | 2,213 | ||||||||
American Tower Corp. — Class A | 125 | (1.52 | )% | 2,086 | ||||||||
Digital Realty Trust, Inc. | 119 | (0.69 | )% | 2,067 | ||||||||
Equitable Holdings, Inc. | 876 | (1.44 | )% | 1,976 | ||||||||
Raymond James Financial, Inc. | 236 | (1.45 | )% | 1,976 | ||||||||
Ryman Hospitality Properties, Inc. | 227 | (1.07 | )% | 1,737 | ||||||||
166 | THE GUGGENHEIM FUNDS ANNUAL REPORT | SEE NOTES TO FINANCIAL STATEMENTS. |
SCHEDULE OF INVESTMENTS (continued) | December 31, 2022 |
SERIES Z (ALPHA OPPORTUNITY SERIES) |
| Shares | Percentage | Value and | |||||||||
Independence Realty Trust, Inc. | 640 | (0.62 | )% | $ | 1,705 | |||||||
Assurant, Inc. | 85 | (0.61 | )% | 1,631 | ||||||||
Host Hotels & Resorts, Inc. | 641 | (0.59 | )% | 1,085 | ||||||||
Pebblebrook Hotel Trust | 429 | (0.33 | )% | 942 | ||||||||
Kite Realty Group Trust | 1,019 | (1.23 | )% | 827 | ||||||||
Ventas, Inc. | 244 | (0.63 | )% | 763 | ||||||||
Alexandria Real Estate Equities, Inc. | 181 | (1.51 | )% | 743 | ||||||||
Wells Fargo & Co. | 237 | (0.56 | )% | 714 | ||||||||
KeyCorp | 1,161 | (1.16 | )% | 700 | ||||||||
Northern Trust Corp. | 305 | (1.55 | )% | 589 | ||||||||
UDR, Inc. | 674 | (1.50 | )% | 513 | ||||||||
Principal Financial Group, Inc. | 94 | (0.45 | )% | 488 | ||||||||
Kimco Realty Corp. | 902 | (1.10 | )% | 388 | ||||||||
Iron Mountain, Inc. | 431 | (1.23 | )% | 337 | ||||||||
Citigroup, Inc. | 414 | (1.08 | )% | 174 | ||||||||
Cboe Global Markets, Inc. | 82 | (0.59 | )% | 152 | ||||||||
Willis Towers Watson plc | 55 | (0.77 | )% | 148 | ||||||||
Cullen/Frost Bankers, Inc. | 64 | (0.49 | )% | (139 | ) | |||||||
Progressive Corp. | 209 | (1.56 | )% | (220 | ) | |||||||
Cincinnati Financial Corp. | 78 | (0.46 | )% | (314 | ) | |||||||
American International Group, Inc. | 194 | (0.70 | )% | (356 | ) | |||||||
TFS Financial Corp. | 737 | (0.61 | )% | (509 | ) | |||||||
Intercontinental Exchange, Inc. | 162 | (0.95 | )% | (646 | ) | |||||||
BlackRock, Inc. — Class A | 22 | (0.90 | )% | (799 | ) | |||||||
Arthur J Gallagher & Co. | 52 | (0.56 | )% | (1,003 | ) | |||||||
CBRE Group, Inc. — Class A | 180 | (0.80 | )% | (1,290 | ) | |||||||
First Republic Bank | 162 | (1.13 | )% | (1,374 | ) | |||||||
Invesco Ltd. | 969 | (1.00 | )% | (1,436 | ) | |||||||
Allstate Corp. | 172 | (1.34 | )% | (1,547 | ) | |||||||
Apollo Global Management, Inc. | 421 | (1.54 | )% | (2,086 | ) | |||||||
Total Financial | 62,231 | |||||||||||
Consumer, Cyclical | ||||||||||||
MillerKnoll, Inc. | 468 | (0.56 | )% | 7,593 | ||||||||
CarMax, Inc. | 165 | (0.58 | )% | 3,712 | ||||||||
American Airlines Group, Inc. | 690 | (0.50 | )% | 3,631 | ||||||||
Hawaiian Holdings, Inc. | 615 | (0.36 | )% | 2,090 | ||||||||
Live Nation Entertainment, Inc. | 147 | (0.59 | )% | 587 | ||||||||
Floor & Decor Holdings, Inc. — Class A | 93 | (0.37 | )% | 502 | ||||||||
Delta Air Lines, Inc. | 685 | (1.29 | )% | (219 | ) | |||||||
Walgreens Boots Alliance, Inc. | 432 | (0.93 | )% | (309 | ) | |||||||
Copart, Inc. | 414 | (1.45 | )% | (821 | ) | |||||||
Madison Square Garden Sports Corp. — Class A | 61 | (0.64 | )% | (2,601 | ) | |||||||
Total Consumer, Cyclical | 14,165 | |||||||||||
Industrial | ||||||||||||
Stanley Black & Decker, Inc. | 124 | (0.54 | )% | 5,710 | ||||||||
Stericycle, Inc. | 129 | (0.37 | )% | 3,132 | ||||||||
Waste Management, Inc. | 163 | (1.47 | )% | 2,146 | ||||||||
TD SYNNEX Corp. | 277 | (1.51 | )% | 961 | ||||||||
Kirby Corp. | 141 | (0.52 | )% | 614 | ||||||||
Jacobs Solutions, Inc. | 225 | (1.55 | )% | 275 | ||||||||
J.B. Hunt Transport Services, Inc. | 43 | (0.43 | )% | (177 | ) | |||||||
Norfolk Southern Corp. | 39 | (0.55 | )% | (562 | ) | |||||||
TransDigm Group, Inc. | 9 | (0.33 | )% | (737 | ) | |||||||
FedEx Corp. | 52 | (0.52 | )% | (948 | ) | |||||||
Boeing Co. | 49 | (0.54 | )% | (1,243 | ) | |||||||
MSA Safety, Inc. | 156 | (1.29 | )% | (3,399 | ) | |||||||
Casella Waste Systems, Inc. — Class A | 213 | (0.97 | )% | (3,630 | ) | |||||||
Total Industrial | 2,142 | |||||||||||
Energy | ||||||||||||
NOV, Inc. | 501 | (0.60 | )% | 1,133 | ||||||||
Helmerich & Payne, Inc. | 177 | (0.50 | )% | (59 | ) | |||||||
Patterson-UTI Energy, Inc. | 789 | (0.76 | )% | (164 | ) | |||||||
Halliburton Co. | 729 | (1.65 | )% | (887 | ) | |||||||
Liberty Energy, Inc. — Class A | 603 | (0.55 | )% | (1,283 | ) | |||||||
ChampionX Corp. | 185 | (0.31 | )% | (1,297 | ) | |||||||
Hess Corp. | 120 | (0.98 | )% | (1,836 | ) | |||||||
Valaris Ltd. | 198 | (0.77 | )% | (3,295 | ) | |||||||
Schlumberger Ltd. | 248 | (0.76 | )% | (3,805 | ) | |||||||
EOG Resources, Inc. | 194 | (1.44 | )% | (4,416 | ) | |||||||
Total Energy | (15,909 | ) | ||||||||||
Communications | ||||||||||||
IAC, Inc. | 288 | (0.73 | )% | 3,218 | ||||||||
Walt Disney Co. | 225 | (1.12 | )% | 2,577 | ||||||||
Warner Bros Discovery, Inc. | 927 | (0.50 | )% | 2,093 | ||||||||
Paramount Global — Class B | 576 | (0.56 | )% | 1,557 | ||||||||
Uber Technologies, Inc. | 556 | (0.79 | )% | 647 | ||||||||
Interpublic Group of Companies, Inc. | 561 | (1.07 | )% | (2,334 | ) | |||||||
Total Communications | 7,758 | |||||||||||
Technology | ||||||||||||
Take-Two Interactive Software, Inc. | 169 | (1.01 | )% | 501 | ||||||||
Science Applications International Corp. | 206 | (1.31 | )% | (331 | ) | |||||||
Total Technology | 170 | |||||||||||
Total GS Equity Short Custom Basket | 89,689 | |||||||||||
SEE NOTES TO FINANCIAL STATEMENTS. | THE GUGGENHEIM FUNDS ANNUAL REPORT | 167 |
SCHEDULE OF INVESTMENTS (concluded) | December 31, 2022 |
SERIES Z (ALPHA OPPORTUNITY SERIES) |
* | Non-income producing security. |
† | Value determined based on Level 1 inputs — See Note 4. |
†† | Value determined based on Level 2 inputs — See Note 4. |
1 | All or a portion of this security is pledged as equity index swap collateral at December 31, 2022. |
2 | Rate indicated is the 7-day yield as of December 31, 2022. |
GS — Goldman Sachs International | |
MS — Morgan Stanley Capital Services LLC | |
plc — Public Limited Company | |
REIT — Real Estate Investment Trust | |
See Sector Classification in Other Information section. |
The following table summarizes the inputs used to value the Fund’s investments at December 31, 2022 (See Note 4 in the Notes to Financial Statements):
Investments in Securities (Assets) | Level 1 | Level 2 | Level 3 | Total | ||||||||||||
Common Stocks | $ | 3,428,329 | $ | — | $ | — | $ | 3,428,329 | ||||||||
Money Market Fund | 48,920 | — | — | 48,920 | ||||||||||||
Equity Custom Basket Swap Agreements** | — | 194,967 | — | 194,967 | ||||||||||||
Total Assets | $ | 3,477,249 | $ | 194,967 | $ | — | $ | 3,672,216 | ||||||||
** | This derivative is reported as unrealized appreciation/depreciation at period end. |
168 | THE GUGGENHEIM FUNDS ANNUAL REPORT | SEE NOTES TO FINANCIAL STATEMENTS. |
SERIES Z (ALPHA OPPORTUNITY SERIES) |
STATEMENT OF ASSETS AND LIABILITIES |
December 31, 2022 |
Assets: | ||||
Investments, at value (cost $3,508,732) | $ | 3,477,249 | ||
Unrealized appreciation on OTC swap agreements | 194,967 | |||
Prepaid expenses | 2,152 | |||
Receivables: | ||||
Investment Adviser | 12,430 | |||
Dividends | 4,859 | |||
Interest | 259 | |||
Total assets | 3,691,916 | |||
Liabilities: | ||||
Overdraft due to custodian bank | 527 | |||
Payable for: | ||||
Professional fees | 29,484 | |||
Transfer agent/maintenance fees | 2,040 | |||
Swap settlement | 1,443 | |||
Fund accounting/administration fees | 1,300 | |||
Trustees’ fees* | 974 | |||
Distribution and service fees | 762 | |||
Fund shares redeemed | 302 | |||
Miscellaneous | 3,918 | |||
Total liabilities | 40,750 | |||
Net assets | $ | 3,651,166 | ||
Net assets consist of: | ||||
Paid in capital | $ | 5,021,884 | ||
Total distributable earnings (loss) | (1,370,718 | ) | ||
Net assets | $ | 3,651,166 | ||
Capital shares outstanding | 239,034 | |||
Net asset value per share | $ | 15.27 | ||
STATEMENT OF OPERATIONS |
Year Ended December 31, 2022 |
Investment Income: | ||||
Dividends | $ | 81,156 | ||
Interest | 1,352 | |||
Other income | 82 | |||
Total investment income | 82,590 | |||
Expenses: | ||||
Management fees | 35,181 | |||
Distribution and service fees | 9,747 | |||
Transfer agent/maintenance fees | 25,091 | |||
Professional fees | 42,954 | |||
Fund accounting/administration fees | 22,229 | |||
Custodian fees | 12,897 | |||
Trustees’ fees* | 11,413 | |||
Line of credit fees | 108 | |||
Miscellaneous | 13,540 | |||
Total expenses | 173,160 | |||
Less: | ||||
Expenses reimbursed by Adviser | (59,659 | ) | ||
Expenses waived by Adviser | (35,552 | ) | ||
Total waived/reimbursed expenses | (95,211 | ) | ||
Net expenses | 77,949 | |||
Net investment income | 4,641 | |||
Net Realized and Unrealized Gain (Loss): | ||||
Net realized gain (loss) on: | ||||
Investments | (231,203 | ) | ||
Swap agreements | 32,877 | |||
Net realized loss | (198,326 | ) | ||
Net change in unrealized appreciation (depreciation) on: | ||||
Investments | (321,360 | ) | ||
Swap agreements | 139,551 | |||
Net change in unrealized appreciation (depreciation) | (181,809 | ) | ||
Net realized and unrealized loss | (380,135 | ) | ||
Net decrease in net assets resulting from operations | $ | (375,494 | ) | |
* | Relates to Trustees not deemed “interested persons” within the meaning of Section 2(a)(19) of the 1940 Act. |
SEE NOTES TO FINANCIAL STATEMENTS. | THE GUGGENHEIM FUNDS ANNUAL REPORT | 169 |
SERIES Z (ALPHA OPPORTUNITY SERIES) |
STATEMENTS OF CHANGES IN NET ASSETS |
| Year Ended | Year Ended | ||||||
Increase (Decrease) in Net Assets from Operations: | ||||||||
Net investment income | $ | 4,641 | $ | 15,946 | ||||
Net realized gain (loss) on investments | (198,326 | ) | 228,457 | |||||
Net change in unrealized appreciation (depreciation) on investments | (181,809 | ) | 331,685 | |||||
Net increase (decrease) in net assets resulting from operations | (375,494 | ) | 576,088 | |||||
Distributions to shareholders | (15,376 | ) | (28,089 | ) | ||||
Capital share transactions: | ||||||||
Proceeds from sale of shares | 107,955 | 50,760 | ||||||
Distributions reinvested | 15,376 | 28,089 | ||||||
Cost of shares redeemed | (576,477 | ) | (667,050 | ) | ||||
Net decrease from capital share transactions | (453,146 | ) | (588,201 | ) | ||||
Net decrease in net assets | (844,016 | ) | (40,202 | ) | ||||
Net assets: | ||||||||
Beginning of year | 4,495,182 | 4,535,384 | ||||||
End of year | $ | 3,651,166 | $ | 4,495,182 | ||||
Capital share activity: | ||||||||
Shares sold | 6,933 | 3,202 | ||||||
Shares issued from reinvestment of distributions | 988 | 1,805 | ||||||
Shares redeemed | (37,088 | ) | (42,689 | ) | ||||
Net decrease in shares | (29,167 | ) | (37,682 | ) | ||||
170 | THE GUGGENHEIM FUNDS ANNUAL REPORT | SEE NOTES TO FINANCIAL STATEMENTS. |
SERIES Z (ALPHA OPPORTUNITY SERIES) |
FINANCIAL HIGHLIGHTS |
This table is presented to show selected data for a share outstanding throughout each period and to assist shareholders in evaluating a Fund’s performance for the periods presented.
| Year Ended | Year Ended | Year Ended | Year Ended | Year Ended | |||||||||||||||
Per Share Data | ||||||||||||||||||||
Net asset value, beginning of period | $ | 16.76 | $ | 14.83 | $ | 14.87 | $ | 15.27 | $ | 20.05 | ||||||||||
Income (loss) from investment operations: | ||||||||||||||||||||
Net investment income (loss)a | .02 | .06 | .06 | .07 | .04 | |||||||||||||||
Net gain (loss) on investments (realized and unrealized) | (1.45 | ) | 1.97 | (.01 | ) | (.45 | ) | (2.28 | ) | |||||||||||
Total from investment operations | (1.43 | ) | 2.03 | .05 | (.38 | ) | (2.24 | ) | ||||||||||||
Less distributions from: | ||||||||||||||||||||
Net investment income | (.06 | ) | (.10 | ) | (.09 | ) | (.02 | ) | — | |||||||||||
Net realized gains | — | — | — | — | (2.54 | ) | ||||||||||||||
Total distributions | (.06 | ) | (.10 | ) | (.09 | ) | (.02 | ) | (2.54 | ) | ||||||||||
Net asset value, end of period | $ | 15.27 | $ | 16.76 | $ | 14.83 | $ | 14.87 | $ | 15.27 | ||||||||||
| ||||||||||||||||||||
Total Returnb | (8.53 | %) | 13.81 | % | 0.27 | % | (2.45 | %) | (11.57 | %) | ||||||||||
Ratios/Supplemental Data | ||||||||||||||||||||
Net assets, end of period (in thousands) | $ | 3,651 | $ | 4,495 | $ | 4,535 | $ | 6,229 | $ | 8,056 | ||||||||||
Ratios to average net assets: | ||||||||||||||||||||
Net investment income (loss) | 0.12 | % | 0.35 | % | 0.41 | % | 0.44 | % | 0.22 | % | ||||||||||
Total expensesc | 4.43 | % | 4.58 | % | 3.98 | % | 3.52 | % | 2.47 | % | ||||||||||
Net expensesd,e | 1.99 | % | 2.01 | % | 2.01 | % | 2.00 | % | 1.99 | % | ||||||||||
Portfolio turnover rate | 294 | % | 204 | % | 171 | % | 172 | % | 219 | % | ||||||||||
a | Net investment income (loss) per share was computed using average shares outstanding throughout the period. |
b | Total return does not take into account any of the expenses associated with an investment in variable insurance products. If total return had taken into account these expenses, performance would have been lower. Shares of a series of Guggenheim Variable Funds Trust are available only through the purchase of such products. |
c | Does not include expenses of the underlying funds in which the Fund invests. |
d | Net expense information reflects the expense ratios after expense waivers and reimbursements, as applicable. |
e | Net expenses may include expenses that are excluded from the expense limitation agreement. Excluding these expenses, the net expense ratios for the years presented would be: |
12/31/22 | 12/31/21 | 12/31/20 | 12/31/19 | 12/31/18 | |
1.99% | 2.00% | 2.00% | 2.00% | 1.99% |
SEE NOTES TO FINANCIAL STATEMENTS. | THE GUGGENHEIM FUNDS ANNUAL REPORT | 171 |
NOTES TO FINANCIAL STATEMENTS |
Note 1 – Organization and Significant Accounting Policies
Organization
Guggenheim Variable Funds Trust (the “Trust”), a Delaware statutory trust, is registered with the SEC under the Investment Company Act of 1940 (“1940 Act”), as an open-ended investment company of the series type. Each series, in effect, is representing a separate fund (each, a “Fund”). The Trust may issue an unlimited number of authorized shares. The Trust accounts for the assets of each Fund separately. At December 31, 2022, the Trust consisted of fourteen funds.The Trust offers shares of the funds to insurance companies for their variable annunity and variable life insurance contracts.
This report covers the following funds (collectively, the “Funds”):
Fund Name | Investment |
Series A (StylePlus—Large Core Series) | Diversified |
Series B (Large Cap Value Series) | Diversified |
Series D (World Equity Income Series) | Diversified |
Series E (Total Return Bond Series) | Diversified |
Series F (Floating Rate Strategies Series) | Diversified |
Series J (StylePlus—Mid Growth Series) | Diversified |
Series N (Managed Asset Allocation Series) | Diversified |
Series O (All Cap Value Series) | Diversified |
Series P (High Yield Series) | Diversified |
Series Q (Small Cap Value Series) | Diversified |
Series V (SMid Cap Value Series) | Diversified |
Series X (StylePlus—Small Growth Series) | Diversified |
Series Y (StylePlus—Large Growth Series) | Diversified |
Series Z (Alpha Opportunity Series) | Diversified |
Security Investors, LLC (“SI” or the “Adviser”) and Guggenheim Partners Investment Management, LLC (“GPIM” or the “Adviser”), which operates under the name Guggenheim Investments (“GI”), provides advisory services. GPIM provides advisory services to Series F (Floating Rate Strategies Series) and SI provides advisory services to the remaining Funds covered in this report. Guggenheim Funds Distributors, LLC (“GFD”) acts as principal underwriter for the Trust. GI and GFD are affiliated entities.
Pursuant to an investment Sub-Advisory Agreement between Security Investors, LLC (“SI”) and Guggenheim Partners Advisors, LLC (“GPA”), that was in effect during a portion of the Reporting Period, GPA was engaged to provide investment subadvisory services to Series E (Total Return Bond Series) (“Series E”) and Series P (High Yield Series) (“Series P”). Pursuant to an investment Sub-Advisory Agreement between GPIM and GPA that was in effect during a portion of the Reporting Period, GPA was engaged to provide investment sub-advisory services to Series F (Floating Rate Strategies Series) (“Series F”). GPA operated as an investment sub-advisor to these Funds from April 29, 2022 to December 22, 2022.
GPA, under the oversight of the Board, SI and GPIM, assisted SI and GPIM, as applicable, in the supervision and direction of the investment strategies of Series E, Series F and Series P in accordance with their investment policies. As compensation for its services, SI and GPIM, as applicable, paid GPA a fee, payable monthly, in an amount equal to 0.005% of the average daily net assets of Series E, Series F and Series P.
Significant Accounting Policies
The Funds operate as investment companies and, accordingly, follow the investment company accounting and reporting guidance of the Financial Accounting Standards Board (“FASB”) Accounting Standards Codification Topic 946 Financial Services – Investment Companies.
The following significant accounting policies are in conformity with U.S. generally accepted accounting principles (“U.S. GAAP”) and are consistently followed by the Trust. This requires management to make estimates and assumptions that affect the reported amount of assets and liabilities, contingent assets and liabilities at the date of the financial statements, and the reported amounts of revenues and expenses during the reporting period. Actual results could differ from these estimates. All time references are based on Eastern Time.
The net asset value per share (“NAV”) of a fund is calculated by dividing the market value of a fund’s securities and other assets, less all liabilities, by the number of outstanding shares of that fund.
(a) Valuation of Investments
The Board of Trustees of the Funds (the “Board”) adopted policies and procedures for the valuation of the Funds’ investments (the “Valuation Procedures”). The U.S. Securities and Exchange Commission (the “SEC”) adopted Rule 2a-5 under the 1940 Act (“Rule 2a-5”) which establishes requirements for determining fair value in good faith and became effective September 8, 2022. Rule 2a-5 also defines “readily available market quotations” for purposes of the 1940 Act and establishes requirements for determining whether a fund must fair value a security in good faith.
Pursuant to Rule 2a-5, the Board has designated the Adviser as the valuation designee to perform fair valuation determinations for the Funds with respect to all Fund investments and/or other assets. As the Funds’ valuation designee pursuant to Rule 2a-5, the Adviser has adopted separate procedures (the “Valuation Designee Procedures”) reasonably designed to prevent violations of the requirements of Rule 2a-5 and Rule 31a-4. The Adviser, in its role as valuation designee, utilizes the assistance of a valuation committee, consisting of representatives from Guggenheim’s investment management, fund administration,
172 | THE GUGGENHEIM FUNDS ANNUAL REPORT |
NOTES TO FINANCIAL STATEMENTS (continued) |
legal and compliance departments (the “Valuation Committee”), in determining the fair value of the Funds’ securities and/or other assets.
Valuations of the Funds’ securities and other assets are supplied primarily by pricing services appointed pursuant to the processes set forth in the Valuation Procedures. The Adviser, with the assistance of the Valuation Committee convenes monthly, or more frequently as needed, to review the valuation of all assets which have been fair valued for reasonableness. The Adviser, consistent with the monitoring and review responsibilities set forth in the Valuation Designee Procedures, regularly reviews the appropriateness of the inputs, methods, models and assumptions employed by the pricing services.
If the pricing service cannot or does not provide a valuation for a particular investment or such valuation is deemed unreliable, such investment is fair valued by the Adviser.
Equity securities listed or traded on a recognized U.S. securities exchange or the National Association of Securities Dealers Automated Quotations (“NASDAQ”) National Market System shall generally be valued on the basis of the last sale price on the primary U.S. exchange or market on which the security is listed or traded; provided, however, that securities listed on NASDAQ will be valued at the NASDAQ official closing price, which may not necessarily represent the last sale price.
Generally, trading in foreign securities markets is substantially completed each day at various times prior to the close of the New York Stock Exchange (“NYSE”). The values of foreign securities are determined as of the close of such foreign markets or the close of the NYSE, if earlier. All investments quoted in foreign currencies are valued in U.S. dollars on the basis of the foreign currency exchange rates prevailing at the close of U.S. business at 4:00 p.m. Investments in foreign securities may involve risks not present in domestic investments. The Adviser will determine the current value of such foreign securities by taking into consideration certain factors which may include those discussed above, as well as the following factors, among others: the value of the securities traded on other foreign markets, ADR trading, closed-end fund trading, foreign currency exchange activity, and the trading prices of financial products that are tied to foreign securities. In addition, under the Valuation Designee Procedures, the Adviser is authorized to use prices and other information supplied by a third party pricing vendor in valuing foreign securities.
Open-end investment companies are valued at their NAV as of the close of business, on the valuation date. Exchange-traded funds and closed-end investment companies are generally valued at the last quoted sale price.
U.S. Government securities are valued by independent pricing services, the last traded fill price, or at the reported bid price at the close of business.
Commercial paper and discount notes with a maturity of greater than 60 days at acquisition are valued at prices that reflect broker-dealer supplied valuations or are obtained from independent pricing services, which may consider the trade activity, treasury spreads, yields or price of bonds of comparable quality, coupon, maturity, and type, as well as prices quoted by dealers who make markets in such securities. Commercial paper and discount notes with a maturity of 60 days or less at acquisition are valued at amortized cost, unless the Adviser concludes that amortized cost does not represent the fair value of the applicable asset in which case it will be valued using an independent pricing service.
Repurchase agreements are generally valued at amortized cost, provided such amounts approximate market value.
CLOs, CDOs, MBS, ABS, and other structured finance securities are generally valued using a pricing service.
Typically, loans are valued using information provided by an independent third party pricing service that uses broker quotes, among other inputs. If the pricing service cannot or does not provide a valuation for a particular loan, or such valuation is deemed unreliable, such investment is valued based on a quote from a broker-dealer or is fair valued by the Adviser.
Exchange-traded options are valued at the mean of the bid and ask prices on the principal exchange on which they are traded. Over-the-counter (“OTC”) options are valued using a price provided by a pricing service.
The value of futures contracts are valued on the basis of the last sale price at the 4:00 p.m. price on the valuation date. In the event that the exchange for a specific futures contract closes earlier than 4:00 p.m., the futures contract is valued at the official settlement price of the exchange. However, the underlying securities from which the futures contract value is derived are monitored until 4:00 p.m. to determine if fair valuation would provide a more accurate valuation.
The value of interest rate swap agreements entered into by a Fund is valued on the basis of the last sale price on the primary exchange on which the swap is traded.
The value of swap agreements entered into by a Fund is generally valued using an evaluated price provided by a third party pricing vendor.
THE GUGGENHEIM FUNDS ANNUAL REPORT | 173 |
NOTES TO FINANCIAL STATEMENTS (continued) |
Forward foreign currency exchange contracts are valued daily based on the applicable exchange rate of the underlying currency.
Investments for which market quotations are not readily available are fair-valued as determined in good faith by the Adviser. Valuations in accordance with these methods are intended to reflect each security’s (or asset’s or liability’s) “fair value”. Each such determination is based on a consideration of all relevant factors, which are likely to vary from one pricing context to another. Examples of such factors may include, but are not limited to market prices; sale prices; broker quotes; and models which derive prices based on inputs such as prices of securities with comparable maturities and characteristics, or based on inputs such as anticipated cash flows or collateral, spread over U.S. Treasury securities, and other information analysis. In connection with futures contracts and other derivative investments, such factors may include obtaining information as to how (a) these contracts and other derivative investments trade in the futures or other derivative markets, respectively, and (b) the securities underlying these contracts and other derivative investments trade in the cash market.
(b) U.S. Government and Agency Obligations
Certain U.S. Government and Agency Obligations are traded on a discount basis; the interest rates shown on the Schedules of Investments reflect the effective rates paid at the time of purchase by the Funds. Other securities bear interest at the rates shown, payable at fixed dates through maturity.
(c) Senior Floating Rate Interests and Loan Investments
Senior floating rate interests in which the Trust invests generally pay interest rates which are periodically adjusted by reference to a base short-term floating rate, plus a premium. These base lending rates are generally (i) the lending rate offered by one or more major European banks, such as the one-month or three-month London Inter-Bank Offered Rate (“LIBOR”), (ii) the prime rate offered by one or more major United States banks, or (iii) the bank’s certificate of deposit rate. Senior floating rate interests often require prepayments from excess cash flows or permit the borrower to repay at its election. The rate at which the borrower repays cannot be predicted with accuracy. As a result, the actual remaining maturity may be substantially less than the stated maturities disclosed in the Funds’ Schedules of Investments.
The Funds invest in loans and other similar debt obligations (“obligations”). A portion of the Funds’ investments in these obligations is sometimes referred to as “covenant lite” loans or obligations (“covenant lite obligations”), which are obligations that lack covenants or possess fewer or less restrictive covenants or constraints on borrowers than certain other types of obligations. The Funds may also obtain exposure to covenant lite obligations through investment in securitization vehicles and other structured products. In recent market conditions, many new or reissued obligations have not featured traditional covenants, which are intended to protect lenders and investors by (i) imposing certain restrictions or other limitations on a borrower’s operations or assets or (ii) providing certain rights to lenders. The Funds may have fewer rights with respect to covenant lite obligations, including fewer protections against the possibility of default and fewer remedies in the event of default. As a result, investments in (or exposure to) covenant lite obligations are subject to more risk than investments in (or exposure to) certain other types of obligations. The Funds are subject to other risks associated with investments in (or exposure to) obligations, including that obligations may not be considered “securities” and, as a result, the Funds may not be entitled to rely on the anti-fraud protections under the federal securities laws and instead may have to resort to state law and direct claims.
(d) Interest on When-Issued Securities
The Funds may purchase and sell interests in securities on a when-issued and delayed delivery basis, with payment and delivery scheduled for a future date. No income accrues to the Funds on such interests or securities in connection with such transactions prior to the date the Funds actually take delivery of such interests or securities. These transactions are subject to market fluctuations and are subject to the risk that the value at delivery may be more or less than the trade date purchase price. Although the Funds will generally purchase these securities with the intention of acquiring such securities, they may sell such securities before the settlement date.
(e) Short Sales
When a Fund engages in a short sale of a security, an amount equal to the proceeds is reflected as an asset and an equivalent liability. The amount of the liability is subsequently marked-to-market to reflect the market value of the short sale.
Fees, if any, paid to brokers to borrow securities in connection with short sales are recorded as interest expense. In addition, the Fund must pay out the dividend rate of the equity or coupon rate of the obligation to the lender and record this as an expense. Short dividend or interest expense is a cost associated with the investment objective of short sales transactions, rather than an operational cost associated with the day-to-day management of any mutual fund. The Fund may also receive rebate income from the broker resulting from the investment of the proceeds from securities sold short.
(f) Options
Upon the purchase of an option, the premium paid is recorded as an investment, the value of which is marked-to-market daily. If a purchased option expires, the Fund realizes a loss in the amount
174 | THE GUGGENHEIM FUNDS ANNUAL REPORT |
NOTES TO FINANCIAL STATEMENTS (continued) |
of the cost of the option. When the Fund enters into a closing sale transaction, it realizes a gain or loss depending on whether the proceeds from the closing sale transaction are greater or less than the cost of the option. If the Fund exercises a put option, it realizes a gain or loss from the sale of the underlying security and the proceeds from such sale will be decreased by the premium originally paid. When the Fund exercises a call option, the cost of the security purchased by the Fund upon exercise increases by the premium originally paid.
When the Fund writes (sells) an option, an amount equal to the premium received is entered in that Fund’s accounting records as an asset and equivalent liability. The amount of the liability is subsequently marked-to-market to reflect the current value of the option written. When a written option expires, or if the Fund enters into a closing purchase transaction, it realizes a gain (or loss if the cost of a closing purchase transaction exceeds the premium received when the option was sold).
The Fund may purchase and write options on swaps (“swaptions”) primarily to preserve a return or spread on a particular investment or portion of the Funds’ holdings, as a duration management technique or to protect against an increase in the price of securities in anticipates purchasing at a later date. The purchaser and writer of a swaption is buying or granting the right to enter into a previously agreed upon interest rate swap agreement at any time before the expiration of the options. The swaptions are forward premium swaptions which have extended settlement dates.
(g) Futures Contracts
Upon entering into a futures contract, a Fund deposits and maintains as collateral such initial margin as required by the exchange on which the transaction is affected. Pursuant to the contract, the Fund agrees to receive from or pay to the broker an amount of cash equal to the daily fluctuation in value of the contract. Such receipts or payments are known as variation margin and are recorded by the Fund as unrealized appreciation or depreciation. When the contract is closed, the Fund records a realized gain or loss equal to the difference between the value of the contract at the time it was opened and the value at the time it was closed.
(h) Swap Agreements
Swap agreements are marked-to-market daily and the change, if any, is recorded as unrealized appreciation or depreciation. Payments received or made as a result of an agreement or termination of an agreement are recognized as realized gains or losses.
Upon entering into certain centrally-cleared swap transactions, a Fund is required to deposit with its clearing broker an amount of cash or securities as an initial margin. Subsequent variation margin receipts or payments are received or made by the Fund depending on fluctuations in the fair value of the reference entity and are recorded by the Fund as unrealized appreciation or depreciation. When the contract is closed, the Fund records a realized gain or loss equal to the difference between the value of the contract at the time it was opened and the value at the time it was closed.
Upfront payments received or made by a Fund on credit default swap agreements and interest rate swap agreements are amortized over the expected life of the agreement. Periodic payments received or paid by a Fund are recorded as realized gains or losses. Payments received or made as a result of a credit event or termination of the contract are recognized, net of a proportional amount of the upfront payment, as realized gains or losses.
(i) Forward Foreign Currency Exchange Contracts
The change in value of a forward foreign currency exchange contract is recorded as unrealized appreciation or depreciation until the contract is closed. When the contract is closed, the Funds record a realized gain or loss equal to the difference between the value at the time the contract was opened and the value at the time it was closed.
(j) Currency Translations
The accounting records of the Funds are maintained in U.S. dollars. All assets and liabilities initially expressed in foreign currencies are converted into U.S. dollars at prevailing exchange rates. Purchases and sales of investment securities, dividend and interest income, and certain expenses are translated at the rates of exchange prevailing on the respective dates of such transactions. Changes in the relationship of these foreign currencies to the U.S. dollar can significantly affect the value of the investments and earnings of the Funds. Foreign investments may also subject the Funds to foreign government exchange restrictions, expropriation, taxation, or other political, social or economic developments, all of which could affect the market and/or credit risk of the investments.
The Funds do not isolate that portion of the results of operations resulting from changes in the foreign exchange rates on investments from the fluctuations arising from changes in the market prices of securities held. Such fluctuations are included with the net realized gain or loss and unrealized appreciation or depreciation on investments.
Reported net realized foreign exchange gains and losses arise from sales of foreign currencies and currency gains or losses realized between the trade and settlement dates on investment transactions. Net unrealized appreciation and depreciation arise from changes in the fair values of assets and liabilities other than investments in securities at the fiscal period end, resulting from changes in exchange rates.
THE GUGGENHEIM FUNDS ANNUAL REPORT | 175 |
NOTES TO FINANCIAL STATEMENTS (continued) |
(k) Foreign Taxes
The Funds may be subject to foreign taxes (a portion of which may be reclaimable) on income, stock dividends, capital gains on investments or certain foreign currency transactions. All foreign taxes are recorded in accordance with the applicable foreign tax regulations and rates that exist in the foreign jurisdictions in which the Funds invest. These foreign taxes, if any, are paid by the Funds and reflected in their Statements of Operations as follows: foreign taxes withheld at source are presented as a reduction of income and foreign taxes on capital gains from sales of investments are included with the net realized gain (loss) on investments. Foreign taxes payable or deferred as of December 31, 2022, if any, are disclosed in the Funds’ Statements of Assets and Liabilities.
(l) Security Transactions
Security transactions are recorded on the trade date for financial reporting purposes. Realized gains and losses from securities transactions are recorded using the identified cost basis. Proceeds from lawsuits related to investment holdings are recorded as a reduction to cost if the securities are still held and as realized gains if no longer held in the respective Fund. Dividend income is recorded on the ex-dividend date, net of applicable taxes withheld by foreign countries, if any. Taxable non-cash dividends are recorded as dividend income. Interest income, including amortization of premiums and accretion of discounts, is accrued on a daily basis. Interest income also includes paydown gains and losses on mortgage-backed and asset-backed securities and senior and subordinated loans. Amendment fees are earned as compensation for evaluating and accepting changes to the original loan agreement and are recognized when received. Dividend income from Real Estate Investment Trusts (“REITs”) is recorded based on the income included in the distributions received from the REIT investments using published REIT classifications, including some management estimates when actual amounts are not available. Distributions received in excess of this estimated amount are recorded as a reduction of the cost of investments or reclassified to realized gains. The actual amounts of income, return of capital, and realized gains are only determined by each REIT after its fiscal year-end, and may differ from the estimated amounts.
Income from residual collateralized loan obligations is recognized using the effective interest method. At the time of purchase, management estimates the future expected cash flows and determines the effective yield and estimated maturity date based on the estimated cash flows. Subsequent to the purchase, the estimated cash flows are updated periodically and a revised yield is calculated prospectively.
Certain Funds may receive other income from investments in senior loan interests including amendment fees, consent fees and commitment fees. For funded loans, these fees are recorded as income when received by the Funds and included in interest income on the Statements of Operations. For unfunded loans, commitment fees are included in realized gain on investments on the Statement of Operations at the end of the commitment period.
(m) Distributions
Distributions of net investment income and net realized gains, if any, are declared and paid at least annually. Normally, all distributions of a Fund will automatically be reinvested without charge in additional shares of the same Fund. Distributions are recorded on the ex-dividend date and are determined in accordance with U.S. federal income tax regulations which may differ from U.S. GAAP.
(n) Expenses
Expenses directly attributable to a Fund are charged directly to the Fund. Other expenses common to various funds within the fund complex are generally allocated amongst such funds on the basis of average net assets.
(o) Earnings Credits
Under the fee arrangement with the custodian, the Funds may earn credits based on overnight custody cash balances. These credits are utilized to reduce related custodial expenses. The custodian fees disclosed in the Statements of Operations are before the reduction in expense from the related earnings credits, if any. Earnings credits for the year ended December 31, 2022, are disclosed in the Statements of Operations.
(p) Cash
The Funds may leave cash overnight in their cash account with the custodian. Periodically, a Fund may have cash due to the custodian bank as an overdraft balance. A fee is incurred on this overdraft, calculated by multiplying the overdraft by a rate based on the federal funds rate, which was 4.33% at December 31, 2022.
(q) Indemnifications
Under the Funds’ organizational documents, the Trustees and Officers are indemnified against certain liabilities arising out of the performance of their duties to the Trust. In addition, throughout the normal course of business, the Funds enter into contracts that contain a variety of representations and warranties which provide general indemnifications. The Funds’ maximum exposure under these arrangements is unknown, as this would involve future claims that may be made against the Funds and/or their affiliates that have not yet occurred. However, based on experience, the Funds expect the risk of loss to be remote.
(r) Special Purpose Acquisition Companies
The Funds may acquire an interest in a special purpose acquisition company (“SPAC”) in an initial public offering or a secondary market transaction. SPAC investments carry many of the same risks as investments in initial public offering securities, such as erratic price movements, greater risk of loss, lack of information about the issuer, limited operating and little public or no trading history, and higher transaction costs. An investment in a SPAC is typically subject to a higher risk of dilution by additional later offerings of interests in the SPAC or by other investors exercising existing rights to purchase shares of the SPAC and interests in SPACs may be illiquid and/or be
176 | THE GUGGENHEIM FUNDS ANNUAL REPORT |
NOTES TO FINANCIAL STATEMENTS (continued) |
subject to restrictions on resale. A SPAC is a publicly traded company that raises investment capital for the purpose of acquiring the equity securities of one or more existing companies (or interests therein) via merger, combination, acquisition or other similar transactions. Unless and until an acquisition is completed, a SPAC generally invests its assets (less a portion retained to cover expenses) in U.S. government securities, money market securities and cash and does not typically pay dividends in respect of its common stock. SPAC investments are also subject to the risk that a significant portion of the funds raised by the SPAC may be expended during the search for a target acquisition or merger and that the SPAC may have limited time in which to conduct due diligence on potential business combination targets. Because SPACs are in essence blank check companies without operating history or ongoing business other than seeking acquisitions, the value of their securities is particularly dependent on the ability of the entity’s management to identify and complete a profitable acquisition. Among other conflicts of interest, the economic interests of the management, directors, officers and related parties of a SPAC can differ from the economic interests of public shareholders, which may lead to conflicts as they evaluate, negotiate and recommend business combination transactions to shareholders. This risk may become more acute as the deadline for the completion of a business combination nears. There is no guarantee that the SPACs in which the Funds invest will complete an acquisition or that any acquisitions that are completed will be profitable.
Note 2 – Financial Instruments and Derivatives
As part of their investment strategy, the Funds may utilize a variety of derivative instruments. These investments involve, to varying degrees, elements of market risk and risks in excess of amounts recognized on the Statements of Assets and Liabilities. Valuation and accounting treatment of these instruments can be found under Significant Accounting Policies in Note 1 of these Notes to Financial Statements.
Short Sales
A short sale is a transaction in which a Fund sells a security it does not own. If the security sold short decreases in price between the time the Fund sells the security and closes its short position, the Fund will realize a gain on the transaction. Conversely, if the security increases in price during the period, the Fund will realize a loss on the transaction. The risk of such price increases is the principal risk of engaging in short sales.
Derivatives
Derivatives are instruments whose values depend on, or are derived from, in whole or in part, the value of one or more other assets, such as securities, currencies, commodities or indices. Derivative instruments may be used to increase investment flexibility (including to maintain cash reserves while maintaining exposure to certain other assets), for risk management (hedging) purposes, to facilitate trading, to reduce transaction costs and to pursue higher investment returns. Derivative instruments may also be used to mitigate certain investment risks, such as foreign currency exchange rate risk, interest rate risk and credit risk. U.S. GAAP requires disclosures to enable investors to better understand how and why a Fund uses derivative instruments, how these derivative instruments are accounted for and their effects on the Fund’s financial position and results of operations.
The Funds may utilize derivatives for the following purposes:
Duration: the use of an instrument to manage the interest rate risk of a portfolio.
Hedge: an investment made in order to reduce the risk of adverse price movements in a security, by taking an offsetting position to protect against broad market moves.
Income: the use of any instrument that distributes cash flows typically based upon some rate of interest.
Index Exposure: the use of an instrument to obtain exposure to a listed or other type of index.
Leverage: gaining total exposure to equities or other assets on the long and short sides at greater than 100% of invested capital.
Speculation: the use of an instrument to express macro-economic and other investment views.
For any Fund whose investment strategy consistently involves applying leverage, the value of the Fund’s shares will tend to increase or decrease more than the value of any increase or decrease in the underlying index or other asset. In addition, because an investment in derivative instruments generally requires a small investment relative to the amount of investment exposure assumed, an opportunity for increased net income is created; but, at the same time, leverage risk will increase. The Fund’s use of leverage, through borrowings or instruments such as derivatives, may cause the Fund to be more volatile and riskier than if they had not been leveraged.
Options Purchased and Written
A call option on a security gives the purchaser of the option the right to buy, and the writer of a call option the obligation to sell, the underlying security. The purchaser of a put option has the right to sell, and the writer of the put option the obligation to buy, the underlying security at any time during the option period. The risk associated with purchasing options is limited to the premium originally paid.
THE GUGGENHEIM FUNDS ANNUAL REPORT | 177 |
NOTES TO FINANCIAL STATEMENTS (continued) |
The following table represents the Funds’ use and volume of call/put options purchased on a monthly basis:
Average Notional Amount | |||||||||
Fund | Use | Call | Put | ||||||
Series E (Total Return Bond Series) | Duration, Hedge | $ | 40,133,333 | $ | 3,451,202 | ||||
The risk in writing a call option is that a Fund may incur a loss if the market price of the underlying security increases and the option is exercised. The risk in writing a put option is that a Fund may incur a loss if the market price of the underlying security decreases and the option is exercised. In addition, there may be an imperfect correlation between the movement in prices of options and the underlying securities where a Fund may not be able to enter into a closing transaction because of an illiquid secondary market; or, for OTC options, a Fund may be at risk because of the counterparty’s inability to perform.
The following table represents the Funds’ use and volume of call/put options written on a monthly basis:
Average Notional Amount | |||||||||
Fund | Use | Call | Put | ||||||
Series E (Total Return Bond Series) | Hedge | $ | 3,492 | $ | 3,509,181 | ||||
Futures Contracts
A futures contract is an agreement to purchase (long) or sell (short) an agreed amount of securities or other instruments at a set price for delivery at a future date. There are significant risks associated with a Fund’s use of futures contracts, including (i) there may be an imperfect or no correlation between the changes in market value of the underlying asset and the prices of futures contracts; (ii) there may not be a liquid secondary market for a futures contract; (iii) trading restrictions or limitations may be imposed by an exchange; and (iv) government regulations may restrict trading in futures contracts. When investing in futures, there is minimal counterparty credit risk to a Fund because futures are exchange-traded and the exchange’s clearinghouse, as counterparty to all exchange-traded futures, guarantees against default. Cash deposits are shown as segregated cash with broker on the Statements of Assets and Liabilities; securities held as collateral are noted on the Schedules of Investments.
The following table represents the Funds’ use and volume of futures on a monthly basis:
Average Notional Amount | |||||||||
Fund | Use | Long | Short | ||||||
Series A (StylePlus—Large Core Series) | Index exposure | $ | 3,841,429 | $ | — | ||||
Series D (World Equity Income Series) | Hedge | — | 9,635,324 | ||||||
Series E (Total Return Bond Series) | Duration, Hedge | 695,953 | — | ||||||
Series J (StylePlus—Mid Growth Series) | Index exposure | 3,759,180 | — | ||||||
Series N (Managed Asset Allocation Series) | Index exposure, Speculation | 8,526,404 | 1,530,109 | ||||||
Series X (StylePlus—Small Growth Series) | Index exposure | 424,140 | — | ||||||
Series Y (StylePlus—Large Growth Series) | Index exposure | 628,568 | — | ||||||
Swap Agreements
A swap is an agreement that obligates two parties to exchange a series of cash flows at specified intervals based upon or calculated by reference to changes in specified prices or rates for a specified amount of an underlying asset. When utilizing OTC swaps, a fund bears the risk of loss of the amount expected to be received under a swap agreement in the event of the default or bankruptcy of a swap agreement counterparty or if the underlying asset declines in value. Certain standardized swaps are subject to mandatory central clearing and are executed on a multi-lateral or other trade facility platform, such as a registered exchange. There is limited counterparty credit risk with respect to centrally-cleared swaps as the transaction is facilitated through a central clearinghouse, much like exchange-traded futures contracts. For a fund utilizing centrally-cleared swaps, the exchange bears the risk of loss resulting from a counterparty not being able to pay. There is no guarantee that a fund or an underlying fund could eliminate its exposure under an outstanding swap agreement by entering into an offsetting swap agreement with the same or another party.
178 | THE GUGGENHEIM FUNDS ANNUAL REPORT |
NOTES TO FINANCIAL STATEMENTS (continued) |
Total return and custom basket swaps involve commitments where single or multiple cash flows are exchanged based on the price of an underlying reference asset (such as an index or custom basket of securities) for a fixed or variable interest rate. Total return and custom basket swaps will usually be computed based on the current value of the reference asset as of the close of regular trading on the NYSE or other exchange, with the swap value being adjusted to include dividends accrued, financing charges and/or interest associated with the swap agreement. When utilizing total return or custom basket swaps, a fund bears the risk of loss of the amount expected to be received under a swap agreement in the event of the default or bankruptcy of a swap agreement counterparty or if the underlying reference asset declines in value.
The following table represents the Funds’ use and volume of total return swaps on a monthly basis:
Average Notional Amount | |||||||||
Fund | Use | Long | Short | ||||||
Series A (StylePlus—Large Core Series) | Index exposure | $ | 175,190,652 | $ | — | ||||
Series J (StylePlus—Mid Growth Series) | Index exposure | 127,994,090 | — | ||||||
Series X (StylePlus—Small Growth Series) | Index exposure | 20,915,016 | — | ||||||
Series Y (StylePlus—Large Growth Series) | Index exposure | 33,985,003 | — | ||||||
The following table represents the Funds’ use and volume of custom basket swaps on a monthly basis:
Average Notional Amount | |||||||||
Fund | Use | Long | Short | ||||||
Series Z (Alpha Opportunity Series) | Hedge, Leverage | $ | 1,866,186 | $ | 3,531,557 | ||||
Interest rate swaps involve the exchange by the Funds with another party for their respective commitment to pay or receive a fixed or variable interest rate on a notional amount of principal. Interest rate swaps are generally centrally-cleared, but central clearing does not make interest rate swap transactions risk free.
The following table represents the Funds’ use and volume of interest rate swaps on a monthly basis:
Average Notional Amount | |||||||||
Fund | Use | Pay Floating Rate | Receive Floating Rate | ||||||
Series E (Total Return Bond Series) | Duration, Hedge | $ | 8,900,000 | $ | 491,667 | ||||
Credit default swaps are instruments which allow for the full or partial transfer of third party credit risk, with respect to a particular entity or entities, from one counterparty to the other. A fund enters into credit default swaps as a “seller” or “buyer” of protection primarily to gain or reduce exposure to the investment grade and/or high yield bond market. A seller of credit default swaps is selling credit protection or assuming credit risk with respect to the underlying entity or entities. The buyer in a credit default swap is obligated to pay the seller a periodic stream of payments over the term of the contract provided that no event of default on an underlying reference obligation has occurred. If a credit event occurs, as defined under the terms of the swap agreement, the seller will either (i) pay to the buyer of protection an amount equal to the notional amount of the swap and take delivery of the referenced obligation or underlying securities comprising the referenced index or (ii) pay a net settlement amount in the form of cash or securities equal to the notional amount of the swap less the recovery value of the referenced obligation or underlying securities comprising the referenced index. The notional amount reflects the maximum potential amount the seller of credit protection could be required to pay to the buyer if a credit event occurs. The seller of protection receives periodic premium payments from the buyer and may also receive or pay an upfront premium adjustment to the stated periodic payments. In the event a credit default occurs on a credit default swap referencing an index, a factor adjustment will take place and the buyer of protection will receive a payment reflecting the par less the default recovery rate of the defaulted index component based on its weighting in the index. If no default occurs, the counterparty will pay the stream of payments and have no further obligations to the fund selling the credit protection. For a fund utilizing centrally cleared credit default swaps, the exchange bears the risk of loss resulting from a counterparty not being able to pay. For OTC credit default swaps, a fund bears the risk of loss of the amount expected to be received under a swap agreement in the event of the default or bankruptcy of a swap agreement counterparty, or in the case of a credit default swap in which a fund is selling credit protection, the default of a third party issuer.
THE GUGGENHEIM FUNDS ANNUAL REPORT | 179 |
NOTES TO FINANCIAL STATEMENTS (continued) |
The quoted market prices and resulting market values for credit default swap agreements on securities and credit indices serve as an indicator of the current status of the payment/performance risk and represent the likelihood of an expected liability (or profit) for the credit derivative had the notional amount of the swap agreement been closed/sold as of the period end. Increasing market values, in absolute terms when compared to the notional amount of the swap, represent a deterioration of the referenced entity’s credit soundness and a greater likelihood or risk of default or other credit event occurring as defined under the terms of the agreement.
The following table represents the Funds’ use and volume of credit default swaps on a monthly basis:
Average Notional Amount | |||||||||
Fund | Use | Protection Sold | Protection Purchased | ||||||
Series P (High Yield Series) | Index exposure | $ | — | $ | 232,167 | ||||
Forward Foreign Currency Exchange Contracts
A forward foreign currency exchange contract is an agreement between two parties to exchange two designated currencies at a specific time in the future. Certain types of contracts may be cash settled, in an amount equal to the change in exchange rates during the term of the contract. The contracts can be used to hedge or manage exposure to foreign currency risks with portfolio investments or to gain exposure to foreign currencies.
The market value of a forward foreign currency exchange contract changes with fluctuations in foreign currency exchange rates. Furthermore, the Funds may be exposed to risk if the counterparties cannot meet the contract terms or if the currency value changes unfavorably as compared to the U.S. dollar.
The following table represents the Funds’ use and volume of forward foreign currency exchange contracts on a monthly basis:
Average Value | |||||||||
Fund | Use | Purchased | Sold | ||||||
Series E (Total Return Bond Series) | Hedge, Income | $ | — | $ | 597,139 | ||||
Series F (Floating Rate Strategies Series) | Hedge | — | 225,877 | ||||||
Series P (High Yield Series) | Hedge | 8,532 | 626,753 | ||||||
Derivative Investment Holdings Categorized by Risk Exposure
The following is a summary of the location of derivative investments on the Funds’ Statements of Assets and Liabilities as of December 31, 2022:
Derivative Investment Type | Asset Derivatives | Liability Derivatives |
Currency/Equity/Interest rate futures contracts | — | Variation margin on futures contracts |
Currency forward contracts | Unrealized appreciation on forward foreign currency exchange contracts | Unrealized depreciation on forward foreign currency exchange contracts |
Equity/Interest rate swap contracts | Unrealized appreciation on OTC swap agreements Unamortized upfront premiums paid on interest rate swap agreements | — Variation margin on interest rate swap agreements |
Interest rate option contracts | Investments in unaffiliated issuers, at value | — |
180 | THE GUGGENHEIM FUNDS ANNUAL REPORT |
NOTES TO FINANCIAL STATEMENTS (continued) |
The following tables set forth the fair value of the Funds’ derivative investments categorized by primary risk exposure at December 31, 2022:
Asset Derivative Investments Value | ||||||||||||||||||||||||||||||||
Fund | Futures | Swaps | Futures | Futures | Swaps | Forward | Options | Total | ||||||||||||||||||||||||
Series A (StylePlus—Large Core Series) | $ | — | $ | 2,201,633 | $ | — | $ | — | $ | — | — | $ | — | $ | 2,201,633 | |||||||||||||||||
Series E (Total Return Bond Series) | — | — | — | — | — | 13,935 | 90,971 | 104,906 | ||||||||||||||||||||||||
Series J (StylePlus—Mid Growth Series) | — | 2,109,057 | — | — | — | — | — | 2,109,057 | ||||||||||||||||||||||||
Series N (Managed Asset Allocation Series) | 52,765 | — | — | 372 | — | — | — | 53,137 | ||||||||||||||||||||||||
Series P (High Yield Series) | — | — | — | — | — | 6,668 | — | 6,668 | ||||||||||||||||||||||||
Series X (StylePlus—Small Growth Series) | — | 455,885 | — | — | — | — | — | 455,885 | ||||||||||||||||||||||||
Series Y (StylePlus—Large Growth Series) | — | 532,587 | — | — | — | — | — | 532,587 | ||||||||||||||||||||||||
Series Z (Alpha Opportunity Series) | — | 194,967 | — | — | — | — | — | 194,967 | ||||||||||||||||||||||||
Liability Derivative Investments Value | ||||||||||||||||||||||||||||||||
Fund | Futures | Swaps | Futures | Futures | Swaps | Forward | Options | Total | ||||||||||||||||||||||||
Series A (StylePlus—Large Core Series) | $ | 92,880 | $ | — | $ | — | $ | — | $ | — | — | $ | — | $ | 92,880 | |||||||||||||||||
Series E (Total Return Bond Series) | — | — | — | 22,377 | 393,151 | — | — | 415,528 | ||||||||||||||||||||||||
Series F (Floating Rate Strategies Series) | — | — | — | — | — | 2,596 | — | 2,596 | ||||||||||||||||||||||||
Series J (StylePlus—Mid Growth Series) | 156,090 | — | — | — | — | — | — | 156,090 | ||||||||||||||||||||||||
Series N (Managed Asset Allocation Series) | 105,330 | — | 5,727 | 3,293 | — | — | — | 114,350 | ||||||||||||||||||||||||
Series P (High Yield Series) | — | — | — | — | — | 1,607 | — | 1,607 | ||||||||||||||||||||||||
Series X (StylePlus—Small Growth Series) | 26,963 | — | — | — | — | — | — | 26,963 | ||||||||||||||||||||||||
Series Y (StylePlus—Large Growth Series) | 64,991 | — | — | — | — | — | — | 64,991 | ||||||||||||||||||||||||
* | Includes cumulative appreciation (depreciation) of exchange-traded, OTC and centrally-cleared derivatives contracts as reported on the Schedules of Investments. For exchange-traded and centrally-cleared derivatives, variation margin is reported within the Statements of Assets and Liabilities. |
THE GUGGENHEIM FUNDS ANNUAL REPORT | 181 |
NOTES TO FINANCIAL STATEMENTS (continued) |
The following is a summary of the location of derivative investments on the Funds’ Statements of Operations for the year ended December 31, 2022:
Derivative Investment Type | Location of Gain (Loss) on Derivatives |
Currency/Equity/Interest rate futures contracts | Net realized gain (loss) on futures contracts Net change in unrealized appreciation (depreciation) on futures contracts |
Currency forward contracts | Net realized gain (loss) on forward foreign currency exchange contracts Net change in unrealized appreciation (depreciation) on forward foreign currency exchange contracts |
Equity/Interest rate option contracts | Net realized gain (loss) on options purchased Net change in unrealized appreciation (depreciation) on options purchased Net realized gain (loss) on options written Net change in unrealized appreciation (depreciation) on options written |
Credit/Equity/Interest rate swap contracts | Net realized gain (loss) on swap agreements Net change in unrealized appreciation (depreciation) on swap agreements |
The following is a summary of the Funds’ realized gain (loss) and change in unrealized appreciation (depreciation) on derivative investments recognized on the Statements of Operations categorized by primary risk exposure for the year ended December 31, 2022:
Realized Gain (Loss) on Derivative Investments Recognized on the Statements of Operations | ||||||||||||||||||||||||||||||||||||||||||||||||
Fund | Futures | Swaps | Futures | Futures | Swaps | Swaps | Options | Options | Forward | Options | Options | Total | ||||||||||||||||||||||||||||||||||||
Series A (StylePlus—Large Core Series) | $ | 382,826 | $ | (25,002,540 | ) | $ | — | $ | — | $ | — | $ | — | $ | — | $ | — | $ | — | $ | — | $ | — | $ | (24,619,714 | ) | ||||||||||||||||||||||
Series D (World Equity Income Series) | — | — | 1,352,842 | — | — | — | — | — | — | — | — | 1,352,842 | ||||||||||||||||||||||||||||||||||||
Series E (Total Return Bond Series) | — | — | — | — | (708,205 | ) | — | (221,272 | ) | 672,913 | 89,353 | (162,795 | ) | (3,804 | ) | (333,810 | ) | |||||||||||||||||||||||||||||||
Series F (Floating Rate Strategies Series) | — | — | — | — | — | — | — | — | 8,645 | — | — | 8,645 | ||||||||||||||||||||||||||||||||||||
Series J (StylePlus—Mid Growth Series) | (106,387 | ) | (43,923,527 | ) | — | — | — | — | — | — | — | — | — | (44,029,914 | ) | |||||||||||||||||||||||||||||||||
Series N (Managed Asset Allocation Series) | (851,760 | ) | — | 77,989 | (346,525 | ) | — | — | — | — | — | — | — | (1,120,296 | ) | |||||||||||||||||||||||||||||||||
Series P (High Yield Series) | — | — | — | — | — | 39,182 | — | — | 53,140 | — | — | 92,322 | ||||||||||||||||||||||||||||||||||||
Series X (StylePlus—Small Growth Series) | (88,803 | ) | (8,395,894 | ) | — | — | — | — | — | — | — | — | — | (8,484,697 | ) | |||||||||||||||||||||||||||||||||
Series Y (StylePlus—Large Growth Series) | (185,509 | ) | (9,485,398 | ) | — | — | — | — | — | — | — | — | — | (9,670,907 | ) | |||||||||||||||||||||||||||||||||
Series Z (Alpha Opportunity Series) | — | 32,877 | — | — | — | — | — | — | — | — | — | 32,877 | ||||||||||||||||||||||||||||||||||||
182 | THE GUGGENHEIM FUNDS ANNUAL REPORT |
NOTES TO FINANCIAL STATEMENTS (continued) |
Change in Unrealized Appreciation (Depreciation) on Derivative Investments Recognized on the Statements of Operations | ||||||||||||||||||||||||||||||||||||||||||||||||
Fund | Futures | Swaps | Futures | Futures | Swaps | Swaps | Options | Options | Forward | Options | Options | Total | ||||||||||||||||||||||||||||||||||||
Series A (StylePlus—Large Core Series) | $ | (193,155 | ) | $ | (17,777,522 | ) | $ | — | $ | — | $ | — | $ | — | $ | — | $ | — | $ | — | $ | — | $ | — | $ | (17,970,677 | ) | |||||||||||||||||||||
Series E (Total Return Bond Series) | — | — | — | (22,377 | ) | (246,347 | ) | — | (2,596 | ) | — | (12,437 | ) | 24,833 | — | (258,924 | ) | |||||||||||||||||||||||||||||||
Series F (Floating Rate Strategies Series) | — | — | — | — | — | — | — | — | (2,596 | ) | — | — | (2,596 | ) | ||||||||||||||||||||||||||||||||||
Series J (StylePlus—Mid Growth Series) | (223,296 | ) | (2,943,839 | ) | — | — | — | — | — | — | — | — | — | (3,167,135 | ) | |||||||||||||||||||||||||||||||||
Series N (Managed Asset Allocation Series) | (155,837 | ) | — | (5,727 | ) | (19,704 | ) | — | — | — | — | — | — | — | (181,268 | ) | ||||||||||||||||||||||||||||||||
Series P (High Yield Series) | — | — | — | — | — | — | — | — | 16,944 | — | — | 16,944 | ||||||||||||||||||||||||||||||||||||
Series X (StylePlus—Small Growth Series) | (52,827 | ) | 555,481 | — | — | — | — | — | — | — | — | — | 502,654 | |||||||||||||||||||||||||||||||||||
Series Y (StylePlus—Large Growth Series) | (89,990 | ) | (4,210,414 | ) | — | — | — | — | — | — | — | — | — | (4,300,404 | ) | |||||||||||||||||||||||||||||||||
Series Z (Alpha Opportunity Series) | — | 139,551 | — | — | — | — | — | — | — | — | — | 139,551 | ||||||||||||||||||||||||||||||||||||
In conjunction with short sales and the use of derivative instruments, the Funds are required to maintain collateral in various forms. Depending on the financial instrument utilized and the broker involved, the Funds use margin deposits at the broker, cash and/or securities segregated at the custodian bank, discount notes or repurchase agreements allocated to the Funds as collateral.
The Trust has established counterparty credit guidelines and enters into transactions only with financial institutions of investment grade or better. The Trust monitors the counterparty credit risk.
Foreign Investments
There are several risks associated with exposure to foreign currencies, foreign issuers and emerging markets.A fund’s indirect and direct exposure to foreign currencies subjects the Fund to the risk that those currencies will decline in value relative to the U.S. dollar, or in the case of short positions, that the U.S. dollar will decline in value relative to the currency being hedged. Currency rates in foreign countries may fluctuate significantly over short periods of time for a number of reasons, including changes in interest rates and the imposition of currency controls or other political developments in the U.S. or abroad. In addition, the Funds may incur transaction costs in connection with conversions between various currencies. The Funds may, but are not obligated to, engage in currency hedging transactions, which generally involve buying currency forward, options or futures contracts. However, not all currency risks may be effectively hedged, and in some cases the costs of hedging techniques may outweigh expected benefits. In such instances, the value of securities denominated in foreign currencies can change significantly when foreign currencies strengthen or weaken relative to the U.S. dollar.
The Funds may invest in securities of foreign companies directly, or in financial instruments, such as ADRs and exchange-traded funds, which are indirectly linked to the performance of foreign issuers. Foreign markets can be more volatile than the U.S. market due to increased risks of adverse issuer, political, regulatory, market, or economic developments and can perform differently from the U.S. market. Investing in securities of foreign companies directly, or in financial instruments that are indirectly linked to the performance of foreign issuers, may involve risks not typically associated with investing in U.S. issuers. The value of securities denominated in foreign currencies, and of dividends from such securities, can change significantly when foreign currencies strengthen or weaken relative to the U.S. dollar. Foreign securities markets generally have less trading volume and less liquidity than U.S. markets, and prices in some foreign markets may fluctuate more than those of securities traded on U.S. markets. Many foreign countries lack accounting and disclosure standards comparable to those that apply to U.S. companies, and it may be more difficult to obtain reliable information regarding a foreign issuer’s financial condition and operations. Transaction costs and
THE GUGGENHEIM FUNDS ANNUAL REPORT | 183 |
NOTES TO FINANCIAL STATEMENTS (continued) |
costs associated with custody services are generally higher for foreign securities than they are for U.S. securities. Some foreign governments levy withholding taxes against dividend and interest income. Although in some countries portions of these taxes are recoverable, the non-recovered portion will reduce the income received by the Funds.
Note 3 – Offsetting
In the normal course of business, the Funds enter into transactions subject to enforceable master netting arrangements or other similar arrangements. Generally, the right to offset in those agreements allows the Funds to counteract the exposure to a specific counterparty with collateral received from or delivered to that counterparty based on the terms of the arrangements. These arrangements provide for the right to liquidate upon the occurrence of an event of default, credit event upon merger or additional termination event.
In order to better define their contractual rights and to secure rights that will help the Funds mitigate their counterparty risk, the Funds may enter into an International Swaps and Derivatives Association, Inc. Master Agreement (“ISDA Master Agreement”) or similar agreement with their derivative contract counterparties. An ISDA Master Agreement is a bilateral agreement between a fund and a counterparty that governs OTC derivatives, including foreign exchange contracts, and typically contains, among other things, collateral posting terms and netting provisions in the event of a default and/or termination event. The provisions of the ISDA Master Agreement typically permit a single net payment in the event of a default (close-out netting) or similar event, including the bankruptcy or insolvency of the counterparty.
For derivatives traded under an ISDA Master Agreement, the collateral requirements are typically calculated by netting the mark-to-market amount for each transaction under such agreement and comparing that amount to the value of any collateral currently pledged by the Funds and the counterparty. For financial reporting purposes, cash collateral that has been pledged to cover obligations of the Funds and cash collateral received from the counterparty, if any, are reported separately on the Statements of Assets and Liabilities as segregated cash with broker/receivable for variation margin, or payable for swap settlement/variation margin. Cash and/or securities pledged or received as collateral by the Funds in connection with an OTC derivative subject to an ISDA Master Agreement generally may not be invested, sold or rehypothecated by the counterparty or the Funds, as applicable, absent an event of default under such agreement, in which case such collateral generally may be applied towards obligations due to and payable by such counterparty or the Funds, as applicable. Generally, the amount of collateral due from or to a counterparty must exceed a minimum transfer amount threshold (e.g., $300,000) before a transfer is required to be made. To the extent amounts due to the Funds from their counterparties are not fully collateralized, contractually or otherwise, the Funds bear the risk of loss from counterparty nonperformance. The Funds attempt to mitigate counterparty risk by only entering into agreements with counterparties that they believe to be of good standing and by monitoring the financial stability of those counterparties.
For financial reporting purposes, the Funds do not offset derivative assets and derivative liabilities that are subject to netting arrangements in the Statements of Assets and Liabilities.
184 | THE GUGGENHEIM FUNDS ANNUAL REPORT |
NOTES TO FINANCIAL STATEMENTS (continued) |
The following tables present derivative financial instruments and secured financing transactions that are subject to enforceable netting arrangements:
Gross Amounts Not Offset | |||||||||||||||||||||||||
Fund | Instrument | Gross | Gross | Net Amount | Financial | Cash | Net | ||||||||||||||||||
Series A (StylePlus—Large Core Series) | Swap equity contracts | $ | 2,201,633 | $ | — | $ | 2,201,633 | $ | — | $ | (2,201,633 | ) | $ | — | |||||||||||
Series E (Total Return Bond Series) | Forward foreign currency exchange contracts | 13,935 | — | 13,935 | — | — | 13,935 | ||||||||||||||||||
Series E (Total Return Bond Series) | Options purchased | 90,971 | — | 90,971 | — | — | 90,971 | ||||||||||||||||||
Series J (StylePlus—Mid Growth Series) | Swap equity contracts | 2,109,057 | — | 2,109,057 | — | (2,109,057 | ) | — | |||||||||||||||||
Series P (High Yield Series) | Forward foreign currency exchange contracts | 6,668 | — | 6,668 | (1,539 | ) | — | 5,129 | |||||||||||||||||
Series X (StylePlus—Small Growth Series) | Swap equity contracts | 455,885 | — | 455,885 | — | (120,000 | ) | 335,885 | |||||||||||||||||
Series Y (StylePlus—Large Growth Series) | Swap equity contracts | 532,587 | — | 532,587 | — | (350,000 | ) | 182,587 | |||||||||||||||||
Series Z (Alpha Opportunity Series) | Custom basket swap agreements | 194,967 | — | 194,967 | — | — | 194,967 | ||||||||||||||||||
Gross Amounts Not Offset | |||||||||||||||||||||||||
Fund | Instrument | Gross | Gross | Net Amount | Financial | Cash | Net | ||||||||||||||||||
Series F (Floating Rate Strategies Series) | Forward foreign currency exchange contracts | $ | 2,596 | $ | — | $ | 2,596 | $ | — | $ | — | $ | 2,596 | ||||||||||||
Series P (High Yield Series) | Forward foreign currency exchange contracts | 1,607 | — | 1,607 | (1,539 | ) | — | 68 | |||||||||||||||||
1 | Exchange-traded or centrally-cleared derivatives are excluded from these reported amounts. |
THE GUGGENHEIM FUNDS ANNUAL REPORT | 185 |
NOTES TO FINANCIAL STATEMENTS (continued) |
The Funds have the right to offset deposits against any related derivative liabilities outstanding with each counterparty with the exception of exchange-traded or centrally-cleared derivatives. The following table presents deposits held by others in connection with derivative investments as of December 31, 2022.
Fund | Counterparty | Asset Type | Cash Pledged | Cash Received | ||||||
Series A (StylePlus—Large Core Series) | Morgan Stanley Capital Services LLC | Futures contracts | $ | 533,000 | $ | — | ||||
| Wells Fargo Bank, N.A. | Total return swap agreements | — | 9,910,000 | ||||||
Series A (StylePlus—Large Core Series) Total |
|
| 533,000 | 9,910,000 | ||||||
Series E (Total Return Bond Series) | BofA Securities, Inc. | Futures contracts, Interest rate | 26,183 | — | ||||||
|
| swap agreements | ||||||||
Series E (Total Return Bond Series) Total |
|
| 26,183 | — | ||||||
Series J (StylePlus—Mid Growth Series) | Morgan Stanley Capital Services LLC | Futures contracts | 333,800 | — | ||||||
| Wells Fargo Bank, N.A. | Total return swap agreements | — | 6,870,000 | ||||||
Series J (StylePlus—Mid Growth Series) Total |
|
| 333,800 | 6,870,000 | ||||||
Series X (StylePlus—Small Growth Series) | Morgan Stanley Capital Services LLC | Futures contracts | 51,000 | — | ||||||
| Wells Fargo Bank, N.A. | Total return swap agreements | — | 120,000 | ||||||
Series X (StylePlus—Small Growth Series) Total |
|
| 51,000 | 120,000 | ||||||
Series Y (StylePlus—Large Growth Series) | Morgan Stanley Capital Services LLC | Futures contracts | 78,000 | — | ||||||
| Wells Fargo Bank, N.A. | Total return swap agreements | — | 350,000 | ||||||
Series Y (StylePlus—Large Growth Series) Total |
|
| 78,000 | 350,000 | ||||||
Note 4 – Fair Value Measurement
In accordance with U.S. GAAP, fair value is defined as the price that the Funds would receive to sell an investment or pay to transfer a liability in an orderly transaction between market participants at the measurement date. U.S. GAAP establishes a three-tier fair value hierarchy based on the types of inputs used to value assets and liabilities and requires corresponding disclosure. U.S. GAAP establishes a three-tier fair value hierarchy based on the types of inputs used to value assets and liabilities and requires corresponding disclosure. The hierarchy and the corresponding inputs are summarized below:
Level 1 — | unadjusted quoted prices in active markets for identical assets or liabilities. |
Level 2 — | significant other observable inputs (for example quoted prices for securities that are similar based on characteristics such as interest rates, prepayment speeds, credit risk, etc.). |
Level 3 — | significant unobservable inputs based on the best information available under the circumstances, to the extent observable inputs are not available, which may include assumptions. |
Rule 2a-5 sets forth a definition of “readily available market quotations,” which is consistent with the definition of a Level 1 input under U.S. GAAP. Rule 2a-5 provides that “a market quotation is readily available only when that quotation is a quoted price (unadjusted) in active markets for identical investments that the fund can access at the measurement date, provided that a quotation will not be readily available if it is not reliable.”
Securities for which market quotations are not readily available must be valued at fair value as determined in good faith. Accordingly, any security priced using inputs other than Level 1 inputs will be subject to fair value requirements. The types of inputs available depend on a variety of factors, such as the type of security and the characteristics of the markets in which it trades, if any. Fair valuation determinations that rely on fewer or no observable inputs require greater judgment. Accordingly, fair value determinations for Level 3 securities require the greatest amount of judgment.
186 | THE GUGGENHEIM FUNDS ANNUAL REPORT |
NOTES TO FINANCIAL STATEMENTS (continued) |
Independent pricing services are used to value a majority of the Funds’ investments. When values are not available from a pricing service, they will be determined using a variety of sources and techniques, including: market prices; broker quotes; and models which derive prices based on inputs such as prices of securities with comparable maturities and characteristics or based on inputs such as anticipated cash flows or collateral, spread over U.S. Treasury securities, and other information and analysis. A significant portion of the Funds’ assets and liabilities are categorized as Level 2, as indicated in this report.
Quotes from broker-dealers, adjusted for fluctuations in criteria such as credit spreads and interest rates, may also be used to value the Funds’ assets and liabilities, i.e. prices provided by a broker-dealer or other market participant who has not committed to trade at that price. Although quotes are typically received from established market participants, the Funds may not have the transparency to view the underlying inputs which support the market quotations. Significant changes in a quote would generally result in significant changes in the fair value of the security.
Certain fixed income securities are valued by obtaining a monthly quote from a broker-dealer, adjusted for fluctuations in criteria such as credit spreads and interest rates.
Certain loans and other securities are valued using a single daily broker quote or a price from a third party vendor based on a single daily or monthly broker quote.
The inputs or methodologies selected and applied for valuing securities are not necessarily an indication of the risk associated with investing in those securities. The suitability, appropriateness and accuracy of the techniques, methodologies and sources employed to determine fair valuation are periodically reviewed and subject to change.
Note 5 – Investment Advisory Agreement and Other Agreements
Under the terms of an investment advisory contract, the Funds pay GI investment advisory fees calculated at the annualized rates below, based on the average daily net assets of the Funds:
Fund | Management Fees | |||
Series A (StylePlus—Large Core Series) | 0.75 | % | ||
Series B (Large Cap Value Series) | 0.65 | % | ||
Series D (World Equity Income Series) | 0.70 | % | ||
Series E (Total Return Bond Series) | 0.39 | % | ||
Series F (Floating Rate Strategies Series) | 0.65 | %1 | ||
Series J (StylePlus—Mid Growth Series) | 0.75 | % | ||
Series N (Managed Asset Allocation Series) | 0.40 | % | ||
Series O (All Cap Value Series) | 0.70 | % | ||
Series P (High Yield Series) | 0.60 | % | ||
Series Q (Small Cap Value Series) | 0.75 | % | ||
Series V (SMid Cap Value Series) | 0.75 | % | ||
Series X (StylePlus—Small Growth Series) | 0.75 | % | ||
Series Y (StylePlus—Large Growth Series) | 0.65 | % | ||
Series Z (Alpha Opportunity Series) | 0.90 | % | ||
1 | The Series F management fee is subject to a 0.05% reduction on assets over $5 billion. |
GI pays operating expenses on behalf of the Trust, such as audit and accounting related services, legal services, custody, printing and mailing, among others, on a pass-through basis. Such expenses are allocated to various Funds within the complex based on relative net assets.
The Board has adopted a Distribution and Shareholder Services Plan pursuant to Rule 12b-1 under the 1940 Act that allows those Funds to pay distribution and shareholder services fees to GFD. The Funds will pay distribution and shareholder services fees to GFD at an annual rate not to exceed 0.25% of average daily net assets. GFD may, in turn, pay all or a portion of the proceeds from the distribution and shareholder services fees to insurance companies or their affiliates and qualified plan administrators (“intermediaries”) for services they provide on behalf of the Funds to current and prospective variable contract owners and qualified plan participants that invest in the Funds through the intermediaries.
THE GUGGENHEIM FUNDS ANNUAL REPORT | 187 |
NOTES TO FINANCIAL STATEMENTS (continued) |
Contractual expense limitation agreements for the following Funds provide that the total expenses be limited to a percentage of average net assets for the Funds, exclusive of brokerage costs, dividends or interest on securities sold short, expenses of other investment companies in which a Fund invests, interest, taxes, litigation, indemnification and extraordinary expenses. The limits are listed below:
| Limit | Effective | Contract | |||||||||
Series A (StylePlus—Large Core Series) | 0.91 | % | 05/01/17 | 05/01/23 | ||||||||
Series B (Large Cap Value Series) | 0.80 | % | 05/01/17 | 05/01/23 | ||||||||
Series D (World Equity Income Series) | 0.90 | % | 05/01/17 | 05/01/23 | ||||||||
Series E (Total Return Bond Series) | 0.81 | % | 11/30/12 | 05/01/23 | ||||||||
Series F (Floating Rate Strategies Series) | 1.15 | % | 04/22/13 | 05/01/23 | ||||||||
Series J (StylePlus—Mid Growth Series) | 0.94 | % | 05/01/17 | 05/01/23 | ||||||||
Series O (All Cap Value Series) | 0.88 | % | 05/01/17 | 05/01/23 | ||||||||
Series P (High Yield Series) | 1.07 | % | 10/20/14 | 05/01/23 | ||||||||
Series Q (Small Cap Value Series) | 1.14 | % | 05/01/17 | 05/01/23 | ||||||||
Series V (Mid Cap Value Series) | 0.91 | % | 05/01/17 | 05/01/23 | ||||||||
Series X (StylePlus—Small Growth Series) | 1.06 | % | 05/01/17 | 05/01/23 | ||||||||
Series Y (StylePlus—Large Growth Series) | 0.93 | % | 05/01/17 | 05/01/23 | ||||||||
Series Z (Alpha Opportunity Series) | 2.00 | % | 05/31/17 | 05/01/23 | ||||||||
GI is entitled to reimbursement by the Funds for fees waived or expenses reimbursed during any of the previous 36 months, beginning on the date of the expense limitation agreement, if on any day the estimated operating expenses are less than the indicated percentages. For purposes of this arrangement, GI is entitled to recoupment of previously waived fees or reimbursed expenses for 36 months from the date of the waiver or reimbursement by GI. At December 31, 2022, the amount of fees waived or expenses reimbursed that are subject to recoupment and will expire during the years ended December 31, 2022, are presented in the following table:
Fund | 2023 | 2024 | 2025 | Total | ||||||||||||
Series A (StylePlus - Large Core Series) | $ | 609,622 | $ | 578,663 | $ | 468,020 | $ | 1,656,305 | ||||||||
Series B (Large Cap Value Series) | 569,190 | 555,924 | 510,071 | 1,635,185 | ||||||||||||
Series D (World Equity Income Series) | 358,470 | 347,403 | 248,699 | 954,572 | ||||||||||||
Series E (Total Return Bond Series) | 102,283 | 72,779 | 23,524 | 198,586 | ||||||||||||
Series F (Floating Rate Strategies Series) | 97,708 | 76,984 | 45,284 | 219,976 | ||||||||||||
Series J (StylePlus—Mid Growth Series) | 445,780 | 434,128 | 323,149 | 1,203,057 | ||||||||||||
Series O (All Cap Value Series) | 288,584 | 268,200 | 231,664 | 788,448 | ||||||||||||
Series P (High Yield Series) | 111,843 | 90,246 | 69,351 | 271,440 | ||||||||||||
Series Q (Small Cap Value Series) | 89,756 | 58,292 | 49,991 | 198,039 | ||||||||||||
Series V (SMid Cap Value Series) | 493,187 | 452,499 | 380,378 | 1,326,064 | ||||||||||||
Series X (StylePlus - Small Growth Series) | 130,501 | 130,621 | 101,526 | 362,648 | ||||||||||||
Series Y (StylePlus - Large Growth Series) | 153,061 | 141,551 | 112,263 | 406,875 | ||||||||||||
Series Z (Alpha Opportunity Series) | 101,516 | 116,608 | 94,632 | 312,756 | ||||||||||||
For the year ended December 31, 2022, GI recouped amounts from the Funds as follows:
|
| |||
Series D (World Equity Income Series) | $ | 357 | ||
Series V (SMid Cap Value Series) | 116 | |||
If a Fund invests in a fund that is advised by the same adviser or an affiliated adviser, the investing Fund’s adviser has agreed to waive fees at the investing fund level to the extent necessary to offset the proportionate share of any management fee paid by each Fund with respect to its investment in such affiliated fund. Fee waivers will be calculated at the investing Fund level without regard to any expense cap in effect for the investing Fund. Fees waived under this arrangement are not subject to reimbursement to GI. For the year ended December 31, 2022, the following Funds waived fees related to investments in affiliated funds:
188 | THE GUGGENHEIM FUNDS ANNUAL REPORT |
NOTES TO FINANCIAL STATEMENTS (continued) |
Fund | Amount Waived | |||
Series A (StylePlus—Large Core Series) | $ | 76,176 | ||
Series E (Total Return Bond Series) | 30,978 | |||
Series J (StylePlus—Mid Growth Series) | 8,401 | |||
Series N (Managed Asset Allocation Series) | 2,555 | |||
Series X (StylePlus—Small Growth Series) | 1,095 | |||
Series Y (StylePlus—Large Growth Series) | 10,044 | |||
Certain trustees and officers of the Trust are also officers of GI and/or GFD. The Trust does not compensate its officers or trustees who are officers, directors and/or employees of GI or GFD.
MUFG Investor Services (US), LLC (“MUIS”) acts as the Funds’ administrator, transfer agent and accounting agent. As administrator, transfer agent and accounting agent, MUIS maintains the books and records of the Funds’ securities and cash. The Bank of New York Mellon Corp. (“BNY”) acts as the Funds’ custodian. As custodian, BNY is responsible for the custody of the Funds’ assets. For providing the aforementioned administrative and accounting services, MUIS is entitled to receive a monthly fee equal to a percentage of the Funds’ average daily net assets and out of pocket expenses. For providing the aforementioned transfer agent and custodian services, MUIS and BNY are entitled to receive a monthly fee based on the number of transactions during the month and the number of accounts under management, subject to certain minimum monthly fees, and out of pocket expenses.
Note 6 – Federal Income Tax Information
The Funds intend to comply with the provisions of Subchapter M of the Internal Revenue Code of 1986, as amended (the “Internal Revenue Code”), applicable to regulated investment companies and will distribute substantially all taxable net investment income and capital gains sufficient to relieve the Funds from all, or substantially all, federal income, excise and state income taxes. Therefore, no provision for federal or state income tax or federal excise tax is required.
Tax positions taken or expected to be taken in the course of preparing the Funds’ tax returns are evaluated to determine whether the tax positions are “more-likely-than-not” of being sustained by the applicable tax authority. Tax positions not deemed to meet the more-likely-than-not threshold would be recorded as a tax benefit or expense in the current year. Management has analyzed the Funds’ tax positions taken, or to be taken, on U.S. federal income tax returns for all open tax years, and has concluded that no provision for income tax is required in the Funds’ financial statements. The Funds’ U.S. federal income tax returns are subject to examination by the Internal Revenue Service (“IRS”) for a period of three years after they are filed.
The tax character of distributions paid during the year ended December 31, 2022 was as follows:
Fund | Ordinary | Long-Term | Total | |||||||||
Series A (StylePlus—Large Core Series) | $ | 58,472,857 | $ | 255,841 | $ | 58,728,698 | ||||||
Series B (Large Cap Value Series) | 4,798,469 | 18,054,554 | 22,853,023 | |||||||||
Series D (World Equity Income Series) | 20,247,249 | 6,913,025 | 27,160,274 | |||||||||
Series E (Total Return Bond Series) | 4,733,547 | — | 4,733,547 | |||||||||
Series F (Floating Rate Strategies Series) | 1,070,948 | — | 1,070,948 | |||||||||
Series J (StylePlus—Mid Growth Series) | 43,841,105 | — | 43,841,105 | |||||||||
Series N (Managed Asset Allocation Series) | 646,522 | 3,402,931 | 4,049,453 | |||||||||
Series O (All Cap Value Series) | 2,554,745 | 8,821,523 | 11,376,268 | |||||||||
Series P (High Yield Series) | 2,232,635 | — | 2,232,635 | |||||||||
Series Q (Small Cap Value Series) | 1,548,297 | 2,236,822 | 3,785,119 | |||||||||
Series V (SMid Cap Value Series) | 5,184,491 | 14,849,902 | 20,034,393 | |||||||||
Series X (StylePlus—Small Growth Series) | 8,871,970 | 80,941 | 8,952,911 | |||||||||
Series Y (StylePlus—Large Growth Series) | 10,472,266 | — | 10,472,266 | |||||||||
Series Z (Alpha Opportunity Series) | 15,376 | — | 15,376 | |||||||||
THE GUGGENHEIM FUNDS ANNUAL REPORT | 189 |
NOTES TO FINANCIAL STATEMENTS (continued) |
The tax character of distributions paid during the year ended December 31, 2021 was as follows:
Fund | Ordinary | Long-Term | Total | |||||||||
Series A (StylePlus—Large Core Series) | $ | 26,897,830 | $ | — | $ | 26,897,830 | ||||||
Series B (Large Cap Value Series) | 4,627,125 | 12,501 | 4,639,626 | |||||||||
Series D (World Equity Income Series) | 2,031,098 | — | 2,031,098 | |||||||||
Series E (Total Return Bond Series) | 5,202,765 | 2,465,765 | 7,668,530 | |||||||||
Series F (Floating Rate Strategies Series) | 1,106,221 | — | 1,106,221 | |||||||||
Series J (StylePlus—Mid Growth Series) | 27,828,628 | 1,704 | 27,830,332 | |||||||||
Series N (Managed Asset Allocation Series) | 900,457 | 2,575,357 | 3,475,814 | |||||||||
Series O (All Cap Value Series) | 1,808,620 | 523,822 | 2,332,442 | |||||||||
Series P (High Yield Series) | 2,204,042 | — | 2,204,042 | |||||||||
Series Q (Small Cap Value Series) | 557,150 | — | 557,150 | |||||||||
Series V (SMid Cap Value Series) | 3,140,125 | — | 3,140,125 | |||||||||
Series X (StylePlus—Small Growth Series) | 1,474,151 | — | 1,474,151 | |||||||||
Series Y (StylePlus—Large Growth Series) | 11,035,296 | — | 11,035,296 | |||||||||
Series Z (Alpha Opportunity Series) | 28,089 | — | 28,089 | |||||||||
Note: For U.S. federal income tax purposes, short-term capital gain distributions are treated as ordinary income distributions.
The tax components of distributable earnings/(loss) as of December 31, 2022 were as follows:
Fund | Undistributed | Undistributed | Net Unrealized | Accumulated | Total | |||||||||||||||
Series A (StylePlus—Large Core Series) | $ | 3,382,560 | $ | — | $ | (3,989,881 | ) | $ | (26,265,530 | ) | $ | (26,872,851 | ) | |||||||
Series B (Large Cap Value Series) | 4,407,354 | 18,825,451 | 39,755,408 | — | 62,988,213 | |||||||||||||||
Series D (World Equity Income Series) | 2,905,783 | — | 1,014,509 | (1,768,202 | ) | 2,152,090 | ||||||||||||||
Series E (Total Return Bond Series) | 5,285,384 | — | (23,365,015 | ) | (6,517,877 | ) | (24,597,508 | ) | ||||||||||||
Series F (Floating Rate Strategies Series) | 1,926,037 | — | (2,481,330 | ) | (4,108,322 | ) | (4,663,615 | ) | ||||||||||||
Series J (StylePlus—Mid Growth Series) | 2,282,488 | — | (2,185,770 | ) | (48,635,995 | ) | (48,539,277 | ) | ||||||||||||
Series N (Managed Asset Allocation Series) | 454,353 | 278,651 | 4,673,583 | — | 5,406,587 | |||||||||||||||
Series O (All Cap Value Series) | 1,921,683 | 7,227,915 | 16,941,582 | — | 26,091,180 | |||||||||||||||
Series P (High Yield Series) | 1,782,949 | — | (5,433,179 | ) | (8,770,500 | ) | (12,420,730 | ) | ||||||||||||
Series Q (Small Cap Value Series) | 993,511 | 3,714,694 | 5,782,073 | — | 10,490,278 | |||||||||||||||
Series V (SMid Cap Value Series) | 2,722,940 | 10,931,977 | 19,283,153 | — | 32,938,070 | |||||||||||||||
Series X (StylePlus—Small Growth Series) | 360,089 | — | (363,741 | ) | (8,868,497 | ) | (8,872,149 | ) | ||||||||||||
Series Y (StylePlus—Large Growth Series) | 586,728 | — | (924,845 | ) | (9,651,153 | ) | (9,989,270 | ) | ||||||||||||
Series Z (Alpha Opportunity Series) | 6,021 | — | 129,399 | (1,506,138 | ) | (1,370,718 | ) | |||||||||||||
190 | THE GUGGENHEIM FUNDS ANNUAL REPORT |
NOTES TO FINANCIAL STATEMENTS (continued) |
For U.S. federal income tax purposes, capital loss carryforwards represent realized losses of the Funds that may be carried forward and applied against future capital gains. The Funds are permitted to carry forward capital losses for an unlimited period and such capital loss carryforwards retain their character as either short-term or long-term capital losses. As of December 31, 2022, capital loss carryforwards for the Funds were as follows:
Unlimited | ||||||||||||
Fund | Short-Term | Long-Term | Total | |||||||||
Series A (StylePlus—Large Core Series) | $ | (26,265,530 | ) | $ | — | $ | (26,265,530 | ) | ||||
Series D (World Equity Income Series) | (1,768,202 | ) | — | (1,768,202 | ) | |||||||
Series E (Total Return Bond Series) | (3,541,456 | ) | (2,892,209 | ) | (6,433,665 | ) | ||||||
Series F (Floating Rate Strategies Series) | (646,378 | ) | (3,461,944 | ) | (4,108,322 | ) | ||||||
Series J (StylePlus—Mid Growth Series) | (47,715,485 | ) | (920,510 | ) | (48,635,995 | ) | ||||||
Series P (High Yield Series) | (228,457 | ) | (8,542,043 | ) | (8,770,500 | ) | ||||||
Series X (StylePlus—Small Growth Series) | (261,439 | ) | (8,607,058 | ) | (8,868,497 | ) | ||||||
Series Y (StylePlus—Large Growth Series) | (9,651,153 | ) | — | (9,651,153 | ) | |||||||
Series Z (Alpha Opportunity Series) | (1,506,138 | ) | — | (1,506,138 | ) | |||||||
For the year ended December 31, 2022, there were no capital loss carryforward amounts utilized.
Net investment income and net realized gains (losses) may differ for financial statement and tax purposes because of temporary or permanent book/tax differences. These differences are primarily due to investments in real estate investment trusts, partnerships, and swap agreements, foreign currency gains and losses, losses deferred due to wash sales, distributions in connection with redemption of fund shares, return of capital distributions received, income accruals on certain investments, income recharacterization from certain investments, and the “mark-to-market,” recharacterization, or disposition of certain Passive Foreign Investment Companies (PFICs). Additional differences may result from the tax treatment of bond premium/discount amortization, the deferral of losses related to tax straddle investments, and the “mark-to-market” of certain derivatives. To the extent these differences are permanent and would require a reclassification between Paid in Capital and Total Distributable Earnings (Loss), such reclassifications are made in the period that the differences arise. These reclassifications have no effect on net assets or NAV per share.
The following adjustments were made on the Statements of Assets and Liabilities as of December 31, 2022 for permanent book/tax differences:
| Fund | Paid In Capital | Total Distributable Earnings/(Loss) | ||||||
| Series B (Large Cap Value Series) | $ | 2,663,805 | $ | (2,663,805 | ) | |||
| Series J (StylePlus—Mid Growth Series) | (1,440 | ) | 1,440 | |||||
| Series N (Managed Asset Allocation Series) | 201,222 | (201,222 | ) | |||||
| Series O (All Cap Value Series) | 773,074 | (773,074 | ) | |||||
| Series Q (Small Cap Value Series) | 824,610 | (824,610 | ) | |||||
| Series V (SMid Cap Value Series) | 2,265,819 | (2,265,819 | ) | |||||
| Series Z (Alpha Opportunity Series) | 13 | (13 | ) | |||||
THE GUGGENHEIM FUNDS ANNUAL REPORT | 191 |
NOTES TO FINANCIAL STATEMENTS (continued) |
At December 31, 2022, the cost of investments for U.S. federal income tax purposes, the aggregate gross unrealized appreciation for all investments for which there was an excess of value over tax cost and the aggregate gross unrealized depreciation for all investments for which there was an excess of tax cost over value, were as follows:
Fund | Tax | Tax | Tax | Net Tax | ||||||||||||
Series A (StylePlus—Large Core Series) | $ | 201,328,533 | $ | 3,930,225 | $ | (7,920,106 | ) | $ | (3,989,881 | ) | ||||||
Series B (Large Cap Value Series) | 172,575,654 | 47,099,788 | (7,344,380 | ) | 39,755,408 | |||||||||||
Series D (World Equity Income Series) | 111,946,438 | 8,726,668 | (7,697,425 | ) | 1,029,243 | |||||||||||
Series E (Total Return Bond Series) | 165,870,851 | 39,781 | (23,404,060 | ) | (23,364,279 | ) | ||||||||||
Series F (Floating Rate Strategies Series) | 52,297,542 | 36,557 | (2,511,989 | ) | (2,475,432 | ) | ||||||||||
Series J (StylePlus—Mid Growth Series) | 147,129,170 | 3,351,720 | (5,537,490 | ) | (2,185,770 | ) | ||||||||||
Series N (Managed Asset Allocation Series) | 31,281,687 | 6,830,686 | (2,157,106 | ) | 4,673,580 | |||||||||||
Series O (All Cap Value Series) | 76,947,629 | 20,697,810 | (3,756,228 | ) | 16,941,582 | |||||||||||
Series P (High Yield Series) | 37,292,503 | 141,560 | (5,573,606 | ) | (5,432,046 | ) | ||||||||||
Series Q (Small Cap Value Series) | 58,248,689 | 10,520,124 | (4,738,051 | ) | 5,782,073 | |||||||||||
Series V (SMid Cap Value Series) | 145,734,074 | 29,681,231 | (10,398,078 | ) | 19,283,153 | |||||||||||
Series X (StylePlus—Small Growth Series) | 24,648,045 | 756,211 | (1,119,952 | ) | (363,741 | ) | ||||||||||
Series Y (StylePlus—Large Growth Series) | 37,948,972 | 808,793 | (1,733,638 | ) | (924,845 | ) | ||||||||||
Series Z (Alpha Opportunity Series) | 3,542,817 | 309,145 | (179,746 | ) | 129,399 | |||||||||||
Note 7 – Securities Transactions
For the year ended December 31, 2022, the cost of purchases and proceeds from sales of investment securities, excluding government securities, short-term investments and derivatives, were as follows:
Fund | Purchases | Sales | ||||||
Series A (StylePlus—Large Core Series) | $ | 135,655,418 | $ | 193,203,479 | ||||
Series B (Large Cap Value Series) | 54,475,827 | 70,900,395 | ||||||
Series D (World Equity Income Series) | 169,119,475 | 176,869,162 | ||||||
Series E (Total Return Bond Series) | 14,966,210 | 37,991,594 | ||||||
Series F (Floating Rate Strategies Series) | 30,857,639 | 31,151,755 | ||||||
Series J (StylePlus—Mid Growth Series) | 134,890,194 | 171,994,901 | ||||||
Series N (Managed Asset Allocation Series) | 300,196 | 5,691,996 | ||||||
Series O (All Cap Value Series) | 27,991,953 | 33,623,210 | ||||||
Series P (High Yield Series) | 11,351,141 | 18,170,141 | ||||||
Series Q (Small Cap Value Series) | 24,803,169 | 29,638,877 | ||||||
Series V (SMid Cap Value Series) | 66,475,505 | 79,877,522 | ||||||
Series X (StylePlus—Small Growth Series) | 19,527,496 | 29,701,800 | ||||||
Series Y (StylePlus—Large Growth Series) | 27,575,088 | 42,666,562 | ||||||
Series Z (Alpha Opportunity Series) | 10,865,558 | 11,260,264 | ||||||
For the year ended December 31, 2022, the cost of purchases and proceeds from sales of government securities were as follows:
Fund | Purchases | Sales | ||||||
Series E (Total Return Bond Series) | $ | 58,124,941 | $ | 49,878,257 | ||||
192 | THE GUGGENHEIM FUNDS ANNUAL REPORT |
NOTES TO FINANCIAL STATEMENTS (continued) |
The Funds are permitted to purchase or sell securities from or to certain affiliated funds under specified conditions outlined in procedures adopted by the Board. The procedures have been designed to ensure that any purchase or sale of securities by a Fund from or to another fund or portfolio that is or could be considered an affiliate by virtue of having a common investment adviser (or affiliated investment advisers), common trustees and/or common officers complies with Rule 17a-7 of the 1940 Act. Further, as defined under these procedures, each transaction is effected at the current market price to save costs, where permissible. For the year ended December 31, 2022, the Funds engaged in purchases and sales of securities, pursuant to Rule 17a-7 of the 1940 Act, as follows:
Fund | Purchases | Sales | Realized Gain | |||||||||
Series E (Total Return Bond Series) | $ | — | $ | 540,013 | $ | (78,720 | ) | |||||
Series P (High Yield Series) | 281,688 | 2,299,422 | (43,850 | ) | ||||||||
Note 8 – Unfunded Loan Commitments
Pursuant to the terms of certain loan agreements, certain Funds held unfunded loan commitments as of December 31, 2022. The Funds are obligated to fund these loan commitments at the borrower’s discretion.
The unfunded loan commitments as of December 31, 2022, were as follows:
Fund | Borrower | Maturity Date | Face Amount | Value | |||||||||
Series E (Total Return Bond Series) | |||||||||||||
Higginbotham Insurance Agency, Inc. | 11/25/26 | $ | 53,904 | $ | 1,569 | ||||||||
Lightning A | 03/01/37 | 253,255 | — | ||||||||||
Thunderbird A | 03/01/37 | 249,909 | — | ||||||||||
| $ | 557,068 | $ | 1,569 | ||||||||||
Series F (Floating Rate Strategies Series) | |||||||||||||
Athenahealth Group, Inc. | 02/15/29 | 54,348 | 5,415 | ||||||||||
Dermatology Intermediate Holdings III, Inc. | 04/02/29 | 4,212 | 116 | ||||||||||
Osmosis Holdings Australia II Pty Ltd. | 07/31/28 | 7,407 | 444 | ||||||||||
TGP Holdings LLC | 06/29/28 | 7,018 | 1,439 | ||||||||||
VT TopCo, Inc. | 08/01/25 | 15,613 | 520 | ||||||||||
| $ | 88,598 | $ | 7,934 | ||||||||||
Series P (High Yield Series) | |||||||||||||
Confluent Health LLC | 11/30/28 | 5,731 | 879 | ||||||||||
Osmosis Holdings Australia II Pty Ltd. | 07/31/28 | 5,556 | 333 | ||||||||||
TGP Holdings LLC | 06/29/28 | 1,456 | 299 | ||||||||||
| $ | 12,743 | $ | 1,511 | ||||||||||
THE GUGGENHEIM FUNDS ANNUAL REPORT | 193 |
NOTES TO FINANCIAL STATEMENTS (continued) |
Note 9 – Restricted Securities
The securities below are considered illiquid and restricted under guidelines established by the Board:
Fund | Restricted Securities | Acquisition Date | Cost | Value | |||||||||
Series E (Total Return Bond Series) | |||||||||||||
Copper River CLO Ltd. | |||||||||||||
2007-1A INC, (WAC) due 01/20/211 | 05/09/14 | $ | — | $ | 235 | ||||||||
FKRT | |||||||||||||
2.21% due 11/30/58 | 09/24/21 | 749,997 | 719,910 | ||||||||||
LSTAR Securities Investment Ltd. | |||||||||||||
2021-1 5.92% (1 Month USD LIBOR + 1.80%, Rate Floor: 1.80%) due 02/01/262 | 02/04/21 | 230,243 | 205,305 | ||||||||||
LSTAR Securities Investment Ltd. | |||||||||||||
2021-2 5.82% (1 Month USD LIBOR + 1.70%, Rate Floor: 1.70%) due 03/02/262 | 03/17/21 | 174,797 | 171,819 | ||||||||||
Towd Point Revolving Trust | |||||||||||||
4.83% due 09/25/64 | 03/17/22 | 499,996 | 481,300 | ||||||||||
| $ | 1,655,033 | $ | 1,578,569 | ||||||||||
Series P (High Yield Series) | |||||||||||||
Mirabela Nickel Ltd. | |||||||||||||
due 06/24/193 | 12/31/13 | 353,909 | 7,802 | ||||||||||
| $ | 353,909 | $ | 7,802 | ||||||||||
1 | Security has no stated coupon. However, it is expected to receive residual cash flow payments on defined deal dates. |
2 | Variable rate security. Rate indicated is the rate effective at December 31, 2022. In some instances, the effective rate is limited by a minimum rate floor or a maximum rate cap established by the issuer. The settlement status of a position may also impact the effective rate indicated. In some cases, a position may be unsettled at period end and may not have a stated effective rate. In instances where multiple underlying reference rates and spread amounts are shown, the effective rate is based on a weighted average. |
3 | Security is in default of interest and/or principal obligations. |
Note 10 – Line of Credit
The Trust, along with other affiliated trusts, secured a 364-day committed, $1,230,000,000 line of credit from Citibank, N.A., which was in place through September 30, 2022, at which time a new line of credit was entered into in the amount of $1,150,000,000. A Fund may draw (borrow) from the line of credit as a temporary measure for emergency purposes, to facilitate redemption requests, or for other short-term liquidity purposes consistent with the Fund’s investment objective and program. For example, it may be advantageous for the Fund to borrow money rather than sell existing portfolio positions to meet redemption requests. Fees related to borrowings, if any, vary under this arrangement between the greater of Citibank’s “base rate”, SOFR plus 1%, or the federal funds rate plus 1/2 of 1%.
The commitment fee that may be paid by the Funds is at an annualized rate of 0.15% of the average daily amount of their allocated unused commitment amount. The commitment fee amount is allocated to the individual Funds based on the respective net assets of each participating Fund and is referenced in the Statements of Operations under “Line of credit fees”. The Funds did not have any borrowings under this agreement as of and for the year ended December 31, 2022.
Note 11 – Reverse Repurchase Agreements
Each of the Funds may enter into reverse repurchase agreements. Under a reverse repurchase agreement, a Fund sells securities and agrees to repurchase them at a particular price at a future date. In the event the buyer of securities under a reverse repurchase agreement files for bankruptcy or becomes insolvent, such buyer or its trustee or receiver may receive an extension of time to determine whether to enforce the Fund’s obligation to repurchase the securities, and the Fund’s use of the proceeds of the reverse repurchase agreement may effectively be restricted pending such decision.
194 | THE GUGGENHEIM FUNDS ANNUAL REPORT |
NOTES TO FINANCIAL STATEMENTS (continued) |
For the year ended December 31, 2022, the following Funds entered into reverse repurchase agreements:
Fund | Number of Days | Balance at | Average Balance | Average | ||||||||||||
Series E (Total Return Bond Series) | 339 | $ | — | $ | 10,277,294 | 1.34 | % | |||||||||
Series P (High Yield Series) | 365 | 238,240 | 705,126 | (0.26 | %) | |||||||||||
The following table presents reverse repurchase agreements that are subject to netting arrangements and offset in the Statement of Assets and Liabilites in conformity with U.S. GAAP:
Gross Amounts Not Offset | |||||||||||||||||||||||||
Fund | Instrument | Gross | Gross | Net Amount | Financial | Cash | Net | ||||||||||||||||||
Series P (High Yield Series) | Reverse Repurchase Agreements | $ | 238,240 | $ | — | $ | 238,240 | $ | (238,240 | ) | $ | — | $ | — | |||||||||||
As of December 31, 2022, Series P (High Yield Series) had $238,240, in reverse repurchase agreements outstanding with various counterparties. Details of the reverse repurchase agreements by counterparty are as follows:
Fund | Counterparty | Interest Rate | Maturity Date | Face Value | ||||||
Series P (High Yield Series) | Goldman Sachs & Co. LLC | 2.25%* | Open Maturity | $ | 238,240 | |||||
* | The rate is adjusted periodically by the counterparty, subject to approval by the Adviser, and is not based upon a set of reference rate and spread. Rate indicated is the rate effective at December 31, 2022. |
The following is a summary of the remaining contractual maturities of the reverse repurchase agreements outstanding as of year end, aggregated by asset class of the related collateral pledged by the Fund:
Fund | Asset Type | Continuous | Total | |||||||||
Series P (High Yield Series) | Corporate Bonds | $ | 238,240 | $ | 238,240 | |||||||
Gross amount of recognized liabilities for reverse repurchase agreements |
| $ | 238,240 | $ | 238,240 | |||||||
Note 12 – Market Risks
The value of, or income generated by, the investments held by the Funds are subject to the possibility of rapid and unpredictable fluctuation, and loss that may result from various factors. These factors include, among others, developments affecting individual companies, or from broader influences, including real or perceived changes in prevailing interest rates (which have since risen and may continue to rise), changes in inflation rates or expectations about inflation rates (which are currently elevated relative to normal conditions), adverse investor confidence or sentiment, changing economic, political (including geopolitical), social or financial market conditions, increased instability or general uncertainty, environmental disasters, governmental actions, public health emergencies (such as the spread of infectious diseases, pandemics and epidemics), debt crises, actual or threatened wars or other armed conflicts (such as the current Russia-Ukraine conflict and its risk of expansion or collateral economic and other effects) or ratings downgrades, and other similar events, each of which may be temporary or last for extended periods. Moreover, changing economic, political, geopolitical, social, financial market or other conditions in one country or geographic region could adversely affect the value, yield and return of the investments held by the Funds in a different country or geographic region, economy, and market because of the increasingly interconnected global economies and financial markets. The duration and extent of the
THE GUGGENHEIM FUNDS ANNUAL REPORT | 195 |
NOTES TO FINANCIAL STATEMENTS (concluded) |
foregoing types of factors or conditions are highly uncertain and difficult to predict and have in the past, and may in the future, cause volatility and distress in economies and financial markets or other adverse circumstances, which may negatively affect the value of the Funds’ investments and performance of the Funds.
Note 13 – Subsequent Events
The Funds evaluated subsequent events through the date the financial statements were available for issue and determined there were no material events that would require adjustment to or disclosure in the Funds’ financial statements.
196 | THE GUGGENHEIM FUNDS ANNUAL REPORT |
REPORT OF INDEPENDENT REGISTERED PUBLIC ACCOUNTING FIRM |
To the Shareholders and the Board of Trustees of Guggenheim Variable Funds Trust
Opinion on the Financial Statements
We have audited the accompanying statements of assets and liabilities of Guggenheim Variable Funds Trust (the “Trust”) (comprising Series A (Style Plus—Large Core Series), Series B (Large Cap Value Series), Series D (World Equity Income Series), Series E (Total Return Bond Series), Series F (Floating Rate Strategies Series), Series J (Style Plus—Mid Growth Series), Series N (Managed Asset Allocation Series), Series O (All Cap Value Series), Series P (High Yield Series), Series Q (Small Cap Value Series), Series V (SMid Cap Value Series), Series X (Style Plus—Small Growth Series), Series Y (Style Plus—Large Growth Series) and Series Z (Alpha Opportunity Series) (collectively referred to as the “Funds”)), including the schedules of investments, as of December 31, 2022, and the related statements of operations for the year then ended, the statements of changes in net assets for each of the two years in the period then ended, the financial highlights for each of the five years in the period then ended and the related notes (collectively referred to as the “financial statements”). In our opinion, the financial statements present fairly, in all material respects, the financial position of each of the Funds comprising Guggenheim Variable Funds Trust at December 31, 2022, the results of their operations for the year then ended, the changes in their net assets for each of the two years in the period then ended and their financial highlights for each of the five years in the period then ended, in conformity with U.S. generally accepted accounting principles.
Basis for Opinion
These financial statements are the responsibility of the Trust’s management. Our responsibility is to express an opinion on each of the Funds’ financial statements based on our audits. We are a public accounting firm registered with the Public Company Accounting Oversight Board (United States) (“PCAOB”) and are required to be independent with respect to the Trust in accordance with the U.S. federal securities laws and the applicable rules and regulations of the Securities and Exchange Commission and the PCAOB.
We conducted our audits in accordance with the standards of the PCAOB. Those standards require that we plan and perform the audit to obtain reasonable assurance about whether the financial statements are free of material misstatement, whether due to error or fraud. The Trust is not required to have, nor were we engaged to perform, an audit of the Trust’s internal control over financial reporting. As part of our audits, we are required to obtain an understanding of internal control over financial reporting but not for the purpose of expressing an opinion on the effectiveness of the Trust’s internal control over financial reporting. Accordingly, we express no such opinion.
Our audits included performing procedures to assess the risks of material misstatement of the financial statements, whether due to error or fraud, and performing procedures that respond to those risks. Such procedures included examining, on a test basis, evidence regarding the amounts and disclosures in the financial statements. Our procedures included confirmation of securities owned as of December 31, 2022, by correspondence with the custodian, transfer agent, paying agents, brokers; when replies were not received from brokers or paying agents, we performed other auditing procedures. Our audits also included evaluating the accounting principles used and significant estimates made by management, as well as evaluating the overall presentation of the financial statements. We believe that our audits provide a reasonable basis for our opinion.

We have served as the auditor of one or more Guggenheim investment companies since 1979.
Tysons, Virginia
February 24, 2023
THE GUGGENHEIM FUNDS ANNUAL REPORT | 197 |
OTHER INFORMATION (Unaudited) |
Federal Income Tax Information
This information is being provided as required by the Internal Revenue Code. Amounts shown may differ from those elsewhere in the report because of differences in tax and financial reporting practice.
In January 2023, shareholders will be advised on IRS Form 1099 DIV or substitute 1099 DIV as to the federal tax status of the distributions received by shareholders in the calendar year 2022.
The Funds’ investment income (dividend income plus short-term capital gains, if any) qualifies as follows:
Of the taxable ordinary income distributions paid during the fiscal year ended December 31, 2022, the following Funds had the corresponding percentages qualify for the dividends received deduction for corporations.
Fund | Dividend | |||
Series A (StylePlus—Large Core Series) | 1.07 | % | ||
Series B (Large Cap Value Series) | 91.11 | % | ||
Series D (World Equity Income Series) | 9.77 | % | ||
Series E (Total Return Bond Series) | 2.40 | % | ||
Series F (Floating Rate Strategies Series) | 1.90 | % | ||
Series J (StylePlus—Mid Growth Series) | 0.47 | % | ||
Series N (Managed Asset Allocation Series) | 18.59 | % | ||
Series O (All Cap Value Series) | 72.23 | % | ||
Series P (High Yield Series) | 1.98 | % | ||
Series Q (Small Cap Value Series) | 78.23 | % | ||
Series V (SMid Cap Value Series) | 53.98 | % | ||
Series X (StylePlus—Small Growth Series) | 0.71 | % | ||
Series Y (StylePlus—Large Growth Series) | 1.43 | % | ||
Series Z (Alpha Opportunity Series) | 100.00 | % | ||
With respect to the taxable year ended December 31, 2022, the Funds hereby designate as capital gain dividends the amounts listed below, or, if subsequently determined to be different, the net capital gain of such year:
Fund | From long-term | From long-term capital | ||||||
Series A (StylePlus—Large Core Series) | $ | 255,841 | $ | — | ||||
Series B (Large Cap Value Series) | 18,054,554 | 2,663,805 | ||||||
Series D (World Equity Income Series) | 6,913,025 | — | ||||||
Series N (Managed Asset Allocation Series) | 3,402,931 | 201,222 | ||||||
Series O (All Cap Value Series) | 8,821,523 | 773,074 | ||||||
Series Q (Small Cap Value Series) | 2,236,822 | 824,610 | ||||||
Series V (SMid Cap Value Series) | 14,849,902 | 2,265,819 | ||||||
Series X (StylePlus—Small Growth Series) | 80,941 | — | ||||||
Delivery of Shareholder Reports
Paper copies of the Funds’ annual and semi-annual shareholder reports are not sent by mail, unless you specifically request paper copies of the reports from the insurance company that offers your contract or from your financial intermediary. Instead, the reports are made available on a website, and you are notified by mail each time a report is posted and provided with a website address to access the report.
You may elect to receive paper copies of all future shareholder reports free of charge. You can inform the insurance company that you wish to receive paper copies of reports by following the instructions provided by the insurance company. Your election to receive reports in paper may apply to all portfolio companies available under your contract.
198 | THE GUGGENHEIM FUNDS ANNUAL REPORT |
OTHER INFORMATION (Unaudited)(concluded) |
Proxy Voting Information
A description of the policies and procedures that the Trust uses to determine how to vote proxies relating to securities held in the Funds’ portfolios is available, without charge and upon request, by calling 800.820.0888. This information is also available from the EDGAR database on the SEC’s website at https://www.sec.gov.
Information regarding how the Funds’ voted proxies relating to portfolio securities during the most recent 12-month period ended June 30 is available without charge, upon request, by calling 800.820.0888. This information is also available from the EDGAR database on the SEC’s website at https://www.sec.gov.
Sector Classification
Information in the “Schedule of Investments” is categorized by sectors using sector-level Classifications defined by the Bloomberg Industry Classification System, a widely recognized industry classification system provider. Each Fund’s registration statement has investment policies relating to concentration in specific sectors/industries. For purposes of these investment policies, the Funds usually classify sectors/industries based on industry-level Classifications used by widely recognized industry classification system providers such as Bloomberg Industry Classification System, Global Industry Classification Standards and Barclays Global Classification Scheme.
Quarterly Portfolio Schedules Information
The Trust files its complete schedule of portfolio holdings with the SEC for the first and third quarters of each fiscal year as an exhibit to its reports on Form N-PORT, and for reporting periods ended prior to March 31, 2019, filed such information on Form N-Q. The Funds’ Forms N-PORT and N-Q are available on the SEC’s website at https://www.sec.gov. Copies of the portfolio holdings are also available to shareholders, without charge and upon request, by calling 800.820.0888.
THE GUGGENHEIM FUNDS ANNUAL REPORT | 199 |
INFORMATION ON BOARD OF TRUSTEES AND OFFICERS (Unaudited) |
A Board of Trustees oversees the Trust, as well as other trusts of GI, in which its members have no stated term of service, and continue to serve after election until resignation. The Statement of Additional Information includes further information about Fund Trustees and Officers, and can be obtained without charge by visiting guggenheiminvestments.com or by calling 800.820.0888.
Name, Address* | Position(s) | Term of Office | Principal Occupation(s) | Number of | Other |
INDEPENDENT TRUSTEES | |||||
Randall C. Barnes (1951) | Trustee and Chair of the Valuation Oversight Committee | Since 2014 (Trustee)
Since 2020 (Chair of the Valuation Oversight Committee) | Current: Private Investor (2001-present). | 155 | Current: Advent Convertible and Income Fund (2005-present); Purpose Investments Funds (2013-present). |
Angela Brock-Kyle (1959) | Trustee | Since 2016 | Current: Founder and Chief Executive Officer, B.O.A.R.D.S. (2013-present); Director, Mutual Fund Directors Forum (2022-present). | 154 | Current: Bowhead Insurance GP, LLC (2020-present); Hunt Companies, Inc. (2019-present). |
Thomas F. Lydon, Jr. (1960) | Trustee and Chair of the Contracts Review Committee | Since 2019 (Trustee)
Since 2020 (Chair of the Contracts Review Committee) | Current: President, Global Trends Investments (1996-present); Chief Executive Officer, ETF Flows, LLC (2019-present); Chief Executive Officer, Lydon Media (2016-present); Director, GDX Index Partners, LLC (2021-present); Vice Chairman, VettaFi (2022-present). | 154 | Current: US Global Investors, Inc. (GROW) (1995-present). |
200 | THE GUGGENHEIM FUNDS ANNUAL REPORT |
INFORMATION ON BOARD OF TRUSTEES AND OFFICERS (Unaudited)(continued) |
Name, Address* | Position(s) | Term of Office | Principal Occupation(s) | Number of | Other |
INDEPENDENT TRUSTEES - continued | |||||
Ronald A. Nyberg (1953) | Trustee and Chair of the Nominating and Governance Committee | Since 2014 | Current: Of Counsel, Momkus LLP (2016-present). | 155 | Current: Advent Convertible and Income Fund (2003-present); PPM Funds (2) (2018-present); NorthShore-Edward-Elmhurst Health (2012-present). |
Sandra G. Sponem (1958) | Trustee and Chair of the Audit Committee | Since 2019 (Trustee)
Since 2020 (Chair of the Audit Committee) | Current: Retired. | 154 | Current: SPDR Series Trust (81) (2018-present); SPDR Index Shares Funds (30) (2018-present); SSGA Active Trust (14) (2018-present).
Former: Fiduciary/Claymore Energy Infrastructure Fund (2019-2022); Guggenheim Enhanced Equity Income Fund (2019-2021); Guggenheim Credit Allocation Fund (2019-2021); SSGA Master Trust (1) (2018-2020). |
THE GUGGENHEIM FUNDS ANNUAL REPORT | 201 |
INFORMATION ON BOARD OF TRUSTEES AND OFFICERS (Unaudited)(continued) |
Name, Address* | Position(s) | Term of Office | Principal Occupation(s) | Number of | Other |
INDEPENDENT TRUSTEES - concluded | |||||
Ronald E. Toupin, Jr. (1958) | Trustee, Chair of the Board and Chair of the Executive Committee | Since 2014 | Current: Portfolio Consultant (2010-present); Member, Governing Council, Independent Directors Council (2013-present); Governor, Board of Governors, Investment Company Institute (2018-present). | 154 | Former: Fiduciary/Claymore Energy Infrastructure Fund (2004-2022); Guggenheim Enhanced Equity Income Fund (2005-2021); Guggenheim Credit Allocation Fund (2013-2021); Western Asset Inflation-Linked Opportunities & Income Fund (2004-2020); Western Asset Inflation-Linked Income Fund (2003-2020). |
INTERESTED TRUSTEE |
|
|
|
| |
Amy J. Lee**** (1961) | Trustee, Vice President and Chief Legal Officer | Since 2018 (Trustee)
Since 2014 (Chief Legal Officer)
Since 2007 (Vice President) | Current: Interested Trustee, certain other funds in the Fund Complex (2018-present); Chief Legal Officer, certain other funds in the Fund Complex (2014-present); Vice President, certain other funds in the Fund Complex (2007-present); Senior Managing Director, Guggenheim Investments (2012-present). | 154 | Former: Fiduciary/Claymore Energy Infrastructure Fund (2018-2022); Guggenheim Enhanced Equity Income Fund (2018-2021); Guggenheim Credit Allocation Fund (2018-2021). |
* | The business address of each Trustee is c/o Guggenheim Investments, 227 West Monroe Street, Chicago, Illinois 60606. |
** | Each Trustee serves an indefinite term, until his or her successor is elected and qualified. |
*** | Each Trustee also serves on the Boards of Trustees of Guggenheim Funds Trust, Guggenheim Variable Funds Trust, Guggenheim Strategy Funds Trust, Guggenheim Taxable Municipal Bond & Investment Grade Debt Trust, Guggenheim Strategic Opportunities Fund, Guggenheim Energy & Income Fund, Guggenheim Active Allocation Fund, Rydex Series Funds, Rydex Dynamic Funds, Rydex Variable Trust and Transparent Value Trust. Messrs. Barnes and Nyberg also serve on the Board of Trustees of Advent Convertible & Income Fund. |
**** | This Trustee is deemed to be an “interested person” of the Funds under the 1940 Act by reason of her position with the Funds’ Investment Manager and/or the parent of the Investment Manager. |
202 | THE GUGGENHEIM FUNDS ANNUAL REPORT |
INFORMATION ON BOARD OF TRUSTEES AND OFFICERS (Unaudited)(continued) |
Name, Address* | Position(s) | Term of Office | Principal Occupation(s) |
OFFICERS | |||
Brian E. Binder (1972) | President and Chief Executive Officer | Since 2018 | Current: President, Mutual Fund Boards, Guggenheim Investments (2022-present); President and Chief Executive Officer, certain other funds in the Fund Complex (2018-present); President, Chief Executive Officer and Chairman of the Board of Managers, Guggenheim Funds Investment Advisors, LLC (2018-present); President and Chief Executive Officer, Security Investors, LLC (2018-present); Board Member, Guggenheim Partners Investment Funds plc (2022-present); Board Member, Guggenheim Global Investments plc (2022-present); Board Member, Guggenheim Partners Fund Management (Europe) Limited (2018-present). |
James M. Howley (1972) | Chief Financial Officer, Chief Accounting Officer and Treasurer | Since 2022 | Current: Managing Director, Guggenheim Investments (2004-present); Chief Financial Officer, Chief Accounting Officer, and Treasurer, certain other funds in the Fund Complex (2022-present). |
Mark E. Mathiasen (1978) | Secretary | Since 2014 | Current: Secretary, certain other funds in the Fund Complex (2007-present); Managing Director, Guggenheim Investments (2007-present). |
Glenn McWhinnie (1969) | Assistant Treasurer | Since 2016 | Current: Vice President, Guggenheim Investments (2009-present); Assistant Treasurer, certain other funds in the Fund Complex (2016-present). |
Michael P. Megaris (1984) | Assistant Secretary | Since 2014 | Current: Assistant Secretary, certain other funds in the Fund Complex (2014-present); Managing Director, Guggenheim Investments (2012-present). |
Elisabeth Miller (1968) | Chief Compliance Officer | Since 2012 | Current: Chief Compliance Officer, certain other funds in the Fund Complex (2012-present); Senior Managing Director, Guggenheim Investments (2012-present); Vice President, Guggenheim Funds Distributors, LLC (2014-present).
Former: Chief Compliance Officer, Security Investors, LLC and Guggenheim Funds Investment Advisors, LLC (2012-2018); Chief Compliance Officer, Guggenheim Distributors, LLC (2009-2014); Senior Manager, Security Investors, LLC (2004-2014); Senior Manager, Guggenheim Distributors, LLC (2004-2014). |
Margaux Misantone (1978) | AML Officer | Since 2017 | Current: Chief Compliance Officer, Security Investors, LLC and Guggenheim Funds Investment Advisors, LLC (2018-present); AML Officer, Security Investors, LLC
Former: Assistant Chief Compliance Officer, Security Investors, LLC and Guggenheim Funds Investments Advisors, LLC (2015-2018). |
THE GUGGENHEIM FUNDS ANNUAL REPORT | 203 |
INFORMATION ON BOARD OF TRUSTEES AND OFFICERS (Unaudited)(concluded) |
Name, Address* | Position(s) | Term of Office | Principal Occupation(s) |
OFFICERS - concluded | |||
Kimberly J. Scott (1974) | Assistant Treasurer | Since 2014 | Current: Director, Guggenheim Investments (2012-present); Assistant Treasurer, certain other funds in the Fund Complex (2012-present). |
Bryan Stone (1979) | Vice President | Since 2014 | Current: Vice President, certain other funds in the Fund Complex (2014-present); Managing Director, Guggenheim Investments (2013-present). |
Jon Szafran (1989) | Assistant Treasurer | Since 2017 | Current: Director, Guggenheim Investments (2017-present); Assistant Treasurer, certain other funds in the Fund Complex (2017-present). |
* | The business address of each officer is c/o Guggenheim Investments, 227 West Monroe Street, Chicago, Illinois 60606. |
** | Each officer serves an indefinite term, until his or her successor is duly elected and qualified. |
204 | THE GUGGENHEIM FUNDS ANNUAL REPORT |
GUGGENHEIM INVESTMENTS PRIVACY NOTICE (Unaudited) |
Who We Are
This Privacy Notice describes the data protection practices of Guggenheim Investments. Guggenheim Investments as used herein refers to the affiliated investment management businesses of Guggenheim Partners, LLC: Guggenheim Funds Investment Advisors, LLC, Guggenheim Partners Investment Management, LLC, Guggenheim Funds Distributors, LLC, Security Investors, LLC, Guggenheim Investment Advisors (Europe) Limited, Guggenheim Real Estate, LLC, GS Gamma Advisors, LLC, Guggenheim Partners India Management, LLC, Guggenheim Partners Europe Limited, as well as the funds in the Guggenheim Funds complex (the “Funds”) (“Guggenheim Investments,” “we,” “us,” or “our”).
Guggenheim Partners Investment Management Holdings, LLC, located at 330 Madison Avenue, New York, New York 10017 is the data controller for your information. The affiliates who are also controllers of certain of your information are: Guggenheim Investment Advisors (Europe) Limited, Guggenheim Partners Europe Limited, Guggenheim Partners, LLC, Guggenheim Funds Investment Advisors, LLC, Guggenheim Partners Investment Management, LLC, Guggenheim Funds Distributors, LLC and Security Investors, LLC, as well as the Funds.
Our Commitment to You
Guggenheim Investments considers your privacy our utmost concern. When you become our client or investor, you entrust us with not only your hard-earned money but also with your personal and financial information. Because we have access to your private information, we hold ourselves to the highest standards in its safekeeping and use. We strictly limit how we share your information with others, whether you are a current or former Guggenheim Investments client or investor.
The Information We Collect About You
We collect certain nonpublic personal information about you from information you provide on applications, other forms, our website, and/or from third parties including investment advisors. This information includes Social Security or other tax identification number, assets, income, tax information, retirement and estate plan information, transaction history, account balance, payment history, bank account information, marital status, family relationships, information that we collect on our website through the use of “cookies,” and other personal information that you or others provide to us. We may also collect such information through your inquiries by mail, e-mail or telephone. We may also collect customer due diligence information, as required by applicable law and regulation, through third party service providers.
How We Handle Your Personal Information
The legal basis for using your information as set out in this Privacy Notice is as follows: (a) use of your personal data is necessary to perform our obligations under any contract with you (such as a contract for us to provide financial services to you); or (b) where use of your personal data is not necessary for performance of a contract, use of your personal data is necessary for our legitimate interests or the legitimate interests of others (for example, to enforce the legal terms governing our services, operate and market our website and other services we offer, ensure safe environments for our personnel and others, make and receive payments, prevent fraud and to know the customer to whom we are providing the services). Some processing is done to comply with applicable law.
In addition to the specific uses described above, we also use your information in the following manner:
● | We use your information in connection with servicing your accounts. |
● | We use information to respond to your requests or questions. For example, we might use your information to respond to your customer feedback. |
● | We use information to improve our products and services. We may use your information to make our website and products better. We may use your information to customize your experience with us. |
● | We use information for security purposes. We may use your information to protect our company and our customers. |
● | We use information to communicate with you. For example, we will communicate with you about your account or our relationship. We may contact you about your feedback. We might also contact you about this Privacy Notice. We may also enroll you in our email newsletter. |
THE GUGGENHEIM FUNDS ANNUAL REPORT | 205 |
GUGGENHEIM INVESTMENTS PRIVACY NOTICE (Unaudited)(continued) |
● | We use information as otherwise permitted by law, as we may notify you. |
● | Aggregate/Anonymous Data. We may aggregate and/or anonymize any information collected through the website so that such information can no longer be linked to you or your device (“Aggregate/Anonymous Information”). We may use Aggregate/Anonymous Information for any purpose, including without limitation for research and marketing purposes, and may also share such data with any third parties, including advertisers, promotional partners, and sponsors. |
We do not sell information about current or former clients or their accounts to third parties. Nor do we share this information, except when necessary to complete transactions at your request, to make you aware of investment products and services that we or our affiliates offer, or as permitted or required by law.
We provide information about you to companies and individuals not affiliated with Guggenheim Investments to complete certain transactions or account changes, or to perform services for us related to your account. For example, if you ask to transfer assets from another financial institution to Guggenheim Investments, we must provide certain information about you to that company to complete the transaction. We provide the third party with only the information necessary to carry out its responsibilities and only for that purpose. And we require these third parties to treat your private information with the same high degree of confidentiality that we do. To alert you to other Guggenheim Investments products and services, we share your information within our family of affiliated companies. You may limit our sharing with affiliated companies as set out below. We may also share information with any successor to all or part of our business, or in connection with steps leading up to a merger or acquisition. For example, if part of our business was sold we may give customer information as part of that transaction. We may also share information about you with your consent.
We will release information about you if you direct us to do so, if we are compelled by law to do so, or in other circumstances as permitted by law (for example, to protect your account from fraud).
If you close your account(s) or become an inactive client or investor, we will continue to adhere to the privacy policies and practices described in this notice.
Opt-Out Provisions and Your Data Choices
The law allows you to “opt out” of certain kinds of information sharing with third parties. We do not share personal information about you with any third parties that triggers this opt-out right. This means YOU ARE ALREADY OPTED OUT.
When you are no longer our client or investor, we continue to share your information as described in this notice, and you may contact us at any time to limit our sharing by sending an email to CorporateDataPrivacy@GuggenheimPartners.com.
European Union Data Subjects and certain others: In addition to the choices set forth above, residents of the European Union and certain other jurisdictions have certain rights to (1) request access to or rectification or deletion of information we collect about them, (2) request a restriction on the processing of their information, (3) object to the processing of their information, or (4) request the portability of certain information. To exercise these or other rights, please contact us using the contact information below. We will consider all requests and provide our response within the time period stated by applicable law. Please note, however, that certain information may be exempt from such requests in some circumstances, which may include if we need to keep processing your information for our legitimate interests or to comply with a legal obligation. We may request you provide us with information necessary to confirm your identity before responding to your request.
Residents of France and certain other jurisdictions may also provide us with instructions regarding the manner in which we may continue to store, erase and share your information after your death, and where applicable, the person you have designated to exercise these rights after your death.
206 | THE GUGGENHEIM FUNDS ANNUAL REPORT |
GUGGENHEIM INVESTMENTS PRIVACY NOTICE (Unaudited)(concluded) |
How We Protect Privacy Online
We take steps to protect your privacy when you use our web site – www.guggenheiminvestments.com – by using secure forms of online communication, including encryption technology, Secure Socket Layer (SSL) protocol, firewalls and user names and passwords. These safeguards vary based on the sensitivity of the information that we collect and store. However, we cannot and do not guarantee that these measures will prevent every unauthorized attempt to access, use, or disclose your information since despite our efforts, no Internet and/or other electronic transmissions can be completely secure. Our web site uses “http cookies”—tiny pieces of information that we ask your browser to store. We use cookies for session management and security features on the Guggenheim Investments web site. We do not use them to pull data from your hard drive, to learn your e-mail address, or to view data in cookies created by other web sites. We will not share the information in our cookies or give others access to it. See the legal information area on our web site for more details about web site security and privacy features.
How We Safeguard Your Personal Information and Data Retention
We restrict access to nonpublic personal information about you to our employees and in some cases to third parties (for example, the service providers described above) as permitted by law. We maintain strict physical, electronic and procedural safeguards that comply with federal standards to guard your nonpublic personal information.
We keep your information for no longer than necessary for the purposes for which it is processed. The length of time for which we retain information depends on the purposes for which we collected and use it and/or as required to comply with applicable laws. Information may persist in copies made for backup and business continuity purposes for additional time.
International Visitors
If you are not a resident of the United States, please be aware that your information may be transferred to, stored and processed in the United States where our servers are located and our databases are operated. The data protection and other laws of the United States and other countries might not be as comprehensive as those in your country.
In such cases, we ensure that a legal basis for such a transfer exists and that adequate protection is provided as required by applicable law, for example, by using standard contractual clauses or by transferring your data to a jurisdiction that has obtained an adequacy finding. Individuals whose data may be transferred on the basis of standard contractual clauses may contact us as described below.
We’ll Keep You Informed
If you have any questions or concerns about how we treat your personal data, we encourage you to consult with us first. You may also contact the relevant supervisory authority.
We reserve the right to modify this policy at any time and will inform you promptly of material changes. You may access our privacy policy from our web site at www.guggenheiminvestments.com. Should you have any questions regarding our privacy policy, contact us by email at CorporateDataPrivacy@GuggenheimPartners.com.
THE GUGGENHEIM FUNDS ANNUAL REPORT | 207 |
|
This page intentionally left blank.
|
This page intentionally left blank.
|
This page intentionally left blank.
|
This page intentionally left blank.
|
This page intentionally left blank.
|
This page intentionally left blank.
Item 2. Code of Ethics.
The registrant’s Board of Trustees has adopted a code of ethics that applies to the registrant’s principal executive officer and principal financial officer. No substantive amendments were approved or waivers were granted to the Code during the period covered by this report. The Code is filed as an exhibit to this Form N-CSR.
Item 3. Audit Committee Financial Expert.
The registrant's Board of Trustees has determined that it has at least one audit committee financial expert serving on its audit committee (the “Audit Committee”), Sandra G. Sponem. Ms. Sponem is “independent,” meaning that she is not an “interested person” of the Registrant (as that term is defined in Section 2(a)(19) of the Investment Company Act of 1940, as amended) and she does not accept any consulting, advisory, or other compensatory fee from the Registrant (except in her capacity as a Board or committee member).
(Under applicable securities laws, a person who is determined to be an audit committee financial expert will not be deemed an "expert" for any purpose, including without limitation for the purposes of Section 11 of the Securities Act of 1933, as amended, as a result of being designated or identified as an audit committee financial expert. The designation or identification of a person as an audit committee financial expert does not impose on such person any duties, obligations, or liabilities that are greater than the duties, obligations, and liabilities imposed on such person as a member of the audit committee and Board of Trustees in the absence of such designation or identification.)
Item 4. Principal Accountant Fees and Services.
(a) Audit Fees. The aggregate Audit Fees billed by the registrant’s principal accountant for professional services rendered for the audit of the annual financial statements or services that are normally provided by the accountant in connection with statutory and regulatory filings or engagements for the fiscal years ended December 31, 2022 and December 31, 2021 were $345,583 and $335,517, respectively.
(b) Audit-Related Fees. The aggregate Audit-Related Fees billed by the registrant’s principal accountant for assurance and related services that are reasonably related to the performance of the audit of the registrant’s financial statements and are not reported under paragraph (a) of this Item for the fiscal years ended December 31, 2022 and December 31, 2021 were $0 and $0, respectively.
The aggregate fees billed in the Reporting Periods for assurance and related services by the Auditor to the registrant’s investment adviser (not including any sub-investment adviser whose role is primarily portfolio management and is subcontracted with or overseen by another investment adviser), and any entity controlling, controlled by or under common control with the investment adviser that provides ongoing services to the Registrant (“Service Affiliates”) which required pre-approval by the Audit Committee which related to the review of the transfer agent function for the fiscal years ended December 31, 2022 and December 31, 2021 were $0 and $0, respectively.
(c) Tax Fees. The aggregate Tax Fees billed by the registrant’s principal accountant for professional services rendered for tax compliance, tax advice, and tax planning, including preparation of tax returns and distribution assistance, for the fiscal years ended December 31, 2022 and December 31, 2021 were $95,548 and $86,828, respectively. These services consisted of [(i) preparation of U.S. federal, state and excise tax returns; (ii) U.S. federal and state tax planning, advice and assistance regarding statutory, regulatory or administrative developments, (iii) tax advice regarding tax qualification matters and/or treatment of various financial instruments held or proposed to be acquired and (iv) review of U.S. federal excise distribution calculations].
(d) All Other Fees. The aggregate All Other Fees billed by the registrant’s principal accountant for products and services provided by the principal accountant, other than the services reported in paragraphs (a) through (c) of this Item, for the fiscal years ended December 31, 2022 and December 31, 2021 were $0 and $0, respectively.
(e) Audit Committee Pre-Approval Policies and Procedures.
(1) Audit Committee pre-approval policies and procedures:
To fulfill its responsibilities and duties the Audit Committee (the “Committee”) shall:
| 1. | Pre-Approval Policy (Trusts). Pre-approve any engagement of the independent auditors to provide any services, other than “prohibited non-audit services,” to the Trust, including the fees and other compensation to be paid to the independent auditors (unless an exception is available under Rule 2-01 of Regulation S-X). |
| (a) | The categories of services to be reviewed and considered for pre-approval include those services set forth under Section II.A.1. of the Background and Definitions for Audit Committee Charter, attached hereto as Appendix B (collectively, “Identified Services”). |
| (b) | The Committee has pre-approved Identified Services for which the estimated fees are less than $25,000. |
| (c) | For Identified Services with estimated fees of $25,000 or more, but less than $50,000, the Chair or any member of the Committee designated by the Chair is hereby authorized to pre-approve such Identified Services on behalf of the Committee. |
| (d) | For Identified Services with estimated fees of $50,000 or more, such Identified Services require pre-approval by the Committee. |
| (e) | All requests for Identified Services to be provided by the independent auditor that were pre-approved by the Committee shall be submitted to the Chief Accounting Officer (“CAO”) of the Trust by the independent auditor using the pre-approval request form attached as Appendix C hereto. The Trust’s CAO will determine whether such services are included within the list of services that have received the general pre-approval of the Committee. |
| (f) | The independent auditors or the CAO of the Trust (or an officer of the Trust who reports to the CAO) shall report to the Committee at each of its regular scheduled meetings all audit, audit-related and permissible non-audit services initiated since the last such report (unless the services were contained in the initial audit plan, as previously presented to, and approved by, the Committee). The report shall include a general description of the services and projected fees, and the means by which such services were approved by the Committee (including the particular category of Identified Services as set forth in Appendix B under which pre-approval was obtained). |
| 2. | Pre-Approval Policy (Adviser or Any Control Affiliate). Pre-approve any engagement of the independent auditors, including the fees and other compensation to be paid to the independent auditors, to provide any non-audit services to the Adviser (or any “control affiliate” of the Adviser providing ongoing services to the Trust), if the engagement relates directly to the operations or financial reporting of the Trust (unless an exception is available under Rule 2-01 of Regulation S-X). |
| (a) | The Chair or any member of the Committee designated by the Chair may grant the pre-approval for non-audit services to the Adviser (or any “control affiliate” of the Adviser providing ongoing services to the Trust) relating directly to the operations or financial reporting of the Trust for which the estimated fees are less than $25,000. All such delegated pre-approvals shall be presented to the Committee no later than the next regularly scheduled Committee meeting. |
| (b) | For non-audit services to the Adviser (or any “control affiliate” of the Adviser providing ongoing services to the Trust) relating directly to the operations or financial reporting of the Trust for which the estimated fees are $25,000 or more, such services require pre-approval by the Committee. |
| a. | Pre-Approval Requirements |
| i. | Categories of Services to be Reviewed and Considered for Pre-Approval |
| 1. | Audit Services |
| a. | Annual financial statement audits |
| b. | Seed audits (related to new product filings, as required) |
| c. | SEC and regulatory filings and consents |
| 2. | Audit-Related Services |
| a. | Accounting consultations |
| b. | Fund merger/reorganization support services |
| c. | Other accounting related matters |
| d. | Agreed upon procedures reports |
| e. | Attestation reports |
| f. | Other internal control reports |
| 3. | Tax Services |
| a. | Recurring tax services: |
| i. | Preparation of Federal and state income tax returns, including extensions |
| ii. | Preparation of calculations of taxable income, including fiscal year tax designations |
| iii. | Preparation of annual Federal excise tax returns (if applicable) |
| iv. | Preparation of calendar year excise distribution calculations |
| v. | Calculation of tax equalization on an as-needed basis |
| vi. | Preparation of monthly/quarterly estimates of tax undistributed position for closed-end funds |
| vii. | Preparation of the estimated excise distribution calculations on an as-needed basis |
| viii. | Preparation of calendar year shareholder reporting designations on Form 1099 |
| ix. | Preparation of quarterly Federal, state and local and franchise tax estimated tax payments on an as-needed basis |
| x. | Preparation of state apportionment calculations to properly allocate Fund taxable income among the states for state tax filing purposes |
| xi. | Assistance with management’s identification of passive foreign investment companies (PFICs) for tax purposes |
| b. | Permissible non-recurring tax services upon request: |
| i. | Assistance with determining ownership changes which impact a Fund’s utilization of loss carryforwards |
| ii. | Assistance with corporate actions and tax treatment of complex securities and structured products |
| iii. | Assistance with IRS ruling requests and calculation of deficiency dividends |
| iv. | Conduct training sessions for the Adviser’s internal tax resources |
| v. | Assistance with Federal, state, local and international tax planning and advice regarding the tax consequences of proposed or actual transactions |
| vi. | Tax services related to amendments to Federal, state and local returns and sales and use tax compliance |
| vii. | RIC qualification reviews |
| viii. | Tax distribution analysis and planning |
| ix. | Tax authority examination services |
| x. | Tax appeals support services |
| xi. | Tax accounting methods studies |
| xii. | Fund merger, reorganization and liquidation support services |
| xiii. | Tax compliance, planning and advice services and related projects |
| xiv. | Assistance with out of state residency status |
| xv. | Provision of tax compliance services in India for Funds with direct investments in India |
| B. | Pre-Approval Not Required |
Under Section 10A(h)(i)(1)(B) of the Exchange Act and Rule 2-01 under Regulation S-X (Section (c)(7)), pre-approval of non-audit services for the Trust pursuant to Section V.B.2 is not required, if:
1. the aggregate amount of all non-audit services provided to the Trust is no more than 5% of the total fees paid by the Trust to the independent auditors during the fiscal year in which the non-audit services are provided;
2. the services were not recognized by Trust management at the time of the engagement as non-audit services; and
3. such services are promptly brought to the attention of the Audit Committee by Trust management and the Committee approves them (which may be by delegation) prior to the completion of the audit.
Under Section 10A(h)(i)(1)(B) of the Exchange Act and Rule 2-01 under Regulation S-X (Section (c)(7)), pre-approval of non-audit services for the Adviser (or any affiliate of the Adviser providing ongoing services to the Trust) pursuant to Section V.B.3 is not required, if:
1. the aggregate amount of all non-audit services provided is no more than 5% of the total fees paid to the Trust’s independent auditors by the Trust, the Adviser and any “control affiliate” of the Adviser providing ongoing services to the Trust during the fiscal year in which the non-audit services are provided;
2. the services were not recognized by Trust management at the time of the engagement as non-audit services; and
3. such services are promptly brought to the attention of the Audit Committee by Trust management and the Committee approves them (which may be by delegation) prior to the completion of the audit.
(2) None of the services described in each of Items 4(b) through (d) were approved by the Audit Committee pursuant to paragraph (c)(7)(i)(C) of Rule 2-01 of Regulation S-X.
(f) Not applicable.
(g) Non-Audit Fees. The aggregate non-audit fees billed by the registrant’s accountant for the most recent fiscal year and the preceding fiscal year for services rendered to the registrant, the investment advisor, and any entity controlling, controlled by, or under common control with the advisor that provides ongoing services to the registrant were $95,548 and $86,828, respectively. These aggregate fees were less than the aggregate fees billed for the same periods by the registrant’s principal accountant for audit services rendered to the registrant, the investment advisor, and any entity controlling, controlled by, or under common control with the advisor that provides ongoing services to the registrant.
(h) Auditor Independence. The registrant’s Audit Committee was provided with information relating to the provision of non-audit services by Ernst & Young, LLP to the registrant’s investment adviser (not including any sub adviser whose role is primarily portfolio management and is subcontracted with or overseen by another investment adviser), and any entity controlling, controlled by, or under common control with the investment adviser that provides ongoing services to the registrant that were not pre-approved by the Audit Committee so that a determination could be made whether the provision of such services is compatible with maintaining Ernst & Young, LLP’s independence.
Item 5. Audit Committee of Listed Registrants.
Not applicable.
Item 6. Investments.
Schedule of Investments is included as part of the report to shareholders filed under Item 1 of this form
Item 7. Disclosure of Proxy Voting Policies and Procedures for Closed-End Management Investment Companies.
Not applicable.
Item 8. Portfolio Managers of Closed-end Management Investment Companies
Not applicable
Item 9. Purchases of Equity Securities by Closed-End Management Investment Company and Affiliated Purchasers.
Not applicable.
Item 10. Submission of Matters to a Vote of Security Holders.
The registrant does not currently have in place procedures by which shareholders may recommend nominees to the registrant’s board.
There have been no changes to the procedures by which shareholders may recommend nominees to the registrant’s board.
Item 11. Controls and Procedures.
(a) The registrant’s President (principal executive officer) and Treasurer (principal financial officer) have evaluated the registrant’s disclosure controls and procedures (as defined in Rule 30a-3(c) under the Investment Company Act) as of a date within 90 days of this filing and have concluded that based on such evaluation as required by Rule 30a-3(b) under the Investment Company Act, that the registrant’s disclosure controls and procedures were effective as of that date in ensuring that information required to be disclosed by the registrant in this Form N-CSR was recorded, processed, summarized, and reported within the time periods specified in the Securities and Exchange Commission’s rules and forms.
(b) The registrant’s principal executive officer and principal financial officer are aware of no change in the registrant’s internal control over financial reporting that occurred during the period covered by this report that has materially affected, or is reasonably likely to materially affect, the registrant’s internal control over financial reporting.
Item 12. Disclosure of Securities Lending Activities for Closed End Management Investment Companies.
Not Applicable
Item 13. Exhibits.
(a)(1) The registrant’s code of ethics pursuant to Item 2 of Form N-CSR is attached.
SIGNATURES
Pursuant to the requirements of the Securities Exchange Act of 1934 and the Investment Company Act of 1940, the registrant has duly caused this report to be signed on its behalf by the undersigned, thereunto duly authorized.
| (Registrant) | Guggenheim Variable Funds Trust | |
| By (Signature and Title)* | /s/ Brian Binder | |
| Brian Binder, President and Chief Executive Officer | ||
| Date | March 6, 2023 |
Pursuant to the requirements of the Securities Exchange Act of 1934 and the Investment Company Act of 1940, this report has been signed below by the following persons on behalf of the registrant and in the capacities and on the dates indicated.
| By (Signature and Title)* | /s/ Brian Binder | |
| Brian Binder, President and Chief Executive Officer | ||
| Date | March 6, 2023 | |
| By (Signature and Title)* | /s/ James M. Howley | |
| James M. Howley, Chief Financial Officer, Chief Accounting Officer and Treasurer | ||
| Date | March 6, 2023 |
| * | Print the name and title of each signing officer under his or her signature. |