UNITED STATES
SECURITIES AND EXCHANGE COMMISSION
Washington, D.C. 20549
FORM N-CSR
CERTIFIED SHAREHOLDER REPORT OF REGISTERED MANAGEMENT INVESTMENT COMPANIES
Investment Company Act file number 811- 02753
Guggenheim Variable Funds Trust
(Exact name of registrant as specified in charter)
702 King Farm Boulevard, Suite 200
Rockville, Maryland 20850
(Address of principal executive offices) (Zip code)
Amy J. Lee
Guggenheim Variable Funds Trust
702 King Farm Boulevard, Suite 200
Rockville, Maryland 20850
(Name and address of agent for service)
Registrant's telephone number, including area code: (301) 296-5100
Date of fiscal year end: December 31
Date of reporting period: January 1, 2024 – December 31, 2024
| Item 1. | Reports to Stockholders. |
| (a) | The registrant’s annual report transmitted to shareholders pursuant to Rule 30e-1 under the Investment Company Act of 1940, as amended (the “Investment Company Act”), is as follows: |

Annual Shareholder Report | 12.31.24
This annual shareholder report contains important information about the Series E (Total Return Bond Series) for the period of January 1, 2024 to December 31, 2024. You can find additional information about the fund at GuggenheimInvestments.com/variable-insurance-funds. You can also request this information by contacting 800 820 0888 or GuggenheimClientServices@mufg-is.com.
This report describes changes to the fund that occurred during the reporting period.
For the period of January 1, 2024 to December 31, 2024, the fund (Series E (Total Return Bond Series)) returned 3.09%, outperforming the fund's benchmark, the Bloomberg U.S. Aggregate Bond Index, which returned 1.25% for the same period.
What factors materially affected the fund's performance over the last year?
The fund outperformed its benchmark, the Bloomberg U.S. Aggregate Bond Index, by 1.84% during the reporting period. Outperformance was driven by sector and security selection and the fund's yield advantage over the benchmark. Duration detracted from absolute returns as interest rates rose following stronger-than-expected economic data and in reaction to the U.S. election results. The fund benefitted from an overweight allocation to structured credit as the sector broadly outperformed other fixed-income sectors such as corporate credit due to more pronounced spread tightening. Security selection within investment grade and high yield corporates were contributors to relative performance as the fund's holdings outperformed respective indices for each sector by 3.4% and 1.1%, respectively.
Cumulative performance* for the fund's most recently completed 10 years (as of 12.31.24), assuming a $10,000 initial investment.
| 12/31/2014 | 10000 | 10000 |
| 03/31/2015 | 10170 | 10161 |
| 06/30/2015 | 10126 | 9990 |
| 09/30/2015 | 10154 | 10113 |
| 12/31/2015 | 10115 | 10055 |
| 03/31/2016 | 10263 | 10360 |
| 06/30/2016 | 10592 | 10589 |
| 09/30/2016 | 10907 | 10638 |
| 12/31/2016 | 10806 | 10321 |
| 03/31/2017 | 11008 | 10405 |
| 06/30/2017 | 11236 | 10556 |
| 09/30/2017 | 11377 | 10645 |
| 12/31/2017 | 11532 | 10687 |
| 03/31/2018 | 11511 | 10531 |
| 06/30/2018 | 11595 | 10514 |
| 09/30/2018 | 11604 | 10516 |
| 12/31/2018 | 11663 | 10688 |
| 03/31/2019 | 11810 | 11003 |
| 06/30/2019 | 12068 | 11341 |
| 09/30/2019 | 12262 | 11599 |
| 12/31/2019 | 12186 | 11620 |
| 03/31/2020 | 12473 | 11985 |
| 06/30/2020 | 13184 | 12332 |
| 09/30/2020 | 13526 | 12409 |
| 12/31/2020 | 13918 | 12492 |
| 03/31/2021 | 13403 | 12071 |
| 06/30/2021 | 13818 | 12291 |
| 09/30/2021 | 13850 | 12298 |
| 12/31/2021 | 13858 | 12299 |
| 03/31/2022 | 12933 | 11569 |
| 06/30/2022 | 11976 | 11026 |
| 09/30/2022 | 11454 | 10502 |
| 12/31/2022 | 11620 | 10699 |
| 03/31/2023 | 12044 | 11016 |
| 06/30/2023 | 11969 | 10923 |
| 09/30/2023 | 11616 | 10570 |
| 12/31/2023 | 12428 | 11291 |
| 03/31/2024 | 12411 | 11203 |
| 06/30/2024 | 12463 | 11210 |
| 09/30/2024 | 13109 | 11793 |
| 12/31/2024 | 12813 | 11432 |
| Series E (Total Return Bond Series) | 3.09% | 1.01% | 2.51% |
| Bloomberg U.S. Aggregate Bond Index | 1.25% | -0.33% | 1.35% |
The fund's past performance is not a good predictor of the fund's future performance.
| Net Assets | $164,038,405 |
| Total Number of Portfolio Holdings | 550 |
| Portfolio Turnover Rate | 88% |
| Total Advisory Fees Paid | $523,363 |
| Series E (Total Return Bond Series) | Variable Annuity | Annual Shareholder Report | December 31, 2024 |
| Interest Swap Agreements | 42.2% |
| Collateralized Mortgage Obligations | 33.9% |
| Corporate Bonds | 25.6% |
| Asset-Backed Securities | 20.9% |
| U.S. Government Securities | 5.8% |
| Preferred Stocks | 2.6% |
| Senior Floating Rate Interests | 2.1% |
| Other | 1.4% |
| Credit Default Swap Agreements Protection Purchased | -3.0% |
| AAA | 32.3% |
| AA | 5.3% |
| A | 12.3% |
| BBB | 14.2% |
| BB | 4.1% |
| B | 1.1% |
| CCC | 0.5% |
| CC | 1.2% |
| C | 0.1% |
| NR3 | 2.7% |
| Other Instruments | 26.2% |
| Guggenheim Variable Insurance Strategy Fund III | 27.7% |
| Uniform MBS 30 Year, 5.00% due 03/01/25 | 3.9% |
| Uniform MBS 30 Year, 5.50% due 02/01/25 | 3.0% |
| Uniform MBS 30 Year, 5.00% due 02/01/25 | 2.9% |
| Uniform MBS 30 Year, 3.00% due 03/25/25 | 2.3% |
| U.S. Treasury Bonds due 05/15/51 | 2.2% |
| Uniform MBS 30 Year, 4.50% due 03/01/25 | 1.5% |
| U.S. Treasury Notes, 4.13% due 11/30/29 | 1.1% |
| Octagon Investment Partners 49 Ltd., 6.61% due 04/15/37 | 1.1% |
| Ginnie Mae due 02/01/25 | 0.9% |
| Top 10 Total | 46.6% |
| |
1 | "Holdings Diversification (Market Exposure as a % of Net Assets)" excludes any temporary cash investments, investments in Guggenheim Strategy Funds Trust mutual funds, or investments in Guggenheim Ultra Short Duration Fund. |
| |
2 | Source: BlackRock Solutions. Credit quality ratings are measured on a scale that generally ranges from AAA (highest) to D (lowest). All securities except for those labeled "NR" have been rated by Moody's, Standard & Poor's ("S&P"), or Fitch, each of which is a Nationally Recognized Statistical Rating Organization ("NRSRO"). For purposes of this presentation, when ratings are available from more than one agency, the highest rating is used. Guggenheim Investments has converted ratings to the equivalent S&P rating. |
3 | NR (not rated) securities do not necessarily indicate low credit quality. |
| |
4 | "10 Largest Holdings (as a % of Net Assets)" excludes any temporary cash or derivative investments. |
| Guggenheim Variable Insurance Strategy Fund III | 27.7% |
| Uniform MBS 30 Year, 5.00% due 03/01/25 | 3.9% |
| Uniform MBS 30 Year, 5.50% due 02/01/25 | 3.0% |
| Uniform MBS 30 Year, 5.00% due 02/01/25 | 2.9% |
| Uniform MBS 30 Year, 3.00% due 03/25/25 | 2.3% |
| U.S. Treasury Bonds due 05/15/51 | 2.2% |
| Uniform MBS 30 Year, 4.50% due 03/01/25 | 1.5% |
| U.S. Treasury Notes, 4.13% due 11/30/29 | 1.1% |
| Octagon Investment Partners 49 Ltd., 6.61% due 04/15/37 | 1.1% |
| Ginnie Mae due 02/01/25 | 0.9% |
| Top 10 Total | 46.6% |
| |
4 | "10 Largest Holdings (as a % of Net Assets)" excludes any temporary cash or derivative investments. |
There were no changes in or disagreements with fund accountants for the period.
This is a summary of certain changes to the fund since December 31, 2023. For more complete information, you may review the fund's next prospectus, which we expect to be available by April 30, 2025 at GuggenheimInvestments.com/variable-insurance-funds or, by calling 800 820 0888.
The fund's net expense ratio, which reflects expense waivers and reimbursements and includes certain expenses that are outside of the contractual expense limit, was 0.89% for the year ended December 31, 2024, a decrease of 0.06% compared to the prior year. The primary driver of the decrease was a decrease in interest expense as the fund utilized fewer reverse repurchase agreements during the reporting period.
Effective November 29, 2024, Guggenheim Partners Investment Management, LLC replaced Security Investors, LLC as the fund's investment adviser in connection with an internal realignment of Guggenheim Investment's lines of business.
| |  | Availability of Additional Information. For additional information, including the fund's prospectus, financial information, holdings and proxy voting information, go to GuggenheimInvestments.com/variable-insurance-funds or, call 800 820 0888. |
AR-C000027865-123124
Annual Shareholder Report | 12.31.24
This annual shareholder report contains important information about the Series F (Floating Rate Strategies Series) for the period of January 1, 2024 to December 31, 2024. You can find additional information about the fund at GuggenheimInvestments.com/variable-insurance-funds. You can also request this information by contacting 800 820 0888 or GuggenheimClientServices@mufg-is.com.
This report describes changes to the fund that occurred during the reporting period.
| Variable Annuity | $120 | 1.16% |
For the period of January 1, 2024 to December 31, 2024, the fund (Series F (Floating Rate Strategies Series)) returned 6.83%, outperforming the fund's benchmark, the Bloomberg U.S. Aggregate Bond Index, which returned 1.25% for the same period and underperforming the fund's secondary index, the S&P UBS Leveraged Loan Index (the "Secondary Index," formerly the Credit Suisse Leveraged Loan Index), which returned 9.05% for the same period.
The fund's broad-based securities market index was changed from the S&P UBS Leveraged Loan Index to the Bloomberg U.S. Aggregate Index to comply with the regulation that requires the fund's broad-based securities market index to represent the overall applicable market.
What factors materially affected the fund's performance over the last year?
High absolute returns for both the fund and the Secondary Index were driven by the high floating-rate coupon in the bank loan asset class. From a supply/demand perspective, collateralized loan obligation issuance set an all-time record at $201B for the year and pushed the supply deficit to all-time highs as robust loan market activity remained primarily opportunistic (refinancings/repricings). Spreads tightened throughout the year as a result, but yields remain above average. Relative performance of the fund compared to the Secondary Index was impacted by idiosyncratic credit issues in the communications and consumer sectors. Offsetting were credit selection in the technology sector and non-rated segment, as well as an underweight to the technology sector, which contributed to relative performance.
Cumulative performance* for the fund's most recently completed 10 years (as of 12.31.24), assuming a $10,000 initial investment.
| 12/31/2014 | 10000 | 10000 | 10000 |
| 01/31/2015 | 10019 | 10210 | 10026 |
| 02/28/2015 | 10130 | 10114 | 10167 |
| 03/31/2015 | 10175 | 10161 | 10207 |
| 04/30/2015 | 10248 | 10124 | 10299 |
| 05/31/2015 | 10290 | 10100 | 10319 |
| 06/30/2015 | 10278 | 9990 | 10287 |
| 07/31/2015 | 10320 | 10059 | 10296 |
| 08/31/2015 | 10273 | 10045 | 10229 |
| 09/30/2015 | 10237 | 10113 | 10161 |
| 10/31/2015 | 10222 | 10114 | 10147 |
| 11/30/2015 | 10159 | 10088 | 10057 |
| 12/31/2015 | 10073 | 10055 | 9962 |
| 01/31/2016 | 10045 | 10193 | 9889 |
| 02/29/2016 | 9932 | 10266 | 9834 |
| 03/31/2016 | 10186 | 10360 | 10094 |
| 04/30/2016 | 10359 | 10400 | 10285 |
| 05/31/2016 | 10441 | 10402 | 10379 |
| 06/30/2016 | 10421 | 10589 | 10383 |
| 07/31/2016 | 10573 | 10656 | 10529 |
| 08/31/2016 | 10643 | 10644 | 10612 |
| 09/30/2016 | 10735 | 10638 | 10704 |
| 10/31/2016 | 10810 | 10556 | 10787 |
| 11/30/2016 | 10848 | 10307 | 10822 |
| 12/31/2016 | 10935 | 10321 | 10945 |
| 01/31/2017 | 10965 | 10341 | 11004 |
| 02/28/2017 | 11015 | 10411 | 11068 |
| 03/31/2017 | 11035 | 10405 | 11077 |
| 04/30/2017 | 11056 | 10486 | 11125 |
| 05/31/2017 | 11090 | 10567 | 11168 |
| 06/30/2017 | 11094 | 10556 | 11160 |
| 07/31/2017 | 11163 | 10601 | 11248 |
| 08/31/2017 | 11159 | 10696 | 11232 |
| 09/30/2017 | 11202 | 10645 | 11278 |
| 10/31/2017 | 11275 | 10652 | 11353 |
| 11/30/2017 | 11292 | 10638 | 11366 |
| 12/31/2017 | 11314 | 10687 | 11410 |
| 01/31/2018 | 11400 | 10564 | 11533 |
| 02/28/2018 | 11400 | 10464 | 11554 |
| 03/31/2018 | 11439 | 10531 | 11591 |
| 04/30/2018 | 11452 | 10452 | 11647 |
| 05/31/2018 | 11456 | 10527 | 11670 |
| 06/30/2018 | 11430 | 10514 | 11682 |
| 07/31/2018 | 11511 | 10516 | 11778 |
| 08/31/2018 | 11547 | 10584 | 11827 |
| 09/30/2018 | 11622 | 10516 | 11907 |
| 10/31/2018 | 11613 | 10433 | 11908 |
| 11/30/2018 | 11520 | 10495 | 11811 |
| 12/31/2018 | 11223 | 10688 | 11541 |
| 01/31/2019 | 11467 | 10801 | 11806 |
| 02/28/2019 | 11653 | 10795 | 11991 |
| 03/31/2019 | 11587 | 11003 | 11977 |
| 04/30/2019 | 11786 | 11005 | 12167 |
| 05/31/2019 | 11720 | 11201 | 12139 |
| 06/30/2019 | 11751 | 11341 | 12166 |
| 07/31/2019 | 11848 | 11366 | 12261 |
| 08/31/2019 | 11820 | 11661 | 12227 |
| 09/30/2019 | 11872 | 11599 | 12278 |
| 10/31/2019 | 11806 | 11634 | 12219 |
| 11/30/2019 | 11900 | 11628 | 12286 |
| 12/31/2019 | 12076 | 11620 | 12484 |
| 01/31/2020 | 12118 | 11843 | 12550 |
| 02/29/2020 | 11913 | 12056 | 12381 |
| 03/31/2020 | 10639 | 11985 | 10838 |
| 04/30/2020 | 10997 | 12198 | 11303 |
| 05/31/2020 | 11383 | 12255 | 11732 |
| 06/30/2020 | 11411 | 12332 | 11890 |
| 07/31/2020 | 11602 | 12517 | 12114 |
| 08/31/2020 | 11726 | 12416 | 12296 |
| 09/30/2020 | 11756 | 12409 | 12381 |
| 10/31/2020 | 11775 | 12353 | 12402 |
| 11/30/2020 | 11934 | 12475 | 12666 |
| 12/31/2020 | 12077 | 12492 | 12831 |
| 01/31/2021 | 12137 | 12402 | 12993 |
| 02/28/2021 | 12171 | 12223 | 13081 |
| 03/31/2021 | 12151 | 12071 | 13089 |
| 04/30/2021 | 12186 | 12166 | 13155 |
| 05/31/2021 | 12231 | 12206 | 13223 |
| 06/30/2021 | 12250 | 12291 | 13278 |
| 07/31/2021 | 12222 | 12429 | 13277 |
| 08/31/2021 | 12263 | 12405 | 13342 |
| 09/30/2021 | 12344 | 12298 | 13428 |
| 10/31/2021 | 12339 | 12294 | 13460 |
| 11/30/2021 | 12303 | 12331 | 13439 |
| 12/31/2021 | 12379 | 12299 | 13524 |
| 01/31/2022 | 12405 | 12034 | 13572 |
| 02/28/2022 | 12323 | 11900 | 13505 |
| 03/31/2022 | 12323 | 11569 | 13510 |
| 04/30/2022 | 12323 | 11130 | 13533 |
| 05/31/2022 | 12029 | 11202 | 13194 |
| 06/30/2022 | 11760 | 11026 | 12922 |
| 07/31/2022 | 12045 | 11296 | 13163 |
| 08/31/2022 | 12206 | 10977 | 13365 |
| 09/30/2022 | 11920 | 10502 | 13076 |
| 10/31/2022 | 12061 | 10366 | 13187 |
| 11/30/2022 | 12211 | 10748 | 13333 |
| 12/31/2022 | 12274 | 10699 | 13381 |
| 01/31/2023 | 12586 | 11028 | 13724 |
| 02/28/2023 | 12632 | 10743 | 13811 |
| 03/31/2023 | 12632 | 11016 | 13797 |
| 04/30/2023 | 12700 | 11083 | 13928 |
| 05/31/2023 | 12653 | 10962 | 13916 |
| 06/30/2023 | 12965 | 10923 | 14227 |
| 07/31/2023 | 13111 | 10915 | 14413 |
| 08/31/2023 | 13262 | 10846 | 14579 |
| 09/30/2023 | 13343 | 10570 | 14707 |
| 10/31/2023 | 13321 | 10403 | 14711 |
| 11/30/2023 | 13472 | 10874 | 14887 |
| 12/31/2023 | 13639 | 11291 | 15126 |
| 01/31/2024 | 13687 | 11260 | 15244 |
| 02/29/2024 | 13795 | 11101 | 15380 |
| 03/31/2024 | 13903 | 11203 | 15508 |
| 04/30/2024 | 13957 | 10920 | 15613 |
| 05/31/2024 | 14064 | 11105 | 15755 |
| 06/30/2024 | 14064 | 11210 | 15798 |
| 07/31/2024 | 14149 | 11472 | 15914 |
| 08/31/2024 | 14243 | 11637 | 16009 |
| 09/30/2024 | 14284 | 11793 | 16126 |
| 10/31/2024 | 14372 | 11500 | 16263 |
| 11/30/2024 | 14494 | 11622 | 16399 |
| 12/31/2024 | 14570 | 11432 | 16495 |
| Series F (Floating Rate Strategies Series) | 6.83% | 3.83% | 3.84% |
| Bloomberg U.S. Aggregate Bond Index | 1.25% | -0.33% | 1.35% |
| S&P UBS Leveraged Loan Index | 9.05% | 5.73% | 5.13% |
The fund's past performance is not a good predictor of the fund's future performance.
| Net Assets | $55,402,132 |
| Total Number of Portfolio Holdings | 266 |
| Portfolio Turnover Rate | 57% |
| Total Advisory Fees Paid | $307,105 |
| Series F (Floating Rate Strategies Series) | Variable Annuity | Annual Shareholder Report | December 31, 2024 |
| Senior Floating Rate Interests | 93.5% |
| Other | 4.9% |
| BBB | 8.3% |
| BB | 31.4% |
| B | 48.1% |
| CCC | 3.2% |
| D | 0.2% |
| NR3 | 1.0% |
| Other Instruments | 7.8% |
| Guggenheim Floating Rate Strategies Fund — Class R6 | 2.8% |
| SPDR Blackstone Senior Loan ETF | 1.3% |
| Arsenal AIC Parent LLC, 7.61% | 1.0% |
| Planview Parent, Inc., 8.10% | 0.9% |
| CACI International, Inc., 6.29% | 0.9% |
| Dealer Tire LLC, 7.86% | 0.9% |
| Restaurant Brands, 6.11% | 0.9% |
| Calpine Construction Finance Company, LP, 6.36% | 0.9% |
| PetSmart LLC, 8.21% | 0.9% |
| Boxer Parent Co., Inc., 8.34% | 0.9% |
| Top 10 Total | 11.4% |
| |
1 | "Holdings Diversification (Market Exposure as a % of Net Assets)" excludes any temporary cash investments, investments in Guggenheim Strategy Funds Trust mutual funds, or investments in Guggenheim Ultra Short Duration Fund. |
| |
2 | Source: BlackRock Solutions. Credit quality ratings are measured on a scale that generally ranges from AAA (highest) to D (lowest). All securities except for those labeled "NR" have been rated by Moody's, Standard & Poor's ("S&P"), or Fitch, each of which is a Nationally Recognized Statistical Rating Organization ("NRSRO"). For purposes of this presentation, when ratings are available from more than one agency, the highest rating is used. Guggenheim Investments has converted ratings to the equivalent S&P rating. |
3 | NR (not rated) securities do not necessarily indicate low credit quality. |
| |
4 | "10 Largest Holdings (as a % of Net Assets)" excludes any temporary cash or derivative investments. |
| Guggenheim Floating Rate Strategies Fund — Class R6 | 2.8% |
| SPDR Blackstone Senior Loan ETF | 1.3% |
| Arsenal AIC Parent LLC, 7.61% | 1.0% |
| Planview Parent, Inc., 8.10% | 0.9% |
| CACI International, Inc., 6.29% | 0.9% |
| Dealer Tire LLC, 7.86% | 0.9% |
| Restaurant Brands, 6.11% | 0.9% |
| Calpine Construction Finance Company, LP, 6.36% | 0.9% |
| PetSmart LLC, 8.21% | 0.9% |
| Boxer Parent Co., Inc., 8.34% | 0.9% |
| Top 10 Total | 11.4% |
| |
4 | "10 Largest Holdings (as a % of Net Assets)" excludes any temporary cash or derivative investments. |
There were no changes in or disagreements with fund accountants for the period.
There were no material changes for the period.
| |  | Availability of Additional Information. For additional information, including the fund's prospectus, financial information, holdings and proxy voting information, go to GuggenheimInvestments.com/variable-insurance-funds or, call 800 820 0888. |
AR-C000125779-123124
Annual Shareholder Report | 12.31.24
This annual shareholder report contains important information about the Series P (High Yield Series) for the period of January 1, 2024 to December 31, 2024. You can find additional information about the fund at GuggenheimInvestments.com/variable-insurance-funds. You can also request this information by contacting 800 820 0888 or GuggenheimClientServices@mufg-is.com.
This report describes changes to the fund that occurred during the reporting period.
| Variable Annuity | $110 | 1.06% |
For the period of January 1, 2024 to December 31, 2024, the fund (Series P (High Yield Series)) returned 7.63%, outperforming the fund's benchmark, the Bloomberg U.S. Aggregate Bond Index, which returned 1.25% for the same period and underperforming the fund's secondary index, the Bloomberg U.S. Corporate High Yield Index, which returned 8.19% for the same period.
The fund's broad-based securities market index was changed from the Bloomberg U.S. Corporate High Yield Index to the Bloomberg U.S. Aggregate Bond Index to comply with the regulation that requires the fund's broad-based securities market index to represent the overall applicable market.
What factors materially affected the fund's performance over the last year?
2024 experienced heavy new issuance volume closer to the pre-Covid average while strong market conditions kept spreads tight. The primary contributors to fund's performance were solid credit selection in communications and basic materials. The fund also benefitted from a small reorganized equity position. The primary detractor was weaker performance by consumer cyclical holdings and a slight drag from bank loans.
Cumulative performance* for the fund's most recently completed 10 years (as of 12.31.24), assuming a $10,000 initial investment.
| 12/31/2014 | 10000 | 10000 | 10000 |
| 03/31/2015 | 10239 | 10161 | 10252 |
| 06/30/2015 | 10372 | 9990 | 10253 |
| 09/30/2015 | 9876 | 10113 | 9755 |
| 12/31/2015 | 9605 | 10055 | 9553 |
| 03/31/2016 | 9695 | 10360 | 9874 |
| 06/30/2016 | 10353 | 10589 | 10418 |
| 09/30/2016 | 10932 | 10638 | 10997 |
| 12/31/2016 | 11287 | 10321 | 11190 |
| 03/31/2017 | 11522 | 10405 | 11492 |
| 06/30/2017 | 11705 | 10556 | 11741 |
| 09/30/2017 | 11898 | 10645 | 11973 |
| 12/31/2017 | 11991 | 10687 | 12029 |
| 03/31/2018 | 11845 | 10531 | 11926 |
| 06/30/2018 | 11891 | 10514 | 12049 |
| 09/30/2018 | 12086 | 10516 | 12338 |
| 12/31/2018 | 11497 | 10688 | 11779 |
| 03/31/2019 | 12077 | 11003 | 12634 |
| 06/30/2019 | 12424 | 11341 | 12950 |
| 09/30/2019 | 12594 | 11599 | 13122 |
| 12/31/2019 | 12843 | 11620 | 13466 |
| 03/31/2020 | 11049 | 11985 | 11757 |
| 06/30/2020 | 12088 | 12332 | 12954 |
| 09/30/2020 | 12648 | 12409 | 13549 |
| 12/31/2020 | 13439 | 12492 | 14423 |
| 03/31/2021 | 13498 | 12071 | 14546 |
| 06/30/2021 | 13898 | 12291 | 14945 |
| 09/30/2021 | 14088 | 12298 | 15077 |
| 12/31/2021 | 14166 | 12299 | 15185 |
| 03/31/2022 | 13544 | 11569 | 14450 |
| 06/30/2022 | 12367 | 11026 | 13030 |
| 09/30/2022 | 12302 | 10502 | 12946 |
| 12/31/2022 | 12792 | 10699 | 13486 |
| 03/31/2023 | 13167 | 11016 | 13967 |
| 06/30/2023 | 13370 | 10923 | 14211 |
| 09/30/2023 | 13512 | 10570 | 14276 |
| 12/31/2023 | 14330 | 11291 | 15299 |
| 03/31/2024 | 14552 | 11203 | 15524 |
| 06/30/2024 | 14686 | 11210 | 15694 |
| 09/30/2024 | 15380 | 11793 | 16523 |
| 12/31/2024 | 15423 | 11432 | 16552 |
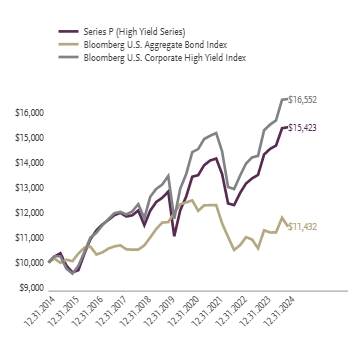
| Series P (High Yield Series) | 7.63% | 3.73% | 4.43% |
| Bloomberg U.S. Aggregate Bond Index | 1.25% | -0.33% | 1.35% |
| Bloomberg U.S. Corporate High Yield Index | 8.19% | 4.21% | 5.17% |
The fund's past performance is not a good predictor of the fund's future performance.
| Net Assets | $30,752,613 |
| Total Number of Portfolio Holdings | 288 |
| Portfolio Turnover Rate | 44% |
| Total Advisory Fees Paid | $109,413 |
| Series P (High Yield Series) | Variable Annuity | Annual Shareholder Report | December 31, 2024 |
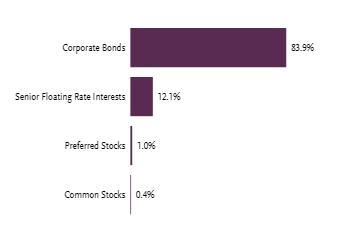
| Corporate Bonds | 83.9% |
| Senior Floating Rate Interests | 12.1% |
| Preferred Stocks | 1.0% |
| Common Stocks | 0.4% |
| BBB | 5.2% |
| BB | 43.8% |
| B | 38.3% |
| CCC | 8.3% |
| D | 0.2% |
| NR3 | 0.6% |
| Other Instruments | 3.6% |
| Terraform Global Operating, LP, 6.13% | 1.4% |
| GrafTech Finance, Inc., 4.63% | 1.1% |
| Enviri Corp., 5.75% | 1.0% |
| ITT Holdings LLC, 6.50% | 1.0% |
| CPI CG, Inc., 10.00% | 1.0% |
| Trinity Industries, Inc., 7.75% | 0.9% |
| Great Lakes Dredge & Dock Corp., 5.25% | 0.8% |
| TransMontaigne Partners Limited Partnership / TLP Finance Corp., 6.13% | 0.8% |
| Jones Deslauriers Insurance Management, Inc., 10.50% | 0.8% |
| AMC Networks, Inc., 4.25% | 0.8% |
| Top 10 Total | 9.6% |
| |
1 | "Holdings Diversification (Market Exposure as a % of Net Assets)" excludes any temporary cash investments, investments in Guggenheim Strategy Funds Trust mutual funds, or investments in Guggenheim Ultra Short Duration Fund. |
| |
2 | Source: BlackRock Solutions. Credit quality ratings are measured on a scale that generally ranges from AAA (highest) to D (lowest). All securities except for those labeled "NR" have been rated by Moody's, Standard & Poor's ("S&P"), or Fitch, each of which is a Nationally Recognized Statistical Rating Organization ("NRSRO"). For purposes of this presentation, when ratings are available from more than one agency, the highest rating is used. Guggenheim Investments has converted ratings to the equivalent S&P rating. |
3 | NR (not rated) securities do not necessarily indicate low credit quality. |
| |
4 | "10 Largest Holdings (as a % of Net Assets)" excludes any temporary cash or derivative investments. |
| Terraform Global Operating, LP, 6.13% | 1.4% |
| GrafTech Finance, Inc., 4.63% | 1.1% |
| Enviri Corp., 5.75% | 1.0% |
| ITT Holdings LLC, 6.50% | 1.0% |
| CPI CG, Inc., 10.00% | 1.0% |
| Trinity Industries, Inc., 7.75% | 0.9% |
| Great Lakes Dredge & Dock Corp., 5.25% | 0.8% |
| TransMontaigne Partners Limited Partnership / TLP Finance Corp., 6.13% | 0.8% |
| Jones Deslauriers Insurance Management, Inc., 10.50% | 0.8% |
| AMC Networks, Inc., 4.25% | 0.8% |
| Top 10 Total | 9.6% |
| |
4 | "10 Largest Holdings (as a % of Net Assets)" excludes any temporary cash or derivative investments. |
There were no changes in or disagreements with fund accountants for the period.
This is a summary of certain changes to the fund since December 31, 2023. For more complete information, you may review the fund's next prospectus, which we expect to be available by April 30, 2025 at GuggenheimInvestments.com/variable-insurance-funds or, by calling 800 820 0888.
Effective November 29, 2024, Guggenheim Partners Investment Management, LLC replaced Security Investors, LLC as the fund's investment adviser in connection with an internal realignment of Guggenheim Investment's lines of business.
| |  | Availability of Additional Information. For additional information, including the fund's prospectus, financial information, holdings and proxy voting information, go to GuggenheimInvestments.com/variable-insurance-funds or, call 800 820 0888. |
AR-C000027854-123124
Collateralized Mortgage Obligations
Asset-Backed Securities
true
The registrant’s Board of Trustees has adopted a code of ethics that applies to the registrant’s principal executive officer and principal financial officer. No substantive amendments were approved or waivers were granted to the code of ethics during the period covered by this report. The code of ethics is filed as an exhibit to this Form N-CSR.
| Item 3. | Audit Committee Financial Expert. |
The registrant's Board of Trustees has determined that it has at least one audit committee financial expert serving on its audit committee (the “Audit Committee”), Sandra G. Sponem. Ms. Sponem is “independent,” meaning that she is not an “interested person” of the registrant (as that term is defined in Section 2(a)(19) of the Investment Company Act) and she does not accept any consulting, advisory, or other compensatory fee from the registrant (except in her capacity as a Board or committee member).
(Under applicable securities laws, a person who is determined to be an audit committee financial expert will not be deemed an "expert" for any purpose, including without limitation for the purposes of Section 11 of the Securities Act of 1933, as amended, as a result of being designated or identified as an audit committee financial expert. The designation or identification of a person as an audit committee financial expert does not impose on such person any duties, obligations, or liabilities that are greater than the duties, obligations, and liabilities imposed on such person as a member of the Audit Committee and Board of Trustees in the absence of such designation or identification. The designation or identification of a person as an audit committee financial expert does not affect the duties, obligations or liability of any other member of the audit committee or Board of Trustees.)
| Item 4. | Principal Accountant Fees and Services. |
(a) Audit Fees: the aggregate Audit Fees billed by the registrant’s principal accountant for professional services rendered for the audit of the annual financial statements, or services that are normally provided by the accountant in connection with statutory and regulatory filings or engagements were $129,879 and $345,583 for the fiscal years ended December 31, 2024 and December 31, 2023, respectively.
| (b) | Audit-Related Fees: the aggregate Audit-Related Fees billed by the registrant’s principal accountant for assurance and related services that are reasonably related to the performance of the audit of the registrant’s financial statements and are not reported under paragraph (a) of this Item 4 were $0 and $0 for fiscal years ended December 31, 2024 and December 31, 2023, respectively. |
| (c) | Tax Fees: the aggregate Tax Fees billed by the registrant’s principal accountant for professional services rendered for tax compliance, tax advice and tax planning including preparation of tax returns and distribution assistance were $35,011 and $91,005 for the fiscal years ended December 31, 2024 and December 31, 2023, respectively. These services consisted of (i) preparation of U.S. federal, state and excise tax returns; (ii) U.S. federal and state tax planning, advice and assistance regarding statutory, regulatory or administrative developments, (iii) tax advice regarding tax qualification matters and/or treatment of various financial instruments held or proposed to be acquired and (iv) review of U.S. federal excise distribution calculations. |
| (d) | All Other Fees: the aggregate All Other Fees billed by the registrant’s principal accountant for products and services provided by the principal accountant, other than the services reported in paragraphs (a) through (c) of this Item 4, were $0 and $0 for the fiscal years ended December 31, 2024 and December 31, 2023, respectively. |
| (e) | Audit Committee Pre-Approval Policies and Procedures. |
(1) The registrant’s pre-approval policy requires the Audit Committee to pre-approve any engagement of the registrant’s independent auditors to provide any services, other than “prohibited non-audit services,” to the registrant, including the fees and other compensation to be paid to the independent auditors (unless an exception is available under Rule 2-01 of Regulation S-X). The independent auditors or the Chief Accounting Officer of the registrant (or an officer of the registrant who reports to the Chief Accounting Officer) report to the Audit Committee at each of its regular scheduled meetings all audit, audit-related and permissible non-audit services initiated since the last such report (unless the services were contained in the initial audit plan, as previously presented to, and approved by, the Audit Committee). The report includes a general description of the services and projected fees, and the means by which such services were approved by the Audit Committee. The Audit Committee is also required to pre-approve any engagement of the registrant’s independent auditors, including the fees and other compensation to be paid to the independent auditors, to provide any non-audit services to the registrant’s investment adviser (or any “control affiliate” of the investment adviser providing ongoing services to the registrant), if the engagement relates directly to the operations or financial reporting of the registrant (unless an exception is available under Rule 2-01 of Regulation S-X).
(2) None of the services described in each of Items 4(b) through (d) were approved by the Audit Committee pursuant to paragraph (c)(7)(i)(C) of Rule 2-01 of Regulation S-X.
| (g) | Non-Audit Fees. The aggregate non-audit fees billed by the registrant's accountant for the most recent fiscal year and the preceding years for services rendered to the registrant, the investment adviser and any entity controlling, controlled by, or under common control with the adviser that provides ongoing services to the registrant were $35,011 and $91,005, respectively. These aggregate fees were less than the aggregate fees billed for the same periods by the registrant’s principal accountant for audit services rendered to the registrant, the investment advisor, and any entity controlling, controlled by, or under common control with the advisor that provides ongoing services to the registrant. |
| (h) | Auditor Independence. The registrant’s Audit Committee was provided with information relating to the provision of non-audit services by Ernst & Young, LLP to the registrant’s investment adviser (not including any sub adviser whose role is primarily portfolio management and is subcontracted with or overseen by another investment adviser), and any entity controlling, controlled by, or under common control with the investment adviser that provides ongoing services to the registrant that were not pre-approved by the Audit Committee so that a determination could be made whether the provision of such services is compatible with maintaining Ernst & Young, LLP’s independence. |
| Item 5. | Audit Committee of Listed Registrants. |
| (a) | Not applicable to this registrant. |
| (b) | Not applicable to this registrant. |
(a) The Schedule of Investments is included under Item 7 of this Form.
(b) Not applicable.
| Item 7. | Financial Statements and Financial Highlights for Open-End Management Investment Companies. |
12.31.2024
Guggenheim Variable Funds Trust Annual
Financial Report
Series |
Series E | (Total Return Bond Series) | |
Series F | (Floating Rate Strategies Series) | |
Series P | (High Yield Series) | |
GuggenheimInvestments.com | GVFT-ANN-1224x1225 |
This report and the financial statements contained herein are submitted for the general information of our shareholders. The report is not authorized for distribution to prospective investors unless preceded or accompanied by an effective prospectus.
Distributed by Guggenheim Funds Distributors, LLC.
| | |
Item 7: Financial Statements and Financial Highlights for Open-End Management Investment Companies (Annual Financial Report) | |
SERIES E (TOTAL RETURN BOND SERIES) | 2 |
SERIES F (FLOATING RATE STRATEGIES SERIES) | 25 |
SERIES P (HIGH YIELD SERIES) | 38 |
NOTES TO FINANCIAL STATEMENTS | 50 |
REPORT OF INDEPENDENT REGISTERED PUBLIC ACCOUNTING FIRM | 70 |
OTHER INFORMATION | 71 |
Item 8: Changes in and Disagreements with Accountants for Open-End Management Investment Companies | 72 |
Item 9: Proxy Disclosures for Open-End Management Investment Companies | 73 |
Item 10: Renumeration Paid to Directors, Officers, and others of Open-End Management Investment Companies | 74 |
Item 11: Statement Regarding Basis for Approval of Investment Advisory Contract | 75 |
| | THE GUGGENHEIM FUNDS ANNUAL FINANCIAL REPORT | 1 |
SCHEDULE OF INVESTMENTS | December 31, 2024 |
SERIES E (TOTAL RETURN BOND SERIES) | |
| | Shares | | | Value | |
COMMON STOCKS† - 0.0% |
| | | | | | | | | |
Communications - 0.0% |
Vacasa, Inc. — Class A* | | | 167 | | | $ | 818 | |
| | | | | | | | | |
Financial - 0.0% |
Pershing Square Tontine Holdings, Ltd. — Class A*,†††,1 | | | 76,590 | | | | 8 | |
| | | | | | | | | |
Total Common Stocks | | | | |
(Cost $33,288) | | | | | | | 826 | |
| | | | | | | | | |
PREFERRED STOCKS† - 2.6% |
Financial - 2.3% |
Wells Fargo & Co.†† |
3.90% | | | 500,000 | | | | 485,810 | |
6.85% | | | 100,000 | | | | 103,215 | |
Equitable Holdings, Inc. †† |
4.95% | | | 511,000 | | | | 508,046 | |
Charles Schwab Corp.†† |
4.00% | | | 500,000 | | | | 431,650 | |
MetLife, Inc.†† |
3.85% | | | 400,000 | | | | 392,708 | |
Citigroup, Inc.†† |
4.00% | | | 200,000 | | | | 194,725 | |
3.88% | | | 200,000 | | | | 194,184 | |
Bank of New York Mellon Corp.†† |
3.75% | | | 400,000 | | | | 378,030 | |
Markel Group, Inc.†† |
6.00% | | | 360,000 | | | | 359,326 | |
JPMorgan Chase & Co.†† |
3.65% | | | 250,000 | | | | 242,521 | |
Goldman Sachs Group, Inc.†† |
3.80% | | | 150,000 | | | | 144,835 | |
CNO Financial Group, Inc. |
5.13% due 11/25/60 | | | 6,000 | | | | 114,720 | |
Kuvare US Holdings, Inc.†† |
7.00% due 02/17/512 | | | 100,000 | | | | 100,125 | |
Bank of America Corp.†† |
4.38% | | | 100,000 | | | | 96,284 | |
Selective Insurance Group, Inc. |
4.60% | | | 4,000 | | | | 69,280 | |
Corebridge Financial, Inc. |
6.38% due 12/15/64 | | | 290 | | | | 7,392 | |
First Republic Bank†† |
4.25%* | | | 16,525 | | | | 10 | |
4.50%* | | | 675 | | | | — | |
Total Financial | | | | | | | 3,822,861 | |
| | | | | | | | | |
Government - 0.2% |
CoBank ACB†† |
7.13% | | | 250,000 | | | | 254,154 | |
| | | | | | | | | |
Energy - 0.1% |
Venture Global LNG, Inc.†† |
9.00%2 | | | 150,000 | | | | 156,832 | |
Total Preferred Stocks | | | | |
(Cost $4,849,461) | | | | | | | 4,233,847 | |
| | | | | | | | | |
WARRANTS† - 0.0% |
Ginkgo Bioworks Holdings, Inc. | | | | | | | | |
Expiring 09/16/26* | | | 684 | | | | 6 | |
Pershing Square SPARC Holdings, Ltd. | | | | | | | | |
Expiring 12/31/49*,†††,1 | | | 23,402 | | | | 3 | |
Pershing Square Tontine Holdings, Ltd. | | | | | | | | |
Expiring 07/24/25*,†††,1 | | | 8,510 | | | | — | |
Total Warrants | | | | |
(Cost $1,584) | | | | | | | 9 | |
| | | | | | | | | |
MUTUAL FUNDS† - 27.7% |
Guggenheim Variable Insurance Strategy Fund III3 | | | 1,821,010 | | | | 45,415,997 | |
Total Mutual Funds | | | | |
(Cost $45,271,606) | | | | | | | 45,415,997 | |
| | | | | | | | | |
MONEY MARKET FUNDS***,† - 1.5% |
Dreyfus Treasury Securities Cash Management Fund — Institutional Shares, 4.33%4 | | | 2,487,106 | | | | 2,487,106 | |
Dreyfus Treasury Obligations Cash Management Fund — Institutional Shares, 4.34%4 | | | 6,002 | | | | 6,002 | |
Total Money Market Funds | | | | |
(Cost $2,493,108) | | | | | | | 2,493,108 | |
| | | | | | | | | |
| | | Face
Amount~ | | | | | |
COLLATERALIZED MORTGAGE OBLIGATIONS†† - 33.9% |
Government Agency - 23.0% | | | | | | | | |
Uniform MBS 30 Year | | | | | | | | |
5.00% due 03/01/255 | | | 6,590,999 | | | | 6,355,746 | |
5.50% due 02/01/255 | | | 4,960,000 | | | | 4,892,990 | |
5.00% due 02/01/255 | | | 5,001,001 | | | | 4,824,846 | |
3.00% due 03/25/255 | | | 4,370,000 | | | | 3,706,586 | |
4.50% due 03/01/255 | | | 2,570,000 | | | | 2,415,299 | |
2.50% due 03/01/255 | | | 1,200,000 | | | | 976,690 | |
2.00% due 02/01/255 | | | 1,210,000 | | | | 940,416 | |
Fannie Mae | | | | | | | | |
5.00% due 05/01/53 | | | 2,324,391 | | | | 2,252,929 | |
6.00% due 09/01/54 | | | 1,059,533 | | | | 1,072,023 | |
5.50% due 09/01/54 | | | 1,062,544 | | | | 1,053,363 | |
5.00% due 04/01/53 | | | 853,415 | | | | 826,084 | |
5.50% due 05/01/53 | | | 675,911 | | | | 668,320 | |
5.00% due 08/01/53 | | | 517,061 | | | | 500,275 | |
5.00% due 06/01/53 | | | 177,892 | | | | 172,020 | |
Freddie Mac | | | | | | | | |
5.50% due 06/01/53 | | | 1,108,859 | | | | 1,097,198 | |
5.50% due 09/01/53 | | | 967,421 | | | | 966,195 | |
5.00% due 04/01/53 | | | 837,964 | | | | 810,803 | |
6.00% due 08/01/54 | | | 775,277 | | | | 785,765 | |
6.00% due 09/01/54 | | | 658,306 | | | | 666,446 | |
5.50% due 09/01/54 | | | 660,633 | | | | 655,920 | |
5.00% due 03/01/53 | | | 446,268 | | | | 431,952 | |
Ginnie Mae | | | | | | | | |
due 02/01/255 | | | 1,593,370 | | | | 1,546,480 | |
2 | THE GUGGENHEIM FUNDS ANNUAL FINANCIAL REPORT | SEE NOTES TO FINANCIAL STATEMENTS. |
SCHEDULE OF INVESTMENTS (continued) | December 31, 2024 |
SERIES E (TOTAL RETURN BOND SERIES) | |
| | Face
Amount~ | | | Value | |
Fannie Mae-Aces | | | | | | | | |
1.49% (WAC) due 03/25/35◊,6 | | | 2,511,889 | | | $ | 209,252 | |
Total Government Agency | | | | | | | 37,827,598 | |
| | | | | | | | | |
Residential Mortgage-Backed Securities - 8.8% | | | | |
OBX Trust | | | | | | | | |
2024-NQM11, 6.13% due 06/25/642,7 | | | 455,571 | | | | 457,365 | |
2024-NQM3, 6.43% due 12/25/637 | | | 399,248 | | | | 402,287 | |
2024-NQM13, 5.37% due 06/25/642,7 | | | 236,814 | | | | 234,745 | |
2024-NQM2, 6.18% due 12/25/637 | | | 205,700 | | | | 206,379 | |
2024-NQM5, 6.29% due 01/25/642,7 | | | 203,419 | | | | 204,493 | |
2022-NQM1, 6.50% (WAC) due 11/25/62◊,2 | | | 181,717 | | | | 182,262 | |
2024-NQM6, 6.85% due 02/25/642,7 | | | 127,376 | | | | 128,710 | |
2024-NQM9, 6.44% due 01/25/642,7 | | | 88,561 | | | | 89,152 | |
2024-NQM8, 6.59% due 05/25/642,7 | | | 85,783 | | | | 86,484 | |
2022-NQM9, 6.45% due 09/25/622,7 | | | 78,676 | | | | 79,052 | |
PRPM LLC | | | | | | | | |
2022-1, 3.72% due 02/25/272,7 | | | 610,946 | | | | 609,194 | |
2021-5, 4.79% due 06/25/262,7 | | | 304,259 | | | | 302,905 | |
2024-4, 6.41% due 08/25/292,7 | | | 95,297 | | | | 95,523 | |
BRAVO Residential Funding Trust | | | | | | | | |
2022-R1, 3.13% due 01/29/702,7 | | | 463,846 | | | | 460,450 | |
2023-NQM2, 4.50% due 05/25/627 | | | 212,556 | | | | 207,237 | |
2024-NQM1, 6.40% due 12/01/632,7 | | | 195,739 | | | | 196,602 | |
FIGRE Trust | | | | | | | | |
2024-HE3, 6.13% (WAC) due 07/25/54◊,2 | | | 362,865 | | | | 365,637 | |
2024-HE2, 6.38% (WAC) due 05/25/54◊,2 | | | 261,668 | | | | 266,581 | |
2024-HE4, 5.06% (WAC) due 09/25/54◊,2 | | | 95,022 | | | | 93,259 | |
2024-HE1, 6.17% (WAC) due 03/25/54◊,2 | | | 84,067 | | | | 84,912 | |
JP Morgan Mortgage Trust | | | | | | | | |
2021-12, 2.50% (WAC) due 02/25/52◊,2 | | | 596,382 | | | | 547,416 | |
2021-13, 2.50% (WAC) due 04/25/52◊,2 | | | 261,605 | | | | 240,056 | |
Legacy Mortgage Asset Trust | | | | | | | | |
2021-GS3, 4.75% due 07/25/612,7 | | | 330,431 | | | | 330,013 | |
2021-GS5, 5.25% due 07/25/672,7 | | | 323,873 | | | | 323,035 | |
Starwood Mortgage Residential Trust | | | | | | | | |
2020-1, 2.41% (WAC) due 02/25/50◊,2 | | | 632,763 | | | | 601,511 | |
Angel Oak Mortgage Trust | | | | | | | | |
2024-2, 6.25% due 01/25/692,7 | | | 431,680 | | | | 433,694 | |
2023-1, 4.75% due 09/26/672,7 | | | 167,657 | | | | 163,506 | |
JP Morgan Mortgage Acquisition Trust | | | | | | | | |
2006-WMC4, 4.69% (1 Month Term SOFR + 0.35%, Rate Floor: 0.24%) due 12/25/36◊ | | | 1,134,398 | | | | 588,287 | |
Ameriquest Mortgage Securities Trust | | | | | | | | |
2006-M3, 4.61% (1 Month Term SOFR + 0.27%, Rate Floor: 0.16%) due 10/25/36◊ | | | 1,970,242 | | | | 568,479 | |
Securitized Asset-Backed Receivables LLC Trust | | | | | | | | |
2007-BR2, 4.81% (1 Month Term SOFR + 0.47%, Rate Floor: 0.36%) due 02/25/37◊,2 | | | 529,534 | | | | 445,060 | |
NYMT Loan Trust | | | | | | | | |
2022-SP1, 5.25% due 07/25/622,7 | | | 403,092 | | | | 399,893 | |
Home Equity Loan Trust | | | | | | | | |
2007-FRE1, 4.64% (1 Month Term SOFR + 0.30%, Rate Floor: 0.19%) due 04/25/37◊ | | | 423,735 | | | | 398,746 | |
GCAT Trust | | | | | | | | |
2023-NQM3, 6.89% due 08/25/682,7 | | | 380,142 | | | | 384,777 | |
Credit Suisse Mortgage Capital Certificates | | | | | | | | |
2021-RPL9, 3.66% (WAC) due 02/25/61◊,2 | | | 359,258 | | | | 358,127 | |
OSAT Trust | | | | | | | | |
2021-RPL1, 5.12% due 05/25/652,7 | | | 347,635 | | | | 346,540 | |
Master Asset-Backed Securities Trust | | | | | | | | |
2006-WMC4, 4.75% (1 Month Term SOFR + 0.41%, Rate Floor: 0.30%) due 10/25/36◊ | | | 1,065,805 | | | | 340,500 | |
First Franklin Mortgage Loan Trust | | | | | | | | |
2006-FF16, 4.87% (1 Month Term SOFR + 0.53%, Rate Floor: 0.42%) due 12/25/36◊ | | | 820,177 | | | | 331,157 | |
CSMC Trust | | | | | | | | |
2021-RPL4, 4.80% (WAC) due 12/27/60◊,2 | | | 318,757 | | | | 317,746 | |
Top Pressure Recovery Turbines | | | | | | | | |
7.51% due 11/01/69 | | | 297,917 | | | | 299,407 | |
New Residential Mortgage Loan Trust | | | | | | | | |
2024-NQM2, 5.42% due 09/25/642 | | | 272,648 | | | | 269,488 | |
NovaStar Mortgage Funding Trust Series | | | | | | | | |
2007-2, 4.65% (1 Month Term SOFR + 0.31%, Rate Cap/Floor: 11.00%/0.20%) due 09/25/37◊ | | | 275,955 | | | | 267,879 | |
HarborView Mortgage Loan Trust | | | | | | | | |
2006-14, 4.78% (1 Month Term SOFR + 0.41%, Rate Floor: 0.30%) due 01/25/47◊ | | | 286,821 | | | | 265,126 | |
American Home Mortgage Investment Trust | | | | | | | | |
2007-1, 2.08% due 05/25/476 | | | 1,632,544 | | | | 225,460 | |
Vista Point Securitization Trust | | | | | | | | |
2024-CES3, 5.68% due 01/25/552,7 | | | 200,000 | | | | 200,313 | |
RCKT Mortgage Trust | | | | | | | | |
2024-CES4, 6.15% due 06/25/442,7 | | | 185,528 | | | | 186,949 | |
Mill City Securities Ltd. | | | | | | | | |
2024-RS2, 3.00% due 08/01/692,7 | | | 200,000 | | | | 184,819 | |
Washington Mutual Mortgage Pass-Through Certificates WMALT Series Trust | | | | | | | | |
2006-AR9, 5.67% (1 Year CMT Rate + 0.84%, Rate Floor: 0.84%) due 11/25/46◊ | | | 178,332 | | | | 145,284 | |
Imperial Fund Mortgage Trust | | | | | | | | |
2022-NQM2, 4.20% (WAC) due 03/25/67◊,2 | | | 156,540 | | | | 142,808 | |
Saluda Grade Alternative Mortgage Trust | | | | | | | | |
2023-FIG4, 6.72% (WAC) due 11/25/53◊,2 | | | 123,134 | | | | 125,826 | |
Sequoia Mortgage Trust | | | | | | | | |
2024-5, 6.00% (WAC) due 06/25/54◊,2 | | | 114,807 | | | | 115,404 | |
LSTAR Securities Investment Ltd. | | | | | | | | |
2024-1, 7.78% (30 Day Average SOFR + 3.10%, Rate Floor: 3.10%) due 01/01/29◊,2 | | | 86,603 | | | | 86,526 | |
SEE NOTES TO FINANCIAL STATEMENTS. | THE GUGGENHEIM FUNDS ANNUAL FINANCIAL REPORT | 3 |
SCHEDULE OF INVESTMENTS (continued) | December 31, 2024 |
SERIES E (TOTAL RETURN BOND SERIES) | |
| | Face
Amount~ | | | Value | |
Morgan Stanley Re-REMIC Trust | | | | | | | | |
2010-R5, 3.50% due 06/26/36 | | | 25,796 | | | $ | 24,114 | |
Total Residential Mortgage-Backed Securities | | | | | | | 14,411,175 | |
| | | | | | | | | |
Commercial Mortgage-Backed Securities - 1.2% | | | | |
BX Commercial Mortgage Trust | | | | | | | | |
2021-VOLT, 6.51% (1 Month Term SOFR + 2.11%, Rate Floor: 2.00%) due 09/15/36◊,2 | | | 350,000 | | | | 349,125 | |
2022-LP2, 6.36% (1 Month Term SOFR + 1.96%, Rate Floor: 1.96%) due 02/15/39◊,2 | | | 350,000 | | | | 348,687 | |
2024-AIRC, 6.54% (1 Month Term SOFR + 2.14%, Rate Floor: 2.14%) due 08/15/39◊,2 | | | 200,000 | | | | 200,875 | |
BX Trust | | | | | | | | |
2024-VLT4, 6.54% (1 Month Term SOFR + 2.14%, Rate Floor: 2.14%) due 07/15/29◊,2 | | | 150,000 | | | | 150,469 | |
2024-VLT4, 6.34% (1 Month Term SOFR + 1.94%, Rate Floor: 1.94%) due 07/15/29◊,2 | | | 100,000 | | | | 100,518 | |
GS Mortgage Securities Trust | | | | | | | | |
2020-GC45, 0.65% (WAC) due 02/13/53◊,6 | | | 9,786,274 | | | | 241,079 | |
Extended Stay America Trust | | | | | | | | |
2021-ESH, 6.76% (1 Month Term SOFR + 2.36%, Rate Floor: 2.25%) due 07/15/38◊,2 | | | 220,198 | | | | 220,748 | |
Life Mortgage Trust | | | | | | | | |
2021-BMR, 6.86% (1 Month Term SOFR + 2.46%, Rate Floor: 2.35%) due 03/15/38◊,2 | | | 198,284 | | | | 192,831 | |
Citigroup Commercial Mortgage Trust | | | | | | | | |
2016-GC37, 1.64% (WAC) due 04/10/49◊,6 | | | 2,728,400 | | | | 31,600 | |
Wells Fargo Commercial Mortgage Trust | | | | | | | | |
2016-NXS5, 1.39% (WAC) due 01/15/59◊,6 | | | 3,137,152 | | | | 31,448 | |
CFCRE Commercial Mortgage Trust | | | | | | | | |
2016-C3, 0.95% (WAC) due 01/10/48◊,6 | | | 4,703,691 | | | | 26,666 | |
COMM Mortgage Trust | | | | | | | | |
2015-CR26, 0.89% (WAC) due 10/10/48◊,6 | | | 5,434,977 | | | | 10,384 | |
Total Commercial Mortgage-Backed Securities | | | | | | | 1,904,430 | |
| | | | | | | | | |
Military Housing - 0.9% | | | | | | | | |
GMAC Commercial Mortgage Asset Corp. | | | | | | | | |
2007-HCKM, 6.11% due 08/10/52†††,2 | | | 900,535 | | | | 792,946 | |
Freddie Mac Military Housing Bonds Resecuritization Trust Certificates | | | | | | | | |
2015-R1, 5.25% (WAC) due 11/25/55◊,2 | | | 886,045 | | | | 760,232 | |
Total Military Housing | | | | | | | 1,553,178 | |
| | | | | | | | | |
Total Collateralized Mortgage Obligations | | | | |
(Cost $58,052,915) | | | 55,696,381 | |
| |
CORPORATE BONDS†† - 25.6% |
Financial - 11.7% | | | | | | | | |
Pershing Square Holdings Ltd. | | | | | | | | |
3.25% due 10/01/312 | | | 1,000,000 | | | | 822,824 | |
Wilton RE Ltd. | | | | | | | | |
6.00% 2,8,9 | | | 519,000 | | | | 519,387 | |
Citigroup, Inc. | | | | | | | | |
2.57% due 06/03/319 | | | 590,000 | | | | 514,221 | |
GLP Capital Limited Partnership / GLP Financing II, Inc. | | | | | | | | |
4.00% due 01/15/31 | | | 290,000 | | | | 265,252 | |
5.30% due 01/15/29 | | | 250,000 | | | | 248,188 | |
Morgan Stanley | | | | | | | | |
6.63% due 11/01/349 | | | 153,000 | | | | 164,412 | |
5.94% due 02/07/399 | | | 150,000 | | | | 150,492 | |
5.52% due 11/19/559 | | | 100,000 | | | | 96,372 | |
5.83% due 04/19/359 | | | 65,000 | | | | 66,238 | |
Nippon Life Insurance Co. | | | | | | | | |
2.75% due 01/21/512,9 | | | 350,000 | | | | 295,281 | |
2.90% due 09/16/512,9 | | | 200,000 | | | | 169,327 | |
Host Hotels & Resorts, LP | | | | | | | | |
3.50% due 09/15/30 | | | 435,000 | | | | 393,954 | |
2.90% due 12/15/31 | | | 50,000 | | | | 42,542 | |
Jefferies Financial Group, Inc. | | | | | | | | |
2.75% due 10/15/32 | | | 300,000 | | | | 245,967 | |
6.20% due 04/14/34 | | | 100,000 | | | | 103,057 | |
2.63% due 10/15/31 | | | 100,000 | | | | 84,369 | |
FS KKR Capital Corp. | | | | | | | | |
2.63% due 01/15/27 | | | 250,000 | | | | 236,626 | |
3.25% due 07/15/27 | | | 200,000 | | | | 189,701 | |
JPMorgan Chase & Co. | | | | | | | | |
5.35% due 06/01/349 | | | 305,000 | | | | 304,787 | |
2.96% due 05/13/319 | | | 135,000 | | | | 120,759 | |
Global Atlantic Finance Co. | | | | | | | | |
4.70% due 10/15/512,9 | | | 250,000 | | | | 241,452 | |
7.95% due 06/15/332 | | | 150,000 | | | | 166,083 | |
Fort Moore Family Communities LLC | | | | | | | | |
6.09% due 01/15/512 | | | 453,572 | | | | 403,446 | |
Safehold GL Holdings LLC | | | | | | | | |
2.80% due 06/15/31 | | | 170,000 | | | | 145,147 | |
2.85% due 01/15/32 | | | 151,000 | | | | 126,867 | |
6.10% due 04/01/34 | | | 100,000 | | | | 101,737 | |
5.65% due 01/15/35 | | | 10,000 | | | | 9,758 | |
Macquarie Group Ltd. | | | | | | | | |
2.87% due 01/14/332,9 | | | 250,000 | | | | 211,189 | |
2.69% due 06/23/322,9 | | | 200,000 | | | | 169,495 | |
CoStar Group, Inc. | | | | | | | | |
2.80% due 07/15/302 | | | 430,000 | | | | 375,491 | |
Iron Mountain, Inc. | | | | | | | | |
4.50% due 02/15/312 | | | 261,000 | | | | 238,609 | |
5.63% due 07/15/322 | | | 125,000 | | | | 119,408 | |
Blue Owl Capital GP LLC | | | | | | | | |
7.21% due 08/22/43††† | | | 350,000 | | | | 356,677 | |
OneMain Finance Corp. | | | | | | | | |
7.13% due 03/15/26 | | | 350,000 | | | | 356,287 | |
Standard Chartered plc | | | | | | | | |
5.01% due 10/15/302,9 | | | 350,000 | | | | 343,681 | |
Liberty Mutual Group, Inc. | | | | | | | | |
4.30% due 02/01/612 | | | 554,000 | | | | 341,848 | |
United Wholesale Mortgage LLC | | | | | | | | |
5.50% due 04/15/292 | | | 300,000 | | | | 288,975 | |
4 | THE GUGGENHEIM FUNDS ANNUAL FINANCIAL REPORT | SEE NOTES TO FINANCIAL STATEMENTS. |
SCHEDULE OF INVESTMENTS (continued) | December 31, 2024 |
SERIES E (TOTAL RETURN BOND SERIES) | |
| | Face
Amount~ | | | Value | |
5.50% due 11/15/252 | | | 50,000 | | | $ | 49,754 | |
Brookfield Finance, Inc. | | | | | | | | |
3.50% due 03/30/51 | | | 280,000 | | | | 192,995 | |
5.68% due 01/15/35 | | | 100,000 | | | | 100,698 | |
4.70% due 09/20/47 | | | 50,000 | | | | 43,092 | |
Maple Grove Funding Trust I | | | | | | | | |
4.16% due 08/15/512 | | | 500,000 | | | | 336,350 | |
First American Financial Corp. | | | | | | | | |
4.00% due 05/15/30 | | | 360,000 | | | | 335,571 | |
LPL Holdings, Inc. | | | | | | | | |
4.00% due 03/15/292 | | | 174,000 | | | | 164,786 | |
6.00% due 05/20/34 | | | 160,000 | | | | 162,903 | |
Fairfax Financial Holdings Ltd. | | | | | | | | |
3.38% due 03/03/31 | | | 250,000 | | | | 222,964 | |
5.63% due 08/16/32 | | | 100,000 | | | | 101,144 | |
Rocket Mortgage LLC / Rocket Mortgage Company-Issuer, Inc. | | | | | | | | |
3.88% due 03/01/312 | | | 350,000 | | | | 304,954 | |
Assurant, Inc. | | | | | | | | |
6.10% due 02/27/26 | | | 200,000 | | | | 201,641 | |
2.65% due 01/15/32 | | | 97,000 | | | | 81,201 | |
Nationwide Mutual Insurance Co. | | | | | | | | |
4.35% due 04/30/502 | | | 370,000 | | | | 276,860 | |
ABN AMRO Bank N.V. | | | | | | | | |
2.47% due 12/13/292,9 | | | 300,000 | | | | 270,244 | |
BPCE S.A. | | | | | | | | |
7.00% due 10/19/342,9 | | | 250,000 | | | | 266,397 | |
Macquarie Bank Ltd. | | | | | | | | |
3.62% due 06/03/302 | | | 290,000 | | | | 264,407 | |
Lazard Group LLC | | | | | | | | |
6.00% due 03/15/31 | | | 250,000 | | | | 256,699 | |
Credit Agricole S.A. | | | | | | | | |
5.34% due 01/10/302,9 | | | 250,000 | | | | 249,940 | |
UBS Group AG | | | | | | | | |
2.10% due 02/11/322,9 | | | 300,000 | | | | 247,405 | |
Ares Finance Company II LLC | | | | | | | | |
3.25% due 06/15/302 | | | 260,000 | | | | 235,081 | |
Jefferies Finance LLC / JFIN Company-Issuer Corp. | | | | | | | | |
5.00% due 08/15/282 | | | 250,000 | | | | 234,509 | |
SBA Communications Corp. | | | | | | | | |
3.13% due 02/01/29 | | | 250,000 | | | | 225,659 | |
CNO Financial Group, Inc. | | | | | | | | |
6.45% due 06/15/34 | | | 170,000 | | | | 175,634 | |
5.25% due 05/30/29 | | | 50,000 | | | | 49,648 | |
Stewart Information Services Corp. | | | | | | | | |
3.60% due 11/15/31 | | | 250,000 | | | | 216,443 | |
Societe Generale S.A. | | | | | | | | |
2.89% due 06/09/322,9 | | | 250,000 | | | | 208,796 | |
OneAmerica Financial Partners, Inc. | | | | | | | | |
4.25% due 10/15/502 | | | 285,000 | | | | 208,251 | |
TPG Operating Group II, LP | | | | | | | | |
5.88% due 03/05/34 | | | 200,000 | | | | 204,582 | |
Westpac Banking Corp. | | | | | | | | |
3.02% due 11/18/369 | | | 150,000 | | | | 126,904 | |
2.96% due 11/16/40 | | | 73,000 | | | | 51,952 | |
2.67% due 11/15/359 | | | 27,000 | | | | 22,969 | |
Lloyds Banking Group plc | | | | | | | | |
5.46% due 01/05/289 | | | 200,000 | | | | 201,681 | |
BNP Paribas S.A. | | | | | | | | |
5.50% due 05/20/302,9 | | | 200,000 | | | | 200,252 | |
Hunt Companies, Inc. | | | | | | | | |
5.25% due 04/15/292 | | | 200,000 | | | | 189,570 | |
Farmers Insurance Exchange | | | | | | | | |
7.00% due 10/15/642,9 | | | 180,000 | | | | 185,574 | |
Trustage Financial Group, Inc. | | | | | | | | |
4.63% due 04/15/322 | | | 200,000 | | | | 182,703 | |
Brown & Brown, Inc. | | | | | | | | |
5.65% due 06/11/34 | | | 100,000 | | | | 100,108 | |
2.38% due 03/15/31 | | | 90,000 | | | | 75,618 | |
Americo Life, Inc. | | | | | | | | |
3.45% due 04/15/312 | | | 200,000 | | | | 167,907 | |
Bank of America Corp. | | | | | | | | |
2.59% due 04/29/319 | | | 190,000 | | | | 167,384 | |
Jane Street Group / JSG Finance, Inc. | | | | | | | | |
7.13% due 04/30/312 | | | 160,000 | | | | 164,427 | |
Capital One Financial Corp. | | | | | | | | |
6.38% due 06/08/349 | | | 150,000 | | | | 155,742 | |
AmFam Holdings, Inc. | | | | | | | | |
2.81% due 03/11/312 | | | 200,000 | | | | 155,708 | |
Equinix Europe 2 Financing Corporation LLC | | | | | | | | |
5.50% due 06/15/34 | | | 150,000 | | | | 150,571 | |
Beacon Funding Trust | | | | | | | | |
6.27% due 08/15/542 | | | 150,000 | | | | 148,135 | |
Pacific Beacon LLC | | | | | | | | |
5.51% due 07/15/362 | | | 150,000 | | | | 141,575 | |
KKR Group Finance Company VIII LLC | | | | | | | | |
3.50% due 08/25/502 | | | 190,000 | | | | 130,958 | |
Dyal Capital Partners III (B) LP | | | | | | | | |
6.55% due 06/15/44††† | | | 132,000 | | | | 130,766 | |
PartnerRe Finance B LLC | | | | | | | | |
4.50% due 10/01/509 | | | 140,000 | | | | 129,459 | |
Fidelity National Financial, Inc. | | | | | | | | |
2.45% due 03/15/31 | | | 150,000 | | | | 126,522 | |
RGA Global Funding | | | | | | | | |
5.50% due 01/11/312 | | | 120,000 | | | | 121,260 | |
Prudential Financial, Inc. | | | | | | | | |
3.70% due 10/01/509 | | | 130,000 | | | | 115,647 | |
Aretec Group, Inc. | | | | | | | | |
10.00% due 08/15/302 | | | 100,000 | | | | 109,214 | |
VFH Parent LLC / Valor Company-Issuer, Inc. | | | | | | | | |
7.50% due 06/15/312 | | | 100,000 | | | | 102,855 | |
Reinsurance Group of America, Inc. | | | | | | | | |
5.75% due 09/15/34 | | | 100,000 | | | | 100,787 | |
Kennedy-Wilson, Inc. | | | | | | | | |
4.75% due 03/01/29 | | | 109,000 | | | | 98,459 | |
Globe Life, Inc. | | | | | | | | |
5.85% due 09/15/34 | | | 65,000 | | | | 65,365 | |
2.15% due 08/15/30 | | | 35,000 | | | | 29,631 | |
Apollo Management Holdings, LP | | | | | | | | |
2.65% due 06/05/302 | | | 90,000 | | | | 79,055 | |
Assured Guaranty US Holdings, Inc. | | | | | | | | |
3.60% due 09/15/51 | | | 100,000 | | | | 68,498 | |
SEE NOTES TO FINANCIAL STATEMENTS. | THE GUGGENHEIM FUNDS ANNUAL FINANCIAL REPORT | 5 |
SCHEDULE OF INVESTMENTS (continued) | December 31, 2024 |
SERIES E (TOTAL RETURN BOND SERIES) | |
| | Face
Amount~ | | | Value | |
Kemper Corp. | | | | | | | | |
2.40% due 09/30/30 | | | 76,000 | | | $ | 64,483 | |
Penn Mutual Life Insurance Co. | | | | | | | | |
3.80% due 04/29/612 | | | 100,000 | | | | 63,686 | |
Nationstar Mortgage Holdings, Inc. | | | | | | | | |
5.00% due 02/01/262 | | | 50,000 | | | | 49,510 | |
Mutual of Omaha Insurance Co. | | | | | | | | |
6.14% due 01/16/642,9 | | | 50,000 | | | | 49,343 | |
Western & Southern Life Insurance Co. | | | | | | | | |
3.75% due 04/28/612 | | | 68,000 | | | | 45,374 | |
Cushman & Wakefield US Borrower LLC | | | | | | | | |
6.75% due 05/15/282 | | | 35,000 | | | | 35,032 | |
Brookfield Finance LLC / Brookfield Finance, Inc. | | | | | | | | |
3.45% due 04/15/50 | | | 50,000 | | | | 34,259 | |
Total Financial | | | | | | | 19,257,457 | |
| | | | | | | | | |
Industrial - 2.8% | | | | | | | | |
AP Grange Holdings | | | | | | | | |
6.50% due 03/20/45††† | | | 915,925 | | | | 927,374 | |
5.00% due 03/20/45††† | | | 200,000 | | | | 211,000 | |
Amsted Industries, Inc. | | | | | | | | |
4.63% due 05/15/302 | | | 470,000 | | | | 442,090 | |
TD SYNNEX Corp. | | | | | | | | |
2.65% due 08/09/31 | | | 210,000 | | | | 176,614 | |
2.38% due 08/09/28 | | | 150,000 | | | | 136,062 | |
6.10% due 04/12/34 | | | 100,000 | | | | 102,622 | |
Crown Americas LLC / Crown Americas Capital Corporation VI | | | | | | | | |
4.75% due 02/01/26 | | | 400,000 | | | | 395,628 | |
Stadco LA LLC | | | | | | | | |
3.75% due 05/15/56††† | | | 500,000 | | | | 337,700 | |
Flowserve Corp. | | | | | | | | |
3.50% due 10/01/30 | | | 270,000 | | | | 246,304 | |
2.80% due 01/15/32 | | | 100,000 | | | | 85,033 | |
Boeing Co. | | | | | | | | |
6.53% due 05/01/34 | | | 210,000 | | | | 219,998 | |
6.86% due 05/01/54 | | | 50,000 | | | | 53,142 | |
3.75% due 02/01/50 | | | 73,000 | | | | 49,789 | |
Vontier Corp. | | | | | | | | |
2.95% due 04/01/31 | | | 350,000 | | | | 300,570 | |
Berry Global, Inc. | | | | | | | | |
5.80% due 06/15/312 | | | 150,000 | | | | 152,677 | |
1.57% due 01/15/26 | | | 50,000 | | | | 48,252 | |
Weir Group plc | | | | | | | | |
2.20% due 05/13/262 | | | 200,000 | | | | 192,304 | |
Dyal Capital Partners III (A) LP | | | | | | | | |
6.55% due 06/15/44††† | | | 168,000 | | | | 166,430 | |
Owens Corning | | | | | | | | |
5.95% due 06/15/54 | | | 110,000 | | | | 108,695 | |
Westinghouse Air Brake Technologies Corp. | | | | | | | | |
5.61% due 03/11/34 | | | 100,000 | | | | 101,282 | |
Sealed Air Corp. | | | | | | | | |
6.50% due 07/15/322 | | | 100,000 | | | | 100,154 | |
Norfolk Southern Corp. | | | | | | | | |
4.10% due 05/15/21 | | | 50,000 | | | | 34,600 | |
Total Industrial | | | | | | | 4,588,320 | |
Energy - 2.4% | | | | | | | | |
BP Capital Markets plc | | | | | | | | |
4.88% 8,9 | | | 516,000 | | | | 491,687 | |
Greensaif Pipelines Bidco SARL | | | | | | | | |
6.13% due 02/23/382 | | | 200,000 | | | | 200,313 | |
6.10% due 08/23/422 | | | 200,000 | | | | 194,996 | |
Targa Resources Corp. | | | | | | | | |
5.50% due 02/15/35 | | | 300,000 | | | | 295,147 | |
6.50% due 03/30/34 | | | 63,000 | | | | 66,563 | |
Venture Global LNG, Inc. | | | | | | | | |
9.50% due 02/01/292 | | | 200,000 | | | | 221,053 | |
9.88% due 02/01/322 | | | 100,000 | | | | 109,728 | |
Plains All American Pipeline Limited Partnership / PAA Finance Corp. | | | | | | | | |
5.70% due 09/15/34 | | | 250,000 | | | | 249,480 | |
Galaxy Pipeline Assets Bidco Ltd. | | | | | | | | |
3.25% due 09/30/402 | | | 328,000 | | | | 247,129 | |
ITT Holdings LLC | | | | | | | | |
6.50% due 08/01/292 | | | 248,000 | | | | 227,029 | |
Hess Midstream Operations, LP | | | | | | | | |
5.63% due 02/15/262 | | | 200,000 | | | | 199,345 | |
Venture Global Calcasieu Pass LLC | | | | | | | | |
4.13% due 08/15/312 | | | 200,000 | | | | 179,106 | |
Cheniere Energy Partners, LP | | | | | | | | |
5.75% due 08/15/342 | | | 150,000 | | | | 150,996 | |
Occidental Petroleum Corp. | | | | | | | | |
5.38% due 01/01/32 | | | 150,000 | | | | 146,873 | |
Kinder Morgan, Inc. | | | | | | | | |
5.20% due 06/01/33 | | | 150,000 | | | | 146,535 | |
Midwest Connector Capital Company LLC | | | | | | | | |
4.63% due 04/01/292 | | | 110,000 | | | | 107,882 | |
Viper Energy, Inc. | | | | | | | | |
7.38% due 11/01/312 | | | 100,000 | | | | 104,694 | |
Sunoco, LP | | | | | | | | |
7.25% due 05/01/322 | | | 100,000 | | | | 103,298 | |
Whistler Pipeline LLC | | | | | | | | |
5.70% due 09/30/312 | | | 100,000 | | | | 99,853 | |
EnLink Midstream LLC | | | | | | | | |
5.65% due 09/01/34 | | | 100,000 | | | | 99,666 | |
NuStar Logistics, LP | | | | | | | | |
5.63% due 04/28/27 | | | 100,000 | | | | 99,272 | |
Parkland Corp. | | | | | | | | |
4.63% due 05/01/302 | | | 100,000 | | | | 91,790 | |
Energy Transfer, LP | | | | | | | | |
7.38% due 02/01/312 | | | 50,000 | | | | 52,286 | |
Targa Resources Partners Limited Partnership / Targa Resources Partners Finance Corp. | | | | | | | | |
5.50% due 03/01/30 | | | 37,000 | | | | 37,116 | |
Total Energy | | | | | | | 3,921,837 | |
| | | | | | | | | |
Consumer, Non-cyclical - 2.4% | | | | | | | | |
Smithfield Foods, Inc. | | | | | | | | |
2.63% due 09/13/312 | | | 300,000 | | | | 246,963 | |
3.00% due 10/15/302 | | | 110,000 | | | | 95,038 | |
JBS USA Holding Lux SARL/ JBS USA Food Company/ JBS Lux Co SARL | | | | | | | | |
3.00% due 05/15/32 | | | 200,000 | | | | 166,492 | |
6 | THE GUGGENHEIM FUNDS ANNUAL FINANCIAL REPORT | SEE NOTES TO FINANCIAL STATEMENTS. |
SCHEDULE OF INVESTMENTS (continued) | December 31, 2024 |
SERIES E (TOTAL RETURN BOND SERIES) | |
| | Face
Amount~ | | | Value | |
5.50% due 01/15/30 | | | 100,000 | | | $ | 99,816 | |
4.38% due 02/02/52 | | | 100,000 | | | | 75,364 | |
Global Payments, Inc. | | | | | | | | |
2.90% due 05/15/30 | | | 195,000 | | | | 173,607 | |
2.90% due 11/15/31 | | | 140,000 | | | | 119,737 | |
3.20% due 08/15/29 | | | 15,000 | | | | 13,740 | |
CVS Health Corp. | | | | | | | | |
5.70% due 06/01/34 | | | 150,000 | | | | 147,439 | |
6.75% due 12/10/549 | | | 150,000 | | | | 147,081 | |
Altria Group, Inc. | | | | | | | | |
3.70% due 02/04/51 | | | 350,000 | | | | 237,953 | |
4.45% due 05/06/50 | | | 50,000 | | | | 38,775 | |
Medline Borrower Limited Partnership/Medline Company-Issuer, Inc. | | | | | | | | |
6.25% due 04/01/292 | | | 250,000 | | | | 252,636 | |
Brink’s Co. | | | | | | | | |
6.75% due 06/15/322 | | | 150,000 | | | | 151,102 | |
6.50% due 06/15/292 | | | 100,000 | | | | 101,341 | |
Royalty Pharma plc | | | | | | | | |
3.55% due 09/02/50 | | | 310,000 | | | | 206,725 | |
GXO Logistics, Inc. | | | | | | | | |
6.50% due 05/06/34 | | | 100,000 | | | | 102,494 | |
6.25% due 05/06/29 | | | 100,000 | | | | 102,399 | |
IQVIA, Inc. | | | | | | | | |
5.00% due 05/15/272 | | | 200,000 | | | | 196,244 | |
Triton Container International Ltd. | | | | | | | | |
3.15% due 06/15/312 | | | 200,000 | | | | 169,786 | |
Graham Holdings Co. | | | | | | | | |
5.75% due 06/01/262 | | | 150,000 | | | | 149,350 | |
Albertsons Companies Incorporated / Safeway Inc / New Albertsons Limited Partnership / Albertsons LLC | | | | | | | | |
3.25% due 03/15/262 | | | 150,000 | | | | 146,337 | |
Universal Health Services, Inc. | | | | | | | | |
2.65% due 10/15/30 | | | 150,000 | | | | 128,927 | |
Transurban Finance Company Pty Ltd. | | | | | | | | |
2.45% due 03/16/312 | | | 150,000 | | | | 126,547 | |
HAH Group Holding Company LLC | | | | | | | | |
9.75% due 10/01/312 | | | 100,000 | | | | 100,080 | |
AZ Battery Property LLC | | | | | | | | |
6.73% due 02/20/46††† | | | 100,000 | | | | 98,611 | |
Kroger Co. | | | | | | | | |
5.50% due 09/15/54 | | | 100,000 | | | | 94,187 | |
Triton Container International Limited / TAL International Container Corp. | | | | | | | | |
3.25% due 03/15/32 | | | 100,000 | | | | 84,665 | |
Tenet Healthcare Corp. | | | | | | | | |
4.63% due 06/15/28 | | | 75,000 | | | | 71,774 | |
Central Garden & Pet Co. | | | | | | | | |
4.13% due 04/30/312 | | | 42,000 | | | | 37,141 | |
Total Consumer, Non-cyclical | | | | | | | 3,882,351 | |
| | | | | | | | | |
Consumer, Cyclical - 2.3% | | | | | | | | |
Warnermedia Holdings, Inc. | | | | | | | | |
4.28% due 03/15/32 | | | 400,000 | | | | 352,483 | |
5.14% due 03/15/52 | | | 196,000 | | | | 145,629 | |
Hyatt Hotels Corp. | | | | | | | | |
5.38% due 04/23/25 | | | 220,000 | | | | 220,129 | |
5.75% due 04/23/30 | | | 190,000 | | | | 194,004 | |
Delta Air Lines, Inc. | | | | | | | | |
7.00% due 05/01/252 | | | 367,000 | | | | 368,552 | |
Choice Hotels International, Inc. | | | | | | | | |
3.70% due 01/15/31 | | | 360,000 | | | | 323,868 | |
5.85% due 08/01/34 | | | 30,000 | | | | 30,036 | |
AS Mileage Plan IP Ltd. | | | | | | | | |
5.31% due 10/20/312 | | | 250,000 | | | | 244,087 | |
International Game Technology plc | | | | | | | | |
4.13% due 04/15/262 | | | 230,000 | | | | 226,132 | |
Flutter Treasury Designated Activity Co. | | | | | | | | |
6.38% due 04/29/292 | | | 200,000 | | | | 202,936 | |
LG Energy Solution Ltd. | | | | | | | | |
5.50% due 07/02/342 | | | 200,000 | | | | 194,006 | |
Ferguson Finance plc | | | | | | | | |
4.65% due 04/20/322 | | | 200,000 | | | | 190,722 | |
Mileage Plus Holdings LLC / Mileage Plus Intellectual Property Assets Ltd. | | | | | | | | |
6.50% due 06/20/272 | | | 175,000 | | | | 176,103 | |
Walgreens Boots Alliance, Inc. | | | | | | | | |
3.45% due 06/01/26 | | | 100,000 | | | | 96,794 | |
4.10% due 04/15/50 | | | 98,000 | | | | 60,585 | |
Hasbro, Inc. | | | | | | | | |
6.05% due 05/14/34 | | | 150,000 | | | | 150,644 | |
United Airlines, Inc. | | | | | | | | |
4.38% due 04/15/262 | | | 150,000 | | | | 147,489 | |
Air Canada | | | | | | | | |
3.88% due 08/15/262 | | | 150,000 | | | | 145,741 | |
Delta Air Lines, Inc. / SkyMiles IP Ltd. | | | | | | | | |
4.50% due 10/20/252 | | | 100,000 | | | | 99,372 | |
Marriott International, Inc. | | | | | | | | |
5.35% due 03/15/35 | | | 100,000 | | | | 98,584 | |
Beacon Roofing Supply, Inc. | | | | | | | | |
4.50% due 11/15/262 | | | 100,000 | | | | 98,245 | |
British Airways Class A Pass Through Trust | | | | | | | | |
2.90% due 03/15/352 | | | 86,309 | | | | 76,128 | |
Total Consumer, Cyclical | | | | | | | 3,842,269 | |
| | | | | | | | | |
Communications - 1.4% | | | | | | | | |
British Telecommunications plc | | | | | | | | |
4.88% due 11/23/812,9 | | | 350,000 | | | | 317,953 | |
9.63% due 12/15/30 | | | 100,000 | | | | 121,149 | |
Level 3 Financing, Inc. | | | | | | | | |
3.88% due 10/15/302 | | | 330,000 | | | | 263,373 | |
11.00% due 11/15/292 | | | 71,086 | | | | 79,966 | |
4.00% due 04/15/312 | | | 100,000 | | | | 78,750 | |
Paramount Global | | | | | | | | |
4.90% due 08/15/44 | | | 132,000 | | | | 99,925 | |
5.25% due 04/01/44 | | | 101,000 | | | | 78,476 | |
5.90% due 10/15/40 | | | 86,000 | | | | 75,414 | |
Cable One, Inc. | | | | | | | | |
4.00% due 11/15/302 | | | 300,000 | | | | 250,673 | |
Vodafone Group plc | | | | | | | | |
4.13% due 06/04/819 | | | 250,000 | | | | 221,297 | |
Rogers Communications, Inc. | | | | | | | | |
4.55% due 03/15/52 | | | 200,000 | | | | 159,885 | |
Sirius XM Radio LLC | | | | | | | | |
4.13% due 07/01/302 | | | 180,000 | | | | 157,095 | |
SEE NOTES TO FINANCIAL STATEMENTS. | THE GUGGENHEIM FUNDS ANNUAL FINANCIAL REPORT | 7 |
SCHEDULE OF INVESTMENTS (continued) | December 31, 2024 |
SERIES E (TOTAL RETURN BOND SERIES) | |
| | Face
Amount~ | | | Value | |
Altice France S.A. | | | | | | | | |
5.13% due 07/15/292 | | | 200,000 | | | $ | 149,772 | |
CSC Holdings LLC | | | | | | | | |
4.13% due 12/01/302 | | | 200,000 | | | | 143,673 | |
Go Daddy Operating Company LLC / GD Finance Co., Inc. | | | | | | | | |
3.50% due 03/01/292 | | | 55,000 | | | | 50,246 | |
Charter Communications Operating LLC / Charter Communications Operating Capital | | | | | | | | |
3.90% due 06/01/52 | | | 50,000 | | | | 32,165 | |
McGraw-Hill Education, Inc. | | | | | | | | |
5.75% due 08/01/282 | | | 16,000 | | | | 15,622 | |
Total Communications | | | | | | | 2,295,434 | |
| | | | | | | | | |
Technology - 1.2% | | | | | | | | |
ACI Worldwide, Inc. | | | | | | | | |
5.75% due 08/15/262 | | | 400,000 | | | | 399,279 | |
Broadcom, Inc. | | | | | | | | |
4.93% due 05/15/372 | | | 277,000 | | | | 263,468 | |
3.19% due 11/15/362 | | | 26,000 | | | | 20,944 | |
Leidos, Inc. | | | | | | | | |
2.30% due 02/15/31 | | | 250,000 | | | | 209,940 | |
Qorvo, Inc. | | | | | | | | |
4.38% due 10/15/29 | | | 119,000 | | | | 111,602 | |
3.38% due 04/01/312 | | | 100,000 | | | | 85,525 | |
Foundry JV Holdco LLC | | | | | | | | |
5.88% due 01/25/342 | | | 200,000 | | | | 195,654 | |
Oracle Corp. | | | | | | | | |
3.95% due 03/25/51 | | | 217,000 | | | | 160,733 | |
MSCI, Inc. | | | | | | | | |
3.63% due 11/01/312 | | | 150,000 | | | | 134,316 | |
Booz Allen Hamilton, Inc. | | | | | | | | |
5.95% due 08/04/33 | | | 100,000 | | | | 102,226 | |
Atlassian Corp. | | | | | | | | |
5.50% due 05/15/34 | | | 100,000 | | | | 100,437 | |
Constellation Software, Inc. | | | | | | | | |
5.46% due 02/16/342 | | | 100,000 | | | | 100,231 | |
Fiserv, Inc. | | | | | | | | |
5.35% due 03/15/31 | | | 50,000 | | | | 50,825 | |
Twilio, Inc. | | | | | | | | |
3.63% due 03/15/29 | | | 38,000 | | | | 34,947 | |
Total Technology | | | | | | | 1,970,127 | |
| | | | | | | | | |
Basic Materials - 0.7% | | | | | | | | |
Anglo American Capital plc | | | | | | | | |
5.63% due 04/01/302 | | | 200,000 | | | | 202,450 | |
2.63% due 09/10/302 | | | 200,000 | | | | 173,462 | |
Alcoa Nederland Holding B.V. | | | | | | | | |
5.50% due 12/15/272 | | | 200,000 | | | | 200,714 | |
Minerals Technologies, Inc. | | | | | | | | |
5.00% due 07/01/282 | | | 190,000 | | | | 182,875 | |
International Flavors & Fragrances, Inc. | | | | | | | | |
1.23% due 10/01/252 | | | 170,000 | | | | 165,256 | |
Yamana Gold, Inc. | | | | | | | | |
2.63% due 08/15/31 | | | 150,000 | | | | 126,231 | |
Arsenal AIC Parent LLC | | | | | | | | |
8.00% due 10/01/302 | | | 100,000 | | | | 103,480 | |
Total Basic Materials | | | | | | | 1,154,468 | |
| | | | | | | | | |
Utilities - 0.6% | | | | | | | | |
NRG Energy, Inc. | | | | | | | | |
2.45% due 12/02/272 | | | 200,000 | | | | 185,709 | |
7.00% due 03/15/332 | | | 100,000 | | | | 107,942 | |
AES Corp. | | | | | | | | |
3.95% due 07/15/302 | | | 170,000 | | | | 156,707 | |
2.45% due 01/15/31 | | | 55,000 | | | | 45,832 | |
Enel Finance International N.V. | | | | | | | | |
5.00% due 06/15/322 | | | 200,000 | | | | 194,705 | |
Brooklyn Union Gas Co. | | | | | | | | |
6.39% due 09/15/332 | | | 100,000 | | | | 104,434 | |
AmeriGas Partners Limited Partnership / AmeriGas Finance Corp. | | | | | | | | |
5.88% due 08/20/26 | | | 100,000 | | | | 96,365 | |
Total Utilities | | | | | | | 891,694 | |
| | | | | | | | | |
Transporation - 0.1% | | | | | | | | |
Stolthaven Houston, Inc. | | | | | | | | |
5.98% due 07/17/34††† | | | 200,000 | | | | 195,393 | |
Total Corporate Bonds | | | | |
(Cost $45,803,860) | | | 41,999,350 | |
| | | | | |
ASSET-BACKED SECURITIES†† - 20.9% |
Collateralized Loan Obligations - 10.4% | | | | |
Octagon Investment Partners 49 Ltd. | | | | | | | | |
2024-5A BR, 6.61% (3 Month Term SOFR + 1.95%, Rate Floor: 1.95%) due 04/15/37◊,2 | | | 1,750,000 | | | | 1,760,453 | |
BXMT Ltd. | | | | | | | | |
2020-FL2 AS, 5.65% (1 Month Term SOFR + 1.26%, Rate Floor: 1.26%) due 02/15/38◊,2 | | | 1,000,000 | | | | 984,760 | |
2020-FL3 C, 7.05% (1 Month Term SOFR + 2.66%, Rate Floor: 2.66%) due 11/15/37◊,2 | | | 250,000 | | | | 232,079 | |
Cerberus Loan Funding XXXIII, LP | | | | | | | | |
2021-3A A, 6.47% (3 Month Term SOFR + 1.82%, Rate Floor: 1.56%) due 07/23/33◊,2 | | | 500,000 | | | | 501,570 | |
2021-3A B, 6.76% (3 Month Term SOFR + 2.11%, Rate Floor: 1.85%) due 07/23/33◊,2 | | | 500,000 | | | | 500,206 | |
Palmer Square Loan Funding Ltd. | | | | | | | | |
2022-1A A2, 6.25% (3 Month Term SOFR + 1.60%, Rate Floor: 1.60%) due 04/15/30◊,2 | | | 1,000,000 | | | | 1,001,486 | |
Cerberus Loan Funding XLIV LLC | | | | | | | | |
2024-5A A, 7.01% (3 Month Term SOFR + 2.35%, Rate Floor: 2.35%) due 01/15/36◊,2 | | | 700,000 | | | | 705,613 | |
2024-5A B, 7.86% (3 Month Term SOFR + 3.20%, Rate Floor: 3.20%) due 01/15/36◊,2 | | | 250,000 | | | | 256,335 | |
8 | THE GUGGENHEIM FUNDS ANNUAL FINANCIAL REPORT | SEE NOTES TO FINANCIAL STATEMENTS. |
SCHEDULE OF INVESTMENTS (continued) | December 31, 2024 |
SERIES E (TOTAL RETURN BOND SERIES) | |
| | Face
Amount~ | | | Value | |
Golub Capital Partners CLO 33M Ltd. | | | | | | | | |
2021-33A AR2, 6.64% (3 Month Term SOFR + 2.12%, Rate Floor: 1.86%) due 08/25/33◊,2 | | | 750,000 | | | $ | 750,915 | |
STWD Ltd. | | | | | | | | |
2019-FL1 B, 6.11% (1 Month Term SOFR + 1.71%, Rate Floor: 1.71%) due 07/15/38◊,2 | | | 750,000 | | | | 748,877 | |
LCCM Trust | | | | | | | | |
2021-FL3 AS, 6.31% (1 Month Term SOFR + 1.91%, Rate Floor: 1.91%) due 11/15/38◊,2 | | | 400,000 | | | | 396,566 | |
2021-FL3 A, 5.96% (1 Month Term SOFR + 1.56%, Rate Floor: 1.56%) due 11/15/38◊,2 | | | 323,197 | | | | 322,912 | |
Dryden 37 Senior Loan Fund | | | | | | | | |
2015-37A Q, due 01/15/312,10 | | | 1,000,000 | | | | 696,767 | |
KREF Ltd. | | | | | | | | |
2021-FL2 C, 6.50% (1 Month Term SOFR + 2.11%, Rate Floor: 2.00%) due 02/15/39◊,2 | | | 500,000 | | | | 481,532 | |
2021-FL2 AS, 5.80% (1 Month Term SOFR + 1.41%, Rate Floor: 1.30%) due 02/15/39◊,2 | | | 150,000 | | | | 147,108 | |
ABPCI Direct Lending Fund CLO I LLC | | | | | | | | |
2021-1A A1A2, 6.58% (3 Month Term SOFR + 1.96%, Rate Floor: 1.96%) due 07/20/33◊,2 | | | 500,000 | | | | 506,004 | |
Cerberus Loan Funding XLII LLC | | | | | | | | |
2023-3A A1, 7.13% (3 Month Term SOFR + 2.48%, Rate Floor: 2.48%) due 09/13/35◊,2 | | | 500,000 | | | | 503,044 | |
Owl Rock CLO XVI LLC | | | | | | | | |
2024-16A A, 6.62% (3 Month Term SOFR + 2.00%, Rate Floor: 2.00%) due 04/20/36◊,2 | | | 500,000 | | | | 502,997 | |
ABPCI Direct Lending Fund CLO II LLC | | | | | | | | |
2024-1A A1RR, 6.58% (3 Month Term SOFR + 1.65%, Rate Floor: 1.65%) due 07/20/37◊,2 | | | 500,000 | | | | 502,545 | |
Golub Capital Partners CLO 16 Ltd. | | | | | | | | |
2021-16A A1R2, 6.50% (3 Month Term SOFR + 1.87%, Rate Floor: 1.61%) due 07/25/33◊,2 | | | 500,000 | | | | 501,905 | |
Cerberus Loan Funding XL LLC | | | | | | | | |
2023-1A A, 7.06% (3 Month Term SOFR + 2.40%, Rate Floor: 2.40%) due 03/22/35◊,2 | | | 500,000 | | | | 500,827 | |
Golub Capital Partners CLO 54M L.P | | | | | | | | |
2021-54A C, 7.47% (3 Month Term SOFR + 2.91%, Rate Floor: 2.65%) due 08/05/33◊,2 | | | 500,000 | | | | 500,753 | |
THL Credit Lake Shore MM CLO I Ltd. | | | | | | | | |
2021-1A A1R, 6.62% (3 Month Term SOFR + 1.96%, Rate Floor: 1.70%) due 04/15/33◊,2 | | | 493,441 | | | | 494,724 | |
HERA Commercial Mortgage Ltd. | | | | | | | | |
2021-FL1 B, 6.09% (1 Month Term SOFR + 1.71%, Rate Floor: 1.60%) due 02/18/38◊,2 | | | 500,000 | | | | 489,955 | |
LoanCore Issuer Ltd. | | | | | | | | |
2021-CRE6 C, 6.81% (1 Month Term SOFR + 2.41%, Rate Floor: 2.30%) due 11/15/38◊,2 | | | 500,000 | | | | 489,245 | |
Cerberus Loan Funding XLVII LLC | | | | | | | | |
2024-3A B, 6.61% (3 Month Term SOFR + 1.95%, Rate Floor: 1.95%) due 07/15/36◊,2 | | | 300,000 | | | | 305,017 | |
Fortress Credit BSL XV Ltd. | | | | | | | | |
2024-2A BR, 6.63% (3 Month Term SOFR + 2.00%, Rate Floor: 2.00%) due 10/18/33◊,2 | | | 300,000 | | | | 301,586 | |
Ares Direct Lending CLO 1 LLC | | | | | | | | |
2024-1A B, 6.83% (3 Month Term SOFR + 2.20%, Rate Floor: 2.20%) due 04/25/36◊,2 | | | 250,000 | | | | 255,376 | |
Owl Rock CLO XVII LLC | | | | | | | | |
2024-17A B, 7.23% (3 Month Term SOFR + 1.95%, Rate Floor: 1.95%) due 07/15/36◊,2 | | | 250,000 | | | | 254,042 | |
Owl Rock CLO III Ltd. | | | | | | | | |
2024-3A AR, 6.47% (3 Month Term SOFR + 1.85%, Rate Floor: 1.85%) due 04/20/36◊,2 | | | 250,000 | | | | 253,125 | |
CIFC Funding 2017-II Ltd. | | | | | | | | |
2021-2A CR, 6.73% (3 Month Term SOFR + 2.11%, Rate Floor: 1.85%) due 04/20/30◊,2 | | | 250,000 | | | | 250,361 | |
Owl Rock CLO IV Ltd. | | | | | | | | |
2021-4A A1R, 6.38% (3 Month Term SOFR + 1.86%, Rate Floor: 1.60%) due 08/20/33◊,2 | | | 250,000 | | | | 250,048 | |
BRSP Ltd. | | | | | | | | |
2024-FL2 A, 6.31% (1 Month Term SOFR + 1.95%, Rate Floor: 1.95%) due 08/19/37◊,2 | | | 250,000 | | | | 249,458 | |
Golub Capital Partners CLO 36M Ltd. | | | | | | | | |
2018-36A A, 6.12% (3 Month Term SOFR + 1.56%, Rate Floor: 0.00%) due 02/05/31◊,2 | | | 239,077 | | | | 239,433 | |
Ares Direct Lending CLO 2 LLC | | | | | | | | |
2024-2A C, 6.95% (3 Month Term SOFR + 2.35%, Rate Floor: 2.35%) due 10/20/36◊,2 | | | 100,000 | | | | 100,421 | |
PFP Ltd. | | | | | | | | |
2024-11 AS, 6.67% (1 Month Term SOFR + 2.19%, Rate Floor: 2.19%) due 09/17/39◊,2 | | | 94,513 | | | | 94,997 | |
Golub Capital Partners CLO 17 Ltd. | | | | | | | | |
2017-17A A1R, 6.54% (3 Month Term SOFR + 1.91%, Rate Floor: 0.00%) due 10/25/30◊,2 | | | 56,503 | | | | 56,536 | |
SEE NOTES TO FINANCIAL STATEMENTS. | THE GUGGENHEIM FUNDS ANNUAL FINANCIAL REPORT | 9 |
SCHEDULE OF INVESTMENTS (continued) | December 31, 2024 |
SERIES E (TOTAL RETURN BOND SERIES) | |
| | Face
Amount~ | | | Value | |
Treman Park CLO Ltd. | | | | | | | | |
2015-1A COM, due 10/20/282,10 | | | 162,950 | | | $ | 466 | |
Copper River CLO Ltd. | | | | | | | | |
2007-1A INC, due 01/20/2110,11 | | | 600,000 | | | | 60 | |
Total Collateralized Loan Obligations | | | | | | | 17,090,104 | |
| | | | | | | | | |
Whole Business - 1.9% | | | | | | | | |
Arbys Funding LLC | | | | | | | | |
2020-1A, 3.24% due 07/30/502 | | | 766,000 | | | | 727,321 | |
Subway Funding LLC | | | | | | | | |
2024-3A, 5.91% due 07/30/542 | | | 250,000 | | | | 244,091 | |
2024-1A, 6.27% due 07/30/542 | | | 200,000 | | | | 203,471 | |
2024-1A, 6.51% due 07/30/542 | | | 150,000 | | | | 153,972 | |
SERVPRO Master Issuer LLC | | | | | | | | |
2021-1A, 2.39% due 04/25/512 | | | 482,500 | | | | 434,753 | |
2024-1A, 6.17% due 01/25/542 | | | 99,250 | | | | 99,555 | |
Applebee’s Funding LLC / IHOP Funding LLC | | | | | | | | |
2019-1A, 4.72% due 06/05/492 | | | 495,000 | | | | 486,292 | |
Taco Bell Funding LLC | | | | | | | | |
2016-1A, 4.97% due 05/25/462 | | | 328,125 | | | | 327,497 | |
ServiceMaster Funding LLC | | | | | | | | |
2020-1, 3.34% due 01/30/512 | | | 235,726 | | | | 199,872 | |
Five Guys Holdings, Inc. | | | | | | | | |
2023-1A, 7.55% due 01/26/542 | | | 150,000 | | | | 155,089 | |
DB Master Finance LLC | | | | | | | | |
2019-1A, 4.02% due 05/20/492 | | | 94,750 | | | | 93,389 | |
Total Whole Business | | | | | | | 3,125,302 | |
| | | | | | | | | |
Transport-Aircraft - 1.8% | | | | | | | | |
AASET Trust | | | | | | | | |
2024-1A, 6.26% due 05/16/492 | | | 242,485 | | | | 244,226 | |
2021-1A, 2.95% due 11/16/412 | | | 258,286 | | | | 240,969 | |
Slam Ltd. | | | | | | | | |
2024-1A, 5.34% due 09/15/492 | | | 196,832 | | | | 192,968 | |
2021-1A, 2.43% due 06/15/462 | | | 195,300 | | | | 177,415 | |
Navigator Aircraft ABS Ltd. | | | | | | | | |
2021-1, 2.77% due 11/15/462 | | | 390,639 | | | | 358,959 | |
Lunar Structured Aircraft Portfolio Notes | | | | | | | | |
2021-1, 2.64% due 10/15/462 | | | 372,256 | | | | 340,026 | |
JOL Air Ltd. | | | | | | | | |
2019-1, 3.97% due 04/15/442 | | | 292,986 | | | | 286,704 | |
Sapphire Aviation Finance II Ltd. | | | | | | | | |
2020-1A, 3.23% due 03/15/402 | | | 290,353 | | | | 272,941 | |
WAVE LLC | | | | | | | | |
2019-1, 3.60% due 09/15/442 | | | 282,011 | | | | 264,332 | |
Navigator Aviation Ltd. | | | | | | | | |
2024-1, 5.40% due 08/15/492 | | | 244,048 | | | | 238,219 | |
Sprite Ltd. | | | | | | | | |
2021-1, 3.75% due 11/15/462 | | | 147,704 | | | | 141,213 | |
Castlelake Aircraft Structured Trust | | | | | | | | |
2021-1A, 3.47% due 01/15/462 | | | 146,212 | | | | 140,503 | |
Falcon Aerospace Ltd. | | | | | | | | |
2017-1, 4.58% due 02/15/422 | | | 27,433 | | | | 27,049 | |
Total Transport-Aircraft | | | | | | | 2,925,524 | |
| | | | | | | | | |
Financial - 1.7% | | | | | | | | |
Station Place Securitization Trust | | | | | | | | |
2024-SP2, 6.15% (1 Month Term SOFR + 1.70%, Rate Floor: 1.70%) due 07/12/26◊,†††,2 | | | 325,000 | | | | 325,000 | |
2024-SP1, 5.85% (1 Month Term SOFR + 1.40%, Rate Floor: 1.40%) due 08/12/25◊,†††,2 | | | 325,000 | | | | 325,000 | |
KKR Core Holding Company LLC | | | | | | | | |
4.00% due 08/12/31††† | | | 482,014 | | | | 435,846 | |
Project Onyx I | | | | | | | | |
7.74% (3 Month Term SOFR + 2.80%, Rate Floor: 2.80%) due 01/26/27◊,††† | | | 368,531 | | | | 364,729 | |
LVNV Funding LLC | | | | | | | | |
7.80% due 11/05/28††† | | | 250,000 | | | | 259,293 | |
6.84% due 06/12/29††† | | | 100,000 | | | | 100,422 | |
Thunderbird A | | | | | | | | |
5.50% due 03/01/37††† | | | 345,961 | | | | 318,803 | |
Lightning A | | | | | | | | |
5.50% due 03/01/37††† | | | 344,915 | | | | 317,840 | |
Ceamer Finance LLC | | | | | | | | |
6.79% due 11/15/39††† | | | 200,000 | | | | 200,000 | |
Project Onyx II | | | | | | | | |
7.74% (3 Month Term SOFR + 2.80%, Rate Floor: 2.80%) due 01/26/27◊,††† | | | 101,282 | | | | 100,403 | |
Nassau LLC | | | | | | | | |
2019-1, 3.98% due 08/15/3411 | | | 98,392 | | | | 91,266 | |
Total Financial | | | | | | | 2,838,602 | |
| | | | | | | | | |
Net Lease - 1.6% | | | | | | | | |
STORE Master Funding I-VII | | | | | | | | |
2016-1A, 3.96% due 10/20/462 | | | 833,332 | | | | 808,989 | |
CF Hippolyta Issuer LLC | | | | | | | | |
2022-1A, 6.11% due 08/15/622 | | | 244,283 | | | | 242,953 | |
2020-1, 2.28% due 07/15/602 | | | 224,863 | | | | 217,978 | |
CARS-DB5, LP | | | | | | | | |
2021-1A, 2.76% due 08/15/512 | | | 495,104 | | | | 410,163 | |
SVC ABS LLC | | | | | | | | |
2023-1A, 5.15% due 02/20/532 | | | 346,792 | | | | 338,936 | |
CMFT Net Lease Master Issuer LLC | | | | | | | | |
2021-1, 3.44% due 07/20/512 | | | 400,000 | | | | 336,173 | |
CARS-DB4, LP | | | | | | | | |
2020-1A, 3.81% due 02/15/502 | | | 245,573 | | | | 220,548 | |
Total Net Lease | | | | | | | 2,575,740 | |
| | | | | | | | | |
Infrastructure - 1.2% | | | | | | | | |
Stack Infrastructure Issuer LLC | | | | | | | | |
2023-1A, 5.90% due 03/25/482 | | | 500,000 | | | | 504,294 | |
Switch ABS Issuer LLC | | | | | | | | |
2024-2A, 5.44% due 06/25/542 | | | 300,000 | | | | 299,247 | |
2024-1A, 6.28% due 03/25/542 | | | 100,000 | | | | 101,434 | |
Hotwire Funding LLC | | | | | | | | |
2021-1, 2.31% due 11/20/512 | | | 250,000 | | | | 236,298 | |
2024-1A, 5.89% due 06/20/542 | | | 150,000 | | | | 151,509 | |
VB-S1 Issuer LLC - VBTEL | | | | | | | | |
2022-1A, 4.29% due 02/15/522 | | | 250,000 | | | | 240,121 | |
10 | THE GUGGENHEIM FUNDS ANNUAL FINANCIAL REPORT | SEE NOTES TO FINANCIAL STATEMENTS. |
SCHEDULE OF INVESTMENTS (continued) | December 31, 2024 |
SERIES E (TOTAL RETURN BOND SERIES) | |
| | Face
Amount~ | | | Value | |
Aligned Data Centers Issuer LLC | | | | | | | | |
2021-1A, 1.94% due 08/15/462 | | | 250,000 | | | $ | 237,659 | |
ALLO Issuer LLC | | | | | | | | |
2024-1A, 5.94% due 07/20/542 | | | 150,000 | | | | 151,363 | |
SBA Tower Trust | | | | | | | | |
4.83% due 10/15/292 | | | 150,000 | | | | 146,518 | |
Total Infrastructure | | | | | | | 2,068,443 | |
| | | | | | | | | |
Single Family Residence - 1.0% | | | | | | | | |
FirstKey Homes Trust | | | | | | | | |
2021-SFR1, 1.79% due 08/17/382 | | | 600,000 | | | | 570,196 | |
2020-SFR2, 4.50% due 10/19/372 | | | 150,000 | | | | 147,639 | |
2020-SFR2, 4.00% due 10/19/372 | | | 150,000 | | | | 147,182 | |
2020-SFR2, 3.37% due 10/19/372 | | | 100,000 | | | | 97,724 | |
Tricon Residential Trust | | | | | | | | |
2023-SFR2, 5.00% due 12/17/402 | | | 250,000 | | | | 242,253 | |
2024-SFR3, 5.25% due 08/17/412 | | | 200,000 | | | | 193,909 | |
2024-SFR2, 5.70% due 06/17/402 | | | 100,000 | | | | 100,080 | |
Invitation Homes Trust | | | | | | | | |
2024-SFR1, 4.00% due 09/17/412 | | | 100,000 | | | | 93,565 | |
Total Single Family Residence | | | | | | | 1,592,548 | |
| | | | | | | | | |
Collateralized Debt Obligations - 0.5% | | | | |
Anchorage Credit Funding 4 Ltd. | | | | | | | | |
2021-4A AR, 2.72% due 04/27/392 | | | 750,000 | | | | 696,368 | |
Oxford Finance Funding | | | | | | | | |
2020-1A A2, 3.10% due 02/15/282 | | | 85,346 | | | | 84,556 | |
Total Collateralized Debt Obligations | | | | | | | 780,924 | |
| | | | | | | | | |
Transport-Container - 0.4% | | | | | | | | |
CLI Funding VIII LLC | | | | | | | | |
2021-1A, 1.64% due 02/18/462 | | | 295,869 | | | | 267,270 | |
Textainer Marine Containers Ltd. | | | | | | | | |
2021-3A, 1.94% due 08/20/462 | | | 220,000 | | | | 192,159 | |
Textainer Marine Containers VII Ltd. | | | | | | | | |
2020-1A, 2.73% due 08/21/452 | | | 131,051 | | | | 124,725 | |
TIF Funding III LLC | | | | | | | | |
2024-1A, 5.48% due 04/20/492 | | | 94,375 | | | | 93,497 | |
Total Transport-Container | | | | | | | 677,651 | |
| | | | | | | | | |
Insurance - 0.3% | | | | | | | | |
Obra Longevity | | | | | | | | |
8.48% due 06/30/39††† | | | 450,000 | | | | 466,943 | |
| | | | | | | | | |
Unsecured Consumer Loans - 0.1% | | | | | | | | |
Service Experts Issuer LLC | | | | | | | | |
2024-1A, 6.39% due 11/20/352 | | | 133,246 | | | | 135,139 | |
Total Asset-Backed Securities | | | | |
(Cost $34,875,478) | | | 34,276,920 | |
| | | | | |
U.S. GOVERNMENT SECURITIES†† - 5.8% |
U.S. Treasury Bonds |
due 05/15/5112,13 | | | 12,850,000 | | | | 3,620,008 | |
due 05/15/446,12 | | | 2,790,000 | | | | 1,049,903 | |
due 02/15/466,12 | | | 1,990,000 | | | | 686,466 | |
due 02/15/5412,13 | | | 2,500,000 | | | | 650,460 | |
due 02/15/5212,13 | | | 2,180,000 | | | | 594,988 | |
due 11/15/446,12 | | | 500,000 | | | | 183,535 | |
due 08/15/5412,13 | | | 700,000 | | | | 179,093 | |
U.S. Treasury Notes |
4.13% due 11/30/29 | | | 1,810,000 | | | | 1,789,436 | |
4.13% due 11/30/31 | | | 750,000 | | | | 733,987 | |
Total U.S. Government Securities | | | | |
(Cost $10,689,088) | | | | | | | 9,487,876 | |
| | | | | | | | | |
SENIOR FLOATING RATE INTERESTS††,◊ - 2.1% |
Financial - 1.0% | | | | | | | | |
Higginbotham Insurance Agency, Inc. | | | | | | | | |
8.86% (1 Month Term SOFR + 4.50%, Rate Floor: 4.50%) due 11/24/28††† | | | 411,873 | | | | 408,825 | |
Worldpay | | | | | | | | |
6.83% (3 Month Term SOFR + 2.50%, Rate Floor: 2.50%) due 01/31/31 | | | 249,375 | | | | 250,363 | |
Jane Street Group, LLC | | | | | | | | |
6.40% (3 Month Term SOFR + 2.25%, Rate Floor: 2.25%) due 01/26/28 | | | 222,570 | | | | 222,266 | |
Citadel Securities, LP | | | | | | | | |
6.33% (3 Month Term SOFR + 2.00%, Rate Floor: 2.00%) due 10/31/31 | | | 198,010 | | | | 198,459 | |
Alliant Holdings Intermediate LLC | | | | | | | | |
7.11% (1 Month Term SOFR + 2.75%, Rate Floor: 2.75%) due 09/19/31 | | | 159,600 | | | | 159,849 | |
CPI Holdco B LLC | | | | | | | | |
6.36% (1 Month Term SOFR + 2.00%, Rate Floor: 2.00%) due 05/17/31 | | | 149,625 | | | | 149,197 | |
Asurion LLC | | | | | | | | |
8.61% (1 Month Term SOFR + 4.25%, Rate Floor: 4.25%) due 09/19/30 | | | 149,625 | | | | 149,091 | |
Eisner Advisory Group | | | | | | | | |
8.36% (1 Month Term SOFR + 4.00%, Rate Floor: 4.50%) due 02/28/31 | | | 99,003 | | | | 99,922 | |
HighTower Holding LLC | | | | | | | | |
8.07% (3 Month Term SOFR + 3.50%, Rate Floor: 3.50%) due 04/21/28 | | | 54,624 | | | | 54,829 | |
Total Financial | | | | | | | 1,692,801 | |
| | | | | | | | | |
Industrial - 0.4% | | | | | | | | |
Amentum Holdings, Inc. | | | | | | | | |
6.61% (1 Month Term SOFR + 2.25%, Rate Floor: 2.25%) due 09/29/31 | | | 400,000 | | | | 398,332 | |
EMRLD Borrower, LP | | | | | | | | |
6.83% (3 Month Term SOFR + 2.50%, Rate Floor: 2.50%) due 08/04/31 | | | 99,750 | | | | 100,041 | |
6.93% (6 Month Term SOFR + 2.50%, Rate Floor: 2.50%) due 05/31/30 | | | 99,000 | | | | 99,292 | |
Capstone Acquisition Holdings, Inc. | | | | | | | | |
8.96% (1 Month Term SOFR + 4.50%, Rate Floor: 5.50%) due 11/12/29††† | | | 137,580 | | | | 136,838 | |
Total Industrial | | | | | | | 734,503 | |
| | | | | | | | | |
Consumer, Non-cyclical - 0.3% | | | | | | | | |
Midwest Veterinary Partners LLC | | | | | | | | |
8.39% (3 Month Term SOFR + 3.75%, Rate Floor: 4.50%) due 04/27/28 | | | 140,012 | | | | 140,187 | |
SEE NOTES TO FINANCIAL STATEMENTS. | THE GUGGENHEIM FUNDS ANNUAL FINANCIAL REPORT | 11 |
SCHEDULE OF INVESTMENTS (continued) | December 31, 2024 |
SERIES E (TOTAL RETURN BOND SERIES) | |
| | Face
Amount~ | | | Value | |
Quirch Foods Holdings LLC | | | | | | | | |
9.64% (3 Month Term SOFR + 5.00%, Rate Floor: 6.00%) due 10/27/27 | | | 144,977 | | | $ | 134,828 | |
Southern Veterinary Partners LLC | | | | | | | | |
7.71% (1 Month Term SOFR + 3.25%, Rate Floor: 3.25%) due 10/30/31 | | | 100,691 | | | | 101,296 | |
HAH Group Holding Co. LLC | | | | | | | | |
9.36% (1 Month Term SOFR + 5.00%, Rate Floor: 5.00%) due 09/24/31 | | | 33,823 | | | | 33,781 | |
Elanco Animal Health, Inc. | | | | | | | | |
6.40% (1 Month Term SOFR + 1.75%, Rate Floor: 1.75%) due 08/01/27 | | | 16,418 | | | | 16,390 | |
Total Consumer, Non-cyclical | | | | | | | 426,482 | |
| | | | | | | | | |
Consumer, Cyclical - 0.2% | | | | | | | | |
MB2 Dental Solutions LLC | | | | | | | | |
9.86% (1 Month Term SOFR + 5.50%, Rate Floor: 6.25%) due 02/13/31††† | | | 143,666 | | | | 143,344 | |
10.02% (3 Month Term SOFR + 5.50%, Rate Floor: 6.25%) due 02/13/31††† | | | 19,372 | | | | 19,033 | |
9.84% (1 Month Term SOFR + 5.50%, Rate Floor: 6.25%) due 02/13/31††† | | | 2,000 | | | | 1,781 | |
First Brands Group LLC | | | | | | | | |
9.85% (3 Month Term SOFR + 5.00%, Rate Floor: 6.00%) due 03/30/27 | | | 132,626 | | | | 123,923 | |
Pacific Bells LLC | | | | | | | | |
8.60% (3 Month Term SOFR + 4.00%, Rate Floor: 4.50%) due 11/10/28 | | | 89,116 | | | | 89,071 | |
Total Consumer, Cyclical | | | | | | | 377,152 | |
| | | | | | | | | |
Communications - 0.1% | | | | | | | | |
Authentic Brands | | | | | | | | |
6.59% (3 Month Term SOFR + 2.75%, Rate Floor: 2.75%) due 12/21/28 | | | 174,563 | | | | 175,053 | |
| | | | | | | | | |
Technology - 0.1% | | | | | | | | |
Datix Bidco Ltd. | | | | | | | | |
10.20% (1 Month GBP SONIA + 5.50%, Rate Floor: 5.50%) due 04/25/31††† | | | GBP 71,200 | | | | 88,476 | |
9.93% (6 Month Term SOFR + 5.50%, Rate Floor: 6.00%) due 04/30/31††† | | | 20,000 | | | | 19,853 | |
10.02% (1 Month GBP SONIA + 5.50%, Rate Floor: 6.00%) due 10/25/30††† | | | GBP 950 | | | | 1,051 | |
10.02% (1 Month Term SOFR + 5.50%, Rate Floor: 6.00%) due 10/25/30††† | | | 1,045 | | | | 923 | |
Total Technology | | | | | | | 110,303 | |
| | | | | | | | | |
Total Senior Floating Rate Interests | | | | |
(Cost $3,521,005) | | | 3,516,294 | |
| | | | | |
FEDERAL AGENCY BONDS†† - 1.1% |
Tennessee Valley Authority |
4.25% due 09/15/65 | | | 1,000,000 | | | | 823,055 | |
5.38% due 04/01/56 | | | 750,000 | | | | 763,517 | |
Tennessee Valley Authority Principal Strips |
due 01/15/4812,13 | | | 500,000 | | | | 144,355 | |
Total Federal Agency Bonds | | | | |
(Cost $2,555,924) | | | | | | | 1,730,927 | |
| | | | | | | | | |
MUNICIPAL BONDS†† - 0.2% |
Illinois - 0.2% | | | | | | | | |
State of Illinois General Obligation Unlimited | | | | | | | | |
5.65% due 12/01/38 | | | 311,111 | | | | 312,744 | |
Total Municipal Bonds | | | | |
(Cost $315,919) | | | 312,744 | |
| | | | | | | | | |
| | | Contracts/
Notional
Value | | | | | |
OTC OPTIONS PURCHASED†† - 0.1% |
Put Options on: | | | | | | | | |
Foreign Exchange Options | | | | | | | | |
Bank of America, N.A. Foreign Exchange EUR/USD Expiring November 2025 with strike price of EUR 1.01 (Notional Value $2,723,171) | | | EUR 1,719,000 | | | | 27,216 | |
Bank of America, N.A. Foreign Exchange EUR/USD Expiring November 2025 with strike price of EUR 1.01 (Notional Value $2,723,170) | | | EUR 1,719,000 | | | | 27,216 | |
Bank of America, N.A. Foreign Exchange EUR/USD Expiring November 2025 with strike price of EUR 1.01 (Notional Value $1,907,328) | | | EUR 1,204,000 | | | | 19,117 | |
Bank of America, N.A. Foreign Exchange EUR/USD Expiring November 2025 with strike price of EUR 1.01 (Notional Value $969,506) | | | EUR 612,000 | | | | 9,718 | |
Bank of America, N.A. Foreign Exchange EUR/USD Expiring November 2025 with strike price of EUR 1.01 (Notional Value $817,426) | | | EUR 516,000 | | | | 8,193 | |
BNP Paribas Foreign Exchange EUR/USD Expiring November 2025 with strike price of EUR 1.01 (Notional Value $160,000) | | | EUR 101,000 | | | | 1,604 | |
Total OTC Options Purchased | | | | |
(Cost $80,805) | | | | | | | 93,064 | |
| | | | | | | | | |
12 | THE GUGGENHEIM FUNDS ANNUAL FINANCIAL REPORT | SEE NOTES TO FINANCIAL STATEMENTS. |
SCHEDULE OF INVESTMENTS (continued) | December 31, 2024 |
SERIES E (TOTAL RETURN BOND SERIES) | |
| | Contracts/
Notional
Value | | | Value | |
OTC INTEREST RATE SWAPTIONS PURCHASED††14 - 0.0% |
Call Swaptions on: | | | | | | | | |
Interest Rate Swaptions | | | | | | | | |
Morgan Stanley Capital Services LLC 1-Year/2-Year Interest Rate Swap Expiring October 2025 with exercise rate of 3.60% (Notional Value $4,383,400) | | | GBP 3,500,000 | | | $ | 18,039 | |
Morgan Stanley Capital Services LLC 1-Year/2-Year Interest Rate Swap Expiring October 2025 with exercise rate of 3.23% (Notional Value $4,383,400) | | | GBP 3,500,000 | | | | 10,683 | |
Total Interest Rate Swaptions | | | | | | | 28,722 | |
| | | | | | | | | |
Put Swaptions on: | | | | | | | | |
Interest Rate Swaptions | | | | | | | | |
Morgan Stanley Capital Services LLC 1-Year/2-Year Interest Rate Swap Expiring October 2025 with exercise rate of 4.48% (Notional Value $4,383,400) | | | GBP 3,500,000 | | | | 17,407 | |
Morgan Stanley Capital Services LLC 1-Year/2-Year Interest Rate Swap Expiring October 2025 with exercise rate of 4.85% (Notional Value $4,383,400) | | | GBP 3,500,000 | | | | 10,315 | |
Total Interest Rate Swaptions | | | | | | | 27,722 | |
Total OTC Interest Rate Swaptions Purchased | | | | |
(Cost $74,753) | | | | | | | 56,444 | |
| | | | | | | | | |
Total Investments - 121.5% | | | | |
(Cost $208,618,794) | | $ | 199,313,787 | |
OTC INTEREST RATE SWAPTIONS WRITTEN††14 - (0.00)% |
Call Swaptions on: | | | | | | | | |
Interest Rate Swaptions | | | | | | | | |
Morgan Stanley Capital Services LLC 1-Year/2-Year Interest Rate Swap Expiring October 2025 with exercise rate of 2.73% (Notional Value $4,383,400) | | | GBP 3,500,000 | | | | (5,324 | ) |
Morgan Stanley Capital Services LLC 1-Year/2-Year Interest Rate Swap Expiring October 2025 with exercise rate of 3.10% (Notional Value $4,383,400) | | | GBP 3,500,000 | | | | (8,937 | ) |
Total Interest Rate Call Swaptions | | | | | | | (14,261 | ) |
| | | | | | | | | |
Put Swaptions on: | | | | | | | | |
Interest Rate Swaptions | | | | | | | | |
Morgan Stanley Capital Services LLC 1-Year/2-Year Interest Rate Swap Expiring October 2025 with exercise rate of 4.60% (Notional Value $4,383,400) | | | GBP 3,500,000 | | | | (14,816 | ) |
Morgan Stanley Capital Services LLC 1-Year/2-Year Interest Rate Swap Expiring October 2025 with exercise rate of 4.23% (Notional Value $4,383,400) | | | GBP 3,500,000 | | | | (24,730 | ) |
Total Interest Rate Put Swaptions | | | | | | | (39,546 | ) |
Total OTC Interest Rate Swaptions Written | | | | |
(Premiums received $65,632) | | | | | | | (53,807 | ) |
Other Assets & Liabilities, net - (21.5)% | | | (35,221,575 | ) |
Total Net Assets - 100.0% | | $ | 164,038,405 | |
Centrally Cleared Credit Default Swap Agreements Protection Purchased†† |
Counterparty | Exchange | Index | Protection
Premium Rate | | Payment
Frequency | | | Maturity
Date | | | Notional
Amount~ | | | Value | | | Upfront
Premiums
Received | | | Unrealized
Depreciation** | |
BofA Securities, Inc. | ICE | ITRAXX.EUR.42.V1 | 1.00% | Quarterly | 12/20/29 | | EUR | 360,000 | | | $ | (7,395 | ) | | $ | (7,336 | ) | | $ | (59 | ) |
BofA Securities, Inc. | ICE | CDX.NA.IG.43.V1 | 1.00% | Quarterly | 12/20/29 | | | 4,204,689 | | | | (93,852 | ) | | | (89,311 | ) | | | (4,541 | ) |
| | | | | | | | | | | | | | | | | | $ | (101,247 | ) | | $ | (96,647 | ) | | $ | (4,600 | ) |
OTC Credit Default Swap Agreements Protection Purchased†† |
Counterparty | | Index | | | Protection
Premium Rate | | | Payment
Frequency | | | Maturity
Date | | | Notional
Amount | | | Value | | | Upfront
Premiums
Received | | | Unrealized
Appreciation | |
Morgan Stanley Capital Services LLC | CDX.NA.HY.43.V1 (15-25%) | | | 5.00 | % | | | Quarterly | | | | 12/20/29 | | | | 175,000 | | | $ | (8,788 | ) | | $ | (10,962 | ) | | $ | 2,174 | |
Morgan Stanley Capital Services LLC | CDX.NA.HY.43.V1 (25-35%) | | | 5.00 | % | | | Quarterly | | | | 12/20/29 | | | | 175,000 | | | | (25,191 | ) | | | (26,333 | ) | | | 1,142 | |
| | | | | | | | | | | | | | | | | | | | | | | $ | (33,979 | ) | | $ | (37,295 | ) | | $ | 3,316 | |
SEE NOTES TO FINANCIAL STATEMENTS. | THE GUGGENHEIM FUNDS ANNUAL FINANCIAL REPORT | 13 |
SCHEDULE OF INVESTMENTS (continued) | December 31, 2024 |
SERIES E (TOTAL RETURN BOND SERIES) | |
Centrally Cleared Interest Rate Swap Agreements††
Counterparty | Exchange | Floating
Rate
Type | Floating
Rate Index | | Fixed
Rate | | | Payment
Frequency | | | Maturity
Date | | | Notional
Amount | | | Value | | | Upfront
Premiums
Paid | | | Unrealized
Appreciation
(Depreciation)** | |
BofA Securities, Inc. | CME | Pay | U.S. Secured Overnight Financing Rate | 4.48% | Annually | 11/02/33 | | $ | 2,380,000 | | | $ | 73,793 | | | $ | 100 | | | $ | 73,693 | |
BofA Securities, Inc. | CME | Pay | U.S. Secured Overnight Financing Rate | 4.99% | Annually | 10/11/25 | | | 9,089,000 | | | | 51,310 | | | | 125 | | | | 51,185 | |
BofA Securities, Inc. | CME | Pay | U.S. Secured Overnight Financing Rate | 4.27% | Annually | 06/27/27 | | | 4,500,000 | | | | 19,712 | | | | 258 | | | | 19,454 | |
BofA Securities, Inc. | CME | Pay | U.S. Secured Overnight Financing Rate | 4.21% | Annually | 07/11/27 | | | 4,000,000 | | | | 12,450 | | | | 260 | | | | 12,190 | |
BofA Securities, Inc. | CME | Pay | U.S. Secured Overnight Financing Rate | 4.50% | Annually | 11/02/30 | | | 462,000 | | | | 10,713 | | | | 252 | | | | 10,461 | |
BofA Securities, Inc. | CME | Pay | U.S. Secured Overnight Financing Rate | 4.09% | Annually | 12/23/29 | | | 3,500,738 | | | | 7,192 | | | | 314 | | | | 6,878 | |
BofA Securities, Inc. | CME | Pay | U.S. Secured Overnight Financing Rate | 4.09% | Annually | 12/23/29 | | | 3,499,262 | | | | 6,823 | | | | 314 | | | | 6,509 | |
BofA Securities, Inc. | CME | Pay | U.S. Secured Overnight Financing Rate | 3.76% | Annually | 02/06/29 | | | 1,300,000 | | | | (14,229 | ) | | | 111 | | | | (14,340 | ) |
BofA Securities, Inc. | CME | Pay | U.S. Secured Overnight Financing Rate | 3.94% | Annually | 06/05/30 | | | 12,200,000 | | | | (16,478 | ) | | | 1,586 | | | | (18,064 | ) |
BofA Securities, Inc. | CME | Pay | U.S. Secured Overnight Financing Rate | 3.73% | Annually | 12/04/34 | | | 2,000,000 | | | | (55,917 | ) | | | 313 | | | | (56,230 | ) |
BofA Securities, Inc. | CME | Pay | U.S. Secured Overnight Financing Rate | 3.66% | Annually | 10/18/27 | | | 5,300,000 | | | | (56,761 | ) | | | 292 | | | | (57,053 | ) |
BofA Securities, Inc. | CME | Pay | U.S. Secured Overnight Financing Rate | 3.40% | Annually | 04/04/28 | | | 5,000,000 | | | | (101,189 | ) | | | 210 | | | | (101,399 | ) |
14 | THE GUGGENHEIM FUNDS ANNUAL FINANCIAL REPORT | SEE NOTES TO FINANCIAL STATEMENTS. |
SCHEDULE OF INVESTMENTS (continued) | December 31, 2024 |
SERIES E (TOTAL RETURN BOND SERIES) | |
Centrally Cleared Interest Rate Swap Agreements†† (continued)
Counterparty | Exchange | Floating
Rate
Type | Floating
Rate Index | | Fixed
Rate | | | Payment
Frequency | | | Maturity
Date | | | Notional
Amount | | | Value | | | Upfront
Premiums
Paid | | | Unrealized
Appreciation
(Depreciation)** | |
BofA Securities, Inc. | CME | Pay | U.S. Secured Overnight Financing Rate | 3.57% | Annually | 10/18/54 | | | 1,700,000 | | | $ | (106,467 | ) | | $ | 327 | | | $ | (106,794 | ) |
BofA Securities, Inc. | CME | Pay | U.S. Secured Overnight Financing Rate | 2.78% | Annually | 07/18/27 | | | 5,000,000 | | | | (156,167 | ) | | | 65 | | | | (156,232 | ) |
BofA Securities, Inc. | CME | Pay | U.S. Secured Overnight Financing Rate | 3.63% | Annually | 10/18/34 | | | 9,300,000 | | | | (330,454 | ) | | | 367 | | | | (330,821 | ) |
| | | | | | | | | | | | | | | | | | | | | | $ | (655,669 | ) | | $ | 4,894 | | | $ | (660,563 | ) |
Forward Foreign Currency Exchange Contracts†† |
Counterparty | | Currency | | | Type | | | Quantity | | | Contract
Amount | | | Settlement
Date | | | Unrealized
Appreciation
(Depreciation) | |
Citibank, N.A. | | | GBP | | | | Sell | | | | 81,000 | | | | 102,678 USD | | | | 01/17/25 | | | $ | 1,277 | |
Bank of America, N.A. | | | EUR | | | | Sell | | | | 49,000 | | | | 51,695 USD | | | | 02/27/25 | | | | 804 | |
Barclays Bank plc | | | EUR | | | | Sell | | | | 30,000 | | | | 31,630 USD | | | | 02/27/25 | | | | 472 | |
Barclays Bank plc | | | EUR | | | | Buy | | | | 47,000 | | | | 49,338 USD | | | | 01/17/25 | | | | (609 | ) |
| | | | | | | | | | | | | | | | | | | | | | | $ | 1,944 | |
OTC Interest Rate Swaptions Purchased |
Counterparty/
Description | Floating
Rate Type | Floating
Rate Index | Payment
Frequency | | Fixed
Rate | | | Expiration
Date | | | Exercise
Rate | | | Swaption
Notional
Amount | | | Swaption
Value | |
Call |
Morgan Stanley Capital Services LLC 1-Year/2-Year Interest Rate Swap | Pay | 12 Month GBP SONIA | Annual | | | 3.60 | % | | | 10/31/25 | | | | 3.60 | % | | $ | 4,383,400 | | | $ | 18,039 | |
Morgan Stanley Capital Services LLC 1-Year/2-Year Interest Rate Swap | Pay | 12 Month GBP SONIA | Annual | | | 3.23 | % | | | 10/28/25 | | | | 3.23 | % | | | 4,383,400 | | | | 10,683 | |
| | | | | | | | | | | | | | | | | | | | | | $ | 28,722 | |
Put |
Morgan Stanley Capital Services LLC 1-Year/2-Year Interest Rate Swap | Receive | 12 Month GBP SONIA | Annual | | | 4.48 | % | | | 10/28/25 | | | | 4.48 | % | | $ | 4,383,400 | | | $ | 17,407 | |
Morgan Stanley Capital Services LLC 1-Year/2-Year Interest Rate Swap | Receive | 12 Month GBP SONIA | Annual | | | 4.85 | % | | | 10/31/25 | | | | 4.85 | % | | | 4,383,400 | | | | 10,315 | |
| | | | | | | | | | | | | | | | | | | | | | $ | 27,722 | |
SEE NOTES TO FINANCIAL STATEMENTS. | THE GUGGENHEIM FUNDS ANNUAL FINANCIAL REPORT | 15 |
SCHEDULE OF INVESTMENTS (continued) | December 31, 2024 |
SERIES E (TOTAL RETURN BOND SERIES) | |
OTC Interest Rate Swaptions Written |
Counterparty/
Description | Floating
Rate Type | Floating
Rate Index | Payment
Frequency | | Fixed
Rate | | | Expiration
Date | | | Exercise
Rate | | | Swaption
Notional
Amount | | | Swaption
Value | |
Call |
Morgan Stanley Capital Services LLC 1-Year/2-Year Interest Rate Swap | Receive | 12 Month GBP SONIA | Annual | | | 2.73 | % | | | 10/28/25 | | | | 2.73 | % | | $ | 4,383,400 | | | $ | (5,324 | ) |
Morgan Stanley Capital Services LLC 1-Year/2-Year Interest Rate Swap | Receive | 12 Month GBP SONIA | Annual | | | 3.10 | % | | | 10/31/25 | | | | 3.10 | % | | | 4,383,400 | | | | (8,937 | ) |
| | | | | | | | | | | | | | | | | | | | | | $ | (14,261 | ) |
Put | | | | | | | | | | | | | | | | | | | | | | | |
Morgan Stanley Capital Services LLC 1-Year/2-Year Interest Rate Swap | Pay | 12 Month GBP SONIA | Annual | | | 4.60 | % | | | 10/31/25 | | | | 4.60 | % | | | 4,383,400 | | | | (14,816 | ) |
Morgan Stanley Capital Services LLC 1-Year/2-Year Interest Rate Swap | Pay | 12 Month GBP SONIA | Annual | | | 4.23 | % | | | 10/28/25 | | | | 4.23 | % | | | 4,383,400 | | | | (24,730 | ) |
| | | | | | | | | | | | | | | | | | | | | | $ | (39,546 | ) |
16 | THE GUGGENHEIM FUNDS ANNUAL FINANCIAL REPORT | SEE NOTES TO FINANCIAL STATEMENTS. |
SCHEDULE OF INVESTMENTS (continued) | December 31, 2024 |
SERIES E (TOTAL RETURN BOND SERIES) | |
~ | The face amount is denominated in U.S. dollars unless otherwise indicated. |
* | Non-income producing security. |
** | Includes cumulative appreciation (depreciation). Variation margin is reported within the Statement of Assets and Liabilities. |
*** | A copy of each underlying unaffiliated fund’s financial statements is available at the SEC’s website at www.sec.gov. |
† | Value determined based on Level 1 inputs, unless otherwise noted — See Note 4. |
†† | Value determined based on Level 2 inputs, unless otherwise noted — See Note 4. |
††† | Value determined based on Level 3 inputs — See Note 4. |
◊ | Variable rate security. Rate indicated is the rate effective at December 31, 2024. In some instances, the effective rate is limited by a minimum rate floor or a maximum rate cap established by the issuer. The settlement status of a position may also impact the effective rate indicated. In some cases, a position may be unsettled at period end and may not have a stated effective rate. In instances where multiple underlying reference rates and spread amounts are shown, the effective rate is based on a weighted average. |
1 | Special Purpose Acquisition Company (SPAC). |
2 | Security is a 144A or Section 4(a)(2) security. These securities have been determined to be liquid under guidelines established by the Board of Trustees. The total market value of 144A or Section 4(a)(2) securities is $67,084,979 (cost $70,159,032), or 40.9% of total net assets. |
3 | Affiliated issuer. |
4 | Rate indicated is the 7-day yield as of December 31, 2024. |
5 | Security is unsettled at period end and may not have a stated effective rate. |
6 | Security is an interest-only strip. |
7 | Security is a step up/down bond. The coupon increases or decreases at regular intervals until the bond reaches full maturity. Rate indicated is the rate at December 31, 2024. See table below for additional step information for each security. |
8 | Perpetual maturity. |
9 | Security has a fixed rate coupon which will convert to a floating or variable rate coupon on a future date. |
10 | Security has no stated coupon. However, it is expected to receive residual cash flow payments on defined deal dates. |
11 | Security is a 144A or Section 4(a)(2) security. These securities have been determined to be illiquid and restricted under guidelines established by the Board of Trustees. The total market value of 144A or Section 4(a)(2) illiquid and restricted securities is $91,326 (cost $98,392), or 0.1% of total net assets — See Note 9. |
12 | Zero coupon rate security. |
13 | Security is a principal-only strip. |
14 | Swaptions — See additional disclosure in the swaptions table above for more information on swaptions. |
| | BofA — Bank of America |
| | CDX.NA.HY.43.V1 — Credit Default Swap North American High Yield Series 43 Index Version 1 |
| | CDX.NA.IG.43.V1 — Credit Default Swap North American Investment Grade Series 43 Index Version 1 |
| | CME — Chicago Mercantile Exchange |
| | CMT — Constant Maturity Treasury |
| | EUR — Euro |
| | GBP — British Pound |
| | ICE — Intercontinental Exchange |
| | ITRAXX.EUR.42.V1 — iTraxx Europe Series 42 Index Version 1 |
| | plc — Public Limited Company |
| | REMIC — Real Estate Mortgage Investment Conduit |
| | SARL — Société à Responsabilité Limitée |
| | SOFR — Secured Overnight Financing Rate |
| | SONIA — Sterling Overnight Index Average |
| | WAC — Weighted Average Coupon |
| | |
| | See Sector Classification in Other Information section. |
SEE NOTES TO FINANCIAL STATEMENTS. | THE GUGGENHEIM FUNDS ANNUAL FINANCIAL REPORT | 17 |
SCHEDULE OF INVESTMENTS (continued) | December 31, 2024 |
SERIES E (TOTAL RETURN BOND SERIES) | |
The following table summarizes the inputs used to value the Fund’s investments at December 31, 2024 (See Note 4 in the Notes to Financial Statements):
Investments in Securities (Assets) | | Level 1
Quoted
Prices | | | Level 2
Significant
Observable
Inputs | | | Level 3
Significant
Unobservable
Inputs | | | Total | |
Common Stocks | | $ | 818 | | | $ | — | | | $ | 8 | | | $ | 826 | |
Preferred Stocks | | | 191,392 | | | | 4,042,455 | | | | — | | | | 4,233,847 | |
Warrants | | | 6 | | | | — | | | | 3 | | | | 9 | |
Mutual Funds | | | 45,415,997 | | | | — | | | | — | | | | 45,415,997 | |
Money Market Funds | | | 2,493,108 | | | | — | | | | — | | | | 2,493,108 | |
Collateralized Mortgage Obligations | | | — | | | | 54,903,435 | | | | 792,946 | | | | 55,696,381 | |
Corporate Bonds | | | — | | | | 39,575,399 | | | | 2,423,951 | | | | 41,999,350 | |
Asset-Backed Securities | | | — | | | | 31,062,641 | | | | 3,214,279 | | | | 34,276,920 | |
U.S. Government Securities | | | — | | | | 9,487,876 | | | | — | | | | 9,487,876 | |
Senior Floating Rate Interests | | | — | | | | 2,696,170 | | | | 820,124 | | | | 3,516,294 | |
Federal Agency Bonds | | | — | | | | 1,730,927 | | | | — | | | | 1,730,927 | |
Municipal Bonds | | | — | | | | 312,744 | | | | — | | | | 312,744 | |
Options Purchased | | | — | | | | 93,064 | | | | — | | | | 93,064 | |
Interest Rate Swaptions Purchased | | | — | | | | 56,444 | | | | — | | | | 56,444 | |
Credit Default Swap Agreements** | | | — | | | | 3,316 | | | | — | | | | 3,316 | |
Interest Rate Swap Agreements** | | | — | | | | 180,370 | | | | — | | | | 180,370 | |
Forward Foreign Currency Exchange Contracts** | | | — | | | | 2,553 | | | | — | | | | 2,553 | |
Total Assets | | $ | 48,101,321 | | | $ | 144,147,394 | | | $ | 7,251,311 | | | $ | 199,500,026 | |
Investments in Securities (Liabilities) | | Level 1
Quoted
Prices | | | Level 2
Significant
Observable
Inputs | | | Level 3
Significant
Unobservable
Inputs | | | Total | |
Interest Rate Swaptions Written | | $ | — | | | $ | 53,807 | | | $ | — | | | $ | 53,807 | |
Credit Default Swap Agreements** | | | — | | | | 4,600 | | | | — | | | | 4,600 | |
Interest Rate Swap Agreements** | | | — | | | | 840,933 | | | | — | | | | 840,933 | |
Forward Foreign Currency Exchange Contracts** | | | — | | | | 609 | | | | — | | | | 609 | |
Unfunded Loan Commitments (Note 8) | | | — | | | | — | | | | 3,041 | | | | 3,041 | |
Total Liabilities | | $ | — | | | $ | 899,949 | | | $ | 3,041 | | | $ | 902,990 | |
** | This derivative is reported as unrealized appreciation/depreciation at period end. |
The Fund may hold assets and/or liabilities in which the fair value approximates the carrying amount for financial statement purposes. As of the period end, reverse repurchase agreements of $9,828,571 are categorized as Level 2 within the disclosure hierarchy — See Note 11.
18 | THE GUGGENHEIM FUNDS ANNUAL FINANCIAL REPORT | SEE NOTES TO FINANCIAL STATEMENTS. |
SCHEDULE OF INVESTMENTS (continued) | December 31, 2024 |
SERIES E (TOTAL RETURN BOND SERIES) | |
The following is a summary of significant unobservable inputs used in the fair valuation of assets and liabilities categorized within Level 3 of the fair value hierarchy:
Category | | Ending Balance at
December 31, 2024 | | | Valuation Technique | | | Unobservable Inputs | | | Input Range | | | Weighted Average* | |
Assets: | | | | | | | | | | | | | | | | | | | | |
Asset-Backed Securities | | $ | 1,432,204 | | Yield Analysis | Yield | 6.8%-7.6% | 7.2% |
Asset-Backed Securities | | | 932,075 | | Option adjusted spread off prior month end broker quote | Broker Quote | — | — |
Asset-Backed Securities | | | 650,000 | | Third Party Pricing | Broker Quote | — | — |
Asset-Backed Securities | | | 200,000 | | Third Party Pricing | Trade Price | — | — |
Collateralized Mortgage Obligations | | | 792,946 | | Option adjusted spread off prior month end broker quote | Broker Quote | — | — |
Common Stocks | | | 8 | | Model Price | Liquidation Value | — | — |
Corporate Bonds | | | 1,285,577 | | Option adjusted spread off prior month end broker quote | Broker Quote | — | — |
Corporate Bonds | | | 1,138,374 | | Yield Analysis | Yield | 6.9%-9.4% | 7.4% |
Senior Floating Rate Interests | | | 709,821 | | Model Price | Purchase Price | — | — |
Senior Floating Rate Interests | | | 110,303 | | Yield Analysis | Yield | 10.0% | — |
Warrants | | | 3 | | Model Price | Liquidation Value | — | — |
Total Assets | | $ | 7,251,311 | | | | | |
Liabilities: | | | | | | | | | | | | | | | | | | | | |
Unfunded Loan Commitments | | $ | 3,041 | | Model Price | Purchase Price | — | — |
* | Inputs are weighted by the fair value of the instruments. |
Significant changes in a quote, yield, or liquidation value would generally result in significant changes in the fair value of the security. Any remaining Level 3 securities held by the Fund and excluded from the table above, were not considered material to the Fund.
The Fund’s fair valuation leveling guidelines classify a single daily broker quote, or a vendor price based on a single daily or monthly broker quote, as Level 3, if such a quote or price cannot be supported with other available market information.
Transfers between Level 2 and Level 3 may occur as markets fluctuate and/or the availability of data used in an investment’s valuation changes. For the year ended December 31, 2024, the Fund did not have any securities to transfer into Level 3 from Level 2 or transfer out of Level 3 into Level 2.
SEE NOTES TO FINANCIAL STATEMENTS. | THE GUGGENHEIM FUNDS ANNUAL FINANCIAL REPORT | 19 |
SCHEDULE OF INVESTMENTS (continued) | December 31, 2024 |
SERIES E (TOTAL RETURN BOND SERIES) | |
Summary of Fair Value Level 3 Activity
Following is a reconciliation of Level 3 assets for which significant unobservable inputs were used to determine fair value for the year ended December 31, 2024:
| | | Assets | | | | | | | Liabilities | |
| | Asset-
Backed
Securities | | | Collateralized
Mortgage
Obligations | | | Corporate
Bonds | | | Senior
Floating
Rate
Interests | | | Warrants | | | Common
Stocks | | | Total Assets | | | Unfunded
Loan
Commitments | |
Beginning Balance | | $ | 2,091,143 | | | $ | 908,966 | | | $ | 707,677 | | | $ | 1,296,906 | | | $ | — | | | $ | 8 | | | $ | 5,004,700 | | | $ | (399 | ) |
Purchases/(Receipts) | | | 1,645,543 | | | | — | | | | 1,715,926 | | | | 588,599 | | | | — | | | | — | | | | 3,950,068 | | | | (5,327 | ) |
(Sales, maturities and paydowns)/Fundings | | | (513,082 | ) | | | (11,852 | ) | | | — | | | | (1,066,523 | ) | | | — | | | | — | | | | (1,591,457 | ) | | | 2,196 | |
Amortization of premiums/discounts | | | — | | | | (3,661 | ) | | | — | | | | 9,544 | | | | — | | | | — | | | | 5,883 | | | | 222 | |
Corporate actions | | | — | | | | — | | | | — | | | | — | | | | — | | | | — | | | | — | | | | — | |
Total realized gains (losses) included in earnings | | | — | | | | — | | | | — | | | | (36,558 | ) | | | — | | | | — | | | | (36,558 | ) | | | (290 | ) |
Total change in unrealized appreciation (depreciation) included in earnings | | | (9,325 | ) | | | (100,507 | ) | | | 348 | | | | 28,156 | | | | 3 | | | | — | | | | (81,325 | ) | | | 557 | |
Transfers into Level 3 | | | — | | | | — | | | | — | | | | — | | | | — | | | | — | | | | — | | | | — | |
Transfers out of Level 3 | | | — | | | | — | | | | — | | | | — | | | | — | | | | — | | | | — | | | | — | |
Ending Balance | | $ | 3,214,279 | | | $ | 792,946 | | | $ | 2,423,951 | | | $ | 820,124 | | | $ | 3 | | | $ | 8 | | | $ | 7,251,311 | | | $ | (3,041 | ) |
Net change in unrealized appreciation (depreciation) for investments in Level 3 securities still held at December 31, 2024 | | $ | (9,511 | ) | | $ | (100,507 | ) | | $ | 348 | | | $ | 760 | | | $ | 3 | | | $ | — | | | $ | (108,907 | ) | | $ | 158 | |
Step Coupon Bonds
The following table discloses additional information related to step coupon bonds held by the Fund. Certain securities are subject to multiple rate changes prior to maturity. For those securities, a range of rates and corresponding dates have been provided. Rates for all step coupon bonds held by the Fund are scheduled to increase, none are scheduled to decrease.
Name | | Coupon Rate at
Next Reset Date | | | Next Rate Reset Date | | | Future Reset Rate(s) | | | Future Reset Date(s) | |
Angel Oak Mortgage Trust 2024-2, 6.25% due 01/25/69 | | | 7.25 | % | | | 01/01/28 | | | | — | | | | — | |
Angel Oak Mortgage Trust 2023-1, 4.75% due 09/26/67 | | | 5.75 | % | | | 01/01/27 | | | | — | | | | — | |
BRAVO Residential Funding Trust 2024-NQM1, 6.40% due 12/01/63 | | | 7.40 | % | | | 01/01/28 | | | | — | | | | — | |
BRAVO Residential Funding Trust 2023-NQM2, 4.50% due 05/25/62 | | | 5.50 | % | | | 02/01/27 | | | | — | | | | — | |
BRAVO Residential Funding Trust 2022-R1, 3.13% due 01/29/70 | | | 6.13 | % | | | 01/30/25 | | | | — | | | | — | |
GCAT Trust 2023-NQM3, 6.89% due 08/25/68 | | | 7.89 | % | | | 09/01/27 | | | | — | | | | — | |
Legacy Mortgage Asset Trust 2021-GS3, 4.75% due 07/25/61 | | | 5.75 | % | | | 05/25/25 | | | | — | | | | — | |
Legacy Mortgage Asset Trust 2021-GS5, 5.25% due 07/25/67 | | | 6.25 | % | | | 11/25/25 | | | | | | | | | |
Mill City Securities Ltd. 2024-RS2, 3.00% due 08/01/69 | | | 6.00 | % | | | 12/01/27 | | | | — | | | | — | |
NYMT Loan Trust 2022-SP1, 5.25% due 07/25/62 | | | 8.25 | % | | | 07/01/25 | | | | 9.25 | % | | | 07/01/26 | |
OBX Trust 2024-NQM6, 6.85% due 02/25/64 | | | 7.85 | % | | | 04/01/28 | | | | — | | | | — | |
OBX Trust 2024-NQM5, 6.29% due 01/25/64 | | | 7.29 | % | | | 03/01/28 | | | | — | | | | — | |
OBX Trust 2022-NQM9, 6.45% due 09/25/62 | | | 7.45 | % | | | 11/01/26 | | | | — | | | | — | |
OBX Trust 2024-NQM13, 5.37% due 06/25/64 | | | 6.37 | % | | | 08/01/28 | | | | — | | | | — | |
20 | THE GUGGENHEIM FUNDS ANNUAL FINANCIAL REPORT | SEE NOTES TO FINANCIAL STATEMENTS. |
SCHEDULE OF INVESTMENTS (concluded) | December 31, 2024 |
SERIES E (TOTAL RETURN BOND SERIES) | |
Name | | Coupon Rate at
Next Reset Date | | | Next Rate Reset Date | | | Future Reset Rate(s) | | | Future Reset Date(s) | |
OBX Trust 2024-NQM3, 6.43% due 12/25/63 | | | 7.43 | % | | | 02/01/28 | | | | — | | | | — | |
OBX Trust 2024-NQM9, 6.44% due 01/25/64 | | | 7.66 | % | | | 06/01/28 | | | | — | | | | — | |
OBX Trust 2024-NQM2, 6.18% due 12/25/63 | | | 7.18 | % | | | 01/01/28 | | | | — | | | | — | |
OBX Trust 2024-NQM8, 6.59% due 05/25/64 | | | 7.59 | % | | | 05/01/28 | | | | — | | | | — | |
OBX Trust 2024-NQM11, 6.13% due 06/25/64 | | | 7.08 | % | | | 07/01/28 | | | | — | | | | — | |
OSAT Trust 2021-RPL1, 5.12% due 05/25/65 | | | 6.12 | % | | | 06/25/25 | | | | — | | | | — | |
PRPM LLC 2022-1, 3.72% due 02/25/27 | | | 6.72 | % | | | 02/25/25 | | | | 7.72 | % | | | 02/25/26 | |
PRPM LLC 2024-4, 6.41% due 08/25/29 | | | 9.41 | % | | | 08/25/27 | | | | 10.41 | % | | | 08/25/28 | |
PRPM LLC 2021-5, 4.79% due 06/25/26 | | | 5.79 | % | | | 06/25/25 | | | | — | | | | — | |
RCKT Mortgage Trust 2024-CES4, 6.15% due 06/25/44 | | | 7.15 | % | | | 05/01/28 | | | | — | | | | — | |
Vista Point Securitization Trust 2024-CES3, 5.68% due 01/25/55 | | | 6.68 | % | | | 12/01/28 | | | | — | | | | — | |
Affiliated Transactions
Investments representing 5% or more of the outstanding voting shares of a company, or control of or by, or common control under Guggenheim Investments (“GI”), result in that company being considered an affiliated person, as defined in the Investment Company Act of 1940 (“affiliated issuer”).
The Fund may invest in certain of the underlying series of Guggenheim Strategy Funds Trust, including Guggenheim Strategy Fund II, Guggenheim Strategy Fund III and Guggenheim Variable Insurance Strategy Fund III (collectively, the “Guggenheim Strategy Funds”), each of which are open-end management investment companies managed by GI. The Guggenheim Strategy Funds, which launched on March 11, 2014, are offered as short-term investment options only to mutual funds, trusts, and other accounts managed by GI and/or its affiliates, and are not available to the public. The Guggenheim Strategy Funds pay no investment management fees. The Guggenheim Strategy Funds’ annual report on Form N-CSR dated September 30, 2024 is available publicly or upon request. This information is available from the EDGAR database on the SEC’s website at https://www.sec.gov/ix?doc=/Archives/edgar/data/1601445/000139834424022509/fp0090292-6_ncsrixbrl.htm. The Fund also may invest in certain of the underlying series of Guggenheim Funds Trust, which are open-end management investment companies managed by GI, are available to the public and whose most recent annual report on Form N-CSR is available publicly or upon request.
Transactions during the year ended December 31, 2024, in which the company is an affiliated issuer, were as follows:
Security Name | | Value
12/31/23 | | | Additions | | | Reductions | | | Realized
Gain (Loss) | | | Change in
Unrealized
Appreciation
(Depreciation) | | | Value
12/31/24 | | | Shares
12/31/24 | | | Investment
Income | |
Mutual Funds | | | | | | | | | | | | | | | | | | | | | | | | | | | | | | | | |
Guggenheim Total Return Bond Fund — R6-Class | | $ | 6,323,894 | | | $ | 236,391 | | | $ | (6,595,446 | ) | | $ | (647,956 | ) | | $ | 683,117 | | | $ | — | | | | — | | | $ | 237,174 | |
Guggenheim Variable Insurance Strategy Fund III | | | — | | | | 48,563,470 | | | | (3,300,000 | ) | | | 8,137 | | | | 144,390 | | | | 45,415,997 | | | | 1,821,010 | | | | 556,704 | |
| | | $ | 6,323,894 | | | $ | 48,799,861 | | | $ | (9,895,446 | ) | | $ | (639,819 | ) | | $ | 827,507 | | | $ | 45,415,997 | | | | | | | $ | 793,878 | |
SEE NOTES TO FINANCIAL STATEMENTS. | THE GUGGENHEIM FUNDS ANNUAL FINANCIAL REPORT | 21 |
SERIES E (TOTAL RETURN BOND SERIES) | |
STATEMENT OF ASSETS AND LIABILITIES |
December 31, 2024 |
Assets: |
Investments in unaffiliated issuers, at value (cost $163,347,188) | | $ | 153,897,790 | |
Investments in affiliated issuers, at value (cost $45,271,606) | | | 45,415,997 | |
Foreign currency, at value (cost $208) | | | 207 | |
Cash | | | 28,161 | |
Segregated cash with broker | | | 110,005 | |
Unamortized upfront premiums paid on interest rate swap agreements | | | 4,894 | |
Unrealized appreciation on OTC swap agreements | | | 3,316 | |
Unrealized appreciation on forward foreign currency exchange contracts | | | 2,553 | |
Prepaid expenses | | | 3,438 | |
Receivables: |
Securities sold | | | 15,035,429 | |
Interest | | | 985,461 | |
Dividends | | | 210,242 | |
Total assets | | | 215,697,493 | |
| | | | | |
Liabilities: |
Unfunded loan commitments, at value (Note 8) (commitment fees received $3,199) | | | 3,041 | |
Reverse repurchase agreements | | | 9,828,571 | |
Options written, at value (premiums received $65,632) | | | 53,807 | |
Unamortized upfront premiums received on credit default swap agreements | | | 133,942 | |
Unrealized depreciation on forward foreign currency exchange contracts | | | 609 | |
Payable for: |
Securities purchased | | | 41,327,846 | |
Variation margin on interest rate swap agreements | | | 37,028 | |
Fund shares redeemed | | | 128,028 | |
Management fees | | | 43,061 | |
Distribution and service fees | | | 33,843 | |
Protection fees on credit default swap agreements | | | 6,533 | |
Fund accounting/administration fees | | | 3,483 | |
Transfer agent/maintenance fees | | | 2,249 | |
Variation margin on credit default swap agreements | | | 631 | |
Trustees’ fees* | | | 321 | |
Swap settlement | | | 82 | |
Due to Investment Adviser | | | 59 | |
Miscellaneous | | | 55,954 | |
Total liabilities | | | 51,659,088 | |
Net assets | | $ | 164,038,405 | |
| | | | | |
Net assets consist of: |
Paid in capital | | $ | 185,564,119 | |
Total distributable earnings (loss) | | | (21,525,714 | ) |
Net assets | | $ | 164,038,405 | |
Capital shares outstanding | | | 11,485,359 | |
Net asset value per share | | $ | 14.28 | |
STATEMENT OF OPERATIONS |
Year Ended December 31, 2024 |
Investment Income: |
Dividends from securities of unaffiliated issuers | | $ | 17,742 | |
Dividends from securities of affiliated issuers | | | 793,878 | |
Interest | | | 8,181,831 | |
Total investment income | | | 8,993,451 | |
| | | | | |
Expenses: |
Management fees | | | 616,744 | |
Distribution and service fees | | | 395,350 | |
Transfer agent/maintenance fees | | | 25,369 | |
Interest expense | | | 182,478 | |
Professional fees | | | 93,358 | |
Fund accounting/administration fees | | | 68,704 | |
Trustees’ fees* | | | 14,790 | |
Custodian fees | | | 14,447 | |
Line of credit fees | | | 5,968 | |
Miscellaneous | | | 17,475 | |
Recoupment of previously waived fees | | | 62,122 | |
Total expenses | | | 1,496,805 | |
Less: |
Expenses reimbursed by Adviser | | | (5,021 | ) |
Expenses waived by Adviser | | | (88,360 | ) |
Earning credits applied | | | (3,425 | ) |
Total waived/reimbursed expenses | | | (96,806 | ) |
Net expenses | | | 1,399,999 | |
Net investment income | | | 7,593,452 | |
| | | | | |
Net Realized and Unrealized Gain (Loss): |
Net realized gain (loss) on: |
Investments in unaffiliated issuers | | | (2,014,346 | ) |
Investments in affiliated issuers | | | (639,819 | ) |
Swap agreements | | | (392,375 | ) |
Futures contracts | | | 17,393 | |
Options purchased | | | 69,088 | |
Options written | | | (85,358 | ) |
Forward foreign currency exchange contracts | | | (2,442 | ) |
Foreign currency transactions | | | (306 | ) |
Net realized loss | | | (3,048,165 | ) |
Net change in unrealized appreciation (depreciation) on: |
Investments in unaffiliated issuers | | | 1,010,891 | |
Investments in affiliated issuers | | | 827,507 | |
Swap agreements | | | (1,419,209 | ) |
Futures contracts | | | (109,629 | ) |
Options purchased | | | 28,386 | |
Options written | | | 11,825 | |
Forward foreign currency exchange contracts | | | 7,524 | |
Foreign currency translations | | | 1,780 | |
Net change in unrealized appreciation (depreciation) | | | 359,075 | |
Net realized and unrealized loss | | | (2,689,090 | ) |
Net increase in net assets resulting from operations | | $ | 4,904,362 | |
* | Relates to Trustees not deemed “interested persons” within the meaning of Section 2(a)(19) of the Investment Company Act of 1940. |
22 | THE GUGGENHEIM FUNDS ANNUAL FINANCIAL REPORT | SEE NOTES TO FINANCIAL STATEMENTS. |
SERIES E (TOTAL RETURN BOND SERIES) | |
STATEMENTS OF CHANGES IN NET ASSETS |
| | Year Ended
December 31,
2024 | | | Year Ended
December 31,
2023 | |
Increase (Decrease) in Net Assets from Operations: | | | | | | | | |
Net investment income | | $ | 7,593,452 | | | $ | 6,281,614 | |
Net realized loss on investments | | | (3,048,165 | ) | | | (8,779,709 | ) |
Net change in unrealized appreciation (depreciation) on investments | | | 359,075 | | | | 12,027,856 | |
Net increase in net assets resulting from operations | | | 4,904,362 | | | | 9,529,761 | |
| | | | | | | | | |
Distributions to shareholders | | | (6,087,264 | ) | | | (5,275,065 | ) |
| | | | | | | | | |
Capital share transactions: | | | | | | | | |
Proceeds from sale of shares | | | 33,660,397 | | | | 33,336,930 | |
Distributions reinvested | | | 6,087,264 | | | | 5,275,065 | |
Cost of shares redeemed | | | (24,808,884 | ) | | | (27,650,396 | ) |
Net increase from capital share transactions | | | 14,938,777 | | | | 10,961,599 | |
Net increase in net assets | | | 13,755,875 | | | | 15,216,295 | |
| | | | | | | | | |
Net assets: | | | | | | | | |
Beginning of year | | | 150,282,530 | | | | 135,066,235 | |
End of year | | $ | 164,038,405 | | | $ | 150,282,530 | |
| | | | | | | | | |
Capital share activity: | | | | | | | | |
Shares sold | | | 2,343,283 | | | | 2,359,120 | |
Shares issued from reinvestment of distributions | | | 432,641 | | | | 378,412 | |
Shares redeemed | | | (1,732,137 | ) | | | (1,967,697 | ) |
Net increase in shares | | | 1,043,787 | | | | 769,835 | |
SEE NOTES TO FINANCIAL STATEMENTS. | THE GUGGENHEIM FUNDS ANNUAL FINANCIAL REPORT | 23 |
SERIES E (TOTAL RETURN BOND SERIES) | |
This table is presented to show selected data for a share outstanding throughout each period and to assist shareholders in evaluating the Fund’s performance for the periods presented.
| | Year Ended
December 31,
2024 | | | Year Ended
December 31,
2023 | | | Year Ended
December 31,
2022 | | | Year Ended
December 31,
2021 | | | Year Ended
December 31,
2020 | |
Per Share Data |
Net asset value, beginning of period | | $ | 14.39 | | | $ | 13.97 | | | $ | 17.23 | | | $ | 18.09 | | | $ | 16.13 | |
Income (loss) from investment operations: |
Net investment income (loss)a | | | .69 | | | | .62 | | | | .53 | | | | .44 | | | | .39 | |
Net gain (loss) on investments (realized and unrealized) | | | (.25 | ) | | | .33 | | | | (3.29 | ) | | | (.51 | ) | | | 1.88 | |
Total from investment operations | | | .44 | | | | .95 | | | | (2.76 | ) | | | (.07 | ) | | | 2.27 | |
Less distributions from: |
Net investment income | | | (.55 | ) | | | (.53 | ) | | | (.46 | ) | | | (.30 | ) | | | (.31 | ) |
Net realized gains | | | — | | | | — | | | | (.04 | ) | | | (.49 | ) | | | — | |
Total distributions | | | (.55 | ) | | | (.53 | ) | | | (.50 | ) | | | (.79 | ) | | | (.31 | ) |
Net asset value, end of period | | $ | 14.28 | | | $ | 14.39 | | | $ | 13.97 | | | $ | 17.23 | | | $ | 18.09 | |
|
Total Returnb | | | 3.09 | % | | | 6.95 | % | | | (16.15 | %) | | | (0.43 | %) | | | 14.21 | % |
Ratios/Supplemental Data |
Net assets, end of period (in thousands) | | $ | 164,038 | | | $ | 150,283 | | | $ | 135,066 | | | $ | 174,203 | | | $ | 177,103 | |
Ratios to average net assets: |
Net investment income (loss) | | | 4.80 | % | | | 4.44 | % | | | 3.54 | % | | | 2.51 | % | | | 2.27 | % |
Total expensesc | | | 0.95 | % | | | 1.02 | % | | | 0.90 | % | | | 0.85 | % | | | 0.88 | % |
Net expensesd,e,f | | | 0.89 | % | | | 0.95 | % | | | 0.85 | % | | | 0.78 | % | | | 0.78 | % |
Portfolio turnover rate | | | 88 | % | | | 91 | % | | | 51 | % | | | 84 | % | | | 123 | % |
a | Net investment income (loss) per share was computed using average shares outstanding throughout the period. |
b | Total return does not take into account any of the expenses associated with an investment in variable insurance products. If total return had taken into account these expenses, performance would have been lower. Shares of a series of Guggenheim Variable Funds Trust are available only through the purchase of such products. |
c | Does not include expenses of the underlying funds in which the Fund invests. |
d | Net expense information reflects the expense ratios after expense waivers and reimbursements, as applicable. |
e | The portion of the ratios of net expenses to average net assets attributable to recoupments of prior fee reductions or expense reimbursements for the years presented was as follows: |
| | 12/31/24 | 12/31/23 | 12/31/22 | 12/31/21 | 12/31/20 |
| | 0.04% | — | — | — | — |
f | Net expenses may include expenses that are excluded from the expense limitation agreement. Excluding these expenses, the net expense ratios for the years presented would be: |
| | 12/31/24 | 12/31/23 | 12/31/22 | 12/31/21 | 12/31/20 |
| | 0.77% | 0.76% | 0.76% | 0.78% | 0.77% |
24 | THE GUGGENHEIM FUNDS ANNUAL FINANCIAL REPORT | SEE NOTES TO FINANCIAL STATEMENTS. |
SCHEDULE OF INVESTMENTS | December 31, 2024 |
SERIES F (FLOATING RATE STRATEGIES SERIES) | |
| | Shares | | | Value | |
COMMON STOCKS† - 0.4% |
| | | | | | | | | |
Industrial - 0.3% |
API Heat Transfer Intermediate*,††† | | | 123 | | | $ | 166,332 | |
BP Holdco LLC*, †††,1 | | | 11,609 | | | | 14,072 | |
Vector Phoenix Holdings, LP*,††† | | | 11,609 | | | | 245 | |
Total Industrial | | | | | | | 180,649 | |
| | | | | | | | | |
Consumer, Non-cyclical - 0.1% |
Endo, Inc.* | | | 1,046 | | | | 25,627 | |
| | | | | | | | | |
Communications - 0.0% |
Xplore Inc.*,†† | | | 3,953 | | | | 19,765 | |
| | | | | | | | | |
Total Common Stocks | | | | |
(Cost $250,388) | | | | | | | 226,041 | |
| | | | | | | | | |
EXCHANGE-TRADED FUND***,† - 1.3% |
SPDR Blackstone Senior Loan ETF | | | 16,295 | | | | 679,990 | |
Total Exchange-Traded Fund | | | | |
(Cost $674,887) | | | | | | | 679,990 | |
| | | | | | | | | |
MUTUAL FUND† - 2.8% |
Guggenheim Floating Rate Strategies Fund — Class R6*,1 | | | 64,446 | | | | 1,562,812 | |
Total Mutual Fund | | | | |
(Cost $1,580,079) | | | | | | | 1,562,812 | |
| | | | | | | | | |
MONEY MARKET FUND***,† - 3.5% |
Federated Hermes U.S. Treasury Cash Reserves Fund — Institutional Shares, 4.30%2 | | | 1,945,170 | | | | 1,945,170 | |
Total Money Market Fund | | | | |
(Cost $1,945,170) | | | | | | | 1,945,170 | |
| | | | | | | | | |
| | | Face
Amount~ | | | | | |
SENIOR FLOATING RATE INTERESTS††,◊ - 93.5% |
Consumer, Cyclical - 18.8% | | | | | | | | |
Alterra Mountain Co. | | | | | | | | |
7.11% (1 Month Term SOFR + 2.75%, Rate Floor: 2.75%) due 08/17/28 | | | 299,250 | | | | 300,935 | |
7.36% (1 Month Term SOFR + 3.00%, Rate Floor: 3.00%) due 05/31/30 | | | 199,500 | | | | 200,873 | |
Dealer Tire LLC | | | | | | | | |
7.86% (1 Month Term SOFR + 3.50%, Rate Floor: 4.00%) due 07/02/31 | | | 498,750 | | | | 498,750 | |
Restaurant Brands | | | | | | | | |
6.11% (1 Month Term SOFR + 1.75%, Rate Floor: 1.75%) due 09/20/30 | | | 499,535 | | | | 496,518 | |
PetSmart LLC | | | | | | | | |
8.21% (1 Month Term SOFR + 3.75%, Rate Floor: 4.50%) due 02/11/28 | | | 496,988 | | | | 494,503 | |
Truck Hero, Inc. | | | | | | | | |
7.97% (1 Month Term SOFR + 3.50%, Rate Floor: 4.25%) due 01/31/28 | | | 496,134 | | | | 480,268 | |
| | | | | | | | | |
Petco Health And Wellness Company, Inc. | | | | | | | | |
7.84% (3 Month Term SOFR + 3.25%, Rate Floor: 4.00%) due 03/03/28 | | | 476,931 | | | | 462,376 | |
Flutter Financing B.V. | | | | | | | | |
6.08% (3 Month Term SOFR + 2.00%, Rate Floor: 2.50%) due 11/30/30 | | | 435,600 | | | | 436,253 | |
Grant Thornton Advisors LLC | | | | | | | | |
7.61% (3 Month Term SOFR + 3.25%, Rate Floor: 3.25%) due 06/02/31 | | | 211,007 | | | | 210,834 | |
due 05/30/31 | | | 200,000 | | | | 199,836 | |
American Tire Distributors, Inc. | | | | | | | | |
11.86% (3 Month Term SOFR + 6.51%, Rate Floor: 7.26%) due 10/20/28††† | | | 438,750 | | | | 197,438 | |
13.84% (1 Month Term SOFR + 1.50%, Rate Floor: 4.50%) (in-kind rate was 8.00%) due 02/24/25†††,3 | | | 140,265 | | | | 141,667 | |
11.43% (3 Month Term SOFR + 6.00%, Rate Floor: 6.00%) due 10/22/26††† | | | 35,051 | | | | 32,597 | |
10.82% (1 Month Term SOFR + 6.00%, Rate Floor: 6.00%) due 10/22/26††† | | | 17,526 | | | | 16,299 | |
Entain Holdings (Gibraltar) Ltd. | | | | | | | | |
7.08% (3 Month Term SOFR + 2.75%, Rate Floor: 3.25%) due 10/31/29 | | | 300,320 | | | | 300,944 | |
PCI Gaming Authority, Inc. | | | | | | | | |
6.36% (1 Month Term SOFR + 2.00%, Rate Floor: 2.00%) due 07/18/31 | | | 287,135 | | | | 286,297 | |
Thevelia US LLC | | | | | | | | |
7.58% (3 Month Term SOFR + 3.25%, Rate Floor: 3.75%) due 06/18/29 | | | 253,520 | | | | 254,787 | |
CCRR Parent, Inc. | | | | | | | | |
9.03% (3 Month Term SOFR + 4.25%, Rate Floor: 5.00%) due 03/06/28 | | | 434,559 | | | | 251,319 | |
Prime Security Services Borrower LLC | | | | | | | | |
6.52% (1 Month Term SOFR + 2.00%, Rate Floor: 2.00%) due 10/15/30 | | | 246,549 | | | | 246,934 | |
Eyemart Express LLC | | | | | | | | |
7.47% (3 Month Term SOFR + 3.11%, Rate Floor: 4.11%) due 08/31/27 | | | 244,937 | | | | 242,487 | |
Sweetwater Sound | | | | | | | | |
8.72% (1 Month Term SOFR + 4.25%, Rate Floor: 5.00%) due 08/07/28 | | | 236,786 | | | | 237,378 | |
Rent-A-Center, Inc. | | | | | | | | |
7.34% (3 Month Term SOFR + 2.75%, Rate Floor: 3.25%) due 02/17/28††† | | | 231,161 | | | | 231,161 | |
Go Daddy Operating Company LLC | | | | | | | | |
6.11% (3 Month Term SOFR + 2.00%, Rate Floor: 2.00%) due 11/09/29 | | | 227,794 | | | | 228,134 | |
Caesars Entertainment, Inc. | | | | | | | | |
6.61% (1 Month Term SOFR + 2.25%, Rate Floor: 2.75%) due 02/06/30 | | | 204,071 | | | | 203,985 | |
6.61% (1 Month Term SOFR + 2.25%, Rate Floor: 2.75%) due 02/06/31 | | | 14,962 | | | | 14,967 | |
Ontario Gaming GTA, LP | | | | | | | | |
8.58% (3 Month Term SOFR + 4.25%, Rate Floor: 4.75%) due 08/01/30 | | | 218,318 | | | | 218,631 | |
SEE NOTES TO FINANCIAL STATEMENTS. | THE GUGGENHEIM FUNDS ANNUAL FINANCIAL REPORT | 25 |
SCHEDULE OF INVESTMENTS (continued) | December 31, 2024 |
SERIES F (FLOATING RATE STRATEGIES SERIES) | |
| | Face
Amount~ | | | Value | |
Galaxy US Opco, Inc. | | | | | | | | |
9.34% (3 Month Term SOFR + 4.75%, Rate Floor: 5.25%) due 04/29/29 | | | 244,375 | | | $ | 216,272 | |
Eagle Parent Corp. | | | | | | | | |
8.58% (3 Month Term SOFR + 4.25%, Rate Floor: 4.75%) due 04/02/29 | | | 218,813 | | | | 214,266 | |
Belron Finance US, LLC | | | | | | | | |
7.27% (3 Month Term SOFR + 2.75%, Rate Floor: 3.25%) due 10/16/31 | | | 199,500 | | | | 201,122 | |
Scientific Games Corp. | | | | | | | | |
7.59% (3 Month Term SOFR + 3.00%, Rate Floor: 3.50%) due 04/04/29 | | | 198,017 | | | | 198,314 | |
Peer Holding III BV | | | | | | | | |
7.33% (3 Month Term SOFR + 3.00%, Rate Floor: 3.00%) due 07/01/31 | | | 190,000 | | | | 190,771 | |
Congruex Group LLC | | | | | | | | |
10.49% (3 Month Term SOFR + 5.75%, Rate Floor: 6.50%) due 05/03/29 | | | 248,725 | | | | 190,585 | |
BIFM CA Buyer, Inc. | | | | | | | | |
8.11% (1 Month Term SOFR + 3.75%, Rate Floor: 4.25%) due 05/31/28 | | | 187,844 | | | | 189,628 | |
Paint Intermediate III LLC | | | | | | | | |
7.52% (3 Month Term SOFR + 3.00%, Rate Floor: 3.00%) due 09/11/31 | | | 185,000 | | | | 185,694 | |
Life Time, Inc. | | | | | | | | |
7.03% (1 Month Term SOFR + 2.50%, Rate Floor: 2.50%) due 10/22/31 | | | 185,000 | | | | 185,509 | |
AmSpec Parent LLC | | | | | | | | |
due 12/11/31 | | | 173,638 | | | | 174,506 | |
Tacala Investment Corp. | | | | | | | | |
7.86% (1 Month Term SOFR + 3.50%, Rate Floor: 4.25%) due 01/31/31 | | | 159,200 | | | | 160,128 | |
Apro LLC | | | | | | | | |
8.27% (3 Month Term SOFR + 3.75%, Rate Floor: 3.75%) due 07/09/31 | | | 149,625 | | | | 150,934 | |
Seaworld Parks & Entertainment, Inc. | | | | | | | | |
6.36% (1 Month Term SOFR + 2.00%, Rate Floor: 2.50%) due 11/19/31 | | | 124,688 | | | | 124,272 | |
Crash Champions Inc. | | | | | | | | |
9.27% (3 Month Term SOFR + 4.75%, Rate Floor: 4.75%) due 02/23/29 | | | 129,505 | | | | 122,342 | |
Packers Holdings LLC | | | | | | | | |
7.71% (1 Month Term SOFR + 3.25%, Rate Floor: 4.00%) due 03/09/28 | | | 243,774 | | | | 121,400 | |
Holding Socotec SAS | | | | | | | | |
due 06/02/28 | | | 120,000 | | | | 120,300 | |
Hanesbrands, Inc. | | | | | | | | |
8.11% (1 Month Term SOFR + 3.75%, Rate Floor: 4.25%) due 03/08/30††† | | | 111,075 | | | | 111,908 | |
Fertitta Entertainment LLC | | | | | | | | |
7.86% (1 Month Term SOFR + 3.50%, Rate Floor: 4.00%) due 01/27/29 | | | 99,744 | | | | 100,031 | |
Frontdoor, Inc. | | | | | | | | |
6.61% (1 Month Term SOFR + 2.25%, Rate Floor: 2.25%) due 12/17/31 | | | 95,875 | | | | 96,115 | |
First Brands Group LLC | | | | | | | | |
9.85% (3 Month Term SOFR + 5.00%, Rate Floor: 6.00%) due 03/30/27 | | | 101,538 | | | | 95,107 | |
TransNetwork LLC | | | | | | | | |
9.08% (3 Month Term SOFR + 5.50%, Rate Floor: 6.00%) due 12/30/30††† | | | 92,069 | | | | 92,529 | |
Bulldog Purchaser, Inc. | | | | | | | | |
8.58% (3 Month Term SOFR + 4.25%, Rate Floor: 4.75%) due 06/30/31 | | | 67,267 | | | | 67,659 | |
due 06/30/31 | | | 22,500 | | | | 22,631 | |
Michaels Stores, Inc. | | | | | | | | |
8.84% (3 Month Term SOFR + 4.25%, Rate Floor: 5.00%) due 04/15/28 | | | 81,836 | | | | 65,736 | |
EG Finco Ltd. | | | | | | | | |
due 02/07/28 | | | 35,000 | | | | 35,269 | |
Prime Security Services Borrower LLC | | | | | | | | |
due 10/13/30 | | | 29,423 | | | | 29,597 | |
BIFM CA Buyer, Inc. | | | | | | | | |
due 05/31/28 | | | 22,500 | | | | 22,669 | |
WW International, Inc. | | | | | | | | |
7.97% (1 Month Term SOFR + 3.50%, Rate Floor: 4.00%) due 04/13/28 | | | 94,500 | | | | 20,412 | |
EG Finco Ltd. | | | | | | | | |
8.61% (1 Month Term SOFR + 4.25%, Rate Floor: 4.25%) due 02/07/28 | | | 19,284 | | | | 19,485 | |
Total Consumer, Cyclical | | | | | | | 10,411,362 | |
| | | | | | | | | |
Industrial - 18.1% | | | | | | | | |
Arcline FM Holdings, LLC | | | | | | | | |
9.31% ((3 Month Term SOFR + 4.50%) and (6 Month Term SOFR + 4.50%), Rate Floor: 5.25%) due 06/23/28 | | | 470,483 | | | | 472,770 | |
Hunter Douglas, Inc. | | | | | | | | |
8.02% (3 Month Term SOFR + 3.50%, Rate Floor: 4.00%) due 02/26/29 | | | 438,750 | | | | 437,653 | |
Park River Holdings, Inc. | | | | | | | | |
8.10% (3 Month Term SOFR + 3.25%, Rate Floor: 4.00%) due 12/28/27 | | | 436,424 | | | | 424,967 | |
AS Mileage Plan Ltd. | | | | | | | | |
6.66% (3 Month Term SOFR + 2.00%, Rate Floor: 2.00%) due 10/15/31 | | | 408,691 | | | | 410,122 | |
LBM Acquisition LLC | | | | | | | | |
8.30% (1 Month Term SOFR + 3.75%, Rate Floor: 4.50%) due 06/06/31 | | | 413,935 | | | | 409,841 | |
American Bath Group LLC | | | | | | | | |
8.21% (3 Month Term SOFR + 3.85%, Rate Floor: 4.35%) due 11/23/27 | | | 388,312 | | | | 377,677 | |
Amentum Holdings, Inc. | | | | | | | | |
6.61% (1 Month Term SOFR + 2.25%, Rate Floor: 2.25%) due 09/29/31 | | | 302,252 | | | | 300,991 | |
Michael Baker International LLC | | | | | | | | |
9.11% (1 Month Term SOFR + 4.75%, Rate Floor: 5.50%) due 12/01/28 | | | 281,870 | | | | 282,753 | |
Fugue Finance LLC | | | | | | | | |
8.51% (3 Month Term SOFR + 4.00%, Rate Floor: 4.50%) due 01/31/28 | | | 275,111 | | | | 277,289 | |
26 | THE GUGGENHEIM FUNDS ANNUAL FINANCIAL REPORT | SEE NOTES TO FINANCIAL STATEMENTS. |
SCHEDULE OF INVESTMENTS (continued) | December 31, 2024 |
SERIES F (FLOATING RATE STRATEGIES SERIES) | |
| | Face
Amount~ | | | Value | |
TransDigm, Inc. | | | | | | | | |
6.83% (3 Month Term SOFR + 2.50%, Rate Floor: 2.50%) due 02/28/31 | | | 195,277 | | | $ | 195,541 | |
6.83% (3 Month Term SOFR + 2.50%, Rate Floor: 2.50%) due 01/19/32 | | | 79,800 | | | | 79,925 | |
DXP Enterprises, Inc. | | | | | | | | |
8.11% (1 Month Term SOFR + 3.75%, Rate Floor: 4.75%) due 10/11/30 | | | 257,106 | | | | 259,785 | |
DG Investment Intermediate Holdings 2, Inc. | | | | | | | | |
8.22% (1 Month Term SOFR + 3.75%, Rate Floor: 4.50%) due 03/31/28 | | | 249,786 | | | | 251,764 | |
Arcosa, Inc. | | | | | | | | |
6.61% (1 Month Term SOFR + 2.25%, Rate Floor: 2.25%) due 08/12/31 | | | 250,000 | | | | 251,720 | |
Air Canada | | | | | | | | |
6.34% (3 Month Term SOFR + 2.00%, Rate Floor: 2.00%) due 03/21/31 | | | 249,372 | | | | 250,152 | |
Core & Main, LP | | | | | | | | |
6.38% (1 Month Term SOFR + 2.00%, Rate Floor: 2.00%) due 02/09/31 | | | 248,125 | | | | 249,056 | |
EMRLD Borrower, LP | | | | | | | | |
6.93% (6 Month Term SOFR + 2.50%, Rate Floor: 2.50%) due 05/31/30 | | | 247,500 | | | | 248,230 | |
GYP Holdings III Corp. | | | | | | | | |
6.61% (1 Month Term SOFR + 2.25%, Rate Floor: 2.25%) due 05/12/30 | | | 247,505 | | | | 247,661 | |
Harsco Corporation | | | | | | | | |
6.72% (1 Month Term SOFR + 2.25%, Rate Floor: 2.75%) due 03/10/28 | | | 244,924 | | | | 244,363 | |
Clean Harbors, Inc. | | | | | | | | |
6.11% (1 Month Term SOFR + 1.75%, Rate Floor: 1.75%) due 10/08/28 | | | 239,388 | | | | 241,064 | |
Quikrete Holdings, Inc. | | | | | | | | |
6.86% (1 Month Term SOFR + 2.50%, Rate Floor: 2.50%) due 04/14/31 | | | 140,604 | | | | 140,444 | |
6.61% (1 Month Term SOFR + 2.25%, Rate Floor: 2.25%) due 03/19/29 | | | 76,145 | | | | 76,057 | |
Anchor Packaging LLC | | | | | | | | |
due 07/18/29 | | | 215,000 | | | | 215,897 | |
Pelican Products, Inc. | | | | | | | | |
8.84% (3 Month Term SOFR + 4.25%, Rate Floor: 4.75%) due 12/29/28 | | | 240,405 | | | | 215,403 | |
United Airlines, Inc. | | | | | | | | |
6.63% (3 Month Term SOFR + 2.00%, Rate Floor: 2.00%) due 02/22/31 | | | 199,896 | | | | 200,254 | |
Hobbs & Associates LLC | | | | | | | | |
7.61% (1 Month Term SOFR + 3.25%, Rate Floor: 3.25%) due 07/23/31 | | | 163,396 | | | | 164,060 | |
7.65% (3 Month Term SOFR + 3.25%, Rate Floor: 3.25%) due 07/23/31 | | | 16,340 | | | | 16,406 | |
Protective Industrial Products, Inc. | | | | | | | | |
8.47% (1 Month Term SOFR + 4.00%, Rate Floor: 4.75%) due 12/29/27 | | | 161,894 | | | | 161,691 | |
MI Windows And Doors LLC | | | | | | | | |
7.36% (1 Month Term SOFR + 3.00%, Rate Floor: 3.00%) due 03/28/31 | | | 155,853 | | | | 157,195 | |
Genesee & Wyoming, Inc. | | | | | | | | |
6.08% (3 Month Term SOFR + 1.75%, Rate Floor: 1.75%) due 04/10/31 | | | 154,613 | | | | 154,156 | |
APi Group DE, Inc. | | | | | | | | |
6.36% (1 Month Term SOFR + 2.00%, Rate Floor: 2.00%) due 01/03/29 | | | 152,912 | | | | 152,880 | |
StandardAero | | | | | | | | |
6.61% (1 Month Term SOFR + 2.25%, Rate Floor: 2.25%) due 10/31/31 | | | 150,000 | | | | 150,562 | |
Engineering Research And Consulting LLC | | | | | | | | |
9.51% (3 Month Term SOFR + 5.00%, Rate Floor: 5.00%) due 08/29/31††† | | | 150,000 | | | | 148,500 | |
Foundation Building Materials Holding Company LLC | | | | | | | | |
8.59% (3 Month Term SOFR + 4.00%, Rate Floor: 4.00%) due 01/29/31 | | | 148,875 | | | | 146,326 | |
Cube A&D Buyer, Inc. | | | | | | | | |
8.13% (3 Month Term SOFR + 3.50%, Rate Floor: 3.50%) due 10/17/31 | | | 145,000 | | | | 145,725 | |
Spring Education Group, Inc. | | | | | | | | |
8.33% (3 Month Term SOFR + 4.00%, Rate Floor: 4.00%) due 10/04/30 | | | 144,610 | | | | 145,333 | |
Artera Services LLC | | | | | | | | |
8.83% (3 Month Term SOFR + 4.50%, Rate Floor: 4.50%) due 02/15/31 | | | 134,806 | | | | 133,420 | |
API Heat Transfer Thermasys Corp. | | | | | | | | |
12.66% (3 Month Term SOFR + 8.00%, Rate Floor: 11.00%) due 11/12/27††† | | | 80,457 | | | | 80,457 | |
9.66% (3 Month Term SOFR + 5.00%, Rate Floor: 5.00%) due 11/10/27††† | | | 46,567 | | | | 46,567 | |
Merlin Buyer, Inc. | | | | | | | | |
due 12/14/28 | | | 121,687 | | | | 121,079 | |
STS Operating, Inc. | | | | | | | | |
8.46% (1 Month Term SOFR + 4.00%, Rate Floor: 4.00%) due 03/25/31 | | | 116,123 | | | | 116,355 | |
PointClickCare Technologies, Inc. | | | | | | | | |
7.58% (3 Month Term SOFR + 3.25%, Rate Floor: 3.25%) due 11/03/31 | | | 105,000 | | | | 105,525 | |
Jefferies Finance LLC | | | | | | | | |
due 10/09/31 | | | 105,000 | | | | 105,525 | |
ASP Dream Acquisiton Co. LLC | | | | | | | | |
8.71% (1 Month Term SOFR + 4.25%, Rate Floor: 5.00%) due 12/15/28 | | | 100,368 | | | | 100,995 | |
XPO, Inc. | | | | | | | | |
6.45% (1 Month Term SOFR + 2.00%, Rate Floor: 2.00%) due 02/03/31 | | | 100,000 | | | | 100,196 | |
Ring Container Technologies Group, LLC | | | | | | | | |
7.11% (1 Month Term SOFR + 2.75%, Rate Floor: 3.25%) due 08/12/28 | | | 99,749 | | | | 99,899 | |
CPM Holdings, Inc. | | | | | | | | |
9.05% (1 Month Term SOFR + 4.50%, Rate Floor: 5.00%) due 09/28/28 | | | 99,375 | | | | 96,174 | |
Construction Partners, Inc. | | | | | | | | |
6.84% (1 Month Term SOFR + 2.50%, Rate Floor: 2.50%) due 10/29/31 | | | 95,000 | | | | 95,297 | |
SEE NOTES TO FINANCIAL STATEMENTS. | THE GUGGENHEIM FUNDS ANNUAL FINANCIAL REPORT | 27 |
SCHEDULE OF INVESTMENTS (continued) | December 31, 2024 |
SERIES F (FLOATING RATE STRATEGIES SERIES) | |
| | Face
Amount~ | | | Value | |
Mauser Packaging Solutions Holding Co. | | | | | | | | |
7.59% (3 Month Term SOFR + 3.00%, Rate Floor: 3.00%) due 04/15/27 | | | 90,000 | | | $ | 90,546 | |
FCG Acquisitions, Inc. | | | | | | | | |
8.22% (1 Month Term SOFR + 3.75%, Rate Floor: 4.25%) due 03/31/28 | | | 89,767 | | | | 90,261 | |
Madison Safety & Flow LLC | | | | | | | | |
7.61% (1 Month Term SOFR + 3.25%, Rate Floor: 3.25%) due 09/26/31 | | | 78,198 | | | | 78,711 | |
TricorBraun Holdings, Inc. | | | | | | | | |
7.72% (1 Month Term SOFR + 3.25%, Rate Floor: 3.25%) due 03/03/28 | | | 70,708 | | | | 70,593 | |
White Cap Supply Holdings LLC | | | | | | | | |
due 10/19/29 | | | 70,000 | | | | 70,058 | |
GFL Environmental, Inc. | | | | | | | | |
6.61% (3 Month Term SOFR + 2.00%, Rate Floor: 2.50%) due 07/03/31 | | | 69,825 | | | | 69,901 | |
Bleriot US Bidco LLC | | | | | | | | |
7.08% (3 Month Term SOFR + 2.75%, Rate Floor: 2.75%) due 10/31/30 | | | 59,738 | | | | 60,008 | |
Total Industrial | | | | | | | 10,035,780 | |
| | | | | | | | | |
Consumer, Non-cyclical - 15.0% | | | | | | | | |
VC GB Holdings I Corp. | | | | | | | | |
8.09% (3 Month Term SOFR + 3.50%, Rate Floor: 4.00%) due 07/21/28 | | | 485,000 | | | | 484,627 | |
Topgolf Callaway Brands Corp. | | | | | | | | |
7.36% (1 Month Term SOFR + 3.00%, Rate Floor: 3.00%) due 03/15/30 | | | 472,434 | | | | 469,873 | |
Bombardier Recreational Products, Inc. | | | | | | | | |
7.11% (1 Month Term SOFR + 2.75%, Rate Floor: 2.75%) due 01/22/31 | | | 467,395 | | | | 467,460 | |
Dermatology Intermediate Holdings III, Inc. | | | | | | | | |
8.84% (3 Month Term SOFR + 4.25%, Rate Floor: 4.75%) due 03/30/29 | | | 455,107 | | | | 438,114 | |
Summit Behavioral Healthcare LLC | | | | | | | | |
8.76% (3 Month Term SOFR + 4.25%, Rate Floor: 5.00%) due 11/24/28††† | | | 496,218 | | | | 396,975 | |
Triton Water Holdings, Inc. | | | | | | | | |
7.84% (3 Month Term SOFR + 3.51%, Rate Floor: 4.01%) due 03/31/28 | | | 390,015 | | | | 392,601 | |
Froneri US, Inc. | | | | | | | | |
6.36% (3 Month Term SOFR + 2.00%, Rate Floor: 2.50%) due 09/30/31 | | | 389,898 | | | | 389,968 | |
Medline Borrower LP | | | | | | | | |
6.61% (1 Month Term SOFR + 2.25%, Rate Floor: 2.75%) due 10/23/28 | | | 388,024 | | | | 389,068 | |
CHG PPC Parent LLC | | | | | | | | |
7.47% (1 Month Term SOFR + 3.00%, Rate Floor: 3.50%) due 12/08/28 | | | 376,003 | | | | 377,650 | |
Medical Solutions Parent Holdings, Inc. | | | | | | | | |
8.19% (3 Month Term SOFR + 3.50%, Rate Floor: 4.00%) due 11/01/28 | | | 486,673 | | | | 341,348 | |
Grifols Worldwide Operations USA, Inc. | | | | | | | | |
6.74% (3 Month Term SOFR + 2.00%, Rate Floor: 3.00%) due 11/15/27 | | | 316,913 | | | | 315,249 | |
Cambrex Corp. | | | | | | | | |
7.96% (1 Month Term SOFR + 3.50%, Rate Floor: 4.25%) due 12/04/26 | | | 297,874 | | | | 297,448 | |
PlayCore | | | | | | | | |
9.09% (3 Month Term SOFR + 4.50%, Rate Floor: 5.50%) due 02/20/30 | | | 270,512 | | | | 272,795 | |
HAH Group Holding Co. LLC | | | | | | | | |
9.36% (1 Month Term SOFR + 5.00%, Rate Floor: 5.00%) due 09/24/31 | | | 271,896 | | | | 271,556 | |
Nomad Foods Ltd. | | | | | | | | |
6.97% (6 Month Term SOFR + 2.50%, Rate Floor: 3.00%) due 11/12/29 | | | 262,341 | | | | 262,887 | |
National Mentor Holdings, Inc. | | | | | | | | |
8.20% ((1 Month Term SOFR + 3.75%) and (3 Month Term SOFR + 3.75%), Rate Floor: 4.50%) due 03/02/28 | | | 237,752 | | | | 235,275 | |
8.18% (3 Month Term SOFR + 3.75%, Rate Floor: 4.50%) due 03/02/28 | | | 12,723 | | | | 12,591 | |
Southern Veterinary Partners LLC | | | | | | | | |
7.71% (1 Month Term SOFR + 3.25%, Rate Floor: 3.25%) due 10/30/31 | | | 239,871 | | | | 241,310 | |
Weber-Stephen Products LLC | | | | | | | | |
7.72% (1 Month Term SOFR + 3.25%, Rate Floor: 4.00%) due 10/30/27 | | | 242,274 | | | | 241,137 | |
Outcomes Group Holdings, Inc. | | | | | | | | |
7.61% (1 Month Term SOFR + 3.25%, Rate Floor: 3.25%) due 05/06/31 | | | 219,052 | | | | 221,133 | |
Del Monte Foods, Inc. | | | | | | | | |
14.62% (3 Month Term SOFR + 8.00%, Rate Floor: 8.00%) (in-kind rate was 2.00%) due 08/02/283 | | | 99,077 | | | | 98,483 | |
8.85% (3 Month Term SOFR + 4.25%, Rate Floor: 4.75%) due 08/01/28 | | | 159,630 | | | | 95,219 | |
TGP Holdings LLC | | | | | | | | |
7.71% (1 Month Term SOFR + 3.25%, Rate Floor: 4.00%) due 06/29/28 | | | 191,253 | | | | 185,973 | |
Heritage Grocers Group LLC | | | | | | | | |
11.18% (3 Month Term SOFR + 6.75%, Rate Floor: 7.50%) due 08/01/29 | | | 188,008 | | | | 178,216 | |
Chefs’ Warehouse, Inc. | | | | | | | | |
7.86% (1 Month Term SOFR + 3.50%, Rate Floor: 4.00%) due 08/23/29 | | | 172,833 | | | | 173,698 | |
Osmosis Holdings Australia II Pty Ltd. | | | | | | | | |
8.05% (1 Month Term SOFR + 3.50%, Rate Floor: 4.00%) due 07/31/28 | | | 172,162 | | | | 172,162 | |
Resonetics LLC | | | | | | | | |
8.37% (3 Month Term SOFR + 3.75%, Rate Floor: 4.50%) due 06/18/31 | | | 168,340 | | | | 169,225 | |
Energizer Holdings, Inc. | | | | | | | | |
6.36% (1 Month Term SOFR + 2.00%, Rate Floor: 2.00%) due 12/22/27 | | | 158,185 | | | | 158,334 | |
Midwest Physician Administrative Services | | | | | | | | |
7.59% (3 Month Term SOFR + 3.00%, Rate Floor: 3.75%) due 03/12/28 | | | 142,638 | | | | 134,597 | |
Hayward Industries, Inc. | | | | | | | | |
6.97% (1 Month Term SOFR + 2.50%, Rate Floor: 3.00%) due 05/30/28 | | | 131,612 | | | | 132,147 | |
28 | THE GUGGENHEIM FUNDS ANNUAL FINANCIAL REPORT | SEE NOTES TO FINANCIAL STATEMENTS. |
SCHEDULE OF INVESTMENTS (continued) | December 31, 2024 |
SERIES F (FLOATING RATE STRATEGIES SERIES) | |
| | Face
Amount~ | | | Value | |
Pacific Dental Services LLC | | | | | | | | |
7.13% (1 Month Term SOFR + 2.75%, Rate Floor: 2.75%) due 03/15/31 | | | 109,175 | | | $ | 109,806 | |
Hanger, Inc. | | | | | | | | |
7.86% (1 Month Term SOFR + 3.50%, Rate Floor: 3.50%) due 10/23/31 | | | 106,312 | | | | 107,242 | |
Concentra Health Services, Inc. | | | | | | | | |
6.61% (1 Month Term SOFR + 2.25%, Rate Floor: 2.25%) due 07/26/31††† | | | 84,788 | | | | 85,317 | |
Total Consumer, Non-cyclical | | | | | | | 8,319,484 | |
| | | | | | | | | |
Technology - 13.4% | | | | | | | | |
Planview Parent, Inc. | | | | | | | | |
8.10% (3 Month Term SOFR + 3.75%, Rate Floor: 3.75%) due 12/17/27 | | | 499,852 | | | | 503,810 | |
CACI International, Inc. | | | | | | | | |
6.29% (1 Month Term SOFR + 1.75%, Rate Floor: 1.75%) due 10/30/31 | | | 500,000 | | | | 500,315 | |
Boxer Parent Co., Inc. | | | | | | | | |
8.34% (3 Month Term SOFR + 3.75%, Rate Floor: 3.75%) due 07/30/31 | | | 485,370 | | | | 488,957 | |
DCert Buyer, Inc. | | | | | | | | |
8.36% (1 Month Term SOFR + 4.00%, Rate Floor: 4.00%) due 10/16/26 | | | 496,094 | | | | 475,322 | |
Athenahealth Group, Inc. | | | | | | | | |
7.61% (1 Month Term SOFR + 3.25%, Rate Floor: 3.75%) due 02/15/29 | | | 434,600 | | | | 435,065 | |
Conair Holdings LLC | | | | | | | | |
8.22% (1 Month Term SOFR + 3.75%, Rate Floor: 4.25%) due 05/17/28 | | | 468,996 | | | | 420,005 | |
Xerox Corp. | | | | | | | | |
8.34% ((1 Month Term SOFR + 4.00%) and (3 Month Term SOFR + 4.00%), Rate Floor: 4.50%) due 11/17/29 | | | 413,529 | | | | 412,408 | |
Iron Mountain Information Management Services, Inc. | | | | | | | | |
6.36% (1 Month Term SOFR + 2.00%, Rate Floor: 2.00%) due 01/31/31 | | | 387,596 | | | | 386,992 | |
Polaris Newco LLC | | | | | | | | |
8.85% (3 Month Term SOFR + 4.00%, Rate Floor: 4.50%) due 06/02/28 | | | 315,438 | | | | 315,759 | |
Dun & Bradstreet Corp. | | | | | | | | |
6.59% (1 Month Term SOFR + 2.25%, Rate Floor: 2.25%) due 01/18/29 | | | 274,309 | | | | 274,358 | |
CoreLogic, Inc. | | | | | | | | |
7.97% (1 Month Term SOFR + 3.50%, Rate Floor: 4.00%) due 06/02/28 | | | 267,028 | | | | 263,308 | |
Sabre GLBL, Inc. | | | | | | | | |
9.46% (1 Month Term SOFR + 5.00%, Rate Floor: 5.50%) due 06/30/28 | | | 87,599 | | | | 85,154 | |
10.46% (1 Month Term SOFR + 6.00%, Rate Floor: 7.50%) due 11/15/29 | | | 74,968 | | | | 74,406 | |
7.97% (1 Month Term SOFR + 3.50%, Rate Floor: 4.00%) due 12/17/27 | | | 36,839 | | | | 35,734 | |
10.46% (1 Month Term SOFR + 6.00%, Rate Floor: 7.50%) due 11/15/29††† | | | 32,652 | | | | 31,836 | |
Wrench Group LLC | | | | | | | | |
8.59% (3 Month Term SOFR + 4.00%, Rate Floor: 5.00%) due 10/30/28 | | | 223,313 | | | | 213,822 | |
Gen Digital, Inc. | | | | | | | | |
6.11% (1 Month Term SOFR + 1.75%, Rate Floor: 2.25%) due 09/12/29 | | | 210,499 | | | | 209,650 | |
Project Ruby Ultimate Parent Corp. | | | | | | | | |
7.47% (1 Month Term SOFR + 3.00%, Rate Floor: 3.00%) due 03/10/28 | | | 200,000 | | | | 200,708 | |
Ascend Learning LLC | | | | | | | | |
7.96% (1 Month Term SOFR + 3.50%, Rate Floor: 4.00%) due 12/11/28 | | | 199,349 | | | | 200,222 | |
Cloud Software Group, Inc. | | | | | | | | |
7.83% (3 Month Term SOFR + 3.50%, Rate Floor: 4.00%) due 03/29/29 | | | 179,954 | | | | 180,343 | |
8.08% (3 Month Term SOFR + 3.75%, Rate Floor: 4.25%) due 03/21/31 | | | 18,509 | | | | 18,548 | |
Atlas CC Acquisition Corp. | | | | | | | | |
9.03% (3 Month Term SOFR + 4.25%, Rate Floor: 5.00%) due 05/25/28 | | | 283,628 | | | | 189,464 | |
Pushpay USA, Inc. | | | | | | | | |
8.83% (3 Month Term SOFR + 4.50%, Rate Floor: 4.50%) due 08/15/31††† | | | 179,837 | | | | 180,736 | |
Blackhawk Network Holdings, Inc. | | | | | | | | |
9.36% (1 Month Term SOFR + 5.00%, Rate Floor: 6.00%) due 03/12/29 | | | 144,275 | | | | 145,872 | |
Instructure Holdings, Inc. | | | | | | | | |
7.52% (3 Month Term SOFR + 3.00%, Rate Floor: 3.00%) due 09/12/31 | | | 143,492 | | | | 143,895 | |
Modena Buyer LLC | | | | | | | | |
8.86% (1 Month Term SOFR + 4.50%, Rate Floor: 4.50%) due 07/01/31 | | | 147,465 | | | | 142,408 | |
DS Admiral Bidco LLC | | | | | | | | |
8.61% (1 Month Term SOFR + 4.25%, Rate Floor: 4.25%) due 06/26/31 | | | 143,199 | | | | 138,545 | |
Zuora, Inc. | | | | | | | | |
due 12/12/31 | | | 134,038 | | | | 133,368 | |
Peraton Corp. | | | | | | | | |
8.21% (1 Month Term SOFR + 3.75%, Rate Floor: 4.50%) due 02/01/28 | | | 132,751 | | | | 123,265 | |
SS&C Technologies, Inc. | | | | | | | | |
6.36% (1 Month Term SOFR + 2.00%, Rate Floor: 2.00%) due 05/09/31 | | | 108,763 | | | | 109,009 | |
Epicor Software | | | | | | | | |
7.11% (3 Month Term SOFR + 3.25%, Rate Floor: 3.25%) due 05/30/31 | | | 106,551 | | | | 107,228 | |
E2open LLC | | | | | | | | |
7.97% (1 Month Term SOFR + 3.50%, Rate Floor: 4.00%) due 02/04/28 | | | 99,742 | | | | 100,116 | |
Dye & Durham Corp. | | | | | | | | |
8.43% (3 Month Term SOFR + 4.00%, Rate Floor: 5.00%) due 04/11/31 | | | 81,145 | | | | 81,922 | |
Azalea TopCo | | | | | | | | |
7.61% (1 Month Term SOFR + 3.25%, Rate Floor: 3.25%) due 04/30/31 | | | 70,278 | | | | 70,410 | |
SEE NOTES TO FINANCIAL STATEMENTS. | THE GUGGENHEIM FUNDS ANNUAL FINANCIAL REPORT | 29 |
SCHEDULE OF INVESTMENTS (continued) | December 31, 2024 |
SERIES F (FLOATING RATE STRATEGIES SERIES) | |
| | Face
Amount~ | | | Value | |
Waystar Technologies, Inc. | | | | | | | | |
due 10/22/29 | | | 47,136 | | | $ | 47,273 | |
Total Technology | | | | | | | 7,440,233 | |
| | | | | | | | | |
Financial - 11.7% | | | | | | | | |
USI, Inc. | | | | | | | | |
6.58% (3 Month Term SOFR + 2.75%, Rate Floor: 2.75%) due 09/27/30 | | | 296,265 | | | | 295,450 | |
6.58% (3 Month Term SOFR + 2.75%, Rate Floor: 2.75%) due 11/22/29 | | | 205,259 | | | | 204,721 | |
Duff & Phelps | | | | | | | | |
8.08% (3 Month Term SOFR + 3.75%, Rate Floor: 4.75%) due 04/09/27 | | | 382,685 | | | | 373,596 | |
Citadel Securities, LP | | | | | | | | |
6.33% (3 Month Term SOFR + 2.00%, Rate Floor: 2.00%) due 10/31/31 | | | 353,751 | | | | 354,554 | |
Corpay, Inc. | | | | | | | | |
6.11% (1 Month Term SOFR + 1.75%, Rate Floor: 1.75%) due 04/28/28 | | | 350,000 | | | | 349,437 | |
Cobham Ultra SeniorCo SARL | | | | | | | | |
9.24% (6 Month Term SOFR + 3.75%, Rate Floor: 4.25%) due 08/03/29 | | | 321,079 | | | | 319,590 | |
Jane Street Group, LLC | | | | | | | | |
6.40% (3 Month Term SOFR + 2.25%, Rate Floor: 2.25%) due 01/26/28 | | | 272,595 | | | | 272,222 | |
Nexus Buyer LLC | | | | | | | | |
8.36% (1 Month Term SOFR + 4.00%, Rate Floor: 4.00%) due 07/31/31 | | | 268,278 | | | | 268,948 | |
Alliant Holdings Intermediate LLC | | | | | | | | |
7.11% (1 Month Term SOFR + 2.75%, Rate Floor: 2.75%) due 09/19/31 | | | 249,375 | | | | 249,764 | |
AmWINS Group, Inc. | | | | | | | | |
6.72% (1 Month Term SOFR + 2.25%, Rate Floor: 3.00%) due 02/19/28 | | | 248,754 | | | | 249,386 | |
Asurion LLC | | | | | | | | |
8.61% (1 Month Term SOFR + 4.25%, Rate Floor: 4.25%) due 09/19/30 | | | 240,722 | | | | 239,862 | |
Harbourvest Partners LP | | | | | | | | |
6.58% (3 Month Term SOFR + 2.25%, Rate Floor: 2.25%) due 04/18/30††† | | | 237,318 | | | | 237,615 | |
Worldpay | | | | | | | | |
6.83% (3 Month Term SOFR + 2.50%, Rate Floor: 2.50%) due 01/31/31 | | | 234,413 | | | | 235,341 | |
Ardonagh Midco 3 plc | | | | | | | | |
8.51% ((3 Month Term SOFR + 3.75%) and (6 Month Term SOFR + 3.75%), Rate Floor: 3.75%) due 02/15/31 | | | 231,314 | | | | 232,470 | |
Capstone Borrower, Inc. | | | | | | | | |
7.58% (3 Month Term SOFR + 3.25%, Rate Floor: 3.25%) due 06/17/30 | | | 216,097 | | | | 217,381 | |
Apex Group Treasury LLC | | | | | | | | |
9.08% (6 Month Term SOFR + 4.00%, Rate Floor: 4.00%) due 07/27/28 | | | 201,967 | | | | 203,567 | |
Orion Advisor Solutions, Inc. | | | | | | | | |
8.34% (3 Month Term SOFR + 3.75%, Rate Floor: 3.75%) due 09/24/30 | | | 188,686 | | | | 190,248 | |
Focus Financial Partners LLC | | | | | | | | |
7.61% (1 Month Term SOFR + 3.25%, Rate Floor: 3.25%) due 09/15/31 | | | 182,937 | | | | 184,468 | |
Virtu Financial | | | | | | | | |
7.11% (1 Month Term SOFR + 2.75%, Rate Floor: 3.25%) due 06/21/31 | | | 175,000 | | | | 175,329 | |
Zodiac Pool Solutions LLC | | | | | | | | |
6.38% (1 Month Term SOFR + 1.93%, Rate Floor: 2.43%) due 01/29/29 | | | 162,351 | | | | 162,283 | |
Jefferies Finance LLC | | | | | | | | |
7.36% (1 Month Term SOFR + 3.00%, Rate Floor: 3.00%) due 10/21/31 | | | 145,000 | | | | 145,454 | |
Tegra118 Wealth Solutions, Inc. | | | | | | | | |
8.52% (3 Month Term SOFR + 4.00%, Rate Floor: 4.00%) due 02/18/27 | | | 148,446 | | | | 141,997 | |
Eisner Advisory Group | | | | | | | | |
8.36% (1 Month Term SOFR + 4.00%, Rate Floor: 4.50%) due 02/28/31 | | | 138,604 | | | | 139,891 | |
HighTower Holding LLC | | | | | | | | |
8.07% (3 Month Term SOFR + 3.50%, Rate Floor: 3.50%) due 04/21/28 | | | 132,142 | | | | 132,638 | |
Starwood Property Mortgage LLC | | | | | | | | |
due 12/12/29 | | | 130,269 | | | | 129,780 | |
Aretec Group, Inc. | | | | | | | | |
7.86% (1 Month Term SOFR + 3.50%, Rate Floor: 3.50%) due 08/09/30 | | | 127,285 | | | | 127,789 | |
Pex Holdings LLC | | | | | | | | |
7.08% (3 Month Term SOFR + 2.75%, Rate Floor: 2.75%) due 11/19/31 | | | 125,000 | | | | 125,469 | |
CPI Holdco B LLC | | | | | | | | |
6.36% (1 Month Term SOFR + 2.00%, Rate Floor: 2.00%) due 05/17/31 | | | 121,545 | | | | 121,197 | |
Franchise Group, Inc. | | | | | | | | |
10.39% (3 Month Term SOFR + 4.75%, Rate Floor: 5.50%) due 03/10/26 | | | 206,919 | | | | 118,461 | |
Alter Domus | | | | | | | | |
8.12% (3 Month Term SOFR + 3.50%, Rate Floor: 4.00%) due 07/17/31 | | | 101,494 | | | | 102,179 | |
GIP Pilot Acquisition Partners, LP | | | | | | | | |
7.09% (3 Month Term SOFR + 2.50%, Rate Floor: 2.50%) due 10/04/30 | | | 100,758 | | | | 101,262 | |
Franchise Group, Inc. | | | | | | | | |
13.60% (1 Month Term SOFR + 9.00%, Rate Floor: 10.00%) due 04/30/25††† | | | 52,243 | | | | 52,243 | |
Assetmark Financial Holdings, Inc. | | | | | | | | |
7.08% (3 Month Term SOFR + 3.00%, Rate Floor: 3.00%) due 09/05/31 | | | 45,000 | | | | 45,126 | |
Total Financial | | | | | | | 6,499,718 | |
| | | | | | | | | |
Communications - 7.8% | | | | | | | | |
CSC Holdings LLC | | | | | | | | |
8.90% (1 Month Term SOFR + 4.50%, Rate Floor: 4.50%) due 01/18/28 | | | 481,491 | | | | 471,327 | |
Virgin Media Bristol LLC | | | | | | | | |
7.01% (1 Month Term SOFR + 2.50%, Rate Floor: 2.50%) due 01/31/28 | | | 400,406 | | | | 397,235 | |
30 | THE GUGGENHEIM FUNDS ANNUAL FINANCIAL REPORT | SEE NOTES TO FINANCIAL STATEMENTS. |
SCHEDULE OF INVESTMENTS (continued) | December 31, 2024 |
SERIES F (FLOATING RATE STRATEGIES SERIES) | |
| | Face
Amount~ | | | Value | |
Level 3 Financing, Inc. | | | | | | | | |
10.92% (1 Month Term SOFR + 6.56%, Rate Floor: 6.56%) due 04/15/30 | | | 194,447 | | | $ | 197,947 | |
10.92% (1 Month Term SOFR + 6.56%, Rate Floor: 6.56%) due 04/15/29 | | | 193,031 | | | | 196,554 | |
Zayo Group Holdings, Inc. | | | | | | | | |
7.47% (1 Month Term SOFR + 3.00%, Rate Floor: 3.00%) due 03/09/27 | | | 401,527 | | | | 375,259 | |
Altice France SA | | | | | | | | |
10.16% (3 Month Term SOFR + 5.50%, Rate Floor: 5.50%) due 08/15/28 | | | 463,144 | | | | 370,399 | |
McGraw Hill LLC | | | | | | | | |
8.33% (3 Month Term SOFR + 4.00%, Rate Floor: 4.50%) due 08/06/31 | | | 319,386 | | | | 322,714 | |
UPC Broadband Holding BV | | | | | | | | |
7.44% (1 Month Term SOFR + 2.93%, Rate Floor: 2.93%) due 01/31/29 | | | 304,199 | | | | 305,443 | |
SBA Senior Finance II LLC | | | | | | | | |
6.11% (1 Month Term SOFR + 1.75%, Rate Floor: 1.75%) due 01/25/31 | | | 299,522 | | | | 299,420 | |
Midcontinent Communications | | | | | | | | |
6.90% (1 Month Term SOFR + 2.50%, Rate Floor: 2.50%) due 08/16/31 | | | 249,375 | | | | 250,467 | |
Speedster Bidco GMBH | | | | | | | | |
due 10/17/31 | | | 243,340 | | | | 243,747 | |
Charter Communications Operating LLC | | | | | | | | |
6.59% (3 Month Term SOFR + 2.00%, Rate Floor: 2.00%) due 12/07/30 | | | 188,100 | | | | 187,415 | |
LCPR Loan Financing LLC | | | | | | | | |
8.26% (1 Month Term SOFR + 3.75%, Rate Floor: 4.75%) due 10/16/28 | | | 167,695 | | | | 149,877 | |
Cengage Learning, Inc. | | | | | | | | |
7.96% ((1 Month Term SOFR + 3.50%) and (3 Month Term SOFR + 3.50%), Rate Floor: 4.50%) due 03/24/31 | | | 138,825 | | | | 139,383 | |
Playtika Holding Corp. | | | | | | | | |
7.22% (1 Month Term SOFR + 2.75%, Rate Floor: 3.75%) due 03/13/28 | | | 139,044 | | | | 139,290 | |
UFC Holdings LLC | | | | | | | | |
6.77% (3 Month Term SOFR + 2.25%, Rate Floor: 2.25%) due 11/21/31 | | | 85,000 | | | | 85,367 | |
Titan AcquisitionCo New Zealand Ltd. (Trade Me) | | | | | | | | |
8.59% (3 Month Term SOFR + 4.00%, Rate Floor: 4.50%) due 10/18/28 | | | 84,676 | | | | 84,835 | |
Xplore, Inc. | | | | | | | | |
6.00% (1 Month Term SOFR + 1.50%, Rate Floor: 1.50%) due 10/24/31 | | | 70,157 | | | | 56,827 | |
9.47% (1 Month Term SOFR + 1.50%, Rate Floor: 1.50%) (in-kind rate was 3.50%) due 10/23/293 | | | 19,580 | | | | 19,237 | |
Total Communications | | | | | | | 4,292,743 | |
| | | | | | | | | |
Basic Materials - 4.3% | | | | | | | | |
Arsenal AIC Parent LLC | | | | | | | | |
7.61% (1 Month Term SOFR + 3.25%, Rate Floor: 3.25%) due 08/18/30 | | | 523,364 | | | | 527,159 | |
LSF11 A5 HoldCo LLC | | | | | | | | |
7.97% (1 Month Term SOFR + 3.50%, Rate Floor: 4.00%) due 10/15/28 | | | 356,220 | | | | 358,002 | |
HB Fuller Co. | | | | | | | | |
6.36% (1 Month Term SOFR + 2.00%, Rate Floor: 2.50%) due 02/15/30 | | | 297,750 | | | | 299,426 | |
CTEC III GmbH | | | | | | | | |
6.41% (3 Month EURIBOR + 3.50%, Rate Floor: 3.50%) due 03/16/29 | | | EUR 275,000 | | | | 283,964 | |
Discovery Purchaser Corp. | | | | | | | | |
8.95% (3 Month Term SOFR + 4.36%, Rate Floor: 4.86%) due 10/04/29 | | | 198,221 | | | | 199,113 | |
Minerals Technologies, Inc. | | | | | | | | |
6.34% (1 Month Term SOFR + 2.00%, Rate Floor: 2.00%) due 11/21/31††† | | | 150,000 | | | | 150,375 | |
Platform Specialty Products | | | | | | | | |
6.11% (1 Month Term SOFR + 1.75%, Rate Floor: 1.75%) due 12/18/30 | | | 146,127 | | | | 146,231 | |
Vantage Specialty Chemicals, Inc. | | | | | | | | |
9.11% (1 Month Term SOFR + 4.75%, Rate Floor: 5.25%) due 10/26/26 | | | 102,900 | | | | 101,356 | |
A-AP Buyer, Inc. | | | | | | | | |
7.61% (1 Month Term SOFR + 3.25%, Rate Floor: 3.25%) due 09/09/31 | | | 100,000 | | | | 100,625 | |
W.R. Grace Holdings LLC | | | | | | | | |
7.58% (3 Month Term SOFR + 3.25%, Rate Floor: 3.75%) due 09/22/28 | | | 97,000 | | | | 97,776 | |
SCIH Salt Holdings, Inc. | | | | | | | | |
7.57% (3 Month Term SOFR + 3.00%, Rate Floor: 3.75%) due 03/16/27 | | | 55,000 | | | | 55,090 | |
TPC Group, Inc. | | | | | | | | |
10.11% (3 Month Term SOFR + 5.75%, Rate Floor: 5.75%) due 11/22/31 | | | 55,000 | | | | 54,656 | |
GrafTech Finance, Inc. | | | | | | | | |
due 11/04/29 | | | 28,445 | | | | 28,445 | |
Total Basic Materials | | | | | | | 2,402,218 | |
| | | | | | | | | |
Utilities - 2.3% | | | | | | | | |
Calpine Construction Finance Company, LP | | | | | | | | |
6.36% (1 Month Term SOFR + 2.00%, Rate Floor: 2.00%) due 07/31/30 | | | 497,500 | | | | 495,978 | |
UGI Energy Services LLC | | | | | | | | |
6.86% (1 Month Term SOFR + 2.50%, Rate Floor: 2.50%) due 02/22/30 | | | 279,481 | | | | 280,470 | |
NRG Energy, Inc. | | | | | | | | |
6.60% (3 Month Term SOFR + 2.00%, Rate Floor: 2.00%) due 04/16/31 | | | 269,283 | | | | 269,261 | |
TerraForm Power Operating LLC | | | | | | | | |
6.93% (3 Month Term SOFR + 2.50%, Rate Floor: 3.00%) due 05/21/29 | | | 225,441 | | | | 225,628 | |
Total Utilities | | | | | | | 1,271,337 | |
| | | | | | | | | |
Energy - 2.1% | | | | | | | | |
AL GCX Holdings LLC | | | | | | | | |
7.26% (1 Month Term SOFR + 2.75%, Rate Floor: 3.25%) due 05/17/29 | | | 241,194 | | | | 242,219 | |
SEE NOTES TO FINANCIAL STATEMENTS. | THE GUGGENHEIM FUNDS ANNUAL FINANCIAL REPORT | 31 |
SCHEDULE OF INVESTMENTS (continued) | December 31, 2024 |
SERIES F (FLOATING RATE STRATEGIES SERIES) | |
| | Face
Amount~ | | | Value | |
BANGL LLC | | | | | | | | |
9.09% (3 Month Term SOFR + 4.50%, Rate Floor: 4.50%) due 02/01/29 | | | 229,275 | | | $ | 230,637 | |
Par Petroleum LLC | | | | | | | | |
8.33% (3 Month Term SOFR + 3.75%, Rate Floor: 4.25%) due 02/28/30 | | | 185,615 | | | | 184,919 | |
ITT Holdings LLC | | | | | | | | |
7.11% (1 Month Term SOFR + 2.75%, Rate Floor: 3.25%) due 10/11/30 | | | 113,567 | | | | 114,106 | |
WhiteWater DBR HoldCo LLC | | | | | | | | |
6.63% (3 Month Term SOFR + 2.75%, Rate Floor: 2.75%) due 03/03/31 | | | 109,725 | | | | 110,170 | |
CVR Energy, Inc. | | | | | | | | |
due 12/30/27 | | | 100,000 | | | | 100,000 | |
Bip PipeCo Holdings LLC | | | | | | | | |
6.84% (3 Month Term SOFR + 2.25%, Rate Floor: 2.25%) due 12/06/30 | | | 96,169 | | | | 96,361 | |
Buckeye Partners, LP | | | | | | | | |
6.36% (1 Month Term SOFR + 2.00%, Rate Floor: 2.00%) due 11/22/30 | | | 52,451 | | | | 52,457 | |
Total Energy | | | | | | | 1,130,869 | |
| | | | | | | | | |
Total Senior Floating Rate Interests | | | | |
(Cost $52,861,492) | | | 51,803,744 | |
| | | | | |
CORPORATE BONDS†† - 0.4% |
Communications - 0.3% | | | | | | | | |
Level 3 Financing, Inc. | | | | | | | | |
11.00% due 11/15/294 | | | 134,610 | | | | 151,425 | |
| | | | | | | | | |
Industrial - 0.1% | | | | | | | | |
GrafTech Global Enterprises, Inc. | | | | | | | | |
9.88% due 12/23/294 | | | 90,000 | | | | 80,100 | |
Total Corporate Bonds | | | | |
(Cost $216,976) | | | 231,525 | |
| | | | | | | | | |
Total Investments - 101.9% | | | | |
(Cost $57,528,992) | | $ | 56,449,282 | |
Other Assets & Liabilities, net - (1.9)% | | | (1,047,150 | ) |
Total Net Assets - 100.0% | | $ | 55,402,132 | |
Forward Foreign Currency Exchange Contracts†† |
Counterparty | | Currency | | | Type | | | Quantity | | | Contract
Amount | | | Settlement
Date | | | Unrealized
Appreciation | |
Barclays Bank plc | | | EUR | | | | Sell | | | | 402,000 | | | | 421,992 USD | | | | 01/17/25 | | | $ | 5,211 | |
~ | The face amount is denominated in U.S. dollars unless otherwise indicated. |
* | Non-income producing security. |
*** | A copy of each underlying unaffiliated fund’s financial statements is available at the SEC’s website at www.sec.gov. |
† | Value determined based on Level 1 inputs, unless otherwise noted — See Note 4. |
†† | Value determined based on Level 2 inputs, unless otherwise noted — See Note 4. |
††† | Value determined based on Level 3 inputs — See Note 4. |
◊ | Variable rate security. Rate indicated is the rate effective at December 31, 2023. In some instances, the effective rate is limited by a minimum rate floor or a maximum rate cap established by the issuer. The settlement status of a position may also impact the effective rate indicated. In some cases, a position may be unsettled at period end and may not have a stated effective rate. In instances where multiple underlying reference rates and spread amounts are shown, the effective rate is based on a weighted average. |
1 | Affiliated issuer. |
2 | Rate indicated is the 7-day yield as of December 31, 2024. |
3 | Payment-in-kind security. |
4 | Security is a 144A or Section 4(a)(2) security. These securities have been determined to be liquid under guidelines established by the Board of Trustees. The total market value of 144A or Section 4(a)(2) securities is $231,525 (cost $216,976), or 0.4% of total net assets. |
| | EUR — Euro |
| | EURIBOR — European Interbank Offered Rate |
| | plc — Public Limited Company |
| | SARL — Société à Responsabilité Limitée |
| | SOFR — Secured Overnight Financing Rate |
| | |
| | See Sector Classification in Other Information section. |
32 | THE GUGGENHEIM FUNDS ANNUAL FINANCIAL REPORT | SEE NOTES TO FINANCIAL STATEMENTS. |
SCHEDULE OF INVESTMENTS (continued) | December 31, 2024 |
SERIES F (FLOATING RATE STRATEGIES SERIES) | |
The following table summarizes the inputs used to value the Fund’s investments at December 31, 2024 (See Note 4 in the Notes to Financial Statements):
Investments in Securities (Assets) | | Level 1
Quoted
Prices | | | Level 2
Significant
Observable
Inputs | | | Level 3
Significant
Unobservable
Inputs | | | Total | |
Common Stocks | | $ | 25,627 | | | $ | 19,765 | | | $ | 180,649 | | | $ | 226,041 | |
Exchange-Traded Fund | | | 679,990 | | | | — | | | | — | | | | 679,990 | |
Mutual Fund | | | 1,562,812 | | | | — | | | | — | | | | 1,562,812 | |
Money Market Fund | | | 1,945,170 | | | | — | | | | — | | | | 1,945,170 | |
Senior Floating Rate Interests | | | — | | | | 49,569,524 | | | | 2,234,220 | | | | 51,803,744 | |
Corporate Bonds | | | — | | | | 231,525 | | | | — | | | | 231,525 | |
Forward Foreign Currency Exchange Contracts** | | | — | | | | 5,211 | | | | — | | | | 5,211 | |
Total Assets | | $ | 4,213,599 | | | $ | 49,826,025 | | | $ | 2,414,869 | | | $ | 56,454,493 | |
Investments in Securities (Liabilities) | | Level 1
Quoted
Prices | | | Level 2
Significant
Observable
Inputs | | | Level 3
Significant
Unobservable
Inputs | | | Total | |
Unfunded Loan Commitments (Note 8) | | $ | — | | | $ | — | | | $ | 772 | | | $ | 772 | |
** | This derivative is reported as unrealized appreciation/depreciation at period end. |
The following is a summary of significant unobservable inputs used in the fair valuation of assets and liabilities categorized within Level 3 of the fair value hierarchy:
Category | | Ending Balance at
December 31, 2024 | | | Valuation Technique | | | Unobservable Inputs | | | Input Range | | | Weighted Average* | |
Assets: | | | | | | | | | | | | | | | | | | | | |
Common Stocks | | $ | 180,649 | | Enterprise Value | Valuation Multiple | 2.6x-8.8x | 4.8x |
Senior Floating Rate Interests | | | 2,058,300 | | Third Party Pricing | Broker Quote | — | — |
Senior Floating Rate Interests | | | 127,024 | | Model Price | Purchase Price | — | — |
Senior Floating Rate Interests | | | 48,896 | | Third Party Pricing | Trade Price | — | — |
Total Assets | | $ | 2,414,869 | | | | | |
Liabilities: | | | | | | | | | | | | | | | | | | | | |
Unfunded Loan Commitments | | $ | 772 | | Model Price | Purchase Price | — | — |
* | Inputs are weighted by the fair value of the instruments. |
Significant changes in a quote or valuation multiple would generally result in significant changes in the fair value of the security. Any remaining Level 3 securities held by the Fund and excluded from the table above, were not considered material to the Fund.
The Fund’s fair valuation leveling guidelines classify a single daily broker quote, or a vendor price based on a single daily or monthly broker quote, as Level 3, if such a quote or price cannot be supported with other available market information.
Transfers between Level 2 and Level 3 may occur as markets fluctuate and/or the availability of data used in an investment’s valuation changes. For the year ended December 31, 2024, the Fund had securities with a total value of $540,507 transfer into Level 3 from Level 2 due to a lack of observable inputs and had securities with a total value of $946,198 transfer out of Level 3 into Level 2 due to the availability of current and reliable market-based data provided by a third-party pricing service which utilizes significant observable inputs.
SEE NOTES TO FINANCIAL STATEMENTS. | THE GUGGENHEIM FUNDS ANNUAL FINANCIAL REPORT | 33 |
SCHEDULE OF INVESTMENTS (concluded) | December 31, 2024 |
SERIES F (FLOATING RATE STRATEGIES SERIES) | |
Summary of Fair Value Level 3 Activity
Following is a reconciliation of Level 3 assets for which significant unobservable inputs were used to determine fair value for the year ended December 31, 2024:
| | | Assets | | | | | | | Liabilities | |
| | Senior Floating
Rate Interests | | | Common Stocks | | | Total Assets | | | Unfunded Loan
Commitments | |
Beginning Balance | | $ | 2,007,344 | | | $ | 186,293 | | | $ | 2,193,637 | | | $ | — | |
Purchases/(Receipts) | | | 976,872 | | | | — | | | | 976,872 | | | | 5,936 | |
(Sales, maturities and paydowns)/Fundings | | | (86,341 | ) | | | — | | | | (86,341 | ) | | | (8,298 | ) |
Amortization of premiums/discounts | | | 5,627 | | | | — | | | | 5,627 | | | | 4,409 | |
Mergers | | | (144,748 | ) | | | — | | | | (144,748 | ) | | | — | |
Total realized gains (losses) included in earnings | | | (14 | ) | | | — | | | | (14 | ) | | | (2,180 | ) |
Total change in unrealized appreciation (depreciation) included in earnings | | | (118,829 | ) | | | (5,644 | ) | | | (124,473 | ) | | | (639 | ) |
Transfers into Level 3 | | | 540,507 | | | | — | | | | 540,507 | | | | — | |
Transfers out of Level 3 | | | (946,198 | ) | | | — | | | | (946,198 | ) | | | — | |
Ending Balance | | $ | 2,234,220 | | | $ | 180,649 | | | $ | 2,414,869 | | | $ | (772 | ) |
Net change in unrealized appreciation (depreciation) for investments in Level 3 securities still held at December 31, 2024 | | $ | (80,198 | ) | | $ | (5,644 | ) | | $ | (85,842 | ) | | $ | (639 | ) |
Affiliated Transactions
Investments representing 5% or more of the outstanding voting shares of a company, or control of or by, or common control under Guggenheim Investments, result in that company being considered an affiliated person, as defined in the Investment Company Act of 1940 (“affiliated issuer”). The Fund also may invest in certain of the underlying series of Guggenheim Funds Trust, which are open-end management investment companies managed by GI, are available to the public and whose most recent annual report on Form N-CSR is available publicly or upon request.
Transactions during the year ended December 31, 2024, in which the company is an affiliated issuer, were as follows:
Security Name | | Value
12/31/23 | | | Additions | | | Reductions | | | Realized
Gain (Loss) | | | Change in
Unrealized
Appreciation
(Depreciation) | | | Value
12/31/24 | | | Shares
12/31/24 | | | Investment
Income | |
Common Stocks | | | | | | | | | | | | | | | | | | | | | | | | | | | | | | | | |
BP Holdco LLC * | | $ | 14,072 | | | $ | — | | | $ | — | | | $ | — | | | $ | — | | | $ | 14,072 | | | | 11,609 | | | $ | — | |
Mutual Funds | | | | | | | | | | | | | | | | | | | | | | | | | | | | | | | | |
Guggenheim Floating Rate Strategies Fund — Class R6 | | | — | | | | 1,580,079 | | | | — | | | | — | | | | (17,267 | ) | | | 1,562,812 | | | | 64,446 | | | | 79,797 | |
| | | $ | 14,072 | | | $ | 1,580,079 | | | $ | — | | | $ | — | | | $ | (17,267 | ) | | $ | 1,576,884 | | | | | | | $ | 79,797 | |
* | Non-income producing security. |
34 | THE GUGGENHEIM FUNDS ANNUAL FINANCIAL REPORT | SEE NOTES TO FINANCIAL STATEMENTS. |
SERIES F (FLOATING RATE STRATEGIES SERIES) | |
STATEMENT OF ASSETS AND LIABILITIES |
December 31, 2024 |
Assets: |
Investments in unaffiliated issuers, at value (cost $55,944,814) | | $ | 54,872,398 | |
Investments in affiliated issuers, at value (cost $1,584,178) | | | 1,576,884 | |
Cash | | | 197,535 | |
Unrealized appreciation on forward foreign currency exchange contracts | | | 5,211 | |
Prepaid expenses | | | 6,823 | |
Receivables: |
Securities sold | | | 818,345 | |
Interest | | | 258,714 | |
Fund shares sold | | | 77,908 | |
Dividends | | | 10,128 | |
Total assets | | | 57,823,946 | |
| | | | | |
Liabilities: |
Unfunded loan commitments, at value (Note 8) (commitment fees received $134) | | | 772 | |
Payable for: |
Securities purchased | | | 2,313,166 | |
Fund shares redeemed | | | 20,181 | |
Management fees | | | 15,644 | |
Distribution and service fees | | | 11,270 | |
Transfer agent/maintenance fees | | | 2,159 | |
Fund accounting/administration fees | | | 1,857 | |
Trustees’ fees* | | | 1,014 | |
Miscellaneous | | | 55,751 | |
Total liabilities | | | 2,421,814 | |
Net assets | | $ | 55,402,132 | |
| | | | | |
Net assets consist of: |
Paid in capital | | $ | 56,981,164 | |
Total distributable earnings (loss) | | | (1,579,032 | ) |
Net assets | | $ | 55,402,132 | |
Capital shares outstanding | | | 2,222,826 | |
Net asset value per share | | $ | 24.92 | |
STATEMENT OF OPERATIONS |
Year Ended December 31, 2024 |
Investment Income: |
Dividends from securities of unaffiliated issuers | | $ | 120,891 | |
Dividends from securities of affiliated issuers | | | 79,797 | |
Interest | | | 5,062,375 | |
Total investment income | | | 5,263,063 | |
| | | | | |
Expenses: |
Management fees | | | 370,853 | |
Distribution and service fees | | | 142,635 | |
Transfer agent/maintenance fees | | | 25,333 | |
Professional fees | | | 71,844 | |
Fund accounting/administration fees | | | 30,583 | |
Custodian fees | | | 28,375 | |
Line of credit fees | | | 19,208 | |
Trustees’ fees* | | | 14,223 | |
Interest expense | | | 4,386 | |
Miscellaneous | | | 16,474 | |
Total expenses | | | 723,914 | |
Less: |
Expenses reimbursed by Adviser | | | (7,975 | ) |
Expenses waived by Adviser | | | (55,772 | ) |
Earnings credits applied | | | (4,830 | ) |
Total waived/reimbursed expenses | | | (68,577 | ) |
Net expenses | | | 655,337 | |
Net investment income | | | 4,607,726 | |
| | | | | |
Net Realized and Unrealized Gain (Loss): |
Net realized gain (loss) on: |
Investments in unaffiliated issuers | | | (606,417 | ) |
Forward foreign currency exchange contracts | | | 19,557 | |
Foreign currency transactions | | | (425 | ) |
Net realized loss | | | (587,285 | ) |
Net change in unrealized appreciation (depreciation) on: |
Investments in unaffiliated issuers | | | (262,503 | ) |
Investments in affiliated issuers | | | (17,267 | ) |
Forward foreign currency exchange contracts | | | 15,499 | |
Foreign currency translations | | | (2,435 | ) |
Net change in unrealized appreciation (depreciation) | | | (266,706 | ) |
Net realized and unrealized loss | | | (853,991 | ) |
Net increase in net assets resulting from operations | | $ | 3,753,735 | |
* | Relates to Trustees not deemed “interested persons” within the meaning of Section 2(a)(19) of the Investment Company Act of 1940. |
SEE NOTES TO FINANCIAL STATEMENTS. | THE GUGGENHEIM FUNDS ANNUAL FINANCIAL REPORT | 35 |
SERIES F (FLOATING RATE STRATEGIES SERIES) | |
STATEMENTS OF CHANGES IN NET ASSETS |
| | Year Ended
December 31,
2024 | | | Year Ended
December 31,
2023 | |
Increase (Decrease) in Net Assets from Operations: | | | | | | | | |
Net investment income | | $ | 4,607,726 | | | $ | 4,458,367 | |
Net realized loss on investments | | | (587,285 | ) | | | (323,367 | ) |
Net change in unrealized appreciation (depreciation) on investments | | | (266,706 | ) | | | 1,575,433 | |
Net increase in net assets resulting from operations | | | 3,753,735 | | | | 5,710,433 | |
| | | | | | | | | |
Distributions to shareholders | | | (4,453,819 | ) | | | (1,925,766 | ) |
| | | | | | | | | |
Capital share transactions: | | | | | | | | |
Proceeds from sale of shares | | | 14,719,689 | | | | 50,185,730 | |
Distributions reinvested | | | 4,453,819 | | | | 1,925,766 | |
Cost of shares redeemed | | | (22,241,105 | ) | | | (45,065,168 | ) |
Net increase (decrease) from capital share transactions | | | (3,067,597 | ) | | | 7,046,328 | |
Net increase (decrease) in net assets | | | (3,767,681 | ) | | | 10,830,995 | |
| | | | | | | | | |
Net assets: | | | | | | | | |
Beginning of year | | | 59,169,813 | | | | 48,338,818 | |
End of year | | $ | 55,402,132 | | | $ | 59,169,813 | |
| | | | | | | | | |
Capital share activity: | | | | | | | | |
Shares sold | | | 578,601 | | | | 2,041,325 | |
Shares issued from reinvestment of distributions | | | 184,271 | | | | 79,184 | |
Shares redeemed | | | (875,459 | ) | | | (1,832,480 | ) |
Net increase (decrease) in shares | | | (112,587 | ) | | | 288,029 | |
36 | THE GUGGENHEIM FUNDS ANNUAL FINANCIAL REPORT | SEE NOTES TO FINANCIAL STATEMENTS. |
SERIES F (FLOATING RATE STRATEGIES SERIES) | |
This table is presented to show selected data for a share outstanding throughout each period and to assist shareholders in evaluating the Fund’s performance for the periods presented.
| | Year Ended
December 31,
2024 | | | Year Ended
December 31,
2023 | | | Year Ended
December 31,
2022 | | | Year Ended
December 31,
2021 | | | Year Ended
December 31,
2020 | |
Per Share Data |
Net asset value, beginning of period | | $ | 25.34 | | | $ | 23.61 | | | $ | 24.40 | | | $ | 24.41 | | | $ | 25.96 | |
Income (loss) from investment operations: |
Net investment income (loss)a | | | 2.04 | | | | 1.99 | | | | .95 | | | | .58 | | | | .68 | |
Net gain (loss) on investments (realized and unrealized) | | | (.39 | ) | | | .61 | | | | (1.18 | ) | | | .02 | | | | (.74 | ) |
Total from investment operations | | | 1.65 | | | | 2.60 | | | | (.23 | ) | | | .60 | | | | (.06 | ) |
Less distributions from: |
Net investment income | | | (2.07 | ) | | | (.87 | ) | | | (.56 | ) | | | (.61 | ) | | | (1.49 | ) |
Total distributions | | | (2.07 | ) | | | (.87 | ) | | | (.56 | ) | | | (.61 | ) | | | (1.49 | ) |
Net asset value, end of period | | $ | 24.92 | | | $ | 25.34 | | | $ | 23.61 | | | $ | 24.40 | | | $ | 24.41 | |
|
Total Returnb | | | 6.83 | % | | | 11.12 | % | | | (0.85 | %) | | | 2.50 | % | | | 0.01 | % |
Ratios/Supplemental Data |
Net assets, end of period (in thousands) | | $ | 55,402 | | | $ | 59,170 | | | $ | 48,339 | | | $ | 50,768 | | | $ | 41,004 | |
Ratios to average net assets: |
Net investment income (loss) | | | 8.08 | % | | | 8.10 | % | | | 4.01 | % | | | 2.36 | % | | | 2.81 | % |
Total expensesc | | | 1.27 | % | | | 1.25 | % | | | 1.27 | % | | | 1.34 | % | | | 1.47 | % |
Net expensesd,e | | | 1.16 | % | | | 1.16 | % | | | 1.16 | % | | | 1.17 | % | | | 1.23 | % |
Portfolio turnover rate | | | 57 | % | | | 66 | % | | | 68 | % | | | 56 | % | | | 60 | % |
a | Net investment income (loss) per share was computed using average shares outstanding throughout the period. |
b | Total return does not take into account any of the expenses associated with an investment in variable insurance products. If total return had taken into account these expenses, performance would have been lower. Shares of a series of Guggenheim Variable Funds Trust are available only through the purchase of such products. |
c | Does not include expenses of the underlying funds in which the Fund invests. |
d | Net expense information reflects the expense ratios after expense waivers and reimbursements, as applicable. |
e | Net expenses may include expenses that are excluded from the expense limitation agreement. Excluding these expenses, the net expense ratios for the years presented would be: |
| | 12/31/24 | 12/31/23 | 12/31/22 | 12/31/21 | 12/31/20 |
| | 1.11% | 1.13% | 1.14% | 1.14% | 1.15% |
SEE NOTES TO FINANCIAL STATEMENTS. | THE GUGGENHEIM FUNDS ANNUAL FINANCIAL REPORT | 37 |
SCHEDULE OF INVESTMENTS | December 31, 2024 |
SERIES P (HIGH YIELD SERIES) | |
| | Shares | | | Value | |
COMMON STOCKS† - 0.4% |
| | | | | | | | | |
Consumer, Non-cyclical - 0.3% |
Endo, Inc.* | | | 3,651 | | | $ | 89,449 | |
MEDIQ, Inc.*,††† | | | 92 | | | | — | |
Total Consumer, Non-cyclical | | | | | | | 89,449 | |
| | | | | | | | | |
Communications - 0.1% |
Xplore Inc.*,†† | | | 1,647 | | | | 8,235 | |
| | | | | | | | | |
Energy - 0.0% |
Legacy Reserves, Inc.††† | | | 1,969 | | | | 7,876 | |
Permian Production Partners LLC*,††† | | | 9,124 | | | | 76 | |
Total Energy | | | | | | | 7,952 | |
| | | | | | | | | |
Industrial - 0.0% |
YAK BLOCKER 2 LLC*,††† | | | 914 | | | | 1,478 | |
YAK BLOCKER 2 LLC*,††† | | | 844 | | | | 1,367 | |
BP Holdco LLC*,†††,1 | | | 523 | | | | 634 | |
Vector Phoenix Holdings, LP*,††† | | | 523 | | | | 11 | |
Total Industrial | | | | | | | 3,490 | |
| | | | | | | | | |
Financial - 0.0% |
Endo Luxembourg Finance Co I SARL / Endo US, Inc.*,†††,2 | | | 225,000 | | | | 23 | |
Endo Luxembourg Finance Co I SARL / Endo US, Inc.*,†††,2 | | | 125,000 | | | | 12 | |
Total Financial | | | | | | | 35 | |
| | | | | | | | | |
Total Common Stocks | | | | |
(Cost $144,290) | | | | | | | 109,161 | |
| | | | | | | | | |
PREFERRED STOCKS† - 1.0% |
Financial - 1.0% |
Citigroup, Inc. |
7.63%†† | | | 125,000 | | | | 130,229 | |
American National Group, Inc. |
8.37% | | | 3,500 | | | | 88,200 | |
Goldman Sachs Group, Inc. |
7.50%†† | | | 75,000 | | | | 79,101 | |
Total Financial | | | | | | | 297,530 | |
| | | | | | | | | |
Industrial - 0.0% |
U.S. Shipping Corp.*,††† | | | 24,529 | | | | 3 | |
Total Preferred Stocks | | | | |
(Cost $912,500) | | | | | | | 297,533 | |
| | | | | | | | | |
MONEY MARKET FUND***,† - 2.3% |
Dreyfus Treasury Securities Cash Management Fund — Institutional Shares, 4.33%3 | | | 705,362 | | | | 705,362 | |
Total Money Market Fund | | | | |
(Cost $705,362) | | | | | | | 705,362 | |
| | Face
Amount~ | | | | |
CORPORATE BONDS†† - 83.9% |
Consumer, Cyclical - 15.6% | | | | | | | | |
Suburban Propane Partners Limited Partnership/Suburban Energy Finance Corp. | | | | | | | | |
5.00% due 06/01/314 | | | 250,000 | | | | 222,868 | |
Allwyn Entertainment Financing UK plc | | | | | | | | |
7.88% due 04/30/294 | | | 200,000 | | | | 205,626 | |
Station Casinos LLC | | | | | | | | |
4.63% due 12/01/314 | | | 225,000 | | | | 201,553 | |
Wolverine World Wide, Inc. | | | | | | | | |
4.00% due 08/15/294 | | | 225,000 | | | | 197,577 | |
Boyd Gaming Corp. | | | | | | | | |
4.75% due 12/01/27 | | | 200,000 | | | | 193,359 | |
Scotts Miracle-Gro Co. | | | | | | | | |
4.38% due 02/01/32 | | | 200,000 | | | | 174,620 | |
Hilton Domestic Operating Company, Inc. | | | | | | | | |
5.88% due 03/15/334 | | | 100,000 | | | | 98,397 | |
6.13% due 04/01/324 | | | 75,000 | | | | 74,795 | |
Ferrellgas Limited Partnership / Ferrellgas Finance Corp. | | | | | | | | |
5.38% due 04/01/264 | | | 175,000 | | | | 173,160 | |
Air Canada | | | | | | | | |
3.88% due 08/15/264 | | | 175,000 | | | | 170,032 | |
Scientific Games Holdings Limited Partnership/Scientific Games US FinCo, Inc. | | | | | | | | |
6.63% due 03/01/304 | | | 175,000 | | | | 167,463 | |
Crocs, Inc. | | | | | | | | |
4.25% due 03/15/294 | | | 175,000 | | | | 161,771 | |
Ritchie Bros Holdings, Inc. | | | | | | | | |
7.75% due 03/15/314 | | | 150,000 | | | | 156,861 | |
Ontario Gaming GTA Limited Partnership/OTG Company-Issuer, Inc. | | | | | | | | |
8.00% due 08/01/304 | | | 150,000 | | | | 154,198 | |
Life Time, Inc. | | | | | | | | |
6.00% due 11/15/314 | | | 150,000 | | | | 148,501 | |
Caesars Entertainment, Inc. | | | | | | | | |
6.00% due 10/15/324 | | | 75,000 | | | | 72,313 | |
8.13% due 07/01/274 | | | 50,000 | | | | 50,500 | |
6.50% due 02/15/324 | | | 25,000 | | | | 25,113 | |
Hanesbrands, Inc. | | | | | | | | |
4.88% due 05/15/264 | | | 150,000 | | | | 147,671 | |
United Airlines, Inc. | | | | | | | | |
4.38% due 04/15/264 | | | 150,000 | | | | 147,489 | |
Wabash National Corp. | | | | | | | | |
4.50% due 10/15/284 | | | 150,000 | | | | 136,971 | |
Velocity Vehicle Group LLC | | | | | | | | |
8.00% due 06/01/294 | | | 125,000 | | | | 129,988 | |
Clarios Global Limited Partnership / Clarios US Finance Co. | | | | | | | | |
8.50% due 05/15/274 | | | 75,000 | | | | 75,114 | |
6.75% due 05/15/284 | | | 50,000 | | | | 50,914 | |
ONE Hotels GmbH | | | | | | | | |
7.75% due 04/02/314 | | | EUR 100,000 | | | | 111,411 | |
AccorInvest Group S.A. | | | | | | | | |
6.38% due 10/15/294 | | | EUR 100,000 | | | | 108,995 | |
38 | THE GUGGENHEIM FUNDS ANNUAL FINANCIAL REPORT | SEE NOTES TO FINANCIAL STATEMENTS. |
SCHEDULE OF INVESTMENTS (continued) | December 31, 2024 |
SERIES P (HIGH YIELD SERIES) | |
| | Face
Amount~ | | | Value | |
Amer Sports Co. | | | | | | | | |
6.75% due 02/16/314 | | | 100,000 | | | $ | 101,313 | |
Vail Resorts, Inc. | | | | | | | | |
6.50% due 05/15/324 | | | 100,000 | | | | 101,122 | |
Wynn Resorts Finance LLC / Wynn Resorts Capital Corp. | | | | | | | | |
6.25% due 03/15/334 | | | 100,000 | | | | 98,249 | |
Newell Brands, Inc. | | | | | | | | |
5.70% due 04/01/26 | | | 94,000 | | | | 93,960 | |
Penn Entertainment, Inc. | | | | | | | | |
4.13% due 07/01/294 | | | 100,000 | | | | 89,670 | |
1011778 BC ULC / New Red Finance, Inc. | | | | | | | | |
4.00% due 10/15/304 | | | 100,000 | | | | 89,434 | |
Park River Holdings, Inc. | | | | | | | | |
5.63% due 02/01/294 | | | 100,000 | | | | 86,286 | |
JB Poindexter & Company, Inc. | | | | | | | | |
8.75% due 12/15/314 | | | 75,000 | | | | 78,947 | |
Michaels Companies, Inc. | | | | | | | | |
5.25% due 05/01/284 | | | 100,000 | | | | 75,501 | |
Asbury Automotive Group, Inc. | | | | | | | | |
5.00% due 02/15/324 | | | 75,000 | | | | 68,416 | |
Tempur Sealy International, Inc. | | | | | | | | |
3.88% due 10/15/314 | | | 75,000 | | | | 65,433 | |
Evergreen Acqco 1 Limited Partnership / TVI, Inc. | | | | | | | | |
9.75% due 04/26/284 | | | 61,000 | | | | 64,139 | |
Fertitta Entertainment LLC / Fertitta Entertainment Finance Company, Inc. | | | | | | | | |
4.63% due 01/15/294 | | | 59,000 | | | | 54,674 | |
Advance Auto Parts, Inc. | | | | | | | | |
5.90% due 03/09/26 | | | 50,000 | | | | 50,347 | |
Superior Plus, LP | | | | | | | | |
4.25% due 05/18/284 | | | CAD 75,000 | | | | 49,410 | |
Papa John’s International, Inc. | | | | | | | | |
3.88% due 09/15/294 | | | 50,000 | | | | 44,793 | |
Sabre GLBL, Inc. | | | | | | | | |
7.38% due 09/01/252 | | | 35,000 | | | | 34,300 | |
9.25% due 04/15/252 | | | 7,000 | | | | 6,930 | |
Total Consumer, Cyclical | | | | | | | 4,810,184 | |
| | | | | | | | | |
Industrial - 14.0% | | | | | | | | |
New Enterprise Stone & Lime Company, Inc. | | | | | | | | |
9.75% due 07/15/284 | | | 200,000 | | | | 204,528 | |
5.25% due 07/15/284 | | | 150,000 | | | | 144,905 | |
GrafTech Finance, Inc. | | | | | | | | |
4.63% due 12/23/294 | | | 430,000 | | | | 346,365 | |
Enviri Corp. | | | | | | | | |
5.75% due 07/31/274 | | | 325,000 | | | | 309,185 | |
Trinity Industries, Inc. | | | | | | | | |
7.75% due 07/15/284 | | | 275,000 | | | | 285,376 | |
Mauser Packaging Solutions Holding Co. | | | | | | | | |
7.88% due 04/15/274 | | | 175,000 | | | | 178,537 | |
9.25% due 04/15/274 | | | 100,000 | | | | 101,170 | |
Great Lakes Dredge & Dock Corp. | | | | | | | | |
5.25% due 06/01/294 | | | 275,000 | | | | 255,080 | |
TransDigm, Inc. | | | | | | | | |
6.88% due 12/15/304 | | | 175,000 | | | | 177,603 | |
6.00% due 01/15/334 | | | 50,000 | | | | 49,003 | |
Builders FirstSource, Inc. | | | | | | | | |
6.38% due 06/15/324 | | | 125,000 | | | | 124,274 | |
6.38% due 03/01/344 | | | 45,000 | | | | 44,412 | |
4.25% due 02/01/324 | | | 25,000 | | | | 22,078 | |
EnerSys | | | | | | | | |
6.63% due 01/15/324 | | | 175,000 | | | | 175,883 | |
Clean Harbors, Inc. | | | | | | | | |
6.38% due 02/01/314 | | | 150,000 | | | | 151,017 | |
Brundage-Bone Concrete Pumping Holdings, Inc. | | | | | | | | |
6.00% due 02/01/264 | | | 150,000 | | | | 149,914 | |
Techem Verwaltungsgesellschaft | | | | | | | | |
5.38% due 07/15/29 | | | EUR 125,000 | | | | 133,647 | |
Advanced Drainage Systems, Inc. | | | | | | | | |
6.38% due 06/15/304 | | | 125,000 | | | | 125,011 | |
Artera Services LLC | | | | | | | | |
8.50% due 02/15/314 | | | 125,000 | | | | 120,484 | |
Hillenbrand, Inc. | | | | | | | | |
6.25% due 02/15/29 | | | 75,000 | | | | 74,951 | |
3.75% due 03/01/31 | | | 50,000 | | | | 43,705 | |
Clearwater Paper Corp. | | | | | | | | |
4.75% due 08/15/284 | | | 125,000 | | | | 118,047 | |
Nidda Healthcare Holding | | | | | | | | |
5.63% due 02/21/30 | | | EUR 100,000 | | | | 106,975 | |
Summit Materials LLC / Summit Materials Finance Corp. | | | | | | | | |
7.25% due 01/15/314 | | | 100,000 | | | | 106,109 | |
Sealed Air Corporation/Sealed Air Corp US | | | | | | | | |
7.25% due 02/15/314 | | | 100,000 | | | | 103,080 | |
EMRLD Borrower Limited Partnership / Emerald Company-Issuer, Inc. | | | | | | | | |
6.63% due 12/15/304 | | | 100,000 | | | | 100,133 | |
Amsted Industries, Inc. | | | | | | | | |
4.63% due 05/15/304 | | | 75,000 | | | | 70,546 | |
5.63% due 07/01/274 | | | 25,000 | | | | 24,759 | |
Calderys Financing LLC | | | | | | | | |
11.25% due 06/01/284 | | | 75,000 | | | | 80,280 | |
Wrangler Holdco Corp. | | | | | | | | |
6.63% due 04/01/324 | | | 75,000 | | | | 76,350 | |
Standard Building Solutions, Inc. | | | | | | | | |
6.50% due 08/15/324 | | | 75,000 | | | | 75,120 | |
MIWD Holdco II LLC / MIWD Finance Corp. | | | | | | | | |
5.50% due 02/01/304 | | | 75,000 | | | | 70,843 | |
Arcosa, Inc. | | | | | | | | |
4.38% due 04/15/294 | | | 75,000 | | | | 69,884 | |
AmeriTex HoldCo Intermediate LLC | | | | | | | | |
10.25% due 10/15/284 | | | 50,000 | | | | 53,299 | |
Miter Brands Acquisition Holdco Incorporated / MIWD Borrower LLC | | | | | | | | |
6.75% due 04/01/324 | | | 25,000 | | | | 25,117 | |
Total Industrial | | | | | | | 4,297,670 | |
| | | | | | | | | |
SEE NOTES TO FINANCIAL STATEMENTS. | THE GUGGENHEIM FUNDS ANNUAL FINANCIAL REPORT | 39 |
SCHEDULE OF INVESTMENTS (continued) | December 31, 2024 |
SERIES P (HIGH YIELD SERIES) | |
| | Face
Amount~ | | | Value | |
Consumer, Non-cyclical - 13.6% | | | | | | | | |
CPI CG, Inc. | | | | | | | | |
10.00% due 07/15/294 | | | 275,000 | | | $ | 293,815 | |
Boost Newco Borrower LLC | | | | | | | | |
7.50% due 01/15/314 | | | 200,000 | | | | 209,672 | |
Tenet Healthcare Corp. | | | | | | | | |
6.13% due 06/15/30 | | | 125,000 | | | | 124,015 | |
6.75% due 05/15/31 | | | 75,000 | | | | 75,768 | |
Grifols S.A. | | | | | | | | |
4.75% due 10/15/284 | | | 200,000 | | | | 183,786 | |
Cheplapharm Arzneimittel GmbH | | | | | | | | |
5.50% due 01/15/284 | | | 200,000 | | | | 181,158 | |
Bausch Health Companies, Inc. | | | | | | | | |
4.88% due 06/01/284 | | | 225,000 | | | | 180,000 | |
Prime Security Services Borrower LLC / Prime Finance, Inc. | | | | | | | | |
5.75% due 04/15/264 | | | 180,000 | | | | 179,899 | |
TriNet Group, Inc. | | | | | | | | |
7.13% due 08/15/314 | | | 175,000 | | | | 178,199 | |
Sotheby’s/Bidfair Holdings, Inc. | | | | | | | | |
5.88% due 06/01/294 | | | 200,000 | | | | 177,358 | |
HAH Group Holding Company LLC | | | | | | | | |
9.75% due 10/01/314 | | | 175,000 | | | | 175,139 | |
Carriage Services, Inc. | | | | | | | | |
4.25% due 05/15/294 | | | 175,000 | | | | 159,336 | |
Upbound Group, Inc. | | | | | | | | |
6.38% due 02/15/294 | | | 157,000 | | | | 152,621 | |
Darling Ingredients, Inc. | | | | | | | | |
6.00% due 06/15/304 | | | 150,000 | | | | 147,972 | |
Albertsons Companies Incorporated / Safeway Inc / New Albertsons Limited Partnership / Albertsons LLC | | | | | | | | |
3.25% due 03/15/264 | | | 150,000 | | | | 146,337 | |
Post Holdings, Inc. | | | | | | | | |
5.50% due 12/15/294 | | | 75,000 | | | | 72,571 | |
4.63% due 04/15/304 | | | 75,000 | | | | 69,169 | |
Service Corporation International | | | | | | | | |
3.38% due 08/15/30 | | | 100,000 | | | | 87,500 | |
5.75% due 10/15/32 | | | 50,000 | | | | 48,499 | |
US Foods, Inc. | | | | | | | | |
7.25% due 01/15/324 | | | 125,000 | | | | 129,364 | |
Williams Scotsman, Inc. | | | | | | | | |
7.38% due 10/01/314 | | | 125,000 | | | | 128,621 | |
BCP V Modular Services Finance II plc | | | | | | | | |
4.75% due 10/30/284 | | | EUR 125,000 | | | | 126,943 | |
Castor S.p.A. | | | | | | | | |
8.14% (3 Month EURIBOR + 5.25%, Rate Floor: 5.25%) due 02/15/29◊,4 | | | EUR 125,000 | | | | 125,860 | |
Performance Food Group, Inc. | | | | | | | | |
6.13% due 09/15/324 | | | 125,000 | | | | 124,994 | |
AMN Healthcare, Inc. | | | | | | | | |
4.63% due 10/01/274 | | | 125,000 | | | | 118,758 | |
Sammontana Italia S.p.A. | | | | | | | | |
6.97% (3 Month EURIBOR + 3.75%, Rate Floor: 3.75%) due 10/15/31◊ | | | EUR 100,000 | | | | 104,134 | |
Medline Borrower, LP | | | | | | | | |
5.25% due 10/01/294 | | | 100,000 | | | | 96,506 | |
DaVita, Inc. | | | | | | | | |
4.63% due 06/01/304 | | | 100,000 | | | | 91,932 | |
Brink’s Co. | | | | | | | | |
6.75% due 06/15/324 | | | 75,000 | | | | 75,551 | |
Central Garden & Pet Co. | | | | | | | | |
4.13% due 04/30/314 | | | 75,000 | | | | 66,322 | |
Graham Holdings Co. | | | | | | | | |
5.75% due 06/01/264 | | | 50,000 | | | | 49,783 | |
WW International, Inc. | | | | | | | | |
4.50% due 04/15/294 | | | 205,000 | | | | 40,917 | |
Molina Healthcare, Inc. | | | | | | | | |
6.25% due 01/15/334 | | | 25,000 | | | | 24,709 | |
Perrigo Finance Unlimited Co. | | | | | | | | |
6.13% due 09/30/32 | | | 25,000 | | | | 24,446 | |
Total Consumer, Non-cyclical | | | | | | | 4,171,654 | |
| | | | | | | | | |
Financial - 11.2% | | | | | | | | |
Alliant Holdings Intermediate LLC / Alliant Holdings Company-Issuer | | | | | | | | |
6.50% due 10/01/314 | | | 175,000 | | | | 173,272 | |
7.00% due 01/15/314 | | | 75,000 | | | | 75,293 | |
Jones Deslauriers Insurance Management, Inc. | | | | | | | | |
10.50% due 12/15/304 | | | 225,000 | | | | 243,253 | |
Jefferies Finance LLC / JFIN Company-Issuer Corp. | | | | | | | | |
5.00% due 08/15/284 | | | 250,000 | | | | 234,509 | |
Ardonagh Finco Ltd. | | | | | | | | |
7.75% due 02/15/314 | | | 200,000 | | | | 205,960 | |
Hunt Companies, Inc. | | | | | | | | |
5.25% due 04/15/294 | | | 200,000 | | | | 189,570 | |
Jane Street Group / JSG Finance, Inc. | | | | | | | | |
7.13% due 04/30/314 | | | 75,000 | | | | 77,075 | |
6.13% due 11/01/324 | | | 50,000 | | | | 49,535 | |
4.50% due 11/15/294 | | | 50,000 | | | | 46,822 | |
United Wholesale Mortgage LLC | | | | | | | | |
5.75% due 06/15/274 | | | 125,000 | | | | 123,469 | |
5.50% due 04/15/294 | | | 50,000 | | | | 48,163 | |
Starwood Property Trust, Inc. | | | | | | | | |
4.38% due 01/15/274 | | | 85,000 | | | | 82,182 | |
7.25% due 04/01/294 | | | 75,000 | | | | 76,935 | |
OneMain Finance Corp. | | | | | | | | |
3.88% due 09/15/28 | | | 100,000 | | | | 92,154 | |
4.00% due 09/15/30 | | | 75,000 | | | | 66,657 | |
Assurant, Inc. | | | | | | | | |
7.00% due 03/27/485 | | | 150,000 | | | | 152,465 | |
Focus Financial Partners LLC | | | | | | | | |
6.75% due 09/15/314 | | | 150,000 | | | | 149,404 | |
Rocket Mortgage LLC / Rocket Mortgage Company-Issuer, Inc. | | | | | | | | |
3.88% due 03/01/314 | | | 170,000 | | | | 148,121 | |
VFH Parent LLC / Valor Company-Issuer, Inc. | | | | | | | | |
7.50% due 06/15/314 | | | 125,000 | | | | 128,569 | |
Iron Mountain, Inc. | | | | | | | | |
5.63% due 07/15/324 | | | 125,000 | | | | 119,408 | |
SLM Corp. | | | | | | | | |
3.13% due 11/02/26 | | | 125,000 | | | | 119,241 | |
40 | THE GUGGENHEIM FUNDS ANNUAL FINANCIAL REPORT | SEE NOTES TO FINANCIAL STATEMENTS. |
SCHEDULE OF INVESTMENTS (continued) | December 31, 2024 |
SERIES P (HIGH YIELD SERIES) | |
| | Face
Amount~ | | | Value | |
Aretec Group, Inc. | | | | | | | | |
10.00% due 08/15/304 | | | 100,000 | | | $ | 109,214 | |
PennyMac Financial Services, Inc. | | | | | | | | |
7.88% due 12/15/294 | | | 100,000 | | | | 104,770 | |
UWM Holdings LLC | | | | | | | | |
6.63% due 02/01/304 | | | 100,000 | | | | 99,382 | |
AmWINS Group, Inc. | | | | | | | | |
4.88% due 06/30/294 | | | 100,000 | | | | 93,900 | |
Kennedy-Wilson, Inc. | | | | | | | | |
4.75% due 03/01/29 | | | 100,000 | | | | 90,329 | |
Hightower Holding LLC | | | | | | | | |
9.13% due 01/31/304 | | | 75,000 | | | | 78,994 | |
Ryan Specialty LLC | | | | | | | | |
5.88% due 08/01/324 | | | 75,000 | | | | 74,208 | |
HUB International Ltd. | | | | | | | | |
5.63% due 12/01/294 | | | 50,000 | | | | 48,498 | |
7.38% due 01/31/324 | | | 25,000 | | | | 25,391 | |
Liberty Mutual Group, Inc. | | | | | | | | |
4.30% due 02/01/614 | | | 100,000 | | | | 61,706 | |
USI, Inc. | | | | | | | | |
7.50% due 01/15/324 | | | 50,000 | | | | 51,710 | |
Total Financial | | | | | | | 3,440,159 | |
| | | | | | | | | |
Communications - 10.6% | | | | | | | | |
CCO Holdings LLC / CCO Holdings Capital Corp. | | | | | | | | |
4.50% due 05/01/32 | | | 225,000 | | | | 193,537 | |
4.50% due 06/01/334 | | | 125,000 | | | | 105,173 | |
6.38% due 09/01/294 | | | 100,000 | | | | 99,145 | |
4.25% due 01/15/344 | | | 100,000 | | | | 81,129 | |
Vmed O2 UK Financing I plc | | | | | | | | |
7.75% due 04/15/324 | | | 200,000 | | | | 201,573 | |
4.25% due 01/31/314 | | | 200,000 | | | | 170,679 | |
CSC Holdings LLC | | | | | | | | |
4.13% due 12/01/304 | | | 200,000 | | | | 143,673 | |
4.63% due 12/01/304 | | | 200,000 | | | | 104,491 | |
3.38% due 02/15/314 | | | 75,000 | | | | 52,606 | |
Altice France S.A. | | | | | | | | |
5.50% due 10/15/294 | | | 225,000 | | | | 168,531 | |
5.13% due 07/15/294 | | | 175,000 | | | | 131,051 | |
Level 3 Financing, Inc. | | | | | | | | |
3.88% due 10/15/304 | | | 175,000 | | | | 139,668 | |
11.00% due 11/15/294 | | | 99,190 | | | | 111,581 | |
McGraw-Hill Education, Inc. | | | | | | | | |
5.75% due 08/01/284 | | | 125,000 | | | | 122,045 | |
8.00% due 08/01/294 | | | 100,000 | | | | 100,008 | |
7.38% due 09/01/314 | | | 25,000 | | | | 25,584 | |
AMC Networks, Inc. | | | | | | | | |
4.25% due 02/15/29 | | | 300,000 | | | | 235,491 | |
Cogent Communications Group Incorporated / Cogent Communications Finance, Inc. | | | | | | | | |
7.00% due 06/15/274 | | | 225,000 | | | | 225,073 | |
Sirius XM Radio LLC | | | | | | | | |
3.88% due 09/01/314 | | | 125,000 | | | | 104,597 | |
4.13% due 07/01/304 | | | 100,000 | | | | 87,275 | |
Sunrise FinCo I B.V. | | | | | | | | |
4.88% due 07/15/314 | | | 200,000 | | | | 181,412 | |
LCPR Senior Secured Financing DAC | | | | | | | | |
6.75% due 10/15/274 | | | 200,000 | | | | 180,960 | |
Match Group Holdings II LLC | | | | | | | | |
3.63% due 10/01/314 | | | 150,000 | | | | 128,003 | |
Outfront Media Capital LLC / Outfront Media Capital Corp. | | | | | | | | |
4.25% due 01/15/294 | | | 100,000 | | | | 92,988 | |
7.38% due 02/15/314 | | | 25,000 | | | | 26,131 | |
Cable One, Inc. | | | | | | | | |
4.00% due 11/15/304 | | | 75,000 | | | | 62,668 | |
Total Communications | | | | | | | 3,275,072 | |
| | | | | | | | | |
Energy - 7.4% | | | | | | | | |
ITT Holdings LLC | | | | | | | | |
6.50% due 08/01/294 | | | 325,000 | | | | 297,518 | |
TransMontaigne Partners Limited Partnership / TLP Finance Corp. | | | | | | | | |
6.13% due 02/15/26 | | | 250,000 | | | | 248,515 | |
Buckeye Partners, LP | | | | | | | | |
3.95% due 12/01/26 | | | 175,000 | | | | 168,431 | |
6.88% due 07/01/294 | | | 75,000 | | | | 75,909 | |
CVR Energy, Inc. | | | | | | | | |
5.75% due 02/15/284 | | | 182,000 | | | | 167,708 | |
8.50% due 01/15/294 | | | 75,000 | | | | 71,939 | |
Global Partners Limited Partnership / GLP Finance Corp. | | | | | | | | |
7.00% due 08/01/27 | | | 125,000 | | | | 125,429 | |
8.25% due 01/15/324 | | | 100,000 | | | | 102,813 | |
Parkland Corp. | | | | | | | | |
4.50% due 10/01/294 | | | 125,000 | | | | 115,936 | |
4.63% due 05/01/304 | | | 75,000 | | | | 68,843 | |
Venture Global LNG, Inc. | | | | | | | | |
9.50% due 02/01/294 | | | 75,000 | | | | 82,895 | |
7.00% due 01/15/304 | | | 75,000 | | | | 76,123 | |
Venture Global Calcasieu Pass LLC | | | | | | | | |
6.25% due 01/15/304 | | | 150,000 | | | | 151,400 | |
NuStar Logistics, LP | | | | | | | | |
5.63% due 04/28/27 | | | 125,000 | | | | 124,090 | |
Viper Energy, Inc. | | | | | | | | |
7.38% due 11/01/314 | | | 100,000 | | | | 104,694 | |
Sunoco Limited Partnership / Sunoco Finance Corp. | | | | | | | | |
6.00% due 04/15/27 | | | 100,000 | | | | 99,802 | |
Sunoco, LP | | | | | | | | |
7.25% due 05/01/324 | | | 75,000 | | | | 77,473 | |
Kinetik Holdings, LP | | | | | | | | |
5.88% due 06/15/304 | | | 75,000 | | | | 73,823 | |
Expand Energy Corp. | | | | | | | | |
5.38% due 02/01/29 | | | 50,000 | | | | 49,253 | |
Total Energy | | | | | | | 2,282,594 | |
| | | | | | | | | |
Basic Materials - 7.0% | | | | | | | | |
Carpenter Technology Corp. | | | | | | | | |
7.63% due 03/15/30 | | | 125,000 | | | | 128,016 | |
SEE NOTES TO FINANCIAL STATEMENTS. | THE GUGGENHEIM FUNDS ANNUAL FINANCIAL REPORT | 41 |
SCHEDULE OF INVESTMENTS (continued) | December 31, 2024 |
SERIES P (HIGH YIELD SERIES) | |
| | Face
Amount~ | | | Value | |
6.38% due 07/15/28 | | | 100,000 | | | $ | 100,015 | |
Ingevity Corp. | | | | | | | | |
3.88% due 11/01/284 | | | 225,000 | | | | 205,707 | |
INEOS Finance plc | | | | | | | | |
6.75% due 05/15/284 | | | 200,000 | | | | 201,983 | |
Alcoa Nederland Holding B.V. | | | | | | | | |
6.13% due 05/15/284 | | | 200,000 | | | | 199,824 | |
Compass Minerals International, Inc. | | | | | | | | |
6.75% due 12/01/274 | | | 200,000 | | | | 196,980 | |
SCIL IV LLC / SCIL USA Holdings LLC | | | | | | | | |
5.38% due 11/01/264 | | | 200,000 | | | | 195,882 | |
Novelis Corp. | | | | | | | | |
4.75% due 01/30/304 | | | 200,000 | | | | 184,605 | |
Kaiser Aluminum Corp. | | | | | | | | |
4.63% due 03/01/284 | | | 110,000 | | | | 103,425 | |
4.50% due 06/01/314 | | | 75,000 | | | | 66,113 | |
Minerals Technologies, Inc. | | | | | | | | |
5.00% due 07/01/284 | | | 175,000 | | | | 168,437 | |
SK Invictus Intermediate II SARL | | | | | | | | |
5.00% due 10/30/294 | | | 125,000 | | | | 116,456 | |
Arsenal AIC Parent LLC | | | | | | | | |
8.00% due 10/01/304 | | | 100,000 | | | | 103,480 | |
Illuminate Buyer LLC / Illuminate Holdings IV, Inc. | | | | | | | | |
9.00% due 07/01/284 | | | 100,000 | | | | 101,254 | |
WR Grace Holdings LLC | | | | | | | | |
4.88% due 06/15/274 | | | 75,000 | | | | 72,679 | |
Mirabela Nickel Ltd. | | | | | | | | |
due 06/24/19†††,2,6 | | | 390,085 | | | | 1,950 | |
Total Basic Materials | | | | | | | 2,146,806 | |
| | | | | | | | | |
Technology - 3.1% | | | | | | | | |
Dye & Durham Ltd. | | | | | | | | |
8.63% due 04/15/294 | | | 200,000 | | | | 209,753 | |
Capstone Borrower, Inc. | | | | | | | | |
8.00% due 06/15/304 | | | 150,000 | | | | 155,266 | |
ACI Worldwide, Inc. | | | | | | | | |
5.75% due 08/15/264 | | | 150,000 | | | | 149,730 | |
TeamSystem S.p.A. | | | | | | | | |
6.68% due 07/31/31 | | | EUR 100,000 | | | | 104,134 | |
SS&C Technologies, Inc. | | | | | | | | |
5.50% due 09/30/274 | | | 100,000 | | | | 99,041 | |
Cloud Software Group, Inc. | | | | | | | | |
6.50% due 03/31/294 | | | 100,000 | | | | 98,154 | |
Central Parent Incorporated / CDK Global, Inc. | | | | | | | | |
7.25% due 06/15/294 | | | 75,000 | | | | 74,114 | |
NCR Voyix Corp. | | | | | | | | |
5.13% due 04/15/294 | | | 59,000 | | | | 56,449 | |
Amentum Holdings, Inc. | | | | | | | | |
7.25% due 08/01/324 | | | 25,000 | | | | 25,189 | |
Total Technology | | | | | | | 971,830 | |
| | | | | | | | | |
Utilities - 1.4% | | | | | | | | |
Terraform Global Operating, LP | | | | | | | | |
6.13% due 03/01/264 | | | 420,000 | | | | 418,908 | |
Total Corporate Bonds | | | | |
(Cost $27,106,227) | | | 25,814,877 | |
SENIOR FLOATING RATE INTERESTS††,◊ - 12.1% |
Consumer, Cyclical - 3.6% | | | | | | | | |
PetSmart LLC | | | | | | | | |
8.21% (1 Month Term SOFR + 3.75%, Rate Floor: 4.50%) due 02/11/28 | | | 145,125 | | | | 144,399 | |
CCRR Parent, Inc. | | | | | | | | |
9.03% (3 Month Term SOFR + 4.25%, Rate Floor: 5.00%) due 03/06/28 | | | 245,841 | | | | 142,177 | |
Crash Champions Inc. | | | | | | | | |
9.27% (3 Month Term SOFR + 4.75%, Rate Floor: 4.75%) due 02/23/29 | | | 149,803 | | | | 141,517 | |
ScribeAmerica Intermediate Holdco LLC (Healthchannels) | | | | | | | | |
9.67% (6 Month Term SOFR + 4.50%, Rate Floor: 4.50%) due 04/03/25 | | | 181,141 | | | | 123,047 | |
Truck Hero, Inc. | | | | | | | | |
7.97% (1 Month Term SOFR + 3.50%, Rate Floor: 4.25%) due 01/31/28 | | | 99,483 | | | | 96,302 | |
AmSpec Parent LLC | | | | | | | | |
due 12/11/31 | | | 91,388 | | | | 91,845 | |
American Tire Distributors, Inc. | | | | | | | | |
11.86% (3 Month Term SOFR + 6.51%, Rate Floor: 7.26%) due 10/20/28††† | | | 170,625 | | | | 76,781 | |
13.84% (1 Month Term SOFR + 1.50%, Rate Floor: 5.84%) (in-kind rate was 8.00%) due 02/24/25†††,7 | | | 54,547 | | | | 55,093 | |
11.43% (3 Month Term SOFR + 6.00%, Rate Floor: 6.00%) due 10/22/26††† | | | 13,631 | | | | 12,677 | |
10.82% (1 Month Term SOFR + 6.00%, Rate Floor: 6.00%) due 10/22/26††† | | | 6,815 | | | | 6,338 | |
TransNetwork LLC | | | | | | | | |
9.08% (3 Month Term SOFR + 5.50%, Rate Floor: 6.00%) due 12/30/30††† | | | 49,874 | | | | 50,124 | |
Rent-A-Center, Inc. | | | | | | | | |
7.34% (3 Month Term SOFR + 2.75%, Rate Floor: 3.25%) due 02/17/28††† | | | 45,743 | | | | 45,744 | |
Galaxy US Opco, Inc. | | | | | | | | |
9.34% (3 Month Term SOFR + 4.75%, Rate Floor: 5.25%) due 04/29/29 | | | 49,746 | | | | 44,025 | |
First Brands Group LLC | | | | | | | | |
9.85% (3 Month Term SOFR + 5.00%, Rate Floor: 6.00%) due 03/30/27 | | | 45,214 | | | | 42,247 | |
Holding Socotec SAS | | | | | | | | |
due 06/02/28 | | | 25,000 | | | | 25,063 | |
WW International, Inc. | | | | | | | | |
7.97% (1 Month Term SOFR + 3.50%, Rate Floor: 4.00%) due 04/13/28 | | | 45,000 | | | | 9,720 | |
Total Consumer, Cyclical | | | | | | | 1,107,099 | |
| | | | | | | | | |
Industrial - 2.6% | | | | | | | | |
Arcline FM Holdings, LLC | | | | | | | | |
9.31% ((3 Month Term SOFR + 4.50%) and (6 Month Term SOFR + 4.50%), Rate Floor: 5.25%) due 06/23/28 | | | 169,762 | | | | 170,587 | |
Dispatch Terra Acquisition LLC | | | | | | | | |
8.73% (3 Month Term SOFR + 4.40%, Rate Floor: 5.15%) due 03/27/28 | | | 144,871 | | | | 137,747 | |
42 | THE GUGGENHEIM FUNDS ANNUAL FINANCIAL REPORT | SEE NOTES TO FINANCIAL STATEMENTS. |
SCHEDULE OF INVESTMENTS (continued) | December 31, 2024 |
SERIES P (HIGH YIELD SERIES) | |
| | Face
Amount~ | | | Value | |
Michael Baker International LLC | | | | | | | | |
9.11% (1 Month Term SOFR + 4.75%, Rate Floor: 5.50%) due 12/01/28 | | | 97,883 | | | $ | 98,190 | |
Pelican Products, Inc. | | | | | | | | |
8.84% (3 Month Term SOFR + 4.25%, Rate Floor: 4.75%) due 12/29/28 | | | 88,578 | | | | 79,366 | |
Hobbs & Associates LLC | | | | | | | | |
7.61% (1 Month Term SOFR + 3.25%, Rate Floor: 3.25%) due 07/23/31 | | | 68,182 | | | | 68,459 | |
7.65% (3 Month Term SOFR + 3.25%, Rate Floor: 3.25%) due 07/23/31 | | | 6,818 | | | | 6,846 | |
Engineering Research And Consulting LLC | | | | | | | | |
9.51% (3 Month Term SOFR + 5.00%, Rate Floor: 5.00%) due 08/29/31††† | | | 75,000 | | | | 74,250 | |
Aegion Corp. | | | | | | | | |
8.11% (1 Month Term SOFR + 3.75%, Rate Floor: 4.50%) due 05/17/28 | | | 72,624 | | | | 73,060 | |
Cognita Ltd. | | | | | | | | |
8.82% (1 Month SOFR + 4.00%, Rate Floor: 4.50%) due 10/27/31††† | | | 50,000 | | | | 50,500 | |
STS Operating, Inc. | | | | | | | | |
8.46% (1 Month Term SOFR + 4.00%, Rate Floor: 4.00%) due 03/25/31 | | | 49,625 | | | | 49,724 | |
Total Industrial | | | | | | | 808,729 | |
| | | | | | | | | |
Consumer, Non-cyclical - 2.3% | | | | | | | | |
Outcomes Group Holdings, Inc. | | | | | | | | |
7.61% (1 Month Term SOFR + 3.25%, Rate Floor: 3.25%) due 05/06/31 | | | 99,501 | | | | 100,446 | |
PlayCore | | | | | | | | |
9.09% (3 Month Term SOFR + 4.50%, Rate Floor: 5.50%) due 02/20/30 | | | 99,312 | | | | 100,150 | |
Gibson Brands, Inc. | | | | | | | | |
10.58% (6 Month Term SOFR + 5.00%, Rate Floor: 5.00%) due 08/11/28 | | | 94,575 | | | | 93,471 | |
National Mentor Holdings, Inc. | | | | | | | | |
8.20% ((1 Month Term SOFR + 3.75%) and (3 Month Term SOFR + 3.75%), Rate Floor: 4.50%) due 03/02/28 | | | 91,989 | | | | 91,031 | |
IVI America LLC | | | | | | | | |
8.83% (3 Month Term SOFR + 4.50%, Rate Floor: 4.50%) due 04/09/31 | | | 69,650 | | | | 70,085 | |
Women’s Care Holdings, Inc. | | | | | | | | |
9.19% (3 Month Term SOFR + 4.50%, Rate Floor: 5.25%) due 01/15/28 | | | 61,742 | | | | 58,655 | |
Blue Ribbon LLC | | | | | | | | |
10.85% (3 Month Term SOFR + 6.00%, Rate Floor: 6.75%) due 05/08/28 | | | 83,750 | | | | 56,113 | |
Balrog Acquisition, Inc. | | | | | | | | |
9.28% (3 Month Term SOFR + 4.50%, Rate Floor: 5.25%) due 09/05/28††† | | | 49,250 | | | | 49,373 | |
TGP Holdings LLC | | | | | | | | |
7.71% (1 Month Term SOFR + 3.25%, Rate Floor: 4.00%) due 06/29/28 | | | 48,496 | | | | 47,157 | |
Midwest Physician Administrative Services | | | | | | | | |
7.59% (3 Month Term SOFR + 3.00%, Rate Floor: 3.75%) due 03/12/28 | | | 49,742 | | | | 46,938 | |
Total Consumer, Non-cyclical | | | | | | | 713,419 | |
| | | | | | | | | |
Technology - 1.7% | | | | | | | | |
Pushpay USA, Inc. | | | | | | | | |
8.83% (3 Month Term SOFR + 4.50%, Rate Floor: 4.50%) due 08/15/31††† | | | 100,000 | | | | 100,500 | |
Blackhawk Network Holdings, Inc. | | | | | | | | |
9.36% (1 Month Term SOFR + 5.00%, Rate Floor: 6.00%) due 03/12/29 | | | 74,625 | | | | 75,451 | |
Cloud Software Group, Inc. | | | | | | | | |
7.83% (3 Month Term SOFR + 3.50%, Rate Floor: 4.00%) due 03/29/29 | | | 73,269 | | | | 73,427 | |
Modena Buyer LLC | | | | | | | | |
8.86% (1 Month Term SOFR + 4.50%, Rate Floor: 4.50%) due 07/01/31 | | | 75,000 | | | | 72,428 | |
DS Admiral Bidco LLC | | | | | | | | |
8.61% (1 Month Term SOFR + 4.25%, Rate Floor: 4.25%) due 06/26/31 | | | 74,813 | | | | 72,381 | |
Planview Parent, Inc. | | | | | | | | |
8.10% (3 Month Term SOFR + 3.75%, Rate Floor: 3.75%) due 12/17/27 | | | 54,725 | | | | 55,159 | |
Atlas CC Acquisition Corp. | | | | | | | | |
9.03% (3 Month Term SOFR + 4.25%, Rate Floor: 5.00%) due 05/25/28 | | | 72,375 | | | | 48,347 | |
Leia Finco US LLC | | | | | | | | |
7.89% (3 Month Term SOFR + 3.25%, Rate Floor: 3.25%) due 10/09/31 | | | 35,000 | | | | 34,940 | |
Total Technology | | | | | | | 532,633 | |
| | | | | | | | | |
Basic Materials - 1.2% | | | | | | | | |
GrafTech Finance, Inc. | | | | | | | | |
due 11/04/29 | | | 135,903 | | | | 135,903 | |
Discovery Purchaser Corp. | | | | | | | | |
8.95% (3 Month Term SOFR + 4.36%, Rate Floor: 4.86%) due 10/04/29 | | | 124,688 | | | | 125,249 | |
NIC Acquisition Corp. | | | | | | | | |
8.34% (3 Month Term SOFR + 3.75%, Rate Floor: 4.50%) due 12/29/27 | | | 87,154 | | | | 77,748 | |
TPC Group, Inc. | | | | | | | | |
10.11% (3 Month Term SOFR + 5.75%, Rate Floor: 5.75%) due 11/22/31 | | | 25,000 | | | | 24,844 | |
Total Basic Materials | | | | | | | 363,744 | |
| | | | | | | | | |
Financial - 0.6% | | | | | | | | |
Asurion LLC | | | | | | | | |
8.71% (1 Month Term SOFR + 4.25%, Rate Floor: 4.25%) due 08/19/28 | | | 79,394 | | | | 79,394 | |
Franchise Group, Inc. | | | | | | | | |
10.39% (3 Month Term SOFR + 4.75%, Rate Floor: 5.50%) due 03/10/26 | | | 103,459 | | | | 59,230 | |
Franchise Group, Inc. | | | | | | | | |
13.60% (1 Month Term SOFR + 9.00%, Rate Floor: 10.00%) due 04/30/25††† | | | 26,122 | | | | 26,122 | |
Total Financial | | | | | | | 164,746 | |
SEE NOTES TO FINANCIAL STATEMENTS. | THE GUGGENHEIM FUNDS ANNUAL FINANCIAL REPORT | 43 |
SCHEDULE OF INVESTMENTS (continued) | December 31, 2024 |
SERIES P (HIGH YIELD SERIES) | |
| | Face
Amount~ | | | Value | |
Communications - 0.1% | | | | | | | | |
Xplore, Inc. | | | | | | | | |
6.00% (1 Month Term SOFR + 1.50%, Rate Floor: 1.50%) due 10/24/31 | | | 29,232 | | | $ | 23,678 | |
9.47% (1 Month Term SOFR + 1.50%, Rate Floor: 5.97%) (in-kind rate was 3.50%) due 10/23/297 | | | 8,158 | | | | 8,015 | |
Total Communications | | | | | | | 31,693 | |
| | | | | | | | | |
Energy - 0.0% | | | | | | | | |
Permian Production Partners LLC | | | | | | | | |
12.47% (1 Month Term SOFR + 6.00%, Rate Floor: 10.47%) (in-kind rate was 2.00%) due 11/24/257 | | | 11,198 | | | | 11,086 | |
Total Senior Floating Rate Interests | | | | |
(Cost $4,063,994) | | | 3,733,149 | |
| | | | | | | | | |
Total Investments - 99.7% | | | | |
(Cost $32,932,373) | | $ | 30,660,082 | |
Other Assets & Liabilities, net - 0.3% | | | 92,531 | |
Total Net Assets - 100.0% | | $ | 30,752,613 | |
Forward Foreign Currency Exchange Contracts†† |
Counterparty | | Currency | | | Type | | | Quantity | | | Contract
Amount | | | Settlement
Date | | | Unrealized
Appreciation | |
Barclays Bank plc | | | EUR | | | | Sell | | | | 904,000 | | | | 948,958 USD | | | | 01/17/25 | | | $ | 11,719 | |
Barclays Bank plc | | | CAD | | | | Sell | | | | 71,000 | | | | 50,033 USD | | | | 01/17/25 | | | | 608 | |
| | | | | | | | | | | | | | | | | | | | | | | $ | 12,327 | |
~ | The face amount is denominated in U.S. dollars unless otherwise indicated. |
* | Non-income producing security. |
*** | A copy of each underlying unaffiliated fund’s financial statements is available at the SEC’s website at www.sec.gov. |
† | Value determined based on Level 1 inputs, unless otherwise noted — See Note 4. |
†† | Value determined based on Level 2 inputs, unless otherwise noted — See Note 4. |
††† | Value determined based on Level 3 inputs — See Note 4. |
◊ | Variable rate security. Rate indicated is the rate effective at December 31, 2024. In some instances, the effective rate is limited by a minimum rate floor or a maximum rate cap established by the issuer. The settlement status of a position may also impact the effective rate indicated. In some cases, a position may be unsettled at period end and may not have a stated effective rate. In instances where multiple underlying reference rates and spread amounts are shown, the effective rate is based on a weighted average. |
1 | Affiliated issuer. |
2 | Security is a 144A or Section 4(a)(2) security. These securities have been determined to be illiquid and restricted under guidelines established by the Board of Trustees. The total market value of 144A or Section 4(a)(2) illiquid and restricted securities is $43,215 (cost $398,223), or 0.1% of total net assets — See Note 9. |
3 | Rate indicated is the 7-day yield as of December 31, 2024. |
4 | Security is a 144A or Section 4(a)(2) security. These securities have been determined to be liquid under guidelines established by the Board of Trustees. The total market value of 144A or Section 4(a)(2) securities is $22,322,947 (cost $23,200,940), or 72.6% of total net assets. |
5 | Security has a fixed rate coupon which will convert to a floating or variable rate coupon on a future date. |
6 | Security is in default of interest and/or principal obligations. |
7 | Payment-in-kind security. |
| | CAD — Canadian Dollar |
| | EUR — Euro |
| | EURIBOR — European Interbank Offered Rate |
| | plc — Public Limited Company |
| | SARL — Société à Responsabilité Limitée |
| | SOFR — Secured Overnight Financing Rate |
| | |
| | See Sector Classification in Other Information section. |
44 | THE GUGGENHEIM FUNDS ANNUAL FINANCIAL REPORT | SEE NOTES TO FINANCIAL STATEMENTS. |
SCHEDULE OF INVESTMENTS (continued) | December 31, 2024 |
SERIES P (HIGH YIELD SERIES) | |
The following table summarizes the inputs used to value the Fund’s investments at December 31, 2024 (See Note 4 in the Notes to Financial Statements):
Investments in Securities (Assets) | | Level 1
Quoted
Prices | | | Level 2
Significant
Observable
Inputs | | | Level 3
Significant
Unobservable
Inputs | | | Total | |
Common Stocks | | $ | 89,449 | | | $ | 8,235 | | | $ | 11,477 | | | $ | 109,161 | |
Preferred Stocks | | | 88,200 | | | | 209,330 | | | | 3 | | | | 297,533 | |
Money Market Fund | | | 705,362 | | | | — | | | | — | | | | 705,362 | |
Corporate Bonds | | | — | | | | 25,812,927 | | | | 1,950 | | | | 25,814,877 | |
Senior Floating Rate Interests | | | — | | | | 3,185,647 | | | | 547,502 | | | | 3,733,149 | |
Forward Foreign Currency Exchange Contracts** | | | — | | | | 12,327 | | | | — | | | | 12,327 | |
Total Assets | | $ | 883,011 | | | $ | 29,228,466 | | | $ | 560,932 | | | $ | 30,672,409 | |
Investments in Securities (Liabilities) | | Level 1
Quoted
Prices | | | Level 2
Significant
Observable
Inputs | | | Level 3
Significant
Unobservable
Inputs | | | Total | |
Unfunded Loan Commitments (Note 8) | | $ | — | | | $ | — | | | $ | 3,691 | | | $ | 3,691 | |
** | This derivative is reported as unrealized appreciation/depreciation at period end. |
The following is a summary of significant unobservable inputs used in the fair valuation of assets and liabilities categorized within Level 3 of the fair value hierarchy:
Category | | Ending Balance at
December 31, 2024 | | | Valuation Technique | | | Unobservable Inputs | | | Input Range | | | Weighted Average* | |
Assets: | | | | | | | | | | | | | | | | | | | | |
Common Stocks | | $ | 8,521 | | Enterprise Value | Valuation Multiple | 2.6x-8.8x | 3.9x |
Common Stocks | | | 2,956 | | Model Price | Liquidation Value | — | — |
Corporate Bonds | | | 1,950 | | Third Party Pricing | Trade Price | — | — |
Preferred Stocks | | | 3 | | Model Price | Liquidation Value | — | — |
Senior Floating Rate Interests | | | 528,487 | | Third Party Pricing | Broker Quote | — | — |
Senior Floating Rate Interests | | | 19,015 | | Third Party Pricing | Trade Price | — | — |
Total Assets | | $ | 560,932 | | | | | |
Liabilities: | | | | | | | | | | | | | | | | | | | | |
Unfunded Loan Commitments | | $ | 3,691 | | Model Price | Purchase Price | — | — |
* | Inputs are weighted by the fair value of the instruments. |
Significant changes in a quote, liquidation value or valuation multiple would generally result in significant changes in the fair value of the security. Any remaining Level 3 securities held by the Fund and excluded from the table above, were not considered material to the Fund.
The Fund’s fair valuation leveling guidelines classify a single daily broker quote, or a vendor price based on a single daily or monthly broker quote, as Level 3, if such a quote or price cannot be supported with other available market information.
Transfers between Level 2 and Level 3 may occur as markets fluctuate and/or the availability of data used in an investment’s valuation changes. For the year ended December 31, 2024, the Fund had securities with a total value of $172,649 transfer into Level 3 from Level 2 due to a lack of observable inputs and and did not have any securities to transfer out of Level 3 into Level 2.
SEE NOTES TO FINANCIAL STATEMENTS. | THE GUGGENHEIM FUNDS ANNUAL FINANCIAL REPORT | 45 |
SCHEDULE OF INVESTMENTS (concluded) | December 31, 2024 |
SERIES P (HIGH YIELD SERIES) | |
Summary of Fair Value Level 3 Activity
Following is a reconciliation of Level 3 assets for which significant unobservable inputs were used to determine fair value for the year ended December 31, 2024:
| | | Assets | | | | | | | Liabilities | |
| | Corporate Bonds | | | Senior Floating
Rate Interests | | | Common Stocks | | | Preferred Stocks | | | Total Assets | | | Unfunded Loan
Commitments | |
Beginning Balance | | $ | 2,790 | | | $ | 520,596 | | | $ | 16,797 | | | $ | 14,565 | | | $ | 554,748 | | | $ | — | |
Purchases/(Receipts) | | | — | | | | 314,755 | | | | 2,090 | | | | — | | | | 316,845 | | | | (4,083 | ) |
(Sales, maturities and paydowns)/Fundings | | | (1,679 | ) | | | (394,643 | ) | | | (155 | ) | | | (31,944 | ) | | | (428,421 | ) | | | 2,968 | |
Amortization of premiums/discounts | | | — | | | | 6,800 | | | | — | | | | — | | | | 6,800 | | | | 2,134 | |
Corporate actions | | | — | | | | (72,579 | ) | | | — | | | | — | | | | (72,579 | ) | | | — | |
Total realized gains (losses) included in earnings | | | (164,711 | ) | | | (27,129 | ) | | | — | | | | (101,482 | ) | | | (293,322 | ) | | | (1,090 | ) |
Total change in unrealized appreciation (depreciation) included in earnings | | | 165,550 | | | | 27,053 | | | | (7,255 | ) | | | 118,864 | | | | 304,212 | | | | (3,620 | ) |
Transfers into Level 3 | | | — | | | | 172,649 | | | | — | | | | — | | | | 172,649 | | | | — | |
Transfers out of Level 3 | | | — | | | | — | | | | — | | | | — | | | | — | | | | — | |
Ending Balance | | $ | 1,950 | | | $ | 547,502 | | | $ | 11,477 | | | $ | 3 | | | $ | 560,932 | | | $ | (3,691 | ) |
Net change in unrealized appreciation (depreciation) for investments in Level 3 securities still held at December 31, 2024 | | $ | — | | | $ | 7,935 | | | $ | (7,252 | ) | | $ | — | | | $ | 683 | | | $ | (3,620 | ) |
Affiliated Transactions
Investments representing 5% or more of the outstanding voting shares of a company, or control of or by, or common control under Guggenheim Investments, result in that company being considered an affiliated person, as defined in the Investment Company Act of 1940 (“affiliated issuer”).
Transactions during the year ended December 31, 2024, in which the company is an affiliated issuer, were as follows:
Security Name | | Value
12/31/23 | | | Additions | | | Reductions | | | Realized
Gain (Loss) | | | Change in
Unrealized
Appreciation
(Depreciation) | | | Value
12/31/24 | | | Shares
12/31/24 | |
Common Stocks | | | | | | | | | | | | | | | | | | | | | | | | | | | | |
BP Holdco LLC * | | $ | 634 | | | $ | — | | | $ | — | | | $ | — | | | $ | — | | | $ | 634 | | | | 523 | |
* | Non-income producing security. |
46 | THE GUGGENHEIM FUNDS ANNUAL FINANCIAL REPORT | SEE NOTES TO FINANCIAL STATEMENTS. |
SERIES P (HIGH YIELD SERIES) | |
STATEMENT OF ASSETS AND LIABILITIES |
December 31, 2024 |
Assets: |
Investments in unaffiliated issuers, at value (cost $32,932,188) | | $ | 30,659,448 | |
Investments in affiliated issuers, at value (cost $185) | | | 634 | |
Foreign currency, at value (cost 2,543) | | | 2,512 | |
Cash | | | 6,932 | |
Unrealized appreciation on forward foreign currency exchange contracts | | | 12,327 | |
Prepaid expenses | | | 2,512 | |
Receivables: |
Interest | | | 471,334 | |
Fund shares sold | | | 635 | |
Securities sold | | | 372 | |
Foreign tax reclaims | | | 366 | |
Total assets | | | 31,157,072 | |
| | | | | |
Liabilities: |
Unfunded loan commitments, at value (Note 8) (commitment fees received $70) | | | 3,691 | |
Payable for: |
Securities purchased | | | 332,970 | |
Professional fees | | | 37,099 | |
Distribution and service fees | | | 6,361 | |
Fund shares redeemed | | | 3,680 | |
Transfer agent/maintenance fees | | | 2,407 | |
Fund accounting and administration fees | | | 1,800 | |
Trustees’ fees* | | | 1,739 | |
Management fees | | | 762 | |
Miscellaneous | | | 13,950 | |
Total liabilities | | | 404,459 | |
Net assets | | $ | 30,752,613 | |
| | | | | |
Net assets consist of: |
Paid in capital | | $ | 40,862,017 | |
Total distributable earnings (loss) | | | (10,109,404 | ) |
Net assets | | $ | 30,752,613 | |
Capital shares outstanding | | | 1,238,618 | |
Net asset value per share | | $ | 24.83 | |
STATEMENT OF OPERATIONS |
Year Ended December 31, 2024 |
Investment Income: |
Dividends from securities of unaffiliated issuers | | $ | 33,554 | |
Interest from securities of unaffiliated issuers | | | 2,293,600 | |
Total investment income | | | 2,327,154 | |
| | | | | |
Expenses: |
Management fees | | | 192,974 | |
Distribution and service fees | | | 80,406 | |
Transfer agent/maintenance fees | | | 25,511 | |
Professional fees | | | 55,657 | |
Fund accounting and administration fees | | | 21,172 | |
Trustees’ fees* | | | 15,268 | |
Custodian fees | | | 13,278 | |
Interest expense | | | 4,753 | |
Line of credit fees | | | 1,744 | |
Miscellaneous | | | 14,340 | |
Total expenses | | | 425,103 | |
Less: |
Expenses reimbursed by Adviser | | | (6,357 | ) |
Expenses waived by Adviser | | | (77,204 | ) |
Earning credits applied | | | (718 | ) |
Total waived/reimbursed expenses | | | (84,279 | ) |
Net expenses | | | 340,824 | |
Net investment income | | | 1,986,330 | |
| | | | | |
Net Realized and Unrealized Gain (Loss): |
Net realized gain (loss) on: |
Investments in unaffiliated issuers | | | (516,269 | ) |
Forward foreign currency exchange contracts | | | 41,679 | |
Foreign currency transactions | | | 6,491 | |
Net realized loss | | | (468,099 | ) |
Net change in unrealized appreciation (depreciation) on: |
Investments in unaffiliated issuers | | | 848,327 | |
Forward foreign currency exchange contracts | | | 23,475 | |
Foreign currency translations | | | (322 | ) |
Net change in unrealized appreciation (depreciation) | | | 871,480 | |
Net realized and unrealized gain | | | 403,381 | |
Net increase in net assets resulting from operations | | $ | 2,389,711 | |
* | Relates to Trustees not deemed “interested persons” within the meaning of Section 2(a)(19) of the Investment Company Act of 1940. |
SEE NOTES TO FINANCIAL STATEMENTS. | THE GUGGENHEIM FUNDS ANNUAL FINANCIAL REPORT | 47 |
SERIES P (HIGH YIELD SERIES) | |
STATEMENTS OF CHANGES IN NET ASSETS |
| | Year Ended
December 31,
2024 | | | Year Ended
December 31,
2023 | |
Increase (Decrease) in Net Assets from Operations: | | | | | | | | |
Net investment income | | $ | 1,986,330 | | | $ | 1,936,311 | |
Net realized loss on investments | | | (468,099 | ) | | | (532,773 | ) |
Net change in unrealized appreciation (depreciation) on investments | | | 871,480 | | | | 2,236,322 | |
Net increase in net assets resulting from operations | | | 2,389,711 | | | | 3,639,860 | |
| | | | | | | | | |
Distributions to shareholders | | | (1,935,296 | ) | | | (1,782,949 | ) |
| | | | | | | | | |
Capital share transactions: | | | | | | | | |
Proceeds from sale of shares | | | 4,347,900 | | | | 22,499,533 | |
Distributions reinvested | | | 1,935,296 | | | | 1,782,949 | |
Cost of shares redeemed | | | (9,170,777 | ) | | | (25,271,728 | ) |
Net decrease from capital share transactions | | | (2,887,581 | ) | | | (989,246 | ) |
Net increase (decrease) in net assets | | | (2,433,166 | ) | | | 867,665 | |
| | | | | | | | | |
Net assets: | | | | | | | | |
Beginning of year | | | 33,185,779 | | | | 32,318,114 | |
End of year | | $ | 30,752,613 | | | $ | 33,185,779 | |
| | | | | | | | | |
Capital share activity: | | | | | | | | |
Shares sold | | | 176,348 | | | | 952,750 | |
Shares issued from reinvestment of distributions | | | 80,671 | | | | 76,951 | |
Shares redeemed | | | (371,486 | ) | | | (1,069,069 | ) |
Net decrease in shares | | | (114,467 | ) | | | (39,368 | ) |
48 | THE GUGGENHEIM FUNDS ANNUAL FINANCIAL REPORT | SEE NOTES TO FINANCIAL STATEMENTS. |
SERIES P (HIGH YIELD SERIES) | |
This table is presented to show selected data for a share outstanding throughout each period and to assist shareholders in evaluating the Fund’s performance for the periods presented.
| | Year Ended
December 31,
2024 | | | Year Ended
December 31,
2023 | | | Year Ended
December 31,
2022 | | | Year Ended
December 31,
2021 | | | Year Ended
December 31,
2020 | |
Per Share Data |
Net asset value, beginning of period | | $ | 24.53 | | | $ | 23.21 | | | $ | 27.55 | | | $ | 27.49 | | | $ | 28.39 | |
Income (loss) from investment operations: |
Net investment income (loss)a | | | 1.53 | | | | 1.47 | | | | 1.28 | | | | 1.30 | | | | 1.37 | |
Net gain (loss) on investments (realized and unrealized) | | | .30 | | | | 1.25 | | | | (3.95 | ) | | | .18 | | | | (.21 | ) |
Total from investment operations | | | 1.83 | | | | 2.72 | | | | (2.67 | ) | | | 1.48 | | | | 1.16 | |
Less distributions from: |
Net investment income | | | (1.53 | ) | | | (1.40 | ) | | | (1.67 | ) | | | (1.42 | ) | | | (2.06 | ) |
Total distributions | | | (1.53 | ) | | | (1.40 | ) | | | (1.67 | ) | | | (1.42 | ) | | | (2.06 | ) |
Net asset value, end of period | | $ | 24.83 | | | $ | 24.53 | | | $ | 23.21 | | | $ | 27.55 | | | $ | 27.49 | |
|
Total Returnb | | | 7.63 | % | | | 12.02 | % | | | (9.70 | %) | | | 5.41 | % | | | 4.64 | % |
Ratios/Supplemental Data |
Net assets, end of period (in thousands) | | $ | 30,753 | | | $ | 33,186 | | | $ | 32,318 | | | $ | 44,592 | | | $ | 45,153 | |
Ratios to average net assets: |
Net investment income (loss) | | | 6.18 | % | | | 6.23 | % | | | 5.19 | % | | | 4.70 | % | | | 5.13 | % |
Total expensesc | | | 1.32 | % | | | 1.34 | % | | | 1.28 | % | | | 1.28 | % | | | 1.38 | % |
Net expensesd,e | | | 1.06 | % | | | 1.08 | % | | | 1.07 | % | | | 1.08 | % | | | 1.12 | % |
Portfolio turnover rate | | | 44 | % | | | 39 | % | | | 33 | % | | | 76 | % | | | 84 | % |
a | Net investment income (loss) per share was computed using average shares outstanding throughout the period. |
b | Total return does not take into account any of the expenses associated with an investment in variable insurance products. If total return had taken into account these expenses, performance would have been lower. Shares of a series of Guggenheim Variable Funds Trust are available only through the purchase of such products. |
c | Does not include expenses of the underlying funds in which the Fund invests. |
d | Net expense information reflects the expense ratios after expense waivers and reimbursements, as applicable. |
e | Net expenses may include expenses that are excluded from the expense limitation agreement. Excluding these expenses, the net expense ratios for the years presented would be: |
| | 12/31/24 | 12/31/23 | 12/31/22 | 12/31/21 | 12/31/20 |
| | 1.04% | 1.05% | 1.05% | 1.06% | 1.07% |
SEE NOTES TO FINANCIAL STATEMENTS. | THE GUGGENHEIM FUNDS ANNUAL FINANCIAL REPORT | 49 |
NOTES TO FINANCIAL STATEMENTS |
Note 1 – Organization and Significant Accounting Policies
Organization
Guggenheim Variable Funds Trust (the “Trust”), a Delaware statutory trust, is registered with the U.S. Securities and Exchange Commission (the “SEC”) under the Investment Company Act of 1940 (the “1940 Act”), as an open-ended investment company. The Trust consists of multiple series. Each series represents a separate fund (each, a “Fund” and collectively, the “Funds”). The Trust may issue an unlimited number of authorized shares. The Trust accounts for the assets of each Fund separately. At December 31, 2024, the Trust consisted of three Funds. The Trust offers shares of the Funds to insurance companies for their variable annuity and variable life insurance contracts.
This report covers the following Funds:
Fund Name | Investment
Company Type |
Series E (Total Return Bond Series) | Diversified |
Series F (Floating Rate Strategies Series) | Diversified |
Series P (High Yield Series) | Diversified |
Guggenheim Partners Investment Management, LLC (“GPIM” or the “Adviser”), which operates under the name Guggenheim Investments (“GI”), provides advisory services to the Funds. Prior to November 29, 2024, Security Investors, LLC (“SI”) provided advisory services to Series E (Total Return Bond Series) and Series P (High Yield Series). In connection with an internal realignment of Guggenheim Investment’s lines of business, effective on November 29, 2024, GPIM replaced SI as a party to the investment advisory agreements between SI and the Trust with respect to Series E (Total Return Bond Series) and Series P (High Yield Series). Guggenheim Funds Distributors, LLC (“GFD”) serves as the distributor for the Trust. GI and GFD are affiliated entities.
Significant Accounting Policies
The Funds operate as investment companies and, accordingly, follow the investment company accounting and reporting guidance of the Financial Accounting Standards Board (“FASB”) Accounting Standards Codification Topic 946 Financial Services – Investment Companies.
The following significant accounting policies are in conformity with U.S. generally accepted accounting principles (“U.S. GAAP”) and are consistently followed by the Trust. This requires management to make estimates and assumptions that affect the reported amount of assets and liabilities, contingent assets and liabilities at the date of the financial statements, and the reported amounts of revenues and expenses during the reporting period. Actual results could differ from these estimates. All time references are based on Eastern Time.
The net asset value per share (“NAV”) of a fund is calculated by dividing the market value of a fund’s securities and other assets, less all liabilities, by the number of outstanding shares of that fund.
(a) Valuation of Investments
The Board of Trustees of the Funds (the “Board”) has adopted policies and procedures for the valuation of the Funds’ investments (the “ Fund Valuation Procedures”).
Pursuant to Rule 2a-5 under the 1940 Act, the Board designated the Adviser as the valuation designee to perform fair valuation determinations for each Fund with respect to all Fund investments and/or other assets. As the Funds’ valuation designee pursuant to Rule 2a-5, the Adviser has adopted separate procedures (“Valuation Designee Procedures” and collectively with the Fund Valuation Procedures, the “Valuation Procedures”) reasonably designed to prevent violations of the requirements of Rule 2a-5 and Rule 31a-4 under the 1940 Act. The Adviser, in its role as valuation designee, utilizes the assistance of a valuation committee, consisting of representatives from Guggenheim’s investment management, fund administration, legal and compliance departments (the “Valuation Committee”), in determining fair value of the Funds’ securities and/or other assets. The Valuation Procedures may be amended and potentially adversely affected as the Funds seek to comply with regulations that apply to the valuation practices of registered investment companies.
Valuations of the Funds’ securities and other assets are supplied primarily by independent third-party pricing services appointed pursuant to the processes set forth in the Valuation Procedures. The Adviser, with the assistance of the Valuation Committee, convenes monthly, or more frequently as needed, to review the valuation of all assets which have been fair valued. The Adviser, consistent with the monitoring and review responsibilities set forth in the Valuation Procedures, regularly reviews the appropriateness of the inputs, methods, models and assumptions employed by the independent third-party pricing services. If the independent third-party pricing service cannot or does not provide a valuation for a particular investment or such valuation is deemed unreliable, such investment is fair valued by the Adviser.
In general, portfolio securities and assets of a Fund will be valued on the basis of readily available market quotations at their current market value. With respect to portfolio securities and assets of a Fund for which market quotations are not readily available, or deemed unreliable by the Adviser, the Fund will fair value those securities and assets in good faith in accordance with the Valuation Procedures. Valuations in accordance with these methods are intended to reflect each security’s (or asset’s or liability’s) “fair value.” Fair value represents a good faith approximation of the value of a security. Fair value determinations
50 | THE GUGGENHEIM FUNDS ANNUAL FINANCIAL REPORT | |
NOTES TO FINANCIAL STATEMENTS (continued) |
may be based on limited inputs and involve the consideration of a number of subjective factors, an analysis of applicable facts and circumstances, and the exercise of judgment. Each such determination is based on a consideration of all relevant factors, which are likely to vary from one pricing context to another. Examples of such factors may include, but are not limited to market prices; sale prices; broker quotes; and models which derive prices based on inputs such as prices of securities with comparable maturities and characteristics, or based on inputs such as anticipated cash flows or collateral, spread over U.S. Treasury securities, and other information analysis. As a result, it is possible that the fair value for a security determined in good faith in accordance with the Valuation Procedures may differ from valuations for the same security determined by other funds using their own valuation procedures. Although the Valuation Procedures are designed to value a portfolio security or asset at the price a Fund may reasonably expect to receive upon its sale in an orderly transaction, there can be no assurance that any fair value determination thereunder would, in fact, approximate the amount that a Fund could reasonably expect to receive upon the sale of the portfolio security or asset.
U.S. Government securities are valued by independent third-party pricing services, using the last traded fill price, or at the reported bid price at the close of business on the valuation date.
Commercial paper and discount notes with a maturity of greater than 60 days at acquisition are valued at prices that reflect broker-dealer supplied valuations or are obtained from independent third-party pricing services, which may consider the trade activity, treasury spreads, yields or price of bonds of comparable quality, coupon, maturity, and type, as well as prices quoted by dealers who make markets in such securities. Commercial paper and discount notes with a maturity of 60 days or less at acquisition are valued at amortized cost, unless the Adviser concludes that amortized cost does not represent the fair value of the applicable asset in which case it will be valued using independent third-party pricing services.
CLOs, CDOs, MBS, ABS, and other structured finance securities are generally valued using an independent third-party pricing service.
Repurchase agreements are generally valued at amortized cost, provided such amounts approximate market value.
Equity securities listed or traded on a recognized U.S. securities exchange or the Nasdaq Stock Market (“NASDAQ”) will generally be valued on the basis of the last sale price on the primary U.S. exchange or market on which the security is listed or traded; provided, however, that securities listed on NASDAQ will be valued at the NASDAQ official closing price, which may not necessarily represent the last sale price.
Open-end investment companies are valued at their NAV as of the close of business, on the valuation date. ETFs and listed closed-end investment companies are generally valued at the last quoted sale price.
Exchange-traded options are valued at the mean of the bid and ask prices on the principal exchange on which they are traded.
Over-the-counter (“OTC”) options and options on swaps (“swaptions”) are valued using a price provided by a pricing service.
Forward foreign currency exchange contracts are valued daily based on the applicable exchange rate of the underlying currency.
Futures contracts are valued on the basis of the last sale price as of 4:00 p.m. on the valuation date. In the event that the exchange for a specific futures contract closes earlier than 4:00 p.m., the futures contract is valued at the official settlement price of the exchange. However, the underlying securities from which the futures contract value is derived are monitored until 4:00 p.m. to determine if fair valuation would provide a more accurate valuation.
Interest rate swap agreements entered into by a Fund are valued on the basis of the last sale price on the primary exchange on which the swap is traded. Other swap agreements entered into by a Fund are generally valued using an evaluated price provided by an independent third-party pricing service.
Typically, loans are valued using information provided by independent third-party pricing services that uses broker quotes, among other inputs. If the independent third-party pricing service cannot or does not provide a valuation for a particular loan, or such valuation is deemed unreliable, such investment is valued based on a quote from a broker-dealer or is fair valued by the Adviser. Funds that invest in loans or asset-backed securities as part of their investment strategies may have a significant amount of these instruments that are fair valued by the Adviser.
Generally, trading in foreign securities markets is substantially completed each day at various times prior to the close of the New York Stock Exchange (“NYSE”). The values of foreign securities are determined as of the close of such foreign markets or the close of the NYSE, if earlier. All investments quoted in foreign currencies are valued in U.S. dollars on the basis of the foreign currency exchange rates prevailing at the close of U.S. business at 4:00 p.m. E.T. Investments in foreign securities may involve risks not present in domestic investments. The Adviser will determine the current value of such foreign securities by taking into consideration certain factors which may include those discussed above, as well as the following factors, among others: the value of the securities traded on other foreign markets, American Depositary Receipts (“ADR”) trading, closed-end fund trading, foreign currency exchange
| | THE GUGGENHEIM FUNDS ANNUAL FINANCIAL REPORT | 51 |
NOTES TO FINANCIAL STATEMENTS (continued) |
activity, and the trading prices of financial products that are tied to foreign securities. In addition, under the Valuation Procedures, the Adviser is authorized to use prices and other information supplied by a third-party pricing vendor in valuing foreign securities.
A Fund may also fair value securities and assets when a significant event is deemed to have occurred after the time of a market quotation including for securities and assets traded on foreign markets and securities and assets for which market quotations are provided by independent third-party pricing services as of a time that is prior to the time when the Funds determine their NAV. There can be no assurance in each case that significant events will be identified.
Valuations of the Funds’ securities and other assets are supplied primarily by independent third-party pricing services pursuant to the processes set forth in the Valuation Designee Procedures. Valuations provided by the independent third-party pricing services are generally based on methods designed to approximate the amount that a Fund could reasonably expect to receive upon the sale of the portfolio security or asset. When providing valuations to the Funds, independent third-party pricing services use various inputs, methods, models and assumptions, which may include information provided by broker-dealers and other market makers. Independent third-party pricing services face the same challenges as the Funds in valuing securities and assets and may rely on limited available information. If the independent third-party pricing service cannot or does not provide a valuation for a particular investment, or such valuation is deemed unreliable, such investment is fair valued by the Adviser. A Fund may also use third-party service providers to model certain securities to determine fair market value. While a Fund’s use of fair valuation is intended to result in calculation of NAV that fairly reflects values of the Fund’s portfolio securities as of the time of pricing, a Fund cannot guarantee that any fair valuation will, in fact, approximate the amount the Fund would actually realize upon the sale of the securities in question.
Quotes from broker-dealers (i.e., prices provided by a broker-dealer or other market participant, which may or may not be committed to trade at that price), adjusted for fluctuations in criteria such as credit spreads and interest rates, may also be used to value a Fund’s assets. Quotes from broker-dealers and vendor prices based on broker quotes can vary in terms of depth (e.g., provided by a single broker-dealer) and frequency (e.g., provided on a daily, weekly, or monthly basis, or any other regular or irregular interval). Although quotes from broker-dealers and vendor prices based on broker quotes are typically received from established market participants, a Fund may not have the transparency to view the underlying inputs which support such quotes. Significant changes in a quote from a broker-dealer would generally result in significant changes in the fair value of the security.
(b) U.S. Government and Agency Obligations
Certain U.S. Government and Agency Obligations are traded on a discount basis; the interest rates shown on the Funds’ Schedules of Investments reflect the effective rates paid at the time of purchase by the Funds. Other securities bear interest at the rates shown, payable at fixed dates through maturity.
Inflation-Indexed bonds are fixed-income securities whose principal value is periodically adjusted to the rate of inflation. The interest rate on these securities is generally fixed at issuance at a rate lower than typical bonds. Over the life of an inflation indexed bond however, interest will be paid based on a principal value which is adjusted for inflation. Any increase in the principal amount of an inflation-indexed bond is recognized as a component of Interest on the Funds’ Statements of Operations, even though principal is not received until maturity.
(c) Senior Floating Rate Interests and Loan Investments
Senior floating rate interests in which the Trust invests generally pay interest rates which are periodically adjusted by reference to a base short-term floating rate, plus a premium. These base lending rates are generally (i) the lending rate offered by one or more major European banks, (ii) the prime rate offered by one or more major United States banks, or (iii) the bank’s certificate of deposit rate. Senior floating rate interests often require prepayments from excess cash flows or permit the borrower to repay at its election. The rate at which the borrower repays cannot be predicted with accuracy. As a result, the actual remaining maturity may be substantially less than the stated maturities disclosed in the Funds’ Schedules of Investments.
The Funds invest in loans and other similar debt obligations (“obligations”). A portion of the Funds’ investments in these obligations is sometimes referred to as “covenant lite” loans or obligations (“covenant lite obligations”), which are obligations that lack financial maintenance covenants or possess fewer or contingent financial maintenance covenants and other financial protections for lenders and investors. The Funds may also obtain exposure to covenant lite obligations through investment in securitization vehicles and other structured products. Many new, restructured or reissued obligations have not featured traditional covenants, which are intended to protect lenders and investors by (i) imposing certain restrictions or other limitations on a borrower’s operations or assets or (ii) providing certain rights to lenders. The Funds may have fewer rights with respect to covenant lite obligations, including fewer protections against the possibility of default and fewer remedies in the event of default. As a result, investments in (or exposure to) covenant lite obligations are subject to more risk than investments in (or exposure to) certain other types of obligations. The Funds are subject to other risks associated with investments in (or exposure to) obligations, including that obligations may not be considered “securities” and,
52 | THE GUGGENHEIM FUNDS ANNUAL FINANCIAL REPORT | |
NOTES TO FINANCIAL STATEMENTS (continued) |
as a result, the Funds may not be entitled to rely on the anti-fraud protections under the federal securities laws and instead may have to resort to state law and direct claims.
(d) Interest on When-Issued Securities
The Funds may purchase and sell interests in securities on a when-issued and delayed delivery basis, with payment and delivery scheduled for a future date. No income accrues to the Funds on such interests or securities in connection with such transactions prior to the date the Funds actually take delivery of such interests or securities. These transactions are subject to market fluctuations and are subject to the risk that the value at delivery may be more or less than the trade date purchase price. Although the Funds will generally purchase these securities with the intention of acquiring such securities, they may sell such securities before the settlement date.
(e) Options
Upon the purchase of an option, the premium paid is recorded as an investment, the value of which is marked-to-market daily. If a purchased option expires, the Fund realizes a loss in the amount of the cost of the option. When the Fund enters into a closing sale transaction, it realizes a gain or loss depending on whether the proceeds from the closing sale transaction are greater or less than the cost of the option. If the Fund exercises a put option, it realizes a gain or loss from the sale of the underlying security and the proceeds from such sale will be decreased by the premium originally paid. When the Fund exercises a call option, the cost of the security purchased by the Fund upon exercise increases by the premium originally paid.
When the Fund writes (sells) an option, an amount equal to the premium received is entered in that Fund’s accounting records as an asset and equivalent liability. The amount of the liability is subsequently marked-to-market to reflect the current value of the option written. When a written option expires, or if the Fund enters into a closing purchase transaction, it realizes a gain (or loss if the cost of a closing purchase transaction exceeds the premium received when the option was sold).
The Fund may purchase and write swaptions primarily to preserve a return or spread on a particular investment or portion of the Funds’ holdings, as a duration management technique or to protect against an increase in the price of securities it anticipates purchasing at a later date. The purchaser and writer of a swaption is buying or granting the right to enter into a previously agreed upon interest rate swap agreement at any time before the expiration of the options. The swaptions are forward premium swaptions which have extended settlement dates.
(f) Futures Contracts
Upon entering into a futures contract, a Fund deposits and maintains as collateral such initial margin as required by the exchange on which the transaction is affected. Pursuant to the contract, the Fund agrees to receive from or pay to the broker an amount of cash equal to the daily fluctuation in value of the contract. Such receipts or payments are known as variation margin and are recorded by the Fund as unrealized appreciation or depreciation. When the contract is closed, the Fund records a realized gain or loss equal to the difference between the value of the contract at the time it was opened and the value at the time it was closed.
(g) Swap Agreements
Swap agreements are marked-to-market daily and the change, if any, is recorded as unrealized appreciation or depreciation.
Payments received or made as a result of an agreement or termination of an agreement are recognized as realized gains or losses.
Upon entering into certain centrally-cleared swap transactions, a Fund is required to deposit with its clearing broker an amount of cash or securities as an initial margin. Subsequent variation margin receipts or payments are received or made by the Fund depending on fluctuations in the fair value of the reference entity and are recorded by the Fund as unrealized appreciation or depreciation. When the contract is closed, the Fund records a realized gain or loss equal to the difference between the value of the contract at the time it was opened and the value at the time it was closed.
Upfront payments received or made by a Fund on credit default swap agreements and interest rate swap agreements are amortized over the expected life of the agreement. Periodic payments received or paid by a Fund are recorded as realized gains or losses. Payments received or made as a result of a credit event or termination of the contract are recognized, net of a proportional amount of the upfront payment, as realized gains or losses.
(h) Forward Foreign Currency Exchange Contracts
The change in value of a forward foreign currency exchange contract is recorded as unrealized appreciation or depreciation until the contract is closed. When the contract is closed, the Funds record a realized gain or loss equal to the difference between the value at the time the contract was opened and the value at the time it was closed.
| | THE GUGGENHEIM FUNDS ANNUAL FINANCIAL REPORT | 53 |
NOTES TO FINANCIAL STATEMENTS (continued) |
(i) Currency Translations
The accounting records of the Funds are maintained in U.S. dollars. All assets and liabilities initially expressed in foreign currencies are converted into U.S. dollars at prevailing exchange rates. Purchases and sales of investment securities, dividend and interest income, and certain expenses are translated at the rates of exchange prevailing on the respective dates of such transactions. Changes in the relationship of these foreign currencies to the U.S. dollar can significantly affect the value of the investments and earnings of the Funds. Foreign investments may also subject the Funds to foreign government exchange restrictions, expropriation, taxation, or other political, social, geopolitical or economic developments, all of which could affect the market and/or credit risk of the investments.
The Funds do not isolate that portion of the results of operations resulting from changes in the foreign exchange rates on investments from the fluctuations arising from changes in the market prices of securities held. Such fluctuations are included with the net realized gain or loss and unrealized appreciation or depreciation on investments.
Reported net realized foreign exchange gains and losses arise from sales of foreign currencies and currency gains or losses realized between the trade and settlement dates on investment transactions. Net unrealized appreciation and depreciation arise from changes in the fair values of assets and liabilities other than investments in securities at the fiscal period end, resulting from changes in exchange rates.
(j) Foreign Taxes
The Funds may be subject to foreign taxes (a portion of which may be reclaimable) on income, stock dividends, capital gains on investments or certain foreign currency transactions. All foreign taxes are recorded in accordance with the applicable foreign tax regulations and rates that exist in the foreign jurisdictions in which the Funds invest. These foreign taxes, if any, are paid by the Funds and reflected in their Statements of Operations as follows: foreign taxes withheld at source are presented as a reduction of income and foreign taxes on capital gains from sales of investments are included with the net realized gain (loss) on investments. Foreign taxes payable or deferred as of December 31, 2024, if any, are disclosed in the Funds’ Statements of Assets and Liabilities.
(k) Security Transactions
Security transactions are recorded on the trade date for financial reporting purposes. Realized gains and losses from securities transactions are recorded using the identified cost basis. Proceeds from lawsuits related to investment holdings are recorded as a reduction to cost if the securities are still held and as realized gains if no longer held in the respective Fund. Dividend income is recorded on the ex-dividend date, net of applicable taxes withheld by foreign countries, if any. Taxable non-cash dividends are recorded as dividend income. Interest income, including amortization of premiums and accretion of discounts, is accrued on a daily basis. Interest income also includes paydown gains and losses on mortgage-backed and asset-backed securities and senior and subordinated loans. Amendment fees are earned as compensation for evaluating and accepting changes to the original loan agreement and are recognized when received. Dividend income from Real Estate Investment Trusts (“REITs”) is recorded based on the income included in the distributions received from the REIT investments using published REIT classifications, including some management estimates when actual amounts are not available. Distributions received in excess of this estimated amount are recorded as a reduction of the cost of investments or reclassified to realized gains. The actual amounts of income, return of capital, and realized gains are only determined by each REIT after its fiscal year-end, and may differ from the estimated amounts.
Income from residual collateralized loan obligations is recognized using the effective interest method. At the time of purchase, management estimates the future expected cash flows and determines the effective yield and estimated maturity date based on the estimated cash flows. Subsequent to the purchase, the estimated cash flows are updated periodically and a revised yield is calculated prospectively.
Certain Funds may receive other income from investments in senior loan interests including amendment fees, consent fees and commitment fees. For funded loans, these fees are recorded as income when received by the Funds and included in interest income on the Funds’ Statements of Operations. For unfunded loans, commitment fees are included in realized gain on investments on the Funds’ Statements of Operations at the end of the commitment period.
(l) Distributions
Distributions of net investment income and net realized gains, if any, are declared and paid at least annually. Normally, all distributions of a Fund will automatically be reinvested without charge in additional shares of the same Fund. Distributions are recorded on the ex-dividend date and are determined in accordance with U.S. federal income tax regulations which may differ from U.S. GAAP.
(m) Expenses
Expenses directly attributable to a Fund are charged directly to the Fund. Other expenses common to various funds within the fund complex are generally allocated amongst such funds on the basis of average net assets.
54 | THE GUGGENHEIM FUNDS ANNUAL FINANCIAL REPORT | |
NOTES TO FINANCIAL STATEMENTS (continued) |
(n) Earnings Credits
Under the fee arrangement with the custodian, the Funds may earn credits based on overnight custody cash balances. These credits are utilized to reduce related custodial expenses. The custodian fees disclosed in the Funds’ Statements of Operations are before the reduction in expense from the related earnings credits, if any. Earnings credits for the year ended December 31, 2024, are disclosed in the Funds’ Statements of Operations.
(o) Cash
The Funds may leave cash overnight in their cash account with their custodian. Periodically, a Fund may have cash due to the custodian bank as an overdraft balance. A fee is incurred on this overdraft, calculated by multiplying the overdraft by a rate based on the federal funds rate, which was 4.33% at December 31, 2024.
(p) Indemnifications
Under the Trust’s organizational documents, the Trustees and Officers are indemnified against certain liabilities arising out of the performance of their duties to the Trust. In addition, throughout the normal course of business, the Funds enter into contracts that contain a variety of representations and warranties which provide general indemnifications. The Funds’ maximum exposure under these arrangements is unknown, as this would involve future claims that may be made against the Funds and/or their affiliates that have not yet occurred. However, based on experience, the Funds expect the risk of loss to be remote.
(q) Special Purpose Acquisition Companies
The Funds may acquire an interest in a special purpose acquisition company (“SPAC”) in an initial public offering or a secondary market transaction. SPAC investments carry many of the same risks as investments in initial public offering securities, such as erratic price movements, greater risk of loss, lack of information about the issuer, limited operating and little public or no trading history, and higher transaction costs. An investment in a SPAC is typically subject to a higher risk of dilution by additional later offerings of interests in the SPAC or by other investors exercising existing rights to purchase shares of the SPAC and interests in SPACs may be illiquid and/or be subject to restrictions on resale. A SPAC is a publicly traded company that raises investment capital for the purpose of acquiring the equity securities of one or more existing companies (or interests therein) via merger, combination, acquisition or other similar transactions. Unless and until an acquisition is completed, a SPAC generally invests its assets (less a portion retained to cover expenses) in U.S. government securities, money market securities and cash and does not typically pay dividends in respect of its common stock. SPAC investments are also subject to the risk that a significant portion of the funds raised by the SPAC may be expended during the search for a target acquisition or merger and that the SPAC may have limited time in which to conduct due diligence on potential business combination targets. Because SPACs are in essence blank check companies without operating history or ongoing business other than seeking acquisitions, the value of their securities is particularly dependent on the ability of the entity’s management to identify and complete a profitable acquisition. Among other conflicts of interest, the economic interests of the management, directors, officers and related parties of a SPAC can differ from the economic interests of public shareholders, which may lead to conflicts as they evaluate, negotiate and recommend business combination transactions to shareholders. This risk may become more acute as the deadline for the completion of a business combination nears. There is no guarantee that the SPACs in which the Funds invest will complete an acquisition or that any acquisitions that are completed will be profitable.
Note 2 – Financial Instruments and Derivatives
As part of their investment strategies, the Funds may utilize a variety of derivative instruments. These investments involve, to varying degrees, elements of market risk and risks in excess of amounts recognized on the Funds’ Statements of Assets and Liabilities. Valuation and accounting treatment of these instruments can be found under Significant Accounting Policies in Note 1 of these Notes to Financial Statements.
Derivatives
Derivatives are instruments whose values depend on, or are derived from, in whole or in part, the value of one or more other assets, such as securities, currencies, commodities or indices. Derivative instruments may be used for investment purposes (including to maintain cash reserves while maintaining exposure to certain other assets), for risk management (hedging) purposes, to facilitate trading, to reduce transaction costs and to pursue higher investment returns. Derivative instruments may also be used to seek to mitigate certain investment risks, such as foreign currency exchange rate risk, interest rate risk and credit risk. U.S. GAAP requires disclosures to enable investors to better understand how and why a Fund uses derivative instruments, how these derivative instruments are accounted for and their effects on the Fund’s financial position and results of operations.
The Funds may utilize derivatives for the following purposes:
Duration: the use of an instrument to manage the interest rate risk of a portfolio.
Hedge: an investment made in order to reduce the risk of adverse price movements in a security, by taking an offsetting position to protect against broad market moves.
Income: the use of any instrument that distributes cash flows typically based upon some rate of interest.
| | THE GUGGENHEIM FUNDS ANNUAL FINANCIAL REPORT | 55 |
NOTES TO FINANCIAL STATEMENTS (continued) |
Index Exposure: the use of an instrument to obtain exposure to a listed or other type of index.
If a Fund’s investment strategy consistently involves applying leverage, the value of the Fund’s shares will tend to increase or decrease more than the value of any increase or decrease in the underlying index or other asset. In addition, because an investment in derivative instruments generally requires a small investment relative to the amount of investment exposure assumed, an opportunity for increased net income is created; but, at the same time, leverage risk will increase. The Fund’s use of leverage, through borrowings or instruments such as derivatives, may cause an investment in the Fund to be more volatile and riskier than if they had not been leveraged.
Options Purchased and Written
A call option on a security gives the purchaser of the option the right to buy, and the writer of a call option the obligation to sell, the underlying security. The purchaser of a put option has the right to sell, and the writer of the put option the obligation to buy, the underlying security at any time during the option period. The risk associated with purchasing options is limited to the premium originally paid.
The following table represents the Funds’ use and volume of call/put options purchased on a monthly basis:
| | | | Average Notional Amount | |
Fund | Use | | Call | | | Put | |
Series E (Total Return Bond Series) | Duration, Hedge | | $ | 10,213,204 | | | $ | 3,166,875 | |
The risk in writing a call option is that a Fund may incur a loss if the market price of the underlying security increases and the option is exercised. The risk in writing a put option is that a Fund may incur a loss if the market price of the underlying security decreases and the option is exercised. In addition, there may be an imperfect correlation between the movement in prices of options and the underlying securities where a Fund may not be able to enter into a closing transaction because of an illiquid secondary market; or, for OTC options, a Fund may be at risk because of the counterparty’s inability to perform.
The following table represents the Funds’ use and volume of call/put options written on a monthly basis:
| | | | Average Notional Amount | |
Fund | Use | | Call | | | Put | |
Series E | Duration, Hedge | | $ | 5,504,871 | | | $ | 1,846,994 | |
Futures Contracts
A futures contract is an agreement to purchase (long) or sell (short) an agreed amount of securities or other instruments at a set price for delivery at a future date. There are significant risks associated with a Fund’s use of futures contracts, including (i) there may be an imperfect or no correlation between the changes in market value of the underlying asset and the prices of futures contracts; (ii) there may not be a liquid secondary market for a futures contract; (iii) trading restrictions or limitations may be imposed by an exchange; and (iv) government regulations may restrict trading in futures contracts. When investing in futures, there is minimal counterparty credit risk to a Fund because futures are exchange-traded and the exchange’s clearinghouse, as counterparty to all exchange-traded futures, guarantees against default. Cash deposits are shown as segregated cash with broker on the Funds’ Statements of Assets and Liabilities; securities held as collateral are noted on the Funds’ Schedules of Investments.
The following table represents the Funds’ use and volume of futures on a monthly basis:
| | | | Average Notional Amount | |
Fund | Use | | Long | | | Short | |
Series E (Total Return Bond Series) | Duration, Hedge | | $ | 9,486,400 | | | $ | — | |
56 | THE GUGGENHEIM FUNDS ANNUAL FINANCIAL REPORT | |
NOTES TO FINANCIAL STATEMENTS (continued) |
Swap Agreements
A swap is an agreement that obligates two parties to exchange a series of cash flows at specified intervals based upon or calculated by reference to changes in specified prices or rates for a specified amount of an underlying asset. When utilizing OTC swaps, a Fund bears the risk of loss of the amount expected to be received under a swap agreement in the event of the default or bankruptcy of a swap agreement counterparty or if the underlying asset declines in value. Certain standardized swaps are subject to mandatory central clearing and are executed on a multi-lateral or other trade facility platform, such as a registered exchange. There is limited counterparty credit risk with respect to centrally-cleared swaps as the transaction is facilitated through a central clearinghouse, much like exchange-traded futures contracts. For a Fund utilizing centrally-cleared swaps, the exchange bears the risk of loss resulting from a counterparty not being able to pay. There is no guarantee that a Fund or an underlying fund could eliminate its exposure under an outstanding swap agreement by entering into an offsetting swap agreement with the same or another party.
Total return swaps involve commitments where single or multiple cash flows are exchanged based on the price of an underlying reference asset (such as an index) for a fixed or variable interest rate. Total return swaps will usually be computed based on the current value of the reference asset as of the close of regular trading on the NYSE or other exchange, with the swap value being adjusted to include dividends accrued, financing charges and/or interest associated with the swap agreement. When utilizing total return swaps, a Fund bears the risk of loss of the amount expected to be received under a swap agreement in the event of the default or bankruptcy of a swap agreement counterparty or if the underlying reference asset declines in value.
The following table represents the Funds’ use and volume of total return swaps on a monthly basis:
Fund | Use | | Long | | | Short | |
Series E (Total Return Bond Series) | Hedge, Index Exposure | | $ | 63,846 | | | $ | 35,670 | |
Interest rate swaps involve the exchange by the Funds with another party for their respective commitment to pay or receive a fixed or variable interest rate on a notional amount of principal. Interest rate swaps are generally centrally-cleared, but central clearing does not make interest rate swap transactions risk free.
The following table represents the Funds’ use and volume of interest rate swaps on a monthly basis:
| | | | Average Notional Amount | |
Fund | Use | | Pay Floating Rate | | | Receive Floating Rate | |
Series E (Total Return Bond Series) | Duration, Income | | $ | 46,916,000 | | | $ | — | |
Credit default swaps are instruments which allow for the full or partial transfer of third-party credit risk, with respect to a particular entity or entities, from one counterparty to the other. A fund enters into credit default swaps as a “seller” or “buyer” of protection primarily to gain or reduce exposure to the investment grade and/or high yield bond market. A seller of credit default swaps is selling credit protection or assuming credit risk with respect to the underlying entity or entities. The buyer in a credit default swap is obligated to pay the seller a periodic stream of payments over the term of the contract provided that no event of default on an underlying reference obligation has occurred. If a credit event occurs, as defined under the terms of the swap agreement, the seller will either (i) pay to the buyer of protection an amount equal to the notional amount of the swap and take delivery of the referenced obligation or underlying securities comprising the referenced index or (ii) pay a net settlement amount in the form of cash or securities equal to the notional amount of the swap less the recovery value of the referenced obligation or underlying securities comprising the referenced index. The notional amount reflects the maximum potential amount the seller of credit protection could be required to pay to the buyer if a credit event occurs. The seller of protection receives periodic premium payments from the buyer and may also receive or pay an upfront premium adjustment to the stated periodic payments. In the event a credit default occurs on a credit default swap referencing an index, a factor adjustment will take place and the buyer of protection will receive a payment reflecting the par less the default recovery rate of the defaulted index component based on its weighting in the index. If no default occurs, the counterparty will pay the stream of payments and have no further obligations to the fund selling the credit protection. For a fund utilizing centrally cleared credit default swaps, the exchange bears the risk of loss resulting from a counterparty not being able to pay. For OTC credit default swaps, a fund bears the risk of loss of the amount expected to be received under a swap agreement in the event of the default or bankruptcy of a swap agreement counterparty, or in the case of a credit default swap in which a fund is selling credit protection, the default of a third party issuer.
| | THE GUGGENHEIM FUNDS ANNUAL FINANCIAL REPORT | 57 |
NOTES TO FINANCIAL STATEMENTS (continued) |
The quoted market prices and resulting market values for credit default swap agreements on securities and credit indices serve as an indicator of the current status of the payment/performance risk and represent the likelihood of an expected liability (or profit) for the credit derivative had the notional amount of the swap agreement been closed/sold as of the period end. Increasing market values, in absolute terms when compared to the notional amount of the swap, represent a deterioration of the referenced entity’s credit soundness and a greater likelihood or risk of default or other credit event occurring as defined under the terms of the agreement.
The following table represents the Funds’ use and volume of credit default swaps on a monthly basis:
| | | | Average Notional Amount | |
Fund | Use | | Protection Sold | | | Protection Purchased | |
Series E (Total Return Bond Series) | Hedge | | $ | — | | | $ | 2,609,454 | |
Forward Foreign Currency Exchange Contracts
A forward foreign currency exchange contract is an agreement between two parties to exchange two designated currencies at a specific time in the future. Certain types of contracts may be cash settled, in an amount equal to the change in exchange rates during the term of the contract. The contracts can be used to hedge or manage exposure to foreign currency risks with portfolio investments or to gain exposure to foreign currencies.
The market value of a forward foreign currency exchange contract changes with fluctuations in foreign currency exchange rates. Furthermore, the Funds may be exposed to risk if the counterparties cannot meet the contract terms or if the currency value changes unfavorably as compared to the U.S. dollar.
The following table represents the Funds’ use and volume of forward foreign currency exchange contracts on a monthly basis:
| | | | Average Value | |
Fund | Use | | Purchased | | | Sold | |
Series E (Total Return Bond Series) | Hedge | | $ | 45,040 | | | $ | 214,784 | |
Series F (Floating Rate Strategies Series) | Hedge | | | 3,335 | | | | 442,676 | |
Series P (High Yield Series) | Hedge | | | — | | | | 659,381 | |
Derivative Investment Holdings Categorized by Risk Exposure
The following is a summary of the location of derivative investments on the Funds’ Statements of Assets and Liabilities as of December 31, 2024:
Derivative Investment Type | Asset Derivatives | Liability Derivatives |
Currency forward contracts | Unrealized appreciation on forward foreign currency exchange contracts | Unrealized depreciation on forward foreign currency exchange contracts |
Credit/Equity/Interest rate swap agreements | Unamortized upfront premiums paid on interest rate swap agreements Unrealized appreciation on OTC swap agreements Variation margin on credit default swap agreements | Unamortized upfront premiums received on credit default swap agreements Variation margin on credit default swap agreements Variation margin on interest rate swap agreements |
Interest rate option contracts | Investments in unaffiliated issuers, at value | Options written, at value |
58 | THE GUGGENHEIM FUNDS ANNUAL FINANCIAL REPORT | |
NOTES TO FINANCIAL STATEMENTS (continued) |
The following tables set forth the fair value of the Funds’ derivative investments categorized by primary risk exposure at December 31, 2024:
Asset Derivative Investments Value |
Fund | | Swaps
Interest
Rate Risk* | | | Swaps
Credit
Risk* | | | Forward
Foreign
Currency
Exchange
Risk | | | Options
Purchased
Foreign
Currency
Exchange
Risk | | | Options
Purchased
Interest
Rate Risk | | | Options
Written
Interest
Rate Risk | | | Total
Value at
December 31,
2024 | |
Series E (Total Return Bond Series) | | $ | 180,370 | | | $ | 3,316 | | | $ | 2,553 | | | $ | 93,064 | | | $ | 56,444 | | | $ | — | | | $ | 335,747 | |
Series F (Floating Rate Strategies Series) | | | — | | | | — | | | | 5,211 | | | | — | | | | — | | | | — | | | | 5,211 | |
Series P (High Yield Series) | | | — | | | | — | | | | 12,327 | | | | — | | | | — | | | | — | | | | 12,327 | |
Liability Derivative Investments Value |
Fund | | Swaps
Interest
Rate Risk* | | | Swaps Credit
Risk* | | | Forward
Foreign
Currency
Exchange
Risk | | | Options
Purchased
Foreign
Currency
Exchange
Risk | | | Options
Purchased
Interest
Rate Risk | | | Options
Written
Interest
Rate Risk | | | Total
Value at
December 31,
2024 | |
Series E (Total Return Bond Series) | | $ | 840,933 | | | $ | 4,600 | | | $ | 609 | | | $ | — | | | $ | — | | | $ | 53,807 | | | $ | 899,949 | |
* | Includes cumulative appreciation (depreciation) of exchange-traded, OTC and centrally-cleared derivatives contracts as reported on the Schedules of Investments. For exchange-traded and centrally-cleared derivatives, variation margin is reported within the Funds’ Statements of Assets and Liabilities. |
The following is a summary of the location of derivative investments on the Funds’ Statements of Operations for the year ended December 31, 2024:
Derivative Investment Type | Location of Gain (Loss) on Derivatives |
Currency/Equity/Interest rate futures contracts | Net realized gain (loss) on futures contracts Net change in unrealized appreciation (depreciation) on futures contracts |
Currency forward contracts | Net realized gain (loss) on forward foreign currency exchange contracts Net change in unrealized appreciation (depreciation) on forward foreign currency exchange contracts |
Interest rate option contracts | Net realized gain (loss) on options purchased Net change in unrealized appreciation (depreciation) on options purchased Net realized gain (loss) on options written Net change in unrealized appreciation (depreciation) on options written |
Credit/Equity/Interest rate swap agreements | Net realized gain (loss) on swap agreements Net change in unrealized appreciation (depreciation) on swap agreements |
The following is a summary of the Funds’ realized gain (loss) and change in unrealized appreciation (depreciation) on derivative investments recognized on the Funds’ Statements of Operations categorized by primary risk exposure for the year ended December 31, 2024:
Realized Gain (Loss) on Derivative Investments Recognized on the Statements of Operations |
Fund | | Swaps
Equity
Risk | | | Futures
Interest
Rate Risk | | | Swaps
Interest
Rate Risk | | | Swaps
Credit
Risk | | | Forward
Foreign
Currency
Exchange
Risk | | | Options
Purchased
Foreign
Currency
Exchange
Risk | | | Options
Purchased
Interest
Rate Risk | | | Options
Written
Interest
Rate Risk | | | Total | |
Series E (Total Return Bond Series) | | $ | (2,245 | ) | | $ | 17,393 | | | $ | (246,557 | ) | | $ | (143,573 | ) | | $ | (2,442 | ) | | $ | — | | | $ | 69,088 | | | $ | (85,358 | ) | | $ | (393,694 | ) |
Series F (Floating Rate Strategies Series) | | | — | | | | — | | | | — | | | | — | | | | 19,557 | | | | — | | | | — | | | | — | | | | 19,557 | |
Series P ( High Yield Series) | | | — | | | | — | | | | — | | | | — | | | | 41,679 | | | | — | | | | — | | | | — | | | | 41,679 | |
| | THE GUGGENHEIM FUNDS ANNUAL FINANCIAL REPORT | 59 |
NOTES TO FINANCIAL STATEMENTS (continued) |
Change in Unrealized Appreciation (Depreciation) on Derivative Investments Recognized on the Statements of Operations |
Fund | | Futures
Interest
Rate Risk | | | Swaps
Interest
Rate Risk | | | Swaps
Credit
Risk | | | Forward
Foreign
Currency
Exchange
Risk | | | Options
Purchased
Foreign
Currency
Exchange
Risk | | | Options
Purchased
Interest
Rate Risk | | | Options
Written
Interest
Rate Risk | | | Total | |
Series E (Total Return Bond Series) | | $ | (109,629 | ) | | $ | (1,512,447 | ) | | $ | 93,238 | | | $ | 7,524 | | | $ | 12,259 | | | $ | 16,127 | | | $ | 11,825 | | | $ | (1,481,103 | ) |
Series F (Floating Rate Strategies Series) | | | — | | | | — | | | | — | | | | 15,499 | | | | — | | | | — | | | | — | | | | 15,499 | |
Series P ( High Yield Series) | | | — | | | | — | | | | — | | | | 23,475 | | | | — | | | | — | | | | — | | | | 23,475 | |
In conjunction with short sales and the use of derivative instruments, the Funds are required to maintain collateral in various forms. Depending on the financial instrument utilized and the broker involved, the Funds use margin deposits at the broker, cash and/or securities segregated at the custodian bank, discount notes or repurchase agreements allocated to the Funds as collateral.
The Trust has established counterparty credit guidelines and enters into transactions only with financial institutions rated/identified as investment grade or better. The Trust monitors the counterparty credit risk associated with each such financial institution.
Foreign Investments
There are several risks associated with exposure to foreign currencies, foreign issuers and emerging markets. A Fund’s indirect and direct exposure to foreign currencies subjects the Fund to the risk that those currencies will decline in value relative to the U.S. dollar, or in the case of short positions, that the U.S. dollar will decline in value relative to the currency being hedged. Currency rates in foreign countries may fluctuate significantly over short periods of time for a number of reasons, including changes in interest rates and the imposition of currency controls or other political developments in the U.S. or abroad. In addition, the Funds may incur transaction costs in connection with conversions between various currencies. The Funds may, but are not obligated to, engage in currency hedging transactions, which generally involve buying currency forward, options or futures contracts. However, not all currency risks may be effectively hedged, and in some cases the costs of hedging techniques may outweigh expected benefits. In such instances, the value of securities denominated in foreign currencies can change significantly when foreign currencies strengthen or weaken relative to the U.S. dollar.
The Funds may invest in securities of foreign companies directly, or in financial instruments, such as ADRs and exchange-traded funds, which are indirectly linked to the performance of foreign issuers. Foreign markets can be more volatile than the U.S. market due to increased risks of adverse issuer, political, regulatory, market, or economic developments and can perform differently from the U.S. market. Investing in securities of foreign companies directly, or in financial instruments that are indirectly linked to the performance of foreign issuers, may involve risks not typically associated with investing in U.S. issuers. The value of securities denominated in foreign currencies, and of dividends from such securities, can change significantly when foreign currencies strengthen or weaken relative to the U.S. dollar. Foreign securities markets generally have less trading volume and less liquidity than U.S. markets, and prices in some foreign markets may fluctuate more than those of securities traded on U.S. markets. Many foreign countries lack accounting and disclosure standards comparable to those that apply to U.S. companies, and it may be more difficult to obtain reliable information regarding a foreign issuer’s financial condition and operations. Transaction costs and costs associated with custody services are generally higher for foreign securities than they are for U.S. securities. Some foreign governments levy withholding taxes against dividend and interest income. Although in some countries portions of these taxes are recoverable, the non-recovered portion will reduce the income received by the Funds.
Note 3 – Offsetting
In the normal course of business, the Funds enter into transactions subject to enforceable master netting arrangements or other similar arrangements. Generally, the right to offset in those agreements allows the Funds to counteract the exposure to a specific counterparty with collateral received from or delivered to that counterparty based on the terms of the arrangements. These arrangements provide for the right to liquidate upon the occurrence of an event of default, credit event upon merger or additional termination event.
In order to better define their contractual rights and to secure rights that will help the Funds mitigate their counterparty risk, the Funds may enter into an International Swaps and Derivatives Association, Inc. Master Agreement (“ISDA Master Agreement”) or similar agreement with their derivative contract counterparties. An ISDA Master Agreement is a bilateral agreement between a fund and a counterparty that governs
60 | THE GUGGENHEIM FUNDS ANNUAL FINANCIAL REPORT | |
NOTES TO FINANCIAL STATEMENTS (continued) |
OTC derivatives, including foreign exchange contracts, and typically contains, among other things, collateral posting terms and netting provisions in the event of a default and/or termination event. The provisions of the ISDA Master Agreement typically permit a single net payment in the event of a default (close-out netting) or similar event, including the bankruptcy or insolvency of the counterparty.
For derivatives traded under an ISDA Master Agreement, the collateral requirements are typically calculated by netting the mark-to-market amount for each transaction under such agreement and comparing that amount to the value of any collateral currently pledged by the Funds and the counterparty. For financial reporting purposes, cash collateral that has been pledged to cover obligations of the Funds and cash collateral received from the counterparty, if any, are reported separately on the Funds’ Statements of Assets and Liabilities as segregated cash with broker/receivable for variation margin, or payable for swap settlement/variation margin. Cash and/or securities pledged or received as collateral by the Funds in connection with an OTC derivative subject to an ISDA Master Agreement generally may not be invested, sold or rehypothecated by the counterparty or the Funds, as applicable, absent an event of default under such agreement, in which case such collateral generally may be applied towards obligations due to and payable by such counterparty or the Funds, as applicable. Generally, the amount of collateral due from or to a counterparty must exceed a minimum transfer amount threshold (e.g., $300,000) before a transfer is required to be made. To the extent amounts due to the Funds from their counterparties are not fully collateralized, contractually or otherwise, the Funds bear the risk of loss from counterparty nonperformance. The Funds attempt to mitigate counterparty risk by only entering into agreements with counterparties that they believe to be of good standing and by monitoring the financial stability of those counterparties.
For financial reporting purposes, the Funds do not offset derivative assets and derivative liabilities that are subject to netting arrangements in the Funds’ Statements of Assets and Liabilities.
The following tables present derivative financial instruments and secured financing transactions that are subject to enforceable netting arrangements:
| | | | | | | | | | | | | | | | Gross Amounts Not Offset
in the Statements of
Assets and Liabilities | | | | | |
Fund | Instrument | | Gross
Amounts of
Recognized
Assets1 | | | Gross
Amounts
Offset in the
Statements
of Assets and
Liabilities | | | Net Amount
of Assets
Presented on
the Statements
of Assets and
Liabilities | | | Financial
Instruments | | | Cash
Collateral
Received | | | Net
Amount | |
Series E (Total Return Bond Series) | Options Purchased | | $ | 149,508 | | | $ | — | | | $ | 149,508 | | | $ | (53,807 | ) | | $ | — | | | $ | 95,701 | |
| | Forward foreign currency exchange contracts | | | 2,553 | | | | — | | | | 2,553 | | | | (472 | ) | | | — | | | | 2,081 | |
| | Credit default swap agreements | | | 3,316 | | | | — | | | | 3,316 | | | | — | | | | — | | | | 3,316 | |
Series F (Floating rate Strategies Series) | Forward foreign currency exchange contracts | | | 5,211 | | | | — | | | | 5,211 | | | | — | | | | — | | | | 5,211 | |
Series P (High Yield Series) | Forward foreign currency exchange contracts | | | 12,327 | | | | — | | | | 12,327 | | | | — | | | | — | | | | 12,327 | |
| | THE GUGGENHEIM FUNDS ANNUAL FINANCIAL REPORT | 61 |
NOTES TO FINANCIAL STATEMENTS (continued) |
| | | | | | | | | | | | | | | | Gross Amounts Not Offset
in the Statements of
Assets and Liabilities | | | | | |
Fund | Instrument | | Gross
Amounts of
Recognized
Liabilities1 | | | Gross
Amounts
Offset in the
Statements
of Assets and
Liabilities | | | Net Amounts
of Liabilities
Presented on
the Statements
of Assets and
Liabilities | | | Financial
Instruments | | | Cash
Collateral
Pledged | | | Net
Amount | |
Series E (Total Return Bond Series) | Options Written | | $ | 53,807 | | | $ | — | | | $ | 53,807 | | | $ | (53,807 | ) | | $ | — | | | $ | — | |
| | Forward foreign currency exchange contracts | | | 609 | | | | — | | | | 609 | | | | (472 | ) | | | — | | | | 137 | |
1 | Exchange-traded or centrally-cleared derivatives are excluded from these reported amounts. |
The Funds have the right to offset deposits against any related derivative liabilities outstanding with each counterparty with the exception of exchange-traded or centrally-cleared derivatives. The following table presents deposits held by others in connection with derivative investments as of December 31, 2024.
Fund | Counterparty | Asset Type | | Cash Pledged | | | Cash Received | |
Series E (Total Return Bond Series) | BofA Securities, Inc. | Credit default swap agreements | | $ | 95,603 | | | $ | — | |
| BofA Securities, Inc. | Interest rate swap agreements | | | 14,402 | | | | — | |
| | | | | 110,005 | | | | — | |
Note 4 – Fair Value Measurement
In accordance with U.S. GAAP, fair value is defined as the price that the Funds would receive to sell an investment or pay to transfer a liability in an orderly transaction between market participants at the measurement date. U.S. GAAP establishes a three-tier fair value hierarchy based on the types of inputs used to value assets and liabilities and requires corresponding disclosure. The hierarchy and the corresponding inputs are summarized below:
Level 1 — | unadjusted quoted prices in active markets for identical assets or liabilities. |
Level 2 — | significant other observable inputs (for example quoted prices for securities that are similar based on characteristics such as interest rates, prepayment speeds, credit risk, etc.). |
Level 3 — | significant unobservable inputs based on the best information available under the circumstances, to the extent observable inputs are not available, which may include assumptions. |
Rule 2a-5 sets forth a definition of “readily available market quotations,” which is consistent with the definition of a Level 1 input under U.S. GAAP. Rule 2a-5 provides that “a market quotation is readily available only when that quotation is a quoted price (unadjusted) in active markets for identical investments that the fund can access at the measurement date, provided that a quotation will not be readily available if it is not reliable.”
Securities for which market quotations are not readily available must be valued at fair value as determined in good faith. Accordingly, any security priced using inputs other than Level 1 inputs will be subject to fair value requirements. The types of inputs available depend on a variety of factors, such as the type of security and the characteristics of the markets in which it trades, if any. Fair valuation determinations that rely on fewer or no observable inputs require greater judgment. Accordingly, fair value determinations for Level 3 securities require the greatest amount of judgment.
62 | THE GUGGENHEIM FUNDS ANNUAL FINANCIAL REPORT | |
NOTES TO FINANCIAL STATEMENTS (continued) |
Independent third-party pricing services are used to value a majority of the Funds’ investments. When values are not available from an independent third-party pricing service, they will be determined using a variety of sources and techniques, including: market prices; broker quotes; and models which derive prices based on inputs such as prices of securities with comparable maturities and characteristics or based on inputs such as anticipated cash flows or collateral, spread over U.S. Treasury securities, and other information and analysis. A significant portion of the Funds’ assets and liabilities are categorized as Level 2, as indicated in this report.
Quotes from broker-dealers, adjusted for fluctuations in criteria such as credit spreads and interest rates, may also be used to value the Funds’ assets and liabilities, i.e. prices provided by a broker-dealer or other market participant who has not committed to trade at that price. Although quotes are typically received from established market participants, the Funds may not have the transparency to view the underlying inputs which support the market quotations. Significant changes in a quote would generally result in significant changes in the fair value of the security.
Certain fixed income securities are valued by obtaining a monthly quote from a broker-dealer, adjusted for fluctuations in criteria such as credit spreads and interest rates.
Certain loans and other securities are valued using a single daily broker quote or a price from a independent third-party pricing services based on a single daily or monthly broker quote.
The inputs or methodologies selected and applied for valuing securities or other assets are not necessarily an indication of the risk associated with investing in those securities. The suitability, appropriateness and accuracy of the techniques, methodologies and sources employed to determine fair valuation are periodically reviewed and subject to change.
Note 5 – Investment Advisory Agreement and Other Agreements
Under the terms of an investment advisory contract, the Funds pay GI investment advisory fees on a monthly basis calculated daily at the annualized rates below, based on the average daily net assets of the Funds:
Fund | | Management Fees
(as a % of Net Assets) | |
Series E (Total Return Bond Series) | | | 0.39 | % |
Series F (Floating Rate Strategies Series) | | | 0.65 | %1 |
Series P (High Yield Series) | | | 0.60 | % |
1 | The Series F management fee is subject to a 0.05% reduction on assets over $5 billion. |
GI pays operating expenses on behalf of the Trust, such as audit and accounting related services, legal services, custody, printing and mailing, among others, on a pass-through basis. Such expenses are allocated to various Funds within the complex based on relative net assets.
The Board has adopted a separate Distribution and Shareholder Services Plan pursuant to Rule 12b-1 under the 1940 Act that allows those Funds to pay distribution and shareholder services fees to GFD. The Funds will pay distribution and shareholder services fees to GFD at an annual rate not to exceed 0.25% of average daily net assets. GFD may, in turn, pay all or a portion of the proceeds from the distribution and shareholder services fees to insurance companies or their affiliates and qualified plan administrators (“intermediaries”) for services they provide on behalf of the Funds to current and prospective variable contract owners and qualified plan participants that invest in the Funds through the intermediaries.
| | THE GUGGENHEIM FUNDS ANNUAL FINANCIAL REPORT | 63 |
NOTES TO FINANCIAL STATEMENTS (continued) |
Contractual expense limitation agreements for the following Funds provide that the total expenses be limited to a percentage of average net assets for the Funds, exclusive of brokerage costs, dividends or interest on securities sold short, expenses of other investment companies in which a Fund invests, interest, taxes, litigation, indemnification and extraordinary expenses. The limits are listed below:
| Limit | Effective
Date | Contract
End Date |
Series E (Total Return Bond Series) | 0.81% | 11/30/12 | 05/01/26 |
Series F (Floating Rate Strategies Series) | 1.15% | 04/22/13 | 05/01/26 |
Series P (High Yield Series) | 1.07% | 10/20/14 | 05/01/26 |
GI is entitled to reimbursement by the Funds for fees waived or expenses reimbursed during any of the previous 36 months, beginning on the date of the expense limitation agreement, if on any day the estimated operating expenses are less than the indicated percentages. For purposes of this arrangement, GI is entitled to recoupment of previously waived fees or reimbursed expenses for 36 months from the date of the waiver or reimbursement by GI. At December 31, 2024, the amount of fees waived or expenses reimbursed that are subject to recoupment and will expire during the years ended December 31, are presented in the following table:
Fund | | 2025 | | | 2026 | | | 2027 | | | Total | |
Series E (Total Return Bond Series) | | $ | 23,524 | | | $ | 21,638 | | | $ | 11,177 | | | $ | 56,339 | |
Series F (Floating Rate Strategies Series) | | | 45,284 | | | | 36,293 | | | | 39,301 | | | | 120,878 | |
Series P (High Yield Series) | | | 69,351 | | | | 72,179 | | | | 73,307 | | | | 214,837 | |
For the year ended December 31, 2024, GI recouped amounts from the Funds as follows:
Series E (Total Return Bond Series) | | $ | 62,122 | |
If a Fund invests in a fund that is advised by the same adviser or an affiliated adviser, the investing Fund’s adviser has agreed to waive fees at the investing fund level to the extent necessary to offset the proportionate share of any management fee paid by each Fund with respect to its investment in such affiliated fund. Fee waivers will be calculated at the investing fund level without regard to any expense cap in effect for the investing fund. Fees waived under this arrangement are not subject to reimbursement to GI. For the year ended December 31, 2024, the following Funds waived fees related to investments in affiliated funds:
Fund | | Amount Waived | |
Series E (Total Return Bond Series) | | $ | 25,423 | |
Series F (Floating Rate Strategies Series) | | | 6,269 | |
Certain trustees and officers of the Trust are also officers of GI and/or GFD. The Trust does not compensate its officers or trustees who are officers, directors and/or employees of GI or GFD.
MUFG Investor Services (US), LLC (“MUIS”) serves as the Funds’ administrator, transfer agent and accounting agent. As administrator, transfer agent and accounting agent, MUIS maintains the books and records of the Funds’ securities and cash. The Bank of New York Mellon Corp. (“BNY”) serves as the Funds’ custodian. As custodian, BNY is responsible for the custody of the Funds’ assets. For providing the aforementioned administrative and accounting services, MUIS is entitled to receive a monthly fee equal to a percentage of the Funds’ average daily net assets and out of pocket expenses. For providing the aforementioned transfer agent and custodian services, MUIS and BNY are entitled to receive a monthly fee based on the number of transactions during the month and the number of accounts under management, subject to certain minimum monthly fees, and out of pocket expenses.
Note 6 – Federal Income Tax Information
The Funds intend to comply with the provisions of Subchapter M of the Internal Revenue Code of 1986, as amended (the “Internal Revenue Code”), applicable to regulated investment companies and will distribute substantially all taxable net investment income and capital gains sufficient to relieve the Funds from all, or substantially all, federal income, excise and state income taxes. Therefore, no provision for federal or state income tax or federal excise tax is required.
64 | THE GUGGENHEIM FUNDS ANNUAL FINANCIAL REPORT | |
NOTES TO FINANCIAL STATEMENTS (continued) |
Tax positions taken or expected to be taken in the course of preparing the Funds’ tax returns are evaluated to determine whether the tax positions are “more-likely-than-not” of being sustained by the applicable tax authority. Tax positions not deemed to meet the “more-likely-than-not” threshold would be recorded as a tax benefit or expense in the current year. Management has analyzed the Funds’ tax positions taken, or to be taken, on U.S. federal income tax returns for all open tax years, and has concluded that no provision for income tax is required in the Funds’ financial statements. The Funds’ U.S. federal income tax returns are subject to examination by the Internal Revenue Service (“IRS”) for a period of three years after they are filed.
If a Fund makes a distribution to its shareholders in excess of its current and accumulated “earnings and profits” in any taxable year, the excess distribution will be treated as a return of capital to the extent of each shareholder’s basis (for tax purposes) in its shares, and any distribution in excess of basis will be treated as capital gain. A return of capital is not taxable, but it reduces the shareholder’s basis in its shares, which reduces the loss (or increases the gain) on a subsequent taxable disposition by such shareholder of the shares.
The tax character of distributions paid during the year ended December 31, 2024 was as follows:
Fund | | Ordinary
Income | | | Long-Term
Capital Gain | | | Total
Distributions | |
Series E (Total Return Bond Series) | | $ | 6,087,264 | | | $ | — | | | $ | 6,087,264 | |
Series F (Floating Rate Strategies Series) | | | 4,453,819 | | | | — | | | | 4,453,819 | |
Series P (High Yield Series) | | | 1,935,296 | | | | — | | | | 1,935,296 | |
The tax character of distributions paid during the year ended December 31, 2023 was as follows:
Fund | | Ordinary
Income | | | Long-Term
Capital Gain | | | Total
Distributions | |
Series E (Total Return Bond Series) | | $ | 5,275,065 | | | $ | — | | | $ | 5,275,065 | |
Series F (Floating Rate Strategies Series) | | | 1,925,766 | | | | — | | | | 1,925,766 | |
Series P (High Yield Series) | | | 1,782,949 | | | | — | | | | 1,782,949 | |
Note: For U.S. federal income tax purposes, short-term capital gain distributions are treated as ordinary income distributions.
The tax components of distributable earnings/(loss) as of December 31, 2024 were as follows:
Fund | | Undistributed
Ordinary
Income | | | Undistributed
Long-Term
Capital Gain | | | Net Unrealized
Appreciation
(Depreciation) | | | Accumulated
Capital and
Other Losses | | | Total | |
Series E (Total Return Bond Series) | | $ | 7,171,232 | | | $ | — | | | $ | (11,205,591 | ) | | $ | (17,491,355 | ) | | $ | (21,525,714 | ) |
Series F (Floating Rate Strategies Series) | | | 4,619,364 | | | | — | | | | (1,099,610 | ) | | | (5,098,786 | ) | | | (1,579,032 | ) |
Series P (High Yield Series) | | | 2,006,525 | | | | — | | | | (2,301,186 | ) | | | (9,814,743 | ) | | | (10,109,404 | ) |
For U.S. federal income tax purposes, capital loss carryforwards represent realized losses of the Funds that may be carried forward and applied against future capital gains. The Funds are permitted to carry forward capital losses for an unlimited period and such capital loss carryforwards retain their character as either short-term or long-term capital losses. As of December 31, 2024, capital loss carryforwards for the Funds were as follows:
| | | Unlimited | | | | | |
Fund | | Short-Term | | | Long-Term | | | Total
Capital Loss
Carryforward | |
Series E (Total Return Bond Series) | | $ | (5,274,590 | ) | | $ | (12,216,691 | ) | | $ | (17,491,281 | ) |
Series F (Floating Rate Strategies Series) | | | (660,612 | ) | | | (4,438,174 | ) | | | (5,098,786 | ) |
Series P (High Yield Series) | | | (38,985 | ) | | | (9,775,758 | ) | | | (9,814,743 | ) |
There were no capital loss carryforward amounts utilized during the year ended December 31, 2024.
| | THE GUGGENHEIM FUNDS ANNUAL FINANCIAL REPORT | 65 |
NOTES TO FINANCIAL STATEMENTS (continued) |
Net investment income and net realized gains (losses) may differ for financial statement and tax purposes because of temporary or permanent book/tax differences. These differences are primarily due to investments in partnerships, CLO securities, and swap agreements, foreign currency gains and losses, losses deferred due to wash sales, income accruals on certain investments, and income recharacterization from certain investments. Additional differences may result from the tax treatment of bond premium/discount amortization, the “mark-to-market” of certain derivatives, and the deferral of losses related to tax straddle investments. To the extent these differences are permanent and would require a reclassification between Paid in Capital and Total Distributable Earnings (Loss), such reclassifications are made in the period that the differences arise. These reclassifications have no effect on net assets or NAV per share.
There were no adjustments made on the Statements of Assets and Liabilities as of December 31, 2024 for permanent book/tax differences.
At December 31, 2024, the cost of investments for U.S. federal income tax purposes, the aggregate gross unrealized appreciation for all investments for which there was an excess of value over tax cost and the aggregate gross unrealized depreciation for all investments for which there was an excess of tax cost over value, were as follows:
Fund | | Tax
Cost | | | Tax
Unrealized
Appreciation | | | Tax
Unrealized
Depreciation | | | Net Tax
Unrealized
Appreciation/
(Depreciation) | |
Series E (Total Return Bond Series) | | $ | 209,805,727 | | | $ | 932,606 | | | $ | (12,140,200 | ) | | $ | (11,207,594 | ) |
Series F (Floating Rate Strategies Series) | | | 57,546,284 | | | | 408,987 | | | | (1,505,989 | ) | | | (1,097,002 | ) |
Series P (High Yield Series) | | | 32,957,422 | | | | 372,575 | | | | (2,669,915 | ) | | | (2,297,340 | ) |
Note 7 – Securities Transactions
For the year ended December 31, 2024, the cost of purchases and proceeds from sales of investment securities, excluding government securities, short-term investments and derivatives, were as follows:
Fund | | Purchases | | | Sales | |
Series E (Total Return Bond Series) | | $ | 95,212,006 | | | $ | 54,511,781 | |
Series F (Floating Rate Strategies Series) | | | 32,317,284 | | | | 34,964,251 | |
Series P (High Yield Series) | | | 13,635,340 | | | | 15,653,279 | |
For the year ended December 31, 2024, the cost of purchases and proceeds from sales of government securities were as follows:
Fund | | Purchases | | | Sales | |
Series E (Total Return Bond Series) | | $ | 61,515,049 | | | $ | 83,813,462 | |
The Funds are permitted to purchase or sell securities from or to certain affiliated funds under specified conditions outlined in procedures adopted by the Board. The procedures have been designed to ensure that any purchase or sale of securities by a Fund from or to another fund or portfolio that is or could be considered an affiliate by virtue of having a common investment adviser (or affiliated investment advisers), common trustees and/or common officers complies with Rule 17a-7 of the 1940 Act. Further, as defined under these procedures, each transaction is effected at the current market price. For the year ended December 31, 2024, the Funds did not engage in purchases and sales of securities, pursuant to Rule 17a-7 of the 1940 Act.
Note 8 – Unfunded Loan Commitments
Pursuant to the terms of certain loan agreements, certain Funds held unfunded loan commitments as of December 31, 2024. The Funds are obligated to fund these loan commitments at the borrower’s discretion.
66 | THE GUGGENHEIM FUNDS ANNUAL FINANCIAL REPORT | |
NOTES TO FINANCIAL STATEMENTS (continued) |
The unfunded loan commitments as of December 31, 2024, were as follows:
Fund | Borrower | | Maturity Date | | | Face Amount* | | | Value | |
Series E (Total Return Bond Series) | | | | | | | | | | | | |
| | Capstone Acquisition Holdings, Inc. | | | 11/12/29 | | | $ | 12,076 | | | $ | 65 | |
| | Datix Bidco Ltd. | | | 04/25/31 | | | | 38,055 | | | | 2,035 | |
| | Lightning A | | | 03/01/37 | | | | 55,085 | | | | — | |
| | MB2 Dental Solutions LLC | | | 02/13/31 | | | | 45,246 | | | | 941 | |
| | Thunderbird A | | | 03/01/37 | | | | 54,039 | | | | — | |
| | | | | | | | $ | 204,501 | | | $ | 3,041 | |
Series F (Floating Rate Strategies Series) | | | | | | | | | | | | |
| | Alter Domus | | | 05/14/31 | | | $ | 7,506 | | | $ | — | |
| | AmSpec Parent LLC | | | 12/11/31 | | | | 26,714 | | | | — | |
| | Convergint | | | 03/31/28 | | | | 4,576 | | | | — | |
| | Focus Financial Partners LLC | | | 09/10/31 | | | | 19,648 | | | | — | |
| | Franchise Group, Inc. | | | 04/30/25 | | | | 18,390 | | | | — | |
| | GrafTech Finance, Inc. | | | 11/04/29 | | | | 16,254 | | | | 772 | |
| | Hanger, Inc. | | | 10/23/31 | | | | 13,688 | | | | — | |
| | | | | | | | $ | 106,776 | | | $ | 772 | |
Series P (High Yield Series) | | | | | | | | | | | | |
| | AmSpec Parent LLC | | | 12/11/31 | | | $ | 14,060 | | | $ | — | |
| | Franchise Group, Inc. | | | 04/30/25 | | | | 9,195 | | | | — | |
| | GrafTech Finance, Inc. | | | 11/04/29 | | | | 77,659 | | | | 3,691 | |
| | | | | | | | $ | 100,914 | | | $ | 3,691 | |
* | The face amount is denominated in U.S. dollars unless otherwise indicated. |
Note 9– Restricted Securities
The securities below are considered illiquid and restricted under guidelines established by the Board:
Fund | Restricted Securities | | Acquisition Date | | | Cost | | | Value | |
Series E (Total Return Bond Series) | | | | | | | | | | | | | |
| | Copper River CLO Ltd. | | | | | | | | | | | | |
| | 2007-1A INC, due 01/20/211 | | | 05/09/14 | | | $ | — | | | $ | 60 | |
| | Nassau LLC | | | | | | | | | | | | |
| 2019-1 3.98% due 08/15/34 | | | 08/16/19 | | | | 98,392 | | | | 91,266 | |
| | | | | | | | $ | 98,392 | | | $ | 91,326 | |
Series P (High Yield Series) | | | | | | | | | | | | | |
| | Endo Luxembourg Finance Co I SARL / Endo US, Inc.* | | | 04/23/24 | | | $ | 1,343 | | | $ | 23 | |
| | Endo Luxembourg Finance Co I SARL / Endo US, Inc.* | | | 04/23/24 | | | | 746 | | | | 12 | |
| | Mirabela Nickel Ltd. | | | | | | | | | | | | |
| | due 06/24/192 | | | 12/31/13 | | | | 353,909 | | | | 1,950 | |
| | Sabre GLBL, Inc. | | | | | | | | | | | | |
| | 7.38% due 09/01/25 | | | 04/27/22 | | | | 35,142 | | | | 34,300 | |
| | Sabre GLBL, Inc. | | | | | | | | | | | | |
| 9.25% due 04/15/25 | | | 01/05/22 | | | | 7,083 | | | | 6,930 | |
| | | | | | | | $ | 398,223 | | | $ | 43,215 | |
* | Non-income producing security. |
1 | Security has no stated coupon. However, it is expected to receive residual cash flow payments on defined deal dates. |
2 | Security is in default of interest and/or principal obligations. |
| | THE GUGGENHEIM FUNDS ANNUAL FINANCIAL REPORT | 67 |
NOTES TO FINANCIAL STATEMENTS (continued) |
Note 10 – Line of Credit
The Trust, along with other affiliated trusts, secured a 364-day committed, $1,165,000,000 line of credit from Citibank, N.A., which was in place through September 29, 2024, at which time the line of credit was renewed as a 364-day committed, $1,115,000,000 line of credit. A Fund may draw (borrow) from the line of credit as a temporary measure for emergency purposes, to facilitate redemption requests, or for other short-term liquidity purposes consistent with the Fund’s investment objective and program. For example, it may be advantageous for the Fund to borrow money rather than sell existing portfolio positions to meet redemption requests. Fees related to borrowings, if any, vary under this arrangement between the greater of Citibank’s “base rate”, SOFR plus 1%, or the federal funds rate plus 1/2 of 1%.
The commitment fee that may be paid by the Funds is at an annualized rate of 0.15% of the average daily amount of their allocated unused commitment amount. The commitment fee amount is allocated to the individual Funds based on the respective net assets of each participating Fund and is referenced in the Funds’ Statements of Operations under “Line of credit fees”. The Funds did not have any borrowings under this agreement as of and for the year ended December 31, 2024.
Note 11 – Reverse Repurchase Agreements
Each of the Funds may enter into reverse repurchase agreements. Under a reverse repurchase agreement, a Fund sells securities and agrees to repurchase them at a particular price at a future date. In the event the buyer of securities under a reverse repurchase agreement files for bankruptcy or becomes insolvent, such buyer or its trustee or receiver may receive an extension of time to determine whether to enforce the Fund’s obligation to repurchase the securities, and the Fund’s use of the proceeds of the reverse repurchase agreement may effectively be restricted pending such decision.
For the year ended December 31, 2024, the following Funds entered into reverse repurchase agreements:
Fund | | Number of Days
Outstanding | | | Balance at
December 31, 2024 | | | Average Balance
Outstanding | | | Average Interest Rate | |
Series E (Total Return Bond Series) | | | 187 | | | $ | 9,828,571 | | | $ | 7,037,711 | | | | 5.12 | % |
Series P (High Yield Series) | | | 177 | | | | — | | | | 245,587 | | | | 3.26 | % |
The following table presents reverse repurchase agreements that are subject to netting arrangements and offset in the Statement of Assets and Liabilities in conformity with U.S. GAAP:
Fund | Instrument | | Gross
Amounts of
Recognized
Liabilities | | | Gross
Amounts
Offset in the
Statements
of Assets and
Liabilities | | | Net Amounts
of Assets
Presented on
the Statements
of Assets and
Liabilities | | | Financial
Instruments | | | Cash
Collateral
Pledged | | | Net
Amount | |
Series E (Total Return Bond Series) | Reverse repurchase agreements | | $ | 9,828,571 | | | $ | — | | | $ | 9,828,571 | | | $ | (9,828,571 | ) | | $ | — | | | $ | — | |
As of December 30, 2024, the Series E (Total Return Bond Series) Fund had $9,828,571, in reverse repurchase agreements outstanding with various counterparties. Details of the reverse repurchase agreements by counterparty are as follows:
Fund | Counterparty | Interest Rate(s) | | Maturity Date(s) | | | Face Value | |
Series E (Total Return Bond Series) | Barclays Capital, Inc. | 4.00%* | Open Maturity | | $ | 148,463 | |
| | BofA Securities, Inc. | 4.55% - 4.88%* | Open Maturity | | | 9,680,108 | |
* | The rate is adjusted periodically by the counterparty, subject to approval by the Adviser, and is not based upon a set of reference rate and spread. Rate indicated is the rate effective at December 31, 2023. |
68 | THE GUGGENHEIM FUNDS ANNUAL FINANCIAL REPORT | |
NOTES TO FINANCIAL STATEMENTS (concluded) |
The following is a summary of the remaining contractual maturities of the reverse repurchase agreements outstanding as of period-end, aggregated by asset class of the related collateral pledged by the Funds:
Fund | Asset Type | | Overnight and
continuous | | | Total | |
Series E (Total Return Bond Series) | Corporate Bonds | | $ | 4,005,353 | | | $ | 4,005,353 | |
| Federal Agency Notes | | $ | 5,823,218 | | | $ | 5,823,218 | |
Gross amount of recognized liabilities for reverse repurchase agreements | | | $ | 9,828,571 | | | $ | 9,828,571 | |
Note 12 – Segment Reporting
In this reporting period, the Funds adopted FASB Accounting Standards Update 2023-07, Segment Reporting (Topic 280) - Improvements to Reportable Segment Disclosures (“ASU 2023-07”). Adoption of the new standard impacted financial statement disclosures only and did not affect the Funds’ financial position or the results of their operations. An operating segment is defined in Topic 280 as a component of a public entity that engages in business activities from which it may recognize revenues and incur expenses, has operating results that are regularly reviewed by the public entity’s chief operating decision maker (“CODM”) to make decisions about resources to be allocated to the segment and assess its performance, and has discrete financial information available. The Officers of the Trust, subject to the oversight and supervision of the Board, serve as the CODM for the Funds.
Each of the Funds represents a single operating segment, as the CODM monitors the operating results of each Fund as a whole and each Fund’s long-term strategic asset allocation is pre-determined in accordance with the Fund’s investment objective which is executed by each Fund’s portfolio managers as a team. Each of the Funds uses a variety of investments to execute its investment strategy. Please refer to Note 1 – Organization and Significant Accounting Policies of these Notes to Financial Statements for additional details on the significant accounting policies and investment types used by the Funds. Please refer to each Fund’s Schedule of Investments for a breakdown of the types of investments from which each of the Funds generates its returns. Financial information in the form of total returns, expense ratios and changes in net assets (i.e., changes in net assets resulting from operations, subscriptions and redemptions), which are used by the CODM to assess the segment’s performance versus each Fund’s comparative benchmarks, among other metrics, and to make resource allocation decisions for each Fund’s single segment, is consistent with that presented within the Fund’s financial statements. Segment assets are reflected on each Fund’s Statement of Assets and Liabilities as “total assets” and significant segment income, expenses, and gain(loss) are listed on each Fund’s Statement of Operations.
Note 13 – Market Risks
The value of, or income generated by, the investments held by the Funds are subject to the possibility of rapid and unpredictable fluctuation, and loss that may result from various factors. These factors include, among others, developments affecting (or perceived to affect) individual companies, or issuers or particular industries, or from broader influences, including real or perceived changes in prevailing interest rates (which may change at any time based on changes in monetary policies and various market and other economic conditions), changes in inflation rates or expectations about inflation rates, deflation, adverse investor confidence or sentiment, general outlook for corporate earnings, changing economic, political (including geopolitical), social or financial market conditions, bank failures, increased instability or general uncertainty, extreme weather, environmental or man-made disasters, or geological events, governmental actions, tariffs, public health emergencies (such as the spread of infectious diseases, pandemics and epidemics), debt crises, terrorism, actual or threatened wars or other armed conflicts (such as the conflict in the Middle East and the ongoing Russia-Ukraine conflict and its collateral economic and other effects, including, but not limited to, sanctions and other international trade barriers) or ratings downgrades, and other similar events, each of which may be temporary or last for extended periods. Different sectors, industries and security types may react differently to such developments. Moreover, changing economic, political, geopolitical, social, financial market or other conditions in one country, geographic region or industry could adversely affect the value, yield and return of the investments held by the Funds in a different country, geographic region, economy, industry or market because of the increasingly interconnected global economies and financial markets. The duration and extent of the foregoing types of factors or conditions are highly uncertain and difficult to predict and have in the past, and may in the future, cause volatility and distress in economies and financial markets or other adverse circumstances, which may negatively affect the value of the Funds’ investments and performance of the Funds.
Note 14 – Subsequent Events
The Funds evaluated subsequent events through the date the financial statements are issued and determined there were no material events that would require adjustment to or disclosure in the Funds’ financial statements.
| | THE GUGGENHEIM FUNDS ANNUAL FINANCIAL REPORT | 69 |
REPORT OF INDEPENDENT REGISTERED PUBLIC ACCOUNTING FIRM |
To the Shareholders and the Board of Trustees of Guggenheim Variable Funds Trust
Opinion on the Financial Statements
We have audited the accompanying statements of assets and liabilities of Guggenheim Variable Funds Trust (the “Trust”) (comprising Series E (Total Return Bond Series), Series F (Floating Rate Strategies Series) and Series P (High Yield Series), (collectively referred to as the “Funds”)), including the schedules of investments, as of December 31, 2024, and the related statements of operations for the year then ended, the statements of changes in net assets for each of the two years in the period then ended, the financial highlights for each of the five years in the period then ended and the related notes (collectively referred to as the “financial statements”). In our opinion, the financial statements present fairly, in all material respects, the financial position of each of the Funds constituting Guggenheim Variable Funds Trust at December 31, 2024, the results of their operations for the year then ended, the changes in their net assets for each of the two years in the period then ended and their financial highlights for each of the five years in the period then ended, in conformity with U.S. generally accepted accounting principles.
Basis for Opinion
These financial statements are the responsibility of the Trust’s management. Our responsibility is to express an opinion on each of the Funds’ financial statements based on our audits. We are a public accounting firm registered with the Public Company Accounting Oversight Board (United States) (“PCAOB”) and are required to be independent with respect to the Trust in accordance with the U.S. federal securities laws and the applicable rules and regulations of the Securities and Exchange Commission and the PCAOB.
We conducted our audits in accordance with the standards of the PCAOB. Those standards require that we plan and perform the audit to obtain reasonable assurance about whether the financial statements are free of material misstatement, whether due to error or fraud. The Trust is not required to have, nor were we engaged to perform, an audit of the Trust’s internal control over financial reporting. As part of our audits, we are required to obtain an understanding of internal control over financial reporting but not for the purpose of expressing an opinion on the effectiveness of the Trust’s internal control over financial reporting. Accordingly, we express no such opinion.
Our audits included performing procedures to assess the risks of material misstatement of the financial statements, whether due to error or fraud, and performing procedures that respond to those risks. Such procedures included examining, on a test basis, evidence regarding the amounts and disclosures in the financial statements. Our procedures included confirmation of securities owned as of December 31, 2024, by correspondence with the custodian, transfer agent, brokers, and paying agents; when replies were not received from brokers or paying agents, we performed other auditing procedures. Our audits also included evaluating the accounting principles used and significant estimates made by management, as well as evaluating the overall presentation of the financial statements. We believe that our audits provide a reasonable basis for our opinion.

We have served as the auditor of one or more Guggenheim investment companies since 1979.
Tysons, Virginia
February 26, 2025
70 | THE GUGGENHEIM FUNDS ANNUAL FINANCIAL REPORT | |
OTHER INFORMATION (Unaudited) |
Federal Income Tax Information
This information is being provided as required by the Internal Revenue Code. Amounts shown may differ from those elsewhere in the report because of differences in tax and financial reporting practice.
In January 2025, shareholders will be advised on IRS Form 1099 DIV or substitute 1099 DIV as to the federal tax status of the distributions received by shareholders in the calendar year 2024.
The Funds’ investment income (dividend income plus short-term capital gains, if any) qualifies as follows:
Of the taxable ordinary income distributions paid during the fiscal year ended December 31, 2024, the following Funds had the corresponding percentages qualify for the dividends received deduction for corporations.
Fund | | Dividend
Received
Deduction | |
Series E (Total Return Bond Series) | | | 0.68 | % |
Series P (High Yield Series) | | | 0.52 | % |
Sector Classification
Information in the “Schedule of Investments” is categorized by sectors using sector-level Classifications defined by the Bloomberg Industry Classification System, a widely recognized industry classification system provider. Each Fund’s registration statement has investment policies relating to concentration in specific sectors/industries. For purposes of these investment policies, the Funds usually classify sectors/industries based on industry-level Classifications used by widely recognized industry classification system providers such as Bloomberg Industry Classification System, Global Industry Classification Standards and Barclays Global Classification Scheme.
Quarterly Portfolio Schedules Information
The Trust files its complete schedule of portfolio holdings with the SEC for the first and third quarters of each fiscal year as an exhibit to its reports on Form N-PORT, and for reporting periods ended prior to March 31, 2019, filed such information on Form N-Q. The Funds’ Forms N-PORT and N-Q are available on the SEC’s website at https://www.sec.gov. Copies of the portfolio holdings are also available to shareholders, without charge and upon request, by calling 800.820.0888.
| | THE GUGGENHEIM FUNDS ANNUAL FINANCIAL REPORT | 71 |
Item 8: Changes in and Disagreements with Accountants for Open-End Management Investment Companies
Note: This is not applicable for any fund included in this document.
72 | THE GUGGENHEIM FUNDS ANNUAL FINANCIAL REPORT | |
Item 9: Proxy Disclosures for Open-End Management Investment Companies
Note: This is not applicable for any fund included in this document.
| | THE GUGGENHEIM FUNDS ANNUAL FINANCIAL REPORT | 73 |
Item 10: Renumeration Paid to Directors, Officers, and others of Open-End Management Investment Companies
The remuneration paid to directors, officers, and others, if applicable, are included as part of the financial statements included under Item 7 of this Form.
74 | THE GUGGENHEIM FUNDS ANNUAL FINANCIAL REPORT | |
Item 11: Statement Regarding Basis for Approval of Investment Advisory Contract
Board Considerations Regarding Approval of Investment Advisory Agreement
At a meeting held in person on November 20-21, 2024, the Board of Trustees of Guggenheim Variable Funds Trust (the “Trust”), including the Independent Trustees, unanimously approved an amended and restated investment advisory agreement (the “GPIM Advisory Agreement”) with Guggenheim Partners Investment Management, LLC (“GPIM”) on behalf of the series of the Trust listed below (each a “Fund” and collectively, the “Funds”) for the purpose of transferring to GPIM the duties and responsibilities of Security Investors, LLC (“Security Investors”), as investment adviser to the Funds under the Funds’ current investment advisory agreement with Security Investors (the “SI Advisory Agreement”), for the remainder of the current term of the SI Advisory Agreement:
● Series E (Total Return Bond Series) | ● Series P (High Yield Series) |
GPIM and Security Investors are each an indirect subsidiary of Guggenheim Partners, LLC, a privately-held, global investment and advisory firm (“Guggenheim Partners”). Guggenheim Partners, Security Investors, GPIM and their affiliates may be referred to herein collectively as “Guggenheim.” GPIM and Security Investors are also known as “Guggenheim Investments,” the global asset management and investment advisory division of Guggenheim Partners that includes other affiliated investment management businesses.
At a meeting held in person on August 20-21, 2024, Guggenheim had preliminary discussions with the Board regarding the proposed GPIM Advisory Agreement in connection with an internal realignment at Guggenheim to consolidate Guggenheim’s fixed-income registered funds under a single investment adviser, GPIM (the “Internal Realignment”). Following those preliminary discussions, independent legal counsel to the Independent Trustees (“Independent Legal Counsel”), on behalf of the Contracts Review Committee of the Board (the “Committee”), consisting solely of the Independent Trustees, submitted formal requests for information to Guggenheim regarding the proposed GPIM Advisory Agreement and the Internal Realignment, and Guggenheim provided information and materials in response to those requests.
At a meeting held in person on November 20, 2024 (the “November Committee Meeting”), the Committee met separately from Guggenheim to consider the proposed GPIM Advisory Agreement. As part of its review process, the Committee was represented by Independent Legal Counsel, from whom the Independent Trustees received separate legal advice and with whom they met separately. Independent Legal Counsel reviewed and discussed with the Committee various key aspects of the Trustees’ legal responsibilities relating to the proposed GPIM Advisory Agreement and certain other related contractual arrangements. Counsel to the Trust (“Fund Counsel”) also provided a legal opinion to the Board, advising that the proposed GPIM Advisory Agreement and the Internal Realignment should not be deemed to constitute an “assignment” for purposes of the Investment Company Act of 1940, as amended, and should not require approval by shareholder vote. In addition, Guggenheim discussed the proposed GPIM Advisory Agreement and the Internal Realignment at the November 20-21, 2024 Board meeting. The Committee reviewed and considered the various information and materials provided by Guggenheim and Fund Counsel.
The Committee considered Guggenheim’s rationale for the proposed GPIM Advisory Agreement and the Internal Realignment, noting Guggenheim’s statement that the proposal to consolidate its fixed-income registered funds under a single adviser will benefit GPIM and Guggenheim to the extent it may eliminate the need for certain intercompany arrangements and simplify certain internal financial accounting and allocation processes. The Committee also considered Guggenheim’s belief that the proposal is consistent with the best interests of each Fund. The Committee noted Guggenheim’s statement that GPIM and Security Investors operate as a single entity, rather than as separate entities with distinct operations and capabilities, and have access to the same personnel, information and other resources. In addition, the Committee considered that Guggenheim had agreed to pay any legal and Board costs associated with the consideration and implementation of the GPIM Advisory Agreement and that the Funds would not bear any costs or expenses in connection with the proposal.
The Committee noted that the Board, including the Independent Trustees, last approved the renewal of the SI Advisory Agreement for each Fund for an additional annual term at a meeting held in person on May 20-21, 2024. The Committee noted that in connection with such approval the Board had concluded for each Fund, based on the information and materials provided by Guggenheim in connection with the 2024 contract review process (the “2024 Contract Review Materials”), that the investment advisory fees are fair and reasonable in light of the extent and quality of the services provided and other benefits received and that the renewal of the SI Advisory Agreement was in the best interest of each Fund.
In reviewing the proposed GPIM Advisory Agreement for each Fund, the Committee considered that the sole purpose of the proposed GPIM Advisory Agreement is to transfer investment adviser duties and responsibilities for each Fund from Security Investors to GPIM in connection with the Internal Realignment. In this regard, the Committee noted Guggenheim’s representations with respect to each Fund indicating that, under the proposed GPIM Advisory Agreement: (1) the Fund’s contractual investment advisory fee would not change; (2) Guggenheim does not expect that the Fund will experience any material changes in its expenses; (3) Guggenheim does not expect any changes in the overall nature,
| | THE GUGGENHEIM FUNDS ANNUAL FINANCIAL REPORT | 75 |
Item 11: Statement Regarding Basis for Approval of Investment Advisory Contract
(Continued)
extent and quality of the services provided to the Fund; (4) because the investment advisers that comprise Guggenheim Investments, including GPIM and Security Investors, effectively function as a single asset manager, the day-to-day management of the Fund would not change and there would be no changes to the Fund’s portfolio managers; and (5) there are no material differences in the terms of the proposed GPIM Advisory Agreement as compared to the SI Advisory Agreement. The Committee also noted Guggenheim’s statement indicating that, as amended and supplemented by the information and materials provided in connection with the proposed GPIM Advisory Agreement, the Committee and the Board may continue to rely on the 2024 Contract Review Materials in their consideration of the proposed GPIM Advisory Agreement.
Following an analysis and discussion of relevant factors, including those identified above, and in the exercise of its business judgment, the Committee concluded that the proposed investment advisory fees are fair and reasonable in light of the nature, extent and quality of the services expected to be provided and other benefits to be received and that it was in the best interest of each Fund to recommend that the Board approve the GPIM Advisory Agreement for each Fund. In reaching this conclusion, no single factor was determinative or conclusive and each Committee member, in the exercise of their informed business judgment, may afford different weights to different factors.
Following its review of the Committee’s analysis and determinations, the Board adopted the considerations and conclusions of the Committee and approved the GPIM Advisory Agreement for each Fund.
76 | THE GUGGENHEIM FUNDS ANNUAL FINANCIAL REPORT | |
This page intentionally left blank.
| Item 8. | Changes in and Disagreements with Accountants for Open-End Management Investment Companies. |
Not applicable
| Item 9. | Proxy Disclosures for Open-End Management Investment Companies. |
The information is included as part of the material filed under Item 7 of this Form
| Item 10. | Remuneration Paid to Directors, Officers, and Others of Open-End Management Investment Companies. |
The information is included as part of the material filed under Item 7 of this Form
| Item 11. | Statement Regarding Basis for Approval of Investment Advisory Contract. |
The information is included as part of the material filed under Item 7 of this Form
| Item 12. | Disclosure of Proxy Voting Policies and Procedures for Closed-End Management Investment Companies. |
Not applicable to this registrant.
| Item 13. | Portfolio Managers of Closed-End Management Investment Companies. |
Not applicable to this registrant.
| Item 14. | Purchases of Equity Securities by Closed-End Management Investment Company and Affiliated Purchases. |
Not applicable to this registrant.
| Item 15. | Submission of Matters to a Vote of Security Holders. |
There have been no changes to the procedures by which shareholders may recommend nominees to the registrant’s board of trustees.
| Item 16. | Controls and Procedures. |
(a) The registrant’s President (principal executive officer) and Treasurer (principal financial officer) have evaluated the registrant’s disclosure controls and procedures (as defined in Rule 30a-3(c) under the Investment Company Act) as of a date within 90 days of this filing and have concluded that based on such evaluation as required by Rule 30a-3(b) under the Investment Company Act, that the registrant’s disclosure controls and procedures were effective as of that date in ensuring that information required to be disclosed by the registrant in this Form N-CSR was recorded, processed, summarized, and reported within the time periods specified in the Securities and Exchange Commission’s rules and forms.
(b) There were no changes in the registrant’s internal control over financial reporting (as defined in Rule 30a-3(d) under the Investment Company Act) that occurred during the period covered by this report that the officers listed above believe to have materially affected, or to be reasonably likely to materially affect, the registrant’s internal control over financial reporting.
| Item 17. | Disclosure of Securities Lending Activities for Closed-End Management Investment Companies. |
Not applicable to this registrant.
| Item 18. | Recovery of Erroneously Awarded Compensation |
(a)(1) Not applicable.
(a)(2) Separate certifications by the President (principal executive officer) and Treasurer (principal financial officer) of the registrant as required by Rule 30a-2(a) under the Investment Company Act (17 CFR 270.30a-2(a)) are attached.
(a)(3) Not applicable.
(a)(4) Not applicable.
(a)(5) Not applicable.
(b) A certification by the registrant’s President (principal executive officer) and Treasurer (principal financial officer) as required by Rule 30a-2(b) under the Investment Company Act (17 CFR 270.30a-2(b)) is attached.
SIGNATURES
Pursuant to the requirements of the Securities Exchange Act of 1934 and the Investment Company Act of 1940, the registrant has duly caused this report to be signed on its behalf by the undersigned, thereunto duly authorized.
| (Registrant) | | Guggenheim Variable Funds Trust | |
| | | | |
| By (Signature and Title)* | | /s/ Brian Binder | |
| | | Brian Binder, President and Chief Executive Officer | |
| | | | |
| Date | | March 7, 2025 | |
Pursuant to the requirements of the Securities Exchange Act of 1934 and the Investment Company Act of 1940, this report has been signed below by the following persons on behalf of the registrant and in the capacities and on the dates indicated.
| By (Signature and Title)* | | /s/ Brian Binder | |
| | Brian Binder, President and Chief Executive Officer | |
| | | | |
| Date | | March 7, 2025 | |
| | | | |
| By (Signature and Title)* | | /s/ James Howley | |
| | | James Howley, Chief Financial Officer, Chief Accounting Officer and Treasurer | |
| | | | |
| Date | | March 7, 2025 | |
| * | Print the name and title of each signing officer under his or her signature. |