UNITED STATES SECURITIES AND EXCHANGE COMMISSION
Washington, D.C. 20549
FORM N-CSR
CERTIFIED SHAREHOLDER REPORT OF REGISTERED
MANAGEMENT INVESTMENT COMPANIES
Investment Company Act file number 811- 0560
John Hancock Investment Trust
(Exact name of registrant as specified in charter)
601 Congress Street, Boston, Massachusetts 02210
(Address of principal executive offices) (Zip code)
Salvatore Schiavone
Treasurer
601 Congress Street
Boston, Massachusetts 02210
(Name and address of agent for service)
Registrant's telephone number, including area code: 617-663-4497
| Date of fiscal year end: | October 31 |
| Date of reporting period: | April 30, 2018 |
ITEM 1. REPORTS TO STOCKHOLDERS.
John Hancock
Fundamental Large Cap Core Fund
Semiannual report 4/30/18


A message to shareholders
Dear shareholder,
Financial markets around the world experienced a meaningful rise in volatility in the last half of the reporting period, leading to some mixed results for equity investors. Stocks generally declined late in the period as investors reacted to a potential trade war between the United States and China and the prospect of rising inflation. While some in the asset management community believe the sell-off will be temporary, we have suggested for some time that the era of extremely low volatility would eventually come to an end, and that now appears to be the case.
Ultimately, the asset prices of stocks are underpinned by fundamentals, and the good news is that those continue to appear supportive. Unemployment remained close to historic lows, consumer confidence rose, and the housing market continued to notch steady gains. One moderating factor was the U.S. Federal Reserve's steady tightening of monetary policy. While higher interest rates alone may not cause the economy to pull back, markets will be closely attuned to any sign of policymakers quickening the pace of interest-rate increases in the year ahead.
Your best resource in unpredictable markets is your financial advisor, who can help position your portfolio so that it's sufficiently diversified to meet your long-term objectives and to withstand the inevitable turbulence along the way.
On behalf of everyone at John Hancock Investments, I'd like to take this opportunity to welcome new shareholders and to thank existing shareholders for the continued trust you've placed in us.
Sincerely,

Andrew G. Arnott
President and CEO,
John Hancock Investments
Head of Wealth and Asset Management,
United States and Europe
This commentary reflects the CEO's views, which are subject to change at any time. Investing involves risks, including the potential loss of principal. Diversification does not guarantee a profit or eliminate the risk of a loss. It is not possible to invest directly into an index. For more up-to-date information, please visit our website at jhinvestments.com.
John Hancock
Fundamental Large Cap Core Fund
INVESTMENT OBJECTIVE
The fund seeks long-term capital appreciation.
AVERAGE ANNUAL TOTAL RETURNS AS OF 4/30/18 (%)
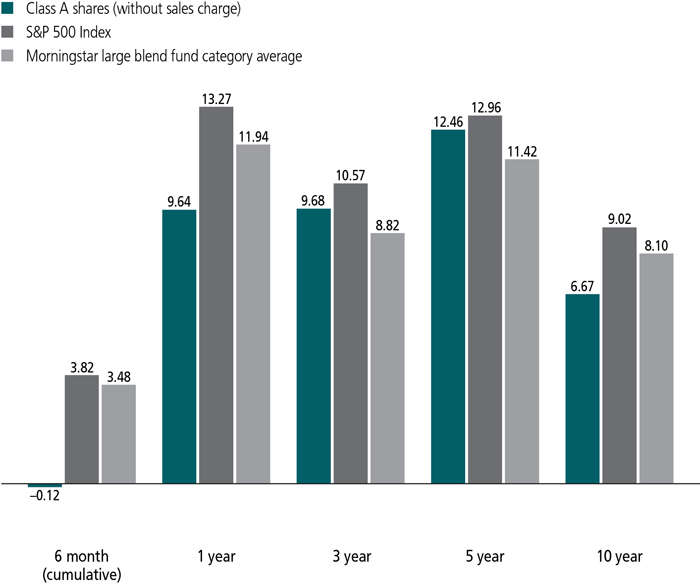
The S&P 500 Index is an unmanaged index that includes 500 widely traded common stocks.
It is not possible to invest directly in an index. Index figures do not reflect expenses and sales charges, which would result in lower returns.
Figures from Morningstar, Inc. include reinvested distributions and do not take into account sales charges. Actual load-adjusted performance is lower.
The past performance shown here reflects reinvested distributions and the beneficial effect of any expense reductions, and does not guarantee future results. Returns for periods shorter than one year are cumulative. Performance of the other share classes will vary based on the difference in the fees and expenses of those classes. Shares will fluctuate in value and, when redeemed, may be worth more or less than their original cost. Current month-end performance may be lower or higher than the performance cited, and can be found at jhinvestments.com or by calling 800-225-5291. For further information on the fund's objectives, risks, and strategy, see the fund's prospectus.
PERFORMANCE HIGHLIGHTS OVER THE LAST SIX MONTHS
U.S. stock market advance slowed in the New Year
The U.S. equity market ended the period with a gain, but was held back as inflation fears and global trade tensions sparked increased volatility in the New Year.
Consumer discretionary and energy stocks led the market
Consumer discretionary stocks benefited from improved economic growth and consumer confidence, while energy stocks rose as oil prices climbed.
Picks in consumer discretionary and industrials detracted
Security selection in the consumer discretionary and industrials sectors hampered the fund's performance versus its benchmark, the S&P 500 Index.
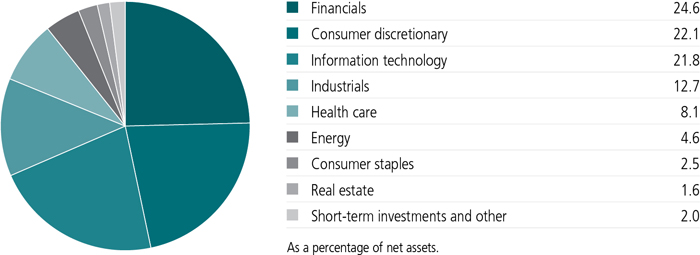
SECTOR COMPOSITION AS OF 4/30/18 (%)
A note about risks
Large company stocks could fall out of favor, and value stocks may decline in price. Foreign investing has additional risks, such as currency and market volatility and political and social instability. Derivatives transactions, such as hedging and other strategic transactions, may increase a fund's volatility and could produce disproportionate losses, potentially more than the fund's principal investment. The value of a company's equity securities is subject to changes in the company's financial condition and overall market and economic conditions. Because the fund may focus on particular sectors of the economy, its performance may depend on the performance of those sectors, and investments focused in one sector may fluctuate more widely than investments diversified across sectors. Please see the fund's prospectus for additional risks.
An interview with Portfolio Manager Emory W. (Sandy) Sanders, Jr., CFA, John Hancock Asset Management a division of Manulife Asset Management (US) LLC

Emory W. (Sandy)Sanders, Jr., CFA
Portfolio Manager
John Hancock Asset Management
What factors drove the stock market during the six months ended April 30, 2018?
It was a tug of war. On the positive side, stocks gained from favorable U.S. economic growth, with roughly 3% annualized growth for the fourth quarter of 2017 followed by 2% growth for the first quarter of 2018. Against this backdrop, the U.S. Federal Reserve edged its short-term interest-rate target higher in December and again in March, while scaling back its bond buying. Added tailwinds included rising oil prices and a new tax law passed by Congress in December that significantly lowered corporate tax rates. Corporate earnings growth largely exceeded expectations.
However, after reaching new records in January, the U.S. stock market plunged in early February, as wage growth spurred inflation fears and, later, as new import tariffs sparked global trade tensions. News in March that social media giant Facebook, Inc. had mishandled user data further rattled investors, raising concern that regulators might step up their oversight of the information technology sector. In addition, the yield on the 10-year Treasury reached 3% in late April, spurring fear that higher borrowing costs would crimp corporate profits.
Which sectors were winners and losers in this environment?
Within the fund's benchmark, the broad-based S&P 500 Index, the consumer discretionary sector posted the biggest gain by far, helped by strengthening economic growth and improving consumer confidence. Energy stocks also stood out, benefiting from significantly higher oil prices. Many other sectors posted modest gains, notably the information technology and financials sectors.
By contrast, more defensive, dividend-paying sectors—including utilities, consumer staples, and real estate—declined, pressured by rising interest rates and better earnings growth opportunities elsewhere. Materials stocks also ended down for the period, hurt by escalating trade tensions.
How did the fund perform for the past six months?
Performance was disappointing. The fund's Class A shares posted a loss of 0.12% (excluding sales charges), lagging the 3.82% gain of the benchmark S&P 500 Index. Security selection accounted for the vast majority of underperformance, with the most notable losses coming from picks in the consumer discretionary and industrials sectors. Investment choices in the financials, healthcare, and information technology sectors also hurt. Despite near-term disappointments, we maintained our long-term focus on financially sound companies with competitive advantages, the ability to generate substantial cash flow over sustained periods, and attractive stock prices relative to our estimates of intrinsic value.
Which stocks were the biggest detractors?
A large overweight in diversified industrials conglomerate General Electric Company (GE) hurt most. GE brought in new leadership last summer to help turn around its struggling business. In November, management cut the company's dividend by 50%, causing the stock to slide. The share price fell even further when earnings results for the fourth quarter disappointed due largely to weak performance in the company's power-generation business. A federal government investigation into GE's updated accounting practices and concern around its reserves for a legacy long-term care
TOP 10 HOLDINGS AS OF 4/30/18 (%)
| Amazon.com, Inc. | 7.7 |
| General Electric Company | 6.7 |
| Apple, Inc. | 6.0 |
| Bank of America Corp. | 4.7 |
| Citigroup, Inc. | 4.1 |
| Alphabet, Inc., Class A | 4.1 |
| The Goldman Sachs Group, Inc. | 4.1 |
| Visa, Inc., Class A | 3.5 |
| Lennar Corp., A Shares | 3.3 |
| Polaris Industries, Inc. | 3.1 |
| TOTAL | 47.3 |
| As a percentage of net assets. | |
| Cash and cash equivalents are not included. | |
Mattress company Tempur Sealy International, Inc. in the consumer discretionary sector was another turnaround story that disappointed. This stock has had a bumpy road since the company decided to terminate its contract with bedding retailer Mattress Firm (not held by the fund) last year in order to focus on profits over volumes. As a result, Tempur Sealy's year-over-year revenue declined. Plus, the company faced competitive pressure for its lower-end Sealy line. Both factors caused the stock to tumble. Tempur Sealy has since been working to expand its retail partnerships and grow its direct-to-consumer sales. It's also approaching the time when the Mattress Firm comparisons will no longer be a factor.
An investment in global racecar franchise Liberty Media Corp.-Liberty Formula One, which also is in the consumer discretionary sector, detracted. Liberty Media is trying to grow Formula One's asset value by increasing the number of races, renegotiating contracts with some of the largest teams and building a digital platform for viewers. However, uncertainty about how long it will take for these turnaround initiatives to deliver results weighed on the stock. Neither this stock nor Tempur Sealy was in the S&P 500.
Elsewhere, in healthcare, an overweight in Ireland-based pharmaceuticals Allergan PLC hurt relative performance. This company, which is best known for its Botox anti-wrinkle cream, saw its stock decline as investors worried about the looming patent expiration of its number two product, Restasis dry-eye drops.
Switching gears, did any choices help relative performance this period?
We benefited from having little or no exposure to some of the weakest performing sectors in the index, including utilities, materials, consumer staples, and real estate. We just didn't find enough stocks in these sectors that fit our investment criteria.
In terms of individual contributors, our sizable overweighting in Amazon.com, Inc. in the consumer discretionary sector gave the biggest boost to our relative result. Amazon's shares soared, as the
company's highly profitable cloud-computing business, the expansion of its e-commerce operation worldwide, and the growing popularity of its Amazon Prime membership program led to earnings results that significantly surpassed expectations. Even President Trump's negative tweets about the company late in the period did little to deter the stock's rise.
In the information technology sector, software-as-a-service company Workday, Inc. stood out, as the addition of new clients in the financials sector and the general migration by corporations to cloud-based services helped fuel accelerated revenue growth. Workday, which was not in the index, was a new addition to the fund over the period.
How is the fund currently positioned?
It continues to have an economically sensitive bias, with sizable overweights in the consumer discretionary and financials sectors. We took advantage of volatility to add some new information technology holdings and to boost our stakes in some existing tech positions, ending the period with a much higher weighting in that sector. The fund finished the period with reduced stakes in healthcare and consumer staples, two sectors that tend not to be tied directly to the economy, and a slightly lower stake in financials.
MANAGED BY
| | Emory W. (Sandy) Sanders, Jr., CFA On the fund since 2011 Investing since 1997 |
 | Jonathan White, CFA On the fund since 2015 Investing since 1997 |
![]()
TOTAL RETURNS FOR THE PERIOD ENDED APRIL 30, 2018
| Average annual total returns (%) with maximum sales charge | Cumulative total returns (%) with maximum sales charge | ||||||
| 1-year | 5-year | 10-year | 6-month | 5-year | 10-year | ||
| Class A | 4.15 | 11.32 | 6.12 | -5.12 | 70.92 | 81.21 | |
| Class B | 3.82 | 11.36 | 6.03 | -5.05 | 71.29 | 79.65 | |
| Class C | 7.83 | 11.62 | 5.88 | -1.38 | 73.30 | 77.00 | |
| Class I1 | 9.88 | 12.76 | 7.01 | 0.00 | 82.27 | 96.85 | |
| Class R11,2 | 9.23 | 12.03 | 6.33 | -0.31 | 76.49 | 84.71 | |
| Class R21,2 | 9.48 | 12.32 | 6.62 | -0.19 | 78.79 | 89.92 | |
| Class R31,2 | 9.35 | 12.15 | 6.41 | -0.23 | 77.44 | 86.11 | |
| Class R41,2 | 9.74 | 12.59 | 6.75 | -0.06 | 80.92 | 92.08 | |
| Class R51,2 | 9.96 | 12.81 | 6.97 | 0.03 | 82.67 | 96.20 | |
| Class R61,2 | 10.05 | 12.88 | 6.94 | 0.07 | 83.29 | 95.65 | |
| Class NAV1,2 | 10.03 | 12.56 | 6.72 | 0.07 | 80.70 | 91.59 | |
| Index† | 13.27 | 12.96 | 9.02 | 3.82 | 83.93 | 137.11 | |
Performance figures assume all distributions have been reinvested. Figures reflect maximum sales charges on Class A shares of 5% and the applicable contingent deferred sales charge (CDSC) on Class B and Class C shares. The Class B shares' CDSC declines annually between years 1 to 6 according to the following schedule: 5%, 4%, 3%, 3%, 2%, 1%. No sales charge will be assessed after the sixth year. Class C shares sold within one year of purchase are subject to a 1% CDSC. Sales charges are not applicable to Class I, Class R1, Class R2, Class R3, Class R4, Class R5, Class R6, and Class NAV shares.
The expense ratios of the fund, both net (including any fee waivers and/or expense limitations) and gross (excluding any fee waivers and/or expense limitations), are set forth according to the most recent publicly available prospectuses for the fund and may differ from those disclosed in the Financial highlights tables in this report. Net expenses reflect contractual expense limitations in effect until February 28, 2019 and are subject to change. Had the contractual fee waivers and expense limitations not been in place, gross expenses would apply. The expense ratios are as follows:
| Class A | Class B | Class C | Class I | Class R1 | Class R2 | Class R3 | Class R4 | Class R5 | Class R6 | Class NAV* | ||
| Gross (%) | 1.04 | 1.79 | 1.79 | 0.78 | 1.44 | 1.19 | 1.34 | 1.04 | 0.74 | 0.69 | 0.68 | |
| Net (%) | 1.04 | 1.79 | 1.79 | 0.78 | 1.44 | 1.19 | 1.34 | 0.94 | 0.74 | 0.69 | 0.68 | |
*Expenses have been estimated for the first year of operations of Class NAV shares.
Please refer to the most recent prospectus and annual or semiannual report for more information on expenses and any expense limitation arrangements for each class.
The returns reflect past results and should not be considered indicative of future performance. The return and principal value of an investment will fluctuate so that shares, when redeemed, may be worth more or less than their original cost. Due to market volatility and other factors, the fund's current performance may be higher or lower than the performance shown. For current to the most recent month-end performance data, please call 800-225-5291 or visit the fund's website at jhinvestments.com.
The performance table above and the chart on the next page do not reflect the deduction of taxes that a shareholder would pay on fund distributions or the redemption of fund shares. The fund's performance results reflect any applicable fee waivers or expense reductions, without which the expenses would increase and results would have been less favorable.
| † | Index is the S&P 500 Index. |
See the following page for footnotes.
This chart and table show what happened to a hypothetical $10,000 investment in John Hancock Fundamental Large Cap Core Fund for the share classes and periods indicated, assuming all distributions were reinvested. For comparison, we've shown the same investment in the S&P 500 Index.
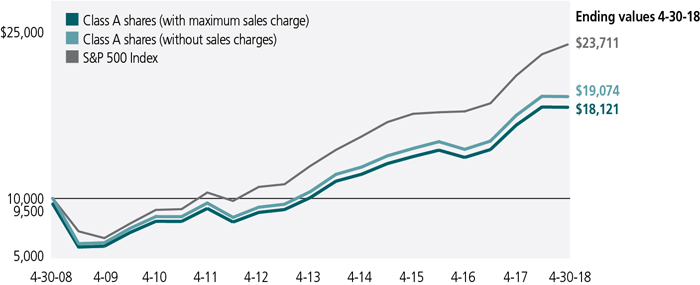
| Start date | With maximum sales charge ($) | Without sales charge ($) | Index ($) | |
| Class B3 | 4-30-08 | 17,965 | 17,965 | 23,711 |
| Class C3 | 4-30-08 | 17,700 | 17,700 | 23,711 |
| Class I1 | 4-30-08 | 19,685 | 19,685 | 23,711 |
| Class R11,2 | 4-30-08 | 18,471 | 18,471 | 23,711 |
| Class R21,2 | 4-30-08 | 18,992 | 18,992 | 23,711 |
| Class R31,2 | 4-30-08 | 18,611 | 18,611 | 23,711 |
| Class R41,2 | 4-30-08 | 19,208 | 19,208 | 23,711 |
| Class R51,2 | 4-30-08 | 19,620 | 19,620 | 23,711 |
| Class R61,2 | 4-30-08 | 19,565 | 19,565 | 23,711 |
| Class NAV1,2 | 4-30-08 | 19,159 | 19,159 | 23,711 |
The S&P 500 Index is an unmanaged index that includes 500 widely traded common stocks.
It is not possible to invest directly in an index. Index figures do not reflect expenses or sales charges, which would result in lower returns.
Footnotes related to performance pages
| 1 | For certain types of investors, as described in the fund's prospectuses. |
| 2 | Class R1, Class R3, Class R4, and Class R5 shares were first offered on 5-22-09; Class R2 shares were first offered on 3-1-12; Class R6 shares were first offered on 9-1-11; Class NAV shares were first offered on 2-8-17. Returns prior to these dates are those of Class A shares (first offered on 9-30-84) that have not been adjusted for class-specific expenses; otherwise, returns would vary. |
| 3 | The contingent deferred sales charge is not applicable. |
These examples are intended to help you understand your ongoing operating expenses of investing in the fund so you can compare these costs with the ongoing costs of investing in other mutual funds.
Understanding fund expenses
As a shareholder of the fund, you incur two types of costs:
| • | Transaction costs, which include sales charges (loads) on purchases or redemptions (varies by share class), minimum account fee charge, etc. |
| • | Ongoing operating expenses, including management fees, distribution and service fees (if applicable), and other fund expenses. |
We are presenting only your ongoing operating expenses here.
Actual expenses/actual returns
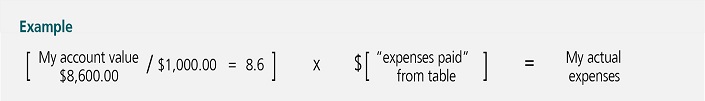
The first line of each share class in the table on the following page is intended to provide information about the fund's actual ongoing operating expenses, and is based on the fund's actual return. It assumes an account value of $1,000.00 on November 1, 2017, with the same investment held until April 30, 2018.
Together with the value of your account, you may use this information to estimate the operating expenses that you paid over the period. Simply divide your account value at April 30, 2018, by $1,000.00, then multiply it by the "expenses paid" for your share class from the table. For example, for an account value of $8,600.00, the operating expenses should be calculated as follows:
Hypothetical example for comparison purposes
The second line of each share class in the table on the following page allows you to compare the fund's ongoing operating expenses with those of any other fund. It provides an example of the fund's hypothetical account values and hypothetical expenses based on each class's actual expense ratio and an assumed 5% annualized return before expenses (which is not the fund's actual return). It assumes an account value of $1,000.00 on November 1, 2017, with the same investment held until April 30, 2018. Look in any other fund shareholder report to find its hypothetical example and you will be able to compare these expenses. Please remember that these hypothetical account values and expenses may not be used to estimate the actual ending account balance or expenses you paid for the period.
Remember, these examples do not include any transaction costs, therefore, these examples will not help you to determine the relative total costs of owning different funds. If transaction costs were included, your expenses would have been higher. See the prospectuses for details regarding transaction costs.
SHAREHOLDER EXPENSE EXAMPLE CHART
| Account value on 11-1-2017 | Ending value on 4-30-2018 | Expenses paid during period ended 4-30-20181 | Annualized expense ratio | ||
| Class A | Actual expenses/actual returns | $1,000.00 | $998.80 | $5.06 | 1.02% |
| Hypothetical example for comparison purposes | 1,000.00 | 1,019.70 | 5.11 | 1.02% | |
| Class B | Actual expenses/actual returns | 1,000.00 | 995.10 | 8.76 | 1.77% |
| Hypothetical example for comparison purposes | 1,000.00 | 1,016.00 | 8.85 | 1.77% | |
| Class C | Actual expenses/actual returns | 1,000.00 | 995.30 | 8.76 | 1.77% |
| Hypothetical example for comparison purposes | 1,000.00 | 1,016.00 | 8.85 | 1.77% | |
| Class I | Actual expenses/actual returns | 1,000.00 | 1,000.00 | 3.82 | 0.77% |
| Hypothetical example for comparison purposes | 1,000.00 | 1,021.00 | 3.86 | 0.77% | |
| Class R1 | Actual expenses/actual returns | 1,000.00 | 996.90 | 6.98 | 1.41% |
| Hypothetical example for comparison purposes | 1,000.00 | 1,017.80 | 7.05 | 1.41% | |
| Class R2 | Actual expenses/actual returns | 1,000.00 | 998.10 | 5.85 | 1.18% |
| Hypothetical example for comparison purposes | 1,000.00 | 1,018.90 | 5.91 | 1.18% | |
| Class R3 | Actual expenses/actual returns | 1,000.00 | 997.70 | 6.29 | 1.27% |
| Hypothetical example for comparison purposes | 1,000.00 | 1,018.50 | 6.36 | 1.27% | |
| Class R4 | Actual expenses/actual returns | 1,000.00 | 999.40 | 4.56 | 0.92% |
| Hypothetical example for comparison purposes | 1,000.00 | 1,020.20 | 4.61 | 0.92% | |
| Class R5 | Actual expenses/actual returns | 1,000.00 | 1,000.30 | 3.57 | 0.72% |
| Hypothetical example for comparison purposes | 1,000.00 | 1,021.20 | 3.61 | 0.72% | |
| Class R6 | Actual expenses/actual returns | 1,000.00 | 1,000.70 | 3.32 | 0.67% |
| Hypothetical example for comparison purposes | 1,000.00 | 1,021.50 | 3.36 | 0.67% | |
| Class NAV | Actual expenses/actual returns | 1,000.00 | 1,000.70 | 3.27 | 0.66% |
| Hypothetical example for comparison purposes | 1,000.00 | 1,021.50 | 3.31 | 0.66% | |
| 1 | Expenses are equal to the annualized expense ratio, multiplied by the average account value over the period, multiplied by 181/365 (to reflect the one-half year period). |
| Fund’s investments |
| Shares | Value | ||||
| Common stocks 98.0% | $4,871,144,027 | ||||
| (Cost $3,978,163,646) | |||||
| Consumer discretionary 22.1% | 1,099,294,337 | ||||
| Hotels, restaurants and leisure 1.5% | |||||
| Starbucks Corp. | 1,270,148 | 73,122,420 | |||
| Household durables 5.2% | |||||
| Lennar Corp., A Shares | 3,074,517 | 162,611,204 | |||
| Lennar Corp., B Shares | 36,366 | 1,552,465 | |||
| Tempur Sealy International, Inc. (A) | 2,130,494 | 95,339,607 | |||
| Internet and direct marketing retail 7.7% | |||||
| Amazon.com, Inc. (A) | 245,103 | 383,863,161 | |||
| Leisure products 3.1% | |||||
| Polaris Industries, Inc. | 1,490,979 | 156,284,419 | |||
| Media 3.0% | |||||
| Liberty Media Corp.-Liberty Formula One, Series C (A) | 3,018,979 | 89,120,260 | |||
| Twenty-First Century Fox, Inc., Class B | 1,666,886 | 60,124,578 | |||
| Specialty retail 1.5% | |||||
| AutoZone, Inc. (A) | 17,491 | 10,923,479 | |||
| CarMax, Inc. (A) | 727,849 | 45,490,563 | |||
| Group 1 Automotive, Inc. | 279,246 | 18,248,726 | |||
| Textiles, apparel and luxury goods 0.1% | |||||
| NIKE, Inc., Class B | 38,214 | 2,613,455 | |||
| Consumer staples 2.5% | 125,336,083 | ||||
| Beverages 2.5% | |||||
| Anheuser-Busch InBev SA, ADR | 878,504 | 87,920,680 | |||
| Diageo PLC, ADR | 263,563 | 37,415,403 | |||
| Energy 4.6% | 228,578,120 | ||||
| Energy equipment and services 2.9% | |||||
| Baker Hughes, a GE Company | 967,963 | 34,953,144 | |||
| Schlumberger, Ltd. | 1,557,923 | 106,811,201 | |||
| Oil, gas and consumable fuels 1.7% | |||||
| Cheniere Energy, Inc. (A) | 1,444,684 | 84,022,821 | |||
| Chevron Corp. | 22,308 | 2,790,954 | |||
| Financials 24.6% | 1,224,707,168 | ||||
| Banks 12.0% | |||||
| Bank of America Corp. | 7,848,708 | 234,833,343 | |||
| Citigroup, Inc. | 3,007,729 | 205,337,659 | |||
| First Republic Bank | 890,868 | 82,734,911 | |||
| JPMorgan Chase & Co. | 693,502 | 75,439,148 | |||
| Capital markets 9.7% | |||||
| Affiliated Managers Group, Inc. | 727,285 | 119,900,205 | |||
| 12 | JOHN HANCOCK FUNDAMENTAL LARGE CAP CORE FUND | SEMIANNUAL REPORT | SEE NOTES TO FINANCIAL STATEMENTS |
| Shares | Value | ||||
| Financials (continued) | |||||
| Capital markets (continued) | |||||
| FactSet Research Systems, Inc. | 135,670 | $25,656,554 | |||
| Morgan Stanley | 2,611,344 | 134,797,577 | |||
| The Goldman Sachs Group, Inc. | 846,552 | 201,758,738 | |||
| Consumer finance 1.5% | |||||
| American Express Company | 611,863 | 60,421,471 | |||
| Synchrony Financial | 379,809 | 12,598,265 | |||
| Insurance 1.4% | |||||
| Prudential Financial, Inc. | 669,952 | 71,229,297 | |||
| Health care 8.1% | 402,707,285 | ||||
| Biotechnology 3.3% | |||||
| Gilead Sciences, Inc. | 1,025,690 | 74,085,589 | |||
| Shire PLC, ADR | 550,497 | 87,765,737 | |||
| Health care equipment and supplies 1.8% | |||||
| Danaher Corp. | 261,603 | 26,244,013 | |||
| Medtronic PLC | 785,545 | 62,945,721 | |||
| Pharmaceuticals 3.0% | |||||
| Allergan PLC | 987,089 | 151,666,225 | |||
| Industrials 12.7% | 628,159,027 | ||||
| Aerospace and defense 1.9% | |||||
| United Technologies Corp. | 765,448 | 91,968,577 | |||
| Industrial conglomerates 6.7% | |||||
| General Electric Company | 23,645,405 | 332,690,848 | |||
| Machinery 0.5% | |||||
| Caterpillar, Inc. | 168,836 | 24,373,165 | |||
| Professional services 1.9% | |||||
| IHS Markit, Ltd. (A) | 1,878,152 | 92,273,607 | |||
| Nielsen Holdings PLC | 77,493 | 2,437,155 | |||
| Road and rail 1.7% | |||||
| Union Pacific Corp. | 631,712 | 84,415,675 | |||
| Information technology 21.8% | 1,082,455,865 | ||||
| Internet software and services 9.6% | |||||
| Alphabet, Inc., Class A (A) | 199,240 | 202,941,879 | |||
| Cargurus, Inc. (A) | 1,668,653 | 51,594,751 | |||
| eBay, Inc. (A) | 1,933,917 | 73,256,776 | |||
| Facebook, Inc., Class A (A) | 876,516 | 150,760,752 | |||
| IT services 3.5% | |||||
| Visa, Inc., Class A | 1,370,854 | 173,933,956 | |||
| Software 2.7% | |||||
| Workday, Inc., Class A (A) | 1,064,940 | 132,947,110 | |||
| SEE NOTES TO FINANCIAL STATEMENTS | SEMIANNUAL REPORT | JOHN HANCOCK FUNDAMENTAL LARGE CAP CORE FUND | 13 |
| Shares | Value | ||||
| Information technology (continued) | |||||
| Technology hardware, storage and peripherals 6.0% | |||||
| Apple, Inc. | 1,797,293 | $297,020,641 | |||
| Real estate 1.6% | 79,906,142 | ||||
| Equity real estate investment trusts 1.6% | |||||
| American Tower Corp. | 585,994 | 79,906,142 | |||
| Yield* (%) | Maturity date | Par value^ | Value | ||
| Short-term investments 2.0% | $102,388,000 | ||||
| (Cost $102,388,000) | |||||
| U.S. Government Agency 1.0% | 53,322,000 | ||||
| Federal Home Loan Bank Discount Note | 1.580 | 05-01-18 | 53,322,000 | 53,322,000 |
| Par value^ | Value | ||||
| Repurchase agreement 1.0% | 49,066,000 | ||||
| Barclays Tri-Party Repurchase Agreement dated 4-30-18 at 1.700% to be repurchased at $47,280,233 on 5-1-18, collateralized by $52,893,200 U.S. Treasury Notes, 1.625% due 2-15-26 (valued at $48,225,895, including interest) | 47,278,000 | 47,278,000 | |||
| Repurchase Agreement with State Street Corp. dated 4-30-18 at 0.740% to be repurchased at $1,788,037 on 5-1-18, collateralized by $1,895,000 U.S. Treasury Notes, 2.125% due 2-29-24 (valued at $1,826,424, including interest) | 1,788,000 | 1,788,000 |
| Total investments (Cost $4,080,551,646) 100.0% | $4,973,532,027 | ||||
| Other assets and liabilities, net (0.0%) | (1,176,927) | ||||
| Total net assets 100.0% | $4,972,355,100 | ||||
| The percentage shown for each investment category is the total value of the category as a percentage of the net assets of the fund. | |
| ^All par values are denominated in U.S. dollars unless otherwise indicated. | |
| Security Abbreviations and Legend | |
| ADR | American Depositary Receipt |
| (A) | Non-income producing security. |
| * | Yield represents either the annualized yield at the date of purchase, the stated coupon rate or, for floating rate securities, the rate at period end. |
| 14 | JOHN HANCOCK FUNDAMENTAL LARGE CAP CORE FUND | SEMIANNUAL REPORT | SEE NOTES TO FINANCIAL STATEMENTS |
Financial statements
STATEMENT OF ASSETS AND LIABILITIES 4-30-18 (unaudited)
| Assets | |||||||||||||||||||
| Investments, at value (Cost $4,080,551,646) | $4,973,532,027 | ||||||||||||||||||
| Cash | 128 | ||||||||||||||||||
| Receivable for fund shares sold | 4,609,177 | ||||||||||||||||||
| Dividends and interest receivable | 2,302,592 | ||||||||||||||||||
| Other receivables and prepaid expenses | 358,529 | ||||||||||||||||||
| Total assets | 4,980,802,453 | ||||||||||||||||||
| Liabilities | |||||||||||||||||||
| Payable for fund shares repurchased | 3,786,766 | ||||||||||||||||||
| Payable to affiliates | |||||||||||||||||||
| Accounting and legal services fees | 565,730 | ||||||||||||||||||
| Transfer agent fees | 279,804 | ||||||||||||||||||
| Distribution and service fees | 574,569 | ||||||||||||||||||
| Trustees' fees | 8,975 | ||||||||||||||||||
| Investment management fees | 2,551,260 | ||||||||||||||||||
| Other liabilities and accrued expenses | 680,249 | ||||||||||||||||||
| Total liabilities | 8,447,353 | ||||||||||||||||||
| Net assets | $4,972,355,100 | ||||||||||||||||||
| Net assets consist of | |||||||||||||||||||
| Paid-in capital | $3,771,277,678 | ||||||||||||||||||
| Undistributed net investment income | 3,893,063 | ||||||||||||||||||
| Accumulated net realized gain (loss) on investments and foreign currency transactions | 304,203,861 | ||||||||||||||||||
| Net unrealized appreciation (depreciation) on investments and translation of assets and liabilities in foreign currencies | 892,980,498 | ||||||||||||||||||
| Net assets | $4,972,355,100 | ||||||||||||||||||
| Net asset value per share | |||||||||||||||||||
| Based on net asset values and shares outstanding-the fund has an unlimited number of shares authorized with no par value | |||||||||||||||||||
| Class A ($1,539,440,647 ÷ 32,305,105 shares)1 | $47.65 | ||||||||||||||||||
| Class B ($20,319,736 ÷ 478,515 shares)1 | $42.46 | ||||||||||||||||||
| Class C ($280,369,788 ÷ 6,603,925 shares)1 | $42.46 | ||||||||||||||||||
| Class I ($901,359,770 ÷ 18,112,871 shares) | $49.76 | ||||||||||||||||||
| Class R1 ($8,178,143 ÷ 166,801 shares) | $49.03 | ||||||||||||||||||
| Class R2 ($1,602,100 ÷ 32,313 shares) | $49.58 | ||||||||||||||||||
| Class R3 ($3,335,620 ÷ 67,845 shares) | $49.17 | ||||||||||||||||||
| Class R4 ($4,343,404 ÷ 87,708 shares) | $49.52 | ||||||||||||||||||
| Class R5 ($1,947,251 ÷ 39,059 shares) | $49.85 | ||||||||||||||||||
| Class R6 ($1,093,072,574 ÷ 21,919,797 shares) | $49.87 | ||||||||||||||||||
| Class NAV ($1,118,386,067 ÷ 22,435,597 shares) | $49.85 | ||||||||||||||||||
| Maximum offering price per share | |||||||||||||||||||
| Class A (net asset value per share ÷ 95%)2 | $50.16 | ||||||||||||||||||
| 1 | Redemption price per share is equal to net asset value less any applicable contingent deferred sales charge. | ||||||||||||||||
| 2 | On single retail sales of less than $50,000. On sales of $50,000 or more and on group sales the offering price is reduced. | ||||||||||||||||
STATEMENT OF OPERATIONS For the six months ended 4-30-18 (unaudited)
| Investment income | ||||||||||||||||||||||||
| Dividends | $34,809,740 | |||||||||||||||||||||||
| Interest | 587,659 | |||||||||||||||||||||||
| Less foreign taxes withheld | (263,473 | ) | ||||||||||||||||||||||
| Total investment income | 35,133,926 | |||||||||||||||||||||||
| Expenses | ||||||||||||||||||||||||
| Investment management fees | 15,758,002 | |||||||||||||||||||||||
| Distribution and service fees | 3,678,653 | |||||||||||||||||||||||
| Accounting and legal services fees | 569,880 | |||||||||||||||||||||||
| Transfer agent fees | 1,660,516 | |||||||||||||||||||||||
| Trustees' fees | 47,882 | |||||||||||||||||||||||
| State registration fees | 117,207 | |||||||||||||||||||||||
| Printing and postage | 265,999 | |||||||||||||||||||||||
| Professional fees | 90,417 | |||||||||||||||||||||||
| Custodian fees | 298,940 | |||||||||||||||||||||||
| Other | 64,539 | |||||||||||||||||||||||
| Total expenses | 22,552,035 | |||||||||||||||||||||||
| Less expense reductions | (221,126 | ) | ||||||||||||||||||||||
| Net expenses | 22,330,909 | |||||||||||||||||||||||
| Net investment income | 12,803,017 | |||||||||||||||||||||||
| Realized and unrealized gain (loss) | ||||||||||||||||||||||||
| Net realized gain (loss) on | ||||||||||||||||||||||||
| Investments and foreign currency transactions | 311,275,835 | |||||||||||||||||||||||
| 311,275,835 | ||||||||||||||||||||||||
| Change in net unrealized appreciation (depreciation) of | ||||||||||||||||||||||||
| Investments and translation of assets and liabilities in foreign currencies | (323,485,304 | ) | ||||||||||||||||||||||
| (323,485,304 | ) | |||||||||||||||||||||||
| Net realized and unrealized loss | (12,209,469 | ) | ||||||||||||||||||||||
| Increase in net assets from operations | $593,548 | |||||||||||||||||||||||
STATEMENTS OF CHANGES IN NET ASSETS
| Six months ended 4-30-18 | Year ended 10-31-17 | ||||||||||||||||||||||||||||||||||||||||||||
| (unaudited) | |||||||||||||||||||||||||||||||||||||||||||||
| Increase (decrease) in net assets | |||||||||||||||||||||||||||||||||||||||||||||
| From operations | |||||||||||||||||||||||||||||||||||||||||||||
| Net investment income | $12,803,017 | $30,090,486 | |||||||||||||||||||||||||||||||||||||||||||
| Net realized gain | 311,275,835 | 381,660,333 | |||||||||||||||||||||||||||||||||||||||||||
| Change in net unrealized appreciation (depreciation) | (323,485,304 | ) | 693,263,240 | ||||||||||||||||||||||||||||||||||||||||||
| Increase in net assets resulting from operations | 593,548 | 1,105,014,059 | |||||||||||||||||||||||||||||||||||||||||||
| Distributions to shareholders | |||||||||||||||||||||||||||||||||||||||||||||
| From net investment income | |||||||||||||||||||||||||||||||||||||||||||||
| Class A | (8,057,285 | ) | (6,690,657 | ) | |||||||||||||||||||||||||||||||||||||||||
| Class I | (7,347,558 | ) | (11,361,222 | ) | |||||||||||||||||||||||||||||||||||||||||
| Class R1 | (12,514 | ) | (5,459 | ) | |||||||||||||||||||||||||||||||||||||||||
| Class R2 | (5,101 | ) | (7,970 | ) | |||||||||||||||||||||||||||||||||||||||||
| Class R3 | (8,567 | ) | (4,093 | ) | |||||||||||||||||||||||||||||||||||||||||
| Class R4 | (18,190 | ) | (13,277 | ) | |||||||||||||||||||||||||||||||||||||||||
| Class R5 | (18,992 | ) | (9,464 | ) | |||||||||||||||||||||||||||||||||||||||||
| Class R6 | (8,044,554 | ) | (8,358,290 | ) | |||||||||||||||||||||||||||||||||||||||||
| Class NAV | (9,295,038 | ) | — | ||||||||||||||||||||||||||||||||||||||||||
| From net realized gain | |||||||||||||||||||||||||||||||||||||||||||||
| Class A | (123,969,640 | ) | (45,947,937 | ) | |||||||||||||||||||||||||||||||||||||||||
| Class B | (2,327,040 | ) | (1,307,130 | ) | |||||||||||||||||||||||||||||||||||||||||
| Class C | (25,759,803 | ) | (9,625,669 | ) | |||||||||||||||||||||||||||||||||||||||||
| Class I | (74,463,826 | ) | (49,784,655 | ) | |||||||||||||||||||||||||||||||||||||||||
| Class R1 | (692,173 | ) | (207,561 | ) | |||||||||||||||||||||||||||||||||||||||||
| Class R2 | (105,932 | ) | (77,548 | ) | |||||||||||||||||||||||||||||||||||||||||
| Class R3 | (284,539 | ) | (71,945 | ) | |||||||||||||||||||||||||||||||||||||||||
| Class R4 | (232,537 | ) | (74,065 | ) | |||||||||||||||||||||||||||||||||||||||||
| Class R5 | (185,680 | ) | (39,359 | ) | |||||||||||||||||||||||||||||||||||||||||
| Class R6 | (74,283,276 | ) | (32,295,978 | ) | |||||||||||||||||||||||||||||||||||||||||
| Class NAV | (83,965,476 | ) | — | ||||||||||||||||||||||||||||||||||||||||||
| Total distributions | (419,077,721 | ) | (165,882,279 | ) | |||||||||||||||||||||||||||||||||||||||||
| From fund share transactions | 305,254,815 | 603,582,491 | |||||||||||||||||||||||||||||||||||||||||||
| Total increase (decrease) | (113,229,358 | ) | 1,542,714,271 | ||||||||||||||||||||||||||||||||||||||||||
| Net assets | |||||||||||||||||||||||||||||||||||||||||||||
| Beginning of period | 5,085,584,458 | 3,542,870,187 | |||||||||||||||||||||||||||||||||||||||||||
| End of period | $4,972,355,100 | $5,085,584,458 | |||||||||||||||||||||||||||||||||||||||||||
| Undistributed net investment income | $3,893,063 | $23,897,845 | |||||||||||||||||||||||||||||||||||||||||||
Financial highlights
| Class A Shares Period ended | 4-30-18 | 1 | 10-31-17 | 10-31-16 | 10-31-15 | 10-31-14 | 10-31-13 | |||||||||||||||||||||||||||||||||||||||||||||||||||||||||||||||||||||||||||||||||||||||||||||||||||||||||||||||
| Per share operating performance | ||||||||||||||||||||||||||||||||||||||||||||||||||||||||||||||||||||||||||||||||||||||||||||||||||||||||||||||||||||||
| Net asset value, beginning of period | $51.87 | $42.42 | $42.89 | $39.44 | $34.92 | $27.52 | ||||||||||||||||||||||||||||||||||||||||||||||||||||||||||||||||||||||||||||||||||||||||||||||||||||||||||||||||
| Net investment income2 | 0.09 | 0.24 | 0.23 | 0.16 | 0.16 | 0.26 | ||||||||||||||||||||||||||||||||||||||||||||||||||||||||||||||||||||||||||||||||||||||||||||||||||||||||||||||||
| Net realized and unrealized gain (loss) on investments | (0.04 | ) | 10.71 | (0.07 | ) | 3.42 | 4.56 | 7.40 | ||||||||||||||||||||||||||||||||||||||||||||||||||||||||||||||||||||||||||||||||||||||||||||||||||||||||||||||
| Total from investment operations | 0.05 | 10.95 | 0.16 | 3.58 | 4.72 | 7.66 | ||||||||||||||||||||||||||||||||||||||||||||||||||||||||||||||||||||||||||||||||||||||||||||||||||||||||||||||||
| Less distributions | ||||||||||||||||||||||||||||||||||||||||||||||||||||||||||||||||||||||||||||||||||||||||||||||||||||||||||||||||||||||
| From net investment income | (0.26 | ) | (0.19 | ) | (0.12 | ) | (0.13 | ) | (0.20 | ) | (0.26 | ) | ||||||||||||||||||||||||||||||||||||||||||||||||||||||||||||||||||||||||||||||||||||||||||||||||||||||||||
| From net realized gain | (4.01 | ) | (1.31 | ) | (0.51 | ) | — | — | — | |||||||||||||||||||||||||||||||||||||||||||||||||||||||||||||||||||||||||||||||||||||||||||||||||||||||||||||
| Total distributions | (4.27 | ) | (1.50 | ) | (0.63 | ) | (0.13 | ) | (0.20 | ) | (0.26 | ) | ||||||||||||||||||||||||||||||||||||||||||||||||||||||||||||||||||||||||||||||||||||||||||||||||||||||||||
| Net asset value, end of period | $47.65 | $51.87 | $42.42 | $42.89 | $39.44 | $34.92 | ||||||||||||||||||||||||||||||||||||||||||||||||||||||||||||||||||||||||||||||||||||||||||||||||||||||||||||||||
| Total return (%)3,4 | (0.12 | ) 5 | 26.39 | 0.37 | 9.11 | 13.59 | 28.07 | |||||||||||||||||||||||||||||||||||||||||||||||||||||||||||||||||||||||||||||||||||||||||||||||||||||||||||||||
| Ratios and supplemental data | ||||||||||||||||||||||||||||||||||||||||||||||||||||||||||||||||||||||||||||||||||||||||||||||||||||||||||||||||||||||
| Net assets, end of period (in millions) | $1,539 | $1,620 | $1,519 | $1,629 | $1,541 | $1,044 | ||||||||||||||||||||||||||||||||||||||||||||||||||||||||||||||||||||||||||||||||||||||||||||||||||||||||||||||||
| Ratios (as a percentage of average net assets): | ||||||||||||||||||||||||||||||||||||||||||||||||||||||||||||||||||||||||||||||||||||||||||||||||||||||||||||||||||||||
| Expenses before reductions | 1.03 | 6 | 1.04 | 1.06 | 1.05 | 1.06 | 1.10 | |||||||||||||||||||||||||||||||||||||||||||||||||||||||||||||||||||||||||||||||||||||||||||||||||||||||||||||||
| Expenses including reductions | 1.02 | 6 | 1.04 | 1.05 | 1.04 | 1.06 | 1.10 | |||||||||||||||||||||||||||||||||||||||||||||||||||||||||||||||||||||||||||||||||||||||||||||||||||||||||||||||
| Net investment income | 0.35 | 6 | 0.51 | 0.57 | 0.40 | 0.43 | 0.83 | |||||||||||||||||||||||||||||||||||||||||||||||||||||||||||||||||||||||||||||||||||||||||||||||||||||||||||||||
| Portfolio turnover (%) | 18 | 54 | 7 | 20 | 8 | 22 | 21 | 8 | 31 | |||||||||||||||||||||||||||||||||||||||||||||||||||||||||||||||||||||||||||||||||||||||||||||||||||||||||||||
| Class B Shares Period ended | 4-30-18 | 1 | 10-31-17 | 10-31-16 | 10-31-15 | 10-31-14 | 10-31-13 | |||||||||||||||||||||||||||||||||||||||||||||||||||||||||||||||||||||||||||||||||||||||||||||||||||||||||||||||
| Per share operating performance | ||||||||||||||||||||||||||||||||||||||||||||||||||||||||||||||||||||||||||||||||||||||||||||||||||||||||||||||||||||||
| Net asset value, beginning of period | $46.58 | $38.34 | $38.99 | $36.01 | $31.94 | $25.20 | ||||||||||||||||||||||||||||||||||||||||||||||||||||||||||||||||||||||||||||||||||||||||||||||||||||||||||||||||
| Net investment income (loss)2 | (0.08 | ) | (0.09 | ) | (0.06 | ) | (0.13 | ) | (0.11 | ) | 0.02 | |||||||||||||||||||||||||||||||||||||||||||||||||||||||||||||||||||||||||||||||||||||||||||||||||||||||||||
| Net realized and unrealized gain (loss) on investments | (0.03 | ) | 9.64 | (0.08 | ) | 3.11 | 4.18 | 6.79 | ||||||||||||||||||||||||||||||||||||||||||||||||||||||||||||||||||||||||||||||||||||||||||||||||||||||||||||||
| Total from investment operations | (0.11 | ) | 9.55 | (0.14 | ) | 2.98 | 4.07 | 6.81 | ||||||||||||||||||||||||||||||||||||||||||||||||||||||||||||||||||||||||||||||||||||||||||||||||||||||||||||||
| Less distributions | ||||||||||||||||||||||||||||||||||||||||||||||||||||||||||||||||||||||||||||||||||||||||||||||||||||||||||||||||||||||
| From net investment income | — | — | — | — | — | (0.07 | ) | |||||||||||||||||||||||||||||||||||||||||||||||||||||||||||||||||||||||||||||||||||||||||||||||||||||||||||||||
| From net realized gain | (4.01 | ) | (1.31 | ) | (0.51 | ) | — | — | — | |||||||||||||||||||||||||||||||||||||||||||||||||||||||||||||||||||||||||||||||||||||||||||||||||||||||||||||
| Total Distributions | (4.01 | ) | (1.31 | ) | (0.51 | ) | — | — | (0.07 | ) | ||||||||||||||||||||||||||||||||||||||||||||||||||||||||||||||||||||||||||||||||||||||||||||||||||||||||||||
| Net asset value, end of period | $42.46 | $46.58 | $38.34 | $38.99 | $36.01 | $31.94 | ||||||||||||||||||||||||||||||||||||||||||||||||||||||||||||||||||||||||||||||||||||||||||||||||||||||||||||||||
| Total return (%)3,4 | (0.49 | ) 5 | 25.44 | (0.37 | ) | 8.28 | 12.74 | 27.07 | ||||||||||||||||||||||||||||||||||||||||||||||||||||||||||||||||||||||||||||||||||||||||||||||||||||||||||||||
| Ratios and supplemental data | ||||||||||||||||||||||||||||||||||||||||||||||||||||||||||||||||||||||||||||||||||||||||||||||||||||||||||||||||||||||
| Net assets, end of period (in millions) | $20 | $29 | $41 | $65 | $79 | $74 | ||||||||||||||||||||||||||||||||||||||||||||||||||||||||||||||||||||||||||||||||||||||||||||||||||||||||||||||||
| Ratios (as a percentage of average net assets): | ||||||||||||||||||||||||||||||||||||||||||||||||||||||||||||||||||||||||||||||||||||||||||||||||||||||||||||||||||||||
| Expenses before reductions | 1.78 | 6 | 1.79 | 1.81 | 1.80 | 1.81 | 1.86 | |||||||||||||||||||||||||||||||||||||||||||||||||||||||||||||||||||||||||||||||||||||||||||||||||||||||||||||||
| Expenses including reductions | 1.77 | 6 | 1.79 | 1.80 | 1.79 | 1.81 | 1.85 | |||||||||||||||||||||||||||||||||||||||||||||||||||||||||||||||||||||||||||||||||||||||||||||||||||||||||||||||
| Net investment income (loss) | (0.36 | ) 6 | (0.21 | ) | (0.17 | ) | (0.34 | ) | (0.31 | ) | 0.08 | |||||||||||||||||||||||||||||||||||||||||||||||||||||||||||||||||||||||||||||||||||||||||||||||||||||||||||
| Portfolio turnover (%) | 18 | 54 | 7 | 20 | 8 | 22 | 21 | 8 | 31 | |||||||||||||||||||||||||||||||||||||||||||||||||||||||||||||||||||||||||||||||||||||||||||||||||||||||||||||
| 1 | Six months ended 4-30-18. Unaudited. | ||||||||||||||||||||||||||||||||||||||||||||||||||||||||||||||||||||||||||||||||||
| 2 | Based on average daily shares outstanding. | ||||||||||||||||||||||||||||||||||||||||||||||||||||||||||||||||||||||||||||||||||
| 3 | Does not reflect the effect of sales charges, if any. | ||||||||||||||||||||||||||||||||||||||||||||||||||||||||||||||||||||||||||||||||||
| 4 | Total returns would have been lower had certain expenses not been reduced during the applicable periods. | ||||||||||||||||||||||||||||||||||||||||||||||||||||||||||||||||||||||||||||||||||
| 5 | Not annualized. | ||||||||||||||||||||||||||||||||||||||||||||||||||||||||||||||||||||||||||||||||||
| 6 | Annualized. | ||||||||||||||||||||||||||||||||||||||||||||||||||||||||||||||||||||||||||||||||||
| 7 | Excludes in-kind transactions. | ||||||||||||||||||||||||||||||||||||||||||||||||||||||||||||||||||||||||||||||||||
| 8 | Excludes merger activity. | ||||||||||||||||||||||||||||||||||||||||||||||||||||||||||||||||||||||||||||||||||
| Class C Shares Period ended | 4-30-18 | 1 | 10-31-17 | 10-31-16 | 10-31-15 | 10-31-14 | 10-31-13 | |||||||||||||||||||||||||||||||||||||||||||||||||||||||||||||||||||||||||||||||||||||||||||||||||||||||||||||||
| Per share operating performance | ||||||||||||||||||||||||||||||||||||||||||||||||||||||||||||||||||||||||||||||||||||||||||||||||||||||||||||||||||||||
| Net asset value, beginning of period | $46.57 | $38.33 | $38.98 | $36.00 | $31.93 | $25.19 | ||||||||||||||||||||||||||||||||||||||||||||||||||||||||||||||||||||||||||||||||||||||||||||||||||||||||||||||||
| Net investment income (loss)2 | (0.09 | ) | (0.10 | ) | (0.07 | ) | (0.13 | ) | (0.11 | ) | 0.02 | |||||||||||||||||||||||||||||||||||||||||||||||||||||||||||||||||||||||||||||||||||||||||||||||||||||||||||
| Net realized and unrealized gain (loss) on investments | (0.01 | ) | 9.65 | (0.07 | ) | 3.11 | 4.18 | 6.79 | ||||||||||||||||||||||||||||||||||||||||||||||||||||||||||||||||||||||||||||||||||||||||||||||||||||||||||||||
| Total from investment operations | (0.10 | ) | 9.55 | (0.14 | ) | 2.98 | 4.07 | 6.81 | ||||||||||||||||||||||||||||||||||||||||||||||||||||||||||||||||||||||||||||||||||||||||||||||||||||||||||||||
| Less distributions | ||||||||||||||||||||||||||||||||||||||||||||||||||||||||||||||||||||||||||||||||||||||||||||||||||||||||||||||||||||||
| From net investment income | — | — | — | — | — | (0.07 | ) | |||||||||||||||||||||||||||||||||||||||||||||||||||||||||||||||||||||||||||||||||||||||||||||||||||||||||||||||
| From net realized gain | (4.01 | ) | (1.31 | ) | (0.51 | ) | — | — | — | |||||||||||||||||||||||||||||||||||||||||||||||||||||||||||||||||||||||||||||||||||||||||||||||||||||||||||||
| Total Distributions | (4.01 | ) | (1.31 | ) | (0.51 | ) | — | — | (0.07 | ) | ||||||||||||||||||||||||||||||||||||||||||||||||||||||||||||||||||||||||||||||||||||||||||||||||||||||||||||
| Net asset value, end of period | $42.46 | $46.57 | $38.33 | $38.98 | $36.00 | $31.93 | ||||||||||||||||||||||||||||||||||||||||||||||||||||||||||||||||||||||||||||||||||||||||||||||||||||||||||||||||
| Total return (%)3,4 | (0.47 | ) 5 | 25.44 | (0.37 | ) | 8.28 | 12.75 | 27.08 | ||||||||||||||||||||||||||||||||||||||||||||||||||||||||||||||||||||||||||||||||||||||||||||||||||||||||||||||
| Ratios and supplemental data | ||||||||||||||||||||||||||||||||||||||||||||||||||||||||||||||||||||||||||||||||||||||||||||||||||||||||||||||||||||||
| Net assets, end of period (in millions) | $280 | $303 | $290 | $314 | $300 | $267 | ||||||||||||||||||||||||||||||||||||||||||||||||||||||||||||||||||||||||||||||||||||||||||||||||||||||||||||||||
| Ratios (as a percentage of average net assets): | ||||||||||||||||||||||||||||||||||||||||||||||||||||||||||||||||||||||||||||||||||||||||||||||||||||||||||||||||||||||
| Expenses before reductions | 1.78 | 6 | 1.79 | 1.81 | 1.80 | 1.81 | 1.85 | |||||||||||||||||||||||||||||||||||||||||||||||||||||||||||||||||||||||||||||||||||||||||||||||||||||||||||||||
| Expenses including reductions | 1.77 | 6 | 1.79 | 1.80 | 1.79 | 1.81 | 1.85 | |||||||||||||||||||||||||||||||||||||||||||||||||||||||||||||||||||||||||||||||||||||||||||||||||||||||||||||||
| Net investment income (loss) | (0.39 | ) 6 | (0.23 | ) | (0.18 | ) | (0.35 | ) | (0.32 | ) | 0.07 | |||||||||||||||||||||||||||||||||||||||||||||||||||||||||||||||||||||||||||||||||||||||||||||||||||||||||||
| Portfolio turnover (%) | 18 | 54 | 7 | 20 | 8 | 22 | 21 | 8 | 31 | |||||||||||||||||||||||||||||||||||||||||||||||||||||||||||||||||||||||||||||||||||||||||||||||||||||||||||||
| 1 | Six months ended 4-30-18. Unaudited. | ||||||||||||||||||||||||||||||||||||||||||||||||||||||||||||||||||||||||||||||||||
| 2 | Based on average daily shares outstanding. | ||||||||||||||||||||||||||||||||||||||||||||||||||||||||||||||||||||||||||||||||||
| 3 | Does not reflect the effect of sales charges, if any. | ||||||||||||||||||||||||||||||||||||||||||||||||||||||||||||||||||||||||||||||||||
| 4 | Total returns would have been lower had certain expenses not been reduced during the applicable periods. | ||||||||||||||||||||||||||||||||||||||||||||||||||||||||||||||||||||||||||||||||||
| 5 | Not annualized. | ||||||||||||||||||||||||||||||||||||||||||||||||||||||||||||||||||||||||||||||||||
| 6 | Annualized. | ||||||||||||||||||||||||||||||||||||||||||||||||||||||||||||||||||||||||||||||||||
| 7 | Excludes in-kind transactions. | ||||||||||||||||||||||||||||||||||||||||||||||||||||||||||||||||||||||||||||||||||
| 8 | Excludes merger activity. | ||||||||||||||||||||||||||||||||||||||||||||||||||||||||||||||||||||||||||||||||||
| Class I Shares Period ended | 4-30-18 | 1 | 10-31-17 | 10-31-16 | 10-31-15 | 10-31-14 | 10-31-13 | |||||||||||||||||||||||||||||||||||||||||||||||||||||||||||||||||||||||||||||||||||||||||||||||||||||||||||||||
| Per share operating performance | ||||||||||||||||||||||||||||||||||||||||||||||||||||||||||||||||||||||||||||||||||||||||||||||||||||||||||||||||||||||
| Net asset value, beginning of period | $54.05 | $44.13 | $44.58 | $40.97 | $36.28 | $28.58 | ||||||||||||||||||||||||||||||||||||||||||||||||||||||||||||||||||||||||||||||||||||||||||||||||||||||||||||||||
| Net investment income2 | 0.16 | 0.40 | 0.36 | 0.27 | 0.26 | 0.35 | ||||||||||||||||||||||||||||||||||||||||||||||||||||||||||||||||||||||||||||||||||||||||||||||||||||||||||||||||
| Net realized and unrealized gain (loss) on investments | (0.04 | ) | 11.12 | (0.08 | ) | 3.55 | 4.75 | 7.70 | ||||||||||||||||||||||||||||||||||||||||||||||||||||||||||||||||||||||||||||||||||||||||||||||||||||||||||||||
| Total from investment operations | 0.12 | 11.52 | 0.28 | 3.82 | 5.01 | 8.05 | ||||||||||||||||||||||||||||||||||||||||||||||||||||||||||||||||||||||||||||||||||||||||||||||||||||||||||||||||
| Less distributions | ||||||||||||||||||||||||||||||||||||||||||||||||||||||||||||||||||||||||||||||||||||||||||||||||||||||||||||||||||||||
| From net investment income | (0.40 | ) | (0.29 | ) | (0.22 | ) | (0.21 | ) | (0.32 | ) | (0.35 | ) | ||||||||||||||||||||||||||||||||||||||||||||||||||||||||||||||||||||||||||||||||||||||||||||||||||||||||||
| From net realized gain | (4.01 | ) | (1.31 | ) | (0.51 | ) | — | — | — | |||||||||||||||||||||||||||||||||||||||||||||||||||||||||||||||||||||||||||||||||||||||||||||||||||||||||||||
| Total distributions | (4.41 | ) | (1.60 | ) | (0.73 | ) | (0.21 | ) | (0.32 | ) | (0.35 | ) | ||||||||||||||||||||||||||||||||||||||||||||||||||||||||||||||||||||||||||||||||||||||||||||||||||||||||||
| Net asset value, end of period | $49.76 | $54.05 | $44.13 | $44.58 | $40.97 | $36.28 | ||||||||||||||||||||||||||||||||||||||||||||||||||||||||||||||||||||||||||||||||||||||||||||||||||||||||||||||||
| Total return (%)3 | 0.00 | 4 | 26.73 | 0.63 | 9.40 | 13.90 | 28.45 | |||||||||||||||||||||||||||||||||||||||||||||||||||||||||||||||||||||||||||||||||||||||||||||||||||||||||||||||
| Ratios and supplemental data | ||||||||||||||||||||||||||||||||||||||||||||||||||||||||||||||||||||||||||||||||||||||||||||||||||||||||||||||||||||||
| Net assets, end of period (in millions) | $901 | $985 | $1,665 | $1,789 | $880 | $428 | ||||||||||||||||||||||||||||||||||||||||||||||||||||||||||||||||||||||||||||||||||||||||||||||||||||||||||||||||
| Ratios (as a percentage of average net assets): | ||||||||||||||||||||||||||||||||||||||||||||||||||||||||||||||||||||||||||||||||||||||||||||||||||||||||||||||||||||||
| Expenses before reductions | 0.78 | 5 | 0.78 | 0.79 | 0.79 | 0.80 | 0.80 | |||||||||||||||||||||||||||||||||||||||||||||||||||||||||||||||||||||||||||||||||||||||||||||||||||||||||||||||
| Expenses including reductions | 0.77 | 5 | 0.78 | 0.78 | 0.78 | 0.79 | 0.80 | |||||||||||||||||||||||||||||||||||||||||||||||||||||||||||||||||||||||||||||||||||||||||||||||||||||||||||||||
| Net investment income | 0.60 | 5 | 0.82 | 0.84 | 0.65 | 0.68 | 1.09 | |||||||||||||||||||||||||||||||||||||||||||||||||||||||||||||||||||||||||||||||||||||||||||||||||||||||||||||||
| Portfolio turnover (%) | 18 | 54 | 6 | 20 | 7 | 22 | 21 | 7 | 31 | |||||||||||||||||||||||||||||||||||||||||||||||||||||||||||||||||||||||||||||||||||||||||||||||||||||||||||||
| 1 | Six months ended 4-30-18. Unaudited. | ||||||||||||||||||||||||||||||||||||||||||||||||||||||||||||||||||||||||||||||||||
| 2 | Based on average daily shares outstanding. | ||||||||||||||||||||||||||||||||||||||||||||||||||||||||||||||||||||||||||||||||||
| 3 | Total returns would have been lower had certain expenses not been reduced during the applicable periods. | ||||||||||||||||||||||||||||||||||||||||||||||||||||||||||||||||||||||||||||||||||
| 4 | Not annualized. | ||||||||||||||||||||||||||||||||||||||||||||||||||||||||||||||||||||||||||||||||||
| 5 | Annualized. | ||||||||||||||||||||||||||||||||||||||||||||||||||||||||||||||||||||||||||||||||||
| 6 | Excludes in-kind transactions. | ||||||||||||||||||||||||||||||||||||||||||||||||||||||||||||||||||||||||||||||||||
| 7 | Excludes merger activity. | ||||||||||||||||||||||||||||||||||||||||||||||||||||||||||||||||||||||||||||||||||
| Class R1 Shares Period ended | 4-30-18 | 1 | 10-31-17 | 10-31-16 | 10-31-15 | 10-31-14 | 10-31-13 | |||||||||||||||||||||||||||||||||||||||||||||||||||||||||||||||||||||||||||||||||||||||||||||||||||||||||||||||
| Per share operating performance | ||||||||||||||||||||||||||||||||||||||||||||||||||||||||||||||||||||||||||||||||||||||||||||||||||||||||||||||||||||||
| Net asset value, beginning of period | $53.16 | $43.46 | $43.98 | $40.47 | $35.85 | $28.26 | ||||||||||||||||||||||||||||||||||||||||||||||||||||||||||||||||||||||||||||||||||||||||||||||||||||||||||||||||
| Net investment income (loss)2 | (0.01 | ) | 0.06 | 0.07 | 0.01 | 0.02 | 0.15 | |||||||||||||||||||||||||||||||||||||||||||||||||||||||||||||||||||||||||||||||||||||||||||||||||||||||||||||||
| Net realized and unrealized gain (loss) on investments | (0.04 | ) | 10.98 | (0.08 | ) | 3.50 | 4.69 | 7.62 | ||||||||||||||||||||||||||||||||||||||||||||||||||||||||||||||||||||||||||||||||||||||||||||||||||||||||||||||
| Total from investment operations | (0.05 | ) | 11.04 | (0.01 | ) | 3.51 | 4.71 | 7.77 | ||||||||||||||||||||||||||||||||||||||||||||||||||||||||||||||||||||||||||||||||||||||||||||||||||||||||||||||
| Less distributions | ||||||||||||||||||||||||||||||||||||||||||||||||||||||||||||||||||||||||||||||||||||||||||||||||||||||||||||||||||||||
| From net investment income | (0.07 | ) | (0.03 | ) | — | — | 3 | (0.09 | ) | (0.18 | ) | |||||||||||||||||||||||||||||||||||||||||||||||||||||||||||||||||||||||||||||||||||||||||||||||||||||||||||
| From net realized gain | (4.01 | ) | (1.31 | ) | (0.51 | ) | — | — | — | |||||||||||||||||||||||||||||||||||||||||||||||||||||||||||||||||||||||||||||||||||||||||||||||||||||||||||||
| Total distributions | (4.08 | ) | (1.34 | ) | (0.51 | ) | — | 3 | (0.09 | ) | (0.18 | ) | ||||||||||||||||||||||||||||||||||||||||||||||||||||||||||||||||||||||||||||||||||||||||||||||||||||||||||
| Net asset value, end of period | $49.03 | $53.16 | $43.46 | $43.98 | $40.47 | $35.85 | ||||||||||||||||||||||||||||||||||||||||||||||||||||||||||||||||||||||||||||||||||||||||||||||||||||||||||||||||
| Total return (%)4 | (0.31 | ) 5 | 25.90 | (0.03 | ) | 8.67 | 13.18 | 27.63 | ||||||||||||||||||||||||||||||||||||||||||||||||||||||||||||||||||||||||||||||||||||||||||||||||||||||||||||||
| Ratios and supplemental data | ||||||||||||||||||||||||||||||||||||||||||||||||||||||||||||||||||||||||||||||||||||||||||||||||||||||||||||||||||||||
| Net assets, end of period (in millions) | $8 | $9 | $7 | $7 | $7 | $8 | ||||||||||||||||||||||||||||||||||||||||||||||||||||||||||||||||||||||||||||||||||||||||||||||||||||||||||||||||
| Ratios (as a percentage of average net assets): | ||||||||||||||||||||||||||||||||||||||||||||||||||||||||||||||||||||||||||||||||||||||||||||||||||||||||||||||||||||||
| Expenses before reductions | 1.42 | 6 | 1.43 | 1.45 | 1.44 | 1.45 | 1.44 | |||||||||||||||||||||||||||||||||||||||||||||||||||||||||||||||||||||||||||||||||||||||||||||||||||||||||||||||
| Expenses including reductions | 1.41 | 6 | 1.42 | 1.44 | 1.43 | 1.44 | 1.43 | |||||||||||||||||||||||||||||||||||||||||||||||||||||||||||||||||||||||||||||||||||||||||||||||||||||||||||||||
| Net investment income (loss) | (0.04 | ) 6 | 0.13 | 0.18 | 0.01 | 0.06 | 0.48 | |||||||||||||||||||||||||||||||||||||||||||||||||||||||||||||||||||||||||||||||||||||||||||||||||||||||||||||||
| Portfolio turnover (%) | 18 | 54 | 7 | 20 | 8 | 22 | 21 | 8 | 31 | |||||||||||||||||||||||||||||||||||||||||||||||||||||||||||||||||||||||||||||||||||||||||||||||||||||||||||||
| 1 | Six months ended 4-30-18. Unaudited. | ||||||||||||||||||||||||||||||||||||||||||||||||||||||||||||||||||||||||||||||||||
| 2 | Based on average daily shares outstanding. | ||||||||||||||||||||||||||||||||||||||||||||||||||||||||||||||||||||||||||||||||||
| 3 | Less than $0.005 per share. | ||||||||||||||||||||||||||||||||||||||||||||||||||||||||||||||||||||||||||||||||||
| 4 | Total returns would have been lower had certain expenses not been reduced during the applicable periods. | ||||||||||||||||||||||||||||||||||||||||||||||||||||||||||||||||||||||||||||||||||
| 5 | Not annualized. | ||||||||||||||||||||||||||||||||||||||||||||||||||||||||||||||||||||||||||||||||||
| 6 | Annualized. | ||||||||||||||||||||||||||||||||||||||||||||||||||||||||||||||||||||||||||||||||||
| 7 | Excludes in-kind transactions. | ||||||||||||||||||||||||||||||||||||||||||||||||||||||||||||||||||||||||||||||||||
| 8 | Excludes merger activity. | ||||||||||||||||||||||||||||||||||||||||||||||||||||||||||||||||||||||||||||||||||
| Class R2 Shares Period ended | 4-30-18 | 1 | 10-31-17 | 10-31-16 | 10-31-15 | 10-31-14 | 10-31-13 | |||||||||||||||||||||||||||||||||||||||||||||||||||||||||||||||||||||||||||||||||||||||||||||||||||||||||||||||
| Per share operating performance | ||||||||||||||||||||||||||||||||||||||||||||||||||||||||||||||||||||||||||||||||||||||||||||||||||||||||||||||||||||||
| Net asset value, beginning of period | $53.77 | $43.93 | $44.40 | $40.84 | $36.22 | $28.56 | ||||||||||||||||||||||||||||||||||||||||||||||||||||||||||||||||||||||||||||||||||||||||||||||||||||||||||||||||
| Net investment income2 | 0.09 | 0.18 | 0.18 | 0.11 | 0.11 | 0.25 | ||||||||||||||||||||||||||||||||||||||||||||||||||||||||||||||||||||||||||||||||||||||||||||||||||||||||||||||||
| Net realized and unrealized gain (loss) on investments | (0.08 | ) | 11.10 | (0.08 | ) | 3.53 | 4.74 | 7.71 | ||||||||||||||||||||||||||||||||||||||||||||||||||||||||||||||||||||||||||||||||||||||||||||||||||||||||||||||
| Total from investment operations | 0.01 | 11.28 | 0.10 | 3.64 | 4.85 | 7.96 | ||||||||||||||||||||||||||||||||||||||||||||||||||||||||||||||||||||||||||||||||||||||||||||||||||||||||||||||||
| Less distributions | ||||||||||||||||||||||||||||||||||||||||||||||||||||||||||||||||||||||||||||||||||||||||||||||||||||||||||||||||||||||
| From net investment income | (0.19 | ) | (0.13 | ) | (0.06 | ) | (0.08 | ) | (0.23 | ) | (0.30 | ) | ||||||||||||||||||||||||||||||||||||||||||||||||||||||||||||||||||||||||||||||||||||||||||||||||||||||||||
| From net realized gain | (4.01 | ) | (1.31 | ) | (0.51 | ) | — | — | — | |||||||||||||||||||||||||||||||||||||||||||||||||||||||||||||||||||||||||||||||||||||||||||||||||||||||||||||
| Total distributions | (4.20 | ) | (1.44 | ) | (0.57 | ) | (0.08 | ) | (0.23 | ) | (0.30 | ) | ||||||||||||||||||||||||||||||||||||||||||||||||||||||||||||||||||||||||||||||||||||||||||||||||||||||||||
| Net asset value, end of period | $49.58 | $53.77 | $43.93 | $44.40 | $40.84 | $36.22 | ||||||||||||||||||||||||||||||||||||||||||||||||||||||||||||||||||||||||||||||||||||||||||||||||||||||||||||||||
| Total return (%)3 | (0.19 | ) 4 | 26.22 | 0.24 | 8.95 | 13.46 | 28.13 | |||||||||||||||||||||||||||||||||||||||||||||||||||||||||||||||||||||||||||||||||||||||||||||||||||||||||||||||
| Ratios and supplemental data | ||||||||||||||||||||||||||||||||||||||||||||||||||||||||||||||||||||||||||||||||||||||||||||||||||||||||||||||||||||||
| Net assets, end of period (in millions) | $2 | $3 | $3 | $2 | $2 | $1 | ||||||||||||||||||||||||||||||||||||||||||||||||||||||||||||||||||||||||||||||||||||||||||||||||||||||||||||||||
| Ratios (as a percentage of average net assets): | ||||||||||||||||||||||||||||||||||||||||||||||||||||||||||||||||||||||||||||||||||||||||||||||||||||||||||||||||||||||
| Expenses before reductions | 1.19 | 5 | 1.18 | 1.20 | 1.19 | 1.19 | 1.07 | |||||||||||||||||||||||||||||||||||||||||||||||||||||||||||||||||||||||||||||||||||||||||||||||||||||||||||||||
| Expenses including reductions | 1.18 | 5 | 1.18 | 1.19 | 1.18 | 1.18 | 1.06 | |||||||||||||||||||||||||||||||||||||||||||||||||||||||||||||||||||||||||||||||||||||||||||||||||||||||||||||||
| Net investment income | 0.34 | 5 | 0.36 | 0.43 | 0.25 | 0.28 | 0.76 | |||||||||||||||||||||||||||||||||||||||||||||||||||||||||||||||||||||||||||||||||||||||||||||||||||||||||||||||
| Portfolio turnover (%) | 18 | 54 | 6 | 20 | 7 | 22 | 21 | 7 | 31 | |||||||||||||||||||||||||||||||||||||||||||||||||||||||||||||||||||||||||||||||||||||||||||||||||||||||||||||
| 1 | Six months ended 4-30-18. Unaudited. | ||||||||||||||||||||||||||||||||||||||||||||||||||||||||||||||||||||||||||||||||||
| 2 | Based on average daily shares outstanding. | ||||||||||||||||||||||||||||||||||||||||||||||||||||||||||||||||||||||||||||||||||
| 3 | Total returns would have been lower had certain expenses not been reduced during the applicable periods. | ||||||||||||||||||||||||||||||||||||||||||||||||||||||||||||||||||||||||||||||||||
| 4 | Not annualized. | ||||||||||||||||||||||||||||||||||||||||||||||||||||||||||||||||||||||||||||||||||
| 5 | Annualized. | ||||||||||||||||||||||||||||||||||||||||||||||||||||||||||||||||||||||||||||||||||
| 6 | Excludes in-kind transactions. | ||||||||||||||||||||||||||||||||||||||||||||||||||||||||||||||||||||||||||||||||||
| 7 | Excludes merger activity. | ||||||||||||||||||||||||||||||||||||||||||||||||||||||||||||||||||||||||||||||||||
| Class R3 Shares Period ended | 4-30-18 | 1 | 10-31-17 | 10-31-16 | 10-31-15 | 10-31-14 | 10-31-13 | |||||||||||||||||||||||||||||||||||||||||||||||||||||||||||||||||||||||||||||||||||||||||||||||||||||||||||||||
| Per share operating performance | ||||||||||||||||||||||||||||||||||||||||||||||||||||||||||||||||||||||||||||||||||||||||||||||||||||||||||||||||||||||
| Net asset value, beginning of period | $53.31 | $43.57 | $44.05 | $40.52 | $35.90 | $28.30 | ||||||||||||||||||||||||||||||||||||||||||||||||||||||||||||||||||||||||||||||||||||||||||||||||||||||||||||||||
| Net investment income2 | 0.03 | 0.09 | 0.12 | 0.05 | 0.06 | 0.18 | ||||||||||||||||||||||||||||||||||||||||||||||||||||||||||||||||||||||||||||||||||||||||||||||||||||||||||||||||
| Net realized and unrealized gain (loss) on investments | (0.04 | ) | 11.03 | (0.08 | ) | 3.51 | 4.69 | 7.61 | ||||||||||||||||||||||||||||||||||||||||||||||||||||||||||||||||||||||||||||||||||||||||||||||||||||||||||||||
| Total from investment operations | (0.01 | ) | 11.12 | 0.04 | 3.56 | 4.75 | 7.79 | |||||||||||||||||||||||||||||||||||||||||||||||||||||||||||||||||||||||||||||||||||||||||||||||||||||||||||||||
| Less distributions | ||||||||||||||||||||||||||||||||||||||||||||||||||||||||||||||||||||||||||||||||||||||||||||||||||||||||||||||||||||||
| From net investment income | (0.12 | ) | (0.07 | ) | (0.01 | ) | (0.03 | ) | (0.13 | ) | (0.19 | ) | ||||||||||||||||||||||||||||||||||||||||||||||||||||||||||||||||||||||||||||||||||||||||||||||||||||||||||
| From net realized gain | (4.01 | ) | (1.31 | ) | (0.51 | ) | — | — | — | |||||||||||||||||||||||||||||||||||||||||||||||||||||||||||||||||||||||||||||||||||||||||||||||||||||||||||||
| Total distributions | (4.13 | ) | (1.38 | ) | (0.52 | ) | (0.03 | ) | (0.13 | ) | (0.19 | ) | ||||||||||||||||||||||||||||||||||||||||||||||||||||||||||||||||||||||||||||||||||||||||||||||||||||||||||
| Net asset value, end of period | $49.17 | $53.31 | $43.57 | $44.05 | $40.52 | $35.90 | ||||||||||||||||||||||||||||||||||||||||||||||||||||||||||||||||||||||||||||||||||||||||||||||||||||||||||||||||
| Total return (%)3 | (0.23 | ) 4 | 26.04 | 0.09 | 8.80 | 13.26 | 27.70 | |||||||||||||||||||||||||||||||||||||||||||||||||||||||||||||||||||||||||||||||||||||||||||||||||||||||||||||||
| Ratios and supplemental data | ||||||||||||||||||||||||||||||||||||||||||||||||||||||||||||||||||||||||||||||||||||||||||||||||||||||||||||||||||||||
| Net assets, end of period (in millions) | $3 | $4 | $2 | $2 | $1 | $3 | ||||||||||||||||||||||||||||||||||||||||||||||||||||||||||||||||||||||||||||||||||||||||||||||||||||||||||||||||
| Ratios (as a percentage of average net assets): | ||||||||||||||||||||||||||||||||||||||||||||||||||||||||||||||||||||||||||||||||||||||||||||||||||||||||||||||||||||||
| Expenses before reductions | 1.28 | 5 | 1.33 | 1.34 | 1.32 | 1.35 | 1.36 | |||||||||||||||||||||||||||||||||||||||||||||||||||||||||||||||||||||||||||||||||||||||||||||||||||||||||||||||
| Expenses including reductions | 1.27 | 5 | 1.33 | 1.33 | 1.32 | 1.34 | 1.36 | |||||||||||||||||||||||||||||||||||||||||||||||||||||||||||||||||||||||||||||||||||||||||||||||||||||||||||||||
| Net investment income | 0.13 | 5 | 0.19 | 0.28 | 0.12 | 0.16 | 0.56 | |||||||||||||||||||||||||||||||||||||||||||||||||||||||||||||||||||||||||||||||||||||||||||||||||||||||||||||||
| Portfolio turnover (%) | 18 | 54 | 6 | 20 | 7 | 22 | 21 | 7 | 31 | |||||||||||||||||||||||||||||||||||||||||||||||||||||||||||||||||||||||||||||||||||||||||||||||||||||||||||||
| 1 | Six months ended 4-30-18. Unaudited. | ||||||||||||||||||||||||||||||||||||||||||||||||||||||||||||||||||||||||||||||||||
| 2 | Based on average daily shares outstanding. | ||||||||||||||||||||||||||||||||||||||||||||||||||||||||||||||||||||||||||||||||||
| 3 | Total returns would have been lower had certain expenses not been reduced during the applicable periods. | ||||||||||||||||||||||||||||||||||||||||||||||||||||||||||||||||||||||||||||||||||
| 4 | Not annualized. | ||||||||||||||||||||||||||||||||||||||||||||||||||||||||||||||||||||||||||||||||||
| 5 | Annualized. | ||||||||||||||||||||||||||||||||||||||||||||||||||||||||||||||||||||||||||||||||||
| 6 | Excludes in-kind transactions. | ||||||||||||||||||||||||||||||||||||||||||||||||||||||||||||||||||||||||||||||||||
| 7 | Excludes merger activity. | ||||||||||||||||||||||||||||||||||||||||||||||||||||||||||||||||||||||||||||||||||
| Class R4 Shares Period ended | 4-30-18 | 1 | 10-31-17 | 10-31-16 | 10-31-15 | 10-31-14 | 10-31-13 | |||||||||||||||||||||||||||||||||||||||||||||||||||||||||||||||||||||||||||||||||||||||||||||||||||||||||||||||
| Per share operating performance | ||||||||||||||||||||||||||||||||||||||||||||||||||||||||||||||||||||||||||||||||||||||||||||||||||||||||||||||||||||||
| Net asset value, beginning of period | $53.76 | $43.91 | $44.37 | $40.80 | $36.12 | $28.47 | ||||||||||||||||||||||||||||||||||||||||||||||||||||||||||||||||||||||||||||||||||||||||||||||||||||||||||||||||
| Net investment income2 | 0.10 | 0.30 | 0.29 | 0.22 | 0.21 | 0.29 | ||||||||||||||||||||||||||||||||||||||||||||||||||||||||||||||||||||||||||||||||||||||||||||||||||||||||||||||||
| Net realized and unrealized gain (loss) on investments | (0.02 | ) | 11.09 | (0.08 | ) | 3.52 | 4.73 | 7.66 | ||||||||||||||||||||||||||||||||||||||||||||||||||||||||||||||||||||||||||||||||||||||||||||||||||||||||||||||
| Total from investment operations | 0.08 | 11.39 | 0.21 | 3.74 | 4.94 | 7.95 | ||||||||||||||||||||||||||||||||||||||||||||||||||||||||||||||||||||||||||||||||||||||||||||||||||||||||||||||||
| Less distributions | ||||||||||||||||||||||||||||||||||||||||||||||||||||||||||||||||||||||||||||||||||||||||||||||||||||||||||||||||||||||
| From net investment income | (0.31 | ) | (0.23 | ) | (0.16 | ) | (0.17 | ) | (0.26 | ) | (0.30 | ) | ||||||||||||||||||||||||||||||||||||||||||||||||||||||||||||||||||||||||||||||||||||||||||||||||||||||||||
| From net realized gain | (4.01 | ) | (1.31 | ) | (0.51 | ) | — | — | — | |||||||||||||||||||||||||||||||||||||||||||||||||||||||||||||||||||||||||||||||||||||||||||||||||||||||||||||
| Total distributions | (4.32 | ) | (1.54 | ) | (0.67 | ) | (0.17 | ) | (0.26 | ) | (0.30 | ) | ||||||||||||||||||||||||||||||||||||||||||||||||||||||||||||||||||||||||||||||||||||||||||||||||||||||||||
| Net asset value, end of period | $49.52 | $53.76 | $43.91 | $44.37 | $40.80 | $36.12 | ||||||||||||||||||||||||||||||||||||||||||||||||||||||||||||||||||||||||||||||||||||||||||||||||||||||||||||||||
| Total return (%)3 | (0.06 | ) 4 | 26.53 | 0.47 | 9.21 | 13.76 | 28.19 | |||||||||||||||||||||||||||||||||||||||||||||||||||||||||||||||||||||||||||||||||||||||||||||||||||||||||||||||
| Ratios and supplemental data | ||||||||||||||||||||||||||||||||||||||||||||||||||||||||||||||||||||||||||||||||||||||||||||||||||||||||||||||||||||||
| Net assets, end of period (in millions) | $4 | $3 | $2 | $3 | $3 | $2 | ||||||||||||||||||||||||||||||||||||||||||||||||||||||||||||||||||||||||||||||||||||||||||||||||||||||||||||||||
| Ratios (as a percentage of average net assets): | ||||||||||||||||||||||||||||||||||||||||||||||||||||||||||||||||||||||||||||||||||||||||||||||||||||||||||||||||||||||
| Expenses before reductions | 1.03 | 5 | 1.04 | 1.04 | 1.04 | 1.05 | 1.06 | |||||||||||||||||||||||||||||||||||||||||||||||||||||||||||||||||||||||||||||||||||||||||||||||||||||||||||||||
| Expenses including reductions | 0.92 | 5 | 0.93 | 0.93 | 0.93 | 0.94 | 0.95 | |||||||||||||||||||||||||||||||||||||||||||||||||||||||||||||||||||||||||||||||||||||||||||||||||||||||||||||||
| Net investment income | 0.40 | 5 | 0.61 | 0.69 | 0.51 | 0.54 | 0.90 | |||||||||||||||||||||||||||||||||||||||||||||||||||||||||||||||||||||||||||||||||||||||||||||||||||||||||||||||
| Portfolio turnover (%) | 18 | 54 | 6 | 20 | 7 | 22 | 21 | 7 | 31 | |||||||||||||||||||||||||||||||||||||||||||||||||||||||||||||||||||||||||||||||||||||||||||||||||||||||||||||
| 1 | Six months ended 4-30-18. Unaudited. | ||||||||||||||||||||||||||||||||||||||||||||||||||||||||||||||||||||||||||||||||||
| 2 | Based on average daily shares outstanding. | ||||||||||||||||||||||||||||||||||||||||||||||||||||||||||||||||||||||||||||||||||
| 3 | Total returns would have been lower had certain expenses not been reduced during the applicable periods. | ||||||||||||||||||||||||||||||||||||||||||||||||||||||||||||||||||||||||||||||||||
| 4 | Not annualized. | ||||||||||||||||||||||||||||||||||||||||||||||||||||||||||||||||||||||||||||||||||
| 5 | Annualized. | ||||||||||||||||||||||||||||||||||||||||||||||||||||||||||||||||||||||||||||||||||
| 6 | Excludes in-kind transactions. | ||||||||||||||||||||||||||||||||||||||||||||||||||||||||||||||||||||||||||||||||||
| 7 | Excludes merger activity. | ||||||||||||||||||||||||||||||||||||||||||||||||||||||||||||||||||||||||||||||||||
| Class R5 Shares Period ended | 4-30-18 | 1 | 10-31-17 | 10-31-16 | 10-31-15 | 10-31-14 | 10-31-13 | |||||||||||||||||||||||||||||||||||||||||||||||||||||||||||||||||||||||||||||||||||||||||||||||||||||||||||||||
| Per share operating performance | ||||||||||||||||||||||||||||||||||||||||||||||||||||||||||||||||||||||||||||||||||||||||||||||||||||||||||||||||||||||
| Net asset value, beginning of period | $54.14 | $44.20 | $44.64 | $41.03 | $36.31 | $28.61 | ||||||||||||||||||||||||||||||||||||||||||||||||||||||||||||||||||||||||||||||||||||||||||||||||||||||||||||||||
| Net investment income2 | 0.17 | 0.38 | 0.38 | 0.30 | 0.29 | 0.37 | ||||||||||||||||||||||||||||||||||||||||||||||||||||||||||||||||||||||||||||||||||||||||||||||||||||||||||||||||
| Net realized and unrealized gain (loss) on investments | (0.04 | ) | 11.18 | (0.08 | ) | 3.54 | 4.75 | 7.69 | ||||||||||||||||||||||||||||||||||||||||||||||||||||||||||||||||||||||||||||||||||||||||||||||||||||||||||||||
| Total from investment operations | 0.13 | 11.56 | 0.30 | 3.84 | 5.04 | 8.06 | ||||||||||||||||||||||||||||||||||||||||||||||||||||||||||||||||||||||||||||||||||||||||||||||||||||||||||||||||
| Less distributions | ||||||||||||||||||||||||||||||||||||||||||||||||||||||||||||||||||||||||||||||||||||||||||||||||||||||||||||||||||||||
| From net investment income | (0.41 | ) | (0.31 | ) | (0.23 | ) | (0.23 | ) | (0.32 | ) | (0.36 | ) | ||||||||||||||||||||||||||||||||||||||||||||||||||||||||||||||||||||||||||||||||||||||||||||||||||||||||||
| From net realized gain | (4.01 | ) | (1.31 | ) | (0.51 | ) | — | — | — | |||||||||||||||||||||||||||||||||||||||||||||||||||||||||||||||||||||||||||||||||||||||||||||||||||||||||||||
| Total distributions | (4.42 | ) | (1.62 | ) | (0.74 | ) | (0.23 | ) | (0.32 | ) | (0.36 | ) | ||||||||||||||||||||||||||||||||||||||||||||||||||||||||||||||||||||||||||||||||||||||||||||||||||||||||||
| Net asset value, end of period | $49.85 | $54.14 | $44.20 | $44.64 | $41.03 | $36.31 | ||||||||||||||||||||||||||||||||||||||||||||||||||||||||||||||||||||||||||||||||||||||||||||||||||||||||||||||||
| Total return (%)3 | 0.03 | 4 | 26.77 | 0.68 | 9.44 | 13.96 | 28.47 | |||||||||||||||||||||||||||||||||||||||||||||||||||||||||||||||||||||||||||||||||||||||||||||||||||||||||||||||
| Ratios and supplemental data | ||||||||||||||||||||||||||||||||||||||||||||||||||||||||||||||||||||||||||||||||||||||||||||||||||||||||||||||||||||||
| Net assets, end of period (in millions) | $2 | $2 | $1 | $2 | $2 | $1 | ||||||||||||||||||||||||||||||||||||||||||||||||||||||||||||||||||||||||||||||||||||||||||||||||||||||||||||||||
| Ratios (as a percentage of average net assets): | ||||||||||||||||||||||||||||||||||||||||||||||||||||||||||||||||||||||||||||||||||||||||||||||||||||||||||||||||||||||
| Expenses before reductions | 0.73 | 5 | 0.74 | 0.75 | 0.74 | 0.75 | 0.76 | |||||||||||||||||||||||||||||||||||||||||||||||||||||||||||||||||||||||||||||||||||||||||||||||||||||||||||||||
| Expenses including reductions | 0.72 | 5 | 0.73 | 0.74 | 0.73 | 0.74 | 0.76 | |||||||||||||||||||||||||||||||||||||||||||||||||||||||||||||||||||||||||||||||||||||||||||||||||||||||||||||||
| Net investment income | 0.64 | 5 | 0.77 | 0.90 | 0.71 | 0.74 | 1.14 | |||||||||||||||||||||||||||||||||||||||||||||||||||||||||||||||||||||||||||||||||||||||||||||||||||||||||||||||
| Portfolio turnover (%) | 18 | 54 | 6 | 20 | 7 | 22 | 21 | 7 | 31 | |||||||||||||||||||||||||||||||||||||||||||||||||||||||||||||||||||||||||||||||||||||||||||||||||||||||||||||
| 1 | Six months ended 4-30-18. Unaudited. | ||||||||||||||||||||||||||||||||||||||||||||||||||||||||||||||||||||||||||||||||||
| 2 | Based on average daily shares outstanding. | ||||||||||||||||||||||||||||||||||||||||||||||||||||||||||||||||||||||||||||||||||
| 3 | Total returns would have been lower had certain expenses not been reduced during the applicable periods. | ||||||||||||||||||||||||||||||||||||||||||||||||||||||||||||||||||||||||||||||||||
| 4 | Not annualized. | ||||||||||||||||||||||||||||||||||||||||||||||||||||||||||||||||||||||||||||||||||
| 5 | Annualized. | ||||||||||||||||||||||||||||||||||||||||||||||||||||||||||||||||||||||||||||||||||
| 6 | Excludes in-kind transactions. | ||||||||||||||||||||||||||||||||||||||||||||||||||||||||||||||||||||||||||||||||||
| 7 | Excludes merger activity. | ||||||||||||||||||||||||||||||||||||||||||||||||||||||||||||||||||||||||||||||||||
| Class R6 Shares Period ended | 4-30-18 | 1 | 10-31-17 | 10-31-16 | 10-31-15 | 10-31-14 | 10-31-13 | |||||||||||||||||||||||||||||||||||||||||||||||||||||||||||||||||||||||||||||||||||||||||||||||||||||||||||||||
| Per share operating performance | ||||||||||||||||||||||||||||||||||||||||||||||||||||||||||||||||||||||||||||||||||||||||||||||||||||||||||||||||||||||
| Net asset value, beginning of period | $54.16 | $44.21 | $44.64 | $41.04 | $36.33 | $28.61 | ||||||||||||||||||||||||||||||||||||||||||||||||||||||||||||||||||||||||||||||||||||||||||||||||||||||||||||||||
| Net investment income2 | 0.18 | 0.28 | 0.40 | 0.31 | 0.32 | 0.38 | ||||||||||||||||||||||||||||||||||||||||||||||||||||||||||||||||||||||||||||||||||||||||||||||||||||||||||||||||
| Net realized and unrealized gain (loss) on investments | (0.02 | ) | 11.31 | (0.07 | ) | 3.55 | 4.74 | 7.70 | ||||||||||||||||||||||||||||||||||||||||||||||||||||||||||||||||||||||||||||||||||||||||||||||||||||||||||||||
| Total from investment operations | 0.16 | 11.59 | 0.33 | 3.86 | 5.06 | 8.08 | ||||||||||||||||||||||||||||||||||||||||||||||||||||||||||||||||||||||||||||||||||||||||||||||||||||||||||||||||
| Less distributions | ||||||||||||||||||||||||||||||||||||||||||||||||||||||||||||||||||||||||||||||||||||||||||||||||||||||||||||||||||||||
| From net investment income | (0.44 | ) | (0.33 | ) | (0.25 | ) | (0.26 | ) | (0.35 | ) | (0.36 | ) | ||||||||||||||||||||||||||||||||||||||||||||||||||||||||||||||||||||||||||||||||||||||||||||||||||||||||||
| From net realized gain | (4.01 | ) | (1.31 | ) | (0.51 | ) | — | — | — | |||||||||||||||||||||||||||||||||||||||||||||||||||||||||||||||||||||||||||||||||||||||||||||||||||||||||||||
| Total distributions | (4.45 | ) | (1.64 | ) | (0.76 | ) | (0.26 | ) | (0.35 | ) | (0.36 | ) | ||||||||||||||||||||||||||||||||||||||||||||||||||||||||||||||||||||||||||||||||||||||||||||||||||||||||||
| Net asset value, end of period | $49.87 | $54.16 | $44.21 | $44.64 | $41.04 | $36.33 | ||||||||||||||||||||||||||||||||||||||||||||||||||||||||||||||||||||||||||||||||||||||||||||||||||||||||||||||||
| Total return (%)3 | 0.07 | 4 | 26.86 | 0.76 | 9.49 | 14.02 | 28.56 | |||||||||||||||||||||||||||||||||||||||||||||||||||||||||||||||||||||||||||||||||||||||||||||||||||||||||||||||
| Ratios and supplemental data | ||||||||||||||||||||||||||||||||||||||||||||||||||||||||||||||||||||||||||||||||||||||||||||||||||||||||||||||||||||||
| Net assets, end of period (in millions) | $1,093 | $975 | $12 | $10 | $4 | — | 5 | |||||||||||||||||||||||||||||||||||||||||||||||||||||||||||||||||||||||||||||||||||||||||||||||||||||||||||||||
| Ratios (as a percentage of average net assets): | ||||||||||||||||||||||||||||||||||||||||||||||||||||||||||||||||||||||||||||||||||||||||||||||||||||||||||||||||||||||
| Expenses before reductions | 0.68 | 6 | 0.69 | 0.70 | 0.70 | 0.70 | 0.72 | |||||||||||||||||||||||||||||||||||||||||||||||||||||||||||||||||||||||||||||||||||||||||||||||||||||||||||||||
| Expenses including reductions | 0.67 | 6 | 0.68 | 0.68 | 0.68 | 0.68 | 0.71 | |||||||||||||||||||||||||||||||||||||||||||||||||||||||||||||||||||||||||||||||||||||||||||||||||||||||||||||||
| Net investment income | 0.68 | 6 | 0.57 | 0.93 | 0.74 | 0.82 | 1.17 | |||||||||||||||||||||||||||||||||||||||||||||||||||||||||||||||||||||||||||||||||||||||||||||||||||||||||||||||
| Portfolio turnover (%) | 18 | 54 | 7 | 20 | 8 | 22 | 21 | 8 | 31 | |||||||||||||||||||||||||||||||||||||||||||||||||||||||||||||||||||||||||||||||||||||||||||||||||||||||||||||
| 1 | Six months ended 4-30-18. Unaudited. | ||||||||||||||||||||||||||||||||||||||||||||||||||||||||||||||||||||||||||||||||||
| 2 | Based on average daily shares outstanding. | ||||||||||||||||||||||||||||||||||||||||||||||||||||||||||||||||||||||||||||||||||
| 3 | Total returns would have been lower had certain expenses not been reduced during the applicable periods. | ||||||||||||||||||||||||||||||||||||||||||||||||||||||||||||||||||||||||||||||||||
| 4 | Not annualized. | ||||||||||||||||||||||||||||||||||||||||||||||||||||||||||||||||||||||||||||||||||
| 5 | Less than $500,000. | ||||||||||||||||||||||||||||||||||||||||||||||||||||||||||||||||||||||||||||||||||
| 6 | Annualized. | ||||||||||||||||||||||||||||||||||||||||||||||||||||||||||||||||||||||||||||||||||
| 7 | Excludes in-kind transactions. | ||||||||||||||||||||||||||||||||||||||||||||||||||||||||||||||||||||||||||||||||||
| 8 | Excludes merger activity. | ||||||||||||||||||||||||||||||||||||||||||||||||||||||||||||||||||||||||||||||||||
| Class NAV Shares Period ended | 4-30-18 | 1 | 10-31-17 | 2 | ||||||||||||||||||||||||||||||||||||||||||||||
| Per share operating performance | ||||||||||||||||||||||||||||||||||||||||||||||||||
| Net asset value, beginning of period | $54.15 | $47.04 | ||||||||||||||||||||||||||||||||||||||||||||||||
| Net investment income3 | 0.18 | 0.35 | ||||||||||||||||||||||||||||||||||||||||||||||||
| Net realized and unrealized gain (loss) on investments | (0.03 | ) | 6.76 | |||||||||||||||||||||||||||||||||||||||||||||||
| Total from investment operations | 0.15 | 7.11 | ||||||||||||||||||||||||||||||||||||||||||||||||
| Less distributions | ||||||||||||||||||||||||||||||||||||||||||||||||||
| From net investment income | (0.44 | ) | — | |||||||||||||||||||||||||||||||||||||||||||||||
| From net realized gain | (4.01 | ) | — | |||||||||||||||||||||||||||||||||||||||||||||||
| Total distributions | (4.45 | ) | — | |||||||||||||||||||||||||||||||||||||||||||||||
| Net asset value, end of period | $49.85 | $54.15 | ||||||||||||||||||||||||||||||||||||||||||||||||
| Total return (%)4 | 0.07 | 5 | 15.11 | 5 | ||||||||||||||||||||||||||||||||||||||||||||||
| Ratios and supplemental data | ||||||||||||||||||||||||||||||||||||||||||||||||||
| Net assets, end of period (in millions) | $1,118 | $1,152 | ||||||||||||||||||||||||||||||||||||||||||||||||
| Ratios (as a percentage of average net assets): | ||||||||||||||||||||||||||||||||||||||||||||||||||
| Expenses before reductions | 0.67 | 6 | 0.68 | 6 | ||||||||||||||||||||||||||||||||||||||||||||||
| Expenses including reductions | 0.66 | 6 | 0.67 | 6 | ||||||||||||||||||||||||||||||||||||||||||||||
| Net investment income | 0.71 | 6 | 0.94 | 6 | ||||||||||||||||||||||||||||||||||||||||||||||
| Portfolio turnover (%) | 18 | 54 | 7,8 | |||||||||||||||||||||||||||||||||||||||||||||||
| 1 | Six months ended 4-30-18. Unaudited. | ||||||||||||||||||||||||||||||||||||||||||||||||||||||||||
| 2 | The inception date for Class NAV shares is 2-8-17. | ||||||||||||||||||||||||||||||||||||||||||||||||||||||||||
| 3 | Based on average daily shares outstanding. | ||||||||||||||||||||||||||||||||||||||||||||||||||||||||||
| 4 | Total returns would have been lower had certain expenses not been reduced during the applicable periods. | ||||||||||||||||||||||||||||||||||||||||||||||||||||||||||
| 5 | Not annualized. | ||||||||||||||||||||||||||||||||||||||||||||||||||||||||||
| 6 | Annualized. | ||||||||||||||||||||||||||||||||||||||||||||||||||||||||||
| 7 | The portfolio turnover is shown for the period from 11-1-16 to 10-31-17. | ||||||||||||||||||||||||||||||||||||||||||||||||||||||||||
| 8 | Excludes in-kind transactions. | ||||||||||||||||||||||||||||||||||||||||||||||||||||||||||
Note 1 — Organization
John Hancock Fundamental Large Cap Core Fund (the fund) is a series of John Hancock Investment Trust (the Trust), an open-end management investment company organized as a Massachusetts business trust and registered under the Investment Company Act of 1940, as amended (the 1940 Act). The investment objective of the fund is to seek long-term capital appreciation.
The fund may offer multiple classes of shares. The shares currently offered by the fund are detailed in the Statement of assets and liabilities. Class A and Class C shares are offered to all investors. Class B shares are closed to new investors. Class I shares are offered to institutions and certain investors. Class R1, Class R2, Class R3, Class R4 and Class R5 shares are available only to certain retirement and 529 plans. Class R6 shares are only available to certain retirement plans, institutions and other investors. Class NAV shares are offered to John Hancock affiliated funds of funds, retirement plans for employees of John Hancock and/or Manulife Financial Corporation, and certain 529 plans. Class B shares convert to Class A shares eight years after purchase. The distribution and service fees, if any, and transfer agent fees for each class may differ. Effective May 1, 2018, Class C shares convert to Class A shares ten years after purchase (certain exclusions may apply).
Note 2 — Significant accounting policies
The financial statements have been prepared in conformity with accounting principles generally accepted in the United States of America (US GAAP), which require management to make certain estimates and assumptions as of the date of the financial statements. Actual results could differ from those estimates and those differences could be significant. The fund qualifies as an investment company under Topic 946 of Accounting Standards Codification of US GAAP.
Events or transactions occurring after the end of the fiscal period through the date that the financial statements were issued have been evaluated in the preparation of the financial statements. The following summarizes the significant accounting policies of the fund:
Security valuation. Investments are stated at value as of the scheduled close of regular trading on the New York Stock Exchange (NYSE), normally at 4:00 p.m., Eastern Time. In case of emergency or other disruption resulting in the NYSE not opening for trading or the NYSE closing at a time other than the regularly scheduled close, the net asset value (NAV) may be determined as of the regularly scheduled close of the NYSE pursuant to the fund's Valuation Policies and Procedures.
In order to value the securities, the fund uses the following valuation techniques: Equity securities held by the fund are typically valued at the last sale price or official closing price on the exchange or principal market where the security trades. In the event there were no sales during the day or closing prices are not available, the securities are valued using the last available bid price. In certain instances, the Pricing Committee may determine to value equity securities using prices obtained from another exchange or market if trading on the exchange or market on which prices are typically obtained did not open for trading as scheduled, or if trading closed earlier than scheduled, and trading occurred as normal on another exchange or market.
Other portfolio securities and assets, for which reliable market quotations are not readily available, are valued at fair value as determined in good faith by the fund's Pricing Committee following procedures established by the Board of Trustees. The frequency with which these fair valuation procedures are used cannot be predicted and fair value of securities may differ significantly from the value that would have been used had a ready market for such securities existed.
The fund uses a three-tier hierarchy to prioritize the pricing assumptions, referred to as inputs, used in valuation techniques to measure fair value. Level 1 includes securities valued using quoted prices in active markets for identical securities. Level 2 includes securities valued using other significant observable inputs. Observable inputs may include quoted prices for similar securities, interest rates, prepayment speeds and credit risk. Prices for securities valued using these inputs are received from independent pricing vendors and brokers and are based on an evaluation of the inputs described. Level 3 includes securities valued using significant unobservable inputs when market prices are not readily available or reliable, including the fund's own assumptions in determining the fair value of investments. Factors used in determining value may include market or issuer specific events or trends, changes in interest rates and credit quality. The inputs or methodology used for valuing
securities are not necessarily an indication of the risks associated with investing in those securities. Changes in valuation techniques and related inputs may result in transfers into or out of an assigned level within the disclosure hierarchy.
As of April 30, 2018, all investments are categorized as Level 1 under the hierarchy described above, except for U.S. Government Agency discount notes and repurchase agreements, which are categorized as Level 2.
Repurchase agreements. The fund may enter into repurchase agreements. When the fund enters into a repurchase agreement, it receives collateral that is held in a segregated account by the fund's custodian, or for tri-party repurchase agreements, collateral is held at a third-party custodian bank in a segregated account for the benefit of the fund. The collateral amount is marked-to-market and monitored on a daily basis to ensure that the collateral held is in an amount not less than the principal amount of the repurchase agreement plus any accrued interest. Collateral received by the fund for repurchase agreements is disclosed in the Fund's investments as part of the caption related to the repurchase agreement.
Repurchase agreements are typically governed by the terms and conditions of the Master Repurchase Agreement and/or Global Master Repurchase Agreement (collectively, MRA). Upon an event of default, the non-defaulting party may close out all transactions traded under the MRA and net amounts owed. Absent an event of default, assets and liabilities resulting from repurchase agreements are not offset in the Statement of assets and liabilities. In the event of a default by the counterparty, realization of the collateral proceeds could be delayed, during which time the collateral value may decline or the counterparty may have insufficient assets to pay back claims resulting from close-out of the transactions.
Security transactions and related investment income. Investment security transactions are accounted for on a trade date plus one basis for daily NAV calculations. However, for financial reporting purposes, investment transactions are reported on trade date. Interest income is accrued as earned. Dividend income is recorded on the ex-date, except for dividends of foreign securities where the dividend may not be known until after the ex-date. In those cases, dividend income, net of withholding taxes, is recorded when the fund becomes aware of the dividends. Gains and losses on securities sold are determined on the basis of identified cost and may include proceeds from litigation.
Foreign investing. Assets, including investments and liabilities denominated in foreign currencies, are translated into U.S. dollar values each day at the prevailing exchange rate. Purchases and sales of securities, income and expenses are translated into U.S. dollars at the prevailing exchange rate on the date of the transaction. The effect of changes in foreign currency exchange rates on the value of securities is reflected as a component of the realized and unrealized gains (losses) on investments. Foreign investments are subject to a decline in the value of a foreign currency versus the U.S. dollar, which reduces the dollar value of securities denominated in that currency.
Funds that invest internationally generally carry more risk than funds that invest strictly in U.S. securities. Risks can result from differences in economic and political conditions, regulations, market practices (including higher transaction costs), accounting standards and other factors.
Foreign taxes. The fund may be subject to withholding tax on income, capital gains or repatriation taxes imposed by certain countries, a portion of which may be recoverable. Foreign taxes are accrued based upon the fund's understanding of the tax rules and rates that exist in the foreign markets in which it invests. Taxes are accrued based on gains realized by the fund as a result of certain foreign security sales. Estimated taxes are accrued based on unrealized appreciation of such securities. Investment income is recorded net of foreign withholding taxes, less any amounts reclaimable.
Line of credit. The fund may have the ability to borrow from banks for temporary or emergency purposes, including meeting redemption requests that otherwise might require the untimely sale of securities. Pursuant to the fund custodian agreement, the custodian may loan money to the fund to make properly authorized payments. The fund is obligated to repay the custodian for any overdraft, including any related costs or expenses. The custodian may have a lien, security interest or security entitlement in any fund property that is not otherwise segregated or pledged, to the extent of any overdraft, and to the maximum extent permitted by law.
The fund and other affiliated funds have entered into a syndicated line of credit agreement with Citibank, N.A. as the administrative agent that enables them to participate in a $750 million unsecured committed line of credit. Excluding
commitments designated for a certain fund and subject to the needs of all other affiliated funds, the fund can borrow up to an aggregate commitment amount of $500 million, subject to asset coverage and other limitations as specified in the agreement. A commitment fee payable at the end of each calendar quarter, based on the average daily unused portion of the line of credit, is charged to each participating fund based on a combination of fixed and asset based allocations and is reflected in Other expenses on the Statement of operations. For the six months ended April 30, 2018, the fund had no borrowings under either line of credit. Commitment fees for the six months ended April 30, 2018 were $7,680.
Expenses. Within the John Hancock group of funds complex, expenses that are directly attributable to an individual fund are allocated to such fund. Expenses that are not readily attributable to a specific fund are allocated among all funds in an equitable manner, taking into consideration, among other things, the nature and type of expense and the fund's relative net assets. Expense estimates are accrued in the period to which they relate and adjustments are made when actual amounts are known.
Class allocations. Income, common expenses and realized and unrealized gains (losses) are determined at the fund level and allocated daily to each class of shares based on the net assets of the class. Class-specific expenses, such as distribution and service fees, if any, and transfer agent fees, for all classes, are charged daily at the class level based on the net assets of each class and the specific expense rates applicable to each class.
Federal income taxes. The fund intends to continue to qualify as a regulated investment company by complying with the applicable provisions of the Internal Revenue Code and will not be subject to federal income tax on taxable income that is distributed to shareholders. Therefore, no federal income tax provision is required.
As of October 31, 2017, the fund had no uncertain tax positions that would require financial statement recognition, derecognition or disclosure. The fund's federal tax returns are subject to examination by the Internal Revenue Service for a period of three years.
Distribution of income and gains. Distributions to shareholders from net investment income and net realized gains, if any, are recorded on the ex-date. The fund generally declares and pays dividends and capital gain distributions, if any, annually.
Distributions paid by the fund with respect to each class of shares are calculated in the same manner, at the same time and in the same amount, except for the effect of class level expenses that may be applied differently to each class.
Such distributions, on a tax basis, are determined in conformity with income tax regulations, which may differ from US GAAP. Distributions in excess of tax basis earnings and profits, if any, are reported in the fund's financial statements as a return of capital. The final determination of tax characteristics of the fund's distribution will occur at the end of the year and will subsequently be reported to shareholders.
Capital accounts within the financial statements are adjusted for permanent book-tax differences. These adjustments have no impact on net assets or the results of operations. Temporary book-tax differences, if any, will reverse in a subsequent period. Book-tax differences are primarily attributable to wash sale loss deferrals.
Note 3 — Guarantees and indemnifications
Under the Trust's organizational documents, its Officers and Trustees are indemnified against certain liabilities arising out of the performance of their duties to the Trust, including the fund. Additionally, in the normal course of business, the fund enters into contracts with service providers that contain general indemnification clauses. The fund's maximum exposure under these arrangements is unknown, as this would involve future claims that may be made against the fund that have not yet occurred. The risk of material loss from such claims is considered remote.
Note 4 — Fees and transactions with affiliates
John Hancock Advisers, LLC (the Advisor) serves as investment advisor for the fund. John Hancock Funds, LLC (the Distributor), an affiliate of the Advisor, serves as principal underwriter of the fund. The Advisor and the Distributor are indirect, wholly owned subsidiaries of Manulife Financial Corporation (MFC).
Management fee. The fund has an investment management agreement with the Advisor under which the fund pays a monthly management fee to the Advisor equivalent on an annual basis to the sum of a) 0.625% of the first $3 billion of the fund's average daily net assets and b) 0.600% of the fund's average daily net assets in excess of $3 billion. The Advisor has a subadvisory agreement with John Hancock Asset Management a division of Manulife Asset Management (US) LLC, an indirectly owned subsidiary of MFC and an affiliate of the Advisor. The fund is not responsible for payment of the subadvisory fees.
The Advisor has contractually agreed to waive a portion of its management fee and/or reimburse expenses for certain funds of the John Hancock group of funds complex, including the fund (the participating portfolios). This waiver is based upon aggregate net assets of all the participating portfolios. The amount of the reimbursement is calculated daily and allocated among all the participating portfolios in proportion to the daily net assets of each fund. During the six months ended April 30, 2018, this waiver amounted to 0.01% of the fund's average net assets on an annualized basis. This arrangement may be amended or terminated at any time by the Advisor upon notice to the fund and with the approval of the Board of Trustees.
The Advisor has contractually agreed to waive and/or reimburse a portion of the fund's total operating expenses for Class B, Class C, and Class I shares of the fund to the extent they exceed 1.82%, 1.82%, and 0.78%, respectively, of the average annual net assets (on an annualized basis) attributable to each class. These waivers and/or reimbursements exclude taxes, brokerage commissions, interest expense, acquired fund fees and expenses paid indirectly, short dividend expense, litigation and indemnification expenses not incurred in the ordinary course of the fund's business, borrowing costs, and prime brokerage fees. The waivers and/or reimbursements will continue in effect until February 28, 2019, unless renewed by mutual agreement of the fund and Advisor based upon determination of that this is appropriate under the circumstances at the time.
For the six months ended April 30, 2018, these expense reductions described above amounted to the following:
| Class | Expense reduction | Class | Expense reduction | |
| Class A | $68,618 | Class R3 | $160 | |
| Class B | 1,092 | Class R4 | 166 | |
| Class C | 12,703 | Class R5 | 107 | |
| Class I | 42,805 | Class R6 | 44,286 | |
| Class R1 | 376 | Class NAV | 48,793 | |
| Class R2 | 81 | Total | $219,187 |
Expenses waived or reimbursed in the current fiscal period are not subject to recapture in future fiscal periods.
The investment management fees incurred for the six months ended April 30, 2018 were equivalent to a net annual effective rate of 0.61% of the fund's average daily net assets.
Accounting and legal services. Pursuant to a service agreement, the fund reimburses the Advisor for all expenses associated with providing the administrative, financial, legal, compliance, accounting and recordkeeping services to the fund, including the preparation of all tax returns, periodic reports to shareholders and regulatory reports, among other services. These expenses are allocated to each share class based on its relative net assets at the time the expense was incurred. These accounting and legal services fees incurred for the six months ended April 30, 2018 amounted to an annual rate of 0.02% of the fund's average daily net assets.
Distribution and service plans. The fund has a distribution agreement with the Distributor. The fund has adopted distribution and service plans with respect to Class A, Class B, Class C, Class R1, Class R2, Class R3 and Class R4 shares pursuant to Rule 12b-1 under the 1940 Act, to pay the Distributor for services provided as the distributor of shares of the fund. In addition, under a service plan for Class R1, Class R2, Class R3, Class R4 and Class R5, the fund pays for certain other
services. The fund may pay up to the following contractual rates of distribution and service fees under these arrangements, expressed as an annual percentage of average daily net assets for each class of the fund's shares.
| Class | Rule 12b-1 fee | Service fee | Class | Rule 12b-1 fee | Service fee | |
| Class A | 0.25% | — | Class R2 | 0.25% | 0.25% | |
| Class B | 1.00% | — | Class R3 | 0.50% | 0.15% | |
| Class C | 1.00% | — | Class R4 | 0.25% | 0.10% | |
| Class R1 | 0.50% | 0.25% | Class R5 | — | 0.05% |
The fund's Distributor has contractually agreed to waive 0.10% of Rule 12b-1 fees for Class R4 shares. The current waiver agreement expires on February 28, 2019, unless renewed by mutual agreement of the fund and the Distributor based upon a determination that this is appropriate under the circumstances at the time. This contractual waiver amounted to $1,939 for Class R4 shares for the six months ended April 30, 2018.
Sales charges. Class A shares are assessed up-front sales charges, which resulted in payments to the Distributor amounting to $701,614 for the six months ended April 30, 2018. Of this amount, $115,851 was retained and used for printing prospectuses, advertising, sales literature and other purposes, $551,806 was paid as sales commissions to broker-dealers and $33,957 was paid as sales commissions to sales personnel of Signator Investors, Inc., a broker-dealer affiliate of the Advisor.
Class A, Class B and Class C shares may be subject to contingent deferred sales charges (CDSCs). Certain Class A shares that are acquired through purchases of $1 million or more and are redeemed within one year of purchase are subject to a 1.00% sales charge. Class B shares that are redeemed within six years of purchase are subject to CDSCs, at declining rates, beginning at 5.00%. Class C shares that are redeemed within one year of purchase are subject to a 1.00% CDSC. CDSCs are applied to the lesser of the current market value at the time of redemption or the original purchase cost of the shares being redeemed. Proceeds from CDSCs are used to compensate the Distributor for providing distribution-related services in connection with the sale of these shares. During the six months ended April 30, 2018, CDSCs received by the Distributor amounted to $5,723, $3,719 and $14,475 for Class A, Class B and Class C shares, respectively.
Transfer agent fees. The John Hancock Group of Funds has a complex-wide transfer agent agreement with John Hancock Signature Services, Inc. (Signature Services), an affiliate of the Advisor. The transfer agent fees paid to Signature Services are determined based on the cost to Signature Services (Signature Services Cost) of providing recordkeeping services. It also includes out-of-pocket expenses, including payments made to third-parties for recordkeeping services provided to their clients who invest in one or more John Hancock funds. In addition, Signature Services Cost may be reduced by certain fees that Signature Services receives in connection with retirement and small accounts. Signature Services Cost is calculated monthly and allocated, as applicable, to five categories of share classes: Retail Share and Institutional Share Classes of Non-Municipal Bond Funds, Class R6 Shares, Retirement Share Classes and Municipal Bond Share Classes. Within each of these categories, the applicable costs are allocated to the affected John Hancock affiliated funds and/or classes, based on the relative average daily net assets.
Class level expenses. Class level expenses for the six months ended April 30, 2018 were:
| Class | Distribution and service fees | Transfer agent fees | ||||||
| Class A | $2,007,844 | $868,502 | ||||||
| Class B | 127,938 | 13,785 | ||||||
| Class C | 1,487,034 | 160,759 | ||||||
| Class I | — | 553,271 | ||||||
| Class R1 | 32,524 | 532 | ||||||
| Class R2 | 4,841 | 115 | ||||||
| Class R3 | 11,077 | 226 | ||||||
| Class R4 | 6,767 | 235 |
| Class | Distribution and service fees | Transfer agent fees | ||||||
| Class R5 | $628 | $152 | ||||||
| Class R6 | — | 62,939 | ||||||
| Total | $3,678,653 | $1,660,516 |
Trustee expenses. The fund compensates each Trustee who is not an employee of the Advisor or its affiliates. The costs of paying Trustee compensation and expenses are allocated to the fund based on its net assets relative to other funds within the John Hancock group of funds complex.
Note 5 — Fund share transactions
Transactions in fund shares for the six months ended April 30, 2018 and for the year ended October 31, 2017 were as follows:
| Six months ended 4-30-18 | Year ended 10-31-17 | |||||||||||||||||||||||||
| Shares | Amount | Shares | Amount | |||||||||||||||||||||||
| Class A shares | ||||||||||||||||||||||||||
| Sold | 1,386,998 | $69,388,925 | 3,264,922 | $154,397,794 | ||||||||||||||||||||||
| Distributions reinvested | 2,572,135 | 126,034,516 | 1,130,753 | 50,307,116 | ||||||||||||||||||||||
| Repurchased | (2,882,386 | ) | (144,333,277 | ) | (8,977,782 | ) | (419,229,333 | ) | ||||||||||||||||||
| Net increase (decrease) | 1,076,747 | $51,090,164 | (4,582,107 | ) | ($214,524,423 | ) | ||||||||||||||||||||
| Class B shares | ||||||||||||||||||||||||||
| Sold | 6,055 | $270,382 | 22,417 | $919,908 | ||||||||||||||||||||||
| Distributions reinvested | 47,963 | 2,100,285 | 28,824 | 1,159,606 | ||||||||||||||||||||||
| Repurchased | (205,671 | ) | (9,218,256 | ) | (483,229 | ) | (20,609,223 | ) | ||||||||||||||||||
| Net decrease | (151,653 | ) | ($6,847,589 | ) | (431,988 | ) | ($18,529,709 | ) | ||||||||||||||||||
| Class C shares | ||||||||||||||||||||||||||
| Sold | 337,047 | $14,998,474 | 699,560 | $29,838,549 | ||||||||||||||||||||||
| Distributions reinvested | 500,633 | 21,917,693 | 188,998 | 7,601,487 | ||||||||||||||||||||||
| Repurchased | (738,181 | ) | (32,845,743 | ) | (1,946,133 | ) | (82,960,217 | ) | ||||||||||||||||||
| Net increase (decrease) | 99,499 | $4,070,424 | (1,057,575 | ) | ($45,520,181 | ) | ||||||||||||||||||||
| Class I shares | ||||||||||||||||||||||||||
| Sold | 3,297,943 | $172,727,535 | 16,691,861 | $819,198,503 | ||||||||||||||||||||||
| Distributions reinvested | 1,292,064 | 66,050,328 | 357,033 | 16,519,894 | ||||||||||||||||||||||
| Repurchased | (4,692,619 | ) | (241,255,758 | ) | (36,556,765 | ) | (1,800,678,005 | ) | ||||||||||||||||||
| Net decrease | (102,612 | ) | ($2,477,895 | ) | (19,507,871 | ) | ($964,959,608 | ) | ||||||||||||||||||
| Class R1 shares | ||||||||||||||||||||||||||
| Sold | 23,815 | $1,225,065 | 74,280 | $3,627,416 | ||||||||||||||||||||||
| Distributions reinvested | 7,248 | 365,941 | 1,918 | 87,730 | ||||||||||||||||||||||
| Repurchased | (35,209 | ) | (1,793,494 | ) | (77,745 | ) | (3,770,183 | ) | ||||||||||||||||||
| Net decrease | (4,146 | ) | ($202,488 | ) | (1,547 | ) | ($55,037 | ) | ||||||||||||||||||
| Class R2 shares | ||||||||||||||||||||||||||
| Sold | 8,207 | $426,742 | 33,654 | $1,674,540 | ||||||||||||||||||||||
| Distributions reinvested | 1,902 | 97,035 | 1,707 | 78,827 | ||||||||||||||||||||||
| Repurchased | (40,170 | ) | (2,171,621 | ) | (33,710 | ) | (1,706,228 | ) | ||||||||||||||||||
| Net increase (decrease) | (30,061 | ) | ($1,647,844 | ) | 1,651 | $47,139 | ||||||||||||||||||||
| Six months ended 4-30-18 | Year ended 10-31-17 | |||||||||||||||||||||||||
| Shares | Amount | Shares | Amount | |||||||||||||||||||||||
| Class R3 shares | ||||||||||||||||||||||||||
| Sold | 4,578 | $235,427 | 27,764 | $1,366,830 | ||||||||||||||||||||||
| Distributions reinvested | 5,746 | 290,724 | 1,641 | 75,243 | ||||||||||||||||||||||
| Repurchased | (14,379 | ) | (740,039 | ) | (11,867 | ) | (589,762 | ) | ||||||||||||||||||
| Net increase (decrease) | (4,055 | ) | ($213,888 | ) | 17,538 | $852,311 | ||||||||||||||||||||
| Class R4 shares | ||||||||||||||||||||||||||
| Sold | 32,071 | $1,647,659 | 9,359 | $467,432 | ||||||||||||||||||||||
| Distributions reinvested | 4,926 | 250,727 | 1,895 | 87,342 | ||||||||||||||||||||||
| Repurchased | (7,576 | ) | (396,579 | ) | (9,803 | ) | (464,899 | ) | ||||||||||||||||||
| Net increase | 29,421 | $1,501,807 | 1,451 | $89,875 | ||||||||||||||||||||||
| Class R5 shares | ||||||||||||||||||||||||||
| Sold | 5,272 | $280,063 | 20,828 | $1,024,936 | ||||||||||||||||||||||
| Distributions reinvested | 3,997 | 204,672 | 1,054 | 48,823 | ||||||||||||||||||||||
| Repurchased | (15,832 | ) | (797,453 | ) | (6,239 | ) | (295,954 | ) | ||||||||||||||||||
| Net increase (decrease) | (6,563 | ) | ($312,718 | ) | 15,643 | $777,805 | ||||||||||||||||||||
| Class R6 shares | ||||||||||||||||||||||||||
| Sold | 6,205,463 | $322,306,970 | 45,161,698 | $2,152,901,8901 | ||||||||||||||||||||||
| Distributions reinvested | 605,341 | 30,999,498 | 877,872 | 40,654,268 | ||||||||||||||||||||||
| Repurchased | (2,896,822 | ) | (150,421,190 | ) | (28,308,615 | ) | (1,336,235,773 | ) | ||||||||||||||||||
| Net increase | 3,913,982 | $202,885,278 | 17,730,955 | $857,320,385 | ||||||||||||||||||||||
| Class NAV shares | ||||||||||||||||||||||||||
| Sold | 536,536 | $27,703,617 | 24,710,346 | $1,163,214,825 | ||||||||||||||||||||||
| Distributions reinvested | 1,821,850 | 93,260,514 | — | — | ||||||||||||||||||||||
| Repurchased | (1,193,870 | ) | (63,554,567 | ) | (3,439,265 | ) | (175,130,891 | ) | ||||||||||||||||||
| Net increase | 1,164,516 | $57,409,564 | 21,271,081 | $988,083,934 | ||||||||||||||||||||||
| Total net increase | 5,985,075 | $305,254,815 | 13,457,231 | $603,582,491 | ||||||||||||||||||||||
1Includes in-kind purchase of approximately $1,135,000,000 by affiliates of the fund. The cost basis of the contributed securities is equal to the market value of the securities on the date of the subscription.
Affiliates of the fund owned 100% of Class NAV shares on April 30, 2018. Such concentration of shareholders' capital could have a material effect on the fund if such shareholders redeem from the fund.
Note 6 — Purchase and sale of securities
Purchases and sales of securities, other than short-term investments, amounted to $920,729,552 and $1,096,879,608, respectively, for the six months ended April 30, 2018.
Note 7 — Investment by affiliated funds
Certain investors in the fund are affiliated funds that are managed by the Advisor and its affiliates. The affiliated funds do not invest in the fund for the purpose of exercising management or control; however, this investment may represent a significant portion of the fund's net assets. At April 30, 2018, funds within the John Hancock group of funds complex held 22.5% of the fund's net assets. The following funds had an affiliate ownership of 5% or more of the fund's net assets:
| Fund | Affiliated concentration |
| John Hancock Funds II Multimanager Lifestyle Growth Portfolio | 8.1% |
| John Hancock Funds II Multimanager Lifestyle Balanced Portfolio | 5.8% |
Trustees Hassell H. McClellan, Chairperson Officers Andrew G. Arnott John J. Danello Francis V. Knox, Jr. Charles A. Rizzo Salvatore Schiavone | Investment advisor John Hancock Advisers, LLC Subadvisor John Hancock Asset Management a division of Manulife Asset Management (US) LLC Principal distributor John Hancock Funds, LLC Custodian State Street Bank and Trust Company Transfer agent John Hancock Signature Services, Inc. Legal counsel K&L Gates LLP |
*Member of the Audit Committee
†Non-Independent Trustee
#Effective 6-20-17
The fund's proxy voting policies and procedures, as well as the fund proxy voting record for the most recent twelve-month period ended June 30, are available free of charge on the Securities and Exchange Commission (SEC) website at sec.gov or on our website.
The fund's complete list of portfolio holdings, for the first and third fiscal quarters, is filed with the SEC on Form N-Q. The fund's Form N-Q is available on our website and the SEC's website, sec.gov, and can be reviewed and copied (for a fee) at the SEC's Public Reference Room in Washington, DC. Call 800-SEC-0330 to receive information on the operation of the SEC's Public Reference Room.
We make this information on your fund, as well as monthly portfolio holdings, and other fund details available on our website at jhinvestments.com or by calling 800-225-5291.
| You can also contact us: | |||
| 800-225-5291 jhinvestments.com | Regular mail: John Hancock Signature Services, Inc. | Express mail: John Hancock Signature Services, Inc. | |
John Hancock family of funds
DOMESTIC EQUITY FUNDS Balanced Blue Chip Growth Classic Value Disciplined Value Disciplined Value Mid Cap Equity Income Fundamental All Cap Core Fundamental Large Cap Core Fundamental Large Cap Value New Opportunities Small Cap Core Small Cap Growth Small Cap Value Strategic Growth U.S. Global Leaders Growth U.S. Growth Value Equity GLOBAL AND INTERNATIONAL EQUITY FUNDS Disciplined Value International Emerging Markets Emerging Markets Equity Fundamental Global Franchise Global Equity Global Shareholder Yield Greater China Opportunities International Growth International Small Company International Value Equity | INCOME FUNDS Bond California Tax-Free Income Emerging Markets Debt Floating Rate Income Government Income High Yield High Yield Municipal Bond Income Investment Grade Bond Money Market Short Duration Credit Opportunities Spectrum Income Strategic Income Opportunities Tax-Free Bond ALTERNATIVE AND SPECIALTY FUNDS Absolute Return Currency Alternative Asset Allocation Enduring Assets Financial Industries Global Absolute Return Strategies Global Conservative Absolute Return Global Focused Strategies Natural Resources Redwood Regional Bank Seaport Long/Short Technical Opportunities |
A fund's investment objectives, risks, charges, and expenses should be considered carefully before investing. The prospectus contains this and other important information about the fund. To obtain a prospectus, contact your financial professional, call John Hancock Investments at 800-225-5291, or visit our website at jhinvestments.com. Please read the prospectus carefully before investing or sending money.
ASSET ALLOCATION Income Allocation Multi-Index Lifetime Portfolios Multi-Index Preservation Portfolios Multimanager Lifestyle Portfolios Multimanager Lifetime Portfolios Retirement Income 2040 EXCHANGE-TRADED FUNDS John Hancock Multifactor Consumer Discretionary ETF John Hancock Multifactor Consumer Staples ETF John Hancock Multifactor Developed International ETF John Hancock Multifactor Energy ETF John Hancock Multifactor Financials ETF John Hancock Multifactor Healthcare ETF John Hancock Multifactor Industrials ETF John Hancock Multifactor Large Cap ETF John Hancock Multifactor Materials ETF John Hancock Multifactor Mid Cap ETF John Hancock Multifactor Small Cap ETF John Hancock Multifactor Technology ETF John Hancock Multifactor Utilities ETF | ENVIRONMENTAL, SOCIAL, AND GOVERNANCE FUNDS ESG All Cap Core ESG Core Bond ESG International Equity ESG Large Cap Core CLOSED-END FUNDS Financial Opportunities Hedged Equity & Income Income Securities Trust Investors Trust Preferred Income Preferred Income II Preferred Income III Premium Dividend Tax-Advantaged Dividend Income Tax-Advantaged Global Shareholder Yield |
John Hancock Multifactor ETF shares are bought and sold at market price (not NAV), and are not individually redeemed
from the fund. Brokerage commissions will reduce returns.
John Hancock ETFs are distributed by Foreside Fund Services, LLC, and are subadvised by Dimensional Fund Advisors LP.
Foreside is not affiliated with John Hancock Funds, LLC or Dimensional Fund Advisors LP.
Dimensional Fund Advisors LP receives compensation from John Hancock in connection with licensing rights to the
John Hancock Dimensional indexes. Dimensional Fund Advisors LP does not sponsor, endorse, or sell, and makes no
representation as to the advisability of investing in, John Hancock Multifactor ETFs.
John Hancock Investments
A trusted brand
John Hancock Investments is a premier asset manager representing one of
America's most trusted brands, with a heritage of financial stewardship dating
back to 1862. Helping our shareholders pursue their financial goals is at the
core of everything we do. It's why we support the role of professional financial
advice and operate with the highest standards of conduct and integrity.
A better way to invest
We serve investors globally through a unique multimanager approach:
We search the world to find proven portfolio teams with specialized
expertise for every strategy we offer, then we apply robust investment
oversight to ensure they continue to meet our uncompromising standards
and serve the best interests of our shareholders.
Results for investors
Our unique approach to asset management enables us to provide a diverse set
of investments backed by some of the world's best managers, along with strong
risk-adjusted returns across asset classes.

 | John Hancock Funds, LLC n Member FINRA, SIPC 601 Congress Street n Boston, MA 02210-2805 800-225-5291 n jhinvestments.com | |
| This report is for the information of the shareholders of John Hancock Fundamental Large Cap Core Fund. It is not authorized for distribution to prospective investors unless preceded or accompanied by a prospectus. | ||
| MF450365 | 50SA 4/18 6/18 | |
John Hancock
Balanced Fund
Semiannual report 4/30/18
A message to shareholders
Dear shareholder,
Financial markets around the world experienced a meaningful rise in volatility in the last half of the reporting period. U.S. equities declined as investors reacted to a potential trade war between the United States and China and the prospect of rising inflation. In developed international markets, macroeconomic data began to suggest that the growth many investors were hoping for may not be as robust as early indications had suggested. Although some in the asset management community believe the sell-off will be temporary, we have suggested for some time that the era of extremely low volatility would eventually come to an end, and that now appears to be the case.
That said, the fundamentals across the global stage continue to appear supportive. One of the challenges investors will face in the coming months is navigating the continued normalization of monetary policy. Stronger economies will continue to prompt central banks to dial back the stimulus they had injected into the financial system in the years following the global financial crisis, and this less-accommodative stance may represent an adjustment for many markets.
Your best resource in unpredictable markets is your financial advisor, who can help position your portfolio so that it's sufficiently diversified to meet your long-term objectives and to withstand the inevitable turbulence along the way.
On behalf of everyone at John Hancock Investments, I'd like to take this opportunity to welcome new shareholders and to thank existing shareholders for the continued trust you've placed in us.
Sincerely,
Andrew G. Arnott
President and CEO,
John Hancock Investments
Head of Wealth and Asset Management,
United States and Europe
This commentary reflects the CEO's views, which are subject to change at any time. Investing involves risks, including the potential loss of principal. Diversification does not guarantee a profit or eliminate the risk of a loss. It is not possible to invest directly into an index. For more up-to-date information, please visit our website at jhinvestments.com.
John Hancock
Balanced Fund
INVESTMENT OBJECTIVE
The fund seeks current income, long-term growth of capital and income, and preservation of capital.
AVERAGE ANNUAL TOTAL RETURNS AS OF 4/30/18 (%)
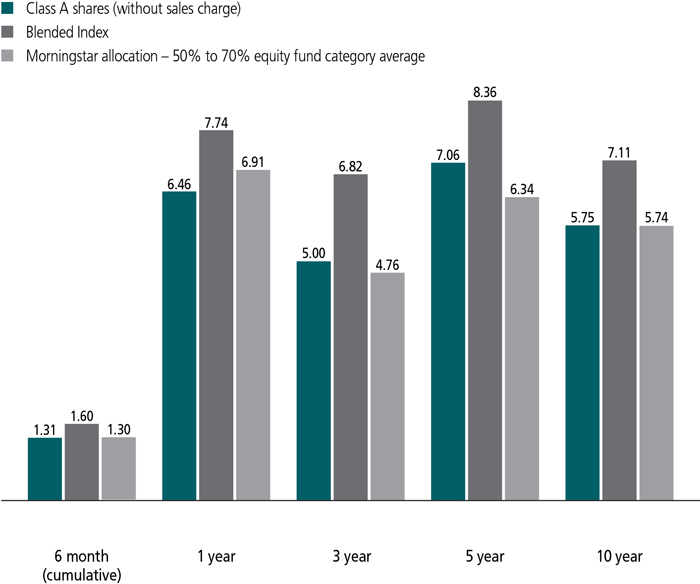
The Blended Index is 60% S&P 500 Index and 40% Bloomberg Barclays U.S. Aggregate Bond Index.
The S&P 500 Index is an unmanaged index that includes 500 widely traded common stocks.
The Bloomberg Barclays U.S. Aggregate Bond Index is an unmanaged index of dollar-denominated and nonconvertible investment-grade debt issues.
It is not possible to invest directly in an index. Index figures do not reflect expenses or sales charges, which would result in lower returns.
Figures from Morningstar, Inc. include reinvested distributions and do not take into account sales charges. Actual load-adjusted performance is lower.
The past performance shown here reflects reinvested distributions and the beneficial effect of any expense reductions, and does not guarantee future results. Returns for periods shorter than one year are cumulative. Performance of the other share classes will vary based on the difference in the fees and expenses of those classes. Shares will fluctuate in value and, when redeemed, may be worth more or less than their original cost. Current month-end performance may be lower or higher than the performance cited, and can be found at jhinvestments.com or by calling 800-225-5291. For further information on the fund's objectives, risks, and strategy, see the fund's prospectus.
PERFORMANCE HIGHLIGHTS OVER THE LAST SIX MONTHS
Volatile stock market conditions
Stock prices rose in the first half of the period, but conditions turned more volatile in the second half due to heightened concerns about inflation, rising interest rates, and trade disputes.
Challenges for bonds
Rising interest rates posed a headwind for most fixed-income securities, as the U.S. Treasury yield curve flattened.
Modest relative underperformance
The fund posted a positive return, but lagged the gain in a 60%/40% blend, respectively, of the S&P 500 Index and the Bloomberg Barclays U.S. Aggregate Bond Index.
PORTFOLIO COMPOSITION AS OF 4/30/18 (%)
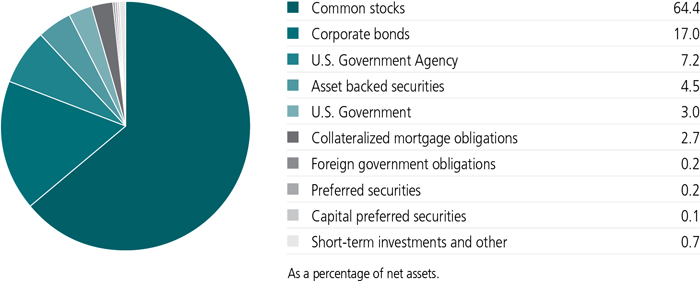
A note about risks
The value of a company's equity securities is subject to change in the company's financial condition and overall market and economic conditions. Large company stocks could fall out of favor and the stock prices of midsize and small companies can change more frequently and dramatically than those of large companies. Foreign investing has additional risks, such as currency and market volatility and political and social instability. Derivatives transactions, such as hedging and other strategic transactions, may increase a fund's volatility and could produce disproportionate losses, potentially more than the fund's principal investment. A fund that invests in particular sectors is particularly susceptible to the impact of market, economic, regulatory, and other factors affecting those sectors. Fixed-income investments are subject to interest-rate and credit risk; their value will normally decline as interest rates rise or if a creditor is unable or unwilling to make principal or interest payments. Investments in higher-yielding, lower-rated securities are subject to a higher risk of default. Mortgage- and asset-backed securities may be sensitive to changes in interest rates, and may be subject to early repayment and the market's perception of issuer creditworthiness. Liquidity—the extent to which a security may be sold or a derivative position closed without negatively affecting its market value—may be impaired by reduced trading volume, heightened volatility, rising interest rates, and other market conditions. Please see the fund's prospectus for additional risks.
An interview with Portfolio Manager Jeffrey N. Given, CFA, John Hancock Asset Management a division of Manulife Asset Management (US) LLC

Jeffrey N. Given, CFA
Portfolio Manager
John Hancock Asset Management
How would you describe economic and market conditions during the six months ended April 30, 2018?
We saw two very different market environments in that time frame. Between October and January, we saw a continuation of the trends that had been in place throughout nearly all of last year, with rising stock prices and very little market volatility. Continued strength in the global economy, favorable earnings growth, and, in December, passage of significant federal tax reform legislation provided big boosts of confidence for equity investors during this time.
Starting in February, however, and continuing through the end of the period, equity market conditions turned more volatile amid renewed concerns about inflation and interest rates, as well as investors' worries about geopolitical developments and U.S. trade policy. Although the S&P 500 Index returned -5.77% in the final three months of the period, very strong results achieved in the previous three months carried the index to a return of 3.82% for the entire six-month timeframe.
In light of continued strength in the U.S. economy and employment picture, the country's central bank, the U.S. Federal Reserve, raised its target short-term interest rate by a quarter-percentage point twice in the past six months. For the full period, the U.S. Treasury yield curve flattened, with rates on short-term government bonds rising faster than those on longer-term issues. After initially falling, credit spreads on high-yield bonds tightened in the period's final months, reflecting reduced eagerness on the part of investors to assume credit risk. For the full period, the Bloomberg Barclays U.S. Aggregate Bond Index lost 1.87%.
Given this environment, how did the fund perform compared with its benchmarks?
The fund's Class A shares gained 1.31% for the period (excluding sales charges), trailing the 1.60% return of a 60%/40% blend, respectively, of the S&P 500 Index and the Bloomberg Barclays U.S. Aggregate Bond Index.
As the fund's portfolio managers, we have three ways in which we can add value relative to the 60%/40% blended index. The first of these is through asset allocation, or the fund's balance between equity and fixed-income securities. During the period, the fund was overweighted, on average, in equities. This positioning helped results over the period, given that equities significantly outperformed bonds.
A second way we can potentially add value comes from the fund's fixed-income positioning. This was another source of strength because the fund's bond investments, on balance, outperformed the Bloomberg Barclays index during the period. The third opportunity for added value derives from the fund's equity portfolio, which, for the period, was a source of relative underperformance, as the fund's stock investments lagged the S&P 500.
Which individual stocks were notable detractors from the fund's results?
In the industrials sector, the fund was hampered by an overweight in General Electric Company. GE, which continued to face questions surrounding its prior management's business strategy, experienced multiple business challenges, reported subpar financial results and cut its dividend during the period. We took advantage of weakness in the stock price to add meaningfully to the fund's position, which we believed continued to provide good value.
Another detractor in industrials was Johnson Controls International PLC, an Ireland-based maker of heating and cooling systems and a supplier to automobile manufacturers, among other businesses. Johnson Controls faced concerns about its cash flow in light of rising lead prices, which has made the company's automotive lead-battery business less profitable.
Elsewhere, a position in utility company PPL Corp. was detrimental. Investors became concerned about PPL's U.K. business, due to a combination of worries about the impact of Brexit and potentially adverse changes to pricing in the future that would affect the company's profitability. At
SECTOR COMPOSITION AS OF 4/30/18 (%)
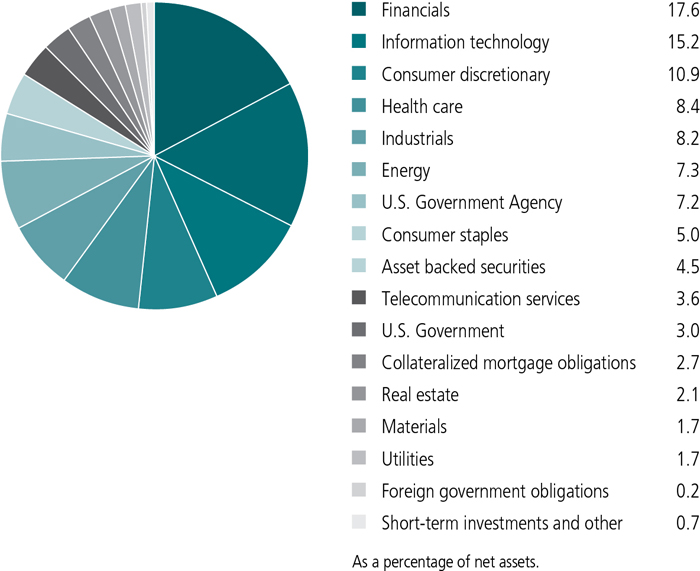
Another detractor was cable and media giant Comcast Corp., which fell due to investors' concern about a potential bidding war for Sky Networks (not a fund holding), as well as an increase in cord cutters leading to fewer cable television subscribers.
Which stocks contributed in relative terms?
The fund benefited from internet retailer Amazon.com, Inc., which produced strong revenue growth on the back of continued expansion in its Amazon Prime subscriber base, along with news of a price increase for Prime subscribers, and robust growth in the company's cloud computing business. Cisco Systems, Inc. also boosted results, as this manufacturer of network communications equipment has been successfully transitioning to a subscription-based revenue model and is poised to repurchase a large amount of stock in light of federal tax reform.
Another contributor was energy producer ConocoPhillips. In addition to benefiting from a rising oil price, the company has been improving its balance sheet by selling non-core assets and reducing debt. Through these efforts, the company has dramatically increased its financial strength in recent years.
Also adding value was SVB Financial Group. This financial institution reported extremely strong earnings that far outpaced analysts' expectations. In addition to benefiting from higher interest rates and the expectation for additional rate hikes in the future, the company's strong presence in its home market of Silicon Valley allowed it to benefit from the strength of the local economy.
Taking a closer look at the fund's equity and fixed-income positioning, what factors influenced results?
Looking at just the equity side of the fund relative to the S&P 500 Index, security selection in the industrials, healthcare, and utilities sectors were negative performance factors. Although stock selection in consumer discretionary hurt, overweighting this outperforming sector helped.
On the fund's fixed-income side, the fund benefited from a combination of sector allocation and security selection, as well as yield curve positioning. An out-of-benchmark allocation to high-yield corporate bonds and an underweight to U.S. Treasuries contributed modestly to relative
TOP FIVE EQUITY HOLDINGS AS OF 4/30/18 (%)
| Alphabet, Inc., Class A | 2.9 |
| Amazon.com, Inc. | 2.6 |
| Apple, Inc. | 2.5 |
| JPMorgan Chase & Co. | 2.5 |
| Microsoft Corp. | 2.4 |
| TOTAL | 12.9 |
| As a percentage of net assets. | |
| Cash and cash equivalents are not included. | |
How was the fund positioned at period end?
At period end the fund's exposure to stocks stood at 64.4% of net assets, similar to six months earlier and higher than our 60% target equity weighting. For a time early in 2018, in light of high valuations and a less favorable risk/reward trade-off in many of the fund's investments, we had reduced the fund's stock allocation by several percentage points. After a severe and rapid market correction in February, however, we again saw an opportunity in early March to increase the fund's exposure to equities. We believed market conditions provided us with this unique opportunity to buy certain stocks offering sound fundamentals and compelling valuations.
On the fund's fixed-income side, the underperformance of corporate bonds and other higher-yielding sectors of the bond market so far in 2018 has led to more attractive valuations there, so the fund continues to emphasize these segments. Despite some uncertainties about the impact of tariffs and tax reform, the U.S. economy has remained on a moderate growth track, which we anticipate should continue to be supportive for the corporate sector.
MANAGED BY
| | Jeffrey N. Given, CFA On the fund since 2006 Investing since 1993 |
 | Michael J. Scanlon, Jr., CFA On the fund since 2015 Investing since 2000 |
 | Lisa A. Welch On the fund since 2016 Investing since 1986 |
![]()
TOP 5 BOND ISSUERS AS OF 4/30/18 (%)
| Federal National Mortgage Association | 4.8 |
| U.S. Treasury | 3.0 |
| Federal Home Loan Mortgage Corp. | 2.5 |
| Wells Fargo & Company | 0.4 |
| Capital One Financial Corp. | 0.4 |
| TOTAL | 11.1 |
| As a percentage of net assets. | |
| Cash and cash equivalents are not included. | |
TOTAL RETURNS FOR THE PERIOD ENDED APRIL 30, 2018
| Average annual total returns (%) with maximum sales charge | Cumulative total returns (%) with maximum sales charge | SEC 30-day yield (%) subsidized | SEC 30-day yield (%) unsubsidized1 | ||||||||
| 1-year | 5-year | 10-year | 6-month | 5-year | 10-year | as of 4-30-18 | as of 4-30-18 | ||||
| Class A | 1.13 | 5.97 | 5.20 | -3.74 | 33.64 | 66.09 | 1.65 | 1.65 | |||
| Class B | 0.73 | 6.01 | 5.15 | -3.95 | 33.90 | 65.24 | 1.04 | 1.03 | |||
| Class C | 4.67 | 6.32 | 5.01 | -0.03 | 35.88 | 63.05 | 1.04 | 1.04 | |||
| Class I2 | 6.79 | 7.40 | 6.13 | 1.47 | 42.91 | 81.27 | 2.04 | 2.03 | |||
| Class R12,3 | 6.06 | 6.70 | 5.42 | 1.13 | 38.33 | 69.51 | 1.37 | 1.37 | |||
| Class R22,3 | 6.31 | 7.02 | 5.75 | 1.26 | 40.37 | 74.89 | 1.62 | 1.61 | |||
| Class R32,3 | 6.21 | 6.82 | 5.53 | 1.21 | 39.08 | 71.23 | 1.50 | 1.49 | |||
| Class R42,3 | 6.59 | 7.25 | 5.89 | 1.38 | 41.89 | 77.18 | 1.89 | 1.78 | |||
| Class R52,3 | 6.81 | 7.46 | 6.13 | 1.43 | 43.30 | 81.27 | 2.09 | 2.08 | |||
| Class R62,3 | 6.88 | 7.52 | 6.05 | 1.51 | 43.71 | 80.02 | 2.14 | 2.13 | |||
| Index 1† | 13.27 | 12.96 | 9.02 | 3.82 | 83.93 | 137.11 | — | — | |||
| Index 2† | -0.32 | 1.47 | 3.57 | -1.87 | 7.56 | 42.08 | — | — | |||
| Index 3 | 7.74 | 8.36 | 7.11 | 1.60 | 49.43 | 98.73 | — | — | |||
Performance figures assume all distributions have been reinvested. Figures reflect maximum sales charges on Class A shares of 5% and the applicable contingent deferred sales charge (CDSC) on Class B and Class C shares. The Class B shares' CDSC declines annually between years 1 to 6 according to the following schedule: 5%, 4%, 3%, 3%, 2%, 1%. No sales charge will be assessed after the sixth year. Class C shares sold within one year of purchase are subject to a 1% CDSC. Sales charges are not applicable to Class I, Class R1, Class R2, Class R3, Class R4, Class R5, and Class R6 shares.
The expense ratios of the fund, both net (including any fee waivers and/or expense limitations) and gross (excluding any fee waivers and/or expense limitations), are set forth according to the most recent publicly available prospectus for the fund and may differ from those disclosed in the Financial highlights tables in this report. Net expenses reflect contractual expense limitations in effect until February 28, 2019 and are subject to change. Had the contractual fee waivers and expense limitations not been in place, gross expenses would apply. The expense ratios are as follows:
| Class A | Class B | Class C | Class I | Class R1 | Class R2 | Class R3 | Class R4 | Class R5 | Class R6 | |
| Gross (%) | 1.09 | 1.79 | 1.79 | 0.78 | 1.44 | 1.19 | 1.34 | 1.04 | 0.74 | 0.69 |
| Net (%) | 1.09 | 1.79 | 1.79 | 0.78 | 1.44 | 1.19 | 1.34 | 0.94 | 0.74 | 0.69 |
Please refer to the most recent prospectus and annual or semiannual report for more information on expenses and any expense limitation arrangements for each class.
The returns reflect past results and should not be considered indicative of future performance. The return and principal value of an investment will fluctuate so that shares, when redeemed, may be worth more or less than their original cost. Due to market volatility and other factors, the fund's current performance may be higher or lower than the performance shown. For current to the most recent month-end performance data, please call 800-225-5291 or visit the fund's website at jhinvestments.com.
The performance table above and the chart on the next page do not reflect the deduction of taxes that a shareholder would pay on fund distributions or the redemption of fund shares. The fund's performance results reflect any applicable fee waivers or expense reductions, without which the expenses would increase and results would have been less favorable.
| † | Index 1 is the S&P 500 Index; Index 2 is the Bloomberg Barclays U.S. Aggregate Bond Index; Index 3 is 60% S&P 500 Index and 40% Bloomberg Barclays U.S. Aggregate Bond Index. |
See the following page for footnotes.
This chart and table show what happened to a hypothetical $10,000 investment in John Hancock Balanced Fund for the share classes and periods indicated, assuming all distributions were reinvested. For comparison, we've shown the same investment in three separate indexes.
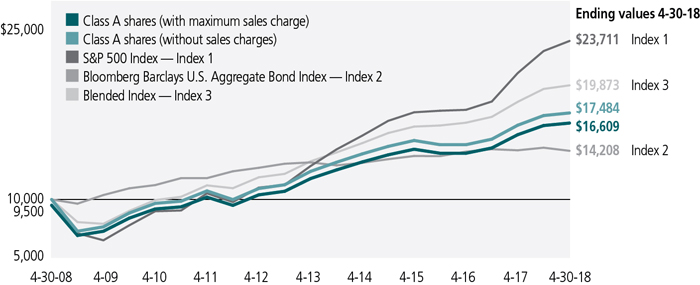
| Start date | With maximum sales charge ($) | Without sales charge ($) | Index 1 ($) | Index 2 ($) | Index 3 ($) | |
| Class B4 | 4-30-08 | 16,524 | 16,524 | 23,711 | 14,208 | 19,873 |
| Class C4 | 4-30-08 | 16,305 | 16,305 | 23,711 | 14,208 | 19,873 |
| Class I2 | 4-30-08 | 18,127 | 18,127 | 23,711 | 14,208 | 19,873 |
| Class R12,3 | 4-30-08 | 16,951 | 16,951 | 23,711 | 14,208 | 19,873 |
| Class R22,3 | 4-30-08 | 17,489 | 17,489 | 23,711 | 14,208 | 19,873 |
| Class R32,3 | 4-30-08 | 17,123 | 17,123 | 23,711 | 14,208 | 19,873 |
| Class R42,3 | 4-30-08 | 17,718 | 17,718 | 23,711 | 14,208 | 19,873 |
| Class R52,3 | 4-30-08 | 18,127 | 18,127 | 23,711 | 14,208 | 19,873 |
| Class R62,3 | 4-30-08 | 18,002 | 18,002 | 23,711 | 14,208 | 19,873 |
The S&P 500 Index is an unmanaged index that includes 500 widely traded common stocks.
The Bloomberg Barclays U.S. Aggregate Bond Index is an unmanaged index of dollar-denominated and non-convertible investment-grade debt issues.
The Blended Index is 60% S&P 500 Index and 40% Bloomberg Barclays U.S. Aggregate Bond Index.
It is not possible to invest directly in an index. Index figures do not reflect expenses or sales charges, which would result in lower returns.
Footnotes related to performance pages
| 1 | Unsubsidized yield reflects what the yield would have been without the effect of reimbursements and waivers. |
| 2 | For certain types of investors, as described in the fund's prospectus. |
| 3 | Class R1, Class R3, Class R4, and Class R5 shares were first offered on 9/8/08; Class R2 shares were first offered on 3/1/12; Class R6 shares were first offered 9/1/11. Returns prior to these dates are those of Class A shares (first offered on 10/5/92) that have not been adjusted for class-specific expenses; otherwise, returns would vary. |
| 4 | The contingent deferred sales charge is not applicable. |
These examples are intended to help you understand your ongoing operating expenses of investing in the fund so you can compare these costs with the ongoing costs of investing in other mutual funds.
Understanding fund expenses
As a shareholder of the fund, you incur two types of costs:
| • | Transaction costs, which include sales charges (loads) on purchases or redemptions (varies by share class), minimum account fee charge, etc. |
| • | Ongoing operating expenses, including management fees, distribution and service fees (if applicable), and other fund expenses. |
We are presenting only your ongoing operating expenses here.
Actual expenses/actual returns
The first line of each share class in the table on the following page is intended to provide information about the fund's actual ongoing operating expenses, and is based on the fund's actual return. It assumes an account value of $1,000.00 on November 1, 2017, with the same investment held until April 30, 2018.
Together with the value of your account, you may use this information to estimate the operating expenses that you paid over the period. Simply divide your account value at April 30, 2018, by $1,000.00, then multiply it by the "expenses paid" for your share class from the table. For example, for an account value of $8,600.00, the operating expenses should be calculated as follows:
Hypothetical example for comparison purposes
The second line of each share class in the table on the following page allows you to compare the fund's ongoing operating expenses with those of any other fund. It provides an example of the fund's hypothetical account values and hypothetical expenses based on each class's actual expense ratio and an assumed 5% annualized return before expenses (which is not the fund's actual return). It assumes an account value of $1,000.00 on November 1, 2017, with the same investment held until April 30, 2018. Look in any other fund shareholder report to find its hypothetical example and you will be able to compare these expenses. Please remember that these hypothetical account values and expenses may not be used to estimate the actual ending account balance or expenses you paid for the period.
Remember, these examples do not include any transaction costs, therefore, these examples will not help you to determine the relative total costs of owning different funds. If transaction costs were included, your expenses would have been higher. See the prospectus for details regarding transaction costs.
SHAREHOLDER EXPENSE EXAMPLE CHART
| Account value on 11-1-2017 | Ending value on 4-30-2018 | Expenses paid during period ended 4-30-20181 | Annualized expense ratio | ||
| Class A | Actual expenses/actual returns | $1,000.00 | $1,013.10 | $5.29 | 1.06% |
| Hypothetical example for comparison purposes | 1,000.00 | 1,019.50 | 5.31 | 1.06% | |
| Class B | Actual expenses/actual returns | 1,000.00 | 1,009.60 | 8.77 | 1.76% |
| Hypothetical example for comparison purposes | 1,000.00 | 1,016.10 | 8.80 | 1.76% | |
| Class C | Actual expenses/actual returns | 1,000.00 | 1,009.60 | 8.77 | 1.76% |
| Hypothetical example for comparison purposes | 1,000.00 | 1,016.10 | 8.80 | 1.76% | |
| Class I | Actual expenses/actual returns | 1,000.00 | 1,014.70 | 3.80 | 0.76% |
| Hypothetical example for comparison purposes | 1,000.00 | 1,021.00 | 3.81 | 0.76% | |
| Class R1 | Actual expenses/actual returns | 1,000.00 | 1,011.30 | 7.03 | 1.41% |
| Hypothetical example for comparison purposes | 1,000.00 | 1,017.80 | 7.05 | 1.41% | |
| Class R2 | Actual expenses/actual returns | 1,000.00 | 1,012.60 | 5.84 | 1.17% |
| Hypothetical example for comparison purposes | 1,000.00 | 1,019.00 | 5.86 | 1.17% | |
| Class R3 | Actual expenses/actual returns | 1,000.00 | 1,012.10 | 6.24 | 1.25% |
| Hypothetical example for comparison purposes | 1,000.00 | 1,018.60 | 6.26 | 1.25% | |
| Class R4 | Actual expenses/actual returns | 1,000.00 | 1,013.80 | 4.59 | 0.92% |
| Hypothetical example for comparison purposes | 1,000.00 | 1,020.20 | 4.61 | 0.92% | |
| Class R5 | Actual expenses/actual returns | 1,000.00 | 1,014.30 | 3.60 | 0.72% |
| Hypothetical example for comparison purposes | 1,000.00 | 1,021.20 | 3.61 | 0.72% | |
| Class R6 | Actual expenses/actual returns | 1,000.00 | 1,015.10 | 3.35 | 0.67% |
| Hypothetical example for comparison purposes | 1,000.00 | 1,021.50 | 3.36 | 0.67% | |
| 1 | Expenses are equal to the annualized expense ratio, multiplied by the average account value over the period, multiplied by 181/365 (to reflect the one-half year period). |
| Fund’s investments |
| Shares | Value | ||||
| Common stocks 64.4% | $1,221,178,413 | ||||
| (Cost $883,683,536) | |||||
| Consumer discretionary 8.6% | 163,101,204 | ||||
| Hotels, restaurants and leisure 1.5% | |||||
| Starbucks Corp. | 487,888 | 28,087,712 | |||
| Household durables 0.7% | |||||
| Lennar Corp., A Shares | 239,504 | 12,667,367 | |||
| Internet and direct marketing retail 2.6% | |||||
| Amazon.com, Inc. (A) | 31,086 | 48,684,717 | |||
| Leisure products 0.6% | |||||
| Hasbro, Inc. | 137,498 | 12,112,199 | |||
| Media 1.7% | |||||
| Comcast Corp., Class A | 888,917 | 27,903,105 | |||
| Lions Gate Entertainment Corp., Class A (B) | 193,278 | 4,810,689 | |||
| Specialty retail 1.5% | |||||
| Lowe's Companies, Inc. | 349,817 | 28,835,415 | |||
| Consumer staples 4.3% | 81,937,649 | ||||
| Food and staples retailing 2.1% | |||||
| CVS Health Corp. | 164,272 | 11,471,114 | |||
| Walmart, Inc. | 310,954 | 27,506,991 | |||
| Food products 0.4% | |||||
| Mondelez International, Inc., Class A | 215,225 | 8,501,388 | |||
| Household products 0.8% | |||||
| The Procter & Gamble Company | 218,748 | 15,824,230 | |||
| Tobacco 1.0% | |||||
| Philip Morris International, Inc. | 227,243 | 18,633,926 | |||
| Energy 5.3% | 100,108,064 | ||||
| Energy equipment and services 1.2% | |||||
| Halliburton Company | 231,942 | 12,290,607 | |||
| Schlumberger, Ltd. | 137,668 | 9,438,518 | |||
| Oil, gas and consumable fuels 4.1% | |||||
| ARC Resources, Ltd. | 456,985 | 5,096,791 | |||
| ConocoPhillips | 338,657 | 22,182,034 | |||
| Devon Energy Corp. | 289,629 | 10,522,222 | |||
| Range Resources Corp. | 256,469 | 3,552,096 | |||
| Royal Dutch Shell PLC, A Shares | 507,645 | 17,661,575 | |||
| Suncor Energy, Inc. | 506,519 | 19,364,221 | |||
| Financials 11.9% | 226,427,933 | ||||
| Banks 5.3% | |||||
| Citigroup, Inc. | 285,635 | 19,500,301 | |||
| 12 | JOHN HANCOCK BALANCED FUND | SEMIANNUAL REPORT | SEE NOTES TO FINANCIAL STATEMENTS |
| Shares | Value | ||||
| Financials (continued) | |||||
| Banks (continued) | |||||
| Citizens Financial Group, Inc. | 161,461 | $6,699,017 | |||
| JPMorgan Chase & Co. | 436,795 | 47,514,560 | |||
| KeyCorp | 608,214 | 12,115,623 | |||
| SVB Financial Group (A) | 47,769 | 14,312,070 | |||
| Capital markets 2.8% | |||||
| BlackRock, Inc. | 23,278 | 12,139,477 | |||
| Invesco, Ltd. | 385,810 | 11,176,916 | |||
| The Charles Schwab Corp. | 219,972 | 12,248,041 | |||
| The Goldman Sachs Group, Inc. | 75,778 | 18,060,171 | |||
| Consumer finance 1.4% | |||||
| Discover Financial Services | 371,818 | 26,492,033 | |||
| Diversified financial services 1.8% | |||||
| Berkshire Hathaway, Inc., Class B (A) | 181,393 | 35,141,266 | |||
| Insurance 0.6% | |||||
| Lincoln National Corp. | 156,122 | 11,028,458 | |||
| Health care 7.5% | 142,007,591 | ||||
| Biotechnology 2.1% | |||||
| Amgen, Inc. | 78,494 | 13,695,633 | |||
| Biogen, Inc. (A) | 44,941 | 12,295,858 | |||
| Gilead Sciences, Inc. | 180,695 | 13,051,600 | |||
| Health care equipment and supplies 1.9% | |||||
| Danaher Corp. | 187,508 | 18,810,803 | |||
| Medtronic PLC | 225,999 | 18,109,300 | |||
| Pharmaceuticals 3.5% | |||||
| Allergan PLC | 111,192 | 17,084,651 | |||
| Johnson & Johnson | 140,763 | 17,805,112 | |||
| Pfizer, Inc. | 850,987 | 31,154,634 | |||
| Industrials 6.5% | 123,257,692 | ||||
| Aerospace and defense 1.8% | |||||
| The Boeing Company | 49,463 | 16,498,878 | |||
| United Technologies Corp. | 151,708 | 18,227,716 | |||
| Building products 0.9% | |||||
| Johnson Controls International PLC | 503,186 | 17,042,910 | |||
| Construction and engineering 0.7% | |||||
| Fluor Corp. | 214,218 | 12,628,151 | |||
| Industrial conglomerates 2.1% | |||||
| General Electric Company | 1,681,886 | 23,664,136 | |||
| Honeywell International, Inc. | 107,080 | 15,492,334 | |||
| Machinery 0.7% | |||||
| Stanley Black & Decker, Inc. | 92,672 | 13,121,428 | |||
| SEE NOTES TO FINANCIAL STATEMENTS | SEMIANNUAL REPORT | JOHN HANCOCK BALANCED FUND | 13 |
| Shares | Value | ||||
| Industrials (continued) | |||||
| Professional services 0.3% | |||||
| Nielsen Holdings PLC | 209,289 | $6,582,139 | |||
| Information technology 14.1% | 266,694,701 | ||||
| Communications equipment 1.6% | |||||
| Cisco Systems, Inc. | 690,083 | 30,563,776 | |||
| Electronic equipment, instruments and components 1.0% | |||||
| TE Connectivity, Ltd. | 194,757 | 17,869,193 | |||
| Internet software and services 4.8% | |||||
| Alphabet, Inc., Class A (A) | 53,208 | 54,196,605 | |||
| Alphabet, Inc., Class C (A) | 6,496 | 6,608,576 | |||
| Facebook, Inc., Class A (A) | 176,849 | 30,418,028 | |||
| IT services 0.6% | |||||
| PayPal Holdings, Inc. (A) | 156,659 | 11,688,328 | |||
| Semiconductors and semiconductor equipment 1.1% | |||||
| Broadcom, Inc. | 91,351 | 20,957,746 | |||
| Software 2.5% | |||||
| Microsoft Corp. | 496,196 | 46,404,250 | |||
| Technology hardware, storage and peripherals 2.5% | |||||
| Apple, Inc. | 290,380 | 47,988,199 | |||
| Materials 1.0% | 19,356,492 | ||||
| Chemicals 0.2% | |||||
| Nutrien, Ltd. | 104,004 | 4,734,634 | |||
| Metals and mining 0.8% | |||||
| Franco-Nevada Corp. | 82,711 | 5,866,654 | |||
| Teck Resources, Ltd., Class B | 348,782 | 8,755,204 | |||
| Real estate 1.6% | 29,834,660 | ||||
| Equity real estate investment trusts 1.6% | |||||
| American Tower Corp. | 93,825 | 12,793,977 | |||
| Digital Realty Trust, Inc. | 80,863 | 8,546,410 | |||
| Park Hotels & Resorts, Inc. | 295,145 | 8,494,273 | |||
| Telecommunication services 2.6% | 49,396,699 | ||||
| Diversified telecommunication services 2.6% | |||||
| CenturyLink, Inc. | 852,441 | 15,838,354 | |||
| Verizon Communications, Inc. | 680,007 | 33,558,345 | |||
| Utilities 1.0% | 19,055,728 | ||||
| Electric utilities 1.0% | |||||
| PPL Corp. | 654,836 | 19,055,728 | |||
| 14 | JOHN HANCOCK BALANCED FUND | SEMIANNUAL REPORT | SEE NOTES TO FINANCIAL STATEMENTS |
| Shares | Value | ||||
| Preferred securities 0.2% | $2,966,217 | ||||
| (Cost $3,082,608) | |||||
| Financials 0.1% | 1,115,586 | ||||
| Banks 0.1% | |||||
| GMAC Capital Trust I (3 month LIBOR + 5.785%), 7.624% (C) | 26,792 | 712,399 | |||
| Regions Financial Corp., 6.375% | 8,275 | 211,095 | |||
| Wells Fargo & Company, Series L, 7.500% | 150 | 192,092 | |||
| Utilities 0.1% | 1,850,631 | ||||
| Multi-utilities 0.1% | |||||
| Dominion Energy, Inc., 6.750% | 28,875 | 1,326,518 | |||
| DTE Energy Company, 6.500% | 9,985 | 524,113 | |||
| Rate (%) | Maturity date | Par value^ | Value | ||
| U.S. Government and Agency obligations 10.2% | $192,536,273 | ||||
| (Cost $198,018,487) | |||||
| U.S. Government 3.0% | 56,913,562 | ||||
| U.S. Treasury | |||||
| Bond | 2.750 | 11-15-42 | 13,480,000 | 12,683,311 | |
| Bond | 2.750 | 11-15-47 | 22,636,000 | 21,038,217 | |
| Bond | 3.000 | 02-15-47 | 15,793,000 | 15,449,379 | |
| Note | 2.750 | 02-15-28 | 5,969,000 | 5,868,040 | |
| Treasury Inflation Protected Security | 0.375 | 07-15-25 | 1,915,885 | 1,874,615 | |
| U.S. Government Agency 7.2% | 135,622,711 | ||||
| Federal Home Loan Mortgage Corp. | |||||
| 30 Yr Pass Thru | 3.000 | 03-01-43 | 901,669 | 877,818 | |
| 30 Yr Pass Thru | 3.000 | 12-01-45 | 4,962,496 | 4,807,970 | |
| 30 Yr Pass Thru | 3.000 | 10-01-46 | 13,810,541 | 13,365,393 | |
| 30 Yr Pass Thru | 3.000 | 10-01-46 | 5,776,777 | 5,583,356 | |
| 30 Yr Pass Thru | 3.000 | 12-01-46 | 4,551,988 | 4,395,309 | |
| 30 Yr Pass Thru | 3.000 | 12-01-46 | 3,489,370 | 3,379,080 | |
| 30 Yr Pass Thru | 3.500 | 10-01-46 | 5,677,561 | 5,657,086 | |
| 30 Yr Pass Thru | 3.500 | 12-01-46 | 3,477,698 | 3,470,047 | |
| 30 Yr Pass Thru | 3.500 | 11-01-47 | 464,151 | 462,840 | |
| 30 Yr Pass Thru | 4.500 | 03-01-41 | 1,946,754 | 2,048,017 | |
| 30 Yr Pass Thru | 5.500 | 11-01-39 | 1,330,048 | 1,464,470 | |
| Federal National Mortgage Association | |||||
| 15 Yr Pass Thru | 3.000 | 07-01-27 | 569,584 | 568,583 | |
| 15 Yr Pass Thru | 3.500 | 02-01-26 | 88,007 | 89,235 | |
| 15 Yr Pass Thru | 3.500 | 03-01-26 | 327,951 | 332,524 | |
| 30 Yr Pass Thru | 3.000 | 02-01-43 | 584,738 | 568,723 | |
| 30 Yr Pass Thru | 3.000 | 03-01-43 | 222,096 | 216,325 | |
| 30 Yr Pass Thru | 3.000 | 05-01-43 | 341,633 | 332,757 | |
| 30 Yr Pass Thru | 3.000 | 02-01-47 | 3,599,661 | 3,488,134 | |
| 30 Yr Pass Thru | 3.000 | 10-01-47 | 7,868,840 | 7,611,519 | |
| 30 Yr Pass Thru | 3.500 | 06-01-42 | 4,800,458 | 4,811,086 | |
| SEE NOTES TO FINANCIAL STATEMENTS | SEMIANNUAL REPORT | JOHN HANCOCK BALANCED FUND | 15 |
| Rate (%) | Maturity date | Par value^ | Value | ||
| U.S. Government Agency (continued) | |||||
| 30 Yr Pass Thru | 3.500 | 06-01-43 | 8,902,098 | $8,909,289 | |
| 30 Yr Pass Thru | 3.500 | 12-01-44 | 9,074,480 | 9,059,124 | |
| 30 Yr Pass Thru | 3.500 | 12-01-44 | 1,861,315 | 1,858,165 | |
| 30 Yr Pass Thru | 3.500 | 04-01-45 | 1,646,091 | 1,643,048 | |
| 30 Yr Pass Thru | 3.500 | 04-01-45 | 678,064 | 676,811 | |
| 30 Yr Pass Thru | 3.500 | 07-01-47 | 13,464,031 | 13,432,831 | |
| 30 Yr Pass Thru | 4.000 | 01-01-41 | 2,223,868 | 2,285,511 | |
| 30 Yr Pass Thru | 4.000 | 09-01-41 | 1,459,460 | 1,500,143 | |
| 30 Yr Pass Thru | 4.000 | 10-01-41 | 8,471,436 | 8,706,256 | |
| 30 Yr Pass Thru | 4.000 | 01-01-47 | 11,199,683 | 11,501,378 | |
| 30 Yr Pass Thru | 4.500 | 11-01-39 | 2,903,684 | 3,055,290 | |
| 30 Yr Pass Thru | 4.500 | 09-01-40 | 1,515,678 | 1,594,340 | |
| 30 Yr Pass Thru | 4.500 | 05-01-41 | 930,782 | 979,089 | |
| 30 Yr Pass Thru | 4.500 | 07-01-41 | 2,794,993 | 2,939,177 | |
| 30 Yr Pass Thru | 4.500 | 01-01-43 | 1,161,204 | 1,220,743 | |
| 30 Yr Pass Thru | 5.000 | 04-01-41 | 1,733,385 | 1,861,263 | |
| 30 Yr Pass Thru | 5.500 | 11-01-39 | 584,117 | 637,104 | |
| 30 Yr Pass Thru | 6.500 | 01-01-39 | 202,629 | 226,509 | |
| 30 Yr Pass Thru | 7.000 | 06-01-32 | 857 | 982 | |
| 30 Yr Pass Thru | 7.500 | 04-01-31 | 2,531 | 2,906 | |
| 30 Yr Pass Thru | 8.000 | 01-01-31 | 1,939 | 2,238 | |
| Government National Mortgage Association 30 Yr Pass Thru | 9.000 | 04-15-21 | 228 | 242 | |
| Foreign government obligations 0.2% | $4,601,125 | ||||
| (Cost $4,562,376) | |||||
| Argentina 0.2% | 2,834,226 | ||||
| City of Buenos Aires Bond (D) | 7.500 | 06-01-27 | 400,000 | 412,336 | |
| Provincia de Buenos Aires Bond (D) | 7.875 | 06-15-27 | 750,000 | 761,250 | |
| Republic of Argentina | |||||
| Bond | 5.875 | 01-11-28 | 1,025,000 | 938,900 | |
| Bond | 6.875 | 01-26-27 | 340,000 | 338,300 | |
| Bond | 8.280 | 12-31-33 | 357,520 | 383,440 | |
| Egypt 0.0% | 602,381 | ||||
| Arab Republic of Egypt Bond (D) | 5.577 | 02-21-23 | 600,000 | 602,381 | |
| Qatar 0.0% | 589,645 | ||||
| Government of Qatar Bond (D) | 5.103 | 04-23-48 | 595,000 | 589,645 | |
| Saudi Arabia 0.0% | 574,873 | ||||
| Kingdom of Saudi Arabia Bond (D) | 5.000 | 04-17-49 | 600,000 | 574,873 | |
| 16 | JOHN HANCOCK BALANCED FUND | SEMIANNUAL REPORT | SEE NOTES TO FINANCIAL STATEMENTS |
| Rate (%) | Maturity date | Par value^ | Value | ||
| Saudi Arabia (continued) | |||||
| Corporate bonds 17.0% | $322,061,997 | ||||
| (Cost $325,197,601) | |||||
| Consumer discretionary 2.3% | 44,155,127 | ||||
| Auto components 0.1% | |||||
| Lear Corp. | 5.250 | 01-15-25 | 560,000 | 589,579 | |
| Nemak SAB de CV (D) | 4.750 | 01-23-25 | 475,000 | 464,313 | |
| Automobiles 0.5% | |||||
| Daimler Finance North America LLC (D) | 2.200 | 05-05-20 | 655,000 | 642,315 | |
| Daimler Finance North America LLC (D) | 3.100 | 05-04-20 | 1,088,000 | 1,087,206 | |
| Ford Motor Company | 4.750 | 01-15-43 | 500,000 | 445,946 | |
| Ford Motor Credit Company LLC | 3.336 | 03-18-21 | 610,000 | 605,525 | |
| Ford Motor Credit Company LLC | 5.875 | 08-02-21 | 1,730,000 | 1,841,267 | |
| General Motors Company | 4.875 | 10-02-23 | 1,130,000 | 1,164,194 | |
| General Motors Financial Company, Inc. | 3.550 | 04-09-21 | 720,000 | 718,903 | |
| General Motors Financial Company, Inc. | 4.000 | 01-15-25 | 1,175,000 | 1,144,632 | |
| General Motors Financial Company, Inc. | 4.300 | 07-13-25 | 800,000 | 786,338 | |
| JB Poindexter & Company, Inc. (D) | 7.125 | 04-15-26 | 175,000 | 178,063 | |
| Diversified consumer services 0.0% | |||||
| Laureate Education, Inc. (D) | 8.250 | 05-01-25 | 330,000 | 354,750 | |
| Hotels, restaurants and leisure 0.2% | |||||
| CCM Merger, Inc. (D) | 6.000 | 03-15-22 | 445,000 | 452,788 | |
| Eldorado Resorts, Inc. | 7.000 | 08-01-23 | 265,000 | 279,575 | |
| GLP Capital LP | 5.375 | 04-15-26 | 560,000 | 564,200 | |
| Hilton Domestic Operating Company, Inc. (D) | 5.125 | 05-01-26 | 335,000 | 335,000 | |
| Hilton Grand Vacations Borrower LLC | 6.125 | 12-01-24 | 340,000 | 359,584 | |
| International Game Technology PLC (D) | 6.500 | 02-15-25 | 570,000 | 607,763 | |
| Jacobs Entertainment, Inc. (D) | 7.875 | 02-01-24 | 295,000 | 307,169 | |
| Internet and direct marketing retail 0.5% | |||||
| Amazon.com, Inc. (D) | 3.150 | 08-22-27 | 1,510,000 | 1,445,562 | |
| Amazon.com, Inc. (D) | 4.050 | 08-22-47 | 1,480,000 | 1,460,724 | |
| Booking Holdings, Inc. | 2.750 | 03-15-23 | 655,000 | 625,055 | |
| Expedia Group, Inc. | 3.800 | 02-15-28 | 1,305,000 | 1,188,973 | |
| Expedia Group, Inc. | 5.000 | 02-15-26 | 1,415,000 | 1,437,463 | |
| Netflix, Inc. (D) | 4.875 | 04-15-28 | 675,000 | 637,875 | |
| Netflix, Inc. (D) | 5.875 | 11-15-28 | 935,000 | 932,663 | |
| QVC, Inc. | 4.375 | 03-15-23 | 565,000 | 562,656 | |
| QVC, Inc. | 5.125 | 07-02-22 | 580,000 | 597,024 | |
| QVC, Inc. | 5.450 | 08-15-34 | 630,000 | 593,130 | |
| Leisure products 0.0% | |||||
| Vista Outdoor, Inc. | 5.875 | 10-01-23 | 550,000 | 512,875 | |
| Media 0.9% | |||||
| Altice Financing SA (D) | 6.625 | 02-15-23 | 325,000 | 325,000 | |
| AMC Entertainment Holdings, Inc. | 6.125 | 05-15-27 | 526,000 | 508,905 | |
| Cablevision Systems Corp. | 5.875 | 09-15-22 | 525,000 | 517,125 | |
| SEE NOTES TO FINANCIAL STATEMENTS | SEMIANNUAL REPORT | JOHN HANCOCK BALANCED FUND | 17 |
| Rate (%) | Maturity date | Par value^ | Value | ||
| Consumer discretionary (continued) | |||||
| Media (continued) | |||||
| CBS Corp. | 3.375 | 03-01-22 | 326,000 | $322,916 | |
| CBS Corp. | 3.700 | 08-15-24 | 585,000 | 573,190 | |
| Cengage Learning, Inc. (D) | 9.500 | 06-15-24 | 625,000 | 487,500 | |
| Cequel Communications Holdings I LLC (D) | 7.500 | 04-01-28 | 520,000 | 527,150 | |
| Charter Communications Operating LLC | 4.200 | 03-15-28 | 1,323,000 | 1,245,350 | |
| Charter Communications Operating LLC | 5.750 | 04-01-48 | 1,225,000 | 1,216,843 | |
| Charter Communications Operating LLC | 6.484 | 10-23-45 | 1,390,000 | 1,497,229 | |
| Clear Channel Worldwide Holdings, Inc. | 6.500 | 11-15-22 | 621,000 | 635,749 | |
| McGraw-Hill Global Education Holdings LLC (D) | 7.875 | 05-15-24 | 455,000 | 423,150 | |
| MDC Partners, Inc. (D) | 6.500 | 05-01-24 | 625,000 | 614,844 | |
| Meredith Corp. (D) | 6.875 | 02-01-26 | 820,000 | 830,250 | |
| Midcontinent Communications (D) | 6.875 | 08-15-23 | 545,000 | 572,250 | |
| Myriad International Holdings BV (D) | 4.850 | 07-06-27 | 250,000 | 251,225 | |
| Myriad International Holdings BV (D) | 5.500 | 07-21-25 | 915,000 | 964,301 | |
| National CineMedia LLC | 6.000 | 04-15-22 | 240,000 | 243,600 | |
| Sinclair Television Group, Inc. (D) | 5.625 | 08-01-24 | 375,000 | 371,250 | |
| Sirius XM Radio, Inc. (D) | 5.000 | 08-01-27 | 1,240,000 | 1,181,875 | |
| Sirius XM Radio, Inc. (D) | 5.375 | 07-15-26 | 700,000 | 686,070 | |
| Time Warner Cable LLC | 8.250 | 04-01-19 | 490,000 | 513,234 | |
| Time Warner, Inc. | 3.800 | 02-15-27 | 621,000 | 600,282 | |
| Viacom, Inc. | 4.375 | 03-15-43 | 518,000 | 457,954 | |
| Viacom, Inc. | 5.850 | 09-01-43 | 1,210,000 | 1,293,129 | |
| Viacom, Inc. (6.250% to 2-28-27, then 3 month LIBOR + 3.899%) | 6.250 | 02-28-57 | 600,000 | 608,400 | |
| WMG Acquisition Corp. (D) | 4.875 | 11-01-24 | 360,000 | 352,800 | |
| WMG Acquisition Corp. (D) | 5.500 | 04-15-26 | 160,000 | 160,800 | |
| Multiline retail 0.1% | |||||
| Dollar Tree, Inc. | 4.200 | 05-15-28 | 1,550,000 | 1,522,964 | |
| Macy's Retail Holdings, Inc. (B) | 3.625 | 06-01-24 | 507,000 | 485,382 | |
| Specialty retail 0.0% | |||||
| L Brands, Inc. | 6.625 | 04-01-21 | 644,000 | 684,250 | |
| L Brands, Inc. | 6.875 | 11-01-35 | 340,000 | 321,300 | |
| Textiles, apparel and luxury goods 0.0% | |||||
| Eagle Intermediate Global Holding BV (D) | 7.500 | 05-01-25 | 230,000 | 235,750 | |
| Consumer staples 0.7% | 12,355,655 | ||||
| Beverages 0.2% | |||||
| Anheuser-Busch InBev Finance, Inc. | 4.900 | 02-01-46 | 2,170,000 | 2,234,004 | |
| Anheuser-Busch InBev Worldwide, Inc. | 4.600 | 04-15-48 | 700,000 | 690,323 | |
| Molson Coors Brewing Company | 3.000 | 07-15-26 | 443,000 | 405,547 | |
| Food and staples retailing 0.2% | |||||
| Alimentation Couche-Tard, Inc. (D) | 2.700 | 07-26-22 | 605,000 | 581,053 | |
| CVS Health Corp. | 3.350 | 03-09-21 | 1,700,000 | 1,703,264 | |
| CVS Health Corp. | 5.050 | 03-25-48 | 1,610,000 | 1,641,056 | |
| 18 | JOHN HANCOCK BALANCED FUND | SEMIANNUAL REPORT | SEE NOTES TO FINANCIAL STATEMENTS |
| Rate (%) | Maturity date | Par value^ | Value | ||
| Consumer staples (continued) | |||||
| Food and staples retailing (continued) | |||||
| Simmons Foods, Inc. (D) | 5.750 | 11-01-24 | 285,000 | $242,723 | |
| Food products 0.2% | |||||
| Bunge, Ltd. Finance Corp. | 8.500 | 06-15-19 | 730,000 | 771,921 | |
| Kraft Heinz Foods Company (D) | 4.875 | 02-15-25 | 525,000 | 546,132 | |
| Kraft Heinz Foods Company | 5.200 | 07-15-45 | 369,000 | 365,234 | |
| Mondelez International Holdings Netherlands BV (D) | 1.625 | 10-28-19 | 850,000 | 833,147 | |
| Post Holdings, Inc. (D) | 5.625 | 01-15-28 | 148,000 | 141,340 | |
| Household products 0.0% | |||||
| Kronos Acquisition Holdings, Inc. (D) | 9.000 | 08-15-23 | 545,000 | 520,475 | |
| Personal products 0.1% | |||||
| Natura Cosmeticos SA (D) | 5.375 | 02-01-23 | 840,000 | 835,800 | |
| Revlon Consumer Products Corp. (B) | 6.250 | 08-01-24 | 910,000 | 546,000 | |
| Tobacco 0.0% | |||||
| Vector Group, Ltd. (D) | 6.125 | 02-01-25 | 300,000 | 297,636 | |
| Energy 2.0% | 37,384,309 | ||||
| Energy equipment and services 0.1% | |||||
| Antero Midstream Partners LP | 5.375 | 09-15-24 | 610,000 | 606,950 | |
| CSI Compressco LP | 7.250 | 08-15-22 | 692,000 | 653,940 | |
| CSI Compressco LP (D) | 7.500 | 04-01-25 | 327,000 | 328,635 | |
| Inkia Energy, Ltd. (D) | 5.875 | 11-09-27 | 220,000 | 210,100 | |
| USA Compression Partners LP (D) | 6.875 | 04-01-26 | 110,000 | 112,200 | |
| Oil, gas and consumable fuels 1.9% | |||||
| Andeavor Logistics LP | 4.250 | 12-01-27 | 380,000 | 369,218 | |
| Andeavor Logistics LP | 5.250 | 01-15-25 | 300,000 | 308,250 | |
| Andeavor Logistics LP | 6.375 | 05-01-24 | 560,000 | 596,400 | |
| Antero Resources Corp. | 5.125 | 12-01-22 | 674,000 | 677,370 | |
| Boardwalk Pipelines LP | 4.450 | 07-15-27 | 472,000 | 459,939 | |
| Cenovus Energy, Inc. | 4.450 | 09-15-42 | 745,000 | 651,737 | |
| Cheniere Corpus Christi Holdings LLC | 5.125 | 06-30-27 | 495,000 | 482,625 | |
| Cheniere Corpus Christi Holdings LLC | 5.875 | 03-31-25 | 365,000 | 376,300 | |
| Cimarex Energy Company | 4.375 | 06-01-24 | 540,000 | 549,949 | |
| Colorado Interstate Gas Company LLC (D) | 4.150 | 08-15-26 | 487,000 | 470,761 | |
| Columbia Pipeline Group, Inc. | 4.500 | 06-01-25 | 1,025,000 | 1,032,938 | |
| Continental Resources, Inc. | 5.000 | 09-15-22 | 1,343,000 | 1,363,145 | |
| DCP Midstream Operating LP | 2.700 | 04-01-19 | 600,000 | 594,006 | |
| DCP Midstream Operating LP (5.850% to 5-21-23, then 3 month LIBOR + 3.850%) (D) | 5.850 | 05-21-43 | 585,000 | 555,750 | |
| DCP Midstream Operating LP (D) | 9.750 | 03-15-19 | 535,000 | 563,195 | |
| Enbridge Energy Partners LP | 4.375 | 10-15-20 | 890,000 | 907,498 | |
| Enbridge Energy Partners LP (3 month LIBOR + 3.798%) (C) | 6.105 | 10-01-77 | 615,000 | 608,850 | |
| Enbridge, Inc. (5.500% to 7-15-27, then 3 month LIBOR + 3.418%) | 5.500 | 07-15-77 | 850,000 | 790,500 | |
| SEE NOTES TO FINANCIAL STATEMENTS | SEMIANNUAL REPORT | JOHN HANCOCK BALANCED FUND | 19 |
| Rate (%) | Maturity date | Par value^ | Value | ||
| Energy (continued) | |||||
| Oil, gas and consumable fuels (continued) | |||||
| Enbridge, Inc. (6.250% to 3-1-28, then 3 month LIBOR + 3.641%) | 6.250 | 03-01-78 | 650,000 | $632,552 | |
| Energy Transfer Equity LP | 5.875 | 01-15-24 | 460,000 | 469,775 | |
| Energy Transfer Partners LP | 4.200 | 04-15-27 | 329,000 | 313,634 | |
| Energy Transfer Partners LP | 5.000 | 10-01-22 | 150,000 | 154,854 | |
| Energy Transfer Partners LP | 5.150 | 03-15-45 | 665,000 | 603,421 | |
| Energy Transfer Partners LP | 5.875 | 03-01-22 | 230,000 | 243,889 | |
| Energy Transfer Partners LP | 9.700 | 03-15-19 | 483,000 | 510,425 | |
| EnLink Midstream Partners LP | 4.850 | 07-15-26 | 750,000 | 749,087 | |
| EnLink Midstream Partners LP (6.000% to 12-15-22, then 3 month LIBOR + 4.110%) (E) | 6.000 | 12-15-22 | 500,000 | 468,750 | |
| Enterprise Products Operating LLC (5.250% to 8-16-27, then 3 month LIBOR + 3.033%) | 5.250 | 08-16-77 | 1,290,000 | 1,243,547 | |
| Enterprise Products Operating LLC (3 month LIBOR + 3.708%) (C) | 5.481 | 08-01-66 | 690,000 | 692,732 | |
| Gulfport Energy Corp. | 6.000 | 10-15-24 | 650,000 | 617,500 | |
| Hess Corp. | 5.800 | 04-01-47 | 465,000 | 480,370 | |
| Kinder Morgan Energy Partners LP | 7.750 | 03-15-32 | 525,000 | 648,661 | |
| MPLX LP | 4.000 | 03-15-28 | 770,000 | 739,983 | |
| Murphy Oil Corp. | 5.750 | 08-15-25 | 419,000 | 417,953 | |
| Newfield Exploration Company | 5.625 | 07-01-24 | 305,000 | 323,300 | |
| Newfield Exploration Company | 5.750 | 01-30-22 | 380,000 | 399,000 | |
| Nostrum Oil & Gas Finance BV (D) | 7.000 | 02-16-25 | 335,000 | 321,659 | |
| NuStar Logistics LP | 5.625 | 04-28-27 | 181,000 | 171,441 | |
| ONEOK Partners LP | 5.000 | 09-15-23 | 375,000 | 391,036 | |
| Petrobras Global Finance BV | 5.625 | 05-20-43 | 1,555,000 | 1,298,192 | |
| Petrobras Global Finance BV | 7.375 | 01-17-27 | 1,270,000 | 1,362,075 | |
| Petroleos Mexicanos | 4.875 | 01-24-22 | 710,000 | 721,538 | |
| Petroleos Mexicanos | 5.375 | 03-13-22 | 260,000 | 268,944 | |
| Sabine Pass Liquefaction LLC | 4.200 | 03-15-28 | 611,000 | 593,031 | |
| Sabine Pass Liquefaction LLC | 5.000 | 03-15-27 | 570,000 | 586,443 | |
| Sabine Pass Liquefaction LLC | 5.750 | 05-15-24 | 590,000 | 633,175 | |
| Sabine Pass Liquefaction LLC | 5.875 | 06-30-26 | 350,000 | 379,762 | |
| Sunoco Logistics Partners Operations LP | 3.900 | 07-15-26 | 960,000 | 901,814 | |
| Sunoco Logistics Partners Operations LP | 4.400 | 04-01-21 | 775,000 | 788,988 | |
| Sunoco Logistics Partners Operations LP | 5.400 | 10-01-47 | 580,000 | 546,095 | |
| Tapstone Energy LLC (D) | 9.750 | 06-01-22 | 235,000 | 202,617 | |
| Targa Resources Partners LP (D) | 5.875 | 04-15-26 | 540,000 | 537,300 | |
| Teekay Offshore Partners LP | 6.000 | 07-30-19 | 680,000 | 680,000 | |
| The Williams Companies, Inc. | 4.550 | 06-24-24 | 1,210,000 | 1,205,463 | |
| The Williams Companies, Inc. | 5.750 | 06-24-44 | 720,000 | 750,600 | |
| Williams Partners LP | 3.750 | 06-15-27 | 945,000 | 888,047 | |
| WPX Energy, Inc. | 5.250 | 09-15-24 | 220,000 | 221,650 | |
| WPX Energy, Inc. | 6.000 | 01-15-22 | 324,000 | 337,770 | |
| YPF SA (D) | 8.500 | 07-28-25 | 565,000 | 616,980 | |
| 20 | JOHN HANCOCK BALANCED FUND | SEMIANNUAL REPORT | SEE NOTES TO FINANCIAL STATEMENTS |
| Rate (%) | Maturity date | Par value^ | Value | ||
| Financials 5.5% | $103,311,266 | ||||
| Banks 3.1% | |||||
| Australia & New Zealand Banking Group, Ltd. | 2.125 | 08-19-20 | 1,130,000 | 1,104,099 | |
| Australia & New Zealand Banking Group, Ltd. (6.750% to 6-15-26, then 5 Year U.S. ISDAFIX + 5.168%) (D)(E) | 6.750 | 06-15-26 | 330,000 | 351,863 | |
| Banco Santander SA | 4.379 | 04-12-28 | 800,000 | 789,899 | |
| Bank of America Corp. | 3.950 | 04-21-25 | 990,000 | 968,980 | |
| Bank of America Corp. | 4.200 | 08-26-24 | 365,000 | 365,514 | |
| Bank of America Corp. | 4.250 | 10-22-26 | 333,000 | 328,188 | |
| Bank of America Corp. | 4.450 | 03-03-26 | 1,160,000 | 1,161,347 | |
| Bank of America Corp. (6.300% to 3-10-26, then 3 month LIBOR + 4.553%) (E) | 6.300 | 03-10-26 | 1,440,000 | 1,524,528 | |
| Banque Federative du Credit Mutuel SA (D) | 2.200 | 07-20-20 | 1,100,000 | 1,075,714 | |
| Barclays Bank PLC | 2.650 | 01-11-21 | 1,760,000 | 1,730,493 | |
| Barclays Bank PLC (D) | 10.179 | 06-12-21 | 345,000 | 403,531 | |
| Barclays PLC | 4.375 | 01-12-26 | 670,000 | 661,346 | |
| BPCE SA (D) | 4.500 | 03-15-25 | 730,000 | 724,864 | |
| BPCE SA (D) | 5.700 | 10-22-23 | 900,000 | 956,756 | |
| Canadian Imperial Bank of Commerce | 2.700 | 02-02-21 | 1,940,000 | 1,911,500 | |
| Citigroup, Inc. | 2.350 | 08-02-21 | 1,135,000 | 1,100,840 | |
| Citigroup, Inc. | 4.600 | 03-09-26 | 1,357,000 | 1,368,310 | |
| Citigroup, Inc. (5.875% to 3-27-20, then 3 month LIBOR + 4.059%) (E) | 5.875 | 03-27-20 | 1,007,000 | 1,034,693 | |
| Citigroup, Inc. (6.250% to 8-15-26, then 3 month LIBOR + 4.517%) (E) | 6.250 | 08-15-26 | 1,080,000 | 1,121,850 | |
| Citizens Bank NA | 2.200 | 05-26-20 | 985,000 | 962,707 | |
| Cooperatieve Rabobank UA (11.000% to 6-30-19, then 3 month LIBOR + 10.868%) (D)(E) | 11.000 | 06-30-19 | 534,000 | 576,720 | |
| Credit Agricole SA (7.875% to 1-23-24, then 5 Year U.S. Swap Rate + 4.898%) (D)(E) | 7.875 | 01-23-24 | 605,000 | 656,437 | |
| Credit Agricole SA (8.125% to 9-19-18, then 5 Year U.S. Swap Rate + 6.283%) (D) | 8.125 | 09-19-33 | 620,000 | 630,492 | |
| Fifth Third Bancorp (5.100% to 6-30-23, then 3 month LIBOR + 3.033%) (E) | 5.100 | 06-30-23 | 665,000 | 654,194 | |
| Freedom Mortgage Corp. (D) | 8.125 | 11-15-24 | 630,000 | 630,000 | |
| Freedom Mortgage Corp. (D) | 8.250 | 04-15-25 | 250,000 | 250,000 | |
| HBOS PLC (D) | 6.750 | 05-21-18 | 768,000 | 769,713 | |
| HSBC Holdings PLC (6.375% to 9-17-24, then 5 Year U.S. ISDAFIX + 3.705%) (E) | 6.375 | 09-17-24 | 255,000 | 260,993 | |
| HSBC Holdings PLC (6.875% to 6-1-21, then 5 Year U.S. ISDAFIX + 5.514%) (E) | 6.875 | 06-01-21 | 775,000 | 821,500 | |
| ING Bank NV (D) | 5.800 | 09-25-23 | 895,000 | 961,814 | |
| ING Groep NV (6.500% to 4-16-25, then 5 Year U.S. Swap Rate + 4.446%) (E) | 6.500 | 04-16-25 | 210,000 | 216,153 | |
| JPMorgan Chase & Co. | 2.400 | 06-07-21 | 1,255,000 | 1,222,230 | |
| JPMorgan Chase & Co. | 3.200 | 06-15-26 | 985,000 | 931,557 | |
| JPMorgan Chase & Co. (5.300% to 5-1-20, then 3 month LIBOR + 3.800%) (E) | 5.300 | 05-01-20 | 950,000 | 978,500 | |
| SEE NOTES TO FINANCIAL STATEMENTS | SEMIANNUAL REPORT | JOHN HANCOCK BALANCED FUND | 21 |
| Rate (%) | Maturity date | Par value^ | Value | ||
| Financials (continued) | |||||
| Banks (continued) | |||||
| JPMorgan Chase & Co. (6.750% to 2-1-24, then 3 month LIBOR + 3.780%) (E) | 6.750 | 02-01-24 | 1,065,000 | $1,156,856 | |
| Lloyds Banking Group PLC | 4.650 | 03-24-26 | 1,700,000 | 1,687,895 | |
| Lloyds Banking Group PLC (7.500% to 6-27-24, then 5 Year U.S. Swap Rate + 4.760%) (E) | 7.500 | 06-27-24 | 550,000 | 593,450 | |
| M&T Bank Corp. (5.125% to 11-1-26, then 3 month LIBOR + 3.520%) (E) | 5.125 | 11-01-26 | 765,000 | 761,634 | |
| Manufacturers & Traders Trust Company (3 month LIBOR + 0.640%) (C) | 2.646 | 12-01-21 | 490,000 | 488,300 | |
| PNC Bank NA | 2.450 | 07-28-22 | 1,410,000 | 1,361,553 | |
| PNC Bank NA | 2.500 | 01-22-21 | 1,575,000 | 1,546,126 | |
| Popular, Inc. | 7.000 | 07-01-19 | 560,000 | 569,800 | |
| Regions Financial Corp. | 2.750 | 08-14-22 | 1,300,000 | 1,253,223 | |
| Santander Holdings USA, Inc. | 2.700 | 05-24-19 | 116,000 | 115,504 | |
| Santander Holdings USA, Inc. | 3.400 | 01-18-23 | 640,000 | 619,917 | |
| Santander Holdings USA, Inc. | 3.700 | 03-28-22 | 1,125,000 | 1,114,838 | |
| Santander UK Group Holdings PLC (D) | 4.750 | 09-15-25 | 700,000 | 698,877 | |
| Societe Generale SA (7.375% to 9-13-21, then 5 Year U.S. Swap Rate + 6.238%) (D)(E) | 7.375 | 09-13-21 | 700,000 | 742,000 | |
| Societe Generale SA (8.000% to 9-29-25, then 5 Year U.S. ISDAFIX + 5.873%) (D)(E) | 8.000 | 09-29-25 | 800,000 | 886,000 | |
| Societe Generale SA (8.250% to 11-29-18, then 5 Year U.S. Swap Rate + 6.394%) (E) | 8.250 | 11-29-18 | 525,000 | 538,781 | |
| Standard Chartered PLC (D) | 2.100 | 08-19-19 | 1,055,000 | 1,040,436 | |
| Sumitomo Mitsui Trust Bank, Ltd. (D) | 2.050 | 03-06-19 | 1,300,000 | 1,292,152 | |
| SunTrust Bank | 2.450 | 08-01-22 | 1,125,000 | 1,079,983 | |
| SunTrust Bank (2.590% to 1-29-20, then 3 month LIBOR + 0.297%) | 2.590 | 01-29-21 | 1,350,000 | 1,337,579 | |
| The PNC Financial Services Group, Inc. (4.850% to 6-1-23, then 3 month LIBOR + 3.040%) (E) | 4.850 | 06-01-23 | 615,000 | 611,310 | |
| The PNC Financial Services Group, Inc. (6.750% to 8-1-21, then 3 month LIBOR + 3.678%) (E) | 6.750 | 08-01-21 | 1,435,000 | 1,548,006 | |
| The Royal Bank of Scotland Group PLC | 3.875 | 09-12-23 | 1,125,000 | 1,105,718 | |
| The Royal Bank of Scotland Group PLC (8.000% to 8-10-25, then 5 Year U.S. Swap Rate + 5.720%) (E) | 8.000 | 08-10-25 | 450,000 | 492,188 | |
| The Royal Bank of Scotland Group PLC (8.625% to 8-15-21, then 5 Year U.S. Swap Rate + 7.598%) (E) | 8.625 | 08-15-21 | 390,000 | 427,050 | |
| Wells Fargo & Company, Series K (3 month LIBOR + 3.770%) (C)(E) | 5.895 | 06-15-18 | 667,000 | 674,504 | |
| Wells Fargo & Company, Series U (5.875% to 6-15-25, then 3 month LIBOR + 3.990%) (E) | 5.875 | 06-15-25 | 2,075,000 | 2,147,625 | |
| Wells Fargo Bank NA | 2.400 | 01-15-20 | 1,970,000 | 1,951,462 | |
| Westpac Banking Corp. | 2.150 | 03-06-20 | 1,670,000 | 1,643,816 | |
| Capital markets 0.8% | |||||
| Ares Capital Corp. | 3.625 | 01-19-22 | 435,000 | 425,509 | |
| 22 | JOHN HANCOCK BALANCED FUND | SEMIANNUAL REPORT | SEE NOTES TO FINANCIAL STATEMENTS |
| Rate (%) | Maturity date | Par value^ | Value | ||
| Financials (continued) | |||||
| Capital markets (continued) | |||||
| Credit Suisse Group AG (7.500% to 12-11-23, then 5 Year U.S. Swap Rate + 4.598%) (D)(E) | 7.500 | 12-11-23 | 450,000 | $487,697 | |
| FS Investment Corp. | 4.000 | 07-15-19 | 505,000 | 503,713 | |
| FS Investment Corp. | 4.250 | 01-15-20 | 640,000 | 638,546 | |
| Jefferies Group LLC | 4.150 | 01-23-30 | 815,000 | 746,680 | |
| Jefferies Group LLC | 4.850 | 01-15-27 | 983,000 | 980,266 | |
| Jefferies Group LLC | 8.500 | 07-15-19 | 1,543,000 | 1,637,462 | |
| Macquarie Bank, Ltd. (D) | 4.875 | 06-10-25 | 960,000 | 964,391 | |
| Morgan Stanley | 3.875 | 01-27-26 | 670,000 | 659,715 | |
| Morgan Stanley | 5.500 | 01-26-20 | 1,000,000 | 1,040,380 | |
| Morgan Stanley | 7.300 | 05-13-19 | 1,210,000 | 1,264,718 | |
| Stifel Financial Corp. | 4.250 | 07-18-24 | 745,000 | 737,940 | |
| The Goldman Sachs Group, Inc. | 2.300 | 12-13-19 | 1,705,000 | 1,687,945 | |
| The Goldman Sachs Group, Inc. | 3.850 | 01-26-27 | 1,580,000 | 1,528,274 | |
| UBS AG (D) | 2.450 | 12-01-20 | 1,270,000 | 1,243,100 | |
| UBS Group Funding Switzerland AG (2.859% to 8-15-22, then 3 month LIBOR + 0.954%) (D) | 2.859 | 08-15-23 | 1,300,000 | 1,245,503 | |
| Consumer finance 0.6% | |||||
| Ally Financial, Inc. | 3.250 | 11-05-18 | 595,000 | 595,000 | |
| Ally Financial, Inc. | 5.125 | 09-30-24 | 1,365,000 | 1,399,125 | |
| American Express Company | 2.500 | 08-01-22 | 1,245,000 | 1,194,178 | |
| Capital One Financial Corp. | 2.400 | 10-30-20 | 545,000 | 532,587 | |
| Capital One Financial Corp. | 3.450 | 04-30-21 | 1,125,000 | 1,122,667 | |
| Capital One Financial Corp. | 3.750 | 07-28-26 | 1,195,000 | 1,117,436 | |
| Capital One Financial Corp. | 4.200 | 10-29-25 | 955,000 | 933,897 | |
| Credit Acceptance Corp. | 6.125 | 02-15-21 | 590,000 | 593,688 | |
| Credito Real SAB de CV (D) | 7.250 | 07-20-23 | 450,000 | 462,960 | |
| Credito Real SAB de CV (9.125% to 11-29-22, then 10 Year CMT + 7.026%) (D)(E) | 9.125 | 11-29-22 | 510,000 | 518,288 | |
| Discover Financial Services | 3.950 | 11-06-24 | 1,090,000 | 1,068,006 | |
| Discover Financial Services | 4.100 | 02-09-27 | 293,000 | 283,773 | |
| Enova International, Inc. (D) | 8.500 | 09-01-24 | 142,000 | 150,875 | |
| Enova International, Inc. | 9.750 | 06-01-21 | 531,000 | 562,860 | |
| Springleaf Finance Corp. | 6.875 | 03-15-25 | 260,000 | 262,600 | |
| Diversified financial services 0.2% | |||||
| ASP AMC Merger Sub, Inc. (D) | 8.000 | 05-15-25 | 485,000 | 435,288 | |
| Doric Nimrod Air Alpha 2013-1 Class B Pass Through Trust (D) | 6.125 | 11-30-21 | 195,703 | 199,323 | |
| Exela Intermediate LLC (D) | 10.000 | 07-15-23 | 315,000 | 315,394 | |
| Leucadia National Corp. | 5.500 | 10-18-23 | 945,000 | 983,074 | |
| Lions Gate Capital Holdings LLC (D) | 5.875 | 11-01-24 | 318,000 | 325,553 | |
| Trident Merger Sub, Inc. (D) | 6.625 | 11-01-25 | 200,000 | 196,000 | |
| Voya Financial, Inc. (5.650% to 5-15-23, then 3 month LIBOR + 3.580%) | 5.650 | 05-15-53 | 984,000 | 1,002,696 | |
| SEE NOTES TO FINANCIAL STATEMENTS | SEMIANNUAL REPORT | JOHN HANCOCK BALANCED FUND | 23 |
| Rate (%) | Maturity date | Par value^ | Value | ||
| Financials (continued) | |||||
| Insurance 0.6% | |||||
| Aquarius & Investments PLC (6.375% to 9-1-19, then 5 Year U.S. Swap Rate + 5.210%) | 6.375 | 09-01-24 | 785,000 | $803,016 | |
| AXA SA | 8.600 | 12-15-30 | 340,000 | 459,850 | |
| Brighthouse Financial, Inc. | 3.700 | 06-22-27 | 1,370,000 | 1,237,506 | |
| CNO Financial Group, Inc. | 5.250 | 05-30-25 | 825,000 | 831,188 | |
| Liberty Mutual Group, Inc. (D) | 7.800 | 03-07-87 | 1,011,000 | 1,223,310 | |
| MetLife, Inc. | 6.400 | 12-15-66 | 660,000 | 719,400 | |
| MetLife, Inc. (D) | 9.250 | 04-08-68 | 320,000 | 435,200 | |
| Nippon Life Insurance Company (5.100% to 10-16-24, then 5 Year U.S. ISDAFIX + 3.650%) (D) | 5.100 | 10-16-44 | 705,000 | 731,438 | |
| Prudential Financial, Inc. (5.875% to 9-15-22, then 3 month LIBOR + 4.175%) | 5.875 | 09-15-42 | 1,528,000 | 1,625,410 | |
| Teachers Insurance & Annuity Association of America (D) | 4.270 | 05-15-47 | 990,000 | 957,636 | |
| The Hartford Financial Services Group, Inc. (8.125% to 6-15-18, then 3 month LIBOR + 4.603%) | 8.125 | 06-15-68 | 1,265,000 | 1,268,163 | |
| Thrifts and mortgage finance 0.2% | |||||
| Ladder Capital Finance Holdings LLLP (D) | 5.250 | 03-15-22 | 220,000 | 220,000 | |
| Ladder Capital Finance Holdings LLLP (D) | 5.250 | 10-01-25 | 340,000 | 323,850 | |
| MGIC Investment Corp. | 5.750 | 08-15-23 | 202,000 | 206,545 | |
| Nationstar Mortgage LLC | 7.875 | 10-01-20 | 330,000 | 335,363 | |
| Quicken Loans, Inc. (D) | 5.250 | 01-15-28 | 1,695,000 | 1,546,688 | |
| Quicken Loans, Inc. (D) | 5.750 | 05-01-25 | 865,000 | 847,700 | |
| Radian Group, Inc. | 4.500 | 10-01-24 | 300,000 | 286,500 | |
| Radian Group, Inc. | 5.250 | 06-15-20 | 216,000 | 220,320 | |
| Stearns Holdings LLC (D) | 9.375 | 08-15-20 | 289,000 | 291,168 | |
| Health care 0.9% | 16,772,125 | ||||
| Biotechnology 0.2% | |||||
| AbbVie, Inc. | 3.600 | 05-14-25 | 885,000 | 858,615 | |
| Celgene Corp. | 2.875 | 08-15-20 | 360,000 | 357,454 | |
| Celgene Corp. | 2.875 | 02-19-21 | 645,000 | 637,166 | |
| Shire Acquisitions Investments Ireland DAC | 1.900 | 09-23-19 | 1,455,000 | 1,429,267 | |
| Shire Acquisitions Investments Ireland DAC | 3.200 | 09-23-26 | 1,190,000 | 1,086,814 | |
| Health care equipment and supplies 0.1% | |||||
| Becton, Dickinson and Company | 2.133 | 06-06-19 | 975,000 | 964,763 | |
| Zimmer Biomet Holdings, Inc. | 3.550 | 04-01-25 | 520,000 | 500,454 | |
| Health care providers and services 0.4% | |||||
| DaVita, Inc. | 5.000 | 05-01-25 | 975,000 | 924,008 | |
| Express Scripts Holding Company | 2.600 | 11-30-20 | 1,215,000 | 1,190,702 | |
| HCA, Inc. | 5.250 | 04-15-25 | 745,000 | 754,313 | |
| HCA, Inc. | 5.250 | 06-15-26 | 710,000 | 713,550 | |
| HCA, Inc. | 7.500 | 02-15-22 | 645,000 | 709,500 | |
| MEDNAX, Inc. (D) | 5.250 | 12-01-23 | 665,000 | 660,013 | |
| 24 | JOHN HANCOCK BALANCED FUND | SEMIANNUAL REPORT | SEE NOTES TO FINANCIAL STATEMENTS |
| Rate (%) | Maturity date | Par value^ | Value | ||
| Health care (continued) | |||||
| Health care providers and services (continued) | |||||
| Select Medical Corp. | 6.375 | 06-01-21 | 805,000 | $817,075 | |
| Team Health Holdings, Inc. (D) | 6.375 | 02-01-25 | 150,000 | 130,500 | |
| Universal Health Services, Inc. (D) | 4.750 | 08-01-22 | 500,000 | 505,000 | |
| Universal Health Services, Inc. (D) | 5.000 | 06-01-26 | 733,000 | 716,508 | |
| Life sciences tools and services 0.0% | |||||
| IQVIA, Inc. (D) | 4.875 | 05-15-23 | 565,000 | 572,063 | |
| Pharmaceuticals 0.2% | |||||
| Allergan Funding SCS | 3.800 | 03-15-25 | 635,000 | 608,675 | |
| Mylan NV | 2.500 | 06-07-19 | 500,000 | 496,211 | |
| Mylan NV | 3.950 | 06-15-26 | 830,000 | 787,798 | |
| Teva Pharmaceutical Finance Netherlands III BV (D) | 6.750 | 03-01-28 | 570,000 | 562,452 | |
| Valeant Pharmaceuticals International, Inc. (D) | 6.125 | 04-15-25 | 875,000 | 789,224 | |
| Industrials 1.7% | 32,814,103 | ||||
| Aerospace and defense 0.1% | |||||
| Arconic, Inc. | 5.125 | 10-01-24 | 791,000 | 800,136 | |
| Huntington Ingalls Industries, Inc. (D) | 5.000 | 11-15-25 | 492,000 | 515,655 | |
| Kratos Defense & Security Solutions, Inc. (D) | 6.500 | 11-30-25 | 500,000 | 515,625 | |
| Lockheed Martin Corp. | 4.700 | 05-15-46 | 559,000 | 593,232 | |
| Textron, Inc. | 7.250 | 10-01-19 | 400,000 | 422,111 | |
| Air freight and logistics 0.0% | |||||
| XPO Logistics, Inc. (D) | 6.500 | 06-15-22 | 639,000 | 659,768 | |
| Airlines 0.8% | |||||
| Air Canada 2013-1 Class A Pass Through Trust (D) | 4.125 | 11-15-26 | 420,796 | 423,771 | |
| Air Canada 2013-1 Class C Pass Through Trust (D) | 6.625 | 05-15-18 | 330,000 | 330,000 | |
| Air Canada 2017-1 Class B Pass Through Trust (D) | 3.700 | 07-15-27 | 485,000 | 465,843 | |
| American Airlines 2001-1 Class A-1 Pass Through Trust | 6.977 | 11-23-22 | 282,692 | 292,939 | |
| American Airlines 2013-2 Class A Pass Through Trust | 4.950 | 07-15-24 | 628,098 | 648,009 | |
| American Airlines 2015-1 Class A Pass Through Trust | 3.375 | 11-01-28 | 690,623 | 664,517 | |
| American Airlines 2015-1 Class B Pass Through Trust | 3.700 | 11-01-24 | 557,561 | 546,019 | |
| American Airlines 2016-1 Class A Pass Through Trust | 4.100 | 07-15-29 | 928,098 | 939,282 | |
| American Airlines 2017-1 Class A Pass Through Trust | 4.000 | 08-15-30 | 615,040 | 610,587 | |
| American Airlines 2017-1 Class AA Pass Through Trust | 3.650 | 08-15-30 | 701,530 | 685,114 | |
| American Airlines 2017-2 Class A Pass Through Trust | 3.600 | 04-15-31 | 395,000 | 383,132 | |
| Azul Investments LLP (D) | 5.875 | 10-26-24 | 740,000 | 710,400 | |
| British Airways 2013-1 Class A Pass Through Trust (D) | 4.625 | 06-20-24 | 700,227 | 721,163 | |
| SEE NOTES TO FINANCIAL STATEMENTS | SEMIANNUAL REPORT | JOHN HANCOCK BALANCED FUND | 25 |
| Rate (%) | Maturity date | Par value^ | Value | ||
| Industrials (continued) | |||||
| Airlines (continued) | |||||
| British Airways 2013-1 Class B Pass Through Trust (D) | 5.625 | 12-20-21 | 179,377 | $183,557 | |
| British Airways 2018-1 Class AA Pass Through Trust (D) | 3.800 | 03-20-33 | 243,000 | 241,481 | |
| Continental Airlines 2007-1 Class A Pass Through Trust | 5.983 | 10-19-23 | 392,759 | 418,131 | |
| Delta Air Lines 2002-1 Class G-1 Pass Through Trust | 6.718 | 07-02-24 | 312,267 | 336,374 | |
| Delta Air Lines 2010-1 Class A Pass Through Trust | 6.200 | 01-02-20 | 176,805 | 178,573 | |
| Delta Air Lines 2011-1 Class A Pass Through Trust | 5.300 | 10-15-20 | 142,630 | 145,212 | |
| Delta Air Lines, Inc. | 3.625 | 03-15-22 | 1,075,000 | 1,065,034 | |
| Delta Air Lines, Inc. | 4.375 | 04-19-28 | 850,000 | 825,700 | |
| Northwest Airlines 2007-1 Class A Pass Through Trust | 7.027 | 05-01-21 | 145,964 | 153,292 | |
| United Airlines 2014-2 Class A Pass Through Trust | 3.750 | 03-03-28 | 981,601 | 973,748 | |
| United Airlines 2014-2 Class B Pass Through Trust | 4.625 | 03-03-24 | 550,660 | 553,854 | |
| United Airlines 2016-1 Class A Pass Through Trust | 3.450 | 01-07-30 | 739,951 | 718,635 | |
| United Airlines 2016-1 Class B Pass Through Trust | 3.650 | 01-07-26 | 1,130,000 | 1,092,378 | |
| US Airways 2010-1 Class A Pass Through Trust | 6.250 | 10-22-24 | 208,273 | 224,872 | |
| US Airways 2012-1 Class A Pass Through Trust | 5.900 | 04-01-26 | 435,540 | 472,408 | |
| Building products 0.1% | |||||
| Masco Corp. | 4.375 | 04-01-26 | 555,000 | 558,469 | |
| Masco Corp. | 4.450 | 04-01-25 | 550,000 | 555,830 | |
| Owens Corning | 4.200 | 12-15-22 | 380,000 | 386,440 | |
| Commercial services and supplies 0.1% | |||||
| LSC Communications, Inc. (D) | 8.750 | 10-15-23 | 450,000 | 462,375 | |
| Prime Security Services Borrower LLC (D) | 9.250 | 05-15-23 | 446,000 | 478,893 | |
| Tervita Escrow Corp. (D) | 7.625 | 12-01-21 | 120,000 | 122,400 | |
| Construction and engineering 0.1% | |||||
| AECOM | 5.125 | 03-15-27 | 920,000 | 884,074 | |
| Tutor Perini Corp. (D) | 6.875 | 05-01-25 | 200,000 | 204,940 | |
| Electrical equipment 0.0% | |||||
| EnerSys (D) | 5.000 | 04-30-23 | 200,000 | 201,000 | |
| Professional services 0.1% | |||||
| Equifax, Inc. | 7.000 | 07-01-37 | 190,000 | 230,743 | |
| IHS Markit, Ltd. (D) | 4.000 | 03-01-26 | 305,000 | 292,138 | |
| IHS Markit, Ltd. (D) | 4.750 | 02-15-25 | 310,000 | 311,581 | |
| IHS Markit, Ltd. (D) | 5.000 | 11-01-22 | 380,000 | 393,300 | |
| Verisk Analytics, Inc. | 4.000 | 06-15-25 | 1,340,000 | 1,329,843 | |
| Trading companies and distributors 0.4% | |||||
| AerCap Global Aviation Trust (6.500% to 6-15-25, then 3 month LIBOR + 4.300%) (D) | 6.500 | 06-15-45 | 730,000 | 773,800 | |
| AerCap Ireland Capital DAC | 4.625 | 10-30-20 | 960,000 | 984,656 | |
| AerCap Ireland Capital DAC | 5.000 | 10-01-21 | 855,000 | 887,903 | |
| Ahern Rentals, Inc. (D) | 7.375 | 05-15-23 | 885,000 | 854,025 | |
| 26 | JOHN HANCOCK BALANCED FUND | SEMIANNUAL REPORT | SEE NOTES TO FINANCIAL STATEMENTS |
| Rate (%) | Maturity date | Par value^ | Value | ||
| Industrials (continued) | |||||
| Trading companies and distributors (continued) | |||||
| Air Lease Corp. | 3.375 | 01-15-19 | 355,000 | $356,099 | |
| Aircastle, Ltd. | 5.500 | 02-15-22 | 415,000 | 433,675 | |
| Aircastle, Ltd. | 6.250 | 12-01-19 | 390,000 | 405,113 | |
| Aircastle, Ltd. | 7.625 | 04-15-20 | 250,000 | 267,500 | |
| Ashtead Capital, Inc. (D) | 4.375 | 08-15-27 | 840,000 | 792,750 | |
| H&E Equipment Services, Inc. | 5.625 | 09-01-25 | 307,000 | 308,535 | |
| International Lease Finance Corp. | 5.875 | 04-01-19 | 510,000 | 523,794 | |
| United Rentals North America, Inc. | 4.875 | 01-15-28 | 750,000 | 710,625 | |
| United Rentals North America, Inc. | 5.500 | 07-15-25 | 580,000 | 593,050 | |
| Information technology 1.1% | 21,726,804 | ||||
| Communications equipment 0.1% | |||||
| Motorola Solutions, Inc. | 4.600 | 02-23-28 | 620,000 | 614,341 | |
| Telefonaktiebolaget LM Ericsson | 4.125 | 05-15-22 | 1,260,000 | 1,247,307 | |
| Electronic equipment, instruments and components 0.1% | |||||
| Tech Data Corp. | 4.950 | 02-15-27 | 1,355,000 | 1,322,675 | |
| Internet software and services 0.1% | |||||
| eBay, Inc. | 2.150 | 06-05-20 | 705,000 | 691,556 | |
| VeriSign, Inc. | 4.750 | 07-15-27 | 340,000 | 325,975 | |
| VeriSign, Inc. | 5.250 | 04-01-25 | 565,000 | 578,068 | |
| IT services 0.0% | |||||
| Sixsigma Networks Mexico SA de CV (D) | 8.250 | 11-07-21 | 229,000 | 237,588 | |
| Semiconductors and semiconductor equipment 0.2% | |||||
| Advanced Micro Devices, Inc. | 7.000 | 07-01-24 | 416,000 | 438,888 | |
| Broadcom Corp. | 2.375 | 01-15-20 | 1,130,000 | 1,113,871 | |
| Broadcom Corp. | 3.875 | 01-15-27 | 1,357,000 | 1,294,289 | |
| NXP BV (D) | 4.625 | 06-01-23 | 1,485,000 | 1,494,950 | |
| Software 0.4% | |||||
| Activision Blizzard, Inc. | 3.400 | 09-15-26 | 650,000 | 619,979 | |
| Activision Blizzard, Inc. (D) | 6.125 | 09-15-23 | 745,000 | 775,563 | |
| Autodesk, Inc. | 3.500 | 06-15-27 | 899,000 | 846,365 | |
| CA, Inc. | 3.600 | 08-15-22 | 815,000 | 814,623 | |
| Citrix Systems, Inc. | 4.500 | 12-01-27 | 1,015,000 | 983,793 | |
| Electronic Arts, Inc. | 4.800 | 03-01-26 | 1,290,000 | 1,356,915 | |
| j2 Cloud Services LLC (D) | 6.000 | 07-15-25 | 272,000 | 280,500 | |
| Microsoft Corp. | 4.450 | 11-03-45 | 825,000 | 879,430 | |
| Open Text Corp. (D) | 5.875 | 06-01-26 | 310,000 | 321,625 | |
| VMware, Inc. | 2.950 | 08-21-22 | 717,000 | 688,887 | |
| Technology hardware, storage and peripherals 0.2% | |||||
| Dell International LLC (D) | 6.020 | 06-15-26 | 1,790,000 | 1,895,716 | |
| Dell International LLC (D) | 7.125 | 06-15-24 | 180,000 | 191,700 | |
| Hewlett Packard Enterprise Company (D) | 2.100 | 10-04-19 | 1,050,000 | 1,035,611 | |
| NetApp, Inc. | 2.000 | 09-27-19 | 850,000 | 838,808 | |
| Western Digital Corp. | 4.750 | 02-15-26 | 850,000 | 837,781 | |
| SEE NOTES TO FINANCIAL STATEMENTS | SEMIANNUAL REPORT | JOHN HANCOCK BALANCED FUND | 27 |
| Rate (%) | Maturity date | Par value^ | Value | ||
| Materials 0.7% | $14,154,487 | ||||
| Chemicals 0.4% | |||||
| Braskem Finance, Ltd. (D) | 7.000 | 05-07-20 | 650,000 | 687,570 | |
| Braskem Netherlands Finance BV (D) | 4.500 | 01-10-28 | 785,000 | 735,938 | |
| Cydsa SAB de CV (D) | 6.250 | 10-04-27 | 665,000 | 639,231 | |
| Mexichem SAB de CV (D) | 4.000 | 10-04-27 | 380,000 | 354,426 | |
| Mexichem SAB de CV (D) | 5.500 | 01-15-48 | 835,000 | 760,894 | |
| NOVA Chemicals Corp. (D) | 5.000 | 05-01-25 | 820,000 | 789,250 | |
| Olin Corp. | 5.000 | 02-01-30 | 215,000 | 204,788 | |
| Platform Specialty Products Corp. (D) | 6.500 | 02-01-22 | 1,180,000 | 1,209,500 | |
| Syngenta Finance NV (D) | 3.698 | 04-24-20 | 965,000 | 966,274 | |
| Syngenta Finance NV (D) | 5.676 | 04-24-48 | 365,000 | 346,375 | |
| The Chemours Company | 6.625 | 05-15-23 | 954,000 | 1,002,893 | |
| The Sherwin-Williams Company | 2.250 | 05-15-20 | 505,000 | 496,259 | |
| Construction materials 0.0% | |||||
| Cemex SAB de CV (D) | 6.125 | 05-05-25 | 580,000 | 600,300 | |
| U.S. Concrete, Inc. | 6.375 | 06-01-24 | 300,000 | 310,500 | |
| Containers and packaging 0.1% | |||||
| Ardagh Packaging Finance PLC (D) | 6.000 | 02-15-25 | 485,000 | 490,456 | |
| Klabin Finance SA (D) | 4.875 | 09-19-27 | 705,000 | 675,919 | |
| Metals and mining 0.2% | |||||
| Anglo American Capital PLC (D) | 4.750 | 04-10-27 | 625,000 | 624,087 | |
| Commercial Metals Company | 5.375 | 07-15-27 | 190,000 | 185,250 | |
| First Quantum Minerals, Ltd. (D) | 6.875 | 03-01-26 | 450,000 | 427,500 | |
| First Quantum Minerals, Ltd. (D) | 7.500 | 04-01-25 | 350,000 | 346,080 | |
| Novelis Corp. (D) | 5.875 | 09-30-26 | 155,000 | 153,838 | |
| Vale Overseas, Ltd. | 6.250 | 08-10-26 | 538,000 | 593,360 | |
| Vedanta Resources PLC (D) | 6.125 | 08-09-24 | 450,000 | 433,334 | |
| Vedanta Resources PLC (D) | 6.375 | 07-30-22 | 535,000 | 538,317 | |
| Paper and forest products 0.0% | |||||
| Norbord, Inc. (D) | 6.250 | 04-15-23 | 550,000 | 582,148 | |
| Real estate 0.5% | 9,132,591 | ||||
| Equity real estate investment trusts 0.5% | |||||
| American Homes 4 Rent LP | 4.250 | 02-15-28 | 765,000 | 734,637 | |
| American Tower Corp. | 3.400 | 02-15-19 | 635,000 | 637,624 | |
| American Tower Corp. | 3.550 | 07-15-27 | 1,228,000 | 1,144,931 | |
| American Tower Corp. | 4.700 | 03-15-22 | 550,000 | 568,707 | |
| Crown Castle Towers LLC (D) | 4.883 | 08-15-40 | 720,000 | 742,877 | |
| Equinix, Inc. | 5.375 | 05-15-27 | 463,000 | 471,103 | |
| Iron Mountain, Inc. (D) | 4.875 | 09-15-27 | 535,000 | 503,569 | |
| Iron Mountain, Inc. | 5.750 | 08-15-24 | 745,000 | 735,688 | |
| Iron Mountain, Inc. | 6.000 | 08-15-23 | 608,000 | 626,240 | |
| Omega Healthcare Investors, Inc. | 4.500 | 01-15-25 | 580,000 | 563,300 | |
| Omega Healthcare Investors, Inc. | 4.950 | 04-01-24 | 715,000 | 720,918 | |
| Ventas Realty LP | 3.500 | 02-01-25 | 820,000 | 787,495 | |
| 28 | JOHN HANCOCK BALANCED FUND | SEMIANNUAL REPORT | SEE NOTES TO FINANCIAL STATEMENTS |
| Rate (%) | Maturity date | Par value^ | Value | ||
| Real estate (continued) | |||||
| Equity real estate investment trusts (continued) | |||||
| VEREIT Operating Partnership LP | 4.600 | 02-06-24 | 900,000 | $895,502 | |
| Telecommunication services 1.0% | 18,358,200 | ||||
| Diversified telecommunication services 0.7% | |||||
| AT&T, Inc. | 4.750 | 05-15-46 | 575,000 | 534,404 | |
| AT&T, Inc. | 5.450 | 03-01-47 | 1,715,000 | 1,743,510 | |
| Cablevision SA (D) | 6.500 | 06-15-21 | 430,000 | 446,663 | |
| Cincinnati Bell, Inc. (D) | 7.000 | 07-15-24 | 860,000 | 788,964 | |
| CSC Holdings LLC (D) | 5.375 | 02-01-28 | 360,000 | 336,600 | |
| CSC Holdings LLC (D) | 5.500 | 04-15-27 | 360,000 | 345,528 | |
| GCI, Inc. | 6.875 | 04-15-25 | 570,000 | 597,075 | |
| Iridium Communications, Inc. (D) | 10.250 | 04-15-23 | 140,000 | 145,950 | |
| Liquid Telecommunications Financing PLC (D) | 8.500 | 07-13-22 | 495,000 | 521,049 | |
| Radiate Holdco LLC (D) | 6.625 | 02-15-25 | 630,000 | 584,325 | |
| Radiate Holdco LLC (D) | 6.875 | 02-15-23 | 215,000 | 208,013 | |
| Sprint Spectrum Company LLC (D) | 3.360 | 03-20-23 | 538,125 | 536,172 | |
| Telecom Italia Capital SA | 7.200 | 07-18-36 | 835,000 | 958,163 | |
| Telecom Italia SpA (D) | 5.303 | 05-30-24 | 600,000 | 611,100 | |
| UPC Holding BV (D) | 5.500 | 01-15-28 | 420,000 | 391,650 | |
| Verizon Communications, Inc. | 4.400 | 11-01-34 | 630,000 | 608,259 | |
| Verizon Communications, Inc. | 4.672 | 03-15-55 | 637,000 | 581,314 | |
| Verizon Communications, Inc. | 4.862 | 08-21-46 | 1,735,000 | 1,689,579 | |
| Verizon Communications, Inc. | 5.012 | 08-21-54 | 555,000 | 535,702 | |
| West Corp. (D) | 8.500 | 10-15-25 | 285,000 | 275,025 | |
| Windstream Services LLC | 7.750 | 10-15-20 | 522,000 | 447,615 | |
| Wireless telecommunication services 0.3% | |||||
| C&W Senior Financing DAC (D) | 6.875 | 09-15-27 | 625,000 | 619,375 | |
| CC Holdings GS V LLC | 3.849 | 04-15-23 | 695,000 | 690,984 | |
| Comunicaciones Celulares SA (D) | 6.875 | 02-06-24 | 285,000 | 295,505 | |
| Digicel Group, Ltd. (D) | 8.250 | 09-30-20 | 595,000 | 531,781 | |
| Digicel, Ltd. (D) | 6.750 | 03-01-23 | 640,000 | 584,858 | |
| Millicom International Cellular SA (D) | 5.125 | 01-15-28 | 200,000 | 188,500 | |
| MTN Mauritius Investment, Ltd. (D) | 4.755 | 11-11-24 | 630,000 | 604,859 | |
| Oztel Holdings SPC, Ltd. (D) | 6.625 | 04-24-28 | 570,000 | 554,499 | |
| Sprint Capital Corp. | 6.875 | 11-15-28 | 685,000 | 698,700 | |
| T-Mobile USA, Inc. | 4.750 | 02-01-28 | 730,000 | 702,479 | |
| Utilities 0.6% | 11,897,330 | ||||
| Electric utilities 0.3% | |||||
| Abengoa Transmision Sur SA (D) | 6.875 | 04-30-43 | 520,328 | 568,458 | |
| Electricite de France SA (D) | 3.625 | 10-13-25 | 550,000 | 542,106 | |
| Electricite de France SA (5.250% to 1-29-23, then 10 Year U.S. Swap Rate + 3.709%) (D)(E) | 5.250 | 01-29-23 | 1,205,000 | 1,208,205 | |
| Emera US Finance LP | 3.550 | 06-15-26 | 420,000 | 398,601 | |
| Empresa Electrica Angamos SA (D) | 4.875 | 05-25-29 | 540,000 | 521,039 | |
| SEE NOTES TO FINANCIAL STATEMENTS | SEMIANNUAL REPORT | JOHN HANCOCK BALANCED FUND | 29 |
| Rate (%) | Maturity date | Par value^ | Value | ||
| Utilities (continued) | |||||
| Electric utilities (continued) | |||||
| Instituto Costarricense de Electricidad (D) | 6.375 | 05-15-43 | 515,000 | $443,544 | |
| Israel Electric Corp., Ltd. (D) | 7.250 | 01-15-19 | 200,000 | 204,894 | |
| Southern California Edison Company (6.250% to 2-1-22, then 3 month LIBOR + 4.199%) (E) | 6.250 | 02-01-22 | 450,000 | 477,000 | |
| Southern Power Company | 1.950 | 12-15-19 | 655,000 | 642,423 | |
| Gas utilities 0.0% | |||||
| AmeriGas Partners LP | 5.500 | 05-20-25 | 680,000 | 668,100 | |
| Independent power and renewable electricity producers 0.3% | |||||
| Greenko Dutch BV (D) | 4.875 | 07-24-22 | 740,000 | 718,688 | |
| Greenko Dutch BV (D) | 5.250 | 07-24-24 | 375,000 | 361,875 | |
| IPALCO Enterprises, Inc. | 3.700 | 09-01-24 | 133,000 | 128,706 | |
| NextEra Energy Capital Holdings, Inc. | 3.550 | 05-01-27 | 1,235,000 | 1,185,257 | |
| NextEra Energy Operating Partners LP (D) | 4.500 | 09-15-27 | 255,000 | 237,788 | |
| NRG Energy, Inc. | 6.250 | 05-01-24 | 1,000,000 | 1,033,750 | |
| NRG Energy, Inc. | 6.625 | 01-15-27 | 670,000 | 690,100 | |
| NRG Yield Operating LLC | 5.375 | 08-15-24 | 679,000 | 679,849 | |
| Multi-utilities 0.0% | |||||
| CenterPoint Energy, Inc. | 2.500 | 09-01-22 | 535,000 | 512,551 | |
| Dominion Energy, Inc. | 2.579 | 07-01-20 | 685,000 | 674,396 | |
| Convertible bonds 0.0% | $624,825 | ||||
| (Cost $625,480) | |||||
| Utilities 0.0% | 624,825 | ||||
| Independent power and renewable electricity producers 0.0% | |||||
| NRG Yield, Inc. (D) | 3.250 | 06-01-20 | 630,000 | 624,825 | |
| Capital preferred securities 0.1% | $1,159,683 | ||||
| (Cost $1,097,312) | |||||
| Financials 0.1% | 1,159,683 | ||||
| Banks 0.0% | |||||
| BAC Capital Trust XIV, Series G (Greater of 3 month LIBOR + 0.400% or 4.000%) (C)(E) | 4.000 | 05-17-18 | 539,000 | 468,930 | |
| Capital markets 0.1% | |||||
| State Street Corp. (3 month LIBOR + 1.000%) (C) | 3.125 | 06-01-77 | 762,000 | 690,753 | |
| Term loans (F) 0.0% | $824,526 | ||||
| (Cost $823,933) | |||||
| Financials 0.0% | 824,526 | ||||
| Capital markets 0.0% | |||||
| LSF9 Atlantis Holdings LLC (1 month LIBOR + 6.000%) | 7.883 | 05-01-23 | 215,875 | 214,526 | |
| Insurance 0.0% | |||||
| Wand Merger Corp. (G) | TBD | 04-27-19 | 184,000 | 184,000 | |
| Wand Merger Corp. (G) | TBD | 04-27-19 | 213,000 | 213,000 | |
| Wand Merger Corp. (G) | TBD | 04-27-19 | 213,000 | 213,000 | |
| 30 | JOHN HANCOCK BALANCED FUND | SEMIANNUAL REPORT | SEE NOTES TO FINANCIAL STATEMENTS |
| Rate (%) | Maturity date | Par value^ | Value | ||
| Collateralized mortgage obligations 2.7% | $51,006,596 | ||||
| (Cost $51,827,085) | |||||
| Commercial and residential 2.2% | 42,352,922 | ||||
| Angel Oak Mortgage Trust I LLC Series 2018-1, Class A1 (D)(H) | 3.258 | 04-27-48 | 289,351 | 289,354 | |
| AOA Mortgage Trust Series 2015-1177, Class C (D)(H) | 3.110 | 12-13-29 | 575,000 | 558,317 | |
| BAMLL Commercial Mortgage Securities Trust Series 2013-DSNY, Class E (1 month LIBOR + 2.600%) (C)(D) | 4.377 | 09-15-26 | 360,000 | 359,965 | |
| BBCMS Mortgage Trust | |||||
| Series 2018-TALL, Class B (1 month LIBOR + 0.971%) (C)(D) | 2.868 | 03-15-37 | 760,000 | 755,719 | |
| Series 2018-TALL, Class E (1 month LIBOR + 2.437%) (C)(D) | 4.334 | 03-15-37 | 500,000 | 496,555 | |
| BBCMS Trust | |||||
| Series 2015-MSQ, Class D (D)(H) | 4.123 | 09-15-32 | 600,000 | 579,899 | |
| Series 2015-SRCH, Class D (D)(H) | 5.122 | 08-10-35 | 840,000 | 856,250 | |
| Bear Stearns Asset Backed Securities Trust Series 2004-AC5, Class A1 | 5.750 | 10-25-34 | 221,194 | 219,730 | |
| BHMS Mortgage Trust Series 2014-ATLS, Class DFL (1 month LIBOR + 3.000%) (C)(D) | 4.887 | 07-05-33 | 470,000 | 472,018 | |
| BWAY Mortgage Trust | |||||
| Series 2015-1740, Class D (D)(H) | 3.787 | 01-10-35 | 445,000 | 422,694 | |
| Series 2015-1740, Class XA IO (D) | 1.023 | 01-10-35 | 7,015,000 | 228,758 | |
| BX Commercial Mortgage Trust Series 2018-BIOA, Class D (1 month LIBOR + 1.321%) (C)(D) | 3.218 | 03-15-37 | 480,000 | 478,796 | |
| CD Mortgage Trust Series 2017-CD3, Class C (H) | 4.714 | 02-10-50 | 718,000 | 714,847 | |
| CGBAM Commercial Mortgage Trust Series 2015-SMRT, Class F (D)(H) | 3.912 | 04-10-28 | 400,000 | 395,390 | |
| CGDB Commercial Mortgage Trust Series 2017-BIO, Class E (1 month LIBOR + 2.500%) (C)(D) | 4.397 | 05-15-30 | 475,000 | 477,299 | |
| CGDBB Commercial Mortgage Trust Series 2017-BIOC, Class E (1 month LIBOR + 2.150%) (C)(D) | 4.047 | 07-15-32 | 625,000 | 625,001 | |
| CHT Mortgage Trust Series 2017-CSMO, Class D (1 month LIBOR + 2.250%) (C)(D) | 4.147 | 11-15-36 | 835,000 | 839,722 | |
| Citigroup Commercial Mortgage Trust Series 2017-1500, Class E (1 month LIBOR + 2.500%) (C)(D) | 4.397 | 07-15-32 | 260,000 | 259,701 | |
| CLNS Trust Series 2017-IKPR, Class C (1 month LIBOR + 1.100%) (C)(D) | 2.997 | 06-11-32 | 370,000 | 370,694 | |
| Cold Storage Trust Series 2017-ICE3, Class D (1 month LIBOR + 2.100%) (C)(D) | 3.997 | 04-15-36 | 835,000 | 839,925 | |
| Commercial Mortgage Trust (Cantor Fitzgerald/Deutsche Bank AG) | |||||
| Series 2012-CR2, Class XA IO | 1.820 | 08-15-45 | 3,994,979 | 230,089 | |
| SEE NOTES TO FINANCIAL STATEMENTS | SEMIANNUAL REPORT | JOHN HANCOCK BALANCED FUND | 31 |
| Rate (%) | Maturity date | Par value^ | Value | ||
| Commercial and residential (continued) | |||||
| Series 2012-CR3 Class XA IO | 2.040 | 10-15-45 | 5,747,901 | $390,584 | |
| Series 2013-CR6, Class XA IO | 1.227 | 03-10-46 | 4,828,355 | 159,704 | |
| Series 2013-CR8, Class XA IO | 0.654 | 06-10-46 | 9,196,682 | 166,155 | |
| Series 2014-CR15, Class XA IO | 1.343 | 02-10-47 | 8,000,951 | 278,372 | |
| Series 2014-CR16, Class C (H) | 5.064 | 04-10-47 | 700,000 | 720,270 | |
| Series 2015-CR27, Class B (H) | 4.510 | 10-10-48 | 377,000 | 380,710 | |
| Commercial Mortgage Trust (Deutsche Bank AG) | |||||
| Series 2013-300P, Class D (D)(H) | 4.540 | 08-10-30 | 1,095,000 | 1,102,665 | |
| Series 2013-CR11, Class B (H) | 5.327 | 08-10-50 | 900,000 | 938,402 | |
| Series 2013-CR13, Class C (H) | 4.902 | 11-10-46 | 375,000 | 381,474 | |
| Series 2013-LC13, Class B (D)(H) | 5.009 | 08-10-46 | 505,000 | 529,577 | |
| Series 2014-FL4, Class D (1 month LIBOR + 2.450%) (C)(D) | 4.346 | 07-13-31 | 645,000 | 643,470 | |
| Series 2014-TWC, Class D (1 month LIBOR + 2.250%) (C)(D) | 4.145 | 02-13-32 | 605,000 | 608,223 | |
| Commercial Mortgage Trust (Deutsche Bank AG/Morgan Stanley) Series 2014-PAT, Class D (1 month LIBOR + 2.150%) (C)(D) | 4.045 | 08-13-27 | 635,000 | 635,097 | |
| Core Industrial Trust Series 2015-CALW, Class F (D)(H) | 3.979 | 02-10-34 | 560,000 | 542,916 | |
| DBJPM Mortgage Trust Series 2017-C6, Class C (H) | 4.174 | 06-10-50 | 635,000 | 615,826 | |
| GAHR Commercial Mortgage Trust | |||||
| Series 2015-NRF, Class DFX (D)(H) | 3.495 | 12-15-34 | 860,000 | 854,757 | |
| Series 2015-NRF, Class EFX (D)(H) | 3.495 | 12-15-34 | 1,305,000 | 1,290,809 | |
| Galton Funding Mortgage Trust Series 2018-1, Class A43 (D)(H) | 3.500 | 11-25-57 | 527,827 | 526,839 | |
| GMACM Mortgage Loan Trust Series 2004-AR2, Class 3A (H) | 4.048 | 08-19-34 | 93,413 | 90,111 | |
| Great Wolf Trust Series 2017-WOLF, Class E (1 month LIBOR + 3.100%) (C)(D) | 5.147 | 09-15-34 | 210,000 | 211,576 | |
| GS Mortgage Securities Trust | |||||
| Series 2012-GC17, Class XA IO | 2.407 | 05-10-45 | 6,441,589 | 354,600 | |
| Series 2014-NEW, Class C (D) | 3.790 | 01-10-31 | 340,000 | 339,995 | |
| Series 2015-590M, Class C (D)(H) | 3.932 | 10-10-35 | 320,000 | 314,555 | |
| Series 2016-RENT, Class D (D)(H) | 4.202 | 02-10-29 | 915,000 | 911,789 | |
| Series 2017-485L, Class C (D)(H) | 4.115 | 02-10-37 | 535,000 | 526,051 | |
| Series 2017-500K, Class F (1 month LIBOR + 1.800%) (C)(D) | 3.697 | 07-15-32 | 215,000 | 215,606 | |
| Series 2017-500K, Class G (1 month LIBOR + 2.500%) (C)(D) | 4.397 | 07-15-32 | 120,000 | 120,413 | |
| Series 2017-GS5, Class C (H) | 4.299 | 03-10-50 | 435,000 | 429,652 | |
| Series 2017-GS6, Class C (H) | 4.322 | 05-10-50 | 350,000 | 349,436 | |
| Series 2018-CHLL, Class E (1 month LIBOR + 2.350%) (C)(D) | 3.938 | 02-15-37 | 350,000 | 350,156 | |
| Hilton Orlando Trust Series 2018-ORL, Class D (1 month LIBOR + 1.700%) (C)(D) | 3.597 | 12-15-34 | 250,000 | 250,624 | |
| 32 | JOHN HANCOCK BALANCED FUND | SEMIANNUAL REPORT | SEE NOTES TO FINANCIAL STATEMENTS |
| Rate (%) | Maturity date | Par value^ | Value | ||
| Commercial and residential (continued) | |||||
| Hudsons Bay Simon JV Trust Series 2015-HBFL, Class DFL (1 month LIBOR + 3.650%) (C)(D) | 5.528 | 08-05-34 | 355,000 | $354,992 | |
| IMT Trust Series 2017-APTS, Class CFX (D)(H) | 3.613 | 06-15-34 | 400,000 | 385,559 | |
| IndyMac Index Mortgage Loan Trust | |||||
| Series 2005-AR12, Class AX2 IO | 1.129 | 07-25-35 | 4,266,904 | 96,094 | |
| Series 2005-AR8, Class AX2 IO | 1.112 | 05-25-35 | 4,565,855 | 125,907 | |
| JPMorgan Chase Commercial Mortgage Securities Trust | |||||
| Series 2012-C14, Class XA IO (D) | 1.582 | 07-05-32 | 6,417,438 | 333,542 | |
| Series 2014-PHH, Class C (1 month LIBOR + 2.350%) (C)(D) | 4.247 | 08-15-27 | 710,000 | 709,999 | |
| Series 2015-MAR7, Class C (D) | 4.490 | 06-05-32 | 570,000 | 564,173 | |
| Series 2015-SGP, Class B (1 month LIBOR + 2.750%) (C)(D) | 4.647 | 07-15-36 | 500,000 | 502,663 | |
| Series 2016-JP3, Class C (H) | 3.620 | 08-15-49 | 362,000 | 334,241 | |
| MAD Mortgage Trust Series 2017-330M, Class D (D)(H) | 4.108 | 08-15-34 | 575,000 | 560,404 | |
| Morgan Stanley Bank of America Merrill Lynch Trust Series 2014-C18, Class 300D | 5.279 | 08-15-31 | 310,000 | 316,935 | |
| Morgan Stanley Capital I Trust | |||||
| Series 2014-150E, Class D (D)(H) | 4.438 | 09-09-32 | 1,315,000 | 1,311,379 | |
| Series 2015, Class XLF1 C (1 month LIBOR + 2.200%) (C)(D) | 3.977 | 08-14-31 | 570,000 | 572,627 | |
| Series 2017-CLS, Class D (1 month LIBOR + 1.400%) (C)(D) | 3.297 | 11-15-34 | 850,000 | 851,869 | |
| Morgan Stanley Mortgage Loan Trust Series 2004-6AR, Class 2A2 (H) | 3.804 | 08-25-34 | 188,498 | 187,870 | |
| MSCG Trust Series 2016-SNR, Class D (D) | 6.550 | 11-15-34 | 750,000 | 742,615 | |
| MSDB Trust Series 2017-712F, Class C (D)(H) | 3.749 | 07-11-39 | 140,000 | 134,389 | |
| MSSG Trust | |||||
| Series 2017-237P, Class D (D) | 3.864 | 09-13-39 | 300,000 | 279,971 | |
| Series 2017-237P, Class E (D) | 3.864 | 09-13-39 | 455,000 | 415,060 | |
| Natixis Commercial Mortgage Securities Trust | |||||
| Series 2018-285M, Class D (D)(H) | 3.917 | 11-15-32 | 745,000 | 721,422 | |
| Series 2018-ALXA, Class C (D)(H) | 4.460 | 01-15-43 | 380,000 | 380,691 | |
| One Market Plaza Trust Series 2017-1MKT, Class D (D) | 4.146 | 02-10-32 | 455,000 | 448,099 | |
| Thornburg Mortgage Securities Trust Series 2004-1, Class II2A (H) | 2.525 | 03-25-44 | 151,116 | 148,004 | |
| TMSQ Mortgage Trust Series 2011-1500, Class D (D)(H) | 3.963 | 10-10-36 | 530,000 | 494,952 | |
| UBS-Barclays Commercial Mortgage Trust Series 2012-C2, Class XA IO (D) | 1.495 | 05-10-63 | 5,425,008 | 245,157 | |
| VNDO Mortgage Trust Series 2013-PENN, Class D (D)(H) | 4.079 | 12-13-29 | 844,000 | 842,060 | |
| VNDO Trust Series 2016-350P, Class D (D)(H) | 4.033 | 01-10-35 | 745,000 | 714,321 | |
| SEE NOTES TO FINANCIAL STATEMENTS | SEMIANNUAL REPORT | JOHN HANCOCK BALANCED FUND | 33 |
| Rate (%) | Maturity date | Par value^ | Value | ||
| Commercial and residential (continued) | |||||
| Wells Fargo Commercial Mortgage Trust | |||||
| Series 2013-120B, Class C (D)(H) | 2.800 | 03-18-28 | 1,050,000 | $1,031,973 | |
| Series 2013-BTC, Class E (D)(H) | 3.668 | 04-16-35 | 600,000 | 563,633 | |
| Series 2015-LC22, Class B (H) | 4.693 | 09-15-58 | 688,000 | 712,165 | |
| Series 2017-RB1, Class C (H) | 4.311 | 03-15-50 | 500,000 | 490,695 | |
| Series 2017-SMP, Class D (1 month LIBOR + 1.650%) (C)(D) | 3.672 | 12-15-34 | 295,000 | 296,633 | |
| WFCG Commercial Mortgage Trust Series 2015-BXRP, Class D (1 month LIBOR + 2.571%) (C)(D) | 4.468 | 11-15-29 | 120,514 | 121,029 | |
| WF-RBS Commercial Mortgage Trust | |||||
| Series 2012-C9, Class B XA IO (D) | 2.053 | 11-15-45 | 5,190,147 | 357,152 | |
| Series 2013-C16, Class B (H) | 5.195 | 09-15-46 | 290,000 | 303,510 | |
| U.S. Government Agency 0.5% | 8,653,674 | ||||
| Federal Home Loan Mortgage Corp. | |||||
| Series 2016-DNA3, Class M2 (1 month LIBOR + 2.000%) (C) | 3.897 | 12-25-28 | 200,000 | 203,419 | |
| Series K005, Class AX IO | 1.535 | 11-25-19 | 5,233,158 | 96,033 | |
| Series K017, Class X1 IO | 1.491 | 12-25-21 | 5,314,310 | 210,208 | |
| Series K021, Class X1 IO | 1.593 | 06-25-22 | 299,682 | 14,826 | |
| Series K022, Class X1 IO | 1.371 | 07-25-22 | 10,876,766 | 473,635 | |
| Series K709, Class X1 IO | 1.633 | 03-25-19 | 2,929,141 | 26,888 | |
| Series K710, Class X1 IO | 1.860 | 05-25-19 | 7,207,755 | 90,215 | |
| Series K711, Class X1 IO | 1.802 | 07-25-19 | 7,818,301 | 102,171 | |
| Government National Mortgage Association | |||||
| Series 2012-114, Class IO | 0.802 | 01-16-53 | 2,670,452 | 146,918 | |
| Series 2016-142, Class IO | 0.994 | 09-16-58 | 2,928,014 | 243,353 | |
| Series 2016-162, Class IO | 0.996 | 09-16-58 | 5,065,781 | 415,689 | |
| Series 2016-174, Class IO | 0.899 | 11-16-56 | 4,948,720 | 382,828 | |
| Series 2016-87, Class IO | 1.006 | 08-16-58 | 4,048,810 | 316,421 | |
| Series 2017-109, Class IO | 0.611 | 04-16-57 | 6,180,461 | 360,568 | |
| Series 2017-124, Class IO | 0.705 | 01-16-59 | 7,545,935 | 507,715 | |
| Series 2017-135, Class IO | 0.840 | 10-16-58 | 4,940,508 | 353,960 | |
| Series 2017-140, Class IO | 0.609 | 02-16-59 | 4,337,292 | 285,828 | |
| Series 2017-159, Class IO | 0.545 | 06-16-59 | 6,039,606 | 350,718 | |
| Series 2017-169, Class IO | 0.744 | 01-16-60 | 10,487,818 | 712,126 | |
| Series 2017-20, Class IO | 0.749 | 12-16-58 | 7,168,209 | 454,559 | |
| Series 2017-22, Class IO | 1.047 | 12-16-57 | 3,269,011 | 290,015 | |
| Series 2017-3, Class IO | 0.908 | 09-16-58 | 5,879,759 | 417,675 | |
| Series 2017-41, Class IO | 0.792 | 07-16-58 | 5,579,301 | 386,002 | |
| Series 2017-46, Class IO | 0.619 | 11-16-57 | 7,036,119 | 428,645 | |
| Series 2017-61, Class IO | 0.767 | 05-16-59 | 3,256,131 | 253,670 | |
| Series 2018-35, Class IO | 0.523 | 03-16-60 | 7,389,094 | 442,022 | |
| Series 2018-43, Class IO | 0.577 | 05-16-60 | 11,390,292 | 687,567 | |
| 34 | JOHN HANCOCK BALANCED FUND | SEMIANNUAL REPORT | SEE NOTES TO FINANCIAL STATEMENTS |
| Rate (%) | Maturity date | Par value^ | Value | ||
| Asset backed securities 4.5% | $85,637,741 | ||||
| (Cost $86,547,168) | |||||
| Asset backed securities 4.5% | 85,637,741 | ||||
| AccessLex Institute | |||||
| Series 2005-1, Class A4 (3 month LIBOR + 0.210%) (C) | 2.458 | 06-22-37 | 415,000 | 399,437 | |
| Series 2006-1, Class A3 (3 month LIBOR + 0.200%) (C) | 2.144 | 08-25-37 | 776,464 | 764,869 | |
| Ally Auto Receivables Trust | |||||
| Series 2017-3, Class A3 | 1.740 | 09-15-21 | 1,150,000 | 1,134,866 | |
| Series 2017-4, Class A4 | 1.960 | 07-15-22 | 725,000 | 708,575 | |
| Series 2018-1, Class A3 | 2.310 | 06-15-22 | 650,000 | 644,342 | |
| Ally Master Owner Trust Series 2018-1, Class A2 | 2.700 | 01-17-23 | 2,125,000 | 2,103,901 | |
| American Express Credit Account Master Trust Series 2017-1, Class A | 1.930 | 09-15-22 | 2,175,000 | 2,141,221 | |
| Applebee's Funding LLC Series 2014-1, Class A2 (D) | 4.277 | 09-05-44 | 1,318,375 | 1,287,973 | |
| Arby's Funding LLC Series 2015-1A, Class A2 (D) | 4.969 | 10-30-45 | 1,204,125 | 1,209,327 | |
| BA Credit Card Trust Series 2017-A1, Class A1 | 1.950 | 08-15-22 | 2,830,000 | 2,785,965 | |
| BMW Vehicle Owner Trust | |||||
| Series 2016-A, Class A4 | 1.370 | 12-27-22 | 405,000 | 395,418 | |
| Series 2018-A, Class A3 | 2.350 | 04-25-22 | 1,060,000 | 1,049,340 | |
| Cabela's Credit Card Master Note Trust Series 2016-1, Class A1 | 1.780 | 06-15-22 | 2,182,000 | 2,157,367 | |
| California Republic Auto Receivables Trust | |||||
| Series 2015-2, Class A4 | 1.750 | 01-15-21 | 695,468 | 691,313 | |
| Series 2016-2, Class A4 | 1.830 | 12-15-21 | 1,155,000 | 1,140,764 | |
| Capital One Multi-Asset Execution Trust | |||||
| Series 2016-A3, Class A3 | 1.340 | 04-15-22 | 1,620,000 | 1,596,288 | |
| Series 2017-A1, Class A1 | 2.000 | 01-17-23 | 2,410,000 | 2,372,544 | |
| CarMax Auto Owner Trust | |||||
| Series 2015-2, Class A4 | 1.800 | 03-15-21 | 335,000 | 332,167 | |
| Series 2016-1, Class A4 | 1.880 | 06-15-21 | 330,000 | 325,039 | |
| Series 2016-2, Class A4 | 1.680 | 09-15-21 | 410,000 | 401,883 | |
| Series 2018-1, Class A3 | 2.480 | 11-15-22 | 575,000 | 568,835 | |
| Chrysler Capital Auto Receivables Trust Series 2016-BA, Class A4 (D) | 1.870 | 02-15-22 | 525,000 | 516,519 | |
| Citibank Credit Card Issuance Trust | |||||
| Series 2016-A1, Class A1 | 1.750 | 11-19-21 | 2,410,000 | 2,373,122 | |
| Series 2018-A1, Class A1 | 2.539 | 01-20-23 | 2,600,000 | 2,568,677 | |
| CKE Restaurant Holdings, Inc. Series 2013-1A, Class A2 (D) | 4.474 | 03-20-43 | 937,188 | 937,449 | |
| CLI Funding LLC Series 2018-1A, Class A (D) | 4.030 | 04-18-43 | 800,000 | 798,013 | |
| CNH Equipment Trust Series 2017-C, Class A3 | 2.080 | 02-15-23 | 680,000 | 667,917 | |
| Coinstar Funding LLC Series 2017-1A, Class A2 (D) | 5.216 | 04-25-47 | 891,000 | 909,722 | |
| SEE NOTES TO FINANCIAL STATEMENTS | SEMIANNUAL REPORT | JOHN HANCOCK BALANCED FUND | 35 |
| Rate (%) | Maturity date | Par value^ | Value | ||
| Asset backed securities (continued) | |||||
| Collegiate Funding Services Education Loan Trust Series 2005-A, Class A4 (3 month LIBOR + 0.200%) (C) | 2.495 | 03-28-35 | 555,000 | $539,474 | |
| Countrywide Asset-Backed Certificates Trust Series 2004-10, Class AF5B | 4.684 | 02-25-35 | 236,089 | 234,996 | |
| DB Master Finance LLC | |||||
| Series 2015-1A, Class A2II (D) | 3.980 | 02-20-45 | 1,236,750 | 1,241,450 | |
| Series 2017-1A, Class A2I (D) | 3.629 | 11-20-47 | 259,350 | 254,536 | |
| Series 2017-1A, Class A2II (D) | 4.030 | 11-20-47 | 309,225 | 305,449 | |
| Discover Card Execution Note Trust Series 2017-A6, Class A6 | 1.880 | 02-15-23 | 2,800,000 | 2,744,251 | |
| Domino's Pizza Master Issuer LLC Series 2017-1A, Class A23 (D) | 4.118 | 07-25-47 | 1,349,800 | 1,337,638 | |
| Driven Brands Funding LLC Series 2015-1A, Class A2 (D) | 5.216 | 07-20-45 | 1,301,625 | 1,329,402 | |
| Evergreen Credit Card Trust Series 2018-1, Class A (D) | 2.950 | 03-15-23 | 1,200,000 | 1,196,450 | |
| FOCUS Brands Funding LLC Series 2017-1A, Class A2I (D) | 3.857 | 04-30-47 | 311,850 | 312,043 | |
| Ford Credit Auto Owner Trust | |||||
| Series 2014-1, Class B (D) | 2.410 | 11-15-25 | 320,000 | 318,611 | |
| Series 2016-B, Class A4 | 1.520 | 08-15-21 | 380,000 | 372,821 | |
| Series 2016-C, Class A4 | 1.400 | 02-15-22 | 685,000 | 664,640 | |
| Series 2017-B, Class A4 | 1.870 | 09-15-22 | 295,000 | 286,746 | |
| Series 2017-C, Class A4 | 2.160 | 03-15-23 | 715,000 | 699,052 | |
| Ford Credit Floorplan Master Owner Trust Series 2017-2, Class A1 | 2.160 | 09-15-22 | 1,185,000 | 1,163,324 | |
| GM Financial Consumer Automobile Receivables Trust Series 2017-2A, Class A3 (D) | 1.860 | 12-16-21 | 1,060,000 | 1,043,057 | |
| Goal Capital Funding Trust Series 2005-2, Class A4 (3 month LIBOR + 0.200%) (C) | 2.144 | 08-25-44 | 2,568,000 | 2,512,566 | |
| Golden Credit Card Trust Series 2018-1A, Class A (D) | 2.620 | 01-15-23 | 1,060,000 | 1,048,099 | |
| Hertz Vehicle Financing II LP Series 2016-3A, Class A (D) | 2.270 | 07-25-20 | 540,000 | 534,704 | |
| Hilton Grand Vacations Trust Series 2017-AA, Class A (D) | 2.660 | 12-26-28 | 620,509 | 609,917 | |
| Honda Auto Receivables Owner Trust | |||||
| Series 2016-4, Class A4 | 1.360 | 01-18-23 | 930,000 | 906,096 | |
| Series 2017-1, Class A3 | 1.720 | 07-21-21 | 1,230,000 | 1,215,431 | |
| Series 2017-2, Class A4 | 1.870 | 09-15-23 | 320,000 | 311,559 | |
| Series 2017-3, Class A4 | 1.980 | 11-20-23 | 380,000 | 370,082 | |
| Huntington Auto Trust Series 2016-1, Class A4 | 1.930 | 04-15-22 | 1,395,000 | 1,372,334 | |
| Hyundai Auto Lease Securitization Trust Series 2018-A, Class A3 (D) | 2.810 | 04-15-21 | 870,000 | 867,385 | |
| Hyundai Auto Receivables Trust Series 2017-A, Class A3 | 1.760 | 08-16-21 | 1,185,000 | 1,167,383 |
| 36 | JOHN HANCOCK BALANCED FUND | SEMIANNUAL REPORT | SEE NOTES TO FINANCIAL STATEMENTS |
| Rate (%) | Maturity date | Par value^ | Value | ||
| Asset backed securities (continued) | |||||
| John Deere Owner Trust Series 2018-A, Class A3 | 2.660 | 04-18-22 | 430,000 | $427,869 | |
| KeyCorp Student Loan Trust Series 2004-A, Class 1A2 (3 month LIBOR + 0.240%) (C) | 2.606 | 10-27-42 | 328,156 | 321,525 | |
| MMAF Equipment Finance LLC Series 2017-B, Class A3 (D) | 2.210 | 10-17-22 | 900,000 | 881,391 | |
| MVW Owner Trust | |||||
| Series 2014-1A, Class A (D) | 2.250 | 09-22-31 | 88,591 | 86,633 | |
| Series 2015-1A, Class A (D) | 2.520 | 12-20-32 | 164,376 | 161,648 | |
| Nelnet Student Loan Trust Series 2006-1, Class A3 (3 month LIBOR + 0.450%) (C)(D) | 2.370 | 08-23-36 | 570,000 | 557,069 | |
| NextGear Floorplan Master Owner Trust Series 2018-1A, Class A2 (D) | 3.220 | 02-15-23 | 260,000 | 259,131 | |
| Nissan Auto Receivables Owner Trust | |||||
| Series 2016-B, Class A4 | 1.540 | 10-17-22 | 500,000 | 487,772 | |
| Series 2017-A, Class A3 | 1.740 | 08-16-21 | 740,000 | 729,678 | |
| Series 2017-B, Class A4 | 1.950 | 10-16-23 | 835,000 | 812,816 | |
| NRZ Excess Spread-Collateralized Notes | |||||
| Series 2018-PLS1, Class A (D) | 3.193 | 01-25-23 | 277,172 | 275,433 | |
| Series 2018-PLS2, Class A (D) | 3.265 | 02-25-23 | 538,113 | 535,437 | |
| PFS Financing Corp. Series 2018-B, Class A (D) | 2.890 | 02-15-23 | 875,000 | 866,575 | |
| Renaissance Home Equity Loan Trust Series 2005-2, Class AF4 | 4.934 | 08-25-35 | 534,758 | 544,119 | |
| Santander Drive Auto Receivables Trust Series 2018-2, Class C | 3.350 | 07-17-23 | 480,000 | 478,125 | |
| SoFi Professional Loan Program LLC Series 2017-E, Class A2A (D) | 1.860 | 11-26-40 | 529,633 | 523,264 | |
| Sonic Capital LLC Series 2016-1A, Class A2 (D) | 4.472 | 05-20-46 | 378,387 | 381,096 | |
| Structured Asset Securities Corp. Mortgage Loan Trust Series 2005-2XS, Class 2A2 (1 month LIBOR + 1.500%) (C) | 3.387 | 02-25-35 | 158,243 | 155,760 | |
| SunTrust Student Loan Trust Series 2006-1A, Class A4 (3 month LIBOR + 0.190%) (C)(D) | 1.950 | 10-28-37 | 2,289,735 | 2,261,236 | |
| Taco Bell Funding LLC Series 2016-1A, Class A2I (D) | 3.832 | 05-25-46 | 1,170,188 | 1,175,044 | |
| TAL Advantage V LLC Series 2014-1A, Class A (D) | 3.510 | 02-22-39 | 274,167 | 271,989 | |
| Towd Point Mortgage Trust | |||||
| Series 2015-1, Class A5 (D)(H) | 3.555 | 10-25-53 | 280,000 | 284,054 | |
| Series 2015-2, Class 1M2 (D)(H) | 3.579 | 11-25-60 | 815,000 | 836,207 | |
| Series 2016-5, Class A1 (D)(H) | 2.500 | 10-25-56 | 743,445 | 728,250 | |
| Series 2017-1, Class A1 (D)(H) | 2.750 | 10-25-56 | 409,583 | 403,345 | |
| Series 2017-2, Class A1 (D)(H) | 2.750 | 04-25-57 | 290,221 | 285,966 | |
| Series 2018-1, Class A1 (D)(H) | 3.000 | 01-25-58 | 518,421 | 512,484 | |
| Toyota Auto Receivables Owner Trust |
| SEE NOTES TO FINANCIAL STATEMENTS | SEMIANNUAL REPORT | JOHN HANCOCK BALANCED FUND | 37 |
| Rate (%) | Maturity date | Par value^ | Value | ||
| Asset backed securities (continued) | |||||
| Series 2016-B, Class A4 | 1.520 | 08-16-21 | 425,000 | $417,856 | |
| Series 2016-C, Class A4 | 1.320 | 11-15-21 | 330,000 | 322,624 | |
| Series 2017-A, Class A3 | 1.730 | 02-16-21 | 1,150,000 | 1,137,415 | |
| Series 2017-B, Class A3 | 1.760 | 07-15-21 | 1,510,000 | 1,489,214 | |
| Series 2017-C, Class A4 | 1.980 | 12-15-22 | 790,000 | 770,625 | |
| Series 2018-A, Class A3 | 2.360 | 05-16-22 | 825,000 | 817,479 | |
| Triton Container Finance V LLC Series 2018-1A, Class A (D) | 3.950 | 03-20-43 | 614,833 | 612,801 | |
| Vantage Data Centers Issuer LLC Series 2018-1A, Class A2 (D) | 4.072 | 02-16-43 | 524,125 | 523,337 | |
| Volvo Financial Equipment LLC Series 2018-1A, Class A3 (D) | 2.540 | 02-15-22 | 1,120,000 | 1,111,891 | |
| VSE VOI Mortgage LLC Series 2017-A, Class A (D) | 2.330 | 03-20-35 | 604,071 | 585,971 | |
| Wachovia Student Loan Trust Series 2006-1, Class B (3 month LIBOR + 0.240%) (C)(D) | 2.600 | 04-25-40 | 171,880 | 163,908 | |
| Westgate Resorts LLC | |||||
| Series 2014-1A, Class A (D) | 2.150 | 12-20-26 | 479,136 | 476,221 | |
| Series 2014-1A, Class B (D) | 3.250 | 12-20-26 | 206,028 | 205,705 | |
| Series 2015-1A, Class A (D) | 2.750 | 05-20-27 | 152,811 | 152,081 | |
| Series 2015-2A, Class B (D) | 4.000 | 07-20-28 | 351,049 | 350,393 | |
| Series 2016-1A, Class A (D) | 3.500 | 12-20-28 | 317,789 | 316,978 | |
| Series 2017-1A, Class A (D) | 3.050 | 12-20-30 | 454,846 | 450,727 | |
| World Omni Auto Receivables Trust | |||||
| Series 2016-A, Class A3 | 1.770 | 09-15-21 | 1,112,853 | 1,104,326 | |
| Series 2017-B, Class A3 | 1.950 | 02-15-23 | 385,000 | 376,824 | |
| Series 2018-A, Class A3 | 2.500 | 04-17-23 | 1,075,000 | 1,065,100 | |
| Yield (%) | Shares | Value | |||
| Securities lending collateral 0.2% | $3,269,533 | ||||
| (Cost $3,269,309) | |||||
| John Hancock Collateral Trust (I) | 1.8834(J) | 326,842 | 3,269,533 | ||
| Yield* (%) | Maturity date | Par value^ | Value | ||
| Short-term investments 0.3% | $6,756,000 | ||||
| (Cost $6,756,000) | |||||
| U.S. Government Agency 0.1% | 3,150,000 | ||||
| Federal Home Loan Bank Discount Note | 1.580 | 05-01-18 | 3,150,000 | 3,150,000 |
| Par value^ | Value | ||||
| Repurchase agreement 0.2% | 3,606,000 | ||||
| Barclays Tri-Party Repurchase Agreement dated 4-30-18 at 1.700% to be repurchased at $2,792,132 on 5-1-18, collateralized by $3,005,200 U.S. Treasury Notes, 2.000% due 2-15-25 (valued at $2,847,975, including interest) | 2,792,000 | 2,792,000 |
| 38 | JOHN HANCOCK BALANCED FUND | SEMIANNUAL REPORT | SEE NOTES TO FINANCIAL STATEMENTS |
| Par value^ | Value | ||||
| Repurchase agreement (continued) | |||||
| Repurchase Agreement with State Street Corp. dated 4-30-18 at 0.740% to be repurchased at $814,017 on 5-1-18, collateralized by $865,000 U.S. Treasury Notes, 2.125% due 2-29-24 (valued at $833,697, including interest) | 814,000 | 814,000 |
| Total investments (Cost $1,565,490,895) 99.8% | $1,892,622,929 | ||||
| Other assets and liabilities, net 0.2% | 3,286,608 | ||||
| Total net assets 100.0% | $1,895,909,537 | ||||
| The percentage shown for each investment category is the total value of the category as a percentage of the net assets of the fund. | |
| ^All par values are denominated in U.S. dollars unless otherwise indicated. | |
| Security Abbreviations and Legend | |
| CMT | Constant Maturity Treasury |
| IO | Interest-Only Security - (Interest Tranche of Stripped Mortgage Pool). Rate shown is the annualized yield at the end of the period. |
| ISDAFIX | International Swaps and Derivatives Association Fixed Interest Rate Swap Rate |
| LIBOR | London Interbank Offered Rate |
| (A) | Non-income producing security. |
| (B) | A portion of this security is on loan as of 4-30-18. |
| (C) | Variable rate obligation. The coupon rate shown represents the rate at period end. |
| (D) | These securities are exempt from registration under Rule 144A of the Securities Act of 1933. Such securities may be resold, normally to qualified institutional buyers, in transactions exempt from registration. |
| (E) | Perpetual bonds have no stated maturity date. Date shown as maturity date is next call date. |
| (F) | Term loans are variable rate obligations. The coupon rate shown represents the rate at period end. |
| (G) | This position represents an unsettled loan commitment at period end. Certain details associated with this purchase are not known prior to the settlement date, including coupon rate, which is disclosed as TBD (To Be Determined). |
| (H) | Variable or floating rate security, the interest rate of which adjusts periodically based on a weighted average of interest rates and prepayments on the underlying pool of assets. The interest rate shown is the current rate as of period end. |
| (I) | Investment is an affiliate of the fund, the advisor and/or subadvisor. This security represents the investment of cash collateral received for securities lending. |
| (J) | The rate shown is the annualized seven-day yield as of 4-30-18. |
| * | Yield represents either the annualized yield at the date of purchase, the stated coupon rate or, for floating rate securities, the rate at period end. |
| SEE NOTES TO FINANCIAL STATEMENTS | SEMIANNUAL REPORT | JOHN HANCOCK BALANCED FUND | 39 |
Financial statements
STATEMENT OF ASSETS AND LIABILITIES 4-30-18 (unaudited)
| Assets | ||||||||||||||||||||||||||||||
| Unaffiliated investments, at value (Cost $1,562,221,586) including $3,188,563 of securities loaned | $1,889,353,396 | |||||||||||||||||||||||||||||
| Affiliated investments, at value (Cost $3,269,309) | 3,269,533 | |||||||||||||||||||||||||||||
| Total investments, at value (Cost $1,565,490,895) | 1,892,622,929 | |||||||||||||||||||||||||||||
| Cash | 6,600 | |||||||||||||||||||||||||||||
| Foreign currency, at value (Cost $166,516) | 166,808 | |||||||||||||||||||||||||||||
| Receivable for investments sold | 7,490,919 | |||||||||||||||||||||||||||||
| Receivable for delayed delivery securities sold | 112,063 | |||||||||||||||||||||||||||||
| Receivable for fund shares sold | 2,458,360 | |||||||||||||||||||||||||||||
| Dividends and interest receivable | 6,827,585 | |||||||||||||||||||||||||||||
| Receivable for securities lending income | 4,944 | |||||||||||||||||||||||||||||
| Other receivables and prepaid expenses | 166,802 | |||||||||||||||||||||||||||||
| Total assets | 1,909,857,010 | |||||||||||||||||||||||||||||
| Liabilities | ||||||||||||||||||||||||||||||
| Payable for investments purchased | 6,338,255 | |||||||||||||||||||||||||||||
| Payable for delayed delivery securities purchased | 340,000 | |||||||||||||||||||||||||||||
| Payable for fund shares repurchased | 2,925,723 | |||||||||||||||||||||||||||||
| Payable upon return of securities loaned | 3,274,703 | |||||||||||||||||||||||||||||
| Payable to affiliates | ||||||||||||||||||||||||||||||
| Accounting and legal services fees | 213,193 | |||||||||||||||||||||||||||||
| Transfer agent fees | 164,712 | |||||||||||||||||||||||||||||
| Distribution and service fees | 416,590 | |||||||||||||||||||||||||||||
| Trustees' fees | 3,613 | |||||||||||||||||||||||||||||
| Other liabilities and accrued expenses | 270,684 | |||||||||||||||||||||||||||||
| Total liabilities | 13,947,473 | |||||||||||||||||||||||||||||
| Net assets | $1,895,909,537 | |||||||||||||||||||||||||||||
| Net assets consist of | ||||||||||||||||||||||||||||||
| Paid-in capital | $1,504,569,719 | |||||||||||||||||||||||||||||
| Undistributed net investment income | 2,198,637 | |||||||||||||||||||||||||||||
| Accumulated net realized gain (loss) on investments and foreign currency transactions | 62,008,066 | |||||||||||||||||||||||||||||
| Net unrealized appreciation (depreciation) on investments and translation of assets and liabilities in foreign currencies | 327,133,115 | |||||||||||||||||||||||||||||
| Net assets | $1,895,909,537 | |||||||||||||||||||||||||||||
STATEMENT OF ASSETS AND LIABILITIES (continued)
| Net asset value per share | ||||||||||||||||||
| Based on net asset values and shares outstanding-the fund has an unlimited number of shares authorized with no par value | ||||||||||||||||||
| Class A ($799,709,566 ÷ 39,917,438 shares)1 | $20.03 | |||||||||||||||||
| Class B ($25,756,519 ÷ 1,288,518 shares)1 | $19.99 | |||||||||||||||||
| Class C ($470,200,252 ÷ 23,505,616 shares)1 | $20.00 | |||||||||||||||||
| Class I ($401,510,734 ÷ 20,055,387 shares) | $20.02 | |||||||||||||||||
| Class R1 ($3,786,225 ÷ 188,255 shares) | $20.11 | |||||||||||||||||
| Class R2 ($3,634,811 ÷ 181,707 shares) | $20.00 | |||||||||||||||||
| Class R3 ($5,035,259 ÷ 250,767 shares) | $20.08 | |||||||||||||||||
| Class R4 ($17,177,155 ÷ 853,685 shares) | $20.12 | |||||||||||||||||
| Class R5 ($10,309,896 ÷ 513,095 shares) | $20.09 | |||||||||||||||||
| Class R6 ($158,789,120 ÷ 7,922,710 shares) | $20.04 | |||||||||||||||||
| Maximum offering price per share | ||||||||||||||||||
| Class A (net asset value per share ÷ 95%)2 | $21.08 | |||||||||||||||||
| 1 | Redemption price per share is equal to net asset value less any applicable contingent deferred sales charge. | ||||||||||||||||
| 2 | On single retail sales of less than $50,000. On sales of $50,000 or more and on group sales the offering price is reduced. | ||||||||||||||||
STATEMENT OF OPERATIONS For the six months ended 4-30-18 (unaudited)
| Investment income | ||||||||||||||||||||||||
| Dividends | $13,079,760 | |||||||||||||||||||||||
| Interest | 12,857,922 | |||||||||||||||||||||||
| Securities lending | 15,212 | |||||||||||||||||||||||
| Less foreign taxes withheld | (133,111 | ) | ||||||||||||||||||||||
| Total investment income | 25,819,783 | |||||||||||||||||||||||
| Expenses | ||||||||||||||||||||||||
| Investment management fees | 5,815,943 | |||||||||||||||||||||||
| Distribution and service fees | 3,918,932 | |||||||||||||||||||||||
| Accounting and legal services fees | 214,483 | |||||||||||||||||||||||
| Transfer agent fees | 964,315 | |||||||||||||||||||||||
| Trustees' fees | 16,269 | |||||||||||||||||||||||
| State registration fees | 92,283 | |||||||||||||||||||||||
| Printing and postage | 85,660 | |||||||||||||||||||||||
| Professional fees | 42,956 | |||||||||||||||||||||||
| Custodian fees | 129,963 | |||||||||||||||||||||||
| Other | 25,407 | |||||||||||||||||||||||
| Total expenses | 11,306,211 | |||||||||||||||||||||||
| Less expense reductions | (93,457 | ) | ||||||||||||||||||||||
| Net expenses | 11,212,754 | |||||||||||||||||||||||
| Net investment income | 14,607,029 | |||||||||||||||||||||||
| Realized and unrealized gain (loss) | ||||||||||||||||||||||||
| Net realized gain (loss) on | ||||||||||||||||||||||||
| Unaffiliated investments and foreign currency transactions | 73,973,244 | |||||||||||||||||||||||
| Affiliated investments | (806 | ) | ||||||||||||||||||||||
| 73,972,438 | ||||||||||||||||||||||||
| Change in net unrealized appreciation (depreciation) of | ||||||||||||||||||||||||
| Unaffiliated investments and translation of assets and liabilities in foreign currencies | (63,508,383 | ) | ||||||||||||||||||||||
| Affiliated investments | 361 | |||||||||||||||||||||||
| (63,508,022 | ) | |||||||||||||||||||||||
| Net realized and unrealized gain | 10,464,416 | |||||||||||||||||||||||
| Increase in net assets from operations | $25,071,445 | |||||||||||||||||||||||
STATEMENTS OF CHANGES IN NET ASSETS
| Six months ended 4-30-18 | Year ended 10-31-17 | ||||||||||||||||||||||||||||||||||||||||||||
| (unaudited) | |||||||||||||||||||||||||||||||||||||||||||||
| Increase (decrease) in net assets | |||||||||||||||||||||||||||||||||||||||||||||
| From operations | |||||||||||||||||||||||||||||||||||||||||||||
| Net investment income | $14,607,029 | $27,596,657 | |||||||||||||||||||||||||||||||||||||||||||
| Net realized gain | 73,972,438 | 59,059,641 | |||||||||||||||||||||||||||||||||||||||||||
| Change in net unrealized appreciation (depreciation) | (63,508,022 | ) | 142,842,912 | ||||||||||||||||||||||||||||||||||||||||||
| Increase in net assets resulting from operations | 25,071,445 | 229,499,210 | |||||||||||||||||||||||||||||||||||||||||||
| Distributions to shareholders | |||||||||||||||||||||||||||||||||||||||||||||
| From net investment income | |||||||||||||||||||||||||||||||||||||||||||||
| Class A | (6,783,995 | ) | (13,848,926 | ) | |||||||||||||||||||||||||||||||||||||||||
| Class B | (149,640 | ) | (427,107 | ) | |||||||||||||||||||||||||||||||||||||||||
| Class C | (2,374,597 | ) | (4,994,722 | ) | |||||||||||||||||||||||||||||||||||||||||
| Class I | (4,029,747 | ) | (8,277,530 | ) | |||||||||||||||||||||||||||||||||||||||||
| Class R1 | (27,355 | ) | (73,151 | ) | |||||||||||||||||||||||||||||||||||||||||
| Class R2 | (28,143 | ) | (116,345 | ) | |||||||||||||||||||||||||||||||||||||||||
| Class R3 | (36,565 | ) | (63,412 | ) | |||||||||||||||||||||||||||||||||||||||||
| Class R4 | (193,945 | ) | (450,066 | ) | |||||||||||||||||||||||||||||||||||||||||
| Class R5 | (58,325 | ) | (37,873 | ) | |||||||||||||||||||||||||||||||||||||||||
| Class R6 | (1,571,471 | ) | (252,670 | ) | |||||||||||||||||||||||||||||||||||||||||
| From net realized gain | |||||||||||||||||||||||||||||||||||||||||||||
| Class A | (18,852,240 | ) | — | ||||||||||||||||||||||||||||||||||||||||||
| Class B | (761,674 | ) | — | ||||||||||||||||||||||||||||||||||||||||||
| Class C | (11,502,518 | ) | — | ||||||||||||||||||||||||||||||||||||||||||
| Class I | (9,356,420 | ) | — | ||||||||||||||||||||||||||||||||||||||||||
| Class R1 | (102,730 | ) | — | ||||||||||||||||||||||||||||||||||||||||||
| Class R2 | (79,629 | ) | — | ||||||||||||||||||||||||||||||||||||||||||
| Class R3 | (113,108 | ) | — | ||||||||||||||||||||||||||||||||||||||||||
| Class R4 | (569,312 | ) | — | ||||||||||||||||||||||||||||||||||||||||||
| Class R5 | (49,464 | ) | — | ||||||||||||||||||||||||||||||||||||||||||
| Class R6 | (3,398,543 | ) | — | ||||||||||||||||||||||||||||||||||||||||||
| Total distributions | (60,039,421 | ) | (28,541,802 | ) | |||||||||||||||||||||||||||||||||||||||||
| From fund share transactions | (556,482 | ) | 19,773,956 | ||||||||||||||||||||||||||||||||||||||||||
| Total increase (decrease) | (35,524,458 | ) | 220,731,364 | ||||||||||||||||||||||||||||||||||||||||||
| Net assets | |||||||||||||||||||||||||||||||||||||||||||||
| Beginning of period | 1,931,433,995 | 1,710,702,631 | |||||||||||||||||||||||||||||||||||||||||||
| End of period | $1,895,909,537 | $1,931,433,995 | |||||||||||||||||||||||||||||||||||||||||||
| Undistributed net investment income | $2,198,637 | $2,845,391 | |||||||||||||||||||||||||||||||||||||||||||
Financial highlights
| Class A Shares Period ended | 4-30-18 | 1 | 10-31-17 | 10-31-16 | 10-31-15 | 10-31-14 | 10-31-13 | |||||||||||||||||||||||||||||||||||||||||||||||||||||||||||||||||||||||||||||||||||||||||||||||||||||||||||||||
| Per share operating performance | ||||||||||||||||||||||||||||||||||||||||||||||||||||||||||||||||||||||||||||||||||||||||||||||||||||||||||||||||||||||
| Net asset value, beginning of period | $20.40 | $18.29 | $18.56 | $19.34 | $18.62 | $16.57 | ||||||||||||||||||||||||||||||||||||||||||||||||||||||||||||||||||||||||||||||||||||||||||||||||||||||||||||||||
| Net investment income2 | 0.16 | 0.32 | 0.32 | 0.36 | 0.39 | 0.36 | ||||||||||||||||||||||||||||||||||||||||||||||||||||||||||||||||||||||||||||||||||||||||||||||||||||||||||||||||
| Net realized and unrealized gain (loss) on investments | 0.12 | 2.12 | 0.25 | (0.19 | ) | 1.46 | 2.40 | |||||||||||||||||||||||||||||||||||||||||||||||||||||||||||||||||||||||||||||||||||||||||||||||||||||||||||||||
| Total from investment operations | 0.28 | 2.44 | 0.57 | 0.17 | 1.85 | 2.76 | ||||||||||||||||||||||||||||||||||||||||||||||||||||||||||||||||||||||||||||||||||||||||||||||||||||||||||||||||
| Less distributions | ||||||||||||||||||||||||||||||||||||||||||||||||||||||||||||||||||||||||||||||||||||||||||||||||||||||||||||||||||||||
| From net investment income | (0.17 | ) | (0.33 | ) | (0.32 | ) | (0.40 | ) | (0.42 | ) | (0.41 | ) | ||||||||||||||||||||||||||||||||||||||||||||||||||||||||||||||||||||||||||||||||||||||||||||||||||||||||||
| From net realized gain | (0.48 | ) | — | (0.52 | ) | (0.55 | ) | (0.71 | ) | (0.30 | ) | |||||||||||||||||||||||||||||||||||||||||||||||||||||||||||||||||||||||||||||||||||||||||||||||||||||||||||
| Total distributions | (0.65 | ) | (0.33 | ) | (0.84 | ) | (0.95 | ) | (1.13 | ) | (0.71 | ) | ||||||||||||||||||||||||||||||||||||||||||||||||||||||||||||||||||||||||||||||||||||||||||||||||||||||||||
| Net asset value, end of period | $20.03 | $20.40 | $18.29 | $18.56 | $19.34 | $18.62 | ||||||||||||||||||||||||||||||||||||||||||||||||||||||||||||||||||||||||||||||||||||||||||||||||||||||||||||||||
| Total return (%)3,4 | 1.31 | 5 | 13.41 | 3.26 | 0.98 | 10.43 | 17.23 | |||||||||||||||||||||||||||||||||||||||||||||||||||||||||||||||||||||||||||||||||||||||||||||||||||||||||||||||
| Ratios and supplemental data | ||||||||||||||||||||||||||||||||||||||||||||||||||||||||||||||||||||||||||||||||||||||||||||||||||||||||||||||||||||||
| Net assets, end of period (in millions) | $800 | $817 | $866 | $808 | $675 | $597 | ||||||||||||||||||||||||||||||||||||||||||||||||||||||||||||||||||||||||||||||||||||||||||||||||||||||||||||||||
| Ratios (as a percentage of average net assets): | ||||||||||||||||||||||||||||||||||||||||||||||||||||||||||||||||||||||||||||||||||||||||||||||||||||||||||||||||||||||
| Expenses before reductions | 1.07 | 6 | 1.08 | 1.09 | 1.09 | 1.10 | 1.14 | |||||||||||||||||||||||||||||||||||||||||||||||||||||||||||||||||||||||||||||||||||||||||||||||||||||||||||||||
| Expenses including reductions | 1.06 | 6 | 1.08 | 1.09 | 1.09 | 1.09 | 1.14 | |||||||||||||||||||||||||||||||||||||||||||||||||||||||||||||||||||||||||||||||||||||||||||||||||||||||||||||||
| Net investment income | 1.60 | 6 | 1.62 | 1.77 | 1.92 | 2.07 | 2.08 | |||||||||||||||||||||||||||||||||||||||||||||||||||||||||||||||||||||||||||||||||||||||||||||||||||||||||||||||
| Portfolio turnover (%) | 27 | 52 | 47 | 49 | 39 | 53 | ||||||||||||||||||||||||||||||||||||||||||||||||||||||||||||||||||||||||||||||||||||||||||||||||||||||||||||||||
| 1 | Six months ended 4-30-18. Unaudited. | ||||||||||||||||||||||||||||||||||||||||||||||||||||||||||||||||||||||||||||||||||
| 2 | Based on average daily shares outstanding. | ||||||||||||||||||||||||||||||||||||||||||||||||||||||||||||||||||||||||||||||||||
| 3 | Does not reflect the effect of sales charges, if any. | ||||||||||||||||||||||||||||||||||||||||||||||||||||||||||||||||||||||||||||||||||
| 4 | Total returns would have been lower had certain expenses not been reduced during the applicable periods. | ||||||||||||||||||||||||||||||||||||||||||||||||||||||||||||||||||||||||||||||||||
| 5 | Not annualized. | ||||||||||||||||||||||||||||||||||||||||||||||||||||||||||||||||||||||||||||||||||
| 6 | Annualized. | ||||||||||||||||||||||||||||||||||||||||||||||||||||||||||||||||||||||||||||||||||
| Class B Shares Period ended | 4-30-18 | 1 | 10-31-17 | 10-31-16 | 10-31-15 | 10-31-14 | 10-31-13 | |||||||||||||||||||||||||||||||||||||||||||||||||||||||||||||||||||||||||||||||||||||||||||||||||||||||||||||||
| Per share operating performance | ||||||||||||||||||||||||||||||||||||||||||||||||||||||||||||||||||||||||||||||||||||||||||||||||||||||||||||||||||||||
| Net asset value, beginning of period | $20.36 | $18.25 | $18.52 | $19.30 | $18.58 | $16.54 | ||||||||||||||||||||||||||||||||||||||||||||||||||||||||||||||||||||||||||||||||||||||||||||||||||||||||||||||||
| Net investment income2 | 0.09 | 0.18 | 0.19 | 0.23 | 0.26 | 0.24 | ||||||||||||||||||||||||||||||||||||||||||||||||||||||||||||||||||||||||||||||||||||||||||||||||||||||||||||||||
| Net realized and unrealized gain (loss) on investments | 0.12 | 2.12 | 0.25 | (0.19 | ) | 1.46 | 2.39 | |||||||||||||||||||||||||||||||||||||||||||||||||||||||||||||||||||||||||||||||||||||||||||||||||||||||||||||||
| Total from investment operations | 0.21 | 2.30 | 0.44 | 0.04 | 1.72 | 2.63 | ||||||||||||||||||||||||||||||||||||||||||||||||||||||||||||||||||||||||||||||||||||||||||||||||||||||||||||||||
| Less distributions | ||||||||||||||||||||||||||||||||||||||||||||||||||||||||||||||||||||||||||||||||||||||||||||||||||||||||||||||||||||||
| From net investment income | (0.10 | ) | (0.19 | ) | (0.19 | ) | (0.27 | ) | (0.29 | ) | (0.29 | ) | ||||||||||||||||||||||||||||||||||||||||||||||||||||||||||||||||||||||||||||||||||||||||||||||||||||||||||
| From net realized gain | (0.48 | ) | — | (0.52 | ) | (0.55 | ) | (0.71 | ) | (0.30 | ) | |||||||||||||||||||||||||||||||||||||||||||||||||||||||||||||||||||||||||||||||||||||||||||||||||||||||||||
| Total distributions | (0.58 | ) | (0.19 | ) | (0.71 | ) | (0.82 | ) | (1.00 | ) | (0.59 | ) | ||||||||||||||||||||||||||||||||||||||||||||||||||||||||||||||||||||||||||||||||||||||||||||||||||||||||||
| Net asset value, end of period | $19.99 | $20.36 | $18.25 | $18.52 | $19.30 | $18.58 | ||||||||||||||||||||||||||||||||||||||||||||||||||||||||||||||||||||||||||||||||||||||||||||||||||||||||||||||||
| Total return (%)3,4 | 0.96 | 5 | 12.66 | 2.54 | 0.27 | 9.68 | 16.38 | |||||||||||||||||||||||||||||||||||||||||||||||||||||||||||||||||||||||||||||||||||||||||||||||||||||||||||||||
| Ratios and supplemental data | ||||||||||||||||||||||||||||||||||||||||||||||||||||||||||||||||||||||||||||||||||||||||||||||||||||||||||||||||||||||
| Net assets, end of period (in millions) | $26 | $36 | $49 | $67 | $80 | $82 | ||||||||||||||||||||||||||||||||||||||||||||||||||||||||||||||||||||||||||||||||||||||||||||||||||||||||||||||||
| Ratios (as a percentage of average net assets): | ||||||||||||||||||||||||||||||||||||||||||||||||||||||||||||||||||||||||||||||||||||||||||||||||||||||||||||||||||||||
| Expenses before reductions | 1.77 | 6 | 1.78 | 1.79 | 1.79 | 1.80 | 1.84 | |||||||||||||||||||||||||||||||||||||||||||||||||||||||||||||||||||||||||||||||||||||||||||||||||||||||||||||||
| Expenses including reductions | 1.76 | 6 | 1.78 | 1.79 | 1.78 | 1.79 | 1.84 | |||||||||||||||||||||||||||||||||||||||||||||||||||||||||||||||||||||||||||||||||||||||||||||||||||||||||||||||
| Net investment income | 0.91 | 6 | 0.93 | 1.08 | 1.23 | 1.38 | 1.38 | |||||||||||||||||||||||||||||||||||||||||||||||||||||||||||||||||||||||||||||||||||||||||||||||||||||||||||||||
| Portfolio turnover (%) | 27 | 52 | 47 | 49 | 39 | 53 | ||||||||||||||||||||||||||||||||||||||||||||||||||||||||||||||||||||||||||||||||||||||||||||||||||||||||||||||||
| 1 | Six months ended 4-30-18. Unaudited. | ||||||||||||||||||||||||||||||||||||||||||||||||||||||||||||||||||||||||||||||||||
| 2 | Based on average daily shares outstanding. | ||||||||||||||||||||||||||||||||||||||||||||||||||||||||||||||||||||||||||||||||||
| 3 | Does not reflect the effect of sales charges, if any. | ||||||||||||||||||||||||||||||||||||||||||||||||||||||||||||||||||||||||||||||||||
| 4 | Total returns would have been lower had certain expenses not been reduced during the applicable periods. | ||||||||||||||||||||||||||||||||||||||||||||||||||||||||||||||||||||||||||||||||||
| 5 | Not annualized. | ||||||||||||||||||||||||||||||||||||||||||||||||||||||||||||||||||||||||||||||||||
| 6 | Annualized. | ||||||||||||||||||||||||||||||||||||||||||||||||||||||||||||||||||||||||||||||||||
| Class C Shares Period ended | 4-30-18 | 1 | 10-31-17 | 10-31-16 | 10-31-15 | 10-31-14 | 10-31-13 | |||||||||||||||||||||||||||||||||||||||||||||||||||||||||||||||||||||||||||||||||||||||||||||||||||||||||||||||
| Per share operating performance | ||||||||||||||||||||||||||||||||||||||||||||||||||||||||||||||||||||||||||||||||||||||||||||||||||||||||||||||||||||||
| Net asset value, beginning of period | $20.37 | $18.26 | $18.53 | $19.31 | $18.59 | $16.55 | ||||||||||||||||||||||||||||||||||||||||||||||||||||||||||||||||||||||||||||||||||||||||||||||||||||||||||||||||
| Net investment income2 | 0.09 | 0.18 | 0.19 | 0.23 | 0.26 | 0.24 | ||||||||||||||||||||||||||||||||||||||||||||||||||||||||||||||||||||||||||||||||||||||||||||||||||||||||||||||||
| Net realized and unrealized gain (loss) on investments | 0.12 | 2.12 | 0.25 | (0.19 | ) | 1.46 | 2.39 | |||||||||||||||||||||||||||||||||||||||||||||||||||||||||||||||||||||||||||||||||||||||||||||||||||||||||||||||
| Total from investment operations | 0.21 | 2.30 | 0.44 | 0.04 | 1.72 | 2.63 | ||||||||||||||||||||||||||||||||||||||||||||||||||||||||||||||||||||||||||||||||||||||||||||||||||||||||||||||||
| Less distributions | ||||||||||||||||||||||||||||||||||||||||||||||||||||||||||||||||||||||||||||||||||||||||||||||||||||||||||||||||||||||
| From net investment income | (0.10 | ) | (0.19 | ) | (0.19 | ) | (0.27 | ) | (0.29 | ) | (0.29 | ) | ||||||||||||||||||||||||||||||||||||||||||||||||||||||||||||||||||||||||||||||||||||||||||||||||||||||||||
| From net realized gain | (0.48 | ) | — | (0.52 | ) | (0.55 | ) | (0.71 | ) | (0.30 | ) | |||||||||||||||||||||||||||||||||||||||||||||||||||||||||||||||||||||||||||||||||||||||||||||||||||||||||||
| Total distributions | (0.58 | ) | (0.19 | ) | (0.71 | ) | (0.82 | ) | (1.00 | ) | (0.59 | ) | ||||||||||||||||||||||||||||||||||||||||||||||||||||||||||||||||||||||||||||||||||||||||||||||||||||||||||
| Net asset value, end of period | $20.00 | $20.37 | $18.26 | $18.53 | $19.31 | $18.59 | ||||||||||||||||||||||||||||||||||||||||||||||||||||||||||||||||||||||||||||||||||||||||||||||||||||||||||||||||
| Total return (%)3,4 | 0.96 | 5 | 12.65 | 2.54 | 0.27 | 9.67 | 16.37 | |||||||||||||||||||||||||||||||||||||||||||||||||||||||||||||||||||||||||||||||||||||||||||||||||||||||||||||||
| Ratios and supplemental data | ||||||||||||||||||||||||||||||||||||||||||||||||||||||||||||||||||||||||||||||||||||||||||||||||||||||||||||||||||||||
| Net assets, end of period (in millions) | $470 | $499 | $507 | $501 | $422 | $344 | ||||||||||||||||||||||||||||||||||||||||||||||||||||||||||||||||||||||||||||||||||||||||||||||||||||||||||||||||
| Ratios (as a percentage of average net assets): | ||||||||||||||||||||||||||||||||||||||||||||||||||||||||||||||||||||||||||||||||||||||||||||||||||||||||||||||||||||||
| Expenses before reductions | 1.77 | 6 | 1.78 | 1.79 | 1.79 | 1.80 | 1.84 | |||||||||||||||||||||||||||||||||||||||||||||||||||||||||||||||||||||||||||||||||||||||||||||||||||||||||||||||
| Expenses including reductions | 1.76 | 6 | 1.78 | 1.79 | 1.78 | 1.79 | 1.84 | |||||||||||||||||||||||||||||||||||||||||||||||||||||||||||||||||||||||||||||||||||||||||||||||||||||||||||||||
| Net investment income | 0.90 | 6 | 0.93 | 1.07 | 1.22 | 1.37 | 1.38 | |||||||||||||||||||||||||||||||||||||||||||||||||||||||||||||||||||||||||||||||||||||||||||||||||||||||||||||||
| Portfolio turnover (%) | 27 | 52 | 47 | 49 | 39 | 53 | ||||||||||||||||||||||||||||||||||||||||||||||||||||||||||||||||||||||||||||||||||||||||||||||||||||||||||||||||
| 1 | Six months ended 4-30-18. Unaudited. | ||||||||||||||||||||||||||||||||||||||||||||||||||||||||||||||||||||||||||||||||||
| 2 | Based on average daily shares outstanding. | ||||||||||||||||||||||||||||||||||||||||||||||||||||||||||||||||||||||||||||||||||
| 3 | Does not reflect the effect of sales charges, if any. | ||||||||||||||||||||||||||||||||||||||||||||||||||||||||||||||||||||||||||||||||||
| 4 | Total returns would have been lower had certain expenses not been reduced during the applicable periods. | ||||||||||||||||||||||||||||||||||||||||||||||||||||||||||||||||||||||||||||||||||
| 5 | Not annualized. | ||||||||||||||||||||||||||||||||||||||||||||||||||||||||||||||||||||||||||||||||||
| 6 | Annualized. | ||||||||||||||||||||||||||||||||||||||||||||||||||||||||||||||||||||||||||||||||||
| Class I Shares Period ended | 4-30-18 | 1 | 10-31-17 | 10-31-16 | 10-31-15 | 10-31-14 | 10-31-13 | |||||||||||||||||||||||||||||||||||||||||||||||||||||||||||||||||||||||||||||||||||||||||||||||||||||||||||||||
| Per share operating performance | ||||||||||||||||||||||||||||||||||||||||||||||||||||||||||||||||||||||||||||||||||||||||||||||||||||||||||||||||||||||
| Net asset value, beginning of period | $20.39 | $18.28 | $18.55 | $19.33 | $18.61 | $16.57 | ||||||||||||||||||||||||||||||||||||||||||||||||||||||||||||||||||||||||||||||||||||||||||||||||||||||||||||||||
| Net investment income2 | 0.19 | 0.37 | 0.37 | 0.42 | 0.45 | 0.42 | ||||||||||||||||||||||||||||||||||||||||||||||||||||||||||||||||||||||||||||||||||||||||||||||||||||||||||||||||
| Net realized and unrealized gain (loss) on investments | 0.12 | 2.12 | 0.26 | (0.19 | ) | 1.47 | 2.40 | |||||||||||||||||||||||||||||||||||||||||||||||||||||||||||||||||||||||||||||||||||||||||||||||||||||||||||||||
| Total from investment operations | 0.31 | 2.49 | 0.63 | 0.23 | 1.92 | 2.82 | ||||||||||||||||||||||||||||||||||||||||||||||||||||||||||||||||||||||||||||||||||||||||||||||||||||||||||||||||
| Less distributions | ||||||||||||||||||||||||||||||||||||||||||||||||||||||||||||||||||||||||||||||||||||||||||||||||||||||||||||||||||||||
| From net investment income | (0.20 | ) | (0.38 | ) | (0.38 | ) | (0.46 | ) | (0.49 | ) | (0.48 | ) | ||||||||||||||||||||||||||||||||||||||||||||||||||||||||||||||||||||||||||||||||||||||||||||||||||||||||||
| From net realized gain | (0.48 | ) | — | (0.52 | ) | (0.55 | ) | (0.71 | ) | (0.30 | ) | |||||||||||||||||||||||||||||||||||||||||||||||||||||||||||||||||||||||||||||||||||||||||||||||||||||||||||
| Total distributions | (0.68 | ) | (0.38 | ) | (0.90 | ) | (1.01 | ) | (1.20 | ) | (0.78 | ) | ||||||||||||||||||||||||||||||||||||||||||||||||||||||||||||||||||||||||||||||||||||||||||||||||||||||||||
| Net asset value, end of period | $20.02 | $20.39 | $18.28 | $18.55 | $19.33 | $18.61 | ||||||||||||||||||||||||||||||||||||||||||||||||||||||||||||||||||||||||||||||||||||||||||||||||||||||||||||||||
| Total return (%)3 | 1.47 | 4 | 13.77 | 3.59 | 1.31 | 10.80 | 17.62 | |||||||||||||||||||||||||||||||||||||||||||||||||||||||||||||||||||||||||||||||||||||||||||||||||||||||||||||||
| Ratios and supplemental data | ||||||||||||||||||||||||||||||||||||||||||||||||||||||||||||||||||||||||||||||||||||||||||||||||||||||||||||||||||||||
| Net assets, end of period (in millions) | $402 | $522 | $233 | $195 | $131 | $89 | ||||||||||||||||||||||||||||||||||||||||||||||||||||||||||||||||||||||||||||||||||||||||||||||||||||||||||||||||
| Ratios (as a percentage of average net assets): | ||||||||||||||||||||||||||||||||||||||||||||||||||||||||||||||||||||||||||||||||||||||||||||||||||||||||||||||||||||||
| Expenses before reductions | 0.77 | 5 | 0.77 | 0.78 | 0.78 | 0.79 | 0.78 | |||||||||||||||||||||||||||||||||||||||||||||||||||||||||||||||||||||||||||||||||||||||||||||||||||||||||||||||
| Expenses including reductions | 0.76 | 5 | 0.77 | 0.78 | 0.77 | 0.78 | 0.78 | |||||||||||||||||||||||||||||||||||||||||||||||||||||||||||||||||||||||||||||||||||||||||||||||||||||||||||||||
| Net investment income | 1.89 | 5 | 1.91 | 2.09 | 2.23 | 2.38 | 2.44 | |||||||||||||||||||||||||||||||||||||||||||||||||||||||||||||||||||||||||||||||||||||||||||||||||||||||||||||||
| Portfolio turnover (%) | 27 | 52 | 47 | 49 | 39 | 53 | ||||||||||||||||||||||||||||||||||||||||||||||||||||||||||||||||||||||||||||||||||||||||||||||||||||||||||||||||
| 1 | Six months ended 4-30-18. Unaudited. | ||||||||||||||||||||||||||||||||||||||||||||||||||||||||||||||||||||||||||||||||||
| 2 | Based on average daily shares outstanding. | ||||||||||||||||||||||||||||||||||||||||||||||||||||||||||||||||||||||||||||||||||
| 3 | Total returns would have been lower had certain expenses not been reduced during the applicable periods. | ||||||||||||||||||||||||||||||||||||||||||||||||||||||||||||||||||||||||||||||||||
| 4 | Not annualized. | ||||||||||||||||||||||||||||||||||||||||||||||||||||||||||||||||||||||||||||||||||
| 5 | Annualized. | ||||||||||||||||||||||||||||||||||||||||||||||||||||||||||||||||||||||||||||||||||
| Class R1 Shares Period ended | 4-30-18 | 1 | 10-31-17 | 10-31-16 | 10-31-15 | 10-31-14 | 10-31-13 | |||||||||||||||||||||||||||||||||||||||||||||||||||||||||||||||||||||||||||||||||||||||||||||||||||||||||||||||
| Per share operating performance | ||||||||||||||||||||||||||||||||||||||||||||||||||||||||||||||||||||||||||||||||||||||||||||||||||||||||||||||||||||||
| Net asset value, beginning of period | $20.48 | $18.36 | $18.62 | $19.41 | $18.68 | $16.63 | ||||||||||||||||||||||||||||||||||||||||||||||||||||||||||||||||||||||||||||||||||||||||||||||||||||||||||||||||
| Net investment income2 | 0.13 | 0.25 | 0.26 | 0.30 | 0.33 | 0.31 | ||||||||||||||||||||||||||||||||||||||||||||||||||||||||||||||||||||||||||||||||||||||||||||||||||||||||||||||||
| Net realized and unrealized gain (loss) on investments | 0.11 | 2.13 | 0.26 | (0.20 | ) | 1.47 | 2.40 | |||||||||||||||||||||||||||||||||||||||||||||||||||||||||||||||||||||||||||||||||||||||||||||||||||||||||||||||
| Total from investment operations | 0.24 | 2.38 | 0.52 | 0.10 | 1.80 | 2.71 | ||||||||||||||||||||||||||||||||||||||||||||||||||||||||||||||||||||||||||||||||||||||||||||||||||||||||||||||||
| Less distributions | ||||||||||||||||||||||||||||||||||||||||||||||||||||||||||||||||||||||||||||||||||||||||||||||||||||||||||||||||||||||
| From net investment income | (0.13 | ) | (0.26 | ) | (0.26 | ) | (0.34 | ) | (0.36 | ) | (0.36 | ) | ||||||||||||||||||||||||||||||||||||||||||||||||||||||||||||||||||||||||||||||||||||||||||||||||||||||||||
| From net realized gain | (0.48 | ) | — | (0.52 | ) | (0.55 | ) | (0.71 | ) | (0.30 | ) | |||||||||||||||||||||||||||||||||||||||||||||||||||||||||||||||||||||||||||||||||||||||||||||||||||||||||||
| Total distributions | (0.61 | ) | (0.26 | ) | (0.78 | ) | (0.89 | ) | (1.07 | ) | (0.66 | ) | ||||||||||||||||||||||||||||||||||||||||||||||||||||||||||||||||||||||||||||||||||||||||||||||||||||||||||
| Net asset value, end of period | $20.11 | $20.48 | $18.36 | $18.62 | $19.41 | $18.68 | ||||||||||||||||||||||||||||||||||||||||||||||||||||||||||||||||||||||||||||||||||||||||||||||||||||||||||||||||
| Total return (%)3 | 1.13 | 4 | 13.03 | 2.95 | 0.58 | 10.10 | 16.84 | |||||||||||||||||||||||||||||||||||||||||||||||||||||||||||||||||||||||||||||||||||||||||||||||||||||||||||||||
| Ratios and supplemental data | ||||||||||||||||||||||||||||||||||||||||||||||||||||||||||||||||||||||||||||||||||||||||||||||||||||||||||||||||||||||
| Net assets, end of period (in millions) | $4 | $5 | $6 | $5 | $4 | $3 | ||||||||||||||||||||||||||||||||||||||||||||||||||||||||||||||||||||||||||||||||||||||||||||||||||||||||||||||||
| Ratios (as a percentage of average net assets): | ||||||||||||||||||||||||||||||||||||||||||||||||||||||||||||||||||||||||||||||||||||||||||||||||||||||||||||||||||||||
| Expenses before reductions | 1.42 | 5 | 1.43 | 1.44 | 1.44 | 1.44 | 1.45 | |||||||||||||||||||||||||||||||||||||||||||||||||||||||||||||||||||||||||||||||||||||||||||||||||||||||||||||||
| Expenses including reductions | 1.41 | 5 | 1.42 | 1.43 | 1.43 | 1.43 | 1.45 | |||||||||||||||||||||||||||||||||||||||||||||||||||||||||||||||||||||||||||||||||||||||||||||||||||||||||||||||
| Net investment income | 1.25 | 5 | 1.29 | 1.43 | 1.59 | 1.73 | 1.76 | |||||||||||||||||||||||||||||||||||||||||||||||||||||||||||||||||||||||||||||||||||||||||||||||||||||||||||||||
| Portfolio turnover (%) | 27 | 52 | 47 | 49 | 39 | 53 | ||||||||||||||||||||||||||||||||||||||||||||||||||||||||||||||||||||||||||||||||||||||||||||||||||||||||||||||||
| 1 | Six months ended 4-30-18. Unaudited. | ||||||||||||||||||||||||||||||||||||||||||||||||||||||||||||||||||||||||||||||||||
| 2 | Based on average daily shares outstanding. | ||||||||||||||||||||||||||||||||||||||||||||||||||||||||||||||||||||||||||||||||||
| 3 | Total returns would have been lower had certain expenses not been reduced during the applicable periods. | ||||||||||||||||||||||||||||||||||||||||||||||||||||||||||||||||||||||||||||||||||
| 4 | Not annualized. | ||||||||||||||||||||||||||||||||||||||||||||||||||||||||||||||||||||||||||||||||||
| 5 | Annualized. | ||||||||||||||||||||||||||||||||||||||||||||||||||||||||||||||||||||||||||||||||||
| Class R2 Shares Period ended | 4-30-18 | 1 | 10-31-17 | 10-31-16 | 10-31-15 | 10-31-14 | 10-31-13 | |||||||||||||||||||||||||||||||||||||||||||||||||||||||||||||||||||||||||||||||||||||||||||||||||||||||||||||||
| Per share operating performance | ||||||||||||||||||||||||||||||||||||||||||||||||||||||||||||||||||||||||||||||||||||||||||||||||||||||||||||||||||||||
| Net asset value, beginning of period | $20.37 | $18.27 | $18.53 | $19.33 | $18.62 | $16.58 | ||||||||||||||||||||||||||||||||||||||||||||||||||||||||||||||||||||||||||||||||||||||||||||||||||||||||||||||||
| Net investment income2 | 0.15 | 0.31 | 0.29 | 0.34 | 0.42 | 0.38 | ||||||||||||||||||||||||||||||||||||||||||||||||||||||||||||||||||||||||||||||||||||||||||||||||||||||||||||||||
| Net realized and unrealized gain (loss) on investments | 0.12 | 2.10 | 0.27 | (0.19 | ) | 1.45 | 2.41 | |||||||||||||||||||||||||||||||||||||||||||||||||||||||||||||||||||||||||||||||||||||||||||||||||||||||||||||||
| Total from investment operations | 0.27 | 2.41 | 0.56 | 0.15 | 1.87 | 2.79 | ||||||||||||||||||||||||||||||||||||||||||||||||||||||||||||||||||||||||||||||||||||||||||||||||||||||||||||||||
| Less distributions | ||||||||||||||||||||||||||||||||||||||||||||||||||||||||||||||||||||||||||||||||||||||||||||||||||||||||||||||||||||||
| From net investment income | (0.16 | ) | (0.31 | ) | (0.30 | ) | (0.40 | ) | (0.45 | ) | (0.45 | ) | ||||||||||||||||||||||||||||||||||||||||||||||||||||||||||||||||||||||||||||||||||||||||||||||||||||||||||
| From net realized gain | (0.48 | ) | — | (0.52 | ) | (0.55 | ) | (0.71 | ) | (0.30 | ) | |||||||||||||||||||||||||||||||||||||||||||||||||||||||||||||||||||||||||||||||||||||||||||||||||||||||||||
| Total distributions | (0.64 | ) | (0.31 | ) | (0.82 | ) | (0.95 | ) | (1.16 | ) | (0.75 | ) | ||||||||||||||||||||||||||||||||||||||||||||||||||||||||||||||||||||||||||||||||||||||||||||||||||||||||||
| Net asset value, end of period | $20.00 | $20.37 | $18.27 | $18.53 | $19.33 | $18.62 | ||||||||||||||||||||||||||||||||||||||||||||||||||||||||||||||||||||||||||||||||||||||||||||||||||||||||||||||||
| Total return (%)3 | 1.26 | 4 | 13.27 | 3.23 | 0.86 | 10.51 | 17.39 | |||||||||||||||||||||||||||||||||||||||||||||||||||||||||||||||||||||||||||||||||||||||||||||||||||||||||||||||
| Ratios and supplemental data | ||||||||||||||||||||||||||||||||||||||||||||||||||||||||||||||||||||||||||||||||||||||||||||||||||||||||||||||||||||||
| Net assets, end of period (in millions) | $4 | $4 | $8 | $2 | $1 | — | 5 | |||||||||||||||||||||||||||||||||||||||||||||||||||||||||||||||||||||||||||||||||||||||||||||||||||||||||||||||
| Ratios (as a percentage of average net assets): | ||||||||||||||||||||||||||||||||||||||||||||||||||||||||||||||||||||||||||||||||||||||||||||||||||||||||||||||||||||||
| Expenses before reductions | 1.18 | 6 | 1.18 | 1.19 | 1.17 | 1.02 | 0.98 | |||||||||||||||||||||||||||||||||||||||||||||||||||||||||||||||||||||||||||||||||||||||||||||||||||||||||||||||
| Expenses including reductions | 1.17 | 6 | 1.17 | 1.18 | 1.17 | 1.01 | 0.98 | |||||||||||||||||||||||||||||||||||||||||||||||||||||||||||||||||||||||||||||||||||||||||||||||||||||||||||||||
| Net investment income | 1.49 | 6 | 1.58 | 1.63 | 1.84 | 2.23 | 2.17 | |||||||||||||||||||||||||||||||||||||||||||||||||||||||||||||||||||||||||||||||||||||||||||||||||||||||||||||||
| Portfolio turnover (%) | 27 | 52 | 47 | 49 | 39 | 53 | ||||||||||||||||||||||||||||||||||||||||||||||||||||||||||||||||||||||||||||||||||||||||||||||||||||||||||||||||
| 1 | Six months ended 4-30-18. Unaudited. | ||||||||||||||||||||||||||||||||||||||||||||||||||||||||||||||||||||||||||||||||||
| 2 | Based on average daily shares outstanding. | ||||||||||||||||||||||||||||||||||||||||||||||||||||||||||||||||||||||||||||||||||
| 3 | Total returns would have been lower had certain expenses not been reduced during the applicable periods. | ||||||||||||||||||||||||||||||||||||||||||||||||||||||||||||||||||||||||||||||||||
| 4 | Not annualized. | ||||||||||||||||||||||||||||||||||||||||||||||||||||||||||||||||||||||||||||||||||
| 5 | Less than $500,000. | ||||||||||||||||||||||||||||||||||||||||||||||||||||||||||||||||||||||||||||||||||
| 6 | Annualized. | ||||||||||||||||||||||||||||||||||||||||||||||||||||||||||||||||||||||||||||||||||
| Class R3 Shares Period ended | 4-30-18 | 1 | 10-31-17 | 10-31-16 | 10-31-15 | 10-31-14 | 10-31-13 | |||||||||||||||||||||||||||||||||||||||||||||||||||||||||||||||||||||||||||||||||||||||||||||||||||||||||||||||
| Per share operating performance | ||||||||||||||||||||||||||||||||||||||||||||||||||||||||||||||||||||||||||||||||||||||||||||||||||||||||||||||||||||||
| Net asset value, beginning of period | $20.45 | $18.33 | $18.59 | $19.38 | $18.66 | $16.61 | ||||||||||||||||||||||||||||||||||||||||||||||||||||||||||||||||||||||||||||||||||||||||||||||||||||||||||||||||
| Net investment income2 | 0.14 | 0.27 | 0.27 | 0.32 | 0.35 | 0.33 | ||||||||||||||||||||||||||||||||||||||||||||||||||||||||||||||||||||||||||||||||||||||||||||||||||||||||||||||||
| Net realized and unrealized gain (loss) on investments | 0.12 | 2.13 | 0.27 | (0.20 | ) | 1.46 | 2.40 | |||||||||||||||||||||||||||||||||||||||||||||||||||||||||||||||||||||||||||||||||||||||||||||||||||||||||||||||
| Total from investment operations | 0.26 | 2.40 | 0.54 | 0.12 | 1.81 | 2.73 | ||||||||||||||||||||||||||||||||||||||||||||||||||||||||||||||||||||||||||||||||||||||||||||||||||||||||||||||||
| Less distributions | ||||||||||||||||||||||||||||||||||||||||||||||||||||||||||||||||||||||||||||||||||||||||||||||||||||||||||||||||||||||
| From net investment income | (0.15 | ) | (0.28 | ) | (0.28 | ) | (0.36 | ) | (0.38 | ) | (0.38 | ) | ||||||||||||||||||||||||||||||||||||||||||||||||||||||||||||||||||||||||||||||||||||||||||||||||||||||||||
| From net realized gain | (0.48 | ) | — | (0.52 | ) | (0.55 | ) | (0.71 | ) | (0.30 | ) | |||||||||||||||||||||||||||||||||||||||||||||||||||||||||||||||||||||||||||||||||||||||||||||||||||||||||||
| Total distributions | (0.63 | ) | (0.28 | ) | (0.80 | ) | (0.91 | ) | (1.09 | ) | (0.68 | ) | ||||||||||||||||||||||||||||||||||||||||||||||||||||||||||||||||||||||||||||||||||||||||||||||||||||||||||
| Net asset value, end of period | $20.08 | $20.45 | $18.33 | $18.59 | $19.38 | $18.66 | ||||||||||||||||||||||||||||||||||||||||||||||||||||||||||||||||||||||||||||||||||||||||||||||||||||||||||||||||
| Total return (%)3 | 1.21 | 4 | 13.17 | 3.07 | 0.69 | 10.17 | 16.97 | |||||||||||||||||||||||||||||||||||||||||||||||||||||||||||||||||||||||||||||||||||||||||||||||||||||||||||||||
| Ratios and supplemental data | ||||||||||||||||||||||||||||||||||||||||||||||||||||||||||||||||||||||||||||||||||||||||||||||||||||||||||||||||||||||
| Net assets, end of period (in millions) | $5 | $5 | $4 | $19 | $20 | $19 | ||||||||||||||||||||||||||||||||||||||||||||||||||||||||||||||||||||||||||||||||||||||||||||||||||||||||||||||||
| Ratios (as a percentage of average net assets): | ||||||||||||||||||||||||||||||||||||||||||||||||||||||||||||||||||||||||||||||||||||||||||||||||||||||||||||||||||||||
| Expenses before reductions | 1.26 | 5 | 1.33 | 1.32 | 1.33 | 1.33 | 1.35 | |||||||||||||||||||||||||||||||||||||||||||||||||||||||||||||||||||||||||||||||||||||||||||||||||||||||||||||||
| Expenses including reductions | 1.25 | 5 | 1.32 | 1.32 | 1.32 | 1.33 | 1.35 | |||||||||||||||||||||||||||||||||||||||||||||||||||||||||||||||||||||||||||||||||||||||||||||||||||||||||||||||
| Net investment income | 1.41 | 5 | 1.37 | 1.50 | 1.68 | 1.84 | 1.87 | |||||||||||||||||||||||||||||||||||||||||||||||||||||||||||||||||||||||||||||||||||||||||||||||||||||||||||||||
| Portfolio turnover (%) | 27 | 52 | 47 | 49 | 39 | 53 | ||||||||||||||||||||||||||||||||||||||||||||||||||||||||||||||||||||||||||||||||||||||||||||||||||||||||||||||||
| 1 | Six months ended 4-30-18. Unaudited. | ||||||||||||||||||||||||||||||||||||||||||||||||||||||||||||||||||||||||||||||||||
| 2 | Based on average daily shares outstanding. | ||||||||||||||||||||||||||||||||||||||||||||||||||||||||||||||||||||||||||||||||||
| 3 | Total returns would have been lower had certain expenses not been reduced during the applicable periods. | ||||||||||||||||||||||||||||||||||||||||||||||||||||||||||||||||||||||||||||||||||
| 4 | Not annualized. | ||||||||||||||||||||||||||||||||||||||||||||||||||||||||||||||||||||||||||||||||||
| 5 | Annualized. | ||||||||||||||||||||||||||||||||||||||||||||||||||||||||||||||||||||||||||||||||||
| Class R4 Shares Period ended | 4-30-18 | 1 | 10-31-17 | 10-31-16 | 10-31-15 | 10-31-14 | 10-31-13 | |||||||||||||||||||||||||||||||||||||||||||||||||||||||||||||||||||||||||||||||||||||||||||||||||||||||||||||||
| Per share operating performance | ||||||||||||||||||||||||||||||||||||||||||||||||||||||||||||||||||||||||||||||||||||||||||||||||||||||||||||||||||||||
| Net asset value, beginning of period | $20.49 | $18.36 | $18.63 | $19.41 | $18.69 | $16.63 | ||||||||||||||||||||||||||||||||||||||||||||||||||||||||||||||||||||||||||||||||||||||||||||||||||||||||||||||||
| Net investment income2 | 0.18 | 0.35 | 0.35 | 0.39 | 0.41 | 0.40 | ||||||||||||||||||||||||||||||||||||||||||||||||||||||||||||||||||||||||||||||||||||||||||||||||||||||||||||||||
| Net realized and unrealized gain (loss) on investments | 0.12 | 2.13 | 0.25 | (0.19 | ) | 1.48 | 2.41 | |||||||||||||||||||||||||||||||||||||||||||||||||||||||||||||||||||||||||||||||||||||||||||||||||||||||||||||||
| Total from investment operations | 0.30 | 2.48 | 0.60 | 0.20 | 1.89 | 2.81 | ||||||||||||||||||||||||||||||||||||||||||||||||||||||||||||||||||||||||||||||||||||||||||||||||||||||||||||||||
| Less distributions | ||||||||||||||||||||||||||||||||||||||||||||||||||||||||||||||||||||||||||||||||||||||||||||||||||||||||||||||||||||||
| From net investment income | (0.19 | ) | (0.35 | ) | (0.35 | ) | (0.43 | ) | (0.46 | ) | (0.45 | ) | ||||||||||||||||||||||||||||||||||||||||||||||||||||||||||||||||||||||||||||||||||||||||||||||||||||||||||
| From net realized gain | (0.48 | ) | — | (0.52 | ) | (0.55 | ) | (0.71 | ) | (0.30 | ) | |||||||||||||||||||||||||||||||||||||||||||||||||||||||||||||||||||||||||||||||||||||||||||||||||||||||||||
| Total distributions | (0.67 | ) | (0.35 | ) | (0.87 | ) | (0.98 | ) | (1.17 | ) | (0.75 | ) | ||||||||||||||||||||||||||||||||||||||||||||||||||||||||||||||||||||||||||||||||||||||||||||||||||||||||||
| Net asset value, end of period | $20.12 | $20.49 | $18.36 | $18.63 | $19.41 | $18.69 | ||||||||||||||||||||||||||||||||||||||||||||||||||||||||||||||||||||||||||||||||||||||||||||||||||||||||||||||||
| Total return (%)3 | 1.38 | 4 | 13.64 | 3.41 | 1.15 | 10.59 | 17.47 | |||||||||||||||||||||||||||||||||||||||||||||||||||||||||||||||||||||||||||||||||||||||||||||||||||||||||||||||
| Ratios and supplemental data | ||||||||||||||||||||||||||||||||||||||||||||||||||||||||||||||||||||||||||||||||||||||||||||||||||||||||||||||||||||||
| Net assets, end of period (in millions) | $17 | $24 | $30 | $19 | $14 | $3 | ||||||||||||||||||||||||||||||||||||||||||||||||||||||||||||||||||||||||||||||||||||||||||||||||||||||||||||||||
| Ratios (as a percentage of average net assets): | ||||||||||||||||||||||||||||||||||||||||||||||||||||||||||||||||||||||||||||||||||||||||||||||||||||||||||||||||||||||
| Expenses before reductions | 1.03 | 5 | 1.03 | 1.03 | 1.04 | 1.04 | 1.05 | |||||||||||||||||||||||||||||||||||||||||||||||||||||||||||||||||||||||||||||||||||||||||||||||||||||||||||||||
| Expenses including reductions | 0.92 | 5 | 0.92 | 0.92 | 0.93 | 0.93 | 0.95 | |||||||||||||||||||||||||||||||||||||||||||||||||||||||||||||||||||||||||||||||||||||||||||||||||||||||||||||||
| Net investment income | 1.72 | 5 | 1.79 | 1.93 | 2.06 | 2.20 | 2.26 | |||||||||||||||||||||||||||||||||||||||||||||||||||||||||||||||||||||||||||||||||||||||||||||||||||||||||||||||
| Portfolio turnover (%) | 27 | 52 | 47 | 49 | 39 | 53 | ||||||||||||||||||||||||||||||||||||||||||||||||||||||||||||||||||||||||||||||||||||||||||||||||||||||||||||||||
| 1 | Six months ended 4-30-18. Unaudited. | ||||||||||||||||||||||||||||||||||||||||||||||||||||||||||||||||||||||||||||||||||
| 2 | Based on average daily shares outstanding. | ||||||||||||||||||||||||||||||||||||||||||||||||||||||||||||||||||||||||||||||||||
| 3 | Total returns would have been lower had certain expenses not been reduced during the applicable periods. | ||||||||||||||||||||||||||||||||||||||||||||||||||||||||||||||||||||||||||||||||||
| 4 | Not annualized. | ||||||||||||||||||||||||||||||||||||||||||||||||||||||||||||||||||||||||||||||||||
| 5 | Annualized. | ||||||||||||||||||||||||||||||||||||||||||||||||||||||||||||||||||||||||||||||||||
| Class R5 Shares Period ended | 4-30-18 | 1 | 10-31-17 | 10-31-16 | 10-31-15 | 10-31-14 | 10-31-13 | |||||||||||||||||||||||||||||||||||||||||||||||||||||||||||||||||||||||||||||||||||||||||||||||||||||||||||||||
| Per share operating performance | ||||||||||||||||||||||||||||||||||||||||||||||||||||||||||||||||||||||||||||||||||||||||||||||||||||||||||||||||||||||
| Net asset value, beginning of period | $20.47 | $18.34 | $18.60 | $19.39 | $18.67 | $16.61 | ||||||||||||||||||||||||||||||||||||||||||||||||||||||||||||||||||||||||||||||||||||||||||||||||||||||||||||||||
| Net investment income2 | 0.20 | 0.39 | 0.38 | 0.44 | 0.45 | 0.44 | ||||||||||||||||||||||||||||||||||||||||||||||||||||||||||||||||||||||||||||||||||||||||||||||||||||||||||||||||
| Net realized and unrealized gain (loss) on investments | 0.11 | 2.13 | 0.26 | (0.21 | ) | 1.47 | 2.40 | |||||||||||||||||||||||||||||||||||||||||||||||||||||||||||||||||||||||||||||||||||||||||||||||||||||||||||||||
| Total from investment operations | 0.31 | 2.52 | 0.64 | 0.23 | 1.92 | 2.84 | ||||||||||||||||||||||||||||||||||||||||||||||||||||||||||||||||||||||||||||||||||||||||||||||||||||||||||||||||
| Less distributions | ||||||||||||||||||||||||||||||||||||||||||||||||||||||||||||||||||||||||||||||||||||||||||||||||||||||||||||||||||||||
| From net investment income | (0.21 | ) | (0.39 | ) | (0.38 | ) | (0.47 | ) | (0.49 | ) | (0.48 | ) | ||||||||||||||||||||||||||||||||||||||||||||||||||||||||||||||||||||||||||||||||||||||||||||||||||||||||||
| From net realized gain | (0.48 | ) | — | (0.52 | ) | (0.55 | ) | (0.71 | ) | (0.30 | ) | |||||||||||||||||||||||||||||||||||||||||||||||||||||||||||||||||||||||||||||||||||||||||||||||||||||||||||
| Total distributions | (0.69 | ) | (0.39 | ) | (0.90 | ) | (1.02 | ) | (1.20 | ) | (0.78 | ) | ||||||||||||||||||||||||||||||||||||||||||||||||||||||||||||||||||||||||||||||||||||||||||||||||||||||||||
| Net asset value, end of period | $20.09 | $20.47 | $18.34 | $18.60 | $19.39 | $18.67 | ||||||||||||||||||||||||||||||||||||||||||||||||||||||||||||||||||||||||||||||||||||||||||||||||||||||||||||||||
| Total return (%)3 | 1.43 | 4 | 13.88 | 3.68 | 1.30 | 10.82 | 17.73 | |||||||||||||||||||||||||||||||||||||||||||||||||||||||||||||||||||||||||||||||||||||||||||||||||||||||||||||||
| Ratios and supplemental data | ||||||||||||||||||||||||||||||||||||||||||||||||||||||||||||||||||||||||||||||||||||||||||||||||||||||||||||||||||||||
| Net assets, end of period (in millions) | $10 | $2 | $2 | $2 | $3 | $2 | ||||||||||||||||||||||||||||||||||||||||||||||||||||||||||||||||||||||||||||||||||||||||||||||||||||||||||||||||
| Ratios (as a percentage of average net assets): | ||||||||||||||||||||||||||||||||||||||||||||||||||||||||||||||||||||||||||||||||||||||||||||||||||||||||||||||||||||||
| Expenses before reductions | 0.73 | 5 | 0.73 | 0.73 | 0.73 | 0.73 | 0.74 | |||||||||||||||||||||||||||||||||||||||||||||||||||||||||||||||||||||||||||||||||||||||||||||||||||||||||||||||
| Expenses including reductions | 0.72 | 5 | 0.72 | 0.72 | 0.72 | 0.72 | 0.74 | |||||||||||||||||||||||||||||||||||||||||||||||||||||||||||||||||||||||||||||||||||||||||||||||||||||||||||||||
| Net investment income | 2.05 | 5 | 1.97 | 2.14 | 2.29 | 2.41 | 2.51 | |||||||||||||||||||||||||||||||||||||||||||||||||||||||||||||||||||||||||||||||||||||||||||||||||||||||||||||||
| Portfolio turnover (%) | 27 | 52 | 47 | 49 | 39 | 53 | ||||||||||||||||||||||||||||||||||||||||||||||||||||||||||||||||||||||||||||||||||||||||||||||||||||||||||||||||
| 1 | Six months ended 4-30-18. Unaudited. | ||||||||||||||||||||||||||||||||||||||||||||||||||||||||||||||||||||||||||||||||||
| 2 | Based on average daily shares outstanding. | ||||||||||||||||||||||||||||||||||||||||||||||||||||||||||||||||||||||||||||||||||
| 3 | Total returns would have been lower had certain expenses not been reduced during the applicable periods. | ||||||||||||||||||||||||||||||||||||||||||||||||||||||||||||||||||||||||||||||||||
| 4 | Not annualized. | ||||||||||||||||||||||||||||||||||||||||||||||||||||||||||||||||||||||||||||||||||
| 5 | Annualized. | ||||||||||||||||||||||||||||||||||||||||||||||||||||||||||||||||||||||||||||||||||
| Class R6 Shares Period ended | 4-30-18 | 1 | 10-31-17 | 10-31-16 | 10-31-15 | 10-31-14 | 10-31-13 | |||||||||||||||||||||||||||||||||||||||||||||||||||||||||||||||||||||||||||||||||||||||||||||||||||||||||||||||
| Per share operating performance | ||||||||||||||||||||||||||||||||||||||||||||||||||||||||||||||||||||||||||||||||||||||||||||||||||||||||||||||||||||||
| Net asset value, beginning of period | $20.41 | $18.30 | $18.56 | $19.35 | $18.63 | $16.58 | ||||||||||||||||||||||||||||||||||||||||||||||||||||||||||||||||||||||||||||||||||||||||||||||||||||||||||||||||
| Net investment income2 | 0.21 | 0.39 | 0.39 | 0.44 | 0.47 | 0.44 | ||||||||||||||||||||||||||||||||||||||||||||||||||||||||||||||||||||||||||||||||||||||||||||||||||||||||||||||||
| Net realized and unrealized gain (loss) on investments | 0.11 | 2.12 | 0.27 | (0.20 | ) | 1.47 | 2.40 | |||||||||||||||||||||||||||||||||||||||||||||||||||||||||||||||||||||||||||||||||||||||||||||||||||||||||||||||
| Total from investment operations | 0.32 | 2.51 | 0.66 | 0.24 | 1.94 | 2.84 | ||||||||||||||||||||||||||||||||||||||||||||||||||||||||||||||||||||||||||||||||||||||||||||||||||||||||||||||||
| Less distributions | ||||||||||||||||||||||||||||||||||||||||||||||||||||||||||||||||||||||||||||||||||||||||||||||||||||||||||||||||||||||
| From net investment income | (0.21 | ) | (0.40 | ) | (0.40 | ) | (0.48 | ) | (0.51 | ) | (0.49 | ) | ||||||||||||||||||||||||||||||||||||||||||||||||||||||||||||||||||||||||||||||||||||||||||||||||||||||||||
| From net realized gain | (0.48 | ) | — | (0.52 | ) | (0.55 | ) | (0.71 | ) | (0.30 | ) | |||||||||||||||||||||||||||||||||||||||||||||||||||||||||||||||||||||||||||||||||||||||||||||||||||||||||||
| Total distributions | (0.69 | ) | (0.40 | ) | (0.92 | ) | (1.03 | ) | (1.22 | ) | (0.79 | ) | ||||||||||||||||||||||||||||||||||||||||||||||||||||||||||||||||||||||||||||||||||||||||||||||||||||||||||
| Net asset value, end of period | $20.04 | $20.41 | $18.30 | $18.56 | $19.35 | $18.63 | ||||||||||||||||||||||||||||||||||||||||||||||||||||||||||||||||||||||||||||||||||||||||||||||||||||||||||||||||
| Total return (%)3 | 1.51 | 4 | 13.87 | 3.76 | 1.38 | 10.91 | 17.76 | |||||||||||||||||||||||||||||||||||||||||||||||||||||||||||||||||||||||||||||||||||||||||||||||||||||||||||||||
| Ratios and supplemental data | ||||||||||||||||||||||||||||||||||||||||||||||||||||||||||||||||||||||||||||||||||||||||||||||||||||||||||||||||||||||
| Net assets, end of period (in millions) | $159 | $18 | $7 | $5 | $1 | — | 5 | |||||||||||||||||||||||||||||||||||||||||||||||||||||||||||||||||||||||||||||||||||||||||||||||||||||||||||||||
| Ratios (as a percentage of average net assets): | ||||||||||||||||||||||||||||||||||||||||||||||||||||||||||||||||||||||||||||||||||||||||||||||||||||||||||||||||||||||
| Expenses before reductions | 0.68 | 6 | 0.68 | 0.69 | 0.69 | 0.69 | 0.70 | |||||||||||||||||||||||||||||||||||||||||||||||||||||||||||||||||||||||||||||||||||||||||||||||||||||||||||||||
| Expenses including reductions | 0.67 | 6 | 0.67 | 0.66 | 0.67 | 0.66 | 0.70 | |||||||||||||||||||||||||||||||||||||||||||||||||||||||||||||||||||||||||||||||||||||||||||||||||||||||||||||||
| Net investment income | 2.03 | 6 | 1.97 | 2.19 | 2.34 | 2.50 | 2.50 | |||||||||||||||||||||||||||||||||||||||||||||||||||||||||||||||||||||||||||||||||||||||||||||||||||||||||||||||
| Portfolio turnover (%) | 27 | 52 | 47 | 49 | 39 | 53 | ||||||||||||||||||||||||||||||||||||||||||||||||||||||||||||||||||||||||||||||||||||||||||||||||||||||||||||||||
| 1 | Six months ended 4-30-18. Unaudited. | ||||||||||||||||||||||||||||||||||||||||||||||||||||||||||||||||||||||||||||||||||
| 2 | Based on average daily shares outstanding. | ||||||||||||||||||||||||||||||||||||||||||||||||||||||||||||||||||||||||||||||||||
| 3 | Total returns would have been lower had certain expenses not been reduced during the applicable periods. | ||||||||||||||||||||||||||||||||||||||||||||||||||||||||||||||||||||||||||||||||||
| 4 | Not annualized. | ||||||||||||||||||||||||||||||||||||||||||||||||||||||||||||||||||||||||||||||||||
| 5 | Less than $500,000. | ||||||||||||||||||||||||||||||||||||||||||||||||||||||||||||||||||||||||||||||||||
| 6 | Annualized. | ||||||||||||||||||||||||||||||||||||||||||||||||||||||||||||||||||||||||||||||||||
Note 1 — Organization
John Hancock Balanced Fund (the fund) is a series of John Hancock Investment Trust (the Trust), an open-end management investment company organized as a Massachusetts business trust and registered under the Investment Company Act of 1940, as amended (the 1940 Act). The investment objective of the fund is to seek current income, long-term growth of capital and income, and preservation of capital.
The fund may offer multiple classes of shares. The shares currently offered by the fund are detailed in the Statement of assets and liabilities. Class A and Class C shares are offered to all investors. Class B shares are closed to new investors. Class I shares are offered to institutions and certain investors. Class R1, Class R2, Class R3, Class R4 and Class R5 shares are available only to certain retirement and 529 plans. Class R6 shares are only available to certain retirement plans, institutions and other investors. Class B shares convert to Class A shares eight years after purchase. Shareholders of each class have exclusive voting rights to matters that affect that class. The distribution and service fees, if any, and transfer agent fees for each class may differ. Effective May 1, 2018, Class C shares convert to Class A shares ten years after purchase (certain exclusions may apply).
Note 2 — Significant accounting policies
The financial statements have been prepared in conformity with accounting principles generally accepted in the United States of America (US GAAP), which require management to make certain estimates and assumptions as of the date of the financial statements. Actual results could differ from those estimates and those differences could be significant. The fund qualifies as an investment company under Topic 946 of Accounting Standards Codification of US GAAP.
Events or transactions occurring after the end of the fiscal period through the date that the financial statements were issued have been evaluated in the preparation of the financial statements. The following summarizes the significant accounting policies of the fund:
Security valuation. Investments are stated at value as of the scheduled close of regular trading on the New York Stock Exchange (NYSE), normally at 4:00 p.m., Eastern Time. In case of emergency or other disruption resulting in the NYSE not opening for trading or the NYSE closing at a time other than the regularly scheduled close, the net asset value (NAV) may be determined as of the regularly scheduled close of the NYSE pursuant to the fund's Valuation Policies and Procedures.
In order to value the securities, the fund uses the following valuation techniques: Equity securities held by the fund are typically valued at the last sale price or official closing price on the exchange or principal market where the security trades. In the event there were no sales during the day or closing prices are not available, the securities are valued using the last available bid price. Investments by the fund in open-end mutual funds, including John Hancock Collateral Trust (JHCT), are valued at their respective NAVs each business day. Debt obligations are valued based on the evaluated prices provided by an independent pricing vendor or from broker-dealers. Independent pricing vendors utilize matrix pricing which takes into account factors such as institutional-size trading in similar groups of securities, yield, quality, coupon rate, maturity, type of issue, trading characteristics and other market data, as well as broker supplied prices. Foreign securities and currencies are valued in U.S. dollars based on foreign currency exchange rates supplied by an independent pricing vendor.
In certain instances, the Pricing Committee may determine to value equity securities using prices obtained from another exchange or market if trading on the exchange or market on which prices are typically obtained did not open for trading as scheduled, or if trading closed earlier than scheduled, and trading occurred as normal on another exchange or market.
Other portfolio securities and assets, for which reliable market quotations are not readily available, are valued at fair value as determined in good faith by the fund's Pricing Committee following procedures established by the Board of Trustees. The frequency with which these fair valuation procedures are used cannot be predicted and fair value of securities may differ significantly from the value that would have been used had a ready market for such securities existed. Trading in foreign securities may be completed before the scheduled daily close of trading on the NYSE. Significant events at the issuer or market level may affect the values of securities between the time when the valuation of the securities is generally determined and the close of the NYSE. If a significant event occurs, these securities may be fair valued, as determined in good faith by the fund's Pricing Committee, following procedures established by the Board of Trustees. The fund uses fair value adjustment factors provided by an independent pricing vendor to value certain foreign securities in order to adjust for events that may occur between the close of foreign exchanges or markets and the close of the NYSE.
The fund uses a three-tier hierarchy to prioritize the pricing assumptions, referred to as inputs, used in valuation techniques to measure fair value. Level 1 includes securities valued using quoted prices in active markets for identical securities. Level 2 includes securities valued using other significant observable inputs. Observable inputs may include quoted prices for similar securities, interest rates, prepayment speeds and credit risk. Prices for securities valued using these inputs are received from independent pricing vendors and brokers and are based on an evaluation of the inputs described. Level 3 includes securities valued using significant unobservable inputs when market prices are not readily available or reliable, including the fund's own assumptions in determining the fair value of investments. Factors used in determining value may include market or issuer specific events or trends, changes in interest rates and credit quality. The inputs or methodology used for valuing securities are not necessarily an indication of the risks associated with investing in those securities. Changes in valuation techniques and related inputs may result in transfers into or out of an assigned level within the disclosure hierarchy.
The following is a summary of the values by input classification of the fund's investments as of April 30, 2018, by major security category or type:
| Total value at 4-30-18 | Level 1 quoted price | Level 2 significant observable inputs | Level 3 significant unobservable inputs | |
| Investments in securities: | ||||
| Assets | ||||
| Common stocks | $1,221,178,413 | $1,203,516,838 | $17,661,575 | — |
| Preferred securities | 2,966,217 | 2,966,217 | — | — |
| U.S. Government and Agency obligations | 192,536,273 | — | 192,536,273 | — |
| Foreign government obligations | 4,601,125 | — | 4,601,125 | — |
| Corporate bonds | 322,061,997 | — | 322,061,997 | — |
| Convertible bonds | 624,825 | — | 624,825 | — |
| Capital preferred securities | 1,159,683 | — | 1,159,683 | — |
| Term loans | 824,526 | — | 824,526 | — |
| Collateralized mortgage obligations | 51,006,596 | — | 51,006,596 | — |
| Asset backed securities | 85,637,741 | — | 85,637,741 | — |
| Securities lending collateral | 3,269,533 | 3,269,533 | — | — |
| Short-term investments | 6,756,000 | — | 6,756,000 | — |
| Total investments in securities | $1,892,622,929 | $1,209,752,588 | $682,870,341 | — |
Repurchase agreements. The fund may enter into repurchase agreements. When the fund enters into a repurchase agreement, it receives collateral that is held in a segregated account by the fund's custodian or for tri-party repurchase agreements, collateral is held at a third-party custodian bank in a segregated account for the benefit of the fund. The collateral amount is marked-to-market and monitored on a daily basis to ensure that the collateral held is in an amount not less than the principal amount of the repurchase agreement plus any accrued interest. Collateral received by the fund for repurchase agreements is disclosed in the Fund's investments as part of the caption related to the repurchase agreement.
Repurchase agreements are typically governed by the terms and conditions of the Master Repurchase Agreement and/or Global Master Repurchase Agreement (collectively, MRA). Upon an event of default, the non-defaulting party may close out all transactions traded under the MRA and net amounts owed. Absent an event of default, assets and liabilities resulting from repurchase agreements are not offset in the Statement of assets and liabilities. In the event of a default by the counterparty, realization of the collateral proceeds could be delayed, during which time the collateral value may decline or the counterparty may have insufficient assets to pay back claims resulting from close-out of the transactions.
Security transactions and related investment income. Investment security transactions are accounted for on a trade date plus one basis for daily NAV calculations. However, for financial reporting purposes, investment transactions are reported on trade date. Interest income is accrued as earned. Interest income includes coupon interest and amortization/accretion of premiums/discounts on debt securities. Debt obligations may be placed in a non-accrual status and related interest income may be reduced by
stopping current accruals and writing off interest receivable when the collection of all or a portion of interest has become doubtful. Dividend income is recorded on the ex-date, except for dividends of foreign securities where the dividend may not be known until after the ex-date. In those cases, dividend income, net of withholding taxes, is recorded when the fund becomes aware of the dividends. Gains and losses on securities sold are determined on the basis of identified cost and may include proceeds from litigation.
Securities lending. The fund may lend its securities to earn additional income. The fund receives cash collateral from the borrower in an amount not less than the market value of the loaned securities. The fund will invest its collateral in JHCT, an affiliate of the fund, which has a floating NAV and is registered with the Securities and Exchange Commission as an investment company. JHCT invests in short-term money market investments. The fund will receive the benefit of any gains and bear any losses generated by JHCT with respect to the cash collateral.
The fund has the right to recall loaned securities on demand. If a borrower fails to return loaned securities when due, then the lending agent is responsible and indemnifies the fund for the lent securities. The lending agent uses the collateral received from the borrower to purchase replacement securities of the same issue, type, class and series of the loaned securities. If the value of the collateral is less than the purchase cost of replacement securities, the lending agent is responsible for satisfying the shortfall but only to the extent that the shortfall is not due to any decrease in the value of JHCT.
Although the risk of the loss of the securities lent is mitigated by receiving collateral from the borrower and through lending agent indemnification, the fund could experience a delay in recovering securities or could experience a lower than expected return if the borrower fails to return the securities on a timely basis. The fund receives compensation for lending its securities by retaining a portion of the return on the investment of the collateral and compensation from fees earned from borrowers of the securities. Securities lending income received by the fund is net of fees retained by the securities lending agent. Net income received from JHCT is a component of securities lending income as recorded on the Statement of operations.
Obligations to repay collateral received by the fund are shown on the Statement(s) of assets and liabilities as Payable upon return of securities loaned and are secured by the loaned securities. As of April 30, 2018, the fund loaned securities valued at $3,188,563 and received $3,274,703 of cash collateral.
Foreign investing. Assets, including investments and liabilities denominated in foreign currencies, are translated into U.S. dollar values each day at the prevailing exchange rate. Purchases and sales of securities, income and expenses are translated into U.S. dollars at the prevailing exchange rate on the date of the transaction. The effect of changes in foreign currency exchange rates on the value of securities is reflected as a component of the realized and unrealized gains (losses) on investments. Foreign investments are subject to a decline in the value of a foreign currency versus the U.S. dollar, which reduces the dollar value of securities denominated in that currency.
Funds that invest internationally generally carry more risk than funds that invest strictly in U.S. securities. These risks are heightened for investments in emerging markets. Risks can result from differences in economic and political conditions, regulations, market practices (including higher transaction costs), accounting standards and other factors.
Foreign taxes. The fund may be subject to withholding tax on income, capital gains or repatriation taxes imposed by certain countries, a portion of which may be recoverable. Foreign taxes are accrued based upon the fund's understanding of the tax rules and rates that exist in the foreign markets in which it invests. Taxes are accrued based on gains realized by the fund as a result of certain foreign security sales. Estimated taxes are accrued based on unrealized appreciation of such securities. Investment income is recorded net of foreign withholding taxes, less any amounts reclaimable.
Line of credit. The fund may have the ability to borrow from banks for temporary or emergency purposes, including meeting redemption requests that otherwise might require the untimely sale of securities. Pursuant to the fund's custodian agreement, the custodian may loan money to the fund to make properly authorized payments. The fund is obligated to repay the custodian for any overdraft, including any related costs or expenses. The custodian may have a lien, security interest or security entitlement in any fund property that is not otherwise segregated or pledged, to the extent of any overdraft, and to the maximum extent permitted by law.
The fund and other affiliated funds have entered into a syndicated line of credit agreement with Citibank, N.A. as the administrative agent that enables them to participate in a $750 million unsecured committed line of credit. Excluding commitments designated for a certain fund and subject to the needs of all other affiliated funds, the fund can borrow up to an aggregate commitment
amount of $500 million, subject to asset coverage and other limitations as specified in the agreement. A commitment fee payable at the end of each calendar quarter, based on the average daily unused portion of the line of credit, is charged to each participating fund based on a combination of fixed and asset based allocations and is reflected in Other expenses on the Statement of operations. For the six months ended April 30, 2018, the fund had no borrowings under the line of credit. Commitment fees for the six months ended April 30, 2018 were $3,924.
Expenses. Within the John Hancock group of funds complex, expenses that are directly attributable to an individual fund are allocated to such fund. Expenses that are not readily attributable to a specific fund are allocated among all funds in an equitable manner, taking into consideration, among other things, the nature and type of expense and the fund's relative net assets. Expense estimates are accrued in the period to which they relate and adjustments are made when actual amounts are known.
Class allocations. Income, common expenses and realized and unrealized gains (losses) are determined at the fund level and allocated daily to each class of shares based on the net assets of the class. Class-specific expenses, such as distribution and service fees, if any, and transfer agent fees, for all classes, are charged daily at the class level based on the net assets of each class and the specific expense rates applicable to each class.
Federal income taxes. The fund intends to continue to qualify as a regulated investment company by complying with the applicable provisions of the Internal Revenue Code and will not be subject to federal income tax on taxable income that is distributed to shareholders. Therefore, no federal income tax provision is required.
As of October 31, 2017, the fund had no uncertain tax positions that would require financial statement recognition, derecognition or disclosure. The fund's federal tax returns are subject to examination by the Internal Revenue Service for a period of three years.
Distribution of income and gains. Distributions to shareholders from net investment income and net realized gains, if any, are recorded on the ex-date. The fund generally declares and pays dividends quarterly and capital gain distributions, if any, annually.
Distributions paid by the fund with respect to each class of shares are calculated in the same manner, at the same time and in the same amount, except for the effect of class level expenses that may be applied differently to each class.
Such distributions, on a tax basis, are determined in conformity with income tax regulations, which may differ from US GAAP. Distributions in excess of tax basis earnings and profits, if any, are reported in the fund's financial statements as a return of capital. The final determination of tax characteristics of the fund's distribution will occur at the end of the year and will subsequently be reported to shareholders.
Capital accounts within the financial statements are adjusted for permanent book-tax differences. These adjustments have no impact on net assets or the results of operations. Temporary book-tax differences, if any, will reverse in a subsequent period. Book-tax differences are primarily attributable to amortization and accretion on debt securities and wash sale loss deferrals.
Note 3 — Guarantees and indemnifications
Under the Trust's organizational documents, its Officers and Trustees are indemnified against certain liabilities arising out of the performance of their duties to the Trust, including the fund. Additionally, in the normal course of business, the fund enters into contracts with service providers that contain general indemnification clauses. The fund's maximum exposure under these arrangements is unknown, as this would involve future claims that may be made against the fund that have not yet occurred. The risk of material loss from such claims is considered remote.
Note 4 — Fees and transactions with affiliates
John Hancock Advisers, LLC (the Advisor) serves as investment advisor for the fund. John Hancock Funds, LLC (the Distributor), an affiliate of the Advisor, serves as principal underwriter of the fund. The Advisor and the Distributor are indirect, wholly owned subsidiaries of Manulife Financial Corporation (MFC).
Management fee. The fund has an investment management agreement with the Advisor under which the fund pays a daily management fee to the Advisor equivalent on an annual basis to the sum of: (a) 0.600% of the first $2 billion of the fund's average daily net assets and (b) 0.550% of the fund's average daily net assets in excess of $2 billion. The Advisor has a subadvisory agreement with John Hancock Asset Management a division of Manulife Asset Management (US) LLC, an indirectly owned subsidiary of MFC and an affiliate of the Advisor. The fund is not responsible for payment of the subadvisory fees.
The Advisor has contractually agreed to waive a portion of its management fee and/or reimburse expenses for certain funds of the John Hancock group of funds complex, including the fund (the participating portfolios). This waiver is based upon aggregate net assets of all the participating portfolios. The amount of the reimbursement is calculated daily and allocated among all the participating portfolios in proportion to the daily net assets of each fund. During the six months ended April 30, 2018, this waiver amounted to 0.01% of the fund's average net assets (on an annualized basis). This arrangement may be amended or terminated at any time by the Advisor upon notice to the fund and with the approval of the Board of Trustees.
For the six months ended April 30, 2018, these expense reductions described above amounted to the following:
| Class | Expense reduction | Class | Expense reduction | |
| Class A | $34,887 | Class R3 | $213 | |
| Class B | 1,336 | Class R4 | 903 | |
| Class C | 21,007 | Class R5 | 255 | |
| Class I | 17,658 | Class R6 | 6,246 | |
| Class R1 | 178 | Total | $82,841 | |
| Class R2 | 158 |
Expenses waived or reimbursed in the current fiscal period are not subject to recapture in future fiscal periods.
The investment management fees incurred for the six months ended April 30, 2018 were equivalent to a net annual effective rate of 0.59% of the fund's average daily net assets.
Accounting and legal services. Pursuant to a service agreement, the fund reimburses the Advisor for all expenses associated with providing the administrative, financial, legal, compliance, accounting and recordkeeping services to the fund, including the preparation of all tax returns, periodic reports to shareholders and regulatory reports, among other services. These expenses are allocated to each share class based on its relative net assets at the time the expense was incurred. These accounting and legal services fees incurred for the six months ended April 30, 2018 amounted to an annual rate of 0.02% of the fund's average daily net assets.
Distribution and service plans. The fund has a distribution agreement with the Distributor. The fund has adopted distribution and service plans with respect to Class A, Class B, Class C, Class R1, Class R2, Class R3 and Class R4 shares pursuant to Rule 12b-1 under the 1940 Act, to pay the Distributor for services provided as the distributor of shares of the fund. In addition, under a service plan for Class R1, Class R2, Class R3, Class R4 and Class R5, the fund pays for certain other services. The fund may pay up to the following contractual rates of distribution and service fees under these arrangements, expressed as an annual percentage of average daily net assets for each class of the fund's shares.
| Class | Rule 12b-1 fee | Service fee | Class | Rule 12b-1 fee | Service fee | |
| Class A | 0.30% | — | Class R2 | 0.25% | 0.25% | |
| Class B | 1.00% | — | Class R3 | 0.50% | 0.15% | |
| Class C | 1.00% | — | Class R4 | 0.25% | 0.10% | |
| Class R1 | 0.50% | 0.25% | Class R5 | — | 0.05% |
The fund's Distributor has contractually agreed to waive 0.10% of Rule12b-1 fees for Class R4 shares. The current waiver agreement expires on February 28, 2019, unless renewed by mutual agreement of the fund and the Distributor based upon a determination that this is appropriate under the circumstances at the time. This contractual waiver amounted to $10,616 for Class R4 shares for the six months ended April 30, 2018.
Sales charges. Class A shares are assessed up-front sales charges, which resulted in payments to the Distributor amounting to $780,261 for the six months ended April 30, 2018. Of this amount, $129,627 was retained and used for printing prospectuses, advertising, sales literature and other purposes, $631,992 was paid as sales commissions to broker-dealers and $18,642 was paid as sales commissions to sales personnel of Signator Investors, Inc., a broker-dealer affiliate of the Advisor.
Class A, Class B and Class C shares may be subject to contingent deferred sales charges (CDSCs). Certain Class A shares that are acquired through purchases of $1 million or more and are redeemed within one year of purchase are subject to a 1.00% sales
charge. Class B shares that are redeemed within six years of purchase are subject to CDSCs, at declining rates, beginning at 5.00%. Class C shares that are redeemed within one year of purchase are subject to a 1.00% CDSC. CDSCs are applied to the lesser of the current market value at the time of redemption or the original purchase cost of the shares being redeemed. Proceeds from CDSCs are used to compensate the Distributor for providing distribution-related services in connection with the sale of these shares. During the six months ended April 30, 2018, CDSCs received by the Distributor amounted to $2,185, $5,983 and $19,717 for Class A, Class B and Class C shares, respectively.
Transfer agent fees. The John Hancock Group of Funds has a complex-wide transfer agent agreement with John Hancock Signature Services, Inc. (Signature Services), an affiliate of the Advisor. The transfer agent fees paid to Signature Services are determined based on the cost to Signature Services (Signature Services Cost) of providing recordkeeping services. It also includes out-of-pocket expenses, including payments made to third-parties for recordkeeping services provided to their clients who invest in one or more John Hancock funds. In addition, Signature Services Cost may be reduced by certain fees that Signature Services receives in connection with retirement and small accounts. Signature Services Cost is calculated monthly and allocated, as applicable, to five categories of share classes: Retail Share and Institutional Share Classes of Non-Municipal Bond Funds, Class R6 Shares, Retirement Share Classes and Municipal Bond Share Classes. Within each of these categories, the applicable costs are allocated to the affected John Hancock affiliated funds and/or classes, based on the relative average daily net assets.
Class level expenses. Class level expenses for the six months ended April 30, 2018 were:
| Class | Distribution and service fees | Transfer agent fees |
| Class A | $1,224,926 | $441,666 |
| Class B | 156,543 | 16,872 |
| Class C | 2,459,252 | 265,910 |
| Class I | — | 228,570 |
| Class R1 | 15,567 | 253 |
| Class R2 | 9,371 | 224 |
| Class R3 | 14,673 | 303 |
| Class R4 | 37,156 | 1,280 |
| Class R5 | 1,444 | 363 |
| Class R6 | — | 8,874 |
| Total | $3,918,932 | $964,315 |
Trustee expenses. The fund compensates each Trustee who is not an employee of the Advisor or its affiliates. The costs of paying Trustee compensation and expenses are allocated to the fund based on its net assets relative to other funds within the John Hancock group of funds complex.
Note 5 — Fund share transactions
Transactions in fund shares for the six months ended April 30, 2018 and for the year ended October 31, 2017 were as follows:
| Six months ended 4-30-18 | Year ended 10-31-17 | |||||||||||||||||||||||||
| Shares | Amount | Shares | Amount | |||||||||||||||||||||||
| Class A shares | ||||||||||||||||||||||||||
| Sold | 3,004,114 | $61,807,522 | 8,691,839 | $168,321,199 | ||||||||||||||||||||||
| Distributions reinvested | 1,216,412 | 24,840,588 | 691,175 | 13,410,564 | ||||||||||||||||||||||
| Repurchased | (4,341,153 | ) | (89,306,202 | ) | (16,713,569 | ) | (323,272,084 | ) | ||||||||||||||||||
| Net decrease | (120,627 | ) | ($2,658,092 | ) | (7,330,555 | ) | ($141,540,321 | ) | ||||||||||||||||||
| Six months ended 4-30-18 | Year ended 10-31-17 | |||||||||||||||||||||||||
| Shares | Amount | Shares | Amount | |||||||||||||||||||||||
| Class B shares | ||||||||||||||||||||||||||
| Sold | 13,147 | $270,933 | 84,654 | $1,619,726 | ||||||||||||||||||||||
| Distributions reinvested | 41,276 | 842,661 | 20,184 | 390,229 | ||||||||||||||||||||||
| Repurchased | (517,294 | ) | (10,626,042 | ) | (1,048,947 | ) | (20,415,869 | ) | ||||||||||||||||||
| Net decrease | (462,871 | ) | ($9,512,448 | ) | (944,109 | ) | ($18,405,914 | ) | ||||||||||||||||||
| Class C shares | ||||||||||||||||||||||||||
| Sold | 1,111,737 | $22,835,657 | 3,477,387 | $67,164,622 | ||||||||||||||||||||||
| Distributions reinvested | 613,547 | 12,530,178 | 227,327 | 4,408,006 | ||||||||||||||||||||||
| Repurchased | (2,696,553 | ) | (55,292,535 | ) | (6,961,503 | ) | (135,114,388 | ) | ||||||||||||||||||
| Net decrease | (971,269 | ) | ($19,926,700 | ) | (3,256,789 | ) | ($63,541,760 | ) | ||||||||||||||||||
| Class I shares | ||||||||||||||||||||||||||
| Sold | 2,669,625 | $54,977,103 | 18,155,519 | $350,402,000 | ||||||||||||||||||||||
| Distributions reinvested | 552,034 | 11,257,372 | 368,216 | 7,188,442 | ||||||||||||||||||||||
| Repurchased | (8,780,947 | ) | (179,701,998 | ) | (5,665,397 | ) | (110,426,183 | ) | ||||||||||||||||||
| Net increase (decrease) | (5,559,288 | ) | ($113,467,523 | ) | 12,858,338 | $247,164,259 | ||||||||||||||||||||
| Class R1 shares | ||||||||||||||||||||||||||
| Sold | 24,278 | $500,797 | 67,160 | $1,306,506 | ||||||||||||||||||||||
| Distributions reinvested | 3,728 | 76,514 | 2,242 | 43,725 | ||||||||||||||||||||||
| Repurchased | (89,894 | ) | (1,853,069 | ) | (125,178 | ) | (2,453,074 | ) | ||||||||||||||||||
| Net decrease | (61,888 | ) | ($1,275,758 | ) | (55,776 | ) | ($1,102,843 | ) | ||||||||||||||||||
| Class R2 shares | ||||||||||||||||||||||||||
| Sold | 41,625 | $858,380 | 96,173 | $1,863,805 | ||||||||||||||||||||||
| Distributions reinvested | 4,075 | 83,092 | 5,475 | 105,763 | ||||||||||||||||||||||
| Repurchased | (55,222 | ) | (1,129,216 | ) | (334,646 | ) | (6,597,986 | ) | ||||||||||||||||||
| Net decrease | (9,522 | ) | ($187,744 | ) | (232,998 | ) | ($4,628,418 | ) | ||||||||||||||||||
| Class R3 shares | ||||||||||||||||||||||||||
| Sold | 22,277 | $463,009 | 157,721 | $3,064,790 | ||||||||||||||||||||||
| Distributions reinvested | 7,311 | 149,673 | 3,253 | 63,404 | ||||||||||||||||||||||
| Repurchased | (13,522 | ) | (281,014 | ) | (130,907 | ) | (2,569,484 | ) | ||||||||||||||||||
| Net increase | 16,066 | $331,668 | 30,067 | $558,710 | ||||||||||||||||||||||
| Class R4 shares | ||||||||||||||||||||||||||
| Sold | 182,724 | $3,806,886 | 339,506 | $6,616,405 | ||||||||||||||||||||||
| Distributions reinvested | 37,209 | 763,256 | 23,144 | 450,066 | ||||||||||||||||||||||
| Repurchased | (557,175 | ) | (11,624,958 | ) | (791,274 | ) | (15,407,394 | ) | ||||||||||||||||||
| Net decrease | (337,242 | ) | ($7,054,816 | ) | (428,624 | ) | ($8,340,923 | ) | ||||||||||||||||||
| Class R5 shares | ||||||||||||||||||||||||||
| Sold | 419,508 | $8,770,287 | 31,396 | $613,332 | ||||||||||||||||||||||
| Distributions reinvested | 5,098 | 103,705 | 1,821 | 35,430 | ||||||||||||||||||||||
| Repurchased | (14,650 | ) | (300,301 | ) | (42,212 | ) | (802,925 | ) | ||||||||||||||||||
| Net increase (decrease) | 409,956 | $8,573,691 | (8,995 | ) | ($154,163 | ) | ||||||||||||||||||||
| Six months ended 4-30-18 | Year ended 10-31-17 | |||||||||||||||||||||||||
| Shares | Amount | Shares | Amount | |||||||||||||||||||||||
| Class R6 shares | ||||||||||||||||||||||||||
| Sold | 7,514,003 | $153,954,664 | 590,954 | $11,499,434 | ||||||||||||||||||||||
| Distributions reinvested | 243,492 | 4,969,120 | 12,891 | 252,670 | ||||||||||||||||||||||
| Repurchased | (697,460 | ) | (14,302,544 | ) | (102,167 | ) | (1,986,775 | ) | ||||||||||||||||||
| Net increase | 7,060,035 | $144,621,240 | 501,678 | $9,765,329 | ||||||||||||||||||||||
| Total net increase (decrease) | (36,650 | ) | ($556,482 | ) | 1,132,237 | $19,773,956 | ||||||||||||||||||||
Affiliates of the fund owned 25% of Class R6 shares on April 30, 2018. Such concentration of shareholders' capital could have a material effect on the fund if such shareholders redeem from the fund.
Note 6 — Purchase and sale of securities
Purchases and sales of securities, other than short-term securities and U.S. Treasury obligations, amounted to $384,184,198 and $395,436,199, respectively, for the six months ended April 30, 2018. Purchases and sales of U.S. Treasury obligations aggregated $146,198,297 and $166,627,790, respectively, for the six months ended April 30, 2018.
Trustees Hassell H. McClellan, Chairperson Officers Andrew G. Arnott John J. Danello Francis V. Knox, Jr. Charles A. Rizzo Salvatore Schiavone | Investment advisor John Hancock Advisers, LLC Subadvisor John Hancock Asset Management a division of Manulife Asset Management (US) LLC Principal distributor John Hancock Funds, LLC Custodian State Street Bank and Trust Company Transfer agent John Hancock Signature Services, Inc. Legal counsel K&L Gates LLP |
*Member of the Audit Committee
†Non-Independent Trustee
#Effective 6-20-17
The fund's proxy voting policies and procedures, as well as the fund proxy voting record for the most recent twelve-month period ended June 30, are available free of charge on the Securities and Exchange Commission (SEC) website at sec.gov or on our website.
The fund's complete list of portfolio holdings, for the first and third fiscal quarters, is filed with the SEC on Form N-Q. The fund's Form N-Q is available on our website and the SEC's website, sec.gov, and can be reviewed and copied (for a fee) at the SEC's Public Reference Room in Washington, DC. Call 800-SEC-0330 to receive information on the operation of the SEC's Public Reference Room.
We make this information on your fund, as well as monthly portfolio holdings, and other fund details available on our website at jhinvestments.com or by calling 800-225-5291.
| You can also contact us: | |||
| 800-225-5291 jhinvestments.com | Regular mail: John Hancock Signature Services, Inc. | Express mail: John Hancock Signature Services, Inc. | |
John Hancock family of funds
DOMESTIC EQUITY FUNDS Balanced Blue Chip Growth Classic Value Disciplined Value Disciplined Value Mid Cap Equity Income Fundamental All Cap Core Fundamental Large Cap Core Fundamental Large Cap Value New Opportunities Small Cap Core Small Cap Growth Small Cap Value Strategic Growth U.S. Global Leaders Growth U.S. Growth Value Equity GLOBAL AND INTERNATIONAL EQUITY FUNDS Disciplined Value International Emerging Markets Emerging Markets Equity Fundamental Global Franchise Global Equity Global Shareholder Yield Greater China Opportunities International Growth International Small Company International Value Equity | INCOME FUNDS Bond California Tax-Free Income Emerging Markets Debt Floating Rate Income Government Income High Yield High Yield Municipal Bond Income Investment Grade Bond Money Market Short Duration Credit Opportunities Spectrum Income Strategic Income Opportunities Tax-Free Bond ALTERNATIVE AND SPECIALTY FUNDS Absolute Return Currency Alternative Asset Allocation Enduring Assets Financial Industries Global Absolute Return Strategies Global Conservative Absolute Return Global Focused Strategies Natural Resources Redwood Regional Bank Seaport Long/Short Technical Opportunities |
A fund's investment objectives, risks, charges, and expenses should be considered carefully before investing. The prospectus contains this and other important information about the fund. To obtain a prospectus, contact your financial professional, call John Hancock Investments at 800-225-5291, or visit our website at jhinvestments.com. Please read the prospectus carefully before investing or sending money.
ASSET ALLOCATION Income Allocation Multi-Index Lifetime Portfolios Multi-Index Preservation Portfolios Multimanager Lifestyle Portfolios Multimanager Lifetime Portfolios Retirement Income 2040 EXCHANGE-TRADED FUNDS John Hancock Multifactor Consumer Discretionary ETF John Hancock Multifactor Consumer Staples ETF John Hancock Multifactor Developed International ETF John Hancock Multifactor Energy ETF John Hancock Multifactor Financials ETF John Hancock Multifactor Healthcare ETF John Hancock Multifactor Industrials ETF John Hancock Multifactor Large Cap ETF John Hancock Multifactor Materials ETF John Hancock Multifactor Mid Cap ETF John Hancock Multifactor Small Cap ETF John Hancock Multifactor Technology ETF John Hancock Multifactor Utilities ETF | ENVIRONMENTAL, SOCIAL, AND GOVERNANCE FUNDS ESG All Cap Core ESG Core Bond ESG International Equity ESG Large Cap Core CLOSED-END FUNDS Financial Opportunities Hedged Equity & Income Income Securities Trust Investors Trust Preferred Income Preferred Income II Preferred Income III Premium Dividend Tax-Advantaged Dividend Income Tax-Advantaged Global Shareholder Yield |
John Hancock Multifactor ETF shares are bought and sold at market price (not NAV), and are not individually redeemed
from the fund. Brokerage commissions will reduce returns.
John Hancock ETFs are distributed by Foreside Fund Services, LLC, and are subadvised by Dimensional Fund Advisors LP.
Foreside is not affiliated with John Hancock Funds, LLC or Dimensional Fund Advisors LP.
Dimensional Fund Advisors LP receives compensation from John Hancock in connection with licensing rights to the
John Hancock Dimensional indexes. Dimensional Fund Advisors LP does not sponsor, endorse, or sell, and makes no
representation as to the advisability of investing in, John Hancock Multifactor ETFs.
John Hancock Investments
A trusted brand
John Hancock Investments is a premier asset manager representing one of
America's most trusted brands, with a heritage of financial stewardship dating
back to 1862. Helping our shareholders pursue their financial goals is at the
core of everything we do. It's why we support the role of professional financial
advice and operate with the highest standards of conduct and integrity.
A better way to invest
We serve investors globally through a unique multimanager approach:
We search the world to find proven portfolio teams with specialized
expertise for every strategy we offer, then we apply robust investment
oversight to ensure they continue to meet our uncompromising standards
and serve the best interests of our shareholders.
Results for investors
Our unique approach to asset management enables us to provide a diverse set
of investments backed by some of the world's best managers, along with strong
risk-adjusted returns across asset classes.
| | John Hancock Funds, LLC n Member FINRA, SIPC 601 Congress Street n Boston, MA 02210-2805 800-225-5291 n jhinvestments.com | |
| This report is for the information of the shareholders of John Hancock Balanced Fund. It is not authorized for distribution to prospective investors unless preceded or accompanied by a prospectus. | ||
| MF450356 | 36SA 4/18 6/18 | |
John Hancock
Small Cap Core Fund
Semiannual report 4/30/18
A message to shareholders
Dear shareholder,
Financial markets around the world experienced a meaningful rise in volatility in the last half of the reporting period, leading to some mixed results for equity investors. Stocks generally declined late in the period as investors reacted to a potential trade war between the United States and China and the prospect of rising inflation. While some in the asset management community believe the sell-off will be temporary, we have suggested for some time that the era of extremely low volatility would eventually come to an end, and that now appears to be the case.
Ultimately, the asset prices of stocks are underpinned by fundamentals, and the good news is that those continue to appear supportive. Unemployment remained close to historic lows, consumer confidence rose, and the housing market continued to notch steady gains. One moderating factor was the U.S. Federal Reserve's steady tightening of monetary policy. While higher interest rates alone may not cause the economy to pull back, markets will be closely attuned to any sign of policymakers quickening the pace of interest-rate increases in the year ahead.
Your best resource in unpredictable markets is your financial advisor, who can help position your portfolio so that it's sufficiently diversified to meet your long-term objectives and to withstand the inevitable turbulence along the way.
On behalf of everyone at John Hancock Investments, I'd like to take this opportunity to welcome new shareholders and to thank existing shareholders for the continued trust you've placed in us.
Sincerely,
Andrew G. Arnott
President and CEO,
John Hancock Investments
Head of Wealth and Asset Management,
United States and Europe
This commentary reflects the CEO's views, which are subject to change at any time. Investing involves risks, including the potential loss of principal. Diversification does not guarantee a profit or eliminate the risk of a loss. It is not possible to invest directly into an index. For more up-to-date information, please visit our website at jhinvestments.com.
John Hancock
Small Cap Core Fund
INVESTMENT OBJECTIVE
The fund seeks long-term capital appreciation.
AVERAGE ANNUAL TOTAL RETURNS AS OF 4/30/18 (%)
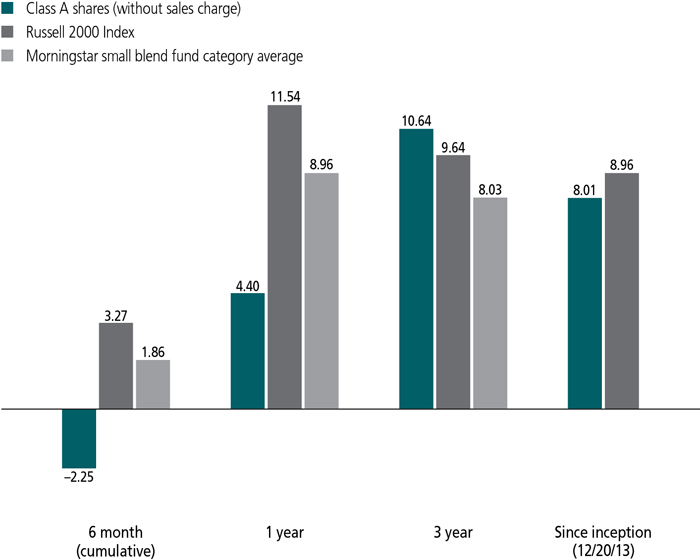
The Russell 2000 Index is an unmanaged index composed of 2,000 U.S. small-capitalization stocks.
It is not possible to invest directly in an index. Index figures do not reflect expenses or sales charges, which would result in lower returns.
Figures from Morningstar, Inc. include reinvested distributions and do not take into account sales charges. Actual load-adjusted performance is lower. Since-inception returns for the Morningstar fund category average are not available.
The past performance shown here reflects reinvested distributions and the beneficial effect of any expense reductions, and does not guarantee future results. Returns for periods shorter than one year are cumulative. Performance of the other share classes will vary based on the difference in the fees and expenses of those classes. Shares will fluctuate in value and, when redeemed, may be worth more or less than their original cost. Current month-end performance may be lower or higher than the performance cited, and can be found at jhinvestments.com or by calling 800-225-5291. For further information on the fund's objectives, risks, and strategy, see the fund's prospectus.
PERFORMANCE HIGHLIGHTS OVER THE LAST SIX MONTHS
Small-cap stocks advanced until they encountered higher volatility
After making strong gains in the first half of the period, small-cap stocks' move higher was temporarily stalled by volatility stemming from inflation fears.
The fund underperformed its benchmark
The fund underperformed its benchmark, the Russell 2000 Index, primarily due to stock selection decisions.
More speculative small caps outperformed
Earnings at many small-cap companies experienced strong growth, driven by tax reform and higher top-line growth, but the market rewarded more speculative small-cap companies over established names.
SECTOR COMPOSITION AS OF 4/30/18 (%)
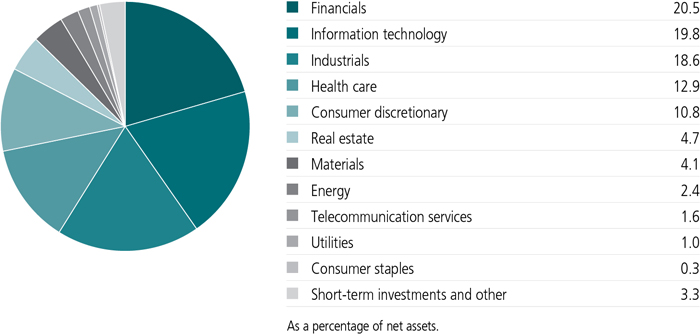
A note about risks
The price of equity securities may decline due to changes in a company's financial condition or overall market conditions. The stock prices of midsize and small companies can change more frequently and dramatically than those of large companies. Foreign investing, especially in emerging markets, has additional risks, such as currency and market volatility and political and social instability. Shares purchased in an initial public offering may have a magnified impact on fund performance and are frequently volatile in price. They can be held for a short period of time, causing an increase in portfolio turnover. Please see the fund's prospectus for additional risks.
An interview with Portfolio Manager Bill Talbot, CFA, John Hancock Asset Management a division of Manulife Asset Management (US) LLC

Bill Talbot, CFA
Portfolio Manager
John Hancock Asset Management
How would you describe the market environment during the six months ended April 30, 2018?
The period overall was positive for small caps, although the widespread market volatility that emerged at the end of January proved to be a temporary drag on stocks across the market-cap spectrum. More specifically for small caps, the passage of tax reform into law at the beginning of 2018 was a key event that boosted stock performance and earnings power. Small caps tend to be more domestically focused than larger-cap companies, which makes small caps inordinately large beneficiaries of a lower corporate tax rate.
Lower tax bills enhance the earnings power of small caps to a greater degree, and the market was quick to recalibrate its earnings expectations for small-cap companies. In the months since the law took effect, we have seen numerous examples of companies using this tax windfall for shareholder-friendly purposes, including raising dividends and enhancing share repurchase programs. In our view, this support for small caps continued to bolster the fundamental attractiveness of many companies throughout the small-cap universe.
Nonetheless, the strongest-performing companies during the period were non-earning companies—more speculative names, particularly in the healthcare and energy sectors—that attracted the lion's share of investors' attention by their apparent potential of future growth.
The fund underperformed its benchmark, the Russell 2000 Index. What factors led to this result?
In the fund, we focus on picking stocks from among what we perceive to be higher-quality small-cap opportunities—companies that have proven to be profitable or that are on the cusp of turning profitable. This focus turned out to be a hurdle to performance during the period in light of the stronger relative performance by more speculative small-cap names.
Which stocks were among the largest detractors from the fund's relative results?
In the industrials sector, the stock of property management and building maintenance company ABM Industries, Inc., was a large detractor. New management at the company had a mandate to raise profit margins, which they sought to do through cross-selling opportunities and diversification of their management services. These efforts had disappointing results, however, and didn't meet our milestones for margin improvement.
Among the fund's consumer staples holdings, the stock of TreeHouse Foods, Inc., was another large detractor. This company sells private-label food products to grocery chains and is also in the business of providing institutional food services. These are not easy niches in which to operate in the first place, due to cost pressures from the stiff competitive landscape. In addition to this inherent industry obstacle to higher profitability, the company and many of its competitors suffered following Amazon.com, Inc.'s acquisition of Whole Foods, Inc. (the fund did not hold either of these stocks). This event spooked investors in TreeHouse and its competitors due to the intense cost pressure implied by Amazon's scale. We exited the position by period end.
TOP 10 HOLDINGS AS OF 4/30/18 (%)
| Patterson-UTI Energy, Inc. | 2.4 |
| Univest Corp. of Pennsylvania | 2.4 |
| Bio-Rad Laboratories, Inc., Class A | 2.1 |
| Banner Corp. | 2.0 |
| Hope Bancorp, Inc. | 2.0 |
| Columbia Banking System, Inc. | 1.9 |
| ConnectOne Bancorp, Inc. | 1.9 |
| Cinemark Holdings, Inc. | 1.9 |
| Brookline Bancorp, Inc. | 1.8 |
| South State Corp. | 1.8 |
| TOTAL | 20.2 |
| As a percentage of net assets. | |
| Cash and cash equivalents are not included. | |
A third major detractor was the stock of Civitas Solutions, Inc., whose primary business is running homes and community-based health services for people with intellectual and developmental disabilities and other special needs. The company derives a large part of its revenue from government spending, and the stock declined in part due to the uncertainty of future government support for a wide swath of U.S. social programs. Moreover, wage inflation appeared to exacerbate staffing issues at the company. We sold the stock during the period.
Which stocks stood out as positive contributors to the fund's relative results?
One of the fund's best-performing positions during the period was the stock of Rapid7, Inc., a data-security software provider that we purchased at an attractive price just as the company was turning the corner on becoming profitable. We trimmed the position during the period to lock in profits for the fund.
Another top contributor was the stock of Copart, Inc., an automotive parts company that works in collision repair and manages car auctions. The stock rose as the company's sales and earnings outpaced investor expectations and as it gained market share. We sold the stock when it reached our estimate of its fair value.
A third large contributor to relative returns was the stock of SS&C Technologies Holdings, Inc., a cloud-based financial services software company that was able to use excess cash to fund acquisitions. During the period, the company completed the integration of Advent Software, Inc. (not held by the fund), a 2015 acquisition. As the company grew larger during the period, we trimmed the position.
How was the fund positioned at period end?
The fund continues to be concentrated in the higher-quality small-cap names that we think offer attractive value and strong growth potential. We recognize that the macroeconomic environment
has numerous conditions that could be conducive to small-cap stock performance, in addition to the benefits this market segment may experience due to tax reform.
While we believe these tailwinds will persist in the near term, we don't count on them to support our theses for any of the fund's positions. Instead, we focus on owning stocks where we are seeing company-specific catalysts that we believe could drive stock performance higher over time.
MANAGED BY
| | Bill Talbot, CFA On the fund since inception Investing since 1994 |
![]()
TOTAL RETURNS FOR THE PERIOD ENDED APRIL 30, 2018
| Average annual total returns (%) with maximum sales charge | Cumulative total returns (%) with maximum sales charge | ||||||
| 1-year | Since inception1 | 6-month | Since inception1 | ||||
| Class A2 | -0.81 | 6.75 | -7.15 | 32.94 | |||
| Class I2,3 | 4.53 | 8.21 | -2.12 | 41.09 | |||
| Class R62,3 | 4.71 | 8.08 | -2.03 | 40.35 | |||
| Class NAV3 | 4.65 | 8.32 | -2.09 | 41.71 | |||
| Index† | 11.54 | 8.96 | 3.27 | 45.40 | |||
Performance figures assume all distributions are reinvested. Figures reflect maximum sales charges on Class A shares of 5%. Sales charges are not applicable to Class I, Class R6, and Class NAV shares.
The expense ratios of the fund, both net (including any fee waivers and/or expense limitations) and gross (excluding any fee waivers and/or expense limitations), are set forth according to the most recent publicly available prospectuses for the fund and may differ from those disclosed in the Financial highlights tables in this report. The expense ratios are as follows:
| Class A* | Class I | Class R6** | Class NAV | |
| Gross/Net (%) | 1.38 | 1.12 | 1.02 | 1.01 |
*Expenses have been estimated for the class's first year of resumed operations.
**Expenses have been estimated for the class's first year of operations.
Please refer to the most recent prospectus and annual or semiannual report for more information on expenses and any expense limitation arrangements for each class.
The returns reflect past results and should not be considered indicative of future performance. The return and principal value of an investment will fluctuate so that shares, when redeemed, may be worth more or less than their original cost. Due to market volatility and other factors, the fund's current performance may be higher or lower than the performance shown. For current to the most recent month-end performance data, please call 800-225-5291 or visit the fund's website at jhinvestments.com.
The performance table above and the chart on the next page do not reflect the deduction of taxes that a shareholder would pay on fund distributions or the redemption of fund shares. The fund's performance results reflect any applicable fee waivers or expense reductions, without which the expenses would increase and results would have been less favorable.
| † | Index is the Russell 2000 Index. |
See the following page for footnotes.
This chart and table show what happened to a hypothetical $10,000 investment in John Hancock Small Cap Core Fund for the share classes and periods indicated, assuming all distributions were reinvested. For comparison, we've shown the same investment in the Russell 2000 Index.
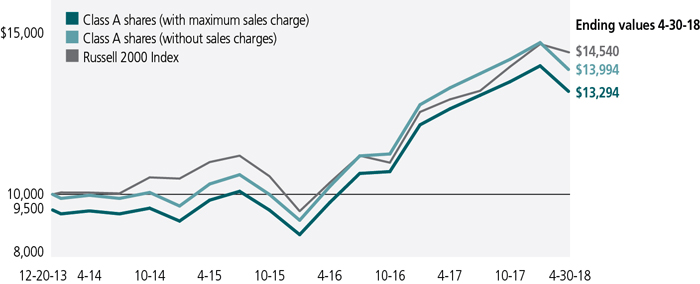
| Start date | With maximum sales charge ($) | Without sales charge ($) | Index ($) | |
| Class I2,3 | 12-20-13 | 14,109 | 14,109 | 14,540 |
| Class R62,3 | 12-20-13 | 14,035 | 14,035 | 14,540 |
| Class NAV3 | 12-20-13 | 14,171 | 14,171 | 14,540 |
The Russell 2000 Index is an unmanaged index composed of 2,000 U.S. small capitalization stocks.
It is not possible to invest directly in an index. Index figures do not reflect expenses or sales charges, which would have resulted in lower returns.
Footnotes related to performance pages
| 1 | From 12-20-13. |
| 2 | Class A and Class I shares were first offered on 12/27/13. Class A shares ceased operations between 3/10/16 and 8/30/17. Returns while Class A shares were not offered are those of Class I shares. Class R6 shares were first offered on 8/30/17. Returns shown prior to this date are those of Class A shares (or Class I shares for the period between 3/10/16 and 8/30/17), that have not been adjusted for class-specific expenses; otherwise, returns would vary. |
| 3 | For certain types of investors, as described in the fund's prospectuses. |
These examples are intended to help you understand your ongoing operating expenses of investing in the fund so you can compare these costs with the ongoing costs of investing in other mutual funds.
Understanding fund expenses
As a shareholder of the fund, you incur two types of costs:
| • | Transaction costs, which include sales charges (loads) on purchases or redemptions (varies by share class), minimum account fee charge, etc. |
| • | Ongoing operating expenses, including management fees, distribution and service fees (if applicable), and other fund expenses. |
We are presenting only your ongoing operating expenses here.
Actual expenses/actual returns
The first line of each share class in the table on the following page is intended to provide information about the fund's actual ongoing operating expenses, and is based on the fund's actual return. It assumes an account value of $1,000.00 on November 1, 2017, with the same investment held until April 30, 2018.
Together with the value of your account, you may use this information to estimate the operating expenses that you paid over the period. Simply divide your account value at April 30, 2018, by $1,000.00, then multiply it by the "expenses paid" for your share class from the table. For example, for an account value of $8,600.00, the operating expenses should be calculated as follows:
Hypothetical example for comparison purposes
The second line of each share class in the table on the following page allows you to compare the fund's ongoing operating expenses with those of any other fund. It provides an example of the fund's hypothetical account values and hypothetical expenses based on each class's actual expense ratio and an assumed 5% annualized return before expenses (which is not the fund's actual return). It assumes an account value of $1,000.00 on November 1, 2017, with the same investment held until April 30, 2018. Look in any other fund shareholder report to find its hypothetical example and you will be able to compare these expenses. Please remember that these hypothetical account values and expenses may not be used to estimate the actual ending account balance or expenses you paid for the period.
Remember, these examples do not include any transaction costs, therefore, these examples will not help you to determine the relative total costs of owning different funds. If transaction costs were included, your expenses would have been higher. See the prospectuses for details regarding transaction costs.
SHAREHOLDER EXPENSE EXAMPLE CHART
| Account value on 11-1-2017 | Ending value on 4-30-2018 | Expenses paid during period ended 4-30-20181 | Annualized expense ratio | ||
| Class A | Actual expenses/actual returns | $1,000.00 | $977.50 | $6.67 | 1.36% |
| Hypothetical example for comparison purposes | 1,000.00 | 1,018.10 | 6.81 | 1.36% | |
| Class I | Actual expenses/actual returns | 1,000.00 | 978.80 | 5.40 | 1.10% |
| Hypothetical example for comparison purposes | 1,000.00 | 1,019.30 | 5.51 | 1.10% | |
| Class R6 | Actual expenses/actual returns | 1,000.00 | 979.70 | 4.91 | 1.00% |
| Hypothetical example for comparison purposes | 1,000.00 | 1,019.80 | 5.01 | 1.00% | |
| Class NAV | Actual expenses/actual returns | 1,000.00 | 979.10 | 4.81 | 0.98% |
| Hypothetical example for comparison purposes | 1,000.00 | 1,019.90 | 4.91 | 0.98% | |
| 1 | Expenses are equal to the annualized expense ratio, multiplied by the average account value over the period, multiplied by 181/365 (to reflect the one-half year period). |
| Fund’s investments |
| Shares | Value | ||||
| Common stocks 96.7% | $493,682,999 | ||||
| (Cost $494,652,489) | |||||
| Consumer discretionary 10.8% | 55,267,177 | ||||
| Auto components 1.4% | |||||
| Tenneco, Inc. | 162,791 | 7,275,130 | |||
| Hotels, restaurants and leisure 3.4% | |||||
| Chuy's Holdings, Inc. (A) | 126,553 | 3,619,416 | |||
| Dave & Buster's Entertainment, Inc. (A) | 150,396 | 6,390,326 | |||
| Vail Resorts, Inc. | 31,202 | 7,154,931 | |||
| Household durables 0.5% | |||||
| Tupperware Brands Corp. | 62,458 | 2,783,128 | |||
| Leisure products 1.5% | |||||
| Nautilus, Inc. (A) | 522,869 | 7,607,744 | |||
| Media 1.9% | |||||
| Cinemark Holdings, Inc. | 241,331 | 9,452,935 | |||
| Specialty retail 2.1% | |||||
| Build-A-Bear Workshop, Inc. (A) | 288,251 | 2,623,084 | |||
| Lithia Motors, Inc., Class A | 48,259 | 4,626,108 | |||
| Williams-Sonoma, Inc. | 78,125 | 3,734,375 | |||
| Consumer staples 0.3% | 1,671,461 | ||||
| Food products 0.3% | |||||
| Amira Nature Foods, Ltd. (A) | 442,186 | 1,671,461 | |||
| Energy 2.4% | 12,377,954 | ||||
| Energy equipment and services 2.4% | |||||
| Patterson-UTI Energy, Inc. | 577,869 | 12,377,954 | |||
| Financials 20.5% | 104,698,416 | ||||
| Banks 18.1% | |||||
| Access National Corp. | 219,095 | 6,093,032 | |||
| Banner Corp. | 182,144 | 10,455,066 | |||
| Brookline Bancorp, Inc. | 555,261 | 9,217,333 | |||
| Columbia Banking System, Inc. | 247,396 | 9,947,793 | |||
| ConnectOne Bancorp, Inc. | 364,171 | 9,614,114 | |||
| First Community Corp. | 118,786 | 2,738,017 | |||
| Hope Bancorp, Inc. | 586,851 | 10,146,654 | |||
| South State Corp. | 104,758 | 9,066,805 | |||
| Union Bankshares Corp. | 201,802 | 7,630,134 | |||
| Univest Corp. of Pennsylvania | 426,802 | 12,270,558 | |||
| Valley National Bancorp | 403,763 | 5,067,226 | |||
| Capital markets 2.4% | |||||
| Evercore, Inc., Class A | 52,428 | 5,308,335 | |||
| Moelis & Company, Class A | 132,776 | 7,143,349 | |||
| 12 | JOHN HANCOCK SMALL CAP CORE FUND | SEMIANNUAL REPORT | SEE NOTES TO FINANCIAL STATEMENTS |
| Shares | Value | ||||
| Health care 12.9% | $65,906,796 | ||||
| Biotechnology 2.5% | |||||
| ACADIA Pharmaceuticals, Inc. (A) | 128,203 | 2,026,889 | |||
| Halozyme Therapeutics, Inc. (A) | 157,633 | 2,983,993 | |||
| MiMedx Group, Inc. (A) | 483,810 | 3,972,080 | |||
| Osiris Therapeutics, Inc. (A) | 169,338 | 1,270,035 | |||
| Recro Pharma, Inc. (A) | 205,585 | 2,499,914 | |||
| Health care equipment and supplies 5.5% | |||||
| AtriCure, Inc. (A) | 227,437 | 5,055,925 | |||
| Integra LifeSciences Holdings Corp. (A) | 76,639 | 4,723,262 | |||
| Merit Medical Systems, Inc. (A) | 118,866 | 5,765,001 | |||
| SeaSpine Holdings Corp. (A) | 391,816 | 4,509,802 | |||
| The Cooper Companies, Inc. | 35,280 | 8,068,889 | |||
| Life sciences tools and services 4.4% | |||||
| Bio-Rad Laboratories, Inc., Class A (A) | 42,589 | 10,805,255 | |||
| Enzo Biochem, Inc. (A) | 647,613 | 3,885,678 | |||
| Syneos Health, Inc. (A) | 203,511 | 7,753,769 | |||
| Pharmaceuticals 0.5% | |||||
| Prestige Brands Holdings, Inc. (A) | 87,850 | 2,586,304 | |||
| Industrials 18.6% | 94,940,594 | ||||
| Building products 2.7% | |||||
| American Woodmark Corp. (A) | 80,729 | 6,635,924 | |||
| Armstrong World Industries, Inc. (A) | 126,114 | 7,062,384 | |||
| Commercial services and supplies 5.5% | |||||
| ABM Industries, Inc. | 282,900 | 8,806,677 | |||
| Deluxe Corp. | 120,291 | 8,244,745 | |||
| Interface, Inc. | 152,371 | 3,352,162 | |||
| UniFirst Corp. | 48,936 | 7,859,122 | |||
| Construction and engineering 3.0% | |||||
| EMCOR Group, Inc. | 117,748 | 8,665,075 | |||
| Granite Construction, Inc. | 127,553 | 6,681,226 | |||
| Electrical equipment 1.6% | |||||
| Regal Beloit Corp. | 117,262 | 8,349,054 | |||
| Machinery 2.8% | |||||
| Mueller Water Products, Inc., Class A | 784,250 | 7,677,808 | |||
| The Timken Company | 153,124 | 6,546,051 | |||
| Trading companies and distributors 3.0% | |||||
| GMS, Inc. (A) | 267,080 | 8,322,213 | |||
| Watsco, Inc. | 40,247 | 6,738,153 | |||
| Information technology 19.8% | 101,230,581 | ||||
| Communications equipment 1.0% | |||||
| Quantenna Communications, Inc. (A) | 400,975 | 5,080,353 | |||
| SEE NOTES TO FINANCIAL STATEMENTS | SEMIANNUAL REPORT | JOHN HANCOCK SMALL CAP CORE FUND | 13 |
| Shares | Value | ||||
| Information technology (continued) | |||||
| Electronic equipment, instruments and components 1.0% | |||||
| nLight, Inc. (A) | 26,175 | $652,543 | |||
| TTM Technologies, Inc. (A) | 340,025 | 4,739,949 | |||
| Internet software and services 3.5% | |||||
| Five9, Inc. (A) | 204,802 | 6,015,035 | |||
| j2 Global, Inc. | 65,532 | 5,201,930 | |||
| LogMeIn, Inc. | 61,930 | 6,824,686 | |||
| Semiconductors and semiconductor equipment 5.3% | |||||
| FormFactor, Inc. (A) | 452,022 | 5,186,952 | |||
| Integrated Device Technology, Inc. (A) | 196,286 | 5,462,639 | |||
| MaxLinear, Inc. (A) | 136,322 | 3,044,070 | |||
| MKS Instruments, Inc. | 73,444 | 7,520,666 | |||
| ON Semiconductor Corp. (A) | 255,434 | 5,639,983 | |||
| Software 7.7% | |||||
| Avaya Holdings Corp. (A) | 278,544 | 6,375,872 | |||
| MobileIron, Inc. (A) | 866,161 | 4,027,649 | |||
| Nice, Ltd., ADR (A) | 81,876 | 7,792,139 | |||
| Rapid7, Inc. (A) | 254,491 | 7,186,826 | |||
| SS&C Technologies Holdings, Inc. | 124,625 | 6,187,631 | |||
| Verint Systems, Inc. (A) | 144,710 | 6,092,291 | |||
| Workiva, Inc. (A) | 73,918 | 1,663,155 | |||
| Technology hardware, storage and peripherals 1.3% | |||||
| Cray, Inc. (A) | 274,055 | 6,536,212 | |||
| Materials 4.1% | 20,944,355 | ||||
| Chemicals 2.8% | |||||
| HB Fuller Company | 111,105 | 5,496,364 | |||
| Valvoline, Inc. | 432,015 | 8,761,264 | |||
| Metals and mining 1.3% | |||||
| Kaiser Aluminum Corp. | 67,858 | 6,686,727 | |||
| Real estate 4.7% | 23,974,317 | ||||
| Equity real estate investment trusts 4.7% | |||||
| American Assets Trust, Inc. | 175,011 | 5,875,119 | |||
| EPR Properties | 103,298 | 5,683,456 | |||
| First Industrial Realty Trust, Inc. | 244,849 | 7,617,252 | |||
| Retail Opportunity Investments Corp. | 278,982 | 4,798,490 | |||
| Telecommunication services 1.6% | 7,817,881 | ||||
| Wireless telecommunication services 1.6% | |||||
| Boingo Wireless, Inc. (A) | 333,243 | 7,817,881 | |||
| Utilities 1.0% | 4,853,467 | ||||
| Electric utilities 1.0% | |||||
| Portland General Electric Company | 114,253 | 4,853,467 | |||
| 14 | JOHN HANCOCK SMALL CAP CORE FUND | SEMIANNUAL REPORT | SEE NOTES TO FINANCIAL STATEMENTS |
| Yield (%) | Shares | Value | |||
| Short-term investments 3.4% | $17,452,330 | ||||
| (Cost $17,452,330) | |||||
| Money market funds 3.4% | 17,452,330 | ||||
| State Street Institutional U.S. Government Money Market Fund, Premier Class | 1.6333(B) | 17,452,330 | 17,452,330 | ||
| Total investments (Cost $512,104,819) 100.1% | $511,135,329 | ||||
| Other assets and liabilities, net (0.1%) | (272,347) | ||||
| Total net assets 100.0% | $510,862,982 | ||||
| The percentage shown for each investment category is the total value of the category as a percentage of the net assets of the fund. | |
| Security Abbreviations and Legend | |
| ADR | American Depositary Receipt |
| (A) | Non-income producing security. |
| (B) | The rate shown is the annualized seven-day yield as of 4-30-18. |
| SEE NOTES TO FINANCIAL STATEMENTS | SEMIANNUAL REPORT | JOHN HANCOCK SMALL CAP CORE FUND | 15 |
Financial statements
STATEMENT OF ASSETS AND LIABILITIES 4-30-18 (unaudited)
| Assets | ||||||||||||||||||||||||||||||
| Investments, at value (Cost $512,104,819) | $511,135,329 | |||||||||||||||||||||||||||||
| Receivable for investments sold | 2,571,468 | |||||||||||||||||||||||||||||
| Receivable for fund shares sold | 1,160,829 | |||||||||||||||||||||||||||||
| Dividends and interest receivable | 473,590 | |||||||||||||||||||||||||||||
| Receivable due from advisor | 42,008 | |||||||||||||||||||||||||||||
| Other receivables and prepaid expenses | 87,880 | |||||||||||||||||||||||||||||
| Total assets | 515,471,104 | |||||||||||||||||||||||||||||
| Liabilities | ||||||||||||||||||||||||||||||
| Payable for investments purchased | 3,942,266 | |||||||||||||||||||||||||||||
| Payable for fund shares repurchased | 465,722 | |||||||||||||||||||||||||||||
| Payable to affiliates | ||||||||||||||||||||||||||||||
| Accounting and legal services fees | 43,830 | |||||||||||||||||||||||||||||
| Transfer agent fees | 32,485 | |||||||||||||||||||||||||||||
| Trustees' fees | 496 | |||||||||||||||||||||||||||||
| Other liabilities and accrued expenses | 123,323 | |||||||||||||||||||||||||||||
| Total liabilities | 4,608,122 | |||||||||||||||||||||||||||||
| Net assets | $510,862,982 | |||||||||||||||||||||||||||||
| Net assets consist of | ||||||||||||||||||||||||||||||
| Paid-in capital | $501,967,687 | |||||||||||||||||||||||||||||
| Accumulated distributions in excess of net investment income | (13,161 | ) | ||||||||||||||||||||||||||||
| Accumulated net realized gain (loss) on investments | 9,877,946 | |||||||||||||||||||||||||||||
| Net unrealized appreciation (depreciation) on investments | (969,490 | ) | ||||||||||||||||||||||||||||
| Net assets | $510,862,982 | |||||||||||||||||||||||||||||
| Net asset value per share | ||||||||||||||||||||||||||||||
| Based on net asset values and shares outstanding-the fund has an unlimited number of shares authorized with no par value | ||||||||||||||||||||||||||||||
| Class A ($248,170,269 ÷ 20,536,440 shares)1 | $12.08 | |||||||||||||||||||||||||||||
| Class I ($21,274,875 ÷ 1,762,965 shares) | $12.07 | |||||||||||||||||||||||||||||
| Class R6 ($74,866,965 ÷ 6,198,197 shares) | $12.08 | |||||||||||||||||||||||||||||
| Class NAV ($166,550,873 ÷ 13,798,660 shares) | $12.07 | |||||||||||||||||||||||||||||
| Maximum offering price per share | ||||||||||||||||||||||||||||||
| Class A (net asset value per share ÷ 95%)2 | $12.72 | |||||||||||||||||||||||||||||
| 1 | Redemption price per share is equal to net asset value less any applicable contingent deferred sales charge. | ||||||||||||||||
| 2 | On single retail sales of less than $50,000. On sales of $50,000 or more and on group sales the offering price is reduced. | ||||||||||||||||
STATEMENT OF OPERATIONS For the six months ended 4-30-18 (unaudited)
| Investment income | ||||||||||||||||||||||||
| Dividends | $1,458,711 | |||||||||||||||||||||||
| Interest | 63,090 | |||||||||||||||||||||||
| Total investment income | 1,521,801 | |||||||||||||||||||||||
| Expenses | ||||||||||||||||||||||||
| Investment management fees | 1,094,623 | |||||||||||||||||||||||
| Distribution and service fees | 71,883 | |||||||||||||||||||||||
| Accounting and legal services fees | 27,964 | |||||||||||||||||||||||
| Transfer agent fees | 42,316 | |||||||||||||||||||||||
| Trustees' fees | 1,590 | |||||||||||||||||||||||
| State registration fees | 52,550 | |||||||||||||||||||||||
| Printing and postage | 19,091 | |||||||||||||||||||||||
| Professional fees | 42,161 | |||||||||||||||||||||||
| Custodian fees | 14,058 | |||||||||||||||||||||||
| Other | 6,030 | |||||||||||||||||||||||
| Total expenses | 1,372,266 | |||||||||||||||||||||||
| Less expense reductions | (10,777 | ) | ||||||||||||||||||||||
| Net expenses | 1,361,489 | |||||||||||||||||||||||
| Net investment income | 160,312 | |||||||||||||||||||||||
| Realized and unrealized gain (loss) | ||||||||||||||||||||||||
| Net realized gain (loss) on | ||||||||||||||||||||||||
| Investments | 10,426,092 | |||||||||||||||||||||||
| 10,426,092 | ||||||||||||||||||||||||
| Change in net unrealized appreciation (depreciation) of | ||||||||||||||||||||||||
| Investments | (14,474,201 | ) | ||||||||||||||||||||||
| (14,474,201 | ) | |||||||||||||||||||||||
| Net realized and unrealized loss | (4,048,109 | ) | ||||||||||||||||||||||
| Decrease in net assets from operations | ($3,887,797 | ) | ||||||||||||||||||||||
STATEMENTS OF CHANGES IN NET ASSETS
| Six months ended 4-30-18 | Year ended 10-31-17 | |||||||||||||||||||||||||||||||||||||||||||||||
| (unaudited) | ||||||||||||||||||||||||||||||||||||||||||||||||
| Increase (decrease) in net assets | ||||||||||||||||||||||||||||||||||||||||||||||||
| From operations | ||||||||||||||||||||||||||||||||||||||||||||||||
| Net investment income | $160,312 | $683,578 | ||||||||||||||||||||||||||||||||||||||||||||||
| Net realized gain | 10,426,092 | 20,004,164 | ||||||||||||||||||||||||||||||||||||||||||||||
| Change in net unrealized appreciation (depreciation) | (14,474,201 | ) | 13,000,280 | |||||||||||||||||||||||||||||||||||||||||||||
| Increase (decrease) in net assets resulting from operations | (3,887,797 | ) | 33,688,022 | |||||||||||||||||||||||||||||||||||||||||||||
| Distributions to shareholders | ||||||||||||||||||||||||||||||||||||||||||||||||
| From net investment income | ||||||||||||||||||||||||||||||||||||||||||||||||
| Class I | (1,340 | ) | (4,505 | ) | ||||||||||||||||||||||||||||||||||||||||||||
| Class R62 | (1,111 | ) | — | |||||||||||||||||||||||||||||||||||||||||||||
| Class NAV | (514,271 | ) | (1,098,566 | ) | ||||||||||||||||||||||||||||||||||||||||||||
| From net realized gain | ||||||||||||||||||||||||||||||||||||||||||||||||
| Class A1 | (235,907 | ) | — | |||||||||||||||||||||||||||||||||||||||||||||
| Class I | (78,374 | ) | — | |||||||||||||||||||||||||||||||||||||||||||||
| Class R62 | (43,018 | ) | — | |||||||||||||||||||||||||||||||||||||||||||||
| Class NAV | (18,666,853 | ) | — | |||||||||||||||||||||||||||||||||||||||||||||
| Total distributions | (19,540,874 | ) | (1,103,071 | ) | ||||||||||||||||||||||||||||||||||||||||||||
| From fund share transactions | 61,887,237 | 6,173,409 | ||||||||||||||||||||||||||||||||||||||||||||||
| Issued in reorganization | 294,730,327 | — | ||||||||||||||||||||||||||||||||||||||||||||||
| Total from fund share transactions | 356,617,564 | — | ||||||||||||||||||||||||||||||||||||||||||||||
| Total increase | 333,188,893 | 38,758,360 | ||||||||||||||||||||||||||||||||||||||||||||||
| Net assets | ||||||||||||||||||||||||||||||||||||||||||||||||
| Beginning of period | 177,674,089 | 138,915,729 | ||||||||||||||||||||||||||||||||||||||||||||||
| End of period | $510,862,982 | $177,674,089 | ||||||||||||||||||||||||||||||||||||||||||||||
| Undistributed (accumulated distributions in excess of) net investment income | ($13,161 | ) | $343,249 | |||||||||||||||||||||||||||||||||||||||||||||
| 1 | Class A shares were liquidated on 3-10-16. Class A relaunched on 8-30-17. | ||||||||||||||||||||||||||||||||||||||||||||||||||||
| 2 | The inception date for Class R6 shares is 8-30-17. | ||||||||||||||||||||||||||||||||||||||||||||||||||||
Financial highlights
| Class A Shares Period ended | 4-30-18 | 1 | 10-31-17 | 2 | 10-31-15 | 10-31-14 | 3 | |||||||||||||||||||||||||||||||||||||||||||||||||||||||||||||||||||||||||
| Per share operating performance | ||||||||||||||||||||||||||||||||||||||||||||||||||||||||||||||||||||||||||||||||
| Net asset value, beginning of period | $13.82 | $12.86 | $10.06 | $10.00 | ||||||||||||||||||||||||||||||||||||||||||||||||||||||||||||||||||||||||||||
| Net investment income (loss)4 | (0.02 | ) | — | 5 | (0.01 | ) | (0.04 | ) | ||||||||||||||||||||||||||||||||||||||||||||||||||||||||||||||||||||||||
| Net realized and unrealized gain (loss) on investments | (0.22 | ) | 0.96 | (0.06 | ) | 0.10 | ||||||||||||||||||||||||||||||||||||||||||||||||||||||||||||||||||||||||||
| Total from investment operations | (0.24 | ) | 0.96 | (0.07 | ) | 0.06 | ||||||||||||||||||||||||||||||||||||||||||||||||||||||||||||||||||||||||||
| Less distributions | ||||||||||||||||||||||||||||||||||||||||||||||||||||||||||||||||||||||||||||||||
| From net realized gain | (1.50 | ) | — | (0.20 | ) | — | ||||||||||||||||||||||||||||||||||||||||||||||||||||||||||||||||||||||||||
| Net asset value, end of period | $12.08 | $13.82 | $9.79 | $10.06 | ||||||||||||||||||||||||||||||||||||||||||||||||||||||||||||||||||||||||||||
| Total return (%)6,7 | (2.25 | ) 8 | 7.47 | 8 | (0.65 | ) | 0.60 | 8 | ||||||||||||||||||||||||||||||||||||||||||||||||||||||||||||||||||||||||
| Ratios and supplemental data | ||||||||||||||||||||||||||||||||||||||||||||||||||||||||||||||||||||||||||||||||
| Net assets, end of period (in millions) | $248 | $1 | — | 9 | — | 9 | ||||||||||||||||||||||||||||||||||||||||||||||||||||||||||||||||||||||||||
| Ratios (as a percentage of average net assets): | ||||||||||||||||||||||||||||||||||||||||||||||||||||||||||||||||||||||||||||||||
| Expenses before reductions | 1.37 | 10 | 1.41 | 10 | 1.40 | 1.44 | 10 | |||||||||||||||||||||||||||||||||||||||||||||||||||||||||||||||||||||||||
| Expenses including reductions | 1.36 | 10 | 1.40 | 10 | 1.40 | 1.43 | 10 | |||||||||||||||||||||||||||||||||||||||||||||||||||||||||||||||||||||||||
| Net investment income (loss) | (0.39 | ) 10 | — | 10,11 | (0.06 | ) | (0.40 | ) 10 | ||||||||||||||||||||||||||||||||||||||||||||||||||||||||||||||||||||||||
| Portfolio turnover (%) | 43 | 12 | 68 | 13 | 68 | 59 | ||||||||||||||||||||||||||||||||||||||||||||||||||||||||||||||||||||||||||
| 1 | Six months ended 4-30-18. Unaudited. | ||||||||||||||||||||||||||||||||||||||||||||||||||||||||||||||||||||||||||||
| 2 | Period from 8-30-17 (relaunch date) to 10-31-17. Class A liquidated on 3-10-16, accordingly, there were no shares of this class outstanding at 10-31-16. | ||||||||||||||||||||||||||||||||||||||||||||||||||||||||||||||||||||||||||||
| 3 | Period from 12-20-13 (commencement of operations) to 10-31-14. | ||||||||||||||||||||||||||||||||||||||||||||||||||||||||||||||||||||||||||||
| 4 | Based on average daily shares outstanding. | ||||||||||||||||||||||||||||||||||||||||||||||||||||||||||||||||||||||||||||
| 5 | Less than $0.005 per share. | ||||||||||||||||||||||||||||||||||||||||||||||||||||||||||||||||||||||||||||
| 6 | Does not reflect the effect of sales charges, if any. | ||||||||||||||||||||||||||||||||||||||||||||||||||||||||||||||||||||||||||||
| 7 | Total returns would have been lower had certain expenses not been reduced during the applicable periods. | ||||||||||||||||||||||||||||||||||||||||||||||||||||||||||||||||||||||||||||
| 8 | Not annualized. | ||||||||||||||||||||||||||||||||||||||||||||||||||||||||||||||||||||||||||||
| 9 | Less than $500,000. | ||||||||||||||||||||||||||||||||||||||||||||||||||||||||||||||||||||||||||||
| 10 | Annualized. | ||||||||||||||||||||||||||||||||||||||||||||||||||||||||||||||||||||||||||||
| 11 | Less than 0.005%. | ||||||||||||||||||||||||||||||||||||||||||||||||||||||||||||||||||||||||||||
| 12 | Excludes merger activity. | ||||||||||||||||||||||||||||||||||||||||||||||||||||||||||||||||||||||||||||
| 13 | The portfolio turnover is shown for the period from 11-1-16 to 10-31-17. | ||||||||||||||||||||||||||||||||||||||||||||||||||||||||||||||||||||||||||||
| Class I Shares Period ended | 4-30-18 | 1 | 10-31-17 | 10-31-16 | 10-31-15 | 10-31-14 | 2 | ||||||||||||||||||||||||||||||||||||||||||||||||||||||||||||||||||||||||||||||||||||||||||||||||
| Per share operating performance | |||||||||||||||||||||||||||||||||||||||||||||||||||||||||||||||||||||||||||||||||||||||||||||||||||||||
| Net asset value, beginning of period | $13.82 | $10.98 | $9.85 | $10.08 | $10.00 | ||||||||||||||||||||||||||||||||||||||||||||||||||||||||||||||||||||||||||||||||||||||||||||||||||
| Net investment income3 | — | 4 | 0.05 | 0.06 | 0.03 | — | 4 | ||||||||||||||||||||||||||||||||||||||||||||||||||||||||||||||||||||||||||||||||||||||||||||||||
| Net realized and unrealized gain (loss) on investments | (0.22 | ) | 2.88 | 1.21 | (0.06 | ) | 0.08 | ||||||||||||||||||||||||||||||||||||||||||||||||||||||||||||||||||||||||||||||||||||||||||||||||
| Total from investment operations | (0.22 | ) | 2.93 | 1.27 | (0.03 | ) | 0.08 | ||||||||||||||||||||||||||||||||||||||||||||||||||||||||||||||||||||||||||||||||||||||||||||||||
| Less distributions | |||||||||||||||||||||||||||||||||||||||||||||||||||||||||||||||||||||||||||||||||||||||||||||||||||||||
| From net investment income | (0.03 | ) | (0.09 | ) | (0.04 | ) | — | — | |||||||||||||||||||||||||||||||||||||||||||||||||||||||||||||||||||||||||||||||||||||||||||||||
| From net realized gain | (1.50 | ) | — | (0.10 | ) | (0.20 | ) | — | |||||||||||||||||||||||||||||||||||||||||||||||||||||||||||||||||||||||||||||||||||||||||||||||
| Total distributions | (1.53 | ) | (0.09 | ) | (0.14 | ) | (0.20 | ) | — | ||||||||||||||||||||||||||||||||||||||||||||||||||||||||||||||||||||||||||||||||||||||||||||||
| Net asset value, end of period | $12.07 | $13.82 | $10.98 | $9.85 | $10.08 | ||||||||||||||||||||||||||||||||||||||||||||||||||||||||||||||||||||||||||||||||||||||||||||||||||
| Total return (%)5 | (2.12 | ) 6 | 26.79 | 13.18 | (0.35 | ) | 0.80 | 6 | |||||||||||||||||||||||||||||||||||||||||||||||||||||||||||||||||||||||||||||||||||||||||||||||
| Ratios and supplemental data | |||||||||||||||||||||||||||||||||||||||||||||||||||||||||||||||||||||||||||||||||||||||||||||||||||||||
| Net assets, end of period (in millions) | $21 | $1 | $1 | — | 7 | — | 7 | ||||||||||||||||||||||||||||||||||||||||||||||||||||||||||||||||||||||||||||||||||||||||||||||||
| Ratios (as a percentage of average net assets): | |||||||||||||||||||||||||||||||||||||||||||||||||||||||||||||||||||||||||||||||||||||||||||||||||||||||
| Expenses before reductions | 1.11 | 8 | 1.15 | 1.09 | 1.09 | 1.12 | 8 | ||||||||||||||||||||||||||||||||||||||||||||||||||||||||||||||||||||||||||||||||||||||||||||||||
| Expenses including reductions | 1.10 | 8 | 1.14 | 1.09 | 1.09 | 1.11 | 8 | ||||||||||||||||||||||||||||||||||||||||||||||||||||||||||||||||||||||||||||||||||||||||||||||||
| Net investment income (loss) | — | 8,9 | 0.41 | 0.60 | 0.28 | (0.03 | ) 8 | ||||||||||||||||||||||||||||||||||||||||||||||||||||||||||||||||||||||||||||||||||||||||||||||||
| Portfolio turnover (%) | 43 | 10 | 68 | 59 | 68 | 59 | |||||||||||||||||||||||||||||||||||||||||||||||||||||||||||||||||||||||||||||||||||||||||||||||||
| 1 | Six months ended 4-30-18. Unaudited. | ||||||||||||||||||||||||||||||||||||||||||||||||||||||||||||||||||||||||||||||||||
| 2 | Period from 12-20-13 (commencement of operations) to 10-31-14. | ||||||||||||||||||||||||||||||||||||||||||||||||||||||||||||||||||||||||||||||||||
| 3 | Based on average daily shares outstanding. | ||||||||||||||||||||||||||||||||||||||||||||||||||||||||||||||||||||||||||||||||||
| 4 | Less than $0.005 per share. | ||||||||||||||||||||||||||||||||||||||||||||||||||||||||||||||||||||||||||||||||||
| 5 | Total returns would have been lower had certain expenses not been reduced during the applicable periods. | ||||||||||||||||||||||||||||||||||||||||||||||||||||||||||||||||||||||||||||||||||
| 6 | Not annualized. | ||||||||||||||||||||||||||||||||||||||||||||||||||||||||||||||||||||||||||||||||||
| 7 | Less than $500,000. | ||||||||||||||||||||||||||||||||||||||||||||||||||||||||||||||||||||||||||||||||||
| 8 | Annualized. | ||||||||||||||||||||||||||||||||||||||||||||||||||||||||||||||||||||||||||||||||||
| 9 | Less than 0.005%. | ||||||||||||||||||||||||||||||||||||||||||||||||||||||||||||||||||||||||||||||||||
| 10 | Excludes merger activity. | ||||||||||||||||||||||||||||||||||||||||||||||||||||||||||||||||||||||||||||||||||
| Class R6 Shares Period ended | 4-30-18 | 1 | 10-31-17 | 2 | ||||||||||||||||||||||||||||||||||||||||||||||
| Per share operating performance | ||||||||||||||||||||||||||||||||||||||||||||||||||
| Net asset value, beginning of period | $13.83 | $12.86 | ||||||||||||||||||||||||||||||||||||||||||||||||
| Net investment income3 | — | 4 | 0.01 | |||||||||||||||||||||||||||||||||||||||||||||||
| Net realized and unrealized gain (loss) on investments | (0.21 | ) | 0.96 | |||||||||||||||||||||||||||||||||||||||||||||||
| Total from investment operations | (0.21 | ) | 0.97 | |||||||||||||||||||||||||||||||||||||||||||||||
| Less distributions | ||||||||||||||||||||||||||||||||||||||||||||||||||
| From net investment income | (0.04 | ) | — | |||||||||||||||||||||||||||||||||||||||||||||||
| From net realized gain | (1.50 | ) | — | |||||||||||||||||||||||||||||||||||||||||||||||
| Total distributions | (1.54 | ) | — | |||||||||||||||||||||||||||||||||||||||||||||||
| Net asset value, end of period | $12.08 | $13.83 | ||||||||||||||||||||||||||||||||||||||||||||||||
| Total return (%)5 | (2.03 | ) 6 | 7.54 | 6 | ||||||||||||||||||||||||||||||||||||||||||||||
| Ratios and supplemental data | ||||||||||||||||||||||||||||||||||||||||||||||||||
| Net assets, end of period (in millions) | $75 | — | 7 | |||||||||||||||||||||||||||||||||||||||||||||||
| Ratios (as a percentage of average net assets): | ||||||||||||||||||||||||||||||||||||||||||||||||||
| Expenses before reductions | 1.01 | 8 | 1.05 | 8 | ||||||||||||||||||||||||||||||||||||||||||||||
| Expenses including reductions | 1.00 | 8 | 1.04 | 8 | ||||||||||||||||||||||||||||||||||||||||||||||
| Net investment income | 0.03 | 8 | 0.45 | 8 | ||||||||||||||||||||||||||||||||||||||||||||||
| Portfolio turnover (%) | 43 | 9 | 68 | 10 | ||||||||||||||||||||||||||||||||||||||||||||||
| 1 | Six months ended 4-30-18. Unaudited. | ||||||||||||||||||||||||||||||||||||||||||||||||||||||||||
| 2 | The inception date for Class R6 shares is 8-30-17. | ||||||||||||||||||||||||||||||||||||||||||||||||||||||||||
| 3 | Based on average daily shares outstanding. | ||||||||||||||||||||||||||||||||||||||||||||||||||||||||||
| 4 | Less than $0.005 per share. | ||||||||||||||||||||||||||||||||||||||||||||||||||||||||||
| 5 | Total returns would have been lower had certain expenses not been reduced during the period. | ||||||||||||||||||||||||||||||||||||||||||||||||||||||||||
| 6 | Not annualized. | ||||||||||||||||||||||||||||||||||||||||||||||||||||||||||
| 7 | Less than $500,000. | ||||||||||||||||||||||||||||||||||||||||||||||||||||||||||
| 8 | Annualized. | ||||||||||||||||||||||||||||||||||||||||||||||||||||||||||
| 9 | Exclude merger activity. | ||||||||||||||||||||||||||||||||||||||||||||||||||||||||||
| 10 | The portfolio turnover is shown for the period from 11-1-16 to 10-31-17. | ||||||||||||||||||||||||||||||||||||||||||||||||||||||||||
| Class NAV Shares Period ended | 4-30-18 | 1 | 10-31-17 | 10-31-16 | 10-31-15 | 10-31-14 | 2 | ||||||||||||||||||||||||||||||||||||||||||||||||||||||||||||||||||||||||||||||||||||||||||||||||
| Per share operating performance | |||||||||||||||||||||||||||||||||||||||||||||||||||||||||||||||||||||||||||||||||||||||||||||||||||||||
| Net asset value, beginning of period | $13.83 | $10.98 | $9.85 | $10.09 | $10.00 | ||||||||||||||||||||||||||||||||||||||||||||||||||||||||||||||||||||||||||||||||||||||||||||||||||
| Net investment income3 | 0.02 | 0.06 | 0.07 | 0.04 | — | 4 | |||||||||||||||||||||||||||||||||||||||||||||||||||||||||||||||||||||||||||||||||||||||||||||||||
| Net realized and unrealized gain (loss) on investments | (0.24 | ) | 2.89 | 1.21 | (0.07 | ) | 0.09 | ||||||||||||||||||||||||||||||||||||||||||||||||||||||||||||||||||||||||||||||||||||||||||||||||
| Total from investment operations | (0.22 | ) | 2.95 | 1.28 | (0.03 | ) | 0.09 | ||||||||||||||||||||||||||||||||||||||||||||||||||||||||||||||||||||||||||||||||||||||||||||||||
| Less distributions | |||||||||||||||||||||||||||||||||||||||||||||||||||||||||||||||||||||||||||||||||||||||||||||||||||||||
| From net investment income | (0.04 | ) | (0.10 | ) | (0.05 | ) | (0.01 | ) | — | ||||||||||||||||||||||||||||||||||||||||||||||||||||||||||||||||||||||||||||||||||||||||||||||
| From net realized gain | (1.50 | ) | — | (0.10 | ) | (0.20 | ) | — | |||||||||||||||||||||||||||||||||||||||||||||||||||||||||||||||||||||||||||||||||||||||||||||||
| Total distributions | (1.54 | ) | (0.10 | ) | (0.15 | ) | (0.21 | ) | — | ||||||||||||||||||||||||||||||||||||||||||||||||||||||||||||||||||||||||||||||||||||||||||||||
| Net asset value, end of period | $12.07 | $13.83 | $10.98 | $9.85 | $10.09 | ||||||||||||||||||||||||||||||||||||||||||||||||||||||||||||||||||||||||||||||||||||||||||||||||||
| Total return (%)5 | (2.09 | ) 6 | 27.00 | 13.21 | (0.23 | ) | 0.90 | 6 | |||||||||||||||||||||||||||||||||||||||||||||||||||||||||||||||||||||||||||||||||||||||||||||||
| Ratios and supplemental data | |||||||||||||||||||||||||||||||||||||||||||||||||||||||||||||||||||||||||||||||||||||||||||||||||||||||
| Net assets, end of period (in millions) | $167 | $176 | $138 | $153 | $169 | ||||||||||||||||||||||||||||||||||||||||||||||||||||||||||||||||||||||||||||||||||||||||||||||||||
| Ratios (as a percentage of average net assets): | |||||||||||||||||||||||||||||||||||||||||||||||||||||||||||||||||||||||||||||||||||||||||||||||||||||||
| Expenses before reductions | 0.99 | 7 | 1.04 | 0.98 | 0.98 | 1.00 | 7 | ||||||||||||||||||||||||||||||||||||||||||||||||||||||||||||||||||||||||||||||||||||||||||||||||
| Expenses including reductions | 0.98 | 7 | 1.03 | 0.97 | 0.97 | 0.99 | 7 | ||||||||||||||||||||||||||||||||||||||||||||||||||||||||||||||||||||||||||||||||||||||||||||||||
| Net investment income | 0.31 | 7 | 0.49 | 0.74 | 0.37 | 0.04 | 7 | ||||||||||||||||||||||||||||||||||||||||||||||||||||||||||||||||||||||||||||||||||||||||||||||||
| Portfolio turnover (%) | 43 | 8 | 68 | 59 | 68 | 59 | |||||||||||||||||||||||||||||||||||||||||||||||||||||||||||||||||||||||||||||||||||||||||||||||||
| 1 | Six months ended 4-30-18. Unaudited. | ||||||||||||||||||||||||||||||||||||||||||||||||||||||||||||||||||||||||||||||||||
| 2 | Period from 12-20-13 (commencement of operations) to 10-31-14. | ||||||||||||||||||||||||||||||||||||||||||||||||||||||||||||||||||||||||||||||||||
| 3 | Based on average daily shares outstanding. | ||||||||||||||||||||||||||||||||||||||||||||||||||||||||||||||||||||||||||||||||||
| 4 | Less than $0.005 per share. | ||||||||||||||||||||||||||||||||||||||||||||||||||||||||||||||||||||||||||||||||||
| 5 | Total returns would have been lower had certain expenses not been reduced during the applicable periods. | ||||||||||||||||||||||||||||||||||||||||||||||||||||||||||||||||||||||||||||||||||
| 6 | Not annualized. | ||||||||||||||||||||||||||||||||||||||||||||||||||||||||||||||||||||||||||||||||||
| 7 | Annualized. | ||||||||||||||||||||||||||||||||||||||||||||||||||||||||||||||||||||||||||||||||||
| 8 | Excludes merger activity. | ||||||||||||||||||||||||||||||||||||||||||||||||||||||||||||||||||||||||||||||||||
Note 1 — Organization
John Hancock Small Cap Core Fund (the fund) is a series of John Hancock Investment Trust (the Trust), an open-end management investment company organized as a Massachusetts business trust and registered under the Investment Company Act of 1940, as amended (the 1940 Act). The investment objective of the fund is to seek long-term capital appreciation.
The fund may offer multiple classes of shares. The shares currently offered by the fund are detailed in the Statement of assets and liabilities. Class A are offered to all investors. Class I shares are offered to institutions and certain investors. Class R6 shares are only available to certain retirement plans, institutions and other investors. Class NAV shares are offered to John Hancock affiliated funds of funds, retirement plans for employees of John Hancock and/or Manulife Financial Corporation, and certain 529 plans. Shareholders of each class have exclusive voting rights to matters that affect that class. The distribution and service fees, if any, and transfer agent fees for each class may differ.
Note 2 — Significant accounting policies
The financial statements have been prepared in conformity with accounting principles generally accepted in the United States of America (US GAAP), which require management to make certain estimates and assumptions as of the date of the financial statements. Actual results could differ from those estimates and those differences could be significant. The fund qualifies as an investment company under Topic 946 of Accounting Standards Codification of US GAAP.
Events or transactions occurring after the end of the fiscal period through the date that the financial statements were issued have been evaluated in the preparation of the financial statements. The following summarizes the significant accounting policies of the fund:
Security valuation. Investments are stated at value as of the scheduled close of regular trading on the New York Stock Exchange (NYSE), normally at 4:00 p.m., Eastern Time. In case of emergency or other disruption resulting in the NYSE not opening for trading or the NYSE closing at a time other than the regularly scheduled close, the net asset value (NAV) may be determined as of the regularly scheduled close of the NYSE pursuant to the fund's Valuation Policies and Procedures.
In order to value the securities, the fund uses the following valuation techniques: Equity securities held by the fund are typically valued at the last sale price or official closing price on the exchange or principal market where the security trades. Investments by the fund in open-end mutual funds are valued at their respective NAVs each business day. In the event there were no sales during the day or closing prices are not available, the securities are valued using the last available bid price.
In certain instances, the Pricing Committee may determine to value equity securities using prices obtained from another exchange or market if trading on the exchange or market on which prices are typically obtained did not open for trading as scheduled, or if trading closed earlier than scheduled, and trading occurred as normal on another exchange or market. Other portfolio securities and assets, for which reliable market quotations are not readily available, are valued at fair value as determined in good faith by the fund's Pricing Committee following procedures established by the Board of Trustees. The frequency with which these fair valuation procedures are used cannot be predicted and fair value of securities may differ significantly from the value that would have been used had a ready market for such securities existed.
The fund uses a three-tier hierarchy to prioritize the pricing assumptions, referred to as inputs, used in valuation techniques to measure fair value. Level 1 includes securities valued using quoted prices in active markets for identical securities. Level 2 includes securities valued using other significant observable inputs. Observable inputs may include quoted prices for similar securities, interest rates, prepayment speeds and credit risk. Prices for securities valued using these inputs are received from independent pricing vendors and brokers and are based on an evaluation of the inputs described. Level 3 includes securities valued using significant unobservable inputs when market prices are not readily available or reliable, including the fund's own assumptions in determining the fair value of investments. Factors used in determining value may include market or issuer specific events or trends, changes in interest rates and credit quality. The inputs or methodology used for valuing securities are not necessarily an indication of the risks associated with investing in those securities. Changes in valuation techniques and related inputs may result in transfers into or out of an assigned level within the disclosure hierarchy.
As of April 30, 2018, all investments are categorized as Level 1 under the hierarchy described above.
Security transactions and related investment income. Investment security transactions are accounted for on a trade date plus one basis for daily NAV calculations. However, for financial reporting purposes, investment transactions are reported on trade date. Interest income is accrued as earned. Dividend income is recorded on the ex-date, except for dividends of foreign securities where the dividend may not be known until after the ex-date. In those cases, dividend income, net of withholding taxes, is recorded when the fund becomes aware of the dividends. Gains and losses on securities sold are determined on the basis of identified cost and may include proceeds from litigation.
Real estate investment trusts. The fund may invest in real estate investment trusts (REITs). Distributions from REITs may be recorded as income and subsequently characterized by the REIT at the end of the fiscal year as a reduction of cost of investments and/or as a realized gain. As a result, the fund will estimate the components of distributions from these securities. Such estimates are revised when the actual components of the distributions are known.
Line of credit. The fund may have the ability to borrow from banks for temporary or emergency purposes, including meeting redemption requests that otherwise might require the untimely sale of securities. Pursuant to the fund's custodian agreement, the custodian may loan money to the fund to make properly authorized payments. The fund is obligated to repay the custodian for any overdraft, including any related costs or expenses. The custodian may have a lien, security interest or security entitlement in any fund property that is not otherwise segregated or pledged, to the extent of any overdraft, and to the maximum extent permitted by law.
The fund and other affiliated funds have entered into a syndicated line of credit agreement with Citibank, N.A. as the administrative agent that enables them to participate in a $750 million unsecured committed line of credit. Excluding commitments designated for a certain fund and subject to the needs of all other affiliated funds, the fund can borrow up to an aggregate commitment amount of $500 million, subject to asset coverage and other limitations as specified in the agreement. A commitment fee payable at the end of each calendar quarter, based on the average daily unused portion of the line of credit, is charged to each participating fund based on a combination of fixed and asset based allocations and is reflected in Other expenses on the Statement of operations. For the six months ended April 30, 2018, the fund had no borrowings under the line of credit. Commitment fees for the six months ended April 30,2018, were $1,582.
Expenses. Within the John Hancock group of funds complex, expenses that are directly attributable to an individual fund are allocated to such fund. Expenses that are not readily attributable to a specific fund are allocated among all funds in an equitable manner, taking into consideration, among other things, the nature and type of expense and the fund's relative net assets. Expense estimates are accrued in the period to which they relate and adjustments are made when actual amounts are known.
Class allocations. Income, common expenses and realized and unrealized gains (losses) are determined at the fund level and allocated daily to each class of shares based on the net assets of the class. Class-specific expenses, such as distribution and service fees, if any, and transfer agent fees, for all classes, are charged daily at the class level based on the net assets of each class and the specific expense rates applicable to each class.
Federal income taxes. The fund intends to continue to qualify as a regulated investment company by complying with the applicable provisions of the Internal Revenue Code and will not be subject to federal income tax on taxable income that is distributed to shareholders. Therefore, no federal income tax provision is required.
As of October 31, 2017, the fund had no uncertain tax positions that would require financial statement recognition, derecognition or disclosure. The fund's federal tax returns are subject to examination by the Internal Revenue Service for a period of three years.
Distribution of income and gains. Distributions to shareholders from net investment income and net realized gains, if any, are recorded on the ex-date. The fund generally declares and pays dividends and capital gain distributions, if any, annually.
Distributions paid by the fund with respect to each class of shares are calculated in the same manner, at the same time and in the same amount, except for the effect of class level expenses that may be applied differently to each class.
Such distributions, on a tax basis, are determined in conformity with income tax regulations, which may differ from US GAAP. Distributions in excess of tax basis earnings and profits, if any, are reported in the fund's financial statements as a return of capital. The final determination of tax characteristics of the fund's distribution will occur at the end of the year and will subsequently be reported to shareholders.
Capital accounts within the financial statements are adjusted for permanent book-tax differences. These adjustments have no impact on net assets or the results of operations. Temporary book-tax differences, if any, will reverse in a subsequent period. Book-tax differences are primarily attributable to wash sale loss deferrals.
Note 3 — Guarantees and indemnifications
Under the Trust's organizational documents, its Officers and Trustees are indemnified against certain liabilities arising out of the performance of their duties to the Trust, including the fund. Additionally, in the normal course of business, the fund enters into contracts with service providers that contain general indemnification clauses. The fund's maximum exposure under these arrangements is unknown, as this would involve future claims that may be made against the fund that have not yet occurred. The risk of material loss from such claims is considered remote.
Note 4 — Fees and transactions with affiliates
John Hancock Advisers, LLC (the Advisor) serves as investment advisor for the fund. John Hancock Funds, LLC (the Distributor), an affiliate of the Advisor, serves as principal underwriter of the fund. The Advisor and the Distributor are indirect, wholly owned subsidiaries of Manulife Financial Corporation (MFC).
Management fee. The fund has an investment management agreement with the Advisor under which the fund pays a daily management fee to the Advisor equivalent on an annual basis to the sum of: (a) 0.870% of the first $300 million of the fund's average daily net assets, (b) 0.830% of the next $300 million of the fund's average daily net assets, (c) 0.815% of the next $300 million of the fund's average daily net assets, and (d) 0.800% of the fund's average daily net assets in excess of $900 million. The Advisor has a subadvisory agreement with John Hancock Asset Management a division of Manulife Asset Management (US) LLC, an indirectly owned subsidiary of MFC and an affiliate of the Advisor. The fund is not responsible for payment of the subadvisory fees.
The Advisor has contractually agreed to waive a portion of its management fee and/or reimburse expenses for certain funds of the John Hancock group of funds complex, including the fund (the participating portfolios). This waiver is based upon aggregate net assets of all the participating portfolios. The amount of the reimbursement is calculated daily and allocated among all the participating portfolios in proportion to the daily net assets of each fund. During the six months ended April 30, 2018, this waiver amounted to 0.01% of the fund's average net assets. This arrangement may be amended or terminated at any time by the Advisor upon notice to the fund and with the approval of the Board of Trustees.
For the six months ended April 30, 2018, the expense reductions described above amounted to the following:
| Class | Expense reduction | Class | Expense reduction | |
| Class A | $2,417 | Class NAV | $7,347 | |
| Class I | 243 | Total | $10,777 | |
| Class R6 | 770 |
Expenses waived or reimbursed in the current fiscal period are not subject to recapture in future fiscal periods.
The investment management fees, including the impact of the waivers and reimbursements as described above, incurred for the six months ended April 30, 2018 were equivalent to a net annual effective rate of 0.85% of the fund's average daily net assets.
Accounting and legal services. Pursuant to a service agreement, the fund reimburses the Advisor for all expenses associated with providing the administrative, financial, legal, compliance, accounting and recordkeeping services to the fund, including the preparation of all tax returns, periodic reports to shareholders and regulatory reports, among other services. These expenses are allocated to each share class based on its relative net assets at the time the expense was
incurred. These accounting and legal services fees incurred for the six months ended April 30, 2018 amounted to an annual rate of 0.02% of the fund's average daily net assets.
Distribution and service plans. The fund has a distribution agreement with the Distributor. The fund has adopted a distribution and service plan with respect to Class A shares pursuant to Rule 12b-1 under the 1940 Act, to pay the Distributor for services provided as the distributor of shares of the fund. The fund pays up to 0.25% for Class A shares distribution and service fees under these arrangements, expressed as an annual percentage of average daily net assets of Class A shares.
Sales charges. Class A shares are assessed up-front sales charges, which resulted in payments to the Distributor amounting to $212,023 for the six months ended April 30, 2018. Of this amount, $36,092 was retained and used for printing prospectuses, advertising, sales literature and other purposes, $175,272 was paid as sales commissions to broker-dealers and $659 was paid as sales commissions to sales personnel of Signator Investors, Inc., a broker-dealer affiliate of the Advisor.
Class A shares may be subject to contingent deferred sales charges (CDSCs). Certain Class A shares that are acquired through purchases of $1 million or more and are redeemed within one year of purchase are subject to a 1.00% sales charge. CDSCs are applied to the lesser of the current market value at the time of redemption or the original purchase cost of the shares being redeemed. Proceeds from CDSCs are used to compensate the Distributor for providing distribution-related services in connection with the sale of these shares. During the six months ended April 30, 2018, there were no CDSCs received by the Distributor for Class A shares.
Transfer agent fees. The John Hancock Group of Funds has a complex-wide transfer agent agreement with John Hancock Signature Services, Inc. (Signature Services), an affiliate of the Advisor. The transfer agent fees paid to Signature Services are determined based on the cost to Signature Services (Signature Services Cost) of providing recordkeeping services. It also includes out-of-pocket expenses, including payments made to third-parties for recordkeeping services provided to their clients who invest in one or more John Hancock funds. In addition, Signature Services Cost may be reduced by certain fees that Signature Services receives in connection with retirement and small accounts. Signature Services Cost is calculated monthly and allocated, as applicable, to five categories of share classes: Retail Share and Institutional Share Classes of Non-Municipal Bond Funds, Class R6 Shares, Retirement Share Classes and Municipal Bond Share Classes. Within each of these categories, the applicable costs are allocated to the affected John Hancock affiliated funds and/or classes, based on the relative average daily net assets.
Class level expenses. Class level expenses for the six months ended April 30, 2018 were:
| Class | Distribution and service fees | Transfer agent fees |
| Class A | $71,883 | $37,626 |
| Class I | — | 3,413 |
| Class R6 | — | 1,277 |
| Total | $71,883 | $42,316 |
Trustee expenses. The fund compensates each Trustee who is not an employee of the Advisor or its affiliates. The costs of paying Trustee compensation and expenses are allocated to the fund based on its net assets relative to other funds within the John Hancock group of funds complex.
Note 5 — Fund share transactions
Transactions in fund shares for the six months ended April 30, 2018 and for the year ended October 31, 2017 were as follows:
| Six months ended 4-30-18 | Year ended 10-31-17 | |||||||||||||||||||||||||
| Shares | Amount | Shares | Amount | |||||||||||||||||||||||
| Class A shares1 | ||||||||||||||||||||||||||
| Sold | 1,845,955 | $23,299,789 | 52,571 | $722,877 | ||||||||||||||||||||||
| Issued in reorganization (Note 8) | 18,975,896 | 228,384,397 | — | — | ||||||||||||||||||||||
| Distributions reinvested | 18,159 | 230,074 | — | — | ||||||||||||||||||||||
| Repurchased | (355,121 | ) | (4,367,602 | ) | (1,020 | ) | (14,149 | ) | ||||||||||||||||||
| Net increase | 20,484,889 | $247,546,658 | 51,551 | $708,728 | ||||||||||||||||||||||
| Class I shares | ||||||||||||||||||||||||||
| Sold | 795,905 | $9,950,628 | 20,616 | $269,448 | ||||||||||||||||||||||
| Issued in reorganization (Note 8) | 995,716 | 11,964,123 | — | — | ||||||||||||||||||||||
| Distributions reinvested | 6,306 | 79,714 | 369 | 4,505 | ||||||||||||||||||||||
| Repurchased | (86,142 | ) | (1,062,622 | ) | (20,632 | ) | (253,347 | ) | ||||||||||||||||||
| Net increase | 1,711,785 | $20,931,843 | 353 | $20,606 | ||||||||||||||||||||||
| Class R6 shares2 | ||||||||||||||||||||||||||
| Sold | 1,816,215 | $22,676,574 | 3,888 | $50,000 | ||||||||||||||||||||||
| Issued in reorganization (Note 8) | 4,522,283 | 54,381,807 | — | — | ||||||||||||||||||||||
| Distributions reinvested | 3,016 | 38,148 | — | — | ||||||||||||||||||||||
| Repurchased | (147,205 | ) | (1,806,328 | ) | — | — | ||||||||||||||||||||
| Net increase | 6,194,309 | $75,290,201 | 3,888 | $50,000 | ||||||||||||||||||||||
| Class NAV shares | ||||||||||||||||||||||||||
| Sold | 141,116 | $1,769,471 | 2,833,315 | $37,916,935 | ||||||||||||||||||||||
| Distributions reinvested | 1,517,522 | 19,181,480 | 90,046 | 1,098,566 | ||||||||||||||||||||||
| Repurchased | (604,851 | ) | (8,102,089 | ) | (2,779,126 | ) | (33,621,426 | ) | ||||||||||||||||||
| Net increase | 1,053,787 | $12,848,862 | 144,235 | $5,394,075 | ||||||||||||||||||||||
| Total net increase | 29,444,770 | $356,617,564 | 200,027 | $6,173,409 | ||||||||||||||||||||||
1Class A shares were liquidated on 3-10-16. Class A relaunched on 8-30-17.
2The inception date for Class R6 shares is 8-30-17.
Affiliates of the fund owned 2% and 100% of shares of Class I and Class NAV, respectively, on April 30, 2018. Such concentration of shareholders' capital could have a material effect on the fund if such shareholders redeem from the fund.
Note 6 — Purchase and sale of securities
Purchases and sales of securities, other than short-term investments and merger activity, amounted to $166,184,120 and $116,444,184, respectively, for the six months ended April 30, 2018.
Note 7 — Investment by affiliated funds
Certain investors in the fund are affiliated funds that are managed by the Advisor and its affiliates. The affiliated funds do not invest in the fund for the purpose of exercising management or control; however, this investment may represent a significant portion of the fund's net assets. At April 30, 2018, funds within the John Hancock group of funds complex held 32.6% of the fund's net assets. The following funds had an affiliate ownership of 5% or more of the fund's net assets:
| Fund | Affliated concentration |
| John Hancock Funds II Multimanager Lifestyle Growth Portfolio | 16.0% |
| John Hancock Funds II Multimanager Lifestyle Balanced Portfolio | 9.5% |
| John Hancock Funds II Multimanager Lifestyle Aggressive Portfolio | 7.1% |
Note 8 — Reorganization
On January 26, 2018, the shareholders of John Hancock Funds III Small Company Fund (the Acquired Portfolio) voted to approve an Agreement and Plan of Reorganization (the Agreement) which provided for an exchange of shares of the fund (the Acquiring Portfolio) with a value equal to the net assets transferred.
The Agreement provided for (a) the acquisition of all the assets, subject to all of the liabilities, of the Acquired Portfolio in exchange for shares of the Acquiring Portfolio with a value equal to the net assets transferred; (b) the liquidation of the Acquired Portfolio; and (c) the distribution to Acquired Portfolio's shareholders of such Acquiring Portfolio's shares. The reorganization was intended to consolidate the Acquired Portfolio with portfolios with similar objectives and achieve economies of scale. As a result of the reorganization, the Acquiring Portfolio is the legal and accounting survivor.
Based on the opinion of tax counsel, the reorganization qualified as a tax-free reorganization for federal income tax purposes with no gain or loss recognized by the Acquired Portfolio or its shareholders. Thus, the investments were transferred to the Acquiring Portfolio at the Acquired Portfolio's identified cost. All distributable amounts of net income and realized gains from the Acquired Portfolio were distributed prior to the reorganization. In addition, the expenses of the reorganization will be shared prorata. The effective time of the reorganization occurred immediately after the close of regularly scheduled trading on the New York Stock Exchange (NYSE) on March 23, 2018. The following outlines the reorganization:
| Acquiring Fund | Acquired Fund | Net asset value of the Acquired Fund | Appreciation of the Acquired Fund's investment | Shares redeemed by the Acquired Fund | Shares issued by the Acquiring Fund | Acquiring Fund net assets prior to combination | Acquiring Fund total net assets after combination | ||||||||||||||||
| Small Cap Core Fund | Small Company Fund | $294,730,327 | ($16,780,146 | ) | 13,378,531 | 24,493,895 | $205,780,002 | $500,510,329 |
Because the combined portfolio has been managed as a single integrated portfolio since the reorganization was completed, it is not practicable to separate the amounts of net investment income and gains attributable to the Acquired Portfolio that have been included in the Acquiring Portfolio's Statement of operations at April 30, 2018. See Note 5 for capital shares issued in connection with the above referenced reorganizations.
Assuming the acquisition had been completed on November 1, 2017, the beginning of the reporting period, the Acquiring Portfolio's pro forma results of operations for the six months ended April 30, 2018 are as follow:
| Net investment income | $276,016 | ||||
| Net realized and unrealized gain | (9,395,085 | ) | |||
| Increase in net assets from operations | ($9,119,069 | ) |
Shareholder meeting
John Hancock Funds III held a Special Meeting of Shareholders on February 16, 2018 (adjourned on January 26, 2018 and reconvened on February 16, 2018). The following proposal was considered by the shareholders:
Proposal: To approve an Agreement and Plan of Reorganization between John Hancock Small Company Fund and John Hancock Small Cap Core Fund.
PROPOSAL ONE PASSED ON February 16, 2018.
| Shares Voted | % of Outstanding Shares | % of Voted Shares | ||
| For | 5,006,620.378 | 43.074% | 84.852% | |
| Against | 178,577.803 | 1.536% | 3.027% | |
| Abstain | 715,220.937 | 6.153% | 12.122% | |
Trustees Hassell H. McClellan, Chairperson Officers Andrew G. Arnott John J. Danello Francis V. Knox, Jr. Charles A. Rizzo Salvatore Schiavone | Investment advisor John Hancock Advisers, LLC Subadvisor John Hancock Asset Management a division of Manulife Asset Management (US) LLC Principal distributor John Hancock Funds, LLC Custodian State Street Bank and Trust Company Transfer agent John Hancock Signature Services, Inc. Legal counsel K&L Gates LLP |
*Member of the Audit Committee
†Non-Independent Trustee
#Effective 6-20-17
The fund's proxy voting policies and procedures, as well as the fund proxy voting record for the most recent twelve-month period ended June 30, are available free of charge on the Securities and Exchange Commission (SEC) website at sec.gov or on our website.
The fund's complete list of portfolio holdings, for the first and third fiscal quarters, is filed with the SEC on Form N-Q. The fund's Form N-Q is available on our website and the SEC's website, sec.gov, and can be reviewed and copied (for a fee) at the SEC's Public Reference Room in Washington, DC. Call 800-SEC-0330 to receive information on the operation of the SEC's Public Reference Room.
We make this information on your fund, as well as monthly portfolio holdings, and other fund details available on our website at jhinvestments.com or by calling 800-225-5291.
| You can also contact us: | |||
| 800-225-5291 jhinvestments.com | Regular mail: John Hancock Signature Services, Inc. | Express mail: John Hancock Signature Services, Inc. | |
John Hancock family of funds
DOMESTIC EQUITY FUNDS Balanced Blue Chip Growth Classic Value Disciplined Value Disciplined Value Mid Cap Equity Income Fundamental All Cap Core Fundamental Large Cap Core Fundamental Large Cap Value New Opportunities Small Cap Core Small Cap Growth Small Cap Value Strategic Growth U.S. Global Leaders Growth U.S. Growth Value Equity GLOBAL AND INTERNATIONAL EQUITY FUNDS Disciplined Value International Emerging Markets Emerging Markets Equity Fundamental Global Franchise Global Equity Global Shareholder Yield Greater China Opportunities International Growth International Small Company International Value Equity | INCOME FUNDS Bond California Tax-Free Income Emerging Markets Debt Floating Rate Income Government Income High Yield High Yield Municipal Bond Income Investment Grade Bond Money Market Short Duration Credit Opportunities Spectrum Income Strategic Income Opportunities Tax-Free Bond ALTERNATIVE AND SPECIALTY FUNDS Absolute Return Currency Alternative Asset Allocation Enduring Assets Financial Industries Global Absolute Return Strategies Global Conservative Absolute Return Global Focused Strategies Natural Resources Redwood Regional Bank Seaport Long/Short Technical Opportunities |
A fund's investment objectives, risks, charges, and expenses should be considered carefully before investing. The prospectus contains this and other important information about the fund. To obtain a prospectus, contact your financial professional, call John Hancock Investments at 800-225-5291, or visit our website at jhinvestments.com. Please read the prospectus carefully before investing or sending money.
ASSET ALLOCATION Income Allocation Multi-Index Lifetime Portfolios Multi-Index Preservation Portfolios Multimanager Lifestyle Portfolios Multimanager Lifetime Portfolios Retirement Income 2040 EXCHANGE-TRADED FUNDS John Hancock Multifactor Consumer Discretionary ETF John Hancock Multifactor Consumer Staples ETF John Hancock Multifactor Developed International ETF John Hancock Multifactor Energy ETF John Hancock Multifactor Financials ETF John Hancock Multifactor Healthcare ETF John Hancock Multifactor Industrials ETF John Hancock Multifactor Large Cap ETF John Hancock Multifactor Materials ETF John Hancock Multifactor Mid Cap ETF John Hancock Multifactor Small Cap ETF John Hancock Multifactor Technology ETF John Hancock Multifactor Utilities ETF | ENVIRONMENTAL, SOCIAL, AND GOVERNANCE FUNDS ESG All Cap Core ESG Core Bond ESG International Equity ESG Large Cap Core CLOSED-END FUNDS Financial Opportunities Hedged Equity & Income Income Securities Trust Investors Trust Preferred Income Preferred Income II Preferred Income III Premium Dividend Tax-Advantaged Dividend Income Tax-Advantaged Global Shareholder Yield |
John Hancock Multifactor ETF shares are bought and sold at market price (not NAV), and are not individually redeemed
from the fund. Brokerage commissions will reduce returns.
John Hancock ETFs are distributed by Foreside Fund Services, LLC, and are subadvised by Dimensional Fund Advisors LP.
Foreside is not affiliated with John Hancock Funds, LLC or Dimensional Fund Advisors LP.
Dimensional Fund Advisors LP receives compensation from John Hancock in connection with licensing rights to the
John Hancock Dimensional indexes. Dimensional Fund Advisors LP does not sponsor, endorse, or sell, and makes no
representation as to the advisability of investing in, John Hancock Multifactor ETFs.
John Hancock Investments
A trusted brand
John Hancock Investments is a premier asset manager representing one of
America's most trusted brands, with a heritage of financial stewardship dating
back to 1862. Helping our shareholders pursue their financial goals is at the
core of everything we do. It's why we support the role of professional financial
advice and operate with the highest standards of conduct and integrity.
A better way to invest
We serve investors globally through a unique multimanager approach:
We search the world to find proven portfolio teams with specialized
expertise for every strategy we offer, then we apply robust investment
oversight to ensure they continue to meet our uncompromising standards
and serve the best interests of our shareholders.
Results for investors
Our unique approach to asset management enables us to provide a diverse set
of investments backed by some of the world's best managers, along with strong
risk-adjusted returns across asset classes.
| | John Hancock Funds, LLC n Member FINRA, SIPC 601 Congress Street n Boston, MA 02210-2805 800-225-5291 n jhinvestments.com | |
| This report is for the information of the shareholders of John Hancock Small Cap Core Fund. It is not authorized for distribution to prospective investors unless preceded or accompanied by a prospectus. | ||
| MF450499 | 445SA 4/18 6/18 | |
John Hancock
Enduring Assets Fund
Semiannual report 4/30/18

A message to shareholders
Dear shareholder,
Financial markets around the world experienced a meaningful rise in volatility in the last half of the reporting period. U.S. equities declined as investors reacted to a potential trade war between the United States and China and the prospect of rising inflation. In developed international markets, macroeconomic data began to suggest that the growth many investors were hoping for may not be as robust as early indications had suggested. Although some in the asset management community believe the sell-off will be temporary, we have suggested for some time that the era of extremely low volatility would eventually come to an end, and that now appears to be the case.
That said, the fundamentals across the global stage continue to appear supportive. One of the challenges investors will face in the coming months is navigating the continued normalization of monetary policy. Stronger economies will continue to prompt central banks to dial back the stimulus they had injected into the financial system in the years following the global financial crisis, and this less-accommodative stance may represent an adjustment for many markets.
Your best resource in unpredictable markets is your financial advisor, who can help position your portfolio so that it's sufficiently diversified to meet your long-term objectives and to withstand the inevitable turbulence along the way.
On behalf of everyone at John Hancock Investments, I'd like to take this opportunity to welcome new shareholders and to thank existing shareholders for the continued trust you've placed in us.
Sincerely,
Andrew G. Arnott
President and CEO,
John Hancock Investments
Head of Wealth and Asset Management,
United States and Europe
This commentary reflects the CEO's views, which are subject to change at any time. Investing involves risks, including the potential loss of principal. Diversification does not guarantee a profit or eliminate the risk of a loss. It is not possible to invest directly into an index. For more up-to-date information, please visit our website at jhinvestments.com.
John Hancock
Enduring Assets Fund
INVESTMENT OBJECTIVE
The fund seeks total return from capital appreciation and income, with an emphasis on absolute returns over a full market cycle.
AVERAGE ANNUAL TOTAL RETURNS AS OF 4/30/18 (%)
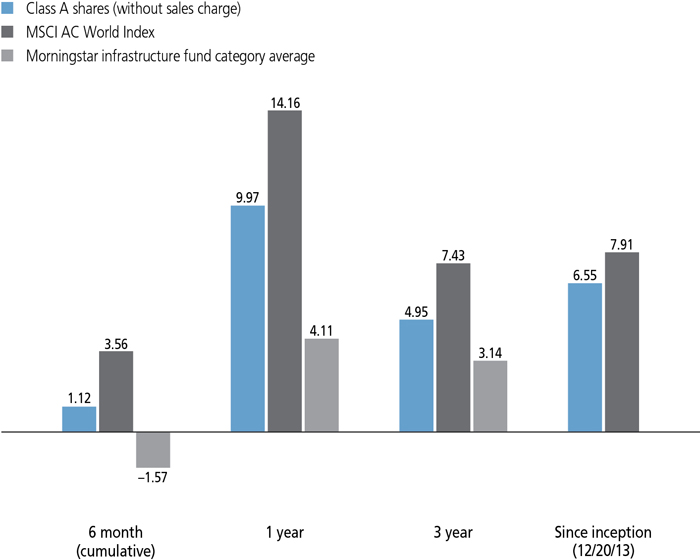
The MSCI AC World Index is a free float-adjusted market capitalization weighted index that is designed to measure the equity market performance of developed markets and emerging markets.
It is not possible to invest directly in an index. Index figures do not reflect expenses or sales charges, which would result in lower returns.
Figures from Morningstar, Inc. include reinvested distributions and do not take into account sales charges. Actual load-adjusted performance is lower. Since inception returns for the Morningstar fund category average are not available.
The past performance shown here reflects reinvested distributions and the beneficial effect of any expense reductions, and does not guarantee future results. Returns for periods shorter than one year are cumulative. Performance of the other share classes will vary based on the difference in the fees and expenses of those classes. Shares will fluctuate in value and, when redeemed, may be worth more or less than their original cost. Current month-end performance may be lower or higher than the performance cited, and can be found at jhinvestments.com or by calling 800-225-5291. For further information on the fund's objectives, risks, and strategy, see the fund's prospectus.
PERFORMANCE HIGHLIGHTS OVER THE LAST SIX MONTHS
Global equities gained ground
Although stocks experienced elevated volatility in the latter half of the period, the fund's benchmark, the MSCI AC World Index, posted a modest advance.
The fund generated a positive return, but trailed the benchmark
Stock selection detracted from performance in the energy sector, but it added value in utilities.
Defensive positioning dampened results
An emphasis on stocks with defensive properties hampered performance given that the value style underperformed growth.
SECTOR COMPOSITION AS OF 4/30/18 (%)
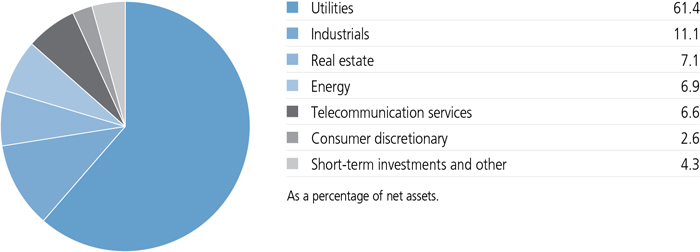
A note about risks
Since the fund is not managed to track a benchmark, its multiple strategies and focus on investments in certain sectors may lead it to lag broad market rallies. Because the fund may focus on particular sectors of the economy, its performance may depend on the performance of those sectors, and investments focused on one sector may fluctuate more widely than investments diversified across sectors. The price of equity securities may decline due to changes in a company's financial condition or overall market conditions. Master limited partnerships and other energy companies are susceptible to changes in energy and commodity prices. Utilities companies' performance may be volatile due to variable fuel, service, and financing costs, conservation efforts, government regulation, and other factors. The stock prices of midsize and small companies can change more frequently and dramatically than those of large companies. Foreign investing, especially in emerging markets, has additional risks, such as currency and market volatility and political and social instability. Fixed-income investments are subject to interest-rate and credit-rate risk; their value will normally decline as interest rates rise or if a creditor, grantor, or counterparty is unable or unwilling to make principal, interest, or settlement payments. Liquidity—the extent to which a security may be sold or a derivative position closed without negatively affecting its market value—may be impaired by reduced trading volume, heightened volatility, rising interest rates, and other market conditions. Real estate investment trusts may decline in value, just like direct ownership of real estate. Please see the fund's prospectus for additional risks.

G. Thomas Levering
Portfolio Manager
Wellington Management Company LLP
How would you describe the market environment during the six months ended April 30, 2018?
Global equities posted a gain of 3.56%, as gauged by the MSCI AC World Index, but market volatility increased significantly as the period progressed. Investment conditions were very positive in the interval from November through January, when the combination of improving global growth, robust corporate profits, and optimism surrounding the tax cut in the United States propelled stocks to a series of new highs.
The backdrop began to change in early February, however, when signs of rising inflation sparked a surge in bond yields and raised concerns that the U.S. Federal Reserve would need to hike interest rates more aggressively than the markets had been anticipating. Stocks finished April near the February low, as worries about U.S. trade policy and weaker-than-expected economic data fueled volatility and depressed sentiment. International equities finished slightly ahead of the United States, while the growth style outpaced value.
Can you review the fund's investment approach?
The fund invests in companies with physical assets that have very long economic lives, typically measured in decades. These assets tend to produce attractive returns that are set by regulations or long-term contracts. Examples include electric, gas, and water networks; power-generation plants; oil and gas pipelines; transportation infrastructure; and the real estate, telecommunication services, and natural resources segments. Our primary valuation metric is intrinsic return, a measure of annualized value creation that evaluates companies based on their free cash flow, the net present value of their investments, and the net present value of pricing power.
How would you characterize the fund's results?
When assessing performance, it's important to keep in mind that the fund, which is not intended to track the benchmark, tends to invest in stocks with defensive properties. At a time in which the growth style outpaced value, this defensive tilt hindered returns. With that said, in our view, the fund held up very well in the second half of the period once the investment backdrop grew less favorable.
Although the fund's return was somewhat muted, the stocks in the portfolio continued to experience increased earnings, cash flow, and dividends in the aggregate. Market fluctuations can lead to variations in the fund's short-term results versus the index, but we believe the collective intrinsic return of the fund's investments is consistent with our objective of attractive absolute returns and longer-term outperformance.
What specific factors hurt and helped performance?
Beijing Enterprises Holdings, Ltd., a provider of fresh water for Hong Kong, was a key detractor. The company faced some pricing challenges, and its earnings missed expectations. We maintained the position on the belief that the stock stands to benefit from an improving regulatory backdrop. Comcast Corp., whose shares declined after the company announced a bid for a U.K. satellite operator, also detracted from performance. Believing Comcast has attractive assets in cable and broadband operations and that it can raise prices in excess of inflation, we held on to the position.
Other detractors included PG&E Corp., which lagged due to its potential liability for the California wildfires, and E.ON SE, which announced 2018 earnings guidance that was well below consensus estimates. We sold PG&E, but we continue to hold E.ON.
The energy sector proved to be a somewhat challenging area for the fund, as shares of TransCanada
TOP 10 HOLDINGS AS OF 4/30/18 (%)
| ENN Energy Holdings, Ltd. | 4.3 |
| China Longyuan Power Group Corp., Ltd., H Shares | 4.3 |
| Iberdrola SA | 4.3 |
| E.ON SE | 4.1 |
| Huaneng Renewables Corp., Ltd., H Shares | 3.9 |
| TransCanada Corp. | 3.8 |
| Enel SpA | 3.8 |
| NTT DOCOMO, Inc. | 3.7 |
| Vinci SA | 3.7 |
| NextEra Energy, Inc. | 3.7 |
| TOTAL | 39.6 |
| As a percentage of net assets. | |
| Cash and cash equivalents are not included. | |
Stock selection in the utilities sector was a key contributor to results. The fund's holdings posted a mid-single-digit gain during the period, which compared very favorably with the modest decline for the utilities sector as a whole. Given that utilities are the largest sector weighting in the fund, positive results in this area made a sizable contribution.
China Longyuan Power Group Corp., Ltd., a large wind-energy operator, was the leading contributor in the sector. The stock rose markedly as a recovery in its capacity utilization, which supported rising output, led to improved profitability. We believe the stock is undervalued and has a high intrinsic return opportunity relative to other portfolio holdings.
Huaneng Renewables Corp., Ltd. also contributed to the fund's results in utilities due to a similar increase in capacity utilization. ENN Energy Holdings, Ltd. was an additional contributor of note. The company holds contracts to provide natural gas to the government of Hong Kong, which allows it to generate a stable profit. We believe the stock remains reasonably valued and could benefit from its new businesses and its ability to offer its customers integrated solutions.
The telecommunications sector was also an area of strength for the fund thanks to the strong showing of the Japanese wireless operator NTT DOCOMO, Inc. We believe the company, along with mobile network operator peers in Japan, is attractive given the stable market structure, attractive valuation, and limited need to make capital expenditures related to 5G networks.
What changes did you make to the fund's portfolio?
Consistent with the long-term nature of the underlying assets owned by the fund's holdings, we
TOP 10 COUNTRIES AS OF 4/30/18 (%)
| United States | 28.6 |
| China | 12.5 |
| United Kingdom | 8.9 |
| Hong Kong | 8.1 |
| Canada | 7.1 |
| France | 6.8 |
| Italy | 6.0 |
| Japan | 5.3 |
| Germany | 5.0 |
| Spain | 4.3 |
| TOTAL | 92.6 |
| As a percentage of net assets. | |
| Cash and cash equivalents are not included. |
maintained a low-turnover approach. We initiated an investment in the California-based utility Edison International, as we think the markets have overestimated the risk associated with the company's wildfire liability. Additionally, we believe Edison is likely to experience significantly less financial impact than has been reflected in its stock price.
We also established a new position in Companhia de Saneamento do Paraná (Sanepar), which provides much-needed water treatment for Brazil. We anticipate the company's leading position will allow it to benefit from increased demand for clean water in the coming years. Additionally, we believe concerns about political risk and Sanepar's pricing power are overstated.
We reduced the fund's position in Innogy SE and increased its allocation to E.ON. We believed the latter company's pending acquisition of Innogy, combined with the high likelihood of deal closure, indicated that the upside in Innogy had become more limited. E.ON's share price responded positively to the announced acquisition, and we believe the potential earnings upside and improved post-deal earnings quality indicate a favorable risk/reward profile for the stock.
MANAGED BY
| | G. Thomas Levering On the fund since 2013 Investing since 1993 |
![]()
TOTAL RETURNS FOR THE PERIOD ENDED APRIL 30, 2018
| Average annual total returns (%) with maximum sales charge | Cumulative total returns (%) with maximum sales charge | SEC 30-day yield (%) subsidized | SEC 30-day yield (%) unsubsidized1 | ||||||||
| 1-year | Since inception1 | 6-month | Since inception1 | as of 4-30-18 | as of 4-30-18 | ||||||
| Class A | 4.47 | 5.30 | -3.94 | 25.28 | 1.42 | 1.37 | |||||
| Class C2 | 8.30 | 5.86 | -0.21 | 28.21 | 0.81 | 0.77 | |||||
| Class I3 | 10.30 | 6.84 | 1.28 | 33.46 | 1.80 | 1.74 | |||||
| Class R63 | 10.47 | 7.00 | 1.40 | 34.32 | 1.87 | 1.83 | |||||
| Class NAV3 | 10.40 | 7.00 | 1.32 | 34.33 | 1.87 | 1.85 | |||||
| Index† | 14.16 | 7.91 | 3.56 | 39.41 | — | — | |||||
Performance figures assume all distributions have been reinvested. Figures reflect maximum sales charges on Class A shares of 5.00% and the applicable contingent deferred sales charge (CDSC) on Class C shares. Class C shares sold within one year of purchase are subject to a 1% CDSC. Sales charges are not applicable to Class I, Class R6, and Class NAV shares.
The expense ratios of the fund, both net (including any fee waivers and/or expense limitations) and gross (excluding any fee waivers and/or expense limitations), are set forth according to the most recent publicly available prospectuses for the fund and may differ from those disclosed in the Financial highlights tables in this report. Net expenses reflect contractual expense limitations in effect until February 28, 2019 and are subject to change. Had the contractual fee waivers and expense limitations not been in place, gross expenses would apply. The expense ratios are as follows:
| Class A | Class C | Class I | Class R6 | Class NAV | |
| Gross (%) | 1.39 | 2.09 | 1.08 | 0.99 | 0.98 |
| Net (%) | 1.31 | 2.01 | 1.00 | 0.92 | 0.92 |
Please refer to the most recent prospectus and annual or semiannual report for more information on expenses and any expense limitation arrangements for each class.
The returns reflect past results and should not be considered indicative of future performance. The return and principal value of an investment will fluctuate so that shares, when redeemed, may be worth more or less than their original cost. Due to market volatility and other factors, the fund's current performance may be higher or lower than the performance shown. For current to the most recent month-end performance data, please call 800-225-5291 or visit the fund's website at jhinvestments.com.
The performance table above and the chart on the next page do not reflect the deduction of taxes that a shareholder would pay on fund distributions or the redemption of fund shares. The fund's performance results reflect any applicable fee waivers or expense reductions, without which the expenses would increase and results would have been less favorable.
| † | Index is the MSCI AC World Index. |
See the following page for footnotes.
This chart and table show what happened to a hypothetical $10,000 investment in John Hancock Enduring Assets Fund for the share classes and periods indicated, assuming all distributions were reinvested. For comparison, we've shown the same investment in the MSCI AC World Index.
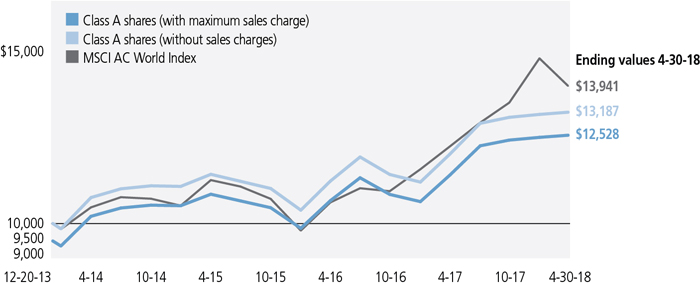
| Start date | With maximum sales charge ($) | Without sales charge ($) | Index ($) | |
| Class C2,4 | 12-20-13 | 12,821 | 12,821 | 13,941 |
| Class I3 | 12-20-13 | 13,346 | 13,346 | 13,941 |
| Class R63 | 12-20-13 | 13,432 | 13,432 | 13,941 |
| Class NAV3 | 12-20-13 | 13,433 | 13,433 | 13,941 |
The MSCI AC World Index is a free float-adjusted market capitalization weighted index that is designed to measure the equity market performance of developed markets and emerging markets.
It is not possible to invest directly in an index. Index figures do not reflect expenses or sales charges, which would result in lower returns.
Footnotes related to performance pages
| 1 | From 12-20-13 |
| 2 | Class C shares were first offered on 5/16/14. Returns prior to this date are those of Class A shares (first offered on 12/20/13) that have not been adjusted for class-specific expenses; otherwise, returns would vary. |
| 3 | For certain types of investors, as described in the fund's prospectuses. |
| 4 | The contingent deferred sales charge is not applicable. |
These examples are intended to help you understand your ongoing operating expenses of investing in the fund so you can compare these costs with the ongoing costs of investing in other mutual funds.
Understanding fund expenses
As a shareholder of the fund, you incur two types of costs:
| • | Transaction costs, which include sales charges (loads) on purchases or redemptions (varies by share class), minimum account fee charge, etc. |
| • | Ongoing operating expenses, including management fees, distribution and service fees (if applicable), and other fund expenses. |
We are presenting only your ongoing operating expenses here.
Actual expenses/actual returns
The first line of each share class in the table on the following page is intended to provide information about the fund's actual ongoing operating expenses, and is based on the fund's actual return. It assumes an account value of $1,000.00 on November 1, 2017, with the same investment held until April 30, 2018.
Together with the value of your account, you may use this information to estimate the operating expenses that you paid over the period. Simply divide your account value at April 30, 2018, by $1,000.00, then multiply it by the "expenses paid" for your share class from the table. For example, for an account value of $8,600.00, the operating expenses should be calculated as follows:
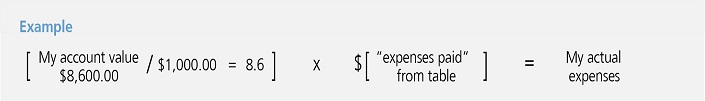
Hypothetical example for comparison purposes
The second line of each share class in the table on the following page allows you to compare the fund's ongoing operating expenses with those of any other fund. It provides an example of the fund's hypothetical account values and hypothetical expenses based on each class's actual expense ratio and an assumed 5% annualized return before expenses (which is not the fund's actual return). It assumes an account value of $1,000.00 on November 1, 2017, with the same investment held until April 30, 2018. Look in any other fund shareholder report to find its hypothetical example and you will be able to compare these expenses. Please remember that these hypothetical account values and expenses may not be used to estimate the actual ending account balance or expenses you paid for the period.
Remember, these examples do not include any transaction costs, therefore, these examples will not help you to determine the relative total costs of owning different funds. If transaction costs were included, your expenses would have been higher. See the prospectuses for details regarding transaction costs.
SHAREHOLDER EXPENSE EXAMPLE CHART
| Account value on 11-1-2017 | Ending value on 4-30-2018 | Expenses paid during period ended 4-30-20181 | Annualized expense ratio | ||
| Class A | Actual expenses/actual returns | $1,000.00 | $1,011.20 | $7.03 | 1.41% |
| Hypothetical example for comparison purposes | 1,000.00 | 1,017.80 | 7.05 | 1.41% | |
| Class C | Actual expenses/actual returns | 1,000.00 | 1,007.90 | 10.50 | 2.11% |
| Hypothetical example for comparison purposes | 1,000.00 | 1,014.29 | 10.54 | 2.11% | |
| Class I | Actual expenses/actual returns | 1,000.00 | 1,012.80 | 5.29 | 1.06% |
| Hypothetical example for comparison purposes | 1,000.00 | 1,019.50 | 5.31 | 1.06% | |
| Class R6 | Actual expenses/actual returns | 1,000.00 | 1,014.00 | 5.09 | 1.02% |
| Hypothetical example for comparison purposes | 1,000.00 | 1,019.70 | 5.11 | 1.02% | |
| Class NAV | Actual expenses/actual returns | 1,000.00 | 1,013.20 | 5.04 | 1.01% |
| Hypothetical example for comparison purposes | 1,000.00 | 1,019.80 | 5.06 | 1.01% | |
| 1 | Expenses are equal to the annualized expense ratio, multiplied by the average account value over the period, multiplied by 181/365 (to reflect the one-half year period). |
| Fund’s investments |
| Shares | Value | ||||
| Common stocks 95.7% | $139,488,615 | ||||
| (Cost $116,550,128) | |||||
| Brazil 1.3% | 1,933,432 | ||||
| Cia de Saneamento do Parana | 114,800 | 1,933,432 | |||
| Canada 7.1% | 10,289,499 | ||||
| Canadian National Railway Company | 61,120 | 4,720,799 | |||
| TransCanada Corp. | 131,336 | 5,568,700 | |||
| China 12.5% | 18,287,627 | ||||
| China Longyuan Power Group Corp., Ltd., H Shares | 6,354,348 | 6,241,369 | |||
| ENN Energy Holdings, Ltd. | 668,205 | 6,248,734 | |||
| Huaneng Renewables Corp., Ltd., H Shares | 13,054,474 | 5,797,524 | |||
| France 6.8% | 9,950,904 | ||||
| Engie SA | 259,299 | 4,548,488 | |||
| Vinci SA (A) | 54,033 | 5,402,416 | |||
| Germany 5.0% | 7,283,840 | ||||
| E.ON SE | 543,591 | 5,952,189 | |||
| Innogy SE (B) | 30,306 | 1,331,651 | |||
| Hong Kong 8.1% | 11,811,986 | ||||
| Beijing Enterprises Holdings, Ltd. | 694,010 | 3,466,505 | |||
| CK Infrastructure Holdings, Ltd. | 494,923 | 3,906,135 | |||
| Guangdong Investment, Ltd. | 2,868,106 | 4,439,346 | |||
| Italy 6.0% | 8,782,183 | ||||
| Enel SpA | 872,175 | 5,532,834 | |||
| Snam SpA | 676,796 | 3,249,349 | |||
| Japan 5.3% | 7,687,781 | ||||
| NTT DOCOMO, Inc. | 209,495 | 5,412,094 | |||
| Osaka Gas Company, Ltd. | 105,679 | 2,275,687 | |||
| Spain 4.3% | 6,240,673 | ||||
| Iberdrola SA | 807,756 | 6,240,673 | |||
| Switzerland 1.8% | 2,549,818 | ||||
| Flughafen Zurich AG | 12,210 | 2,549,818 | |||
| United Kingdom 8.9% | 12,980,470 | ||||
| BT Group PLC | 1,226,899 | 4,211,133 | |||
| Severn Trent PLC | 145,942 | 3,886,109 | |||
| SSE PLC | 257,302 | 4,883,228 | |||
| United States 28.6% | 41,690,402 | ||||
| American Tower Corp. | 38,688 | 5,275,496 | |||
| Avangrid, Inc. | 99,657 | 5,252,920 |
| 12 | JOHN HANCOCK ENDURING ASSETS FUND | SEMIANNUAL REPORT | SEE NOTES TO FINANCIAL STATEMENTS |
| Shares | Value | ||||
| United States (continued) | |||||
| Comcast Corp., Class A | 121,551 | $3,815,486 | |||
| Edison International | 71,650 | 4,694,508 | |||
| Equity LifeStyle Properties, Inc. | 57,615 | 5,136,953 | |||
| Kinder Morgan, Inc. | 77,801 | 1,230,812 | |||
| NextEra Energy Partners LP (A) | 20,626 | 859,485 | |||
| NextEra Energy, Inc. | 32,958 | 5,402,146 | |||
| Sempra Energy | 41,696 | 4,661,613 | |||
| UGI Corp. | 110,787 | 5,360,983 | |||
| Yield (%) | Shares | Value | |||
| Securities lending collateral 4.2% | $6,127,989 | ||||
| (Cost $6,127,634) | |||||
| John Hancock Collateral Trust (C) | 1.8834(D) | 612,591 | 6,127,989 | ||
| Short-term investments 4.3% | $6,297,903 | ||||
| (Cost $6,297,903) | |||||
| Money market funds 0.5% | 797,903 | ||||
| State Street Institutional U.S. Government Money Market Fund, Premier Class | 1.6333(D) | 797,903 | 797,903 | ||
| Par value^ | Value | ||||
| Repurchase agreement 3.8% | 5,500,000 | ||||
| Royal Bank of Scotland Tri-Party Repurchase Agreement dated 4-30-18 at 1.700% to be repurchased at $5,500,260 on 5-1-18, collateralized by $5,700,000 U.S. Treasury Notes, 1.500% due 6-15-20 (valued at $5,612,815, including interest) | 5,500,000 | 5,500,000 | |||
| Total investments (Cost $128,975,665) 104.2% | $151,914,507 | ||||
| Other assets and liabilities, net (4.2%) | (6,122,254) | ||||
| Total net assets 100.0% | $145,792,253 | ||||
| The percentage shown for each investment category is the total value of the category as a percentage of the net assets of the fund. | |
| ^All par values are denominated in U.S. dollars unless otherwise indicated. | |
| Security Abbreviations and Legend | |
| (A) | A portion of this security is on loan as of 4-30-18. |
| (B) | These securities are exempt from registration under Rule 144A of the Securities Act of 1933. Such securities may be resold, normally to qualified institutional buyers, in transactions exempt from registration. |
| (C) | Investment is an affiliate of the fund, the advisor and/or subadvisor. This security represents the investment of cash collateral received for securities lending. |
| (D) | The rate shown is the annualized seven-day yield as of 4-30-18. |
| SEE NOTES TO FINANCIAL STATEMENTS | SEMIANNUAL REPORT | JOHN HANCOCK ENDURING ASSETS FUND | 13 |
Financial statements
STATEMENT OF ASSETS AND LIABILITIES 4-30-18 (unaudited)
| Assets | ||||||||||||||||||||||||||||||
| Unaffiliated investments, at value (Cost $122,848,031) including $5,857,130 of securities loaned | $145,786,518 | |||||||||||||||||||||||||||||
| Affiliated investments, at value (Cost $6,127,634) | 6,127,989 | |||||||||||||||||||||||||||||
| Total investments, at value (Cost $128,975,665) | 151,914,507 | |||||||||||||||||||||||||||||
| Foreign currency, at value (Cost $148,457) | 148,106 | |||||||||||||||||||||||||||||
| Receivable for investments sold | 209,899 | |||||||||||||||||||||||||||||
| Receivable for fund shares sold | 392,004 | |||||||||||||||||||||||||||||
| Dividends and interest receivable | 222,771 | |||||||||||||||||||||||||||||
| Receivable for securities lending income | 1,366 | |||||||||||||||||||||||||||||
| Receivable due from advisor | 282 | |||||||||||||||||||||||||||||
| Other receivables and prepaid expenses | 70,204 | |||||||||||||||||||||||||||||
| Total assets | 152,959,139 | |||||||||||||||||||||||||||||
| Liabilities | ||||||||||||||||||||||||||||||
| Payable for investments purchased | 250,747 | |||||||||||||||||||||||||||||
| Payable for fund shares repurchased | 724,989 | |||||||||||||||||||||||||||||
| Payable upon return of securities loaned | 6,127,746 | |||||||||||||||||||||||||||||
| Payable to affiliates | ||||||||||||||||||||||||||||||
| Accounting and legal services fees | 13,245 | |||||||||||||||||||||||||||||
| Transfer agent fees | 4,648 | |||||||||||||||||||||||||||||
| Trustees' fees | 345 | |||||||||||||||||||||||||||||
| Other liabilities and accrued expenses | 45,166 | |||||||||||||||||||||||||||||
| Total liabilities | 7,166,886 | |||||||||||||||||||||||||||||
| Net assets | $145,792,253 | |||||||||||||||||||||||||||||
| Net assets consist of | ||||||||||||||||||||||||||||||
| Paid-in capital | $122,247,071 | |||||||||||||||||||||||||||||
| Undistributed net investment income | 434,669 | |||||||||||||||||||||||||||||
| Accumulated net realized gain (loss) on investments and foreign currency transactions | 173,884 | |||||||||||||||||||||||||||||
| Net unrealized appreciation (depreciation) on investments and translation of assets and liabilities in foreign currencies | 22,936,629 | |||||||||||||||||||||||||||||
| Net assets | $145,792,253 | |||||||||||||||||||||||||||||
STATEMENT OF ASSETS AND LIABILITIES (continued)
| Net asset value per share | ||||||||||||||||||
| Based on net asset values and shares outstanding-the fund has an unlimited number of shares authorized with no par value | ||||||||||||||||||
| Class A ($6,002,263 ÷ 489,575 shares)1 | $12.26 | |||||||||||||||||
| Class C ($666,756 ÷ 54,843 shares)1 | $12.16 | |||||||||||||||||
| Class I ($44,521,903 ÷ 3,627,701 shares) | $12.27 | |||||||||||||||||
| Class R6 ($1,327,015 ÷ 107,923 shares) | $12.30 | |||||||||||||||||
| Class NAV ($93,274,316 ÷ 7,586,787 shares) | $12.29 | |||||||||||||||||
| Maximum offering price per share | ||||||||||||||||||
| Class A (net asset value per share ÷ 95%)2 | $12.91 | |||||||||||||||||
| 1 | Redemption price per share is equal to net asset value less any applicable contingent deferred sales charge. | ||||||||||||||||
| 2 | On single retail sales of less than $50,000. On sales of $50,000 or more and on group sales the offering price is reduced. | ||||||||||||||||
STATEMENT OF OPERATIONS For the six months ended 4-30-18 (unaudited)
| Investment income | ||||||||||||||||||||||||
| Dividends | $1,438,089 | |||||||||||||||||||||||
| Non-cash dividends | 114,500 | |||||||||||||||||||||||
| Interest | 38,725 | |||||||||||||||||||||||
| Securities lending | 4,404 | |||||||||||||||||||||||
| Less foreign taxes withheld | (102,668 | ) | ||||||||||||||||||||||
| Total investment income | 1,493,050 | |||||||||||||||||||||||
| Expenses | ||||||||||||||||||||||||
| Investment management fees | 585,005 | |||||||||||||||||||||||
| Distribution and service fees | 11,641 | |||||||||||||||||||||||
| Accounting and legal services fees | 13,337 | |||||||||||||||||||||||
| Transfer agent fees | 11,455 | |||||||||||||||||||||||
| Trustees' fees | 1,105 | |||||||||||||||||||||||
| State registration fees | 27,888 | |||||||||||||||||||||||
| Printing and postage | 12,013 | |||||||||||||||||||||||
| Professional fees | 19,602 | |||||||||||||||||||||||
| Custodian fees | 16,805 | |||||||||||||||||||||||
| Other | 6,955 | |||||||||||||||||||||||
| Total expenses | 705,806 | |||||||||||||||||||||||
| Less expense reductions | (85,405 | ) | ||||||||||||||||||||||
| Net expenses | 620,401 | |||||||||||||||||||||||
| Net investment income | 872,649 | |||||||||||||||||||||||
| Realized and unrealized gain (loss) | ||||||||||||||||||||||||
| Net realized gain (loss) on | ||||||||||||||||||||||||
| Unaffiliated investments and foreign currency transactions | 2,190,582 | |||||||||||||||||||||||
| Affiliated investments | (726 | ) | ||||||||||||||||||||||
| 2,189,856 | ||||||||||||||||||||||||
| Change in net unrealized appreciation (depreciation) of | ||||||||||||||||||||||||
| Unaffiliated investments and translation of assets and liabilities in foreign currencies | 556,234 | |||||||||||||||||||||||
| Affiliated investments | 506 | |||||||||||||||||||||||
| 556,740 | ||||||||||||||||||||||||
| Net realized and unrealized gain | 2,746,596 | |||||||||||||||||||||||
| Increase in net assets from operations | $3,619,245 | |||||||||||||||||||||||
STATEMENTS OF CHANGES IN NET ASSETS
| Six months ended 4-30-18 | Year ended 10-31-17 | ||||||||||||||||||||||||||||||||||||||||||||
| (unaudited) | |||||||||||||||||||||||||||||||||||||||||||||
| Increase (decrease) in net assets | |||||||||||||||||||||||||||||||||||||||||||||
| From operations | |||||||||||||||||||||||||||||||||||||||||||||
| Net investment income | $872,649 | $2,629,010 | |||||||||||||||||||||||||||||||||||||||||||
| Net realized gain | 2,189,856 | 857,474 | |||||||||||||||||||||||||||||||||||||||||||
| Change in net unrealized appreciation (depreciation) | 556,740 | 11,393,590 | |||||||||||||||||||||||||||||||||||||||||||
| Increase in net assets resulting from operations | 3,619,245 | 14,880,074 | |||||||||||||||||||||||||||||||||||||||||||
| Distributions to shareholders | |||||||||||||||||||||||||||||||||||||||||||||
| From net investment income | |||||||||||||||||||||||||||||||||||||||||||||
| Class A | (16,794 | ) | (94,033 | ) | |||||||||||||||||||||||||||||||||||||||||
| Class C | (351 | ) | (8,302 | ) | |||||||||||||||||||||||||||||||||||||||||
| Class I | (65,355 | ) | (8,641 | ) | |||||||||||||||||||||||||||||||||||||||||
| Class R6 | (6,388 | ) | (30,202 | ) | |||||||||||||||||||||||||||||||||||||||||
| Class NAV | (494,946 | ) | (2,538,226 | ) | |||||||||||||||||||||||||||||||||||||||||
| From net realized gain | |||||||||||||||||||||||||||||||||||||||||||||
| Class A | (17,665 | ) | — | ||||||||||||||||||||||||||||||||||||||||||
| Class C | (2,189 | ) | — | ||||||||||||||||||||||||||||||||||||||||||
| Class I | (11,944 | ) | — | ||||||||||||||||||||||||||||||||||||||||||
| Class R6 | (4,097 | ) | — | ||||||||||||||||||||||||||||||||||||||||||
| Class NAV | (317,108 | ) | — | ||||||||||||||||||||||||||||||||||||||||||
| Total distributions | (936,837 | ) | (2,679,404 | ) | |||||||||||||||||||||||||||||||||||||||||
| From fund share transactions | 32,485,319 | (24,276,701 | ) | ||||||||||||||||||||||||||||||||||||||||||
| Total increase (decrease) | 35,167,727 | (12,076,031 | ) | ||||||||||||||||||||||||||||||||||||||||||
| Net assets | |||||||||||||||||||||||||||||||||||||||||||||
| Beginning of period | 110,624,526 | 122,700,557 | |||||||||||||||||||||||||||||||||||||||||||
| End of period | $145,792,253 | $110,624,526 | |||||||||||||||||||||||||||||||||||||||||||
| Undistributed net investment income | $434,669 | $145,854 | |||||||||||||||||||||||||||||||||||||||||||
Financial highlights
| Class A Shares Period ended | 4-30-18 | 1 | 10-31-17 | 10-31-16 | 10-31-15 | 10-31-14 | 2 | ||||||||||||||||||||||||||||||||||||||||||||||||||||||||||||||||||||||||||||||||||||||||||||||||
| Per share operating performance | |||||||||||||||||||||||||||||||||||||||||||||||||||||||||||||||||||||||||||||||||||||||||||||||||||||||
| Net asset value, beginning of period | $12.20 | $10.89 | $10.70 | $10.99 | $10.00 | ||||||||||||||||||||||||||||||||||||||||||||||||||||||||||||||||||||||||||||||||||||||||||||||||||
| Net investment income3 | 0.06 | 0.24 | 0.19 | 0.10 | 0.10 | 4 | |||||||||||||||||||||||||||||||||||||||||||||||||||||||||||||||||||||||||||||||||||||||||||||||||
| Net realized and unrealized gain (loss) on investments | 0.07 | 1.31 | 0.20 | (0.17 | ) | 0.98 | |||||||||||||||||||||||||||||||||||||||||||||||||||||||||||||||||||||||||||||||||||||||||||||||||
| Total from investment operations | 0.13 | 1.55 | 0.39 | (0.07 | ) | 1.08 | |||||||||||||||||||||||||||||||||||||||||||||||||||||||||||||||||||||||||||||||||||||||||||||||||
| Less distributions | |||||||||||||||||||||||||||||||||||||||||||||||||||||||||||||||||||||||||||||||||||||||||||||||||||||||
| From net investment income | (0.03 | ) | (0.24 | ) | (0.20 | ) | (0.22 | ) | (0.09 | ) | |||||||||||||||||||||||||||||||||||||||||||||||||||||||||||||||||||||||||||||||||||||||||||||
| From net realized gain | (0.04 | ) | — | — | — | — | |||||||||||||||||||||||||||||||||||||||||||||||||||||||||||||||||||||||||||||||||||||||||||||||||
| Total distributions | (0.07 | ) | (0.24 | ) | (0.20 | ) | (0.22 | ) | (0.09 | ) | |||||||||||||||||||||||||||||||||||||||||||||||||||||||||||||||||||||||||||||||||||||||||||||
| Net asset value, end of period | $12.26 | $12.20 | $10.89 | $10.70 | $10.99 | ||||||||||||||||||||||||||||||||||||||||||||||||||||||||||||||||||||||||||||||||||||||||||||||||||
| Total return (%)5,6 | 1.12 | 7 | 14.35 | 3.64 | (0.69 | ) | 10.80 | 7 | |||||||||||||||||||||||||||||||||||||||||||||||||||||||||||||||||||||||||||||||||||||||||||||||
| Ratios and supplemental data | |||||||||||||||||||||||||||||||||||||||||||||||||||||||||||||||||||||||||||||||||||||||||||||||||||||||
| Net assets, end of period (in millions) | $6 | $5 | $3 | $5 | $7 | ||||||||||||||||||||||||||||||||||||||||||||||||||||||||||||||||||||||||||||||||||||||||||||||||||
| Ratios (as a percentage of average net assets): | |||||||||||||||||||||||||||||||||||||||||||||||||||||||||||||||||||||||||||||||||||||||||||||||||||||||
| Expenses before reductions | 1.56 | 8 | 1.69 | 1.75 | 1.85 | 2.28 | 8 | ||||||||||||||||||||||||||||||||||||||||||||||||||||||||||||||||||||||||||||||||||||||||||||||||
| Expenses including reductions | 1.41 | 8 | 1.49 | 1.68 | 1.83 | 1.90 | 8 | ||||||||||||||||||||||||||||||||||||||||||||||||||||||||||||||||||||||||||||||||||||||||||||||||
| Net investment income | 1.05 | 8 | 2.06 | 1.79 | 0.95 | 1.10 | 4,8 | ||||||||||||||||||||||||||||||||||||||||||||||||||||||||||||||||||||||||||||||||||||||||||||||||
| Portfolio turnover (%) | 13 | 14 | 35 | 35 | 17 | ||||||||||||||||||||||||||||||||||||||||||||||||||||||||||||||||||||||||||||||||||||||||||||||||||
| 1 | Six months ended 4-30-18. Unaudited. | ||||||||||||||||||||||||||||||||||||||||||||||||||||||||||||||||||||||||||||||||||
| 2 | Period from 12-20-13 (commencement of operations) to 10-31-14. | ||||||||||||||||||||||||||||||||||||||||||||||||||||||||||||||||||||||||||||||||||
| 3 | Based on average daily shares outstanding. | ||||||||||||||||||||||||||||||||||||||||||||||||||||||||||||||||||||||||||||||||||
| 4 | Net investment income (loss) per share and ratio of net investment income (loss) to average net assets reflect a special dividend received by the fund, which amounted to $0.15 and 1.39%, respectively. | ||||||||||||||||||||||||||||||||||||||||||||||||||||||||||||||||||||||||||||||||||
| 5 | Does not reflect the effect of sales charges, if any. | ||||||||||||||||||||||||||||||||||||||||||||||||||||||||||||||||||||||||||||||||||
| 6 | Total returns would have been lower had certain expenses not been reduced during the period. | ||||||||||||||||||||||||||||||||||||||||||||||||||||||||||||||||||||||||||||||||||
| 7 | Not annualized. | ||||||||||||||||||||||||||||||||||||||||||||||||||||||||||||||||||||||||||||||||||
| 8 | Annualized. | ||||||||||||||||||||||||||||||||||||||||||||||||||||||||||||||||||||||||||||||||||
| Class C Shares Period ended | 4-30-18 | 1 | 10-31-17 | 10-31-16 | 10-31-15 | 10-31-14 | 2 | ||||||||||||||||||||||||||||||||||||||||||||||||||||||||||||||||||||||||||||||||||||||||||||||||
| Per share operating performance | |||||||||||||||||||||||||||||||||||||||||||||||||||||||||||||||||||||||||||||||||||||||||||||||||||||||
| Net asset value, beginning of period | $12.11 | $10.81 | $10.64 | $11.00 | $10.80 | ||||||||||||||||||||||||||||||||||||||||||||||||||||||||||||||||||||||||||||||||||||||||||||||||||
| Net investment income (loss)3 | 0.02 | 0.15 | 0.12 | (0.03 | ) | (0.02 | ) | ||||||||||||||||||||||||||||||||||||||||||||||||||||||||||||||||||||||||||||||||||||||||||||||||
| Net realized and unrealized gain (loss) on investments | 0.07 | 1.31 | 0.19 | (0.14 | ) | 0.28 | |||||||||||||||||||||||||||||||||||||||||||||||||||||||||||||||||||||||||||||||||||||||||||||||||
| Total from investment operations | 0.09 | 1.46 | 0.31 | (0.17 | ) | 0.26 | |||||||||||||||||||||||||||||||||||||||||||||||||||||||||||||||||||||||||||||||||||||||||||||||||
| Less distributions | |||||||||||||||||||||||||||||||||||||||||||||||||||||||||||||||||||||||||||||||||||||||||||||||||||||||
| From net investment income | — | 4 | (0.16 | ) | (0.14 | ) | (0.19 | ) | (0.06 | ) | |||||||||||||||||||||||||||||||||||||||||||||||||||||||||||||||||||||||||||||||||||||||||||||
| From net realized gain | (0.04 | ) | — | — | — | — | |||||||||||||||||||||||||||||||||||||||||||||||||||||||||||||||||||||||||||||||||||||||||||||||||
| Total distributions | (0.04 | ) | (0.16 | ) | (0.14 | ) | (0.19 | ) | (0.06 | ) | |||||||||||||||||||||||||||||||||||||||||||||||||||||||||||||||||||||||||||||||||||||||||||||
| Net asset value, end of period | $12.16 | $12.11 | $10.81 | $10.64 | $11.00 | ||||||||||||||||||||||||||||||||||||||||||||||||||||||||||||||||||||||||||||||||||||||||||||||||||
| Total return (%)5,6 | 0.79 | 7 | 13.57 | 2.94 | (1.58 | ) | 2.43 | 7 | |||||||||||||||||||||||||||||||||||||||||||||||||||||||||||||||||||||||||||||||||||||||||||||||
| Ratios and supplemental data | |||||||||||||||||||||||||||||||||||||||||||||||||||||||||||||||||||||||||||||||||||||||||||||||||||||||
| Net assets, end of period (in millions) | $1 | $1 | $1 | — | 8 | $2 | |||||||||||||||||||||||||||||||||||||||||||||||||||||||||||||||||||||||||||||||||||||||||||||||||
| Ratios (as a percentage of average net assets): | |||||||||||||||||||||||||||||||||||||||||||||||||||||||||||||||||||||||||||||||||||||||||||||||||||||||
| Expenses before reductions | 2.26 | 9 | 2.39 | 2.45 | 3.18 | 3.49 | 9 | ||||||||||||||||||||||||||||||||||||||||||||||||||||||||||||||||||||||||||||||||||||||||||||||||
| Expenses including reductions | 2.11 | 9 | 2.19 | 2.36 | 2.60 | 2.60 | 9 | ||||||||||||||||||||||||||||||||||||||||||||||||||||||||||||||||||||||||||||||||||||||||||||||||
| Net investment income (loss) | 0.36 | 9 | 1.32 | 1.11 | (0.29 | ) | (0.40 | ) 9 | |||||||||||||||||||||||||||||||||||||||||||||||||||||||||||||||||||||||||||||||||||||||||||||||
| Portfolio turnover (%) | 13 | 14 | 35 | 35 | 17 | 10 | |||||||||||||||||||||||||||||||||||||||||||||||||||||||||||||||||||||||||||||||||||||||||||||||||
| 1 | Six months ended 4-30-18. Unaudited. | ||||||||||||||||||||||||||||||||||||||||||||||||||||||||||||||||||||||||||||||||||
| 2 | The inception date for Class C shares is 5-16-14. | ||||||||||||||||||||||||||||||||||||||||||||||||||||||||||||||||||||||||||||||||||
| 3 | Based on average daily shares outstanding. | ||||||||||||||||||||||||||||||||||||||||||||||||||||||||||||||||||||||||||||||||||
| 4 | Less than $0.005 per share. | ||||||||||||||||||||||||||||||||||||||||||||||||||||||||||||||||||||||||||||||||||
| 5 | Does not reflect the effect of sales charges, if any. | ||||||||||||||||||||||||||||||||||||||||||||||||||||||||||||||||||||||||||||||||||
| 6 | Total returns would have been lower had certain expenses not been reduced during the period. | ||||||||||||||||||||||||||||||||||||||||||||||||||||||||||||||||||||||||||||||||||
| 7 | Not annualized. | ||||||||||||||||||||||||||||||||||||||||||||||||||||||||||||||||||||||||||||||||||
| 8 | Less than $500,000. | ||||||||||||||||||||||||||||||||||||||||||||||||||||||||||||||||||||||||||||||||||
| 9 | Annualized. | ||||||||||||||||||||||||||||||||||||||||||||||||||||||||||||||||||||||||||||||||||
| 10 | The portfolio turnover is shown for the period from 12-20-13 to 10-31-14. | ||||||||||||||||||||||||||||||||||||||||||||||||||||||||||||||||||||||||||||||||||
| Class I Shares Period ended | 4-30-18 | 1 | 10-31-17 | 10-31-16 | 10-31-15 | 10-31-14 | 2 | ||||||||||||||||||||||||||||||||||||||||||||||||||||||||||||||||||||||||||||||||||||||||||||||||
| Per share operating performance | |||||||||||||||||||||||||||||||||||||||||||||||||||||||||||||||||||||||||||||||||||||||||||||||||||||||
| Net asset value, beginning of period | $12.21 | $10.91 | $10.71 | $11.00 | $10.00 | ||||||||||||||||||||||||||||||||||||||||||||||||||||||||||||||||||||||||||||||||||||||||||||||||||
| Net investment income3 | 0.11 | 0.18 | 0.24 | 0.14 | 0.24 | 4 | |||||||||||||||||||||||||||||||||||||||||||||||||||||||||||||||||||||||||||||||||||||||||||||||||
| Net realized and unrealized gain (loss) on investments | 0.05 | 1.40 | 0.18 | (0.19 | ) | 0.87 | |||||||||||||||||||||||||||||||||||||||||||||||||||||||||||||||||||||||||||||||||||||||||||||||||
| Total from investment operations | 0.16 | 1.58 | 0.42 | (0.05 | ) | 1.11 | |||||||||||||||||||||||||||||||||||||||||||||||||||||||||||||||||||||||||||||||||||||||||||||||||
| Less distributions | |||||||||||||||||||||||||||||||||||||||||||||||||||||||||||||||||||||||||||||||||||||||||||||||||||||||
| From net investment income | (0.06 | ) | (0.28 | ) | (0.22 | ) | (0.24 | ) | (0.11 | ) | |||||||||||||||||||||||||||||||||||||||||||||||||||||||||||||||||||||||||||||||||||||||||||||
| From net realized gain | (0.04 | ) | — | — | — | — | |||||||||||||||||||||||||||||||||||||||||||||||||||||||||||||||||||||||||||||||||||||||||||||||||
| Total distributions | (0.10 | ) | (0.28 | ) | (0.22 | ) | (0.24 | ) | (0.11 | ) | |||||||||||||||||||||||||||||||||||||||||||||||||||||||||||||||||||||||||||||||||||||||||||||
| Net asset value, end of period | $12.27 | $12.21 | $10.91 | $10.71 | $11.00 | ||||||||||||||||||||||||||||||||||||||||||||||||||||||||||||||||||||||||||||||||||||||||||||||||||
| Total return (%)5 | 1.28 | 6 | 14.60 | 3.98 | (0.44 | ) | 11.07 | 6 | |||||||||||||||||||||||||||||||||||||||||||||||||||||||||||||||||||||||||||||||||||||||||||||||
| Ratios and supplemental data | |||||||||||||||||||||||||||||||||||||||||||||||||||||||||||||||||||||||||||||||||||||||||||||||||||||||
| Net assets, end of period (in millions) | $45 | $1 | $4 | — | 7 | — | 7 | ||||||||||||||||||||||||||||||||||||||||||||||||||||||||||||||||||||||||||||||||||||||||||||||||
| Ratios (as a percentage of average net assets): | |||||||||||||||||||||||||||||||||||||||||||||||||||||||||||||||||||||||||||||||||||||||||||||||||||||||
| Expenses before reductions | 1.26 | 8 | 1.38 | 1.44 | 6.36 | 15.29 | 8 | ||||||||||||||||||||||||||||||||||||||||||||||||||||||||||||||||||||||||||||||||||||||||||||||||
| Expenses including reductions | 1.06 | 8 | 1.17 | 1.26 | 1.52 | 1.60 | 8 | ||||||||||||||||||||||||||||||||||||||||||||||||||||||||||||||||||||||||||||||||||||||||||||||||
| Net investment income | 1.94 | 8 | 1.61 | 2.21 | 1.26 | 2.58 | 4,8 | ||||||||||||||||||||||||||||||||||||||||||||||||||||||||||||||||||||||||||||||||||||||||||||||||
| Portfolio turnover (%) | 13 | 14 | 35 | 35 | 17 | ||||||||||||||||||||||||||||||||||||||||||||||||||||||||||||||||||||||||||||||||||||||||||||||||||
| 1 | Six months ended 4-30-18. Unaudited. | ||||||||||||||||||||||||||||||||||||||||||||||||||||||||||||||||||||||||||||||||||
| 2 | Period from 12-20-13 (commencement of operations) to 10-31-14. | ||||||||||||||||||||||||||||||||||||||||||||||||||||||||||||||||||||||||||||||||||
| 3 | Based on average daily shares outstanding. | ||||||||||||||||||||||||||||||||||||||||||||||||||||||||||||||||||||||||||||||||||
| 4 | Net investment income (loss) per share and ratio of net investment income (loss) to average net assets reflect a special dividend received by the fund, which amounted to $0.15 and 1.39%, respectively. | ||||||||||||||||||||||||||||||||||||||||||||||||||||||||||||||||||||||||||||||||||
| 5 | Total returns would have been lower had certain expenses not been reduced during the period. | ||||||||||||||||||||||||||||||||||||||||||||||||||||||||||||||||||||||||||||||||||
| 6 | Not annualized. | ||||||||||||||||||||||||||||||||||||||||||||||||||||||||||||||||||||||||||||||||||
| 7 | Less than $500,000. | ||||||||||||||||||||||||||||||||||||||||||||||||||||||||||||||||||||||||||||||||||
| 8 | Annualized. | ||||||||||||||||||||||||||||||||||||||||||||||||||||||||||||||||||||||||||||||||||
| Class R6 Shares Period ended | 4-30-18 | 1 | 10-31-17 | 10-31-16 | 10-31-15 | 10-31-14 | 2 | ||||||||||||||||||||||||||||||||||||||||||||||||||||||||||||||||||||||||||||||||||||||||||||||||
| Per share operating performance | |||||||||||||||||||||||||||||||||||||||||||||||||||||||||||||||||||||||||||||||||||||||||||||||||||||||
| Net asset value, beginning of period | $12.23 | $10.92 | $10.72 | $11.00 | $10.00 | ||||||||||||||||||||||||||||||||||||||||||||||||||||||||||||||||||||||||||||||||||||||||||||||||||
| Net investment income3 | 0.08 | 0.28 | 0.25 | 0.16 | 0.29 | 4 | |||||||||||||||||||||||||||||||||||||||||||||||||||||||||||||||||||||||||||||||||||||||||||||||||
| Net realized and unrealized gain (loss) on investments | 0.09 | 1.32 | 0.18 | (0.18 | ) | 0.82 | |||||||||||||||||||||||||||||||||||||||||||||||||||||||||||||||||||||||||||||||||||||||||||||||||
| Total from investment operations | 0.17 | 1.60 | 0.43 | (0.02 | ) | 1.11 | |||||||||||||||||||||||||||||||||||||||||||||||||||||||||||||||||||||||||||||||||||||||||||||||||
| Less distributions | |||||||||||||||||||||||||||||||||||||||||||||||||||||||||||||||||||||||||||||||||||||||||||||||||||||||
| From net investment income | (0.06 | ) | (0.29 | ) | (0.23 | ) | (0.26 | ) | (0.11 | ) | |||||||||||||||||||||||||||||||||||||||||||||||||||||||||||||||||||||||||||||||||||||||||||||
| From net realized gain | (0.04 | ) | — | — | — | — | |||||||||||||||||||||||||||||||||||||||||||||||||||||||||||||||||||||||||||||||||||||||||||||||||
| Total distributions | (0.10 | ) | (0.29 | ) | (0.23 | ) | (0.26 | ) | (0.11 | ) | |||||||||||||||||||||||||||||||||||||||||||||||||||||||||||||||||||||||||||||||||||||||||||||
| Net asset value, end of period | $12.30 | $12.23 | $10.92 | $10.72 | $11.00 | ||||||||||||||||||||||||||||||||||||||||||||||||||||||||||||||||||||||||||||||||||||||||||||||||||
| Total return (%)5 | 1.40 | 6 | 14.77 | 4.08 | (0.22 | ) | 11.13 | 6 | |||||||||||||||||||||||||||||||||||||||||||||||||||||||||||||||||||||||||||||||||||||||||||||||
| Ratios and supplemental data | |||||||||||||||||||||||||||||||||||||||||||||||||||||||||||||||||||||||||||||||||||||||||||||||||||||||
| Net assets, end of period (in millions) | $1 | $1 | $1 | — | 7 | — | 7 | ||||||||||||||||||||||||||||||||||||||||||||||||||||||||||||||||||||||||||||||||||||||||||||||||
| Ratios (as a percentage of average net assets): | |||||||||||||||||||||||||||||||||||||||||||||||||||||||||||||||||||||||||||||||||||||||||||||||||||||||
| Expenses before reductions | 1.16 | 8 | 1.29 | 1.34 | 7.86 | 20.14 | 8 | ||||||||||||||||||||||||||||||||||||||||||||||||||||||||||||||||||||||||||||||||||||||||||||||||
| Expenses including reductions | 1.02 | 8 | 1.08 | 1.18 | 1.34 | 1.50 | 8 | ||||||||||||||||||||||||||||||||||||||||||||||||||||||||||||||||||||||||||||||||||||||||||||||||
| Net investment income | 1.43 | 8 | 2.42 | 1.29 | 1.46 | 3.15 | 4,8 | ||||||||||||||||||||||||||||||||||||||||||||||||||||||||||||||||||||||||||||||||||||||||||||||||
| Portfolio turnover (%) | 13 | 14 | 35 | 35 | 17 | ||||||||||||||||||||||||||||||||||||||||||||||||||||||||||||||||||||||||||||||||||||||||||||||||||
| 1 | Six months ended 4-30-18. Unaudited. | ||||||||||||||||||||||||||||||||||||||||||||||||||||||||||||||||||||||||||||||||||
| 2 | Period from 12-20-13 (commencement of operations) to 10-31-14. | ||||||||||||||||||||||||||||||||||||||||||||||||||||||||||||||||||||||||||||||||||
| 3 | Based on average daily shares outstanding. | ||||||||||||||||||||||||||||||||||||||||||||||||||||||||||||||||||||||||||||||||||
| 4 | Net investment income (loss) per share and ratio of net investment income (loss) to average net assets reflect a special dividend received by the fund, which amounted to $0.15 and 1.39%, respectively. | ||||||||||||||||||||||||||||||||||||||||||||||||||||||||||||||||||||||||||||||||||
| 5 | Total returns would have been lower had certain expenses not been reduced during the period. | ||||||||||||||||||||||||||||||||||||||||||||||||||||||||||||||||||||||||||||||||||
| 6 | Not annualized. | ||||||||||||||||||||||||||||||||||||||||||||||||||||||||||||||||||||||||||||||||||
| 7 | Less than $500,000. | ||||||||||||||||||||||||||||||||||||||||||||||||||||||||||||||||||||||||||||||||||
| 8 | Annualized. | ||||||||||||||||||||||||||||||||||||||||||||||||||||||||||||||||||||||||||||||||||
| Class NAV Shares Period ended | 4-30-18 | 1 | 10-31-17 | 10-31-16 | 10-31-15 | 10-31-14 | 2 | ||||||||||||||||||||||||||||||||||||||||||||||||||||||||||||||||||||||||||||||||||||||||||||||||
| Per share operating performance | |||||||||||||||||||||||||||||||||||||||||||||||||||||||||||||||||||||||||||||||||||||||||||||||||||||||
| Net asset value, beginning of period | $12.23 | $10.92 | $10.72 | $11.01 | $10.00 | ||||||||||||||||||||||||||||||||||||||||||||||||||||||||||||||||||||||||||||||||||||||||||||||||||
| Net investment income3 | 0.09 | 0.27 | 0.24 | 0.15 | 0.28 | 4 | |||||||||||||||||||||||||||||||||||||||||||||||||||||||||||||||||||||||||||||||||||||||||||||||||
| Net realized and unrealized gain (loss) on investments | 0.07 | 1.33 | 0.19 | (0.18 | ) | 0.85 | |||||||||||||||||||||||||||||||||||||||||||||||||||||||||||||||||||||||||||||||||||||||||||||||||
| Total from investment operations | 0.16 | 1.60 | 0.43 | (0.03 | ) | 1.13 | |||||||||||||||||||||||||||||||||||||||||||||||||||||||||||||||||||||||||||||||||||||||||||||||||
| Less distributions | |||||||||||||||||||||||||||||||||||||||||||||||||||||||||||||||||||||||||||||||||||||||||||||||||||||||
| From net investment income | (0.06 | ) | (0.29 | ) | (0.23 | ) | (0.26 | ) | (0.12 | ) | |||||||||||||||||||||||||||||||||||||||||||||||||||||||||||||||||||||||||||||||||||||||||||||
| From net realized gain | (0.04 | ) | — | — | — | — | |||||||||||||||||||||||||||||||||||||||||||||||||||||||||||||||||||||||||||||||||||||||||||||||||
| Total distributions | (0.10 | ) | (0.29 | ) | (0.23 | ) | (0.26 | ) | (0.12 | ) | |||||||||||||||||||||||||||||||||||||||||||||||||||||||||||||||||||||||||||||||||||||||||||||
| Net asset value, end of period | $12.29 | $12.23 | $10.92 | $10.72 | $11.01 | ||||||||||||||||||||||||||||||||||||||||||||||||||||||||||||||||||||||||||||||||||||||||||||||||||
| Total return (%)5 | 1.32 | 6 | 14.78 | 4.09 | (0.28 | ) | 11.28 | 6 | |||||||||||||||||||||||||||||||||||||||||||||||||||||||||||||||||||||||||||||||||||||||||||||||
| Ratios and supplemental data | |||||||||||||||||||||||||||||||||||||||||||||||||||||||||||||||||||||||||||||||||||||||||||||||||||||||
| Net assets, end of period (in millions) | $93 | $102 | $113 | $137 | $149 | ||||||||||||||||||||||||||||||||||||||||||||||||||||||||||||||||||||||||||||||||||||||||||||||||||
| Ratios (as a percentage of average net assets): | |||||||||||||||||||||||||||||||||||||||||||||||||||||||||||||||||||||||||||||||||||||||||||||||||||||||
| Expenses before reductions | 1.15 | 7 | 1.28 | 1.33 | 1.35 | 1.38 | 7 | ||||||||||||||||||||||||||||||||||||||||||||||||||||||||||||||||||||||||||||||||||||||||||||||||
| Expenses including reductions | 1.01 | 7 | 1.07 | 1.26 | 1.34 | 1.37 | 7 | ||||||||||||||||||||||||||||||||||||||||||||||||||||||||||||||||||||||||||||||||||||||||||||||||
| Net investment income | 1.43 | 7 | 2.38 | 2.21 | 1.41 | 3.03 | 4,7 | ||||||||||||||||||||||||||||||||||||||||||||||||||||||||||||||||||||||||||||||||||||||||||||||||
| Portfolio turnover (%) | 13 | 14 | 35 | 35 | 17 | ||||||||||||||||||||||||||||||||||||||||||||||||||||||||||||||||||||||||||||||||||||||||||||||||||
| 1 | Six months ended 4-30-18. Unaudited. | ||||||||||||||||||||||||||||||||||||||||||||||||||||||||||||||||||||||||||||||||||
| 2 | Period from 12-20-13 (commencement of operations) to 10-31-14. | ||||||||||||||||||||||||||||||||||||||||||||||||||||||||||||||||||||||||||||||||||
| 3 | Based on average daily shares outstanding. | ||||||||||||||||||||||||||||||||||||||||||||||||||||||||||||||||||||||||||||||||||
| 4 | Net investment income (loss) per share and ratio of net investment income (loss) to average net assets reflect a special dividend received by the fund, which amounted to $0.15 and 1.39%, respectively. | ||||||||||||||||||||||||||||||||||||||||||||||||||||||||||||||||||||||||||||||||||
| 5 | Total returns would have been lower had certain expenses not been reduced during the period. | ||||||||||||||||||||||||||||||||||||||||||||||||||||||||||||||||||||||||||||||||||
| 6 | Not annualized. | ||||||||||||||||||||||||||||||||||||||||||||||||||||||||||||||||||||||||||||||||||
| 7 | Annualized. | ||||||||||||||||||||||||||||||||||||||||||||||||||||||||||||||||||||||||||||||||||
Note 1 — Organization
John Hancock Enduring Assets Fund (the fund) is a series of John Hancock Investment Trust (the Trust), an open-end management investment company organized as a Massachusetts business trust and registered under the Investment Company Act of 1940, as amended (the 1940 Act). The investment objective of the fund is to seek total return from capital appreciation and income, with an emphasis on absolute returns over a full market cycle.
The fund may offer multiple classes of shares. The shares currently offered by the fund are detailed in the Statement of assets and liabilities. Class A and Class C are offered to all investors. Class I shares are offered to institutions and certain investors. Class R6 shares are only available to certain retirement plans, institutions and other investors. Class NAV shares are offered to John Hancock affiliated funds of funds, retirement plans for employees of John Hancock and/or Manulife Financial Corporation, and certain 529 funds. Shareholders of each class have exclusive voting rights to matters that affect that class. The distribution and service fees, if any, and transfer agent fees for each class may differ. Effective May 1, 2018, Class C shares convert to Class A shares ten years after purchase (certain exclusions may apply).
Note 2 — Significant accounting policies
The financial statements have been prepared in conformity with accounting principles generally accepted in the United States of America (US GAAP), which require management to make certain estimates and assumptions as of the date of the financial statements. Actual results could differ from those estimates and those differences could be significant. The fund qualifies as an investment company under Topic 946 of Accounting Standards Codification of US GAAP.
Events or transactions occurring after the end of the fiscal period through the date that the financial statements were issued have been evaluated in the preparation of the financial statements. The following summarizes the significant accounting policies of the fund:
Security valuation. Investments are stated at value as of the scheduled close of regular trading on the New York Stock Exchange (NYSE), normally at 4:00 p.m., Eastern Time. In case of emergency or other disruption resulting in the NYSE not opening for trading or the NYSE closing at a time other than the regularly scheduled close, the net asset value (NAV) may be determined as of the regularly scheduled close of the NYSE pursuant to the fund's Valuation Policies and Procedures.
In order to value the securities, the fund uses the following valuation techniques: Equity securities held by the fund are typically valued at the last sale price or official closing price on the exchange or principal market where the security trades. In the event there were no sales during the day or closing prices are not available, the securities are valued using the last available bid price. Investments by the fund in open-end mutual funds, including John Hancock Collateral Trust (JHCT), are valued at their respective NAVs each business day. Foreign securities and currencies are valued in U.S. dollars based on foreign currency exchange rates supplied by an independent pricing vendor.
In certain instances, the Pricing Committee may determine to value equity securities using prices obtained from another exchange or market if trading on the exchange or market on which prices are typically obtained did not open for trading as scheduled, or if trading closed earlier than scheduled, and trading occurred as normal on another exchange or market.
Other portfolio securities and assets, for which reliable market quotations are not readily available, are valued at fair value as determined in good faith by the fund's Pricing Committee following procedures established by the Board of Trustees. The frequency with which these fair valuation procedures are used cannot be predicted and fair value of securities may differ significantly from the value that would have been used had a ready market for such securities existed. Trading in foreign securities may be completed before the scheduled daily close of trading on the NYSE. Significant events at the issuer or market level may affect the values of securities between the time when the valuation of the securities is generally determined and the close of the NYSE. If a significant event occurs, these securities may be fair valued, as determined in good faith by the fund's Pricing Committee, following procedures established by the Board of Trustees. The fund uses fair value adjustment factors provided by an independent pricing vendor to value certain foreign securities in order to adjust for events that may occur between the close of foreign exchanges or markets and the close of the NYSE.
The fund uses a three-tier hierarchy to prioritize the pricing assumptions, referred to as inputs, used in valuation techniques to measure fair value. Level 1 includes securities valued using quoted prices in active markets for identical securities. Level 2 includes securities valued using other significant observable inputs. Observable inputs may include quoted prices for similar securities, interest rates, prepayment speeds and credit risk. Prices for securities valued using these inputs are received from independent pricing vendors and brokers and are based on an evaluation of the inputs described. Level 3 includes securities valued using significant unobservable inputs when market prices are not readily available or reliable, including the fund's own assumptions in determining the fair value of investments. Factors used in determining value may include market or issuer specific events or trends, changes in interest rates and credit quality. The inputs or methodology used for valuing securities are not necessarily an indication of the risks associated with investing in those securities. Changes in valuation techniques and related inputs may result in transfers into or out of an assigned level within the disclosure hierarchy.
The following is a summary of the values by input classification of the fund's investments as of April 30, 2018, by major security category or type:
| Total value at 4-30-18 | Level 1 quoted price | Level 2 significant observable inputs | Level 3 significant unobservable inputs | ||
| Investments in securities: | |||||
| Assets | |||||
| Common stocks | |||||
| Brazil | $1,933,432 | $1,933,432 | — | — | |
| Canada | 10,289,499 | 10,289,499 | — | — | |
| China | 18,287,627 | — | $18,287,627 | — | |
| France | 9,950,904 | — | 9,950,904 | — | |
| Germany | 7,283,840 | — | 7,283,840 | — | |
| Hong Kong | 11,811,986 | — | 11,811,986 | — | |
| Italy | 8,782,183 | — | 8,782,183 | — | |
| Japan | 7,687,781 | — | 7,687,781 | — | |
| Spain | 6,240,673 | — | 6,240,673 | — | |
| Switzerland | 2,549,818 | — | 2,549,818 | — | |
| United Kingdom | 12,980,470 | — | 12,980,470 | — | |
| United States | 41,690,402 | 41,690,402 | — | — | |
| Securities lending collateral | 6,127,989 | 6,127,989 | — | — | |
| Short-term investments | 6,297,903 | 797,903 | 5,500,000 | — | |
| Total investments in securities | $151,914,507 | $60,839,225 | $91,075,282 | — | |
Repurchase agreements. The fund may enter into repurchase agreements. When the fund enters into a repurchase agreement, it receives collateral that is held in a segregated account by the fund's custodian, or for tri-party repurchase agreements, collateral is held at a third-party custodian bank in a segregated account for the benefit of the fund. The collateral amount is marked-to-market and monitored on a daily basis to ensure that the collateral held is in an amount not less than the principal amount of the repurchase agreement plus any accrued interest. Collateral received by the fund for repurchase agreements is disclosed in the Fund's investments as part of the caption related to the repurchase agreement.
Repurchase agreements are typically governed by the terms and conditions of the Master Repurchase Agreement and/or Global Master Repurchase Agreement (collectively, MRA). Upon an event of default, the non-defaulting party may close out all transactions traded under the MRA and net amounts owed. Absent an event of default, assets and liabilities resulting from repurchase agreements are not offset in the Statement of assets and liabilities. In the event of a default by the counterparty, realization of the collateral proceeds could be delayed, during which time the collateral value may decline or the counterparty may have insufficient assets to pay back claims resulting from close-out of the transactions.
Security transactions and related investment income. Investment security transactions are accounted for on a trade date plus one basis for daily NAV calculations. However, for financial reporting purposes, investment transactions are reported on trade date. Interest income is accrued as earned. Dividend income is recorded on the ex-date, except for dividends of foreign securities where the dividend may not be known until after the ex-date. In those cases, dividend income, net of withholding taxes, is recorded when the fund becomes aware of the dividends. Gains and losses on securities sold are determined on the basis of identified cost and may include proceeds from litigation.
Securities lending. The fund may lend its securities to earn additional income. The fund receives cash collateral from the borrower in an amount not less than the market value of the loaned securities. The fund will invest collateral in JHCT, an affiliate of the fund, which has a floating NAV and is registered with the Securities and Exchange Commission as an investment company. JHCT invests in short-term money market investments. The Fund will receive the benefit of any gains and bear any losses generated by JHCT with respect to the cash collateral.
The fund has the right to recall loaned securities on demand. If a borrower fails to return loaned securities when due, then the lending agent is responsible and indemnifies the fund for the lent securities. The lending agent uses the collateral received from the borrower to purchase replacement securities of the same issue, type, class and series of the loaned securities. If the value of the collateral is less than the purchase cost of replacement securities, the lending agent is responsible for satisfying the shortfall but only to the extent that the shortfall is not due to any decrease in the value of JHCT.
Although the risk of the loss of the securities lent is mitigated by receiving collateral from the borrower and through lending agent indemnification, the fund could experience a delay in recovering securities or could experience a lower than expected return if the borrower fails to return the securities on a timely basis. The fund receives compensation for lending its securities by retaining a portion of the return on the investment of the collateral and compensation from fees earned from borrowers of the securities. Securities lending income received by the fund is net of fees retained by the securities lending agent. Net income received from JHCT is a component of securities lending income as recorded on the Statement of operations.
Obligations to repay collateral received by the fund are shown on the Statement of assets and liabilities as Payable upon return of securities loaned and are secured by the loaned securities. As of April 30, 2018, the fund loaned common stocks valued at $5,857,130 and received $6,127,746 of cash collateral.
Foreign investing. Assets, including investments and liabilities denominated in foreign currencies, are translated into U.S. dollar values each day at the prevailing exchange rate. Purchases and sales of securities, income and expenses are translated into U.S. dollars at the prevailing exchange rate on the date of the transaction. The effect of changes in foreign currency exchange rates on the value of securities is reflected as a component of the realized and unrealized gains (losses) on investments. Foreign investments are subject to a decline in the value of a foreign currency versus the U.S. dollar, which reduces the dollar value of securities denominated in that currency.
Foreign taxes. The fund may be subject to withholding tax on income, capital gains or repatriation taxes imposed by certain countries, a portion of which may be recoverable. Foreign taxes are accrued based upon the fund's understanding of the tax rules and rates that exist in the foreign markets in which it invests. Taxes are accrued based on gains realized by the fund as a result of certain foreign security sales. Estimated taxes are accrued based on unrealized appreciation of such securities. Investment income is recorded net of foreign withholding taxes, less any amounts reclaimable.
Line of credit. The fund may have the ability to borrow from banks for temporary or emergency purposes, including meeting redemption requests that otherwise might require the untimely sale of securities. Pursuant to the fund's custodian agreement, the custodian may loan money to the fund to make properly authorized payments. The fund is obligated to repay the custodian for any overdraft, including any related costs or expenses. The custodian may have a lien, security interest or security entitlement in any fund property that is not otherwise segregated or pledged, to the extent of any overdraft, and to the maximum extent permitted by law.
The fund and other affiliated funds have entered into a syndicated line of credit agreement with Citibank, N.A. as the administrative agent that enables them to participate in a $750 million unsecured committed line of credit. Excluding commitments designated for a certain fund and subject to the needs of all other affiliated funds, the fund can borrow up to
an aggregate commitment amount of $500 million, subject to asset coverage and other limitations as specified in the agreement. A commitment fee payable at the end of each calendar quarter, based on the average daily unused portion of the line of credit, is charged to each participating fund based on a combination of fixed and asset based allocations and is reflected in Other expenses on the Statement of operations. For the six months ended April 30, 2018, the fund had no borrowings under the line of credit. Commitment fees for the six months ended April 30, 2018 were $1,553.
Expenses. Within the John Hancock group of funds complex, expenses that are directly attributable to an individual fund are allocated to such fund. Expenses that are not readily attributable to a specific fund are allocated among all funds in an equitable manner, taking into consideration, among other things, the nature and type of expense and the fund's relative net assets. Expense estimates are accrued in the period to which they relate and adjustments are made when actual amounts are known.
Class allocations. Income, common expenses and realized and unrealized gains (losses) are determined at the fund level and allocated daily to each class of shares based on the net assets of the class. Class-specific expenses, such as distribution and service fees, if any, and transfer agent fees, for all classes, are charged daily at the class level based on the net assets of each class and the specific expense rates applicable to each class.
Federal income taxes. The fund intends to continue to qualify as a regulated investment company by complying with the applicable provisions of the Internal Revenue Code and will not be subject to federal income tax on taxable income that is distributed to shareholders. Therefore, no federal income tax provision is required.
As of October 31, 2017, the fund had no uncertain tax positions that would require financial statement recognition, derecognition or disclosure. The fund's federal tax returns are subject to examination by the Internal Revenue Service for a period of three years.
Distribution of income and gains. Distributions to shareholders from net investment income and net realized gains, if any, are recorded on the ex-date. The fund generally declares and pays dividends quarterly and capital gain distributions, if any, annually.
Distributions paid by the fund with respect to each class of shares are calculated in the same manner, at the same time and in the same amount, except for the effect of class level expenses that may be applied differently to each class.
Such distributions, on a tax basis, are determined in conformity with income tax regulations, which may differ from US GAAP. Distributions in excess of tax basis earnings and profits, if any, are reported in the fund's financial statements as a return of capital. The final determination of tax characteristics of the fund's distribution will occur at the end of the year and will subsequently be reported to shareholders.
Capital accounts within the financial statements are adjusted for permanent book-tax differences. These adjustments have no impact on net assets or the results of operations. Temporary book-tax differences, if any, will reverse in a subsequent period. Book-tax differences are primarily attributable to wash sale loss deferrals.
Note 3 — Guarantees and indemnifications
Under the Trust's organizational documents, its Officers and Trustees are indemnified against certain liabilities arising out of the performance of their duties to the Trust, including the fund. Additionally, in the normal course of business, the fund enters into contracts with service providers that contain general indemnification clauses. The fund's maximum exposure under these arrangements is unknown, as this would involve future claims that may be made against the fund that have not yet occurred. The risk of material loss from such claims is considered remote.
Note 4 — Fees and transactions with affiliates
John Hancock Advisers, LLC (the Advisor) serves as investment advisor for the fund. John Hancock Funds, LLC (the Distributor), an affiliate of the Advisor, serves as principal underwriter of the fund. The Advisor and the Distributor are indirect, wholly owned subsidiaries of MFC.
Management fee. Effective March 1, 2018, the fund has an investment management agreement with the Advisor under which the fund pays a daily management fee to the Advisor equivalent on an annual basis the sum of: (a) 0.800% of the first $250 million of the fund's aggregate net assets and (b) 0.750% of fund's aggregate net assets in excess of $250 million. Aggregate net assets include the net assets of the fund and Diversified Real Assets Fund (Infrastructure Sleeve), a series of John Hancock Investment Trust. The Advisor has a subadvisory agreement with Wellington Management Company LLP. The fund is not responsible for payment of the subadvisory fees. Prior to March 1, 2018, the fund had an investment management agreement with the Advisor under which the fund paid a daily management fee to the Advisor equivalent on an annual basis the sum of: (a) 1.100% of the first $250 million of the fund's average daily net assets and (b) 1.050% of fund's average daily net assets in excess of $250 million. The Advisor had the same subadvisory agreement with Wellington Management Company LLP, as described above.
Effective March 1, 2018, the Advisor contractually agreed to reduce its management fee or, if necessary make payment to Class A, Class C, Class I, Class R6 and Class NAV shares, in an amount equal to the amount by which the expenses of Class A, Class C, Class I, Class R6 and Class NAV shares, as applicable, exceed 1.31%, 2.01%, 1.00%, 0.92% and 0.92% respectively, of the average annual net assets attributable to the class. For purposes of this agreement, "expenses of Class A, Class C, Class I, Class R6 and Class NAV shares" means all expenses of the applicable class excluding taxes, brokerage commissions, interest expense, litigation and indemnification expenses and other extraordinary expenses not incurred in the ordinary course of the fund's business, acquired fund fees paid indirectly, borrowing costs, prime brokerage fees, and short dividend expenses. This agreement expires on February 28, 2019, unless renewed by mutual agreement of the fund and the Advisor based upon determination that this is appropriate under the circumstances at that time.
Prior to March 1, 2018, the Advisor had contractually agreed to reduce its management fee by an annual rate of 0.20% of the fund's average daily net assets. This agreement expired on February 28, 2018.
The Advisor has contractually agreed to waive a portion of its management fee and/or reimburse expenses for certain funds of the John Hancock group of funds complex, including the fund (the participating portfolios). This waiver is based upon aggregate net assets of all the participating portfolios. The amount of the reimbursement is calculated daily and allocated among all the participating portfolios in proportion to the daily net assets of each fund. During the six months ended April 30, 2018, this waiver amounted to 0.01% of the fund's average net assets on an annualized basis. This arrangement may be amended or terminated at any time by the Advisor upon notice to the fund and with the approval of the Board of Trustees.
For the six months ended April 30, 2018, the expense reductions amounted to the following:
| Class | Expense reduction | Class | Expense reduction | |
| Class A | $4,308 | Class R6 | $964 | |
| Class C | 506 | Class NAV | 71,766 | |
| Class I | 7,861 | Total | $85,405 |
Expenses waived or reimbursed in the current fiscal period are not subject to recapture in future fiscal periods.
The investment management fees incurred for the six months ended April 30, 2018 were equivalent to a net annual effective rate of 0.84% of the fund's average daily net assets.
Accounting and legal services. Pursuant to a service agreement, the fund reimburses the Advisor for all expenses associated with providing the administrative, financial, legal, compliance, accounting and recordkeeping services to the fund, including the preparation of all tax returns, periodic reports to shareholders and regulatory reports, among other services. These expenses are allocated to each share class based on its relative net assets at the time the expense was incurred. These accounting and legal services fees incurred for the six months ended April 30, 2018 amounted to an annual rate of 0.02% of the fund's average daily net assets.
Distribution and service plans. The fund has a distribution agreement with the Distributor. The fund has adopted distribution and service plans with respect to Class A and Class C pursuant to Rule 12b-1 under the 1940 Act, to pay the Distributor for services provided as the distributor of shares of the fund. The fund may pay up to the following contractual
rates of distribution and service fees under these arrangements, expressed as an annual percentage of average daily net assets for each class of the fund's shares:
| Class | Rule 12b-1 fee |
| Class A | 0.30% |
| Class C | 1.00% |
Sales charges. Class A shares are assessed up-front sales charges, which resulted in payments to the Distributor amounting to $9,710 for the six months ended April 30, 2018. Of this amount, $1,757 was retained and used for printing prospectuses, advertising, sales literature and other purposes, $7,793 was paid as sales commissions to broker-dealers and $160 was paid as sales commissions to sales personnel of Signator Investors, Inc., a broker-dealer affiliate of the Advisor.
Class A and Class C shares may be subject to contingent deferred sales charges (CDSCs). Certain Class A shares that are acquired through purchases of $1 million or more and are redeemed within one year of purchase are subject to a 1.00% sales charge. Class C shares that are redeemed within one year of purchase are subject to a 1.00% CDSC. CDSCs are applied to the lesser of the current market value at the time of redemption or the original purchase cost of the shares being redeemed. Proceeds from CDSCs are used to compensate the Distributor for providing distribution-related services in connection with the sale of these shares. During the six months ended April 30, 2018, CDSCs received by the Distributor amounted to $58 for Class C shares.
Transfer agent fees. The John Hancock Group of Funds has a complex-wide transfer agent agreement with John Hancock Signature Services, Inc. (Signature Services), an affiliate of the Advisor. The transfer agent fees paid to Signature Services are determined based on the cost to Signature Services (Signature Services Cost) of providing recordkeeping services. It also includes out-of-pocket expenses, including payments made to third-parties for recordkeeping services provided to their clients who invest in one or more John Hancock funds. In addition, Signature Services Cost may be reduced by certain fees that Signature Services receives in connection with retirement and small accounts. Signature Services Cost is calculated monthly and allocated, as applicable, to five categories of share classes: Retail Share and Institutional Share Classes of Non-Municipal Bond Funds, Class R6 Shares, Retirement Share Classes and Municipal Bond Share Classes. Within each of these categories, the applicable costs are allocated to the affected John Hancock affiliated funds and/or classes, based on the relative average daily net assets.
Class level expenses. Class level expenses for the six months ended April 30, 2018 were:
| Class | Distribution and service fees | Transfer agent fees |
| Class A | $8,398 | $3,029 |
| Class C | 3,243 | 351 |
| Class I | — | 7,998 |
| Class R6 | — | 77 |
| Total | $11,641 | $11,455 |
Trustee expenses. The fund compensates each Trustee who is not an employee of the Advisor or its affiliates. The costs of paying Trustee compensation and expenses are allocated to the fund based on its net assets relative to other funds within the John Hancock group of funds complex.
Note 5 — Fund share transactions
Transactions in fund shares for the six months ended April 30, 2018 and for the year ended October 31, 2017 were as follows:
| Six months ended 4-30-18 | Year ended 10-31-17 | |||||||||||||||||||||||||
| Shares | Amount | Shares | Amount | |||||||||||||||||||||||
| Class A shares | ||||||||||||||||||||||||||
| Sold | 79,396 | $950,968 | 260,806 | $2,957,326 | ||||||||||||||||||||||
| Distributions reinvested | 2,883 | 34,454 | 8,027 | 94,033 | ||||||||||||||||||||||
| Repurchased | (39,409 | ) | (469,048 | ) | (104,358 | ) | (1,160,737 | ) | ||||||||||||||||||
| Net increase | 42,870 | $516,374 | 164,475 | $1,890,622 | ||||||||||||||||||||||
| Class C shares | ||||||||||||||||||||||||||
| Sold | 10,155 | $121,460 | 11,426 | $128,722 | ||||||||||||||||||||||
| Distributions reinvested | 152 | 1,806 | 500 | 5,845 | ||||||||||||||||||||||
| Repurchased | (7,178 | ) | (86,164 | ) | (14,992 | ) | (163,701 | ) | ||||||||||||||||||
| Net increase (decrease) | 3,129 | $37,102 | (3,066 | ) | ($29,134 | ) | ||||||||||||||||||||
| Class I shares | ||||||||||||||||||||||||||
| Sold | 3,886,091 | $45,259,779 | 104,606 | $1,258,127 | ||||||||||||||||||||||
| Distributions reinvested | 4,212 | 49,917 | 502 | 5,878 | ||||||||||||||||||||||
| Repurchased | (371,016 | ) | (4,352,189 | ) | (400,916 | ) | (4,112,866 | ) | ||||||||||||||||||
| Net increase (decrease) | 3,519,287 | $40,957,507 | (295,808 | ) | ($2,848,861 | ) | ||||||||||||||||||||
| Class R6 shares | ||||||||||||||||||||||||||
| Sold | 1,163 | $14,139 | 5,040 | $61,678 | ||||||||||||||||||||||
| Distributions reinvested | 877 | 10,485 | 2,434 | 28,288 | ||||||||||||||||||||||
| Repurchased | — | — | (10,002 | ) | (118,120 | ) | ||||||||||||||||||||
| Net increase (decrease) | 2,040 | $24,624 | (2,528 | ) | ($28,154 | ) | ||||||||||||||||||||
| Class NAV shares | ||||||||||||||||||||||||||
| Sold | 169,879 | $2,017,773 | 582,097 | $6,589,517 | ||||||||||||||||||||||
| Distributions reinvested | 67,943 | 812,054 | 219,333 | 2,538,226 | ||||||||||||||||||||||
| Repurchased | (983,005 | ) | (11,880,115 | ) | (2,855,064 | ) | (32,388,917 | ) | ||||||||||||||||||
| Net decrease | (745,183 | ) | ($9,050,288 | ) | (2,053,634 | ) | ($23,261,174 | ) | ||||||||||||||||||
| Total net increase (decrease) | 2,822,143 | $32,485,319 | (2,190,561 | ) | ($24,276,701 | ) | ||||||||||||||||||||
Affiliates of the fund owned 100% of Class NAV shares on April 30, 2018. Such concentration of shareholders' capital could have a material effect on the fund if such shareholders redeem from the fund.
Note 6 — Purchase and sale of securities
Purchases and sales of securities, other than short-term investments, amounted to $45,954,897 and $14,349,484, respectively, for the six months ended April 30, 2018.
Note 7 — Industry or sector risk
The fund may invest a large percentage of its assets in one or more particular industries or sectors of the economy. If a large percentage of the fund's assets are economically tied to a single or small number of industries or sectors of the economy, the fund will be less diversified than a more broadly diversified fund, and it may cause the fund to underperform if that industry or sector underperforms. In addition, focusing on a particular industry or sector may make the fund's NAV more volatile. Further, a fund that invests in particular industries or sectors is particularly susceptible to the impact of market, economic, regulatory and other factors affecting those industries or sectors.
Note 8 — Investment by affiliated funds
Certain investors in the fund are affiliated funds that are managed by the Advisor and its affiliates. The affiliated funds do not invest in the fund for the purpose of exercising management or control; however, this investment may represent a significant portion of the fund's net assets. At April 30, 2018, funds within the John Hancock group of funds complex held 64.0% of the fund's net assets. The following funds had an affiliate ownership of 5% or more of the fund's net assets:
| Fund | Affiliate concentration |
| John Hancock Funds II Multimanager Lifestyle Conservative Portfolio | 31.9% |
| John Hancock Funds II Alternative Asset Allocation Portfolio | 19.7% |
| John Hancock Funds II Multimanager Lifestyle Moderate Portfolio | 12.3% |
Trustees Hassell H. McClellan, Chairperson Officers Andrew G. Arnott John J. Danello Francis V. Knox, Jr. Charles A. Rizzo Salvatore Schiavone | Investment advisor John Hancock Advisers, LLC Subadvisor Wellington Management Company LLP Principal distributor John Hancock Funds, LLC Custodian State Street Bank and Trust Company Transfer agent John Hancock Signature Services, Inc. Legal counsel K&L Gates LLP |
*Member of the Audit Committee
†Non-Independent Trustee
#Effective 6-20-17
The fund's proxy voting policies and procedures, as well as the fund proxy voting record for the most recent twelve-month period ended June 30, are available free of charge on the Securities and Exchange Commission (SEC) website at sec.gov or on our website.
The fund's complete list of portfolio holdings, for the first and third fiscal quarters, is filed with the SEC on Form N-Q. The fund's Form N-Q is available on our website and the SEC's website, sec.gov, and can be reviewed and copied (for a fee) at the SEC's Public Reference Room in Washington, DC. Call 800-SEC-0330 to receive information on the operation of the SEC's Public Reference Room.
We make this information on your fund, as well as monthly portfolio holdings, and other fund details available on our website at jhinvestments.com or by calling 800-225-5291.
| You can also contact us: | |||
| 800-225-5291 jhinvestments.com | Regular mail: John Hancock Signature Services, Inc. | Express mail: John Hancock Signature Services, Inc. | |
John Hancock family of funds
DOMESTIC EQUITY FUNDS Balanced Blue Chip Growth Classic Value Disciplined Value Disciplined Value Mid Cap Equity Income Fundamental All Cap Core Fundamental Large Cap Core Fundamental Large Cap Value New Opportunities Small Cap Core Small Cap Growth Small Cap Value Strategic Growth U.S. Global Leaders Growth U.S. Growth Value Equity GLOBAL AND INTERNATIONAL EQUITY FUNDS Disciplined Value International Emerging Markets Emerging Markets Equity Fundamental Global Franchise Global Equity Global Shareholder Yield Greater China Opportunities International Growth International Small Company International Value Equity | INCOME FUNDS Bond California Tax-Free Income Emerging Markets Debt Floating Rate Income Government Income High Yield High Yield Municipal Bond Income Investment Grade Bond Money Market Short Duration Credit Opportunities Spectrum Income Strategic Income Opportunities Tax-Free Bond ALTERNATIVE AND SPECIALTY FUNDS Absolute Return Currency Alternative Asset Allocation Enduring Assets Financial Industries Global Absolute Return Strategies Global Conservative Absolute Return Global Focused Strategies Natural Resources Redwood Regional Bank Seaport Long/Short Technical Opportunities |
A fund's investment objectives, risks, charges, and expenses should be considered carefully before investing. The prospectus contains this and other important information about the fund. To obtain a prospectus, contact your financial professional, call John Hancock Investments at 800-225-5291, or visit our website at jhinvestments.com. Please read the prospectus carefully before investing or sending money.
ASSET ALLOCATION Income Allocation Multi-Index Lifetime Portfolios Multi-Index Preservation Portfolios Multimanager Lifestyle Portfolios Multimanager Lifetime Portfolios Retirement Income 2040 EXCHANGE-TRADED FUNDS John Hancock Multifactor Consumer Discretionary ETF John Hancock Multifactor Consumer Staples ETF John Hancock Multifactor Developed International ETF John Hancock Multifactor Energy ETF John Hancock Multifactor Financials ETF John Hancock Multifactor Healthcare ETF John Hancock Multifactor Industrials ETF John Hancock Multifactor Large Cap ETF John Hancock Multifactor Materials ETF John Hancock Multifactor Mid Cap ETF John Hancock Multifactor Small Cap ETF John Hancock Multifactor Technology ETF John Hancock Multifactor Utilities ETF | ENVIRONMENTAL, SOCIAL, AND GOVERNANCE FUNDS ESG All Cap Core ESG Core Bond ESG International Equity ESG Large Cap Core CLOSED-END FUNDS Financial Opportunities Hedged Equity & Income Income Securities Trust Investors Trust Preferred Income Preferred Income II Preferred Income III Premium Dividend Tax-Advantaged Dividend Income Tax-Advantaged Global Shareholder Yield |
John Hancock Multifactor ETF shares are bought and sold at market price (not NAV), and are not individually redeemed
from the fund. Brokerage commissions will reduce returns.
John Hancock ETFs are distributed by Foreside Fund Services, LLC, and are subadvised by Dimensional Fund Advisors LP.
Foreside is not affiliated with John Hancock Funds, LLC or Dimensional Fund Advisors LP.
Dimensional Fund Advisors LP receives compensation from John Hancock in connection with licensing rights to the
John Hancock Dimensional indexes. Dimensional Fund Advisors LP does not sponsor, endorse, or sell, and makes no
representation as to the advisability of investing in, John Hancock Multifactor ETFs.
John Hancock Investments
A trusted brand
John Hancock Investments is a premier asset manager representing one of
America's most trusted brands, with a heritage of financial stewardship dating
back to 1862. Helping our shareholders pursue their financial goals is at the
core of everything we do. It's why we support the role of professional financial
advice and operate with the highest standards of conduct and integrity.
A better way to invest
We serve investors globally through a unique multimanager approach:
We search the world to find proven portfolio teams with specialized
expertise for every strategy we offer, then we apply robust investment
oversight to ensure they continue to meet our uncompromising standards
and serve the best interests of our shareholders.
Results for investors
Our unique approach to asset management enables us to provide a diverse set
of investments backed by some of the world's best managers, along with strong
risk-adjusted returns across asset classes.
| | John Hancock Funds, LLC n Member FINRA, SIPC 601 Congress Street n Boston, MA 02210-2805 800-225-5291 n jhinvestments.com | |
| This report is for the information of the shareholders of John Hancock Enduring Assets Fund. It is not authorized for distribution to prospective investors unless preceded or accompanied by a prospectus. | ||
| MF450360 | 438SA 4/18 6/18 | |
John Hancock
Seaport Long/Short Fund
(formerly John Hancock Seaport Fund)
Semiannual report 4/30/18
A message to shareholders
Dear shareholder,
Financial markets around the world experienced a meaningful rise in volatility in the last half of the reporting period. Stocks in developed international markets hit a rough patch after macroeconomic data began to suggest that the growth many investors were hoping for may not be as robust as early indications had suggested, but advanced for the period nonetheless. Many emerging markets advanced overall, thanks in large part to a weaker U.S. dollar and continued economic improvement in developing markets.
One of the challenges investors will face in the coming months is navigating the continued normalization of monetary policy. Stronger economies will continue to prompt global central banks to dial back the stimulus they had injected into the financial system in the years following the financial crisis, and this less-accommodative stance may represent an adjustment for many markets.
Your best resource in unpredictable markets is your financial advisor, who can help position your portfolio so that it's sufficiently diversified to meet your long-term objectives and to withstand the inevitable turbulence along the way.
On behalf of everyone at John Hancock Investments, I'd like to take this opportunity to welcome new shareholders and to thank existing shareholders for the continued trust you've placed in us.
Sincerely,
Andrew G. Arnott
President and CEO,
John Hancock Investments
Head of Wealth and Asset Management,
United States and Europe
This commentary reflects the CEO's views, which are subject to change at any time. Investing involves risks, including the potential loss of principal. Diversification does not guarantee a profit or eliminate the risk of a loss. It is not possible to invest directly into an index. For more up-to-date information, please visit our website at jhinvestments.com.
John Hancock
Seaport Long/Short Fund
INVESTMENT OBJECTIVE
The fund seeks capital appreciation.
AVERAGE ANNUAL TOTAL RETURNS AS OF 4/30/18 (%)
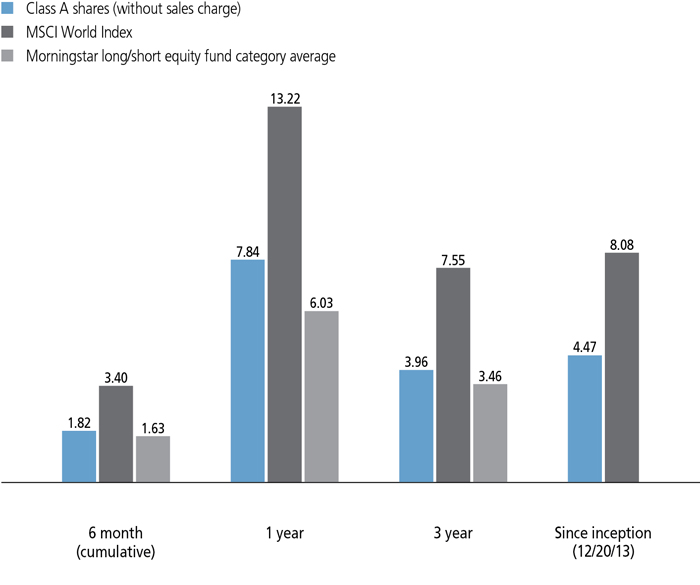
The MSCI World Index is a free float-adjusted market-capitalization-weighted index that is designed to measure the equity market performance of developed markets.
It is not possible to invest directly in an index. Index figures do not reflect expenses or sales charges, which would result in lower returns.
Figures from Morningstar, Inc. include reinvested distributions and do not take into account sales charges. Actual load-adjusted performance is lower. Since inception returns for the Morningstar fund category average are not available.
The past performance shown here reflects reinvested distributions and the beneficial effect of any expense reductions, and does not guarantee future results. Returns for periods shorter than one year are cumulative. Performance of the other share classes will vary based on the difference in the fees and expenses of those classes. Shares will fluctuate in value and, when redeemed, may be worth more or less than their original cost. Current month-end performance may be lower or higher than the performance cited, and can be found at jhinvestments.com or by calling 800-225-5291. For further information on the fund's objectives, risks, and strategy, see the fund's prospectus.
PERFORMANCE HIGHLIGHTS OVER THE LAST SIX MONTHS
Global equities posted positive returns
Although stock market volatility increased significantly in the latter half of the period, the fund's benchmark, the MSCI World Index, produced a gain.
The fund generated a positive absolute return but trailed the index
Four of the fund's five underlying portfolios gained ground, with the diversified equity and technology strategies producing the strongest results.
Short positions detracted
The fund's short positions declined in value as stocks rose, preventing it from fully capitalizing on the modest gain for global equities.
PORTFOLIO COMPOSITION AS OF 4/30/18 (%)
| Common stocks | 62.6 |
| Financials | 16.4 |
| Health care | 15.2 |
| Information technology | 10.4 |
| Energy | 5.7 |
| Industrials | 4.4 |
| Consumer discretionary | 4.0 |
| Materials | 2.5 |
| Utilities | 2.1 |
| Telecommunication services | 1.0 |
| Real estate | 0.8 |
| Consumer staples | 0.1 |
| Purchased options | 0.8 |
| Preferred securities | 0.3 |
| Term loans | 0.1 |
| Short-term investments and other | 36.2 |
| TOTAL | 100.0 |
| As a percentage of net assets. |
A note about risks
Derivatives transactions, such as hedging and other strategic transactions, may increase a fund's volatility and could produce disproportionate losses, potentially more than the fund's principal investment. Using derivatives may result in a leveraged portfolio. Synthetic short exposures involve the risk that losses may be exaggerated, potentially losing more money than the actual cost of the investment. Investments in certain foreign markets or security types may restrict or otherwise affect the fund's ability to implement its investment strategy. Leveraging, short positions, and a portfolio focused in a few sectors increases the fund's exposure to market volatility, may greatly amplify the risk of potential loss, and can increase costs. Leveraging long exposures increases a fund's losses when the value of its investments declines. Some derivatives have the potential for unlimited loss, regardless of the size of the initial investment. The stock prices of midsize and small companies can change more frequently and dramatically than those of large companies. The value of a company's equity securities is subject to changes in the company's financial condition and overall market and economic conditions. Foreign investing, especially in emerging markets, has additional risks, such as currency and market volatility and political and social instability. Owning an exchange-traded fund (ETF) generally reflects the risks of owning the underlying securities it is designed to track, although a lack of liquidity in an ETF could result in it being more volatile. ETFs have their own fees and expenses, which are indirectly borne by the fund, including management fees that increase their costs. Sector investing is subject to greater risks than the market as a whole. Because the fund may focus on particular sectors of the economy, its performance may depend on the performance of those sectors, and investments focused on one sector may fluctuate more widely than investments diversified across sectors. Actively trading securities can increase transaction costs and taxable distributions. Please see the fund's prospectus for additional risks.
From the Investment Management Team
Wellington Management Company LLP
Why did the name of the fund change?
On April 20, 2018, the name of the fund was changed from John Hancock Seaport Fund to John Hancock Seaport Long/Short Fund. This change is meant to capture the types of positions the fund may take, long or short, to help achieve its investment objective of outperforming the MSCI World Index over a full market cycle with a lower degree of volatility.
Can you review the fund's investment strategy?
We use a multifaceted approach with allocations among five long/short strategies: diversified equity (22% of assets as of April 30, 2018), healthcare (23%), financials (19%), technology (16%), and capital cycles (20%). We strive to identify attractive individual stocks within each of these segments and offset some of the impact of broader market performance through certain short exposures. The fund establishes its short positions using derivatives, including total return swaps.
We believe this strategy, which combines the insight and expertise of multiple investment teams in a single portfolio, enables the fund to capitalize on various sources of potential return without being fully reliant on rising market prices to drive performance.
How would you characterize the market environment during the six months ended April 30, 2018?
The global equity markets produced a modest gain of 3.40%, as gauged by the fund's benchmark, the MSCI World Index. Stocks began the period in rally mode, as the combination of synchronized global growth, robust corporate earnings, and optimism surrounding the tax cut in the United States fueled strong gains from the beginning of November through the end of January.
The markets subsequently grew more volatile and most indexes declined from February through April, as signs of rising inflation led to a jump in bond yields and contributed to a downturn in investor sentiment. In addition, the United States' imposition of tariffs on steel and aluminum sparked concerns about the possibility that a global trade war could emerge as a headwind to economic growth. Although both of these issues moved into the background by April, the markets remained on edge due to emerging worries that the world economy may not be growing as fast as it appeared to be in late 2017.
In total, this environment proved supportive for growth-oriented stocks in the technology, consumer discretionary, and financials sectors, while the more defensive segments—including the healthcare sector—trailed the broader market.
How did the fund perform, and what elements of its positioning helped and hurt results?
The fund's Class A shares returned 1.82% (excluding sales charges) and lagged the benchmark. All of the shortfall occurred in the first half of the period, when the short component of the portfolio prevented the fund from fully participating in the stock market's rally. However, the fund's approach helped dampen the volatility that occurred from early February onward.
Four of the fund's five underlying strategies posted positive absolute returns. The diversified equity and technology strategies advanced the most, followed by the capital cycles and healthcare strategies. However, the financials strategy declined.
Contributions from the fund's long portfolio exceeded the detraction from the short portfolio. Holdings in the information technology, financials, and healthcare sectors were the most meaningful contributors to absolute performance in the long portfolio. In the short portfolio, positions in broad market indexes detracted from results given that the equity market registered a positive return. Short positions in the strong-performing financials and healthcare sectors also weighed on performance. The fund's short positions are achieved through the use of derivatives, which had a negative impact overall.
COUNTRY COMPOSITION AS OF 4/30/18 (%)
| United States | 64.1 |
| China | 4.7 |
| United Kingdom | 4.0 |
| Japan | 3.8 |
| Canada | 3.2 |
| Hong Kong | 2.6 |
| Brazil | 2.1 |
| Spain | 1.5 |
| Switzerland | 1.3 |
| Belgium | 1.2 |
| Other countries | 11.5 |
| TOTAL | 100.0 |
| As a percentage of net assets. |
Relative to the benchmark, underweights in the consumer discretionary, materials, and industrials sectors detracted from performance, as did stock selection in these categories. Strong selection within, and underweight exposure to, information technology partially offset these results. Effective stock selection in the healthcare and financials sectors was a further plus.
On an absolute basis, the top contributors in the long portfolio included Viper Energy Partners LP, Insulet Corp. (healthcare), and Planet Fitness, Inc. (consumer discretionary). The leading detractors from performance included Prothena Corp PLC (healthcare), TESARO, Inc. (healthcare), and Alta Mesa Resources, Inc. (energy). The fund gained exposure to TESARO through total return swaps, a form of derivative.
How was the portfolio positioned at the end of the period?
The fund had 125% of its capital invested in long positions and a negative 73% in short positions, for a net exposure of 52% long.
In the diversified equity strategy, we strive to capitalize on our best ideas anywhere in the global financial markets. Here, our bottom-up process seeks to identify attractively valued growth companies while accounting for macroeconomic risks.. At the sector level, the fund's largest net long positions were in information technology, consumer discretionary, and industrials.
The fund's healthcare strategy focuses, in part, on companies whose products address as-yet unmet needs, which has historically led us to hold a meaningful weighting in biopharmaceutical stocks. The strategy also has a noteworthy position in the medical technology industry.
In the financials strategy, we continued to emphasize banks and insurance companies. We believe the combination of a more pragmatic regulatory environment, lower corporate tax rates, and rising interest rates, coupled with diverging central bank policies, the potential for political instability, and
TOP 10 HOLDINGS AS OF 4/30/18 (%)
| Viper Energy Partners LP | 1.4 |
| AstraZeneca PLC | 0.9 |
| Sony Financial Holdings, Inc. | 0.8 |
| Spotify Technology | 0.7 |
| Eisai Company, Ltd. | 0.7 |
| Banco Santander SA | 0.7 |
| China Unicom Hong Kong, Ltd. | 0.6 |
| Alta Mesa Resources, Inc. | 0.6 |
| Fairfax India Holdings Corp. | 0.6 |
| Anima Holding SpA | 0.6 |
| TOTAL | 7.6 |
| As a percentage of net assets. | |
| Cash and cash equivalents are not included. | |
fundamental differences among companies in the various subsectors, makes financial services a fertile ground for long/short investing.
In the information technology strategy, net exposure was driven by software and services companies with predictable business models and the potential for continued profit margin expansion. While we are cautiously optimistic that demand will remain robust across the technology sector, we are focused on buying stocks whose earnings aren't reliant on significant economic improvement.
The capital cycles portfolio is managed in a contrarian style with an emphasis on market segments that tend to be less affected by the economic cycle by virtue of their long-lasting or enduring assets. The portfolio's largest net long positions were in energy, financials, and utilities.
MANAGED BY
| The Seaport Long/Short Fund is managed by a team of portfolio managers at Wellington Management. |
![]()
TOTAL RETURNS FOR THE PERIOD ENDED APRIL 30, 2018
| Average annual total returns (%) with maximum sales charge | Cumulative total returns (%) with maximum sales charge | ||||||
| 1-year | Since inception1 | 6-month | Since inception1 | ||||
| Class A | 2.45 | 3.25 | -3.27 | 14.96 | |||
| Class C2 | 6.06 | 3.81 | 0.56 | 17.72 | |||
| Class I3 | 8.11 | 4.81 | 1.97 | 22.72 | |||
| Class R63 | 8.25 | 4.96 | 2.05 | 23.53 | |||
| Class NAV3 | 8.25 | 4.96 | 2.05 | 23.53 | |||
| Index† | 13.22 | 8.08 | 3.40 | 40.35 | |||
Performance figures assume all distributions have been reinvested. Figures reflect maximum sales charges on Class A shares of 5.00% and the applicable contingent deferred sales charge (CDSC) on Class C shares. Class C shares sold within one year of purchase are subject to a 1% CDSC. Sales charges are not applicable to Class I, Class R6, and Class NAV shares.
The expense ratios of the fund, both net (including any fee waivers and/or expense limitations) and gross (excluding any fee waivers and/or expense limitations), are set forth according to the most recent publicly available prospectuses for the fund and may differ from those disclosed in the Financial highlights tables in this report. Effective December 14, 2017, the "Non-Fundamental Investment Restrictions" for the fund have been changed to prohibit the fund from physically shorting securities, e.g., via prime brokerage agreements. Although the fund may incur costs associated with total return swaps, it will no longer incur dividend and interest expense on short sales and the interest expense on borrowings that are related to the prime brokerage relationship.
| Class A | Class C | Class I | Class R6 | Class NAV | ||
| Gross/Net (%) | 2.00 | 2.70 | 1.69 | 1.59 | 1.58 |
Please refer to the most recent prospectus and annual or semiannual report for more information on expenses and any expense limitation arrangements for each class.
The returns reflect past results and should not be considered indicative of future performance. The return and principal value of an investment will fluctuate so that shares, when redeemed, may be worth more or less than their original cost. Due to market volatility and other factors, the fund's current performance may be higher or lower than the performance shown. For current to the most recent month-end performance data, please call 800-225-5291 or visit the fund's website at jhinvestments.com.
The performance table above and the chart on the next page do not reflect the deduction of taxes that a shareholder would pay on fund distributions or the redemption of fund shares. The fund's performance results reflect any applicable fee waivers or expense reductions, without which the expenses would increase and results would have been less favorable.
| † | Index is the MSCI World Index. |
See the following page for footnotes.
This chart and table show what happened to a hypothetical $10,000 investment in John Hancock Seaport Long/Short Fund for the share classes and periods indicated, assuming all distributions were reinvested. For comparison, we've shown the same investment in the MSCI World Index.
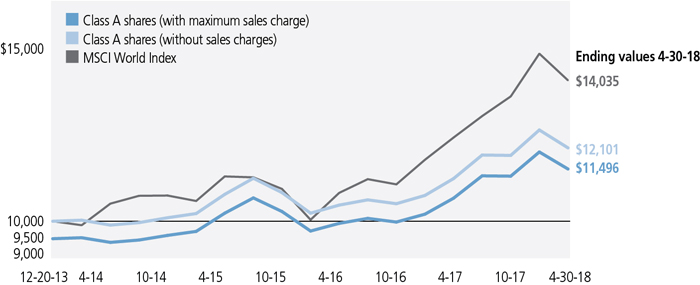
| Start date | With maximum sales charge ($) | Without sales charge ($) | Index ($) | |
| Class C2,4 | 12-20-13 | 11,772 | 11,772 | 14,035 |
| Class I3 | 12-20-13 | 12,272 | 12,272 | 14,035 |
| Class R63 | 12-20-13 | 12,353 | 12,353 | 14,035 |
| Class NAV3 | 12-20-13 | 12,353 | 12,353 | 14,035 |
The MSCI World Index is a free float-adjusted market capitalization weighted index that is designed to measure the equity market performance of developed markets.
It is not possible to invest directly in an index. Index figures do not reflect expenses or sales charges, which would result in lower returns.
Footnotes related to performance pages
| 1 | From 12-20-13 |
| 2 | Class C shares were first offered on 5/16/14. Returns prior to this date are those of Class A shares (first offered on 12/20/13) that have not been adjusted for class-specific expenses; otherwise, returns would vary. |
| 3 | For certain types of investors, as described in the fund's prospectuses. |
| 4 | The contingent deferred sales charge is not applicable. |
These examples are intended to help you understand your ongoing operating expenses of investing in the fund so you can compare these costs with the ongoing costs of investing in other mutual funds.
Understanding fund expenses
As a shareholder of the fund, you incur two types of costs:
| • | Transaction costs, which include sales charges (loads) on purchases or redemptions (varies by share class), minimum account fee charge, etc. |
| • | Ongoing operating expenses, including management fees, distribution and service fees (if applicable), and other fund expenses. |
We are presenting only your ongoing operating expenses here.
Actual expenses/actual returns
The first line of each share class in the table on the following page is intended to provide information about the fund's actual ongoing operating expenses, and is based on the fund's actual return. It assumes an account value of $1,000.00 on November 1, 2017, with the same investment held until April 30, 2018.
Together with the value of your account, you may use this information to estimate the operating expenses that you paid over the period. Simply divide your account value at April 30, 2018, by $1,000.00, then multiply it by the "expenses paid" for your share class from the table. For example, for an account value of $8,600.00, the operating expenses should be calculated as follows:
Hypothetical example for comparison purposes
The second line of each share class in the table on the following page allows you to compare the fund's ongoing operating expenses with those of any other fund. It provides an example of the fund's hypothetical account values and hypothetical expenses based on each class's actual expense ratio and an assumed 5% annualized return before expenses (which is not the fund's actual return). It assumes an account value of $1,000.00 on November 1, 2017, with the same investment held until April 30, 2018. Look in any other fund shareholder report to find its hypothetical example and you will be able to compare these expenses. Please remember that these hypothetical account values and expenses may not be used to estimate the actual ending account balance or expenses you paid for the period.
Remember, these examples do not include any transaction costs, therefore, these examples will not help you to determine the relative total costs of owning different funds. If transaction costs were included, your expenses would have been higher. See the prospectuses for details regarding transaction costs.
SHAREHOLDER EXPENSE EXAMPLE CHART
| Account value on 11-1-2017 | Ending value on 4-30-2018 | Expenses paid during period ended 4-30-20181 | Annualized expense ratio | ||
| Class A | Actual expenses/actual returns | $1,000.00 | $1,018.20 | $9.86 | 1.97% |
| Hypothetical example for comparison purposes | 1,000.00 | 1,015.00 | 9.84 | 1.97% | |
| Class C | Actual expenses/actual returns | 1,000.00 | 1,015.00 | 13.34 | 2.67% |
| Hypothetical example for comparison purposes | 1,000.00 | 1,011.60 | 13.32 | 2.67% | |
| Class I | Actual expenses/actual returns | 1,000.00 | 1,019.70 | 8.36 | 1.67% |
| Hypothetical example for comparison purposes | 1,000.00 | 1,016.50 | 8.35 | 1.67% | |
| Class R6 | Actual expenses/actual returns | 1,000.00 | 1,020.50 | 7.92 | 1.58% |
| Hypothetical example for comparison purposes | 1,000.00 | 1,017.00 | 7.90 | 1.58% | |
| Class NAV | Actual expenses/actual returns | 1,000.00 | 1,020.50 | 7.82 | 1.56% |
| Hypothetical example for comparison purposes | 1,000.00 | 1,017.10 | 7.80 | 1.56% | |
| 1 | Expenses are equal to the annualized expense ratio, multiplied by the average account value over the period, multiplied by 181/365 (to reflect the one-half year period). |
| Fund’s investments |
| Shares | Value | ||||
| Common stocks 62.6% | $447,152,285 | ||||
| (Cost $405,100,162) | |||||
| Consumer discretionary 4.0% | 28,203,284 | ||||
| Diversified consumer services 0.3% | |||||
| China Xinhua Education Group (A)(B) | 3,561,675 | 1,388,611 | |||
| New Oriental Education & Technology Group, Inc., ADR | 10,378 | 932,360 | |||
| Hotels, restaurants and leisure 1.2% | |||||
| Boyd Gaming Corp. | 81,724 | 2,714,054 | |||
| Hilton Worldwide Holdings, Inc. | 5,982 | 471,621 | |||
| Marriott Vacations Worldwide Corp. | 14,011 | 1,717,889 | |||
| Melco Resorts & Entertainment, Ltd., ADR | 84,529 | 2,638,150 | |||
| Planet Fitness, Inc., Class A (B) | 24,654 | 993,310 | |||
| Household durables 0.7% | |||||
| Lennar Corp., A Shares | 19,632 | 1,038,336 | |||
| Neinor Homes SA (A)(B) | 73,250 | 1,418,056 | |||
| Roku, Inc. (B) | 8,921 | 290,289 | |||
| TRI Pointe Group, Inc. (B) | 130,940 | 2,240,383 | |||
| Internet and direct marketing retail 0.4% | |||||
| Amazon.com, Inc. (B) | 161 | 252,147 | |||
| Booking Holdings, Inc. (B) | 62 | 135,036 | |||
| Expedia Group, Inc. | 2,469 | 284,281 | |||
| Shutterfly, Inc. (B) | 6,863 | 555,354 | |||
| Wayfair, Inc., Class A (B) | 28,659 | 1,785,456 | |||
| Multiline retail 0.1% | |||||
| Dollar Tree, Inc. (B) | 3,214 | 308,190 | |||
| Ping An Healthcare and Technology Company, Ltd. (A)(B)(C) | 20,300 | 141,736 | |||
| Specialty retail 0.8% | |||||
| Floor & Decor Holdings, Inc., Class A (B) | 6,300 | 350,217 | |||
| The TJX Companies, Inc. (D) | 40,187 | 3,409,867 | |||
| Via Varejo SA | 214,000 | 1,817,338 | |||
| Textiles, apparel and luxury goods 0.5% | |||||
| Crystal International Group, Ltd. (A)(B) | 415,212 | 480,938 | |||
| Skechers U.S.A., Inc., Class A (B) | 12,926 | 368,391 | |||
| Under Armour, Inc., Class A (B) | 137,074 | 2,434,434 | |||
| Under Armour, Inc., Class C (B) | 2,400 | 36,840 | |||
| Consumer staples 0.1% | 560,564 | ||||
| Food and staples retailing 0.1% | |||||
| Zur Rose Group AG (B) | 4,782 | 560,564 | |||
| Energy 5.7% | 40,599,863 | ||||
| Energy equipment and services 0.6% | |||||
| Baker Hughes, a GE Company | 52,374 | 1,891,225 | |||
| China Oilfield Services, Ltd., H Shares | 676,000 | 674,442 | |||
| 12 | JOHN HANCOCK SEAPORT LONG/SHORT FUND | SEMIANNUAL REPORT | SEE NOTES TO FINANCIAL STATEMENTS |
| Shares | Value | ||||
| Energy (continued) | |||||
| Energy equipment and services (continued) | |||||
| Transocean, Ltd. (B) | 31,933 | $395,011 | |||
| Trican Well Service, Ltd. (B) | 417,812 | 1,112,907 | |||
| Oil, gas and consumable fuels 5.1% | |||||
| Alta Mesa Resources, Inc. (B)(D) | 602,598 | 4,519,485 | |||
| Antero Resources Corp. (B) | 156,102 | 2,965,938 | |||
| ARC Resources, Ltd. | 107,304 | 1,196,769 | |||
| Cameco Corp. | 43,909 | 462,362 | |||
| China Shenhua Energy Company, Ltd., H Shares | 710,500 | 1,742,755 | |||
| EQT Corp. | 22,481 | 1,128,321 | |||
| Euronav NV | 82,399 | 664,863 | |||
| Jagged Peak Energy, Inc. (B) | 165,137 | 2,366,413 | |||
| Noble Midstream Partners LP | 17,390 | 782,550 | |||
| Petroleo Brasileiro SA, ADR (B) | 188,665 | 2,658,290 | |||
| Plains All American Pipeline LP | 47,832 | 1,124,530 | |||
| Raging River Exploration, Inc. (B) | 639,906 | 3,558,494 | |||
| Scorpio Tankers, Inc. | 324,969 | 864,418 | |||
| Seven Generations Energy, Ltd., Class A (B) | 52,547 | 749,765 | |||
| Tourmaline Oil Corp. | 98,846 | 1,859,209 | |||
| Viper Energy Partners LP | 342,120 | 9,882,116 | |||
| Financials 16.4% | 117,228,793 | ||||
| Banks 8.1% | |||||
| Agricultural Bank of China, Ltd., H Shares | 2,464,521 | 1,389,526 | |||
| Banco Santander SA | 730,285 | 4,718,314 | |||
| Bank Central Asia Tbk PT | 1,198,400 | 1,895,008 | |||
| Bank Mandiri Persero Tbk PT | 3,541,900 | 1,794,165 | |||
| Bank of China, Ltd., H Shares | 1,264,000 | 686,138 | |||
| Bank of Communications Company, Ltd., H Shares | 1,490,389 | 1,219,562 | |||
| Bank of the Ozarks | 26,770 | 1,252,836 | |||
| BAWAG Group AG (A)(B) | 3,809 | 199,468 | |||
| BNP Paribas SA | 25,872 | 1,997,299 | |||
| China Construction Bank Corp., H Shares | 1,145,000 | 1,199,569 | |||
| DBS Group Holdings, Ltd. | 105,128 | 2,425,522 | |||
| First Citizens BancShares, Inc., Class A | 1,600 | 691,664 | |||
| HDFC Bank, Ltd., ADR | 9,911 | 949,573 | |||
| Hilltop Holdings, Inc. | 26,190 | 587,180 | |||
| ICICI Bank, Ltd., ADR | 97,450 | 829,300 | |||
| Independent Bank Group, Inc. | 13,847 | 988,676 | |||
| IndusInd Bank, Ltd. | 106,542 | 3,016,207 | |||
| Industrial & Commercial Bank of China, Ltd., H Shares | 1,502,000 | 1,318,577 | |||
| ING Groep NV | 113,936 | 1,919,880 | |||
| Itau Unibanco Holding SA, ADR | 167,791 | 2,438,003 | |||
| KeyCorp | 91,203 | 1,816,764 | |||
| Liberbank SA (B) | 858,114 | 490,831 | |||
| SEE NOTES TO FINANCIAL STATEMENTS | SEMIANNUAL REPORT | JOHN HANCOCK SEAPORT LONG/SHORT FUND | 13 |
| Shares | Value | ||||
| Financials (continued) | |||||
| Banks (continued) | |||||
| Metro Bank PLC (B) | 73,386 | $3,331,339 | |||
| Mitsubishi UFJ Financial Group, Inc. | 90,000 | 603,121 | |||
| Mitsubishi UFJ Financial Group, Inc., ADR | 185,453 | 1,238,826 | |||
| OTP Bank PLC | 53,808 | 2,346,209 | |||
| Pinnacle Financial Partners, Inc. | 14,643 | 937,884 | |||
| Postal Savings Bank of China Company, Ltd., H Shares (A) | 1,113,000 | 762,518 | |||
| Sberbank of Russia PJSC, ADR | 146,400 | 2,162,328 | |||
| Standard Chartered PLC | 137,002 | 1,439,073 | |||
| State Bank of India, GDR | 49,723 | 1,828,676 | |||
| Sumitomo Mitsui Financial Group, Inc. | 45,000 | 1,875,521 | |||
| SunTrust Banks, Inc. | 3,850 | 257,180 | |||
| The Shiga Bank, Ltd. | 274,000 | 1,387,996 | |||
| Unicaja Banco SA (A)(B) | 826,284 | 1,498,644 | |||
| United Bank, Ltd., GDR | 9,243 | 59,155 | |||
| Van Lanschot Kempen NV | 75,113 | 2,320,255 | |||
| Zions Bancorporation | 42,289 | 2,315,323 | |||
| Capital markets 3.1% | |||||
| Anima Holding SpA (A) | 571,664 | 4,101,658 | |||
| Fairfax India Holdings Corp. (A)(B) | 244,335 | 4,275,863 | |||
| Federal Street Acquisition Corp. (B) | 145,300 | 1,498,043 | |||
| GAM Holding AG (B) | 83,660 | 1,335,399 | |||
| Hamilton Lane, Inc., Class A | 4,124 | 172,589 | |||
| IG Group Holdings PLC | 244,727 | 2,794,413 | |||
| IOOF Holdings, Ltd. | 147,164 | 988,312 | |||
| Northern Trust Corp. | 13,071 | 1,395,329 | |||
| Raymond James Financial, Inc. | 15,882 | 1,425,410 | |||
| Sanne Group PLC | 147,434 | 1,260,604 | |||
| UBS Group AG (B) | 138,280 | 2,321,015 | |||
| Victory Capital Holdings, Inc., Class A (B) | 50,977 | 563,806 | |||
| Consumer finance 0.6% | |||||
| Acom Company, Ltd. (B) | 127,600 | 577,662 | |||
| OneMain Holdings, Inc. (B) | 31,593 | 974,644 | |||
| Resurs Holding AB (A) | 207,362 | 1,335,961 | |||
| SLM Corp. (B) | 104,833 | 1,203,483 | |||
| Diversified financial services 0.7% | |||||
| AMP, Ltd. | 165,064 | 502,044 | |||
| Banca Farmafactoring SpA (A)(B) | 235,565 | 1,473,947 | |||
| ECN Capital Corp. | 403,640 | 1,068,870 | |||
| KBC Ancora | 26,439 | 1,597,133 | |||
| Voya Financial, Inc. | 11,880 | 621,918 | |||
| Insurance 3.7% | |||||
| Ageas | 51,793 | 2,770,538 | |||
| AIA Group, Ltd. | 228,000 | 2,037,681 | |||
| Athene Holding, Ltd., Class A (B) | 54,000 | 2,646,000 | |||
| 14 | JOHN HANCOCK SEAPORT LONG/SHORT FUND | SEMIANNUAL REPORT | SEE NOTES TO FINANCIAL STATEMENTS |
| Shares | Value | ||||
| Financials (continued) | |||||
| Insurance (continued) | |||||
| Aviva PLC | 287,701 | $2,090,340 | |||
| Intact Financial Corp. | 18,943 | 1,444,386 | |||
| Lancashire Holdings, Ltd. | 119,715 | 981,082 | |||
| Ping An Insurance Group Company of China, Ltd., H Shares | 342,632 | 3,347,994 | |||
| Sabre Insurance Group PLC (A)(B) | 119,800 | 420,334 | |||
| Sanlam, Ltd. | 249,071 | 1,573,386 | |||
| Sony Financial Holdings, Inc. | 302,400 | 5,516,947 | |||
| Tokio Marine Holdings, Inc. | 53,300 | 2,515,613 | |||
| Trupanion, Inc. (B) | 38,713 | 1,017,378 | |||
| Thrifts and mortgage finance 0.2% | |||||
| LIC Housing Finance, Ltd., GDR | 35,033 | 574,541 | |||
| MGIC Investment Corp. (B) | 61,513 | 616,360 | |||
| Health care 15.2% | 108,411,353 | ||||
| Biotechnology 5.0% | |||||
| Aduro Biotech, Inc. (B) | 140,350 | 968,415 | |||
| Aimmune Therapeutics, Inc. (B) | 24,460 | 759,238 | |||
| Alder Biopharmaceuticals, Inc. (B) | 113,975 | 1,618,445 | |||
| Alkermes PLC (B) | 8,165 | 361,465 | |||
| Arcus Biosciences, Inc. (B) | 63,531 | 966,942 | |||
| Arena Pharmaceuticals, Inc. (B) | 18,232 | 726,363 | |||
| BeiGene, Ltd., ADR (B) | 23,245 | 3,941,887 | |||
| Biohaven Pharmaceutical Holding Company, Ltd. (B) | 10,100 | 294,516 | |||
| Coherus Biosciences, Inc. (B) | 136,566 | 1,652,449 | |||
| Dyax Corp. (B)(C) | 107,720 | 425,494 | |||
| Exact Sciences Corp. (B) | 12,831 | 641,678 | |||
| Five Prime Therapeutics, Inc. (B) | 35,091 | 587,774 | |||
| G1 Therapeutics, Inc. (B) | 70,325 | 2,696,964 | |||
| Galapagos NV (B) | 16,871 | 1,511,704 | |||
| Galapagos NV (B) | 8,493 | 761,004 | |||
| Genmab A/S (B) | 16,643 | 3,360,191 | |||
| Genus PLC | 33,718 | 1,166,097 | |||
| GlycoMimetics, Inc. (B) | 112,466 | 1,899,551 | |||
| Heron Therapeutics, Inc. (B) | 40,000 | 1,212,000 | |||
| Innate Pharma SA (B) | 59,361 | 454,214 | |||
| Invitae Corp. (B) | 153,017 | 846,184 | |||
| Ironwood Pharmaceuticals, Inc. (B) | 77,727 | 1,408,413 | |||
| Jounce Therapeutics, Inc. (B) | 54,110 | 1,114,125 | |||
| Karyopharm Therapeutics, Inc. (B) | 145,980 | 1,909,418 | |||
| Momenta Pharmaceuticals, Inc. (B) | 61,151 | 1,271,941 | |||
| Otonomy, Inc. (B) | 61,329 | 229,984 | |||
| Portola Pharmaceuticals, Inc. (B) | 10,377 | 374,921 | |||
| Prothena Corp. PLC (B) | 3,500 | 42,000 | |||
| Radius Health, Inc. (B) | 20,614 | 622,543 | |||
| SEE NOTES TO FINANCIAL STATEMENTS | SEMIANNUAL REPORT | JOHN HANCOCK SEAPORT LONG/SHORT FUND | 15 |
| Shares | Value | ||||
| Health care (continued) | |||||
| Biotechnology (continued) | |||||
| Regeneron Pharmaceuticals, Inc. (B) | 200 | $60,736 | |||
| UroGen Pharma, Ltd. (B) | 30,000 | 1,680,600 | |||
| Zealand Pharma A/S, ADR (B) | 16,705 | 248,905 | |||
| Health care equipment and supplies 2.5% | |||||
| AtriCure, Inc. (B) | 66,730 | 1,483,408 | |||
| Baxter International, Inc. | 38,264 | 2,659,348 | |||
| Boston Scientific Corp. (B) | 33,637 | 966,055 | |||
| Cardiovascular Systems, Inc. (B) | 45,697 | 1,044,176 | |||
| Danaher Corp. | 15,945 | 1,599,602 | |||
| Edwards Lifesciences Corp. (B) | 12,705 | 1,618,109 | |||
| Glaukos Corp. (B) | 8,675 | 292,174 | |||
| Globus Medical, Inc., Class A (B) | 23,384 | 1,197,027 | |||
| Hologic, Inc. (B) | 19,690 | 763,775 | |||
| Insulet Corp. (B) | 8,145 | 700,470 | |||
| Intuitive Surgical, Inc. (B) | 2,229 | 982,499 | |||
| K2M Group Holdings, Inc. (B) | 38,837 | 741,787 | |||
| Olympus Corp. | 9,890 | 368,803 | |||
| Siemens Healthineers AG (A)(B) | 5,600 | 218,329 | |||
| STERIS PLC | 8,930 | 844,064 | |||
| Stryker Corp. | 9,435 | 1,598,478 | |||
| Teleflex, Inc. | 3,000 | 803,640 | |||
| Health care providers and services 1.8% | |||||
| Acadia Healthcare Company, Inc. (B) | 22,870 | 813,715 | |||
| China Resources Phoenix Healthcare Holdings Company, Ltd. | 577,740 | 755,142 | |||
| Cross Country Healthcare, Inc. (B) | 51,491 | 647,757 | |||
| Humana, Inc. | 627 | 184,451 | |||
| Laboratory Corp. of America Holdings (B) | 9,036 | 1,542,897 | |||
| LifePoint Health, Inc. (B) | 10,985 | 526,182 | |||
| R1 RCM, Inc. (B) | 227,739 | 1,692,101 | |||
| UDG Healthcare PLC | 59,910 | 752,703 | |||
| UnitedHealth Group, Inc. | 2,230 | 527,172 | |||
| Universal Health Services, Inc., Class B | 32,230 | 3,680,666 | |||
| WellCare Health Plans, Inc. (B) | 7,399 | 1,517,979 | |||
| Health care technology 0.3% | |||||
| Cerner Corp. (B) | 11,630 | 677,448 | |||
| HMS Holdings Corp. (B) | 45,723 | 823,471 | |||
| Teladoc, Inc. (B) | 20,955 | 901,065 | |||
| Life sciences tools and services 0.5% | |||||
| Bio-Techne Corp. | 4,767 | 719,388 | |||
| ICON PLC (B) | 6,357 | 747,774 | |||
| PRA Health Sciences, Inc. (B) | 9,364 | 769,440 | |||
| Tecan Group AG | 3,877 | 852,458 | |||
| Wuxi Biologics Cayman, Inc. (A)(B) | 8,000 | 72,568 | |||
| 16 | JOHN HANCOCK SEAPORT LONG/SHORT FUND | SEMIANNUAL REPORT | SEE NOTES TO FINANCIAL STATEMENTS |
| Shares | Value | ||||
| Health care (continued) | |||||
| Pharmaceuticals 5.1% | |||||
| Aerie Pharmaceuticals, Inc. (B) | 240 | $12,288 | |||
| Allergan PLC | 3,900 | 599,235 | |||
| AstraZeneca PLC | 93,007 | 6,510,704 | |||
| Bristol-Myers Squibb Company | 9,267 | 483,089 | |||
| China Traditional Chinese Medicine Holdings Company, Ltd. | 1,218,550 | 1,047,809 | |||
| Chugai Pharmaceutical Company, Ltd. | 26,605 | 1,403,131 | |||
| Dermira, Inc. (B) | 48,445 | 441,334 | |||
| Eisai Company, Ltd. | 71,825 | 4,817,232 | |||
| Eli Lilly & Company | 1,576 | 127,766 | |||
| Hikma Pharmaceuticals PLC | 115,107 | 2,029,618 | |||
| Hutchison China MediTech, Ltd., ADR (B) | 18,449 | 628,188 | |||
| Impax Laboratories, Inc. (B) | 8,532 | 160,402 | |||
| Intersect ENT, Inc. (B) | 36,375 | 1,453,181 | |||
| Kyowa Hakko Kirin Company, Ltd. | 33,750 | 730,280 | |||
| Mylan NV (B) | 4,375 | 169,575 | |||
| Novartis AG | 19,235 | 1,480,601 | |||
| Ocular Therapeutix, Inc. (B) | 113,760 | 715,550 | |||
| Ono Pharmaceutical Company, Ltd. | 137,940 | 3,188,519 | |||
| Revance Therapeutics, Inc. (B) | 63,548 | 1,776,167 | |||
| Roche Holding AG | 8,682 | 1,929,031 | |||
| Sino Biopharmaceutical, Ltd. | 1,104,245 | 2,325,329 | |||
| Takeda Pharmaceutical Company, Ltd. | 13,700 | 576,907 | |||
| Teva Pharmaceutical Industries, Ltd., ADR | 75,900 | 1,364,682 | |||
| The Medicines Company (B) | 36,135 | 1,087,302 | |||
| UCB SA | 19,268 | 1,451,151 | |||
| Industrials 4.4% | 31,311,014 | ||||
| Aerospace and defense 0.8% | |||||
| Cobham PLC (B) | 771,784 | 1,218,936 | |||
| Safran SA | 27,605 | 3,237,791 | |||
| Ultra Electronics Holdings PLC | 75,782 | 1,466,693 | |||
| Airlines 0.2% | |||||
| Azul SA, ADR (B) | 36,634 | 1,135,654 | |||
| JetBlue Airways Corp. (B) | 12,589 | 241,583 | |||
| Commercial services and supplies 0.6% | |||||
| Atento SA | 211,075 | 1,583,063 | |||
| Edenred | 59,833 | 2,061,274 | |||
| The Brink's Company | 4,951 | 365,384 | |||
| Construction and engineering 0.3% | |||||
| China Machinery Engineering Corp., H Shares | 3,399,000 | 1,974,743 | |||
| Machinery 0.3% | |||||
| Deere & Company (D) | 11,394 | 1,541,950 | |||
| FANUC Corp. | 1,002 | 214,639 | |||
| ITT, Inc. | 1,628 | 79,593 | |||
| SEE NOTES TO FINANCIAL STATEMENTS | SEMIANNUAL REPORT | JOHN HANCOCK SEAPORT LONG/SHORT FUND | 17 |
| Shares | Value | ||||
| Industrials (continued) | |||||
| Machinery (continued) | |||||
| Milacron Holdings Corp. (B) | 23,008 | $414,834 | |||
| Marine 0.6% | |||||
| Irish Continental Group PLC | 600,410 | 4,067,465 | |||
| Professional services 1.1% | |||||
| CoStar Group, Inc. (B) | 3,497 | 1,282,210 | |||
| Equifax, Inc. | 24,873 | 2,787,020 | |||
| Experian PLC | 101,952 | 2,335,941 | |||
| Huron Consulting Group, Inc. (B) | 29,696 | 1,112,115 | |||
| TransUnion (B) | 4,664 | 302,740 | |||
| TriNet Group, Inc. (B) | 5,395 | 278,652 | |||
| WageWorks, Inc. (B) | 874 | 36,402 | |||
| Road and rail 0.5% | |||||
| Genesee & Wyoming, Inc., Class A (B) | 23,686 | 1,686,443 | |||
| Knight-Swift Transportation Holdings, Inc. | 29,466 | 1,149,469 | |||
| Localiza Rent a Car SA | 92,500 | 736,420 | |||
| Information technology 10.4% | 74,481,629 | ||||
| Communications equipment 0.3% | |||||
| Infinera Corp. (B) | 7,559 | 88,591 | |||
| Quantenna Communications, Inc. (B) | 35,350 | 447,885 | |||
| Telefonaktiebolaget LM Ericsson, B Shares | 252,632 | 1,925,931 | |||
| Electronic equipment, instruments and components 0.4% | |||||
| Chroma ATE, Inc. | 94,000 | 472,654 | |||
| Flex, Ltd. (B) | 12,721 | 165,373 | |||
| II-VI, Inc. (B) | 6,957 | 265,062 | |||
| Itron, Inc. (B) | 2,845 | 186,063 | |||
| nLight, Inc. (B) | 1,900 | 47,367 | |||
| Sunny Optical Technology Group Company, Ltd. | 32,000 | 522,164 | |||
| Zebra Technologies Corp., Class A (B) | 8,016 | 1,080,797 | |||
| Internet software and services 4.0% | |||||
| Akamai Technologies, Inc. (B) | 10,753 | 770,452 | |||
| Alibaba Group Holding, Ltd., ADR (B) | 18,719 | 3,342,090 | |||
| Alphabet, Inc., Class A (B) | 131 | 133,434 | |||
| Alphabet, Inc., Class C (B) | 383 | 389,637 | |||
| Blucora, Inc. (B) | 4,100 | 106,600 | |||
| Cafe24 Corp. (B) | 3,908 | 495,063 | |||
| Cloudera, Inc. (B) | 57,599 | 820,786 | |||
| Delivery Hero AG (A)(B) | 8,877 | 422,862 | |||
| DocuSign, Inc. (B) | 1,100 | 42,493 | |||
| eBay, Inc. (B) | 29,320 | 1,110,642 | |||
| Facebook, Inc., Class A (B) | 519 | 89,268 | |||
| GoDaddy, Inc., Class A (B) | 41,560 | 2,683,114 | |||
| Just Eat PLC (B) | 121,779 | 1,296,446 | |||
| Mimecast, Ltd. (B) | 73,614 | 2,801,013 | |||
| 18 | JOHN HANCOCK SEAPORT LONG/SHORT FUND | SEMIANNUAL REPORT | SEE NOTES TO FINANCIAL STATEMENTS |
| Shares | Value | ||||
| Information technology (continued) | |||||
| Internet software and services (continued) | |||||
| Okta, Inc. (B) | 22,198 | $950,296 | |||
| Shopify, Inc., Class A (B) | 14,932 | 1,995,363 | |||
| Spotify Technology (B) | 30,706 | 4,964,239 | |||
| Tencent Holdings, Ltd. | 54,768 | 2,692,553 | |||
| The Trade Desk, Inc., Class A (B) | 18,810 | 962,508 | |||
| VeriSign, Inc. (B) | 950 | 111,549 | |||
| Wix.com, Ltd. (B) | 12,263 | 1,008,632 | |||
| Yandex NV, Class A (B) | 32,459 | 1,082,832 | |||
| IT services 0.5% | |||||
| Accenture PLC, Class A | 8,466 | 1,280,059 | |||
| Alliance Data Systems Corp. | 3,870 | 785,804 | |||
| Automatic Data Processing, Inc. | 6,761 | 798,339 | |||
| EPAM Systems, Inc. (B) | 1,203 | 137,563 | |||
| ExlService Holdings, Inc. (B) | 1,920 | 110,995 | |||
| FleetCor Technologies, Inc. (B) | 747 | 154,838 | |||
| Genpact, Ltd. | 6,849 | 218,415 | |||
| Global Payments, Inc. | 1,307 | 147,756 | |||
| Mastercard, Inc., Class A | 192 | 34,228 | |||
| PayPal Holdings, Inc. (B) | 609 | 45,437 | |||
| Semiconductors and semiconductor equipment 2.1% | |||||
| Advanced Micro Devices, Inc. (B) | 171,195 | 1,862,602 | |||
| ams AG | 5,433 | 448,097 | |||
| Axcelis Technologies, Inc. (B) | 22,769 | 500,918 | |||
| Broadcom, Inc. | 4,228 | 969,988 | |||
| FormFactor, Inc. (B) | 25,152 | 288,619 | |||
| KLA-Tencor Corp. | 21,206 | 2,157,498 | |||
| Marvell Technology Group, Ltd. | 146,920 | 2,947,215 | |||
| Microchip Technology, Inc. | 26,873 | 2,248,195 | |||
| Micron Technology, Inc. (B) | 30,447 | 1,399,953 | |||
| NVIDIA Corp. | 1,777 | 399,647 | |||
| Sino-American Silicon Products, Inc. (B) | 138,000 | 592,285 | |||
| SunPower Corp. (B) | 122,245 | 1,042,750 | |||
| Tower Semiconductor, Ltd. (B) | 8,337 | 215,678 | |||
| Software 2.6% | |||||
| Adobe Systems, Inc. (B) | 6,749 | 1,495,578 | |||
| Blackbaud, Inc. | 8,844 | 928,266 | |||
| Ceridian HCM Holding, Inc. (B) | 7,800 | 246,324 | |||
| Fair Isaac Corp. (B) | 10,985 | 1,902,382 | |||
| Globant SA (B) | 5,897 | 265,424 | |||
| Guidewire Software, Inc. (B) | 3,106 | 262,830 | |||
| HubSpot, Inc. (B) | 18,136 | 1,920,602 | |||
| Intuit, Inc. | 5,692 | 1,051,825 | |||
| Microsoft Corp. | 6,187 | 578,608 | |||
| Nexon Company, Ltd. (B) | 167,764 | 2,441,200 | |||
| SEE NOTES TO FINANCIAL STATEMENTS | SEMIANNUAL REPORT | JOHN HANCOCK SEAPORT LONG/SHORT FUND | 19 |
| Shares | Value | ||||
| Information technology (continued) | |||||
| Software (continued) | |||||
| salesforce.com, Inc. (B) | 12,127 | $1,467,246 | |||
| ServiceNow, Inc. (B) | 12,946 | 2,150,848 | |||
| SS&C Technologies Holdings, Inc. | 25,224 | 1,252,372 | |||
| Workday, Inc., Class A (B) | 18,553 | 2,316,157 | |||
| Technology hardware, storage and peripherals 0.5% | |||||
| Cray, Inc. (B) | 20,222 | 482,295 | |||
| Samsung Electronics Company, Ltd. | 914 | 2,265,446 | |||
| Samsung Electronics Company, Ltd., GDR (A) | 975 | 1,193,588 | |||
| Materials 2.5% | 17,975,369 | ||||
| Chemicals 0.5% | |||||
| Nutrien, Ltd. | 30,411 | 1,384,613 | |||
| The Mosaic Company | 72,308 | 1,948,701 | |||
| Construction materials 0.4% | |||||
| Anhui Conch Cement Company, Ltd., H Shares | 150,006 | 936,259 | |||
| LafargeHolcim, Ltd. (B) | 12,125 | 673,562 | |||
| Summit Materials, Inc., Class A (B) | 16,371 | 460,680 | |||
| Vulcan Materials Company | 10,189 | 1,138,009 | |||
| Containers and packaging 0.6% | |||||
| Ball Corp. | 18,183 | 728,956 | |||
| Packaging Corp. of America | 24,496 | 2,833,942 | |||
| RPC Group PLC | 96,718 | 1,049,474 | |||
| Metals and mining 1.0% | |||||
| ArcelorMittal (B) | 74,653 | 2,530,263 | |||
| Barrick Gold Corp. | 73,820 | 994,355 | |||
| Eldorado Gold Corp. (B) | 255,804 | 243,014 | |||
| Gerdau SA, ADR | 378,135 | 1,765,890 | |||
| Kinross Gold Corp. (B) | 165,775 | 643,207 | |||
| Lynas Corp., Ltd. (B) | 176,754 | 340,639 | |||
| Northern Dynasty Minerals, Ltd. (B) | 345,744 | 303,805 | |||
| Real estate 0.8% | 6,042,095 | ||||
| Equity real estate investment trusts 0.2% | |||||
| Dream Global Real Estate Investment Trust | 145,953 | 1,556,211 | |||
| Grivalia Properties REIC AE | 23,255 | 255,388 | |||
| Real estate management and development 0.6% | |||||
| Aedas Homes SAU (A)(B) | 25,958 | 928,037 | |||
| BR Properties SA | 534,100 | 1,356,899 | |||
| Henderson Land Development Company, Ltd. | 164,000 | 1,039,850 | |||
| New World Development Company, Ltd. | 617,591 | 905,710 | |||
| Telecommunication services 1.0% | 7,088,585 | ||||
| Diversified telecommunication services 1.0% | |||||
| China Unicom Hong Kong, Ltd. (B) | 3,215,000 | 4,546,167 | |||
| 20 | JOHN HANCOCK SEAPORT LONG/SHORT FUND | SEMIANNUAL REPORT | SEE NOTES TO FINANCIAL STATEMENTS |
| Shares | Value | ||||
| Telecommunication services (continued) | |||||
| Diversified telecommunication services (continued) | |||||
| China Unicom Hong Kong, Ltd., ADR (B) | 52,347 | $734,428 | |||
| ORBCOMM, Inc. (B) | 65,846 | 593,931 | |||
| Verizon Communications, Inc. | 24,601 | 1,214,059 | |||
| Utilities 2.1% | 15,249,736 | ||||
| Electric utilities 0.4% | |||||
| Avangrid, Inc. | 12,977 | 684,018 | |||
| Edison International | 34,566 | 2,264,764 | |||
| Independent power and renewable electricity producers 0.9% | |||||
| China Longyuan Power Group Corp., Ltd., H Shares | 2,903,000 | 2,851,385 | |||
| China Resources Power Holdings Company, Ltd. | 907,345 | 1,740,389 | |||
| Datang International Power Generation Company, Ltd., H Shares (B) | 2,144,221 | 702,274 | |||
| Huadian Fuxin Energy Corp., Ltd., H Shares | 1,702,318 | 483,094 | |||
| Huaneng Power International, Inc., H Shares | 1,150,100 | 760,101 | |||
| Multi-utilities 0.5% | |||||
| E.ON SE | 140,857 | 1,542,350 | |||
| National Grid PLC, ADR | 32,806 | 1,908,653 | |||
| Water utilities 0.3% | |||||
| Cia de Saneamento do Parana | 137,320 | 2,312,708 | |||
| Preferred securities 0.3% | $2,379,869 | ||||
| (Cost $1,690,359) | |||||
| Financials 0.2% | 1,682,375 | ||||
| Diversified financial services 0.2% | |||||
| Mandatory Exchangeable Trust, 5.750% (A) | 8,342 | 1,682,375 | |||
| Utilities 0.1% | 697,494 | ||||
| Electric utilities 0.1% | |||||
| Cia Paranaense de Energia, B Shares | 51,300 | 392,306 | |||
| Water utilities 0.0% | |||||
| Cia de Saneamento do Parana | 100,200 | 305,188 | |||
| Warrants 0.0% | $111,121 | ||||
| (Cost $177,282) | |||||
| Alta Mesa Resources, Inc. (Expiration Date: 4-27-22) (B)(E) | 70,330 | 111,121 | |||
| Contracts/Notional amount | Value | ||||
| Purchased options 0.8% | $5,560,659 | ||||
| (Cost $7,918,333) | |||||
| Calls 0.4% | 2,745,645 | ||||
| Exchange Traded Option on Nutrien, Ltd. (Expiration Date: 9-21-18; Strike Price: $50.00; Notional Amount: 45,100) (B) | 451 | 62,013 | |||
| Exchange Traded Option on S&P 500 Index (Expiration Date: 6-15-18; Strike Price: $2,950.00; Notional Amount: 18,100) (B) | 181 | 5,883 |
| SEE NOTES TO FINANCIAL STATEMENTS | SEMIANNUAL REPORT | JOHN HANCOCK SEAPORT LONG/SHORT FUND | 21 |
| Contracts/Notional amount | Value | ||||
| Calls (continued) | |||||
| Exchange Traded Option on SPDR S&P Metals & Mining ETF (Expiration Date: 6-15-18; Strike Price: $41.00; Notional Amount: 111,100) (B) | 1,111 | $7,777 | |||
| Exchange Traded Option on The Mosaic Company (Expiration Date: 9-21-18; Strike Price: $28.00; Notional Amount: 72,000) (B) | 720 | 130,320 | |||
| Over the Counter Option on Airports Corp. of Vietnam (Expiration Date: 8-24-27; Counterparty: Deutsche Bank AG) (B)(E)(F) | 109,000 | 428,625 | |||
| Over the Counter Option on the USD vs. CAD (Expiration Date: 7-13-18; Strike Price: $1.30; Counterparty: Deutsche Bank AG) (B)(F) | 29,051,000 | 227,760 | |||
| Over the Counter Option on the USD vs. JPY (Expiration Date: 9-23-21; Strike Price: $114.00; Counterparty: Goldman Sachs & Company) (B)(F) | 20,020,323 | 250,034 | |||
| Over the Counter Option on the USD vs. MXN (Expiration Date: 5-7-18; Strike Price: $20.00; Counterparty: Deutsche Bank AG) (B)(F) | 9,338,000 | 84 | |||
| Over the Counter Option on United Bank, Ltd. (Expiration Date: 6-28-19; Counterparty: JPMorgan Chase Bank N.A.) (B)(E)(F) | 229,600 | 398,479 | |||
| Over the Counter Option on Vincom Retail JSC (Expiration Date: 10-9-27; Counterparty: Deutsche Bank AG) (B)(E)(F) | 605,997 | 1,225,471 | |||
| Over the Counter Option on VP Bank AG (Expiration Date: 7-21-27; Counterparty: Deutsche Bank AG) (B)(E)(F) | 3,933 | 9,199 | |||
| Puts 0.4% | 2,815,014 | ||||
| Exchange Traded Option on iShares MSCI Emerging Markets ETF (Expiration Date: 5-18-18; Strike Price: $46.00; Notional Amount: 529,300) (B) | 5,293 | 190,548 | |||
| Exchange Traded Option on iShares Russell 2000 ETF (Expiration Date: 6-15-18; Strike Price: $148.00; Notional Amount: 115,800) (B) | 1,158 | 173,700 | |||
| Exchange Traded Option on iShares Russell 2000 ETF (Expiration Date: 7-20-18; Strike Price: $149.00; Notional Amount: 85,700) (B) | 857 | 248,530 | |||
| Exchange Traded Option on PowerShares QQQ Trust Series 1 (Expiration Date: 5-18-18; Strike Price: $152.00; Notional Amount: 47,600) (B) | 476 | 31,416 | |||
| Exchange Traded Option on PowerShares QQQ Trust Series 1 (Expiration Date: 5-18-18; Strike Price: $157.00; Notional Amount: 29,200) (B) | 292 | 44,092 | |||
| Exchange Traded Option on PowerShares QQQ Trust Series 1 (Expiration Date: 6-15-18; Strike Price: $155.00; Notional Amount: 23,600) (B) | 236 | 55,932 | |||
| Exchange Traded Option on PowerShares QQQ Trust Series 1 (Expiration Date: 6-15-18; Strike Price: $158.00; Notional Amount: 71,500) (B) | 715 | 226,298 | |||
| Exchange Traded Option on PowerShares QQQ Trust Series 1 (Expiration Date: 9-21-18; Strike Price: $153.00; Notional Amount: 47,300) (B) | 473 | 228,223 |
| 22 | JOHN HANCOCK SEAPORT LONG/SHORT FUND | SEMIANNUAL REPORT | SEE NOTES TO FINANCIAL STATEMENTS |
| Contracts/Notional amount | Value | ||||
| Puts (continued) | |||||
| Exchange Traded Option on S&P 500 Index (Expiration Date: 6-15-18; Strike Price: $2,575.00; Notional Amount: 18,500) (B) | 185 | $530,950 | |||
| Exchange Traded Option on S&P 500 Index (Expiration Date: 6-15-18; Strike Price: $2,600.00; Notional Amount: 2,800) (B) | 28 | 98,140 | |||
| Exchange Traded Option on S&P 500 Index (Expiration Date: 7-20-18; Strike Price: $2,550.00; Notional Amount: 5,900) (B) | 59 | 238,950 | |||
| Over the Counter Option on 1 Year Interest Rate Swap. Receive a floating rate based on 3-month LIBOR and pay a fixed rate of 3.250% (Expiration Date: 1-14-19; Strike Rate: 3.250%; Counterparty: Morgan Stanley & Company, Inc.) (B)(F) | 16,945,000 | 180,998 | |||
| Over the Counter Option on EURO STOXX Banks Index (Expiration Date: 6-15-18; Strike Price: EUR 120.58; Counterparty: Goldman Sachs & Company) (B)(F) | 84,530 | 84,259 | |||
| Over the Counter Option on EURO STOXX Banks Index (Expiration Date: 6-15-18; Strike Price: EUR 121.70; Counterparty: Goldman Sachs & Company) (B)(F) | 39,943 | 48,947 | |||
| Over the Counter Option on FTSE MIB Index (Expiration Date: 6-15-18; Strike Price: EUR 20,500.00; Counterparty: Goldman Sachs & Company) (B)(F) | 278 | 11,465 | |||
| Over the Counter Option on FTSE MIB Index (Expiration Date: 6-15-18; Strike Price: EUR 20,500.00; Counterparty: Goldman Sachs & Company) (B)(F) | 184 | 7,589 | |||
| Over the Counter Option on Hong Kong Hang Seng Index (Expiration Date: 6-28-18; Strike Price: HKD 28,843.47; Counterparty: Goldman Sachs & Company) (B)(F) | 3,763 | 137,541 | |||
| Over the Counter Option on iShares Russell 2000 ETF (Expiration Date: 5-18-18; Strike Price: $186.72; Counterparty: Credit Suisse Securities USA LLC) (B)(F) | 24,402 | 31,458 | |||
| Over the Counter Option on iShares Russell 2000 ETF (Expiration Date: 6-15-18; Strike Price: $178.30; Counterparty: Goldman Sachs & Company) (B)(F) | 20,740 | 24,759 | |||
| Over the Counter Option on iShares Russell 2000 ETF (Expiration Date: 6-15-18; Strike Price: $186.40; Counterparty: Goldman Sachs & Company) (B)(F) | 39,395 | 103,422 | |||
| Over the Counter Option on iShares Russell 2000 ETF (Expiration Date: 7-20-18; Strike Price: $184.35; Counterparty: Goldman Sachs & Company) (B)(F) | 32,832 | 117,797 |
| SEE NOTES TO FINANCIAL STATEMENTS | SEMIANNUAL REPORT | JOHN HANCOCK SEAPORT LONG/SHORT FUND | 23 |
| Rate (%) | Maturity date | Par value^ | Value | ||
| Term loans (G) 0.1% | $375,489 | ||||
| (Cost $373,617) | |||||
| Energy 0.1% | 375,489 | ||||
| Oil, gas and consumable fuels 0.1% | |||||
| Chief Exploration & Development LLC (2 month LIBOR + 6.500%) | 8.416 | 05-16-21 | 380,000 | 375,489 | |
| Yield* (%) | Maturity date | Par value^ | Value | ||
| Short-term investments 29.9% | $213,924,361 | ||||
| (Cost $213,919,800) | |||||
| U.S. Government 28.5% | 204,011,465 | ||||
| U.S. Treasury Bill (D) | 1.430 | 05-03-18 | 39,465,000 | 39,461,565 | |
| U.S. Treasury Bill (D) | 1.527 | 05-10-18 | 4,455,000 | 4,453,282 | |
| U.S. Treasury Bill (D) | 1.621 | 05-24-18 | 22,010,000 | 21,987,517 | |
| U.S. Treasury Bill (D) | 1.630 | 05-17-18 | 10,100,000 | 10,092,839 | |
| U.S. Treasury Bill (D) | 1.640 | 05-31-18 | 2,750,000 | 2,746,223 | |
| U.S. Treasury Bill (D) | 1.640 | 06-07-18 | 2,125,000 | 2,121,424 | |
| U.S. Treasury Bill (D) | 1.670 | 06-14-18 | 17,725,000 | 17,689,312 | |
| U.S. Treasury Bill (D) | 1.695 | 07-05-18 | 20,765,000 | 20,699,751 | |
| U.S. Treasury Bill (D) | 1.721 | 06-28-18 | 8,180,000 | 8,157,717 | |
| U.S. Treasury Bill (D) | 1.760 | 06-21-18 | 19,070,000 | 19,024,446 | |
| U.S. Treasury Bill (D) | 1.785 | 07-19-18 | 18,025,000 | 17,955,547 | |
| U.S. Treasury Bill | 1.816 | 07-26-18 | 31,045,000 | 30,912,923 | |
| U.S. Treasury Bill (D) | 1.940 | 09-20-18 | 8,775,000 | 8,708,919 |
| Yield (%) | Shares | Value | |||
| Money market funds 1.4% | 9,912,896 | ||||
| State Street Institutional U.S. Government Money Market Fund, Premier Class | 1.6333(H) | 9,912,896 | 9,912,896 | ||
| Total investments (Cost $629,179,553) 93.7% | $669,503,784 | ||||
| Other assets and liabilities, net 6.3% | 45,229,364 | ||||
| Total net assets 100.0% | $714,733,148 | ||||
| The percentage shown for each investment category is the total value of the category as a percentage of the net assets of the fund. | |
| ^All par values are denominated in U.S. dollars unless otherwise indicated. | |
| Currency Abbreviations | |
| CAD | Canadian Dollar |
| EUR | Euro |
| HKD | Hong Kong Dollar |
| JPY | Japanese Yen |
| MXN | Mexican Peso |
| Security Abbreviations and Legend | |
| ADR | American Depositary Receipt |
| GDR | Global Depositary Receipt |
| LIBOR | London Interbank Offered Rate |
| 24 | JOHN HANCOCK SEAPORT LONG/SHORT FUND | SEMIANNUAL REPORT | SEE NOTES TO FINANCIAL STATEMENTS |
| (A) | These securities are exempt from registration under Rule 144A of the Securities Act of 1933. Such securities may be resold, normally to qualified institutional buyers, in transactions exempt from registration. |
| (B) | Non-income producing security. |
| (C) | Security is valued using significant unobservable inputs and is classified as Level 3 in the fair value hierarchy. |
| (D) | All or a portion of this security is segregated at the custodian as collateral for certain derivatives. |
| (E) | Strike price and/or expiration date not available. |
| (F) | For this type of option, notional amounts are equivalent to number of contracts. |
| (G) | Term loans are variable rate obligations. The coupon rate shown represents the rate at period end. |
| (H) | The rate shown is the annualized seven-day yield as of 4-30-18. |
| * | Yield represents either the annualized yield at the date of purchase, the stated coupon rate or, for floating rate securities, the rate at period end. |
| SEE NOTES TO FINANCIAL STATEMENTS | SEMIANNUAL REPORT | JOHN HANCOCK SEAPORT LONG/SHORT FUND | 25 |
| Open contracts | Number of contracts | Position | Expiration date | Notional basis* | Notional value* | Unrealized appreciation (depreciation) |
| NASDAQ 100 Index E-Mini Futures | 12 | Short | Jun 2018 | $(1,719,756) | $(1,587,120) | $132,636 |
| Russell 2000 E-Mini Index Futures | 102 | Short | Jun 2018 | (8,180,227) | (7,873,380) | 306,847 |
| S&P 500 Index E-Mini Futures | 28 | Short | Jun 2018 | (3,904,614) | (3,705,800) | 198,814 |
| SGX Nifty 50 Index Futures | 137 | Short | May 2018 | (2,899,251) | (2,955,090) | (55,839) |
| $582,458 |
| Contract to buy | Contract to sell | Counterparty (OTC) | Contractual settlement date | Unrealized appreciation | Unrealized depreciation | ||
| AUD | 1,665,000 | USD | 1,260,269 | BNP Paribas SA | 5/31/2018 | — | $(6,715) |
| CHF | 545,000 | USD | 582,625 | Deutsche Bank AG London | 6/20/2018 | — | (30,379) |
| EUR | 3,450,000 | USD | 4,220,754 | Deutsche Bank AG London | 5/31/2018 | — | (46,213) |
| EUR | 335,000 | USD | 415,511 | Deutsche Bank AG London | 6/20/2018 | — | (9,490) |
| JPY | 435,058,000 | USD | 3,992,164 | JPMorgan Chase Bank N.A. | 5/31/2018 | — | (5,229) |
| JPY | 104,600,000 | USD | 987,261 | Deutsche Bank AG London | 6/20/2018 | — | (27,259) |
| JPY | 63,800,000 | USD | 603,407 | Morgan Stanley and Company International PLC | 6/20/2018 | — | (17,860) |
| SGD | 330,000 | USD | 249,480 | Citibank N.A. | 5/31/2018 | — | (477) |
| USD | 8,455,412 | AUD | 10,983,000 | Goldman Sachs International | 6/20/2018 | $185,734 | — |
| USD | 2,234,729 | CNY | 14,195,000 | Goldman Sachs International | 6/20/2018 | — | (4,303) |
| USD | 12,717,316 | EUR | 10,395,000 | Deutsche Bank AG London | 5/31/2018 | 139,242 | — |
| USD | 3,847,504 | EUR | 3,102,000 | Deutsche Bank AG London | 6/20/2018 | 87,873 | — |
| USD | 3,692,694 | EUR | 2,952,000 | Morgan Stanley and Company International PLC | 9/19/2018 | 88,563 | — |
| USD | 8,312,799 | GBP | 5,960,000 | BNP Paribas SA | 5/31/2018 | 97,201 | — |
| USD | 3,663,777 | GBP | 2,598,000 | Morgan Stanley and Company International PLC | 6/20/2018 | 78,711 | — |
| USD | 2,542,203 | JPY | 268,541,000 | State Street Bank and Trust Company | 6/20/2018 | 77,576 | — |
| USD | 1,322,256 | KRW | 1,406,788,000 | State Street Bank and Trust Company | 6/20/2018 | 7,247 | — |
| USD | 4,475,375 | SGD | 5,852,000 | Goldman Sachs International | 6/20/2018 | 57,513 | — |
| $819,660 | $(147,925) | ||||||
| Options on securities | ||||||||
| Counterparty (OTC)/ Exchange-traded | Name of issuer | Exercise price | Expiration date | Number of contracts | Notional amount | Premium | Value | |
| Calls | ||||||||
| Exchange-traded | SunPower Corp. | USD | 10.00 | May 2018 | 1,222 | 122,200 | $70,828 | $(22,607) |
| $70,828 | $(22,607) | |||||||
| 26 | JOHN HANCOCK SEAPORT LONG/SHORT FUND | SEMIANNUAL REPORT | SEE NOTES TO FINANCIAL STATEMENTS |
| Options on securities (continued) | ||||||||
| Counterparty (OTC)/ Exchange-traded | Name of issuer | Exercise price | Expiration date | Number of contracts | Notional amount | Premium | Value | |
| Puts | ||||||||
| Credit Suisse Securities USA LLC | iShares Russell 2000 Growth ETF | USD | 173.24 | May 2018 | 24,402 | 24,402 | $14,080 | $(3,672) |
| Goldman Sachs & Company | iShares Russell 2000 Growth ETF | USD | 159.53 | Jun 2018 | 20,740 | 20,740 | 42,932 | (5,794) |
| Goldman Sachs & Company | iShares Russell 2000 Growth ETF | USD | 166.78 | Jun 2018 | 39,395 | 39,395 | 47,124 | (16,747) |
| Goldman Sachs & Company | iShares Russell 2000 Growth ETF | USD | 161.55 | Jul 2018 | 32,832 | 32,832 | 39,687 | (26,640) |
| $143,823 | $(52,853) | |||||||
| Exchange-traded | iShares MSCI Emerging Markets ETF | USD | 43.00 | May 2018 | 5,293 | 529,300 | 33,435 | (29,112) |
| Exchange-traded | iShares Russell 2000 ETF | USD | 130.00 | Jun 2018 | 305 | 30,500 | 32,013 | (7,015) |
| Exchange-traded | iShares Russell 2000 ETF | USD | 132.00 | Jun 2018 | 853 | 85,300 | 83,560 | (22,605) |
| Exchange-traded | iShares Russell 2000 ETF | USD | 130.00 | Jul 2018 | 857 | 85,700 | 105,376 | (49,278) |
| Exchange-traded | PowerShares QQQ Trust Series 1 | USD | 141.00 | May 2018 | 476 | 47,600 | 42,013 | (5,950) |
| Exchange-traded | PowerShares QQQ Trust Series 1 | USD | 146.00 | May 2018 | 292 | 29,200 | 25,100 | (7,446) |
| Exchange-traded | PowerShares QQQ Trust Series 1 | USD | 139.00 | Jun 2018 | 951 | 95,100 | 91,809 | (49,452) |
| Exchange-traded | PowerShares QQQ Trust Series 1 | USD | 136.00 | Sep 2018 | 473 | 47,300 | 136,493 | (88,687) |
| $549,799 | $(259,545) | |||||||
| $764,450 | $(335,005) | |||||||
| Options on index | ||||||||
| Counterparty (OTC)/ Exchange- traded | Name of issuer | Exercise price | Expiration date | Number of contracts | Notional amount | Premium | Value | |
| Puts | ||||||||
| Goldman Sachs & Company | Euro STOXX Banks Price Index | EUR | 108.18 | Jun 2018 | 39,943 | 39,943 | $33,011 | $(5,018) |
| Goldman Sachs & Company | Euro STOXX Banks Price Index | EUR | 107.61 | Jun 2018 | 84,530 | 84,530 | 56,936 | (9,700) |
| $89,947 | $(14,718) | |||||||
| Exchange-traded | S&P 500 Index | USD | 2,325.00 | Jun 2018 | 28 | 2,800 | 39,675 | (13,580) |
| Exchange-traded | S&P 500 Index | USD | 2,250.00 | Jul 2018 | 59 | 5,900 | 82,421 | (51,625) |
| $122,096 | $(65,205) | |||||||
| $212,043 | $(79,923) | |||||||
| SEE NOTES TO FINANCIAL STATEMENTS | SEMIANNUAL REPORT | JOHN HANCOCK SEAPORT LONG/SHORT FUND | 27 |
| Foreign currency options | |||||||
| Description | Counterparty (OTC) | Exercise price | Expiration date | Notional amount* | Premium | Value | |
| Calls | |||||||
| U.S. Dollar vs. Japanese Yen | Goldman Sachs International | USD | 135.00 | Sep 2021 | 20,020,323 | 271,275 | (48,709) |
| $271,275 | $(48,709) | ||||||
| * For this type of option, notional amounts are equivalent to number of contracts. | |||||||
| Credit default swaps - Buyer | ||||||||||
| Counterparty (OTC)/ Centrally cleared | Reference obligation | Notional amount | Currency | USD notional amount | Pay fixed rate | Fixed payment frequency | Maturity date | Unamortized upfront payment paid (received) | Unrealized appreciation (depreciation) | Value |
| Goldman Sachs International | Republic of Korea | 11,800,000 | USD | $ 11,800,000 | 1.000% | Quarterly | Jun 2023 | $ (285,745) | $ (25,722) | $ (311,467) |
| $11,800,000 | $(285,745) | $(25,722) | $(311,467) | |||||||
| Total return swaps | ||||||||||
| Pay/receive total return* | Reference entity | Floating rate | Payment frequency | Currency | Notional amount/ contract amount | Maturity date | Counterparty (OTC) | Unamortized upfront payment paid (received) | Unrealized appreciation (depreciation) | Value |
| Pay | Consumer Discretionary Select Sector SPDR Fund | 1-Month USD LIBOR | Monthly | USD | 6,535,823 | May 2020 | Deutsche Bank AG | — | $(131,154) | $(131,154) |
| Pay | Consumer Discretionary Select Sector SPDR Fund | 1-Month USD LIBOR | Monthly | USD | 1,385,931 | May 2020 | Deutsche Bank AG | — | (28,082) | (28,082) |
| Pay | Consumer Discretionary Select Sector SPDR Fund | 1-Month USD LIBOR | Monthly | USD | 2,220,661 | May 2020 | Deutsche Bank AG | — | (44,562) | (44,562) |
| Pay | Consumer Discretionary Select Sector SPDR Fund | 1-Month USD LIBOR | Monthly | USD | 3,044,717 | May 2020 | Deutsche Bank AG | — | (60,198) | (60,198) |
| Pay | Financial Select Sector SPDR Fund | 1-Month USD LIBOR - 0.10% | Monthly | USD | 1,086,434 | May 2020 | Deutsche Bank AG | — | 10,970 | 10,970 |
| Pay | Health Care Select Sector SPDR Fund | 1-Month USD LIBOR - 0.11% | Monthly | USD | 13,320,442 | May 2020 | Deutsche Bank AG | — | (37,349) | (37,349) |
| Pay | iShares Core S&P Small-Cap ETF | 1-Month USD LIBOR - 0.60% | Monthly | USD | 4,607,115 | May 2020 | Deutsche Bank AG | — | 11,221 | 11,221 |
| Pay | iShares Core S&P Small-Cap ETF | 1-Month USD LIBOR - 0.60% | Monthly | USD | 153,524 | May 2020 | Deutsche Bank AG | — | 374 | 374 |
| 28 | JOHN HANCOCK SEAPORT LONG/SHORT FUND | SEMIANNUAL REPORT | SEE NOTES TO FINANCIAL STATEMENTS |
| Total return swaps (continued) | ||||||||||
| Pay/receive total return* | Reference entity | Floating rate | Payment frequency | Currency | Notional amount/ contract amount | Maturity date | Counterparty (OTC) | Unamortized upfront payment paid (received) | Unrealized appreciation (depreciation) | Value |
| Pay | iShares Core S&P Small-Cap ETF | 1-Month USD LIBOR - 0.60% | Monthly | USD | 128,873 | May 2020 | Deutsche Bank AG | — | $314 | $314 |
| Pay | iShares Dow Jones U.S. ETF | 1-Month USD LIBOR - 2.77% | Monthly | USD | 816,213 | May 2020 | Deutsche Bank AG | — | (7,846) | (7,846) |
| Pay | iShares Dow Jones U.S. Technology ETF | 1-Month USD LIBOR - 4.00% | Monthly | USD | 582,147 | May 2020 | Deutsche Bank AG | — | 7,459 | 7,459 |
| Pay | iShares Dow Jones U.S. Technology ETF | 1-Month USD LIBOR - 4.00% | Monthly | USD | 1,153,756 | May 2020 | Deutsche Bank AG | — | 14,872 | 14,872 |
| Pay | iShares Edge MSCI USA Momentum Factor ETF | 1-Month USD LIBOR - 1.75% | Monthly | USD | 2,149,364 | May 2020 | Deutsche Bank AG | — | (11,571) | (11,571) |
| Pay | iShares Edge MSCI USA Momentum Factor ETF | 1-Month USD LIBOR - 1.75% | Monthly | USD | 2,467,745 | May 2020 | Deutsche Bank AG | — | (13,285) | (13,285) |
| Pay | iShares Edge MSCI USA Momentum Factor ETF | 1-Month USD LIBOR - 1.75% | Monthly | USD | 105,880 | May 2020 | Deutsche Bank AG | — | (570) | (570) |
| Pay | iShares JPMorgan USD Emerging Markets Bond ETF | 1-Month USD LIBOR + 0.02% | Monthly | USD | 1,618,965 | May 2020 | Deutsche Bank AG | — | 30,857 | 30,857 |
| Pay | iShares JPMorgan USD Emerging Markets Bond ETF | 1-Month USD LIBOR + 0.02% | Monthly | USD | 583,295 | May 2020 | Deutsche Bank AG | — | 11,117 | 11,117 |
| Pay | iShares MSCI United Kingdom ETF | 1-Month USD LIBOR - 0.05% | Monthly | USD | 4,211,051 | May 2020 | Deutsche Bank AG | — | (22,188) | (22,188) |
| Pay | iShares MSCI United Kingdom ETF | 1-Month USD LIBOR - 0.05% | Monthly | USD | 1,832,894 | May 2020 | Deutsche Bank AG | — | (9,658) | (9,658) |
| Pay | iShares Nasdaq Biotechnology ETF | 1-Month USD LIBOR - 0.43% | Monthly | USD | 15,221,857 | May 2020 | Deutsche Bank AG | — | 295,221 | 295,221 |
| Pay | iShares North American Technology ETF | 1-Month USD LIBOR - 0.60% | Monthly | USD | 4,527,182 | May 2020 | Deutsche Bank AG | — | (50,071) | (50,071) |
| Pay | iShares North American Technology ETF | 1-Month USD LIBOR - 0.85% | Monthly | USD | 3,607,601 | May 2020 | Deutsche Bank AG | — | 15,272 | 15,272 |
| SEE NOTES TO FINANCIAL STATEMENTS | SEMIANNUAL REPORT | JOHN HANCOCK SEAPORT LONG/SHORT FUND | 29 |
| Total return swaps (continued) | ||||||||||
| Pay/receive total return* | Reference entity | Floating rate | Payment frequency | Currency | Notional amount/ contract amount | Maturity date | Counterparty (OTC) | Unamortized upfront payment paid (received) | Unrealized appreciation (depreciation) | Value |
| Pay | iShares North American Technology ETF | 1-Month USD LIBOR - 0.50% | Monthly | USD | 7,003,273 | May 2020 | Deutsche Bank AG | — | $(8,814) | $(8,814) |
| Pay | iShares North American Technology ETF | 1-Month USD LIBOR - 0.60% | Monthly | USD | 111,663 | May 2020 | Deutsche Bank AG | — | (1,235) | (1,235) |
| Pay | iShares North American Technology ETF | 1-Month USD LIBOR - 0.85% | Monthly | USD | 140,111 | May 2020 | Deutsche Bank AG | — | 593 | 593 |
| Pay | iShares North American Technology ETF | 1-Month USD LIBOR - 0.50% | Monthly | USD | 143,333 | May 2020 | Deutsche Bank AG | — | (169) | (169) |
| Pay | iShares Russell 2000 Index ETF | 1-Month USD LIBOR - 0.03% | Monthly | USD | 35,346,268 | May 2020 | Deutsche Bank AG | — | 13,827 | 13,827 |
| Pay | iShares Russell 2000 Value ETF | 1-Month USD LIBOR - 0.29% | Monthly | USD | 4,686,458 | May 2020 | Deutsche Bank AG | — | (33,461) | (33,461) |
| Pay | iShares Russell 2000 Value ETF | 1-Month USD LIBOR - 0.29% | Monthly | USD | 1,998,375 | May 2020 | Deutsche Bank AG | — | (14,268) | (14,268) |
| Pay | iShares Russell 2000 Value ETF | 1-Month USD LIBOR - 0.29% | Monthly | USD | 2,660,598 | May 2020 | Deutsche Bank AG | — | (18,997) | (18,997) |
| Pay | iShares Russell Growth ETF | 1-Month USD LIBOR - 0.40% | Monthly | USD | 3,625,439 | May 2020 | Deutsche Bank AG | — | 24,323 | 24,323 |
| Pay | iShares Russell Growth ETF | 1-Month USD LIBOR - 0.40% | Monthly | USD | 5,904,919 | May 2020 | Deutsche Bank AG | — | 39,616 | 39,616 |
| Pay | iShares Russell Growth ETF | 1-Month USD LIBOR - 0.40% | Monthly | USD | 217,853 | May 2020 | Deutsche Bank AG | — | 1,462 | 1,462 |
| Pay | iShares Russell Growth ETF | 1-Month USD LIBOR - 0.40% | Monthly | USD | 131,712 | May 2020 | Deutsche Bank AG | — | 884 | 884 |
| Pay | iShares Russell Mid-Cap Growth ETF | 1-Month USD LIBOR - 0.73% | Monthly | USD | 5,262,421 | May 2020 | Deutsche Bank AG | — | 37,770 | 37,770 |
| Pay | iShares Russell Mid-Cap Growth ETF | 1-Month USD LIBOR - 0.73% | Monthly | USD | 2,072,967 | May 2020 | Deutsche Bank AG | — | 14,878 | 14,878 |
| Pay | iShares Russell Mid-Cap Growth ETF | 1-Month USD LIBOR - 0.73% | Monthly | USD | 13,141,708 | May 2020 | Deutsche Bank AG | — | 94,321 | 94,321 |
| Pay | iShares Russell Mid-Cap Growth ETF | 1-Month USD LIBOR - 0.73% | Monthly | USD | 126,656 | May 2020 | Deutsche Bank AG | — | 909 | 909 |
| Pay | iShares S&P 500 Growth ETF | 1-Month USD LIBOR - 1.00% | Monthly | USD | 382,661 | May 2020 | Deutsche Bank AG | — | 1,031 | 1,031 |
| Pay | iShares S&P 500 North American Tech ETF | 1-Month USD LIBOR - 0.60% | Monthly | USD | 446,654 | May 2020 | Deutsche Bank AG | — | (4,940) | (4,940) |
| Pay | iShares S&P Small-Cap 600 Growth ETF | 1-Month USD LIBOR - 2.50% | Monthly | USD | 2,536,944 | May 2020 | Deutsche Bank AG | — | 20,295 | 20,295 |
| 30 | JOHN HANCOCK SEAPORT LONG/SHORT FUND | SEMIANNUAL REPORT | SEE NOTES TO FINANCIAL STATEMENTS |
| Total return swaps (continued) | ||||||||||
| Pay/receive total return* | Reference entity | Floating rate | Payment frequency | Currency | Notional amount/ contract amount | Maturity date | Counterparty (OTC) | Unamortized upfront payment paid (received) | Unrealized appreciation (depreciation) | Value |
| Pay | iShares S&P Small-Cap 600 Growth ETF | 1-Month USD LIBOR - 2.50% | Monthly | USD | 1,754,468 | May 2020 | Deutsche Bank AG | — | $14,035 | $14,035 |
| Pay | PowerShares QQQ Trust Series 1 | 1-Month USD LIBOR - 0.07% | Monthly | USD | 2,170,370 | May 2020 | Deutsche Bank AG | — | 3,635 | 3,635 |
| Pay | PowerShares QQQ Trust Series 1 | 1-Month USD LIBOR - 0.07% | Monthly | USD | 209,251 | May 2020 | Deutsche Bank AG | — | 350 | 350 |
| Pay | PowerShares QQQ Trust Series 1 | 1-Month USD LIBOR - 0.07% | Monthly | USD | 128,484 | May 2020 | Deutsche Bank AG | — | 215 | 215 |
| Pay | PowerShares QQQ Trust Series 1 | 1-Month USD LIBOR - 0.07% | Monthly | USD | 789,284 | May 2020 | Deutsche Bank AG | — | 1,322 | 1,322 |
| Pay | PureFunds ISE Cyber Security ETF | 1-Month USD LIBOR - 4.00% | Monthly | USD | 4,147,956 | May 2020 | Deutsche Bank AG | — | (76,999) | (76,999) |
| Pay | PureFunds ISE Cyber Security ETF | 1-Month USD LIBOR - 4.00% | Monthly | USD | 315,962 | May 2020 | Deutsche Bank AG | — | (5,844) | (5,844) |
| Pay | PureFunds ISE Cyber Security ETF | 1-Month USD LIBOR - 4.00% | Monthly | USD | 118,946 | May 2020 | Deutsche Bank AG | — | (2,199) | (2,199) |
| Pay | SPDR S&P 500 ETF | 1-Month USD LIBOR + 0.15% | Monthly | USD | 268,597 | May 2020 | Deutsche Bank AG | — | 648 | 648 |
| Pay | SPDR S&P Biotechnology ETF | 1-Month USD LIBOR - 0.87% | Monthly | USD | 34,802,771 | May 2020 | Deutsche Bank AG | — | 562,210 | 562,210 |
| Pay | SPDR S&P MidCap 400 ETF | 1-Month USD LIBOR + 0.05% | Monthly | USD | 2,600,906 | May 2020 | Deutsche Bank AG | — | 15,414 | 15,414 |
| Pay | SPDR S&P Pharmaceuticals ETF | 1-Month USD LIBOR - 1.90% | Monthly | USD | 13,246,847 | May 2020 | Deutsche Bank AG | — | 568,130 | 568,130 |
| Pay | SPDR S&P Regional Banking ETF | 1-Month USD LIBOR - 0.30% | Monthly | USD | 16,632,633 | May 2020 | Deutsche Bank AG | — | (316,210) | (316,210) |
| Pay | SPDR S&P Regional Banking ETF | 1-Month USD LIBOR - 0.30% | Monthly | USD | 1,026,213 | May 2020 | Deutsche Bank AG | — | (19,510) | (19,510) |
| Pay | SPDR S&P Regional Banking ETF | 1-Month USD LIBOR - 0.30% | Monthly | USD | 4,008,249 | May 2020 | Deutsche Bank AG | — | (76,202) | (76,202) |
| Pay | Vanguard FTSE Developed Markets ETF | 1-Month USD LIBOR - 0.55% | Monthly | USD | 11,686,391 | May 2020 | Deutsche Bank AG | — | 15,627 | 15,627 |
| Pay | Vanguard FTSE Developed Markets ETF | 1-Month USD LIBOR - 0.55% | Monthly | USD | 1,203,503 | May 2020 | Deutsche Bank AG | — | 1,609 | 1,609 |
| SEE NOTES TO FINANCIAL STATEMENTS | SEMIANNUAL REPORT | JOHN HANCOCK SEAPORT LONG/SHORT FUND | 31 |
| Total return swaps (continued) | ||||||||||
| Pay/receive total return* | Reference entity | Floating rate | Payment frequency | Currency | Notional amount/ contract amount | Maturity date | Counterparty (OTC) | Unamortized upfront payment paid (received) | Unrealized appreciation (depreciation) | Value |
| Pay | Vanguard FTSE Developed Markets ETF | 1-Month USD LIBOR - 0.55% | Monthly | USD | 69,683 | May 2020 | Deutsche Bank AG | — | $93 | $93 |
| Pay | Vanguard FTSE Developed Markets ETF | 1-Month USD LIBOR - 0.55% | Monthly | USD | 2,921,934 | May 2020 | Deutsche Bank AG | — | 3,907 | 3,907 |
| Pay | Vanguard FTSE Developed Markets ETF | 1-Month USD LIBOR - 0.55% | Monthly | USD | 3,404,161 | May 2020 | Deutsche Bank AG | — | 17,466 | 17,466 |
| Pay | Vanguard FTSE Europe ETF | 1-Month USD LIBOR + 0.05% | Monthly | USD | 5,362,498 | May 2020 | Deutsche Bank AG | — | 3,609 | 3,609 |
| Pay | Vanguard Small-Cap Growth ETF | 1-Month USD LIBOR - 0.60% | Monthly | USD | 1,704,949 | May 2020 | Deutsche Bank AG | — | 104 | 104 |
| Pay | Vanguard Small-Cap Growth ETF | 1-Month USD LIBOR - 0.60% | Monthly | USD | 5,244,708 | May 2020 | Deutsche Bank AG | — | 319 | 319 |
| Pay | Vanguard Small-Cap Growth ETF | 1-Month USD LIBOR - 0.60% | Monthly | USD | 226,844 | May 2020 | Deutsche Bank AG | — | 14 | 14 |
| Pay | Vanguard Small-Cap Growth ETF | 1-Month USD LIBOR - 0.60% | Monthly | USD | 161,914 | May 2020 | Deutsche Bank AG | — | 10 | 10 |
| Pay | STOXX 600 Basic Resources Index | 1-Month EUR EURIBOR | Monthly | EUR | 2,187,911 | Jun 2018 | Goldman Sachs International | — | 61,317 | 61,317 |
| Pay | iBoxx Markit ETF | 3-Month EUR EURIBOR | Annual | EUR | 1,200,000 | Jun 2018 | Goldman Sachs International | $(600) | (12,199) | (12,799) |
| Pay | CN Property Beta | 1-Month HKD HIBOR - 0.20% | Monthly | HKD | 2,008,091 | May 2020 | Goldman Sachs International | — | (5,028) | (5,028) |
| Pay | CN Property Beta | 1-Month HKD HIBOR - 0.20% | Monthly | HKD | 4,561,037 | May 2020 | Goldman Sachs International | — | (11,423) | (11,423) |
| Pay | CN Property Beta | 1-Month HKD HIBOR - 0.20% | Monthly | HKD | 4,563,428 | May 2020 | Goldman Sachs International | — | (11,429) | (11,429) |
| Pay | iShares PHLX Semiconductor ETF | 1-Month USD LIBOR - 0.33% | Monthly | USD | 2,158,950 | May 2020 | Goldman Sachs International | — | 45,283 | 45,283 |
| Pay | iShares PHLX Semiconductor ETF | 1-Month USD LIBOR - 1.46% | Monthly | USD | 1,814,510 | May 2020 | Goldman Sachs International | — | 37,690 | 37,690 |
| Pay | iShares PHLX Semiconductor ETF | 1-Month USD LIBOR - 1.46% | Monthly | USD | 1,140,441 | May 2020 | Goldman Sachs International | — | 23,190 | 23,190 |
| Pay | iShares PHLX Semiconductor ETF | 1-Month USD LIBOR - 1.46% | Monthly | USD | 2,325,142 | May 2020 | Goldman Sachs International | — | 47,254 | 47,254 |
| Pay | iShares PHLX Semiconductor ETF | 1-Month USD LIBOR - 1.46% | Monthly | USD | 787,481 | May 2020 | Goldman Sachs International | (45) | (1,195) | (1,240) |
| 32 | JOHN HANCOCK SEAPORT LONG/SHORT FUND | SEMIANNUAL REPORT | SEE NOTES TO FINANCIAL STATEMENTS |
| Total return swaps (continued) | ||||||||||
| Pay/receive total return* | Reference entity | Floating rate | Payment frequency | Currency | Notional amount/ contract amount | Maturity date | Counterparty (OTC) | Unamortized upfront payment paid (received) | Unrealized appreciation (depreciation) | Value |
| Pay | SPDR S&P Regional Banking ETF | 1-Month USD LIBOR - 0.33% | Monthly | USD | 2,152,249 | May 2020 | Goldman Sachs International | — | $33,683 | $33,683 |
| Pay | iBoxx Markit ETF | 3-Month EUR EURIBOR | Quarterly | EUR | 2,735,000 | Jun 2018 | JPMorgan Chase Bank | $(52) | (14,417) | (14,469) |
| Pay | iShares Edge MSCI USA Momentum Factor ETF | 1-Month USD LIBOR - 1.50% | Monthly | USD | 1,842,486 | May 2020 | JPMorgan Chase Bank | — | (7,779) | (7,779) |
| Pay | iShares Edge MSCI USA Momentum Factor ETF | 1-Month USD LIBOR - 1.50% | Monthly | USD | 1,874,253 | May 2020 | JPMorgan Chase Bank | — | (7,913) | (7,913) |
| Pay | iShares MSCI Taiwan ETF | 1-Month USD LIBOR - 0.33% | Monthly | USD | 2,309,799 | May 2020 | JPMorgan Chase Bank | — | 90,308 | 90,308 |
| Pay | iShares PHLX Semiconductor ETF | 1-Month USD LIBOR - 0.33% | Monthly | USD | 59 | May 2020 | JPMorgan Chase Bank | 59 | 1,181 | 1,240 |
| Pay | iShares PHLX Semiconductor ETF | 1-Month USD LIBOR - 1.00% | Monthly | USD | 1,227,617 | May 2020 | JPMorgan Chase Bank | — | 58,287 | 58,287 |
| Pay | iShares Russell Mid-Cap Growth ETF | 1-Month USD LIBOR - 1.50% | Monthly | USD | 1,091,232 | May 2020 | JPMorgan Chase Bank | — | 13,892 | 13,892 |
| Pay | iShares S&P 500 Growth ETF | 1-Month USD LIBOR - 1.50% | Monthly | USD | 1,855,947 | May 2020 | JPMorgan Chase Bank | — | 9,468 | 9,468 |
| Pay | iShares S&P 500 Growth ETF | 1-Month USD LIBOR - 1.50% | Monthly | USD | 1,863,751 | May 2020 | JPMorgan Chase Bank | — | 9,508 | 9,508 |
| Pay | iShares S&P Small-Cap 600 Growth ETF | 1-Month USD LIBOR - 2.75% | Monthly | USD | 1,848,627 | May 2020 | JPMorgan Chase Bank | — | 21,433 | 21,433 |
| Pay | Vanguard Small-Cap Growth ETF | 1-Month USD LIBOR - 1.50% | Monthly | USD | 1,853,201 | May 2020 | JPMorgan Chase Bank | — | 1,402 | 1,402 |
| Pay | Financial Select Sector SPDR Fund | 1-Month USD LIBOR - 0.30% | Monthly | USD | 819,540 | May 2020 | Morgan Stanley and Company International | — | 5,303 | 5,303 |
| Pay | Financial Select Sector SPDR Fund | 1-Month USD LIBOR - 0.30% | Monthly | USD | 157,206 | May 2020 | Morgan Stanley and Company International | — | 935 | 935 |
| Pay | Financial Select Sector SPDR Fund | 1-Month USD LIBOR - 0.30% | Monthly | USD | 255,781 | May 2020 | Morgan Stanley and Company International | — | 2,802 | 2,802 |
| Pay | Health Care Select Sector SPDR Fund | 1-Month USD LIBOR - 0.45% | Monthly | USD | 2,080,329 | May 2020 | Morgan Stanley and Company International | — | 9,797 | 9,797 |
| Pay | iShares Core S&P Small-Cap ETF | 1-Month USD LIBOR - 0.45% | Monthly | USD | 170,743 | May 2020 | Morgan Stanley and Company International | 2 | 3,069 | 3,071 |
| SEE NOTES TO FINANCIAL STATEMENTS | SEMIANNUAL REPORT | JOHN HANCOCK SEAPORT LONG/SHORT FUND | 33 |
| Total return swaps (continued) | ||||||||||
| Pay/receive total return* | Reference entity | Floating rate | Payment frequency | Currency | Notional amount/ contract amount | Maturity date | Counterparty (OTC) | Unamortized upfront payment paid (received) | Unrealized appreciation (depreciation) | Value |
| Pay | iShares Dow Jones U.S. ETF | 1-Month USD LIBOR - 3.66% | Monthly | USD | 56,556 | May 2020 | Morgan Stanley and Company International | — | $148 | $148 |
| Pay | iShares Dow Jones U.S. Technology ETF | 1-Month USD LIBOR - 2.66% | Monthly | USD | 3,172,504 | May 2020 | Morgan Stanley and Company International | — | 80,718 | 80,718 |
| Pay | iShares Dow Jones U.S. Technology ETF | 1-Month USD LIBOR - 2.66% | Monthly | USD | 1,292,718 | May 2020 | Morgan Stanley and Company International | — | 33,276 | 33,276 |
| Pay | iShares Dow Jones U.S. Technology ETF | 1-Month USD LIBOR - 2.66% | Monthly | USD | 268,147 | May 2020 | Morgan Stanley and Company International | — | 6,902 | 6,902 |
| Pay | iShares Dow Jones U.S. Technology ETF | 1-Month USD LIBOR - 2.66% | Monthly | USD | 535,262 | May 2020 | Morgan Stanley and Company International | — | 13,750 | 13,750 |
| Pay | iShares Dow Jones U.S. Technology ETF | 1-Month USD LIBOR - 2.66% | Monthly | USD | 732,383 | May 2020 | Morgan Stanley and Company International | — | 10,948 | 10,948 |
| Pay | iShares Edge MSCI USA Momentum Factor ETF | 1-Month USD LIBOR - 1.66% | Monthly | USD | 2,318,162 | May 2020 | Morgan Stanley and Company International | — | 1,398 | 1,398 |
| Pay | iShares Edge MSCI USA Momentum Factor ETF | 1-Month USD LIBOR - 1.66% | Monthly | USD | 189,055 | May 2020 | Morgan Stanley and Company International | — | 131 | 131 |
| Pay | iShares Edge MSCI USA Momentum Factor ETF | 1-Month USD LIBOR - 1.66% | Monthly | USD | 191,610 | May 2020 | Morgan Stanley and Company International | — | 37 | 37 |
| Pay | iShares Edge MSCI USA Momentum Factor ETF | 1-Month USD LIBOR - 1.66% | Monthly | USD | 798,375 | May 2020 | Morgan Stanley and Company International | — | 167 | 167 |
| Pay | iShares MSCI Emerging Markets ETF | 1-Month USD LIBOR - 0.45% | Monthly | USD | 1,848,758 | May 2020 | Morgan Stanley and Company International | — | 32,239 | 32,239 |
| Pay | iShares MSCI Emerging Markets ETF | 1-Month USD LIBOR - 0.45% | Monthly | USD | 1,505,822 | May 2020 | Morgan Stanley and Company International | — | 24,834 | 24,834 |
| Pay | iShares MSCI Emerging Markets ETF | 1-Month USD LIBOR - 0.45% | Monthly | USD | 2,285,028 | May 2020 | Morgan Stanley and Company International | — | 48,398 | 48,398 |
| Pay | iShares MSCI Emerging Markets ETF | 1-Month USD LIBOR - 0.45% | Monthly | USD | 1,464,037 | May 2020 | Morgan Stanley and Company International | — | 10,502 | 10,502 |
| 34 | JOHN HANCOCK SEAPORT LONG/SHORT FUND | SEMIANNUAL REPORT | SEE NOTES TO FINANCIAL STATEMENTS |
| Total return swaps (continued) | ||||||||||
| Pay/receive total return* | Reference entity | Floating rate | Payment frequency | Currency | Notional amount/ contract amount | Maturity date | Counterparty (OTC) | Unamortized upfront payment paid (received) | Unrealized appreciation (depreciation) | Value |
| Pay | iShares MSCI Emerging Markets ETF | 1-Month USD LIBOR - 0.45% | Monthly | USD | 740,705 | May 2020 | Morgan Stanley and Company International | — | $2,418 | $2,418 |
| Pay | iShares MSCI Emerging Markets ETF | 1-Month USD LIBOR | Monthly | USD | 1,205,832 | May 2020 | Morgan Stanley and Company International | — | — | — |
| Pay | iShares MSCI United Kingdom ETF | 1-Month USD LIBOR - 1.16% | Monthly | USD | 35,611 | May 2020 | Morgan Stanley and Company International | — | (39) | (39) |
| Pay | iShares MSCI United Kingdom ETF | 1-Month USD LIBOR - 1.16% | Monthly | USD | 2,137,164 | May 2020 | Morgan Stanley and Company International | — | (2,098) | (2,098) |
| Pay | iShares Nasdaq Biotechnology ETF | 1-Month USD LIBOR - 1.16% | Monthly | USD | 12,013,146 | May 2020 | Morgan Stanley and Company International | — | 189,969 | 189,969 |
| Pay | iShares Nasdaq Biotechnology ETF | 1-Month USD LIBOR - 1.16% | Monthly | USD | 878,649 | May 2020 | Morgan Stanley and Company International | — | 13,921 | 13,921 |
| Pay | iShares Nasdaq Biotechnology ETF | 1-Month USD LIBOR - 1.16% | Monthly | USD | 2,835,376 | May 2020 | Morgan Stanley and Company International | — | 44,994 | 44,994 |
| Pay | iShares Nasdaq Biotechnology ETF | 1-Month USD LIBOR - 1.16% | Monthly | USD | 287,516 | May 2020 | Morgan Stanley and Company International | — | 4,493 | 4,493 |
| Pay | iShares North American Technology ETF | 1-Month USD LIBOR - 2.16% | Monthly | USD | 2,360,697 | May 2020 | Morgan Stanley and Company International | — | 23,509 | 23,509 |
| Pay | iShares North American Technology ETF | 1-Month USD LIBOR - 1.41% | Monthly | USD | 1,472,745 | May 2020 | Morgan Stanley and Company International | — | 3,489 | 3,489 |
| Pay | iShares North American Technology ETF | 1-Month USD LIBOR - 1.41% | Monthly | USD | 254,187 | May 2020 | Morgan Stanley and Company International | — | 821 | 821 |
| Pay | iShares North American Technology ETF | 1-Month USD LIBOR - 1.41% | Monthly | USD | 1,330,490 | May 2020 | Morgan Stanley and Company International | — | 3,738 | 3,738 |
| Pay | iShares North American Technology ETF | 1-Month USD LIBOR - 3.42% | Monthly | USD | 152,686 | May 2020 | Morgan Stanley and Company International | — | 1,566 | 1,566 |
| Pay | iShares North American Technology ETF | 1-Month USD LIBOR - 3.42% | Monthly | USD | 273,265 | May 2020 | Morgan Stanley and Company International | — | 2,803 | 2,803 |
| Pay | iShares North American Technology ETF | 1-Month USD LIBOR - 1.41% | Monthly | USD | 166,571 | May 2020 | Morgan Stanley and Company International | — | 468 | 468 |
| Pay | iShares PHLX Semiconductor ETF | 1-Month USD LIBOR - 1.05% | Monthly | USD | 363,628 | May 2020 | Morgan Stanley and Company International | — | 25,421 | 25,421 |
| Pay | iShares PHLX Semiconductor ETF | 1-Month USD LIBOR - 1.05% | Monthly | USD | 1,649,866 | May 2020 | Morgan Stanley and Company International | — | 109,699 | 109,699 |
| SEE NOTES TO FINANCIAL STATEMENTS | SEMIANNUAL REPORT | JOHN HANCOCK SEAPORT LONG/SHORT FUND | 35 |
| Total return swaps (continued) | ||||||||||
| Pay/receive total return* | Reference entity | Floating rate | Payment frequency | Currency | Notional amount/ contract amount | Maturity date | Counterparty (OTC) | Unamortized upfront payment paid (received) | Unrealized appreciation (depreciation) | Value |
| Pay | iShares PHLX Semiconductor ETF | 1-Month USD LIBOR - 1.05% | Monthly | USD | 1,020,830 | May 2020 | Morgan Stanley and Company International | — | $67,754 | $67,754 |
| Pay | iShares PHLX Semiconductor ETF | 1-Month USD LIBOR - 1.05% | Monthly | USD | 1,128,437 | May 2020 | Morgan Stanley and Company International | — | 74,897 | 74,897 |
| Pay | iShares PHLX Semiconductor ETF | 1-Month USD LIBOR - 1.05% | Monthly | USD | 1,172,131 | May 2020 | Morgan Stanley and Company International | — | 77,588 | 77,588 |
| Pay | iShares PHLX Semiconductor ETF | 1-Month USD LIBOR - 1.05% | Monthly | USD | 2,306,071 | May 2020 | Morgan Stanley and Company International | — | 83,522 | 83,522 |
| Pay | iShares PHLX Semiconductor ETF | 1-Month USD LIBOR - 0.25% | Monthly | USD | 1,095,055 | May 2020 | Morgan Stanley and Company International | — | 21,142 | 21,142 |
| Pay | iShares PHLX Semiconductor ETF | 1-Month USD LIBOR - 1.05% | Monthly | USD | 2,380,834 | May 2020 | Morgan Stanley and Company International | — | 75,612 | 75,612 |
| Pay | iShares PHLX Semiconductor ETF | 1-Month USD LIBOR - 0.25% | Monthly | USD | 2,941,216 | May 2020 | Morgan Stanley and Company International | — | (3,025) | (3,025) |
| Pay | iShares Russell 2000 Growth ETF | 1-Month USD LIBOR - 1.16% | Monthly | USD | 170,929 | May 2020 | Morgan Stanley and Company International | — | 3,360 | 3,360 |
| Pay | iShares Russell 2000 Index ETF | 1-Month USD LIBOR - 0.66% | Monthly | USD | 3,426,219 | May 2020 | Morgan Stanley and Company International | — | 49,655 | 49,655 |
| Pay | iShares Russell 2000 Value ETF | 1-Month USD LIBOR - 1.16% | Monthly | USD | 940,396 | May 2020 | Morgan Stanley and Company International | — | 6,119 | 6,119 |
| Pay | iShares Russell Growth ETF | 1-Month USD LIBOR - 1.16% | Monthly | USD | 1,462,047 | May 2020 | Morgan Stanley and Company International | — | 28,699 | 28,699 |
| Pay | iShares Russell Growth ETF | 1-Month USD LIBOR - 1.16% | Monthly | USD | 68,333 | May 2020 | Morgan Stanley and Company International | — | 1,335 | 1,335 |
| Pay | iShares Russell Mid-Cap Growth ETF | 1-Month USD LIBOR - 0.91% | Monthly | USD | 1,388,140 | May 2020 | Morgan Stanley and Company International | — | 22,483 | 22,483 |
| Pay | iShares Russell Mid-Cap Growth ETF | 1-Month USD LIBOR - 0.91% | Monthly | USD | 5,853,799 | May 2020 | Morgan Stanley and Company International | — | 94,812 | 94,812 |
| Pay | iShares Russell Mid-Cap Growth ETF | 1-Month USD LIBOR - 0.91% | Monthly | USD | 2,463,176 | May 2020 | Morgan Stanley and Company International | — | 39,940 | 39,940 |
| Pay | iShares Russell Mid-Cap Growth ETF | 1-Month USD LIBOR - 0.91% | Monthly | USD | 5,388,531 | May 2020 | Morgan Stanley and Company International | — | 87,409 | 87,409 |
| Pay | iShares Russell Mid-Cap Growth ETF | 1-Month USD LIBOR - 0.93% | Monthly | USD | 1,524,358 | May 2020 | Morgan Stanley and Company International | — | 24,795 | 24,795 |
| 36 | JOHN HANCOCK SEAPORT LONG/SHORT FUND | SEMIANNUAL REPORT | SEE NOTES TO FINANCIAL STATEMENTS |
| Total return swaps (continued) | ||||||||||
| Pay/receive total return* | Reference entity | Floating rate | Payment frequency | Currency | Notional amount/ contract amount | Maturity date | Counterparty (OTC) | Unamortized upfront payment paid (received) | Unrealized appreciation (depreciation) | Value |
| Pay | iShares S&P 500 North American Tech ETF | 1-Month USD LIBOR - 3.50% | Monthly | USD | 189,899 | May 2020 | Morgan Stanley and Company International | — | $1,454 | $1,454 |
| Pay | iShares S&P 500 North American Tech ETF | 1-Month USD LIBOR - 1.41% | Monthly | USD | 1,130,740 | May 2020 | Morgan Stanley and Company International | — | 2,028 | 2,028 |
| Pay | iShares S&P 500 North American Tech ETF | 1-Month USD LIBOR - 2.39% | Monthly | USD | 5,530,156 | May 2020 | Morgan Stanley and Company International | $(151) | (98,425) | (98,576) |
| Pay | iShares S&P 500 North American Tech ETF | 1-Month USD LIBOR - 1.41% | Monthly | USD | 1,464,126 | May 2020 | Morgan Stanley and Company International | (75) | (12,089) | (12,164) |
| Pay | iShares S&P Small-Cap 600 Growth ETF | 1-Month USD LIBOR - 1.92% | Monthly | USD | 108,690 | May 2020 | Morgan Stanley and Company International | — | 2,477 | 2,477 |
| Pay | iShares S&P Small-Cap 600 Growth ETF | 1-Month USD LIBOR - 1.92% | Monthly | USD | 137,555 | May 2020 | Morgan Stanley and Company International | — | 2,880 | 2,880 |
| Pay | iShares UK Property UCITS ETF | 1-Month GBP LIBOR - 0.88% | Monthly | GBP | 1,207,156 | May 2020 | Morgan Stanley and Company International | — | (69,351) | (69,351) |
| Pay | iShares UK Property UCITS ETF | 1-Month GBP LIBOR - 0.88% | Monthly | GBP | 430,935 | May 2020 | Morgan Stanley and Company International | (406) | (24,831) | (25,237) |
| Pay | Netflix, Inc. | 1-Month USD LIBOR + 0.50% | Monthly | USD | 1,807 | May 2020 | Morgan Stanley and Company International | — | (875) | (875) |
| Pay | PowerShares QQQ Trust Series 1 | 1-Month USD LIBOR - 0.45% | Monthly | USD | 2,645,665 | May 2020 | Morgan Stanley and Company International | — | 31,215 | 31,215 |
| Pay | PowerShares QQQ Trust Series 1 | 1-Month USD LIBOR - 0.45% | Monthly | USD | 168,616 | May 2020 | Morgan Stanley and Company International | — | 1,990 | 1,990 |
| Pay | PowerShares QQQ Trust Series 1 | 1-Month USD LIBOR - 0.45% | Monthly | USD | 164,389 | May 2020 | Morgan Stanley and Company International | — | 1,942 | 1,942 |
| Pay | PowerShares QQQ Trust Series 1 | 1-Month USD LIBOR - 0.45% | Monthly | USD | 1,097,588 | May 2020 | Morgan Stanley and Company International | — | 8,990 | 8,990 |
| Pay | PureFunds ISE Cyber Security ETF | 1-Month USD LIBOR - 3.22% | Monthly | USD | 177,532 | May 2020 | Morgan Stanley and Company International | — | 1,346 | 1,346 |
| Pay | PureFunds ISE Cyber Security ETF | 1-Month USD LIBOR - 3.22% | Monthly | USD | 132,859 | May 2020 | Morgan Stanley and Company International | — | 771 | 771 |
| Pay | SPDR S&P MidCap 400 ETF | 1-Month USD LIBOR - 0.45% | Monthly | USD | 305,776 | May 2020 | Morgan Stanley and Company International | — | 5,205 | 5,205 |
| Pay | SPDR S&P MidCap 400 ETF | 1-Month USD LIBOR - 0.45% | Monthly | USD | 124,178 | May 2020 | Morgan Stanley and Company International | — | 2,127 | 2,127 |
| SEE NOTES TO FINANCIAL STATEMENTS | SEMIANNUAL REPORT | JOHN HANCOCK SEAPORT LONG/SHORT FUND | 37 |
| Total return swaps (continued) | ||||||||||
| Pay/receive total return* | Reference entity | Floating rate | Payment frequency | Currency | Notional amount/ contract amount | Maturity date | Counterparty (OTC) | Unamortized upfront payment paid (received) | Unrealized appreciation (depreciation) | Value |
| Pay | SPDR S&P MidCap 400 ETF | 1-Month USD LIBOR - 0.45% | Monthly | USD | 155,309 | May 2020 | Morgan Stanley and Company International | — | $2,662 | $2,662 |
| Pay | SPDR S&P Oil & Gas Exploration & Production ETF | 1-Month USD LIBOR - 1.08% | Monthly | USD | 2,483,537 | May 2020 | Morgan Stanley and Company International | $(138) | (49,045) | (49,183) |
| Pay | SPDR S&P Pharmaceuticals ETF | 1-Month USD LIBOR - 2.41% | Monthly | USD | 495,990 | May 2020 | Morgan Stanley and Company International | — | 18,499 | 18,499 |
| Pay | SPDR S&P Pharmaceuticals ETF | 1-Month USD LIBOR - 2.41% | Monthly | USD | 527,929 | May 2020 | Morgan Stanley and Company International | — | 18,594 | 18,594 |
| Pay | SPDR S&P Pharmaceuticals ETF | 1-Month USD LIBOR - 2.41% | Monthly | USD | 1,703,692 | May 2020 | Morgan Stanley and Company International | — | 60,005 | 60,005 |
| Pay | SPDR S&P Pharmaceuticals ETF | 1-Month USD LIBOR - 2.41% | Monthly | USD | 172,803 | May 2020 | Morgan Stanley and Company International | — | 6,092 | 6,092 |
| Pay | Vanguard FTSE Developed Markets ETF | 1-Month USD LIBOR - 0.30% | Monthly | USD | 24,870,251 | May 2020 | Morgan Stanley and Company International | — | 119,595 | 119,595 |
| Pay | Vanguard FTSE Developed Markets ETF | 1-Month USD LIBOR - 0.30% | Monthly | USD | 4,940,410 | May 2020 | Morgan Stanley and Company International | — | 21,442 | 21,442 |
| Pay | Vanguard FTSE Europe ETF | 1-Month USD LIBOR - 0.66% | Monthly | USD | 5,298,689 | May 2020 | Morgan Stanley and Company International | — | 31,515 | 31,515 |
| Pay | Vanguard FTSE Europe ETF | 1-Month USD LIBOR - 0.66% | Monthly | USD | 318,631 | May 2020 | Morgan Stanley and Company International | — | 1,905 | 1,905 |
| Pay | Vanguard FTSE Europe ETF | 1-Month USD LIBOR - 0.66% | Monthly | USD | 847,456 | May 2020 | Morgan Stanley and Company International | — | 5,087 | 5,087 |
| Pay | Vanguard FTSE Europe ETF | 1-Month USD LIBOR - 0.66% | Monthly | USD | 102,292 | May 2020 | Morgan Stanley and Company International | — | 569 | 569 |
| Pay | Vanguard Small-Cap Growth ETF | 1-Month USD LIBOR - 1.81% | Monthly | USD | 231,213 | May 2020 | Morgan Stanley and Company International | — | 4,362 | 4,362 |
| Pay | Vanguard Small-Cap Growth ETF | 1-Month USD LIBOR - 1.81% | Monthly | USD | 248,525 | May 2020 | Morgan Stanley and Company International | — | 3,130 | 3,130 |
| Receive | Airports Corp of Vie | 1-Month USD LIBOR + 1.25% | Monthly | USD | 14,300 | May 2020 | Deutsche Bank AG | — | (2,714) | (2,714) |
| Receive | Airports Corp of Vie | 1-Month USD LIBOR + 1.25% | Monthly | USD | 47,200 | May 2020 | Deutsche Bank AG | — | (8,983) | (8,983) |
| Receive | Alnylam Pharmaceuticals, Inc. | 1-Month USD LIBOR + 0.30% | Monthly | USD | 12,710 | May 2020 | Deutsche Bank AG | — | (46,290) | (46,290) |
| 38 | JOHN HANCOCK SEAPORT LONG/SHORT FUND | SEMIANNUAL REPORT | SEE NOTES TO FINANCIAL STATEMENTS |
| Total return swaps (continued) | ||||||||||
| Pay/receive total return* | Reference entity | Floating rate | Payment frequency | Currency | Notional amount/ contract amount | Maturity date | Counterparty (OTC) | Unamortized upfront payment paid (received) | Unrealized appreciation (depreciation) | Value |
| Receive | Alphabet, Inc., Class C | 1-Month USD LIBOR + 0.30% | Monthly | USD | 1,598 | May 2020 | Deutsche Bank AG | — | $(24,414) | $(24,414) |
| Receive | American Express Company | 1-Month USD LIBOR + 0.30% | Monthly | USD | 13,444 | May 2020 | Deutsche Bank AG | — | 76,130 | 76,130 |
| Receive | American Express Company | 1-Month USD LIBOR + 0.30% | Monthly | USD | 10,657 | May 2020 | Deutsche Bank AG | — | 60,348 | 60,348 |
| Receive | American Tower Corp. | 1-Month USD LIBOR + 0.30% | Monthly | USD | 804 | May 2020 | Deutsche Bank AG | — | (964) | (964) |
| Receive | Amgen, Inc. | 1-Month USD LIBOR + 0.30% | Monthly | USD | 10,675 | May 2020 | Deutsche Bank AG | — | 12,678 | 12,678 |
| Receive | Anima Holding SpA | 1-Month EUR EURIBOR + 0.50% | Monthly | EUR | 99,884 | May 2020 | Deutsche Bank AG | — | 18,648 | 18,648 |
| Receive | Anima Holding SpA | 1-Month EUR EURIBOR + 0.50% | Monthly | EUR | 23,303 | May 2020 | Deutsche Bank AG | — | 50,653 | 50,653 |
| Receive | Anthem, Inc. | 1-Month USD LIBOR + 0.30% | Monthly | USD | 13,270 | May 2020 | Deutsche Bank AG | — | 143,701 | 143,701 |
| Receive | Atento SA | 1-Month USD LIBOR + 0.30% | Monthly | USD | 1,155 | May 2020 | Deutsche Bank AG | — | (240) | (240) |
| Receive | athenahealth, Inc. | 1-Month USD LIBOR + 0.30% | Monthly | USD | 15,641 | May 2020 | Deutsche Bank AG | — | (259,176) | (259,176) |
| Receive | Atlassian Corp PLC | 1-Month USD LIBOR + 0.30% | Monthly | USD | 26,736 | May 2020 | Deutsche Bank AG | — | (28,432) | (28,432) |
| Receive | Bank of the Ozarks, Inc. | 1-Month USD LIBOR + 0.30% | Monthly | USD | 42,723 | May 2020 | Deutsche Bank AG | — | (6,579) | (6,579) |
| Receive | Bank of the Ozarks, Inc. | 1-Month USD LIBOR + 0.30% | Monthly | USD | 15,192 | May 2020 | Deutsche Bank AG | — | (2,340) | (2,340) |
| Receive | Biogen, Inc. | 1-Month USD LIBOR + 0.30% | Monthly | USD | 8,520 | May 2020 | Deutsche Bank AG | — | 70,387 | 70,387 |
| Receive | Blucora, Inc. | 1-Month USD LIBOR + 0.30% | Monthly | USD | 2,000 | May 2020 | Deutsche Bank AG | — | 3,452 | 3,452 |
| Receive | Blucora, Inc. | 1-Month USD LIBOR + 0.30% | Monthly | USD | 5,500 | May 2020 | Deutsche Bank AG | — | 9,493 | 9,493 |
| Receive | Blucora, Inc. | 1-Month USD LIBOR + 0.30% | Monthly | USD | 2,500 | May 2020 | Deutsche Bank AG | — | 4,315 | 4,315 |
| Receive | Broadcom, Ltd. | 1-Month USD LIBOR + 0.30% | Monthly | USD | 2,086 | May 2020 | Deutsche Bank AG | — | (22,128) | (22,128) |
| Receive | Broadcom, Ltd. | 1-Month USD LIBOR + 0.30% | Monthly | USD | 1,097 | May 2020 | Deutsche Bank AG | — | (11,637) | (11,637) |
| Receive | CIGNA Corp. | 1-Month USD LIBOR + 0.30% | Monthly | USD | 14,798 | May 2020 | Deutsche Bank AG | — | 26,795 | 26,795 |
| Receive | CommScope Holding Company, Inc. | 1-Month USD LIBOR + 0.30% | Monthly | USD | 28,732 | May 2020 | Deutsche Bank AG | — | (34,353) | (34,353) |
| Receive | Costar Group, Inc. | 1-Month USD LIBOR + 0.30% | Monthly | USD | 13,666 | May 2020 | Deutsche Bank AG | — | 83,392 | 83,392 |
| SEE NOTES TO FINANCIAL STATEMENTS | SEMIANNUAL REPORT | JOHN HANCOCK SEAPORT LONG/SHORT FUND | 39 |
| Total return swaps (continued) | ||||||||||
| Pay/receive total return* | Reference entity | Floating rate | Payment frequency | Currency | Notional amount/ contract amount | Maturity date | Counterparty (OTC) | Unamortized upfront payment paid (received) | Unrealized appreciation (depreciation) | Value |
| Receive | EOG Resources, Inc. | 1-Month USD LIBOR + 0.30% | Monthly | USD | 29,664 | May 2020 | Deutsche Bank AG | — | $308,773 | $308,773 |
| Receive | ExlService Holdings, Inc. | 1-Month USD LIBOR + 0.30% | Monthly | USD | 37,266 | May 2020 | Deutsche Bank AG | — | 80,042 | 80,042 |
| Receive | Fabrinet | 1-Month USD LIBOR + 0.30% | Monthly | USD | 7,392 | May 2020 | Deutsche Bank AG | — | (28,882) | (28,882) |
| Receive | Fabrinet | 1-Month USD LIBOR + 0.30% | Monthly | USD | 3,351 | May 2020 | Deutsche Bank AG | — | (13,093) | (13,093) |
| Receive | GoDaddy, Inc., Class A | 1-Month USD LIBOR + 0.30% | Monthly | USD | 30,696 | May 2020 | Deutsche Bank AG | — | 101,684 | 101,684 |
| Receive | Ho Chi Minh City Development Joint Stock Commercial Bank | 1-Month USD LIBOR + 1.25% | Monthly | USD | 1,085,070 | May 2020 | Deutsche Bank AG | — | (372,219) | (372,219) |
| Receive | Ho Chi Minh City Development Joint Stock Commercial Bank | 1-Month USD LIBOR + 1.25% | Monthly | USD | 544,680 | May 2020 | Deutsche Bank AG | — | (186,911) | (186,911) |
| Receive | Humana, Inc. | 1-Month USD LIBOR + 0.30% | Monthly | USD | 11,904 | May 2020 | Deutsche Bank AG | — | 84,173 | 84,173 |
| Receive | IHS Markit, Ltd. | 1-Month USD LIBOR + 0.30% | Monthly | USD | 28,077 | May 2020 | Deutsche Bank AG | — | 16,973 | 16,973 |
| Receive | Marvell Technology Group, Ltd. | 1-Month USD LIBOR + 0.30% | Monthly | USD | 17,953 | May 2020 | Deutsche Bank AG | — | (25,872) | (25,872) |
| Receive | Microchip Technology, Inc. | 1-Month USD LIBOR + 0.30% | Monthly | USD | 15,562 | May 2020 | Deutsche Bank AG | — | (80,500) | (80,500) |
| Receive | Micron Technology, Inc. | 1-Month USD LIBOR + 0.30% | Monthly | USD | 6,362 | May 2020 | Deutsche Bank AG | — | (28,948) | (28,948) |
| Receive | Micron Technology, Inc. | 1-Month USD LIBOR + 0.30% | Monthly | USD | 27,264 | May 2020 | Deutsche Bank AG | — | (124,059) | (124,059) |
| Receive | Mitsubishi UFJ Financial Group, Inc. | 1-Month JPY LIBOR + 0.40% | Monthly | JPY | 176,300 | May 2020 | Deutsche Bank AG | — | 46,231 | 46,231 |
| Receive | NetApp, Inc. | 1-Month USD LIBOR + 0.30% | Monthly | USD | 12,629 | May 2020 | Deutsche Bank AG | — | 5,785 | 5,785 |
| Receive | PayPal Holdings, Inc. | 1-Month USD LIBOR + 0.30% | Monthly | USD | 42,259 | May 2020 | Deutsche Bank AG | — | (95,168) | (95,168) |
| Receive | Regeneron Pharmaceuticals, Inc. | 1-Month USD LIBOR + 0.30% | Monthly | USD | 10,938 | May 2020 | Deutsche Bank AG | — | (269,815) | (269,815) |
| Receive | Roku, Inc. | 1-Month USD LIBOR + 0.30% | Monthly | USD | 16,529 | May 2020 | Deutsche Bank AG | — | 3,844 | 3,844 |
| Receive | Samsung Electronics Company, Ltd. | 1-Month USD LIBOR + 0.55% | Monthly | USD | 248 | May 2020 | Deutsche Bank AG | — | 41,348 | 41,348 |
| 40 | JOHN HANCOCK SEAPORT LONG/SHORT FUND | SEMIANNUAL REPORT | SEE NOTES TO FINANCIAL STATEMENTS |
| Total return swaps (continued) | ||||||||||
| Pay/receive total return* | Reference entity | Floating rate | Payment frequency | Currency | Notional amount/ contract amount | Maturity date | Counterparty (OTC) | Unamortized upfront payment paid (received) | Unrealized appreciation (depreciation) | Value |
| Receive | Samsung Electronics Company, Ltd. | 1-Month USD LIBOR + 0.55% | Monthly | USD | 239 | May 2020 | Deutsche Bank AG | — | $39,837 | $39,837 |
| Receive | ServiceNow, Inc. | 1-Month USD LIBOR + 0.30% | Monthly | USD | 9,419 | May 2020 | Deutsche Bank AG | — | (5,708) | (5,708) |
| Receive | Shutterfly, Inc. | 1-Month USD LIBOR + 0.30% | Monthly | USD | 2,590 | May 2020 | Deutsche Bank AG | — | (4,227) | (4,227) |
| Receive | Shutterfly, Inc. | 1-Month USD LIBOR + 0.30% | Monthly | USD | 7,932 | May 2020 | Deutsche Bank AG | — | (12,948) | (12,948) |
| Receive | Silicon Laboratories, Inc. | 1-Month USD LIBOR + 0.30% | Monthly | USD | 1,194 | May 2020 | Deutsche Bank AG | — | 1,204 | 1,204 |
| Receive | Silicon Laboratories, Inc. | 1-Month USD LIBOR + 0.30% | Monthly | USD | 928 | May 2020 | Deutsche Bank AG | — | 936 | 936 |
| Receive | Silicon Laboratories, Inc. | 1-Month USD LIBOR + 0.30% | Monthly | USD | 1,145 | May 2020 | Deutsche Bank AG | — | 1,154 | 1,154 |
| Receive | Silicon Laboratories, Inc. | 1-Month USD LIBOR + 0.30% | Monthly | USD | 2,727 | May 2020 | Deutsche Bank AG | — | 2,749 | 2,749 |
| Receive | Sony Financial Holdings, Inc. | 1-Month JPY LIBOR + 0.40% | Monthly | JPY | 11,200 | May 2020 | Deutsche Bank AG | — | 473 | 473 |
| Receive | Sony Financial Holdings, Inc. | 1-Month JPY LIBOR + 0.40% | Monthly | JPY | 4,500 | May 2020 | Deutsche Bank AG | — | 191 | 191 |
| Receive | Sony Financial Holdings, Inc. | 1-Month JPY LIBOR + 0.40% | Monthly | JPY | 8,500 | May 2020 | Deutsche Bank AG | — | 361 | 361 |
| Receive | Sony Financial Holdings, Inc. | 1-Month JPY LIBOR + 0.40% | Monthly | JPY | 2,729 | May 2020 | Deutsche Bank AG | — | 115 | 115 |
| Receive | Sony Financial Holdings, Inc. | 1-Month JPY LIBOR + 0.40% | Monthly | JPY | 1,600 | May 2020 | Deutsche Bank AG | — | 52 | 52 |
| Receive | Sony Financial Holdings, Inc. | 1-Month JPY LIBOR + 0.40% | Monthly | JPY | 1,976 | May 2020 | Deutsche Bank AG | — | 83 | 83 |
| Receive | Sony Financial Holdings, Inc. | 1-Month JPY LIBOR + 0.40% | Monthly | JPY | 189 | May 2020 | Deutsche Bank AG | — | 8 | 8 |
| Receive | Sony Financial Holdings, Inc. | 1-Month JPY LIBOR + 0.40% | Monthly | JPY | 377 | May 2020 | Deutsche Bank AG | — | 16 | 16 |
| Receive | Sony Financial Holdings, Inc. | 1-Month JPY LIBOR + 0.40% | Monthly | JPY | 2,257 | May 2020 | Deutsche Bank AG | — | 95 | 95 |
| Receive | Sony Financial Holdings, Inc. | 1-Month JPY LIBOR + 0.40% | Monthly | JPY | 565 | May 2020 | Deutsche Bank AG | — | 24 | 24 |
| Receive | Sony Financial Holdings, Inc. | 1-Month JPY LIBOR + 0.40% | Monthly | JPY | 376 | May 2020 | Deutsche Bank AG | — | 16 | 16 |
| Receive | Sony Financial Holdings, Inc. | 1-Month JPY LIBOR + 0.40% | Monthly | JPY | 940 | May 2020 | Deutsche Bank AG | — | 40 | 40 |
| Receive | Sony Financial Holdings, Inc. | 1-Month JPY LIBOR + 0.40% | Monthly | JPY | 1,128 | May 2020 | Deutsche Bank AG | — | 48 | 48 |
| Receive | Sony Financial Holdings, Inc. | 1-Month JPY LIBOR + 0.40% | Monthly | JPY | 1,663 | May 2020 | Deutsche Bank AG | — | 70 | 70 |
| SEE NOTES TO FINANCIAL STATEMENTS | SEMIANNUAL REPORT | JOHN HANCOCK SEAPORT LONG/SHORT FUND | 41 |
| Total return swaps (continued) | ||||||||||
| Pay/receive total return* | Reference entity | Floating rate | Payment frequency | Currency | Notional amount/ contract amount | Maturity date | Counterparty (OTC) | Unamortized upfront payment paid (received) | Unrealized appreciation (depreciation) | Value |
| Receive | Square, Inc., Class A | 1-Month USD LIBOR + 0.30% | Monthly | USD | 10,946 | May 2020 | Deutsche Bank AG | — | $12,516 | $12,516 |
| Receive | Synchrony Financial, Inc. | 1-Month USD LIBOR + 0.30% | Monthly | USD | 27,633 | May 2020 | Deutsche Bank AG | — | (36,540) | (36,540) |
| Receive | Synchrony Financial, Inc. | 1-Month USD LIBOR + 0.30% | Monthly | USD | 23,493 | May 2020 | Deutsche Bank AG | — | (31,065) | (31,065) |
| Receive | TD Ameritrade Holding Corp. | 1-Month USD LIBOR + 0.30% | Monthly | USD | 49,613 | May 2020 | Deutsche Bank AG | — | (93,580) | (93,580) |
| Receive | TD Ameritrade Holding Corp. | 1-Month USD LIBOR + 0.30% | Monthly | USD | 6,238 | May 2020 | Deutsche Bank AG | — | (11,778) | (11,778) |
| Receive | Teradyne, Inc. | 1-Month USD LIBOR + 0.30% | Monthly | USD | 13,975 | May 2020 | Deutsche Bank AG | — | (152,757) | (152,757) |
| Receive | The ADT Corp. | 1-Month USD LIBOR + 0.30% | Monthly | USD | 7,865 | May 2020 | Deutsche Bank AG | — | (1,184) | (1,184) |
| Receive | The ADT Corp. | 1-Month USD LIBOR + 0.30% | Monthly | USD | 8,200 | May 2020 | Deutsche Bank AG | — | (1,498) | (1,498) |
| Receive | Thermo Fisher Scientific, Inc. | 1-Month USD LIBOR + 0.30% | Monthly | USD | 12,527 | May 2020 | Deutsche Bank AG | — | (63,159) | (63,159) |
| Receive | TransUnion | 1-Month USD LIBOR + 0.30% | Monthly | USD | 13,944 | May 2020 | Deutsche Bank AG | — | 108,435 | 108,435 |
| Receive | TransUnion | 1-Month USD LIBOR + 0.30% | Monthly | USD | 34,688 | May 2020 | Deutsche Bank AG | — | 269,750 | 269,750 |
| Receive | Vincom Retail JSC | 1-Month USD LIBOR + 1.25% | Monthly | USD | 137,490 | May 2020 | Deutsche Bank AG | — | (40,522) | (40,522) |
| Receive | Vincom Retail JSC | 1-Month USD LIBOR + 1.25% | Monthly | USD | 358,950 | May 2020 | Deutsche Bank AG | — | (105,839) | (105,839) |
| Receive | Visa, Inc., Class A | 1-Month USD LIBOR + 0.30% | Monthly | USD | 30,717 | May 2020 | Deutsche Bank AG | — | 185,739 | 185,739 |
| Receive | Voya Financial, Inc. | 1-Month USD LIBOR + 0.30% | Monthly | USD | 38,930 | May 2020 | Deutsche Bank AG | — | 58,097 | 58,097 |
| Receive | Western Alliance Bancorp | 1-Month USD LIBOR + 0.30% | Monthly | USD | 14,992 | May 2020 | Deutsche Bank AG | — | 24,531 | 24,531 |
| Receive | Wex, Inc. | 1-Month USD LIBOR + 0.30% | Monthly | USD | 34,516 | May 2020 | Deutsche Bank AG | — | 203,085 | 203,085 |
| Receive | Wix.com, Ltd. | 1-Month USD LIBOR + 0.20% | Monthly | USD | 20,895 | May 2020 | Deutsche Bank AG | — | (49,731) | (49,731) |
| Receive | Alkermes PLC | 1-Month USD LIBOR + 0.20% | Monthly | USD | 74,709 | May 2020 | Goldman Sachs International | — | (140,246) | (140,246) |
| Receive | Alta Mesa Resources, Inc. | 1-Month USD LIBOR + 0.20% | Monthly | USD | 114,580 | May 2020 | Goldman Sachs International | — | (5,551) | (5,551) |
| Receive | Alta Mesa Resources, Inc. | 1-Month USD LIBOR + 0.20% | Monthly | USD | 38,193 | May 2020 | Goldman Sachs International | $1,146 | (533) | 613 |
| Receive | Amicus Therapeutics, Inc. | 1-Month USD LIBOR + 0.20% | Monthly | USD | 214,330 | May 2020 | Goldman Sachs International | — | (19,611) | (19,611) |
| Receive | AstraZeneca PLC | 1-Month GBP LIBOR + 0.20% | Monthly | GBP | 2,982 | May 2020 | Goldman Sachs International | — | 5,110 | 5,110 |
| 42 | JOHN HANCOCK SEAPORT LONG/SHORT FUND | SEMIANNUAL REPORT | SEE NOTES TO FINANCIAL STATEMENTS |
| Total return swaps (continued) | ||||||||||
| Pay/receive total return* | Reference entity | Floating rate | Payment frequency | Currency | Notional amount/ contract amount | Maturity date | Counterparty (OTC) | Unamortized upfront payment paid (received) | Unrealized appreciation (depreciation) | Value |
| Receive | Athene Holding, Ltd., Class A | 1-Month USD LIBOR + 0.20% | Monthly | USD | 21,938 | May 2020 | Goldman Sachs International | — | $(9,860) | $(9,860) |
| Receive | Baloise Holding AG | 1-Month CHF LIBOR + 0.20% | Monthly | CHF | 1,147 | May 2020 | Goldman Sachs International | — | 2,274 | 2,274 |
| Receive | Baloise Holding AG | 1-Month CHF LIBOR + 0.20% | Monthly | CHF | 2,129 | May 2020 | Goldman Sachs International | — | 139 | 139 |
| Receive | Biohaven Pharmaceutical Holding Company, Ltd. | 1-Month USD LIBOR + 0.20% | Monthly | USD | 1,423 | May 2020 | Goldman Sachs International | — | 2,764 | 2,764 |
| Receive | Boston Scientific Corp. | 1-Month USD LIBOR + 0.20% | Monthly | USD | 111,890 | May 2020 | Goldman Sachs International | — | (20,214) | (20,214) |
| Receive | Bristol-Myers Squibb Company | 1-Month USD LIBOR + 0.20% | Monthly | USD | 113,898 | May 2020 | Goldman Sachs International | — | 93,366 | 93,366 |
| Receive | Caesarstone, Ltd. | 1-Month USD LIBOR + 0.20% | Monthly | USD | 2,447 | May 2020 | Goldman Sachs International | — | (916) | (916) |
| Receive | Caesarstone, Ltd. | 1-Month USD LIBOR + 0.20% | Monthly | USD | 6,334 | May 2020 | Goldman Sachs International | — | (2,361) | (2,361) |
| Receive | Caesarstone, Ltd. | 1-Month USD LIBOR + 0.20% | Monthly | USD | 3,408 | May 2020 | Goldman Sachs International | — | (1,267) | (1,267) |
| Receive | Caesarstone, Ltd. | 1-Month USD LIBOR + 0.20% | Monthly | USD | 5,482 | May 2020 | Goldman Sachs International | — | (2,032) | (2,032) |
| Receive | Caesarstone, Ltd. | 1-Month USD LIBOR + 0.20% | Monthly | USD | 1,684 | May 2020 | Goldman Sachs International | — | (624) | (624) |
| Receive | Caesarstone, Ltd. | 1-Month USD LIBOR + 0.20% | Monthly | USD | 6,044 | May 2020 | Goldman Sachs International | — | (2,171) | (2,171) |
| Receive | Caesarstone, Ltd. | 1-Month USD LIBOR + 0.20% | Monthly | USD | 8,718 | May 2020 | Goldman Sachs International | — | (3,131) | (3,131) |
| Receive | CenterState Bank Corp. | 1-Month USD LIBOR + 0.20% | Monthly | USD | 4,000 | May 2020 | Goldman Sachs International | — | (548) | (548) |
| Receive | CenterState Bank Corp. | 1-Month USD LIBOR + 0.20% | Monthly | USD | 11,611 | May 2020 | Goldman Sachs International | — | 3,188 | 3,188 |
| Receive | CenterState Bank Corp. | 1-Month USD LIBOR | Monthly | USD | 3,000 | May 2020 | Goldman Sachs International | — | — | — |
| Receive | China Machinery Engineering Corp. | 1-Month HKD HIBOR + 0.20% | Monthly | HKD | 88,983 | May 2020 | Goldman Sachs International | — | 3,005 | 3,005 |
| Receive | China Machinery Engineering Corp. | 1-Month HKD HIBOR + 0.20% | Monthly | HKD | 310,017 | May 2020 | Goldman Sachs International | — | 10,468 | 10,468 |
| Receive | China Traditional Chinese Medicine Holdings Company, Ltd. | 1-Month HKD HIBOR + 0.20% | Monthly | HKD | 72,000 | May 2020 | Goldman Sachs International | — | 3,907 | 3,907 |
| SEE NOTES TO FINANCIAL STATEMENTS | SEMIANNUAL REPORT | JOHN HANCOCK SEAPORT LONG/SHORT FUND | 43 |
| Total return swaps (continued) | ||||||||||
| Pay/receive total return* | Reference entity | Floating rate | Payment frequency | Currency | Notional amount/ contract amount | Maturity date | Counterparty (OTC) | Unamortized upfront payment paid (received) | Unrealized appreciation (depreciation) | Value |
| Receive | Chugai Pharmaceutical Company, Ltd. | 1-Month JPY LIBOR + 0.20% | Monthly | JPY | 800 | May 2020 | Goldman Sachs International | — | $(370) | $(370) |
| Receive | CN Property Beta | 1-Month HKD HIBOR - 0.10% | Monthly | HKD | 4,162,941 | May 2020 | Goldman Sachs International | — | (10,365) | (10,365) |
| Receive | CN Property Beta | 1-Month HKD HIBOR - 0.20% | Monthly | HKD | 8,541,780 | May 2020 | Goldman Sachs International | $1,083,990 | (1,106,115) | (22,125) |
| Receive | Dollar Tree, Inc. | 1-Month USD LIBOR + 0.20% | Monthly | USD | 2,866 | May 2020 | Goldman Sachs International | — | (5,389) | (5,389) |
| Receive | Dollar Tree, Inc. | 1-Month USD LIBOR + 0.20% | Monthly | USD | 17,435 | May 2020 | Goldman Sachs International | — | (32,721) | (32,721) |
| Receive | Dollar Tree, Inc. | 1-Month USD LIBOR + 0.20% | Monthly | USD | 2,742 | May 2020 | Goldman Sachs International | — | (5,147) | (5,147) |
| Receive | Dollar Tree, Inc. | 1-Month USD LIBOR + 0.20% | Monthly | USD | 12,918 | May 2020 | Goldman Sachs International | — | (24,314) | (24,314) |
| Receive | Dollar Tree, Inc. | 1-Month USD LIBOR + 0.20% | Monthly | USD | 3,808 | May 2020 | Goldman Sachs International | — | (7,167) | (7,167) |
| Receive | Eisai Company, Ltd. | 1-Month JPY LIBOR + 0.20% | Monthly | JPY | 2,200 | May 2020 | Goldman Sachs International | — | 5,440 | 5,440 |
| Receive | First Solar, Inc. | 1-Month USD LIBOR + 0.20% | Monthly | USD | 7,381 | May 2020 | Goldman Sachs International | — | (34,087) | (34,087) |
| Receive | Flextronics International, Ltd. | 1-Month USD LIBOR + 0.20% | Monthly | USD | 106,968 | May 2020 | Goldman Sachs International | — | (455,531) | (455,531) |
| Receive | Floor & Decor Holdings, Inc. | 1-Month USD LIBOR + 0.20% | Monthly | USD | 1,402 | May 2020 | Goldman Sachs International | — | (1,439) | (1,439) |
| Receive | Floor & Decor Holdings, Inc. | 1-Month USD LIBOR + 0.20% | Monthly | USD | 3,739 | May 2020 | Goldman Sachs International | — | (3,787) | (3,787) |
| Receive | Floor & Decor Holdings, Inc. | 1-Month USD LIBOR + 0.20% | Monthly | USD | 2,804 | May 2020 | Goldman Sachs International | — | (2,626) | (2,626) |
| Receive | Floor & Decor Holdings, Inc. | 1-Month USD LIBOR + 0.20% | Monthly | USD | 935 | May 2020 | Goldman Sachs International | — | (1,082) | (1,082) |
| Receive | Floor & Decor Holdings, Inc. | 1-Month USD LIBOR + 0.20% | Monthly | USD | 935 | May 2020 | Goldman Sachs International | — | (928) | (928) |
| Receive | Floor & Decor Holdings, Inc. | 1-Month USD LIBOR + 0.20% | Monthly | USD | 2,579 | May 2020 | Goldman Sachs International | — | (2,523) | (2,523) |
| Receive | Floor & Decor Holdings, Inc. | 1-Month USD LIBOR + 0.20% | Monthly | USD | 1,869 | May 2020 | Goldman Sachs International | — | (1,808) | (1,808) |
| Receive | Floor & Decor Holdings, Inc. | 1-Month USD LIBOR + 0.20% | Monthly | USD | 370 | May 2020 | Goldman Sachs International | — | (345) | (345) |
| Receive | Fortune Brands Home & Security, Inc. | 1-Month USD LIBOR + 0.20% | Monthly | USD | 19,739 | May 2020 | Goldman Sachs International | — | (23,126) | (23,126) |
| Receive | Genpact, Ltd. | 1-Month USD LIBOR + 0.20% | Monthly | USD | 123,277 | May 2020 | Goldman Sachs International | — | (34,578) | (34,578) |
| Receive | Genus PLC | 1-Month GBP LIBOR + 0.20% | Monthly | GBP | 1,013 | May 2020 | Goldman Sachs International | — | (156) | (156) |
| 44 | JOHN HANCOCK SEAPORT LONG/SHORT FUND | SEMIANNUAL REPORT | SEE NOTES TO FINANCIAL STATEMENTS |
| Total return swaps (continued) | ||||||||||
| Pay/receive total return* | Reference entity | Floating rate | Payment frequency | Currency | Notional amount/ contract amount | Maturity date | Counterparty (OTC) | Unamortized upfront payment paid (received) | Unrealized appreciation (depreciation) | Value |
| Receive | Global Blood Therapeutics, Inc. | 1-Month USD LIBOR + 0.20% | Monthly | USD | 65,270 | May 2020 | Goldman Sachs International | — | $44,863 | $44,863 |
| Receive | Global Payments, Inc. | 1-Month USD LIBOR + 0.20% | Monthly | USD | 49,564 | May 2020 | Goldman Sachs International | — | 75,143 | 75,143 |
| Receive | Guidewire Software, Inc. | 1-Month USD LIBOR + 0.20% | Monthly | USD | 17,985 | May 2020 | Goldman Sachs International | — | (23,127) | (23,127) |
| Receive | Hikma Pharmaceuticals PLC | 1-Month GBP LIBOR + 0.20% | Monthly | GBP | 9,298 | May 2020 | Goldman Sachs International | $2,985 | 10,075 | 13,060 |
| Receive | Hikma Pharmaceuticals PLC | 1-Month GBP LIBOR + 0.20% | Monthly | GBP | 1,124 | May 2020 | Goldman Sachs International | — | 1,228 | 1,228 |
| Receive | Iberiabank Corp. | 1-Month USD LIBOR + 0.20% | Monthly | USD | 13,413 | May 2020 | Goldman Sachs International | — | (8,422) | (8,422) |
| Receive | ICICI Bank, Ltd., ADR | 1-Month USD LIBOR + 0.20% | Monthly | USD | 153,609 | May 2020 | Goldman Sachs International | — | 4,666 | 4,666 |
| Receive | IHS Markit, Ltd. | 1-Month USD LIBOR + 0.20% | Monthly | USD | 2,746 | May 2020 | Goldman Sachs International | — | (678) | (678) |
| Receive | Integrated Device Technology, Inc. | 1-Month USD LIBOR + 0.20% | Monthly | USD | 56,709 | May 2020 | Goldman Sachs International | — | (108,903) | (108,903) |
| Receive | Itau Unibanco Holding SA, ADR | 1-Month USD LIBOR + 0.20% | Monthly | USD | 12,138 | May 2020 | Goldman Sachs International | — | (5,143) | (5,143) |
| Receive | ITT, Inc. | 1-Month USD LIBOR + 0.20% | Monthly | USD | 9,147 | May 2020 | Goldman Sachs International | — | (20,980) | (20,980) |
| Receive | ITT, Inc. | 1-Month USD LIBOR + 0.20% | Monthly | USD | 7,748 | May 2020 | Goldman Sachs International | — | (17,772) | (17,772) |
| Receive | ITT, Inc. | 1-Month USD LIBOR + 0.20% | Monthly | USD | 4,863 | May 2020 | Goldman Sachs International | — | (11,156) | (11,156) |
| Receive | ITT, Inc. | 1-Month USD LIBOR + 0.20% | Monthly | USD | 10,670 | May 2020 | Goldman Sachs International | — | (24,478) | (24,478) |
| Receive | ITT, Inc. | 1-Month USD LIBOR + 0.20% | Monthly | USD | 11,621 | May 2020 | Goldman Sachs International | — | (25,334) | (25,334) |
| Receive | ITT, Inc. | 1-Month USD LIBOR + 0.20% | Monthly | USD | 7,747 | May 2020 | Goldman Sachs International | — | (17,758) | (17,758) |
| Receive | JELD-WEN Holding, Inc. | 1-Month USD LIBOR + 0.20% | Monthly | USD | 49,262 | May 2020 | Goldman Sachs International | — | (86,873) | (86,873) |
| Receive | JFE Holdings, Inc. | 1-Month JPY LIBOR + 0.20% | Monthly | JPY | 69,700 | May 2020 | Goldman Sachs International | — | (11,888) | (11,888) |
| Receive | Kyowa Hakko Kirin Company, Ltd. | 1-Month JPY LIBOR + 0.20% | Monthly | JPY | 1,000 | May 2020 | Goldman Sachs International | — | 7 | 7 |
| Receive | Localiza Rent a Car SA | 1-Month USD LIBOR + 0.55% | Monthly | USD | 140,176 | May 2020 | Goldman Sachs International | — | (85,520) | (85,520) |
| Receive | Micron Technology, Inc. | 1-Month USD LIBOR + 0.20% | Monthly | USD | 43,980 | May 2020 | Goldman Sachs International | — | (209,777) | (209,777) |
| SEE NOTES TO FINANCIAL STATEMENTS | SEMIANNUAL REPORT | JOHN HANCOCK SEAPORT LONG/SHORT FUND | 45 |
| Total return swaps (continued) | ||||||||||
| Pay/receive total return* | Reference entity | Floating rate | Payment frequency | Currency | Notional amount/ contract amount | Maturity date | Counterparty (OTC) | Unamortized upfront payment paid (received) | Unrealized appreciation (depreciation) | Value |
| Receive | Mylan NV | 1-Month USD LIBOR + 0.20% | Monthly | USD | 79,775 | May 2020 | Goldman Sachs International | — | $(163,393) | $(163,393) |
| Receive | Novartis AG | 1-Month CHF LIBOR + 0.20% | Monthly | CHF | 578 | May 2020 | Goldman Sachs International | — | 372 | 372 |
| Receive | Oasis Midstream Partners LP | 1-Month USD LIBOR + 0.80% | Monthly | USD | 5,295 | May 2020 | Goldman Sachs International | — | 323 | 323 |
| Receive | Oasis Midstream Partners LP | 1-Month USD LIBOR + 0.80% | Monthly | USD | 5,283 | May 2020 | Goldman Sachs International | — | 322 | 322 |
| Receive | Oasis Midstream Partners LP | 1-Month USD LIBOR + 0.80% | Monthly | USD | 10,588 | May 2020 | Goldman Sachs International | — | 645 | 645 |
| Receive | Oasis Midstream Partners LP | 1-Month USD LIBOR + 0.80% | Monthly | USD | 9,754 | May 2020 | Goldman Sachs International | — | 594 | 594 |
| Receive | Oasis Midstream Partners LP | 1-Month USD LIBOR + 0.80% | Monthly | USD | 6,284 | May 2020 | Goldman Sachs International | — | 383 | 383 |
| Receive | Oasis Midstream Partners LP | 1-Month USD LIBOR + 0.80% | Monthly | USD | 1,015 | May 2020 | Goldman Sachs International | — | 62 | 62 |
| Receive | Oasis Midstream Partners LP | 1-Month USD LIBOR + 0.80% | Monthly | USD | 3,807 | May 2020 | Goldman Sachs International | — | 232 | 232 |
| Receive | Oasis Midstream Partners LP | 1-Month USD LIBOR + 0.80% | Monthly | USD | 1,948 | May 2020 | Goldman Sachs International | — | 119 | 119 |
| Receive | Oasis Midstream Partners LP | 1-Month USD LIBOR + 0.80% | Monthly | USD | 3,855 | May 2020 | Goldman Sachs International | — | 235 | 235 |
| Receive | Oasis Midstream Partners LP | 1-Month USD LIBOR + 0.80% | Monthly | USD | 940 | May 2020 | Goldman Sachs International | — | 57 | 57 |
| Receive | Oasis Midstream Partners LP | 1-Month USD LIBOR + 0.80% | Monthly | USD | 467 | May 2020 | Goldman Sachs International | — | 28 | 28 |
| Receive | Oasis Midstream Partners LP | 1-Month USD LIBOR + 0.80% | Monthly | USD | 1,919 | May 2020 | Goldman Sachs International | — | 117 | 117 |
| Receive | Oasis Midstream Partners LP | 1-Month USD LIBOR + 0.80% | Monthly | USD | 2,816 | May 2020 | Goldman Sachs International | — | 171 | 171 |
| Receive | Oasis Midstream Partners LP | 1-Month USD LIBOR + 0.80% | Monthly | USD | 1,290 | May 2020 | Goldman Sachs International | — | 79 | 79 |
| Receive | Oasis Midstream Partners LP | 1-Month USD LIBOR + 0.80% | Monthly | USD | 2,534 | May 2020 | Goldman Sachs International | — | 154 | 154 |
| 46 | JOHN HANCOCK SEAPORT LONG/SHORT FUND | SEMIANNUAL REPORT | SEE NOTES TO FINANCIAL STATEMENTS |
| Total return swaps (continued) | ||||||||||
| Pay/receive total return* | Reference entity | Floating rate | Payment frequency | Currency | Notional amount/ contract amount | Maturity date | Counterparty (OTC) | Unamortized upfront payment paid (received) | Unrealized appreciation (depreciation) | Value |
| Receive | Oasis Midstream Partners LP | 1-Month USD LIBOR + 0.80% | Monthly | USD | 1,034 | May 2020 | Goldman Sachs International | — | $63 | $63 |
| Receive | Oasis Midstream Partners LP | 1-Month USD LIBOR + 0.80% | Monthly | USD | 1,812 | May 2020 | Goldman Sachs International | — | 110 | 110 |
| Receive | Oasis Midstream Partners LP | 1-Month USD LIBOR + 0.80% | Monthly | USD | 431 | May 2020 | Goldman Sachs International | — | 26 | 26 |
| Receive | Oasis Midstream Partners LP | 1-Month USD LIBOR + 0.80% | Monthly | USD | 5,905 | May 2020 | Goldman Sachs International | — | 359 | 359 |
| Receive | Oasis Midstream Partners LP | 1-Month USD LIBOR + 0.80% | Monthly | USD | 3,388 | May 2020 | Goldman Sachs International | — | 206 | 206 |
| Receive | Oasis Midstream Partners LP | 1-Month USD LIBOR + 0.80% | Monthly | USD | 6,488 | May 2020 | Goldman Sachs International | — | 394 | 394 |
| Receive | Oasis Midstream Partners LP | 1-Month USD LIBOR + 0.80% | Monthly | USD | 7,080 | May 2020 | Goldman Sachs International | $(566) | 429 | (137) |
| Receive | Ono Pharmaceutical Company, Ltd. | 1-Month JPY LIBOR + 0.20% | Monthly | JPY | 4,100 | May 2020 | Goldman Sachs International | — | 1,939 | 1,939 |
| Receive | Portola Pharmaceuticals, Inc. | 1-Month USD LIBOR + 0.20% | Monthly | USD | 88,979 | May 2020 | Goldman Sachs International | — | 249,957 | 249,957 |
| Receive | Prudential Financial, Inc. | 1-Month USD LIBOR + 0.20% | Monthly | USD | 12,480 | May 2020 | Goldman Sachs International | — | (11,816) | (11,816) |
| Receive | Qualcomm, Inc. | 1-Month USD LIBOR + 0.20% | Monthly | USD | 8,689 | May 2020 | Goldman Sachs International | — | (4,819) | (4,819) |
| Receive | Raging River Exploration, Inc. | 1-Month CAD CDOR + 0.20% | Monthly | CAD | 34,097 | May 2020 | Goldman Sachs International | — | 14,294 | 14,294 |
| Receive | Raging River Exploration, Inc. | 1-Month CAD CDOR + 0.20% | Monthly | CAD | 39,729 | May 2020 | Goldman Sachs International | — | 16,901 | 16,901 |
| Receive | Range Resources Corp. | 1-Month USD LIBOR + 0.20% | Monthly | USD | 107,808 | May 2020 | Goldman Sachs International | — | (21,960) | (21,960) |
| Receive | Silver Run Acquisition Corp. | 1-Month USD LIBOR + 0.20% | Monthly | USD | 26,287 | May 2020 | Goldman Sachs International | — | (1,271) | (1,271) |
| Receive | Sterling Bancorp | 1-Month USD LIBOR + 0.20% | Monthly | USD | 25,568 | May 2020 | Goldman Sachs International | — | 39,571 | 39,571 |
| Receive | Summit Materials, Inc., Class A | 1-Month USD LIBOR + 0.20% | Monthly | USD | 31,380 | May 2020 | Goldman Sachs International | — | (25,061) | (25,061) |
| Receive | Summit Materials, Inc., Class A | 1-Month USD LIBOR + 0.20% | Monthly | USD | 15,472 | May 2020 | Goldman Sachs International | — | (12,356) | (12,356) |
| SEE NOTES TO FINANCIAL STATEMENTS | SEMIANNUAL REPORT | JOHN HANCOCK SEAPORT LONG/SHORT FUND | 47 |
| Total return swaps (continued) | ||||||||||
| Pay/receive total return* | Reference entity | Floating rate | Payment frequency | Currency | Notional amount/ contract amount | Maturity date | Counterparty (OTC) | Unamortized upfront payment paid (received) | Unrealized appreciation (depreciation) | Value |
| Receive | Summit Materials, Inc., Class A | 1-Month USD LIBOR + 0.20% | Monthly | USD | 4,871 | May 2020 | Goldman Sachs International | — | $(3,897) | $(3,897) |
| Receive | SunTrust Banks, Inc. | 1-Month USD LIBOR + 0.20% | Monthly | USD | 3,023 | May 2020 | Goldman Sachs International | — | (583) | (583) |
| Receive | SunTrust Banks, Inc. | 1-Month USD LIBOR + 0.20% | Monthly | USD | 7,722 | May 2020 | Goldman Sachs International | — | (1,490) | (1,490) |
| Receive | SunTrust Banks, Inc. | 1-Month USD LIBOR + 0.20% | Monthly | USD | 10,370 | May 2020 | Goldman Sachs International | — | (1,992) | (1,992) |
| Receive | SunTrust Banks, Inc. | 1-Month USD LIBOR + 0.20% | Monthly | USD | 5,891 | May 2020 | Goldman Sachs International | — | (1,140) | (1,140) |
| Receive | Syneos Health, Inc. | 1-Month USD LIBOR + 0.20% | Monthly | USD | 17,715 | May 2020 | Goldman Sachs International | — | 4,700 | 4,700 |
| Receive | Takeda Pharmaceutical Company, Ltd. | 1-Month JPY LIBOR + 0.20% | Monthly | JPY | 400 | May 2020 | Goldman Sachs International | — | (865) | (865) |
| Receive | The ADT Corp. | 1-Month USD LIBOR + 0.20% | Monthly | USD | 25,000 | May 2020 | Goldman Sachs International | — | (1,028) | (1,028) |
| Receive | The ADT Corp. | 1-Month USD LIBOR + 0.20% | Monthly | USD | 2,200 | May 2020 | Goldman Sachs International | — | (197) | (197) |
| Receive | The ADT Corp. | 1-Month USD LIBOR + 0.20% | Monthly | USD | 17,800 | May 2020 | Goldman Sachs International | — | (1,257) | (1,257) |
| Receive | The ADT Corp. | 1-Month USD LIBOR + 0.20% | Monthly | USD | 5,000 | May 2020 | Goldman Sachs International | — | (1,090) | (1,090) |
| Receive | Total System Services, Inc. | 1-Month USD LIBOR + 0.20% | Monthly | USD | 40,279 | May 2020 | Goldman Sachs International | — | (137,539) | (137,539) |
| Receive | Tower Semiconductor, Ltd. | 1-Month USD LIBOR + 0.20% | Monthly | USD | 33,259 | May 2020 | Goldman Sachs International | — | (24,949) | (24,949) |
| Receive | Transocean, Ltd. | 1-Month USD LIBOR + 0.20% | Monthly | USD | 66,412 | May 2020 | Goldman Sachs International | — | 1,187 | 1,187 |
| Receive | Trican Well Service, Ltd. | 1-Month CAD CDOR | Monthly | CAD | 50,000 | May 2020 | Goldman Sachs International | — | — | — |
| Receive | TriNet Group, Inc. | 1-Month USD LIBOR + 0.20% | Monthly | USD | 52,742 | May 2020 | Goldman Sachs International | — | 26,086 | 26,086 |
| Receive | UCB SA | 1-Month EUR EURIBOR + 0.20% | Monthly | EUR | 579 | May 2020 | Goldman Sachs International | — | (1,759) | (1,759) |
| Receive | Under Armour, Inc., Class A | 1-Month USD LIBOR + 0.20% | Monthly | USD | 7,557 | May 2020 | Goldman Sachs International | — | 12,268 | 12,268 |
| Receive | Under Armour, Inc., Class A | 1-Month USD LIBOR + 0.20% | Monthly | USD | 7,557 | May 2020 | Goldman Sachs International | — | 12,274 | 12,274 |
| Receive | Union Bankshares Corp. | 1-Month USD LIBOR + 0.20% | Monthly | USD | 6,941 | May 2020 | Goldman Sachs International | — | 8,164 | 8,164 |
| Receive | Union Bankshares Corp. | 1-Month USD LIBOR + 0.20% | Monthly | USD | 6,656 | May 2020 | Goldman Sachs International | — | 7,816 | 7,816 |
| 48 | JOHN HANCOCK SEAPORT LONG/SHORT FUND | SEMIANNUAL REPORT | SEE NOTES TO FINANCIAL STATEMENTS |
| Total return swaps (continued) | ||||||||||
| Pay/receive total return* | Reference entity | Floating rate | Payment frequency | Currency | Notional amount/ contract amount | Maturity date | Counterparty (OTC) | Unamortized upfront payment paid (received) | Unrealized appreciation (depreciation) | Value |
| Receive | Union Bankshares Corp. | 1-Month USD LIBOR + 0.20% | Monthly | USD | 5,000 | May 2020 | Goldman Sachs International | — | $5,872 | $5,872 |
| Receive | Union Bankshares Corp. | 1-Month USD LIBOR + 0.20% | Monthly | USD | 3,912 | May 2020 | Goldman Sachs International | — | 4,594 | 4,594 |
| Receive | Union Bankshares Corp. | 1-Month USD LIBOR + 0.20% | Monthly | USD | 6,088 | May 2020 | Goldman Sachs International | — | 7,149 | 7,149 |
| Receive | Vulcan Materials Company | 1-Month USD LIBOR + 0.20% | Monthly | USD | 6,434 | May 2020 | Goldman Sachs International | — | (14,890) | (14,890) |
| Receive | Vulcan Materials Company | 1-Month USD LIBOR + 0.20% | Monthly | USD | 2,427 | May 2020 | Goldman Sachs International | — | (5,617) | (5,617) |
| Receive | WestRock Company | 1-Month USD LIBOR + 0.20% | Monthly | USD | 19,710 | May 2020 | Goldman Sachs International | — | (143,010) | (143,010) |
| Receive | Workday, Inc., Class A | 1-Month USD LIBOR + 0.20% | Monthly | USD | 13,149 | May 2020 | Goldman Sachs International | — | (78,737) | (78,737) |
| Receive | AerCap Holdings NV | 1-Month USD LIBOR + 0.20% | Monthly | USD | 3,479 | May 2020 | JPMorgan Chase Bank | — | (1,452) | (1,452) |
| Receive | Aetna, Inc. | 1-Month USD LIBOR + 0.20% | Monthly | USD | 4,122 | May 2020 | JPMorgan Chase Bank | — | 33,676 | 33,676 |
| Receive | Allergan PLC | 1-Month USD LIBOR + 0.20% | Monthly | USD | 28,124 | May 2020 | JPMorgan Chase Bank | — | (327,495) | (327,495) |
| Receive | Alliance Data Systems Corp. | 1-Month USD LIBOR + 0.20% | Monthly | USD | 15,469 | May 2020 | JPMorgan Chase Bank | — | (115,546) | (115,546) |
| Receive | Alphabet, Inc., Class A | 1-Month USD LIBOR + 0.20% | Monthly | USD | 1,986 | May 2020 | JPMorgan Chase Bank | — | (33,526) | (33,526) |
| Receive | Alphabet, Inc., Class C | 1-Month USD LIBOR + 0.20% | Monthly | USD | 2,127 | May 2020 | JPMorgan Chase Bank | — | (28,268) | (28,268) |
| Receive | Amazon.com, Inc. | 1-Month USD LIBOR + 0.20% | Monthly | USD | 2,685 | May 2020 | JPMorgan Chase Bank | — | 296,534 | 296,534 |
| Receive | American International Group, Inc. | 1-Month USD LIBOR + 0.20% | Monthly | USD | 3,489 | May 2020 | JPMorgan Chase Bank | — | 4,815 | 4,815 |
| Receive | American Tower Corp. | 1-Month USD LIBOR + 0.20% | Monthly | USD | 6,886 | May 2020 | JPMorgan Chase Bank | — | (54,149) | (54,149) |
| Receive | Assured Guaranty, Ltd. | 1-Month USD LIBOR + 0.20% | Monthly | USD | 3,915 | May 2020 | JPMorgan Chase Bank | — | (4,768) | (4,768) |
| Receive | Athene Holding, Ltd., Class A | 1-Month USD LIBOR + 0.20% | Monthly | USD | 10,472 | May 2020 | JPMorgan Chase Bank | — | 10,352 | 10,352 |
| Receive | Bank of America Corp. | 1-Month USD LIBOR + 0.20% | Monthly | USD | 6,415 | May 2020 | JPMorgan Chase Bank | — | (2,815) | (2,815) |
| Receive | Bank of the Ozarks, Inc. | 1-Month USD LIBOR + 0.20% | Monthly | USD | 4,184 | May 2020 | JPMorgan Chase Bank | — | (7,708) | (7,708) |
| Receive | Bluebird Bio, Inc. | 1-Month USD LIBOR + 0.20% | Monthly | USD | 20,750 | May 2020 | JPMorgan Chase Bank | — | (3,521) | (3,521) |
| SEE NOTES TO FINANCIAL STATEMENTS | SEMIANNUAL REPORT | JOHN HANCOCK SEAPORT LONG/SHORT FUND | 49 |
| Total return swaps (continued) | ||||||||||
| Pay/receive total return* | Reference entity | Floating rate | Payment frequency | Currency | Notional amount/ contract amount | Maturity date | Counterparty (OTC) | Unamortized upfront payment paid (received) | Unrealized appreciation (depreciation) | Value |
| Receive | Brink's Company | 1-Month USD LIBOR + 0.20% | Monthly | USD | 34,350 | May 2020 | JPMorgan Chase Bank | — | $(46,297) | $(46,297) |
| Receive | Bristol-Myers Squibb Company | 1-Month USD LIBOR + 0.20% | Monthly | USD | 1,987 | May 2020 | JPMorgan Chase Bank | — | (3,352) | (3,352) |
| Receive | Bristol-Myers Squibb Company | 1-Month USD LIBOR + 0.20% | Monthly | USD | 1,068 | May 2020 | JPMorgan Chase Bank | — | (1,122) | (1,122) |
| Receive | Broadcom, Ltd. | 1-Month USD LIBOR + 0.20% | Monthly | USD | 1,864 | May 2020 | JPMorgan Chase Bank | — | (14,085) | (14,085) |
| Receive | Capital One Financial Corp. | 1-Month USD LIBOR + 0.20% | Monthly | USD | 9,911 | May 2020 | JPMorgan Chase Bank | — | (69,350) | (69,350) |
| Receive | Capital One Financial Corp. | 1-Month USD LIBOR + 0.20% | Monthly | USD | 707 | May 2020 | JPMorgan Chase Bank | — | (4,967) | (4,967) |
| Receive | Celgene Corp. | 1-Month USD LIBOR + 0.20% | Monthly | USD | 13,898 | May 2020 | JPMorgan Chase Bank | — | (25,414) | (25,414) |
| Receive | Cisco Systems, Inc. | 1-Month USD LIBOR + 0.20% | Monthly | USD | 11,291 | May 2020 | JPMorgan Chase Bank | — | 26,295 | 26,295 |
| Receive | Cohen & Steers, Inc. | 1-Month USD LIBOR + 0.20% | Monthly | USD | 2,500 | May 2020 | JPMorgan Chase Bank | — | (983) | (983) |
| Receive | Cohen & Steers, Inc. | 1-Month USD LIBOR + 0.20% | Monthly | USD | 1,400 | May 2020 | JPMorgan Chase Bank | — | (551) | (551) |
| Receive | Cohen & Steers, Inc. | 1-Month USD LIBOR + 0.20% | Monthly | USD | 1,359 | May 2020 | JPMorgan Chase Bank | — | (535) | (535) |
| Receive | Cohen & Steers, Inc. | 1-Month USD LIBOR + 0.20% | Monthly | USD | 3,294 | May 2020 | JPMorgan Chase Bank | — | (1,324) | (1,324) |
| Receive | Comcast Corp., Class A | 1-Month USD LIBOR + 0.20% | Monthly | USD | 33,706 | May 2020 | JPMorgan Chase Bank | — | (110,091) | (110,091) |
| Receive | Companhia Paranaense de Energia, Preferred B Shares | 1-Month USD LIBOR + 0.50% | Monthly | USD | 8,338 | May 2020 | JPMorgan Chase Bank | — | (1,965) | (1,965) |
| Receive | Companhia Paranaense de Energia, Preferred B Shares | 1-Month USD LIBOR + 0.50% | Monthly | USD | 7,880 | May 2020 | JPMorgan Chase Bank | — | (1,850) | (1,850) |
| Receive | Companhia Paranaense de Energia, Preferred B Shares | 1-Month USD LIBOR + 0.50% | Monthly | USD | 3,564 | May 2020 | JPMorgan Chase Bank | — | (837) | (837) |
| Receive | Eli Lilly & Company | 1-Month USD LIBOR + 0.20% | Monthly | USD | 27,523 | May 2020 | JPMorgan Chase Bank | — | 65,273 | 65,273 |
| Receive | Euronet Worldwide, Inc. | 1-Month USD LIBOR + 0.20% | Monthly | USD | 9,549 | May 2020 | JPMorgan Chase Bank | — | 57,754 | 57,754 |
| Receive | Euronet Worldwide, Inc. | 1-Month USD LIBOR + 0.20% | Monthly | USD | 4,965 | May 2020 | JPMorgan Chase Bank | — | 30,029 | 30,029 |
| 50 | JOHN HANCOCK SEAPORT LONG/SHORT FUND | SEMIANNUAL REPORT | SEE NOTES TO FINANCIAL STATEMENTS |
| Total return swaps (continued) | ||||||||||
| Pay/receive total return* | Reference entity | Floating rate | Payment frequency | Currency | Notional amount/ contract amount | Maturity date | Counterparty (OTC) | Unamortized upfront payment paid (received) | Unrealized appreciation (depreciation) | Value |
| Receive | Facebook, Inc., Class A | 1-Month USD LIBOR + 0.20% | Monthly | USD | 21,479 | May 2020 | JPMorgan Chase Bank | — | $261,756 | $261,756 |
| Receive | Facebook, Inc., Class A | 1-Month USD LIBOR + 0.20% | Monthly | USD | 15,278 | May 2020 | JPMorgan Chase Bank | — | 186,464 | 186,464 |
| Receive | Facebook, Inc., Class A | 1-Month USD LIBOR + 0.20% | Monthly | USD | 1,460 | May 2020 | JPMorgan Chase Bank | — | 17,766 | 17,766 |
| Receive | First Citizens, Inc., Class A | 1-Month USD LIBOR + 0.20% | Monthly | USD | 2,200 | May 2020 | JPMorgan Chase Bank | — | 26,227 | 26,227 |
| Receive | Flextronics International, Ltd. | 1-Month USD LIBOR + 0.20% | Monthly | USD | 58,781 | May 2020 | JPMorgan Chase Bank | — | (201,976) | (201,976) |
| Receive | Flextronics International, Ltd. | 1-Month USD LIBOR + 0.20% | Monthly | USD | 5,682 | May 2020 | JPMorgan Chase Bank | — | (19,543) | (19,543) |
| Receive | Flextronics International, Ltd. | 1-Month USD LIBOR + 0.20% | Monthly | USD | 5,901 | May 2020 | JPMorgan Chase Bank | — | (20,296) | (20,296) |
| Receive | Flextronics International, Ltd. | 1-Month USD LIBOR + 0.20% | Monthly | USD | 16,726 | May 2020 | JPMorgan Chase Bank | — | (57,536) | (57,536) |
| Receive | Formfactor, Inc. | 1-Month USD LIBOR + 0.20% | Monthly | USD | 3,918 | May 2020 | JPMorgan Chase Bank | — | (8,629) | (8,629) |
| Receive | Formfactor, Inc. | 1-Month USD LIBOR + 0.20% | Monthly | USD | 13,289 | May 2020 | JPMorgan Chase Bank | — | (29,253) | (29,253) |
| Receive | Formfactor, Inc. | 1-Month USD LIBOR + 0.20% | Monthly | USD | 5,096 | May 2020 | JPMorgan Chase Bank | — | (11,201) | (11,201) |
| Receive | Formfactor, Inc. | 1-Month USD LIBOR + 0.20% | Monthly | USD | 11,763 | May 2020 | JPMorgan Chase Bank | — | (25,847) | (25,847) |
| Receive | Formfactor, Inc. | 1-Month USD LIBOR + 0.20% | Monthly | USD | 4,403 | May 2020 | JPMorgan Chase Bank | — | (9,670) | (9,670) |
| Receive | Formfactor, Inc. | 1-Month USD LIBOR + 0.20% | Monthly | USD | 2,550 | May 2020 | JPMorgan Chase Bank | — | (5,601) | (5,601) |
| Receive | Hamilton Lane, Inc., Class A | 1-Month USD LIBOR + 0.20% | Monthly | USD | 1,835 | May 2020 | JPMorgan Chase Bank | — | 7,435 | 7,435 |
| Receive | HCA Holdings, Inc. | 1-Month USD LIBOR + 0.20% | Monthly | USD | 16,728 | May 2020 | JPMorgan Chase Bank | — | (43,459) | (43,459) |
| Receive | Hilton Worldwide Holdings, Inc. | 1-Month USD LIBOR + 0.20% | Monthly | USD | 35,922 | May 2020 | JPMorgan Chase Bank | — | (14,914) | (14,914) |
| Receive | Incyte Corp. | 1-Month USD LIBOR + 0.20% | Monthly | USD | 27,303 | May 2020 | JPMorgan Chase Bank | — | (579,174) | (579,174) |
| Receive | Independent Bank Group, Inc. | 1-Month USD LIBOR + 0.20% | Monthly | USD | 5,623 | May 2020 | JPMorgan Chase Bank | — | (3,778) | (3,778) |
| Receive | Independent Bank Group, Inc. | 1-Month USD LIBOR + 0.20% | Monthly | USD | 1,204 | May 2020 | JPMorgan Chase Bank | — | (833) | (833) |
| Receive | Inphi Corp. | 1-Month USD LIBOR + 0.20% | Monthly | USD | 2,353 | May 2020 | JPMorgan Chase Bank | — | (7,775) | (7,775) |
| SEE NOTES TO FINANCIAL STATEMENTS | SEMIANNUAL REPORT | JOHN HANCOCK SEAPORT LONG/SHORT FUND | 51 |
| Total return swaps (continued) | ||||||||||
| Pay/receive total return* | Reference entity | Floating rate | Payment frequency | Currency | Notional amount/ contract amount | Maturity date | Counterparty (OTC) | Unamortized upfront payment paid (received) | Unrealized appreciation (depreciation) | Value |
| Receive | IPG Photonics Corp. | 1-Month USD LIBOR + 0.20% | Monthly | USD | 2,354 | May 2020 | JPMorgan Chase Bank | — | $(39,141) | $(39,141) |
| Receive | IPG Photonics Corp. | 1-Month USD LIBOR + 0.20% | Monthly | USD | 1,178 | May 2020 | JPMorgan Chase Bank | — | (19,578) | (19,578) |
| Receive | KeyCorp | 1-Month USD LIBOR + 0.20% | Monthly | USD | 3,495 | May 2020 | JPMorgan Chase Bank | — | 541 | 541 |
| Receive | Marvell Technology Group, Ltd. | 1-Month USD LIBOR + 0.20% | Monthly | USD | 11,722 | May 2020 | JPMorgan Chase Bank | — | (13,285) | (13,285) |
| Receive | Marvell Technology Group, Ltd. | 1-Month USD LIBOR + 0.20% | Monthly | USD | 18,866 | May 2020 | JPMorgan Chase Bank | — | (7,048) | (7,048) |
| Receive | MaxLinear, Inc., Class A | 1-Month USD LIBOR + 0.20% | Monthly | USD | 4,882 | May 2020 | JPMorgan Chase Bank | — | (4,608) | (4,608) |
| Receive | Medtronic PLC | 1-Month USD LIBOR + 0.20% | Monthly | USD | 18,447 | May 2020 | JPMorgan Chase Bank | — | 6,466 | 6,466 |
| Receive | Microchip Technology, Inc. | 1-Month USD LIBOR + 0.20% | Monthly | USD | 3,442 | May 2020 | JPMorgan Chase Bank | — | (16,207) | (16,207) |
| Receive | Micron Technology, Inc. | 1-Month USD LIBOR + 0.20% | Monthly | USD | 7,222 | May 2020 | JPMorgan Chase Bank | — | (23,592) | (23,592) |
| Receive | Mohawk Industries, Inc. | 1-Month USD LIBOR + 0.20% | Monthly | USD | 9,087 | May 2020 | JPMorgan Chase Bank | — | (272,559) | (272,559) |
| Receive | MyoKardia, Inc. | 1-Month USD LIBOR + 0.20% | Monthly | USD | 118,405 | May 2020 | JPMorgan Chase Bank | — | 403,072 | 403,072 |
| Receive | NetApp, Inc. | 1-Month USD LIBOR + 0.20% | Monthly | USD | 130 | May 2020 | JPMorgan Chase Bank | — | 275 | 275 |
| Receive | OneMain Holdings, Inc. | 1-Month USD LIBOR + 0.20% | Monthly | USD | 7,585 | May 2020 | JPMorgan Chase Bank | — | 1,979 | 1,979 |
| Receive | PayPal Holdings, Inc. | 1-Month USD LIBOR + 0.20% | Monthly | USD | 20,737 | May 2020 | JPMorgan Chase Bank | — | (52,974) | (52,974) |
| Receive | PayPal Holdings, Inc. | 1-Month USD LIBOR + 0.20% | Monthly | USD | 22,464 | May 2020 | JPMorgan Chase Bank | — | (57,877) | (57,877) |
| Receive | PetroVietnam Power | 1-Month USD LIBOR + 1.25% | Monthly | USD | 315,081 | May 2020 | JPMorgan Chase Bank | — | (36,300) | (36,300) |
| Receive | PetroVietnam Power | 1-Month USD LIBOR + 1.25% | Monthly | USD | 319,914 | May 2020 | JPMorgan Chase Bank | — | (36,846) | (36,846) |
| Receive | PetroVietnam Power | 1-Month USD LIBOR + 1.25% | Monthly | USD | 55,766 | May 2020 | JPMorgan Chase Bank | — | (6,419) | (6,419) |
| Receive | PetroVietnam Power | 1-Month USD LIBOR + 1.25% | Monthly | USD | 27,884 | May 2020 | JPMorgan Chase Bank | — | (3,208) | (3,208) |
| Receive | PetroVietnam Power | 1-Month USD LIBOR + 1.25% | Monthly | USD | 236,355 | May 2020 | JPMorgan Chase Bank | — | (27,176) | (27,176) |
| Receive | PetroVietnam Power | 1-Month USD LIBOR + 1.25% | Monthly | USD | 24,885 | May 2020 | JPMorgan Chase Bank | — | (2,841) | (2,841) |
| Receive | PetroVietnam Power | 1-Month USD LIBOR + 1.25% | Monthly | USD | 46,731 | May 2020 | JPMorgan Chase Bank | — | (5,333) | (5,333) |
| Receive | PetroVietnam Power | 1-Month USD LIBOR + 1.25% | Monthly | USD | 74,742 | May 2020 | JPMorgan Chase Bank | — | (8,511) | (8,511) |
| 52 | JOHN HANCOCK SEAPORT LONG/SHORT FUND | SEMIANNUAL REPORT | SEE NOTES TO FINANCIAL STATEMENTS |
| Total return swaps (continued) | ||||||||||
| Pay/receive total return* | Reference entity | Floating rate | Payment frequency | Currency | Notional amount/ contract amount | Maturity date | Counterparty (OTC) | Unamortized upfront payment paid (received) | Unrealized appreciation (depreciation) | Value |
| Receive | PetroVietnam Power | 1-Month USD LIBOR + 1.25% | Monthly | USD | 92,706 | May 2020 | JPMorgan Chase Bank | — | $(10,552) | $(10,552) |
| Receive | PetroVietnam Power | 1-Month USD LIBOR + 1.25% | Monthly | USD | 104,328 | May 2020 | JPMorgan Chase Bank | — | (11,876) | (11,876) |
| Receive | PetroVietnam Power | 1-Month USD LIBOR + 1.25% | Monthly | USD | 102,798 | May 2020 | JPMorgan Chase Bank | — | (11,695) | (11,695) |
| Receive | PetroVietnam Power | 1-Month USD LIBOR + 1.25% | Monthly | USD | 94,192 | May 2020 | JPMorgan Chase Bank | — | (10,710) | (10,710) |
| Receive | PetroVietnam Power | 1-Month USD LIBOR + 1.25% | Monthly | USD | 106,455 | May 2020 | JPMorgan Chase Bank | — | (12,111) | (12,111) |
| Receive | PetroVietnam Power | 1-Month USD LIBOR + 1.25% | Monthly | USD | 73,276 | May 2020 | JPMorgan Chase Bank | — | (8,313) | (8,313) |
| Receive | PetroVietnam Power | 1-Month USD LIBOR + 1.25% | Monthly | USD | 76,693 | May 2020 | JPMorgan Chase Bank | — | (7,933) | (7,933) |
| Receive | PetroVietnam Power | 1-Month USD LIBOR + 1.25% | Monthly | USD | 63,873 | May 2020 | JPMorgan Chase Bank | — | (6,671) | (6,671) |
| Receive | PetroVietnam Power | 1-Month USD LIBOR + 1.25% | Monthly | USD | 39,407 | May 2020 | JPMorgan Chase Bank | — | (3,604) | (3,604) |
| Receive | PetroVietnam Power | 1-Month USD LIBOR + 1.25% | Monthly | USD | 63,548 | May 2020 | JPMorgan Chase Bank | — | (5,481) | (5,481) |
| Receive | PetroVietnam Power | 1-Month USD LIBOR + 1.25% | Monthly | USD | 72,163 | May 2020 | JPMorgan Chase Bank | — | (6,308) | (6,308) |
| Receive | PetroVietnam Power | 1-Month USD LIBOR + 1.25% | Monthly | USD | 31,160 | May 2020 | JPMorgan Chase Bank | — | (2,650) | (2,650) |
| Receive | PetroVietnam Power | 1-Month USD LIBOR + 1.25% | Monthly | USD | 34,443 | May 2020 | JPMorgan Chase Bank | — | (2,718) | (2,718) |
| Receive | Pinnacle Financial Partners, Inc. | 1-Month USD LIBOR + 0.20% | Monthly | USD | 1,027 | May 2020 | JPMorgan Chase Bank | — | (1,421) | (1,421) |
| Receive | Priceline Group, Inc. | 1-Month USD LIBOR + 0.20% | Monthly | USD | 897 | May 2020 | JPMorgan Chase Bank | — | 73,060 | 73,060 |
| Receive | QUALCOMM, Inc. | 1-Month USD LIBOR + 0.20% | Monthly | USD | 5,759 | May 2020 | JPMorgan Chase Bank | — | (24,275) | (24,275) |
| Receive | salesforce.com, Inc. | 1-Month USD LIBOR + 0.20% | Monthly | USD | 12,220 | May 2020 | JPMorgan Chase Bank | — | 19,690 | 19,690 |
| Receive | Shutterfly, Inc. | 1-Month USD LIBOR + 0.20% | Monthly | USD | 17,092 | May 2020 | JPMorgan Chase Bank | — | 6,181 | 6,181 |
| Receive | SSE PLC | 1-Month GBP LIBOR + 0.20% | Monthly | GBP | 116,392 | May 2020 | JPMorgan Chase Bank | — | 168,719 | 168,719 |
| Receive | Sterling Bancorp | 1-Month USD LIBOR + 0.20% | Monthly | USD | 11,976 | May 2020 | JPMorgan Chase Bank | — | 15,824 | 15,824 |
| Receive | SunTrust Banks, Inc. | 1-Month USD LIBOR + 0.20% | Monthly | USD | 700 | May 2020 | JPMorgan Chase Bank | — | (1,279) | (1,279) |
| Receive | Synchrony Financial, Inc. | 1-Month USD LIBOR + 0.20% | Monthly | USD | 3,009 | May 2020 | JPMorgan Chase Bank | — | (5,039) | (5,039) |
| Receive | TD Ameritrade Holding Corp. | 1-Month USD LIBOR + 0.20% | Monthly | USD | 4,612 | May 2020 | JPMorgan Chase Bank | — | (5,285) | (5,285) |
| SEE NOTES TO FINANCIAL STATEMENTS | SEMIANNUAL REPORT | JOHN HANCOCK SEAPORT LONG/SHORT FUND | 53 |
| Total return swaps (continued) | ||||||||||
| Pay/receive total return* | Reference entity | Floating rate | Payment frequency | Currency | Notional amount/ contract amount | Maturity date | Counterparty (OTC) | Unamortized upfront payment paid (received) | Unrealized appreciation (depreciation) | Value |
| Receive | TESARO, Inc. | 1-Month USD LIBOR + 0.20% | Monthly | USD | 27,066 | May 2020 | JPMorgan Chase Bank | — | $(151,740) | $(151,740) |
| Receive | The ADT Corp. | 1-Month USD LIBOR + 0.20% | Monthly | USD | 15,000 | May 2020 | JPMorgan Chase Bank | — | (2,079) | (2,079) |
| Receive | The ADT Corp. | 1-Month USD LIBOR + 0.20% | Monthly | USD | 10,000 | May 2020 | JPMorgan Chase Bank | — | (30) | (30) |
| Receive | TriNet Group, Inc. | 1-Month USD LIBOR + 0.20% | Monthly | USD | 8,382 | May 2020 | JPMorgan Chase Bank | — | 23,766 | 23,766 |
| Receive | Under Armour, Inc., Class A | 1-Month USD LIBOR + 0.20% | Monthly | USD | 4,631 | May 2020 | JPMorgan Chase Bank | — | 1,180 | 1,180 |
| Receive | Under Armour, Inc., Class A | 1-Month USD LIBOR + 0.20% | Monthly | USD | 4,629 | May 2020 | JPMorgan Chase Bank | — | 1,184 | 1,184 |
| Receive | Under Armour, Inc., Class A | 1-Month USD LIBOR + 0.20% | Monthly | USD | 3,704 | May 2020 | JPMorgan Chase Bank | — | 949 | 949 |
| Receive | Under Armour, Inc., Class A | 1-Month USD LIBOR + 0.20% | Monthly | USD | 4,629 | May 2020 | JPMorgan Chase Bank | — | 1,190 | 1,190 |
| Receive | Under Armour, Inc., Class A | 1-Month USD LIBOR + 0.20% | Monthly | USD | 3,704 | May 2020 | JPMorgan Chase Bank | — | 967 | 967 |
| Receive | Under Armour, Inc., Class A | 1-Month USD LIBOR + 0.20% | Monthly | USD | 1,852 | May 2020 | JPMorgan Chase Bank | — | 485 | 485 |
| Receive | Under Armour, Inc., Class A | 1-Month USD LIBOR + 0.20% | Monthly | USD | 1,353 | May 2020 | JPMorgan Chase Bank | — | 356 | 356 |
| Receive | Under Armour, Inc., Class A | 1-Month USD LIBOR + 0.20% | Monthly | USD | 19,110 | May 2020 | JPMorgan Chase Bank | — | 5,025 | 5,025 |
| Receive | Under Armour, Inc., Class A | 1-Month USD LIBOR + 0.20% | Monthly | USD | 23,886 | May 2020 | JPMorgan Chase Bank | — | 6,300 | 6,300 |
| Receive | Union Bankshares Corp. | 1-Month USD LIBOR + 0.20% | Monthly | USD | 5,150 | May 2020 | JPMorgan Chase Bank | — | 4,752 | 4,752 |
| Receive | UnitedHealth Group, Inc. | 1-Month USD LIBOR + 0.20% | Monthly | USD | 17,547 | May 2020 | JPMorgan Chase Bank | — | 124,611 | 124,611 |
| Receive | Vertex Pharmaceuticals, Inc. | 1-Month USD LIBOR + 0.20% | Monthly | USD | 25,055 | May 2020 | JPMorgan Chase Bank | — | (116,687) | (116,687) |
| Receive | Western Alliance Bancorp | 1-Month USD LIBOR + 0.20% | Monthly | USD | 1,710 | May 2020 | JPMorgan Chase Bank | — | 1,583 | 1,583 |
| Receive | Wix.com, Ltd. | 1-Month USD LIBOR + 0.20% | Monthly | USD | 5,599 | May 2020 | JPMorgan Chase Bank | — | (5,412) | (5,412) |
| Receive | Zebra Technologies Corp. | 1-Month USD LIBOR + 0.20% | Monthly | USD | 6,777 | May 2020 | JPMorgan Chase Bank | — | (32,176) | (32,176) |
| Receive | Zebra Technologies Corp. | 1-Month USD LIBOR + 0.20% | Monthly | USD | 36,489 | May 2020 | JPMorgan Chase Bank | — | (172,762) | (172,762) |
| Receive | Zebra Technologies Corp. | 1-Month USD LIBOR + 0.20% | Monthly | USD | 442 | May 2020 | JPMorgan Chase Bank | — | (2,098) | (2,098) |
| 54 | JOHN HANCOCK SEAPORT LONG/SHORT FUND | SEMIANNUAL REPORT | SEE NOTES TO FINANCIAL STATEMENTS |
| Total return swaps (continued) | ||||||||||
| Pay/receive total return* | Reference entity | Floating rate | Payment frequency | Currency | Notional amount/ contract amount | Maturity date | Counterparty (OTC) | Unamortized upfront payment paid (received) | Unrealized appreciation (depreciation) | Value |
| Receive | Zions Bancorporation | 1-Month USD LIBOR + 0.20% | Monthly | USD | 1,540 | May 2020 | JPMorgan Chase Bank | — | $2,760 | $2,760 |
| Receive | Abbott Laboratories | 1-Month USD LIBOR + 0.50% | Monthly | USD | 29,796 | May 2020 | Morgan Stanley and Company International | — | (38,837) | (38,837) |
| Receive | Aedas Homes SL | 1-Month EUR EURIBOR + 0.50% | Monthly | EUR | 4,086 | May 2020 | Morgan Stanley and Company International | — | (8,016) | (8,016) |
| Receive | AerCap Holdings NV | 1-Month USD LIBOR + 0.50% | Monthly | USD | 55,586 | May 2020 | Morgan Stanley and Company International | — | (14,714) | (14,714) |
| Receive | Aerie Pharmaceuticals, Inc. | 1-Month USD LIBOR + 0.50% | Monthly | USD | 56,216 | May 2020 | Morgan Stanley and Company International | — | (115,190) | (115,190) |
| Receive | Aimmune Therapeutics, Inc. | 1-Month USD LIBOR + 0.50% | Monthly | USD | 735 | May 2020 | Morgan Stanley and Company International | — | (16) | (16) |
| Receive | Akamai Technologies, Inc. | 1-Month USD LIBOR + 0.50% | Monthly | USD | 3,779 | May 2020 | Morgan Stanley and Company International | — | (709) | (709) |
| Receive | Alder Biopharmaceuticals, Inc. | 1-Month USD LIBOR + 0.50% | Monthly | USD | 3,423 | May 2020 | Morgan Stanley and Company International | — | (1,278) | (1,278) |
| Receive | Allergan PLC | 1-Month USD LIBOR + 0.50% | Monthly | USD | 962 | May 2020 | Morgan Stanley and Company International | — | (12,586) | (12,586) |
| Receive | Alnylam Pharmaceuticals, Inc. | 1-Month USD LIBOR + 0.50% | Monthly | USD | 800 | May 2020 | Morgan Stanley and Company International | — | (1,188) | (1,188) |
| Receive | American Express Company | 1-Month USD LIBOR + 0.50% | Monthly | USD | 2,411 | May 2020 | Morgan Stanley and Company International | — | (7,023) | (7,023) |
| Receive | American Express Company | 1-Month USD LIBOR + 0.50% | Monthly | USD | 2,409 | May 2020 | Morgan Stanley and Company International | — | (1,294) | (1,294) |
| Receive | American International Group, Inc. | 1-Month USD LIBOR + 0.50% | Monthly | USD | 55,749 | May 2020 | Morgan Stanley and Company International | — | 87,829 | 87,829 |
| Receive | American Tower Corp. | 1-Month USD LIBOR + 0.50% | Monthly | USD | 4,842 | May 2020 | Morgan Stanley and Company International | — | (12,312) | (12,312) |
| Receive | ams AG | 1-Month CHF LIBOR + 0.50% | Monthly | CHF | 4,701 | May 2020 | Morgan Stanley and Company International | — | (101,544) | (101,544) |
| Receive | ams AG | 1-Month CHF LIBOR + 0.50% | Monthly | CHF | 2,705 | May 2020 | Morgan Stanley and Company International | — | (58,440) | (58,440) |
| Receive | Anhui Conch Cement Company, Ltd. | 1-Month USD LIBOR + 1.20% | Monthly | USD | 270,100 | May 2020 | Morgan Stanley and Company International | — | 68,559 | 68,559 |
| SEE NOTES TO FINANCIAL STATEMENTS | SEMIANNUAL REPORT | JOHN HANCOCK SEAPORT LONG/SHORT FUND | 55 |
| Total return swaps (continued) | ||||||||||
| Pay/receive total return* | Reference entity | Floating rate | Payment frequency | Currency | Notional amount/ contract amount | Maturity date | Counterparty (OTC) | Unamortized upfront payment paid (received) | Unrealized appreciation (depreciation) | Value |
| Receive | Anthem, Inc. | 1-Month USD LIBOR + 0.50% | Monthly | USD | 1,091 | May 2020 | Morgan Stanley and Company International | — | $11,271 | $11,271 |
| Receive | Arena Pharmaceuticals, Inc. | 1-Month USD LIBOR + 0.50% | Monthly | USD | 548 | May 2020 | Morgan Stanley and Company International | — | 3,003 | 3,003 |
| Receive | Assured Guaranty, Ltd. | 1-Month USD LIBOR + 0.50% | Monthly | USD | 54,849 | May 2020 | Morgan Stanley and Company International | — | (57,853) | (57,853) |
| Receive | AstraZeneca PLC | 1-Month GBP LIBOR + 0.50% | Monthly | GBP | 6,300 | May 2020 | Morgan Stanley and Company International | — | 15,765 | 15,765 |
| Receive | Atento SA | 1-Month USD LIBOR + 0.50% | Monthly | USD | 3,693 | May 2020 | Morgan Stanley and Company International | — | (1,930) | (1,930) |
| Receive | Atento SA | 1-Month USD LIBOR + 0.50% | Monthly | USD | 4,022 | May 2020 | Morgan Stanley and Company International | — | (2,108) | (2,108) |
| Receive | Atento SA | 1-Month USD LIBOR + 0.50% | Monthly | USD | 20,172 | May 2020 | Morgan Stanley and Company International | — | (10,562) | (10,562) |
| Receive | Atento SA | 1-Month USD LIBOR - 3.22% | Monthly | USD | 3,952 | May 2020 | Morgan Stanley and Company International | — | (2,056) | (2,056) |
| Receive | Atento SA | 1-Month USD LIBOR + 0.50% | Monthly | USD | 5,147 | May 2020 | Morgan Stanley and Company International | — | (2,698) | (2,698) |
| Receive | Atento SA | 1-Month USD LIBOR + 0.50% | Monthly | USD | 1,453 | May 2020 | Morgan Stanley and Company International | — | (762) | (762) |
| Receive | Atento SA | 1-Month USD LIBOR + 0.50% | Monthly | USD | 2,204 | May 2020 | Morgan Stanley and Company International | — | (1,156) | (1,156) |
| Receive | Atento SA | 1-Month USD LIBOR + 0.50% | Monthly | USD | 1,579 | May 2020 | Morgan Stanley and Company International | — | (828) | (828) |
| Receive | Atento SA | 1-Month USD LIBOR + 0.50% | Monthly | USD | 185 | May 2020 | Morgan Stanley and Company International | — | (97) | (97) |
| Receive | Atento SA | 1-Month USD LIBOR + 0.50% | Monthly | USD | 4,208 | May 2020 | Morgan Stanley and Company International | — | (2,206) | (2,206) |
| Receive | Atento SA | 1-Month USD LIBOR + 0.50% | Monthly | USD | 8,400 | May 2020 | Morgan Stanley and Company International | — | (4,404) | (4,404) |
| Receive | Atento SA | 1-Month USD LIBOR + 0.50% | Monthly | USD | 3,841 | May 2020 | Morgan Stanley and Company International | — | (2,017) | (2,017) |
| Receive | Atento SA | 1-Month USD LIBOR + 0.50% | Monthly | USD | 688 | May 2020 | Morgan Stanley and Company International | — | (361) | (361) |
| 56 | JOHN HANCOCK SEAPORT LONG/SHORT FUND | SEMIANNUAL REPORT | SEE NOTES TO FINANCIAL STATEMENTS |
| Total return swaps (continued) | ||||||||||
| Pay/receive total return* | Reference entity | Floating rate | Payment frequency | Currency | Notional amount/ contract amount | Maturity date | Counterparty (OTC) | Unamortized upfront payment paid (received) | Unrealized appreciation (depreciation) | Value |
| Receive | Atento SA | 1-Month USD LIBOR + 0.50% | Monthly | USD | 417 | May 2020 | Morgan Stanley and Company International | — | $(219) | $(219) |
| Receive | athenahealth, Inc. | 1-Month USD LIBOR + 0.50% | Monthly | USD | 3,656 | May 2020 | Morgan Stanley and Company International | — | (22,220) | (22,220) |
| Receive | Audentes Therapeutics, Inc. | 1-Month USD LIBOR + 0.50% | Monthly | USD | 32,311 | May 2020 | Morgan Stanley and Company International | — | (80,336) | (80,336) |
| Receive | Audentes Therapeutics, Inc. | 1-Month USD LIBOR + 0.50% | Monthly | USD | 11,310 | May 2020 | Morgan Stanley and Company International | — | (28,122) | (28,122) |
| Receive | Audentes Therapeutics, Inc. | 1-Month USD LIBOR + 0.50% | Monthly | USD | 46,679 | May 2020 | Morgan Stanley and Company International | — | (116,068) | (116,068) |
| Receive | Banc of California, Inc. | 1-Month USD LIBOR + 0.50% | Monthly | USD | 76,383 | May 2020 | Morgan Stanley and Company International | — | 53,171 | 53,171 |
| Receive | Banca Farmafactoring SpA | 1-Month EUR EURIBOR + 0.50% | Monthly | EUR | 9,445 | May 2020 | Morgan Stanley and Company International | — | (2,699) | (2,699) |
| Receive | Banca Farmafactoring SpA | 1-Month EUR EURIBOR + 0.50% | Monthly | EUR | 55,456 | May 2020 | Morgan Stanley and Company International | — | (18,108) | (18,108) |
| Receive | Bank of America Corp. | 1-Month USD LIBOR + 0.50% | Monthly | USD | 96,400 | May 2020 | Morgan Stanley and Company International | — | (9,012) | (9,012) |
| Receive | Bank of America Corp. | 1-Month USD LIBOR + 0.50% | Monthly | USD | 76,035 | May 2020 | Morgan Stanley and Company International | — | (2,413) | (2,413) |
| Receive | Bank of America Corp. | 1-Month USD LIBOR + 0.50% | Monthly | USD | 18,041 | May 2020 | Morgan Stanley and Company International | — | (1,666) | (1,666) |
| Receive | Bank of the Ozarks, Inc. | 1-Month USD LIBOR + 0.50% | Monthly | USD | 12,033 | May 2020 | Morgan Stanley and Company International | — | 4,353 | 4,353 |
| Receive | Bank of the Ozarks, Inc. | 1-Month USD LIBOR + 0.50% | Monthly | USD | 8,217 | May 2020 | Morgan Stanley and Company International | — | 2,936 | 2,936 |
| Receive | Bank of the Ozarks, Inc. | 1-Month USD LIBOR + 0.50% | Monthly | USD | 8,034 | May 2020 | Morgan Stanley and Company International | — | 2,870 | 2,870 |
| Receive | Bank of the Ozarks, Inc. | 1-Month USD LIBOR + 0.50% | Monthly | USD | 20,967 | May 2020 | Morgan Stanley and Company International | — | 7,495 | 7,495 |
| Receive | Bank of the Ozarks, Inc. | 1-Month USD LIBOR + 0.50% | Monthly | USD | 8,935 | May 2020 | Morgan Stanley and Company International | — | 3,185 | 3,185 |
| Receive | Bank of the Ozarks, Inc. | 1-Month USD LIBOR + 0.50% | Monthly | USD | 16,880 | May 2020 | Morgan Stanley and Company International | — | 6,031 | 6,031 |
| SEE NOTES TO FINANCIAL STATEMENTS | SEMIANNUAL REPORT | JOHN HANCOCK SEAPORT LONG/SHORT FUND | 57 |
| Total return swaps (continued) | ||||||||||
| Pay/receive total return* | Reference entity | Floating rate | Payment frequency | Currency | Notional amount/ contract amount | Maturity date | Counterparty (OTC) | Unamortized upfront payment paid (received) | Unrealized appreciation (depreciation) | Value |
| Receive | Bank of the Ozarks, Inc. | 1-Month USD LIBOR + 0.50% | Monthly | USD | 22,982 | May 2020 | Morgan Stanley and Company International | — | $11,118 | $11,118 |
| Receive | BAWAG Group AG | 1-Month EUR EURIBOR + 0.50% | Monthly | EUR | 90,382 | May 2020 | Morgan Stanley and Company International | — | 18,898 | 18,898 |
| Receive | BAWAG Group AG | 1-Month EUR EURIBOR + 0.50% | Monthly | EUR | 4,740 | May 2020 | Morgan Stanley and Company International | — | 1,006 | 1,006 |
| Receive | Baxter International, Inc. | 1-Month USD LIBOR + 0.50% | Monthly | USD | 29,614 | May 2020 | Morgan Stanley and Company International | — | 89,959 | 89,959 |
| Receive | Blackbaud, Inc. | 1-Month USD LIBOR + 0.50% | Monthly | USD | 2,806 | May 2020 | Morgan Stanley and Company International | — | (6,088) | (6,088) |
| Receive | Blucora, Inc. | 1-Month USD LIBOR + 0.50% | Monthly | USD | 3,446 | May 2020 | Morgan Stanley and Company International | — | 2,701 | 2,701 |
| Receive | Blucora, Inc. | 1-Month USD LIBOR + 0.50% | Monthly | USD | 16,000 | May 2020 | Morgan Stanley and Company International | — | 12,542 | 12,542 |
| Receive | Blucora, Inc. | 1-Month USD LIBOR + 0.50% | Monthly | USD | 5,000 | May 2020 | Morgan Stanley and Company International | — | 3,920 | 3,920 |
| Receive | Blueprint Medicines Corp. | 1-Month USD LIBOR + 0.50% | Monthly | USD | 47,401 | May 2020 | Morgan Stanley and Company International | — | (474,286) | (474,286) |
| Receive | Blueprint Medicines Corp. | 1-Month USD LIBOR + 0.50% | Monthly | USD | 7,000 | May 2020 | Morgan Stanley and Company International | — | (68,297) | (68,297) |
| Receive | BR Properties SA | 1-Month USD LIBOR + 0.75% | Monthly | USD | 17,546 | May 2020 | Morgan Stanley and Company International | — | (941) | (941) |
| Receive | BR Properties SA | 1-Month USD LIBOR + 0.75% | Monthly | USD | 111,026 | May 2020 | Morgan Stanley and Company International | — | (5,955) | (5,955) |
| Receive | BR Properties SA | 1-Month USD LIBOR + 0.75% | Monthly | USD | 28,742 | May 2020 | Morgan Stanley and Company International | — | (1,548) | (1,548) |
| Receive | BR Properties SA | 1-Month USD LIBOR + 0.75% | Monthly | USD | 28,334 | May 2020 | Morgan Stanley and Company International | — | (1,526) | (1,526) |
| Receive | BR Properties SA | 1-Month USD LIBOR + 0.75% | Monthly | USD | 25,208 | May 2020 | Morgan Stanley and Company International | — | (1,358) | (1,358) |
| Receive | BR Properties SA | 1-Month USD LIBOR + 0.75% | Monthly | USD | 98,144 | May 2020 | Morgan Stanley and Company International | — | (5,285) | (5,285) |
| Receive | Bristol-Myers Squibb Company | 1-Month USD LIBOR + 0.50% | Monthly | USD | 3,699 | May 2020 | Morgan Stanley and Company International | — | (7,582) | (7,582) |
| 58 | JOHN HANCOCK SEAPORT LONG/SHORT FUND | SEMIANNUAL REPORT | SEE NOTES TO FINANCIAL STATEMENTS |
| Total return swaps (continued) | ||||||||||
| Pay/receive total return* | Reference entity | Floating rate | Payment frequency | Currency | Notional amount/ contract amount | Maturity date | Counterparty (OTC) | Unamortized upfront payment paid (received) | Unrealized appreciation (depreciation) | Value |
| Receive | Bristol-Myers Squibb Company | 1-Month USD LIBOR + 0.50% | Monthly | USD | 4,500 | May 2020 | Morgan Stanley and Company International | — | $(8,808) | $(8,808) |
| Receive | Broadcom, Ltd. | 1-Month USD LIBOR + 0.50% | Monthly | USD | 2,384 | May 2020 | Morgan Stanley and Company International | — | (48,955) | (48,955) |
| Receive | Broadcom, Ltd. | 1-Month USD LIBOR + 0.50% | Monthly | USD | 1,227 | May 2020 | Morgan Stanley and Company International | — | (25,172) | (25,172) |
| Receive | Cardinal Health, Inc. | 1-Month USD LIBOR + 0.50% | Monthly | USD | 39,685 | May 2020 | Morgan Stanley and Company International | — | 67,416 | 67,416 |
| Receive | Cisco Systems, Inc. | 1-Month USD LIBOR + 0.50% | Monthly | USD | 12,757 | May 2020 | Morgan Stanley and Company International | — | 11,092 | 11,092 |
| Receive | Cognizant Technology Solutions Corp. | 1-Month USD LIBOR + 0.50% | Monthly | USD | 11,576 | May 2020 | Morgan Stanley and Company International | — | (2,210) | (2,210) |
| Receive | Cohen & Steers, Inc. | 1-Month USD LIBOR + 0.50% | Monthly | USD | 3,596 | May 2020 | Morgan Stanley and Company International | — | 2,990 | 2,990 |
| Receive | Cohen & Steers, Inc. | 1-Month USD LIBOR + 0.50% | Monthly | USD | 10,858 | May 2020 | Morgan Stanley and Company International | — | 9,029 | 9,029 |
| Receive | Cohen & Steers, Inc. | 1-Month USD LIBOR + 0.50% | Monthly | USD | 7,792 | May 2020 | Morgan Stanley and Company International | — | 6,479 | 6,479 |
| Receive | Coherus Biosciences, Inc. | 1-Month USD LIBOR + 0.50% | Monthly | USD | 4,102 | May 2020 | Morgan Stanley and Company International | — | (2,750) | (2,750) |
| Receive | Companhia Paranaense de Energia, Preferred B Shares | 1-Month USD LIBOR + 0.75% | Monthly | USD | 13,568 | May 2020 | Morgan Stanley and Company International | — | 6,666 | 6,666 |
| Receive | Costar Group, Inc. | 1-Month USD LIBOR + 0.50% | Monthly | USD | 747 | May 2020 | Morgan Stanley and Company International | — | (1,305) | (1,305) |
| Receive | Delivery Hero AG | 1-Month EUR EURIBOR + 0.50% | Monthly | EUR | 9,998 | May 2020 | Morgan Stanley and Company International | — | 3,067 | 3,067 |
| Receive | Dermira, Inc. | 1-Month USD LIBOR + 0.50% | Monthly | USD | 3,222 | May 2020 | Morgan Stanley and Company International | — | 1,885 | 1,885 |
| Receive | Dermira, Inc. | 1-Month USD LIBOR + 0.50% | Monthly | USD | 1,552 | May 2020 | Morgan Stanley and Company International | — | 925 | 925 |
| Receive | Edison International | 1-Month USD LIBOR + 0.50% | Monthly | USD | 26,189 | May 2020 | Morgan Stanley and Company International | — | 23,547 | 23,547 |
| SEE NOTES TO FINANCIAL STATEMENTS | SEMIANNUAL REPORT | JOHN HANCOCK SEAPORT LONG/SHORT FUND | 59 |
| Total return swaps (continued) | ||||||||||
| Pay/receive total return* | Reference entity | Floating rate | Payment frequency | Currency | Notional amount/ contract amount | Maturity date | Counterparty (OTC) | Unamortized upfront payment paid (received) | Unrealized appreciation (depreciation) | Value |
| Receive | Edison International | 1-Month USD LIBOR + 0.50% | Monthly | USD | 7,332 | May 2020 | Morgan Stanley and Company International | — | $6,590 | $6,590 |
| Receive | Edwards Lifesciences Corp. | 1-Month USD LIBOR + 0.50% | Monthly | USD | 945 | May 2020 | Morgan Stanley and Company International | — | (10,519) | (10,519) |
| Receive | Eli Lilly & Company | 1-Month USD LIBOR + 0.50% | Monthly | USD | 874 | May 2020 | Morgan Stanley and Company International | — | 712 | 712 |
| Receive | Envision Healthcare Corp. | 1-Month USD LIBOR + 0.50% | Monthly | USD | 21,674 | May 2020 | Morgan Stanley and Company International | — | (24,696) | (24,696) |
| Receive | EPAM Systems, Inc. | 1-Month USD LIBOR + 0.50% | Monthly | USD | 18,617 | May 2020 | Morgan Stanley and Company International | — | (8,698) | (8,698) |
| Receive | Equifax, Inc. | 1-Month USD LIBOR + 0.50% | Monthly | USD | 4,488 | May 2020 | Morgan Stanley and Company International | — | (22,112) | (22,112) |
| Receive | Euronet Worldwide, Inc. | 1-Month USD LIBOR + 0.50% | Monthly | USD | 5,883 | May 2020 | Morgan Stanley and Company International | — | 13,571 | 13,571 |
| Receive | Expedia, Inc. | 1-Month USD LIBOR + 0.50% | Monthly | USD | 15,587 | May 2020 | Morgan Stanley and Company International | — | 88,754 | 88,754 |
| Receive | Fabrinet | 1-Month USD LIBOR + 0.50% | Monthly | USD | 15,845 | May 2020 | Morgan Stanley and Company International | — | (32,216) | (32,216) |
| Receive | FANUC Corp. | 1-Month JPY LIBOR + 0.50% | Monthly | JPY | 2,330 | May 2020 | Morgan Stanley and Company International | — | (59,012) | (59,012) |
| Receive | FANUC Corp. | 1-Month JPY LIBOR + 0.50% | Monthly | JPY | 3,850 | May 2020 | Morgan Stanley and Company International | — | (97,509) | (97,509) |
| Receive | FleetCor Technologies, Inc. | 1-Month USD LIBOR + 0.50% | Monthly | USD | 25,544 | May 2020 | Morgan Stanley and Company International | — | 100,207 | 100,207 |
| Receive | FleetCor Technologies, Inc. | 1-Month USD LIBOR + 0.50% | Monthly | USD | 10,351 | May 2020 | Morgan Stanley and Company International | — | 40,389 | 40,389 |
| Receive | FleetCor Technologies, Inc. | 1-Month USD LIBOR + 0.50% | Monthly | USD | 5,058 | May 2020 | Morgan Stanley and Company International | — | 22,373 | 22,373 |
| Receive | Flextronics International, Ltd. | 1-Month USD LIBOR + 0.50% | Monthly | USD | 26,560 | May 2020 | Morgan Stanley and Company International | — | (108,305) | (108,305) |
| Receive | Flextronics International, Ltd. | 1-Month USD LIBOR + 0.50% | Monthly | USD | 26,559 | May 2020 | Morgan Stanley and Company International | — | (108,301) | (108,301) |
| Receive | Formfactor, Inc. | 1-Month USD LIBOR + 0.50% | Monthly | USD | 2,993 | May 2020 | Morgan Stanley and Company International | — | (9,322) | (9,322) |
| 60 | JOHN HANCOCK SEAPORT LONG/SHORT FUND | SEMIANNUAL REPORT | SEE NOTES TO FINANCIAL STATEMENTS |
| Total return swaps (continued) | ||||||||||
| Pay/receive total return* | Reference entity | Floating rate | Payment frequency | Currency | Notional amount/ contract amount | Maturity date | Counterparty (OTC) | Unamortized upfront payment paid (received) | Unrealized appreciation (depreciation) | Value |
| Receive | Formfactor, Inc. | 1-Month USD LIBOR + 0.50% | Monthly | USD | 1,163 | May 2020 | Morgan Stanley and Company International | — | $(3,622) | $(3,622) |
| Receive | Formfactor, Inc. | 1-Month USD LIBOR + 0.50% | Monthly | USD | 4,067 | May 2020 | Morgan Stanley and Company International | — | (12,667) | (12,667) |
| Receive | Formfactor, Inc. | 1-Month USD LIBOR + 0.50% | Monthly | USD | 1,453 | May 2020 | Morgan Stanley and Company International | — | (4,526) | (4,526) |
| Receive | Formfactor, Inc. | 1-Month USD LIBOR + 0.50% | Monthly | USD | 2,905 | May 2020 | Morgan Stanley and Company International | — | (9,048) | (9,048) |
| Receive | Formfactor, Inc. | 1-Month USD LIBOR + 0.50% | Monthly | USD | 7,263 | May 2020 | Morgan Stanley and Company International | — | (22,622) | (22,622) |
| Receive | Formfactor, Inc. | 1-Month USD LIBOR + 0.50% | Monthly | USD | 1,163 | May 2020 | Morgan Stanley and Company International | — | (3,622) | (3,622) |
| Receive | Formfactor, Inc. | 1-Month USD LIBOR + 0.50% | Monthly | USD | 1,162 | May 2020 | Morgan Stanley and Company International | — | (3,619) | (3,619) |
| Receive | Formfactor, Inc. | 1-Month USD LIBOR + 0.50% | Monthly | USD | 1,162 | May 2020 | Morgan Stanley and Company International | — | (3,619) | (3,619) |
| Receive | Formfactor, Inc. | 1-Month USD LIBOR + 0.50% | Monthly | USD | 1,163 | May 2020 | Morgan Stanley and Company International | — | (3,622) | (3,622) |
| Receive | Formfactor, Inc. | 1-Month USD LIBOR + 0.50% | Monthly | USD | 3,486 | May 2020 | Morgan Stanley and Company International | — | (10,858) | (10,858) |
| Receive | Formfactor, Inc. | 1-Month USD LIBOR + 0.50% | Monthly | USD | 3,486 | May 2020 | Morgan Stanley and Company International | — | (10,858) | (10,858) |
| Receive | Formfactor, Inc. | 1-Month USD LIBOR + 0.50% | Monthly | USD | 40,481 | May 2020 | Morgan Stanley and Company International | — | (126,100) | (126,100) |
| Receive | Formfactor, Inc. | 1-Month USD LIBOR + 0.50% | Monthly | USD | 2,979 | May 2020 | Morgan Stanley and Company International | — | (9,280) | (9,280) |
| Receive | Formfactor, Inc. | 1-Month USD LIBOR + 0.50% | Monthly | USD | 6,391 | May 2020 | Morgan Stanley and Company International | — | (19,806) | (19,806) |
| Receive | Formfactor, Inc. | 1-Month USD LIBOR + 0.50% | Monthly | USD | 20,454 | May 2020 | Morgan Stanley and Company International | — | (63,377) | (63,377) |
| Receive | Genesee & Wyoming, Inc., Class A | 1-Month USD LIBOR + 0.50% | Monthly | USD | 7,084 | May 2020 | Morgan Stanley and Company International | — | (3,604) | (3,604) |
| Receive | Guidewire Software, Inc. | 1-Month USD LIBOR + 0.50% | Monthly | USD | 7,054 | May 2020 | Morgan Stanley and Company International | — | 11,521 | 11,521 |
| SEE NOTES TO FINANCIAL STATEMENTS | SEMIANNUAL REPORT | JOHN HANCOCK SEAPORT LONG/SHORT FUND | 61 |
| Total return swaps (continued) | ||||||||||
| Pay/receive total return* | Reference entity | Floating rate | Payment frequency | Currency | Notional amount/ contract amount | Maturity date | Counterparty (OTC) | Unamortized upfront payment paid (received) | Unrealized appreciation (depreciation) | Value |
| Receive | Guidewire Software, Inc. | 1-Month USD LIBOR + 0.50% | Monthly | USD | 18,146 | May 2020 | Morgan Stanley and Company International | — | $29,636 | $29,636 |
| Receive | Guidewire Software, Inc. | 1-Month USD LIBOR + 0.50% | Monthly | USD | 4,844 | May 2020 | Morgan Stanley and Company International | — | 7,909 | 7,909 |
| Receive | Guidewire Software, Inc. | 1-Month USD LIBOR + 0.50% | Monthly | USD | 4,844 | May 2020 | Morgan Stanley and Company International | — | 7,911 | 7,911 |
| Receive | Guidewire Software, Inc. | 1-Month USD LIBOR + 0.50% | Monthly | USD | 2,954 | May 2020 | Morgan Stanley and Company International | — | 4,817 | 4,817 |
| Receive | Hamilton Lane, Inc., Class A | 1-Month USD LIBOR + 0.50% | Monthly | USD | 8,080 | May 2020 | Morgan Stanley and Company International | — | 20,211 | 20,211 |
| Receive | Hamilton Lane, Inc., Class A | 1-Month USD LIBOR + 0.50% | Monthly | USD | 13,120 | May 2020 | Morgan Stanley and Company International | — | 32,819 | 32,819 |
| Receive | Hamilton Lane, Inc., Class A | 1-Month USD LIBOR + 0.50% | Monthly | USD | 4,250 | May 2020 | Morgan Stanley and Company International | — | 10,647 | 10,647 |
| Receive | Harris Corp. | 1-Month USD LIBOR + 0.50% | Monthly | USD | 3,215 | May 2020 | Morgan Stanley and Company International | — | (29,306) | (29,306) |
| Receive | Harris Corp. | 1-Month USD LIBOR + 0.50% | Monthly | USD | 1,851 | May 2020 | Morgan Stanley and Company International | — | (16,792) | (16,792) |
| Receive | Harris Corp. | 1-Month USD LIBOR + 0.50% | Monthly | USD | 2,382 | May 2020 | Morgan Stanley and Company International | — | (21,587) | (21,587) |
| Receive | Huron Consulting Group, Inc. | 1-Month USD LIBOR + 0.50% | Monthly | USD | 3,062 | May 2020 | Morgan Stanley and Company International | — | (5,772) | (5,772) |
| Receive | Huron Consulting Group, Inc. | 1-Month USD LIBOR + 0.50% | Monthly | USD | 5,687 | May 2020 | Morgan Stanley and Company International | — | (10,705) | (10,705) |
| Receive | Hutchison China MediTech, Ltd., ADR | 1-Month USD LIBOR + 0.50% | Monthly | USD | 554 | May 2020 | Morgan Stanley and Company International | — | 740 | 740 |
| Receive | II-VI, Inc. | 1-Month USD LIBOR + 0.50% | Monthly | USD | 7,734 | May 2020 | Morgan Stanley and Company International | — | (30,337) | (30,337) |
| Receive | II-VI, Inc. | 1-Month USD LIBOR + 0.50% | Monthly | USD | 6,416 | May 2020 | Morgan Stanley and Company International | — | (25,167) | (25,167) |
| Receive | II-VI, Inc. | 1-Month USD LIBOR + 0.50% | Monthly | USD | 11,551 | May 2020 | Morgan Stanley and Company International | — | (45,309) | (45,309) |
| Receive | II-VI, Inc. | 1-Month USD LIBOR + 0.50% | Monthly | USD | 1,956 | May 2020 | Morgan Stanley and Company International | — | (7,659) | (7,659) |
| 62 | JOHN HANCOCK SEAPORT LONG/SHORT FUND | SEMIANNUAL REPORT | SEE NOTES TO FINANCIAL STATEMENTS |
| Total return swaps (continued) | ||||||||||
| Pay/receive total return* | Reference entity | Floating rate | Payment frequency | Currency | Notional amount/ contract amount | Maturity date | Counterparty (OTC) | Unamortized upfront payment paid (received) | Unrealized appreciation (depreciation) | Value |
| Receive | II-VI, Inc. | 1-Month USD LIBOR + 0.50% | Monthly | USD | 37,558 | May 2020 | Morgan Stanley and Company International | — | $(147,209) | $(147,209) |
| Receive | Infinera Corp. | 1-Month USD LIBOR + 0.50% | Monthly | USD | 45,744 | May 2020 | Morgan Stanley and Company International | — | 30,480 | 30,480 |
| Receive | Insulet Corp. | 1-Month USD LIBOR + 0.50% | Monthly | USD | 61,469 | May 2020 | Morgan Stanley and Company International | — | 7,072 | 7,072 |
| Receive | Integrated Device Technology, Inc. | 1-Month USD LIBOR + 0.50% | Monthly | USD | 1,546 | May 2020 | Morgan Stanley and Company International | — | (5,486) | (5,486) |
| Receive | iRobot Corp. | 1-Month USD LIBOR + 0.50% | Monthly | USD | 9,461 | May 2020 | Morgan Stanley and Company International | — | (6,258) | (6,258) |
| Receive | Itron, Inc. | 1-Month USD LIBOR + 0.50% | Monthly | USD | 12,182 | May 2020 | Morgan Stanley and Company International | — | (59,628) | (59,628) |
| Receive | Jagged Peak Energy, Inc. | 1-Month USD LIBOR + 0.50% | Monthly | USD | 23,897 | May 2020 | Morgan Stanley and Company International | — | 1,822 | 1,822 |
| Receive | Jagged Peak Energy, Inc. | 1-Month USD LIBOR + 0.50% | Monthly | USD | 929 | May 2020 | Morgan Stanley and Company International | — | 71 | 71 |
| Receive | Jagged Peak Energy, Inc. | 1-Month USD LIBOR + 0.50% | Monthly | USD | 3,000 | May 2020 | Morgan Stanley and Company International | — | 229 | 229 |
| Receive | Jagged Peak Energy, Inc. | 1-Month USD LIBOR + 0.50% | Monthly | USD | 4,000 | May 2020 | Morgan Stanley and Company International | — | 305 | 305 |
| Receive | Jagged Peak Energy, Inc. | 1-Month USD LIBOR + 0.50% | Monthly | USD | 3,500 | May 2020 | Morgan Stanley and Company International | — | 267 | 267 |
| Receive | Jagged Peak Energy, Inc. | 1-Month USD LIBOR + 0.50% | Monthly | USD | 5,828 | May 2020 | Morgan Stanley and Company International | — | 444 | 444 |
| Receive | JetBlue Airways Corp. | 1-Month USD LIBOR + 0.50% | Monthly | USD | 3,225 | May 2020 | Morgan Stanley and Company International | — | (2,055) | (2,055) |
| Receive | JetBlue Airways Corp. | 1-Month USD LIBOR + 0.50% | Monthly | USD | 31,457 | May 2020 | Morgan Stanley and Company International | — | (20,017) | (20,017) |
| Receive | JetBlue Airways Corp. | 1-Month USD LIBOR + 0.50% | Monthly | USD | 52,729 | May 2020 | Morgan Stanley and Company International | — | (33,598) | (33,598) |
| Receive | KeyCorp | 1-Month USD LIBOR + 0.50% | Monthly | USD | 13,397 | May 2020 | Morgan Stanley and Company International | — | (1,621) | (1,621) |
| Receive | KLA-Tencor Corp. | 1-Month USD LIBOR + 0.50% | Monthly | USD | 1,275 | May 2020 | Morgan Stanley and Company International | — | (9,462) | (9,462) |
| SEE NOTES TO FINANCIAL STATEMENTS | SEMIANNUAL REPORT | JOHN HANCOCK SEAPORT LONG/SHORT FUND | 63 |
| Total return swaps (continued) | ||||||||||
| Pay/receive total return* | Reference entity | Floating rate | Payment frequency | Currency | Notional amount/ contract amount | Maturity date | Counterparty (OTC) | Unamortized upfront payment paid (received) | Unrealized appreciation (depreciation) | Value |
| Receive | KLA-Tencor Corp. | 1-Month USD LIBOR + 0.50% | Monthly | USD | 1,032 | May 2020 | Morgan Stanley and Company International | — | $(7,649) | $(7,649) |
| Receive | KLA-Tencor Corp. | 1-Month USD LIBOR + 0.50% | Monthly | USD | 478 | May 2020 | Morgan Stanley and Company International | — | (3,549) | (3,549) |
| Receive | KLA-Tencor Corp. | 1-Month USD LIBOR + 0.50% | Monthly | USD | 2,505 | May 2020 | Morgan Stanley and Company International | — | (18,623) | (18,623) |
| Receive | Koninklijke Philips NV | 1-Month EUR EURIBOR + 0.50% | Monthly | EUR | 7,644 | May 2020 | Morgan Stanley and Company International | — | 30,924 | 30,924 |
| Receive | Koninklijke Philips NV | 1-Month EUR EURIBOR + 0.50% | Monthly | EUR | 1,884 | May 2020 | Morgan Stanley and Company International | — | 7,622 | 7,622 |
| Receive | Koninklijke Philips NV | 1-Month EUR EURIBOR + 0.50% | Monthly | EUR | 4,357 | May 2020 | Morgan Stanley and Company International | — | 17,626 | 17,626 |
| Receive | Koninklijke Philips NV | 1-Month EUR EURIBOR + 0.50% | Monthly | EUR | 2,500 | May 2020 | Morgan Stanley and Company International | — | 10,114 | 10,114 |
| Receive | Koninklijke Philips NV | 1-Month EUR EURIBOR + 0.50% | Monthly | EUR | 2,268 | May 2020 | Morgan Stanley and Company International | — | 9,175 | 9,175 |
| Receive | Koninklijke Philips NV | 1-Month EUR EURIBOR + 0.50% | Monthly | EUR | 1,232 | May 2020 | Morgan Stanley and Company International | — | 4,984 | 4,984 |
| Receive | Koninklijke Philips NV | 1-Month EUR EURIBOR + 0.50% | Monthly | EUR | 2,000 | May 2020 | Morgan Stanley and Company International | — | 8,091 | 8,091 |
| Receive | Koninklijke Philips NV | 1-Month EUR EURIBOR + 0.50% | Monthly | EUR | 3,000 | May 2020 | Morgan Stanley and Company International | — | 12,137 | 12,137 |
| Receive | Koninklijke Philips NV | 1-Month EUR EURIBOR + 0.50% | Monthly | EUR | 4,000 | May 2020 | Morgan Stanley and Company International | — | 16,182 | 16,182 |
| Receive | Koninklijke Philips NV | 1-Month EUR EURIBOR + 0.50% | Monthly | EUR | 1,000 | May 2020 | Morgan Stanley and Company International | — | 4,046 | 4,046 |
| Receive | Koninklijke Philips NV | 1-Month EUR EURIBOR + 0.50% | Monthly | EUR | 2,000 | May 2020 | Morgan Stanley and Company International | — | 8,091 | 8,091 |
| Receive | Koninklijke Philips NV | 1-Month EUR EURIBOR + 0.50% | Monthly | EUR | 7,000 | May 2020 | Morgan Stanley and Company International | — | 28,319 | 28,319 |
| Receive | LabCorp | 1-Month USD LIBOR + 0.50% | Monthly | USD | 5,904 | May 2020 | Morgan Stanley and Company International | — | 23,414 | 23,414 |
| Receive | Localiza Rent a Car SA | 1-Month USD LIBOR + 0.75% | Monthly | USD | 12,100 | May 2020 | Morgan Stanley and Company International | — | (6,093) | (6,093) |
| 64 | JOHN HANCOCK SEAPORT LONG/SHORT FUND | SEMIANNUAL REPORT | SEE NOTES TO FINANCIAL STATEMENTS |
| Total return swaps (continued) | ||||||||||
| Pay/receive total return* | Reference entity | Floating rate | Payment frequency | Currency | Notional amount/ contract amount | Maturity date | Counterparty (OTC) | Unamortized upfront payment paid (received) | Unrealized appreciation (depreciation) | Value |
| Receive | Localiza Rent a Car SA | 1-Month USD LIBOR + 0.75% | Monthly | USD | 24,100 | May 2020 | Morgan Stanley and Company International | — | $(12,136) | $(12,136) |
| Receive | Loxo Oncology, Inc. | 1-Month USD LIBOR + 0.50% | Monthly | USD | 33,680 | May 2020 | Morgan Stanley and Company International | — | (265,206) | (265,206) |
| Receive | Marriott Vacations Worldwide Corp. | 1-Month USD LIBOR + 0.50% | Monthly | USD | 2,851 | May 2020 | Morgan Stanley and Company International | — | (40,957) | (40,957) |
| Receive | Marvell Technology Group, Ltd. | 1-Month USD LIBOR + 0.50% | Monthly | USD | 29,710 | May 2020 | Morgan Stanley and Company International | — | (52,245) | (52,245) |
| Receive | Marvell Technology Group, Ltd. | 1-Month USD LIBOR + 0.50% | Monthly | USD | 2,321 | May 2020 | Morgan Stanley and Company International | — | (4,087) | (4,087) |
| Receive | Marvell Technology Group, Ltd. | 1-Month USD LIBOR + 0.50% | Monthly | USD | 19,172 | May 2020 | Morgan Stanley and Company International | — | (33,724) | (33,724) |
| Receive | Marvell Technology Group, Ltd. | 1-Month USD LIBOR + 0.50% | Monthly | USD | 5,104 | May 2020 | Morgan Stanley and Company International | — | (8,979) | (8,979) |
| Receive | Marvell Technology Group, Ltd. | 1-Month USD LIBOR + 0.50% | Monthly | USD | 1,532 | May 2020 | Morgan Stanley and Company International | — | (2,695) | (2,695) |
| Receive | Marvell Technology Group, Ltd. | 1-Month USD LIBOR + 0.50% | Monthly | USD | 6,124 | May 2020 | Morgan Stanley and Company International | — | (10,774) | (10,774) |
| Receive | Marvell Technology Group, Ltd. | 1-Month USD LIBOR + 0.50% | Monthly | USD | 2,551 | May 2020 | Morgan Stanley and Company International | — | (4,488) | (4,488) |
| Receive | Mastercard, Inc., Class A | 1-Month USD LIBOR + 0.50% | Monthly | USD | 12,292 | May 2020 | Morgan Stanley and Company International | — | 48,444 | 48,444 |
| Receive | MaxLinear, Inc. Class A | 1-Month USD LIBOR + 0.50% | Monthly | USD | 27,938 | May 2020 | Morgan Stanley and Company International | — | (21,967) | (21,967) |
| Receive | MaxLinear, Inc. Class A | 1-Month USD LIBOR + 0.50% | Monthly | USD | 1,601 | May 2020 | Morgan Stanley and Company International | — | (1,254) | (1,254) |
| Receive | McKesson Corp. | 1-Month USD LIBOR + 0.50% | Monthly | USD | 23,055 | May 2020 | Morgan Stanley and Company International | — | 182,745 | 182,745 |
| Receive | Mercury Computer Systems | 1-Month USD LIBOR + 0.50% | Monthly | USD | 1,890 | May 2020 | Morgan Stanley and Company International | — | (26,331) | (26,331) |
| Receive | Mercury Computer Systems | 1-Month USD LIBOR + 0.50% | Monthly | USD | 787 | May 2020 | Morgan Stanley and Company International | — | (10,954) | (10,954) |
| SEE NOTES TO FINANCIAL STATEMENTS | SEMIANNUAL REPORT | JOHN HANCOCK SEAPORT LONG/SHORT FUND | 65 |
| Total return swaps (continued) | ||||||||||
| Pay/receive total return* | Reference entity | Floating rate | Payment frequency | Currency | Notional amount/ contract amount | Maturity date | Counterparty (OTC) | Unamortized upfront payment paid (received) | Unrealized appreciation (depreciation) | Value |
| Receive | Mercury Computer Systems | 1-Month USD LIBOR + 0.50% | Monthly | USD | 2,098 | May 2020 | Morgan Stanley and Company International | — | $(29,200) | $(29,200) |
| Receive | Mercury Computer Systems | 1-Month USD LIBOR + 0.50% | Monthly | USD | 1,312 | May 2020 | Morgan Stanley and Company International | — | (18,255) | (18,255) |
| Receive | Mercury Computer Systems | 1-Month USD LIBOR + 0.50% | Monthly | USD | 1,574 | May 2020 | Morgan Stanley and Company International | — | (21,896) | (21,896) |
| Receive | Mercury Computer Systems | 1-Month USD LIBOR + 0.50% | Monthly | USD | 1,050 | May 2020 | Morgan Stanley and Company International | — | (14,603) | (14,603) |
| Receive | Mercury Computer Systems | 1-Month USD LIBOR + 0.50% | Monthly | USD | 1,836 | May 2020 | Morgan Stanley and Company International | — | (25,518) | (25,518) |
| Receive | Mercury Computer Systems | 1-Month USD LIBOR + 0.50% | Monthly | USD | 1,835 | May 2020 | Morgan Stanley and Company International | — | (25,498) | (25,498) |
| Receive | Metro Bank PLC | 1-Month GBP LIBOR + 0.50% | Monthly | GBP | 7,255 | May 2020 | Morgan Stanley and Company International | — | (15,256) | (15,256) |
| Receive | MGIC Investment Corp. | 1-Month USD LIBOR + 0.50% | Monthly | USD | 146,294 | May 2020 | Morgan Stanley and Company International | — | (124,625) | (124,625) |
| Receive | MGIC Investment Corp. | 1-Month USD LIBOR + 0.50% | Monthly | USD | 13,000 | May 2020 | Morgan Stanley and Company International | — | (4,284) | (4,284) |
| Receive | MGIC Investment Corp. | 1-Month USD LIBOR + 0.50% | Monthly | USD | 14,617 | May 2020 | Morgan Stanley and Company International | — | (7,044) | (7,044) |
| Receive | Microchip Technology, Inc. | 1-Month USD LIBOR + 0.50% | Monthly | USD | 4,411 | May 2020 | Morgan Stanley and Company International | — | (12,406) | (12,406) |
| Receive | Micron Technology, Inc. | 1-Month USD LIBOR + 0.50% | Monthly | USD | 23,779 | May 2020 | Morgan Stanley and Company International | — | (138,429) | (138,429) |
| Receive | Molina Healthcare, Inc. | 1-Month USD LIBOR + 0.50% | Monthly | USD | 3,787 | May 2020 | Morgan Stanley and Company International | — | (332) | (332) |
| Receive | Molina Healthcare, Inc. | 1-Month USD LIBOR + 0.50% | Monthly | USD | 1,782 | May 2020 | Morgan Stanley and Company International | — | (156) | (156) |
| Receive | Molina Healthcare, Inc. | 1-Month USD LIBOR + 0.50% | Monthly | USD | 4,633 | May 2020 | Morgan Stanley and Company International | — | (93) | (93) |
| Receive | Momenta Pharmaceuticals, Inc. | 1-Month USD LIBOR + 0.50% | Monthly | USD | 1,837 | May 2020 | Morgan Stanley and Company International | — | 2,236 | 2,236 |
| Receive | Mylan NV | 1-Month USD LIBOR + 0.50% | Monthly | USD | 2,527 | May 2020 | Morgan Stanley and Company International | — | (5,128) | (5,128) |
| 66 | JOHN HANCOCK SEAPORT LONG/SHORT FUND | SEMIANNUAL REPORT | SEE NOTES TO FINANCIAL STATEMENTS |
| Total return swaps (continued) | ||||||||||
| Pay/receive total return* | Reference entity | Floating rate | Payment frequency | Currency | Notional amount/ contract amount | Maturity date | Counterparty (OTC) | Unamortized upfront payment paid (received) | Unrealized appreciation (depreciation) | Value |
| Receive | NetApp, Inc. | 1-Month USD LIBOR + 0.50% | Monthly | USD | 4,731 | May 2020 | Morgan Stanley and Company International | — | $(8,823) | $(8,823) |
| Receive | Nordea Bank AB | 1-Month SEK STIBOR + 0.50% | Monthly | SEK | 70,702 | May 2020 | Morgan Stanley and Company International | — | (338) | (338) |
| Receive | Nordea Bank AB | 1-Month SEK STIBOR | Monthly | SEK | 73,997 | May 2020 | Morgan Stanley and Company International | — | — | — |
| Receive | NuVasive, Inc. | 1-Month USD LIBOR + 0.50% | Monthly | USD | 15,557 | May 2020 | Morgan Stanley and Company International | — | (10,699) | (10,699) |
| Receive | Oasis Midstream Partners LP | 1-Month USD LIBOR + 1.00% | Monthly | USD | 944 | May 2020 | Morgan Stanley and Company International | — | 4 | 4 |
| Receive | OneMain Holdings, Inc. | 1-Month USD LIBOR + 0.50% | Monthly | USD | 88,871 | May 2020 | Morgan Stanley and Company International | — | 90,554 | 90,554 |
| Receive | OraSure Technologies, Inc. | 1-Month USD LIBOR + 0.50% | Monthly | USD | 15,339 | May 2020 | Morgan Stanley and Company International | — | 5,864 | 5,864 |
| Receive | OraSure Technologies, Inc. | 1-Month USD LIBOR + 0.50% | Monthly | USD | 18,721 | May 2020 | Morgan Stanley and Company International | — | 7,147 | 7,147 |
| Receive | OraSure Technologies, Inc. | 1-Month USD LIBOR + 0.50% | Monthly | USD | 7,302 | May 2020 | Morgan Stanley and Company International | — | 2,788 | 2,788 |
| Receive | OraSure Technologies, Inc. | 1-Month USD LIBOR + 0.50% | Monthly | USD | 3,313 | May 2020 | Morgan Stanley and Company International | — | 1,264 | 1,264 |
| Receive | OraSure Technologies, Inc. | 1-Month USD LIBOR + 0.50% | Monthly | USD | 16,297 | May 2020 | Morgan Stanley and Company International | — | 6,196 | 6,196 |
| Receive | OraSure Technologies, Inc. | 1-Month USD LIBOR + 0.50% | Monthly | USD | 3,853 | May 2020 | Morgan Stanley and Company International | — | 1,465 | 1,465 |
| Receive | OraSure Technologies, Inc. | 1-Month USD LIBOR + 0.50% | Monthly | USD | 9,689 | May 2020 | Morgan Stanley and Company International | — | 3,703 | 3,703 |
| Receive | OraSure Technologies, Inc. | 1-Month USD LIBOR + 0.50% | Monthly | USD | 3,229 | May 2020 | Morgan Stanley and Company International | — | 1,241 | 1,241 |
| Receive | OraSure Technologies, Inc. | 1-Month USD LIBOR + 0.50% | Monthly | USD | 1,938 | May 2020 | Morgan Stanley and Company International | — | 753 | 753 |
| Receive | OraSure Technologies, Inc. | 1-Month USD LIBOR + 0.50% | Monthly | USD | 3,229 | May 2020 | Morgan Stanley and Company International | — | 1,259 | 1,259 |
| Receive | OraSure Technologies, Inc. | 1-Month USD LIBOR + 0.50% | Monthly | USD | 7,313 | May 2020 | Morgan Stanley and Company International | — | 2,863 | 2,863 |
| SEE NOTES TO FINANCIAL STATEMENTS | SEMIANNUAL REPORT | JOHN HANCOCK SEAPORT LONG/SHORT FUND | 67 |
| Total return swaps (continued) | ||||||||||
| Pay/receive total return* | Reference entity | Floating rate | Payment frequency | Currency | Notional amount/ contract amount | Maturity date | Counterparty (OTC) | Unamortized upfront payment paid (received) | Unrealized appreciation (depreciation) | Value |
| Receive | Orbcomm, Inc. | 1-Month USD LIBOR + 0.50% | Monthly | USD | 1,097 | May 2020 | Morgan Stanley and Company International | — | $(269) | $(269) |
| Receive | Orbcomm, Inc. | 1-Month USD LIBOR + 0.50% | Monthly | USD | 9,351 | May 2020 | Morgan Stanley and Company International | — | (2,290) | (2,290) |
| Receive | Orbcomm, Inc. | 1-Month USD LIBOR + 0.50% | Monthly | USD | 7,069 | May 2020 | Morgan Stanley and Company International | — | (1,732) | (1,732) |
| Receive | Orbcomm, Inc. | 1-Month USD LIBOR + 0.50% | Monthly | USD | 10,365 | May 2020 | Morgan Stanley and Company International | — | (2,539) | (2,539) |
| Receive | Petrobras Argentina SA, ADR | 1-Month USD LIBOR + 0.50% | Monthly | USD | 78,511 | May 2020 | Morgan Stanley and Company International | — | 52,173 | 52,173 |
| Receive | Petrobras Argentina SA, ADR | 1-Month USD LIBOR + 0.50% | Monthly | USD | 29,396 | May 2020 | Morgan Stanley and Company International | — | 16,453 | 16,453 |
| Receive | Pinnacle Financial Partners, Inc. | 1-Month USD LIBOR + 0.50% | Monthly | USD | 6,526 | May 2020 | Morgan Stanley and Company International | — | 151 | 151 |
| Receive | Pinnacle Financial Partners, Inc. | 1-Month USD LIBOR + 0.50% | Monthly | USD | 8,468 | May 2020 | Morgan Stanley and Company International | — | (6,293) | (6,293) |
| Receive | Planet Fitness, Inc., Class A | 1-Month USD LIBOR + 0.50% | Monthly | USD | 111,540 | May 2020 | Morgan Stanley and Company International | — | 112,341 | 112,341 |
| Receive | Prothena Corp. PLC | 1-Month USD LIBOR + 0.50% | Monthly | USD | 39,827 | May 2020 | Morgan Stanley and Company International | — | (1,042,464) | (1,042,464) |
| Receive | Prothena Corp. PLC | 1-Month USD LIBOR + 0.50% | Monthly | USD | 3,601 | May 2020 | Morgan Stanley and Company International | — | (94,144) | (94,144) |
| Receive | Prudential PLC | 1-Month GBP LIBOR + 0.50% | Monthly | GBP | 38,672 | May 2020 | Morgan Stanley and Company International | — | 14,188 | 14,188 |
| Receive | Qualicorp SA | 1-Month USD LIBOR + 0.75% | Monthly | USD | 15,380 | May 2020 | Morgan Stanley and Company International | — | 6,096 | 6,096 |
| Receive | Qualicorp SA | 1-Month USD LIBOR + 0.75% | Monthly | USD | 15,380 | May 2020 | Morgan Stanley and Company International | — | 6,096 | 6,096 |
| Receive | Qualicorp SA | 1-Month USD LIBOR + 0.75% | Monthly | USD | 30,914 | May 2020 | Morgan Stanley and Company International | — | 12,216 | 12,216 |
| Receive | Qualicorp SA | 1-Month USD LIBOR + 0.75% | Monthly | USD | 15,226 | May 2020 | Morgan Stanley and Company International | — | 6,035 | 6,035 |
| Receive | Radius Health, Inc. | 1-Month USD LIBOR + 0.50% | Monthly | USD | 7,271 | May 2020 | Morgan Stanley and Company International | — | (27,897) | (27,897) |
| 68 | JOHN HANCOCK SEAPORT LONG/SHORT FUND | SEMIANNUAL REPORT | SEE NOTES TO FINANCIAL STATEMENTS |
| Total return swaps (continued) | ||||||||||
| Pay/receive total return* | Reference entity | Floating rate | Payment frequency | Currency | Notional amount/ contract amount | Maturity date | Counterparty (OTC) | Unamortized upfront payment paid (received) | Unrealized appreciation (depreciation) | Value |
| Receive | Radius Health, Inc. | 1-Month USD LIBOR + 0.50% | Monthly | USD | 8,348 | May 2020 | Morgan Stanley and Company International | — | $(31,996) | $(31,996) |
| Receive | Radius Health, Inc. | 1-Month USD LIBOR + 0.50% | Monthly | USD | 4,453 | May 2020 | Morgan Stanley and Company International | — | (17,051) | (17,051) |
| Receive | Radius Health, Inc. | 1-Month USD LIBOR + 0.50% | Monthly | USD | 2,784 | May 2020 | Morgan Stanley and Company International | — | (10,639) | (10,639) |
| Receive | Radius Health, Inc. | 1-Month USD LIBOR + 0.50% | Monthly | USD | 6,227 | May 2020 | Morgan Stanley and Company International | — | (23,768) | (23,768) |
| Receive | Radius Health, Inc. | 1-Month USD LIBOR + 0.50% | Monthly | USD | 1,492 | May 2020 | Morgan Stanley and Company International | — | (5,671) | (5,671) |
| Receive | Regeneron Pharmaceuticals, Inc. | 1-Month USD LIBOR + 0.50% | Monthly | USD | 118 | May 2020 | Morgan Stanley and Company International | — | (1,779) | (1,779) |
| Receive | Revance Therapeutics, Inc. | 1-Month USD LIBOR + 0.50% | Monthly | USD | 1,909 | May 2020 | Morgan Stanley and Company International | — | (8,311) | (8,311) |
| Receive | salesforce.com, Inc. | 1-Month USD LIBOR + 0.50% | Monthly | USD | 18,778 | May 2020 | Morgan Stanley and Company International | — | 23,644 | 23,644 |
| Receive | Seattle Genetics, Inc. | 1-Month USD LIBOR + 0.50% | Monthly | USD | 8,578 | May 2020 | Morgan Stanley and Company International | — | 6,190 | 6,190 |
| Receive | Seattle Genetics, Inc. | 1-Month USD LIBOR + 0.50% | Monthly | USD | 48,604 | May 2020 | Morgan Stanley and Company International | — | 35,056 | 35,056 |
| Receive | Simon Property Group, Inc. | 1-Month USD LIBOR + 0.50% | Monthly | USD | 6,929 | May 2020 | Morgan Stanley and Company International | — | 25,609 | 25,609 |
| Receive | Sino Biopharmaceutical, Ltd. | 1-Month HKD HIBOR + 0.50% | Monthly | HKD | 33,000 | May 2020 | Morgan Stanley and Company International | — | 1,455 | 1,455 |
| Receive | Skechers U.S.A., Inc. | 1-Month USD LIBOR + 0.50% | Monthly | USD | 39,998 | May 2020 | Morgan Stanley and Company International | — | (560,290) | (560,290) |
| Receive | SLM Corp. | 1-Month USD LIBOR + 0.50% | Monthly | USD | 62,566 | May 2020 | Morgan Stanley and Company International | — | (8,769) | (8,769) |
| Receive | SS&C Technologies, Inc. | 1-Month USD LIBOR + 0.50% | Monthly | USD | 27,476 | May 2020 | Morgan Stanley and Company International | — | (32,912) | (32,912) |
| Receive | SS&C Technologies, Inc. | 1-Month USD LIBOR + 0.50% | Monthly | USD | 1,489 | May 2020 | Morgan Stanley and Company International | — | (1,720) | (1,720) |
| Receive | Sterling Bancorp | 1-Month USD LIBOR + 0.50% | Monthly | USD | 109,357 | May 2020 | Morgan Stanley and Company International | — | 151,559 | 151,559 |
| SEE NOTES TO FINANCIAL STATEMENTS | SEMIANNUAL REPORT | JOHN HANCOCK SEAPORT LONG/SHORT FUND | 69 |
| Total return swaps (continued) | ||||||||||
| Pay/receive total return* | Reference entity | Floating rate | Payment frequency | Currency | Notional amount/ contract amount | Maturity date | Counterparty (OTC) | Unamortized upfront payment paid (received) | Unrealized appreciation (depreciation) | Value |
| Receive | Syneos Health, Inc. | 1-Month USD LIBOR + 0.50% | Monthly | USD | 2,379 | May 2020 | Morgan Stanley and Company International | — | $689 | $689 |
| Receive | Syneos Health, Inc. | 1-Month USD LIBOR + 0.50% | Monthly | USD | 1,935 | May 2020 | Morgan Stanley and Company International | — | 584 | 584 |
| Receive | Syneos Health, Inc. | 1-Month USD LIBOR + 0.50% | Monthly | USD | 2,580 | May 2020 | Morgan Stanley and Company International | — | 800 | 800 |
| Receive | Syneos Health, Inc. | 1-Month USD LIBOR + 0.50% | Monthly | USD | 662 | May 2020 | Morgan Stanley and Company International | — | 209 | 209 |
| Receive | Syneos Health, Inc. | 1-Month USD LIBOR + 0.50% | Monthly | USD | 5,750 | May 2020 | Morgan Stanley and Company International | — | 1,895 | 1,895 |
| Receive | TD Ameritrade Holding Corp. | 1-Month USD LIBOR + 0.50% | Monthly | USD | 24,718 | May 2020 | Morgan Stanley and Company International | — | (63,306) | (63,306) |
| Receive | TD Ameritrade Holding Corp. | 1-Month USD LIBOR + 0.50% | Monthly | USD | 9,912 | May 2020 | Morgan Stanley and Company International | — | (25,385) | (25,385) |
| Receive | TD Ameritrade Holding Corp. | 1-Month USD LIBOR + 0.50% | Monthly | USD | 9,062 | May 2020 | Morgan Stanley and Company International | — | (23,199) | (23,199) |
| Receive | Tesla Motors, Inc. | 1-Month USD LIBOR + 0.50% | Monthly | USD | 3,988 | May 2020 | Morgan Stanley and Company International | — | (15,155) | (15,155) |
| Receive | Teva Pharmaceutical Finance Netherlands III BV | 1-Month USD LIBOR + 0.50% | Monthly | USD | 2,280 | May 2020 | Morgan Stanley and Company International | — | (251) | (251) |
| Receive | The ADT Corp. | 1-Month USD LIBOR + 0.50% | Monthly | USD | 15,000 | May 2020 | Morgan Stanley and Company International | — | (7,623) | (7,623) |
| Receive | Tower Semiconductor, Ltd. | 1-Month USD LIBOR + 0.50% | Monthly | USD | 88,075 | May 2020 | Morgan Stanley and Company International | — | (257,405) | (257,405) |
| Receive | Trade Desk, Inc., Class A | 1-Month USD LIBOR + 0.50% | Monthly | USD | 26,933 | May 2020 | Morgan Stanley and Company International | — | (41,567) | (41,567) |
| Receive | Ultra Electronics Holdings PLC | 1-Month GBP LIBOR + 0.50% | Monthly | GBP | 6,447 | May 2020 | Morgan Stanley and Company International | — | (100) | (100) |
| Receive | Ultragenyx Pharmaceutical, Inc. | 1-Month USD LIBOR + 0.50% | Monthly | USD | 35,300 | May 2020 | Morgan Stanley and Company International | — | (110,160) | (110,160) |
| Receive | VeriSign, Inc. | 1-Month USD LIBOR + 0.50% | Monthly | USD | 17,123 | May 2020 | Morgan Stanley and Company International | — | (114,552) | (114,552) |
| 70 | JOHN HANCOCK SEAPORT LONG/SHORT FUND | SEMIANNUAL REPORT | SEE NOTES TO FINANCIAL STATEMENTS |
| Total return swaps (continued) | ||||||||||
| Pay/receive total return* | Reference entity | Floating rate | Payment frequency | Currency | Notional amount/ contract amount | Maturity date | Counterparty (OTC) | Unamortized upfront payment paid (received) | Unrealized appreciation (depreciation) | Value |
| Receive | WageWorks, Inc. | 1-Month USD LIBOR + 0.50% | Monthly | USD | 29,922 | May 2020 | Morgan Stanley and Company International | — | $(93,248) | $(93,248) |
| Receive | WageWorks, Inc. | 1-Month USD LIBOR + 0.50% | Monthly | USD | 3,759 | May 2020 | Morgan Stanley and Company International | — | (11,729) | (11,729) |
| Receive | Walgreens Boots Alliance, Inc. | 1-Month USD LIBOR + 0.50% | Monthly | USD | 20,568 | May 2020 | Morgan Stanley and Company International | — | 1,076 | 1,076 |
| Receive | Wex, Inc. | 1-Month USD LIBOR + 0.50% | Monthly | USD | 6,344 | May 2020 | Morgan Stanley and Company International | — | (512) | (512) |
| Receive | Workday, Inc., Class A | 1-Month USD LIBOR + 0.50% | Monthly | USD | 1,664 | May 2020 | Morgan Stanley and Company International | — | (3,905) | (3,905) |
| Receive | Yandex NV, Class A | 1-Month USD LIBOR + 0.50% | Monthly | USD | 22,919 | May 2020 | Morgan Stanley and Company International | — | (8,543) | (8,543) |
| Receive | Yandex NV, Class A | 1-Month USD LIBOR + 0.50% | Monthly | USD | 18,786 | May 2020 | Morgan Stanley and Company International | — | (7,003) | (7,003) |
| Receive | Zealand Pharma A/S, ADR | 1-Month USD LIBOR + 0.50% | Monthly | USD | 502 | May 2020 | Morgan Stanley and Company International | — | (68) | (68) |
| Receive | Zimmer Biomet Holdings, Inc. | 1-Month USD LIBOR + 0.50% | Monthly | USD | 1,083 | May 2020 | Morgan Stanley and Company International | — | 8,289 | 8,289 |
| Receive | Zimmer Biomet Holdings, Inc. | 1-Month USD LIBOR + 0.50% | Monthly | USD | 2,784 | May 2020 | Morgan Stanley and Company International | — | 21,240 | 21,240 |
| Receive | Zions Bancorporation | 1-Month USD LIBOR + 0.50% | Monthly | USD | 11,211 | May 2020 | Morgan Stanley and Company International | — | 16,064 | 16,064 |
| $1,086,149 | $(5,466,929) | $(4,380,780) | ||||||||
| Derivatives Currency Abbreviations | |
| AUD | Australian Dollar |
| CAD | Canadian Dollar |
| CHF | Swiss Franc |
| CNY | Chinese Yuan Renminbi |
| EUR | Euro |
| GBP | Pound Sterling |
| HKD | Hong Kong Dollar |
| JPY | Japanese Yen |
| SEE NOTES TO FINANCIAL STATEMENTS | SEMIANNUAL REPORT | JOHN HANCOCK SEAPORT LONG/SHORT FUND | 71 |
| KRW | Korean Won |
| SEK | Swedish Krona |
| SGD | Singapore Dollar |
| USD | U.S. Dollar |
| Derivatives Abbreviations | |
| ADR | American Depositary Receipt |
| CDOR | Canadian Dollar Offered Rate |
| EURIBOR | Euro Interbank Offered Rate |
| HIBOR | Hong Kong Interbank Offered Rate |
| LIBOR | London Interbank Offered Rate |
| STIBOR | Stockholm Interbank Offered Rate |
| 72 | JOHN HANCOCK SEAPORT LONG/SHORT FUND | SEMIANNUAL REPORT | SEE NOTES TO FINANCIAL STATEMENTS |
Financial statements
STATEMENT OF ASSETS AND LIABILITIES 4-30-18 (unaudited)
| Assets | ||||||||||||||||||||||||||||||
| Investments, at value (Cost $629,179,553) | $669,503,784 | |||||||||||||||||||||||||||||
| Receivable for futures variation margin | 583,119 | |||||||||||||||||||||||||||||
| Unrealized appreciation on forward foreign currency contracts | 819,660 | |||||||||||||||||||||||||||||
| Swap contracts, at value (including net unamortized upfront payment on swaps $1,088,182) | 10,917,316 | |||||||||||||||||||||||||||||
| Cash | 57,755,686 | |||||||||||||||||||||||||||||
| Foreign currency, at value (Cost $1,185,280) | 1,132,526 | |||||||||||||||||||||||||||||
| Cash held at broker for futures contracts | 228,618 | |||||||||||||||||||||||||||||
| Cash segregated at custodian for OTC derivative contracts | 723,000 | |||||||||||||||||||||||||||||
| Receivable for investments sold | 4,924,367 | |||||||||||||||||||||||||||||
| Receivable for fund shares sold | 1,504,241 | |||||||||||||||||||||||||||||
| Dividends and interest receivable | 1,049,753 | |||||||||||||||||||||||||||||
| Other receivables and prepaid expenses | 83,877 | |||||||||||||||||||||||||||||
| Total assets | 749,225,947 | |||||||||||||||||||||||||||||
| Liabilities | ||||||||||||||||||||||||||||||
| Unrealized depreciation on forward foreign currency contracts | 147,925 | |||||||||||||||||||||||||||||
| Written options, at value (premium received $1,247,768) | 463,637 | |||||||||||||||||||||||||||||
| Swap contracts, at value (net unamortized upfront payment on swaps $287,778) | 15,609,563 | |||||||||||||||||||||||||||||
| Payable for collateral on OTC derivatives | 1,460,000 | |||||||||||||||||||||||||||||
| Foreign capital gains tax payable | 21,356 | |||||||||||||||||||||||||||||
| Payable for investments purchased | 15,881,874 | |||||||||||||||||||||||||||||
| Payable for fund shares repurchased | 588,325 | |||||||||||||||||||||||||||||
| Payable to affiliates | ||||||||||||||||||||||||||||||
| Accounting and legal services fees | 74,156 | |||||||||||||||||||||||||||||
| Transfer agent fees | 53,556 | |||||||||||||||||||||||||||||
| Trustees' fees | 1,303 | |||||||||||||||||||||||||||||
| Other liabilities and accrued expenses | 191,104 | |||||||||||||||||||||||||||||
| Total liabilities | 34,492,799 | |||||||||||||||||||||||||||||
| Net assets | $714,733,148 | |||||||||||||||||||||||||||||
| Net assets consist of | ||||||||||||||||||||||||||||||
| Paid-in capital | $672,845,291 | |||||||||||||||||||||||||||||
| Accumulated net investment loss | (13,037,780 | ) | ||||||||||||||||||||||||||||
| Accumulated net realized gain (loss) on investments, futures contracts, options written, foreign currency transactions and swap contracts | 18,096,497 | |||||||||||||||||||||||||||||
| Net unrealized appreciation (depreciation) on investments, futures contracts, options written, translation of assets and liabilities in foreign currencies and swap contracts | 36,829,140 | |||||||||||||||||||||||||||||
| Net assets | $714,733,148 | |||||||||||||||||||||||||||||
STATEMENT OF ASSETS AND LIABILITIES (continued)
| Net asset value per share | ||||||||||||||||||
| Based on net asset values and shares outstanding-the fund has an unlimited number of shares authorized with no par value | ||||||||||||||||||
| Class A ($20,731,859 ÷ 1,865,913 shares)1 | $11.11 | |||||||||||||||||
| Class C ($12,563,190 ÷ 1,160,867 shares)1 | $10.82 | |||||||||||||||||
| Class I ($525,260,308 ÷ 46,545,094 shares) | $11.28 | |||||||||||||||||
| Class R6 ($14,382,492 ÷ 1,265,623 shares) | $11.36 | |||||||||||||||||
| Class NAV ($141,795,299 ÷ 12,478,600 shares) | $11.36 | |||||||||||||||||
| Maximum offering price per share | ||||||||||||||||||
| Class A (net asset value per share ÷ 95%)2 | $11.69 | |||||||||||||||||
| 1 | Redemption price per share is equal to net asset value less any applicable contingent deferred sales charge. | ||||||||||||||||
| 2 | On single retail sales of less than $50,000. On sales of $50,000 or more and on group sales the offering price is reduced. | ||||||||||||||||
STATEMENT OF OPERATIONS For the six months ended 4-30-18 (unaudited)
| Investment income | |||||||||||||||||||||||||||||||||
| Dividends | $4,475,567 | ||||||||||||||||||||||||||||||||
| Interest | 1,542,594 | ||||||||||||||||||||||||||||||||
| Less foreign taxes withheld | (216,190 | ) | |||||||||||||||||||||||||||||||
| Total investment income | 5,801,971 | ||||||||||||||||||||||||||||||||
| Expenses | |||||||||||||||||||||||||||||||||
| Investment management fees | 4,954,385 | ||||||||||||||||||||||||||||||||
| Distribution and service fees | 92,935 | ||||||||||||||||||||||||||||||||
| Accounting and legal services fees | 75,021 | ||||||||||||||||||||||||||||||||
| Transfer agent fees | 285,378 | ||||||||||||||||||||||||||||||||
| Trustees' fees | 6,350 | ||||||||||||||||||||||||||||||||
| State registration fees | 35,596 | ||||||||||||||||||||||||||||||||
| Printing and postage | 38,428 | ||||||||||||||||||||||||||||||||
| Professional fees | 45,816 | ||||||||||||||||||||||||||||||||
| Custodian fees | 141,883 | ||||||||||||||||||||||||||||||||
| Other | 9,600 | ||||||||||||||||||||||||||||||||
| Total expenses | 5,685,392 | ||||||||||||||||||||||||||||||||
| Less expense reductions | (28,818 | ) | |||||||||||||||||||||||||||||||
| Net expenses | 5,656,574 | ||||||||||||||||||||||||||||||||
| Net investment income | 145,397 | ||||||||||||||||||||||||||||||||
| Realized and unrealized gain (loss) | |||||||||||||||||||||||||||||||||
| Net realized gain (loss) on | |||||||||||||||||||||||||||||||||
| Investments and foreign currency transactions | 31,837,694 | 1 | |||||||||||||||||||||||||||||||
| Futures contracts | (660,371 | ) | |||||||||||||||||||||||||||||||
| Forward foreign currency contracts | (1,145,507 | ) | |||||||||||||||||||||||||||||||
| Written options | 559,446 | ||||||||||||||||||||||||||||||||
| Swap contracts | (8,430,937 | ) | |||||||||||||||||||||||||||||||
| 22,160,325 | |||||||||||||||||||||||||||||||||
| Change in net unrealized appreciation (depreciation) of | |||||||||||||||||||||||||||||||||
| Investments and translation of assets and liabilities in foreign currencies | (5,713,913 | )2 | |||||||||||||||||||||||||||||||
| Futures contracts | 737,600 | ||||||||||||||||||||||||||||||||
| Forward foreign currency contracts | 455,069 | ||||||||||||||||||||||||||||||||
| Written options | (92,739 | ) | |||||||||||||||||||||||||||||||
| Swap contracts | (6,716,012 | ) | |||||||||||||||||||||||||||||||
| (11,329,995 | ) | ||||||||||||||||||||||||||||||||
| Net realized and unrealized gain | 10,830,330 | ||||||||||||||||||||||||||||||||
| Increase in net assets from operations | $10,975,727 | ||||||||||||||||||||||||||||||||
| 1 | Net of India foreign taxes of $108,635. | ||||||||||||||||||||||
| 2 | Net of ($267,013) in deferred India foreign withholding taxes. | ||||||||||||||||||||||
STATEMENTS OF CHANGES IN NET ASSETS
| Six months ended 4-30-18 | Year ended 10-31-17 | ||||||||||||||||||||||||||||||||||||||||||||
| (unaudited) | |||||||||||||||||||||||||||||||||||||||||||||
| Increase (decrease) in net assets | |||||||||||||||||||||||||||||||||||||||||||||
| From operations | |||||||||||||||||||||||||||||||||||||||||||||
| Net investment income (loss) | $145,397 | ($9,954,855 | ) | ||||||||||||||||||||||||||||||||||||||||||
| Net realized gain | 22,160,325 | 62,437,926 | |||||||||||||||||||||||||||||||||||||||||||
| Change in net unrealized appreciation (depreciation) | (11,329,995 | ) | 25,879,864 | ||||||||||||||||||||||||||||||||||||||||||
| Increase in net assets resulting from operations | 10,975,727 | 78,362,935 | |||||||||||||||||||||||||||||||||||||||||||
| Distributions to shareholders | |||||||||||||||||||||||||||||||||||||||||||||
| From net realized gain | |||||||||||||||||||||||||||||||||||||||||||||
| Class A | (1,668,359 | ) | (8,982 | ) | |||||||||||||||||||||||||||||||||||||||||
| Class C | (966,403 | ) | (6,334 | ) | |||||||||||||||||||||||||||||||||||||||||
| Class I | (34,773,974 | ) | (190,572 | ) | |||||||||||||||||||||||||||||||||||||||||
| Class R6 | (727,719 | ) | (2,624 | ) | |||||||||||||||||||||||||||||||||||||||||
| Class NAV | (11,396,993 | ) | (82,720 | ) | |||||||||||||||||||||||||||||||||||||||||
| Total distributions | (49,533,448 | ) | (291,232 | ) | |||||||||||||||||||||||||||||||||||||||||
| From fund share transactions | 103,747,409 | (78,629,348 | ) | ||||||||||||||||||||||||||||||||||||||||||
| Total increase (decrease) | 65,189,688 | (557,645 | ) | ||||||||||||||||||||||||||||||||||||||||||
| Net assets | |||||||||||||||||||||||||||||||||||||||||||||
| Beginning of period | 649,543,460 | 650,101,105 | |||||||||||||||||||||||||||||||||||||||||||
| End of period | $714,733,148 | $649,543,460 | |||||||||||||||||||||||||||||||||||||||||||
| Accumulated net investment loss | ($13,037,780 | ) | ($13,183,177 | ) | |||||||||||||||||||||||||||||||||||||||||
Financial highlights
| Class A Shares Period ended | 4-30-18 | 1 | 10-31-17 | 10-31-16 | 10-31-15 | 10-31-14 | 2 | ||||||||||||||||||||||||||||||||||||||||||||||||||||||||||||||||||||||||||||||||||||||||||||||||
| Per share operating performance | |||||||||||||||||||||||||||||||||||||||||||||||||||||||||||||||||||||||||||||||||||||||||||||||||||||||
| Net asset value, beginning of period | $11.82 | $10.45 | $10.81 | $10.10 | $10.00 | ||||||||||||||||||||||||||||||||||||||||||||||||||||||||||||||||||||||||||||||||||||||||||||||||||
| Net investment loss3 | (0.02 | ) | (0.22 | ) | (0.28 | ) | (0.24 | ) | (0.21 | ) | |||||||||||||||||||||||||||||||||||||||||||||||||||||||||||||||||||||||||||||||||||||||||||||
| Net realized and unrealized gain (loss) on investments | 0.22 | 1.60 | (0.03 | ) | 0.95 | 0.31 | |||||||||||||||||||||||||||||||||||||||||||||||||||||||||||||||||||||||||||||||||||||||||||||||||
| Total from investment operations | 0.20 | 1.38 | (0.31 | ) | 0.71 | 0.10 | |||||||||||||||||||||||||||||||||||||||||||||||||||||||||||||||||||||||||||||||||||||||||||||||||
| Less distributions | |||||||||||||||||||||||||||||||||||||||||||||||||||||||||||||||||||||||||||||||||||||||||||||||||||||||
| From net realized gain | (0.91 | ) | (0.01 | ) | (0.05 | ) | — | — | |||||||||||||||||||||||||||||||||||||||||||||||||||||||||||||||||||||||||||||||||||||||||||||||
| Net asset value, end of period | $11.11 | $11.82 | $10.45 | $10.81 | $10.10 | ||||||||||||||||||||||||||||||||||||||||||||||||||||||||||||||||||||||||||||||||||||||||||||||||||
| Total return (%)4,5 | 1.82 | 6 | 13.16 | (2.94 | ) | 7.13 | 1.00 | 6 | |||||||||||||||||||||||||||||||||||||||||||||||||||||||||||||||||||||||||||||||||||||||||||||||
| Ratios and supplemental data | |||||||||||||||||||||||||||||||||||||||||||||||||||||||||||||||||||||||||||||||||||||||||||||||||||||||
| Net assets, end of period (in millions) | $21 | $22 | $22 | $16 | $5 | ||||||||||||||||||||||||||||||||||||||||||||||||||||||||||||||||||||||||||||||||||||||||||||||||||
| Ratios (as a percentage of average net assets): | |||||||||||||||||||||||||||||||||||||||||||||||||||||||||||||||||||||||||||||||||||||||||||||||||||||||
| Expenses before reductions | 1.98 | 7,9 | 3.86 | 8 | 4.22 | 8 | 3.43 | 8 | 4.29 | 7,8 | |||||||||||||||||||||||||||||||||||||||||||||||||||||||||||||||||||||||||||||||||||||||||||||
| Expenses including reductions | 1.97 | 7,9 | 3.85 | 8 | 4.21 | 8 | 3.28 | 8 | 3.44 | 7,8 | |||||||||||||||||||||||||||||||||||||||||||||||||||||||||||||||||||||||||||||||||||||||||||||
| Net investment loss | (0.30 | ) 7 | (1.99 | ) | (2.71 | ) | (2.31 | ) | (2.51 | ) 7 | |||||||||||||||||||||||||||||||||||||||||||||||||||||||||||||||||||||||||||||||||||||||||||||
| Portfolio turnover (%) | 83 | 485 | 403 | 396 | 375 | ||||||||||||||||||||||||||||||||||||||||||||||||||||||||||||||||||||||||||||||||||||||||||||||||||
| 1 | Six months ended 4-30-18. Unaudited. | ||||||||||||||||||||||||||||||||||||||||||||||||||||||||||||||||||||||||||||||||||
| 2 | Period from 12-20-13 (commencement of operations) to 10-31-14. | ||||||||||||||||||||||||||||||||||||||||||||||||||||||||||||||||||||||||||||||||||
| 3 | Based on average daily shares outstanding. | ||||||||||||||||||||||||||||||||||||||||||||||||||||||||||||||||||||||||||||||||||
| 4 | Total returns would have been lower had certain expenses not been reduced during the applicable periods. | ||||||||||||||||||||||||||||||||||||||||||||||||||||||||||||||||||||||||||||||||||
| 5 | Does not reflect the effect of sales charges, if any. | ||||||||||||||||||||||||||||||||||||||||||||||||||||||||||||||||||||||||||||||||||
| 6 | Not annualized. | ||||||||||||||||||||||||||||||||||||||||||||||||||||||||||||||||||||||||||||||||||
| 7 | Annualized. | ||||||||||||||||||||||||||||||||||||||||||||||||||||||||||||||||||||||||||||||||||
| 8 | Includes dividends on investments sold short and broker fees and expenses on short sales for the periods ended 10-31-17, 10-31-16, 10-31-15 and 10-31-14, which were equivalent to a net annual effective rate of 1.84%, 2.16%, 1.34% and 1.11%, respectively, of the fund's average daily net assets. | ||||||||||||||||||||||||||||||||||||||||||||||||||||||||||||||||||||||||||||||||||
| 9 | Expense ratios have decreased due to a change in the fund's fundamental investment restrictions and the related discontinued use of prime brokerage services and their associated expenses on short sales (dividends on investments sold short and broker fees and expenses on short sales). | ||||||||||||||||||||||||||||||||||||||||||||||||||||||||||||||||||||||||||||||||||
| Class C Shares Period ended | 4-30-18 | 1 | 10-31-17 | 10-31-16 | 10-31-15 | 10-31-14 | 2 | ||||||||||||||||||||||||||||||||||||||||||||||||||||||||||||||||||||||||||||||||||||||||||||||||
| Per share operating performance | |||||||||||||||||||||||||||||||||||||||||||||||||||||||||||||||||||||||||||||||||||||||||||||||||||||||
| Net asset value, beginning of period | $11.57 | $10.30 | $10.74 | $10.10 | $9.86 | ||||||||||||||||||||||||||||||||||||||||||||||||||||||||||||||||||||||||||||||||||||||||||||||||||
| Net investment loss3 | (0.06 | ) | (0.29 | ) | (0.35 | ) | (0.32 | ) | (0.15 | ) | |||||||||||||||||||||||||||||||||||||||||||||||||||||||||||||||||||||||||||||||||||||||||||||
| Net realized and unrealized gain (loss) on investments | 0.22 | 1.57 | (0.04 | ) | 0.96 | 0.39 | |||||||||||||||||||||||||||||||||||||||||||||||||||||||||||||||||||||||||||||||||||||||||||||||||
| Total from investment operations | 0.16 | 1.28 | (0.39 | ) | 0.64 | 0.24 | |||||||||||||||||||||||||||||||||||||||||||||||||||||||||||||||||||||||||||||||||||||||||||||||||
| Less distributions | |||||||||||||||||||||||||||||||||||||||||||||||||||||||||||||||||||||||||||||||||||||||||||||||||||||||
| From net realized gain | (0.91 | ) | (0.01 | ) | (0.05 | ) | — | — | |||||||||||||||||||||||||||||||||||||||||||||||||||||||||||||||||||||||||||||||||||||||||||||||
| Net asset value, end of period | $10.82 | $11.57 | $10.30 | $10.74 | $10.10 | ||||||||||||||||||||||||||||||||||||||||||||||||||||||||||||||||||||||||||||||||||||||||||||||||||
| Total return (%)4,5 | 1.50 | 6 | 12.38 | (3.61 | ) | 6.34 | 2.43 | 6 | |||||||||||||||||||||||||||||||||||||||||||||||||||||||||||||||||||||||||||||||||||||||||||||||
| Ratios and supplemental data | |||||||||||||||||||||||||||||||||||||||||||||||||||||||||||||||||||||||||||||||||||||||||||||||||||||||
| Net assets, end of period (in millions) | $13 | $12 | $16 | $9 | — | 7 | |||||||||||||||||||||||||||||||||||||||||||||||||||||||||||||||||||||||||||||||||||||||||||||||||
| Ratios (as a percentage of average net assets): | |||||||||||||||||||||||||||||||||||||||||||||||||||||||||||||||||||||||||||||||||||||||||||||||||||||||
| Expenses before reductions | 2.68 | 8,11 | 4.56 | 9 | 4.93 | 9 | 4.34 | 9 | 10.15 | 8,9 | |||||||||||||||||||||||||||||||||||||||||||||||||||||||||||||||||||||||||||||||||||||||||||||
| Expenses including reductions | 2.67 | 8,11 | 4.55 | 9 | 4.92 | 9 | 4.00 | 9 | 4.12 | 8,9 | |||||||||||||||||||||||||||||||||||||||||||||||||||||||||||||||||||||||||||||||||||||||||||||
| Net investment loss | (1.00 | ) 8 | (2.66 | ) | (3.42 | ) | (3.04 | ) | (3.31 | ) 8 | |||||||||||||||||||||||||||||||||||||||||||||||||||||||||||||||||||||||||||||||||||||||||||||
| Portfolio turnover (%) | 83 | 485 | 403 | 396 | 375 | 10 | |||||||||||||||||||||||||||||||||||||||||||||||||||||||||||||||||||||||||||||||||||||||||||||||||
| 1 | Six months ended 4-30-18. Unaudited. | ||||||||||||||||||||||||||||||||||||||||||||||||||||||||||||||||||||||||||||||||||
| 2 | The inception date for Class C shares is 5-16-14. | ||||||||||||||||||||||||||||||||||||||||||||||||||||||||||||||||||||||||||||||||||
| 3 | Based on average daily shares outstanding. | ||||||||||||||||||||||||||||||||||||||||||||||||||||||||||||||||||||||||||||||||||
| 4 | Total returns would have been lower had certain expenses not been reduced during the applicable periods. | ||||||||||||||||||||||||||||||||||||||||||||||||||||||||||||||||||||||||||||||||||
| 5 | Does not reflect the effect of sales charges, if any. | ||||||||||||||||||||||||||||||||||||||||||||||||||||||||||||||||||||||||||||||||||
| 6 | Not annualized. | ||||||||||||||||||||||||||||||||||||||||||||||||||||||||||||||||||||||||||||||||||
| 7 | Less than $500,000. | ||||||||||||||||||||||||||||||||||||||||||||||||||||||||||||||||||||||||||||||||||
| 8 | Annualized. | ||||||||||||||||||||||||||||||||||||||||||||||||||||||||||||||||||||||||||||||||||
| 9 | Includes dividends on investments sold short and broker fees and expenses on short sales for the periods ended 10-31-17, 10-31-16, 10-31-15 and 10-31-14, which were equivalent to a net annual effective rate of 1.84%, 2.16%, 1.34% and 1.11%, respectively, of the fund's average daily net assets. | ||||||||||||||||||||||||||||||||||||||||||||||||||||||||||||||||||||||||||||||||||
| 10 | The portfolio turnover is shown for the period from 12-20-13 to 10-31-14. | ||||||||||||||||||||||||||||||||||||||||||||||||||||||||||||||||||||||||||||||||||
| 11 | Expense ratios have decreased due to a change in the fund's fundamental investment restrictions and the related discontinued use of prime brokerage services and their associated expenses on short sales (dividends on investments sold short and broker fees and expenses on short sales). | ||||||||||||||||||||||||||||||||||||||||||||||||||||||||||||||||||||||||||||||||||
| Class I Shares Period ended | 4-30-18 | 1 | 10-31-17 | 10-31-16 | 10-31-15 | 10-31-14 | 2 | ||||||||||||||||||||||||||||||||||||||||||||||||||||||||||||||||||||||||||||||||||||||||||||||||
| Per share operating performance | |||||||||||||||||||||||||||||||||||||||||||||||||||||||||||||||||||||||||||||||||||||||||||||||||||||||
| Net asset value, beginning of period | $11.97 | $10.55 | $10.89 | $10.13 | $10.00 | ||||||||||||||||||||||||||||||||||||||||||||||||||||||||||||||||||||||||||||||||||||||||||||||||||
| Net investment loss3 | — | (0.19 | ) | (0.25 | ) | (0.21 | ) | (0.19 | ) | ||||||||||||||||||||||||||||||||||||||||||||||||||||||||||||||||||||||||||||||||||||||||||||||
| Net realized and unrealized gain (loss) on investments | 0.22 | 1.62 | (0.04 | ) | 0.97 | 0.32 | |||||||||||||||||||||||||||||||||||||||||||||||||||||||||||||||||||||||||||||||||||||||||||||||||
| Total from investment operations | 0.22 | 1.43 | (0.29 | ) | 0.76 | 0.13 | |||||||||||||||||||||||||||||||||||||||||||||||||||||||||||||||||||||||||||||||||||||||||||||||||
| Less distributions | |||||||||||||||||||||||||||||||||||||||||||||||||||||||||||||||||||||||||||||||||||||||||||||||||||||||
| From net realized gain | (0.91 | ) | (0.01 | ) | (0.05 | ) | — | — | |||||||||||||||||||||||||||||||||||||||||||||||||||||||||||||||||||||||||||||||||||||||||||||||
| Net asset value, end of period | $11.28 | $11.97 | $10.55 | $10.89 | $10.13 | ||||||||||||||||||||||||||||||||||||||||||||||||||||||||||||||||||||||||||||||||||||||||||||||||||
| Total return (%)4 | 1.97 | 5 | 13.51 | (2.64 | ) | 7.50 | 1.30 | 5 | |||||||||||||||||||||||||||||||||||||||||||||||||||||||||||||||||||||||||||||||||||||||||||||||
| Ratios and supplemental data | |||||||||||||||||||||||||||||||||||||||||||||||||||||||||||||||||||||||||||||||||||||||||||||||||||||||
| Net assets, end of period (in millions) | $525 | $454 | $422 | $502 | $18 | ||||||||||||||||||||||||||||||||||||||||||||||||||||||||||||||||||||||||||||||||||||||||||||||||||
| Ratios (as a percentage of average net assets): | |||||||||||||||||||||||||||||||||||||||||||||||||||||||||||||||||||||||||||||||||||||||||||||||||||||||
| Expenses before reductions | 1.68 | 6,8 | 3.54 | 7 | 3.87 | 7 | 3.00 | 7 | 3.16 | 6,7 | |||||||||||||||||||||||||||||||||||||||||||||||||||||||||||||||||||||||||||||||||||||||||||||
| Expenses including reductions | 1.67 | 6,8 | 3.54 | 7 | 3.87 | 7 | 2.99 | 7 | 3.03 | 6,7 | |||||||||||||||||||||||||||||||||||||||||||||||||||||||||||||||||||||||||||||||||||||||||||||
| Net investment loss | 0.02 | 6 | (1.65 | ) | (2.40 | ) | (2.04 | ) | (2.20 | ) 6 | |||||||||||||||||||||||||||||||||||||||||||||||||||||||||||||||||||||||||||||||||||||||||||||
| Portfolio turnover (%) | 83 | 485 | 403 | 396 | 375 | ||||||||||||||||||||||||||||||||||||||||||||||||||||||||||||||||||||||||||||||||||||||||||||||||||
| 1 | Six months ended 4-30-18. Unaudited. | ||||||||||||||||||||||||||||||||||||||||||||||||||||||||||||||||||||||||||||||||||
| 2 | Period from 12-20-13 (commencement of operations) to 10-31-14. | ||||||||||||||||||||||||||||||||||||||||||||||||||||||||||||||||||||||||||||||||||
| 3 | Based on average daily shares outstanding. | ||||||||||||||||||||||||||||||||||||||||||||||||||||||||||||||||||||||||||||||||||
| 4 | Total returns would have been lower had certain expenses not been reduced during the applicable periods. | ||||||||||||||||||||||||||||||||||||||||||||||||||||||||||||||||||||||||||||||||||
| 5 | Not annualized. | ||||||||||||||||||||||||||||||||||||||||||||||||||||||||||||||||||||||||||||||||||
| 6 | Annualized. | ||||||||||||||||||||||||||||||||||||||||||||||||||||||||||||||||||||||||||||||||||
| 7 | Includes dividends on investments sold short and broker fees and expenses on short sales for the periods ended 10-31-17, 10-31-16, 10-31-15 and 10-31-14, which were equivalent to a net annual effective rate of 1.84%, 2.16%, 1.34% and 1.11%, respectively, of the fund's average daily net assets. | ||||||||||||||||||||||||||||||||||||||||||||||||||||||||||||||||||||||||||||||||||
| 8 | Expense ratios have decreased due to a change in the fund's fundamental investment restrictions and the related discontinued use of prime brokerage services and their associated expenses on short sales (dividends on investments sold short and broker fees and expenses on short sales). | ||||||||||||||||||||||||||||||||||||||||||||||||||||||||||||||||||||||||||||||||||
| Class R6 Shares Period ended | 4-30-18 | 1 | 10-31-17 | 10-31-16 | 10-31-15 | 10-31-14 | 2 | ||||||||||||||||||||||||||||||||||||||||||||||||||||||||||||||||||||||||||||||||||||||||||||||||
| Per share operating performance | |||||||||||||||||||||||||||||||||||||||||||||||||||||||||||||||||||||||||||||||||||||||||||||||||||||||
| Net asset value, beginning of period | $12.04 | $10.60 | $10.93 | $10.16 | $10.00 | ||||||||||||||||||||||||||||||||||||||||||||||||||||||||||||||||||||||||||||||||||||||||||||||||||
| Net investment income (loss)3 | 0.01 | (0.19 | ) | (0.24 | ) | (0.22 | ) | (0.17 | ) | ||||||||||||||||||||||||||||||||||||||||||||||||||||||||||||||||||||||||||||||||||||||||||||||
| Net realized and unrealized gain (loss) on investments | 0.22 | 1.64 | (0.04 | ) | 0.99 | 0.33 | |||||||||||||||||||||||||||||||||||||||||||||||||||||||||||||||||||||||||||||||||||||||||||||||||
| Total from investment operations | 0.23 | 1.45 | (0.28 | ) | 0.77 | 0.16 | |||||||||||||||||||||||||||||||||||||||||||||||||||||||||||||||||||||||||||||||||||||||||||||||||
| Less distributions | |||||||||||||||||||||||||||||||||||||||||||||||||||||||||||||||||||||||||||||||||||||||||||||||||||||||
| From net realized gain | (0.91 | ) | (0.01 | ) | (0.05 | ) | — | — | |||||||||||||||||||||||||||||||||||||||||||||||||||||||||||||||||||||||||||||||||||||||||||||||
| Total distributions | (0.91 | ) | (0.01 | ) | (0.05 | ) | — | — | |||||||||||||||||||||||||||||||||||||||||||||||||||||||||||||||||||||||||||||||||||||||||||||||
| Net asset value, end of period | $11.36 | $12.04 | $10.60 | $10.93 | $10.16 | ||||||||||||||||||||||||||||||||||||||||||||||||||||||||||||||||||||||||||||||||||||||||||||||||||
| Total return (%)4 | 2.05 | 5 | 13.64 | (2.54 | ) | 7.58 | 1.60 | 5 | |||||||||||||||||||||||||||||||||||||||||||||||||||||||||||||||||||||||||||||||||||||||||||||||
| Ratios and supplemental data | |||||||||||||||||||||||||||||||||||||||||||||||||||||||||||||||||||||||||||||||||||||||||||||||||||||||
| Net assets, end of period (in millions) | $14 | $9 | $5 | — | 6 | — | 6 | ||||||||||||||||||||||||||||||||||||||||||||||||||||||||||||||||||||||||||||||||||||||||||||||||
| Ratios (as a percentage of average net assets): | |||||||||||||||||||||||||||||||||||||||||||||||||||||||||||||||||||||||||||||||||||||||||||||||||||||||
| Expenses before reductions | 1.59 | 7,9 | 3.45 | 8 | 4.04 | 8 | 5.99 | 8 | 22.57 | 78 | |||||||||||||||||||||||||||||||||||||||||||||||||||||||||||||||||||||||||||||||||||||||||||||
| Expenses including reductions | 1.58 | 7,9 | 3.44 | 8 | 4.01 | 8 | 3.03 | 8 | 2.84 | 78 | |||||||||||||||||||||||||||||||||||||||||||||||||||||||||||||||||||||||||||||||||||||||||||||
| Net investment income (loss) | 0.17 | 7 | (1.57 | ) | (2.35 | ) | (2.05 | ) | (1.90 | ) 7 | |||||||||||||||||||||||||||||||||||||||||||||||||||||||||||||||||||||||||||||||||||||||||||||
| Portfolio turnover (%) | 83 | 485 | 403 | 396 | 375 | ||||||||||||||||||||||||||||||||||||||||||||||||||||||||||||||||||||||||||||||||||||||||||||||||||
| 1 | Six months ended 4-30-18. Unaudited. | ||||||||||||||||||||||||||||||||||||||||||||||||||||||||||||||||||||||||||||||||||
| 2 | Period from 12-20-13 (commencement of operations) to 10-31-14. | ||||||||||||||||||||||||||||||||||||||||||||||||||||||||||||||||||||||||||||||||||
| 3 | Based on average daily shares outstanding. | ||||||||||||||||||||||||||||||||||||||||||||||||||||||||||||||||||||||||||||||||||
| 4 | Total returns would have been lower had certain expenses not been reduced during the applicable periods. | ||||||||||||||||||||||||||||||||||||||||||||||||||||||||||||||||||||||||||||||||||
| 5 | Not annualized. | ||||||||||||||||||||||||||||||||||||||||||||||||||||||||||||||||||||||||||||||||||
| 6 | Less than $500,000. | ||||||||||||||||||||||||||||||||||||||||||||||||||||||||||||||||||||||||||||||||||
| 7 | Annualized. | ||||||||||||||||||||||||||||||||||||||||||||||||||||||||||||||||||||||||||||||||||
| 8 | Includes dividends on investments sold short and broker fees and expenses on short sales for the periods ended 10-31-17, 10-31-16, 10-31-15 and 10-31-14, which were equivalent to a net annual effective rate of 1.84%, 2.16%, 1.34% and 1.11%, respectively, of the fund's average daily net assets. | ||||||||||||||||||||||||||||||||||||||||||||||||||||||||||||||||||||||||||||||||||
| 9 | Expense ratios have decreased due to a change in the fund's fundamental investment restrictions and the related discontinued use of prime brokerage services and their associated expenses on short sales (dividends on investments sold short and broker fees and expenses on short sales). | ||||||||||||||||||||||||||||||||||||||||||||||||||||||||||||||||||||||||||||||||||
| Class NAV Shares Period ended | 4-30-18 | 1 | 10-31-17 | 10-31-16 | 10-31-15 | 10-31-14 | 2 | ||||||||||||||||||||||||||||||||||||||||||||||||||||||||||||||||||||||||||||||||||||||||||||||||
| Per share operating performance | |||||||||||||||||||||||||||||||||||||||||||||||||||||||||||||||||||||||||||||||||||||||||||||||||||||||
| Net asset value, beginning of period | $12.04 | $10.60 | $10.93 | $10.16 | $10.00 | ||||||||||||||||||||||||||||||||||||||||||||||||||||||||||||||||||||||||||||||||||||||||||||||||||
| Net investment loss3 | 0.01 | (0.17 | ) | (0.24 | ) | (0.20 | ) | (0.17 | ) | ||||||||||||||||||||||||||||||||||||||||||||||||||||||||||||||||||||||||||||||||||||||||||||||
| Net realized and unrealized gain (loss) on investments | 0.22 | 1.62 | (0.04 | ) | 0.97 | 0.33 | |||||||||||||||||||||||||||||||||||||||||||||||||||||||||||||||||||||||||||||||||||||||||||||||||
| Total from investment operations | 0.23 | 1.45 | (0.28 | ) | 0.77 | 0.16 | |||||||||||||||||||||||||||||||||||||||||||||||||||||||||||||||||||||||||||||||||||||||||||||||||
| Less distributions | |||||||||||||||||||||||||||||||||||||||||||||||||||||||||||||||||||||||||||||||||||||||||||||||||||||||
| From net realized gain | (0.91 | ) | (0.01 | ) | (0.05 | ) | — | — | |||||||||||||||||||||||||||||||||||||||||||||||||||||||||||||||||||||||||||||||||||||||||||||||
| Net asset value, end of period | $11.36 | $12.04 | $10.60 | $10.93 | $10.16 | ||||||||||||||||||||||||||||||||||||||||||||||||||||||||||||||||||||||||||||||||||||||||||||||||||
| Total return (%)4 | 2.05 | 5 | 13.64 | (2.54 | ) | 7.58 | 1.60 | 5 | |||||||||||||||||||||||||||||||||||||||||||||||||||||||||||||||||||||||||||||||||||||||||||||||
| Ratios and supplemental data | |||||||||||||||||||||||||||||||||||||||||||||||||||||||||||||||||||||||||||||||||||||||||||||||||||||||
| Net assets, end of period (in millions) | $142 | $152 | $185 | $230 | $196 | ||||||||||||||||||||||||||||||||||||||||||||||||||||||||||||||||||||||||||||||||||||||||||||||||||
| Ratios (as a percentage of average net assets): | |||||||||||||||||||||||||||||||||||||||||||||||||||||||||||||||||||||||||||||||||||||||||||||||||||||||
| Expenses before reductions | 1.57 | 6,8 | 3.44 | 7 | 3.78 | 7 | 2.99 | 7 | 2.87 | 6,7 | |||||||||||||||||||||||||||||||||||||||||||||||||||||||||||||||||||||||||||||||||||||||||||||
| Expenses including reductions | 1.56 | 6,8 | 3.43 | 7 | 3.77 | 7 | 2.99 | 7 | 2.85 | 6,7 | |||||||||||||||||||||||||||||||||||||||||||||||||||||||||||||||||||||||||||||||||||||||||||||
| Net investment loss | 0.09 | 6 | (1.54 | ) | (2.30 | ) | (1.82 | ) | (1.91 | ) 6 | |||||||||||||||||||||||||||||||||||||||||||||||||||||||||||||||||||||||||||||||||||||||||||||
| Portfolio turnover (%) | 83 | 485 | 403 | 396 | 375 | ||||||||||||||||||||||||||||||||||||||||||||||||||||||||||||||||||||||||||||||||||||||||||||||||||
| 1 | Six months ended 4-30-18. Unaudited. | ||||||||||||||||||||||||||||||||||||||||||||||||||||||||||||||||||||||||||||||||||
| 2 | Period from 12-20-13 (commencement of operations) to 10-31-14. | ||||||||||||||||||||||||||||||||||||||||||||||||||||||||||||||||||||||||||||||||||
| 3 | Based on average daily shares outstanding. | ||||||||||||||||||||||||||||||||||||||||||||||||||||||||||||||||||||||||||||||||||
| 4 | Total returns would have been lower had certain expenses not been reduced during the applicable periods. | ||||||||||||||||||||||||||||||||||||||||||||||||||||||||||||||||||||||||||||||||||
| 5 | Not annualized. | ||||||||||||||||||||||||||||||||||||||||||||||||||||||||||||||||||||||||||||||||||
| 6 | Annualized. | ||||||||||||||||||||||||||||||||||||||||||||||||||||||||||||||||||||||||||||||||||
| 7 | Includes dividends on investments sold short and broker fees and expenses on short sales for the periods ended 10-31-17, 10-31-16, 10-31-15 and 10-31-14, which were equivalent to a net annual effective rate of 1.84%, 2.16%, 1.34% and 1.11%, respectively, of the fund's average daily net assets. | ||||||||||||||||||||||||||||||||||||||||||||||||||||||||||||||||||||||||||||||||||
| 8 | Expense ratios have decreased due to a change in the fund's fundamental investment restrictions and the related discontinued use of prime brokerage services and their associated expenses on short sales (dividends on investments sold short and broker fees and expenses on short sales). | ||||||||||||||||||||||||||||||||||||||||||||||||||||||||||||||||||||||||||||||||||
Note 1 — Organization
John Hancock Seaport Long/Short Fund, formerly John Hancock Seaport Fund, (the fund) is a series of John Hancock Investment Trust (the Trust), an open-end management investment company organized as a Massachusetts business trust and registered under the Investment Company Act of 1940, as amended (the 1940 Act). The investment objective of the fund is to seek capital appreciation.
The fund may offer multiple classes of shares. The shares currently offered by the fund are detailed in the Statement of assets and liabilities. Class A and Class C are offered to all investors. Class I shares are offered to institutions and certain investors. Class R6 shares are only available to certain retirement plans, institutions and other investors. Class NAV shares are offered to John Hancock affiliated funds of funds, retirement plans for employees of John Hancock and/or Manulife Financial Corporation (MFC), and certain 529 plans. Shareholders of each class have exclusive voting rights to matters that affect that class. The distribution and service fees, if any, and transfer agent fees for each class may differ. Effective May 1, 2018, Class C shares convert to Class A shares ten years after purchase (certain exclusions may apply).
Effective April 20, 2018, John Hancock Seaport Fund changed its name to John Hancock Seaport Long/Short Fund.
Note 2 — Significant accounting policies
The financial statements have been prepared in conformity with accounting principles generally accepted in the United States of America (US GAAP), which require management to make certain estimates and assumptions as of the date of the financial statements. Actual results could differ from those estimates and those differences could be significant. The fund qualifies as an investment company under Topic 946 of Accounting Standards Codification of US GAAP.
Events or transactions occurring after the end of the fiscal period through the date that the financial statements were issued have been evaluated in the preparation of the financial statements. The following summarizes the significant accounting policies of the fund:
Security valuation. Investments are stated at value as of the scheduled close of regular trading on the New York Stock Exchange (NYSE), normally at 4:00 p.m., Eastern Time. In case of emergency or other disruption resulting in the NYSE not opening for trading or the NYSE closing at a time other than the regularly scheduled close, the net asset value (NAV) may be determined as of the regularly scheduled close of the NYSE pursuant to the fund's Valuation Policies and Procedures.
In order to value the securities, the fund uses the following valuation techniques: Equity securities held by the fund are typically valued at the last sale price or official closing price on the exchange or principal market where the security trades. In the event there were no sales during the day or closing prices are not available, the securities are valued using the last available bid price. Investments by the fund in open-end management investment companies are valued at their respective NAVs each business day. Debt obligations are valued based on the evaluated prices provided by an independent pricing vendor or from broker-dealers. Independent pricing vendors utilize matrix pricing which takes into account factors such as institutional-size trading in similar groups of securities, yield, quality, coupon rate, maturity, type of issue, trading characteristics and other market data, as well as broker supplied prices. Options listed on an exchange are valued at the mean of the most recent bid and ask prices from the exchange where the option trades. Swaps and unlisted options are valued using evaluated prices obtained from an independent pricing vendor. Futures contracts are typically valued at settlement prices, which are the official closing prices published by the exchange on which they trade. Foreign securities and currencies, including forward foreign currency contracts, are valued in U.S. dollars based on foreign currency exchange rates supplied by an independent pricing vendor.
In certain instances, the Pricing Committee may determine to value equity securities using prices obtained from another exchange or market if trading on the exchange or market on which prices are typically obtained did not open for trading as scheduled, or if trading closed earlier than scheduled, and trading occurred as normal on another exchange or market.
Other portfolio securities and assets, for which reliable market quotations are not readily available, are valued at fair value as determined in good faith by the fund's Pricing Committee following procedures established by the Board of Trustees. The frequency with which these fair valuation procedures are used cannot be predicted and fair value of securities may differ
significantly from the value that would have been used had a ready market for such securities existed. Trading in foreign securities may be completed before the scheduled daily close of trading on the NYSE. Significant events at the issuer or market level may affect the values of securities between the time when the valuation of the securities is generally determined and the close of the NYSE. If a significant event occurs, these securities may be fair valued, as determined in good faith by the fund's Pricing Committee, following procedures established by the Board of Trustees. The fund uses fair value adjustment factors provided by an independent pricing vendor to value certain foreign securities in order to adjust for events that may occur between the close of foreign exchanges or markets and the close of the NYSE.
The fund uses a three-tier hierarchy to prioritize the pricing assumptions, referred to as inputs, used in valuation techniques to measure fair value. Level 1 includes securities valued using quoted prices in active markets for identical securities. Level 2 includes securities valued using other significant observable inputs. Observable inputs may include quoted prices for similar securities, interest rates, prepayment speeds and credit risk. Prices for securities valued using these inputs are received from independent pricing vendors and brokers and are based on an evaluation of the inputs described. Level 3 includes securities valued using significant unobservable inputs when market prices are not readily available or reliable, including the fund's own assumptions in determining the fair value of investments. Factors used in determining value may include market or issuer specific events or trends, changes in interest rates and credit quality. The inputs or methodology used for valuing securities are not necessarily an indication of the risks associated with investing in those securities. Changes in valuation techniques and related inputs may result in transfers into or out of an assigned level within the disclosure hierarchy.
The following is a summary of the values by input classification of the fund's investments as of April 30, 2018, by major security category or type:
| Total value at 4-30-18 | Level 1 quoted price | Level 2 significant observable inputs | Level 3 significant unobservable inputs | ||
| Investments in securities: | |||||
| Assets | |||||
| Common stocks | |||||
| Consumer discretionary | $28,203,284 | $24,773,943 | $3,287,605 | $141,736 | |
| Consumer staples | 560,564 | — | 560,564 | — | |
| Energy | 40,599,863 | 37,517,803 | 3,082,060 | — | |
| Financials | 117,228,793 | 35,389,616 | 81,839,177 | — | |
| Health care | 108,411,353 | 70,222,334 | 37,763,525 | 425,494 | |
| Industrials | 31,311,014 | 14,733,532 | 16,577,482 | — | |
| Information technology | 74,481,629 | 59,713,340 | 14,768,289 | — | |
| Materials | 17,975,369 | 12,445,172 | 5,530,197 | — | |
| Real estate | 6,042,095 | 2,913,110 | 3,128,985 | — | |
| Telecommunication services | 7,088,585 | 2,542,418 | 4,546,167 | — | |
| Utilities | 15,249,736 | 7,170,143 | 8,079,593 | — | |
| Preferred securities | |||||
| Financials | 1,682,375 | — | 1,682,375 | — | |
| Utilities | 697,494 | 305,188 | 392,306 | — | |
| Warrants | 111,121 | 111,121 | — | — | |
| Purchased options | 5,560,659 | 2,272,772 | 3,287,887 | — | |
| Term loans | 375,489 | — | 375,489 | — | |
| Short-term investments | 213,924,361 | 9,912,896 | 204,011,465 | — | |
| Total investments in securities | $669,503,784 | $280,023,388 | $388,913,166 | $567,230 | |
| Total value at 4-30-18 | Level 1 quoted price | Level 2 significant observable inputs | Level 3 significant unobservable inputs | |||||||||||
| Derivatives: | ||||||||||||||
| Assets | ||||||||||||||
| Futures | $638,297 | $638,297 | — | — | ||||||||||
| Forward foreign currency contracts | 819,660 | — | $819,660 | — | ||||||||||
| Swap contracts | 10,917,316 | — | 10,917,316 | — | ||||||||||
| Liabilities | ||||||||||||||
| Futures | (55,839 | ) | (55,839 | ) | — | — | ||||||||
| Forward foreign currency contracts | (147,925 | ) | — | (147,925 | ) | — | ||||||||
| Written options | (463,637 | ) | (347,357 | ) | (116,280 | ) | — | |||||||
| Swap contracts | (15,609,563 | ) | — | (15,609,563 | ) | — |
Security transactions and related investment income. Investment security transactions are accounted for on a trade date plus one basis for daily NAV calculations. However, for financial reporting purposes, investment transactions are reported on trade date. Interest income is accrued as earned. Interest income includes coupon interest and amortization/accretion of premiums/discounts on debt securities. Debt obligations may be placed in a non-accrual status and related interest income may be reduced by stopping current accruals and writing off interest receivable when the collection of all or a portion of interest has become doubtful. Dividend income is recorded on the ex-date, except for dividends of foreign securities where the dividend may not be known until after the ex-date. In those cases, dividend income, net of withholding taxes, is recorded when the fund becomes aware of the dividends. Gains and losses on securities sold are determined on the basis of identified cost and may include proceeds from litigation.
Foreign investing. Assets, including investments and liabilities denominated in foreign currencies, are translated into U.S. dollar values each day at the prevailing exchange rate. Purchases and sales of securities, income and expenses are translated into U.S. dollars at the prevailing exchange rate on the date of the transaction. The effect of changes in foreign currency exchange rates on the value of securities is reflected as a component of the realized and unrealized gains (losses) on investments. Foreign investments are subject to a decline in the value of a foreign currency versus the U.S. dollar, which reduces the dollar value of securities denominated in that currency.
Funds that invest internationally generally carry more risk than funds that invest strictly in U.S. securities. These risks are heightened for investments in emerging markets Risks can result from differences in economic and political conditions, regulations, market practices (including higher transaction costs), accounting standards and other factors.
Foreign taxes. The fund may be subject to withholding tax on income, capital gains or repatriation taxes imposed by certain countries, a portion of which may be recoverable. Foreign taxes are accrued based upon the fund's understanding of the tax rules and rates that exist in the foreign markets in which it invests. Taxes are accrued based on gains realized by the fund as a result of certain foreign security sales. Estimated taxes are accrued based on unrealized appreciation of such securities. Investment income is recorded net of foreign withholding taxes, less any amounts reclaimable.
Line of credit. The fund may have the ability to borrow from banks for temporary or emergency purposes, including meeting redemption requests that otherwise might require the untimely sale of securities. Pursuant to the fund's custodian agreement, the custodian may loan money to the fund to make properly authorized payments. The fund is obligated to repay the custodian for any overdraft, including any related costs or expenses. The custodian may have a lien, security interest or security entitlement in any fund property that is not otherwise segregated or pledged, to the extent of any overdraft, and to the maximum extent permitted by law.
The fund and other affiliated funds have entered into a syndicated line of credit agreement with Citibank, N.A. as the administrative agent that enables them to participate in a $750 million unsecured committed line of credit. Excluding commitments designated for a certain fund and subject to the needs of all other affiliated funds, the fund can borrow up to
an aggregate commitment amount of $500 million, subject to asset coverage and other limitations as specified in the agreement. A commitment fee payable at the end of each calendar quarter, based on the average daily unused portion of the line of credit, is charged to each participating fund based on a combination of fixed and asset based allocations and is reflected in Other expenses on the Statement of operations. For the six months ended April 30, 2018, the fund had no borrowings under the line of credit. Commitment fees for the six months ended April 30, 2018, were $2,248.
Expenses. Within the John Hancock group of funds complex, expenses that are directly attributable to an individual fund are allocated to such fund. Expenses that are not readily attributable to a specific fund are allocated among all funds in an equitable manner, taking into consideration, among other things, the nature and type of expense and the fund's relative net assets. Expense estimates are accrued in the period to which they relate and adjustments are made when actual amounts are known.
Class allocations. Income, common expenses and realized and unrealized gains (losses) are determined at the fund level and allocated daily to each class of shares based on the net assets of the class. Class-specific expenses, such as distribution and service fees, if any, and transfer agent fees, for all classes, are charged daily at the class level based on the net assets of each class and the specific expense rates applicable to each class.
Federal income taxes. The fund intends to continue to qualify as a regulated investment company by complying with the applicable provisions of the Internal Revenue Code and will not be subject to federal income tax on taxable income that is distributed to shareholders. Therefore, no federal income tax provision is required.
As of October 31, 2017, the fund had no uncertain tax positions that would require financial statement recognition, derecognition or disclosure. The fund's federal tax returns are subject to examination by the Internal Revenue Service for a period of three years.
Distribution of income and gains. Distributions to shareholders from net investment income and net realized gains, if any, are recorded on the ex-date. The fund generally declares and pays dividends and capital gain distributions, if any, annually.
Distributions paid by the fund with respect to each class of shares are calculated in the same manner, at the same time and in the same amount, except for the effect of class level expenses that may be applied differently to each class.
Such distributions, on a tax basis, are determined in conformity with income tax regulations, which may differ from US GAAP. Distributions in excess of tax basis earnings and profits, if any, are reported in the fund's financial statements as a return of capital. The final determination of tax characteristics of the fund's distribution will occur at the end of the year and will subsequently be reported to shareholders.
Capital accounts within the financial statements are adjusted for permanent book-tax differences. These adjustments have no impact on net assets or the results of operations. Temporary book-tax differences, if any, will reverse in a subsequent period. Book-tax differences are primarily attributable to net operating losses, foreign currency transactions, wash sale loss deferrals, investments in passive foreign investment companies, and derivative transactions.
Note 3 — Derivative Instruments
The fund may invest in derivatives in order to meet its investment objective. Derivatives include a variety of different instruments that may be traded in the over-the-counter (OTC) market, on a regulated exchange or through a clearing facility. The risks in using derivatives vary depending upon the structure of the instruments, including the use of leverage, optionality, the liquidity or lack of liquidity of the contract, the creditworthiness of the counterparty or clearing organization and the volatility of the position. Some derivatives involve risks that are potentially greater than the risks associated with investing directly in the referenced securities or other referenced underlying instrument. Specifically, the fund is exposed to the risk that the counterparty to an OTC derivatives contract will be unable or unwilling to make timely settlement payments or otherwise honor its obligations. OTC derivatives transactions typically can only be closed out with the other party to the transaction.
Forward foreign currency contracts, certain options and certain swaps are typically traded through the OTC market. Certain forwards, options and swaps are regulated by the Commodity Futures Trading Commission. Derivative counterparty risk is
managed through an ongoing evaluation of the creditworthiness of all potential counterparties and, if applicable, designated clearing organizations. The fund attempts to reduce its exposure to counterparty risk for derivatives traded in the OTC market, whenever possible, by entering into an International Swaps and Derivatives Association (ISDA) Master Agreement with each of its OTC counterparties. The ISDA gives each party to the agreement the right to terminate all transactions traded under the agreement if there is certain deterioration in the credit quality or contractual default of the other party, as defined in the ISDA. Upon an event of default or a termination of the ISDA, the non-defaulting party has the right to close out all transactions and to net amounts owed.
As defined by the ISDA, the fund may have collateral agreements with certain counterparties to mitigate counterparty risk on OTC derivatives. Subject to established minimum levels, collateral for OTC transactions is generally determined based on the net aggregate unrealized gain or loss on contracts with a particular counterparty. Collateral pledged to the fund is held in a segregated account by a third-party agent or held by the custodian bank for the benefit of the fund and can be in the form of cash or debt securities issued by the U.S. government or related agencies; collateral posted by the fund for OTC transactions is held in a segregated account at the fund's custodian and is noted in the accompanying fund's investments, or if cash is posted, on the Statement of assets and liabilities. The fund's risk of loss due to counterparty risk is equal to the asset value of outstanding contracts offset by collateral received.
Futures, certain options and centrally-cleared swaps are traded or cleared on an exchange or central clearinghouse. Exchange-traded or centrally-cleared transactions generally present less counterparty risk to a fund than OTC transactions. The exchange or clearinghouse stands between the fund and the broker to the contract and therefore, credit risk is generally limited to the failure of the exchange or clearinghouse and the clearing member.
Futures. A futures contract is a contractual agreement to buy or sell a particular currency or financial instrument at a pre-determined price in the future. Risks related to the use of futures contracts include possible illiquidity of the futures markets, contract prices that can be highly volatile and imperfectly correlated to movements in the underlying financial instrument and potential losses in excess of the amounts recognized on the Statement of assets and liabilities. Use of long futures contracts subjects the fund to the risk of loss up to the notional value of the futures contracts. Use of short futures contracts subjects the fund to unlimited risk of loss.
Upon entering into a futures contract, the fund is required to deposit initial margin with the broker in the form of cash or securities. The amount of required margin is generally based on a percentage of the contract value; this amount is the initial margin for the trade. The margin deposit must then be maintained at the established level over the life of the contract. Futures margin receivable / payable is included on the Statement of assets and liabilities. Futures contracts are marked-to-market daily and an appropriate payable or receivable for the change in value (variation margin) and unrealized gain or loss is recorded by the fund. When the contract is closed, the fund records a realized gain or loss equal to the difference between the value of the contract at the time it was opened and the value at the time it was closed.
During the six months ended April 30, 2018, the fund used futures contracts to manage against anticipated changes in securities markets. The fund held futures contracts with notional values ranging from $2.3 million to $20.0 million, as measured at each quarter end.
Forward foreign currency contracts. A forward foreign currency contract is an agreement between two parties to buy and sell specific currencies at a price that is set on the date of the contract. The forward contract calls for delivery of the currencies on a future date that is specified in the contract. Risks related to the use of forwards include the possible failure of counterparties to meet the terms of the forward agreement, the failure of the counterparties to timely post collateral if applicable, the risk that currency movements will not favor the fund thereby reducing the fund's total return, and the potential for losses in excess of the amounts recognized on the Statement of assets and liabilities.
The market value of a forward foreign currency contract fluctuates with changes in foreign currency exchange rates. Forward foreign currency contracts are marked-to-market daily and the change in value is recorded by the fund as an unrealized gain or loss. Realized gains or losses, equal to the difference between the value of the contract at the time it was opened and the value at the time it was closed, are recorded upon delivery or receipt of the currency or settlement with the counterparty.
During the six months ended April 30, 2018, the fund used forward foreign currency contracts to manage against anticipated charges in currency exchange rates and gain exposure to foreign currency. The fund held forward foreign currency contracts with U.S. Dollar notional values ranging from $45.6 million to $63.6 million, as measured at each quarter end.
Options. There are two types of options, put options and call options. Options are traded either OTC or on an exchange. A call option gives the purchaser of the option the right to buy (and the seller the obligation to sell) the underlying instrument at the exercise price. A put option gives the purchaser of the option the right to sell (and the writer the obligation to buy) the underlying instrument at the exercise price. Writing puts and buying calls may increase the fund's exposure to changes in the value of the underlying instrument. Buying puts and writing calls may decrease the fund's exposure to such changes. Risks related to the use of options include the loss of premiums, possible illiquidity of the options markets, trading restrictions imposed by an exchange and movements in underlying security values, and for written options, potential losses in excess of the amounts recognized on the Statement of assets and liabilities. In addition, OTC options are subject to the risks of all OTC derivatives contracts.
When the fund purchases an option, the premium paid by the fund is included in the Fund's investments and subsequently "marked-to-market" to reflect current market value. If the purchased option expires, the fund realizes a loss equal to the cost of the option. If the fund exercises a call option, the cost of the securities acquired by exercising the call is increased by the premium paid to buy the call. If the fund exercises a put option, it realizes a gain or loss from the sale of the underlying security and the proceeds from such sale are decreased by the premium paid. If the fund enters into a closing sale transaction, the fund realizes a gain or loss, depending on whether proceeds from the closing sale are greater or less than the original cost. When the fund writes an option, the premium received is included as a liability and subsequently "marked-to-market" to reflect the current market value of the option written. Premiums received from writing options that expire unexercised are recorded as realized gains. Premiums received from writing options which are exercised or are closed are added to or offset against the proceeds or amount paid on the transaction to determine the realized gain or loss. If a put option on a security is exercised, the premium received reduces the cost basis of the securities purchased by the fund.
During the six months ended April 30, 2018, the fund used purchased options contracts to manage against anticipated changes in securities markets, gain exposure to certain securities markets and as a substitute for securities purchased. The fund held purchased options contracts with market values ranging from $2.8 million to $6.8 million, as measured at each quarter end.
During the six months ended April 30, 2018, the fund wrote option contracts to manage against anticipated changes in securities markets, gain exposure to certain securities markets and as a substitute for securities purchased. The fund held written options contracts with market values ranging from $464,000 to $1.4 million, as measured at each quarter end.
Swaps. Swap agreements are agreements between the fund and counterparty to exchange cash flows, assets, foreign currencies or market-linked returns at specified intervals. Swap agreements are privately negotiated in the OTC market (OTC swaps) or may be executed on a registered commodities exchange (centrally cleared swaps). Swaps are marked-to-market daily and the change in value is recorded as a component of unrealized appreciation/depreciation of swap contracts. The value of the swap will typically impose collateral posting obligations on the party that is considered out-of-the-money on the swap.
Upfront payments made/received by the fund are amortized/accreted for financial reporting purposes, with the unamortized/unaccreted portion included in the Statement of assets and liabilities. A termination payment by the counterparty or the fund is recorded as realized gain or loss, as well as the net periodic payments received or paid by the fund.
Entering into swap agreements involves, to varying degrees, elements of credit, market and documentation risk that may provide outcomes that are in excess of the amounts recognized on the Statement of assets and liabilities. Such risks involve the possibility that there will be no liquid market for the swap, or that a counterparty may default on its obligation or delay payment under the swap terms. The counterparty may disagree or contest the terms of the swap. In addition to interest rate risk, market risks may also impact the swap. The fund may also suffer losses if it is unable to terminate or assign outstanding swaps or reduce its exposure through offsetting transactions.
Credit default swaps. Credit default swaps (CDS) involve the exchange of a fixed rate premium (paid by the Buyer), for protection against the loss in value of an underlying debt instrument, referenced entity or index, in the event of a defined credit event (such as payment default or bankruptcy). Under the terms of the swap, one party acts as a "guarantor" (the Seller), receiving the premium and agreeing to contingent payments that are specified within the credit default agreement. The fund may enter into CDS in which it may act as either Buyer or Seller. By acting as the Seller, the fund may incur economic leverage since it would be obligated to pay the Buyer the notional amount of the contract in the event of a default. The amount of loss in such case could be significant, but would typically be reduced by any recovery value on the underlying credit.
During the six months ended April 30, 2018, the fund used CDS as a Buyer of protection to manage against potential credit events. The fund held credit default swap contracts with total USD notional amounts approximately $11.8 million, as measured at each quarter end.
Total Return Swaps. The fund may enter into total return swap contracts to obtain synthetic exposure to a specific reference asset or index without owning, taking physical custody of, or short selling the underlying assets. Total return swaps are commitments where one party pays a fixed or variable rate premium (the Buyer) in exchange for a market-linked return (the Seller). The Seller pays the total return of a specific reference asset or index and in return receives interest payments from the Buyer To the extent the total return of the underlying asset or index exceeds or falls short of the offsetting interest rate obligation, the Buyer will receive or make a payment to the Seller. The fund may enter into total return swaps in which it may act as either the Buyer or the Seller. Total return swap contracts are subject to the risk associated with the investment in the underlying reference asset or index. The risk in the case of short total return swap contracts is unlimited based on the potential for unlimited increases in the market value of the underlying reference asset or index.
During the six months ended April 30, 2018, the fund used total return swaps to manage equity exposure. The fund held total return swaps with total USD notional amounts ranging from $854.6 million to $939.8 million, as measured at each quarter end.
Fair value of derivative instruments by risk category
The table below summarizes the fair value of derivatives held by the fund at April 30, 2018 by risk category:
| Risk | Statement of assets and liabilities location | Financial instruments location | Assets derivatives fair value | Liabilities derivatives fair value | |||||||||||||
| Equity | Receivable/payable for futures | Futures† | $638,297 | ($55,839 | ) | ||||||||||||
| Foreign currency | Unrealized appreciation / depreciation on forward foreign currency contracts | Forward foreign currency contracts | 819,660 | (147,925 | ) | ||||||||||||
| Equity | Investments, at value* | Purchased options | 5,082,781 | — | |||||||||||||
| Foreign currency | Investments, at value* | Purchased options | 477,878 | — | |||||||||||||
| Equity | Written options, at value | Written options | — | (414,928 | ) | ||||||||||||
| Foreign currency | Written options, at value | Written options | — | (48,709 | ) | ||||||||||||
| Credit | Swap contracts, at value | Credit default swaps | — | (311,467 | ) | ||||||||||||
| Equity | Swap contracts, at value | Total return swaps | 10,917,316 | (15,298,096 | ) | ||||||||||||
| Total | $17,935,932 | ($16,276,964 | ) | ||||||||||||||
| † Reflects cumulative appreciation/depreciation on futures as disclosed in the Fund's investments. Only the year end variation margin is separately disclosed on the Statement of assets and liabilities. | |||||||||||||||||
| * Purchased options are included in the Fund's investments. | |||||||||||||||||
For financial reporting purposes, the portfolio does not offset OTC derivative assets or liabilities that are subject to master netting arrangements, as defined by the ISDAs, in the Statement of assets and liabilities. In the event of default by the counterparty or a termination of the agreement, the ISDA allows an offset of amounts across the various transactions between the fund and the applicable counterparty.
The table below reflects certain fund's exposure to counterparties subject to an ISDA for OTC derivative transactions:
| OTC Financial Instruments | Asset | Liability | ||||||
| Foreign forward currency contracts | $819,660 | ($147,925 | ) | |||||
| Purchased options | 3,287,887 | — | ||||||
| Swaps | 10,917,316 | (15,609,563 | ) | |||||
| Written options | — | (116,280 | ) | |||||
| Totals | $15,024,863 | ($15,873,768 | ) |
| Counterparty | Total market value of OTC derivatives | Collateral posted by counterparty | Collateral posted by fund | Net exposure | ||||||||||
| BNP Paribas SA | $90,486 | — | — | $90,486 | ||||||||||
| Citibank N.A. | (477 | ) | — | — | (477 | ) | ||||||||
| Credit Suisse Securities | 27,786 | — | — | 27,786 | ||||||||||
| Deutsche Bank AG | 2,740,051 | — | $86,388,461 | 89,128,512 | ||||||||||
| Goldman Sachs International | (702,564 | ) | 820,000 | 459,801 | (1,062,763 | ) | ||||||||
| JPMorgan Chase Bank, N.A. | (691,946 | ) | — | 691,946 | — | |||||||||
| Morgan Stanley | (2,397,064 | ) | 480,000 | 2,877,064 | — | |||||||||
| State Street Bank and Trust Company | 84,823 | 80,000 | — | 4,823 | ||||||||||
| Totals | ($848,905 | ) | $1,380,000 | $90,417,272 | $88,188,367 |
Effect of derivative instruments on the Statement of operations
The table below summarizes the net realized gain (loss) included in the net increase (decrease) in net assets from operations, classified by derivative instrument and risk category, for the six months ended April 30, 2018:
| Statement of operations location - net realized gain (loss) on: | ||||||||||||||||||||
| Risk | Investments and foreign currency transactions 1 | Futures contracts | Forward foreign currency contracts | Written options | Swap contracts | Total | ||||||||||||||
| Credit | — | — | — | — | ($122,583 | ) | ($122,583 | ) | ||||||||||||
| Equity | $367,007 | ($660,371 | ) | — | $590,613 | (8,308,354 | ) | (8,011,105 | ) | |||||||||||
| Foreign currency | 71,456 | — | ($1,145,507 | ) | (31,167 | ) | — | (1,105,218 | ) | |||||||||||
| Total | $438,463 | ($660,371 | ) | ($1,145,507 | ) | $559,446 | ($8,430,937 | ) | ($9,238,906 | ) | ||||||||||
| 1 Realized gain/loss associated with purchased options is included in this caption on the Statement of operations. | ||||||||||||||||||||
The table below summarizes the net change in unrealized appreciation (depreciation) included in the net increase (decrease) in net assets from operations, classified by derivative instrument and risk category, for the six months ended April 30, 2018:
| Statement of operations location - change in net unrealized appreciation (depreciation) of: | ||||||||||||||||||||
| Risk | Investments and translation of assets and liabilities in foreign currencies 1 | Futures contracts | Forward foreign currency contracts | Written options | Swap contracts | Total | ||||||||||||||
| Credit | — | — | — | — | ($50,328 | ) | ($50,328 | ) | ||||||||||||
| Equity | $1,160,707 | $737,600 | — | ($250,039 | ) | (6,665,684 | ) | (5,017,416 | ) | |||||||||||
| Foreign currency | (437,176 | ) | — | $455,069 | 157,300 | — | 175,193 | |||||||||||||
| Total | $723,531 | $737,600 | $455,069 | ($92,739 | ) | ($6,716,012 | ) | ($4,892,551 | ) | |||||||||||
| 1 Change in unrealized appreciation/depreciation associated with purchased options is included in this caption on the Statement of operations. | ||||||||||||||||||||
Note 4 — Guarantees and indemnifications
Under the Trust's organizational documents, its Officers and Trustees are indemnified against certain liabilities arising out of the performance of their duties to the Trust, including the fund. Additionally, in the normal course of business, the fund enters into contracts with service providers that contain general indemnification clauses. The fund's maximum exposure under these arrangements is unknown, as this would involve future claims that may be made against the fund that have not yet occurred. The risk of material loss from such claims is considered remote.
Note 5 — Fees and transactions with affiliates
John Hancock Advisers, LLC (the Advisor) serves as investment advisor for the fund. John Hancock Funds, LLC (the Distributor), an affiliate of the Advisor, serves as principal underwriter of the fund. The Advisor and the Distributor are indirect, wholly owned subsidiaries of MFC.
Management fee. The fund has an investment management agreement with the Advisor under which the fund pays a daily management fee to the Advisor equivalent on an annual basis to the sum of: (a) 1.500% of the first $250 million of the fund's average daily net assets and (b) 1.450% of the fund's average daily net assets in excess of $250 million. The Advisor has a subadvisory agreement with Wellington Management Company LLP. The fund is not responsible for payment of the subadvisory fees.
The Advisor has contractually agreed to waive a portion of its management fee and/or reimburse expenses for certain funds of the John Hancock group of funds complex, including the fund (the participating portfolios). This waiver is based upon aggregate net assets of all the participating portfolios. The amount of the reimbursement is calculated daily and allocated among all the participating portfolios in proportion to the daily net assets of each fund. During the six months ended April 30, 2018, this waiver amounted to 0.01% of the fund's average net assets on an annualized basis. This arrangement may be amended or terminated at any time by the Advisor upon notice to the fund and with the approval of the Board of Trustees.
The expense reductions described above for the six months ended April 30, 2018 amounted to the following:
| Class | Expense reduction | Class | Expense reduction | |
| Class A | $846 | Class R6 | $475 | |
| Class C | 538 | Class NAV | 6,313 | |
| Class I | 20,646 | Total | $28,818 |
Expenses waived or reimbursed in the current fiscal period are not subject to recapture in future fiscal periods.
The investment management fees incurred for the six months ended April 30, 2018 were equivalent to a net annual effective rate of 1.46% of the fund's average daily net assets.
Accounting and legal services. Pursuant to a service agreement, the fund reimburses the Advisor for all expenses associated with providing the administrative, financial, legal, compliance, accounting and recordkeeping services to the fund, including the preparation of all tax returns, periodic reports to shareholders and regulatory reports, among other services. These expenses are allocated to each share class based on its relative net assets at the time the expense was incurred. These accounting and legal services fees incurred for the six months ended April 30, 2018 amounted to an annual rate of 0.02% of the fund's average daily net assets.
Distribution and service plans. The fund has a distribution agreement with the Distributor. The fund has adopted distribution and service plans with respect to Class A and Class C shares pursuant to Rule 12b-1 under the 1940 Act, to pay the Distributor for services provided as the distributor of shares of the fund. The fund may pay up to the following contractual rates of distribution and service fees under these arrangements, expressed as an annual percentage of average daily net assets for each class of the fund's shares:
| Class | Rule 2b-1 fee |
| Class A | 0.30% |
| Class C | 1.00% |
Sales charges. Class A shares are assessed up-front sales charges, which resulted in payments to the Distributor amounting to $42,759 for the six months ended April 30, 2018. Of this amount, $6,950 was retained and used for printing prospectuses, advertising, sales literature and other purposes, $34,384 was paid as sales commissions to broker-dealers and $1,425 was paid as sales commissions to sales personnel of Signator Investors, Inc., a broker-dealer affiliate of the Advisor.
Class A and Class C shares may be subject to contingent deferred sales charges (CDSCs). Certain Class A shares that are acquired through purchases of $1 million or more and are redeemed within one year of purchase are subject to a 1.00% sales charge. Class C shares that are redeemed within one year of purchase are subject to a 1.00% CDSC. CDSCs are applied to the lesser of the current market value at the time of redemption or the original purchase cost of the shares being redeemed. Proceeds from CDSCs are used to compensate the Distributor for providing distribution-related services in connection with the sale of these shares. During the six months ended April 30, 2018, CDSCs received by the Distributor amounted to $4,791 and $201 for Class A and Class C shares, respectively.
Transfer agent fees. The John Hancock Group of Funds has a complex-wide transfer agent agreement with John Hancock Signature Services, Inc. (Signature Services), an affiliate of the Advisor. The transfer agent fees paid to Signature Services are determined based on the cost to Signature Services (Signature Services Cost) of providing recordkeeping services. It also includes out-of-pocket expenses, including payments made to third-parties for recordkeeping services provided to their clients who invest in one or more John Hancock funds. In addition, Signature Services Cost may be reduced by certain fees that Signature Services receives in connection with retirement and small accounts. Signature Services Cost is calculated monthly and allocated, as applicable, to five categories of share classes: Retail Share and Institutional Share Classes of Non-Municipal Bond Funds, Class R6 Shares, Retirement Share Classes and Municipal Bond Share Classes. Within each of these categories, the applicable costs are allocated to the affected John Hancock affiliated funds and/or classes, based on the relative average daily net assets.
Class level expenses. Class level expenses for the six months ended April 30, 2018 were:
| Class | Distribution and service fees | Transfer agent fees |
| Class A | $29,887 | $10,779 |
| Class C | 63,048 | 6,823 |
| Class I | — | 267,101 |
| Class R6 | — | 675 |
| Total | $92,935 | $285,378 |
Trustee expenses. The fund compensates each Trustee who is not an employee of the Advisor or its affiliates. The costs of paying Trustee compensation and expenses are allocated to the fund based on its net assets relative to other funds within the John Hancock group of funds complex.
Note 6 — Fund share transactions
Transactions in fund shares for the six months ended April 30, 2018 and for the year ended October 31, 2017 were as follows:
| Six months ended 4-30-18 | Year ended 10-31-17 | |||||||||||||||||||||||||
| Shares | Amount | Shares | Amount | |||||||||||||||||||||||
| Class A shares | ||||||||||||||||||||||||||
| Sold | 998,630 | $11,487,084 | 1,435,224 | $16,493,089 | ||||||||||||||||||||||
| Distributions reinvested | 79,895 | 874,846 | 649 | 6,767 | ||||||||||||||||||||||
| Repurchased | (1,105,051 | ) | (12,348,426 | ) | (1,690,702 | ) | (18,446,567 | ) | ||||||||||||||||||
| Net decrease | (26,526 | ) | $13,504 | (254,829 | ) | ($1,946,711 | ) | |||||||||||||||||||
| Class C shares | ||||||||||||||||||||||||||
| Sold | 194,209 | $2,157,911 | 470,293 | $5,166,250 | ||||||||||||||||||||||
| Distributions reinvested | 51,485 | 550,372 | 408 | 4,194 | ||||||||||||||||||||||
| Repurchased | (144,435 | ) | (1,593,077 | ) | (985,206 | ) | (10,542,546 | ) | ||||||||||||||||||
| Net increase (decrease) | 101,259 | $1,115,206 | (514,505 | ) | ($5,372,102 | ) | ||||||||||||||||||||
| Class I shares | ||||||||||||||||||||||||||
| Sold | 11,900,952 | $136,904,631 | 11,794,858 | $133,873,732 | ||||||||||||||||||||||
| Distributions reinvested | 2,976,924 | 33,073,629 | 17,015 | 179,342 | ||||||||||||||||||||||
| Repurchased | (6,244,047 | ) | (71,179,228 | ) | (13,882,032 | ) | (153,920,403 | ) | ||||||||||||||||||
| Net increase (decrease) | 8,633,829 | $98,799,032 | (2,070,159 | ) | ($19,867,329 | ) | ||||||||||||||||||||
| Class R6 shares | ||||||||||||||||||||||||||
| Sold | 513,202 | $5,959,800 | 431,276 | $5,004,000 | ||||||||||||||||||||||
| Distributions reinvested | 65,091 | 727,719 | 248 | 2,624 | ||||||||||||||||||||||
| Repurchased | (71,873 | ) | (846,826 | ) | (140,476 | ) | (1,681,445 | ) | ||||||||||||||||||
| Net increase | 506,420 | $5,840,693 | 291,048 | $3,325,179 | ||||||||||||||||||||||
| Class NAV shares | ||||||||||||||||||||||||||
| Sold | 76,556 | $881,991 | 225,274 | $2,581,818 | ||||||||||||||||||||||
| Distributions reinvested | 1,019,409 | 11,396,993 | 7,811 | 82,720 | ||||||||||||||||||||||
| Repurchased | (1,230,755 | ) | (14,300,010 | ) | (5,048,715 | ) | (57,432,923 | ) | ||||||||||||||||||
| Net decrease | (134,790 | ) | ($2,021,026 | ) | (4,815,630 | ) | ($54,768,385 | ) | ||||||||||||||||||
| Total net increase (decrease) | 9,080,192 | $103,747,409 | (7,364,075 | ) | ($78,629,348 | ) | ||||||||||||||||||||
Affiliates of the fund owned 100% of shares of the fund of Class NAV on April 30, 2018. Such concentration of shareholders' capital could have a material effect on the fund if such shareholders redeem from the fund.
Note 7 — Purchase and sale of securities
Purchases and sales of securities, other than short-term investments, amounted to $367,667,556 and $352,709,985, respectively, for the six months ended April 30, 2018.
Note 8 — Industry or sector risk
The fund may invest a large percentage of its assets in one or more particular industries or sectors of the economy. If a large percentage of the fund's assets are economically tied to a single or small number of industries or sectors of the economy, the fund will be less diversified than a more broadly diversified fund, and it may cause the fund to underperform if that industry or
sector underperforms. In addition, focusing on a particular industry or sector may make the fund's NAV more volatile. Further, a fund that invests in particular industries or sectors is particularly susceptible to the impact of market, economic, regulatory and other factors affecting those industries or sectors.
Note 9 — Investment by affiliated funds
Certain investors in the fund are affiliated funds that are managed by the Advisor and its affiliates. The affiliated funds do not invest in the fund for the purpose of exercising management or control; however, this investment may represent a significant portion of the fund's net assets. At April 30, 2018, funds within the John Hancock group of funds complex held 19.8% of the fund's net assets. John Hancock Funds II Alternative Asset Allocation Fund had an affiliate ownership of 5% or more at 7.3% of the fund's net assets.
Trustees Hassell H. McClellan, Chairperson Officers Andrew G. Arnott John J. Danello Francis V. Knox, Jr. Charles A. Rizzo Salvatore Schiavone | Investment advisor John Hancock Advisers, LLC Subadvisor Wellington Management Company LLP Principal distributor John Hancock Funds, LLC Custodian State Street Bank and Trust Company Transfer agent John Hancock Signature Services, Inc. Legal counsel K&L Gates LLP |
*Member of the Audit Committee
†Non-Independent Trustee
#Effective 6-20-17
The fund's proxy voting policies and procedures, as well as the fund proxy voting record for the most recent twelve-month period ended June 30, are available free of charge on the Securities and Exchange Commission (SEC) website at sec.gov or on our website.
The fund's complete list of portfolio holdings, for the first and third fiscal quarters, is filed with the SEC on Form N-Q. The fund's Form N-Q is available on our website and the SEC's website, sec.gov, and can be reviewed and copied (for a fee) at the SEC's Public Reference Room in Washington, DC. Call 800-SEC-0330 to receive information on the operation of the SEC's Public Reference Room.
We make this information on your fund, as well as monthly portfolio holdings, and other fund details available on our website at jhinvestments.com or by calling 800-225-5291.
| You can also contact us: | |||
| 800-225-5291 jhinvestments.com | Regular mail: John Hancock Signature Services, Inc. | Express mail: John Hancock Signature Services, Inc. | |
John Hancock family of funds
DOMESTIC EQUITY FUNDS Balanced Blue Chip Growth Classic Value Disciplined Value Disciplined Value Mid Cap Equity Income Fundamental All Cap Core Fundamental Large Cap Core Fundamental Large Cap Value New Opportunities Small Cap Core Small Cap Growth Small Cap Value Strategic Growth U.S. Global Leaders Growth U.S. Growth Value Equity GLOBAL AND INTERNATIONAL EQUITY FUNDS Disciplined Value International Emerging Markets Emerging Markets Equity Fundamental Global Franchise Global Equity Global Shareholder Yield Greater China Opportunities International Growth International Small Company International Value Equity | INCOME FUNDS Bond California Tax-Free Income Emerging Markets Debt Floating Rate Income Government Income High Yield High Yield Municipal Bond Income Investment Grade Bond Money Market Short Duration Credit Opportunities Spectrum Income Strategic Income Opportunities Tax-Free Bond ALTERNATIVE AND SPECIALTY FUNDS Absolute Return Currency Alternative Asset Allocation Enduring Assets Financial Industries Global Absolute Return Strategies Global Conservative Absolute Return Global Focused Strategies Natural Resources Redwood Regional Bank Seaport Long/Short Technical Opportunities |
A fund's investment objectives, risks, charges, and expenses should be considered carefully before investing. The prospectus contains this and other important information about the fund. To obtain a prospectus, contact your financial professional, call John Hancock Investments at 800-225-5291, or visit our website at jhinvestments.com. Please read the prospectus carefully before investing or sending money.
ASSET ALLOCATION Income Allocation Multi-Index Lifetime Portfolios Multi-Index Preservation Portfolios Multimanager Lifestyle Portfolios Multimanager Lifetime Portfolios Retirement Income 2040 EXCHANGE-TRADED FUNDS John Hancock Multifactor Consumer Discretionary ETF John Hancock Multifactor Consumer Staples ETF John Hancock Multifactor Developed International ETF John Hancock Multifactor Energy ETF John Hancock Multifactor Financials ETF John Hancock Multifactor Healthcare ETF John Hancock Multifactor Industrials ETF John Hancock Multifactor Large Cap ETF John Hancock Multifactor Materials ETF John Hancock Multifactor Mid Cap ETF John Hancock Multifactor Small Cap ETF John Hancock Multifactor Technology ETF John Hancock Multifactor Utilities ETF | ENVIRONMENTAL, SOCIAL, AND GOVERNANCE FUNDS ESG All Cap Core ESG Core Bond ESG International Equity ESG Large Cap Core CLOSED-END FUNDS Financial Opportunities Hedged Equity & Income Income Securities Trust Investors Trust Preferred Income Preferred Income II Preferred Income III Premium Dividend Tax-Advantaged Dividend Income Tax-Advantaged Global Shareholder Yield |
John Hancock Multifactor ETF shares are bought and sold at market price (not NAV), and are not individually redeemed
from the fund. Brokerage commissions will reduce returns.
John Hancock ETFs are distributed by Foreside Fund Services, LLC, and are subadvised by Dimensional Fund Advisors LP.
Foreside is not affiliated with John Hancock Funds, LLC or Dimensional Fund Advisors LP.
Dimensional Fund Advisors LP receives compensation from John Hancock in connection with licensing rights to the
John Hancock Dimensional indexes. Dimensional Fund Advisors LP does not sponsor, endorse, or sell, and makes no
representation as to the advisability of investing in, John Hancock Multifactor ETFs.
John Hancock Investments
A trusted brand
John Hancock Investments is a premier asset manager representing one of
America's most trusted brands, with a heritage of financial stewardship dating
back to 1862. Helping our shareholders pursue their financial goals is at the
core of everything we do. It's why we support the role of professional financial
advice and operate with the highest standards of conduct and integrity.
A better way to invest
We serve investors globally through a unique multimanager approach:
We search the world to find proven portfolio teams with specialized
expertise for every strategy we offer, then we apply robust investment
oversight to ensure they continue to meet our uncompromising standards
and serve the best interests of our shareholders.
Results for investors
Our unique approach to asset management enables us to provide a diverse set
of investments backed by some of the world's best managers, along with strong
risk-adjusted returns across asset classes.
| | John Hancock Funds, LLC n Member FINRA, SIPC 601 Congress Street n Boston, MA 02210-2805 800-225-5291 n jhinvestments.com | |
| This report is for the information of the shareholders of John Hancock Seaport Long/Short Fund. It is not authorized for distribution to prospective investors unless preceded or accompanied by a prospectus. | ||
| MF450498 | 437SA 4/18 6/18 | |
John Hancock
Disciplined Value International Fund
Semiannual report 4/30/18

A message to shareholders
Dear shareholder,
Financial markets around the world experienced a meaningful rise in volatility in the last half of the reporting period. Stocks in developed international markets hit a rough patch after macroeconomic data began to suggest that the growth many investors were hoping for may not be as robust as early indications had suggested, but advanced for the period nonetheless. Many emerging markets advanced overall, thanks in large part to a weaker U.S. dollar and continued economic improvement in developing markets.
One of the challenges investors will face in the coming months is navigating the continued normalization of monetary policy. Stronger economies will continue to prompt global central banks to dial back the stimulus they had injected into the financial system in the years following the financial crisis, and this less-accommodative stance may represent an adjustment for many markets.
Your best resource in unpredictable markets is your financial advisor, who can help position your portfolio so that it's sufficiently diversified to meet your long-term objectives and to withstand the inevitable turbulence along the way.
On behalf of everyone at John Hancock Investments, I'd like to take this opportunity to welcome new shareholders and to thank existing shareholders for the continued trust you've placed in us.
Sincerely,
Andrew G. Arnott
President and CEO,
John Hancock Investments
Head of Wealth and Asset Management,
United States and Europe
This commentary reflects the CEO's views, which are subject to change at any time. Investing involves risks, including the potential loss of principal. Diversification does not guarantee a profit or eliminate the risk of a loss. It is not possible to invest directly into an index. For more up-to-date information, please visit our website at jhinvestments.com.
John Hancock
Disciplined Value International Fund
INVESTMENT OBJECTIVE
The fund seeks long-term capital growth.
AVERAGE ANNUAL TOTAL RETURNS AS OF 4/30/18 (%)
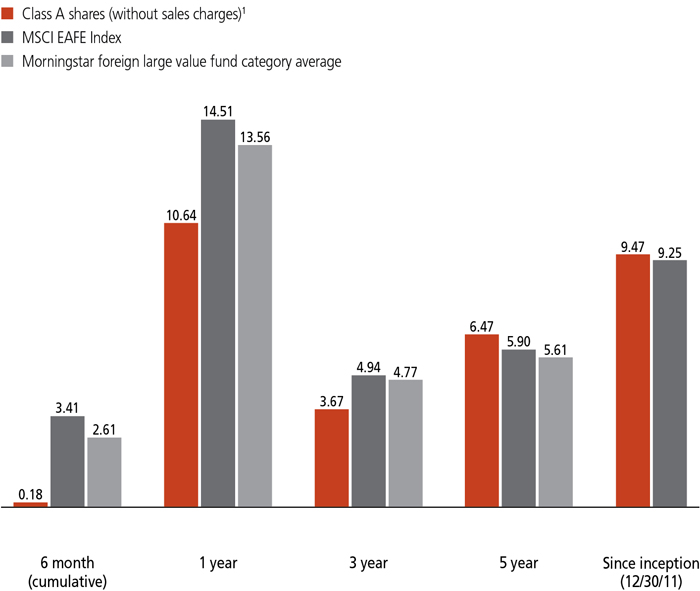
The MSCI EAFE Index (Europe, Australasia, Far East) is a free-float-adjusted market-capitalization-weighted index that is designed to measure developed market equity performance.
It is not possible to invest directly in an index. Index figures do not reflect expenses or sales charges, which would result in lower returns.
Figures from Morningstar, Inc. include reinvested distributions and do not take into account sales charges. Actual load-adjusted performance is lower. Since inception returns for the Morningstar fund category average are not available.
| 1 | The fund is the successor to Robeco Boston Partners International Equity Fund (predecessor fund) and Class A, Class C, Class I, Class R2, Class R4, and Class R6 shares were first offered on 9-29-14. Class NAV shares were first offered on 4-13-15. Returns prior to this date are those of the predecessor fund's institutional class shares (first offered on 12-30-11), that have not been adjusted for class-specific expenses; otherwise, returns would vary. |
The past performance shown here reflects reinvested distributions and the beneficial effect of any expense reductions, and does not guarantee future results. Returns for periods shorter than one year are cumulative. Performance of the other share classes will vary based on the difference in the fees and expenses of those classes. Shares will fluctuate in value and, when redeemed, may be worth more or less than their original cost. Current month-end performance may be lower or higher than the performance cited, and can be found at jhinvestments.com or by calling 800-225-5291. For further information on the fund's objectives, risks, and strategy, see the fund's prospectus.
PERFORMANCE HIGHLIGHTS OVER THE LAST SIX MONTHS
Most international stocks posted positive returns
The fund's benchmark, the MSCI EAFE Index, posted a positive overall return, despite elevated market volatility during the latter half of the period.
Stock picking in selected sectors weighed on relative performance
The fund underperformed relative to its benchmark, as stock selection in the information technology and consumer discretionary sectors weighed on relative results.
The fund's positioning in consumer staples and energy added value
Stock picking in the consumer staples sector aided relative results; in energy, the fund's overweight had a positive impact.
PORTFOLIO COMPOSITION AS OF 4/30/18 (%)
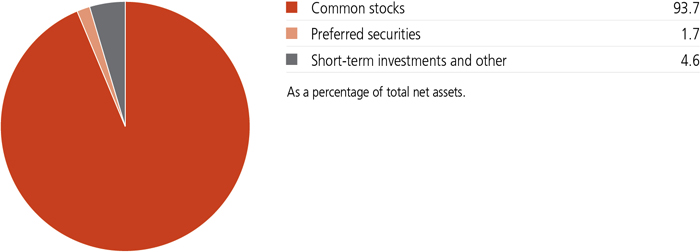
A note about risks
Value stocks may underperform the market as a whole, which may cause value-oriented funds to underperform equity funds with other investment strategies. The price of equity securities may decline due to changes in a company's financial condition or overall market conditions. Foreign investing, especially in emerging and frontier markets, has additional risks, such as currency and market volatility and political and social instability. Large company stocks could fall out of favor. The stock prices of small and midsize companies can change more frequently and dramatically than those of large companies. Currency transactions and valuations are affected by fluctuations in exchange rates. Derivatives transactions, such as hedging and other strategic transactions, may increase a fund's volatility and could produce disproportionate losses, potentially more than the fund's principal investment. Liquidity—the extent to which a security may be sold or a derivative position closed without negatively affecting its market value—may be impaired by reduced trading volume, heightened volatility, rising interest rates, and other market conditions. Please see the fund's prospectus for additional risks.

Christopher K. Hart, CFA
Portfolio Manager
Boston Partners
Most developed-market stocks outside North America posted modestly positive returns during the six months ended April 30, 2018. What factors were driving the market?
The fund's non-U.S. developed-market equity benchmark, the MSCI EAFE Index, accelerated higher through most of the first half of the period, but this upward momentum came to a jarring halt in late January and early February 2018, when the benchmark tumbled. This spike in volatility eased somewhat during the closing weeks of the period, although markets remained turbulent. Overall, the benchmark posted a 3.41% total return for the period. At the sector level, energy and consumer discretionary posted the strongest performance within the benchmark, while performance was weakest in telecommunication services and consumer staples.
Economic growth in international developed markets remained generally solid throughout the period. However, investor sentiment turned decidedly cautious after the U.S. Federal Reserve reiterated its commitment to further interest-rate increases, fueling concern that a possible acceleration in the transition away from accommodative U.S. monetary policies could curtail global growth.
While equity markets eventually resumed their upward trend, this comeback was brief, as a proposal to impose tariffs on certain Chinese goods by the administration of U.S. President Donald Trump heightened concerns that a potential trade war could weigh on global growth. Trade tensions involving the United States, China, and other global trading partners had a negative impact on stock performance, particularly in Japan.
Broadly speaking, a more fundamental explanation for the volatility during the latter half of the period was that many investors had come to view equities as overvalued following the benchmark's rise to a record high in late January 2018. In our view, the benchmark's subsequent pullback was a welcome event in that it helped clear some of the anxiety concerning the market's long-term rise; we viewed the pullback as a correction, and not the beginning of the end of a bull market trend.
How did the team manage the portfolio in this environment?
We are value investors, and our strategy remained focused on identifying dislocations between underlying fundamentals and equity valuations on an individual company basis. While external events do impact broad market performance, our strategy remains focused on bottom-up company analysis to uncover security mispricings, with stock selection usually driving the fund's performance.
What factors affected relative performance at the sector and geographic levels?
Overall, stock picking detracted from the fund's performance relative to the benchmark, with the most significant negative impact in the information technology and consumer discretionary sectors. Security selection in the healthcare and materials sectors also significantly weighed on relative results.
Conversely, stock picking in consumer staples had a positive impact. In energy, the fund was overweight; this had a significantly positive impact on relative performance, as a sharp increase in crude oil prices during the period provided support to many energy stocks.
From a geographic standpoint, securities selection in the United Kingdom, Japan, and Continental Europe had a negative impact.
At the individual security level, which holdings detracted the most from performance?
Among the notable detractors in the information technology sector was the fund's out-of-benchmark position in Flex, Ltd., a U.S.-based technology manufacturing services company with multinational operations. Shares of Flex fell sharply after the company lowered its guidance of future earnings expectations, owing in part to a slower-than-expected timeline for achieving profitability in one of its newer business lines. A position in Alps Electric Company, Ltd., also was a
SECTOR COMPOSITION AS OF 4/30/18 (%)
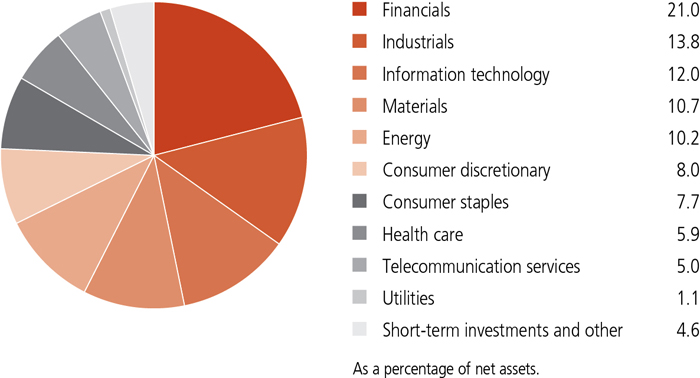
Also weighing on relative results was the fund's position in Micro Focus International PLC, a U.K.-based business software company. Its shares declined after the company announced the resignation of its chief executive officer and warned that it would fall short of its revenue expectations. We subsequently sold the fund's position in Micro Focus during the period.
In the consumer discretionary sector, a position in U.K.-based theater chain Cineworld Group PLC weighed on relative results after the company announced plans to acquire U.S.-based Regal Entertainment Group (not held by the fund). Cineworld was not held by the benchmark, and we subsequently sold the fund's position during the period.
Which holdings had the biggest positive impact on the fund's relative performance?
Among the biggest contributors were positions in multinational energy companies Royal Dutch Shell PLC (Netherlands) and Total SA (France). Rising crude oil prices supported shares of both companies.
Another significant contributor was a position in Matsumotokiyoshi Holdings Company, Ltd., a Japanese retail pharmacy chain not held by the benchmark. Its shares rose after the company reported better-than-expected earnings results.
Other strong contributors included positions in business consultancy Capgemini SE (France) and reinsurance and specialty insurance provider Validus Holdings, Ltd. (Bermuda). Validus was not held by the benchmark, and we subsequently sold the fund's position during the period.
How was the fund positioned at the end of the period?
At the sector level, the fund's most significant overweights were in information technology and energy; the information technology overweight was driven in part by selected emerging-market
TOP 10 HOLDINGS AS OF 4/30/18 (%)
| Royal Dutch Shell PLC, A Shares | 3.6 |
| TOTAL SA | 2.8 |
| Capgemini SE | 2.2 |
| Roche Holding AG | 2.2 |
| Everest Re Group, Ltd. | 2.0 |
| Swiss Re AG | 1.9 |
| Nomad Foods, Ltd. | 1.8 |
| Atos SE | 1.7 |
| Aviva PLC | 1.7 |
| Fuji Electric Company, Ltd. | 1.6 |
| TOTAL | 21.5 |
| As a percentage of net assets. | |
| Cash and cash equivalents are not included. | |
The fund had the most significant underweights in the consumer discretionary and healthcare sectors. In consumer discretionary, we had a difficult time finding stocks in the automotive and luxury goods segments that ranked highly in our investment process. In healthcare, weak fundamentals and business momentum offset relatively attractive valuations, in our view. The fund also remained underweight in real estate, consumer staples, and utilities—sectors that we viewed as having generally unattractive valuations. From a regional perspective, the fund was overweight in the United Kingdom and underweight in Continental Europe.
MANAGED BY
| | Christopher K. Hart, CFA On the fund since 2011 Investing since 1991 |
 | Joshua M. Jones, CFA On the fund since 2013 Investing since 2004 |
 | Joseph F. Feeney, Jr., CFA On the fund since 2011 Investing since 1985 |
![]()
TOP 10 COUNTRIES AS OF 4/30/18 (%)
| Japan | 21.2 |
| United Kingdom | 16.8 |
| France | 12.1 |
| Germany | 8.3 |
| United States | 8.1 |
| Switzerland | 8.1 |
| Netherlands | 4.8 |
| South Korea | 4.4 |
| Hong Kong | 2.5 |
| Bermuda | 2.0 |
| TOTAL | 88.3 |
| As a percentage of net assets. | |
| Cash and cash equivalents are not included. |
TOTAL RETURNS FOR THE PERIOD ENDED APRIL 30, 2018
| Average annual total returns (%) with maximum sales charge | Cumulative total returns (%) with maximum sales charge | ||||||
| 1-year | 5-year | Since inception1 | 6-month | 5-year | Since inception1 | ||
| Class A2 | 5.11 | 5.39 | 8.58 | -4.83 | 30.00 | 68.51 | |
| Class C2 | 8.93 | 5.97 | 9.05 | -1.11 | 33.62 | 73.19 | |
| Class I2,3 | 11.03 | 6.72 | 9.66 | 0.33 | 38.42 | 79.42 | |
| Class R22,3 | 10.61 | 6.46 | 9.45 | 0.24 | 36.75 | 77.25 | |
| Class R42,3 | 10.90 | 6.65 | 9.61 | 0.36 | 37.98 | 78.85 | |
| Class R62,3 | 11.13 | 6.80 | 9.73 | 0.42 | 38.97 | 80.12 | |
| Class NAV2,3 | 11.13 | 6.80 | 9.73 | 0.49 | 38.97 | 80.13 | |
| Index† | 14.51 | 5.90 | 9.25 | 3.41 | 33.17 | 75.18 | |
Performance figures assume all distributions have been reinvested. Figures reflect maximum sales charges on Class A shares of 5.00% and the applicable contingent deferred sales charge (CDSC) on Class C shares. Class C shares sold within one year of purchase are subject to a 1% CDSC. Sales charges are not applicable to Class I, Class R2, Class R4, Class R6, and Class NAV shares.
The expense ratios of the fund, both net (including any fee waivers and/or expense limitations) and gross (excluding any fee waivers and/or expense limitations), are set forth according to the most recent publicly available prospectuses for the fund and may differ from those disclosed in the Financial highlights tables in this report. Net expenses reflect contractual expense limitations in effect until February 28, 2019 and are subject to change. Had the contractual fee waivers and expense limitations not been in place, gross expenses would apply. The expense ratios are as follows:
| Class A | Class C | Class I | Class R2 | Class R4 | Class R6 | Class NAV | |
| Gross (%) | 1.32 | 2.02 | 1.01 | 1.41 | 1.26 | 0.91 | 0.90 |
| Net (%) | 1.30 | 2.00 | 0.98 | 1.39 | 1.14 | 0.88 | 0.88 |
Please refer to the most recent prospectus and annual or semiannual report for more information on expenses and any expense limitation arrangements for each class.
The returns reflect past results and should not be considered indicative of future performance. The return and principal value of an investment will fluctuate so that shares, when redeemed, may be worth more or less than their original cost. Due to market volatility and other factors, the fund's current performance may be higher or lower than the performance shown. For current to the most recent month-end performance data, please call 800-225-5291 or visit the fund's website at jhinvestments.com.
The performance table above and the chart on the next page do not reflect the deduction of taxes that a shareholder would pay on fund distributions or the redemption of fund shares. The fund's performance results reflect any applicable fee waivers or expense reductions, without which the expenses would increase and results would have been less favorable.
| † | Index is the MSCI EAFE Index. |
See the following page for footnotes.
This chart and table show what happened to a hypothetical $10,000 investment in John Hancock Disciplined Value International Fund for the share classes and periods indicated, assuming all distributions were reinvested. For comparison, we've shown the same investment in the MSCI EAFE Index.
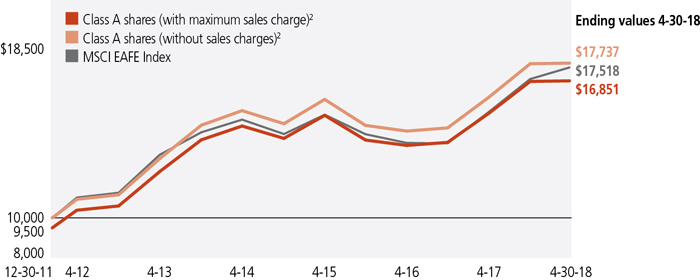
| Start date | With maximum sales charge ($) | Without sales charge ($) | Index ($) | |
| Class C2,4 | 12-30-11 | 17,319 | 17,319 | 17,518 |
| Class I2,3 | 12-30-11 | 17,942 | 17,942 | 17,518 |
| Class R22,3 | 12-30-11 | 17,725 | 17,725 | 17,518 |
| Class R42,3 | 12-30-11 | 17,885 | 17,885 | 17,518 |
| Class R62,3 | 12-30-11 | 18,012 | 18,012 | 17,518 |
| Class NAV2,3 | 12-30-11 | 18,013 | 18,013 | 17,518 |
The MSCI EAFE Index (Europe, Australasia, Far East) is a free-float-adjusted market capitalization index that is designed to measure developed market equity performance.
It is not possible to invest directly in an index. Index figures do not reflect expenses or sales charges, which would result in lower returns.
Footnotes related to performance pages
These examples are intended to help you understand your ongoing operating expenses of investing in the fund so you can compare these costs with the ongoing costs of investing in other mutual funds.
Understanding fund expenses
As a shareholder of the fund, you incur two types of costs:
| • | Transaction costs, which include sales charges (loads) on purchases or redemptions (varies by share class), minimum account fee charge, etc. |
| • | Ongoing operating expenses, including management fees, distribution and service fees (if applicable), and other fund expenses. |
We are presenting only your ongoing operating expenses here.
Actual expenses/actual returns
The first line of each share class in the table on the following page is intended to provide information about the fund's actual ongoing operating expenses, and is based on the fund's actual return. It assumes an account value of $1,000.00 on November 1, 2017, with the same investment held until April 30, 2018.
Together with the value of your account, you may use this information to estimate the operating expenses that you paid over the period. Simply divide your account value at April 30, 2018, by $1,000.00, then multiply it by the "expenses paid" for your share class from the table. For example, for an account value of $8,600.00, the operating expenses should be calculated as follows:
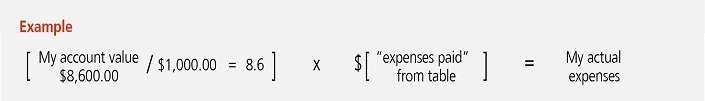
Hypothetical example for comparison purposes
The second line of each share class in the table on the following page allows you to compare the fund's ongoing operating expenses with those of any other fund. It provides an example of the fund's hypothetical account values and hypothetical expenses based on each class's actual expense ratio and an assumed 5% annualized return before expenses (which is not the fund's actual return). It assumes an account value of $1,000.00 on November 1, 2017, with the same investment held until April 30, 2018. Look in any other fund shareholder report to find its hypothetical example and you will be able to compare these expenses. Please remember that these hypothetical account values and expenses may not be used to estimate the actual ending account balance or expenses you paid for the period.
Remember, these examples do not include any transaction costs, therefore, these examples will not help you to determine the relative total costs of owning different funds. If transaction costs were included, your expenses would have been higher. See the prospectuses for details regarding transaction costs.
SHAREHOLDER EXPENSE EXAMPLE CHART
| Account value on 11-1-2017 | Ending value on 4-30-2018 | Expenses paid during period ended 4-30-20181 | Annualized expense ratio | ||
| Class A | Actual expenses/actual returns | $1,000.00 | $1,001.80 | $6.40 | 1.29% |
| Hypothetical example for comparison purposes | 1,000.00 | 1,018.40 | 6.46 | 1.29% | |
| Class C | Actual expenses/actual returns | 1,000.00 | 998.70 | 9.86 | 1.99% |
| Hypothetical example for comparison purposes | 1,000.00 | 1,014.90 | 9.94 | 1.99% | |
| Class I | Actual expenses/actual returns | 1,000.00 | 1,003.30 | 4.87 | 0.98% |
| Hypothetical example for comparison purposes | 1,000.00 | 1,019.90 | 4.91 | 0.98% | |
| Class R2 | Actual expenses/actual returns | 1,000.00 | 1,002.40 | 6.85 | 1.38% |
| Hypothetical example for comparison purposes | 1,000.00 | 1,018.00 | 6.90 | 1.38% | |
| Class R4 | Actual expenses/actual returns | 1,000.00 | 1,003.60 | 5.51 | 1.11% |
| Hypothetical example for comparison purposes | 1,000.00 | 1,019.30 | 5.56 | 1.11% | |
| Class R6 | Actual expenses/actual returns | 1,000.00 | 1,004.20 | 4.37 | 0.88% |
| Hypothetical example for comparison purposes | 1,000.00 | 1,020.40 | 4.41 | 0.88% | |
| Class NAV | Actual expenses/actual returns | 1,000.00 | 1,004.90 | 4.37 | 0.88% |
| Hypothetical example for comparison purposes | 1,000.00 | 1,020.40 | 4.41 | 0.88% | |
| 1 | Expenses are equal to the annualized expense ratio, multiplied by the average account value over the period, multiplied by 181/365 (to reflect the one-half year period). |
| Fund’s investments |
| Shares | Value | ||||
| Common stocks 93.7% | $1,009,079,777 | ||||
| (Cost $971,826,396) | |||||
| Australia 1.6% | 16,990,331 | ||||
| BHP Billiton, Ltd. | 247,084 | 5,764,284 | |||
| Syrah Resources, Ltd. (A)(B) | 1,902,184 | 4,554,204 | |||
| Woodside Petroleum, Ltd. | 275,315 | 6,671,843 | |||
| Belgium 0.8% | 8,627,486 | ||||
| Ageas | 161,284 | 8,627,486 | |||
| Bermuda 2.0% | 21,464,273 | ||||
| Everest Re Group, Ltd. | 92,252 | 21,464,273 | |||
| Brazil 0.4% | 4,625,725 | ||||
| Minerva SA (A) | 1,976,200 | 4,625,725 | |||
| Canada 1.5% | 16,648,619 | ||||
| Husky Energy, Inc. | 517,875 | 7,244,079 | |||
| Nutrien, Ltd. | 206,557 | 9,404,540 | |||
| China 0.9% | 9,514,514 | ||||
| China Construction Bank Corp., H Shares | 5,147,000 | 5,392,298 | |||
| Vipshop Holdings, Ltd., ADR (A) | 266,293 | 4,122,216 | |||
| France 12.1% | 130,056,629 | ||||
| Atos SE | 135,027 | 18,228,645 | |||
| Bollore SA | 1,100,910 | 5,471,655 | |||
| Capgemini SE | 168,923 | 23,238,015 | |||
| Renault SA | 104,066 | 11,278,830 | |||
| Schneider Electric SE | 165,881 | 15,036,180 | |||
| Sopra Steria Group | 38,004 | 8,112,248 | |||
| Teleperformance | 63,353 | 10,180,974 | |||
| TOTAL SA | 473,989 | 29,791,008 | |||
| Vinci SA (B) | 87,205 | 8,719,074 | |||
| Germany 7.3% | 78,430,510 | ||||
| Allianz SE | 53,122 | 12,564,618 | |||
| Bayer AG | 61,261 | 7,321,887 | |||
| E.ON SE | 1,094,605 | 11,985,658 | |||
| Fresenius SE & Company KGaA | 130,406 | 9,930,973 | |||
| Henkel AG & Company KGaA | 50,585 | 6,021,819 | |||
| Muenchener Rueckversicherungs-Gesellschaft AG | 29,709 | 6,799,266 | |||
| Norma Group SE | 144,149 | 10,569,616 | |||
| Siemens AG | 104,230 | 13,236,673 | |||
| Hong Kong 2.5% | 26,818,727 | ||||
| China Mobile, Ltd. | 573,000 | 5,458,678 | |||
| CK Hutchison Holdings, Ltd. | 813,412 | 9,618,480 |
| 12 | JOHN HANCOCK DISCIPLINED VALUE INTERNATIONAL FUND | SEMIANNUAL REPORT | SEE NOTES TO FINANCIAL STATEMENTS |
| Shares | Value | ||||
| Hong Kong (continued) | |||||
| WH Group, Ltd. (C) | 11,341,500 | $11,741,569 | |||
| Hungary 0.5% | 5,220,412 | ||||
| OTP Bank PLC | 119,725 | 5,220,412 | |||
| India 0.4% | 4,311,986 | ||||
| Dish TV India, Ltd., GDR (A) | 3,849,987 | 4,311,986 | |||
| Indonesia 0.5% | 5,731,124 | ||||
| Bank Rakyat Indonesia Persero Tbk PT | 24,856,500 | 5,731,124 | |||
| Ireland 1.5% | 16,540,633 | ||||
| CRH PLC | 466,051 | 16,540,633 | |||
| Japan 21.2% | 228,196,571 | ||||
| Aisin Seiki Company, Ltd. | 122,700 | 6,647,260 | |||
| Alps Electric Company, Ltd. | 474,300 | 10,475,550 | |||
| Amano Corp. | 195,900 | 4,855,556 | |||
| Asahi Group Holdings, Ltd. | 111,000 | 5,615,016 | |||
| Fuji Electric Company, Ltd. | 2,472,000 | 17,631,096 | |||
| Haseko Corp. | 445,400 | 7,005,969 | |||
| Inpex Corp. | 770,700 | 9,852,477 | |||
| KDDI Corp. | 358,400 | 9,620,744 | |||
| Kinden Corp. | 435,900 | 7,602,478 | |||
| KYB Corp. | 104,300 | 5,024,819 | |||
| Matsumotokiyoshi Holdings Company, Ltd. | 144,700 | 6,445,825 | |||
| Mitsubishi Electric Corp. | 631,300 | 9,678,176 | |||
| Mitsubishi UFJ Financial Group, Inc. | 602,200 | 4,035,548 | |||
| Nippon Telegraph & Telephone Corp. | 174,900 | 8,299,907 | |||
| Nomura Holdings, Inc. | 1,896,800 | 10,924,717 | |||
| Resona Holdings, Inc. | 1,480,700 | 8,413,455 | |||
| Sanwa Holdings Corp. | 546,700 | 7,020,225 | |||
| Seven & i Holdings Company, Ltd. | 223,900 | 9,865,208 | |||
| Sony Corp. | 218,800 | 10,219,294 | |||
| SUMCO Corp. | 432,500 | 10,563,608 | |||
| Sumitomo Electric Industries, Ltd. | 657,700 | 10,068,769 | |||
| Sumitomo Mitsui Financial Group, Inc. | 164,100 | 6,839,399 | |||
| Suzuki Motor Corp. | 134,200 | 7,212,959 | |||
| Tokio Marine Holdings, Inc. | 339,800 | 16,037,624 | |||
| Tokuyama Corp. | 304,000 | 9,054,749 | |||
| Zenkoku Hosho Company, Ltd. | 222,600 | 9,186,143 | |||
| Luxembourg 0.6% | 7,023,256 | ||||
| Ternium SA, ADR | 177,042 | 7,023,256 | |||
| Malta 0.0% | 3 | ||||
| BGP Holdings PLC (A)(D) | 2,714,128 | 3 |
| SEE NOTES TO FINANCIAL STATEMENTS | SEMIANNUAL REPORT | JOHN HANCOCK DISCIPLINED VALUE INTERNATIONAL FUND | 13 |
| Shares | Value | ||||
| Mexico 1.6% | $17,330,334 | ||||
| Alpek SAB de CV | 5,937,361 | 8,482,829 | |||
| Cemex SAB de CV, ADR (A) | 1,424,719 | 8,847,505 | |||
| Netherlands 4.8% | 51,271,900 | ||||
| ING Groep NV | 490,815 | 8,270,483 | |||
| Koninklijke Ahold Delhaize NV | 182,644 | 4,406,191 | |||
| Royal Dutch Shell PLC, A Shares | 1,109,339 | 38,595,226 | |||
| Norway 0.9% | 9,515,166 | ||||
| DNB ASA | 508,796 | 9,515,166 | |||
| South Korea 3.7% | 39,830,841 | ||||
| Hana Financial Group, Inc. | 177,630 | 7,892,667 | |||
| KT Corp., ADR | 390,785 | 5,248,243 | |||
| LG Uplus Corp. | 826,967 | 9,467,366 | |||
| NAVER Corp. | 8,101 | 5,402,090 | |||
| Samsung Electronics Company, Ltd. | 4,769 | 11,820,475 | |||
| Switzerland 8.1% | 87,159,356 | ||||
| ABB, Ltd. | 560,157 | 13,060,374 | |||
| Glencore PLC (A) | 2,124,921 | 10,235,732 | |||
| Novartis AG | 132,414 | 10,192,474 | |||
| Roche Holding AG | 104,279 | 23,169,475 | |||
| Swiss Re AG | 218,310 | 20,798,224 | |||
| UBS Group AG (A) | 578,084 | 9,703,077 | |||
| Taiwan 0.5% | 5,064,062 | ||||
| Hon Hai Precision Industry Company, Ltd. | 1,820,700 | 5,064,062 | |||
| United Kingdom 16.8% | 180,862,505 | ||||
| Aviva PLC | 2,447,723 | 17,784,344 | |||
| Cairn Energy PLC (A) | 2,756,033 | 8,577,886 | |||
| Coca-Cola European Partners PLC | 226,688 | 8,886,170 | |||
| Direct Line Insurance Group PLC | 3,179,771 | 16,338,566 | |||
| Equiniti Group PLC (C) | 3,196,259 | 12,056,441 | |||
| GlaxoSmithKline PLC | 626,973 | 12,575,296 | |||
| Ibstock PLC (C) | 1,651,189 | 6,750,652 | |||
| Imperial Brands PLC | 156,241 | 5,590,243 | |||
| Lloyds Banking Group PLC | 11,568,790 | 10,260,902 | |||
| Nomad Foods, Ltd. (A) | 1,198,672 | 19,766,101 | |||
| RPC Group PLC | 988,655 | 10,727,766 | |||
| Smiths Group PLC | 581,144 | 12,733,588 | |||
| The Royal Bank of Scotland Group PLC (A) | 1,180,965 | 4,373,343 | |||
| Tullow Oil PLC (A) | 3,058,251 | 9,570,710 | |||
| Vodafone Group PLC | 5,258,301 | 15,344,828 | |||
| WPP PLC | 555,105 | 9,525,669 | |||
| United States 3.5% | 37,844,814 | ||||
| Air Lease Corp. | 187,817 | 7,830,091 |
| 14 | JOHN HANCOCK DISCIPLINED VALUE INTERNATIONAL FUND | SEMIANNUAL REPORT | SEE NOTES TO FINANCIAL STATEMENTS |
| Shares | Value | ||||
| United States (continued) | |||||
| Flex, Ltd. (A) | 898,824 | $11,684,712 | |||
| The Mosaic Company | 290,899 | 7,839,728 | |||
| Trinseo SA | 143,801 | 10,490,283 | |||
| Preferred securities 1.7% | $17,742,272 | ||||
| (Cost $14,657,753) | |||||
| Germany 1.0% | 10,458,786 | ||||
| Volkswagen AG | 50,713 | 10,458,786 | |||
| South Korea 0.7% | 7,283,486 | ||||
| Samsung Electronics Company, Ltd. | 3,663 | 7,283,486 | |||
| Yield (%) | Shares | Value | |||
| Securities lending collateral 1.3% | $13,892,076 | ||||
| (Cost $13,890,543) | |||||
| John Hancock Collateral Trust (E) | 1.8834(F) | 1,388,735 | 13,892,076 | ||
| Short-term investments 3.5% | $38,317,675 | ||||
| (Cost $38,317,675) | |||||
| Money market funds 3.5% | 38,317,675 | ||||
| State Street Institutional U.S. Government Money Market Fund, Premier Class | 1.6333(F) | 38,317,675 | 38,317,675 | ||
| Total investments (Cost $1,038,692,367) 100.2% | $1,079,031,800 | ||||
| Other assets and liabilities, net (0.2%) | (2,520,597) | ||||
| Total net assets 100.0% | $1,076,511,203 | ||||
| The percentage shown for each investment category is the total value of the category as a percentage of the net assets of the fund. | |
| Security Abbreviations and Legend | |
| ADR | American Depositary Receipt |
| GDR | Global Depositary Receipt |
| (A) | Non-income producing security. |
| (B) | A portion of this security is on loan as of 4-30-18. |
| (C) | These securities are exempt from registration under Rule 144A of the Securities Act of 1933. Such securities may be resold, normally to qualified institutional buyers, in transactions exempt from registration. |
| (D) | Security is valued using significant unobservable inputs and is classified as Level 3 in the fair value hierarchy. |
| (E) | Investment is an affiliate of the fund, the advisor and/or subadvisor. This security represents the investment of cash collateral received for securities lending. |
| (F) | The rate shown is the annualized seven-day yield as of 4-30-18. |
| SEE NOTES TO FINANCIAL STATEMENTS | SEMIANNUAL REPORT | JOHN HANCOCK DISCIPLINED VALUE INTERNATIONAL FUND | 15 |
Financial statements
STATEMENT OF ASSETS AND LIABILITIES 4-30-18 (unaudited)
| Assets | ||||||||||||||||||||||||||||||
| Unaffiliated investments, at value (Cost $1,024,801,824) including $13,217,163 of securities loaned | $1,065,139,724 | |||||||||||||||||||||||||||||
| Affiliated investments, at value (Cost $13,890,543) | 13,892,076 | |||||||||||||||||||||||||||||
| Total investments, at value (Cost $1,038,692,367) | 1,079,031,800 | |||||||||||||||||||||||||||||
| Foreign currency, at value (Cost $775,324) | 764,802 | |||||||||||||||||||||||||||||
| Receivable for investments sold | 15,255,168 | |||||||||||||||||||||||||||||
| Receivable for fund shares sold | 2,003,905 | |||||||||||||||||||||||||||||
| Dividends and interest receivable | 7,562,085 | |||||||||||||||||||||||||||||
| Receivable for securities lending income | 111,597 | |||||||||||||||||||||||||||||
| Receivable due from advisor | 1,381 | |||||||||||||||||||||||||||||
| Other receivables and prepaid expenses | 121,674 | |||||||||||||||||||||||||||||
| Total assets | 1,104,852,412 | |||||||||||||||||||||||||||||
| Liabilities | ||||||||||||||||||||||||||||||
| Payable for investments purchased | 12,523,273 | |||||||||||||||||||||||||||||
| Payable for fund shares repurchased | 1,535,669 | |||||||||||||||||||||||||||||
| Payable upon return of securities loaned | 13,895,069 | |||||||||||||||||||||||||||||
| Payable to affiliates | ||||||||||||||||||||||||||||||
| Accounting and legal services fees | 117,659 | |||||||||||||||||||||||||||||
| Transfer agent fees | 54,443 | |||||||||||||||||||||||||||||
| Distribution and service fees | 4,223 | |||||||||||||||||||||||||||||
| Trustees' fees | 3,595 | |||||||||||||||||||||||||||||
| Other liabilities and accrued expenses | 207,278 | |||||||||||||||||||||||||||||
| Total liabilities | 28,341,209 | |||||||||||||||||||||||||||||
| Net assets | $1,076,511,203 | |||||||||||||||||||||||||||||
| Net assets consist of | ||||||||||||||||||||||||||||||
| Paid-in capital | $1,239,507,198 | |||||||||||||||||||||||||||||
| Undistributed net investment income | 5,761,501 | |||||||||||||||||||||||||||||
| Accumulated net realized gain (loss) on investments and foreign currency transactions | (208,964,298 | ) | ||||||||||||||||||||||||||||
| Net unrealized appreciation (depreciation) on investments and translation of assets and liabilities in foreign currencies | 40,206,802 | |||||||||||||||||||||||||||||
| Net assets | $1,076,511,203 | |||||||||||||||||||||||||||||
STATEMENT OF ASSETS AND LIABILITIES (continued)
| Net asset value per share | ||||||||||||||||||
| Based on net asset values and shares outstanding-the fund has an unlimited number of shares authorized with no par value | ||||||||||||||||||
| Class A ($136,030,177 ÷ 9,741,749 shares)1 | $13.96 | |||||||||||||||||
| Class C ($17,850,877 ÷ 1,280,927 shares)1 | $13.94 | |||||||||||||||||
| Class I ($390,225,348 ÷ 27,906,945 shares) | $13.98 | |||||||||||||||||
| Class R2 ($20,483,231 ÷ 1,464,583 shares) | $13.99 | |||||||||||||||||
| Class R4 ($184,620 ÷ 13,206 shares) | $13.98 | |||||||||||||||||
| Class R6 ($196,151,777 ÷ 14,028,049 shares) | $13.98 | |||||||||||||||||
| Class NAV ($315,585,173 ÷ 22,580,451 shares) | $13.98 | |||||||||||||||||
| Maximum offering price per share | ||||||||||||||||||
| Class A (net asset value per share ÷ 95%)2 | $14.69 | |||||||||||||||||
| 1 | Redemption price per share is equal to net asset value less any applicable contingent deferred sales charge. | ||||||||||||||||
| 2 | On single retail sales of less than $50,000. On sales of $50,000 or more and on group sales the offering price is reduced. | ||||||||||||||||
STATEMENT OF OPERATIONS For the six months ended 4-30-18 (unaudited)
| Investment income | ||||||||||||||||||||||||
| Dividends | $14,991,921 | |||||||||||||||||||||||
| Interest | 253,818 | |||||||||||||||||||||||
| Securities lending | 241,325 | |||||||||||||||||||||||
| Less foreign taxes withheld | (1,502,863 | ) | ||||||||||||||||||||||
| Total investment income | 13,984,201 | |||||||||||||||||||||||
| Expenses | ||||||||||||||||||||||||
| Investment management fees | 4,181,977 | |||||||||||||||||||||||
| Distribution and service fees | 337,337 | |||||||||||||||||||||||
| Accounting and legal services fees | 116,173 | |||||||||||||||||||||||
| Transfer agent fees | 300,861 | |||||||||||||||||||||||
| Trustees' fees | 7,991 | |||||||||||||||||||||||
| State registration fees | 62,975 | |||||||||||||||||||||||
| Printing and postage | 37,691 | |||||||||||||||||||||||
| Professional fees | 42,247 | |||||||||||||||||||||||
| Custodian fees | 171,563 | |||||||||||||||||||||||
| Other | 32,166 | |||||||||||||||||||||||
| Total expenses | 5,290,981 | |||||||||||||||||||||||
| Less expense reductions | (147,693 | ) | ||||||||||||||||||||||
| Net expenses | 5,143,288 | |||||||||||||||||||||||
| Net investment income | 8,840,913 | |||||||||||||||||||||||
| Realized and unrealized gain (loss) | ||||||||||||||||||||||||
| Net realized gain (loss) on | ||||||||||||||||||||||||
| Unaffiliated investments and foreign currency transactions | 59,120,641 | |||||||||||||||||||||||
| Affiliated investments | (9,286 | ) | ||||||||||||||||||||||
| 59,111,355 | ||||||||||||||||||||||||
| Change in net unrealized appreciation (depreciation) of | ||||||||||||||||||||||||
| Unaffiliated investments and translation of assets and liabilities in foreign currencies | (65,789,573 | ) | ||||||||||||||||||||||
| Affiliated investments | 2,265 | |||||||||||||||||||||||
| (65,787,308 | ) | |||||||||||||||||||||||
| Net realized and unrealized loss | (6,675,953 | ) | ||||||||||||||||||||||
| Increase in net assets from operations | $2,164,960 | |||||||||||||||||||||||
STATEMENTS OF CHANGES IN NET ASSETS
| Six months ended 4-30-18 | Year ended 10-31-17 | ||||||||||||||||||||||||||||||||||||||||||||
| (unaudited) | |||||||||||||||||||||||||||||||||||||||||||||
| Increase (decrease) in net assets | |||||||||||||||||||||||||||||||||||||||||||||
| From operations | |||||||||||||||||||||||||||||||||||||||||||||
| Net investment income | $8,840,913 | $9,103,871 | |||||||||||||||||||||||||||||||||||||||||||
| Net realized gain | 59,111,355 | 42,291,877 | |||||||||||||||||||||||||||||||||||||||||||
| Change in net unrealized appreciation (depreciation) | (65,787,308 | ) | 104,266,239 | ||||||||||||||||||||||||||||||||||||||||||
| Increase in net assets resulting from operations | 2,164,960 | 155,661,987 | |||||||||||||||||||||||||||||||||||||||||||
| Distributions to shareholders | |||||||||||||||||||||||||||||||||||||||||||||
| From net investment income | |||||||||||||||||||||||||||||||||||||||||||||
| Class A | (1,009,922 | ) | (1,550,874 | ) | |||||||||||||||||||||||||||||||||||||||||
| Class C | (22,435 | ) | (76,552 | ) | |||||||||||||||||||||||||||||||||||||||||
| Class I | (3,868,262 | ) | (3,598,096 | ) | |||||||||||||||||||||||||||||||||||||||||
| Class R2 | (130,951 | ) | (104,060 | ) | |||||||||||||||||||||||||||||||||||||||||
| Class R4 | (2,654 | ) | (2,854 | ) | |||||||||||||||||||||||||||||||||||||||||
| Class R6 | (1,707,297 | ) | (1,060,305 | ) | |||||||||||||||||||||||||||||||||||||||||
| Class NAV | (3,742,821 | ) | (1,860,385 | ) | |||||||||||||||||||||||||||||||||||||||||
| From net realized gain | |||||||||||||||||||||||||||||||||||||||||||||
| Class A | (2,130,156 | ) | — | ||||||||||||||||||||||||||||||||||||||||||
| Class C | (287,406 | ) | — | ||||||||||||||||||||||||||||||||||||||||||
| Class I | (5,966,393 | ) | — | ||||||||||||||||||||||||||||||||||||||||||
| Class R2 | (309,234 | ) | — | ||||||||||||||||||||||||||||||||||||||||||
| Class R4 | (4,558 | ) | — | ||||||||||||||||||||||||||||||||||||||||||
| Class R6 | (2,422,370 | ) | — | ||||||||||||||||||||||||||||||||||||||||||
| Class NAV | (5,309,478 | ) | — | ||||||||||||||||||||||||||||||||||||||||||
| Total distributions | (26,913,937 | ) | (8,253,126 | ) | |||||||||||||||||||||||||||||||||||||||||
| From fund share transactions | 111,845,964 | 453,388,357 | |||||||||||||||||||||||||||||||||||||||||||
| Total increase | 87,096,987 | 600,797,218 | |||||||||||||||||||||||||||||||||||||||||||
| Net assets | |||||||||||||||||||||||||||||||||||||||||||||
| Beginning of period | 989,414,216 | 388,616,998 | |||||||||||||||||||||||||||||||||||||||||||
| End of period | $1,076,511,203 | $989,414,216 | |||||||||||||||||||||||||||||||||||||||||||
| Undistributed net investment income | $5,761,501 | $7,404,930 | |||||||||||||||||||||||||||||||||||||||||||
Financial highlights
| Class A Shares Period ended | 4-30-18 | 1 | 10-31-17 | 10-31-16 | 10-31-15 | 2 | 8-31-15 | 3 | |||||||||||||||||||||||||||||||||||||||||||||||||||||||||||||||||||||||||||||||||||||||||||||||
| Per share operating performance | |||||||||||||||||||||||||||||||||||||||||||||||||||||||||||||||||||||||||||||||||||||||||||||||||||||||
| Net asset value, beginning of period | $14.28 | $11.83 | $12.04 | $12.13 | $13.10 | ||||||||||||||||||||||||||||||||||||||||||||||||||||||||||||||||||||||||||||||||||||||||||||||||||
| Net investment income4 | 0.10 | 0.12 | 0.29 | 5 | 0.01 | 0.13 | |||||||||||||||||||||||||||||||||||||||||||||||||||||||||||||||||||||||||||||||||||||||||||||||||
| Net realized and unrealized gain (loss) on investments | (0.07 | ) | 2.47 | (0.39 | ) | (0.10 | ) | (0.38 | ) | ||||||||||||||||||||||||||||||||||||||||||||||||||||||||||||||||||||||||||||||||||||||||||||||
| Total from investment operations | 0.03 | 2.59 | (0.10 | ) | (0.09 | ) | (0.25 | ) | |||||||||||||||||||||||||||||||||||||||||||||||||||||||||||||||||||||||||||||||||||||||||||||||
| Less distributions | |||||||||||||||||||||||||||||||||||||||||||||||||||||||||||||||||||||||||||||||||||||||||||||||||||||||
| From net investment income | (0.11 | ) | (0.14 | ) | (0.11 | ) | — | (0.10 | ) | ||||||||||||||||||||||||||||||||||||||||||||||||||||||||||||||||||||||||||||||||||||||||||||||
| From net realized gain | (0.24 | ) | — | — | — | (0.62 | ) | ||||||||||||||||||||||||||||||||||||||||||||||||||||||||||||||||||||||||||||||||||||||||||||||||
| Total distributions | (0.35 | ) | (0.14 | ) | (0.11 | ) | — | (0.72 | ) | ||||||||||||||||||||||||||||||||||||||||||||||||||||||||||||||||||||||||||||||||||||||||||||||
| Net asset value, end of period | $13.96 | $14.28 | $11.83 | $12.04 | $12.13 | ||||||||||||||||||||||||||||||||||||||||||||||||||||||||||||||||||||||||||||||||||||||||||||||||||
| Total return (%)6,7 | 0.18 | 8 | 22.14 | (0.86 | ) | (0.74 | ) 8 | (1.75 | ) 8 | ||||||||||||||||||||||||||||||||||||||||||||||||||||||||||||||||||||||||||||||||||||||||||||||
| Ratios and supplemental data | |||||||||||||||||||||||||||||||||||||||||||||||||||||||||||||||||||||||||||||||||||||||||||||||||||||||
| Net assets, end of period (in millions) | $136 | $129 | $36 | $33 | $27 | ||||||||||||||||||||||||||||||||||||||||||||||||||||||||||||||||||||||||||||||||||||||||||||||||||
| Ratios (as a percentage of average net assets): | |||||||||||||||||||||||||||||||||||||||||||||||||||||||||||||||||||||||||||||||||||||||||||||||||||||||
| Expenses before reductions | 1.31 | 9 | 1.36 | 1.53 | 1.66 | 9 | 1.81 | 9 | |||||||||||||||||||||||||||||||||||||||||||||||||||||||||||||||||||||||||||||||||||||||||||||||
| Expenses including reductions | 1.29 | 9 | 1.34 | 1.37 | 1.39 | 9 | 1.39 | 9 | |||||||||||||||||||||||||||||||||||||||||||||||||||||||||||||||||||||||||||||||||||||||||||||||
| Net investment income | 1.40 | 9 | 0.97 | 2.52 | 5 | 0.74 | 9 | 1.03 | 9 | ||||||||||||||||||||||||||||||||||||||||||||||||||||||||||||||||||||||||||||||||||||||||||||||
| Portfolio turnover (%) | 53 | 84 | 11 | 63 | 14 | 91 | 10 | ||||||||||||||||||||||||||||||||||||||||||||||||||||||||||||||||||||||||||||||||||||||||||||||||
| 1 | Six months ended 4-30-18. Unaudited. | ||||||||||||||||||||||||||||||||||||||||||||||||||||||||||||||||||||||||||||||||||
| 2 | For the two-month period ended 10-31-15. The fund changed its fiscal year end from August 31 to October 31. | ||||||||||||||||||||||||||||||||||||||||||||||||||||||||||||||||||||||||||||||||||
| 3 | The inception date for Class A shares is 9-29-14. | ||||||||||||||||||||||||||||||||||||||||||||||||||||||||||||||||||||||||||||||||||
| 4 | Based on average daily shares outstanding. | ||||||||||||||||||||||||||||||||||||||||||||||||||||||||||||||||||||||||||||||||||
| 5 | Net investment income per share and ratio of net investment income to average net assets reflect a special dividend received by the fund which amounted to $0.14 and 1.17%, respectively. | ||||||||||||||||||||||||||||||||||||||||||||||||||||||||||||||||||||||||||||||||||
| 6 | Total returns would have been lower had certain expenses not been reduced during the period. | ||||||||||||||||||||||||||||||||||||||||||||||||||||||||||||||||||||||||||||||||||
| 7 | Does not reflect the effect of sales charges, if any. | ||||||||||||||||||||||||||||||||||||||||||||||||||||||||||||||||||||||||||||||||||
| 8 | Not annualized. | ||||||||||||||||||||||||||||||||||||||||||||||||||||||||||||||||||||||||||||||||||
| 9 | Annualized. | ||||||||||||||||||||||||||||||||||||||||||||||||||||||||||||||||||||||||||||||||||
| 10 | The portfolio turnover is shown for the period from 9-1-14 to 8-31-15. | ||||||||||||||||||||||||||||||||||||||||||||||||||||||||||||||||||||||||||||||||||
| 11 | Excludes merger activity. | ||||||||||||||||||||||||||||||||||||||||||||||||||||||||||||||||||||||||||||||||||
| Class C Shares Period ended | 4-30-18 | 1 | 10-31-17 | 10-31-16 | 10-31-15 | 2 | 8-31-15 | 3 | |||||||||||||||||||||||||||||||||||||||||||||||||||||||||||||||||||||||||||||||||||||||||||||||
| Per share operating performance | |||||||||||||||||||||||||||||||||||||||||||||||||||||||||||||||||||||||||||||||||||||||||||||||||||||||
| Net asset value, beginning of period | $14.21 | $11.78 | $11.98 | $12.08 | $13.10 | ||||||||||||||||||||||||||||||||||||||||||||||||||||||||||||||||||||||||||||||||||||||||||||||||||
| Net investment income4 | 0.05 | 0.04 | 0.20 | 5 | — | 6 | 0.08 | ||||||||||||||||||||||||||||||||||||||||||||||||||||||||||||||||||||||||||||||||||||||||||||||||
| Net realized and unrealized gain (loss) on investments | (0.06 | ) | 2.45 | (0.38 | ) | (0.10 | ) | (0.40 | ) | ||||||||||||||||||||||||||||||||||||||||||||||||||||||||||||||||||||||||||||||||||||||||||||||
| Total from investment operations | (0.01 | ) | 2.49 | (0.18 | ) | (0.10 | ) | (0.32 | ) | ||||||||||||||||||||||||||||||||||||||||||||||||||||||||||||||||||||||||||||||||||||||||||||||
| Less distributions | |||||||||||||||||||||||||||||||||||||||||||||||||||||||||||||||||||||||||||||||||||||||||||||||||||||||
| From net investment income | (0.02 | ) | (0.06 | ) | (0.02 | ) | — | (0.08 | ) | ||||||||||||||||||||||||||||||||||||||||||||||||||||||||||||||||||||||||||||||||||||||||||||||
| From net realized gain | (0.24 | ) | — | — | — | (0.62 | ) | ||||||||||||||||||||||||||||||||||||||||||||||||||||||||||||||||||||||||||||||||||||||||||||||||
| Total distributions | (0.26 | ) | (0.06 | ) | (0.02 | ) | — | (0.70 | ) | ||||||||||||||||||||||||||||||||||||||||||||||||||||||||||||||||||||||||||||||||||||||||||||||
| Net asset value, end of period | $13.94 | $14.21 | $11.78 | $11.98 | $12.08 | ||||||||||||||||||||||||||||||||||||||||||||||||||||||||||||||||||||||||||||||||||||||||||||||||||
| Total return (%)7,8 | (0.13 | ) 9 | 21.22 | (1.42 | ) | (0.83 | ) 9 | (2.33 | ) | ||||||||||||||||||||||||||||||||||||||||||||||||||||||||||||||||||||||||||||||||||||||||||||||
| Ratios and supplemental data | |||||||||||||||||||||||||||||||||||||||||||||||||||||||||||||||||||||||||||||||||||||||||||||||||||||||
| Net assets, end of period (in millions) | $18 | $18 | $7 | $6 | $6 | ||||||||||||||||||||||||||||||||||||||||||||||||||||||||||||||||||||||||||||||||||||||||||||||||||
| Ratios (as a percentage of average net assets): | |||||||||||||||||||||||||||||||||||||||||||||||||||||||||||||||||||||||||||||||||||||||||||||||||||||||
| Expenses before reductions | 2.01 | 10 | 2.06 | 2.23 | 2.36 | 10 | 2.64 | 10 | |||||||||||||||||||||||||||||||||||||||||||||||||||||||||||||||||||||||||||||||||||||||||||||||
| Expenses including reductions | 1.99 | 10 | 2.04 | 2.08 | 2.08 | 10 | 2.08 | 10 | |||||||||||||||||||||||||||||||||||||||||||||||||||||||||||||||||||||||||||||||||||||||||||||||
| Net investment income | 0.67 | 10 | 0.32 | 1.71 | 5 | 0.02 | 10 | 0.60 | 10 | ||||||||||||||||||||||||||||||||||||||||||||||||||||||||||||||||||||||||||||||||||||||||||||||
| Portfolio turnover (%) | 53 | 84 | 12 | 63 | 14 | 91 | 11 | ||||||||||||||||||||||||||||||||||||||||||||||||||||||||||||||||||||||||||||||||||||||||||||||||
| 1 | Six months ended 4-30-18. Unaudited. | ||||||||||||||||||||||||||||||||||||||||||||||||||||||||||||||||||||||||||||||||||
| 2 | For the two-month period ended 10-31-15. The fund changed its fiscal year end from August 31 to October 31. | ||||||||||||||||||||||||||||||||||||||||||||||||||||||||||||||||||||||||||||||||||
| 3 | The inception date for Class C shares is 9-29-14. | ||||||||||||||||||||||||||||||||||||||||||||||||||||||||||||||||||||||||||||||||||
| 4 | Based on average daily shares outstanding. | ||||||||||||||||||||||||||||||||||||||||||||||||||||||||||||||||||||||||||||||||||
| 5 | Net investment income per share and ratio of net investment income to average net assets reflect a special dividend received by the fund which amounted to $0.14 and 1.17%, respectively. | ||||||||||||||||||||||||||||||||||||||||||||||||||||||||||||||||||||||||||||||||||
| 6 | Less than $0.005 per share. | ||||||||||||||||||||||||||||||||||||||||||||||||||||||||||||||||||||||||||||||||||
| 7 | Total returns would have been lower had certain expenses not been reduced during the applicable periods. | ||||||||||||||||||||||||||||||||||||||||||||||||||||||||||||||||||||||||||||||||||
| 8 | Does not reflect the effect of sales charges, if any. | ||||||||||||||||||||||||||||||||||||||||||||||||||||||||||||||||||||||||||||||||||
| 9 | Not annualized. | ||||||||||||||||||||||||||||||||||||||||||||||||||||||||||||||||||||||||||||||||||
| 10 | Annualized. | ||||||||||||||||||||||||||||||||||||||||||||||||||||||||||||||||||||||||||||||||||
| 11 | The portfolio turnover is shown for the period from 9-1-14 to 8-31-15. | ||||||||||||||||||||||||||||||||||||||||||||||||||||||||||||||||||||||||||||||||||
| 12 | Excludes merger activity. | ||||||||||||||||||||||||||||||||||||||||||||||||||||||||||||||||||||||||||||||||||
| Class I Shares Period ended | 4-30-18 | 1 | 10-31-17 | 10-31-16 | 10-31-15 | 2 | 8-31-15 | 3 | |||||||||||||||||||||||||||||||||||||||||||||||||||||||||||||||||||||||||||||||||||||||||||||||
| Per share operating performance | |||||||||||||||||||||||||||||||||||||||||||||||||||||||||||||||||||||||||||||||||||||||||||||||||||||||
| Net asset value, beginning of period | $14.32 | $11.87 | $12.07 | $12.16 | $13.10 | ||||||||||||||||||||||||||||||||||||||||||||||||||||||||||||||||||||||||||||||||||||||||||||||||||
| Net investment income4 | 0.12 | 0.18 | 0.25 | 5 | 0.02 | 0.19 | |||||||||||||||||||||||||||||||||||||||||||||||||||||||||||||||||||||||||||||||||||||||||||||||||
| Net realized and unrealized gain (loss) on investments | (0.07 | ) | 2.44 | (0.30 | ) | (0.11 | ) | (0.40 | ) | ||||||||||||||||||||||||||||||||||||||||||||||||||||||||||||||||||||||||||||||||||||||||||||||
| Total from investment operations | 0.05 | 2.62 | (0.05 | ) | (0.09 | ) | (0.21 | ) | |||||||||||||||||||||||||||||||||||||||||||||||||||||||||||||||||||||||||||||||||||||||||||||||
| Less distributions | |||||||||||||||||||||||||||||||||||||||||||||||||||||||||||||||||||||||||||||||||||||||||||||||||||||||
| From net investment income | (0.15 | ) | (0.17 | ) | (0.15 | ) | — | (0.11 | ) | ||||||||||||||||||||||||||||||||||||||||||||||||||||||||||||||||||||||||||||||||||||||||||||||
| From net realized gain | (0.24 | ) | — | — | — | (0.62 | ) | ||||||||||||||||||||||||||||||||||||||||||||||||||||||||||||||||||||||||||||||||||||||||||||||||
| Total distributions | (0.39 | ) | (0.17 | ) | (0.15 | ) | — | (0.73 | ) | ||||||||||||||||||||||||||||||||||||||||||||||||||||||||||||||||||||||||||||||||||||||||||||||
| Net asset value, end of period | $13.98 | $14.32 | $11.87 | $12.07 | $12.16 | ||||||||||||||||||||||||||||||||||||||||||||||||||||||||||||||||||||||||||||||||||||||||||||||||||
| Total return (%)6 | 0.33 | 7 | 22.45 | (0.45 | ) | (0.74 | ) 7 | (1.43 | ) 7 | ||||||||||||||||||||||||||||||||||||||||||||||||||||||||||||||||||||||||||||||||||||||||||||||
| Ratios and supplemental data | |||||||||||||||||||||||||||||||||||||||||||||||||||||||||||||||||||||||||||||||||||||||||||||||||||||||
| Net assets, end of period (in millions) | $390 | $357 | $201 | $36 | $30 | ||||||||||||||||||||||||||||||||||||||||||||||||||||||||||||||||||||||||||||||||||||||||||||||||||
| Ratios (as a percentage of average net assets): | |||||||||||||||||||||||||||||||||||||||||||||||||||||||||||||||||||||||||||||||||||||||||||||||||||||||
| Expenses before reductions | 1.01 | 8 | 1.04 | 1.21 | 1.35 | 8 | 1.49 | 8 | |||||||||||||||||||||||||||||||||||||||||||||||||||||||||||||||||||||||||||||||||||||||||||||||
| Expenses including reductions | 0.98 | 8 | 1.03 | 1.08 | 1.07 | 8 | 1.08 | 8 | |||||||||||||||||||||||||||||||||||||||||||||||||||||||||||||||||||||||||||||||||||||||||||||||
| Net investment income | 1.73 | 8 | 1.38 | 2.13 | 5 | 1.00 | 8 | 1.64 | 8 | ||||||||||||||||||||||||||||||||||||||||||||||||||||||||||||||||||||||||||||||||||||||||||||||
| Portfolio turnover (%) | 53 | 84 | 10 | 63 | 14 | 91 | 9 | ||||||||||||||||||||||||||||||||||||||||||||||||||||||||||||||||||||||||||||||||||||||||||||||||
| 1 | Six months ended 4-30-18. Unaudited. | ||||||||||||||||||||||||||||||||||||||||||||||||||||||||||||||||||||||||||||||||||
| 2 | For the two-month period ended 10-31-15. The fund changed its fiscal year end from August 31 to October 31. | ||||||||||||||||||||||||||||||||||||||||||||||||||||||||||||||||||||||||||||||||||
| 3 | The inception date for Class I shares is 9-29-14. | ||||||||||||||||||||||||||||||||||||||||||||||||||||||||||||||||||||||||||||||||||
| 4 | Based on average daily shares outstanding. | ||||||||||||||||||||||||||||||||||||||||||||||||||||||||||||||||||||||||||||||||||
| 5 | Net investment income per share and ratio of net investment income to average net assets reflect a special dividend received by the fund which amounted to $0.14 and 1.17%, respectively. | ||||||||||||||||||||||||||||||||||||||||||||||||||||||||||||||||||||||||||||||||||
| 6 | Total returns would have been lower had certain expenses not been reduced during the applicable periods. | ||||||||||||||||||||||||||||||||||||||||||||||||||||||||||||||||||||||||||||||||||
| 7 | Not annualized. | ||||||||||||||||||||||||||||||||||||||||||||||||||||||||||||||||||||||||||||||||||
| 8 | Annualized. | ||||||||||||||||||||||||||||||||||||||||||||||||||||||||||||||||||||||||||||||||||
| 9 | The portfolio turnover is shown for the period from 9-1-14 to 8-31-15. | ||||||||||||||||||||||||||||||||||||||||||||||||||||||||||||||||||||||||||||||||||
| 10 | Excludes merger activity. | ||||||||||||||||||||||||||||||||||||||||||||||||||||||||||||||||||||||||||||||||||
| Class R2 Shares Period ended | 4-30-18 | 1 | 10-31-17 | 10-31-16 | 10-31-15 | 2 | 8-31-15 | 3 | |||||||||||||||||||||||||||||||||||||||||||||||||||||||||||||||||||||||||||||||||||||||||||||||
| Per share operating performance | |||||||||||||||||||||||||||||||||||||||||||||||||||||||||||||||||||||||||||||||||||||||||||||||||||||||
| Net asset value, beginning of period | $14.29 | $11.85 | $12.05 | $12.14 | $13.10 | ||||||||||||||||||||||||||||||||||||||||||||||||||||||||||||||||||||||||||||||||||||||||||||||||||
| Net investment income4 | 0.09 | 0.12 | 0.30 | 5 | 0.01 | 0.16 | |||||||||||||||||||||||||||||||||||||||||||||||||||||||||||||||||||||||||||||||||||||||||||||||||
| Net realized and unrealized gain (loss) on investments | (0.05 | ) | 2.45 | (0.40 | ) | (0.10 | ) | (0.40 | ) | ||||||||||||||||||||||||||||||||||||||||||||||||||||||||||||||||||||||||||||||||||||||||||||||
| Total from investment operations | 0.04 | 2.57 | (0.10 | ) | (0.09 | ) | (0.24 | ) | |||||||||||||||||||||||||||||||||||||||||||||||||||||||||||||||||||||||||||||||||||||||||||||||
| Less distributions | |||||||||||||||||||||||||||||||||||||||||||||||||||||||||||||||||||||||||||||||||||||||||||||||||||||||
| From net investment income | (0.10 | ) | (0.13 | ) | (0.10 | ) | — | (0.10 | ) | ||||||||||||||||||||||||||||||||||||||||||||||||||||||||||||||||||||||||||||||||||||||||||||||
| From net realized gain | (0.24 | ) | — | — | — | (0.62 | ) | ||||||||||||||||||||||||||||||||||||||||||||||||||||||||||||||||||||||||||||||||||||||||||||||||
| Total distributions | (0.34 | ) | (0.13 | ) | (0.10 | ) | — | (0.72 | ) | ||||||||||||||||||||||||||||||||||||||||||||||||||||||||||||||||||||||||||||||||||||||||||||||
| Net asset value, end of period | $13.99 | $14.29 | $11.85 | $12.05 | $12.14 | ||||||||||||||||||||||||||||||||||||||||||||||||||||||||||||||||||||||||||||||||||||||||||||||||||
| Total return (%)6 | 0.24 | 8 | 21.92 | (0.87 | ) | (0.74 | ) 7 | (1.68 | ) 7 | ||||||||||||||||||||||||||||||||||||||||||||||||||||||||||||||||||||||||||||||||||||||||||||||
| Ratios and supplemental data | |||||||||||||||||||||||||||||||||||||||||||||||||||||||||||||||||||||||||||||||||||||||||||||||||||||||
| Net assets, end of period (in millions) | $20 | $18 | $8 | — | 9 | — | 9 | ||||||||||||||||||||||||||||||||||||||||||||||||||||||||||||||||||||||||||||||||||||||||||||||||
| Ratios (as a percentage of average net assets): | |||||||||||||||||||||||||||||||||||||||||||||||||||||||||||||||||||||||||||||||||||||||||||||||||||||||
| Expenses before reductions | 1.40 | 10 | 1.43 | 1.61 | 1.61 | 10 | 4.32 | 10 | |||||||||||||||||||||||||||||||||||||||||||||||||||||||||||||||||||||||||||||||||||||||||||||||
| Expenses including reductions | 1.38 | 10 | 1.42 | 1.61 | 1.30 | 10 | 1.31 | 10 | |||||||||||||||||||||||||||||||||||||||||||||||||||||||||||||||||||||||||||||||||||||||||||||||
| Net investment income | 1.34 | 10 | 0.94 | 2.57 | 5 | 0.73 | 10 | 1.33 | 10 | ||||||||||||||||||||||||||||||||||||||||||||||||||||||||||||||||||||||||||||||||||||||||||||||
| Portfolio turnover (%) | 53 | 84 | 12 | 63 | 14 | 91 | 11 | ||||||||||||||||||||||||||||||||||||||||||||||||||||||||||||||||||||||||||||||||||||||||||||||||
| 1 | Six months ended 4-30-18. Unaudited. | ||||||||||||||||||||||||||||||||||||||||||||||||||||||||||||||||||||||||||||||||||
| 2 | For the two-month period ended 10-31-15. The fund changed its fiscal year end from August 31 to October 31. | ||||||||||||||||||||||||||||||||||||||||||||||||||||||||||||||||||||||||||||||||||
| 3 | The inception date for Class R2 shares is 9-29-14. | ||||||||||||||||||||||||||||||||||||||||||||||||||||||||||||||||||||||||||||||||||
| 4 | Based on average daily shares outstanding. | ||||||||||||||||||||||||||||||||||||||||||||||||||||||||||||||||||||||||||||||||||
| 5 | Net investment income per share and ratio of net investment income to average net assets reflect a special dividend received by the fund which amounted to $0.14 and 1.17%, respectively. | ||||||||||||||||||||||||||||||||||||||||||||||||||||||||||||||||||||||||||||||||||
| 6 | Total returns would have been lower had certain expenses not been reduced during the period. | ||||||||||||||||||||||||||||||||||||||||||||||||||||||||||||||||||||||||||||||||||
| 7 | Not annualized. | ||||||||||||||||||||||||||||||||||||||||||||||||||||||||||||||||||||||||||||||||||
| 8 | Total returns would have been lower had certain expenses not been reduced during the applicable periods. | ||||||||||||||||||||||||||||||||||||||||||||||||||||||||||||||||||||||||||||||||||
| 9 | Less than $500,000. | ||||||||||||||||||||||||||||||||||||||||||||||||||||||||||||||||||||||||||||||||||
| 10 | Annualized. | ||||||||||||||||||||||||||||||||||||||||||||||||||||||||||||||||||||||||||||||||||
| 11 | The portfolio turnover is shown for the period from 9-1-14 to 8-31-15. | ||||||||||||||||||||||||||||||||||||||||||||||||||||||||||||||||||||||||||||||||||
| 12 | Excludes merger activity. | ||||||||||||||||||||||||||||||||||||||||||||||||||||||||||||||||||||||||||||||||||
| Class R4 Shares Period ended | 4-30-18 | 1 | 10-31-17 | 10-31-16 | 10-31-15 | 2 | 8-31-15 | 3 | |||||||||||||||||||||||||||||||||||||||||||||||||||||||||||||||||||||||||||||||||||||||||||||||
| Per share operating performance | |||||||||||||||||||||||||||||||||||||||||||||||||||||||||||||||||||||||||||||||||||||||||||||||||||||||
| Net asset value, beginning of period | $14.30 | $11.86 | $12.06 | $12.15 | $13.10 | ||||||||||||||||||||||||||||||||||||||||||||||||||||||||||||||||||||||||||||||||||||||||||||||||||
| Net investment income4 | 0.09 | 0.16 | 0.33 | 5 | 0.02 | 0.14 | |||||||||||||||||||||||||||||||||||||||||||||||||||||||||||||||||||||||||||||||||||||||||||||||||
| Net realized and unrealized gain (loss) on investments | (0.03 | ) | 2.45 | (0.40 | ) | (0.11 | ) | (0.36 | ) | ||||||||||||||||||||||||||||||||||||||||||||||||||||||||||||||||||||||||||||||||||||||||||||||
| Total from investment operations | 0.06 | 2.61 | (0.07 | ) | (0.09 | ) | (0.22 | ) | |||||||||||||||||||||||||||||||||||||||||||||||||||||||||||||||||||||||||||||||||||||||||||||||
| Less distributions | |||||||||||||||||||||||||||||||||||||||||||||||||||||||||||||||||||||||||||||||||||||||||||||||||||||||
| From net investment income | (0.14 | ) | (0.17 | ) | (0.13 | ) | — | (0.11 | ) | ||||||||||||||||||||||||||||||||||||||||||||||||||||||||||||||||||||||||||||||||||||||||||||||
| From net realized gain | (0.24 | ) | — | — | — | (0.62 | ) | ||||||||||||||||||||||||||||||||||||||||||||||||||||||||||||||||||||||||||||||||||||||||||||||||
| Total distributions | (0.38 | ) | (0.17 | ) | (0.13 | ) | — | (0.73 | ) | ||||||||||||||||||||||||||||||||||||||||||||||||||||||||||||||||||||||||||||||||||||||||||||||
| Net asset value, end of period | $13.98 | $14.30 | $11.86 | $12.06 | $12.15 | ||||||||||||||||||||||||||||||||||||||||||||||||||||||||||||||||||||||||||||||||||||||||||||||||||
| Total return (%)6 | 0.36 | 7 | 22.30 | (0.57 | ) | (0.74 | ) 7 | (1.53 | ) 7 | ||||||||||||||||||||||||||||||||||||||||||||||||||||||||||||||||||||||||||||||||||||||||||||||
| Ratios and supplemental data | |||||||||||||||||||||||||||||||||||||||||||||||||||||||||||||||||||||||||||||||||||||||||||||||||||||||
| Net assets, end of period (in millions) | — | 8 | — | 8 | — | 8 | — | 8 | — | 8 | |||||||||||||||||||||||||||||||||||||||||||||||||||||||||||||||||||||||||||||||||||||||||||||
| Ratios (as a percentage of average net assets): | |||||||||||||||||||||||||||||||||||||||||||||||||||||||||||||||||||||||||||||||||||||||||||||||||||||||
| Expenses before reductions | 1.23 | 9 | 1.26 | 1.37 | 1.51 | 9 | 5.28 | 9 | |||||||||||||||||||||||||||||||||||||||||||||||||||||||||||||||||||||||||||||||||||||||||||||||
| Expenses including reductions | 1.11 | 9 | 1.14 | 1.37 | 1.51 | 9 | 1.17 | 9 | |||||||||||||||||||||||||||||||||||||||||||||||||||||||||||||||||||||||||||||||||||||||||||||||
| Net investment income | 1.29 | 9 | 1.22 | 2.84 | 5 | 0.97 | 9 | 1.20 | 9 | ||||||||||||||||||||||||||||||||||||||||||||||||||||||||||||||||||||||||||||||||||||||||||||||
| Portfolio turnover (%) | 53 | 84 | 11 | 63 | 14 | 91 | 10 | ||||||||||||||||||||||||||||||||||||||||||||||||||||||||||||||||||||||||||||||||||||||||||||||||
| 1 | Six months ended 4-30-18. Unaudited. | ||||||||||||||||||||||||||||||||||||||||||||||||||||||||||||||||||||||||||||||||||
| 2 | For the two-month period ended 10-31-15. The fund changed its fiscal year end from August 31 to October 31. | ||||||||||||||||||||||||||||||||||||||||||||||||||||||||||||||||||||||||||||||||||
| 3 | The inception date for Class R4 shares is 9-29-14. | ||||||||||||||||||||||||||||||||||||||||||||||||||||||||||||||||||||||||||||||||||
| 4 | Based on average daily shares outstanding. | ||||||||||||||||||||||||||||||||||||||||||||||||||||||||||||||||||||||||||||||||||
| 5 | Net investment income per share and ratio of net investment income to average net assets reflect a special dividend received by the fund which amounted to $0.14 and 1.17%, respectively. | ||||||||||||||||||||||||||||||||||||||||||||||||||||||||||||||||||||||||||||||||||
| 6 | Total returns would have been lower had certain expenses not been reduced during the period. | ||||||||||||||||||||||||||||||||||||||||||||||||||||||||||||||||||||||||||||||||||
| 7 | Not annualized. | ||||||||||||||||||||||||||||||||||||||||||||||||||||||||||||||||||||||||||||||||||
| 8 | Less than $500,000. | ||||||||||||||||||||||||||||||||||||||||||||||||||||||||||||||||||||||||||||||||||
| 9 | Annualized. | ||||||||||||||||||||||||||||||||||||||||||||||||||||||||||||||||||||||||||||||||||
| 10 | The portfolio tunover is shown for the period from 9-1-14 to 8-31-15. | ||||||||||||||||||||||||||||||||||||||||||||||||||||||||||||||||||||||||||||||||||
| 11 | Excludes merger activity. | ||||||||||||||||||||||||||||||||||||||||||||||||||||||||||||||||||||||||||||||||||
| Class R6 Shares Period ended | 4-30-18 | 1 | 10-31-17 | 10-31-16 | 10-31-15 | 2 | 8-31-15 | 3 | 8-31-14 | 4 | 8-31-13 | 4 | |||||||||||||||||||||||||||||||||||||||||||||||||||||||||||||||||||||||||||||||||||||||||||||||||||||||||||||||||||||||||||||||
| Per share operating performance | |||||||||||||||||||||||||||||||||||||||||||||||||||||||||||||||||||||||||||||||||||||||||||||||||||||||||||||||||||||||||||||||||||||||||||
| Net asset value, beginning of period | $14.32 | $11.87 | $12.08 | $12.16 | $13.54 | $12.88 | $10.79 | ||||||||||||||||||||||||||||||||||||||||||||||||||||||||||||||||||||||||||||||||||||||||||||||||||||||||||||||||||||||||||||||||||||
| Net investment income5 | 0.14 | 0.18 | 0.34 | 6 | 0.02 | 0.27 | 0.27 | 0.20 | |||||||||||||||||||||||||||||||||||||||||||||||||||||||||||||||||||||||||||||||||||||||||||||||||||||||||||||||||||||||||||||||||||
| Net realized and unrealized gain (loss) on investments | (0.07 | ) | 2.46 | (0.39 | ) | (0.10 | ) | (0.91 | ) | 1.98 | 2.10 | ||||||||||||||||||||||||||||||||||||||||||||||||||||||||||||||||||||||||||||||||||||||||||||||||||||||||||||||||||||||||||||||||
| Total from investment operations | 0.07 | 2.64 | (0.05 | ) | (0.08 | ) | (0.64 | ) | 2.25 | 2.30 | |||||||||||||||||||||||||||||||||||||||||||||||||||||||||||||||||||||||||||||||||||||||||||||||||||||||||||||||||||||||||||||||||
| Less distributions | |||||||||||||||||||||||||||||||||||||||||||||||||||||||||||||||||||||||||||||||||||||||||||||||||||||||||||||||||||||||||||||||||||||||||||
| From net investment income | (0.17 | ) | (0.19 | ) | (0.16 | ) | — | (0.12 | ) | (0.20 | ) | (0.13 | ) | ||||||||||||||||||||||||||||||||||||||||||||||||||||||||||||||||||||||||||||||||||||||||||||||||||||||||||||||||||||||||||||||
| From net realized gain | (0.24 | ) | — | — | — | (0.62 | ) | (1.39 | ) | (0.08 | ) | ||||||||||||||||||||||||||||||||||||||||||||||||||||||||||||||||||||||||||||||||||||||||||||||||||||||||||||||||||||||||||||||||
| Total distributions | (0.41 | ) | (0.19 | ) | (0.16 | ) | — | (0.74 | ) | (1.59 | ) | (0.21 | ) | ||||||||||||||||||||||||||||||||||||||||||||||||||||||||||||||||||||||||||||||||||||||||||||||||||||||||||||||||||||||||||||||
| Net asset value, end of period | $13.98 | $14.32 | $11.87 | $12.08 | $12.16 | $13.54 | $12.88 | ||||||||||||||||||||||||||||||||||||||||||||||||||||||||||||||||||||||||||||||||||||||||||||||||||||||||||||||||||||||||||||||||||||
| Total return (%)7 | 0.42 | 8 | 22.59 | (0.41 | ) | (0.66 | ) 8 | (4.56 | ) | 18.18 | 21.52 | ||||||||||||||||||||||||||||||||||||||||||||||||||||||||||||||||||||||||||||||||||||||||||||||||||||||||||||||||||||||||||||||||
| Ratios and supplemental data | |||||||||||||||||||||||||||||||||||||||||||||||||||||||||||||||||||||||||||||||||||||||||||||||||||||||||||||||||||||||||||||||||||||||||||
| Net assets, end of period (in millions) | $196 | $140 | $46 | $74 | $73 | $14 | $11 | ||||||||||||||||||||||||||||||||||||||||||||||||||||||||||||||||||||||||||||||||||||||||||||||||||||||||||||||||||||||||||||||||||||
| Ratios (as a percentage of average net assets): | |||||||||||||||||||||||||||||||||||||||||||||||||||||||||||||||||||||||||||||||||||||||||||||||||||||||||||||||||||||||||||||||||||||||||||
| Expenses before reductions | 0.91 | 9 | 0.95 | 1.12 | 1.24 | 9 | 1.38 | 2.84 | 3.18 | ||||||||||||||||||||||||||||||||||||||||||||||||||||||||||||||||||||||||||||||||||||||||||||||||||||||||||||||||||||||||||||||||||
| Expenses including reductions | 0.88 | 9 | 0.92 | 0.95 | 0.95 | 9 | 0.95 | 0.98 | 1.30 | ||||||||||||||||||||||||||||||||||||||||||||||||||||||||||||||||||||||||||||||||||||||||||||||||||||||||||||||||||||||||||||||||||
| Net investment income | 2.04 | 9 | 1.41 | 2.92 | 6 | 1.15 | 9 | 2.12 | 1.99 | 1.63 | |||||||||||||||||||||||||||||||||||||||||||||||||||||||||||||||||||||||||||||||||||||||||||||||||||||||||||||||||||||||||||||||||
| Portfolio turnover (%) | 53 | 84 | 10 | 63 | 14 | 91 | 67 | 87 | |||||||||||||||||||||||||||||||||||||||||||||||||||||||||||||||||||||||||||||||||||||||||||||||||||||||||||||||||||||||||||||||||||
| 1 | Six months ended 4-30-18. Unaudited. | ||||||||||||||||||||||||||||||||||||||||||||||||||||||||||||||||||||||||||||||||||
| 2 | For the two-month period ended 10-31-15. The fund changed its fiscal year end from August 31 to October 31. | ||||||||||||||||||||||||||||||||||||||||||||||||||||||||||||||||||||||||||||||||||
| 3 | After the close of business on 9-26-14, holders of Institutional Class shares of the former Robeco Boston Partners International Equity Fund (the Predecessor fund) became owners of an equal number of full and fractional Class R6 shares of the John Hancock Disciplined Value International Fund. These shares were first offered on 9-29-14. Additionally, the accounting and performance history of the Institutional Class shares of the Predecessor fund was redesignated as that of John Hancock Disciplined Value International Fund Class R6. | ||||||||||||||||||||||||||||||||||||||||||||||||||||||||||||||||||||||||||||||||||
| 4 | Audited by previous independent registered public accounting firm. | ||||||||||||||||||||||||||||||||||||||||||||||||||||||||||||||||||||||||||||||||||
| 5 | Based on average daily shares outstanding. | ||||||||||||||||||||||||||||||||||||||||||||||||||||||||||||||||||||||||||||||||||
| 6 | Net investment income per share and ratio of net investment income to average net assets reflect a special dividend received by the fund which amounted to $0.14 and 1.17%, respectively. | ||||||||||||||||||||||||||||||||||||||||||||||||||||||||||||||||||||||||||||||||||
| 7 | Total returns would have been lower had certain expenses not been reduced during the applicable periods. | ||||||||||||||||||||||||||||||||||||||||||||||||||||||||||||||||||||||||||||||||||
| 8 | Not annualized. | ||||||||||||||||||||||||||||||||||||||||||||||||||||||||||||||||||||||||||||||||||
| 9 | Annualized. | ||||||||||||||||||||||||||||||||||||||||||||||||||||||||||||||||||||||||||||||||||
| 10 | Excludes merger activity. | ||||||||||||||||||||||||||||||||||||||||||||||||||||||||||||||||||||||||||||||||||
| Class NAV Shares Period ended | 4-30-18 | 1 | 10-31-17 | 10-31-16 | 10-31-15 | 2 | 8-31-15 | 3 | |||||||||||||||||||||||||||||||||||||||||||||||||||||||||||||||||||||||||||||||||||||||||||||||
| Per share operating performance | |||||||||||||||||||||||||||||||||||||||||||||||||||||||||||||||||||||||||||||||||||||||||||||||||||||||
| Net asset value, beginning of period | $14.32 | $11.87 | $12.07 | $12.16 | $12.98 | ||||||||||||||||||||||||||||||||||||||||||||||||||||||||||||||||||||||||||||||||||||||||||||||||||
| Net investment income4 | 0.12 | 0.17 | 0.34 | 5 | 0.02 | 0.11 | |||||||||||||||||||||||||||||||||||||||||||||||||||||||||||||||||||||||||||||||||||||||||||||||||
| Net realized and unrealized gain (loss) on investments | (0.05 | ) | 2.47 | (0.38 | ) | (0.11 | ) | (0.93 | ) | ||||||||||||||||||||||||||||||||||||||||||||||||||||||||||||||||||||||||||||||||||||||||||||||
| Total from investment operations | 0.07 | 2.64 | (0.04 | ) | (0.09 | ) | (0.82 | ) | |||||||||||||||||||||||||||||||||||||||||||||||||||||||||||||||||||||||||||||||||||||||||||||||
| Less distributions | |||||||||||||||||||||||||||||||||||||||||||||||||||||||||||||||||||||||||||||||||||||||||||||||||||||||
| From net investment income | (0.17 | ) | (0.19 | ) | (0.16 | ) | — | — | |||||||||||||||||||||||||||||||||||||||||||||||||||||||||||||||||||||||||||||||||||||||||||||||
| From net realized gain | (0.24 | ) | — | — | — | — | |||||||||||||||||||||||||||||||||||||||||||||||||||||||||||||||||||||||||||||||||||||||||||||||||
| Total distributions | (0.41 | ) | (0.19 | ) | (0.16 | ) | — | — | |||||||||||||||||||||||||||||||||||||||||||||||||||||||||||||||||||||||||||||||||||||||||||||||
| Net asset value, end of period | $13.98 | $14.32 | $11.87 | $12.07 | $12.16 | ||||||||||||||||||||||||||||||||||||||||||||||||||||||||||||||||||||||||||||||||||||||||||||||||||
| Total return (%)6 | 0.49 | 7 | 22.50 | (0.33 | ) | (0.74 | ) 7 | (6.32 | ) 7 | ||||||||||||||||||||||||||||||||||||||||||||||||||||||||||||||||||||||||||||||||||||||||||||||
| Ratios and supplemental data | |||||||||||||||||||||||||||||||||||||||||||||||||||||||||||||||||||||||||||||||||||||||||||||||||||||||
| Net assets, end of period (in millions) | $316 | $327 | $91 | $92 | $91 | ||||||||||||||||||||||||||||||||||||||||||||||||||||||||||||||||||||||||||||||||||||||||||||||||||
| Ratios (as a percentage of average net assets): | |||||||||||||||||||||||||||||||||||||||||||||||||||||||||||||||||||||||||||||||||||||||||||||||||||||||
| Expenses before reductions | 0.90 | 8 | 0.94 | 1.10 | 1.22 | 8 | 1.35 | 8 | |||||||||||||||||||||||||||||||||||||||||||||||||||||||||||||||||||||||||||||||||||||||||||||||
| Expenses including reductions | 0.88 | 8 | 0.92 | 0.95 | 0.95 | 8 | 0.95 | 8 | |||||||||||||||||||||||||||||||||||||||||||||||||||||||||||||||||||||||||||||||||||||||||||||||
| Net investment income | 1.75 | 8 | 1.34 | 2.90 | 5 | 1.15 | 8 | 2.29 | 8 | ||||||||||||||||||||||||||||||||||||||||||||||||||||||||||||||||||||||||||||||||||||||||||||||
| Portfolio turnover (%) | 53 | 84 | 10 | 63 | 14 | 91 | 9 | ||||||||||||||||||||||||||||||||||||||||||||||||||||||||||||||||||||||||||||||||||||||||||||||||
| 1 | Six months ended 4-30-18. Unaudited. | ||||||||||||||||||||||||||||||||||||||||||||||||||||||||||||||||||||||||||||||||||
| 2 | For the two-month period ended 10-31-15. The fund changed its fiscal year end from August 31 to October 31. | ||||||||||||||||||||||||||||||||||||||||||||||||||||||||||||||||||||||||||||||||||
| 3 | The inception date for Class NAV shares is 4-13-15. | ||||||||||||||||||||||||||||||||||||||||||||||||||||||||||||||||||||||||||||||||||
| 4 | Based on average daily shares outstanding. | ||||||||||||||||||||||||||||||||||||||||||||||||||||||||||||||||||||||||||||||||||
| 5 | Net investment income per share and ratio of net investment income to average net assets reflect a special dividend received by the fund which amounted to $0.14 and 1.17%, respectively. | ||||||||||||||||||||||||||||||||||||||||||||||||||||||||||||||||||||||||||||||||||
| 6 | Total returns would have been lower had certain expenses not been reduced during the applicable periods. | ||||||||||||||||||||||||||||||||||||||||||||||||||||||||||||||||||||||||||||||||||
| 7 | Not annualized. | ||||||||||||||||||||||||||||||||||||||||||||||||||||||||||||||||||||||||||||||||||
| 8 | Annualized. | ||||||||||||||||||||||||||||||||||||||||||||||||||||||||||||||||||||||||||||||||||
| 9 | The portfolio turnover is shown for the period from 9-1-14 to 8-31-15. | ||||||||||||||||||||||||||||||||||||||||||||||||||||||||||||||||||||||||||||||||||
| 10 | Excludes merger activity. | ||||||||||||||||||||||||||||||||||||||||||||||||||||||||||||||||||||||||||||||||||
Note 1 — Organization
John Hancock Disciplined Value International Fund (the fund) is a series of John Hancock Investment Trust (the Trust), an open-end management investment company organized as a Massachusetts business trust and registered under the Investment Company Act of 1940, as amended (the 1940 Act). The investment objective of the fund is to seek long-term capital growth.
The fund may offer multiple classes of shares. The shares currently offered by the fund are detailed in the Statement of assets and liabilities. Class A and Class C shares are offered to all investors. Class I shares are offered to institutions and certain investors. Class R2 and Class R4 shares are available only to certain retirement and 529 plans. Class R6 shares are only available to certain retirement plans, institutions and other investors. Class NAV shares are offered to John Hancock affiliated funds of funds, retirement plans for employees of John Hancock and/or Manulife Financial Corporation, and certain 529 plans. Shareholders of each class have exclusive voting rights to matters that affect that class. The distribution and service fees, if any, and transfer agent fees for each class may differ. Effective May 1, 2018, Class C shares convert to Class A shares ten years after purchase (certain exclusions may apply).
Note 2 — Significant accounting policies
The financial statements have been prepared in conformity with accounting principles generally accepted in the United States of America (US GAAP), which require management to make certain estimates and assumptions as of the date of the financial statements. Actual results could differ from those estimates and those differences could be significant. The fund qualifies as an investment company under Topic 946 of Accounting Standards Codification of US GAAP.
Events or transactions occurring after the end of the fiscal period through the date that the financial statements were issued have been evaluated in the preparation of the financial statements. The following summarizes the significant accounting policies of the fund:
Security valuation. Investments are stated at value as of the scheduled close of regular trading on the New York Stock Exchange (NYSE), normally at 4:00 p.m., Eastern Time. In case of emergency or other disruption resulting in the NYSE not opening for trading or the NYSE closing at a time other than the regularly scheduled close, the net asset value (NAV) may be determined as of the regularly scheduled close of the NYSE pursuant to the fund's Valuation Policies and Procedures.
In order to value the securities, the fund uses the following valuation techniques: Equity securities held by the fund are typically valued at the last sale price or official closing price on the exchange or principal market where the security trades. In the event there were no sales during the day or closing prices are not available, the securities are valued using the last available bid price. Investments by the fund in open-end mutual funds, including John Hancock Collateral Trust (JHCT), are valued at their respective NAVs each business day. Foreign securities and currencies are valued in U.S. dollars based on foreign currency exchange rates supplied by an independent pricing vendor.
In certain instances, the Pricing Committee may determine to value equity securities using prices obtained from another exchange or market if trading on the exchange or market on which prices are typically obtained did not open for trading as scheduled, or if trading closed earlier than scheduled, and trading occurred as normal on another exchange or market.
Other portfolio securities and assets, for which reliable market quotations are not readily available, are valued at fair value as determined in good faith by the fund's Pricing Committee following procedures established by the Board of Trustees. The frequency with which these fair valuation procedures are used cannot be predicted and fair value of securities may differ significantly from the value that would have been used had a ready market for such securities existed. Trading in foreign securities may be completed before the scheduled daily close of trading on the NYSE. Significant events at the issuer or market level may affect the values of securities between the time when the valuation of the securities is generally determined and the close of the NYSE. If a significant event occurs, these securities may be fair valued, as determined in good faith by the fund's Pricing Committee, following procedures established by the Board of Trustees. The fund uses fair value adjustment factors provided by an independent pricing vendor to value certain foreign securities in order to adjust for events that may occur between the close of foreign exchanges or markets and the close of the NYSE.
The fund uses a three-tier hierarchy to prioritize the pricing assumptions, referred to as inputs, used in valuation techniques to measure fair value. Level 1 includes securities valued using quoted prices in active markets for identical securities. Level 2
includes securities valued using other significant observable inputs. Observable inputs may include quoted prices for similar securities, interest rates, prepayment speeds and credit risk. Prices for securities valued using these inputs are received from independent pricing vendors and brokers and are based on an evaluation of the inputs described. Level 3 includes securities valued using significant unobservable inputs when market prices are not readily available or reliable, including the fund's own assumptions in determining the fair value of investments. Factors used in determining value may include market or issuer specific events or trends, changes in interest rates and credit quality. The inputs or methodology used for valuing securities are not necessarily an indication of the risks associated with investing in those securities. Changes in valuation techniques and related inputs may result in transfers into or out of an assigned level within the disclosure hierarchy.
The following is a summary of the values by input classification of the fund's investments as of April 30, 2018, by major security category or type:
| Total value at 4-30-18 | Level 1 quoted price | Level 2 significant observable inputs | Level 3 significant unobservable inputs | ||
| Investments in securities: | |||||
| Assets | |||||
| Common stocks | |||||
| Australia | $16,990,331 | — | $16,990,331 | — | |
| Belgium | 8,627,486 | — | 8,627,486 | — | |
| Bermuda | 21,464,273 | $21,464,273 | — | — | |
| Brazil | 4,625,725 | 4,625,725 | — | — | |
| Canada | 16,648,619 | 16,648,619 | — | — | |
| China | 9,514,514 | 4,122,216 | 5,392,298 | — | |
| France | 130,056,629 | — | 130,056,629 | — | |
| Germany | 78,430,510 | — | 78,430,510 | — | |
| Hong Kong | 26,818,727 | — | 26,818,727 | — | |
| Hungary | 5,220,412 | — | 5,220,412 | — | |
| India | 4,311,986 | 4,311,986 | — | — | |
| Indonesia | 5,731,124 | — | 5,731,124 | — | |
| Ireland | 16,540,633 | — | 16,540,633 | — | |
| Japan | 228,196,571 | — | 228,196,571 | — | |
| Luxembourg | 7,023,256 | 7,023,256 | — | — | |
| Malta | 3 | — | — | $3 | |
| Mexico | 17,330,334 | 17,330,334 | — | — | |
| Netherlands | 51,271,900 | — | 51,271,900 | — | |
| Norway | 9,515,166 | — | 9,515,166 | — | |
| South Korea | 39,830,841 | 5,248,243 | 34,582,598 | — | |
| Switzerland | 87,159,356 | — | 87,159,356 | — | |
| Taiwan | 5,064,062 | — | 5,064,062 | — | |
| United Kingdom | 180,862,505 | 28,652,271 | 152,210,234 | — | |
| United States | 37,844,814 | 37,844,814 | — | — | |
| Preferred securities | 17,742,272 | — | 17,742,272 | — | |
| Securities lending collateral | 13,892,076 | 13,892,076 | — | — | |
| Short-term investments | 38,317,675 | 38,317,675 | — | — | |
| Total investments in securities | $1,079,031,800 | $199,481,488 | $879,550,309 | $3 | |
Security transactions and related investment income. Investment security transactions are accounted for on a trade date plus one basis for daily NAV calculations. However, for financial reporting purposes, investment transactions are
reported on trade date. Interest income is accrued as earned. Dividend income is recorded on the ex-date, except for dividends of foreign securities where the dividend may not be known until after the ex-date. In those cases, dividend income, net of withholding taxes, is recorded when the fund becomes aware of the dividends. Gains and losses on securities sold are determined on the basis of identified cost and may include proceeds from litigation.
Securities lending. The fund may lend its securities to earn additional income. The fund receives cash collateral from the borrower in an amount not less than the market value of the loaned securities. The fund will invest its collateral in JHCT, an affiliate of the fund, which has a floating NAV and is registered with the Securities and Exchange Commission as an investment company. JHCT invests in short-term money market investments. The fund will receive the benefit of any gains and bear any losses generated by JHCT with respect to the cash collateral.
The fund has the right to recall loaned securities on demand. If a borrower fails to return loaned securities when due, then the lending agent is responsible and indemnifies the fund for the lent securities. The lending agent uses the collateral received from the borrower to purchase replacement securities of the same issue, type, class and series of the loaned securities. If the value of the collateral is less than the purchase cost of replacement securities, the lending agent is responsible for satisfying the shortfall but only to the extent that the shortfall is not due to any decrease in the value of JHCT.
Although the risk of the loss of the securities lent is mitigated by receiving collateral from the borrower and through lending agent indemnification, the fund could experience a delay in recovering securities or could experience a lower than expected return if the borrower fails to return the securities on a timely basis. The fund receives compensation for lending its securities by retaining a portion of the return on the investment of the collateral and compensation from fees earned from borrowers of the securities. Securities lending income received by the fund is net of fees retained by the securities lending agent. Net income received from JHCT is a component of securities lending income as recorded on the Statement of operations.
Obligations to repay collateral received by the fund are shown on the Statement of assets and liabilities as Payable upon return of securities loaned and are secured by the loaned securities. As of April 30, 2018, the fund loaned securities valued at $13,217,163 and received $13,895,069 of cash collateral.
Foreign investing. Assets, including investments and liabilities denominated in foreign currencies, are translated into U.S. dollar values each day at the prevailing exchange rate. Purchases and sales of securities, income and expenses are translated into U.S. dollars at the prevailing exchange rate on the date of the transaction. The effect of changes in foreign currency exchange rates on the value of securities is reflected as a component of the realized and unrealized gains (losses) on investments. Foreign investments are subject to a decline in the value of a foreign currency versus the U.S. dollar, which reduces the dollar value of securities denominated in that currency.
Funds that invest internationally generally carry more risk than funds that invest strictly in U.S. securities. These risks are heightened for investments in emerging markets. Risks can result from differences in economic and political conditions, regulations, market practices (including higher transaction costs), accounting standards and other factors.
Foreign taxes. The fund may be subject to withholding tax on income, capital gains or repatriation taxes imposed by certain countries, a portion of which may be recoverable. Foreign taxes are accrued based upon the fund's understanding of the tax rules and rates that exist in the foreign markets in which it invests. Taxes are accrued based on gains realized by the fund as a result of certain foreign security sales. Estimated taxes are accrued based on unrealized appreciation of such securities. Investment income is recorded net of foreign withholding taxes, less any amounts reclaimable.
Line of credit. The fund may have the ability to borrow from banks for temporary or emergency purposes, including meeting redemption requests that otherwise might require the untimely sale of securities. Pursuant to the fund custodian agreement, the custodian may loan money to the fund to make properly authorized payments. The fund is obligated to repay the custodian for any overdraft, including any related costs or expenses. The custodian may have a lien, security interest or security entitlement in any fund property that is not otherwise segregated or pledged, to the extent of any overdraft, and to the maximum extent permitted by law.
The fund and other affiliated funds have entered into a syndicated line of credit agreement with Citibank, N.A. as the administrative agent that enables them to participate in a $750 million unsecured committed line of credit. Excluding commitments designated for a certain fund and subject to the needs of all other affiliated funds, the fund can borrow up to
an aggregate commitment amount of $500 million, subject to asset coverage and other limitations as specified in the agreement. A commitment fee payable at the end of each calendar quarter, based on the average daily unused portion of the line of credit, is charged to each participating fund based on a combination of fixed and asset based allocations and is reflected in Other expenses on the Statement of operations. For the six months ended April 30, 2018, the fund had no borrowings under the line of credit. Commitment fees for the six months ended April 30, 2018 were $2,663.
Expenses. Within the John Hancock group of funds complex, expenses that are directly attributable to an individual fund are allocated to such fund. Expenses that are not readily attributable to a specific fund are allocated among all funds in an equitable manner, taking into consideration, among other things, the nature and type of expense and the fund's relative net assets. Expense estimates are accrued in the period to which they relate and adjustments are made when actual amounts are known.
Class allocations. Income, common expenses and realized and unrealized gains (losses) are determined at the fund level and allocated daily to each class of shares based on the net assets of the class. Class-specific expenses, such as distribution and service fees, if any, and transfer agent fees, for all classes, are charged daily at the class level based on the net assets of each class and the specific expense rates applicable to each class.
Federal income taxes. The fund intends to continue to qualify as a regulated investment company by complying with the applicable provisions of the Internal Revenue Code and will not be subject to federal income tax on taxable income that is distributed to shareholders. Therefore, no federal income tax provision is required.
Under the Regulated Investment Company Modernization Act of 2010, the fund is permitted to carry forward capital losses incurred in taxable years beginning after December 22, 2010 for an unlimited period. Any losses incurred during those taxable years will be required to be utilized prior to the losses incurred in pre-enactment taxable years. As a result of this ordering rule, pre-enactment capital loss carryforwards may be more likely to expire unused. Additionally, post-enactment capital losses that are carried forward will retain their character as either short-term or long-term capital losses rather than being considered all short-term as under previous law.
For federal income tax purposes, as of October 31, 2017, the fund has a capital loss carryforward of $265,975,158 available to offset future net realized capital gains. The following table details the capital loss carryforward available as of October 31, 2017:
| Capital loss carryforward expiring October 31 | No expiration date | |
| 2018 | Short term | Long term |
| $7,043,412 | $132,784,073 | $126,147,673 |
The utilization of the loss carryforwards, which were acquired in a merger, are limited to $2,610,689 each fiscal year due to IRC Section 382 Limitation. Any unused portion of this Limitation will carryforward to the following fiscal year.
As of October 31, 2017, the fund had no uncertain tax positions that would require financial statement recognition, derecognition or disclosure. The fund's federal tax returns are subject to examination by the Internal Revenue Service for a period of three years.
Distribution of income and gains. Distributions to shareholders from net investment income and net realized gains, if any, are recorded on the ex-date. The fund generally declares and pays dividends and capital gain distributions, if any, annually.
Distributions paid by the fund with respect to each class of shares are calculated in the same manner, at the same time and in the same amount, except for the effect of class level expenses that may be applied differently to each class.
Such distributions, on a tax basis, are determined in conformity with income tax regulations, which may differ from US GAAP. Distributions in excess of tax basis earnings and profits, if any, are reported in the fund's financial statements as a return of capital. The final determination of tax characteristics of the fund's distribution will occur at the end of the year and will subsequently be reported to shareholders.
Capital accounts within the financial statements are adjusted for permanent book-tax differences. These adjustments have no impact on net assets or the results of operations. Temporary book-tax differences, if any, will reverse in a subsequent
period. Book-tax differences are primarily attributable to foreign currency transactions, investments in passive foreign investment companies, expiration of capital loss carryforwards, and wash sale loss deferrals.
Note 3 — Guarantees and indemnifications
Under the Trust's organizational documents, its Officers and Trustees are indemnified against certain liabilities arising out of the performance of their duties to the Trust, including the fund. Additionally, in the normal course of business, the fund enters into contracts with service providers that contain general indemnification clauses. The fund's maximum exposure under these arrangements is unknown, as this would involve future claims that may be made against the fund's that have not yet occurred. The risk of material loss from such claims is considered remote.
Note 4 — Fees and transactions with affiliates
John Hancock Advisers, LLC (the Advisor) serves as investment advisor for the fund. John Hancock Funds, LLC (the Distributor), an affiliate of the Advisor, serves as principal underwriter of the fund. The Advisor and the Distributor are indirect, wholly owned subsidiaries of Manulife Financial Corporation (MFC).
Management fee. The fund has an investment management agreement with the Advisor under which the fund pays a daily management fee to the Advisor equivalent on an annual basis to the sum of: (a) 0.825% of the first $500 million of the fund's aggregate net assets. (b) 0.800% of the next $1 billion of the fund's aggregate net assets and (c) 0.775% of the fund's aggregate net assets in excess of $1.5 billion. The Advisor has a subadvisory agreement with Boston Partners Global Investors, Inc. The fund is not responsible for payment of the subadvisory fees.
The Advisor has contractually agreed to waive a portion of its management fee and/or reimburse expenses for certain funds of the John Hancock group of funds complex, including the fund (the participating portfolios). This waiver is based upon aggregate net assets of all the participating portfolios. The amount of the reimbursement is calculated daily and allocated among all the participating portfolios in proportion to the daily net assets of each fund. During the six months ended April 30, 2018, this waiver amounted to 0.01% of the fund's average net assets on an annualized basis. This arrangement may be amended or terminated at any time by the Advisor upon notice to the fund and with the approval of the Board of Trustees.
The Advisor has contractually agreed to reduce its management fee or, if necessary, make payment to the fund, in an amount equal to the amount by which expenses of the fund exceed 0.88% of average net assets, excluding taxes, brokerage commissions, interest expense, litigation and indemnification expenses and other extraordinary expenses not incurred in the ordinary course of the fund's business, class-specific expenses, acquired fund fees and expenses paid indirectly, borrowing costs, prime brokerage fees, and short dividend expense. This expense limitation expires on February 28, 2019, unless renewed by mutual agreement of the fund and the Advisor based upon a determination that this is appropriate under the circumstances at that time.
The Advisor has contractually agreed to waive and/or reimburse expenses for Class I and Class R6 shares of the fund to the extent they exceed 0.98% and 0.88% of the respective class's average net assets, on an annualized basis. This expense limitation excludes taxes, brokerage commissions, interest expense, acquired fund fees and expenses paid indirectly, short dividend expense, borrowing costs, prime brokerage fees, litigation and indemnification expenses and other extraordinary expenses not incurred in the ordinary course of the fund's business. The waiver expires on February 28, 2019, unless renewed by mutual agreement of the fund and the Advisor based upon a determination that this is appropriate under the circumstances at the time.
For the six months ended April 30, 2018, these expense reductions described above amounted to the following:
| Class | Expense reduction | Class | Expense reduction | |
| Class A | $15,019 | Class R4 | $29 | |
| Class C | 2,030 | Class R6 | 29,554 | |
| Class I | 62,306 | Class NAV | 36,418 | |
| Class R2 | 2,206 | Total | $147,562 |
Expenses waived or reimbursed in the current fiscal period are not subject to recapture in future fiscal periods.
The investment management fees incurred for the six months ended April 30, 2018 were equivalent to a net annual effective rate of 0.78% of the fund's average daily net assets.
Accounting and legal services. Pursuant to a service agreement, the fund reimburses the Advisor for all expenses associated with providing the administrative, financial, legal, compliance, accounting and recordkeeping services to the fund, including the preparation of all tax returns, periodic reports to shareholders and regulatory reports, among other services. These expenses are allocated to each share class based on its relative net assets at the time the expense was incurred. These accounting and legal services fees incurred for the six months ended April 30, 2018 amounted to an annual rate of 0.02% of the fund's average daily net assets.
Distribution and service plans. The fund has a distribution agreement with the Distributor. The fund has adopted distribution and service plans with respect to Class A, Class C, Class R2 and Class R4 shares pursuant to Rule 12b-1 under the 1940 Act, to pay the Distributor for services provided as the distributor of shares of the fund. In addition, under a service plan for Class R2 and Class R4, the fund pays for certain other services. The fund may pay up to the following contractual rates of distribution and service fees under these arrangements, expressed as an annual percentage of average daily net assets for each class of the fund's shares:
| Class | Rule 12b-1 fee | Service fee | Class | Rule 12b-1 fee | Service fee | |
| Class A | 0.30% | — | Class R2 | 0.25% | 0.25% | |
| Class C | 1.00% | — | Class R4 | 0.25% | 0.10% |
The fund's Distributor has contractually agreed to waive 0.10% of Rule12b-1 fees for Class R4 shares. The current waiver agreement expires on February 28, 2019, unless renewed by mutual agreement of the fund and the Distributor based upon a determination that this is appropriate under the circumstances at the time. This contractual waiver amounted to $131 for Class R4 shares for the six months ended April 30, 2018.
Sales charges. Class A shares are assessed up-front sales charges, which resulted in payments to the Distributor amounting to $194,385 for the six months ended April 30, 2018. Of this amount, $33,163 was retained and used for printing prospectuses, advertising, sales literature and other purposes, $157,567 was paid as sales commissions to broker-dealers and $3,655 was paid as sales commissions to sales personnel of Signator Investors, Inc., a broker-dealer affiliate of the Advisor.
Class A and Class C shares may be subject to contingent deferred sales charges (CDSCs). Certain Class A shares that are acquired through purchases of $1 million or more and are redeemed within one year of purchase are subject to a 1.00% sales charge. Class C shares that are redeemed within one year of purchase are subject to a 1.00% CDSC. CDSCs are applied to the lesser of the current market value at the time of redemption or the original purchase cost of the shares being redeemed. Proceeds from CDSCs are used to compensate the Distributor for providing distribution-related services in connection with the sale of these shares. During the six months ended April 30, 2018, CDSCs received by the Distributor amounted to $2,500 and $1,756 for Class A and Class C shares, respectively.
Transfer agent fees. The John Hancock Group of Funds has a complex-wide transfer agent agreement with John Hancock Signature Services, Inc. (Signature Services), an affiliate of the Advisor. The transfer agent fees paid to Signature Services are determined based on the cost to Signature Services (Signature Services Cost) of providing recordkeeping services. It also includes out-of-pocket expenses, including payments made to third-parties for recordkeeping services provided to their clients who invest in one or more John Hancock funds. In addition, Signature Services Cost may be reduced by certain fees that Signature Services receives in connection with retirement and small accounts. Signature Services Cost is calculated monthly and allocated, as applicable, to five categories of share classes: Retail Share and Institutional Share Classes of Non-Municipal Bond Funds, Class R6 Shares, Retirement Share Classes and Municipal Bond Share Classes. Within each of these categories, the applicable costs are allocated to the affected John Hancock affiliated funds and/or classes, based on the relative average daily net assets.
Class level expenses. Class level expenses for the six months ended April 30, 2018 were:
| Class | Distribution and service fees | Transfer agent fees |
| Class A | $199,428 | $71,970 |
| Class C | 90,006 | 9,737 |
| Class I | — | 208,116 |
| Class R2 | 47,489 | 1,184 |
| Class R4 | 414 | 16 |
| Class R6 | — | 9,838 |
| Total | $337,337 | $300,861 |
Trustee expenses. The fund compensates each Trustee who is not an employee of the Advisor or its affiliates. The costs of paying Trustee compensation and expenses are allocated to the fund based on its net assets relative to other funds within the John Hancock group of funds complex.
Interfund lending program. Pursuant to an Exemptive Order issued by the SEC, the fund, along with certain other funds advised by the Advisor or its affiliates, may participate in an interfund lending program. This program provides an alternative credit facility allowing the funds to borrow from, or lend money to, other participating affiliated funds. At period end, no interfund loans were outstanding. The fund's activity in this program during the period for which loans were outstanding was as follows:
| Borrower or lender | Weighted average loan balance | Days outstanding | Weighted average interest rate | Interest income |
| Lender | $10,698,314 | 1 | 1.480% | $440 |
Note 5 — Fund share transactions
Transactions in fund shares for the six months ended April 30, 2018 and for the year ended October 31, 2017 were as follows:
| Six months ended 4-30-18 | Year ended 10-31-17 | |||||||||||||||||||||||||
| Shares | Amount | Shares | Amount | |||||||||||||||||||||||
| Class A shares | ||||||||||||||||||||||||||
| Sold | 1,458,721 | $20,744,781 | 1,439,350 | $18,448,225 | ||||||||||||||||||||||
| Issued in reorganization (Note 8) | — | — | 8,821,998 | 102,236,368 | ||||||||||||||||||||||
| Distributions reinvested | 221,496 | 3,103,155 | 131,787 | 1,533,998 | ||||||||||||||||||||||
| Repurchased | (995,903 | ) | (14,187,602 | ) | (4,363,564 | ) | (54,146,597 | ) | ||||||||||||||||||
| Net increase | 684,314 | $9,660,334 | 6,029,571 | $68,071,994 | ||||||||||||||||||||||
| Class C shares | ||||||||||||||||||||||||||
| Sold | 215,873 | $3,104,214 | 351,965 | $4,437,753 | ||||||||||||||||||||||
| Issued in reorganization (Note 8) | — | — | 726,082 | 8,372,961 | ||||||||||||||||||||||
| Distributions reinvested | 21,895 | 306,965 | 6,432 | 74,932 | ||||||||||||||||||||||
| Repurchased | (242,552 | ) | (3,457,274 | ) | (426,521 | ) | (5,400,443 | ) | ||||||||||||||||||
| Net increase (decrease) | (4,784 | ) | ($46,095 | ) | 657,958 | $7,485,203 | ||||||||||||||||||||
| Class I shares | ||||||||||||||||||||||||||
| Sold | 5,121,605 | $73,542,908 | 14,631,946 | $185,549,962 | ||||||||||||||||||||||
| Issued in reorganization (Note 8) | — | — | 3,057,479 | 35,531,569 | ||||||||||||||||||||||
| Distributions reinvested | 700,142 | 9,808,991 | 298,142 | 3,470,382 | ||||||||||||||||||||||
| Repurchased | (2,823,185 | ) | (40,142,211 | ) | (9,998,106 | ) | (132,557,154 | ) | ||||||||||||||||||
| Net increase | 2,998,562 | $43,209,688 | 7,989,461 | $91,994,759 | ||||||||||||||||||||||
| Six months ended 4-30-18 | Year ended 10-31-17 | |||||||||||||||||||||||||
| Shares | Amount | Shares | Amount | |||||||||||||||||||||||
| Class R2 shares | ||||||||||||||||||||||||||
| Sold | 276,735 | $3,972,083 | 572,918 | $7,445,875 | ||||||||||||||||||||||
| Issued in reorganization (Note 8) | — | — | 144,921 | 1,681,431 | ||||||||||||||||||||||
| Distributions reinvested | 28,427 | 399,122 | 7,867 | 91,734 | ||||||||||||||||||||||
| Repurchased | (90,841 | ) | (1,292,832 | ) | (121,391 | ) | (1,543,825 | ) | ||||||||||||||||||
| Net increase | 214,321 | $3,078,373 | 604,315 | $7,675,215 | ||||||||||||||||||||||
| Class R4 shares | ||||||||||||||||||||||||||
| Sold | 8,360 | $119,782 | 3,893 | $50,009 | ||||||||||||||||||||||
| Issued in reorganization (Note 8) | — | — | 8,183 | 95,074 | ||||||||||||||||||||||
| Distributions reinvested | 422 | 5,917 | 135 | 1,578 | ||||||||||||||||||||||
| Repurchased | (14,250 | ) | (200,925 | ) | (1,171 | ) | (14,469 | ) | ||||||||||||||||||
| Net increase (decrease) | (5,468 | ) | ($75,226 | ) | 11,040 | $132,192 | ||||||||||||||||||||
| Class R6 shares | ||||||||||||||||||||||||||
| Sold | 5,534,962 | $78,574,266 | 5,117,099 | $70,412,199 | ||||||||||||||||||||||
| Issued in reorganization (Note 8) | — | — | 1,858,693 | 21,607,859 | ||||||||||||||||||||||
| Distributions reinvested | 294,756 | 4,129,528 | 91,036 | 1,058,751 | ||||||||||||||||||||||
| Repurchased | (1,609,391 | ) | (22,910,518 | ) | (1,121,499 | ) | (14,265,601 | ) | ||||||||||||||||||
| Net increase | 4,220,327 | $59,793,276 | 5,945,329 | $78,813,208 | ||||||||||||||||||||||
| Class NAV shares | ||||||||||||||||||||||||||
| Sold | 618,700 | $8,803,531 | 17,143,339 | $226,126,444 | ||||||||||||||||||||||
| Distributions reinvested | 646,593 | 9,052,299 | 159,964 | 1,860,385 | ||||||||||||||||||||||
| Repurchased | (1,503,683 | ) | (21,630,216 | ) | (2,158,316 | ) | (28,771,043 | ) | ||||||||||||||||||
| Net increase (decrease) | (238,390 | ) | ($3,774,386 | ) | 15,144,987 | $199,215,786 | ||||||||||||||||||||
| Total net increase | 7,868,882 | $111,845,964 | 36,382,661 | $453,388,357 | ||||||||||||||||||||||
Affiliates of the fund owned 67% of shares of Class NAV, on April 30, 2018. Such concentration of shareholders' capital could have a material effect on the fund if such shareholders redeem from the fund.
Note 6 — Purchase and sale of securities
Purchases and sales of securities, other than short-term investments, amounted to $630,109,408 and $531,288,413 respectively, for the six months ended April 30, 2018.
Note 7 — Investment by affiliated funds
Certain investors in the fund are affiliated funds that are managed by the Advisor and its affiliates. The affiliated funds do not invest in the fund for the purpose of exercising management or control; however, this investment may represent a significant portion of the fund's net assets. At April 30, 2018, funds within the John Hancock group of funds complex held 17.9% of the fund's net assets. The following funds had an affiliate ownership of 5% or more of the fund's net assets:
| Fund | Affiliated concentration |
| John Hancock Funds II Multimanager Lifestyle Growth Portfolio | 7.0% |
Note 8 — Reorganization
On October 19, 2016, the shareholders of John Hancock Funds III International Core Fund (the Acquired Fund) voted to approve an Agreement and Plan of Reorganization (the Agreement) which provided for an exchange of shares of the John Hancock Disciplined Value International Fund (the Acquiring Fund) with a value equal to the net assets transferred.
The Agreement provided for (a) the acquisition of all the assets, subject to all of the liabilities, of the Acquired Fund in exchange for shares of the Acquiring Fund with a value equal to the net assets transferred; (b) the liquidation of the Acquired Fund; and (c) the distribution to Acquired Fund's shareholders of such Acquiring Fund's shares. The reorganization was intended to consolidate the Acquired Fund with portfolios with similar objectives and achieve economies of scale. As a result of the reorganization, the Acquiring Fund is the legal and accounting survivor.
Based on the opinion of tax counsel, the reorganization qualified as a tax-free reorganization for federal income tax purposes with no gain or loss recognized by the Acquired Fund or its shareholders. Thus, the investments were transferred to the Acquiring Fund at the Acquired Fund's identified cost. All distributable amounts of net income and realized gains from the Acquired Fund were distributed prior to the reorganization. In addition, the expenses of the reorganization were borne by the Acquired Fund. The effective time of the reorganization occurred immediately after the close of regularly scheduled trading on the New York Stock Exchange (NYSE) on November 4, 2016. The following outlines the reorganization:
| Acquiring Fund | Acquired Fund | Net asset value of the Acquired Fund | Depreciation of the Acquired Fund's investment | Shares redeemed by the Acquired Fund | Shares issued by the Acquiring Fund | Acquiring Fund net assets prior to combination | Acquiring Fund total net assets after combination | ||||||||||||||||
| Disciplined Value International Fund | International Core Fund | $169,525,262 | ($5,512,994 | ) | 6,309,456 | 14,617,356 | $398,438,749 | $567,964,011 |
See Note 5 for capital shares issued in connection with the above referenced reorganization.
Trustees Hassell H. McClellan, Chairperson Officers Andrew G. Arnott John J. Danello Francis V. Knox, Jr. Charles A. Rizzo Salvatore Schiavone | Investment advisor John Hancock Advisers, LLC Subadvisor Boston Partners Global Investors, Inc. Principal distributor John Hancock Funds, LLC Custodian State Street Bank and Trust Company Transfer agent John Hancock Signature Services, Inc. Legal counsel K&L Gates LLP |
*Member of the Audit Committee
†Non-Independent Trustee
#Effective 6-20-17
The fund's proxy voting policies and procedures, as well as the fund proxy voting record for the most recent twelve-month period ended June 30, are available free of charge on the Securities and Exchange Commission (SEC) website at sec.gov or on our website.
The fund's complete list of portfolio holdings, for the first and third fiscal quarters, is filed with the SEC on Form N-Q. The fund's Form N-Q is available on our website and the SEC's website, sec.gov, and can be reviewed and copied (for a fee) at the SEC's Public Reference Room in Washington, DC. Call 800-SEC-0330 to receive information on the operation of the SEC's Public Reference Room.
We make this information on your fund, as well as monthly portfolio holdings, and other fund details available on our website at jhinvestments.com or by calling 800-225-5291.
| You can also contact us: | |||
| 800-225-5291 jhinvestments.com | Regular mail: John Hancock Signature Services, Inc. | Express mail: John Hancock Signature Services, Inc. | |
John Hancock family of funds
DOMESTIC EQUITY FUNDS Balanced Blue Chip Growth Classic Value Disciplined Value Disciplined Value Mid Cap Equity Income Fundamental All Cap Core Fundamental Large Cap Core Fundamental Large Cap Value New Opportunities Small Cap Core Small Cap Growth Small Cap Value Strategic Growth U.S. Global Leaders Growth U.S. Growth Value Equity GLOBAL AND INTERNATIONAL EQUITY FUNDS Disciplined Value International Emerging Markets Emerging Markets Equity Fundamental Global Franchise Global Equity Global Shareholder Yield Greater China Opportunities International Growth International Small Company International Value Equity | INCOME FUNDS Bond California Tax-Free Income Emerging Markets Debt Floating Rate Income Government Income High Yield High Yield Municipal Bond Income Investment Grade Bond Money Market Short Duration Credit Opportunities Spectrum Income Strategic Income Opportunities Tax-Free Bond ALTERNATIVE AND SPECIALTY FUNDS Absolute Return Currency Alternative Asset Allocation Enduring Assets Financial Industries Global Absolute Return Strategies Global Conservative Absolute Return Global Focused Strategies Natural Resources Redwood Regional Bank Seaport Long/Short Technical Opportunities |
A fund's investment objectives, risks, charges, and expenses should be considered carefully before investing. The prospectus contains this and other important information about the fund. To obtain a prospectus, contact your financial professional, call John Hancock Investments at 800-225-5291, or visit our website at jhinvestments.com. Please read the prospectus carefully before investing or sending money.
ASSET ALLOCATION Income Allocation Multi-Index Lifetime Portfolios Multi-Index Preservation Portfolios Multimanager Lifestyle Portfolios Multimanager Lifetime Portfolios Retirement Income 2040 EXCHANGE-TRADED FUNDS John Hancock Multifactor Consumer Discretionary ETF John Hancock Multifactor Consumer Staples ETF John Hancock Multifactor Developed International ETF John Hancock Multifactor Energy ETF John Hancock Multifactor Financials ETF John Hancock Multifactor Healthcare ETF John Hancock Multifactor Industrials ETF John Hancock Multifactor Large Cap ETF John Hancock Multifactor Materials ETF John Hancock Multifactor Mid Cap ETF John Hancock Multifactor Small Cap ETF John Hancock Multifactor Technology ETF John Hancock Multifactor Utilities ETF | ENVIRONMENTAL, SOCIAL, AND GOVERNANCE FUNDS ESG All Cap Core ESG Core Bond ESG International Equity ESG Large Cap Core CLOSED-END FUNDS Financial Opportunities Hedged Equity & Income Income Securities Trust Investors Trust Preferred Income Preferred Income II Preferred Income III Premium Dividend Tax-Advantaged Dividend Income Tax-Advantaged Global Shareholder Yield |
John Hancock Multifactor ETF shares are bought and sold at market price (not NAV), and are not individually redeemed
from the fund. Brokerage commissions will reduce returns.
John Hancock ETFs are distributed by Foreside Fund Services, LLC, and are subadvised by Dimensional Fund Advisors LP.
Foreside is not affiliated with John Hancock Funds, LLC or Dimensional Fund Advisors LP.
Dimensional Fund Advisors LP receives compensation from John Hancock in connection with licensing rights to the
John Hancock Dimensional indexes. Dimensional Fund Advisors LP does not sponsor, endorse, or sell, and makes no
representation as to the advisability of investing in, John Hancock Multifactor ETFs.
John Hancock Investments
A trusted brand
John Hancock Investments is a premier asset manager representing one of
America's most trusted brands, with a heritage of financial stewardship dating
back to 1862. Helping our shareholders pursue their financial goals is at the
core of everything we do. It's why we support the role of professional financial
advice and operate with the highest standards of conduct and integrity.
A better way to invest
We serve investors globally through a unique multimanager approach:
We search the world to find proven portfolio teams with specialized
expertise for every strategy we offer, then we apply robust investment
oversight to ensure they continue to meet our uncompromising standards
and serve the best interests of our shareholders.
Results for investors
Our unique approach to asset management enables us to provide a diverse set
of investments backed by some of the world's best managers, along with strong
risk-adjusted returns across asset classes.
| | John Hancock Funds, LLC n Member FINRA, SIPC 601 Congress Street n Boston, MA 02210-2805 800-225-5291 n jhinvestments.com | |
| This report is for the information of the shareholders of John Hancock Disciplined Value International Fund. It is not authorized for distribution to prospective investors unless preceded or accompanied by a prospectus. | ||
| MF450358 | 455SA 4/18 6/18 | |
John Hancock
Value Equity Fund
Semiannual report 4/30/18
A message to shareholders
Dear shareholder,
Financial markets around the world experienced a meaningful rise in volatility in the last half of the reporting period, leading to some mixed results for equity investors. Stocks generally declined late in the period as investors reacted to a potential trade war between the United States and China and the prospect of rising inflation. While some in the asset management community believe the sell-off will be temporary, we have suggested for some time that the era of extremely low volatility would eventually come to an end, and that now appears to be the case.
Ultimately, the asset prices of stocks are underpinned by fundamentals, and the good news is that those continue to appear supportive. Unemployment remained close to historic lows, consumer confidence rose, and the housing market continued to notch steady gains. One moderating factor was the U.S. Federal Reserve's steady tightening of monetary policy. While higher interest rates alone may not cause the economy to pull back, markets will be closely attuned to any sign of policymakers quickening the pace of interest-rate increases in the year ahead.
Your best resource in unpredictable markets is your financial advisor, who can help position your portfolio so that it's sufficiently diversified to meet your long-term objectives and to withstand the inevitable turbulence along the way.
On behalf of everyone at John Hancock Investments, I'd like to take this opportunity to welcome new shareholders and to thank existing shareholders for the continued trust you've placed in us.
Sincerely,
Andrew G. Arnott
President and CEO,
John Hancock Investments
Head of Wealth and Asset Management,
United States and Europe
This commentary reflects the CEO's views, which are subject to change at any time. Investing involves risks, including the potential loss of principal. Diversification does not guarantee a profit or eliminate the risk of a loss. It is not possible to invest directly into an index. For more up-to-date information, please visit our website at jhinvestments.com.
John Hancock
Value Equity Fund
INVESTMENT OBJECTIVE
The fund seeks capital appreciation over the long term.
AVERAGE ANNUAL TOTAL RETURNS AS OF 4/30/18 (%)
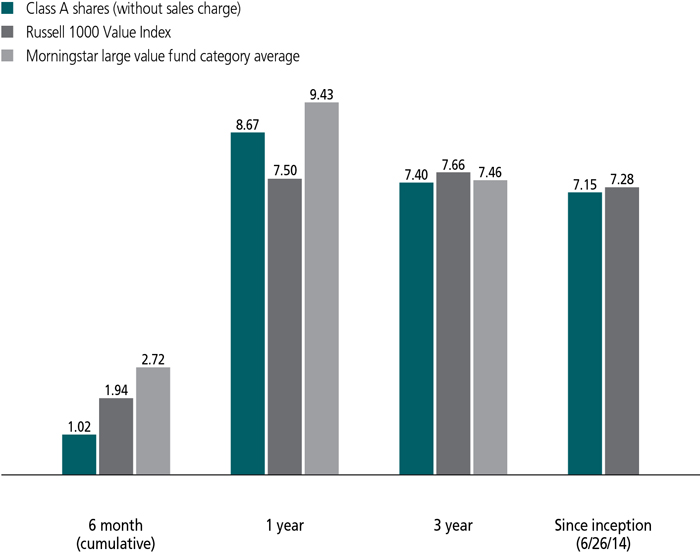
The Russell 1000 Value Index is an unmanaged index containing those securities in the Russell 1000 Index with a lower price-to-book ratio and less-than-average growth orientation.
It is not possible to invest directly in an index. Index figures do not reflect expenses or sales charges, which would result in lower returns.
Figures from Morningstar, Inc. include reinvested distributions and do not take into account sales charges. Actual load-adjusted performance is lower. Since inception returns for the Morningstar fund category average are not available.
The past performance shown here reflects reinvested distributions and the beneficial effect of any expense reductions, and does not guarantee future results. Returns for periods shorter than one year are cumulative. Performance of the other share classes will vary based on the difference in the fees and expenses of those classes. Shares will fluctuate in value and, when redeemed, may be worth more or less than their original cost. Current month-end performance may be lower or higher than the performance cited, and can be found at jhinvestments.com or by calling 800-225-5291. For further information on the fund's objectives, risks, and strategy, see the fund's prospectus.
PERFORMANCE HIGHLIGHTS OVER THE LAST SIX MONTHS
U.S. stocks gained amid increased volatility
Despite wide swings in investor sentiment, the U.S. stock market advanced thanks to improving economic conditions, stronger corporate earnings, and tax reform legislation.
Stock selection led to underperformance
The fund's underperformance of its benchmark, the Russell 1000 Value Index, was driven primarily by stock selection in the information technology and industrials sectors.
Financials and energy added value
Security selection in the financials and energy sectors contributed positively to relative results.
SECTOR COMPOSITION AS OF 4/30/18 (%)
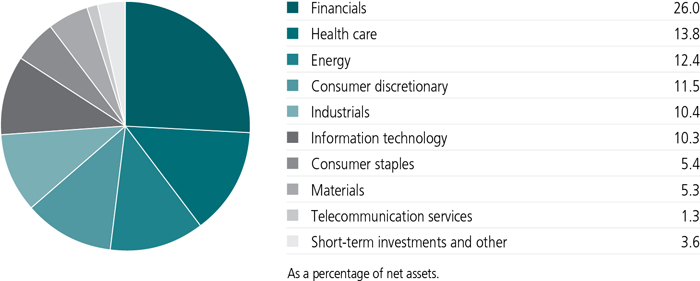
A note about risks
Value stocks may underperform the market as a whole, which may cause value-oriented funds to underperform equity funds with other investment strategies. Large company stocks could fall out of favor and the stock prices of small and midsize companies may be more volatile and less liquid than those of large companies. The value of a company's equity securities is subject to changes in the company's financial condition and overall market and economic conditions. Investing in foreign securities may entail the risk of currency fluctuations or heightened economic and political instability. Derivatives transactions, such as hedging and other strategic transactions, may increase a fund's volatility and could produce disproportionate losses, potentially more than the fund's principal investment. A fund that invests in particular sectors is particularly susceptible to the impact of market, economic, regulatory, and other factors affecting those sectors. Please see the fund's prospectus for additional risks.

Mark Giambrone
Portfolio Manager
Barrow, Hanley, Mewhinney &Strauss
How did the U.S. equity market perform during the six months ended April 30, 2018?
U.S. stocks advanced despite dramatic shifts in investor sentiment. Early in the period, sentiment was enthusiastically positive as economic conditions improved and substantial federal tax reform legislation was enacted, both of which were viewed by investors as positive for corporate earnings growth. As a result, the stock market rallied sharply from the beginning of the period through the end of January.
Investor sentiment turned negative in the latter half of the period amid concerns about geopolitical tensions, a possible trade war between the United States and China, and continued interest-rate increases by the U.S. Federal Reserve (Fed). Market volatility increased significantly—in the first quarter of 2018, the S&P 500 Index experienced 23 daily moves of more than 1%, compared with eight times for all of 2017.
Value stocks underperformed growth stocks; the fund's benchmark, the Russell 1000 Value Index, returned 1.94%. Growth-oriented sectors, such as information technology and consumer discretionary, continued to lead the market's advance during the period.
In this environment, how did the fund perform?
The fund posted a positive return, but trailed the performance of the benchmark. Sector allocation contributed favorably to performance, particularly a lack of exposure to the underperforming utilities and real estate sectors, as well as an underweight position in the consumer staples sector. However, individual stock selection detracted from relative results, more than offsetting the positive impact of sector allocation.
What were some of the biggest individual detractors from fund performance versus the index?
Stock selection in the information technology and industrials sectors detracted the most. In the information technology sector, the most significant detractors included U.K.-based enterprise software company Micro Focus International PLC and microcontroller manufacturer Microchip
Microchip Technology makes microcontrollers used by a diverse set of industrial, consumer, and technology customers around the world. Microchip shares sold off in early 2018 after mixed quarterly results and an underwhelming outlook spooked investors. On the positive side, the company agreed to acquire Microsemi Corp., a competitor with a complementary portfolio of assets (which was not held by the fund). Microchip's management has a track record of delivering shareholder value through mergers and acquisitions, and we believe Microsemi is a good strategic fit that will strengthen the company's position over the long run.
In the industrials sector, roofing and insulation maker Owens Corning was the biggest detractor. Despite strong underlying fundamentals and a favorable pricing environment, Owens Corning declined as the market shifted away from economically sensitive cyclical stocks late in the reporting period. We believe the company is executing well and remains an attractive value.
Another notable detractor was consumer products company Newell Brands, Inc. The stock price fell in response to a series of headwinds beyond the company's control—a shortage of raw materials resulting from Hurricane Harvey, the bankruptcy of a key customer, and changing consumer habits
TOP 10 HOLDINGS AS OF 4/30/18 (%)
| JPMorgan Chase & Co. | 2.6 |
| Citigroup, Inc. | 2.4 |
| Bank of America Corp. | 2.3 |
| Anthem, Inc. | 2.0 |
| UnitedHealth Group, Inc. | 1.9 |
| SLM Corp. | 1.9 |
| ConocoPhillips | 1.9 |
| E*TRADE Financial Corp. | 1.8 |
| Microsoft Corp. | 1.7 |
| Dollar General Corp. | 1.7 |
| TOTAL | 20.2 |
| As a percentage of net assets. | |
| Cash and cash equivalents are not included. | |
due to e-commerce and declining foot traffic in retail stores. A proxy fight threatened by activist investors was also a distraction for the company in early 2018.
What holdings contributed positively to relative performance?
Stock selection added the most value in the energy and financials sectors. The top contributor in the energy sector was oil and gas producer Hess Corp. Rising production growth in several of the company's oil fields, including North Dakota and the Gulf of Mexico, helped drive the stock price higher. In addition, a joint project developing an offshore field near Guyana could boost production growth into the next decade at a very low development cost.
In the financials sector, the leading contributors were online brokerage firm E*Trade Financial Corp. and insurer XL Group, Ltd. E*Trade benefited from increased equity market volatility, which boosted trading activity, and the company also expanded its product offerings through acquisition. Growing profitability and expected benefits from regulatory reform also provided a favorable backdrop for E*Trade's stock price. XL Group agreed to be acquired by French insurance conglomerate AXA SA (not held by the fund) in early 2018, at which point we viewed the stock as fully valued and sold the position.
Another strong contributor was Twenty-First Century Fox, Inc., which owns and operates a collection of cable and broadcast networks, as well as film and television libraries and studios. The stock benefited from a late-2017 offer by The Walt Disney Company (not held) to purchase most of the company's assets. News of a potential competing offer also helped drive the stock price higher.
What changes did you make to the portfolio over the period?
In addition to Micro Focus and XL Group, we sold five other fund holdings, many of which reached our estimate of fair value during the market rally in late 2017 and early 2018. They were consumer electronics maker Apple, Inc., pharmaceutical firm Bayer AG, financial services provider Discover Financial Services, building materials manufacturer CRH PLC, and mortgage analytical services provider Black Knight, Inc.
We added four new positions to the portfolio—auto parts retailer Advance Auto Parts, Inc., semiconductor manufacturer Broadcom, Inc., energy producer Vermilion Energy, Inc., and financial services provider The Bank of New York Mellon Corp.
How was the fund positioned at the end of the reporting period?
Sector weightings within the portfolio are a by-product of our fundamental value-oriented stock selection process, so they can vary substantially from those of the benchmark index. As of the end of the reporting period, the fund's largest overweight positions versus the index included the
consumer discretionary, industrials, and materials sectors, while its largest underweight positions were in the real estate, utilities, and consumer staples sectors.
Stock market valuations have fallen in recent months, but they remain above average on a historical basis. Over the long term, earnings and dividends have been the main driver of stock market performance, but from 2013 to 2017, the expansion of price-earnings multiples was responsible for more than half of the market's overall return. The fund's long-term performance track record, which is based on owning stocks trading at a meaningful valuation discount to the overall market, more closely resembles the historical components of total return. As such, we believe the fund is well positioned for a return to normalcy for the market's performance drivers.
MANAGED BY
| | Mark Giambrone On the fund since inception Investing since 1992 |
 | Michael Nayfa, CFA On the fund since inception Investing since 2002 |
 | Terry Pelzel, CFA On the fund since inception Investing since 2005 |
![]()
TOTAL RETURNS FOR THE PERIOD ENDED APRIL 30, 2018
| Average annual total returns (%) with maximum sales charge | Cumulative total returns (%) with maximum sales charge | ||||||
| 1-year | Since inception1 | 6-month | Since inception1 | ||||
| Class A | 3.25 | 5.72 | -4.04 | 23.85 | |||
| Class C | 6.81 | 6.38 | -0.36 | 26.86 | |||
| Class I2 | 8.99 | 7.46 | 1.16 | 31.87 | |||
| Class R62 | 9.07 | 7.64 | 1.16 | 32.75 | |||
| Class NAV2 | 9.08 | 7.64 | 1.17 | 32.74 | |||
| Index† | 7.50 | 7.28 | 1.94 | 31.02 | |||
Performance figures assume all distributions have been reinvested. Figures reflect maximum sales charges on Class A shares of 5.00% and the applicable contingent deferred sales charge (CDSC) on Class C shares. Class C shares sold within one year of purchase are subject to a 1% CDSC. Sales charges are not applicable to Class I, Class R6, and Class NAV shares.
The expense ratios of the fund, both net (including any fee waivers and/or expense limitations) and gross (excluding any fee waivers and/or expense limitations), are set forth according to the most recent publicly available prospectuses for the fund and may differ from those disclosed in the Financial highlights tables in this report. Net expenses reflect contractual expense limitations in effect until February 28, 2019 and are subject to change. Had the fee waivers and expense limitations not been in place, gross expenses would apply. The expense ratios are as follows:
| Class A | Class C | Class I | Class R6 | Class NAV | |
| Gross (%) | 1.26 | 1.96 | 0.95 | 0.86 | 0.85 |
| Net (%) | 1.11 | 1.81 | 0.80 | 0.71 | 0.70 |
Please refer to the most recent prospectus and annual or semiannual report for more information on expenses and any expense limitation arrangements for each class.
The returns reflect past results and should not be considered indicative of future performance. The return and principal value of an investment will fluctuate so that shares, when redeemed, may be worth more or less than their original cost. Due to market volatility and other factors, the fund's current performance may be higher or lower than the performance shown. For current to the most recent month-end performance data, please call 800-225-5291 or visit the fund's website at jhinvestments.com.
The performance table above and the chart on the next page do not reflect the deduction of taxes that a shareholder would pay on fund distributions or the redemption of fund shares. The fund's performance results reflect any applicable fee waivers or expense reductions, without which the expenses would increase and results would have been less favorable.
| † | Index is the Russell 1000 Value Index. |
See the following page for footnotes.
This chart and table show what happened to a hypothetical $10,000 investment in John Hancock Value Equity Fund for the share classes and periods indicated, assuming all distributions were reinvested. For comparison, we've shown the same investment in the Russell 1000 Value Index.
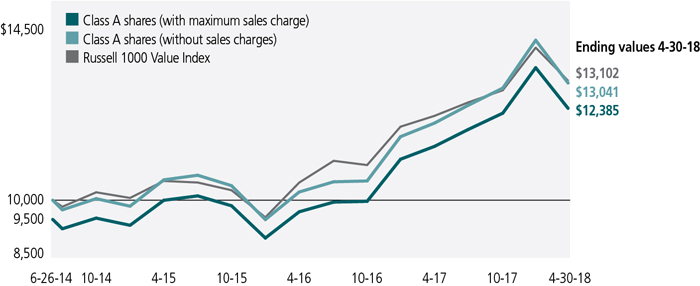
| Start date | With maximum sales charge ($) | Without sales charge ($) | Index ($) | |
| Class C3 | 6-26-14 | 12,686 | 12,686 | 13,102 |
| Class I2 | 6-26-14 | 13,187 | 13,187 | 13,102 |
| Class R62 | 6-26-14 | 13,275 | 13,275 | 13,102 |
| Class NAV2 | 6-26-14 | 13,274 | 13,274 | 13,102 |
The Russell 1000 Value Index is an unmanaged index containing those securities in the Russell 1000 Index with a less-than-average growth orientation.
It is not possible to invest directly in an index. Index figures do not reflect expenses or sales charges, which would result in lower returns.
Footnotes related to performance pages
| 1 | From 6-26-14. |
| 2 | For certain types of investors, as described in the fund's prospectuses. |
| 3 | The contingent deferred sales charge is not applicable. |
These examples are intended to help you understand your ongoing operating expenses of investing in the fund so you can compare these costs with the ongoing costs of investing in other mutual funds.
Understanding fund expenses
As a shareholder of the fund, you incur two types of costs:
| • | Transaction costs, which include sales charges (loads) on purchases or redemptions (varies by share class), minimum account fee charge, etc. |
| • | Ongoing operating expenses, including management fees, distribution and service fees (if applicable), and other fund expenses. |
We are presenting only your ongoing operating expenses here.
Actual expenses/actual returns
The first line of each share class in the table on the following page is intended to provide information about the fund's actual ongoing operating expenses, and is based on the fund's actual return. It assumes an account value of $1,000.00 on November 1, 2017, with the same investment held until April 30, 2018.
Together with the value of your account, you may use this information to estimate the operating expenses that you paid over the period. Simply divide your account value at April 30, 2018, by $1,000.00, then multiply it by the "expenses paid" for your share class from the table. For example, for an account value of $8,600.00, the operating expenses should be calculated as follows:
Hypothetical example for comparison purposes
The second line of each share class in the table on the following page allows you to compare the fund's ongoing operating expenses with those of any other fund. It provides an example of the fund's hypothetical account values and hypothetical expenses based on each class's actual expense ratio and an assumed 5% annualized return before expenses (which is not the fund's actual return). It assumes an account value of $1,000.00 on November 1, 2017, with the same investment held until April 30, 2018. Look in any other fund shareholder report to find its hypothetical example and you will be able to compare these expenses. Please remember that these hypothetical account values and expenses may not be used to estimate the actual ending account balance or expenses you paid for the period.
Remember, these examples do not include any transaction costs, therefore, these examples will not help you to determine the relative total costs of owning different funds. If transaction costs were included, your expenses would have been higher. See the prospectuses for details regarding transaction costs.
SHAREHOLDER EXPENSE EXAMPLE CHART
| Account value on 11-1-2017 | Ending value on 4-30-2018 | Expenses paid during period ended 4-30-20181 | Annualized expense ratio | ||
| Class A | Actual expenses/actual returns | $1,000.00 | $1,010.20 | $5.53 | 1.11% |
| Hypothetical example for comparison purposes | 1,000.00 | 1,019.30 | 5.56 | 1.11% | |
| Class C | Actual expenses/actual returns | 1,000.00 | 1,006.00 | 9.00 | 1.81% |
| Hypothetical example for comparison purposes | 1,000.00 | 1,015.80 | 9.05 | 1.81% | |
| Class I | Actual expenses/actual returns | 1,000.00 | 1,011.60 | 4.04 | 0.81% |
| Hypothetical example for comparison purposes | 1,000.00 | 1,020.80 | 4.06 | 0.81% | |
| Class R6 | Actual expenses/actual returns | 1,000.00 | 1,011.60 | 3.54 | 0.71% |
| Hypothetical example for comparison purposes | 1,000.00 | 1,021.30 | 3.56 | 0.71% | |
| Class NAV | Actual expenses/actual returns | 1,000.00 | 1,011.70 | 3.49 | 0.70% |
| Hypothetical example for comparison purposes | 1,000.00 | 1,021.30 | 3.51 | 0.70% | |
| 1 | Expenses are equal to the annualized expense ratio, multiplied by the average account value over the period, multiplied by 181/365 (to reflect the one-half year period). |
| Fund’s investments |
| Shares | Value | ||||
| Common stocks 96.4% | $586,294,189 | ||||
| (Cost $495,244,234) | |||||
| Consumer discretionary 11.5% | 70,038,779 | ||||
| Hotels, restaurants and leisure 4.3% | |||||
| Carnival Corp. | 84,600 | 5,334,876 | |||
| Norwegian Cruise Line Holdings, Ltd. (A) | 173,952 | 9,301,213 | |||
| Royal Caribbean Cruises, Ltd. | 75,040 | 8,118,578 | |||
| SeaWorld Entertainment, Inc. (A)(B) | 244,800 | 3,694,032 | |||
| Household durables 0.4% | |||||
| Newell Brands, Inc. | 99,400 | 2,746,422 | |||
| Media 2.1% | |||||
| Comcast Corp., Class A | 202,400 | 6,353,336 | |||
| Twenty-First Century Fox, Inc., Class A | 169,502 | 6,196,993 | |||
| Multiline retail 1.7% | |||||
| Dollar General Corp. | 106,600 | 10,290,098 | |||
| Specialty retail 2.2% | |||||
| Advance Auto Parts, Inc. | 33,061 | 3,783,831 | |||
| Lowe's Companies, Inc. | 114,200 | 9,413,506 | |||
| Textiles, apparel and luxury goods 0.8% | |||||
| Hanesbrands, Inc. (B) | 260,200 | 4,805,894 | |||
| Consumer staples 5.4% | 32,801,455 | ||||
| Beverages 1.6% | |||||
| Coca-Cola European Partners PLC | 241,300 | 9,458,960 | |||
| Food and staples retailing 1.6% | |||||
| CVS Health Corp. | 139,368 | 9,732,066 | |||
| Tobacco 2.2% | |||||
| Altria Group, Inc. | 123,900 | 6,952,029 | |||
| Philip Morris International, Inc. | 81,200 | 6,658,400 | |||
| Energy 12.4% | 75,368,533 | ||||
| Energy equipment and services 0.4% | |||||
| Fairmount Santrol Holdings, Inc. (A)(B) | 475,800 | 2,616,900 | |||
| Oil, gas and consumable fuels 12.0% | |||||
| BP PLC, ADR | 218,500 | 9,742,915 | |||
| Chevron Corp. | 74,900 | 9,370,739 | |||
| ConocoPhillips | 172,600 | 11,305,300 | |||
| Hess Corp. | 180,300 | 10,275,297 | |||
| Kosmos Energy, Ltd. (A) | 662,605 | 4,664,739 | |||
| Occidental Petroleum Corp. | 110,800 | 8,560,408 | |||
| Phillips 66 | 86,400 | 9,617,184 | |||
| Vermilion Energy, Inc. (B) | 272,554 | 9,215,051 | |||
| 12 | JOHN HANCOCK VALUE EQUITY FUND | SEMIANNUAL REPORT | SEE NOTES TO FINANCIAL STATEMENTS |
| Shares | Value | ||||
| Financials 26.0% | $158,034,544 | ||||
| Banks 11.3% | |||||
| Bank of America Corp. | 467,300 | 13,981,616 | |||
| Citigroup, Inc. | 218,000 | 14,882,860 | |||
| JPMorgan Chase & Co. | 145,200 | 15,794,856 | |||
| KeyCorp | 289,900 | 5,774,808 | |||
| The PNC Financial Services Group, Inc. | 66,700 | 9,712,187 | |||
| Wells Fargo & Company | 160,700 | 8,349,972 | |||
| Capital markets 4.4% | |||||
| E*TRADE Financial Corp. (A) | 182,067 | 11,047,826 | |||
| State Street Corp. | 98,500 | 9,828,330 | |||
| The Bank of New York Mellon Corp. | 111,700 | 6,088,767 | |||
| Consumer finance 4.8% | |||||
| American Express Company | 102,100 | 10,082,375 | |||
| Capital One Financial Corp. | 25,400 | 2,301,748 | |||
| Navient Corp. | 414,100 | 5,490,966 | |||
| SLM Corp. (A) | 1,009,900 | 11,593,652 | |||
| Diversified financial services 1.5% | |||||
| Berkshire Hathaway, Inc., Class B (A) | 47,000 | 9,105,310 | |||
| Insurance 2.9% | |||||
| American International Group, Inc. | 88,100 | 4,933,600 | |||
| FNF Group | 148,400 | 5,465,572 | |||
| Willis Towers Watson PLC | 46,900 | 6,965,119 | |||
| Thrifts and mortgage finance 1.1% | |||||
| New York Community Bancorp, Inc. | 558,500 | 6,634,980 | |||
| Health care 13.8% | 84,166,478 | ||||
| Health care equipment and supplies 1.5% | |||||
| Medtronic PLC | 114,600 | 9,182,898 | |||
| Health care providers and services 7.6% | |||||
| Anthem, Inc. | 50,400 | 11,893,896 | |||
| Cardinal Health, Inc. | 96,300 | 6,179,571 | |||
| Cigna Corp. | 54,439 | 9,353,709 | |||
| Express Scripts Holding Company (A) | 93,500 | 7,077,950 | |||
| UnitedHealth Group, Inc. | 50,050 | 11,831,820 | |||
| Pharmaceuticals 4.7% | |||||
| Johnson & Johnson | 41,526 | 5,252,624 | |||
| Merck & Company, Inc. | 124,800 | 7,346,976 | |||
| Pfizer, Inc. | 240,000 | 8,786,400 | |||
| Sanofi, ADR | 102,300 | 4,022,436 | |||
| Teva Pharmaceutical Industries, Ltd., ADR | 180,100 | 3,238,198 | |||
| Industrials 10.4% | 63,420,858 | ||||
| Aerospace and defense 3.9% | |||||
| General Dynamics Corp. | 28,500 | 5,737,335 | |||
| Spirit AeroSystems Holdings, Inc., Class A | 116,560 | 9,367,927 | |||
| SEE NOTES TO FINANCIAL STATEMENTS | SEMIANNUAL REPORT | JOHN HANCOCK VALUE EQUITY FUND | 13 |
| Shares | Value | ||||
| Industrials (continued) | |||||
| Aerospace and defense (continued) | |||||
| United Technologies Corp. | 72,010 | $8,652,002 | |||
| Building products 2.1% | |||||
| Johnson Controls International PLC | 193,732 | 6,561,703 | |||
| Owens Corning | 96,600 | 6,326,334 | |||
| Industrial conglomerates 1.3% | |||||
| General Electric Company | 588,000 | 8,273,160 | |||
| Machinery 1.3% | |||||
| Stanley Black & Decker, Inc. | 54,850 | 7,766,212 | |||
| Professional services 0.7% | |||||
| Nielsen Holdings PLC | 132,100 | 4,154,545 | |||
| Road and rail 1.1% | |||||
| AMERCO | 19,500 | 6,581,640 | |||
| Information technology 10.3% | 62,844,494 | ||||
| Semiconductors and semiconductor equipment 5.7% | |||||
| Broadcom, Inc. | 22,600 | 5,184,892 | |||
| Microchip Technology, Inc. | 115,000 | 9,620,900 | |||
| QUALCOMM, Inc. | 156,061 | 7,960,672 | |||
| Texas Instruments, Inc. | 81,500 | 8,266,545 | |||
| Versum Materials, Inc. | 105,300 | 3,704,454 | |||
| Software 3.0% | |||||
| Microsoft Corp. | 110,400 | 10,324,608 | |||
| Oracle Corp. | 180,900 | 8,261,703 | |||
| Technology hardware, storage and peripherals 1.6% | |||||
| Hewlett Packard Enterprise Company | 558,400 | 9,520,720 | |||
| Materials 5.3% | 32,009,278 | ||||
| Chemicals 5.3% | |||||
| Air Products & Chemicals, Inc. | 58,300 | 9,461,507 | |||
| Celanese Corp., Series A | 70,393 | 7,649,607 | |||
| DowDuPont, Inc. | 135,937 | 8,596,656 | |||
| LyondellBasell Industries NV, Class A | 59,600 | 6,301,508 | |||
| Telecommunication services 1.3% | 7,609,770 | ||||
| Diversified telecommunication services 1.3% | |||||
| Verizon Communications, Inc. | 154,200 | 7,609,770 | |||
| Yield (%) | Shares | Value | |||
| Securities lending collateral 2.9% | $17,586,569 | ||||
| (Cost $17,584,998) | |||||
| John Hancock Collateral Trust (C) | 1.8834(D) | 1,758,059 | 17,586,569 |
| 14 | JOHN HANCOCK VALUE EQUITY FUND | SEMIANNUAL REPORT | SEE NOTES TO FINANCIAL STATEMENTS |
| Yield (%) | Shares | Value | |||
| Short-term investments 3.7% | $22,865,131 | ||||
| (Cost $22,865,131) | |||||
| Money market funds 3.7% | 22,865,131 | ||||
| State Street Institutional Treasury Money Market Fund, Premier Class | 1.5926(D) | 22,865,131 | 22,865,131 | ||
| Total investments (Cost $535,694,363) 103.0% | $626,745,889 | ||||
| Other assets and liabilities, net (3.0%) | (18,489,533) | ||||
| Total net assets 100.0% | $608,256,356 | ||||
| The percentage shown for each investment category is the total value of the category as a percentage of the net assets of the fund. | |
| Security Abbreviations and Legend | |
| ADR | American Depositary Receipt |
| (A) | Non-income producing security. |
| (B) | A portion of this security is on loan as of 4-30-18. |
| (C) | Investment is an affiliate of the fund, the advisor and/or subadvisor. This security represents the investment of cash collateral received for securities lending. |
| (D) | The rate shown is the annualized seven-day yield as of 4-30-18. |
| SEE NOTES TO FINANCIAL STATEMENTS | SEMIANNUAL REPORT | JOHN HANCOCK VALUE EQUITY FUND | 15 |
Financial statements
STATEMENT OF ASSETS AND LIABILITIES 4-30-18 (unaudited)
| Assets | |||||||||||||||||||
| Unaffiliated investments, at value (Cost $518,109,365) including $17,178,687 of securities loaned | $609,159,320 | ||||||||||||||||||
| Affiliated investments, at value (Cost $17,584,998) | 17,586,569 | ||||||||||||||||||
| Total investments, at value (Cost $535,694,363) | 626,745,889 | ||||||||||||||||||
| Receivable for fund shares sold | 89,384 | ||||||||||||||||||
| Dividends and interest receivable | 591,286 | ||||||||||||||||||
| Receivable for securities lending income | 18,622 | ||||||||||||||||||
| Receivable due from advisor | 6,903 | ||||||||||||||||||
| Other receivables and prepaid expenses | 53,517 | ||||||||||||||||||
| Total assets | 627,505,601 | ||||||||||||||||||
| Liabilities | |||||||||||||||||||
| Payable for investments purchased | 1,505,264 | ||||||||||||||||||
| Payable for fund shares repurchased | 2,283 | ||||||||||||||||||
| Payable upon return of securities loaned | 17,592,879 | ||||||||||||||||||
| Payable to affiliates | |||||||||||||||||||
| Accounting and legal services fees | 67,978 | ||||||||||||||||||
| Transfer agent fees | 597 | ||||||||||||||||||
| Trustees' fees | 1,284 | ||||||||||||||||||
| Other liabilities and accrued expenses | 78,960 | ||||||||||||||||||
| Total liabilities | 19,249,245 | ||||||||||||||||||
| Net assets | $608,256,356 | ||||||||||||||||||
| Net assets consist of | |||||||||||||||||||
| Paid-in capital | $506,841,956 | ||||||||||||||||||
| Undistributed net investment income | 2,216,786 | ||||||||||||||||||
| Accumulated net realized gain (loss) on investments and foreign currency transactions | 8,146,015 | ||||||||||||||||||
| Net unrealized appreciation (depreciation) on investments and translation of assets and liabilities in foreign currencies | 91,051,599 | ||||||||||||||||||
| Net assets | $608,256,356 | ||||||||||||||||||
| Net asset value per share | |||||||||||||||||||
| Based on net asset values and shares outstanding-the fund has an unlimited number of shares authorized with no par value | |||||||||||||||||||
| Class A ($4,024,284 ÷ 336,023 shares)1 | $11.98 | ||||||||||||||||||
| Class C ($512,495 ÷ 42,944 shares)1 | $11.93 | ||||||||||||||||||
| Class I ($1,659,806 ÷ 138,481 shares) | $11.99 | ||||||||||||||||||
| Class R6 ($475,752 ÷ 39,643 shares) | $12.00 | ||||||||||||||||||
| Class NAV ($601,584,019 ÷ 50,120,309 shares) | $12.00 | ||||||||||||||||||
| Maximum offering price per share | |||||||||||||||||||
| Class A (net asset value per share ÷ 95%)2 | $12.61 | ||||||||||||||||||
| 1 | Redemption price per share is equal to net asset value less any applicable contingent deferred sales charge. | ||||||||||||||||
| 2 | On single retail sales of less than $50,000. On sales of $50,000 or more and on group sales the offering price is reduced. | ||||||||||||||||
STATEMENT OF OPERATIONS For the six months ended 4-30-18 (unaudited)
| Investment income | ||||||||||||||||||||||||
| Dividends | $6,393,911 | |||||||||||||||||||||||
| Interest | 89,118 | |||||||||||||||||||||||
| Securities lending | 70,376 | |||||||||||||||||||||||
| Less foreign taxes withheld | (30,507 | ) | ||||||||||||||||||||||
| Total investment income | 6,522,898 | |||||||||||||||||||||||
| Expenses | ||||||||||||||||||||||||
| Investment management fees | 2,426,632 | |||||||||||||||||||||||
| Distribution and service fees | 8,848 | |||||||||||||||||||||||
| Accounting and legal services fees | 68,364 | |||||||||||||||||||||||
| Transfer agent fees | 3,398 | |||||||||||||||||||||||
| Trustees' fees | 6,222 | |||||||||||||||||||||||
| State registration fees | 31,904 | |||||||||||||||||||||||
| Printing and postage | 10,609 | |||||||||||||||||||||||
| Professional fees | 27,981 | |||||||||||||||||||||||
| Custodian fees | 36,158 | |||||||||||||||||||||||
| Other | 14,818 | |||||||||||||||||||||||
| Total expenses | 2,634,934 | |||||||||||||||||||||||
| Less expense reductions | (450,013 | ) | ||||||||||||||||||||||
| Net expenses | 2,184,921 | |||||||||||||||||||||||
| Net investment income | 4,337,977 | |||||||||||||||||||||||
| Realized and unrealized gain (loss) | ||||||||||||||||||||||||
| Net realized gain (loss) on | ||||||||||||||||||||||||
| Unaffiliated investments and foreign currency transactions | 8,398,188 | |||||||||||||||||||||||
| Affiliated investments | (5,703 | ) | ||||||||||||||||||||||
| Capital gain distributions received from unaffiliated investments | 221 | |||||||||||||||||||||||
| 8,392,706 | ||||||||||||||||||||||||
| Change in net unrealized appreciation (depreciation) of | ||||||||||||||||||||||||
| Unaffiliated investments and translation of assets and liabilities in foreign currencies | (4,381,405 | ) | ||||||||||||||||||||||
| Affiliated investments | 1,719 | |||||||||||||||||||||||
| (4,379,686 | ) | |||||||||||||||||||||||
| Net realized and unrealized gain | 4,013,020 | |||||||||||||||||||||||
| Increase in net assets from operations | $8,350,997 | |||||||||||||||||||||||
STATEMENTS OF CHANGES IN NET ASSETS
| Six months ended 4-30-18 | Year ended 10-31-17 | ||||||||||||||||||||||||||||||||||||||||||||
| (unaudited) | |||||||||||||||||||||||||||||||||||||||||||||
| Increase (decrease) in net assets | |||||||||||||||||||||||||||||||||||||||||||||
| From operations | |||||||||||||||||||||||||||||||||||||||||||||
| Net investment income | $4,337,977 | $8,989,500 | |||||||||||||||||||||||||||||||||||||||||||
| Net realized gain | 8,392,706 | 31,910,153 | |||||||||||||||||||||||||||||||||||||||||||
| Change in net unrealized appreciation (depreciation) | (4,379,686 | ) | 80,334,433 | ||||||||||||||||||||||||||||||||||||||||||
| Increase in net assets resulting from operations | 8,350,997 | 121,234,086 | |||||||||||||||||||||||||||||||||||||||||||
| Distributions to shareholders | |||||||||||||||||||||||||||||||||||||||||||||
| From net investment income | |||||||||||||||||||||||||||||||||||||||||||||
| Class A | (40,436 | ) | (15,206 | ) | |||||||||||||||||||||||||||||||||||||||||
| Class C | (2,588 | ) | (1,003 | ) | |||||||||||||||||||||||||||||||||||||||||
| Class I | (21,593 | ) | (14,729 | ) | |||||||||||||||||||||||||||||||||||||||||
| Class R6 | (5,531 | ) | (1,560 | ) | |||||||||||||||||||||||||||||||||||||||||
| Class NAV | (8,949,915 | ) | (8,636,767 | ) | |||||||||||||||||||||||||||||||||||||||||
| From net realized gain | |||||||||||||||||||||||||||||||||||||||||||||
| Class A | (156,615 | ) | — | ||||||||||||||||||||||||||||||||||||||||||
| Class C | (25,869 | ) | — | ||||||||||||||||||||||||||||||||||||||||||
| Class I | (65,783 | ) | — | ||||||||||||||||||||||||||||||||||||||||||
| Class R6 | (15,869 | ) | — | ||||||||||||||||||||||||||||||||||||||||||
| Class NAV | (25,348,465 | ) | — | ||||||||||||||||||||||||||||||||||||||||||
| Total distributions | (34,632,664 | ) | (8,669,265 | ) | |||||||||||||||||||||||||||||||||||||||||
| From fund share transactions | 10,772,055 | 108,468,709 | |||||||||||||||||||||||||||||||||||||||||||
| Total increase (decrease) | (15,509,612 | ) | 221,033,530 | ||||||||||||||||||||||||||||||||||||||||||
| Net assets | |||||||||||||||||||||||||||||||||||||||||||||
| Beginning of period | 623,765,968 | 402,732,438 | |||||||||||||||||||||||||||||||||||||||||||
| End of period | $608,256,356 | $623,765,968 | |||||||||||||||||||||||||||||||||||||||||||
| Undistributed net investment income | $2,216,786 | $6,898,872 | |||||||||||||||||||||||||||||||||||||||||||
Financial highlights
| Class A Shares Period ended | 4-30-18 | 1 | 10-31-17 | 10-31-16 | 10-31-15 | 10-31-14 | 2 | ||||||||||||||||||||||||||||||||||||||||||||||||||||||||||||||||||||||||||||||||||||||||||||||||
| Per share operating performance | |||||||||||||||||||||||||||||||||||||||||||||||||||||||||||||||||||||||||||||||||||||||||||||||||||||||
| Net asset value, beginning of period | $12.50 | $10.27 | $10.33 | $10.04 | $10.00 | ||||||||||||||||||||||||||||||||||||||||||||||||||||||||||||||||||||||||||||||||||||||||||||||||||
| Net investment income3 | 0.06 | 0.12 | 0.16 | 0.08 | 0.02 | ||||||||||||||||||||||||||||||||||||||||||||||||||||||||||||||||||||||||||||||||||||||||||||||||||
| Net realized and unrealized gain (loss) on investments | 0.08 | 2.22 | (0.05 | ) | 0.26 | 0.02 | |||||||||||||||||||||||||||||||||||||||||||||||||||||||||||||||||||||||||||||||||||||||||||||||||
| Total from investment operations | 0.14 | 2.34 | 0.11 | 0.34 | 0.04 | ||||||||||||||||||||||||||||||||||||||||||||||||||||||||||||||||||||||||||||||||||||||||||||||||||
| Less distributions | |||||||||||||||||||||||||||||||||||||||||||||||||||||||||||||||||||||||||||||||||||||||||||||||||||||||
| From net investment income | (0.13 | ) | (0.11 | ) | (0.10 | ) | (0.05 | ) | — | ||||||||||||||||||||||||||||||||||||||||||||||||||||||||||||||||||||||||||||||||||||||||||||||
| From net realized gain | (0.53 | ) | — | (0.07 | ) | — | — | ||||||||||||||||||||||||||||||||||||||||||||||||||||||||||||||||||||||||||||||||||||||||||||||||
| Total distributions | (0.66 | ) | (0.11 | ) | (0.17 | ) | (0.05 | ) | — | ||||||||||||||||||||||||||||||||||||||||||||||||||||||||||||||||||||||||||||||||||||||||||||||
| Net asset value, end of period | $11.98 | $12.50 | $10.27 | $10.33 | $10.04 | ||||||||||||||||||||||||||||||||||||||||||||||||||||||||||||||||||||||||||||||||||||||||||||||||||
| Total return (%)4,5 | 1.02 | 6 | 22.95 | 1.17 | 3.36 | 0.40 | 6 | ||||||||||||||||||||||||||||||||||||||||||||||||||||||||||||||||||||||||||||||||||||||||||||||||
| Ratios and supplemental data | |||||||||||||||||||||||||||||||||||||||||||||||||||||||||||||||||||||||||||||||||||||||||||||||||||||||
| Net assets, end of period (in millions) | $4 | $4 | $1 | $1 | —7 | ||||||||||||||||||||||||||||||||||||||||||||||||||||||||||||||||||||||||||||||||||||||||||||||||||
| Ratios (as a percentage of average net assets): | |||||||||||||||||||||||||||||||||||||||||||||||||||||||||||||||||||||||||||||||||||||||||||||||||||||||
| Expenses before reductions | 1.25 | 8 | 1.26 | 1.30 | 2.86 | 12.48 | 8 | ||||||||||||||||||||||||||||||||||||||||||||||||||||||||||||||||||||||||||||||||||||||||||||||||
| Expenses including reductions | 1.11 | 8 | 1.12 | 1.17 | 1.42 | 1.45 | 8 | ||||||||||||||||||||||||||||||||||||||||||||||||||||||||||||||||||||||||||||||||||||||||||||||||
| Net investment income | 0.99 | 8 | 0.99 | 1.64 | 0.78 | 0.54 | 8 | ||||||||||||||||||||||||||||||||||||||||||||||||||||||||||||||||||||||||||||||||||||||||||||||||
| Portfolio turnover (%) | 12 | 30 | 27 | 19 | 10 | ||||||||||||||||||||||||||||||||||||||||||||||||||||||||||||||||||||||||||||||||||||||||||||||||||
| 1 | Six months ended 4-30-18. Unaudited. | ||||||||||||||||||||||||||||||||||||||||||||||||||||||||||||||||||||||||||||||||||
| 2 | Period from 6-26-14 (commencement of operations) to 10-31-14. | ||||||||||||||||||||||||||||||||||||||||||||||||||||||||||||||||||||||||||||||||||
| 3 | Based on average daily shares outstanding. | ||||||||||||||||||||||||||||||||||||||||||||||||||||||||||||||||||||||||||||||||||
| 4 | Does not reflect the effect of sales charges, if any. | ||||||||||||||||||||||||||||||||||||||||||||||||||||||||||||||||||||||||||||||||||
| 5 | Total returns would have been lower had certain expenses not been reduced during the applicable periods. | ||||||||||||||||||||||||||||||||||||||||||||||||||||||||||||||||||||||||||||||||||
| 6 | Not annualized. | ||||||||||||||||||||||||||||||||||||||||||||||||||||||||||||||||||||||||||||||||||
| 7 | Less than $500,000. | ||||||||||||||||||||||||||||||||||||||||||||||||||||||||||||||||||||||||||||||||||
| 8 | Annualized. | ||||||||||||||||||||||||||||||||||||||||||||||||||||||||||||||||||||||||||||||||||
| Class C Shares Period ended | 4-30-18 | 1 | 10-31-17 | 10-31-16 | 10-31-15 | 10-31-14 | 2 | ||||||||||||||||||||||||||||||||||||||||||||||||||||||||||||||||||||||||||||||||||||||||||||||||
| Per share operating performance | |||||||||||||||||||||||||||||||||||||||||||||||||||||||||||||||||||||||||||||||||||||||||||||||||||||||
| Net asset value, beginning of period | $12.42 | $10.21 | $10.27 | $10.01 | $10.00 | ||||||||||||||||||||||||||||||||||||||||||||||||||||||||||||||||||||||||||||||||||||||||||||||||||
| Net investment income3 | 0.02 | 0.04 | 0.09 | 0.01 | — | 4 | |||||||||||||||||||||||||||||||||||||||||||||||||||||||||||||||||||||||||||||||||||||||||||||||||
| Net realized and unrealized gain (loss) on investments | 0.07 | 2.21 | (0.05 | ) | 0.26 | 0.01 | |||||||||||||||||||||||||||||||||||||||||||||||||||||||||||||||||||||||||||||||||||||||||||||||||
| Total from investment operations | 0.09 | 2.25 | 0.04 | 0.27 | 0.01 | ||||||||||||||||||||||||||||||||||||||||||||||||||||||||||||||||||||||||||||||||||||||||||||||||||
| Less distributions | |||||||||||||||||||||||||||||||||||||||||||||||||||||||||||||||||||||||||||||||||||||||||||||||||||||||
| From net investment income | (0.05 | ) | (0.04 | ) | (0.03 | ) | (0.01 | ) | — | ||||||||||||||||||||||||||||||||||||||||||||||||||||||||||||||||||||||||||||||||||||||||||||||
| From net realized gain | (0.53 | ) | — | (0.07 | ) | — | — | ||||||||||||||||||||||||||||||||||||||||||||||||||||||||||||||||||||||||||||||||||||||||||||||||
| Total distributions | (0.58 | ) | (0.04 | ) | (0.10 | ) | (0.01 | ) | — | ||||||||||||||||||||||||||||||||||||||||||||||||||||||||||||||||||||||||||||||||||||||||||||||
| Net asset value, end of period | $11.93 | $12.42 | $10.21 | $10.27 | $10.01 | ||||||||||||||||||||||||||||||||||||||||||||||||||||||||||||||||||||||||||||||||||||||||||||||||||
| Total return (%)5,6 | 0.60 | 7 | 22.12 | 0.45 | 2.70 | 0.10 | 7 | ||||||||||||||||||||||||||||||||||||||||||||||||||||||||||||||||||||||||||||||||||||||||||||||||
| Ratios and supplemental data | |||||||||||||||||||||||||||||||||||||||||||||||||||||||||||||||||||||||||||||||||||||||||||||||||||||||
| Net assets, end of period (in millions) | $1 | $1 | — | 8 | — | 8 | — | 8 | |||||||||||||||||||||||||||||||||||||||||||||||||||||||||||||||||||||||||||||||||||||||||||||||
| Ratios (as a percentage of average net assets): | |||||||||||||||||||||||||||||||||||||||||||||||||||||||||||||||||||||||||||||||||||||||||||||||||||||||
| Expenses before reductions | 1.96 | 9 | 1.96 | 2.00 | 5.43 | 18.19 | 9 | ||||||||||||||||||||||||||||||||||||||||||||||||||||||||||||||||||||||||||||||||||||||||||||||||
| Expenses including reductions | 1.81 | 9 | 1.82 | 1.88 | 2.12 | 2.15 | 9 | ||||||||||||||||||||||||||||||||||||||||||||||||||||||||||||||||||||||||||||||||||||||||||||||||
| Net investment income (loss) | 0.28 | 9 | 0.31 | 0.92 | 0.09 | (0.03 | ) 9 | ||||||||||||||||||||||||||||||||||||||||||||||||||||||||||||||||||||||||||||||||||||||||||||||||
| Portfolio turnover (%) | 12 | 30 | 27 | 19 | 10 | ||||||||||||||||||||||||||||||||||||||||||||||||||||||||||||||||||||||||||||||||||||||||||||||||||
| 1 | Six months ended 4-30-18. Unaudited. | ||||||||||||||||||||||||||||||||||||||||||||||||||||||||||||||||||||||||||||||||||
| 2 | Period from 6-26-14 (commencement of operations) to 10-31-14. | ||||||||||||||||||||||||||||||||||||||||||||||||||||||||||||||||||||||||||||||||||
| 3 | Based on average daily shares outstanding. | ||||||||||||||||||||||||||||||||||||||||||||||||||||||||||||||||||||||||||||||||||
| 4 | Less than $0.005 per share. | ||||||||||||||||||||||||||||||||||||||||||||||||||||||||||||||||||||||||||||||||||
| 5 | Does not reflect the effect of sales charges, if any. | ||||||||||||||||||||||||||||||||||||||||||||||||||||||||||||||||||||||||||||||||||
| 6 | Total returns would have been lower had certain expenses not been reduced during the applicable periods. | ||||||||||||||||||||||||||||||||||||||||||||||||||||||||||||||||||||||||||||||||||
| 7 | Not annualized. | ||||||||||||||||||||||||||||||||||||||||||||||||||||||||||||||||||||||||||||||||||
| 8 | Less than $500,000. | ||||||||||||||||||||||||||||||||||||||||||||||||||||||||||||||||||||||||||||||||||
| 9 | Annualized. | ||||||||||||||||||||||||||||||||||||||||||||||||||||||||||||||||||||||||||||||||||
| Class I Shares Period ended | 4-30-18 | 1 | 10-31-17 | 10-31-16 | 10-31-15 | 10-31-14 | 2 | ||||||||||||||||||||||||||||||||||||||||||||||||||||||||||||||||||||||||||||||||||||||||||||||||
| Per share operating performance | |||||||||||||||||||||||||||||||||||||||||||||||||||||||||||||||||||||||||||||||||||||||||||||||||||||||
| Net asset value, beginning of period | $12.53 | $10.29 | $10.36 | $10.04 | $10.00 | ||||||||||||||||||||||||||||||||||||||||||||||||||||||||||||||||||||||||||||||||||||||||||||||||||
| Net investment income3 | 0.08 | 0.16 | 0.22 | 0.11 | 0.03 | ||||||||||||||||||||||||||||||||||||||||||||||||||||||||||||||||||||||||||||||||||||||||||||||||||
| Net realized and unrealized gain (loss) on investments | 0.08 | 2.23 | (0.09 | ) | 0.27 | 0.01 | |||||||||||||||||||||||||||||||||||||||||||||||||||||||||||||||||||||||||||||||||||||||||||||||||
| Total from investment operations | 0.16 | 2.39 | 0.13 | 0.38 | 0.04 | ||||||||||||||||||||||||||||||||||||||||||||||||||||||||||||||||||||||||||||||||||||||||||||||||||
| Less distributions | |||||||||||||||||||||||||||||||||||||||||||||||||||||||||||||||||||||||||||||||||||||||||||||||||||||||
| From net investment income | (0.17 | ) | (0.15 | ) | (0.13 | ) | (0.06 | ) | — | ||||||||||||||||||||||||||||||||||||||||||||||||||||||||||||||||||||||||||||||||||||||||||||||
| From net realized gain | (0.53 | ) | — | (0.07 | ) | — | — | ||||||||||||||||||||||||||||||||||||||||||||||||||||||||||||||||||||||||||||||||||||||||||||||||
| Total distributions | (0.70 | ) | (0.15 | ) | (0.20 | ) | (0.06 | ) | — | ||||||||||||||||||||||||||||||||||||||||||||||||||||||||||||||||||||||||||||||||||||||||||||||
| Net asset value, end of period | $11.99 | $12.53 | $10.29 | $10.36 | $10.04 | ||||||||||||||||||||||||||||||||||||||||||||||||||||||||||||||||||||||||||||||||||||||||||||||||||
| Total return (%)4 | 1.16 | 5 | 23.36 | 1.38 | 3.82 | 0.40 | 5 | ||||||||||||||||||||||||||||||||||||||||||||||||||||||||||||||||||||||||||||||||||||||||||||||||
| Ratios and supplemental data | |||||||||||||||||||||||||||||||||||||||||||||||||||||||||||||||||||||||||||||||||||||||||||||||||||||||
| Net assets, end of period (in millions) | $2 | $1 | $1 | — | 6 | — | 6 | ||||||||||||||||||||||||||||||||||||||||||||||||||||||||||||||||||||||||||||||||||||||||||||||||
| Ratios (as a percentage of average net assets): | |||||||||||||||||||||||||||||||||||||||||||||||||||||||||||||||||||||||||||||||||||||||||||||||||||||||
| Expenses before reductions | 0.96 | 7 | 0.95 | 0.99 | 6.77 | 18.75 | 7 | ||||||||||||||||||||||||||||||||||||||||||||||||||||||||||||||||||||||||||||||||||||||||||||||||
| Expenses including reductions | 0.81 | 7 | 0.81 | 0.84 | 1.13 | 1.15 | 7 | ||||||||||||||||||||||||||||||||||||||||||||||||||||||||||||||||||||||||||||||||||||||||||||||||
| Net investment income | 1.29 | 7 | 1.37 | 2.18 | 1.08 | 0.98 | 7 | ||||||||||||||||||||||||||||||||||||||||||||||||||||||||||||||||||||||||||||||||||||||||||||||||
| Portfolio turnover (%) | 12 | 30 | 27 | 19 | 10 | ||||||||||||||||||||||||||||||||||||||||||||||||||||||||||||||||||||||||||||||||||||||||||||||||||
| 1 | Six months ended 4-30-18. Unaudited. | ||||||||||||||||||||||||||||||||||||||||||||||||||||||||||||||||||||||||||||||||||
| 2 | Period from 6-26-14 (commencement of operations) to 10-31-14. | ||||||||||||||||||||||||||||||||||||||||||||||||||||||||||||||||||||||||||||||||||
| 3 | Based on average daily shares outstanding. | ||||||||||||||||||||||||||||||||||||||||||||||||||||||||||||||||||||||||||||||||||
| 4 | Total returns would have been lower had certain expenses not been reduced during the applicable periods. | ||||||||||||||||||||||||||||||||||||||||||||||||||||||||||||||||||||||||||||||||||
| 5 | Not annualized. | ||||||||||||||||||||||||||||||||||||||||||||||||||||||||||||||||||||||||||||||||||
| 6 | Less than $500,000. | ||||||||||||||||||||||||||||||||||||||||||||||||||||||||||||||||||||||||||||||||||
| 7 | Annualized. | ||||||||||||||||||||||||||||||||||||||||||||||||||||||||||||||||||||||||||||||||||
| Class R6 Shares Period ended | 4-30-18 | 1 | 10-31-17 | 10-31-16 | 10-31-15 | 10-31-14 | 2 | ||||||||||||||||||||||||||||||||||||||||||||||||||||||||||||||||||||||||||||||||||||||||||||||||
| Per share operating performance | |||||||||||||||||||||||||||||||||||||||||||||||||||||||||||||||||||||||||||||||||||||||||||||||||||||||
| Net asset value, beginning of period | $12.55 | $10.31 | $10.38 | $10.05 | $10.00 | ||||||||||||||||||||||||||||||||||||||||||||||||||||||||||||||||||||||||||||||||||||||||||||||||||
| Net investment income3 | 0.09 | 0.16 | 0.20 | 0.14 | 0.04 | ||||||||||||||||||||||||||||||||||||||||||||||||||||||||||||||||||||||||||||||||||||||||||||||||||
| Net realized and unrealized gain (loss) on investments | 0.07 | 2.24 | (0.04 | ) | 0.27 | 0.01 | |||||||||||||||||||||||||||||||||||||||||||||||||||||||||||||||||||||||||||||||||||||||||||||||||
| Total from investment operations | 0.16 | 2.40 | 0.16 | 0.41 | 0.05 | ||||||||||||||||||||||||||||||||||||||||||||||||||||||||||||||||||||||||||||||||||||||||||||||||||
| Less distributions | |||||||||||||||||||||||||||||||||||||||||||||||||||||||||||||||||||||||||||||||||||||||||||||||||||||||
| From net investment income | (0.18 | ) | (0.16 | ) | (0.16 | ) | (0.08 | ) | — | ||||||||||||||||||||||||||||||||||||||||||||||||||||||||||||||||||||||||||||||||||||||||||||||
| From net realized gain | (0.53 | ) | — | (0.07 | ) | — | — | ||||||||||||||||||||||||||||||||||||||||||||||||||||||||||||||||||||||||||||||||||||||||||||||||
| Total distributions | (0.71 | ) | (0.16 | ) | (0.23 | ) | (0.08 | ) | — | ||||||||||||||||||||||||||||||||||||||||||||||||||||||||||||||||||||||||||||||||||||||||||||||
| Net asset value, end of period | $12.00 | $12.55 | $10.31 | $10.38 | $10.05 | ||||||||||||||||||||||||||||||||||||||||||||||||||||||||||||||||||||||||||||||||||||||||||||||||||
| Total return (%)4 | 1.16 | 5 | 23.43 | 1.64 | 4.08 | 0.50 | 5 | ||||||||||||||||||||||||||||||||||||||||||||||||||||||||||||||||||||||||||||||||||||||||||||||||
| Ratios and supplemental data | |||||||||||||||||||||||||||||||||||||||||||||||||||||||||||||||||||||||||||||||||||||||||||||||||||||||
| Net assets, end of period (in millions) | — | 6 | — | 6 | — | 6 | — | 6 | — | 6 | |||||||||||||||||||||||||||||||||||||||||||||||||||||||||||||||||||||||||||||||||||||||||||||
| Ratios (as a percentage of average net assets): | |||||||||||||||||||||||||||||||||||||||||||||||||||||||||||||||||||||||||||||||||||||||||||||||||||||||
| Expenses before reductions | 0.86 | 7 | 0.86 | 0.90 | 7.69 | 18.64 | 7 | ||||||||||||||||||||||||||||||||||||||||||||||||||||||||||||||||||||||||||||||||||||||||||||||||
| Expenses including reductions | 0.71 | 7 | 0.71 | 0.75 | 0.84 | 0.85 | 7 | ||||||||||||||||||||||||||||||||||||||||||||||||||||||||||||||||||||||||||||||||||||||||||||||||
| Net investment income | 1.38 | 7 | 1.34 | 2.05 | 1.39 | 1.27 | 7 | ||||||||||||||||||||||||||||||||||||||||||||||||||||||||||||||||||||||||||||||||||||||||||||||||
| Portfolio turnover (%) | 12 | 30 | 27 | 19 | 10 | ||||||||||||||||||||||||||||||||||||||||||||||||||||||||||||||||||||||||||||||||||||||||||||||||||
| 1 | Six months ended 4-30-18. Unaudited. | ||||||||||||||||||||||||||||||||||||||||||||||||||||||||||||||||||||||||||||||||||
| 2 | Period from 6-26-14 (commencement of operations) to 10-31-14. | ||||||||||||||||||||||||||||||||||||||||||||||||||||||||||||||||||||||||||||||||||
| 3 | Based on average daily shares outstanding. | ||||||||||||||||||||||||||||||||||||||||||||||||||||||||||||||||||||||||||||||||||
| 4 | Total returns would have been lower had certain expenses not been reduced during the applicable periods. | ||||||||||||||||||||||||||||||||||||||||||||||||||||||||||||||||||||||||||||||||||
| 5 | Not annualized. | ||||||||||||||||||||||||||||||||||||||||||||||||||||||||||||||||||||||||||||||||||
| 6 | Less than $500,000. | ||||||||||||||||||||||||||||||||||||||||||||||||||||||||||||||||||||||||||||||||||
| 7 | Annualized. | ||||||||||||||||||||||||||||||||||||||||||||||||||||||||||||||||||||||||||||||||||
| Class NAV Shares Period ended | 4-30-18 | 1 | 10-31-17 | 10-31-16 | 10-31-15 | 10-31-14 | 2 | ||||||||||||||||||||||||||||||||||||||||||||||||||||||||||||||||||||||||||||||||||||||||||||||||
| Per share operating performance | |||||||||||||||||||||||||||||||||||||||||||||||||||||||||||||||||||||||||||||||||||||||||||||||||||||||
| Net asset value, beginning of period | $12.55 | $10.31 | $10.38 | $10.05 | $10.00 | ||||||||||||||||||||||||||||||||||||||||||||||||||||||||||||||||||||||||||||||||||||||||||||||||||
| Net investment income3 | 0.09 | 0.17 | 0.20 | 0.14 | 0.04 | ||||||||||||||||||||||||||||||||||||||||||||||||||||||||||||||||||||||||||||||||||||||||||||||||||
| Net realized and unrealized gain (loss) on investments | 0.07 | 2.23 | (0.04 | ) | 0.26 | 0.01 | |||||||||||||||||||||||||||||||||||||||||||||||||||||||||||||||||||||||||||||||||||||||||||||||||
| Total from investment operations | 0.16 | 2.40 | 0.16 | 0.40 | 0.05 | ||||||||||||||||||||||||||||||||||||||||||||||||||||||||||||||||||||||||||||||||||||||||||||||||||
| Less distributions | |||||||||||||||||||||||||||||||||||||||||||||||||||||||||||||||||||||||||||||||||||||||||||||||||||||||
| From net investment income | (0.18 | ) | (0.16 | ) | (0.16 | ) | (0.07 | ) | — | ||||||||||||||||||||||||||||||||||||||||||||||||||||||||||||||||||||||||||||||||||||||||||||||
| From net realized gain | (0.53 | ) | — | (0.07 | ) | — | — | ||||||||||||||||||||||||||||||||||||||||||||||||||||||||||||||||||||||||||||||||||||||||||||||||
| Total distributions | (0.71 | ) | (0.16 | ) | (0.23 | ) | (0.07 | ) | — | ||||||||||||||||||||||||||||||||||||||||||||||||||||||||||||||||||||||||||||||||||||||||||||||
| Net asset value, end of period | $12.00 | $12.55 | $10.31 | $10.38 | $10.05 | ||||||||||||||||||||||||||||||||||||||||||||||||||||||||||||||||||||||||||||||||||||||||||||||||||
| Total return (%)4 | 1.17 | 5 | 23.43 | 1.64 | 4.06 | 0.50 | 5 | ||||||||||||||||||||||||||||||||||||||||||||||||||||||||||||||||||||||||||||||||||||||||||||||||
| Ratios and supplemental data | |||||||||||||||||||||||||||||||||||||||||||||||||||||||||||||||||||||||||||||||||||||||||||||||||||||||
| Net assets, end of period (in millions) | $602 | $618 | $401 | $403 | $439 | ||||||||||||||||||||||||||||||||||||||||||||||||||||||||||||||||||||||||||||||||||||||||||||||||||
| Ratios (as a percentage of average net assets): | |||||||||||||||||||||||||||||||||||||||||||||||||||||||||||||||||||||||||||||||||||||||||||||||||||||||
| Expenses before reductions | 0.85 | 6 | 0.85 | 0.88 | 0.88 | 0.86 | 6 | ||||||||||||||||||||||||||||||||||||||||||||||||||||||||||||||||||||||||||||||||||||||||||||||||
| Expenses including reductions | 0.70 | 6 | 0.70 | 0.75 | 0.84 | 0.86 | 6 | ||||||||||||||||||||||||||||||||||||||||||||||||||||||||||||||||||||||||||||||||||||||||||||||||
| Net investment income | 1.40 | 6 | 1.46 | 2.05 | 1.39 | 1.28 | 6 | ||||||||||||||||||||||||||||||||||||||||||||||||||||||||||||||||||||||||||||||||||||||||||||||||
| Portfolio turnover (%) | 12 | 30 | 27 | 19 | 10 | ||||||||||||||||||||||||||||||||||||||||||||||||||||||||||||||||||||||||||||||||||||||||||||||||||
| 1 | Six months ended 4-30-18. Unaudited. | ||||||||||||||||||||||||||||||||||||||||||||||||||||||||||||||||||||||||||||||||||
| 2 | Period from 6-26-14 (commencement of operations) to 10-31-14. | ||||||||||||||||||||||||||||||||||||||||||||||||||||||||||||||||||||||||||||||||||
| 3 | Based on average daily shares outstanding. | ||||||||||||||||||||||||||||||||||||||||||||||||||||||||||||||||||||||||||||||||||
| 4 | Total returns would have been lower had certain expenses not been reduced during the applicable periods. | ||||||||||||||||||||||||||||||||||||||||||||||||||||||||||||||||||||||||||||||||||
| 5 | Not annualized. | ||||||||||||||||||||||||||||||||||||||||||||||||||||||||||||||||||||||||||||||||||
| 6 | Annualized. | ||||||||||||||||||||||||||||||||||||||||||||||||||||||||||||||||||||||||||||||||||
Note 1 — Organization
John Hancock Value Equity Fund (the fund) is a series of John Hancock Investment Trust (the Trust), an open-end management investment company organized as a Massachusetts business trust and registered under the Investment Company Act of 1940, as amended (the 1940 Act). The investment objective of the fund is to seek capital appreciation over the long term.
The fund may offer multiple classes of shares. The shares currently offered by the fund are detailed in the Statement of assets and liabilities. Class A and Class C are offered to all investors. Class I shares are offered to institutions and certain investors. Class R6 shares are only available to certain retirement plans, institutions and other investors. Class NAV shares are offered to John Hancock affiliated funds of funds, retirement plans for employees of John Hancock and/or Manulife Financial Corporation (MFC), and certain 529 plans. Shareholders of each class have exclusive voting rights to matters that affect that class. The distribution and service fees, if any, and transfer agent fees for each class may differ. Effective May 1, 2018, Class C shares convert to Class A shares ten years after purchase (certain exclusions may apply).
Note 2 — Significant accounting policies
The financial statements have been prepared in conformity with accounting principles generally accepted in the United States of America (US GAAP), which require management to make certain estimates and assumptions as of the date of the financial statements. Actual results could differ from those estimates and those differences could be significant. The fund qualifies as an investment company under Topic 946 of Accounting Standards Codification of US GAAP.
Events or transactions occurring after the end of the fiscal period through the date that the financial statements were issued have been evaluated in the preparation of the financial statements. The following summarizes the significant accounting policies of the fund:
Security valuation. Investments are stated at value as of the scheduled close of regular trading on the New York Stock Exchange (NYSE), normally at 4:00 p.m., Eastern Time. In case of emergency or other disruption resulting in the NYSE not opening for trading or the NYSE closing at a time other than the regularly scheduled close, the net asset value (NAV) may be determined as of the regularly scheduled close of the NYSE pursuant to the fund's Valuation Policies and Procedures.
In order to value the securities, the fund uses the following valuation techniques: Equity securities held by the fund are typically valued at the last sale price or official closing price on the exchange or principal market where the security trades. In the event there were no sales during the day or closing prices are not available, the securities are valued using the last available bid price. Investments by the fund in open-end mutual funds, including John Hancock Collateral Trust (JHCT), are valued at their respective NAVs each business day. Foreign securities and currencies, are valued in U.S. dollars based on foreign currency exchange rates supplied by an independent pricing vendor.
In certain instances, the Pricing Committee may determine to value equity securities using prices obtained from another exchange or market if trading on the exchange or market on which prices are typically obtained did not open for trading as scheduled, or if trading closed earlier than scheduled, and trading occurred as normal on another exchange or market.
Other portfolio securities and assets, for which reliable market quotations are not readily available, are valued at fair value as determined in good faith by the fund's Pricing Committee following procedures established by the Board of Trustees. The frequency with which these fair valuation procedures are used cannot be predicted and fair value of securities may differ significantly from the value that would have been used had a ready market for such securities existed. Trading in foreign securities may be completed before the scheduled daily close of trading on the NYSE. Significant events at the issuer or market level may affect the values of securities between the time when the valuation of the securities is generally determined and the close of the NYSE. If a significant event occurs, these securities may be fair valued, as determined in good faith by the fund's Pricing Committee, following procedures established by the Board of Trustees. The fund uses fair value adjustment factors provided by an independent pricing vendor to value certain foreign securities in order to adjust for events that may occur between the close of foreign exchanges or markets and the close of the NYSE.
The fund uses a three-tier hierarchy to prioritize the pricing assumptions, referred to as inputs, used in valuation techniques to measure fair value. Level 1 includes securities valued using quoted prices in active markets for identical securities. Level 2
includes securities valued using other significant observable inputs. Observable inputs may include quoted prices for similar securities, interest rates, prepayment speeds and credit risk. Prices for securities valued using these inputs are received from independent pricing vendors and brokers and are based on an evaluation of the inputs described. Level 3 includes securities valued using significant unobservable inputs when market prices are not readily available or reliable, including the fund's own assumptions in determining the fair value of investments. Factors used in determining value may include market or issuer specific events or trends, changes in interest rates and credit quality. The inputs or methodology used for valuing securities are not necessarily an indication of the risks associated with investing in those securities. Changes in valuation techniques and related inputs may result in transfers into or out of an assigned level within the disclosure hierarchy.
As of April 30, 2018, all investments are categorized as Level 1 under the hierarchy described above.
Security transactions and related investment income. Investment security transactions are accounted for on a trade date plus one basis for daily NAV calculations. However, for financial reporting purposes, investment transactions are reported on trade date. Interest income is accrued as earned. Dividend income is recorded on the ex-date, except for dividends of foreign securities where the dividend may not be known until after the ex-date. In those cases, dividend income, net of withholding taxes, is recorded when the fund becomes aware of the dividends. Gains and losses on securities sold are determined on the basis of identified cost and may include proceeds from litigation.
Securities lending. The fund may lend its securities to earn additional income. The fund receives cash collateral from the borrower in an amount not less than the market value of the loaned securities. The fund will invest collateral in JHCT, an affiliate of the fund, which has a floating NAV and is registered with the Securities and Exchange Commission as an investment company. JHCT invests in short term money market investments. The fund will receive the benefit of any gains and bear any losses generated by JHCT with respect to the cash collateral.
The fund has the right to recall loaned securities on demand. If a borrower fails to return loaned securities when due, then the lending agent is responsible and indemnifies the fund for the lent securities. The lending agent uses the collateral received from the borrower to purchase replacement securities of the same issue, type, class and series of the loaned securities. If the value of the collateral is less than the purchase cost of replacement securities, the lending agent is responsible for satisfying the shortfall but only to the extent that the shortfall is not due to any decrease in the value of JHCT.
Although the risk of the loss of the securities lent is mitigated by receiving collateral from the borrower and through lending agent indemnification, the fund could experience a delay in recovering securities or could experience a lower than expected return if the borrower fails to return the securities on a timely basis. The fund receives compensation for lending its securities by retaining a portion of the return on the investment of the collateral and compensation from fees earned from borrowers of the securities. Securities lending income received by the fund is net of fees retained by the securities lending agent. Net income received from JHCT is a component of securities lending income as recorded on the Statement of operations.
Obligations to repay collateral received by the fund are shown on the Statement of assets and liabilities as Payable upon return of securities loaned and are secured by the loaned securities. As of April 30, 2018, the fund loaned common stocks valued at $17,178,687 and received $17,592,879 of cash collateral.
Foreign investing. Assets, including investments and liabilities denominated in foreign currencies, are translated into U.S. dollar values each day at the prevailing exchange rate. Purchases and sales of securities, income and expenses are translated into U.S. dollars at the prevailing exchange rate on the date of the transaction. The effect of changes in foreign currency exchange rates on the value of securities is reflected as a component of the realized and unrealized gains (losses) on investments. Foreign investments are subject to a decline in the value of a foreign currency versus the U.S. dollar, which reduces the dollar value of securities denominated in that currency.
Funds that invest internationally generally carry more risk than funds that invest strictly in U.S. securities. These risks are heightened for investments in emerging markets. Risks can result from differences in economic and political conditions, regulations, market practices (including higher transaction costs), accounting standards and other factors.
Foreign taxes. The fund may be subject to withholding tax on income, capital gains or repatriation taxes imposed by certain countries, a portion of which may be recoverable. Foreign taxes are accrued based upon the fund's understanding of the tax
rules and rates that exist in the foreign markets in which it invests. Taxes are accrued based on gains realized by the fund as a result of certain foreign security sales. Estimated taxes are accrued based on unrealized appreciation of such securities. Investment income is recorded net of foreign withholding taxes, less any amounts reclaimable.
Line of credit. The fund may have the ability to borrow from banks for temporary or emergency purposes, including meeting redemption requests that otherwise might require the untimely sale of securities. Pursuant to the fund's custodian agreement, the custodian may loan money to the fund to make properly authorized payments. The fund is obligated to repay the custodian for any overdraft, including any related costs or expenses. The custodian may have a lien, security interest or security entitlement in any fund property that is not otherwise segregated or pledged, to the extent of any overdraft, and to the maximum extent permitted by law.
The fund and other affiliated funds have entered into a syndicated line of credit agreement with Citibank, N.A. as the administrative agent that enables them to participate in a $750 million unsecured committed line of credit. Excluding commitments designated for a certain fund and subject to the needs of all other affiliated funds, the fund can borrow up to an aggregate commitment amount of $500 million, subject to asset coverage and other limitations as specified in the agreement. A commitment fee payable at the end of each calendar quarter, based on the average daily unused portion of the line of credit, is charged to each participating fund based on a combination of fixed and asset based allocations and is reflected in Other expenses on the Statement of operations. For the six months ended April 30, 2018, the fund had no borrowings under the line of credit. Commitment fees for the six months ended April 30, 2018 were $2,228.
Expenses. Within the John Hancock group of funds complex, expenses that are directly attributable to an individual fund are allocated to such fund. Expenses that are not readily attributable to a specific fund are allocated among all funds in an equitable manner, taking into consideration, among other things, the nature and type of expense and the fund's relative net assets. Expense estimates are accrued in the period to which they relate and adjustments are made when actual amounts are known.
Class allocations. Income, common expenses and realized and unrealized gains (losses) are determined at the fund level and allocated daily to each class of shares based on the net assets of the class. Class-specific expenses, such as distribution and service fees, if any, and transfer agent fees, for all classes, are charged daily at the class level based on the net assets of each class and the specific expense rates applicable to each class.
Federal income taxes. The fund intends to continue to qualify as a regulated investment company by complying with the applicable provisions of the Internal Revenue Code and will not be subject to federal income tax on taxable income that is distributed to shareholders. Therefore, no federal income tax provision is required.
As of October 31, 2017, the fund had no uncertain tax positions that would require financial statement recognition, derecognition or disclosure. The fund's federal tax returns are subject to examination by the Internal Revenue Service for a period of three years.
Distribution of income and gains. Distributions to shareholders from net investment income and net realized gains, if any, are recorded on the ex-date. The fund generally declares and pays dividends and capital gain distributions, if any, annually.
Distributions paid by the fund with respect to each class of shares are calculated in the same manner, at the same time and in the same amount, except for the effect of class level expenses that may be applied differently to each class.
Such distributions, on a tax basis, are determined in conformity with income tax regulations, which may differ from US GAAP. Distributions in excess of tax basis earnings and profits, if any, are reported in the fund's financial statements as a return of capital. The final determination of tax characteristics of the fund's distribution will occur at the end of the year and will subsequently be reported to shareholders.
Capital accounts within the financial statements are adjusted for permanent book-tax differences. These adjustments have no impact on net assets or the results of operations. Temporary book-tax differences, if any, will reverse in a subsequent period. Book-tax differences are primarily attributable to wash sale loss deferrals.
Note 3 — Guarantees and indemnifications
Under the Fund's organizational documents, its Officers and Trustees are indemnified against certain liabilities arising out of the performance of their duties to the Trust, including the fund. Additionally, in the normal course of business, the fund enters into contracts with service providers that contain general indemnification clauses. The fund's maximum exposure under these arrangements is unknown, as this would involve future claims that may be made against the fund that have not yet occurred. The risk of material loss from such claims is considered remote.
Note 4 — Fees and transactions with affiliates
John Hancock Advisers, LLC (the Advisor) serves as investment advisor for the fund. John Hancock Funds, LLC (the Distributor), an affiliate of the Advisor, serves as principal underwriter of the fund. The Advisor and the Distributor are indirect, wholly owned subsidiaries of MFC.
Management fee. The fund has an investment management agreement with the Advisor under which the fund pays a daily management fee to the Advisor, equivalent on an annual basis, to the sum of: (a) 0.850% of the first $200 million of the fund's average daily net assets; (b) 0.750% of the next $800 million of the fund's average daily net assets; and (c) 0.650% of the fund's average daily net assets in excess of $1 billion. The Advisor has a subadvisory agreement with Barrow, Hanley, Mewhinney & Strauss, LLC. The fund is not responsible for payment of the subadvisory fees.
The Advisor has contractually agreed to limit the maximum annual management fee to 0.66% of the fund's average daily net assets. The advisor also contractually agrees to reduce its management fee for the fund, or if necessary make payment to the fund, in an amount equal to the amount by which "Other expenses" of the fund exceed 0.04% (on an annualized basis) of the fund. "Other expenses" means all of the expenses of the fund, excluding: management fees, taxes, brokerage commissions, interest expense, litigation and indemnification expenses and other extraordinary expenses not incurred in the ordinary course of the fund's business, class-specific expenses, borrowing costs, prime brokerage fees, acquired fund fees and expenses paid indirectly, and short dividend expense. Each of the agreements expires on February 28, 2019, unless renewed by mutual agreement of the fund and the Advisor based upon a determination that this is appropriate under the circumstances at that time.
The Advisor has contractually agreed to waive a portion of its management fee and/or reimburse expenses for certain funds of the John Hancock complex, including the fund (the participating portfolios). This waiver is based upon aggregate net assets of all the participating portfolios. The amount of the reimbursement is calculated daily and allocated among all the participating portfolios in proportion to the daily net assets of each fund. During the six months ended April 30, 2018, this waiver amounted to 0.01% of the fund's average net assets on an annualized basis. This arrangement may be amended or terminated at any time by the Advisor upon notice to the fund and with the approval of the Board of Trustees.
For the six months ended April 30, 2018, the expense reductions amounted to the following:
| Class | Expense reduction | Class | Expense reduction | |
| Class A | $2,896 | Class R6 | $339 | |
| Class C | 416 | Class NAV | 445,181 | |
| Class I | 1,181 | Total | $450,013 |
Expenses waived or reimbursed in the current fiscal period are not subject to recapture in future fiscal periods.
The investment management fees incurred for the six months ended April 30, 2018 were equivalent to a net annual effective rate of 0.64% of the fund's average daily net assets.
Accounting and legal services. Pursuant to a service agreement, the fund reimburses the Advisor for all expenses associated with providing the administrative, financial, legal, compliance, accounting and recordkeeping services to the fund, including the preparation of all tax returns, periodic reports to shareholders and regulatory reports, among other services. These expenses are allocated to each share class based on its relative net assets at the time the expense was incurred. These accounting and legal services fees incurred for the six months ended April 30, 2018 amounted to an annual rate of 0.02% of the fund's average daily net assets.
Distribution and service plans. The fund has a distribution agreement with the Distributor. The fund has adopted distribution and service plans with respect to Class A and Class C pursuant to Rule 12b-1 under the 1940 Act, to pay the Distributor for services provided as the distributor of shares of the fund. The fund may pay up to the following contractual rates of distribution and service fees under these arrangements, expressed as an annual percentage of average daily net assets for each class of the fund's shares:
| Class | Rule 12b-1 fee |
| Class A | 0.30% |
| Class C | 1.00% |
Sales charges. Class A shares are assessed up-front sales charges, which resulted in payments to the Distributor amounting to $3,033 for the six months ended April 30, 2018. Of this amount, $407 was retained and used for printing prospectuses, advertising, sales literature and other purposes, $2,492 was paid as sales commissions to broker-dealers and $134 was paid as sales commissions to sales personnel of Signator Investors, Inc., a broker-dealer affiliate of the Advisor.
Class A and Class C shares may be subject to contingent deferred sales charges (CDSCs). Certain Class A shares that are acquired through purchases of $1 million or more and are redeemed within one year of purchase are subject to a 1.00% sales charge. Class C shares that are redeemed within one year of purchase are subject to a 1.00% CDSC.CDSCs are applied to the lesser of the current market value at the time of redemption or the original purchase cost of the shares being redeemed. Proceeds from CDSCs are used to compensate the Distributor for providing distribution-related services in connection with the sale of these shares. During the six months ended April 30, 2018, CDSCs received by the Distributor amounted to $106 for Class C shares.
Transfer agent fees. The John Hancock Group of Funds has a complex-wide transfer agent agreement with John Hancock Signature Services, Inc. (Signature Services), an affiliate of the Advisor. The transfer agent fees paid to Signature Services are determined based on the cost to Signature Services (Signature Services Cost) of providing recordkeeping services. It also includes out-of-pocket expenses, including payments made to third-parties for recordkeeping services provided to their clients who invest in one or more John Hancock funds. In addition, Signature Services Cost may be reduced by certain fees that Signature Services receives in connection with retirement and small accounts. Signature Services Cost is calculated monthly and allocated, as applicable, to five categories of share classes: Retail Share and Institutional Share Classes of Non-Municipal Bond Funds, Class R6 Shares, Retirement Share Classes and Municipal Bond Share Classes. Within each of these categories, the applicable costs are allocated to the affected John Hancock affiliated funds and/or classes, based on the relative average daily net assets.
Class level expenses. Class level expenses for the six months ended April 30, 2018 were:
| Class | Distribution and service fees | Transfer agent fees |
| Class A | $5,978 | $2,161 |
| Class C | 2,870 | 310 |
| Class I | — | 899 |
| Class R6 | — | 28 |
| Total | $8,848 | $3,398 |
Trustee expenses. The fund compensates each Trustee who is not an employee of the Advisor or its affiliates. The costs of paying Trustee compensation and expenses are allocated to the fund based on its net assets relative to other funds within the John Hancock group of funds complex.
Interfund lending program. Pursuant to an Exemptive Order issued by the SEC, the fund, along with certain other funds advised by the Advisor or its affiliates, may participate in an interfund lending program. This program provides an alternative credit facility allowing the funds to borrow from, or lend money to, other participating affiliated funds. At period end, no
interfund loans were outstanding. The fund's activity in this program during the period for which loans were outstanding was as follows:
| Borrower or lender | Weighted average loan balance | Days outstanding | Weighted average interest rate | Interest income |
| Lender | $4,054,210 | 4 | 1.48% | $667 |
Note 5 — Fund share transactions
Transactions in fund shares for the six months ended April 30, 2018 and for the year ended October 31, 2017 were as follows:
| Six months ended 4-30-18 | Year ended 10-31-17 | |||||||||||||||||||||||||
| Shares | Amount | Shares | Amount | |||||||||||||||||||||||
| Class A shares | ||||||||||||||||||||||||||
| Sold | 73,368 | $912,424 | 272,255 | $3,165,191 | ||||||||||||||||||||||
| Distributions reinvested | 16,086 | 197,051 | 1,361 | 15,206 | ||||||||||||||||||||||
| Repurchased | (50,035 | ) | (626,477 | ) | (62,154 | ) | (723,892 | ) | ||||||||||||||||||
| Net increase | 39,419 | $482,998 | 211,462 | $2,456,505 | ||||||||||||||||||||||
| Class C shares | ||||||||||||||||||||||||||
| Sold | 11,938 | $148,149 | 29,052 | $333,859 | ||||||||||||||||||||||
| Distributions reinvested | 2,325 | 28,457 | 90 | 1,003 | ||||||||||||||||||||||
| Repurchased | (16,817 | ) | (209,646 | ) | (7,154 | ) | (81,777 | ) | ||||||||||||||||||
| Net increase (decrease) | (2,554 | ) | ($33,040 | ) | 21,988 | $253,085 | ||||||||||||||||||||
| Class I shares | ||||||||||||||||||||||||||
| Sold | 22,526 | $280,283 | 83,820 | $974,855 | ||||||||||||||||||||||
| Distributions reinvested | 7,139 | 87,376 | 1,189 | 13,269 | ||||||||||||||||||||||
| Repurchased | (8,419 | ) | (105,896 | ) | (58,832 | ) | (715,810 | ) | ||||||||||||||||||
| Net increase | 21,246 | $261,763 | 26,177 | $272,314 | ||||||||||||||||||||||
| Class R6 shares | ||||||||||||||||||||||||||
| Sold | 11,242 | $139,791 | 27,037 | $338,584 | ||||||||||||||||||||||
| Distributions reinvested | 1,522 | 18,650 | — | — | ||||||||||||||||||||||
| Repurchased | (8,699 | ) | (110,857 | ) | (1,459 | ) | (18,316 | ) | ||||||||||||||||||
| Net increase | 4,065 | $47,584 | 25,578 | $320,268 | ||||||||||||||||||||||
| Class NAV shares | ||||||||||||||||||||||||||
| Sold | 1,181,785 | $14,494,584 | 18,040,855 | $196,399,896 | ||||||||||||||||||||||
| Distributions reinvested | 2,797,584 | 34,298,380 | 773,211 | 8,636,767 | ||||||||||||||||||||||
| Repurchased | (3,069,456 | ) | (38,780,214 | ) | (8,462,577 | ) | (99,870,126 | ) | ||||||||||||||||||
| Net increase | 909,913 | $10,012,750 | 10,351,489 | $105,166,537 | ||||||||||||||||||||||
| Total net increase | 972,089 | $10,772,055 | 10,636,694 | $108,468,709 | ||||||||||||||||||||||
Affiliates of the fund owned 10% and 100% of shares of Class R6 and Class NAV, respectively, on April 30, 2018. Such concentration of shareholders' capital could have a material effect on the fund if such shareholders redeem from the fund.
Note 6 — Purchase and sale of securities
Purchases and sales of securities, other than short-term investments, amounted to $70,605,841 and $109,242,941, respectively, for the six months ended April 30, 2018.
Note 7 — Industry or sector risk
The fund may invest a large percentage of its assets in one or more particular industries or sectors of the economy. If a large percentage of the fund's assets are economically tied to a single or small number of industries or sectors of the economy, the fund will be less diversified than a more broadly diversified fund, and it may cause the fund to underperform if that industry or sector underperforms. In addition, focusing on a particular industry or sector may make the fund's NAV more volatile. Further, a fund that invests in particular industries or sectors is particularly susceptible to the impact of market, economic, regulatory and other factors affecting those industries or sectors.
Note 8 — Investment by affiliated funds
Certain investors in the fund are affiliated funds that are managed by the Advisor and its affiliates. The affiliated funds do not invest in the fund for the purpose of exercising management or control; however, this investment may represent a significant portion of the fund's net assets. At April 30, 2018, funds within the John Hancock group of funds complex held 98.9% of the fund's net assets. The following funds had an affiliate ownership of 5% or more of the fund's net assets:
| Fund | Affiliate concentration |
| John Hancock Funds II Multimanager Lifestyle Growth Portfolio | 38.6% |
| John Hancock Funds II Multimanager Lifestyle Balanced Portfolio | 27.2% |
| John Hancock Funds II Multimanager Lifestyle Aggressive Portfolio | 15.9% |
Trustees Hassell H. McClellan, Chairperson Officers Andrew G. Arnott John J. Danello Francis V. Knox, Jr. Charles A. Rizzo Salvatore Schiavone | Investment advisor John Hancock Advisers, LLC Subadvisor Barrow, Hanley, Mewhinney & Strauss, LLC Principal distributor John Hancock Funds, LLC Custodian State Street Bank and Trust Company Transfer agent John Hancock Signature Services, Inc. Legal counsel K&L Gates LLP |
*Member of the Audit Committee
†Non-Independent Trustee
#Effective 6-20-17
The fund's proxy voting policies and procedures, as well as the fund proxy voting record for the most recent twelve-month period ended June 30, are available free of charge on the Securities and Exchange Commission (SEC) website at sec.gov or on our website.
The fund's complete list of portfolio holdings, for the first and third fiscal quarters, is filed with the SEC on Form N-Q. The fund's Form N-Q is available on our website and the SEC's website, sec.gov, and can be reviewed and copied (for a fee) at the SEC's Public Reference Room in Washington, DC. Call 800-SEC-0330 to receive information on the operation of the SEC's Public Reference Room.
We make this information on your fund, as well as monthly portfolio holdings, and other fund details available on our website at jhinvestments.com or by calling 800-225-5291.
| You can also contact us: | |||
| 800-225-5291 jhinvestments.com | Regular mail: John Hancock Signature Services, Inc. | Express mail: John Hancock Signature Services, Inc. | |
John Hancock family of funds
DOMESTIC EQUITY FUNDS Balanced Blue Chip Growth Classic Value Disciplined Value Disciplined Value Mid Cap Equity Income Fundamental All Cap Core Fundamental Large Cap Core Fundamental Large Cap Value New Opportunities Small Cap Core Small Cap Growth Small Cap Value Strategic Growth U.S. Global Leaders Growth U.S. Growth Value Equity GLOBAL AND INTERNATIONAL EQUITY FUNDS Disciplined Value International Emerging Markets Emerging Markets Equity Fundamental Global Franchise Global Equity Global Shareholder Yield Greater China Opportunities International Growth International Small Company International Value Equity | INCOME FUNDS Bond California Tax-Free Income Emerging Markets Debt Floating Rate Income Global Income Government Income High Yield High Yield Municipal Bond Income Investment Grade Bond Money Market Short Duration Credit Opportunities Spectrum Income Strategic Income Opportunities Tax-Free Bond ALTERNATIVE AND SPECIALTY FUNDS Absolute Return Currency Alternative Asset Allocation Enduring Assets Financial Industries Global Absolute Return Strategies Global Conservative Absolute Return Global Focused Strategies Natural Resources Redwood Regional Bank Seaport Long/Short Technical Opportunities |
A fund's investment objectives, risks, charges, and expenses should be considered carefully before investing. The prospectus contains this and other important information about the fund. To obtain a prospectus, contact your financial professional, call John Hancock Investments at 800-225-5291, or visit our website at jhinvestments.com. Please read the prospectus carefully before investing or sending money.
ASSET ALLOCATION Income Allocation Multi-Index Lifetime Portfolios Multi-Index Preservation Portfolios Multimanager Lifestyle Portfolios Multimanager Lifetime Portfolios Retirement Income 2040 EXCHANGE-TRADED FUNDS John Hancock Multifactor Consumer Discretionary ETF John Hancock Multifactor Consumer Staples ETF John Hancock Multifactor Developed International ETF John Hancock Multifactor Energy ETF John Hancock Multifactor Financials ETF John Hancock Multifactor Healthcare ETF John Hancock Multifactor Industrials ETF John Hancock Multifactor Large Cap ETF John Hancock Multifactor Materials ETF John Hancock Multifactor Mid Cap ETF John Hancock Multifactor Small Cap ETF John Hancock Multifactor Technology ETF John Hancock Multifactor Utilities ETF | ENVIRONMENTAL, SOCIAL, AND GOVERNANCE FUNDS ESG All Cap Core ESG Core Bond ESG International Equity ESG Large Cap Core CLOSED-END FUNDS Financial Opportunities Hedged Equity & Income Income Securities Trust Investors Trust Preferred Income Preferred Income II Preferred Income III Premium Dividend Tax-Advantaged Dividend Income Tax-Advantaged Global Shareholder Yield |
John Hancock Multifactor ETF shares are bought and sold at market price (not NAV), and are not individually redeemed
from the fund. Brokerage commissions will reduce returns.
John Hancock ETFs are distributed by Foreside Fund Services, LLC, and are subadvised by Dimensional Fund Advisors LP.
Foreside is not affiliated with John Hancock Funds, LLC or Dimensional Fund Advisors LP.
Dimensional Fund Advisors LP receives compensation from John Hancock in connection with licensing rights to the
John Hancock Dimensional indexes. Dimensional Fund Advisors LP does not sponsor, endorse, or sell, and makes no
representation as to the advisability of investing in, John Hancock Multifactor ETFs.
John Hancock Investments
A trusted brand
John Hancock Investments is a premier asset manager representing one of
America's most trusted brands, with a heritage of financial stewardship dating
back to 1862. Helping our shareholders pursue their financial goals is at the
core of everything we do. It's why we support the role of professional financial
advice and operate with the highest standards of conduct and integrity.
A better way to invest
We serve investors globally through a unique multimanager approach:
We search the world to find proven portfolio teams with specialized
expertise for every strategy we offer, then we apply robust investment
oversight to ensure they continue to meet our uncompromising standards
and serve the best interests of our shareholders.
Results for investors
Our unique approach to asset management enables us to provide a diverse set
of investments backed by some of the world's best managers, along with strong
risk-adjusted returns across asset classes.
| | John Hancock Funds, LLC n Member FINRA, SIPC 601 Congress Street n Boston, MA 02210-2805 800-225-5291 n jhinvestments.com | |
| This report is for the information of the shareholders of John Hancock Value Equity Fund. It is not authorized for distribution to prospective investors unless preceded or accompanied by a prospectus. | ||
| MF450503 | 454SA 4/18 6/18 | |
John Hancock
Emerging Markets Equity Fund
Semiannual report 4/30/18
A message to shareholders
Dear shareholder,
Financial markets around the world experienced a meaningful rise in volatility in the last half of the reporting period. Stocks in developed international markets hit a rough patch after macroeconomic data began to suggest that the growth many investors were hoping for may not be as robust as early indications had suggested, but advanced for the period nonetheless. Many emerging markets advanced overall, thanks in large part to a weaker U.S. dollar and continued economic improvement in developing markets.
One of the challenges investors will face in the coming months is navigating the continued normalization of monetary policy. Stronger economies will continue to prompt global central banks to dial back the stimulus they had injected into the financial system in the years following the financial crisis, and this less-accommodative stance may represent an adjustment for many markets.
Your best resource in unpredictable markets is your financial advisor, who can help position your portfolio so that it's sufficiently diversified to meet your long-term objectives and to withstand the inevitable turbulence along the way.
On behalf of everyone at John Hancock Investments, I'd like to take this opportunity to welcome new shareholders and to thank existing shareholders for the continued trust you've placed in us.
Sincerely,
Andrew G. Arnott
President and CEO,
John Hancock Investments
Head of Wealth and Asset Management,
United States and Europe
This commentary reflects the CEO's views, which are subject to change at any time. Investing involves risks, including the potential loss of principal. Diversification does not guarantee a profit or eliminate the risk of a loss. It is not possible to invest directly into an index. For more up-to-date information, please visit our website at jhinvestments.com.
John Hancock
Emerging Markets Equity Fund
INVESTMENT OBJECTIVE
The fund seeks long-term capital growth.
AVERAGE ANNUAL TOTAL RETURNS AS OF 4/30/18 (%)
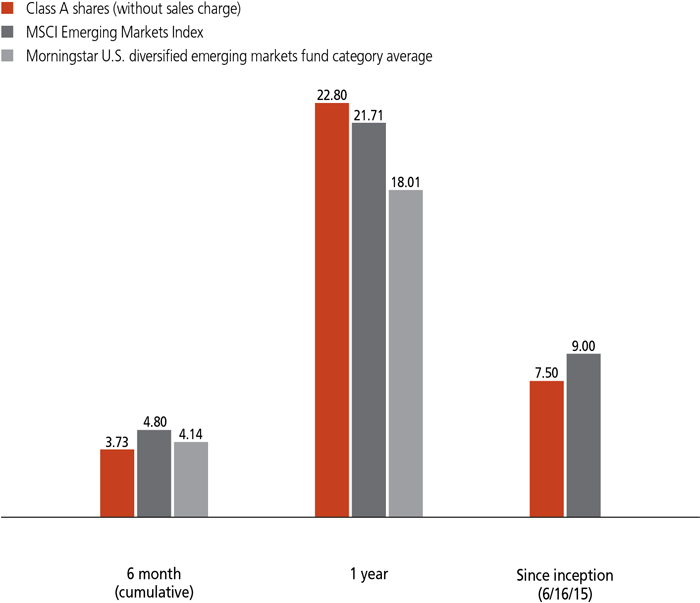
The MSCI Emerging Markets Index is an unmanaged index designed to measure the performance of developing markets.
It is not possible to invest directly in an index. Index figures do not reflect expenses or sales charges, which would result in lower returns.
Figures from Morningstar, Inc. include reinvested distributions and do not take into account sales charges. Actual load-adjusted performance is lower. Since inception returns for the Morningstar fund category average are not available.
The past performance shown here reflects reinvested distributions and the beneficial effect of any expense reductions, and does not guarantee future results. Returns for periods shorter than one year are cumulative. Performance of the other share classes will vary based on the difference in the fees and expenses of those classes. Shares will fluctuate in value and, when redeemed, may be worth more or less than their original cost. Current month-end performance may be lower or higher than the performance cited, and can be found at jhinvestments.com or by calling 800-225-5291. For further information on the fund's objectives, risks, and strategy, see the fund's prospectus.
PERFORMANCE HIGHLIGHTS OVER THE LAST SIX MONTHS
Volatile market conditions
Emerging-market stocks began the period in strong fashion, but volatility grew in the second half of the period, weighing on the asset class.
Sources of relative underperformance
The fund trailed the benchmark, the MSCI Emerging Markets Index, due primarily to stock picking in the information technology, energy, and industrial sectors.
Positive influences on results
The fund benefited from good stock picking in consumer discretionary, as well as an overweighting in the financials area.
PORTFOLIO COMPOSITION AS OF 4/30/18 (%)
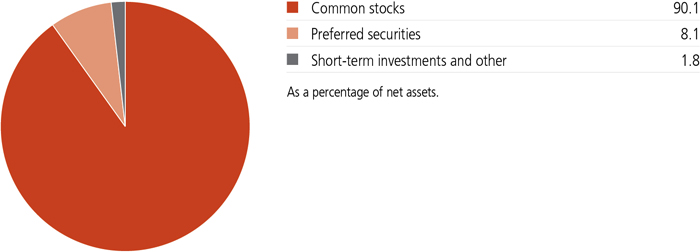
A note about risks
The stock prices of midsize and small companies can change more frequently and dramatically than those of large companies. Larger, more established companies may be slow to respond to challenges and may grow more slowly than smaller companies. Foreign investing, especially in emerging markets, has additional risks, such as currency and market volatility and political and social instability. Investments in foreign securities listed and traded on a foreign stock exchange are subject to additional risks that may affect the performance of the fund. The value of a company's equity securities is subject to changes in the company's financial condition and overall market and economic conditions. Events in the U.S. and global financial markets have resulted, and may continue to result, in an unusually high degree of volatility. Preferred stock may be subject to redemption provisions and dividends are payable only if declared by the issuer's Board. Investments in certain foreign markets or security types may restrict or otherwise affect the fund's ability to implement its investment strategy. Please see the fund's prospectus for additional risks.
An interview with Portfolio Manager Kathryn Langridge, John Hancock Asset Management a division of Manulife Asset Management (US) LLC

Kathryn Langridge
Portfolio Manager
John Hancock Asset Management
How did the fund perform for the six months ended April 30, 2018, and what backdrop did emerging-market stocks encounter during that time?
The fund's Class A shares gained 3.73% (excluding sales charges). This result trailed the benchmark, the MSCI Emerging Markets Index, which returned 4.80% for the same timeframe.
Emerging-market stocks began the period on an upswing, rallying from the start of the period through January of the new year. The strength reflected better margins and profitability for companies, as well as improved business confidence. As the global economic recovery broadened, business conditions for emerging-market companies continued to improve.
By February, however, market volatility grew. U.S. Treasury yields began to trend higher and the U.S. dollar began to appreciate in value, leading emerging-market stocks to struggle over the remaining three months of the period. This weakness also partly reflected investors' concerns about the introduction of import tariffs and other divisive trade policies from the Trump administration.
Compared to the benchmark, the fund was most hurt by security selection in the information technology, energy, and industrial sectors. On the positive side, stock picking in the consumer discretionary area added value, as did an overweighting in the strong-performing financials sector.
Given this environment, how did you manage the fund?
In all types of market and economic conditions, our management approach remains consistent. This approach entails buying and selling stocks grounded in individual company fundamentals. We base investment decisions on our belief that well-run businesses in emerging markets can generate and sustain superior growth and returns. Ultimately, we are searching for high-return, best-in-class companies offering the potential for sustainable quality growth at a reasonable price.
Which individual stocks hampered the fund's results?
Several big relative detractors came from the information technology sector, including NAVER Corp., a leading Korean search engine company, whose shares declined seemingly due to investors' short-term profit taking. As of period end, we saw this share-price drop as a temporary setback for an otherwise fundamentally solid business. We had a similar view of Taiwan Semiconductor
Also detracting was LandMark Optoelectronics Corp., a Taiwanese manufacturer of communication components. Its stock was hurt when two of the firm's Chinese customers became affected by U.S. sanctions relating to Iran, resulting in a loss of business. Although we agree this diplomatic situation could hurt LandMark in the short term, we also expect the company's equipment sales to other manufacturers to ultimately fill this void.
Looking at other sectors, notable detractors from the fund's relative performance included Kroton Educacional SA and Cemex SAB de CV. Kroton, Brazil's largest provider of private education for schools and colleges, saw its shares lag after the Brazilian government ruled late last year that the company could not acquire its largest competitor. We exited the position soon after.
Meanwhile, shares of Cemex, a Mexican building materials company, appear to have been hurt by poor investor sentiment surrounding Mexico, as the country's looming presidential election and potential trade challenges weighed on the company's stock price. As of period end, we continued to see good potential with Cemex. The company is generating solid free cash flow that is being channeled into reducing debt, and we believe that as Cemex continues to rebuild its balance sheet, its cost of capital should fall, and earnings should benefit.
Which stocks contributed to the fund's results?
Strong security selection in the financials sector was partly driven by a position in Ping An Insurance Group Company of China, Ltd. Ping An, a leading Chinese life insurer, produced good financial results that, combined with an improving business environment, resulted in a rising stock price for the period. Ping An further benefited from increased clarity about China's regulatory requirements
SECTOR COMPOSITION AS OF 4/30/18 (%)
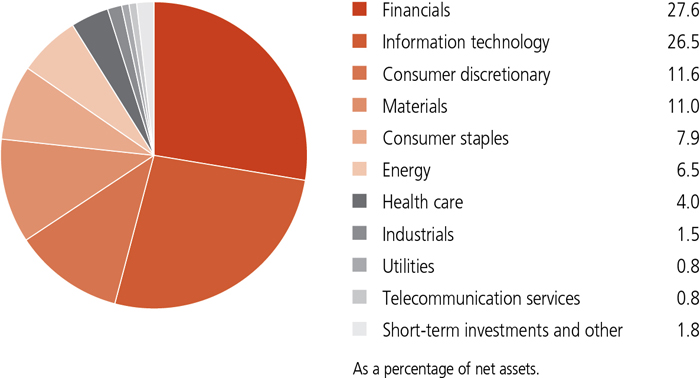
Meanwhile, in healthcare, the fund benefited from an investment in Wuxi Biologics Cayman, Inc., a Chinese biotechnology manufacturing and services company. Wuxi continued to produce strong financial results and benefit from its favorable competitive position. We see the company as well situated to participate in the potential future revenue streams of a growing number of pharmaceutical clients with drugs close to commercialization.
Several materials stocks also made strong contributions to the fund's results, reflecting an environment of rising commodity prices and solid demand for raw materials amid global economic growth. Specifically, investments in Rio Tinto PLC and Vale SA, both iron-ore mining stocks based in the U.K. and Brazil, respectively, added value. In similar fashion, CNOOC, Ltd., China's leading offshore oil exploration and production company, responded well to continuing oil-price strength.
How were you positioning the fund as of the end of the reporting period?
In terms of the fund's country positioning, our view of China remains constructive. We see it as an under-owned market and likely beneficiary of several trends, including continued growth in businesses focused on the internet or other cutting-edge technologies, middle-class consumption, industrial restructuring, and capital market reform. Another area of opportunity, in our view, is Brazil, where we see leading materials stocks beginning to benefit from global economic growth, a strong and emerging service sector, and a recovering Brazilian consumer after a severe economic recession. As of period end, we have a less favorable view of Taiwan, where we are pursuing select investment opportunities among technology hardware companies.
On a sector basis, we continue to emphasize financial stocks at period end, particularly those we see as able to benefit from the trends of consolidation and rising loan growth in select banking markets, as well as from the development of insurance and savings products. We also see opportunity in the
TOP 10 HOLDINGS AS OF 4/30/18 (%)
| Samsung Electronics Company, Ltd. | 5.4 |
| Alibaba Group Holding, Ltd., ADR | 3.8 |
| Naspers, Ltd., N Shares | 3.6 |
| Ping An Insurance Group Company of China, Ltd., H Shares | 3.3 |
| AIA Group, Ltd. | 3.2 |
| Baidu, Inc., ADR | 3.2 |
| Taiwan Semiconductor Manufacturing Company, Ltd., ADR | 2.8 |
| China Construction Bank Corp., H Shares | 2.8 |
| Sberbank of Russia PJSC, ADR | 2.7 |
| Rio Tinto PLC | 2.6 |
| TOTAL | 33.4 |
| As a percentage of net assets. | |
| Cash and cash equivalents are not included. | |
In contrast, we are generally unenthusiastic about telecommunication stocks, due to challenging local regulatory environments and generally extended valuations. We are also selective on many industrial stocks, which appear to be hampered by slow growth and excess capacity undermining the companies' profitability.
Can you tell us about a recent manager addition?
Effective March 1, 2018, Philip Ehrmann was added to the fund. He has been focusing on the emerging markets since 1990.
MANAGED BY
| | Kathryn Langridge On the fund since inception Investing since 1985 |
 | Philip Ehrmann On the fund since 2018 Investing since 1981 |
![]()
TOP 10 COUNTRIES AS OF 4/30/18 (%)
| China | 29.1 |
| South Korea | 12.1 |
| Brazil | 10.0 |
| India | 8.6 |
| Taiwan | 7.0 |
| Hong Kong | 5.1 |
| South Africa | 5.0 |
| Russia | 4.2 |
| Mexico | 3.5 |
| United Kingdom | 2.6 |
| TOTAL | 87.2 |
| As a percentage of net assets. | |
| Cash and cash equivalents are not included. |
TOTAL RETURNS FOR THE PERIOD ENDED APRIL 30, 2018
| Average annual total returns (%) with maximum sales charge | Cumulative total returns (%) with maximum sales charge | ||||||
| 1-year | Since inception1 | 6-month | Since inception1 | ||||
| Class A | 16.62 | 5.59 | -1.43 | 16.93 | |||
| Class C | 21.06 | 6.77 | 2.36 | 20.72 | |||
| Class I2 | 23.21 | 7.79 | 3.92 | 24.09 | |||
| Class R22 | 23.09 | 7.61 | 3.78 | 23.48 | |||
| Class R42 | 23.16 | 7.72 | 3.87 | 23.84 | |||
| Class R62 | 23.44 | 7.90 | 3.92 | 24.45 | |||
| Class NAV2 | 23.45 | 7.89 | 3.93 | 24.42 | |||
| Index† | 21.71 | 9.00 | 4.80 | 28.15 | |||
Performance figures assume all distributions are reinvested. Figures reflect maximum sales charges on Class A shares of 5% and the applicable contingent deferred sales charge (CDSC) on Class C shares. Class C shares sold within one year of purchase are subject to a 1% CDSC. Sales charges are not applicable to Class I, Class R2, Class R4, Class R6, and Class NAV shares.
The expense ratios of the fund, both net (including any fee waivers and/or expense limitations) and gross (excluding any fee waivers and/or expense limitations), are set forth according to the most recent publicly available prospectuses for the fund and may differ from those disclosed in the Financial highlights tables in this report. Net expenses reflect contractual expense limitations in effect until February 28, 2019 and are subject to change. Had the contractual fee waivers and expense limitations not been in place, gross expenses would apply. The expense ratios are as follows:
| Class A | Class C | Class I | Class R2 | Class R4 | Class R6 | Class NAV | |
| Gross (%) | 1.51 | 2.21 | 1.20 | 1.61 | 1.46 | 1.11 | 1.10 |
| Net (%) | 1.50 | 2.20 | 1.20 | 1.60 | 1.35 | 1.11 | 1.10 |
Please refer to the most recent prospectus and annual or semiannual report for more information on expenses and any expense limitation arrangements for each class.
The returns reflect past results and should not be considered indicative of future performance. The return and principal value of an investment will fluctuate so that shares, when redeemed, may be worth more or less than their original cost. Due to market volatility and other factors, the fund's current performance may be higher or lower than the performance shown. For current to the most recent month-end performance data, please call 800-225-5291 or visit the fund's website at jhinvestments.com.
The performance table above and the chart on the next page do not reflect the deduction of taxes that a shareholder would pay on fund distributions or the redemption of fund shares. The fund's performance results reflect any applicable fee waivers or expense reductions, without which the expenses would increase and results would have been less favorable.
| † | Index is the MSCI Emerging Markets Index. |
See the following page for footnotes.
This chart and table show what happened to a hypothetical $10,000 investment in John Hancock Emerging Markets Equity Fund for the share classes and periods indicated, assuming all distributions were reinvested. For comparison, we've shown the same investment in the MSCI Emerging Markets Index.
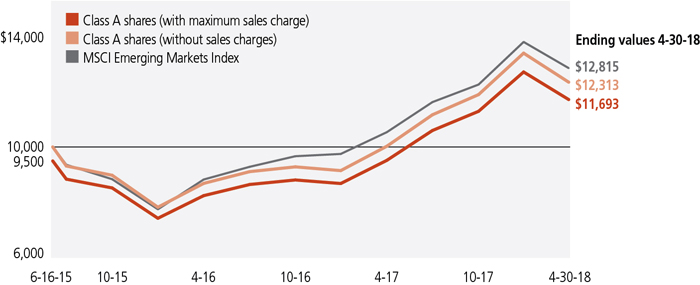
| Start date | With maximum sales charge ($) | Without sales charge ($) | Index ($) | |
| Class C3 | 6-16-15 | 12,072 | 12,072 | 12,815 |
| Class I2 | 6-16-15 | 12,409 | 12,409 | 12,815 |
| Class R22 | 6-16-15 | 12,348 | 12,348 | 12,815 |
| Class R42 | 6-16-15 | 12,384 | 12,384 | 12,815 |
| Class R62 | 6-16-15 | 12,445 | 12,445 | 12,815 |
| Class NAV2 | 6-16-15 | 12,442 | 12,442 | 12,815 |
The MSCI Emerging Markets Index is an unmanaged index designed to measure the performance of developing markets.
It is not possible to invest directly in an index. Index figures do not reflect expenses or sales charges, which would result in lower returns.
Footnotes related to performance pages
| 1 | From 6-16-15. |
| 2 | For certain types of investors, as described in the fund's prospectuses. |
| 3 | The contingent deferred sales charge is not applicable. |
These examples are intended to help you understand your ongoing operating expenses of investing in the fund so you can compare these costs with the ongoing costs of investing in other mutual funds.
Understanding fund expenses
As a shareholder of the fund, you incur two types of costs:
| • | Transaction costs, which include sales charges (loads) on purchases or redemptions (varies by share class), minimum account fee charge, etc. |
| • | Ongoing operating expenses, including management fees, distribution and service fees (if applicable), and other fund expenses. |
We are presenting only your ongoing operating expenses here.
Actual expenses/actual returns
The first line of each share class in the table on the following page is intended to provide information about the fund's actual ongoing operating expenses, and is based on the fund's actual return. It assumes an account value of $1,000.00 on November 1, 2017, with the same investment held until April 30, 2018.
Together with the value of your account, you may use this information to estimate the operating expenses that you paid over the period. Simply divide your account value at April 30, 2018, by $1,000.00, then multiply it by the "expenses paid" for your share class from the table. For example, for an account value of $8,600.00, the operating expenses should be calculated as follows:
Hypothetical example for comparison purposes
The second line of each share class in the table on the following page allows you to compare the fund's ongoing operating expenses with those of any other fund. It provides an example of the fund's hypothetical account values and hypothetical expenses based on each class's actual expense ratio and an assumed 5% annualized return before expenses (which is not the fund's actual return). It assumes an account value of $1,000.00 on November 1, 2017, with the same investment held until April 30, 2018. Look in any other fund shareholder report to find its hypothetical example and you will be able to compare these expenses. Please remember that these hypothetical account values and expenses may not be used to estimate the actual ending account balance or expenses you paid for the period.
Remember, these examples do not include any transaction costs, therefore, these examples will not help you to determine the relative total costs of owning different funds. If transaction costs were included, your expenses would have been higher. See the prospectuses for details regarding transaction costs.
SHAREHOLDER EXPENSE EXAMPLE CHART
| Account value on 11-1-2017 | Ending value on 4-30-2018 | Expenses paid during period ended 4-30-20181 | Annualized expense ratio | ||
| Class A | Actual expenses/actual returns | $1,000.00 | $1,037.30 | $7.27 | 1.44% |
| Hypothetical example for comparison purposes | 1,000.00 | 1,017.70 | 7.20 | 1.44% | |
| Class C | Actual expenses/actual returns | 1,000.00 | 1,033.60 | 10.79 | 2.14% |
| Hypothetical example for comparison purposes | 1,000.00 | 1,014.20 | 10.69 | 2.14% | |
| Class I | Actual expenses/actual returns | 1,000.00 | 1,039.20 | 5.71 | 1.14% |
| Hypothetical example for comparison purposes | 1,000.00 | 1,019.20 | 5.66 | 1.14% | |
| Class R2 | Actual expenses/actual returns | 1,000.00 | 1,037.80 | 6.47 | 1.29% |
| Hypothetical example for comparison purposes | 1,000.00 | 1,018.40 | 6.41 | 1.29% | |
| Class R4 | Actual expenses/actual returns | 1,000.00 | 1,038.70 | 6.02 | 1.20% |
| Hypothetical example for comparison purposes | 1,000.00 | 1,018.90 | 5.96 | 1.20% | |
| Class R6 | Actual expenses/actual returns | 1,000.00 | 1,039.20 | 5.36 | 1.04% |
| Hypothetical example for comparison purposes | 1,000.00 | 1,019.50 | 5.31 | 1.04% | |
| Class NAV | Actual expenses/actual returns | 1,000.00 | 1,039.30 | 5.21 | 1.03% |
| Hypothetical example for comparison purposes | 1,000.00 | 1,019.70 | 5.16 | 1.03% | |
| 1 | Expenses are equal to the annualized expense ratio, multiplied by the average account value over the period, multiplied by 181/365 (to reflect the one-half year period). |
| Fund’s investments |
| Shares | Value | ||||
| Common stocks 90.1% | $952,178,287 | ||||
| (Cost $772,892,570) | |||||
| Argentina 2.4% | 25,612,075 | ||||
| Grupo Supervielle SA, ADR | 169,212 | 4,727,783 | |||
| Loma Negra Cia Industrial Argentina SA, ADR (A) | 258,506 | 5,361,414 | |||
| YPF SA, ADR | 709,131 | 15,522,878 | |||
| Brazil 7.3% | 76,887,500 | ||||
| Ambev SA, ADR | 2,100,132 | 13,902,874 | |||
| B3 SA - Brasil Bolsa Balcao | 1,397,000 | 10,089,090 | |||
| Cielo SA | 1,428,600 | 7,829,733 | |||
| Klabin SA | 2,286,600 | 13,857,193 | |||
| Odontoprev SA | 2,845,800 | 12,209,515 | |||
| Vale SA, ADR | 1,372,767 | 18,999,095 | |||
| China 29.1% | 307,723,312 | ||||
| 3SBio, Inc. (A)(B) | 5,094,000 | 10,945,310 | |||
| Alibaba Group Holding, Ltd., ADR (A) | 222,398 | 39,706,939 | |||
| Baidu, Inc., ADR (A) | 132,770 | 33,311,993 | |||
| Bank of China, Ltd., H Shares | 37,784,000 | 20,510,336 | |||
| Beijing Capital International Airport Company, Ltd., H Shares | 4,752,000 | 6,472,097 | |||
| China Construction Bank Corp., H Shares | 27,774,000 | 29,097,683 | |||
| CNOOC, Ltd. | 15,168,000 | 25,659,914 | |||
| Ctrip.com International, Ltd., ADR (A) | 291,008 | 11,902,227 | |||
| Dali Foods Group Company, Ltd. (B) | 14,887,500 | 10,305,946 | |||
| iQIYI, Inc., ADR (A) | 200,100 | 3,607,803 | |||
| Kweichow Moutai Company, Ltd., Class A | 85,706 | 8,927,592 | |||
| PetroChina Company, Ltd., H Shares | 14,872,000 | 10,958,720 | |||
| Ping An Insurance Group Company of China, Ltd., H Shares | 3,548,000 | 34,668,926 | |||
| Qingdao Haier Company, Ltd., Class A | 3,008,604 | 8,112,147 | |||
| Sinopharm Group Company, Ltd., H Shares | 2,572,000 | 10,845,409 | |||
| Tencent Holdings, Ltd. | 326,200 | 16,036,947 | |||
| Wuxi Biologics Cayman, Inc. (A)(B) | 894,000 | 8,109,423 | |||
| Yum China Holdings, Inc. | 433,674 | 18,543,900 | |||
| Czech Republic 1.2% | 13,129,711 | ||||
| Komercni banka AS | 304,321 | 13,129,711 | |||
| Greece 0.5% | 5,543,474 | ||||
| Alpha Bank AE (A) | 2,098,366 | 5,543,474 | |||
| Hong Kong 5.1% | 54,066,227 | ||||
| AIA Group, Ltd. | 3,789,200 | 33,864,839 | |||
| Nine Dragons Paper Holdings, Ltd. | 7,121,000 | 10,620,681 | |||
| Pacific Basin Shipping, Ltd. (A) | 36,032,000 | 9,580,707 |
| 12 | JOHN HANCOCK EMERGING MARKETS EQUITY FUND | SEMIANNUAL REPORT | SEE NOTES TO FINANCIAL STATEMENTS |
| Shares | Value | ||||
| India 8.6% | $90,608,187 | ||||
| HDFC Bank, Ltd. | 415,011 | 12,456,650 | |||
| Housing Development Finance Corp., Ltd. | 582,745 | 16,386,199 | |||
| ICICI Bank, Ltd. | 2,436,840 | 10,384,171 | |||
| IndusInd Bank, Ltd. | 236,653 | 6,699,659 | |||
| ITC, Ltd. | 3,607,708 | 15,218,512 | |||
| Reliance Industries, Ltd. | 1,157,406 | 16,636,922 | |||
| UltraTech Cement, Ltd. | 209,351 | 12,826,074 | |||
| Indonesia 2.3% | 24,020,281 | ||||
| Astra International Tbk PT | 21,602,100 | 11,056,537 | |||
| Matahari Department Store Tbk PT | 6,644,400 | 4,919,674 | |||
| Telekomunikasi Indonesia Persero Tbk PT | 29,479,000 | 8,044,070 | |||
| Macau 1.6% | 16,822,624 | ||||
| Sands China, Ltd. | 2,910,800 | 16,822,624 | |||
| Mexico 3.5% | 37,230,851 | ||||
| Cemex SAB de CV (A) | 18,542,200 | 11,570,254 | |||
| Fomento Economico Mexicano SAB de CV | 1,497,800 | 14,491,829 | |||
| Grupo Financiero Banorte SAB de CV, Series O | 1,785,900 | 11,168,768 | |||
| Peru 1.7% | 17,528,351 | ||||
| Credicorp, Ltd. | 75,394 | 17,528,351 | |||
| Russia 4.2% | 44,199,379 | ||||
| Mail.Ru Group, Ltd., GDR (A) | 345,841 | 10,961,314 | |||
| Sberbank of Russia PJSC, ADR | 1,916,298 | 28,303,721 | |||
| Yandex NV, Class A (A) | 147,912 | 4,934,344 | |||
| South Africa 5.0% | 53,113,059 | ||||
| Mondi PLC | 560,471 | 15,601,980 | |||
| Naspers, Ltd., N Shares | 153,974 | 37,511,079 | |||
| South Korea 6.7% | 70,552,646 | ||||
| Hana Financial Group, Inc. | 377,166 | 16,758,698 | |||
| LG Household & Health Care, Ltd. | 16,528 | 21,104,256 | |||
| NAVER Corp. | 21,307 | 14,208,422 | |||
| SK Hynix, Inc. | 234,999 | 18,481,270 | |||
| Taiwan 7.0% | 74,274,875 | ||||
| ASE Industrial Holding Company, Ltd. | 4,730,000 | 12,837,578 | |||
| Delta Electronics, Inc. | 1,152,000 | 4,176,588 | |||
| LandMark Optoelectronics Corp. | 908,000 | 8,468,734 | |||
| Taiwan Semiconductor Manufacturing Company, Ltd. | 2,529,000 | 19,264,259 | |||
| Taiwan Semiconductor Manufacturing Company, Ltd., ADR | 767,951 | 29,527,716 | |||
| United Kingdom 2.6% | 27,294,409 | ||||
| Rio Tinto PLC | 500,757 | 27,294,409 |
| SEE NOTES TO FINANCIAL STATEMENTS | SEMIANNUAL REPORT | JOHN HANCOCK EMERGING MARKETS EQUITY FUND | 13 |
| Shares | Value | ||||
| United States 1.3% | $13,571,326 | ||||
| Samsonite International SA | 3,008,700 | 13,571,326 | |||
| Preferred securities 8.1% | $85,365,017 | ||||
| (Cost $52,071,878) | |||||
| Brazil 2.7% | 28,898,577 | ||||
| Centrais Eletricas Brasileiras SA, B Shares | 1,318,400 | 8,580,589 | |||
| Itau Unibanco Holding SA | 1,395,373 | 20,317,988 | |||
| South Korea 5.4% | 56,466,440 | ||||
| Samsung Electronics Company, Ltd. | 28,398 | 56,466,440 | |||
| Yield (%) | Shares | Value | |||
| Short-term investments 1.9% | $19,473,305 | ||||
| (Cost $19,473,305) | |||||
| Money market funds 1.9% | 19,473,305 | ||||
| JPMorgan U.S. Treasury Plus Money Market Fund, Institutional Class | 1.5629(C) | 19,473,305 | 19,473,305 | ||
| Total investments (Cost $844,437,753) 100.1% | $1,057,016,609 | ||||
| Other assets and liabilities, net (0.1%) | (706,702) | ||||
| Total net assets 100.0% | $1,056,309,907 | ||||
| The percentage shown for each investment category is the total value of the category as a percentage of the net assets of the fund. | |
| Security Abbreviations and Legend | |
| ADR | American Depositary Receipt |
| GDR | Global Depositary Receipt |
| (A) | Non-income producing security. |
| (B) | These securities are exempt from registration under Rule 144A of the Securities Act of 1933. Such securities may be resold, normally to qualified institutional buyers, in transactions exempt from registration. |
| (C) | The rate shown is the annualized seven-day yield as of 4-30-18. |
| 14 | JOHN HANCOCK EMERGING MARKETS EQUITY FUND | SEMIANNUAL REPORT | SEE NOTES TO FINANCIAL STATEMENTS |
Financial statements
STATEMENT OF ASSETS AND LIABILITIES 4-30-18 (unaudited)
| Assets | ||||||||||||||||||||||
| Investments, at value (Cost $844,437,753) | $1,057,016,609 | |||||||||||||||||||||
| Foreign currency, at value (Cost $288) | 281 | |||||||||||||||||||||
| Receivable for fund shares sold | 57,193 | |||||||||||||||||||||
| Dividends and interest receivable | 1,530,924 | |||||||||||||||||||||
| Other receivables and prepaid expenses | 81,005 | |||||||||||||||||||||
| Total assets | 1,058,686,012 | |||||||||||||||||||||
| Liabilities | ||||||||||||||||||||||
| Foreign capital gains tax payable | 2,065,521 | |||||||||||||||||||||
| Payable to affiliates | ||||||||||||||||||||||
| Accounting and legal services fees | 117,912 | |||||||||||||||||||||
| Transfer agent fees | 443 | |||||||||||||||||||||
| Trustees' fees | 1,688 | |||||||||||||||||||||
| Other liabilities and accrued expenses | 190,541 | |||||||||||||||||||||
| Total liabilities | 2,376,105 | |||||||||||||||||||||
| Net assets | $1,056,309,907 | |||||||||||||||||||||
| Net assets consist of | ||||||||||||||||||||||
| Paid-in capital | $752,721,702 | |||||||||||||||||||||
| Undistributed net investment income | 620,163 | |||||||||||||||||||||
| Accumulated net realized gain (loss) on investments and foreign currency transactions | 92,477,503 | |||||||||||||||||||||
| Net unrealized appreciation (depreciation) on investments and translation of assets and liabilities in foreign currencies | 210,490,539 | |||||||||||||||||||||
| Net assets | $1,056,309,907 | |||||||||||||||||||||
| Net asset value per share | ||||||||||||||||||||||
| Based on net asset value and shares outstanding - The fund has an unlimited number of shares authorized with no par value | ||||||||||||||||||||||
| Class A ($4,202,682 ÷ 346,685 shares)1 | $12.12 | |||||||||||||||||||||
| Class C ($280,572 ÷ 23,502 shares)1 | $11.94 | |||||||||||||||||||||
| Class I ($100,668 ÷ 8,293 shares) | $12.14 | |||||||||||||||||||||
| Class R2 ($65,025 ÷ 5,364 shares) | $12.12 | |||||||||||||||||||||
| Class R4 ($62,615 ÷ 5,162 shares) | $12.13 | |||||||||||||||||||||
| Class R6 ($609,430 ÷ 50,200 shares) | $12.14 | |||||||||||||||||||||
| Class NAV ($1,050,988,915 ÷ 86,583,068 shares) | $12.14 | |||||||||||||||||||||
| Maximum offering price per share | ||||||||||||||||||||||
| Class A (net assets value per share ÷ 95%)2 | $12.76 | |||||||||||||||||||||
| 1 | Redemption price per share is equal to net asset value less any applicable contingent deferred sales charge. | |||||||||||||||||||
| 2 | On single retail sales of less than $50,000. On sales of $50,000 or more and on group sales the offering price is reduced. | |||||||||||||||||||
STATEMENT OF OPERATIONS For the six months ended 4-30-18 (unaudited)
| Investment income | ||||||||||||||||||||||||
| Dividends | $7,110,712 | |||||||||||||||||||||||
| Interest | 56,117 | |||||||||||||||||||||||
| Less foreign taxes withheld | (642,690 | ) | ||||||||||||||||||||||
| Total investment income | 6,524,139 | |||||||||||||||||||||||
| Expenses | ||||||||||||||||||||||||
| Investment management fees | 5,101,785 | |||||||||||||||||||||||
| Distribution and service fees | 6,858 | |||||||||||||||||||||||
| Accounting and legal services fees | 118,540 | |||||||||||||||||||||||
| Transfer agent fees | 2,106 | |||||||||||||||||||||||
| Trustees' fees | 8,584 | |||||||||||||||||||||||
| State registration fees | 42,811 | |||||||||||||||||||||||
| Printing and postage | 13,389 | |||||||||||||||||||||||
| Professional fees | 33,567 | |||||||||||||||||||||||
| Custodian fees | 230,455 | |||||||||||||||||||||||
| Other | 30,861 | |||||||||||||||||||||||
| Total expenses | 5,588,956 | |||||||||||||||||||||||
| Less expense reductions | (45,932 | ) | ||||||||||||||||||||||
| Net expenses | 5,543,024 | |||||||||||||||||||||||
| Net investment income | 981,115 | |||||||||||||||||||||||
| Realized and unrealized gain (loss) | ||||||||||||||||||||||||
| Net realized gain (loss) on investments and foreign currency transactions | 93,661,339 | |||||||||||||||||||||||
| Change in net unrealized appreciation (depreciation) of investments and translation of assets and liabilities in foreign currencies | (51,143,386 | ) | ||||||||||||||||||||||
| Net realized and unrealized gain | 42,517,953 | |||||||||||||||||||||||
| Increase in net assets from operations | $43,499,068 | |||||||||||||||||||||||
STATEMENTS OF CHANGES IN NET ASSETS
| Six months ended 4-30-18 | Year ended 10-31-17 | |||||||||||||||||||||||||||||||||||||||||||||||
| (unaudited) | ||||||||||||||||||||||||||||||||||||||||||||||||
| Increase (decrease) in net assets | ||||||||||||||||||||||||||||||||||||||||||||||||
| From operations | ||||||||||||||||||||||||||||||||||||||||||||||||
| Net investment income | $981,115 | $7,109,247 | ||||||||||||||||||||||||||||||||||||||||||||||
| Net realized gain | 93,661,339 | 31,233,730 | ||||||||||||||||||||||||||||||||||||||||||||||
| Change in net unrealized appreciation (depreciation) | (51,143,386 | ) | 208,708,588 | |||||||||||||||||||||||||||||||||||||||||||||
| Increase in net assets resulting from operations | 43,499,068 | 247,051,565 | ||||||||||||||||||||||||||||||||||||||||||||||
| Distributions to shareholders | ||||||||||||||||||||||||||||||||||||||||||||||||
| From net investment income | ||||||||||||||||||||||||||||||||||||||||||||||||
| Class A | (9,061 | ) | (665 | ) | ||||||||||||||||||||||||||||||||||||||||||||
| Class I | (549 | ) | (423 | ) | ||||||||||||||||||||||||||||||||||||||||||||
| Class R2 | (290 | ) | (277 | ) | ||||||||||||||||||||||||||||||||||||||||||||
| Class R4 | (309 | ) | (365 | ) | ||||||||||||||||||||||||||||||||||||||||||||
| Class R6 | (1,079 | ) | (512 | ) | ||||||||||||||||||||||||||||||||||||||||||||
| Class NAV | (7,192,957 | ) | (4,825,297 | ) | ||||||||||||||||||||||||||||||||||||||||||||
| From net realized gain | ||||||||||||||||||||||||||||||||||||||||||||||||
| Class A | (30,419 | ) | — | |||||||||||||||||||||||||||||||||||||||||||||
| Class C | (3,164 | ) | — | |||||||||||||||||||||||||||||||||||||||||||||
| Class I | (1,004 | ) | — | |||||||||||||||||||||||||||||||||||||||||||||
| Class R2 | (688 | ) | — | |||||||||||||||||||||||||||||||||||||||||||||
| Class R4 | (619 | ) | — | |||||||||||||||||||||||||||||||||||||||||||||
| Class R6 | (1,719 | ) | — | |||||||||||||||||||||||||||||||||||||||||||||
| Class NAV | (11,291,054 | ) | — | |||||||||||||||||||||||||||||||||||||||||||||
| Total distributions | (18,532,912 | ) | (4,827,539 | ) | ||||||||||||||||||||||||||||||||||||||||||||
| From fund share transactions | (47,873,983 | ) | (22,677,865 | ) | ||||||||||||||||||||||||||||||||||||||||||||
| Total increase (decrease) | (22,907,827 | ) | 219,546,161 | |||||||||||||||||||||||||||||||||||||||||||||
| Net assets | ||||||||||||||||||||||||||||||||||||||||||||||||
| Beginning of period | 1,079,217,734 | 859,671,573 | ||||||||||||||||||||||||||||||||||||||||||||||
| End of period | $1,056,309,907 | $1,079,217,734 | ||||||||||||||||||||||||||||||||||||||||||||||
| Undistributed net investment income | $620,163 | $6,843,293 | ||||||||||||||||||||||||||||||||||||||||||||||
Financial highlights
| Class A Shares Period ended | 4-30-18 | 1 | 10-31-17 | 10-31-16 | 10-31-15 | 2 | ||||||||||||||||||||||||||||||||||||||||||||||||||||||||||||||||||||||||||||||||||
| Per share operating performance | ||||||||||||||||||||||||||||||||||||||||||||||||||||||||||||||||||||||||||||||||||||||||
| Net asset value, beginning of period | $11.85 | $9.29 | $8.99 | $10.00 | ||||||||||||||||||||||||||||||||||||||||||||||||||||||||||||||||||||||||||||||||||||
| Net investment income (loss)3 | (0.01 | ) | 0.04 | 0.02 | 0.01 | |||||||||||||||||||||||||||||||||||||||||||||||||||||||||||||||||||||||||||||||||||
| Net realized and unrealized gain (loss) on investments | 0.45 | 2.53 | 0.28 | (1.02 | ) | |||||||||||||||||||||||||||||||||||||||||||||||||||||||||||||||||||||||||||||||||||
| Total from investment operations | 0.44 | 2.57 | 0.30 | (1.01 | ) | |||||||||||||||||||||||||||||||||||||||||||||||||||||||||||||||||||||||||||||||||||
| Less distributions | ||||||||||||||||||||||||||||||||||||||||||||||||||||||||||||||||||||||||||||||||||||||||
| From net investment income | (0.04 | ) | (0.01 | ) | — | — | ||||||||||||||||||||||||||||||||||||||||||||||||||||||||||||||||||||||||||||||||||
| From net realized gain | (0.13 | ) | — | — | — | |||||||||||||||||||||||||||||||||||||||||||||||||||||||||||||||||||||||||||||||||||
| Total distributions | (0.17 | ) | (0.01 | ) | — | — | ||||||||||||||||||||||||||||||||||||||||||||||||||||||||||||||||||||||||||||||||||
| Net asset value, end of period | $12.12 | $11.85 | $9.29 | $8.99 | ||||||||||||||||||||||||||||||||||||||||||||||||||||||||||||||||||||||||||||||||||||
| Total return (%)4,5 | 3.73 | 6 | 27.78 | 3.34 | (10.10 | ) 6 | ||||||||||||||||||||||||||||||||||||||||||||||||||||||||||||||||||||||||||||||||||
| Ratios and supplemental data | ||||||||||||||||||||||||||||||||||||||||||||||||||||||||||||||||||||||||||||||||||||||||
| Net assets, end of period (in millions) | $4 | $3 | — | 7 | — | 7 | ||||||||||||||||||||||||||||||||||||||||||||||||||||||||||||||||||||||||||||||||||
| Ratios (as a percentage of average net assets): | ||||||||||||||||||||||||||||||||||||||||||||||||||||||||||||||||||||||||||||||||||||||||
| Expenses before reductions | 1.45 | 8 | 1.51 | 1.58 | 1.64 | 8 | ||||||||||||||||||||||||||||||||||||||||||||||||||||||||||||||||||||||||||||||||||
| Expenses including reductions | 1.44 | 8 | 1.50 | 1.50 | 1.50 | 8 | ||||||||||||||||||||||||||||||||||||||||||||||||||||||||||||||||||||||||||||||||||
| Net investment income (loss) | (0.16 | ) 8 | 0.37 | 0.24 | 0.44 | 8 | ||||||||||||||||||||||||||||||||||||||||||||||||||||||||||||||||||||||||||||||||||
| Portfolio turnover (%) | 23 | 54 | 42 | 17 | ||||||||||||||||||||||||||||||||||||||||||||||||||||||||||||||||||||||||||||||||||||
| 1 | Six months ended 4-30-18. Unaudited. | ||||||||||||||||||||||||||||||||||||||||||||||||||||||||||||||||||||||||||||||||||
| 2 | Period from 6-16-15 (commencement of operations) to 10-31-15. | ||||||||||||||||||||||||||||||||||||||||||||||||||||||||||||||||||||||||||||||||||
| 3 | Based on average daily shares outstanding. | ||||||||||||||||||||||||||||||||||||||||||||||||||||||||||||||||||||||||||||||||||
| 4 | Total returns would have been lower had certain expenses not been reduced during the applicable periods. | ||||||||||||||||||||||||||||||||||||||||||||||||||||||||||||||||||||||||||||||||||
| 5 | Does not reflect the effect of sales charges, if any. | ||||||||||||||||||||||||||||||||||||||||||||||||||||||||||||||||||||||||||||||||||
| 6 | Not annualized. | ||||||||||||||||||||||||||||||||||||||||||||||||||||||||||||||||||||||||||||||||||
| 7 | Less than $500,000. | ||||||||||||||||||||||||||||||||||||||||||||||||||||||||||||||||||||||||||||||||||
| 8 | Annualized. | ||||||||||||||||||||||||||||||||||||||||||||||||||||||||||||||||||||||||||||||||||
| Class C Shares Period ended | 4-30-18 | 1 | 10-31-17 | 10-31-16 | 10-31-15 | 2 | ||||||||||||||||||||||||||||||||||||||||||||||||||||||||||||||||||||||||||||||||||
| Per share operating performance | ||||||||||||||||||||||||||||||||||||||||||||||||||||||||||||||||||||||||||||||||||||||||
| Net asset value, beginning of period | $11.68 | $9.20 | $8.97 | $10.00 | ||||||||||||||||||||||||||||||||||||||||||||||||||||||||||||||||||||||||||||||||||||
| Net investment loss3 | (0.06 | ) | (0.05 | ) | (0.03 | ) | (0.01 | ) | ||||||||||||||||||||||||||||||||||||||||||||||||||||||||||||||||||||||||||||||||
| Net realized and unrealized gain (loss) on investments | 0.45 | 2.53 | 0.26 | (1.02 | ) | |||||||||||||||||||||||||||||||||||||||||||||||||||||||||||||||||||||||||||||||||||
| Total from investment operations | 0.39 | 2.48 | 0.23 | (1.03 | ) | |||||||||||||||||||||||||||||||||||||||||||||||||||||||||||||||||||||||||||||||||||
| From net realized gain | (0.13 | ) | — | — | — | |||||||||||||||||||||||||||||||||||||||||||||||||||||||||||||||||||||||||||||||||||
| Total distributions | (0.13 | ) | — | — | — | |||||||||||||||||||||||||||||||||||||||||||||||||||||||||||||||||||||||||||||||||||
| Net asset value, end of period | $11.94 | $11.68 | $9.20 | $8.97 | ||||||||||||||||||||||||||||||||||||||||||||||||||||||||||||||||||||||||||||||||||||
| Total return (%)4,5 | 3.36 | 6 | 26.96 | 2.56 | (10.30 | ) 6 | ||||||||||||||||||||||||||||||||||||||||||||||||||||||||||||||||||||||||||||||||||
| Ratios and supplemental data | ||||||||||||||||||||||||||||||||||||||||||||||||||||||||||||||||||||||||||||||||||||||||
| Net assets, end of period (in millions) | — | 7 | — | 7 | — | 7 | — | 7 | ||||||||||||||||||||||||||||||||||||||||||||||||||||||||||||||||||||||||||||||||
| Ratios (as a percentage of average net assets): | ||||||||||||||||||||||||||||||||||||||||||||||||||||||||||||||||||||||||||||||||||||||||
| Expenses before reductions | 2.15 | 8 | 2.21 | 2.28 | 2.35 | 8 | ||||||||||||||||||||||||||||||||||||||||||||||||||||||||||||||||||||||||||||||||||
| Expenses including reductions | 2.14 | 8 | 2.20 | 2.20 | 2.20 | 8 | ||||||||||||||||||||||||||||||||||||||||||||||||||||||||||||||||||||||||||||||||||
| Net investment loss | (0.93 | ) 8 | (0.53 | ) | (0.36 | ) | (0.17 | ) 8 | ||||||||||||||||||||||||||||||||||||||||||||||||||||||||||||||||||||||||||||||||
| Portfolio turnover (%) | 23 | 54 | 42 | 17 | ||||||||||||||||||||||||||||||||||||||||||||||||||||||||||||||||||||||||||||||||||||
| 1 | Six months ended 4-30-18. Unaudited. | ||||||||||||||||||||||||||||||||||||||||||||||||||||||||||||||||||||||||||||||||||
| 2 | Period from 6-16-15 (commencement of operations) to 10-31-15. | ||||||||||||||||||||||||||||||||||||||||||||||||||||||||||||||||||||||||||||||||||
| 3 | Based on average daily shares outstanding. | ||||||||||||||||||||||||||||||||||||||||||||||||||||||||||||||||||||||||||||||||||
| 4 | Does not reflect the effect of sales charges, if any. | ||||||||||||||||||||||||||||||||||||||||||||||||||||||||||||||||||||||||||||||||||
| 5 | Total returns would have been lower had certain expenses not been reduced during the applicable periods. | ||||||||||||||||||||||||||||||||||||||||||||||||||||||||||||||||||||||||||||||||||
| 6 | Not annualized. | ||||||||||||||||||||||||||||||||||||||||||||||||||||||||||||||||||||||||||||||||||
| 7 | Less than $500,000. | ||||||||||||||||||||||||||||||||||||||||||||||||||||||||||||||||||||||||||||||||||
| 8 | Annualized. | ||||||||||||||||||||||||||||||||||||||||||||||||||||||||||||||||||||||||||||||||||
| Class I Shares Period ended | 4-30-18 | 1 | 10-31-17 | 10-31-16 | 10-31-15 | 2 | ||||||||||||||||||||||||||||||||||||||||||||||||||||||||||||||||||||||||||||||||||
| Per share operating performance | ||||||||||||||||||||||||||||||||||||||||||||||||||||||||||||||||||||||||||||||||||||||||
| Net asset value, beginning of period | $11.89 | $9.31 | $9.00 | $10.00 | ||||||||||||||||||||||||||||||||||||||||||||||||||||||||||||||||||||||||||||||||||||
| Net investment income3 | — | 0.07 | 0.05 | 0.03 | ||||||||||||||||||||||||||||||||||||||||||||||||||||||||||||||||||||||||||||||||||||
| Net realized and unrealized gain (loss) on investments | 0.45 | 2.55 | 0.27 | (1.03 | ) | |||||||||||||||||||||||||||||||||||||||||||||||||||||||||||||||||||||||||||||||||||
| Total from investment operations | 0.45 | 2.62 | 0.32 | (1.00 | ) | |||||||||||||||||||||||||||||||||||||||||||||||||||||||||||||||||||||||||||||||||||
| Less distributions | ||||||||||||||||||||||||||||||||||||||||||||||||||||||||||||||||||||||||||||||||||||||||
| From net investment income | (0.07 | ) | (0.04 | ) | (0.01 | ) | — | |||||||||||||||||||||||||||||||||||||||||||||||||||||||||||||||||||||||||||||||||
| From net realized gain | (0.13 | ) | — | — | — | |||||||||||||||||||||||||||||||||||||||||||||||||||||||||||||||||||||||||||||||||||
| Total distributions | (0.20 | ) | (0.04 | ) | (0.01 | ) | — | |||||||||||||||||||||||||||||||||||||||||||||||||||||||||||||||||||||||||||||||||
| Net asset value, end of period | $12.14 | $11.89 | $9.31 | $9.00 | ||||||||||||||||||||||||||||||||||||||||||||||||||||||||||||||||||||||||||||||||||||
| Total return (%)4 | 3.92 | 5 | 28.15 | 3.53 | (10.00 | ) 5 | ||||||||||||||||||||||||||||||||||||||||||||||||||||||||||||||||||||||||||||||||||
| Ratios and supplemental data | ||||||||||||||||||||||||||||||||||||||||||||||||||||||||||||||||||||||||||||||||||||||||
| Net assets, end of period (in millions) | — | 6 | — | 6 | — | 6 | — | 6 | ||||||||||||||||||||||||||||||||||||||||||||||||||||||||||||||||||||||||||||||||
| Ratios (as a percentage of average net assets): | ||||||||||||||||||||||||||||||||||||||||||||||||||||||||||||||||||||||||||||||||||||||||
| Expenses before reductions | 1.15 | 7 | 1.20 | 1.26 | 1.33 | 7 | ||||||||||||||||||||||||||||||||||||||||||||||||||||||||||||||||||||||||||||||||||
| Expenses including reductions | 1.14 | 7 | 1.20 | 1.25 | 1.25 | 7 | ||||||||||||||||||||||||||||||||||||||||||||||||||||||||||||||||||||||||||||||||||
| Net investment income (loss) | (0.01 | ) 7 | 0.66 | 0.63 | 0.78 | 7 | ||||||||||||||||||||||||||||||||||||||||||||||||||||||||||||||||||||||||||||||||||
| Portfolio turnover (%) | 23 | 54 | 42 | 17 | ||||||||||||||||||||||||||||||||||||||||||||||||||||||||||||||||||||||||||||||||||||
| 1 | Six months ended 4-30-18. Unaudited. | ||||||||||||||||||||||||||||||||||||||||||||||||||||||||||||||||||||||||||||||||||
| 2 | Period from 6-16-15 (commencement of operations) to 10-31-15. | ||||||||||||||||||||||||||||||||||||||||||||||||||||||||||||||||||||||||||||||||||
| 3 | Based on average daily shares outstanding. | ||||||||||||||||||||||||||||||||||||||||||||||||||||||||||||||||||||||||||||||||||
| 4 | Total returns would have been lower had certain expenses not been reduced during the applicable periods. | ||||||||||||||||||||||||||||||||||||||||||||||||||||||||||||||||||||||||||||||||||
| 5 | Not annualized. | ||||||||||||||||||||||||||||||||||||||||||||||||||||||||||||||||||||||||||||||||||
| 6 | Less than $500,000. | ||||||||||||||||||||||||||||||||||||||||||||||||||||||||||||||||||||||||||||||||||
| 7 | Annualized. | ||||||||||||||||||||||||||||||||||||||||||||||||||||||||||||||||||||||||||||||||||
| Class R2 Shares Period ended | 4-30-18 | 1 | 10-31-17 | 10-31-16 | 10-31-15 | 2 | ||||||||||||||||||||||||||||||||||||||||||||||||||||||||||||||||||||||||||||||||||
| Per share operating performance | ||||||||||||||||||||||||||||||||||||||||||||||||||||||||||||||||||||||||||||||||||||||||
| Net asset value, beginning of period | $11.86 | $9.30 | $8.99 | $10.00 | ||||||||||||||||||||||||||||||||||||||||||||||||||||||||||||||||||||||||||||||||||||
| Net investment income (loss)3 | (0.01 | ) | 0.05 | 0.04 | 0.02 | |||||||||||||||||||||||||||||||||||||||||||||||||||||||||||||||||||||||||||||||||||
| Net realized and unrealized gain (loss) on investments | 0.45 | 2.54 | 0.27 | (1.03 | ) | |||||||||||||||||||||||||||||||||||||||||||||||||||||||||||||||||||||||||||||||||||
| Total from investment operations | 0.44 | 2.59 | 0.31 | (1.01 | ) | |||||||||||||||||||||||||||||||||||||||||||||||||||||||||||||||||||||||||||||||||||
| Less distributions | ||||||||||||||||||||||||||||||||||||||||||||||||||||||||||||||||||||||||||||||||||||||||
| From net investment income | (0.05 | ) | (0.03 | ) | — | — | ||||||||||||||||||||||||||||||||||||||||||||||||||||||||||||||||||||||||||||||||||
| From net realized gain | (0.13 | ) | — | — | — | |||||||||||||||||||||||||||||||||||||||||||||||||||||||||||||||||||||||||||||||||||
| Total distributions | (0.18 | ) | (0.03 | ) | — | — | ||||||||||||||||||||||||||||||||||||||||||||||||||||||||||||||||||||||||||||||||||
| Net asset value, end of period | $12.12 | $11.86 | $9.30 | $8.99 | ||||||||||||||||||||||||||||||||||||||||||||||||||||||||||||||||||||||||||||||||||||
| Total return (%)4 | 3.78 | 5 | 27.94 | 3.45 | (10.10 | ) 5 | ||||||||||||||||||||||||||||||||||||||||||||||||||||||||||||||||||||||||||||||||||
| Ratios and supplemental data | ||||||||||||||||||||||||||||||||||||||||||||||||||||||||||||||||||||||||||||||||||||||||
| Net assets, end of period (in millions) | — | 6 | — | 6 | — | 6 | — | 6 | ||||||||||||||||||||||||||||||||||||||||||||||||||||||||||||||||||||||||||||||||
| Ratios (as a percentage of average net assets): | ||||||||||||||||||||||||||||||||||||||||||||||||||||||||||||||||||||||||||||||||||||||||
| Expenses before reductions | 1.30 | 7 | 1.36 | 1.42 | 1.48 | 7 | ||||||||||||||||||||||||||||||||||||||||||||||||||||||||||||||||||||||||||||||||||
| Expenses including reductions | 1.29 | 7 | 1.35 | 1.41 | 1.48 | 7 | ||||||||||||||||||||||||||||||||||||||||||||||||||||||||||||||||||||||||||||||||||
| Net investment income (loss) | (0.21 | ) 7 | 0.47 | 0.44 | 0.56 | 7 | ||||||||||||||||||||||||||||||||||||||||||||||||||||||||||||||||||||||||||||||||||
| Portfolio turnover (%) | 23 | 54 | 42 | 17 | ||||||||||||||||||||||||||||||||||||||||||||||||||||||||||||||||||||||||||||||||||||
| 1 | Six months ended 4-30-18. Unaudited. | ||||||||||||||||||||||||||||||||||||||||||||||||||||||||||||||||||||||||||||||||||
| 2 | Period from 6-16-15 (commencement of operations) to 10-31-15. | ||||||||||||||||||||||||||||||||||||||||||||||||||||||||||||||||||||||||||||||||||
| 3 | Based on average daily shares outstanding. | ||||||||||||||||||||||||||||||||||||||||||||||||||||||||||||||||||||||||||||||||||
| 4 | Total returns would have been lower had certain expenses not been reduced during the applicable periods. | ||||||||||||||||||||||||||||||||||||||||||||||||||||||||||||||||||||||||||||||||||
| 5 | Not annualized. | ||||||||||||||||||||||||||||||||||||||||||||||||||||||||||||||||||||||||||||||||||
| 6 | Less than $500,000. | ||||||||||||||||||||||||||||||||||||||||||||||||||||||||||||||||||||||||||||||||||
| 7 | Annualized. | ||||||||||||||||||||||||||||||||||||||||||||||||||||||||||||||||||||||||||||||||||
| Class R4 Shares Period ended | 4-30-18 | 1 | 10-31-17 | 10-31-16 | 10-31-15 | 2 | ||||||||||||||||||||||||||||||||||||||||||||||||||||||||||||||||||||||||||||||||||
| Per share operating performance | ||||||||||||||||||||||||||||||||||||||||||||||||||||||||||||||||||||||||||||||||||||||||
| Net asset value, beginning of period | $11.88 | $9.31 | $8.99 | $10.00 | ||||||||||||||||||||||||||||||||||||||||||||||||||||||||||||||||||||||||||||||||||||
| Net investment income (loss)3 | (0.01 | ) | 0.06 | 0.05 | 0.02 | |||||||||||||||||||||||||||||||||||||||||||||||||||||||||||||||||||||||||||||||||||
| Net realized and unrealized gain (loss) on investments | 0.45 | 2.55 | 0.27 | (1.03 | ) | |||||||||||||||||||||||||||||||||||||||||||||||||||||||||||||||||||||||||||||||||||
| Total from investment operations | 0.44 | 2.61 | 0.32 | (1.01 | ) | |||||||||||||||||||||||||||||||||||||||||||||||||||||||||||||||||||||||||||||||||||
| Less distributions | ||||||||||||||||||||||||||||||||||||||||||||||||||||||||||||||||||||||||||||||||||||||||
| From net investment income | (0.06 | ) | (0.04 | ) | — | 4 | — | |||||||||||||||||||||||||||||||||||||||||||||||||||||||||||||||||||||||||||||||||
| From net realized gain | (0.13 | ) | — | — | — | |||||||||||||||||||||||||||||||||||||||||||||||||||||||||||||||||||||||||||||||||||
| Total distributions | (0.19 | ) | (0.04 | ) | — | — | ||||||||||||||||||||||||||||||||||||||||||||||||||||||||||||||||||||||||||||||||||
| Net asset value, end of period | $12.13 | $11.88 | $9.31 | $8.99 | ||||||||||||||||||||||||||||||||||||||||||||||||||||||||||||||||||||||||||||||||||||
| Total return (%)5 | 3.87 | 6 | 28.04 | 3.59 | (10.10 | ) 6 | ||||||||||||||||||||||||||||||||||||||||||||||||||||||||||||||||||||||||||||||||||
| Ratios and supplemental data | ||||||||||||||||||||||||||||||||||||||||||||||||||||||||||||||||||||||||||||||||||||||||
| Net assets, end of period (in millions) | — | 7 | — | 7 | — | 7 | — | 7 | ||||||||||||||||||||||||||||||||||||||||||||||||||||||||||||||||||||||||||||||||
| Ratios (as a percentage of average net assets): | ||||||||||||||||||||||||||||||||||||||||||||||||||||||||||||||||||||||||||||||||||||||||
| Expenses before reductions | 1.31 | 8 | 1.36 | 1.42 | 1.48 | 8 | ||||||||||||||||||||||||||||||||||||||||||||||||||||||||||||||||||||||||||||||||||
| Expenses including reductions | 1.20 | 8 | 1.26 | 1.31 | 1.35 | 8 | ||||||||||||||||||||||||||||||||||||||||||||||||||||||||||||||||||||||||||||||||||
| Net investment income (loss) | (0.12 | ) 8 | 0.59 | 0.54 | 0.68 | 8 | ||||||||||||||||||||||||||||||||||||||||||||||||||||||||||||||||||||||||||||||||||
| Portfolio turnover (%) | 23 | 54 | 42 | 17 | ||||||||||||||||||||||||||||||||||||||||||||||||||||||||||||||||||||||||||||||||||||
| 1 | Six months ended 4-30-18. Unaudited. | ||||||||||||||||||||||||||||||||||||||||||||||||||||||||||||||||||||||||||||||||||
| 2 | Period from 6-16-15 (commencement of operations) to 10-31-15. | ||||||||||||||||||||||||||||||||||||||||||||||||||||||||||||||||||||||||||||||||||
| 3 | Based on average daily shares outstanding. | ||||||||||||||||||||||||||||||||||||||||||||||||||||||||||||||||||||||||||||||||||
| 4 | Less than $0.005 per share. | ||||||||||||||||||||||||||||||||||||||||||||||||||||||||||||||||||||||||||||||||||
| 5 | Total returns would have been lower had certain expenses not been reduced during the applicable periods. | ||||||||||||||||||||||||||||||||||||||||||||||||||||||||||||||||||||||||||||||||||
| 6 | Not annualized. | ||||||||||||||||||||||||||||||||||||||||||||||||||||||||||||||||||||||||||||||||||
| 7 | Less than $500,000. | ||||||||||||||||||||||||||||||||||||||||||||||||||||||||||||||||||||||||||||||||||
| 8 | Annualized. | ||||||||||||||||||||||||||||||||||||||||||||||||||||||||||||||||||||||||||||||||||
| Class R6 Shares Period ended | 4-30-18 | 1 | 10-31-17 | 10-31-16 | 10-31-15 | 2 | ||||||||||||||||||||||||||||||||||||||||||||||||||||||||||||||||||||||||||||||||||
| Per share operating performance | ||||||||||||||||||||||||||||||||||||||||||||||||||||||||||||||||||||||||||||||||||||||||
| Net asset value, beginning of period | $11.89 | $9.32 | $9.00 | $10.00 | ||||||||||||||||||||||||||||||||||||||||||||||||||||||||||||||||||||||||||||||||||||
| Net investment income3 | — | 0.09 | 0.06 | 0.03 | ||||||||||||||||||||||||||||||||||||||||||||||||||||||||||||||||||||||||||||||||||||
| Net realized and unrealized gain (loss) on investments | 0.46 | 2.53 | 0.27 | (1.03 | ) | |||||||||||||||||||||||||||||||||||||||||||||||||||||||||||||||||||||||||||||||||||
| Total from investment operations | 0.46 | 2.62 | 0.33 | (1.00 | ) | |||||||||||||||||||||||||||||||||||||||||||||||||||||||||||||||||||||||||||||||||||
| Less distributions | ||||||||||||||||||||||||||||||||||||||||||||||||||||||||||||||||||||||||||||||||||||||||
| From net investment income | (0.08 | ) | (0.05 | ) | (0.01 | ) | — | |||||||||||||||||||||||||||||||||||||||||||||||||||||||||||||||||||||||||||||||||
| From tax return of capital | (0.13 | ) | — | — | — | |||||||||||||||||||||||||||||||||||||||||||||||||||||||||||||||||||||||||||||||||||
| Total distributions | (0.21 | ) | (0.05 | ) | (0.01 | ) | — | |||||||||||||||||||||||||||||||||||||||||||||||||||||||||||||||||||||||||||||||||
| Net asset value, end of period | $12.14 | $11.89 | $9.32 | $9.00 | ||||||||||||||||||||||||||||||||||||||||||||||||||||||||||||||||||||||||||||||||||||
| Total return (%)4 | 3.92 | 5 | 28.33 | 3.69 | (10.00 | ) 5 | ||||||||||||||||||||||||||||||||||||||||||||||||||||||||||||||||||||||||||||||||||
| Ratios and supplemental data | ||||||||||||||||||||||||||||||||||||||||||||||||||||||||||||||||||||||||||||||||||||||||
| Net assets, end of period (in millions) | $1 | — | 6 | — | 6 | — | 6 | |||||||||||||||||||||||||||||||||||||||||||||||||||||||||||||||||||||||||||||||||
| Ratios (as a percentage of average net assets): | ||||||||||||||||||||||||||||||||||||||||||||||||||||||||||||||||||||||||||||||||||||||||
| Expenses before reductions | 1.05 | 7 | 1.11 | 1.17 | 1.23 | 7 | ||||||||||||||||||||||||||||||||||||||||||||||||||||||||||||||||||||||||||||||||||
| Expenses including reductions | 1.04 | 7 | 1.10 | 1.14 | 1.21 | 7 | ||||||||||||||||||||||||||||||||||||||||||||||||||||||||||||||||||||||||||||||||||
| Net investment income | 0.06 | 7 | 0.88 | 0.71 | 0.82 | 7 | ||||||||||||||||||||||||||||||||||||||||||||||||||||||||||||||||||||||||||||||||||
| Portfolio turnover (%) | 23 | 54 | 42 | 17 | ||||||||||||||||||||||||||||||||||||||||||||||||||||||||||||||||||||||||||||||||||||
| 1 | Six months ended 4-30-18. Unaudited. | ||||||||||||||||||||||||||||||||||||||||||||||||||||||||||||||||||||||||||||||||||
| 2 | Period from 6-16-15 (commencement of operations) to 10-31-15. | ||||||||||||||||||||||||||||||||||||||||||||||||||||||||||||||||||||||||||||||||||
| 3 | Based on average daily shares outstanding. | ||||||||||||||||||||||||||||||||||||||||||||||||||||||||||||||||||||||||||||||||||
| 4 | Total returns would have been lower had certain expenses not been reduced during the applicable periods. | ||||||||||||||||||||||||||||||||||||||||||||||||||||||||||||||||||||||||||||||||||
| 5 | Not annualized. | ||||||||||||||||||||||||||||||||||||||||||||||||||||||||||||||||||||||||||||||||||
| 6 | Less than $500,000. | ||||||||||||||||||||||||||||||||||||||||||||||||||||||||||||||||||||||||||||||||||
| 7 | Annualized. | ||||||||||||||||||||||||||||||||||||||||||||||||||||||||||||||||||||||||||||||||||
| Class NAV Shares Period ended | 4-30-18 | 1 | 10-31-17 | 10-31-16 | 10-31-15 | 2 | ||||||||||||||||||||||||||||||||||||||||||||||||||||||||||||||||||||||||||||||||||
| Per share operating performance | ||||||||||||||||||||||||||||||||||||||||||||||||||||||||||||||||||||||||||||||||||||||||
| Net asset value, beginning of period | $11.89 | $9.32 | $9.00 | $10.00 | ||||||||||||||||||||||||||||||||||||||||||||||||||||||||||||||||||||||||||||||||||||
| Net investment income3 | 0.01 | 0.08 | 0.07 | 0.02 | ||||||||||||||||||||||||||||||||||||||||||||||||||||||||||||||||||||||||||||||||||||
| Net realized and unrealized gain (loss) on investments | 0.45 | 2.54 | 0.26 | (1.02 | ) | |||||||||||||||||||||||||||||||||||||||||||||||||||||||||||||||||||||||||||||||||||
| Total from investment operations | 0.46 | 2.62 | 0.33 | (1.00 | ) | |||||||||||||||||||||||||||||||||||||||||||||||||||||||||||||||||||||||||||||||||||
| Less distributions | ||||||||||||||||||||||||||||||||||||||||||||||||||||||||||||||||||||||||||||||||||||||||
| From net investment income | (0.08 | ) | (0.05 | ) | (0.01 | ) | — | |||||||||||||||||||||||||||||||||||||||||||||||||||||||||||||||||||||||||||||||||
| From net realized gain | (0.13 | ) | — | — | — | |||||||||||||||||||||||||||||||||||||||||||||||||||||||||||||||||||||||||||||||||||
| Total distributions | (0.21 | ) | (0.05 | ) | (0.01 | ) | — | |||||||||||||||||||||||||||||||||||||||||||||||||||||||||||||||||||||||||||||||||
| Net asset value, end of period | $12.14 | $11.89 | $9.32 | $9.00 | ||||||||||||||||||||||||||||||||||||||||||||||||||||||||||||||||||||||||||||||||||||
| Total return (%)4 | 3.93 | 5 | 28.33 | 3.65 | (10.00 | ) 5 | ||||||||||||||||||||||||||||||||||||||||||||||||||||||||||||||||||||||||||||||||||
| Ratios and supplemental data | ||||||||||||||||||||||||||||||||||||||||||||||||||||||||||||||||||||||||||||||||||||||||
| Net assets, end of period (in millions) | $1,051 | $1,076 | $859 | $365 | ||||||||||||||||||||||||||||||||||||||||||||||||||||||||||||||||||||||||||||||||||||
| Ratios (as a percentage of average net assets): | ||||||||||||||||||||||||||||||||||||||||||||||||||||||||||||||||||||||||||||||||||||||||
| Expenses before reductions | 1.04 | 6 | 1.10 | 1.15 | 1.22 | 6 | ||||||||||||||||||||||||||||||||||||||||||||||||||||||||||||||||||||||||||||||||||
| Expenses including reductions | 1.03 | 6 | 1.09 | 1.14 | 1.21 | 6 | ||||||||||||||||||||||||||||||||||||||||||||||||||||||||||||||||||||||||||||||||||
| Net investment income | 0.18 | 6 | 0.75 | 0.77 | 0.61 | 6 | ||||||||||||||||||||||||||||||||||||||||||||||||||||||||||||||||||||||||||||||||||
| Portfolio turnover (%) | 23 | 54 | 42 | 17 | ||||||||||||||||||||||||||||||||||||||||||||||||||||||||||||||||||||||||||||||||||||
| 1 | Six months ended 4-30-18. Unaudited. | ||||||||||||||||||||||||||||||||||||||||||||||||||||||||||||||||||||||||||||||||||
| 2 | Period from 6-16-15 (commencement of operations) to 10-31-15. | ||||||||||||||||||||||||||||||||||||||||||||||||||||||||||||||||||||||||||||||||||
| 3 | Based on average daily shares outstanding. | ||||||||||||||||||||||||||||||||||||||||||||||||||||||||||||||||||||||||||||||||||
| 4 | Total returns would have been lower had certain expenses not been reduced during the applicable periods. | ||||||||||||||||||||||||||||||||||||||||||||||||||||||||||||||||||||||||||||||||||
| 5 | Not annualized. | ||||||||||||||||||||||||||||||||||||||||||||||||||||||||||||||||||||||||||||||||||
| 6 | Annualized. | ||||||||||||||||||||||||||||||||||||||||||||||||||||||||||||||||||||||||||||||||||
Note 1 — Organization
John Hancock Emerging Markets Equity Fund (the fund) is a series of John Hancock Investment Trust (the Trust), an open-end management investment company organized as a Massachusetts business trust and registered under the Investment Company Act of 1940, as amended (the 1940 Act). The investment objective of the fund is to seek long-term capital growth.
The fund may offer multiple classes of shares. The shares currently offered by the Trust are detailed in the Statements of assets and liabilities. Class A and Class C are offered to all investors. Class I shares are offered to institutions and certain investors. Class R2 and Class R4 shares are available only to certain retirement and 529 plans. Class R6 shares are only available to certain retirement plans, institutions and other investors. Class NAV shares are offered to John Hancock affiliated funds of funds, retirement plans for employees of John Hancock and/or Manulife Financial Corporation, and certain 529 plans. Shareholders of each class have exclusive voting rights to matters that affect that class. The distribution and service fees, if any, and transfer agent fees for each class may differ. Effective May 1, 2018, Class C shares convert to Class A shares ten years after purchase (certain exclusions may apply).
Note 2 — Significant accounting policies
The financial statements have been prepared in conformity with accounting principles generally accepted in the United States of America (US GAAP), which require management to make certain estimates and assumptions as of the date of the financial statements. Actual results could differ from those estimates and those differences could be significant. The fund qualifies as an investment company under Topic 946 of Accounting Standards Codification of US GAAP.
Events or transactions occurring after the end of the fiscal period through the date that the financial statements were issued have been evaluated in the preparation of the financial statements. The following summarizes the significant accounting policies of the fund:
Security valuation. Investments are stated at value as of the scheduled close of regular trading on the New York Stock Exchange (NYSE), normally at 4:00 p.m., Eastern Time. In case of emergency or other disruption resulting in the NYSE not opening for trading or the NYSE closing at a time other than the regularly scheduled close, the net asset value (NAV) may be determined as of the regularly scheduled close of the NYSE pursuant to the fund's Valuation Policies and Procedures.
In order to value the securities, the fund uses the following valuation techniques: Equity securities held by the fund are typically valued at the last sale price or official closing price on the exchange or principal market where the security trades. In the event there were no sales during the day or closing prices are not available, the securities are valued using the last available bid price. Investments by the fund in open-end mutual funds are valued at their respective NAVs each business day. Foreign securities are valued in U.S. dollars based on foreign currency exchange rates supplied by an independent pricing vendor.
In certain instances, the Pricing Committee may determine to value equity securities using prices obtained from another exchange or market if trading on the exchange or market on which prices are typically obtained did not open for trading as scheduled, or if trading closed earlier than scheduled, and trading occurred as normal on another exchange or market.
Other portfolio securities and assets, for which reliable market quotations are not readily available, are valued at fair value as determined in good faith by the fund's Pricing Committee following procedures established by the Board of Trustees. The frequency with which these fair valuation procedures are used cannot be predicted and fair value of securities may differ significantly from the value that would have been used had a ready market for such securities existed. Trading in foreign securities may be completed before the scheduled daily close of trading on the NYSE. Significant events at the issuer or market level may affect the values of securities between the time when the valuation of the securities is generally determined and the close of the NYSE. If a significant event occurs, these securities may be fair valued, as determined in good faith by the fund's Pricing Committee, following procedures established by the Board of Trustees. The fund uses fair value adjustment factors provided by an independent pricing vendor to value certain foreign securities in order to adjust for events that may occur between the close of foreign exchanges or markets and the close of the NYSE.
The fund uses a three-tier hierarchy to prioritize the pricing assumptions, referred to as inputs, used in valuation techniques to measure fair value. Level 1 includes securities valued using quoted prices in active markets for identical securities. Level 2 includes securities valued using other significant observable inputs. Observable inputs may include quoted prices for similar securities, interest rates, prepayment speeds and credit risk. Prices for securities valued using these inputs are received from independent pricing vendors and brokers and are based on an evaluation of the inputs described. Level 3 includes securities valued using significant unobservable inputs when market prices are not readily available or reliable, including the fund's own assumptions in determining the fair value of investments. Factors used in determining value may include market or issuer specific events or trends, changes in interest rates and credit quality. The inputs or methodology used for valuing securities are not necessarily an indication of the risks associated with investing in those securities. Changes in valuation techniques and related inputs may result in transfers into or out of an assigned level within the disclosure hierarchy.
The following is a summary of the values by input classification of the fund's investments as of April 30, 2018, by major security category or type:
| Total value at 4-30-18 | Level 1 quoted price | Level 2 significant observable inputs | Level 3 significant unobservable inputs | ||
| Investments in securities: | |||||
| Assets | |||||
| Common stocks | |||||
| Argentina | $25,612,075 | $25,612,075 | — | — | |
| Brazil | 76,887,500 | 76,887,500 | — | — | |
| China | 307,723,312 | 107,072,862 | $200,650,450 | — | |
| Czech Republic | 13,129,711 | — | 13,129,711 | — | |
| Greece | 5,543,474 | — | 5,543,474 | — | |
| Hong Kong | 54,066,227 | — | 54,066,227 | — | |
| India | 90,608,187 | — | 90,608,187 | — | |
| Indonesia | 24,020,281 | — | 24,020,281 | — | |
| Macau | 16,822,624 | — | 16,822,624 | — | |
| Mexico | 37,230,851 | 37,230,851 | — | — | |
| Peru | 17,528,351 | 17,528,351 | — | — | |
| Russia | 44,199,379 | 33,238,065 | 10,961,314 | — | |
| South Africa | 53,113,059 | — | 53,113,059 | — | |
| South Korea | 70,552,646 | — | 70,552,646 | — | |
| Taiwan | 74,274,875 | 29,527,716 | 44,747,159 | — | |
| United Kingdom | 27,294,409 | — | 27,294,409 | — | |
| United States | 13,571,326 | — | 13,571,326 | — | |
| Preferred securities | |||||
| Brazil | 28,898,577 | 28,898,577 | — | — | |
| South Korea | 56,466,440 | — | 56,466,440 | — | |
| Short-term investments | 19,473,305 | 19,473,305 | — | — | |
| Total investments in securities | $1,057,016,609 | $375,469,302 | $681,547,307 | — | |
Security transactions and related investment income. Investment security transactions are accounted for on a trade date plus one basis for daily NAV calculations. However, for financial reporting purposes, investment transactions are reported on trade date. Interest income is accrued as earned. Dividend income is recorded on the ex-date, except for dividends of foreign securities where the dividend may not be known until after the ex-date. In those cases, dividend income, net of withholding taxes, is recorded when the fund becomes aware of the dividends. Distributions received on securities that represent a tax return of capital or capital gain are recorded as a reduction of cost of investments and/or as a realized gain if
amounts are estimable. Gains and losses on securities sold are determined on the basis of identified cost and may include proceeds from litigation.
Foreign investing. Assets, including investments and liabilities denominated in foreign currencies, are translated into U.S. dollar values each day at the prevailing exchange rate. Purchases and sales of securities, income and expenses are translated into U.S. dollars at the prevailing exchange rate on the date of the transaction. The effect of changes in foreign currency exchange rates on the value of securities is reflected as a component of the realized and unrealized gains (losses) on investments. Foreign investments are subject to a decline in the value of a foreign currency versus the U.S. dollar, which reduces the dollar value of securities denominated in that currency.
Funds that invest internationally generally carry more risk than funds that invest strictly in U.S. securities. Risks can result from differences in economic and political conditions, regulations, market practices (including higher transaction costs), accounting standards and other factors.
Foreign taxes. The fund may be subject to withholding tax on income, capital gains or repatriation taxes imposed by certain countries, a portion of which may be recoverable. Foreign taxes are accrued based upon the fund's understanding of the tax rules and rates that exist in the foreign markets in which it invests. Taxes are accrued based on gains realized by the fund as a result of certain foreign security sales. Estimated taxes are accrued based on unrealized appreciation of such securities. Investment income is recorded net of foreign withholding taxes, less any amounts reclaimable.
Line of credit. The fund may have the ability to borrow from banks for temporary or emergency purposes, including meeting redemption requests that otherwise might require the untimely sale of securities. Pursuant to the fund's custodian agreement, the custodian may loan money to the fund to make properly authorized payments. The fund is obligated to repay the custodian for any overdraft, including any related costs or expenses. The custodian may have a lien, security interest or security entitlement in any fund property that is not otherwise segregated or pledged, to the extent of any overdraft, and to the maximum extent permitted by law.
The fund and other affiliated funds have entered into a syndicated line of credit agreement with Citibank, N.A. as the administrative agent that enables them to participate in a $750 million unsecured committed line of credit. Excluding commitments designated for a certain fund and subject to the needs of all other affiliated funds, the fund can borrow up to an aggregate commitment amount of $500 million, subject to asset coverage and other limitations as specified in the agreement. A commitment fee payable at the end of each calendar quarter, based on the average daily unused portion of the line of credit, is charged to each participating fund based on a combination of fixed and asset based allocations and is reflected in Other expenses on the Statement of operations. For the six months ended April 30, 2018, the fund had no borrowings under the line of credit. Commitment fees for the six months ended April 30, 2018 were $2,617.
Expenses. Within the John Hancock group of funds complex, expenses that are directly attributable to an individual fund are allocated to such fund. Expenses that are not readily attributable to a specific fund are allocated among all funds in an equitable manner, taking into consideration, among other things, the nature and type of expense and the fund's relative net assets. Expense estimates are accrued in the period to which they relate and adjustments are made when actual amounts are known.
Class allocations. Income, common expenses and realized and unrealized gains (losses) are determined at the fund level and allocated daily to each class of shares based on the net assets of the class. Class-specific expenses, such as distribution and service fees, if any, and transfer agent fees, for all classes, are charged daily at the class level based on the net assets of each class and the specific expense rates applicable to each class.
Federal income taxes. The fund may be subject to withholding tax on income, capital gains or repatriation taxes imposed by certain countries, a portion of which may be recoverable. Foreign taxes are accrued based upon the fund's understanding of the tax rules and rates that exist in the foreign markets in which it invests. Taxes are accrued based on gains realized by the fund as a result of certain foreign security sales. Estimated taxes are accrued based on unrealized appreciation of such securities. Investment income is recorded net of foreign withholding taxes, less any amounts reclaimable.
As of October 31, 2017, the fund had no uncertain tax positions that would require financial statement recognition, derecognition or disclosure. The fund's federal tax returns are subject to examination by the Internal Revenue Service for a period of three years.
Distribution of income and gains. Distributions to shareholders from net investment income and net realized gains, if any, are recorded on the ex-date. The fund generally declares and pays dividends and capital gain distributions, if any, at least annually.
Such distributions, on a tax basis, are determined in conformity with income tax regulations, which may differ from US GAAP. Distributions in excess of tax basis earnings and profits, if any, are reported in the fund's financial statements as a return of capital. The final determination of tax characteristics of the fund's distribution will occur at the end of the year and will subsequently be reported to shareholders.
Capital accounts within the financial statements are adjusted for permanent book-tax differences. These adjustments have no impact on net assets or the results of operations. Temporary book-tax differences, if any, will reverse in a subsequent period. Book-tax differences are primarily attributable to wash sale loss deferrals.
Note 3 — Guarantees and indemnifications
Under the Trust's organizational documents, its Officers and Trustees are indemnified against certain liabilities arising out of the performance of their duties to the Trust, including the fund. Additionally, in the normal course of business, the fund enters into contracts with service providers that contain general indemnification clauses. The fund's maximum exposure under these arrangements is unknown, as this would involve future claims that may be made against the fund that have not yet occurred. The risk of material loss from such claims is considered remote.
Note 4 — Fees and transactions with affiliates
John Hancock Advisers, LLC (the Advisor) serves as investment advisor for the fund. John Hancock Funds, LLC (the Distributor), an affiliate of the Advisor, serves as principal underwriter of the fund. The Advisor and the Distributor are indirect, wholly owned subsidiaries of Manulife Financial Corporation (MFC).
Management fee. The fund has an investment management agreement with the Advisor under which the fund pays a daily management fee to the Advisor equivalent on an annual basis to the sum of (a) 1.050% of the first $500 million of the fund's average daily net assets; (b) 1.000% of the next $500 million of the fund's average daily net assets; (c) 0.950% of the fund's average daily net assets, if aggregate net assets exceed $1 billion, but are less than or equal to $2 billion, the rate applies retroactively to all assets; and (d) 0.900% of the fund's average daily net assets, if the aggregate net assets exceed $2 billion, the rate applies retroactively to all assets. The Advisor has a subadvisory agreement with John Hancock Asset Management a division of Manulife Asset Management (US) LLC, an indirectly owned subsidiary of MFC and an affiliate of the Advisor. The fund is not responsible for payment of the subadvisory fees.
The Advisor has contractually agreed to waive a portion of its management fee and/or reimburse expenses for certain funds of the John Hancock group of funds complex, including the fund (the participating portfolios). This waiver is based upon aggregate net assets of all the participating portfolios. The amount of the reimbursement is calculated daily and allocated among all the participating portfolios in proportion to the daily net assets of each fund. During the six months ended April 30, 2018, this waiver amounted to 0.01% of the fund's average net assets (on an annualized basis). This arrangement may be amended or terminated at any time by the Advisor upon notice to the fund and with the approval of the Board of Trustees.
The Advisor has contractually agreed to reduce its management fee or, if necessary, make payment to Class A, Class C, Class R2, and Class R4 shares of the fund in an amount equal to the amount by which expenses of the share class exceed 1.50%, 2.20%, 1.60% and 1.35% of the respective class's average net assets, on an annualized basis. Prior to March 1, 2018, the Advisor has contractually agreed to waive and/or reimburse expenses for Class I shares to the extent they exceed 1.25% of the respective class's average net assets, on an annualized basis. This limit excludes taxes, brokerage commissions, interest expense, litigation and indemnification expenses and other extraordinary expenses not incurred in the ordinary course of the fund's business, acquired fund fees and expenses paid indirectly, borrowing costs, prime brokerage fees, and short dividend
expense. The waiver expires on February 28, 2019, unless renewed by mutual agreement of the fund and the Advisor based upon a determination that this is appropriate under the circumstances at the time.
For the six months ended April 30, 2018, the expense reductions described above amounted to the following:
| Class | Expense reduction | Class | Expense reduction | |
| Class A | $145 | Class R4 | $42 | |
| Class C | 14 | Class R6 | 14 | |
| Class I | 5 | Class NAV | 45,708 | |
| Class R2 | 4 | Total | $45,932 |
Expenses waived or reimbursed in the current fiscal period are not subject to recapture in future fiscal periods.
The investment management fees, including the impact of the waivers and reimbursements as described above, incurred for the six months ended April 30, 2018 were equivalent to a net annual effective rate of 0.94% of the fund's average daily net assets.
Accounting and legal services. Pursuant to a service agreement, the fund reimburses the Advisor for all expenses associated with providing the administrative, financial, legal, compliance, accounting and recordkeeping services to the fund, including the preparation of all tax returns, periodic reports to shareholders and regulatory reports, among other services. These expenses are allocated to each share class based on its relative net assets at the time the expense was incurred. These accounting and legal services fees incurred for the six months ended April 30, 2018 amounted to an annual rate of 0.02% of the fund's average daily net assets.
Distribution and service plans. The fund has a distribution agreement with the Distributor. The fund has adopted distribution and service plans with respect to Class A, Class C, Class R2, and Class R4 shares pursuant to Rule 12b-1 under the 1940 Act, to pay the Distributor for services provided as the distributor of shares of the fund. In addition, under a service plan for Class R2 and Class R4 shares, the fund pays for certain other services. The fund may pay up to the following contractual rates of distribution and service fees under these arrangements, expressed as an annual percentage of average daily net assets for each class of the fund's shares:
| Class | Rule 12b-1 fee | Service fee | Class | Rule 12b-1 fee | Service fee | |
| Class A | 0.30% | — | Class R2 | 0.25% | 0.25% | |
| Class C | 1.00% | — | Class R4 | 0.25% | 0.10% |
The fund's Distributor has contractually agreed to waive 0.10% of Rule 12b-1 fees for Class R4 shares. The current waiver agreement expires on February 28, 2019, unless renewed by mutual agreement of the fund and the Distributor based upon a determination that this is appropriate under the circumstances at the time. This contractual waiver amounted to $39 for Class R4 shares for the six months ended April 30, 2018.
Sales charges. Class A shares may be subject to up-front sales charges. For the six months ended April 30, 2018, no sales charges were assessed.
Class A and Class C shares may be subject to contingent deferred sales charges (CDSCs). Certain Class A shares that are acquired through purchases of $1 million or more and are redeemed within one year of purchase are subject to a 1.00% sales charge. Class C shares that are redeemed within one year of purchase are subject to a 1.00% CDSC. CDSCs are applied to the lesser of the current market value at the time of redemption or the original purchase cost of the shares being redeemed. Proceeds from CDSCs are used to compensate the Distributor for providing distribution-related services in connection with the sale of these shares. During the six months ended April 30, 2018, CDSCs received by the Distributor amounted to $5,100 for Class C shares.
Transfer agent fees. The John Hancock Group of Funds has a complex-wide transfer agent agreement with John Hancock Signature Services, Inc. (Signature Services), an affiliate of the Advisor. The transfer agent fees paid to Signature Services are determined based on the cost to Signature Services (Signature Services Cost) of providing recordkeeping services. It also
includes out-of-pocket expenses, including payments made to third-parties for recordkeeping services provided to their clients who invest in one or more John Hancock funds. In addition, Signature Services Cost may be reduced by certain fees that Signature Services receives in connection with retirement and small accounts. Signature Services Cost is calculated monthly and allocated, as applicable, to five categories of share classes: Retail Share and Institutional Share Classes of Non-Municipal Bond Funds, Class R6 Shares, Retirement Share Classes and Municipal Bond Share Classes. Within each of these categories, the applicable costs are allocated to the affected John Hancock affiliated funds and/or classes, based on the relative average daily net assets.
Class level expenses. Class level expenses for the six months ended April 30, 2018 were:
| Class | Distribution and service fees | Transfer agent fees |
| Class A | $5,078 | $1,843 |
| Class C | 1,578 | 171 |
| Class I | — | 62 |
| Class R2 | 103 | 5 |
| Class R4 | 99 | 5 |
| Class R6 | — | 20 |
| Total | $6,858 | $2,106 |
Trustee expenses. The fund compensates each Trustee who is not an employee of the Advisor or its affiliates. The costs of paying Trustee compensation and expenses are allocated to the fund based on its net assets relative to other funds within the John Hancock group of funds complex.
Note 5 — Fund share transactions
Transactions in fund shares for the six months ended April 30, 2018 and for the year ended October 31, 2017 were as follows:
| Six months ended 4-30-18 | Year ended 10-31-17 | |||||||||||||||||||||||||
| Shares | Amount | Shares | Amount | |||||||||||||||||||||||
| Class A shares | ||||||||||||||||||||||||||
| Sold | 217,299 | $2,701,760 | 223,447 | $2,359,031 | ||||||||||||||||||||||
| Distributions reinvested | 3,354 | 39,480 | 59 | 513 | ||||||||||||||||||||||
| Repurchased | (97,830 | ) | (1,200,411 | ) | (42,710 | ) | (425,950 | ) | ||||||||||||||||||
| Net increase | 122,823 | $1,540,829 | 180,796 | $1,933,594 | ||||||||||||||||||||||
| Class C shares | ||||||||||||||||||||||||||
| Sold | 9,648 | $116,294 | 13,822 | $154,033 | ||||||||||||||||||||||
| Distributions reinvested | 225 | 2,615 | — | — | ||||||||||||||||||||||
| Repurchased | (10,828 | ) | (129,643 | ) | (4 | ) | (45 | ) | ||||||||||||||||||
| Net increase (decrease) | (955 | ) | ($10,734 | ) | 13,818 | $153,988 | ||||||||||||||||||||
| Class I shares | ||||||||||||||||||||||||||
| Sold | 1,251 | $15,009 | 2,793 | $27,643 | ||||||||||||||||||||||
| Distributions reinvested | 61 | 720 | 6 | 53 | ||||||||||||||||||||||
| Repurchased | (5,812 | ) | (69,733 | ) | (1,431 | ) | (14,112 | ) | ||||||||||||||||||
| Net increase (decrease) | (4,500 | ) | ($54,004 | ) | 1,368 | $13,584 | ||||||||||||||||||||
| Class R2 shares | ||||||||||||||||||||||||||
| Sold | — | — | 1,148 | $13,002 | ||||||||||||||||||||||
| Distributions reinvested | 18 | 210 | — | — | ||||||||||||||||||||||
| Repurchased | (5,802 | ) | (69,451 | ) | — | — | ||||||||||||||||||||
| Net increase (decrease) | (5,784 | ) | ($69,241 | ) | 1,148 | $13,002 | ||||||||||||||||||||
| Six months ended 4-30-18 | Year ended 10-31-17 | |||||||||||||||||||||||||
| Shares | Amount | Shares | Amount | |||||||||||||||||||||||
| Class R4 shares | ||||||||||||||||||||||||||
| Sold | 379 | $4,763 | 589 | $6,149 | ||||||||||||||||||||||
| Distributions reinvested | 10 | 119 | — | — | ||||||||||||||||||||||
| Repurchased | (5,812 | ) | (69,675 | ) | (4 | ) | (46 | ) | ||||||||||||||||||
| Net increase (decrease) | (5,424 | ) | ($64,793 | ) | 585 | $6,103 | ||||||||||||||||||||
| Class R6 shares | ||||||||||||||||||||||||||
| Sold | 36,675 | $458,059 | 9,218 | $86,971 | ||||||||||||||||||||||
| Distributions reinvested | 163 | 1,921 | — | — | ||||||||||||||||||||||
| Repurchased | (5,812 | ) | (69,764 | ) | (44 | ) | (498 | ) | ||||||||||||||||||
| Net increase | 31,026 | $390,216 | 9,174 | $86,473 | ||||||||||||||||||||||
| Class NAV shares | ||||||||||||||||||||||||||
| Sold | 2,418,930 | $29,152,158 | 13,443,243 | $135,258,748 | ||||||||||||||||||||||
| Distributions reinvested | 1,570,434 | 18,484,011 | 559,131 | 4,825,297 | ||||||||||||||||||||||
| Repurchased | (7,869,595 | ) | (97,242,425 | ) | (15,656,652 | ) | (164,968,654 | ) | ||||||||||||||||||
| Net decrease | (3,880,231 | ) | ($49,606,256 | ) | (1,654,278 | ) | ($24,884,609 | ) | ||||||||||||||||||
| Total net decrease | (3,743,044 | ) | ($47,873,983 | ) | (1,447,389 | ) | ($22,677,865 | ) | ||||||||||||||||||
Affiliates of the fund owned 51%, 78%, 81%, 8%, and 100% of shares of Class I, Class R2, Class R4, Class R6 and Class NAV, respectively, on April 30, 2018. Such concentration of shareholders' capital could have a material effect on the fund if such shareholders redeem from the fund.
Note 6 — Purchase and sale of securities
Purchases and sales of securities, other than short-term investments, amounted to $248,810,628 and $341,065,019, respectively, for the six months ended April 30, 2018.
Note 7 — Industry or sector risk
The fund may invest a large percentage of its assets in one or more particular industries or sectors of the economy. If a large percentage of the fund's assets are economically tied to a single or small number of industries or sectors of the economy, the fund will be less diversified than a more broadly diversified fund, and it may cause the fund to underperform if that industry or sector underperforms. In addition, focusing on a particular industry or sector may make the fund's NAV more volatile. Further, a fund that invests in particular industries or sectors is particularly susceptible to the impact of market, economic, regulatory and other factors affecting those industries or sectors.
Note 8 — Emerging-market risk
Foreign investing especially in emerging markets, has additional risks, such as currency and market volatility and political and social instability. Funds that invest a significant portion of assets in the securities of issuers based in countries with emerging-market economies are subject to greater levels of foreign investment risk than funds investing primarily in more-developed foreign markets, since emerging-market securities may present other risks greater than, or in addition to, the risks of investing in developed foreign countries.
Note 9 — Investment by affiliated funds
Certain investors in the fund are affiliated funds that are managed by the Advisor and its affiliates. The affiliated funds do not invest in the fund for the purpose of exercising management or control; however, this investment may represent a significant portion of the fund's net assets. At April 30, 2018, funds within the John Hancock group of funds complex held 99.5% of the fund's net assets. The following funds had an affiliate ownership of 5% or more of the fund's net assets:
| Fund | Affiliated concentration |
| John Hancock Funds II Multimanager Lifestyle Growth Portfolio | 31.0% |
| John Hancock Funds II Multimanager Lifestyle Balanced Portfolio | 19.3% |
| John Hancock Funds II Multimanager Lifestyle Aggressive Portfolio | 15.9% |
| John Hancock Variable Insurance Trust Managed Volatility Growth Portfolio | 9.6% |
Trustees Hassell H. McClellan, Chairperson Officers Andrew G. Arnott John J. Danello Francis V. Knox, Jr. Charles A. Rizzo Salvatore Schiavone | Investment advisor John Hancock Advisers, LLC Subadvisor John Hancock Asset Management a division of Manulife Asset Management (US) LLC Principal distributor John Hancock Funds, LLC Custodian Citibank, N.A. Transfer agent John Hancock Signature Services, Inc. Legal counsel K&L Gates LLP |
*Member of the Audit Committee
†Non-Independent Trustee
#Effective 6-20-17
The fund's proxy voting policies and procedures, as well as the fund proxy voting record for the most recent twelve-month period ended June 30, are available free of charge on the Securities and Exchange Commission (SEC) website at sec.gov or on our website.
The fund's complete list of portfolio holdings, for the first and third fiscal quarters, is filed with the SEC on Form N-Q. The fund's Form N-Q is available on our website and the SEC's website, sec.gov, and can be reviewed and copied (for a fee) at the SEC's Public Reference Room in Washington, DC. Call 800-SEC-0330 to receive information on the operation of the SEC's Public Reference Room.
We make this information on your fund, as well as monthly portfolio holdings, and other fund details available on our website at jhinvestments.com or by calling 800-225-5291.
| You can also contact us: | |||
| 800-225-5291 jhinvestments.com | Regular mail: John Hancock Signature Services, Inc. | Express mail: John Hancock Signature Services, Inc. | |
John Hancock family of funds
DOMESTIC EQUITY FUNDS Balanced Blue Chip Growth Classic Value Disciplined Value Disciplined Value Mid Cap Equity Income Fundamental All Cap Core Fundamental Large Cap Core Fundamental Large Cap Value New Opportunities Small Cap Core Small Cap Growth Small Cap Value Strategic Growth U.S. Global Leaders Growth U.S. Growth Value Equity GLOBAL AND INTERNATIONAL EQUITY FUNDS Disciplined Value International Emerging Markets Emerging Markets Equity Fundamental Global Franchise Global Equity Global Shareholder Yield Greater China Opportunities International Growth International Small Company International Value Equity | INCOME FUNDS Bond California Tax-Free Income Emerging Markets Debt Floating Rate Income Government Income High Yield High Yield Municipal Bond Income Investment Grade Bond Money Market Short Duration Credit Opportunities Spectrum Income Strategic Income Opportunities Tax-Free Bond ALTERNATIVE AND SPECIALTY FUNDS Absolute Return Currency Alternative Asset Allocation Enduring Assets Financial Industries Global Absolute Return Strategies Global Conservative Absolute Return Global Focused Strategies Natural Resources Redwood Regional Bank Seaport Long/Short Technical Opportunities |
A fund's investment objectives, risks, charges, and expenses should be considered carefully before investing. The prospectus contains this and other important information about the fund. To obtain a prospectus, contact your financial professional, call John Hancock Investments at 800-225-5291, or visit our website at jhinvestments.com. Please read the prospectus carefully before investing or sending money.
ASSET ALLOCATION Income Allocation Multi-Index Lifetime Portfolios Multi-Index Preservation Portfolios Multimanager Lifestyle Portfolios Multimanager Lifetime Portfolios Retirement Income 2040 EXCHANGE-TRADED FUNDS John Hancock Multifactor Consumer Discretionary ETF John Hancock Multifactor Consumer Staples ETF John Hancock Multifactor Developed International ETF John Hancock Multifactor Energy ETF John Hancock Multifactor Financials ETF John Hancock Multifactor Healthcare ETF John Hancock Multifactor Industrials ETF John Hancock Multifactor Large Cap ETF John Hancock Multifactor Materials ETF John Hancock Multifactor Mid Cap ETF John Hancock Multifactor Small Cap ETF John Hancock Multifactor Technology ETF John Hancock Multifactor Utilities ETF | ENVIRONMENTAL, SOCIAL, AND GOVERNANCE FUNDS ESG All Cap Core ESG Core Bond ESG International Equity ESG Large Cap Core CLOSED-END FUNDS Financial Opportunities Hedged Equity & Income Income Securities Trust Investors Trust Preferred Income Preferred Income II Preferred Income III Premium Dividend Tax-Advantaged Dividend Income Tax-Advantaged Global Shareholder Yield |
John Hancock Multifactor ETF shares are bought and sold at market price (not NAV), and are not individually redeemed
from the fund. Brokerage commissions will reduce returns.
John Hancock ETFs are distributed by Foreside Fund Services, LLC, and are subadvised by Dimensional Fund Advisors LP.
Foreside is not affiliated with John Hancock Funds, LLC or Dimensional Fund Advisors LP.
Dimensional Fund Advisors LP receives compensation from John Hancock in connection with licensing rights to the
John Hancock Dimensional indexes. Dimensional Fund Advisors LP does not sponsor, endorse, or sell, and makes no
representation as to the advisability of investing in, John Hancock Multifactor ETFs.
John Hancock Investments
A trusted brand
John Hancock Investments is a premier asset manager representing one of
America's most trusted brands, with a heritage of financial stewardship dating
back to 1862. Helping our shareholders pursue their financial goals is at the
core of everything we do. It's why we support the role of professional financial
advice and operate with the highest standards of conduct and integrity.
A better way to invest
We serve investors globally through a unique multimanager approach:
We search the world to find proven portfolio teams with specialized
expertise for every strategy we offer, then we apply robust investment
oversight to ensure they continue to meet our uncompromising standards
and serve the best interests of our shareholders.
Results for investors
Our unique approach to asset management enables us to provide a diverse set
of investments backed by some of the world's best managers, along with strong
risk-adjusted returns across asset classes.
| | John Hancock Funds, LLC n Member FINRA, SIPC 601 Congress Street n Boston, MA 02210-2805 800-225-5291 n jhinvestments.com | |
| This report is for the information of the shareholders of John Hancock Emerging Markets Equity Fund. It is not authorized for distribution to prospective investors unless preceded or accompanied by a prospectus. | ||
| MF450359 | 456SA 4/18 6/18 | |
John Hancock
Global Focused Strategies Fund
Semiannual report 4/30/18
A message to shareholders
Dear shareholder,
Financial markets around the world experienced a meaningful rise in volatility in the last half of the reporting period. U.S. equities declined as investors reacted to a potential trade war between the United States and China and the prospect of rising inflation. In developed international markets, macroeconomic data began to suggest that the growth many investors were hoping for may not be as robust as early indications had suggested. Although some in the asset management community believe the sell-off will be temporary, we have suggested for some time that the era of extremely low volatility would eventually come to an end, and that now appears to be the case.
That said, the fundamentals across the global stage continue to appear supportive. One of the challenges investors will face in the coming months is navigating the continued normalization of monetary policy. Stronger economies will continue to prompt central banks to dial back the stimulus they had injected into the financial system in the years following the global financial crisis, and this less-accommodative stance may represent an adjustment for many markets.
Your best resource in unpredictable markets is your financial advisor, who can help position your portfolio so that it's sufficiently diversified to meet your long-term objectives and to withstand the inevitable turbulence along the way.
On behalf of everyone at John Hancock Investments, I'd like to take this opportunity to welcome new shareholders and to thank existing shareholders for the continued trust you've placed in us.
Sincerely,
Andrew G. Arnott
President and CEO,
John Hancock Investments
Head of Wealth and Asset Management,
United States and Europe
This commentary reflects the CEO's views, which are subject to change at any time. Investing involves risks, including the potential loss of principal. Diversification does not guarantee a profit or eliminate the risk of a loss. It is not possible to invest directly into an index. For more up-to-date information, please visit our website at jhinvestments.com.
John Hancock
Global Focused Strategies Fund
INVESTMENT OBJECTIVE
The fund seeks long-term total return.
AVERAGE ANNUAL TOTAL RETURNS AS OF 4/30/18 (%)
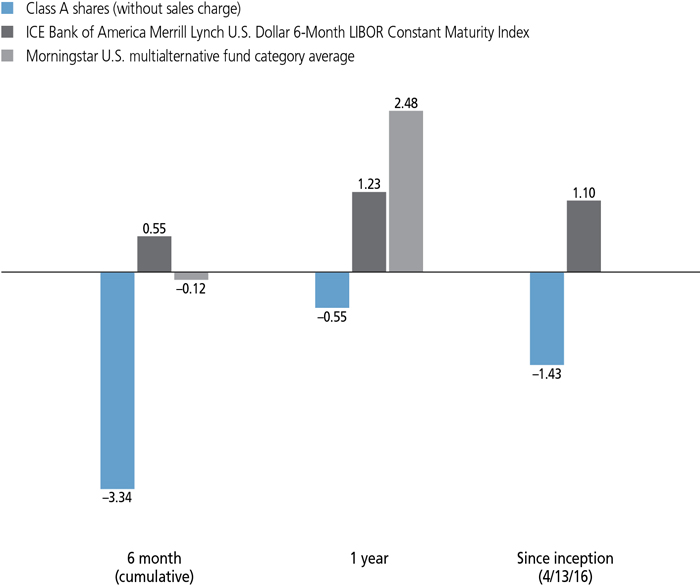
The ICE Bank of America Merrill Lynch U.S. Dollar 6-Month LIBOR Constant Maturity Index tracks the performance of a synthetic asset paying LIBOR (London Interbank Offered Rate) to a stated maturity.
It is not possible to invest directly in an index. Index figures do not reflect expenses or sales charges, which would result in lower returns.
Figures from Morningstar, Inc. include reinvested distributions and do not take into account sales charges. Actual load adjusted performance is lower. Since inception returns for the Morningstar fund category average are not available.
The past performance shown here reflects reinvested distributions and the beneficial effect of any expense reductions, and does not guarantee future results. Returns for periods shorter than one year are cumulative. Performance of the other share classes will vary based on the difference in the fees and expenses of those classes. Shares will fluctuate in value and, when redeemed, may be worth more or less than their original cost. Current month-end performance may be lower or higher than the performance cited, and can be found at jhinvestments.com or by calling 800-225-5291. For further information on the fund's objectives, risks, and strategy, see the fund's prospectus.
PERFORMANCE HIGHLIGHTS OVER THE LAST SIX MONTHS
The fund declined
The fund fell for the period, trailing its cash benchmark and the global equity market.
U.S. market volatility hurt results, overpowering the fund's absolute return focus
A sharp increase in U.S. market volatility weighed on the fund's European versus U.S. equity market volatility relative value strategy, the most significant detractor for the period. Setting the U.S. large-cap segment against the small-cap equity also weighed on results.
Rising oil prices helped offset losses
A position favoring global integrated oil stocks relative to the broader global market fared much better, as oil's rebound helped shares of companies engaged in its production, refining, and distribution.
PORTFOLIO ALLOCATION AS OF 4/30/18 (%)
| Common stocks | 20.5 | Foreign government obligations | 6.7 | |||
| Energy | 8.3 | U.S. Government | 4.5 | |||
| Financials | 6.0 | Purchased options | 3.3 | |||
| Consumer Staples | 4.8 | Short-term investments and other | 47.6 | |||
| Information technology | 0.6 | Certificate of deposit | 18.3 | |||
| Materials | 0.6 | U.S. Government | 15.0 | |||
| Utilities | 0.2 | Commercial paper | 6.5 | |||
| Corporate bonds | 17.4 | Time deposits | 5.7 | |||
| Financials | 9.8 | Money market funds | 1.4 | |||
| Energy | 2.9 | Other assets and liabilities, net | 0.7 | |||
| Telecommunication Services | 2.3 | TOTAL | 100.0 | |||
| Materials | 0.6 | |||||
| Real Estate | 0.6 | |||||
| Consumer discretionary | 0.6 | |||||
| Utilities | 0.6 | |||||
| As a percentage of net assets. | ||||||
A note about risks
Absolute return funds are not designed to outperform stocks and bonds in strong markets. There is no guarantee of a positive return, of the fund achieving its objective, or that volatility-reducing strategies will be successful. The value of a company's equity securities is subject to changes in the company's financial condition and overall market and economic conditions. Foreign investing, especially in emerging markets, has additional risks, such as currency and market volatility and political and social instability. Investments in certain foreign markets or security types may restrict or otherwise affect the fund's ability to implement its investment strategy. Derivatives transactions, such as hedging and other strategic transactions, may increase a fund's volatility and could produce disproportionate losses, potentially more than the fund's principal investment. Fixed-income investments are subject to interest-rate and credit risk; their value will normally decline as interest rates rise or if an issuer is unable or unwilling to make principal or interest payments. Liquidity—the extent to which a security may be sold or a derivative position closed without negatively affecting its market value—may be impaired by reduced trading volume, heightened volatility, rising interest rates, and other market conditions. Currency transactions are affected by fluctuations in exchange rates. Please see the fund's prospectus for additional risks.

Neil J. Richardson
Portfolio Manager
Standard Life Investments
Would you walk us through your investment philosophy and how you think about implementing the fund's mandate of seeking long-term total return?
Our investment process is designed to capitalize on the broader team's macro- and microeconomic research findings across an array of asset classes around the world, with an emphasis on multi-year views. We work closely with specialist colleagues in rigorously examining and reviewing any new strategy proposals as they arise, and we continually revisit and test the investment thesis behind each existing position in the fund.
The fund seeks long-term total return. Our goal is to build and maintain a collection of strategies that work well together in a variety of different market environments. The portfolio construction process blends asset allocation and risk management expertise to achieve what we view as a favorable combination of return-generation potential and resilience.
What were some of your key observations about the macroeconomic and market environment during the six months ended April 30, 2018?
Global equities posted modest gains for the period, but the subdued market volatility readings of recent quarters came to an abrupt end in February as a number of developments prompted investors to begin taking profits. Price volatility was particularly pronounced in the U.S. market. Rising inflation expectations stoked fears that the U.S. Federal Reserve would be prompted to hike interest rates more quickly than anticipated. Meanwhile, the U.S. administration's plans to implement tariffs on aluminum, steel, and a range of other imports caused market participants to contemplate the prospects of a trade war.
The price of crude oil staged an impressive comeback, sharply lifting stocks of companies engaged in oil exploration, production, refining, and distribution. Along with energy, the U.S. consumer discretionary sector posted robust returns. Brazil's equity market, too, was strong for the period.
Global government bonds fared less well, as rising yields—and volatile yield movements—weighed down high-quality bond prices in the Unites States and in other debt markets around the world.
Against that backdrop, how did the fund perform?
The fund's Class A shares declined 3.34% (excluding sales charges). By comparison, the fund's cash benchmark, the ICE Bank of America Merrill Lynch U.S. Dollar 6-Month LIBOR Constant Maturity Index, was up 0.55%, while the average peer in Morningstar's multialternative fund category was down 0.12%. Developed-market stocks, as represented by the MSCI World Index, were up 3.68%.
Of the fund's underlying strategies, which of them were among the most significant detractors from performance for the period?
The most significant detractor from performance for the period was the fund's European versus U.S. equity market volatility strategy, implemented with variance swaps and volatility index futures. Europe's EURO STOXX 50 Index represents relatively concentrated and cyclical equity exposure when compared with the more diversified and defensive S&P 500 Index, representing the U.S. market. We expect markets with fewer members and greater concentration in specific stocks and sectors to be statistically more prone to higher intra-market correlations, hence our expectations for greater market volatility in Europe than in the United States. However, that expectation did not materialize in this particular period.
Another relative value pairing, setting the U.S. large-cap segment against small-cap equity, also
PORTFOLIO COMPOSITION AS OF 4/30/18 (%)
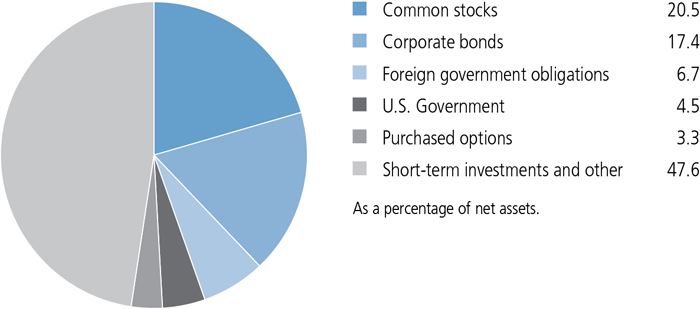
An allocation to the South Korea's equity market also weighed on the fund's results, as the twists and turns of geopolitical tensions on the Korean peninsula continued. Separately, certain currency pairs and inflation positions also hindered performance.
What about strategies that were positive contributors?
The fund's oil majors versus global equity relative value strategy, a new position with long exposure to oil company stocks and short exposure to the broader global equity market, was among the fund's leading contributors. Rebounding crude prices boosted large integrated oil shares, representing companies engaged in oil exploration, production, refining, and distribution.
Certain holdings designed to benefit from global rate movements, including three new positions—Italian versus German interest rates, Greek versus German government bonds, and short U.S. interest rates—fared well, too, partially offsetting losses elsewhere in the fund.
At a high level, how was the fund positioned at the end of the period, and how did that positioning reflect your expectations of key opportunities and risks?
The fund closed the period with continued equity exposure, designed to benefit from our central expectation of modest, broad-based global growth. We expect the European Central Bank to remain relatively cautious in the near term given elevated levels of uncertainty around the United Kingdom's withdrawal from the European Union. Some of the fund's largest equity positions
COUNTRY COMPOSITION AS OF 4/30/18 (%)
| United States | 31.7 |
| France | 11.4 |
| United Kingdom | 7.8 |
| Greece | 6.7 |
| Netherlands | 4.3 |
| Japan | 4.3 |
| Canada | 3.8 |
| Switzerland | 3.6 |
| Denmark | 3.5 |
| Russia | 3.4 |
| Other countries | 19.5 |
| TOTAL | 100.0 |
| As a percentage of net assets. |
included European dividends, European equity banks, U.S. equity banks, European equity, and South Korean equity. The fund also held a Russian versus Brazilian equity relative value strategy.
The fund also holds a broad collection of other types of positions with exposure to inflation, credit, duration, foreign exchange, and volatility. They included the emerging-markets income and short U.K. inflation strategies. The fund maintains a position designed to benefit from the steepening of the U.S. inflation curve as longer-term inflation expectations seem poised to rise. Meanwhile, the United States has continued to move toward an environment of tightening monetary policy.
We will continue seeking to exploit the opportunities-—and guard against the risks—that these conditions present by implementing a diversified range of strategies using multiple asset classes from regions around the world.
MANAGED BY
 | Neil J. Richardson On the fund since inception Investing since 1985 |
 | David Sol On the fund since inception Investing since 2003 |
![]()
TOTAL RETURNS FOR THE PERIOD ENDED APRIL 30, 2018
| Average annual total returns (%) with maximum sales charge | Cumulative total returns (%) with maximum sales charge | |||||
| 1-year | Since inception1 | 6-month | Since inception1 | |||
| Class A | -5.52 | -3.89 | -8.21 | -7.80 | ||
| Class C | -2.15 | -2.10 | -4.52 | -4.25 | ||
| Class I2 | -0.13 | -1.10 | -3.03 | -2.23 | ||
| Class R62 | -0.13 | -1.00 | -3.03 | -2.04 | ||
| Class NAV2 | -0.13 | -1.00 | -3.03 | -2.04 | ||
| Index 1† | 1.23 | 1.10 | 0.55 | 2.26 | ||
Performance figures assume all distributions have been reinvested. Figures reflect maximum sales charges on Class A shares of 5% and the applicable contingent deferred sales charge (CDSC) on Class C shares. Class C shares sold within one year of purchase are subject to a 1% CDSC. Sales charges are not applicable to Class I, Class R6, and Class NAV shares.
The expense ratios of the fund, both net (including any fee waivers and/or expense limitations) and gross (excluding any fee waivers and/or expense limitations), are set forth according to the most recent publicly available prospectuses for the fund and may differ from those disclosed in the Financial highlights tables in this report. Net expenses reflect contractual expense limitations in effect until February 28, 2019 and are subject to change. Had the contractual fee waivers and expense limitations not been in place, gross expenses would apply. The expense ratios are as follows:
| Class A | Class C | Class I | Class R6 | Class NAV | |
| Gross (%) | 2.89 | 3.64 | 2.63 | 2.54 | 2.52 |
| Net (%) | 1.99 | 2.74 | 1.73 | 1.64 | 1.62 |
Please refer to the most recent prospectus and annual or semiannual report for more information on expenses and any expense limitation arrangements for each class.
The returns reflect past results and should not be considered indicative of future performance. The return and principal value of an investment will fluctuate so that shares, when redeemed, may be worth more or less than their original cost. Due to market volatility and other factors, the fund's current performance may be higher or lower than the performance shown. For current to the most recent month-end performance data, please call 800-225-5291 or visit the fund's website at jhinvestments.com.
The performance table above and the chart on the next page do not reflect the deduction of taxes that a shareholder would pay on fund distributions or the redemption of fund shares. The fund's performance results reflect any applicable fee waivers or expense reductions, without which the expenses would increase and results would have been less favorable.
| † | Index is the ICE Bank of America Merrill Lynch U.S. Dollar 6-Month LIBOR Constant Maturity Index. |
See the following page for footnotes.
This chart and table show what happened to a hypothetical $10,000 investment in John Hancock Global Focused Strategies Fund for the share classes and periods indicated, assuming all distributions were reinvested. For comparison, we've shown the same investment in the ICE Bank of America Merrill Lynch U. S. Dollar 6-Month LIBOR Constant Maturity Index.
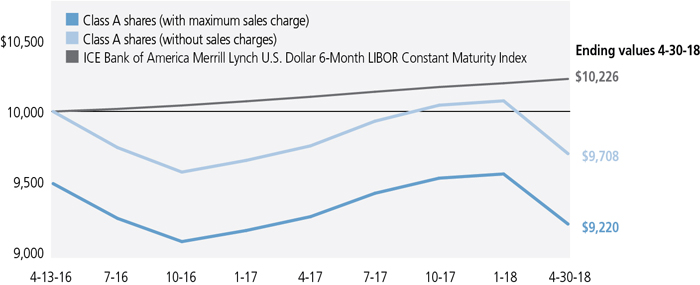
| Start date | With maximum sales charge ($) | Without sales charge ($) | Index ($) | |
| Class C | 4-13-16 | 9,575 | 9,575 | 10,226 |
| Class I2 | 4-13-16 | 9,777 | 9,777 | 10,226 |
| Class R62 | 4-13-16 | 9,796 | 9,796 | 10,226 |
| Class NAV2 | 4-13-16 | 9,796 | 9,796 | 10,226 |
The ICE Bank of America Merrill Lynch U.S. Dollar 6-Month LIBOR Constant Maturity Index tracks the performance of a synthetic asset paying LIBOR (London Interbank Offered Rate) to a stated maturity.
It is not possible to invest directly in an index. Index figures do not reflect expenses or sales charges, which would result in lower returns.
Footnotes related to performance pages
| 1 | From 4-13-16 |
| 2 | For certain types of investors, as described in the fund's prospectuses. |
These examples are intended to help you understand your ongoing operating expenses of investing in the fund so you can compare these costs with the ongoing costs of investing in other mutual funds.
Understanding fund expenses
As a shareholder of the fund, you incur two types of costs:
| • | Transaction costs, which include sales charges (loads) on purchases or redemptions (varies by share class), minimum account fee charge, etc. |
| • | Ongoing operating expenses, including management fees, distribution and service fees (if applicable), and other fund expenses. |
We are presenting only your ongoing operating expenses here.
Actual expenses/actual returns
The first line of each share class in the table on the following page is intended to provide information about the fund's actual ongoing operating expenses, and is based on the fund's actual return. It assumes an account value of $1,000.00 on November 1, 2017, with the same investment held until April 30, 2018.
Together with the value of your account, you may use this information to estimate the operating expenses that you paid over the period. Simply divide your account value at April 30, 2018, by $1,000.00, then multiply it by the "expenses paid" for your share class from the table. For example, for an account value of $8,600.00, the operating expenses should be calculated as follows:
Hypothetical example for comparison purposes
The second line of each share class in the table on the following page allows you to compare the fund's ongoing operating expenses with those of any other fund. It provides an example of the fund's hypothetical account values and hypothetical expenses based on each class's actual expense ratio and an assumed 5% annualized return before expenses (which is not the fund's actual return). It assumes an account value of $1,000.00 on November 1, 2017, with the same investment held until April 30, 2018. Look in any other fund shareholder report to find its hypothetical example and you will be able to compare these expenses. Please remember that these hypothetical account values and expenses may not be used to estimate the actual ending account balance or expenses you paid for the period.
Remember, these examples do not include any transaction costs, therefore, these examples will not help you to determine the relative total costs of owning different funds. If transaction costs were included, your expenses would have been higher. See the prospectuses for details regarding transaction costs.
SHAREHOLDER EXPENSE EXAMPLE CHART
| Account value on 11-1-2017 | Ending value on 4-30-2018 | Expenses paid during period ended 4-30-20181 | Annualized expense ratio | ||
| Class A | Actual expenses/actual returns | $1,000.00 | $1,000.00 | $9.82 | 1.98% |
| Hypothetical example for comparison purposes | 1,000.00 | 1,015.00 | 9.89 | 1.98% | |
| Class C | Actual expenses/actual returns | 1,000.00 | 1,000.00 | 13.54 | 2.73% |
| Hypothetical example for comparison purposes | 1,000.00 | 1,011.30 | 13.61 | 2.73% | |
| Class I | Actual expenses/actual returns | 1,000.00 | 1,000.00 | 8.58 | 1.73% |
| Hypothetical example for comparison purposes | 1,000.00 | 1,016.20 | 8.65 | 1.73% | |
| Class R6 | Actual expenses/actual returns | 1,000.00 | 1,000.00 | 8.03 | 1.62% |
| Hypothetical example for comparison purposes | 1,000.00 | 1,016.80 | 8.10 | 1.62% | |
| Class NAV | Actual expenses/actual returns | 1,000.00 | 969.70 | 7.91 | 1.62% |
| Hypothetical example for comparison purposes | 1,000.00 | 1,016.80 | 8.10 | 1.62% | |
| 1 | Expenses are equal to the annualized expense ratio, multiplied by the average account value over the period, multiplied by 181/365 (to reflect the one-half year period). |
| Fund’s investments |
| Rate (%) | Maturity date | Par value^ | Value | ||
| U.S. Government and Agency obligations 4.5% | $2,108,034 | ||||
| (Cost $2,121,147) | |||||
| United States 4.5% | 2,108,034 | ||||
| U.S. Treasury Treasury Inflation Protected Security (A) | 1.375 | 02-15-44 | 1,785,800 | 2,108,034 | |
| Foreign government obligations 6.7% | $3,132,640 | ||||
| (Cost $3,111,175) | |||||
| Greece 6.7% | 3,132,640 | ||||
| Republic of Greece | |||||
| Bond (B) | 3.375 | 02-15-25 | EUR | 882,000 | 1,057,058 |
| Bond | 3.500 | 01-30-23 | EUR | 848,000 | 1,052,926 |
| Bond (B) | 4.375 | 08-01-22 | EUR | 795,000 | 1,022,656 |
| Corporate bonds 17.4% | $8,062,192 | ||||
| (Cost $8,004,447) | |||||
| Argentina 0.5% | 259,684 | ||||
| Cablevision SA | 6.500 | 06-15-21 | 250,000 | 259,684 | |
| Brazil 0.6% | 273,000 | ||||
| Petrobras Global Finance BV | 4.375 | 05-20-23 | 280,000 | 273,000 | |
| Canada 0.6% | 264,358 | ||||
| PTTEP Canada International Finance, Ltd. | 5.692 | 04-05-21 | 250,000 | 264,358 | |
| Cayman Islands 0.6% | 265,497 | ||||
| MAF Global Securities, Ltd. (5.500% to 9-7-22, then 5 Year U.S. Swap Rate + 3.476) (C) | 5.500 | 09-07-22 | 270,000 | 265,497 | |
| Colombia 0.5% | 259,875 | ||||
| Bancolombia SA (4.875% to 10-18-22, then 1 Year CMT + 2.929%) | 4.875 | 10-18-27 | 270,000 | 259,875 | |
| Denmark 1.3% | 614,588 | ||||
| Danske Bank A/S (6.125% to 3-28-24, then 7 Year U.S. Swap Rate + 3.896%) (C) | 6.125 | 03-28-24 | 607,000 | 614,588 | |
| France 2.8% | 1,290,422 | ||||
| Credit Agricole SA (8.125% to 9-19-18, then 5 Year U.S. Swap Rate + 6.283%) | 8.125 | 09-19-33 | 435,000 | 442,512 | |
| Societe Generale SA (6.750% to 4-7-21, then 5 Year Euro Swap Rate + 5.538%) (C) | 6.750 | 04-07-21 | EUR | 326,000 | 437,410 |
| Societe Generale SA (8.250% to 11-29-18, then 5 Year U.S. Swap Rate + 6.394%) (C) | 8.250 | 11-29-18 | 400,000 | 410,500 | |
| Germany 0.6% | 261,721 | ||||
| Aareal Bank AG (7.625% to 4-30-20, then 1 Year Euro Swap Rate + 7.180%) (C) | 7.625 | 04-30-20 | EUR | 200,000 | 261,721 |
| 12 | JOHN HANCOCK GLOBAL FOCUSED STRATEGIES FUND | SEMIANNUAL REPORT | SEE NOTES TO FINANCIAL STATEMENTS |
| Rate (%) | Maturity date | Par value^ | Value | ||
| Guatemala 0.6% | $269,703 | ||||
| Comunicaciones Celulares SA | 6.875 | 02-06-24 | 260,000 | 269,703 | |
| Hong Kong 1.1% | 531,736 | ||||
| China Resources Gas Group, Ltd. | 4.500 | 04-05-22 | 260,000 | 265,048 | |
| Shimao Property Holdings, Ltd. | 8.375 | 02-10-22 | 250,000 | 266,688 | |
| Italy 0.6% | 264,873 | ||||
| Intesa Sanpaolo SpA (7.000% to 1-19-21, then 5 Year Euro Swap Rate + 6.884%) (C) | 7.000 | 01-19-21 | EUR | 200,000 | 264,873 |
| Kazakhstan 0.6% | 266,793 | ||||
| KazMunayGas National Company JSC | 3.875 | 04-19-22 | 270,000 | 266,793 | |
| Mexico 1.1% | 507,990 | ||||
| Petroleos Mexicanos | 3.500 | 01-30-23 | 270,000 | 255,015 | |
| Unifin Financiera SA | 7.250 | 09-27-23 | 250,000 | 252,975 | |
| Netherlands 0.6% | 263,256 | ||||
| ABN AMRO Bank NV (5.750% to 9-22-20, then 5 Year Euro Swap Rate + 5.452%) (C) | 5.750 | 09-22-20 | EUR | 200,000 | 263,256 |
| Russia 0.6% | 275,652 | ||||
| Gazprom OAO | 6.510 | 03-07-22 | 260,000 | 275,652 | |
| Switzerland 2.0% | 938,252 | ||||
| Credit Suisse Group AG (7.125% to 7-29-22, then 5 Year U.S. Swap Rate + 5.108%) (C) | 7.125 | 07-29-22 | 513,000 | 538,137 | |
| UBS AG (4.750% to 5-22-18, then 5 Year U.S. Swap Rate + 3.765%) | 4.750 | 05-22-23 | 400,000 | 400,115 | |
| Turkey 0.6% | 268,558 | ||||
| Turk Telekomunikasyon AS | 3.750 | 06-19-19 | 270,000 | 268,558 | |
| United Kingdom 1.5% | 716,481 | ||||
| Liquid Telecommunications Financing PLC | 8.500 | 07-13-22 | 250,000 | 263,151 | |
| The Royal Bank of Scotland Group PLC (8.625% to 8-15-21, then 5 Year U.S. Swap Rate + 7.598%) (C) | 8.625 | 08-15-21 | 414,000 | 453,330 | |
| Virgin Islands, British 0.6% | 269,753 | ||||
| Gerdau Trade, Inc. | 5.750 | 01-30-21 | 260,000 | 269,753 | |
| Shares | Value | ||||
| Common stocks 20.5% | $9,504,232 | ||||
| (Cost $8,926,432) | |||||
| France 1.6% | 727,492 | ||||
| Danone SA | 3,437 | 278,417 | |||
| TOTAL SA | 7,145 | 449,075 |
| SEE NOTES TO FINANCIAL STATEMENTS | SEMIANNUAL REPORT | JOHN HANCOCK GLOBAL FOCUSED STRATEGIES FUND | 13 |
| Shares | Value | ||||
| Germany 0.4% | $199,182 | ||||
| Suedzucker AG | 4,300 | 71,468 | |||
| Symrise AG | 1,580 | 127,714 | |||
| Ireland 0.5% | 234,388 | ||||
| Glanbia PLC | 4,830 | 81,580 | |||
| Kerry Group PLC, Class A | 1,499 | 152,808 | |||
| Italy 1.0% | 450,923 | ||||
| Eni SpA | 23,067 | 450,923 | |||
| Netherlands 1.6% | 736,237 | ||||
| Heineken NV | 2,750 | 289,507 | |||
| Royal Dutch Shell PLC, A Shares | 12,766 | 446,730 | |||
| Norway 0.2% | 101,428 | ||||
| Orkla ASA | 10,959 | 101,428 | |||
| Russia 2.8% | 1,290,273 | ||||
| Lenta, Ltd. (D) | 20,479 | 115,048 | |||
| LUKOIL PJSC, ADR | 3,996 | 266,356 | |||
| Magnit PJSC, GDR | 5,174 | 97,827 | |||
| Mail.Ru Group, Ltd., GDR (D) | 3,977 | 126,050 | |||
| RusHydro PJSC, ADR | 100,572 | 113,646 | |||
| Sberbank of Russia PJSC, ADR | 14,936 | 220,605 | |||
| VTB Bank PJSC, GDR | 98,551 | 184,341 | |||
| Yandex NV, Class A (D) | 4,988 | 166,400 | |||
| Spain 0.9% | 436,309 | ||||
| Repsol SA | 22,864 | 436,309 | |||
| Switzerland 1.6% | 731,837 | ||||
| Chocoladefabriken Lindt & Spruengli AG (D) | 2 | 151,694 | |||
| Givaudan SA | 73 | 162,502 | |||
| Nestle SA | 5,391 | 417,641 | |||
| United Kingdom 1.9% | 898,326 | ||||
| BP PLC | 60,329 | 448,125 | |||
| Unilever NV | 7,853 | 450,201 | |||
| United States 8.0% | 3,697,837 | ||||
| Bank of America Corp. | 12,504 | 374,120 | |||
| BB&T Corp. | 2,160 | 114,048 | |||
| Chevron Corp. | 3,585 | 448,519 | |||
| Citigroup, Inc. | 4,712 | 321,688 | |||
| Comerica, Inc. | 565 | 53,438 | |||
| Exxon Mobil Corp. | 5,511 | 428,480 | |||
| Fifth Third Bancorp | 2,322 | 77,021 | |||
| Huntington Bancshares, Inc. | 2,442 | 36,410 | |||
| JPMorgan Chase & Co. | 3,409 | 370,831 | |||
| KeyCorp | 3,720 | 74,102 |
| 14 | JOHN HANCOCK GLOBAL FOCUSED STRATEGIES FUND | SEMIANNUAL REPORT | SEE NOTES TO FINANCIAL STATEMENTS |
| Shares | Value | ||||
| United States (continued) | |||||
| M&T Bank Corp. | 349 | $63,612 | |||
| Occidental Petroleum Corp. | 5,749 | 444,168 | |||
| People's United Financial, Inc. | 1,836 | 33,580 | |||
| Regions Financial Corp. | 4,268 | 79,812 | |||
| SunTrust Banks, Inc. | 1,346 | 89,913 | |||
| The PNC Financial Services Group, Inc. | 1,097 | 159,734 | |||
| U.S. Bancorp | 3,013 | 152,006 | |||
| Wells Fargo & Company | 6,239 | 324,178 | |||
| Zions Bancorporation | 953 | 52,177 | |||
| Contracts/Notional amount | Value | ||||
| Purchased options 3.3% | $1,552,420 | ||||
| (Cost $1,495,181) | |||||
| Calls 2.0% | 916,932 | ||||
| Exchange Traded Option on Euro STOXX 50 Price Index (Expiration Date: 3-15-19; Strike Price: EUR 3,450.00; Notional Amount: 590) (D) | 59 | 125,468 | |||
| Over the Counter Option on 10 Year Interest Rate Swap. Receive a fixed rate of 2.740% and pay a floating rate based on 3-month LIBOR (Expiration Date: 10-12-27; Strike Rate: 2.740%; Counterparty: Morgan Stanley & Company, Inc.) (D)(E) | 5,340,000 | 371,397 | |||
| Over the Counter Option on Euro STOXX Banks Index (Expiration Date: 6-18-18; Strike Price: EUR 127.42; Counterparty: Merrill Lynch) (D)(E) | 5,725 | 20,312 | |||
| Over the Counter Option on Euro STOXX Banks Index (Expiration Date: 6-18-18; Strike Price: EUR 128.41; Counterparty: Merrill Lynch) (D)(E) | 5,725 | 16,811 | |||
| Over the Counter Option on KOSPI 200 Index (Expiration Date: 12-14-18; Strike Price: KRW 310.00; Counterparty: Societe Generale Paris) (D)(E) | 12,754,015 | 282,571 | |||
| Over the Counter Option on KOSPI 200 Index (Expiration Date: 12-14-18; Strike Price: KRW 330.00; Counterparty: Societe Generale Paris) (D)(E) | 9,000,000 | 100,373 | |||
| Puts 1.3% | 635,488 | ||||
| Over the Counter Option on 10 Year Interest Rate Swap. Receive a floating rate based on 3-month LIBOR and pay a fixed rate of 2.740% (Expiration Date: 10-12-27; Strike Rate: 2.740%; Counterparty: Morgan Stanley & Company, Inc.) (D)(E) | 5,340,000 | 564,945 | |||
| Over the Counter Option on the EUR vs. USD (Expiration Date: 3-5-19; Strike Price: EUR 1.21; Counterparty: Deutsche Bank) (D)(E) | 3,770,000 | 70,543 | |||
| Yield* (%) | Maturity date | Par value^ | Value | ||
| Short-term investments 46.9% | $21,769,679 | ||||
| (Cost $21,769,093) | |||||
| Certificate of deposit 18.3% | 8,496,391 | ||||
| Bank of Montreal | 1.920 | 05-25-18 | 1,000,000 | 1,000,290 | |
| Danske Bank A/S | 1.790 | 05-02-18 | 1,000,000 | 1,000,020 | |
| DZ Bank AG | 2.290 | 07-10-18 | 1,000,000 | 1,000,270 | |
| ING Bank NV | 1.910 | 06-20-18 | 1,000,000 | 999,776 | |
| Mizuho Bank, Ltd. | 2.386 | 07-23-18 | 1,000,000 | 994,604 | |
| Natixis SA | 2.350 | 08-01-18 | 1,000,000 | 1,001,590 | |
| Standard Chartered PLC | 2.480 | 10-23-18 | 1,000,000 | 999,869 | |
| Sumitomo Mitsui Financial Group, Inc. | 2.060 | 06-25-18 | 1,000,000 | 999,990 |
| SEE NOTES TO FINANCIAL STATEMENTS | SEMIANNUAL REPORT | JOHN HANCOCK GLOBAL FOCUSED STRATEGIES FUND | 15 |
| Yield* (%) | Maturity date | Par value^ | Value | ||
| Certificate of deposit (continued) | |||||
| The Toronto-Dominion Bank | 1.760 | 05-16-18 | 500,000 | $499,982 | |
| Commercial paper 6.5% | 2,992,601 | ||||
| Agence Centrale Organismes | 1.979 | 05-09-18 | 1,000,000 | 999,489 | |
| Nationwide Building Society | 1.822 | 05-14-18 | 1,000,000 | 999,223 | |
| OP Corporate Bank PLC | 2.306 | 07-31-18 | 1,000,000 | 993,889 | |
| Time deposits 5.7% | 2,646,315 | ||||
| BNP Paribas SA | 1.650 | 05-01-18 | 1,280,883 | 1,280,883 | |
| KBC Bank NV | 1.690 | 05-01-18 | 1,365,432 | 1,365,432 | |
| U.S. Government 15.0% | 6,977,353 | ||||
| U.S. Treasury Bill | 1.622 | 05-17-18 | 2,000,000 | 1,998,584 | |
| U.S. Treasury Bill (A) | 1.705 | 07-26-18 | 5,000,000 | 4,978,769 |
| Yield (%) | Shares | Value | |||
| Money market funds 1.4% | 657,019 | ||||
| Federated Government Obligations Fund, Institutional Class | 1.5571(F) | 657,019 | 657,019 | ||
| Total investments (Cost $45,427,475) 99.3% | $46,129,197 | ||||
| Other assets and liabilities, net 0.7% | 342,529 | ||||
| Total net assets 100.0% | $46,471,726 | ||||
| The percentage shown for each investment category is the total value of the category as a percentage of the net assets of the fund. | |
| ^All par values are denominated in U.S. dollars unless otherwise indicated. | |
| Currency Abbreviations | |
| EUR | Euro |
| KRW | Korean Won |
| Security Abbreviations and Legend | |
| ADR | American Depositary Receipt |
| CMT | Constant Maturity Treasury |
| GDR | Global Depositary Receipt |
| LIBOR | London Interbank Offered Rate |
| (A) | All or a portion of this security is segregated at the custodian as collateral for certain derivatives. |
| (B) | These securities are exempt from registration under Rule 144A of the Securities Act of 1933. Such securities may be resold, normally to qualified institutional buyers, in transactions exempt from registration. |
| (C) | Perpetual bonds have no stated maturity date. Date shown as maturity date is next call date. |
| (D) | Non-income producing security. |
| (E) | For this type of option, notional amounts are equivalent to number of contracts. |
| (F) | The rate shown is the annualized seven-day yield as of 4-30-18. |
| * | Yield represents either the annualized yield at the date of purchase, the stated coupon rate or, for floating rate securities, the rate at period end. |
| 16 | JOHN HANCOCK GLOBAL FOCUSED STRATEGIES FUND | SEMIANNUAL REPORT | SEE NOTES TO FINANCIAL STATEMENTS |
| Open contracts | Number of contracts | Position | Expiration date | Notional basis* | Notional value* | Unrealized appreciation (depreciation) |
| CBOE Volatility Index Futures | 18 | Long | Jul 2018 | $319,808 | $310,950 | $(8,858) |
| CBOE Volatility Index Futures | 18 | Long | Aug 2018 | 346,980 | 313,650 | (33,330) |
| Euro STOXX 50 Index Dividend Futures | 243 | Long | Dec 2022 | 3,597,652 | 3,615,259 | 17,607 |
| Euro-BTP Italian Government Bond Futures | 49 | Long | Jun 2018 | 7,973,079 | 8,225,543 | 252,464 |
| FTSE 100 Index Futures | 19 | Long | Jun 2018 | 1,863,000 | 1,949,125 | 86,125 |
| S&P 500 Index E-Mini Futures | 47 | Long | Jun 2018 | 6,483,354 | 6,220,450 | (262,904) |
| SGX Nifty 50 Index Futures | 68 | Long | Jun 2018 | 1,444,493 | 1,460,776 | 16,283 |
| STOXX Europe 600 Index Futures | 102 | Long | Jun 2018 | 2,289,946 | 2,340,941 | 50,995 |
| CBOE Volatility Index Futures | 18 | Short | May 2018 | (321,821) | (299,250) | 22,571 |
| CBOE Volatility Index Futures | 18 | Short | Jun 2018 | (346,658) | (304,650) | 42,008 |
| Euro- BOBL Futures | 20 | Short | Jun 2018 | (3,149,669) | (3,163,907) | (14,238) |
| Euro STOXX 50 Index Futures | 40 | Short | Jun 2018 | (1,647,787) | (1,673,248) | (25,461) |
| German Euro-BUND Futures | 40 | Short | Jun 2018 | (7,594,996) | (7,667,766) | (72,770) |
| Russell 2000 E-Mini Index Futures | 61 | Short | Jun 2018 | (4,859,317) | (4,708,590) | 150,727 |
| $221,219 |
| Contract to buy | Contract to sell | Counterparty (OTC) | Contractual settlement date | Unrealized appreciation | Unrealized depreciation | ||
| ARS | 2,904,200 | USD | 135,707 | Chase | 6/27/2018 | — | $(642) |
| ARS | 2,171,500 | USD | 102,236 | JPMorgan Chase & Co. | 7/17/2018 | — | (2,593) |
| BRL | 440,000 | USD | 125,160 | Chase | 6/7/2018 | — | (13) |
| BRL | 380,000 | USD | 116,279 | Deutsche Bank AG | 6/7/2018 | — | (8,197) |
| BRL | 5,724,400 | USD | 1,750,153 | Merrill Lynch | 6/7/2018 | — | (121,986) |
| BRL | 2,708,700 | USD | 822,488 | Merrill Lynch | 6/27/2018 | — | (53,566) |
| COP | 989,200,000 | USD | 344,585 | Barclays Capital | 6/27/2018 | $7,260 | — |
| COP | 847,150,000 | USD | 304,851 | JPMorgan Chase & Co. | 7/17/2018 | — | (3,706) |
| CZK | 3,638,800 | USD | 176,983 | Bank National Paris | 6/27/2018 | — | (4,753) |
| EUR | 3,007,548 | SEK | 31,080,000 | Barclays Capital | 5/11/2018 | 82,619 | — |
| EUR | 153,687 | USD | 189,456 | Morgan Stanley & Company, Inc. | 5/11/2018 | — | (3,736) |
| EUR | 108,000 | USD | 134,107 | Chase | 5/23/2018 | — | (3,478) |
| EUR | 1,166,606 | USD | 1,466,381 | Deutsche Bank AG | 5/23/2018 | — | (55,333) |
| GBP | 130,000 | USD | 184,910 | JPMorgan Chase & Co. | 5/23/2018 | — | (5,757) |
| GBP | 96,000 | USD | 137,273 | Royal Bank of Canada | 5/23/2018 | — | (4,975) |
| GBP | 1,852,000 | USD | 2,612,005 | HSBC | 5/29/2018 | — | (59,019) |
| HUF | 121,385,000 | USD | 482,514 | Deutsche Bank AG | 6/27/2018 | — | (13,552) |
| IDR | 15,393,500,000 | USD | 1,106,332 | Merrill Lynch | 6/27/2018 | — | (7,605) |
| INR | 26,340,000 | USD | 400,112 | Merrill Lynch | 6/27/2018 | — | (6,621) |
| JPY | 268,300,000 | USD | 2,554,155 | Chase | 6/14/2018 | — | (92,477) |
| KRW | 130,000,000 | USD | 120,356 | Bank National Paris | 6/7/2018 | 1,119 | — |
| KRW | 150,000,000 | USD | 141,785 | HSBC | 6/7/2018 | — | (1,622) |
| SEE NOTES TO FINANCIAL STATEMENTS | SEMIANNUAL REPORT | JOHN HANCOCK GLOBAL FOCUSED STRATEGIES FUND | 17 |
| Contract to buy | Contract to sell | Counterparty (OTC) | Contractual settlement date | Unrealized appreciation | Unrealized depreciation | ||
| KRW | 2,792,000,000 | USD | 2,652,732 | Morgan Stanley & Company, Inc. | 6/7/2018 | — | $(43,825) |
| MXN | 12,264,500 | USD | 647,347 | Citigroup | 6/27/2018 | $2,589 | — |
| MXN | 3,976,000 | USD | 214,199 | Societe Generale Paris | 7/17/2018 | — | (4,158) |
| MYR | 1,414,350 | USD | 361,486 | Barclays Capital | 6/27/2018 | — | (3,743) |
| PEN | 493,600 | USD | 151,064 | Chase | 6/27/2018 | 411 | — |
| PEN | 442,100 | USD | 136,278 | Citigroup | 7/17/2018 | — | (675) |
| RON | 1,506,450 | USD | 398,606 | Citigroup | 6/27/2018 | — | (8,290) |
| RUB | 32,489,000 | USD | 564,820 | Barclays Capital | 6/27/2018 | — | (52,398) |
| SEK | 31,080,000 | EUR | 3,161,235 | Barclays Capital | 5/11/2018 | — | (268,339) |
| SEK | 1,050,000 | USD | 125,925 | Royal Bank of Canada | 7/12/2018 | — | (5,331) |
| THB | 21,979,000 | USD | 704,907 | Merrill Lynch | 6/27/2018 | — | (7,377) |
| TRY | 1,457,350 | USD | 369,793 | Citigroup | 6/27/2018 | — | (17,269) |
| USD | 2,314,154 | AUD | 3,010,000 | Morgan Stanley & Company, Inc. | 7/3/2018 | 47,586 | — |
| USD | 116,137 | BRL | 380,000 | Deutsche Bank AG | 6/7/2018 | 8,055 | — |
| USD | 282,385 | BRL | 950,000 | JPMorgan Chase & Co. | 6/7/2018 | 12,181 | — |
| USD | 800,662 | CHF | 734,926 | Deutsche Bank AG | 5/23/2018 | 57,701 | — |
| USD | 476,600 | EUR | 386,083 | Bank National Paris | 5/23/2018 | 9,621 | — |
| USD | 183,254 | EUR | 150,000 | Chase | 5/23/2018 | 1,824 | — |
| USD | 4,138,686 | EUR | 3,292,607 | Deutsche Bank AG | 5/23/2018 | 156,172 | — |
| USD | 4,502,990 | EUR | 3,637,389 | Morgan Stanley & Company, Inc. | 5/23/2018 | 103,452 | — |
| USD | 794,256 | EUR | 640,000 | Deutsche Bank AG | 6/27/2018 | 17,972 | — |
| USD | 2,140,421 | EUR | 1,720,000 | Morgan Stanley & Company, Inc. | 7/17/2018 | 50,806 | — |
| USD | 98,531 | GBP | 69,865 | Bank National Paris | 5/23/2018 | 2,250 | — |
| USD | 82,912 | GBP | 58,830 | Citigroup | 5/23/2018 | 1,839 | — |
| USD | 92,072 | GBP | 65,285 | JPMorgan Chase & Co. | 5/23/2018 | 2,102 | — |
| USD | 80,008 | GBP | 56,342 | Morgan Stanley & Company, Inc. | 5/23/2018 | 2,362 | — |
| USD | 65,810 | GBP | 46,570 | Royal Bank of Canada | 5/23/2018 | 1,632 | — |
| USD | 2,606,103 | GBP | 1,852,000 | Societe Generale Paris | 5/29/2018 | 53,116 | — |
| USD | 2,889,394 | GBP | 2,075,000 | Royal Bank of Scotland | 6/27/2018 | 24,719 | — |
| USD | 256,613 | GBP | 181,900 | Citigroup | 7/12/2018 | 5,301 | — |
| USD | 77,512 | JPY | 8,200,000 | Societe Generale Paris | 5/23/2018 | 2,393 | — |
| USD | 215,818 | JPY | 22,800,000 | Morgan Stanley & Company, Inc. | 6/14/2018 | 6,625 | — |
| USD | 3,150,081 | KRW | 3,369,000,000 | Bank National Paris | 6/7/2018 | 2,014 | — |
| USD | 121,148 | NOK | 940,937 | JPMorgan Chase & Co. | 5/23/2018 | 3,771 | — |
| USD | 1,274,671 | RUB | 72,010,000 | HSBC | 6/7/2018 | 136,326 | — |
| ZAR | 9,868,500 | USD | 820,721 | Deutsche Bank AG | 6/27/2018 | — | (34,943) |
| $803,818 | $(895,979) | ||||||
| 18 | JOHN HANCOCK GLOBAL FOCUSED STRATEGIES FUND | SEMIANNUAL REPORT | SEE NOTES TO FINANCIAL STATEMENTS |
| Options on index | ||||||||
| Counterparty (OTC)/ Exchange- traded | Name of issuer | Exercise price | Expiration date | Number of contracts | Notional amount | Premium | Value | |
| Calls | ||||||||
| Barclays Bank | S&P 500 Index | USD | 2,640.87 | May 2018 | 294 | 294 | $15,541 | $(2,111) |
| Merrill Lynch | S&P 500 Index | USD | 2,648.05 | Jun 2018 | 291 | 291 | 11,640 | (11,640) |
| Societe Generale Paris | OMX Stockholm 30 Index | SEK | 1,535.00 | May 2018 | 4,240 | 4,240 | 10,156 | (17,290) |
| Societe Generale Paris | OMX Stockholm 30 Index | SEK | 1,577.00 | Jun 2018 | 4,290 | 4,290 | 9,676 | (9,676) |
| Societe Generale Paris | S&P/ASX 200 Index | AUD | 5,765.00 | May 2018 | 173 | 173 | 11,959 | (28,358) |
| Societe Generale Paris | S&P/ASX 200 Index | AUD | 5,983.00 | Jun 2018 | 173 | 173 | 8,075 | (8,075) |
| $67,047 | $(77,150) | |||||||
| Puts | ||||||||
| Barclays Bank | S&P 500 Index | USD | 2,640.87 | May 2018 | 294 | 294 | $14,700 | — |
| Merrill Lynch | Euro STOXX Banks Price Index | EUR | 128.41 | Jun 2018 | 5,725 | 5,725 | 35,452 | $(22,271) |
| Merrill Lynch | Euro STOXX Banks Price Index | EUR | 127.42 | Jun 2018 | 5,725 | 5,725 | 36,028 | (18,925) |
| Merrill Lynch | S&P 500 Index | USD | 2,648.05 | Jun 2018 | 291 | 291 | 11,747 | (11,747) |
| Societe Generale Paris | OMX Stockholm 30 Index | SEK | 1,535.00 | May 2018 | 4,240 | 4,240 | 17,570 | — |
| Societe Generale Paris | OMX Stockholm 30 Index | SEK | 1,577.00 | Jun 2018 | 4,290 | 4,290 | 13,721 | (13,721) |
| Societe Generale Paris | S&P/ASX 200 Index | AUD | 5,765.00 | May 2018 | 173 | 173 | 11,289 | — |
| Societe Generale Paris | S&P/ASX 200 Index | AUD | 5,983.00 | Jun 2018 | 173 | 173 | 10,634 | (10,634) |
| $151,141 | $(77,298) | |||||||
| Exchange-traded | Euro STOXX 50 Price Index | EUR | 3,200.00 | Mar 2019 | 59 | 590 | 91,628 | (75,096) |
| $91,628 | $(75,096) | |||||||
| $309,816 | $(229,544) | |||||||
| Interest rate swaps | ||||||||||
| Counterparty (OTC)/ Centrally cleared | Notional amount | Currency | Payments made | Payments received | Fixed payment frequency | Floating payment frequency | Maturity date | Unamortized upfront payment paid (received) | Unrealized appreciation (depreciation) | Value |
| Centrally cleared | 26,200,000 | CAD | 3 month CDOR | Fixed 1.843% | Semi-Annual | Semi-Annual | Dec 2019 | — | $(82,678) | $(82,678) |
| Centrally cleared | 167,000,000 | SEK | Fixed -0.245% | 3 month STIBOR | Annual | Quarterly | Dec 2019 | — | 2,640 | 2,640 |
| Centrally cleared | 36,600,000 | USD | Fixed 2.652% | 3 month LIBOR | Semi-Annual | Quarterly | Mar 2020 | — | 90,666 | 90,666 |
| Centrally cleared | 3,690,000 | CAD | 3 month CDOR | Fixed 2.278% | Semi-Annual | Semi-Annual | Apr 2020 | — | 1,811 | 1,811 |
| Centrally cleared | 25,400,000 | SEK | Fixed -0.117% | 3 month STIBOR | Annual | Quarterly | Apr 2020 | — | (3,263) | (3,263) |
| Centrally cleared | 5,070,000 | CAD | Fixed 2.235% | 3 month CDOR | Semi-Annual | Semi-Annual | Dec 2027 | — | 133,739 | 133,739 |
| Centrally cleared | 31,500,000 | SEK | 3 month STIBOR | Fixed 1.048% | Annual | Quarterly | Dec 2027 | — | (33,462) | (33,462) |
| Centrally cleared | 332,000 | CAD | Fixed 2.735% | 3 month CDOR | Semi-Annual | Semi-Annual | Apr 2028 | — | (1,595) | (1,595) |
| SEE NOTES TO FINANCIAL STATEMENTS | SEMIANNUAL REPORT | JOHN HANCOCK GLOBAL FOCUSED STRATEGIES FUND | 19 |
| Interest rate swaps (continued) | ||||||||||
| Counterparty (OTC)/ Centrally cleared | Notional amount | Currency | Payments made | Payments received | Fixed payment frequency | Floating payment frequency | Maturity date | Unamortized upfront payment paid (received) | Unrealized appreciation (depreciation) | Value |
| Centrally cleared | 1,510,000 | SEK | 3 month STIBOR | Fixed 1.322% | Annual | Quarterly | Apr 2028 | — | $1,433 | $1,433 |
| Centrally cleared | 736,000,000 | JPY | 6 month LIBOR | Fixed 0.242% | Semi-Annual | Semi-Annual | Sep 2028 | — | (65,386) | (65,386) |
| Centrally cleared | 68,700,000 | JPY | 6 month LIBOR | Fixed 0.300% | Semi-Annual | Semi-Annual | Dec 2028 | — | (3,674) | (3,674) |
| Centrally cleared | 539,000,000 | JPY | 6 month LIBOR | Fixed 0.380% | Semi-Annual | Semi-Annual | May 2029 | — | (8,271) | (8,271) |
| Centrally cleared | 373,000,000 | JPY | Fixed 0.548% | 6 month LIBOR | Semi-Annual | Semi-Annual | Sep 2038 | — | 122,301 | 122,301 |
| Centrally cleared | 37,300,000 | JPY | Fixed 0.640% | 6 month LIBOR | Semi-Annual | Semi-Annual | Dec 2038 | — | 7,110 | 7,110 |
| Centrally cleared | 281,000,000 | JPY | Fixed 0.758% | 6 month LIBOR | Semi-Annual | Semi-Annual | May 2039 | — | 10,287 | 10,287 |
| Centrally cleared | 1,550,000 | EUR | Fixed 1.469% | 6 month EURIBOR | Annual | Semi-Annual | Sep 2047 | — | 5,237 | 5,237 |
| Centrally cleared | 1,610,000 | USD | Fixed 2.740% | 3 month LIBOR | Semi-Annual | Quarterly | Oct 2047 | — | 58,324 | 58,324 |
| Centrally cleared | 488,000 | USD | 3 month LIBOR | Fixed 2.740% | Semi-Annual | Quarterly | Oct 2047 | $(6,309) | (11,369) | (17,678) |
| $(6,309) | $223,850 | $217,541 | ||||||||
| Total return swaps | ||||||||||
| Pay/receive total return* | Reference entity | Floating rate | Payment frequency | Currency | Notional amount/ contract amount | Maturity date | Counterparty (OTC) | Unamortized upfront payment paid (received) | Unrealized appreciation (depreciation) | Value |
| Pay | Kingfisher PLC | 1 month GBP LIBOR - 0.25% | Monthly | GBP | 33,657 | Sep 2018 | BNP Paribas SA | — | $841 | $841 |
| Pay | Marks and Spencer Group PLC | 1 month GBP LIBOR - 0.25% | Monthly | GBP | 70,778 | Sep 2018 | BNP Paribas SA | — | (1,264) | (1,264) |
| Pay | Tesco PLC | 1 month GBP LIBOR - 0.25% | Monthly | GBP | 66,612 | Sep 2018 | BNP Paribas SA | — | 1,496 | 1,496 |
| Pay | Campbell Soup Company | 1 month USD LIBOR | Monthly | USD | 146,410 | Jun 2018 | Goldman Sachs | — | 7,051 | 7,051 |
| Pay | Campbell Soup Company | 1 month USD LIBOR | Monthly | USD | 9,247 | Jun 2018 | Goldman Sachs | — | 445 | 445 |
| Pay | Conagra Brands, Inc. | 1 month USD LIBOR | Monthly | USD | 172,654 | Jun 2018 | Goldman Sachs | — | (209) | (209) |
| Pay | Conagra Brands, Inc. | 1 month USD LIBOR | Monthly | USD | 22,549 | Jun 2018 | Goldman Sachs | — | (27) | (27) |
| Pay | Flowers Foods, Inc. | 1 month USD LIBOR | Monthly | USD | 71,597 | Jun 2018 | Goldman Sachs | — | (522) | (522) |
| Pay | Flowers Foods, Inc. | 1 month USD LIBOR | Monthly | USD | 1,256 | Jun 2018 | Goldman Sachs | — | (9) | (9) |
| Pay | General Mills, Inc. | 1 month USD LIBOR | Monthly | USD | 262,166 | Jun 2018 | Goldman Sachs | — | 8,886 | 8,886 |
| Pay | General Mills, Inc. | 1 month USD LIBOR | Monthly | USD | 12,079 | Jun 2018 | Goldman Sachs | — | 409 | 409 |
| Pay | Hormel Foods Corp. | 1 month USD LIBOR | Monthly | USD | 194,140 | Jun 2018 | Goldman Sachs | — | (4,294) | (4,294) |
| Pay | J.M. Smucker Company | 1 month USD LIBOR | Monthly | USD | 155,905 | Jun 2018 | Goldman Sachs | — | 8,970 | 8,970 |
| Pay | J.M. Smucker Company | 1 month USD LIBOR | Monthly | USD | 5,806 | Jun 2018 | Goldman Sachs | — | 334 | 334 |
| 20 | JOHN HANCOCK GLOBAL FOCUSED STRATEGIES FUND | SEMIANNUAL REPORT | SEE NOTES TO FINANCIAL STATEMENTS |
| Total return swaps (continued) | ||||||||||
| Pay/receive total return* | Reference entity | Floating rate | Payment frequency | Currency | Notional amount/ contract amount | Maturity date | Counterparty (OTC) | Unamortized upfront payment paid (received) | Unrealized appreciation (depreciation) | Value |
| Pay | Kellogg Company | 1 month USD LIBOR | Monthly | USD | 230,426 | Jun 2018 | Goldman Sachs | — | $17,967 | $17,967 |
| Pay | Kellogg Company | 1 month USD LIBOR | Monthly | USD | 16,532 | Jun 2018 | Goldman Sachs | — | 1,289 | 1,289 |
| Pay | McCormick & Company | 1 month USD LIBOR | Monthly | USD | 148,126 | Jun 2018 | Goldman Sachs | — | 2,664 | 2,664 |
| Pay | McCormick & Company | 1 month USD LIBOR | Monthly | USD | 13,729 | Jun 2018 | Goldman Sachs | — | 247 | 247 |
| Pay | Mondelez International, Inc. | 1 month USD LIBOR | Monthly | USD | 433,660 | Jun 2018 | Goldman Sachs | — | 28,354 | 28,354 |
| Pay | Mondelez International, Inc. | 1 month USD LIBOR | Monthly | USD | 6,546 | Jun 2018 | Goldman Sachs | — | 428 | 428 |
| Pay | Pilgrim’s Pride Corp. | 1 month USD LIBOR | Monthly | USD | 76,687 | Jun 2018 | Goldman Sachs | — | 7,926 | 7,926 |
| Pay | The Hershey Company | 1 month USD LIBOR | Monthly | USD | 218,574 | Jun 2018 | Goldman Sachs | — | 11,135 | 11,135 |
| Pay | The Hershey Company | 1 month USD LIBOR | Monthly | USD | 12,971 | Jun 2018 | Goldman Sachs | — | 661 | 661 |
| Pay | Atresmedia Corp. de Medios de Comunicacion SA | 1 month EURIBOR - 0.60% | Monthly | EUR | 34,228 | Mar 2019 | Goldman Sachs | — | (1,707) | (1,707) |
| Pay | Atresmedia Corp. de Medios de Comunicacion SA | 1 month EURIBOR - 0.60% | Monthly | EUR | 23,225 | Mar 2019 | Goldman Sachs | — | (1,158) | (1,158) |
| Pay | Atresmedia Corp. de Medios de Comunicacion SA | 1 month EURIBOR - 0.60% | Monthly | EUR | 71,379 | Mar 2019 | Goldman Sachs | — | (3,559) | (3,559) |
| Pay | ITV PLC | 1 month GBP LIBOR - 0.30% | Monthly | GBP | 114,143 | Mar 2019 | Goldman Sachs | — | (8,104) | (8,104) |
| Pay | Mediaset Espana Comunicacion SA | 1 month EURIBOR - 0.40% | Monthly | EUR | 56,862 | Mar 2019 | Goldman Sachs | — | (2,930) | (2,930) |
| Pay | Mediaset Espana Comunicacion SA | 1 month EURIBOR - 0.40% | Monthly | EUR | 59,527 | Mar 2019 | Goldman Sachs | — | (3,068) | (3,068) |
| Pay | Metropole Television | 1 month EURIBOR - 0.40% | Monthly | EUR | 44,135 | Mar 2019 | Goldman Sachs | — | (230) | (230) |
| Pay | Metropole Television | 1 month EURIBOR - 0.40% | Monthly | EUR | 4,003 | Mar 2019 | Goldman Sachs | — | (21) | (21) |
| Pay | ProSiebenSat.1 Media SE | 1 month EURIBOR - 0.40% | Monthly | EUR | 135,443 | Mar 2019 | Goldman Sachs | — | (5,451) | (5,451) |
| Pay | RTL Group SA | 1 month EURIBOR - 0.40% | Monthly | EUR | 91,632 | Mar 2019 | Goldman Sachs | — | (3,651) | (3,651) |
| Pay | Television Francaise 1 | 1 month EURIBOR - 0.40% | Monthly | EUR | 62,749 | Mar 2019 | Goldman Sachs | — | (3,125) | (3,125) |
| Pay | Card Factory PLC | 1 month GBP LIBOR - 0.15% | Monthly | GBP | 13,573 | Jul 2018 | HSBC | — | (4,077) | (4,077) |
| Pay | Card Factory PLC | 1 month GBP LIBOR - 0.15% | Monthly | GBP | 7,700 | Jul 2018 | HSBC | — | (2,313) | (2,313) |
| SEE NOTES TO FINANCIAL STATEMENTS | SEMIANNUAL REPORT | JOHN HANCOCK GLOBAL FOCUSED STRATEGIES FUND | 21 |
| Total return swaps (continued) | ||||||||||
| Pay/receive total return* | Reference entity | Floating rate | Payment frequency | Currency | Notional amount/ contract amount | Maturity date | Counterparty (OTC) | Unamortized upfront payment paid (received) | Unrealized appreciation (depreciation) | Value |
| Pay | Card Factory PLC | 1 month GBP LIBOR - 0.15% | Monthly | GBP | 7,271 | Jul 2018 | HSBC | — | $(2,184) | $(2,184) |
| Pay | Card Factory PLC | 1 month GBP LIBOR - 0.15% | Monthly | GBP | 34,007 | Jul 2018 | HSBC | — | (9,031) | (9,031) |
| Pay | Halfords Group PLC | 1 month GBP LIBOR - 0.15% | Monthly | GBP | 24,179 | Jul 2018 | HSBC | — | (5,384) | (5,384) |
| Pay | Halfords Group PLC | 1 month GBP LIBOR - 0.15% | Monthly | GBP | 12,826 | Jul 2018 | HSBC | — | (2,856) | (2,856) |
| Pay | Halfords Group PLC | 1 month GBP LIBOR - 0.15% | Monthly | GBP | 14,035 | Jul 2018 | HSBC | — | (3,125) | (3,125) |
| Pay | Halfords Group PLC | 1 month GBP LIBOR - 0.15% | Monthly | GBP | 28,377 | Jul 2018 | HSBC | — | (6,429) | (6,429) |
| Pay | J Sainsbury PLC | 1 month GBP LIBOR - 0.25% | Monthly | GBP | 34,200 | Jul 2018 | HSBC | — | (14,166) | (14,166) |
| Pay | Kingfisher PLC | 1 month GBP LIBOR - 0.05% | Monthly | GBP | 46,948 | Jul 2018 | HSBC | — | (3,101) | (3,101) |
| Pay | Marks and Spencer Group PLC | 1 month GBP LIBOR - 0.05% | Monthly | GBP | 26,860 | Jul 2018 | HSBC | — | (2,617) | (2,617) |
| Pay | N. Brown Group PLC | 1 month GBP LIBOR - 0.25% | Monthly | GBP | 48,335 | Jul 2018 | HSBC | — | (12,877) | (12,877) |
| Pay | Next PLC | 1 month GBP LIBOR - 0.05% | Monthly | GBP | 238,014 | Jul 2018 | HSBC | — | (33,581) | (33,581) |
| Pay | Tesco PLC | 1 month GBP LIBOR - 0.05% | Monthly | GBP | 59,015 | Jul 2018 | HSBC | — | (12,909) | (12,909) |
| Pay | Wm Morrison Supermarkets PLC | 1 month GBP LIBOR - 0.25% | Monthly | GBP | 22,928 | Jul 2018 | HSBC | — | (4,574) | (4,574) |
| Pay | Card Factory PLC | 1 month GBP LIBOR - 0.25% | Monthly | GBP | 7,841 | Apr 2019 | HSBC | — | 474 | 474 |
| Pay | J Sainsbury PLC | 1 month GBP LIBOR - 0.25% | Monthly | GBP | 113,816 | Apr 2019 | HSBC | — | (27,990) | (27,990) |
| Pay | Kingfisher PLC | 1 month GBP LIBOR - 0.25% | Monthly | GBP | 128,346 | Apr 2019 | HSBC | — | (1,003) | (1,003) |
| Pay | Marks and Spencer Group PLC | 1 month GBP LIBOR - 0.25% | Monthly | GBP | 99,805 | Apr 2019 | HSBC | — | (3,144) | (3,144) |
| Pay | N. Brown Group PLC | 1 month GBP LIBOR - 0.25% | Monthly | GBP | 24,925 | Apr 2019 | HSBC | — | (1,497) | (1,497) |
| Pay | Tesco PLC | 1 month GBP LIBOR - 0.25% | Monthly | GBP | 78,726 | Apr 2019 | HSBC | — | 1,571 | 1,571 |
| Pay | Wm Morrison Supermarkets PLC | 1 month GBP LIBOR - 0.25% | Monthly | GBP | 155,903 | Apr 2019 | HSBC | — | (8,472) | (8,472) |
| Pay | Atresmedia Corp. de Medios de Comunicacion SA | 1 month EURIBOR - 0.15% | Monthly | EUR | 123,722 | Jun 2018 | Merrill Lynch | — | (1,417) | (1,417) |
| Pay | Atresmedia Corp. de Medios de Comunicacion SA | 1 month EURIBOR - 0.15% | Monthly | EUR | 8,250 | Jun 2018 | Merrill Lynch | — | (95) | (95) |
| Pay | ITV PLC | 1 month GBP LIBOR - 0.15% | Monthly | GBP | 12,759 | Jun 2018 | Merrill Lynch | — | (1,781) | (1,781) |
| 22 | JOHN HANCOCK GLOBAL FOCUSED STRATEGIES FUND | SEMIANNUAL REPORT | SEE NOTES TO FINANCIAL STATEMENTS |
| Total return swaps (continued) | ||||||||||
| Pay/receive total return* | Reference entity | Floating rate | Payment frequency | Currency | Notional amount/ contract amount | Maturity date | Counterparty (OTC) | Unamortized upfront payment paid (received) | Unrealized appreciation (depreciation) | Value |
| Pay | ITV PLC | 1 month GBP LIBOR - 0.15% | Monthly | GBP | 106,941 | Jun 2018 | Merrill Lynch | — | $(14,928) | $(14,928) |
| Pay | Mediaset Espana Comunicacion SA | 1 month EURIBOR - 0.15% | Monthly | EUR | 65,874 | Jun 2018 | Merrill Lynch | — | (2,146) | (2,146) |
| Pay | Mediaset Espana Comunicacion SA | 1 month EURIBOR - 0.15% | Monthly | EUR | 48,464 | Jun 2018 | Merrill Lynch | — | (1,579) | (1,579) |
| Pay | Mediaset Espana Comunicacion SA | 1 month EURIBOR - 0.15% | Monthly | EUR | 18,175 | Jun 2018 | Merrill Lynch | — | (592) | (592) |
| Pay | Mediaset SpA | 1 month EURIBOR - 0.15% | Monthly | EUR | 38,353 | Jun 2018 | Merrill Lynch | — | 219 | 219 |
| Pay | Mediaset SpA | 1 month EURIBOR - 0.15% | Monthly | EUR | 45,239 | Jun 2018 | Merrill Lynch | — | 258 | 258 |
| Pay | Mediaset SpA | 1 month EURIBOR - 0.15% | Monthly | EUR | 56,728 | Jun 2018 | Merrill Lynch | — | 324 | 324 |
| Pay | Mediaset SpA | 1 month EURIBOR - 0.15% | Monthly | EUR | 24,433 | Jun 2018 | Merrill Lynch | — | 139 | 139 |
| Pay | Metropole Television | 1 month EURIBOR - 0.15% | Monthly | EUR | 25,071 | Jun 2018 | Merrill Lynch | — | 135 | 135 |
| Pay | Metropole Television | 1 month EURIBOR - 0.15% | Monthly | EUR | 38,151 | Jun 2018 | Merrill Lynch | — | 206 | 206 |
| Pay | Metropole Television | 1 month EURIBOR - 0.15% | Monthly | EUR | 13,140 | Jun 2018 | Merrill Lynch | — | 71 | 71 |
| Pay | Metropole Television | 1 month EURIBOR - 0.15% | Monthly | EUR | 11,644 | Jun 2018 | Merrill Lynch | — | 63 | 63 |
| Pay | ProSiebenSat.1 Media SE | 1 month EURIBOR - 0.15% | Monthly | EUR | 129,035 | Jun 2018 | Merrill Lynch | — | (15,044) | (15,044) |
| Pay | RTL Group SA | 1 month EURIBOR - 0.15% | Monthly | EUR | 15,990 | Jun 2018 | Merrill Lynch | — | (1,434) | (1,434) |
| Pay | RTL Group SA | 1 month EURIBOR - 0.15% | Monthly | EUR | 30,985 | Jun 2018 | Merrill Lynch | — | (2,779) | (2,779) |
| Pay | RTL Group SA | 1 month EURIBOR - 0.15% | Monthly | EUR | 72,587 | Jun 2018 | Merrill Lynch | — | (6,509) | (6,509) |
| Pay | RTL Group SA | 1 month EURIBOR - 0.15% | Monthly | EUR | 56,729 | Jun 2018 | Merrill Lynch | — | (5,087) | (5,087) |
| Pay | Television Francaise 1 | 1 month EURIBOR - 0.15% | Monthly | EUR | 26,094 | Jun 2018 | Merrill Lynch | — | (922) | (922) |
| Pay | Television Francaise 1 | 1 month EURIBOR - 0.15% | Monthly | EUR | 18,658 | Jun 2018 | Merrill Lynch | — | (659) | (659) |
| Pay | Television Francaise 1 | 1 month EURIBOR - 0.15% | Monthly | EUR | 14,269 | Jun 2018 | Merrill Lynch | — | (504) | (504) |
| Pay | Television Francaise 1 | 1 month EURIBOR - 0.15% | Monthly | EUR | 16,193 | Jun 2018 | Merrill Lynch | — | (572) | (572) |
| Pay | Marks and Spencer Group PLC | 1 month GBP LIBOR - 0.30% | Monthly | GBP | 72,938 | Jan 2019 | Merrill Lynch | — | (7,125) | (7,125) |
| Pay | Bovespa Index | 3 month USD LIBOR + 0.35% | Quarterly | USD | 1,566,765 | Sep 2018 | Morgan Stanley & Company, Inc. | — | 64,535 | 64,535 |
| Pay | J Sainsbury PLC | 1 month GBP LIBOR - 0.20% | Monthly | GBP | 64,725 | Sep 2018 | Societe Generale Paris | — | (14,128) | (14,128) |
| SEE NOTES TO FINANCIAL STATEMENTS | SEMIANNUAL REPORT | JOHN HANCOCK GLOBAL FOCUSED STRATEGIES FUND | 23 |
| Total return swaps (continued) | ||||||||||
| Pay/receive total return* | Reference entity | Floating rate | Payment frequency | Currency | Notional amount/ contract amount | Maturity date | Counterparty (OTC) | Unamortized upfront payment paid (received) | Unrealized appreciation (depreciation) | Value |
| Pay | Wm Morrison Supermarkets PLC | 1 month GBP LIBOR - 0.20% | Monthly | GBP | 29,781 | Sep 2018 | Societe Generale Paris | — | $(1,375) | $(1,375) |
| — | $(112,237) | $(112,237) | ||||||||
| Inflation swaps | |||||||||||
| Counterparty (OTC)/ Centrally cleared | Notional amount | Currency | USD notional amount | Payments made | Payments received | Fixed payment frequency | Floating payment frequency | Maturity date | Unamortized upfront payment paid (received) | Unrealized appreciation (depreciation) | Value |
| Merrill Lynch International | 2,460,000 | USD | $2,460,000 | USD - Non-Revised CPI | Fixed 2.145% | At Maturity | At Maturity | Mar 2022 | — | $(11,463) | $(11,463) |
| Merrill Lynch International | 508,000 | USD | 508,000 | Fixed 2.305% | USD - Non-Revised CPI | At Maturity | At Maturity | Mar 2047 | — | 14,922 | 14,922 |
| Merrill Lynch International | 1,150,000 | EUR | 1,369,015 | EUR - Ex Tobacco Non-Revised CPI | Fixed 1.833% | At Maturity | At Maturity | Aug 2047 | — | (42,798) | (42,798) |
| Morgan Stanley & Company, Inc. | 2,400,000 | GBP | 2,921,770 | Fixed 3.660% | GBP - Non-Revised RPI | At Maturity | At Maturity | Mar 2020 | — | (31,473) | (31,473) |
| Morgan Stanley & Company, Inc. | 7,200,000 | GBP | 8,936,661 | Fixed 3.630% | GBP - Non-Revised RPI | At Maturity | At Maturity | Apr 2020 | — | (134,960) | (134,960) |
| Morgan Stanley & Company, Inc. | 9,440,000 | USD | 9,440,000 | USD - Non-Revised CPI | Fixed 1.490% | At Maturity | At Maturity | Sep 2021 | — | (348,007) | (348,007) |
| Morgan Stanley & Company, Inc. | 9,420,000 | USD | 9,420,000 | USD - Non-Revised CPI | Fixed 2.010% | At Maturity | At Maturity | Nov 2021 | — | (132,215) | (132,215) |
| Morgan Stanley & Company, Inc. | 9,870,000 | USD | 9,870,000 | USD - Non-Revised CPI | Fixed 1.968% | At Maturity | At Maturity | May 2022 | — | (153,060) | (153,060) |
| Morgan Stanley & Company, Inc. | 2,100,000 | USD | 2,100,000 | USD - Non-Revised CPI | Fixed 2.028% | At Maturity | At Maturity | Oct 2022 | — | (38,833) | (38,833) |
| Morgan Stanley & Company, Inc. | 2,400,000 | GBP | 2,921,770 | GBP - Non-Revised RPI | Fixed 3.560% | At Maturity | At Maturity | Mar 2023 | — | 44,336 | 44,336 |
| Morgan Stanley & Company, Inc. | 7,200,000 | GBP | 8,936,661 | GBP - Non-Revised RPI | Fixed 3.565% | At Maturity | At Maturity | Apr 2023 | — | 196,393 | 196,393 |
| Morgan Stanley & Company, Inc. | 3,350,000 | USD | 3,350,000 | USD - Non-Revised CPI | Fixed 2.258% | At Maturity | At Maturity | Apr 2023 | — | (2,368) | (2,368) |
| Morgan Stanley & Company, Inc. | 1,370,000 | USD | 1,370,000 | Fixed 1.898% | USD - Non-Revised CPI | At Maturity | At Maturity | Sep 2046 | — | 188,797 | 188,797 |
| Morgan Stanley & Company, Inc. | 1,590,000 | USD | 1,590,000 | Fixed 2.339% | USD - Non-Revised CPI | At Maturity | At Maturity | Nov 2046 | — | 35,500 | 35,500 |
| Morgan Stanley & Company, Inc. | 1,380,000 | USD | 1,380,000 | Fixed 2.205% | USD - Non-Revised CPI | At Maturity | At Maturity | May 2047 | — | 81,082 | 81,082 |
| Morgan Stanley & Company, Inc. | 331,000 | USD | 331,000 | Fixed 2.398% | USD - Non-Revised CPI | At Maturity | At Maturity | Apr 2048 | — | 1,570 | 1,570 |
| $66,904,877 | — | $(332,577) | $(332,577) | ||||||||
| 24 | JOHN HANCOCK GLOBAL FOCUSED STRATEGIES FUND | SEMIANNUAL REPORT | SEE NOTES TO FINANCIAL STATEMENTS |
| Variance swaps | |||||||||||
| Counterparty (OTC) | Reference entity | Currency | Notional amount | USD notional amount | Pay/ receive volatility | Volatility strike rate | Payment frequency | Maturity date | Unamortized upfront payment paid (received) | Unrealized appreciation (depreciation) | Value |
| BNP Paribas Securities Corp. | Euro STOXX 50 Index | EUR | 22,000 | $ 26,938 | Receive | 21.700% | At Maturity | Dec 2019 | — | $ (68,036) | $ (68,036) |
| BNP Paribas Securities Corp. | S&P 500 Index | USD | 27,000 | 27,000 | Pay | 20.200% | At Maturity | Dec 2019 | — | 21,609 | 21,609 |
| BNP Paribas Securities Corp. | Euro STOXX 50 Index | EUR | 15,600 | 19,102 | Receive | 22.500% | At Maturity | Dec 2019 | — | (61,455) | (61,455) |
| BNP Paribas Securities Corp. | S&P 500 Index | USD | 18,200 | 18,200 | Pay | 20.750% | At Maturity | Dec 2019 | — | 23,630 | 23,630 |
| BNP Paribas Securities Corp. | Russell 2000 Index | USD | 29,300 | 29,300 | Receive | 22.850% | At Maturity | Dec 2019 | — | (53,694) | (53,694) |
| BNP Paribas Securities Corp. | S&P 500 Index | USD | 28,000 | 28,000 | Pay | 20.000% | At Maturity | Dec 2019 | — | 14,127 | 14,127 |
| Societe Generale Paris | Russell 2000 Index | USD | 19,797 | 19,797 | Receive | 24.300% | At Maturity | Dec 2018 | — | (131,313) | (131,313) |
| Societe Generale Paris | S&P 500 Index | USD | 19,797 | 19,797 | Pay | 18.800% | At Maturity | Dec 2018 | — | 74,909 | 74,909 |
| $188,134 | — | $(180,223) | $(180,223) | ||||||||
| Derivatives Currency Abbreviations | |
| ARS | Argentine Peso |
| AUD | Australian Dollar |
| BRL | Brazilian Real |
| CAD | Canadian Dollar |
| CHF | Swiss Franc |
| COP | Colombian Peso |
| CZK | Czech Republic Koruna |
| EUR | Euro |
| GBP | Pound Sterling |
| HUF | Hungarian Forint |
| IDR | Indonesian Rupiah |
| INR | Indian Rupee |
| JPY | Japanese Yen |
| KRW | Korean Won |
| MXN | Mexican Peso |
| MYR | Malaysian Ringgit |
| NOK | Norwegian Krone |
| PEN | Peruvian Nuevo Sol |
| RON | Romanian New Leu |
| RUB | Russian Ruble |
| SEK | Swedish Krona |
| THB | Thai Bhat |
| TRY | Turkish Lira |
| USD | U.S. Dollar |
| ZAR | South African Rand |
| SEE NOTES TO FINANCIAL STATEMENTS | SEMIANNUAL REPORT | JOHN HANCOCK GLOBAL FOCUSED STRATEGIES FUND | 25 |
| Derivatives Abbreviations | |
| CDOR | Canadian Dollar Offered Rate |
| CPI | Consumer Price Index |
| EURIBOR | Euro Interbank Offered Rate |
| LIBOR | London Interbank Offered Rate |
| RPI | Retail Price Index |
| STIBOR | Stockholm Interbank Offered Rate |
| 26 | JOHN HANCOCK GLOBAL FOCUSED STRATEGIES FUND | SEMIANNUAL REPORT | SEE NOTES TO FINANCIAL STATEMENTS |
Financial statements
STATEMENT OF ASSETS AND LIABILITIES 4-30-18 (unaudited)
| Assets | |||||||||||||||||||||||||||||||||
| Investments, at value (Cost $45,427,475) | $46,129,197 | ||||||||||||||||||||||||||||||||
| Foreign currency, at value (Cost $110,496) | 114,463 | ||||||||||||||||||||||||||||||||
| Cash held at broker for futures contracts | 1,035,650 | ||||||||||||||||||||||||||||||||
| Cash collateral for OTC derivative contracts | 527,105 | ||||||||||||||||||||||||||||||||
| Unrealized appreciation on forward foreign currency contracts | 803,818 | ||||||||||||||||||||||||||||||||
| Swap contracts, at value | 863,973 | ||||||||||||||||||||||||||||||||
| Dividends and interest receivable | 165,824 | ||||||||||||||||||||||||||||||||
| Receivable for investments sold | 178,785 | ||||||||||||||||||||||||||||||||
| Other receivables and prepaid expenses | 54,128 | ||||||||||||||||||||||||||||||||
| Total assets | 49,872,943 | ||||||||||||||||||||||||||||||||
| Liabilities | |||||||||||||||||||||||||||||||||
| Unrealized depreciation on forward foreign currency contracts | 895,979 | ||||||||||||||||||||||||||||||||
| Payable for centrally cleared swaps | 711 | ||||||||||||||||||||||||||||||||
| Payable for futures variation margin | 42,914 | ||||||||||||||||||||||||||||||||
| Written options, at value (Premium received ($309,816)) | 229,544 | ||||||||||||||||||||||||||||||||
| Swap contracts, at value | 1,489,010 | ||||||||||||||||||||||||||||||||
| Payable for investments purchased | 374,513 | ||||||||||||||||||||||||||||||||
| Payable for fund shares repurchased | 241,318 | ||||||||||||||||||||||||||||||||
| Payable to affiliates | |||||||||||||||||||||||||||||||||
| Accounting and legal services fees | 5,105 | ||||||||||||||||||||||||||||||||
| Transfer agent fees | 14 | ||||||||||||||||||||||||||||||||
| Trustees' fees | 212 | ||||||||||||||||||||||||||||||||
| Investment management fees | 7,970 | ||||||||||||||||||||||||||||||||
| Other liabilities and accrued expenses | 113,927 | ||||||||||||||||||||||||||||||||
| Total liabilities | 3,401,217 | ||||||||||||||||||||||||||||||||
| Net assets | $46,471,726 | ||||||||||||||||||||||||||||||||
| Net assets consist of | |||||||||||||||||||||||||||||||||
| Paid-in capital | $45,857,573 | ||||||||||||||||||||||||||||||||
| Undistributed net investment income | 372,222 | ||||||||||||||||||||||||||||||||
| Accumulated net realized gain (loss) on investments, futures contracts, options written, foreign currency transactions and swap contracts | (298,059 | ) | |||||||||||||||||||||||||||||||
| Net unrealized appreciation (depreciation) on investments, futures contracts, options written, translation of assets and liabilities in foreign currencies and swap contracts | 539,990 | ||||||||||||||||||||||||||||||||
| Net assets | $46,471,726 | ||||||||||||||||||||||||||||||||
STATEMENT OF ASSETS AND LIABILITIES (continued)
| Net asset value per share | |||||||||||||||||||||
| Based on net asset value and shares outstanding - The fund has an unlimited number of shares authorized with no par value | |||||||||||||||||||||
| Class A ($55,728 ÷ 5,824 shares)1 | $9.57 | ||||||||||||||||||||
| Class C ($48,470 ÷ 5,108 shares)1 | $9.49 | ||||||||||||||||||||
| Class I ($48,660 ÷ 5,061 shares) | $9.61 | ||||||||||||||||||||
| Class R6 ($48,685 ÷ 5,056 shares) | $9.63 | ||||||||||||||||||||
| Class NAV ($46,270,183 ÷ 4,805,940 shares) | $9.63 | ||||||||||||||||||||
| Maximum offering price per share | |||||||||||||||||||||
| Class A (net assets value per share ÷ 95%)2 | $10.07 | ||||||||||||||||||||
| 1 | Redemption price per share is equal to net asset value less any applicable contingent deferred sales charge. | |||||||||||||||||||
| 2 | On single retail sales of less than $50,000. On sales of $50,000 or more and on group sales the offering price is reduced. | |||||||||||||||||||
STATEMENT OF OPERATIONS For the six months ended 4-30-18 (unaudited)
| Investment income | ||||||||||||||||||||||||
| Interest | $341,746 | |||||||||||||||||||||||
| Dividends | 97,600 | |||||||||||||||||||||||
| Less foreign taxes withheld | (14,467 | ) | ||||||||||||||||||||||
| Total investment income | 424,879 | |||||||||||||||||||||||
| Expenses | ||||||||||||||||||||||||
| Investment management fees | 360,709 | |||||||||||||||||||||||
| Distribution and service fees | 397 | |||||||||||||||||||||||
| Accounting and legal services fees | 5,137 | |||||||||||||||||||||||
| Transfer agent fees | 112 | |||||||||||||||||||||||
| Trustees' fees | 526 | |||||||||||||||||||||||
| State registration fees | 27,925 | |||||||||||||||||||||||
| Printing and postage | 10,282 | |||||||||||||||||||||||
| Professional fees | 63,688 | |||||||||||||||||||||||
| Custodian fees | 54,505 | |||||||||||||||||||||||
| Other | 7,049 | |||||||||||||||||||||||
| Total expenses | 530,330 | |||||||||||||||||||||||
| Less expense reductions | (152,789 | ) | ||||||||||||||||||||||
| Net expenses | 377,541 | |||||||||||||||||||||||
| Net investment income | 47,338 | |||||||||||||||||||||||
| Realized and unrealized gain (loss) | ||||||||||||||||||||||||
| Net realized gain (loss) on | ||||||||||||||||||||||||
| Investments and foreign currency transactions | 863,918 | |||||||||||||||||||||||
| Futures contracts | 297,912 | |||||||||||||||||||||||
| Forward foreign currency contracts | (802,892 | ) | ||||||||||||||||||||||
| Written options | 120,284 | |||||||||||||||||||||||
| Swap contracts | (32,857 | ) | ||||||||||||||||||||||
| 446,365 | ||||||||||||||||||||||||
| Change in net unrealized appreciation (depreciation) of | ||||||||||||||||||||||||
| Investments and translation of assets and liabilities in foreign currencies | (1,078,443 | ) | ||||||||||||||||||||||
| Futures contracts | (706,377 | ) | ||||||||||||||||||||||
| Forward foreign currency contracts | 370,648 | |||||||||||||||||||||||
| Written options | 17,386 | |||||||||||||||||||||||
| Swap contracts | (558,993 | ) | ||||||||||||||||||||||
| (1,955,779 | ) | |||||||||||||||||||||||
| Net realized and unrealized loss | (1,509,414 | ) | ||||||||||||||||||||||
| Decrease in net assets from operations | ($1,462,076 | ) | ||||||||||||||||||||||
STATEMENTS OF CHANGES IN NET ASSETS
| Six months ended 4-30-18 | Year ended 10-31-17 | ||||||||||||||||||||||||||||||||||||||||||||
| (unaudited) | |||||||||||||||||||||||||||||||||||||||||||||
| Increase (decrease) in net assets | |||||||||||||||||||||||||||||||||||||||||||||
| From operations | |||||||||||||||||||||||||||||||||||||||||||||
| Net investment income | $47,338 | $94,716 | |||||||||||||||||||||||||||||||||||||||||||
| Net realized gain (loss) | 446,365 | (257,330 | ) | ||||||||||||||||||||||||||||||||||||||||||
| Change in net unrealized appreciation (depreciation) | (1,955,779 | ) | 2,622,823 | ||||||||||||||||||||||||||||||||||||||||||
| Increase (decrease) in net assets resulting from operations | (1,462,076 | ) | 2,460,209 | ||||||||||||||||||||||||||||||||||||||||||
| Distributions to shareholders | |||||||||||||||||||||||||||||||||||||||||||||
| From net investment income | |||||||||||||||||||||||||||||||||||||||||||||
| Class A | — | (640 | ) | ||||||||||||||||||||||||||||||||||||||||||
| Class C | — | (82 | ) | ||||||||||||||||||||||||||||||||||||||||||
| Class I | — | (785 | ) | ||||||||||||||||||||||||||||||||||||||||||
| Class R6 | — | (876 | ) | ||||||||||||||||||||||||||||||||||||||||||
| Class NAV | — | (434,624 | ) | ||||||||||||||||||||||||||||||||||||||||||
| From net realized gain | |||||||||||||||||||||||||||||||||||||||||||||
| Class A | (575 | ) | — | ||||||||||||||||||||||||||||||||||||||||||
| Class C | (401 | ) | — | ||||||||||||||||||||||||||||||||||||||||||
| Class I | (398 | ) | — | ||||||||||||||||||||||||||||||||||||||||||
| Class R6 | (397 | ) | — | ||||||||||||||||||||||||||||||||||||||||||
| Class NAV | (372,263 | ) | — | ||||||||||||||||||||||||||||||||||||||||||
| Total distributions | (374,034 | ) | (437,007 | ) | |||||||||||||||||||||||||||||||||||||||||
| From fund share transactions | 772,868 | (1,775,214 | ) | ||||||||||||||||||||||||||||||||||||||||||
| Total increase (decrease) | (1,063,242 | ) | 247,988 | ||||||||||||||||||||||||||||||||||||||||||
| Net assets | |||||||||||||||||||||||||||||||||||||||||||||
| Beginning of period | 47,534,968 | 47,286,980 | |||||||||||||||||||||||||||||||||||||||||||
| End of period | $46,471,726 | $47,534,968 | |||||||||||||||||||||||||||||||||||||||||||
| Undistributed net investment income | $372,222 | $324,884 | |||||||||||||||||||||||||||||||||||||||||||
Financial highlights
| Class A Shares Period ended | 4-30-18 | 1 | 10-31-17 | 10-31-16 | 2 | ||||||||||||||||||||||||||||||||||||||||||||||||||||||||||||||||||
| Per share operating performance | |||||||||||||||||||||||||||||||||||||||||||||||||||||||||||||||||||||||
| Net asset value, beginning of period | $9.98 | $9.58 | $10.00 | ||||||||||||||||||||||||||||||||||||||||||||||||||||||||||||||||||||
| Net investment income (loss)3 | (0.01 | ) | (0.02 | ) | 0.01 | ||||||||||||||||||||||||||||||||||||||||||||||||||||||||||||||||||
| Net realized and unrealized gain (loss) on investments | (0.32 | ) | 0.48 | (0.43 | ) | ||||||||||||||||||||||||||||||||||||||||||||||||||||||||||||||||||
| Total from investment operations | (0.33 | ) | 0.46 | (0.42 | ) | ||||||||||||||||||||||||||||||||||||||||||||||||||||||||||||||||||
| Less distributions | |||||||||||||||||||||||||||||||||||||||||||||||||||||||||||||||||||||||
| From net investment income | (0.08 | ) | (0.06 | ) | — | ||||||||||||||||||||||||||||||||||||||||||||||||||||||||||||||||||
| Net asset value, end of period | $9.57 | $9.98 | $9.58 | ||||||||||||||||||||||||||||||||||||||||||||||||||||||||||||||||||||
| Total return (%)4,5 | (3.34 | ) 6 | 4.84 | (4.20 | ) 6 | ||||||||||||||||||||||||||||||||||||||||||||||||||||||||||||||||||
| Ratios and supplemental data | |||||||||||||||||||||||||||||||||||||||||||||||||||||||||||||||||||||||
| Net assets, end of period (in millions) | — | 7 | — | 7 | — | 7 | |||||||||||||||||||||||||||||||||||||||||||||||||||||||||||||||||
| Ratios (as a percentage of average net assets): | |||||||||||||||||||||||||||||||||||||||||||||||||||||||||||||||||||||||
| Expenses before reductions | 2.63 | 8 | 2.89 | 2.92 | 8 | ||||||||||||||||||||||||||||||||||||||||||||||||||||||||||||||||||
| Expenses including reductions | 1.98 | 8 | 1.99 | 2.00 | 8 | ||||||||||||||||||||||||||||||||||||||||||||||||||||||||||||||||||
| Net investment income (loss) | (0.14 | ) 8 | (0.17 | ) | 0.10 | 8 | |||||||||||||||||||||||||||||||||||||||||||||||||||||||||||||||||
| Portfolio turnover (%) | 47 | 91 | 36 | ||||||||||||||||||||||||||||||||||||||||||||||||||||||||||||||||||||
| 1 | Six months ended 4-30-18. Unaudited. | |||||||||||||||||||||||||||||||||||||||||||||||||||||||||||||||||||||||||||||||
| 2 | Period from 4-13-16 (commencement of operations) to 10-31-16. | |||||||||||||||||||||||||||||||||||||||||||||||||||||||||||||||||||||||||||||||
| 3 | Based on average daily shares outstanding. | |||||||||||||||||||||||||||||||||||||||||||||||||||||||||||||||||||||||||||||||
| 4 | Total returns would have been lower had certain expenses not been reduced during the applicable periods. | |||||||||||||||||||||||||||||||||||||||||||||||||||||||||||||||||||||||||||||||
| 5 | Does not reflect the effect of sales charges, if any. | |||||||||||||||||||||||||||||||||||||||||||||||||||||||||||||||||||||||||||||||
| 6 | Not annualized. | |||||||||||||||||||||||||||||||||||||||||||||||||||||||||||||||||||||||||||||||
| 7 | Less than $500,000. | |||||||||||||||||||||||||||||||||||||||||||||||||||||||||||||||||||||||||||||||
| 8 | Annualized. | |||||||||||||||||||||||||||||||||||||||||||||||||||||||||||||||||||||||||||||||
| Class C Shares Period ended | 4-30-18 | 1 | 10-31-17 | 10-31-16 | 2 | ||||||||||||||||||||||||||||||||||||||||||||||||||||||||||||||||||
| Per share operating performance | |||||||||||||||||||||||||||||||||||||||||||||||||||||||||||||||||||||||
| Net asset value, beginning of period | $9.92 | $9.54 | $10.00 | ||||||||||||||||||||||||||||||||||||||||||||||||||||||||||||||||||||
| Net investment loss3 | (0.04 | ) | (0.09 | ) | (0.03 | ) | |||||||||||||||||||||||||||||||||||||||||||||||||||||||||||||||||
| Net realized and unrealized gain (loss) on investments | (0.31 | ) | 0.48 | (0.43 | ) | ||||||||||||||||||||||||||||||||||||||||||||||||||||||||||||||||||
| Total from investment operations | (0.35 | ) | 0.39 | (0.46 | ) | ||||||||||||||||||||||||||||||||||||||||||||||||||||||||||||||||||
| Less distributions | |||||||||||||||||||||||||||||||||||||||||||||||||||||||||||||||||||||||
| From net investment income | (0.08 | ) | (0.01 | ) | — | ||||||||||||||||||||||||||||||||||||||||||||||||||||||||||||||||||
| Net asset value, end of period | $9.49 | $9.92 | $9.54 | ||||||||||||||||||||||||||||||||||||||||||||||||||||||||||||||||||||
| Total return (%)4,5 | (3.56 | ) 6 | 4.07 | (4.60 | ) 6 | ||||||||||||||||||||||||||||||||||||||||||||||||||||||||||||||||||
| Ratios and supplemental data | |||||||||||||||||||||||||||||||||||||||||||||||||||||||||||||||||||||||
| Net assets, end of period (in millions) | — | 7 | — | 7 | — | 7 | |||||||||||||||||||||||||||||||||||||||||||||||||||||||||||||||||
| Ratios (as a percentage of average net assets): | |||||||||||||||||||||||||||||||||||||||||||||||||||||||||||||||||||||||
| Expenses before reductions | 3.38 | 8 | 3.64 | 3.67 | 8 | ||||||||||||||||||||||||||||||||||||||||||||||||||||||||||||||||||
| Expenses including reductions | 2.73 | 8 | 2.74 | 2.75 | 8 | ||||||||||||||||||||||||||||||||||||||||||||||||||||||||||||||||||
| Net investment loss | (0.88 | ) 8 | (0.92 | ) | (0.65 | ) 8 | |||||||||||||||||||||||||||||||||||||||||||||||||||||||||||||||||
| Portfolio turnover (%) | 47 | 91 | 36 | ||||||||||||||||||||||||||||||||||||||||||||||||||||||||||||||||||||
| 1 | Six months ended 4-30-18. Unaudited. | |||||||||||||||||||||||||||||||||||||||||||||||||||||||||||||||||||||||||||||||
| 2 | Period from 4-13-16 (commencement of operations) to 10-31-16. | |||||||||||||||||||||||||||||||||||||||||||||||||||||||||||||||||||||||||||||||
| 3 | Based on average daily shares outstanding. | |||||||||||||||||||||||||||||||||||||||||||||||||||||||||||||||||||||||||||||||
| 4 | Total returns would have been lower had certain expenses not been reduced during the applicable periods. | |||||||||||||||||||||||||||||||||||||||||||||||||||||||||||||||||||||||||||||||
| 5 | Does not reflect the effect of sales charges, if any. | |||||||||||||||||||||||||||||||||||||||||||||||||||||||||||||||||||||||||||||||
| 6 | Not annualized. | |||||||||||||||||||||||||||||||||||||||||||||||||||||||||||||||||||||||||||||||
| 7 | Less than $500,000. | |||||||||||||||||||||||||||||||||||||||||||||||||||||||||||||||||||||||||||||||
| 8 | Annualized. | |||||||||||||||||||||||||||||||||||||||||||||||||||||||||||||||||||||||||||||||
| Class I Shares Period ended | 4-30-18 | 1 | 10-31-17 | 10-31-16 | 2 | ||||||||||||||||||||||||||||||||||||||||||||||||||||||||||||||||||
| Per share operating performance | |||||||||||||||||||||||||||||||||||||||||||||||||||||||||||||||||||||||
| Net asset value, beginning of period | $10.00 | $9.59 | $10.00 | ||||||||||||||||||||||||||||||||||||||||||||||||||||||||||||||||||||
| Net investment income3 | 0.01 | 0.01 | 0.02 | ||||||||||||||||||||||||||||||||||||||||||||||||||||||||||||||||||||
| Net realized and unrealized gain (loss) on investments | (0.32 | ) | 0.48 | (0.43 | ) | ||||||||||||||||||||||||||||||||||||||||||||||||||||||||||||||||||
| Total from investment operations | (0.31 | ) | 0.49 | (0.41 | ) | ||||||||||||||||||||||||||||||||||||||||||||||||||||||||||||||||||
| Less distributions | |||||||||||||||||||||||||||||||||||||||||||||||||||||||||||||||||||||||
| From net investment income | (0.08 | ) | (0.08 | ) | — | ||||||||||||||||||||||||||||||||||||||||||||||||||||||||||||||||||
| Net asset value, end of period | $9.61 | $10.00 | $9.59 | ||||||||||||||||||||||||||||||||||||||||||||||||||||||||||||||||||||
| Total return (%)4 | (3.03 | ) 5 | 5.13 | (4.10 | ) 5 | ||||||||||||||||||||||||||||||||||||||||||||||||||||||||||||||||||
| Ratios and supplemental data | |||||||||||||||||||||||||||||||||||||||||||||||||||||||||||||||||||||||
| Net assets, end of period (in millions) | — | 6 | — | 6 | — | 6 | |||||||||||||||||||||||||||||||||||||||||||||||||||||||||||||||||
| Ratios (as a percentage of average net assets): | |||||||||||||||||||||||||||||||||||||||||||||||||||||||||||||||||||||||
| Expenses before reductions | 2.39 | 7 | 2.63 | 2.65 | 7 | ||||||||||||||||||||||||||||||||||||||||||||||||||||||||||||||||||
| Expenses including reductions | 1.73 | 7 | 1.73 | 1.73 | 7 | ||||||||||||||||||||||||||||||||||||||||||||||||||||||||||||||||||
| Net investment income | 0.12 | 7 | 0.09 | 0.37 | 7 | ||||||||||||||||||||||||||||||||||||||||||||||||||||||||||||||||||
| Portfolio turnover (%) | 47 | 91 | 36 | ||||||||||||||||||||||||||||||||||||||||||||||||||||||||||||||||||||
| 1 | Six months ended 4-30-18. Unaudited. | |||||||||||||||||||||||||||||||||||||||||||||||||||||||||||||||||||||||||||||||
| 2 | Period from 4-13-16 (commencement of operations) to 10-31-16. | |||||||||||||||||||||||||||||||||||||||||||||||||||||||||||||||||||||||||||||||
| 3 | Based on average daily shares outstanding. | |||||||||||||||||||||||||||||||||||||||||||||||||||||||||||||||||||||||||||||||
| 4 | Total returns would have been lower had certain expenses not been reduced during the applicable periods. | |||||||||||||||||||||||||||||||||||||||||||||||||||||||||||||||||||||||||||||||
| 5 | Not annualized. | |||||||||||||||||||||||||||||||||||||||||||||||||||||||||||||||||||||||||||||||
| 6 | Less than $500,000. | |||||||||||||||||||||||||||||||||||||||||||||||||||||||||||||||||||||||||||||||
| 7 | Annualized. | |||||||||||||||||||||||||||||||||||||||||||||||||||||||||||||||||||||||||||||||
| Class R6 Shares Period ended | 4-30-18 | 1 | 10-31-17 | 10-31-16 | 2 | ||||||||||||||||||||||||||||||||||||||||||||||||||||||||||||||||||
| Per share operating performance | |||||||||||||||||||||||||||||||||||||||||||||||||||||||||||||||||||||||
| Net asset value, beginning of period | $10.01 | $9.60 | $10.00 | ||||||||||||||||||||||||||||||||||||||||||||||||||||||||||||||||||||
| Net investment income3 | 0.01 | 0.02 | 0.03 | ||||||||||||||||||||||||||||||||||||||||||||||||||||||||||||||||||||
| Net realized and unrealized gain (loss) on investments | (0.31 | ) | 0.48 | (0.43 | ) | ||||||||||||||||||||||||||||||||||||||||||||||||||||||||||||||||||
| Total from investment operations | (0.30 | ) | 0.50 | (0.40 | ) | ||||||||||||||||||||||||||||||||||||||||||||||||||||||||||||||||||
| Less distributions | |||||||||||||||||||||||||||||||||||||||||||||||||||||||||||||||||||||||
| From net investment income | (0.08 | ) | (0.09 | ) | — | ||||||||||||||||||||||||||||||||||||||||||||||||||||||||||||||||||
| Net asset value, end of period | $9.63 | $10.01 | $9.60 | ||||||||||||||||||||||||||||||||||||||||||||||||||||||||||||||||||||
| Total return (%)4 | (3.03 | ) 5 | 5.23 | (4.00 | ) 5 | ||||||||||||||||||||||||||||||||||||||||||||||||||||||||||||||||||
| Ratios and supplemental data | |||||||||||||||||||||||||||||||||||||||||||||||||||||||||||||||||||||||
| Net assets, end of period (in millions) | — | 6 | — | 6 | — | 6 | |||||||||||||||||||||||||||||||||||||||||||||||||||||||||||||||||
| Ratios (as a percentage of average net assets): | |||||||||||||||||||||||||||||||||||||||||||||||||||||||||||||||||||||||
| Expenses before reductions | 2.29 | 7 | 2.54 | 2.56 | 7 | ||||||||||||||||||||||||||||||||||||||||||||||||||||||||||||||||||
| Expenses including reductions | 1.62 | 7 | 1.62 | 1.62 | 7 | ||||||||||||||||||||||||||||||||||||||||||||||||||||||||||||||||||
| Net investment income | 0.22 | 7 | 0.19 | 0.48 | 7 | ||||||||||||||||||||||||||||||||||||||||||||||||||||||||||||||||||
| Portfolio turnover (%) | 47 | 91 | 36 | ||||||||||||||||||||||||||||||||||||||||||||||||||||||||||||||||||||
| 1 | Six months ended 4-30-18. Unaudited. | |||||||||||||||||||||||||||||||||||||||||||||||||||||||||||||||||||||||||||||||
| 2 | Period from 4-13-16 (commencement of operations) to 10-31-16. | |||||||||||||||||||||||||||||||||||||||||||||||||||||||||||||||||||||||||||||||
| 3 | Based on average daily shares outstanding. | |||||||||||||||||||||||||||||||||||||||||||||||||||||||||||||||||||||||||||||||
| 4 | Total returns would have been lower had certain expenses not been reduced during the applicable periods. | |||||||||||||||||||||||||||||||||||||||||||||||||||||||||||||||||||||||||||||||
| 5 | Not annualized. | |||||||||||||||||||||||||||||||||||||||||||||||||||||||||||||||||||||||||||||||
| 6 | Less than $500,000. | |||||||||||||||||||||||||||||||||||||||||||||||||||||||||||||||||||||||||||||||
| 7 | Annualized. | |||||||||||||||||||||||||||||||||||||||||||||||||||||||||||||||||||||||||||||||
| Class NAV Shares Period ended | 4-30-18 | 1 | 10-31-17 | 10-31-16 | 2 | ||||||||||||||||||||||||||||||||||||||||||||||||||||||||||||||||||
| Per share operating performance | |||||||||||||||||||||||||||||||||||||||||||||||||||||||||||||||||||||||
| Net asset value, beginning of period | $10.01 | $9.60 | $10.00 | ||||||||||||||||||||||||||||||||||||||||||||||||||||||||||||||||||||
| Net investment income3 | 0.02 | 0.02 | 0.03 | ||||||||||||||||||||||||||||||||||||||||||||||||||||||||||||||||||||
| Net realized and unrealized gain (loss) on investments | (0.32 | ) | 0.48 | (0.43 | ) | ||||||||||||||||||||||||||||||||||||||||||||||||||||||||||||||||||
| Total from investment operations | (0.30 | ) | 0.50 | (0.40 | ) | ||||||||||||||||||||||||||||||||||||||||||||||||||||||||||||||||||
| Less distributions | |||||||||||||||||||||||||||||||||||||||||||||||||||||||||||||||||||||||
| From net investment income | (0.08 | ) | (0.09 | ) | — | ||||||||||||||||||||||||||||||||||||||||||||||||||||||||||||||||||
| Net asset value, end of period | $9.63 | $10.01 | $9.60 | ||||||||||||||||||||||||||||||||||||||||||||||||||||||||||||||||||||
| Total return (%)4 | (3.03 | ) 5 | 5.23 | (4.00 | ) 5 | ||||||||||||||||||||||||||||||||||||||||||||||||||||||||||||||||||
| Ratios and supplemental data | |||||||||||||||||||||||||||||||||||||||||||||||||||||||||||||||||||||||
| Net assets, end of period (in millions) | $46 | $47 | $47 | ||||||||||||||||||||||||||||||||||||||||||||||||||||||||||||||||||||
| Ratios (as a percentage of average net assets): | |||||||||||||||||||||||||||||||||||||||||||||||||||||||||||||||||||||||
| Expenses before reductions | 2.29 | 6 | 2.52 | 2.54 | 6 | ||||||||||||||||||||||||||||||||||||||||||||||||||||||||||||||||||
| Expenses including reductions | 1.62 | 6 | 1.62 | 1.62 | 6 | ||||||||||||||||||||||||||||||||||||||||||||||||||||||||||||||||||
| Net investment income | 0.33 | 6 | 0.20 | 0.48 | 6 | ||||||||||||||||||||||||||||||||||||||||||||||||||||||||||||||||||
| Portfolio turnover (%) | 47 | 91 | 36 | ||||||||||||||||||||||||||||||||||||||||||||||||||||||||||||||||||||
| 1 | Six months ended 4-30-18. Unaudited. | |||||||||||||||||||||||||||||||||||||||||||||||||||||||||||||||||||||||||||||||
| 2 | Period from 4-13-16 (commencement of operations) to 10-31-16. | |||||||||||||||||||||||||||||||||||||||||||||||||||||||||||||||||||||||||||||||
| 3 | Based on average daily shares outstanding. | |||||||||||||||||||||||||||||||||||||||||||||||||||||||||||||||||||||||||||||||
| 4 | Total returns would have been lower had certain expenses not been reduced during the applicable periods. | |||||||||||||||||||||||||||||||||||||||||||||||||||||||||||||||||||||||||||||||
| 5 | Not annualized. | |||||||||||||||||||||||||||||||||||||||||||||||||||||||||||||||||||||||||||||||
| 6 | Annualized. | |||||||||||||||||||||||||||||||||||||||||||||||||||||||||||||||||||||||||||||||
Note 1 — Organization
John Hancock Global Focused Strategies Fund (the fund) is a series of John Hancock Investment Trust (the Trust), an open-end management investment company organized as a Massachusetts business trust and registered under the Investment Company Act of 1940, as amended (the 1940 Act). The investment objective of the fund is to seek long-term total return.
The fund may offer multiple classes of shares. The shares currently offered by the fund are detailed in the Statement of assets and liabilities. Class A and Class C are offered to all investors. Class I shares are offered to institutions and certain investors. Class R6 shares are only available to certain retirement plans, institutions and other investors. Class NAV shares are offered to John Hancock affiliated funds of funds, retirement plans for employees of John Hancock and/or Manulife Financial Corporation, and certain 529 plans. Shareholders of each class have exclusive voting rights to matters that affect that class. The distribution and service fees, if any, and transfer agent fees for each class may differ. Effective May 1, 2018, Class C shares convert to Class A shares ten years after purchase (certain exclusions may apply).
Note 2 — Significant accounting policies
The financial statements have been prepared in conformity with accounting principles generally accepted in the United States of America (US GAAP), which require management to make certain estimates and assumptions as of the date of the financial statements. Actual results could differ from those estimates and those differences could be significant. The fund qualifies as an investment company under Topic 946 of Accounting Standards Codification of US GAAP.
Events or transactions occurring after the end of the fiscal period through the date that the financial statements were issued have been evaluated in the preparation of the financial statements. The following summarizes the significant accounting policies of the fund:
Security valuation. Investments are stated at value as of the scheduled close of regular trading on the New York Stock Exchange (NYSE), normally at 4:00 p.m., Eastern Time. In case of emergency or other disruption resulting in the NYSE not opening for trading or the NYSE closing at a time other than the regularly scheduled close, the net asset value (NAV) may be determined as of the regularly scheduled close of the NYSE pursuant to the fund's Valuation Policies and Procedures.
In order to value the securities, the fund uses the following valuation techniques: Equity securities held by the fund are typically valued at the last sale price or official closing price on the exchange or principal market where the security trades. In the event there were no sales during the day or closing prices are not available, the securities are valued using the last available bid price. Investments by the fund in open-end management investment companies are valued at their respective NAVs each business day. Debt obligations are valued based on the evaluated prices provided by an independent pricing vendor or from broker-dealers. Independent pricing vendors utilize matrix pricing which takes into account factors such as institutional-size trading in similar groups of securities, yield, quality, coupon rate, maturity, type of issue, trading characteristics and other market data, as well as broker supplied prices. Options listed on an exchange are valued at the mean of the most recent bid and ask prices from the exchange where the option trades. Swaps and unlisted options are valued using evaluated prices obtained from an independent pricing vendor. Futures contracts are typically valued at settlement prices, which are the official closing prices published by the exchange on which they trade. Foreign equity index futures that trade in the electronic trading market subsequent to the close of regular trading may be valued at the last traded price in the electronic trading market as of 4:00 p.m. ET, or may be fair valued based on fair value adjustment factors provided by an independent pricing vendor in order to adjust for events that may occur between the close of foreign exchanges or markets and the close of the NYSE. Foreign securities and currencies, including forward foreign currency contracts, are valued in U.S. dollars based on foreign currency exchange rates supplied by an independent pricing vendor.
In certain instances, the Pricing Committee may determine to value equity securities using prices obtained from another exchange or market if trading on the exchange or market on which prices are typically obtained did not open for trading as scheduled, or if trading closed earlier than scheduled, and trading occurred as normal on another exchange or market.
Other portfolio securities and assets, for which reliable market quotations are not readily available, are valued at fair value as determined in good faith by the fund's Pricing Committee following procedures established by the Board of Trustees. The frequency with which these fair valuation procedures are used cannot be predicted and fair value of securities may differ significantly from the value that would have been used had a ready market for such securities existed. Trading in foreign securities may be completed
before the scheduled daily close of trading on the NYSE. Significant events at the issuer or market level may affect the values of securities between the time when the valuation of the securities is generally determined and the close of the NYSE. If a significant event occurs, these securities may be fair valued, as determined in good faith by the fund's Pricing Committee, following procedures established by the Board of Trustees. The fund uses fair value adjustment factors provided by an independent pricing vendor to value certain foreign securities in order to adjust for events that may occur between the close of foreign exchanges or markets and the close of the NYSE.
The fund uses a three-tier hierarchy to prioritize the pricing assumptions, referred to as inputs, used in valuation techniques to measure fair value. Level 1 includes securities valued using quoted prices in active markets for identical securities. Level 2 includes securities valued using other significant observable inputs. Observable inputs may include quoted prices for similar securities, interest rates, prepayment speeds and credit risk. Prices for securities valued using these inputs are received from independent pricing vendors and brokers and are based on an evaluation of the inputs described. Level 3 includes securities valued using significant unobservable inputs when market prices are not readily available or reliable, including the fund's own assumptions in determining the fair value of investments. Factors used in determining value may include market or issuer specific events or trends, changes in interest rates and credit quality. The inputs or methodology used for valuing securities are not necessarily an indication of the risks associated with investing in those securities. Changes in valuation techniques and related inputs may result in transfers into or out of an assigned level within the disclosure hierarchy.
The following is a summary of the values by input classification of the fund's investments as of April 30, 2018, by major security category or type:
| Total value at 4-30-18 | Level 1 quoted price | Level 2 significant observable inputs | Level 3 significant unobservable inputs | |||||||||||
| Investments in securities: | ||||||||||||||
| Assets | ||||||||||||||
| U.S. Government and Agency obligations | $2,108,034 | — | $2,108,034 | — | ||||||||||
| Foreign government obligations | 3,132,640 | — | 3,132,640 | — | ||||||||||
| Corporate bonds | 8,062,192 | — | 8,062,192 | — | ||||||||||
| Common stocks | 9,504,232 | $4,198,488 | 5,305,744 | — | ||||||||||
| Purchased options | 1,552,420 | 125,468 | 1,426,952 | — | ||||||||||
| Short-term investments | 21,769,679 | 657,019 | 21,112,660 | — | ||||||||||
| Total investments in securities | $46,129,197 | $4,980,975 | $41,148,222 | — | ||||||||||
| Derivatives: | ||||||||||||||
| Assets | ||||||||||||||
| Futures | $638,780 | $638,780 | — | — | ||||||||||
| Forward foreign currency contracts | 803,818 | — | $803,818 | — | ||||||||||
| Swap contracts | 1,297,521 | — | 1,297,521 | — | ||||||||||
| Liabilities | ||||||||||||||
| Futures | (417,561 | ) | (417,561 | ) | — | — | ||||||||
| Forward foreign currency contracts | (895,979 | ) | — | (895,979 | ) | — | ||||||||
| Written options | (229,544 | ) | (75,096 | ) | (154,448 | ) | — | |||||||
| Swap contracts | (1,705,017 | ) | — | (1,705,017 | ) | — |
Security transactions and related investment income. Investment security transactions are accounted for on a trade date plus one basis for daily NAV calculations. However, for financial reporting purposes, investment transactions are reported on trade date. Interest income is accrued as earned. Interest income includes coupon interest and amortization/accretion of premiums/discounts on debt securities. Debt obligations may be placed in a non-accrual status and related interest income may be reduced by stopping current accruals and writing off interest receivable when the collection of all or a portion of interest has become doubtful. Dividend income is recorded on the ex-date, except for dividends of foreign securities where the dividend may not be known until
after the ex-date. In those cases, dividend income, net of withholding taxes, is recorded when the fund becomes aware of the dividends. Gains and losses on securities sold are determined on the basis of identified cost and may include proceeds from litigation.
Foreign investing. Assets, including investments and liabilities denominated in foreign currencies, are translated into U.S. dollar values each day at the prevailing exchange rate. Purchases and sales of securities, income and expenses are translated into U.S. dollars at the prevailing exchange rate on the date of the transaction. The effect of changes in foreign currency exchange rates on the value of securities is reflected as a component of the realized and unrealized gains (losses) on investments. Foreign investments are subject to a decline in the value of a foreign currency versus the U.S. dollar, which reduces the dollar value of securities denominated in that currency.
Funds that invest internationally generally carry more risk than funds that invest strictly in U.S. securities. These risks are heightened for investments in emerging markets. Risks can result from differences in economic and political conditions, regulations, market practices (including higher transaction costs), accounting standards and other factors.
Foreign taxes. The fund may be subject to withholding tax on income, capital gains or repatriation taxes imposed by certain countries, a portion of which may be recoverable. Foreign taxes are accrued based upon the fund's understanding of the tax rules and rates that exist in the foreign markets in which it invests. Taxes are accrued based on gains realized by the fund as a result of certain foreign security sales. Estimated taxes are accrued based on unrealized appreciation of such securities. Investment income is recorded net of foreign withholding taxes, less any amounts reclaimable.
Line of credit. The fund may have the ability to borrow from banks for temporary or emergency purposes, including meeting redemption requests that otherwise might require the untimely sale of securities. Pursuant to the fund's custodian agreement, the custodian may loan money to the fund to make properly authorized payments. The fund is obligated to repay the custodian for any overdraft, including any related costs or expenses. The custodian may have a lien, security interest or security entitlement in any fund property that is not otherwise segregated or pledged, to the extent of any overdraft, and to the maximum extent permitted by law.
The fund and other affiliated funds have entered into a syndicated line of credit agreement with Citibank, N.A. as the administrative agent that enables them to participate in a $750 million unsecured committed line of credit. Excluding commitments designated for a certain fund and subject to the needs of all other affiliated funds, the fun can borrow up to an aggregate commitment amount of $500 million, subject to asset coverage and other limitations as specified in the agreement. A commitment fee payable at the end of each calendar quarter, based on the average daily unused portion of the line of credit, is charged to each participating fund based on a combination of fixed and asset based allocations and is reflected in Other expenses on the Statement of operations. For the six months ended April 30, 2018, the fund had no borrowings under the line of credit. Commitment fees for the six months ended April 30, 2018 were $1,464.
Expenses. Within the John Hancock group of funds complex, expenses that are directly attributable to an individual fund are allocated to such fund. Expenses that are not readily attributable to a specific fund are allocated among all funds in an equitable manner, taking into consideration, among other things, the nature and type of expense and the fund's relative net assets. Expense estimates are accrued in the period to which they relate and adjustments are made when actual amounts are known.
Class allocations. Income, common expenses and realized and unrealized gains (losses) are determined at the fund level and allocated daily to each class of shares based on the net assets of the class. Class-specific expenses, such as distribution and service fees, if any, and transfer agent fees, for all classes, are charged daily at the class level based on the net assets of each class and the specific expense rates applicable to each class.
Federal income taxes. The fund intends to continue to qualify as a regulated investment company by complying with the applicable provisions of the Internal Revenue Code and will not be subject to federal income tax on taxable income that is distributed to shareholders. Therefore, no federal income tax provision is required.
As of October 31,2017, the fund had no uncertain tax positions that would require financial statement recognition, derecognition or disclosure. The fund's federal tax returns are subject to examination by the Internal Revenue Service for a period of three years.
Distribution of income and gains. Distributions to shareholders from net investment income and net realized gains, if any, are recorded on the ex-date. The fund generally declares and pays dividends and capital gain distributions, if any, at least annually.
Such distributions, on a tax basis, are determined in conformity with income tax regulations, which may differ from USGAAP. Distributions in excess of tax basis earnings and profits, if any, are reported in the fund's financial statements as a return of capital. The final determination of tax characteristics of the fund's distribution will occur at the end of the year and will subsequently be reported to shareholders.
Capital accounts within the financial statements are adjusted for permanent book-tax differences. These adjustments have no impact on net assets or the results of operations. Temporary book-tax differences, if any, will reverse in a subsequent period. Book tax differences are primarily attributable to net operating losses, foreign currency transactions, characterization of distributions and derivative transactions.
Note 3 — Derivative Instruments
The fund may invest in derivatives in order to meet its investment objective. Derivatives include a variety of different instruments that may be traded in the over-the-counter (OTC) market, on a regulated exchange or through a clearing facility. The risks in using derivatives vary depending upon the structure of the instruments, including the use of leverage, optionality, the liquidity or lack of liquidity of the contract, the creditworthiness of the counterparty or clearing organization and the volatility of the position. Some derivatives involve risks that are potentially greater than the risks associated with investing directly in the referenced securities or other referenced underlying instrument. Specifically, the fund is exposed to the risk that the counterparty to an OTC derivatives contract will be unable or unwilling to make timely settlement payments or otherwise honor its obligations. OTC derivatives transactions typically can only be closed out with the other party to the transaction.
Forward foreign currency contracts, certain options and certain swaps are typically traded through the OTC market. Certain forwards, options and swaps are regulated by the Commodity Futures Trading Commission. Derivative counterparty risk is managed through an ongoing evaluation of the creditworthiness of all potential counterparties and, if applicable, designated clearing organizations. The fund attempts to reduce its exposure to counterparty risk for derivatives traded in the OTC market, whenever possible, by entering into an International Swaps and Derivatives Association (ISDA) Master Agreement with each of its OTC counterparties. The ISDA gives each party to the agreement the right to terminate all transactions traded under the agreement if there is certain deterioration in the credit quality or contractual default of the other party, as defined in the ISDA. Upon an event of default or a termination of the ISDA, the non-defaulting party has the right to close out all transactions and to net amounts owed.
As defined by the ISDA, the fund may have collateral agreements with certain counterparties to mitigate counterparty risk on OTC derivatives. Subject to established minimum levels, collateral for OTC transactions is generally determined based on the net aggregate unrealized gain or loss on contracts with a particular counterparty. Collateral pledged to the fund is held in a segregated account by a third-party agent or held by the custodian bank for the benefit of the fund and can be in the form of cash or debt securities issued by the U.S. government or related agencies; collateral posted by the fund for OTC transactions is held in a segregated account at the fund's custodian and is noted in the accompanying fund's investments, or if cash is posted, on the Statement of assets and liabilities. The fund's risk of loss due to counterparty risk is equal to the asset value of outstanding contracts offset by collateral received.
Futures, certain options and centrally-cleared swaps are traded or cleared on an exchange or central clearinghouse. Exchange-traded or centrally-cleared transactions generally present less counterparty risk to a fund than OTC transactions. The exchange or clearinghouse stands between the fund and the broker to the contract and therefore, credit risk is generally limited to the failure of the exchange or clearinghouse and the clearing member.
Centrally-cleared swap contracts are subject to clearinghouse rules, including initial and variation margin requirements, daily settlement of obligations and the clearinghouse guarantee of payments to the broker. There is, however, still counterparty risk due
to the potential insolvency of the broker with respect to any margin held in the brokers' customer accounts. While clearing members are required to segregate customer assets from their own assets, in the event of insolvency, there may be a shortfall in the amount of margin held by the broker for its clients. Collateral or margin requirements for exchange-traded or centrally-cleared derivatives are set by the broker or applicable clearinghouse. Margin for exchange-traded and centrally-cleared transactions is detailed in the Statements of assets and liabilities as Cash held at broker for futures contracts and payable for centrally-cleared swaps, respectively. Securities pledged by the fund for exchange-traded and centrally-cleared transactions, if any, are identified in the Fund's investments.
Futures. A futures contract is a contractual agreement to buy or sell a particular currency or financial instrument at a pre-determined price in the future. Risks related to the use of futures contracts include possible illiquidity of the futures markets, contract prices that can be highly volatile and imperfectly correlated to movements in the underlying financial instrument and potential losses in excess of the amounts recognized on the Statement of assets and liabilities. Use of long futures contracts subjects the fund to the risk of loss up to the notional value of the futures contracts. Use of short futures contracts subjects the fund to unlimited risk of loss.
Upon entering into a futures contract, the fund is required to deposit initial margin with the broker in the form of cash or securities. The amount of required margin is generally based on a percentage of the contract value; this amount is the initial margin for the trade. The margin deposit must then be maintained at the established level over the life of the contract. Futures margin receivable / payable is included on the Statement of assets and liabilities. Futures contracts are marked-to-market daily and an appropriate payable or receivable for the change in value (variation margin) and unrealized gain or loss is recorded by the fund. When the contract is closed, the fund records a realized gain or loss equal to the difference between the value of the contract at the time it was opened and the value at the time it was closed.
During the six months ended April 30, 2018, the fund used futures contracts to gain exposure to certain securities markets and to foreign bond markets, maintain diversity of the fund and manage exposure to equity volatility. The fund held futures contracts with notional values ranging from $23.7 million to $42.3 million, as measured at each quarter end.
Forward foreign currency contracts. A forward foreign currency contract is an agreement between two parties to buy and sell specific currencies at a price that is set on the date of the contract. The forward contract calls for delivery of the currencies on a future date that is specified in the contract. Risks related to the use of forwards include the possible failure of counterparties to meet the terms of the forward agreement, the failure of the counterparties to timely post collateral if applicable, the risk that currency movements will not favor the fund thereby reducing the fund's total return, and the potential for losses in excess of the amounts recognized on the Statement of assets and liabilities.
The market value of a forward foreign currency contract fluctuates with changes in foreign currency exchange rates. Forward foreign currency contracts are marked-to-market daily and the change in value is recorded by the fund as an unrealized gain or loss. Realized gains or losses, equal to the difference between the value of the contract at the time it was opened and the value at the time it was closed, are recorded upon delivery or receipt of the currency or settlement with the counterparty.
During the six months ended April 30, 2018 the fund used forward foreign currency contracts to manage against anticipated changes in currency exchange rates, gain exposure to foreign currency and to maintain diversity of the fund. The fund held forward foreign currency contracts with U.S. Dollar notional values ranging from $38.4 million to $54.5 million, as measured at each quarter end.
Options. There are two types of options, put options and call options. Options are traded either OTC or on an exchange. A call option gives the purchaser of the option the right to buy (and the seller the obligation to sell) the underlying instrument at the exercise price. A put option gives the purchaser of the option the right to sell (and the writer the obligation to buy) the underlying instrument at the exercise price. Writing puts and buying calls may increase the fund's exposure to changes in the value of the underlying instrument. Buying puts and writing calls may decrease the fund's exposure to such changes. Risks related to the use of options include the loss of premiums, possible illiquidity of the options markets, trading restrictions imposed by an exchange and movements in underlying security values, and for written options, potential losses in excess of the amounts recognized on the Statement of assets and liabilities. In addition, OTC options are subject to the risks of all OTC derivatives contracts.
When the fund purchases an option, the premium paid by the fund is included in the Fund's investments and subsequently "marked-to-market" to reflect current market value. If the purchased option expires, the fund realizes a loss equal to the cost of the option. If the fund exercises a call option, the cost of the securities acquired by exercising the call is increased by the premium paid to buy the call. If the fund exercises a put option, it realizes a gain or loss from the sale of the underlying security and the proceeds from such sale are decreased by the premium paid. Use the following disclosure only when fund has written/purchased options: If the fund enters into a closing sale transaction, the fund realizes a gain or loss, depending on whether proceeds from the closing sale are greater or less than the original cost. When the fund writes an option, the premium received is included as a liability and subsequently "marked-to-market" to reflect the current market value of the option written. Premiums received from writing options that expire unexercised are recorded as realized gains. Premiums received from writing options which are exercised or are closed are added to or offset against the proceeds or amount paid on the transaction to determine the realized gain or loss. If a put option on a security is exercised, the premium received reduces the cost basis of the securities purchased by the fund.
During the six months ended April 30, 2018, the fund used purchased options contracts to manage against anticipated changes in securities markets and interest rate changes, gain exposure to certain securities markets, manage duration of the fund and to maintain diversity of the fund. The fund held purchased options contracts with market values ranging from $1.6 million to $1.7 million, as measured at each quarter end.
During the six months ended April 30, 2018, the fund wrote option contracts to gain exposure to foreign currency and certain securities markets, to maintain diversity of the fund and to manage against anticipated changes in currency exchange rates and securities markets. The fund held written options contracts with market values ranging from $68.1 thousand to $229.5 thousand, as measured at each quarter end.
Swaps. Swap agreements are agreements between the fund and counterparty to exchange cash flows, assets, foreign currencies or market-linked returns at specified intervals. Swap agreements are privately negotiated in the OTC market (OTC swaps) or may be executed on a registered commodities exchange (centrally cleared swaps). Swaps are marked-to-market daily and the change in value is recorded as a component of unrealized appreciation/depreciation of swap contracts. The value of the swap will typically impose collateral posting obligations on the party that is considered out-of-the-money on the swap.
Upfront payments made/received by the fund are amortized/accreted for financial reporting purposes, with the unamortized/unaccreted portion included in the Statement of assets and liabilities. A termination payment by the counterparty or the fund is recorded as realized gain or loss, as well as the net periodic payments received or paid by the fund.
Entering into swap agreements involves, to varying degrees, elements of credit, market and documentation risk that may provide outcomes that are in excess of the amounts recognized on the Statement of assets and liabilities. Such risks involve the possibility that there will be no liquid market for the swap, or that a counterparty may default on its obligation or delay payment under the swap terms. The counterparty may disagree or contest the terms of the swap. In addition to interest rate risk, market risks may also impact the swap. The fund may also suffer losses if it is unable to terminate or assign outstanding swaps or reduce its exposure through offsetting transactions.
Interest rate swaps. Interest rate swaps represent an agreement between the fund and a counterparty to exchange cash flows based on the difference between two interest rates applied to a notional amount. The payment flows are usually netted against each other, with the difference being paid by one party to the other. The fund settles accrued net interest receivable or payable under the swap contracts at specified, future intervals.
During the six months ended April 30, 2018, the fund used interest rate swap contracts to manage duration of the fund, manage against anticipated interest rate changes, maintain diversity of the fund and gain exposure to the treasuries market. The fund held interest rate swaps with total USD notional amounts ranging from $102.5 million to $147.0 million, as measured at each quarter end.
Credit default swaps. Credit default swaps (CDS) involve the exchange of a fixed rate premium (paid by the Buyer), for protection against the loss in value of an underlying debt instrument, referenced entity or index, in the event of a defined credit event (such as payment default or bankruptcy). Under the terms of the swap, one party acts as a "guarantor" (the Seller), receiving the premium and agreeing to contingent payments that are specified within the credit default agreement. The fund may enter into
CDS in which it may act as either Buyer or Seller. By acting as the Seller, the fund may incur economic leverage since it would be obligated to pay the Buyer the notional amount of the contract in the event of a default. The amount of loss in such case could be significant, but would typically be reduced by any recovery value on the underlying credit.
Credit default swaps—Buyer
During the six months ended April 30, 2018, the fund used CDS as a Buyer of protection to manage against potential credit events. The fund held credit default swap contracts with total USD notional amounts ranging up to $4.6 million, as measured at each quarter end.
Implied credit spreads are utilized in determining the market value of CDS agreements in which the fund is the Seller at period end. The implied credit spread generally represents the yield of the instrument above a credit-risk free rate, such as the U.S. Treasury Bond Yield, and may include upfront payments required to be made to enter into the agreement. It also serves as an indicator of the current status of the payment/performance risk and represents the likelihood or risk of default for the credit derivative. Wider credit spreads represent a deterioration of the referenced entity's creditworthiness and an increased risk of default or other credit event occurring as defined under the terms of the agreement.
For CDS agreements where implied credit spreads are not reported or available, the average credit rating on the underlying index is shown. Increasing market values, in absolute terms when compared to the notional amount of the swap, represent a deterioration of the referenced entity's creditworthiness and a greater likelihood of a credit event occurring. This is also represented by a decrease in the average credit rating of the underlying index. The maximum potential amount of future payments (undiscounted) that a fund as the Seller could be required to make under any CDS agreement equals the notional amount of the agreement.
During the six months ended April 30, 2018, the fund used CDS as a Seller of protection to take a long position in the exposure of the benchmark credit. The fund acted as Seller on credit default swap contracts with total USD notional amounts ranging up to $6.8 million, as measured at each quarter end.
Inflation Swaps. In an inflation swap, one party pays a fixed rate on a notional principal amount while the other party pays a floating rate linked to an inflation index on that same notional amount. The party paying the floating rate pays the inflation adjusted rate multiplied by the notional principal amount. If the average inflation rate over the term of the swap is the same as the fixed rate of the swap, the two legs will have the same value and the swap will break even.
During the six months ended April 30, 2018, the fund used inflation swaps to manage inflation duration of the fund, maintain diversity of the fund and manage against anticipated changes in inflation. The fund held inflation swaps with total USD notional amounts ranging from $66.9 million to $92.4 million, as measured at each quarter end.
Total Return Swaps. The fund may enter into total return swap contracts to obtain synthetic exposure to a specific reference asset or index without owning, taking physical custody of, or short selling the underlying assets. Total return swaps are commitments where one party pays a fixed or variable rate premium (the Buyer) in exchange for a market-linked return (the Seller). The Seller pays the total return of a specific reference asset or index and in return receives interest payments from the Buyer To the extent the total return of the underlying asset or index exceeds or falls short of the offsetting interest rate obligation, the Buyer will receive or make a payment to the Seller. The fund may enter into total return swaps in which it may act as either the Buyer or the Seller. Total return swap contracts are subject to the risk associated with the investment in the underlying reference asset or index. The risk in the case of short total return swap contracts is unlimited based on the potential for unlimited increases in the market value of the underlying reference asset or index.
During the six months ended April 30, 2018, the fund used total return swaps to manage against anticipated changes in securities, gain exposure to certain securities markets and maintain diversity of the fund. The fund held total return swaps with total USD notional amounts ranging from $7.4 million to $9.8 million, as measured at each quarter end.
Variance Swaps. Variance swap agreements involve two parties agreeing to exchange cash flows based on the measured variance (or square of volatility) of a specified underlying asset. One party agrees to exchange a "fixed rate" or strike price payment for the "floating rate" or realized price variance on the underlying asset with respect to the notional amount. At inception, the strike
price is generally chosen such that the fair value of the swap is zero. At the maturity date, a net cash flow is exchanged, where the payoff amount is equivalent to the difference between the realized price variance of the underlying asset and the strike price multiplied by the notional amount. As a receiver of the realized price variance, the fund would receive the payoff amount when the realized price variance of the underlying asset is greater than the strike price and would owe the payoff amount when the price variance is less than the strike price. As a payer of the realized price variance the fund would owe the payoff amount when the realized price variance of the underlying asset is greater than the strike price and would receive the payoff amount when the variance is less than the strike price
During the six months ended April 30, 2018 the fund used variance swaps to maintain diversity of the fund and to manage against anticipated changes in securities markets. The fund held variance swaps with total USD notional amounts ranging from $40.0 thousand to $188.1 thousand, as measured at each quarter end.
Fair value of derivative instruments by risk category
The table below summarizes the fair value of derivatives held by the fund at April 30, 2018 by risk category:
| Risk | Statement of assets and liabilities location | Financial instruments location | Assets derivatives fair value | Liabilities derivatives fair value | |||||||||||||
| Equity | Receivable/payable for futures | Futures† | $386,316 | ($330,553 | ) | ||||||||||||
| Interest rate | Receivable/payable for futures | Futures† | 252,464 | (87,008 | ) | ||||||||||||
| Foreign currency | Unrealized appreciation / depreciation on forward foreign currency contracts | Forward foreign currency contracts | 803,818 | (895,979 | ) | ||||||||||||
| Equity | Investments, at value* | Purchased options | 545,535 | — | |||||||||||||
| Interest rate | Investments, at value* | Purchased options | 1,006,885 | — | |||||||||||||
| Equity | Written options, at value | Written options | — | (229,544 | ) | ||||||||||||
| Equity | Swap contracts, at value | Variance swaps^ | 134,275 | (314,498 | ) | ||||||||||||
| Equity | Swap contracts, at value | Total return swaps^ | 167,098 | (279,335 | ) | ||||||||||||
| Interest rate | Swap contracts, at value | Interest rate swaps^ | 433,548 | (216,007 | ) | ||||||||||||
| Interest rate | Swap contracts, at value | Inflation swaps^ | 562,600 | (895,177 | ) | ||||||||||||
| † Reflects cumulative appreciation/depreciation on futures as disclosed in Fund's investments. Only the year end variation margin is separately disclosed on the Statement of assets and liabilities. | |||||||||||||||||
| * Purchased options are included in Fund's investment. | |||||||||||||||||
| ^ Reflects cumulative value of swap contracts. Receivable for centrally cleared swaps, which includes value and margin, and swap contracts at value, which represents OTC swaps, are shown separately on the Statement of assets and liabilities. | |||||||||||||||||
For financial reporting purposes, the portfolio does not offset OTC derivative assets or liabilities that are subject to master netting arrangements, as defined by the ISDAs, in the Statement of assets and liabilities. In the event of default by the counterparty or a termination of the agreement, the ISDA allows an offset of amounts across the various transactions between the fund and the applicable counterparty. The table below reflects certain portfolio's exposure to counterparties subject to an ISDA for OTC derivative transactions:
| OTC Financial Instruments | Asset | Liability | ||||||
| Purchased options | $1,426,952 | — | ||||||
| Forward foreign currency contracts | 803,818 | ($895,979 | ) | |||||
| Written options | — | (154,448 | ) | |||||
| Inflation swaps | 562,600 | (895,177 | ) | |||||
| Total return swaps | 167,098 | (279,335 | ) | |||||
| Variance swaps | 134,275 | (314,498 | ) | |||||
| Totals | $3,094,743 | ($2,539,437 | ) |
| Counterparty | Total market value of OTC derivatives | Collateral posted by counterparty | Collateral posted by fund | Net exposure | ||||||||||
| Barclays Capital | ($236,712 | ) | — | $236,712 | — | |||||||||
| BNP Paribas SA | (112,495 | ) | — | — | ($112,495 | ) | ||||||||
| Citigroup | (16,505 | ) | — | — | (16,505 | ) | ||||||||
| Deutsche Bank AG | 198,418 | — | — | 198,418 | ||||||||||
| Goldman Sachs | 58,701 | — | — | 58,701 | ||||||||||
| HSBC | (83,600 | ) | — | — | (83,600 | ) | ||||||||
| JPMorgan Chase | (88,377 | ) | — | — | (88,377 | ) | ||||||||
| Merrill Lynch | (325,712 | ) | — | 305,327 | (20,385 | ) | ||||||||
| Morgan Stanley & Company, Inc. | 870,909 | 1,000,000 | 223,280 | 94,189 | ||||||||||
| Royal Bank of Canada | (8,674 | ) | — | — | (8,674 | ) | ||||||||
| Royal Bank of Scotland | 24,719 | — | — | 24,719 | ||||||||||
| Societe Generale Paris | 274,634 | 274,634 | — | — | ||||||||||
| Total | $555,306 | 1,274,634 | $765,319 | $45,991 |
Effect of derivative instruments on the Statement of operations
The table below summarizes the net realized gain (loss) included in the net increase (decrease) in net assets from operations, classified by derivative instrument and risk category, for the six months ended April 30, 2018:
| Statements of operations location - net realized gain (loss) on: | ||||||||||||||||||||
| Risk | Investments and foreign currency transactions 1 | Futures contracts | Forward foreign currency contracts | Written options | Swap contracts | Total | ||||||||||||||
| Credit | — | — | — | — | ($211 | ) | ($211 | ) | ||||||||||||
| Equity | ($87,124 | ) | ($129,085 | ) | — | $120,284 | 51,412 | (44,513 | ) | |||||||||||
| Foreign currency | — | — | ($802,892 | ) | — | — | (802,892 | ) | ||||||||||||
| Interest rate | — | 426,997 | — | — | (84,058 | ) | 342,939 | |||||||||||||
| Total | ($87,124 | ) | $297,912 | ($802,892 | ) | $120,284 | ($32,857 | ) | ($504,677 | ) | ||||||||||
| 1 Realized gain/loss associated with purchased options is included in this caption on the Statement of operations. | ||||||||||||||||||||
The table below summarizes the net change in unrealized appreciation (depreciation) included in the net increase (decrease) in net assets from operations, classified by derivative instrument and risk category, for the six months ended April 30, 2018:
| Statement of operations location - change in net unrealized appreciation (depreciation) of: | ||||||||||||||||||||
| Risk | Investments and translation of assets and liabilities in foreign currencies 1 | Futures contracts | Forward foreign currency contracts | Written options | Swap contracts | Total | ||||||||||||||
| Credit | — | — | — | — | ($20,809 | ) | ($20,809 | ) | ||||||||||||
| Equity | ($199,948 | ) | ($779,186 | ) | — | $17,386 | (399,849 | ) | (1,361,597 | ) | ||||||||||
| Foreign currency | 13,522 | — | $370,648 | — | — | 384,170 | ||||||||||||||
| Interest rate | (135,365 | ) | 72,809 | — | — | (138,335 | ) | (200,891 | ) | |||||||||||
| Total | ($321,791 | ) | ($706,377 | ) | $370,648 | $17,386 | ($558,993 | ) | ($1,199,127 | ) | ||||||||||
| 1 Change in unrealized appreciation/depreciation associated with purchased options is included in this caption on the Statement of operations. | ||||||||||||||||||||
Note 4 — Guarantees and indemnifications
Under the Trust's organizational documents, its Officers and Trustees are indemnified against certain liabilities arising out of the performance of their duties to the Trust, including the fund. Additionally, in the normal course of business, the fund enters into contracts with service providers that contain general indemnification clauses. The fund's maximum exposure under these arrangements is unknown, as this would involve future claims that may be made against the fund that have not yet occurred. The risk of material loss from such claims is considered remote.
Note 5 — Fees and transactions with affiliates
John Hancock Advisers, LLC (the Advisor) serves as investment advisor for the fund. John Hancock Funds, LLC (the Distributor), an affiliate of the Advisor, serves as principal underwriter of the fund. The Advisor and the Distributor are indirect, wholly owned subsidiaries of Manulife Financial Corporation (MFC).
Management fee. The fund has an investment management agreement with the Advisor under which the fund pays a daily management fee to the Advisor equivalent on an annual basis to the sum of (a) 1.550% of the first $500 million of the fund's average daily net assets; and (b) 1.500% of the fund's average daily net assets in excess of $500 million. The Advisor has a subadvisory agreement with Standard Life Investment (Corporate Funds) Limited. The fund is not responsible for payment of the subadvisory fees.
The Advisor has contractually agreed to waive a portion of its management fee and/or reimburse expenses for certain funds of the John Hancock group of funds complex, including the fund (the participating portfolios). This waiver is based upon aggregate net assets of all the participating portfolios. The amount of the reimbursement is calculated daily and allocated among all the participating portfolios in proportion to the daily net assets of each fund. During the six months ended April 30, 2018, this waiver amounted to 0.01% of the fund's average net assets (on an annualized basis). This arrangement may be amended or terminated at any time by the Advisor upon notice to the fund and with the approval of the Board of Trustees.
The Advisor has contractually agreed to reduce its management fee or, if necessary, make payment to the fund in an amount equal to the amount by which expenses of the fund exceed 1.62% of the fund's average net assets, on an annualized basis. For purposes of this agreement, "expenses of the fund" means all fund expenses, excluding taxes, brokerage commissions, interest expense, litigation and indemnification expenses and other extraordinary expenses not incurred in the ordinary course of the fund's business, class-specific expenses, borrowing costs, prime brokerage fees, acquired fund fees and expenses paid indirectly, and short dividend expense. This agreement expires on February 28, 2019, unless renewed by mutual agreement of the Advisor and the fund based upon a determination that this is appropriate under the circumstances at that time.
For the six months ended April 30, 2018, the expense reductions described above amounted to the following:
| Class | Expense reduction | Class | Expense reduction | |
| Class A | $262 | Class R6 | $210 | |
| Class C | 206 | Class NAV | 151,904 | |
| Class I | 207 | Total | $152,789 |
Expenses waived or reimbursed in the current fiscal period are not subject to recapture in future fiscal periods.
The investment management fees, including the impact of the waivers and reimbursements as described above, incurred for the six months ended April 30, 2018, were equivalent to a net annual effective rate of 0.89% of the fund's average daily net assets.
Accounting and legal services. Pursuant to a service agreement, the fund reimburses the Advisor for all expenses associated with providing the administrative, financial, legal, compliance, accounting and recordkeeping services to the fund, including the preparation of all tax returns, periodic reports to shareholders and regulatory reports, among other services. These expenses are allocated to each share class based on its relative net assets at the time the expense was incurred. These accounting and legal services fees incurred for the six months ended April 30, 2018, amounted to an annual rate of 0.02% of the fund's average daily net assets.
Distribution and service plans. The fund has a distribution agreement with the Distributor. The fund has adopted distribution and service plans with respect to Class A and Class C shares pursuant to Rule 12b-1 under the 1940 Act, to pay the Distributor for services provided as the distributor of shares of the fund. The fund may pay up to the following contractual rates of distribution and service fees under these arrangements, expressed as an annual percentage of average daily net assets for each class of the fund's shares:
| Class | Rule 12b-1 fee |
| Class A | 0.25% |
| Class C | 1.00% |
Sales charges. Class A shares may be subject to up-front sales charges. For the six months ended April 30, 2018, no sales charges were assessed.
Class A and Class C shares may be subject to contingent deferred sales charges (CDSCs). Certain Class A shares that are acquired through purchases of $1 million or more and are redeemed within one year of purchase are subject to a 1.00% sales charge. Class C shares that are redeemed within one year of purchase are subject to a 1.00% CDSC. CDSCs are applied to the lesser of the current market value at the time of redemption or the original purchase cost of the shares being redeemed. Proceeds from CDSCs are used to compensate the Distributor for providing distribution-related services in connection with the sale of these shares. During the six months ended April 30, 2018, there were no CDSCs received by the Distributor for Class A and Class C shares.
Transfer agent fees. The John Hancock Group of Funds has a complex-wide transfer agent agreement with John Hancock Signature Services, Inc. (Signature Services), an affiliate of the Advisor. The transfer agent fees paid to Signature Services are determined based on the cost to Signature Services (Signature Services Cost) of providing recordkeeping services. It also includes out-of-pocket expenses, including payments made to third-parties for recordkeeping services provided to their clients who invest in one or more John Hancock funds. In addition, Signature Services Cost may be reduced by certain fees that Signature Services receives in connection with retirement and small accounts. Signature Services Cost is calculated monthly and allocated, as applicable, to five categories of share classes: Retail Share and Institutional Share Classes of Non-Municipal Bond Funds, Class R6 Shares, Retirement Share Classes and Municipal Bond Share Classes. Within each of these categories, the applicable costs are allocated to the affected John Hancock affiliated funds and/or classes, based on the relative average daily net assets.
Class level expenses. Class level expenses for the six months ended April 30, 2018 were:
| Class | Distribution and service fees | Transfer agent fees |
| Class A | $95 | $41 |
| Class C | 302 | 33 |
| Class I | — | 34 |
| Class R6 | — | 4 |
| Total | $397 | $112 |
Trustee expenses. The fund compensates each Trustee who is not an employee of the Advisor or its affiliates. The costs of paying Trustee compensation and expenses are allocated to the fund based on its net assets relative to other funds within the John Hancock group of funds complex.
Note 6 — Fund share transactions
Transactions in fund shares for the six months ended April 30, 2018 and for the year ended October 31, 2017 were as follows:
| Six months ended 4-30-18 | Year ended 10-31-17 | |||||||||||||||||||||||||
| Shares | Amount | Shares | Amount | |||||||||||||||||||||||
| Class A shares | ||||||||||||||||||||||||||
| Sold | — | — | 3,011 | $29,669 | ||||||||||||||||||||||
| Distributions reinvested | 18 | $176 | 3 | 32 | ||||||||||||||||||||||
| Repurchased | (6,440 | ) | (62,998 | ) | (768 | ) | (7,486 | ) | ||||||||||||||||||
| Net increase (decrease) | (6,422 | ) | ($62,822 | ) | 2,246 | $22,215 | ||||||||||||||||||||
| Class C shares | ||||||||||||||||||||||||||
| Sold | — | — | 1,778 | $17,000 | ||||||||||||||||||||||
| Distributions reinvested | — | — | — | 2 | ||||||||||||||||||||||
| Repurchased | (4,892 | ) | ($48,039 | ) | (1,948 | ) | (19,155 | ) | ||||||||||||||||||
| Net decrease | (4,892 | ) | ($48,039 | ) | (170 | ) | ($2,153 | ) | ||||||||||||||||||
| Class I shares | ||||||||||||||||||||||||||
| Repurchased | (4,939 | ) | ($48,945 | ) | — | — | ||||||||||||||||||||
| Net decrease | (4,939 | ) | ($48,945 | ) | — | — | ||||||||||||||||||||
| Class R6 shares | ||||||||||||||||||||||||||
| Repurchased | (4,944 | ) | ($49,044 | ) | — | — | ||||||||||||||||||||
| Net decrease | (4,944 | ) | ($49,044 | ) | — | — | ||||||||||||||||||||
| Class NAV shares | ||||||||||||||||||||||||||
| Sold | 132,535 | $1,297,693 | 272,284 | $2,637,523 | ||||||||||||||||||||||
| Distributions reinvested | 37,909 | 372,263 | 45,558 | 434,624 | ||||||||||||||||||||||
| Repurchased | (71,875 | ) | (688,238 | ) | (497,740 | ) | (4,867,423 | ) | ||||||||||||||||||
| Net increase (decrease) | 98,569 | $981,718 | (179,898 | ) | ($1,795,276 | ) | ||||||||||||||||||||
| Total net increase (decrease) | 77,372 | $772,868 | (177,822 | ) | ($1,775,214 | ) | ||||||||||||||||||||
Affiliates of the fund owned 87%, 100%, 100%, 100% and 100% of shares of Class A, Class C, Class I, Class R6 and Class NAV, respectively, on April 30, 2018. Such concentration of shareholders' capital could have a material effect on the fund if such shareholders redeem from the fund.
Note 7 — Purchase and sale of securities
Purchases and sales of securities, other than short-term securities and U.S. Treasury obligations, amounted to $13,852,417 and $8,039,537, respectively, for the six months ended April 30, 2018. Purchases of U.S. Treasury obligations aggregated $2,107,543 for the six months ended April 30, 2018.
Note 8 — Investment by affiliated funds
Certain investors in the fund are affiliated funds that are managed by the Advisor and its affiliates. The affiliated funds do not invest in the fund for the purpose of exercising management or control; however, this investment may represent a significant portion of the fund's net assets. At April 30, 2018, within the John Hancock group of funds complex, John Hancock Funds II Multimanager Lifestyle Aggressive Portfolio had an affiliated ownership of 99.6% of the fund's net assets.
Trustees Hassell H. McClellan, Chairperson Officers Andrew G. Arnott John J. Danello Francis V. Knox, Jr. Charles A. Rizzo Salvatore Schiavone | Investment advisor John Hancock Advisers, Inc. Subadvisor Standard Life Investments (Corporate Funds) Limited Principal distributor John Hancock Funds, LLC Custodian Citibank, N.A. Transfer agent John Hancock Signature Services, Inc. Legal counsel K&L Gates LLP |
*Member of the Audit Committee
†Non-Independent Trustee
#Effective 6-20-17
The fund's proxy voting policies and procedures, as well as the fund proxy voting record for the most recent twelve-month period ended June 30, are available free of charge on the Securities and Exchange Commission (SEC) website at sec.gov or on our website.
The fund's complete list of portfolio holdings, for the first and third fiscal quarters, is filed with the SEC on Form N-Q. The fund's Form N-Q is available on our website and the SEC's website, sec.gov, and can be reviewed and copied (for a fee) at the SEC's Public Reference Room in Washington, DC. Call 800-SEC-0330 to receive information on the operation of the SEC's Public Reference Room.
We make this information on your fund, as well as monthly portfolio holdings, and other fund details available on our website at jhinvestments.com or by calling 800-225-5291.
| You can also contact us: | |||
| 800-225-5291 jhinvestments.com | Regular mail: John Hancock Signature Services, Inc. | Express mail: John Hancock Signature Services, Inc. | |
John Hancock family of funds
DOMESTIC EQUITY FUNDS Balanced Blue Chip Growth Classic Value Disciplined Value Disciplined Value Mid Cap Equity Income Fundamental All Cap Core Fundamental Large Cap Core Fundamental Large Cap Value New Opportunities Small Cap Core Small Cap Growth Small Cap Value Strategic Growth U.S. Global Leaders Growth U.S. Growth Value Equity GLOBAL AND INTERNATIONAL EQUITY FUNDS Disciplined Value International Emerging Markets Emerging Markets Equity Fundamental Global Franchise Global Equity Global Shareholder Yield Greater China Opportunities International Growth International Small Company International Value Equity | INCOME FUNDS Bond California Tax-Free Income Emerging Markets Debt Floating Rate Income Government Income High Yield High Yield Municipal Bond Income Investment Grade Bond Money Market Short Duration Credit Opportunities Spectrum Income Strategic Income Opportunities Tax-Free Bond ALTERNATIVE AND SPECIALTY FUNDS Absolute Return Currency Alternative Asset Allocation Enduring Assets Financial Industries Global Absolute Return Strategies Global Conservative Absolute Return Global Focused Strategies Natural Resources Redwood Regional Bank Seaport Long/Short Technical Opportunities |
A fund's investment objectives, risks, charges, and expenses should be considered carefully before investing. The prospectus contains this and other important information about the fund. To obtain a prospectus, contact your financial professional, call John Hancock Investments at 800-225-5291, or visit our website at jhinvestments.com. Please read the prospectus carefully before investing or sending money.
ASSET ALLOCATION Income Allocation Multi-Index Lifetime Portfolios Multi-Index Preservation Portfolios Multimanager Lifestyle Portfolios Multimanager Lifetime Portfolios Retirement Income 2040 EXCHANGE-TRADED FUNDS John Hancock Multifactor Consumer Discretionary ETF John Hancock Multifactor Consumer Staples ETF John Hancock Multifactor Developed International ETF John Hancock Multifactor Energy ETF John Hancock Multifactor Financials ETF John Hancock Multifactor Healthcare ETF John Hancock Multifactor Industrials ETF John Hancock Multifactor Large Cap ETF John Hancock Multifactor Materials ETF John Hancock Multifactor Mid Cap ETF John Hancock Multifactor Small Cap ETF John Hancock Multifactor Technology ETF John Hancock Multifactor Utilities ETF | ENVIRONMENTAL, SOCIAL, AND GOVERNANCE FUNDS ESG All Cap Core ESG Core Bond ESG International Equity ESG Large Cap Core CLOSED-END FUNDS Financial Opportunities Hedged Equity & Income Income Securities Trust Investors Trust Preferred Income Preferred Income II Preferred Income III Premium Dividend Tax-Advantaged Dividend Income Tax-Advantaged Global Shareholder Yield |
John Hancock Multifactor ETF shares are bought and sold at market price (not NAV), and are not individually redeemed
from the fund. Brokerage commissions will reduce returns.
John Hancock ETFs are distributed by Foreside Fund Services, LLC, and are subadvised by Dimensional Fund Advisors LP.
Foreside is not affiliated with John Hancock Funds, LLC or Dimensional Fund Advisors LP.
Dimensional Fund Advisors LP receives compensation from John Hancock in connection with licensing rights to the
John Hancock Dimensional indexes. Dimensional Fund Advisors LP does not sponsor, endorse, or sell, and makes no
representation as to the advisability of investing in, John Hancock Multifactor ETFs.
John Hancock Investments
A trusted brand
John Hancock Investments is a premier asset manager representing one of
America's most trusted brands, with a heritage of financial stewardship dating
back to 1862. Helping our shareholders pursue their financial goals is at the
core of everything we do. It's why we support the role of professional financial
advice and operate with the highest standards of conduct and integrity.
A better way to invest
We serve investors globally through a unique multimanager approach:
We search the world to find proven portfolio teams with specialized
expertise for every strategy we offer, then we apply robust investment
oversight to ensure they continue to meet our uncompromising standards
and serve the best interests of our shareholders.
Results for investors
Our unique approach to asset management enables us to provide a diverse set
of investments backed by some of the world's best managers, along with strong
risk-adjusted returns across asset classes.
| | John Hancock Funds, LLC n Member FINRA, SIPC 601 Congress Street n Boston, MA 02210-2805 800-225-5291 n jhinvestments.com | |
| This report is for the information of the shareholders of John Hancock Global Focused Strategies Fund. It is not authorized for distribution to prospective investors unless preceded or accompanied by a prospectus. | ||
| MF450366 | 462SA 4/18 6/18 | |
John Hancock
ESG All Cap Core Fund
A message to shareholders
Dear shareholder,
Financial markets around the world experienced a meaningful rise in volatility in the last half of the reporting period, leading to some mixed results for equity investors. Stocks generally declined late in the period as investors reacted to a potential trade war between the United States and China and the prospect of rising inflation. While some in the asset management community believe the sell-off will be temporary, we have suggested for some time that the era of extremely low volatility would eventually come to an end, and that now appears to be the case.
Ultimately, the asset prices of stocks are underpinned by fundamentals, and the good news is that those continue to appear supportive. Unemployment remained close to historic lows, consumer confidence rose, and the housing market continued to notch steady gains. One moderating factor was the U.S. Federal Reserve's steady tightening of monetary policy. While higher interest rates alone may not cause the economy to pull back, markets will be closely attuned to any sign of policymakers quickening the pace of interest-rate increases in the year ahead.
Your best resource in unpredictable markets is your financial advisor, who can help position your portfolio so that it's sufficiently diversified to meet your long-term objectives and to withstand the inevitable turbulence along the way.
On behalf of everyone at John Hancock Investments, I'd like to take this opportunity to welcome new shareholders and to thank existing shareholders for the continued trust you've placed in us.
Sincerely,
Andrew G. Arnott
President and CEO,
John Hancock Investments
Head of Wealth and Asset Management,
United States and Europe
This commentary reflects the CEO's views, which are subject to change at any time. Investing involves risks, including the potential loss of principal. Diversification does not guarantee a profit or eliminate the risk of a loss. It is not possible to invest directly into an index. For more up-to-date information, please visit our website at jhinvestments.com.
John Hancock
ESG All Cap Core Fund
INVESTMENT OBJECTIVE
The fund seeks long-term capital appreciation.
AVERAGE ANNUAL TOTAL RETURNS AS OF 4/30/18 (%)
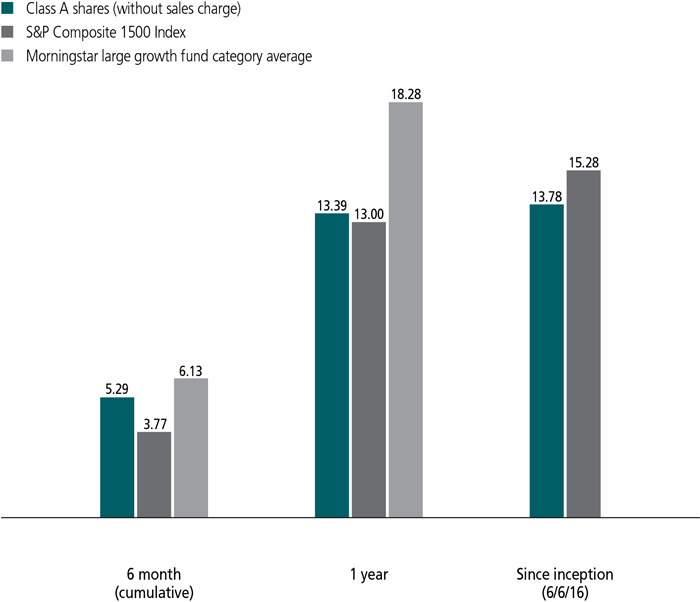
The S&P Composite 1500 Index combines three indexes, the S&P 500, the S&P MidCap 400, and the S&P SmallCap 600 to cover approximately 90% of the U.S. market capitalization.
It is not possible to invest directly in an index. Index figures do not reflect expenses or sales charges, which would result in lower returns.
Figures from Morningstar, Inc. include reinvested distributions and do not take into account sales charges. Actual load-adjusted performance is lower. Since inception returns for the Morningstar fund category average are not available.
The past performance shown here reflects reinvested distributions and the beneficial effect of any expense reductions, and does not guarantee future results. Returns for periods shorter than one year are cumulative. Performance of the other share classes will vary based on the difference in the fees and expenses of those classes. Shares will fluctuate in value and, when redeemed, may be worth more or less than their original cost. Current month-end performance may be lower or higher than the performance cited, and can be found at jhinvestments.com or by calling 800-225-5291. For further information on the fund's objectives, risks, and strategy, see the fund's prospectus.
PERFORMANCE HIGHLIGHTS OVER THE LAST SIX MONTHS
Volatility spiked during the period
After making strong gains in the first half of the period, the market's broad-based advance was stalled by volatility stemming from inflation fears.
The fund outperformed its benchmark
The fund outpaced its benchmark, the S&P Composite 1500 Index.
Stock selection contributed to relative returns
Selection in the information technology, consumer staples, and energy sectors contributed positively to the fund's results, while stock selection in the healthcare sector detracted from performance.
SECTOR COMPOSITION AS OF 4/30/18 (%)
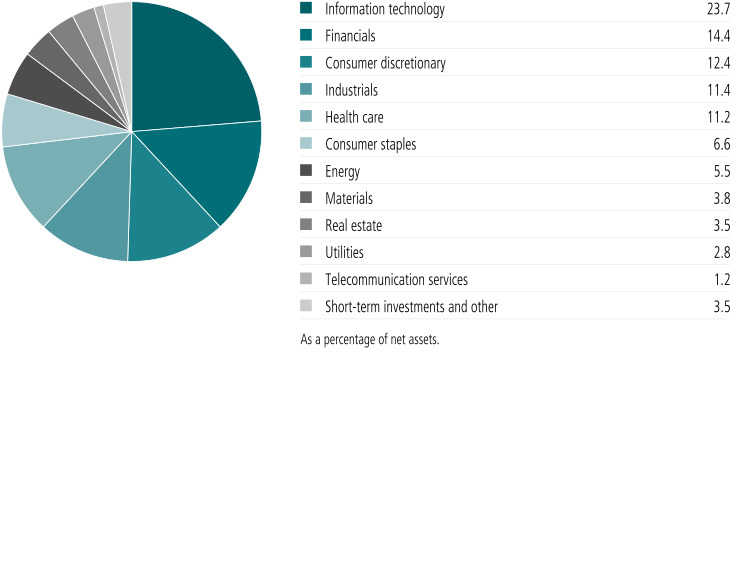
A note about risks
Large company stocks could fall out of favor. The stock prices of midsize and small companies can change more frequently and dramatically than those of large companies. The price of equity securities may decline due to changes in a company's financial condition or overall market conditions. Foreign investing has additional risks, such as currency and market volatility and political and social instability. A fund concentrated in one sector or that holds a limited number of securities may fluctuate more than a fund that invests in a wider variety of sectors. Investing primarily in responsible investments carries the risk that the fund may underperform funds that do not utilize a responsible investment strategy. The fund's environmental, social, and governance (ESG) policy could cause it to perform differently than similar funds that do not have such a policy. Successful application of the fund's investment strategy will depend on the managers' skill in properly identifying and analyzing material ESG issues. Please see the fund's prospectus for additional risks.

Elizabeth R. Levy, CFA
Portfolio Manager
Trillium AssetManagement
How would you describe the market environment during the six-month period ended April 30, 2018, and how did the fund perform?
The market advanced steadily in the first three months of the period, with large-cap growth stocks, particularly the FAANG group of internet stocks—Facebook, Inc., Apple, Inc., Amazon.com, Inc., Netflix, Inc., and Alphabet, Inc. (Google)—leading the way. In early February, the market pulled back sharply across the market-cap spectrum before partially recovering, but remaining volatile, for the remainder of the period.
The volatility that emerged in February was driven by several factors, including fears of inflation and faster interest-rate increases by the U.S. Federal Reserve. In addition, investors began to worry about how much longer the record bull market could last, particularly in the context of an emerging trade war between the United States and China. The information technology sector was hit particularly hard in March, with the FAANGs leading the way down.
In this context, the fund outperformed its benchmark, the S&P Composite 1500 Index. The fund had a significant underweight position in momentum stocks as we have believed that their valuations were stretched. In fact, Alphabet is the only stock of the group to which the fund had any exposure. Our stock selection in the information technology, consumer staples, and energy sectors contributed positively to the fund's results, while selection in the healthcare sector was a net detractor from benchmark-relative returns.
Could you describe your approach to ESG investing?
We seek to invest in well-managed companies with positive environmental, social, and governance (ESG) practices as well as attractive business fundamentals. We believe that companies
What were some of the stocks or strategies that contributed most to relative results?
Most of the outperformance during the period came from stock selection, particularly in information technology. Network security provider Palo Alto Networks, Inc. was one of the strongest positive contributors. The stock rose as the company's quarterly earnings results beat market expectations, with strong revenue and earnings growth underpinning the continued uptrend in spending on information technology to support data security.
Another strong performer was the stock of software company Adobe Systems, Inc. The company reported solid fundamental results in its flagship suite of software products, driven by market share gains and double-digit revenue growth across all product lines. This led management to boost its earnings estimates.
TOP 10 HOLDINGS AS OF 4/30/18 (%)
| Alphabet, Inc., Class A | 3.2 |
| Bank of America Corp. | 2.5 |
| Microsoft Corp. | 2.5 |
| PayPal Holdings, Inc. | 2.1 |
| Mastercard, Inc., Class A | 2.0 |
| Adobe Systems, Inc. | 1.9 |
| The PNC Financial Services Group, Inc. | 1.9 |
| salesforce.com, Inc. | 1.8 |
| EOG Resources, Inc. | 1.8 |
| American Water Works Company, Inc. | 1.7 |
| TOTAL | 21.4 |
| As a percentage of net assets. | |
| Cash and cash equivalents are not included. | |
What were some stocks or strategies that detracted from returns?
One of the weakest areas for the fund was healthcare, with health insurer Cigna Corp. one of the more significant detractors. Cigna's stock suffered during the latter half period, but particularly after Amazon, JPMorgan Chase & Co., and Berkshire Hathaway, Inc. (none of which are held by the fund) announced a still-undefined entrance into the healthcare world, spooking investors in insurance. Cigna came under further pressure with the announcement of a proposed acquisition of drug plan manager Express Scripts Holding Company (not held). While we agree with Cigna's acquisition rationale, we are cautious that the next year may continue to be rocky for the stock, especially after a particularly strong 2017. Despite these concerns, the fund continued to hold the security.
The stock of biotech drug company Celgene Corp. was weak as well. Although the company appeared to generate decent earnings on the back of strong product sales, concerns began to grow over the company's pipeline of future drugs. In the absence of new patent-protected drugs, the long-term outlook for companies like Celgene can raise the level of uncertainty with investors.
Another significant detractor for the period was the stock of consumer brands company Newell Brands, Inc. The company experienced a challenging period, which we attribute to changing retail dynamics. We hope that changes at the company's board level will contribute to stabilization and improvement going forward. In addition, we think Newell's more recently announced plan to accelerate growth through deleveraging could boost the company's financial performance.
Did you make any notable changes to the fund's positioning?
During the period, and particularly against the backdrop of higher market volatility, we proceeded cautiously. As we were generally pleased with the portfolio's positioning, trading was fairly light, although we did take advantage of specific situations. For example, in the industrials sector, we initiated a position in Swiss electric grid and automation leader ABB, Ltd. after the stock dropped on
disappointing earnings. To fund the position, we trimmed our exposure to carbon fiber aerospace component manufacturer Hexcel Corp., which had been particularly strong.
We also increased our position in household durables marketer Newell Brands, while in information technology, we took some profits from PV systems manufacturer First Solar, Inc. (PV, or photovoltaic systems, transform sunlight into energy). We also sold out of business software firm Citrix Systems, Inc. to increase our exposure to MasterCard, Inc., which we believe is well positioned in the attractive payments processor space. Lastly, in the energy sector, we sold the fund's position in oil production company Apache Corp. and offshore services firm National Oilwell Varco, Inc. to consolidate a position in oil field services technology leader Core Laboratories NV, which we feel will benefit from the continued focus on technology and efficiency in the oil field.
MANAGED BY
 | Stephanie R. Leighton, CFA On the fund since inception Investing since 1986 |
 | Elizabeth R. Levy, CFA On the fund since inception Investing since 2004 |
 | Cheryl I. Smith, Ph.D., CFA On the fund since inception Investing since 1987 |
![]()
TOTAL RETURNS FOR THE PERIOD ENDED APRIL 30, 2018
| Average annual total returns (%) with maximum sales charge | Cumulative total returns (%) with maximum sales charge | ||||||
| 1-year | Since inception1 | 6-month | Since inception1 | ||||
| Class A | 7.70 | 10.73 | 0.05 | 21.39 | |||
| Class C | 11.53 | 12.92 | 3.81 | 25.99 | |||
| Class I2 | 13.63 | 14.04 | 5.34 | 28.38 | |||
| Class R62 | 13.76 | 14.15 | 5.37 | 28.62 | |||
| Index† | 13.00 | 15.28 | 3.77 | 31.04 | |||
Performance figures assume all distributions have been reinvested. Figures reflect maximum sales charges on Class A shares of 5%, and the applicable contingent deferred sales charge (CDSC) on Class C shares. Class C shares sold within one year of purchase are subject to a 1% CDSC. Sales charges are not applicable to Class I or Class R6 shares.
The expense ratios of the fund, both net (including any fee waivers and/or expense limitations) and gross (excluding any fee waivers and/or expense limitations), are set forth according to the most recent publicly available prospectus for the fund and may differ from those disclosed in the Financial highlights tables in this report. Net expenses reflect contractual expense limitations in effect until February 28, 2019 and are subject to change. Had the contractual fee waivers and expense limitations not been in place, gross expenses would apply. The expense ratios are as follows:
| Class A | Class C | Class I | Class R6 | |
| Gross (%) | 2.34 | 3.09 | 2.08 | 1.99 |
| Net (%) | 1.17 | 1.92 | 0.91 | 0.82 |
Please refer to the most recent prospectus and annual or semiannual report for more information on expenses and any expense limitation arrangements for each class.
The returns reflect past results and should not be considered indicative of future performance. The return and principal value of an investment will fluctuate so that shares, when redeemed, may be worth more or less than their original cost. Due to market volatility and other factors, the fund's current performance may be higher or lower than the performance shown. For current to the most recent month-end performance data, please call 800-225-5291 or visit the fund's website at jhinvestments.com.
The performance table above and the chart on the next page do not reflect the deduction of taxes that a shareholder would pay on fund distributions or the redemption of fund shares. The fund's performance results reflect any applicable fee waivers or expense reductions, without which the expenses would increase and results would have been less favorable.
| † | Index is the S&P Composite 1500 Index. |
See the following page for footnotes.
This chart and table show what happened to a hypothetical $10,000 investment in John Hancock ESG All Cap Core Fund for the share classes and periods indicated, assuming all distributions were reinvested. For comparison, we've shown the same investment in the S&P Composite 1500 Index.
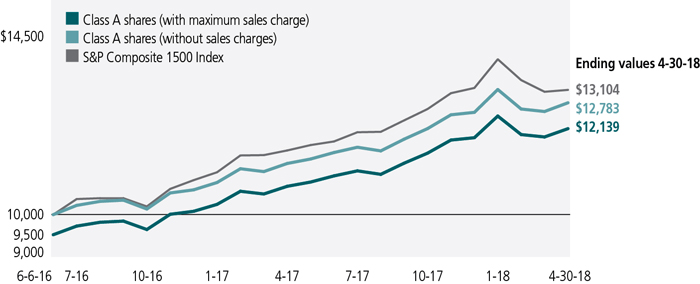
| Start date | With maximum sales charge ($) | Without sales charge ($) | Index ($) | |
| Class C3 | 6-6-16 | 12,599 | 12,599 | 13,104 |
| Class I2 | 6-6-16 | 12,838 | 12,838 | 13,104 |
| Class R62 | 6-6-16 | 12,862 | 12,862 | 13,104 |
The S&P Composite 1500 Index combines three indexes, the S&P 500, the S&P MidCap 400, and the S&P SmallCap 600 to cover approximately 90% of the U.S. market capitalization.
It is not possible to invest directly in an index. Index figures do not reflect expenses or sales charges, which would result in lower returns.
Footnotes related to performance pages
| 1 | From 6-6-16. |
| 2 | For certain types of investors as described in the fund's prospectus. |
| 3 | The contingent deferred sales charge is not applicable. |
These examples are intended to help you understand your ongoing operating expenses of investing in the fund so you can compare these costs with the ongoing costs of investing in other mutual funds.
Understanding fund expenses
As a shareholder of the fund, you incur two types of costs:
| • | Transaction costs, which include sales charges (loads) on purchases or redemptions (varies by share class), minimum account fee charge, etc. |
| • | Ongoing operating expenses, including management fees, distribution and service fees (if applicable), and other fund expenses. |
We are presenting only your ongoing operating expenses here.
Actual expenses/actual returns
The first line of each share class in the table on the following page is intended to provide information about the fund's actual ongoing operating expenses, and is based on the fund's actual return. It assumes an account value of $1,000.00 on November 1, 2017, with the same investment held until April 30, 2018.
Together with the value of your account, you may use this information to estimate the operating expenses that you paid over the period. Simply divide your account value at April 30, 2018, by $1,000.00, then multiply it by the "expenses paid" for your share class from the table. For example, for an account value of $8,600.00, the operating expenses should be calculated as follows:
Hypothetical example for comparison purposes
The second line of each share class in the table on the following page allows you to compare the fund's ongoing operating expenses with those of any other fund. It provides an example of the fund's hypothetical account values and hypothetical expenses based on each class's actual expense ratio and an assumed 5% annualized return before expenses (which is not the fund's actual return). It assumes an account value of $1,000.00 on November 1, 2017, with the same investment held until April 30, 2018. Look in any other fund shareholder report to find its hypothetical example and you will be able to compare these expenses. Please remember that these hypothetical account values and expenses may not be used to estimate the actual ending account balance or expenses you paid for the period.
Remember, these examples do not include any transaction costs, therefore, these examples will not help you to determine the relative total costs of owning different funds. If transaction costs were included, your expenses would have been higher. See the prospectus for details regarding transaction costs.
SHAREHOLDER EXPENSE EXAMPLE CHART
| Account value on 11-1-2017 | Ending value on 4-30-2018 | Expenses paid during period ended 4-30-20181 | Annualized expense ratio | ||
| Class A | Actual expenses/actual returns | $1,000.00 | $1,052.90 | $5.96 | 1.17% |
| Hypothetical example for comparison purposes | 1,000.00 | 1,019.00 | 5.86 | 1.17% | |
| Class C | Actual expenses/actual returns | 1,000.00 | 1,048.10 | 9.75 | 1.92% |
| Hypothetical example for comparison purposes | 1,000.00 | 1,015.30 | 9.59 | 1.92% | |
| Class I | Actual expenses/actual returns | 1,000.00 | 1,053.40 | 4.68 | 0.92% |
| Hypothetical example for comparison purposes | 1,000.00 | 1,020.20 | 4.61 | 0.92% | |
| Class R6 | Actual expenses/actual returns | 1,000.00 | 1,053.70 | 4.18 | 0.82% |
| Hypothetical example for comparison purposes | 1,000.00 | 1,020.70 | 4.11 | 0.82% | |
| 1 | Expenses are equal to the annualized expense ratio, multiplied by the average account value over the period, multiplied by 181/365 (to reflect the one-half year period). |
| Fund’s investments |
| Shares | Value | ||||
| Common stocks 96.5% | $21,383,557 | ||||
| (Cost $17,979,042) | |||||
| Consumer discretionary 12.4% | 2,758,018 | ||||
| Auto components 0.9% | |||||
| BorgWarner, Inc. | 3,944 | 193,019 | |||
| Hotels, restaurants and leisure 1.4% | |||||
| Starbucks Corp. | 5,538 | 318,823 | |||
| Household durables 1.0% | |||||
| Newell Brands, Inc. | 7,932 | 219,161 | |||
| Internet and direct marketing retail 1.2% | |||||
| Booking Holdings, Inc. (A) | 124 | 270,072 | |||
| Media 0.9% | |||||
| Omnicom Group, Inc. | 2,719 | 200,282 | |||
| Multiline retail 1.4% | |||||
| Target Corp. | 4,237 | 307,606 | |||
| Specialty retail 3.2% | |||||
| The Home Depot, Inc. | 1,841 | 340,217 | |||
| The TJX Companies, Inc. | 4,475 | 379,704 | |||
| Textiles, apparel and luxury goods 2.4% | |||||
| Lululemon Athletica, Inc. (A) | 2,382 | 237,724 | |||
| NIKE, Inc., Class B | 4,261 | 291,410 | |||
| Consumer staples 6.6% | 1,460,987 | ||||
| Food and staples retailing 3.1% | |||||
| Costco Wholesale Corp. | 1,601 | 315,653 | |||
| CVS Health Corp. | 2,392 | 167,033 | |||
| United Natural Foods, Inc. (A) | 4,393 | 197,773 | |||
| Food products 1.2% | |||||
| McCormick & Company, Inc. | 2,626 | 276,807 | |||
| Household products 0.8% | |||||
| The Procter & Gamble Company | 2,303 | 166,599 | |||
| Personal products 1.5% | |||||
| Unilever NV | 5,902 | 337,122 | |||
| Energy 5.5% | 1,218,989 | ||||
| Energy equipment and services 0.8% | |||||
| Core Laboratories NV | 1,492 | 182,695 | |||
| Oil, gas and consumable fuels 4.7% | |||||
| EOG Resources, Inc. | 3,333 | 393,861 | |||
| Hess Corp. | 3,542 | 201,859 | |||
| Marathon Petroleum Corp. | 2,382 | 178,436 | |||
| ONEOK, Inc. | 4,353 | 262,138 | |||
| 12 | JOHN HANCOCK ESG ALL CAP CORE FUND | SEMIANNUAL REPORT | SEE NOTES TO FINANCIAL STATEMENTS |
| Shares | Value | ||||
| Financials 14.4% | $3,186,354 | ||||
| Banks 9.1% | |||||
| Bank of America Corp. | 18,862 | 564,351 | |||
| East West Bancorp, Inc. | 5,491 | 365,810 | |||
| First Republic Bank | 3,811 | 353,928 | |||
| KeyCorp | 16,527 | 329,218 | |||
| The PNC Financial Services Group, Inc. | 2,815 | 409,892 | |||
| Capital markets 1.1% | |||||
| The Bank of New York Mellon Corp. | 4,400 | 239,844 | |||
| Insurance 4.2% | |||||
| Aflac, Inc. | 7,038 | 320,722 | |||
| Chubb, Ltd. | 2,781 | 377,294 | |||
| Reinsurance Group of America, Inc. | 1,508 | 225,295 | |||
| Health care 11.2% | 2,493,720 | ||||
| Biotechnology 1.4% | |||||
| Celgene Corp. (A) | 3,269 | 284,730 | |||
| Five Prime Therapeutics, Inc. (A) | 1,955 | 32,746 | |||
| Health care equipment and supplies 3.0% | |||||
| Hologic, Inc. (A) | 7,072 | 274,323 | |||
| Medtronic PLC | 2,249 | 180,212 | |||
| Zimmer Biomet Holdings, Inc. | 1,812 | 208,688 | |||
| Health care providers and services 2.5% | |||||
| Cigna Corp. | 2,080 | 357,386 | |||
| Quest Diagnostics, Inc. | 2,026 | 205,031 | |||
| Life sciences tools and services 2.0% | |||||
| Illumina, Inc. (A) | 746 | 179,734 | |||
| IQVIA Holdings, Inc. (A) | 2,742 | 262,574 | |||
| Pharmaceuticals 2.3% | |||||
| Johnson & Johnson | 1,347 | 170,382 | |||
| Merck & Company, Inc. | 5,740 | 337,914 | |||
| Industrials 11.4% | 2,533,926 | ||||
| Aerospace and defense 1.1% | |||||
| Hexcel Corp. | 3,730 | 247,933 | |||
| Building products 0.8% | |||||
| Johnson Controls International PLC | 5,225 | 176,971 | |||
| Construction and engineering 0.7% | |||||
| Quanta Services, Inc. (A) | 4,972 | 161,590 | |||
| Electrical equipment 2.9% | |||||
| ABB, Ltd., ADR | 10,326 | 240,286 | |||
| Acuity Brands, Inc. | 1,035 | 123,962 | |||
| Eaton Corp. PLC | 3,697 | 277,386 | |||
| Machinery 4.5% | |||||
| The Middleby Corp. (A) | 2,065 | 259,860 | |||
| SEE NOTES TO FINANCIAL STATEMENTS | SEMIANNUAL REPORT | JOHN HANCOCK ESG ALL CAP CORE FUND | 13 |
| Shares | Value | ||||
| Industrials (continued) | |||||
| Machinery (continued) | |||||
| Wabtec Corp. | 4,361 | $387,300 | |||
| Xylem, Inc. | 4,663 | 339,933 | |||
| Road and rail 1.4% | |||||
| J.B. Hunt Transport Services, Inc. | 2,714 | 318,705 | |||
| Information technology 23.7% | 5,246,615 | ||||
| Communications equipment 3.1% | |||||
| F5 Networks, Inc. (A) | 1,944 | 317,047 | |||
| Palo Alto Networks, Inc. (A) | 1,929 | 371,352 | |||
| Internet software and services 4.3% | |||||
| Alphabet, Inc., Class A (A) | 696 | 708,932 | |||
| LogMeIn, Inc. | 2,223 | 244,975 | |||
| IT services 4.0% | |||||
| Mastercard, Inc., Class A | 2,471 | 440,505 | |||
| PayPal Holdings, Inc. (A) | 6,094 | 454,673 | |||
| Semiconductors and semiconductor equipment 3.9% | |||||
| Analog Devices, Inc. | 3,813 | 333,066 | |||
| First Solar, Inc. (A) | 1,702 | 120,689 | |||
| Maxim Integrated Products, Inc. | 4,098 | 223,341 | |||
| Xilinx, Inc. | 2,837 | 182,249 | |||
| Software 8.4% | |||||
| Adobe Systems, Inc. (A) | 1,898 | 420,597 | |||
| ANSYS, Inc. (A) | 1,748 | 282,582 | |||
| Blackbaud, Inc. | 1,804 | 189,348 | |||
| Microsoft Corp. | 5,854 | 547,466 | |||
| salesforce.com, Inc. (A) | 3,387 | 409,793 | |||
| Materials 3.8% | 833,764 | ||||
| Chemicals 2.8% | |||||
| Ecolab, Inc. | 2,649 | 383,496 | |||
| International Flavors & Fragrances, Inc. | 1,632 | 230,536 | |||
| Containers and packaging 1.0% | |||||
| Sealed Air Corp. | 5,011 | 219,732 | |||
| Real estate 3.5% | 767,730 | ||||
| Equity real estate investment trusts 3.5% | |||||
| AvalonBay Communities, Inc. | 1,188 | 193,644 | |||
| Federal Realty Investment Trust | 1,086 | 125,813 | |||
| HCP, Inc. | 4,422 | 103,298 | |||
| SBA Communications Corp. (A) | 2,153 | 344,975 | |||
| Telecommunication services 1.2% | 256,867 | ||||
| Diversified telecommunication services 1.2% | |||||
| Verizon Communications, Inc. | 5,205 | 256,867 | |||
| 14 | JOHN HANCOCK ESG ALL CAP CORE FUND | SEMIANNUAL REPORT | SEE NOTES TO FINANCIAL STATEMENTS |
| Shares | Value | ||||
| Utilities 2.8% | $626,587 | ||||
| Electric utilities 1.1% | |||||
| Avangrid, Inc. | 4,532 | 238,882 | |||
| Water utilities 1.7% | |||||
| American Water Works Company, Inc. | 4,478 | 387,705 | |||
| Yield (%) | Shares | Value | |||
| Short-term investments 2.0% | $447,580 | ||||
| (Cost $447,580) | |||||
| Money market funds 2.0% | 447,580 | ||||
| Federated Government Obligations Fund, Institutional Class | 1.5571(B) | 447,580 | 447,580 | ||
| Total investments (Cost $18,426,622) 98.5% | $21,831,137 | ||||
| Other assets and liabilities, net 1.5% | 324,163 | ||||
| Total net assets 100.0% | $22,155,300 | ||||
| The percentage shown for each investment category is the total value of the category as a percentage of the net assets of the fund. | |
| Security Abbreviations and Legend | |
| ADR | American Depositary Receipt |
| (A) | Non-income producing security. |
| (B) | The rate shown is the annualized seven-day yield as of 4-30-18. |
| SEE NOTES TO FINANCIAL STATEMENTS | SEMIANNUAL REPORT | JOHN HANCOCK ESG ALL CAP CORE FUND | 15 |
Financial statements
STATEMENT OF ASSETS AND LIABILITIES 4-30-18 (unaudited)
| Assets | ||||||||||||||||||||||
| Investments, at value (Cost $18,426,622) | $21,831,137 | |||||||||||||||||||||
| Receivable for investments sold | 283,626 | |||||||||||||||||||||
| Dividends and interest receivable | 23,335 | |||||||||||||||||||||
| Receivable due from advisor | 2,341 | |||||||||||||||||||||
| Other receivables and prepaid expenses | 50,281 | |||||||||||||||||||||
| Total assets | 22,190,720 | |||||||||||||||||||||
| Liabilities | ||||||||||||||||||||||
| Payable to affiliates | ||||||||||||||||||||||
| Accounting and legal services fees | 2,370 | |||||||||||||||||||||
| Transfer agent fees | 1,999 | |||||||||||||||||||||
| Trustees' fees | 145 | |||||||||||||||||||||
| Other liabilities and accrued expenses | 30,906 | |||||||||||||||||||||
| Total liabilities | 35,420 | |||||||||||||||||||||
| Net assets | $22,155,300 | |||||||||||||||||||||
| Net assets consist of | ||||||||||||||||||||||
| Paid-in capital | $18,282,029 | |||||||||||||||||||||
| Undistributed net investment income | 14,562 | |||||||||||||||||||||
| Accumulated net realized gain (loss) on investments | 454,194 | |||||||||||||||||||||
| Net unrealized appreciation (depreciation) on investments | 3,404,515 | |||||||||||||||||||||
| Net assets | $22,155,300 | |||||||||||||||||||||
| Net asset value per share | ||||||||||||||||||||||
| Based on net asset value and shares outstanding - The fund has an unlimited number of shares authorized with no par value | ||||||||||||||||||||||
| Class A ($6,518,615 ÷ 526,729 shares)1 | $12.38 | |||||||||||||||||||||
| Class C ($1,422,963 ÷ 115,793 shares)1 | $12.29 | |||||||||||||||||||||
| Class I ($13,051,274 ÷ 1,053,180 shares) | $12.39 | |||||||||||||||||||||
| Class R6 ($1,162,448 ÷ 93,786 shares) | $12.39 | |||||||||||||||||||||
| Maximum offering price per share | ||||||||||||||||||||||
| Class A (net assets value per share ÷ 95%)2 | $13.03 | |||||||||||||||||||||
| 1 | Redemption price per share is equal to net asset value less any applicable contingent deferred sales charge. | |||||||||||||||||||
| 2 | On single retail sales of less than $50,000. On sales of $50,000 or more and on group sales the offering price is reduced. | |||||||||||||||||||
STATEMENT OF OPERATIONS For the six months ended 4-30-18 (unaudited)
| Investment income | ||||||||||||||||||||||||
| Dividends | $161,870 | |||||||||||||||||||||||
| Interest | 1,713 | |||||||||||||||||||||||
| Less foreign taxes withheld | (1,360 | ) | ||||||||||||||||||||||
| Total investment income | 162,223 | |||||||||||||||||||||||
| Expenses | ||||||||||||||||||||||||
| Investment management fees | 80,080 | |||||||||||||||||||||||
| Distribution and service fees | 14,233 | |||||||||||||||||||||||
| Accounting and legal services fees | 2,397 | |||||||||||||||||||||||
| Transfer agent fees | 11,154 | |||||||||||||||||||||||
| Trustees' fees | 386 | |||||||||||||||||||||||
| State registration fees | 29,036 | |||||||||||||||||||||||
| Printing and postage | 9,858 | |||||||||||||||||||||||
| Professional fees | 25,321 | |||||||||||||||||||||||
| Custodian fees | 6,047 | |||||||||||||||||||||||
| Other | 6,371 | |||||||||||||||||||||||
| Total expenses | 184,883 | |||||||||||||||||||||||
| Less expense reductions | (72,989 | ) | ||||||||||||||||||||||
| Net expenses | 111,894 | |||||||||||||||||||||||
| Net investment income | 50,329 | |||||||||||||||||||||||
| Realized and unrealized gain (loss) | ||||||||||||||||||||||||
| Net realized gain on Investments | 461,091 | |||||||||||||||||||||||
| Change in net unrealized appreciation (depreciation) of Investments | 563,341 | |||||||||||||||||||||||
| Net realized and unrealized gain | 1,024,432 | |||||||||||||||||||||||
| Increase in net assets from operations | $1,074,761 | |||||||||||||||||||||||
STATEMENTS OF CHANGES IN NET ASSETS
| Six months ended 4-30-18 | Year ended 10-31-17 | ||||||||||||||||||||||||||||||||||||||||||||
| (unaudited) | |||||||||||||||||||||||||||||||||||||||||||||
| Increase (decrease) in net assets | |||||||||||||||||||||||||||||||||||||||||||||
| From operations | |||||||||||||||||||||||||||||||||||||||||||||
| Net investment income | $50,329 | $94,195 | |||||||||||||||||||||||||||||||||||||||||||
| Net realized gain | 461,091 | 405,112 | |||||||||||||||||||||||||||||||||||||||||||
| Change in net unrealized appreciation (depreciation) | 563,341 | 2,737,327 | |||||||||||||||||||||||||||||||||||||||||||
| Increase in net assets resulting from operations | 1,074,761 | 3,236,634 | |||||||||||||||||||||||||||||||||||||||||||
| Distributions to shareholders | |||||||||||||||||||||||||||||||||||||||||||||
| From net investment income | |||||||||||||||||||||||||||||||||||||||||||||
| Class A | (19,205 | ) | (29,473 | ) | |||||||||||||||||||||||||||||||||||||||||
| Class C | — | (2,264 | ) | ||||||||||||||||||||||||||||||||||||||||||
| Class I | (68,241 | ) | (78,073 | ) | |||||||||||||||||||||||||||||||||||||||||
| Class R6 | (7,560 | ) | (8,198 | ) | |||||||||||||||||||||||||||||||||||||||||
| From net realized gain | |||||||||||||||||||||||||||||||||||||||||||||
| Class A | (117,399 | ) | (12,393 | ) | |||||||||||||||||||||||||||||||||||||||||
| Class C | (24,824 | ) | (2,608 | ) | |||||||||||||||||||||||||||||||||||||||||
| Class I | (247,190 | ) | (27,096 | ) | |||||||||||||||||||||||||||||||||||||||||
| Class R6 | (22,596 | ) | (2,608 | ) | |||||||||||||||||||||||||||||||||||||||||
| Total distributions | (507,015 | ) | (162,713 | ) | |||||||||||||||||||||||||||||||||||||||||
| From fund share transactions | 1,217,717 | 1,815,587 | |||||||||||||||||||||||||||||||||||||||||||
| Total increase | 1,785,463 | 4,889,508 | |||||||||||||||||||||||||||||||||||||||||||
| Net assets | |||||||||||||||||||||||||||||||||||||||||||||
| Beginning of period | 20,369,837 | 15,480,329 | |||||||||||||||||||||||||||||||||||||||||||
| End of period | $22,155,300 | $20,369,837 | |||||||||||||||||||||||||||||||||||||||||||
| Undistributed net investment income | $14,562 | $59,239 | |||||||||||||||||||||||||||||||||||||||||||
Financial highlights
| Class A Shares Period ended | 4-30-18 | 1 | 10-31-17 | 10-31-16 | 2 | ||||||||||||||||||||||||||||||||||||||||||||||||||||||||||||||||||
| Per share operating performance | |||||||||||||||||||||||||||||||||||||||||||||||||||||||||||||||||||||||
| Net asset value, beginning of period | $12.03 | $10.14 | $10.00 | ||||||||||||||||||||||||||||||||||||||||||||||||||||||||||||||||||||
| Net investment income3 | 0.02 | 0.04 | 0.04 | ||||||||||||||||||||||||||||||||||||||||||||||||||||||||||||||||||||
| Net realized and unrealized gain on investments | 0.61 | 1.95 | 0.10 | ||||||||||||||||||||||||||||||||||||||||||||||||||||||||||||||||||||
| Total from investment operations | 0.63 | 1.99 | 0.14 | ||||||||||||||||||||||||||||||||||||||||||||||||||||||||||||||||||||
| Less distributions | |||||||||||||||||||||||||||||||||||||||||||||||||||||||||||||||||||||||
| From net investment income | (0.04 | ) | (0.07 | ) | — | ||||||||||||||||||||||||||||||||||||||||||||||||||||||||||||||||||
| From net realized gain | (0.24 | ) | (0.03 | ) | — | ||||||||||||||||||||||||||||||||||||||||||||||||||||||||||||||||||
| Total distributions | (0.28 | ) | (0.10 | ) | — | ||||||||||||||||||||||||||||||||||||||||||||||||||||||||||||||||||
| Net asset value, end of period | $12.38 | $12.03 | $10.14 | ||||||||||||||||||||||||||||||||||||||||||||||||||||||||||||||||||||
| Total return (%)4,5 | 5.29 | 6 | 19.73 | 1.40 | 6 | ||||||||||||||||||||||||||||||||||||||||||||||||||||||||||||||||||
| Ratios and supplemental data | |||||||||||||||||||||||||||||||||||||||||||||||||||||||||||||||||||||||
| Net assets, end of period (in millions) | $7 | $6 | $4 | ||||||||||||||||||||||||||||||||||||||||||||||||||||||||||||||||||||
| Ratios (as a percentage of average net assets): | |||||||||||||||||||||||||||||||||||||||||||||||||||||||||||||||||||||||
| Expenses before reductions | 1.85 | 7 | 2.34 | 2.62 | 7 | ||||||||||||||||||||||||||||||||||||||||||||||||||||||||||||||||||
| Expenses including reductions | 1.17 | 7 | 1.18 | 1.19 | 7 | ||||||||||||||||||||||||||||||||||||||||||||||||||||||||||||||||||
| Net investment income | 0.35 | 7 | 0.38 | 0.47 | 7,8 | ||||||||||||||||||||||||||||||||||||||||||||||||||||||||||||||||||
| Portfolio turnover (%) | 12 | 21 | 13 | ||||||||||||||||||||||||||||||||||||||||||||||||||||||||||||||||||||
| 1 | Six months ended 4-30-18. Unaudited. | |||||||||||||||||||||||||||||||||||||||||||||||||||||||||||||||||||||||||||||||
| 2 | Period from 6-6-16 (commencement of operations) to 10-31-16. | |||||||||||||||||||||||||||||||||||||||||||||||||||||||||||||||||||||||||||||||
| 3 | Based on average daily shares outstanding. | |||||||||||||||||||||||||||||||||||||||||||||||||||||||||||||||||||||||||||||||
| 4 | Does not reflect the effect of sales charges, if any. | |||||||||||||||||||||||||||||||||||||||||||||||||||||||||||||||||||||||||||||||
| 5 | Total returns would have been lower had certain expenses not been reduced during the applicable periods. | |||||||||||||||||||||||||||||||||||||||||||||||||||||||||||||||||||||||||||||||
| 6 | Not annualized. | |||||||||||||||||||||||||||||||||||||||||||||||||||||||||||||||||||||||||||||||
| 7 | Annualized. | |||||||||||||||||||||||||||||||||||||||||||||||||||||||||||||||||||||||||||||||
| 8 | A portion of income is presented unannualized. | |||||||||||||||||||||||||||||||||||||||||||||||||||||||||||||||||||||||||||||||
| Class C Shares Period ended | 4-30-18 | 1 | 10-31-17 | 10-31-16 | 2 | ||||||||||||||||||||||||||||||||||||||||||||||||||||||||||||||||||
| Per share operating performance | |||||||||||||||||||||||||||||||||||||||||||||||||||||||||||||||||||||||
| Net asset value, beginning of period | $11.96 | $10.11 | $10.00 | ||||||||||||||||||||||||||||||||||||||||||||||||||||||||||||||||||||
| Net investment income (loss)3 | (0.02 | ) | (0.04 | ) | 0.01 | ||||||||||||||||||||||||||||||||||||||||||||||||||||||||||||||||||
| Net realized and unrealized gain on investments | 0.59 | 1.95 | 0.10 | ||||||||||||||||||||||||||||||||||||||||||||||||||||||||||||||||||||
| Total from investment operations | 0.57 | 1.91 | 0.11 | ||||||||||||||||||||||||||||||||||||||||||||||||||||||||||||||||||||
| Less distributions | |||||||||||||||||||||||||||||||||||||||||||||||||||||||||||||||||||||||
| From net investment income | — | (0.03 | ) | — | |||||||||||||||||||||||||||||||||||||||||||||||||||||||||||||||||||
| From net realized gain | (0.24 | ) | (0.03 | ) | — | ||||||||||||||||||||||||||||||||||||||||||||||||||||||||||||||||||
| Total distributions | (0.24 | ) | (0.06 | ) | — | ||||||||||||||||||||||||||||||||||||||||||||||||||||||||||||||||||
| Net asset value, end of period | $12.29 | $11.96 | $10.11 | ||||||||||||||||||||||||||||||||||||||||||||||||||||||||||||||||||||
| Total return (%)4,5 | 4.81 | 6 | 18.90 | 1.10 | 6 | ||||||||||||||||||||||||||||||||||||||||||||||||||||||||||||||||||
| Ratios and supplemental data | |||||||||||||||||||||||||||||||||||||||||||||||||||||||||||||||||||||||
| Net assets, end of period (in millions) | $1 | $1 | $1 | ||||||||||||||||||||||||||||||||||||||||||||||||||||||||||||||||||||
| Ratios (as a percentage of average net assets): | |||||||||||||||||||||||||||||||||||||||||||||||||||||||||||||||||||||||
| Expenses before reductions | 2.60 | 7 | 3.09 | 3.37 | 7 | ||||||||||||||||||||||||||||||||||||||||||||||||||||||||||||||||||
| Expenses including reductions | 1.92 | 7 | 1.93 | 1.94 | 7 | ||||||||||||||||||||||||||||||||||||||||||||||||||||||||||||||||||
| Net investment loss | (0.40 | ) 7 | (0.37 | ) | (0.28 | ) 7,8 | |||||||||||||||||||||||||||||||||||||||||||||||||||||||||||||||||
| Portfolio turnover (%) | 12 | 21 | 13 | ||||||||||||||||||||||||||||||||||||||||||||||||||||||||||||||||||||
| 1 | Six months ended 4-30-18. Unaudited. | |||||||||||||||||||||||||||||||||||||||||||||||||||||||||||||||||||||||||||||||
| 2 | Period from 6-6-16 (commencement of operations) to 10-31-16. | |||||||||||||||||||||||||||||||||||||||||||||||||||||||||||||||||||||||||||||||
| 3 | Based on average daily shares outstanding. | |||||||||||||||||||||||||||||||||||||||||||||||||||||||||||||||||||||||||||||||
| 4 | Does not reflect the effect of sales charges, if any. | |||||||||||||||||||||||||||||||||||||||||||||||||||||||||||||||||||||||||||||||
| 5 | Total returns would have been lower had certain expenses not been reduced during the applicable periods. | |||||||||||||||||||||||||||||||||||||||||||||||||||||||||||||||||||||||||||||||
| 6 | Not annualized. | |||||||||||||||||||||||||||||||||||||||||||||||||||||||||||||||||||||||||||||||
| 7 | Annualized. | |||||||||||||||||||||||||||||||||||||||||||||||||||||||||||||||||||||||||||||||
| 8 | A portion of income is presented unannualized. | |||||||||||||||||||||||||||||||||||||||||||||||||||||||||||||||||||||||||||||||
| Class I Shares Period ended | 4-30-18 | 1 | 10-31-17 | 10-31-16 | 2 | ||||||||||||||||||||||||||||||||||||||||||||||||||||||||||||||||||
| Per share operating performance | |||||||||||||||||||||||||||||||||||||||||||||||||||||||||||||||||||||||
| Net asset value, beginning of period | $12.06 | $10.15 | $10.00 | ||||||||||||||||||||||||||||||||||||||||||||||||||||||||||||||||||||
| Net investment income3 | 0.04 | 0.07 | 0.05 | ||||||||||||||||||||||||||||||||||||||||||||||||||||||||||||||||||||
| Net realized and unrealized gain (loss) on investments | 0.60 | 1.95 | 0.10 | ||||||||||||||||||||||||||||||||||||||||||||||||||||||||||||||||||||
| Total from investment operations | 0.64 | 2.02 | 0.15 | ||||||||||||||||||||||||||||||||||||||||||||||||||||||||||||||||||||
| Less distributions | |||||||||||||||||||||||||||||||||||||||||||||||||||||||||||||||||||||||
| From net investment income | (0.07 | ) | (0.08 | ) | — | ||||||||||||||||||||||||||||||||||||||||||||||||||||||||||||||||||
| From net realized gain | (0.24 | ) | (0.03 | ) | — | ||||||||||||||||||||||||||||||||||||||||||||||||||||||||||||||||||
| Total distributions | (0.31 | ) | (0.11 | ) | — | ||||||||||||||||||||||||||||||||||||||||||||||||||||||||||||||||||
| Net asset value, end of period | $12.39 | $12.06 | $10.15 | ||||||||||||||||||||||||||||||||||||||||||||||||||||||||||||||||||||
| Total return (%)4 | 5.34 | 5 | 20.07 | 1.50 | 5 | ||||||||||||||||||||||||||||||||||||||||||||||||||||||||||||||||||
| Ratios and supplemental data | |||||||||||||||||||||||||||||||||||||||||||||||||||||||||||||||||||||||
| Net assets, end of period (in millions) | $13 | $12 | $9 | ||||||||||||||||||||||||||||||||||||||||||||||||||||||||||||||||||||
| Ratios (as a percentage of average net assets): | |||||||||||||||||||||||||||||||||||||||||||||||||||||||||||||||||||||||
| Expenses before reductions | 1.60 | 6 | 2.08 | 2.36 | 6 | ||||||||||||||||||||||||||||||||||||||||||||||||||||||||||||||||||
| Expenses including reductions | 0.92 | 6 | 0.92 | 0.92 | 6 | ||||||||||||||||||||||||||||||||||||||||||||||||||||||||||||||||||
| Net investment income | 0.60 | 6 | 0.64 | 0.74 | 6,7 | ||||||||||||||||||||||||||||||||||||||||||||||||||||||||||||||||||
| Portfolio turnover (%) | 12 | 21 | 13 | ||||||||||||||||||||||||||||||||||||||||||||||||||||||||||||||||||||
| 1 | Six months ended 4-30-18. Unaudited. | |||||||||||||||||||||||||||||||||||||||||||||||||||||||||||||||||||||||||||||||
| 2 | Period from 6-6-16 (commencement of operations) to 10-31-16. | |||||||||||||||||||||||||||||||||||||||||||||||||||||||||||||||||||||||||||||||
| 3 | Based on average daily shares outstanding. | |||||||||||||||||||||||||||||||||||||||||||||||||||||||||||||||||||||||||||||||
| 4 | Total returns would have been lower had certain expenses not been reduced during the applicable periods. | |||||||||||||||||||||||||||||||||||||||||||||||||||||||||||||||||||||||||||||||
| 5 | Not annualized. | |||||||||||||||||||||||||||||||||||||||||||||||||||||||||||||||||||||||||||||||
| 6 | Annualized. | |||||||||||||||||||||||||||||||||||||||||||||||||||||||||||||||||||||||||||||||
| 7 | A portion of income is presented unannualized. | |||||||||||||||||||||||||||||||||||||||||||||||||||||||||||||||||||||||||||||||
| Class R6 Shares Period ended | 4-30-18 | 1 | 10-31-17 | 10-31-16 | 2 | ||||||||||||||||||||||||||||||||||||||||||||||||||||||||||||||||||
| Per share operating performance | |||||||||||||||||||||||||||||||||||||||||||||||||||||||||||||||||||||||
| Net asset value, beginning of period | $12.07 | $10.16 | $10.00 | ||||||||||||||||||||||||||||||||||||||||||||||||||||||||||||||||||||
| Net investment income3 | 0.04 | 0.08 | 0.06 | ||||||||||||||||||||||||||||||||||||||||||||||||||||||||||||||||||||
| Net realized and unrealized gain on investments | 0.60 | 1.95 | 0.10 | ||||||||||||||||||||||||||||||||||||||||||||||||||||||||||||||||||||
| Total from investment operations | 0.64 | 2.03 | 0.16 | ||||||||||||||||||||||||||||||||||||||||||||||||||||||||||||||||||||
| Less distributions | |||||||||||||||||||||||||||||||||||||||||||||||||||||||||||||||||||||||
| From net investment income | (0.08 | ) | (0.09 | ) | — | ||||||||||||||||||||||||||||||||||||||||||||||||||||||||||||||||||
| From net realized gain | (0.24 | ) | (0.03 | ) | — | ||||||||||||||||||||||||||||||||||||||||||||||||||||||||||||||||||
| Total distributions | (0.32 | ) | (0.12 | ) | — | ||||||||||||||||||||||||||||||||||||||||||||||||||||||||||||||||||
| Net asset value, end of period | $12.39 | $12.07 | $10.16 | ||||||||||||||||||||||||||||||||||||||||||||||||||||||||||||||||||||
| Total return (%)4 | 5.37 | 5 | 20.14 | 1.60 | 5 | ||||||||||||||||||||||||||||||||||||||||||||||||||||||||||||||||||
| Ratios and supplemental data | |||||||||||||||||||||||||||||||||||||||||||||||||||||||||||||||||||||||
| Net assets, end of period (in millions) | $1 | $1 | $1 | ||||||||||||||||||||||||||||||||||||||||||||||||||||||||||||||||||||
| Ratios (as a percentage of average net assets): | |||||||||||||||||||||||||||||||||||||||||||||||||||||||||||||||||||||||
| Expenses before reductions | 1.51 | 6 | 1.99 | 2.26 | 6 | ||||||||||||||||||||||||||||||||||||||||||||||||||||||||||||||||||
| Expenses including reductions | 0.82 | 6 | 0.81 | 0.81 | 6 | ||||||||||||||||||||||||||||||||||||||||||||||||||||||||||||||||||
| Net investment income | 0.71 | 6 | 0.75 | 0.84 | 6,7 | ||||||||||||||||||||||||||||||||||||||||||||||||||||||||||||||||||
| Portfolio turnover (%) | 12 | 21 | 13 | ||||||||||||||||||||||||||||||||||||||||||||||||||||||||||||||||||||
| 1 | Six months ended 4-30-18. Unaudited. | |||||||||||||||||||||||||||||||||||||||||||||||||||||||||||||||||||||||||||||||
| 2 | Period from 6-6-16 (commencement of operations) to 10-31-16. | |||||||||||||||||||||||||||||||||||||||||||||||||||||||||||||||||||||||||||||||
| 3 | Based on average daily shares outstanding. | |||||||||||||||||||||||||||||||||||||||||||||||||||||||||||||||||||||||||||||||
| 4 | Total returns would have been lower had certain expenses not been reduced during the applicable periods. | |||||||||||||||||||||||||||||||||||||||||||||||||||||||||||||||||||||||||||||||
| 5 | Not annualized. | |||||||||||||||||||||||||||||||||||||||||||||||||||||||||||||||||||||||||||||||
| 6 | Annualized. | |||||||||||||||||||||||||||||||||||||||||||||||||||||||||||||||||||||||||||||||
| 7 | A portion of income is presented unannualized. | |||||||||||||||||||||||||||||||||||||||||||||||||||||||||||||||||||||||||||||||
Note 1 — Organization
John Hancock ESG All Cap Core Fund (the fund) is a series of John Hancock Investment Trust (the Trust), an open-end management investment company organized as a Massachusetts business trust and registered under the Investment Company Act of 1940, as amended (the 1940 Act). The investment objective of the fund is to seek long-term capital appreciation.
The fund may offer multiple classes of shares. The shares currently offered by the fund are detailed in the Statement of assets and liabilities. Class A and Class C shares are offered to all investors. Class I shares are offered to institutions and certain investors. Class R6 shares are only available to certain retirement plans, institutions and other investors. Shareholders of each class have exclusive voting rights to matters that affect that class. The distribution and service fees, if any, and transfer agent fees for each class may differ. Effective May 1, 2018, Class C shares convert to Class A shares ten years after purchase (certain exclusions may apply).
Note 2 — Significant accounting policies
The financial statements have been prepared in conformity with accounting principles generally accepted in the United States of America (US GAAP), which require management to make certain estimates and assumptions as of the date of the financial statements. Actual results could differ from those estimates and those differences could be significant. The fund qualifies as an investment company under Topic 946 of Accounting Standards Codification of US GAAP.
Events or transactions occurring after the end of the fiscal period through the date that the financial statements were issued have been evaluated in the preparation of the financial statements. The following summarizes the significant accounting policies of the fund:
Security valuation. Investments are stated at value as of the scheduled close of regular trading on the New York Stock Exchange (NYSE), normally at 4:00 p.m., Eastern Time. In case of emergency or other disruption resulting in the NYSE not opening for trading or the NYSE closing at a time other than the regularly scheduled close, the net asset value (NAV) may be determined as of the regularly scheduled close of the NYSE pursuant to the fund's Valuation Policies and Procedures.
In order to value the securities, the fund uses the following valuation techniques: Equity securities held by the fund are typically valued at the last sale price or official closing price on the exchange or principal market where the security trades. In the event there were no sales during the day or closing prices are not available, the securities are valued using the last available bid price. Investments by the fund in open-end mutual funds are valued at their respective NAVs each business day.
In certain instances, the Pricing Committee may determine to value equity securities using prices obtained from another exchange or market if trading on the exchange or market on which prices are typically obtained did not open for trading as scheduled, or if trading closed earlier than scheduled, and trading occurred as normal on another exchange or market.
Other portfolio securities and assets, for which reliable market quotations are not readily available, are valued at fair value as determined in good faith by the fund's Pricing Committee following procedures established by the Board of Trustees. The frequency with which these fair valuation procedures are used cannot be predicted and fair value of securities may differ significantly from the value that would have been used had a ready market for such securities existed.
The fund uses a three-tier hierarchy to prioritize the pricing assumptions, referred to as inputs, used in valuation techniques to measure fair value. Level 1 includes securities valued using quoted prices in active markets for identical securities. Level 2 includes securities valued using other significant observable inputs. Observable inputs may include quoted prices for similar securities, interest rates, prepayment speeds and credit risk. Prices for securities valued using these inputs are received from independent pricing vendors and brokers and are based on an evaluation of the inputs described. Level 3 includes securities valued using significant unobservable inputs when market prices are not readily available or reliable, including the fund's own assumptions in determining the fair value of investments. Factors used in determining value may include market or issuer specific events or trends, changes in interest rates and credit quality. The inputs or methodology used for valuing securities are not necessarily an indication of the risks associated with investing in those securities. Changes in valuation techniques and related inputs may result in transfers into or out of an assigned level within the disclosure hierarchy.
As of April 30, 2018, all investments are categorized as Level 1 under the hierarchy described above.
Security transactions and related investment income. Investment security transactions are accounted for on a trade date plus one basis for daily NAV calculations. However, for financial reporting purposes, investment transactions are reported on trade date. Interest income is accrued as earned. Dividend income is recorded on the ex-date, except for dividends of foreign securities where the dividend may not be known until after the ex-date. In those cases, dividend income, net of withholding taxes, is recorded when the fund becomes aware of the dividends. Gains and losses on securities sold are determined on the basis of identified cost and may include proceeds from litigation.
Foreign taxes. The fund may be subject to withholding tax on income, capital gains or repatriation taxes imposed by certain countries, a portion of which may be recoverable. Foreign taxes are accrued based upon the fund's understanding of the tax rules and rates that exist in the foreign markets in which it invests. Taxes are accrued based on gains realized by the fund as a result of certain foreign security sales. Estimated taxes are accrued based on unrealized appreciation of such securities. Investment income is recorded net of foreign withholding taxes, less any amounts reclaimable.
Line of credit. The fund may have the ability to borrow from banks for temporary or emergency purposes, including meeting redemption requests that otherwise might require the untimely sale of securities. Pursuant to the fund's custodian agreement, the custodian may loan money to the fund to make properly authorized payments. The fund is obligated to repay the custodian for any overdraft, including any related costs or expenses. The custodian may have a lien, security interest or security entitlement in any fund property that is not otherwise segregated or pledged, to the extent of any overdraft, and to the maximum extent permitted by law.
The fund and other affiliated funds have entered into a syndicated line of credit agreement with Citibank, N.A. as the administrative agent that enables them to participate in a $750 million unsecured committed line of credit. Excluding commitments designated for a certain fund and subject to the needs of all other affiliated funds, the fund can borrow up to an aggregate commitment amount of $500 million, subject to asset coverage and other limitations as specified in the agreement. A commitment fee payable at the end of each calendar quarter, based on the average daily unused portion of the line of credit, is charged to each participating fund based on a combination of fixed and asset based allocations and is reflected in Other expenses on the Statement of operations. For the six months ended April 30, 2018, the fund had no borrowings under the line of credit. Commitment fees for six months ended April 30, 2018 were $1,423.
Expenses. Within the John Hancock group of funds complex, expenses that are directly attributable to an individual fund are allocated to such fund. Expenses that are not readily attributable to a specific fund are allocated among all funds in an equitable manner, taking into consideration, among other things, the nature and type of expense and the fund's relative net assets. Expense estimates are accrued in the period to which they relate and adjustments are made when actual amounts are known.
Class allocations. Income, common expenses and realized and unrealized gains (losses) are determined at the fund level and allocated daily to each class of shares based on the net assets of the class. Class-specific expenses, such as distribution and service fees, if any, and transfer agent fees, for all classes, are charged daily at the class level based on the net assets of each class and the specific expense rates applicable to each class.
Federal income taxes. The fund intends to continue to qualify as a regulated investment company by complying with the applicable provisions of the Internal Revenue Code and will not be subject to federal income tax on taxable income that is distributed to shareholders. Therefore, no federal income tax provision is required.
As of October 31, 2017, the fund had no uncertain tax positions that would require financial statement recognition, derecognition or disclosure. The fund's federal tax returns are subject to examination by the Internal Revenue Service for a period of three years.
Distribution of income and gains. Distributions to shareholders from net investment income and net realized gains, if any, are recorded on the ex-date. The fund typically declares and pays dividends and capital gain distributions, if any, at least annually.
Distributions paid by the fund with respect to each class of shares are calculated in the same manner, at the same time and in the same amount, except for the effect of class level expenses that may be applied differently to each class.
Such distributions, on a tax basis, are determined in conformity with income tax regulations, which may differ from US GAAP. Distributions in excess of tax basis earnings and profits, if any, are reported in the fund's financial statements as a return of capital. The final determination of tax characteristics of the fund's distribution will occur at the end of the year and will subsequently be reported to shareholders.
Capital accounts within the financial statements are adjusted for permanent book-tax differences. These adjustments have no impact on net assets or the results of operations. Temporary book-tax differences, if any, will reverse in a subsequent period. Temporary book-tax differences, if any, will reverse in a subsequent period. The fund had no material book-tax differences at October 31, 2017.
Note 3 — Guarantees and indemnifications
Under the Trust's organizational documents, its Officers and Trustees are indemnified against certain liabilities arising out of the performance of their duties to the Trust, including the fund. Additionally, in the normal course of business, the fund enters into contracts with service providers that contain general indemnification clauses. The fund's maximum exposure under these arrangements is unknown, as this would involve future claims that may be made against the fund that have not yet occurred. The risk of material loss from such claims is considered remote.
Note 4 — Fees and transactions with affiliates
John Hancock Advisers, LLC (the Advisor) serves as investment advisor for the fund. John Hancock Funds, LLC (the Distributor), an affiliate of the Advisor, serves as principal underwriter of the fund. The Advisor and the Distributor are indirect, wholly owned subsidiaries of Manulife Financial Corporation (MFC).
Management fee. The fund has an investment management agreement with the Advisor under which the fund pays a daily management fee to the Advisor equivalent on an annual basis, to the sum of: (a) 0.750% of the first $250 million of the fund's average daily net assets; (b) 0.725% of the next $250 million of the fund's average daily net assets; (c) 0.700% of the next $500 million of the fund's average daily net assets, and (d) 0.700% of the fund's average daily net assets in excess of $1 billion. If net assets exceed $1 billion, then the advisory fee to be paid is 0.700% on all asset levels of average daily net assets. The Advisor has a subadvisory agreement with Trillium Asset Management, LLC. The fund is not responsible for payment of the subadvisory fees.
The Advisor has contractually agreed to waive a portion of its management fee and/or reimburse expenses for certain funds of the John Hancock group of funds complex, including the fund (the participating portfolios). This waiver is based upon aggregate net assets of all the participating portfolios. The amount of the reimbursement is calculated daily and allocated among all the participating portfolios in proportion to the daily net assets of each fund. During the six months ended April 30, 2018, this waiver amounted to 0.01% of the fund's average net assets (on an annualized basis). This arrangement may be amended or terminated at any time by the Advisor upon notice to the fund and with the approval of the Board of Trustees.
The Advisor has contractually agreed to reduce its management fee for the fund, or if necessary, make payment to the fund, in an amount equal to the amount by which the fund's expenses exceed 0.81% of average net assets, on an annualized basis. Expenses means all the expenses of the fund, excluding taxes, brokerage commissions, interest expense, litigation and indemnification expenses and other extraordinary expenses not incurred in the ordinary course of the fund's business, class specific expenses, borrowing costs, prime brokerage fees, acquired fund fees and expenses paid indirectly, and short dividend expense. The expense limitation expires on February 28, 2019, unless renewed by mutual agreement of the fund and Advisor based upon a determination of that this is appropriate under the circumstances at that time.
Prior to March 1, 2018, the Advisor had contractually agreed to waive and/or reimburse all class-specific expenses for Class R6 shares of the fund to the extent they exceeded 0.00% of average net assets attributable to Class R6 shares, on an annualized basis.
For the six months ended April 30, 2018, the expense reductions described above amounted to the following:
| Class | Expense reduction | Class | Expense reduction | |
| Class A | $21,251 | Class R6 | $3,948 | |
| Class C | 4,434 | Total | $72,989 | |
| Class I | 43,356 |
Expenses waived or reimbursed in the current fiscal period are not subject to recapture in future fiscal periods.
The investment management fees incurred for the six months ended April 30, 2018 were equivalent to a net annual effective rate of 0.07% of the fund's average daily net assets.
Accounting and legal services. Pursuant to a service agreement, the fund reimburses the Advisor for all expenses associated with providing the administrative, financial, legal, compliance, accounting and recordkeeping services to the fund, including the preparation of all tax returns, periodic reports to shareholders and regulatory reports, among other services. These expenses are allocated to each share class based on its relative net assets at the time the expense was incurred. These accounting and legal services fees incurred for the six months ended April 30, 2018 amounted to an annual rate of 0.02% of the fund's average daily net assets.
Distribution and service plans. The fund has a distribution agreement with the Distributor. The fund has adopted distribution and service plans with respect to Class A and Class C shares pursuant to Rule 12b-1 under the 1940 Act, to pay the Distributor for services provided as the distributor of shares of the fund. The fund may pay up to the following contractual rates of distribution and service fees under these arrangements, expressed as an annual percentage of average daily net assets for each class of the fund's shares:
| Class | Rule 12b-1 fee |
| Class A | 0.25% |
| Class C | 1.00% |
Sales charges. Class A shares are assessed up-front sales charges, which resulted in payments to the Distributor amounting to $5,967 for the six months ended April 30, 2018. Of this amount, $981 was retained and used for printing prospectuses, advertising, sales literature and other purposes, $4,723 was paid as sales commissions to broker-dealers and $263 was paid as sales commissions to sales personnel of Signator Investors, Inc., a broker-dealer affiliate of the Advisor.
Class A and Class C shares may be subject to contingent deferred sales charges (CDSCs). Certain Class A shares that are acquired through purchases of $1 million or more and are redeemed within one year of purchase are subject to a 1.00% sales charge. Class C shares that are redeemed within one year of purchase are subject to a 1.00% CDSC. CDSCs are applied to the lesser of the current market value at the time of redemption or the original purchase cost of the shares being redeemed. Proceeds from CDSCs are used to compensate the Distributor for providing distribution-related services in connection with the sale of these shares. During the six months ended April 30, 2018, CDSCs received by the Distributor amounted to $128 for Class C shares. There were no CDSCs for Class A shares during six months ended April 30, 2018.
Transfer agent fees. The John Hancock Group of Funds has a complex-wide transfer agent agreement with John Hancock Signature Services, Inc. (Signature Services), an affiliate of the Advisor. The transfer agent fees paid to Signature Services are determined based on the cost to Signature Services (Signature Services Cost) of providing recordkeeping services. It also includes out-of-pocket expenses, including payments made to third-parties for recordkeeping services provided to their clients who invest in one or more John Hancock funds. In addition, Signature Services Cost may be reduced by certain fees that Signature Services receives in connection with retirement and small accounts. Signature Services Cost is calculated monthly and allocated, as applicable, to five categories of share classes: Retail Share and Institutional Share Classes of Non-Municipal Bond Funds, Class R6 Shares, Retirement Share Classes and Municipal Bond Share Classes. Within each of these categories, the applicable costs are allocated to the affected John Hancock affiliated funds and/or classes, based on the relative average daily net assets.
Class level expenses. Class level expenses for the six months ended April 30, 2018 were:
| Class | Distribution and service fees | Transfer agent fees |
| Class A | $7,759 | $3,363 |
| Class C | 6,474 | 702 |
| Class I | — | 7,020 |
| Class R6 | — | 69 |
| Total | $14,233 | $11,154 |
Trustee expenses. The fund compensates each Trustee who is not an employee of the Advisor or its affiliates. The costs of paying Trustee compensation and expenses are allocated to the fund based on its net assets relative to other funds within the John Hancock group of funds complex.
Note 5 — Fund share transactions
Transactions in fund shares for the six months ended April 30, 2018 and for the year ended October 31, 2017 were as follows:
| Six months ended 4-30-18 | Year ended 10-31-17 | |||||||||||||||||||||||||
| Shares | Amount | Shares | Amount | |||||||||||||||||||||||
| Class A shares | ||||||||||||||||||||||||||
| Sold | 77,014 | $949,690 | 54,262 | $600,150 | ||||||||||||||||||||||
| Distributions reinvested | 1,547 | 18,777 | 70 | 748 | ||||||||||||||||||||||
| Repurchased | (20,751 | ) | (252,777 | ) | (11,237 | ) | (123,809 | ) | ||||||||||||||||||
| Net increase | 57,810 | $715,690 | 43,095 | $477,089 | ||||||||||||||||||||||
| Class C shares | ||||||||||||||||||||||||||
| Sold | 16,257 | $201,940 | 12,770 | $142,776 | ||||||||||||||||||||||
| Distributions reinvested | 259 | 3,125 | — | — | ||||||||||||||||||||||
| Repurchased | (2,972 | ) | (37,230 | ) | (521 | ) | (6,082 | ) | ||||||||||||||||||
| Net increase | 13,544 | $167,835 | 12,249 | $136,694 | ||||||||||||||||||||||
| Class I shares | ||||||||||||||||||||||||||
| Sold | 34,321 | $423,183 | 129,398 | $1,420,596 | ||||||||||||||||||||||
| Distributions reinvested | 3,174 | 38,537 | 370 | 3,937 | ||||||||||||||||||||||
| Repurchased | (10,214 | ) | (126,547 | ) | (23,476 | ) | (267,762 | ) | ||||||||||||||||||
| Net increase | 27,281 | $335,173 | 106,292 | $1,156,771 | ||||||||||||||||||||||
| Class R6 shares | ||||||||||||||||||||||||||
| Sold | 813 | $9,975 | 3,855 | $45,033 | ||||||||||||||||||||||
| Distributions reinvested | 99 | 1,198 | — | — | ||||||||||||||||||||||
| Repurchased | (981 | ) | (12,154 | ) | — | — | ||||||||||||||||||||
| Net increase (decrease) | (69 | ) | ($981 | ) | 3,855 | $45,033 | ||||||||||||||||||||
| Total net increase | 98,566 | $1,217,717 | 165,491 | $1,815,587 | ||||||||||||||||||||||
Affiliates of the fund owned 80%, 78%, 85% and 96% of shares of Class A, Class C, Class I and Class R6, respectively, on April 30, 2018. Such concentration of shareholders' capital could have a material effect on the fund if such shareholders redeem from the fund.
Note 6 — Purchase and sale of securities
Purchases and sales of securities, other than short-term investments, amounted to $2,747,248 and $2,454,928, respectively, for the six months ended April 30, 2018.
Trustees Hassell H. McClellan, Chairperson Officers Andrew G. Arnott John J. Danello Francis V. Knox, Jr. Charles A. Rizzo Salvatore Schiavone | Investment advisor John Hancock Advisers, LLC Subadvisor Trillium Asset Management, LLC Principal distributor John Hancock Funds, LLC Custodian Citibank, N.A. Transfer agent John Hancock Signature Services, Inc. Legal counsel K&L Gates LLP |
*Member of the Audit Committee
†Non-Independent Trustee
#Effective 6-20-17
The fund's proxy voting policies and procedures, as well as the fund proxy voting record for the most recent twelve-month period ended June 30, are available free of charge on the Securities and Exchange Commission (SEC) website at sec.gov or on our website.
The fund's complete list of portfolio holdings, for the first and third fiscal quarters, is filed with the SEC on Form N-Q. The fund's Form N-Q is available on our website and the SEC's website, sec.gov, and can be reviewed and copied (for a fee) at the SEC's Public Reference Room in Washington, DC. Call 800-SEC-0330 to receive information on the operation of the SEC's Public Reference Room.
We make this information on your fund, as well as monthly portfolio holdings, and other fund details available on our website at jhinvestments.com or by calling 800-225-5291.
| You can also contact us: | |||
| 800-225-5291 jhinvestments.com | Regular mail: John Hancock Signature Services, Inc. | Express mail: John Hancock Signature Services, Inc. | |
John Hancock family of funds
DOMESTIC EQUITY FUNDS Balanced Blue Chip Growth Classic Value Disciplined Value Disciplined Value Mid Cap Equity Income Fundamental All Cap Core Fundamental Large Cap Core Fundamental Large Cap Value New Opportunities Small Cap Core Small Cap Growth Small Cap Value Strategic Growth U.S. Global Leaders Growth U.S. Growth Value Equity GLOBAL AND INTERNATIONAL EQUITY FUNDS Disciplined Value International Emerging Markets Emerging Markets Equity Fundamental Global Franchise Global Equity Global Shareholder Yield Greater China Opportunities International Growth International Small Company International Value Equity | INCOME FUNDS Bond California Tax-Free Income Emerging Markets Debt Floating Rate Income Government Income High Yield High Yield Municipal Bond Income Investment Grade Bond Money Market Short Duration Credit Opportunities Spectrum Income Strategic Income Opportunities Tax-Free Bond ALTERNATIVE AND SPECIALTY FUNDS Absolute Return Currency Alternative Asset Allocation Enduring Assets Financial Industries Global Absolute Return Strategies Global Conservative Absolute Return Global Focused Strategies Natural Resources Redwood Regional Bank Seaport Long/Short Technical Opportunities |
A fund's investment objectives, risks, charges, and expenses should be considered carefully before investing. The prospectus contains this and other important information about the fund. To obtain a prospectus, contact your financial professional, call John Hancock Investments at 800-225-5291, or visit our website at jhinvestments.com. Please read the prospectus carefully before investing or sending money.
ASSET ALLOCATION Income Allocation Multi-Index Lifetime Portfolios Multi-Index Preservation Portfolios Multimanager Lifestyle Portfolios Multimanager Lifetime Portfolios Retirement Income 2040 EXCHANGE-TRADED FUNDS John Hancock Multifactor Consumer Discretionary ETF John Hancock Multifactor Consumer Staples ETF John Hancock Multifactor Developed International ETF John Hancock Multifactor Energy ETF John Hancock Multifactor Financials ETF John Hancock Multifactor Healthcare ETF John Hancock Multifactor Industrials ETF John Hancock Multifactor Large Cap ETF John Hancock Multifactor Materials ETF John Hancock Multifactor Mid Cap ETF John Hancock Multifactor Small Cap ETF John Hancock Multifactor Technology ETF John Hancock Multifactor Utilities ETF | ENVIRONMENTAL, SOCIAL, AND GOVERNANCE FUNDS ESG All Cap Core ESG Core Bond ESG International Equity ESG Large Cap Core CLOSED-END FUNDS Financial Opportunities Hedged Equity & Income Income Securities Trust Investors Trust Preferred Income Preferred Income II Preferred Income III Premium Dividend Tax-Advantaged Dividend Income Tax-Advantaged Global Shareholder Yield |
John Hancock Multifactor ETF shares are bought and sold at market price (not NAV), and are not individually redeemed
from the fund. Brokerage commissions will reduce returns.
John Hancock ETFs are distributed by Foreside Fund Services, LLC, and are subadvised by Dimensional Fund Advisors LP.
Foreside is not affiliated with John Hancock Funds, LLC or Dimensional Fund Advisors LP.
Dimensional Fund Advisors LP receives compensation from John Hancock in connection with licensing rights to the
John Hancock Dimensional indexes. Dimensional Fund Advisors LP does not sponsor, endorse, or sell, and makes no
representation as to the advisability of investing in, John Hancock Multifactor ETFs.
John Hancock Investments
A trusted brand
John Hancock Investments is a premier asset manager representing one of
America's most trusted brands, with a heritage of financial stewardship dating
back to 1862. Helping our shareholders pursue their financial goals is at the
core of everything we do. It's why we support the role of professional financial
advice and operate with the highest standards of conduct and integrity.
A better way to invest
We serve investors globally through a unique multimanager approach:
We search the world to find proven portfolio teams with specialized
expertise for every strategy we offer, then we apply robust investment
oversight to ensure they continue to meet our uncompromising standards
and serve the best interests of our shareholders.
Results for investors
Our unique approach to asset management enables us to provide a diverse set
of investments backed by some of the world's best managers, along with strong
risk-adjusted returns across asset classes.
| | John Hancock Funds, LLC n Member FINRA, SIPC 601 Congress Street n Boston, MA 02210-2805 800-225-5291 n jhinvestments.com | |
| This report is for the information of the shareholders of John Hancock ESG All Cap Core Fund. It is not authorized for distribution to prospective investors unless preceded or accompanied by a prospectus. | ||
| MF450361 | 466SA 4/18 6/18 | |
John Hancock
ESG Large Cap Core Fund
A message to shareholders
Dear shareholder,
Financial markets around the world experienced a meaningful rise in volatility in the last half of the reporting period, leading to some mixed results for equity investors. Stocks generally declined late in the period as investors reacted to a potential trade war between the United States and China and the prospect of rising inflation. While some in the asset management community believe the sell-off will be temporary, we have suggested for some time that the era of extremely low volatility would eventually come to an end, and that now appears to be the case.
Ultimately, the asset prices of stocks are underpinned by fundamentals, and the good news is that those continue to appear supportive. Unemployment remained close to historic lows, consumer confidence rose, and the housing market continued to notch steady gains. One moderating factor was the U.S. Federal Reserve's steady tightening of monetary policy. While higher interest rates alone may not cause the economy to pull back, markets will be closely attuned to any sign of policymakers quickening the pace of interest-rate increases in the year ahead.
Your best resource in unpredictable markets is your financial advisor, who can help position your portfolio so that it's sufficiently diversified to meet your long-term objectives and to withstand the inevitable turbulence along the way.
On behalf of everyone at John Hancock Investments, I'd like to take this opportunity to welcome new shareholders and to thank existing shareholders for the continued trust you've placed in us.
Sincerely,
Andrew G. Arnott
President and CEO,
John Hancock Investments
Head of Wealth and Asset Management,
United States and Europe
This commentary reflects the CEO's views, which are subject to change at any time. Investing involves risks, including the potential loss of principal. Diversification does not guarantee a profit or eliminate the risk of a loss. It is not possible to invest directly into an index. For more up-to-date information, please visit our website at jhinvestments.com.
John Hancock
ESG Large Cap Core Fund
INVESTMENT OBJECTIVE
The fund seeks long-term capital appreciation.
TOTAL RETURNS AS OF 4/30/18 (%)
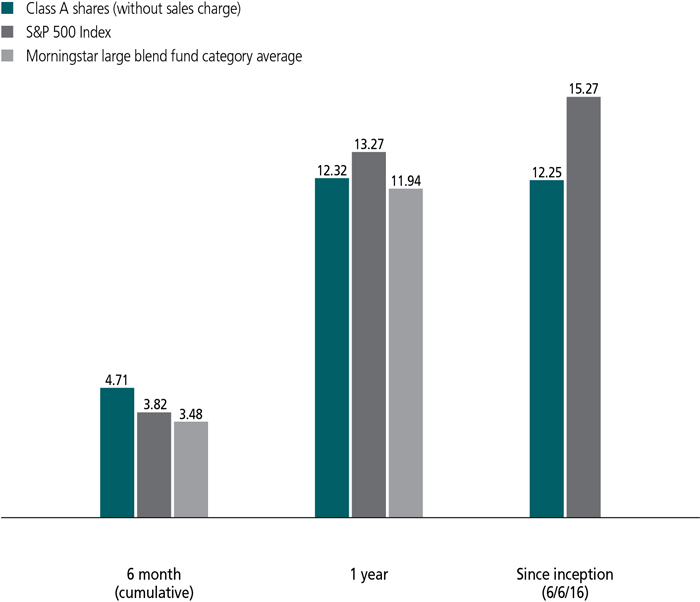
The S&P 500 Index is an unmanaged index that includes 500 widely traded common stocks.
It is not possible to invest directly in an index. Index figures do not reflect expenses or sales charges, which would result in lower returns.
Figures from Morningstar, Inc. include reinvested distributions and do not take into account sales charges. Actual load-adjusted performance is lower. Since-inception returns for the Morningstar fund category average are not available.
The past performance shown here reflects reinvested distributions and the beneficial effect of any expense reductions, and does not guarantee future results. Returns for periods shorter than one year are cumulative. Performance of the other share classes will vary based on the difference in the fees and expenses of those classes. Shares will fluctuate in value and, when redeemed, may be worth more or less than their original cost. Current month-end performance may be lower or higher than the performance cited, and can be found at jhinvestments.com or by calling 800-225-5291. For further information on the fund's objectives, risks, and strategy, see the fund's prospectus.
PERFORMANCE HIGHLIGHTS OVER THE LAST SIX MONTHS
Volatility spiked during the period
After generating strong gains in the first half of the period, the market's broad-based advance was halted by volatility stemming largely from inflation fears.
The fund outperformed its benchmark
The fund outpaced its benchmark, the S&P 500 Index.
Stock selection helped boost the fund's relative returns
Selection in the information technology and consumer staples sectors contributed positively to returns, while selection in the healthcare and consumer discretionary sectors detracted.
SECTOR COMPOSITION AS OF 4/30/18 (%)
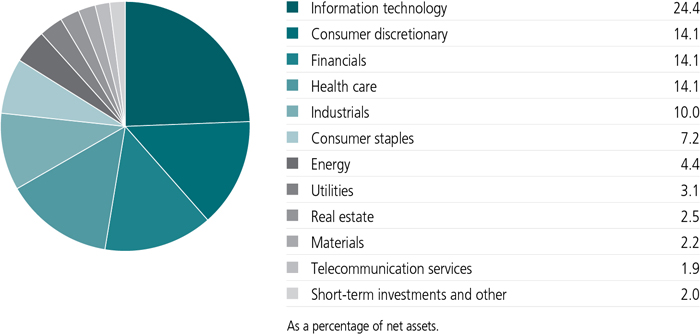
A note about risks
Large company stocks could fall out of favor. Foreign investing has additional risks, such as currency and market volatility and political and social instability. A fund concentrated in one sector or that holds a limited number of securities may fluctuate more than a fund that invests in a wider variety of sectors. Investing primarily in responsible investments carries the risk that the fund may underperform funds that do not utilize a responsible investment strategy. The fund's environmental, social, and governance (ESG) policy could cause it to perform differently than similar funds that do not have such a policy. Successful application of the fund's investment strategy will depend on the managers' skill in properly identifying and analyzing material ESG issues. Please see the fund's prospectus for additional risks.
An interview with Portfolio Managers Stephanie R. Leighton, CFA, and Cheryl I. Smith, Ph.D., CFA, Trillium Asset Management

Stephanie R. Leighton, CFA
Portfolio Manager
Trillium AssetManagement

Cheryl I. Smith, Ph.D., CFA
Portfolio Manager
Trillium AssetManagement
How would you describe the market environment during the six-month period ended April 30, 2018, and how did the fund perform?
The market advanced steadily in the first three months of the period, with large-cap growth stocks, particularly the FAANG group of internet stocks—Facebook, Inc., Apple, Inc., Amazon.com, Inc., Netflix, Inc. and Alphabet, Inc. (Google)—leading the way. In early February, the market pulled back sharply before partially recovering and then remaining somewhat volatile for the remainder of the period.
The volatility that emerged in February was driven by several factors, including fears of inflation and faster interest-rate increases by the U.S. Federal Reserve. In addition, investors began to worry about how much longer the record bull market could last, particularly in the context of an emerging trade war between the United States and China. The information technology sector was hit particularly hard in March, with the FAANGs leading the way down.
In this context, the fund outperformed its benchmark, the S&P 500 Index. The fund had a significant underweight position in momentum stocks, as we have believed that their valuations were generally stretched. Our stock selection in the information technology and consumer staples contributed positively to the fund's results, while selection in the healthcare and consumer discretionary sectors were net detractors from benchmark-relative returns.
Could you describe your approach to ESG investing?
We seek to invest in well-managed companies with positive environmental, social, and governance (ESG) practices as well as attractive business fundamentals. We believe that companies incorporating ESG factors into their long-term strategic planning—and communicating that fact to
What were some of the stocks or strategies that contributed most to relative results?
Most of the fund's outperformance during the period came from stock selection, particularly in information technology. Network security provider Palo Alto Networks, Inc. was one of the strongest positive contributors. The stock rose as the company's quarterly earnings results beat market expectations, with strong revenue and earnings growth underpinning the continued uptrend in spending on information technology supporting data security.
Another strong performer was the stock of software company Adobe Systems, Inc. The company reported solid fundamental results in its flagship suite of software products, driven by market share gains and double-digit revenue growth across all product lines. This led management to revise earnings estimates higher.
A third large contributor was the stock of payments processor Mastercard, Inc., which rose on strong revenue and earnings-per-share growth.
TOP 10 HOLDINGS AS OF 4/30/18 (%)
| Alphabet, Inc., Class A | 4.2 |
| Microsoft Corp. | 3.6 |
| Bank of America Corp. | 3.0 |
| The Home Depot, Inc. | 2.6 |
| Mastercard, Inc., Class A | 2.6 |
| The PNC Financial Services Group, Inc. | 2.6 |
| EOG Resources, Inc. | 2.2 |
| Unilever NV | 2.2 |
| Chubb, Ltd. | 2.1 |
| Johnson & Johnson | 2.1 |
| TOTAL | 27.2 |
| As a percentage of net assets. | |
| Cash and cash equivalents are not included. | |
What were some stocks or strategies that detracted from returns?
One of the weakest areas of the fund was healthcare, with health insurer Cigna Corp. one of the more significant detractors. Cigna's stock suffered during the latter half period, but particularly after Amazon, JPMorgan Chase & Co., and Berkshire Hathaway, Inc. (all not held by the fund) each announced its entrance into the healthcare world. The stock declined again with the announcement of a proposed acquisition of drug plan manager Express Scripts Holding Company (not held). While we agree with Cigna's acquisition rationale, we are cautious that the next year or so may continue to be rocky for the stock, especially after a particularly strong 2017.
The stock of biotech drug company Celgene Corp. was weak as well. Although the company appeared to generate decent earnings on the back of strong product sales, concerns began to grow over the company's pipeline of future drugs. In the absence of new patent-protected drugs, the long-term outlook for companies like Celgene can raise the level of uncertainty with investors. We maintained the stock at period end, but continue to monitor it closely.
Another significant detractor for the period was the stock of consumer brands company Newell Brands, Inc. The company experienced a challenging period, which we attribute to changing retail dynamics. We hope that changes at the company's board level will contribute to stabilization and improvement going forward. In addition, we think Newell's more recently announced plan to accelerate growth through deleveraging could boost the company's financial performance.
Did you make any notable changes to the fund's positioning?
During the period, and particularly against the backdrop of higher market volatility, we proceeded cautiously. As we were generally pleased with the portfolio's positioning, trading was fairly light, although we did take advantage of specific situations. We increased the fund's exposure to consumer discretionary stocks, which we think should generally benefit from strong U.S. employment in 2018. As an example, we increased the fund's position in Home Depot, Inc., as we believe the company will continue to benefit from consumer spending on home repair and remodeling.
Looking ahead, we intend to stay fairly close to the fund's benchmark unless and until the market exhibits less uncertainty and/or better value. As always, we remain focused on high-quality and sustainable growth companies selling at what we consider to be reasonable prices and that can demonstrate growth in earnings independent of a more challenging, slower-growth environment.
MANAGED BY
| | Stephanie R. Leighton, CFA On the fund since inception Investing since 1986 |
| | Elizabeth R. Levy, CFA On the fund since inception Investing since 2004 |
| | Cheryl I. Smith, Ph.D., CFA On the fund since inception Investing since 1987 |
![]()
TOTAL RETURNS FOR THE PERIOD ENDED APRIL 30, 2018
| Average annual total returns (%) with maximum sales charge | Cumulative total returns (%) with maximum sales charge | ||||||
| 1-year | Since inception1 | 6-month | Since inception1 | ||||
| Class A | 6.70 | 9.24 | -0.52 | 18.30 | |||
| Class C | 10.53 | 11.43 | 3.40 | 22.86 | |||
| Class I2 | 12.65 | 12.56 | 4.85 | 25.23 | |||
| Class R62 | 12.78 | 12.67 | 4.88 | 25.46 | |||
| Index† | 13.27 | 15.27 | 3.82 | 31.03 | |||
Performance figures assume all distributions have been reinvested. Figures reflect maximum sales charges on Class A shares of 5%, and the applicable contingent deferred sales charge (CDSC) on Class C shares. Class C shares sold within one year of purchase are subject to a 1% CDSC. Sales charges are not applicable to Class I and Class R6 shares.
The expense ratios of the fund, both net (including any fee waivers and/or expense limitations) and gross (excluding any fee waivers and/or expense limitations), are set forth according to the most recent publicly available prospectus for the fund and may differ from those disclosed in the Financial highlights tables in this report. Net expenses reflect contractual expense limitations in effect until February 28, 2019 and are subject to change. Had the contractual fee waivers and expense limitations not been in place, gross expenses would apply. The expense ratios are as follows:
| Class A | Class C | Class I | Class R6 | |
| Gross (%) | 2.23 | 2.98 | 1.97 | 1.87 |
| Net (%) | 1.18 | 1.93 | 0.92 | 0.82 |
Please refer to the most recent prospectus and annual or semiannual report for more information on expenses and any expense limitation arrangements for each class.
The returns reflect past results and should not be considered indicative of future performance. The return and principal value of an investment will fluctuate so that shares, when redeemed, may be worth more or less than their original cost. Due to market volatility and other factors, the fund's current performance may be higher or lower than the performance shown. For current to the most recent month-end performance data, please call 800-225-5291 or visit the fund's website at jhinvestments.com.
The performance table above and the chart on the next page do not reflect the deduction of taxes that a shareholder would pay on fund distributions or the redemption of fund shares. The fund's performance results reflect any applicable fee waivers or expense reductions, without which the expenses would increase and results would have been less favorable.
| † | Index is the S&P 500 Index. |
This chart and table show what happened to a hypothetical $10,000 investment in John Hancock ESG Large Cap Core Fund for the share classes and periods indicated, assuming all distributions were reinvested. For comparison, we've shown the same investment in the S&P 500 Index.
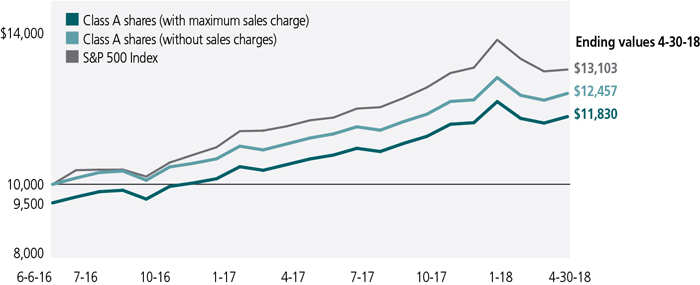
| Start date | With maximum sales charge ($) | Without sales charge ($) | Index ($) | |
| Class C3 | 6-6-16 | 12,286 | 12,286 | 13,103 |
| Class I2 | 6-6-16 | 12,523 | 12,523 | 13,103 |
| Class R62 | 6-6-16 | 12,546 | 12,546 | 13,103 |
The S&P 500 Index is an unmanaged index that includes 500 widely traded common stocks.
It is not possible to invest directly in an index. Index figures do not reflect expenses or sales charges, which would result in lower returns.
| 1 | From 6-6-2016. |
| 2 | For certain types of investors as described in the fund's prospectus. |
| 3 | The contingent deferred sales charge is not applicable. |
These examples are intended to help you understand your ongoing operating expenses of investing in the fund so you can compare these costs with the ongoing costs of investing in other mutual funds.
Understanding fund expenses
As a shareholder of the fund, you incur two types of costs:
| • | Transaction costs, which include sales charges (loads) on purchases or redemptions (varies by share class), minimum account fee charge, etc. |
| • | Ongoing operating expenses, including management fees, distribution and service fees (if applicable), and other fund expenses. |
We are presenting only your ongoing operating expenses here.
Actual expenses/actual returns
The first line of each share class in the table on the following page is intended to provide information about the fund's actual ongoing operating expenses, and is based on the fund's actual return. It assumes an account value of $1,000.00 on November 1, 2017, with the same investment held until April 30, 2018.
Together with the value of your account, you may use this information to estimate the operating expenses that you paid over the period. Simply divide your account value at April 30, 2018, by $1,000.00, then multiply it by the "expenses paid" for your share class from the table. For example, for an account value of $8,600.00, the operating expenses should be calculated as follows:
Hypothetical example for comparison purposes
The second line of each share class in the table on the following page allows you to compare the fund's ongoing operating expenses with those of any other fund. It provides an example of the fund's hypothetical account values and hypothetical expenses based on each class's actual expense ratio and an assumed 5% annualized return before expenses (which is not the fund's actual return). It assumes an account value of $1,000.00 on November 1, 2017, with the same investment held until April 30, 2018. Look in any other fund shareholder report to find its hypothetical example and you will be able to compare these expenses. Please remember that these hypothetical account values and expenses may not be used to estimate the actual ending account balance or expenses you paid for the period.
Remember, these examples do not include any transaction costs, therefore, these examples will not help you to determine the relative total costs of owning different funds. If transaction costs were included, your expenses would have been higher. See the prospectus for details regarding transaction costs.
SHAREHOLDER EXPENSE EXAMPLE CHART
| Account value on 11-1-2017 | Ending value on 4-30-2018 | Expenses paid during period ended 4-30-20181 | Annualized expense ratio | ||
| Class A | Actual expenses/actual returns | $1,000.00 | $1,047.10 | $5.94 | 1.17% |
| Hypothetical example for comparison purposes | 1,000.00 | 1,019.00 | 5.86 | 1.17% | |
| Class C | Actual expenses/actual returns | 1,000.00 | 1,044.00 | 9.73 | 1.92% |
| Hypothetical example for comparison purposes | 1,000.00 | 1,015.30 | 9.59 | 1.92% | |
| Class I | Actual expenses/actual returns | 1,000.00 | 1,048.50 | 4.67 | 0.92% |
| Hypothetical example for comparison purposes | 1,000.00 | 1,020.20 | 4.61 | 0.92% | |
| Class R6 | Actual expenses/actual returns | 1,000.00 | 1,048.80 | 4.11 | 0.81% |
| Hypothetical example for comparison purposes | 1,000.00 | 1,020.80 | 4.06 | 0.81% | |
| 1 | Expenses are equal to the annualized expense ratio, multiplied by the average account value over the period, multiplied by 181/365 (to reflect the one-half year period). |
| Fund’s investments |
| Shares | Value | ||||
| Common stocks 98.0% | $40,096,706 | ||||
| (Cost $35,814,846) | |||||
| Consumer discretionary 14.1% | 5,758,826 | ||||
| Hotels, restaurants and leisure 1.9% | |||||
| Starbucks Corp. | 13,423 | 772,762 | |||
| Household durables 0.8% | |||||
| Newell Brands, Inc. | 12,522 | 345,983 | |||
| Internet and direct marketing retail 1.3% | |||||
| Booking Holdings, Inc. (A) | 237 | 516,186 | |||
| Media 1.5% | |||||
| Omnicom Group, Inc. | 5,065 | 373,088 | |||
| Time Warner, Inc. | 2,761 | 261,743 | |||
| Multiline retail 1.3% | |||||
| Target Corp. | 7,073 | 513,500 | |||
| Specialty retail 5.4% | |||||
| The Home Depot, Inc. | 5,789 | 1,069,807 | |||
| The TJX Companies, Inc. | 9,849 | 835,688 | |||
| Tractor Supply Company | 4,327 | 294,236 | |||
| Textiles, apparel and luxury goods 1.9% | |||||
| NIKE, Inc., Class B | 5,582 | 381,753 | |||
| VF Corp. | 4,873 | 394,080 | |||
| Consumer staples 7.2% | 2,939,169 | ||||
| Food and staples retailing 2.9% | |||||
| Costco Wholesale Corp. | 2,156 | 425,077 | |||
| CVS Health Corp. | 3,840 | 268,147 | |||
| Sysco Corp. | 8,122 | 507,950 | |||
| Food products 1.3% | |||||
| McCormick & Company, Inc. | 4,843 | 510,501 | |||
| Household products 0.8% | |||||
| The Procter & Gamble Company | 4,784 | 346,075 | |||
| Personal products 2.2% | |||||
| Unilever NV | 15,431 | 881,419 | |||
| Energy 4.4% | 1,813,421 | ||||
| Oil, gas and consumable fuels 4.4% | |||||
| EOG Resources, Inc. | 7,487 | 884,739 | |||
| Marathon Petroleum Corp. | 6,438 | 482,271 | |||
| ONEOK, Inc. | 7,413 | 446,411 | |||
| Financials 14.1% | 5,762,098 | ||||
| Banks 7.9% | |||||
| Bank of America Corp. | 41,362 | 1,237,551 | |||
| 12 | JOHN HANCOCK ESG LARGE CAP CORE FUND | SEMIANNUAL REPORT | SEE NOTES TO FINANCIAL STATEMENTS |
| Shares | Value | ||||
| Financials (continued) | |||||
| Banks (continued) | |||||
| First Republic Bank | 3,500 | $325,045 | |||
| KeyCorp | 30,671 | 610,966 | |||
| The PNC Financial Services Group, Inc. | 7,192 | 1,047,227 | |||
| Capital markets 2.6% | |||||
| MSCI, Inc. | 3,056 | 457,880 | |||
| The Bank of New York Mellon Corp. | 11,370 | 619,779 | |||
| Insurance 3.6% | |||||
| Aflac, Inc. | 13,172 | 600,248 | |||
| Chubb, Ltd. | 6,364 | 863,402 | |||
| Health care 14.1% | 5,760,167 | ||||
| Biotechnology 2.5% | |||||
| Biogen, Inc. (A) | 1,093 | 299,045 | |||
| Celgene Corp. (A) | 5,390 | 469,469 | |||
| Shire PLC, ADR | 1,683 | 268,321 | |||
| Health care equipment and supplies 3.3% | |||||
| Becton, Dickinson and Company | 1,757 | 407,396 | |||
| Hologic, Inc. (A) | 5,922 | 229,714 | |||
| Medtronic PLC | 5,301 | 424,769 | |||
| Zimmer Biomet Holdings, Inc. | 2,422 | 278,942 | |||
| Health care providers and services 3.0% | |||||
| Cigna Corp. | 4,799 | 824,564 | |||
| Quest Diagnostics, Inc. | 3,750 | 379,500 | |||
| Life sciences tools and services 1.7% | |||||
| Illumina, Inc. (A) | 870 | 209,609 | |||
| IQVIA Holdings, Inc. (A) | 5,168 | 494,888 | |||
| Pharmaceuticals 3.6% | |||||
| Johnson & Johnson | 6,670 | 843,688 | |||
| Merck & Company, Inc. | 10,706 | 630,262 | |||
| Industrials 10.0% | 4,076,435 | ||||
| Air freight and logistics 0.9% | |||||
| United Parcel Service, Inc., Class B | 3,101 | 351,964 | |||
| Building products 0.9% | |||||
| Johnson Controls International PLC | 11,016 | 373,112 | |||
| Commercial services and supplies 1.0% | |||||
| Waste Management, Inc. | 4,770 | 387,753 | |||
| Electrical equipment 2.3% | |||||
| Eaton Corp. PLC | 8,343 | 625,975 | |||
| Rockwell Automation, Inc. | 1,994 | 328,073 | |||
| Machinery 2.8% | |||||
| Ingersoll-Rand PLC | 5,050 | 423,645 | |||
| Xylem, Inc. | 10,101 | 736,363 | |||
| SEE NOTES TO FINANCIAL STATEMENTS | SEMIANNUAL REPORT | JOHN HANCOCK ESG LARGE CAP CORE FUND | 13 |
| Shares | Value | ||||
| Industrials (continued) | |||||
| Professional services 0.8% | |||||
| Verisk Analytics, Inc. (A) | 2,850 | $303,383 | |||
| Road and rail 1.3% | |||||
| J.B. Hunt Transport Services, Inc. | 4,651 | 546,167 | |||
| Information technology 24.4% | 9,994,469 | ||||
| Communications equipment 3.5% | |||||
| Cisco Systems, Inc. | 16,170 | 716,169 | |||
| Palo Alto Networks, Inc. (A) | 3,810 | 733,463 | |||
| Internet software and services 6.1% | |||||
| Alphabet, Inc., Class A (A) | 1,698 | 1,729,549 | |||
| Facebook, Inc., Class A (A) | 4,574 | 786,728 | |||
| IT services 4.4% | |||||
| Mastercard, Inc., Class A | 5,907 | 1,053,041 | |||
| PayPal Holdings, Inc. (A) | 10,219 | 762,440 | |||
| Semiconductors and semiconductor equipment 2.3% | |||||
| Analog Devices, Inc. | 4,164 | 363,725 | |||
| First Solar, Inc. (A) | 2,511 | 178,055 | |||
| Texas Instruments, Inc. | 3,729 | 378,232 | |||
| Software 6.2% | |||||
| Adobe Systems, Inc. (A) | 3,056 | 677,210 | |||
| Autodesk, Inc. (A) | 2,850 | 358,815 | |||
| Microsoft Corp. | 15,889 | 1,485,939 | |||
| Technology hardware, storage and peripherals 1.9% | |||||
| Apple, Inc. | 4,666 | 771,103 | |||
| Materials 2.2% | 901,797 | ||||
| Chemicals 1.6% | |||||
| Ecolab, Inc. | 2,673 | 386,970 | |||
| International Flavors & Fragrances, Inc. | 2,008 | 283,650 | |||
| Containers and packaging 0.6% | |||||
| Sealed Air Corp. | 5,272 | 231,177 | |||
| Real estate 2.5% | 1,038,051 | ||||
| Equity real estate investment trusts 2.5% | |||||
| AvalonBay Communities, Inc. | 1,964 | 320,132 | |||
| HCP, Inc. | 12,803 | 299,078 | |||
| SBA Communications Corp. (A) | 2,614 | 418,841 | |||
| Telecommunication services 1.9% | 775,338 | ||||
| Diversified telecommunication services 1.9% | |||||
| Verizon Communications, Inc. | 15,711 | 775,338 | |||
| 14 | JOHN HANCOCK ESG LARGE CAP CORE FUND | SEMIANNUAL REPORT | SEE NOTES TO FINANCIAL STATEMENTS |
| Shares | Value | ||||
| Utilities 3.1% | $1,276,935 | ||||
| Electric utilities 1.1% | |||||
| Avangrid, Inc. | 8,388 | 442,131 | |||
| Water utilities 2.0% | |||||
| American Water Works Company, Inc. | 9,642 | 834,804 | |||
| Yield (%) | Shares | Value | |||
| Short-term investments 1.7% | $693,365 | ||||
| (Cost $693,365) | |||||
| Money market funds 1.7% | 693,365 | ||||
| Federated Government Obligations Fund, Institutional Class | 1.5571(B) | 693,365 | 693,365 | ||
| Total investments (Cost $36,508,211) 99.7% | $40,790,071 | ||||
| Other assets and liabilities, net 0.3% | 142,649 | ||||
| Total net assets 100.0% | $40,932,720 | ||||
| The percentage shown for each investment category is the total value of the category as a percentage of the net assets of the fund. | |
| Security Abbreviations and Legend | |
| ADR | American Depositary Receipt |
| (A) | Non-income producing security. |
| (B) | The rate shown is the annualized seven-day yield as of 4-30-18. |
| SEE NOTES TO FINANCIAL STATEMENTS | SEMIANNUAL REPORT | JOHN HANCOCK ESG LARGE CAP CORE FUND | 15 |
Financial statements
STATEMENT OF ASSETS AND LIABILITIES 4-30-18 (unaudited)
| Assets | ||||||||||||||||||||||
| Investments, at value (Cost $36,508,211) | $40,790,071 | |||||||||||||||||||||
| Receivable for fund shares sold | 94,740 | |||||||||||||||||||||
| Dividends and interest receivable | 32,598 | |||||||||||||||||||||
| Receivable due from advisor | 2,448 | |||||||||||||||||||||
| Other receivables and prepaid expenses | 54,719 | |||||||||||||||||||||
| Total assets | 40,974,576 | |||||||||||||||||||||
| Liabilities | ||||||||||||||||||||||
| Payable to affiliates | ||||||||||||||||||||||
| Accounting and legal services fees | 4,777 | |||||||||||||||||||||
| Transfer agent fees | 3,773 | |||||||||||||||||||||
| Trustees' fees | 138 | |||||||||||||||||||||
| Other liabilities and accrued expenses | 33,168 | |||||||||||||||||||||
| Total liabilities | 41,856 | |||||||||||||||||||||
| Net assets | $40,932,720 | |||||||||||||||||||||
| Net assets consist of | ||||||||||||||||||||||
| Paid-in capital | $35,836,370 | |||||||||||||||||||||
| Undistributed net investment income | 68,484 | |||||||||||||||||||||
| Accumulated net realized gain (loss) on investments | 746,006 | |||||||||||||||||||||
| Net unrealized appreciation (depreciation) on investments | 4,281,860 | |||||||||||||||||||||
| Net assets | $40,932,720 | |||||||||||||||||||||
| Net asset value per share | ||||||||||||||||||||||
| Based on net asset value and shares outstanding - The fund has an unlimited number of shares authorized with no par value | ||||||||||||||||||||||
| Class A ($6,128,159 ÷ 500,483 shares)1 | $12.24 | |||||||||||||||||||||
| Class C ($1,215,584 ÷ 100,049 shares)1 | $12.15 | |||||||||||||||||||||
| Class I ($32,475,733 ÷ 2,648,494 shares) | $12.26 | |||||||||||||||||||||
| Class R6 ($1,113,244 ÷ 90,784 shares) | $12.26 | |||||||||||||||||||||
| Maximum offering price per share | ||||||||||||||||||||||
| Class A (net assets value per share ÷ 95%)2 | $12.88 | |||||||||||||||||||||
| 1 | Redemption price per share is equal to net asset value less any applicable contingent deferred sales charge. | |||||||||||||||||||
| 2 | On single retail sales of less than $50,000. On sales of $50,000 or more and on group sales the offering price is reduced. | |||||||||||||||||||
STATEMENT OF OPERATIONS For the six months ended 4-30-18 (unaudited)
| Investment income | ||||||||||||||||||||||||
| Dividends | $338,374 | |||||||||||||||||||||||
| Interest | 3,035 | |||||||||||||||||||||||
| Total investment income | 341,409 | |||||||||||||||||||||||
| Expenses | ||||||||||||||||||||||||
| Investment management fees | 148,078 | |||||||||||||||||||||||
| Distribution and service fees | 13,342 | |||||||||||||||||||||||
| Accounting and legal services fees | 4,516 | |||||||||||||||||||||||
| Transfer agent fees | 21,195 | |||||||||||||||||||||||
| Trustees' fees | 462 | |||||||||||||||||||||||
| State registration fees | 29,195 | |||||||||||||||||||||||
| Printing and postage | 12,524 | |||||||||||||||||||||||
| Professional fees | 29,214 | |||||||||||||||||||||||
| Custodian fees | 8,212 | |||||||||||||||||||||||
| Other | 6,515 | |||||||||||||||||||||||
| Total expenses | 273,253 | |||||||||||||||||||||||
| Less expense reductions | (78,808 | ) | ||||||||||||||||||||||
| Net expenses | 194,445 | |||||||||||||||||||||||
| Net investment income | 146,964 | |||||||||||||||||||||||
| Realized and unrealized gain (loss) | ||||||||||||||||||||||||
| Net realized gain on Investments | 746,530 | |||||||||||||||||||||||
| Change in net unrealized appreciation (depreciation) of Investments | 947,727 | |||||||||||||||||||||||
| Net realized and unrealized gain | 1,694,257 | |||||||||||||||||||||||
| Increase in net assets from operations | $1,841,221 | |||||||||||||||||||||||
STATEMENTS OF CHANGES IN NET ASSETS
| Six months ended 4-30-18 | Year ended 10-31-17 | ||||||||||||||||||||||||||||||||||||||||||||
| (unaudited) | |||||||||||||||||||||||||||||||||||||||||||||
| Increase (decrease) in net assets | |||||||||||||||||||||||||||||||||||||||||||||
| From operations | |||||||||||||||||||||||||||||||||||||||||||||
| Net investment income | $146,964 | $133,213 | |||||||||||||||||||||||||||||||||||||||||||
| Net realized gain | 746,530 | 380,345 | |||||||||||||||||||||||||||||||||||||||||||
| Change in net unrealized appreciation (depreciation) | 947,727 | 3,160,140 | |||||||||||||||||||||||||||||||||||||||||||
| Increase in net assets resulting from operations | 1,841,221 | 3,673,698 | |||||||||||||||||||||||||||||||||||||||||||
| Distributions to shareholders | |||||||||||||||||||||||||||||||||||||||||||||
| From net investment income | |||||||||||||||||||||||||||||||||||||||||||||
| Class A | (14,259 | ) | (34,138 | ) | |||||||||||||||||||||||||||||||||||||||||
| Class C | — | (3,231 | ) | ||||||||||||||||||||||||||||||||||||||||||
| Class I | (146,303 | ) | (84,618 | ) | |||||||||||||||||||||||||||||||||||||||||
| Class R6 | (6,466 | ) | (9,020 | ) | |||||||||||||||||||||||||||||||||||||||||
| From net realized gain | |||||||||||||||||||||||||||||||||||||||||||||
| Class A | (45,765 | ) | — | ||||||||||||||||||||||||||||||||||||||||||
| Class C | (9,377 | ) | — | ||||||||||||||||||||||||||||||||||||||||||
| Class I | (243,273 | ) | — | ||||||||||||||||||||||||||||||||||||||||||
| Class R6 | (8,598 | ) | — | ||||||||||||||||||||||||||||||||||||||||||
| Total distributions | (474,041 | ) | (131,007 | ) | |||||||||||||||||||||||||||||||||||||||||
| From fund share transactions | 1,521,407 | 19,061,151 | |||||||||||||||||||||||||||||||||||||||||||
| Total increase | 2,888,587 | 22,603,842 | |||||||||||||||||||||||||||||||||||||||||||
| Net assets | |||||||||||||||||||||||||||||||||||||||||||||
| Beginning of period | 38,044,133 | 15,440,291 | |||||||||||||||||||||||||||||||||||||||||||
| End of period | $40,932,720 | $38,044,133 | |||||||||||||||||||||||||||||||||||||||||||
| Undistributed net investment income | $68,484 | $88,548 | |||||||||||||||||||||||||||||||||||||||||||
Financial highlights
| Class A Shares Period ended | 4-30-18 | 1 | 10-31-17 | 10-31-16 | 2 | ||||||||||||||||||||||||||||||||||||||||||||||||||||||||||||||||||
| Per share operating performance | |||||||||||||||||||||||||||||||||||||||||||||||||||||||||||||||||||||||
| Net asset value, beginning of period | $11.81 | $10.11 | $10.00 | ||||||||||||||||||||||||||||||||||||||||||||||||||||||||||||||||||||
| Net investment income3 | 0.03 | 0.07 | 0.04 | ||||||||||||||||||||||||||||||||||||||||||||||||||||||||||||||||||||
| Net realized and unrealized gain on investments | 0.52 | 1.71 | 0.07 | ||||||||||||||||||||||||||||||||||||||||||||||||||||||||||||||||||||
| Total from investment operations | 0.55 | 1.78 | 0.11 | ||||||||||||||||||||||||||||||||||||||||||||||||||||||||||||||||||||
| Less distributions | |||||||||||||||||||||||||||||||||||||||||||||||||||||||||||||||||||||||
| From net investment income | (0.03 | ) | (0.08 | ) | — | ||||||||||||||||||||||||||||||||||||||||||||||||||||||||||||||||||
| From net realized gain | (0.09 | ) | — | — | |||||||||||||||||||||||||||||||||||||||||||||||||||||||||||||||||||
| Total distributions | (0.12 | ) | (0.08 | ) | — | ||||||||||||||||||||||||||||||||||||||||||||||||||||||||||||||||||
| Net asset value, end of period | $12.24 | $11.81 | $10.11 | ||||||||||||||||||||||||||||||||||||||||||||||||||||||||||||||||||||
| Total return (%)4,5 | 4.71 | 6 | 17.68 | 1.10 | 6 | ||||||||||||||||||||||||||||||||||||||||||||||||||||||||||||||||||
| Ratios and supplemental data | |||||||||||||||||||||||||||||||||||||||||||||||||||||||||||||||||||||||
| Net assets, end of period (in millions) | $6 | $6 | $4 | ||||||||||||||||||||||||||||||||||||||||||||||||||||||||||||||||||||
| Ratios (as a percentage of average net assets): | |||||||||||||||||||||||||||||||||||||||||||||||||||||||||||||||||||||||
| Expenses before reductions | 1.57 | 7 | 2.23 | 2.73 | 7 | ||||||||||||||||||||||||||||||||||||||||||||||||||||||||||||||||||
| Expenses including reductions | 1.17 | 7 | 1.18 | 1.19 | 7 | ||||||||||||||||||||||||||||||||||||||||||||||||||||||||||||||||||
| Net investment income | 0.56 | 7 | 0.59 | 0.64 | 7,8 | ||||||||||||||||||||||||||||||||||||||||||||||||||||||||||||||||||
| Portfolio turnover (%) | 16 | 17 | 23 | ||||||||||||||||||||||||||||||||||||||||||||||||||||||||||||||||||||
| 1 | Six months ended 4-30-18. Unaudited. | |||||||||||||||||||||||||||||||||||||||||||||||||||||||||||||||||||||||||||||||
| 2 | Period from 6-6-16 (commencement of operations) to 10-31-16. | |||||||||||||||||||||||||||||||||||||||||||||||||||||||||||||||||||||||||||||||
| 3 | Based on average daily shares outstanding. | |||||||||||||||||||||||||||||||||||||||||||||||||||||||||||||||||||||||||||||||
| 4 | Total returns would have been lower had certain expenses not been reduced during the applicable periods. | |||||||||||||||||||||||||||||||||||||||||||||||||||||||||||||||||||||||||||||||
| 5 | Does not reflect the effect of sales charges, if any. | |||||||||||||||||||||||||||||||||||||||||||||||||||||||||||||||||||||||||||||||
| 6 | Not annualized. | |||||||||||||||||||||||||||||||||||||||||||||||||||||||||||||||||||||||||||||||
| 7 | Annualized. | |||||||||||||||||||||||||||||||||||||||||||||||||||||||||||||||||||||||||||||||
| 8 | A portion of income is presented unannualized. | |||||||||||||||||||||||||||||||||||||||||||||||||||||||||||||||||||||||||||||||
| Class C Shares Period ended | 4-30-18 | 1 | 10-31-17 | 10-31-16 | 2 | ||||||||||||||||||||||||||||||||||||||||||||||||||||||||||||||||||
| Per share operating performance | |||||||||||||||||||||||||||||||||||||||||||||||||||||||||||||||||||||||
| Net asset value, beginning of period | $11.73 | $10.08 | $10.00 | ||||||||||||||||||||||||||||||||||||||||||||||||||||||||||||||||||||
| Net investment income (loss)3 | (0.01 | ) | (0.02 | ) | 0.01 | ||||||||||||||||||||||||||||||||||||||||||||||||||||||||||||||||||
| Net realized and unrealized gain on investments | 0.52 | 1.70 | 0.07 | ||||||||||||||||||||||||||||||||||||||||||||||||||||||||||||||||||||
| Total from investment operations | 0.51 | 1.68 | 0.08 | ||||||||||||||||||||||||||||||||||||||||||||||||||||||||||||||||||||
| Less distributions | |||||||||||||||||||||||||||||||||||||||||||||||||||||||||||||||||||||||
| From net investment income | — | (0.03 | ) | — | |||||||||||||||||||||||||||||||||||||||||||||||||||||||||||||||||||
| From net realized gain | (0.09 | ) | — | — | |||||||||||||||||||||||||||||||||||||||||||||||||||||||||||||||||||
| Total distributions | (0.09 | ) | (0.03 | ) | — | ||||||||||||||||||||||||||||||||||||||||||||||||||||||||||||||||||
| Net asset value, end of period | $12.15 | $11.73 | $10.08 | ||||||||||||||||||||||||||||||||||||||||||||||||||||||||||||||||||||
| Total return (%)4,5 | 4.40 | 6 | 16.75 | 0.80 | 6 | ||||||||||||||||||||||||||||||||||||||||||||||||||||||||||||||||||
| Ratios and supplemental data | |||||||||||||||||||||||||||||||||||||||||||||||||||||||||||||||||||||||
| Net assets, end of period (in millions) | $1 | $1 | $1 | ||||||||||||||||||||||||||||||||||||||||||||||||||||||||||||||||||||
| Ratios (as a percentage of average net assets): | |||||||||||||||||||||||||||||||||||||||||||||||||||||||||||||||||||||||
| Expenses before reductions | 2.32 | 7 | 2.98 | 3.48 | 7 | ||||||||||||||||||||||||||||||||||||||||||||||||||||||||||||||||||
| Expenses including reductions | 1.92 | 7 | 1.93 | 1.94 | 7 | ||||||||||||||||||||||||||||||||||||||||||||||||||||||||||||||||||
| Net investment loss | (0.19 | ) 7 | (0.16 | ) | (0.11 | ) 7,8 | |||||||||||||||||||||||||||||||||||||||||||||||||||||||||||||||||
| Portfolio turnover (%) | 16 | 17 | 23 | ||||||||||||||||||||||||||||||||||||||||||||||||||||||||||||||||||||
| 1 | Six months ended 4-30-18. Unaudited. | |||||||||||||||||||||||||||||||||||||||||||||||||||||||||||||||||||||||||||||||
| 2 | Period from 6-6-16 (commencement of operations) to 10-31-16. | |||||||||||||||||||||||||||||||||||||||||||||||||||||||||||||||||||||||||||||||
| 3 | Based on average daily shares outstanding. | |||||||||||||||||||||||||||||||||||||||||||||||||||||||||||||||||||||||||||||||
| 4 | Total returns would have been lower had certain expenses not been reduced during the applicable periods. | |||||||||||||||||||||||||||||||||||||||||||||||||||||||||||||||||||||||||||||||
| 5 | Does not reflect the effect of sales charges, if any. | |||||||||||||||||||||||||||||||||||||||||||||||||||||||||||||||||||||||||||||||
| 6 | Not annualized. | |||||||||||||||||||||||||||||||||||||||||||||||||||||||||||||||||||||||||||||||
| 7 | Annualized. | |||||||||||||||||||||||||||||||||||||||||||||||||||||||||||||||||||||||||||||||
| 8 | A portion of income is presented unannualized. | |||||||||||||||||||||||||||||||||||||||||||||||||||||||||||||||||||||||||||||||
| Class I Shares Period ended | 4-30-18 | 1 | 10-31-17 | 10-31-16 | 2 | ||||||||||||||||||||||||||||||||||||||||||||||||||||||||||||||||||
| Per share operating performance | |||||||||||||||||||||||||||||||||||||||||||||||||||||||||||||||||||||||
| Net asset value, beginning of period | $11.84 | $10.12 | $10.00 | ||||||||||||||||||||||||||||||||||||||||||||||||||||||||||||||||||||
| Net investment income3 | 0.05 | 0.08 | 0.05 | ||||||||||||||||||||||||||||||||||||||||||||||||||||||||||||||||||||
| Net realized and unrealized gain (loss) on investments | 0.52 | 1.73 | 0.07 | ||||||||||||||||||||||||||||||||||||||||||||||||||||||||||||||||||||
| Total from investment operations | 0.57 | 1.81 | 0.12 | ||||||||||||||||||||||||||||||||||||||||||||||||||||||||||||||||||||
| Less distributions | |||||||||||||||||||||||||||||||||||||||||||||||||||||||||||||||||||||||
| From net investment income | (0.06 | ) | (0.09 | ) | — | ||||||||||||||||||||||||||||||||||||||||||||||||||||||||||||||||||
| From net realized gain | (0.09 | ) | — | — | |||||||||||||||||||||||||||||||||||||||||||||||||||||||||||||||||||
| Total distributions | (0.15 | ) | (0.09 | ) | — | ||||||||||||||||||||||||||||||||||||||||||||||||||||||||||||||||||
| Net asset value, end of period | $12.26 | $11.84 | $10.12 | ||||||||||||||||||||||||||||||||||||||||||||||||||||||||||||||||||||
| Total return (%)4 | 4.85 | 5 | 18.02 | 1.20 | 5 | ||||||||||||||||||||||||||||||||||||||||||||||||||||||||||||||||||
| Ratios and supplemental data | |||||||||||||||||||||||||||||||||||||||||||||||||||||||||||||||||||||||
| Net assets, end of period (in millions) | $32 | $30 | $9 | ||||||||||||||||||||||||||||||||||||||||||||||||||||||||||||||||||||
| Ratios (as a percentage of average net assets): | |||||||||||||||||||||||||||||||||||||||||||||||||||||||||||||||||||||||
| Expenses before reductions | 1.32 | 6 | 1.97 | 2.47 | 6 | ||||||||||||||||||||||||||||||||||||||||||||||||||||||||||||||||||
| Expenses including reductions | 0.92 | 6 | 0.92 | 0.92 | 6 | ||||||||||||||||||||||||||||||||||||||||||||||||||||||||||||||||||
| Net investment income | 0.81 | 6 | 0.69 | 0.88 | 6,7 | ||||||||||||||||||||||||||||||||||||||||||||||||||||||||||||||||||
| Portfolio turnover (%) | 16 | 17 | 23 | ||||||||||||||||||||||||||||||||||||||||||||||||||||||||||||||||||||
| 1 | Six months ended 4-30-18. Unaudited. | |||||||||||||||||||||||||||||||||||||||||||||||||||||||||||||||||||||||||||||||
| 2 | Period from 6-6-16 (commencement of operations) to 10-31-16. | |||||||||||||||||||||||||||||||||||||||||||||||||||||||||||||||||||||||||||||||
| 3 | Based on average daily shares outstanding. | |||||||||||||||||||||||||||||||||||||||||||||||||||||||||||||||||||||||||||||||
| 4 | Total returns would have been lower had certain expenses not been reduced during the applicable periods. | |||||||||||||||||||||||||||||||||||||||||||||||||||||||||||||||||||||||||||||||
| 5 | Not annualized. | |||||||||||||||||||||||||||||||||||||||||||||||||||||||||||||||||||||||||||||||
| 6 | Annualized. | |||||||||||||||||||||||||||||||||||||||||||||||||||||||||||||||||||||||||||||||
| 7 | A portion of income is presented unannualized. | |||||||||||||||||||||||||||||||||||||||||||||||||||||||||||||||||||||||||||||||
| Class R6 Shares Period ended | 4-30-18 | 1 | 10-31-17 | 10-31-16 | 2 | ||||||||||||||||||||||||||||||||||||||||||||||||||||||||||||||||||
| Per share operating performance | |||||||||||||||||||||||||||||||||||||||||||||||||||||||||||||||||||||||
| Net asset value, beginning of period | $11.85 | $10.13 | $10.00 | ||||||||||||||||||||||||||||||||||||||||||||||||||||||||||||||||||||
| Net investment income3 | 0.06 | 0.11 | 0.06 | ||||||||||||||||||||||||||||||||||||||||||||||||||||||||||||||||||||
| Net realized and unrealized gain on investments | 0.51 | 1.71 | 0.07 | ||||||||||||||||||||||||||||||||||||||||||||||||||||||||||||||||||||
| Total from investment operations | 0.57 | 1.82 | 0.13 | ||||||||||||||||||||||||||||||||||||||||||||||||||||||||||||||||||||
| Less distributions | |||||||||||||||||||||||||||||||||||||||||||||||||||||||||||||||||||||||
| From net investment income | (0.07 | ) | (0.10 | ) | — | ||||||||||||||||||||||||||||||||||||||||||||||||||||||||||||||||||
| From net realized gain | (0.09 | ) | — | — | |||||||||||||||||||||||||||||||||||||||||||||||||||||||||||||||||||
| Total distributions | (0.16 | ) | (0.10 | ) | — | ||||||||||||||||||||||||||||||||||||||||||||||||||||||||||||||||||
| Net asset value, end of period | $12.26 | $11.85 | $10.13 | ||||||||||||||||||||||||||||||||||||||||||||||||||||||||||||||||||||
| Total return (%)4 | 4.88 | 5 | 18.09 | 1.30 | 5 | ||||||||||||||||||||||||||||||||||||||||||||||||||||||||||||||||||
| Ratios and supplemental data | |||||||||||||||||||||||||||||||||||||||||||||||||||||||||||||||||||||||
| Net assets, end of period (in millions) | $1 | $1 | $1 | ||||||||||||||||||||||||||||||||||||||||||||||||||||||||||||||||||||
| Ratios (as a percentage of average net assets): | |||||||||||||||||||||||||||||||||||||||||||||||||||||||||||||||||||||||
| Expenses before reductions | 1.22 | 6 | 1.87 | 2.38 | 6 | ||||||||||||||||||||||||||||||||||||||||||||||||||||||||||||||||||
| Expenses including reductions | 0.81 | 6 | 0.81 | 0.81 | 6 | ||||||||||||||||||||||||||||||||||||||||||||||||||||||||||||||||||
| Net investment income | 0.92 | 6 | 0.97 | 0.99 | 6,7 | ||||||||||||||||||||||||||||||||||||||||||||||||||||||||||||||||||
| Portfolio turnover (%) | 16 | 17 | 23 | ||||||||||||||||||||||||||||||||||||||||||||||||||||||||||||||||||||
| 1 | Six months ended 4-30-18. Unaudited. | |||||||||||||||||||||||||||||||||||||||||||||||||||||||||||||||||||||||||||||||
| 2 | Period from 6-6-16 (commencement of operations) to 10-31-16. | |||||||||||||||||||||||||||||||||||||||||||||||||||||||||||||||||||||||||||||||
| 3 | Based on average daily shares outstanding. | |||||||||||||||||||||||||||||||||||||||||||||||||||||||||||||||||||||||||||||||
| 4 | Total returns would have been lower had certain expenses not been reduced during the applicable periods. | |||||||||||||||||||||||||||||||||||||||||||||||||||||||||||||||||||||||||||||||
| 5 | Not annualized. | |||||||||||||||||||||||||||||||||||||||||||||||||||||||||||||||||||||||||||||||
| 6 | Annualized. | |||||||||||||||||||||||||||||||||||||||||||||||||||||||||||||||||||||||||||||||
| 7 | A portion of income is presented unannualized. | |||||||||||||||||||||||||||||||||||||||||||||||||||||||||||||||||||||||||||||||
Note 1 — Organization
John Hancock ESG Large Cap Core Fund (the fund) is a series of John Hancock Investment Trust (the Trust), an open-end management investment company organized as a Massachusetts business trust and registered under the Investment Company Act of 1940, as amended (the 1940 Act). The investment objective of the fund is to seek long-term capital appreciation.
The fund may offer multiple classes of shares. The shares currently offered by the fund are detailed in the Statement of assets and liabilities. Class A and Class C shares are offered to all investors. Class I shares are offered to institutions and certain investors. Class R6 shares are only available to certain retirement plans, institutions and other investors. Shareholders of each class have exclusive voting rights to matters that affect that class. The distribution and service fees, if any, and transfer agent fees for each class may differ. Effective May 1, 2018, Class C shares convert to Class A shares ten years after purchase (certain exclusions may apply).
Note 2 — Significant accounting policies
The financial statements have been prepared in conformity with accounting principles generally accepted in the United States of America (US GAAP), which require management to make certain estimates and assumptions as of the date of the financial statements. Actual results could differ from those estimates and those differences could be significant. The fund qualifies as an investment company under Topic 946 of Accounting Standards Codification of US GAAP.
Events or transactions occurring after the end of the fiscal period through the date that the financial statements were issued have been evaluated in the preparation of the financial statements. The following summarizes the significant accounting policies of the fund:
Security valuation. Investments are stated at value as of the scheduled close of regular trading on the New York Stock Exchange (NYSE), normally at 4:00 p.m., Eastern Time. In case of emergency or other disruption resulting in the NYSE not opening for trading or the NYSE closing at a time other than the regularly scheduled close, the net asset value (NAV) may be determined as of the regularly scheduled close of the NYSE pursuant to the fund's Valuation Policies and Procedures.
In order to value the securities, the fund uses the following valuation techniques: Equity securities held by the fund are typically valued at the last sale price or official closing price on the exchange or principal market where the security trades. In the event there were no sales during the day or closing prices are not available, the securities are valued using the last available bid price. Investments by the fund in open-end mutual funds are valued at their respective NAVs each business day.
In certain instances, the Pricing Committee may determine to value equity securities using prices obtained from another exchange or market if trading on the exchange or market on which prices are typically obtained did not open for trading as scheduled, or if trading closed earlier than scheduled, and trading occurred as normal on another exchange or market.
Other portfolio securities and assets, for which reliable market quotations are not readily available, are valued at fair value as determined in good faith by the fund's Pricing Committee following procedures established by the Board of Trustees. The frequency with which these fair valuation procedures are used cannot be predicted and fair value of securities may differ significantly from the value that would have been used had a ready market for such securities existed.
The fund uses a three-tier hierarchy to prioritize the pricing assumptions, referred to as inputs, used in valuation techniques to measure fair value. Level 1 includes securities valued using quoted prices in active markets for identical securities. Level 2 includes securities valued using other significant observable inputs. Observable inputs may include quoted prices for similar securities, interest rates, prepayment speeds and credit risk. Prices for securities valued using these inputs are received from independent pricing vendors and brokers and are based on an evaluation of the inputs described. Level 3 includes securities valued using significant unobservable inputs when market prices are not readily available or reliable, including the fund's own assumptions in determining the fair value of investments. Factors used in determining value may include market or issuer specific events or trends, changes in interest rates and credit quality. The inputs or methodology used for valuing securities are not necessarily an indication of the risks associated with investing in those securities. Changes in valuation techniques and related inputs may result in transfers into or out of an assigned level within the disclosure hierarchy.
As of April 30, 2018, all investments are categorized as Level 1 under the hierarchy described above.
Security transactions and related investment income. Investment security transactions are accounted for on a trade date plus one basis for daily NAV calculations. However, for financial reporting purposes, investment transactions are reported on trade date. Interest income is accrued as earned. Dividend income is recorded on the ex-date, except for dividends of foreign securities where the dividend may not be known until after the ex-date. In those cases, dividend income, net of withholding taxes, is recorded when the fund becomes aware of the dividends. Gains and losses on securities sold are determined on the basis of identified cost and may include proceeds from litigation.
Line of credit. The fund may have the ability to borrow from banks for temporary or emergency purposes, including meeting redemption requests that otherwise might require the untimely sale of securities. Pursuant to the fund's custodian agreement, the custodian may loan money to the fund to make properly authorized payments. The fund is obligated to repay the custodian for any overdraft, including any related costs or expenses. The custodian may have a lien, security interest or security entitlement in any fund property that is not otherwise segregated or pledged, to the extent of any overdraft, and to the maximum extent permitted by law.
The fund and other affiliated funds have entered into a syndicated line of credit agreement with Citibank, N.A. as the administrative agent that enables them to participate in a $750 million unsecured committed line of credit. Excluding commitments designated for a certain fund and subject to the needs of all other affiliated funds, the fund can borrow up to an aggregate commitment amount of $500 million, subject to asset coverage and other limitations as specified in the agreement. A commitment fee payable at the end of each calendar quarter, based on the average daily unused portion of the line of credit, is charged to each participating fund based on a combination of fixed and asset based allocations and is reflected in Other expenses on the Statement of operations. For the six months ended April 30, 2018, the fund had no borrowings under the line of credit. Commitment fees for six months ended April 30, 2018 were $1,423.
Expenses. Within the John Hancock group of funds complex, expenses that are directly attributable to an individual fund are allocated to such fund. Expenses that are not readily attributable to a specific fund are allocated among all funds in an equitable manner, taking into consideration, among other things, the nature and type of expense and the fund's relative net assets. Expense estimates are accrued in the period to which they relate and adjustments are made when actual amounts are known.
Class allocations. Income, common expenses and realized and unrealized gains (losses) are determined at the fund level and allocated daily to each class of shares based on the net assets of the class. Class-specific expenses, such as distribution and service fees, if any, and transfer agent fees, for all classes, are charged daily at the class level based on the net assets of each class and the specific expense rates applicable to each class.
Federal income taxes. The fund intends to continue to qualify as a regulated investment company by complying with the applicable provisions of the Internal Revenue Code and will not be subject to federal income tax on taxable income that is distributed to shareholders. Therefore, no federal income tax provision is required.
As of October 31, 2017, the fund had no uncertain tax positions that would require financial statement recognition, derecognition or disclosure. The fund's federal tax returns are subject to examination by the Internal Revenue Service for a period of three years.
Distribution of income and gains. Distributions to shareholders from net investment income and net realized gains, if any, are recorded on the ex-date. The fund typically declares and pays dividends and capital gain distributions, if any, at least annually.
Distributions paid by the fund with respect to each class of shares are calculated in the same manner, at the same time and in the same amount, except for the effect of class level expenses that may be applied differently to each class.
Such distributions, on a tax basis, are determined in conformity with income tax regulations, which may differ from US GAAP. Distributions in excess of tax basis earnings and profits, if any, are reported in the fund's financial statements as a return of
capital. The final determination of tax characteristics of the fund's distribution will occur at the end of the year and will subsequently be reported to shareholders.
Capital accounts within the financial statements are adjusted for permanent book-tax differences. These adjustments have no impact on net assets or the results of operations. Temporary book-tax differences, if any, will reverse in a subsequent period. Temporary book-tax differences, if any, will reverse in a subsequent period. The fund had no material book-tax differences at October 31, 2017.
Note 3 — Guarantees and indemnifications
Under the Trust's organizational documents, its Officers and Trustees are indemnified against certain liabilities arising out of the performance of their duties to the Trust, including the fund. Additionally, in the normal course of business, the fund enters into contracts with service providers that contain general indemnification clauses. The fund's maximum exposure under these arrangements is unknown, as this would involve future claims that may be made against the fund that have not yet occurred. The risk of material loss from such claims is considered remote.
Note 4 — Fees and transactions with affiliates
John Hancock Advisers, LLC (the Advisor) serves as investment advisor for the fund. John Hancock Funds, LLC (the Distributor), an affiliate of the Advisor, serves as principal underwriter of the fund. The Advisor and the Distributor are indirect, wholly owned subsidiaries of Manulife Financial Corporation (MFC).
Management fee. The fund has an investment management agreement with the Advisor under which the fund pays a daily management fee to the Advisor equivalent on an annual basis to the sum of: a) 0.750% of the first $250 million of the fund's average daily net assets; b) 0.725% of the next $250 million of the fund's average daily net assets; c) 0.700% of the next $500 million of the fund's average daily net assets; and d) 0.700% of the fund's average daily net assets in excess of $1 billion. If net assets exceed $1 billion, then the advisory fee to be paid is 0.700% on all asset levels of average daily net assets. The Advisor has a subadvisory agreement with Trillium Asset Management, LLC. The fund is not responsible for payment of the subadvisory fees.
The Advisor has contractually agreed to waive a portion of its management fee and/or reimburse expenses for certain funds of the John Hancock group of funds complex, including the fund (the participating portfolios). This waiver is based upon aggregate net assets of all the participating portfolios. The amount of the reimbursement is calculated daily and allocated among all the participating portfolios in proportion to the daily net assets of each fund. During the six months ended April 30, 2018, this waiver amounted to 0.01% of the fund's average net assets (on an annualized basis). This arrangement may be amended or terminated at any time by the Advisor upon notice to the fund and with the approval of the Board of Trustees.
The Advisor has contractually agreed to reduce its management fee or, if necessary, make payment to the fund in an amount equal to the amount by which expenses of the fund exceed 0.81% of average net assets of the fund. Expenses of the fund means all expenses of the fund, excluding taxes, brokerage commissions, interest expense, litigation and indemnification expenses and other extraordinary expenses not incurred in the ordinary course of the fund's business, class-specific expenses, borrowing costs, prime brokerage fees, acquired fund fees and expenses paid indirectly, and short dividend expense. The expense limitation expires on February 28, 2019, unless renewed by mutual agreement of the Advisor and the fund based upon a determination that this is appropriate under the circumstances at that time.
Prior to March 1, 2018, the Advisor had contractually agreed to waive and/or reimburse all class-specific expenses for Class R6 shares of the fund to the extent they exceeded 0.00% of average net assets attributable to Class R6 shares, on an annualized basis.
For the six months ended April 30, 2018, the expense reductions described above amounted to the following:
| Class | Expense reduction | Class | Expense reduction | |
| Class A | $11,777 | Class R6 | $2,233 | |
| Class C | 2,380 | Total | $78,808 | |
| Class I | 62,418 |
Expenses waived or reimbursed in the current fiscal period are not subject to recapture in future fiscal periods.
The investment management fees incurred for the six months ended April 30, 2018 were equivalent to a net annual effective rate of 0.35% of the fund's average daily net assets.
Accounting and legal services. Pursuant to a service agreement, the fund reimburses the Advisor for all expenses associated with providing the administrative, financial, legal, compliance, accounting and recordkeeping services to the fund, including the preparation of all tax returns, periodic reports to shareholders and regulatory reports, among other services. These expenses are allocated to each share class based on its relative net assets at the time the expense was incurred. These accounting and legal services fees incurred for the six months ended April 30, 2018 amounted to an annual rate of 0.02% of the fund's average daily net assets.
Distribution and service plans. The fund has a distribution agreement with the Distributor. The fund has adopted distribution and service plans with respect to Class A and Class C shares pursuant to Rule 12b-1 under the 1940 Act, to pay the Distributor for services provided as the distributor of shares of the fund. The fund may pay up to the following contractual rates of distribution and service fees under these arrangements, expressed as an annual percentage of average daily net assets for each class of the fund's shares:
| Class | Rule 12b-1 fee |
| Class A | 0.25% |
| Class C | 1.00% |
Sales charges. Class A shares are assessed up-front sales charges, which resulted in payments to the Distributor amounting to $4,160 for the six months ended April 30, 2018. Of this amount, $716 was retained and used for printing prospectuses, advertising, sales literature and other purposes, and $3,444 was paid as sales commissions to broker-dealers.
Class A and Class C shares may be subject to contingent deferred sales charges (CDSCs). Certain Class A shares that are acquired through purchases of $1 million or more and are redeemed within one year of purchase are subject to a 1.00% sales charge. Class C shares that are redeemed within one year of purchase are subject to a 1.00% CDSC. CDSCs are applied to the lesser of the current market value at the time of redemption or the original purchase cost of the shares being redeemed. Proceeds from CDSCs are used to compensate the Distributor for providing distribution-related services in connection with the sale of these shares. During the six months ended April 30, 2018, there were no CDSCs for Class A and Class C shares.
Transfer agent fees. The John Hancock Group of Funds has a complex-wide transfer agent agreement with John Hancock Signature Services, Inc. (Signature Services), an affiliate of the Advisor. The transfer agent fees paid to Signature Services are determined based on the cost to Signature Services (Signature Services Cost) of providing recordkeeping services. It also includes out-of-pocket expenses, including payments made to third-parties for recordkeeping services provided to their clients who invest in one or more John Hancock funds. In addition, Signature Services Cost may be reduced by certain fees that Signature Services receives in connection with retirement and small accounts. Signature Services Cost is calculated monthly and allocated, as applicable, to five categories of share classes: Retail Share and Institutional Share Classes of Non-Municipal Bond Funds, Class R6 Shares, Retirement Share Classes and Municipal Bond Share Classes. Within each of these categories, the applicable costs are allocated to the affected John Hancock affiliated funds and/or classes, based on the relative average daily net assets.
Class level expenses. Class level expenses for the six months ended April 30, 2018 were:
| Class | Distribution and service fees | Transfer agent fees |
| Class A | $7,375 | $3,194 |
| Class C | 5,967 | 646 |
| Class I | — | 17,288 |
| Class R6 | — | 67 |
| Total | $13,342 | $21,195 |
Trustee expenses. The fund compensates each Trustee who is not an employee of the Advisor or its affiliates. The costs of paying Trustee compensation and expenses are allocated to the fund based on its net assets relative to other funds within the John Hancock group of funds complex.
Note 5 — Fund share transactions
Transactions in fund shares for the six months ended April 30, 2018 and for the year ended October 31, 2017 were as follows:
| Six months ended 4-30-18 | Year ended 10-31-17 | |||||||||||||||||||||||||
| Shares | Amount | Shares | Amount | |||||||||||||||||||||||
| Class A shares | ||||||||||||||||||||||||||
| Sold | 36,986 | $449,563 | 55,007 | $604,471 | ||||||||||||||||||||||
| Distributions reinvested | 647 | 7,814 | 126 | 1,332 | ||||||||||||||||||||||
| Repurchased | (12,974 | ) | (155,555 | ) | (11,851 | ) | (130,311 | ) | ||||||||||||||||||
| Net increase | 24,659 | $301,822 | 43,282 | $475,492 | ||||||||||||||||||||||
| Class C shares | ||||||||||||||||||||||||||
| Sold | 5,936 | $72,528 | 2,979 | $33,367 | ||||||||||||||||||||||
| Distributions reinvested | 70 | 847 | 12 | 127 | ||||||||||||||||||||||
| Repurchased | (2,595 | ) | (31,966 | ) | (12 | ) | (124 | ) | ||||||||||||||||||
| Net increase | 3,411 | $41,409 | 2,979 | $33,370 | ||||||||||||||||||||||
| Class I shares | ||||||||||||||||||||||||||
| Sold | 105,889 | $1,300,554 | 1,656,593 | $18,697,010 | ||||||||||||||||||||||
| Distributions reinvested | 2,054 | 24,834 | 116 | 1,224 | ||||||||||||||||||||||
| Repurchased | (12,225 | ) | (149,517 | ) | (13,884 | ) | (152,755 | ) | ||||||||||||||||||
| Net increase | 95,718 | $1,175,871 | 1,642,825 | $18,545,479 | ||||||||||||||||||||||
| Class R6 shares | ||||||||||||||||||||||||||
| Sold | 1,074 | $13,295 | 598 | $6,810 | ||||||||||||||||||||||
| Distributions reinvested | 10 | 118 | — | — | ||||||||||||||||||||||
| Repurchased | (898 | ) | (11,108 | ) | — | — | ||||||||||||||||||||
| Net increase | 186 | $2,305 | 598 | $6,810 | ||||||||||||||||||||||
| Total net increase | 123,974 | $1,521,407 | 1,689,684 | $19,061,151 | ||||||||||||||||||||||
Affiliates of the fund owned 84%, 90%, 34% and 99% of shares of Class A, Class C, Class I and Class R6, respectively, on April 30, 2018. Such concentration of shareholders' capital could have a material effect on the fund if such shareholders redeem from the fund.
Note 6 — Purchase and sale of securities
Purchases and sales of securities, other than short-term investments, amounted to $6,922,669 and $6,158,044, respectively, for the six months ended April 30, 2018.
Trustees Hassell H. McClellan, Chairperson Officers Andrew G. Arnott John J. Danello Francis V. Knox, Jr. Charles A. Rizzo Salvatore Schiavone | Investment advisor John Hancock Advisers, LLC Subadvisor Trillium Asset Management, LLC Principal distributor John Hancock Funds, LLC Custodian Citibank, N.A. Transfer agent John Hancock Signature Services, Inc. Legal counsel K&L Gates LLP |
*Member of the Audit Committee
†Non-Independent Trustee
#Effective 6-20-17
The fund's proxy voting policies and procedures, as well as the fund proxy voting record for the most recent twelve-month period ended June 30, are available free of charge on the Securities and Exchange Commission (SEC) website at sec.gov or on our website.
The fund's complete list of portfolio holdings, for the first and third fiscal quarters, is filed with the SEC on Form N-Q. The fund's Form N-Q is available on our website and the SEC's website, sec.gov, and can be reviewed and copied (for a fee) at the SEC's Public Reference Room in Washington, DC. Call 800-SEC-0330 to receive information on the operation of the SEC's Public Reference Room.
We make this information on your fund, as well as monthly portfolio holdings, and other fund details available on our website at jhinvestments.com or by calling 800-225-5291.
| You can also contact us: | |||
| 800-225-5291 jhinvestments.com | Regular mail: John Hancock Signature Services, Inc. | Express mail: John Hancock Signature Services, Inc. | |
John Hancock family of funds
DOMESTIC EQUITY FUNDS Balanced Blue Chip Growth Classic Value Disciplined Value Disciplined Value Mid Cap Equity Income Fundamental All Cap Core Fundamental Large Cap Core Fundamental Large Cap Value New Opportunities Small Cap Core Small Cap Growth Small Cap Value Strategic Growth U.S. Global Leaders Growth U.S. Growth Value Equity GLOBAL AND INTERNATIONAL EQUITY FUNDS Disciplined Value International Emerging Markets Emerging Markets Equity Fundamental Global Franchise Global Equity Global Shareholder Yield Greater China Opportunities International Growth International Small Company International Value Equity | INCOME FUNDS Bond California Tax-Free Income Emerging Markets Debt Floating Rate Income Government Income High Yield High Yield Municipal Bond Income Investment Grade Bond Money Market Short Duration Credit Opportunities Spectrum Income Strategic Income Opportunities Tax-Free Bond ALTERNATIVE AND SPECIALTY FUNDS Absolute Return Currency Alternative Asset Allocation Enduring Assets Financial Industries Global Absolute Return Strategies Global Conservative Absolute Return Global Focused Strategies Natural Resources Redwood Regional Bank Seaport Long/Short Technical Opportunities |
A fund's investment objectives, risks, charges, and expenses should be considered carefully before investing. The prospectus contains this and other important information about the fund. To obtain a prospectus, contact your financial professional, call John Hancock Investments at 800-225-5291, or visit our website at jhinvestments.com. Please read the prospectus carefully before investing or sending money.
ASSET ALLOCATION Income Allocation Multi-Index Lifetime Portfolios Multi-Index Preservation Portfolios Multimanager Lifestyle Portfolios Multimanager Lifetime Portfolios Retirement Income 2040 EXCHANGE-TRADED FUNDS John Hancock Multifactor Consumer Discretionary ETF John Hancock Multifactor Consumer Staples ETF John Hancock Multifactor Developed International ETF John Hancock Multifactor Energy ETF John Hancock Multifactor Financials ETF John Hancock Multifactor Healthcare ETF John Hancock Multifactor Industrials ETF John Hancock Multifactor Large Cap ETF John Hancock Multifactor Materials ETF John Hancock Multifactor Mid Cap ETF John Hancock Multifactor Small Cap ETF John Hancock Multifactor Technology ETF John Hancock Multifactor Utilities ETF | ENVIRONMENTAL, SOCIAL, AND GOVERNANCE FUNDS ESG All Cap Core ESG Core Bond ESG International Equity ESG Large Cap Core CLOSED-END FUNDS Financial Opportunities Hedged Equity & Income Income Securities Trust Investors Trust Preferred Income Preferred Income II Preferred Income III Premium Dividend Tax-Advantaged Dividend Income Tax-Advantaged Global Shareholder Yield |
John Hancock Multifactor ETF shares are bought and sold at market price (not NAV), and are not individually redeemed
from the fund. Brokerage commissions will reduce returns.
John Hancock ETFs are distributed by Foreside Fund Services, LLC, and are subadvised by Dimensional Fund Advisors LP.
Foreside is not affiliated with John Hancock Funds, LLC or Dimensional Fund Advisors LP.
Dimensional Fund Advisors LP receives compensation from John Hancock in connection with licensing rights to the
John Hancock Dimensional indexes. Dimensional Fund Advisors LP does not sponsor, endorse, or sell, and makes no
representation as to the advisability of investing in, John Hancock Multifactor ETFs.
John Hancock Investments
A trusted brand
John Hancock Investments is a premier asset manager representing one of
America's most trusted brands, with a heritage of financial stewardship dating
back to 1862. Helping our shareholders pursue their financial goals is at the
core of everything we do. It's why we support the role of professional financial
advice and operate with the highest standards of conduct and integrity.
A better way to invest
We serve investors globally through a unique multimanager approach:
We search the world to find proven portfolio teams with specialized
expertise for every strategy we offer, then we apply robust investment
oversight to ensure they continue to meet our uncompromising standards
and serve the best interests of our shareholders.
Results for investors
Our unique approach to asset management enables us to provide a diverse set
of investments backed by some of the world's best managers, along with strong
risk-adjusted returns across asset classes.
| | John Hancock Funds, LLC n Member FINRA, SIPC 601 Congress Street n Boston, MA 02210-2805 800-225-5291 n jhinvestments.com | |
| This report is for the information of the shareholders of John Hancock ESG Large Cap Core Fund. It is not authorized for distribution to prospective investors unless preceded or accompanied by a prospectus. | ||
| MF450363 | 467SA 4/18 6/18 | |
John Hancock
ESG International Equity Fund
A message to shareholders
Dear shareholder,
Financial markets around the world experienced a meaningful rise in volatility in the last half of the reporting period. Stocks in developed international markets hit a rough patch after macroeconomic data began to suggest that the growth many investors were hoping for may not be as robust as early indications had suggested, but advanced for the period nonetheless. Many emerging markets advanced overall, thanks in large part to a weaker U.S. dollar and continued economic improvement in developing markets.
One of the challenges investors will face in the coming months is navigating the continued normalization of monetary policy. Stronger economies will continue to prompt global central banks to dial back the stimulus they had injected into the financial system in the years following the financial crisis, and this less-accommodative stance may represent an adjustment for many markets.
Your best resource in unpredictable markets is your financial advisor, who can help position your portfolio so that it's sufficiently diversified to meet your long-term objectives and to withstand the inevitable turbulence along the way.
On behalf of everyone at John Hancock Investments, I'd like to take this opportunity to welcome new shareholders and to thank existing shareholders for the continued trust you've placed in us.
Sincerely,
Andrew G. Arnott
President and CEO,
John Hancock Investments
Head of Wealth and Asset Management,
United States and Europe
This commentary reflects the CEO's views, which are subject to change at any time. Investing involves risks, including the potential loss of principal. Diversification does not guarantee a profit or eliminate the risk of a loss. It is not possible to invest directly into an index. For more up-to-date information, please visit our website at jhinvestments.com.
John Hancock
ESG International Equity Fund
INVESTMENT OBJECTIVE
The fund seeks long-term capital appreciation.
AVERAGE ANNUAL TOTAL RETURNS AS OF 4/30/18 (%)
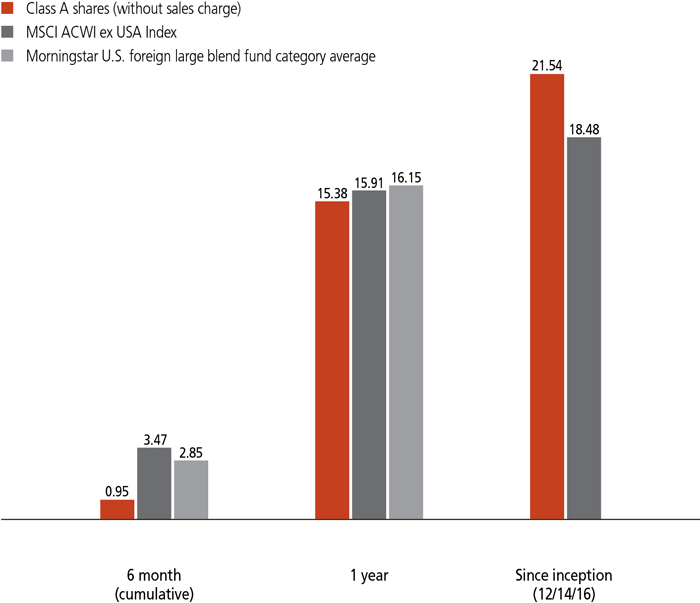
The MSCI ACWI ex USA Index is a free-float adjusted market capitalization weighted index designed to measure the equity market performance of developed markets and emerging markets, excluding the United States.
It is not possible to invest directly in an index. Index figures do not reflect expenses or sales charges, which would result in lower returns.
Figures from Morningstar, Inc. include reinvested distributions and do not take into account sales charges. Actual load-adjusted performance is lower. Since inception returns for the Morningstar fund category average are not available.
The past performance shown here reflects reinvested distributions and the beneficial effect of any expense reductions, and does not guarantee future results. Returns for periods shorter than one year are cumulative. Performance of the other share classes will vary based on the difference in the fees and expenses of those classes. Shares will fluctuate in value and, when redeemed, may be worth more or less than their original cost. Current month-end performance may be lower or higher than the performance cited, and can be found at jhinvestments.com or by calling 800-225-5291. For further information on the fund's objectives, risks, and strategy, see the fund's prospectus.
PERFORMANCE HIGHLIGHTS OVER THE LAST SIX MONTHS
International stocks posted gains
Despite a significant increase in market volatility in the latter half of the period, the fund's benchmark, the MSCI ACWI ex-USA Index, returned 3.47%.
The fund finished behind its benchmark
Stock selection in the consumer discretionary and information technology sectors contributed to the fund's underperformance.
Sector allocations were also a modest detractor
An underweight in the energy sector, which delivered a return well in excess of the index, cost the fund some relative performance.
SECTOR COMPOSITION AS OF 4/30/18 (%)
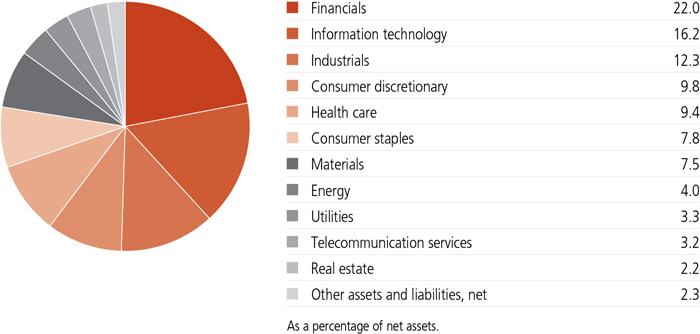
A note about risks
Larger companies may grow more slowly than smaller companies, may be slower to respond to business developments, and may underperform the market as a whole. Small and midsized companies are generally less established, may be more volatile than larger companies, and may underperform the market as a whole. The value of a company's equity securities is subject to change in the company's financial condition and overall market and economic conditions. Foreign investing has additional risks, such as currency and market volatility and political and social instability. A fund that invests in particular sectors is particularly susceptible to the impact of market, economic, regulatory, and other factors affecting those sectors. Investing primarily in responsible investments carries the risk that the fund may underperform funds that do not utilize a responsible investment strategy. The fund's environmental, social, and governance (ESG) policy could cause it to perform differently than similar funds that do not have such a policy. Successful application of the fund's investment strategy will depend on the managers' skill in properly identifying and analyzing material ESG issues. Please see the fund's prospectus for additional risks.

Praveen S. Abichandani, CFA
Portfolio Manager
Boston CommonAsset Management
How would you describe the investment environment during the six months ended April 30, 2018?
Despite a sharp increase in market volatility in the second half of the period, the fund's benchmark, the MSCI ACWI ex-USA Index, registered a total return of 3.47%. All of the gain occurred in the interval from November through January, when the combination of improving global growth, rising corporate earnings, and a tax cut in the United States fueled ebullient investor sentiment and led to strong gains for higher-risk investments.
The backdrop grew more challenging from February onward, however, as several developments prompted investors to take profits. Signs of rising inflation stoked fears that global central banks would be forced to hike interest rates more quickly than expected, and the United States' imposition of tariffs on steel and aluminum raised the prospect of a trade war. In addition, the markets were further pressured in April by concerns that the expansion in world economic growth may not be as robust as it appeared in late 2017. Together, these factors led to a decline of 4.73% for the index in the latter half of the period and caused the major world stock indexes to finish well off of their previous highs.
Can you review how the fund is invested?
We integrate traditional fundamental stock research with analysis of environmental, social, and governance (ESG) factors. The core of our philosophy is the view that companies attentive to ESG issues tend to be better-managed, higher-quality businesses and are therefore in a better position to generate superior market performance over time.
We invest with a long-term horizon and an emphasis on quality from both a traditional point of view (strategic and financial) and from an ESG perspective. We look for companies with positive ESG attributes, after exclusions for certain revenue sources, and we strive to invest in those that are generating attractive returns on invested capital from sustainable business models with limited financial leverage. At the same time, we avoid those with business models we consider unsustainable and whose financial reporting and managerial accountability we find untrustworthy.
While we prefer to own the stocks of the strongest companies from an ESG perspective, we will not buy shares of a company with a weak investment outlook even if it has a compelling ESG profile. In industries where we are unable to identify enough stocks that are attractive from both an investment and ESG standpoint, we invest in those with above-average ESG scores and use active shareholder engagement to urge their management teams to improve their policies and operations.
What factors helped and hurt the fund's results during the period?
Individual stock selection—or in other words, the performance of the fund's holdings compared to the stocks in the index—was the primary driver of results. The fund's investments fell short of the benchmark components in the consumer discretionary and information technology sectors. Conversely, we added value through stock selection in consumer staples and energy.
Two Chinese stocks—BYD Company, Ltd. and Ctrip.com International, Ltd.—were the largest detractors in the consumer discretionary space. BYD, a manufacturer of electric vehicles, lost ground due to concerns about changes in China's subsidy regime, while shares of the travel-booking firm Ctrip.com were pressured by uneven profits. We continue to hold both stocks based on their long-term growth prospects and favorable ESG profiles. Asia-based companies also weighed on our results in technology, where the Korean internet content provider NAVER Corp. reported rising
TOP 10 HOLDINGS AS OF 4/30/18 (%)
| Naspers, Ltd., N Shares | 2.2 |
| Alibaba Group Holding, Ltd., ADR | 2.1 |
| Hoya Corp. | 2.1 |
| Roche Holding AG | 2.1 |
| Shiseido Company, Ltd. | 2.0 |
| ING Groep NV | 2.0 |
| Daikin Industries, Ltd. | 2.0 |
| ORIX Corp. | 2.0 |
| Ferguson PLC | 2.0 |
| Unilever NV | 1.9 |
| TOTAL | 20.4 |
| As a percentage of net assets. | |
| Cash and cash equivalents are not included. | |
On the positive side, we posted robust results in the consumer staples sector thanks to a position in the Japanese makeup producer Shiseido Company, Ltd. The company successfully restructured its operations, leading to a sharp improvement in its profitability. Our healthy performance in energy largely stemmed from the outsize gains for Statoil ASA and Australia-based Origin Energy, Ltd., which helped offset the adverse effect of holding an underweight in the sector. Outside of these two areas, Umicore SA—a Belgium-based company that recycles metals and manufactures cathodes for lithium-ion batteries—was the top performer.
How would you summarize the fund's positioning at the close of the period?
In managing the portfolio, we incorporate important ESG themes that we think can support market-beating returns for the associated companies over time. One such theme is electric vehicles, which are gaining traction as consumers and governments look to take a more sustainable approach to transportation. We invest in stocks along the supply chain, which leads us to hold positions not just in electric vehicle producers—including BYD Company—but also providers of components, such as Umicore.
We believe the green chemical space is an additional area of long-term opportunity. For instance, U.K.-based Croda International PLC produces ingredients that consumer companies use to make natural or organic personal care products. We see this as a prime example of a company that features both a favorable ESG profile and a compelling longer-term growth opportunity. Companies that can capitalize on the shift toward energy efficiency, including Schneider Electric SE (France) and
TOP 10 COUNTRIES AS OF 4/30/18 (%)
| Japan | 14.3 |
| United Kingdom | 8.7 |
| China | 7.3 |
| Germany | 6.9 |
| Switzerland | 6.6 |
| France | 5.2 |
| South Korea | 5.0 |
| Denmark | 4.1 |
| Hong Kong | 3.7 |
| Sweden | 3.4 |
| TOTAL | 65.2 |
| As a percentage of net assets. | |
| Cash and cash equivalents are not included. |
Spirax-Sarco Engineering PLC (United Kingdom), represent another case of the intersection between a fast-growing market space and positive ESG profiles.
We hold a relatively large weighting in emerging-market stocks, an aspect of our approach that has aided performance since the fund's inception in December 2016. We believe the emerging markets are home to a wide range of companies that meet our criteria, but in many cases with more attractive valuations than their developed-market peers. We remain focused on companies that are in a position to benefit from the expansion of the middle class population in Asia, especially China. In this vein, Beijing Enterprises Water Group, Ltd., which is striving to identify ways to solve water-quality issues for consumer and industrial uses, was one of the most notable additions to the portfolio.
Although we see these areas as being particularly interesting sources of long-term return potential, we also seek to have exposure across all sectors and geographies in order to maintain a balanced portfolio. Within the context of this diversified strategy, the fund is tilted in favor of economically sensitive companies. This approach reflects our view that the developed and emerging overseas markets are earlier in their economic cycles than the United States and thus have latitude for continued expansion. The fund's pro-cyclical bias is visible in its overweight in the information technology and industrials sectors. At the same time, we retain an element of defensiveness through an overweight position in healthcare.
Looking ahead, we will continue managing the fund in a way that integrates both ESG and traditional financial metrics, while also using active engagement with corporate management teams in an effort to make already good companies better through shareowner advocacy.
MANAGED BY
| | Praveen S. Abichandani, CFA On the fund since inception Investing since 1991 |
 | Corné A. Biemans On the fund since inception Investing since 1990 |
 | Matt A. Zalosh, CFA On the fund since inception Investing since 1996 |

TOTAL RETURNS FOR THE PERIOD ENDED APRIL 30, 2018
| Average annual total returns (%) with maximum sales charge | Cumulative total returns (%) with maximum sales charge | ||||||
| 1-year | Since inception1 | 6-month | Since inception1 | ||||
| Class A | 9.58 | 17.07 | -4.08 | 24.25 | |||
| Class I2 | 15.54 | 21.82 | 0.97 | 31.26 | |||
| Class R62 | 15.73 | 21.96 | 1.13 | 31.47 | |||
| Index† | 15.91 | 18.48 | 3.47 | 26.32 | |||
Performance figures assume all distributions have been reinvested. Figures reflect the maximum sales charge on Class A shares of 5%. Sales charges are not applicable to Class I and Class R6 shares.
The expense ratios of the fund, both net (including any fee waivers and/or expense limitations) and gross (excluding any fee waivers and/or expense limitations), are set forth according to the most recent publicly available prospectus for the fund and may differ from those disclosed in the Financial highlights tables in this report. Net expenses reflect contractual expense limitations in effect until February 28, 2019 and are subject to change. Had the contractual fee waivers and expense limitations not been in place, gross expenses would apply. The expense ratios are as follows:
| Class A | Class I | Class R6 | |
| Gross (%) | 2.11 | 1.85 | 1.75 |
| Net (%) | 1.28 | 1.02 | 0.92 |
Please refer to the most recent prospectus and annual report for more information on expenses and any expense limitation arrangements for each class.
The returns reflect past results and should not be considered indicative of future performance. The return and principal value of an investment will fluctuate so that shares, when redeemed, may be worth more or less than their original cost. Due to market volatility and other factors, the fund's current performance may be higher or lower than the performance shown. For current to the most recent month-end performance data, please call 800-225-5291 or visit the fund's website at jhinvestments.com.
The performance table above and the chart on the next page do not reflect the deduction of taxes that a shareholder would pay on fund distributions or the redemption of fund shares. The fund's performance results reflect any applicable fee waivers or expense reductions, without which the expenses would increase and results would have been less favorable.
| † | Index is the MSCI ACWI ex USA Index. |
See the following page for footnotes.
This chart and table show what happened to a hypothetical $10,000 investment in John Hancock ESG International Equity Fund for the share classes and periods indicated, assuming all distributions were reinvested. For comparison, we've shown the same investment in the MSCI ACWI ex USA Index.
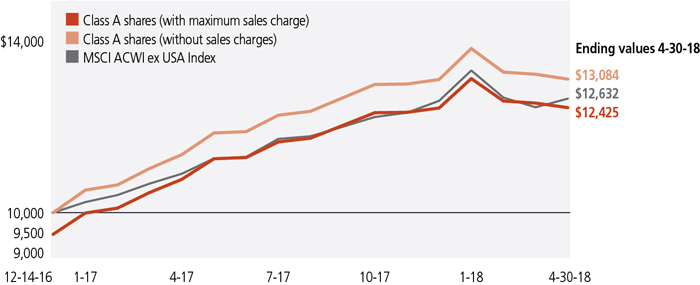
| Start date | With maximum sales charge ($) | Without sales charge ($) | Index ($) | |
| Class I2 | 12-14-16 | 13,126 | 13,126 | 12,632 |
| Class R62 | 12-14-16 | 13,147 | 13,147 | 12,632 |
The MSCI ACWI ex USA Index is a free-float adjusted market capitalization weighted index designed to measure the equity market performance of developed markets and emerging markets, excluding the United States.
It is not possible to invest directly in an index. Index figures do not reflect expenses or sales charges, which would result in lower returns.
Footnotes related to performance pages
| 1 | From 12-14-16. |
| 2 | For certain types of investors, as described in the fund's prospectus. |
These examples are intended to help you understand your ongoing operating expenses of investing in the fund so you can compare these costs with the ongoing costs of investing in other mutual funds.
Understanding fund expenses
As a shareholder of the fund, you incur two types of costs:
| • | Transaction costs, which include sales charges (loads) on purchases or redemptions (varies by share class), minimum account fee charge, etc. |
| • | Ongoing operating expenses, including management fees, distribution and service fees (if applicable), and other fund expenses. |
We are presenting only your ongoing operating expenses here.
Actual expenses/actual returns
The first line of each share class in the table on the following page is intended to provide information about the fund's actual ongoing operating expenses, and is based on the fund's actual return. It assumes an account value of $1,000.00 on November 1, 2017, with the same investment held until April 30, 2018.
Together with the value of your account, you may use this information to estimate the operating expenses that you paid over the period. Simply divide your account value at April 30, 2018, by $1,000.00, then multiply it by the "expenses paid" for your share class from the table. For example, for an account value of $8,600.00, the operating expenses should be calculated as follows:
Hypothetical example for comparison purposes
The second line of each share class in the table on the following page allows you to compare the fund's ongoing operating expenses with those of any other fund. It provides an example of the fund's hypothetical account values and hypothetical expenses based on each class's actual expense ratio and an assumed 5% annualized return before expenses (which is not the fund's actual return). It assumes an account value of $1,000.00 on November 1, 2017, with the same investment held until April 30, 2018. Look in any other fund shareholder report to find its hypothetical example and you will be able to compare these expenses. Please remember that these hypothetical account values and expenses may not be used to estimate the actual ending account balance or expenses you paid for the period.
Remember, these examples do not include any transaction costs, therefore, these examples will not help you to determine the relative total costs of owning different funds. If transaction costs were included, your expenses would have been higher. See the prospectus for details regarding transaction costs.
SHAREHOLDER EXPENSE EXAMPLE CHART
| Account value on 11-1-2017 | Ending value on 4-30-2018 | Expenses paid during period ended 4-30-20181 | Annualized expense ratio | ||
| Class A | Actual expenses/actual returns | $1,000.00 | $1,009.50 | $6.33 | 1.27% |
| Hypothetical example for comparison purposes | 1,000.00 | 1,018.50 | 6.36 | 1.27% | |
| Class I | Actual expenses/actual returns | 1,000.00 | 1,009.70 | 5.08 | 1.02% |
| Hypothetical example for comparison purposes | 1,000.00 | 1,019.70 | 5.11 | 1.02% | |
| Class R6 | Actual expenses/actual returns | 1,000.00 | 1,011.30 | 4.59 | 0.92% |
| Hypothetical example for comparison purposes | 1,000.00 | 1,020.20 | 4.61 | 0.92% | |
| 1 | Expenses are equal to the annualized expense ratio, multiplied by the average account value over the period, multiplied by 181/365 (to reflect the one-half year period). |
| Fund’s investments |
| Shares | Value | ||||
| Common stocks 96.7% | $57,035,637 | ||||
| (Cost $51,120,715) | |||||
| Australia 3.2% | 1,856,667 | ||||
| Macquarie Group, Ltd. | 12,160 | 990,286 | |||
| Origin Energy, Ltd. (A) | 118,670 | 866,381 | |||
| Belgium 1.7% | 1,003,079 | ||||
| Umicore SA | 18,035 | 1,003,079 | |||
| Brazil 1.5% | 903,040 | ||||
| Itau Unibanco Holding SA, ADR | 62,150 | 903,040 | |||
| Canada 1.5% | 898,517 | ||||
| Canadian Pacific Railway, Ltd. | 4,925 | 898,517 | |||
| Chile 1.9% | 1,119,756 | ||||
| Sociedad Quimica y Minera de Chile SA, ADR | 20,400 | 1,119,756 | |||
| China 7.3% | 4,280,362 | ||||
| Alibaba Group Holding, Ltd., ADR (A) | 6,990 | 1,247,994 | |||
| BYD Company, Ltd., H Shares | 77,000 | 538,313 | |||
| Ctrip.com International, Ltd., ADR (A) | 14,185 | 580,167 | |||
| Ping An Insurance Group Company of China, Ltd., H Shares | 94,000 | 918,512 | |||
| Sunny Optical Technology Group Company, Ltd. | 61,000 | 995,376 | |||
| Denmark 4.1% | 2,399,817 | ||||
| Novo Nordisk A/S, B Shares | 18,960 | 891,650 | |||
| Novozymes A/S, B Shares | 12,315 | 578,964 | |||
| Orsted A/S (B) | 14,114 | 929,203 | |||
| Finland 1.3% | 739,566 | ||||
| Sampo OYJ, A Shares | 13,675 | 739,566 | |||
| France 5.2% | 3,081,504 | ||||
| Air Liquide SA | 5,965 | 775,308 | |||
| AXA SA | 27,000 | 772,163 | |||
| Schneider Electric SE | 10,700 | 969,894 | |||
| Veolia Environnement SA | 23,845 | 564,139 | |||
| Germany 5.9% | 3,488,681 | ||||
| Bayerische Motoren Werke AG | 5,360 | 595,934 | |||
| Deutsche Telekom AG | 37,690 | 659,711 | |||
| Infineon Technologies AG | 27,805 | 711,966 | |||
| SAP SE | 8,290 | 921,065 | |||
| Vonovia SE | 11,975 | 600,005 | |||
| Hong Kong 3.7% | 2,171,526 | ||||
| AIA Group, Ltd. | 113,000 | 1,009,904 | |||
| Beijing Enterprises Water Group, Ltd. (A) | 782,000 | 454,016 |
| 12 | JOHN HANCOCK ESG INTERNATIONAL EQUITY FUND | SEMIANNUAL REPORT | SEE NOTES TO FINANCIAL STATEMENTS |
| Shares | Value | ||||
| Hong Kong (continued) | |||||
| Hang Lung Properties, Ltd. | 299,000 | $707,606 | |||
| India 1.7% | 990,196 | ||||
| HDFC Bank, Ltd., ADR | 10,335 | 990,196 | |||
| Indonesia 2.6% | 1,561,323 | ||||
| Bank Rakyat Indonesia Persero Tbk PT | 4,529,600 | 1,044,383 | |||
| Kalbe Farma Tbk PT | 4,788,500 | 516,940 | |||
| Israel 1.1% | 651,925 | ||||
| Check Point Software Technologies, Ltd. (A) | 6,755 | 651,925 | |||
| Japan 14.3% | 8,420,548 | ||||
| Daikin Industries, Ltd. | 10,100 | 1,179,839 | |||
| Hoya Corp. | 23,200 | 1,239,456 | |||
| Keyence Corp. | 1,600 | 975,647 | |||
| Kubota Corp. | 39,300 | 662,619 | |||
| Nippon Telegraph & Telephone Corp. | 12,700 | 602,681 | |||
| ORIX Corp. | 65,900 | 1,155,810 | |||
| Panasonic Corp. | 46,800 | 692,975 | |||
| Shimano, Inc. | 5,300 | 704,734 | |||
| Shiseido Company, Ltd. | 18,600 | 1,206,787 | |||
| Mexico 1.2% | 721,070 | ||||
| Grupo Financiero Banorte SAB de CV, Series O | 115,300 | 721,070 | |||
| Netherlands 3.4% | 1,975,601 | ||||
| ASML Holding NV | 4,115 | 783,428 | |||
| ING Groep NV | 70,750 | 1,192,173 | |||
| Norway 1.2% | 718,210 | ||||
| Statoil ASA | 28,085 | 718,210 | |||
| Russia 1.3% | 751,267 | ||||
| Yandex NV, Class A (A) | 22,520 | 751,267 | |||
| Singapore 1.1% | 655,455 | ||||
| Singapore Telecommunications, Ltd. | 247,800 | 655,455 | |||
| South Africa 2.2% | 1,310,673 | ||||
| Naspers, Ltd., N Shares | 5,380 | 1,310,673 | |||
| South Korea 5.0% | 2,968,778 | ||||
| Coway Company, Ltd. | 6,977 | 570,163 | |||
| LG Household & Health Care, Ltd. | 620 | 791,665 | |||
| NAVER Corp. | 700 | 466,790 | |||
| Samsung Electronics Company, Ltd. | 460 | 1,140,160 | |||
| Spain 2.6% | 1,518,761 | ||||
| Melia Hotels International SA | 51,034 | 758,789 | |||
| Repsol SA | 39,825 | 759,972 |
| SEE NOTES TO FINANCIAL STATEMENTS | SEMIANNUAL REPORT | JOHN HANCOCK ESG INTERNATIONAL EQUITY FUND | 13 |
| Shares | Value | ||||
| Sweden 3.4% | $2,033,349 | ||||
| Assa Abloy AB, B Shares | 40,175 | 841,944 | |||
| Atlas Copco AB, B Shares | 20,325 | 720,389 | |||
| Svenska Handelsbanken AB, A Shares | 42,235 | 471,016 | |||
| Switzerland 6.6% | 3,904,358 | ||||
| Ferguson PLC | 15,075 | 1,153,955 | |||
| Julius Baer Group, Ltd. (A) | 9,865 | 585,472 | |||
| Novartis AG | 12,365 | 951,787 | |||
| Roche Holding AG | 5,460 | 1,213,144 | |||
| Taiwan 1.5% | 906,651 | ||||
| Taiwan Semiconductor Manufacturing Company, Ltd., ADR | 23,580 | 906,651 | |||
| Thailand 1.5% | 899,024 | ||||
| Kasikornbank PCL | 141,600 | 899,024 | |||
| United Kingdom 8.7% | 5,105,933 | ||||
| Barclays PLC | 204,310 | 582,513 | |||
| Croda International PLC | 15,580 | 953,076 | |||
| Reckitt Benckiser Group PLC | 11,020 | 864,503 | |||
| Smith & Nephew PLC | 39,435 | 755,226 | |||
| Spirax-Sarco Engineering PLC | 10,125 | 802,612 | |||
| Unilever NV | 20,025 | 1,148,003 | |||
| Preferred securities 1.0% | $583,318 | ||||
| (Cost $618,096) | |||||
| Germany 1.0% | 583,318 | ||||
| Henkel AG & Company KGaA | 4,590 | 583,318 | |||
| Total investments (Cost $51,738,811) 97.7% | $57,618,955 | ||||
| Other assets and liabilities, net 2.3% | 1,363,084 | ||||
| Total net assets 100.0% | $58,982,039 | ||||
| The percentage shown for each investment category is the total value of the category as a percentage of the net assets of the fund. | |
| Security Abbreviations and Legend | |
| ADR | American Depositary Receipt |
| (A) | Non-income producing security. |
| (B) | These securities are exempt from registration under Rule 144A of the Securities Act of 1933. Such securities may be resold, normally to qualified institutional buyers, in transactions exempt from registration. |
| 14 | JOHN HANCOCK ESG INTERNATIONAL EQUITY FUND | SEMIANNUAL REPORT | SEE NOTES TO FINANCIAL STATEMENTS |
Financial statements
STATEMENT OF ASSETS AND LIABILITIES 4-30-18 (unaudited)
| Assets | ||||||||||||||||||||||
| Investments, at value (Cost $51,738,811) | $57,618,955 | |||||||||||||||||||||
| Cash | 1,038,800 | |||||||||||||||||||||
| Foreign currency, at value (Cost $14,134) | 14,134 | |||||||||||||||||||||
| Receivable for fund shares sold | 48,998 | |||||||||||||||||||||
| Dividends and interest receivable | 277,735 | |||||||||||||||||||||
| Other receivables and prepaid expenses | 40,038 | |||||||||||||||||||||
| Total assets | 59,038,660 | |||||||||||||||||||||
| Liabilities | ||||||||||||||||||||||
| Payable to affiliates | ||||||||||||||||||||||
| Accounting and legal services fees | 6,642 | |||||||||||||||||||||
| Transfer agent fees | 5,492 | |||||||||||||||||||||
| Trustees' fees | 171 | |||||||||||||||||||||
| Investment management fees | 1,911 | |||||||||||||||||||||
| Other liabilities and accrued expenses | 42,405 | |||||||||||||||||||||
| Total liabilities | 56,621 | |||||||||||||||||||||
| Net assets | $58,982,039 | |||||||||||||||||||||
| Net assets consist of | ||||||||||||||||||||||
| Paid-in capital | $52,596,970 | |||||||||||||||||||||
| Undistributed net investment income | 223,106 | |||||||||||||||||||||
| Accumulated net realized gain (loss) on investments and foreign currency transactions | 285,199 | |||||||||||||||||||||
| Net unrealized appreciation (depreciation) on investments and translation of assets and liabilities in foreign currencies | 5,876,764 | |||||||||||||||||||||
| Net assets | $58,982,039 | |||||||||||||||||||||
| Net asset value per share | ||||||||||||||||||||||
| Based on net asset value and shares outstanding - The fund has an unlimited number of shares authorized with no par value | ||||||||||||||||||||||
| Class A ($7,190,055 ÷ 554,042 shares)1 | $12.98 | |||||||||||||||||||||
| Class I ($49,830,357 ÷ 3,834,599 shares) | $12.99 | |||||||||||||||||||||
| Class R6 ($1,961,627 ÷ 150,930 shares) | $13.00 | |||||||||||||||||||||
| Maximum offering price per share | ||||||||||||||||||||||
| Class A (net assets value per share ÷ 95%)2 | $13.66 | |||||||||||||||||||||
| 1 | Redemption price per share is equal to net asset value less any applicable contingent deferred sales charge. | |||||||||||||||||||
| 2 | On single retail sales of less than $50,000. On sales of $50,000 or more and on group sales the offering price is reduced. | |||||||||||||||||||
STATEMENT OF OPERATIONS For the six months ended 4-30-18 (unaudited)
| Investment income | ||||||||||||||||||||||||
| Dividends | $688,148 | |||||||||||||||||||||||
| Interest | 5,791 | |||||||||||||||||||||||
| Less foreign taxes withheld | (66,782 | ) | ||||||||||||||||||||||
| Total investment income | 627,157 | |||||||||||||||||||||||
| Expenses | ||||||||||||||||||||||||
| Investment management fees | 244,891 | |||||||||||||||||||||||
| Distribution and service fees | 8,583 | |||||||||||||||||||||||
| Accounting and legal services fees | 6,253 | |||||||||||||||||||||||
| Transfer agent fees | 30,796 | |||||||||||||||||||||||
| Trustees' fees | 622 | |||||||||||||||||||||||
| State registration fees | 22,459 | |||||||||||||||||||||||
| Printing and postage | 14,699 | |||||||||||||||||||||||
| Professional fees | 23,445 | |||||||||||||||||||||||
| Custodian fees | 35,873 | |||||||||||||||||||||||
| Registration and filing fees | 19,873 | |||||||||||||||||||||||
| Other | 5,584 | |||||||||||||||||||||||
| Total expenses | 413,078 | |||||||||||||||||||||||
| Less expense reductions | (111,522 | ) | ||||||||||||||||||||||
| Net expenses | 301,556 | |||||||||||||||||||||||
| Net investment income | 325,601 | |||||||||||||||||||||||
| Realized and unrealized gain (loss) | ||||||||||||||||||||||||
| Net realized gain on investments and foreign currency transactions | 290,815 | |||||||||||||||||||||||
| Change in net unrealized appreciation (depreciation) of investments and translation of assets and liabilities in foreign currencies | (79,942 | ) | ||||||||||||||||||||||
| Net realized and unrealized gain | 210,873 | |||||||||||||||||||||||
| Increase in net assets from operations | $536,474 | |||||||||||||||||||||||
STATEMENTS OF CHANGES IN NET ASSETS
| Six months ended 4-30-18 | Period ended 10-31-171 | |||||||||||||||||||||||||||||||||||||||||||||||
| (unaudited) | ||||||||||||||||||||||||||||||||||||||||||||||||
| Increase (decrease) in net assets | ||||||||||||||||||||||||||||||||||||||||||||||||
| From operations | ||||||||||||||||||||||||||||||||||||||||||||||||
| Net investment income | $325,601 | $253,006 | ||||||||||||||||||||||||||||||||||||||||||||||
| Net realized gain | 290,815 | 191,542 | ||||||||||||||||||||||||||||||||||||||||||||||
| Change in net unrealized appreciation (depreciation) | (79,942 | ) | 5,956,706 | |||||||||||||||||||||||||||||||||||||||||||||
| Increase in net assets resulting from operations | 536,474 | 6,401,254 | ||||||||||||||||||||||||||||||||||||||||||||||
| Distributions to shareholders | ||||||||||||||||||||||||||||||||||||||||||||||||
| From net investment income | ||||||||||||||||||||||||||||||||||||||||||||||||
| Class A | (20,156 | ) | — | |||||||||||||||||||||||||||||||||||||||||||||
| Class I | (262,607 | ) | — | |||||||||||||||||||||||||||||||||||||||||||||
| Class R6 | (12,323 | ) | — | |||||||||||||||||||||||||||||||||||||||||||||
| From net realized gain | ||||||||||||||||||||||||||||||||||||||||||||||||
| Class A | (31,754 | ) | — | |||||||||||||||||||||||||||||||||||||||||||||
| Class I | (230,007 | ) | — | |||||||||||||||||||||||||||||||||||||||||||||
| Class R6 | (9,356 | ) | — | |||||||||||||||||||||||||||||||||||||||||||||
| Total distributions | (566,203 | ) | — | |||||||||||||||||||||||||||||||||||||||||||||
| From fund share transactions | 2,969,217 | 49,641,297 | ||||||||||||||||||||||||||||||||||||||||||||||
| Total increase | 2,939,488 | 56,042,551 | ||||||||||||||||||||||||||||||||||||||||||||||
| Net assets | ||||||||||||||||||||||||||||||||||||||||||||||||
| Beginning of period | 56,042,551 | — | ||||||||||||||||||||||||||||||||||||||||||||||
| End of period | $58,982,039 | $56,042,551 | ||||||||||||||||||||||||||||||||||||||||||||||
| Undistributed net investment income | $223,106 | $192,591 | ||||||||||||||||||||||||||||||||||||||||||||||
| 1 | Period from 12-14-16 (commencement of operations) to 10-31-17. | ||||||||||||||||||||||||||||||||||||||||||||||
Financial highlights
| Class A Shares Period ended | 4-30-18 | 1 | 10-31-17 | 2 | ||||||||||||||||||||||||||||||||||||||||||||||
| Per share operating performance | ||||||||||||||||||||||||||||||||||||||||||||||||||
| Net asset value, beginning of period | $12.96 | $10.00 | ||||||||||||||||||||||||||||||||||||||||||||||||
| Net investment income3 | 0.06 | 0.13 | ||||||||||||||||||||||||||||||||||||||||||||||||
| Net realized and unrealized gain on investments | 0.06 | 2.83 | ||||||||||||||||||||||||||||||||||||||||||||||||
| Total from investment operations | 0.12 | 2.96 | ||||||||||||||||||||||||||||||||||||||||||||||||
| Less distributions | ||||||||||||||||||||||||||||||||||||||||||||||||||
| From net investment income | (0.04 | ) | — | |||||||||||||||||||||||||||||||||||||||||||||||
| From net realized gain | (0.06 | ) | — | |||||||||||||||||||||||||||||||||||||||||||||||
| Total distributions | (0.10 | ) | — | |||||||||||||||||||||||||||||||||||||||||||||||
| Net asset value, end of period | $12.98 | $12.96 | ||||||||||||||||||||||||||||||||||||||||||||||||
| Total return (%)4,5 | 0.95 | 6 | 29.60 | 6 | ||||||||||||||||||||||||||||||||||||||||||||||
| Ratios and supplemental data | ||||||||||||||||||||||||||||||||||||||||||||||||||
| Net assets, end of period (in millions) | $7 | $6 | ||||||||||||||||||||||||||||||||||||||||||||||||
| Ratios (as a percentage of average net assets): | ||||||||||||||||||||||||||||||||||||||||||||||||||
| Expenses before reductions | 1.66 | 7 | 2.11 | 7 | ||||||||||||||||||||||||||||||||||||||||||||||
| Expenses including reductions | 1.27 | 7 | 1.28 | 7 | ||||||||||||||||||||||||||||||||||||||||||||||
| Net investment income | 0.93 | 7 | 1.27 | 7 | ||||||||||||||||||||||||||||||||||||||||||||||
| Portfolio turnover (%) | 11 | 10 | ||||||||||||||||||||||||||||||||||||||||||||||||
| 1 | Six months ended 4-30-18. Unaudited. | ||||||||||||||||||||||||||||||||||||||||||||||||||||||||||
| 2 | Period from 12-14-16 (commencement of operations) to 10-31-17. | ||||||||||||||||||||||||||||||||||||||||||||||||||||||||||
| 3 | Based on average daily shares outstanding. | ||||||||||||||||||||||||||||||||||||||||||||||||||||||||||
| 4 | Does not reflect the effect of sales charges, if any. | ||||||||||||||||||||||||||||||||||||||||||||||||||||||||||
| 5 | Total returns would have been lower had certain expenses not been reduced during the applicable periods. | ||||||||||||||||||||||||||||||||||||||||||||||||||||||||||
| 6 | Not annualized. | ||||||||||||||||||||||||||||||||||||||||||||||||||||||||||
| 7 | Annualized. | ||||||||||||||||||||||||||||||||||||||||||||||||||||||||||
| Class I Shares Period ended | 4-30-18 | 1 | 10-31-17 | 2 | ||||||||||||||||||||||||||||||||||||||||||||||
| Per share operating performance | ||||||||||||||||||||||||||||||||||||||||||||||||||
| Net asset value, beginning of period | $13.00 | $10.00 | ||||||||||||||||||||||||||||||||||||||||||||||||
| Net investment income3 | 0.08 | 0.11 | ||||||||||||||||||||||||||||||||||||||||||||||||
| Net realized and unrealized gain (loss) on investments | 0.04 | 2.89 | ||||||||||||||||||||||||||||||||||||||||||||||||
| Total from investment operations | 0.12 | 3.00 | ||||||||||||||||||||||||||||||||||||||||||||||||
| Less distributions | ||||||||||||||||||||||||||||||||||||||||||||||||||
| From net investment income | (0.07 | ) | — | |||||||||||||||||||||||||||||||||||||||||||||||
| From net realized gain | (0.06 | ) | — | |||||||||||||||||||||||||||||||||||||||||||||||
| Total distributions | (0.13 | ) | — | |||||||||||||||||||||||||||||||||||||||||||||||
| Net asset value, end of period | $12.99 | $13.00 | ||||||||||||||||||||||||||||||||||||||||||||||||
| Total return (%)4 | 0.97 | 5 | 30.00 | 5 | ||||||||||||||||||||||||||||||||||||||||||||||
| Ratios and supplemental data | ||||||||||||||||||||||||||||||||||||||||||||||||||
| Net assets, end of period (in millions) | $50 | $48 | ||||||||||||||||||||||||||||||||||||||||||||||||
| Ratios (as a percentage of average net assets): | ||||||||||||||||||||||||||||||||||||||||||||||||||
| Expenses before reductions | 1.41 | 6 | 1.85 | 6 | ||||||||||||||||||||||||||||||||||||||||||||||
| Expenses including reductions | 1.02 | 6 | 1.02 | 6 | ||||||||||||||||||||||||||||||||||||||||||||||
| Net investment income | 1.15 | 6 | 1.07 | 6 | ||||||||||||||||||||||||||||||||||||||||||||||
| Portfolio turnover (%) | 11 | 10 | ||||||||||||||||||||||||||||||||||||||||||||||||
| 1 | Six months ended 4-30-18. Unaudited. | ||||||||||||||||||||||||||||||||||||||||||||||||||||||||||
| 2 | Period from 12-14-16 (commencement of operations) to 10-31-17. | ||||||||||||||||||||||||||||||||||||||||||||||||||||||||||
| 3 | Based on average daily shares outstanding. | ||||||||||||||||||||||||||||||||||||||||||||||||||||||||||
| 4 | Total returns would have been lower had certain expenses not been reduced during the applicable periods. | ||||||||||||||||||||||||||||||||||||||||||||||||||||||||||
| 5 | Not annualized. | ||||||||||||||||||||||||||||||||||||||||||||||||||||||||||
| 6 | Annualized. | ||||||||||||||||||||||||||||||||||||||||||||||||||||||||||
| Class R6 Shares Period ended | 4-30-18 | 1 | 10-31-17 | 2 | ||||||||||||||||||||||||||||||||||||||||||||||
| Per share operating performance | ||||||||||||||||||||||||||||||||||||||||||||||||||
| Net asset value, beginning of period | $13.00 | $10.00 | ||||||||||||||||||||||||||||||||||||||||||||||||
| Net investment income3 | 0.08 | 0.17 | ||||||||||||||||||||||||||||||||||||||||||||||||
| Net realized and unrealized gain on investments | 0.06 | 2.83 | ||||||||||||||||||||||||||||||||||||||||||||||||
| Total from investment operations | 0.14 | 3.00 | ||||||||||||||||||||||||||||||||||||||||||||||||
| Less distributions | ||||||||||||||||||||||||||||||||||||||||||||||||||
| From net investment income | (0.08 | ) | — | |||||||||||||||||||||||||||||||||||||||||||||||
| From net realized gain | (0.06 | ) | — | |||||||||||||||||||||||||||||||||||||||||||||||
| Total distributions | (0.14 | ) | — | |||||||||||||||||||||||||||||||||||||||||||||||
| Net asset value, end of period | $13.00 | $13.00 | ||||||||||||||||||||||||||||||||||||||||||||||||
| Total return (%)4 | 1.13 | 5 | 30.00 | 5 | ||||||||||||||||||||||||||||||||||||||||||||||
| Ratios and supplemental data | ||||||||||||||||||||||||||||||||||||||||||||||||||
| Net assets, end of period (in millions) | $2 | $2 | ||||||||||||||||||||||||||||||||||||||||||||||||
| Ratios (as a percentage of average net assets): | ||||||||||||||||||||||||||||||||||||||||||||||||||
| Expenses before reductions | 1.31 | 6 | 1.75 | 6 | ||||||||||||||||||||||||||||||||||||||||||||||
| Expenses including reductions | 0.92 | 6 | 0.93 | 6 | ||||||||||||||||||||||||||||||||||||||||||||||
| Net investment income | 1.23 | 6 | 1.64 | 6 | ||||||||||||||||||||||||||||||||||||||||||||||
| Portfolio turnover (%) | 11 | 10 | ||||||||||||||||||||||||||||||||||||||||||||||||
| 1 | Six months ended 4-30-18. Unaudited. | ||||||||||||||||||||||||||||||||||||||||||||||||||||||||||
| 2 | Period from 12-14-16 (commencement of operations) to 10-31-17. | ||||||||||||||||||||||||||||||||||||||||||||||||||||||||||
| 3 | Based on average daily shares outstanding. | ||||||||||||||||||||||||||||||||||||||||||||||||||||||||||
| 4 | Total returns would have been lower had certain expenses not been reduced during the applicable periods. | ||||||||||||||||||||||||||||||||||||||||||||||||||||||||||
| 5 | Not annualized. | ||||||||||||||||||||||||||||||||||||||||||||||||||||||||||
| 6 | Annualized. | ||||||||||||||||||||||||||||||||||||||||||||||||||||||||||
Note 1 — Organization
John Hancock ESG International Equity Fund (the fund) is a series of John Hancock Investment Trust (the Trust), an open-end management investment company organized as a Massachusetts business trust and registered under the Investment Company Act of 1940, as amended (the 1940 Act). The investment objective of the fund is to seek long-term capital appreciation.
The fund may offer multiple classes of shares. The shares currently offered by the fund are detailed in the Statement of assets and liabilities. Class A shares are offered to all investors. Class I shares are offered to institutions and certain investors. Class R6 shares are only available to certain retirement plans, institutions and other investors. Shareholders of each class have exclusive voting rights to matters that affect that class. The distribution and service fees, if any, and transfer agent fees for each class may differ.
Note 2 — Significant accounting policies
The financial statements have been prepared in conformity with accounting principles generally accepted in the United States of America (US GAAP), which require management to make certain estimates and assumptions as of the date of the financial statements. Actual results could differ from those estimates and those differences could be significant. The fund qualifies as an investment company under Topic 946 of Accounting Standards Codification of US GAAP.
Events or transactions occurring after the end of the fiscal period through the date that the financial statements were issued have been evaluated in the preparation of the financial statements. The following summarizes the significant accounting policies of the fund:
Security valuation. Investments are stated at value as of the scheduled close of regular trading on the New York Stock Exchange (NYSE), normally at 4:00 p.m., Eastern Time. In case of emergency or other disruption resulting in the NYSE not opening for trading or the NYSE closing at a time other than the regularly scheduled close, the net asset value (NAV) may be determined as of the regularly scheduled close of the NYSE pursuant to the fund's Valuation Policies and Procedures.
In order to value the securities, the fund uses the following valuation techniques: Equity securities held by the fund are typically valued at the last sale price or official closing price on the exchange or principal market where the security trades. In the event there were no sales during the day or closing prices are not available, the securities are valued using the last available bid price. Foreign securities are valued in U.S. dollars based on foreign currency exchange rates supplied by an independent pricing vendor.
In certain instances, the Pricing Committee may determine to value equity securities using prices obtained from another exchange or market if trading on the exchange or market on which prices are typically obtained did not open for trading as scheduled, or if trading closed earlier than scheduled, and trading occurred as normal on another exchange or market.
Other portfolio securities and assets, for which reliable market quotations are not readily available, are valued at fair value as determined in good faith by the fund's Pricing Committee following procedures established by the Board of Trustees. The frequency with which these fair valuation procedures are used cannot be predicted and fair value of securities may differ significantly from the value that would have been used had a ready market for such securities existed. Trading in foreign securities may be completed before the scheduled daily close of trading on the NYSE. Significant events at the issuer or market level may affect the values of securities between the time when the valuation of the securities is generally determined and the close of the NYSE. If a significant event occurs, these securities may be fair valued, as determined in good faith by the fund's Pricing Committee, following procedures established by the Board of Trustees. The fund uses fair value adjustment factors provided by an independent pricing vendor to value certain foreign securities in order to adjust for events that may occur between the close of foreign exchanges or markets and the close of the NYSE.
The fund uses a three-tier hierarchy to prioritize the pricing assumptions, referred to as inputs, used in valuation techniques to measure fair value. Level 1 includes securities valued using quoted prices in active markets for identical securities. Level 2 includes securities valued using other significant observable inputs. Observable inputs may include quoted prices for similar securities, interest rates, prepayment speeds and credit risk. Prices for securities valued using these inputs are received from
independent pricing vendors and brokers and are based on an evaluation of the inputs described. Level 3 includes securities valued using significant unobservable inputs when market prices are not readily available or reliable, including the fund's own assumptions in determining the fair value of investments. Factors used in determining value may include market or issuer specific events or trends, changes in interest rates and credit quality. The inputs or methodology used for valuing securities are not necessarily an indication of the risks associated with investing in those securities. Changes in valuation techniques and related inputs may result in transfers into or out of an assigned level within the disclosure hierarchy.
The following is a summary of the values by input classification of the fund's investments as of April 30, 2018, by major security category or type:
| Total value at 4-30-18 | Level 1 quoted price | Level 2 significant observable inputs | Level 3 significant unobservable inputs | ||
| Investments in securities: | |||||
| Assets | |||||
| Common stocks | |||||
| Australia | $1,856,667 | — | $1,856,667 | — | |
| Belgium | 1,003,079 | — | 1,003,079 | — | |
| Brazil | 903,040 | $903,040 | — | — | |
| Canada | 898,517 | 898,517 | — | — | |
| Chile | 1,119,756 | 1,119,756 | — | — | |
| China | 4,280,362 | 1,828,161 | 2,452,201 | — | |
| Denmark | 2,399,817 | — | 2,399,817 | — | |
| Finland | 739,566 | — | 739,566 | — | |
| France | 3,081,504 | — | 3,081,504 | — | |
| Germany | 3,488,681 | — | 3,488,681 | — | |
| Hong Kong | 2,171,526 | — | 2,171,526 | — | |
| India | 990,196 | 990,196 | — | — | |
| Indonesia | 1,561,323 | — | 1,561,323 | — | |
| Israel | 651,925 | 651,925 | — | — | |
| Japan | 8,420,548 | — | 8,420,548 | — | |
| Mexico | 721,070 | 721,070 | — | — | |
| Netherlands | 1,975,601 | — | 1,975,601 | — | |
| Norway | 718,210 | — | 718,210 | — | |
| Russia | 751,267 | 751,267 | — | — | |
| Singapore | 655,455 | — | 655,455 | — | |
| South Africa | 1,310,673 | — | 1,310,673 | — | |
| South Korea | 2,968,778 | — | 2,968,778 | — | |
| Spain | 1,518,761 | — | 1,518,761 | — | |
| Sweden | 2,033,349 | — | 2,033,349 | — | |
| Switzerland | 3,904,358 | — | 3,904,358 | — | |
| Taiwan | 906,651 | 906,651 | — | — | |
| Thailand | 899,024 | — | 899,024 | — | |
| United Kingdom | 5,105,933 | — | 5,105,933 | — | |
| Preferred securities | 583,318 | — | 583,318 | — | |
| Total investments in securities | $57,618,955 | $8,770,583 | $48,848,372 | — | |
Security transactions and related investment income. Investment security transactions are accounted for on a trade date plus one basis for daily NAV calculations. However, for financial reporting purposes, investment transactions are
reported on trade date. Interest income is accrued as earned. Dividend income is recorded on the ex-date, except for dividends of foreign securities where the dividend may not be known until after the ex-date. In those cases, dividend income, net of withholding taxes, is recorded when the fund becomes aware of the dividends. Gains and losses on securities sold are determined on the basis of identified cost and may include proceeds from litigation.
Foreign investing. Assets, including investments and liabilities denominated in foreign currencies, are translated into U.S. dollar values each day at the prevailing exchange rate. Purchases and sales of securities, income and expenses are translated into U.S. dollars at the prevailing exchange rate on the date of the transaction. The effect of changes in foreign currency exchange rates on the value of securities is reflected as a component of the realized and unrealized gains (losses) on investments. Foreign investments are subject to a decline in the value of a foreign currency versus the U.S. dollar, which reduces the dollar value of securities denominated in that currency.
Funds that invest internationally generally carry more risk than funds that invest strictly in U.S. securities. Risks can result from differences in economic and political conditions, regulations, market practices (including higher transaction costs), accounting standards and other factors.
Foreign taxes. The fund may be subject to withholding tax on income, capital gains or repatriation taxes imposed by certain countries, a portion of which may be recoverable. Foreign taxes are accrued based upon the fund's understanding of the tax rules and rates that exist in the foreign markets in which it invests. Taxes are accrued based on gains realized by the fund as a result of certain foreign security sales. Estimated taxes are accrued based on unrealized appreciation of such securities. Investment income is recorded net of foreign withholding taxes, less any amounts reclaimable.
Line of credit. The fund may have the ability to borrow from banks for temporary or emergency purposes, including meeting redemption requests that otherwise might require the untimely sale of securities. Pursuant to the fund's custodian agreement, the custodian may loan money to the fund to make properly authorized payments. The fund is obligated to repay the custodian for any overdraft, including any related costs or expenses. The custodian may have a lien, security interest or security entitlement in any fund property that is not otherwise segregated or pledged, to the extent of any overdraft, and to the maximum extent permitted by law.
The fund and other affiliated funds have entered into a syndicated line of credit agreement with Citibank, N.A. as the administrative agent that enables them to participate in a $750 million unsecured committed line of credit. Excluding commitments designated for a certain fund and subject to the needs of all other affiliated funds, the fund can borrow up to an aggregate commitment amount of $500 million, subject to asset coverage and other limitations as specified in the agreement. A commitment fee payable at the end of each calendar quarter, based on the average daily unused portion of the line of credit, is charged to each participating fund based on a combination of fixed and asset based allocations and is reflected in Other expenses on the Statement of operations. For the six months ended April 30, 2018, the fund had no borrowings under the line of credit. Commitment fees for the six months ended April 30, 2018 were $1,068.
Expenses. Within the John Hancock group of funds complex, expenses that are directly attributable to an individual fund are allocated to such fund. Expenses that are not readily attributable to a specific fund are allocated among all funds in an equitable manner, taking into consideration, among other things, the nature and type of expense and the fund's relative net assets. Expense estimates are accrued in the period to which they relate and adjustments are made when actual amounts are known.
Class allocations. Income, common expenses and realized and unrealized gains (losses) are determined at the fund level and allocated daily to each class of shares based on the net assets of the class. Class-specific expenses, such as distribution and service fees, if any, and transfer agent fees, for all classes, are charged daily at the class level based on the net assets of each class and the specific expense rates applicable to each class.
Federal income taxes. The fund intends to continue to qualify as a regulated investment company by complying with the applicable provisions of the Internal Revenue Code and will not be subject to federal income tax on taxable income that is distributed to shareholders. Therefore, no federal income tax provision is required.
As of October 31, 2017, the fund had no uncertain tax positions that would require financial statement recognition, derecognition or disclosure. The fund's federal tax returns are subject to examination by the Internal Revenue Service for a period of three years.
Distribution of income and gains. Distributions to shareholders from net investment income and net realized gains, if any, are recorded on the ex-date. The fund generally declares and pays dividends and capital gain distributions, if any, at least annually.
Distributions paid by the fund with respect to each class of shares are calculated in the same manner, at the same time and in the same amount, except for the effect of class level expenses that may be applied differently to each class.
Such distributions, on a tax basis, are determined in conformity with income tax regulations, which may differ from US GAAP. Distributions in excess of tax basis earnings and profits, if any, are reported in the fund's financial statements as a return of capital. The final determination of tax characteristics of the fund's distribution will occur at the end of the year and will subsequently be reported to shareholders.
Capital accounts within the financial statements are adjusted for permanent book-tax differences. These adjustments have no impact on net assets or the results of operations. Temporary book-tax differences, if any, will reverse in a subsequent period. Book-tax differences are primarily attributable to foreign currency transactions and investments in passive foreign investment companies.
Note 3 — Guarantees and indemnifications
Under the Trust's organizational documents, its Officers and Trustees are indemnified against certain liabilities arising out of the performance of their duties to the Trust, including the fund. Additionally, in the normal course of business, the fund enters into contracts with service providers that contain general indemnification clauses. The fund's maximum exposure under these arrangements is unknown, as this would involve future claims that may be made against the fund that have not yet occurred. The risk of material loss from such claims is considered remote.
Note 4 — Fees and transactions with affiliates
John Hancock Advisers, LLC (the Advisor) serves as investment advisor for the fund. John Hancock Funds, LLC (the Distributor), an affiliate of the Advisor, serves as principal underwriter of the fund. The Advisor and the Distributor are indirect, wholly owned subsidiaries of Manulife Financial Corporation (MFC).
Management fee. The fund has an investment management agreement with the Advisor under which the fund pays a daily management fee to the Advisor equivalent on an annual basis to the sum of: a) 0.850% of the first $250 million of the fund's average daily net assets; b) 0.800% of the next $500 million of the fund's average daily net assets; and c) 0.750% of the fund's average daily net assets in excess of $750 million. The Advisor has a subadvisory agreement with Boston Common Asset Management, LLC. The fund is not responsible for payment of the subadvisory fees.
The Advisor has contractually agreed to waive a portion of its management fee and/or reimburse expenses for certain funds of the John Hancock group of funds complex, including the fund (the participating portfolios). This waiver is based upon aggregate net assets of all the participating portfolios. The amount of the reimbursement is calculated daily and allocated among all the participating portfolios in proportion to the daily net assets of each fund. During the six months ended April 30, 2018, this waiver amounted to 0.01% of the fund's average net assets (on an annualized basis). This arrangement may be amended or terminated at any time by the Advisor upon notice to the fund and with the approval of the Board of Trustees.
The Advisor has contractually agreed to reduce its management fee or, if necessary, make payment to the fund in an amount equal to the amount by which expenses of the fund exceed 0.91% of average net assets of the fund on an annualized basis. For purposes of this agreement, "expenses of the fund" means all fund expenses, excluding taxes, brokerage commissions, interest expense, litigation and indemnification expenses and other extraordinary expenses not incurred in the ordinary course of the fund's business, class-specific expenses, borrowing costs, prime brokerage fees, acquired fund fees and expenses paid indirectly, and short dividend expense. This agreement expires on February 28, 2019, unless renewed by
mutual agreement of the Advisor and the fund based upon a determination that this is appropriate under the circumstances at that time.
For the six months ended April 30, 2018, the expense reductions described above amounted to the following:
| Class | Expense reduction | Class | Expense reduction | |
| Class A | $13,234 | Class R6 | $3,814 | |
| Class I | 94,474 | Total | $111,522 |
Expenses waived or reimbursed in the current fiscal period are not subject to recapture in future fiscal periods.
The investment management fees, including the impact of the waivers and reimbursements as described above, incurred for the six months ended April 30, 2018 were equivalent to a net annual effective rate of 0.46% of the fund's average daily net assets.
Accounting and legal services. Pursuant to a service agreement, the fund reimburses the Advisor for all expenses associated with providing the administrative, financial, legal, compliance, accounting and recordkeeping services to the fund, including the preparation of all tax returns, periodic reports to shareholders and regulatory reports, among other services. These expenses are allocated to each share class based on its relative net assets at the time the expense was incurred. These accounting and legal services fees incurred for the six months ended April 30, 2018 amounted to an annual rate of 0.02% of the fund's average daily net assets.
Distribution and service plans. The fund has a distribution agreement with the Distributor. The fund has adopted distribution and service plans with respect to Class A shares pursuant to Rule 12b-1 under the 1940 Act, to pay the Distributor for services provided as the distributor of shares of the fund. The fund may pay up to the following contractual rates of distribution and service fees under these arrangements, expressed as an annual percentage of average daily net assets for each class of the fund's shares:
| Class | Rule 12b-1 fee |
| Class A | 0.25% |
Sales charges. Class A shares are assessed up-front sales charges, which resulted in payments to the Distributor amounting to $12,299 for the six months ended April 30, 2018. Of this amount, $1,962 was retained and used for printing prospectuses, advertising, sales literature and other purposes, $10,074 was paid as sales commissions to broker-dealers and $263 was paid as sales commissions to sales personnel of Signator Investors, Inc., a broker-dealer affiliate of the Advisor.
Class A shares may be subject to contingent deferred sales charges (CDSCs). Certain Class A shares that are acquired through purchases of $1 million or more and are redeemed within one year of purchase are subject to a 1.00% sales charge. CDSCs are applied to the lesser of the current market value at the time of redemption or the original purchase cost of the shares being redeemed. Proceeds from CDSCs are used to compensate the Distributor for providing distribution-related services in connection with the sale of these shares. During the six months ended April 30, 2018, there were no CDSCs received by the Distributor for Class A shares.
Transfer agent fees. The John Hancock Group of Funds has a complex-wide transfer agent agreement with John Hancock Signature Services, Inc. (Signature Services), an affiliate of the Advisor. The transfer agent fees paid to Signature Services are determined based on the cost to Signature Services (Signature Services Cost) of providing recordkeeping services. It also includes out-of-pocket expenses, including payments made to third-parties for recordkeeping services provided to their clients who invest in one or more John Hancock funds. In addition, Signature Services Cost may be reduced by certain fees that Signature Services receives in connection with retirement and small accounts. Signature Services Cost is calculated monthly and allocated, as applicable, to five categories of share classes: Retail Share and Institutional Share Classes of Non-Municipal Bond Funds, Class R6 Shares, Retirement Share Classes and Municipal Bond Share Classes. Within each of these categories, the applicable costs are allocated to the affected John Hancock affiliated funds and/or classes, based on the relative average daily net assets.
Class level expenses. Class level expenses for the six months ended April 30, 2018 were:
| Class | Distribution and service fees | Transfer agent fees |
| Class A | $8,583 | $3,720 |
| Class I | — | 26,957 |
| Class R6 | — | 119 |
| Total | $8,583 | $30,796 |
Trustee expenses. The fund compensates each Trustee who is not an employee of the Advisor or its affiliates. The costs of paying Trustee compensation and expenses are allocated to the fund based on its net assets relative to other funds within the John Hancock group of funds complex.
Note 5 — Fund share transactions
Transactions in fund shares for the six months ended April 30, 2018 and for the period ended October 31, 2017 were as follows:
| Six months ended 4-30-18 | Period ended 10-31-171 | |||||||||||||||||||||||||
| Shares | Amount | Shares | Amount | |||||||||||||||||||||||
| Class A shares | ||||||||||||||||||||||||||
| Sold | 68,523 | $900,772 | 501,175 | $5,119,516 | ||||||||||||||||||||||
| Distributions reinvested | 481 | 6,131 | — | — | ||||||||||||||||||||||
| Repurchased | (12,016 | ) | (161,614 | ) | (4,121 | ) | (50,577 | ) | ||||||||||||||||||
| Net increase | 56,988 | $745,289 | 497,054 | $5,068,939 | ||||||||||||||||||||||
| Class I shares | ||||||||||||||||||||||||||
| Sold | 199,369 | $2,623,857 | 3,674,537 | $43,178,473 | ||||||||||||||||||||||
| Distributions reinvested | 7,150 | 91,161 | — | — | ||||||||||||||||||||||
| Repurchased | (37,769 | ) | (498,929 | ) | (8,688 | ) | (110,175 | ) | ||||||||||||||||||
| Net increase | 168,750 | $2,216,089 | 3,665,849 | $43,068,298 | ||||||||||||||||||||||
| Class R6 shares | ||||||||||||||||||||||||||
| Sold | 925 | $12,304 | 150,365 | $1,504,310 | ||||||||||||||||||||||
| Distributions reinvested | 4 | 49 | — | — | ||||||||||||||||||||||
| Repurchased | (341 | ) | (4,514 | ) | (23 | ) | (250 | ) | ||||||||||||||||||
| Net increase | 588 | $7,839 | 150,342 | $1,504,060 | ||||||||||||||||||||||
| Total net increase | 226,326 | $2,969,217 | 4,313,245 | $49,641,297 | ||||||||||||||||||||||
1Period from 12-14-16 (commencement of operations) to 10-31-17.
Affiliates of the fund owned 81%, 78% and 99% of shares of Class A, Class I and Class R6, respectively, on April 30, 2018. Such concentration of shareholders' capital could have a material effect on the fund if such shareholders redeem from the fund.
Note 6 — Purchase and sale of securities
Purchases and sales of securities, other than short-term investments, amounted to $8,893,477 and $5,997,079, respectively, for the six months ended April 30, 2018.
Trustees Hassell H. McClellan, Chairperson Officers Andrew G. Arnott John J. Danello Francis V. Knox, Jr. Charles A. Rizzo Salvatore Schiavone | Investment advisor John Hancock Advisers, LLC Subadvisor Boston Common Asset Management, LLC Principal distributor John Hancock Funds, LLC Custodian Citibank, N.A. Transfer agent John Hancock Signature Services, Inc. Legal counsel K&L Gates LLP |
*Member of the Audit Committee
†Non-Independent Trustee
#Effective 6-20-17
The fund's proxy voting policies and procedures, as well as the fund proxy voting record for the most recent twelve-month period ended June 30, are available free of charge on the Securities and Exchange Commission (SEC) website at sec.gov or on our website.
The fund's complete list of portfolio holdings, for the first and third fiscal quarters, is filed with the SEC on Form N-Q. The fund's Form N-Q is available on our website and the SEC's website, sec.gov, and can be reviewed and copied (for a fee) at the SEC's Public Reference Room in Washington, DC. Call 800-SEC-0330 to receive information on the operation of the SEC's Public Reference Room.
We make this information on your fund, as well as monthly portfolio holdings, and other fund details available on our website at jhinvestments.com or by calling 800-225-5291.
| You can also contact us: | |||
| 800-225-5291 jhinvestments.com | Regular mail: John Hancock Signature Services, Inc. | Express mail: John Hancock Signature Services, Inc. | |
John Hancock family of funds
DOMESTIC EQUITY FUNDS Balanced Blue Chip Growth Classic Value Disciplined Value Disciplined Value Mid Cap Equity Income Fundamental All Cap Core Fundamental Large Cap Core Fundamental Large Cap Value New Opportunities Small Cap Core Small Cap Growth Small Cap Value Strategic Growth U.S. Global Leaders Growth U.S. Growth Value Equity GLOBAL AND INTERNATIONAL EQUITY FUNDS Disciplined Value International Emerging Markets Emerging Markets Equity Fundamental Global Franchise Global Equity Global Shareholder Yield Greater China Opportunities International Growth International Small Company International Value Equity | INCOME FUNDS Bond California Tax-Free Income Emerging Markets Debt Floating Rate Income Government Income High Yield High Yield Municipal Bond Income Investment Grade Bond Money Market Short Duration Credit Opportunities Spectrum Income Strategic Income Opportunities Tax-Free Bond ALTERNATIVE AND SPECIALTY FUNDS Absolute Return Currency Alternative Asset Allocation Enduring Assets Financial Industries Global Absolute Return Strategies Global Conservative Absolute Return Global Focused Strategies Natural Resources Redwood Regional Bank Seaport Long/Short Technical Opportunities |
A fund's investment objectives, risks, charges, and expenses should be considered carefully before investing. The prospectus contains this and other important information about the fund. To obtain a prospectus, contact your financial professional, call John Hancock Investments at 800-225-5291, or visit our website at jhinvestments.com. Please read the prospectus carefully before investing or sending money.
ASSET ALLOCATION Income Allocation Multi-Index Lifetime Portfolios Multi-Index Preservation Portfolios Multimanager Lifestyle Portfolios Multimanager Lifetime Portfolios Retirement Income 2040 EXCHANGE-TRADED FUNDS John Hancock Multifactor Consumer Discretionary ETF John Hancock Multifactor Consumer Staples ETF John Hancock Multifactor Developed International ETF John Hancock Multifactor Energy ETF John Hancock Multifactor Financials ETF John Hancock Multifactor Healthcare ETF John Hancock Multifactor Industrials ETF John Hancock Multifactor Large Cap ETF John Hancock Multifactor Materials ETF John Hancock Multifactor Mid Cap ETF John Hancock Multifactor Small Cap ETF John Hancock Multifactor Technology ETF John Hancock Multifactor Utilities ETF | ENVIRONMENTAL, SOCIAL, AND GOVERNANCE FUNDS ESG All Cap Core ESG Core Bond ESG International Equity ESG Large Cap Core CLOSED-END FUNDS Financial Opportunities Hedged Equity & Income Income Securities Trust Investors Trust Preferred Income Preferred Income II Preferred Income III Premium Dividend Tax-Advantaged Dividend Income Tax-Advantaged Global Shareholder Yield |
John Hancock Multifactor ETF shares are bought and sold at market price (not NAV), and are not individually redeemed
from the fund. Brokerage commissions will reduce returns.
John Hancock ETFs are distributed by Foreside Fund Services, LLC, and are subadvised by Dimensional Fund Advisors LP.
Foreside is not affiliated with John Hancock Funds, LLC or Dimensional Fund Advisors LP.
Dimensional Fund Advisors LP receives compensation from John Hancock in connection with licensing rights to the
John Hancock Dimensional indexes. Dimensional Fund Advisors LP does not sponsor, endorse, or sell, and makes no
representation as to the advisability of investing in, John Hancock Multifactor ETFs.
John Hancock Investments
A trusted brand
John Hancock Investments is a premier asset manager representing one of
America's most trusted brands, with a heritage of financial stewardship dating
back to 1862. Helping our shareholders pursue their financial goals is at the
core of everything we do. It's why we support the role of professional financial
advice and operate with the highest standards of conduct and integrity.
A better way to invest
We serve investors globally through a unique multimanager approach:
We search the world to find proven portfolio teams with specialized
expertise for every strategy we offer, then we apply robust investment
oversight to ensure they continue to meet our uncompromising standards
and serve the best interests of our shareholders.
Results for investors
Our unique approach to asset management enables us to provide a diverse set
of investments backed by some of the world's best managers, along with strong
risk-adjusted returns across asset classes.
| | John Hancock Funds, LLC n Member FINRA, SIPC 601 Congress Street n Boston, MA 02210-2805 800-225-5291 n jhinvestments.com | |
| This report is for the information of the shareholders of John Hancock ESG International Equity Fund. It is not authorized for distribution to prospective investors unless preceded or accompanied by a prospectus. | ||
| MF450362 | 469SA 4/18 6/18 | |
ITEM 2. CODE OF ETHICS.
Not applicable at this time.
ITEM 3. AUDIT COMMITTEE FINANCIAL EXPERT.
Not applicable at this time.
ITEM 4. PRINCIPAL ACCOUNTANT FEES AND SERVICES.
Not applicable at this time.
ITEM 5. AUDIT COMMITTEE OF LISTED REGISTRANTS.
Not applicable at this time.
ITEM 6. SCHEDULE OF INVESTMENTS.
(a) Not applicable.
(b) Not applicable.
ITEM 7. DISCLOSURE OF PROXY VOTING POLICIES AND PROCEDURES FOR CLOSED-END MANAGEMENT INVESTMENT COMPANIES.
Not applicable.
ITEM 8. PORTFOLIO MANAGERS OF CLOSED-END MANAGEMENT INVESTMENT COMPANIES.
Not applicable.
ITEM 9. PURCHASES OF EQUITY SECURITIES BY CLOSED-END MANAGEMENT INVESTMENT COMPANY AND AFFILIATED PURCHASERS.
Not applicable.
ITEM 10. SUBMISSION OF MATTERS TO A VOTE OF SECURITY HOLDERS.
The registrant has adopted procedures by which shareholders may recommend nominees to the registrant's Board of Trustees. A copy of the procedures is filed as an exhibit to this Form N-CSR. See attached “John Hancock Funds – Nominating, Governance and Administration Committee Charter.”
ITEM 11. CONTROLS AND PROCEDURES.
(a) Based upon their evaluation of the registrant's disclosure controls and procedures as conducted within 90 days of the filing date of this Form N-CSR, the registrant's principal executive officer and principal financial officer have concluded that those disclosure controls and procedures provide reasonable assurance that the material information required to be disclosed by the registrant on this report is recorded, processed, summarized and reported within the time periods specified in the Securities and Exchange Commission's rules and forms.
(b) There were no changes in the registrant's internal control over financial reporting that occurred during the second fiscal quarter of the period covered by this report that have materially affected, or are reasonably likely to materially affect, the registrant's internal control over financial reporting.
ITEM 12. DISCLOSURE OF SECURITIES LENDING ACTIVITIES FOR CLOSED-END MANAGEMENT INVESTMENT COMPANIES.: Not applicable.
ITEM 13. EXHIBITS.
(a) Separate certifications for the registrant's principal executive officer and principal financial officer, as required by Section 302 of the Sarbanes-Oxley Act of 2002 and Rule 30a-2(a) under the Investment Company Act of 1940, are attached.
(b) Separate certifications for the registrant's principal executive officer and principal financial officer, as required by 18 U.S.C. Section 1350, as adopted pursuant to Section 906 of the Sarbanes-Oxley Act of 2002, and Rule 30a-2(b) under the Investment Company Act of 1940, are attached. The certifications furnished pursuant to this paragraph are not deemed to be "filed" for purposes of Section 18 of the Securities Exchange Act of 1934, or otherwise subject to the liability of that section. Such certifications are not deemed to be incorporated by reference into any filing under the Securities Act of 1933 or the Securities Exchange Act of 1934, except to the extent that the Registrant specifically incorporates them by reference.
(c)(1) Submission of Matters to a Vote of Security Holders is attached. See attached “John Hancock Funds – Nominating, Governance and Administration Committee Charter.”
SIGNATURES
Pursuant to the requirements of the Securities Exchange Act of 1934 and the Investment Company Act of 1940, the registrant has duly caused this report to be signed on its behalf by the undersigned, thereunto duly authorized.
John Hancock Investment Trust
| By: | /s/ Andrew Arnott |
| Andrew Arnott | |
| President | |
| Date: | June 15, 2018 |
Pursuant to the requirements of the Securities Exchange Act of 1934 and the Investment Company Act of 1940, this report has been signed below by the following persons on behalf of the registrant and in the capacities and on the dates indicated.
| By: | /s/ Andrew Arnott |
| Andrew Arnott President | |
| Date: | June 15, 2018 |
| By: | /s/ Charles A. Rizzo |
| Charles A. Rizzo Chief Financial Officer | |
| Date: | June 15, 2018 |