UNITED STATES
SECURITIES AND EXCHANGE COMMISSION
Washington, D.C. 20549
FORM N-CSR
CERTIFIED SHAREHOLDER REPORT OF REGISTERED
MANAGEMENT INVESTMENT COMPANIES
Investment Company Act file number 811-0560
John Hancock Investment Trust
(Exact name of registrant as specified in charter)
601 Congress Street, Boston, Massachusetts 02210
(Address of principal executive offices) (Zip code)
Salvatore Schiavone
Treasurer
601 Congress Street
Boston, Massachusetts 02210
(Name and address of agent for service)
Registrant's telephone number, including area code: 617-663-4497
| Date of fiscal year end: | March 31 | |
| Date of reporting period: | September 30, 2018 |
ITEM 1. REPORTS TO STOCKHOLDERS.
John Hancock
Diversified Real Assets Fund
Semiannual report 9/30/18

John Hancock
Diversified Real Assets Fund
INVESTMENT OBJECTIVE
The fund seeks a long-term total return in excess of inflation.
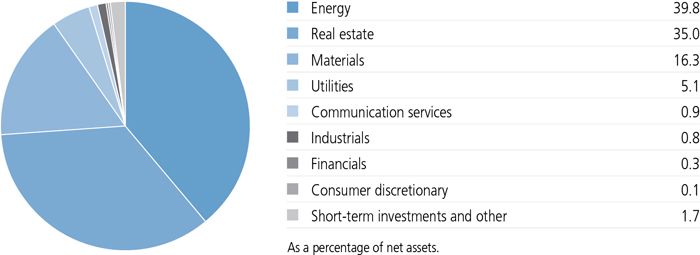
SECTOR COMPOSITION AS OF 9/30/18 (%)
A note about risks
The fund may be subject to various risks as described in the fund's prospectus. For more information, please refer to the "Principal risks" section of the prospectus.
COUNTRY COMPOSITION AS OF 9/30/18 (%)
| United States | 57.0 |
| Canada | 16.1 |
| United Kingdom | 4.7 |
| Australia | 3.6 |
| France | 2.6 |
| Netherlands | 2.5 |
| Japan | 2.5 |
| Hong Kong | 2.2 |
| Germany | 1.3 |
| Sweden | 1.3 |
| Other countries | 6.2 |
| TOTAL | 100.0 |
| As a percentage of net assets. |
TOP 10 HOLDINGS AS OF 9/30/18 (%)
| Royal Dutch Shell PLC, A Shares | 2.5 |
| Simon Property Group, Inc. | 2.0 |
| Prologis, Inc. | 1.9 |
| Chevron Corp. | 1.9 |
| Exxon Mobil Corp. | 1.6 |
| BP PLC | 1.5 |
| Equity Residential | 1.4 |
| Suncor Energy, Inc. | 1.4 |
| Equinix, Inc. | 1.4 |
| BHP Billiton, Ltd., ADR | 1.3 |
| TOTAL | 16.9 |
| As a percentage of net assets. | |
| Cash and cash equivalents are not included. | |
| Your expenses |

| SEMIANNUAL REPORT | JOHN HANCOCK DIVERSIFIED REAL ASSETS FUND | 4 |
| Account value on 4-1-2018 | Ending value on 9-30-2018 | Expenses paid during period ended 9-30-20181 | Annualized expense ratio | ||
| Class NAV | Actual expenses/actual returns | $1,000.00 | $1,049.00 | $4.52 | 0.88% |
| Hypothetical example | 1,000.00 | 1,020.70 | 4.46 | 0.88% |
| 1 | Expenses are equal to the annualized expense ratio, multiplied by the average account value over the period, multiplied by 183/365 (to reflect the one-half year period). |
| 5 | JOHN HANCOCK DIVERSIFIED REAL ASSETS FUND | SEMIANNUAL REPORT |
| Fund’s investments |
| Shares | Value | ||||
| Common stocks 98.3% | $1,051,805,877 | ||||
| (Cost $1,030,280,106) | |||||
| Communication services 0.9% | 9,762,501 | ||||
| Diversified telecommunication services 0.3% | |||||
| BT Group PLC | 782,228 | 2,296,122 | |||
| China Tower Corp., Ltd., H Shares (A)(B) | 7,770,000 | 1,131,503 | |||
| Media 0.3% | |||||
| Comcast Corp., Class A | 84,326 | 2,985,984 | |||
| Wireless telecommunication services 0.3% | |||||
| NTT DOCOMO, Inc. | 124,598 | 3,348,892 | |||
| Consumer discretionary 0.1% | 866,168 | ||||
| Hotels, restaurants and leisure 0.1% | |||||
| Extended Stay America, Inc. | 42,816 | 866,168 | |||
| Energy 39.8% | 425,484,687 | ||||
| Energy equipment and services 3.4% | |||||
| Calfrac Well Services, Ltd. (B) | 145,317 | 487,146 | |||
| Halliburton Company | 204,717 | 8,297,180 | |||
| Helmerich & Payne, Inc. | 24,727 | 1,700,476 | |||
| Patterson-UTI Energy, Inc. | 280,585 | 4,800,809 | |||
| Precision Drilling Corp. (B) | 555,652 | 1,918,637 | |||
| Rowan Companies PLC, Class A (B) | 143,207 | 2,696,588 | |||
| RPC, Inc. (C) | 118,662 | 1,836,888 | |||
| Schlumberger, Ltd. | 124,351 | 7,575,463 | |||
| TechnipFMC PLC | 172,656 | 5,395,500 | |||
| Transocean, Ltd. (B) | 62,236 | 868,192 | |||
| Trican Well Service, Ltd. (B) | 576,403 | 1,030,845 | |||
| Oil, gas and consumable fuels 36.4% | |||||
| Abraxas Petroleum Corp. (B) | 208,569 | 485,966 | |||
| Advantage Oil & Gas, Ltd. (B) | 673,153 | 1,876,167 | |||
| Anadarko Petroleum Corp. | 132,804 | 8,952,318 | |||
| Andeavor | 35,706 | 5,480,871 | |||
| Apache Corp. | 78,928 | 3,762,498 | |||
| ARC Resources, Ltd. | 160,220 | 1,786,218 | |||
| BP PLC | 2,075,245 | 15,906,308 | |||
| Cabot Oil & Gas Corp. | 222,788 | 5,017,186 | |||
| Callon Petroleum Company (B) | 211,255 | 2,532,947 | |||
| Cameco Corp. | 206,700 | 2,357,211 | |||
| Canadian Natural Resources, Ltd. | 258,376 | 8,441,503 | |||
| Cenovus Energy, Inc. | 673,536 | 6,763,258 | |||
| Cheniere Energy, Inc. (B) | 19,205 | 1,334,555 | |||
| Chevron Corp. | 166,431 | 20,351,183 | |||
| Cimarex Energy Company | 77,570 | 7,209,356 | |||
| SEE NOTES TO FINANCIAL STATEMENTS | SEMIANNUAL REPORT | JOHN HANCOCK DIVERSIFIED REAL ASSETS FUND | 6 |
| Shares | Value | ||||
| Energy (continued) | |||||
| Oil, gas and consumable fuels (continued) | |||||
| Concho Resources, Inc. (B) | 89,977 | $13,743,987 | |||
| ConocoPhillips | 132,909 | 10,287,157 | |||
| Continental Resources, Inc. (B) | 138,484 | 9,455,688 | |||
| Devon Energy Corp. | 265,858 | 10,618,369 | |||
| DHT Holdings, Inc. | 175,271 | 823,774 | |||
| Diamondback Energy, Inc. (C) | 65,667 | 8,877,522 | |||
| Encana Corp. | 534,879 | 7,010,801 | |||
| Enerplus Corp. | 281,049 | 3,470,547 | |||
| EOG Resources, Inc. | 100,505 | 12,821,423 | |||
| EQT Corp. | 98,839 | 4,371,649 | |||
| Equinor ASA | 360,864 | 10,146,149 | |||
| Exxon Mobil Corp. | 197,060 | 16,754,041 | |||
| Galp Energia SGPS SA | 451,650 | 8,955,236 | |||
| Hess Corp. | 77,886 | 5,575,080 | |||
| Hurricane Energy PLC (B) | 798,568 | 607,881 | |||
| Husky Energy, Inc. | 492,030 | 8,639,523 | |||
| Kelt Exploration, Ltd. (B) | 340,305 | 2,215,743 | |||
| Keyera Corp. | 81,838 | 2,192,864 | |||
| Kinder Morgan, Inc. | 50,205 | 890,135 | |||
| Lundin Petroleum AB | 201,934 | 7,697,162 | |||
| Marathon Oil Corp. | 321,767 | 7,490,736 | |||
| NexGen Energy, Ltd. (B) | 221,300 | 448,888 | |||
| Noble Energy, Inc. | 74,173 | 2,313,456 | |||
| NuVista Energy, Ltd. (B) | 417,894 | 2,426,513 | |||
| Occidental Petroleum Corp. | 172,569 | 14,179,995 | |||
| Paramount Resources, Ltd., Class A (B)(C) | 64,427 | 754,679 | |||
| Parex Resources, Inc. (B) | 85,337 | 1,450,197 | |||
| Parsley Energy, Inc., Class A (B) | 169,708 | 4,963,959 | |||
| Pembina Pipeline Corp. | 75,593 | 2,568,635 | |||
| Phillips 66 | 96,091 | 10,831,378 | |||
| Pioneer Natural Resources Company | 62,049 | 10,808,315 | |||
| Range Resources Corp. | 105,285 | 1,788,792 | |||
| Resolute Energy Corp. (B) | 12,120 | 458,257 | |||
| Royal Dutch Shell PLC, A Shares | 769,655 | 26,390,432 | |||
| Seven Generations Energy, Ltd., Class A (B) | 65,127 | 776,492 | |||
| Snam SpA | 430,458 | 1,790,050 | |||
| Suncor Energy, Inc. | 391,278 | 15,140,382 | |||
| The Williams Companies, Inc. | 271,500 | 7,382,085 | |||
| TOTAL SA | 217,372 | 14,133,681 | |||
| Tourmaline Oil Corp. | 62,568 | 1,101,534 | |||
| TransCanada Corp. | 162,840 | 6,588,486 | |||
| Valero Energy Corp. | 99,719 | 11,343,036 | |||
| Vermilion Energy, Inc. | 32,633 | 1,075,261 | |||
| WPX Energy, Inc. (B) | 261,404 | 5,259,448 | |||
| 7 | JOHN HANCOCK DIVERSIFIED REAL ASSETS FUND | SEMIANNUAL REPORT | SEE NOTES TO FINANCIAL STATEMENTS |
| Shares | Value | ||||
| Financials 0.3% | $3,004,392 | ||||
| Diversified financial services 0.3% | |||||
| Berkshire Hathaway, Inc., Class B (B) | 14,032 | 3,004,392 | |||
| Industrials 0.8% | 8,086,138 | ||||
| Construction and engineering 0.4% | |||||
| Vinci SA | 36,701 | 3,491,724 | |||
| Road and rail 0.3% | |||||
| Canadian National Railway Company | 38,779 | 3,479,647 | |||
| Transportation infrastructure 0.1% | |||||
| Flughafen Zurich AG | 5,517 | 1,114,767 | |||
| Information technology 0.0% | 591,971 | ||||
| IT services 0.0% | |||||
| InterXion Holding NV (B) | 8,796 | 591,971 | |||
| Materials 16.3% | 174,324,602 | ||||
| Chemicals 0.9% | |||||
| Albemarle Corp. | 12,132 | 1,210,531 | |||
| DowDuPont, Inc. | 52,273 | 3,361,677 | |||
| LyondellBasell Industries NV, Class A | 21,688 | 2,223,237 | |||
| Nutrien, Ltd. (C) | 37,700 | 2,176,802 | |||
| Metals and mining 15.2% | |||||
| Agnico Eagle Mines, Ltd. | 149,300 | 5,099,769 | |||
| Alacer Gold Corp. (B) | 229,900 | 355,979 | |||
| Alamos Gold, Inc., Class A | 186,700 | 857,145 | |||
| Alcoa Corp. (B) | 115,000 | 4,646,000 | |||
| Altius Minerals Corp. | 89,700 | 876,409 | |||
| B2Gold Corp. (B) | 845,600 | 1,924,720 | |||
| Barrick Gold Corp. | 261,600 | 2,894,177 | |||
| BHP Billiton PLC, ADR | 197,650 | 8,692,647 | |||
| BHP Billiton, Ltd., ADR (C) | 285,700 | 14,239,288 | |||
| Boliden AB | 106,902 | 2,973,036 | |||
| Cobalt 27 Capital Corp. (B)(C) | 248,600 | 1,235,638 | |||
| Continental Gold, Inc. (B) | 112,700 | 229,475 | |||
| Detour Gold Corp. (B) | 271,400 | 2,193,641 | |||
| Endeavour Mining Corp. (B) | 124,800 | 1,947,871 | |||
| ERO Copper Corp. (B)(C) | 316,100 | 2,985,654 | |||
| First Quantum Minerals, Ltd. | 462,400 | 5,266,058 | |||
| Franco-Nevada Corp. | 99,750 | 6,239,926 | |||
| Freeport-McMoRan, Inc. | 505,700 | 7,039,344 | |||
| Fresnillo PLC | 37,727 | 402,977 | |||
| Glencore PLC (B) | 1,196,366 | 5,157,179 | |||
| Goldcorp, Inc. | 452,500 | 4,610,305 | |||
| Guyana Goldfields, Inc. (B) | 151,234 | 333,695 | |||
| Hudbay Minerals, Inc. | 175,200 | 887,089 | |||
| Ivanhoe Mines, Ltd., Class A (B) | 1,154,000 | 2,456,935 | |||
| SEE NOTES TO FINANCIAL STATEMENTS | SEMIANNUAL REPORT | JOHN HANCOCK DIVERSIFIED REAL ASSETS FUND | 8 |
| Shares | Value | ||||
| Materials (continued) | |||||
| Metals and mining (continued) | |||||
| Kinross Gold Corp. (B) | 537,900 | $1,465,883 | |||
| Kirkland Lake Gold, Ltd. | 187,400 | 3,551,699 | |||
| Lucara Diamond Corp. (C) | 847,900 | 1,417,926 | |||
| Lundin Mining Corp. | 752,314 | 3,983,918 | |||
| MAG Silver Corp. (B) | 137,200 | 1,108,944 | |||
| Nevada Copper Corp. (B) | 4,500,000 | 1,846,475 | |||
| Nevsun Resources, Ltd. | 588,015 | 2,608,544 | |||
| New Gold, Inc. (B) | 497,500 | 392,870 | |||
| Newcrest Mining, Ltd. | 82,349 | 1,156,370 | |||
| Newmont Mining Corp. | 250,000 | 7,550,000 | |||
| Nucor Corp. | 28,400 | 1,801,980 | |||
| OceanaGold Corp. (C) | 482,100 | 1,455,650 | |||
| Osisko Gold Royalties, Ltd. | 159,000 | 1,206,364 | |||
| Osisko Mining, Inc. (B)(C) | 633,700 | 1,152,940 | |||
| Randgold Resources, Ltd., ADR | 50,900 | 3,590,995 | |||
| Rio Tinto PLC, ADR | 222,500 | 11,351,950 | |||
| Sandstorm Gold, Ltd. (B) | 139,100 | 517,997 | |||
| SEMAFO, Inc. (B) | 540,700 | 1,272,580 | |||
| South32, Ltd. | 444,996 | 1,250,577 | |||
| Southern Copper Corp. | 95,600 | 4,124,184 | |||
| SSR Mining, Inc. (B) | 226,100 | 1,965,783 | |||
| Steel Dynamics, Inc. | 30,000 | 1,355,700 | |||
| Stornoway Diamond Corp. (B) | 1,562,000 | 471,629 | |||
| Tahoe Resources, Inc. (B) | 143,300 | 396,068 | |||
| Teck Resources, Ltd., Class B | 368,904 | 8,890,939 | |||
| TMAC Resources, Inc. (B) | 63,800 | 231,659 | |||
| Trevali Mining Corp. (B) | 1,220,300 | 689,675 | |||
| Turquoise Hill Resources, Ltd. (B) | 891,900 | 1,898,908 | |||
| Vale SA, ADR | 163,500 | 2,426,340 | |||
| Western Areas, Ltd. | 1,517,661 | 2,917,674 | |||
| Wheaton Precious Metals Corp. | 243,000 | 4,251,771 | |||
| Yamana Gold, Inc. | 387,400 | 965,763 | |||
| Paper and forest products 0.2% | |||||
| Interfor Corp. (B) | 70,700 | 1,046,556 | |||
| West Fraser Timber Company, Ltd. | 26,200 | 1,491,087 | |||
| Real estate 35.0% | 375,133,870 | ||||
| Equity real estate investment trusts 31.2% | |||||
| Acadia Realty Trust | 125,937 | 3,530,014 | |||
| Agree Realty Corp. | 91,580 | 4,864,722 | |||
| Alexandria Real Estate Equities, Inc. | 84,796 | 10,666,489 | |||
| alstria office REIT-AG | 55,238 | 819,142 | |||
| American Tower Corp. | 24,674 | 3,585,132 | |||
| Americold Realty Trust | 157,761 | 3,947,180 | |||
| 9 | JOHN HANCOCK DIVERSIFIED REAL ASSETS FUND | SEMIANNUAL REPORT | SEE NOTES TO FINANCIAL STATEMENTS |
| Shares | Value | ||||
| Real estate (continued) | |||||
| Equity real estate investment trusts (continued) | |||||
| Assura PLC | 867,759 | $612,958 | |||
| Boston Properties, Inc. | 69,987 | 8,614,700 | |||
| Brixmor Property Group, Inc. | 196,158 | 3,434,727 | |||
| Camden Property Trust | 96,878 | 9,064,874 | |||
| Canadian Apartment Properties REIT | 65,133 | 2,404,825 | |||
| CapitaLand Commercial Trust | 1,034,000 | 1,347,145 | |||
| Columbia Property Trust, Inc. | 142,540 | 3,369,646 | |||
| CoreSite Realty Corp. | 59,385 | 6,600,049 | |||
| Cousins Properties, Inc. | 430,261 | 3,825,020 | |||
| CubeSmart | 276,262 | 7,881,755 | |||
| CyrusOne, Inc. | 45,669 | 2,895,415 | |||
| Derwent London PLC | 24,567 | 914,658 | |||
| Dexus | 88,186 | 673,703 | |||
| Douglas Emmett, Inc. | 215,079 | 8,112,780 | |||
| Dream Office Real Estate Investment Trust | 70,320 | 1,316,952 | |||
| Equinix, Inc. | 34,414 | 14,897,476 | |||
| Equity LifeStyle Properties, Inc. | 137,755 | 13,286,470 | |||
| Equity Residential | 231,044 | 15,308,975 | |||
| Extra Space Storage, Inc. | 91,229 | 7,904,081 | |||
| Frontier Real Estate Investment Corp. | 243 | 946,235 | |||
| Gecina SA | 19,023 | 3,178,646 | |||
| Global One Real Estate Investment Corp. | 2,434 | 2,504,398 | |||
| GLP J-REIT | 1,251 | 1,215,853 | |||
| Goodman Group | 177,322 | 1,330,199 | |||
| Granite Real Estate Investment Trust | 51,278 | 2,202,137 | |||
| Great Portland Estates PLC | 118,280 | 1,030,445 | |||
| Green REIT PLC | 375,624 | 658,234 | |||
| Hammerson PLC | 79,962 | 475,789 | |||
| Hibernia REIT PLC | 336,464 | 554,601 | |||
| Host Hotels & Resorts, Inc. | 345,078 | 7,281,146 | |||
| Invitation Homes, Inc. | 135,320 | 3,100,181 | |||
| Japan Logistics Fund, Inc. | 622 | 1,223,747 | |||
| Japan Real Estate Investment Corp. | 259 | 1,358,145 | |||
| JBG SMITH Properties | 34,251 | 1,261,464 | |||
| Link REIT | 353,100 | 3,476,607 | |||
| Mapletree Logistics Trust | 1,773,800 | 1,596,207 | |||
| Merlin Properties Socimi SA | 117,170 | 1,588,785 | |||
| Mid-America Apartment Communities, Inc. | 101,233 | 10,141,522 | |||
| Mirvac Group | 917,738 | 1,599,622 | |||
| Mori Hills REIT Investment Corp. | 526 | 668,541 | |||
| Mori Trust Sogo REIT, Inc. | 358 | 510,523 | |||
| National Retail Properties, Inc. | 20,524 | 919,886 | |||
| Omega Healthcare Investors, Inc. | 163,556 | 5,359,730 | |||
| Physicians Realty Trust | 253,438 | 4,272,965 | |||
| SEE NOTES TO FINANCIAL STATEMENTS | SEMIANNUAL REPORT | JOHN HANCOCK DIVERSIFIED REAL ASSETS FUND | 10 |
| Shares | Value | ||||
| Real estate (continued) | |||||
| Equity real estate investment trusts (continued) | |||||
| Premier Investment Corp. | 2,538 | $2,667,153 | |||
| Prologis, Inc. | 302,497 | 20,506,272 | |||
| Realty Income Corp. | 201,198 | 11,446,154 | |||
| Regency Centers Corp. | 115,486 | 7,468,480 | |||
| Retail Properties of America, Inc., Class A | 194,546 | 2,371,516 | |||
| Rexford Industrial Realty, Inc. | 170,916 | 5,462,475 | |||
| Ryman Hospitality Properties, Inc. | 85,665 | 7,381,753 | |||
| Scentre Group | 905,580 | 2,602,425 | |||
| Segro PLC | 209,688 | 1,744,884 | |||
| Simon Property Group, Inc. | 123,337 | 21,799,815 | |||
| STORE Capital Corp. | 235,063 | 6,532,401 | |||
| Sunstone Hotel Investors, Inc. | 288,601 | 4,721,512 | |||
| Suntec Real Estate Investment Trust | 567,200 | 800,936 | |||
| The British Land Company PLC | 215,764 | 1,735,435 | |||
| The GPT Group | 602,636 | 2,269,712 | |||
| The Macerich Company | 40,780 | 2,254,726 | |||
| The PRS REIT PLC | 396,236 | 529,366 | |||
| The UNITE Group PLC | 74,001 | 860,768 | |||
| Tritax EuroBox PLC (A)(B) | 252,826 | 346,381 | |||
| Unibail-Rodamco-Westfield, Stapled Shares | 19,635 | 3,955,402 | |||
| Ventas, Inc. | 166,215 | 9,038,772 | |||
| VICI Properties, Inc. | 271,730 | 5,874,803 | |||
| Warehouse REIT PLC | 128,851 | 163,814 | |||
| Welltower, Inc. | 201,198 | 12,941,055 | |||
| XYMAX REIT Investment Corp. | 627 | 631,971 | |||
| Real estate management and development 3.8% | |||||
| Castellum AB | 103,568 | 1,855,203 | |||
| CK Asset Holdings, Ltd. | 521,500 | 3,909,264 | |||
| Daibiru Corp. | 41,200 | 434,868 | |||
| Deutsche Wohnen SE | 61,351 | 2,946,791 | |||
| Essential Properties Realty Trust, Inc. | 165,936 | 2,354,632 | |||
| Fabege AB | 75,294 | 1,042,629 | |||
| Grainger PLC | 173,503 | 677,118 | |||
| Hongkong Land Holdings, Ltd. | 348,600 | 2,308,904 | |||
| Hufvudstaden AB, A Shares | 31,250 | 475,404 | |||
| Mitsubishi Estate Company, Ltd. | 297,600 | 5,053,263 | |||
| Mitsui Fudosan Company, Ltd. | 120,600 | 2,852,294 | |||
| New World Development Company, Ltd. | 753,588 | 1,023,544 | |||
| NTT Urban Development Corp. | 129,300 | 1,483,066 | |||
| PSP Swiss Property AG | 17,415 | 1,688,287 | |||
| Sino Land Company, Ltd. | 1,000,000 | 1,713,212 | |||
| Sun Hung Kai Properties, Ltd. | 102,000 | 1,480,245 | |||
| TLG Immobilien AG | 35,474 | 927,006 | |||
| UOL Group, Ltd. | 188,900 | 952,650 | |||
| 11 | JOHN HANCOCK DIVERSIFIED REAL ASSETS FUND | SEMIANNUAL REPORT | SEE NOTES TO FINANCIAL STATEMENTS |
| Shares | Value | ||||
| Real estate (continued) | |||||
| Real estate management and development (continued) | |||||
| Urban & Civic PLC | 187,090 | $742,841 | |||
| VGP NV | 2,608 | 212,350 | |||
| Vonovia SE | 105,763 | 5,172,675 | |||
| Wharf Real Estate Investment Company, Ltd. | 215,000 | 1,385,147 | |||
| Utilities 5.1% | 54,551,548 | ||||
| Electric utilities 1.8% | |||||
| Avangrid, Inc. | 63,460 | 3,041,638 | |||
| CK Infrastructure Holdings, Ltd. | 316,688 | 2,506,258 | |||
| Edison International | 45,625 | 3,087,900 | |||
| Enel SpA | 555,352 | 2,838,694 | |||
| Iberdrola SA | 529,032 | 3,885,661 | |||
| NextEra Energy, Inc. | 21,080 | 3,533,008 | |||
| Gas utilities 1.0% | |||||
| Beijing Enterprises Holdings, Ltd. | 570,313 | 3,196,343 | |||
| ENN Energy Holdings, Ltd. | 312,397 | 2,715,859 | |||
| Osaka Gas Company, Ltd. | 67,838 | 1,324,645 | |||
| UGI Corp. | 66,485 | 3,688,588 | |||
| Independent power and renewable electricity producers 0.6% | |||||
| China Longyuan Power Group Corp., Ltd., H Shares | 4,041,113 | 3,402,987 | |||
| Huaneng Renewables Corp., Ltd., H Shares | 8,306,647 | 2,476,929 | |||
| NextEra Energy Partners LP | 13,037 | 632,295 | |||
| Multi-utilities 1.2% | |||||
| E.ON SE | 346,757 | 3,528,508 | |||
| Engie SA (C) | 174,080 | 2,562,848 | |||
| Innogy SE (B) | 19,418 | 823,149 | |||
| National Grid PLC | 245,432 | 2,535,025 | |||
| Sempra Energy | 26,552 | 3,020,290 | |||
| Water utilities 0.5% | |||||
| Cia de Saneamento do Parana | 72,656 | 745,531 | |||
| Guangdong Investment, Ltd. | 1,560,578 | 2,765,287 | |||
| Severn Trent PLC | 92,931 | 2,240,105 | |||
| Yield (%) | Shares | Value | |||
| Securities lending collateral 1.1% | $11,973,310 | ||||
| (Cost $11,972,093) | |||||
| John Hancock Collateral Trust (D) | 2.1505(E) | 1,196,781 | 11,973,310 | ||
| Yield* (%) | Maturity date | Par value^ | Value | ||
| Short-term investments 1.4% | $15,100,000 | ||||
| (Cost $15,100,000) | |||||
| U.S. Government Agency 1.4% | 15,100,000 | ||||
| Federal Home Loan Bank Discount Note | 1.850 | 10-01-18 | 15,100,000 | 15,100,000 |
| SEE NOTES TO FINANCIAL STATEMENTS | SEMIANNUAL REPORT | JOHN HANCOCK DIVERSIFIED REAL ASSETS FUND | 12 |
| Total investments (Cost $1,057,352,199) 100.8% | $1,078,879,187 | ||||
| Other assets and liabilities, net (0.8%) | (8,689,066) | ||||
| Total net assets 100.0% | $1,070,190,121 | ||||
| The percentage shown for each investment category is the total value of the category as a percentage of the net assets of the fund. | |
| ^All par values are denominated in U.S. dollars unless otherwise indicated. | |
| Security Abbreviations and Legend | |
| ADR | American Depositary Receipt |
| (A) | These securities are exempt from registration under Rule 144A of the Securities Act of 1933. Such securities may be resold, normally to qualified institutional buyers, in transactions exempt from registration. |
| (B) | Non-income producing security. |
| (C) | All or a portion of this security is on loan as of 9-30-18. |
| (D) | Investment is an affiliate of the fund, the advisor and/or subadvisor. This security represents the investment of cash collateral received for securities lending. |
| (E) | The rate shown is the annualized seven-day yield as of 9-30-18. |
| * | Yield represents either the annualized yield at the date of purchase, the stated coupon rate or, for floating rate securities, the rate at period end. |
| 13 | JOHN HANCOCK DIVERSIFIED REAL ASSETS FUND | SEMIANNUAL REPORT | SEE NOTES TO FINANCIAL STATEMENTS |
| Financial statements |
| Assets | |
| Unaffiliated investments, at value (Cost $1,045,380,106) including $11,520,308 of securities loaned | $1,066,905,877 |
| Affiliated investments, at value (Cost $11,972,093) | 11,973,310 |
| Total investments, at value (Cost $1,057,352,199) | 1,078,879,187 |
| Cash | 4,059,058 |
| Foreign currency, at value (Cost $1,331,018) | 1,331,883 |
| Dividends and interest receivable | 2,647,948 |
| Receivable for investments sold | 5,819,591 |
| Receivable for securities lending income | 35,594 |
| Other assets | 140,828 |
| Total assets | 1,092,914,089 |
| Liabilities | |
| Payable for investments purchased | 6,070,915 |
| Payable for fund shares repurchased | 4,401,659 |
| Payable upon return of securities loaned | 11,971,880 |
| Payable to affiliates | |
| Accounting and legal services fees | 64,100 |
| Trustees' fees | 161 |
| Other liabilities and accrued expenses | 215,253 |
| Total liabilities | 22,723,968 |
| Net assets | $1,070,190,121 |
| Net assets consist of | |
| Paid-in capital | $1,026,508,182 |
| Undistributed net investment income | 13,650,416 |
| Accumulated net realized gain (loss) on investments and foreign currency transactions | 8,510,458 |
| Net unrealized appreciation (depreciation) on investments and translation of assets and liabilities in foreign currencies | 21,521,065 |
| Net assets | $1,070,190,121 |
| Net asset value per share | |
| Based on net asset value and shares outstanding - the fund has an unlimited number of shares authorized with no par value | |
| Class NAV ($1,070,190,121 ÷ 102,023,202 shares) | $10.49 |
| SEE NOTES TO FINANCIAL STATEMENTS | SEMIANNUAL REPORT | JOHN HANCOCK DIVERSIFIED REAL ASSETS FUND | 14 |
| Investment income | |
| Dividends | $15,363,318 |
| Interest | 192,723 |
| Securities lending | 133,074 |
| Less foreign taxes withheld | (669,061) |
| Total investment income | 15,020,054 |
| Expenses | |
| Investment management fees | 4,360,333 |
| Accounting and legal services fees | 82,556 |
| Trustees' fees | 3,676 |
| Custodian fees | 183,198 |
| Printing and postage | 46,132 |
| Professional fees | 73,209 |
| Other | 45,735 |
| Total expenses | 4,794,839 |
| Less expense reductions | (299,863) |
| Net expenses | 4,494,976 |
| Net investment income | 10,525,078 |
| Realized and unrealized gain (loss) | |
| Net realized gain (loss) on | |
| Unaffiliated investments and foreign currency transactions | 10,245,462 |
| Affiliated investments | 701 |
| Forward foreign currency contracts | (3,321) |
| 10,242,842 | |
| Change in net unrealized appreciation (depreciation) of | |
| Unaffiliated investments and translation of assets and liabilities in foreign currencies | 22,990,020 |
| Affiliated investments | 1,217 |
| 22,991,237 | |
| Net realized and unrealized gain | 33,234,079 |
| Increase in net assets from operations | $43,759,157 |
| 15 | JOHN HANCOCK Diversified Real Assets Fund | SEMIANNUAL REPORT | SEE NOTES TO FINANCIAL STATEMENTS |
| Six months ended 9-30-18 (unaudited) | Period ended 3-31-181 | |
| Increase (decrease) in net assets | ||
| From operations | ||
| Net investment income | $10,525,078 | $3,289,664 |
| Net realized gain (loss) | 10,242,842 | (1,904,080) |
| Change in net unrealized appreciation (depreciation) | 22,991,237 | (1,470,172) |
| Increase (decrease) in net assets resulting from operations | 43,759,157 | (84,588) |
| From fund share transactions | 88,574,445 | 937,941,107 |
| Total increase | 132,333,602 | 937,856,519 |
| Net assets | ||
| Beginning of period | 937,856,519 | — |
| End of period | $1,070,190,121 | $937,856,519 |
| Undistributed net investment income | $13,650,416 | $3,125,338 |
| 1 | Period from 2-26-18 (commencement of operations) to 3-31-18. |
| SEE NOTES TO FINANCIAL STATEMENTS | SEMIANNUAL REPORT | JOHN HANCOCK DIVERSIFIED REAL ASSETS FUND | 16 |
| Financial highlights |
| CLASS NAV SHARES Period ended | 9-30-18 1 | 3-31-18 2 |
| Per share operating performance | ||
| Net asset value, beginning of period | $10.00 | $10.00 |
| Net investment income3 | 0.11 | 0.03 |
| Net realized and unrealized gain (loss) on investments | 0.38 | (0.03) |
| Total from investment operations | 0.49 | — 4 |
| Net asset value, end of period | $10.49 | $10.00 |
| Total return (%)5 | 4.90 6 | 0.00 6 |
| Ratios and supplemental data | ||
| Net assets, end of period (in millions) | $1,070 | $938 |
| Ratios (as a percentage of average net assets): | ||
| Expenses before reductions | 0.93 7 | 0.94 7,8 |
| Expenses including reductions | 0.88 7 | 0.88 7,8 |
| Net investment income | 2.05 7 | 3.84 7 |
| Portfolio turnover (%) | 39 | 40 9 |
| 1 | Six months ended 9-30-18. Unaudited. |
| 2 | Period from 2-26-18 (commencement of operations) to 3-31-18. |
| 3 | Based on average daily shares outstanding. |
| 4 | Less than $0.005 per share. |
| 5 | Total returns would have been lower had certain expenses not been reduced during the applicable periods. |
| 6 | Not annualized. |
| 7 | Annualized. |
| 8 | Certain expenses are presented unannualized due to the short reporting period. |
| 9 | Excludes in-kind transactions. |
| 17 | JOHN HANCOCK Diversified Real Assets Fund | SEMIANNUAL REPORT | SEE NOTES TO FINANCIAL STATEMENTS |
Note 1 — Organization
John Hancock Diversified Real Assets Fund (the fund) is a series of John Hancock Investment Trust (the Trust), an open-end management investment company organized as a Massachusetts business trust and registered under the Investment Company Act of 1940, as amended (the 1940 Act). The investment objective of the fund is to seek a long-term total return in excess of inflation.
The fund may offer multiple classes of shares. The shares currently offered are detailed in the Statement of assets and liabilities. Class NAV shares are offered to John Hancock affiliated funds of funds, retirement plans for employees of John Hancock and/or Manulife Financial Corporation, and certain 529 plans. Shareholders of each class have exclusive voting rights to matters that affect that class. The distribution and service fees, if any, and transfer agent fees for each class may differ.
Note 2 — Significant accounting policies
The financial statements have been prepared in conformity with accounting principles generally accepted in the United States of America (US GAAP), which require management to make certain estimates and assumptions as of the date of the financial statements. Actual results could differ from those estimates and those differences could be significant. The fund qualifies as an investment company under Topic 946 of Accounting Standards Codification of US GAAP.
Events or transactions occurring after the end of the fiscal period through the date that the financial statements were issued have been evaluated in the preparation of the financial statements. The following summarizes the significant accounting policies of the fund:
Security valuation. Investments are stated at value as of the scheduled close of regular trading on the New York Stock Exchange (NYSE), normally at 4:00 p.m., Eastern Time. In case of emergency or other disruption resulting in the NYSE not opening for trading or the NYSE closing at a time other than the regularly scheduled close, the net asset value (NAV) may be determined as of the regularly scheduled close of the NYSE pursuant to the fund's Valuation Policies and Procedures.
In order to value the securities, the fund uses the following valuation techniques: Equity securities held by the fund are typically valued at the last sale price or official closing price on the exchange or principal market where the security trades. In the event there were no sales during the day or closing prices are not available, the securities are valued using the last available bid price. Investments by the fund in open-end mutual funds, including John Hancock Collateral Trust (JHCT), are valued at their respective NAVs each business day. Investments by the fund in open-end management investment companies are valued at their respective NAVs each business day. Debt obligations are valued based on the evaluated prices provided by an independent pricing vendor or from broker-dealers. Independent pricing vendors utilize matrix pricing which takes into account factors such as institutional-size trading in similar groups of securities, yield, quality, coupon rate, maturity, type of issue, trading characteristics and other market data, as well as broker supplied prices. Foreign securities and currencies are valued in U.S. dollars based on foreign currency exchange rates supplied by an independent pricing vendor.
In certain instances, the Pricing Committee may determine to value equity securities using prices obtained from another exchange or market if trading on the exchange or market on which prices are typically obtained did not open for trading as scheduled, or if trading closed earlier than scheduled, and trading occurred as normal on another exchange or market.
Other portfolio securities and assets, for which reliable market quotations are not readily available, are valued at fair value as determined in good faith by the fund's Pricing Committee following procedures established by the Board of Trustees. The frequency with which these fair valuation procedures are used cannot be predicted and fair value of securities may differ significantly from the value that would have been used had a ready market for such securities existed. Trading in foreign securities may be completed before the scheduled daily close of trading on the NYSE. Significant events at the issuer or market level may affect the values of securities between the time when the valuation of the securities is generally determined and the close of the NYSE. If a significant event occurs, these securities may be fair valued, as determined in good faith by the fund's Pricing Committee, following procedures established by the Board of Trustees. The fund uses fair value adjustment factors provided by an independent pricing vendor to value certain foreign securities in order to adjust for events that may occur between the close of foreign exchanges or markets and the close of the NYSE.
The fund uses a three-tier hierarchy to prioritize the pricing assumptions, referred to as inputs, used in valuation techniques to measure fair value. Level 1 includes securities valued using quoted prices in active markets for identical securities. Level 2 includes securities valued using other significant observable inputs. Observable inputs may include quoted prices for similar securities, interest rates, prepayment speeds and credit risk. Prices for securities valued using these inputs are received from independent pricing vendors and brokers and are based on an evaluation of the inputs described. Level 3 includes securities valued using significant unobservable inputs when market prices are not readily available or reliable, including the fund's own assumptions in determining the fair value of investments. Factors used in determining value may include market or issuer specific events or trends, changes in interest rates and credit quality. The inputs or methodology used for valuing securities are not necessarily an indication of the risks associated with investing in those securities. Changes in valuation techniques and related inputs may result in transfers into or out of an assigned level within the disclosure hierarchy.
The following is a summary of the values by input classification of the fund's investments as of September 30, 2018, by major security category or type:
| Total value at 9-30-18 | Level 1 quoted price | Level 2 significant observable inputs | Level 3 significant unobservable inputs | ||
| Investments in securities: | |||||
| Assets | |||||
| Common stocks | |||||
| Communication services | $9,762,501 | $2,985,984 | $6,776,517 | — | |
| Consumer discretionary | 866,168 | 866,168 | — | — | |
| Energy | 425,484,687 | 339,857,788 | 85,626,899 | — | |
| Financials | 3,004,392 | 3,004,392 | — | — | |
| Industrials | 8,086,138 | 3,479,647 | 4,606,491 | — | |
| Information technology | 591,971 | 591,971 | — | — | |
| Materials | 174,324,602 | 160,466,789 | 13,857,813 | — | |
| Real estate | 375,133,870 | 290,204,679 | 84,929,191 | — | |
| Utilities | 54,551,548 | 17,749,250 | 36,802,298 | — | |
| Securities lending collateral | 11,973,310 | 11,973,310 | — | — | |
| Short-term investments | 15,100,000 | — | 15,100,000 | — | |
| Total investments in securities | $1,078,879,187 | $831,179,978 | $247,699,209 | — | |
Security transactions and related investment income. Investment security transactions are accounted for on a trade date plus one basis for daily NAV calculations. However, for financial reporting purposes, investment transactions are reported on trade date. Interest income is accrued as earned. Dividend income is recorded on the ex-date, except for dividends of foreign securities where the dividend may not be known until after the ex-date. In those cases, dividend income, net of withholding taxes, is recorded when the fund becomes aware of the dividends. Non-cash dividends, if any, are recorded at the fair market value of the securities received. Gains and losses on securities sold are determined on the basis of identified cost and may include proceeds from litigation.
Securities lending. The fund may lend its securities to earn additional income. The fund receives cash collateral from the borrower in an amount not less than the market value of the loaned securities. The fund will invest its collateral in JHCT, an affiliate of the fund, which has a floating NAV and is registered with the Securities and Exchange Commission (SEC) as an investment company. JHCT invests in short-term money market investments. The fund will receive the benefit of any gains and bear any losses generated by JHCT with respect to the cash collateral.
The fund has the right to recall loaned securities on demand. If a borrower fails to return loaned securities when due, then the lending agent is responsible and indemnifies the fund for the lent securities. The lending agent uses the collateral received from the borrower to purchase replacement securities of the same issue, type, class and series of the loaned securities. If the
value of the collateral is less than the purchase cost of replacement securities, the lending agent is responsible for satisfying the shortfall but only to the extent that the shortfall is not due to any decrease in the value of JHCT.
Although the risk of the loss of the securities lent is mitigated by receiving collateral from the borrower and through lending agent indemnification, the fund could experience a delay in recovering securities or could experience a lower than expected return if the borrower fails to return the securities on a timely basis. The fund receives compensation for lending its securities by retaining a portion of the return on the investment of the collateral and compensation from fees earned from borrowers of the securities. Securities lending income received by the fund is net of fees retained by the securities lending agent. Net income received from JHCT is a component of securities lending income as recorded on the Statement of operations.
Obligations to repay collateral received by the fund are shown on the Statement of assets and liabilities as Payable upon return of securities loaned and are secured by the loaned securities. As of September 30, 2018, the fund loaned common stocks valued at $11,520,308 and received $11,971,880 of cash collateral.
Foreign investing. Assets, including investments, and liabilities denominated in foreign currencies are translated into U.S. dollar values each day at the prevailing exchange rate. Purchases and sales of securities, income and expenses are translated into U.S. dollars at the prevailing exchange rate on the date of the transaction. The effect of changes in foreign currency exchange rates on the value of securities is reflected as a component of the realized and unrealized gains (losses) on investments. Foreign investments are subject to a decline in the value of a foreign currency versus the U.S. dollar, which reduces the dollar value of securities denominated in that currency.
Funds that invest internationally generally carry more risk than funds that invest strictly in U.S. securities. These risks are heightened for investments in emerging markets. Risks can result from differences in economic and political conditions, regulations, market practices (including higher transaction costs), accounting standards and other factors.
Foreign taxes. The fund may be subject to withholding tax on income, capital gains or repatriation taxes imposed by certain countries, a portion of which may be recoverable. Foreign taxes are accrued based upon the fund's understanding of the tax rules and rates that exist in the foreign markets in which it invests. Taxes are accrued based on gains realized by the fund as a result of certain foreign security sales. In certain circumstances, estimated taxes are accrued based on unrealized appreciation of such securities. Investment income is recorded net of foreign withholding taxes, less any amounts reclaimable.
Line of credit. The fund may have the ability to borrow from banks for temporary or emergency purposes, including meeting redemption requests that otherwise might require the untimely sale of securities. Pursuant to the fund's custodian agreement, the custodian may loan money to the fund to make properly authorized payments. The fund is obligated to repay the custodian for any overdraft, including any related costs or expenses. The custodian may have a lien, security interest or security entitlement in any fund property that is not otherwise segregated or pledged, to the extent of any overdraft, and to the maximum extent permitted by law.
The fund and other affiliated funds have entered into a syndicated line of credit agreement with Citibank, N.A. as the administrative agent that enables them to participate in a $750 million unsecured committed line of credit. Excluding commitments designated for a certain fund and subject to the needs of all other affiliated funds, the fund can borrow up to an aggregate commitment amount of $500 million, subject to asset coverage and other limitations as specified in the agreement. A commitment fee payable at the end of each calendar quarter, based on the average daily unused portion of the line of credit, is charged to each participating fund based on a combination of fixed and asset based allocations and is reflected in Other expenses on the Statement of operations. For the six months ended September 30, 2018, the fund had no borrowings under the line of credit. Commitment fees for the six months ended September 30, 2018 were $3,082.
Expenses. Within the John Hancock group of funds complex, expenses that are directly attributable to an individual fund are allocated to such fund. Expenses that are not readily attributable to a specific fund are allocated among all funds in an equitable manner, taking into consideration, among other things, the nature and type of expense and the fund's relative net assets. Expense estimates are accrued in the period to which they relate and adjustments are made when actual amounts are known.
Federal income taxes. The fund intends to continue to qualify as a regulated investment company by complying with the applicable provisions of the Internal Revenue Code and will not be subject to federal income tax on taxable income that is distributed to shareholders. Therefore, no federal income tax provision is required.
For federal income tax purposes, as of March 31, 2018, the fund has a short-term capital loss carryforward of $1,306,847 available to offset future net realized capital gains. This carryforward does not expire.
As of March 31, 2018, the fund had no uncertain tax positions that would require financial statement recognition, derecognition or disclosure. The fund's federal tax returns are subject to examination by the Internal Revenue Service for a period of three years.
Distribution of income and gains. Distributions to shareholders from net investment income and net realized gains, if any, are recorded on the ex-date. The fund generally declares and pays dividends and capital gain distributions, if any, annually.
Such distributions, on a tax basis, are determined in conformity with income tax regulations, which may differ from US GAAP. Distributions in excess of tax basis earnings and profits, if any, are reported in the fund's financial statements as a return of capital. The final determination of tax characteristics of the fund's distribution will occur at the end of the year and will subsequently be reported to shareholders.
Capital accounts within the financial statements are adjusted for permanent book-tax differences. These adjustments have no impact on net assets or the results of operations. Temporary book-tax differences, if any, will reverse in a subsequent period. The fund had no material book-tax differences at March 31, 2018.
Note 3 — Derivative Instruments
The fund may invest in derivatives in order to meet its investment objective. Derivatives include a variety of different instruments that may be traded in the over-the-counter (OTC) market, on a regulated exchange or through a clearing facility. The risks in using derivatives vary depending upon the structure of the instruments, including the use of leverage, optionality, the liquidity or lack of liquidity of the contract, the creditworthiness of the counterparty or clearing organization and the volatility of the position. Some derivatives involve risks that are potentially greater than the risks associated with investing directly in the referenced securities or other referenced underlying instrument. Specifically, the fund is exposed to the risk that the counterparty to an OTC derivatives contract will be unable or unwilling to make timely settlement payments or otherwise honor its obligations. OTC derivatives transactions typically can only be closed out with the other party to the transaction.
Forward foreign currency contracts are typically traded through the OTC market. Certain forwards are regulated by the Commodity Futures Trading Commission. Derivative counterparty risk is managed through an ongoing evaluation of the creditworthiness of all potential counterparties and, if applicable, designated clearing organizations. The fund attempts to reduce its exposure to counterparty risk for derivatives traded in the OTC market, whenever possible, by entering into an International Swaps and Derivatives Association (ISDA) Master Agreement with each of its OTC counterparties. The ISDA gives each party to the agreement the right to terminate all transactions traded under the agreement if there is certain deterioration in the credit quality or contractual default of the other party, as defined in the ISDA. Upon an event of default or a termination of the ISDA, the non-defaulting party has the right to close out all transactions and to net amounts owed.
Forward foreign currency contracts. A forward foreign currency contract is an agreement between two parties to buy and sell specific currencies at a price that is set on the date of the contract. The forward contract calls for delivery of the currencies on a future date that is specified in the contract. Risks related to the use of forwards include the possible failure of counterparties to meet the terms of the forward agreement, the failure of the counterparties to timely post collateral if applicable, the risk that currency movements will not favor the fund thereby reducing the fund's total return, and the potential for losses in excess of the amounts recognized on the Statement of assets and liabilities.
The market value of a forward foreign currency contract fluctuates with changes in foreign currency exchange rates. Forward foreign currency contracts are marked-to-market daily and the change in value is recorded by the fund as an unrealized gain
or loss. Realized gains or losses, equal to the difference between the value of the contract at the time it was opened and the value at the time it was closed, are recorded upon delivery or receipt of the currency or settlement with the counterparty.
Effect of derivative instruments on the Statement of operations
The table below summarizes the net realized gain (loss) included in the net increase (decrease) in net assets from operations, classified by derivative instrument and risk category, for the six months ended September 30, 2018:
| Statement of operations location - net realized gain (loss) on: | |||||
| Risk | Forward foreign currency contracts | ||||
| Foreign currency | ($3,321 | ) | |||
Note 4 — Guarantees and indemnifications
Under the Trust's organizational documents, its Officers and Trustees are indemnified against certain liabilities arising out of the performance of their duties to the Trust, including the fund. Additionally, in the normal course of business, the fund enters into contracts with service providers that contain general indemnification clauses. The fund's maximum exposure under these arrangements is unknown, as this would involve future claims that may be made against the fund that have not yet occurred. The risk of material loss from such claims is considered remote.
Note 5 — Fees and transactions with affiliates
John Hancock Advisers, LLC (the Advisor) serves as investment Advisor for the fund. John Hancock Distributors, LLC (the Distributor), an affiliate of the Advisor, serves as principal underwriter of the fund. The Advisor and the Distributor are indirect, wholly owned subsidiaries of Manulife Financial Corporation (MFC).
Management fee. The fund has an investment management agreement with the Advisor under which the fund pays a daily management fee to the Advisor equivalent on an annual basis to the sum of: (a) 0.850% of the first $2 billion of the fund's average daily net assets and (b) 0.800% of the fund's average daily net assets in excess of $2 billion. The Advisor has subadvisory agreements with DWS Investment Management Americas, Inc., John Hancock Asset Management a division of Manulife Asset Management (North America) Limited, and Wellington Management Company LLP. The fund is not responsible for payment of the subadvisory fees.
The Advisor has contractually agreed to waive a portion of its management fee and/or reimburse expenses for certain funds of the John Hancock group of funds complex, including the fund (the participating portfolios). This waiver is based upon aggregate net assets of all the participating portfolios. The amount of the reimbursement is calculated daily and allocated among all the participating portfolios in proportion to the daily net assets of each fund. During the six months ended September 30, 2018, this waiver amounted to 0.01% of the fund's average net assets (on an annualized basis). This agreement expires on June 30, 2020, unless renewed by mutual agreement of the fund and the Advisor based upon a determination that this is appropriate under the circumstances at that time.
The Advisor contractually agrees to reduce its management fee by an annual rate of 0.05% of the fund's average daily net assets. This agreement expires on July 31, 2019, unless renewed by mutual agreement of the fund and the Advisor based upon a determination that this is appropriate under the circumstances at that time.
The expense reductions described above amounted to $299,863 for the six months ended September 30, 2018.
Expenses waived or reimbursed in the current fiscal period are not subject to recapture in future fiscal periods.
The investment management fees, including the impact of the waivers and reimbursements as described above, incurred for the six months ended September 30, 2018 were equivalent to a net annual effective rate of 0.79% of the fund's average daily net assets.
Accounting and legal services. Pursuant to a service agreement, the fund reimburses the Advisor for all expenses associated with providing the administrative, financial, legal, compliance, accounting and recordkeeping services to the fund, including the preparation of all tax returns, periodic reports to shareholders and regulatory reports, among other
services. These expenses are allocated to each share class based on its relative net assets at the time the expense was incurred. These accounting and legal services fees incurred for the six ended September 30, 2018 amounted to an annual rate of 0.02% of the fund's average daily net assets.
Trustee expenses. The fund compensates each Trustee who is not an employee of the Advisor or its affiliates. The costs of paying Trustee compensation and expenses are allocated to the fund based on its net assets relative to other funds within the John Hancock group of funds complex.
Interfund lending program. Pursuant to an Exemptive Order issued by the SEC, the fund(s), along with certain other funds advised by the Advisor or its affiliates, may participate in an interfund lending program. This program provides an alternative credit facility allowing the funds to borrow from, or lend money to, other participating affiliated funds. Any open loans at period end are presented under the caption Payable for interfund lending in the Statement of assets and liabilities. The fund's activity in this program during the period for which loans were outstanding was as follows:
| Borrower | Weighted average loan balance | Days outstanding | Weighted average interest rate | Interest income (expense) |
| Borrower | $2,661,582 | 8 | 1.557% | ($1,846) |
Note 6 — Fund share transactions
Transactions in fund shares for the six months ended September 30, 2018 and for the period ended March 31, 2018 were as follows:
| Six months ended 9-30-18 | Period ended 3-31-181 | |||||||||||||||||||||||||
| Shares | Amount | Shares | Amount | |||||||||||||||||||||||
| Class NAV shares | ||||||||||||||||||||||||||
| Sold | 15,701,593 | $166,188,862 | 96,067,721 | $960,675,505 | ||||||||||||||||||||||
| Repurchased | (7,467,409 | ) | (77,614,417 | ) | (2,278,703 | ) | (22,734,398 | ) | ||||||||||||||||||
| Net increase | 8,234,184 | $88,574,445 | 93,789,018 | $937,941,107 | ||||||||||||||||||||||
| Total net increase | 8,234,184 | $88,574,445 | 93,789,018 | $937,941,107 | ||||||||||||||||||||||
| 1 | Period from 2-26-18 (commencement of operations) to 3-31-18. |
Affiliates of the fund owned 100% of shares of Class NAV on September 30, 2018. Such concentration of shareholders' capital could have a material effect on the fund if such shareholders redeem from the fund.
Note 7 — Purchase and sale of securities
Purchases and sales of securities, other than short-term investments, amounted to $474,928,320 and $389,001,499, respectively, for the six months ended September 30, 2018.
Note 8 — Investment by affiliated funds
Certain investors in the fund are affiliated funds that are managed by the Advisor and its affiliates. The affiliated funds do not invest in the fund for the purpose of exercising management or control; however, this investment may represent a significant portion of the fund's net assets. At September 30, 2018, funds within the John Hancock group of funds complex held 100.0% of the fund's net assets. The following funds had an affiliate ownership of 5% or more of the fund's net assets:
| Fund | Affiliated concentration |
| John Hancock Funds II Multimanager Lifestyle Growth Portfolio | 32.1% |
| John Hancock Funds II Multimanager Lifestyle Balanced Portfolio | 26.0% |
| John Hancock Funds II Multimanager Lifestyle Aggressive Portfolio | 12.6% |
| John Hancock Funds II Multimanager Lifestyle Moderate Portfolio | 6.0% |
Note 9 — Investment in affiliated underlying funds
The fund may invest in affiliated underlying funds that are managed by the Advisor and its affiliates. Information regarding the fund's purchases and sales of the affiliated underlying funds as well as income and capital gains earned, if any, during the period is as follows:
| Dividends and distributions | ||||||||||||||||||||||||||||||||||||||
| Fund | Beginning share amount | Shares purchased | Shares sold | Ending share amount | Income distributions received | Capital gain distributions received | Realized gain (loss) | Change in unrealized appreciation (depreciation) | Ending value | |||||||||||||||||||||||||||||
| John Hancock Collateral Trust* | — | 19,792,351 | (18,595,570 | ) | 1,196,781 | — | — | $701 | $1,217 | $11,973,310 | ||||||||||||||||||||||||||||
| *Refer to the Securities lending note within Note 2 for details regarding this investment. | ||||||||||||||||||||||||||||||||||||||
Trustees Hassell H. McClellan, Chairperson Officers Andrew G. Arnott Francis V. Knox, Jr. Charles A. Rizzo Salvatore Schiavone Christopher (Kit) Sechler** | Investment advisor John Hancock Advisers, LLC Subadvisors DWS Investment Management Americas, Inc. (DIMA) Principal distributor John Hancock Funds, LLC Custodian Citibank, N.A. Transfer agent John Hancock Signature Services, Inc. Legal counsel K&L Gates LLP |
* Member of the Audit Committee
† Non-Independent Trustee
#Effective 6-19-18
**Effective 9-13-18
The fund's proxy voting policies and procedures, as well as the fund proxy voting record for the most recent twelve-month period ended June 30, are available free of charge on the Securities and Exchange Commission (SEC) website at sec.gov or on our website.
The fund's complete list of portfolio holdings, for the first and third fiscal quarters, is filed with the SEC on Form N-Q. The fund's Form N-Q is available on our website and the SEC's website, sec.gov, and can be reviewed and copied (for a fee) at the SEC's Public Reference Room in Washington, DC. Call 800-SEC-0330 to receive information on the operation of the SEC's Public Reference Room.
We make this information on your fund, as well as monthly portfolio holdings, and other fund details available on our website at jhinvestments.com or by calling 800-225-5291.
| You can also contact us: | |||
| 800-225-5291 jhinvestments.com | Regular mail: John Hancock Signature Services, Inc. | Express mail: John Hancock Signature Services, Inc. | |
John Hancock family of funds
DOMESTIC EQUITY FUNDS Blue Chip Growth Classic Value Disciplined Value Disciplined Value Mid Cap Equity Income Financial Industries Fundamental All Cap Core Fundamental Large Cap Core Fundamental Large Cap Value New Opportunities Regional Bank Small Cap Core Small Cap Growth Small Cap Value Strategic Growth U.S. Global Leaders Growth U.S. Growth Value Equity GLOBAL AND INTERNATIONAL EQUITY FUNDS Disciplined Value International Emerging Markets Emerging Markets Equity Fundamental Global Franchise Global Equity Global Shareholder Yield Greater China Opportunities International Growth International Small Company | INCOME FUNDS Bond California Tax-Free Income Emerging Markets Debt Floating Rate Income Government Income High Yield High Yield Municipal Bond Income Investment Grade Bond Money Market Short Duration Credit Opportunities Spectrum Income Strategic Income Opportunities Tax-Free Bond ALTERNATIVE AND SPECIALTY FUNDS Absolute Return Currency Alternative Asset Allocation Enduring Assets Global Absolute Return Strategies Global Conservative Absolute Return Global Focused Strategies Redwood Seaport Long/Short Technical Opportunities |
A fund's investment objectives, risks, charges, and expenses should be considered carefully before investing. The prospectus contains this and other important information about the fund. To obtain a prospectus, contact your financial professional, call John Hancock Investments at 800-225-5291, or visit our website at jhinvestments.com. Please read the prospectus carefully before investing or sending money.
ASSET ALLOCATION Balanced Income Allocation Multi-Index Lifetime Portfolios Multi-Index Preservation Portfolios Multimanager Lifestyle Portfolios Multimanager Lifetime Portfolios Retirement Income 2040 EXCHANGE-TRADED FUNDS John Hancock Multifactor Consumer Discretionary ETF John Hancock Multifactor Consumer Staples ETF John Hancock Multifactor Developed International ETF John Hancock Multifactor Emerging Markets ETF John Hancock Multifactor Energy ETF John Hancock Multifactor Financials ETF John Hancock Multifactor Healthcare ETF John Hancock Multifactor Industrials ETF John Hancock Multifactor Large Cap ETF John Hancock Multifactor Materials ETF John Hancock Multifactor Mid Cap ETF John Hancock Multifactor Small Cap ETF John Hancock Multifactor Technology ETF John Hancock Multifactor Utilities ETF | ENVIRONMENTAL, SOCIAL, AND GOVERNANCE FUNDS ESG All Cap Core ESG Core Bond ESG International Equity ESG Large Cap Core CLOSED-END FUNDS Financial Opportunities Hedged Equity & Income Income Securities Trust Investors Trust Preferred Income Preferred Income II Preferred Income III Premium Dividend Tax-Advantaged Dividend Income Tax-Advantaged Global Shareholder Yield |
John Hancock Multifactor ETF shares are bought and sold at market price (not NAV), and are not individually redeemed
from the fund. Brokerage commissions will reduce returns.
John Hancock ETFs are distributed by Foreside Fund Services, LLC, and are subadvised by Dimensional Fund Advisors LP.
Foreside is not affiliated with John Hancock Funds, LLC or Dimensional Fund Advisors LP.
Dimensional Fund Advisors LP receives compensation from John Hancock in connection with licensing rights to the
John Hancock Dimensional indexes. Dimensional Fund Advisors LP does not sponsor, endorse, or sell, and makes no
representation as to the advisability of investing in, John Hancock Multifactor ETFs.
John Hancock Investments
A trusted brand
John Hancock Investments is a premier asset manager representing one of
America's most trusted brands, with a heritage of financial stewardship dating
back to 1862. Helping our shareholders pursue their financial goals is at the
core of everything we do. It's why we support the role of professional financial
advice and operate with the highest standards of conduct and integrity.
A better way to invest
We serve investors globally through a unique multimanager approach:
We search the world to find proven portfolio teams with specialized
expertise for every strategy we offer, then we apply robust investment
oversight to ensure they continue to meet our uncompromising standards
and serve the best interests of our shareholders.
Results for investors
Our unique approach to asset management enables us to provide a diverse set
of investments backed by some of the world's best managers, along with strong
risk-adjusted returns across asset classes.

 | John Hancock Funds, LLC n Member FINRA, SIPC 601 Congress Street n Boston, MA 02210-2805 800-225-5291 n jhinvestments.com | |
| This report is for the information of the shareholders of John Hancock Diversified Real Assets Fund. It is not authorized for distribution to prospective investors unless preceded or accompanied by a prospectus. | ||
| DRASA 9/18 11/18 | ||
ITEM 2. CODE OF ETHICS.
Not applicable at this time.
ITEM 3. AUDIT COMMITTEE FINANCIAL EXPERT.
Not applicable at this time.
ITEM 4. PRINCIPAL ACCOUNTANT FEES AND SERVICES.
Not applicable at this time.
ITEM 5. AUDIT COMMITTEE OF LISTED REGISTRANTS.
Not applicable at this time.
ITEM 6. SCHEDULE OF INVESTMENTS.
Not applicable.
ITEM 7. DISCLOSURE OF PROXY VOTING POLICIES AND PROCEDURES FOR CLOSED-END MANAGEMENT INVESTMENT COMPANIES.
Not applicable.
ITEM 8. PORTFOLIO MANAGERS OF CLOSED-END MANAGEMENT INVESTMENT COMPANIES.
Not applicable.
ITEM 9. PURCHASES OF EQUITY SECURITIES BY CLOSED-END MANAGEMENT INVESTMENT COMPANY AND AFFILIATED PURCHASERS.
Not applicable.
ITEM 10. SUBMISSION OF MATTERS TO A VOTE OF SECURITY HOLDERS.
(a) The registrant has adopted procedures by which shareholders may recommend nominees to the registrant’s Board of Trustees. A copy of the procedures is filed as an exhibit to this Form N-CSR. See attached “John Hancock Funds – Nominating and Governance Committee Charter”.
ITEM 11. CONTROLS AND PROCEDURES.
(a) Based upon their evaluation of the registrant's disclosure controls and procedures as conducted within 90 days of the filing date of this Form N-CSR, the registrant's principal executive officer and principal financial officer have concluded that those disclosure controls and procedures provide reasonable assurance that the material information required to be disclosed by the registrant on this report is recorded, processed, summarized and reported within the time periods specified in the Securities and Exchange Commission's rules and forms.
(b) There were no changes in the registrant's internal control over financial reporting that occurred during the second fiscal quarter of the period covered by this report that have materially affected, or are reasonably likely to materially affect, the registrant's internal control over financial reporting.
ITEM 12. DISCLOSURE OF SECURITIES LENDING ACTIVITIES FOR CLOSED-END MANGEMENT INVESTMENT COMPANIES.
Not applicable.
ITEM 13. EXHIBITS.
(a)(1) Separate certifications for the registrant's principal executive officer and principal financial officer, as required by Section 302 of the Sarbanes-Oxley Act of 2002 and Rule 30a-2(a) under the Investment Company Act of 1940, are attached.
(b)(1) Separate certifications for the registrant's principal executive officer and principal financial officer, as required by 18 U.S.C. Section 1350, as adopted pursuant to Section 906 of the Sarbanes-Oxley Act of 2002, and Rule 30a-2(b) under the Investment Company Act of 1940, are attached. The certifications furnished pursuant to this paragraph are not deemed to be "filed" for purposes of Section 18 of the Securities Exchange Act of 1934, or otherwise subject to the liability of that section. Such certifications are not deemed to be incorporated by reference into any filing under the Securities Act of 1933 or the Securities Exchange Act of 1934, except to the extent that the Registrant specifically incorporates them by reference.
(c)(1) Submission of Matters to a Vote of Security Holders is attached. See attached “John Hancock Funds – Nominating and Governance Committee Charter”.
SIGNATURES
Pursuant to the requirements of the Securities Exchange Act of 1934 and the Investment Company Act of 1940, the registrant has duly caused this report to be signed on its behalf by the undersigned, thereunto duly authorized.
John Hancock Investment Trust
| By: | /s/ Andrew Arnott |
| Andrew Arnott | |
| President | |
| Date: | November 12, 2018 |
Pursuant to the requirements of the Securities Exchange Act of 1934 and the Investment Company Act of 1940, this report has been signed below by the following persons on behalf of the registrant and in the capacities and on the dates indicated.
| By: | /s/ Andrew Arnott |
| Andrew Arnott | |
| President | |
| Date: | November 12, 2018 |
| By: | /s/ Charles A. Rizzo |
| Charles A. Rizzo | |
| Chief Financial Officer | |
| Date: | November 12, 2018 |