UNITED STATES
SECURITIES AND EXCHANGE COMMISSION
Washington, D.C. 20549
FORM N-CSR
CERTIFIED SHAREHOLDER REPORT OF REGISTERED MANAGEMENT
INVESTMENT COMPANIES
Investment Company Act File Number: 811-3493
American Federation of Labor and
Congress of Industrial Organizations
Housing Investment Trust
(Exact name of registrant as specified in charter)
1227 25th Street, N.W., Suite 500
Washington, D.C. 20037
(Address of principal executive offices) (Zip code)
Corey F. Rose, Esq.
Dechert LLP
1900 K Street, NW
Washington, DC 20006-1110
(Name and address of agent for service)
(202) 331-8055
(Registrant’s telephone number, including area code)
Date of fiscal year end: December 31
Date of reporting period: January 1, 2020 - December 31, 2020
Item 1. Reports to Stockholders.
A copy of the 2020 Annual Report (the “Report”) of the AFL-CIO Housing Investment Trust (the “Trust” or “Registrant”) transmitted to Trust participants pursuant to Rule 30e-1 under the Investment Company Act of 1940, as amended (17 CFR 270.30e-1) (the “Act”), is included herewith.


2020 was an unforgettable year. We continue to grapple with the consequences of the ongoing impact of COVID-19’s devastation of the global economy and the lives of millions of people, the extraordinarily divisive U.S. elections and their violent aftermath and the ongoing reverberations from the murder of George Floyd and too many other men and women of color.
Despite these unforeseen challenges, the AFL-CIO Housing Investment Trust (HIT) successfully navigated 2020. The strength of the entire HIT team, coupled with the strong support of our investors, Board of Trustees, other labor leaders, and stakeholders throughout this year made 2020 one of the HIT’s most productive years.
It was a special honor in 2020 to know that the HIT’s investments, including 35 projects under construction at year end, contributed to meeting the financial security, employment, and affordable housing needs of union members. Their daily work and sacrifices have kept the HIT, and our entire country, moving forward during the pandemic and an extraordinarily challenging year.
2020 HIGHLIGHTS INCLUDE:
| • | Producing gross and net annual returns of 6.54% and 6.20%, respectively; |
| • | Financing 13 construction and substantial rehabilitation projects with $429.7 million of HIT capital, generating $652.7 million of total development costs that created 2,231 union jobs and 1,674 housing units—72% of which will be affordable; |
| • | Finishing the year at $6.75 billion in net assets and raising $554 million of new capital—our second highest year despite the limitations caused by COVID-19, plus $172 million in reinvested dividends; and |
| • | Operating at the lowest expense ratio in the HIT’s history, 32 basis points at year end. |
We have proven that we can be successful no matter the challenges when we work together and are committed to serving our investors and our communities. We can see light at the end of this tunnel with COVID-19 vaccinations underway and a policy environment that presents new opportunities for investments, labor and housing. While uncertainties remain regarding the way forward from the political and social divisions and the scope of COVID-19’s lasting damage to some sectors of our economy, there is new hope. When people unite for a common purpose, we can do great things, even in the most difficult circumstances.
Thank you for your support in 2020. Here’s to more success in 2021 for the HIT and its investors and to a better time for our country and the world.

Chang Suh
Chief Executive Officer and Co-Chief Portfolio Manager

“Now, more than ever, it is vitally important that the HIT’s investments
help our members earn a family-supporting wage with benefits and a
career path today as well as retire with dignity in the future.”
In the face of the COVID-19 pandemic and all the turmoil of 2020, I am proud to recognize that the HIT rose through this uncertainty to contribute to advancing the retirement security of union members and working families and creating union jobs and affordable and workforce housing, just as it has for over 35 years. We give special thanks to the union workers playing an essential role in keeping our country going—often at risk to themselves. Now, more than ever, it is vitally important that the HIT’s investments help our members earn a family-supporting wage with benefits and a career path today as well as retire with dignity in the future.
In 2020, the HIT committed $429.7 million to construction and development deals. The HIT’s portfolio performance generated positive returns for its investors and its expense ratio was at the lowest level in its history. As of December 31, 2020, construction work was underway at 35 project sites across the country. HIT’s 2020 investments are expected to generate more than 2,231 union jobs and to create and renovate 1,674 housing units—more than 72% of which will be affordable. Since its inception, the HIT has invested $9.1 billion in 545 projects nationwide, with total development costs of $17.1 billion, generating 182.2 million hours of on-site union construction work.
As we look ahead together to better days in 2021 and beyond, I believe that the HIT’s investments will continue to support and strengthen retirement security, job security, economic security, and housing security for our members and for working families throughout our country. We need this empowerment to build a sustainable economy and a stronger democracy for generations to come.
On behalf of the HIT, thank you for your continued support of its mission at this critical time for our nation and for working families.
In Solidarity,

Richard L. Trumka
President, AFL-CIO; Trustee, AFL-CIO Housing Investment Trust
| 2 |  |

DISCUSSION OF FUND PERFORMANCE
(Unaudited)
2020 OVERVIEW The AFL-CIO Housing Investment Trust (HIT) successfully navigated the challenges caused by the COVID-19 pandemic in 2020, generating positive returns for its investors, raising $554 million of new capital (its second highest year on record), managing expenses to an all-time low 32 basis points (bps), while committing $429.7 million in new impact investments (one of the highest levels in its history). These investments are expected to generate 2,231 union construction jobs and create or rehabilitate 1,674 housing units. Despite unprecedented challenges stemming from the pandemic, these results, taken as a whole, reflect that 2020 was one of the HIT’s most successful years. Further, the HIT’s strategy of overweighting high credit multifamily mortgage investments enabled the HIT to end the year well positioned, with a high degree of liquidity and a significant yield advantage. At the end of 2020, the HIT’s yield advantage stood at 48 bps relative to the Bloomberg Barclays U.S. Aggregate Bond Index (Barclay’s Aggregate or Benchmark) and 66 bps to the AAA component of the Barclays Aggregate (AAA Index). The HIT believes that it has a strong pipeline of impact investments heading into 2021.
2020 RETURN SUMMARY 2020 was defined by the impact of the COVID-19 pandemic on capital markets. The HIT delivered positive returns with its high credit quality portfolio and strategy
of overweighting agency-insured multifamily mortgage-backed securities (MBS) that provide a yield spread over Treasuries and superior prepayment protection, compared to other mortgage products. As of December 31, 2020, the HIT’s gross and net annual returns were 6.54% and 6.20%, respectively, compared to 7.51% for the Benchmark. In 2020, riskier investments, including equities and lower credit quality fixed income investments, outperformed. Treasury yields reached historical lows while equity and credit markets soared to new highs despite an economy reeling from the pandemic. Relative to a comparable credit profile, the HIT portfolio’s 2020 returns exceeded the AAA Index’s annual return by 11 bps on a gross of fee basis.
PERFORMANCE ATTRIBUTION SUMMARY Interest rates fell considerably in 2020, as capital markets reacted to the pandemic, driving a flight to safety, and responding to central bank action supporting low interest rates. Accordingly, fixed income assets generated strong, positive returns. Corporate bonds and Treasuries were 2020’s best performing fixed income sectors. Agency multifamily securities had a mixed performance compared to Treasuries. Government-sponsored enterprise (GSE) benchmark spreads tightened 18 bps on robust demand, while Federal Housing Administration (FHA)/Government National Mortgage Association (Ginnie Mae) construction and permanent
mortgage securities widened by 9 bps. On a relative basis, conventional multifamily MBS outperformed single-family MBS due to their duration, call protection and stable cash flow, and investors’ demand for yield spread and prepayment protection drove agency multifamily spreads tighter. HIT returns were positively driven by its yield advantage. HIT’s relative returns were challenged because of its portfolio strategy and composition differences to the Benchmark. Corporate bonds and Treasuries, combined, make up two thirds of the Benchmark. The HIT holds no corporate bonds and averaged only 5% in Treasury holdings in 2020. Additionally, the HIT managed its duration short relative to the Benchmark, defending against Benchmark extension, which also detracted from performance as rates hit all-time lows.
2020 MARKET ENVIRONMENT— IMPACT OF COVID-19
The United States saw Great Depression era unemployment rates by spring, with businesses shuttering and many developed countries completely locking down for several months in 2020. However, the swift action in fiscal and monetary policy stimulus supported growth and capital markets throughout the year. U.S. GDP contracted an estimated 3.5% in 2020, recovering from the worst recession since the Great Depression1. The Covid-19 recession ended the longest U.S. expansion on record.
1 Bureau of Economic Analysis

The long-awaited U.S. presidential election resulted in a new Democratic administration that will shape future economic policy and pandemic response.
At year end 2020, the domestic economic recovery had lost momentum. The pandemic caused employment to contract. The unemployment rate of 6.7% was twice as high as pre-pandemic rates, and many consider the real unemployment rate to be much higher2. Nevertheless, capital markets showed optimism due to the approval of multiple vaccines, the Federal Reserve’s continued commitment to dovish monetary policy and the passage of additional fiscal stimulus. This led to improved expectations of U.S. growth and outlook. Expectations for continued easing monetary policy in the face of a highly uncertain outlook drove investors into riskier assets.
THE YIELD CURVE AND INTEREST RATES Interest rates dropped across all maturities in 2020, driven primarily by the historic flight to quality caused by the market’s reaction to the pandemic. The Federal Reserve took historic steps to inject liquidity in capital markets and the federal government provided support to stabilize the economy with two stimulus bills exceeding $3 trillion. Interest rates fell to record lows and remained there across the curve for most of the year supported by Federal Reserve action. While cutting interest rates to zero, the central bank ballooned its balance sheet to a record level, providing liquidity and credit to fixed income markets including
securitized mortgage assets. The Federal Reserve’s balance sheet stood at $7.4 trillion or approximately 35% of U.S. GDP at year end and is trending upward. Ultimately, the yield curve bull-steepened as short-term rates declined more precipitously than longer term rates. During 2020, the two-year rate fell by 145 bps, while the 5-, 7-, 10- and 30-year rates decreased by 133, 119, 100 and 74 bps, respectively. While longer term rates pushed higher in the fourth quarter above their well-most of 2020, an extremely accommodative Federal Reserve and low realized inflation will likely keep interest rates lower longer. Market expectations along with the Federal Reserve’s forward guidance do not anticipate short term rates rising until 2023.
MULTIFAMILY MBS
In response to rapid pandemic-related job losses, the Federal Housing Finance Agency (FHFA) and the federal government enacted eviction moratoria for GSE and federally insured loans that helped renters affected by the pandemic and provided mortgage payment deferrals. Rent collections and fundamentals of multifamily rental properties, in aggregate, have performed better than market expectations. More specifically, multifamily securities in the HIT portfolio have performed well as the overwhelming majority of these securities are agency/ government guaranteed. Agency-insured multifamily securities have experienced low levels of forbearance and defaults, which
have been concentrated in small balance loans, and senior and student housing. The HIT has minimal exposure to these types of housing investments. In aggregate, as of December 31, 2020, 1.2% of Fannie Mae Delegated Underwriting and Servicing (DUS) MBS and 2.3% of Freddie Mac securities outstanding were in forbearance, while 1.2% of Ginnie Mae project loans are classified as over 60 days delinquent.
The fundamentals of the multifamily market held up reasonably well despite the pandemic, due in large part to the federal policy action. The apartment vacancy rate held relatively steady throughout 2020. National vacancies ended the year at 5.2%, representing a 50-bps increase year-over-year, according to Moody’s Analytics/Reis Inc. While the pandemic temporarily shutdown some worksites, 285,000 multifamily units were delivered in 2020, about 7% less than 20193. The roll out of vaccines and additional stimulus legislation can be expected to support a job market rebound in 2021, leading to greater housing demand. The long-term fundamentals of multifamily housing remain on solid ground and demographics favoring rental housing point to sustained long-term demand.
SPREADS Despite a near halt at the end of the first quarter, multifamily origination ended 2020 with record level issuance in agency lending as refinancing of existing loans skyrocketed. Substantial demand from institutional investors in search of yield spread with prepayment protection drove spreads tighter to
2 Bureau of Labor Statistics
3 Yardi Matrix
| 4 |  |

Treasuries in the last three quarters of the year. However, agency multifamily MBS ultimately underperformed both Treasuries and investment grade credit in 2020. Investment grade corporate bond spreads finished 3 bps wider to Treasuries at historic low yields as investors reached for returns despite credit risk and highly leveraged balance sheets. The decline in Treasury rates in 2020 weighed on spread performance in higher premium multifamily securities including the HIT’s investments, as mortgage security spreads widened. Spreads on FHA/Ginnie Mae permanent and construction/ permanent MBS, and Fannie Mae DUS 10/9.5 structures, in which the HIT specializes, widened by 24, 25 and 4 bps, respectively.
THE HIT’S 2020 MULTIFAMILY INVESTMENTS—STRONG RESULTS
The HIT’s 2020 multifamily housing production totaled $429.7 million across 13 projects with total development costs of $652.7 million4. These investments generated 2,231 union jobs and financed the creation or rehabilitation of 1,674 housing units, of which 72% will be affordable. Overcoming a slow start due to the uncertainty of the pandemic in the the HIT committed seven of its 2020 transactions in the fourth quarter alone. The HIT continued to diversify its production in 2020, using its direct and bridge lending authorities and varied construction and permanent loan vehicles through its relationships with state housing financing agencies.
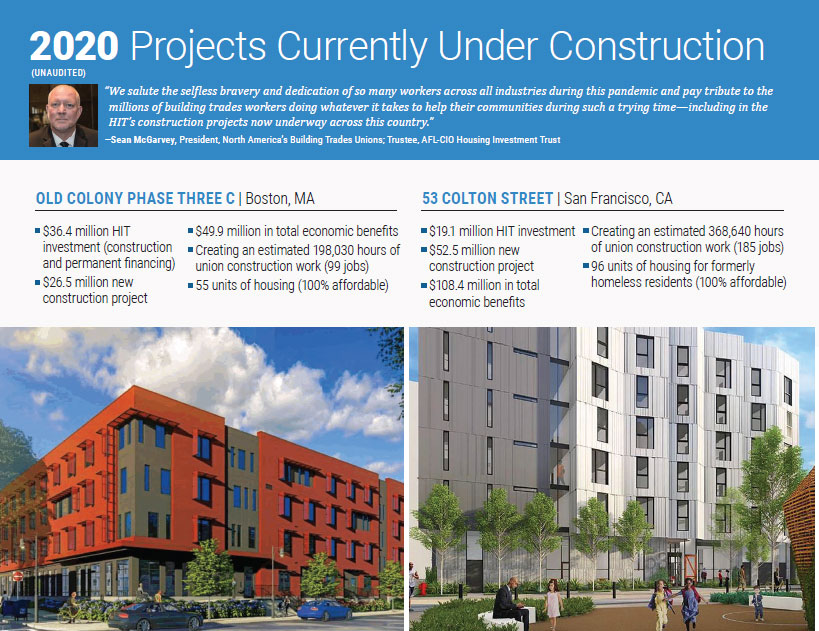
The HIT launched its $1 billion five-year Bay Area Investment Initiative in September 2020 and committed to its first two financings in the fourth quarter. In the Bay Area Investment Initiative, the HIT plans to invest $500 million of its own funds and join forces with public-, private- and nonprofit-sector partners to leverage an additional $500 million from other sources to develop affordable, workforce and market-rate housing in the Bay Area. Its first two projects are expected to contribute positively to the HIT’s portfolio’s yield and to create approximately 1.2 million hours of union construction work, 289 housing units (144 affordable) and $342.8 million in total economic benefits5.
The HIT continued a high volume of activity in its other key markets nationwide (Boston, Chicago, Minnesota, New York), and is tracking a healthy 2021 pipeline, working with lending partners on affordable, workforce and market rate housing developments.
LOOKING AHEAD—UNCERTAINTY REMAINS
The COVID-19 pandemic will continue to be the dominant factor in the global economy in 2021. Economic growth has lost momentum as output struggles with recent restrictions to respond to the COVID-19 resurgence. However, capital markets are pricing risk assets to near perfection, looking past the short-term risks. Markets are instead expecting a return to growth and renewed business activity. These valuations could
potentially experience volatility if risks to the outlook materialize. The Federal Reserve has committed to maintaining its current rate range for federal funds of 0–0.25% until 2023 and guided new principles and a framework to maximize employment while allowing higher inflation levels averaging above 2%. The central bank has also committed to keep their current level of asset purchases, supporting interest rates from rising significantly. We believe investors could be served well by diversifying into investment grade fixed income products, away from lower grade assets such as riskier credit, that focus on safety and liquidity without sacrificing yield, like the HIT portfolio.
The importance of affordable housing, job creation and the ability to generate relative value in a historically low interest rate environment have only grown as the pandemic continues. The HIT’s ability to finance direct, credit-enhanced multifamily construction and bridge loans augments the fundamental value of the portfolio and generates higher income without adding significant credit risk, all while providing mission-related collateral benefits of generating housing and union jobs. The HIT believes that it should be well-positioned to weather potential financial market and economic volatility with a fundamentally sound portfolio of high credit quality and liquid assets that provide capital preservation, attractive risk-adjusted income and diversification away from deteriorating credit fundamentals and record high valuations in corporate credit.
| 4 | This includes New Markets Tax Credits allocated by HIT subsidiary Building America CDE, Inc. |
| 5 | Job and economic impact figures are estimates calculated using IMPLAN, an input-output model, based on HIT and HIT subsidiary Building America CDE, Inc. project data. Data is current as of December 31, 2020. Economic impact data is in 2019 dollars and all other figures are nominal. |

OTHER IMPORTANT INFORMATION
(Unaudited)
EXPENSE EXAMPLE
Participants in the HIT incur ongoing expenses related to the management and distribution activities of the HIT, as well as certain other expenses. The expense example in the table below is intended to help participants understand the ongoing costs (in dollars) of investing in the HIT and to compare these costs with the ongoing costs of investing in other mutual funds. The example is based on an investment of $1,000 invested at the beginning of the period, July 1, 2020, and held for the entire period ended December 31, 2020.
Actual Expenses: The first line of the table below provides information about actual account values and actual expenses. Participants may use the information in this line, together with the amount they invested, to estimate the expenses that they paid over the period. Simply divide the account value by $1,000 (for example, an $800,000 account value divided by $ 1,000 = 800), then multiply the result by the number in the first line under the heading entitled “Expenses Paid During Six-Month Period Ended December 31, 2020” to estimate the expenses paid on a particular account during this period.
Hypothetical Expenses (for Comparison Purposes Only): The second line of the table below provides information about hypothetical account values and hypothetical expenses based on the HIT’s actual expense ratio and an assumed rate of return of 5% per year before expenses, which is not the HIT’s actual return. The hypothetical account values and expenses may not be used to estimate the actual ending account balance or
expenses a participant paid for the period. Participants may use this information to compare the ongoing costs of investing in the HIT and other mutual funds. To do so, compare this 5% hypothetical example with the 5% hypothetical examples that appear in the shareholder reports of the other mutual funds.
Please note that this example is useful in comparing funds’ ongoing costs only. It does not include any transactional costs, such as sales charges (loads), redemption fees, or exchange fees. The HIT does not have such transactional costs, but many other funds do.
AVAILABILITY OF QUARTERLY PORTFOLIO SCHEDULE
In addition to disclosure in its Annual and Semi-Annual Reports to Participants, the HIT also files its complete schedule of portfolio holdings with the Securities and Exchange Commission (SEC) for the first and third quarters of each fiscal year as an exhibit to its reports on Form N-PORT. The HIT’s Forms N -PORT are available on the SEC’s website at http://www.sec.gov. Participants may also obtain copies of the information on HIT’s Form N-PORT, without charge, upon request, by calling the HIT collect at 202-331-8055.
PROXY VOTING
Except for its interest in its wholly owned subsidiary, HIT Advisers LLC, and shares in mutual funds holding short-term or overnight cash, if applicable, the HIT invests exclusively in nonvoting securities and has not deemed it necessary to adopt
policies and procedures for the voting of portfolio securities. The HIT has reported information regarding how it voted in matters related to its subsidiary in its most recent filing with the SEC on Form N-PX. This filing is available on the SEC’s website at http://www.sec.gov. Participants may also obtain a copy of the HIT’s report on Form N- PX, without charge, upon request, by calling the HIT collect at 202-331-8055.
2020 HIT PARTICIPANTS MEETING
The 2020 Annual Meeting of Participants was held via videoconference on Wednesday, December 30, 2020. The following matters were put to a vote of the Participants at the meeting through the solicitation of proxies:
Election of Chair of the Board of Trustees Chris Coleman was elected to chair the Board of Trustees by: votes for 4,026,202.297; no votes against; votes abstaining 46,167.321; votes not cast 1,584,883.87.
Election of Class I Trustees (see chart below).
Ernst & Young LLP was ratified as the HIT’s Independent Registered Public Accounting Firm by: votes for 4,026,202.297; no votes against; votes abstaining 46,167.321; votes not cast 1,584,883.871.
The following Trustees were not up for reelection and their terms of office continued after the meeting: Timothy J. Driscoll, Sean McGarvey, Terry O’Sullivan, Elizabeth Shuler, Kevin Filter, Jamie S. Rubin, Tony Stanley and Harry Thompson.
| | | | | | |
| | EXPENSE EXAMPLE | Beginning
Account Value
July 1, 2020 | Ending
Account Value
December 31, 2020 | Expenses Paid During
Six-Month Period Ended
December 31, 2020* | |
| | Actual expenses | $ 1,000 | $ 1,008.63 | $ 1.67 | |
| | Hypothetical expenses | $ 1,000 | $ 1,023.48 | $ 1.68 | |
| | (5% annual return before expenses) | | | |
| | | | | | |
| | * Expenses are equal to the HIT’s annualized six-month expense ratio of 0.33%, as of December 31, 2020, multiplied by the average account value over the period, multiplied by 184/366 (to reflect the one-half period). | |
| | | |
| | | |
| | ANNUAL MEETING OF PARTICIPANTS: CLASS I TRUSTEES RESULTS | |
| | Trustee | Votes For | Votes Against | Votes Abstaining* | |
| | Kenneth W. Cooper | 4,026,202.297 | 0 | 46,167.321 | |
| | Kenneth E. Rigmaiden | 4,026,202.297 | 0 | 46,167.321 | |
| | Anthony Shelton | 4,026,202.297 | 0 | 46,167.321 | |
| | Richard L. Trumka | 4,026,202.297 | 0 | 46,167.321 | |
| | Bridget Gainer | 4,024,139.879 | 0 | 48,229.739 | |
| | Jack F. Quinn, Jr. | 4,024,139.879 | 0 | 48,229.739 | |
| | Deidre L. Schmidt | 4,024,139.879 | 0 | 48,229.739 | |
| | William C. Thompson, Jr. | 4,024,139.879 | 0 | 48,229.739 | |
| | | | |
| | * Votes not cast: 1,584,883.871 | | |
| | | | |
| | | | |
| | | | |
| 8 | |

Report of Independent Registered Public Accounting Firm
To the Board of Trustees and Participants of American Federation of Labor and Congress of Industrial Organizations Housing Investment Trust:
Opinion on the Financial Statements
We have audited the accompanying statement of assets and liabilities of American Federation of Labor and Congress of Industrial Organizations Housing Investment Trust (the “Trust”), including the schedule of portfolio investments, as of December 31, 2020, and the related statement of operations for the year then ended, the statements of changes in net assets for each of the two years in the period then ended, the financial highlights for each of the five years in the period then ended and the related notes (collectively referred to as the “financial statements”). In our opinion, the financial statements present fairly, in all material respects, the financial position of the Trust as of December 31, 2020, the results of its operations for the year then ended, the changes in its net assets for each of the two years in the period then ended, and its financial highlights for each of the five years in the period then ended, in conformity with U.S. generally accepted accounting principles.
Basis for Opinion
These financial statements are the responsibility of the Trust’s management. Our responsibility is to express an opinion on the Trust’s financial statements based on our audits. We are a public accounting firm registered with the Public Company Accounting Oversight Board (United States) (“PCAOB”) and are required to be independent with respect to the Trust in accordance with the U.S. federal securities laws and the applicable rules and regulations of the Securities and Exchange Commission and the PCAOB.
We conducted our audits in accordance with the standards of the PCAOB. Those standards require that we plan and perform the audit to obtain reasonable assurance about whether the financial statements are free of material misstatement, whether due to error or fraud. The Trust is not required to have, nor were we engaged to perform, an audit of the Trust’s internal control over financial reporting. As part of our audits, we are required to obtain an understanding of internal control over financial reporting, but not for the purpose of expressing an opinion on the effectiveness of the Trust’s internal control over financial reporting. Accordingly, we express no such opinion.
Our audits included performing procedures to assess the risks of material misstatement of the financial statements, whether due to error or fraud, and performing procedures that respond to those risks. Such procedures include examining, on a test basis, evidence regarding the amounts and disclosures in the financial statements. Our procedures included confirmation of securities owned as of December 31, 2020, by correspondence with the custodian, brokers, and counterparties. Our audits also included evaluating the accounting principles used and significant estimates made by management, as well as evaluating the overall presentation of the financial statements. We believe that our audits provide a reasonable basis for our opinion.

We have served as the Trust’s auditor since 2002.
Tysons, Virginia
February 26, 2021
| 10 | |
Statement of Assets and Liabilities
December 31, 2020 (dollars in thousands, except per share data)
| Assets | | |
| | Investments, at value (cost $6,477,968) | $ 6,836,208 |
| | Cash | 743 |
| | Accrued interest receivable | 18,055 |
| | Receivables for investments sold | 26,047 |
| | Right of use asset | 4,744 |
| | Other assets | 3,433 |
| | Total assets | 6,889,230 |
| | | |
| Liabilities | | |
| | Payables for investments purchased | 108,831 |
| | Redemptions payable | 16,208 |
| | Income distribution and capital gains payable, net of dividends reinvested of $39,962 | 3,439 |
| | Refundable deposits | 742 |
| | Accrued salaries and fringe benefits | 4,463 |
| | Lease Liability | 5,090 |
| | Other liabilities and accrued expenses | 1,169 |
| | Total liabilities | 139,942 |
| | | |
| | Other commitments and contingencies (Note 5 of financial statements) | — |
| | | |
| Net assets applicable to participants’ equity— | | |
| | Certificates of participation—authorized unlimited; | |
| | Outstanding 5,736,083 units | $6,749,288 |
| | | |
| Net asset value per unit of participation (in dollars) | $ 1,176.64 |
| | | |
| | | |
| Participants’ equity | | |
| | Participants’ equity consisted of the following: | |
| | Amount invested and reinvested by current participants | $ 6,392,413 |
| | Distributable earnings (accumulated losses) | 356,875 |
| | Total participants’ equity | $6,749,288 |
See accompanying Notes to Financial Statements.
Schedule of Portfolio Investments
December 31, 2020 (dollars in thousands)
FHA Permanent Securities (2.4% of net assets)
| | Interest Rate | Maturity Date | Unfunded
Commitments1 | Face Amount | Amortized Cost | Value |
| Multifamily | | 3.65% | | Dec-2037 | $ | — | | $ | 8,229 | | $ | 8,367 | | $ | 8,499 | |
| | | 3.75% | | Aug-2048 | | — | | | 3,750 | | | 3,746 | | | 3,826 | |
| | | 4.00% | | Dec-2053 | | — | | | 61,715 | | | 61,692 | | | 67,640 | |
| | | 4.10% | | Dec-2060 | | — | | | 21,986 | | | 21,995 | | | 24,508 | |
| | | 4.79% | | May-2053 | | — | | | 5,012 | | | 5,223 | | | 5,667 | |
| | | 5.17% | | Feb-2050 | | — | | | 7,627 | | | 8,150 | | | 8,457 | |
| | | 5.35% | | Mar-2047 | | — | | | 6,881 | | | 6,890 | | | 6,922 | |
| | | 5.55% | | Aug-2042 | | — | | | 7,276 | | | 7,278 | | | 7,322 | |
| | | 5.60% | | Jun-2038 | | — | | | 2,168 | | | 2,171 | | | 2,182 | |
| | | 5.80% | | Jan-2053 | | — | | | 1,966 | | | 1,975 | | | 2,275 | |
| | | 5.87% | | May-2044 | | — | | | 1,655 | | | 1,654 | | | 1,666 | |
| | | 5.89% | | Apr-2038 | | — | | | 4,083 | | | 4,087 | | | 4,112 | |
| | | 6.20% | | Apr-2052 | | — | | | 11,114 | | | 11,110 | | | 12,813 | |
| | | 6.40% | | Aug-2046 | | — | | | 3,595 | | | 3,596 | | | 3,680 | |
| | | 6.60% | | Jan-2050 | | — | | | 3,228 | | | 3,250 | | | 3,703 | |
| | | | | | | — | | | 150,285 | | | 151,184 | | | 163,272 | |
| When Issued2 | | 2.50% | | Sep-2063 | | 5,702 | | | — | | | — | | | (63 | ) |
| | | 3.72% | | Feb-2062 | | 4,470 | | | — | | | — | | | 315 | |
| | | 3.90% | | Mar-2062 | | 3,090 | | | — | | | — | | | 257 | |
| | | | | | | 13,262 | | | — | | | — | | | 509 | |
| Total FHA Permanent Securities | $ | 13,262 | | $ | 150,285 | | $ | 151,184 | | $ | 163,781 | |
Ginnie Mae Securities (26.1% of net assets)
| | Interest Rate | Maturity Date | Face Amount | Amortized Cost | Value |
| Single Family | 4.00% | Feb-2040–Jun-2040 | $ 1,882 | $ 1,900 | $ 2,086 |
| | 4.50% | Aug–2040 | 1,077 | 1,095 | 1,220 |
| | 5.50% | Jan-2033–Jun-2037 | 1,231 | 1,229 | 1,420 |
| | 6.00% | Jan-2032–Aug-2037 | 885 | 884 | 1,033 |
| | 6.50% | Jul-2028 | 43 | 43 | 49 |
| | 7.00% | Apr-2026–Jan-2030 | 569 | 571 | 646 |
| | 7.50% | Aug-2025–Aug-2030 | 279 | 281 | 315 |
| | 8.00% | Sep-2026–Nov-2030 | 252 | 254 | 285 |
| | 8.50% | Jun-2022–Aug-2027 | 98 | 99 | 107 |
| | 9.00% | Dec-2022–Jun-2025 | 6 | 6 | 6 |
| | | | 6,322 | 6,362 | 7,167 |
| | | | | | |
| Multifamily | 2.00% | Sep-2062 | 30,000 | 31,015 | 30,760 |
| | 2.15% | May-2056 | 3,981 | 3,974 | 4,066 |
| | 2.20% | May-2042–Jun-2056 | 15,409 | 15,830 | 16,001 |
| | 2.25% | Dec-2048 | 4,875 | 4,837 | 5,011 |
| | 2.30% | Mar-2056–Oct-2056 | 36,122 | 35,919 | 37,146 |
| | 2.31% | Nov-2051 | 7,076 | 7,076 | 7,422 |
| | 2.32% | Sep-2060 | 27,655 | 29,227 | 29,434 |
| | 2.35% | Dec-2040–Nov-2056 | 12,065 | 12,090 | 12,477 |
| | 2.40% | Aug-2047 | 6,173 | 6,181 | 6,381 |
| | 2.46% | Jan-2053 | 51,015 | 51,381 | 53,062 |
| | 2.50% | Jul-2045–Mar-2057 | 20,491 | 20,476 | 21,313 |
| | 2.50% | Sep-2058 | 30,190 | 29,678 | 31,586 |
| | 2.53% | Jul-2038–Feb-2040 | 5,294 | 5,349 | 5,334 |
| | 2.60% | Apr-2048–Jun-2059 | 40,304 | 40,468 | 41,807 |
| | 2.70% | May-2048–Jul-2058 | 31,524 | 31,699 | 32,765 |
| | 2.72% | Feb-2044 | 310 | 318 | 319 |
| | 2.74% | Apr-2057 | 24,458 | 26,697 | 26,484 |
| | 2.79% | Apr-2049 | 10,489 | 10,586 | 11,021 |
| | 2.80% | Feb-2053 | 60,000 | 57,109 | 64,769 |
| 12 | |
Schedule of Portfolio Investments continued
December 31, 2020 (dollars in thousands)
Ginnie Mae Securities continued | |
| | | | | | |
| Interest Rate | Maturity Date | Face Amount | Amortized Cost | Value | |
| 2.80% | Dec-2059 | 15,095 | 14,887 | 15,661 | |
| 2.82% | Apr-2050 | 1,500 | 1,529 | 1,583 | |
| 2.89% | Mar-2046 | 27,953 | 28,114 | 28,770 | |
| 2.99% | Jul-2048 | 8,385 | 9,131 | 9,216 | |
| 3.00% | Mar-2051–May-2062 | 20,000 | 20,087 | 20,707 | |
| 3.00% | May-2062 | 95,014 | 103,052 | 103,833 | |
| 3.03% | Jan-2056 | 31,203 | 33,335 | 34,460 | |
| 3.05% | May-2054 | 11,545 | 11,595 | 12,553 | |
| 3.10% | Jan-2044–May-2059 | 24,333 | 24,265 | 24,935 | |
| 3.11% | Jan-2049 | 17,025 | 17,605 | 17,577 | |
| 3.19% | Sep-2051 | 5,000 | 5,029 | 5,179 | |
| 3.20% | Jul-2041 | 8,198 | 8,101 | 8,329 | |
| 3.21% | Jul-2046 | 7,760 | 7,976 | 8,187 | |
| 3.25% | Sep-2054 | 35,000 | 34,704 | 37,824 | |
| 3.25% | Sep-2054–Jun-2059 | 30,944 | 31,549 | 34,186 | |
| 3.25% | Apr-2059 | 45,000 | 43,190 | 49,519 | |
| 3.26% | Nov-2043 | 14,601 | 14,622 | 15,365 | |
| 3.30% | May-2055 | 10,000 | 9,491 | 11,037 | |
| 3.33% | Jun-2043 | 8,811 | 9,061 | 9,050 | |
| 3.34% | Sep-2059 | 17,268 | 17,606 | 19,103 | |
| 3.35% | Nov-2042–Mar-2044 | 23,181 | 22,743 | 24,516 | |
| 3.37% | Dec-2046 | 18,691 | 18,907 | 19,307 | |
| 3.38% | Aug-2059 | 34,995 | 35,857 | 39,020 | |
| 3.38% | Aug-2059 | 44,010 | 44,867 | 48,522 | |
| 3.38% | Jan-2060 | 59,797 | 59,806 | 66,464 | |
| 3.39% | Feb-2059 | 14,367 | 14,653 | 16,018 | |
| 3.42% | May-2042 | 10,000 | 10,136 | 10,702 | |
| 3.44% | Feb-2044 | 2,535 | 2,646 | 2,590 | |
| 3.46% | Apr-2051 | 1,516 | 1,563 | 1,544 | |
| 3.48% | May-2059 | 10,955 | 11,177 | 12,169 | |
| 3.49% | Aug-2058 | 11,017 | 11,278 | 11,911 | |
Ginnie Mae Securities continued
| | Interest Rate | Maturity Date | Face Amount | Amortized Cost | Value |
| | 3.50% | Feb-2051–Jan-2054 | 20,164 | 20,059 | 20,830 |
| | 3.51% | Mar-2053 | 46,122 | 49,786 | 51,079 |
| | 3.53% | Apr-2042 | 16,636 | 17,168 | 18,430 |
| | 3.55% | Apr-2057 | 41,486 | 42,519 | 41,833 |
| | 3.57% | Sep-2052 | 6,500 | 6,725 | 7,199 |
| | 3.57% | Nov-2059 | 48,983 | 49,702 | 54,887 |
| | 3.60% | Jun-2057 | 13,751 | 14,243 | 15,291 |
| | 3.62% | Dec-2057 | 28,759 | 29,273 | 32,014 |
| | 3.65% | Dec-2045–Oct-2058 | 18,930 | 18,758 | 20,691 |
| | 3.67% | Nov-2035 | 14,501 | 14,964 | 16,003 |
| | 3.74% | Aug-2059 | 15,713 | 16,021 | 17,584 |
| | 3.75% | Apr-2046 | 6,499 | 6,514 | 6,977 |
| | 3.77% | Jun-2045 | 2,768 | 2,799 | 2,800 |
| | 3.92% | Aug-2039 | 42,838 | 45,252 | 47,215 |
| | 4.10% | May-2051 | 3,880 | 4,205 | 4,385 |
| | 4.15% | Sep-2051 | 17,382 | 17,442 | 17,484 |
| | 4.19% | May-2060 | 28,435 | 28,815 | 32,051 |
| | 4.20% | Aug-2060 | 47,580 | 48,535 | 54,250 |
| | 4.25% | Sep-2038 | 32,575 | 32,720 | 34,848 |
| | 4.45% | Jun-2055 | 2,512 | 2,418 | 2,835 |
| | 4.50% | May-2038 | 17,307 | 18,504 | 18,380 |
| | 4.63%3 | Sep-2037 | 1,500 | 1,467 | 1,504 |
| | 4.90%3 | Mar-2044 | 1,000 | 991 | 1,003 |
| | 5.25% | Apr-2037 | 17,420 | 17,415 | 17,839 |
| | 5.34% | Jul-2040 | 2,394 | 2,368 | 2,449 |
| | | | 1,578,765 | 1,607,135 | 1,696,856 |
| When Issued2 | 2.00% | Sep-2062–Jun-2063 | 45,000 | 46,602 | 46,948 |
| | 2.78% | Aug-2058 | 11,003 | 12,014 | 12,054 |
| | | | 56,003 | 58,616 | 59,002 |
| Total Ginnie Mae Securities | | $1,641,090 | $1,672,113 | $1,763,025 |
Schedule of Portfolio Investments continued
December 31, 2020 (dollars in thousands)
Fannie Mae Securities (44.2% of net assets) | |
| | | | | | | | | |
| | | | Maturity | Unfunded | Face | Amortized | | |
| | Interest Rate4 | Date | Commitments1 | Amount | Cost | Value | |
| Single Family | 0.40% | 1M LIBOR+25 | Mar-2037 | $— | $ 163 | $ 162 | $ 163 | |
| | 0.47% | 1M LIBOR+32 | Jun-2037 | — | 974 | 974 | 980 | |
| | 0.55% | 1M LIBOR+40 | Apr-2037 | — | 403 | 402 | 406 | |
| | 0.61% | 1M LIBOR+46 | Oct-2042 | — | 2,932 | 2,943 | 2,965 | |
| | 0.65% | 1M LIBOR+50 | Jun-2042 | — | 5,285 | 5,289 | 5,345 | |
| | 0.70% | 1M LIBOR+55 | Mar-2042 | — | 4,390 | 4,396 | 4,449 | |
| | 0.75% | 1M LIBOR+60 | Oct-2043 | — | 6,118 | 6,145 | 6,210 | |
| | 1.81% | 6M LIBOR+155 | Nov-2033 | — | 1,080 | 1,080 | 1,107 | |
| | 2.00% | | Jul-2050 | — | 36,275 | 37,476 | 37,712 | |
| | 2.05% | 12M LIBOR+168 | Nov-2034 | — | 318 | 324 | 331 | |
| | 2.35% | 12M LIBOR+150 | Jul-2033 | — | 149 | 148 | 154 | |
| | 2.39% | 12M LIBOR+170 | Oct-2042 | — | 2,822 | 2,877 | 2,951 | |
| | 2.40% | 12M LIBOR+153 | Feb-2045 | — | 3,498 | 3,559 | 3,644 | |
| | 2.48% | 6M LIBOR+161 | Aug-2033 | — | 131 | 131 | 135 | |
| | 2.49% | 1Y UST+222 | Aug-2033 | — | 259 | 259 | 272 | |
| | 2.50% | | May-2050–Sep-2050 | — | 145,689 | 152,810 | 153,471 | |
| | 2.50% | | Jul-2050 | — | 29,053 | 30,211 | 30,652 | |
| | 2.50% | | Jul-2050 | — | 38,754 | 40,570 | 41,072 | |
| | 2.50% | | Nov-2050 | — | 29,729 | 31,261 | 31,327 | |
| | 2.60% | 1Y UST+222 | Jul-2033 | — | 680 | 682 | 713 | |
| | 2.71% | 1Y UST+220 | Aug-2033 | — | 558 | 558 | 585 | |
| | 3.00% | | Apr-2031–Jun-2050 | — | 74,621 | 77,024 | 79,360 | |
| | 3.36% | 12M LIBOR+156 | Apr-2034 | — | 576 | 586 | 601 | |
| | 3.50% | | Oct-2026–Jan-2050 | — | 148,434 | 153,306 | 158,832 | |
| | 3.61% | 1Y UST+211 | May-2033 | — | 269 | 270 | 283 | |
| | 4.00% | | May-2024–Jun-2048 | — | 75,276 | 77,746 | 81,784 | |
| | 4.50% | | May-2024–Dec-2048 | — | 52,531 | 54,246 | 57,554 | |
| | 5.00% | | Sep-2022–Apr-2041 | — | 8,061 | 8,272 | 9,287 | |
| | 5.50% | | Sep-2032–Jun-2038 | — | 3,793 | 3,798 | 4,400 | |
| | 6.00% | | Nov-2028–Nov-2037 | — | 2,827 | 2,836 | 3,350 | |
| | 6.50% | | Sep-2028–Jul-2036 | — | 445 | 454 | 521 | |
| | 7.00% | | Sep-2027–May-2032 | — | 573 | 573 | 665 | |
| | 7.50% | | Jan-2027–Sep-2031 | — | 126 | 125 | 137 | |
| | 8.00% | | Aug-2030–May-2031 | — | 38 | 38 | 38 | |
| | | | | — | 676,830 | 701,531 | 721,456 | |
| Multifamily | 0.44% | 1M LIBOR+29 | Feb-2028 | — | 30,420 | 30,425 | 30,358 | |
| | 0.46% | 1M LIBOR+31 | Mar-2028 | — | 38,275 | 38,285 | 38,227 | |
| | 0.49% | 1M LIBOR+34 | Jan-2028 | — | 22,425 | 22,429 | 22,379 | |
| | 0.50% | 1M LIBOR+35 | Dec-2027 | — | 32,050 | 32,053 | 32,059 | |
| | 0.55% | 1M LIBOR+40 | Sep-2028 | — | 26,082 | 26,085 | 26,051 | |
Fannie Mae Securities continued
| | | | Maturity | Unfunded | Face | Amortized | |
| | Interest Rate4 | Date | Commitments1 | Amount | Cost | Value |
| | 0.59% | 1M LIBOR+44 | May-2027 | — | 16,840 | 16,841 | 16,844 |
| | 0.73% | 1M LIBOR+58 | May-2029 | — | 25,000 | 25,012 | 25,042 |
| | 0.73% | 1M LIBOR+58 | Jun-2029 | — | 41,302 | 41,338 | 41,372 |
| | 0.99% | 1M LIBOR+85 | Jan-2023 | — | 7,803 | 7,802 | 7,862 |
| | 1.06% | | Dec-2027 | — | 21,424 | 21,437 | 21,619 |
| | 1.17% | | Aug-2030–Nov-2030 | — | 34,867 | 34,871 | 34,734 |
| | 1.22% | | Jul-2030 | — | 25,610 | 25,728 | 25,824 |
| | 1.25% | | Jul-2030 | — | 37,950 | 38,124 | 38,074 |
| | 1.27% | | Jul-2030 | — | 14,235 | 14,374 | 14,413 |
| | 1.31% | | Aug-2030 | — | 4,483 | 4,569 | 4,539 |
| | 1.32% | | Aug-2030 | — | 21,000 | 21,380 | 21,339 |
| | 1.38% | | Jul-2030 | — | 10,500 | 10,696 | 10,722 |
| | 1.41% | | Jul-2030 | — | 3,373 | 3,421 | 3,458 |
| | 1.46% | | Jul-2030 | — | 7,758 | 7,903 | 7,986 |
| | 1.47% | | Jul-2030–Dec-2030 | — | 15,425 | 15,605 | 15,843 |
| | 1.50% | | Aug-2030 | — | 1,193 | 1,232 | 1,231 |
| | 1.52% | | Jul-2032 | — | 16,530 | 16,711 | 16,855 |
| | 1.53% | | Jul-2032 | — | 10,500 | 10,702 | 10,717 |
| | 1.55% | | Jul-2032 | — | 20,500 | 20,895 | 20,965 |
| | 1.57% | | Aug-2037 | — | 48,705 | 48,962 | 48,581 |
| | 1.65% | | Jul-2030 | — | 1,290 | 1,333 | 1,348 |
| | 1.68% | | Sep-2032 | — | 13,139 | 13,419 | 13,339 |
| | 1.71% | | Sep-2035–Nov-2035 | — | 25,605 | 25,970 | 26,165 |
| | 1.76% | | Aug-2035 | — | 9,100 | 9,149 | 9,261 |
| | 1.77% | | Sep-2035 | — | 3,270 | 3,351 | 3,363 |
| | 1.82% | | Jul-2035 | — | 4,722 | 4,768 | 4,877 |
| | 1.94% | | Apr-2035 | — | 6,400 | 6,521 | 6,715 |
| | 2.09% | | May-2032–Jul-2050 | — | 21,792 | 22,082 | 22,713 |
| | 2.16% | | Sep-2050 | — | 14,200 | 14,375 | 14,300 |
| | 2.19% | | Mar-2027 | — | 7,150 | 7,240 | 7,657 |
| | 2.26% | | Nov-2022 | — | 5,922 | 5,923 | 6,110 |
| | 2.33% | | Nov-2029–Feb-2030 | — | 18,255 | 18,318 | 19,768 |
| | 2.38% | | Jul-2026 | — | 21,840 | 21,858 | 23,636 |
| | 2.43% | | Nov-2031 | — | 18,655 | 18,665 | 20,284 |
| | 2.44% | | Aug-2026 | — | 21,891 | 21,891 | 23,771 |
| | 2.46% | | Aug-2026–Nov-2034 | — | 35,330 | 35,443 | 38,265 |
| | 2.48% | | Oct-2028 | — | 24,485 | 24,543 | 26,974 |
| | 2.49% | | Dec-2026–Nov-2031 | — | 27,800 | 27,877 | 30,331 |
| | 2.50% | | Jun-2026 | — | 60,000 | 60,000 | 65,020 |
| 14 | |
Schedule of Portfolio Investments continued
December 31, 2020 (dollars in thousands)
Fannie Mae Securities continued | |
| | | | | | | |
| | | Unfunded | Face | Amortized | | |
| Interest Rate4 | Maturity Date | Commitments1 | Amount | Cost | Value | |
| 2.50% | Jul-2026 | — | 37,680 | 37,718 | 40,609 | |
| 2.53% | Jan-2030 | — | 20,550 | 20,732 | 22,409 | |
| 2.55% | Sep-2026 | — | 14,210 | 14,216 | 15,370 | |
| 2.55% | Mar-2030 | — | 51,656 | 52,037 | 56,163 | |
| 2.57% | Sep-2028 | — | 39,930 | 40,257 | 44,074 | |
| 2.61% | Nov-2026 | — | 9,800 | 9,887 | 10,662 | |
| 2.67% | Aug-2029 | — | 37,700 | 38,106 | 41,564 | |
| 2.70% | Nov-2025 | — | 15,055 | 15,063 | 16,395 | |
| 2.72% | Jul-2028 | — | 36,400 | 36,642 | 40,506 | |
| 2.75% | Jul-2028 | — | 15,129 | 15,240 | 16,816 | |
| 2.76% | Oct-2031 | — | 10,189 | 10,362 | 11,349 | |
| 2.80% | Apr-2025 | — | 15,197 | 15,265 | 16,329 | |
| 2.81% | Sep-2027 | — | 12,349 | 12,404 | 13,713 | |
| 2.85% | Dec-2027–Aug-2031 | — | 32,350 | 32,446 | 35,935 | |
| 2.87% | Oct-2027 | — | 9,401 | 9,466 | 10,477 | |
| 2.91% | Jun-2031 | — | 25,000 | 25,146 | 28,168 | |
| 2.92% | May-2026–Apr-2028 | — | 25,333 | 25,540 | 28,075 | |
| 2.92% | Jun-2027 | — | 68,116 | 68,184 | 75,722 | |
| 2.94% | Jun-2027 | — | 28,770 | 28,800 | 32,010 | |
| 2.94% | Jul-2039 | — | 4,512 | 4,564 | 4,634 | |
| 2.94% | Sep-2027 | — | 30,000 | 30,131 | 33,696 | |
| 2.96% | Sep-2034 | — | 20,000 | 20,847 | 22,631 | |
| 2.97% | Nov-2032–Sep-2034 | — | 32,618 | 32,904 | 36,742 | |
| 2.99% | Jun-2025 | — | 2,639 | 2,642 | 2,879 | |
| 3.00% | May-2027–Mar-2028 | — | 15,863 | 15,882 | 17,626 | |
| 3.02% | Jun-2027 | — | 3,772 | 3,779 | 4,212 | |
| 3.03% | Jun-2026 | — | 12,762 | 12,929 | 13,882 | |
| 3.04% | Apr-2030 | — | 25,100 | 25,168 | 28,483 | |
| 3.05% | Apr-2030 | — | 26,853 | 26,877 | 30,297 | |
| 3.10% | Sep-2029 | — | 8,515 | 8,545 | 9,013 | |
| 3.12% | Mar-2025–Apr-2030 | — | 25,689 | 25,754 | 27,583 | |
| 3.14% | Apr-2029 | — | 7,810 | 7,826 | 8,864 | |
| 3.15% | Jan-2027 | — | 19,634 | 19,652 | 21,481 | |
| 3.17% | Jun-2029–Sep-2029 | — | 61,557 | 61,853 | 68,007 | |
| 3.18% | May-2035 | — | 10,143 | 10,271 | 11,361 | |
| 3.20% | Oct-2027 | — | 10,075 | 10,113 | 11,360 | |
| 3.21% | May-2030 | — | 6,738 | 6,821 | 7,596 | |
| 3.25% | Nov-2027 | — | 10,067 | 10,104 | 11,389 | |
| 3.26% | Jan-2027 | — | 7,260 | 7,274 | 8,110 | |
| 3.31% | Oct-2027 | — | 15,536 | 15,637 | 17,572 | |
Fannie Mae Securities continued
| | | | Unfunded | Face | Amortized | |
| | Interest Rate4 | Maturity Date | Commitments1 | Amount | Cost | Value |
| | 3.32% | Apr-2029 | — | 20,080 | 20,154 | 22,821 |
| | 3.33% | May-2026 | — | 10,795 | 10,826 | 11,958 |
| | 3.35% | Feb-2029 | — | 19,106 | 19,290 | 21,960 |
| | 3.36% | May-2029–Oct-2029 | — | 34,256 | 35,379 | 39,496 |
| | 3.40% | Oct-2026 | — | 2,860 | 2,868 | 3,222 |
| | 3.41% | Sep-2023–Apr-2029 | — | 31,027 | 31,234 | 34,806 |
| | 3.42% | Apr-2035 | — | 5,219 | 5,290 | 6,015 |
| | 3.46% | Dec-2023–Apr-2031 | — | 16,143 | 16,225 | 18,330 |
| | 3.54% | Oct-2021 | — | 6,656 | 6,656 | 6,702 |
| | 3.61% | Sep-2023 | — | 6,132 | 6,139 | 6,575 |
| | 3.63% | Jul-2035 | — | 21,861 | 21,889 | 25,287 |
| | 3.66% | Oct-2023 | — | 4,497 | 4,504 | 4,831 |
| | 3.68% | Jul-2028 | — | 12,011 | 12,655 | 13,702 |
| | 3.87% | Sep-2023 | — | 2,370 | 2,376 | 2,547 |
| | 4.06% | Oct-2025 | — | 22,292 | 22,317 | 25,076 |
| | 4.27% | Jan-2034 | — | 75,059 | 75,317 | 80,502 |
| | 4.52% | May-2021 | — | 3,749 | 3,749 | 3,788 |
| | 4.69% | Jun-2035 | — | 573 | 586 | 655 |
| | 4.71% | Mar-2021 | — | 5,254 | 5,254 | 5,282 |
| | 4.73% | Feb-2021 | — | 1,387 | 1,387 | 1,389 |
| | 5.15% | Oct-2022 | — | 651 | 651 | 661 |
| | 5.29% | May-2022 | — | 4,687 | 4,687 | 4,843 |
| | 5.30% | Aug-2029 | — | 4,512 | 4,474 | 5,282 |
| | 5.69% | Jun-2041 | — | 4,385 | 4,484 | 5,297 |
| | 5.75% | Jun-2041 | — | 2,128 | 2,183 | 2,580 |
| | 5.91% | Mar-2037 | — | 1,652 | 1,675 | 1,737 |
| | 5.96% | Jan-2029 | — | 268 | 268 | 273 |
| | 6.15% | Jan-2023 | — | 3,267 | 3,267 | 3,334 |
| | 7.75% | Dec-2024 | — | 745 | 745 | 765 |
| | 8.40% | Jul-2023 | — | 143 | 143 | 147 |
| | | — | 2,060,819 | 2,073,362 | 2,214,618 |
| When Issued2 | 1.26% | Feb-2031 | — | 25,000 | 25,016 | 25,035 |
| | 1.57% | Jan-2031 | — | 21,950 | 22,049 | 22,125 |
| | 2.21% | Dec-2039 | 41,844 | — | — | 160 |
| | | 41,844 | 46,950 | 47,065 | 47,320 |
| Total Fannie Mae Securities | $41,844 | $2,784,599 | $2,821,958 | $2,983,394 |
Schedule of Portfolio Investments continued
December 31, 2020 (dollars in thousands)
Ginnie Mae Construction Securities (3.0% of net assets)
| | Interest Rates5 | Maturity | Unfunded | | Face | Amortized | | |
| | Permanent | Construction | | Date | Commitments1 | | Amount | | Cost | | Value |
| Multifamily | 2.45% | 2.45% | | Nov-2062 | $ | 16,478 | $ | 25 | $ | 355 | $ | 468 |
| | 2.55% | 2.55% | | Mar-2063 | | 37,000 | | — | | 1,087 | | 1,220 |
| | 2.62% | 2.62% | | Mar-2063 | | 13,800 | | — | | 518 | | 943 |
| | 2.65% | 2.65% | | Nov-2062 | | 6,584 | | — | | 165 | | 408 |
| | 2.67% | 2.67% | | Mar-2062 | | 25,701 | | 9,282 | | 10,156 | | 11,450 |
| | 3.30% | 3.30% | | Sep-2060 | | 759 | | 8,441 | | 8,651 | | 9,413 |
| | 3.41% | 3.41% | | Sep-2061 | | 25,982 | | 16,303 | | 17,995 | | 20,652 |
| | 3.43% | 3.43% | | Nov-2061 | | 27,307 | | 26,183 | | 27,989 | | 31,250 |
| | 3.60% | 3.60% | | Apr-2061 | | 11,103 | | 23,082 | | 24,280 | | 27,008 |
| | 3.75% | 3.75% | | Nov-2060 | | 569 | | 13,939 | | 14,376 | | 15,847 |
| | 3.78% | 7.00% | | Aug-2060 | | 2,905 | | 37,035 | | 37,338 | | 41,592 |
| | 4.21% | 4.21% | | May-2061 | | 36,278 | | 15,662 | | 15,926 | | 22,423 |
| | 4.35% | 4.35% | | Dec-2060 | | 546 | | 1,754 | | 1,797 | | 2,075 |
| | 4.53% | 4.53% | | Jan-2061 | | 269 | | 14,646 | | 15,103 | | 16,868 |
| Total Ginnie Mae Construction Securities | | $ | 205,281 | $166,352 | $175,736 | $201,617 |
| | Freddie Mac Securities (9.2% of net assets) |
| | | | | | | | | | | |
| | | Interest Rate4 | Maturity Date | | Face Amount | Amortized Cost | | Value |
| | Single Family | 0.46% | 1M LIBOR+30 | Feb-2036 | $ | 529 | $ | 529 | $ | 531 |
| | | 0.49% | 1M LIBOR+33 | May-2037 | | 75 | | 75 | | 75 |
| | | 0.51% | 1M LIBOR+35 | Apr-2036–Jan-2043 | | 3,315 | | 3,319 | | 3,334 |
| | | 0.56% | 1M LIBOR+40 | Aug-2043 | | 3,202 | | 3,201 | | 3,228 |
| | | 0.64% | 1M LIBOR+48 | Oct-2040 | | 2,453 | | 2,451 | | 2,482 |
| | | 0.66% | 1M LIBOR+50 | Oct-2040–Jun-2044 | | 11,650 | | 11,661 | | 11,788 |
| | | 0.71% | 1M LIBOR+55 | Nov-2040 | | 2,596 | | 2,616 | | 2,629 |
| | | 0.83% | 1M LIBOR+67 | Aug-2037 | | 2,671 | | 2,696 | | 2,718 |
| | | 2.36% | 1Y UST+223 | Oct-2033 | | 247 | | 246 | | 259 |
| | | 2.50% | | Jan-2043–Aug-2046 | | 10,827 | | 10,960 | | 11,491 |
| | | 2.52% | 12M LIBOR+178 | Jul-2035 | | 109 | | 109 | | 114 |
| | | 2.72% | 1Y UST+223 | Jun-2033 | | 98 | | 98 | | 103 |
| | | 3.00% | | Aug-2042–Sep-2046 | | 44,144 | | 45,019 | | 47,099 |
| | | 3.50% | | Jan-2026–Oct-2046 | | 94,660 | | 96,828 | | 102,033 |
| | | 4.00% | | Nov-2024–Aug-2047 | | 93,447 | | 97,210 | | 101,715 |
| | | 4.50% | | Jan-2038–Dec-2044 | | 21,652 | | 22,594 | | 24,169 |
| | | 5.00% | | May-2022–Mar-2041 | | 3,309 | | 3,302 | | 3,763 |
| | | 5.50% | | Apr-2033–Jul-2038 | | 2,444 | | 2,440 | | 2,850 |
| | | 6.00% | | Jul-2021–Oct-2037 | | 3,442 | | 3,471 | | 4,071 |
| | | 6.50% | | Apr-2028–Nov-2037 | | 555 | | 560 | | 667 |
| | | 7.00% | | Apr-2028–Mar-2030 | | 22 | | 22 | | 28 |
| | | 7.50% | | Aug-2029–Apr-2031 | | 37 | | 36 | | 42 |
| | | 8.00% | | Dec-2029 | | 1 | | 1 | | 1 |
| | | 8.50% | | Jul-2024–Jan-2025 | | 35 | | 35 | | 39 |
| | | 9.00% | | Mar-2025 | | 22 | | 22 | | 25 |
| | | | | | 301,542 | 309,501 | 325,254 |
| | Multifamily | 0.39% | | Dec-2030 | | 27,000 | | 27,000 | | 27,000 |
| | | 0.41% | | Nov-2030 | | 18,000 | | 18,000 | | 18,004 |
| | | 0.44% | | Oct-2030 | | 15,000 | | 15,000 | | 15,000 |
| | | 0.48% | | Oct-2030 | | 8,500 | | 8,500 | | 8,502 |
| | | 0.57% | 1M LIBOR+42 | May-2027 | | 6,391 | | 6,391 | | 6,387 |
| 16 | |
Schedule of Portfolio Investments continued
December 31, 2020 (dollars in thousands)
Freddie Mac Securities continued | |
| | | | | | | |
| Interest Rate4 | Maturity Date | Face Amount | Amortized Cost | Value | |
| 0.80% | 1M LIBOR+65 | Jan-2023 | 1,846 | 1,846 | 1,852 | |
| 0.85% | 1M LIBOR+70 | Sep-2022 | 562 | 562 | 562 | |
| 2.04% | | May-2050 | 20,804 | 21,350 | 20,753 | |
| 2.40% | | Jun-2031 | 7,444 | 7,558 | 8,202 | |
| 2.41% | | Jun-2031 | 11,733 | 11,924 | 12,938 | |
| 2.42% | | Jun-2031 | 11,768 | 11,971 | 12,988 | |
| 3.28% | | Dec-2029 | 16,337 | 16,563 | 18,696 | |
| 3.34% | | Dec-2029 | 9,624 | 9,789 | 11,069 | |
| 3.35% | | Oct-2033 | 33,450 | 33,295 | 38,358 | |
| 3.38% | | Apr-2030 | 14,180 | 14,457 | 16,387 | |
| 3.48% | | Jun-2030 | 18,514 | 18,985 | 21,575 | |
| 3.50% | | Jan-2026 | 18,000 | 18,094 | 19,645 | |
| 3.60% | | Apr-2030 | 25,286 | 26,090 | 29,542 | |
| 3.68% | | Oct-2025 | 10,000 | 10,129 | 10,860 | |
| | | | 274,439 | 277,504 | 298,320 | |
| Total Freddie Mac Securities | | $575,981 | $587,005 | $623,574 | |
FNMA Construction Securities (0.3% of net assets)
| | Interest Rates5 | Maturity | Face | Amortized | |
| | Permanent | Construction | Date | Amount | Cost | Value |
| Multifamily | 2.46% | 2.46% | Jan-2038 | $20,950 | $20,950 | $21,898 |
| Total FNMA Construction Securities | | $20,950 | $20,950 | $21,898 |
Schedule of Portfolio Investments continued
December 31, 2020 (dollars in thousands)
State Housing Finance Agency Securities (5.7% of net assets)
| | | Interest Rates5 | | Unfunded | | | |
| | Issuer | Permanent | Construction | Maturity Date | Commitments1 | Face Amount | Amortized Cost | Value |
| Multifamily | Illinois State Housing Finance Auth | — | 0.33% | Aug-2023 | $ — | $ 20,000 | $ 20,000 | $ 19,993 |
| | Mass Housing | — | 0.50% | Dec-2023 | — | 10,020 | 10,020 | 10,022 |
| | Mass Housing6 | — | 1.50% | Dec-2022 | — | 8,750 | 8,754 | 8,821 |
| | Mass Housing | — | 2.15% | Sep-2023 | 35,722 | 1,025 | 1,025 | 1,305 |
| | Connecticut Housing Finance Auth6 | — | 3.70% | Nov-2021 | — | 22,500 | 22,465 | 22,500 |
| | Mass Housing6 | — | 3.55% | Oct-2022 | 13,520 | 50 | 51 | 431 |
| | Mass Housing6 | — | 4.20% | Sep-2021 | 973 | 28,867 | 28,868 | 29,435 |
| | Mass Housing | 2.60% | — | Jun-2063 | — | 26,410 | 26,410 | 26,547 |
| | NYC Housing Development Corp | 2.95% | — | Nov-2045 | — | 5,000 | 5,000 | 5,459 |
| | NYC Housing Development Corp | 3.10% | — | Oct-2046 | — | 23,872 | 23,873 | 24,018 |
| | NYC Housing Development Corp | 3.25% | — | Nov-2049 | — | 12,000 | 12,000 | 12,530 |
| | Connecticut Housing Finance Auth | 3.25% | — | May-2050 | — | 12,310 | 12,197 | 12,484 |
| | Mass Housing6 | 3.30% | — | Dec-2059 | — | 8,340 | 8,345 | 8,825 |
| | NYC Housing Development Corp | 3.35% | — | Nov-2054 | — | 20,000 | 20,000 | 20,926 |
| | NYC Housing Development Corp | 3.45% | — | May-2059 | — | 20,000 | 20,000 | 21,025 |
| | NYC Housing Development Corp | 3.75% | — | May-2035 | — | 3,860 | 3,860 | 4,028 |
| | Mass Housing6 | 3.85% | — | Dec-2058 | — | 9,735 | 9,732 | 10,098 |
| | NYC Housing Development Corp | 3.95% | — | Nov-2043 | — | 15,000 | 15,000 | 16,453 |
| | NYC Housing Development Corp | 4.00% | — | Dec-2028 - Nov-2048 | — | 15,000 | 15,103 | 16,189 |
| | MassHousing | 4.04% | — | Nov-2032 | — | 1,305 | 1,305 | 1,330 |
| | MassHousing | 4.13% | — | Dec-2036 | — | 5,000 | 5,000 | 5,254 |
| | NYC Housing Development Corp | 4.13% | — | Nov-2053 | — | 10,000 | 10,000 | 10,839 |
| | NYC Housing Development Corp | 4.20% | — | Dec-2039 | — | 8,305 | 8,305 | 8,731 |
| | NYC Housing Development Corp | 4.29% | — | Nov-2037 | — | 1,190 | 1,190 | 1,213 |
| | Chicago Housing Authority | 4.36% | — | Jan-2038 | — | 25,000 | 25,000 | 27,957 |
| | NYC Housing Development Corp | 4.44% | — | Nov-2041 | — | 1,120 | 1,120 | 1,142 |
| | NYC Housing Development Corp | 4.49% | — | Nov-2044 | — | 455 | 455 | 464 |
| | MassHousing | 4.50% | — | Jun-2056 | — | 45,000 | 45,000 | 47,115 |
| | NYC Housing Development Corp | 4.78% | — | Aug-2026 | — | 12,500 | 12,500 | 12,534 |
| Total State Housing Finance Agency Securities | | | | $50,215 | $372,614 | $372,578 | $387,668 |
| 18 | |
Schedule of Portfolio Investments continued
December 31, 2020 (dollars in thousands)
Other Mutifamily Investments (0.9% of net assets)
| | | Interest Rates4,5 | | Unfunded | | | |
| | Issuer | Permanent | Construction | Maturity Date | Commitments1 | Face Amount | Amortized Cost | Value |
| Direct Loans | | | | | | | | |
| | 18 Sixth Ave at Pacific Park (Level 3) | — | 2.35% | 1M LIBOR+220 | Dec-2024 | $ 13,958 | $ 3,264 | $ 3,216 | $ 2,898 |
| | 18 Sixth Ave at Pacific Park (Level 3) | — | 2.35% | 1M LIBOR+220 | Dec-2024 | 51,015 | 31,764 | 31,451 | 30,004 |
| | 53 Colton Street (Level 3) | — | 2.60% | | Nov-2023 | 16,017 | — | (120) | 82 |
| | 53 Colton Street (Level 3) | — | 2.80% | | Nov-2023 | 3,042 | — | (8) | 16 |
| | University and Fairview (Level 3) | — | 3.45% | | Jun-2024 | 12,117 | 2,883 | 2,775 | 2,922 |
| | University and Fairview (Level 3) | — | 3.45% | | Dec-2023 | 20,882 | 1,631 | 1,467 | 1,662 |
| | 99 Ocean (Level 3) | — | 4.05% | | Oct-2024 | 52,000 | — | (520) | 444 |
| | Lake Street Apartments (Level 3) | — | 4.25% | | Jul-2039 | 49 | 13,451 | 13,340 | 15,123 |
| | The Block 803 Waimanu (Level 3) | — | 4.50% | | Sep-2021 | 16,398 | 1,540 | 1,468 | 1,620 |
| | | | | | 185,478 | 54,533 | 53,069 | 54,771 |
| Privately Insured Construction/Permanent Mortgages7 | | | | |
| | IL Housing Development Authority | 6.20% | — | | Dec-2047 | — | 2,947 | 2,956 | 2,948 |
| | IL Housing Development Authority | 6.40% | — | | Nov-2048 | — | 895 | 905 | 896 |
| | | | | | — | 3,842 | 3,861 | 3,844 |
| Total Other Multifamily Investments | | | | | $185,478 | $58,375 | $56,930 | $58,615 |
Schedule of Portfolio Investments continued
December 31, 2020 (dollars in thousands)
Commercial Mortgage-Backed Securities (1.6% of net assets) | |
| | | | | | | |
| | | Maturity | Face | Amortized | | |
| Issuer | Interest Rate | Date | Amount | Cost | Value | |
| Nomura | 2.77% | Dec-2045 | $ 10,000 | $ 10,136 | $ 10,385 | |
| Nomura | 3.19% | Mar-2046 | 20,000 | 20,326 | 20,863 | |
| JP Morgan | 3.48% | Jun-2045 | 9,214 | 9,572 | 9,360 | |
| Citigroup | 3.62% | Jul-2047 | 8,000 | 8,179 | 8,749 | |
| Barclays/ JP Morgan | 3.81% | Jul-2047 | 2,250 | 2,300 | 2,463 | |
| RBS/ Wells Fargo | 3.82% | Aug-2050 | 5,000 | 5,117 | 5,437 | |
| Deutsche Bank/UBS | 3.96% | Mar-2047 | 5,000 | 5,112 | 5,476 | |
| Barclays/ JP Morgan | 4.00% | Apr-2047 | 5,000 | 5,113 | 5,481 | |
| Cantor/Deutsche Bank | 4.01% | Apr-2047 | 20,000 | 20,450 | 21,818 | |
| Barclays/ JP Morgan | 4.08% | Feb-2047 | 6,825 | 7,122 | 7,485 | |
| Cantor/Deutsche Bank | 4.24% | Feb-2047 | 7,000 | 7,155 | 7,688 | |
| Deutsche Bank | 5.00% | Nov-2046 | 2,585 | 2,638 | 2,588 | |
| Total Commercial Mortgage Backed Securities | $100,874 | $103,220 | $107,793 | |
| | | | | | |
| | | | | | |
| | | | | | |
| | | | | | |
| | | | | | |
| | | | | | |
| | | | | | |
| | | | | | |
| | | | | | |
| | | | | | |
| | | | | | |
| | | | | | |
| | | | | | |
| | | | | | |
| | | | | | |
| | | | | | |
| | | | | | |
| | | | | | |
| | | | | | |
| | | | | | |
| | | | | | |
| | | | | | |
| | | | | | |
| | | | | | |
| | | | | | |
| | | | | | |
| | | | | | |
| | | | | | |
| | | | | | |
| | | | | | |
United States Treasury Securities (6.7% of net assets)
| | Maturity | | Face | | Amortized | | |
| Interest Rate | Date | | Amount | | Cost | | Value |
| 0.63% | May-2030 | $ | 63,000 | $ | 62,348 | $ | 61,604 |
| 0.63% | Aug-2030 | | 30,000 | | 29,766 | | 29,250 |
| 0.88% | Nov-2030 | | 85,000 | | 84,686 | | 84,713 |
| 1.13% | May-2040–Aug-2040 | | 42,000 | | 41,234 | | 39,836 |
| 1.50% | Feb-2030 | | 35,000 | | 36,668 | | 37,034 |
| 1.63% | Aug-2029 | | 45,000 | | 44,760 | | 48,139 |
| 1.75% | Nov-2029 | | 30,000 | | 30,034 | | 32,421 |
| 2.00% | Feb-2050 | | 50,000 | | 56,954 | | 54,333 |
| 2.63% | Feb-2029 | | 25,000 | | 26,176 | | 28,700 |
| 2.88% | Aug-2028 | | 10,000 | | 9,851 | | 11,616 |
| 3.13% | Nov-2028 | | 20,000 | | 20,402 | | 23,678 |
| Total United States Treasury Securities | $ | 435,000 | $ | 442,879 | $ | 451,324 |
| | | | | | | | |
| Total Fixed-Income Investments | $6,306,120 | $6,404,553 | $ | 6,762,689 |
Equity Investment in Wholly-Owned Subsidiary (less than 0.01% of net assets)
| | Face Amount | Amount of Dividends | |
| Issuer | (Cost) | of Interest | Value |
| HIT Advisers8 (Level 3) | $1 | $— | $105 |
| Total Equity Investment | $1 | $— | $105 |
Short-Term Investments (1.1% of net assets)
| | Interest | Maturity | | Face | | Amortized | | |
| Issuer | Rate | Date | | Amount | | Cost | | Value |
| Blackrock Federal Funds | 0.01%9 | Jan-2021 | $ | 73,414 | $ | 73,414 | $ | 73,414 |
| Total Short-Term Investments | | | $ | 73,414 | $ | 73,414 | $ | 73,414 |
| | | | | | |
| Total Investments | | | $ | 6,379,535 | $ | 6,477,968 | $ | 6,836,208 |
| 20 | |
Schedule of Portfolio Investments continued
December 31, 2020
Footnotes |
| | |
| 1 | The HIT may make commitments in securities or loans that fund over time on a draw basis or forward commitments that fund at a single point in time. The unfunded amount of these commitments totaled $496.1 million at period end. Generally, GNMA construction securities fund over a 12- to 24-month period. Funding periods for State Housing Finance Agency construction securities and Direct Loans vary by project, but generally fund over a one- to 48-month period. Forward commitments generally settle within 12 months of the original commitment date. |
| | |
| 2 | The HIT records when issued securities on the trade date and maintains security positions such that sufficient liquid assets will be available to make payment for the securities purchased. Securities purchased on a when issued basis are marked to market monthly and begin earning interest on the settlement date. Losses may occur on these transactions due to changes in market conditions or the failure of counterparties to perform under the contract. |
| | |
| 3 | Federally tax-exempt bonds collateralized by Ginnie Mae securities. |
| | |
| 4 | For floating and variable rate securities the rate indicated is for the period end. With respect to these securities, the schedule also includes the reference rate and spread in basis points. |
| | |
| 5 | Construction interest rates are the rates charged to the borrower during the construction phase of the project. The permanent interest rates are charged to the borrower during the amortization period of the loan, unless the U.S. Department of Housing and Urban Development requires that such rates be charged earlier. |
| | |
| 6 | Securities exempt from registration under the Securities Act of 1933 and were privately placed directly by a state housing agency (a not-for-profit public agency) with the HIT. The securities are backed by mortgages and are general obligations of the state housing agency, and therefore secured by the full faith and credit of said agency. These securities may be resold in transactions exempt from registration, normally to qualified institutional buyers. These securities are considered liquid, under procedures established by and under the general supervision of the HIT’s Board of Trustees. |
| | |
| 7 | Loans insured by Ambac Assurance Corporation, are additionally backed by a repurchase option from the mortgagee for the benefit of the HIT. The repurchase price is defined as the unpaid principal balance of the loan plus all accrued unpaid interest due through the remittance date. The repurchase option can be exercised by the HIT in the event of a payment failure by Ambac Assurance Corporation. |
| | |
| 8 | The HIT has a participation interest in HIT Advisers, a Delaware limited liability company. HIT Advisers is a New York based adviser currently exempt from investment adviser registration in New York. The investment in HIT Advisers is valued by the HIT’s valuation committee in accordance with the fair value procedures adopted by the HIT’s Board of Trustees, and approximates carrying value of HIT Advisors and its subsidiary on a consolidated basis. The participation interest is not registered under the federal securities laws. |
| | |
| 9 | Rate indicated is the annualized 1-day yield as of December 31, 2020. |
Key to Abbreviations
| LIBOR | London Interbank Offered Rate |
Statement of Operations
For the Year Ended December 31, 2020 (dollars in thousands)
| Investment income | $159,827 |
| | |
| Expenses | |
| | |
| Non-officer salaries and fringe benefits | 7,969 |
| Officer salaries and fringe benefits | 5,179 |
| Investment management | 1,359 |
| Marketing and sales promotion (12b-1) | 960 |
| Legal fees | 511 |
| Consulting fees | 733 |
| Auditing, tax and accounting fees | 433 |
| Insurance | 474 |
| Trustee expenses | 24 |
| Rental expenses | 863 |
| General expenses | 2,411 |
| Total expenses | 20,916 |
| | |
| Net investment income | 138,911 |
| | |
| Net realized and unrealized gains (losses) on investments | |
| Net realized gains (losses) on investments | 53,377 |
| Net change in unrealized appreciation (depreciation) on investments | 196,505 |
| Net realized and unrealized gains (losses) on investments | 249,882 |
| | |
| Net increase (decrease) in net assets resulting from operations | $388,793 |
| See accompanying Notes to Financial Statements. | |
| 22 | |
Statement of Changes in Net Assets
For the Years Ended December 31, 2020 and 2019 (dollars in thousands)
| Increase (decrease) in net assets from operations | 2020 | | 2019 | |
| Net investment income | $ | 138,911 | | $ | 165,621 | |
| Net realized gains (losses) on investments | | 53,377 | | | 11,675 | |
| Net change in unrealized appreciation (depreciation) on investments | | 196,505 | | | 286,125 | |
| Net increase (decrease) in net assets resulting from operations | | 388,793 | | | 463,421 | |
| | | | | | | |
| Distributions to participants or reinvested | | (188,004 | ) | | (175,979 | ) |
| | | | | | | |
| Increase (decrease) in net assets from unit transactions | | | | | | |
| Proceeds from the sale of units of participation | | 553,607 | | | 317,239 | |
| Dividend reinvestment of units of participation | | 171,676 | | | 159,113 | |
| Payments for redemption of units of participation | | (731,710 | ) | | (98,318 | ) |
| Net increase (decrease) from unit transactions | | (6,427 | ) | | 378,034 | |
| | | | | | | |
| | | | | | | |
| Total increase (decrease) in net assets | | 194,362 | | | 665,476 | |
| | | | | | | |
| Net assets | | | | | | |
| Beginning of period | $ | 6,554,926 | | $ | 5,889,450 | |
| End of period | $ | 6,749,288 | | $ | 6,554,926 | |
| | | | | | | |
| Unit information | | | | | | |
| Units sold | | 467,256 | | | 281,141 | |
| Distributions reinvested | | 145,522 | | | 140,946 | |
| Units redeemed | | (625,419 | ) | | (87,206 | ) |
| Increase (decrease) in units outstanding | | (12,641 | ) | | 334,881 | |
See accompanying Notes to Financial Statements.
Notes To Financial Statements
NOTE 1. SUMMARY OF SIGNIFICANT ACCOUNTING POLICIES The American Federation of Labor and Congress of Industrial Organizations (AFL-CIO) Housing Investment Trust (HIT) is a common law trust created under the laws of the District of Columbia and is registered under the Investment Company Act of 1940, as amended (the Investment Company Act), as a no-load, open-end investment company. The HIT has obtained certain exemptions from the requirements of the Investment Company Act that are described in the HIT’s Prospectus and Statement of Additional Information. Participation in the HIT is limited to eligible pension plans and labor organizations, including health and welfare, general, voluntary employees’ benefit associations and other funds that have beneficiaries who are represented by labor organizations. The following is a summary of significant accounting policies followed by the HIT in the preparation of its financial statements. The policies are in conformity with generally accepted accounting principles (GAAP) in the United States. The HIT follows the investment company accounting and reporting guidance of the Financial Accounting Standards Board (FASB) Accounting Standards Codification Topic 946 Financial Services—Investment Companies. INVESTMENT VALUATION Net asset value per share (NAV) is calculated as of the close of business of the major bond markets in New York City on the last business day of each month. The HIT’s Board of Trustees is responsible for the valuation process and has delegated the supervision of the valuation process to a Valuation Committee. The Valuation Committee, in accordance with the policies and procedures adopted by the HIT’s Board of Trustees, is responsible for evaluating the effectiveness of the HIT’s pricing policies, determining the reliability of third-party pricing information and reporting to the Board of Trustees on valuation matters, including fair value determinations. Following is a description of the valuation methods and inputs applied to the HIT’s major categories of assets. Portfolio securities for which market quotations are readily available are valued by using independent pricing services. For U.S. Treasury securities, independent pricing services generally base prices on actual transactions as well as dealer-supplied market information. For state housing finance agency securities, independent pricing services generally base prices using models that utilize trading spreads, new issue scales, verified bid information and credit ratings. For commercial mortgage-backed securities, independent pricing services generally base prices on cash flow models that take into consideration benchmark yields and utilize available trade information, dealer quotes and market color. For U.S. agency and government-sponsored enterprise securities, including single family and multifamily mortgage-backed securities, construction mortgage securities and loans and collateralized mortgage obligations, independent pricing services generally base prices on an active TBA (“to-be-announced”) market for mortgage pools, discounted cash flow models, |
or option-adjusted spread models. Independent pricing services examine reference data and use observable inputs such as issue name, issue size, ratings, maturity, call type and spread/ benchmark yields, as well as dealer-supplied market information. The discounted cash flow or option-adjusted spread models utilize inputs from matrix pricing, which consider observable market-based discount and prepayment rates, attributes of the collateral, and yield or price of bonds of comparable quality, coupon, maturity and type. Investments in registered open-end investment management companies are valued based upon the NAV of such investments. When the HIT finances the construction and permanent securities or participation interests, value is determined based upon the total amount, funded and/or unfunded, of the commitment. Portfolio investments for which market quotations are not readily available or deemed unreliable are valued at their fair value determined in good faith by the HIT’s Valuation Committee using consistently applied procedures adopted by the HIT’s Board of Trustees. In determining fair market value, the Valuation Committee will employ a valuation method that it believes reflects fair value for that asset, which may include the use of an independent valuation consultant or the utilization of a discounted cash flow model based on broker and/or other market inputs. The frequency with which these fair value procedures may be used cannot be predicted. However, on December 31, 2020, the Valuation Committee fair valued less than 0.01% of the HIT’s net assets utilizing internally derived unobservable inputs. Short-term investments acquired with a stated maturity of 60 days or less are generally valued at amortized cost, which approximates fair market value. The HIT holds a 100% ownership interest, either directly or indirectly in HIT Advisers LLC (HIT Advisers). HIT Advisers is valued at its fair value determined in good faith under consistently applied procedures adopted by the HIT’s Board of Trustees, which approximates its respective carrying value. GAAP establishes a disclosure hierarchy that categorizes the inputs to valuation techniques used to value assets and liabilities at measurement date. The HIT classifies its assets and liabilities into three levels based on the method used to value the assets or liabilities. Level 1 values are based on quoted prices in active markets for identical securities. Level 2 values are based on significant observable market inputs, such as quoted prices for similar securities, interest rates, prepayment speeds, credit risk and quoted prices in inactive markets. Level 3 values are based on significant unobservable inputs that reflect the HIT’s determination of assumptions that market participants might reasonably use in valuing the securities. |
| 24 | |
Notes to financial statements continued
The following table presents the HIT’s valuation levels as of December 31, 2020:
| | | Investment Securities | |
| (dollars in thousands) | Level 1 | | Level 2 | | Level 3 | | Total | |
| FHA Permanent Securities | $ | — | | $ | 163,272 | | $ | — | | $ | 163,272 | |
| Ginnie Mae Securities | | — | | | 1,704,023 | | | — | | | 1,704,023 | |
| Ginnie Mae Construction Securities | | — | | | 201,617 | | | — | | | 201,617 | |
| Fannie Mae Securities | | — | | | 2,936,074 | | | — | | | 2,936,074 | |
| Fannie Mae Construction Securities | | — | | | 21,898 | | | — | | | 21,898 | |
| Freddie Mac Securities | | — | | | 623,574 | | | — | | | 623,574 | |
| Commercial Mortgage-Backed Securities | | — | | | 107,793 | | | — | | | 107,793 | |
| State Housing Finance Agency Securities | | — | | | 387,668 | | | — | | | 387,668 | |
| Other Multifamily Investments | | | | | | | | | | | | |
| Direct Loans | | — | | | — | | | 54,771 | | | 54,771 | |
| Privately Insured Construction/Permanent Mortgages | | — | | | 3,844 | | | — | | | 3,844 | |
| Total Other Multifamily Investments | | — | | | 3,844 | | | 54,771 | | | 58,615 | |
| United States Treasury Securities | | — | | | 451,324 | | | — | | | 451,324 | |
| Equity Investment | | — | | | — | | | 105 | | | 105 | |
| Short-Term Investments | | 73,414 | | | — | | | — | | | 73,414 | |
| Other Financial Instruments* | | — | | | 106,831 | | | — | | | 106,831 | |
| Total | $ | 73,414 | | $ | 6,707,918 | | $ | 54,876 | | $ | 6,836,208 | |
* If held in the portfolio at report date, other financial instruments includes forward commitments, TBA and when-issued securities.
The following table reconciles the valuation of the HIT’s Level 3 investment securities and related transactions for the period ended December 31, 2020:
| | Investments in Securities |
| | | Equity | |
| (dollars in thousands) | Direct Loans | Investment | Total |
| Beginning Balance, 12/31/2019 | $ | 5,753 | | $ | (134 | ) | $ | 5,619 | |
| Total Change in Unrealized Gain (Loss)* | | (229 | ) | | 239 | | | 10 | |
| Cost of Purchases | | 49,247 | | | — | | | 49,247 | |
| Ending Balance, 12/31/2020 | $ | 54,771 | | $ | 105 | | $ | 54,876 | |
| * | Net change in unrealized gain (loss) attributable to Level 3 securities held at December 31, 2020 totaled $10,000 and is included on the accompanying Statement of Operations. |
For the year ended December 31, 2020, there were no transfers in levels.
Level 3 securities primarily consists of Direct Loans which were valued by an independent pricing service as of December 31, 2020 utilizing a discounted cash flow model. Weighted average lives for the loans ranged from 0.67 to 18.57 years. Unobservable inputs include spreads to relevant U.S. Treasuries ranging from 141 to 373 basis points. A change in unobservable inputs may impact the value of the loans. USE OF ESTIMATES The preparation of financial statements in conformity with GAAP requires management to make estimates and assumptions that affect the reported amounts of assets and liabilities at the date of the financial statements and the reported amounts of revenues and expenses during the period. Actual results could differ from those estimates. FEDERAL INCOME TAXES The HIT’s policy is to comply with the requirements of the Internal Revenue Code of 1986, as amended (the Internal Revenue Code), that are applicable to regulated investment companies, and to distribute all of its taxable income to its participants. Therefore, no federal income tax provision is required. Tax positions taken or expected to be taken in the course of preparing the HIT’s tax returns are evaluated to determine whether the tax positions are “more-likely-than-not” of being sustained by the applicable tax authority. Tax positions not deemed to meet the more-likely-than-not threshold would be recorded as a tax benefit or expense in the current year. Management has analyzed for all open years the HIT’s tax positions taken on federal income tax returns and has concluded that no provision for income tax is required in the HIT’s financial statements. The HIT files U.S. federal, state and local tax returns as required. The HIT’s tax returns are subject to examination by the relevant tax authorities until the expiration of the applicable statutes of limitations, which is generally three years after the filing of the tax return but could be longer in certain circumstances. DISTRIBUTIONS TO PARTICIPANTS At the end of each calendar month, a pro- rata distribution is made to participants of the net investment income earned during the month. This pro-rata distribution is based on the participant’s number of units held as of the immediately preceding month-end and excludes realized gains (losses) which are distributed at year-end. Participants redeeming their investments are paid their pro -rata share of undistributed net income accrued through the month-end of the month in which they redeem. The HIT offers a reinvestment plan that permits current participants to automatically reinvest their distributions of income and capital gains, if any, into the HIT’s units of participation. Total reinvestment was approximately 91% of distributed income for the year ended December 31, 2020. |
Notes to financial statements continued
INVESTMENT TRANSACTIONS AND INCOME For financial reporting purposes, security transactions are accounted for as of the trade date. Gains and losses on securities sold are determined on the basis of amortized cost. Realized gains (losses) on paydowns of mortgage- and asset-backed securities are classified as interest income. Interest income, which includes amortization of premium and accretion of discount on debt securities, is accrued as earned. 12B-1 PLAN OF DISTRIBUTION The HIT’s Board of Trustees has approved a Plan of Distribution under Rule 12b-1 under the Investment Company Act to pay for marketing and sales promotion expenses incurred in connection with the offer and sale of units and related distribution activities (12b-1 expenses). For the year ended December 31, 2020, the HIT was authorized to pay 12b-1 expenses in an annual amount up to $ 600,000 or 0.05% of its average net assets on an annualized basis per fiscal year, whichever was greater. During the year ended December 31, 2020, the HIT incurred approximately $960,000, or 0.015% of its average monthly net assets, in 12b-1 expenses. NOTE 2. INVESTMENT RISK INTEREST RATE RISK As with any fixed-income investment, the market value of the HIT’s investments will generally fall at times when market interest rates rise. Rising interest rates may also reduce prepayment rates, causing the average life of the HIT’s investments to increase. This could in turn further reduce the value of the HIT’s portfolio. Certain instruments held by the HIT pay an interest rate based on the London Interbank Offered Rate (“LIBOR”), which is the average offered rate for various maturities of short-term loans between certain major international banks. LIBOR is expected to be phased out by the end of 2021. The bulk of LIBOR based instruments held by the Trust are issued and backed by government-sponsored enterprises and will be subject to an industry- wide transition. With regard to other such instruments held by the HIT, which are related to its direct loans, the HIT has included language in its investment loan documentations to provide for an agreed upon methodology to calculate a new benchmark rate spread. While the effect of the phase out cannot yet be determined, it may result in, among other things, financial market disruptions, increased volatility in risk-free benchmark rates, fluctuations in market liquidity and changes in the value of LIBOR based instruments. PREPAYMENT AND EXTENSION RISK The HIT invests in certain fixed-income securities whose value is derived from an underlying pool of mortgage loans that are subject to prepayment and extension risk. |
Prepayment risk is the risk that a security will pay more quickly than its assumed payment rate, shortening its expected average life. In such an event, the HIT may be required to reinvest the proceeds of such prepayments in other investments bearing lower interest rates. The majority of the HIT’s securities backed by loans for multifamily projects include restrictions on prepayments for specified periods to mitigate this risk or include prepayment penalties to compensate the HIT. Prepayment penalties, when received, are included in realized gains. Extension risk is the risk that a security will pay more slowly than its assumed payment rate, extending its expected average life. When this occurs, the HIT’s ability to reinvest principal repayments in higher returning investments may be limited. These two risks may increase the sensitivity of the HIT’s portfolio to fluctuations in interest rates and negatively affect the value of the HIT’s portfolio. CREDIT RISK A majority of HIT’s investments have a form of credit enhancement to protect against losses in the event of a default. However, in the event of a default of an underlying mortgage loan where the investment does not have credit enhancement or that an entity providing credit enhancement for an investment fails to meet its obligations under the credit enhancement, the HIT would be subject to the risks that apply to real estate investments generally with respect to that investment. Certain real estate risks include construction failure, loan non-repayment, foreclosure, and environmental and litigation risk. NOTE 3. TRANSACTIONS WITH RELATED ENTITIES HIT ADVISERS HIT Advisers, a Delaware limited liability company, was formed by the HIT to operate as an investment adviser and be registered, as appropriate under applicable federal or state law. HIT Advisers is owned by HIT directly (99.9%), and indirectly through HIT Advisers Managing Member (0.1%) which is also wholly owned by the HIT. This ownership structure is intended to insulate the HIT from any potential liabilities associated with the conduct of HIT Advisers’ business. The HIT receives no services from HIT Advisers and carries it as a portfolio investment that meets the definition of a controlled affiliate. In accordance with a contract, in addition to its membership interest, the HIT provides HIT Advisers advances to assist with its operations and cash flow management as needed. Advances are expected to be repaid as cash becomes available. However, as with many start-up operations, there is no certainty that HIT Advisers will generate sufficient revenue to cover its operations and liabilities and HIT has determined an allowance for doubtful receivable due to an aging balance as reflected in the table below. Also in accordance with the contract, the HIT may provide the time of certain personnel and allocates operational expenses to HIT Advisers on a cost-reimbursement basis. As of December 31, 2020, HIT Advisers had no assets under management. |
| 26 | |
Notes to financial statements continued
| A rollforward of advances to HIT Advisers by the HIT is included in the table below: | |
| | |
| Advances to HIT Advisers by HIT | (dollars in thousands) | |
| Ending Balance, 12/31/2019 | | $ | 879 | | |
| Advances in 2020 | | | 61 | | |
| Allowance for Doubtful Accounts | | | (600 | ) | |
| Ending Balance, 12/31/2020 | | $ | 340 | | |
| Building America, a wholly owned subsidiary of HIT Advisers, is a Community Development Entity, certified by the Community Development Financial Institutions Fund (CDFI Fund) of the U.S. Department of the Treasury. | |
| | |
| In accordance with a contract, the HIT provides the time of certain personnel to Building America and allocates operational expenses on a cost-reimbursement basis. Also, in accordance with the contract, the HIT provides Building America advances to assist with its operations and cash flow management as needed. Advances are repaid as cash becomes available. | |
| | |
| A rollforward of advances to Building America by the HIT is included in the table below: | |
| | |
| Advances to BACDE by HIT | (dollars in thousands) | |
| Ending Balance, 12/31/2019 | | $ | 76 | | |
| Advances in 2020 | | | 1,066 | | |
| Repayment by BACDE in 2020 | | | (1,142 | ) | |
| Ending Balance, 12/31/2020 | | $ | — | | |
| | |
| Summarized financial information on a consolidated basis for HIT Advisers and Building America in included in the table below: | |
| | |
| | (dollars in thousands) | |
| As of December 31, 2020 | | | | | |
| Assets | | $ | 1,238 | | |
| Liabilities | | $ | 1,133 | | |
| Equity | | $ | 105 | | |
| For the year ended December 31, 2020 | | | | | |
| Income | | $ | 1,495 | | |
| Expenses | | | (1,089 | ) | |
| Tax Expenses | | | (44 | ) | |
| Net Income (Loss) | | $ | 362 | | |
| | | | | | |
NOTE 4. LEASES
The HIT leases certain real estate properties for office space which are classified as operating leases. The HIT also leases equipment which is classified as a financing lease. The leases are included in right-of- use (ROU) assets on the HIT’s statement of assets and liabilities. ROU assets represent the HIT’s right to use an underlying asset for the lease term and lease obligations represent the HIT’s obligation to make lease payments arising from the lease. ROU assets and obligations are recognized at the commencement date based on the present value of lease payments over the lease term. As most of the HIT’s leases do not provide an implicit rate, the HIT uses its incremental borrowing rate based on the information available at the commencement date of the lease in determining the present value of lease payments. The HIT determines if an arrangement is a lease at inception. The HIT’s lease terms may include options to extend or terminate the lease when it is reasonably certain that the HIT will exercise that option. Lease expense and amortization expense are recognized on a straight-line basis over the lease term.
| (dollars in thousands) | | Operating Lease | | Financing Lease | | Total | |
| ROU Asset, 01/01/2020 | | $ | 546 | | | $ | 198 | | | $ | 744 | |
| Addition of ROU Asset | | | 5,042 | | | | 4 | | | | 5,046 | |
| Reduction/Amortization of ROU Asset | | | (929 | ) | | | (117 | ) | | | (1,046 | ) |
| ROU Asset, 12/31/2020 | | $ | 4,659 | | | $ | 85 | | | $ | 4,744 | |
| | | | | | | | | | | | | |
| Lease Liability, 01/01/2020 | | $ | 913 | | | $ | 202 | | | $ | 1,115 | |
| Addition of Lease Liability | | | 5,042 | | | | 4 | | | | 5,046 | |
| Lease Payments | | | (909 | ) | | | (119 | ) | | | (1,028 | ) |
| Imputed Interest | | | (48 | ) | | | 5 | | | | (43 | ) |
| Reduction of Lease Liability | | | (957 | ) | | | (114 | ) | | | (1,071 | ) |
| Lease Liability, 12/31/2020 | | $ | 4,998 | | | $ | 92 | | | $ | 5,090 | |
| | | | | | | | | | | | | |
| Lease Expense | | $ | (881 | ) | | $ | (122 | ) | | $ | (1,003 | ) |
| Weighted Average Discount Rate | | | 2.02 | % | | | 3.57 | % | | | | |
| Weighted Average Remaining Term (Years) | | | 10.1 | | | | 1.5 | | | | | |
Notes to financial statements continued
NOTE 5. COMMITMENTS The HIT may make commitments in securities or loans that fund over time on a draw basis or forward commitments that fund at a single point in time. The HIT agrees to an interest rate and purchase price for these securities or loans when the commitment to purchase is originated. Certain assets of the HIT are invested in liquid investments until they are required to fund these purchase commitments. As of December 31, 2020, the HIT had outstanding unfunded purchase commitments of approximately $496.1 million. The HIT maintains a sufficient level of liquid securities of no less than the total of the outstanding unfunded purchase commitments. As of December 31, 2020, the value of liquid securities, less short-term investments, maintained in a custodial trading account was approximately $6.5 billion. NOTE 6. INVESTMENT TRANSACTIONS Purchases and sales of investments, excluding short-term securities and U.S. Treasury securities, for the year ended December 31, 2020, were $1.6 billion and $600.9 million, respectively. NOTE 7. INCOME TAXES No provision for federal income taxes is required since the HIT intends to continue to qualify as a regulated investment company under Subchapter M of the Internal Revenue Code and distribute to shareholders all of its taxable income and gains. Federal income tax regulations differ from GAAP; therefore, distributions determined in accordance with tax regulations may differ in amount or character from net investment income and realized gains for financial reporting purposes. Financial reporting records were adjusted for permanent book/tax differences to reflect tax character. The tax character of distributions paid during 2020 and 2019 were as follows: | |
| (dollars in thousands) | | | 2020 | | | 2019 | | |
| Ordinary Investment Income | | | $171,911 | | | $175,979 | | |
| Long-term capital gain on investments | | | 16,093 | | | — | | |
| Total Distributions Paid to Participants or Reinvested | | | $188,004 | | | $175,979 | | |
| | | | | | | | | |
| As of December 31, 2020, the components of accumulated earnings on a tax basis were as follows: | |
| (dollars in thousands) | | | 2020 | | |
| Accumulated Capital Loss Carryforward | | | $— | | |
| Unrealized Appreciation | | | 357,817 | | |
| Undistributed Ordinary Income | | | 2,053 | | |
| Other Temporary Differences | | | (2,995) | | |
| Total Accumulated Losses | | | $356,875 | | |
| | | | | | |
The differences between book basis and tax basis components of net assets are primarily attributable to wash sales and the tax treatment of deferred compensation plans, accrued expenses and depreciation.
During 2020, the HIT utilized its entire accumulated capital loss carryforward from prior years of $4,707,000 to offset current capital gains.
For financial reporting purposes, capital accounts are adjusted to reflect the tax character of permanent book/tax differences. These reclassifications are primarily due to the different book and tax treatment of paydowns, distributions, meals and entertainment and insurance premiums paid. Results of operations and net assets are not affected by these reclassifications.
For the year ended December 31, 2020, the HIT recorded the following permanent reclassifications:
| (dollars in thousands) | | | 2020 | |
| Accumulated Net Investment Income | | | $18,315 | |
| Accumulated Net Realized Losses | | | $(17,969) | |
| Amount Invested and Reinvested by Current Participants | | | $(346) | |
At December 31, 2020, the cost of investments for federal income tax purposes was $6,478,391,000. Net unrealized gain aggregated $357,817,000 at period-end, of which $368,749,000 related to appreciated investments and $10,932,000 related to depreciated investments.
NOTE 8. RETIREMENT AND DEFERRED COMPENSATION PLANS
The HIT participates in the AFL-CIO Staff Retirement Plan (Plan), which is a multiemployer defined benefit pension plan, under the terms of a collective bargaining agreement. The Plan covers substantially all employees, including non -bargaining unit employees. The risks of participating in a multiemployer plan are different from a single-employer plan in the following aspects:
| a. | Assets contributed to a multiemployer plan by one employer may be used to provide benefits to employees of other participating employers. |
| b. | If a participating employer stops contributing to the plan, the unfunded obligations of the plan may be borne by the remaining participating employers based on their level of contributions to the plan. |
| c. | If the HIT chooses to stop participating in its multiemployer plan, the HIT may be required to pay the plan an amount based on the HIT’s share of the underfunded status of the plan, referred to as a withdrawal liability. |
| | |
| 28 | |
Notes to financial statements continued
The HIT’s participation in the Plan for the year ended December 31, 2020, is outlined in the table below. The “EIN/Pension Plan Number” line provides the Employer Identification Number (EIN) and the three-digit plan number. The most recent Pension Protection Act (PPA) zone status available as of December 31, 2020 is for the 2018 Plan year ended at June 30, 2019. The zone status is based on information that the HIT received from the Plan and is certified by the Plan’s actuary. Among other factors, plans in the red zone are generally less than 65% funded, plans in the yellow zone are less than 80% funded, and plans in the green zone are at least 80% funded. The “FIP/ RP Status Pending/Implemented” line indicates whether a financial improvement plan (FIP) or a rehabilitation plan (RP) is either pending or has been implemented.
Pension Fund: AFL-CIO Staff Retirement Plan
| EIN/Pension Plan Number | | 53-0228172 / 001 | |
| 2018 Plan Year PPA Zone Status | | Green | |
| FIP/RP Status Pending/ Implemented | | No | |
| 2020 Contributions | | $ 1,967,972 | |
| 2020 Contribution Rate | | 24 | % |
| Surcharge Imposed | | No | |
| Expiration Date of Collective Bargaining Agreement | | 03/31/2022 | |
The HIT was listed in the Plan’s Form 5500 as providing more than 5% of the total contributions for the following plan year:
| Pension Fund | Year Contributions to Plan Exceeded 5 Percent of Total Contributions |
| AFL-CIO Staff Retirement Plan | 20181 |
| 1 | The 2018 plan year ended at June 30, 2019. |
At the date the HIT financial statements were issued, the Plan’s Form 5500 was not available for the plan year ended June 30, 2020.
The HIT also sponsors a deferred compensation plan, referred to as a 401(k) plan, covering all employees. This plan permits employees to defer the lesser of 100% of their total compensation or the applicable Internal Revenue Service limit. During 2020, the HIT matched dollar for dollar the first $6,200 of each employee’s contributions. The HIT’s 401(k) contribution for the year ended December 31, 2020, was approximately $222,000.
NOTE 9. LOAN FACILITY The HIT has a $15 million uncommitted loan facility that expires on June 7, 2021. Under this facility, borrowings bear interest per annum equal to 1.25% plus the highest of (a) the Federal Funds Effective Rate, (b) the Overnight Eurodollar Rate, (c) the one-month LIBOR, or (d) 0.00%. The HIT did not borrow against the facility and had no outstanding balance under the facility for the year ended December 31, 2020. No compensating balances are required. NOTE 10. CONTRACT OBLIGATIONS In the ordinary course of business, the HIT enters into contracts that contain a variety of indemnifications. The HIT’s maximum exposure under these arrangements is unknown. However, the HIT has not had any prior claims or losses pursuant to these contracts and expects the risk of loss to be low. NOTE 11. COVID-19 The outbreak of COVID-19 has caused a global ongoing crisis materially reducing economic output, disrupting supply chains, and resulting in market closures. Investors should be aware that in light of the current uncertainty and distress in economies and financial markets, the value of HIT’s investments is subject to volatility and other adverse events. The HIT, its service providers, the markets in which it invests and market intermediaries are also impacted by quarantines and similar measures intended to contain the ongoing pandemic, which can obstruct their functioning and subject them to heightened operational risks. NOTE 12. SUBSEQUENT EVENTS The HIT evaluated subsequent events through the date the financial statements were available for issue and determined there were no additional material events that would require adjustment to or disclosure in the HIT’s financial statements. |
Financial Highlights
Select Per Share Data and Ratios for the Years Ended December 31
| Per share data | | | 2020 | | | | 2019 | | | | 2018 | | | | 2017 | | | | 2016 | |
| Net asset value, beginning of period | | $ | 1,140.24 | | | $ | 1,087.85 | | | $ | 1,117.32 | | | $ | 1,113.29 | | | $ | 1,121.13 | |
| | | | | | | | | | | | | | | | | | | | | |
| Income from investment operations: | | | | | | | | | | | | | | | | | | | | |
| Net investment income* | | | 25.13 | | | | 29.65 | | | | 29.25 | | | | 27.36 | | | | 27.46 | |
| Net realized and unrealized gains (losses) on investments | | | 45.18 | | | | 54.26 | | | | (27.99) | | | | 7.58 | | | | (5.33) | |
| Total income (loss) from investment operations | | | 70.31 | | | | 83.91 | | | | 1.26 | | | | 34.94 | | | | 22.13 | |
| Less distributions from: | | | | | | | | | | | | | | | | | | | | |
| Net investment income | | | (28.41 | ) | | | (31.52 | ) | | | (30.73 | ) | | | (30.23 | ) | | | (29.97 | ) |
| Net realized gains on investments | | | (5.50 | ) | | | — | | | | — | | | | (0.68 | ) | | | — | |
| Total distributions | | | (33.91 | ) | | | (31.52 | ) | | | (30.73 | ) | | | (30.91 | ) | | | (29.97 | ) |
| | | | | | | | | | | | | | | | | | | | | |
| Net asset value, end of period | | $ | 1,176.64 | | | $ | 1,140.24 | | | $ | 1,087.85 | | | $ | 1,117.32 | | | $ | 1,113.29 | |
| | | | | | | | | | | | | | | | | | | | | |
| Total return | | | 6.20 | % | | | 7.78 | % | | | 0.16 | % | | | 3.17 | % | | | 1.94 | % |
| | | | | | | | | | | | | | | | | | | | | |
| Net assets, end of period (in thousands) | | $ | 6,749,288 | | | $ | 6,554,926 | | | $ | 5,889,450 | | | $ | 6,199,225 | | | $ | 5,790,753 | |
| | | | | | | | | | | | | | | | | | | | | |
| Ratios/supplemental data | | | | | | | | | | | | | | | | | | | | |
| Ratio of expenses to average net assets | | | 0.32 | % | | | 0.34 | % | | | 0.42 | % | | | 0.40 | % | | | 0.41 | % |
| Ratio of net investment income to average net assets | | | 2.1 | % | | | 2.6 | % | | | 2.7 | % | | | 2.4 | % | | | 2.4 | % |
| Portfolio turnover rate | | | 30.3 | % | | | 17.6 | % | | | 15.2 | % | | | 24.6 | % | | | 20.3 | % |
* The average shares outstanding method has been applied for this per share information.
See accompanying Notes to Financial Statements.
| 30 | |
Board Of Trustees
As of December 31, 2020
Correspondence intended for a Trustee may be sent to the AFL-CIO Housing Investment Trust, 1227 25th Street, NW, Suite 500, Washington, DC 20037.
Overall responsibility for the management of the HIT, the establishment of policies, and the oversight of activities is vested in its Board of Trustees. The list below provides the following information for each of the Trustees:
Name, age, position, term of office, length of time served, principal occupations during at least the past five years and other directorships held.* The HIT’s Statement of Additional Information includes additional information about the Trustees and is available without charge, upon request, by placing a collect call to the HIT’s Investor Relations Office at (202) 331-8055 or by viewing the HIT’s website at www.aflcio-hit.com.
| Name / Age | | Position | | Term of Office / Length of Time Served | | Principal Occupation During at Least Past 5 Years / Other Directorships Held |
Chris Coleman** Age 59 | | Chairman | | Service Commenced December 2020, Term Expires 2021 | | President and CEO, Twin Cities Habitat for Humanity; Formerly, Mayor, City of Saint Paul, MN; President, National League of Cities; Member, St. Paul City Council;Investment Advisor, RBC Cain Rauscher. |
Vincent Alvarez Age 52 | | Union Trustee | | Service Commenced December 2012, Term Expires 2022 | | President, New York City Central Labor Council; formerly Assistant Legislative Director, New York State AFL-CIO; New York City Central Labor Council Chief of Staff. |
Kenneth W. Cooper Age 59 | | Union Trustee | | Service Commenced January 2018, Term Expires 2023 | | International Secretary-Treasurer, International Brotherhood of Electrical Workers (“IBEW”); formerly International Vice President, Fourth District, IBEW. |
Timothy J. Driscoll Age 57 | | Union Trustee | | Service Commenced March 2020, Term Expires 2022 | | President, International Union of Bricklayers and Allied Craftworkers (“BAC”); Member, BAC Executive Board; Co-Chair of both Bricklayers and Trowel Trades International Pension Fund and International Health Fund; Member, Governing Board of Presidents, NABTU; formerly, Secretary-Treasurer and Executive Vice President, International Union BAC. |
Sean McGarvey Age 58 | | Union Trustee | | Service Commenced December 2012, Term Expires 2021 | | President, North America’s Building Trades Unions; formerly Secretary-Treasurer, Building and Construction Trades Department, AFL-CIO. |
Terry O’Sullivan Age 65 | | Union Trustee | | Service Commenced December 2019, Term Expires 2022 | | General President, LIUNA; Labor Co-Chairman of the Laborers’ Training and Education Fund; Board Chairman of the LIUNA Charitable Foundation; Member, Governing Board of Presidents of North America’s Building Trades Unions, AFL-CIO; Member of the Executive Council and Executive Committee of the AFL-CIO; Trustee, ULLICO. |
Kenneth E. Rigmaiden** Age 67 | | Union Trustee | | Service Commenced December 2011, Term Expires 2023 | | General President, International Union of Painters and Allied Trades of the United States & Canada (“IUPAT”); Director, Coalition of Black Trade Unionists and Board for Partnership for Working Families; formerly Assistant to the General President, IUPAT; National Project Coordinator, IUPAT Job Corps Program; Director, United Way. |
Anthony Shelton Age 67 | | Union Trustee | | Service Commenced June 2020, Term Expires 2023 | | International President, Bakery, Confectionery, Tobacco Workers & Grain Millers Union (“BCTGM”); formerly International Secretary-Treasurer, BCTGM. |
Elizabeth Shuler** Age 48 | | Union Trustee | | Service Commenced October 2009, Term Expires 2021 | | Secretary-Treasurer, AFL-CIO; Trustee, AFL-CIO Staff Retirement Plan; formerly Executive Assistant to the President, IBEW. |
Richard L. Trumka** Age 71 | | Union Trustee | | Service Commenced December 1995, Term Expires 2023 | | President, AFL-CIO; Chairman, AFL-CIO Staff Retirement Plan; formerly Secretary-Treasurer, AFL-CIO. |
Kevin Filter Age 67 | | Management | | Service Commenced December 2019, Term Expires 2022 | | Managing Principal, GFW Equities, Mud Duck Capital & Los Cielos; formerly International Director, JLL; Co-Founder, Principal and President, Oak Grove Capital; Co-Founder, Principal and President, Glaser Financial Group. |
Bridget Gainer Age 52 | | Management Trustee | | Service Commenced January 2018, Term Expires 2023 | | Commissioner, Cook County Board; Vice President Global Affairs, Head of Public Affairs & Business Development & Strategy, Aon; formerly Director, Chicago Parks District. |
Jack Quinn, Jr.** Age 69 | | Management Trustee | | Service Commenced June 2005, Term Expires 2023 | | Senior Advisor for Public & Community Relations, Barclay Damon; formerly President, Erie Community College; formerly President, Cassidy & Associates; Member of Congress, 27th District, New York. |
Jamie S. Rubin Age 53 | | Management Trustee | | Service Commenced April 2018, Term Expires 2022 | | CEO, Meridiam Infrastructure North America Corp.; formerly Director of State Operations, State of New York; Commissioner, New York State Homes & Community Renewal; founding Executive Director, Governor’s Office of Storm Recovery. |
Deidre L. Schmidt Age 50 | | Management Trustee | | Service Commenced January 2018, Term Expires 2023 | | President & CEO, CommonBond Communities; formerly Principal, One Roof Global Consulting; Lecturer, Harvard Graduate School of Design; Executive Director, Affordable Housing Institute. |
Tony Stanley** Age 87 | | Management Trustee | | Service Commenced December 1983, Term Expires 2022 | | Director, TransCon Builders, Inc.; formerly Executive Vice President, TransCon Builders, Inc. |
Harry W. Thompson Age 61 | | Managemen Trustee | | Service Commenced April 2019, Term Expires 2021 | | Consultant, Harry Thompson Associates; formerly, Chief Financial Officer, Community Preservation & Development Corporation; Chief Financial Officer, Realty Investment Company, Inc. |
William C. Thompson Age 67 | | Managemen Trustee | | Service Commenced January 2018, Term Expires 2023 | | Senior Managing Director, Chief Administrative Officer, Siebert Cisneros Shank & Co., LLC; formerly Comptroller, City of New York. |
| * | Includes any directorships in a corporation or trust having securities registered pursuant to Section 12 of the Securities Exchange Act of 1934, as amended, or subject to the requirements of Section 15(d) of such Act, or a company registered as an investment company under the Investment Company Act of 1940, as amended. |
** Executive Committee Member.
Leadership
All officers of the HIT are located at 1227 25th Street, NW, Suite 500, Washington, DC 20037 except Mr. Chandler who is located at 155 N. Lake Avenue, Suite 800, Pasadena, CA 91191.*
CHANG SUH, CFA, age 49; Chief Executive Officer/Co-Chief Portfolio Manager, AFL-CIO Housing Investment Trust since 2018; formerly Senior Executive Vice President and Chief Portfolio Manager, Assistant Portfolio Manager, and Senior Portfolio Analyst, AFL-CIO Housing Investment Trust; Senior Auditor, Arthur Andersen.
THEODORE S. CHANDLER, age 61; Managing Director, Regional Operations, AFL-CIO Housing Investment Trust since 2018; formerly Chief Operating Officer, AFL-CIO Housing Investment Trust; Vice President, Fannie Mae; Deputy Director, Chief Financial Officer and General Counsel, Massachusetts Industrial Finance Agency.
MICHAEL COOK, CFA, FRM, age 40; Co-Chief Portfolio Manager, AFL-CIO Housing Investment trust since 2018; formerly Financial Analyst, Senior Financial Analyst, Assistant Portfolio Manager, Senior Portfolio Manager, AFL-CIO Housing Investment Trust.
JOHN HANLEY, age 54; Senior Managing Director, AFL-CIO Housing Investment Trust since 2019; formerly Director—Investments, National Real Estate Advisors; Executive Vice President—Investments and Portfolio Management, AFL-CIO Housing Investment Trust; Executive Vice President—Investments, AFL-CIO Investment Trust Corporation.
CHRISTOPHER KAISER, age 56; Deputy General Counsel (since 2008) and Chief Compliance Officer (since 2007), AFL-CIO Housing Investment Trust; General Counsel, Building America CDE, Inc.; formerly Associate General Counsel, AFL- CIO Housing Investment Trust; Branch Chief, Division of Investment Management, U.S. Securities and Exchange Commission.
ERICA KHATCHADOURIAN, age 53; Chief Financial Officer, AFL-CIO Housing Investment Trust since 2001; formerly Controller, Chief of Staff and Director of Operations, AFL-CIO Housing Investment Trust; Senior Consultant, Price Waterhouse.
NICHOLAS C. MILANO, age 53, General Counsel, AFL-CIO Housing Investment Trust since 2013; formerly Of Counsel, Perkins Coie LLP; Deputy General Counsel and Chief Compliance Officer, Legg Mason Capital Management; Deputy General Counsel and Chief Compliance Officer, AFL-CIO Housing Investment Trust; Senior Counsel, Division of Investment Management, Securities and Exchange Commission.
HARPREET S. PELEG, CFA, age 46; Controller, AFL- CIO Housing Investment Trust since 2005; Chief Executive Officer, Building America CDE, Inc.; formerly Chief Financial Officer, AFL-CIO Investment Trust Corporation; Financial Analyst, Goldman Sachs & Co.; Senior Associate, Pricewaterhouse Coopers.
LESYLLEE WHITE, age 58; Chief Marketing Officer, AFL-CIO Housing Investment Trust since 2018; formerly Executive Vice President and Managing Director of Defined Benefit Marketing, Director of Marketing, Regional Marketing Director and Senior Marketing Associate, AFL-CIO Housing Investment Trust; Vice President, Northern Trust Company.
| * | No officer of the HIT serves as a trustee or director in any corporation or trust having securities registered pursuant to Section 12 of the Securities Exchange Act of 1934, as amended, or subject to the requirements of Section 15(d) of such Act, or any company registered as an investment company under the Investment Company Act of 1940, as amended. These officers are appointed annually, serving for a period of approximately one year or until their respective successors are duly appointed and qualified. |
| 32 | |
| | | |
| | Service Providers | |
| | | |
| | INDEPENDENT REGISTERED PUBLIC ACCOUNTING FIRM Ernst & Young LLP Tysons, VA LEGAL COUNSEL Dechert LLP Washington, DC TRANSFER AGENT BNY Mellon Investment Servicing (US) Inc. Wilmington, DE CUSTODIAN Bank of New York Mellon New York, NY Investors should consider the HIT’s investment objectives, risks and expenses carefully before investing. A prospectus containing more complete information may be obtained from the HIT by calling the Marketing and Investor Relations Department collect at (202) 331-8055 or by viewing the HIT’s website at www.aflcio-hit.com. The prospectus should be read carefully before investing. The calculations of the HIT yield herein represent widely accepted portfolio characteristics information based on coupon rate, current price and, for yield to worst, certain prepayment assumptions, and are not current yield or other performance data as defined by the SEC in Rule 482. Job and economic impact figures are estimates calculated using IMPLAN, an input-output model, based on HIT and HIT subsidiary Building America CDE, Inc. project data. Data is current as of December 31, 2020. Economic impact data is in 2019 dollars and all other figures are nominal. This document contains forecasts, estimates, opinions and/or other information that is subjective. Statements concerning economic, financial, or market trends are based on current conditions, which will fluctuate. There is no guarantee that such statements will be applicable under all market conditions, especially during periods of downturn. Actual outcomes and results may differ significantly from the views expressed. It should not be considered as investment advice or a recommendation of any kind. | |
| | | |

1227 25th Street, NW, Suite 500 | Washington, D.C. 20037 | (202) 331-8055 www.aflcio-hit.com  |
Item 2. Code of Ethics.
| (a) | The Trust has adopted a Code of Ethics to comply with Section 406 of the Sarbanes-Oxley Act of 2002, as of December 31, 2020. This Code of Ethics applies to the Trust’s principal executive officer, principal financial officer, and principal accounting officer or controller or persons performing similar functions. |
| (b) | For purposes of this Item, the term “Code of Ethics” means written standards that are reasonably designed to deter wrongdoing and to promote: |
| (1) | Honest and ethical conduct, including the ethical handling of actual or apparent conflicts of interest between personal and professional relationships; |
| (2) | Full, fair, accurate, timely, and understandable disclosure in reports and documents that a registrant files with, or submits to, the Commission and in other public communications made by the Registrant; |
| (3) | Compliance with applicable governmental laws, rules, and regulations; |
| (4) | The prompt internal reporting of violations of the code to an appropriate person or persons identified in the code; and |
| (5) | Accountability for adherence to the code. |
| (c) | The Trust’s Code of Ethics was not amended during the period covered by the Report. |
| (d) | There have been no waivers granted from any provision of the Trust’s Code of Ethics during the period covered by the Report. |
| (f) | (1) | A copy of the Trust’s Code of Ethics is filed herewith as an Exhibit pursuant to Item 13(a)(1). |
Item 3. Audit Committee Financial Expert.
| (a) | (1) | The Trust’s Board of Trustees has determined that Harry Thompson possesses the attributes to qualify as an Audit Committee financial expert and has designated Mr. Thompson the Audit Committee’s financial expert. |
| (2) | Mr. Thompson is independent for purposes of this Item 3. |
Item 4. Principal Accountant Fees and Services.
(a) Audit Fees
Fees billed by Ernst & Young LLP (“EY”) to the Registrant:
Fiscal Year Ended 2020: $357,300
Fiscal Year Ended 2019: $427,600
The amounts above reflect the aggregate fees billed by EY, the Registrant’s independent auditor, for professional services provided to the Registrant for the audit of the Registrant’s annual financial statements and for services normally provided by the independent auditors in connection with statutory and regulatory filings or engagements.
(b) Audit-Related Fees
Fees billed by EY to the Registrant:
Fiscal Year Ended 2020: $0
Fiscal Year Ended 2019: $0
The amounts above reflect the aggregate fees billed by the Registrant’s independent auditors for assurance and related services relating to the performance of the audit of the Registrant’s financial statements that are not reported under paragraph (a) of this Item.
Fees billed by EY to the Registrant’s investment adviser (“Adviser”) and any entity controlling, controlled by or under common control with the registrant’s adviser that provides ongoing services to the registrant (hereinafter referred to as “service affiliates”) that were pre-approved:
Fiscal Year Ended 2020: $0
Fiscal Year Ended 2019: $0
The amounts above reflect the aggregate fees billed by EY for services relating to the performance of the audit of the financial statements of the Adviser and service affiliates and that relate directly to the operations or financial reporting of the Registrant.
(c) Tax Fees
Fees billed by EY to the Registrant:
Fiscal Year Ended 2020: $35,000
Fiscal Year Ended 2019: $36,500
The amounts above reflect the aggregate fees billed by EY for professional services provided to the Registrant for tax compliance, including preparation of tax returns and distribution assistance.
Fees billed by EY to the Adviser and any service affiliates:
Fiscal Year Ended 2020: $0
Fiscal Year Ended 2019: $0
The amounts above reflect the aggregate fees billed by EY for tax-related services provided to the Adviser and service affiliates and that relate directly to the operations or financial reporting of the Registrant.
Fees billed by EY to the Registrant:
Fiscal Year Ended 2020: $16,000
Fiscal Year Ended 2019: $16,000
The amounts above reflect the aggregate fees billed for all services provided by EY to the Registrant in connection with the preparation of a report on the Schedule of Rates of Return including an opinion on the Global Investment Performance Standards.
Fees billed by EY to the Adviser and any service affiliates:
Fiscal Year Ended 2020: $0
Fiscal Year Ended 2019: $0
The amounts above reflect the aggregate fees billed for all services other than those set forth in paragraphs (a), (b) and (c) of this Item provided by the EY to the Adviser and service affiliates and that relate directly to the operations or financial reporting of the Registrant
| (e) | (1) | Audit Committee’s Pre-Approval Policies |
The Charter of the Trust’s Audit Committee provides that the Audit Committee shall review and, if appropriate, approve in advance all audit and non-audit services (as such term may be from time to time defined in the Securities Exchange Act of 1934, as amended) to be provided to the Trust by the Trust’s independent auditor. In making a determination, the Audit Committee considers whether the services are consistent with maintaining the principal accountant’s independence. If such a service is required between regularly scheduled audit committee meetings, pre-approval may be authorized by a majority of the audit committee members at a special meeting called for such purposes or by unanimous written consent. The Audit Committee’s Charter does not permit waiver of pre-approval for audit or non-audit services requiring fees of a de minimis amount.
| (2) | Percentages of Services Approved by the Audit Committee |
No percentage of the services included in (b)-(d) above were approved by the audit committee pursuant to paragraph (c)(7)(i)(C) of Rule 2-01 of Regulation S-X.
| (f) | For the most recent fiscal year, less than 50% of the hours expended by the Trust’s principal accountant on the principal accountant’s engagement to audit the Trust’s financial statements were attributed to work performed by persons other than the principal accountant’s full-time, permanent employees. |
| (g) | The aggregate non-audit fees billed by the Trust’s accountant for services rendered to the Registrant for fiscal years ending December 31, 2020 and December 31, 2019 were $51,000 and $52,500, respectively. The Trust does not have an investment adviser. |
| (h) | Not applicable. The Trust does not have an investment adviser. |
Item 5. Audit Committee of Listed Registrants.
Not applicable to open-end investment companies.
Item 6. Schedule of Investments.
| (a) | Included herein under Item 1. |
Item 7. Disclosure of Proxy Voting Policies and Procedures for Closed-End Management Investment Companies.
Not applicable to open-end investment companies.
Item 8. Portfolio Managers of Closed-End Management Investment Companies.
Not applicable to open-end investment companies.
Item 9. Purchases of Equity Securities by Closed-End Management Investment Company and Affiliated Purchasers.
Not applicable to open-end investment companies.
Item 10. Submission of Matters to a Vote of Security Holders.
No material changes have been made to the procedures by which participants may recommend nominees to the Board of Trustees of the Trust, where those changes were implemented after the Registrant last provided disclosure in response to the requirements of Item 407(c)(2)(iv) of Regulation S-K (per Item 22(b)(15) of Schedule 14A) or this Item.
Item 11. Controls and Procedures.
| (a) | The Trust’s Chief Executive Officer (the principal executive officer) and Chief Financial Officer (the principal financial officer) have concluded that the Trust’s disclosure controls and procedures (as defined in Rule 30a-3(c) under the Act (17 CFR 270.30a-3(c))) are effective to ensure that material information relating to the Trust is made known to them by appropriate persons, based on their evaluation of such controls and procedures as of December 31, 2020. |
| (b) | There were no changes in the Trust’s internal control over financial reporting (as defined in Rule 30a-3(d) under the Act (17 CFR 270.30a-3(d)) that occurred during the Trust’s last fiscal half year of the period covered by this report that have materially affected, or are reasonably likely to materially affect, the Trust’s internal control over financial reporting. |
Item 12. Disclosure of Securities Lending Activities for Closed-End Management Investment Companies.
Not applicable to open-end investment companies.
Item 13. Exhibits.
| (a) | (1) | The Trust’s Code of Ethics applicable to its principal executive officer, principal financial officer, and principal accounting officer or persons performing similar functions is attached hereto. |
| (2) | A separate certification for each principal executive officer and principal financial officer of the registrant as required by Rule 30a-2(a) under the Act (17 CFR 270.30a-2(a)). |
| (4) | There was no change in the Registrant’s independent public accountant for the period covered by this report. |
| (b) | A separate certification for each principal executive officer and principal financial officer of the registrant as required by Rule 30a-2(b) under the Act. |
SIGNATURES
Pursuant to the requirements of the Securities Exchange Act of 1934 and the Investment Company Act of 1940, the AFL-CIO Housing Investment Trust has duly caused this report to be signed on its behalf by the undersigned, thereunto duly authorized.
AFL-CIO HOUSING INVESTMENT TRUST
By:
/s/ Chang Suh
Chang Suh
Chief Executive Officer
Date: March 8, 2021
Pursuant to the requirements of the Securities Exchange Act of 1934 and the Investment Company Act of 1940, this report has been signed below by the following persons on behalf of the AFL-CIO Housing Investment Trust and in the capacities and on the dates indicated.
/s/ Chang Suh
Chang Suh
Chief Executive Officer
AFL-CIO Housing Investment Trust
(Principal Executive Officer)
Date: March 8, 2021
/s/ Erica Khatchadourian
Erica Khatchadourian,
Chief Financial Officer
AFL-CIO Housing Investment Trust
(Principal Financial Officer)
Date: March 5, 2021