UNITED STATES
SECURITIES AND EXCHANGE COMMISSION
Washington, D.C. 20549
FORM N-CSR
CERTIFIED SHAREHOLDER REPORT OF REGISTERED MANAGEMENT
INVESTMENT COMPANIES
Investment Company Act File Number: 811-3493
American Federation of Labor and
Congress of Industrial Organizations
Housing Investment Trust
(Exact name of registrant as specified in charter)
1227 25th Street, N.W., Suite 500
Washington, D.C. 20037
(Address of principal executive offices) (Zip code)
Corey F. Rose, Esq.
Dechert LLP
1900 K Street, NW
Washington, DC 20006-1110
(Name and address of agent for service)
(202) 331-8055
(Registrant’s telephone number, including area code)
Date of fiscal year end: December 31
Date of reporting period: January 1, 2023 - December 31, 2023
Item 1. Reports to Stockholders.
A copy of the 2023 Annual Report (the “Report”) of the AFL-CIO Housing Investment Trust (the “Trust” or “Registrant”) transmitted to Trust participants pursuant to Rule 30e-1 under the Investment Company Act of 1940, as amended (17 CFR 270.30e-1) (the “Act”), is included herewith.

TO OUR INVESTORS |  |
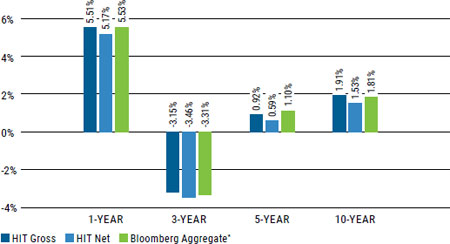
During much of 2023, the Federal Reserve (the Fed) continued hiking interest rates in its ongoing effort to bring down persistently high inflation. By the latter part of the year, rates had reached their highest level in years, broadly hurting the value of rate-sensitive fixed income investments. However, the Fed’s pausing of its rate hike program and market expectations of a pivot to rate cuts in 2024 helped fixed income markets rally in the fourth quarter. The HIT’s return for 2023 was 5.51% gross of fees and 5.17% net of fees compared to 5.53% for its benchmark, the Bloomberg U.S. Aggregate Bond Index* (Bloomberg Aggregate or Benchmark).1 The HIT ended 2023 with a yield-to-worst of 5.36%, an advantage of 82 basis points over the Benchmark, which we expect will be a positive harbinger going into 2024.2
The HIT continues to increase its impact investing and committed to 15 projects in 2023, despite the challenges posed by higher rates in the earlier part of the year. Currently, the HIT has 40 projects under construction nationwide, which are expected to generate an estimated $6.2 billion of economic activity and create or rehabilitate 6,534 housing units. Looking forward to 2024, the HIT will seek to secure more investments that finance new housing development as we expect the demand for additional housing, particularly affordable housing, will continue to grow. Despite 2023’s difficult interest rate environment, the HIT was able to provide financing for 15 projects without sacrificing credit quality: 92% of the portfolio was guaranteed by the government,
a Government-Sponsored Enterprise or a state housing finance agency. We believe that the HIT’s ability to provide flexible and creative financing to housing projects, as well as the return of longer-term interest rates to levels seen at the start of 2023, should allow it to be an attractive financing source as borrowers may confront challenges in the coming year.
Continuing its strategy of maintaining a high credit quality portfolio with a very attractive yield, the HIT persists in seeking competitive returns for its investors while building much-needed housing in communities across the U.S. The HIT also strives to do more as a record number of renters were cost-burdened and home purchase affordability in 99% of counties was worse than its historical average in 2023. We believe that the HIT’s commitment to constantly improving operations allows the HIT to help fill financing gaps that could lead to more attractive investments, jobs and housing. The growth of the HIT, lower operating expenses and the large volume of impact investments made in the past four years have strengthened the HIT’s position. We believe the HIT’s higher yield and its impact investments will bring value to its investors and partners.

Chang Suh
Chief Executive Officer and Chief Investment Officer
*Source: Bloomberg
| 1. | The performance data quoted represents past performance and is no guarantee of future results. Investment results and principal value will fluctuate so that units in the HIT, when redeemed, may be worth more or less than the original cost. The HIT’s current performance data may be lower or higher than the performance data quoted. Performance data current to the most recent month-end is available from the HIT’s website at www.aflcio-hit.com. Gross performance figures do not reflect the deduction of HIT expenses. Net performance figures reflect the deduction of HIT expenses and are the performance returns that HIT’s investors obtain. Information about HIT expenses can be found on page 1 of the HIT’s current prospectus. |
| 2. | Yield-to-Worst is a measure of the lowest possible yield that can be received on a bond that fully operates within the terms of its contract without defaulting. It does not represent the performance yield. It is calculated by using the lower of either the yield to maturity or the yield to call on every possible call date. |
MESSAGE FROM THE AFL-CIO PRESIDENT |  |
“Over the course of 2023, the HIT proved that a long-established union-friendly investment strategy really is a model for modern, impactful investments.”
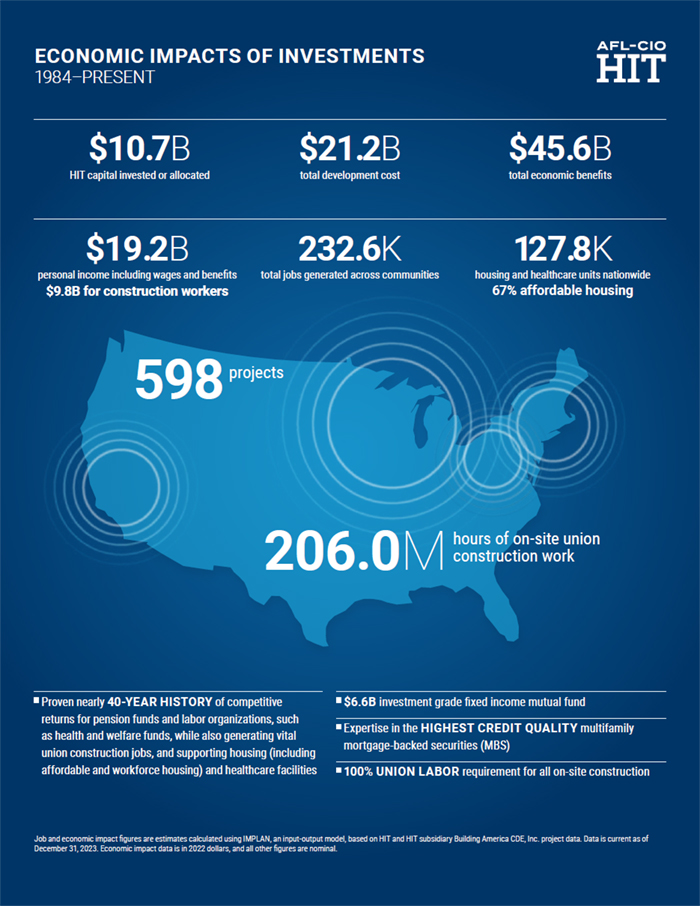
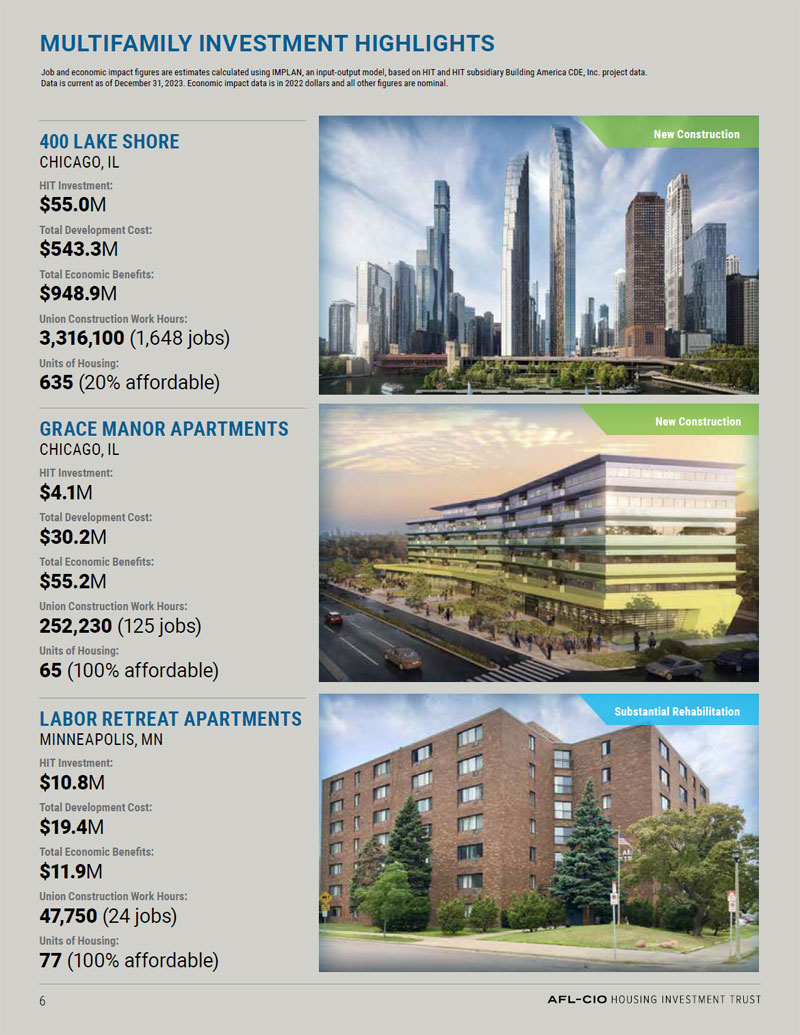
During 2023, the HIT remained true to its guiding principle to create additional employment for the construction trades and help address America’s tremendous unmet housing need. By all measures, it succeeded: investing $357.2 million in 15 projects nationwide in 2023, with $1.9 billion in total development costs, creating or rehabilitating 2,873 housing units (45% affordable), and generating an estimated 13,554 jobs across communities.
The history of the American labor movement is woven through the very streets and neighborhoods in which the HIT invests; and while every city is distinct, the HIT’s investments are uniformly aligned with creating local opportunities. By seeking to generate competitive returns for investors while promoting the creation of union jobs, affordable housing and sustainable development, the HIT responded to some of the most critical challenges Americans face. Then, by engaging and educating
stakeholders in key markets, the HIT put the power of union capital center stage and encouraged others to join its efforts. In short, over the course of 2023, the HIT proved that a long-established union-friendly investment strategy really is a model for modern, impactful investments.
I welcome another year working alongside the HIT and the labor movement as we forge solutions, weather change, and create real opportunity for union members nationwide.
In Solidarity,

Elizabeth H. Shuler
President, AFL-CIO; Trustee, AFL-CIO Housing Investment Trust
| 2 |  |
DISCUSSION OF FUND PERFORMANCE
(unaudited)
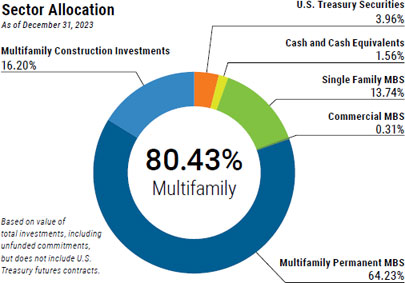
2023 OVERVIEW The AFL-CIO Housing Investment Trust (HIT) continued to put labor’s capital to work through high credit-quality multifamily investments in 2023, a year with continuing restrictive monetary policy as the Federal Open Market Committee (FOMC) raised the Federal Funds Rate by 100 basis points (bps) after raising it by 400 bps the prior year.1 The HIT committed $357.2 million to finance the construction, substantial rehabilitation or affordability preservation of 15 projects during the year.2 These investments, with a total development cost of $1.9 billion, are expected to generate approximately 5,726 union construction jobs and an estimated $2.8 billion in economic impacts.3 Fixed income strategies rebounded from a difficult 2022 by generating positive returns in 2023; and the HIT performed in-line with its benchmark, the Bloomberg U.S. Aggregate Bond Index* (Bloomberg Aggregate or Benchmark). The HIT ended 2023 with a yield-to-worst of 5.36%, 82 bps higher than the Benchmark, and we believe this yield advantage reflects the relative value of the HIT’s portfolio.4 2023 RETURNS For 2023, the HIT generated a gross return of 5.51% and net return of 5.17%, compared to the Benchmark’s 5.53% return. The HIT narrowly trailed the Benchmark despite a structural underweight to corporate | | credit, the best performing sector in investment grade fixed income for 2023. The HIT delivered competitive returns as the portfolio yield continued to rise alongside interest rates. PERFORMANCE ATTRIBUTION SUMMARY Total returns for investment grade fixed income strategies were positive for 2023 as interest rates fell from their highs in the fourth quarter. The 10-year U.S. Treasury closed the year with a yield of 3.88%, which was exactly the same as the yield at the end of the previous year. Interest rates fluctuated greatly throughout the year, reaching their highest levels in 15 years in October before closing the year over 100 bps lower. By adding higher coupon assets into its portfolio, the HIT was able to generate a meaningful income return of 3.88%, a 63-bp advantage to the Benchmark. In this volatile rate environment, the HIT delivered competitive returns that narrowly underperformed the Benchmark by 2 bps on a gross of fees basis despite not holding any corporate credit, which was the best performing sector for the year in investment grade fixed income on both an excess and total return basis, by a wide margin. The HIT’s relative performance for 2023 benefitted from the HIT’s overweight to conventional agency multifamily mortgage-backed securities, overweight to adjustable-rate investments, and underweight to U.S. Treasuries, which |
| | | |
Relative Returns As of December 31, 2023, periods over one year are annualized | | Comparison of a $50,000 Investment in the HIT and Bloomberg Aggregate (10 Years) |
| | | |
 | | 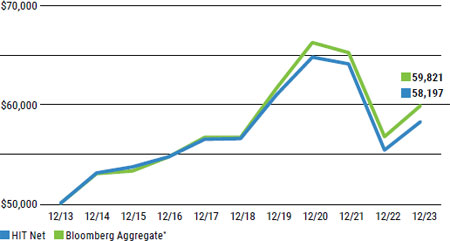 |
Past performance is no guarantee of future results. Economic and market conditions change, and both will cause investment return, principal value, and yield to fluctuate so that a participant’s units, when redeemed, may be worth more or less than their original cost. Current performance may be lower or higher than the performance data quoted. Performance data current to the most recent month-end is available at www.aflcio-hit. com. Gross performance figures do not reflect the deduction of HIT expenses. Net performance figures reflect the deduction of HIT expenses and are the performance figures investors experience in the HIT. Information about HIT expenses can be found on page 1 of the HIT’s current prospectus. The Bloomberg Aggregate is an unmanaged index and is not available for direct investment, although certain funds attempt to replicate this index. Returns for the index would be lower if they reflected the actual trading costs or expenses associated with management of an actual portfolio.
| 2. | This includes New Markets Tax Credits allocated by HIT subsidiary Building America CDE, Inc. |
| 3. | Job and economic impact figures are estimates calculated using IMPLAN, an input]output model, based on HIT and HIT subsidiary Building America CDE, Inc. project data. Data is current as of December 31, 2023. |
| 4. | Yield-to-Worst is a measure of the lowest possible yield that can be received on a bond that fully operates within the terms of its contract without defaulting. It does not represent the performance yield. It is calculated by using the lower of either the yield to maturity or the yield to call on every possible call date. |
DISCUSSION OF FUND PERFORMANCE
continued
Treasury Yield Curve Shift
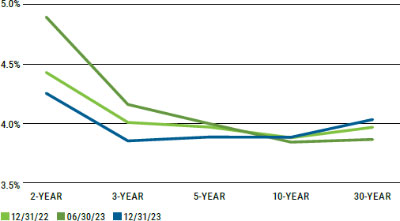
Source: Bloomberg L.P.
S&P vs 10-Year Treasury
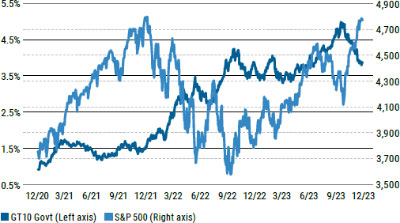
Source: Bloomberg L.P.
Historical Multifamily Spreads

Source: HIT and Securities Dealers
was the worst performing asset class in the Benchmark on an excess and total return basis. In addition to the HIT’s lack of corporate bonds, the HIT’s underweight to the lower credit quality sectors of the investment grade universe hindered relative returns.
2023 MARKET OVERVIEW
The U.S. economy continued to expand in 2023, backed by strong consumer spending, steady job growth and growing real wages. Despite a slight softening in the fourth quarter, the U.S. labor market ended 2023 with an unemployment rate of only 3.7%.5 Following its peak in the summer of 2022, inflation demonstrated a persistent downward trend for the year, although it remains well above the Federal Reserve’s long run 2% target. Shelter prices, however, remained elevated throughout 2023, fueled by high home prices and rents.
To address heightened inflation, the Federal Reserve (the Fed) hiked the Federal Funds rate 100 bps during the first seven months of the year.6 The Fed did not change interest rates for the rest of the year to assess the lagged impact of its increasingly restrictive monetary policy.
Housing affordability continued to erode in 2023 due to elevated mortgage rates and home prices. Median-priced single-family homes and condos were less affordable in 2023 compared to historical averages in 99% of counties around the nation.7 While the national apartment vacancy rate rose half a percentage point and rents softened from record highs, the average American renter remains cost burdened. The share of American household income needed to rent an average-priced apartment crossed the rent-burdening 30% threshold in 2023 for the first time in nearly 25 years of tracking.8
HIT’S MULTIFAMILY INVESTMENTS
The HIT committed $357.2 million in financing across 15 investments in 2023, which will generate, rehabilitate or preserve 2,873 housing units, of which approximately 45% will be affordable.9 These projects have development costs totaling over $1.9 billion, marking the highest in the HIT’s nearly 40-year history. These investments are expected to contribute positively to the HIT’s portfolio’s yield while generating approximately 5,726 union construction jobs and an estimated $2.8 billion in economic impacts, revitalizing communities across the U.S. as spending on these projects circulate through local economies.10
In 2023, the HIT continued to utilize its varied financing products, primarily utilizing its Federal Housing Administration (FHA)-insured construction and permanent lending program, and its direct and bridge lending authorities. The HIT committed to three direct loans in 2023, including 400 Lake Shore, a mixed-income, 72-story housing project located at the intersection of the Chicago River and Lake Michigan, which will redefine the Chicago skyline.
| 5. | Bureau of Labor Statistics |
| 9. | This includes New Markets Tax Credits allocated by HIT subsidiary Building America CDE, Inc. |
| 10. | Job and economic impact figures are estimates calculated using IMPLAN, an input]output model, based on HIT and HIT subsidiary Building America CDE, Inc. project data. Data is current as of December 31, 2023. |
| 4 | |
DISCUSSION OF FUND PERFORMANCE
continued
 | “As the housing shortage and housing costs continue to rise, the HIT is doing its part to grow, rehabilitate and maintain the supply across the U.S. In 2023, the HIT provided financing for 2,873 units of housing, with 1,290 of those affordable.” Chris Coleman President and CEO, Twin Cities Habitat for Humanity; Chair of the Board, AFL-CIO Housing Investment Trust |
The HIT continued to be very active in some of its key markets during 2023. In addition to 400 Lake Shore, the HIT closed on six Chicago developments, which will create 652 units of housing, of which approximately 96% will be affordable. Additionally, the HIT committed to provide financing for projects in Massachusetts, Minnesota, New Jersey, and Pennsylvania; and to preserve affordability in New York City.
At year-end, 40 projects receiving HIT financing were under construction. These projects are providing significant economic benefits and positively impacting communities in 19 cities across 10 states. With a positive outlook on interest rates heading into 2024, the HIT is tracking an extensive pipeline of projects and continues to work with its numerous lending partners to finance affordable, workforce, and market rate housing developments.
LOOKING AHEAD
The U.S. economy is expected to slow in the coming months as the lagged effects of higher interest rates and a slowing labor market could weigh on consumer spending. Ongoing turmoil in the Middle East, including the unrest in the Red Sea, could impact supply chains and cause oil prices to rise. Higher oil and gas prices act as a tax on consumers, who are already experiencing strained budgets from still elevated inflation.
Risk Comparison
As of December 31, 2022
| | HIT | Bloomberg
Aggregate* |
Credit Profile U.S. Government/Agency/AAA/Cash | 88.80% | 74.37% |
| A & Below/Not Rated | 6.25% | 24.18% |
| Yield |
| Current Yield | 3.93% | 3.38% |
| Yield to Worst | 5.36% | 4.54% |
| Interest Rate Risk |
| Effective Duration | 6.01 | 6.12 |
| Convexity | 0.24 | 0.28 |
| Call Risk |
| Call Protected | 75% | 73% |
| Not Call Protected | 25% | 27% |
| Source: HIT and Bloomberg* |
Disinflation, as well as the slower job growth in the fourth quarter, has raised market expectations for more cuts in short-term rates in 2024. Currently, the Fed is forecasting three quarter-point rate cuts by the end of 2024, with the Federal Funds Effective Rate futures market predicting a much more aggressive policy of at least six quarter-point cuts by the end of 2024.
Additionally, there continues to be a high degree of political uncertainty going into the new year. The latest budget agreement, passed in mid-January, is just a stopgap measure that now pushes the possibility of a government shutdown into March 2024.
Single family home prices remain near record highs and are expected to be out of reach for many in 2024, so multifamily rental housing should continue to be in high demand. At the same time, a record number of renters are cost burdened, demonstrating the critical need for more affordable housing in the U.S. The HIT has a proven track record of investing in affordable and market rate housing, often using flexible financing tools that can create a competitive advantage. In times of heightened market uncertainty, the HIT’s portfolio continues to offer an attractive yield advantage, liquidity, diversification from corporate credit, and defensive positioning relative to other core fixed income managers.
| * | Source: Bloomberg Index Services Limited. BLOOMBERG® is a trademark and service mark of Bloomberg Finance L.P. and its affiliates (collectively “Bloomberg”). Bloomberg or Bloomberg’s licensors own all proprietary rights in the Bloomberg Indices. Bloomberg does not approve or endorse this material or guarantee the accuracy or completeness of any information herein, nor does Bloomberg make any warranty, express or implied, as to the results to be obtained therefrom, and, to the maximum extent allowed by law, Bloomberg shall not have any liability or responsibility for injury or damages arising in connection therewith. |

OTHER IMPORTANT INFORMATION
(unaudited)
| Expense Example | Beginning | Ending | Expenses Paid During |
| | Account Value | Account Value | Six Month Period Ended |
| | July 1, 2023 | December 31, 2023 | December 31, 2023* |
| Actual Expenses | $1,000.00 | $1,031.60 | $1.74 |
Hypothetical Expenses
(5% annual return before expenses) | $1,000.00 | $1,023.49 | $1.73 |
| * | Expenses are equal to the HIT’s annualized six-month expense ratio of 0.340%, as of December 31, 2023, multiplied by the average account value over the period, multiplied by 184/365 (to reflect the one-half period). |
Annual Meeting of Participants: Class I Trustees Results
| Trustee | | Votes For | | Votes Against | | Votes Abstaining* |
| Paul A. Noble | | 4,290,114.485 | | 0 | | 0 |
| Fredrick Redmond | | 4,290,114.485 | | 0 | | 0 |
| Anthony Shelton | | 4,290,114.485 | | 0 | | 0 |
| James A. Williams, Jr. | | 4,290,114.485 | | 0 | | 0 |
| Bridget Gainer | | 4,290,114.485 | | 0 | | 0 |
| Jack F. Quinn, Jr. | | 4,290,114.485 | | 0 | | 0 |
| Deidre L. Schmidt | | 4,290,114.485 | | 0 | | 0 |
| William C. Thompson, Jr. | | 4,290,114.485 | | 0 | | 0 |
* Votes not cast: 2,415,635.711
Expense Example
Participants in the HIT incur ongoing expenses related to the management and distribution activities of the HIT, as well as certain other expenses. The expense example in the table above is intended to help participants understand the ongoing costs (in dollars) of investing in the HIT and to compare these costs with the ongoing costs of investing in other mutual funds.
The example is based on an investment of $1,000 invested at the beginning of the period, July 1, 2023, and held for the entire period ended December 31, 2023.
Actual Expenses The first line of the table above provides information about actual account values and actual expenses. Participants may use the information in this line, together with the amount they invested, to estimate the expenses that they paid over the period. Simply divide the account value by $1,000 (for example, an $800,000 account value divided by $1,000=$800), then multiply the result by the number in the first line under the heading entitled “Expenses Paid During Six-Month Period Ended December 31, 2023” to estimate the expenses paid on a particular account during this period.
Hypothetical Expenses (for Comparison Purposes Only): The second line of the table above provides information about hypothetical account values and hypothetical expenses based on the HIT’s actual expense ratio and an assumed rate of return of 5% per year before expenses, which is not the HIT’s actual return. The hypothetical account values and expenses may not be used to estimate the actual ending account balance or expenses a participant paid for the period. Participants may use this information to compare the ongoing costs of investing in the HIT and other mutual funds. To do so, compare this 5% hypothetical example with the 5% hypothetical examples that appear in the shareholder reports of the other mutual funds.
Please note that this example is useful in comparing funds’ ongoing costs only. It does not include any transactional costs, such as sales charges (loads), redemption fees, or exchange fees. The HIT does not have such transactional costs, but many other funds do.
Availability of Quarterly Portfolio Schedule
In addition to disclosure in its Annual and Semi-Annual Reports to Participants, the HIT also files its complete schedule of portfolio holdings with the Securities and Exchange Commission (SEC) for the first and third quarters of each fiscal year as an exhibit to its reports on Form N-PORT. The HIT’s Forms N-PORT are available on the SEC’s website at http://www.sec.gov.
Participants may also obtain copies of the information on HIT’s Form N-PORT, without charge, upon request, by calling the HIT at 202-331-8055.
Proxy Voting
Except for its interest in its wholly owned subsidiary, HIT Advisers LLC, and shares in mutual funds holding short-term or overnight cash, if applicable, the HIT invests exclusively in nonvoting securities and has not deemed it necessary to adopt policies and procedures for the voting of portfolio securities. The HIT has reported information regarding how it voted in matters related to its subsidiary in its most recent filing with the SEC on Form N-PX. This filing is available on the SEC’s website at http://www.sec. gov. Participants may also obtain a copy of the HIT’s report on Form N-PX, without charge, upon request, by calling the HIT at 202-331-8055.
2023 HIT Participants Meeting
The HIT’s 2023 Annual Meeting of Participants was held on Tuesday, December 19, 2023. The following matters were put to a vote of the participants at the meeting through the solicitation of proxies:
Election of Chair of the Board of Trustees Chris Coleman was elected to chair the Board of Trustees by: votes for 4,290,114.485; votes against 0; votes abstaining 0; votes not cast 2,415,635.711.
Election of Class I Trustees (See table above).
Ernst & Young LLP was ratified as the HIT’s Independent Registered Public Accounting Firm by: votes for 4,290,114.485; votes against 0; votes abstaining 0; votes not cast 2,415,635.711.
The following Trustees were not up for reelection and their terms of office continued after the meeting: Vincent Alvarez, Timothy J. Driscoll, Sean McGarvey, Terry O’Sullivan, Elizabeth Shuler, Kevin Filter, Tony Stanley, Harry W. Thompson.
| 8 | |

REPORT OF INDEPENDENT REGISTERED PUBLIC ACCOUNTING FIRM
To the Board of Trustees and Participants of American Federation of Labor and Congress of
Industrial Organizations Housing Investment Trust:
Opinion on the Financial Statements
We have audited the accompanying statement of assets and liabilities of American Federation of Labor and Congress of Industrial Organizations Housing Investment Trust (the “Trust”), including the schedule of portfolio investments, as of December 31, 2023, and the related statement of operations for the year then ended, the statements of changes in net assets for each of the two years in the period then ended, the financial highlights for each of the five years in the period then ended and the related notes (collectively referred to as the “financial statements”). In our opinion, the financial statements present fairly, in all material respects, the financial position of the Trust at December 31, 2023, the results of its operations for the year then ended, the changes in its net assets for each of the two years in the period then ended, and its financial highlights for each of the five years in the period then ended, in conformity with U.S. generally accepted accounting principles.
Basis for Opinion
These financial statements are the responsibility of the Trust’s management. Our responsibility is to express an opinion on the Trust’s financial statements based on our audits. We are a public accounting firm registered with the Public Company Accounting Oversight Board (United States) (“PCAOB”) and are required to be independent with respect to the Trust in accordance with the U.S. federal securities laws and the applicable rules and regulations of the Securities and Exchange Commission and the PCAOB.
We conducted our audits in accordance with the standards of the PCAOB. Those standards require that we plan and perform the audit to obtain reasonable assurance about whether the financial statements are free of material misstatement, whether due to error or fraud. The Trust is not required to have, nor were we engaged to perform, an audit of the Trust’s internal control over financial reporting. As part of our audits, we are required to obtain an understanding of internal control over financial reporting but not for the purpose of expressing an opinion on the effectiveness of the Trust’s internal control over financial reporting. Accordingly, we express no such opinion.
Our audits included performing procedures to assess the risks of material misstatement of the financial statements, whether due to error or fraud, and performing procedures that respond to those risks. Such procedures included examining, on a test basis, evidence regarding the amounts and disclosures in the financial statements. Our procedures included confirmation of securities owned as of December 31, 2023, by correspondence with the custodian and counterparties. Our audits also included evaluating the accounting principles used and significant estimates made by management, as well as evaluating the overall presentation of the financial statements. We believe that our audits provide a reasonable basis for our opinion.
We have served as the HIT’s auditor since 2002.
Tysons, Virginia
February 29, 2024
| 10 | |
STATEMENT OF ASSETS AND LIABILITIES
December 31, 2023 (dollars in thousands, except per share data)
| Assets |
| | Investments, at value (cost $7,337,164) | $ | 6,541,881 |
| | Cash | 330 |
| | Accrued interest receivable | 25,823 |
| | Receivables for investments sold | 189 |
| | Cash collateral held with broker | 2,532 |
| | Variation margin due from broker | 5,071 |
| | Right of use asset | 3,856 |
| | Other assets | 4,610 |
| | Total assets | 6,584,292 |
| | | |
| Liabilities |
| | Payables for investments purchased | 3,915 |
| | Redemptions payable | 7,007 |
| | Income distribution and capital gains payable, net of dividends reinvested of $17,613 | 1,749 |
| | Refundable deposits | 1,082 |
| | Accrued salaries and fringe benefits | 6,164 |
| | Lease Liability | 4,387 |
| | Other liabilities and accrued expenses | 1,157 |
| | Total liabilities | 25,461 |
| | | |
| | Other commitments and contingencies (Note 5 of financial statements) | - |
| | | |
| Net assets applicable to participants’ equity — | |
| | Certificates of participation—authorized unlimited; | |
| | Outstanding 6,736,060 units | $ | 6,558,831 |
| | | |
| Net asset value per unit of participation (in dollars) | $ | 973.69 |
| | | |
| | | |
| Participants’ equity | |
| | Participants’ equity consisted of the following: | |
| | Amount invested and reinvested by current participants | $ | 7,453,767 |
| | Distributable earnings (accumulated losses) | (894,936) |
| | Total participants’ equity | $ | 6,558,831 |
See accompanying Notes to Financial Statements.
SCHEDULE OF PORTFOLIO INVESTMENTS
December 31, 2023 (dollars in thousands)
FHA Permanent Securities | 1.8% of net assets
| | | Interest Rate | | Maturity Date | | Face Amount | | Amortized Cost | | Value |
| Multifamily | | 2.50% | | Apr-2063 | | $ | 5,650 | | | $ | 5,658 | | | $ | 4,556 | |
| | | 3.65% | | Dec-2037 | | | 7,121 | | | | 7,207 | | | | 7,088 | |
| | | 3.72% | | Feb-2062 | | | 4,384 | | | | 4,394 | | | | 3,966 | |
| | | 3.90% | | Mar-2062 | | | 3,056 | | | | 3,059 | | | | 2,796 | |
| | | 4.00% | | Dec-2053 | | | 59,076 | | | | 59,051 | | | | 56,632 | |
| | | 4.10% | | Dec-2060 | | | 21,285 | | | | 21,303 | | | | 19,204 | |
| | | 4.70% | | May-2053 | | | 4,475 | | | | 4,643 | | | | 3,645 | |
| | | 5.17% | | Feb-2050 | | | 7,262 | | | | 7,696 | | | | 7,095 | |
| | | 5.60% | | Jun-2038 | | | 1,930 | | | | 1,932 | | | | 1,927 | |
| | | 5.80% | | Jan-2053 | | | 1,897 | | | | 1,905 | | | | 1,933 | |
| | | 5.87% | | May-2044 | | | 1,547 | | | | 1,547 | | | | 1,545 | |
| | | 5.89% | | Apr-2038 | | | 3,638 | | | | 3,641 | | | | 3,634 | |
| | | 6.40% | | Aug-2046 | | | 3,412 | | | | 3,413 | | | | 3,411 | |
| | | 6.60% | | Jan-2050 | | | 3,106 | | | | 3,123 | | | | 3,099 | |
| Total FHA Permanent Securities | | | | | | $ | 127,839 | | | $ | 128,572 | | | $ | 120,531 | |
Ginnie Mae Securities | 25.7% of net assets
| | | Interest Rate | | Maturity Date | | Face Amount | | Amortized Cost | | Value |
| Single Family | | 4.00% | | Feb-2040 - Jun-2040 | | $ | 906 | | | $ | 912 | | | $ | 880 | |
| | | 4.50% | | Aug-2040 | | | 483 | | | | 489 | | | | 478 | |
| | | 5.50% | | Jan-2033 - Jun-2037 | | | 745 | | | | 746 | | | | 765 | |
| | | 6.00% | | Jan-2032 - Aug-2037 | | | 514 | | | | 516 | | | | 535 | |
| | | 6.50% | | Jul-2028 | | | 29 | | | | 29 | | | | 30 | |
| | | 7.00% | | Apr-2026 - Jan-2030 | | | 230 | | | | 230 | | | | 235 | |
| | | 7.50% | | Aug-2025 - Aug-2030 | | | 107 | | | | 107 | | | | 108 | |
| | | 8.00% | | Sep-2026 - Nov-2030 | | | 105 | | | | 105 | | | | 108 | |
| | | 8.50% | | Aug-2024 - Aug-2027 | | | 20 | | | | 21 | | | | 21 | |
| | | 9.00% | | Sep-2024 - Jun-2025 | | | 1 | | | | 1 | | | | 1 | |
| | | | | | | | 3,140 | | | | 3,156 | | | | 3,161 | |
| Multifamily | | 1.90% | | Feb-2061 | | | 22,712 | | | | 20,582 | | | | 13,604 | |
| | | 1.95% | | Mar-2064 | | | 37,504 | | | | 37,037 | | | | 30,145 | |
| | | 1.95% | | Mar-2064 | | | 34,068 | | | | 34,516 | | | | 27,493 | |
| | | 2.00% | | Oct-2062 | | | 52,855 | | | | 54,569 | | | | 41,816 | |
| | | 2.00% | | Apr-2063 | | | 51,246 | | | | 52,076 | | | | 41,244 | |
| | | 2.00% | | Apr-2063 | | | 48,497 | | | | 49,475 | | | | 38,651 | |
| | | 2.00% | | Jul-2063 | | | 44,283 | | | | 44,665 | | | | 35,710 | |
| | | 2.00% | | Oct-2063 | | | 42,011 | | | | 41,616 | | | | 33,120 | |
| | | 2.00% | | Jul-2062 - Mar-2064 | | | 299,790 | | | | 303,092 | | | | 234,997 | |
| | | 2.08% | | Nov-2056 | | | 50,876 | | | | 52,723 | | | | 42,720 | |
| | | 2.15% | | May-2056 | | | 423 | | | | 422 | | | | 413 | |
| | | 2.20% | | Jun-2056 | | | 828 | | | | 826 | | | | 791 | |
| | | 2.25% | | Dec-2048 | | | 2,683 | | | | 2,665 | | | | 2,506 | |
| | | 2.30% | | Mar-2056 - Oct-2056 | | | 3,081 | | | | 3,054 | | | | 2,919 | |
| | | 2.31% | | Nov-2051 | | | 7,076 | | | | 7,076 | | | | 6,300 | |
| | | 2.32% | | Sep-2060 | | | 26,408 | | | | 27,743 | | | | 22,618 | |
| | | 2.35% | | Nov-2056 - Feb-2061 | | | 28,191 | | | | 28,990 | | | | 23,805 | |
| 12 | |
Schedule of Portfolio Investments
December 31, 2023 (dollars in thousands) continued
Ginnie Mae Securities continued
| | | Interest Rate | | Maturity Date | | Face Amount | | Amortized Cost | | Value |
| | | 2.37% | | Jan-2053 | | | 22,024 | | | | 22,158 | | | | 19,853 | |
| | | 2.40% | | Aug-2047 - Dec-2057 | | | 18,370 | | | | 18,769 | | | | 15,375 | |
| | | 2.45% | | Apr-2062 | | | 14,398 | | | | 14,621 | | | | 12,014 | |
| | | 2.50% | | Dec-2052 - Jan-2061 | | | 52,670 | | | | 53,435 | | | | 44,863 | |
| | | 2.58% | | May-2063 | | | 28,274 | | | | 29,146 | | | | 23,394 | |
| | | 2.60% | | Dec-2055 - Jun-2059 | | | 8,415 | | | | 8,437 | | | | 7,749 | |
| | | 2.62% | | Feb-2063 | | | 13,646 | | | | 14,122 | | | | 11,381 | |
| | | 2.64% | | Jan-2063 | | | 18,073 | | | | 18,578 | | | | 15,250 | |
| | | 2.65% | | Oct-2062 | | | 6,345 | | | | 6,493 | | | | 5,382 | |
| | | 2.67% | | Mar-2062 | | | 34,597 | | | | 35,369 | | | | 29,693 | |
| | | 2.70% | | May-2048 - Jul-2058 | | | 4,842 | | | | 4,844 | | | | 4,629 | |
| | | 2.72% | | Feb-2044 | | | 91 | | | | 93 | | | | 89 | |
| | | 2.74% | | Apr-2057 | | | 23,289 | | | | 25,167 | | | | 20,555 | |
| | | 2.75% | | Apr-2063 | | | 21,474 | | | | 22,325 | | | | 18,134 | |
| | | 2.78% | | Aug-2058 | | | 10,407 | | | | 11,258 | | | | 9,208 | |
| | | 2.79% | | Apr-2049 | | | 4,393 | | | | 4,427 | | | | 4,116 | |
| | | 2.80% | | Feb-2053 | | | 60,000 | | | | 57,386 | | | | 46,354 | |
| | | 2.80% | | Dec-2059 | | | 4,223 | | | | 4,170 | | | | 4,077 | |
| | | 2.82% | | Apr-2050 | | | 738 | | | | 750 | | | | 705 | |
| | | 2.94% | | Nov-2059 | | | 46,459 | | | | 51,382 | | | | 40,611 | |
| | | 2.98% | | Jun-2063 | | | 31,540 | | | | 32,626 | | | | 26,998 | |
| | | 3.00% | | May-2062 | | | 58,984 | | | | 63,505 | | | | 51,384 | |
| | | 3.03% | | Jan-2056 | | | 29,436 | | | | 31,205 | | | | 26,960 | |
| | | 3.05% | | May-2054 | | | 11,545 | | | | 11,588 | | | | 10,227 | |
| | | 3.17% | | Aug-2059 | | | 33,627 | | | | 36,988 | | | | 30,041 | |
| | | 3.25% | | Apr-2059 | | | 30,996 | | | | 29,861 | | | | 29,558 | |
| | | 3.25% | | Sep-2054 | | | 17,188 | | | | 17,058 | | | | 16,404 | |
| | | 3.26% | | Nov-2043 | | | 18 | | | | 18 | | | | 18 | |
| | | 3.27% | | Apr-2046 | | | 23,493 | | | | 24,628 | | | | 20,961 | |
| | | 3.30% | | Sep-2060 | | | 7,460 | | | | 7,633 | | | | 6,850 | |
| | | 3.33% | | May-2055 | | | 6,753 | | | | 6,437 | | | | 6,132 | |
| | | 3.34% | | Sep-2059 | | | 16,496 | | | | 16,787 | | | | 15,274 | |
| | | 3.35% | | Mar-2044 | | | 9,639 | | | | 9,319 | | | | 9,349 | |
| | | 3.36% | | May-2061 | | | 50,498 | | | | 55,800 | | | | 45,626 | |
| | | 3.38% | | Jan-2060 | | | 57,656 | | | | 57,661 | | | | 53,961 | |
| | | 3.39% | | Feb-2059 | | | 13,816 | | | | 14,063 | | | | 12,925 | |
| | | 3.41% | | Sep-2061 | | | 40,983 | | | | 42,482 | | | | 37,620 | |
| | | 3.43% | | Nov-2061 | | | 51,731 | | | | 53,259 | | | | 46,794 | |
| | | 3.48% | | Sep-2052 | | | 2,843 | | | | 2,929 | | | | 2,705 | |
| | | 3.50% | | Jan-2054 | | | 3,168 | | | | 3,155 | | | | 3,122 | |
| | | 3.53% | | Apr-2042 | | | 15,024 | | | | 15,400 | | | | 14,344 | |
| | | 3.60% | | Apr-2061 | | | 33,175 | | | | 34,185 | | | | 30,542 | |
| | | 3.60% | | Jun-2057 | | | 13,203 | | | | 13,625 | | | | 12,720 | |
| | | 3.62% | | Dec-2057 | | | 27,647 | | | | 28,089 | | | | 26,377 | |
| | | 3.63% | | Dec-2045 | | | 8,257 | | | | 7,993 | | | | 8,030 | |
| | | 3.65% | | Oct-2058 | | | 9,966 | | | | 10,103 | | | | 9,535 | |
| | | 3.67% | | Nov-2035 | | | 12,227 | | | | 12,489 | | | | 11,881 | |
| | | 3.74% | | Aug-2059 | | | 15,169 | | | | 15,438 | | | | 14,492 | |
| | | 3.75% | | Nov-2060 | | | 11,001 | | | | 11,323 | | | | 10,295 | |
Schedule of Portfolio Investments
December 31, 2023 (dollars in thousands) continued
Ginnie Mae Securities continued
| | | Interest Rate | | | Maturity Date | | Face Amount | | Amortized Cost | | Value |
| | | 3.78 | % | | | | | Aug-2060 | | | 38,506 | | | | 38,769 | | | | 35,920 | |
| | | 3.92 | % | | | | | Aug-2039 | | | 37,989 | | | | 39,591 | | | | 36,867 | |
| | | 4.00 | % | | | | | Nov-2057 | | | 24,162 | | | | 25,104 | | | | 22,742 | |
| | | 4.10 | % | | | | | May-2051 | | | 3,684 | | | | 3,951 | | | | 3,617 | |
| | | 4.35 | % | | | | | Dec-2060 | | | 2,236 | | | | 2,274 | | | | 2,179 | |
| | | 4.37 | % | | | | | Feb-2034 | | | 22,572 | | | | 24,253 | | | | 21,781 | |
| | | 4.45 | % | | | | | Jun-2055 | | | 2,420 | | | | 2,338 | | | | 2,413 | |
| | | 4.53 | % | | | | | Jan-2061 | | | 14,535 | | | | 14,952 | | | | 14,207 | |
| | | 4.63 | %1 | | | | | Sep-2037 | | | 1,500 | | | | 1,471 | | | | 1,501 | |
| | | 4.90 | %1 | | | | | Mar-2044 | | | 1,000 | | | | 992 | | | | 1,000 | |
| | | 5.25 | % | | | | | Apr-2037 | | | 15,290 | | | | 15,286 | | | | 15,256 | |
| | | | | | | | | | | | 1,952,693 | | | | 1,998,685 | | | | 1,680,892 | |
| Total Ginnie Mae Securities | | | | | | $ | 1,955,833 | | | $ | 2,001,841 | | | $ | 1,684,053 | |
Ginnie Mae Construction Securities | 2.6% of net assets
| | | Interest Rates2 | | | | Unfunded | | | | | | |
| | | Permanent | | Construction | | Maturity Date | | Commitments3 | | Face Amount | | Amortized Cost | | Value |
| Multifamily | | 2.25 | % | | 4.10 | % | | Apr-2064 | | $ | 43,979 | | | $ | 21,949 | | | $ | 23,958 | | | $ | 8,403 | |
| | | 2.59 | % | | 3.59 | % | | Aug-2064 | | | 26,047 | | | | 16,266 | | | | 17,222 | | | | 8,281 | |
| | | 3.05 | % | | 3.05 | % | | Dec-2063 | (Level 3) | | 52,651 | | | | 52,092 | | | | 53,133 | | | | 45,828 | |
| | | 3.24 | % | | 3.24 | % | | Jan-2064 | | | 2,327 | | | | 24,104 | | | | 24,637 | | | | 20,587 | |
| | | 3.60 | % | | 5.70 | % | | Jan-2064 | | | 259 | | | | 4,649 | | | | 4,815 | | | | 4,159 | |
| | | 3.69 | % | | 4.75 | % | | Nov-2063 | | | 2,619 | | | | 9,885 | | | | 10,052 | | | | 8,700 | |
| | | 3.75 | % | | 5.35 | % | | Jan-2064 | | | 290 | | | | 5,512 | | | | 5,705 | | | | 4,999 | |
| | | 4.08 | % | | 4.08 | % | | Feb-2064 | | | 1,150 | | | | 14,277 | | | | 14,617 | | | | 13,268 | |
| | | 4.14 | % | | 4.14 | % | | Sep-2063 | | | — | | | | 11,197 | | | | 11,398 | | | | 10,539 | |
| | | 5.17 | % | | 8.75 | % | | Jul-2064 | | | 280 | | | | 10,470 | | | | 10,600 | | | | 11,069 | |
| | | 5.90 | % | | 5.90 | % | | Aug-2065 | | | 4,085 | | | | 25 | | | | 135 | | | | 300 | |
| | | 6.15 | % | | 6.15 | % | | Apr-2065 - Aug-2065 | | | 5,871 | | | | 28,501 | | | | 29,232 | | | | 31,828 | |
| | | | | | | | | | | | 139,558 | | | | 198,927 | | | | 205,504 | | | | 167,961 | |
| Forward Commitments | | 5.34 | % | | 9.75 | % | | Sep-2065 | | | 20,957 | | | | — | | | | 733 | | | | 1,362 | |
| | | 5.92 | % | | 5.92 | % | | May-2065 - Jan-2066 | | | 22,479 | | | | — | | | | (825 | ) | | | 1,672 | |
| | | 6.10 | % | | 7.65 | % | | Aug-2065 | | | 2,171 | | | | — | | | | 66 | | | | 224 | |
| | | | | | | | | | | | 45,607 | | | | — | | | | (26 | ) | | | 3,258 | |
| Total Ginnie Mae Construction Securities | | | | $ | 185,165 | | | $ | 198,927 | | | $ | 205,478 | | | $ | 171,219 | |
Fannie Mae Securities | 44.3% of net assets
| | | | | | | | | Unfunded | | | | | | |
| | | Interest Rate4 | | | Maturity Date | | Commitments3 | | Face Amount | | Amortized Cost | | Value |
| Single Family | | 2.50 | % | | | | | May-2050 - Jan-2052 | | $ | — | | | $ | 111,309 | | | $ | 115,403 | | | $ | 95,411 | |
| | | 2.50 | % | | | | | Jan-2052 | | | — | | | | 43,281 | | | | 43,435 | | | | 37,180 | |
| | | 3.00 | % | | | | | Apr-2031 - Mar-2052 | | | — | | | | 129,519 | | | | 133,933 | | | | 116,096 | |
| | | 3.00 | % | | | | | Oct-2051 | | | — | | | | 42,756 | | | | 44,748 | | | | 38,049 | |
| | | 3.50 | % | | | | | Jan-2042 - Feb-2052 | | | — | | | | 93,007 | | | | 95,654 | | | | 86,462 | |
| | | 3.50 | % | | | | | Jan-2052 | | | — | | | | 36,320 | | | | 37,208 | | | | 33,330 | |
| | | 4.00 | % | | | | | Jul-2024 - Jul-2052 | | | — | | | | 45,072 | | | | 45,708 | | | | 43,191 | |
| | | 4.00 | % | | | | | Jun-2052 | | | — | | | | 32,725 | | | | 32,317 | | | | 31,028 | |
| | | 4.50 | % | | | | | May-2024 - Oct-2052 | | | — | | | | 123,506 | | | | 122,869 | | | | 120,764 | |
| | | 4.76 | %12M SOFR+227 | | | Apr-2034 | | | — | | | | 347 | | | | 350 | | | | 351 | |
| 14 | |
Schedule of Portfolio Investments
December 31, 2023 (dollars in thousands) continued
Fannie Mae Securities continued
| | | | | | | | Unfunded | | | | | | |
| | | Interest Rate4 | | Maturity Date | | Commitments3 | | Face Amount | | Amortized Cost | | Value |
| | 4.86% | | 6M SOFR+204 | | Aug-2033 | | | — | | | | 106 | | | | 105 | | | | 106 | |
| | | 5.00% | | | | May-2034 - Jun-2053 | | | — | | | | 132,038 | | | | 132,760 | | | | 131,418 | |
| | | 5.23% | | 1Y UST+223 | | May-2033 | | | — | | | | 111 | | | | 111 | | | | 112 | |
| | | 5.37% | | 12M SOFR+224 | | Feb-2045 | | | — | | | | 1,662 | | | | 1,685 | | | | 1,686 | |
| | | 5.50% | | | | Sep-2032 - Jul-2053 | | | — | | | | 41,937 | | | | 41,870 | | | | 42,382 | |
| | | 5.70% | | 1M SOFR+36 | | Mar-2037 | | | — | | | | 90 | | | | 89 | | | | 88 | |
| | | 5.74% | | 12M SOFR+221 | | Jul-2033 | | | — | | | | 98 | | | | 97 | | | | 99 | |
| | | 5.77% | | 1M SOFR+43 | | Jun-2037 | | | — | | | | 438 | | | | 438 | | | | 430 | |
| | | 5.81% | | 1Y UST+220 | | Aug-2033 | | | — | | | | 322 | | | | 322 | | | | 326 | |
| | | 5.85% | | 1M SOFR+51 | | Apr-2037 | | | — | | | | 212 | | | | 212 | | | | 208 | |
| | | 5.87% | | 12M SOFR+234 | | Nov-2034 | | | — | | | | 127 | | | | 128 | | | | 128 | |
| | | 5.91% | | 1M SOFR+57 | | Oct-2042 | | | — | | | | 1,279 | | | | 1,283 | | | | 1,244 | |
| | | 5.91% | | 12M SOFR+241 | | Oct-2042 | | | — | | | | 1,161 | | | | 1,179 | | | | 1,182 | |
| | | 5.95% | | 1M SOFR+61 | | Jun-2042 | | | — | | | | 2,876 | | | | 2,877 | | | | 2,805 | |
| | | 5.97% | | 1Y UST+222 | | Jul-2033 | | | — | | | | 236 | | | | 237 | | | | 239 | |
| | | 6.00% | | | | Nov-2028 - Aug-2053 | | | — | | | | 27,785 | | | | 27,880 | | | | 28,274 | |
| | | 6.00% | | 1M SOFR+66 | | Mar-2042 | | | — | | | | 1,520 | | | | 1,521 | | | | 1,492 | |
| | | 6.05% | | 1M SOFR+71 | | Oct-2043 | | | — | | | | 3,018 | | | | 3,029 | | | | 2,955 | |
| | | 6.22% | | 1Y UST+222 | | Aug-2033 | | | — | | | | 157 | | | | 157 | | | | 159 | |
| | | 6.50% | | | | Sep-2028 - Nov-2053 | | | — | | | | 20,174 | | | | 20,047 | | | | 20,743 | |
| | | 7.00% | | | | Sep-2027 - May-2032 | | | — | | | | 381 | | | | 381 | | | | 396 | |
| | | 7.41% | | 6M SOFR+198 | | Nov-2033 | | | — | | | | 596 | | | | 596 | | | | 600 | |
| | | 7.50% | | | | Mar-2030 - Jun-2030 | | | — | | | | 4 | | | | 4 | | | | 4 | |
| | | 8.00% | | | | Aug-2030 - May-2031 | | | — | | | | 29 | | | | 29 | | | | 31 | |
| | | | | | | | | | — | | | | 894,199 | | | | 908,662 | | | | 838,969 | |
| Multifamily | | 1.06% | | | | Dec-2027 | | | — | | | | 20,959 | | | | 20,963 | | | | 18,388 | |
| | | 1.17% | | | | Aug-2030 - Nov-2030 | | | — | | | | 34,290 | | | | 34,292 | | | | 27,865 | |
| | | 1.22% | | | | Aug-2028 - Jul-2030 | | | — | | | | 35,610 | | | | 35,679 | | | | 29,753 | |
| | | 1.25% | | | | Jul-2030 | | | — | | | | 37,949 | | | | 38,033 | | | | 31,142 | |
| | | 1.26% | | | | Jan-2031 | | | — | | | | 25,000 | | | | 24,996 | | | | 20,579 | |
| | | 1.27% | | | | Jul-2030 | | | — | | | | 14,235 | | | | 14,301 | | | | 11,725 | |
| | | 1.31% | | | | Aug-2030 | | | — | | | | 4,319 | | | | 4,359 | | | | 3,585 | |
| | | 1.32% | | | | Aug-2030 | | | — | | | | 21,000 | | | | 21,184 | | | | 17,420 | |
| | | 1.38% | | | | Jul-2030 | | | — | | | | 10,500 | | | | 10,594 | | | | 8,711 | |
| | | 1.41% | | | | Jul-2030 | | | — | | | | 3,168 | | | | 3,189 | | | | 2,669 | |
| | | 1.46% | | | | Jul-2030 | | | — | | | | 7,244 | | | | 7,309 | | | | 6,129 | |
| | | 1.47% | | | | Jul-2030 - Dec-2030 | | | — | | | | 15,425 | | | | 15,515 | | | | 12,502 | |
| | | 1.50% | | | | Aug-2030 | | | — | | | | 1,122 | | | | 1,140 | | | | 948 | |
| | | 1.52% | | | | Jul-2032 | | | — | | | | 14,158 | | | | 14,245 | | | | 11,332 | |
| | | 1.53% | | | | Jul-2032 | | | — | | | | 10,500 | | | | 10,614 | | | | 8,446 | |
| | | 1.55% | | | | Jul-2032 | | | — | | | | 20,333 | | | | 20,555 | | | | 16,455 | |
| | | 1.57% | | | | Aug-2037 | | | — | | | | 46,073 | | | | 46,242 | | | | 33,503 | |
| | | 1.57% | | | | Jan-2031 | | | — | | | | 21,950 | | | | 22,001 | | | | 18,280 | |
| | | 1.58% | | | | Oct-2031 | | | — | | | | 57,950 | | | | 58,143 | | | | 45,969 | |
| | | 1.65% | | | | Jul-2030 | | | — | | | | 1,215 | | | | 1,234 | | | | 1,038 | |
| | | 1.71% | | | | Sep-2035 - Nov-2035 | | | — | | | | 25,605 | | | | 25,846 | | | | 19,200 | |
| | | 1.74% | | | | Mar-2033 | | | — | | | | 6,160 | | | | 6,224 | | | | 4,906 | |
| | | 1.76% | | | | Aug-2031 - Dec-2036 | | | — | | | | 52,899 | | | | 53,026 | | | | 43,165 | |
| | | 1.77% | | | | Sep-2035 | | | — | | | | 3,270 | | | | 3,324 | | | | 2,468 | |
| | | 1.82% | | | | Jul-2035 | | | — | | | | 4,508 | | | | 4,537 | | | | 3,535 | |
| | | 1.88% | | | | Nov-2031 | | | — | | | | 25,400 | | | | 25,426 | | | | 20,640 | |
| | | 1.94% | | | | Apr-2035 | | | — | | | | 6,400 | | | | 6,479 | | | | 5,124 | |
| | | 2.00% | | | | Apr-2031 | | | — | | | | 18,000 | | | | 18,437 | | | | 15,260 | |
| | | 2.09% | | | | May-2032 - Jul-2050 | | | — | | | | 21,792 | | | | 22,002 | | | | 16,411 | |
Schedule of Portfolio Investments
December 31, 2023 (dollars in thousands) continued
Fannie Mae Securities continued
| | | | | | | | | Unfunded | | | | | | |
| | | Interest Rate4 | | | | Maturity Date | | Commitments3 | | Face Amount | | Amortized Cost | | Value |
| | | 2.16% | | | | Sep-2050 | | | — | | | | 14,200 | | | | 14,346 | | | | 8,482 | |
| | | 2.21% | | | | Nov-2039 | | | — | | | | 45,530 | | | | 45,530 | | | | 34,029 | |
| | | 2.33% | | | | Nov-2029 - Feb-2030 | | | — | | | | 17,774 | | | | 17,800 | | | | 15,734 | |
| | | 2.41% | | | | Apr-2051 | | | — | | | | 3,645 | | | | 3,679 | | | | 2,644 | |
| | | 2.43% | | | | Nov-2031 | | | — | | | | 18,655 | | | | 18,660 | | | | 15,968 | |
| | | 2.46% | | | | Aug-2026 - Jan-2038 | | | — | | | | 55,890 | | | | 55,960 | | | | 49,274 | |
| | | 2.47% | | | | Dec-2051 | | | — | | | | 13,128 | | | | 13,300 | | | | 9,601 | |
| | | 2.49% | | | | Dec-2026 - Nov-2031 | | | — | | | | 26,703 | | | | 26,738 | | | | 24,108 | |
| | | 2.53% | | | | Jan-2030 | | | — | | | | 20,550 | | | | 20,633 | | | | 18,174 | |
| | | 2.55% | | | | Sep-2026 - Mar-2030 | | | — | | | | 25,164 | | | | 25,204 | | | | 23,193 | |
| | | 2.56% | | | | Sep-2038 - Dec-2051 | | | — | | | | 24,075 | | | | 24,104 | | | | 18,507 | |
| | | 2.57% | | | | Mar-2042 | | | — | | | | 25,155 | | | | 25,165 | | | | 18,458 | |
| | | 2.61% | | | | Nov-2026 | | | — | | | | 9,785 | | | | 9,805 | | | | 9,217 | |
| | | 2.67% | | | | Aug-2029 | | | — | | | | 37,700 | | | | 37,873 | | | | 34,595 | |
| | | 2.70% | | | | Nov-2025 | | | — | | | | 13,985 | | | | 13,985 | | | | 13,475 | |
| | | 2.76% | | | | Oct-2031 | | | — | | | | 10,189 | | | | 10,282 | | | | 9,118 | |
| | | 2.85% | | | | Aug-2031 | | | — | | | | 8,760 | | | | 8,790 | | | | 7,767 | |
| | | 2.91% | | | | Jun-2031 | | | — | | | | 25,000 | | | | 25,076 | | | | 22,560 | |
| | | 2.92% | | | | Jun-2027 | | | — | | | | 64,036 | | | | 64,055 | | | | 60,954 | |
| | | 2.92% | | | | Apr-2028 | | | — | | | | 15,195 | | | | 15,216 | | | | 14,329 | |
| | | 2.93% | | | | Sep-2027 - Apr-2038 | | | — | | | | 58,189 | | | | 58,241 | | | | 51,302 | |
| | | 2.94% | | | | Jun-2027 - Jul-2039 | | | — | | | | 28,843 | | | | 28,863 | | | | 27,450 | |
| | | 2.96% | | | | Sep-2034 | | | — | | | | 20,000 | | | | 20,540 | | | | 16,960 | |
| | | 2.97% | | | | Sep-2034 | | | — | | | | 12,756 | | | | 12,900 | | | | 11,229 | |
| | | 2.99% | | | | Jun-2025 | | | — | | | | 2,487 | | | | 2,487 | | | | 2,418 | |
| | | 3.00% | | | | May-2027 | | | — | | | | 6,187 | | | | 6,190 | | | | 5,885 | |
| | | 3.01% | | | | Apr-2052 | | | — | | | | 7,293 | | | | 7,297 | | | | 5,712 | |
| | | 3.02% | | | | Jun-2027 | | | — | | | | 3,507 | | | | 3,509 | | | | 3,350 | |
| | | 3.04% | | | | Apr-2030 | | | — | | | | 24,378 | | | | 24,409 | | | | 22,668 | |
| | | 3.05% | | | | Apr-2030 | | | — | | | | 25,030 | | | | 25,041 | | | | 23,278 | |
| | | 3.12% | | | | Apr-2030 | | | — | | | | 12,313 | | | | 12,315 | | | | 11,428 | |
| | | 3.13% | | | | May-2026 | | | — | | | | 3,100 | | | | 3,110 | | | | 2,985 | |
| | | 3.14% | | | | Apr-2029 | | | — | | | | 7,419 | | | | 7,425 | | | | 7,003 | |
| | | 3.17% | | | | Jun-2029 | | | — | | | | 22,345 | | | | 22,399 | | | | 21,030 | |
| | | 3.18% | | | | May-2035 | | | — | | | | 8,562 | | | | 8,634 | | | | 7,927 | |
| | | 3.21% | | | | May-2030 | | | — | | | | 6,247 | | | | 6,284 | | | | 5,828 | |
| | | 3.24% | | | | May-2052 | | | — | | | | 6,333 | | | | 6,454 | | | | 5,111 | |
| | | 3.30% | | | | May-2029 | | | — | | | | 3,518 | | | | 3,593 | | | | 3,386 | |
| | | 3.31% | | | | Oct-2027 | | | — | | | | 14,669 | | | | 14,697 | | | | 14,098 | |
| | | 3.36% | | | | Oct-2029 | | | — | | | | 10,212 | | | | 10,214 | | | | 9,720 | |
| | | 3.40% | | | | Oct-2026 | | | — | | | | 2,655 | | | | 2,657 | | | | 2,578 | |
| | | 3.42% | | | | Apr-2035 | | | — | | | | 4,899 | | | | 4,943 | | | | 4,469 | |
| | | 3.50% | | | | Aug-2039 | | | — | | | | 13,029 | | | | 13,029 | | | | 11,531 | |
| | | 3.63% | | | | Jul-2035 | | | — | | | | 20,848 | | | | 20,866 | | | | 19,233 | |
| | | 3.68% | | | | Jul-2028 | | | — | | | | 11,769 | | | | 11,996 | | | | 11,262 | |
| | | 3.70% | | | | Oct-2033 | | | — | | | | 19,865 | | | | 19,919 | | | | 18,756 | |
| | | 3.91% | | | | Aug-2032 | | | — | | | | 26,250 | | | | 26,511 | | | | 25,256 | |
| | | 4.05% | | | | Jun-2030 | | | — | | | | 10,632 | | | | 10,522 | | | | 10,423 | |
| | | 4.11% | | | | Aug-2032 | | | — | | | | 15,627 | | | | 15,690 | | | | 15,090 | |
| | | 4.31% | | | | Jun-2033 | | | — | | | | 8,587 | | | | 8,612 | | | | 8,517 | |
| | | 4.32% | | | | Mar-2028 | | | — | | | | 41,707 | | | | 41,813 | | | | 41,070 | |
| | | 4.37% | | | | Jun-2033 | | | — | | | | 21,805 | | | | 21,830 | | | | 21,712 | |
| | | 4.39% | | | | Feb-2030 | | | — | | | | 21,148 | | | | 21,098 | | | | 20,766 | |
| | | 4.48% | | | | Aug-2030 | | | — | | | | 20,915 | | | | 20,915 | | | | 21,006 | |
| 16 | |
Schedule of Portfolio Investments
December 31, 2023 (dollars in thousands) continued
Fannie Mae Securities continued
| | | | | | | | | Unfunded | | | | | | |
| | | Interest Rate4 | | Maturity Date | | Commitments3 | | Face Amount | | Amortized Cost | | Value |
| | | 4.52% | | | | Sep-2033 | | | — | | | | 11,361 | | | | 11,257 | | | | 11,447 | |
| | | 4.55% | | | | Jul-2030 | | | — | | | | 10,699 | | | | 10,720 | | | | 10,787 | |
| | | 4.56% | | | | Feb-2028 | | | — | | | | 29,834 | | | | 29,889 | | | | 29,650 | |
| | | 4.69% | | | | Feb-2030 - Jun-2035 | | | — | | | | 19,343 | | | | 19,388 | | | | 19,492 | |
| | | 4.74% | | | | Sep-2033 | | | — | | | | 13,405 | | | | 13,439 | | | | 13,734 | |
| | | 4.76% | | | | Sep-2030 | | | — | | | | 7,757 | | | | 7,760 | | | | 7,904 | |
| | | 4.80% | | | | Oct-2052 | | | — | | | | 12,296 | | | | 12,332 | | | | 11,821 | |
| | | 4.82% | | | | Jul-2030 | | | — | | | | 4,860 | | | | 4,864 | | | | 4,973 | |
| | | 4.86% | | | | Jun-2033 | | | — | | | | 10,000 | | | | 10,077 | | | | 10,070 | |
| | | 4.88% | | | | Jul-2030 | | | — | | | | 11,665 | | | | 11,853 | | | | 11,981 | |
| | | 4.96% | | | | Aug-2033 | | | — | | | | 3,465 | | | | 3,465 | | | | 3,510 | |
| | | 4.99% | | | | Apr-2033 | | | — | | | | 22,738 | | | | 23,055 | | | | 23,113 | |
| | | 5.00% | | | | Sep-2033 | | | — | | | | 15,366 | | | | 15,400 | | | | 16,054 | |
| | | 5.02% | | | | Dec-2033 | | | — | | | | 5,222 | | | | 5,189 | | | | 5,472 | |
| | | 5.05% | | | | Oct-2030 | | | — | | | | 14,596 | | | | 14,668 | | | | 15,159 | |
| | | 5.06% | | | | Dec-2032 | | | — | | | | 46,805 | | | | 48,262 | | | | 48,967 | |
| | | 5.13% | | | | Sep-2028 | | | — | | | | 14,584 | | | | 14,753 | | | | 15,042 | |
| | | 5.16% | | | | Oct-2030 | | | — | | | | 8,020 | | | | 8,097 | | | | 8,375 | |
| | | 5.30% | | | | Aug-2029 - Sep-2033 | | | — | | | | 6,958 | | | | 7,018 | | | | 7,273 | |
| | | 5.35% | | | | Dec-2032 | | | — | | | | 11,954 | | | | 12,588 | | | | 12,710 | |
| | | 5.47% | | | | Nov-2033 | | | — | | | | 6,140 | | | | 6,235 | | | | 6,651 | |
| | | 5.52% | | | | Oct-2033 | | | — | | | | 3,860 | | | | 3,957 | | | | 4,193 | |
| | | 5.53% | | 1M SOFR+20 | | Nov-2031 | | | — | | | | 40,943 | | | | 40,947 | | | | 40,057 | |
| | | 5.54% | | 1M SOFR+21 | | Mar-2031 | | | — | | | | 23,855 | | | | 23,855 | | | | 23,366 | |
| | | 5.62% | | 1M SOFR+29 | | Feb-2029 | | | — | | | | 20,000 | | | | 20,004 | | | | 19,603 | |
| | | 5.69% | | | | Jun-2041 | | | — | | | | 4,077 | | | | 4,151 | | | | 4,128 | |
| | | 5.74% | | 1M SOFR+40 | | Feb-2028 | | | — | | | | 30,013 | | | | 30,013 | | | | 29,548 | |
| | | 5.75% | | | | Jun-2041 | | | — | | | | 1,981 | | | | 2,022 | | | | 2,026 | |
| | | 5.76% | | 1M SOFR+42 | | Mar-2028 | | | — | | | | 37,793 | | | | 37,792 | | | | 37,228 | |
| | | 5.79% | | 1M SOFR+45 | | Jan-2028 | | | — | | | | 22,425 | | | | 22,425 | | | | 22,120 | |
| | | 5.80% | | 1M SOFR+46 | | Dec-2027 | | | — | | | | 17,727 | | | | 17,727 | | | | 17,497 | |
| | | 5.80% | | 1M SOFR+47 | | Jun-2029 | | | — | | | | 70,000 | | | | 70,014 | | | | 69,879 | |
| | | 5.82% | | 1M SOFR+49 | | May-2032 | | | — | | | | 28,526 | | | | 28,529 | | | | 28,520 | |
| | | 5.85% | | 1M SOFR+52 | | Jun-2032 | | | — | | | | 30,975 | | | | 30,975 | | | | 30,985 | |
| | | 5.94% | | 1M SOFR+60 | | Apr-2034 | | | — | | | | 24,882 | | | | 24,370 | | | | 24,613 | |
| | | 5.96% | | | | Jan-2029 | | | — | | | | 185 | | | | 185 | | | | 184 | |
| | | 6.03% | | 1M SOFR+69 | | Jun-2029 | | | — | | | | 41,302 | | | | 41,302 | | | | 41,327 | |
| | | 6.03% | | 1M SOFR+69 | | May-2029 | | | — | | | | 17,364 | | | | 17,368 | | | | 17,373 | |
| | | 6.18% | | 1M SOFR+85 | | Nov-2032 | | | — | | | | 15,800 | | | | 15,804 | | | | 15,775 | |
| | | | | | | | | | — | | | | 2,284,053 | | | | 2,292,842 | | | | 2,080,379 | |
| Forward Commitments | | 2.58% | | | | Jul-2040 | | | 11,700 | | | | — | | | | — | | | | (2,505 | ) |
| | | 2.59% | | | | Feb-2039 - Mar-2040 | | | 35,409 | | | | — | | | | — | | | | (7,365 | ) |
| | | 2.72% | | | | Jul-2040 | | | 27,794 | | | | — | | | | 278 | | | | (5,765 | ) |
| | | 4.47% | | | | Jul-2041 | | | 10,058 | | | | — | | | | — | | | | (618 | ) |
| | | | | | | | | | 84,961 | | | | — | | | | 278 | | | | (16,253 | ) |
| Total Fannie Mae Securities | | | | | | | $84,961 | | | | $3,178,252 | | | | $3,201,782 | | | | $2,903,095 | |
Schedule of Portfolio Investments
December 31, 2023 (dollars in thousands) continued
Freddie Mac Securities | 7.8% of net assets
| | | | | | | Unfunded | | | | | | |
| | | Interest Rate4 | | Maturity Date | | Commitments3 | | Face Amount | | Amortized Cost | | Value |
| Single Family | | 2.50% | | | | Jan-2043 - Aug-2046 | | | $ — | | | | $ 5,350 | | | | $ 5,403 | | | | $ 4,688 | |
| | | 3.00% | | | | Aug-2042 - Sep-2046 | | | — | | | | 21,948 | | | | 22,290 | | | | 20,147 | |
| | | 3.50% | | | | Jan-2026 - Oct-2046 | | | — | | | | 40,232 | | | | 40,994 | | | | 37,881 | |
| | | 4.00% | | | | Nov-2024 - Aug-2047 | | | — | | | | 37,987 | | | | 39,256 | | | | 36,616 | |
| | | 4.50% | | | | Jan-2038 - Dec-2044 | | | — | | | | 10,392 | | | | 10,750 | | | | 10,377 | |
| | | 5.00% | | | | Jun-2026 - Mar-2041 | | | — | | | | 1,596 | | | | 1,592 | | | | 1,625 | |
| | | 5.35% | | 1Y UST+223 | | Jun-2033 | | | — | | | | 27 | | | | 27 | | | | 28 | |
| | | 5.50% | | | | Apr-2033 - Jul-2038 | | | — | | | | 1,362 | | | | 1,360 | | | | 1,405 | |
| | | 5.75% | | 1M SOFR+41 | | Feb-2036 | | | — | | | | 202 | | | | 202 | | | | 199 | |
| | | 5.78% | | 1M SOFR+44 | | May-2037 | | | — | | | | 66 | | | | 66 | | | | 65 | |
| | | 5.80% | | 1M SOFR+46 | | Apr-2036 - Jan-2043 | | | — | | | | 1,948 | | | | 1,949 | | | | 1,885 | |
| | | 5.85% | | 1M SOFR+51 | | Aug-2043 | | | — | | | | 1,773 | | | | 1,772 | | | | 1,722 | |
| | | 5.93% | | 1M SOFR+59 | | Oct-2040 | | | — | | | | 1,349 | | | | 1,348 | | | | 1,324 | |
| | | 5.95% | | 1M SOFR+61 | | Oct-2040 - Jun-2044 | | | — | | | | 4,777 | | | | 4,779 | | | | 4,661 | |
| | | 6.00% | | | | Dec-2033 - Oct-2037 | | | — | | | | 2,074 | | | | 2,087 | | | | 2,151 | |
| | | 6.00% | | 1M SOFR+66 | | Nov-2040 | | | — | | | | 1,214 | | | | 1,220 | | | | 1,187 | |
| | | 6.02% | | 12M SOFR+250 | | Jul-2035 | | | — | | | | 91 | | | | 91 | | | | 92 | |
| | | 6.12% | | 1M SOFR+78 | | Aug-2037 | | | — | | | | 1,470 | | | | 1,480 | | | | 1,463 | |
| | | 6.34% | | 1Y UST+223 | | Oct-2033 | | | — | | | | 116 | | | | 116 | | | | 117 | |
| | | 6.50% | | | | Apr-2028 - Nov-2037 | | | — | | | | 268 | | | | 270 | | | | 282 | |
| | | 7.00% | | | | Apr-2028 - Mar-2030 | | | — | | | | 14 | | | | 14 | | | | 15 | |
| | | 7.50% | | | | Aug-2029 - Apr-2031 | | | — | | | | 13 | | | | 13 | | | | 14 | |
| | | 8.50% | | | | Jul-2024 | | | — | | | | 3 | | | | 3 | | | | 3 | |
| | | | | | | | | | — | | | | 134,272 | | | | 137,082 | | | | 127,947 | |
| Multifamily | | 2.04% | | | | May-2050 | | | — | | | | 19,700 | | | | 20,136 | | | | 13,840 | |
| | | 2.40% | | | | Jun-2031 | | | — | | | | 7,444 | | | | 7,504 | | | | 6,523 | |
| | | 2.42% | | | | Jun-2031 | | | — | | | | 11,768 | | | | 11,874 | | | | 10,326 | |
| | | 3.28% | | | | Dec-2029 | | | — | | | | 15,551 | | | | 15,649 | | | | 14,557 | |
| | | 3.34% | | | | Dec-2029 | | | — | | | | 9,230 | | | | 9,302 | | | | 8,666 | |
| | | 3.35% | | | | Oct-2033 | | | — | | | | 33,450 | | | | 33,349 | | | | 30,970 | |
| | | 3.50% | | | | Jan-2026 | | | — | | | | 17,677 | | | | 17,693 | | | | 17,244 | |
| | | 3.60% | | | | Apr-2030 | | | — | | | | 24,106 | | | | 24,470 | | | �� | 22,838 | |
| | | 3.68% | | | | Oct-2025 | | | — | | | | 10,000 | | | | 10,019 | | | | 9,798 | |
| | | 4.19% | | | | Jul-2033 | | | — | | | | 13,015 | | | | 12,036 | | | | 12,399 | |
| | | 4.25% | | | | Jan-2028 | | | — | | | | 93,650 | | | | 92,809 | | | | 92,076 | |
| | | 4.36% | | | | Dec-2029 | | | — | | | | 9,198 | | | | 9,147 | | | | 9,093 | |
| | | 4.83% | | | | Jan-2039 | | | — | | | | 9,935 | | | | 10,027 | | | | 10,107 | |
| | | 4.90% | | | | Dec-2032 | | | — | | | | 10,207 | | | | 10,186 | | | | 10,240 | |
| | | 5.53% | | 1M SOFR+20 | | Aug-2031 | | | — | | | | 23,345 | | | | 23,345 | | | | 22,919 | |
| | | 5.55% | | 1M SOFR+23 | | Jul-2027 | | | — | | | | 3,873 | | | | 3,873 | | | | 3,859 | |
| | | 5.57% | | 1M SOFR+24 | | Nov-2027 - Jun-2031 | | | — | | | | 57,111 | | | | 57,111 | | | | 56,145 | |
| | | 5.58% | | 1M SOFR+25 | | Dec-2030 | | | — | | | | 14,299 | | | | 14,299 | | | | 14,177 | |
| | | 5.63% | | 1M SOFR+30 | | Dec-2030 | | | — | | | | 12,248 | | | | 12,248 | | | | 12,132 | |
| | | 5.69% | | 1M SOFR+36 | | Oct-2030 | | | — | | | | 4,937 | | | | 4,937 | | | | 4,893 | |
| | | 5.71% | | 1M SOFR+37 | | Nov-2030 | | | — | | | | 8,849 | | | | 8,849 | | | | 8,797 | |
| | | 5.78% | | 1M SOFR+44 | | Oct-2030 | | | — | | | | 2,798 | | | | 2,798 | | | | 2,779 | |
| | | | | | | | | | — | | | | 412,391 | | | | 411,661 | | | | 394,378 | |
| Forward Commitments | | 2.38% | | | | Feb-2034 | | | 43,500 | | | | — | | | | 171 | | | | (6,383 | ) |
| | | 3.86% | | | | May-2040 | | | 27,450 | | | | — | | | | — | | | | (2,289 | ) |
| | | | | | | | | | 70,950 | | | | — | | | | 171 | | | | (8,672 | ) |
| Total Freddie Mac Securities | | | | | $70,950 | | | | $546,663 | | | | $548,914 | | | | $513,653 | |
| 18 | |
Schedule of Portfolio Investments
December 31, 2023 (dollars in thousands) continued
State Housing Finance Agency Securities | 7.2% of net assets
| | | Interest Rates2 | | | | |
| | Issuer | Permanent | Construction | Maturity Date | Face Amount | Amortized Cost | Value |
| Multifamily | Illinois Housing Development Auth | – | 0.40% | Dec-2024 | $ 470 | $ 470 | $ 460 |
| | City of St. Louis Park, MN | – | 2.93% | Jan-2026 | 20,577 | 20,576 | 20,435 |
| | Illinois Housing Development Auth | 2.06% | – | Jan-2042 | 27,175 | 27,178 | 20,300 |
| | Illinois Housing Development Auth | 2.07% | – | Jul-2041 | 84,895 | 84,894 | 60,149 |
| | Mass Housing | 2.60% | – | Jun-2063 | 26,250 | 26,250 | 16,287 |
| | Illinois Housing Development Auth | 2.65% | – | Jul-2062 | 21,455 | 21,484 | 14,082 |
| | NYC Housing Development Corp | 2.95% | – | Nov-2041 - Nov-2045 | 11,275 | 11,275 | 9,577 |
| | NYC Housing Development Corp | 3.05% | – | Nov-2046 | 13,000 | 13,000 | 9,008 |
| | NYC Housing Development Corp | 3.10% | – | Oct-2046 | 20,133 | 20,133 | 15,528 |
| | NYC Housing Development Corp | 3.25% | – | May-2050 | 11,845 | 11,870 | 9,504 |
| | Connecticut Housing Finance Auth | 3.25% | – | Nov-2049 | 10,240 | 10,240 | 8,635 |
| | Mass Housing5 | 3.30% | – | Dec-2059 | 8,340 | 8,345 | 6,272 |
| | NYC Housing Development Corp | 3.35% | – | Nov-2054 | 20,000 | 20,000 | 16,328 |
| | NYC Housing Development Corp | 3.45% | – | May-2059 | 20,000 | 20,000 | 16,519 |
| | NYC Housing Development Corp | 3.75% | – | May-2035 | 3,200 | 3,200 | 3,200 |
| | Mass Housing5 | 3.85% | – | Dec-2058 | 9,390 | 9,387 | 7,489 |
| | NYC Housing Development Corp | 3.95% | – | Nov-2043 | 12,800 | 12,800 | 12,537 |
| | NYC Housing Development Corp | 4.00% | – | Dec-2028 - Nov-2048 | 14,315 | 14,418 | 14,259 |
| | MassHousing | 4.13% | – | Dec-2036 | 5,000 | 5,000 | 5,000 |
| | NYC Housing Development Corp | 4.13% | – | Nov-2040 - Nov-2053 | 13,305 | 13,305 | 13,265 |
| | NYC Housing Development Corp | 4.20% | – | Dec-2039 | 8,305 | 8,305 | 8,306 |
| | NYC Housing Development Corp | 4.30% | – | Nov-2045 | 3,000 | 3,000 | 3,021 |
| | Chicago Housing Authority | 4.36% | – | Jan-2038 | 25,000 | 25,000 | 22,309 |
| | MassHousing | 4.50% | – | Jun-2056 | 45,000 | 45,000 | 44,999 |
| | MassHousing | 4.50% | – | Dec-2065 | 30,060 | 30,092 | 29,979 |
| | Mass Housing5 | 4.90% | – | Jun-2066 | 26,645 | 26,682 | 27,410 |
| | Mass Housing5 | 5.11% | – | Jun-2066 | 53,425 | 53,467 | 56,168 |
| Total State Housing Finance Agency Securities | $545,100 | $545,371 | $471,026 |
Schedule of Portfolio Investments
December 31, 2023 (dollars in thousands) continued
Commercial Mortgage-Backed Securities | 0.3% of net assets
| Issuer | Interest Rate | Maturity Date | Face Amount | Amortized Cost | Value |
| Citigroup | 3.62% | Jul-2047 | $ 8,000 | $ 8,151 | $ 7,863 |
| Deutsche Bank/UBS | 3.96% | Mar-2047 | 1,992 | 2,032 | 1,969 |
| Barclays/ JP Morgan | 4.00% | Apr-2047 | 1,129 | 1,150 | 1,123 |
| Cantor/Deutsche Bank | 4.01% | Apr-2047 | 10,481 | 10,682 | 10,363 |
| Cantor/Deutsche Bank | 4.24% | Feb-2047 | 970 | 988 | 968 |
| Total Commercial Mortgage Backed Securities | $22,572 | $23,003 | $22,286 |
Other Mutifamily Investments | 4.1% of net assets
| | Interest Rates2,4 | | Unfunded | Face | | |
| Issuer | Permanent | Construction | Maturity Date | Commitments3 | Amount | Amortized Cost | Value |
| Direct Loans | | | | | | | |
| Peregrine Apartments (Level 3) | – | 3.60% | | Jun-2024 - Dec-2024 | $ 2,419 | $ 19,337 | $ 19,356 | $ 18,940 |
| The Crest Apartments (Level 3) | – | 3.75% | | Dec-2023 - Jun-2024 | 1,478 | 11,837 | 11,833 | 11,561 |
| Ladder 260 - Tax Exempt (Level 3) | – | 4.04% | | Nov-2025 | 1,930 | 6,232 | 6,227 | 5,963 |
| 99 Ocean (Level 3) | – | 4.05% | | Oct-2024 | 2,086 | 49,914 | 49,702 | 48,805 |
| Wilder Square (Level 3) | – | 5.26% | | Mar-2024 | – | 8,023 | 8,023 | 7,977 |
| Hudson Exchange (Level 3) | – | 5.50% | | Jun-2027 | 42,857 | 7,143 | 7,037 | 7,478 |
| 400 Lake Shore (Level 3) | – | 7.26% | 80% of Overnight SOFR+300 | Dec-20586 | 39,276 | 10 | (282) | (130) |
| Soul (Level 3) | – | 7.34% | 1M SOFR+225 | Apr-2025 | 4,991 | 19,759 | 19,604 | 19,577 |
| San Cristina (Level 3) | – | 7.69% | 1M SOFR+260 | Sep-2024 | 3,472 | 14,000 | 13,915 | 13,926 |
| 18 Sixth Ave at Pacific Park (Level 3) | – | 7.69% | 1M Term SOFR+231 | Dec-2024 | 6,666 | 76,111 | 76,026 | 75,670 |
| 18 Sixth Ave at Pacific Park (Level 3) | – | 7.69% | 1M Term SOFR+231 | Dec-2024 | 2,829 | 14,393 | 14,379 | 14,301 |
| 311 W 42nd Street (Level 3) | – | 8.45% | 1M Term SOFR+311 | Nov-2024 | 23,667 | 26,333 | 26,192 | 26,373 |
| Granada (Level 3) | – | 11.44% | 1M SOFR+635 | Jan-2024 | – | 13,000 | 12,998 | 12,880 |
| | | | | 131,671 | 266,092 | 265,010 | 263,321 |
| Forward Commitments (Direct Loans) | | | | | | | |
| 400 Lake Shore (Level 3) | – | 7.26% | 80% of Overnight SOFR+300 | Dec-20536 | 15,714 | – | (116) | (56) |
| Soul (Level 3) | – | 7.94% | 1M SOFR+285 | Apr-2025 | 12,501 | – | (101) | (12) |
| Landmark Tower (Level 3) | – | 7.71% | | Jun-2027 | 18,660 | – | (93) | (103) |
| | | | | 46,875 | – | (310) | (171) |
| Privately Insured Construction/Permanent Mortgages7 | | | | | |
| Illinois Housing Development Auth | 6.20% | – | | Dec-2047 | – | 2,808 | 2,815 | 2,788 |
| Illinois Housing Development Auth | 6.40% | – | | Nov-2048 | – | 857 | 865 | 851 |
| | | – | 3,665 | 3,680 | 3,639 |
| Total Other Multifamily Investments | | $178,546 | $269,757 | $268,380 | $266,789 |
| 20 | |
Schedule of Portfolio Investments
December 31, 2023 (dollars in thousands) continued
United States Treasury Securities | 4.3% of net assets
| Interest Rate | Maturity Date | Face Amount | Amortized Cost | Value |
| 1.75% | Aug-2041 | $ 20,000 | $ 19,499 | $ 13,928 |
| 2.00% | Nov-2041 | 7,000 | 6,674 | 5,073 |
| 2.25% | May-2041 | 42,000 | 43,234 | 32,045 |
| 2.38% | Feb-2042 | 15,000 | 15,282 | 11,529 |
| 2.88% | May-2032 | 15,000 | 14,900 | 13,906 |
| 3.00% | Aug-2052 | 20,000 | 18,169 | 16,391 |
| 3.63% | Feb-2053 | 10,000 | 9,696 | 9,256 |
| 3.88% | Feb-2043 | 105,000 | 105,192 | 100,314 |
| 4.00% | Nov-2042 | 15,000 | 14,766 | 14,605 |
| 4.13% | Aug-2053 | 40,000 | 37,021 | 40,532 |
| 4.75% | Nov-2043 - Nov-2053 | 20,000 | 20,062 | 21,989 |
| Total United States Treasury Securities | | $ 309,000 | $ 304,495 | $ 279,568 |
| | | | | |
| Total Fixed Income Investments | | $7,153,943 | $7,227,836 | $6,432,220 |
Equity Investment in Wholly-Owned Subsidiary | Less than 0.01% of net assets
| Issuer | Face Amount (Cost) | Amount of Dividends or Interest | Value |
| HIT Advisers8 (Level 3) | $1 | $– | $334 |
| Total Equity Investment | $1 | $– | $334 |
Short-Term Investments | 1.7% of net assets
| Issuer | Interest Rate | Maturity Date | Face Amount | Amortized Cost | Value |
| Commercial Paper | | | | | |
| Halkin Finance | 5.33%9 | Jan-2024 | $ 40,000 | $ 39,994 | $ 39,994 |
| | | | | | |
| Blackrock Federal Funds | 5.26%10 | Jan-2024 | 69,333 | 69,333 | 69,333 |
| Total Short-Term Investments | | $ 109,333 | $ 109,327 | $ 109,327 |
| | | | | | |
| Total Investments | | | $7,263,277 | $7,337,164 | $6,541,881 |
Futures Contracts | Notional Amount 1.2% of net assets
| Description | Number of Contracts | Expiration Date | Notional Amount | Market Value | Unrealized Appreciation (Depreciation) |
| Futures Long | | | | | |
| CBOT Ultra 10-Year U.S. Treasury | 200 | Mar-2024 | $22,451 | $23,603 | $1,152 |
| CBOT U.S. Treasury Bond | 460 | Mar-2024 | 56,156 | 57,471 | 1,315 |
| Total Futures Contracts | | | | | $2,467 |
Schedule of Portfolio Investments
December 31, 2023 (dollars in thousands) continued
Footnotes
| 1 | Federally tax-exempt bonds collateralized by Ginnie Mae securities. |
| 2 | Construction interest rates are the rates charged to the borrower during the construction phase of the project. The permanent interest rates are charged to the borrower during the amortization period of the loan, unless the U.S. Department of Housing and Urban Development requires that such rates be charged earlier. |
| 3 | The HIT may make commitments, including forward commitments, in securities or loans that fund over time on a draw basis or fund at a single point in time. Generally, GNMA construction securities fund over a 12-to-24 month period. Funding periods for State Housing Agency construction securities and Direct Loans vary by project, but generally fund over a one-to-48 month period. Forward commitments generally settle within 12 months of the original commitment date. At period end, unfunded commitments totaled $519.6 million for which unrealized losses of $38.9 million are included in the related Value column of the Schedule of Portfolio Investments for such commitments. |
| 4 | For floating and variable rate securities the rate indicated is for the period end. With respect to these securities, the schedule also includes the reference rate and spread in basis points. |
| 5 | Securities exempt from registration under the Securities Act of 1933 and were privately placed directly by a state housing agency (a not-for-profit public agency) with the HIT. The securities are backed by mortgages and are general obligations of the state housing agency, and therefore secured by the full faith and credit of said agency. These securities may be resold in transactions exempt from registration, normally to qualified institutional buyers. These securities are considered liquid, under procedures established by and under the general supervision of the HIT’s Board of Trustees. |
| 6 | Date reflects the stated maturity date of the bond. However, the bond is subject to a mandatory tender for purchase in December 2027, which may be extended to December 2028 under certain conditions. |
| 7 | Loans insured by Ambac Assurance Corporation, are additionally backed by a repurchase option from the mortgagee for the benefit of the HIT. The repurchase price is defined as the unpaid principal balance of the loan plus all accrued unpaid interest due through the remittance date. The repurchase option can be exercised by the HIT in the event of a payment failure by Ambac Assurance Corporation. |
| 8 | The HIT has a participation interest in HIT Advisers, a Delaware limited liability company. HIT Advisers is a New York based adviser currently exempt from investment adviser registration in New York. The investment in HIT Advisers is valued by the HIT’s valuation committee in accordance with the fair value procedures adopted by the HIT’s Board of Trustees, and approximates carrying value of HIT Advisers and its subsidiary on a consolidated basis. The participation interest is not registered under the federal securities laws. |
| 9 | Rate indicated is the effective yield at the time of purchase. |
| 10 | Rate indicated is the annualized 1-day yield as of December 29, 2023. |
Key to Abbreviations
| SOFR | Secured Overnight Financing Rate |
| 22 | |
STATEMENT OF OPERATIONS
For the Year Ended December 31, 2023 (dollars in thousands)
| Investment income | $231,852 |
| | |
| Expenses | |
| | Non-officer salaries and fringe benefits | 8,544 |
| | Officer salaries and fringe benefits | 5,128 |
| | Investment management | 1,430 |
| | Marketing and sales promotion (12b-1) | 1,091 |
| | Legal fees | 458 |
| | Auditing, tax and accounting fees | 418 |
| | Consulting fees | 388 |
| | Insurance | 350 |
| | Trustee expenses | 81 |
| | Rental expenses | 590 |
| | General expenses | 2,099 |
| | Total expenses | 20,577 |
| | |
| Net investment Income | 211,275 |
| | |
| Net realized and unrealized gains (losses) on investments | |
| | Net realized gains (losses) on investments | (31,737) |
| | Net realized gains (losses) on futures | (3,897) |
| | Total net realized gains (losses) | (35,634) |
| | |
| | Net change in unrealized appreciation (depreciation) on investments | 143,313 |
| | Net change in unrealized appreciation (depreciation) on futures | 1,276 |
| | Total net change in unrealized gains (losses) | 144,589 |
| | Net realized and unrealized gains (losses) on investments | 108,955 |
| | |
| Net increase (decrease) in net assets resulting from operations | $320,230 |
See accompanying Notes to Financial Statements.
STATEMENT OF CHANGES IN NET ASSETS
For the Years Ended December 31, 2023 and 2022 (dollars in thousands)
Increase (decrease) in net assets from operations | 2023 | 2022 |
| | Net investment income | $ 211,275 | $ 145,844 |
| | Net realized gains (losses) | (35,634) | (46,299) |
| | Net change in unrealized appreciation (depreciation) | 144,589 | (1,062,497) |
| | Net increase (decrease) in net assets resulting from operations | 320,230 | (962,952) |
| | | |
| Distributions to participants or reinvested | (215,874) | (160,154) |
| | | |
| Increase (decrease) in net assets from unit transactions | | |
| | Proceeds from the sale of units of participation | 311,874 | 93,068 |
| | Dividend reinvestment of units of participation | 199,710 | 148,507 |
| | Payments for redemption of units of participation | (82,172) | (199,962) |
| | Net increase (decrease) from unit transactions | 429,412 | 41,613 |
| | | |
| | | |
| Total increase (decrease) in net assets | 533,768 | (1,081,493) |
| | | |
| Net assets | | |
| | Beginning of period | $ 6,025,063 | $ 7,106,556 |
| | End of period | $ 6,558,831 | $ 6,025,063 |
| | | |
| Unit information | | |
| | Units sold | 326,967 | 92,026 |
| | Distributions reinvested | 209,393 | 147,014 |
| | Units redeemed | (86,124) | (203,171) |
| | Increase in units outstanding | 450,236 | 35,869 |
See accompanying Notes to Financial Statements.
| 24 | |
NOTES TO FINANCIAL STATEMENTS
Note 1. Summary of Significant Accounting Policies
The American Federation of Labor and Congress of Industrial Organizations (AFL-CIO) Housing Investment Trust (HIT) is a common law trust created under the laws of the District of Columbia and is registered under the Investment Company Act of 1940, as amended (Investment Company Act), as a no-load, open-end investment company. The HIT has obtained certain exemptions from the requirements of the Investment Company Act that are described in the HIT’s Prospectus and Statement of Additional Information. Participation in the HIT is limited to eligible pension plans, state public funds and labor organizations, including health and welfare, general, voluntary employees’ benefit associations and other funds that have beneficiaries who are represented by labor organizations. The following is a summary of significant accounting policies followed by the HIT in the preparation of its financial statements. The policies are in conformity with generally accepted accounting principles (GAAP) in the United States. The HIT follows the investment company accounting and reporting guidance of the Financial Accounting Standards Board (FASB) Accounting Standards Codification Topic 946 Financial Services—Investment Companies.
Investment Valuation
Net asset value per share (NAV) is determined as of the close of regular trading (normally 4:00 p.m.) of the New York Stock Exchange on the last business day of each calendar month. The HIT’s Board of Trustees is responsible for the valuation process. The HIT’s Board of Trustees has designated the officers of the HIT that comprise the HIT’s Valuation Committee as the “valuation designee” to perform fair valuations of the HIT’s investments pursuant to Rule 2a-5 under the Investment Company Act. The Valuation Committee, in accordance with the policies and procedures approved by the HIT’s Board of Trustees, is also responsible for evaluating the effectiveness of the HIT’s pricing policies, determining the reliability of third-party pricing information and reporting to the Board of Trustees on valuation matters, including fair value determinations. Following is a description of the valuation methods and inputs applied to the HIT’s major categories of assets. The majority of the HIT’s assets are valued using evaluated prices provided by independent third-party pricing services that are approved by the Board of Trustees. Portfolio securities for which market quotations are readily available are valued through exchange determined market pricing. For U.S. Treasury securities, independent pricing services generally base evaluated prices on actual transactions as well as dealer-supplied market information. For State Housing Finance Agency securities, independent pricing services generally base evaluated prices using models that utilize trading spreads, new issue scales, verified bid information and credit ratings. For commercial mortgage-backed securities, independent pricing services generally base evaluated prices on cash flow models that take into consideration benchmark yields and utilize available trade information, dealer quotes and market color.
For U.S. agency and government-sponsored enterprise securities, including single family and multifamily mortgage-backed securities, construction mortgage securities and loans and collateralized mortgage obligations, independent pricing services generally base evaluated prices on an active TBA (to-be-announced) market for mortgage pools, discounted cash flow models, or option-adjusted spread models. Independent pricing services examine reference data and use observable inputs such as issue name, issue size, ratings, maturity, call type and spread/benchmark yields, as well as dealer-supplied market information. The discounted cash flow or option-adjusted spread models utilize inputs from matrix pricing, which consider observable market-based discount and prepayment rates, attributes of the collateral, and yield or price of bonds of comparable quality, coupon, maturity and type.
Investments in registered open-end investment management companies are valued based upon the NAV of such investments.
When the HIT finances the construction and permanent securities or participation interests, value is determined based upon the total amount, funded and/or unfunded, of the commitment.
Portfolio investments for which market quotations or independent third-party provider evaluated prices are deemed unreliable or not available are valued at their fair value determined in good faith by the HIT’s Valuation Committee, as valuation designee, pursuant to procedures approved by the HIT’s Board of Trustees. In determining fair market value, the Valuation Committee will employ a valuation method that it believes reflects fair value for that asset, which may include the use of an independent valuation consultant or the utilization of a discounted cash flow model based on broker and/or other market inputs. The frequency with which these fair value procedures may be used cannot be predicted. However, on December 31, 2023 the Valuation Committee fair valued less than 0.01% of the HIT’s net assets utilizing internally derived unobservable inputs.
Futures contracts are valued at the settlement price established each day by the board of trade or exchange on which they are traded.
Short-term investments acquired with a stated maturity of 60 days or less are generally valued at amortized cost, which approximates fair market value.
The HIT holds a 100% ownership interest, either directly or indirectly in HIT Advisers LLC (HIT Advisers). HIT Advisers is valued at its fair value determined in good faith under consistently applied procedures approved by the HIT’s Board of Trustees, which approximates its respective carrying value.
Notes to Financial Statements
continued
GAAP establishes a disclosure hierarchy that categorizes the inputs to valuation techniques used to value assets and liabilities at measurement date. The HIT classifies its assets and liabilities into three levels based on the method used to value the assets or liabilities. Level 1 values are based on quoted prices in active markets for identical securities. Level 2 values are based on significant observable market inputs, such as quoted prices for similar securities, interest rates, prepayment speeds, credit risk and quoted prices in inactive markets. Level 3 values are based on significant unobservable inputs that reflect the HIT’s determination of assumptions that market participants might reasonably use in valuing the securities.
The following table presents the HIT’s valuation levels as of December 31, 2023:
| | Investment Securities |
| (dollars in thousands) | | | Level 1 | | | | Level 2 | | | | Level 3 | | | | Total | |
| Investments in Securities: | | | | | | | | | | | | | | | | |
| FHA Permanent Securities | | $ | – | | | $ | 120,531 | | | $ | – | | | $ | 120,531 | |
| Ginnie Mae Securities | | | – | | | | 1,684,053 | | | | – | | | | 1,684,053 | |
| Ginnie Mae Construction Securities | | | – | | | | 122,133 | | | | 45,828 | | | | 167,961 | |
| Fannie Mae Securities | | | – | | | | 2,919,348 | | | | – | | | | 2,919,348 | |
| Freddie Mac Securities | | | – | | | | 522,325 | | | | – | | | | 522,325 | |
| State Housing Finance Agency Securities | | | – | | | | 471,026 | | | | – | | | | 471,026 | |
| Commercial Mortgage-Backed Securities | | | – | | | | 22,286 | | | | – | | | | 22,286 | |
| Other Multifamily Investments | | | | | | | | | | | | | | | | |
| Direct Loans | | | – | | | | – | | | | 263,321 | | | | 263,321 | |
| Privately Insured Construction/Permanent Mortgages | | | – | | | | 3,639 | | | | – | | | | 3,639 | |
| Total Other Multifamily Investments | | | – | | | | 3,639 | | | | 263,321 | | | | 266,960 | |
| United States Treasury Securities | | | – | | | | 279,558 | | | | – | | | | 279,568 | |
| Equity Investments | | | – | | | | – | | | | 334 | | | | 334 | |
| Short-Term Investments | | | 109,327 | | | | – | | | | – | | | | 109,327 | |
| Other Financial Instruments1 | | | – | | | | (21,667 | ) | | | (171 | ) | | | (21,838 | ) |
| Total Investments in Securities | | $ | 109,327 | | | $ | 6,123,242 | | | $ | 309,312 | | | $ | 6,541,881 | |
| | | | | | | | | | | | | | | | | |
| Derivatives Investments: | | | | | | | | | | | | | | | | |
| Assets | | | | | | | | | | | | | | | | |
| Futures Contracts2 | | $ | 2,467 | | | $ | – | | | $ | – | | | $ | 2,467 | |
| Total Derivatives Investments | | $ | 2,467 | | | $ | – | | | $ | – | | | $ | 2,467 | |
| 1. | If held in the portfolio at report date, other financial instruments includes forward commitments, TBA and when-issued securities. |
| 2. | Amounts shown represent unrealized appreciation (depreciation) at period end as presented in the Schedule of Investments. Only initial margin and variation margin on exchange-traded and centrally cleared derivatives, if any, are reported in the Statement of Assets and Liabilities. |
The following table reconciles the valuation of the HIT’s Level 3 investment securities and related transactions for the period ended December 31, 2023:
| | Investments in Securities |
| | Other Multifamly | Ginnie Mae Construction | Equity | Other Financial | |
| (dollars in thousands) | Investments | Securities | Investment | Instruments | Total |
| Beginning Balance, 12/31/2022 | $ 217,373 | $ – | $236 | $(174) | $ 217,435 |
| Paydowns/Settlements | (73,610) | – | – | – | (73,610) |
| Total Unrealized Gain (Loss)* | 5,640 | – | 98 | 3 | 5,741 |
| Cost of Purchases | 113,918 | – | – | – | 113,918 |
| Transfers in/out of Level 3 | – | 45,828 | – | – | 45,828 |
| Ending Balance, 12/31/2023 | $ 263,321 | $45,828 | $334 | $(171) | $309,312 |
| * | Net change in unrealized gain (loss) attributable to Level 3 securities held at December 31, 2023 totaled $5,741,000 and is included on the accompanying Statement of Operations. |
Transfers into Level 3 category occur when unobservable inputs, such as the HIT’s best estimate of what a market participant would use to determine a fair value price, become more significant to the fair value measurement. For the year ended December 31, 2023, there was one asset transferred from Level 2 into Level 3 to reflect an option of prepayment based on non-public information.
Level 3 securities primarily consist of Direct Loans and one Ginnie Mae Construction Security which were valued using evaluated prices provided by an independent, third-party pricing service as of December 31, 2023 employing a discounted cash flow model. Weighted average lives for the loans
| 26 | |
Notes to Financial Statements
continued
ranged from 0.09 to 4.14 years. Unobservable inputs include spreads to relevant U.S. Treasuries ranging from 168 to 390 basis points. For the Ginnie Mae Construction Security, weighted average life was 3.34 years. A change in unobservable inputs may impact the value of the loans or securities.
Use of Estimates
The preparation of financial statements in conformity with GAAP requires management to make estimates and assumptions that affect the reported amounts of assets and liabilities at the date of the financial statements and the reported amounts of revenues and expenses during the period. Actual results could differ from those estimates.
Federal Income Taxes
The HIT’s policy is to comply with the requirements of the Internal Revenue Code of 1986, as amended (Internal Revenue Code), that are applicable to regulated investment companies, and to distribute all of its taxable income to its participants. Therefore, no federal income tax provision is required.
Tax positions taken or expected to be taken in the course of preparing the HIT’s tax returns are evaluated to determine whether the tax positions are “more-likely-than-not” of being sustained by the applicable tax authority. Tax positions not deemed to meet the more-likely-than-not threshold would be recorded as a tax benefit or expense in the current year. Management has analyzed for all open years the HIT’s tax positions taken on federal income tax returns and has concluded that no provision for income tax is required in the HIT’s financial statements.
The HIT files U.S. federal, state and local tax returns as required. The HIT’s tax returns are subject to examination by the relevant tax authorities until the expiration of the applicable statutes of limitations, which is generally three years after the filing of the tax return but could be longer in certain circumstances.
Distributions to Participants
At the end of each calendar month, a pro-rata distribution is made to participants of the net investment income earned during the month. This pro-rata distribution is based on the participant’s number of units held as of the immediately preceding month-end and excludes realized gains (losses) which are distributed at year-end. Participants redeeming their investments are paid their pro-rata share of undistributed net income accrued through the month-end of the month in which they redeem. The HIT offers a reinvestment plan that permits current participants to automatically reinvest their distributions of income and capital gains, if any, into the HIT’s units of participation. Total reinvestment was approximately 93% of distributed income for the year ended December 31, 2023.
Investment Transactions and Income
For financial reporting purposes, security transactions are accounted for as of the trade date. Gains and losses on securities sold are determined on the basis of amortized cost. Realized gains (losses) on paydowns of mortgage- and asset-backed securities are classified as interest income.
Interest income is accrued as earned. Premiums, purchase discounts, and loan origination discounts, including related direct costs, are amortized as adjustments to the related loan’s yield over the contractual life of the loan using the effective interest method. In connection with the prepayment of a loan or security, any remaining unamortized amounts are recognized into income as a gain or loss and, depending upon the terms of the loan, there may be additional income that is earned based upon the prepayment and recognized in the period of the prepayment.
12b-1 Plan of Distribution
The HIT’s Board of Trustees has approved a Plan of Distribution under Rule 12b-1 under the Investment Company Act to pay for marketing and sales promotion expenses incurred in connection with the offer and sale of units and related distribution activities (12b-1 expenses). For the year ended December 31, 2023, the HIT was authorized to pay 12b-1 expenses in an annual amount up to $600,000 or 0.05% of its average net assets on an annualized basis per fiscal year, whichever was greater. During the year ended December 31, 2023, the HIT incurred approximately $1,091,000, or 0.02% of its average monthly net assets on an annualized basis, in 12b-1 expenses.
Notes to Financial Statements
continued
Note 2. Investment Risk
Interest Rate Risk
As with any fixed income investment, the market value of the HIT’s investments will generally fall at times when market interest rates rise. Rising interest rates may also reduce prepayment rates, causing the average life of the HIT’s investments to increase. This could in turn further reduce the value of the HIT’s portfolio.
Prepayment and Extension Risk
The HIT invests in certain fixed income securities whose value is derived from an underlying pool of mortgage loans that are subject to prepayment and extension risk.
Prepayment risk is the risk that a security will pay more quickly than its assumed payment rate, shortening its expected average life. In such an event, the HIT may be required to reinvest the proceeds of such prepayments in other investments bearing lower interest rates. The majority of the HIT’s securities backed by loans for multifamily projects include restrictions on prepayments for specified periods to mitigate this risk or include prepayment penalties to compensate the HIT. Prepayment penalties, when received, are included in realized gains.
Extension risk is the risk that a security will pay more slowly than its assumed payment rate, extending its expected average life. When this occurs, the HIT’s ability to reinvest principal repayments in higher returning investments may be limited.
These two risks may increase the sensitivity of the HIT’s portfolio to fluctuations in interest rates and negatively affect the value of the HIT’s portfolio.
Credit Risk
A majority of HIT’s investments have a form of credit enhancement to protect against losses in the event of a default. However, in the event of a default of an underlying mortgage loan where the investment does not have credit enhancement or that an entity providing credit enhancement for an investment fails to meet its obligations under the credit enhancement, the HIT would be subject to the risks that apply to real estate investments generally with respect to that investment. Certain real estate risks include construction failure, loan non-repayment, foreclosure, and environmental and litigation risk.
Futures Contracts
A futures contract is a standardized, exchange-traded agreement to buy or sell a specific quantity of an underlying asset at a specified price on a specified day or days in the future. The HIT may use U.S. Treasury futures contracts to manage the interest rate risk of the HIT portfolio. Upon entering into a futures contract, the HIT is required to deposit either cash or securities (Initial Margin) with a clearing broker. Non-cash collateral pledged by the HIT, if any, is disclosed in the Schedule of Investments, and cash collateral, if any, is held in a segregated account with the broker, which is reflected as Cash collateral held with broker in the Statement of Assets and Liabilities. Positions taken in the futures market are not normally held to maturity but are instead liquidated through offsetting transactions which may result in a profit or a loss. While the HIT will usually liquidate futures contracts in this manner, the HIT may instead make or take delivery of the underlying asset whenever it appears economically advantageous for the HIT to do so.
The HIT may invest up to 5% of its net assets, measured using notional value, in U.S. Treasury futures contracts for duration management purposes. Investments in U.S. Treasury futures contracts may add leverage because the HIT would be subject to investment exposure on the notional amount of the futures contracts. Investments in derivatives can increase the volatility of the HIT’s NAV and may expose it to significant additional costs. The use of derivatives is a highly specialized activity that involves investment techniques and risks different from those associated with investments in more traditional securities and instruments. There is no guarantee that the use of derivatives will achieve their intended result.
Any open futures contracts at period end are presented in the Schedule of Investments, which reflects unrealized cumulative appreciation (depreciation). The notional amount at value reflects each contract’s exposure to the underlying instrument at period end. The period end variation margin is reflected as Variation margin due from broker in the Statement of Assets and Liabilities, and the net cumulative appreciation (depreciation) is included in Net realized and change in unrealized gains (losses) on futures in the Statement of Operations. The average month-end notional amount of short and long futures contracts held was $7.4 million and $58.6 million, respectively, for the period ended December 31, 2023.
Market Risk
The value of securities held by the HIT may fluctuate, sometimes rapidly or unpredictably, due to general market conditions, such as real or perceived adverse economic, political or regulatory conditions, inflation, changes in interest rates, adverse investor sentiment and other global market developments and disruptions, including those arising out of geopolitical events (such as war), health emergencies (such as pandemics), natural disasters, terrorism, supply chain disruptions, sanctions and government or quasi-government actions. It Is difficult to predict when events affecting the U.S or global financial markets may occur.
| 28 | |
Notes to Financial Statements
continued
Note 3. Transactions with Related Entities
HIT Advisers
HIT Advisers, a Delaware limited liability company, was formed by the HIT to operate as an investment adviser and be registered, as appropriate under applicable federal or state law. HIT Advisers is owned by HIT directly (99.9%), and indirectly through HIT Advisers Managing Member (0.1%), which is also wholly owned by the HIT. This ownership structure is intended to insulate the HIT from any potential liabilities associated with the conduct of HIT Advisers’ business. The HIT receives no services from HIT Advisers and carries it as a portfolio investment that meets the definition of a controlled affiliate.
In accordance with a contract, in addition to its membership interest, the HIT provides HIT Advisers advances to assist with its operations and cash flow management as needed. Advances are expected to be repaid as cash becomes available. HIT maintains an allowance for doubtful receivable due to aging balances. Also, in accordance with the contract, the HIT may provide the time of certain personnel and allocates operational expenses to HIT Advisers on a cost-reimbursement basis. As of December 31, 2023, HIT Advisers had no assets under management.
A rollforward of advances to HIT Advisers by the HIT is included in the table below:
| Advances to HIT Advisers by HIT | | (dollars in thousands) |
| Ending Balance, 12/31/2022 | | $ | 500 | |
| Advances in 2023 | | | 71 | |
| Repayment by HIT Advisers in 2023 | | | — | |
| Ending Balance, 12/31/2023 | | $ | 571 | |
Building America
Building America CDE, Inc. (Building America), a wholly owned subsidiary of HIT Advisers, is a Community Development Entity, certified by the Community Development Financial Institutions Fund (CDFI Fund) of the U.S. Department of the Treasury.
In accordance with a contract, the HIT provides the time of certain personnel to Building America and allocates operational expenses on a cost- reimbursement basis. Also, in accordance with the contract, the HIT provides Building America advances to assist with its operations and cash flow management as needed. Advances are repaid as cash becomes available.
A rollforward of advances to Building America by the HIT is included in the table below:
| Advances to Building America by HIT | | (dollars in thousands) |
| Ending Balance, 12/31/2022 | | $ | 100 | |
| Advances in 2023 | | | 1,318 | |
| Repayment by Building America in 2023 | | | (1,271 | ) |
| Ending Balance, 12/31/2023 | | $ | 147 | |
Summarized financial information on a consolidated basis for HIT Advisers and Building America included in the table below:
| | | (dollars in thousands) |
| As of December 31, 2023 | | | |
| Assets | | $ | 2,253 | |
| Liabilities | | $ | 1,919 | |
| Equity | | $ | 334 | |
| For the year ended Decemeber 31, 2023 | | | | |
| Income | | $ | 1,629 | |
| Expenses | | | (1,441 | ) |
| Tax Expenses | | | (76 | ) |
| Net Income (Loss) | | $ | 112 | |
Notes to Financial Statements
continued
Note 4. Leases
The HIT leases certain real estate properties for office space which are classified as operating leases. The HIT also leases equipment which is classified as a financing lease. The leases are included in right-of-use (ROU) assets on the HIT’s statement of assets and liabilities. ROU assets represent the HIT’s right to use an underlying asset for the lease term and lease obligations represent the HIT’s obligation to make lease payments arising from the lease. ROU assets and obligations are recognized at the commencement date based on the present value of lease payments over the lease term. As most of the HIT’s leases do not provide an implicit rate, the HIT uses its incremental borrowing rate based on the information available at the commencement date of the lease in determining the present value of lease payments. The HIT determines if an arrangement is a lease at inception. The HIT’s lease terms may include options to extend or terminate the lease when it is reasonably certain that the HIT will exercise that option. Lease expense and amortization expense are recognized on a straight-line basis over the lease term.
| (dollars in thousands) | | Operating Lease | | Financing Lease | | Total |
| ROU Asset, 1/1/2023 | | $ | 4,313 | | | $ | 2 | | | $ | 4,315 | |
| Addition of ROU Asset | | | – | | | | 39 | | | | 39 | |
| Reduction/Amortization of ROU Asset | | | (488 | ) | | | (10 | ) | | | (498 | ) |
| Right-of-Use Asset, 12/31/2023 | | $ | 3,825 | | | $ | 31 | | | $ | 3,856 | |
| | | | | | | | | | | | | |
| Lease Liability, 1/1/2023 | | $ | 4,850 | | | $ | 2 | | | | | |
| Addition of Lease Liability | | | – | | | | 39 | | | | 39 | |
| | | | | | | | | | | | | |
Lease Payments
| | | (574 | ) | | | (11 | ) | | | (585 | ) |
| Imputed Interest | | | 79 | | | | 2 | | | | 81 | |
| Reduction of Lease Liability | | | (495 | ) | | | (9 | ) | | | (504 | ) |
| Lease Liability, 12/31/2023 | | $ | 4,355 | | | $ | 32 | | | $ | 4,387 | |
| | | | | | | | | | | | | |
| Lease Expense | | $ | (567 | ) | | $ | (12 | ) | | $ | (579 | ) |
| Weighted Average Discount Rate | | | 1.94 | % | | | 5.09 | % | | | | |
| Weighted Average Remaining Term (Years) | | | 7.4 | | | | 3.2 | | | | | |
Note 5. Commitments
The HIT may make commitments, including forward commitments, in securities or loans that fund over time on a draw basis or fund at a single point in time. The HIT agrees to an interest rate and purchase price for these securities or loans when the commitment to purchase is originated.
Certain assets of the HIT are invested in liquid investments until they are required to fund these purchase commitments. As of December 31, 2023, the HIT had outstanding unfunded purchase commitments of approximately $519.6 million. The HIT maintains a sufficient level of liquid securities of no less than the total of the outstanding unfunded purchase commitments. As of December 31, 2023, the value of liquid securities, less short-term investments, maintained in a custodial trading account was approximately $6.2 billion.
Note 6. Investment Transactions
Purchases and sales of investments, excluding short-term securities and U.S. Treasury securities, for the year ended December 31, 2023, were $1.0 billion and $187.7 million, respectively.
Note 7. Income Taxes
No provision for federal income taxes is required since the HIT intends to continue to qualify as a regulated investment company under Subchapter M of the Internal Revenue Code and distribute to shareholders all of its taxable income and gains. Federal income tax regulations differ from GAAP; therefore, distributions determined in accordance with tax regulations may differ in amount or character from net investment income and realized gains for financial reporting purposes. Financial reporting records were adjusted for permanent book/tax differences to reflect tax character.
The tax character of distributions paid during 2023 and 2022 were as follows:
| (dollars in thousands) | 2023 | 2022 |
| Ordinary Investment Income | $ 215,874 | $ 160,154 |
| Total Distributions Paid to Participants or Reinvested | $ 215,874 | $ 160,154 |
| 30 | |
Notes to Financial Statements
continued
As of December 31, 2023, the components of accumulated earnings on a tax basis were as follows:
| (dollars in thousands) | | 2023 |
| Accumulated Capital Loss Carryforward | | $ | (98,006 | ) |
| Unrealized Depreciation | | | (795,490 | ) |
| Undistributed Ordinary Income | | | 3,603 | |
| Other Temporary Differences | | | (5,043) | |
| Total Accumulated Losses | | $ | (894,936 | ) |
During 2023, the HIT accumulated a capital loss carryforward of $98,006,000, consisting of $13,571,000 short-term and $84,435,000 long-term capital losses, which may be used to offset future capital gains for an unlimited period.
The differences between book basis and tax basis components are primarily attributed to wash sales, recognition for tax purposes of unrealized gains (losses) on certain derivative instruments and the tax treatment of deferred compensation plans, accrued expenses and depreciation. For financial reporting purposes, capital accounts are adjusted to reflect the tax character of permanent book/tax differences. These reclassifications are primarily due to the different book and tax treatment of meals and entertainment and insurance premiums paid. Results of operations and net assets are not affected by these reclassifications.
For the year ended December 31, 2023, the HIT recorded the following permanent reclassifications:
| (dollars in thousands) | | 2023 |
| Distributable earnings (accumulated losses) | | $ | 313 | |
| Amount Invested and Reinvested by Current Participants | | $ | (313 | ) |
At December 31, 2023, the cost of investments for federal income tax purposes was $7,337,371,000. Net unrealized loss aggregated $795,490,000 at period-end, of which $24,815,000 related to appreciated investments and $820,305,000 related to depreciated investments.
Note 8. Retirement and Deferred Compensation Plans
The HIT participates in the AFL-CIO Staff Retirement Plan (Plan), which is a multiemployer defined benefit pension plan, under the terms of a collective bargaining agreement. The Plan covers substantially all employees, including non-bargaining unit employees. The risks of participating in a multiemployer plan are different from a single-employer plan in the following aspects:
| a. | Assets contributed to a multiemployer plan by one employer may be used to provide benefits to employees of other participating employers. |
| b. | If a participating employer stops contributing to the plan, the unfunded obligations of the plan may be borne by the remaining participating employers based on their level of contributions to the plan. |
| c. | If the HIT chooses to stop participating in its multiemployer plan, the HIT may be required to pay the plan an amount based on the HIT’s share of the underfunded status of the plan, referred to as a withdrawal liability. |
The HIT’s participation in the Plan for the year ended December 31, 2023, is outlined in the table below. The “EIN/Pension Plan Number” line provides the Employer Identification Number (EIN) and the three-digit plan number. The most recent Pension Protection Act (PPA) zone status available as of December 31, 2023 is for the 2021 Plan year ended at June 30, 2022. The zone status is based on information that the HIT received from the Plan and is certified by the Plan’s actuary. Among other factors, plans in the red zone are generally less than 65% funded, plans in the yellow zone are less than 80% funded, and plans in the green zone are at least 80% funded. The “FIP/RP Status Pending/Implemented” line indicates whether a financial improvement plan (FIP) or a rehabilitation plan (RP) is either pending or has been implemented. The HIT was listed in the Plan’s Form 5500 as providing more than 5% of the total contributions for the following plan year:
Pension Fund: AFL-CIO Staff Retirement Plan (dollars in thousands)
| EIN/Pension Plan Number | 53-0228172 / 001 |
| 2022 Plan Year PPA Zone Status | Green |
| FIP/RP Status Pending/ Implemented | No |
| 2023 Contributions1 | $2,127 |
| 2023 Contribution Rate | 24% |
| Surcharge Imposed | No |
| Expiration Date of Collective Bargaining Agreement | 04/01/2024 |
1. Included in salaries and fringe benefits expense line items on the Statement of Operations.
Notes to Financial Statements
continued
The HIT was listed in the Plan’s Form 5500 as providing more than 5% of the total contributions for the following plan year:
| | Year Contributions to Plan Exceeded |
| Pension Fund | 5 Percent of Total Contributions |
| AFL-CIO Staff Retirement Plan | 20211 |
1. The 2021 plan year ended at June 30, 2022.
At the date the HIT financial statements were issued, the Plan’s Form 5500 was not available for the plan year ended June 30, 2023.
The HIT also sponsors a deferred compensation plan, referred to as a 401(k) plan, covering all employees. This plan permits employees to defer the lesser of 100% of their total compensation or the applicable Internal Revenue Service limit. During 2023, the HIT matched dollar for dollar the first $6,400 of each employee’s contributions. The HIT’s 401(k) contribution of approximately $254,600 was included in the salaries and fringe benefits expense line items on the Statement of Operations for the year ended December 31, 2023.
Note 9. Contract Obligations
In the ordinary course of business, the HIT enters into contracts that contain a variety of indemnifications. The HIT’s maximum exposure under these arrangements is unknown. However, the HIT has not had any prior claims or losses pursuant to these contracts and expects the risk of loss to be low.
Note 10. Subsequent Events
The HIT evaluated subsequent events through the date the financial statements were available for issue and determined there were no additional material events that would require adjustment to or disclosure in the HIT’s financial statements.
| 32 | |
FINANCIAL HIGHLIGHTS
Select Per Share Data and Ratios for the Years Ended December 31
| Per share data | | 2023 | | | 2022 | | | 2021 | | | 2020 | | | 2019 | |
| Net asset value, beginning of period | | $ | 958.52 | | | $ | 1,137.06 | | | $ | 1,176.64 | | | $ | 1,140.24 | | | $ | 1,087.85 | |
| Income from investment operations: | | | | | | | | | | | | | | | | | | | | |
| Net investment income* | | | 32.45 | | | | 23.21 | | | | 20.20 | | | | 25.13 | | | | 29.65 | |
| Net realized and unrealized gains (losses) on investments | | | 15.84 | | | | (176.26 | ) | | | (32.43 | ) | | | 45.18 | | | | 54.26 | |
| Total income (loss) from investment operations | | | 48.29 | | | | (153.05 | ) | | | (12.23 | ) | | | 70.31 | | | | 83.91 | |
| Less distributions from: | | | | | | | | | | | | | | | | | | | | |
| Net investment income | | | (33.12 | ) | | | (25.49 | ) | | | (24.29 | ) | | | (28.41 | ) | | | (31.52 | ) |
| Net realized gains on investments | | | – | | | | – | | | | (3.06 | ) | | | (5.50 | ) | | | – | |
| Total distributions | | | (33.12 | ) | | | (25.49 | ) | | | (27.35 | ) | | | (33.91 | ) | | | (31.52 | ) |
| | | | | | | | | | | | | | | | | | | | | |
| Net asset value, end of period | | $ | 973.69 | | | $ | 958.52 | | | $ | 1,137.06 | | | $ | 1,176.64 | | | $ | 1,140.24 | |
| | | | | | | | | | | | | | | | | | | | | |
| Total return | | | 5.17 | % | | | -13.55 | % | | | -1.04 | % | | | 6.20 | % | | | 7.78 | % |
| | | | | | | | | | | | | | | | | | | | | |
| Net assets, end of period (in thousands) | | $ | 6,558,831 | | | $ | 6,025,063 | | | $ | 7,106,556 | | | $ | 6,749,288 | | | $ | 6,554,926 | |
| | | | | | | | | | | | | | | | | | | | |
| Ratios/supplemental data | | | | | | | | | | | | | | | | | | | | |
| Ratio of expenses to average net assets | | | 0.33 | % | | | 0.32 | % | | | 0.31 | % | | | 0.32 | % | | | 0.34 | % |
| Ratio of net investment income to average net assets | | | 3.4 | % | | | 2.3 | % | | | 1.7 | % | | | 2.1 | % | | | 2.6 | % |
| Portfolio turnover rate | | | 14.5 | % | | | 25.3 | % | | | 30.4 | % | | | 30.3 | % | | | 17.6 | % |
*The average shares outstanding method has been applied for this per share information.
See accompanying Notes to Financial Statements.
BOARD OF TRUSTEES
As of December 31, 2023
Correspondence intended for a Trustee may be sent to the AFL-CIO Housing Investment Trust, 1227 25th Street, NW, Suite 500, Washington, DC 20037.
Overall responsibility for the management of the HIT, the establishment of policies, and the oversight of activities is vested in its Board of Trustees. The list below provides the following information for each of the Trustees: Name, age, position, term of office, length of time served, principal occupations during at least the past five years and other directorships held.* The HIT’s Statement of Additional Information includes additional information about the Trustees and is available without charge, upon request, by placing a call to the HIT’s Investor Relations Office at (202) 331-8055 or by viewing the HIT’s website at www.aflcio-hit.com.
| Name/Age | Position | Term of Office | Principal Occupation During at Least Past Five Years/Other Directorships Held |
Chris Coleman** Age 62 | Chair | Service Commenced December 2020 Term Expires 2024 | President and CEO, Twin Cities Habitat for Humanity; formerly, Mayor, City of Saint Paul, MN; President, National League of Cities; Member, St. Paul City Council; Investment Advisor, RBC Cain Rauscher. |
Vincent Alvarez Age 55 | Union Trustee | Service Commenced December 2012 Term Expires 2025 | President, New York City Central Labor Council; formerly Assistant Legislative Director, New York State AFL-CIO; Chief of Staff, New York City Central Labor Council. |
Timothy J. Driscoll Age 60 | Union Trustee | Service Commenced March 2020 Term Expires 2025 | President, International Union of Bricklayers and Allied Craftworkers (“BAC”); Member, BAC Executive Board; Co-Chair of both Bricklayers and Trowel Trades International Pension Fund and International Health Fund; Member, NABTU Governing Board of Presidents; formerly, Secretary-Treasurer and Executive Vice President, International Union BAC. |
Sean McGarvey** Age 61 | Union Trustee | Service Commenced December 2012 Term Expires 2024 | President, North America’s Building Trades Unions (“NABTU”); formerly Secretary-Treasurer, Building and Construction Trades Department, AFL-CIO. |
Paul A. Noble Age 57 | Union Trustee | Service Commenced March 2023, Term Expires 2026 | International Secretary-Treasurer, International Brotherhood of Electrical Workers (“IBEW”); formerly International Vice President, Sixth District, IBEW. |
Terry O’Sullivan Age 68 | Union Trustee | Service Commenced December 2019 Term Expires 2025 | General President Emeritus, LIUNA; Labor Co-Chairman of the Laborers’ Training and Education Fund; Board Chairman of the LIUNA Charitable Foundation; Trustee, ULLICO; formerly General President, LIUNA. |
Fredrick Redmond Age 69 | Union Trustee | Service Commenced September 2021 Term Expires 2026 | Secretary-Treasurer, AFL-CIO; Trustee, AFL-CIO Staff Retirement Plan, President, Trade Union Confederation of Americas; Chair, A. Philip Randolph Institute; formerly Member, AFL-CIO Executive Council; International Vice President (Human Affairs), United Steelworkers. |
Anthony Shelton Age 70 | Union Trustee | Service Commenced June 2020 Term Expires 2026 | International President, Bakery, Confectionery, Tobacco Workers & Grain Millers Union (“BCTGM”); formerly International Secretary-Treasurer, BCTGM. |
Elizabeth Shuler** Age 53 | Union Trustee | Service Commenced October 2009 Term Expires 2024 | President, AFL-CIO; Trustee, AFL-CIO Staff Retirement Plan; formerly Secretary-Treasurer, AFL-CIO; Executive Assistant to the President, IBEW. |
James A. Williams, Jr. Age 55 | Union Trustee | Service Commenced December 2023 Term Expires 2026 | General President, International Union of Painters and Allied Trades (“IUPAT”); Member, Executive Council and Governing Board, AFL-CIO; Member, NABTU Governing Board of Presidents; Co-Chair of the U.S. Industry Pension Fund, the Labor Management Cooperation Initiative, and the International Finishing Trades Institute; formerly, General Vice President At-Large, IUPAT. |
Kevin Filter Age 70 | Management Trustee | Service Commenced December 2019 Term Expires 2025 | Managing Principal, GFW Equities, Mud Duck Capital & Los Cielos; formerly International Director, JLL; Co-Founder, Principal and President, Oak Grove Capital; Co- Founder, Principal and President, Glaser Financial Group. |
Bridget Gainer Age 55 | Management Trustee | Service Commenced January 2018 Term Expires 2026 | Commissioner, Cook County Board; Vice President Global Affairs, Head of Public Affairs & Business Development & Strategy, Aon; formerly Director, Chicago Parks District. |
Jack Quinn, Jr.** Age 72 | Management Trustee | Service Commenced June 2005 Term Expires 2026 | Senior Advisor for Public & Community Relations, Barclay Damon; formerly President, Erie Community College; President, Cassidy & Associates; Member of Congress, 27th District, New York. |
Deidre L. Schmidt Age 53 | Management Trustee | Service Commenced January 2018 Term Expires 2026 | President & CEO, CommonBond Communities; formerly Principal, One Roof Global Consulting; Lecturer, Harvard Graduate School of Design; Executive Director, Affordable Housing Institute. |
Tony Stanley** Age 90 | Management Trustee | Service Commenced December 1983 Term Expires 2025 | Director, TransCon Builders, Inc.; formerly Executive Vice President, TransCon Builders, Inc. |
Harry W. Thompson** Age 64 | Management Trustee | Service Commenced April 2019 Term Expires 2024 | Consultant, Harry Thompson Associates; formerly, Chief Financial Officer, Community Preservation & Development Corporation; Chief Financial Officer, Realty Investment Company, Inc. |
William C. Thompson Age 70 | Management Trustee | Service Commenced January 2018 Term Expires 2026 | Senior Managing Director, Chief Administrative Officer, Siebert Cisneros Shank & Co., LLC; formerly Comptroller, City of New York. |
| * | Includes any directorships in a corporation or trust having securities registered pursuant to Section 12 of the Securities Exchange Act of 1934, as amended, or subject to the requirements of Section 15(d) of such Act, or a company registered as an investment company under the Investment Company Act of 1940, as amended. |
** Executive Committee Member.
| 34 | |
OFFICERS*
Chang Suh, CFA, age 52; Chief Executive Officer (since 2018) and Chief Investment Officer (since 2003), AFL-CIO Housing Investment Trust; formerly Chief Portfolio Manager, Senior Executive Vice President, Assistant Portfolio Manager, and Senior Portfolio Analyst, AFL-CIO Housing Investment Trust; Senior Auditor, Arthur Andersen.
Theodore S. Chandler, age 64; Senior Managing Director—Strategic Initiatives, AFL- CIO Housing Investment Trust since 2021; formerly Managing Director/Regional Operations, Chief Operating Officer, AFL- CIO Housing Investment Trust; Vice President, Fannie Mae; Deputy Director, Chief Financial Officer and General Counsel, Massachusetts Industrial Finance Agency.
John Hanley, age 57; Senior Managing Director—Multifamily Originations, AFL-CIO Housing Investment Trust since 2019; formerly Director—Investments, National Real Estate Advisors; Executive Vice President—Investments and Portfolio Management, AFL-CIO Housing Investment Trust; Executive Vice President—Investments, AFL-CIO Investment Trust Corporation.
Erica Khatchadourian, age 56; Chief Operating Officer, AFL-CIO Housing Investment Trust since 2022; formerly Chief Financial Officer, Controller, Chief of Staff and Director of Operations, AFL- CIO Housing Investment Trust; Senior Consultant, Price Waterhouse.
Nicholas C. Milano, age 56, General Counsel, AFL-CIO Housing Investment Trust since 2013; formerly Of Counsel, Perkins Coie LLP; Deputy General Counsel and Chief Compliance Officer, Legg Mason Capital Management; Deputy General Counsel and Chief Compliance Officer, AFL-CIO Housing Investment Trust; Senior Counsel, Division of Investment Management, Securities and Exchange Commission.
Laureen O’Brien, age 53; Chief Compliance Officer and Counsel, AFL-CIO Housing Investment Trust since 2022; formerly Director of Compliance, Special Counsel and Chief of Staff, AFL-CIO Housing Investment Trust.
Harpreet S. Peleg, CFA, age 49; Chief Financial Officer, AFL-CIO Housing Investment Trust since 2022; Chief Executive Officer, Building America CDE, Inc.; formerly Senior Managing Director-Finance and Controller, AFL-CIO Housing Investment Trust; Chief Financial Officer, AFL- CIO Investment Trust Corporation; Financial Analyst, Goldman Sachs & Co.; Senior Associate, Pricewaterhouse Coopers.
William K. Pierce, age 31, Senior Portfolio Manager, AFL-CIO Housing Investment Trust since 2022; formerly Portfolio Manager, AFL-CIO Housing Investment Trust; Portfolio Manager, Capital One.
Julissa Servello, age 46, Managing Director—Investor Relations, AFL-CIO Housing Investment Trust since 2023; formerly Director of Investor Relations, Senior Investor Relations Manager, Investor Relations Manager, Marketing Coordinator, AFL-CIO Housing Investment Trust.
Lesyllee White, age 61; Chief Marketing Officer, AFL-CIO Housing Investment Trust since 2018; formerly Executive Vice President and Managing Director of Defined Benefit Marketing, Director of Marketing, Regional Marketing Director and Senior Marketing Associate, AFL-CIO Housing Investment Trust; Vice President, Northern Trust Company.
| * | All officers of the HIT are located at 1227 25th Street, NW, Suite 500, Washington, DC 20037 except Mr. Chandler who is located at 155 N. Lake Avenue, Suite 800, Pasadena, CA 91191. No officer of the HIT serves as a trustee or director in any corporation or trust having securities registered pursuant to Section 12 of the Securities Exchange Act of 1934, as amended, or subject to the requirements of Section 15(d) of such Act, or any company registered as an investment company under the Investment Company Act of 1940, as amended. These officers are appointed annually, serving for a period of approximately one year or until their respective successors are duly appointed and qualified. |
SERVICE PROVIDERS
Independent Registered Public Accounting Firm
Ernst & Young LLP
Tysons, VA
Legal Counsel
Dechert LLP
Washington, DC
Transfer Agent
BNY Mellon Investment Servicing (US) Inc.
Wilmington, DE
Custodian
Bank of New York Mellon
New York, NY
| 36 | |
| |
| |
Investors should consider the HIT’s investment objectives, risks and expenses carefully before investing. A prospectus containing more complete information may be obtained from the HIT by calling the Marketing and Investor Relations Department at (202) 331-8055 or by viewing the HIT’s website at www.aflcio-hit.com. The prospectus should be read carefully before investing. The calculations of the HIT yield herein represent widely accepted portfolio characteristics information based on coupon rate, current price and, for yield to worst, certain prepayment assumptions, and are not current yield or other performance data as defined by the SEC in Rule 482. Job and economic impact figures are estimates calculated using IMPLAN, an input-output model, based on HIT and HIT subsidiary Building America CDE, Inc. project data. Data is current as of December 31, 2023. Economic impact data is in 2022 dollars and all other figures are nominal. This document contains forecasts, estimates, opinions and/or other information that is subjective. Statements concerning economic, financial, or market trends are based on current conditions, which will fluctuate. There is no guarantee that such statements will be applicable under all market conditions, especially during periods of downturn. Actual outcomes and results may differ significantly from the views expressed. It should not be considered as investment advice or a recommendation of any kind. |
| |
| |
| |
Item 2. Code of Ethics.
| (a) | The Trust has adopted a Code of Ethics to comply with Section 406 of the Sarbanes-Oxley Act of 2002, as of December 31, 2023. This Code of Ethics applies to the Trust’s principal executive officer, principal financial officer, and principal accounting officer or controller or persons performing similar functions. |
| (b) | For purposes of this Item, the term “Code of Ethics” means written standards that are reasonably designed to deter wrongdoing and to promote: |
| (1) | Honest and ethical conduct, including the ethical handling of actual or apparent conflicts of interest between personal and professional relationships; |
| (2) | Full, fair, accurate, timely, and understandable disclosure in reports and documents that a registrant files with, or submits to, the Commission and in other public communications made by the Registrant; |
| (3) | Compliance with applicable governmental laws, rules, and regulations; |
| (4) | The prompt internal reporting of violations of the code to an appropriate person or persons identified in the code; and |
| (5) | Accountability for adherence to the code. |
| (c) | The Trust’s Code of Ethics was not amended during the period covered by the Report. |
| (d) | There have been no waivers granted from any provision of the Trust’s Code of Ethics during the period covered by the Report. |
| | (f) | (1) | A copy of the Trust’s Code of Ethics is filed herewith as an Exhibit pursuant to Item 13(a)(1). |
Item 3. Audit Committee Financial Expert.
| | (a) | (1) | The Trust’s Board of Trustees has determined that Harry Thompson possesses the attributes to qualify as an Audit Committee financial expert and has designated Mr. Thompson the Audit Committee’s financial expert. |
| (2) | Mr. Thompson is independent for purposes of this Item 3. |
Item 4. Principal Accountant Fees and Services.
Fees billed by Ernst & Young LLP (“EY”) to the Registrant:
Fiscal Year Ended 2023: $382,300
Fiscal Year Ended 2022: $352,600
The amounts above reflect the aggregate fees billed by EY, the Registrant’s independent auditor, for professional services provided to the Registrant for the audit of the Registrant’s annual financial statements and for services normally provided by the independent auditors in connection with statutory and regulatory filings or engagements.
Fees billed by EY to the Registrant:
Fiscal Year Ended 2023: $0
Fiscal Year Ended 2022: $0
The amounts above reflect the aggregate fees billed by the Registrant’s independent auditors for assurance and related services relating to the performance of the audit of the Registrant’s financial statements that are not reported under paragraph (a) of this Item.
Fees billed by EY to the Registrant’s investment adviser (“Adviser”) and any entity controlling, controlled by or under common control with the registrant’s adviser that provides ongoing services to the registrant (hereinafter referred to as “service affiliates”) that were pre-approved:
Fiscal Year Ended 2023: $0
Fiscal Year Ended 2022: $0
The amounts above reflect the aggregate fees billed by EY for services relating to the performance of the audit of the financial statements of the Adviser and service affiliates and that relate directly to the operations or financial reporting of the Registrant.
Fees billed by EY to the Registrant:
Fiscal Year Ended 2023: $38,000
Fiscal Year Ended 2022: $35,500
The amounts above reflect the aggregate fees billed by EY for professional services provided to the Registrant for tax compliance, including preparation of tax returns and distribution assistance.
Fees billed by EY to the Adviser and any service affiliates:
Fiscal Year Ended 2023: $0
Fiscal Year Ended 2022: $0
The amounts above reflect the aggregate fees billed by EY for tax-related services provided to the Adviser and service affiliates and that relate directly to the operations or financial reporting of the Registrant.
Fees billed by EY to the Registrant:
Fiscal Year Ended 2023: $18,000
Fiscal Year Ended 2022: $16,000
The amounts above reflect the aggregate fees billed for all services provided by EY to the Registrant in connection with the preparation of a report on the Schedule of Rates of Return including an opinion on the Global Investment Performance Standards.
Fees billed by EY to the Adviser and any service affiliates:
Fiscal Year Ended 2023: $0
Fiscal Year Ended 2022: $0
The amounts above reflect the aggregate fees billed for all services other than those set forth in paragraphs (a), (b) and (c) of this Item provided by the EY to the Adviser and service affiliates and that relate directly to the operations or financial reporting of the Registrant.
| | (e) | (1) | Audit Committee’s Pre-Approval Policies |
The Charter of the Trust’s Audit Committee provides that the Audit Committee shall review and, if appropriate, approve in advance all audit and non-audit services (as such term may be from time to time defined in the Securities Exchange Act of 1934, as amended) to be provided to the Trust by the Trust’s independent auditor. In making a determination, the Audit Committee considers whether the services are consistent with maintaining the principal accountant’s independence. If such a service is required between regularly scheduled audit committee meetings, pre-approval may be authorized by a majority of the audit committee members at a special meeting called for such purposes or by unanimous written consent. The Audit Committee’s Charter does not permit waiver of pre-approval for audit or non-audit services requiring fees of a de minimis amount.
| (2) | Percentages of Services Approved by the Audit Committee |
No percentage of the services included in (b)-(d) above were approved by the audit committee pursuant to paragraph (c)(7)(i)(C) of Rule 2-01 of Regulation S-X.
| (f) | For the most recent fiscal year, less than 50% of the hours expended by the Trust’s principal accountant on the principal accountant’s engagement to audit the Trust’s financial statements were attributed to work performed by persons other than the principal accountant’s full-time, permanent employees. |
| (g) | The aggregate non-audit fees billed by the Trust’s accountant for services rendered to the Registrant for fiscal years ending December 31, 2022 and December 31, 2023 were $51,500 and $56,000 respectively. The Trust does not have an investment adviser. |
| (h) | Not applicable. The Trust does not have an investment adviser. |
Item 5. Audit Committee of Listed Registrants.
Not applicable to open-end investment companies.
Item 6. Schedule of Investments.
| (a) | Included herein under Item 1. |
Item 7. Disclosure of Proxy Voting Policies and Procedures for Closed-End Management Investment Companies.
Not applicable to open-end investment companies.
Item 8. Portfolio Managers of Closed-End Management Investment Companies.
Not applicable to open-end investment companies.
Item 9. Purchases of Equity Securities by Closed-End Management Investment Company and Affiliated Purchasers.
Not applicable to open-end investment companies.
Item 10. Submission of Matters to a Vote of Security Holders.
No material changes have been made to the procedures by which participants may recommend nominees to the Board of Trustees of the Trust, where those changes were implemented after the Registrant last provided disclosure in response to the requirements of Item 407(c)(2)(iv) of Regulation S-K (per Item 22(b)(15) of Schedule 14A) or this Item.
Item 11. Controls and Procedures.
| (a) | The Trust’s Chief Executive Officer (the principal executive officer) and Chief Financial Officer (the principal financial officer) have concluded that the Trust’s disclosure controls and procedures (as defined in Rule 30a-3(c) under the Act (17 CFR 270.30a-3(c))) are effective to ensure that material information relating to the Trust is made known to them by appropriate persons, based on their evaluation of such controls and procedures as of December 31, 2023. |
| (b) | There were no changes in the Trust’s internal control over financial reporting (as defined in Rule 30a-3(d) under the Act (17 CFR 270.30a-3(d)) that occurred during the Trust’s last fiscal half year of the period covered by this report that have materially affected, or are reasonably likely to materially affect, the Trust’s internal control over financial reporting. |
Item 12. Disclosure of Securities Lending Activities for Closed-End Management Investment Companies.
Not applicable to open-end investment companies.
Item 13. Recovery of Erroneously Awarded Compensation.
Item 14. Exhibits.
| (4) | There was no change in the Registrant’s independent public accountant for the period covered by this report. |
SIGNATURES
Pursuant to the requirements of the Securities Exchange Act of 1934 and the Investment Company Act of 1940, the AFL-CIO Housing Investment Trust has duly caused this report to be signed on its behalf by the undersigned, thereunto duly authorized.
AFL-CIO HOUSING INVESTMENT TRUST
By:
Chang Suh
Chief Executive Officer
Date: March 8, 2024
Pursuant to the requirements of the Securities Exchange Act of 1934 and the Investment Company Act of 1940, this report has been signed below by the following persons on behalf of the AFL-CIO Housing Investment Trust and in the capacities and on the dates indicated.
Chang Suh
Chief Executive Officer
AFL-CIO Housing Investment Trust
(Principal Executive Officer)
Date: March 8, 2024
Harpreet S. Peleg,
Chief Financial Officer
AFL-CIO Housing Investment Trust
(Principal Financial Officer)
Date: March 6, 2024