UNITED STATES
SECURITIES AND EXCHANGE COMMISSION
Washington, D.C. 20549
FORM N-CSR
CERTIFIED SHAREHOLDER REPORT OF REGISTERED
MANAGEMENT INVESTMENT COMPANIES
Investment Company Act file number 811-02737
Fidelity Summer Street Trust
(Exact name of registrant as specified in charter)
245 Summer St., Boston, MA 02210
(Address of principal executive offices) (Zip code)
Margaret Carey, Secretary
245 Summer St.
Boston, Massachusetts 02210
(Name and address of agent for service)
Registrant's telephone number, including area code:
617-563-7000
| |
Date of fiscal year end: | April 30 |
|
|
Date of reporting period: | October 31, 2023 |
Item 1.
Reports to Stockholders
Fidelity® Short Duration High Income Fund
Semi-Annual Report
October 31, 2023
Includes Fidelity and Fidelity Advisor share classes
Contents
To view a fund's proxy voting guidelines and proxy voting record for the 12-month period ended June 30, visit http://www.fidelity.com/proxyvotingresults or visit the Securities and Exchange Commission's (SEC) web site at http://www.sec.gov.
You may also call 1-800-544-8544 if you're an individual investing directly with Fidelity, call 1-800-835-5092 if you're a plan sponsor or participant with Fidelity as your recordkeeper or call 1-877-208-0098 on institutional accounts or if you're an advisor or invest through one to request a free copy of the proxy voting guidelines.
Standard & Poor's, S&P and S&P 500 are registered service marks of The McGraw-Hill Companies, Inc. and have been licensed for use by Fidelity Distributors Corporation.
Other third-party marks appearing herein are the property of their respective owners.
All other marks appearing herein are registered or unregistered trademarks or service marks of FMR LLC or an affiliated company. © 2023 FMR LLC. All rights reserved.
This report and the financial statements contained herein are submitted for the general information of the shareholders of the Fund. This report is not authorized for distribution to prospective investors in the Fund unless preceded or accompanied by an effective prospectus.
A fund files its complete schedule of portfolio holdings with the SEC for the first and third quarters of each fiscal year on Form N-PORT. Forms N-PORT are available on the SEC's web site at http://www.sec.gov. A fund's Forms N-PORT may be reviewed and copied at the SEC's Public Reference Room in Washington, DC. Information regarding the operation of the SEC's Public Reference Room may be obtained by calling 1-800-SEC-0330.
For a complete list of a fund's portfolio holdings, view the most recent holdings listing, semiannual report, or annual report on Fidelity's web site at http://www.fidelity.com, http://www.institutional.fidelity.com, or http://www.401k.com, as applicable.
NOT FDIC INSURED •MAY LOSE VALUE •NO BANK GUARANTEE
Neither the Fund nor Fidelity Distributors Corporation is a bank.
| Top Bond Issuers (% of Fund's net assets) |
(with maturities greater than one year) |
| TransDigm, Inc. | 3.5 | |
| Ford Motor Credit Co. LLC | 2.2 | |
| Community Health Systems, Inc. | 1.6 | |
| Royal Caribbean Cruises Ltd. | 1.5 | |
| SBA Communications Corp. | 1.2 | |
| NOVA Chemicals Corp | 1.1 | |
| Univision Communications, Inc. | 1.1 | |
| DISH Network Corp. | 1.1 | |
| Centennial Resource Production LLC | 1.0 | |
| WASH Multifamily Acquisition Inc. | 1.0 | |
| | 15.3 | |
| |
| Market Sectors (% of Fund's net assets) |
| |
| Energy | 15.4 | |
| Services | 8.1 | |
| Healthcare | 6.0 | |
| Chemicals | 5.9 | |
| Telecommunications | 5.9 | |
| |
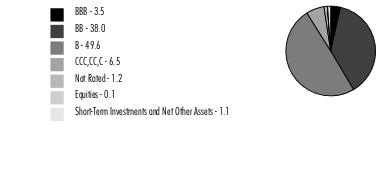
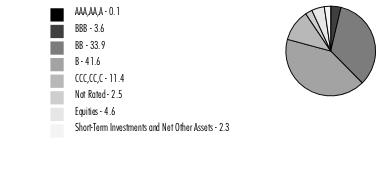
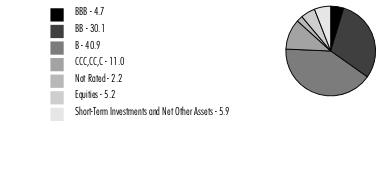
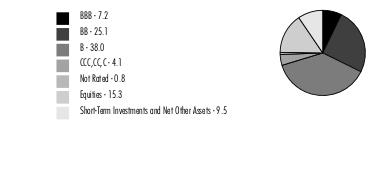
Quality Diversification (% of Fund's net assets) |
|
| |
| We have used ratings from Moody's Investors Service, Inc. Where Moody's® ratings are not available, we have used S&P® ratings. All ratings are as of the date indicated and do not reflect subsequent changes. |
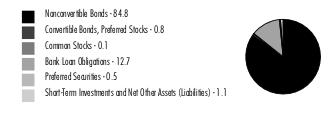
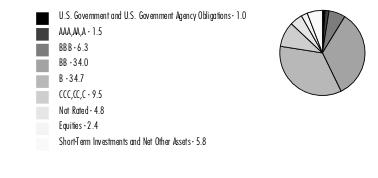
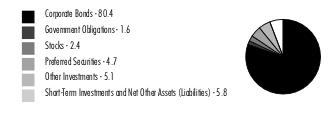
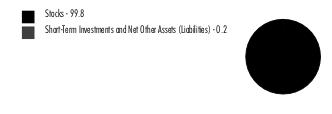
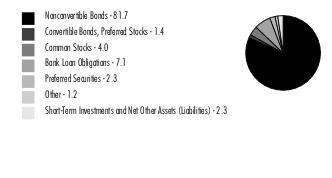
Asset Allocation (% of Fund's net assets) |
|
|
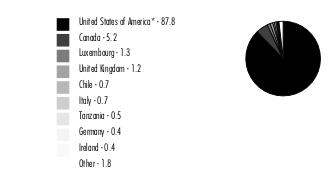
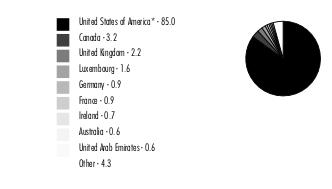
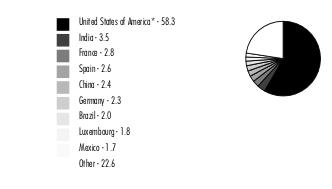
Geographic Diversification (% of Fund's net assets) |
|
* Includes Short-Term investments and Net Other Assets (Liabilities). Percentages are adjusted for the effect of derivatives, if applicable. |
| |
Showing Percentage of Net Assets
| Corporate Bonds - 85.6% |
| | | Principal Amount (a) | Value ($) |
| Convertible Bonds - 0.8% | | | |
| Broadcasting - 0.8% | | | |
| DISH Network Corp. 3.375% 8/15/26 | | 4,710,000 | 2,413,875 |
| Nonconvertible Bonds - 84.8% | | | |
| Aerospace - 5.8% | | | |
| Bombardier, Inc.: | | | |
| 6% 2/15/28 (b) | | 125,000 | 110,610 |
| 7.125% 6/15/26 (b) | | 2,000,000 | 1,924,831 |
| 7.875% 4/15/27 (b) | | 1,000,000 | 962,134 |
| Howmet Aerospace, Inc.: | | | |
| 5.9% 2/1/27 | | 1,255,000 | 1,237,396 |
| 6.875% 5/1/25 | | 1,248,000 | 1,252,420 |
| Rolls-Royce PLC 5.75% 10/15/27 (b) | | 1,300,000 | 1,231,930 |
| Spirit Aerosystems, Inc. 7.5% 4/15/25 (b) | | 650,000 | 648,397 |
| TransDigm, Inc.: | | | |
| 5.5% 11/15/27 | | 1,235,000 | 1,147,006 |
| 6.25% 3/15/26 (b) | | 7,365,000 | 7,191,611 |
| 6.75% 8/15/28 (b) | | 2,935,000 | 2,849,836 |
| 7.5% 3/15/27 | | 25,000 | 24,969 |
| | | | 18,581,140 |
| Air Transportation - 1.8% | | | |
| American Airlines, Inc. 7.25% 2/15/28 (b) | | 380,000 | 353,333 |
| American Airlines, Inc. / AAdvantage Loyalty IP Ltd. 5.5% 4/20/26 (b) | | 2,333,333 | 2,269,047 |
| Forward Air Corp. 9.5% 10/15/31 (b) | | 410,000 | 399,750 |
| Rand Parent LLC 8.5% 2/15/30 (b) | | 1,570,000 | 1,433,718 |
| United Airlines, Inc. 4.375% 4/15/26 (b) | | 1,325,000 | 1,229,089 |
| Western Global Airlines LLC 10.375% (b)(c) | | 250,000 | 1,875 |
| | | | 5,686,812 |
| Automotive & Auto Parts - 2.6% | | | |
| Clarios Global LP / Clarios U.S. Finance Co. 6.75% 5/15/28 (b) | | 180,000 | 175,475 |
| Ford Motor Credit Co. LLC: | | | |
| 2.3% 2/10/25 | | 540,000 | 509,739 |
| 3.375% 11/13/25 | | 4,700,000 | 4,386,052 |
| 4.687% 6/9/25 | | 455,000 | 440,298 |
| 5.125% 6/16/25 | | 250,000 | 243,253 |
| 7.35% 11/4/27 | | 1,420,000 | 1,437,286 |
| Macquarie AirFinance Holdings: | | | |
| 8.125% 3/30/29 (b) | | 485,000 | 477,749 |
| 8.375% 5/1/28 (b) | | 600,000 | 598,050 |
| Real Hero Merger Sub 2 6.25% 2/1/29 (b) | | 30,000 | 23,864 |
| | | | 8,291,766 |
| Banks & Thrifts - 0.6% | | | |
| Ally Financial, Inc. 3.875% 5/21/24 | | 970,000 | 953,819 |
| VistaJet Malta Finance PLC / XO Management Holding, Inc. 7.875% 5/1/27 (b) | | 1,035,000 | 796,950 |
| Western Alliance Bancorp. 3% 6/15/31 (d) | | 315,000 | 240,660 |
| | | | 1,991,429 |
| Broadcasting - 2.2% | | | |
| Clear Channel Outdoor Holdings, Inc.: | | | |
| 5.125% 8/15/27 (b) | | 1,000,000 | 888,796 |
| 9% 9/15/28 (b) | | 1,025,000 | 998,330 |
| Diamond Sports Group LLC/Diamond Sports Finance Co. 5.375% (b)(c) | | 410,000 | 4,223 |
| DISH Network Corp. 11.75% 11/15/27 (b) | | 1,130,000 | 1,119,333 |
| iHeartCommunications, Inc. 4.75% 1/15/28 (b) | | 1,400,000 | 989,774 |
| Sirius XM Radio, Inc. 3.125% 9/1/26 (b) | | 1,995,000 | 1,789,056 |
| Univision Communications, Inc. 6.625% 6/1/27 (b) | | 1,375,000 | 1,255,920 |
| | | | 7,045,432 |
| Building Materials - 0.4% | | | |
| Advanced Drain Systems, Inc. 5% 9/30/27 (b) | | 245,000 | 228,463 |
| AmeriTex Holdco Intermediate LLC 10.25% 10/15/28 (b) | | 355,000 | 335,653 |
| Beacon Roofing Supply, Inc. 6.5% 8/1/30 (b) | | 545,000 | 520,392 |
| Global Infrastructure Solutions, Inc. 5.625% 6/1/29 (b) | | 185,000 | 148,000 |
| SRS Distribution, Inc. 4.625% 7/1/28 (b) | | 95,000 | 82,873 |
| | | | 1,315,381 |
| Cable/Satellite TV - 1.9% | | | |
| CCO Holdings LLC/CCO Holdings Capital Corp. 5.125% 5/1/27 (b) | | 2,425,000 | 2,232,690 |
| CSC Holdings LLC 5.25% 6/1/24 | | 1,450,000 | 1,355,740 |
| DISH DBS Corp.: | | | |
| 5.25% 12/1/26 (b) | | 800,000 | 645,321 |
| 5.875% 11/15/24 | | 1,000,000 | 920,261 |
| 7.75% 7/1/26 | | 650,000 | 435,546 |
| Telenet Finance Luxembourg Notes SARL 5.5% 3/1/28 (b) | | 600,000 | 535,500 |
| | | | 6,125,058 |
| Capital Goods - 0.4% | | | |
| Vertical U.S. Newco, Inc. 5.25% 7/15/27 (b) | | 1,300,000 | 1,183,581 |
| Chemicals - 4.7% | | | |
| Compass Minerals International, Inc. 6.75% 12/1/27 (b) | | 205,000 | 193,100 |
| INEOS Finance PLC 6.75% 5/15/28 (b) | | 1,485,000 | 1,386,592 |
| Kobe U.S. Midco 2, Inc. 9.25% 11/1/26 pay-in-kind (b)(d) | | 270,000 | 195,750 |
| LSB Industries, Inc. 6.25% 10/15/28 (b) | | 1,990,000 | 1,765,352 |
| Methanex Corp. 5.125% 10/15/27 | | 2,400,000 | 2,188,819 |
| NOVA Chemicals Corp.: | | | |
| 4.875% 6/1/24 (b) | | 300,000 | 294,817 |
| 5% 5/1/25 (b) | | 3,205,000 | 3,027,000 |
| 5.25% 6/1/27 (b) | | 400,000 | 337,866 |
| Rhodia Acetow Management GmbH 10.5% 2/15/27 (b) | | 130,000 | 127,799 |
| SCIH Salt Holdings, Inc.: | | | |
| 4.875% 5/1/28 (b) | | 1,995,000 | 1,722,437 |
| 6.625% 5/1/29 (b) | | 300,000 | 251,468 |
| SPCM SA 3.125% 3/15/27 (b) | | 395,000 | 349,530 |
| The Chemours Co. LLC 5.375% 5/15/27 | | 2,900,000 | 2,619,905 |
| Tronox, Inc. 4.625% 3/15/29 (b) | | 530,000 | 417,498 |
| W.R. Grace Holding LLC 7.375% 3/1/31 (b) | | 180,000 | 166,729 |
| | | | 15,044,662 |
| Consumer Products - 1.0% | | | |
| Coty, Inc. 5% 4/15/26 (b) | | 1,100,000 | 1,050,907 |
| Gannett Holdings LLC 6% 11/1/26 (b) | | 75,000 | 63,000 |
| Kohl's Corp. 4.25% 7/17/25 | | 70,000 | 65,379 |
| Mattel, Inc. 5.875% 12/15/27 (b) | | 460,000 | 441,009 |
| Newell Brands, Inc. 4.7% 4/1/26 | | 675,000 | 637,303 |
| Tempur Sealy International, Inc. 4% 4/15/29 (b) | | 865,000 | 709,641 |
| TKC Holdings, Inc. 10.5% 5/15/29 (b) | | 335,000 | 267,918 |
| | | | 3,235,157 |
| Containers - 2.9% | | | |
| Ardagh Packaging Finance PLC/Ardagh MP Holdings U.S.A., Inc.: | | | |
| 4.125% 8/15/26 (b) | | 610,000 | 536,127 |
| 5.25% 8/15/27 (b) | | 400,000 | 290,644 |
| 5.25% 8/15/27 (b) | | 500,000 | 363,305 |
| Ball Corp.: | | | |
| 4% 11/15/23 | | 400,000 | 399,005 |
| 5.25% 7/1/25 | | 1,900,000 | 1,870,354 |
| Berry Global, Inc. 4.875% 7/15/26 (b) | | 1,175,000 | 1,121,173 |
| BWAY Holding Co.: | | | |
| 7.875% 8/15/26 (b) | | 525,000 | 491,725 |
| 9.25% 4/15/27 (b) | | 550,000 | 458,045 |
| Owens-Brockway Glass Container, Inc. 7.25% 5/15/31 (b) | | 750,000 | 686,250 |
| Sealed Air Corp. 5% 4/15/29 (b) | | 1,500,000 | 1,330,252 |
| Sealed Air Corp./Sealed Air Cor 6.125% 2/1/28 (b) | | 515,000 | 490,187 |
| Trivium Packaging Finance BV 8.5% 8/15/27 (b) | | 1,250,000 | 1,042,865 |
| | | | 9,079,932 |
| Diversified Financial Services - 3.1% | | | |
| Cargo Aircraft Management, Inc. 4.75% 2/1/28 (b) | | 225,000 | 198,000 |
| Freedom Mortgage Corp. 6.625% 1/15/27 (b) | | 250,000 | 216,373 |
| GGAM Finance Ltd. 7.75% 5/15/26 (b) | | 1,240,000 | 1,230,105 |
| Hightower Holding LLC 6.75% 4/15/29 (b) | | 150,000 | 127,942 |
| HTA Group Ltd. 7% 12/18/25 (b) | | 1,700,000 | 1,637,389 |
| Icahn Enterprises LP/Icahn Enterprises Finance Corp.: | | | |
| 4.75% 9/15/24 | | 690,000 | 661,776 |
| 5.25% 5/15/27 | | 1,310,000 | 1,121,688 |
| 6.25% 5/15/26 | | 750,000 | 685,526 |
| Navient Corp.: | | | |
| 6.125% 3/25/24 | | 2,000,000 | 1,989,968 |
| 6.75% 6/15/26 | | 250,000 | 236,875 |
| OneMain Finance Corp.: | | | |
| 3.5% 1/15/27 | | 235,000 | 198,575 |
| 6.125% 3/15/24 | | 375,000 | 374,029 |
| 6.875% 3/15/25 | | 1,090,000 | 1,075,388 |
| | | | 9,753,634 |
| Diversified Media - 0.1% | | | |
| Advantage Sales & Marketing, Inc. 6.5% 11/15/28 (b) | | 425,000 | 346,375 |
| Energy - 15.1% | | | |
| Berry Petroleum Co. LLC 7% 2/15/26 (b) | | 100,000 | 96,000 |
| Buckeye Partners LP: | | | |
| 4.125% 3/1/25 (b) | | 525,000 | 499,958 |
| 4.125% 12/1/27 | | 1,400,000 | 1,216,320 |
| California Resources Corp. 7.125% 2/1/26 (b) | | 250,000 | 250,938 |
| Calumet Specialty Products Partners LP/Calumet Finance Corp.: | | | |
| 9.75% 7/15/28 (b) | | 315,000 | 294,012 |
| 11% 4/15/25 (b) | | 5,000 | 5,009 |
| Centennial Resource Production LLC 5.875% 7/1/29 (b) | | 3,570,000 | 3,320,100 |
| Cheniere Energy, Inc. 4.625% 10/15/28 | | 625,000 | 571,059 |
| Chesapeake Energy Corp. 5.5% 2/1/26 (b) | | 180,000 | 174,740 |
| Chord Energy Corp. 6.375% 6/1/26 (b) | | 100,000 | 98,174 |
| Citgo Petroleum Corp. 6.375% 6/15/26 (b) | | 525,000 | 515,790 |
| Comstock Resources, Inc. 6.75% 3/1/29 (b) | | 120,000 | 109,203 |
| Continental Resources, Inc. 2.268% 11/15/26 (b) | | 100,000 | 88,614 |
| Crestwood Midstream Partners LP/Crestwood Midstream Finance Corp.: | | | |
| 6% 2/1/29 (b) | | 560,000 | 541,800 |
| 7.375% 2/1/31 (b) | | 525,000 | 529,205 |
| CrownRock LP/CrownRock Finance, Inc. 5.625% 10/15/25 (b) | | 2,300,000 | 2,262,217 |
| CVR Energy, Inc. 5.25% 2/15/25 (b) | | 1,615,000 | 1,584,267 |
| DCP Midstream Operating LP 5.375% 7/15/25 | | 525,000 | 518,693 |
| Delek Logistics Partners LP 7.125% 6/1/28 (b) | | 80,000 | 72,800 |
| Energy Ventures GoM LLC / EnVen Finance Corp. 11.75% 4/15/26 (b) | | 58,500 | 60,548 |
| EnLink Midstream Partners LP 4.85% 7/15/26 | | 1,400,000 | 1,316,023 |
| EQM Midstream Partners LP: | | | |
| 6% 7/1/25 (b) | | 147,000 | 143,756 |
| 7.5% 6/1/27 (b) | | 2,550,000 | 2,525,468 |
| EQT Corp. 3.125% 5/15/26 (b) | | 175,000 | 162,073 |
| Genesis Energy LP/Genesis Energy Finance Corp. 8% 1/15/27 | | 1,145,000 | 1,099,488 |
| Gulfport Energy Corp. 8% 5/17/26 | | 100,000 | 99,828 |
| Hess Midstream Partners LP 5.625% 2/15/26 (b) | | 2,450,000 | 2,372,676 |
| Holly Energy Partners LP/Holly Energy Finance Corp. 6.375% 4/15/27 (b) | | 105,000 | 101,649 |
| Magnolia Oil & Gas Operating LLC 6% 8/1/26 (b) | | 475,000 | 456,000 |
| Mesquite Energy, Inc. 7.25% (b)(c)(e) | | 135,000 | 0 |
| Nabors Industries, Inc. 5.75% 2/1/25 | | 2,550,000 | 2,473,500 |
| New Fortress Energy, Inc.: | | | |
| 6.5% 9/30/26 (b) | | 615,000 | 550,854 |
| 6.75% 9/15/25 (b) | | 1,290,000 | 1,196,777 |
| NGL Energy Operating LLC/NGL Energy Finance Corp. 7.5% 2/1/26 (b) | | 1,450,000 | 1,415,462 |
| Northern Oil & Gas, Inc. 8.75% 6/15/31 (b) | | 285,000 | 283,560 |
| NuStar Logistics LP 6% 6/1/26 | | 150,000 | 144,729 |
| Occidental Petroleum Corp.: | | | |
| 5.875% 9/1/25 | | 1,650,000 | 1,644,275 |
| 6.95% 7/1/24 | | 424,000 | 425,781 |
| 8.5% 7/15/27 | | 750,000 | 799,103 |
| PBF Holding Co. LLC/PBF Finance Corp. 7.875% 9/15/30 (b) | | 1,580,000 | 1,531,510 |
| PDC Energy, Inc. 5.75% 5/15/26 | | 1,750,000 | 1,742,563 |
| Precision Drilling Corp. 7.125% 1/15/26 (b) | | 1,660,000 | 1,635,548 |
| Range Resources Corp. 4.875% 5/15/25 | | 1,250,000 | 1,215,625 |
| Seadrill Finance Ltd. 8.375% 8/1/30 (b) | | 430,000 | 430,138 |
| Sitio Royalties OP / Sitio Finance Corp. 7.875% 11/1/28 (b) | | 1,002,000 | 988,373 |
| SM Energy Co. 6.625% 1/15/27 | | 1,156,000 | 1,123,324 |
| Southwestern Energy Co. 5.7% 1/23/25 (f) | | 1,128,000 | 1,112,016 |
| Sunnova Energy Corp. 5.875% 9/1/26 (b) | | 2,210,000 | 1,790,166 |
| Sunoco LP/Sunoco Finance Corp. 6% 4/15/27 | | 1,010,000 | 972,521 |
| Tallgrass Energy Partners LP / Tallgrass Energy Finance Corp. 6% 3/1/27 (b) | | 2,000,000 | 1,829,791 |
| Transocean Aquila Ltd. 8% 9/30/28 (b) | | 540,000 | 531,220 |
| Transocean, Inc. 8.75% 2/15/30 (b) | | 617,500 | 615,678 |
| U.S.A. Compression Partners LP 6.875% 4/1/26 | | 550,000 | 534,107 |
| Valaris Ltd. 8.375% 4/30/30 (b) | | 305,000 | 299,281 |
| Venture Global Calcasieu Pass LLC 6.25% 1/15/30 (b) | | 265,000 | 249,990 |
| Western Gas Partners LP 4.65% 7/1/26 | | 1,300,000 | 1,242,935 |
| | | | 47,865,235 |
| Entertainment/Film - 0.4% | | | |
| Live Nation Entertainment, Inc. 4.75% 10/15/27 (b) | | 1,450,000 | 1,325,025 |
| Environmental - 0.6% | | | |
| Clean Harbors, Inc. 6.375% 2/1/31 (b) | | 210,000 | 199,597 |
| Madison IAQ LLC 4.125% 6/30/28 (b) | | 1,900,000 | 1,587,413 |
| | | | 1,787,010 |
| Food & Drug Retail - 0.6% | | | |
| Albertsons Companies LLC/Safeway, Inc./New Albertson's, Inc./Albertson's LLC: | | | |
| 3.25% 3/15/26 (b) | | 1,100,000 | 1,016,059 |
| 6.5% 2/15/28 (b) | | 985,000 | 967,066 |
| | | | 1,983,125 |
| Food/Beverage/Tobacco - 0.8% | | | |
| C&S Group Enterprises LLC 5% 12/15/28 (b) | | 1,005,000 | 777,619 |
| Performance Food Group, Inc. 5.5% 10/15/27 (b) | | 1,100,000 | 1,028,582 |
| Post Holdings, Inc.: | | | |
| 5.625% 1/15/28 (b) | | 125,000 | 116,171 |
| 5.75% 3/1/27 (b) | | 596,000 | 568,171 |
| Turning Point Brands, Inc. 5.625% 2/15/26 (b) | | 100,000 | 91,750 |
| United Natural Foods, Inc. 6.75% 10/15/28 (b) | | 95,000 | 74,754 |
| | | | 2,657,047 |
| Gaming - 4.6% | | | |
| Affinity Gaming LLC 6.875% 12/15/27 (b) | | 1,030,000 | 839,539 |
| Boyd Gaming Corp. 4.75% 12/1/27 | | 1,300,000 | 1,182,994 |
| Caesars Entertainment, Inc.: | | | |
| 6.25% 7/1/25 (b) | | 1,350,000 | 1,328,248 |
| 8.125% 7/1/27 (b) | | 900,000 | 891,787 |
| Caesars Resort Collection LLC 5.75% 7/1/25 (b) | | 495,000 | 487,089 |
| Carnival Corp. 10.5% 6/1/30 (b) | | 245,000 | 248,583 |
| Churchill Downs, Inc.: | | | |
| 4.75% 1/15/28 (b) | | 300,000 | 268,658 |
| 6.75% 5/1/31 (b) | | 495,000 | 456,638 |
| Golden Entertainment, Inc. 7.625% 4/15/26 (b) | | 500,000 | 500,001 |
| International Game Technology PLC 4.125% 4/15/26 (b) | | 2,200,000 | 2,070,151 |
| Las Vegas Sands Corp. 3.5% 8/18/26 | | 1,100,000 | 1,006,985 |
| Melco Resorts Finance Ltd. 5.25% 4/26/26 (b) | | 200,000 | 182,994 |
| Ontario Gaming GTA LP 8% 8/1/30 (b) | | 275,000 | 268,823 |
| Raptor Acquisition Corp. / Raptor Co-Issuer LLC 4.875% 11/1/26 (b) | | 95,000 | 88,398 |
| Scientific Games Corp. 7% 5/15/28 (b) | | 1,000,000 | 974,788 |
| Studio City Finance Ltd. 5% 1/15/29 (b) | | 225,000 | 160,521 |
| VICI Properties LP / VICI Note Co.: | | | |
| 3.5% 2/15/25 (b) | | 715,000 | 681,947 |
| 4.625% 6/15/25 (b) | | 300,000 | 288,144 |
| 5.625% 5/1/24 (b) | | 1,000,000 | 993,144 |
| Wynn Las Vegas LLC/Wynn Las Vegas Capital Corp.: | | | |
| 5.25% 5/15/27 (b) | | 900,000 | 831,392 |
| 5.5% 3/1/25 (b) | | 1,025,000 | 1,006,329 |
| | | | 14,757,153 |
| Healthcare - 5.0% | | | |
| 1375209 BC Ltd. 9% 1/30/28 (b) | | 562,000 | 544,795 |
| Bausch Health Companies, Inc.: | | | |
| 5.5% 11/1/25 (b) | | 1,085,000 | 935,813 |
| 11% 9/30/28 (b) | | 850,000 | 518,500 |
| 14% 10/15/30 (b) | | 197,000 | 106,096 |
| Centene Corp. 3% 10/15/30 | | 210,000 | 166,147 |
| Community Health Systems, Inc.: | | | |
| 5.625% 3/15/27 (b) | | 6,050,000 | 4,915,224 |
| 6.875% 4/15/29 (b) | | 750,000 | 309,683 |
| HCA Holdings, Inc. 5.875% 2/15/26 | | 650,000 | 644,281 |
| IQVIA, Inc. 5% 5/15/27 (b) | | 1,675,000 | 1,575,813 |
| Modivcare, Inc. 5.875% 11/15/25 (b) | | 650,000 | 614,250 |
| Molina Healthcare, Inc. 3.875% 5/15/32 (b) | | 235,000 | 184,653 |
| Organon & Co. / Organon Foreign Debt Co-Issuer BV 4.125% 4/30/28 (b) | | 1,500,000 | 1,295,640 |
| Owens & Minor, Inc. 4.5% 3/31/29 (b) | | 65,000 | 52,152 |
| RegionalCare Hospital Partners Holdings, Inc. 11% 10/15/30 (b) | | 790,000 | 743,451 |
| RP Escrow Issuer LLC 5.25% 12/15/25 (b) | | 200,000 | 142,500 |
| Surgery Center Holdings, Inc. 6.75% 7/1/25 (b) | | 877,000 | 858,364 |
| Tenet Healthcare Corp. 5.125% 11/1/27 | | 2,300,000 | 2,123,170 |
| | | | 15,730,532 |
| Homebuilders/Real Estate - 3.0% | | | |
| Brookfield Property REIT, Inc./BPR Nimbus LLC/BPR Cumulus LLC/GGSI Sellco LLC 5.75% 5/15/26 (b) | | 1,050,000 | 961,434 |
| Greystar Real Estate Partners 7.75% 9/1/30 (b) | | 230,000 | 225,975 |
| MPT Operating Partnership LP/MPT Finance Corp.: | | | |
| 5% 10/15/27 | | 1,700,000 | 1,312,625 |
| 5.25% 8/1/26 | | 1,285,000 | 1,106,402 |
| Railworks Holdings LP 8.25% 11/15/28 (b) | | 230,000 | 218,737 |
| Service Properties Trust: | | | |
| 4.35% 10/1/24 | | 400,000 | 383,055 |
| 7.5% 9/15/25 | | 800,000 | 777,257 |
| Starwood Property Trust, Inc. 4.75% 3/15/25 | | 1,500,000 | 1,435,345 |
| Uniti Group LP / Uniti Group Finance, Inc.: | | | |
| 4.75% 4/15/28 (b) | | 2,700,000 | 2,182,066 |
| 6.5% 2/15/29 (b) | | 1,400,000 | 909,171 |
| | | | 9,512,067 |
| Insurance - 0.3% | | | |
| Acrisure LLC / Acrisure Finance, Inc. 7% 11/15/25 (b) | | 720,000 | 698,065 |
| Alliant Holdings Intermediate LLC 6.75% 10/15/27 (b) | | 30,000 | 27,398 |
| Enact Holdings, Inc. 6.5% 8/15/25 (b) | | 200,000 | 196,452 |
| | | | 921,915 |
| Leisure - 3.3% | | | |
| Carnival Corp. 7.625% 3/1/26 (b) | | 2,430,000 | 2,362,914 |
| NCL Corp. Ltd.: | | | |
| 5.875% 3/15/26 (b) | | 400,000 | 359,000 |
| 5.875% 2/15/27 (b) | | 525,000 | 483,241 |
| Royal Caribbean Cruises Ltd.: | | | |
| 5.375% 7/15/27 (b) | | 120,000 | 110,589 |
| 5.5% 8/31/26 (b) | | 1,435,000 | 1,354,181 |
| 5.5% 4/1/28 (b) | | 1,600,000 | 1,459,225 |
| 7.25% 1/15/30 (b) | | 445,000 | 438,981 |
| 11.625% 8/15/27 (b) | | 1,500,000 | 1,627,133 |
| Six Flags Entertainment Corp. 5.5% 4/15/27 (b) | | 1,500,000 | 1,365,555 |
| Viking Cruises Ltd. 9.125% 7/15/31 (b) | | 1,000,000 | 982,500 |
| | | | 10,543,319 |
| Metals/Mining - 2.0% | | | |
| Arsenal AIC Parent LLC 8% 10/1/30 (b) | | 110,000 | 108,625 |
| Cleveland-Cliffs, Inc. 6.75% 4/15/30 (b) | | 195,000 | 180,802 |
| ERO Copper Corp. 6.5% 2/15/30 (b) | | 340,000 | 288,419 |
| First Quantum Minerals Ltd. 6.875% 3/1/26 (b) | | 960,000 | 842,160 |
| Howmet Aerospace, Inc. 5.125% 10/1/24 | | 166,000 | 164,008 |
| HudBay Minerals, Inc. 4.5% 4/1/26 (b) | | 2,355,000 | 2,191,832 |
| Mineral Resources Ltd. 9.25% 10/1/28 (b) | | 185,000 | 185,000 |
| Novelis Corp. 3.25% 11/15/26 (b) | | 2,550,000 | 2,269,862 |
| | | | 6,230,708 |
| Paper - 0.7% | | | |
| Ardagh Metal Packaging Finance U.S.A. LLC/Ardagh Metal Packaging Finance PLC 6% 6/15/27 (b) | | 2,500,000 | 2,362,490 |
| Restaurants - 0.9% | | | |
| 1011778 BC Unlimited Liability Co./New Red Finance, Inc.: | | | |
| 3.875% 1/15/28 (b) | | 675,000 | 602,638 |
| 5.75% 4/15/25 (b) | | 1,000,000 | 991,830 |
| Garden SpinCo Corp. 8.625% 7/20/30 (b) | | 55,000 | 56,747 |
| Yum! Brands, Inc. 3.875% 11/1/23 | | 1,225,000 | 1,225,000 |
| | | | 2,876,215 |
| Services - 6.6% | | | |
| AECOM 5.125% 3/15/27 | | 2,505,000 | 2,364,973 |
| APX Group, Inc. 6.75% 2/15/27 (b) | | 1,505,000 | 1,452,942 |
| Aramark Services, Inc. 5% 4/1/25 (b) | | 1,025,000 | 1,001,951 |
| Brand Energy & Infrastructure Services, Inc. 10.375% 8/1/30 (b) | | 2,065,000 | 2,049,513 |
| CoreCivic, Inc.: | | | |
| 4.75% 10/15/27 | | 35,000 | 30,406 |
| 8.25% 4/15/26 | | 1,465,000 | 1,483,208 |
| CoreLogic, Inc. 4.5% 5/1/28 (b) | | 590,000 | 467,575 |
| Iron Mountain, Inc. 4.875% 9/15/27 (b) | | 1,300,000 | 1,188,366 |
| Life Time, Inc. 5.75% 1/15/26 (b) | | 1,125,000 | 1,089,437 |
| Neptune BidCo U.S., Inc. 9.29% 4/15/29 (b) | | 360,000 | 317,718 |
| PowerTeam Services LLC 9.033% 12/4/25 (b) | | 365,000 | 328,500 |
| Prime Securities Services Borrower LLC/Prime Finance, Inc. 5.75% 4/15/26 (b) | | 875,000 | 848,844 |
| Sabre GLBL, Inc. 7.375% 9/1/25 (b) | | 2,200,000 | 1,972,950 |
| Sotheby's 7.375% 10/15/27 (b) | | 465,000 | 415,285 |
| TriNet Group, Inc. 7.125% 8/15/31 (b) | | 510,000 | 493,078 |
| Uber Technologies, Inc. 7.5% 9/15/27 (b) | | 925,000 | 927,324 |
| United Rentals North America, Inc. 3.875% 11/15/27 | | 1,500,000 | 1,376,833 |
| WASH Multifamily Acquisition, Inc. 5.75% 4/15/26 (b) | | 3,440,000 | 3,182,000 |
| | | | 20,990,903 |
| Super Retail - 1.3% | | | |
| At Home Group, Inc. 4.875% 7/15/28 (b) | | 60,000 | 20,400 |
| Carvana Co.: | | | |
| 4.875% 9/1/29 (b) | | 80,000 | 45,032 |
| 5.5% 4/15/27 (b) | | 200,000 | 132,608 |
| 5.875% 10/1/28 (b) | | 115,000 | 66,671 |
| EG Global Finance PLC: | | | |
| 6.75% 2/7/25 (b) | | 817,000 | 808,340 |
| 8.5% 10/30/25 (b) | | 741,000 | 728,959 |
| Hanesbrands, Inc. 4.875% 5/15/26 (b) | | 900,000 | 826,933 |
| Staples, Inc. 7.5% 4/15/26 (b) | | 1,900,000 | 1,549,818 |
| Upbound Group, Inc. 6.375% 2/15/29 (b) | | 30,000 | 25,800 |
| | | | 4,204,561 |
| Technology - 4.3% | | | |
| Acuris Finance U.S. 5% 5/1/28 (b) | | 1,280,000 | 1,008,000 |
| Camelot Finance SA 4.5% 11/1/26 (b) | | 2,600,000 | 2,403,412 |
| CNT PRNT/CDK GLO II/FIN 8% 6/15/29 (b) | | 1,005,000 | 992,671 |
| CommScope, Inc. 6% 3/1/26 (b) | | 775,000 | 650,985 |
| Elastic NV 4.125% 7/15/29 (b) | | 225,000 | 189,622 |
| GrafTech Global Enterprises, Inc. 9.875% 12/15/28 (b) | | 175,000 | 156,710 |
| MicroStrategy, Inc. 6.125% 6/15/28 (b) | | 85,000 | 76,925 |
| Open Text Corp. 3.875% 2/15/28 (b) | | 1,700,000 | 1,477,427 |
| Qorvo, Inc. 4.375% 10/15/29 | | 1,350,000 | 1,172,169 |
| Seagate HDD Cayman 8.25% 12/15/29 (b) | | 165,000 | 167,677 |
| Sensata Technologies BV 5% 10/1/25 (b) | | 2,300,000 | 2,236,217 |
| SS&C Technologies, Inc. 5.5% 9/30/27 (b) | | 2,000,000 | 1,876,544 |
| Veritas U.S., Inc./Veritas Bermuda Ltd. 7.5% 9/1/25 (b) | | 625,000 | 511,609 |
| Virtusa Corp. 7.125% 12/15/28 (b) | | 50,000 | 39,565 |
| VM Consolidated, Inc. 5.5% 4/15/29 (b) | | 875,000 | 774,874 |
| | | | 13,734,407 |
| Telecommunications - 5.5% | | | |
| Altice Financing SA 5% 1/15/28 (b) | | 1,400,000 | 1,138,573 |
| Altice France SA 8.125% 2/1/27 (b) | | 410,000 | 345,629 |
| C&W Senior Financing Designated Activity Co. 6.875% 9/15/27 (b) | | 25,000 | 21,370 |
| Cogent Communications Group, Inc. 7% 6/15/27 (b) | | 1,800,000 | 1,701,000 |
| Consolidated Communications, Inc. 5% 10/1/28 (b) | | 1,060,000 | 798,509 |
| Hughes Satellite Systems Corp. 5.25% 8/1/26 | | 1,400,000 | 1,258,978 |
| Level 3 Financing, Inc. 10.5% 5/15/30 (b) | | 260,000 | 260,204 |
| Northwest Fiber LLC/Northwest Fiber Finance Sub, Inc. 4.75% 4/30/27 (b) | | 95,000 | 84,788 |
| Sable International Finance Ltd. 5.75% 9/7/27 (b) | | 2,402,000 | 2,150,126 |
| Sabre GLBL, Inc. 9.25% 4/15/25 (b) | | 25,000 | 23,732 |
| SBA Communications Corp. 3.875% 2/15/27 | | 4,200,000 | 3,824,919 |
| T-Mobile U.S.A., Inc.: | | | |
| 2.25% 2/15/26 | | 1,210,000 | 1,112,935 |
| 2.625% 4/15/26 | | 320,000 | 295,731 |
| Telecom Italia SpA 5.303% 5/30/24 (b) | | 2,150,000 | 2,108,359 |
| ViaSat, Inc. 5.625% 9/15/25 (b) | | 1,500,000 | 1,393,485 |
| Zayo Group Holdings, Inc. 4% 3/1/27 (b) | | 1,200,000 | 903,171 |
| | | | 17,421,509 |
| Transportation Ex Air/Rail - 0.4% | | | |
| Great Lakes Dredge & Dock Corp. 5.25% 6/1/29 (b) | | 70,000 | 57,225 |
| Seaspan Corp. 5.5% 8/1/29 (b) | | 790,000 | 606,056 |
| XPO, Inc. 6.25% 6/1/28 (b) | | 470,000 | 450,288 |
| | | | 1,113,569 |
| Utilities - 1.9% | | | |
| Calpine Corp. 5.125% 3/15/28 (b) | | 750,000 | 671,199 |
| Global Partners LP/GLP Finance Corp. 7% 8/1/27 | | 2,157,000 | 2,033,102 |
| NextEra Energy Partners LP: | | | |
| 4.25% 7/15/24 (b) | | 500,000 | 490,383 |
| 4.25% 9/15/24 (b) | | 41,000 | 38,745 |
| PG&E Corp. 5% 7/1/28 | | 1,210,000 | 1,096,194 |
| Solaris Midstream Holdings LLC 7.625% 4/1/26 (b) | | 120,000 | 114,474 |
| Vistra Operations Co. LLC: | | | |
| 5% 7/31/27 (b) | | 825,000 | 754,699 |
| 5.625% 2/15/27 (b) | | 805,000 | 757,516 |
| 7.75% 10/15/31 (b) | | 30,000 | 28,957 |
| | | | 5,985,269 |
TOTAL NONCONVERTIBLE BONDS | | | 269,682,418 |
| TOTAL CORPORATE BONDS (Cost $281,485,653) | | | 272,096,293 |
| | | | |
| Common Stocks - 0.1% |
| | | Shares | Value ($) |
| Diversified Financial Services - 0.0% | | | |
| Lime Tree Bay Ltd. (e)(g) | | 80 | 4,095 |
| Energy - 0.1% | | | |
| California Resources Corp. warrants 10/27/24 (g) | | 2 | 36 |
| Forbes Energy Services Ltd. (e)(g) | | 6,468 | 0 |
| Mesquite Energy, Inc. (e)(g) | | 1,922 | 152,615 |
TOTAL ENERGY | | | 152,651 |
| TOTAL COMMON STOCKS (Cost $364,526) | | | 156,746 |
| | | | |
| Bank Loan Obligations - 12.7% |
| | | Principal Amount (a) | Value ($) |
| Automotive & Auto Parts - 0.3% | | | |
| CWGS Group LLC Tranche B 1LN, term loan CME Term SOFR 1 Month Index + 2.500% 7.9485% 6/3/28 (d)(h)(i) | | 1,190,840 | 1,095,573 |
| Broadcasting - 0.7% | | | |
| Diamond Sports Group LLC 2LN, term loan CME Term SOFR 1 Month Index + 3.250% 10.6625% (c)(d)(h)(i) | | 196,992 | 2,094 |
| Univision Communications, Inc. Tranche B 1LN, term loan CME Term SOFR 1 Month Index + 3.250% 8.6886% 1/31/29 (d)(h)(i) | | 2,335,984 | 2,294,381 |
TOTAL BROADCASTING | | | 2,296,475 |
| Building Materials - 0.6% | | | |
| Acproducts Holdings, Inc. Tranche B 1LN, term loan CME Term SOFR 3 Month Index + 4.250% 9.9017% 5/17/28 (d)(h)(i) | | 615,648 | 487,390 |
| Oscar AcquisitionCo LLC 1LN, term loan CME Term SOFR 3 Month Index + 4.500% 9.9901% 4/29/29 (d)(h)(i) | | 495,000 | 481,595 |
| SRS Distribution, Inc. Tranche B 1LN, term loan CME Term SOFR 1 Month Index + 3.500% 8.9386% 6/4/28 (d)(h)(i) | | 857,248 | 835,816 |
TOTAL BUILDING MATERIALS | | | 1,804,801 |
| Chemicals - 1.2% | | | |
| ARC Falcon I, Inc. Tranche B 1LN, term loan CME Term SOFR 1 Month Index + 3.750% 9.1741% 9/30/28 (d)(h)(i) | | 397,212 | 381,736 |
| Aruba Investment Holdings LLC Tranche B 1LN, term loan CME Term SOFR 1 Month Index + 4.000% 9.4241% 11/24/27 (d)(h)(i) | | 367,405 | 360,975 |
| Discovery Purchaser Corp. 1LN, term loan CME Term SOFR 3 Month Index + 4.370% 9.7651% 10/4/29 (d)(h)(i) | | 367,500 | 340,658 |
| Hexion Holdings Corp. 1LN, term loan CME Term SOFR 3 Month Index + 4.500% 10.0332% 3/15/29 (d)(h)(i) | | 397,222 | 366,239 |
| Olympus Water U.S. Holding Corp. Tranche B 1LN, term loan CME Term SOFR 3 Month Index + 3.750% 9.4017% 11/9/28 (d)(h)(i) | | 714,702 | 695,941 |
| SCIH Salt Holdings, Inc. Tranche B 1LN, term loan CME Term SOFR 3 Month Index + 4.000% 9.6307% 3/16/27 (d)(h)(i) | | 32,076 | 31,615 |
| W.R. Grace Holding LLC Tranche B 1LN, term loan 3 month U.S. LIBOR + 3.750% 9.4017% 9/22/28 (d)(h)(i) | | 1,509,449 | 1,478,007 |
TOTAL CHEMICALS | | | 3,655,171 |
| Consumer Products - 0.0% | | | |
| Conair Holdings LLC Tranche B 1LN, term loan 3 month U.S. LIBOR + 3.750% 9.4017% 5/17/28 (d)(h)(i) | | 24,500 | 22,650 |
| TKC Holdings, Inc. 1LN, term loan 13.5% 2/14/27 (d)(i) | | 227,378 | 102,320 |
TOTAL CONSUMER PRODUCTS | | | 124,970 |
| Diversified Financial Services - 0.8% | | | |
| Broadstreet Partners, Inc. Tranche B 1LN, term loan CME Term SOFR 1 Month Index + 3.000% 8.4386% 1/27/27 (d)(h)(i) | | 341,162 | 337,293 |
| Hightower Holding LLC Tranche B 1LN, term loan CME Term SOFR 3 Month Index + 4.000% 9.3796% 4/21/28 (d)(h)(i) | | 2,286,568 | 2,234,160 |
TOTAL DIVERSIFIED FINANCIAL SERVICES | | | 2,571,453 |
| Energy - 0.0% | | | |
| Forbes Energy Services LLC Tranche B, term loan 0% (c)(e)(i) | | 60,604 | 0 |
| Mesquite Energy, Inc.: | | | |
| 1LN, term loan 3 month U.S. LIBOR + 8.000% 0% (c)(e)(h)(i) | | 35,876 | 0 |
| term loan 3 month U.S. LIBOR + 0.000% 0% (c)(e)(h)(i) | | 15,000 | 0 |
TOTAL ENERGY | | | 0 |
| Environmental - 0.2% | | | |
| LRS Holdings LLC Tranche B 1LN, term loan 1 month U.S. LIBOR + 4.250% 9.6886% 6/28/28 (d)(h)(i) | | 687,750 | 672,276 |
| Food/Beverage/Tobacco - 0.3% | | | |
| Del Monte Foods, Inc. Tranche B 1LN, term loan CME Term SOFR 1 Month Index + 4.250% 9.6769% 5/16/29 (d)(h)(i) | | 990,000 | 955,350 |
| Triton Water Holdings, Inc. Tranche B 1LN, term loan CME Term SOFR 1 Month Index + 3.250% 8.9017% 3/31/28 (d)(h)(i) | | 53,763 | 50,855 |
TOTAL FOOD/BEVERAGE/TOBACCO | | | 1,006,205 |
| Gaming - 0.1% | | | |
| Fertitta Entertainment LLC NV Tranche B 1LN, term loan CME Term SOFR 1 Month Index + 4.000% 9.3241% 1/27/29 (d)(h)(i) | | 319,217 | 311,757 |
| Healthcare - 1.0% | | | |
| Cano Health, Inc. Tranche B 1LN, term loan CME Term SOFR 1 Month Index + 4.000% 9.53% 11/23/27 (d)(h)(i) | | 1,756,276 | 1,011,106 |
| Confluent Health LLC Tranche B 1LN, term loan CME Term SOFR 1 Month Index + 4.000% 9.4306% 11/30/28 (d)(h)(i) | | 14,790 | 13,921 |
| Insulet Corp. Tranche B 1LN, term loan CME Term SOFR 1 Month Index + 3.250% 8.6886% 5/4/28 (d)(h)(i) | | 19,550 | 19,460 |
| Jazz Financing Lux SARL Tranche B 1LN, term loan CME Term SOFR 1 Month Index + 3.500% 8.9386% 5/5/28 (d)(h)(i) | | 48,440 | 48,413 |
| MED ParentCo LP 1LN, term loan CME Term SOFR 1 Month Index + 4.250% 9.6886% 8/31/26 (d)(h)(i) | | 440,698 | 415,172 |
| Medical Solutions Holdings, Inc. 1LN, term loan CME Term SOFR 3 Month Index + 3.250% 8.7725% 11/1/28 (d)(h)(i) | | 394,317 | 366,715 |
| Mozart Borrower LP Tranche B 1LN, term loan CME Term SOFR 1 Month Index + 3.250% 8.6886% 10/23/28 (d)(h)(i) | | 113,275 | 112,497 |
| Organon & Co. Tranche B 1LN, term loan CME Term SOFR 3 Month Index + 3.000% 8.4505% 6/2/28 (d)(h)(i) | | 804,266 | 801,652 |
| Packaging Coordinators Midco, Inc. Tranche B 1LN, term loan CME Term SOFR 3 Month Index + 3.500% 9.1517% 11/30/27 (d)(h)(i) | | 14,698 | 14,496 |
| Phoenix Newco, Inc. Tranche B 1LN, term loan CME Term SOFR 1 Month Index + 3.250% 8.6886% 11/15/28 (d)(h)(i) | | 59,100 | 58,346 |
| RadNet Management, Inc. Tranche B 1LN, term loan CME Term SOFR 1 Month Index + 3.000% 8.4306% 4/23/28 (d)(h)(i) | | 327,642 | 326,096 |
| U.S. Anesthesia Partners, Inc. Tranche B 1LN, term loan CME Term SOFR 1 Month Index + 4.250% 9.6791% 10/1/28 (d)(h)(i) | | 29,400 | 25,464 |
TOTAL HEALTHCARE | | | 3,213,338 |
| Homebuilders/Real Estate - 0.5% | | | |
| Breakwater Energy Partners LLC Tranche B 1LN, term loan 11.25% 9/1/26 (d)(e)(h)(i) | | 1,505,418 | 1,454,685 |
| Hotels - 0.0% | | | |
| Hilton Grand Vacations Borrower LLC Tranche B 1LN, term loan CME Term SOFR 1 Month Index + 3.000% 8.1886% 8/2/28 (d)(h)(i) | | 49,000 | 48,947 |
| Insurance - 0.7% | | | |
| Alliant Holdings Intermediate LLC: | | | |
| Tranche B3 1LN, term loan 1 month U.S. LIBOR + 3.500% 8.9386% 11/5/27 (d)(h)(i) | | 287,748 | 286,618 |
| Tranche B5 1LN, term loan CME Term SOFR 1 Month Index + 3.500% 8.8347% 11/6/27 (d)(h)(i) | | 179,178 | 178,488 |
| AssuredPartners, Inc. Tranche B 1LN, term loan CME Term SOFR 1 Month Index + 3.500% 8.9386% 2/13/27 (d)(h)(i) | | 480,856 | 476,317 |
| Asurion LLC 1LN, term loan CME Term SOFR 3 Month Index + 4.000% 9.4241% 8/19/28 (d)(h)(i) | | 367,481 | 350,077 |
| USI, Inc. 1LN, term loan CME Term SOFR 1 Month Index + 3.750% 9.1401% 11/22/29 (d)(h)(i) | | 992,481 | 988,968 |
TOTAL INSURANCE | | | 2,280,468 |
| Leisure - 0.1% | | | |
| Hayward Industries, Inc. Tranche B 1LN, term loan CME Term SOFR 1 Month Index + 2.750% 8.1894% 5/28/28 (d)(h)(i) | | 391,000 | 383,528 |
| MajorDrive Holdings IV LLC 1LN, term loan CME Term SOFR 1 Month Index + 4.000% 9.6517% 5/12/28 (d)(h)(i) | | 24,438 | 23,684 |
TOTAL LEISURE | | | 407,212 |
| Paper - 0.9% | | | |
| Clydesdale Acquisition Holdings, Inc. 1LN, term loan CME Term SOFR 1 Month Index + 4.170% 9.5991% 4/13/29 (d)(h)(i) | | 3,027,844 | 2,924,655 |
| Railroad - 0.1% | | | |
| Genesee & Wyoming, Inc. 1LN, term loan CME Term SOFR 3 Month Index + 2.000% 7.4901% 12/30/26 (d)(h)(i) | | 322,674 | 322,271 |
| Services - 1.5% | | | |
| ABG Intermediate Holdings 2 LLC Tranche B1 LN, term loan CME Term SOFR 1 Month Index + 3.500% 8.9241% 12/21/28 (d)(h)(i) | | 563,068 | 561,357 |
| Allied Universal Holdco LLC Tranche B 1LN, term loan CME Term SOFR 1 Month Index + 3.750% 9.1741% 5/14/28 (d)(h)(i) | | 1,460,746 | 1,384,612 |
| Ascend Learning LLC: | | | |
| 2LN, term loan CME Term SOFR 1 Month Index + 5.750% 11.1741% 12/10/29 (d)(h)(i) | | 20,000 | 16,817 |
| Tranche B 1LN, term loan CME Term SOFR 1 Month Index + 3.500% 8.9241% 12/10/28 (d)(h)(i) | | 884,092 | 820,827 |
| Brand Energy & Infrastructure Services, Inc. Tranche B 1LN, term loan CME Term SOFR 1 Month Index + 5.500% 10.8719% 8/1/30 (d)(h)(i) | | 265,000 | 255,063 |
| CHG Healthcare Services, Inc. 1LN, term loan CME Term SOFR 1 Month Index + 3.250% 8.6886% 9/30/28 (d)(h)(i) | | 14,700 | 14,533 |
| CoreLogic, Inc. Tranche B 1LN, term loan CME Term SOFR 1 Month Index + 3.500% 8.9386% 6/2/28 (d)(h)(i) | | 49,000 | 44,485 |
| Neptune BidCo U.S., Inc. Tranche B 1LN, term loan CME Term SOFR 1 Month Index + 5.000% 10.5067% 4/11/29 (d)(h)(i) | | 999,425 | 871,379 |
| Spin Holdco, Inc. Tranche B 1LN, term loan 3 month U.S. LIBOR + 4.000% 9.6639% 3/4/28 (d)(h)(i) | | 895,010 | 762,996 |
TOTAL SERVICES | | | 4,732,069 |
| Super Retail - 0.9% | | | |
| Bass Pro Group LLC Tranche B 1LN, term loan CME Term SOFR 1 Month Index + 3.750% 9.4017% 3/5/28 (d)(h)(i) | | 1,156,333 | 1,145,972 |
| Empire Today LLC Tranche B 1LN, term loan CME Term SOFR 1 Month Index + 5.000% 10.4531% 4/1/28 (d)(h)(i) | | 489,975 | 377,075 |
| LBM Acquisition LLC Tranche B 1LN, term loan CME Term SOFR 1 Month Index + 3.750% 9.1741% 12/18/27 (d)(h)(i) | | 1,356,528 | 1,288,701 |
TOTAL SUPER RETAIL | | | 2,811,748 |
| Technology - 1.2% | | | |
| Acuris Finance U.S., Inc. 1LN, term loan CME Term SOFR 3 Month Index + 4.000% 9.5401% 2/16/28 (d)(h)(i) | | 10,156 | 9,991 |
| Aptean, Inc. 2LN, term loan 1 month U.S. LIBOR + 7.000% 12.4241% 4/23/27 (d)(h)(i) | | 200,000 | 186,000 |
| Athenahealth Group, Inc. Tranche B 1LN, term loan CME Term SOFR 1 Month Index + 3.500% 8.5769% 2/15/29 (d)(h)(i) | | 2,328,348 | 2,252,258 |
| Ceridian HCM Holding, Inc. Tranche B, term loan CME Term SOFR 1 Month Index + 2.500% 7.9386% 4/30/25 (d)(h)(i) | | 367,167 | 366,708 |
| DG Investment Intermediate Holdings, Inc.: | | | |
| 2LN, term loan CME Term SOFR 1 Month Index + 6.750% 12.1886% 3/31/29 (d)(h)(i) | | 80,000 | 71,100 |
| Tranche B 1LN, term loan CME Term SOFR 1 Month Index + 3.750% 9.1998% 3/31/28 (d)(h)(i) | | 14,663 | 14,171 |
| Electro Rent Corp. 1LN, term loan CME Term SOFR 1 Month Index + 5.500% 11.0023% 11/1/24 (d)(h)(i) | | 388,512 | 361,316 |
| Maverick Bidco, Inc. Tranche B 1LN, term loan CME Term SOFR 1 Month Index + 3.750% 9.2832% 5/18/28 (d)(h)(i) | | 294,019 | 286,913 |
| Park Place Technologies LLC 1LN, term loan CME Term SOFR 1 Month Index + 5.000% 10.4241% 11/10/27 (d)(h)(i) | | 341,250 | 333,429 |
TOTAL TECHNOLOGY | | | 3,881,886 |
| Telecommunications - 0.4% | | | |
| Cablevision Lightpath LLC Tranche B 1LN, term loan CME Term SOFR 1 Month Index + 3.250% 8.699% 11/30/27 (d)(h)(i) | | 480,147 | 474,246 |
| Consolidated Communications, Inc. Tranche B 1LN, term loan CME Term SOFR 1 Month Index + 3.500% 8.9386% 10/2/27 (d)(h)(i) | | 250,000 | 224,095 |
| Northwest Fiber LLC Tranche B 1LN, term loan CME Term SOFR 1 Month Index + 3.750% 9.3898% 4/30/27 (d)(h)(i) | | 151,125 | 148,551 |
| Windstream Services LLC Tranche B 1LN, term loan CME Term SOFR 1 Month Index + 6.250% 11.6741% 9/21/27 (d)(h)(i) | | 341,049 | 314,475 |
TOTAL TELECOMMUNICATIONS | | | 1,161,367 |
| Textiles/Apparel - 0.5% | | | |
| Tory Burch LLC Tranche B 1LN, term loan CME Term SOFR 1 Month Index + 3.500% 8.6886% 4/16/28 (d)(h)(i) | | 1,604,819 | 1,571,391 |
| Utilities - 0.7% | | | |
| Brookfield WEC Holdings, Inc. 1LN, term loan CME Term SOFR 1 Month Index + 3.750% 9.0741% 8/1/25 (d)(h)(i) | | 603,800 | 603,969 |
| Limetree Bay Terminals LLC Tranche B 1LN, term loan 3 month U.S. LIBOR + 4.000% 10.6517% 2/15/24 (d)(h)(i) | | 458,407 | 420,446 |
| PG&E Corp. Tranche B 1LN, term loan CME Term SOFR 1 Month Index + 3.000% 8.4386% 6/23/25 (d)(h)(i) | | 1,118,619 | 1,115,822 |
TOTAL UTILITIES | | | 2,140,237 |
| TOTAL BANK LOAN OBLIGATIONS (Cost $41,236,184) | | | 40,488,955 |
| | | | |
| Preferred Securities - 0.5% |
| | | Principal Amount (a) | Value ($) |
| Banks & Thrifts - 0.2% | | | |
| Ally Financial, Inc.: | | | |
| 4.7% (d)(j) | | 220,000 | 144,993 |
| 4.7% (d)(j) | | 230,000 | 136,567 |
| Wells Fargo & Co. 7.625% (d)(j) | | 290,000 | 293,126 |
TOTAL BANKS & THRIFTS | | | 574,686 |
| Diversified Financial Services - 0.1% | | | |
| Charles Schwab Corp. 5.375% (d)(j) | | 515,000 | 493,661 |
| Energy - 0.2% | | | |
| Energy Transfer LP 3 month U.S. LIBOR + 4.020% 9.6542% (d)(h)(j) | | 625,000 | 602,033 |
| TOTAL PREFERRED SECURITIES (Cost $1,598,663) | | | 1,670,380 |
| | | | |
| Money Market Funds - 0.3% |
| | | Shares | Value ($) |
Fidelity Cash Central Fund 5.40% (k) (Cost $810,744) | | 810,621 | 810,783 |
| | | | |
| TOTAL INVESTMENT IN SECURITIES - 99.2% (Cost $325,495,770) | 315,223,157 |
NET OTHER ASSETS (LIABILITIES) - 0.8% | 2,696,556 |
| NET ASSETS - 100.0% | 317,919,713 |
| | |
Legend
| (a) | Amount is stated in United States dollars unless otherwise noted. |
| (b) | Security exempt from registration under Rule 144A of the Securities Act of 1933. These securities may be resold in transactions exempt from registration, normally to qualified institutional buyers. At the end of the period, the value of these securities amounted to $195,144,776 or 61.4% of net assets. |
| (c) | Non-income producing - Security is in default. |
| (d) | Coupon rates for floating and adjustable rate securities reflect the rates in effect at period end. |
| (f) | Security initially issued at one coupon which converts to a higher coupon at a specified date. The rate shown is the rate at period end. |
| (h) | Coupon is indexed to a floating interest rate which may be multiplied by a specified factor and/or subject to caps or floors. |
| (i) | Remaining maturities of bank loan obligations may be less than the stated maturities shown as a result of contractual or optional prepayments by the borrower. Such prepayments cannot be predicted with certainty. |
| (j) | Security is perpetual in nature with no stated maturity date. |
| (k) | Affiliated fund that is generally available only to investment companies and other accounts managed by Fidelity Investments. The rate quoted is the annualized seven-day yield of the fund at period end. A complete unaudited listing of the fund's holdings as of its most recent quarter end is available upon request. In addition, each Fidelity Central Fund's financial statements are available on the SEC's website or upon request. |
Affiliated Central Funds
Fiscal year to date information regarding the Fund's investments in Fidelity Central Funds, including the ownership percentage, is presented below.
| Affiliate | Value, beginning of period ($) | Purchases ($) | Sales Proceeds ($) | Dividend Income ($) | Realized Gain (loss) ($) | Change in Unrealized appreciation (depreciation) ($) | Value, end of period ($) | % ownership, end of period |
| Fidelity Cash Central Fund 5.40% | 35,169,742 | 88,424,340 | 122,783,299 | 827,776 | - | - | 810,783 | 0.0% |
| Total | 35,169,742 | 88,424,340 | 122,783,299 | 827,776 | - | - | 810,783 | |
| | | | | | | | | |
Amounts in the dividend income column in the above table include any capital gain distributions from underlying funds, which are presented in the corresponding line item in the Statement of Operations, if applicable.
Amounts included in the purchases and sales proceeds columns may include in-kind transactions, if applicable.
Investment Valuation
The following is a summary of the inputs used, as of October 31, 2023, involving the Fund's assets and liabilities carried at fair value. The inputs or methodology used for valuing securities may not be an indication of the risk associated with investing in those securities. For more information on valuation inputs, and their aggregation into the levels used below, please refer to the Investment Valuation section in the accompanying Notes to Financial Statements.
| Valuation Inputs at Reporting Date: |
| Description | Total ($) | Level 1 ($) | Level 2 ($) | Level 3 ($) |
Investments in Securities: | | | | |
|
| Equities: | | | | |
Energy | 152,651 | 36 | - | 152,615 |
Financials | 4,095 | - | - | 4,095 |
|
| Corporate Bonds | 272,096,293 | - | 272,096,293 | - |
|
| Bank Loan Obligations | 40,488,955 | - | 39,034,270 | 1,454,685 |
|
| Preferred Securities | 1,670,380 | - | 1,670,380 | - |
|
| Money Market Funds | 810,783 | 810,783 | - | - |
| Total Investments in Securities: | 315,223,157 | 810,819 | 312,800,943 | 1,611,395 |
| Statement of Assets and Liabilities |
| | | | October 31, 2023 (Unaudited) |
| | | | | |
| Assets | | | | |
| Investment in securities, at value - See accompanying schedule: | | | | |
Unaffiliated issuers (cost $324,685,026) | $ | 314,412,374 | | |
Fidelity Central Funds (cost $810,744) | | 810,783 | | |
| | | | | |
| | | | | |
| Total Investment in Securities (cost $325,495,770) | | | $ | 315,223,157 |
| Cash | | | | 265,947 |
| Receivable for investments sold | | | | 66,596,022 |
| Receivable for fund shares sold | | | | 2,828,743 |
| Interest receivable | | | | 5,461,877 |
| Distributions receivable from Fidelity Central Funds | | | | 130,690 |
| Prepaid expenses | | | | 685 |
| Receivable from investment adviser for expense reductions | | | | 12,772 |
| Other receivables | | | | 728 |
Total assets | | | | 390,520,621 |
| Liabilities | | | | |
| Payable for investments purchased | $ | 786,014 | | |
| Payable for fund shares redeemed | | 29,107,306 | | |
| Distributions payable | | 209,466 | | |
| Accrued management fee | | 237,419 | | |
| Distribution and service plan fees payable | | 7,661 | | |
| Notes payable to affiliates | | 42,146,000 | | |
| Other affiliated payables | | 57,468 | | |
| Other payables and accrued expenses | | 49,574 | | |
| Total Liabilities | | | | 72,600,908 |
| Net Assets | | | $ | 317,919,713 |
| Net Assets consist of: | | | | |
| Paid in capital | | | $ | 339,792,821 |
| Total accumulated earnings (loss) | | | | (21,873,108) |
| Net Assets | | | $ | 317,919,713 |
| | | | | |
| Net Asset Value and Maximum Offering Price | | | | |
| Class A : | | | | |
Net Asset Value and redemption price per share ($24,238,420 ÷ 2,851,139 shares)(a) | | | $ | 8.50 |
| Maximum offering price per share (100/96.00 of $8.50) | | | $ | 8.85 |
| Class M : | | | | |
Net Asset Value and redemption price per share ($2,006,777 ÷ 236,084 shares)(a) | | | $ | 8.50 |
| Maximum offering price per share (100/96.00 of $8.50) | | | $ | 8.85 |
| Class C : | | | | |
Net Asset Value and offering price per share ($2,822,605 ÷ 331,971 shares)(a) | | | $ | 8.50 |
| Short Duration High Income : | | | | |
Net Asset Value, offering price and redemption price per share ($273,925,947 ÷ 32,219,564 shares) | | | $ | 8.50 |
| Class I : | | | | |
Net Asset Value, offering price and redemption price per share ($6,163,510 ÷ 724,922 shares) | | | $ | 8.50 |
| Class Z : | | | | |
Net Asset Value, offering price and redemption price per share ($8,762,454 ÷ 1,030,271 shares) | | | $ | 8.50 |
(a)Redemption price per share is equal to net asset value less any applicable contingent deferred sales charge. |
| Statement of Operations |
| | | | Six months ended October 31, 2023 (Unaudited) |
| Investment Income | | | | |
| Dividends | | | $ | 95,971 |
| Interest | | | | 19,230,913 |
| Income from Fidelity Central Funds | | | | 827,776 |
| Total Income | | | | 20,154,660 |
| Expenses | | | | |
| Management fee | $ | 1,397,583 | | |
| Transfer agent fees | | 231,501 | | |
| Distribution and service plan fees | | 45,523 | | |
| Accounting fees and expenses | | 105,480 | | |
| Custodian fees and expenses | | 6,638 | | |
| Independent trustees' fees and expenses | | 1,252 | | |
| Registration fees | | 94,391 | | |
| Audit | | 35,036 | | |
| Legal | | (5,949) | | |
| Interest | | 6,515 | | |
| Miscellaneous | | 813 | | |
| Total expenses before reductions | | 1,918,783 | | |
| Expense reductions | | (20,164) | | |
| Total expenses after reductions | | | | 1,898,619 |
| Net Investment income (loss) | | | | 18,256,041 |
| Realized and Unrealized Gain (Loss) | | | | |
| Net realized gain (loss) on: | | | | |
| Investment Securities: | | | | |
| Unaffiliated issuers | | (7,688,886) | | |
| Foreign currency transactions | | (1) | | |
| Total net realized gain (loss) | | | | (7,688,887) |
| Change in net unrealized appreciation (depreciation) on investment securities | | | | (6,363,081) |
| Net gain (loss) | | | | (14,051,968) |
| Net increase (decrease) in net assets resulting from operations | | | $ | 4,204,073 |
| Statement of Changes in Net Assets |
| |
| | Six months ended October 31, 2023 (Unaudited) | | Year ended April 30, 2023 |
| Increase (Decrease) in Net Assets | | | | |
| Operations | | | | |
| Net investment income (loss) | $ | 18,256,041 | $ | 18,111,555 |
| Net realized gain (loss) | | (7,688,887) | | (2,582,867) |
| Change in net unrealized appreciation (depreciation) | | (6,363,081) | | 2,108,837 |
| Net increase (decrease) in net assets resulting from operations | | 4,204,073 | | 17,637,525 |
| Distributions to shareholders | | (14,393,905) | | (15,367,826) |
| | | | | |
| Share transactions - net increase (decrease) | | (174,398,529) | | 372,738,743 |
| Total increase (decrease) in net assets | | (184,588,361) | | 375,008,442 |
| | | | | |
| Net Assets | | | | |
| Beginning of period | | 502,508,074 | | 127,499,632 |
| End of period | $ | 317,919,713 | $ | 502,508,074 |
| | | | | |
| | | | | |
Financial Highlights
| Fidelity Advisor® Short Duration High Income Fund Class A |
| |
| | Six months ended (Unaudited) October 31, 2023 | | Years ended April 30, 2023 | | 2022 | | 2021 | | 2020 | | 2019 |
Selected Per-Share Data | | | | | | | | | | | | |
| Net asset value, beginning of period | $ | 8.66 | $ | 8.98 | $ | 9.52 | $ | 8.87 | $ | 9.44 | $ | 9.42 |
| Income from Investment Operations | | | | | | | | | | | | |
Net investment income (loss) A,B | | .296 | | .502 | | .307 | | .300 | | .348 | | .409 |
| Net realized and unrealized gain (loss) | | (.224) | | (.429) | | (.546) | | .651 | | (.571) | | .004 |
| Total from investment operations | | .072 | | .073 | | (.239) | | .951 | | (.223) | | .413 |
| Distributions from net investment income | | (.232) | | (.393) | | (.301) | | (.301) | | (.347) | | (.393) |
| Total distributions | | (.232) | | (.393) | | (.301) | | (.301) | | (.347) | | (.393) |
| Net asset value, end of period | $ | 8.50 | $ | 8.66 | $ | 8.98 | $ | 9.52 | $ | 8.87 | $ | 9.44 |
Total Return C,D,E | | .83% | | .93% | | (2.60)% | | 10.83% | | (2.47)% | | 4.52% |
Ratios to Average Net Assets B,F,G | | | | | | | | | | | | |
| Expenses before reductions | | 1.04% H | | 1.10% | | 1.13% | | 1.15% | | 1.15% | | 1.15% |
| Expenses net of fee waivers, if any | | 1.00% H | | 1.00% | | 1.01% | | 1.05% | | 1.05% | | 1.05% |
| Expenses net of all reductions | | 1.00% H | | 1.00% | | 1.01% | | 1.05% | | 1.05% | | 1.05% |
| Net investment income (loss) | | 6.86% H | | 5.81% | | 3.27% | | 3.21% | | 3.74% | | 4.37% |
| Supplemental Data | | | | | | | | | | | | |
| Net assets, end of period (000 omitted) | $ | 24,238 | $ | 21,379 | $ | 22,554 | $ | 17,126 | $ | 12,603 | $ | 15,050 |
Portfolio turnover rate I | | 31% H | | 14% | | 42% | | 74% | | 77% | | 33% |
ACalculated based on average shares outstanding during the period.
BNet investment income (loss) is affected by the timing of the declaration of dividends by any underlying mutual funds or exchange-traded funds (ETFs). Net investment income (loss) of any mutual funds or ETFs is not included in the Fund's net investment income (loss) ratio.
CTotal returns for periods of less than one year are not annualized.
DTotal returns would have been lower if certain expenses had not been reduced during the applicable periods shown.
ETotal returns do not include the effect of the sales charges.
FFees and expenses of any underlying mutual funds or exchange-traded funds (ETFs) are not included in the Fund's expense ratio. The Fund indirectly bears its proportionate share of these expenses. For additional expense information related to investments in Fidelity Central Funds, please refer to the "Investments in Fidelity Central Funds" note found in the Notes to Financial Statements section of the most recent Annual or Semi-Annual report.
GExpense ratios reflect operating expenses of the class. Expenses before reductions do not reflect amounts reimbursed, waived, or reduced through arrangements with the investment adviser, brokerage services, or other offset arrangements, if applicable, and do not represent the amount paid by the class during periods when reimbursements, waivers or reductions occur.
HAnnualized.
IAmount does not include the portfolio activity of any underlying mutual funds or exchange-traded funds (ETFs).
| Fidelity Advisor® Short Duration High Income Fund Class M |
| |
| | Six months ended (Unaudited) October 31, 2023 | | Years ended April 30, 2023 | | 2022 | | 2021 | | 2020 | | 2019 |
Selected Per-Share Data | | | | | | | | | | | | |
| Net asset value, beginning of period | $ | 8.66 | $ | 8.98 | $ | 9.52 | $ | 8.86 | $ | 9.44 | $ | 9.42 |
| Income from Investment Operations | | | | | | | | | | | | |
Net investment income (loss) A,B | | .297 | | .502 | | .307 | | .300 | | .348 | | .408 |
| Net realized and unrealized gain (loss) | | (.225) | | (.429) | | (.546) | | .661 | | (.581) | | .005 |
| Total from investment operations | | .072 | | .073 | | (.239) | | .961 | | (.233) | | .413 |
| Distributions from net investment income | | (.232) | | (.393) | | (.301) | | (.301) | | (.347) | | (.393) |
| Total distributions | | (.232) | | (.393) | | (.301) | | (.301) | | (.347) | | (.393) |
| Net asset value, end of period | $ | 8.50 | $ | 8.66 | $ | 8.98 | $ | 9.52 | $ | 8.86 | $ | 9.44 |
Total Return C,D,E | | .83% | | .93% | | (2.60)% | | 10.96% | | (2.58)% | | 4.52% |
Ratios to Average Net Assets B,F,G | | | | | | | | | | | | |
| Expenses before reductions | | 1.05% H | | 1.12% | | 1.13% | | 1.17% | | 1.16% | | 1.16% |
| Expenses net of fee waivers, if any | | 1.00% H | | 1.00% | | 1.01% | | 1.05% | | 1.05% | | 1.05% |
| Expenses net of all reductions | | 1.00% H | | 1.00% | | 1.01% | | 1.05% | | 1.05% | | 1.05% |
| Net investment income (loss) | | 6.86% H | | 5.81% | | 3.27% | | 3.21% | | 3.74% | | 4.37% |
| Supplemental Data | | | | | | | | | | | | |
| Net assets, end of period (000 omitted) | $ | 2,007 | $ | 2,318 | $ | 2,812 | $ | 2,289 | $ | 2,106 | $ | 2,537 |
Portfolio turnover rate I | | 31% H | | 14% | | 42% | | 74% | | 77% | | 33% |
ACalculated based on average shares outstanding during the period.
BNet investment income (loss) is affected by the timing of the declaration of dividends by any underlying mutual funds or exchange-traded funds (ETFs). Net investment income (loss) of any mutual funds or ETFs is not included in the Fund's net investment income (loss) ratio.
CTotal returns for periods of less than one year are not annualized.
DTotal returns would have been lower if certain expenses had not been reduced during the applicable periods shown.
ETotal returns do not include the effect of the sales charges.
FFees and expenses of any underlying mutual funds or exchange-traded funds (ETFs) are not included in the Fund's expense ratio. The Fund indirectly bears its proportionate share of these expenses. For additional expense information related to investments in Fidelity Central Funds, please refer to the "Investments in Fidelity Central Funds" note found in the Notes to Financial Statements section of the most recent Annual or Semi-Annual report.
GExpense ratios reflect operating expenses of the class. Expenses before reductions do not reflect amounts reimbursed, waived, or reduced through arrangements with the investment adviser, brokerage services, or other offset arrangements, if applicable, and do not represent the amount paid by the class during periods when reimbursements, waivers or reductions occur.
HAnnualized.
IAmount does not include the portfolio activity of any underlying mutual funds or exchange-traded funds (ETFs).
| Fidelity Advisor® Short Duration High Income Fund Class C |
| |
| | Six months ended (Unaudited) October 31, 2023 | | Years ended April 30, 2023 | | 2022 | | 2021 | | 2020 | | 2019 |
Selected Per-Share Data | | | | | | | | | | | | |
| Net asset value, beginning of period | $ | 8.66 | $ | 8.98 | $ | 9.52 | $ | 8.87 | $ | 9.44 | $ | 9.42 |
| Income from Investment Operations | | | | | | | | | | | | |
Net investment income (loss) A,B | | .265 | | .439 | | .237 | | .230 | | .278 | | .338 |
| Net realized and unrealized gain (loss) | | (.226) | | (.430) | | (.546) | | .651 | | (.571) | | .005 |
| Total from investment operations | | .039 | | .009 | | (.309) | | .881 | | (.293) | | .343 |
| Distributions from net investment income | | (.199) | | (.329) | | (.231) | | (.231) | | (.277) | | (.323) |
| Total distributions | | (.199) | | (.329) | | (.231) | | (.231) | | (.277) | | (.323) |
| Net asset value, end of period | $ | 8.50 | $ | 8.66 | $ | 8.98 | $ | 9.52 | $ | 8.87 | $ | 9.44 |
Total Return C,D,E | | .45% | | .18% | | (3.33)% | | 10.01% | | (3.20)% | | 3.74% |
Ratios to Average Net Assets B,F,G | | | | | | | | | | | | |
| Expenses before reductions | | 1.82% H | | 1.90% | | 1.91% | | 1.94% | | 1.93% | | 1.92% |
| Expenses net of fee waivers, if any | | 1.75% H | | 1.75% | | 1.76% | | 1.80% | | 1.80% | | 1.80% |
| Expenses net of all reductions | | 1.75% H | | 1.75% | | 1.76% | | 1.80% | | 1.80% | | 1.80% |
| Net investment income (loss) | | 6.11% H | | 5.06% | | 2.52% | | 2.46% | | 2.99% | | 3.61% |
| Supplemental Data | | | | | | | | | | | | |
| Net assets, end of period (000 omitted) | $ | 2,823 | $ | 2,795 | $ | 3,884 | $ | 4,018 | $ | 4,017 | $ | 4,541 |
Portfolio turnover rate I | | 31% H | | 14% | | 42% | | 74% | | 77% | | 33% |
ACalculated based on average shares outstanding during the period.
BNet investment income (loss) is affected by the timing of the declaration of dividends by any underlying mutual funds or exchange-traded funds (ETFs). Net investment income (loss) of any mutual funds or ETFs is not included in the Fund's net investment income (loss) ratio.
CTotal returns for periods of less than one year are not annualized.
DTotal returns would have been lower if certain expenses had not been reduced during the applicable periods shown.
ETotal returns do not include the effect of the contingent deferred sales charge.
FFees and expenses of any underlying mutual funds or exchange-traded funds (ETFs) are not included in the Fund's expense ratio. The Fund indirectly bears its proportionate share of these expenses. For additional expense information related to investments in Fidelity Central Funds, please refer to the "Investments in Fidelity Central Funds" note found in the Notes to Financial Statements section of the most recent Annual or Semi-Annual report.
GExpense ratios reflect operating expenses of the class. Expenses before reductions do not reflect amounts reimbursed, waived, or reduced through arrangements with the investment adviser, brokerage services, or other offset arrangements, if applicable, and do not represent the amount paid by the class during periods when reimbursements, waivers or reductions occur.
HAnnualized.
IAmount does not include the portfolio activity of any underlying mutual funds or exchange-traded funds (ETFs).
| Fidelity® Short Duration High Income Fund |
| |
| | Six months ended (Unaudited) October 31, 2023 | | Years ended April 30, 2023 | | 2022 | | 2021 | | 2020 | | 2019 |
Selected Per-Share Data | | | | | | | | | | | | |
| Net asset value, beginning of period | $ | 8.66 | $ | 8.98 | $ | 9.52 | $ | 8.87 | $ | 9.44 | $ | 9.42 |
| Income from Investment Operations | | | | | | | | | | | | |
Net investment income (loss) A,B | | .310 | | .523 | | .331 | | .323 | | .372 | | .431 |
| Net realized and unrealized gain (loss) | | (.226) | | (.428) | | (.546) | | .651 | | (.572) | | .006 |
| Total from investment operations | | .084 | | .095 | | (.215) | | .974 | | (.200) | | .437 |
| Distributions from net investment income | | (.244) | | (.415) | | (.325) | | (.324) | | (.370) | | (.417) |
| Total distributions | | (.244) | | (.415) | | (.325) | | (.324) | | (.370) | | (.417) |
| Net asset value, end of period | $ | 8.50 | $ | 8.66 | $ | 8.98 | $ | 9.52 | $ | 8.87 | $ | 9.44 |
Total Return C,D | | .96% | | 1.18% | | (2.35)% | | 11.11% | | (2.23)% | | 4.78% |
Ratios to Average Net Assets B,E,F | | | | | | | | | | | | |
| Expenses before reductions | | .73% G | | .76% | | .83% | | .87% | | .86% | | .86% |
| Expenses net of fee waivers, if any | | .72% G | | .75% | | .75% | | .80% | | .80% | | .80% |
| Expenses net of all reductions | | .72% G | | .75% | | .75% | | .80% | | .80% | | .80% |
| Net investment income (loss) | | 7.13% G | | 6.06% | | 3.52% | | 3.46% | | 3.99% | | 4.61% |
| Supplemental Data | | | | | | | | | | | | |
| Net assets, end of period (000 omitted) | $ | 273,926 | $ | 460,873 | $ | 87,949 | $ | 83,066 | $ | 63,703 | $ | 88,429 |
Portfolio turnover rate H | | 31% G | | 14% | | 42% | | 74% | | 77% | | 33% |
ACalculated based on average shares outstanding during the period.
BNet investment income (loss) is affected by the timing of the declaration of dividends by any underlying mutual funds or exchange-traded funds (ETFs). Net investment income (loss) of any mutual funds or ETFs is not included in the Fund's net investment income (loss) ratio.
CTotal returns for periods of less than one year are not annualized.
DTotal returns would have been lower if certain expenses had not been reduced during the applicable periods shown.
EFees and expenses of any underlying mutual funds or exchange-traded funds (ETFs) are not included in the Fund's expense ratio. The Fund indirectly bears its proportionate share of these expenses. For additional expense information related to investments in Fidelity Central Funds, please refer to the "Investments in Fidelity Central Funds" note found in the Notes to Financial Statements section of the most recent Annual or Semi-Annual report.
FExpense ratios reflect operating expenses of the class. Expenses before reductions do not reflect amounts reimbursed, waived, or reduced through arrangements with the investment adviser, brokerage services, or other offset arrangements, if applicable, and do not represent the amount paid by the class during periods when reimbursements, waivers or reductions occur.
GAnnualized.
HAmount does not include the portfolio activity of any underlying mutual funds or exchange-traded funds (ETFs).
| Fidelity Advisor® Short Duration High Income Fund Class I |
| |
| | Six months ended (Unaudited) October 31, 2023 | | Years ended April 30, 2023 | | 2022 | | 2021 | | 2020 | | 2019 |
Selected Per-Share Data | | | | | | | | | | | | |
| Net asset value, beginning of period | $ | 8.66 | $ | 8.98 | $ | 9.52 | $ | 8.87 | $ | 9.44 | $ | 9.42 |
| Income from Investment Operations | | | | | | | | | | | | |
Net investment income (loss) A,B | | .306 | | .524 | | .331 | | .323 | | .372 | | .430 |
| Net realized and unrealized gain (loss) | | (.223) | | (.429) | | (.546) | | .651 | | (.572) | | .007 |
| Total from investment operations | | .083 | | .095 | | (.215) | | .974 | | (.200) | | .437 |
| Distributions from net investment income | | (.243) | | (.415) | | (.325) | | (.324) | | (.370) | | (.417) |
| Total distributions | | (.243) | | (.415) | | (.325) | | (.324) | | (.370) | | (.417) |
| Net asset value, end of period | $ | 8.50 | $ | 8.66 | $ | 8.98 | $ | 9.52 | $ | 8.87 | $ | 9.44 |
Total Return C,D | | .95% | | 1.18% | | (2.35)% | | 11.11% | | (2.23)% | | 4.78% |
Ratios to Average Net Assets B,E,F | | | | | | | | | | | | |
| Expenses before reductions | | .76% G | | .84% | | .88% | | .92% | | .89% | | .89% |
| Expenses net of fee waivers, if any | | .75% G | | .75% | | .76% | | .80% | | .80% | | .80% |
| Expenses net of all reductions | | .75% G | | .75% | | .76% | | .80% | | .80% | | .80% |
| Net investment income (loss) | | 7.11% G | | 6.06% | | 3.52% | | 3.46% | | 3.99% | | 4.60% |
| Supplemental Data | | | | | | | | | | | | |
| Net assets, end of period (000 omitted) | $ | 6,164 | $ | 4,855 | $ | 5,055 | $ | 5,023 | $ | 3,950 | $ | 4,060 |
Portfolio turnover rate H | | 31% G | | 14% | | 42% | | 74% | | 77% | | 33% |
ACalculated based on average shares outstanding during the period.
BNet investment income (loss) is affected by the timing of the declaration of dividends by any underlying mutual funds or exchange-traded funds (ETFs). Net investment income (loss) of any mutual funds or ETFs is not included in the Fund's net investment income (loss) ratio.
CTotal returns for periods of less than one year are not annualized.
DTotal returns would have been lower if certain expenses had not been reduced during the applicable periods shown.
EFees and expenses of any underlying mutual funds or exchange-traded funds (ETFs) are not included in the Fund's expense ratio. The Fund indirectly bears its proportionate share of these expenses. For additional expense information related to investments in Fidelity Central Funds, please refer to the "Investments in Fidelity Central Funds" note found in the Notes to Financial Statements section of the most recent Annual or Semi-Annual report.
FExpense ratios reflect operating expenses of the class. Expenses before reductions do not reflect amounts reimbursed, waived, or reduced through arrangements with the investment adviser, brokerage services, or other offset arrangements, if applicable, and do not represent the amount paid by the class during periods when reimbursements, waivers or reductions occur.
GAnnualized.
HAmount does not include the portfolio activity of any underlying mutual funds or exchange-traded funds (ETFs).
| Fidelity Advisor® Short Duration High Income Fund Class Z |
| |
| | Six months ended (Unaudited) October 31, 2023 | | Years ended April 30, 2023 | | 2022 | | 2021 | | 2020 | | 2019 A |
Selected Per-Share Data | | | | | | | | | | | | |
| Net asset value, beginning of period | $ | 8.66 | $ | 8.98 | $ | 9.52 | $ | 8.87 | $ | 9.45 | $ | 9.46 |
| Income from Investment Operations | | | | | | | | | | | | |
Net investment income (loss) B,C | | .312 | | .531 | | .339 | | .331 | | .378 | | .261 |
| Net realized and unrealized gain (loss) | | (.226) | | (.428) | | (.546) | | .652 | | (.579) | | (.016) |
| Total from investment operations | | .086 | | .103 | | (.207) | | .983 | | (.201) | | .245 |
| Distributions from net investment income | | (.246) | | (.423) | | (.333) | | (.333) | | (.379) | | (.255) |
| Total distributions | | (.246) | | (.423) | | (.333) | | (.333) | | (.379) | | (.255) |
| Net asset value, end of period | $ | 8.50 | $ | 8.66 | $ | 8.98 | $ | 9.52 | $ | 8.87 | $ | 9.45 |
Total Return D,E | | 1.00% | | 1.27% | | (2.27)% | | 11.21% | | (2.24)% | | 2.67% |
Ratios to Average Net Assets C,F,G | | | | | | | | | | | | |
| Expenses before reductions | | .69% H | | .75% | | .78% | | .80% | | .80% | | .82% H |
| Expenses net of fee waivers, if any | | .66% H | | .66% | | .66% | | .71% | | .71% | | .71% H |
| Expenses net of all reductions | | .66% H | | .66% | | .66% | | .71% | | .71% | | .71% H |
| Net investment income (loss) | | 7.20% H | | 6.15% | | 3.61% | | 3.55% | | 4.08% | | 4.86% H |
| Supplemental Data | | | | | | | | | | | | |
| Net assets, end of period (000 omitted) | $ | 8,762 | $ | 10,289 | $ | 5,246 | $ | 3,815 | $ | 2,031 | $ | 425 |
Portfolio turnover rate I | | 31% H | | 14% | | 42% | | 74% | | 77% | | 33% H |
AFor the period October 2, 2018 (commencement of sale of shares) through April 30, 2019.
BCalculated based on average shares outstanding during the period.
CNet investment income (loss) is affected by the timing of the declaration of dividends by any underlying mutual funds or exchange-traded funds (ETFs). Net investment income (loss) of any mutual funds or ETFs is not included in the Fund's net investment income (loss) ratio.
DTotal returns for periods of less than one year are not annualized.
ETotal returns would have been lower if certain expenses had not been reduced during the applicable periods shown.
FFees and expenses of any underlying mutual funds or exchange-traded funds (ETFs) are not included in the Fund's expense ratio. The Fund indirectly bears its proportionate share of these expenses. For additional expense information related to investments in Fidelity Central Funds, please refer to the "Investments in Fidelity Central Funds" note found in the Notes to Financial Statements section of the most recent Annual or Semi-Annual report.
GExpense ratios reflect operating expenses of the class. Expenses before reductions do not reflect amounts reimbursed, waived, or reduced through arrangements with the investment adviser, brokerage services, or other offset arrangements, if applicable, and do not represent the amount paid by the class during periods when reimbursements, waivers or reductions occur.
HAnnualized.
IAmount does not include the portfolio activity of any underlying mutual funds or exchange-traded funds (ETFs).
For the period ended October 31, 2023
1. Organization.
Fidelity Short Duration High Income Fund (the Fund) is a fund of Fidelity Summer Street Trust (the Trust) and is authorized to issue an unlimited number of shares. The Trust is registered under the Investment Company Act of 1940, as amended (the 1940 Act), as an open-end management investment company organized as a Massachusetts business trust. The Fund offers Class A, Class M, Class C, Short Duration High Income, Class I and Class Z shares, each of which has equal rights as to assets and voting privileges. Class A, Class M, Class C, Class I and Class Z are Fidelity Advisor classes. Each class has exclusive voting rights with respect to matters that affect that class. Class C shares will automatically convert to Class A shares after a holding period of eight years from the initial date of purchase, with certain exceptions.
2. Investments in Fidelity Central Funds.
Funds may invest in Fidelity Central Funds, which are open-end investment companies generally available only to other investment companies and accounts managed by the investment adviser and its affiliates. The Schedule of Investments lists any Fidelity Central Funds held as an investment as of period end, but does not include the underlying holdings of each Fidelity Central Fund. An investing fund indirectly bears its proportionate share of the expenses of the underlying Fidelity Central Funds.
Based on its investment objective, each Fidelity Central Fund may invest or participate in various investment vehicles or strategies that are similar to those of the investing fund. These strategies are consistent with the investment objectives of the investing fund and may involve certain economic risks which may cause a decline in value of each of the Fidelity Central Funds and thus a decline in the value of the investing fund.
| Fidelity Central Fund | Investment Manager | Investment Objective | Investment Practices | Expense RatioA |
| Fidelity Money Market Central Funds | Fidelity Management & Research Company LLC (FMR) | Each fund seeks to obtain a high level of current income consistent with the preservation of capital and liquidity. | Short-term Investments | Less than .005% |
A Expenses expressed as a percentage of average net assets and are as of each underlying Central Fund's most recent annual or semi-annual shareholder report.
A complete unaudited list of holdings for each Fidelity Central Fund is available upon request or at the Securities and Exchange Commission website at www.sec.gov. In addition, the financial statements of the Fidelity Central Funds which contain the significant accounting policies (including investment valuation policies) of those funds, and are not covered by the Report of Independent Registered Public Accounting Firm, are available on the Securities and Exchange Commission website or upon request.
3. Significant Accounting Policies.
The Fund is an investment company and applies the accounting and reporting guidance of the Financial Accounting Standards Board (FASB) Accounting Standards Codification Topic 946 Financial Services - Investment Companies. The financial statements have been prepared in conformity with accounting principles generally accepted in the United States of America (GAAP), which require management to make certain estimates and assumptions at the date of the financial statements. Actual results could differ from those estimates. Subsequent events, if any, through the date that the financial statements were issued have been evaluated in the preparation of the financial statements. The Fund's Schedule of Investments lists any underlying mutual funds or exchange-traded funds (ETFs) but does not include the underlying holdings of these funds. The following summarizes the significant accounting policies of the Fund:
Investment Valuation. Investments are valued as of 4:00 p.m. Eastern time on the last calendar day of the period. The Board of Trustees (the Board) has designated the Fund's investment adviser as the valuation designee responsible for the fair valuation function and performing fair value determinations as needed. The investment adviser has established a Fair Value Committee (the Committee) to carry out the day-to-day fair valuation responsibilities and has adopted policies and procedures to govern the fair valuation process and the activities of the Committee. In accordance with these fair valuation policies and procedures, which have been approved by the Board, the Fund attempts to obtain prices from one or more third party pricing services or brokers to value its investments. When current market prices, quotations or currency exchange rates are not readily available or reliable, investments will be fair valued in good faith by the Committee, in accordance with the policies and procedures. Factors used in determining fair value vary by investment type and may include market or investment specific events, transaction data, estimated cash flows, and market observations of comparable investments. The frequency that the fair valuation procedures are used cannot be predicted and they may be utilized to a significant extent. The Committee manages the Fund's fair valuation practices and maintains the fair valuation policies and procedures. The Fund's investment adviser reports to the Board information regarding the fair valuation process and related material matters.
The Fund categorizes the inputs to valuation techniques used to value its investments into a disclosure hierarchy consisting of three levels as shown below:
Level 1 - unadjusted quoted prices in active markets for identical investments
Level 2 - other significant observable inputs (including quoted prices for similar investments, interest rates, prepayment speeds, etc.)
Level 3 - unobservable inputs (including the Fund's own assumptions based on the best information available)
Valuation techniques used to value the Fund's investments by major category are as follows:
Debt securities, including restricted securities, are valued based on evaluated prices received from third party pricing services or from brokers who make markets in such securities. Corporate bonds, bank loan obligations and preferred securities are valued by pricing services who utilize matrix pricing which considers yield or price of bonds of comparable quality, coupon, maturity and type or by broker-supplied prices. When independent prices are unavailable or unreliable, debt securities may be valued utilizing pricing methodologies which consider similar factors that would be used by third party pricing services. Debt securities are generally categorized as Level 2 in the hierarchy but may be Level 3 depending on the circumstances. The Fund invests a significant portion of its assets in below investment grade securities. The value of these securities can be more volatile due to changes in the credit quality of the issuer and is sensitive to changes in economic, market and regulatory conditions.
Equity securities, including restricted securities, for which market quotations are readily available, are valued at the last reported sale price or official closing price as reported by a third party pricing service on the primary market or exchange on which they are traded and are categorized as Level 1 in the hierarchy. In the event there were no sales during the day or closing prices are not available, securities are valued at the last quoted bid price or may be valued using the last available price and are generally categorized as Level 2 in the hierarchy. For foreign equity securities, when market or security specific events arise, comparisons to the valuation of American Depositary Receipts (ADRs), futures contracts, ETFs and certain indexes as well as quoted prices for similar securities may be used and would be categorized as Level 2 in the hierarchy. For equity securities, including restricted securities, where observable inputs are limited, assumptions about market activity and risk are used and these securities may be categorized as Level 3 in the hierarchy.
Investments in open-end mutual funds, including the Fidelity Central Funds, are valued at their closing net asset value (NAV) each business day and are categorized as Level 1 in the hierarchy.
Changes in valuation techniques may result in transfers in or out of an assigned level within the disclosure hierarchy. The aggregate value of investments by input level as of October 31, 2023 is included at the end of the Fund's Schedule of Investments.
Foreign Currency. Certain Funds may use foreign currency contracts to facilitate transactions in foreign-denominated securities. Gains and losses from these transactions may arise from changes in the value of the foreign currency or if the counterparties do not perform under the contracts' terms.
Foreign-denominated assets, including investment securities, and liabilities are translated into U.S. dollars at the exchange rates at period end. Purchases and sales of investment securities, income and dividends received, and expenses denominated in foreign currencies are translated into U.S. dollars at the exchange rate in effect on the transaction date.
The effects of exchange rate fluctuations on investments are included with the net realized and unrealized gain (loss) on investment securities. Other foreign currency transactions resulting in realized and unrealized gain (loss) are disclosed separately.
Investment Transactions and Income. For financial reporting purposes, the Fund's investment holdings and NAV include trades executed through the end of the last business day of the period. The NAV per share for processing shareholder transactions is calculated as of the close of business of the New York Stock Exchange (NYSE), normally 4:00 p.m. Eastern time and includes trades executed through the end of the prior business day. Gains and losses on securities sold are determined on the basis of identified cost. Commissions paid to certain brokers with whom the investment adviser, or its affiliates, places trades on behalf of a fund include an amount in addition to trade execution, which may be rebated back to a fund. Any such rebates are included in net realized gain (loss) on investments in the Statement of Operations. Dividend income is recorded on the ex-dividend date. Income and capital gain distributions from Fidelity Central Funds, if any, are recorded on the ex-dividend date. Interest income is accrued as earned and includes coupon interest and amortization of premium and accretion of discount on debt securities as applicable. Paid in Kind (PIK) income is recorded at the fair market value of the securities received. Investment income is recorded net of foreign taxes withheld where recovery of such taxes is uncertain. Debt obligations may be placed on non-accrual status and related interest income may be reduced by ceasing current accruals and writing off interest receivables when the collection of all or a portion of interest has become doubtful based on consistently applied procedures. A debt obligation is removed from non-accrual status when the issuer resumes interest payments or when collectability of interest is reasonably assured.
Class Allocations and Expenses. Investment income, realized and unrealized capital gains and losses, common expenses of a fund, and certain fund-level expense reductions, if any, are allocated daily on a pro-rata basis to each class based on the relative net assets of each class to the total net assets of a fund. Each class differs with respect to transfer agent and distribution and service plan fees incurred, as applicable. Certain expense reductions may also differ by class, if applicable. For the reporting period, the allocated portion of income and expenses to each class as a percent of its average net assets may vary due to the timing of recording these transactions in relation to fluctuating net assets of the classes. Expenses directly attributable to a fund are charged to that fund. Expenses attributable to more than one fund are allocated among the respective funds on the basis of relative net assets or other appropriate methods. Expenses included in the accompanying financial statements reflect the expenses of that fund and do not include any expenses associated with any underlying mutual funds or exchange-traded funds (ETFs). Although not included in a fund's expenses, a fund indirectly bears its proportionate share of these expenses through the net asset value of each underlying mutual fund or exchange-traded fund (ETF). Expense estimates are accrued in the period to which they relate and adjustments are made when actual amounts are known.
Income Tax Information and Distributions to Shareholders. Each year, the Fund intends to qualify as a regulated investment company under Subchapter M of the Internal Revenue Code, including distributing substantially all of its taxable income and realized gains. As a result, no provision for U.S. Federal income taxes is required. The Fund files a U.S. federal tax return, in addition to state and local tax returns as required. The Fund's federal income tax returns are subject to examination by the Internal Revenue Service (IRS) for a period of three fiscal years after they are filed. State and local tax returns may be subject to examination for an additional fiscal year depending on the jurisdiction. Foreign taxes are provided for based on the Fund's understanding of the tax rules and rates that exist in the foreign markets in which it invests.
Distributions are declared and recorded daily and paid monthly from net investment income. Distributions from realized gains, if any, are declared and recorded on the ex-dividend date. Income and capital gain distributions are declared separately for each class. Income and capital gain distributions are determined in accordance with income tax regulations, which may differ from GAAP.
Capital accounts within the financial statements are adjusted for permanent book-tax differences. These adjustments have no impact on net assets or the results of operations. Capital accounts are not adjusted for temporary book-tax differences which will reverse in a subsequent period.
Book-tax differences are primarily due to market discount, capital loss carryforwards and losses deferred due to wash sales.
As of period end, the cost and unrealized appreciation (depreciation) in securities, and derivatives if applicable, for federal income tax purposes were as follows:
| Gross unrealized appreciation | $4,815,465 |
| Gross unrealized depreciation | (10,591,968) |
| Net unrealized appreciation (depreciation) | $(5,776,503) |
| Tax cost | $320,999,660 |
Capital loss carryforwards are only available to offset future capital gains of the Fund to the extent provided by regulations and may be limited. The capital loss carryforward information presented below, including any applicable limitation, is estimated as of prior fiscal period end and is subject to adjustment.
Short-term | $(4,879,806) |
Long-term | (5,807,839) |
| Total capital loss carryforward | $(10,687,645) |
Restricted Securities (including Private Placements). Funds may invest in securities that are subject to legal or contractual restrictions on resale. These securities generally may be resold in transactions exempt from registration or to the public if the securities are registered. Disposal of these securities may involve time-consuming negotiations and expense, and prompt sale at an acceptable price may be difficult. Information regarding restricted securities held at period end is included at the end of the Schedule of Investments, if applicable.
Loans and Other Direct Debt Instruments. Direct debt instruments are interests in amounts owed to lenders by corporate or other borrowers. These instruments may be in the form of loans, trade claims or other receivables and may include standby financing commitments such as revolving credit facilities that obligate a fund to supply additional cash to the borrower on demand. Loans may be acquired through assignment, participation, or may be made directly to a borrower. Such instruments are presented in the Bank Loan Obligations section in the Schedule of Investments. Certain funds may also invest in unfunded loan commitments, which are contractual obligations for future funding. Information regarding unfunded commitments is included at the end of the Schedule of Investments, if applicable.
4. Purchases and Sales of Investments.
Purchases and sales of securities, other than short-term securities and in-kind transactions, as applicable, are noted in the table below.
| | Purchases ($) | Sales ($) |
| Fidelity Short Duration High Income Fund | 69,949,658 | 206,544,623 |
5. Fees and Other Transactions with Affiliates.
Management Fee. Fidelity Management & Research Company LLC (the investment adviser) and its affiliates provide the Fund with investment management related services for which the Fund pays a monthly management fee. The management fee is the sum of an individual fund fee rate that is based on an annual rate of .45% of the Fund's average net assets and an annualized group fee rate that averaged .10% during the period. The group fee rate is based upon the monthly average net assets of a group of registered investment companies with which the investment adviser has management contracts. The group fee rate decreases as assets under management increase and increases as assets under management decrease. For the reporting period, the total annualized management fee rate was .55% of the Fund's average net assets.
Distribution and Service Plan Fees. In accordance with Rule 12b-1 of the 1940 Act, the Fund has adopted separate Distribution and Service Plans for each class of shares. Certain classes pay Fidelity Distributors Company LLC (FDC), an affiliate of the investment adviser, separate Distribution and Service Fees, each of which is based on an annual percentage of each class' average net assets. In addition, FDC may pay financial intermediaries for selling shares of the Fund and providing shareholder support services. For the period, the Distribution and Service Fee rates, total fees and amounts retained by FDC were as follows:
| | Distribution Fee | Service Fee | Total Fees | Retained by FDC |
| Class A | - % | .25% | $28,058 | $1,594 |
| Class M | - % | .25% | 2,677 | - |
| Class C | .75% | .25% | 14,788 | 2,204 |
| | | | $45,523 | $3,798 |
Sales Load. FDC may receive a front-end sales charge of up to 4.00% for selling Class A shares and Class M shares, some of which is paid to financial intermediaries for selling shares of the Fund. Depending on the holding period, FDC may receive contingent deferred sales charges levied on Class A, Class M and Class C redemptions. The deferred sales charges are 1.00% for Class C shares, 1.00% for certain purchases of Class A shares and .25% for certain purchases of Class M shares.
For the period, sales charge amounts retained by FDC were as follows:
| | Retained by FDC |
| Class A | $4,237 |
| Class M | 54 |
Class C A | 37 |
| | $4,328 |
A When Class C shares are initially sold, FDC pays commissions from its own resources to financial intermediaries through which the sales are made.
Transfer Agent Fees. Fidelity Investments Institutional Operations Company LLC (FIIOC), an affiliate of the investment adviser, is the transfer, dividend disbursing and shareholder servicing agent for each class of the Fund. FIIOC receives account fees and asset-based fees that vary according to the account size and type of account of the shareholders of the respective classes of the Fund, except for Class Z. FIIOC receives an asset-based fee of Class Z's average net assets. FIIOC pays for typesetting, printing and mailing of shareholder reports, except proxy statements.
For the period, transfer agent fees for each class were as follows:
| | Amount | % of Class-Level Average Net AssetsA |
| Class A | $16,497 | .15 |
| Class M | 1,780 | .17 |
| Class C | 2,712 | .18 |
| Short Duration High Income | 204,930 | .09 |
| Class I | 2,951 | .11 |
| Class Z | 2,631 | .05 |
| | $231,501 | |
A Annualized
During November 2023, the Board approved a change in the transfer agent fees effective December 1, 2023 to a fixed annual rate of class-level average net assets as follows:
| | % of Class-Level Average Net Assets |
| Class A | 0.1459 |
| Class M | 0.1577 |
| Class C | 0.1792 |
| Short Duration High Income | 0.1120 |
| Class I | 0.0869 |
Accounting Fees. Fidelity Service Company, Inc. (FSC), an affiliate of the investment adviser, maintains the Fund's accounting records. The accounting fee is based on the level of average net assets for each month. For the period, the fees were equivalent to the following annualized rates:
| | % of Average Net Assets |
| Fidelity Short Duration High Income Fund | .04 |
During November 2023, the Board approved a change in the accounting fees effective December 1, 2023 to a fixed annual rate of average net assets as follows:
| | % of Average Net Assets |
| Fidelity Short Duration High Income Fund | 0.0413 |
Brokerage Commissions. A portion of portfolio transactions were placed with brokerage firms which are affiliates of the investment adviser. Brokerage commissions are included in net realized gain (loss) and change in net unrealized appreciation (depreciation) in the Statement of Operations. The commissions paid to these affiliated firms were as follows:
| | Amount |
| Fidelity Short Duration High Income Fund | $5 |
Interfund Lending Program. Pursuant to an Exemptive Order issued by the Securities and Exchange Commission (the SEC), the Fund, along with other registered investment companies having management contracts with Fidelity Management & Research Company LLC (FMR), or other affiliated entities of FMR, may participate in an interfund lending program. This program provides an alternative credit facility allowing the Fund to borrow from, or lend money to, other participating affiliated funds. Any open loans, including accrued interest, at period end are presented as Notes payable to affiliates in the Statement of Assets and Liabilities. Activity in this program during the period for which loans were outstanding was as follows:
| | Borrower or Lender | Average Loan Balance | Weighted Average Interest Rate | Interest Expense |
Fidelity Short Duration High Income Fund | Borrower | $42,146,000 | 5.57% | $6,515 |
Interfund Trades. Funds may purchase from or sell securities to other Fidelity Funds under procedures adopted by the Board. The procedures have been designed to ensure these interfund trades are executed in accordance with Rule 17a-7 of the 1940 Act. Any interfund trades are included within the respective purchases and sales amounts shown in the Purchases and Sales of Investments note. During the period, there were no interfund trades.
6. Committed Line of Credit.
Certain Funds participate with other funds managed by the investment adviser or an affiliate in a $4.25 billion credit facility (the "line of credit") to be utilized for temporary or emergency purposes to fund shareholder redemptions or for other short-term liquidity purposes. The participating funds have agreed to pay commitment fees on their pro-rata portion of the line of credit, which are reflected in Miscellaneous expenses on the Statement of Operations, and are listed below. During the period, there were no borrowings on this line of credit.
| | Amount |
| Fidelity Short Duration High Income Fund | $421 |
7. Expense Reductions.
The investment adviser contractually agreed to reimburse expenses of each class to the extent annual operating expenses exceeded certain levels of class-level average net assets as noted in the table below. This reimbursement will remain in place through August 31, 2024. Some expenses, for example the compensation of the independent Trustees, and certain miscellaneous expenses such as proxy and shareholder meeting expenses, are excluded from this reimbursement.
The following classes were in reimbursement during the period:
| | Expense Limitations | Reimbursement |
| Class A | 1.00% | $4,012 |
| Class M | 1.00% | 572 |
| Class C | 1.75% | 974 |
| Class I | .75% | 106 |
| Class Z | .66% | 1,578 |
| | | $7,242 |
Through arrangements with the Fund's custodian, credits realized as a result of certain uninvested cash balances were used to reduce the Fund's expenses. During the period, custodian credits reduced the Fund's expenses by $2,691.
In addition, during the period the investment adviser or an affiliate reimbursed and/or waived a portion of fund-level operating expenses in the amount of $10,231.
8. Distributions to Shareholders.
Distributions to shareholders of each class were as follows:
| | Six months ended October 31, 2023 | Year ended April 30, 2023 |
| Fidelity Short Duration High Income Fund | | |
| Distributions to shareholders | | |
| Class A | $604,374 | $977,618 |
| Class M | 57,586 | 110,316 |
| Class C | 68,495 | 119,358 |
| Short Duration High Income | 13,214,376 | 13,395,089 |
| Class I | 148,300 | 233,578 |
| Class Z | 300,774 | 531,867 |
Total | $14,393,905 | $15,367,826 |
9. Share Transactions.
Share transactions for each class were as follows and may contain in-kind transactions, automatic conversions between classes or exchanges between affiliated funds:
| | Shares | Shares | Dollars | Dollars |
| | Six months ended October 31, 2023 | Year ended April 30, 2023 | Six months ended October 31, 2023 | Year ended April 30, 2023 |
| Fidelity Short Duration High Income Fund | | | | |
| Class A | | | | |
| Shares sold | 595,110 | 610,442 | $5,116,241 | $5,296,397 |
| Reinvestment of distributions | 68,986 | 111,049 | 593,502 | 957,537 |
| Shares redeemed | (281,547) | (764,843) | (2,428,010) | (6,627,528) |
| Net increase (decrease) | 382,549 | (43,352) | $3,281,733 | $(373,594) |
| Class M | | | | |
| Shares sold | 13,627 | 128,913 | $117,620 | $1,113,204 |
| Reinvestment of distributions | 6,525 | 12,392 | 56,142 | 106,876 |
| Shares redeemed | (51,711) | (186,791) | (446,128) | (1,605,675) |
| Net increase (decrease) | (31,559) | (45,486) | $(272,366) | $(385,595) |
| Class C | | | | |
| Shares sold | 80,751 | 110,217 | $695,528 | $951,412 |
| Reinvestment of distributions | 7,829 | 13,729 | 67,382 | 118,460 |
| Shares redeemed | (79,299) | (233,652) | (683,316) | (2,022,594) |
| Net increase (decrease) | 9,281 | (109,706) | $79,594 | $(952,722) |
| Short Duration High Income | | | | |
| Shares sold | 9,897,411 | 51,006,236 | $85,262,001 | $434,795,776 |
| Reinvestment of distributions | 1,371,744 | 1,386,203 | 11,803,781 | 11,955,926 |
| Shares redeemed | (32,263,340) | (8,974,356) | (274,645,744) | (77,559,285) |
| Net increase (decrease) | (20,994,185) | 43,418,083 | $(177,579,962) | $369,192,417 |
| Class I | | | | |
| Shares sold | 314,018 | 227,106 | $2,707,031 | $1,961,038 |
| Reinvestment of distributions | 16,124 | 24,795 | 138,675 | 213,807 |
| Shares redeemed | (165,749) | (254,191) | (1,422,743) | (2,192,726) |
| Net increase (decrease) | 164,393 | (2,290) | $1,422,963 | $(17,881) |
| Class Z | | | | |
| Shares sold | 324,231 | 1,699,944 | $2,791,119 | $14,714,297 |
| Reinvestment of distributions | 33,334 | 48,777 | 286,920 | 420,604 |
| Shares redeemed | (514,819) | (1,145,441) | (4,408,530) | (9,858,783) |
| Net increase (decrease) | (157,254) | 603,280 | $(1,330,491) | $5,276,118 |
10. Other.
A fund's organizational documents provide former and current trustees and officers with a limited indemnification against liabilities arising in connection with the performance of their duties to the fund. In the normal course of business, a fund may also enter into contracts that provide general indemnifications. A fund's maximum exposure under these arrangements is unknown as this would be dependent on future claims that may be made against a fund. The risk of material loss from such claims is considered remote.
11. Risk and Uncertainties.
Many factors affect a fund's performance. Developments that disrupt global economies and financial markets, such as pandemics, epidemics, outbreaks of infectious diseases, war, terrorism, and environmental disasters, may significantly affect a fund's investment performance. The effects of these developments to a fund will be impacted by the types of securities in which a fund invests, the financial condition, industry, economic sector, and geographic location of an issuer, and a fund's level of investment in the securities of that issuer. Significant concentrations in security types, issuers, industries, sectors, and geographic locations may magnify the factors that affect a fund's performance.
As a shareholder, you incur two types of costs: (1) transaction costs, which may include sales charges (loads) on purchase payments or redemption proceeds, as applicable and (2) ongoing costs, which generally include management fees, distribution and/or service (12b-1) fees and other Fund expenses. This Example is intended to help you understand your ongoing costs (in dollars) of investing in a fund and to compare these costs with the ongoing costs of investing in other mutual funds.
| The Example is based on an investment of $1,000 invested at the beginning of the period and held for the entire period (May 1, 2023 to October 31, 2023). |
Actual Expenses
The first line of the accompanying table provides information about actual account values and actual expenses. You may use the information in this line, together with the amount you invested, to estimate the expenses that you paid over the period. Simply divide your account value by $1,000.00 (for example, an $8,600 account value divided by $1,000.00 = 8.6), then multiply the result by the number in the first line for a class/Fund under the heading entitled "Expenses Paid During Period" to estimate the expenses you paid on your account during this period. If any fund is a shareholder of any underlying mutual funds or exchange-traded funds (ETFs) (the Underlying Funds), such fund indirectly bears its proportional share of the expenses of the Underlying Funds in addition to the direct expenses incurred presented in the table. These fees and expenses are not included in the annualized expense ratio used to calculate the expense estimate in the table below.
Hypothetical Example for Comparison Purposes
The second line of the accompanying table provides information about hypothetical account values and hypothetical expenses based on the actual expense ratio and an assumed rate of return of 5% per year before expenses, which is not the actual return. The hypothetical account values and expenses may not be used to estimate the actual ending account balance or expenses you paid for the period. You may use this information to compare the ongoing costs of investing in the Fund and other funds. To do so, compare this 5% hypothetical example with the 5% hypothetical examples that appear in the shareholder reports of the other funds. If any fund is a shareholder of any Underlying Funds, such fund indirectly bears its proportional share of the expenses of the Underlying Funds in addition to the direct expenses as presented in the table. These fees and expenses are not included in the annualized expense ratio used to calculate the expense estimate in the table below.
Please note that the expenses shown in the table are meant to highlight your ongoing costs only and do not reflect any transaction costs. Therefore, the second line of the table is useful in comparing ongoing costs only, and will not help you determine the relative total costs of owning different funds. In addition, if these transactional costs were included, your costs would have been higher.
| | | | | Annualized Expense Ratio- A | | Beginning Account Value May 1, 2023 | | Ending Account Value October 31, 2023 | | Expenses Paid During Period- C May 1, 2023 to October 31, 2023 |
| Fidelity® Short Duration High Income Fund | | | | | | | | | | |
| Class A | | | | 1.00% | | | | | | |
| Actual | | | | | | $ 1,000 | | $ 1,008.30 | | $ 5.05 |
Hypothetical-B | | | | | | $ 1,000 | | $ 1,020.11 | | $ 5.08 |
| Class M | | | | 1.00% | | | | | | |
| Actual | | | | | | $ 1,000 | | $ 1,008.30 | | $ 5.05 |
Hypothetical-B | | | | | | $ 1,000 | | $ 1,020.11 | | $ 5.08 |
| Class C | | | | 1.75% | | | | | | |
| Actual | | | | | | $ 1,000 | | $ 1,004.50 | | $ 8.82 |
Hypothetical-B | | | | | | $ 1,000 | | $ 1,016.34 | | $ 8.87 |
| Fidelity® Short Duration High Income Fund | | | | .72% | | | | | | |
| Actual | | | | | | $ 1,000 | | $ 1,009.60 | | $ 3.64 |
Hypothetical-B | | | | | | $ 1,000 | | $ 1,021.52 | | $ 3.66 |
| Class I | | | | .75% | | | | | | |
| Actual | | | | | | $ 1,000 | | $ 1,009.50 | | $ 3.79 |
Hypothetical-B | | | | | | $ 1,000 | | $ 1,021.37 | | $ 3.81 |
| Class Z | | | | .66% | | | | | | |
| Actual | | | | | | $ 1,000 | | $ 1,010.00 | | $ 3.33 |
Hypothetical-B | | | | | | $ 1,000 | | $ 1,021.82 | | $ 3.35 |
| |
A Annualized expense ratio reflects expenses net of applicable fee waivers.
B 5% return per year before expenses
C Expenses are equal to the annualized expense ratio, multiplied by the average account value over the period, multiplied by 184/ 366 (to reflect the one-half year period). The fees and expenses of any Underlying Funds are not included in each annualized expense ratio.
Board Approval of Investment Advisory Contracts and Management Fees
Fidelity Short Duration High Income Fund
Each year, the Board of Trustees, including the Independent Trustees (together, the Board), considers the renewal of the fund's management contract with Fidelity Management & Research Company LLC (FMR) and the sub-advisory agreements (together, the Advisory Contracts) for the fund. FMR and the sub-advisers are referred to herein as the Investment Advisers. The Board, assisted by the advice of fund counsel and Independent Trustees' counsel, requests and considers a broad range of information relevant to the renewal of the Advisory Contracts throughout the year.
The Board meets regularly and, at each of its meetings, covers an extensive agenda of topics and materials and considers factors that are relevant to its annual consideration of the renewal of the fund's Advisory Contracts, including the services and support provided to the fund and its shareholders. The Board, acting directly and through its Committees (each of which is composed of and chaired by Independent Trustees), requests and receives information concerning the annual consideration of the renewal of the fund's Advisory Contracts. The Board also meets as needed to review matters specifically related to the Board's annual consideration of the renewal of the Advisory Contracts. Members of the Board may also meet with trustees of other Fidelity funds through joint ad hoc committees to discuss certain matters relevant to all of the Fidelity funds.
Approval of Stub Period Continuation. At its May 2023 meeting, the Board of Trustees voted to continue the fund's management contract with FMR, and the sub-advisory agreements and sub-sub-advisory agreements, in each case, where applicable (together, the Advisory Contracts), without modification, for two months from June 1, 2023 through July 31, 2023. The Board considered that the approval of the fund's Advisory Contracts will not result in any changes in (i) the investment process or strategies employed in the management of the fund's assets; (ii) the fees and expenses paid by shareholders; (iii) the nature, extent or quality of services provided under the fund's Advisory Contracts; or (iv) the day-to-day management of the fund or the persons primarily responsible for such management. The Board also considered that since its last approval of the fund's Advisory Contracts, FMR had provided additional information on the fund in support of the annual contract renewal process, including competitive analyses on total expenses and management fees and in-depth reviews of fund performance and fund profitability information. The Board concluded that the fund's Advisory Contracts are fair and reasonable, and that the fund's Advisory Contracts should be renewed, without modification, through July 31, 2023, with the understanding that the Board would consider the annual renewal for a full one year period in July 2023.
At its July 2023 meeting, the Board unanimously determined to renew the fund's Advisory Contracts. In reaching its determination, the Board considered all factors it believed relevant, including (i) the nature, extent, and quality of the services provided to the fund and its shareholders (including the investment performance of the fund); (ii) the competitiveness relative to peer funds of the fund's management fee and the total expense ratio of a representative class (the retail class, which was selected because it was the largest class without 12b-1 fees); (iii) the total costs of the services provided by and the profits realized by FMR and its affiliates (Fidelity) from its relationships with the fund; and (iv) the extent to which, if any, economies of scale exist and are realized as the fund grows, and whether any economies of scale are appropriately shared with fund shareholders. The Board also considered the broad range of investment choices available to shareholders from FMR's competitors and that the fund's shareholders have chosen to invest in the fund, which is part of the Fidelity family of funds. The Board's decision to renew the Advisory Contracts was not based on any single factor.
The Board reached a determination, with the assistance of fund counsel and Independent Trustees' counsel and through the exercise of its business judgment, that the renewal of the Advisory Contracts was in the best interests of the fund and its shareholders and that the compensation payable under the Advisory Contracts was fair and reasonable in light of all of the surrounding circumstances.
Nature, Extent, and Quality of Services Provided. The Board considered staffing as it relates to the fund, including the backgrounds and experience of investment personnel of the Investment Advisers, and also considered the Investment Advisers' implementation of the fund's investment program. The Independent Trustees also had discussions with senior management of Fidelity's investment operations and investment groups. The Board considered the structure of the investment personnel compensation program and whether this structure provides appropriate incentives to act in the best interests of the fund. Additionally, the Board considered the portfolio managers' investments, if any, in the funds that they manage.
Resources Dedicated to Investment Management and Support Services. The Board and the Fund Oversight and Research Committees reviewed the general qualifications and capabilities of Fidelity's investment staff, including its size, education, experience, and resources, as well as Fidelity's approach to recruiting, training, managing, and compensating investment personnel. The Board noted the resources devoted to expansion of Fidelity's global investment organization, and that Fidelity's analysts have extensive resources, tools, and capabilities that allow them to conduct sophisticated quantitative and fundamental analysis, as well as credit analysis of issuers, counterparties, and guarantors. Further, the Board considered that Fidelity's investment professionals have sufficient access to global information and data so as to provide competitive investment results over time, and that those professionals also have access to sophisticated tools that permit them to assess portfolio construction and risk and performance attribution characteristics continuously, as well as to transmit new information and research conclusions rapidly around the world. Additionally, in its deliberations, the Board considered Fidelity's trading, risk management, compliance, and technology and operations capabilities and resources, which are integral parts of the investment management process.
Shareholder and Administrative Services. The Board considered (i) the nature, extent, quality, and cost of advisory, administrative, and shareholder services performed by the Investment Advisers and their affiliates under the Advisory Contracts and under separate agreements covering transfer agency, pricing and bookkeeping, and securities lending services for the fund; (ii) the nature and extent of Fidelity's supervision of third party service providers, principally custodians, subcustodians, and pricing vendors; and (iii) the resources devoted by Fidelity to, and the record of compliance with, the fund's compliance policies and procedures. The Board also reviewed the allocation of fund brokerage, including allocations to brokers affiliated with the Investment Advisers, the use of brokerage commissions to pay fund expenses, and the use of "soft" commission dollars to pay for research services. The Board also considered the fund's securities lending activities and any payments made to Fidelity relating to securities lending.
The Board noted that the growth of fund assets over time across the complex allows Fidelity to reinvest in the development of services designed to enhance the value and convenience of the Fidelity funds as investment vehicles. These services include 24-hour access to account information and market information over the Internet and through telephone representatives, investor education materials, and asset allocation tools. The Board also considered that it reviews customer service metrics such as telephone response times, continuity of services on the website and metrics addressing services at Fidelity Investor Centers.
Investment in a Large Fund Family. The Board considered the benefits to shareholders of investing in a fund that is part of a large family of funds offering a variety of investment disciplines and providing a large variety of fund investor services. The Board noted that Fidelity had taken, or had made recommendations that resulted in the Fidelity funds taking, a number of actions over the previous year that benefited particular funds and/or the Fidelity funds in general.
Investment Performance. The Board took into account discussions that occur with representatives of the Investment Advisers, and reports that it receives, at Board meetings throughout the year, relating to fund investment performance. In this regard the Board noted that as part of regularly scheduled fund reviews and other reports to the Board on fund performance, the Board considered annualized return information for the fund for different time periods, measured against an appropriate securities market index (benchmark index). The Board also considered information about performance attribution. In its ongoing evaluation of fund investment performance, the Board gives particular attention to information indicating changes in performance of the funds over different time periods and discussed with the Investment Advisers the reasons for any overperformance or underperformance. The fund underperformed its benchmark and peers for the one- and three-year periods ended February 28, 2023, and as a result, the Board continues to engage in discussions with FMR about the steps it is taking to address the fund's performance.
In addition to reviewing absolute and relative fund performance, the Independent Trustees periodically consider the appropriateness of fund performance metrics in evaluating the results achieved. The Independent Trustees generally give greater weight to fund performance over longer time periods than over shorter time periods. Depending on the circumstances, the Independent Trustees may be satisfied with a fund's performance notwithstanding that it lags its benchmark index for certain periods.
Based on its review, the Board concluded that the nature, extent, and quality of services provided to the fund under the Advisory Contracts should continue to benefit the shareholders of the fund.
Competitiveness of Management Fee and Total Expense Ratio. The Board was provided with information regarding industry trends in management fees and expenses. In its review of the fund's management fee and the total expense ratio of the retail class, the Board considered the fund's management fee rate as well as other fund or class expenses, as applicable, such as transfer agent fees, pricing and bookkeeping fees, fund-paid 12b-1 fees, and custodial, legal, and audit fees. The Board noted that Fidelity may agree to waive fees or reimburse expenses from time to time, and the extent to which, if any, it has done so for the fund.
Comparisons of Management Fees and Total Expense Ratios. Among other things, the Board reviewed data for selected groups of competitive funds and classes (referred to as "mapped groups") that were compiled by Fidelity based on combining similar investment objective categories (as classified by Lipper) that have comparable investment mandates. The data reviewed by the Board included (i) gross management fee comparisons (before taking into account expense reimbursements or caps) relative to the total universe of funds within the mapped group; (ii) gross management fee comparisons relative to a subset of non-Fidelity funds in the mapped group that are similar in size and management fee structure to the fund (referred to as the "asset size peer group"); (iii) total expense comparisons of the retail class of the fund relative to funds and classes in the mapped group that have a similar sales load structure to the retail class of the fund (referred to as the "similar sales load structure group"); and (iv) total expense comparisons of the retail class of the fund relative to funds and classes in the similar sales load structure group that are similar in size and management fee structure to the fund (referred to as the "total expense asset size peer group"). The total expense asset size peer group comparison excludes performance adjustments and fund-paid 12b-1 fees to eliminate variability in fee structures.
The information provided to the Board indicated that the fund's management fee rate ranked below the competitive median of the mapped group for the 12-month period ended September 30, 2022 and below the competitive median of the asset size peer group for the 12-month period ended September 30, 2022. Further, the information provided to the Board indicated that the total expense ratio of the retail class of the fund ranked below the competitive median of the similar sales load structure group for the 12-month period ended September 30, 2022 and below the competitive median of the total expense asset size peer group for the 12-month period ended September 30, 2022.
The Board also considered that, for funds subject to the group fee, FMR agreed to voluntarily waive fees over a specified period of time in amounts designed to account for assets converted from certain funds to certain collective investment trusts.
Other Contractual Arrangements. The Board further considered that FMR has contractually agreed to reimburse Class A, Class M, Class C, Class I, Class Z and the retail class of the fund to the extent that total operating expenses, with certain exceptions, as a percentage of their respective average net assets, exceed 1.00%, 1.00%, 1.75%, 0.75%, 0.66% and 0.75% through August 31, 2024.
Fees Charged to Other Fidelity Clients. The Board also considered Fidelity fee structures and other information with respect to clients of Fidelity, such as other funds advised or subadvised by Fidelity, pension plan clients, and other institutional clients with similar mandates. The Board noted that a joint ad hoc committee created by it and the boards of other Fidelity funds periodically reviews and compares Fidelity's institutional investment advisory business with its business of providing services to the Fidelity funds and also noted the most recent findings of the committee. The Board noted that the committee's review included a consideration of the differences in services provided, fees charged, and costs incurred, as well as competition in the markets serving the different categories of clients.
Based on its review, the Board concluded that the fund's management fee is fair and reasonable in light of the services that the fund receives and the other factors considered. Further, based on its review of total expense ratios and fees charged to other Fidelity clients, the Board concluded that the total expense ratio of each class of the fund was reasonable in light of the services that the fund and its shareholders receive and the other factors considered.
Costs of the Services and Profitability. The Board considered the revenues earned and the expenses incurred by Fidelity in conducting the business of developing, marketing, distributing, managing, administering and servicing the fund and servicing the fund's shareholders. The Board also considered the level of Fidelity's profits in respect of all the Fidelity funds.
On an annual basis, Fidelity presents to the Board information about the profitability of its relationships with the fund. Fidelity calculates profitability information for each fund, as well as aggregate profitability information for groups of Fidelity funds and all Fidelity funds, using a series of detailed revenue and cost allocation methodologies which originate with the books and records of Fidelity on which Fidelity's audited financial statements are based. The Audit Committee of the Board reviews any significant changes from the prior year's methodologies and the full Board approves such changes.
A public accounting firm has been engaged annually by the Board as part of the Board's assessment of Fidelity's profitability analysis. The engagement includes the review and assessment of the methodologies used by Fidelity in determining the revenues and expenses attributable to Fidelity's fund business, and completion of agreed-upon procedures in respect of the mathematical accuracy of certain fund profitability information and its conformity to established allocation methodologies. After considering the reports issued under the engagement and information provided by Fidelity, the Board concluded that while other allocation methods may also be reasonable, Fidelity's profitability methodologies are reasonable in all material respects.
The Board also reviewed Fidelity's non-fund businesses and potential indirect benefits such businesses may have received as a result of their association with Fidelity's fund business (i.e., fall-out benefits) as well as cases where Fidelity's affiliates may benefit from the funds' business. The Board considered areas where potential indirect benefits to the Fidelity funds from their relationships with Fidelity may exist. The Board's consideration of these matters was informed by the findings of a joint ad hoc committee created by it and the boards of other Fidelity funds to evaluate potential fall-out benefits.
The Board considered the costs of the services provided by and the profits realized by Fidelity in connection with the operation of the fund and was satisfied that the profitability was not excessive.
Economies of Scale. The Board considered whether there have been economies of scale in respect of the management of the Fidelity funds, whether the Fidelity funds (including the fund) have appropriately benefited from any such economies of scale, and whether there is potential for realization of any further economies of scale. The Board considered the extent to which the fund will benefit from economies of scale as assets grow through increased services to the fund, through waivers or reimbursements, or through fee or expense ratio reductions. The Board also noted that a committee (the Economies of Scale Committee) created by it and the boards of other Fidelity funds periodically analyzes whether Fidelity attains economies of scale in respect of the management and servicing of the Fidelity funds, whether the Fidelity funds have appropriately benefited from such economies of scale, and whether there is potential for realization of any further economies of scale.
The Board recognized that the fund's management contract incorporates a "group fee" structure, which provides for lower group fee rates as total "group assets" increase, and for higher group fee rates as total "group assets" decrease ("group assets" as defined in the management contract). FMR calculates the group fee rates based on a tiered asset "breakpoint" schedule that varies based on asset class. The Board considered that the group fee is designed to deliver the benefits of economies of scale to fund shareholders when total Fidelity fund assets increase, even if assets of any particular fund are unchanged or have declined, because some portion of Fidelity's costs are attributable to services provided to all Fidelity funds, and all funds benefit if those costs can be allocated among more assets. The Board further considered that Fidelity agreed to impose a temporary fee waiver in the form of additional breakpoints to the current breakpoint schedule. The Board concluded that, given the group fee structure, fund shareholders will benefit from lower management fees as "group assets" increase at the fund complex level, regardless of whether Fidelity achieves any such economies of scale.
The Board concluded, taking into account the analysis of the Economies of Scale Committee, that economies of scale, if any, are being appropriately shared between fund shareholders and Fidelity.
Additional Information Requested by the Board. In order to develop fully the factual basis for consideration of the Fidelity funds' advisory contracts, the Board requested and received additional information on certain topics, including: (i) fund flow and performance trends, in particular the underperformance of certain funds and strategies, and Fidelity's long-term strategies for certain funds, including any consideration of fund liquidations or mergers; (ii) the operation of performance fees and competitor use of performance fees; (iii) Fidelity's pricing philosophy compared to competitors; (iv) fund profitability methodology and data; (v) evaluation of competitive fund data and peer group classifications and fee and expense comparisons; (vi) the management fee and expense structures for different funds and classes and information about the differences between various fee and expense structures; (vii) group fee breakpoints and related voluntary fee waivers; and (viii) information regarding other accounts managed by Fidelity and the funds' sub-advisory arrangements.
Conclusion. Based on its evaluation of all of the conclusions noted above, and after considering all factors it believed relevant, the Board, including the Independent Trustees, concluded that the advisory and sub-advisory fee arrangements are fair and reasonable in light of all of the surrounding circumstances and that the fund's Advisory Contracts should be renewed through July 31, 2024.
1.969437.109
SDH-SANN-1223
Fidelity® Women's Leadership Fund
Semi-Annual Report
October 31, 2023
Includes Fidelity and Fidelity Advisor share classes
Contents
To view a fund's proxy voting guidelines and proxy voting record for the 12-month period ended June 30, visit http://www.fidelity.com/proxyvotingresults or visit the Securities and Exchange Commission's (SEC) web site at http://www.sec.gov.
You may also call 1-800-544-8544 if you're an individual investing directly with Fidelity, call 1-800-835-5092 if you're a plan sponsor or participant with Fidelity as your recordkeeper or call 1-877-208-0098 on institutional accounts or if you're an advisor or invest through one to request a free copy of the proxy voting guidelines.
Standard & Poor's, S&P and S&P 500 are registered service marks of The McGraw-Hill Companies, Inc. and have been licensed for use by Fidelity Distributors Corporation.
Other third-party marks appearing herein are the property of their respective owners.
All other marks appearing herein are registered or unregistered trademarks or service marks of FMR LLC or an affiliated company. © 2023 FMR LLC. All rights reserved.
This report and the financial statements contained herein are submitted for the general information of the shareholders of the Fund. This report is not authorized for distribution to prospective investors in the Fund unless preceded or accompanied by an effective prospectus.
A fund files its complete schedule of portfolio holdings with the SEC for the first and third quarters of each fiscal year on Form N-PORT. Forms N-PORT are available on the SEC's web site at http://www.sec.gov. A fund's Forms N-PORT may be reviewed and copied at the SEC's Public Reference Room in Washington, DC. Information regarding the operation of the SEC's Public Reference Room may be obtained by calling 1-800-SEC-0330.
For a complete list of a fund's portfolio holdings, view the most recent holdings listing, semiannual report, or annual report on Fidelity's web site at http://www.fidelity.com, http://www.institutional.fidelity.com, or http://www.401k.com, as applicable.
NOT FDIC INSURED •MAY LOSE VALUE •NO BANK GUARANTEE
Neither the Fund nor Fidelity Distributors Corporation is a bank.
Top Holdings (% of Fund's net assets) |
| |
| Microsoft Corp. | 4.4 | |
| Accenture PLC Class A | 2.4 | |
| Amazon.com, Inc. | 2.4 | |
| Apple, Inc. | 2.2 | |
| Adobe, Inc. | 1.9 | |
| NVIDIA Corp. | 1.9 | |
| Salesforce, Inc. | 1.9 | |
| Intuit, Inc. | 1.9 | |
| MasterCard, Inc. Class A | 1.8 | |
| Hologic, Inc. | 1.6 | |
| | 22.4 | |
| |
| Market Sectors (% of Fund's net assets) |
| |
| Information Technology | 24.0 | |
| Financials | 14.0 | |
| Health Care | 13.3 | |
| Industrials | 12.5 | |
| Consumer Discretionary | 11.4 | |
| Communication Services | 6.0 | |
| Energy | 4.1 | |
| Consumer Staples | 3.8 | |
| Materials | 3.7 | |
| Utilities | 2.9 | |
| Real Estate | 2.1 | |
| |
Asset Allocation (% of Fund's net assets) |
|
|
Showing Percentage of Net Assets
| Common Stocks - 97.5% |
| | | Shares | Value ($) |
| COMMUNICATION SERVICES - 6.0% | | | |
| Entertainment - 2.9% | | | |
| Netflix, Inc. (a) | | 4,619 | 1,901,596 |
| The Walt Disney Co. (a) | | 25,155 | 2,052,396 |
| | | | 3,953,992 |
| Interactive Media & Services - 1.8% | | | |
| Alphabet, Inc. Class A (a) | | 14,686 | 1,822,239 |
| Bumble, Inc. (a) | | 40,104 | 538,998 |
| | | | 2,361,237 |
| Media - 1.3% | | | |
| Interpublic Group of Companies, Inc. | | 61,225 | 1,738,790 |
TOTAL COMMUNICATION SERVICES | | | 8,054,019 |
| CONSUMER DISCRETIONARY - 11.4% | | | |
| Automobiles - 0.4% | | | |
| General Motors Co. | | 22,722 | 640,760 |
| Broadline Retail - 3.7% | | | |
| Amazon.com, Inc. (a) | | 23,984 | 3,192,031 |
| Etsy, Inc. (a) | | 15,542 | 968,267 |
| Kohl's Corp. | | 35,713 | 805,328 |
| | | | 4,965,626 |
| Diversified Consumer Services - 1.0% | | | |
| Adtalem Global Education, Inc. (a) | | 16,832 | 871,898 |
| Bright Horizons Family Solutions, Inc. (a) | | 6,357 | 470,799 |
| | | | 1,342,697 |
| Hotels, Restaurants & Leisure - 1.4% | | | |
| Marriott International, Inc. Class A | | 5,380 | 1,014,453 |
| Vail Resorts, Inc. | | 3,985 | 845,816 |
| | | | 1,860,269 |
| Household Durables - 0.8% | | | |
| Taylor Morrison Home Corp. (a) | | 27,980 | 1,072,194 |
| Specialty Retail - 3.1% | | | |
| Aritzia, Inc. (a) | | 25,730 | 400,214 |
| Best Buy Co., Inc. | | 9,340 | 624,099 |
| Foot Locker, Inc. | | 17,709 | 371,712 |
| Lowe's Companies, Inc. | | 7,545 | 1,437,851 |
| Williams-Sonoma, Inc. | | 8,938 | 1,342,845 |
| | | | 4,176,721 |
| Textiles, Apparel & Luxury Goods - 1.0% | | | |
| LVMH Moet Hennessy Louis Vuitton SE | | 1,225 | 877,015 |
| Tapestry, Inc. | | 17,416 | 479,985 |
| | | | 1,357,000 |
TOTAL CONSUMER DISCRETIONARY | | | 15,415,267 |
| CONSUMER STAPLES - 3.8% | | | |
| Consumer Staples Distribution & Retail - 0.3% | | | |
| Maplebear, Inc. | | 15,068 | 371,125 |
| Food Products - 1.7% | | | |
| Bunge Ltd. | | 7,778 | 824,312 |
| The Hershey Co. | | 8,087 | 1,515,099 |
| | | | 2,339,411 |
| Household Products - 0.6% | | | |
| The Clorox Co. | | 6,829 | 803,773 |
| Personal Care Products - 1.2% | | | |
| Estee Lauder Companies, Inc. Class A | | 9,092 | 1,171,686 |
| Shiseido Co. Ltd. | | 13,219 | 419,247 |
| | | | 1,590,933 |
TOTAL CONSUMER STAPLES | | | 5,105,242 |
| ENERGY - 4.1% | | | |
| Energy Equipment & Services - 1.0% | | | |
| Baker Hughes Co. Class A | | 38,037 | 1,309,234 |
| Oil, Gas & Consumable Fuels - 3.1% | | | |
| Antero Resources Corp. (a) | | 30,966 | 911,639 |
| EQT Corp. | | 15,316 | 649,092 |
| Equinor ASA | | 25,102 | 841,500 |
| Marathon Petroleum Corp. | | 5,456 | 825,220 |
| Occidental Petroleum Corp. | | 15,665 | 968,254 |
| | | | 4,195,705 |
TOTAL ENERGY | | | 5,504,939 |
| FINANCIALS - 14.0% | | | |
| Banks - 4.1% | | | |
| Bank of America Corp. | | 74,229 | 1,955,192 |
| Citigroup, Inc. | | 24,558 | 969,795 |
| Huntington Bancshares, Inc. | | 94,389 | 910,854 |
| JPMorgan Chase & Co. | | 11,258 | 1,565,537 |
| Starling Bank Ltd. Series D (a)(b)(c) | | 34,700 | 123,998 |
| | | | 5,525,376 |
| Capital Markets - 2.8% | | | |
| Franklin Resources, Inc. | | 27,177 | 619,364 |
| Macquarie Group Ltd. | | 10,825 | 1,112,701 |
| NASDAQ, Inc. | | 40,548 | 2,011,181 |
| | | | 3,743,246 |
| Financial Services - 3.4% | | | |
| MasterCard, Inc. Class A | | 6,440 | 2,423,694 |
| WEX, Inc. (a) | | 12,968 | 2,158,913 |
| | | | 4,582,607 |
| Insurance - 3.7% | | | |
| Hartford Financial Services Group, Inc. | | 28,129 | 2,066,075 |
| Marsh & McLennan Companies, Inc. | | 6,440 | 1,221,346 |
| Progressive Corp. | | 10,824 | 1,711,166 |
| | | | 4,998,587 |
TOTAL FINANCIALS | | | 18,849,816 |
| HEALTH CARE - 13.0% | | | |
| Biotechnology - 2.2% | | | |
| Alnylam Pharmaceuticals, Inc. (a) | | 3,919 | 594,904 |
| Moderna, Inc. (a) | | 4,688 | 356,100 |
| Sage Therapeutics, Inc. (a) | | 9,937 | 186,120 |
| Vertex Pharmaceuticals, Inc. (a) | | 4,504 | 1,630,943 |
| Zai Lab Ltd. ADR (a) | | 8,171 | 205,909 |
| | | | 2,973,976 |
| Health Care Equipment & Supplies - 2.1% | | | |
| Axonics Modulation Technologies, Inc. (a) | | 4,980 | 255,026 |
| Hologic, Inc. (a) | | 32,783 | 2,169,251 |
| Insulet Corp. (a) | | 3,502 | 464,260 |
| Outset Medical, Inc. (a) | | 5,606 | 19,845 |
| | | | 2,908,382 |
| Health Care Providers & Services - 4.2% | | | |
| Centene Corp. (a) | | 21,950 | 1,514,111 |
| Cigna Group | | 6,215 | 1,921,678 |
| CVS Health Corp. | | 15,404 | 1,063,030 |
| Elevance Health, Inc. | | 2,491 | 1,121,174 |
| | | | 5,619,993 |
| Life Sciences Tools & Services - 0.9% | | | |
| ICON PLC (a) | | 4,875 | 1,189,305 |
| Pharmaceuticals - 3.6% | | | |
| Eli Lilly & Co. | | 1,816 | 1,005,937 |
| Merck KGaA | | 7,772 | 1,170,623 |
| UCB SA | | 14,145 | 1,033,609 |
| Zoetis, Inc. Class A | | 10,383 | 1,630,131 |
| | | | 4,840,300 |
TOTAL HEALTH CARE | | | 17,531,956 |
| INDUSTRIALS - 12.5% | | | |
| Air Freight & Logistics - 1.0% | | | |
| United Parcel Service, Inc. Class B | | 9,410 | 1,329,163 |
| Commercial Services & Supplies - 0.3% | | | |
| Veralto Corp. | | 5,404 | 372,876 |
| Electrical Equipment - 4.0% | | | |
| AMETEK, Inc. | | 12,024 | 1,692,618 |
| Eaton Corp. PLC | | 5,024 | 1,044,540 |
| nVent Electric PLC | | 20,897 | 1,005,773 |
| Prysmian SpA | | 18,313 | 683,814 |
| Regal Rexnord Corp. | | 6,591 | 780,440 |
| Sunrun, Inc. (a) | | 25,085 | 242,070 |
| | | | 5,449,255 |
| Ground Transportation - 0.4% | | | |
| ArcBest Corp. | | 4,798 | 522,406 |
| Machinery - 4.1% | | | |
| Chart Industries, Inc. (a) | | 4,667 | 542,445 |
| Deere & Co. | | 3,528 | 1,288,990 |
| Federal Signal Corp. | | 18,934 | 1,098,929 |
| Hillenbrand, Inc. | | 16,297 | 619,775 |
| Otis Worldwide Corp. | | 15,465 | 1,194,053 |
| Parker Hannifin Corp. | | 2,123 | 783,196 |
| | | | 5,527,388 |
| Professional Services - 2.7% | | | |
| Leidos Holdings, Inc. | | 14,677 | 1,454,784 |
| Manpower, Inc. | | 9,802 | 685,846 |
| Science Applications International Corp. | | 13,423 | 1,466,329 |
| | | | 3,606,959 |
TOTAL INDUSTRIALS | | | 16,808,047 |
| INFORMATION TECHNOLOGY - 24.0% | | | |
| Communications Equipment - 0.7% | | | |
| Arista Networks, Inc. (a) | | 5,010 | 1,003,854 |
| Electronic Equipment, Instruments & Components - 1.9% | | | |
| CDW Corp. | | 8,405 | 1,684,362 |
| Insight Enterprises, Inc. (a) | | 5,987 | 857,937 |
| | | | 2,542,299 |
| IT Services - 2.4% | | | |
| Accenture PLC Class A | | 10,893 | 3,236,201 |
| Semiconductors & Semiconductor Equipment - 4.9% | | | |
| Advanced Micro Devices, Inc. (a) | | 12,498 | 1,231,053 |
| Axcelis Technologies, Inc. (a) | | 4,179 | 532,823 |
| Marvell Technology, Inc. | | 20,921 | 987,890 |
| NVIDIA Corp. | | 6,298 | 2,568,324 |
| NXP Semiconductors NV | | 7,625 | 1,314,779 |
| | | | 6,634,869 |
| Software - 11.9% | | | |
| Adobe, Inc. (a) | | 4,919 | 2,617,203 |
| HubSpot, Inc. (a) | | 4,371 | 1,852,299 |
| Intuit, Inc. | | 5,066 | 2,507,417 |
| Microsoft Corp. | | 17,617 | 5,956,483 |
| Pagerduty, Inc. (a) | | 25,217 | 508,627 |
| Salesforce, Inc. (a) | | 12,556 | 2,521,621 |
| | | | 15,963,650 |
| Technology Hardware, Storage & Peripherals - 2.2% | | | |
| Apple, Inc. | | 17,494 | 2,987,450 |
TOTAL INFORMATION TECHNOLOGY | | | 32,368,323 |
| MATERIALS - 3.7% | | | |
| Chemicals - 2.1% | | | |
| Cabot Corp. | | 11,432 | 759,999 |
| Celanese Corp. Class A | | 6,864 | 785,997 |
| Eastman Chemical Co. | | 8,690 | 649,404 |
| The Chemours Co. LLC | | 23,787 | 573,505 |
| | | | 2,768,905 |
| Construction Materials - 0.6% | | | |
| Summit Materials, Inc. | | 24,407 | 802,990 |
| Metals & Mining - 1.0% | | | |
| Commercial Metals Co. | | 21,408 | 905,344 |
| Schnitzer Steel Industries, Inc. Class A | | 21,665 | 492,012 |
| | | | 1,397,356 |
TOTAL MATERIALS | | | 4,969,251 |
| REAL ESTATE - 2.1% | | | |
| Equity Real Estate Investment Trusts (REITs) - 2.1% | | | |
| Equity Lifestyle Properties, Inc. | | 24,271 | 1,597,032 |
| Ventas, Inc. | | 29,918 | 1,270,318 |
| | | | 2,867,350 |
| UTILITIES - 2.9% | | | |
| Electric Utilities - 1.5% | | | |
| NextEra Energy, Inc. | | 19,295 | 1,124,899 |
| SSE PLC | | 46,012 | 913,260 |
| | | | 2,038,159 |
| Independent Power and Renewable Electricity Producers - 0.5% | | | |
| Clearway Energy, Inc. Class C | | 30,686 | 666,193 |
| Water Utilities - 0.9% | | | |
| American Water Works Co., Inc. | | 10,068 | 1,184,500 |
TOTAL UTILITIES | | | 3,888,852 |
| TOTAL COMMON STOCKS (Cost $122,818,449) | | | 131,363,062 |
| | | | |
| Convertible Preferred Stocks - 0.3% |
| | | Shares | Value ($) |
| HEALTH CARE - 0.3% | | | |
| Health Care Providers & Services - 0.3% | | | |
Somatus, Inc. Series E (a)(b)(c) (Cost $350,799) | | 402 | 411,415 |
| | | | |
| Money Market Funds - 2.2% |
| | | Shares | Value ($) |
Fidelity Cash Central Fund 5.40% (d) (Cost $2,945,850) | | 2,945,261 | 2,945,850 |
| | | | |
| TOTAL INVESTMENT IN SECURITIES - 100.0% (Cost $126,115,098) | 134,720,327 |
NET OTHER ASSETS (LIABILITIES) - 0.0% | (21,206) |
| NET ASSETS - 100.0% | 134,699,121 |
| | |
Legend
| (b) | Restricted securities (including private placements) - Investment in securities not registered under the Securities Act of 1933 (excluding 144A issues). At the end of the period, the value of restricted securities (excluding 144A issues) amounted to $535,413 or 0.4% of net assets. |
| (d) | Affiliated fund that is generally available only to investment companies and other accounts managed by Fidelity Investments. The rate quoted is the annualized seven-day yield of the fund at period end. A complete unaudited listing of the fund's holdings as of its most recent quarter end is available upon request. In addition, each Fidelity Central Fund's financial statements are available on the SEC's website or upon request. |
| Additional information on each restricted holding is as follows: |
| Security | Acquisition Date | Acquisition Cost ($) |
| Somatus, Inc. Series E | 1/31/22 | 350,799 |
| | | |
| Starling Bank Ltd. Series D | 6/18/21 - 4/05/22 | 68,001 |
| | | |
Affiliated Central Funds
Fiscal year to date information regarding the Fund's investments in Fidelity Central Funds, including the ownership percentage, is presented below.
| Affiliate | Value, beginning of period ($) | Purchases ($) | Sales Proceeds ($) | Dividend Income ($) | Realized Gain (loss) ($) | Change in Unrealized appreciation (depreciation) ($) | Value, end of period ($) | % ownership, end of period |
| Fidelity Cash Central Fund 5.40% | 4,527,991 | 17,902,245 | 19,484,386 | 93,700 | - | - | 2,945,850 | 0.0% |
| Total | 4,527,991 | 17,902,245 | 19,484,386 | 93,700 | - | - | 2,945,850 | |
| | | | | | | | | |
Amounts in the dividend income column in the above table include any capital gain distributions from underlying funds, which are presented in the corresponding line item in the Statement of Operations, if applicable.
Amounts included in the purchases and sales proceeds columns may include in-kind transactions, if applicable.
Investment Valuation
The following is a summary of the inputs used, as of October 31, 2023, involving the Fund's assets and liabilities carried at fair value. The inputs or methodology used for valuing securities may not be an indication of the risk associated with investing in those securities. For more information on valuation inputs, and their aggregation into the levels used below, please refer to the Investment Valuation section in the accompanying Notes to Financial Statements.
| Valuation Inputs at Reporting Date: |
| Description | Total ($) | Level 1 ($) | Level 2 ($) | Level 3 ($) |
Investments in Securities: | | | | |
|
| Equities: | | | | |
Communication Services | 8,054,019 | 8,054,019 | - | - |
Consumer Discretionary | 15,415,267 | 14,538,252 | 877,015 | - |
Consumer Staples | 5,105,242 | 4,685,995 | 419,247 | - |
Energy | 5,504,939 | 4,663,439 | 841,500 | - |
Financials | 18,849,816 | 17,613,117 | 1,112,701 | 123,998 |
Health Care | 17,943,371 | 17,531,956 | - | 411,415 |
Industrials | 16,808,047 | 16,808,047 | - | - |
Information Technology | 32,368,323 | 32,368,323 | - | - |
Materials | 4,969,251 | 4,969,251 | - | - |
Real Estate | 2,867,350 | 2,867,350 | - | - |
Utilities | 3,888,852 | 3,888,852 | - | - |
|
| Money Market Funds | 2,945,850 | 2,945,850 | - | - |
| Total Investments in Securities: | 134,720,327 | 130,934,451 | 3,250,463 | 535,413 |
| Statement of Assets and Liabilities |
| | | | October 31, 2023 (Unaudited) |
| | | | | |
| Assets | | | | |
| Investment in securities, at value - See accompanying schedule: | | | | |
Unaffiliated issuers (cost $123,169,248) | $ | 131,774,477 | | |
Fidelity Central Funds (cost $2,945,850) | | 2,945,850 | | |
| | | | | |
| | | | | |
| Total Investment in Securities (cost $126,115,098) | | | $ | 134,720,327 |
| Receivable for fund shares sold | | | | 51,171 |
| Dividends receivable | | | | 77,336 |
| Reclaims receivable | | | | 21,666 |
| Distributions receivable from Fidelity Central Funds | | | | 5,262 |
| Prepaid expenses | | | | 209 |
| Other receivables | | | | 192 |
Total assets | | | | 134,876,163 |
| Liabilities | | | | |
| Payable for fund shares redeemed | $ | 61,284 | | |
| Accrued management fee | | 49,002 | | |
| Transfer agent fee payable | | 27,362 | | |
| Distribution and service plan fees payable | | 3,066 | | |
| Other affiliated payables | | 4,038 | | |
| Custody fee payable | | 28,289 | | |
| Other payables and accrued expenses | | 4,001 | | |
| Total Liabilities | | | | 177,042 |
| Net Assets | | | $ | 134,699,121 |
| Net Assets consist of: | | | | |
| Paid in capital | | | $ | 133,932,801 |
| Total accumulated earnings (loss) | | | | 766,320 |
| Net Assets | | | $ | 134,699,121 |
| | | | | |
| Net Asset Value and Maximum Offering Price | | | | |
| Class A : | | | | |
Net Asset Value and redemption price per share ($6,228,910 ÷ 479,340 shares)(a) | | | $ | 12.99 |
| Maximum offering price per share (100/94.25 of $12.99) | | | $ | 13.78 |
| Class M : | | | | |
Net Asset Value and redemption price per share ($1,104,472 ÷ 85,404 shares)(a) | | | $ | 12.93 |
| Maximum offering price per share (100/96.50 of $12.93) | | | $ | 13.40 |
| Class C : | | | | |
Net Asset Value and offering price per share ($1,510,694 ÷ 118,580 shares)(a) | | | $ | 12.74 |
| Fidelity Women's Leadership Fund : | | | | |
Net Asset Value, offering price and redemption price per share ($99,878,099 ÷ 7,654,649 shares) | | | $ | 13.05 |
| Class I : | | | | |
Net Asset Value, offering price and redemption price per share ($13,394,842 ÷ 1,026,849 shares) | | | $ | 13.04 |
| Class Z : | | | | |
Net Asset Value, offering price and redemption price per share ($12,582,104 ÷ 960,596 shares) | | | $ | 13.10 |
(a)Redemption price per share is equal to net asset value less any applicable contingent deferred sales charge. |
| Statement of Operations |
| | | | Six months ended October 31, 2023 (Unaudited) |
| Investment Income | | | | |
| Dividends | | | $ | 1,014,477 |
| Income from Fidelity Central Funds | | | | 93,700 |
| Total Income | | | | 1,108,177 |
| Expenses | | | | |
| Management fee | | | | |
| Basic fee | $ | 390,577 | | |
| Performance adjustment | | (60,355) | | |
| Transfer agent fees | | 172,216 | | |
| Distribution and service plan fees | | 19,214 | | |
| Accounting fees and expenses | | 26,422 | | |
| Custodian fees and expenses | | 4,970 | | |
| Independent trustees' fees and expenses | | 370 | | |
| Registration fees | | 28,051 | | |
| Audit | | 27,528 | | |
| Legal | | 351 | | |
| Miscellaneous | | 278 | | |
| Total expenses before reductions | | 609,622 | | |
| Expense reductions | | (5,719) | | |
| Total expenses after reductions | | | | 603,903 |
| Net Investment income (loss) | | | | 504,274 |
| Realized and Unrealized Gain (Loss) | | | | |
| Net realized gain (loss) on: | | | | |
| Investment Securities: | | | | |
| Unaffiliated issuers (net of foreign taxes of $466) | | (2,832,776) | | |
| Foreign currency transactions | | (1,937) | | |
| Total net realized gain (loss) | | | | (2,834,713) |
| Change in net unrealized appreciation (depreciation) on: | | | | |
| Investment Securities: | | | | |
| Unaffiliated issuers(net of decrease in deferred foreign taxes of $365) | | (1,272,930) | | |
| Assets and liabilities in foreign currencies | | (816) | | |
| Total change in net unrealized appreciation (depreciation) | | | | (1,273,746) |
| Net gain (loss) | | | | (4,108,459) |
| Net increase (decrease) in net assets resulting from operations | | | $ | (3,604,185) |
| Statement of Changes in Net Assets |
| |
| | Six months ended October 31, 2023 (Unaudited) | | Year ended April 30, 2023 |
| Increase (Decrease) in Net Assets | | | | |
| Operations | | | | |
| Net investment income (loss) | $ | 504,274 | $ | 964,545 |
| Net realized gain (loss) | | (2,834,713) | | (4,429,525) |
| Change in net unrealized appreciation (depreciation) | | (1,273,746) | | 6,424,381 |
| Net increase (decrease) in net assets resulting from operations | | (3,604,185) | | 2,959,401 |
| Distributions to shareholders | | (167,829) | | (755,398) |
| | | | | |
| Share transactions - net increase (decrease) | | (9,026,206) | | 16,505,229 |
| Total increase (decrease) in net assets | | (12,798,220) | | 18,709,232 |
| | | | | |
| Net Assets | | | | |
| Beginning of period | | 147,497,341 | | 128,788,109 |
| End of period | $ | 134,699,121 | $ | 147,497,341 |
| | | | | |
| | | | | |
Financial Highlights
| Fidelity Advisor® Women's Leadership Fund Class A |
| |
| | Six months ended (Unaudited) October 31, 2023 | | Years ended April 30, 2023 | | 2022 | | 2021 | | 2020 A |
Selected Per-Share Data | | | | | | | | | | |
| Net asset value, beginning of period | $ | 13.39 | $ | 13.18 | $ | 15.28 | $ | 9.80 | $ | 10.00 |
| Income from Investment Operations | | | | | | | | | | |
Net investment income (loss) B,C | | .03 | | .07 | | - D | | - D | | .04 |
| Net realized and unrealized gain (loss) | | (.42) | | .20 | | (1.70) | | 5.49 | | (.22) |
| Total from investment operations | | (.39) | | .27 | | (1.70) | | 5.49 | | (.18) |
| Distributions from net investment income | | (.01) | | (.06) | | - D | | (.01) | | (.02) |
| Distributions from net realized gain | | - | | - | | (.40) | | - | | - |
| Total distributions | | (.01) | | (.06) | | (.40) | | (.01) | | (.02) |
| Net asset value, end of period | $ | 12.99 | $ | 13.39 | $ | 13.18 | $ | 15.28 | $ | 9.80 |
Total Return E,F,G | | (2.95)% | | 2.10% | | (11.46)% | | 56.03% | | (1.84)% |
Ratios to Average Net Assets B,H,I | | | | | | | | | | |
| Expenses before reductions | | 1.02% J | | 1.09% | | 1.10% | | 1.28% | | 2.50% |
| Expenses net of fee waivers, if any | | 1.01% J | | 1.09% | | 1.10% | | 1.25% | | 1.25% |
| Expenses net of all reductions | | 1.01% J | | 1.09% | | 1.10% | | 1.24% | | 1.25% |
| Net investment income (loss) | | .48% J | | .57% | | (.01)% | | (.03)% | | .37% |
| Supplemental Data | | | | | | | | | | |
| Net assets, end of period (000 omitted) | $ | 6,229 | $ | 6,104 | $ | 5,171 | $ | 2,865 | $ | 769 |
Portfolio turnover rate K | | 21% J | | 22% | | 48% | | 35% | | 52% |
AFor the period May 1, 2019 (commencement of operations) through April 30, 2020.
BNet investment income (loss) is affected by the timing of the declaration of dividends by any underlying mutual funds or exchange-traded funds (ETFs). Net investment income (loss) of any mutual funds or ETFs is not included in the Fund's net investment income (loss) ratio.
CCalculated based on average shares outstanding during the period.
DAmount represents less than $.005 per share.
ETotal returns for periods of less than one year are not annualized.
FTotal returns would have been lower if certain expenses had not been reduced during the applicable periods shown.
GTotal returns do not include the effect of the sales charges.
HFees and expenses of any underlying mutual funds or exchange-traded funds (ETFs) are not included in the Fund's expense ratio. The Fund indirectly bears its proportionate share of these expenses. For additional expense information related to investments in Fidelity Central Funds, please refer to the "Investments in Fidelity Central Funds" note found in the Notes to Financial Statements section of the most recent Annual or Semi-Annual report.
IExpense ratios reflect operating expenses of the class. Expenses before reductions do not reflect amounts reimbursed, waived, or reduced through arrangements with the investment adviser, brokerage services, or other offset arrangements, if applicable, and do not represent the amount paid by the class during periods when reimbursements, waivers or reductions occur.
JAnnualized.
KAmount does not include the portfolio activity of any underlying mutual funds or exchange-traded funds (ETFs).
| Fidelity Advisor® Women's Leadership Fund Class M |
| |
| | Six months ended (Unaudited) October 31, 2023 | | Years ended April 30, 2023 | | 2022 | | 2021 | | 2020 A |
Selected Per-Share Data | | | | | | | | | | |
| Net asset value, beginning of period | $ | 13.34 | $ | 13.14 | $ | 15.22 | $ | 9.78 | $ | 10.00 |
| Income from Investment Operations | | | | | | | | | | |
Net investment income (loss) B,C | | .01 | | .04 | | (.04) | | (.04) | | .01 |
| Net realized and unrealized gain (loss) | | (.42) | | .20 | | (1.69) | | 5.48 | | (.22) |
| Total from investment operations | | (.41) | | .24 | | (1.73) | | 5.44 | | (.21) |
| Distributions from net investment income | | - | | (.04) | | - | | - D | | (.01) |
| Distributions from net realized gain | | - | | - | | (.35) | | - | | - |
| Total distributions | | - | | (.04) | | (.35) | | - D | | (.01) |
| Net asset value, end of period | $ | 12.93 | $ | 13.34 | $ | 13.14 | $ | 15.22 | $ | 9.78 |
Total Return E,F,G | | (3.07)% | | 1.83% | | (11.66)% | | 55.65% | | (2.12)% |
Ratios to Average Net Assets B,H,I | | | | | | | | | | |
| Expenses before reductions | | 1.29% J | | 1.37% | | 1.35% | | 1.52% | | 2.86% |
| Expenses net of fee waivers, if any | | 1.29% J | | 1.37% | | 1.35% | | 1.50% | | 1.50% |
| Expenses net of all reductions | | 1.29% J | | 1.37% | | 1.35% | | 1.49% | | 1.50% |
| Net investment income (loss) | | .20% J | | .28% | | (.27)% | | (.28)% | | .12% |
| Supplemental Data | | | | | | | | | | |
| Net assets, end of period (000 omitted) | $ | 1,104 | $ | 1,122 | $ | 1,054 | $ | 974 | $ | 443 |
Portfolio turnover rate K | | 21% J | | 22% | | 48% | | 35% | | 52% |
AFor the period May 1, 2019 (commencement of operations) through April 30, 2020.
BNet investment income (loss) is affected by the timing of the declaration of dividends by any underlying mutual funds or exchange-traded funds (ETFs). Net investment income (loss) of any mutual funds or ETFs is not included in the Fund's net investment income (loss) ratio.
CCalculated based on average shares outstanding during the period.
DAmount represents less than $.005 per share.
ETotal returns for periods of less than one year are not annualized.
FTotal returns would have been lower if certain expenses had not been reduced during the applicable periods shown.
GTotal returns do not include the effect of the sales charges.
HFees and expenses of any underlying mutual funds or exchange-traded funds (ETFs) are not included in the Fund's expense ratio. The Fund indirectly bears its proportionate share of these expenses. For additional expense information related to investments in Fidelity Central Funds, please refer to the "Investments in Fidelity Central Funds" note found in the Notes to Financial Statements section of the most recent Annual or Semi-Annual report.
IExpense ratios reflect operating expenses of the class. Expenses before reductions do not reflect amounts reimbursed, waived, or reduced through arrangements with the investment adviser, brokerage services, or other offset arrangements, if applicable, and do not represent the amount paid by the class during periods when reimbursements, waivers or reductions occur.
JAnnualized.
KAmount does not include the portfolio activity of any underlying mutual funds or exchange-traded funds (ETFs).
| Fidelity Advisor® Women's Leadership Fund Class C |
| |
| | Six months ended (Unaudited) October 31, 2023 | | Years ended April 30, 2023 | | 2022 | | 2021 | | 2020 A |
Selected Per-Share Data | | | | | | | | | | |
| Net asset value, beginning of period | $ | 13.18 | $ | 13.00 | $ | 15.09 | $ | 9.74 | $ | 10.00 |
| Income from Investment Operations | | | | | | | | | | |
Net investment income (loss) B,C | | (.02) | | (.03) | | (.11) | | (.10) | | (.04) |
| Net realized and unrealized gain (loss) | | (.42) | | .21 | | (1.68) | | 5.45 | | (.22) |
| Total from investment operations | | (.44) | | .18 | | (1.79) | | 5.35 | | (.26) |
| Distributions from net realized gain | | - | | - | | (.30) | | - | | - |
| Total distributions | | - | | - | | (.30) | | - | | - |
| Net asset value, end of period | $ | 12.74 | $ | 13.18 | $ | 13.00 | $ | 15.09 | $ | 9.74 |
Total Return D,E,F | | (3.34)% | | 1.38% | | (12.12)% | | 54.93% | | (2.60)% |
Ratios to Average Net Assets B,G,H | | | | | | | | | | |
| Expenses before reductions | | 1.79% I | | 1.86% | | 1.84% | | 1.99% | | 3.36% |
| Expenses net of fee waivers, if any | | 1.78% I | | 1.86% | | 1.84% | | 1.99% | | 2.00% |
| Expenses net of all reductions | | 1.78% I | | 1.86% | | 1.84% | | 1.98% | | 2.00% |
| Net investment income (loss) | | (.29)% I | | (.20)% | | (.75)% | | (.77)% | | (.38)% |
| Supplemental Data | | | | | | | | | | |
| Net assets, end of period (000 omitted) | $ | 1,511 | $ | 1,603 | $ | 1,540 | $ | 937 | $ | 468 |
Portfolio turnover rate J | | 21% I | | 22% | | 48% | | 35% | | 52% |
AFor the period May 1, 2019 (commencement of operations) through April 30, 2020.
BNet investment income (loss) is affected by the timing of the declaration of dividends by any underlying mutual funds or exchange-traded funds (ETFs). Net investment income (loss) of any mutual funds or ETFs is not included in the Fund's net investment income (loss) ratio.
CCalculated based on average shares outstanding during the period.
DTotal returns for periods of less than one year are not annualized.
ETotal returns would have been lower if certain expenses had not been reduced during the applicable periods shown.
FTotal returns do not include the effect of the contingent deferred sales charge.
GFees and expenses of any underlying mutual funds or exchange-traded funds (ETFs) are not included in the Fund's expense ratio. The Fund indirectly bears its proportionate share of these expenses. For additional expense information related to investments in Fidelity Central Funds, please refer to the "Investments in Fidelity Central Funds" note found in the Notes to Financial Statements section of the most recent Annual or Semi-Annual report.
HExpense ratios reflect operating expenses of the class. Expenses before reductions do not reflect amounts reimbursed, waived, or reduced through arrangements with the investment adviser, brokerage services, or other offset arrangements, if applicable, and do not represent the amount paid by the class during periods when reimbursements, waivers or reductions occur.
IAnnualized.
JAmount does not include the portfolio activity of any underlying mutual funds or exchange-traded funds (ETFs).
| Fidelity® Women's Leadership Fund |
| |
| | Six months ended (Unaudited) October 31, 2023 | | Years ended April 30, 2023 | | 2022 | | 2021 | | 2020 A |
Selected Per-Share Data | | | | | | | | | | |
| Net asset value, beginning of period | $ | 13.45 | $ | 13.22 | $ | 15.31 | $ | 9.81 | $ | 10.00 |
| Income from Investment Operations | | | | | | | | | | |
Net investment income (loss) B,C | | .05 | | .10 | | .03 | | .03 | | .06 |
| Net realized and unrealized gain (loss) | | (.43) | | .21 | | (1.70) | | 5.50 | | (.22) |
| Total from investment operations | | (.38) | | .31 | | (1.67) | | 5.53 | | (.16) |
| Distributions from net investment income | | (.02) | | (.08) | | (.02) | | (.03) | | (.03) |
| Distributions from net realized gain | | - | | - | | (.40) | | - | | - |
| Total distributions | | (.02) | | (.08) | | (.42) | | (.03) | | (.03) |
| Net asset value, end of period | $ | 13.05 | $ | 13.45 | $ | 13.22 | $ | 15.31 | $ | 9.81 |
Total Return D,E | | (2.87)% | | 2.37% | | (11.25)% | | 56.44% | | (1.63)% |
Ratios to Average Net Assets B,F,G | | | | | | | | | | |
| Expenses before reductions | | .82% H | | .89% | | .92% | | 1.10% | | 2.19% |
| Expenses net of fee waivers, if any | | .81% H | | .89% | | .90% | | 1.00% | | 1.00% |
| Expenses net of all reductions | | .81% H | | .89% | | .90% | | .99% | | 1.00% |
| Net investment income (loss) | | .67% H | | .76% | | .18% | | .22% | | .62% |
| Supplemental Data | | | | | | | | | | |
| Net assets, end of period (000 omitted) | $ | 99,878 | $ | 115,107 | $ | 101,533 | $ | 98,888 | $ | 22,272 |
Portfolio turnover rate I | | 21% H | | 22% | | 48% | | 35% | | 52% |
AFor the period May 1, 2019 (commencement of operations) through April 30, 2020.
BNet investment income (loss) is affected by the timing of the declaration of dividends by any underlying mutual funds or exchange-traded funds (ETFs). Net investment income (loss) of any mutual funds or ETFs is not included in the Fund's net investment income (loss) ratio.
CCalculated based on average shares outstanding during the period.
DTotal returns for periods of less than one year are not annualized.
ETotal returns would have been lower if certain expenses had not been reduced during the applicable periods shown.
FFees and expenses of any underlying mutual funds or exchange-traded funds (ETFs) are not included in the Fund's expense ratio. The Fund indirectly bears its proportionate share of these expenses. For additional expense information related to investments in Fidelity Central Funds, please refer to the "Investments in Fidelity Central Funds" note found in the Notes to Financial Statements section of the most recent Annual or Semi-Annual report.
GExpense ratios reflect operating expenses of the class. Expenses before reductions do not reflect amounts reimbursed, waived, or reduced through arrangements with the investment adviser, brokerage services, or other offset arrangements, if applicable, and do not represent the amount paid by the class during periods when reimbursements, waivers or reductions occur.
HAnnualized.
IAmount does not include the portfolio activity of any underlying mutual funds or exchange-traded funds (ETFs).
| Fidelity Advisor® Women's Leadership Fund Class I |
| |
| | Six months ended (Unaudited) October 31, 2023 | | Years ended April 30, 2023 | | 2022 | | 2021 | | 2020 A |
Selected Per-Share Data | | | | | | | | | | |
| Net asset value, beginning of period | $ | 13.44 | $ | 13.21 | $ | 15.31 | $ | 9.81 | $ | 10.00 |
| Income from Investment Operations | | | | | | | | | | |
Net investment income (loss) B,C | | .05 | | .11 | | .04 | | .03 | | .06 |
| Net realized and unrealized gain (loss) | | (.43) | | .21 | | (1.70) | | 5.51 | | (.22) |
| Total from investment operations | | (.38) | | .32 | | (1.66) | | 5.54 | | (.16) |
| Distributions from net investment income | | (.02) | | (.09) | | (.04) | | (.04) | | (.03) |
| Distributions from net realized gain | | - | | - | | (.40) | | - | | - |
| Total distributions | | (.02) | | (.09) | | (.44) | | (.04) | | (.03) |
| Net asset value, end of period | $ | 13.04 | $ | 13.44 | $ | 13.21 | $ | 15.31 | $ | 9.81 |
Total Return D,E | | (2.84)% | | 2.46% | | (11.20)% | | 56.52% | | (1.63)% |
Ratios to Average Net Assets B,F,G | | | | | | | | | | |
| Expenses before reductions | | .72% H | | .80% | | .81% | | .98% | | 2.22% |
| Expenses net of fee waivers, if any | | .72% H | | .79% | | .81% | | .98% | | 1.00% |
| Expenses net of all reductions | | .72% H | | .79% | | .81% | | .97% | | 1.00% |
| Net investment income (loss) | | .77% H | | .86% | | .28% | | .24% | | .62% |
| Supplemental Data | | | | | | | | | | |
| Net assets, end of period (000 omitted) | $ | 13,395 | $ | 13,381 | $ | 11,273 | $ | 3,874 | $ | 702 |
Portfolio turnover rate I | | 21% H | | 22% | | 48% | | 35% | | 52% |
AFor the period May 1, 2019 (commencement of operations) through April 30, 2020.
BNet investment income (loss) is affected by the timing of the declaration of dividends by any underlying mutual funds or exchange-traded funds (ETFs). Net investment income (loss) of any mutual funds or ETFs is not included in the Fund's net investment income (loss) ratio.
CCalculated based on average shares outstanding during the period.
DTotal returns for periods of less than one year are not annualized.
ETotal returns would have been lower if certain expenses had not been reduced during the applicable periods shown.
FFees and expenses of any underlying mutual funds or exchange-traded funds (ETFs) are not included in the Fund's expense ratio. The Fund indirectly bears its proportionate share of these expenses. For additional expense information related to investments in Fidelity Central Funds, please refer to the "Investments in Fidelity Central Funds" note found in the Notes to Financial Statements section of the most recent Annual or Semi-Annual report.
GExpense ratios reflect operating expenses of the class. Expenses before reductions do not reflect amounts reimbursed, waived, or reduced through arrangements with the investment adviser, brokerage services, or other offset arrangements, if applicable, and do not represent the amount paid by the class during periods when reimbursements, waivers or reductions occur.
HAnnualized.
IAmount does not include the portfolio activity of any underlying mutual funds or exchange-traded funds (ETFs).
| Fidelity Advisor® Women's Leadership Fund Class Z |
| |
| | Six months ended (Unaudited) October 31, 2023 | | Years ended April 30, 2023 | | 2022 | | 2021 | | 2020 A |
Selected Per-Share Data | | | | | | | | | | |
| Net asset value, beginning of period | $ | 13.49 | $ | 13.25 | $ | 15.35 | $ | 9.83 | $ | 10.00 |
| Income from Investment Operations | | | | | | | | | | |
Net investment income (loss) B,C | | .06 | | .13 | | .06 | | .05 | | .08 |
Net realized and unrealized gain (loss) C | | (.43) | | .21 | | (1.71) | | 5.51 | | (.22) |
| Total from investment operations | | (.37) | | .34 | | (1.65) | | 5.56 | | (.14) |
| Distributions from net investment income | | (.02) | | (.10) | | (.05) | | (.04) | | (.03) |
| Distributions from net realized gain | | - | | - | | (.40) | | - | | - |
| Total distributions | | (.02) | | (.10) | | (.45) | | (.04) | | (.03) |
| Net asset value, end of period | $ | 13.10 | $ | 13.49 | $ | 13.25 | $ | 15.35 | $ | 9.83 |
Total Return D,E | | (2.72)% | | 2.59% | | (11.13)% | | 56.63% | | (1.43)% |
Ratios to Average Net Assets B,F,G | | | | | | | | | | |
| Expenses before reductions | | .60% H | | .68% | | .69% | | .87% | | 1.88% |
| Expenses net of fee waivers, if any | | .60% H | | .67% | | .69% | | .85% | | .85% |
| Expenses net of all reductions | | .60% H | | .67% | | .69% | | .84% | | .85% |
Net investment income (loss) B | | .89% H | | .98% | | .40% | | .37% | | .76% |
| Supplemental Data | | | | | | | | | | |
| Net assets, end of period (000 omitted) | $ | 12,582 | $ | 10,181 | $ | 8,216 | $ | 9,043 | $ | 2,376 |
Portfolio turnover rate I | | 21% H | | 22% | | 48% | | 35% | | 52% |
AFor the period May 1, 2019 (commencement of operations) through April 30, 2020.
BNet investment income (loss) is affected by the timing of the declaration of dividends by any underlying mutual funds or exchange-traded funds (ETFs). Net investment income (loss) of any mutual funds or ETFs is not included in the Fund's net investment income (loss) ratio.
CCalculated based on average shares outstanding during the period.
DTotal returns for periods of less than one year are not annualized.
ETotal returns would have been lower if certain expenses had not been reduced during the applicable periods shown.
FFees and expenses of any underlying mutual funds or exchange-traded funds (ETFs) are not included in the Fund's expense ratio. The Fund indirectly bears its proportionate share of these expenses. For additional expense information related to investments in Fidelity Central Funds, please refer to the "Investments in Fidelity Central Funds" note found in the Notes to Financial Statements section of the most recent Annual or Semi-Annual report.
GExpense ratios reflect operating expenses of the class. Expenses before reductions do not reflect amounts reimbursed, waived, or reduced through arrangements with the investment adviser, brokerage services, or other offset arrangements, if applicable, and do not represent the amount paid by the class during periods when reimbursements, waivers or reductions occur.
HAnnualized.
IAmount does not include the portfolio activity of any underlying mutual funds or exchange-traded funds (ETFs).
For the period ended October 31, 2023
1. Organization.
Fidelity Women's Leadership Fund (the Fund) is a fund of Fidelity Summer Street Trust (the Trust) and is authorized to issue an unlimited number of shares. The Trust is registered under the Investment Company Act of 1940, as amended (the 1940 Act), as an open-end management investment company organized as a Massachusetts business trust. The Fund offers Class A, Class M, Class C, Fidelity Women's Leadership Fund, Class I and Class Z shares, each of which has equal rights as to assets and voting privileges. Class A, Class M, Class C, Class I and Class Z are Fidelity Advisor classes. Each class has exclusive voting rights with respect to matters that affect that class. Class C shares will automatically convert to Class A shares after a holding period of eight years from the initial date of purchase, with certain exceptions.
2. Investments in Fidelity Central Funds.
Funds may invest in Fidelity Central Funds, which are open-end investment companies generally available only to other investment companies and accounts managed by the investment adviser and its affiliates. The Schedule of Investments lists any Fidelity Central Funds held as an investment as of period end, but does not include the underlying holdings of each Fidelity Central Fund. An investing fund indirectly bears its proportionate share of the expenses of the underlying Fidelity Central Funds.
Based on its investment objective, each Fidelity Central Fund may invest or participate in various investment vehicles or strategies that are similar to those of the investing fund. These strategies are consistent with the investment objectives of the investing fund and may involve certain economic risks which may cause a decline in value of each of the Fidelity Central Funds and thus a decline in the value of the investing fund.
| Fidelity Central Fund | Investment Manager | Investment Objective | Investment Practices | Expense RatioA |
| Fidelity Money Market Central Funds | Fidelity Management & Research Company LLC (FMR) | Each fund seeks to obtain a high level of current income consistent with the preservation of capital and liquidity. | Short-term Investments | Less than .005% |
A Expenses expressed as a percentage of average net assets and are as of each underlying Central Fund's most recent annual or semi-annual shareholder report.
A complete unaudited list of holdings for each Fidelity Central Fund is available upon request or at the Securities and Exchange Commission website at www.sec.gov. In addition, the financial statements of the Fidelity Central Funds which contain the significant accounting policies (including investment valuation policies) of those funds, and are not covered by the Report of Independent Registered Public Accounting Firm, are available on the Securities and Exchange Commission website or upon request.
3. Significant Accounting Policies.
The Fund is an investment company and applies the accounting and reporting guidance of the Financial Accounting Standards Board (FASB) Accounting Standards Codification Topic 946 Financial Services - Investment Companies. The financial statements have been prepared in conformity with accounting principles generally accepted in the United States of America (GAAP), which require management to make certain estimates and assumptions at the date of the financial statements. Actual results could differ from those estimates. Subsequent events, if any, through the date that the financial statements were issued have been evaluated in the preparation of the financial statements. The Fund's Schedule of Investments lists any underlying mutual funds or exchange-traded funds (ETFs) but does not include the underlying holdings of these funds. The following summarizes the significant accounting policies of the Fund:
Investment Valuation. Investments are valued as of 4:00 p.m. Eastern time on the last calendar day of the period. The Board of Trustees (the Board) has designated the Fund's investment adviser as the valuation designee responsible for the fair valuation function and performing fair value determinations as needed. The investment adviser has established a Fair Value Committee (the Committee) to carry out the day-to-day fair valuation responsibilities and has adopted policies and procedures to govern the fair valuation process and the activities of the Committee. In accordance with these fair valuation policies and procedures, which have been approved by the Board, the Fund attempts to obtain prices from one or more third party pricing services or brokers to value its investments. When current market prices, quotations or currency exchange rates are not readily available or reliable, investments will be fair valued in good faith by the Committee, in accordance with the policies and procedures. Factors used in determining fair value vary by investment type and may include market or investment specific events, transaction data, estimated cash flows, and market observations of comparable investments. The frequency that the fair valuation procedures are used cannot be predicted and they may be utilized to a significant extent. The Committee manages the Fund's fair valuation practices and maintains the fair valuation policies and procedures. The Fund's investment adviser reports to the Board information regarding the fair valuation process and related material matters.
The Fund categorizes the inputs to valuation techniques used to value its investments into a disclosure hierarchy consisting of three levels as shown below:
Level 1 - unadjusted quoted prices in active markets for identical investments
Level 2 - other significant observable inputs (including quoted prices for similar investments, interest rates, prepayment speeds, etc.)
Level 3 - unobservable inputs (including the Fund's own assumptions based on the best information available)
Valuation techniques used to value the Fund's investments by major category are as follows:
Equity securities, including restricted securities, for which market quotations are readily available, are valued at the last reported sale price or official closing price as reported by a third party pricing service on the primary market or exchange on which they are traded and are categorized as Level 1 in the hierarchy. In the event there were no sales during the day or closing prices are not available, securities are valued at the last quoted bid price or may be valued using the last available price and are generally categorized as Level 2 in the hierarchy. For foreign equity securities, when market or security specific events arise, comparisons to the valuation of American Depositary Receipts (ADRs), futures contracts, ETFs and certain indexes as well as quoted prices for similar securities may be used and would be categorized as Level 2 in the hierarchy. For equity securities, including restricted securities, where observable inputs are limited, assumptions about market activity and risk are used and these securities may be categorized as Level 3 in the hierarchy.
Investments in open-end mutual funds, including the Fidelity Central Funds, are valued at their closing net asset value (NAV) each business day and are categorized as Level 1 in the hierarchy.
Changes in valuation techniques may result in transfers in or out of an assigned level within the disclosure hierarchy. The aggregate value of investments by input level as of October 31, 2023 is included at the end of the Fund's Schedule of Investments.
Foreign Currency. Certain Funds may use foreign currency contracts to facilitate transactions in foreign-denominated securities. Gains and losses from these transactions may arise from changes in the value of the foreign currency or if the counterparties do not perform under the contracts' terms.
Foreign-denominated assets, including investment securities, and liabilities are translated into U.S. dollars at the exchange rates at period end. Purchases and sales of investment securities, income and dividends received, and expenses denominated in foreign currencies are translated into U.S. dollars at the exchange rate in effect on the transaction date.
The effects of exchange rate fluctuations on investments are included with the net realized and unrealized gain (loss) on investment securities. Other foreign currency transactions resulting in realized and unrealized gain (loss) are disclosed separately.
Investment Transactions and Income. For financial reporting purposes, the Fund's investment holdings and NAV include trades executed through the end of the last business day of the period. The NAV per share for processing shareholder transactions is calculated as of the close of business of the New York Stock Exchange (NYSE), normally 4:00 p.m. Eastern time and includes trades executed through the end of the prior business day. Gains and losses on securities sold are determined on the basis of identified cost and include proceeds received from litigation. Commissions paid to certain brokers with whom the investment adviser, or its affiliates, places trades on behalf of a fund include an amount in addition to trade execution, which may be rebated back to a fund. Any such rebates are included in net realized gain (loss) on investments in the Statement of Operations. Dividend income is recorded on the ex-dividend date except for certain dividends from foreign securities where the ex-dividend date may have passed, which are recorded as soon as the Fund is informed of the ex-dividend date. Non-cash dividends included in dividend income, if any, are recorded at the fair market value of the securities received. Income and capital gain distributions from Fidelity Central Funds, if any, are recorded on the ex-dividend date. Certain distributions received by the Fund represent a return of capital or capital gain. The Fund determines the components of these distributions subsequent to the ex-dividend date, based upon receipt of tax filings or other correspondence relating to the underlying investment. These distributions are recorded as a reduction of cost of investments and/or as a realized gain. Investment income is recorded net of foreign taxes withheld where recovery of such taxes is uncertain. Funds may file withholding tax reclaims in certain jurisdictions to recover a portion of amounts previously withheld. Any withholding tax reclaims income is included in the Statement of Operations in dividends. Any receivables for withholding tax reclaims are included in the Statement of Assets and Liabilities in reclaims receivable.
Class Allocations and Expenses. Investment income, realized and unrealized capital gains and losses, common expenses of a fund, and certain fund-level expense reductions, if any, are allocated daily on a pro-rata basis to each class based on the relative net assets of each class to the total net assets of a fund. Each class differs with respect to transfer agent and distribution and service plan fees incurred, as applicable. Certain expense reductions may also differ by class, if applicable. For the reporting period, the allocated portion of income and expenses to each class as a percent of its average net assets may vary due to the timing of recording these transactions in relation to fluctuating net assets of the classes. Expenses directly attributable to a fund are charged to that fund. Expenses attributable to more than one fund are allocated among the respective funds on the basis of relative net assets or other appropriate methods. Expenses included in the accompanying financial statements reflect the expenses of that fund and do not include any expenses associated with any underlying mutual funds or exchange-traded funds (ETFs). Although not included in a fund's expenses, a fund indirectly bears its proportionate share of these expenses through the net asset value of each underlying mutual fund or exchange-traded fund (ETF). Expense estimates are accrued in the period to which they relate and adjustments are made when actual amounts are known.
Income Tax Information and Distributions to Shareholders. Each year, the Fund intends to qualify as a regulated investment company under Subchapter M of the Internal Revenue Code, including distributing substantially all of its taxable income and realized gains. As a result, no provision for U.S. Federal income taxes is required. The Fund files a U.S. federal tax return, in addition to state and local tax returns as required. The Fund's federal income tax returns are subject to examination by the Internal Revenue Service (IRS) for a period of three fiscal years after they are filed. State and local tax returns may be subject to examination for an additional fiscal year depending on the jurisdiction. Foreign taxes are provided for based on the Fund's understanding of the tax rules and rates that exist in the foreign markets in which it invests. The Fund is subject to a tax imposed on capital gains by certain countries in which it invests.
Distributions are declared and recorded on the ex-dividend date. Income and capital gain distributions are declared separately for each class. Income and capital gain distributions are determined in accordance with income tax regulations, which may differ from GAAP.
Capital accounts within the financial statements are adjusted for permanent book-tax differences. These adjustments have no impact on net assets or the results of operations. Capital accounts are not adjusted for temporary book-tax differences which will reverse in a subsequent period.
Book-tax differences are primarily due to foreign currency transactions, capital loss carryforwards and losses deferred due to wash sales and excise tax regulations.
As of period end, the cost and unrealized appreciation (depreciation) in securities, and derivatives if applicable, for federal income tax purposes were as follows:
| Gross unrealized appreciation | $23,151,709 |
| Gross unrealized depreciation | (15,092,245) |
| Net unrealized appreciation (depreciation) | $8,059,464 |
| Tax cost | $126,660,863 |
Capital loss carryforwards are only available to offset future capital gains of the Fund to the extent provided by regulations and may be limited. The capital loss carryforward information presented below, including any applicable limitation, is estimated as of prior fiscal period end and is subject to adjustment.
Short-term | $(5,078,623) |
| Total capital loss carryforward | $(5,078,623) |
Restricted Securities (including Private Placements). Funds may invest in securities that are subject to legal or contractual restrictions on resale. These securities generally may be resold in transactions exempt from registration or to the public if the securities are registered. Disposal of these securities may involve time-consuming negotiations and expense, and prompt sale at an acceptable price may be difficult. Information regarding restricted securities held at period end is included at the end of the Schedule of Investments, if applicable.
4. Purchases and Sales of Investments.
Purchases and sales of securities, other than short-term securities and in-kind transactions, as applicable, are noted in the table below.
| | Purchases ($) | Sales ($) |
| Fidelity Women's Leadership Fund | 15,253,357 | 22,961,699 |
5. Fees and Other Transactions with Affiliates.
Management Fee. Fidelity Management & Research Company LLC (the investment adviser) and its affiliates provide the Fund with investment management related services for which the Fund pays a monthly management fee. The management fee is the sum of an individual fund fee rate that is based on an annual rate of .30% of the Fund's average net assets and an annualized group fee rate that averaged .23% during the period. The group fee rate is based upon the monthly average net assets of a group of registered investment companies with which the investment adviser has management contracts. The group fee rate decreases as assets under management increase and increases as assets under management decrease. In addition, the management fee is subject to a performance adjustment (up to a maximum of +/- .10% of the Fund's average net assets over a 36 month performance period). The upward or downward adjustment to the management fee is based on the relative investment performance of Fidelity Women's Leadership Fund as compared to its benchmark index, the Russell 3000 Index, over the same 36 month performance period. For the reporting period, the total annualized management fee rate, including the performance adjustment, was .44% of the Fund's average net assets. The performance adjustment included in the management fee rate may be higher or lower than the maximum performance adjustment rate due to the difference between the average net assets for the reporting and performance periods.
Distribution and Service Plan Fees. In accordance with Rule 12b-1 of the 1940 Act, the Fund has adopted separate Distribution and Service Plans for each class of shares. Certain classes pay Fidelity Distributors Company LLC (FDC), an affiliate of the investment adviser, separate Distribution and Service Fees, each of which is based on an annual percentage of each class' average net assets. In addition, FDC may pay financial intermediaries for selling shares of the Fund and providing shareholder support services. For the period, the Distribution and Service Fee rates, total fees and amounts retained by FDC were as follows:
| | Distribution Fee | Service Fee | Total Fees | Retained by FDC |
| Class A | -% | .25% | $8,040 | $99 |
| Class M | .25% | .25% | 2,911 | - |
| Class C | .75% | .25% | 8,263 | 774 |
| | | | $19,214 | $873 |
Sales Load. FDC may receive a front-end sales charge of up to 5.75% for selling Class A shares and 3.50% for selling Class M shares, some of which is paid to financial intermediaries for selling shares of the Fund. Depending on the holding period, FDC may receive contingent deferred sales charges levied on Class A, Class M and Class C redemptions. The deferred sales charges are 1.00% for Class C shares, 1.00% for certain purchases of Class A shares and .25% for certain purchases of Class M shares.
For the period, sales charge amounts retained by FDC were as follows:
| | Retained by FDC |
| Class A | $3,349 |
| Class M | 97 |
Class CA | 2 |
| | $3,448 |
A When Class C shares are initially sold, FDC pays commissions from its own resources to financial intermediaries through which the sales are made.
Transfer Agent Fees. Fidelity Investments Institutional Operations Company LLC (FIIOC), an affiliate of the investment adviser, is the transfer, dividend disbursing and shareholder servicing agent for each class of the Fund. FIIOC receives account fees and asset-based fees that vary according to the account size and type of account of the shareholders of the respective classes of the Fund, except for Class Z. FIIOC receives an asset-based fee of Class Z's average net assets. FIIOC pays for typesetting, printing and mailing of shareholder reports, except proxy statements.
For the period, transfer agent fees for each class were as follows:
| | Amount | % of Class-Level Average Net Assets A |
| Class A | $6,638 | .21 |
| Class M | 1,360 | .23 |
| Class C | 1,857 | .22 |
| Fidelity Women's Leadership Fund | 148,445 | .26 |
| Class I | 11,411 | .16 |
| Class Z | 2,505 | .04 |
| | $172,216 | |
A Annualized
During November 2023, the Board approved a change in the transfer agent fees effective December 1, 2023 to a fixed annual rate of class-level average net assets as follows:
| | % of Class-Level Average Net Assets |
| Class A | 0.2000% |
| Class M | 0.2000% |
| Class C | 0.2000% |
| Fidelity Women's Leadership Fund | 0.1597% |
| Class I | 0.2000% |
Accounting Fees. Fidelity Service Company, Inc. (FSC), an affiliate of the investment adviser, maintains the Fund's accounting records. The accounting fee is based on the level of average net assets for each month. For the period, the fees were equivalent to the following annualized rates:
| | % of Average Net Assets |
| Fidelity Women's Leadership Fund | .04 |
During November 2023, the Board approved a change in the accounting fees effective December 1, 2023 to a fixed annual rate of average net assets as follows:
| | % of Average Net Assets |
| Fidelity Women's Leadership Fund | 0.0354% |
Brokerage Commissions. A portion of portfolio transactions were placed with brokerage firms which are affiliates of the investment adviser. Brokerage commissions are included in net realized gain (loss) and change in net unrealized appreciation (depreciation) in the Statement of Operations. The commissions paid to these affiliated firms were as follows:
| | Amount |
| Fidelity Women's Leadership Fund | $ 345 |
Interfund Trades. Funds may purchase from or sell securities to other Fidelity Funds under procedures adopted by the Board. The procedures have been designed to ensure these interfund trades are executed in accordance with Rule 17a-7 of the 1940 Act. Any interfund trades are included within the respective purchases and sales amounts shown in the Purchases and Sales of Investments note. Interfund trades during the period are noted in the table below.
| | Purchases ($) | Sales ($) | Realized Gain (Loss) ($) |
| Fidelity Women's Leadership Fund | - | 1,219,910 | 113,830 |
6. Committed Line of Credit.
Certain Funds participate with other funds managed by the investment adviser or an affiliate in a $4.25 billion credit facility (the "line of credit") to be utilized for temporary or emergency purposes to fund shareholder redemptions or for other short-term liquidity purposes. The participating funds have agreed to pay commitment fees on their pro-rata portion of the line of credit, which are reflected in Miscellaneous expenses on the Statement of Operations, and are listed below. During the period, there were no borrowings on this line of credit.
| | Amount |
| Fidelity Women's Leadership Fund | $125 |
7. Expense Reductions.
Through arrangements with the Fund's custodian and each class' transfer agent, credits realized as a result of certain uninvested cash balances were used to reduce the Fund's expenses. During the period, custodian credits reduced the Fund's expenses by $116. During the period, transfer agent credits reduced each class' expenses as noted in the table below.
| | Expense reduction |
| Class A | $17 |
| Class C | 2 |
| | $19 |
In addition, during the period the investment adviser or an affiliate reimbursed and/or waived a portion of fund-level operating expenses in the amount of $5,584.
8. Distributions to Shareholders.
Distributions to shareholders of each class were as follows:
| | Six months ended hdrPeriod | Year ended April 30, 2023 |
| Fidelity Women's Leadership Fund | | |
| Distributions to shareholders | | |
| Class A | $2,769 | $27,652 |
| Class M | - | 3,208 |
| Fidelity Women's Leadership Fund | 126,323 | 578,127 |
| Class I | 19,286 | 87,523 |
| Class Z | 19,451 | 58,888 |
Total | $167,829 | $755,398 |
9. Share Transactions.
Share transactions for each class were as follows and may contain in-kind transactions, automatic conversions between classes or exchanges between affiliated funds:
| | Shares | Shares | Dollars | Dollars |
| | Six months ended October 31, 2023 | Year ended April 30, 2023 | Six months ended October 31, 2023 | Year ended April 30, 2023 |
| Fidelity Women's Leadership Fund | | | | |
| Class A | | | | |
| Shares sold | 43,320 | 141,008 | $600,144 | $1,797,187 |
| Reinvestment of distributions | 195 | 2,161 | 2,694 | 27,138 |
| Shares redeemed | (19,852) | (79,981) | (278,456) | (1,015,214) |
| Net increase (decrease) | 23,663 | 63,188 | $324,382 | $809,111 |
| Class M | | | | |
| Shares sold | 1,481 | 11,061 | $20,364 | $139,353 |
| Reinvestment of distributions | - | 256 | - | 3,208 |
| Shares redeemed | (178) | (7,469) | (2,385) | (93,120) |
| Net increase (decrease) | 1,303 | 3,848 | $17,979 | $49,441 |
| Class C | | | | |
| Shares sold | 7,804 | 20,115 | $106,712 | $255,147 |
| Shares redeemed | (10,861) | (16,959) | (148,745) | (213,813) |
| Net increase (decrease) | (3,057) | 3,156 | $(42,033) | $41,334 |
| Fidelity Women's Leadership Fund | | | | |
| Shares sold | 526,600 | 2,347,545 | $7,349,761 | $30,916,025 |
| Reinvestment of distributions | 8,470 | 42,668 | 117,649 | 537,622 |
| Shares redeemed | (1,441,577) | (1,511,874) | (19,987,642) | (19,406,034) |
| Net increase (decrease) | (906,507) | 878,339 | $(12,520,232) | $12,047,613 |
| Class I | | | | |
| Shares sold | 256,057 | 444,612 | $3,412,120 | $5,699,005 |
| Reinvestment of distributions | 1,369 | 6,932 | 18,997 | 87,280 |
| Shares redeemed | (226,312) | (309,351) | (3,094,660) | (3,964,930) |
| Net increase (decrease) | 31,114 | 142,193 | $336,457 | $1,821,355 |
| Class Z | | | | |
| Shares sold | 246,402 | 325,511 | $3,421,789 | $4,239,577 |
| Reinvestment of distributions | 1,224 | 4,454 | 17,046 | 56,255 |
| Shares redeemed | (41,676) | (195,364) | (581,594) | (2,559,457) |
| Net increase (decrease) | 205,950 | 134,601 | $2,857,241 | $1,736,375 |
10. Other.
A fund's organizational documents provide former and current trustees and officers with a limited indemnification against liabilities arising in connection with the performance of their duties to the fund. In the normal course of business, a fund may also enter into contracts that provide general indemnifications. A fund's maximum exposure under these arrangements is unknown as this would be dependent on future claims that may be made against a fund. The risk of material loss from such claims is considered remote.
11. Risk and Uncertainties.
Many factors affect a fund's performance. Developments that disrupt global economies and financial markets, such as pandemics, epidemics, outbreaks of infectious diseases, war, terrorism, and environmental disasters, may significantly affect a fund's investment performance. The effects of these developments to a fund will be impacted by the types of securities in which a fund invests, the financial condition, industry, economic sector, and geographic location of an issuer, and a fund's level of investment in the securities of that issuer. Significant concentrations in security types, issuers, industries, sectors, and geographic locations may magnify the factors that affect a fund's performance.
As a shareholder, you incur two types of costs: (1) transaction costs, which may include sales charges (loads) on purchase payments or redemption proceeds, as applicable and (2) ongoing costs, which generally include management fees, distribution and/or service (12b-1) fees and other Fund expenses. This Example is intended to help you understand your ongoing costs (in dollars) of investing in a fund and to compare these costs with the ongoing costs of investing in other mutual funds.
| The Example is based on an investment of $1,000 invested at the beginning of the period and held for the entire period (May 1, 2023 to October 31, 2023). |
Actual Expenses
The first line of the accompanying table provides information about actual account values and actual expenses. You may use the information in this line, together with the amount you invested, to estimate the expenses that you paid over the period. Simply divide your account value by $1,000.00 (for example, an $8,600 account value divided by $1,000.00 = 8.6), then multiply the result by the number in the first line for a class/Fund under the heading entitled "Expenses Paid During Period" to estimate the expenses you paid on your account during this period. If any fund is a shareholder of any underlying mutual funds or exchange-traded funds (ETFs) (the Underlying Funds), such fund indirectly bears its proportional share of the expenses of the Underlying Funds in addition to the direct expenses incurred presented in the table. These fees and expenses are not included in the annualized expense ratio used to calculate the expense estimate in the table below.
Hypothetical Example for Comparison Purposes
The second line of the accompanying table provides information about hypothetical account values and hypothetical expenses based on the actual expense ratio and an assumed rate of return of 5% per year before expenses, which is not the actual return. The hypothetical account values and expenses may not be used to estimate the actual ending account balance or expenses you paid for the period. You may use this information to compare the ongoing costs of investing in the Fund and other funds. To do so, compare this 5% hypothetical example with the 5% hypothetical examples that appear in the shareholder reports of the other funds. If any fund is a shareholder of any Underlying Funds, such fund indirectly bears its proportional share of the expenses of the Underlying Funds in addition to the direct expenses as presented in the table. These fees and expenses are not included in the annualized expense ratio used to calculate the expense estimate in the table below.
Please note that the expenses shown in the table are meant to highlight your ongoing costs only and do not reflect any transaction costs. Therefore, the second line of the table is useful in comparing ongoing costs only, and will not help you determine the relative total costs of owning different funds. In addition, if these transactional costs were included, your costs would have been higher.
| | | | | Annualized Expense Ratio- A | | Beginning Account Value May 1, 2023 | | Ending Account Value October 31, 2023 | | Expenses Paid During Period- C May 1, 2023 to October 31, 2023 |
| Fidelity® Women's Leadership Fund | | | | | | | | | | |
| Class A | | | | 1.01% | | | | | | |
| Actual | | | | | | $ 1,000 | | $ 970.50 | | $ 5.00 |
Hypothetical-B | | | | | | $ 1,000 | | $ 1,020.06 | | $ 5.13 |
| Class M | | | | 1.29% | | | | | | |
| Actual | | | | | | $ 1,000 | | $ 969.30 | | $ 6.39 |
Hypothetical-B | | | | | | $ 1,000 | | $ 1,018.65 | | $ 6.55 |
| Class C | | | | 1.78% | | | | | | |
| Actual | | | | | | $ 1,000 | | $ 966.60 | | $ 8.80 |
Hypothetical-B | | | | | | $ 1,000 | | $ 1,016.19 | | $ 9.02 |
Fidelity® Women's Leadership Fund ** | | | | .81% | | | | | | |
| Actual | | | | | | $ 1,000 | | $ 971.30 | | $ 4.01 |
Hypothetical-B | | | | | | $ 1,000 | | $ 1,021.06 | | $ 4.12 |
| Class I | | | | .72% | | | | | | |
| Actual | | | | | | $ 1,000 | | $ 971.60 | | $ 3.57 |
Hypothetical-B | | | | | | $ 1,000 | | $ 1,021.52 | | $ 3.66 |
| Class Z | | | | .60% | | | | | | |
| Actual | | | | | | $ 1,000 | | $ 972.80 | | $ 2.98 |
Hypothetical-B | | | | | | $ 1,000 | | $ 1,022.12 | | $ 3.05 |
| |
A Annualized expense ratio reflects expenses net of applicable fee waivers.
B 5% return per year before expenses
C Expenses are equal to the annualized expense ratio, multiplied by the average account value over the period, multiplied by 184/ 366 (to reflect the one-half year period). The fees and expenses of any Underlying Funds are not included in each annualized expense ratio.
** If fees and changes to the expense contract and/or expense cap, effective December 1, 2023, had been in effect during the current period, the restated annualized expense ratio and the expenses paid in the actual and hypothetical examples above would have been as shown in table below:
| | | | | Annualized Expense Ratio- A | | Expenses Paid |
| Fidelity® Women's Leadership Fund | | | | | | |
| Fidelity® Women's Leadership Fund | | | | .75% | | |
| Actual | | | | | | $ 3.72 |
Hypothetical- B | | | | | | $ 3.81 |
| | | | | | | |
| A Annualized expense ratio reflects expenses net of applicable fee waivers. | | | | | | |
| B 5% return per year before expenses | | | | | | |
Board Approval of Investment Advisory Contracts and Management Fees
Fidelity Women's Leadership Fund
Each year, the Board of Trustees, including the Independent Trustees (together, the Board), considers the renewal of the fund's management contract with Fidelity Management & Research Company LLC (FMR) and the sub-advisory agreements (together, the Advisory Contracts) for the fund. FMR and the sub-advisers are referred to herein as the Investment Advisers. The Board, assisted by the advice of fund counsel and Independent Trustees' counsel, requests and considers a broad range of information relevant to the renewal of the Advisory Contracts throughout the year.
The Board meets regularly and, at each of its meetings, covers an extensive agenda of topics and materials and considers factors that are relevant to its annual consideration of the renewal of the fund's Advisory Contracts, including the services and support provided to the fund and its shareholders. The Board, acting directly and through its Committees (each of which is composed of and chaired by Independent Trustees), requests and receives information concerning the annual consideration of the renewal of the fund's Advisory Contracts. The Board also meets as needed to review matters specifically related to the Board's annual consideration of the renewal of the Advisory Contracts. Members of the Board may also meet with trustees of other Fidelity funds through joint ad hoc committees to discuss certain matters relevant to all of the Fidelity funds.
Approval of Stub Period Continuation. At its May 2023 meeting, the Board of Trustees voted to continue the fund's management contract with FMR, and the sub-advisory agreements and sub-sub-advisory agreements, in each case, where applicable (together, the Advisory Contracts), without modification, for two months from June 1, 2023 through July 31, 2023. The Board considered that the approval of the fund's Advisory Contracts will not result in any changes in (i) the investment process or strategies employed in the management of the fund's assets; (ii) the fees and expenses paid by shareholders; (iii) the nature, extent or quality of services provided under the fund's Advisory Contracts; or (iv) the day-to-day management of the fund or the persons primarily responsible for such management. The Board also considered that since its last approval of the fund's Advisory Contracts, FMR had provided additional information on the fund in support of the annual contract renewal process, including competitive analyses on total expenses and management fees and in-depth reviews of fund performance and fund profitability information. The Board concluded that the fund's Advisory Contracts are fair and reasonable, and that the fund's Advisory Contracts should be renewed, without modification, through July 31, 2023, with the understanding that the Board would consider the annual renewal for a full one year period in July 2023.
At its July 2023 meeting, the Board unanimously determined to renew the fund's Advisory Contracts. In reaching its determination, the Board considered all factors it believed relevant, including (i) the nature, extent, and quality of the services provided to the fund and its shareholders (including the investment performance of the fund); (ii) the competitiveness relative to peer funds of the fund's management fee and the total expense ratio of a representative class (the retail class, which was selected because it was the largest class without 12b-1 fees); (iii) the total costs of the services provided by and the profits realized by FMR and its affiliates (Fidelity) from its relationships with the fund; and (iv) the extent to which, if any, economies of scale exist and are realized as the fund grows, and whether any economies of scale are appropriately shared with fund shareholders. The Board also considered the broad range of investment choices available to shareholders from FMR's competitors and that the fund's shareholders have chosen to invest in the fund, which is part of the Fidelity family of funds. The Board's decision to renew the Advisory Contracts was not based on any single factor.
The Board reached a determination, with the assistance of fund counsel and Independent Trustees' counsel and through the exercise of its business judgment, that the renewal of the Advisory Contracts was in the best interests of the fund and its shareholders and that the compensation payable under the Advisory Contracts was fair and reasonable in light of all of the surrounding circumstances.
Nature, Extent, and Quality of Services Provided. The Board considered staffing as it relates to the fund, including the backgrounds and experience of investment personnel of the Investment Advisers, and also considered the Investment Advisers' implementation of the fund's investment program. The Independent Trustees also had discussions with senior management of Fidelity's investment operations and investment groups. The Board considered the structure of the investment personnel compensation program and whether this structure provides appropriate incentives to act in the best interests of the fund. Additionally, the Board considered the portfolio managers' investments, if any, in the funds that they manage.
Resources Dedicated to Investment Management and Support Services. The Board and the Fund Oversight and Research Committees reviewed the general qualifications and capabilities of Fidelity's investment staff, including its size, education, experience, and resources, as well as Fidelity's approach to recruiting, training, managing, and compensating investment personnel. The Board noted the resources devoted to expansion of Fidelity's global investment organization, and that Fidelity's analysts have extensive resources, tools, and capabilities that allow them to conduct sophisticated quantitative and fundamental analysis, as well as credit analysis of issuers, counterparties, and guarantors. Further, the Board considered that Fidelity's investment professionals have sufficient access to global information and data so as to provide competitive investment results over time, and that those professionals also have access to sophisticated tools that permit them to assess portfolio construction and risk and performance attribution characteristics continuously, as well as to transmit new information and research conclusions rapidly around the world. Additionally, in its deliberations, the Board considered Fidelity's trading, risk management, compliance, and technology and operations capabilities and resources, which are integral parts of the investment management process.
Shareholder and Administrative Services. The Board considered (i) the nature, extent, quality, and cost of advisory, administrative, and shareholder services performed by the Investment Advisers and their affiliates under the Advisory Contracts and under separate agreements covering transfer agency, pricing and bookkeeping, and securities lending services for the fund; (ii) the nature and extent of Fidelity's supervision of third party service providers, principally custodians, subcustodians, and pricing vendors; and (iii) the resources devoted by Fidelity to, and the record of compliance with, the fund's compliance policies and procedures. The Board also reviewed the allocation of fund brokerage, including allocations to brokers affiliated with the Investment Advisers, the use of brokerage commissions to pay fund expenses, and the use of "soft" commission dollars to pay for research services. The Board also considered the fund's securities lending activities and any payments made to Fidelity relating to securities lending.
The Board noted that the growth of fund assets over time across the complex allows Fidelity to reinvest in the development of services designed to enhance the value and convenience of the Fidelity funds as investment vehicles. These services include 24-hour access to account information and market information over the Internet and through telephone representatives, investor education materials and asset allocation tools. The Board also considered that it reviews customer service metrics such as telephone response times, continuity of services on the website and metrics addressing services at Fidelity Investor Centers.
Investment in a Large Fund Family. The Board considered the benefits to shareholders of investing in a fund that is part of a large family of funds offering a variety of investment disciplines and providing a large variety of fund investor services. The Board noted that Fidelity had taken, or had made recommendations that resulted in the Fidelity funds taking, a number of actions over the previous year that benefited particular funds and/or the Fidelity funds in general.
Investment Performance. The Board took into account discussions that occur with representatives of the Investment Advisers, and reports that it receives, at Board meetings throughout the year, relating to fund investment performance. In this regard the Board noted that as part of regularly scheduled fund reviews and other reports to the Board on fund performance, the Board considered annualized return information for the fund for different time periods, measured against an appropriate securities market index (benchmark index). The Board also considered information about performance attribution. In its ongoing evaluation of fund investment performance, the Board gives particular attention to information indicating changes in performance of the funds over different time periods and discussed with the Investment Advisers the reasons for any overperformance or underperformance.
In addition to reviewing absolute and relative fund performance, the Independent Trustees periodically consider the appropriateness of fund performance metrics in evaluating the results achieved. The Independent Trustees generally give greater weight to fund performance over longer time periods than over shorter time periods. Depending on the circumstances, the Independent Trustees may be satisfied with a fund's performance notwithstanding that it lags its benchmark index for certain periods.
Based on its review, the Board concluded that the nature, extent, and quality of services provided to the fund under the Advisory Contracts should continue to benefit the shareholders of the fund.
Competitiveness of Management Fee and Total Expense Ratio. The Board was provided with information regarding industry trends in management fees and expenses. In its review of the fund's management fee and the total expense ratio of the retail class, the Board considered the fund's management fee rate as well as other fund or class expenses, as applicable, such as transfer agent fees, pricing and bookkeeping fees, fund-paid 12b-1 fees, and custodial, legal, and audit fees. The Board noted that Fidelity may agree to waive fees or reimburse expenses from time to time, and the extent to which, if any, it has done so for the fund. The Board also considered information about the impact of the fund's performance adjustment.
Comparisons of Management Fees and Total Expense Ratios. Among other things, the Board reviewed data for selected groups of competitive funds and classes (referred to as "mapped groups") that were compiled by Fidelity based on combining similar investment objective categories (as classified by Lipper) that have comparable investment mandates. The data reviewed by the Board included (i) gross management fee comparisons (before taking into account expense reimbursements or caps and without taking into account the fund's performance adjustment) relative to the total universe of funds within the mapped group; (ii) gross management fee comparisons relative to a subset of non-Fidelity funds in the mapped group that are similar in size and management fee structure to the fund (referred to as the "asset size peer group"); (iii) total expense comparisons of the retail class of the fund relative to funds and classes in the mapped group that have a similar sales load structure to the retail class of the fund (referred to as the "similar sales load structure group"); and (iv) total expense comparisons of the retail class of the fund relative to funds and classes in the similar sales load structure group that are similar in size and management fee structure to the fund (referred to as the "total expense asset size peer group"). The total expense asset size peer group comparison excludes performance adjustments and fund-paid 12b-1 fees to eliminate variability in fee structures.
The information provided to the Board indicated that the fund's management fee rate ranked below the competitive median of the mapped group for the 12-month period ended September 30, 2022 and below the competitive median of the asset size peer group for the 12-month period ended September 30, 2022. Further, the information provided to the Board indicated that the total expense ratio of the retail class of the fund ranked below the competitive median of the similar sales load structure group for the 12-month period ended September 30, 2022 and below the competitive median of the total expense asset size peer group for the 12-month period ended September 30, 2022.
The Board also considered that, for funds subject to the group fee, FMR agreed to voluntarily waive fees over a specified period of time in amounts designed to account for assets converted from certain funds to certain collective investment trusts.
The Board also considered that the fund's management fee is subject to upward or downward adjustment depending upon whether, and to what extent, the fund's investment performance for the performance period (a rolling 36-month period) exceeds, or is exceeded by, a securities index, thus leading to a performance adjustment for the same period. The Board noted that the performance adjustment provides FMR with a strong economic incentive to seek to achieve superior long-term performance for the fund's shareholders and helps to more closely align the interests of FMR and the shareholders of the fund.
In connection with its consideration of the fund's performance adjustment, the Board noted that the performance of the retail class is used for purposes of determining the performance adjustment. The Board noted that to the extent the performance adjustment was based on the performance of a share class with higher total annual operating expenses, the fund would be subject to a smaller positive and larger negative performance adjustment. The Board considered the appropriateness of the use of the retail class as the basis for the performance adjustment. The Board noted that the retail class is typically the largest class (reflecting the actual investment experience for the plurality of shareholders), employs a standard expense structure, and does not include fund-paid 12b-1 fees, which Fidelity believes makes it a more appropriate measurement of Fidelity's investment skill.
Other Contractual Arrangements. The Board considered that FMR has contractually agreed to reimburse Class A, Class M, Class C, Class I, Class Z, and the retail class of the fund to the extent that total operating expenses (excluding interest, certain taxes, fees and expenses associated with a wholly owned subsidiary, if any, as well as non-operating expenses such as brokerage commissions and fees and expenses associated with the fund's securities lending program, if applicable) as a percentage of their respective average net assets, exceed 1.15%, 1.40%, 1.90%, 0.90%, 0.75%, and 0.90% through August 31, 2024.
Fees Charged to Other Fidelity Clients. The Board also considered Fidelity fee structures and other information with respect to clients of Fidelity, such as other funds advised or subadvised by Fidelity, pension plan clients, and other institutional clients with similar mandates. The Board noted that a joint ad hoc committee created by it and the boards of other Fidelity funds periodically reviews and compares Fidelity's institutional investment advisory business with its business of providing services to the Fidelity funds and also noted the most recent findings of the committee. The Board noted that the committee's review included a consideration of the differences in services provided, fees charged, and costs incurred, as well as competition in the markets serving the different categories of clients.
Based on its review, the Board concluded that the fund's management fee, including the use of the retail class as the basis for the performance adjustment, is fair and reasonable in light of the services that the fund receives and the other factors considered. Further, based on its review of total expense ratios and fees charged to other Fidelity clients, the Board concluded that the total expense ratio of each class of the fund was reasonable in light of the services that the fund and its shareholders receive and the other factors considered.
Costs of the Services and Profitability. The Board considered the revenues earned and the expenses incurred by Fidelity in conducting the business of developing, marketing, distributing, managing, administering and servicing the fund and servicing the fund's shareholders. The Board also considered the level of Fidelity's profits in respect of all the Fidelity funds.
On an annual basis, Fidelity presents to the Board information about the profitability of its relationships with the fund. Fidelity calculates profitability information for each fund, as well as aggregate profitability information for groups of Fidelity funds and all Fidelity funds, using a series of detailed revenue and cost allocation methodologies which originate with the books and records of Fidelity on which Fidelity's audited financial statements are based. The Audit Committee of the Board reviews any significant changes from the prior year's methodologies and the full Board approves such changes.
A public accounting firm has been engaged annually by the Board as part of the Board's assessment of Fidelity's profitability analysis. The engagement includes the review and assessment of the methodologies used by Fidelity in determining the revenues and expenses attributable to Fidelity's fund business, and completion of agreed-upon procedures in respect of the mathematical accuracy of certain fund profitability information and its conformity to established allocation methodologies. After considering the reports issued under the engagement and information provided by Fidelity, the Board concluded that while other allocation methods may also be reasonable, Fidelity's profitability methodologies are reasonable in all material respects.
The Board also reviewed Fidelity's non-fund businesses and potential indirect benefits such businesses may have received as a result of their association with Fidelity's fund business (i.e., fall-out benefits) as well as cases where Fidelity's affiliates may benefit from the funds' business. The Board considered areas where potential indirect benefits to the Fidelity funds from their relationships with Fidelity may exist. The Board's consideration of these matters was informed by the findings of a joint ad hoc committee created by it and the boards of other Fidelity funds to evaluate potential fall-out benefits.
The Board considered the costs of the services provided by and the profits realized by Fidelity in connection with the operation of the fund and was satisfied that the profitability was not excessive.
Economies of Scale. The Board considered whether there have been economies of scale in respect of the management of the Fidelity funds, whether the Fidelity funds (including the fund) have appropriately benefited from any such economies of scale, and whether there is potential for realization of any further economies of scale. The Board considered the extent to which the fund will benefit from economies of scale as assets grow through increased services to the fund, through waivers or reimbursements, or through fee or expense ratio reductions. The Board also noted that a committee (the Economies of Scale Committee) created by it and the boards of other Fidelity funds periodically analyzes whether Fidelity attains economies of scale in respect of the management and servicing of the Fidelity funds, whether the Fidelity funds have appropriately benefited from such economies of scale, and whether there is potential for realization of any further economies of scale.
The Board recognized that the fund's management contract incorporates a "group fee" structure, which provides for lower group fee rates as total "group assets" increase, and for higher group fee rates as total "group assets" decrease ("group assets" as defined in the management contract). FMR calculates the group fee rates based on a tiered asset "breakpoint" schedule that varies based on asset class. The Board considered that the group fee is designed to deliver the benefits of economies of scale to fund shareholders when total Fidelity fund assets increase, even if assets of any particular fund are unchanged or have declined, because some portion of Fidelity's costs are attributable to services provided to all Fidelity funds, and all funds benefit if those costs can be allocated among more assets. The Board further considered that Fidelity agreed to impose a temporary fee waiver in the form of additional breakpoints to the current breakpoint schedule. The Board concluded that, given the group fee structure, fund shareholders will benefit from lower management fees as "group assets" increase at the fund complex level, regardless of whether Fidelity achieves any such economies of scale.
The Board concluded, taking into account the analysis of the Economies of Scale Committee, that economies of scale, if any, are being appropriately shared between fund shareholders and Fidelity.
Additional Information Requested by the Board. In order to develop fully the factual basis for consideration of the Fidelity funds' advisory contracts, the Board requested and received additional information on certain topics, including: (i) fund flow and performance trends, in particular the underperformance of certain funds and strategies, and Fidelity's long-term strategies for certain funds, including any consideration of fund liquidations or mergers; (ii) the operation of performance fees and competitor use of performance fees; (iii) Fidelity's pricing philosophy compared to competitors; (iv) fund profitability methodology and data; (v) evaluation of competitive fund data and peer group classifications and fee and expense comparisons; (vi) the management fee and expense structures for different funds and classes and information about the differences between various fee and expense structures; (vii) group fee breakpoints and related voluntary fee waivers; and (viii) information regarding other accounts managed by Fidelity and the funds' sub-advisory arrangements.
Conclusion. Based on its evaluation of all of the conclusions noted above, and after considering all factors it believed relevant, the Board, including the Independent Trustees, concluded that the advisory and sub-advisory fee arrangements are fair and reasonable in light of all of the surrounding circumstances and that the fund's Advisory Contracts should be renewed through July 31, 2024.
1.9893106.104
WLF-SANN-1223
Fidelity® High Income Fund
Semi-Annual Report
October 31, 2023
Includes Fidelity and Fidelity Advisor share classes
Contents
To view a fund's proxy voting guidelines and proxy voting record for the 12-month period ended June 30, visit http://www.fidelity.com/proxyvotingresults or visit the Securities and Exchange Commission's (SEC) web site at http://www.sec.gov.
You may also call 1-800-544-8544 if you're an individual investing directly with Fidelity, call 1-800-835-5092 if you're a plan sponsor or participant with Fidelity as your recordkeeper or call 1-877-208-0098 on institutional accounts or if you're an advisor or invest through one to request a free copy of the proxy voting guidelines.
Standard & Poor's, S&P and S&P 500 are registered service marks of The McGraw-Hill Companies, Inc. and have been licensed for use by Fidelity Distributors Corporation.
Other third-party marks appearing herein are the property of their respective owners.
All other marks appearing herein are registered or unregistered trademarks or service marks of FMR LLC or an affiliated company. © 2023 FMR LLC. All rights reserved.
This report and the financial statements contained herein are submitted for the general information of the shareholders of the Fund. This report is not authorized for distribution to prospective investors in the Fund unless preceded or accompanied by an effective prospectus.
A fund files its complete schedule of portfolio holdings with the SEC for the first and third quarters of each fiscal year on Form N-PORT. Forms N-PORT are available on the SEC's web site at http://www.sec.gov. A fund's Forms N-PORT may be reviewed and copied at the SEC's Public Reference Room in Washington, DC. Information regarding the operation of the SEC's Public Reference Room may be obtained by calling 1-800-SEC-0330.
For a complete list of a fund's portfolio holdings, view the most recent holdings listing, semiannual report, or annual report on Fidelity's web site at http://www.fidelity.com, http://www.institutional.fidelity.com, or http://www.401k.com, as applicable.
NOT FDIC INSURED •MAY LOSE VALUE •NO BANK GUARANTEE
Neither the Fund nor Fidelity Distributors Corporation is a bank.
| Top Bond Issuers (% of Fund's net assets) |
(with maturities greater than one year) |
| New Fortress Energy, Inc. | 2.0 | |
| Ford Motor Credit Co. LLC | 1.7 | |
| Community Health Systems, Inc. | 1.6 | |
| Icahn Enterprises LP/Icahn Enterprises Finance Corp. | 1.5 | |
| Uniti Group LP / Uniti Group Finance, Inc. | 1.5 | |
| Tallgrass Energy Partners LP / Tallgrass Energy Finance Corp. | 1.5 | |
| DISH Network Corp. | 1.4 | |
| Southeastern Grocers, Inc. | 1.3 | |
| MPT Operating Partnership LP/MPT Finance Corp. | 1.3 | |
| CCO Holdings LLC/CCO Holdings Corp. | 1.3 | |
| | 15.1 | |
| |
| Market Sectors (% of Fund's net assets) |
| |
| Energy | 15.0 | |
| Healthcare | 7.3 | |
| Services | 7.2 | |
| Technology | 6.5 | |
| Telecommunications | 6.0 | |
| |
Quality Diversification (% of Fund's net assets) |
|
| |
| We have used ratings from Moody's Investors Service, Inc. Where Moody's® ratings are not available, we have used S&P® ratings. All ratings are as of the date indicated and do not reflect subsequent changes. |
Asset Allocation (% of Fund's net assets) |
|
|
Geographic Diversification (% of Fund's net assets) |
|
* Includes Short-Term investments and Net Other Assets (Liabilities). Percentages are adjusted for the effect of derivatives, if applicable. |
| |
Showing Percentage of Net Assets
| Corporate Bonds - 84.3% |
| | | Principal Amount (a) (000s) | Value ($) (000s) |
| Convertible Bonds - 1.3% | | | |
| Broadcasting - 1.1% | | | |
| DISH Network Corp.: | | | |
| 2.375% 3/15/24 | | 13,488 | 12,898 |
| 3.375% 8/15/26 | | 28,589 | 14,652 |
| | | | 27,550 |
| Homebuilders/Real Estate - 0.1% | | | |
| Redfin Corp. 0.5% 4/1/27 | | 6,174 | 3,396 |
| Technology - 0.1% | | | |
| Seagate HDD Cayman 3.5% 6/1/28 (b) | | 2,701 | 2,800 |
TOTAL CONVERTIBLE BONDS | | | 33,746 |
| Nonconvertible Bonds - 83.0% | | | |
| Aerospace - 2.1% | | | |
| ATI, Inc.: | | | |
| 4.875% 10/1/29 | | 570 | 485 |
| 5.875% 12/1/27 | | 3,130 | 2,903 |
| 7.25% 8/15/30 | | 1,350 | 1,300 |
| Bombardier, Inc. 7.875% 4/15/27 (b) | | 9,547 | 9,185 |
| BWX Technologies, Inc. 4.125% 6/30/28 (b) | | 7,903 | 6,955 |
| Howmet Aerospace, Inc.: | | | |
| 5.9% 2/1/27 | | 1,380 | 1,361 |
| 6.875% 5/1/25 | | 1,380 | 1,385 |
| Kaiser Aluminum Corp.: | | | |
| 4.5% 6/1/31 (b) | | 360 | 266 |
| 4.625% 3/1/28 (b) | | 1,205 | 1,004 |
| Moog, Inc. 4.25% 12/15/27 (b) | | 410 | 365 |
| TransDigm, Inc.: | | | |
| 4.625% 1/15/29 | | 5,930 | 5,113 |
| 5.5% 11/15/27 | | 20,422 | 18,967 |
| 6.25% 3/15/26 (b) | | 1,225 | 1,196 |
| 6.75% 8/15/28 (b) | | 4,100 | 3,981 |
| VistaJet Malta Finance PLC / XO Management Holding, Inc. 9.5% 6/1/28 (b) | | 1,065 | 816 |
| | | | 55,282 |
| Air Transportation - 1.1% | | | |
| Air Canada 3.875% 8/15/26 (b) | | 2,030 | 1,847 |
| American Airlines, Inc. 7.25% 2/15/28 (b) | | 1,370 | 1,274 |
| American Airlines, Inc. / AAdvantage Loyalty IP Ltd. 5.5% 4/20/26 (b) | | 7,671 | 7,459 |
| Forward Air Corp. 9.5% 10/15/31 (b) | | 1,115 | 1,087 |
| Mileage Plus Holdings LLC 6.5% 6/20/27 (b) | | 1,035 | 1,022 |
| Rand Parent LLC 8.5% 2/15/30 (b) | | 12,038 | 10,993 |
| Spirit Loyalty Cayman Ltd. / Spirit IP Cayman Ltd. 8% 9/20/25 (b) | | 5,235 | 4,136 |
| | | | 27,818 |
| Automotive - 0.3% | | | |
| Ford Motor Co.: | | | |
| 6.1% 8/19/32 | | 3,105 | 2,875 |
| 7.4% 11/1/46 | | 1,085 | 1,019 |
| Ford Motor Credit Co. LLC 3.625% 6/17/31 | | 3,945 | 3,118 |
| | | | 7,012 |
| Automotive & Auto Parts - 2.5% | | | |
| Adient Global Holdings Ltd. 7% 4/15/28 (b) | | 815 | 802 |
| Dana, Inc.: | | | |
| 4.25% 9/1/30 | | 1,115 | 883 |
| 5.375% 11/15/27 | | 745 | 685 |
| Ford Motor Co.: | | | |
| 3.25% 2/12/32 | | 2,745 | 2,070 |
| 5.291% 12/8/46 | | 550 | 400 |
| Ford Motor Credit Co. LLC: | | | |
| U.S. Secured Overnight Fin. Rate (SOFR) Index + 2.950% 8.2802% 3/6/26 (c)(d) | | 3,910 | 3,940 |
| 2.3% 2/10/25 | | 12,405 | 11,710 |
| 2.9% 2/10/29 | | 3,905 | 3,196 |
| 3.375% 11/13/25 | | 1,380 | 1,288 |
| 3.815% 11/2/27 | | 4,080 | 3,644 |
| 4% 11/13/30 | | 1,415 | 1,166 |
| 4.389% 1/8/26 | | 2,765 | 2,621 |
| 4.95% 5/28/27 | | 5,655 | 5,304 |
| 5.125% 6/16/25 | | 1,385 | 1,348 |
| 6.95% 3/6/26 | | 6,030 | 6,043 |
| IHO Verwaltungs GmbH 4.75% 9/15/26 pay-in-kind (b)(c) | | 550 | 511 |
| LCM Investments Holdings 8.25% 8/1/31 (b) | | 1,315 | 1,251 |
| Macquarie AirFinance Holdings: | | | |
| 8.125% 3/30/29 (b) | | 4,054 | 3,993 |
| 8.375% 5/1/28 (b) | | 2,865 | 2,856 |
| PECF USS Intermediate Holding III Corp. 8% 11/15/29 (b) | | 4,315 | 2,047 |
| Rivian Holdco & Rivian LLC & Rivian Automotive LLC 6 month U.S. LIBOR + 5.620% 11.4932% 10/15/26 (b)(c)(d) | | 1,645 | 1,641 |
| ZF North America Capital, Inc.: | | | |
| 4.75% 4/29/25 (b) | | 3,320 | 3,201 |
| 6.875% 4/14/28 (b) | | 1,440 | 1,395 |
| 7.125% 4/14/30 (b) | | 1,440 | 1,394 |
| | | | 63,389 |
| Banks & Thrifts - 0.7% | | | |
| Ally Financial, Inc.: | | | |
| 5.75% 11/20/25 | | 268 | 256 |
| 6.7% 2/14/33 | | 5,480 | 4,606 |
| Jane Street Group LLC/JSG Finance, Inc. 4.5% 11/15/29 (b) | | 2,430 | 2,071 |
| Quicken Loans LLC/Quicken Loans Co.-Issuer, Inc. 4% 10/15/33 (b) | | 1,095 | 805 |
| UniCredit SpA: | | | |
| 5.459% 6/30/35 (b)(c) | | 2,626 | 2,154 |
| 5.861% 6/19/32 (b)(c) | | 1,495 | 1,345 |
| VistaJet Malta Finance PLC / XO Management Holding, Inc.: | | | |
| 6.375% 2/1/30 (b) | | 5,833 | 3,890 |
| 7.875% 5/1/27 (b) | | 1,090 | 839 |
| Western Alliance Bancorp. 3% 6/15/31 (c) | | 2,365 | 1,807 |
| | | | 17,773 |
| Broadcasting - 1.8% | | | |
| Clear Channel Outdoor Holdings, Inc.: | | | |
| 5.125% 8/15/27 (b) | | 2,150 | 1,911 |
| 7.5% 6/1/29 (b) | | 2,809 | 2,045 |
| 9% 9/15/28 (b) | | 4,650 | 4,529 |
| Diamond Sports Group LLC/Diamond Sports Finance Co. 5.375% (b)(e) | | 22,770 | 235 |
| DISH Network Corp. 11.75% 11/15/27 (b) | | 7,125 | 7,058 |
| Sinclair Television Group, Inc. 5.5% 3/1/30 (b) | | 2,700 | 1,466 |
| Sirius XM Radio, Inc.: | | | |
| 4% 7/15/28 (b) | | 5,800 | 4,933 |
| 4.125% 7/1/30 (b) | | 5,380 | 4,272 |
| 5.5% 7/1/29 (b) | | 8,285 | 7,341 |
| TEGNA, Inc.: | | | |
| 4.625% 3/15/28 | | 1,735 | 1,496 |
| 5% 9/15/29 | | 1,775 | 1,487 |
| Univision Communications, Inc.: | | | |
| 4.5% 5/1/29 (b) | | 5,615 | 4,463 |
| 6.625% 6/1/27 (b) | | 3,655 | 3,338 |
| 7.375% 6/30/30 (b) | | 790 | 696 |
| 8% 8/15/28 (b) | | 1,955 | 1,846 |
| | | | 47,116 |
| Building Materials - 0.9% | | | |
| Advanced Drain Systems, Inc.: | | | |
| 5% 9/30/27 (b) | | 1,486 | 1,386 |
| 6.375% 6/15/30 (b) | | 1,420 | 1,341 |
| AmeriTex Holdco Intermediate LLC 10.25% 10/15/28 (b) | | 635 | 600 |
| Beacon Roofing Supply, Inc. 6.5% 8/1/30 (b) | | 2,616 | 2,498 |
| Builders FirstSource, Inc. 4.25% 2/1/32 (b) | | 5,595 | 4,453 |
| Eco Material Technologies, Inc. 7.875% 1/31/27 (b) | | 4,150 | 3,930 |
| Oscar Acquisition Co. LLC / Oscar Finance, Inc. 9.5% 4/15/30 (b) | | 2,950 | 2,603 |
| SRS Distribution, Inc.: | | | |
| 4.625% 7/1/28 (b) | | 3,455 | 3,014 |
| 6% 12/1/29 (b) | | 3,095 | 2,577 |
| | | | 22,402 |
| Cable/Satellite TV - 2.4% | | | |
| CCO Holdings LLC/CCO Holdings Capital Corp.: | | | |
| 4.25% 2/1/31 (b) | | 8,354 | 6,501 |
| 4.25% 1/15/34 (b) | | 5,535 | 3,998 |
| 4.5% 8/15/30 (b) | | 4,140 | 3,320 |
| 4.5% 5/1/32 | | 12,236 | 9,367 |
| 4.5% 6/1/33 (b) | | 11,280 | 8,414 |
| 4.75% 3/1/30 (b) | | 80 | 66 |
| 5.375% 6/1/29 (b) | | 640 | 560 |
| CSC Holdings LLC: | | | |
| 3.375% 2/15/31 (b) | | 5,000 | 3,198 |
| 4.125% 12/1/30 (b) | | 2,939 | 1,969 |
| 4.5% 11/15/31 (b) | | 1,430 | 944 |
| 4.625% 12/1/30 (b) | | 7,174 | 3,638 |
| 5.375% 2/1/28 (b) | | 4,870 | 3,878 |
| DIRECTV Financing LLC / DIRECTV Financing Co-Obligor, Inc. 5.875% 8/15/27 (b) | | 1,355 | 1,187 |
| DISH DBS Corp. 5.75% 12/1/28 (b) | | 5,065 | 3,678 |
| Dolya Holdco 18 DAC 5% 7/15/28 (b) | | 1,213 | 1,030 |
| Radiate Holdco LLC/Radiate Financial Service Ltd.: | | | |
| 4.5% 9/15/26 (b) | | 3,424 | 2,618 |
| 6.5% 9/15/28 (b) | | 3,013 | 1,491 |
| Telenet Finance Luxembourg Notes SARL 5.5% 3/1/28 (b) | | 2,400 | 2,142 |
| Ziggo BV 4.875% 1/15/30 (b) | | 5,005 | 3,998 |
| | | | 61,997 |
| Capital Goods - 1.0% | | | |
| Mueller Water Products, Inc. 4% 6/15/29 (b) | | 4,685 | 4,006 |
| Regal Rexnord Corp.: | | | |
| 6.05% 2/15/26 (b) | | 2,150 | 2,115 |
| 6.05% 4/15/28 (b) | | 2,765 | 2,645 |
| 6.3% 2/15/30 (b) | | 2,765 | 2,602 |
| Vertical Holdco GmbH 7.625% 7/15/28 (b) | | 3,980 | 3,590 |
| Vertical U.S. Newco, Inc. 5.25% 7/15/27 (b) | | 12,934 | 11,776 |
| | | | 26,734 |
| Chemicals - 4.1% | | | |
| CVR Partners LP 6.125% 6/15/28 (b) | | 1,775 | 1,566 |
| Element Solutions, Inc. 3.875% 9/1/28 (b) | | 2,554 | 2,173 |
| Kobe U.S. Midco 2, Inc. 9.25% 11/1/26 pay-in-kind (b)(c) | | 3,470 | 2,516 |
| LSB Industries, Inc. 6.25% 10/15/28 (b) | | 2,215 | 1,965 |
| Methanex Corp.: | | | |
| 5.125% 10/15/27 | | 11,101 | 10,124 |
| 5.65% 12/1/44 | | 8,249 | 6,062 |
| NOVA Chemicals Corp.: | | | |
| 4.25% 5/15/29 (b) | | 5,020 | 3,712 |
| 4.875% 6/1/24 (b) | | 4,330 | 4,255 |
| 5% 5/1/25 (b) | | 2,270 | 2,144 |
| 5.25% 6/1/27 (b) | | 4,970 | 4,198 |
| Nufarm Australia Ltd. 5% 1/27/30 (b) | | 6,520 | 5,656 |
| Olin Corp. 5% 2/1/30 | | 5,755 | 4,971 |
| Olympus Water U.S. Holding Corp.: | | | |
| 4.25% 10/1/28 (b) | | 5,155 | 4,113 |
| 6.25% 10/1/29 (b) | | 5,435 | 4,076 |
| 9.75% 11/15/28 (b) | | 6,748 | 6,591 |
| SCIH Salt Holdings, Inc.: | | | |
| 4.875% 5/1/28 (b) | | 1,208 | 1,043 |
| 6.625% 5/1/29 (b) | | 3,690 | 3,093 |
| SCIL IV LLC / SCIL U.S.A. Holdings LLC 5.375% 11/1/26 (b) | | 3,935 | 3,490 |
| The Chemours Co. LLC: | | | |
| 4.625% 11/15/29 (b) | | 1,785 | 1,379 |
| 5.375% 5/15/27 | | 10,144 | 9,164 |
| 5.75% 11/15/28 (b) | | 6,620 | 5,599 |
| TPC Group, Inc. 13% 12/16/27 (b) | | 2,885 | 2,879 |
| Tronox, Inc. 4.625% 3/15/29 (b) | | 8,400 | 6,617 |
| W.R. Grace Holding LLC: | | | |
| 5.625% 8/15/29 (b) | | 9,670 | 7,494 |
| 7.375% 3/1/31 (b) | | 1,105 | 1,024 |
| | | | 105,904 |
| Consumer Products - 0.7% | | | |
| Ferrellgas LP/Ferrellgas Finance Corp. 5.375% 4/1/26 (b) | | 740 | 693 |
| Kohl's Corp. 4.25% 7/17/25 | | 335 | 313 |
| Mattel, Inc.: | | | |
| 3.375% 4/1/26 (b) | | 3,425 | 3,164 |
| 5.45% 11/1/41 | | 1,100 | 858 |
| Newell Brands, Inc.: | | | |
| 4.7% 4/1/26 | | 1,380 | 1,303 |
| 6.375% 9/15/27 | | 1,380 | 1,292 |
| 6.5% 4/1/46 (f) | | 1,100 | 772 |
| 6.625% 9/15/29 | | 1,470 | 1,352 |
| The Scotts Miracle-Gro Co.: | | | |
| 4% 4/1/31 | | 550 | 409 |
| 4.375% 2/1/32 | | 820 | 601 |
| TKC Holdings, Inc.: | | | |
| 6.875% 5/15/28 (b) | | 3,200 | 2,768 |
| 10.5% 5/15/29 (b) | | 1,710 | 1,368 |
| Windsor Holdings III, LLC 8.5% 6/15/30 (b) | | 2,810 | 2,735 |
| | | | 17,628 |
| Containers - 1.7% | | | |
| ARD Finance SA 6.5% 6/30/27 pay-in-kind (b)(c) | | 7,175 | 4,178 |
| Ardagh Packaging Finance PLC/Ardagh MP Holdings U.S.A., Inc.: | | | |
| 5.25% 8/15/27 (b) | | 4,935 | 3,586 |
| 5.25% 8/15/27 (b) | | 9,700 | 7,048 |
| Ball Corp.: | | | |
| 2.875% 8/15/30 | | 1,370 | 1,069 |
| 4.875% 3/15/26 | | 4,150 | 3,985 |
| 6% 6/15/29 | | 1,720 | 1,645 |
| Berry Global, Inc. 4.875% 7/15/26 (b) | | 2,210 | 2,109 |
| BWAY Holding Co. 7.875% 8/15/26 (b) | | 4,120 | 3,859 |
| Graham Packaging Co., Inc. 7.125% 8/15/28 (b) | | 1,690 | 1,295 |
| Graphic Packaging International, Inc. 3.75% 2/1/30 (b) | | 2,160 | 1,766 |
| LABL, Inc.: | | | |
| 5.875% 11/1/28 (b) | | 800 | 677 |
| 6.75% 7/15/26 (b) | | 535 | 492 |
| 9.5% 11/1/28 (b) | | 535 | 517 |
| 10.5% 7/15/27 (b) | | 4,243 | 3,673 |
| Owens-Brockway Glass Container, Inc. 7.25% 5/15/31 (b) | | 1,340 | 1,226 |
| Sealed Air Corp. 5% 4/15/29 (b) | | 5,450 | 4,833 |
| Sealed Air Corp./Sealed Air Cor 6.125% 2/1/28 (b) | | 1,655 | 1,575 |
| Trivium Packaging Finance BV: | | | |
| 5.5% 8/15/26 (b) | | 737 | 668 |
| 8.5% 8/15/27 (b) | | 646 | 539 |
| | | | 44,740 |
| Diversified Financial Services - 4.6% | | | |
| Aercap Global Aviation Trust 6.5% 6/15/45 (b)(c) | | 2,540 | 2,492 |
| Coinbase Global, Inc. 3.625% 10/1/31 (b) | | 5,180 | 3,522 |
| Emerald Debt Merger Sub LLC 6.625% 12/15/30 (b) | | 6,235 | 5,931 |
| FLY Leasing Ltd. 7% 10/15/24 (b) | | 915 | 841 |
| GGAM Finance Ltd.: | | | |
| 7.75% 5/15/26 (b) | | 2,635 | 2,614 |
| 8% 6/15/28 (b) | | 7,305 | 7,206 |
| GTCR W-2 Merger Sub LLC 7.5% 1/15/31 (b) | | 6,390 | 6,309 |
| Hightower Holding LLC 6.75% 4/15/29 (b) | | 3,880 | 3,309 |
| HTA Group Ltd. 7% 12/18/25 (b) | | 11,385 | 10,966 |
| Icahn Enterprises LP/Icahn Enterprises Finance Corp.: | | | |
| 4.375% 2/1/29 | | 7,765 | 5,979 |
| 5.25% 5/15/27 | | 30,900 | 26,458 |
| 6.25% 5/15/26 | | 9,296 | 8,497 |
| Jefferies Finance LLC/JFIN Co-Issuer Corp. 5% 8/15/28 (b) | | 980 | 782 |
| Ladder Capital Finance Holdings LLLP/Ladder Capital Finance Corp. 4.75% 6/15/29 (b) | | 3,635 | 2,923 |
| LPL Holdings, Inc. 4.375% 5/15/31 (b) | | 1,370 | 1,147 |
| MSCI, Inc. 3.625% 9/1/30 (b) | | 5,655 | 4,679 |
| OneMain Finance Corp.: | | | |
| 3.5% 1/15/27 | | 1,425 | 1,204 |
| 3.875% 9/15/28 | | 8,180 | 6,467 |
| 6.875% 3/15/25 | | 4,965 | 4,898 |
| 7.125% 3/15/26 | | 10,330 | 10,032 |
| 9% 1/15/29 | | 335 | 327 |
| Scientific Games Holdings LP/Scientific Games U.S. Finco, Inc. 6.625% 3/1/30 (b) | | 3,118 | 2,681 |
| | | | 119,264 |
| Diversified Media - 0.2% | | | |
| Advantage Sales & Marketing, Inc. 6.5% 11/15/28 (b) | | 5,518 | 4,497 |
| Energy - 12.9% | | | |
| Altus Midstream LP 5.875% 6/15/30 (b) | | 3,635 | 3,335 |
| Antero Midstream Partners LP/Antero Midstream Finance Corp.: | | | |
| 5.75% 3/1/27 (b) | | 1,375 | 1,314 |
| 7.875% 5/15/26 (b) | | 1,375 | 1,385 |
| Atlantica Sustainable Infrastructure PLC 4.125% 6/15/28 (b) | | 6,465 | 5,583 |
| California Resources Corp. 7.125% 2/1/26 (b) | | 1,930 | 1,937 |
| Calumet Specialty Products Partners LP/Calumet Finance Corp. 9.75% 7/15/28 (b) | | 2,005 | 1,871 |
| Centennial Resource Production LLC: | | | |
| 5.875% 7/1/29 (b) | | 4,725 | 4,394 |
| 7% 1/15/32 (b) | | 640 | 620 |
| 7.75% 2/15/26 (b) | | 660 | 659 |
| CGG SA 8.75% 4/1/27 (b) | | 5,284 | 4,664 |
| Citgo Petroleum Corp.: | | | |
| 6.375% 6/15/26 (b) | | 6,098 | 5,991 |
| 8.375% 1/15/29 (b) | | 1,595 | 1,580 |
| CNX Resources Corp. 7.375% 1/15/31 (b) | | 1,580 | 1,510 |
| Comstock Resources, Inc.: | | | |
| 5.875% 1/15/30 (b) | | 3,370 | 2,881 |
| 6.75% 3/1/29 (b) | | 4,280 | 3,895 |
| Crestwood Midstream Partners LP/Crestwood Midstream Finance Corp.: | | | |
| 5.625% 5/1/27 (b) | | 22,398 | 21,544 |
| 5.75% 4/1/25 | | 4,057 | 4,006 |
| 7.375% 2/1/31 (b) | | 2,760 | 2,782 |
| CrownRock LP/CrownRock Finance, Inc.: | | | |
| 5% 5/1/29 (b) | | 3,830 | 3,612 |
| 5.625% 10/15/25 (b) | | 560 | 551 |
| CVR Energy, Inc.: | | | |
| 5.25% 2/15/25 (b) | | 9,749 | 9,563 |
| 5.75% 2/15/28 (b) | | 5,483 | 4,926 |
| Delek Logistics Partners LP 7.125% 6/1/28 (b) | | 7,451 | 6,780 |
| DT Midstream, Inc.: | | | |
| 4.125% 6/15/29 (b) | | 1,250 | 1,075 |
| 4.375% 6/15/31 (b) | | 740 | 615 |
| Endeavor Energy Resources LP/EER Finance, Inc. 5.75% 1/30/28 (b) | | 2,520 | 2,417 |
| Energean PLC 6.5% 4/30/27 (b) | | 1,598 | 1,329 |
| EnLink Midstream LLC: | | | |
| 5.625% 1/15/28 (b) | | 1,630 | 1,537 |
| 6.5% 9/1/30 (b) | | 5,060 | 4,857 |
| EnLink Midstream Partners LP 4.85% 7/15/26 | | 2,485 | 2,336 |
| EQM Midstream Partners LP: | | | |
| 4% 8/1/24 | | 2,545 | 2,474 |
| 4.75% 1/15/31 (b) | | 1,120 | 943 |
| 6% 7/1/25 (b) | | 355 | 347 |
| 6.5% 7/1/27 (b) | | 1,097 | 1,066 |
| 6.5% 7/15/48 | | 555 | 469 |
| Global Partners LP/GLP Finance Corp. 6.875% 1/15/29 | | 1,785 | 1,575 |
| Harvest Midstream I LP 7.5% 9/1/28 (b) | | 5,420 | 5,136 |
| Hess Midstream Partners LP: | | | |
| 4.25% 2/15/30 (b) | | 1,880 | 1,609 |
| 5.125% 6/15/28 (b) | | 5,610 | 5,180 |
| 5.5% 10/15/30 (b) | | 1,370 | 1,244 |
| 5.625% 2/15/26 (b) | | 6,625 | 6,416 |
| Holly Energy Partners LP/Holly Energy Finance Corp. 5% 2/1/28 (b) | | 4,080 | 3,777 |
| Howard Midstream Energy Partners LLC 8.875% 7/15/28 (b) | | 5,370 | 5,399 |
| Jonah Energy Parent LLC 12% 11/5/25 (g)(h) | | 4,708 | 4,832 |
| Mesquite Energy, Inc. 7.25% (b)(e)(h) | | 28,768 | 0 |
| New Fortress Energy, Inc.: | | | |
| 6.5% 9/30/26 (b) | | 31,990 | 28,653 |
| 6.75% 9/15/25 (b) | | 17,262 | 16,015 |
| NGL Energy Operating LLC/NGL Energy Finance Corp. 7.5% 2/1/26 (b) | | 4,350 | 4,246 |
| Northern Oil & Gas, Inc.: | | | |
| 8.125% 3/1/28 (b) | | 4,220 | 4,167 |
| 8.75% 6/15/31 (b) | | 1,345 | 1,338 |
| Occidental Petroleum Corp.: | | | |
| 4.2% 3/15/48 | | 1,360 | 917 |
| 4.4% 4/15/46 | | 4,100 | 2,925 |
| 4.4% 8/15/49 | | 1,900 | 1,242 |
| 4.5% 7/15/44 | | 3,365 | 2,338 |
| 6.125% 1/1/31 | | 4,795 | 4,689 |
| 6.45% 9/15/36 | | 3,155 | 3,064 |
| 7.5% 5/1/31 | | 6,195 | 6,496 |
| 7.95% 6/15/39 | | 685 | 732 |
| 8.875% 7/15/30 | | 4,715 | 5,236 |
| PBF Holding Co. LLC/PBF Finance Corp. 7.875% 9/15/30 (b) | | 8,654 | 8,388 |
| Rockies Express Pipeline LLC: | | | |
| 4.8% 5/15/30 (b) | | 1,900 | 1,597 |
| 4.95% 7/15/29 (b) | | 4,294 | 3,784 |
| 6.875% 4/15/40 (b) | | 1,598 | 1,330 |
| Seadrill Finance Ltd. 8.375% 8/1/30 (b) | | 1,240 | 1,240 |
| Sitio Royalties OP / Sitio Finance Corp. 7.875% 11/1/28 (b) | | 1,585 | 1,563 |
| SM Energy Co. 5.625% 6/1/25 | | 3,075 | 2,993 |
| Southwestern Energy Co. 4.75% 2/1/32 | | 3,580 | 3,079 |
| Suburban Propane Partners LP/Suburban Energy Finance Corp. 5.875% 3/1/27 | | 525 | 497 |
| Sunnova Energy Corp.: | | | |
| 5.875% 9/1/26 (b) | | 3,530 | 2,859 |
| 11.75% 10/1/28 (b) | | 320 | 273 |
| Sunoco LP/Sunoco Finance Corp.: | | | |
| 4.5% 5/15/29 | | 5,094 | 4,413 |
| 5.875% 3/15/28 | | 4,990 | 4,721 |
| Superior Plus LP / Superior General Partner, Inc. 4.5% 3/15/29 (b) | | 2,990 | 2,550 |
| Tallgrass Energy Partners LP / Tallgrass Energy Finance Corp.: | | | |
| 5.5% 1/15/28 (b) | | 9,865 | 8,642 |
| 6% 3/1/27 (b) | | 5,517 | 5,047 |
| 6% 12/31/30 (b) | | 9,160 | 7,711 |
| 6% 9/1/31 (b) | | 9,425 | 7,931 |
| 7.5% 10/1/25 (b) | | 9,570 | 9,428 |
| Teine Energy Ltd. 6.875% 4/15/29 (b) | | 745 | 690 |
| Transocean Aquila Ltd. 8% 9/30/28 (b) | | 895 | 880 |
| Transocean Poseidon Ltd. 6.875% 2/1/27 (b) | | 1,849 | 1,812 |
| Transocean, Inc.: | | | |
| 7.5% 1/15/26 (b) | | 2,085 | 1,997 |
| 8% 2/1/27 (b) | | 6,175 | 5,796 |
| 8.75% 2/15/30 (b) | | 3,406 | 3,396 |
| Valaris Ltd. 8.375% 4/30/30 (b) | | 4,285 | 4,205 |
| Viper Energy Partners LP 7.375% 11/1/31 (b) | | 960 | 958 |
| Western Gas Partners LP: | | | |
| 5.25% 2/1/50 | | 2,720 | 2,010 |
| 5.3% 3/1/48 | | 1,360 | 1,017 |
| 5.5% 8/15/48 | | 815 | 618 |
| | | | 333,499 |
| Environmental - 1.2% | | | |
| Clean Harbors, Inc. 6.375% 2/1/31 (b) | | 1,305 | 1,240 |
| Covanta Holding Corp. 4.875% 12/1/29 (b) | | 5,220 | 4,072 |
| Darling Ingredients, Inc. 6% 6/15/30 (b) | | 2,155 | 2,022 |
| GFL Environmental, Inc.: | | | |
| 3.75% 8/1/25 (b) | | 2,765 | 2,615 |
| 5.125% 12/15/26 (b) | | 2,765 | 2,624 |
| Madison IAQ LLC: | | | |
| 4.125% 6/30/28 (b) | | 6,715 | 5,610 |
| 5.875% 6/30/29 (b) | | 6,055 | 4,690 |
| Stericycle, Inc.: | | | |
| 3.875% 1/15/29 (b) | | 7,910 | 6,721 |
| 5.375% 7/15/24 (b) | | 1,385 | 1,367 |
| | | | 30,961 |
| Food & Drug Retail - 0.9% | | | |
| Albertsons Companies LLC/Safeway, Inc./New Albertson's, Inc./Albertson's LLC: | | | |
| 3.25% 3/15/26 (b) | | 740 | 684 |
| 3.5% 3/15/29 (b) | | 6,553 | 5,587 |
| 4.875% 2/15/30 (b) | | 2,310 | 2,062 |
| BellRing Brands, Inc. 7% 3/15/30 (b) | | 1,100 | 1,068 |
| Emergent BioSolutions, Inc. 3.875% 8/15/28 (b) | | 9,414 | 3,702 |
| Murphy Oil U.S.A., Inc. 3.75% 2/15/31 (b) | | 1,690 | 1,358 |
| Parkland Corp.: | | | |
| 4.5% 10/1/29 (b) | | 1,673 | 1,439 |
| 4.625% 5/1/30 (b) | | 8,235 | 7,020 |
| | | | 22,920 |
| Food/Beverage/Tobacco - 1.7% | | | |
| C&S Group Enterprises LLC 5% 12/15/28 (b) | | 4,855 | 3,757 |
| Chobani LLC/Finance Corp., Inc. 4.625% 11/15/28 (b) | | 1,100 | 951 |
| Lamb Weston Holdings, Inc.: | | | |
| 4.125% 1/31/30 (b) | | 7,855 | 6,664 |
| 4.375% 1/31/32 (b) | | 1,370 | 1,133 |
| Performance Food Group, Inc. 5.5% 10/15/27 (b) | | 542 | 507 |
| Pilgrim's Pride Corp.: | | | |
| 3.5% 3/1/32 | | 1,370 | 1,044 |
| 4.25% 4/15/31 | | 1,615 | 1,330 |
| Post Holdings, Inc.: | | | |
| 4.625% 4/15/30 (b) | | 3,666 | 3,070 |
| 5.5% 12/15/29 (b) | | 3,587 | 3,199 |
| Primo Water Holdings, Inc. 4.375% 4/30/29 (b) | | 3,090 | 2,607 |
| TreeHouse Foods, Inc. 4% 9/1/28 | | 2,065 | 1,679 |
| Triton Water Holdings, Inc. 6.25% 4/1/29 (b) | | 14,125 | 11,642 |
| U.S. Foods, Inc.: | | | |
| 4.625% 6/1/30 (b) | | 2,045 | 1,746 |
| 4.75% 2/15/29 (b) | | 2,520 | 2,223 |
| 6.875% 9/15/28 (b) | | 1,600 | 1,564 |
| United Natural Foods, Inc. 6.75% 10/15/28 (b) | | 550 | 433 |
| | | | 43,549 |
| Gaming - 2.0% | | | |
| Affinity Gaming LLC 6.875% 12/15/27 (b) | | 10,355 | 8,440 |
| Caesars Entertainment, Inc.: | | | |
| 6.25% 7/1/25 (b) | | 4,530 | 4,457 |
| 7% 2/15/30 (b) | | 1,300 | 1,255 |
| 8.125% 7/1/27 (b) | | 6,319 | 6,261 |
| Caesars Resort Collection LLC 5.75% 7/1/25 (b) | | 5,565 | 5,476 |
| Carnival Corp. 10.5% 6/1/30 (b) | | 4,995 | 5,068 |
| Fertitta Entertainment LLC / Fertitta Entertainment Finance Co., Inc. 6.75% 1/15/30 (b) | | 5,390 | 4,284 |
| Golden Entertainment, Inc. 7.625% 4/15/26 (b) | | 3,921 | 3,921 |
| Jacobs Entertainment, Inc. 6.75% 2/15/29 (b) | | 2,400 | 2,040 |
| Scientific Games Corp. 7.5% 9/1/31 (b) | | 545 | 532 |
| Station Casinos LLC 4.5% 2/15/28 (b) | | 4,745 | 4,098 |
| Transocean, Inc. 7.25% 11/1/25 (b) | | 1,350 | 1,317 |
| VICI Properties LP / VICI Note Co. 4.125% 8/15/30 (b) | | 2,740 | 2,260 |
| Wynn Resorts Finance LLC / Wynn Resorts Capital Corp. 7.125% 2/15/31 (b) | | 1,365 | 1,271 |
| | | | 50,680 |
| Healthcare - 6.9% | | | |
| 1375209 BC Ltd. 9% 1/30/28 (b) | | 3,606 | 3,496 |
| 180 Medical, Inc. 3.875% 10/15/29 (b) | | 2,575 | 2,139 |
| AdaptHealth LLC 5.125% 3/1/30 (b) | | 4,965 | 3,761 |
| AMN Healthcare 4% 4/15/29 (b) | | 1,674 | 1,386 |
| Avantor Funding, Inc.: | | | |
| 3.875% 11/1/29 (b) | | 3,310 | 2,770 |
| 4.625% 7/15/28 (b) | | 2,215 | 1,972 |
| Bausch Health Companies, Inc.: | | | |
| 5.5% 11/1/25 (b) | | 6,469 | 5,580 |
| 9% 12/15/25 (b) | | 640 | 555 |
| Cano Health, Inc. 6.25% 10/1/28 (b) | | 2,303 | 921 |
| Catalent Pharma Solutions 3.5% 4/1/30 (b) | | 2,900 | 2,273 |
| Charles River Laboratories International, Inc.: | | | |
| 3.75% 3/15/29 (b) | | 2,975 | 2,511 |
| 4% 3/15/31 (b) | | 2,475 | 2,020 |
| 4.25% 5/1/28 (b) | | 768 | 682 |
| Community Health Systems, Inc.: | | | |
| 4.75% 2/15/31 (b) | | 10,365 | 6,947 |
| 5.25% 5/15/30 (b) | | 19,665 | 13,965 |
| 5.625% 3/15/27 (b) | | 13,825 | 11,232 |
| 6% 1/15/29 (b) | | 6,140 | 4,651 |
| 6.125% 4/1/30 (b) | | 6,525 | 2,528 |
| 6.875% 4/15/29 (b) | | 8,190 | 3,382 |
| 8% 3/15/26 (b) | | 635 | 580 |
| CTR Partnership LP/CareTrust Capital Corp. 3.875% 6/30/28 (b) | | 5,375 | 4,516 |
| DaVita HealthCare Partners, Inc.: | | | |
| 3.75% 2/15/31 (b) | | 2,170 | 1,560 |
| 4.625% 6/1/30 (b) | | 9,260 | 7,257 |
| Embecta Corp. 5% 2/15/30 (b) | | 2,745 | 2,180 |
| Grifols SA 4.75% 10/15/28 (b) | | 3,442 | 2,883 |
| Hologic, Inc. 3.25% 2/15/29 (b) | | 1,530 | 1,284 |
| IQVIA, Inc. 6.5% 5/15/30 (b) | | 2,670 | 2,590 |
| Jazz Securities DAC 4.375% 1/15/29 (b) | | 4,925 | 4,283 |
| ModivCare Escrow Issuer, Inc. 5% 10/1/29 (b) | | 2,950 | 2,150 |
| Modivcare, Inc. 5.875% 11/15/25 (b) | | 3,500 | 3,308 |
| Molina Healthcare, Inc.: | | | |
| 3.875% 11/15/30 (b) | | 3,370 | 2,749 |
| 3.875% 5/15/32 (b) | | 1,465 | 1,151 |
| Mozart Borrower LP 3.875% 4/1/29 (b) | | 1,375 | 1,161 |
| Omega Healthcare Investors, Inc. 3.25% 4/15/33 | | 6,820 | 4,861 |
| Organon & Co. / Organon Foreign Debt Co-Issuer BV: | | | |
| 4.125% 4/30/28 (b) | | 9,435 | 8,150 |
| 5.125% 4/30/31 (b) | | 1,580 | 1,234 |
| Owens & Minor, Inc. 4.5% 3/31/29 (b) | | 2,610 | 2,094 |
| Pediatrix Medical Group, Inc. 5.375% 2/15/30 (b) | | 7,060 | 6,089 |
| Regionalcare Hospital Partners 9.75% 12/1/26 (b) | | 2,640 | 2,468 |
| RegionalCare Hospital Partners Holdings, Inc.: | | | |
| 5.375% 1/15/29 (b) | | 2,305 | 1,396 |
| 9.875% 8/15/30 (b) | | 3,000 | 2,711 |
| 11% 10/15/30 (b) | | 320 | 301 |
| RP Escrow Issuer LLC 5.25% 12/15/25 (b) | | 6,530 | 4,653 |
| Teleflex, Inc. 4.25% 6/1/28 (b) | | 1,540 | 1,359 |
| Tenet Healthcare Corp.: | | | |
| 4.25% 6/1/29 | | 6,395 | 5,473 |
| 4.375% 1/15/30 | | 4,965 | 4,200 |
| 4.625% 6/15/28 | | 1,728 | 1,537 |
| 6.125% 10/1/28 | | 5,720 | 5,305 |
| 6.125% 6/15/30 | | 6,675 | 6,179 |
| 6.25% 2/1/27 | | 3,134 | 3,005 |
| 6.75% 5/15/31 (b) | | 945 | 897 |
| Teva Pharmaceutical Finance Netherlands III BV: | | | |
| 3.15% 10/1/26 | | 3,265 | 2,875 |
| 7.875% 9/15/29 | | 830 | 818 |
| 8.125% 9/15/31 | | 830 | 822 |
| | | | 176,850 |
| Homebuilders/Real Estate - 3.7% | | | |
| Anywhere Real Estate Group LLC 7% 4/15/30 (b) | | 2,120 | 1,745 |
| Ashton Woods U.S.A. LLC/Ashton Woods Finance Co. 4.625% 8/1/29 (b) | | 2,515 | 2,035 |
| Greystar Real Estate Partners 7.75% 9/1/30 (b) | | 1,240 | 1,218 |
| Howard Hughes Corp.: | | | |
| 4.125% 2/1/29 (b) | | 2,350 | 1,886 |
| 4.375% 2/1/31 (b) | | 1,765 | 1,344 |
| Kennedy-Wilson, Inc. 4.75% 2/1/30 | | 3,915 | 2,858 |
| MPT Operating Partnership LP/MPT Finance Corp.: | | | |
| 3.5% 3/15/31 | | 10,750 | 6,519 |
| 4.625% 8/1/29 | | 7,355 | 5,092 |
| 5% 10/15/27 | | 23,595 | 18,218 |
| 5.25% 8/1/26 | | 2,913 | 2,508 |
| Railworks Holdings LP 8.25% 11/15/28 (b) | | 5,744 | 5,463 |
| Realogy Group LLC/Realogy Co-Issuer Corp. 5.75% 1/15/29 (b) | | 76 | 48 |
| Realogy Group LLC/Realogy Co.-Issuer Corp. 5.25% 4/15/30 (b) | | 59 | 37 |
| Safehold Operating Partnership LP 2.8% 6/15/31 | | 3,525 | 2,598 |
| Taylor Morrison Communities, Inc./Monarch Communities, Inc. 5.125% 8/1/30 (b) | | 1,005 | 845 |
| TopBuild Corp. 4.125% 2/15/32 (b) | | 2,115 | 1,673 |
| TRI Pointe Group, Inc./TRI Pointe Holdings, Inc. 5.875% 6/15/24 | | 70 | 69 |
| TRI Pointe Homes, Inc. 5.7% 6/15/28 | | 545 | 485 |
| Uniti Group LP / Uniti Group Finance, Inc.: | | | |
| 4.75% 4/15/28 (b) | | 16,235 | 13,121 |
| 6.5% 2/15/29 (b) | | 33,830 | 21,969 |
| 10.5% 2/15/28 (b) | | 5,485 | 5,282 |
| | | | 95,013 |
| Hotels - 0.5% | | | |
| Hilton Domestic Operating Co., Inc.: | | | |
| 3.625% 2/15/32 (b) | | 11,850 | 9,367 |
| 3.75% 5/1/29 (b) | | 215 | 185 |
| 4% 5/1/31 (b) | | 3,495 | 2,894 |
| Lindblad Expeditions LLC 6.75% 2/15/27 (b) | | 655 | 597 |
| | | | 13,043 |
| Insurance - 0.9% | | | |
| Acrisure LLC / Acrisure Finance, Inc.: | | | |
| 4.25% 2/15/29 (b) | | 1,100 | 902 |
| 7% 11/15/25 (b) | | 550 | 533 |
| Alliant Holdings Intermediate LLC: | | | |
| 4.25% 10/15/27 (b) | | 8,485 | 7,460 |
| 6.75% 10/15/27 (b) | | 1,355 | 1,237 |
| 6.75% 4/15/28 (b) | | 1,370 | 1,302 |
| AmWINS Group, Inc. 4.875% 6/30/29 (b) | | 3,390 | 2,902 |
| AssuredPartners, Inc. 5.625% 1/15/29 (b) | | 3,295 | 2,795 |
| HUB International Ltd.: | | | |
| 7% 5/1/26 (b) | | 1,900 | 1,849 |
| 7.25% 6/15/30 (b) | | 3,345 | 3,263 |
| National Financial Partners Corp. 8.5% 10/1/31 (b) | | 1,600 | 1,573 |
| | | | 23,816 |
| Leisure - 2.5% | | | |
| Carnival Corp.: | | | |
| 5.75% 3/1/27 (b) | | 8,485 | 7,592 |
| 6% 5/1/29 (b) | | 5,195 | 4,389 |
| 6.65% 1/15/28 | | 750 | 631 |
| 7% 8/15/29 (b) | | 1,425 | 1,397 |
| 7.625% 3/1/26 (b) | | 11,060 | 10,755 |
| ClubCorp Holdings, Inc. 8.5% 9/15/25 (b) | | 705 | 597 |
| MajorDrive Holdings IV LLC 6.375% 6/1/29 (b) | | 4,950 | 3,836 |
| NCL Corp. Ltd.: | | | |
| 5.875% 3/15/26 (b) | | 2,175 | 1,952 |
| 7.75% 2/15/29 (b) | | 4,840 | 4,224 |
| NCL Finance Ltd. 6.125% 3/15/28 (b) | | 1,660 | 1,388 |
| Royal Caribbean Cruises Ltd.: | | | |
| 4.25% 7/1/26 (b) | | 3,620 | 3,330 |
| 5.375% 7/15/27 (b) | | 3,900 | 3,594 |
| 5.5% 8/31/26 (b) | | 10,740 | 10,135 |
| 5.5% 4/1/28 (b) | | 6,610 | 6,028 |
| Viking Cruises Ltd. 9.125% 7/15/31 (b) | | 905 | 889 |
| Viking Ocean Cruises Ship VII Ltd. 5.625% 2/15/29 (b) | | 1,605 | 1,422 |
| Voc Escrow Ltd. 5% 2/15/28 (b) | | 2,130 | 1,914 |
| | | | 64,073 |
| Metals/Mining - 1.6% | | | |
| Arsenal AIC Parent LLC 8% 10/1/30 (b) | | 1,655 | 1,634 |
| Constellium NV 5.875% 2/15/26 (b) | | 1,255 | 1,203 |
| Eldorado Gold Corp. 6.25% 9/1/29 (b) | | 1,505 | 1,285 |
| ERO Copper Corp. 6.5% 2/15/30 (b) | | 7,950 | 6,744 |
| First Quantum Minerals Ltd.: | | | |
| 6.875% 3/1/26 (b) | | 1,985 | 1,741 |
| 6.875% 10/15/27 (b) | | 9,420 | 7,936 |
| 7.5% 4/1/25 (b) | | 1,708 | 1,593 |
| 8.625% 6/1/31 (b) | | 285 | 241 |
| FMG Resources Pty Ltd.: | | | |
| 4.375% 4/1/31 (b) | | 1,375 | 1,108 |
| 4.5% 9/15/27 (b) | | 1,595 | 1,436 |
| Howmet Aerospace, Inc. 5.95% 2/1/37 | | 1,100 | 1,005 |
| HudBay Minerals, Inc. 4.5% 4/1/26 (b) | | 530 | 493 |
| Mineral Resources Ltd.: | | | |
| 8% 11/1/27 (b) | | 3,825 | 3,696 |
| 8.5% 5/1/30 (b) | | 3,355 | 3,226 |
| 9.25% 10/1/28 (b) | | 2,425 | 2,425 |
| Novelis Corp.: | | | |
| 3.25% 11/15/26 (b) | | 815 | 725 |
| 3.875% 8/15/31 (b) | | 1,360 | 1,062 |
| PMHC II, Inc. 9% 2/15/30 (b) | | 5,155 | 4,103 |
| | | | 41,656 |
| Paper - 0.7% | | | |
| Ardagh Metal Packaging Finance U.S.A. LLC/Ardagh Metal Packaging Finance PLC: | | | |
| 4% 9/1/29 (b) | | 3,020 | 2,265 |
| 6% 6/15/27 (b) | | 4,690 | 4,432 |
| Clydesdale Acquisition Holdings, Inc.: | | | |
| 6.625% 4/15/29 (b) | | 1,950 | 1,771 |
| 8.75% 4/15/30 (b) | | 3,995 | 3,184 |
| Mercer International, Inc. 5.125% 2/1/29 | | 1,780 | 1,396 |
| SPA Holdings 3 OY 4.875% 2/4/28 (b) | | 5,695 | 4,646 |
| | | | 17,694 |
| Publishing/Printing - 0.0% | | | |
| Cimpress PLC 7% 6/15/26 | | 1,120 | 1,036 |
| Railroad - 0.0% | | | |
| First Student Bidco, Inc./First Transit Parent, Inc. 4% 7/31/29 (b) | | 1,470 | 1,183 |
| Restaurants - 0.8% | | | |
| 1011778 BC Unlimited Liability Co./New Red Finance, Inc.: | | | |
| 3.875% 1/15/28 (b) | | 2,310 | 2,062 |
| 4% 10/15/30 (b) | | 7,316 | 5,992 |
| 5.75% 4/15/25 (b) | | 1,055 | 1,046 |
| Garden SpinCo Corp. 8.625% 7/20/30 (b) | | 1,415 | 1,460 |
| Yum! Brands, Inc.: | | | |
| 3.625% 3/15/31 | | 1,370 | 1,113 |
| 4.625% 1/31/32 | | 8,980 | 7,652 |
| 5.375% 4/1/32 | | 1,100 | 989 |
| | | | 20,314 |
| Services - 5.5% | | | |
| ADT Corp. 4.125% 8/1/29 (b) | | 3,320 | 2,847 |
| AECOM 5.125% 3/15/27 | | 1,845 | 1,742 |
| Allied Universal Holdco LLC / Allied Universal Finance Corp.: | | | |
| 6% 6/1/29 (b) | | 4,930 | 3,562 |
| 9.75% 7/15/27 (b) | | 7,745 | 6,728 |
| APX Group, Inc.: | | | |
| 5.75% 7/15/29 (b) | | 3,330 | 2,768 |
| 6.75% 2/15/27 (b) | | 2,720 | 2,626 |
| ASGN, Inc. 4.625% 5/15/28 (b) | | 2,500 | 2,214 |
| Brand Energy & Infrastructure Services, Inc. 10.375% 8/1/30 (b) | | 11,100 | 11,017 |
| CoreCivic, Inc.: | | | |
| 4.75% 10/15/27 | | 10,744 | 9,334 |
| 8.25% 4/15/26 | | 6,415 | 6,495 |
| CoreLogic, Inc. 4.5% 5/1/28 (b) | | 3,795 | 3,008 |
| Fair Isaac Corp. 4% 6/15/28 (b) | | 5,065 | 4,510 |
| Gartner, Inc. 3.625% 6/15/29 (b) | | 890 | 752 |
| GEMS MENASA Cayman Ltd. 7.125% 7/31/26 (b) | | 16,457 | 15,758 |
| Hertz Corp. 5% 12/1/29 (b) | | 660 | 474 |
| Iron Mountain, Inc. 4.5% 2/15/31 (b) | | 1,370 | 1,121 |
| Korn Ferry 4.625% 12/15/27 (b) | | 1,015 | 923 |
| Legends Hospitality Holding Co. LLC/Legends Hospitality Co-Issuer, Inc. 5% 2/1/26 (b) | | 4,015 | 3,829 |
| Life Time, Inc. 8% 4/15/26 (b) | | 5,340 | 5,207 |
| Neptune BidCo U.S., Inc. 9.29% 4/15/29 (b) | | 3,320 | 2,930 |
| PowerTeam Services LLC 9.033% 12/4/25 (b) | | 7,208 | 6,487 |
| Prime Securities Services Borrower LLC/Prime Finance, Inc. 5.75% 4/15/26 (b) | | 900 | 873 |
| Service Corp. International: | | | |
| 4% 5/15/31 | | 2,300 | 1,862 |
| 5.125% 6/1/29 | | 1,443 | 1,320 |
| Sotheby's 7.375% 10/15/27 (b) | | 2,745 | 2,452 |
| The GEO Group, Inc.: | | | |
| 6% 4/15/26 | | 835 | 760 |
| 9.5% 12/31/28 (b) | | 3,820 | 3,677 |
| 10.5% 6/30/28 | | 1,425 | 1,421 |
| TriNet Group, Inc.: | | | |
| 3.5% 3/1/29 (b) | | 8,560 | 7,068 |
| 7.125% 8/15/31 (b) | | 1,445 | 1,397 |
| Uber Technologies, Inc.: | | | |
| 7.5% 5/15/25 (b) | | 7,195 | 7,204 |
| 8% 11/1/26 (b) | | 9,595 | 9,663 |
| WASH Multifamily Acquisition, Inc. 5.75% 4/15/26 (b) | | 9,077 | 8,396 |
| | | | 140,425 |
| Steel - 0.3% | | | |
| Commercial Metals Co.: | | | |
| 3.875% 2/15/31 | | 1,655 | 1,342 |
| 4.125% 1/15/30 | | 4,160 | 3,511 |
| Roller Bearing Co. of America, Inc. 4.375% 10/15/29 (b) | | 3,630 | 3,078 |
| | | | 7,931 |
| Super Retail - 1.8% | | | |
| Bath & Body Works, Inc. 6.694% 1/15/27 | | 1,315 | 1,271 |
| Carvana Co.: | | | |
| 4.875% 9/1/29 (b) | | 2,513 | 1,415 |
| 5.5% 4/15/27 (b) | | 2,422 | 1,606 |
| 5.875% 10/1/28 (b) | | 1,267 | 735 |
| 9% 12/1/28 pay-in-kind (b)(c) | | 1,087 | 809 |
| 9% 6/1/30 pay-in-kind (b)(c) | | 1,633 | 1,208 |
| 9% 6/1/31 pay-in-kind (b)(c) | | 1,933 | 1,440 |
| 10.25% 5/1/30 (b) | | 357 | 266 |
| EG Global Finance PLC: | | | |
| 6.75% 2/7/25 (b) | | 8,256 | 8,168 |
| 8.5% 10/30/25 (b) | | 10,371 | 10,202 |
| Hanesbrands, Inc. 4.875% 5/15/26 (b) | | 740 | 680 |
| LBM Acquisition LLC 6.25% 1/15/29 (b) | | 5,580 | 4,408 |
| Levi Strauss & Co. 3.5% 3/1/31 (b) | | 1,785 | 1,390 |
| Michaels Companies, Inc.: | | | |
| 5.25% 5/1/28 (b) | | 3,550 | 2,572 |
| 7.875% 5/1/29 (b) | | 2,730 | 1,522 |
| Nordstrom, Inc.: | | | |
| 4.25% 8/1/31 | | 1,175 | 861 |
| 4.375% 4/1/30 | | 870 | 675 |
| Sally Holdings LLC 5.625% 12/1/25 | | 3,045 | 2,943 |
| Wolverine World Wide, Inc. 4% 8/15/29 (b) | | 4,605 | 3,433 |
| | | | 45,604 |
| Technology - 5.7% | | | |
| Acuris Finance U.S. 5% 5/1/28 (b) | | 11,650 | 9,174 |
| Athenahealth Group, Inc. 6.5% 2/15/30 (b) | | 2,510 | 2,051 |
| Black Knight InfoServ LLC 3.625% 9/1/28 (b) | | 8,405 | 7,480 |
| Block, Inc.: | | | |
| 2.75% 6/1/26 | | 1,375 | 1,234 |
| 3.5% 6/1/31 | | 8,155 | 6,294 |
| Clarivate Science Holdings Corp.: | | | |
| 3.875% 7/1/28 (b) | | 1,720 | 1,477 |
| 4.875% 7/1/29 (b) | | 1,735 | 1,463 |
| Cloud Software Group, Inc. 9% 9/30/29 (b) | | 11,880 | 10,117 |
| CNT PRNT/CDK GLO II/FIN 8% 6/15/29 (b) | | 3,270 | 3,230 |
| Coherent Corp. 5% 12/15/29 (b) | | 6,960 | 5,906 |
| CommScope, Inc. 4.75% 9/1/29 (b) | | 3,600 | 2,457 |
| Elastic NV 4.125% 7/15/29 (b) | | 2,410 | 2,031 |
| Entegris Escrow Corp.: | | | |
| 4.75% 4/15/29 (b) | | 2,000 | 1,791 |
| 5.95% 6/15/30 (b) | | 8,335 | 7,625 |
| Entegris, Inc. 3.625% 5/1/29 (b) | | 2,550 | 2,133 |
| Gartner, Inc. 4.5% 7/1/28 (b) | | 4,490 | 4,040 |
| Gen Digital, Inc.: | | | |
| 5% 4/15/25 (b) | | 2,715 | 2,629 |
| 7.125% 9/30/30 (b) | | 1,360 | 1,323 |
| Go Daddy Operating Co. LLC / GD Finance Co., Inc.: | | | |
| 3.5% 3/1/29 (b) | | 5,240 | 4,399 |
| 5.25% 12/1/27 (b) | | 945 | 886 |
| GrafTech Global Enterprises, Inc. 9.875% 12/15/28 (b) | | 1,660 | 1,487 |
| ION Trading Technologies Ltd. 5.75% 5/15/28 (b) | | 7,345 | 6,096 |
| Match Group Holdings II LLC: | | | |
| 3.625% 10/1/31 (b) | | 820 | 629 |
| 4.125% 8/1/30 (b) | | 1,760 | 1,430 |
| McAfee Corp. 7.375% 2/15/30 (b) | | 2,290 | 1,832 |
| MicroStrategy, Inc. 6.125% 6/15/28 (b) | | 8,160 | 7,385 |
| NCR Atleos Escrow Corp. 9.5% 4/1/29 (b) | | 2,875 | 2,818 |
| ON Semiconductor Corp. 3.875% 9/1/28 (b) | | 3,675 | 3,157 |
| Open Text Corp. 3.875% 12/1/29 (b) | | 4,020 | 3,287 |
| Open Text Holdings, Inc.: | | | |
| 4.125% 2/15/30 (b) | | 4,620 | 3,828 |
| 4.125% 12/1/31 (b) | | 4,170 | 3,276 |
| Rackspace Hosting, Inc.: | | | |
| 3.5% 2/15/28 (b) | | 7,610 | 3,336 |
| 5.375% 12/1/28 (b) | | 7,809 | 2,284 |
| Roblox Corp. 3.875% 5/1/30 (b) | | 4,035 | 3,274 |
| Seagate HDD Cayman: | | | |
| 5.75% 12/1/34 | | 3,695 | 3,127 |
| 8.25% 12/15/29 (b) | | 1,310 | 1,331 |
| 8.5% 7/15/31 (b) | | 1,585 | 1,613 |
| Sensata Technologies BV: | | | |
| 4% 4/15/29 (b) | | 3,440 | 2,926 |
| 5% 10/1/25 (b) | | 550 | 535 |
| Sensata Technologies, Inc. 3.75% 2/15/31 (b) | | 1,370 | 1,096 |
| SS&C Technologies, Inc. 5.5% 9/30/27 (b) | | 1,085 | 1,018 |
| TTM Technologies, Inc. 4% 3/1/29 (b) | | 13,015 | 10,672 |
| Veritas U.S., Inc./Veritas Bermuda Ltd. 7.5% 9/1/25 (b) | | 1,900 | 1,555 |
| Virtusa Corp. 7.125% 12/15/28 (b) | | 1,345 | 1,064 |
| VM Consolidated, Inc. 5.5% 4/15/29 (b) | | 640 | 567 |
| | | | 147,363 |
| Telecommunications - 5.5% | | | |
| Altice Financing SA: | | | |
| 5% 1/15/28 (b) | | 5,598 | 4,553 |
| 5.75% 8/15/29 (b) | | 15,535 | 12,013 |
| Altice France Holding SA 6% 2/15/28 (b) | | 10,793 | 4,733 |
| Altice France SA: | | | |
| 5.125% 1/15/29 (b) | | 12,809 | 8,842 |
| 5.125% 7/15/29 (b) | | 5,655 | 3,872 |
| 5.5% 1/15/28 (b) | | 5,700 | 4,235 |
| 5.5% 10/15/29 (b) | | 50 | 34 |
| C&W Senior Financing Designated Activity Co. 6.875% 9/15/27 (b) | | 11,832 | 10,114 |
| Cablevision Lightpath LLC: | | | |
| 3.875% 9/15/27 (b) | | 2,199 | 1,789 |
| 5.625% 9/15/28 (b) | | 1,290 | 965 |
| Consolidated Communications, Inc. 5% 10/1/28 (b) | | 2,395 | 1,804 |
| Frontier Communications Holdings LLC: | | | |
| 5% 5/1/28 (b) | | 5,510 | 4,757 |
| 5.875% 10/15/27 (b) | | 258 | 235 |
| 5.875% 11/1/29 | | 3,789 | 2,848 |
| 8.75% 5/15/30 (b) | | 4,055 | 3,863 |
| IHS Netherlands Holdco BV 8% 9/18/27 (b) | | 1,575 | 1,285 |
| Intelsat Jackson Holdings SA 6.5% 3/15/30 (b) | | 8,320 | 7,305 |
| LCPR Senior Secured Financing DAC 5.125% 7/15/29 (b) | | 2,555 | 1,990 |
| Level 3 Financing, Inc.: | | | |
| 3.625% 1/15/29 (b) | | 4,904 | 2,504 |
| 4.25% 7/1/28 (b) | | 2,180 | 1,233 |
| 10.5% 5/15/30 (b) | | 9,537 | 9,544 |
| Millicom International Cellular SA: | | | |
| 4.5% 4/27/31 (b) | | 7,907 | 5,893 |
| 5.125% 1/15/28 (b) | | 3,560 | 3,053 |
| Sable International Finance Ltd. 5.75% 9/7/27 (b) | | 1,577 | 1,412 |
| SBA Communications Corp. 3.125% 2/1/29 | | 1,400 | 1,158 |
| Sprint Corp. 7.125% 6/15/24 | | 11,040 | 11,096 |
| Telecom Italia Capital SA: | | | |
| 6% 9/30/34 | | 3,477 | 2,859 |
| 7.2% 7/18/36 | | 3,069 | 2,654 |
| 7.721% 6/4/38 | | 995 | 878 |
| Uniti Group, Inc. 6% 1/15/30 (b) | | 16,540 | 10,028 |
| Virgin Media Secured Finance PLC 4.5% 8/15/30 (b) | | 5,830 | 4,807 |
| VMED O2 UK Financing I PLC 4.25% 1/31/31 (b) | | 1,079 | 849 |
| Windstream Escrow LLC 7.75% 8/15/28 (b) | | 6,160 | 4,885 |
| Zayo Group Holdings, Inc.: | | | |
| 4% 3/1/27 (b) | | 2,170 | 1,633 |
| 6.125% 3/1/28 (b) | | 2,568 | 1,701 |
| | | | 141,424 |
| Textiles/Apparel - 0.2% | | | |
| Crocs, Inc. 4.125% 8/15/31 (b) | | 1,815 | 1,379 |
| Foot Locker, Inc. 4% 10/1/29 (b) | | 1,740 | 1,279 |
| Kontoor Brands, Inc. 4.125% 11/15/29 (b) | | 1,460 | 1,202 |
| Victoria's Secret & Co. 4.625% 7/15/29 (b) | | 1,945 | 1,430 |
| | | | 5,290 |
| Transportation Ex Air/Rail - 0.7% | | | |
| Golar LNG Ltd. 7% 10/20/25 (b) | | 4,710 | 4,618 |
| Great Lakes Dredge & Dock Corp. 5.25% 6/1/29 (b) | | 2,635 | 2,154 |
| Navios South American Logistics, Inc./Navios Logistics Finance U.S., Inc. 10.75% 7/1/25 (b) | | 1,380 | 1,345 |
| Seaspan Corp. 5.5% 8/1/29 (b) | | 10,205 | 7,829 |
| XPO, Inc.: | | | |
| 6.25% 6/1/28 (b) | | 800 | 766 |
| 7.125% 6/1/31 (b) | | 1,330 | 1,296 |
| | | | 18,008 |
| Utilities - 2.9% | | | |
| Clearway Energy Operating LLC: | | | |
| 3.75% 2/15/31 (b) | | 6,515 | 5,080 |
| 3.75% 1/15/32 (b) | | 670 | 507 |
| 4.75% 3/15/28 (b) | | 1,540 | 1,375 |
| DPL, Inc.: | | | |
| 4.125% 7/1/25 | | 3,465 | 3,261 |
| 4.35% 4/15/29 | | 460 | 375 |
| EnLink Midstream Partners LP 4.15% 6/1/25 | | 1,385 | 1,332 |
| FirstEnergy Corp. 3.4% 3/1/50 | | 5,445 | 3,293 |
| Global Partners LP/GLP Finance Corp. 7% 8/1/27 | | 6,506 | 6,132 |
| NRG Energy, Inc.: | | | |
| 3.375% 2/15/29 (b) | | 6,240 | 5,079 |
| 3.625% 2/15/31 (b) | | 1,990 | 1,502 |
| 5.25% 6/15/29 (b) | | 5,350 | 4,720 |
| PG&E Corp.: | | | |
| 5% 7/1/28 | | 9,760 | 8,842 |
| 5.25% 7/1/30 | | 14,760 | 12,928 |
| Pike Corp. 5.5% 9/1/28 (b) | | 1,762 | 1,507 |
| Vistra Operations Co. LLC: | | | |
| 5% 7/31/27 (b) | | 8,646 | 7,909 |
| 5.5% 9/1/26 (b) | | 2,845 | 2,707 |
| 5.625% 2/15/27 (b) | | 6,375 | 5,999 |
| 7.75% 10/15/31 (b) | | 2,240 | 2,162 |
| | | | 74,710 |
TOTAL NONCONVERTIBLE BONDS | | | 2,138,598 |
| TOTAL CORPORATE BONDS (Cost $2,529,152) | | | 2,172,344 |
| | | | |
| Commercial Mortgage Securities - 0.4% |
| | | Principal Amount (a) (000s) | Value ($) (000s) |
| BX Trust floater Series 2021-SOAR Class G, CME Term SOFR 1 Month Index + 2.910% 8.2495% 6/15/38 (b)(c)(d) | | 1,989 | 1,881 |
| ELP Commercial Mortgage Trust floater Series 2021-ELP Class F, CME Term SOFR 1 Month Index + 2.780% 8.1165% 11/15/38 (b)(c)(d) | | 2,683 | 2,549 |
| Extended Stay America Trust floater Series 2021-ESH Class F, CME Term SOFR 1 Month Index + 3.810% 9.1485% 7/15/38 (b)(c)(d) | | 1,112 | 1,079 |
| Hilton U.S.A. Trust Series 2016-HHV Class F, 4.1935% 11/5/38 (b)(c) | | 1,700 | 1,498 |
| Merit floater Series 2021-STOR Class F, CME Term SOFR 1 Month Index + 2.310% 7.6495% 7/15/38 (b)(c)(d) | | 3,994 | 3,784 |
| TOTAL COMMERCIAL MORTGAGE SECURITIES (Cost $10,907) | | | 10,791 |
| | | | |
| Common Stocks - 2.8% |
| | | Shares | Value ($) (000s) |
| Automotive & Auto Parts - 0.1% | | | |
| Aptiv PLC (i) | | 31,300 | 2,729 |
| Capital Goods - 0.1% | | | |
| Regal Rexnord Corp. | | 22,700 | 2,688 |
| Energy - 0.8% | | | |
| California Resources Corp. warrants 10/27/24 (i) | | 4,683 | 84 |
| Forbes Energy Services Ltd. (h)(i) | | 47,062 | 0 |
| Mesquite Energy, Inc. (h)(i) | | 213,506 | 16,950 |
| New Fortress Energy, Inc. (j) | | 174,600 | 5,290 |
TOTAL ENERGY | | | 22,324 |
| Food & Drug Retail - 1.3% | | | |
| Southeastern Grocers, Inc. (g)(h)(i) | | 1,235,303 | 33,034 |
| Healthcare - 0.2% | | | |
| Centene Corp. (i) | | 66,300 | 4,573 |
| Technology - 0.1% | | | |
| Coherent Corp. (i) | | 83,800 | 2,480 |
| Telecommunications - 0.2% | | | |
| CUI Acquisition Corp. Class E (h)(i) | | 1 | 0 |
| GTT Communications, Inc. (h) | | 113,281 | 3,225 |
| Helios Towers PLC (i) | | 1,814,300 | 1,335 |
TOTAL TELECOMMUNICATIONS | | | 4,560 |
| TOTAL COMMON STOCKS (Cost $40,251) | | | 72,388 |
| | | | |
| Bank Loan Obligations - 6.0% |
| | | Principal Amount (a) (000s) | Value ($) (000s) |
| Automotive & Auto Parts - 0.0% | | | |
| PECF USS Intermediate Holding III Corp. Tranche B 1LN, term loan CME Term SOFR 1 Month Index + 4.250% 9.8943% 12/17/28 (c)(d)(k) | | 1,586 | 1,194 |
| Broadcasting - 0.1% | | | |
| Diamond Sports Group LLC: | | | |
| 1LN, term loan CME Term SOFR 1 Month Index + 8.000% 15.4146% 8/24/26 (c)(d)(k) | | 4,991 | 1,875 |
| 2LN, term loan CME Term SOFR 1 Month Index + 3.250% 10.6625% (c)(d)(e)(k) | | 11,482 | 122 |
TOTAL BROADCASTING | | | 1,997 |
| Building Materials - 0.2% | | | |
| Acproducts Holdings, Inc. Tranche B 1LN, term loan CME Term SOFR 3 Month Index + 4.250% 9.9017% 5/17/28 (c)(d)(k) | | 6,360 | 5,035 |
| Chemicals - 0.3% | | | |
| Discovery Purchaser Corp. 1LN, term loan CME Term SOFR 3 Month Index + 4.370% 9.7651% 10/4/29 (c)(d)(k) | | 5,486 | 5,086 |
| Olympus Water U.S. Holding Corp. Tranche B 1LN, term loan CME Term SOFR 3 Month Index + 3.750% 9.4017% 11/9/28 (c)(d)(k) | | 1,995 | 1,943 |
TOTAL CHEMICALS | | | 7,029 |
| Consumer Products - 0.2% | | | |
| Mattress Firm, Inc. Tranche B 1LN, term loan 6 month U.S. LIBOR + 4.250% 9.95% 9/24/28 (c)(d)(k) | | 3,934 | 3,879 |
| Energy - 0.4% | | | |
| EG America LLC: | | | |
| 1LN, term loan CME Term SOFR 1 Month Index + 5.500% 9.4763% 2/7/28 (c)(d)(k) | | 3,566 | 3,392 |
| Tranche BB 1LN, term loan: | | | |
CME Term SOFR 1 Month Index + 4.000% 9.4145% 2/5/25 (c)(d)(k) | | 1,686 | 1,682 |
CME Term SOFR 3 Month Index + 4.000% 9.4145% 2/5/25 (c)(d)(k) | | 1,050 | 1,046 |
| Tranche BC 1LN, term loan CME Term SOFR 1 Month Index + 5.500% 9.4145% 2/7/28 (c)(d)(h)(k) | | 2,445 | 2,335 |
| Mesquite Energy, Inc.: | | | |
| 1LN, term loan 3 month U.S. LIBOR + 8.000% 0% (d)(e)(h)(k) | | 3,958 | 0 |
| term loan 3 month U.S. LIBOR + 0.000% 0% (d)(e)(h)(k) | | 1,690 | 0 |
| New Fortress Energy, Inc. Tranche B 1LN, term loan CME Term SOFR 1 Month Index + 5.000% 10/30/28 (d)(k)(l) | | 2,845 | 2,617 |
TOTAL ENERGY | | | 11,072 |
| Gaming - 0.0% | | | |
| Ontario Gaming GTA LP Tranche B 1LN, term loan CME Term SOFR 1 Month Index + 4.250% 9.6401% 8/1/30 (c)(d)(k) | | 230 | 230 |
| Healthcare - 0.2% | | | |
| Cano Health, Inc. Tranche B 1LN, term loan CME Term SOFR 1 Month Index + 4.000% 9.53% 11/23/27 (c)(d)(k) | | 6,080 | 3,500 |
| Da Vinci Purchaser Corp. Tranche B 1LN, term loan CME Term SOFR 1 Month Index + 4.000% 9.4386% 1/8/27 (c)(d)(k) | | 343 | 338 |
| Gainwell Acquisition Corp. Tranche B 1LN, term loan CME Term SOFR 3 Month Index + 4.000% 9.4901% 10/1/27 (c)(d)(k) | | 2,718 | 2,593 |
TOTAL HEALTHCARE | | | 6,431 |
| Homebuilders/Real Estate - 0.0% | | | |
| Breakwater Energy Partners LLC Tranche B 1LN, term loan 11.25% 9/1/26 (c)(d)(h)(k) | | 1,249 | 1,207 |
| Insurance - 0.0% | | | |
| Alliant Holdings Intermediate LLC Tranche B5 1LN, term loan CME Term SOFR 1 Month Index + 3.500% 8.8347% 11/6/27 (c)(d)(k) | | 506 | 504 |
| Leisure - 1.0% | | | |
| City Football Group Ltd. Tranche B 1LN, term loan CME Term SOFR 1 Month Index + 3.000% 8.4531% 7/21/28 (c)(d)(k) | | 14,685 | 14,524 |
| ClubCorp Holdings, Inc. Tranche B 1LN, term loan 3 month U.S. LIBOR + 2.750% 8.1806% 9/18/24 (c)(d)(k) | | 8,992 | 8,706 |
| United PF Holdings LLC 1LN, term loan CME Term SOFR 1 Month Index + 4.000% 9.6448% 12/30/26 (c)(d)(k) | | 2,428 | 2,090 |
TOTAL LEISURE | | | 25,320 |
| Paper - 0.0% | | | |
| Clydesdale Acquisition Holdings, Inc. 1LN, term loan CME Term SOFR 1 Month Index + 4.170% 9.5991% 4/13/29 (c)(d)(k) | | 858 | 829 |
| Services - 1.5% | | | |
| ABG Intermediate Holdings 2 LLC: | | | |
| Tranche B2 1LN, term loan CME Term SOFR 1 Month Index + 4.000% 9.4241% 12/21/28 (c)(d)(k) | | 2,098 | 2,093 |
| Tranche DD 1LN, term loan CME Term SOFR 1 Month Index + 4.000% 12/21/28 (d)(k)(m) | | 402 | 401 |
| Ascend Learning LLC: | | | |
| 2LN, term loan CME Term SOFR 1 Month Index + 5.750% 11.1741% 12/10/29 (c)(d)(k) | | 1,580 | 1,329 |
| Tranche B 1LN, term loan CME Term SOFR 1 Month Index + 3.500% 8.9241% 12/10/28 (c)(d)(k) | | 5,560 | 5,162 |
| Brand Energy & Infrastructure Services, Inc. Tranche B 1LN, term loan CME Term SOFR 1 Month Index + 5.500% 10.8719% 8/1/30 (c)(d)(k) | | 2,932 | 2,822 |
| CoreLogic, Inc. Tranche B 1LN, term loan CME Term SOFR 1 Month Index + 3.500% 8.9386% 6/2/28 (c)(d)(k) | | 6,178 | 5,609 |
| Finastra U.S.A., Inc. term loan CME Term SOFR 1 Month Index + 7.250% 12.7129% 9/13/29 (c)(d)(h)(k) | | 4,749 | 4,668 |
| Neptune BidCo U.S., Inc. Tranche B 1LN, term loan CME Term SOFR 1 Month Index + 5.000% 10.5067% 4/11/29 (c)(d)(k) | | 6,151 | 5,363 |
| PowerTeam Services LLC Tranche B 1LN, term loan CME Term SOFR 3 Month Index + 3.500% 8.8901% 3/6/25 (c)(d)(k) | | 2,790 | 2,516 |
| Spin Holdco, Inc. Tranche B 1LN, term loan 3 month U.S. LIBOR + 4.000% 9.6639% 3/4/28 (c)(d)(k) | | 9,980 | 8,508 |
TOTAL SERVICES | | | 38,471 |
| Super Retail - 0.8% | | | |
| Bass Pro Group LLC Tranche B 1LN, term loan CME Term SOFR 1 Month Index + 3.750% 9.4017% 3/5/28 (c)(d)(k) | | 6,614 | 6,555 |
| LBM Acquisition LLC Tranche B 1LN, term loan CME Term SOFR 1 Month Index + 3.750% 9.1741% 12/18/27 (c)(d)(k) | | 13,461 | 12,788 |
TOTAL SUPER RETAIL | | | 19,343 |
| Technology - 0.6% | | | |
| Athenahealth Group, Inc. Tranche B 1LN, term loan CME Term SOFR 1 Month Index + 3.500% 8.5769% 2/15/29 (c)(d)(k) | | 3,889 | 3,762 |
| DH Corp./Societe term loan CME Term SOFR 3 Month Index + 7.250% 12.7129% 9/13/29 (c)(d)(h)(k) | | 111 | 109 |
| McAfee Corp. Tranche B 1LN, term loan CME Term SOFR 1 Month Index + 3.750% 9.1646% 3/1/29 (c)(d)(k) | | 635 | 606 |
| Sophia LP Tranche B 1LN, term loan CME Term SOFR 3 Month Index + 3.500% 8.9241% 10/7/27 (c)(d)(k) | | 1,563 | 1,542 |
| Ukg, Inc.: | | | |
| 1LN, term loan CME Term SOFR 3 Month Index + 3.250% 8.7643% 5/4/26 (c)(d)(k) | | 5,777 | 5,742 |
| 2LN, term loan CME Term SOFR 3 Month Index + 5.250% 10.7643% 5/3/27 (c)(d)(k) | | 1,500 | 1,497 |
| Verscend Holding Corp. Tranche B 1LN, term loan CME Term SOFR 1 Month Index + 4.000% 9.4386% 8/27/25 (c)(d)(k) | | 1,939 | 1,936 |
TOTAL TECHNOLOGY | | | 15,194 |
| Telecommunications - 0.3% | | | |
| GTT Communications, Inc. 1LN, term loan CME Term SOFR 3 Month Index + 9.000% 14.4901% 6/30/28 (c)(d)(k) | | 4,768 | 2,813 |
| Gtt Remainco LLC 1LN, term loan CME Term SOFR 1 Month Index + 7.000% 12.4269% 12/30/27 (c)(d)(k) | | 5,936 | 5,105 |
TOTAL TELECOMMUNICATIONS | | | 7,918 |
| Utilities - 0.4% | | | |
| PG&E Corp. Tranche B 1LN, term loan CME Term SOFR 1 Month Index + 3.000% 8.4386% 6/23/25 (c)(d)(k) | | 10,223 | 10,197 |
| TOTAL BANK LOAN OBLIGATIONS (Cost $175,777) | | | 155,850 |
| | | | |
| Preferred Securities - 2.4% |
| | | Principal Amount (a) (000s) | Value ($) (000s) |
| Air Transportation - 0.2% | | | |
| AerCap Holdings NV 5.875% 10/10/79 (c) | | 6,905 | 6,505 |
| Banks & Thrifts - 0.9% | | | |
| Ally Financial, Inc.: | | | |
| 4.7% (c)(n) | | 4,475 | 2,949 |
| 4.7% (c)(n) | | 4,365 | 2,592 |
| Bank of America Corp. 5.875% (c)(n) | | 5,385 | 4,677 |
| JPMorgan Chase & Co.: | | | |
| 4.6% (c)(n) | | 3,885 | 3,664 |
| 6.1% (c)(n) | | 5,400 | 5,353 |
| Wells Fargo & Co. 5.9% (c)(n) | | 2,970 | 2,987 |
TOTAL BANKS & THRIFTS | | | 22,222 |
| Diversified Financial Services - 0.2% | | | |
| Aircastle Ltd. 5.25% (b)(c)(n) | | 5,175 | 4,093 |
| Charles Schwab Corp. 4% (c)(n) | | 3,465 | 2,388 |
TOTAL DIVERSIFIED FINANCIAL SERVICES | | | 6,481 |
| Energy - 0.9% | | | |
| Energy Transfer LP 3 month U.S. LIBOR + 4.020% 9.6542% (c)(d)(n) | | 13,948 | 13,435 |
| EnLink Midstream Partners LP CME Term SOFR 3 Month Index + 4.370% 9.7798% (c)(d)(n) | | 3,431 | 3,097 |
| Plains All American Pipeline LP CME Term SOFR 3 Month Index + 4.110% 9.7362% (c)(d)(n) | | 6,013 | 5,777 |
TOTAL ENERGY | | | 22,309 |
| Services - 0.2% | | | |
| Air Lease Corp. 4.125% (c)(n) | | 5,559 | 4,030 |
| TOTAL PREFERRED SECURITIES (Cost $61,081) | | | 61,547 |
| | | | |
| Other - 1.8% |
| | | Shares | Value ($) (000s) |
| Other - 1.8% | | | |
Fidelity Private Credit Central Fund LLC (g)(q) (Cost $46,253) | | 4,650,410 | 47,155 |
| | | | |
| Money Market Funds - 1.0% |
| | | Shares | Value ($) (000s) |
| Fidelity Cash Central Fund 5.40% (o) | | 19,392,797 | 19,397 |
| Fidelity Securities Lending Cash Central Fund 5.40% (o)(p) | | 5,496,200 | 5,497 |
| TOTAL MONEY MARKET FUNDS (Cost $24,894) | | | 24,894 |
| | | | |
| TOTAL INVESTMENT IN SECURITIES - 98.7% (Cost $2,888,315) | 2,544,969 |
NET OTHER ASSETS (LIABILITIES) - 1.3% | 32,676 |
| NET ASSETS - 100.0% | 2,577,645 |
| | |
Any values shown as $0 in the Schedule of Investments may reflect amounts less than $500.
Legend
| (a) | Amount is stated in United States dollars unless otherwise noted. |
| (b) | Security exempt from registration under Rule 144A of the Securities Act of 1933. These securities may be resold in transactions exempt from registration, normally to qualified institutional buyers. At the end of the period, the value of these securities amounted to $1,690,833,000 or 65.6% of net assets. |
| (c) | Coupon rates for floating and adjustable rate securities reflect the rates in effect at period end. |
| (d) | Coupon is indexed to a floating interest rate which may be multiplied by a specified factor and/or subject to caps or floors. |
| (e) | Non-income producing - Security is in default. |
| (f) | Security initially issued at one coupon which converts to a higher coupon at a specified date. The rate shown is the rate at period end. |
| (g) | Restricted securities (including private placements) - Investment in securities not registered under the Securities Act of 1933 (excluding 144A issues). At the end of the period, the value of restricted securities (excluding 144A issues) amounted to $85,021,000 or 3.3% of net assets. |
| (j) | Security or a portion of the security is on loan at period end. |
| (k) | Remaining maturities of bank loan obligations may be less than the stated maturities shown as a result of contractual or optional prepayments by the borrower. Such prepayments cannot be predicted with certainty. |
| (l) | The coupon rate will be determined upon settlement of the loan after period end. |
| (m) | Position or a portion of the position represents an unfunded loan commitment. At period end, the total principal amount and market value of unfunded commitments totaled $402,000 and $401,000, respectively. |
| (n) | Security is perpetual in nature with no stated maturity date. |
| (o) | Affiliated fund that is generally available only to investment companies and other accounts managed by Fidelity Investments. The rate quoted is the annualized seven-day yield of the fund at period end. A complete unaudited listing of the fund's holdings as of its most recent quarter end is available upon request. In addition, each Fidelity Central Fund's financial statements are available on the SEC's website or upon request. |
| (p) | Investment made with cash collateral received from securities on loan. |
| (q) | Affiliated fund that is generally available only to investment companies and other accounts managed by Fidelity Investments. |
| Additional information on each restricted holding is as follows: |
| Security | Acquisition Date | Acquisition Cost ($) (000s) |
| Fidelity Private Credit Central Fund LLC | 6/06/22 | 46,253 |
| | | |
| Jonah Energy Parent LLC 12% 11/5/25 | 5/05/23 | 4,614 |
| | | |
| Southeastern Grocers, Inc. | 6/01/18 | 8,689 |
| | | |
Affiliated Central Funds
Fiscal year to date information regarding the Fund's investments in Fidelity Central Funds, including the ownership percentage, is presented below.
| Affiliate (Amounts in thousands) | Value, beginning of period ($) | Purchases ($) | Sales Proceeds ($) | Dividend Income ($) | Realized Gain (loss) ($) | Change in Unrealized appreciation (depreciation) ($) | Value, end of period ($) | % ownership, end of period |
| Fidelity Cash Central Fund 5.40% | 70,215 | 417,159 | 467,977 | 1,385 | - | - | 19,397 | 0.0% |
| Fidelity Private Credit Central Fund LLC | 46,120 | - | - | 2,546 | - | 1,035 | 47,155 | 7.0% |
| Fidelity Securities Lending Cash Central Fund 5.40% | 428 | 11,600 | 6,531 | 1 | - | - | 5,497 | 0.0% |
| Total | 116,763 | 428,759 | 474,508 | 3,932 | - | 1,035 | 72,049 | |
| | | | | | | | | |
Amounts in the dividend income column in the above table include any capital gain distributions from underlying funds, which are presented in the corresponding line item in the Statement of Operations, if applicable.
Amounts in the dividend income column for Fidelity Securities Lending Cash Central Fund represents the income earned on investing cash collateral, less rebates paid to borrowers and any lending agent fees associated with the loan, plus any premium payments received for lending certain types of securities.
Amounts included in the purchases and sales proceeds columns may include in-kind transactions, if applicable.
Investment Valuation
The following is a summary of the inputs used, as of October 31, 2023, involving the Fund's assets and liabilities carried at fair value. The inputs or methodology used for valuing securities may not be an indication of the risk associated with investing in those securities. For more information on valuation inputs, and their aggregation into the levels used below, please refer to the Investment Valuation section in the accompanying Notes to Financial Statements.
| Valuation Inputs at Reporting Date: |
Description (Amounts in thousands) | Total ($) | Level 1 ($) | Level 2 ($) | Level 3 ($) |
Investments in Securities: | | | | |
|
| Equities: | | | | |
Communication Services | 1,335 | 1,335 | - | - |
Consumer Discretionary | 2,729 | 2,729 | - | - |
Consumer Staples | 33,034 | - | - | 33,034 |
Energy | 22,324 | 5,374 | - | 16,950 |
Health Care | 4,573 | 4,573 | - | - |
Industrials | 2,688 | 2,688 | - | - |
Information Technology | 5,705 | 2,480 | - | 3,225 |
|
| Corporate Bonds | 2,172,344 | - | 2,167,512 | 4,832 |
|
| Commercial Mortgage Securities | 10,791 | - | 10,791 | - |
|
| Bank Loan Obligations | 155,850 | - | 147,531 | 8,319 |
|
| Preferred Securities | 61,547 | - | 61,547 | - |
|
| Other | 47,155 | - | 47,155 | - |
|
| Money Market Funds | 24,894 | 24,894 | - | - |
| Total Investments in Securities: | 2,544,969 | 44,073 | 2,434,536 | 66,360 |
The following is a reconciliation of Investments in Securities for which Level 3 inputs were used in determining value:
| (Amounts in thousands) | |
| Investments in Securities: | |
| Consumer Staples | | | |
| Beginning Balance | $ | 30,339 | |
| Net Realized Gain (Loss) on Investment Securities | | - | |
| Net Unrealized Gain (Loss) on Investment Securities | | 2,695 | |
| Cost of Purchases | | - | |
| Proceeds of Sales | | - | |
| Amortization/Accretion | | - | |
| Transfers into Level 3 | | - | |
| Transfers out of Level 3 | | - | |
| Ending Balance | $ | 33,034 | |
| The change in unrealized gain (loss) for the period attributable to Level 3 securities held at October 31, 2023 | $ | 2,693 | |
| Corporate Bonds | | | |
| Beginning Balance | $ | 30,766 | |
| Net Realized Gain (Loss) on Investment Securities | | - | |
| Net Unrealized Gain (Loss) on Investment Securities | | (25,985) | |
| Cost of Purchases | | 4,614 | |
| Proceeds of Sales | | (4,579) | |
| Amortization/Accretion | | 16 | |
| Transfers into Level 3 | | - | |
| Transfers out of Level 3 | | - | |
| Ending Balance | $ | 4,832 | |
| The change in unrealized gain (loss) for the period attributable to Level 3 securities held at October 31, 2023 | $ | 202 | |
| Other Investments in Securities | | | |
| Beginning Balance | $ | 32,046 | |
| Net Realized Gain (Loss) on Investment Securities | | 6,535 | |
| Net Unrealized Gain (Loss) on Investment Securities | | (879) | |
| Cost of Purchases | | 4,763 | |
| Proceeds of Sales | | (17,724) | |
| Amortization/Accretion | | 28 | |
| Transfers into Level 3 | | 3,725 | |
| Transfers out of Level 3 | | - | |
| Ending Balance | $ | 28,494 | |
| The change in unrealized gain (loss) for the period attributable to Level 3 securities held at October 31, 2023 | $ | 5,659 | |
| The information used in the above reconciliation represents fiscal year to date activity for any Investments in Securities identified as using Level 3 inputs at either the beginning or the end of the current fiscal period. Cost of purchases and proceeds of sales may include securities received and/or delivered through in-kind transactions, corporate actions or exchanges. Transfers into Level 3 were attributable to a lack of observable market data resulting from decreases in market activity, decreases in liquidity, security restructurings or corporate actions. Transfers out of Level 3 were attributable to observable market data becoming available for those securities. Transfers in or out of Level 3 represent the beginning value of any Security or Instrument where a change in the pricing level occurred from the beginning to the end of the period. Realized and unrealized gains (losses) disclosed in the reconciliation are included in Net Gain (Loss) on the Fund's Statement of Operations. | |
| Statement of Assets and Liabilities |
| Amounts in thousands (except per-share amounts) | | | | October 31, 2023 (Unaudited) |
| | | | | |
| Assets | | | | |
| Investment in securities, at value (including securities loaned of $5,287) - See accompanying schedule: | | | | |
Unaffiliated issuers (cost $2,817,168) | $ | 2,472,920 | | |
Fidelity Central Funds (cost $71,147) | | 72,049 | | |
| | | | | |
| | | | | |
| Total Investment in Securities (cost $2,888,315) | | | $ | 2,544,969 |
| Cash | | | | 1,017 |
| Receivable for investments sold | | | | 3,156 |
| Receivable for fund shares sold | | | | 8,951 |
| Interest receivable | | | | 38,996 |
| Distributions receivable from Fidelity Central Funds | | | | 131 |
| Prepaid expenses | | | | 4 |
| Receivable from investment adviser for expense reductions | | | | 1,006 |
Total assets | | | | 2,598,230 |
| Liabilities | | | | |
| Payable for investments purchased | $ | 9,267 | | |
| Payable for fund shares redeemed | | 1,591 | | |
| Distributions payable | | 2,647 | | |
| Accrued management fee | | 1,158 | | |
| Distribution and service plan fees payable | | 38 | | |
| Other affiliated payables | | 335 | | |
| Other payables and accrued expenses | | 52 | | |
| Collateral on securities loaned | | 5,497 | | |
| Total Liabilities | | | | 20,585 |
| Commitments and contingent liabilities (see Commitments note) | | | | |
| Net Assets | | | $ | 2,577,645 |
| Net Assets consist of: | | | | |
| Paid in capital | | | $ | 3,605,997 |
| Total accumulated earnings (loss) | | | | (1,028,352) |
| Net Assets | | | $ | 2,577,645 |
| | | | | |
| Net Asset Value and Maximum Offering Price | | | | |
| Class A : | | | | |
Net Asset Value and redemption price per share ($112,719 ÷ 15,777 shares)(a) | | | $ | 7.14 |
| Maximum offering price per share (100/96.00 of $7.14) | | | $ | 7.44 |
| Class M : | | | | |
Net Asset Value and redemption price per share ($27,645 ÷ 3,870 shares)(a) | | | $ | 7.14 |
| Maximum offering price per share (100/96.00 of $7.14) | | | $ | 7.44 |
| Class C : | | | | |
Net Asset Value and offering price per share ($10,391 ÷ 1,454 shares)(a) | | | $ | 7.15 |
| Fidelity High Income Fund : | | | | |
Net Asset Value, offering price and redemption price per share ($2,316,383 ÷ 324,208 shares) | | | $ | 7.14 |
| Class I : | | | | |
Net Asset Value, offering price and redemption price per share ($55,044 ÷ 7,701 shares) | | | $ | 7.15 |
| Class Z : | | | | |
Net Asset Value, offering price and redemption price per share ($55,463 ÷ 7,764 shares) | | | $ | 7.14 |
(a)Redemption price per share is equal to net asset value less any applicable contingent deferred sales charge. |
| Statement of Operations |
| Amounts in thousands | | | | Six months ended October 31, 2023 (Unaudited) |
| Investment Income | | | | |
| Dividends | | | $ | 1,501 |
| Interest | | | | 86,974 |
| Income from Fidelity Central Funds (including $1 from security lending) | | | | 3,932 |
| Total Income | | | | 92,407 |
| Expenses | | | | |
| Management fee | $ | 7,443 | | |
| Transfer agent fees | | 1,632 | | |
| Distribution and service plan fees | | 239 | | |
| Accounting fees | | 439 | | |
| Custodian fees and expenses | | 10 | | |
| Independent trustees' fees and expenses | | 7 | | |
| Registration fees | | 40 | | |
| Audit | | 48 | | |
| Legal | | (700) | | |
| Miscellaneous | | 7 | | |
| Total expenses before reductions | | 9,165 | | |
| Expense reductions | | (169) | | |
| Total expenses after reductions | | | | 8,996 |
| Net Investment income (loss) | | | | 83,411 |
| Realized and Unrealized Gain (Loss) | | | | |
| Net realized gain (loss) on: | | | | |
| Investment Securities: | | | | |
| Unaffiliated issuers | | (109,767) | | |
| Total net realized gain (loss) | | | | (109,767) |
| Change in net unrealized appreciation (depreciation) on: | | | | |
| Investment Securities: | | | | |
| Unaffiliated issuers | | (5,263) | | |
| Fidelity Central Funds | | 1,035 | | |
| Total change in net unrealized appreciation (depreciation) | | | | (4,228) |
| Net gain (loss) | | | | (113,995) |
| Net increase (decrease) in net assets resulting from operations | | | $ | (30,584) |
| Statement of Changes in Net Assets |
| |
| Amount in thousands | | Six months ended October 31, 2023 (Unaudited) | | Year ended April 30, 2023 |
| Increase (Decrease) in Net Assets | | | | |
| Operations | | | | |
| Net investment income (loss) | $ | 83,411 | $ | 167,641 |
| Net realized gain (loss) | | (109,767) | | (210,957) |
| Change in net unrealized appreciation (depreciation) | | (4,228) | | (9,172) |
| Net increase (decrease) in net assets resulting from operations | | (30,584) | | (52,488) |
| Distributions to shareholders | | (75,203) | | (158,804) |
| | | | | |
| Share transactions - net increase (decrease) | | (213,033) | | (471,047) |
| Total increase (decrease) in net assets | | (318,820) | | (682,339) |
| | | | | |
| Net Assets | | | | |
| Beginning of period | | 2,896,465 | | 3,578,804 |
| End of period | $ | 2,577,645 | $ | 2,896,465 |
| | | | | |
| | | | | |
Financial Highlights
| Fidelity Advisor® High Income Fund Class A |
| |
| | Six months ended (Unaudited) October 31, 2023 | | Years ended April 30, 2023 | | 2022 | | 2021 | | 2020 | | 2019 A |
Selected Per-Share Data | | | | | | | | | | | | |
| Net asset value, beginning of period | $ | 7.43 | $ | 7.91 | $ | 8.71 | $ | 7.93 | $ | 8.83 | $ | 8.56 |
| Income from Investment Operations | | | | | | | | | | | | |
Net investment income (loss) B,C | | .215 | | .387 | | .345 | | .368 | | .438 | | .192 |
| Net realized and unrealized gain (loss) | | (.312) | | (.501) | | (.760) | | .772 | | (.908) | | .286 |
| Total from investment operations | | (.097) | | (.114) | | (.415) | | 1.140 | | (.470) | | .478 |
| Distributions from net investment income | | (.193) | | (.366) | | (.385) | | (.360) | | (.430) | | (.208) |
| Total distributions | | (.193) | | (.366) | | (.385) | | (.360) | | (.430) | | (.208) |
| Net asset value, end of period | $ | 7.14 | $ | 7.43 | $ | 7.91 | $ | 8.71 | $ | 7.93 | $ | 8.83 |
Total Return D,E,F | | (1.35)% | | (1.33)% | | (5.02)% | | 14.56% | | (5.63)% | | 5.68% |
Ratios to Average Net Assets C,G,H | | | | | | | | | | | | |
| Expenses before reductions | | .94% I | | 1.02% | | .99% | | .98% | | .98% | | .99% I |
| Expenses net of fee waivers, if any | | .93% I | | 1.02% | | .99% | | .98% | | .98% | | .99% I |
| Expenses net of all reductions | | .93% I | | 1.02% | | .99% | | .98% | | .98% | | .99% I |
| Net investment income (loss) | | 5.82% I | | 5.19% | | 4.02% | | 4.32% | | 5.04% | | 5.60% I |
| Supplemental Data | | | | | | | | | | | | |
| Net assets, end of period (in millions) | $ | 113 | $ | 119 | $ | 132 | $ | 148 | $ | 144 | $ | 170 |
Portfolio turnover rate J | | 38% I | | 35% | | 54% K | | 62% | | 44% K | | 62% L |
AFor the period December 4, 2018 (commencement of sale of shares) through April 30, 2019.
BCalculated based on average shares outstanding during the period.
CNet investment income (loss) is affected by the timing of the declaration of dividends by any underlying mutual funds or exchange-traded funds (ETFs). Net investment income (loss) of any mutual funds or ETFs is not included in the Fund's net investment income (loss) ratio.
DTotal returns for periods of less than one year are not annualized.
ETotal returns would have been lower if certain expenses had not been reduced during the applicable periods shown.
FTotal returns do not include the effect of the sales charges.
GFees and expenses of any underlying mutual funds or exchange-traded funds (ETFs) are not included in the Fund's expense ratio. The Fund indirectly bears its proportionate share of these expenses. For additional expense information related to investments in Fidelity Central Funds, please refer to the "Investments in Fidelity Central Funds" note found in the Notes to Financial Statements section of the most recent Annual or Semi-Annual report. For additional expense information related to investments in Fidelity Private Credit Central Fund LLC, please refer to the Investment in Fidelity Private Credit Central Fund LLC note found in the Notes to Financial Statements section of the most recent Annual or Semi-Annual report.
HExpense ratios reflect operating expenses of the class. Expenses before reductions do not reflect amounts reimbursed, waived, or reduced through arrangements with the investment adviser, brokerage services, or other offset arrangements, if applicable, and do not represent the amount paid by the class during periods when reimbursements, waivers or reductions occur.
IAnnualized.
JAmount does not include the portfolio activity of any underlying mutual funds or exchange-traded funds (ETFs).
KPortfolio turnover rate excludes securities received or delivered in-kind.
LThe portfolio turnover rate does not include the assets acquired in the merger.
| Fidelity Advisor® High Income Fund Class M |
| |
| | Six months ended (Unaudited) October 31, 2023 | | Years ended April 30, 2023 | | 2022 | | 2021 | | 2020 | | 2019 A |
Selected Per-Share Data | | �� | | | | | | | | | | |
| Net asset value, beginning of period | $ | 7.43 | $ | 7.91 | $ | 8.71 | $ | 7.93 | $ | 8.83 | $ | 8.56 |
| Income from Investment Operations | | | | | | | | | | | | |
Net investment income (loss) B,C | | .215 | | .386 | | .345 | | .367 | | .438 | | .191 |
| Net realized and unrealized gain (loss) | | (.312) | | (.500) | | (.761) | | .772 | | (.909) | | .286 |
| Total from investment operations | | (.097) | | (.114) | | (.416) | | 1.139 | | (.471) | | .477 |
| Distributions from net investment income | | (.193) | | (.366) | | (.384) | | (.359) | | (.429) | | (.207) |
| Total distributions | | (.193) | | (.366) | | (.384) | | (.359) | | (.429) | | (.207) |
| Net asset value, end of period | $ | 7.14 | $ | 7.43 | $ | 7.91 | $ | 8.71 | $ | 7.93 | $ | 8.83 |
Total Return D,E,F | | (1.35)% | | (1.34)% | | (5.03)% | | 14.55% | | (5.64)% | | 5.68% |
Ratios to Average Net Assets C,G,H | | | | | | | | | | | | |
| Expenses before reductions | | .94% I | | 1.03% | | 1.00% | | .99% | | .99% | | 1.01% I |
| Expenses net of fee waivers, if any | | .93% I | | 1.02% | | 1.00% | | .99% | | .99% | | 1.01% I |
| Expenses net of all reductions | | .93% I | | 1.02% | | 1.00% | | .99% | | .99% | | 1.01% I |
| Net investment income (loss) | | 5.82% I | | 5.18% | | 4.01% | | 4.31% | | 5.02% | | 5.59% I |
| Supplemental Data | | | | | | | | | | | | |
| Net assets, end of period (in millions) | $ | 28 | $ | 29 | $ | 30 | $ | 36 | $ | 40 | $ | 50 |
Portfolio turnover rate J | | 38% I | | 35% | | 54% K | | 62% | | 44% K | | 62% L |
AFor the period December 4, 2018 (commencement of sale of shares) through April 30, 2019.
BCalculated based on average shares outstanding during the period.
CNet investment income (loss) is affected by the timing of the declaration of dividends by any underlying mutual funds or exchange-traded funds (ETFs). Net investment income (loss) of any mutual funds or ETFs is not included in the Fund's net investment income (loss) ratio.
DTotal returns for periods of less than one year are not annualized.
ETotal returns would have been lower if certain expenses had not been reduced during the applicable periods shown.
FTotal returns do not include the effect of the sales charges.
GFees and expenses of any underlying mutual funds or exchange-traded funds (ETFs) are not included in the Fund's expense ratio. The Fund indirectly bears its proportionate share of these expenses. For additional expense information related to investments in Fidelity Central Funds, please refer to the "Investments in Fidelity Central Funds" note found in the Notes to Financial Statements section of the most recent Annual or Semi-Annual report. For additional expense information related to investments in Fidelity Private Credit Central Fund LLC, please refer to the Investment in Fidelity Private Credit Central Fund LLC note found in the Notes to Financial Statements section of the most recent Annual or Semi-Annual report.
HExpense ratios reflect operating expenses of the class. Expenses before reductions do not reflect amounts reimbursed, waived, or reduced through arrangements with the investment adviser, brokerage services, or other offset arrangements, if applicable, and do not represent the amount paid by the class during periods when reimbursements, waivers or reductions occur.
IAnnualized.
JAmount does not include the portfolio activity of any underlying mutual funds or exchange-traded funds (ETFs).
KPortfolio turnover rate excludes securities received or delivered in-kind.
LThe portfolio turnover rate does not include the assets acquired in the merger.
| Fidelity Advisor® High Income Fund Class C |
| |
| | Six months ended (Unaudited) October 31, 2023 | | Years ended April 30, 2023 | | 2022 | | 2021 | | 2020 | | 2019 A |
Selected Per-Share Data | | | | | | | | | | | | |
| Net asset value, beginning of period | $ | 7.43 | $ | 7.91 | $ | 8.71 | $ | 7.93 | $ | 8.83 | $ | 8.56 |
| Income from Investment Operations | | | | | | | | | | | | |
Net investment income (loss) B,C | | .187 | | .330 | | .281 | | .302 | | .372 | | .166 |
| Net realized and unrealized gain (loss) | | (.303) | | (.501) | | (.763) | | .772 | | (.909) | | .285 |
| Total from investment operations | | (.116) | | (.171) | | (.482) | | 1.074 | | (.537) | | .451 |
| Distributions from net investment income | | (.164) | | (.309) | | (.318) | | (.294) | | (.363) | | (.181) |
| Total distributions | | (.164) | | (.309) | | (.318) | | (.294) | | (.363) | | (.181) |
| Net asset value, end of period | $ | 7.15 | $ | 7.43 | $ | 7.91 | $ | 8.71 | $ | 7.93 | $ | 8.83 |
Total Return D,E,F | | (1.59)% | | (2.09)% | | (5.75)% | | 13.68% | | (6.35)% | | 5.36% |
Ratios to Average Net Assets C,G,H | | | | | | | | | | | | |
| Expenses before reductions | | 1.71% I | | 1.79% | | 1.76% | | 1.75% | | 1.75% | | 1.77% I |
| Expenses net of fee waivers, if any | | 1.70% I | | 1.79% | | 1.76% | | 1.75% | | 1.75% | | 1.77% I |
| Expenses net of all reductions | | 1.70% I | | 1.79% | | 1.76% | | 1.75% | | 1.75% | | 1.77% I |
| Net investment income (loss) | | 5.04% I | | 4.42% | | 3.25% | | 3.55% | | 4.27% | | 4.84% I |
| Supplemental Data | | | | | | | | | | | | |
| Net assets, end of period (in millions) | $ | 10 | $ | 12 | $ | 17 | $ | 30 | $ | 36 | $ | 52 |
Portfolio turnover rate J | | 38% I | | 35% | | 54% K | | 62% | | 44% K | | 62% L |
AFor the period December 4, 2018 (commencement of sale of shares) through April 30, 2019.
BCalculated based on average shares outstanding during the period.
CNet investment income (loss) is affected by the timing of the declaration of dividends by any underlying mutual funds or exchange-traded funds (ETFs). Net investment income (loss) of any mutual funds or ETFs is not included in the Fund's net investment income (loss) ratio.
DTotal returns for periods of less than one year are not annualized.
ETotal returns would have been lower if certain expenses had not been reduced during the applicable periods shown.
FTotal returns do not include the effect of the contingent deferred sales charge.
GFees and expenses of any underlying mutual funds or exchange-traded funds (ETFs) are not included in the Fund's expense ratio. The Fund indirectly bears its proportionate share of these expenses. For additional expense information related to investments in Fidelity Central Funds, please refer to the "Investments in Fidelity Central Funds" note found in the Notes to Financial Statements section of the most recent Annual or Semi-Annual report. For additional expense information related to investments in Fidelity Private Credit Central Fund LLC, please refer to the Investment in Fidelity Private Credit Central Fund LLC note found in the Notes to Financial Statements section of the most recent Annual or Semi-Annual report.
HExpense ratios reflect operating expenses of the class. Expenses before reductions do not reflect amounts reimbursed, waived, or reduced through arrangements with the investment adviser, brokerage services, or other offset arrangements, if applicable, and do not represent the amount paid by the class during periods when reimbursements, waivers or reductions occur.
IAnnualized.
JAmount does not include the portfolio activity of any underlying mutual funds or exchange-traded funds (ETFs).
KPortfolio turnover rate excludes securities received or delivered in-kind.
LThe portfolio turnover rate does not include the assets acquired in the merger.
| Fidelity® High Income Fund |
| |
| | Six months ended (Unaudited) October 31, 2023 | | Years ended April 30, 2023 | | 2022 | | 2021 | | 2020 | | 2019 |
Selected Per-Share Data | | | | | | | | | | | | |
| Net asset value, beginning of period | $ | 7.43 | $ | 7.91 | $ | 8.71 | $ | 7.93 | $ | 8.83 | $ | 8.83 |
| Income from Investment Operations | | | | | | | | | | | | |
Net investment income (loss) A,B | | .226 | | .408 | | .371 | | .392 | | .464 | | .493 |
| Net realized and unrealized gain (loss) | | (.312) | | (.500) | | (.761) | | .772 | | (.909) | | - |
| Total from investment operations | | (.086) | | (.092) | | (.390) | | 1.164 | | (.445) | | .493 |
| Distributions from net investment income | | (.204) | | (.388) | | (.410) | | (.384) | | (.455) | | (.493) |
| Total distributions | | (.204) | | (.388) | | (.410) | | (.384) | | (.455) | | (.493) |
| Net asset value, end of period | $ | 7.14 | $ | 7.43 | $ | 7.91 | $ | 8.71 | $ | 7.93 | $ | 8.83 |
Total Return C,D | | (1.20)% | | (1.04)% | | (4.75)% | | 14.89% | | (5.35)% | | 5.83% |
Ratios to Average Net Assets B,E,F | | | | | | | | | | | | |
| Expenses before reductions | | .65% G | | .73% | | .70% | | .69% | | .69% | | .70% |
| Expenses net of fee waivers, if any | | .64% G | | .73% | | .70% | | .69% | | .69% | | .70% |
| Expenses net of all reductions | | .64% G | | .73% | | .70% | | .69% | | .69% | | .70% |
| Net investment income (loss) | | 6.11% G | | 5.48% | | 4.31% | | 4.61% | | 5.33% | | 5.66% |
| Supplemental Data | | | | | | | | | | | | |
| Net assets, end of period (in millions) | $ | 2,316 | $ | 2,567 | $ | 3,181 | $ | 4,139 | $ | 3,871 | $ | 4,392 |
Portfolio turnover rate H | | 38% G | | 35% | | 54% I | | 62% | | 44% I | | 62% J |
ACalculated based on average shares outstanding during the period.
BNet investment income (loss) is affected by the timing of the declaration of dividends by any underlying mutual funds or exchange-traded funds (ETFs). Net investment income (loss) of any mutual funds or ETFs is not included in the Fund's net investment income (loss) ratio.
CTotal returns for periods of less than one year are not annualized.
DTotal returns would have been lower if certain expenses had not been reduced during the applicable periods shown.
EFees and expenses of any underlying mutual funds or exchange-traded funds (ETFs) are not included in the Fund's expense ratio. The Fund indirectly bears its proportionate share of these expenses. For additional expense information related to investments in Fidelity Central Funds, please refer to the "Investments in Fidelity Central Funds" note found in the Notes to Financial Statements section of the most recent Annual or Semi-Annual report. For additional expense information related to investments in Fidelity Private Credit Central Fund LLC, please refer to the Investment in Fidelity Private Credit Central Fund LLC note found in the Notes to Financial Statements section of the most recent Annual or Semi-Annual report.
FExpense ratios reflect operating expenses of the class. Expenses before reductions do not reflect amounts reimbursed, waived, or reduced through arrangements with the investment adviser, brokerage services, or other offset arrangements, if applicable, and do not represent the amount paid by the class during periods when reimbursements, waivers or reductions occur.
GAnnualized.
HAmount does not include the portfolio activity of any underlying mutual funds or exchange-traded funds (ETFs).
IPortfolio turnover rate excludes securities received or delivered in-kind.
JThe portfolio turnover rate does not include the assets acquired in the merger.
| Fidelity Advisor® High Income Fund Class I |
| |
| | Six months ended (Unaudited) October 31, 2023 | | Years ended April 30, 2023 | | 2022 | | 2021 | | 2020 | | 2019 A |
Selected Per-Share Data | | | | | | | | | | | | |
| Net asset value, beginning of period | $ | 7.43 | $ | 7.91 | $ | 8.71 | $ | 7.93 | $ | 8.83 | $ | 8.56 |
| Income from Investment Operations | | | | | | | | | | | | |
Net investment income (loss) B,C | | .221 | | .401 | | .390 | | .390 | | .458 | | .199 |
| Net realized and unrealized gain (loss) | | (.302) | | (.499) | | (.774) | | .771 | | (.907) | | .286 |
| Total from investment operations | | (.081) | | (.098) | | (.384) | | 1.161 | | (.449) | | .485 |
| Distributions from net investment income | | (.199) | | (.382) | | (.416) | | (.381) | | (.451) | | (.215) |
| Total distributions | | (.199) | | (.382) | | (.416) | | (.381) | | (.451) | | (.215) |
| Net asset value, end of period | $ | 7.15 | $ | 7.43 | $ | 7.91 | $ | 8.71 | $ | 7.93 | $ | 8.83 |
Total Return D,E | | (1.12)% | | (1.12)% | | (4.68)% | | 14.85% | | (5.40)% | | 5.77% |
Ratios to Average Net Assets C,F,G | | | | | | | | | | | | |
| Expenses before reductions | | .78% H | | .85% | | .72% | | .73% | | .74% | | .78% H |
| Expenses net of fee waivers, if any | | .75% H | | .80% | | .71% | | .73% | | .74% | | .78% H |
| Expenses net of all reductions | | .75% H | | .80% | | .71% | | .73% | | .74% | | .78% H |
| Net investment income (loss) | | 5.99% H | | 5.41% | | 4.29% | | 4.57% | | 5.28% | | 5.81% H |
| Supplemental Data | | | | | | | | | | | | |
| Net assets, end of period (in millions) | $ | 55 | $ | 111 | $ | 85 | $ | 4,010 | $ | 558 | $ | 448 |
Portfolio turnover rate I | | 38% H | | 35% | | 54% J | | 62% | | 44% J | | 62% K |
AFor the period December 4, 2018 (commencement of sale of shares) through April 30, 2019.
BCalculated based on average shares outstanding during the period.
CNet investment income (loss) is affected by the timing of the declaration of dividends by any underlying mutual funds or exchange-traded funds (ETFs). Net investment income (loss) of any mutual funds or ETFs is not included in the Fund's net investment income (loss) ratio.
DTotal returns for periods of less than one year are not annualized.
ETotal returns would have been lower if certain expenses had not been reduced during the applicable periods shown.
FFees and expenses of any underlying mutual funds or exchange-traded funds (ETFs) are not included in the Fund's expense ratio. The Fund indirectly bears its proportionate share of these expenses. For additional expense information related to investments in Fidelity Central Funds, please refer to the "Investments in Fidelity Central Funds" note found in the Notes to Financial Statements section of the most recent Annual or Semi-Annual report. For additional expense information related to investments in Fidelity Private Credit Central Fund LLC, please refer to the Investment in Fidelity Private Credit Central Fund LLC note found in the Notes to Financial Statements section of the most recent Annual or Semi-Annual report.
GExpense ratios reflect operating expenses of the class. Expenses before reductions do not reflect amounts reimbursed, waived, or reduced through arrangements with the investment adviser, brokerage services, or other offset arrangements, if applicable, and do not represent the amount paid by the class during periods when reimbursements, waivers or reductions occur.
HAnnualized.
IAmount does not include the portfolio activity of any underlying mutual funds or exchange-traded funds (ETFs).
JPortfolio turnover rate excludes securities received or delivered in-kind.
KThe portfolio turnover rate does not include the assets acquired in the merger.
| Fidelity Advisor® High Income Fund Class Z |
| |
| | Six months ended (Unaudited) October 31, 2023 | | Years ended April 30, 2023 | | 2022 | | 2021 | | 2020 | | 2019 A |
Selected Per-Share Data | | | | | | | | | | | | |
| Net asset value, beginning of period | $ | 7.43 | $ | 7.91 | $ | 8.71 | $ | 7.93 | $ | 8.83 | $ | 8.56 |
| Income from Investment Operations | | | | | | | | | | | | |
Net investment income (loss) B,C | | .228 | | .415 | | .378 | | .399 | | .464 | | .201 |
| Net realized and unrealized gain (loss) | | (.312) | | (.502) | | (.763) | | .770 | | (.904) | | .289 |
| Total from investment operations | | (.084) | | (.087) | | (.385) | | 1.169 | | (.440) | | .490 |
| Distributions from net investment income | | (.206) | | (.393) | | (.415) | | (.389) | | (.460) | | (.220) |
| Total distributions | | (.206) | | (.393) | | (.415) | | (.389) | | (.460) | | (.220) |
| Net asset value, end of period | $ | 7.14 | $ | 7.43 | $ | 7.91 | $ | 8.71 | $ | 7.93 | $ | 8.83 |
Total Return D,E | | (1.17)% | | (.98)% | | (4.68)% | | 14.96% | | (5.30)% | | 5.83% |
Ratios to Average Net Assets C,F,G | | | | | | | | | | | | |
| Expenses before reductions | | .58% H | | .66% | | .64% | | .63% | | .63% | | .64% H |
| Expenses net of fee waivers, if any | | .57% H | | .66% | | .63% | | .63% | | .63% | | .64% H |
| Expenses net of all reductions | | .57% H | | .66% | | .63% | | .62% | | .63% | | .63% H |
| Net investment income (loss) | | 6.17% H | | 5.54% | | 4.37% | | 4.67% | | 5.39% | | 5.85% H |
| Supplemental Data | | | | | | | | | | | | |
| Net assets, end of period (in millions) | $ | 55 | $ | 58 | $ | 133 | $ | 250 | $ | 61 | $ | 13 |
Portfolio turnover rate I | | 38% H | | 35% | | 54% J | | 62% | | 44% J | | 62% K |
AFor the period December 4, 2018 (commencement of sale of shares) through April 30, 2019.
BCalculated based on average shares outstanding during the period.
CNet investment income (loss) is affected by the timing of the declaration of dividends by any underlying mutual funds or exchange-traded funds (ETFs). Net investment income (loss) of any mutual funds or ETFs is not included in the Fund's net investment income (loss) ratio.
DTotal returns for periods of less than one year are not annualized.
ETotal returns would have been lower if certain expenses had not been reduced during the applicable periods shown.
FFees and expenses of any underlying mutual funds or exchange-traded funds (ETFs) are not included in the Fund's expense ratio. The Fund indirectly bears its proportionate share of these expenses. For additional expense information related to investments in Fidelity Central Funds, please refer to the "Investments in Fidelity Central Funds" note found in the Notes to Financial Statements section of the most recent Annual or Semi-Annual report. For additional expense information related to investments in Fidelity Private Credit Central Fund LLC, please refer to the Investment in Fidelity Private Credit Central Fund LLC note found in the Notes to Financial Statements section of the most recent Annual or Semi-Annual report.
GExpense ratios reflect operating expenses of the class. Expenses before reductions do not reflect amounts reimbursed, waived, or reduced through arrangements with the investment adviser, brokerage services, or other offset arrangements, if applicable, and do not represent the amount paid by the class during periods when reimbursements, waivers or reductions occur.
HAnnualized.
IAmount does not include the portfolio activity of any underlying mutual funds or exchange-traded funds (ETFs).
JPortfolio turnover rate excludes securities received or delivered in-kind.
KThe portfolio turnover rate does not include the assets acquired in the merger.
For the period ended October 31, 2023
(Amounts in thousands except percentages)
1. Organization.
Fidelity High Income Fund (the Fund) is a fund of Fidelity Summer Street Trust (the Trust) and is authorized to issue an unlimited number of shares. The Trust is registered under the Investment Company Act of 1940, as amended (the 1940 Act), as an open-end management investment company organized as a Massachusetts business trust. The Fund offers Class A, Class M, Class C, Fidelity High Income Fund, Class I and Class Z shares, each of which has equal rights as to assets and voting privileges. Class A, Class M, Class C, Class I and Class Z are Fidelity Advisor classes. Each class has exclusive voting rights with respect to matters that affect that class. Class C shares will automatically convert to Class A shares after a holding period of eight years from the initial date of purchase, with certain exceptions.
2. Investments in Fidelity Central Funds.
Funds may invest in Fidelity Central Funds, which are open-end investment companies generally available only to other investment companies and accounts managed by the investment adviser and its affiliates. The Schedule of Investments lists any Fidelity Central Funds held as an investment as of period end, but does not include the underlying holdings of each Fidelity Central Fund. An investing fund indirectly bears its proportionate share of the expenses of the underlying Fidelity Central Funds.
Based on its investment objective, each Fidelity Central Fund may invest or participate in various investment vehicles or strategies that are similar to those of the investing fund. These strategies are consistent with the investment objectives of the investing fund and may involve certain economic risks which may cause a decline in value of each of the Fidelity Central Funds and thus a decline in the value of the investing fund.
| Fidelity Central Fund | Investment Manager | Investment Objective | Investment Practices | Expense RatioA |
| Fidelity Money Market Central Funds | Fidelity Management & Research Company LLC (FMR) | Each fund seeks to obtain a high level of current income consistent with the preservation of capital and liquidity. | Short-term Investments | Less than .005% |
A Expenses expressed as a percentage of average net assets and are as of each underlying Central Fund's most recent annual or semi-annual shareholder report.
A complete unaudited list of holdings for each Fidelity Central Fund is available upon request or at the Securities and Exchange Commission website at www.sec.gov. In addition, the financial statements of the Fidelity Central Funds which contain the significant accounting policies (including investment valuation policies) of those funds, and are not covered by the Report of Independent Registered Public Accounting Firm, are available on the Securities and Exchange Commission website or upon request.
3. Investment in Fidelity Private Credit Central Fund LLC.
The Fund invests in Fidelity Private Credit Central Fund LLC (formerly Fidelity Direct Lending Fund, LP), which is a limited liability company available only to certain investment companies managed by the investment adviser and its affiliates. On June 1, 2023, Fidelity Private Credit Central Fund elected to be regulated as a business development company (BDC). Fidelity Private Credit Central Fund LLC's units are not registered under the Securities Act of 1933 and are subject to substantial restrictions on transfer. The Fund has no redemption rights under Fidelity Private Credit Central Fund LLC's limited liability company agreement. There will be no trading market for the units.
Based on its investment objective, Fidelity Private Credit Central Fund LLC may invest or participate in various investments or strategies that are similar to those in which the Fund may invest or participate. These strategies are consistent with the investment objectives of the Fund and may involve certain economic risks which may cause a decline in value of Fidelity Private Credit Central Fund LLC and thus a decline in the value of the Fund. Fidelity Private Credit Central Fund LLC intends to invest primarily in directly originated loans to private companies but also with liquid credit investments, like broadly syndicated loans, and other select private credit investments.
The Schedule of Investments lists Fidelity Private Credit Central Fund LLC as an investment as of period end, but does not include the underlying holdings of Fidelity Private Credit Central Fund LLC. Fidelity Private Credit Central Fund LLC represented less than 5% of the Fund's net assets at period end. The Fund indirectly bears its proportionate share of the expenses of Fidelity Private Credit Central Fund LLC. The annualized expense ratio for Fidelity Private Credit Central Fund LLC for the nine month period ended September 30, 2023 was 9.63%.
4. Significant Accounting Policies.
The Fund is an investment company and applies the accounting and reporting guidance of the Financial Accounting Standards Board (FASB) Accounting Standards Codification Topic 946 Financial Services - Investment Companies. The financial statements have been prepared in conformity with accounting principles generally accepted in the United States of America (GAAP), which require management to make certain estimates and assumptions at the date of the financial statements. Actual results could differ from those estimates. Subsequent events, if any, through the date that the financial statements were issued have been evaluated in the preparation of the financial statements. The Fund's Schedule of Investments lists any underlying mutual funds or exchange-traded funds (ETFs) but does not include the underlying holdings of these funds. The following summarizes the significant accounting policies of the Fund:
Investment Valuation. Investments are valued as of 4:00 p.m. Eastern time on the last calendar day of the period. The Board of Trustees (the Board) has designated the Fund's investment adviser as the valuation designee responsible for the fair valuation function and performing fair value determinations as needed. The investment adviser has established a Fair Value Committee (the Committee) to carry out the day-to-day fair valuation responsibilities and has adopted policies and procedures to govern the fair valuation process and the activities of the Committee. In accordance with these fair valuation policies and procedures, which have been approved by the Board, the Fund attempts to obtain prices from one or more third party pricing services or brokers to value its investments. When current market prices, quotations or currency exchange rates are not readily available or reliable, investments will be fair valued in good faith by the Committee, in accordance with the policies and procedures. Factors used in determining fair value vary by investment type and may include market or investment specific events, transaction data, estimated cash flows, and market observations of comparable investments. The frequency that the fair valuation procedures are used cannot be predicted and they may be utilized to a significant extent. The Committee manages the Fund's fair valuation practices and maintains the fair valuation policies and procedures. The Fund's investment adviser reports to the Board information regarding the fair valuation process and related material matters.
The Fund categorizes the inputs to valuation techniques used to value its investments into a disclosure hierarchy consisting of three levels as shown below:
Level 1 - unadjusted quoted prices in active markets for identical investments
Level 2 - other significant observable inputs (including quoted prices for similar investments, interest rates, prepayment speeds, etc.)
Level 3 - unobservable inputs (including the Fund's own assumptions based on the best information available)
Valuation techniques used to value the Fund's investments by major category are as follows:
Debt securities, including restricted securities, are valued based on evaluated prices received from third party pricing services or from brokers who make markets in such securities. Corporate bonds, bank loan obligations and preferred securities are valued by pricing services who utilize matrix pricing which considers yield or price of bonds of comparable quality, coupon, maturity and type or by broker-supplied prices. Commercial mortgage securities are valued by pricing services who utilize matrix pricing which considers prepayment speed assumptions, attributes of the collateral, yield or price of bonds of comparable quality, coupon, maturity and type or by broker-supplied prices. When independent prices are unavailable or unreliable, debt securities may be valued utilizing pricing methodologies which consider similar factors that would be used by third party pricing services. Debt securities are generally categorized as Level 2 in the hierarchy but may be Level 3 depending on the circumstances. The Fund invests a significant portion of its assets in below investment grade securities. The value of these securities can be more volatile due to changes in the credit quality of the issuer and is sensitive to changes in economic, market and regulatory conditions.
Equity securities, including restricted securities, for which market quotations are readily available, are valued at the last reported sale price or official closing price as reported by a third party pricing service on the primary market or exchange on which they are traded and are categorized as Level 1 in the hierarchy. In the event there were no sales during the day or closing prices are not available, securities are valued at the last quoted bid price or may be valued using the last available price and are generally categorized as Level 2 in the hierarchy. For foreign equity securities, when market or security specific events arise, comparisons to the valuation of American Depositary Receipts (ADRs), futures contracts, ETFs and certain indexes as well as quoted prices for similar securities may be used and would be categorized as Level 2 in the hierarchy. For equity securities, including restricted securities, where observable inputs are limited, assumptions about market activity and risk are used and these securities may be categorized as Level 3 in the hierarchy. Securities, including private placements or other restricted securities, for which observable inputs are not available are valued using alternate valuation approaches, including the market approach, the income approach and cost approach, and are categorized as Level 3 in the hierarchy. The market approach considers factors including the price of recent investments in the same or a similar security or financial metrics of comparable securities. The income approach considers factors including expected future cash flows, security specific risks and corresponding discount rates. The cost approach considers factors including the value of the security's underlying assets and liabilities.
Investments in open-end mutual funds, including the Fidelity Central Funds, are valued at their closing net asset value (NAV) each business day and are categorized as Level 1 in the hierarchy.
Fidelity Private Credit Central Fund LLC is valued at its net asset value (NAV) each month end and is categorized as Level 2 in the hierarchy.
The following provides information on Level 3 securities held by the Fund that were valued at period end based on unobservable inputs. These amounts exclude valuations provided by a broker and valuations using NAV as a practical expedient.
| Asset Type | Fair Value | Valuation Technique(s) | Unobservable Input | Amount or Range/Weighted Average | Impact to Valuation from an Increase in InputA |
| Equities | $53,209 | Market comparable | Enterprise value/EBITDA multiple (EV/EBITDA) | 4.3 - 6.8 / 4.5 | Increase |
| | | Market approach | Transaction price | $0.00 - $79.39 / $79.39 | Increase |
| | | Recovery value | Recovery value | $0.00 | Increase |
| Corporate Bonds | $4,832 | Market comparable | Enterprise value/EBITDA multiple (EV/EBITDA) | 6.5 | Increase |
| | | | Enterprise value/Proved reserves multiple (EV/PR) | 0.8 | Increase |
| | | | Enterprise value/PV-10 multiple (EV/PV-10) | 0.3 | Increase |
| | | | Daily production multiple ($/Million cubic feet per day) | $3,850.00 | Increase |
| | | Recovery value | Recovery value | $0.00 | Increase |
| | | Discounted cash flow | Yield | 19.1% | Decrease |
| Bank Loan Obligations | $8,319 | Market comparable | Enterprise value/EBITDA multiple (EV/EBITDA) | 2.5 | Increase |
| | | Indicative market price | Evaluated bid | $95.50 | Increase |
| | | Recovery value | Recovery value | $0.00 | Increase |
| | | Discounted cash flow | Yield | 13.0% - 15.0% / 13.4% | Decrease |
A Represents the directional change in the fair value of the Level 3 investments that could have resulted from an increase in the corresponding input as of period end. A decrease to the unobservable input would have had the opposite effect. Significant changes in these inputs may have resulted in a significantly higher or lower fair value measurement at period end.
Changes in valuation techniques may result in transfers in or out of an assigned level within the disclosure hierarchy. The aggregate value of investments by input level as of October 31, 2023, as well as a roll forward of Level 3 investments, is included at the end of the Fund's Schedule of Investments.
Foreign Currency. Certain Funds may use foreign currency contracts to facilitate transactions in foreign-denominated securities. Gains and losses from these transactions may arise from changes in the value of the foreign currency or if the counterparties do not perform under the contracts' terms.
Foreign-denominated assets, including investment securities, and liabilities are translated into U.S. dollars at the exchange rates at period end. Purchases and sales of investment securities, income and dividends received, and expenses denominated in foreign currencies are translated into U.S. dollars at the exchange rate in effect on the transaction date.
The effects of exchange rate fluctuations on investments are included with the net realized and unrealized gain (loss) on investment securities. Other foreign currency transactions resulting in realized and unrealized gain (loss) are disclosed separately.
Investment Transactions and Income. For financial reporting purposes, the Fund's investment holdings and NAV include trades executed through the end of the last business day of the period. The NAV per share for processing shareholder transactions is calculated as of the close of business of the New York Stock Exchange (NYSE), normally 4:00 p.m. Eastern time and includes trades executed through the end of the prior business day. Gains and losses on securities sold are determined on the basis of identified cost and include proceeds received from litigation. Commissions paid to certain brokers with whom the investment adviser, or its affiliates, places trades on behalf of a fund include an amount in addition to trade execution, which may be rebated back to a fund. Any such rebates are included in net realized gain (loss) on investments in the Statement of Operations. Dividend income is recorded on the ex-dividend date, except for certain dividends from foreign securities where the ex-dividend date may have passed, which are recorded as soon as the Fund is informed of the ex-dividend date. Non-cash dividends included in dividend income, if any, are recorded at the fair market value of the securities received. Income and capital gain distributions from Fidelity Central Funds, if any, are recorded on the ex-dividend date. Interest income is accrued as earned and includes coupon interest and amortization of premium and accretion of discount on debt securities as applicable. Paid in Kind (PIK) income is recorded at the fair market value of the securities received. Investment income is recorded net of foreign taxes withheld where recovery of such taxes is uncertain. Debt obligations may be placed on non-accrual status and related interest income may be reduced by ceasing current accruals and writing off interest receivables when the collection of all or a portion of interest has become doubtful based on consistently applied procedures. A debt obligation is removed from non-accrual status when the issuer resumes interest payments or when collectability of interest is reasonably assured.
Class Allocations and Expenses. Investment income, realized and unrealized capital gains and losses, common expenses of a fund, and certain fund-level expense reductions, if any, are allocated daily on a pro-rata basis to each class based on the relative net assets of each class to the total net assets of a fund. Each class differs with respect to transfer agent and distribution and service plan fees incurred, as applicable. Certain expense reductions may also differ by class, if applicable. For the reporting period, the allocated portion of income and expenses to each class as a percent of its average net assets may vary due to the timing of recording these transactions in relation to fluctuating net assets of the classes. Expenses directly attributable to a fund are charged to that fund. Expenses attributable to more than one fund are allocated among the respective funds on the basis of relative net assets or other appropriate methods. Expenses included in the accompanying financial statements reflect the expenses of that fund and do not include any expenses associated with any underlying mutual funds or exchange-traded funds (ETFs). Although not included in a fund's expenses, a fund indirectly bears its proportionate share of these expenses through the net asset value of each underlying mutual fund or exchange-traded fund (ETF). Expense estimates are accrued in the period to which they relate and adjustments are made when actual amounts are known.
Income Tax Information and Distributions to Shareholders. Each year, the Fund intends to qualify as a regulated investment company under Subchapter M of the Internal Revenue Code, including distributing substantially all of its taxable income and realized gains. As a result, no provision for U.S. Federal income taxes is required. The Fund files a U.S. federal tax return, in addition to state and local tax returns as required. The Fund's federal income tax returns are subject to examination by the Internal Revenue Service (IRS) for a period of three fiscal years after they are filed. State and local tax returns may be subject to examination for an additional fiscal year depending on the jurisdiction. Foreign taxes are provided for based on the Fund's understanding of the tax rules and rates that exist in the foreign markets in which it invests.
Distributions are declared and recorded daily and paid monthly from net investment income. Distributions from realized gains, if any, are declared and recorded on the ex-dividend date. Income and capital gain distributions are declared separately for each class. Income and capital gain distributions are determined in accordance with income tax regulations, which may differ from GAAP.
Capital accounts within the financial statements are adjusted for permanent book-tax differences. These adjustments have no impact on net assets or the results of operations. Capital accounts are not adjusted for temporary book-tax differences which will reverse in a subsequent period.
Book-tax differences are primarily due to prior period premium and discount on debt securities, market discount, partnerships, capital loss carryforwards and losses deferred due to wash sales.
As of period end, the cost and unrealized appreciation (depreciation) in securities, and derivatives if applicable, for federal income tax purposes were as follows:
| Gross unrealized appreciation | $51,475 |
| Gross unrealized depreciation | (375,567) |
| Net unrealized appreciation (depreciation) | $(324,092) |
| Tax cost | $2,869,061 |
Capital loss carryforwards are only available to offset future capital gains of the Fund to the extent provided by regulations and may be limited. The capital loss carryforward information presented below, including any applicable limitation, is estimated as of prior fiscal period end and is subject to adjustment.
| Short-term | $(130,281) |
| Long-term | (468,132) |
Total capital loss carryforward | $(598,413) |
Restricted Securities (including Private Placements). Funds may invest in securities that are subject to legal or contractual restrictions on resale. These securities generally may be resold in transactions exempt from registration or to the public if the securities are registered. Disposal of these securities may involve time-consuming negotiations and expense, and prompt sale at an acceptable price may be difficult. Information regarding restricted securities held at period end is included at the end of the Schedule of Investments, if applicable.
Loans and Other Direct Debt Instruments. Direct debt instruments are interests in amounts owed to lenders by corporate or other borrowers. These instruments may be in the form of loans, trade claims or other receivables and may include standby financing commitments such as revolving credit facilities that obligate a fund to supply additional cash to the borrower on demand. Loans may be acquired through assignment, participation, or may be made directly to a borrower. Such instruments are presented in the Bank Loan Obligations section in the Schedule of Investments. Certain funds may also invest in unfunded loan commitments, which are contractual obligations for future funding. Information regarding unfunded commitments is included at the end of the Schedule of Investments, if applicable.
Commitments. A commitment is an agreement to acquire an investment at a future date (subject to conditions) in connection with a potential public or non-public offering. The amount of commitments outstanding at period end are presented in the table below. These commitments are not included in the net assets of the Fund at period end.
| | Investment to be Acquired | Commitment Amount |
| Fidelity High Income Fund | Fidelity Private Credit Central Fund LLC | $12,276 |
New Accounting Pronouncement. In June 2022, the Financial Accounting Standards Board (FASB) issued Accounting Standards Update (ASU) 2022-03 Fair Value Measurement (Topic 820): Fair Value Measurement of Equity Securities Subject to Contractual Sale Restrictions. The amendments in this ASU clarify that a contractual restriction on the sale of an equity security is not considered part of the unit of account of the equity security and, therefore, is not considered in measuring fair value. They also clarify that an entity cannot, as a separate unit of account, recognize and measure a contractual sale restriction. They also require additional disclosures for equity securities subject to contractual sale restrictions. ASU 2022-03 will be effective for fiscal years, including interim periods within those fiscal years, beginning after December 15, 2023, and allows for early adoption. ASU 2022-03 will only be applicable to an equity security in which the contractual arrangement that restricts its sale is executed or modified on or after the adoption date. Management is currently evaluating the potential impact of ASU 2022-03 to the financial statements.
5. Purchases and Sales of Investments.
Purchases and sales of securities, other than short-term securities and in-kind transactions, as applicable, are noted in the table below.
| | Purchases ($) | Sales ($) |
| Fidelity High Income Fund | 504,987 | 669,041 |
6. Fees and Other Transactions with Affiliates.
Management Fee. Fidelity Management & Research Company LLC (the investment adviser) and its affiliates provide the Fund with investment management related services for which the Fund pays a monthly management fee. The management fee is the sum of an individual fund fee rate that is based on an annual rate of .45% of the Fund's average net assets and an annualized group fee rate that averaged .10% during the period. The group fee rate is based upon the monthly average net assets of a group of registered investment companies with which the investment adviser has management contracts. The group fee rate decreases as assets under management increase and increases as assets under management decrease. For the reporting period, the total annualized management fee rate was .55% of the Fund's average net assets.
Distribution and Service Plan Fees. In accordance with Rule 12b-1 of the 1940 Act, the Fund has adopted separate Distribution and Service Plans for each class of shares. Certain classes pay Fidelity Distributors Company LLC (FDC), an affiliate of the investment adviser, separate Distribution and Service Fees, each of which is based on an annual percentage of each class' average net assets. In addition, FDC may pay financial intermediaries for selling shares of the Fund and providing shareholder support services. For the period, the Distribution and Service Fee rates, total fees and amounts retained by FDC were as follows:
| | Distribution Fee | Service Fee | Total Fees | Retained by FDC |
| Class A | - % | .25% | $147 | $-A |
| Class M | - % | .25% | 35 | - |
| Class C | .75% | .25% | 57 | 4 |
| | | | $239 | $4 |
A Amount is less than five-hundred dollars.
Sales Load. FDC may receive a front-end sales charge of up to 4.00% for selling Class A shares and Class M shares, some of which is paid to financial intermediaries for selling shares of the Fund. Depending on the holding period, FDC may receive contingent deferred sales charges levied on Class A, Class M and Class C redemptions. The deferred sales charges are 1.00% for Class C shares, 1.00% for certain purchases of Class A shares and .25% for certain purchases of Class M shares.
For the period, sales charge amounts retained by FDC were as follows:
| | Retained by FDC |
| Class A | $5 |
| Class M | -A |
Class CB | -A |
| | $5 |
A Amount is less than five-hundred dollars.
B When Class C shares are initially sold, FDC pays commissions from its own resources to financial intermediaries through which the sales are made.
Transfer Agent Fees. Fidelity Investments Institutional Operations Company LLC (FIIOC), an affiliate of the investment adviser, is the transfer, dividend disbursing and shareholder servicing agent for each class of the Fund. FIIOC receives account fees and asset-based fees that vary according to the account size and type of account of the shareholders of the respective classes of the Fund, except for Class Z. FIIOC receives an asset-based fee of Class Z's average net assets. FIIOC pays for typesetting, printing and mailing of shareholder reports, except proxy statements.
For the period, transfer agent fees for each class were as follows:
| | Amount | % of Class-Level Average Net AssetsA |
| Class A | $92 | .16 |
| Class M | 22 | .16 |
| Class C | 11 | .19 |
| Fidelity High Income Fund | 1,413 | .11 |
| Class I | 80 | .25 |
| Class Z | 14 | .05 |
| | $1,632 | |
A Annualized
During the period, the investment adviser or its affiliates waived a portion of these fees.
During November 2023, the Board approved a change in the transfer agent fees effective December 1, 2023 to a fixed annual rate of class-level average net assets as follows:
| | % of Class-Level Average Net Assets |
| Class A | 0.1544% |
| Class M | 0.1566% |
| Class C | 0.1856% |
| Fidelity High Income Fund | 0.1146% |
| Class I | 0.2000% |
Accounting Fees. Fidelity Service Company, Inc. (FSC), an affiliate of the investment adviser, maintains the Fund's accounting records. The accounting fee is based on the level of average net assets for each month. For the period, the fees were equivalent to the following annualized rates:
| | % of Average Net Assets |
| Fidelity High Income Fund | .03 |
During November 2023, the Board approved a change in the accounting fees effective December 1, 2023 to a fixed annual rate of average net assets as follows:
| | % of Average Net Assets |
| Fidelity High Income Fund | 0.0321% |
Brokerage Commissions. A portion of portfolio transactions were placed with brokerage firms which are affiliates of the investment adviser. Brokerage commissions are included in net realized gain (loss) and change in net unrealized appreciation (depreciation) in the Statement of Operations. The commissions paid to these affiliated firms were as follows:
| | Amount |
| Fidelity High Income Fund | $-A |
A Amount is less than five-hundred dollars.
Interfund Trades. Funds may purchase from or sell securities to other Fidelity Funds under procedures adopted by the Board. The procedures have been designed to ensure these interfund trades are executed in accordance with Rule 17a-7 of the 1940 Act. Any interfund trades are included within the respective purchases and sales amounts shown in the Purchases and Sales of Investments note. During the period, there were no interfund trades.
7. Committed Line of Credit.
Certain Funds participate with other funds managed by the investment adviser or an affiliate in a $4.25 billion credit facility (the "line of credit") to be utilized for temporary or emergency purposes to fund shareholder redemptions or for other short-term liquidity purposes. The participating funds have agreed to pay commitment fees on their pro-rata portion of the line of credit, which are reflected in Miscellaneous expenses on the Statement of Operations, and are listed below. During the period, there were no borrowings on this line of credit.
| | Amount |
| Fidelity High Income Fund | $2 |
8. Security Lending.
Funds lend portfolio securities from time to time in order to earn additional income. Lending agents are used, including National Financial Services (NFS), an affiliate of the investment adviser. Pursuant to a securities lending agreement, NFS will receive a fee, which is capped at 9.9% of a fund's daily lending revenue, for its services as lending agent. A fund may lend securities to certain qualified borrowers, including NFS. On the settlement date of the loan, a fund receives collateral (in the form of U.S. Treasury obligations, letters of credit and/or cash) against the loaned securities and maintains collateral in an amount not less than 100% of the market value of the loaned securities during the period of the loan. The market value of the loaned securities is determined at the close of business of a fund and any additional required collateral is delivered to a fund on the next business day. A fund or borrower may terminate the loan at any time, and if the borrower defaults on its obligation to return the securities loaned because of insolvency or other reasons, a fund may apply collateral received from the borrower against the obligation. A fund may experience delays and costs in recovering the securities loaned. Any cash collateral received is invested in the Fidelity Securities Lending Cash Central Fund. Any loaned securities are identified as such in the Schedule of Investments, and the value of loaned securities and cash collateral at period end, as applicable, are presented in the Statement of Assets and Liabilities. Security lending income represents the income earned on investing cash collateral, less rebates paid to borrowers and any lending agent fees associated with the loan, plus any premium payments received for lending certain types of securities. Security lending income is presented in the Statement of Operations as a component of income from Fidelity Central Funds. Affiliated security lending activity, if any, was as follows:
| | Total Security Lending Fees Paid to NFS | Security Lending Income From Securities Loaned to NFS | Value of Securities Loaned to NFS at Period End |
| Fidelity High Income Fund | $-A | $- | $- |
A Amount is less than five-hundred dollars.
9. Expense Reductions.
The investment adviser has contractually agreed to waive the Fund's management fee with respect to the portion of the Fund's assets invested in Fidelity Private Credit Central Fund LLC until August 31, 2024. During the period, this waiver reduced the Fund's management fee by $99.
FIIOC voluntarily agreed to waive Class I transfer agent fees to the extent that they exceeded certain levels of class-level average net assets as noted in the table below. This waiver was discontinued effective July 1, 2023.
| | Transfer Agent Fees Limitation | Waiver |
| Class I | .19% | $6 |
Through arrangements with the Fund's custodian and each class' transfer agent, credits realized as a result of certain uninvested cash balances were used to reduce the Fund's expenses. During the period, custodian credits reduced the Fund's expenses by $9. During the period, transfer agent credits reduced each class' expenses as noted in the table below.
| | Expense reduction |
| Class M | -A |
A Amount is less than five-hundred dollars.
In addition, during the period the investment adviser or an affiliate reimbursed and/or waived a portion of fund-level operating expenses in the amount of $55.
10. Distributions to Shareholders.
Distributions to shareholders of each class were as follows:
| | Six months ended October 31, 2023 | Year ended April 30, 2023 |
| Fidelity High Income Fund | | |
| Distributions to shareholders | | |
| Class A | $3,070 | $5,949 |
| Class M | 744 | 1,395 |
| Class C | 255 | 576 |
| Fidelity High Income Fund | 67,791 | 143,007 |
| Class I | 1,744 | 4,409 |
| Class Z | 1,599 | 3,468 |
Total | $75,203 | $158,804 |
11. Share Transactions.
Share transactions for each class were as follows and may contain in-kind transactions, automatic conversions between classes or exchanges between affiliated funds:
| | Shares | Shares | Dollars | Dollars |
| | Six months ended October 31, 2023 | Year ended April 30, 2023 | Six months ended October 31, 2023 | Year ended April 30, 2023 |
| Fidelity High Income Fund | | | | |
| Class A | | | | |
| Shares sold | 650 | 1,601 | $4,811 | $12,031 |
| Reinvestment of distributions | 382 | 734 | 2,798 | 5,448 |
| Shares redeemed | (1,337) | (2,939) | (9,822) | (21,937) |
| Net increase (decrease) | (305) | (604) | $(2,213) | $(4,458) |
| Class M | | | | |
| Shares sold | 75 | 482 | $557 | $3,625 |
| Reinvestment of distributions | 89 | 165 | 655 | 1,223 |
| Shares redeemed | (192) | (573) | (1,416) | (4,281) |
| Net increase (decrease) | (28) | 74 | $(204) | $567 |
| Class C | | | | |
| Shares sold | 84 | 199 | $615 | $1,483 |
| Reinvestment of distributions | 33 | 73 | 242 | 544 |
| Shares redeemed | (319) | (769) | (2,342) | (5,721) |
| Net increase (decrease) | (202) | (497) | $(1,485) | $(3,694) |
| Fidelity High Income Fund | | | | |
| Shares sold | 13,857 | 36,311 | $101,957 | $272,258 |
| Reinvestment of distributions | 7,253 | 15,389 | 53,180 | 114,248 |
| Shares redeemed | (42,361) | (108,580) | (311,159) | (811,949) |
| Net increase (decrease) | (21,251) | (56,880) | $(156,022) | $(425,443) |
| Class I | | | | |
| Shares sold | 1,334 | 18,269 | $9,817 | $137,197 |
| Reinvestment of distributions | 219 | 555 | 1,608 | 4,118 |
| Shares redeemed | (8,772) | (14,626) | (64,199) | (109,771) |
| Net increase (decrease) | (7,219) | 4,198 | $(52,774) | $31,544 |
| Class Z | | | | |
| Shares sold | 1,054 | 3,793 | $7,753 | $27,871 |
| Reinvestment of distributions | 200 | 416 | 1,465 | 3,101 |
| Shares redeemed | (1,300) | (13,283) | (9,553) | (100,535) |
| Net increase (decrease) | (46) | (9,074) | $(335) | $(69,563) |
12. Other.
A fund's organizational documents provide former and current trustees and officers with a limited indemnification against liabilities arising in connection with the performance of their duties to the fund. In the normal course of business, a fund may also enter into contracts that provide general indemnifications. A fund's maximum exposure under these arrangements is unknown as this would be dependent on future claims that may be made against a fund. The risk of material loss from such claims is considered remote.
13. Litigation.
The Fund and other entities managed by FMR or its affiliates are involved with proceedings arising out of disputes in the United States Bankruptcy Court for the Southern District of Texas ("Bankruptcy Court"), relating to the In re Sanchez Energy Corporation chapter 11 bankruptcy case (Case No. 19-34508). A Bankruptcy Court-appointed representative of unsecured creditors asserted that eight million shares of Mesquite Energy, Inc. (formerly known as Sanchez Energy Corporation) (the "Company"), held in escrow pursuant to the terms of the Company's confirmed chapter 11 plan, should be awarded to the unsecured creditors instead of the Company's current equity holders, including the Fund, which were providers of debtor-in-possession financing to the Company during its chapter 11 case and holders of secured notes issued by the Company in 2018. The unsecured creditors also asserted that certain additional equity issued by the Company in 2020 in connection with two post-bankruptcy financings, also held by the Fund, is invalid. During August 2023, the Bankruptcy Court issued an opinion awarding a portion of the eight million shares to the unsecured creditors, diluting the value of the Fund's holdings in Mesquite. The Fund will appeal this decision. At this time, Management cannot determine any additional loss or dilution that may be realized. The Fund is also incurring legal costs in defending the disputes and has recovered a portion of these legal costs through an insurance claim.
14. Risk and Uncertainties.
Many factors affect a fund's performance. Developments that disrupt global economies and financial markets, such as pandemics, epidemics, outbreaks of infectious diseases, war, terrorism, and environmental disasters, may significantly affect a fund's investment performance. The effects of these developments to a fund will be impacted by the types of securities in which a fund invests, the financial condition, industry, economic sector, and geographic location of an issuer, and a fund's level of investment in the securities of that issuer. Significant concentrations in security types, issuers, industries, sectors, and geographic locations may magnify the factors that affect a fund's performance.
As a shareholder, you incur two types of costs: (1) transaction costs, which may include sales charges (loads) on purchase payments or redemption proceeds, as applicable and (2) ongoing costs, which generally include management fees, distribution and/or service (12b-1) fees and other Fund expenses. This Example is intended to help you understand your ongoing costs (in dollars) of investing in a fund and to compare these costs with the ongoing costs of investing in other mutual funds.
| The Example is based on an investment of $1,000 invested at the beginning of the period and held for the entire period (May 1, 2023 to October 31, 2023). |
Actual Expenses
The first line of the accompanying table provides information about actual account values and actual expenses. You may use the information in this line, together with the amount you invested, to estimate the expenses that you paid over the period. Simply divide your account value by $1,000.00 (for example, an $8,600 account value divided by $1,000.00 = 8.6), then multiply the result by the number in the first line for a class/Fund under the heading entitled "Expenses Paid During Period" to estimate the expenses you paid on your account during this period. If any fund is a shareholder of any underlying mutual funds or exchange-traded funds (ETFs) (the Underlying Funds), such fund indirectly bears its proportional share of the expenses of the Underlying Funds in addition to the direct expenses incurred presented in the table. These fees and expenses are not included in the annualized expense ratio used to calculate the expense estimate in the table below.
Hypothetical Example for Comparison Purposes
The second line of the accompanying table provides information about hypothetical account values and hypothetical expenses based on the actual expense ratio and an assumed rate of return of 5% per year before expenses, which is not the actual return. The hypothetical account values and expenses may not be used to estimate the actual ending account balance or expenses you paid for the period. You may use this information to compare the ongoing costs of investing in the Fund and other funds. To do so, compare this 5% hypothetical example with the 5% hypothetical examples that appear in the shareholder reports of the other funds. If any fund is a shareholder of any Underlying Funds, such fund indirectly bears its proportional share of the expenses of the Underlying Funds in addition to the direct expenses as presented in the table. These fees and expenses are not included in the annualized expense ratio used to calculate the expense estimate in the table below.
Please note that the expenses shown in the table are meant to highlight your ongoing costs only and do not reflect any transaction costs. Therefore, the second line of the table is useful in comparing ongoing costs only, and will not help you determine the relative total costs of owning different funds. In addition, if these transactional costs were included, your costs would have been higher.
| | | | | Annualized Expense Ratio- A | | Beginning Account Value May 1, 2023 | | Ending Account Value October 31, 2023 | | Expenses Paid During Period- C May 1, 2023 to October 31, 2023 |
| Fidelity® High Income Fund | | | | | | | | | | |
| Class A | | | | .93% | | | | | | |
| Actual | | | | | | $ 1,000 | | $ 986.50 | | $ 4.64 |
Hypothetical-B | | | | | | $ 1,000 | | $ 1,020.46 | | $ 4.72 |
| Class M | | | | .93% | | | | | | |
| Actual | | | | | | $ 1,000 | | $ 986.50 | | $ 4.64 |
Hypothetical-B | | | | | | $ 1,000 | | $ 1,020.46 | | $ 4.72 |
| Class C | | | | 1.70% | | | | | | |
| Actual | | | | | | $ 1,000 | | $ 984.10 | | $ 8.48 |
Hypothetical-B | | | | | | $ 1,000 | | $ 1,016.59 | | $ 8.62 |
| Fidelity® High Income Fund | | | | .64% | | | | | | |
| Actual | | | | | | $ 1,000 | | $ 988.00 | | $ 3.20 |
Hypothetical-B | | | | | | $ 1,000 | | $ 1,021.92 | | $ 3.25 |
Class I ** | | | | .75% | | | | | | |
| Actual | | | | | | $ 1,000 | | $ 988.80 | | $ 3.75 |
Hypothetical-B | | | | | | $ 1,000 | | $ 1,021.37 | | $ 3.81 |
| Class Z | | | | .57% | | | | | | |
| Actual | | | | | | $ 1,000 | | $ 988.30 | | $ 2.85 |
Hypothetical-B | | | | | | $ 1,000 | | $ 1,022.27 | | $ 2.90 |
| |
A Annualized expense ratio reflects expenses net of applicable fee waivers.
B 5% return per year before expenses
C Expenses are equal to the annualized expense ratio, multiplied by the average account value over the period, multiplied by 184/ 366 (to reflect the one-half year period). The fees and expenses of any Underlying Funds are not included in each annualized expense ratio.
** If fees and changes to the expense contract and/or expense cap, effective December 1, 2023, had been in effect during the current period, the restated annualized expense ratio and the expenses paid in the actual and hypothetical examples above would have been as shown in table below:
| | | | | Annualized Expense Ratio- A | | Expenses Paid |
| Fidelity® High Income Fund | | | | | | |
| Class I | | | | .70% | | |
| Actual | | | | | | $ 3.50 |
Hypothetical- B | | | | | | $ 3.56 |
| | | | | | | |
| A Annualized expense ratio reflects expenses net of applicable fee waivers. | | | | | | |
| B 5% return per year before expenses | | | | | | |
Board Approval of Investment Advisory Contracts and Management Fees
Fidelity High Income Fund
Each year, the Board of Trustees, including the Independent Trustees (together, the Board), considers the renewal of the fund's management contract with Fidelity Management & Research Company LLC (FMR) and the sub-advisory agreements (together, the Advisory Contracts) for the fund. FMR and the sub-advisers are referred to herein as the Investment Advisers. The Board, assisted by the advice of fund counsel and Independent Trustees' counsel, requests and considers a broad range of information relevant to the renewal of the Advisory Contracts throughout the year.
The Board meets regularly and, at each of its meetings, covers an extensive agenda of topics and materials and considers factors that are relevant to its annual consideration of the renewal of the fund's Advisory Contracts, including the services and support provided to the fund and its shareholders. The Board, acting directly and through its Committees (each of which is composed of and chaired by Independent Trustees), requests and receives information concerning the annual consideration of the renewal of the fund's Advisory Contracts. The Board also meets as needed to review matters specifically related to the Board's annual consideration of the renewal of the Advisory Contracts. Members of the Board may also meet with trustees of other Fidelity funds through joint ad hoc committees to discuss certain matters relevant to all of the Fidelity funds.
Approval of Stub Period Continuation. At its May 2023 meeting, the Board of Trustees voted to continue the fund's management contract with FMR, and the sub-advisory agreements and sub-sub-advisory agreements, in each case, where applicable (together, the Advisory Contracts), without modification, for two months from June 1, 2023 through July 31, 2023. The Board considered that the approval of the fund's Advisory Contracts will not result in any changes in (i) the investment process or strategies employed in the management of the fund's assets; (ii) the fees and expenses paid by shareholders; (iii) the nature, extent or quality of services provided under the fund's Advisory Contracts; or (iv) the day-to-day management of the fund or the persons primarily responsible for such management. The Board also considered that since its last approval of the fund's Advisory Contracts, FMR had provided additional information on the fund in support of the annual contract renewal process, including competitive analyses on total expenses and management fees and in-depth reviews of fund performance and fund profitability information. The Board concluded that the fund's Advisory Contracts are fair and reasonable, and that the fund's Advisory Contracts should be renewed, without modification, through July 31, 2023, with the understanding that the Board would consider the annual renewal for a full one year period in July 2023.
At its July 2023 meeting, the Board unanimously determined to renew the fund's Advisory Contracts. In reaching its determination, the Board considered all factors it believed relevant, including (i) the nature, extent, and quality of the services provided to the fund and its shareholders (including the investment performance of the fund); (ii) the competitiveness relative to peer funds of the fund's management fee and the total expense ratio of a representative class (the retail class, which was selected because it was the largest class without 12b-1 fees); (iii) the total costs of the services provided by and the profits realized by FMR and its affiliates (Fidelity) from its relationships with the fund; and (iv) the extent to which, if any, economies of scale exist and are realized as the fund grows, and whether any economies of scale are appropriately shared with fund shareholders. The Board also considered the broad range of investment choices available to shareholders from FMR's competitors and that the fund's shareholders have chosen to invest in the fund, which is part of the Fidelity family of funds. The Board's decision to renew the Advisory Contracts was not based on any single factor.
The Board reached a determination, with the assistance of fund counsel and Independent Trustees' counsel and through the exercise of its business judgment, that the renewal of the Advisory Contracts was in the best interests of the fund and its shareholders and that the compensation payable under the Advisory Contracts was fair and reasonable in light of all of the surrounding circumstances.
Nature, Extent, and Quality of Services Provided. The Board considered staffing as it relates to the fund, including the backgrounds and experience of investment personnel of the Investment Advisers, and also considered the Investment Advisers' implementation of the fund's investment program. The Independent Trustees also had discussions with senior management of Fidelity's investment operations and investment groups. The Board considered the structure of the investment personnel compensation program and whether this structure provides appropriate incentives to act in the best interests of the fund. Additionally, the Board considered the portfolio managers' investments, if any, in the funds that they manage.
Resources Dedicated to Investment Management and Support Services. The Board and the Fund Oversight and Research Committees reviewed the general qualifications and capabilities of Fidelity's investment staff, including its size, education, experience, and resources, as well as Fidelity's approach to recruiting, training, managing, and compensating investment personnel. The Board noted the resources devoted to expansion of Fidelity's global investment organization, and that Fidelity's analysts have extensive resources, tools, and capabilities that allow them to conduct sophisticated quantitative and fundamental analysis, as well as credit analysis of issuers, counterparties, and guarantors. Further, the Board considered that Fidelity's investment professionals have sufficient access to global information and data so as to provide competitive investment results over time, and that those professionals also have access to sophisticated tools that permit them to assess portfolio construction and risk and performance attribution characteristics continuously, as well as to transmit new information and research conclusions rapidly around the world. Additionally, in its deliberations, the Board considered Fidelity's trading, risk management, compliance, and technology and operations capabilities and resources, which are integral parts of the investment management process.
Shareholder and Administrative Services. The Board considered (i) the nature, extent, quality, and cost of advisory, administrative, and shareholder services performed by the Investment Advisers and their affiliates under the Advisory Contracts and under separate agreements covering transfer agency, pricing and bookkeeping, and securities lending services for the fund; (ii) the nature and extent of Fidelity's supervision of third party service providers, principally custodians, subcustodians, and pricing vendors; and (iii) the resources devoted by Fidelity to, and the record of compliance with, the fund's compliance policies and procedures. The Board also reviewed the allocation of fund brokerage, including allocations to brokers affiliated with the Investment Advisers, the use of brokerage commissions to pay fund expenses, and the use of "soft" commission dollars to pay for research services. The Board also considered the fund's securities lending activities and any payments made to Fidelity relating to securities lending.
The Board noted that the growth of fund assets over time across the complex allows Fidelity to reinvest in the development of services designed to enhance the value and convenience of the Fidelity funds as investment vehicles. These services include 24-hour access to account information and market information over the Internet and through telephone representatives, investor education materials, and asset allocation tools. The Board also considered that it reviews customer service metrics such as telephone response times, continuity of services on the website and metrics addressing services at Fidelity Investor Centers.
Investment in a Large Fund Family. The Board considered the benefits to shareholders of investing in a fund that is part of a large family of funds offering a variety of investment disciplines and providing a large variety of fund investor services. The Board noted that Fidelity had taken, or had made recommendations that resulted in the Fidelity funds taking, a number of actions over the previous year that benefited particular funds and/or the Fidelity funds in general.
Investment Performance. The Board took into account discussions that occur with representatives of the Investment Advisers, and reports that it receives, at Board meetings throughout the year, relating to fund investment performance. In this regard the Board noted that as part of regularly scheduled fund reviews and other reports to the Board on fund performance, the Board considered annualized return information for the fund for different time periods, measured against an appropriate securities market index (benchmark index) and an appropriate peer group of funds with similar objectives (peer group). The Board also considered information about performance attribution. In its ongoing evaluation of fund investment performance, the Board gives particular attention to information indicating changes in performance of the funds over different time periods and discussed with the Investment Advisers the reasons for any overperformance or underperformance. The fund underperformed its benchmark and peers for the one- and three-year periods ended February 28, 2023, and as a result, the Board continues to engage in discussions with FMR about the steps it is taking to address the fund's performance.
In addition to reviewing absolute and relative fund performance, the Independent Trustees periodically consider the appropriateness of fund performance metrics in evaluating the results achieved. The Independent Trustees generally give greater weight to fund performance over longer time periods than over shorter time periods. Depending on the circumstances, the Independent Trustees may be satisfied with a fund's performance notwithstanding that it lags its benchmark index or peer group for certain periods.
Based on its review, the Board concluded that the nature, extent, and quality of services provided to the fund under the Advisory Contracts should continue to benefit the shareholders of the fund.
Competitiveness of Management Fee and Total Expense Ratio. The Board was provided with information regarding industry trends in management fees and expenses. In its review of the fund's management fee and the total expense ratio of the retail class, the Board considered the fund's management fee rate as well as other fund or class expenses, as applicable, such as transfer agent fees, pricing and bookkeeping fees, fund-paid 12b-1 fees, and custodial, legal, and audit fees. The Board noted that Fidelity may agree to waive fees or reimburse expenses from time to time, and the extent to which, if any, it has done so for the fund.
Comparisons of Management Fees and Total Expense Ratios. Among other things, the Board reviewed data for selected groups of competitive funds and classes (referred to as "mapped groups") that were compiled by Fidelity based on combining similar investment objective categories (as classified by Lipper) that have comparable investment mandates. The data reviewed by the Board included (i) gross management fee comparisons (before taking into account expense reimbursements or caps) relative to the total universe of funds within the mapped group; (ii) gross management fee comparisons relative to a subset of non-Fidelity funds in the mapped group that are similar in size and management fee structure to the fund (referred to as the "asset size peer group"); (iii) total expense comparisons of the retail class of the fund relative to funds and classes in the mapped group that have a similar sales load structure to the retail class of the fund (referred to as the "similar sales load structure group"); and (iv) total expense comparisons of the retail class of the fund relative to funds and classes in the similar sales load structure group that are similar in size and management fee structure to the fund (referred to as the "total expense asset size peer group"). The total expense asset size peer group comparison excludes performance adjustments and fund-paid 12b-1 fees to eliminate variability in fee structures.
The information provided to the Board indicated that the fund's management fee rate ranked below the competitive median of the mapped group for the 12-month period ended September 30, 2022 and below the competitive median of the asset size peer group for the 12-month period ended September 30, 2022. Further, the information provided to the Board indicated that the total expense ratio of the retail class of the fund ranked below the competitive median of the similar sales load structure group for the 12-month period ended September 30, 2022 and below the competitive median of the total expense asset size peer group for the 12-month period ended September 30, 2022.
The Board also considered that, for funds subject to the group fee, FMR agreed to voluntarily waive fees over a specified period of time in amounts designed to account for assets converted from certain funds to certain collective investment trusts.
Fees Charged to Other Fidelity Clients. The Board also considered Fidelity fee structures and other information with respect to clients of Fidelity, such as other funds advised or subadvised by Fidelity, pension plan clients, and other institutional clients with similar mandates. The Board noted that a joint ad hoc committee created by it and the boards of other Fidelity funds periodically reviews and compares Fidelity's institutional investment advisory business with its business of providing services to the Fidelity funds and also noted the most recent findings of the committee. The Board noted that the committee's review included a consideration of the differences in services provided, fees charged, and costs incurred, as well as competition in the markets serving the different categories of clients.
Based on its review, the Board concluded that the fund's management fee is fair and reasonable in light of the services that the fund receives and the other factors considered. Further based on its review of total expense ratios and fees charged to other Fidelity clients, the Board concluded that the total expense ratio of each class of the fund was reasonable in light of the services that the fund and its shareholders receive and the other factors considered.
Costs of the Services and Profitability. The Board considered the revenues earned and the expenses incurred by Fidelity in conducting the business of developing, marketing, distributing, managing, administering and servicing the fund and servicing the fund's shareholders. The Board also considered the level of Fidelity's profits in respect of all the Fidelity funds.
On an annual basis, Fidelity presents to the Board information about the profitability of its relationships with the fund. Fidelity calculates profitability information for each fund, as well as aggregate profitability information for groups of Fidelity funds and all Fidelity funds, using a series of detailed revenue and cost allocation methodologies which originate with the books and records of Fidelity on which Fidelity's audited financial statements are based. The Audit Committee of the Board reviews any significant changes from the prior year's methodologies and the full Board approves such changes.
A public accounting firm has been engaged annually by the Board as part of the Board's assessment of Fidelity's profitability analysis. The engagement includes the review and assessment of the methodologies used by Fidelity in determining the revenues and expenses attributable to Fidelity's fund business, and completion of agreed-upon procedures in respect of the mathematical accuracy of certain fund profitability information and its conformity to established allocation methodologies. After considering the reports issued under the engagement and information provided by Fidelity, the Board concluded that while other allocation methods may also be reasonable, Fidelity's profitability methodologies are reasonable in all material respects.
The Board also reviewed Fidelity's non-fund businesses and potential indirect benefits such businesses may have received as a result of their association with Fidelity's fund business (i.e., fall-out benefits) as well as cases where Fidelity's affiliates may benefit from the funds' business. The Board considered areas where potential indirect benefits to the Fidelity funds from their relationships with Fidelity may exist. The Board's consideration of these matters was informed by the findings of a joint ad hoc committee created by it and the boards of other Fidelity funds to evaluate potential fall-out benefits.
The Board considered the costs of the services provided by and the profits realized by Fidelity in connection with the operation of the fund and was satisfied that the profitability was not excessive.
Economies of Scale. The Board considered whether there have been economies of scale in respect of the management of the Fidelity funds, whether the Fidelity funds (including the fund) have appropriately benefited from any such economies of scale, and whether there is potential for realization of any further economies of scale. The Board considered the extent to which the fund will benefit from economies of scale as assets grow through increased services to the fund, through waivers or reimbursements, or through fee or expense ratio reductions. The Board also noted that a committee (the Economies of Scale Committee) created by it and the boards of other Fidelity funds periodically analyzes whether Fidelity attains economies of scale in respect of the management and servicing of the Fidelity funds, whether the Fidelity funds have appropriately benefited from such economies of scale, and whether there is potential for realization of any further economies of scale.
The Board recognized that the fund's management contract incorporates a "group fee" structure, which provides for lower group fee rates as total "group assets" increase, and for higher group fee rates as total "group assets" decrease ("group assets" as defined in the management contract). FMR calculates the group fee rates based on a tiered asset "breakpoint" schedule that varies based on asset class. The Board considered that the group fee is designed to deliver the benefits of economies of scale to fund shareholders when total Fidelity fund assets increase, even if assets of any particular fund are unchanged or have declined, because some portion of Fidelity's costs are attributable to services provided to all Fidelity funds, and all funds benefit if those costs can be allocated among more assets. The Board further considered that Fidelity agreed to impose a temporary fee waiver in the form of additional breakpoints to the current breakpoint schedule. The Board concluded that, given the group fee structure, fund shareholders will benefit from lower management fees as "group assets" increase at the fund complex level, regardless of whether Fidelity achieves any such economies of scale.
The Board concluded, taking into account the analysis of the Economies of Scale Committee, that economies of scale, if any, are being appropriately shared between fund shareholders and Fidelity.
Additional Information Requested by the Board. In order to develop fully the factual basis for consideration of the Fidelity funds' advisory contracts, the Board requested and received additional information on certain topics, including: (i) fund flow and performance trends, in particular the underperformance of certain funds and strategies, and Fidelity's long-term strategies for certain funds, including any consideration of fund liquidations or mergers; (ii) the operation of performance fees and competitor use of performance fees; (iii) Fidelity's pricing philosophy compared to competitors; (iv) fund profitability methodology and data; (v) evaluation of competitive fund data and peer group classifications and fee and expense comparisons; (vi) the management fee and expense structures for different funds and classes and information about the differences between various fee and expense structures; (vii) group fee breakpoints and related voluntary fee waivers; and (viii) information regarding other accounts managed by Fidelity and the funds' sub-advisory arrangements.
Conclusion. Based on its evaluation of all of the conclusions noted above, and after considering all factors it believed relevant, the Board, including the Independent Trustees, concluded that the advisory and sub-advisory fee arrangements are fair and reasonable in light of all of the surrounding circumstances and that the fund's Advisory Contracts should be renewed through July 31, 2024.
1.538299.126
SPH-SANN-1223
Fidelity® Series High Income Fund
Semi-Annual Report
October 31, 2023
Contents
To view a fund's proxy voting guidelines and proxy voting record for the 12-month period ended June 30, visit http://www.fidelity.com/proxyvotingresults or visit the Securities and Exchange Commission's (SEC) web site at http://www.sec.gov.
You may also call 1-800-544-8544 to request a free copy of the proxy voting guidelines.
Standard & Poor's, S&P and S&P 500 are registered service marks of The McGraw-Hill Companies, Inc. and have been licensed for use by Fidelity Distributors Corporation.
Other third-party marks appearing herein are the property of their respective owners.
All other marks appearing herein are registered or unregistered trademarks or service marks of FMR LLC or an affiliated company. © 2023 FMR LLC. All rights reserved.
This report and the financial statements contained herein are submitted for the general information of the shareholders of the Fund. This report is not authorized for distribution to prospective investors in the Fund unless preceded or accompanied by an effective prospectus.
A fund files its complete schedule of portfolio holdings with the SEC for the first and third quarters of each fiscal year on Form N-PORT. Forms N-PORT are available on the SEC's web site at http://www.sec.gov. A fund's Forms N-PORT may be reviewed and copied at the SEC's Public Reference Room in Washington, DC. Information regarding the operation of the SEC's Public Reference Room may be obtained by calling 1-800-SEC-0330.
For a complete list of a fund's portfolio holdings, view the most recent holdings listing, semiannual report, or annual report on Fidelity's web site at http://www.fidelity.com, http://www.institutional.fidelity.com, or http://www.401k.com, as applicable.
NOT FDIC INSURED •MAY LOSE VALUE •NO BANK GUARANTEE
Neither the Fund nor Fidelity Distributors Corporation is a bank.
| Top Bond Issuers (% of Fund's net assets) |
(with maturities greater than one year) |
| Southeastern Grocers, Inc. | 2.2 | |
| Ford Motor Credit Co. LLC | 1.7 | |
| Uniti Group LP / Uniti Group Finance, Inc. | 1.6 | |
| CCO Holdings LLC/CCO Holdings Capital Corp. | 1.5 | |
| Occidental Petroleum Corp. | 1.5 | |
| TransDigm, Inc. | 1.3 | |
| Community Health Systems, Inc. | 1.4 | |
| DISH Network Corp. | 1.2 | |
| Tallgrass Energy Partners LP / Tallgrass Energy Finance Corp. | 1.2 | |
| Tenet Healthcare Corp. | 1.1 | |
| | 14.7 | |
| |
| Market Sectors (% of Fund's net assets) |
| |
| Energy | 13.7 | |
| Technology | 7.0 | |
| Services | 6.8 | |
| Healthcare | 6.5 | |
| Telecommunications | 5.0 | |
| |
Quality Diversification (% of Fund's net assets) |
|
| |
| We have used ratings from Moody's Investors Service, Inc. Where Moody's® ratings are not available, we have used S&P® ratings. All ratings are as of the date indicated and do not reflect subsequent changes. |
Asset Allocation (% of Fund's net assets) |
|
|
Geographic Diversification (% of Fund's net assets) |
|
* Includes Short-Term investments and Net Other Assets (Liabilities). Percentages are adjusted for the effect of derivatives, if applicable. |
| |
Showing Percentage of Net Assets
| Corporate Bonds - 82.1% |
| | | Principal Amount (a) | Value ($) |
| Convertible Bonds - 1.1% | | | |
| Broadcasting - 1.0% | | | |
| DISH Network Corp.: | | | |
| 2.375% 3/15/24 | | 5,862,000 | 5,605,538 |
| 3.375% 8/15/26 | | 13,185,000 | 6,757,313 |
| | | | 12,362,851 |
| Homebuilders/Real Estate - 0.1% | | | |
| Redfin Corp. 0.5% 4/1/27 | | 1,686,000 | 927,300 |
TOTAL CONVERTIBLE BONDS | | | 13,290,151 |
| Nonconvertible Bonds - 81.0% | | | |
| Aerospace - 2.5% | | | |
| ATI, Inc.: | | | |
| 4.875% 10/1/29 | | 1,215,000 | 1,034,716 |
| 5.875% 12/1/27 | | 1,230,000 | 1,140,740 |
| Bombardier, Inc. 7.875% 4/15/27 (b) | | 3,678,000 | 3,538,728 |
| BWX Technologies, Inc. 4.125% 6/30/28 (b) | | 3,247,000 | 2,857,311 |
| Howmet Aerospace, Inc.: | | | |
| 5.9% 2/1/27 | | 545,000 | 537,355 |
| 6.875% 5/1/25 | | 545,000 | 546,930 |
| Kaiser Aluminum Corp.: | | | |
| 4.5% 6/1/31 (b) | | 830,000 | 613,290 |
| 4.625% 3/1/28 (b) | | 2,375,000 | 1,979,010 |
| Moog, Inc. 4.25% 12/15/27 (b) | | 165,000 | 146,893 |
| TransDigm, Inc.: | | | |
| 4.625% 1/15/29 | | 2,335,000 | 2,013,330 |
| 5.5% 11/15/27 | | 8,055,000 | 7,481,081 |
| 6.25% 3/15/26 (b) | | 3,980,000 | 3,886,309 |
| 6.75% 8/15/28 (b) | | 1,630,000 | 1,582,703 |
| 7.5% 3/15/27 | | 1,455,000 | 1,453,219 |
| VistaJet Malta Finance PLC / XO Management Holding, Inc. 9.5% 6/1/28 (b) | | 440,000 | 337,116 |
| | | | 29,148,731 |
| Air Transportation - 1.0% | | | |
| Air Canada 3.875% 8/15/26 (b) | | 805,000 | 732,439 |
| American Airlines, Inc. 7.25% 2/15/28 (b) | | 540,000 | 502,104 |
| American Airlines, Inc. / AAdvantage Loyalty IP Ltd. 5.5% 4/20/26 (b) | | 2,862,500 | 2,783,634 |
| Forward Air Corp. 9.5% 10/15/31 (b) | | 2,490,000 | 2,427,750 |
| Mileage Plus Holdings LLC 6.5% 6/20/27 (b) | | 408,750 | 403,795 |
| Rand Parent LLC 8.5% 2/15/30 (b) | | 4,015,000 | 3,666,482 |
| Spirit Loyalty Cayman Ltd. / Spirit IP Cayman Ltd. 8% 9/20/25 (b) | | 2,100,000 | 1,659,000 |
| | | | 12,175,204 |
| Automotive - 0.5% | | | |
| Ford Motor Co.: | | | |
| 6.1% 8/19/32 | | 4,525,000 | 4,189,382 |
| 7.4% 11/1/46 | | 435,000 | 408,391 |
| Ford Motor Credit Co. LLC 3.625% 6/17/31 | | 1,540,000 | 1,217,327 |
| | | | 5,815,100 |
| Automotive & Auto Parts - 2.3% | | | |
| Adient Global Holdings Ltd. 7% 4/15/28 (b) | | 330,000 | 324,827 |
| Dana, Inc.: | | | |
| 4.25% 9/1/30 | | 440,000 | 348,251 |
| 5.375% 11/15/27 | | 295,000 | 271,400 |
| Ford Motor Co.: | | | |
| 3.25% 2/12/32 | | 1,085,000 | 818,279 |
| 4.75% 1/15/43 | | 545,000 | 378,144 |
| 5.291% 12/8/46 | | 215,000 | 156,198 |
| Ford Motor Credit Co. LLC: | | | |
| U.S. Secured Overnight Fin. Rate (SOFR) Index + 2.950% 8.2802% 3/6/26 (c)(d) | | 1,540,000 | 1,551,838 |
| 2.3% 2/10/25 | | 4,905,000 | 4,630,133 |
| 2.9% 2/10/29 | | 2,715,000 | 2,222,337 |
| 3.375% 11/13/25 | | 545,000 | 508,595 |
| 3.815% 11/2/27 | | 1,640,000 | 1,464,932 |
| 4% 11/13/30 | | 550,000 | 453,028 |
| 4.389% 1/8/26 | | 1,090,000 | 1,033,213 |
| 4.95% 5/28/27 | | 2,190,000 | 2,054,212 |
| 5.125% 6/16/25 | | 545,000 | 530,292 |
| 6.95% 3/6/26 | | 4,385,000 | 4,394,374 |
| IHO Verwaltungs GmbH 4.75% 9/15/26 pay-in-kind (b)(c) | | 215,000 | 199,806 |
| LCM Investments Holdings 8.25% 8/1/31 (b) | | 755,000 | 718,289 |
| Macquarie AirFinance Holdings: | | | |
| 8.125% 3/30/29 (b) | | 1,115,000 | 1,098,331 |
| 8.375% 5/1/28 (b) | | 1,180,000 | 1,176,165 |
| Rivian Holdco & Rivian LLC & Rivian Automotive LLC 6 month U.S. LIBOR + 5.620% 11.4932% 10/15/26 (b)(c)(d) | | 335,000 | 334,110 |
| ZF North America Capital, Inc.: | | | |
| 4.75% 4/29/25 (b) | | 1,310,000 | 1,263,202 |
| 6.875% 4/14/28 (b) | | 595,000 | 576,584 |
| 7.125% 4/14/30 (b) | | 595,000 | 575,962 |
| | | | 27,082,502 |
| Banks & Thrifts - 0.5% | | | |
| Ally Financial, Inc.: | | | |
| 5.75% 11/20/25 | | 110,000 | 105,079 |
| 6.7% 2/14/33 | | 2,170,000 | 1,824,016 |
| Jane Street Group LLC/JSG Finance, Inc. 4.5% 11/15/29 (b) | | 970,000 | 826,575 |
| Quicken Loans LLC/Quicken Loans Co.-Issuer, Inc. 4% 10/15/33 (b) | | 435,000 | 319,725 |
| UniCredit SpA: | | | |
| 5.861% 6/19/32 (b)(c) | | 552,000 | 496,610 |
| 7.296% 4/2/34 (b)(c) | | 1,403,000 | 1,301,919 |
| VistaJet Malta Finance PLC / XO Management Holding, Inc.: | | | |
| 6.375% 2/1/30 (b) | | 435,000 | 290,098 |
| 7.875% 5/1/27 (b) | | 435,000 | 334,950 |
| Western Alliance Bancorp. 3% 6/15/31 (c) | | 715,000 | 546,260 |
| | | | 6,045,232 |
| Broadcasting - 1.5% | | | |
| Clear Channel Outdoor Holdings, Inc. 9% 9/15/28 (b) | | 3,050,000 | 2,970,639 |
| Diamond Sports Group LLC/Diamond Sports Finance Co. 5.375% (b)(e) | | 9,005,000 | 92,752 |
| DISH Network Corp. 11.75% 11/15/27 (b) | | 2,760,000 | 2,733,946 |
| Sinclair Television Group, Inc. 5.5% 3/1/30 (b) | | 1,110,000 | 602,619 |
| Sirius XM Radio, Inc.: | | | |
| 4% 7/15/28 (b) | | 2,505,000 | 2,130,333 |
| 4.125% 7/1/30 (b) | | 2,200,000 | 1,746,833 |
| 5.5% 7/1/29 (b) | | 660,000 | 584,809 |
| TEGNA, Inc.: | | | |
| 4.625% 3/15/28 | | 1,895,000 | 1,634,438 |
| 5% 9/15/29 | | 725,000 | 607,188 |
| Univision Communications, Inc.: | | | |
| 4.5% 5/1/29 (b) | | 2,170,000 | 1,724,963 |
| 6.625% 6/1/27 (b) | | 3,080,000 | 2,813,262 |
| | | | 17,641,782 |
| Building Materials - 0.6% | | | |
| Advanced Drain Systems, Inc.: | | | |
| 5% 9/30/27 (b) | | 824,000 | 768,380 |
| 6.375% 6/15/30 (b) | | 490,000 | 462,643 |
| AmeriTex Holdco Intermediate LLC 10.25% 10/15/28 (b) | | 815,000 | 770,583 |
| Beacon Roofing Supply, Inc. 6.5% 8/1/30 (b) | | 1,325,000 | 1,265,174 |
| Builders FirstSource, Inc. 4.25% 2/1/32 (b) | | 2,210,000 | 1,758,844 |
| SRS Distribution, Inc.: | | | |
| 4.625% 7/1/28 (b) | | 1,335,000 | 1,164,579 |
| 6% 12/1/29 (b) | | 1,230,000 | 1,023,975 |
| | | | 7,214,178 |
| Cable/Satellite TV - 3.1% | | | |
| CCO Holdings LLC/CCO Holdings Capital Corp.: | | | |
| 4.25% 2/1/31 (b) | | 3,680,000 | 2,863,768 |
| 4.25% 1/15/34 (b) | | 2,145,000 | 1,549,339 |
| 4.5% 8/15/30 (b) | | 675,000 | 541,239 |
| 4.5% 5/1/32 | | 5,635,000 | 4,313,574 |
| 4.75% 3/1/30 (b) | | 4,755,000 | 3,922,508 |
| 4.75% 2/1/32 (b) | | 3,090,000 | 2,411,930 |
| 5% 2/1/28 (b) | | 1,495,000 | 1,342,416 |
| 5.375% 6/1/29 (b) | | 1,705,000 | 1,492,352 |
| CSC Holdings LLC: | | | |
| 4.125% 12/1/30 (b) | | 2,050,000 | 1,373,422 |
| 4.5% 11/15/31 (b) | | 555,000 | 366,552 |
| 4.625% 12/1/30 (b) | | 5,335,000 | 2,705,495 |
| 5.375% 2/1/28 (b) | | 3,840,000 | 3,057,928 |
| 5.75% 1/15/30 (b) | | 3,435,000 | 1,797,088 |
| 7.5% 4/1/28 (b) | | 1,530,000 | 980,620 |
| DIRECTV Financing LLC / DIRECTV Financing Co-Obligor, Inc. 5.875% 8/15/27 (b) | | 535,000 | 468,786 |
| DISH DBS Corp. 5.75% 12/1/28 (b) | | 2,740,000 | 1,989,925 |
| Dolya Holdco 18 DAC 5% 7/15/28 (b) | | 1,505,000 | 1,278,184 |
| Radiate Holdco LLC/Radiate Financial Service Ltd.: | | | |
| 4.5% 9/15/26 (b) | | 1,630,000 | 1,246,362 |
| 6.5% 9/15/28 (b) | | 1,465,000 | 725,175 |
| Telenet Finance Luxembourg Notes SARL 5.5% 3/1/28 (b) | | 1,000,000 | 892,500 |
| Ziggo BV 4.875% 1/15/30 (b) | | 1,455,000 | 1,162,125 |
| | | | 36,481,288 |
| Capital Goods - 0.9% | | | |
| Mueller Water Products, Inc. 4% 6/15/29 (b) | | 1,905,000 | 1,628,775 |
| Regal Rexnord Corp.: | | | |
| 6.05% 2/15/26 (b) | | 1,640,000 | 1,613,112 |
| 6.05% 4/15/28 (b) | | 1,090,000 | 1,042,686 |
| 6.3% 2/15/30 (b) | | 1,090,000 | 1,025,674 |
| Vertical Holdco GmbH 7.625% 7/15/28 (b) | | 1,645,000 | 1,483,854 |
| Vertical U.S. Newco, Inc. 5.25% 7/15/27 (b) | | 4,865,000 | 4,429,326 |
| | | | 11,223,427 |
| Chemicals - 3.7% | | | |
| CVR Partners LP 6.125% 6/15/28 (b) | | 1,807,000 | 1,594,678 |
| Element Solutions, Inc. 3.875% 9/1/28 (b) | | 1,044,000 | 888,291 |
| Kobe U.S. Midco 2, Inc. 9.25% 11/1/26 pay-in-kind (b)(c) | | 1,645,000 | 1,192,625 |
| Kronos Acquisition Holdings, Inc. / KIK Custom Products, Inc. 5% 12/31/26 (b) | | 1,360,000 | 1,230,190 |
| LSB Industries, Inc. 6.25% 10/15/28 (b) | | 880,000 | 780,658 |
| Methanex Corp.: | | | |
| 5.125% 10/15/27 | | 3,800,000 | 3,465,630 |
| 5.65% 12/1/44 | | 3,722,000 | 2,735,086 |
| NOVA Chemicals Corp.: | | | |
| 4.25% 5/15/29 (b) | | 1,900,000 | 1,404,847 |
| 4.875% 6/1/24 (b) | | 1,290,000 | 1,267,714 |
| 5% 5/1/25 (b) | | 940,000 | 887,794 |
| 5.25% 6/1/27 (b) | | 1,935,000 | 1,634,426 |
| Nufarm Australia Ltd. 5% 1/27/30 (b) | | 2,575,000 | 2,233,786 |
| Olin Corp. 5% 2/1/30 | | 1,110,000 | 958,772 |
| Olympus Water U.S. Holding Corp.: | | | |
| 4.25% 10/1/28 (b) | | 2,030,000 | 1,619,818 |
| 6.25% 10/1/29 (b) | | 2,255,000 | 1,691,250 |
| 9.75% 11/15/28 (b) | | 2,225,000 | 2,173,160 |
| SCIH Salt Holdings, Inc.: | | | |
| 4.875% 5/1/28 (b) | | 3,750,000 | 3,237,664 |
| 6.625% 5/1/29 (b) | | 1,815,000 | 1,521,380 |
| SCIL IV LLC / SCIL U.S.A. Holdings LLC 5.375% 11/1/26 (b) | | 1,550,000 | 1,374,890 |
| The Chemours Co. LLC: | | | |
| 4.625% 11/15/29 (b) | | 790,000 | 610,179 |
| 5.375% 5/15/27 | | 2,604,000 | 2,352,494 |
| 5.75% 11/15/28 (b) | | 2,625,000 | 2,220,093 |
| Tronox, Inc. 4.625% 3/15/29 (b) | | 3,860,000 | 3,040,648 |
| W.R. Grace Holding LLC: | | | |
| 5.625% 8/15/29 (b) | | 3,750,000 | 2,906,250 |
| 7.375% 3/1/31 (b) | | 440,000 | 407,559 |
| | | | 43,429,882 |
| Consumer Products - 0.6% | | | |
| Ferrellgas LP/Ferrellgas Finance Corp. 5.375% 4/1/26 (b) | | 295,000 | 276,114 |
| HFC Prestige Products, Inc./HFC Prestige International U.S. LLC 6.625% 7/15/30 (b) | | 1,850,000 | 1,762,535 |
| Kohl's Corp. 4.25% 7/17/25 | | 150,000 | 140,097 |
| Mattel, Inc.: | | | |
| 3.375% 4/1/26 (b) | | 1,750,000 | 1,616,426 |
| 5.45% 11/1/41 | | 435,000 | 339,327 |
| Newell Brands, Inc.: | | | |
| 4.7% 4/1/26 | | 545,000 | 514,563 |
| 6.375% 9/15/27 | | 545,000 | 510,400 |
| 6.5% 4/1/46 (f) | | 435,000 | 305,476 |
| 6.625% 9/15/29 | | 605,000 | 556,573 |
| The Scotts Miracle-Gro Co.: | | | |
| 4% 4/1/31 | | 215,000 | 159,940 |
| 4.375% 2/1/32 | | 330,000 | 241,857 |
| TKC Holdings, Inc. 10.5% 5/15/29 (b) | | 780,000 | 623,808 |
| | | | 7,047,116 |
| Containers - 1.6% | | | |
| ARD Finance SA 6.5% 6/30/27 pay-in-kind (b)(c) | | 1,940,000 | 1,129,771 |
| Ardagh Packaging Finance PLC/Ardagh MP Holdings U.S.A., Inc.: | | | |
| 5.25% 8/15/27 (b) | | 2,345,000 | 1,703,902 |
| 5.25% 8/15/27 (b) | | 2,775,000 | 2,016,344 |
| Ball Corp.: | | | |
| 2.875% 8/15/30 | | 545,000 | 425,188 |
| 4.875% 3/15/26 | | 1,635,000 | 1,570,161 |
| 6% 6/15/29 | | 710,000 | 679,133 |
| Berry Global, Inc. 4.875% 7/15/26 (b) | | 875,000 | 834,916 |
| BWAY Holding Co.: | | | |
| 7.875% 8/15/26 (b) | | 1,630,000 | 1,526,689 |
| 9.25% 4/15/27 (b) | | 1,335,000 | 1,111,800 |
| Graham Packaging Co., Inc. 7.125% 8/15/28 (b) | | 545,000 | 417,544 |
| Graphic Packaging International, Inc. 3.75% 2/1/30 (b) | | 610,000 | 498,760 |
| LABL, Inc.: | | | |
| 5.875% 11/1/28 (b) | | 330,000 | 279,261 |
| 6.75% 7/15/26 (b) | | 220,000 | 202,226 |
| 9.5% 11/1/28 (b) | | 220,000 | 212,622 |
| 10.5% 7/15/27 (b) | | 1,295,000 | 1,121,077 |
| Owens-Brockway Glass Container, Inc. 7.25% 5/15/31 (b) | | 555,000 | 507,825 |
| Sealed Air Corp. 5% 4/15/29 (b) | | 3,300,000 | 2,926,554 |
| Sealed Air Corp./Sealed Air Cor 6.125% 2/1/28 (b) | | 655,000 | 623,442 |
| Trivium Packaging Finance BV: | | | |
| 5.5% 8/15/26 (b) | | 494,000 | 447,800 |
| 8.5% 8/15/27 (b) | | 810,000 | 675,776 |
| | | | 18,910,791 |
| Diversified Financial Services - 3.3% | | | |
| Aercap Global Aviation Trust 6.5% 6/15/45 (b)(c) | | 1,090,000 | 1,069,372 |
| Coinbase Global, Inc. 3.375% 10/1/28 (b) | | 900,000 | 660,819 |
| Emerald Debt Merger Sub LLC 6.625% 12/15/30 (b) | | 4,830,000 | 4,594,538 |
| GGAM Finance Ltd.: | | | |
| 7.75% 5/15/26 (b) | | 1,115,000 | 1,106,102 |
| 8% 6/15/28 (b) | | 1,675,000 | 1,652,245 |
| GTCR W-2 Merger Sub LLC 7.5% 1/15/31 (b) | | 1,525,000 | 1,505,709 |
| Hightower Holding LLC 6.75% 4/15/29 (b) | | 1,675,000 | 1,428,683 |
| HTA Group Ltd. 7% 12/18/25 (b) | | 3,830,000 | 3,688,941 |
| Icahn Enterprises LP/Icahn Enterprises Finance Corp.: | | | |
| 4.375% 2/1/29 | | 4,560,000 | 3,511,273 |
| 5.25% 5/15/27 | | 3,780,000 | 3,236,625 |
| 6.25% 5/15/26 | | 4,515,000 | 4,126,866 |
| 6.375% 12/15/25 | | 1,225,000 | 1,152,510 |
| Jefferies Finance LLC/JFIN Co-Issuer Corp. 5% 8/15/28 (b) | | 390,000 | 311,254 |
| Ladder Capital Finance Holdings LLLP/Ladder Capital Finance Corp. 4.75% 6/15/29 (b) | | 1,415,000 | 1,137,663 |
| LPL Holdings, Inc. 4.375% 5/15/31 (b) | | 545,000 | 456,454 |
| OneMain Finance Corp.: | | | |
| 3.5% 1/15/27 | | 3,265,000 | 2,758,925 |
| 3.875% 9/15/28 | | 4,040,000 | 3,194,160 |
| 6.875% 3/15/25 | | 220,000 | 217,051 |
| 7.125% 3/15/26 | | 3,970,000 | 3,855,509 |
| | | | 39,664,699 |
| Diversified Media - 0.5% | | | |
| Advantage Sales & Marketing, Inc. 6.5% 11/15/28 (b) | | 2,875,000 | 2,343,125 |
| Cmg Media Corp. 8.875% 12/15/27 (b) | | 5,100,000 | 3,939,750 |
| | | | 6,282,875 |
| Energy - 11.9% | | | |
| Altus Midstream LP 5.875% 6/15/30 (b) | | 1,535,000 | 1,408,439 |
| Antero Midstream Partners LP/Antero Midstream Finance Corp.: | | | |
| 5.75% 3/1/27 (b) | | 545,000 | 520,896 |
| 7.875% 5/15/26 (b) | | 545,000 | 548,844 |
| Apache Corp.: | | | |
| 4.25% 1/15/30 | | 775,000 | 674,800 |
| 5.1% 9/1/40 | | 980,000 | 761,509 |
| Atlantica Sustainable Infrastructure PLC 4.125% 6/15/28 (b) | | 2,540,000 | 2,193,470 |
| California Resources Corp. 7.125% 2/1/26 (b) | | 765,000 | 767,869 |
| Calumet Specialty Products Partners LP/Calumet Finance Corp. 9.75% 7/15/28 (b) | | 960,000 | 896,038 |
| Centennial Resource Production LLC: | | | |
| 5.875% 7/1/29 (b) | | 1,573,000 | 1,462,890 |
| 7% 1/15/32 (b) | | 1,275,000 | 1,235,976 |
| 7.75% 2/15/26 (b) | | 860,000 | 859,228 |
| CGG SA 8.75% 4/1/27 (b) | | 1,310,000 | 1,156,219 |
| Cheniere Energy Partners LP: | | | |
| 3.25% 1/31/32 | | 2,190,000 | 1,698,209 |
| 4% 3/1/31 | | 1,085,000 | 908,542 |
| Citgo Petroleum Corp.: | | | |
| 6.375% 6/15/26 (b) | | 2,380,000 | 2,338,247 |
| 8.375% 1/15/29 (b) | | 1,230,000 | 1,218,145 |
| CNX Resources Corp. 7.375% 1/15/31 (b) | | 625,000 | 597,173 |
| Comstock Resources, Inc.: | | | |
| 5.875% 1/15/30 (b) | | 1,410,000 | 1,205,564 |
| 6.75% 3/1/29 (b) | | 1,535,000 | 1,396,884 |
| Crestwood Midstream Partners LP/Crestwood Midstream Finance Corp.: | | | |
| 5.625% 5/1/27 (b) | | 9,034,000 | 8,689,624 |
| 5.75% 4/1/25 | | 2,285,000 | 2,256,438 |
| 7.375% 2/1/31 (b) | | 1,090,000 | 1,098,731 |
| CrownRock LP/CrownRock Finance, Inc.: | | | |
| 5% 5/1/29 (b) | | 1,855,000 | 1,749,636 |
| 5.625% 10/15/25 (b) | | 230,000 | 226,222 |
| CVR Energy, Inc.: | | | |
| 5.25% 2/15/25 (b) | | 3,735,000 | 3,663,923 |
| 5.75% 2/15/28 (b) | | 2,890,000 | 2,596,549 |
| Delek Logistics Partners LP 7.125% 6/1/28 (b) | | 3,165,000 | 2,880,150 |
| DT Midstream, Inc.: | | | |
| 4.125% 6/15/29 (b) | | 1,140,000 | 980,182 |
| 4.375% 6/15/31 (b) | | 545,000 | 452,601 |
| Endeavor Energy Resources LP/EER Finance, Inc. 5.75% 1/30/28 (b) | | 1,020,000 | 978,476 |
| EnLink Midstream LLC: | | | |
| 5.625% 1/15/28 (b) | | 665,000 | 627,045 |
| 6.5% 9/1/30 (b) | | 1,020,000 | 979,067 |
| EnLink Midstream Partners LP 4.85% 7/15/26 | | 985,000 | 925,917 |
| EQM Midstream Partners LP: | | | |
| 4% 8/1/24 | | 1,005,000 | 976,994 |
| 4.75% 1/15/31 (b) | | 445,000 | 374,691 |
| 6% 7/1/25 (b) | | 140,000 | 136,911 |
| 6.5% 7/1/27 (b) | | 437,000 | 424,766 |
| 6.5% 7/15/48 | | 220,000 | 186,025 |
| Global Partners LP/GLP Finance Corp. 6.875% 1/15/29 | | 835,000 | 736,931 |
| Harvest Midstream I LP 7.5% 9/1/28 (b) | | 1,110,000 | 1,051,784 |
| Hess Midstream Partners LP: | | | |
| 4.25% 2/15/30 (b) | | 1,115,000 | 954,079 |
| 5.125% 6/15/28 (b) | | 3,025,000 | 2,793,157 |
| 5.5% 10/15/30 (b) | | 545,000 | 494,754 |
| 5.625% 2/15/26 (b) | | 2,610,000 | 2,527,626 |
| Holly Energy Partners LP/Holly Energy Finance Corp. 5% 2/1/28 (b) | | 2,280,000 | 2,110,562 |
| Howard Midstream Energy Partners LLC 8.875% 7/15/28 (b) | | 1,170,000 | 1,176,233 |
| Jonah Energy Parent LLC 12% 11/5/25 (g)(h) | | 3,297,992 | 3,384,729 |
| Mesquite Energy, Inc. 7.25% (b)(e)(h) | | 10,580,000 | 1 |
| New Fortress Energy, Inc. 6.5% 9/30/26 (b) | | 5,850,000 | 5,239,826 |
| NGL Energy Operating LLC/NGL Energy Finance Corp. 7.5% 2/1/26 (b) | | 1,725,000 | 1,683,912 |
| Northern Oil & Gas, Inc.: | | | |
| 8.125% 3/1/28 (b) | | 1,730,000 | 1,708,427 |
| 8.75% 6/15/31 (b) | | 555,000 | 552,196 |
| Occidental Petroleum Corp.: | | | |
| 4.2% 3/15/48 | | 545,000 | 367,346 |
| 4.4% 4/15/46 | | 1,630,000 | 1,162,793 |
| 4.4% 8/15/49 | | 760,000 | 496,956 |
| 4.5% 7/15/44 | | 1,335,000 | 927,705 |
| 5.5% 12/1/25 | | 2,335,000 | 2,304,601 |
| 5.55% 3/15/26 | | 325,000 | 320,635 |
| 5.875% 9/1/25 | | 1,656,000 | 1,650,254 |
| 6.125% 1/1/31 | | 1,895,000 | 1,853,234 |
| 6.625% 9/1/30 | | 3,190,000 | 3,199,749 |
| 7.5% 5/1/31 | | 2,575,000 | 2,700,119 |
| 7.875% 9/15/31 | | 635,000 | 679,863 |
| 7.95% 6/15/39 | | 270,000 | 288,630 |
| 8.875% 7/15/30 | | 2,170,000 | 2,409,698 |
| PBF Holding Co. LLC/PBF Finance Corp. 7.875% 9/15/30 (b) | | 2,660,000 | 2,578,365 |
| Rockies Express Pipeline LLC: | | | |
| 4.8% 5/15/30 (b) | | 145,000 | 121,895 |
| 4.95% 7/15/29 (b) | | 1,480,000 | 1,304,366 |
| 6.875% 4/15/40 (b) | | 655,000 | 545,165 |
| Seadrill Finance Ltd. 8.375% 8/1/30 (b) | | 925,000 | 925,296 |
| Sitio Royalties OP / Sitio Finance Corp. 7.875% 11/1/28 (b) | | 2,285,000 | 2,253,924 |
| SM Energy Co. 5.625% 6/1/25 | | 1,200,000 | 1,168,072 |
| Southwestern Energy Co. 4.75% 2/1/32 | | 1,640,000 | 1,410,379 |
| Suburban Propane Partners LP/Suburban Energy Finance Corp. 5.875% 3/1/27 | | 210,000 | 198,975 |
| Sunnova Energy Corp.: | | | |
| 5.875% 9/1/26 (b) | | 880,000 | 712,826 |
| 11.75% 10/1/28 (b) | | 1,210,000 | 1,032,166 |
| Sunoco LP/Sunoco Finance Corp.: | | | |
| 4.5% 5/15/29 | | 1,670,000 | 1,446,608 |
| 5.875% 3/15/28 | | 875,000 | 827,743 |
| Superior Plus LP / Superior General Partner, Inc. 4.5% 3/15/29 (b) | | 1,155,000 | 985,134 |
| Tallgrass Energy Partners LP / Tallgrass Energy Finance Corp.: | | | |
| 5.5% 1/15/28 (b) | | 3,125,000 | 2,737,658 |
| 6% 12/31/30 (b) | | 6,055,000 | 5,097,301 |
| 6% 9/1/31 (b) | | 3,695,000 | 3,109,232 |
| 7.5% 10/1/25 (b) | | 3,970,000 | 3,911,049 |
| Targa Resources Partners LP/Targa Resources Partners Finance Corp. 4.875% 2/1/31 | | 1,085,000 | 956,463 |
| Teine Energy Ltd. 6.875% 4/15/29 (b) | | 295,000 | 273,244 |
| Transocean Poseidon Ltd. 6.875% 2/1/27 (b) | | 757,500 | 742,350 |
| Transocean, Inc.: | | | |
| 7.5% 1/15/26 (b) | | 845,000 | 809,392 |
| 8% 2/1/27 (b) | | 2,050,000 | 1,924,212 |
| 8.75% 2/15/30 (b) | | 1,344,250 | 1,340,284 |
| Valaris Ltd. 8.375% 4/30/30 (b) | | 2,135,000 | 2,094,969 |
| Venture Global Calcasieu Pass LLC: | | | |
| 3.875% 8/15/29 (b) | | 2,155,000 | 1,793,344 |
| 4.125% 8/15/31 (b) | | 1,680,000 | 1,350,731 |
| 6.25% 1/15/30 (b) | | 1,445,000 | 1,363,152 |
| Western Gas Partners LP: | | | |
| 3.1% 2/1/25 | | 1,950,000 | 1,873,458 |
| 3.95% 6/1/25 | | 540,000 | 519,328 |
| 5.25% 2/1/50 | | 1,085,000 | 801,772 |
| 5.3% 3/1/48 | | 540,000 | 403,672 |
| 5.5% 8/15/48 | | 325,000 | 246,422 |
| | | | 141,687,637 |
| Environmental - 1.0% | | | |
| Clean Harbors, Inc. 6.375% 2/1/31 (b) | | 515,000 | 489,488 |
| Covanta Holding Corp. 4.875% 12/1/29 (b) | | 1,650,000 | 1,287,000 |
| Darling Ingredients, Inc. 6% 6/15/30 (b) | | 910,000 | 853,762 |
| GFL Environmental, Inc.: | | | |
| 3.75% 8/1/25 (b) | | 1,090,000 | 1,030,892 |
| 5.125% 12/15/26 (b) | | 1,090,000 | 1,034,289 |
| Madison IAQ LLC: | | | |
| 4.125% 6/30/28 (b) | | 2,375,000 | 1,984,266 |
| 5.875% 6/30/29 (b) | | 2,280,000 | 1,766,168 |
| Stericycle, Inc.: | | | |
| 3.875% 1/15/29 (b) | | 3,330,000 | 2,829,341 |
| 5.375% 7/15/24 (b) | | 575,000 | 567,703 |
| | | | 11,842,909 |
| Food & Drug Retail - 0.8% | | | |
| Albertsons Companies LLC/Safeway, Inc./New Albertson's, Inc./Albertson's LLC: | | | |
| 3.25% 3/15/26 (b) | | 295,000 | 272,488 |
| 3.5% 3/15/29 (b) | | 2,690,000 | 2,293,497 |
| 4.875% 2/15/30 (b) | | 1,855,000 | 1,656,173 |
| BellRing Brands, Inc. 7% 3/15/30 (b) | | 435,000 | 422,494 |
| Emergent BioSolutions, Inc. 3.875% 8/15/28 (b) | | 4,325,000 | 1,700,698 |
| Murphy Oil U.S.A., Inc. 3.75% 2/15/31 (b) | | 785,000 | 630,647 |
| Parkland Corp. 4.625% 5/1/30 (b) | | 3,475,000 | 2,962,438 |
| | | | 9,938,435 |
| Food/Beverage/Tobacco - 2.4% | | | |
| C&S Group Enterprises LLC 5% 12/15/28 (b) | | 2,380,000 | 1,841,525 |
| Chobani LLC/Finance Corp., Inc. 4.625% 11/15/28 (b) | | 435,000 | 376,089 |
| Lamb Weston Holdings, Inc.: | | | |
| 4.125% 1/31/30 (b) | | 3,660,000 | 3,104,861 |
| 4.375% 1/31/32 (b) | | 545,000 | 450,915 |
| Performance Food Group, Inc.: | | | |
| 4.25% 8/1/29 (b) | | 2,690,000 | 2,269,756 |
| 5.5% 10/15/27 (b) | | 1,505,000 | 1,407,287 |
| Pilgrim's Pride Corp.: | | | |
| 3.5% 3/1/32 | | 545,000 | 415,181 |
| 4.25% 4/15/31 | | 640,000 | 527,154 |
| Post Holdings, Inc.: | | | |
| 4.625% 4/15/30 (b) | | 1,290,000 | 1,080,231 |
| 5.5% 12/15/29 (b) | | 3,980,000 | 3,549,419 |
| Primo Water Holdings, Inc. 4.375% 4/30/29 (b) | | 2,685,000 | 2,265,361 |
| TreeHouse Foods, Inc. 4% 9/1/28 | | 860,000 | 699,122 |
| Triton Water Holdings, Inc. 6.25% 4/1/29 (b) | | 7,460,000 | 6,148,419 |
| U.S. Foods, Inc.: | | | |
| 4.625% 6/1/30 (b) | | 820,000 | 700,203 |
| 4.75% 2/15/29 (b) | | 2,180,000 | 1,923,103 |
| 7.25% 1/15/32 (b) | | 1,225,000 | 1,202,506 |
| United Natural Foods, Inc. 6.75% 10/15/28 (b) | | 215,000 | 169,179 |
| | | | 28,130,311 |
| Gaming - 2.3% | | | |
| Affinity Gaming LLC 6.875% 12/15/27 (b) | | 3,630,000 | 2,958,762 |
| Caesars Entertainment, Inc.: | | | |
| 6.25% 7/1/25 (b) | | 2,675,000 | 2,631,899 |
| 7% 2/15/30 (b) | | 1,305,000 | 1,259,446 |
| 8.125% 7/1/27 (b) | | 2,509,000 | 2,486,103 |
| Caesars Resort Collection LLC 5.75% 7/1/25 (b) | | 2,205,000 | 2,169,761 |
| Carnival Corp. 10.5% 6/1/30 (b) | | 1,985,000 | 2,014,027 |
| CDI Escrow Issuer, Inc. 5.75% 4/1/30 (b) | | 3,965,000 | 3,542,350 |
| Fertitta Entertainment LLC / Fertitta Entertainment Finance Co., Inc.: | | | |
| 4.625% 1/15/29 (b) | | 2,730,000 | 2,294,101 |
| 6.75% 1/15/30 (b) | | 2,125,000 | 1,688,846 |
| Golden Entertainment, Inc. 7.625% 4/15/26 (b) | | 1,515,000 | 1,515,002 |
| Jacobs Entertainment, Inc. 6.75% 2/15/29 (b) | | 975,000 | 828,750 |
| Ontario Gaming GTA LP 8% 8/1/30 (b) | | 660,000 | 645,175 |
| Station Casinos LLC 4.5% 2/15/28 (b) | | 1,665,000 | 1,437,937 |
| Transocean, Inc. 7.25% 11/1/25 (b) | | 545,000 | 531,795 |
| VICI Properties LP / VICI Note Co. 4.125% 8/15/30 (b) | | 1,085,000 | 895,071 |
| Wynn Resorts Finance LLC / Wynn Resorts Capital Corp. 7.125% 2/15/31 (b) | | 545,000 | 507,516 |
| | | | 27,406,541 |
| Healthcare - 6.2% | | | |
| 1375209 BC Ltd. 9% 1/30/28 (b) | | 1,306,000 | 1,266,018 |
| 180 Medical, Inc. 3.875% 10/15/29 (b) | | 1,055,000 | 876,470 |
| Amgen, Inc. 5.6% 3/2/43 | | 1,195,000 | 1,065,839 |
| AMN Healthcare 4% 4/15/29 (b) | | 680,000 | 563,163 |
| Avantor Funding, Inc.: | | | |
| 3.875% 11/1/29 (b) | | 1,345,000 | 1,125,679 |
| 4.625% 7/15/28 (b) | | 885,000 | 787,747 |
| Bausch Health Companies, Inc. 5.5% 11/1/25 (b) | | 2,740,000 | 2,363,250 |
| Cano Health, Inc. 6.25% 10/1/28 (b) | | 550,000 | 220,000 |
| Catalent Pharma Solutions 3.5% 4/1/30 (b) | | 1,320,000 | 1,034,550 |
| Centene Corp. 2.5% 3/1/31 | | 1,470,000 | 1,113,466 |
| Charles River Laboratories International, Inc.: | | | |
| 3.75% 3/15/29 (b) | | 1,150,000 | 970,681 |
| 4% 3/15/31 (b) | | 975,000 | 795,790 |
| 4.25% 5/1/28 (b) | | 472,000 | 419,391 |
| Community Health Systems, Inc.: | | | |
| 4.75% 2/15/31 (b) | | 4,055,000 | 2,717,844 |
| 5.25% 5/15/30 (b) | | 7,690,000 | 5,461,084 |
| 5.625% 3/15/27 (b) | | 4,905,000 | 3,984,987 |
| 6% 1/15/29 (b) | | 2,290,000 | 1,734,675 |
| 6.125% 4/1/30 (b) | | 2,340,000 | 906,750 |
| 6.875% 4/15/29 (b) | | 1,490,000 | 615,236 |
| 8% 3/15/26 (b) | | 1,075,000 | 982,610 |
| CTR Partnership LP/CareTrust Capital Corp. 3.875% 6/30/28 (b) | | 2,070,000 | 1,739,080 |
| DaVita HealthCare Partners, Inc.: | | | |
| 3.75% 2/15/31 (b) | | 855,000 | 614,579 |
| 4.625% 6/1/30 (b) | | 4,560,000 | 3,573,718 |
| Embecta Corp. 5% 2/15/30 (b) | | 860,000 | 682,900 |
| Grifols SA 4.75% 10/15/28 (b) | | 1,365,000 | 1,143,188 |
| HCA Holdings, Inc. 5.5% 6/15/47 | | 1,085,000 | 874,027 |
| HealthEquity, Inc. 4.5% 10/1/29 (b) | | 1,865,000 | 1,597,558 |
| Hologic, Inc. 3.25% 2/15/29 (b) | | 840,000 | 705,196 |
| Humana, Inc. 5.875% 3/1/33 | | 1,085,000 | 1,051,957 |
| IQVIA, Inc. 6.5% 5/15/30 (b) | | 1,110,000 | 1,076,700 |
| Jazz Securities DAC 4.375% 1/15/29 (b) | | 1,850,000 | 1,608,887 |
| ModivCare Escrow Issuer, Inc. 5% 10/1/29 (b) | | 785,000 | 572,100 |
| Modivcare, Inc. 5.875% 11/15/25 (b) | | 1,490,000 | 1,408,050 |
| Molina Healthcare, Inc. 3.875% 11/15/30 (b) | | 1,465,000 | 1,194,883 |
| Mozart Borrower LP 3.875% 4/1/29 (b) | | 545,000 | 460,179 |
| Option Care Health, Inc. 4.375% 10/31/29 (b) | | 255,000 | 213,117 |
| Organon & Co. / Organon Foreign Debt Co-Issuer BV: | | | |
| 4.125% 4/30/28 (b) | | 3,935,000 | 3,398,896 |
| 5.125% 4/30/31 (b) | | 1,050,000 | 819,963 |
| Owens & Minor, Inc. 4.5% 3/31/29 (b) | | 1,010,000 | 810,364 |
| Pediatrix Medical Group, Inc. 5.375% 2/15/30 (b) | | 2,895,000 | 2,496,764 |
| RP Escrow Issuer LLC 5.25% 12/15/25 (b) | | 1,540,000 | 1,097,250 |
| Teleflex, Inc. 4.25% 6/1/28 (b) | | 930,000 | 820,726 |
| Tenet Healthcare Corp.: | | | |
| 4.25% 6/1/29 | | 2,790,000 | 2,387,604 |
| 4.375% 1/15/30 | | 1,990,000 | 1,683,356 |
| 4.625% 6/15/28 | | 2,545,000 | 2,264,154 |
| 6.125% 10/1/28 | | 3,035,000 | 2,814,963 |
| 6.125% 6/15/30 | | 2,820,000 | 2,610,420 |
| 6.25% 2/1/27 | | 2,741,000 | 2,628,473 |
| 6.75% 5/15/31 (b) | | 390,000 | 370,357 |
| Teva Pharmaceutical Finance Netherlands III BV: | | | |
| 3.15% 10/1/26 | | 1,310,000 | 1,153,357 |
| 7.875% 9/15/29 | | 330,000 | 325,404 |
| 8.125% 9/15/31 | | 330,000 | 326,724 |
| | | | 73,530,124 |
| Homebuilders/Real Estate - 3.4% | | | |
| Anywhere Real Estate Group LLC 7% 4/15/30 (b) | | 874,400 | 719,741 |
| Ashton Woods U.S.A. LLC/Ashton Woods Finance Co. 4.625% 8/1/29 (b) | | 985,000 | 797,043 |
| Greystar Real Estate Partners 7.75% 9/1/30 (b) | | 555,000 | 545,288 |
| Howard Hughes Corp.: | | | |
| 4.125% 2/1/29 (b) | | 945,000 | 758,363 |
| 4.375% 2/1/31 (b) | | 775,000 | 589,927 |
| Kennedy-Wilson, Inc. 4.75% 2/1/30 | | 1,605,000 | 1,171,650 |
| MPT Operating Partnership LP/MPT Finance Corp.: | | | |
| 3.5% 3/15/31 | | 5,035,000 | 3,053,193 |
| 4.625% 8/1/29 | | 2,850,000 | 1,973,144 |
| 5% 10/15/27 | | 9,335,000 | 7,207,855 |
| 5.25% 8/1/26 | | 1,085,000 | 934,199 |
| Railworks Holdings LP 8.25% 11/15/28 (b) | | 1,990,000 | 1,892,550 |
| Realogy Group LLC/Realogy Co-Issuer Corp. 5.75% 1/15/29 (b) | | 32,000 | 20,080 |
| Realogy Group LLC/Realogy Co.-Issuer Corp. 5.25% 4/15/30 (b) | | 25,000 | 15,566 |
| Taylor Morrison Communities, Inc./Monarch Communities, Inc. 5.125% 8/1/30 (b) | | 395,000 | 331,959 |
| TopBuild Corp. 4.125% 2/15/32 (b) | | 1,185,000 | 937,454 |
| TRI Pointe Group, Inc./TRI Pointe Holdings, Inc. 5.875% 6/15/24 | | 30,000 | 29,699 |
| TRI Pointe Homes, Inc. 5.7% 6/15/28 | | 220,000 | 195,877 |
| Uniti Group LP / Uniti Group Finance, Inc.: | | | |
| 4.75% 4/15/28 (b) | | 6,395,000 | 5,168,264 |
| 6.5% 2/15/29 (b) | | 18,671,000 | 12,125,089 |
| 10.5% 2/15/28 (b) | | 2,175,000 | 2,094,425 |
| | | | 40,561,366 |
| Hotels - 0.7% | | | |
| Hilton Domestic Operating Co., Inc.: | | | |
| 3.625% 2/15/32 (b) | | 4,715,000 | 3,727,082 |
| 3.75% 5/1/29 (b) | | 495,000 | 426,094 |
| 4% 5/1/31 (b) | | 2,420,000 | 2,004,162 |
| Wyndham Hotels & Resorts, Inc. 4.375% 8/15/28 (b) | | 1,785,000 | 1,575,352 |
| | | | 7,732,690 |
| Insurance - 1.6% | | | |
| Acrisure LLC / Acrisure Finance, Inc.: | | | |
| 4.25% 2/15/29 (b) | | 435,000 | 356,687 |
| 7% 11/15/25 (b) | | 215,000 | 208,450 |
| Alliant Holdings Intermediate LLC: | | | |
| 4.25% 10/15/27 (b) | | 3,740,000 | 3,288,058 |
| 5.875% 11/1/29 (b) | | 1,365,000 | 1,133,275 |
| 6.75% 10/15/27 (b) | | 6,945,000 | 6,342,591 |
| 6.75% 4/15/28 (b) | | 540,000 | 513,133 |
| AmWINS Group, Inc. 4.875% 6/30/29 (b) | | 1,660,000 | 1,421,030 |
| AssuredPartners, Inc. 5.625% 1/15/29 (b) | | 1,355,000 | 1,149,488 |
| HUB International Ltd.: | | | |
| 7% 5/1/26 (b) | | 765,000 | 744,660 |
| 7.25% 6/15/30 (b) | | 3,595,000 | 3,506,779 |
| | | | 18,664,151 |
| Leisure - 2.6% | | | |
| Carnival Corp.: | | | |
| 5.75% 3/1/27 (b) | | 3,414,000 | 3,054,723 |
| 6% 5/1/29 (b) | | 2,235,000 | 1,888,405 |
| 6.65% 1/15/28 | | 300,000 | 252,570 |
| 7% 8/15/29 (b) | | 2,465,000 | 2,417,032 |
| 7.625% 3/1/26 (b) | | 4,415,000 | 4,293,114 |
| ClubCorp Holdings, Inc. 8.5% 9/15/25 (b) | | 315,000 | 266,931 |
| MajorDrive Holdings IV LLC 6.375% 6/1/29 (b) | | 1,705,000 | 1,321,375 |
| NCL Corp. Ltd.: | | | |
| 5.875% 3/15/26 (b) | | 890,000 | 798,775 |
| 7.75% 2/15/29 (b) | | 3,300,000 | 2,880,206 |
| NCL Finance Ltd. 6.125% 3/15/28 (b) | | 640,000 | 535,192 |
| Royal Caribbean Cruises Ltd.: | | | |
| 4.25% 7/1/26 (b) | | 4,110,000 | 3,780,387 |
| 5.375% 7/15/27 (b) | | 1,535,000 | 1,414,619 |
| 5.5% 8/31/26 (b) | | 3,160,000 | 2,982,029 |
| 5.5% 4/1/28 (b) | | 2,745,000 | 2,503,482 |
| 7.25% 1/15/30 (b) | | 540,000 | 532,696 |
| Viking Cruises Ltd. 9.125% 7/15/31 (b) | | 1,195,000 | 1,174,088 |
| Viking Ocean Cruises Ship VII Ltd. 5.625% 2/15/29 (b) | | 630,000 | 558,338 |
| Voc Escrow Ltd. 5% 2/15/28 (b) | | 865,000 | 777,136 |
| | | | 31,431,098 |
| Metals/Mining - 1.5% | | | |
| Arsenal AIC Parent LLC 8% 10/1/30 (b) | | 740,000 | 730,750 |
| Cleveland-Cliffs, Inc. 4.875% 3/1/31 (b) | | 215,000 | 177,336 |
| Constellium NV 5.875% 2/15/26 (b) | | 797,000 | 763,917 |
| Eldorado Gold Corp. 6.25% 9/1/29 (b) | | 1,005,000 | 858,019 |
| ERO Copper Corp. 6.5% 2/15/30 (b) | | 5,665,000 | 4,805,563 |
| First Quantum Minerals Ltd.: | | | |
| 6.875% 10/15/27 (b) | | 3,115,000 | 2,624,388 |
| 8.625% 6/1/31 (b) | | 1,180,000 | 996,040 |
| FMG Resources Pty Ltd.: | | | |
| 4.375% 4/1/31 (b) | | 545,000 | 439,302 |
| 4.5% 9/15/27 (b) | | 630,000 | 567,258 |
| Howmet Aerospace, Inc. 5.95% 2/1/37 | | 435,000 | 397,376 |
| HudBay Minerals, Inc. 4.5% 4/1/26 (b) | | 860,000 | 800,414 |
| Mineral Resources Ltd.: | | | |
| 8.5% 5/1/30 (b) | | 1,400,000 | 1,346,184 |
| 9.25% 10/1/28 (b) | | 1,105,000 | 1,105,000 |
| Novelis Corp.: | | | |
| 3.25% 11/15/26 (b) | | 330,000 | 293,747 |
| 3.875% 8/15/31 (b) | | 545,000 | 425,645 |
| PMHC II, Inc. 9% 2/15/30 (b) | | 2,130,000 | 1,695,254 |
| | | | 18,026,193 |
| Paper - 0.9% | | | |
| Ardagh Metal Packaging Finance U.S.A. LLC/Ardagh Metal Packaging Finance PLC: | | | |
| 4% 9/1/29 (b) | | 2,840,000 | 2,130,197 |
| 6% 6/15/27 (b) | | 1,985,000 | 1,875,817 |
| Clydesdale Acquisition Holdings, Inc.: | | | |
| 6.625% 4/15/29 (b) | | 3,325,000 | 3,020,421 |
| 8.75% 4/15/30 (b) | | 2,330,000 | 1,857,196 |
| Mercer International, Inc. 5.125% 2/1/29 | | 710,000 | 556,731 |
| SPA Holdings 3 OY 4.875% 2/4/28 (b) | | 2,205,000 | 1,798,883 |
| | | | 11,239,245 |
| Publishing/Printing - 0.1% | | | |
| News Corp. 5.125% 2/15/32 (b) | | 1,685,000 | 1,455,082 |
| Railroad - 0.1% | | | |
| First Student Bidco, Inc./First Transit Parent, Inc. 4% 7/31/29 (b) | | 1,045,000 | 841,225 |
| Restaurants - 0.8% | | | |
| 1011778 BC Unlimited Liability Co./New Red Finance, Inc.: | | | |
| 3.875% 1/15/28 (b) | | 930,000 | 830,302 |
| 4% 10/15/30 (b) | | 5,530,000 | 4,529,193 |
| 5.75% 4/15/25 (b) | | 425,000 | 421,528 |
| Garden SpinCo Corp. 8.625% 7/20/30 (b) | | 550,000 | 567,474 |
| Yum! Brands, Inc.: | | | |
| 3.625% 3/15/31 | | 545,000 | 442,564 |
| 4.625% 1/31/32 | | 3,225,000 | 2,748,109 |
| 5.375% 4/1/32 | | 435,000 | 391,026 |
| | | | 9,930,196 |
| Services - 5.6% | | | |
| AECOM 5.125% 3/15/27 | | 730,000 | 689,194 |
| Allied Universal Holdco LLC / Allied Universal Finance Corp.: | | | |
| 6% 6/1/29 (b) | | 2,040,000 | 1,473,900 |
| 9.75% 7/15/27 (b) | | 1,455,000 | 1,263,851 |
| APX Group, Inc.: | | | |
| 5.75% 7/15/29 (b) | | 1,390,000 | 1,155,596 |
| 6.75% 2/15/27 (b) | | 1,280,000 | 1,235,725 |
| Aramark Services, Inc. 5% 2/1/28 (b) | | 1,560,000 | 1,430,752 |
| ASGN, Inc. 4.625% 5/15/28 (b) | | 1,025,000 | 907,622 |
| Atlas Luxco 4 SARL / Allied Universal Holdco LLC / Allied Universal Finance Corp. 4.625% 6/1/28 (b) | | 2,190,000 | 1,784,198 |
| Booz Allen Hamilton, Inc. 3.875% 9/1/28 (b) | | 3,975,000 | 3,551,981 |
| Brand Energy & Infrastructure Services, Inc. 10.375% 8/1/30 (b) | | 5,400,000 | 5,359,500 |
| CoreCivic, Inc.: | | | |
| 4.75% 10/15/27 | | 3,661,000 | 3,180,494 |
| 8.25% 4/15/26 | | 940,000 | 951,683 |
| CoreLogic, Inc. 4.5% 5/1/28 (b) | | 1,535,000 | 1,216,488 |
| Fair Isaac Corp. 4% 6/15/28 (b) | | 1,535,000 | 1,366,899 |
| Gartner, Inc.: | | | |
| 3.625% 6/15/29 (b) | | 345,000 | 291,338 |
| 3.75% 10/1/30 (b) | | 555,000 | 459,368 |
| GEMS MENASA Cayman Ltd. 7.125% 7/31/26 (b) | | 7,291,000 | 6,981,133 |
| Iron Mountain, Inc. 4.5% 2/15/31 (b) | | 545,000 | 445,801 |
| Korn Ferry 4.625% 12/15/27 (b) | | 400,000 | 363,828 |
| Legends Hospitality Holding Co. LLC/Legends Hospitality Co-Issuer, Inc. 5% 2/1/26 (b) | | 1,565,000 | 1,492,534 |
| Life Time, Inc. 8% 4/15/26 (b) | | 1,655,000 | 1,613,625 |
| Neptune BidCo U.S., Inc. 9.29% 4/15/29 (b) | | 2,925,000 | 2,581,455 |
| PowerTeam Services LLC 9.033% 12/4/25 (b) | | 2,760,000 | 2,484,000 |
| Prime Securities Services Borrower LLC/Prime Finance, Inc. 5.75% 4/15/26 (b) | | 1,090,000 | 1,057,418 |
| Service Corp. International: | | | |
| 4% 5/15/31 | | 945,000 | 764,892 |
| 5.125% 6/1/29 | | 597,000 | 546,255 |
| Sotheby's 7.375% 10/15/27 (b) | | 1,270,000 | 1,134,218 |
| The GEO Group, Inc.: | | | |
| 9.5% 12/31/28 (b) | | 2,110,000 | 2,030,875 |
| 10.5% 6/30/28 | | 355,000 | 354,113 |
| TriNet Group, Inc. 3.5% 3/1/29 (b) | | 3,950,000 | 3,261,692 |
| Uber Technologies, Inc.: | | | |
| 4.5% 8/15/29 (b) | | 6,630,000 | 5,847,227 |
| 7.5% 5/15/25 (b) | | 2,835,000 | 2,838,519 |
| 8% 11/1/26 (b) | | 3,275,000 | 3,298,095 |
| United Rentals North America, Inc. 6% 12/15/29 (b) | | 545,000 | 523,640 |
| WASH Multifamily Acquisition, Inc. 5.75% 4/15/26 (b) | | 2,762,000 | 2,554,850 |
| | | | 66,492,759 |
| Steel - 0.2% | | | |
| Commercial Metals Co.: | | | |
| 3.875% 2/15/31 | | 655,000 | 530,953 |
| 4.125% 1/15/30 | | 1,140,000 | 962,117 |
| Roller Bearing Co. of America, Inc. 4.375% 10/15/29 (b) | | 1,475,000 | 1,250,815 |
| | | | 2,743,885 |
| Super Retail - 1.9% | | | |
| Bath & Body Works, Inc. 6.694% 1/15/27 | | 625,000 | 604,109 |
| Carvana Co.: | | | |
| 4.875% 9/1/29 (b) | | 1,855,000 | 1,044,188 |
| 5.5% 4/15/27 (b) | | 1,025,000 | 679,617 |
| 5.875% 10/1/28 (b) | | 507,000 | 293,933 |
| 9% 12/1/28 pay-in-kind (b)(c) | | 575,000 | 427,888 |
| 9% 6/1/30 pay-in-kind (b)(c) | | 864,000 | 639,360 |
| 9% 6/1/31 pay-in-kind (b)(c) | | 1,021,000 | 760,645 |
| 10.25% 5/1/30 (b) | | 150,000 | 111,750 |
| EG Global Finance PLC: | | | |
| 6.75% 2/7/25 (b) | | 2,970,000 | 2,938,518 |
| 8.5% 10/30/25 (b) | | 4,887,000 | 4,807,586 |
| Hanesbrands, Inc. 4.875% 5/15/26 (b) | | 295,000 | 271,050 |
| LBM Acquisition LLC 6.25% 1/15/29 (b) | | 2,315,000 | 1,828,850 |
| Levi Strauss & Co. 3.5% 3/1/31 (b) | | 700,000 | 544,994 |
| Michaels Companies, Inc.: | | | |
| 5.25% 5/1/28 (b) | | 1,425,000 | 1,032,498 |
| 7.875% 5/1/29 (b) | | 1,100,000 | 613,250 |
| Nordstrom, Inc.: | | | |
| 4.25% 8/1/31 | | 1,630,000 | 1,194,105 |
| 4.375% 4/1/30 | | 1,090,000 | 846,074 |
| Sally Holdings LLC 5.625% 12/1/25 | | 1,200,000 | 1,159,993 |
| Wolverine World Wide, Inc. 4% 8/15/29 (b) | | 3,250,000 | 2,423,191 |
| | | | 22,221,599 |
| Technology - 6.2% | | | |
| Acuris Finance U.S. 5% 5/1/28 (b) | | 4,495,000 | 3,539,813 |
| Athenahealth Group, Inc. 6.5% 2/15/30 (b) | | 760,000 | 621,107 |
| Black Knight InfoServ LLC 3.625% 9/1/28 (b) | | 3,485,000 | 3,101,650 |
| Block, Inc.: | | | |
| 2.75% 6/1/26 | | 545,000 | 489,062 |
| 3.5% 6/1/31 | | 3,117,000 | 2,405,559 |
| Broadcom, Inc.: | | | |
| 2.45% 2/15/31 (b) | | 2,035,000 | 1,561,693 |
| 2.6% 2/15/33 (b) | | 1,570,000 | 1,139,104 |
| Clarivate Science Holdings Corp.: | | | |
| 3.875% 7/1/28 (b) | | 710,000 | 609,608 |
| 4.875% 7/1/29 (b) | | 720,000 | 607,237 |
| Cloud Software Group, Inc.: | | | |
| 6.5% 3/31/29 (b) | | 2,710,000 | 2,379,238 |
| 9% 9/30/29 (b) | | 5,045,000 | 4,296,246 |
| CNT PRNT/CDK GLO II/FIN 8% 6/15/29 (b) | | 2,415,000 | 2,385,374 |
| Coherent Corp. 5% 12/15/29 (b) | | 2,885,000 | 2,448,124 |
| CommScope, Inc.: | | | |
| 4.75% 9/1/29 (b) | | 1,415,000 | 965,738 |
| 6% 3/1/26 (b) | | 1,260,000 | 1,058,375 |
| Elastic NV 4.125% 7/15/29 (b) | | 1,715,000 | 1,445,341 |
| Entegris Escrow Corp.: | | | |
| 4.75% 4/15/29 (b) | | 3,475,000 | 3,112,016 |
| 5.95% 6/15/30 (b) | | 3,270,000 | 2,991,536 |
| Entegris, Inc. 3.625% 5/1/29 (b) | | 990,000 | 827,932 |
| Gartner, Inc. 4.5% 7/1/28 (b) | | 2,505,000 | 2,253,795 |
| Gen Digital, Inc.: | | | |
| 5% 4/15/25 (b) | | 1,090,000 | 1,055,273 |
| 7.125% 9/30/30 (b) | | 545,000 | 530,204 |
| Go Daddy Operating Co. LLC / GD Finance Co., Inc.: | | | |
| 3.5% 3/1/29 (b) | | 2,070,000 | 1,737,663 |
| 5.25% 12/1/27 (b) | | 625,000 | 585,708 |
| GrafTech Global Enterprises, Inc. 9.875% 12/15/28 (b) | | 1,090,000 | 976,082 |
| ION Trading Technologies Ltd. 5.75% 5/15/28 (b) | | 4,095,000 | 3,398,850 |
| Match Group Holdings II LLC: | | | |
| 3.625% 10/1/31 (b) | | 325,000 | 249,438 |
| 4.125% 8/1/30 (b) | | 695,000 | 564,708 |
| MicroStrategy, Inc. 6.125% 6/15/28 (b) | | 3,355,000 | 3,036,275 |
| ON Semiconductor Corp. 3.875% 9/1/28 (b) | | 1,875,000 | 1,610,775 |
| Open Text Corp.: | | | |
| 3.875% 2/15/28 (b) | | 1,310,000 | 1,138,488 |
| 3.875% 12/1/29 (b) | | 1,655,000 | 1,353,427 |
| Open Text Holdings, Inc.: | | | |
| 4.125% 2/15/30 (b) | | 1,840,000 | 1,524,622 |
| 4.125% 12/1/31 (b) | | 875,000 | 687,329 |
| Rackspace Hosting, Inc.: | | | |
| 3.5% 2/15/28 (b) | | 2,710,000 | 1,187,893 |
| 5.375% 12/1/28 (b) | | 3,360,000 | 982,533 |
| Roblox Corp. 3.875% 5/1/30 (b) | | 3,450,000 | 2,799,365 |
| Seagate HDD Cayman: | | | |
| 5.75% 12/1/34 | | 1,210,000 | 1,024,082 |
| 8.25% 12/15/29 (b) | | 555,000 | 564,006 |
| 8.5% 7/15/31 (b) | | 670,000 | 681,767 |
| Sensata Technologies BV: | | | |
| 4% 4/15/29 (b) | | 3,430,000 | 2,917,349 |
| 5% 10/1/25 (b) | | 215,000 | 209,038 |
| Sensata Technologies, Inc. 3.75% 2/15/31 (b) | | 545,000 | 436,189 |
| SS&C Technologies, Inc. 5.5% 9/30/27 (b) | | 440,000 | 412,840 |
| TTM Technologies, Inc. 4% 3/1/29 (b) | | 4,905,000 | 4,022,051 |
| VM Consolidated, Inc. 5.5% 4/15/29 (b) | | 2,020,000 | 1,788,851 |
| | | | 73,713,354 |
| Telecommunications - 4.7% | | | |
| Altice Financing SA: | | | |
| 5% 1/15/28 (b) | | 1,570,000 | 1,276,829 |
| 5.75% 8/15/29 (b) | | 6,145,000 | 4,751,833 |
| Altice France Holding SA 6% 2/15/28 (b) | | 2,945,000 | 1,291,547 |
| Altice France SA: | | | |
| 5.125% 1/15/29 (b) | | 2,620,000 | 1,808,598 |
| 5.5% 1/15/28 (b) | | 4,455,000 | 3,310,215 |
| 5.5% 10/15/29 (b) | | 20,000 | 13,758 |
| C&W Senior Financing Designated Activity Co. 6.875% 9/15/27 (b) | | 6,814,000 | 5,824,607 |
| Cablevision Lightpath LLC: | | | |
| 3.875% 9/15/27 (b) | | 765,000 | 622,300 |
| 5.625% 9/15/28 (b) | | 605,000 | 452,714 |
| Consolidated Communications, Inc. 5% 10/1/28 (b) | | 930,000 | 700,578 |
| Frontier Communications Holdings LLC: | | | |
| 5% 5/1/28 (b) | | 430,000 | 371,258 |
| 5.875% 10/15/27 (b) | | 1,685,000 | 1,536,161 |
| 5.875% 11/1/29 | | 2,485,000 | 1,867,771 |
| 8.75% 5/15/30 (b) | | 1,675,000 | 1,595,860 |
| IHS Netherlands Holdco BV 8% 9/18/27 (b) | | 680,000 | 554,710 |
| Intelsat Jackson Holdings SA 6.5% 3/15/30 (b) | | 3,100,000 | 2,721,896 |
| LCPR Senior Secured Financing DAC 5.125% 7/15/29 (b) | | 1,010,000 | 786,803 |
| Level 3 Financing, Inc.: | | | |
| 3.625% 1/15/29 (b) | | 565,000 | 288,543 |
| 4.25% 7/1/28 (b) | | 2,100,000 | 1,187,493 |
| 10.5% 5/15/30 (b) | | 2,909,000 | 2,911,279 |
| Millicom International Cellular SA: | | | |
| 4.5% 4/27/31 (b) | | 3,880,000 | 2,891,764 |
| 5.125% 1/15/28 (b) | | 211,500 | 181,361 |
| Sable International Finance Ltd. 5.75% 9/7/27 (b) | | 748,000 | 669,565 |
| SBA Communications Corp. 3.125% 2/1/29 | | 550,000 | 454,742 |
| Telecom Italia Capital SA: | | | |
| 6% 9/30/34 | | 3,032,000 | 2,493,422 |
| 7.2% 7/18/36 | | 1,449,000 | 1,252,933 |
| 7.721% 6/4/38 | | 400,000 | 353,104 |
| Uniti Group, Inc. 6% 1/15/30 (b) | | 5,630,000 | 3,413,375 |
| Virgin Media Secured Finance PLC 4.5% 8/15/30 (b) | | 2,980,000 | 2,457,189 |
| VMED O2 UK Financing I PLC 4.25% 1/31/31 (b) | | 3,745,000 | 2,945,510 |
| Windstream Escrow LLC 7.75% 8/15/28 (b) | | 2,745,000 | 2,176,749 |
| Zayo Group Holdings, Inc.: | | | |
| 4% 3/1/27 (b) | | 2,600,000 | 1,956,871 |
| 6.125% 3/1/28 (b) | | 1,755,000 | 1,162,597 |
| | | | 56,283,935 |
| Textiles/Apparel - 0.2% | | | |
| Crocs, Inc. 4.125% 8/15/31 (b) | | 720,000 | 547,170 |
| Foot Locker, Inc. 4% 10/1/29 (b) | | 715,000 | 525,546 |
| Kontoor Brands, Inc. 4.125% 11/15/29 (b) | | 580,000 | 477,405 |
| Victoria's Secret & Co. 4.625% 7/15/29 (b) | | 810,000 | 595,469 |
| | | | 2,145,590 |
| Transportation Ex Air/Rail - 0.6% | | | |
| Golar LNG Ltd. 7% 10/20/25 (b) | | 1,690,000 | 1,657,079 |
| Great Lakes Dredge & Dock Corp. 5.25% 6/1/29 (b) | | 1,020,000 | 833,850 |
| Seaspan Corp. 5.5% 8/1/29 (b) | | 4,095,000 | 3,141,520 |
| XPO, Inc.: | | | |
| 6.25% 6/1/28 (b) | | 335,000 | 320,950 |
| 7.125% 6/1/31 (b) | | 550,000 | 535,835 |
| | | | 6,489,234 |
| Utilities - 2.7% | | | |
| Clearway Energy Operating LLC: | | | |
| 3.75% 2/15/31 (b) | | 2,580,000 | 2,011,751 |
| 3.75% 1/15/32 (b) | | 280,000 | 212,089 |
| DPL, Inc.: | | | |
| 4.125% 7/1/25 | | 1,370,000 | 1,289,235 |
| 4.35% 4/15/29 | | 185,000 | 150,895 |
| EnLink Midstream Partners LP 4.15% 6/1/25 | | 545,000 | 524,189 |
| FirstEnergy Corp. 3.4% 3/1/50 | | 2,175,000 | 1,315,348 |
| Global Partners LP/GLP Finance Corp. 7% 8/1/27 | | 2,927,000 | 2,758,873 |
| NRG Energy, Inc.: | | | |
| 3.375% 2/15/29 (b) | | 2,360,000 | 1,920,797 |
| 3.625% 2/15/31 (b) | | 790,000 | 596,163 |
| 5.25% 6/15/29 (b) | | 2,565,000 | 2,262,998 |
| PG&E Corp.: | | | |
| 5% 7/1/28 | | 4,420,000 | 4,004,278 |
| 5.25% 7/1/30 | | 5,970,000 | 5,229,129 |
| Pike Corp. 5.5% 9/1/28 (b) | | 4,027,000 | 3,443,890 |
| Vistra Operations Co. LLC: | | | |
| 5% 7/31/27 (b) | | 2,849,000 | 2,606,226 |
| 5.5% 9/1/26 (b) | | 1,130,000 | 1,075,051 |
| 5.625% 2/15/27 (b) | | 1,965,000 | 1,849,091 |
| 7.75% 10/15/31 (b) | | 1,220,000 | 1,177,568 |
| | | | 32,427,571 |
TOTAL NONCONVERTIBLE BONDS | | | 963,097,937 |
| TOTAL CORPORATE BONDS (Cost $1,129,416,831) | | | 976,388,088 |
| | | | |
| Commercial Mortgage Securities - 0.4% |
| | | Principal Amount (a) | Value ($) |
| BX Trust floater Series 2021-SOAR Class G, CME Term SOFR 1 Month Index + 2.910% 8.2495% 6/15/38 (b)(c)(d) | | 887,555 | 839,425 |
| ELP Commercial Mortgage Trust floater Series 2021-ELP Class F, CME Term SOFR 1 Month Index + 2.780% 8.1165% 11/15/38 (b)(c)(d) | | 1,198,000 | 1,137,962 |
| Extended Stay America Trust floater Series 2021-ESH Class F, CME Term SOFR 1 Month Index + 3.810% 9.1485% 7/15/38 (b)(c)(d) | | 508,727 | 493,425 |
| Hilton U.S.A. Trust Series 2016-HHV Class F, 4.1935% 11/5/38 (b)(c) | | 772,000 | 680,121 |
| Merit floater Series 2021-STOR Class F, CME Term SOFR 1 Month Index + 2.310% 7.6495% 7/15/38 (b)(c)(d) | | 1,791,000 | 1,696,724 |
| TOTAL COMMERCIAL MORTGAGE SECURITIES (Cost $4,899,974) | | | 4,847,657 |
| | | | |
| Common Stocks - 3.9% |
| | | Shares | Value ($) |
| Automotive & Auto Parts - 0.1% | | | |
| Aptiv PLC (i) | | 12,300 | 1,072,560 |
| Capital Goods - 0.1% | | | |
| Regal Rexnord Corp. | | 9,000 | 1,065,690 |
| Energy - 1.2% | | | |
| California Resources Corp. warrants 10/27/24 (i) | | 2,871 | 51,219 |
| Mesquite Energy, Inc. (h)(i) | | 149,356 | 11,857,395 |
| New Fortress Energy, Inc. | | 70,300 | 2,130,090 |
TOTAL ENERGY | | | 14,038,704 |
| Food & Drug Retail - 2.2% | | | |
| Southeastern Grocers, Inc. (g)(h)(i) | | 963,443 | 25,752,814 |
| Healthcare - 0.1% | | | |
| Centene Corp. (i) | | 27,200 | 1,876,256 |
| Metals/Mining - 0.0% | | | |
| Elah Holdings, Inc. (i) | | 333 | 15,984 |
| Technology - 0.1% | | | |
| Coherent Corp. (i) | | 34,300 | 1,015,280 |
| Telecommunications - 0.1% | | | |
| GTT Communications, Inc. (h) | | 40,978 | 1,166,644 |
| TOTAL COMMON STOCKS (Cost $18,436,326) | | | 46,003,932 |
| | | | |
| Bank Loan Obligations - 5.0% |
| | | Principal Amount (a) | Value ($) |
| Broadcasting - 0.1% | | | |
| Diamond Sports Group LLC: | | | |
| 1LN, term loan CME Term SOFR 1 Month Index + 8.000% 15.4146% 8/24/26 (c)(d)(j) | | 1,960,555 | 736,443 |
| 2LN, term loan CME Term SOFR 1 Month Index + 3.250% 10.6625% (c)(d)(e)(j) | | 4,452,028 | 47,325 |
TOTAL BROADCASTING | | | 783,768 |
| Building Materials - 0.2% | | | |
| Acproducts Holdings, Inc. Tranche B 1LN, term loan CME Term SOFR 3 Month Index + 4.250% 9.9017% 5/17/28 (c)(d)(j) | | 2,270,828 | 1,797,746 |
| Chemicals - 0.2% | | | |
| Discovery Purchaser Corp. 1LN, term loan CME Term SOFR 3 Month Index + 4.370% 9.7651% 10/4/29 (c)(d)(j) | | 1,905,600 | 1,766,415 |
| Consumer Products - 0.1% | | | |
| Mattress Firm, Inc. Tranche B 1LN, term loan 6 month U.S. LIBOR + 4.250% 9.95% 9/24/28 (c)(d)(j) | | 1,696,021 | 1,672,345 |
| Energy - 0.3% | | | |
| EG America LLC: | | | |
| 1LN, term loan CME Term SOFR 1 Month Index + 5.500% 9.4763% 2/7/28 (c)(d)(j) | | 1,411,044 | 1,342,256 |
| Tranche BB 1LN, term loan: | | | |
CME Term SOFR 1 Month Index + 4.000% 9.4145% 2/5/25 (c)(d)(j) | | 667,028 | 665,360 |
CME Term SOFR 3 Month Index + 4.000% 9.4145% 2/5/25 (c)(d)(j) | | 406,819 | 405,293 |
| Tranche BC 1LN, term loan CME Term SOFR 1 Month Index + 5.500% 9.4145% 2/7/28 (c)(d)(h)(j) | | 947,080 | 904,461 |
| Mesquite Energy, Inc.: | | | |
| 1LN, term loan 3 month U.S. LIBOR + 8.000% 0% (d)(e)(h)(j) | | 2,735,146 | 0 |
| term loan 3 month U.S. LIBOR + 0.000% 0% (d)(e)(h)(j) | | 1,217,000 | 0 |
TOTAL ENERGY | | | 3,317,370 |
| Healthcare - 0.2% | | | |
| Cano Health, Inc. Tranche B 1LN, term loan CME Term SOFR 1 Month Index + 4.000% 9.53% 11/23/27 (c)(d)(j) | | 2,385,112 | 1,373,133 |
| Da Vinci Purchaser Corp. Tranche B 1LN, term loan CME Term SOFR 1 Month Index + 4.000% 9.4386% 1/8/27 (c)(d)(j) | | 127,367 | 125,510 |
| Gainwell Acquisition Corp. Tranche B 1LN, term loan CME Term SOFR 3 Month Index + 4.000% 9.4901% 10/1/27 (c)(d)(j) | | 793,878 | 757,494 |
TOTAL HEALTHCARE | | | 2,256,137 |
| Homebuilders/Real Estate - 0.0% | | | |
| Breakwater Energy Partners LLC Tranche B 1LN, term loan 11.25% 9/1/26 (c)(d)(h)(j) | | 502,258 | 485,332 |
| Insurance - 0.0% | | | |
| Alliant Holdings Intermediate LLC Tranche B5 1LN, term loan CME Term SOFR 1 Month Index + 3.500% 8.8347% 11/6/27 (c)(d)(j) | | 195,775 | 195,021 |
| Leisure - 0.7% | | | |
| City Football Group Ltd. Tranche B 1LN, term loan CME Term SOFR 1 Month Index + 3.000% 8.4531% 7/21/28 (c)(d)(j) | | 5,734,611 | 5,671,875 |
| ClubCorp Holdings, Inc. Tranche B 1LN, term loan 3 month U.S. LIBOR + 2.750% 8.1806% 9/18/24 (c)(d)(j) | | 2,358,464 | 2,283,299 |
TOTAL LEISURE | | | 7,955,174 |
| Paper - 0.0% | | | |
| Clydesdale Acquisition Holdings, Inc. 1LN, term loan CME Term SOFR 1 Month Index + 4.170% 9.5991% 4/13/29 (c)(d)(j) | | 347,114 | 335,284 |
| Services - 1.2% | | | |
| ABG Intermediate Holdings 2 LLC: | | | |
| Tranche B2 1LN, term loan CME Term SOFR 1 Month Index + 4.000% 9.4241% 12/21/28 (c)(d)(j) | | 640,782 | 639,180 |
| Tranche DD 1LN, term loan CME Term SOFR 1 Month Index + 4.000% 12/21/28 (d)(j)(k) | | 122,778 | 122,471 |
| Ascend Learning LLC: | | | |
| 2LN, term loan CME Term SOFR 1 Month Index + 5.750% 11.1741% 12/10/29 (c)(d)(j) | | 225,000 | 189,187 |
| Tranche B 1LN, term loan CME Term SOFR 1 Month Index + 3.500% 8.9241% 12/10/28 (c)(d)(j) | | 2,230,275 | 2,070,677 |
| Brand Energy & Infrastructure Services, Inc. Tranche B 1LN, term loan CME Term SOFR 1 Month Index + 5.500% 10.8719% 8/1/30 (c)(d)(j) | | 635,000 | 611,188 |
| CoreLogic, Inc. Tranche B 1LN, term loan CME Term SOFR 1 Month Index + 3.500% 8.9386% 6/2/28 (c)(d)(j) | | 2,500,861 | 2,270,431 |
| Finastra U.S.A., Inc. term loan CME Term SOFR 1 Month Index + 7.250% 12.7129% 9/13/29 (c)(d)(h)(j) | | 3,268,662 | 3,213,095 |
| Neptune BidCo U.S., Inc. Tranche B 1LN, term loan CME Term SOFR 1 Month Index + 5.000% 10.5067% 4/11/29 (c)(d)(j) | | 2,706,400 | 2,359,656 |
| Spin Holdco, Inc. Tranche B 1LN, term loan 3 month U.S. LIBOR + 4.000% 9.6639% 3/4/28 (c)(d)(j) | | 3,334,351 | 2,842,534 |
TOTAL SERVICES | | | 14,318,419 |
| Super Retail - 0.7% | | | |
| Bass Pro Group LLC Tranche B 1LN, term loan CME Term SOFR 1 Month Index + 3.750% 9.4017% 3/5/28 (c)(d)(j) | | 2,757,789 | 2,733,079 |
| LBM Acquisition LLC Tranche B 1LN, term loan CME Term SOFR 1 Month Index + 3.750% 9.1741% 12/18/27 (c)(d)(j) | | 5,424,720 | 5,153,484 |
TOTAL SUPER RETAIL | | | 7,886,563 |
| Technology - 0.7% | | | |
| Athenahealth Group, Inc. Tranche B 1LN, term loan CME Term SOFR 1 Month Index + 3.500% 8.5769% 2/15/29 (c)(d)(j) | | 1,583,475 | 1,531,727 |
| DH Corp./Societe term loan CME Term SOFR 3 Month Index + 7.250% 12.7129% 9/13/29 (c)(d)(h)(j) | | 76,338 | 75,040 |
| Sophia LP Tranche B 1LN, term loan CME Term SOFR 3 Month Index + 3.500% 8.9241% 10/7/27 (c)(d)(j) | | 620,253 | 611,725 |
| Ukg, Inc.: | | | |
| 1LN, term loan CME Term SOFR 3 Month Index + 3.250% 8.7643% 5/4/26 (c)(d)(j) | | 2,469,265 | 2,454,103 |
| 2LN, term loan CME Term SOFR 3 Month Index + 5.250% 10.7643% 5/3/27 (c)(d)(j) | | 3,330,000 | 3,322,508 |
| Verscend Holding Corp. Tranche B 1LN, term loan CME Term SOFR 1 Month Index + 4.000% 9.4386% 8/27/25 (c)(d)(j) | | 819,087 | 817,891 |
TOTAL TECHNOLOGY | | | 8,812,994 |
| Telecommunications - 0.2% | | | |
| GTT Communications, Inc. 1LN, term loan CME Term SOFR 3 Month Index + 9.000% 14.4901% 6/30/28 (c)(d)(j) | | 1,724,924 | 1,017,705 |
| Gtt Remainco LLC 1LN, term loan CME Term SOFR 1 Month Index + 7.000% 12.4269% 12/30/27 (c)(d)(j) | | 2,147,119 | 1,846,523 |
TOTAL TELECOMMUNICATIONS | | | 2,864,228 |
| Textiles/Apparel - 0.1% | | | |
| Tory Burch LLC Tranche B 1LN, term loan CME Term SOFR 1 Month Index + 3.500% 8.6886% 4/16/28 (c)(d)(j) | | 733,125 | 717,854 |
| Utilities - 0.3% | | | |
| PG&E Corp. Tranche B 1LN, term loan CME Term SOFR 1 Month Index + 3.000% 8.4386% 6/23/25 (c)(d)(j) | | 3,920,049 | 3,910,249 |
| TOTAL BANK LOAN OBLIGATIONS (Cost $67,814,841) | | | 59,074,899 |
| | | | |
| Preferred Securities - 1.3% |
| | | Principal Amount (a) | Value ($) |
| Air Transportation - 0.1% | | | |
| AerCap Holdings NV 5.875% 10/10/79 (c) | | 1,225,000 | 1,154,053 |
| Banks & Thrifts - 0.8% | | | |
| Ally Financial, Inc.: | | | |
| 4.7% (c)(l) | | 1,820,000 | 1,199,490 |
| 4.7% (c)(l) | | 1,785,000 | 1,059,882 |
| Bank of America Corp. 5.875% (c)(l) | | 2,195,000 | 1,906,546 |
| JPMorgan Chase & Co.: | | | |
| 4.6% (c)(l) | | 1,580,000 | 1,490,198 |
| 6.1% (c)(l) | | 2,190,000 | 2,171,110 |
| Wells Fargo & Co.: | | | |
| 5.9% (c)(l) | | 1,205,000 | 1,211,883 |
| 7.625% (c)(l) | | 615,000 | 621,629 |
TOTAL BANKS & THRIFTS | | | 9,660,738 |
| Diversified Financial Services - 0.1% | | | |
| Charles Schwab Corp. 4% (c)(l) | | 1,405,000 | 968,215 |
| Energy - 0.3% | | | |
| Energy Transfer LP 3 month U.S. LIBOR + 4.020% 9.6542% (c)(d)(l) | | 4,070,000 | 3,920,437 |
| TOTAL PREFERRED SECURITIES (Cost $15,499,712) | | | 15,703,443 |
| | | | |
| Other - 1.3% |
| | | Shares | Value ($) |
| Other - 1.3% | | | |
Fidelity Private Credit Central Fund LLC (g)(m) (Cost $15,642,089) | | 1,571,858 | 15,938,635 |
| | | | |
| Money Market Funds - 4.7% |
| | | Shares | Value ($) |
Fidelity Cash Central Fund 5.40% (m) (Cost $55,870,064) | | 55,858,893 | 55,870,064 |
| | | | |
| TOTAL INVESTMENT IN SECURITIES - 98.7% (Cost $1,307,579,837) | 1,173,826,718 |
NET OTHER ASSETS (LIABILITIES) - 1.3% | 14,866,717 |
| NET ASSETS - 100.0% | 1,188,693,435 |
| | |
Legend
| (a) | Amount is stated in United States dollars unless otherwise noted. |
| (b) | Security exempt from registration under Rule 144A of the Securities Act of 1933. These securities may be resold in transactions exempt from registration, normally to qualified institutional buyers. At the end of the period, the value of these securities amounted to $761,653,359 or 64.1% of net assets. |
| (c) | Coupon rates for floating and adjustable rate securities reflect the rates in effect at period end. |
| (d) | Coupon is indexed to a floating interest rate which may be multiplied by a specified factor and/or subject to caps or floors. |
| (e) | Non-income producing - Security is in default. |
| (f) | Security initially issued at one coupon which converts to a higher coupon at a specified date. The rate shown is the rate at period end. |
| (g) | Restricted securities (including private placements) - Investment in securities not registered under the Securities Act of 1933 (excluding 144A issues). At the end of the period, the value of restricted securities (excluding 144A issues) amounted to $45,076,178 or 3.8% of net assets. |
| (j) | Remaining maturities of bank loan obligations may be less than the stated maturities shown as a result of contractual or optional prepayments by the borrower. Such prepayments cannot be predicted with certainty. |
| (k) | Position or a portion of the position represents an unfunded loan commitment. At period end, the total principal amount and market value of unfunded commitments totaled $122,778 and $122,471, respectively. |
| (l) | Security is perpetual in nature with no stated maturity date. |
| (m) | Affiliated fund that is generally available only to investment companies and other accounts managed by Fidelity Investments. |
| Additional information on each restricted holding is as follows: |
| Security | Acquisition Date | Acquisition Cost ($) |
| Fidelity Private Credit Central Fund LLC | 4/15/22 - 10/27/23 | 15,642,089 |
| | | |
| Jonah Energy Parent LLC 12% 11/5/25 | 5/05/23 | 3,232,032 |
| | | |
| Southeastern Grocers, Inc. | 6/01/18 | 6,776,820 |
| | | |
Affiliated Central Funds
Fiscal year to date information regarding the Fund's investments in Fidelity Central Funds, including the ownership percentage, is presented below.
| Affiliate | Value, beginning of period ($) | Purchases ($) | Sales Proceeds ($) | Dividend Income ($) | Realized Gain (loss) ($) | Change in Unrealized appreciation (depreciation) ($) | Value, end of period ($) | % ownership, end of period |
| Fidelity Cash Central Fund 5.40% | 50,252,241 | 145,118,385 | 139,500,562 | 1,534,111 | - | - | 55,870,064 | 0.1% |
| Fidelity Private Credit Central Fund LLC | 14,258,260 | 1,346,593 | - | 816,159 | - | 333,782 | 15,938,635 | 2.4% |
| Fidelity Securities Lending Cash Central Fund 5.40% | 1,171,350 | 4,548,017 | 5,719,367 | 42 | - | - | - | 0.0% |
| Total | 65,681,851 | 151,012,995 | 145,219,929 | 2,350,312 | - | 333,782 | 71,808,699 | |
| | | | | | | | | |
Amounts in the dividend income column in the above table include any capital gain distributions from underlying funds, which are presented in the corresponding line item in the Statement of Operations, if applicable.
Amounts in the dividend income column for Fidelity Securities Lending Cash Central Fund represents the income earned on investing cash collateral, less rebates paid to borrowers and any lending agent fees associated with the loan, plus any premium payments received for lending certain types of securities.
Amounts included in the purchases and sales proceeds columns may include in-kind transactions, if applicable.
Investment Valuation
The following is a summary of the inputs used, as of October 31, 2023, involving the Fund's assets and liabilities carried at fair value. The inputs or methodology used for valuing securities may not be an indication of the risk associated with investing in those securities. For more information on valuation inputs, and their aggregation into the levels used below, please refer to the Investment Valuation section in the accompanying Notes to Financial Statements.
| Valuation Inputs at Reporting Date: |
| Description | Total ($) | Level 1 ($) | Level 2 ($) | Level 3 ($) |
Investments in Securities: | | | | |
|
| Equities: | | | | |
Consumer Discretionary | 1,072,560 | 1,072,560 | - | - |
Consumer Staples | 25,752,814 | - | - | 25,752,814 |
Energy | 14,038,704 | 2,181,309 | - | 11,857,395 |
Health Care | 1,876,256 | 1,876,256 | - | - |
Industrials | 1,065,690 | 1,065,690 | - | - |
Information Technology | 2,181,924 | 1,015,280 | - | 1,166,644 |
Materials | 15,984 | - | 15,984 | - |
|
| Corporate Bonds | 976,388,088 | - | 973,003,358 | 3,384,730 |
|
| Commercial Mortgage Securities | 4,847,657 | - | 4,847,657 | - |
|
| Bank Loan Obligations | 59,074,899 | - | 54,396,971 | 4,677,928 |
|
| Preferred Securities | 15,703,443 | - | 15,703,443 | - |
|
| Other | 15,938,635 | - | 15,938,635 | - |
|
| Money Market Funds | 55,870,064 | 55,870,064 | - | - |
| Total Investments in Securities: | 1,173,826,718 | 63,081,159 | 1,063,906,048 | 46,839,511 |
The following is a reconciliation of Investments in Securities for which Level 3 inputs were used in determining value:
| |
| Investments in Securities: | |
| Consumer Staples | | | |
| Beginning Balance | $ | 23,662,145 | |
| Net Realized Gain (Loss) on Investment Securities | | - | |
| Net Unrealized Gain (Loss) on Investment Securities | | 2,090,669 | |
| Cost of Purchases | | - | |
| Proceeds of Sales | | - | |
| Amortization/Accretion | | - | |
| Transfers into Level 3 | | - | |
| Transfers out of Level 3 | | - | |
| Ending Balance | $ | 25,752,814 | |
| The change in unrealized gain (loss) for the period attributable to Level 3 securities held at October 31, 2023 | $ | 2,090,669 | |
| Energy | | | |
| Beginning Balance | $ | 16,085,086 | |
| Net Realized Gain (Loss) on Investment Securities | | 4,654,055 | |
| Net Unrealized Gain (Loss) on Investment Securities | | (2,179,261) | |
| Cost of Purchases | | - | |
| Proceeds of Sales | | (6,702,485) | |
| Amortization/Accretion | | - | |
| Transfers into Level 3 | | - | |
| Transfers out of Level 3 | | - | |
| Ending Balance | $ | 11,857,395 | |
| The change in unrealized gain (loss) for the period attributable to Level 3 securities held at October 31, 2023 | $ | 2,474,834 | |
| Corporate Bonds | | | |
| Beginning Balance | $ | 21,528,391 | |
| Net Realized Gain (Loss) on Investment Securities | | - | |
| Net Unrealized Gain (Loss) on Investment Securities | | (18,182,863) | |
| Cost of Purchases | | 3,232,032 | |
| Proceeds of Sales | | (3,204,154) | |
| Amortization/Accretion | | 11,324 | |
| Transfers into Level 3 | | - | |
| Transfers out of Level 3 | | - | |
| Ending Balance | $ | 3,384,730 | |
| The change in unrealized gain (loss) for the period attributable to Level 3 securities held at October 31, 2023 | $ | 141,373 | |
| Other Investments in Securities | | | |
| Beginning Balance | $ | 3,501,820 | |
| Net Realized Gain (Loss) on Investment Securities | | (41,887) | |
| Net Unrealized Gain (Loss) on Investment Securities | | 820,196 | |
| Cost of Purchases | | 3,278,100 | |
| Proceeds of Sales | | (3,168,007) | |
| Amortization/Accretion | | 11,320 | |
| Transfers into Level 3 | | 1,443,030 | |
| Transfers out of Level 3 | | - | |
| Ending Balance | $ | 5,844,572 | |
| The change in unrealized gain (loss) for the period attributable to Level 3 securities held at October 31, 2023 | $ | 779,078 | |
| The information used in the above reconciliation represents fiscal year to date activity for any Investments in Securities identified as using Level 3 inputs at either the beginning or the end of the current fiscal period. Cost of purchases and proceeds of sales may include securities received and/or delivered through in-kind transactions, corporate actions or exchanges. Transfers into Level 3 were attributable to a lack of observable market data resulting from decreases in market activity, decreases in liquidity, security restructurings or corporate actions. Transfers out of Level 3 were attributable to observable market data becoming available for those securities. Transfers in or out of Level 3 represent the beginning value of any Security or Instrument where a change in the pricing level occurred from the beginning to the end of the period. Realized and unrealized gains (losses) disclosed in the reconciliation are included in Net Gain (Loss) on the Fund's Statement of Operations. | |
| Statement of Assets and Liabilities |
| | | | October 31, 2023 (Unaudited) |
| | | | | |
| Assets | | | | |
| Investment in securities, at value - See accompanying schedule: | | | | |
Unaffiliated issuers (cost $1,236,067,684) | $ | 1,102,018,019 | | |
Fidelity Central Funds (cost $71,512,153) | | 71,808,699 | | |
| | | | | |
| | | | | |
| Total Investment in Securities (cost $1,307,579,837) | | | $ | 1,173,826,718 |
| Cash | | | | 528,575 |
| Receivable for fund shares sold | | | | 444,599 |
| Interest receivable | | | | 16,726,275 |
| Distributions receivable from Fidelity Central Funds | | | | 251,763 |
| Receivable from investment adviser for expense reductions | | | | 852,369 |
Total assets | | | | 1,192,630,299 |
| Liabilities | | | | |
| Payable for investments purchased | $ | 387,561 | | |
| Payable for fund shares redeemed | | 3,545,037 | | |
| Other payables and accrued expenses | | 4,266 | | |
| Total Liabilities | | | | 3,936,864 |
| Commitments and contingent liabilities (see Commitments note) | | | | |
| Net Assets | | | $ | 1,188,693,435 |
| Net Assets consist of: | | | | |
| Paid in capital | | | $ | 1,724,776,440 |
| Total accumulated earnings (loss) | | | | (536,083,005) |
| Net Assets | | | $ | 1,188,693,435 |
Net Asset Value, offering price and redemption price per share ($1,188,693,435 ÷ 150,424,812 shares) | | | $ | 7.90 |
| Statement of Operations |
| | | | Six months ended October 31, 2023 (Unaudited) |
| Investment Income | | | | |
| Dividends | | | $ | 454,948 |
| Interest | | | | 37,532,579 |
| Income from Fidelity Central Funds (including $42 from security lending) | | | | 2,350,312 |
| Other income | | | $ | 644,922 |
| Payment from investment adviser | | | | 32,253 |
| Total Income | | | | 41,015,014 |
| Expenses | | | | |
| Custodian fees and expenses | $ | 6,107 | | |
| Independent trustees' fees and expenses | | 2,976 | | |
| Legal | | 153,561 | | |
| Total expenses before reductions | | 162,644 | | |
| Expense reductions | | (147,734) | | |
| Total expenses after reductions | | | | 14,910 |
| Net Investment income (loss) | | | | 41,000,104 |
| Realized and Unrealized Gain (Loss) | | | | |
| Net realized gain (loss) on: | | | | |
| Investment Securities: | | | | |
| Unaffiliated issuers | | (25,546,662) | | |
| Foreign currency transactions | | (1) | | |
| Total net realized gain (loss) | | | | (25,546,663) |
| Change in net unrealized appreciation (depreciation) on: | | | | |
| Investment Securities: | | | | |
| Unaffiliated issuers | | (28,160,174) | | |
| Fidelity Central Funds | | 333,782 | | |
| Total change in net unrealized appreciation (depreciation) | | | | (27,826,392) |
| Net gain (loss) | | | | (53,373,055) |
| Net increase (decrease) in net assets resulting from operations | | | $ | (12,372,951) |
| Statement of Changes in Net Assets |
| |
| | Six months ended October 31, 2023 (Unaudited) | | Year ended April 30, 2023 |
| Increase (Decrease) in Net Assets | | | | |
| Operations | | | | |
| Net investment income (loss) | $ | 41,000,104 | $ | 79,437,342 |
| Net realized gain (loss) | | (25,546,663) | | (75,164,666) |
| Change in net unrealized appreciation (depreciation) | | (27,826,392) | | (8,053,810) |
| Net increase (decrease) in net assets resulting from operations | | (12,372,951) | | (3,781,134) |
| Distributions to shareholders | | (37,177,440) | | (76,803,551) |
| | | | | |
| Share transactions | | | | |
| Proceeds from sales of shares | | 75,051,975 | | 114,999,411 |
| Reinvestment of distributions | | 37,177,440 | | 76,697,542 |
| Cost of shares redeemed | | (74,054,383) | | (385,925,272) |
| | | | | |
Net increase (decrease) in net assets resulting from share transactions | | 38,175,032 | | (194,228,319) |
| Total increase (decrease) in net assets | | (11,375,359) | | (274,813,004) |
| | | | | |
| Net Assets | | | | |
| Beginning of period | | 1,200,068,794 | | 1,474,881,798 |
| End of period | $ | 1,188,693,435 | $ | 1,200,068,794 |
| | | | | |
| Other Information | | | | |
| Shares | | | | |
| Sold | | 9,248,077 | | 13,920,010 |
| Issued in reinvestment of distributions | | 4,585,349 | | 9,311,777 |
| Redeemed | | (9,110,596) | | (46,319,197) |
| Net increase (decrease) | | 4,722,830 | | (23,087,410) |
| | | | | |
Financial Highlights
| Fidelity® Series High Income Fund |
| |
| | Six months ended (Unaudited) October 31, 2023 | | Years ended April 30, 2023 | | 2022 | | 2021 | | 2020 | | 2019 |
Selected Per-Share Data | | | | | | | | | | | | |
| Net asset value, beginning of period | $ | 8.24 | $ | 8.74 | $ | 9.44 | $ | 8.54 | $ | 9.50 | $ | 9.56 |
| Income from Investment Operations | | | | | | | | | | | | |
Net investment income (loss) A,B | | .276 | | .536 | | .510 | | .513 | | .577 | | .607 |
| Net realized and unrealized gain (loss) | | (.366) | | (.516) | | (.699) | | .890 | | (.935) | | (.051) |
| Total from investment operations | | (.090) | | .020 | | (.189) | | 1.403 | | (.358) | | .556 |
| Distributions from net investment income | | (.250) | | (.520) | | (.511) | | (.503) | | (.598) | | (.616) |
| Distributions from net realized gain | | - | | - | | - | | - | | (.004) | | - |
| Total distributions | | (.250) | | (.520) | | (.511) | | (.503) | | (.602) | | (.616) |
| Net asset value, end of period | $ | 7.90 | $ | 8.24 | $ | 8.74 | $ | 9.44 | $ | 8.54 | $ | 9.50 |
Total Return C,D | | (1.13)% | | .41% | | (2.24)% | | 16.72% | | (4.11)% | | 6.12% |
Ratios to Average Net Assets B,E,F | | | | | | | | | | | | |
| Expenses before reductions | | .03% G | | .04% | | .02% | | -% H | | -% H | | -% H |
| Expenses net of fee waivers, if any | | -% G | | -% H | | -% H | | -% H | | -% H | | -% H |
| Expenses net of all reductions | | -% G | | -% H | | -% H | | -% H | | -% H | | -% H |
| Net investment income (loss) | | 6.76% G | | 6.49% | | 5.42% | | 5.58% | | 6.20% | | 6.44% |
| Supplemental Data | | | | | | | | | | | | |
| Net assets, end of period (000 omitted) | $ | 1,188,693 | $ | 1,200,069 | $ | 1,474,882 | $ | 1,702,161 | $ | 1,491,532 | $ | 1,510,741 |
Portfolio turnover rate I | | 29% G | | 34% | | 49% | | 68% | | 41% J | | 69% |
ACalculated based on average shares outstanding during the period.
BNet investment income (loss) is affected by the timing of the declaration of dividends by any underlying mutual funds or exchange-traded funds (ETFs). Net investment income (loss) of any mutual funds or ETFs is not included in the Fund's net investment income (loss) ratio.
CTotal returns for periods of less than one year are not annualized.
DTotal returns would have been lower if certain expenses had not been reduced during the applicable periods shown.
EFees and expenses of any underlying mutual funds or exchange-traded funds (ETFs) are not included in the Fund's expense ratio. The Fund indirectly bears its proportionate share of these expenses. For additional expense information related to investments in Fidelity Central Funds, please refer to the "Investments in Fidelity Central Funds" note found in the Notes to Financial Statements section of the most recent Annual or Semi-Annual report. For additional expense information related to investments in Fidelity Private Credit Central Fund LLC, please refer to the Investment in Fidelity Private Credit Central Fund LLC note found in the Notes to Financial Statements section of the most recent Annual or Semi-Annual report.
FExpense ratios reflect operating expenses of the class. Expenses before reductions do not reflect amounts reimbursed, waived, or reduced through arrangements with the investment adviser, brokerage services, or other offset arrangements, if applicable, and do not represent the amount paid by the class during periods when reimbursements, waivers or reductions occur.
GAnnualized.
HAmount represents less than .005%.
IAmount does not include the portfolio activity of any underlying mutual funds or exchange-traded funds (ETFs).
JPortfolio turnover rate excludes securities received or delivered in-kind.
For the period ended October 31, 2023
1. Organization.
Fidelity Series High Income Fund (the Fund) is a fund of Fidelity Summer Street Trust (the Trust) and is authorized to issue an unlimited number of shares. Shares are offered only to certain other Fidelity funds, Fidelity managed 529 plans, and Fidelity managed collective investment trusts. The Trust is registered under the Investment Company Act of 1940, as amended (the 1940 Act), as an open-end management investment company organized as a Massachusetts business trust.
2. Investments in Fidelity Central Funds.
Funds may invest in Fidelity Central Funds, which are open-end investment companies generally available only to other investment companies and accounts managed by the investment adviser and its affiliates. The Schedule of Investments lists any Fidelity Central Funds held as an investment as of period end, but does not include the underlying holdings of each Fidelity Central Fund. An investing fund indirectly bears its proportionate share of the expenses of the underlying Fidelity Central Funds.
Based on its investment objective, each Fidelity Central Fund may invest or participate in various investment vehicles or strategies that are similar to those of the investing fund. These strategies are consistent with the investment objectives of the investing fund and may involve certain economic risks which may cause a decline in value of each of the Fidelity Central Funds and thus a decline in the value of the investing fund.
| Fidelity Central Fund | Investment Manager | Investment Objective | Investment Practices | Expense RatioA |
| Fidelity Money Market Central Funds | Fidelity Management & Research Company LLC (FMR) | Each fund seeks to obtain a high level of current income consistent with the preservation of capital and liquidity. | Short-term Investments | Less than .005% |
A Expenses expressed as a percentage of average net assets and are as of each underlying Central Fund's most recent annual or semi-annual shareholder report.
A complete unaudited list of holdings for each Fidelity Central Fund is available upon request or at the Securities and Exchange Commission website at www.sec.gov. In addition, the financial statements of the Fidelity Central Funds which contain the significant accounting policies (including investment valuation policies) of those funds, and are not covered by the Report of Independent Registered Public Accounting Firm, are available on the Securities and Exchange Commission website or upon request.
3. Investment in Fidelity Private Credit Central Fund LLC.
The Fund invests in Fidelity Private Credit Central Fund LLC (formerly Fidelity Direct Lending Fund, LP), which is a limited liability company available only to certain investment companies managed by the investment adviser and its affiliates. On June 1, 2023, Fidelity Private Credit Central Fund elected to be regulated as a business development company (BDC). Fidelity Private Credit Central Fund LLC's units are not registered under the Securities Act of 1933 and are subject to substantial restrictions on transfer. The Fund has no redemption rights under Fidelity Private Credit Central Fund LLC's limited liability company agreement. There will be no trading market for the units.
Based on its investment objective, Fidelity Private Credit Central Fund LLC may invest or participate in various investments or strategies that are similar to those in which the Fund may invest or participate. These strategies are consistent with the investment objectives of the Fund and may involve certain economic risks which may cause a decline in value of Fidelity Private Credit Central Fund LLC and thus a decline in the value of the Fund. Fidelity Private Credit Central Fund LLC intends to invest primarily in directly originated loans to private companies but also with liquid credit investments, like broadly syndicated loans, and other select private credit investments.
The Schedule of Investments lists Fidelity Private Credit Central Fund LLC as an investment as of period end, but does not include the underlying holdings of Fidelity Private Credit Central Fund LLC. Fidelity Private Credit Central Fund LLC represented less than 5% of the Fund's net assets at period end. The Fund indirectly bears its proportionate share of the expenses of Fidelity Private Credit Central Fund LLC. The annualized expense ratio for Fidelity Private Credit Central Fund LLC for the nine month period ended September 30, 2023 was 9.63%.
4. Significant Accounting Policies.
The Fund is an investment company and applies the accounting and reporting guidance of the Financial Accounting Standards Board (FASB) Accounting Standards Codification Topic 946 Financial Services - Investment Companies. The financial statements have been prepared in conformity with accounting principles generally accepted in the United States of America (GAAP), which require management to make certain estimates and assumptions at the date of the financial statements. Actual results could differ from those estimates. Subsequent events, if any, through the date that the financial statements were issued have been evaluated in the preparation of the financial statements. The Fund's Schedule of Investments lists any underlying mutual funds or exchange-traded funds (ETFs) but does not include the underlying holdings of these funds. The following summarizes the significant accounting policies of the Fund:
Investment Valuation. Investments are valued as of 4:00 p.m. Eastern time on the last calendar day of the period. The Board of Trustees (the Board) has designated the Fund's investment adviser as the valuation designee responsible for the fair valuation function and performing fair value determinations as needed. The investment adviser has established a Fair Value Committee (the Committee) to carry out the day-to-day fair valuation responsibilities and has adopted policies and procedures to govern the fair valuation process and the activities of the Committee. In accordance with these fair valuation policies and procedures, which have been approved by the Board, the Fund attempts to obtain prices from one or more third party pricing services or brokers to value its investments. When current market prices, quotations or currency exchange rates are not readily available or reliable, investments will be fair valued in good faith by the Committee, in accordance with the policies and procedures. Factors used in determining fair value vary by investment type and may include market or investment specific events, transaction data, estimated cash flows, and market observations of comparable investments. The frequency that the fair valuation procedures are used cannot be predicted and they may be utilized to a significant extent. The Committee manages the Fund's fair valuation practices and maintains the fair valuation policies and procedures. The Fund's investment adviser reports to the Board information regarding the fair valuation process and related material matters.
The Fund categorizes the inputs to valuation techniques used to value its investments into a disclosure hierarchy consisting of three levels as shown below:
Level 1 - unadjusted quoted prices in active markets for identical investments
Level 2 - other significant observable inputs (including quoted prices for similar investments, interest rates, prepayment speeds, etc.)
Level 3 - unobservable inputs (including the Fund's own assumptions based on the best information available)
Valuation techniques used to value the Fund's investments by major category are as follows:
Debt securities, including restricted securities, are valued based on evaluated prices received from third party pricing services or from brokers who make markets in such securities. Corporate bonds, bank loan obligations and preferred securities are valued by pricing services who utilize matrix pricing which considers yield or price of bonds of comparable quality, coupon, maturity and type or by broker-supplied prices. Commercial mortgage securities are valued by pricing services who utilize matrix pricing which considers prepayment speed assumptions, attributes of the collateral, yield or price of bonds of comparable quality, coupon, maturity and type or by broker-supplied prices. When independent prices are unavailable or unreliable, debt securities may be valued utilizing pricing methodologies which consider similar factors that would be used by third party pricing services. Debt securities are generally categorized as Level 2 in the hierarchy but may be Level 3 depending on the circumstances. The Fund invests a significant portion of its assets in below investment grade securities. The value of these securities can be more volatile due to changes in the credit quality of the issuer and is sensitive to changes in economic, market and regulatory conditions.
Equity securities, including restricted securities, for which market quotations are readily available, are valued at the last reported sale price or official closing price as reported by a third party pricing service on the primary market or exchange on which they are traded and are categorized as Level 1 in the hierarchy. In the event there were no sales during the day or closing prices are not available, securities are valued at the last quoted bid price or may be valued using the last available price and are generally categorized as Level 2 in the hierarchy. For foreign equity securities, when market or security specific events arise, comparisons to the valuation of American Depositary Receipts (ADRs), futures contracts, ETFs and certain indexes as well as quoted prices for similar securities may be used and would be categorized as Level 2 in the hierarchy. For equity securities, including restricted securities, where observable inputs are limited, assumptions about market activity and risk are used and these securities may be categorized as Level 3 in the hierarchy.
Investments in open-end mutual funds, including the Fidelity Central Funds, are valued at their closing net asset value (NAV) each business day and are categorized as Level 1 in the hierarchy.
Fidelity Private Credit Central Fund LLC is valued at its net asset value (NAV) each month end and is categorized as Level 2 in the hierarchy.
The following provides information on Level 3 securities held by the Fund that were valued at period end based on unobservable inputs. These amounts exclude valuations provided by a broker and valuations using NAV as a practical expedient.
| Asset Type | Fair Value | Valuation Technique(s) | Unobservable Input | Amount or Range/Weighted Average | Impact to Valuation from an Increase in InputA |
| Equities | $38,776,853 | Market comparable | Enterprise value/EBITDA multiple (EV/EBITDA) | 4.3 - 6.8 / 4.4 | Increase |
| | �� | Market approach | Transaction price | $79.39 | Increase |
| Corporate Bonds | $3,384,730 | Market comparable | Enterprise value/EBITDA multiple (EV/EBITDA) | 6.5 | Increase |
| | | | Enterprise value/Proved reserves multiple (EV/PR) | 0.8 | Increase |
| | | | Enterprise value/PV-10 multiple (EV/PV-10) | 0.3 | Increase |
| | | | Daily production multiple ($/Million cubic feet per day) | $3,850.00 | Increase |
| | | Recovery value | Recovery value | $0.00 | Increase |
| | | Discounted cash flow | Yield | 19.1% | Decrease |
| Bank Loan Obligations | $4,677,928 | Market comparable | Enterprise value/EBITDA multiple (EV/EBITDA) | 2.5 | Increase |
| | | Indicative market price | Evaluated bid | $95.50 | Increase |
| | | Recovery value | Recovery value | $0.00 | Increase |
| | | Discounted cash flow | Yield | 13.0% - 15.0% / 13.3% | Decrease |
A Represents the directional change in the fair value of the Level 3 investments that could have resulted from an increase in the corresponding input as of period end. A decrease to the unobservable input would have had the opposite effect. Significant changes in these inputs may have resulted in a significantly higher or lower fair value measurement at period end.
Changes in valuation techniques may result in transfers in or out of an assigned level within the disclosure hierarchy. The aggregate value of investments by input level as of October 31, 2023, as well as a roll forward of Level 3 investments, is included at the end of the Fund's Schedule of Investments.
Foreign Currency. Certain Funds may use foreign currency contracts to facilitate transactions in foreign-denominated securities. Gains and losses from these transactions may arise from changes in the value of the foreign currency or if the counterparties do not perform under the contracts' terms.
Foreign-denominated assets, including investment securities, and liabilities are translated into U.S. dollars at the exchange rates at period end. Purchases and sales of investment securities, income and dividends received, and expenses denominated in foreign currencies are translated into U.S. dollars at the exchange rate in effect on the transaction date.
The effects of exchange rate fluctuations on investments are included with the net realized and unrealized gain (loss) on investment securities. Other foreign currency transactions resulting in realized and unrealized gain (loss) are disclosed separately.
Investment Transactions and Income. For financial reporting purposes, the Fund's investment holdings and NAV include trades executed through the end of the last business day of the period. The NAV per share for processing shareholder transactions is calculated as of the close of business of the New York Stock Exchange (NYSE), normally 4:00 p.m. Eastern time and includes trades executed through the end of the prior business day. Gains and losses on securities sold are determined on the basis of identified cost and include proceeds received from litigation. Commissions paid to certain brokers with whom the investment adviser, or its affiliates, places trades on behalf of a fund include an amount in addition to trade execution, which may be rebated back to a fund. Any such rebates are included in net realized gain (loss) on investments in the Statement of Operations. Dividend income is recorded on the ex-dividend date, except for certain dividends from foreign securities where the ex-dividend date may have passed, which are recorded as soon as the Fund is informed of the ex-dividend date. Non-cash dividends included in dividend income, if any, are recorded at the fair market value of the securities received. Income and capital gain distributions from Fidelity Central Funds, if any, are recorded on the ex-dividend date. Interest income is accrued as earned and includes coupon interest and amortization of premium and accretion of discount on debt securities as applicable. Paid in Kind (PIK) income is recorded at the fair market value of the securities received. Investment income is recorded net of foreign taxes withheld where recovery of such taxes is uncertain. Debt obligations may be placed on non-accrual status and related interest income may be reduced by ceasing current accruals and writing off interest receivables when the collection of all or a portion of interest has become doubtful based on consistently applied procedures. A debt obligation is removed from non-accrual status when the issuer resumes interest payments or when collectability of interest is reasonably assured. The investment adviser has contractually agreed to reimburse the Fund with respect to the portion of the Fund's assets invested in Fidelity Private Credit Central Fund LLC until August 31, 2024 as presented in the Statement of Operations in payment from investment adviser.
Expenses. Expenses directly attributable to a fund are charged to that fund. Expenses attributable to more than one fund are allocated among the respective funds on the basis of relative net assets or other appropriate methods. Expenses included in the accompanying financial statements reflect the expenses of that fund and do not include any expenses associated with any underlying mutual funds or exchange-traded funds. Although not included in a fund's expenses, a fund indirectly bears its proportionate share of these expenses through the net asset value of each underlying mutual fund or exchange-traded fund. Expense estimates are accrued in the period to which they relate and adjustments are made when actual amounts are known.
Income Tax Information and Distributions to Shareholders. Each year, the Fund intends to qualify as a regulated investment company under Subchapter M of the Internal Revenue Code, including distributing substantially all of its taxable income and realized gains. As a result, no provision for U.S. Federal income taxes is required. The Fund files a U.S. federal tax return, in addition to state and local tax returns as required. The Fund's federal income tax returns are subject to examination by the Internal Revenue Service (IRS) for a period of three fiscal years after they are filed. State and local tax returns may be subject to examination for an additional fiscal year depending on the jurisdiction. Foreign taxes are provided for based on the Fund's understanding of the tax rules and rates that exist in the foreign markets in which it invests.
Distributions are declared and recorded daily and paid monthly from net investment income. Distributions from realized gains, if any, are declared and recorded on the ex-dividend date. Income and capital gain distributions are determined in accordance with income tax regulations, which may differ from GAAP.
Capital accounts within the financial statements are adjusted for permanent book-tax differences. These adjustments have no impact on net assets or the results of operations. Capital accounts are not adjusted for temporary book-tax differences which will reverse in a subsequent period.
Book-tax differences are primarily due to prior period premium and discount on debt securities, market discount, partnerships, capital loss carryforwards and losses deferred due to wash sales.
As of period end, the cost and unrealized appreciation (depreciation) in securities, and derivatives if applicable, for federal income tax purposes were as follows:
| Gross unrealized appreciation | $35,971,114 |
| Gross unrealized depreciation | (160,630,941) |
| Net unrealized appreciation (depreciation) | $(124,659,827) |
| Tax cost | $1,298,486,545 |
Capital loss carryforwards are only available to offset future capital gains of the Fund to the extent provided by regulations and may be limited. The capital loss carryforward information presented below, including any applicable limitation, is estimated as of prior fiscal period end and is subject to adjustment.
| Short-term | $(47,920,977) |
| Long-term | (341,711,652) |
Total capital loss carryforward | $(389,632,629) |
Restricted Securities (including Private Placements). Funds may invest in securities that are subject to legal or contractual restrictions on resale. These securities generally may be resold in transactions exempt from registration or to the public if the securities are registered. Disposal of these securities may involve time-consuming negotiations and expense, and prompt sale at an acceptable price may be difficult. Information regarding restricted securities held at period end is included at the end of the Schedule of Investments, if applicable.
Loans and Other Direct Debt Instruments. Direct debt instruments are interests in amounts owed to lenders by corporate or other borrowers. These instruments may be in the form of loans, trade claims or other receivables and may include standby financing commitments such as revolving credit facilities that obligate a fund to supply additional cash to the borrower on demand. Loans may be acquired through assignment, participation, or may be made directly to a borrower. Such instruments are presented in the Bank Loan Obligations section in the Schedule of Investments. Certain funds may also invest in unfunded loan commitments, which are contractual obligations for future funding. Information regarding unfunded commitments is included at the end of the Schedule of Investments, if applicable.
Commitments. A commitment is an agreement to acquire an investment at a future date (subject to conditions) in connection with a potential public or non-public offering. The amount of commitments outstanding at period end are presented in the table below. These commitments are not included in the net assets of the Fund at period end.
| | Investment to be Acquired | Commitment Amount |
| Fidelity Series High Income Fund | Fidelity Private Credit Central Fund LLC | $3,263,009 |
New Accounting Pronouncement. In June 2022, the Financial Accounting Standards Board (FASB) issued Accounting Standards Update (ASU) 2022-03 Fair Value Measurement (Topic 820): Fair Value Measurement of Equity Securities Subject to Contractual Sale Restrictions. The amendments in this ASU clarify that a contractual restriction on the sale of an equity security is not considered part of the unit of account of the equity security and, therefore, is not considered in measuring fair value. They also clarify that an entity cannot, as a separate unit of account, recognize and measure a contractual sale restriction. They also require additional disclosures for equity securities subject to contractual sale restrictions. ASU 2022-03 will be effective for fiscal years, including interim periods within those fiscal years, beginning after December 15, 2023, and allows for early adoption. ASU 2022-03 will only be applicable to an equity security in which the contractual arrangement that restricts its sale is executed or modified on or after the adoption date. Management is currently evaluating the potential impact of ASU 2022-03 to the financial statements.
5. Purchases and Sales of Investments.
Purchases and sales of securities, other than short-term securities and in-kind transactions, as applicable, are noted in the table below.
| | Purchases ($) | Sales ($) |
| Fidelity Series High Income Fund | 204,140,837 | 168,241,934 |
6. Fees and Other Transactions with Affiliates.
Management Fee. Fidelity Management & Research Company LLC (the investment adviser) and its affiliates provide the Fund with investment management related services for which the Fund does not pay a management fee. Under the management contract, the investment adviser or an affiliate pays all ordinary operating expenses of the Fund, except custody fees, fees and expenses of the independent Trustees, and certain miscellaneous expenses such as proxy and shareholder meeting expenses.
Brokerage Commissions. A portion of portfolio transactions were placed with brokerage firms which are affiliates of the investment adviser. Brokerage commissions are included in net realized gain (loss) and change in net unrealized appreciation (depreciation) in the Statement of Operations. The commissions paid to these affiliated firms were as follows:
| | Amount |
| Fidelity Series High Income Fund | $82 |
Interfund Trades. Funds may purchase from or sell securities to other Fidelity Funds under procedures adopted by the Board. The procedures have been designed to ensure these interfund trades are executed in accordance with Rule 17a-7 of the 1940 Act. Any interfund trades are included within the respective purchases and sales amounts shown in the Purchases and Sales of Investments note. During the period, there were no interfund trades.
Other. During the period, the investment adviser reimbursed the Fund for certain losses as follows:
| | Amount ($) |
| Fidelity Series High Income Fund | 83,190 |
7. Committed Line of Credit.
Certain Funds participate with other funds managed by the investment adviser or an affiliate in a $4.25 billion credit facility (the "line of credit") to be utilized for temporary or emergency purposes to fund shareholder redemptions or for other short-term liquidity purposes. The commitment fees on the pro-rata portion of the line of credit are borne by the investment adviser. During the period, there were no borrowings on this line of credit.
8. Security Lending.
Funds lend portfolio securities from time to time in order to earn additional income. Lending agents are used, including National Financial Services (NFS), an affiliate of the investment adviser. Pursuant to a securities lending agreement, NFS will receive a fee, which is capped at 9.9% of a fund's daily lending revenue, for its services as lending agent. A fund may lend securities to certain qualified borrowers, including NFS. On the settlement date of the loan, a fund receives collateral (in the form of U.S. Treasury obligations, letters of credit and/or cash) against the loaned securities and maintains collateral in an amount not less than 100% of the market value of the loaned securities during the period of the loan. The market value of the loaned securities is determined at the close of business of a fund and any additional required collateral is delivered to a fund on the next business day. A fund or borrower may terminate the loan at any time, and if the borrower defaults on its obligation to return the securities loaned because of insolvency or other reasons, a fund may apply collateral received from the borrower against the obligation. A fund may experience delays and costs in recovering the securities loaned. Any cash collateral received is invested in the Fidelity Securities Lending Cash Central Fund. Any loaned securities are identified as such in the Schedule of Investments, and the value of loaned securities and cash collateral at period end, as applicable, are presented in the Statement of Assets and Liabilities. Security lending income represents the income earned on investing cash collateral, less rebates paid to borrowers and any lending agent fees associated with the loan, plus any premium payments received for lending certain types of securities. Security lending income is presented in the Statement of Operations as a component of income from Fidelity Central Funds. Affiliated security lending activity, if any, was as follows:
| | Total Security Lending Fees Paid to NFS | Security Lending Income From Securities Loaned to NFS | Value of Securities Loaned to NFS at Period End |
| Fidelity Series High Income Fund | $3 | $- | $- |
9. Expense Reductions.
The investment adviser contractually agreed to reimburse the Fund to the extent annual operating expenses exceeded .003% of average net assets. This reimbursement will remain in place through August 31, 2026. Some expenses, for example the compensation of the independent Trustees, and certain other expenses such as interest expense, are excluded from this reimbursement. During the period this reimbursement reduced the Fund's expenses by $141,486.
Through arrangements with the Fund's custodian, credits realized as a result of certain uninvested cash balances were used to reduce the Fund's expenses by $6,248.
10. Other.
A fund's organizational documents provide former and current trustees and officers with a limited indemnification against liabilities arising in connection with the performance of their duties to the fund. In the normal course of business, a fund may also enter into contracts that provide general indemnifications. A fund's maximum exposure under these arrangements is unknown as this would be dependent on future claims that may be made against a fund. The risk of material loss from such claims is considered remote.
At the end of the period, mutual funds and accounts managed by the investment adviser or its affiliates were the owners of record of all of the outstanding shares of the Fund.
11. Litigation.
The Fund and other entities managed by FMR or its affiliates are involved with proceedings arising out of disputes in the United States Bankruptcy Court for the Southern District of Texas ("Bankruptcy Court"), relating to the In re Sanchez Energy Corporation chapter 11 bankruptcy case (Case No. 19-34508). A Bankruptcy Court-appointed representative of unsecured creditors asserted that eight million shares of Mesquite Energy, Inc. (formerly known as Sanchez Energy Corporation) (the "Company"), held in escrow pursuant to the terms of the Company's confirmed chapter 11 plan, should be awarded to the unsecured creditors instead of the Company's current equity holders, including the Fund, which were providers of debtor-in-possession financing to the Company during its chapter 11 case and holders of secured notes issued by the Company in 2018. The unsecured creditors also asserted that certain additional equity issued by the Company in 2020 in connection with two post-bankruptcy financings, also held by the Fund, is invalid. During August 2023, the Bankruptcy Court issued an opinion awarding a portion of the eight million shares to the unsecured creditors, diluting the value of the Fund's holdings in Mesquite. The Fund will appeal this decision. At this time, Management cannot determine any additional loss or dilution that may be realized. The Fund is also incurring legal costs in defending the disputes and has recovered a portion of these legal costs through an insurance claim that is presented as other income in the Statement of Operations.
12. Risk and Uncertainties.
Many factors affect a fund's performance. Developments that disrupt global economies and financial markets, such as pandemics, epidemics, outbreaks of infectious diseases, war, terrorism, and environmental disasters, may significantly affect a fund's investment performance. The effects of these developments to a fund will be impacted by the types of securities in which a fund invests, the financial condition, industry, economic sector, and geographic location of an issuer, and a fund's level of investment in the securities of that issuer. Significant concentrations in security types, issuers, industries, sectors, and geographic locations may magnify the factors that affect a fund's performance.
As a shareholder, you incur two types of costs: (1) transaction costs, which may include sales charges (loads) on purchase payments or redemption proceeds, as applicable and (2) ongoing costs, which generally include management fees, distribution and/or service (12b-1) fees and other Fund expenses. This Example is intended to help you understand your ongoing costs (in dollars) of investing in a fund and to compare these costs with the ongoing costs of investing in other mutual funds.
| The Example is based on an investment of $1,000 invested at the beginning of the period and held for the entire period (May 1, 2023 to October 31, 2023). |
Actual Expenses
The first line of the accompanying table provides information about actual account values and actual expenses. You may use the information in this line, together with the amount you invested, to estimate the expenses that you paid over the period. Simply divide your account value by $1,000.00 (for example, an $8,600 account value divided by $1,000.00 = 8.6), then multiply the result by the number in the first line for a class/Fund under the heading entitled "Expenses Paid During Period" to estimate the expenses you paid on your account during this period. If any fund is a shareholder of any underlying mutual funds or exchange-traded funds (ETFs) (the Underlying Funds), such fund indirectly bears its proportional share of the expenses of the Underlying Funds in addition to the direct expenses incurred presented in the table. These fees and expenses are not included in the annualized expense ratio used to calculate the expense estimate in the table below.
Hypothetical Example for Comparison Purposes
The second line of the accompanying table provides information about hypothetical account values and hypothetical expenses based on the actual expense ratio and an assumed rate of return of 5% per year before expenses, which is not the actual return. The hypothetical account values and expenses may not be used to estimate the actual ending account balance or expenses you paid for the period. You may use this information to compare the ongoing costs of investing in the Fund and other funds. To do so, compare this 5% hypothetical example with the 5% hypothetical examples that appear in the shareholder reports of the other funds. If any fund is a shareholder of any Underlying Funds, such fund indirectly bears its proportional share of the expenses of the Underlying Funds in addition to the direct expenses as presented in the table. These fees and expenses are not included in the annualized expense ratio used to calculate the expense estimate in the table below.
Please note that the expenses shown in the table are meant to highlight your ongoing costs only and do not reflect any transaction costs. Therefore, the second line of the table is useful in comparing ongoing costs only, and will not help you determine the relative total costs of owning different funds. In addition, if these transactional costs were included, your costs would have been higher.
| | | | | Annualized Expense Ratio- A | | Beginning Account Value May 1, 2023 | | Ending Account Value October 31, 2023 | | Expenses Paid During Period- C May 1, 2023 to October 31, 2023 |
| | | | | | | | | | |
| Fidelity® Series High Income Fund | | | | -%-D | | | | | | |
| Actual | | | | | | $ 1,000 | | $ 988.70 | | $-E |
Hypothetical-B | | | | | | $ 1,000 | | $ 1,025.14 | | $-E |
| |
A Annualized expense ratio reflects expenses net of applicable fee waivers.
B 5% return per year before expenses
C Expenses are equal to the annualized expense ratio, multiplied by the average account value over the period, multiplied by 184/ 366 (to reflect the one-half year period). The fees and expenses of any Underlying Funds are not included in each annualized expense ratio.
D Amount represents less than .005%.
E Amount represents less than $.005.
Board Approval of Investment Advisory Contracts and Management Fees
Fidelity Series High Income Fund
Each year, the Board of Trustees, including the Independent Trustees (together, the Board), considers the renewal of the fund's management contract with Fidelity Management & Research Company LLC (FMR) and the sub-advisory agreements (together, the Advisory Contracts) for the fund. FMR and the sub-advisers are referred to herein as the Investment Advisers. The Board, assisted by the advice of fund counsel and Independent Trustees' counsel, requests and considers a broad range of information relevant to the renewal of the Advisory Contracts throughout the year.
The Board meets regularly and, at each of its meetings, covers an extensive agenda of topics and materials and considers factors that are relevant to its annual consideration of the renewal of the fund's Advisory Contracts, including the services and support provided to the fund and its shareholders. The Board, acting directly and through its Committees (each of which is composed of and chaired by Independent Trustees), requests and receives information concerning the annual consideration of the renewal of the fund's Advisory Contracts. The Board also meets as needed to review matters specifically related to the Board's annual consideration of the renewal of the Advisory Contracts. Members of the Board may also meet with trustees of other Fidelity funds through joint ad hoc committees to discuss certain matters relevant to all of the Fidelity funds.
Approval of Stub Period Continuation. At its May 2023 meeting, the Board of Trustees voted to continue the fund's management contract with FMR, and the sub-advisory agreements and sub-sub-advisory agreements, in each case, where applicable (together, the Advisory Contracts), without modification, for two months from June 1, 2023 through July 31, 2023. The Board considered that the approval of the fund's Advisory Contracts will not result in any changes in (i) the investment process or strategies employed in the management of the fund's assets; (ii) the fees and expenses paid by shareholders; (iii) the nature, extent or quality of services provided under the fund's Advisory Contracts; or (iv) the day-to-day management of the fund or the persons primarily responsible for such management. The Board also considered that since its last approval of the fund's Advisory Contracts, FMR had provided additional information on the fund in support of the annual contract renewal process, including competitive analyses on total expenses and management fees and in-depth reviews of fund performance and fund profitability information. The Board concluded that the fund's Advisory Contracts are fair and reasonable, and that the fund's Advisory Contracts should be renewed, without modification, through July 31, 2023, with the understanding that the Board would consider the annual renewal for a full one year period in July 2023.
At its July 2023 meeting, the Board unanimously determined to renew the fund's Advisory Contracts. The Board considered all factors it believed relevant and reached a determination, with the assistance of fund counsel and Independent Trustees' counsel and through the exercise of its business judgment, that the renewal of the Advisory Contracts was in the best interests of the fund and its shareholders and the fact that no fee is payable under the management contract was fair and reasonable in light of all of the surrounding circumstances.
Nature, Extent, and Quality of Services Provided. The Board considered staffing as it relates to the fund, including the backgrounds and experience of investment personnel of the Investment Advisers, and also considered the Investment Advisers' implementation of the fund's investment program. The Independent Trustees also had discussions with senior management of Fidelity's investment operations and investment groups. The Board considered the structure of the investment personnel compensation program and whether this structure provides appropriate incentives to act in the best interests of the fund.
Resources Dedicated to Investment Management and Support Services. The Board and the Fund Oversight and Research Committees reviewed the general qualifications and capabilities of Fidelity's investment staff, including its size, education, experience, and resources, as well as Fidelity's approach to recruiting, training, managing, and compensating investment personnel. The Board noted the resources devoted to expansion of Fidelity's global investment organization, and that Fidelity's analysts have extensive resources, tools, and capabilities that allow them to conduct sophisticated quantitative and fundamental analysis, as well as credit analysis of issuers, counterparties, and guarantors. Further, the Board considered that Fidelity's investment professionals have sufficient access to global information and data so as to provide competitive investment results over time, and that those professionals also have access to sophisticated tools that permit them to assess portfolio construction and risk and performance attribution characteristics continuously, as well as to transmit new information and research conclusions rapidly around the world. Additionally, in its deliberations, the Board considered Fidelity's trading, risk management, compliance, and technology and operations capabilities and resources, which are integral parts of the investment management process.
Administrative Services. The Board considered (i) the nature, extent, quality, and cost of advisory and administrative services performed by the Investment Advisers and their affiliates under the Advisory Contracts and under separate agreements covering transfer agency, pricing and bookkeeping, and securities lending services for the fund; (ii) the nature and extent of Fidelity's supervision of third party service providers, principally custodians, subcustodians, and pricing vendors; and (iii) the resources devoted by Fidelity to, and the record of compliance with, the fund's compliance policies and procedures. The Board also reviewed the allocation of fund brokerage, including allocations to brokers affiliated with the Investment Advisers, the use of brokerage commissions to pay fund expenses, and the use of "soft" commission dollars to pay for research services. The Board also considered the fund's securities lending activities and any payments made to Fidelity relating to securities lending.
Investment Performance. The Board reviewed the fund's absolute investment performance, as well as the fund's relative investment performance, but did not consider performance to be a material factor in its decision to renew the fund's Advisory Contracts, as the fund is not publicly offered as a stand-alone investment product. In this regard, the Board noted that the fund is designed to offer an investment option for other investment companies, 529 plans, and collective investment trusts managed by Fidelity and ultimately to enhance the performance of those investment companies, 529 plans, and collective investment trusts.
Based on its review, the Board concluded that the nature, extent, and quality of services provided to the fund under the Advisory Contracts should continue to benefit the shareholders of the fund.
Competitiveness of Management Fee and Total Expense Ratio. The Board considered that the fund does not pay FMR a management fee for investment advisory services, but that FMR receives fees for providing services to funds that invest in the fund. The Board noted that FMR or an affiliate undertakes to pay all operating expenses of the fund, except transfer agent fees, 12b-1 fees, Independent Trustee fees and expenses, custodian fees and expenses, proxy and shareholder meeting expenses, interest, taxes, and extraordinary expenses (such as litigation expenses). The Board further noted that the fund pays its non-operating expenses, including brokerage commissions and fees and expenses associated with the fund's securities lending program, if applicable.
Other Contractual Arrangements. The Board further considered that FMR has contractually agreed to reimburse the fund to the extent that total operating expenses, with certain exceptions, as a percentage of its average net assets, exceed 0.003% through August 31, 2026.
Based on its review, the Board considered that the fund does not pay a management fee and concluded that the total expense ratio of the fund was reasonable in light of the services that the fund and its shareholders receive and the other factors considered.
Costs of the Services and Profitability. The Board considered the level of Fidelity's profits in respect of all the Fidelity funds.
A public accounting firm has been engaged annually by the Board as part of the Board's assessment of Fidelity's profitability analysis. The engagement includes the review and assessment of the methodologies used by Fidelity in determining the revenues and expenses attributable to Fidelity's fund business, and completion of agreed-upon procedures in respect of the mathematical accuracy of certain fund profitability information and its conformity to established allocation methodologies. After considering the reports issued under the engagement and information provided by Fidelity, the Board concluded that while other allocation methods may also be reasonable, Fidelity's profitability methodologies are reasonable in all material respects.
The Board also reviewed Fidelity's non-fund businesses and potential indirect benefits such businesses may have received as a result of their association with Fidelity's fund business (i.e., fall-out benefits) as well as cases where Fidelity's affiliates may benefit from the funds' business. The Board considered areas where potential indirect benefits to the Fidelity funds from their relationships with Fidelity may exist. The Board's consideration of these matters was informed by the findings of a joint ad hoc committee created by it and the boards of other Fidelity funds to evaluate potential fall-out benefits.
The Board concluded that the costs of the services provided by and the profits realized by Fidelity in connection with the operation of the fund were not relevant to the renewal of the Advisory Contracts because the fund pays no advisory fees and FMR bears all expenses of the fund with certain exceptions.
Economies of Scale. The Board concluded that because the fund pays no advisory fees and FMR bears all expenses of the fund with certain exceptions, the realization of economies of scale was not a material factor in the Board's decision to renew the fund's Advisory Contracts.
Additional Information Requested by the Board. In order to develop fully the factual basis for consideration of the Fidelity funds' advisory contracts, the Board requested and received additional information on certain topics, including: (i) fund flow and performance trends, in particular the underperformance of certain funds and strategies, and Fidelity's long-term strategies for certain funds, including any consideration of fund liquidations or mergers; (ii) the operation of performance fees and competitor use of performance fees; (iii) Fidelity's pricing philosophy compared to competitors; (iv) fund profitability methodology and data; (v) evaluation of competitive fund data and peer group classifications and fee and expense comparisons; (vi) the management fee and expense structures for different funds and classes and information about the differences between various fee and expense structures; (vii) group fee breakpoints and related voluntary fee waivers; and (viii) information regarding other accounts managed by Fidelity and the funds' sub-advisory arrangements.
Conclusion. Based on its evaluation of all of the conclusions noted above, and after considering all factors it believed relevant, the Board, including the Independent Trustees, concluded that the advisory and sub-advisory fee arrangements are fair and reasonable in light of all of the surrounding circumstances, and that the fund's Advisory Contracts should be renewed through July 31, 2024.
1.924273.112
FSH-SANN-1223
Fidelity® Global High Income Fund
Semi-Annual Report
October 31, 2023
Includes Fidelity and Fidelity Advisor share classes
Contents
To view a fund's proxy voting guidelines and proxy voting record for the 12-month period ended June 30, visit http://www.fidelity.com/proxyvotingresults or visit the Securities and Exchange Commission's (SEC) web site at http://www.sec.gov.
You may also call 1-800-544-8544 if you're an individual investing directly with Fidelity, call 1-800-835-5092 if you're a plan sponsor or participant with Fidelity as your recordkeeper or call 1-877-208-0098 on institutional accounts or if you're an advisor or invest through one to request a free copy of the proxy voting guidelines.
Standard & Poor's, S&P and S&P 500 are registered service marks of The McGraw-Hill Companies, Inc. and have been licensed for use by Fidelity Distributors Corporation.
Other third-party marks appearing herein are the property of their respective owners.
All other marks appearing herein are registered or unregistered trademarks or service marks of FMR LLC or an affiliated company. © 2023 FMR LLC. All rights reserved.
This report and the financial statements contained herein are submitted for the general information of the shareholders of the Fund. This report is not authorized for distribution to prospective investors in the Fund unless preceded or accompanied by an effective prospectus.
A fund files its complete schedule of portfolio holdings with the SEC for the first and third quarters of each fiscal year on Form N-PORT. Forms N-PORT are available on the SEC's web site at http://www.sec.gov. A fund's Forms N-PORT may be reviewed and copied at the SEC's Public Reference Room in Washington, DC. Information regarding the operation of the SEC's Public Reference Room may be obtained by calling 1-800-SEC-0330.
For a complete list of a fund's portfolio holdings, view the most recent holdings listing, semiannual report, or annual report on Fidelity's web site at http://www.fidelity.com, http://www.institutional.fidelity.com, or http://www.401k.com, as applicable.
NOT FDIC INSURED •MAY LOSE VALUE •NO BANK GUARANTEE
Neither the Fund nor Fidelity Distributors Corporation is a bank.
| Top Bond Issuers (% of Fund's net assets) |
(with maturities greater than one year) |
| TransDigm, Inc. | 1.4 | |
| Icahn Enterprises LP/Icahn Enterprises Finance Corp. | 1.2 | |
| Ford Motor Credit Co. LLC | 1.2 | |
| U.S. Treasury Obligations | 1.0 | |
| Tenet Healthcare Corp. | 1.0 | |
| Uber Technologies, Inc. | 0.9 | |
| CCO Holdings LLC/CCO Holdings Capital Corp. | 0.8 | |
| Royal Caribbean Cruises Ltd. | 0.8 | |
| DISH Network Corp. | 0.8 | |
| Altice France SA | 0.8 | |
| | 9.9 | |
| |
| Market Sectors (% of Fund's net assets) |
| |
| Energy | 14.3 | |
| Diversified Financial Services | 6.2 | |
| Telecommunications | 6.2 | |
| Banks & Thrifts | 5.4 | |
| Technology | 5.4 | |
| |
Quality Diversification (% of Fund's net assets) |
|
| |
| We have used ratings from Moody's Investors Service, Inc. Where Moody's® ratings are not available, we have used S&P® ratings. All ratings are as of the date indicated and do not reflect subsequent changes. |
Asset Allocation (% of Fund's net assets) |
|
|
Geographic Diversification (% of Fund's net assets) |
|
* Includes Short-Term investments and Net Other Assets (Liabilities). Percentages are adjusted for the effect of derivatives, if applicable. |
| |
Showing Percentage of Net Assets
| Corporate Bonds - 80.4% |
| | | Principal Amount (a) | Value ($) |
| Convertible Bonds - 1.3% | | | |
| Broadcasting - 0.8% | | | |
| DISH Network Corp.: | | | |
| 0% 12/15/25 | | 86,000 | 52,462 |
| 2.375% 3/15/24 | | 210,000 | 200,813 |
| 3.375% 8/15/26 | | 646,000 | 331,075 |
| | | | 584,350 |
| Diversified Financial Services - 0.3% | | | |
| New Cotai LLC 5% 2/24/27 (b) | | 154,531 | 237,375 |
| Homebuilders/Real Estate - 0.2% | | | |
| Fastighets AB Balder 3.5% 2/23/28 (Reg. S) | EUR | 100,000 | 95,288 |
TOTAL CONVERTIBLE BONDS | | | 917,013 |
| Nonconvertible Bonds - 79.1% | | | |
| Aerospace - 2.0% | | | |
| ATI, Inc.: | | | |
| 4.875% 10/1/29 | | 35,000 | 29,807 |
| 5.125% 10/1/31 | | 25,000 | 20,625 |
| 5.875% 12/1/27 | | 70,000 | 64,920 |
| Bombardier, Inc.: | | | |
| 6% 2/15/28 (c) | | 110,000 | 97,337 |
| 7.875% 4/15/27 (c) | | 170,000 | 163,563 |
| Embraer Netherlands Finance BV: | | | |
| 5.4% 2/1/27 | | 50,000 | 48,095 |
| 6.95% 1/17/28 (c) | | 20,000 | 19,800 |
| Moog, Inc. 4.25% 12/15/27 (c) | | 20,000 | 17,805 |
| Rolls-Royce PLC 5.75% 10/15/27 (c) | | 55,000 | 52,120 |
| TransDigm, Inc.: | | | |
| 4.875% 5/1/29 | | 200,000 | 173,277 |
| 5.5% 11/15/27 | | 335,000 | 311,131 |
| 6.25% 3/15/26 (c) | | 180,000 | 175,763 |
| 6.75% 8/15/28 (c) | | 110,000 | 106,808 |
| 6.875% 12/15/30 (c) | | 150,000 | 144,834 |
| Wesco Aircraft Holdings, Inc. 8.5% (c)(d) | | 45,000 | 1,575 |
| | | | 1,427,460 |
| Air Transportation - 1.1% | | | |
| Air Canada 3.875% 8/15/26 (c) | | 65,000 | 59,141 |
| Air France KLM 8.125% 5/31/28 (Reg. S) | EUR | 100,000 | 110,943 |
| Allegiant Travel Co. 7.25% 8/15/27 (c) | | 40,000 | 36,200 |
| Forward Air Corp. 9.5% 10/15/31 (c) | | 95,000 | 92,625 |
| Indira Gandhi International Airport 6.125% 10/31/26 (Reg. S) | | 200,000 | 189,488 |
| Mileage Plus Holdings LLC 6.5% 6/20/27 (c) | | 41,250 | 40,750 |
| Rand Parent LLC 8.5% 2/15/30 (c) | | 165,000 | 150,677 |
| Spirit Loyalty Cayman Ltd. / Spirit IP Cayman Ltd. 8% 9/20/25 (c) | | 38,896 | 28,686 |
| United Airlines, Inc.: | | | |
| 4.375% 4/15/26 (c) | | 80,000 | 74,209 |
| 4.625% 4/15/29 (c) | | 50,000 | 42,235 |
| Western Global Airlines LLC 10.375% (c)(d) | | 60,000 | 450 |
| | | | 825,404 |
| Automotive - 0.7% | | | |
| Ford Motor Credit Co. LLC 3.625% 6/17/31 | | 600,000 | 474,283 |
| Automotive & Auto Parts - 2.2% | | | |
| Adient Global Holdings Ltd.: | | | |
| 7% 4/15/28 (c) | | 95,000 | 93,511 |
| 8.25% 4/15/31 (c) | | 95,000 | 92,444 |
| Albion Financing 1 SARL 5.25% 10/15/26 (Reg. S) | EUR | 219,000 | 218,913 |
| Ford Motor Co. 3.25% 2/12/32 | | 140,000 | 105,584 |
| Ford Motor Credit Co. LLC: | | | |
| 2.9% 2/16/28 | | 50,000 | 42,599 |
| 5.125% 6/16/25 | | 170,000 | 165,412 |
| 6.125% 5/15/28 | EUR | 100,000 | 110,158 |
| Forvia 2.75% 2/15/27 (Reg. S) | EUR | 136,000 | 130,542 |
| IHO Verwaltungs GmbH 3.75% 9/15/26 pay-in-kind(Reg. S) (e) | EUR | 100,000 | 99,342 |
| Jaguar Land Rover Automotive PLC 4.5% 1/15/26 (Reg. S) | EUR | 100,000 | 102,998 |
| LCM Investments Holdings 4.875% 5/1/29 (c) | | 70,000 | 58,658 |
| Macquarie AirFinance Holdings: | | | |
| 8.125% 3/30/29 (c) | | 40,000 | 39,402 |
| 8.375% 5/1/28 (c) | | 55,000 | 54,821 |
| Nesco Holdings II, Inc. 5.5% 4/15/29 (c) | | 45,000 | 38,588 |
| ZF Finance GmbH 5.75% 8/3/26 (Reg. S) | EUR | 200,000 | 211,772 |
| | | | 1,564,744 |
| Banks & Thrifts - 3.0% | | | |
| Access Bank PLC 6.125% 9/21/26 (c) | | 190,000 | 158,294 |
| Ally Financial, Inc.: | | | |
| 8% 11/1/31 | | 155,000 | 150,504 |
| 8% 11/1/31 | | 108,000 | 105,413 |
| Aretec Escrow Issuer, Inc. 10% 8/15/30 (c) | | 145,000 | 146,631 |
| Banca Monte dei Paschi di Siena SpA 5Y ISDAFIX 11AM LDN TM EUR FXG + 5.000% 7.708% 1/18/28 (e)(f) | EUR | 100,000 | 91,949 |
| Banco de Credito Social Cooperativo SA: | | | |
| EURIBOR ICE Swap Rate + 4.260% 7.5% 9/14/29 (Reg. S) (e)(f) | EUR | 100,000 | 103,609 |
| 5.25% 11/27/31 (Reg. S) (e) | EUR | 100,000 | 87,822 |
| Banco de Sabadell SA 6% 8/16/33 (Reg. S) (e) | EUR | 100,000 | 98,136 |
| Bank of East Asia Ltd. 6.75% 3/15/27 (Reg. S) (e) | | 250,000 | 246,375 |
| BankMuscat SAOG 4.75% 3/17/26 (Reg. S) | | 200,000 | 190,590 |
| Commerzbank AG 6.5% 12/6/32 (Reg. S) (e) | EUR | 100,000 | 104,876 |
| CQP Holdco LP / BIP-V Chinook Holdco LLC 5.5% 6/15/31 (c) | | 250,000 | 217,438 |
| Intesa Sanpaolo SpA 2.925% 10/14/30 (Reg. S) | EUR | 100,000 | 86,382 |
| Piraeus Bank SA 3.875% 11/3/27 (Reg. S) (e) | EUR | 100,000 | 97,536 |
| Shinhan Bank 4.375% 4/13/32 (Reg. S) | | 200,000 | 170,796 |
| VistaJet Malta Finance PLC / XO Management Holding, Inc. 6.375% 2/1/30 (c) | | 130,000 | 86,696 |
| | | | 2,143,047 |
| Broadcasting - 1.6% | | | |
| Cable Onda SA 4.5% 1/30/30 (c) | | 200,000 | 156,250 |
| Clear Channel Outdoor Holdings, Inc.: | | | |
| 7.5% 6/1/29 (c) | | 75,000 | 54,591 |
| 7.75% 4/15/28 (c) | | 35,000 | 26,757 |
| Diamond Sports Group LLC/Diamond Sports Finance Co. 5.375% (c)(d) | | 70,000 | 721 |
| Gray Escrow II, Inc. 5.375% 11/15/31 (c) | | 90,000 | 56,723 |
| Nexstar Media, Inc. 5.625% 7/15/27 (c) | | 75,000 | 67,497 |
| Scripps Escrow II, Inc.: | | | |
| 3.875% 1/15/29 (c) | | 50,000 | 37,956 |
| 5.375% 1/15/31 (c) | | 25,000 | 15,523 |
| Scripps Escrow, Inc. 5.875% 7/15/27 (c) | | 50,000 | 37,375 |
| Sirius XM Radio, Inc.: | | | |
| 4% 7/15/28 (c) | | 315,000 | 267,886 |
| 4.125% 7/1/30 (c) | | 65,000 | 51,611 |
| Summer (BC) Holdco B SARL 5.75% 10/31/26 (Reg. S) | EUR | 100,000 | 95,469 |
| TV Azteca SA de CV 8.25% (Reg. S) (d) | | 200,000 | 73,000 |
| Univision Communications, Inc.: | | | |
| 4.5% 5/1/29 (c) | | 100,000 | 79,491 |
| 6.625% 6/1/27 (c) | | 110,000 | 100,474 |
| | | | 1,121,324 |
| Building Materials - 1.0% | | | |
| Acproducts Holdings, Inc. 6.375% 5/15/29 (c) | | 100,000 | 61,000 |
| Advanced Drain Systems, Inc. 5% 9/30/27 (c) | | 115,000 | 107,238 |
| CEMEX S.A.B. de CV 5.45% 11/19/29 (c) | | 200,000 | 185,125 |
| Loxam SAS 6.375% 5/15/28 (Reg. S) | EUR | 100,000 | 102,896 |
| MIWD Holdco II LLC / MIWD Finance Corp. 5.5% 2/1/30 (c) | | 20,000 | 15,875 |
| SRS Distribution, Inc.: | | | |
| 4.625% 7/1/28 (c) | | 55,000 | 47,979 |
| 6% 12/1/29 (c) | | 55,000 | 45,788 |
| 6.125% 7/1/29 (c) | | 30,000 | 25,125 |
| West China Cement Ltd. 4.95% 7/8/26 (Reg. S) | | 200,000 | 136,400 |
| | | | 727,426 |
| Cable/Satellite TV - 1.8% | | | |
| Adria Bidco BV 3.125% 2/15/26 (Reg. S) | EUR | 100,000 | 95,880 |
| CCO Holdings LLC/CCO Holdings Capital Corp.: | | | |
| 4.25% 2/1/31 (c) | | 100,000 | 77,820 |
| 4.25% 1/15/34 (c) | | 115,000 | 83,065 |
| 4.5% 8/15/30 (c) | | 195,000 | 156,358 |
| 4.5% 6/1/33 (c) | | 120,000 | 89,516 |
| 5.125% 5/1/27 (c) | | 225,000 | 207,157 |
| CSC Holdings LLC: | | | |
| 4.5% 11/15/31 (c) | | 65,000 | 42,930 |
| 4.625% 12/1/30 (c) | | 75,000 | 38,034 |
| 5% 11/15/31 (c) | | 65,000 | 33,237 |
| 5.75% 1/15/30 (c) | | 100,000 | 52,317 |
| 7.5% 4/1/28 (c) | | 230,000 | 147,413 |
| DISH DBS Corp. 5.75% 12/1/28 (c) | | 45,000 | 32,681 |
| Radiate Holdco LLC/Radiate Financial Service Ltd.: | | | |
| 4.5% 9/15/26 (c) | | 150,000 | 114,696 |
| 6.5% 9/15/28 (c) | | 110,000 | 54,450 |
| Ziggo Bond Co. BV 5.125% 2/28/30 (c) | | 35,000 | 25,501 |
| Ziggo BV 4.875% 1/15/30 (c) | | 50,000 | 39,936 |
| | | | 1,290,991 |
| Capital Goods - 0.5% | | | |
| Benteler International AG 9.375% 5/15/28 (Reg. S) | EUR | 150,000 | 160,092 |
| Tk Elevator Midco GmbH 4.375% 7/15/27 (Reg. S) | EUR | 100,000 | 95,584 |
| Vertical Holdco GmbH 6.625% 7/15/28 (Reg. S) | EUR | 90,000 | 81,541 |
| | | | 337,217 |
| Chemicals - 3.8% | | | |
| Braskem Idesa SAPI: | | | |
| 6.99% 2/20/32 (c) | | 55,000 | 32,090 |
| 7.45% 11/15/29 (c) | | 30,000 | 18,996 |
| CF Industries Holdings, Inc.: | | | |
| 5.15% 3/15/34 | | 45,000 | 39,877 |
| 5.375% 3/15/44 | | 80,000 | 65,057 |
| CVR Partners LP 6.125% 6/15/28 (c) | | 90,000 | 79,425 |
| ENN Clean Energy International Investment Ltd.: | | | |
| 3.375% 5/12/26 (c) | | 200,000 | 182,270 |
| 3.375% 5/12/26 (Reg. S) | | 200,000 | 182,270 |
| INEOS Finance PLC 6.625% 5/15/28 (Reg. S) | EUR | 200,000 | 207,761 |
| INEOS Quattro Finance 2 PLC 2.5% 1/15/26 (Reg. S) | EUR | 100,000 | 98,384 |
| Kobe U.S. Midco 2, Inc. 9.25% 11/1/26 pay-in-kind (c)(e) | | 185,000 | 134,125 |
| LSB Industries, Inc. 6.25% 10/15/28 (c) | | 20,000 | 17,742 |
| MEGlobal Canada, Inc. 5% 5/18/25 (c) | | 200,000 | 194,313 |
| NOVA Chemicals Corp. 4.25% 5/15/29 (c) | | 75,000 | 55,454 |
| OCP SA: | | | |
| 3.75% 6/23/31 (c) | | 200,000 | 156,586 |
| 6.875% 4/25/44 (c) | | 150,000 | 122,625 |
| Olympus Water U.S. Holding Corp. 9.75% 11/15/28 (c) | | 200,000 | 195,340 |
| Sasol Financing U.S.A. LLC 4.375% 9/18/26 | | 200,000 | 176,000 |
| SCIH Salt Holdings, Inc.: | | | |
| 4.875% 5/1/28 (c) | | 160,000 | 138,140 |
| 6.625% 5/1/29 (c) | | 45,000 | 37,720 |
| The Chemours Co. LLC: | | | |
| 4.625% 11/15/29 (c) | | 70,000 | 54,067 |
| 5.375% 5/15/27 | | 75,000 | 67,756 |
| 5.75% 11/15/28 (c) | | 230,000 | 194,522 |
| Tronox, Inc. 4.625% 3/15/29 (c) | | 55,000 | 43,325 |
| W.R. Grace Holding LLC: | | | |
| 4.875% 6/15/27 (c) | | 70,000 | 62,885 |
| 5.625% 8/15/29 (c) | | 70,000 | 54,250 |
| 7.375% 3/1/31 (c) | | 120,000 | 111,152 |
| | | | 2,722,132 |
| Consumer Products - 1.3% | | | |
| Central Garden & Pet Co. 4.125% 10/15/30 | | 35,000 | 28,546 |
| Ferrellgas LP/Ferrellgas Finance Corp. 5.875% 4/1/29 (c) | | 45,000 | 39,712 |
| Gannett Holdings LLC 6% 11/1/26 (c) | | 45,000 | 37,800 |
| Kernel Holding SA 6.75% 10/27/27 (c) | | 100,000 | 62,610 |
| Mattel, Inc. 3.375% 4/1/26 (c) | | 20,000 | 18,473 |
| Meituan 2.125% 10/28/25 (c) | | 200,000 | 184,186 |
| PetSmart, Inc. / PetSmart Finance Corp. 7.75% 2/15/29 (c) | | 75,000 | 69,048 |
| Prosus NV 4.027% 8/3/50 (c) | | 200,000 | 109,000 |
| Spectrum Brands Holdings, Inc. 4% 10/1/26 | EUR | 100,000 | 101,117 |
| Tempur Sealy International, Inc.: | | | |
| 3.875% 10/15/31 (c) | | 75,000 | 56,166 |
| 4% 4/15/29 (c) | | 60,000 | 49,224 |
| The Scotts Miracle-Gro Co. 4% 4/1/31 | | 40,000 | 29,756 |
| TKC Holdings, Inc.: | | | |
| 6.875% 5/15/28 (c) | | 50,000 | 43,250 |
| 10.5% 5/15/29 (c) | | 80,000 | 63,980 |
| Turkiye Sise ve Cam Fabrikalari A/S 6.95% 3/14/26 (c) | | 75,000 | 72,185 |
| | | | 965,053 |
| Containers - 0.7% | | | |
| ARD Finance SA: | | | |
| 5% 6/30/27 pay-in-kind (Reg. S) (e) | EUR | 100,000 | 61,350 |
| 6.5% 6/30/27 pay-in-kind (c)(e) | | 70,000 | 40,765 |
| Ardagh Packaging Finance PLC/Ardagh MP Holdings U.S.A., Inc. 2.125% 8/15/26 (Reg. S) | EUR | 200,000 | 182,281 |
| Ball Corp. 4.875% 3/15/26 | | 85,000 | 81,629 |
| Berry Global, Inc. 4.875% 7/15/26 (c) | | 40,000 | 38,168 |
| Graham Packaging Co., Inc. 7.125% 8/15/28 (c) | | 30,000 | 22,984 |
| Graphic Packaging International, Inc. 3.75% 2/1/30 (c) | | 35,000 | 28,617 |
| Trident Holdings, Inc. 12.75% 12/31/28 (c) | | 25,000 | 25,547 |
| | | | 481,341 |
| Diversified Financial Services - 4.6% | | | |
| Altice France Holding SA 4% 2/15/28 (Reg. S) | EUR | 175,000 | 81,204 |
| Broadstreet Partners, Inc. 5.875% 4/15/29 (c) | | 30,000 | 26,156 |
| Coinbase Global, Inc. 3.625% 10/1/31 (c) | | 185,000 | 125,775 |
| Emerald Debt Merger Sub LLC 6.625% 12/15/30 (c) | | 155,000 | 147,444 |
| FLY Leasing Ltd. 7% 10/15/24 (c) | | 105,000 | 96,493 |
| Fortune Star (BVI) Ltd. 6.85% 7/2/24 (Reg. S) | | 200,000 | 180,136 |
| Garfunkelux Holdco 3 SA 6.75% 11/1/25 (Reg. S) | EUR | 100,000 | 79,334 |
| GTCR W-2 Merger Sub LLC 7.5% 1/15/31 (c) | | 295,000 | 291,268 |
| Hightower Holding LLC 6.75% 4/15/29 (c) | | 25,000 | 21,324 |
| HTA Group Ltd. 7% 12/18/25 (c) | | 75,000 | 72,238 |
| Icahn Enterprises LP/Icahn Enterprises Finance Corp.: | | | |
| 4.375% 2/1/29 | | 165,000 | 127,053 |
| 4.75% 9/15/24 | | 90,000 | 86,319 |
| 5.25% 5/15/27 | | 400,000 | 342,500 |
| 6.375% 12/15/25 | | 295,000 | 277,543 |
| Liberty Costa Rica SR SF 10.875% 1/15/31 (c) | | 200,000 | 193,990 |
| MDGH GMTN RSC Ltd. 5.084% 5/22/53 (c) | | 200,000 | 165,750 |
| Motion Finco SARL 7.375% 6/15/30 (Reg. S) | EUR | 100,000 | 100,551 |
| OneMain Finance Corp.: | | | |
| 4% 9/15/30 | | 165,000 | 120,698 |
| 7.125% 3/15/26 | | 200,000 | 194,232 |
| Qtel International Finance Ltd. 2.625% 4/8/31 (c) | | 200,000 | 161,250 |
| Vedanta Resources Finance II PLC 8.95% 3/11/25 (Reg. S) | | 200,000 | 145,742 |
| Verisure Holding AB: | | | |
| 3.25% 2/15/27 (Reg. S) | EUR | 100,000 | 95,591 |
| 3.875% 7/15/26 (Reg. S) | EUR | 125,000 | 125,028 |
| Vivion Investments SARL 7.9% 8/31/28 pay-in-kind (Reg. S) (e) | EUR | 100,000 | 80,416 |
| Yihua Overseas Investment Ltd. 8.5% (Reg. S) (b)(d) | | 200,000 | 4,380 |
| | | | 3,342,415 |
| Diversified Media - 0.4% | | | |
| Allen Media LLC 10.5% 2/15/28 (c) | | 220,000 | 114,577 |
| Cmg Media Corp. 8.875% 12/15/27 (c) | | 220,000 | 169,950 |
| Lamar Media Corp. 4.875% 1/15/29 | | 45,000 | 41,259 |
| | | | 325,786 |
| Energy - 12.7% | | | |
| Antero Midstream Partners LP/Antero Midstream Finance Corp. 5.75% 3/1/27 (c) | | 140,000 | 133,808 |
| Archrock Partners LP / Archrock Partners Finance Corp. 6.25% 4/1/28 (c) | | 70,000 | 65,013 |
| Atlantica Sustainable Infrastructure PLC 4.125% 6/15/28 (c) | | 200,000 | 172,714 |
| Centennial Resource Production LLC 5.875% 7/1/29 (c) | | 80,000 | 74,400 |
| Citgo Petroleum Corp.: | | | |
| 6.375% 6/15/26 (c) | | 70,000 | 68,772 |
| 7% 6/15/25 (c) | | 130,000 | 127,741 |
| 8.375% 1/15/29 (c) | | 105,000 | 103,988 |
| CNX Resources Corp. 6% 1/15/29 (c) | | 25,000 | 22,924 |
| Comstock Resources, Inc.: | | | |
| 5.875% 1/15/30 (c) | | 50,000 | 42,751 |
| 6.75% 3/1/29 (c) | | 90,000 | 81,902 |
| Crestwood Midstream Partners LP/Crestwood Midstream Finance Corp. 6% 2/1/29 (c) | | 285,000 | 275,738 |
| CrownRock LP/CrownRock Finance, Inc. 5% 5/1/29 (c) | | 25,000 | 23,580 |
| CVR Energy, Inc.: | | | |
| 5.25% 2/15/25 (c) | | 140,000 | 137,336 |
| 5.75% 2/15/28 (c) | | 115,000 | 103,323 |
| DCP Midstream Operating LP 8.125% 8/16/30 | | 5,000 | 5,452 |
| Delek Logistics Partners LP 7.125% 6/1/28 (c) | | 45,000 | 40,950 |
| DT Midstream, Inc.: | | | |
| 4.125% 6/15/29 (c) | | 75,000 | 64,486 |
| 4.375% 6/15/31 (c) | | 75,000 | 62,284 |
| Ecopetrol SA 8.875% 1/13/33 | | 40,000 | 38,240 |
| EIG Pearl Holdings SARL 3.545% 8/31/36 (c) | | 80,000 | 62,200 |
| Endeavor Energy Resources LP/EER Finance, Inc. 5.75% 1/30/28 (c) | | 125,000 | 119,911 |
| Energean Israel Finance Ltd. 4.875% 3/30/26 (Reg. S) (c) | | 40,000 | 35,200 |
| EnfraGen Energia Sur SA 5.375% 12/30/30 (c) | | 200,000 | 132,374 |
| EnLink Midstream LLC 5.625% 1/15/28 (c) | | 25,000 | 23,573 |
| EQM Midstream Partners LP 6.5% 7/1/27 (c) | | 70,000 | 68,040 |
| EQT Corp. 3.625% 5/15/31 (c) | | 50,000 | 41,170 |
| FEL Energy VI SARL 5.75% 12/1/40 (c) | | 41,128 | 32,578 |
| Galaxy Pipeline Assets BidCo Ltd. 2.625% 3/31/36 (c) | | 85,000 | 63,538 |
| GeoPark Ltd. 5.5% 1/17/27 (c) | | 65,000 | 54,421 |
| Global Partners LP/GLP Finance Corp. 6.875% 1/15/29 | | 55,000 | 48,540 |
| Greenko Solar Mauritius Ltd. 5.55% 1/29/25 (Reg. S) | | 200,000 | 191,970 |
| Harvest Midstream I LP 7.5% 9/1/28 (c) | | 135,000 | 127,920 |
| Hess Midstream Partners LP: | | | |
| 4.25% 2/15/30 (c) | | 50,000 | 42,784 |
| 5.125% 6/15/28 (c) | | 80,000 | 73,869 |
| 5.5% 10/15/30 (c) | | 30,000 | 27,234 |
| 5.625% 2/15/26 (c) | | 100,000 | 96,844 |
| HPCL-Mittal Energy Ltd. 5.45% 10/22/26 (Reg. S) | | 200,000 | 188,488 |
| India Clean Energy Holdings 4.5% 4/18/27 (Reg. S) | | 200,000 | 162,086 |
| Indika Energy Capital IV Pte Ltd. 8.25% 10/22/25 (Reg. S) | | 250,000 | 246,943 |
| Investment Energy Resources Ltd. 6.25% 4/26/29 (c) | | 200,000 | 174,000 |
| Jonah Energy Parent LLC 12% 11/5/25 (b)(g) | | 80,399 | 82,513 |
| KLX Energy Services Holdings, Inc. 11.5% 11/1/25 (c) | | 95,000 | 93,880 |
| Kosmos Energy Ltd. 7.125% 4/4/26 (c) | | 160,000 | 147,086 |
| Leeward Renewable Energy LLC 4.25% 7/1/29 (c) | | 170,000 | 138,834 |
| Leviathan Bond Ltd. 6.125% 6/30/25 (Reg. S) (c) | | 150,000 | 138,870 |
| MC Brazil Downstream Trading SARL 7.25% 6/30/31 (c) | | 328,526 | 233,746 |
| Medco Oak Tree Pte Ltd.: | | | |
| 7.375% 5/14/26 (c) | | 200,000 | 197,782 |
| 7.375% 5/14/26 (Reg. S) | | 200,000 | 197,782 |
| MEG Energy Corp. 5.875% 2/1/29 (c) | | 110,000 | 102,793 |
| Nabors Industries, Inc. 5.75% 2/1/25 | | 105,000 | 101,850 |
| New Fortress Energy, Inc. 6.75% 9/15/25 (c) | | 55,000 | 51,025 |
| Northern Oil & Gas, Inc.: | | | |
| 8.125% 3/1/28 (c) | | 90,000 | 88,878 |
| 8.75% 6/15/31 (c) | | 50,000 | 49,747 |
| Nostrum Oil & Gas Finance BV: | | | |
| 5% 6/30/26 (c) | | 89,000 | 53,352 |
| 14% 6/30/26 pay-in-kind (c)(e) | | 45,255 | 11,350 |
| Occidental Petroleum Corp.: | | | |
| 5.5% 12/1/25 | | 35,000 | 34,544 |
| 5.875% 9/1/25 | | 40,000 | 39,861 |
| 6.375% 9/1/28 | | 70,000 | 70,445 |
| 6.6% 3/15/46 | | 55,000 | 52,960 |
| 6.625% 9/1/30 | | 90,000 | 90,275 |
| 6.95% 7/1/24 | | 31,000 | 31,130 |
| 7.5% 5/1/31 | | 125,000 | 131,074 |
| 8.875% 7/15/30 | | 60,000 | 66,628 |
| Oq Saoc 5.125% 5/6/28 (c) | | 200,000 | 188,750 |
| PBF Holding Co. LLC/PBF Finance Corp.: | | | |
| 6% 2/15/28 | | 70,000 | 64,351 |
| 7.875% 9/15/30 (c) | | 250,000 | 242,328 |
| Petroleos Mexicanos: | | | |
| 4.25% 1/15/25 | | 185,000 | 176,213 |
| 6.49% 1/23/27 | | 175,000 | 154,550 |
| 7.69% 1/23/50 | | 75,000 | 46,313 |
| Petrorio Luxembourg SARL 6.125% 6/9/26 (c) | | 100,000 | 94,563 |
| Renew Power Ltd. 5.875% 3/5/27 (Reg. S) | | 200,000 | 181,840 |
| Rio Oil Finance Trust 9.25% 7/6/24 (c) | | 13,007 | 13,073 |
| Saudi Arabian Oil Co.: | | | |
| 2.25% 11/24/30 (c) | | 200,000 | 156,750 |
| 3.25% 11/24/50 (c) | | 150,000 | 88,688 |
| 3.5% 4/16/29 (c) | | 125,000 | 111,094 |
| Seadrill Finance Ltd. 8.375% 8/1/30 (c) | | 20,000 | 20,006 |
| SM Energy Co.: | | | |
| 6.5% 7/15/28 | | 25,000 | 24,068 |
| 6.625% 1/15/27 | | 65,000 | 63,163 |
| Southwestern Energy Co.: | | | |
| 4.75% 2/1/32 | | 65,000 | 55,899 |
| 5.375% 2/1/29 | | 50,000 | 46,189 |
| Strathcona Resources Ltd. 6.875% 8/1/26 (c) | | 210,000 | 193,725 |
| Sunoco LP/Sunoco Finance Corp.: | | | |
| 4.5% 5/15/29 | | 50,000 | 43,312 |
| 6% 4/15/27 | | 175,000 | 168,506 |
| Tallgrass Energy Partners LP / Tallgrass Energy Finance Corp. 6% 12/31/30 (c) | | 55,000 | 46,301 |
| Tengizchevroil Finance Co. International Ltd. 3.25% 8/15/30 (c) | | 100,000 | 74,350 |
| Termocandelaria Power Ltd. 7.875% 1/30/29 (c) | | 155,000 | 145,320 |
| Transportadora de Gas del Sur SA 6.75% 5/2/25 (c) | | 70,000 | 64,199 |
| Tullow Oil PLC: | | | |
| 7% 3/1/25 (c) | | 200,000 | 155,750 |
| 10.25% 5/15/26 (c) | | 358,000 | 306,761 |
| U.S.A. Compression Partners LP 6.875% 4/1/26 | | 35,000 | 33,989 |
| Venture Global Calcasieu Pass LLC: | | | |
| 3.875% 8/15/29 (c) | | 70,000 | 58,252 |
| 6.25% 1/15/30 (c) | | 155,000 | 146,220 |
| YPF SA 8.5% 3/23/25 (c) | | 101,625 | 93,290 |
| | | | 9,123,303 |
| Entertainment/Film - 0.1% | | | |
| Live Nation Entertainment, Inc. 4.75% 10/15/27 (c) | | 80,000 | 73,105 |
| Environmental - 0.4% | | | |
| Clean Harbors, Inc. 6.375% 2/1/31 (c) | | 20,000 | 19,009 |
| Covanta Holding Corp. 4.875% 12/1/29 (c) | | 40,000 | 31,200 |
| Madison IAQ LLC: | | | |
| 4.125% 6/30/28 (c) | | 55,000 | 45,951 |
| 5.875% 6/30/29 (c) | | 85,000 | 65,844 |
| Paprec Holding SA 4% 3/31/25 | EUR | 100,000 | 104,189 |
| Stericycle, Inc. 3.875% 1/15/29 (c) | | 35,000 | 29,738 |
| | | | 295,931 |
| Food & Drug Retail - 1.0% | | | |
| Albertsons Companies LLC/Safeway, Inc./New Albertson's, Inc./Albertson's LLC: | | | |
| 3.5% 3/15/29 (c) | | 35,000 | 29,841 |
| 4.625% 1/15/27 (c) | | 95,000 | 89,035 |
| 4.875% 2/15/30 (c) | | 275,000 | 245,524 |
| BellRing Brands, Inc. 7% 3/15/30 (c) | | 25,000 | 24,281 |
| Camposol SA 6% 2/3/27 (c) | | 200,000 | 117,254 |
| Casino Guichard Perrachon SA 4.048% (Reg. S) (d)(e) | EUR | 100,000 | 1,057 |
| Emergent BioSolutions, Inc. 3.875% 8/15/28 (c) | | 30,000 | 11,797 |
| Iceland Bondco PLC 3 month EURIBOR EURO INTER + 5.500% 9.254% 12/15/27 (Reg. S) (e)(f) | EUR | 100,000 | 104,752 |
| Murphy Oil U.S.A., Inc. 3.75% 2/15/31 (c) | | 25,000 | 20,084 |
| SEG Holding LLC/SEG Finance Corp. 5.625% 10/15/28 (c) | | 100,000 | 100,173 |
| | | | 743,798 |
| Food/Beverage/Tobacco - 2.0% | | | |
| Adecoagro SA 6% 9/21/27 (c) | | 100,000 | 92,427 |
| C&S Group Enterprises LLC 5% 12/15/28 (c) | | 40,000 | 30,950 |
| Central American Bottling Corp. 5.25% 4/27/29 (c) | | 200,000 | 175,674 |
| Chobani LLC/Finance Corp., Inc.: | | | |
| 4.625% 11/15/28 (c) | | 30,000 | 25,937 |
| 7.5% 4/15/25 (c) | | 15,000 | 14,737 |
| JBS U.S.A. Lux SA / JBS Food Co. 5.5% 1/15/30 | | 120,000 | 109,665 |
| KeHE Distributors LLC / KeHE Finance Corp. 8.625% 10/15/26 (c) | | 48,000 | 48,000 |
| Kraft Heinz Foods Co. 5.5% 6/1/50 | | 25,000 | 21,587 |
| Lamb Weston Holdings, Inc. 4.125% 1/31/30 (c) | | 70,000 | 59,383 |
| MARB BondCo PLC 3.95% 1/29/31 (c) | | 100,000 | 72,750 |
| MHP SA 7.75% 5/10/24 (c) | | 100,000 | 91,000 |
| NBM U.S. Holdings, Inc. 6.625% 8/6/29 (c) | | 65,000 | 58,017 |
| Performance Food Group, Inc.: | | | |
| 4.25% 8/1/29 (c) | | 40,000 | 33,751 |
| 5.5% 10/15/27 (c) | | 100,000 | 93,507 |
| Post Holdings, Inc. 4.625% 4/15/30 (c) | | 34,000 | 28,471 |
| TreeHouse Foods, Inc. 4% 9/1/28 | | 20,000 | 16,259 |
| Triton Water Holdings, Inc. 6.25% 4/1/29 (c) | | 145,000 | 119,507 |
| U.S. Foods, Inc.: | | | |
| 4.625% 6/1/30 (c) | | 35,000 | 29,887 |
| 4.75% 2/15/29 (c) | | 80,000 | 70,573 |
| 6.875% 9/15/28 (c) | | 150,000 | 146,605 |
| 7.25% 1/15/32 (c) | | 50,000 | 49,082 |
| United Natural Foods, Inc. 6.75% 10/15/28 (c) | | 40,000 | 31,475 |
| | | | 1,419,244 |
| Gaming - 3.2% | | | |
| Affinity Gaming LLC 6.875% 12/15/27 (c) | | 20,000 | 16,302 |
| Allwyn Entertainment Financing (UK) PLC 7.25% 4/30/30 (Reg. S) | EUR | 100,000 | 105,016 |
| Caesars Entertainment, Inc.: | | | |
| 4.625% 10/15/29 (c) | | 90,000 | 73,964 |
| 6.25% 7/1/25 (c) | | 110,000 | 108,228 |
| CDI Escrow Issuer, Inc. 5.75% 4/1/30 (c) | | 135,000 | 120,610 |
| Cirsa Finance International SARL: | | | |
| 4.5% 3/15/27 (Reg. S) | EUR | 100,000 | 95,854 |
| 7.875% 7/31/28 (Reg. S) | EUR | 100,000 | 105,089 |
| 10.375% 11/30/27 (Reg. S) | EUR | 100,000 | 112,688 |
| Fertitta Entertainment LLC / Fertitta Entertainment Finance Co., Inc.: | | | |
| 4.625% 1/15/29 (c) | | 90,000 | 75,630 |
| 6.75% 1/15/30 (c) | | 45,000 | 35,764 |
| GENM Capital Labuan Ltd. 3.882% 4/19/31 (c) | | 200,000 | 152,028 |
| GLP Capital LP/GLP Financing II, Inc.: | | | |
| 5.25% 6/1/25 | | 95,000 | 92,662 |
| 5.375% 4/15/26 | | 30,000 | 28,752 |
| Jacobs Entertainment, Inc. 6.75% 2/15/29 (c) | | 40,000 | 34,000 |
| Melco Resorts Finance Ltd. 5.375% 12/4/29 (Reg. S) | | 200,000 | 158,349 |
| MGM China Holdings Ltd. 4.75% 2/1/27 (Reg. S) | | 200,000 | 174,985 |
| Scientific Games Corp. 7.5% 9/1/31 (c) | | 35,000 | 34,175 |
| Station Casinos LLC 4.625% 12/1/31 (c) | | 115,000 | 90,799 |
| Studio City Finance Ltd.: | | | |
| 6.5% 1/15/28 (c) | | 110,000 | 89,827 |
| 6.5% 1/15/28 (Reg. S) | | 200,000 | 163,322 |
| VICI Properties LP / VICI Note Co. 5.75% 2/1/27 (c) | | 70,000 | 66,991 |
| Wynn Macau Ltd. 5.125% 12/15/29 (Reg. S) | | 250,000 | 194,840 |
| Wynn Resorts Finance LLC / Wynn Resorts Capital Corp. 7.125% 2/15/31 (c) | | 150,000 | 139,683 |
| | | | 2,269,558 |
| Healthcare - 4.4% | | | |
| 1375209 BC Ltd. 9% 1/30/28 (c) | | 14,000 | 13,571 |
| AHP Health Partners, Inc. 5.75% 7/15/29 (c) | | 80,000 | 65,600 |
| Avantor Funding, Inc. 3.875% 11/1/29 (c) | | 70,000 | 58,586 |
| Bausch Health Companies, Inc.: | | | |
| 11% 9/30/28 (c) | | 25,000 | 15,250 |
| 14% 10/15/30 (c) | | 4,000 | 2,154 |
| Centene Corp.: | | | |
| 3.375% 2/15/30 | | 160,000 | 132,296 |
| 4.625% 12/15/29 | | 105,000 | 93,792 |
| Charles River Laboratories International, Inc.: | | | |
| 3.75% 3/15/29 (c) | | 20,000 | 16,881 |
| 4% 3/15/31 (c) | | 55,000 | 44,891 |
| Community Health Systems, Inc.: | | | |
| 4.75% 2/15/31 (c) | | 75,000 | 50,268 |
| 5.25% 5/15/30 (c) | | 155,000 | 110,074 |
| 6% 1/15/29 (c) | | 140,000 | 106,050 |
| 6.125% 4/1/30 (c) | | 170,000 | 65,875 |
| 6.875% 4/15/29 (c) | | 75,000 | 30,968 |
| 8% 3/15/26 (c) | | 95,000 | 86,835 |
| DaVita HealthCare Partners, Inc.: | | | |
| 3.75% 2/15/31 (c) | | 60,000 | 43,128 |
| 4.625% 6/1/30 (c) | | 80,000 | 62,697 |
| Encompass Health Corp. 5.75% 9/15/25 | | 15,000 | 14,582 |
| Grifols SA: | | | |
| 3.875% 10/15/28 (Reg. S) | EUR | 100,000 | 88,028 |
| 4.75% 10/15/28 (c) | | 200,000 | 167,500 |
| HealthEquity, Inc. 4.5% 10/1/29 (c) | | 30,000 | 25,698 |
| Hologic, Inc. 3.25% 2/15/29 (c) | | 55,000 | 46,174 |
| Jazz Securities DAC 4.375% 1/15/29 (c) | | 55,000 | 47,832 |
| Molina Healthcare, Inc.: | | | |
| 3.875% 11/15/30 (c) | | 50,000 | 40,781 |
| 3.875% 5/15/32 (c) | | 100,000 | 78,576 |
| 4.375% 6/15/28 (c) | | 40,000 | 35,601 |
| Nidda Healthcare Holding AG 7.5% 8/21/26 (Reg. S) | EUR | 200,000 | 211,649 |
| Organon & Co. / Organon Foreign Debt Co-Issuer BV: | | | |
| 2.875% 4/30/28 (Reg. S) | EUR | 147,000 | 134,152 |
| 4.125% 4/30/28 (c) | | 80,000 | 69,101 |
| 5.125% 4/30/31 (c) | | 80,000 | 62,473 |
| RP Escrow Issuer LLC 5.25% 12/15/25 (c) | | 50,000 | 35,625 |
| Surgery Center Holdings, Inc.: | | | |
| 6.75% 7/1/25 (c) | | 16,000 | 15,660 |
| 10% 4/15/27 (c) | | 40,000 | 39,927 |
| Teleflex, Inc. 4.625% 11/15/27 | | 30,000 | 27,450 |
| Tenet Healthcare Corp.: | | | |
| 4.25% 6/1/29 | | 130,000 | 111,250 |
| 4.375% 1/15/30 | | 210,000 | 177,641 |
| 6.125% 10/1/28 | | 210,000 | 194,775 |
| 6.25% 2/1/27 | | 195,000 | 186,995 |
| 6.875% 11/15/31 | | 10,000 | 9,219 |
| Teva Pharmaceutical Finance Netherlands III BV: | | | |
| 1.625% 10/15/28 (Reg. S) | EUR | 100,000 | 82,477 |
| 3.15% 10/1/26 | | 75,000 | 66,032 |
| 4.1% 10/1/46 | | 200,000 | 119,739 |
| 7.875% 9/15/29 | | 100,000 | 98,607 |
| | | | 3,186,460 |
| Homebuilders/Real Estate - 1.9% | | | |
| Adler Financing SARL 12.5% 6/30/25 pay-in-kind (e) | EUR | 25,000 | 27,907 |
| Arcosa, Inc. 4.375% 4/15/29 (c) | | 40,000 | 34,900 |
| Ashton Woods U.S.A. LLC/Ashton Woods Finance Co.: | | | |
| 4.625% 8/1/29 (c) | | 40,000 | 32,367 |
| 6.625% 1/15/28 (c) | | 5,000 | 4,575 |
| China Aoyuan Group Ltd. 6.2% (Reg. S) (d) | | 200,000 | 2,000 |
| Easy Tactic Ltd. 7.5% 7/11/28 pay-in-kind (e) | | 224,177 | 8,972 |
| GMR Hyderabad International Airport Ltd. 4.75% 2/2/26 (Reg. S) | | 200,000 | 187,130 |
| Greensaif Pipelines Bidco SARL 6.129% 2/23/38 (c) | | 70,000 | 65,100 |
| Greentown China Holdings Ltd. 4.7% 4/29/25 (Reg. S) | | 200,000 | 140,716 |
| Kennedy-Wilson, Inc.: | | | |
| 4.75% 3/1/29 | | 55,000 | 41,388 |
| 5% 3/1/31 | | 55,000 | 39,463 |
| Modernland Overseas Pte Ltd.: | | | |
| 3% 4/30/27 pay-in-kind (Reg. S) (b)(e) | | 6,115 | 550 |
| 4% 4/30/27 pay-in-kind (e) | | 106,828 | 10,683 |
| New Home Co., Inc. 8.25% 10/15/27 (c)(h) | | 30,000 | 27,342 |
| RKPF Overseas 2020 A Ltd. 5.125% 7/26/26 (Reg. S) | | 200,000 | 57,380 |
| Starwood Property Trust, Inc. 4.75% 3/15/25 | | 75,000 | 71,767 |
| Taylor Morrison Communities, Inc./Monarch Communities, Inc.: | | | |
| 5.75% 1/15/28 (c) | | 80,000 | 72,612 |
| 5.875% 6/15/27 (c) | | 55,000 | 51,563 |
| TRI Pointe Homes, Inc. 5.7% 6/15/28 | | 15,000 | 13,355 |
| Uniti Group LP / Uniti Group Finance, Inc.: | | | |
| 4.75% 4/15/28 (c) | | 55,000 | 44,449 |
| 6.5% 2/15/29 (c) | | 85,000 | 55,200 |
| 10.5% 2/15/28 (c) | | 110,000 | 105,925 |
| VICI Properties LP / VICI Note Co. 3.75% 2/15/27 (c) | | 205,000 | 184,464 |
| Weekley Homes LLC/Weekley Finance Corp. 4.875% 9/15/28 (c) | | 25,000 | 21,469 |
| Yango Justice International Ltd.: | | | |
| 8.25% (Reg. S) (d) | | 220,000 | 550 |
| 10% (Reg. S) (d) | | 200,000 | 1,002 |
| Yanlord Land Group Ltd. 5.125% 5/20/26 (Reg. S) | | 200,000 | 99,416 |
| | | | 1,402,245 |
| Hotels - 0.6% | | | |
| Carnival Holdings (Bermuda) Ltd. 10.375% 5/1/28 (c) | | 125,000 | 133,277 |
| Hilton Domestic Operating Co., Inc.: | | | |
| 3.625% 2/15/32 (c) | | 40,000 | 31,619 |
| 3.75% 5/1/29 (c) | | 35,000 | 30,128 |
| Lindblad Expeditions Holdings 9% 5/15/28 (c) | | 185,000 | 177,961 |
| Lindblad Expeditions LLC 6.75% 2/15/27 (c) | | 65,000 | 59,236 |
| | | | 432,221 |
| Insurance - 1.7% | | | |
| Acrisure LLC / Acrisure Finance, Inc.: | | | |
| 7% 11/15/25 (c) | | 250,000 | 242,384 |
| 10.125% 8/1/26 (c) | | 35,000 | 35,223 |
| Alliant Holdings Intermediate LLC: | | | |
| 5.875% 11/1/29 (c) | | 190,000 | 157,745 |
| 6.75% 10/15/27 (c) | | 225,000 | 205,484 |
| AmWINS Group, Inc. 4.875% 6/30/29 (c) | | 40,000 | 34,242 |
| AssuredPartners, Inc. 5.625% 1/15/29 (c) | | 30,000 | 25,450 |
| HUB International Ltd.: | | | |
| 5.625% 12/1/29 (c) | | 60,000 | 51,673 |
| 7% 5/1/26 (c) | | 190,000 | 184,948 |
| MGIC Investment Corp. 5.25% 8/15/28 | | 40,000 | 36,767 |
| USI, Inc. 6.875% 5/1/25 (c) | | 275,000 | 272,487 |
| | | | 1,246,403 |
| Leisure - 1.7% | | | |
| Carnival Corp.: | | | |
| 5.75% 3/1/27 (c) | | 135,000 | 120,793 |
| 7.625% 3/1/26 (Reg. S) | EUR | 100,000 | 103,667 |
| 9.875% 8/1/27 (c) | | 210,000 | 218,883 |
| NCL Corp. Ltd.: | | | |
| 5.875% 3/15/26 (c) | | 20,000 | 17,950 |
| 7.75% 2/15/29 (c) | | 80,000 | 69,823 |
| NCL Finance Ltd. 6.125% 3/15/28 (c) | | 25,000 | 20,906 |
| Royal Caribbean Cruises Ltd.: | | | |
| 4.25% 7/1/26 (c) | | 130,000 | 119,574 |
| 5.375% 7/15/27 (c) | | 60,000 | 55,295 |
| 5.5% 8/31/26 (c) | | 135,000 | 127,397 |
| 7.25% 1/15/30 (c) | | 45,000 | 44,391 |
| 11.625% 8/15/27 (c) | | 220,000 | 238,646 |
| Vail Resorts, Inc. 6.25% 5/15/25 (c) | | 35,000 | 34,784 |
| Viking Cruises Ltd. 9.125% 7/15/31 (c) | | 25,000 | 24,563 |
| | | | 1,196,672 |
| Metals/Mining - 3.2% | | | |
| Abja Investment Co. Pte Ltd. 5.45% 1/24/28 | | 200,000 | 192,556 |
| Alcoa Nederland Holding BV 4.125% 3/31/29 (c) | | 70,000 | 60,965 |
| Alpha Natural Resources, Inc. 9.75% (b)(d) | | 210,000 | 0 |
| Antofagasta PLC 2.375% 10/14/30 (c) | | 200,000 | 150,700 |
| Arsenal AIC Parent LLC 8% 10/1/30 (c) | | 30,000 | 29,625 |
| Cleveland-Cliffs, Inc. 4.875% 3/1/31 (c) | | 40,000 | 32,993 |
| Endeavour Mining PLC 5% 10/14/26 (c) | | 100,000 | 87,611 |
| ERO Copper Corp. 6.5% 2/15/30 (c) | | 365,000 | 309,626 |
| First Quantum Minerals Ltd.: | | | |
| 6.875% 3/1/26 (c) | | 50,000 | 43,863 |
| 6.875% 10/15/27 (c) | | 75,000 | 63,188 |
| FMG Resources Pty Ltd.: | | | |
| 4.375% 4/1/31 (c) | | 40,000 | 32,242 |
| 5.875% 4/15/30 (c) | | 130,000 | 116,667 |
| Gcm Mining Corp. 6.875% 8/9/26 (c) | | 200,000 | 164,000 |
| HudBay Minerals, Inc. 6.125% 4/1/29 (c) | | 105,000 | 93,955 |
| Industrias Penoles SA de CV 4.75% 8/6/50 (c) | | 200,000 | 138,484 |
| Mineral Resources Ltd.: | | | |
| 8% 11/1/27 (c) | | 85,000 | 82,135 |
| 8.5% 5/1/30 (c) | | 20,000 | 19,231 |
| Minsur SA 4.5% 10/28/31 (c) | | 50,000 | 40,400 |
| Nexa Resources SA 6.5% 1/18/28 (c) | | 200,000 | 186,750 |
| Novelis Corp. 3.875% 8/15/31 (c) | | 115,000 | 89,815 |
| PT Freeport Indonesia 5.315% 4/14/32 (c) | | 200,000 | 177,652 |
| Stillwater Mining Co.: | | | |
| 4% 11/16/26 (c) | | 140,000 | 120,400 |
| 4.5% 11/16/29 (c) | | 65,000 | 49,238 |
| Volcan Compania Minera SAA 4.375% 2/11/26 (c) | | 95,000 | 44,964 |
| | | | 2,327,060 |
| Paper - 0.4% | | | |
| Berry Global, Inc. 5.625% 7/15/27 (c) | | 35,000 | 33,408 |
| Clydesdale Acquisition Holdings, Inc.: | | | |
| 6.625% 4/15/29 (c) | | 35,000 | 31,794 |
| 8.75% 4/15/30 (c) | | 200,000 | 159,416 |
| Mercer International, Inc. 5.125% 2/1/29 | | 55,000 | 43,127 |
| SPA Holdings 3 OY 4.875% 2/4/28 (c) | | 45,000 | 36,712 |
| | | | 304,457 |
| Restaurants - 0.9% | | | |
| 1011778 BC Unlimited Liability Co./New Red Finance, Inc. 4% 10/15/30 (c) | | 160,000 | 131,044 |
| Bimbo Bakeries U.S.A., Inc. 6.4% 1/15/34 (b)(c) | | 200,000 | 200,020 |
| CEC Entertainment LLC 6.75% 5/1/26 (c) | | 60,000 | 56,036 |
| Papa John's International, Inc. 3.875% 9/15/29 (c) | | 25,000 | 20,511 |
| Yum! Brands, Inc.: | | | |
| 4.625% 1/31/32 | | 70,000 | 59,649 |
| 4.75% 1/15/30 (c) | | 200,000 | 178,042 |
| | | | 645,302 |
| Services - 3.5% | | | |
| Allied Universal Holdco LLC / Allied Universal Finance Corp. 6% 6/1/29 (c) | | 30,000 | 21,675 |
| ASGN, Inc. 4.625% 5/15/28 (c) | | 160,000 | 141,678 |
| Atlas Luxco 4 SARL / Allied Universal Holdco LLC / Allied Universal Finance Corp. 4.625% 6/1/28 (c) | | 38,000 | 30,959 |
| Avis Budget Car Rental LLC/Avis Budget Finance, Inc. 5.375% 3/1/29 (c) | | 40,000 | 34,267 |
| Booz Allen Hamilton, Inc. 4% 7/1/29 (c) | | 30,000 | 26,475 |
| Brand Energy & Infrastructure Services, Inc. 10.375% 8/1/30 (c) | | 155,000 | 153,838 |
| CoreCivic, Inc. 8.25% 4/15/26 | | 45,000 | 45,559 |
| CoreLogic, Inc. 4.5% 5/1/28 (c) | | 125,000 | 99,063 |
| GEMS MENASA Cayman Ltd. 7.125% 7/31/26 (c) | | 520,000 | 497,894 |
| H&E Equipment Services, Inc. 3.875% 12/15/28 (c) | | 90,000 | 76,233 |
| Hertz Corp.: | | | |
| 4.625% 12/1/26 (c) | | 55,000 | 46,069 |
| 5% 12/1/29 (c) | | 70,000 | 50,253 |
| 5.5% (b)(c)(d) | | 65,000 | 2,275 |
| 6% (b)(c)(d) | | 85,000 | 4,994 |
| 6.25% (b)(d) | | 60,000 | 2,100 |
| 7.125% (b)(c)(d) | | 85,000 | 7,438 |
| IPD BV 8% 6/15/28 (Reg. S) | EUR | 100,000 | 106,464 |
| Koc Holding A/S 6.5% 3/11/25 (c) | | 35,000 | 34,563 |
| Legends Hospitality Holding Co. LLC/Legends Hospitality Co-Issuer, Inc. 5% 2/1/26 (c) | | 35,000 | 33,379 |
| PeopleCert Wisdom Issuer PLC 5.75% 9/15/26 (Reg. S) | EUR | 114,000 | 115,524 |
| Sabre GLBL, Inc. 7.375% 9/1/25 (c) | | 60,000 | 53,808 |
| Service Corp. International 5.125% 6/1/29 | | 35,000 | 32,025 |
| The Bidvest Group UK PLC 3.625% 9/23/26 (c) | | 75,000 | 66,375 |
| The GEO Group, Inc.: | | | |
| 9.5% 12/31/28 (c) | | 170,000 | 163,625 |
| 10.5% 6/30/28 | | 67,000 | 66,833 |
| Uber Technologies, Inc.: | | | |
| 4.5% 8/15/29 (c) | | 485,000 | 427,738 |
| 6.25% 1/15/28 (c) | | 100,000 | 96,250 |
| 7.5% 9/15/27 (c) | | 90,000 | 90,226 |
| WASH Multifamily Acquisition, Inc. 5.75% 4/15/26 (c) | | 45,000 | 41,625 |
| | | | 2,569,205 |
| Steel - 1.2% | | | |
| Commercial Metals Co. 3.875% 2/15/31 | | 30,000 | 24,318 |
| CSN Islands XI Corp. 6.75% 1/28/28 (c) | | 50,000 | 45,735 |
| CSN Resources SA: | | | |
| 5.875% 4/8/32 (c) | | 40,000 | 31,500 |
| 7.625% 4/17/26 (c) | | 15,000 | 14,841 |
| JSW Steel Ltd.: | | | |
| 3.95% 4/5/27 (c) | | 100,000 | 85,625 |
| 5.375% 4/4/25 (Reg. S) | | 200,000 | 193,278 |
| Metinvest BV 5.625% 6/17/25 (Reg. S) | EUR | 100,000 | 82,003 |
| Roller Bearing Co. of America, Inc. 4.375% 10/15/29 (c) | | 20,000 | 16,960 |
| TMK Capital SA 4.3% (Reg. S) (b)(d) | | 200,000 | 126,500 |
| Vallourec SA 8.5% 6/30/26 (Reg. S) | EUR | 200,000 | 211,355 |
| | | | 832,115 |
| Super Retail - 1.2% | | | |
| Academy Ltd. 6% 11/15/27 (c) | | 75,000 | 70,604 |
| Asbury Automotive Group, Inc.: | | | |
| 4.5% 3/1/28 | | 21,000 | 18,607 |
| 4.625% 11/15/29 (c) | | 45,000 | 38,065 |
| 4.75% 3/1/30 | | 20,000 | 16,972 |
| 5% 2/15/32 (c) | | 45,000 | 36,498 |
| Bath & Body Works, Inc. 6.625% 10/1/30 (c) | | 110,000 | 101,838 |
| Carvana Co.: | | | |
| 9% 12/1/28 pay-in-kind (c)(e) | | 9,000 | 6,697 |
| 9% 6/1/30 pay-in-kind (c)(e) | | 13,000 | 9,620 |
| 9% 6/1/31 pay-in-kind (c)(e) | | 16,000 | 11,920 |
| EG Global Finance PLC: | | | |
| 6.75% 2/7/25 (c) | | 231,000 | 228,551 |
| 8.5% 10/30/25 (c) | | 47,000 | 46,236 |
| Group 1 Automotive, Inc. 4% 8/15/28 (c) | | 200,000 | 172,149 |
| Macy's Retail Holdings LLC 6.125% 3/15/32 (c) | | 35,000 | 28,905 |
| Michaels Companies, Inc.: | | | |
| 5.25% 5/1/28 (c) | | 65,000 | 47,096 |
| 7.875% 5/1/29 (c) | | 95,000 | 52,963 |
| | | | 886,721 |
| Technology - 4.0% | | | |
| Acuris Finance U.S. 5% 5/1/28 (c) | | 170,000 | 133,875 |
| Athenahealth Group, Inc. 6.5% 2/15/30 (c) | | 175,000 | 143,018 |
| Black Knight InfoServ LLC 3.625% 9/1/28 (c) | | 60,000 | 53,400 |
| Block, Inc.: | | | |
| 2.75% 6/1/26 | | 75,000 | 67,302 |
| 3.5% 6/1/31 | | 75,000 | 57,882 |
| Boxer Parent Co., Inc. 9.125% 3/1/26 (c) | | 5,000 | 4,969 |
| CA Magnum Holdings 5.375% 10/31/26 (c) | | 400,000 | 348,344 |
| Camelot Finance SA 4.5% 11/1/26 (c) | | 150,000 | 138,658 |
| Cloud Software Group, Inc. 9% 9/30/29 (c) | | 185,000 | 157,543 |
| Coherent Corp. 5% 12/15/29 (c) | | 45,000 | 38,186 |
| Crowdstrike Holdings, Inc. 3% 2/15/29 | | 70,000 | 58,511 |
| Elastic NV 4.125% 7/15/29 (c) | | 40,000 | 33,711 |
| Iliad Holding SAS 5.625% 10/15/28 (Reg. S) | EUR | 100,000 | 99,683 |
| Iliad SA 5.375% 6/14/27 (Reg. S) | EUR | 200,000 | 208,360 |
| Lenovo Group Ltd. 3.421% 11/2/30 (c) | | 200,000 | 160,188 |
| Match Group Holdings II LLC 4.125% 8/1/30 (c) | | 100,000 | 81,253 |
| MicroStrategy, Inc. 6.125% 6/15/28 (c) | | 235,000 | 212,675 |
| NCR Atleos Escrow Corp. 9.5% 4/1/29 (c) | | 100,000 | 98,023 |
| NCR Corp. 5.125% 4/15/29 (c) | | 45,000 | 38,696 |
| Northwest Fiber LLC/Northwest Fiber Finance Sub, Inc. 10.75% 6/1/28 (c) | | 30,000 | 28,597 |
| Open Text Holdings, Inc. 4.125% 2/15/30 (c) | | 200,000 | 165,720 |
| Qorvo, Inc. 4.375% 10/15/29 | | 45,000 | 39,072 |
| Rackspace Hosting, Inc.: | | | |
| 3.5% 2/15/28 (c) | | 100,000 | 43,834 |
| 5.375% 12/1/28 (c) | | 30,000 | 8,773 |
| Roblox Corp. 3.875% 5/1/30 (c) | | 185,000 | 150,111 |
| Seagate HDD Cayman: | | | |
| 8.25% 12/15/29 (c) | | 45,000 | 45,730 |
| 8.5% 7/15/31 (c) | | 40,000 | 40,703 |
| Sensata Technologies BV 4% 4/15/29 (c) | | 65,000 | 55,285 |
| Synaptics, Inc. 4% 6/15/29 (c) | | 30,000 | 24,750 |
| TTM Technologies, Inc. 4% 3/1/29 (c) | | 60,000 | 49,199 |
| VMED O2 UK Financing I PLC 3.25% 1/31/31 (Reg. S) | EUR | 100,000 | 87,172 |
| | | | 2,873,223 |
| Telecommunications - 5.4% | | | |
| Altice France Holding SA 6% 2/15/28 (c) | | 75,000 | 32,892 |
| Altice France SA: | | | |
| 5.125% 1/15/29 (c) | | 50,000 | 34,515 |
| 5.125% 7/15/29 (c) | | 120,000 | 82,164 |
| 5.5% 1/15/28 (c) | | 130,000 | 96,594 |
| AXIAN Telecom 7.375% 2/16/27 (c) | | 200,000 | 177,225 |
| C&W Senior Financing Designated Activity Co. 6.875% 9/15/27 (c) | | 330,000 | 282,084 |
| Cellnex Telecom SA 1.75% 10/23/30 (Reg. S) | EUR | 100,000 | 84,728 |
| Consolidated Communications, Inc. 5% 10/1/28 (c) | | 135,000 | 101,697 |
| CT Trust 5.125% 2/3/32 (c) | | 200,000 | 153,000 |
| Digicel Group Ltd. 6.75% (c)(d) | | 150,000 | 3,000 |
| Frontier Communications Holdings LLC: | | | |
| 5% 5/1/28 (c) | | 55,000 | 47,486 |
| 5.875% 10/15/27 (c) | | 50,000 | 45,583 |
| 5.875% 11/1/29 | | 14,771 | 11,102 |
| 6% 1/15/30 (c) | | 95,000 | 71,510 |
| 8.75% 5/15/30 (c) | | 65,000 | 61,929 |
| IHS Netherlands Holdco BV 8% 9/18/27 (c) | | 200,000 | 163,150 |
| Intelsat Jackson Holdings SA: | | | |
| 5.5% (b)(d) | | 200,000 | 0 |
| 6.5% 3/15/30 (c) | | 135,000 | 118,534 |
| 8.5% (b)(c)(d) | | 45,000 | 0 |
| LCPR Senior Secured Financing DAC: | | | |
| 5.125% 7/15/29 (c) | | 400,000 | 311,605 |
| 6.75% 10/15/27 (c) | | 90,000 | 81,195 |
| Level 3 Financing, Inc.: | | | |
| 3.75% 7/15/29 (c) | | 95,000 | 48,299 |
| 4.25% 7/1/28 (c) | | 75,000 | 42,410 |
| Liquid Telecommunications Financing PLC 5.5% 9/4/26 (c) | | 200,000 | 121,458 |
| Lorca Telecom Bondco SAU 4% 9/18/27 (Reg. S) | EUR | 100,000 | 98,081 |
| Millicom International Cellular SA 4.5% 4/27/31 (c) | | 200,000 | 149,060 |
| Northwest Fiber LLC/Northwest Fiber Finance Sub, Inc.: | | | |
| 4.75% 4/30/27 (c) | | 50,000 | 44,625 |
| 6% 2/15/28 (c) | | 20,000 | 16,500 |
| Sable International Finance Ltd. 5.75% 9/7/27 (c) | | 180,000 | 161,125 |
| Sabre GLBL, Inc. 9.25% 4/15/25 (c) | | 6,000 | 5,696 |
| SBA Communications Corp.: | | | |
| 3.125% 2/1/29 | | 100,000 | 82,680 |
| 3.875% 2/15/27 | | 200,000 | 182,139 |
| Telefonica Celular del Paraguay SA 5.875% 4/15/27 (c) | | 200,000 | 180,300 |
| Turkcell Iletisim Hizmet A/S 5.8% 4/11/28 (c) | | 200,000 | 181,000 |
| Uniti Group, Inc. 6% 1/15/30 (c) | | 210,000 | 127,319 |
| VTR Comunicaciones SpA 5.125% 1/15/28 (c) | | 176,000 | 77,000 |
| Windstream Escrow LLC 7.75% 8/15/28 (c) | | 200,000 | 158,597 |
| WP/AP Telecom Holdings IV BV 3.75% 1/15/29 (Reg. S) | EUR | 100,000 | 91,208 |
| Zayo Group Holdings, Inc.: | | | |
| 4% 3/1/27 (c) | | 115,000 | 86,554 |
| 6.125% 3/1/28 (c) | | 60,000 | 39,747 |
| | | | 3,853,791 |
| Textiles/Apparel - 0.4% | | | |
| Crocs, Inc.: | | | |
| 4.125% 8/15/31 (c) | | 115,000 | 87,395 |
| 4.25% 3/15/29 (c) | | 55,000 | 45,100 |
| CT Investment GmbH 5.5% 4/15/26 (Reg. S) | EUR | 100,000 | 98,942 |
| Victoria's Secret & Co. 4.625% 7/15/29 (c) | | 50,000 | 36,757 |
| | | | 268,194 |
| Transportation Ex Air/Rail - 0.3% | | | |
| Great Lakes Dredge & Dock Corp. 5.25% 6/1/29 (c) | | 40,000 | 32,700 |
| Mersin Uluslararasi Liman Isletmeciligi A/S 5.375% 11/15/24 (c) | | 100,000 | 97,353 |
| Seaspan Corp. 5.5% 8/1/29 (c) | | 110,000 | 84,388 |
| | | | 214,441 |
| Utilities - 4.2% | | | |
| Abu Dhabi National Energy Co. PJSC 4.696% 4/24/33 (c) | | 200,000 | 183,500 |
| Aegea Finance SARL 9% 1/20/31 (c) | | 200,000 | 199,500 |
| Clearway Energy Operating LLC 4.75% 3/15/28 (c) | | 40,000 | 35,706 |
| ContourGlobal Power Holdings SA 3.125% 1/1/28 (Reg. S) | EUR | 221,000 | 189,336 |
| DPL, Inc.: | | | |
| 4.125% 7/1/25 | | 180,000 | 169,389 |
| 4.35% 4/15/29 | | 215,000 | 175,365 |
| Energia Group ROI 6.875% 7/31/28 (Reg. S) | EUR | 213,000 | 219,337 |
| Energias de Portugal SA 5.943% 4/23/83 (Reg. S) (e) | EUR | 100,000 | 104,752 |
| Eskom Holdings SOC Ltd. 8.45% 8/10/28 (c) | | 60,000 | 56,685 |
| Mong Duong Finance Holdings BV: | | | |
| 5.125% 5/7/29 (c) | | 100,000 | 90,052 |
| 5.125% 5/7/29 (Reg. S) | | 250,000 | 225,130 |
| NextEra Energy Partners LP 4.25% 9/15/24 (c) | | 4,000 | 3,780 |
| NRG Energy, Inc. 3.875% 2/15/32 (c) | | 45,000 | 33,442 |
| Pacific Gas & Electric Co.: | | | |
| 3.75% 8/15/42 | | 10,000 | 6,150 |
| 3.95% 12/1/47 | | 55,000 | 32,816 |
| 4.55% 7/1/30 | | 130,000 | 112,516 |
| 4.95% 7/1/50 | | 415,000 | 289,682 |
| PG&E Corp. 5% 7/1/28 | | 375,000 | 339,729 |
| Pike Corp. 5.5% 9/1/28 (c) | | 240,000 | 205,248 |
| Solaris Midstream Holdings LLC 7.625% 4/1/26 (c) | | 70,000 | 66,776 |
| Star Energy Geothermal Wayang Windu Ltd. 6.75% 4/24/33 (Reg. S) | | 162,160 | 153,799 |
| Vertiv Group Corp. 4.125% 11/15/28 (c) | | 95,000 | 83,030 |
| Vistra Operations Co. LLC 5.625% 2/15/27 (c) | | 60,000 | 56,461 |
| | | | 3,032,181 |
TOTAL NONCONVERTIBLE BONDS | | | 56,944,253 |
| TOTAL CORPORATE BONDS (Cost $67,671,372) | | | 57,861,266 |
| | | | |
| Government Obligations - 1.6% |
| | | Principal Amount (a) | Value ($) |
| Germany - 0.6% | | | |
| German Federal Republic: | | | |
| 0% 4/5/24 | EUR | 305,000 | 317,784 |
| 2.2% 4/13/28(Reg. S) | EUR | 75,000 | 77,850 |
TOTAL GERMANY | | | 395,634 |
| United States of America - 1.0% | | | |
| U.S. Treasury Bonds: | | | |
| 2.875% 5/15/52 | | 336,000 | 224,214 |
| 3.625% 2/15/53 | | 428,000 | 333,506 |
| U.S. Treasury Notes 3.875% 8/15/33 | | 189,000 | 173,969 |
TOTAL UNITED STATES OF AMERICA | | | 731,689 |
| TOTAL GOVERNMENT OBLIGATIONS (Cost $1,282,904) | | | 1,127,323 |
| | | | |
| Common Stocks - 2.4% |
| | | Shares | Value ($) |
| Automotive & Auto Parts - 0.0% | | | |
| UC Holdings, Inc. (b)(i) | | 3,510 | 6,037 |
| Energy - 1.5% | | | |
| California Resources Corp. | | 5,429 | 285,511 |
| California Resources Corp. warrants 10/27/24 (i) | | 530 | 9,455 |
| Chesapeake Energy Corp. | | 1,694 | 145,820 |
| Denbury, Inc. (i) | | 660 | 58,667 |
| Denbury, Inc. warrants 9/18/25 | | 1,038 | 61,445 |
| EP Energy Corp. (b)(i) | | 7,975 | 13,159 |
| Mesquite Energy, Inc. (b)(i) | | 3,543 | 268,900 |
| Noble Corp. PLC: | | | |
| warrants 2/4/28 (i) | | 600 | 16,548 |
| warrants 2/4/28 (i) | | 600 | 14,304 |
| Nostrum Oil & Gas LP warrants (b)(i) | | 6,753 | 0 |
| PureWest Energy (b)(i) | | 105 | 196 |
| PureWest Energy rights (b)(i) | | 63 | 0 |
| Superior Energy Services, Inc. Class A (b)(i) | | 609 | 46,113 |
| Tidewater, Inc. warrants 11/14/42 (i) | | 1,897 | 142,622 |
TOTAL ENERGY | | | 1,062,740 |
| Entertainment/Film - 0.1% | | | |
| New Cotai LLC/New Cotai Capital Corp. (b)(g)(i) | | 125,816 | 71,715 |
| Food & Drug Retail - 0.4% | | | |
| Northeast Grocery, Inc. (b)(g)(i) | | 12,754 | 60,454 |
| Southeastern Grocers, Inc. (b)(g)(i) | | 7,744 | 206,997 |
TOTAL FOOD & DRUG RETAIL | | | 267,451 |
| Telecommunications - 0.0% | | | |
| Intelsat Jackson Holdings SA: | | | |
| Series A rights (b)(i) | | 240 | 2,266 |
| Series B rights (b)(i) | | 240 | 8,354 |
TOTAL TELECOMMUNICATIONS | | | 10,620 |
| Textiles/Apparel - 0.1% | | | |
| Intelsat Emergence SA (b)(i) | | 2,308 | 97,051 |
| Utilities - 0.3% | | | |
| PG&E Corp. (i) | | 7,733 | 126,048 |
| Vistra Corp. | | 3,895 | 127,444 |
TOTAL UTILITIES | | | 253,492 |
| TOTAL COMMON STOCKS (Cost $1,235,300) | | | 1,769,106 |
| | | | |
| Bank Loan Obligations - 5.1% |
| | | Principal Amount (a) | Value ($) |
| Aerospace - 0.1% | | | |
| TransDigm, Inc. 1LN, term loan CME Term SOFR 1 Month Index + 3.250% 8.6401% 8/24/28 (e)(f)(j) | | 64,716 | 64,614 |
| Air Transportation - 0.7% | | | |
| Echo Global Logistics, Inc.: | | | |
| 1LN, term loan CME Term SOFR 3 Month Index + 4.750% 10.1741% 11/23/28 (b)(e)(f)(j) | | 191,070 | 191,070 |
| 2LN, term loan: | | | |
CME Term SOFR 3 Month Index + 7.000% 12.3161% 11/23/29 (b)(e)(f)(j) | | 30,000 | 29,760 |
CME Term SOFR 3 Month Index + 8.000% 13.4832% 11/23/29 (b)(e)(f)(j) | | 257,000 | 257,000 |
TOTAL AIR TRANSPORTATION | | | 477,830 |
| Banks & Thrifts - 0.0% | | | |
| First Eagle Holdings, Inc. Tranche B 1LN, term loan 3 month U.S. LIBOR + 2.500% 7.9901% 2/1/27 (e)(f)(j) | | 28,102 | 27,771 |
| Building Materials - 0.1% | | | |
| Hunter Douglas, Inc. Tranche B 1LN, term loan CME Term SOFR 3 Month Index + 3.500% 8.8911% 2/25/29 (e)(f)(j) | | 49,375 | 46,567 |
| Chemicals - 0.3% | | | |
| Consolidated Energy Finance SA Tranche B 1LN, term loan CME Term SOFR 1 Month Index + 3.500% 8.9241% 5/7/25 (b)(e)(f)(j) | | 116,175 | 112,690 |
| Discovery Purchaser Corp. 1LN, term loan CME Term SOFR 3 Month Index + 4.370% 9.7651% 10/4/29 (e)(f)(j) | | 79,400 | 73,601 |
TOTAL CHEMICALS | | | 186,291 |
| Consumer Products - 0.1% | | | |
| The Golub Corp. 2LN, term loan 3 month U.S. LIBOR + 13.500% 18.9347% 5/8/26 (b)(e)(f)(j) | | 74,493 | 73,658 |
| Diversified Financial Services - 0.5% | | | |
| BCP Renaissance Parent LLC Tranche B 1LN, term loan CME Term SOFR 1 Month Index + 3.500% 8.8998% 10/31/28 (e)(f)(j) | | 12,845 | 12,764 |
| GTCR W-2 Merger Sub LLC Tranche B 1LN, term loan CME Term SOFR 1 Month Index + 3.000% 9/21/30 (f)(j)(k) | | 125,000 | 124,010 |
| HarbourVest Partners LLC Tranche B 1LN, term loan CME Term SOFR 1 Month Index + 2.750% 8.3901% 4/20/30 (e)(f)(j) | | 14,426 | 14,390 |
| Softbank SVF II Cayman LP 1LN, term loan 3 month U.S. LIBOR + 5.000% 5% 12/31/24 (b)(e)(f)(j) | | 246,841 | 246,841 |
TOTAL DIVERSIFIED FINANCIAL SERVICES | | | 398,005 |
| Diversified Media - 0.2% | | | |
| Cmg Media Corp. Tranche B 1LN, term loan CME Term SOFR 3 Month Index + 3.500% 8.9901% 12/17/26 (e)(f)(j) | | 139,284 | 125,007 |
| Energy - 0.0% | | | |
| Mesquite Energy, Inc.: | | | |
| 1LN, term loan 3 month U.S. LIBOR + 8.000% 0% (b)(d)(f)(j) | | 65,772 | 0 |
| term loan 3 month U.S. LIBOR + 0.000% 0% (b)(d)(f)(j) | | 28,000 | 0 |
TOTAL ENERGY | | | 0 |
| Food/Beverage/Tobacco - 0.1% | | | |
| Oatly Group AB Tranche B 1LN, term loan CME Term SOFR 1 Month Index + 7.500% 12.895% 4/18/28 (b)(e)(f)(j) | | 79,800 | 73,616 |
| Healthcare - 0.0% | | | |
| Electron BidCo, Inc. Tranche B 1LN, term loan CME Term SOFR 1 Month Index + 3.000% 8.4386% 11/1/28 (e)(f)(j) | | 9,850 | 9,741 |
| Homebuilders/Real Estate - 0.3% | | | |
| Breakwater Energy Partners LLC Tranche B 1LN, term loan 11.25% 9/1/26 (b)(e)(f)(j) | | 241,049 | 232,925 |
| Hotels - 0.0% | | | |
| Travelport Finance Luxembourg SARL 1LN, term loan U.S. Secured Overnight Fin. Rate (SOFR) Index + 6.750% 13.8901% 5/29/26 (e)(f)(j) | | 39,975 | 20,387 |
| Insurance - 0.1% | | | |
| Acrisure LLC Tranche B 1LN, term loan CME Term SOFR 1 Month Index + 4.250% 9.6886% 2/15/27 (e)(f)(j) | | 4,913 | 4,874 |
| Alliant Holdings Intermediate LLC Tranche B5 1LN, term loan CME Term SOFR 1 Month Index + 3.500% 8.8347% 11/6/27 (e)(f)(j) | | 38,385 | 38,237 |
TOTAL INSURANCE | | | 43,111 |
| Leisure - 0.0% | | | |
| Alterra Mountain Co. Tranche B 1LN, term loan CME Term SOFR 1 Month Index + 3.500% 8.9386% 8/17/28 (e)(f)(j) | | 4,729 | 4,723 |
| Services - 0.8% | | | |
| ABG Intermediate Holdings 2 LLC Tranche B 2LN, term loan CME Term SOFR 1 Month Index + 6.000% 11.4269% 12/20/29 (e)(f)(j) | | 2,000 | 2,006 |
| Ascend Learning LLC 2LN, term loan CME Term SOFR 1 Month Index + 5.750% 11.1741% 12/10/29 (e)(f)(j) | | 10,000 | 8,408 |
| CoreLogic, Inc. Tranche B 1LN, term loan CME Term SOFR 1 Month Index + 3.500% 8.9386% 6/2/28 (e)(f)(j) | | 158,785 | 144,154 |
| Finastra U.S.A., Inc. term loan CME Term SOFR 1 Month Index + 7.250% 12.7129% 9/13/29 (b)(e)(f)(j) | | 191,556 | 188,300 |
| Maverick Purchaser Sub LLC Tranche B 1LN, term loan CME Term SOFR 1 Month Index + 4.000% 9.4386% 1/23/27 (e)(f)(j) | | 14,513 | 14,222 |
| Spin Holdco, Inc. Tranche B 1LN, term loan 3 month U.S. LIBOR + 4.000% 9.6639% 3/4/28 (e)(f)(j) | | 192,817 | 164,376 |
| Uber Technologies, Inc. Tranche B 1LN, term loan CME Term SOFR 1 Month Index + 3.000% 8.1594% 3/3/30 (e)(f)(j) | | 64,513 | 64,425 |
TOTAL SERVICES | | | 585,891 |
| Super Retail - 0.2% | | | |
| Bass Pro Group LLC Tranche B 1LN, term loan CME Term SOFR 1 Month Index + 3.750% 9.4017% 3/5/28 (e)(f)(j) | | 155,624 | 154,230 |
| Technology - 1.1% | | | |
| Anastasia Parent LLC Tranche B, term loan CME Term SOFR 3 Month Index + 3.750% 9.4017% 8/10/25 (e)(f)(j) | | 113,925 | 77,958 |
| Athenahealth Group, Inc. Tranche B 1LN, term loan CME Term SOFR 1 Month Index + 3.500% 8.5769% 2/15/29 (e)(f)(j) | | 88,034 | 85,157 |
| DH Corp./Societe term loan CME Term SOFR 3 Month Index + 7.250% 12.7129% 9/13/29 (b)(e)(f)(j) | | 4,474 | 4,398 |
| MH Sub I LLC Tranche B 1LN, term loan CME Term SOFR 1 Month Index + 4.250% 9.5741% 5/3/28 (e)(f)(j) | | 159,373 | 152,112 |
| Ukg, Inc.: | | | |
| 1LN, term loan: | | | |
CME Term SOFR 3 Month Index + 3.250% 8.7643% 5/4/26 (e)(f)(j) | | 195,765 | 194,563 |
CME Term SOFR 3 Month Index + 3.750% 9.2332% 5/4/26 (e)(f)(j) | | 19,200 | 19,148 |
| 2LN, term loan CME Term SOFR 3 Month Index + 5.250% 10.7643% 5/3/27 (e)(f)(j) | | 286,989 | 286,344 |
TOTAL TECHNOLOGY | | | 819,680 |
| Telecommunications - 0.5% | | | |
| Altice France SA Tranche B14 1LN, term loan CME Term SOFR 1 Month Index + 5.500% 10.8939% 8/15/28 (e)(f)(j) | | 368,150 | 326,273 |
| TOTAL BANK LOAN OBLIGATIONS (Cost $3,815,365) | | | 3,670,320 |
| | | | |
| Preferred Securities - 4.7% |
| | | Principal Amount (a) | Value ($) |
| Banks & Thrifts - 2.4% | | | |
| AIB Group PLC 5.25% (Reg. S) (e)(l) | EUR | 200,000 | 202,596 |
| Banco de Sabadell SA 9.375% (Reg. S) (e)(l) | EUR | 200,000 | 208,097 |
| Banco Mercantil del Norte SA 7.625% (c)(e)(l) | | 40,000 | 36,266 |
| Bank of America Corp.: | | | |
| 4.375% (e)(l) | | 100,000 | 80,770 |
| 5.875% (e)(l) | | 190,000 | 165,031 |
| Bank of Communications Co. Ltd. 3.8% (Reg. S) (e)(l) | | 200,000 | 197,796 |
| CaixaBank SA 5.875% (Reg. S) (e)(l) | EUR | 200,000 | 191,908 |
| Citigroup, Inc. 7.625% (e)(l) | | 120,000 | 116,574 |
| Deutsche Bank AG 6.75% (e)(l) | EUR | 200,000 | 181,688 |
| Industrial & Commercial Bank of China Ltd. 3.2% (Reg. S) (e)(l) | | 200,000 | 184,700 |
| Tinkoff Credit Systems 6% (b)(c)(d)(e)(l) | | 100,000 | 5,000 |
| Woori Bank 4.25% (Reg. S) (e)(l) | | 200,000 | 192,900 |
TOTAL BANKS & THRIFTS | | | 1,763,326 |
| Building Materials - 0.3% | | | |
| CEMEX S.A.B. de CV 5.125% (c)(e)(l) | | 200,000 | 185,593 |
| Diversified Financial Services - 0.7% | | | |
| CAS Capital No 1 Ltd. 4% (Reg. S) (e)(l) | | 200,000 | 160,143 |
| Charles Schwab Corp. 5.375% (e)(l) | | 340,000 | 325,912 |
TOTAL DIVERSIFIED FINANCIAL SERVICES | | | 486,055 |
| Energy - 0.1% | | | |
| Wintershall Dea Finance 2 BV 2.4985% (Reg. S) (e)(l) | EUR | 100,000 | 93,337 |
| Homebuilders/Real Estate - 0.1% | | | |
| Abertis Infraestructuras Finance BV 3.248% (Reg. S) (e)(l) | EUR | 100,000 | 99,947 |
| Technology - 0.3% | | | |
| Network i2i Ltd. 5.65% (Reg. S) (e)(l) | | 200,000 | 194,126 |
| Telecommunications - 0.3% | | | |
| Telefonica Europe BV 6.75% (Reg. S) (e)(l) | EUR | 200,000 | 206,958 |
| Utilities - 0.5% | | | |
| Electricite de France SA: | | | |
| 5% (Reg. S) (e)(l) | EUR | 100,000 | 105,039 |
| 7.5% (Reg. S) (e)(l) | EUR | 200,000 | 228,086 |
TOTAL UTILITIES | | | 333,125 |
| TOTAL PREFERRED SECURITIES (Cost $3,543,883) | | | 3,362,467 |
| | | | |
| Money Market Funds - 4.6% |
| | | Shares | Value ($) |
Fidelity Cash Central Fund 5.40% (m) (Cost $3,307,817) | | 3,307,248 | 3,307,910 |
| | | | |
| TOTAL INVESTMENT IN SECURITIES - 98.8% (Cost $80,856,641) | 71,098,392 |
NET OTHER ASSETS (LIABILITIES) - 1.2% | 891,182 |
| NET ASSETS - 100.0% | 71,989,574 |
| | |
Currency Abbreviations
| EUR | - | European Monetary Unit |
Legend
| (a) | Amount is stated in United States dollars unless otherwise noted. |
| (c) | Security exempt from registration under Rule 144A of the Securities Act of 1933. These securities may be resold in transactions exempt from registration, normally to qualified institutional buyers. At the end of the period, the value of these securities amounted to $37,141,233 or 51.6% of net assets. |
| (d) | Non-income producing - Security is in default. |
| (e) | Coupon rates for floating and adjustable rate securities reflect the rates in effect at period end. |
| (f) | Coupon is indexed to a floating interest rate which may be multiplied by a specified factor and/or subject to caps or floors. |
| (g) | Restricted securities (including private placements) - Investment in securities not registered under the Securities Act of 1933 (excluding 144A issues). At the end of the period, the value of restricted securities (excluding 144A issues) amounted to $421,679 or 0.6% of net assets. |
| (h) | Security initially issued at one coupon which converts to a higher coupon at a specified date. The rate shown is the rate at period end. |
| (j) | Remaining maturities of bank loan obligations may be less than the stated maturities shown as a result of contractual or optional prepayments by the borrower. Such prepayments cannot be predicted with certainty. |
| (k) | The coupon rate will be determined upon settlement of the loan after period end. |
| (l) | Security is perpetual in nature with no stated maturity date. |
| (m) | Affiliated fund that is generally available only to investment companies and other accounts managed by Fidelity Investments. The rate quoted is the annualized seven-day yield of the fund at period end. A complete unaudited listing of the fund's holdings as of its most recent quarter end is available upon request. In addition, each Fidelity Central Fund's financial statements are available on the SEC's website or upon request. |
| Additional information on each restricted holding is as follows: |
| Security | Acquisition Date | Acquisition Cost ($) |
| Jonah Energy Parent LLC 12% 11/5/25 | 5/05/23 | 78,791 |
| | | |
| New Cotai LLC/New Cotai Capital Corp. | 9/11/20 | 623,261 |
| | | |
| Northeast Grocery, Inc. | 11/08/21 | 5,075 |
| | | |
| Southeastern Grocers, Inc. | 6/01/18 | 54,475 |
| | | |
Affiliated Central Funds
Fiscal year to date information regarding the Fund's investments in Fidelity Central Funds, including the ownership percentage, is presented below.
| Affiliate | Value, beginning of period ($) | Purchases ($) | Sales Proceeds ($) | Dividend Income ($) | Realized Gain (loss) ($) | Change in Unrealized appreciation (depreciation) ($) | Value, end of period ($) | % ownership, end of period |
| Fidelity Cash Central Fund 5.40% | 2,730,646 | 16,993,482 | 16,416,218 | 86,318 | - | - | 3,307,910 | 0.0% |
| Fidelity Securities Lending Cash Central Fund 5.40% | - | 298,338 | 298,338 | 14 | - | - | - | 0.0% |
| Total | 2,730,646 | 17,291,820 | 16,714,556 | 86,332 | - | - | 3,307,910 | |
| | | | | | | | | |
Amounts in the dividend income column in the above table include any capital gain distributions from underlying funds, which are presented in the corresponding line item in the Statement of Operations, if applicable.
Amounts in the dividend income column for Fidelity Securities Lending Cash Central Fund represents the income earned on investing cash collateral, less rebates paid to borrowers and any lending agent fees associated with the loan, plus any premium payments received for lending certain types of securities.
Amounts included in the purchases and sales proceeds columns may include in-kind transactions, if applicable.
Investment Valuation
The following is a summary of the inputs used, as of October 31, 2023, involving the Fund's assets and liabilities carried at fair value. The inputs or methodology used for valuing securities may not be an indication of the risk associated with investing in those securities. For more information on valuation inputs, and their aggregation into the levels used below, please refer to the Investment Valuation section in the accompanying Notes to Financial Statements.
| Valuation Inputs at Reporting Date: |
| Description | Total ($) | Level 1 ($) | Level 2 ($) | Level 3 ($) |
Investments in Securities: | | | | |
|
| Equities: | | | | |
Communication Services | 107,671 | - | - | 107,671 |
Consumer Discretionary | 77,752 | - | - | 77,752 |
Consumer Staples | 267,451 | - | - | 267,451 |
Energy | 1,062,544 | 530,305 | 204,067 | 328,172 |
Utilities | 253,688 | 253,492 | - | 196 |
|
| Corporate Bonds | 57,861,266 | - | 57,193,121 | 668,145 |
|
| Government Obligations | 1,127,323 | - | 1,127,323 | - |
|
| Bank Loan Obligations | 3,670,320 | - | 2,260,062 | 1,410,258 |
|
| Preferred Securities | 3,362,467 | - | 3,357,467 | 5,000 |
|
| Money Market Funds | 3,307,910 | 3,307,910 | - | - |
| Total Investments in Securities: | 71,098,392 | 4,091,707 | 64,142,040 | 2,864,645 |
The following is a reconciliation of Investments in Securities for which Level 3 inputs were used in determining value:
| |
| Investments in Securities: | |
| Bank Loan Obligations | | | |
| Beginning Balance | $ | 1,341,958 | |
| Net Realized Gain (Loss) on Investment Securities | | 848 | |
| Net Unrealized Gain (Loss) on Investment Securities | | 20,644 | |
| Cost of Purchases | | 192,109 | |
| Proceeds of Sales | | (148,454) | |
| Amortization/Accretion | | 3,153 | |
| Transfers into Level 3 | | - | |
| Transfers out of Level 3 | | - | |
| Ending Balance | $ | 1,410,258 | |
| The change in unrealized gain (loss) for the period attributable to Level 3 securities held at October 31, 2023 | $ | 20,644 | |
| Corporate Bonds | | | |
| Beginning Balance | $ | 1,006,268 | |
| Net Realized Gain (Loss) on Investment Securities | | 261 | |
| Net Unrealized Gain (Loss) on Investment Securities | | (549,051) | |
| Cost of Purchases | | 285,336 | |
| Proceeds of Sales | | (75,521) | |
| Amortization/Accretion | | 852 | |
| Transfers into Level 3 | | - | |
| Transfers out of Level 3 | | - | |
| Ending Balance | $ | 668,145 | |
| The change in unrealized gain (loss) for the period attributable to Level 3 securities held at October 31, 2023 | $ | (118,646) | |
| Other Investments in Securities | | | |
| Beginning Balance | $ | 1,018,185 | |
| Net Realized Gain (Loss) on Investment Securities | | 137,558 | |
| Net Unrealized Gain (Loss) on Investment Securities | | (183,119) | |
| Cost of Purchases | | 12,861 | |
| Proceeds of Sales | | (199,243) | |
| Amortization/Accretion | | - | |
| Transfers into Level 3 | | - | |
| Transfers out of Level 3 | | - | |
| Ending Balance | $ | 786,242 | |
| The change in unrealized gain (loss) for the period attributable to Level 3 securities held at October 31, 2023 | $ | (68,758) | |
| The information used in the above reconciliation represents fiscal year to date activity for any Investments in Securities identified as using Level 3 inputs at either the beginning or the end of the current fiscal period. Cost of purchases and proceeds of sales may include securities received and/or delivered through in-kind transactions, corporate actions or exchanges. Transfers into Level 3 were attributable to a lack of observable market data resulting from decreases in market activity, decreases in liquidity, security restructurings or corporate actions. Transfers out of Level 3 were attributable to observable market data becoming available for those securities. Transfers in or out of Level 3 represent the beginning value of any Security or Instrument where a change in the pricing level occurred from the beginning to the end of the period. Realized and unrealized gains (losses) disclosed in the reconciliation are included in Net Gain (Loss) on the Fund's Statement of Operations. | |
| Statement of Assets and Liabilities |
| | | | October 31, 2023 (Unaudited) |
| | | | | |
| Assets | | | | |
| Investment in securities, at value - See accompanying schedule: | | | | |
Unaffiliated issuers (cost $77,548,824) | $ | 67,790,482 | | |
Fidelity Central Funds (cost $3,307,817) | | 3,307,910 | | |
| | | | | |
| | | | | |
| Total Investment in Securities (cost $80,856,641) | | | $ | 71,098,392 |
| Cash | | | | 239,853 |
| Foreign currency held at value (cost $13,446) | | | | 13,407 |
| Receivable for investments sold | | | | 148,652 |
| Receivable for fund shares sold | | | | 18,460 |
| Dividends receivable | | | | 1,903 |
| Interest receivable | | | | 1,058,870 |
| Distributions receivable from Fidelity Central Funds | | | | 14,487 |
| Prepaid expenses | | | | 105 |
| Receivable from investment adviser for expense reductions | | | | 30,707 |
Total assets | | | | 72,624,836 |
| Liabilities | | | | |
| Payable for investments purchased | $ | 438,310 | | |
| Payable for fund shares redeemed | | 24,433 | | |
| Distributions payable | | 50,161 | | |
| Accrued management fee | | 42,108 | | |
| Distribution and service plan fees payable | | 3,233 | | |
| Other affiliated payables | | 12,574 | | |
| Audit fee payable | | 47,325 | | |
| Other payables and accrued expenses | | 17,118 | | |
| Total Liabilities | | | | 635,262 |
| Net Assets | | | $ | 71,989,574 |
| Net Assets consist of: | | | | |
| Paid in capital | | | $ | 95,522,262 |
| Total accumulated earnings (loss) | | | | (23,532,688) |
| Net Assets | | | $ | 71,989,574 |
| | | | | |
| Net Asset Value and Maximum Offering Price | | | | |
| Class A : | | | | |
Net Asset Value and redemption price per share ($7,601,606 ÷ 943,564 shares)(a) | | | $ | 8.06 |
| Maximum offering price per share (100/96.00 of $8.06) | | | $ | 8.40 |
| Class M : | | | | |
Net Asset Value and redemption price per share ($2,508,242 ÷ 311,388 shares)(a) | | | $ | 8.06 |
| Maximum offering price per share (100/96.00 of $8.06) | | | $ | 8.40 |
| Class C : | | | | |
Net Asset Value and offering price per share ($1,310,396 ÷ 162,664 shares)(a) | | | $ | 8.06 |
| Global High Income : | | | | |
Net Asset Value, offering price and redemption price per share ($57,757,217 ÷ 7,168,618 shares) | | | $ | 8.06 |
| Class I : | | | | |
Net Asset Value, offering price and redemption price per share ($2,812,113 ÷ 349,044 shares) | | | $ | 8.06 |
(a)Redemption price per share is equal to net asset value less any applicable contingent deferred sales charge. |
| Statement of Operations |
| | | | Six months ended October 31, 2023 (Unaudited) |
| Investment Income | | | | |
| Dividends | | | $ | 91,424 |
| Interest | | | | 2,325,861 |
| Income from Fidelity Central Funds (including $14 from security lending) | | | | 86,332 |
| Total Income | | | | 2,503,617 |
| Expenses | | | | |
| Management fee | $ | 263,602 | | |
| Transfer agent fees | | 61,143 | | |
| Distribution and service plan fees | | 20,217 | | |
| Accounting fees | | 15,715 | | |
| Custodian fees and expenses | | 6,739 | | |
| Independent trustees' fees and expenses | | 191 | | |
| Registration fees | | 57,191 | | |
| Audit | | 49,181 | | |
| Legal | | (9,279) | | |
| Miscellaneous | | 148 | | |
| Total expenses before reductions | | 464,848 | | |
| Expense reductions | | (147,161) | | |
| Total expenses after reductions | | | | 317,687 |
| Net Investment income (loss) | | | | 2,185,930 |
| Realized and Unrealized Gain (Loss) | | | | |
| Net realized gain (loss) on: | | | | |
| Investment Securities: | | | | |
| Unaffiliated issuers | | (2,445,693) | | |
| Foreign currency transactions | | (4,000) | | |
| Total net realized gain (loss) | | | | (2,449,693) |
| Change in net unrealized appreciation (depreciation) on: | | | | |
| Investment Securities: | | | | |
| Unaffiliated issuers | | (854,742) | | |
| Assets and liabilities in foreign currencies | | (5,000) | | |
| Total change in net unrealized appreciation (depreciation) | | | | (859,742) |
| Net gain (loss) | | | | (3,309,435) |
| Net increase (decrease) in net assets resulting from operations | | | $ | (1,123,505) |
| Statement of Changes in Net Assets |
| |
| | Six months ended October 31, 2023 (Unaudited) | | Year ended April 30, 2023 |
| Increase (Decrease) in Net Assets | | | | |
| Operations | | | | |
| Net investment income (loss) | $ | 2,185,930 | $ | 4,276,750 |
| Net realized gain (loss) | | (2,449,693) | | (6,611,422) |
| Change in net unrealized appreciation (depreciation) | | (859,742) | | 2,033,258 |
| Net increase (decrease) in net assets resulting from operations | | (1,123,505) | | (301,414) |
| Distributions to shareholders | | (1,648,255) | | (3,486,392) |
| Distributions to shareholders from tax return of capital | | - | | (291,964) |
| | | | | |
| Total Distributions | | (1,648,255) | | (3,778,356) |
| Share transactions - net increase (decrease) | | (3,568,261) | | (13,836,765) |
| Total increase (decrease) in net assets | | (6,340,021) | | (17,916,535) |
| | | | | |
| Net Assets | | | | |
| Beginning of period | | 78,329,595 | | 96,246,130 |
| End of period | $ | 71,989,574 | $ | 78,329,595 |
| | | | | |
| | | | | |
Financial Highlights
| Fidelity Advisor® Global High Income Fund Class A |
| |
| | Six months ended (Unaudited) October 31, 2023 | | Years ended April 30, 2023 | | 2022 | | 2021 | | 2020 | | 2019 |
Selected Per-Share Data | | | | | | | | | | | | |
| Net asset value, beginning of period | $ | 8.36 | $ | 8.69 | $ | 9.79 | $ | 8.38 | $ | 9.48 | $ | 9.61 |
| Income from Investment Operations | | | | | | | | | | | | |
Net investment income (loss) A,B | | .230 | | .422 | | .367 | | .391 | | .445 | | .468 |
| Net realized and unrealized gain (loss) | | (.359) | | (.382) | | (1.089) | | 1.394 | | (1.120) | | (.115) |
| Total from investment operations | | (.129) | | .040 | | (.722) | | 1.785 | | (.675) | | .353 |
| Distributions from net investment income | | (.171) | | (.341) | | (.378) | | (.375) | | (.425) | | (.457) |
| Distributions from net realized gain | | - | | - | | - | | - | | - | | (.026) |
| Tax return of capital | | - | | (.029) | | - | | - | | - | | - |
| Total distributions | | (.171) | | (.370) | | (.378) | | (.375) | | (.425) | | (.483) |
| Net asset value, end of period | $ | 8.06 | $ | 8.36 | $ | 8.69 | $ | 9.79 | $ | 8.38 | $ | 9.48 |
Total Return C,D,E | | (1.56)% | | .64% | | (7.64)% | | 21.59% | | (7.44)% | | 3.88% |
Ratios to Average Net Assets B,F,G | | | | | | | | | | | | |
| Expenses before reductions | | 1.44% H | | 1.38% | | 1.37% | | 1.34% | | 1.34% | | 1.32% |
| Expenses net of fee waivers, if any | | 1.04% H | | 1.17% | | 1.16% | | 1.25% | | 1.25% | | 1.25% |
| Expenses net of all reductions | | 1.04% H | | 1.17% | | 1.16% | | 1.25% | | 1.25% | | 1.25% |
| Net investment income (loss) | | 5.54% H | | 5.13% | | 3.89% | | 4.17% | | 4.77% | | 5.00% |
| Supplemental Data | | | | | | | | | | | | |
| Net assets, end of period (000 omitted) | $ | 7,602 | $ | 7,663 | $ | 15,467 | $ | 8,582 | $ | 5,927 | $ | 7,365 |
Portfolio turnover rate I | | 42% H | | 29% | | 45% | | 53% | | 54% | | 44% |
ACalculated based on average shares outstanding during the period.
BNet investment income (loss) is affected by the timing of the declaration of dividends by any underlying mutual funds or exchange-traded funds (ETFs). Net investment income (loss) of any mutual funds or ETFs is not included in the Fund's net investment income (loss) ratio.
CTotal returns for periods of less than one year are not annualized.
DTotal returns would have been lower if certain expenses had not been reduced during the applicable periods shown.
ETotal returns do not include the effect of the sales charges.
FFees and expenses of any underlying mutual funds or exchange-traded funds (ETFs) are not included in the Fund's expense ratio. The Fund indirectly bears its proportionate share of these expenses. For additional expense information related to investments in Fidelity Central Funds, please refer to the "Investments in Fidelity Central Funds" note found in the Notes to Financial Statements section of the most recent Annual or Semi-Annual report.
GExpense ratios reflect operating expenses of the class. Expenses before reductions do not reflect amounts reimbursed, waived, or reduced through arrangements with the investment adviser, brokerage services, or other offset arrangements, if applicable, and do not represent the amount paid by the class during periods when reimbursements, waivers or reductions occur.
HAnnualized.
IAmount does not include the portfolio activity of any underlying mutual funds or exchange-traded funds (ETFs).
| Fidelity Advisor® Global High Income Fund Class M |
| |
| | Six months ended (Unaudited) October 31, 2023 | | Years ended April 30, 2023 | | 2022 | | 2021 | | 2020 | | 2019 |
Selected Per-Share Data | | | | | | | | | | | | |
| Net asset value, beginning of period | $ | 8.36 | $ | 8.69 | $ | 9.79 | $ | 8.38 | $ | 9.48 | $ | 9.61 |
| Income from Investment Operations | | | | | | | | | | | | |
Net investment income (loss) A,B | | .230 | | .421 | | .372 | | .389 | | .445 | | .467 |
| Net realized and unrealized gain (loss) | | (.359) | | (.381) | | (1.094) | | 1.396 | | (1.120) | | (.114) |
| Total from investment operations | | (.129) | | .040 | | (.722) | | 1.785 | | (.675) | | .353 |
| Distributions from net investment income | | (.171) | | (.341) | | (.378) | | (.375) | | (.425) | | (.457) |
| Distributions from net realized gain | | - | | - | | - | | - | | - | | (.026) |
| Tax return of capital | | - | | (.029) | | - | | - | | - | | - |
| Total distributions | | (.171) | | (.370) | | (.378) | | (.375) | | (.425) | | (.483) |
| Net asset value, end of period | $ | 8.06 | $ | 8.36 | $ | 8.69 | $ | 9.79 | $ | 8.38 | $ | 9.48 |
Total Return C,D,E | | (1.56)% | | .64% | | (7.64)% | | 21.59% | | (7.44)% | | 3.88% |
Ratios to Average Net Assets B,F,G | | | | | | | | | | | | |
| Expenses before reductions | | 1.51% H | | 1.45% | | 1.41% | | 1.41% | | 1.41% | | 1.40% |
| Expenses net of fee waivers, if any | | 1.04% H | | 1.17% | | 1.16% | | 1.25% | | 1.25% | | 1.25% |
| Expenses net of all reductions | | 1.03% H | | 1.17% | | 1.16% | | 1.25% | | 1.25% | | 1.25% |
| Net investment income (loss) | | 5.54% H | | 5.13% | | 3.89% | | 4.16% | | 4.77% | | 5.00% |
| Supplemental Data | | | | | | | | | | | | |
| Net assets, end of period (000 omitted) | $ | 2,508 | $ | 2,634 | $ | 3,118 | $ | 3,164 | $ | 2,928 | $ | 3,971 |
Portfolio turnover rate I | | 42% H | | 29% | | 45% | | 53% | | 54% | | 44% |
ACalculated based on average shares outstanding during the period.
BNet investment income (loss) is affected by the timing of the declaration of dividends by any underlying mutual funds or exchange-traded funds (ETFs). Net investment income (loss) of any mutual funds or ETFs is not included in the Fund's net investment income (loss) ratio.
CTotal returns for periods of less than one year are not annualized.
DTotal returns would have been lower if certain expenses had not been reduced during the applicable periods shown.
ETotal returns do not include the effect of the sales charges.
FFees and expenses of any underlying mutual funds or exchange-traded funds (ETFs) are not included in the Fund's expense ratio. The Fund indirectly bears its proportionate share of these expenses. For additional expense information related to investments in Fidelity Central Funds, please refer to the "Investments in Fidelity Central Funds" note found in the Notes to Financial Statements section of the most recent Annual or Semi-Annual report.
GExpense ratios reflect operating expenses of the class. Expenses before reductions do not reflect amounts reimbursed, waived, or reduced through arrangements with the investment adviser, brokerage services, or other offset arrangements, if applicable, and do not represent the amount paid by the class during periods when reimbursements, waivers or reductions occur.
HAnnualized.
IAmount does not include the portfolio activity of any underlying mutual funds or exchange-traded funds (ETFs).
| Fidelity Advisor® Global High Income Fund Class C |
| |
| | Six months ended (Unaudited) October 31, 2023 | | Years ended April 30, 2023 | | 2022 | | 2021 | | 2020 | | 2019 |
Selected Per-Share Data | | | | | | | | | | | | |
| Net asset value, beginning of period | $ | 8.36 | $ | 8.69 | $ | 9.79 | $ | 8.38 | $ | 9.48 | $ | 9.61 |
| Income from Investment Operations | | | | | | | | | | | | |
Net investment income (loss) A,B | | .200 | | .360 | | .301 | | .319 | | .375 | | .398 |
| Net realized and unrealized gain (loss) | | (.360) | | (.381) | | (1.094) | | 1.396 | | (1.119) | | (.115) |
| Total from investment operations | | (.160) | | (.021) | | (.793) | | 1.715 | | (.744) | | .283 |
| Distributions from net investment income | | (.140) | | (.285) | | (.307) | | (.305) | | (.356) | | (.387) |
| Distributions from net realized gain | | - | | - | | - | | - | | - | | (.026) |
| Tax return of capital | | - | | (.024) | | - | | - | | - | | - |
| Total distributions | | (.140) | | (.309) | | (.307) | | (.305) | | (.356) | | (.413) |
| Net asset value, end of period | $ | 8.06 | $ | 8.36 | $ | 8.69 | $ | 9.79 | $ | 8.38 | $ | 9.48 |
Total Return C,D,E | | (1.93)% | | (.11)% | | (8.33)% | | 20.69% | | (8.13)% | | 3.10% |
Ratios to Average Net Assets B,F,G | | | | | | | | | | | | |
| Expenses before reductions | | 2.25% H | | 2.20% | | 2.12% | | 2.14% | | 2.11% | | 2.08% |
| Expenses net of fee waivers, if any | | 1.78% H | | 1.92% | | 1.91% | | 2.00% | | 2.00% | | 2.00% |
| Expenses net of all reductions | | 1.77% H | | 1.92% | | 1.91% | | 2.00% | | 2.00% | | 2.00% |
| Net investment income (loss) | | 4.80% H | | 4.38% | | 3.14% | | 3.41% | | 4.02% | | 4.25% |
| Supplemental Data | | | | | | | | | | | | |
| Net assets, end of period (000 omitted) | $ | 1,310 | $ | 1,599 | $ | 2,246 | $ | 3,249 | $ | 2,684 | $ | 3,723 |
Portfolio turnover rate I | | 42% H | | 29% | | 45% | | 53% | | 54% | | 44% |
ACalculated based on average shares outstanding during the period.
BNet investment income (loss) is affected by the timing of the declaration of dividends by any underlying mutual funds or exchange-traded funds (ETFs). Net investment income (loss) of any mutual funds or ETFs is not included in the Fund's net investment income (loss) ratio.
CTotal returns for periods of less than one year are not annualized.
DTotal returns would have been lower if certain expenses had not been reduced during the applicable periods shown.
ETotal returns do not include the effect of the contingent deferred sales charge.
FFees and expenses of any underlying mutual funds or exchange-traded funds (ETFs) are not included in the Fund's expense ratio. The Fund indirectly bears its proportionate share of these expenses. For additional expense information related to investments in Fidelity Central Funds, please refer to the "Investments in Fidelity Central Funds" note found in the Notes to Financial Statements section of the most recent Annual or Semi-Annual report.
GExpense ratios reflect operating expenses of the class. Expenses before reductions do not reflect amounts reimbursed, waived, or reduced through arrangements with the investment adviser, brokerage services, or other offset arrangements, if applicable, and do not represent the amount paid by the class during periods when reimbursements, waivers or reductions occur.
HAnnualized.
IAmount does not include the portfolio activity of any underlying mutual funds or exchange-traded funds (ETFs).
| Fidelity® Global High Income Fund |
| |
| | Six months ended (Unaudited) October 31, 2023 | | Years ended April 30, 2023 | | 2022 | | 2021 | | 2020 | | 2019 |
Selected Per-Share Data | | | | | | | | | | | | |
| Net asset value, beginning of period | $ | 8.36 | $ | 8.69 | $ | 9.79 | $ | 8.38 | $ | 9.48 | $ | 9.62 |
| Income from Investment Operations | | | | | | | | | | | | |
Net investment income (loss) A,B | | .241 | | .442 | | .397 | | .413 | | .468 | | .491 |
| Net realized and unrealized gain (loss) | | (.359) | | (.381) | | (1.094) | | 1.395 | | (1.119) | | (.125) |
| Total from investment operations | | (.118) | | .061 | | (.697) | | 1.808 | | (.651) | | .366 |
| Distributions from net investment income | | (.182) | | (.361) | | (.403) | | (.398) | | (.449) | | (.480) |
| Distributions from net realized gain | | - | | - | | - | | - | | - | | (.026) |
| Tax return of capital | | - | | (.030) | | - | | - | | - | | - |
| Total distributions | | (.182) | | (.391) | | (.403) | | (.398) | | (.449) | | (.506) |
| Net asset value, end of period | $ | 8.06 | $ | 8.36 | $ | 8.69 | $ | 9.79 | $ | 8.38 | $ | 9.48 |
Total Return C,D | | (1.44)% | | .89% | | (7.40)% | | 21.89% | | (7.21)% | | 4.03% |
Ratios to Average Net Assets B,E,F | | | | | | | | | | | | |
| Expenses before reductions | | 1.16% G | | 1.10% | | 1.04% | | 1.04% | | 1.03% | | 1.01% |
| Expenses net of fee waivers, if any | | .79% G | | .92% | | .91% | | 1.00% | | 1.00% | | 1.00% |
| Expenses net of all reductions | | .78% G | | .92% | | .91% | | 1.00% | | 1.00% | | 1.00% |
| Net investment income (loss) | | 5.79% G | | 5.38% | | 4.15% | | 4.41% | | 5.02% | | 5.25% |
| Supplemental Data | | | | | | | | | | | | |
| Net assets, end of period (000 omitted) | $ | 57,757 | $ | 63,000 | $ | 72,441 | $ | 89,338 | $ | 73,039 | $ | 97,619 |
Portfolio turnover rate H | | 42% G | | 29% | | 45% | | 53% | | 54% | | 44% |
ACalculated based on average shares outstanding during the period.
BNet investment income (loss) is affected by the timing of the declaration of dividends by any underlying mutual funds or exchange-traded funds (ETFs). Net investment income (loss) of any mutual funds or ETFs is not included in the Fund's net investment income (loss) ratio.
CTotal returns for periods of less than one year are not annualized.
DTotal returns would have been lower if certain expenses had not been reduced during the applicable periods shown.
EFees and expenses of any underlying mutual funds or exchange-traded funds (ETFs) are not included in the Fund's expense ratio. The Fund indirectly bears its proportionate share of these expenses. For additional expense information related to investments in Fidelity Central Funds, please refer to the "Investments in Fidelity Central Funds" note found in the Notes to Financial Statements section of the most recent Annual or Semi-Annual report.
FExpense ratios reflect operating expenses of the class. Expenses before reductions do not reflect amounts reimbursed, waived, or reduced through arrangements with the investment adviser, brokerage services, or other offset arrangements, if applicable, and do not represent the amount paid by the class during periods when reimbursements, waivers or reductions occur.
GAnnualized.
HAmount does not include the portfolio activity of any underlying mutual funds or exchange-traded funds (ETFs).
| Fidelity Advisor® Global High Income Fund Class I |
| |
| | Six months ended (Unaudited) October 31, 2023 | | Years ended April 30, 2023 | | 2022 | | 2021 | | 2020 | | 2019 |
Selected Per-Share Data | | | | | | | | | | | | |
| Net asset value, beginning of period | $ | 8.36 | $ | 8.69 | $ | 9.79 | $ | 8.38 | $ | 9.48 | $ | 9.62 |
| Income from Investment Operations | | | | | | | | | | | | |
Net investment income (loss) A,B | | .241 | | .442 | | .400 | | .411 | | .473 | | .491 |
| Net realized and unrealized gain (loss) | | (.359) | | (.381) | | (1.097) | | 1.397 | | (1.124) | | (.125) |
| Total from investment operations | | (.118) | | .061 | | (.697) | | 1.808 | | (.651) | | .366 |
| Distributions from net investment income | | (.182) | | (.361) | | (.403) | | (.398) | | (.449) | | (.480) |
| Distributions from net realized gain | | - | | - | | - | | - | | - | | (.026) |
| Tax return of capital | | - | | (.030) | | - | | - | | - | | - |
| Total distributions | | (.182) | | (.391) | | (.403) | | (.398) | | (.449) | | (.506) |
| Net asset value, end of period | $ | 8.06 | $ | 8.36 | $ | 8.69 | $ | 9.79 | $ | 8.38 | $ | 9.48 |
Total Return C,D | | (1.44)% | | .89% | | (7.40)% | | 21.89% | | (7.21)% | | 4.03% |
Ratios to Average Net Assets B,E,F | | | | | | | | | | | | |
| Expenses before reductions | | 1.18% G | | 1.15% | | 1.05% | | 1.05% | | 1.03% | | 1.05% |
| Expenses net of fee waivers, if any | | .78% G | | .92% | | .91% | | 1.00% | | 1.00% | | 1.00% |
| Expenses net of all reductions | | .77% G | | .92% | | .91% | | 1.00% | | 1.00% | | 1.00% |
| Net investment income (loss) | | 5.80% G | | 5.38% | | 4.14% | | 4.42% | | 5.02% | | 5.25% |
| Supplemental Data | | | | | | | | | | | | |
| Net assets, end of period (000 omitted) | $ | 2,812 | $ | 3,433 | $ | 2,975 | $ | 7,844 | $ | 4,350 | $ | 7,352 |
Portfolio turnover rate H | | 42% G | | 29% | | 45% | | 53% | | 54% | | 44% |
ACalculated based on average shares outstanding during the period.
BNet investment income (loss) is affected by the timing of the declaration of dividends by any underlying mutual funds or exchange-traded funds (ETFs). Net investment income (loss) of any mutual funds or ETFs is not included in the Fund's net investment income (loss) ratio.
CTotal returns for periods of less than one year are not annualized.
DTotal returns would have been lower if certain expenses had not been reduced during the applicable periods shown.
EFees and expenses of any underlying mutual funds or exchange-traded funds (ETFs) are not included in the Fund's expense ratio. The Fund indirectly bears its proportionate share of these expenses. For additional expense information related to investments in Fidelity Central Funds, please refer to the "Investments in Fidelity Central Funds" note found in the Notes to Financial Statements section of the most recent Annual or Semi-Annual report.
FExpense ratios reflect operating expenses of the class. Expenses before reductions do not reflect amounts reimbursed, waived, or reduced through arrangements with the investment adviser, brokerage services, or other offset arrangements, if applicable, and do not represent the amount paid by the class during periods when reimbursements, waivers or reductions occur.
GAnnualized.
HAmount does not include the portfolio activity of any underlying mutual funds or exchange-traded funds (ETFs).
For the period ended October 31, 2023
1. Organization.
Fidelity Global High Income Fund (the Fund) is a fund of Fidelity Summer Street Trust (the Trust) and is authorized to issue an unlimited number of shares. The Trust is registered under the Investment Company Act of 1940, as amended (the 1940 Act), as an open-end management investment company organized as a Massachusetts business trust. The Fund offers Class A, Class M, Class C, Global High Income and Class I shares, each of which has equal rights as to assets and voting privileges. Class A, Class M, Class C and Class I are Fidelity Advisor classes. Each class has exclusive voting rights with respect to matters that affect that class. Class C shares will automatically convert to Class A shares after a holding period of eight years from the initial date of purchase, with certain exceptions. The Fund's investments in emerging markets can be subject to social, economic, regulatory, and political uncertainties and can be extremely volatile.
2. Investments in Fidelity Central Funds.
Funds may invest in Fidelity Central Funds, which are open-end investment companies generally available only to other investment companies and accounts managed by the investment adviser and its affiliates. The Schedule of Investments lists any Fidelity Central Funds held as an investment as of period end, but does not include the underlying holdings of each Fidelity Central Fund. An investing fund indirectly bears its proportionate share of the expenses of the underlying Fidelity Central Funds.
Based on its investment objective, each Fidelity Central Fund may invest or participate in various investment vehicles or strategies that are similar to those of the investing fund. These strategies are consistent with the investment objectives of the investing fund and may involve certain economic risks which may cause a decline in value of each of the Fidelity Central Funds and thus a decline in the value of the investing fund.
| Fidelity Central Fund | Investment Manager | Investment Objective | Investment Practices | Expense RatioA |
| Fidelity Money Market Central Funds | Fidelity Management & Research Company LLC (FMR) | Each fund seeks to obtain a high level of current income consistent with the preservation of capital and liquidity. | Short-term Investments | Less than .005% |
A Expenses expressed as a percentage of average net assets and are as of each underlying Central Fund's most recent annual or semi-annual shareholder report.
A complete unaudited list of holdings for each Fidelity Central Fund is available upon request or at the Securities and Exchange Commission website at www.sec.gov. In addition, the financial statements of the Fidelity Central Funds which contain the significant accounting policies (including investment valuation policies) of those funds, and are not covered by the Report of Independent Registered Public Accounting Firm, are available on the Securities and Exchange Commission website or upon request.
3. Significant Accounting Policies.
The Fund is an investment company and applies the accounting and reporting guidance of the Financial Accounting Standards Board (FASB) Accounting Standards Codification Topic 946 Financial Services - Investment Companies. The financial statements have been prepared in conformity with accounting principles generally accepted in the United States of America (GAAP), which require management to make certain estimates and assumptions at the date of the financial statements. Actual results could differ from those estimates. Subsequent events, if any, through the date that the financial statements were issued have been evaluated in the preparation of the financial statements. The Fund's Schedule of Investments lists any underlying mutual funds or exchange-traded funds (ETFs) but does not include the underlying holdings of these funds. The following summarizes the significant accounting policies of the Fund:
Investment Valuation. Investments are valued as of 4:00 p.m. Eastern time on the last calendar day of the period. The Board of Trustees (the Board) has designated the Fund's investment adviser as the valuation designee responsible for the fair valuation function and performing fair value determinations as needed. The investment adviser has established a Fair Value Committee (the Committee) to carry out the day-to-day fair valuation responsibilities and has adopted policies and procedures to govern the fair valuation process and the activities of the Committee. In accordance with these fair valuation policies and procedures, which have been approved by the Board, the Fund attempts to obtain prices from one or more third party pricing services or brokers to value its investments. When current market prices, quotations or currency exchange rates are not readily available or reliable, investments will be fair valued in good faith by the Committee, in accordance with the policies and procedures. Factors used in determining fair value vary by investment type and may include market or investment specific events, transaction data, estimated cash flows, and market observations of comparable investments. The frequency that the fair valuation procedures are used cannot be predicted and they may be utilized to a significant extent. The Committee manages the Fund's fair valuation practices and maintains the fair valuation policies and procedures. The Fund's investment adviser reports to the Board information regarding the fair valuation process and related material matters.
The Fund categorizes the inputs to valuation techniques used to value its investments into a disclosure hierarchy consisting of three levels as shown below:
Level 1 - unadjusted quoted prices in active markets for identical investments
Level 2 - other significant observable inputs (including quoted prices for similar investments, interest rates, prepayment speeds, etc.)
Level 3 - unobservable inputs (including the Fund's own assumptions based on the best information available)
Valuation techniques used to value the Fund's investments by major category are as follows:
Debt securities, including restricted securities, are valued based on evaluated prices received from third party pricing services or from brokers who make markets in such securities. Corporate bonds, bank loan obligations, foreign government and government agency obligations and preferred securities are valued by pricing services who utilize matrix pricing which considers yield or price of bonds of comparable quality, coupon, maturity and type or by broker-supplied prices. When independent prices are unavailable or unreliable, debt securities may be valued utilizing pricing methodologies which consider similar factors that would be used by third party pricing services. For foreign debt securities, when significant market or security specific events arise, valuations may be determined in good faith in accordance with procedures adopted by the Board. Debt securities are generally categorized as Level 2 in the hierarchy but may be Level 3 depending on the circumstances. The Fund invests a significant portion of its assets in below investment grade securities. The value of these securities can be more volatile due to changes in the credit quality of the issuer and is sensitive to changes in economic, market and regulatory conditions.
Equity securities, including restricted securities, for which market quotations are readily available, are valued at the last reported sale price or official closing price as reported by a third party pricing service on the primary market or exchange on which they are traded and are categorized as Level 1 in the hierarchy. In the event there were no sales during the day or closing prices are not available, securities are valued at the last quoted bid price or may be valued using the last available price and are generally categorized as Level 2 in the hierarchy. For foreign equity securities, when market or security specific events arise, comparisons to the valuation of American Depositary Receipts (ADRs), futures contracts, ETFs and certain indexes as well as quoted prices for similar securities may be used and would be categorized as Level 2 in the hierarchy. For equity securities, including restricted securities, where observable inputs are limited, assumptions about market activity and risk are used and these securities may be categorized as Level 3 in the hierarchy. Securities, including private placements or other restricted securities, for which observable inputs are not available are valued using alternate valuation approaches, including the market approach, the income approach and cost approach, and are categorized as Level 3 in the hierarchy. The market approach considers factors including the price of recent investments in the same or a similar security or financial metrics of comparable securities. The income approach considers factors including expected future cash flows, security specific risks and corresponding discount rates. The cost approach considers factors including the value of the security's underlying assets and liabilities.
Investments in open-end mutual funds, including the Fidelity Central Funds, are valued at their closing net asset value (NAV) each business day and are categorized as Level 1 in the hierarchy.
The following provides information on Level 3 securities held by the Fund that were valued at period end based on unobservable inputs. These amounts exclude valuations provided by a broker.
| Asset Type | Fair Value | Valuation Technique(s) | Unobservable Input | Amount or Range/Weighted Average | Impact to Valuation from an Increase in InputA |
| | | | | | |
| Equities | $781,242 | Market comparable | Enterprise value/EBITDA multiple (EV/EBITDA) | 4.0 - 5.3 / 4.5 | Increase |
| | | Market approach | Transaction price | $75.89 | Increase |
| | | Recovery value | Recovery value | $0.00 - $1.86 / $1.86 | Increase |
| | | Discounted cash flow | Discount rate | 5.6% - 13.5% / 10.0% | Decrease |
| | | | Term | 0.2 | Increase |
| | | Black scholes | Discount rate | 5.5% | Increase |
| | | | Volatility | 45% | Increase |
| | | | Term | 0.7 | Increase |
| Corporate Bonds | $668,145 | Market comparable | Enterprise value/EBITDA multiple (EV/EBITDA) | 6.5 | Increase |
| | | | Enterprise value/Proved reserves multiple (EV/PR) | 0.8 | Increase |
| | | | Enterprise value/PV-10 multiple (EV/PV-10) | 0.3 | Increase |
| | | | Daily production multiple ($/Million cubic feet per day) | $3,850.00 | Increase |
| | | Indicative market price | Evaluated bid | $2.19 - $100.01 / $80.77 | Increase |
| | | Recovery value | Recovery value | $0.00 | Increase |
| | | Discounted cash flow | Yield | 19.1% | Decrease |
| | | Black scholes | Discount rate | 5.5% | Increase |
| | | | Volatility | 45.0% | Increase |
| | | | Term | 0.7 | Increase |
| Bank Loan Obligations | $1,410,258 | Market comparable | Enterprise value/EBITDA multiple (EV/EBITDA) | 2.5 | Increase |
| | | Market approach | Transaction price | $100.00 | Increase |
| | | Indicative market price | Evaluated bid | $97.00 | Increase |
| | | Recovery value | Recovery value | $0.00 | Increase |
| | | Discounted cash flow | Yield | 9.4% - 15.6% / 12.8% | Decrease |
| | | | Discount rate | 20.0% | Decrease |
| Preferred Securities | $5,000 | Indicative market price | Evaluated bid | $5.00 | Increase |
| | | | | | |
A Represents the directional change in the fair value of the Level 3 investments that could have resulted from an increase in the corresponding input as of period end. A decrease to the unobservable input would have had the opposite effect. Significant changes in these inputs may have resulted in a significantly higher or lower fair value measurement at period end.
Changes in valuation techniques may result in transfers in or out of an assigned level within the disclosure hierarchy. The aggregate value of investments by input level as of October 31, 2023, as well as a roll forward of Level 3 investments, is included at the end of the Fund's Schedule of Investments.
Foreign Currency. Certain Funds may use foreign currency contracts to facilitate transactions in foreign-denominated securities. Gains and losses from these transactions may arise from changes in the value of the foreign currency or if the counterparties do not perform under the contracts' terms.
Foreign-denominated assets, including investment securities, and liabilities are translated into U.S. dollars at the exchange rates at period end. Purchases and sales of investment securities, income and dividends received, and expenses denominated in foreign currencies are translated into U.S. dollars at the exchange rate in effect on the transaction date.
The effects of exchange rate fluctuations on investments are included with the net realized and unrealized gain (loss) on investment securities. Other foreign currency transactions resulting in realized and unrealized gain (loss) are disclosed separately.
Investment Transactions and Income. For financial reporting purposes, the Fund's investment holdings and NAV include trades executed through the end of the last business day of the period. The NAV per share for processing shareholder transactions is calculated as of the close of business of the New York Stock Exchange (NYSE), normally 4:00 p.m. Eastern time and includes trades executed through the end of the prior business day. Gains and losses on securities sold are determined on the basis of identified cost and include proceeds received from litigation. Commissions paid to certain brokers with whom the investment adviser, or its affiliates, places trades on behalf of a fund include an amount in addition to trade execution, which may be rebated back to a fund. Any such rebates are included in net realized gain (loss) on investments in the Statement of Operations. Dividend income is recorded on the ex-dividend date, except for certain dividends from foreign securities where the ex-dividend date may have passed, which are recorded as soon as the Fund is informed of the ex-dividend date. Non-cash dividends included in dividend income, if any, are recorded at the fair market value of the securities received. Income and capital gain distributions from Fidelity Central Funds, if any, are recorded on the ex-dividend date. Certain distributions received by the Fund represent a return of capital or capital gain. The Fund determines the components of these distributions subsequent to the ex-dividend date, based upon receipt of tax filings or other correspondence relating to the underlying investment. These distributions are recorded as a reduction of cost of investments and/or as a realized gain. Interest income is accrued as earned and includes coupon interest and amortization of premium and accretion of discount on debt securities as applicable. Paid in Kind (PIK) income is recorded at the fair market value of the securities received. Investment income is recorded net of foreign taxes withheld where recovery of such taxes is uncertain. Debt obligations may be placed on non-accrual status and related interest income may be reduced by ceasing current accruals and writing off interest receivables when the collection of all or a portion of interest has become doubtful based on consistently applied procedures. A debt obligation is removed from non-accrual status when the issuer resumes interest payments or when collectability of interest is reasonably assured.
Class Allocations and Expenses. Investment income, realized and unrealized capital gains and losses, common expenses of a fund, and certain fund-level expense reductions, if any, are allocated daily on a pro-rata basis to each class based on the relative net assets of each class to the total net assets of a fund. Each class differs with respect to transfer agent and distribution and service plan fees incurred, as applicable. Certain expense reductions may also differ by class, if applicable. For the reporting period, the allocated portion of income and expenses to each class as a percent of its average net assets may vary due to the timing of recording these transactions in relation to fluctuating net assets of the classes. Expenses directly attributable to a fund are charged to that fund. Expenses attributable to more than one fund are allocated among the respective funds on the basis of relative net assets or other appropriate methods. Expenses included in the accompanying financial statements reflect the expenses of that fund and do not include any expenses associated with any underlying mutual funds or exchange-traded funds (ETFs). Although not included in a fund's expenses, a fund indirectly bears its proportionate share of these expenses through the net asset value of each underlying mutual fund or exchange-traded fund (ETF). Expense estimates are accrued in the period to which they relate and adjustments are made when actual amounts are known.
Income Tax Information and Distributions to Shareholders. Each year, the Fund intends to qualify as a regulated investment company under Subchapter M of the Internal Revenue Code, including distributing substantially all of its taxable income and realized gains. As a result, no provision for U.S. Federal income taxes is required. The Fund files a U.S. federal tax return, in addition to state and local tax returns as required. The Fund's federal income tax returns are subject to examination by the Internal Revenue Service (IRS) for a period of three fiscal years after they are filed. State and local tax returns may be subject to examination for an additional fiscal year depending on the jurisdiction. Foreign taxes are provided for based on the Fund's understanding of the tax rules and rates that exist in the foreign markets in which it invests.
Distributions are declared and recorded daily and paid monthly from net investment income. Distributions from realized gains, if any, are declared and recorded on the ex-dividend date. Income and capital gain distributions are declared separately for each class. Income and capital gain distributions are determined in accordance with income tax regulations, which may differ from GAAP.
Capital accounts within the financial statements are adjusted for permanent book-tax differences. These adjustments have no impact on net assets or the results of operations. Capital accounts are not adjusted for temporary book-tax differences which will reverse in a subsequent period.
Book-tax differences are primarily due to foreign currency transactions, market discount, partnerships, certain conversion ratio adjustments, capital loss carryforwards, tax return of capital distribution and losses deferred due to wash sales.
For the period ended April 30, 2023, the Fund's distributions exceeded the aggregate amount of taxable income and net realized gains resulting in a return of capital for tax purposes. This was due to reductions in taxable income available for distribution after certain distributions had been made.
As of period end, the cost and unrealized appreciation (depreciation) in securities, and derivatives if applicable, for federal income tax purposes were as follows:
| Gross unrealized appreciation | $1,737,068 |
| Gross unrealized depreciation | (11,105,027) |
| Net unrealized appreciation (depreciation) | $(9,367,959) |
| Tax cost | $80,466,351 |
Capital loss carryforwards are only available to offset future capital gains of the Fund to the extent provided by regulations and may be limited. The capital loss carryforward information presented below, including any applicable limitation, is estimated as of prior fiscal period end and is subject to adjustment.
| Short-term | $(1,607,422) |
| Long-term | (10,450,384) |
Total capital loss carryforward | $(12,057,806) |
Restricted Securities (including Private Placements). Funds may invest in securities that are subject to legal or contractual restrictions on resale. These securities generally may be resold in transactions exempt from registration or to the public if the securities are registered. Disposal of these securities may involve time-consuming negotiations and expense, and prompt sale at an acceptable price may be difficult. Information regarding restricted securities held at period end is included at the end of the Schedule of Investments, if applicable.
Loans and Other Direct Debt Instruments. Direct debt instruments are interests in amounts owed to lenders by corporate or other borrowers. These instruments may be in the form of loans, trade claims or other receivables and may include standby financing commitments such as revolving credit facilities that obligate a fund to supply additional cash to the borrower on demand. Loans may be acquired through assignment, participation, or may be made directly to a borrower. Such instruments are presented in the Bank Loan Obligations section in the Schedule of Investments. Certain funds may also invest in unfunded loan commitments, which are contractual obligations for future funding. Information regarding unfunded commitments is included at the end of the Schedule of Investments, if applicable.
New Accounting Pronouncement. In June 2022, the Financial Accounting Standards Board (FASB) issued Accounting Standards Update (ASU) 2022-03 Fair Value Measurement (Topic 820): Fair Value Measurement of Equity Securities Subject to Contractual Sale Restrictions. The amendments in this ASU clarify that a contractual restriction on the sale of an equity security is not considered part of the unit of account of the equity security and, therefore, is not considered in measuring fair value. They also clarify that an entity cannot, as a separate unit of account, recognize and measure a contractual sale restriction. They also require additional disclosures for equity securities subject to contractual sale restrictions. ASU 2022-03 will be effective for fiscal years, including interim periods within those fiscal years, beginning after December 15, 2023, and allows for early adoption. ASU 2022-03 will only be applicable to an equity security in which the contractual arrangement that restricts its sale is executed or modified on or after the adoption date. Management is currently evaluating the potential impact of ASU 2022-03 to the financial statements.
4. Purchases and Sales of Investments.
Purchases and sales of securities, other than short-term securities, U.S. government securities and in-kind transactions, as applicable, are noted in the table below.
| | Purchases ($) | Sales ($) |
| Fidelity Global High Income Fund | 14,417,263 | 17,478,908 |
5. Fees and Other Transactions with Affiliates.
Management Fee. Fidelity Management & Research Company LLC (the investment adviser) and its affiliates provide the Fund with investment management related services for which the Fund pays a monthly management fee. The management fee is the sum of an individual fund fee rate that is based on an annual rate of .60% of the Fund's average net assets and an annualized group fee rate that averaged .10% during the period. The group fee rate is based upon the monthly average net assets of a group of registered investment companies with which the investment adviser has management contracts. The group fee rate decreases as assets under management increase and increases as assets under management decrease. For the reporting period, the total annualized management fee rate was .70% of the Fund's average net assets.
Distribution and Service Plan Fees. In accordance with Rule 12b-1 of the 1940 Act, the Fund has adopted separate Distribution and Service Plans for each class of shares. Certain classes pay Fidelity Distributors Company LLC (FDC), an affiliate of the investment adviser, separate Distribution and Service Fees, each of which is based on an annual percentage of each class' average net assets. In addition, FDC may pay financial intermediaries for selling shares of the Fund and providing shareholder support services. For the period, the Distribution and Service Fee rates, total fees and amounts retained by FDC were as follows:
| | Distribution Fee | Service Fee | Total Fees | Retained by FDC |
| Class A | - % | .25% | $9,615 | $140 |
| Class M | - % | .25% | 3,234 | - |
| Class C | .75% | .25% | 7,368 | 401 |
| | | | $20,217 | $541 |
Sales Load. FDC may receive a front-end sales charge of up to 4.00% for selling Class A shares and Class M shares, some of which is paid to financial intermediaries for selling shares of the Fund. Depending on the holding period, FDC may receive contingent deferred sales charges levied on Class A, Class M and Class C redemptions. The deferred sales charges are 1.00% for Class C shares, 1.00% for certain purchases of Class A shares and .25% for certain purchases of Class M shares.
For the period, sales charge amounts retained by FDC were as follows:
| | Retained by FDC |
| Class A | $467 |
| Class M | 205 |
Class C A | 41 |
| | $713 |
A When Class C shares are initially sold, FDC pays commissions from its own resources to financial intermediaries through which the sales are made.
Transfer Agent Fees. Fidelity Investments Institutional Operations Company LLC (FIIOC), an affiliate of the investment adviser, is the transfer, dividend disbursing and shareholder servicing agent for each class of the Fund. FIIOC receives account fees and asset-based fees that vary according to the account size and type of account of the shareholders of the respective classes of the Fund. FIIOC pays for typesetting, printing and mailing of shareholder reports, except proxy statements.
For the period, transfer agent fees for each class were as follows:
| | Amount | % of Class-Level Average Net AssetsA |
| Class A | $7,124 | .18 |
| Class M | 3,254 | .25 |
| Class C | 1,877 | .25 |
| Global High Income | 46,117 | .15 |
| Class I | 2,771 | .17 |
| | $61,143 | |
A Annualized.
During November 2023, the Board approved a change in the transfer agent fees effective December 1, 2023 to a fixed annual rate of class-level average net assets as follows:
| | % of Class-Level Average Net Assets |
| Class A | 0.1824% |
| Class M | 0.2000% |
| Class C | 0.2000% |
| Global High Income | 0.1497% |
| Class I | 0.1928% |
Accounting Fees. Fidelity Service Company, Inc. (FSC), an affiliate of the investment adviser, maintains the Fund's accounting records. The accounting fee is based on the level of average net assets for each month. For the period, the fees were equivalent to the following annualized rates:
| | % of Average Net Assets |
| Fidelity Global High Income Fund | .04 |
During November 2023, the Board approved a change in the accounting fees effective December 1, 2023 to a fixed annual rate of average net assets as follows:
| | % of Average Net Assets |
| Fidelity Global High Income Fund | 0.0414% |
Interfund Trades. Funds may purchase from or sell securities to other Fidelity Funds under procedures adopted by the Board. The procedures have been designed to ensure these interfund trades are executed in accordance with Rule 17a-7 of the 1940 Act. Any interfund trades are included within the respective purchases and sales amounts shown in the Purchases and Sales of Investments note. During the period, there were no interfund trades.
6. Committed Line of Credit.
Certain Funds participate with other funds managed by the investment adviser or an affiliate in a $4.25 billion credit facility (the "line of credit") to be utilized for temporary or emergency purposes to fund shareholder redemptions or for other short-term liquidity purposes. The participating funds have agreed to pay commitment fees on their pro-rata portion of the line of credit, which are reflected in Miscellaneous expenses on the Statement of Operations, and are listed below. During the period, there were no borrowings on this line of credit.
| | Amount |
| Fidelity Global High Income Fund | $64 |
7. Security Lending.
Funds lend portfolio securities from time to time in order to earn additional income. Lending agents are used, including National Financial Services (NFS), an affiliate of the investment adviser. Pursuant to a securities lending agreement, NFS will receive a fee, which is capped at 9.9% of a fund's daily lending revenue, for its services as lending agent. A fund may lend securities to certain qualified borrowers, including NFS. On the settlement date of the loan, a fund receives collateral (in the form of U.S. Treasury obligations, letters of credit and/or cash) against the loaned securities and maintains collateral in an amount not less than 100% of the market value of the loaned securities during the period of the loan. The market value of the loaned securities is determined at the close of business of a fund and any additional required collateral is delivered to a fund on the next business day. A fund or borrower may terminate the loan at any time, and if the borrower defaults on its obligation to return the securities loaned because of insolvency or other reasons, a fund may apply collateral received from the borrower against the obligation. A fund may experience delays and costs in recovering the securities loaned. Any cash collateral received is invested in the Fidelity Securities Lending Cash Central Fund. Any loaned securities are identified as such in the Schedule of Investments, and the value of loaned securities and cash collateral at period end, as applicable, are presented in the Statement of Assets and Liabilities. Security lending income represents the income earned on investing cash collateral, less rebates paid to borrowers and any lending agent fees associated with the loan, plus any premium payments received for lending certain types of securities. Security lending income is presented in the Statement of Operations as a component of income from Fidelity Central Funds. Affiliated security lending activity, if any, was as follows:
| | Total Security Lending Fees Paid to NFS | Security Lending Income From Securities Loaned to NFS | Value of Securities Loaned to NFS at Period End |
| Fidelity Global High Income Fund | $1 | $- | $- |
8. Expense Reductions.
The investment adviser contractually agreed to reimburse expenses of each class to the extent annual operating expenses exceeded certain levels of class-level average net assets as noted in the table below. This reimbursement will remain in place through August 31, 2024. Some expenses, for example the compensation of the independent Trustees, and certain miscellaneous expenses such as proxy and shareholder meeting expenses, are excluded from this reimbursement.
The following classes were in reimbursement during the period:
| | Expense Limitations | Reimbursement |
| Class A | 1.15%/1.05%A | $15,280 |
| Class M | 1.15%/1.05%A | 6,034 |
| Class C | 1.90%/1.80%A | 3,495 |
| Global High Income | .90%/.80%A | 112,366 |
| Class I | .90%/.80%A | 6,361 |
| | | $143,536 |
A Expense limitation effective June 1, 2023.
Through arrangements with the Fund's custodian and each class' transfer agent, credits realized as a result of certain uninvested cash balances were used to reduce the Fund's expenses. During the period, custodian credits reduced the Fund's expenses by $2,099. During the period, transfer agent credits reduced each class' expenses as noted in the table below.
| | Expense reduction |
| | |
| Class M | 10 |
In addition, during the period the investment adviser or an affiliate reimbursed and/or waived a portion of fund-level operating expenses in the amount of $1,516.
9. Distributions to Shareholders.
Distributions to shareholders of each class were as follows:
| | Six months ended October 31, 2023 | Year ended April 30, 2023 |
| Fidelity Global High Income Fund | | |
| Distributions to shareholders | | |
| Class A | $159,573 | $380,555 |
| Class M | 53,746 | 118,501 |
| Class C | 25,133 | 69,010 |
| Global High Income | 1,340,113 | 3,044,980 |
| Class I | 69,690 | 165,310 |
Total | $1,648,255 | $3,778,356 |
10. Share Transactions.
Share transactions for each class were as follows and may contain in-kind transactions, automatic conversions between classes or exchanges between affiliated funds:
| | Shares | Shares | Dollars | Dollars |
| | Six months ended October 31, 2023 | Year ended April 30, 2023 | Six months ended October 31, 2023 | Year ended April 30, 2023 |
| Fidelity Global High Income Fund | | | | |
| Class A | | | | |
| Shares sold | 79,142 | 117,663 | $658,084 | $965,194 |
| Reinvestment of distributions | 18,913 | 45,152 | 155,716 | 370,851 |
| Shares redeemed | (71,263) | (1,026,071) | (586,738) | (8,638,977) |
| Net increase (decrease) | 26,792 | (863,256) | $227,062 | $(7,302,932) |
| Class M | | | | |
| Shares sold | 11,188 | 29,016 | $93,373 | $241,895 |
| Reinvestment of distributions | 6,450 | 14,213 | 53,092 | 116,461 |
| Shares redeemed | (21,437) | (86,940) | (175,882) | (717,956) |
| Net increase (decrease) | (3,799) | (43,711) | $(29,417) | $(359,600) |
| Class C | | | | |
| Shares sold | 7,432 | 14,105 | $61,758 | $115,329 |
| Reinvestment of distributions | 3,041 | 8,356 | 25,038 | 68,433 |
| Shares redeemed | (39,125) | (89,592) | (324,435) | (738,846) |
| Net increase (decrease) | (28,652) | (67,131) | $(237,639) | $(555,084) |
| Global High Income | | | | |
| Shares sold | 507,301 | 1,464,734 | $4,199,268 | $12,141,545 |
| Reinvestment of distributions | 125,071 | 287,398 | 1,029,877 | 2,353,838 |
| Shares redeemed | (1,000,303) | (2,551,630) | (8,246,313) | (20,718,743) |
| Net increase (decrease) | (367,931) | (799,498) | $(3,017,168) | $(6,223,360) |
| Class I | | | | |
| Shares sold | 50,386 | 411,632 | $416,612 | $3,447,408 |
| Reinvestment of distributions | 6,854 | 16,694 | 56,446 | 137,183 |
| Shares redeemed | (119,039) | (359,777) | (984,157) | (2,980,380) |
| Net increase (decrease) | (61,799) | 68,549 | $(511,099) | $604,211 |
11. Other.
A fund's organizational documents provide former and current trustees and officers with a limited indemnification against liabilities arising in connection with the performance of their duties to the fund. In the normal course of business, a fund may also enter into contracts that provide general indemnifications. A fund's maximum exposure under these arrangements is unknown as this would be dependent on future claims that may be made against a fund. The risk of material loss from such claims is considered remote.
12. Credit Risk.
The Fund's relatively large investment in countries with limited or developing capital markets may involve greater risks than investments in more developed markets and the prices of such investments may be volatile. The yields of emerging market debt obligations reflect, among other things, perceived credit risk. The consequences of political, social or economic changes in these markets may have disruptive effects on the market prices of the Fund's investments and the income they generate, as well as the Fund's ability to repatriate such amounts.
13. Litigation.
The Fund and other entities managed by FMR or its affiliates are involved with proceedings arising out of disputes in the United States Bankruptcy Court for the Southern District of Texas ("Bankruptcy Court"), relating to the In re Sanchez Energy Corporation chapter 11 bankruptcy case (Case No. 19-34508). A Bankruptcy Court-appointed representative of unsecured creditors asserted that eight million shares of Mesquite Energy, Inc. (formerly known as Sanchez Energy Corporation) (the "Company"), held in escrow pursuant to the terms of the Company's confirmed chapter 11 plan, should be awarded to the unsecured creditors instead of the Company's current equity holders, including the Fund, which were providers of debtor-in-possession financing to the Company during its chapter 11 case and holders of secured notes issued by the Company in 2018. The unsecured creditors also asserted that certain additional equity issued by the Company in 2020 in connection with two post-bankruptcy financings, also held by the Fund, is invalid. During August 2023, the Bankruptcy Court issued an opinion awarding a portion of the eight million shares to the unsecured creditors, diluting the value of the Fund's holdings in Mesquite. The Fund will appeal this decision. At this time, Management cannot determine any additional loss or dilution that may be realized. The Fund is also incurring legal costs in defending the disputes and has recovered a portion of these legal costs through an insurance claim.
14. Risk and Uncertainties.
Many factors affect a fund's performance. Developments that disrupt global economies and financial markets, such as pandemics, epidemics, outbreaks of infectious diseases, war, terrorism, and environmental disasters, may significantly affect a fund's investment performance. The effects of these developments to a fund will be impacted by the types of securities in which a fund invests, the financial condition, industry, economic sector, and geographic location of an issuer, and a fund's level of investment in the securities of that issuer. Significant concentrations in security types, issuers, industries, sectors, and geographic locations may magnify the factors that affect a fund's performance.
As a shareholder, you incur two types of costs: (1) transaction costs, which may include sales charges (loads) on purchase payments or redemption proceeds, as applicable and (2) ongoing costs, which generally include management fees, distribution and/or service (12b-1) fees and other Fund expenses. This Example is intended to help you understand your ongoing costs (in dollars) of investing in a fund and to compare these costs with the ongoing costs of investing in other mutual funds.
| The Example is based on an investment of $1,000 invested at the beginning of the period and held for the entire period (May 1, 2023 to October 31, 2023). |
Actual Expenses
The first line of the accompanying table provides information about actual account values and actual expenses. You may use the information in this line, together with the amount you invested, to estimate the expenses that you paid over the period. Simply divide your account value by $1,000.00 (for example, an $8,600 account value divided by $1,000.00 = 8.6), then multiply the result by the number in the first line for a class/Fund under the heading entitled "Expenses Paid During Period" to estimate the expenses you paid on your account during this period. If any fund is a shareholder of any underlying mutual funds or exchange-traded funds (ETFs) (the Underlying Funds), such fund indirectly bears its proportional share of the expenses of the Underlying Funds in addition to the direct expenses incurred presented in the table. These fees and expenses are not included in the annualized expense ratio used to calculate the expense estimate in the table below.
Hypothetical Example for Comparison Purposes
The second line of the accompanying table provides information about hypothetical account values and hypothetical expenses based on the actual expense ratio and an assumed rate of return of 5% per year before expenses, which is not the actual return. The hypothetical account values and expenses may not be used to estimate the actual ending account balance or expenses you paid for the period. You may use this information to compare the ongoing costs of investing in the Fund and other funds. To do so, compare this 5% hypothetical example with the 5% hypothetical examples that appear in the shareholder reports of the other funds. If any fund is a shareholder of any Underlying Funds, such fund indirectly bears its proportional share of the expenses of the Underlying Funds in addition to the direct expenses as presented in the table. These fees and expenses are not included in the annualized expense ratio used to calculate the expense estimate in the table below.
Please note that the expenses shown in the table are meant to highlight your ongoing costs only and do not reflect any transaction costs. Therefore, the second line of the table is useful in comparing ongoing costs only, and will not help you determine the relative total costs of owning different funds. In addition, if these transactional costs were included, your costs would have been higher.
| | | | | Annualized Expense Ratio- A | | Beginning Account Value May 1, 2023 | | Ending Account Value October 31, 2023 | | Expenses Paid During Period- C May 1, 2023 to October 31, 2023 |
| Fidelity® Global High Income Fund | | | | | | | | | | |
| Class A | | | | 1.04% | | | | | | |
| Actual | | | | | | $ 1,000 | | $ 984.40 | | $ 5.19 |
Hypothetical-B | | | | | | $ 1,000 | | $ 1,019.91 | | $ 5.28 |
| Class M | | | | 1.04% | | | | | | |
| Actual | | | | | | $ 1,000 | | $ 984.40 | | $ 5.19 |
Hypothetical-B | | | | | | $ 1,000 | | $ 1,019.91 | | $ 5.28 |
| Class C | | | | 1.78% | | | | | | |
| Actual | | | | | | $ 1,000 | | $ 980.70 | | $ 8.86 |
Hypothetical-B | | | | | | $ 1,000 | | $ 1,016.19 | | $ 9.02 |
| Fidelity® Global High Income Fund | | | | .79% | | | | | | |
| Actual | | | | | | $ 1,000 | | $ 985.60 | | $ 3.94 |
Hypothetical-B | | | | | | $ 1,000 | | $ 1,021.17 | | $ 4.01 |
| Class I | | | | .78% | | | | | | |
| Actual | | | | | | $ 1,000 | | $ 985.60 | | $ 3.89 |
Hypothetical-B | | | | | | $ 1,000 | | $ 1,021.22 | | $ 3.96 |
| |
A Annualized expense ratio reflects expenses net of applicable fee waivers.
B 5% return per year before expenses
C Expenses are equal to the annualized expense ratio, multiplied by the average account value over the period, multiplied by 184/ 366 (to reflect the one-half year period). The fees and expenses of any Underlying Funds are not included in each annualized expense ratio.
Board Approval of Investment Advisory Contracts and Management Fees
Fidelity Global High Income Fund
Each year, the Board of Trustees, including the Independent Trustees (together, the Board), considers the renewal of the fund's management contract with Fidelity Management & Research Company LLC (FMR) and the sub-advisory agreements (together, the Advisory Contracts) for the fund. FMR and the sub-advisers are referred to herein as the Investment Advisers. The Board, assisted by the advice of fund counsel and Independent Trustees' counsel, requests and considers a broad range of information relevant to the renewal of the Advisory Contracts throughout the year.
The Board meets regularly and, at each of its meetings, covers an extensive agenda of topics and materials and considers factors that are relevant to its annual consideration of the renewal of the fund's Advisory Contracts, including the services and support provided to the fund and its shareholders. The Board, acting directly and through its Committees (each of which is composed of and chaired by Independent Trustees), requests and receives information concerning the annual consideration of the renewal of the fund's Advisory Contracts. The Board also meets as needed to review matters specifically related to the Board's annual consideration of the renewal of the Advisory Contracts. Members of the Board may also meet with trustees of other Fidelity funds through joint ad hoc committees to discuss certain matters relevant to all of the Fidelity funds.
Approval of Stub Period Continuation. At its May 2023 meeting, the Board of Trustees voted to continue the fund's management contract with FMR, and the sub-advisory agreements and sub-sub-advisory agreements, in each case, where applicable (together, the Advisory Contracts), without modification, for two months from June 1, 2023 through July 31, 2023. The Board considered that the approval of the fund's Advisory Contracts will not result in any changes in (i) the investment process or strategies employed in the management of the fund's assets; (ii) the fees and expenses paid by shareholders; (iii) the nature, extent or quality of services provided under the fund's Advisory Contracts; or (iv) the day-to-day management of the fund or the persons primarily responsible for such management. The Board also considered that since its last approval of the fund's Advisory Contracts, FMR had provided additional information on the fund in support of the annual contract renewal process, including competitive analyses on total expenses and management fees and in-depth reviews of fund performance and fund profitability information. The Board concluded that the fund's Advisory Contracts are fair and reasonable, and that the fund's Advisory Contracts should be renewed, without modification, through July 31, 2023, with the understanding that the Board would consider the annual renewal for a full one year period in July 2023.
At its July 2023 meeting, the Board unanimously determined to renew the fund's Advisory Contracts. In reaching its determination, the Board considered all factors it believed relevant, including (i) the nature, extent, and quality of the services provided to the fund and its shareholders (including the investment performance of the fund); (ii) the competitiveness relative to peer funds of the fund's management fee and the total expense ratio of a representative class (the retail class, which was selected because it was the largest class without 12b-1 fees); (iii) the total costs of the services provided by and the profits realized by FMR and its affiliates (Fidelity) from its relationships with the fund; and (iv) the extent to which, if any, economies of scale exist and are realized as the fund grows, and whether any economies of scale are appropriately shared with fund shareholders. The Board also considered the broad range of investment choices available to shareholders from FMR's competitors and that the fund's shareholders have chosen to invest in the fund, which is part of the Fidelity family of funds. The Board's decision to renew the Advisory Contracts was not based on any single factor.
The Board reached a determination, with the assistance of fund counsel and Independent Trustees' counsel and through the exercise of its business judgment, that the renewal of the Advisory Contracts was in the best interests of the fund and its shareholders and that the compensation payable under the Advisory Contracts was fair and reasonable in light of all of the surrounding circumstances.
Nature, Extent, and Quality of Services Provided. The Board considered staffing as it relates to the fund, including the backgrounds and experience of investment personnel of the Investment Advisers, and also considered the Investment Advisers' implementation of the fund's investment program. The Independent Trustees also had discussions with senior management of Fidelity's investment operations and investment groups. The Board considered the structure of the investment personnel compensation program and whether this structure provides appropriate incentives to act in the best interests of the fund. Additionally, the Board considered the portfolio managers' investments, if any, in the funds that they manage.
Resources Dedicated to Investment Management and Support Services. The Board and the Fund Oversight and Research Committees reviewed the general qualifications and capabilities of Fidelity's investment staff, including its size, education, experience, and resources, as well as Fidelity's approach to recruiting, training, managing, and compensating investment personnel. The Board noted the resources devoted to expansion of Fidelity's global investment organization, and that Fidelity's analysts have extensive resources, tools, and capabilities that allow them to conduct sophisticated quantitative and fundamental analysis, as well as credit analysis of issuers, counterparties, and guarantors. Further, the Board considered that Fidelity's investment professionals have sufficient access to global information and data so as to provide competitive investment results over time, and that those professionals also have access to sophisticated tools that permit them to assess portfolio construction and risk and performance attribution characteristics continuously, as well as to transmit new information and research conclusions rapidly around the world. Additionally, in its deliberations, the Board considered Fidelity's trading, risk management, compliance, and technology and operations capabilities and resources, which are integral parts of the investment management process.
Shareholder and Administrative Services. The Board considered (i) the nature, extent, quality, and cost of advisory, administrative, and shareholder services performed by the Investment Advisers and their affiliates under the Advisory Contracts and under separate agreements covering transfer agency, pricing and bookkeeping, and securities lending services for the fund; (ii) the nature and extent of Fidelity's supervision of third party service providers, principally custodians, subcustodians, and pricing vendors; and (iii) the resources devoted by Fidelity to, and the record of compliance with, the fund's compliance policies and procedures. The Board also reviewed the allocation of fund brokerage, including allocations to brokers affiliated with the Investment Advisers, the use of brokerage commissions to pay fund expenses, and the use of "soft" commission dollars to pay for research services. The Board also considered the fund's securities lending activities and any payments made to Fidelity relating to securities lending.
The Board noted that the growth of fund assets over time across the complex allows Fidelity to reinvest in the development of services designed to enhance the value and convenience of the Fidelity funds as investment vehicles. These services include 24-hour access to account information and market information over the Internet and through telephone representatives, investor education materials, and asset allocation tools. The Board also considered that it reviews customer service metrics such as telephone response times, continuity of services on the website and metrics addressing services at Fidelity Investor Centers.
Investment in a Large Fund Family. The Board considered the benefits to shareholders of investing in a fund that is part of a large family of funds offering a variety of investment disciplines and providing a large variety of fund investor services. The Board noted that Fidelity had taken, or had made recommendations that resulted in the Fidelity funds taking, a number of actions over the previous year that benefited particular funds and/or the Fidelity funds in general.
Investment Performance. The Board took into account discussions that occur with representatives of the Investment Advisers, and reports that it receives, at Board meetings throughout the year, relating to fund investment performance. In this regard the Board noted that as part of regularly scheduled fund reviews and other reports to the Board on fund performance, the Board considered annualized return information for the fund for different time periods, measured against an appropriate securities market index (benchmark index). The Board also considered information about performance attribution. In its ongoing evaluation of fund investment performance, the Board gives particular attention to information indicating changes in performance of the funds over different time periods and discussed with the Investment Advisers the reasons for any overperformance or underperformance.
In addition to reviewing absolute and relative fund performance, the Independent Trustees periodically consider the appropriateness of fund performance metrics in evaluating the results achieved. The Independent Trustees generally give greater weight to fund performance over longer time periods than over shorter time periods. Depending on the circumstances, the Independent Trustees may be satisfied with a fund's performance notwithstanding that it lags its benchmark index for certain periods.
Based on its review, the Board concluded that the nature, extent, and quality of services provided to the fund under the Advisory Contracts should continue to benefit the shareholders of the fund.
Competitiveness of Management Fee and Total Expense Ratio. The Board was provided with information regarding industry trends in management fees and expenses. In its review of the fund's management fee and the total expense ratio of the retail class, the Board considered the fund's management fee rate as well as other fund or class expenses, as applicable, such as transfer agent fees, pricing and bookkeeping fees, fund-paid 12b-1 fees, and custodial, legal, and audit fees. The Board noted that Fidelity may agree to waive fees or reimburse expenses from time to time, and the extent to which, if any, it has done so for the fund.
Comparisons of Management Fees and Total Expense Ratios. Among other things, the Board reviewed data for selected groups of competitive funds and classes (referred to as "mapped groups") that were compiled by Fidelity based on combining similar investment objective categories (as classified by Lipper) that have comparable investment mandates. The data reviewed by the Board included (i) gross management fee comparisons (before taking into account expense reimbursements or caps) relative to the total universe of funds within the mapped group; (ii) gross management fee comparisons relative to a subset of non-Fidelity funds in the mapped group that are similar in size and management fee structure to the fund (referred to as the "asset size peer group"); (iii) total expense comparisons of the retail class of the fund relative to funds and classes in the mapped group that have a similar sales load structure to the retail class of the fund (referred to as the "similar sales load structure group"); and (iv) total expense comparisons of the retail class of the fund relative to funds and classes in the similar sales load structure group that are similar in size and management fee structure to the fund (referred to as the "total expense asset size peer group"). The total expense asset size peer group comparison excludes performance adjustments and fund-paid 12b-1 fees to eliminate variability in fee structures.
The information provided to the Board indicated that the fund's management fee rate ranked above the competitive median of the mapped group for the 12-month period ended September 30, 2022 and above the competitive median of the asset size peer group for the 12-month period ended September 30, 2022. Further, the information provided to the Board indicated that the total expense ratio of the retail class of the fund ranked above the competitive median of the similar sales load structure group for the 12-month period ended September 30, 2022 and above the competitive median of the asset size peer group for the 12-month period ended September 30, 2022. The Board considered that the fund invests a greater portion of its assets internationally than other funds in its mapped group, which consists primarily of domestic high income funds, and also that the fund invests in an asset allocation strategy on top of its global allocation, and, as such, competitive rankings are less meaningful.
The Board noted that the fund offers multiple classes, each of which has a different sales load and 12b-1 fee structure, and that the multiple structures are intended to offer a range of pricing options for the intermediary market. The Board also noted that the total expense ratios of the classes vary primarily by the level of their 12b-1 fees, although differences in transfer agent fees may also cause expenses to vary from class to class.
The Board also considered that, for funds subject to the group fee, FMR agreed to voluntarily waive fees over a specified period of time in amounts designed to account for assets converted from certain funds to certain collective investment trusts.
Other Contractual Arrangements. The Board further considered that FMR has contractually agreed to reimburse Class A, Class M, Class C, Class I, and the retail class of the fund to the extent that total operating expenses, with certain exceptions, as a percentage of their respective average net assets, exceed 1.05%, 1.05%, 1.80%, 0.80%, and 0.80% through August 31, 2024.
Fees Charged to Other Fidelity Clients. The Board also considered Fidelity fee structures and other information with respect to clients of Fidelity, such as other funds advised or subadvised by Fidelity, pension plan clients, and other institutional clients with similar mandates. The Board noted that a joint ad hoc committee created by it and the boards of other Fidelity funds periodically reviews and compares Fidelity's institutional investment advisory business with its business of providing services to the Fidelity funds and also noted the most recent findings of the committee. The Board noted that the committee's review included a consideration of the differences in services provided, fees charged, and costs incurred, as well as competition in the markets serving the different categories of clients.
Based on its review, the Board concluded that the fund's management fee is fair and reasonable in light of the services that the fund receives and the other factors considered. Further, based on its review of total expense ratios and fees charged to other Fidelity clients, the Board concluded that the total expense ratio of each class of the fund was reasonable in light of the services that the fund and its shareholders receive and the other factors considered.
Costs of the Services and Profitability. The Board considered the revenues earned and the expenses incurred by Fidelity in conducting the business of developing, marketing, distributing, managing, administering and servicing the fund and servicing the fund's shareholders. The Board also considered the level of Fidelity's profits in respect of all the Fidelity funds.
On an annual basis, Fidelity presents to the Board information about the profitability of its relationships with the fund. Fidelity calculates profitability information for each fund, as well as aggregate profitability information for groups of Fidelity funds and all Fidelity funds, using a series of detailed revenue and cost allocation methodologies which originate with the books and records of Fidelity on which Fidelity's audited financial statements are based. The Audit Committee of the Board reviews any significant changes from the prior year's methodologies and the full Board approves such changes.
A public accounting firm has been engaged annually by the Board as part of the Board's assessment of Fidelity's profitability analysis. The engagement includes the review and assessment of the methodologies used by Fidelity in determining the revenues and expenses attributable to Fidelity's fund business, and completion of agreed-upon procedures in respect of the mathematical accuracy of certain fund profitability information and its conformity to established allocation methodologies. After considering the reports issued under the engagement and information provided by Fidelity, the Board concluded that while other allocation methods may also be reasonable, Fidelity's profitability methodologies are reasonable in all material respects.
The Board also reviewed Fidelity's non-fund businesses and potential indirect benefits such businesses may have received as a result of their association with Fidelity's fund business (i.e., fall-out benefits) as well as cases where Fidelity's affiliates may benefit from the funds' business. The Board considered areas where potential indirect benefits to the Fidelity funds from their relationships with Fidelity may exist. The Board's consideration of these matters was informed by the findings of a joint ad hoc committee created by it and the boards of other Fidelity funds to evaluate potential fall-out benefits.
The Board considered the costs of the services provided by and the profits realized by Fidelity in connection with the operation of the fund and was satisfied that the profitability was not excessive.
Economies of Scale. The Board considered whether there have been economies of scale in respect of the management of the Fidelity funds, whether the Fidelity funds (including the fund) have appropriately benefited from any such economies of scale, and whether there is potential for realization of any further economies of scale. The Board considered the extent to which the fund will benefit from economies of scale as assets grow through increased services to the fund, through waivers or reimbursements, or through fee or expense ratio reductions. The Board also noted that a committee (the Economies of Scale Committee) created by it and the boards of other Fidelity funds periodically analyzes whether Fidelity attains economies of scale in respect of the management and servicing of the Fidelity funds, whether the Fidelity funds have appropriately benefited from such economies of scale, and whether there is potential for realization of any further economies of scale.
The Board recognized that the fund's management contract incorporates a "group fee" structure, which provides for lower group fee rates as total "group assets" increase, and for higher group fee rates as total "group assets" decrease ("group assets" as defined in the management contract). FMR calculates the group fee rates based on a tiered asset "breakpoint" schedule that varies based on asset class. The Board considered that the group fee is designed to deliver the benefits of economies of scale to fund shareholders when total Fidelity fund assets increase, even if assets of any particular fund are unchanged or have declined, because some portion of Fidelity's costs are attributable to services provided to all Fidelity funds, and all funds benefit if those costs can be allocated among more assets. The Board further considered that Fidelity agreed to impose a temporary fee waiver in the form of additional breakpoints to the current breakpoint schedule. The Board concluded that, given the group fee structure, fund shareholders will benefit from lower management fees as "group assets" increase at the fund complex level, regardless of whether Fidelity achieves any such economies of scale.
The Board concluded, taking into account the analysis of the Economies of Scale Committee, that economies of scale, if any, are being appropriately shared between fund shareholders and Fidelity.
Additional Information Requested by the Board. In order to develop fully the factual basis for consideration of the Fidelity funds' advisory contracts, the Board requested and received additional information on certain topics, including: (i) fund flow and performance trends, in particular the underperformance of certain funds and strategies, and Fidelity's long-term strategies for certain funds, including any consideration of fund liquidations or mergers; (ii) the operation of performance fees and competitor use of performance fees; (iii) Fidelity's pricing philosophy compared to competitors; (iv) fund profitability methodology and data; (v) evaluation of competitive fund data and peer group classifications and fee and expense comparisons; (vi) the management fee and expense structures for different funds and classes and information about the differences between various fee and expense structures; (vii) group fee breakpoints and related voluntary fee waivers; and (viii) information regarding other accounts managed by Fidelity and the funds' sub-advisory arrangements.
Conclusion. Based on its evaluation of all of the conclusions noted above, and after considering all factors it believed relevant, the Board, including the Independent Trustees, concluded that the advisory and sub-advisory fee arrangements are fair and reasonable in light of all of the surrounding circumstances and that the fund's Advisory Contracts should be renewed through July 31, 2024.
1.926252.112
GHI-SANN-1223
Fidelity® Healthy Future Fund
Semi-Annual Report
October 31, 2023
Includes Fidelity and Fidelity Advisor share classes
Contents
To view a fund's proxy voting guidelines and proxy voting record for the 12-month period ended June 30, visit http://www.fidelity.com/proxyvotingresults or visit the Securities and Exchange Commission's (SEC) web site at http://www.sec.gov.
You may also call 1-800-544-8544 if you're an individual investing directly with Fidelity, call 1-800-835-5092 if you're a plan sponsor or participant with Fidelity as your recordkeeper or call 1-877-208-0098 on institutional accounts or if you're an advisor or invest through one to request a free copy of the proxy voting guidelines.
Standard & Poor's, S&P and S&P 500 are registered service marks of The McGraw-Hill Companies, Inc. and have been licensed for use by Fidelity Distributors Corporation.
Other third-party marks appearing herein are the property of their respective owners.
All other marks appearing herein are registered or unregistered trademarks or service marks of FMR LLC or an affiliated company. © 2023 FMR LLC. All rights reserved.
This report and the financial statements contained herein are submitted for the general information of the shareholders of the Fund. This report is not authorized for distribution to prospective investors in the Fund unless preceded or accompanied by an effective prospectus.
A fund files its complete schedule of portfolio holdings with the SEC for the first and third quarters of each fiscal year on Form N-PORT. Forms N-PORT are available on the SEC's web site at http://www.sec.gov. A fund's Forms N-PORT may be reviewed and copied at the SEC's Public Reference Room in Washington, DC. Information regarding the operation of the SEC's Public Reference Room may be obtained by calling 1-800-SEC-0330.
For a complete list of a fund's portfolio holdings, view the most recent holdings listing, semiannual report, or annual report on Fidelity's web site at http://www.fidelity.com, http://www.institutional.fidelity.com, or http://www.401k.com, as applicable.
NOT FDIC INSURED •MAY LOSE VALUE •NO BANK GUARANTEE
Neither the Fund nor Fidelity Distributors Corporation is a bank.
Top Holdings (% of Fund's net assets) |
| |
| NVIDIA Corp. | 9.0 | |
| Procter & Gamble Co. | 7.6 | |
| UnitedHealth Group, Inc. | 7.6 | |
| Nestle SA (Reg. S) | 6.6 | |
| Thermo Fisher Scientific, Inc. | 4.3 | |
| L'Oreal SA | 3.9 | |
| Vertex Pharmaceuticals, Inc. | 3.8 | |
| Tesla, Inc. | 3.3 | |
| AIA Group Ltd. | 2.6 | |
| Eli Lilly & Co. | 2.6 | |
| | 51.3 | |
| |
| Market Sectors (% of Fund's net assets) |
| |
| Health Care | 37.4 | |
| Consumer Staples | 26.7 | |
| Consumer Discretionary | 11.9 | |
| Information Technology | 11.1 | |
| Financials | 9.5 | |
| Industrials | 3.6 | |
| Utilities | 0.9 | |
| Real Estate | 0.8 | |
| |
Asset Allocation (% of Fund's net assets) |
|
Short-Term Investments and Net Other Assets (Liabilities) - (1.9)% |
|
Showing Percentage of Net Assets
| Common Stocks - 101.9% |
| | | Shares | Value ($) |
| CONSUMER DISCRETIONARY - 11.9% | | | |
| Automobile Components - 1.1% | | | |
| Aptiv PLC (a) | | 742 | 64,702 |
| Automobiles - 3.3% | | | |
| Tesla, Inc. (a) | | 966 | 194,011 |
| Hotels, Restaurants & Leisure - 2.9% | | | |
| Cava Group, Inc. | | 453 | 14,310 |
| Chipotle Mexican Grill, Inc. (a) | | 55 | 106,821 |
| Hilton Worldwide Holdings, Inc. | | 320 | 48,490 |
| Sweetgreen, Inc. Class A (a) | | 480 | 4,958 |
| | | | 174,579 |
| Leisure Products - 0.4% | | | |
| YETI Holdings, Inc. (a) | | 518 | 22,025 |
| Specialty Retail - 2.2% | | | |
| TJX Companies, Inc. | | 1,013 | 89,215 |
| Warby Parker, Inc. (a) | | 2,970 | 38,551 |
| | | | 127,766 |
| Textiles, Apparel & Luxury Goods - 2.0% | | | |
| Deckers Outdoor Corp. (a) | | 89 | 53,138 |
| lululemon athletica, Inc. (a) | | 47 | 18,494 |
| On Holding AG (a) | | 1,901 | 48,799 |
| | | | 120,431 |
TOTAL CONSUMER DISCRETIONARY | | | 703,514 |
| CONSUMER STAPLES - 26.7% | | | |
| Consumer Staples Distribution & Retail - 2.3% | | | |
| Costco Wholesale Corp. | | 143 | 78,999 |
| Dollar Tree, Inc. (a) | | 180 | 19,996 |
| U.S. Foods Holding Corp. (a) | | 864 | 33,644 |
| | | | 132,639 |
| Food Products - 7.1% | | | |
| Freshpet, Inc. (a) | | 501 | 28,757 |
| Nestle SA (Reg. S) | | 3,615 | 389,837 |
| | | | 418,594 |
| Household Products - 11.3% | | | |
| Church & Dwight Co., Inc. | | 1,222 | 111,129 |
| Colgate-Palmolive Co. | | 1,420 | 106,670 |
| Procter & Gamble Co. | | 2,993 | 449,040 |
| | | | 666,839 |
| Personal Care Products - 6.0% | | | |
| elf Beauty, Inc. (a) | | 584 | 54,096 |
| Estee Lauder Companies, Inc. Class A | | 250 | 32,218 |
| Kenvue, Inc. | | 2,001 | 37,219 |
| L'Oreal SA | | 553 | 232,443 |
| | | | 355,976 |
TOTAL CONSUMER STAPLES | | | 1,574,048 |
| FINANCIALS - 9.5% | | | |
| Capital Markets - 1.4% | | | |
| BlackRock, Inc. Class A | | 136 | 83,270 |
| Insurance - 8.1% | | | |
| AIA Group Ltd. | | 17,874 | 155,214 |
| Chubb Ltd. | | 577 | 123,836 |
| Globe Life, Inc. | | 561 | 65,278 |
| Hartford Financial Services Group, Inc. | | 633 | 46,494 |
| Marsh & McLennan Companies, Inc. | | 457 | 86,670 |
| | | | 477,492 |
TOTAL FINANCIALS | | | 560,762 |
| HEALTH CARE - 37.4% | | | |
| Biotechnology - 6.5% | | | |
| Gilead Sciences, Inc. | | 1,372 | 107,757 |
| Moderna, Inc. (a) | | 686 | 52,109 |
| Vertex Pharmaceuticals, Inc. (a) | | 620 | 224,508 |
| | | | 384,374 |
| Health Care Equipment & Supplies - 5.1% | | | |
| Abbott Laboratories | | 1,261 | 119,228 |
| Boston Scientific Corp. (a) | | 1,704 | 87,228 |
| DexCom, Inc. (a) | | 242 | 21,497 |
| Penumbra, Inc. (a) | | 178 | 34,025 |
| The Cooper Companies, Inc. | | 75 | 23,381 |
| TransMedics Group, Inc. (a) | | 402 | 15,067 |
| | | | 300,426 |
| Health Care Providers & Services - 15.0% | | | |
| agilon health, Inc. (a) | | 5,229 | 94,122 |
| Centene Corp. (a) | | 1,891 | 130,441 |
| CVS Health Corp. | | 1,737 | 119,870 |
| LifeStance Health Group, Inc. (a) | | 8,060 | 46,990 |
| Molina Healthcare, Inc. (a) | | 120 | 39,954 |
| Surgery Partners, Inc. (a) | | 136 | 3,146 |
| UnitedHealth Group, Inc. | | 834 | 446,657 |
| | | | 881,180 |
| Life Sciences Tools & Services - 6.3% | | | |
| Agilent Technologies, Inc. | | 367 | 37,937 |
| Danaher Corp. | | 400 | 76,808 |
| Thermo Fisher Scientific, Inc. | | 570 | 253,519 |
| | | | 368,264 |
| Pharmaceuticals - 4.5% | | | |
| Eli Lilly & Co. | | 280 | 155,100 |
| UCB SA | | 1,232 | 90,025 |
| Zoetis, Inc. Class A | | 144 | 22,608 |
| | | | 267,733 |
TOTAL HEALTH CARE | | | 2,201,977 |
| INDUSTRIALS - 3.6% | | | |
| Commercial Services & Supplies - 0.1% | | | |
| Veralto Corp. | | 133 | 9,177 |
| Electrical Equipment - 1.5% | | | |
| Generac Holdings, Inc. (a) | | 331 | 27,827 |
| Sensata Technologies, Inc. PLC | | 1,938 | 61,783 |
| | | | 89,610 |
| Ground Transportation - 2.0% | | | |
| Uber Technologies, Inc. (a) | | 2,673 | 115,687 |
TOTAL INDUSTRIALS | | | 214,474 |
| INFORMATION TECHNOLOGY - 11.1% | | | |
| Semiconductors & Semiconductor Equipment - 9.0% | | | |
| NVIDIA Corp. | | 1,296 | 528,508 |
| Technology Hardware, Storage & Peripherals - 2.1% | | | |
| Apple, Inc. | | 635 | 108,439 |
| Samsung Electronics Co. Ltd. GDR (Reg. S) | | 13 | 16,198 |
| | | | 124,637 |
TOTAL INFORMATION TECHNOLOGY | | | 653,145 |
| REAL ESTATE - 0.8% | | | |
| Equity Real Estate Investment Trusts (REITs) - 0.8% | | | |
| Welltower, Inc. | | 596 | 49,832 |
| UTILITIES - 0.9% | | | |
| Electric Utilities - 0.9% | | | |
| NextEra Energy, Inc. | | 892 | 52,004 |
| TOTAL COMMON STOCKS (Cost $5,993,601) | | | 6,009,756 |
| | | | |
| TOTAL INVESTMENT IN SECURITIES - 101.9% (Cost $5,993,601) | 6,009,756 |
NET OTHER ASSETS (LIABILITIES) - (1.9)% | (114,706) |
| NET ASSETS - 100.0% | 5,895,050 |
| | |
Legend
Affiliated Central Funds
Fiscal year to date information regarding the Fund's investments in Fidelity Central Funds, including the ownership percentage, is presented below.
| Affiliate | Value, beginning of period ($) | Purchases ($) | Sales Proceeds ($) | Dividend Income ($) | Realized Gain (loss) ($) | Change in Unrealized appreciation (depreciation) ($) | Value, end of period ($) | % ownership, end of period |
| Fidelity Cash Central Fund 5.40% | 25,605 | 2,508,144 | 2,533,749 | 2,736 | - | - | - | 0.0% |
| Total | 25,605 | 2,508,144 | 2,533,749 | 2,736 | - | - | - | |
| | | | | | | | | |
Amounts in the dividend income column in the above table include any capital gain distributions from underlying funds, which are presented in the corresponding line item in the Statement of Operations, if applicable.
Amounts included in the purchases and sales proceeds columns may include in-kind transactions, if applicable.
Investment Valuation
The following is a summary of the inputs used, as of October 31, 2023, involving the Fund's assets and liabilities carried at fair value. The inputs or methodology used for valuing securities may not be an indication of the risk associated with investing in those securities. For more information on valuation inputs, and their aggregation into the levels used below, please refer to the Investment Valuation section in the accompanying Notes to Financial Statements.
| Valuation Inputs at Reporting Date: |
| Description | Total ($) | Level 1 ($) | Level 2 ($) | Level 3 ($) |
Investments in Securities: | | | | |
|
| Equities: | | | | |
Consumer Discretionary | 703,514 | 703,514 | - | - |
Consumer Staples | 1,574,048 | 951,768 | 622,280 | - |
Financials | 560,762 | 405,548 | 155,214 | - |
Health Care | 2,201,977 | 2,201,977 | - | - |
Industrials | 214,474 | 214,474 | - | - |
Information Technology | 653,145 | 653,145 | - | - |
Real Estate | 49,832 | 49,832 | - | - |
Utilities | 52,004 | 52,004 | - | - |
| | | | | |
| Total Investments in Securities: | 6,009,756 | 5,232,262 | 777,494 | - |
| Statement of Assets and Liabilities |
| | | | October 31, 2023 (Unaudited) |
| | | | | |
| Assets | | | | |
Investment in securities, at value - See accompanying schedule Unaffiliated issuers (cost $5,993,601): | | | $ | 6,009,756 |
| Foreign currency held at value (cost $7) | | | | 7 |
| Receivable for fund shares sold | | | | 4,133 |
| Dividends receivable | | | | 7,550 |
| Distributions receivable from Fidelity Central Funds | | | | 342 |
| Prepaid expenses | | | | 7 |
| Receivable from investment adviser for expense reductions | | | | 2,996 |
Total assets | | | | 6,024,791 |
| Liabilities | | | | |
| Payable to custodian bank | $ | 102,274 | | |
| Payable for fund shares redeemed | | 3,616 | | |
| Accrued management fee | | 3,421 | | |
| Distribution and service plan fees payable | | 468 | | |
| Other affiliated payables | | 1,391 | | |
| Audit fee payable | | 17,159 | | |
| Other payables and accrued expenses | | 1,412 | | |
| Total Liabilities | | | | 129,741 |
| Net Assets | | | $ | 5,895,050 |
| Net Assets consist of: | | | | |
| Paid in capital | | | $ | 6,020,255 |
| Total accumulated earnings (loss) | | | | (125,205) |
| Net Assets | | | $ | 5,895,050 |
| | | | | |
| Net Asset Value and Maximum Offering Price | | | | |
| Class A : | | | | |
Net Asset Value and redemption price per share ($478,857 ÷ 47,583 shares)(a) | | | $ | 10.06 |
| Maximum offering price per share (100/94.25 of $10.06) | | | $ | 10.67 |
| Class M : | | | | |
Net Asset Value and redemption price per share ($606,393 ÷ 60,467 shares)(a) | | | $ | 10.03 |
| Maximum offering price per share (100/96.50 of $10.03) | | | $ | 10.39 |
| Class C : | | | | |
Net Asset Value and offering price per share ($149,353 ÷ 15,002 shares)(a) | | | $ | 9.96 |
| Fidelity Healthy Future Fund : | | | | |
Net Asset Value, offering price and redemption price per share ($4,444,506 ÷ 440,382 shares) | | | $ | 10.09 |
| Class I : | | | | |
Net Asset Value, offering price and redemption price per share ($113,996 ÷ 11,298 shares) | | | $ | 10.09 |
| Class Z : | | | | |
Net Asset Value, offering price and redemption price per share ($101,945 ÷ 10,082 shares) | | | $ | 10.11 |
(a)Redemption price per share is equal to net asset value less any applicable contingent deferred sales charge. |
| Statement of Operations |
| | | | Six months ended October 31, 2023 (Unaudited) |
| Investment Income | | | | |
| Dividends | | | $ | 23,635 |
| Interest | | | | 56 |
| Income from Fidelity Central Funds | | | | 2,736 |
| Total Income | | | | 26,427 |
| Expenses | | | | |
| Management fee | $ | 18,346 | | |
| Transfer agent fees | | 7,001 | | |
| Distribution and service plan fees | | 2,200 | | |
| Accounting fees and expenses | | 965 | | |
| Custodian fees and expenses | | 2,725 | | |
| Independent trustees' fees and expenses | | 12 | | |
| Registration fees | | 26,096 | | |
| Audit | | 19,400 | | |
| Legal | | 2 | | |
| Miscellaneous | | 8 | | |
| Total expenses before reductions | | 76,755 | | |
| Expense reductions | | (46,459) | | |
| Total expenses after reductions | | | | 30,296 |
| Net Investment income (loss) | | | | (3,869) |
| Realized and Unrealized Gain (Loss) | | | | |
| Net realized gain (loss) on: | | | | |
| Investment Securities: | | | | |
| Unaffiliated issuers | | (36,898) | | |
| Foreign currency transactions | | 35 | | |
| Total net realized gain (loss) | | | | (36,863) |
| Change in net unrealized appreciation (depreciation) on: | | | | |
| Investment Securities: | | | | |
| Unaffiliated issuers | | (305,676) | | |
| Assets and liabilities in foreign currencies | | (46) | | |
| Total change in net unrealized appreciation (depreciation) | | | | (305,722) |
| Net gain (loss) | | | | (342,585) |
| Net increase (decrease) in net assets resulting from operations | | | $ | (346,454) |
| Statement of Changes in Net Assets |
| |
| | Six months ended October 31, 2023 (Unaudited) | | For the period May 24, 2022 (commencement of operations) through April 30, 2023 |
| Increase (Decrease) in Net Assets | | | | |
| Operations | | | | |
| Net investment income (loss) | $ | (3,869) | $ | 2,409 |
| Net realized gain (loss) | | (36,863) | | (100,000) |
| Change in net unrealized appreciation (depreciation) | | (305,722) | | 321,841 |
| Net increase (decrease) in net assets resulting from operations | | (346,454) | | 224,250 |
| Distributions to shareholders | | (3,025) | | - |
| | | | | |
| Share transactions - net increase (decrease) | | 2,175,585 | | 3,844,694 |
| Total increase (decrease) in net assets | | 1,826,106 | | 4,068,944 |
| | | | | |
| Net Assets | | | | |
| Beginning of period | | 4,068,944 | | - |
| End of period | $ | 5,895,050 | $ | 4,068,944 |
| | | | | |
| | | | | |
Financial Highlights
| Fidelity Advisor® Healthy Future Fund Class A |
| |
| | Six months ended (Unaudited) October 31, 2023 | | Years ended April 30, 2023 A |
Selected Per-Share Data | | | | |
| Net asset value, beginning of period | $ | 10.57 | $ | 10.00 |
| Income from Investment Operations | | | | |
Net investment income (loss) B,C | | (.02) | | (.01) |
| Net realized and unrealized gain (loss) | | (.49) | | .58 |
| Total from investment operations | | (.51) | | .57 |
| Net asset value, end of period | $ | 10.06 | $ | 10.57 |
Total Return D,E,F | | (4.82)% | | 5.70% |
Ratios to Average Net Assets C,G,H | | | | |
| Expenses before reductions | | 3.01% I | | 9.78% I,J |
| Expenses net of fee waivers, if any | | 1.30% I | | 1.29% I |
| Expenses net of all reductions | | 1.29% I | | 1.29% I |
| Net investment income (loss) | | (.31)% I | | (.09)% I |
| Supplemental Data | | | | |
| Net assets, end of period (000 omitted) | $ | 479 | $ | 205 |
Portfolio turnover rate K | | 32% I | | 68% I |
AFor the period May 24, 2022 (commencement of operations) through April 30, 2023
BCalculated based on average shares outstanding during the period.
CNet investment income (loss) is affected by the timing of the declaration of dividends by any underlying mutual funds or exchange-traded funds (ETFs). Net investment income (loss) of any mutual funds or ETFs is not included in the Fund's net investment income (loss) ratio.
DTotal returns for periods of less than one year are not annualized.
ETotal returns would have been lower if certain expenses had not been reduced during the applicable periods shown.
FTotal returns do not include the effect of the sales charges.
GFees and expenses of any underlying mutual funds or exchange-traded funds (ETFs) are not included in the Fund's expense ratio. The Fund indirectly bears its proportionate share of these expenses. For additional expense information related to investments in Fidelity Central Funds, please refer to the "Investments in Fidelity Central Funds" note found in the Notes to Financial Statements section of the most recent Annual or Semi-Annual report.
HExpense ratios reflect operating expenses of the class. Expenses before reductions do not reflect amounts reimbursed, waived, or reduced through arrangements with the investment adviser, brokerage services, or other offset arrangements, if applicable, and do not represent the amount paid by the class during periods when reimbursements, waivers or reductions occur.
IAnnualized.
JAudit fees are not annualized.
KAmount does not include the portfolio activity of any underlying mutual funds or exchange-traded funds (ETFs).
| Fidelity Advisor® Healthy Future Fund Class M |
| |
| | Six months ended (Unaudited) October 31, 2023 | | Years ended April 30, 2023 A |
Selected Per-Share Data | | | | |
| Net asset value, beginning of period | $ | 10.54 | $ | 10.00 |
| Income from Investment Operations | | | | |
Net investment income (loss) B,C | | (.03) | | (.03) |
| Net realized and unrealized gain (loss) | | (.48) | | .57 |
| Total from investment operations | | (.51) | | .54 |
| Net asset value, end of period | $ | 10.03 | $ | 10.54 |
Total Return D,E,F | | (4.84)% | | 5.40% |
Ratios to Average Net Assets C,G,H | | | | |
| Expenses before reductions | | 3.01% I | | 10.17% I,J |
| Expenses net of fee waivers, if any | | 1.54% I | | 1.54% I |
| Expenses net of all reductions | | 1.53% I | | 1.54% I |
| Net investment income (loss) | | (.56)% I | | (.34)% I |
| Supplemental Data | | | | |
| Net assets, end of period (000 omitted) | $ | 606 | $ | 136 |
Portfolio turnover rate K | | 32% I | | 68% I |
AFor the period May 24, 2022 (commencement of operations) through April 30, 2023
BCalculated based on average shares outstanding during the period.
CNet investment income (loss) is affected by the timing of the declaration of dividends by any underlying mutual funds or exchange-traded funds (ETFs). Net investment income (loss) of any mutual funds or ETFs is not included in the Fund's net investment income (loss) ratio.
DTotal returns for periods of less than one year are not annualized.
ETotal returns would have been lower if certain expenses had not been reduced during the applicable periods shown.
FTotal returns do not include the effect of the sales charges.
GFees and expenses of any underlying mutual funds or exchange-traded funds (ETFs) are not included in the Fund's expense ratio. The Fund indirectly bears its proportionate share of these expenses. For additional expense information related to investments in Fidelity Central Funds, please refer to the "Investments in Fidelity Central Funds" note found in the Notes to Financial Statements section of the most recent Annual or Semi-Annual report.
HExpense ratios reflect operating expenses of the class. Expenses before reductions do not reflect amounts reimbursed, waived, or reduced through arrangements with the investment adviser, brokerage services, or other offset arrangements, if applicable, and do not represent the amount paid by the class during periods when reimbursements, waivers or reductions occur.
IAnnualized.
JAudit fees are not annualized.
KAmount does not include the portfolio activity of any underlying mutual funds or exchange-traded funds (ETFs).
| Fidelity Advisor® Healthy Future Fund Class C |
| |
| | Six months ended (Unaudited) October 31, 2023 | | Years ended April 30, 2023 A |
Selected Per-Share Data | | | | |
| Net asset value, beginning of period | $ | 10.49 | $ | 10.00 |
| Income from Investment Operations | | | | |
Net investment income (loss) B,C | | (.06) | | (.08) |
| Net realized and unrealized gain (loss) | | (.47) | | .57 |
| Total from investment operations | | (.53) | | .49 |
| Net asset value, end of period | $ | 9.96 | $ | 10.49 |
Total Return D,E,F | | (5.05)% | | 4.90% |
Ratios to Average Net Assets C,G,H | | | | |
| Expenses before reductions | | 3.82% I | | 10.48% I,J |
| Expenses net of fee waivers, if any | | 2.05% I | | 2.04% I |
| Expenses net of all reductions | | 2.04% I | | 2.04% I |
| Net investment income (loss) | | (1.07)% I | | (.84)% I |
| Supplemental Data | | | | |
| Net assets, end of period (000 omitted) | $ | 149 | $ | 130 |
Portfolio turnover rate K | | 32% I | | 68% I |
AFor the period May 24, 2022 (commencement of operations) through April 30, 2023
BCalculated based on average shares outstanding during the period.
CNet investment income (loss) is affected by the timing of the declaration of dividends by any underlying mutual funds or exchange-traded funds (ETFs). Net investment income (loss) of any mutual funds or ETFs is not included in the Fund's net investment income (loss) ratio.
DTotal returns for periods of less than one year are not annualized.
ETotal returns would have been lower if certain expenses had not been reduced during the applicable periods shown.
FTotal returns do not include the effect of the contingent deferred sales charge.
GFees and expenses of any underlying mutual funds or exchange-traded funds (ETFs) are not included in the Fund's expense ratio. The Fund indirectly bears its proportionate share of these expenses. For additional expense information related to investments in Fidelity Central Funds, please refer to the "Investments in Fidelity Central Funds" note found in the Notes to Financial Statements section of the most recent Annual or Semi-Annual report.
HExpense ratios reflect operating expenses of the class. Expenses before reductions do not reflect amounts reimbursed, waived, or reduced through arrangements with the investment adviser, brokerage services, or other offset arrangements, if applicable, and do not represent the amount paid by the class during periods when reimbursements, waivers or reductions occur.
IAnnualized.
JAudit fees are not annualized.
KAmount does not include the portfolio activity of any underlying mutual funds or exchange-traded funds (ETFs).
| Fidelity® Healthy Future Fund |
| |
| | Six months ended (Unaudited) October 31, 2023 | | Years ended April 30, 2023 A |
Selected Per-Share Data | | | | |
| Net asset value, beginning of period | $ | 10.59 | $ | 10.00 |
| Income from Investment Operations | | | | |
Net investment income (loss) B,C | | - D | | .02 |
| Net realized and unrealized gain (loss) | | (.49) | | .57 |
| Total from investment operations | | (.49) | | .59 |
| Distributions from net investment income | | (.01) | | - |
| Total distributions | | (.01) | | - |
| Net asset value, end of period | $ | 10.09 | $ | 10.59 |
Total Return E,F | | (4.65)% | | 5.90% |
Ratios to Average Net Assets C,G,H | | | | |
| Expenses before reductions | | 2.76% I | | 9.38% I,J |
| Expenses net of fee waivers, if any | | 1.05% I | | 1.04% I |
| Expenses net of all reductions | | 1.04% I | | 1.04% I |
| Net investment income (loss) | | (.06)% I | | .16% I |
| Supplemental Data | | | | |
| Net assets, end of period (000 omitted) | $ | 4,445 | $ | 3,376 |
Portfolio turnover rate K | | 32% I | | 68% I |
AFor the period May 24, 2022 (commencement of operations) through April 30, 2023
BCalculated based on average shares outstanding during the period.
CNet investment income (loss) is affected by the timing of the declaration of dividends by any underlying mutual funds or exchange-traded funds (ETFs). Net investment income (loss) of any mutual funds or ETFs is not included in the Fund's net investment income (loss) ratio.
DAmount represents less than $.005 per share.
ETotal returns for periods of less than one year are not annualized.
FTotal returns would have been lower if certain expenses had not been reduced during the applicable periods shown.
GFees and expenses of any underlying mutual funds or exchange-traded funds (ETFs) are not included in the Fund's expense ratio. The Fund indirectly bears its proportionate share of these expenses. For additional expense information related to investments in Fidelity Central Funds, please refer to the "Investments in Fidelity Central Funds" note found in the Notes to Financial Statements section of the most recent Annual or Semi-Annual report.
HExpense ratios reflect operating expenses of the class. Expenses before reductions do not reflect amounts reimbursed, waived, or reduced through arrangements with the investment adviser, brokerage services, or other offset arrangements, if applicable, and do not represent the amount paid by the class during periods when reimbursements, waivers or reductions occur.
IAnnualized.
JAudit fees are not annualized.
KAmount does not include the portfolio activity of any underlying mutual funds or exchange-traded funds (ETFs).
| Fidelity Advisor® Healthy Future Fund Class I |
| |
| | Six months ended (Unaudited) October 31, 2023 | | Years ended April 30, 2023 A |
Selected Per-Share Data | | | | |
| Net asset value, beginning of period | $ | 10.59 | $ | 10.00 |
| Income from Investment Operations | | | | |
Net investment income (loss) B,C | | - | | .02 |
| Net realized and unrealized gain (loss) | | (.49) | | .57 |
| Total from investment operations | | (.49) | | .59 |
| Distributions from net investment income | | (.01) | | - |
| Total distributions | | (.01) | | - |
| Net asset value, end of period | $ | 10.09 | $ | 10.59 |
Total Return D,E | | (4.65)% | | 5.90% |
Ratios to Average Net Assets C,F,G | | | | |
| Expenses before reductions | | 2.81% H | | 9.48% H,I |
| Expenses net of fee waivers, if any | | 1.05% H | | 1.05% H |
| Expenses net of all reductions | | 1.04% H | | 1.04% H |
| Net investment income (loss) | | (.07)% H | | .16% H |
| Supplemental Data | | | | |
| Net assets, end of period (000 omitted) | $ | 114 | $ | 115 |
Portfolio turnover rate J | | 32% H | | 68% H |
AFor the period May 24, 2022 (commencement of operations) through April 30, 2023
BCalculated based on average shares outstanding during the period.
CNet investment income (loss) is affected by the timing of the declaration of dividends by any underlying mutual funds or exchange-traded funds (ETFs). Net investment income (loss) of any mutual funds or ETFs is not included in the Fund's net investment income (loss) ratio.
DTotal returns for periods of less than one year are not annualized.
ETotal returns would have been lower if certain expenses had not been reduced during the applicable periods shown.
FFees and expenses of any underlying mutual funds or exchange-traded funds (ETFs) are not included in the Fund's expense ratio. The Fund indirectly bears its proportionate share of these expenses. For additional expense information related to investments in Fidelity Central Funds, please refer to the "Investments in Fidelity Central Funds" note found in the Notes to Financial Statements section of the most recent Annual or Semi-Annual report.
GExpense ratios reflect operating expenses of the class. Expenses before reductions do not reflect amounts reimbursed, waived, or reduced through arrangements with the investment adviser, brokerage services, or other offset arrangements, if applicable, and do not represent the amount paid by the class during periods when reimbursements, waivers or reductions occur.
HAnnualized.
IAudit fees are not annualized.
JAmount does not include the portfolio activity of any underlying mutual funds or exchange-traded funds (ETFs).
| Fidelity Advisor® Healthy Future Fund Class Z |
| |
| | Six months ended (Unaudited) October 31, 2023 | | Years ended April 30, 2023 A |
Selected Per-Share Data | | | | |
| Net asset value, beginning of period | $ | 10.61 | $ | 10.00 |
| Income from Investment Operations | | | | |
Net investment income (loss) B,C | | - | | .03 |
| Net realized and unrealized gain (loss) | | (.49) | | .58 |
| Total from investment operations | | (.49) | | .61 |
| Distributions from net investment income | | (.01) | | - |
| Total distributions | | (.01) | | - |
| Net asset value, end of period | $ | 10.11 | $ | 10.61 |
Total Return D,E | | (4.64)% | | 6.10% |
Ratios to Average Net Assets C,F,G | | | | |
| Expenses before reductions | | 2.65% H | | 9.34% H,I |
| Expenses net of fee waivers, if any | | .90% H | | .90% H |
| Expenses net of all reductions | | .89% H | | .89% H |
| Net investment income (loss) | | .08% H | | .31% H |
| Supplemental Data | | | | |
| Net assets, end of period (000 omitted) | $ | 102 | $ | 107 |
Portfolio turnover rate J | | 32% H | | 68% H |
AFor the period May 24, 2022 (commencement of operations) through April 30, 2023
BCalculated based on average shares outstanding during the period.
CNet investment income (loss) is affected by the timing of the declaration of dividends by any underlying mutual funds or exchange-traded funds (ETFs). Net investment income (loss) of any mutual funds or ETFs is not included in the Fund's net investment income (loss) ratio.
DTotal returns for periods of less than one year are not annualized.
ETotal returns would have been lower if certain expenses had not been reduced during the applicable periods shown.
FFees and expenses of any underlying mutual funds or exchange-traded funds (ETFs) are not included in the Fund's expense ratio. The Fund indirectly bears its proportionate share of these expenses. For additional expense information related to investments in Fidelity Central Funds, please refer to the "Investments in Fidelity Central Funds" note found in the Notes to Financial Statements section of the most recent Annual or Semi-Annual report.
GExpense ratios reflect operating expenses of the class. Expenses before reductions do not reflect amounts reimbursed, waived, or reduced through arrangements with the investment adviser, brokerage services, or other offset arrangements, if applicable, and do not represent the amount paid by the class during periods when reimbursements, waivers or reductions occur.
HAnnualized.
IAudit fees are not annualized.
JAmount does not include the portfolio activity of any underlying mutual funds or exchange-traded funds (ETFs).
For the period ended October 31, 2023
1. Organization.
Fidelity Healthy Future Fund (the Fund) is a non-diversified fund of Fidelity Summer Street Trust (the Trust) and is authorized to issue an unlimited number of shares. The Trust is registered under the Investment Company Act of 1940, as amended (the 1940 Act), as an open-end management investment company organized as a Massachusetts business trust. The Fund offers Class A, Class M, Class C, Fidelity Healthy Future Fund, Class I and Class Z shares, each of which has equal rights as to assets and voting privileges. Class A, Class M, Class C, Class I and Class Z are Fidelity Advisor classes. Each class has exclusive voting rights with respect to matters that affect that class. Class C shares will automatically convert to Class A shares after a holding period of eight years from the initial date of purchase, with certain exceptions.
2. Investments in Fidelity Central Funds.
Funds may invest in Fidelity Central Funds, which are open-end investment companies generally available only to other investment companies and accounts managed by the investment adviser and its affiliates. The Schedule of Investments lists any Fidelity Central Funds held as an investment as of period end, but does not include the underlying holdings of each Fidelity Central Fund. An investing fund indirectly bears its proportionate share of the expenses of the underlying Fidelity Central Funds.
Based on its investment objective, each Fidelity Central Fund may invest or participate in various investment vehicles or strategies that are similar to those of the investing fund. These strategies are consistent with the investment objectives of the investing fund and may involve certain economic risks which may cause a decline in value of each of the Fidelity Central Funds and thus a decline in the value of the investing fund.
| Fidelity Central Fund | Investment Manager | Investment Objective | Investment Practices | Expense RatioA |
| Fidelity Money Market Central Funds | Fidelity Management & Research Company LLC (FMR) | Each fund seeks to obtain a high level of current income consistent with the preservation of capital and liquidity. | Short-term Investments | Less than .005% |
A Expenses expressed as a percentage of average net assets and are as of each underlying Central Fund's most recent annual or semi-annual shareholder report.
A complete unaudited list of holdings for each Fidelity Central Fund is available upon request or at the Securities and Exchange Commission website at www.sec.gov. In addition, the financial statements of the Fidelity Central Funds which contain the significant accounting policies (including investment valuation policies) of those funds, and are not covered by the Report of Independent Registered Public Accounting Firm, are available on the Securities and Exchange Commission website or upon request.
3. Significant Accounting Policies.
The Fund is an investment company and applies the accounting and reporting guidance of the Financial Accounting Standards Board (FASB) Accounting Standards Codification Topic 946 Financial Services - Investment Companies. The financial statements have been prepared in conformity with accounting principles generally accepted in the United States of America (GAAP), which require management to make certain estimates and assumptions at the date of the financial statements. Actual results could differ from those estimates. Subsequent events, if any, through the date that the financial statements were issued have been evaluated in the preparation of the financial statements. The Fund's Schedule of Investments lists any underlying mutual funds or exchange-traded funds (ETFs) but does not include the underlying holdings of these funds. The following summarizes the significant accounting policies of the Fund:
Investment Valuation. Investments are valued as of 4:00 p.m. Eastern time on the last calendar day of the period. The Board of Trustees (the Board) has designated the Fund's investment adviser as the valuation designee responsible for the fair valuation function and performing fair value determinations as needed. The investment adviser has established a Fair Value Committee (the Committee) to carry out the day-to-day fair valuation responsibilities and has adopted policies and procedures to govern the fair valuation process and the activities of the Committee. In accordance with these fair valuation policies and procedures, which have been approved by the Board, the Fund attempts to obtain prices from one or more third party pricing services or brokers to value its investments. When current market prices, quotations or currency exchange rates are not readily available or reliable, investments will be fair valued in good faith by the Committee, in accordance with the policies and procedures. Factors used in determining fair value vary by investment type and may include market or investment specific events, transaction data, estimated cash flows, and market observations of comparable investments. The frequency that the fair valuation procedures are used cannot be predicted and they may be utilized to a significant extent. The Committee manages the Fund's fair valuation practices and maintains the fair valuation policies and procedures. The Fund's investment adviser reports to the Board information regarding the fair valuation process and related material matters.
The Fund categorizes the inputs to valuation techniques used to value its investments into a disclosure hierarchy consisting of three levels as shown below:
Level 1 - unadjusted quoted prices in active markets for identical investments
Level 2 - other significant observable inputs (including quoted prices for similar investments, interest rates, prepayment speeds, etc.)
Level 3 - unobservable inputs (including the Fund's own assumptions based on the best information available)
Valuation techniques used to value the Fund's investments by major category are as follows:
Equity securities, including restricted securities, for which market quotations are readily available, are valued at the last reported sale price or official closing price as reported by a third party pricing service on the primary market or exchange on which they are traded and are categorized as Level 1 in the hierarchy. In the event there were no sales during the day or closing prices are not available, securities are valued at the last quoted bid price or may be valued using the last available price and are generally categorized as Level 2 in the hierarchy. For foreign equity securities, when market or security specific events arise, comparisons to the valuation of American Depositary Receipts (ADRs), futures contracts, ETFs and certain indexes as well as quoted prices for similar securities may be used and would be categorized as Level 2 in the hierarchy. For equity securities, including restricted securities, where observable inputs are limited, assumptions about market activity and risk are used and these securities may be categorized as Level 3 in the hierarchy.
Changes in valuation techniques may result in transfers in or out of an assigned level within the disclosure hierarchy. The aggregate value of investments by input level as of October 31, 2023is included at the end of the Fund's Schedule of Investments.
Foreign Currency. Certain Funds may use foreign currency contracts to facilitate transactions in foreign-denominated securities. Gains and losses from these transactions may arise from changes in the value of the foreign currency or if the counterparties do not perform under the contracts' terms.
Foreign-denominated assets, including investment securities, and liabilities are translated into U.S. dollars at the exchange rates at period end. Purchases and sales of investment securities, income and dividends received, and expenses denominated in foreign currencies are translated into U.S. dollars at the exchange rate in effect on the transaction date.
The effects of exchange rate fluctuations on investments are included with the net realized and unrealized gain (loss) on investment securities. Other foreign currency transactions resulting in realized and unrealized gain (loss) are disclosed separately.
Investment Transactions and Income. For financial reporting purposes, the Fund's investment holdings and NAV include trades executed through the end of the last business day of the period. The NAV per share for processing shareholder transactions is calculated as of the close of business of the New York Stock Exchange (NYSE), normally 4:00 p.m. Eastern time and includes trades executed through the end of the prior business day. Gains and losses on securities sold are determined on the basis of identified cost. Commissions paid to certain brokers with whom the investment adviser, or its affiliates, places trades on behalf of a fund include an amount in addition to trade execution, which may be rebated back to a fund. Any such rebates are included in net realized gain (loss) on investments in the Statement of Operations. Dividend income is recorded on the ex-dividend date, except for certain dividends from foreign securities where the ex-dividend date may have passed, which are recorded as soon as the Fund is informed of the ex-dividend date. Non-cash dividends included in dividend income, if any, are recorded at the fair market value of the securities received. Income and capital gain distributions from Fidelity Central Funds, if any, are recorded on the ex-dividend date. Interest income is accrued as earned and includes coupon interest and amortization of premium and accretion of discount on debt securities as applicable. Investment income is recorded net of foreign taxes withheld where recovery of such taxes is uncertain. Funds may file withholding tax reclaims in certain jurisdictions to recover a portion of amounts previously withheld. Any withholding tax reclaims income is included in the Statement of Operations in dividends. Any receivables for withholding tax reclaims are included in the Statement of Assets and Liabilities in dividends receivable.
Class Allocations and Expenses. Investment income, realized and unrealized capital gains and losses, common expenses of a fund, and certain fund-level expense reductions, if any, are allocated daily on a pro-rata basis to each class based on the relative net assets of each class to the total net assets of a fund. Each class differs with respect to transfer agent and distribution and service plan fees incurred, as applicable. Certain expense reductions may also differ by class, if applicable. For the reporting period, the allocated portion of income and expenses to each class as a percent of its average net assets may vary due to the timing of recording these transactions in relation to fluctuating net assets of the classes. Expenses directly attributable to a fund are charged to that fund. Expenses attributable to more than one fund are allocated among the respective funds on the basis of relative net assets or other appropriate methods. Expenses included in the accompanying financial statements reflect the expenses of that fund and do not include any expenses associated with any underlying mutual funds or exchange-traded funds (ETFs). Although not included in a fund's expenses, a fund indirectly bears its proportionate share of these expenses through the net asset value of each underlying mutual fund or exchange-traded fund (ETF). Expense estimates are accrued in the period to which they relate and adjustments are made when actual amounts are known.
Income Tax Information and Distributions to Shareholders. Each year, the Fund intends to qualify as a regulated investment company under Subchapter M of the Internal Revenue Code, including distributing substantially all of its taxable income and realized gains. As a result, no provision for U.S. Federal income taxes is required. The Fund files a U.S. federal tax return, in addition to state and local tax returns as required. The Fund's federal income tax returns are subject to examination by the Internal Revenue Service (IRS) for a period of three fiscal years after they are filed. State and local tax returns may be subject to examination for an additional fiscal year depending on the jurisdiction. Foreign taxes are provided for based on the Fund's understanding of the tax rules and rates that exist in the foreign markets in which it invests.
Distributions are declared and recorded on the ex-dividend date. Income and capital gain distributions are declared separately for each class. Income and capital gain distributions are determined in accordance with income tax regulations, which may differ from GAAP.
Capital accounts within the financial statements are adjusted for permanent book-tax differences. These adjustments have no impact on net assets or the results of operations. Capital accounts are not adjusted for temporary book-tax differences which will reverse in a subsequent period.
Book-tax differences are primarily due to foreign currency transactions, capital loss carryforwards and losses deferred due to wash sales.
As of period end, the cost and unrealized appreciation (depreciation) in securities, and derivatives if applicable, for federal income tax purposes were as follows:
| Gross unrealized appreciation | $527,115 |
| Gross unrealized depreciation | (541,847) |
| Net unrealized appreciation (depreciation) | $(14,732) |
| Tax cost | $6,024,488 |
Capital loss carryforwards are only available to offset future capital gains of the Fund to the extent provided by regulations and may be limited. The capital loss carryforward information presented below, including any applicable limitation, is estimated as of prior fiscal period end and is subject to adjustment.
Short-term | $(69,420) |
Long-term | (221) |
| Total capital loss carryforward | $(69,641) |
4. Purchases and Sales of Investments.
Purchases and sales of securities, other than short-term securities and in-kind transactions, as applicable, are noted in the table below.
| | Purchases ($) | Sales ($) |
| Fidelity Healthy Future Fund | 3,255,586 | 861,523 |
5. Fees and Other Transactions with Affiliates.
Management Fee. Fidelity Management & Research Company LLC (the investment adviser) and its affiliates provide the Fund with investment management related services for which the Fund pays a monthly management fee. The management fee is the sum of an individual fund fee rate that is based on an annual rate of .45% of the Fund's average net assets and an annualized group fee rate that averaged .22% during the period. The group fee rate is based upon the monthly average net assets of a group of registered investment companies with which the investment adviser has management contracts. The group fee rate decreases as assets under management increase and increases as assets under management decrease. For the reporting period, the total annualized management fee rate was .67% of the Fund's average net assets.
Distribution and Service Plan Fees. In accordance with Rule 12b-1 of the 1940 Act, the Fund has adopted separate Distribution and Service Plans for each class of shares. Certain classes pay Fidelity Distributors Company LLC (FDC), an affiliate of the investment adviser, separate Distribution and Service Fees, each of which is based on an annual percentage of each class' average net assets. In addition, FDC may pay financial intermediaries for selling shares of the Fund and providing shareholder support services. For the period, the Distribution and Service Fee rates, total fees and amounts retained by FDC were as follows:
| | Distribution Fee | Service Fee | Total Fees | Retained by FDC |
| Class A | - % | .25% | $567 | $457 |
| Class M | .25% | .25% | 893 | 286 |
| Class C | .75% | .25% | 740 | 663 |
| | | | $2,200 | $1,406 |
Sales Load. FDC may receive a front-end sales charge of up to 5.75% for selling Class A shares and 3.50% for selling Class M shares, some of which is paid to financial intermediaries for selling shares of the Fund. Depending on the holding period, FDC may receive contingent deferred sales charges levied on Class A, Class M and Class C redemptions. The deferred sales charges are 1.00% for Class C shares, 1.00% for certain purchases of Class A shares and .25% for certain purchases of Class M shares.
For the period, sales charge amounts retained by FDC were as follows:
| | Retained by FDC |
| Class A | $505 |
| Class M | 76 |
Class CA | 27 |
| | $608 |
A When Class C shares are initially sold, FDC pays commissions from its own resources to financial intermediaries through which the sales are made.
Transfer Agent Fees. Fidelity Investments Institutional Operations Company LLC (FIIOC), an affiliate of the investment adviser, is the transfer, dividend disbursing and shareholder servicing agent for each class of the Fund. FIIOC receives account fees and asset-based fees that vary according to the account size and type of account of the shareholders of the respective classes of the Fund, except for Class. FIIOC receives an asset-based fee of Class Z's average net assets. FIIOC pays for typesetting, printing and mailing of shareholder reports, except proxy statements.
For the period, transfer agent fees for each class were as follows:
| | Amount | % of Class-Level Average Net AssetsA |
| Class A | $627 | .28 |
| Class M | 349 | .20 |
| Class C | 195 | .26 |
| Fidelity Healthy Future Fund | 5,692 | .27 |
| Class I | 115 | .19 |
| Class Z | 23 | .04 |
| | $7,001 | |
A Annualized
During November 2023, the Board approved a change in the transfer agent fees effective December 1, 2023 to a fixed annual rate of class-level average net assets as follows:
| | % of Class-Level Average Net Assets |
| Class A | 0.2000 |
| Class M | 0.1988 |
| Class C | 0.2000 |
| Fidelity Healthy Future Fund | 0.1792 |
| Class I | 0.2000 |
Accounting Fees. Fidelity Service Company, Inc. (FSC), an affiliate of the investment adviser, maintains the Fund's accounting records. The accounting fee is based on the level of average net assets for each month. For the period, the fees were equivalent to the following annualized rates:
| | % of Average Net Assets |
| Fidelity Healthy Future Fund | .04 |
During November 2023, the Board approved a change in the accounting fees effective December 1, 2023 to a fixed annual rate of average net assets as follows:
| | % of Average Net Assets |
| Fidelity Healthy Future Fund | 0.0354 |
Brokerage Commissions. A portion of portfolio transactions were placed with brokerage firms which are affiliates of the investment adviser. Brokerage commissions are included in net realized gain (loss) and change in net unrealized appreciation (depreciation) in the Statement of Operations. The commissions paid to these affiliated firms were as follows:
| | Amount |
| Fidelity Healthy Future Fund | $27 |
Interfund Trades. Funds may purchase from or sell securities to other Fidelity Funds under procedures adopted by the Board. The procedures have been designed to ensure these interfund trades are executed in accordance with Rule 17a-7 of the 1940 Act. Any interfund trades are included within the respective purchases and sales amounts shown in the Purchases and Sales of Investments note. Interfund trades during the period are noted in the table below.
| | Purchases ($) | Sales ($) | Realized Gain (Loss) ($) |
| Fidelity Healthy Future Fund | 70,300 | 9,586 | (1,365) |
6. Committed Line of Credit.
Certain Funds participate with other funds managed by the investment adviser or an affiliate in a $4.25 billion credit facility (the "line of credit") to be utilized for temporary or emergency purposes to fund shareholder redemptions or for other short-term liquidity purposes. The participating funds have agreed to pay commitment fees on their pro-rata portion of the line of credit, which are reflected in Miscellaneous expenses on the Statement of Operations, and are listed below. During the period, there were no borrowings on this line of credit.
| | Amount |
| Fidelity Healthy Future Fund | $4 |
7. Expense Reductions.
The investment adviser contractually agreed to reimburse expenses of each class to the extent annual operating expenses exceeded certain levels of class-level average net assets as noted in the table below. This reimbursement will remain in place through August 31, 2024. Some expenses, for example the compensation of the independent Trustees, are excluded from this reimbursement.
The following classes were in reimbursement during the period:
| | Expense Limitations | Reimbursement |
| Class A | 1.30% | $3,869 |
| Class M | 1.55% | 2,618 |
| Class C | 2.05% | 1,310 |
| Fidelity Healthy Future Fund | 1.05% | 36,276 |
| Class I | 1.05% | 1,064 |
| Class Z | .90% | 948 |
| | | $46,085 |
Through arrangements with the Fund's custodian, credits realized as a result of certain uninvested cash balances were used to reduce the Fund's expenses. During the period, custodian credits reduced the Fund's expenses by $264.
In addition, during the period the investment adviser or an affiliate reimbursed and/or waived a portion of fund-level operating expenses in the amount of $110.
8. Distributions to Shareholders.
Distributions to shareholders of each class were as follows:
| | Six months ended October 31, 2023 |
| Fidelity Healthy Future Fund | |
| Distributions to shareholders | |
| Fidelity Healthy Future Fund | $2,853 |
| Class I | 91 |
| Class Z | 81 |
Total | $3,025 |
9. Share Transactions.
Share transactions for each class were as follows and may contain in-kind transactions, automatic conversions between classes or exchanges between affiliated funds:
| | Shares | Shares | Dollars | Dollars |
| | Six months ended October 31, 2023 | Year ended April 30, 2023 A | Six months ended October 31, 2023 | Year ended April 30, 2023 A |
| Fidelity Healthy Future Fund | | | | |
| Class A | | | | |
| Shares sold | 33,949 | 21,624 | $365,491 | $214,288 |
| Shares redeemed | (5,793) | (2,197) | (63,972) | (22,414) |
| Net increase (decrease) | 28,156 | 19,427 | $301,519 | $191,874 |
| Class M | | | | |
| Shares sold | 53,289 | 12,903 | $570,457 | $129,961 |
| Shares redeemed | (5,725) | - | (62,116) | - |
| Net increase (decrease) | 47,564 | 12,903 | $508,341 | $129,961 |
| Class C | | | | |
| Shares sold | 3,053 | 12,345 | $32,733 | $123,179 |
| Shares redeemed | (396) | - | (4,201) | - |
| Net increase (decrease) | 2,657 | 12,345 | $28,532 | $123,179 |
| Fidelity Healthy Future Fund | | | | |
| Shares sold | 204,478 | 405,307 | $2,204,933 | $4,047,257 |
| Reinvestment of distributions | 215 | - | 2,296 | - |
| Shares redeemed | (83,029) | (86,589) | (874,455) | (856,749) |
| Net increase (decrease) | 121,664 | 318,718 | $1,332,774 | $3,190,508 |
| Class I | | | | |
| Shares sold | 505 | 10,884 | $5,348 | $108,773 |
| Reinvestment of distributions | 9 | - | 91 | - |
| Shares redeemed | (100) | - | (1,101) | - |
| Net increase (decrease) | 414 | 10,884 | $4,338 | $108,773 |
| Class Z | | | | |
| Shares sold | - | 10,820 | $ - | $107,700 |
| Reinvestment of distributions | 8 | - | 81 | - |
| Shares redeemed | - | (746) | - | (7,301) |
| Net increase (decrease) | 8 | 10,074 | $81 | $100,399 |
A For the period May 24, 2022 (commencement of operations) through April 30, 2023.
10. Other.
A fund's organizational documents provide former and current trustees and officers with a limited indemnification against liabilities arising in connection with the performance of their duties to the fund. In the normal course of business, a fund may also enter into contracts that provide general indemnifications. A fund's maximum exposure under these arrangements is unknown as this would be dependent on future claims that may be made against a fund. The risk of material loss from such claims is considered remote.
At the end of the period, the investment adviser or its affiliates were owners of record of more than 10% of the outstanding shares as follows:
| Fund | Affiliated % |
| Fidelity Healthy Future Fund | 17% |
11. Risk and Uncertainties.
Many factors affect a fund's performance. Developments that disrupt global economies and financial markets, such as pandemics, epidemics, outbreaks of infectious diseases, war, terrorism, and environmental disasters, may significantly affect a fund's investment performance. The effects of these developments to a fund will be impacted by the types of securities in which a fund invests, the financial condition, industry, economic sector, and geographic location of an issuer, and a fund's level of investment in the securities of that issuer. Significant concentrations in security types, issuers, industries, sectors, and geographic locations may magnify the factors that affect a fund's performance.
As a shareholder, you incur two types of costs: (1) transaction costs, which may include sales charges (loads) on purchase payments or redemption proceeds, as applicable and (2) ongoing costs, which generally include management fees, distribution and/or service (12b-1) fees and other Fund expenses. This Example is intended to help you understand your ongoing costs (in dollars) of investing in a fund and to compare these costs with the ongoing costs of investing in other mutual funds.
| The Example is based on an investment of $1,000 invested at the beginning of the period and held for the entire period (May 1, 2023 to October 31, 2023). |
Actual Expenses
The first line of the accompanying table provides information about actual account values and actual expenses. You may use the information in this line, together with the amount you invested, to estimate the expenses that you paid over the period. Simply divide your account value by $1,000.00 (for example, an $8,600 account value divided by $1,000.00 = 8.6), then multiply the result by the number in the first line for a class/Fund under the heading entitled "Expenses Paid During Period" to estimate the expenses you paid on your account during this period. If any fund is a shareholder of any underlying mutual funds or exchange-traded funds (ETFs) (the Underlying Funds), such fund indirectly bears its proportional share of the expenses of the Underlying Funds in addition to the direct expenses incurred presented in the table. These fees and expenses are not included in the annualized expense ratio used to calculate the expense estimate in the table below.
Hypothetical Example for Comparison Purposes
The second line of the accompanying table provides information about hypothetical account values and hypothetical expenses based on the actual expense ratio and an assumed rate of return of 5% per year before expenses, which is not the actual return. The hypothetical account values and expenses may not be used to estimate the actual ending account balance or expenses you paid for the period. You may use this information to compare the ongoing costs of investing in the Fund and other funds. To do so, compare this 5% hypothetical example with the 5% hypothetical examples that appear in the shareholder reports of the other funds. If any fund is a shareholder of any Underlying Funds, such fund indirectly bears its proportional share of the expenses of the Underlying Funds in addition to the direct expenses as presented in the table. These fees and expenses are not included in the annualized expense ratio used to calculate the expense estimate in the table below.
Please note that the expenses shown in the table are meant to highlight your ongoing costs only and do not reflect any transaction costs. Therefore, the second line of the table is useful in comparing ongoing costs only, and will not help you determine the relative total costs of owning different funds. In addition, if these transactional costs were included, your costs would have been higher.
| | | | | Annualized Expense Ratio- A | | Beginning Account Value May 1, 2023 | | Ending Account Value October 31, 2023 | | Expenses Paid During Period- C May 1, 2023 to October 31, 2023 |
| Fidelity® Healthy Future Fund | | | | | | | | | | |
Class A ** | | | | 1.30% | | | | | | |
| Actual | | | | | | $ 1,000 | | $ 951.80 | | $ 6.38 |
Hypothetical-B | | | | | | $ 1,000 | | $ 1,018.60 | | $ 6.60 |
| Class M | | | | 1.54% | | | | | | |
| Actual | | | | | | $ 1,000 | | $ 951.60 | | $ 7.55 |
Hypothetical-B | | | | | | $ 1,000 | | $ 1,017.39 | | $ 7.81 |
| Class C | | | | 2.05% | | | | | | |
| Actual | | | | | | $ 1,000 | | $ 949.50 | | $ 10.05 |
Hypothetical-B | | | | | | $ 1,000 | | $ 1,014.83 | | $ 10.38 |
Fidelity® Healthy Future Fund ** | | | | 1.05% | | | | | | |
| Actual | | | | | | $ 1,000 | | $ 953.50 | | $ 5.16 |
Hypothetical-B | | | | | | $ 1,000 | | $ 1,019.86 | | $ 5.33 |
| Class I | | | | 1.05% | | | | | | |
| Actual | | | | | | $ 1,000 | | $ 953.50 | | $ 5.16 |
Hypothetical-B | | | | | | $ 1,000 | | $ 1,019.86 | | $ 5.33 |
| Class Z | | | | .90% | | | | | | |
| Actual | | | | | | $ 1,000 | | $ 953.60 | | $ 4.42 |
Hypothetical-B | | | | | | $ 1,000 | | $ 1,020.61 | | $ 4.57 |
| |
A Annualized expense ratio reflects expenses net of applicable fee waivers.
B 5% return per year before expenses
C Expenses are equal to the annualized expense ratio, multiplied by the average account value over the period, multiplied by 184/ 366 (to reflect the one-half year period). The fees and expenses of any Underlying Funds are not included in each annualized expense ratio.
** If fees and changes to the expense contract and/or expense cap, effective December 1, 2023, had been in effect during the current period, the restated annualized expense ratio and the expenses paid in the actual and hypothetical examples above would have been as shown in table below:
| | | | | Annualized Expense Ratio- A | | Expenses Paid |
| Fidelity® Healthy Future Fund | | | | | | |
| Class A | | | | 1.22% | | |
| Actual | | | | | | $ 5.99 |
Hypothetical- B | | | | | | $ 6.19 |
| Fidelity® Healthy Future Fund | | | | .98% | | |
| Actual | | | | | | $ 4.81 |
Hypothetical- B | | | | | | $ 4.98 |
| | | | | | | |
| A Annualized expense ratio reflects expenses net of applicable fee waivers. | | | | | | |
| B 5% return per year before expenses | | | | | | |
Board Approval of Investment Advisory Contracts and Management Fees
Fidelity Healthy Future Fund
Each year, the Board of Trustees, including the Independent Trustees (together, the Board), considers the renewal of the fund's management contract with Fidelity Management & Research Company LLC (FMR) and the sub-advisory agreements (together, the Advisory Contracts) for the fund. FMR and the sub-advisers are referred to herein as the Investment Advisers. The Board, assisted by the advice of fund counsel and Independent Trustees' counsel, requests and considers a broad range of information relevant to the renewal of the Advisory Contracts throughout the year.
The Board meets regularly and, at each of its meetings, covers an extensive agenda of topics and materials and considers factors that are relevant to its annual consideration of the renewal of the fund's Advisory Contracts, including the services and support provided to the fund and its shareholders. The Board, acting directly and through its Committees (each of which is composed of and chaired by Independent Trustees), requests and receives information concerning the annual consideration of the renewal of the fund's Advisory Contracts. The Board also meets as needed to review matters specifically related to the Board's annual consideration of the renewal of the Advisory Contracts. Members of the Board may also meet with trustees of other Fidelity funds through joint ad hoc committees to discuss certain matters relevant to all of the Fidelity funds.
Approval of Stub Period Continuation. At its May 2023 meeting, the Board of Trustees voted to continue the fund's management contract with FMR, and the sub-advisory agreements and sub-sub-advisory agreements, in each case, where applicable (together, the Advisory Contracts), without modification, for two months from June 1, 2023 through July 31, 2023. The Board considered that the approval of the fund's Advisory Contracts will not result in any changes in (i) the investment process or strategies employed in the management of the fund's assets; (ii) the fees and expenses paid by shareholders; (iii) the nature, extent or quality of services provided under the fund's Advisory Contracts; or (iv) the day-to-day management of the fund or the persons primarily responsible for such management. The Board also considered that since its last approval of the fund's Advisory Contracts, FMR had provided additional information on the fund in support of the annual contract renewal process, including competitive analyses on total expenses and management fees and in-depth reviews of fund performance and fund profitability information. The Board concluded that the fund's Advisory Contracts are fair and reasonable, and that the fund's Advisory Contracts should be renewed, without modification, through July 31, 2023, with the understanding that the Board would consider the annual renewal for a full one year period in July 2023.
At its July 2023 meeting, the Board unanimously determined to renew the fund's Advisory Contracts. In reaching its determination, the Board considered all factors it believed relevant, including (i) the nature, extent, and quality of the services provided to the fund and its shareholders (including the investment performance of the fund); (ii) the competitiveness relative to peer funds of the fund's management fee and the total expense ratio of a representative class (the retail class, which was selected because it was the largest class without 12b-1 fees); (iii) the total costs of the services provided by and the profits realized by FMR and its affiliates (Fidelity) from its relationships with the fund; and (iv) the extent to which, if any, economies of scale exist and are realized as the fund grows, and whether any economies of scale are appropriately shared with fund shareholders. The Board also considered the broad range of investment choices available to shareholders from FMR's competitors and that the fund's shareholders have chosen to invest in the fund, which is part of the Fidelity family of funds. The Board's decision to renew the Advisory Contracts was not based on any single factor.
The Board reached a determination, with the assistance of fund counsel and Independent Trustees' counsel and through the exercise of its business judgment, that the renewal of the Advisory Contracts was in the best interests of the fund and its shareholders and that the compensation payable under the Advisory Contracts was fair and reasonable in light of all of the surrounding circumstances.
Nature, Extent, and Quality of Services Provided. The Board considered staffing as it relates to the fund, including the backgrounds and experience of investment personnel of the Investment Advisers, and also considered the Investment Advisers' implementation of the fund's investment program. The Independent Trustees also had discussions with senior management of Fidelity's investment operations and investment groups. The Board considered the structure of the investment personnel compensation program and whether this structure provides appropriate incentives to act in the best interests of the fund. Additionally, the Board considered the portfolio managers' investments, if any, in the funds that they manage.
Resources Dedicated to Investment Management and Support Services. The Board and the Fund Oversight and Research Committees reviewed the general qualifications and capabilities of Fidelity's investment staff, including its size, education, experience, and resources, as well as Fidelity's approach to recruiting, training, managing, and compensating investment personnel. The Board noted the resources devoted to expansion of Fidelity's global investment organization, and that Fidelity's analysts have extensive resources, tools, and capabilities that allow them to conduct sophisticated quantitative and fundamental analysis, as well as credit analysis of issuers, counterparties, and guarantors. Further, the Board considered that Fidelity's investment professionals have sufficient access to global information and data so as to provide competitive investment results over time, and that those professionals also have access to sophisticated tools that permit them to assess portfolio construction and risk and performance attribution characteristics continuously, as well as to transmit new information and research conclusions rapidly around the world. Additionally, in its deliberations, the Board considered Fidelity's trading, risk management, compliance, and technology and operations capabilities and resources, which are integral parts of the investment management process.
Shareholder and Administrative Services. The Board considered (i) the nature, extent, quality, and cost of advisory, administrative, and shareholder services performed by the Investment Advisers and their affiliates under the Advisory Contracts and under separate agreements covering transfer agency, pricing and bookkeeping, and securities lending services for the fund; (ii) the nature and extent of Fidelity's supervision of third party service providers, principally custodians, subcustodians, and pricing vendors; and (iii) the resources devoted by Fidelity to, and the record of compliance with, the fund's compliance policies and procedures. The Board also reviewed the allocation of fund brokerage, including allocations to brokers affiliated with the Investment Advisers, the use of brokerage commissions to pay fund expenses, and the use of "soft" commission dollars to pay for research services. The Board also considered the fund's securities lending activities and any payments made to Fidelity relating to securities lending.
The Board noted that the growth of fund assets over time across the complex allows Fidelity to reinvest in the development of services designed to enhance the value and convenience of the Fidelity funds as investment vehicles. These services include 24-hour access to account information and market information over the Internet and through telephone representatives, investor education materials, and asset allocation tools. The Board also considered that it reviews customer service metrics such as telephone response times, continuity of services on the website and metrics addressing services at Fidelity Investor Centers.
Investment in a Large Fund Family. The Board considered the benefits to shareholders of investing in a fund that is part of a large family of funds offering a variety of investment disciplines and providing a large variety of fund investor services. The Board noted that Fidelity had taken, or had made recommendations that resulted in the Fidelity funds taking, a number of actions over the previous year that benefited particular funds and/or the Fidelity funds in general.
Investment Performance. The Board took into account discussions that occur with representatives of the Investment Advisers, and reports that it receives, at Board meetings throughout the year, relating to fund investment performance. In this regard the Board noted that as part of regularly scheduled fund reviews and other reports to the Board on fund performance, the Board considered annualized return information for the fund for different time periods, measured against an appropriate securities market index (benchmark index). The Board also considered information about performance attribution. In its ongoing evaluation of fund investment performance, the Board gives particular attention to information indicating changes in performance of the funds over different time periods and discussed with the Investment Advisers the reasons for any overperformance or underperformance.
In addition to reviewing absolute and relative fund performance, the Independent Trustees periodically consider the appropriateness of fund performance metrics in evaluating the results achieved. The Independent Trustees generally give greater weight to fund performance over longer time periods than over shorter time periods. Depending on the circumstances, the Independent Trustees may be satisfied with a fund's performance notwithstanding that it lags its benchmark index for certain periods.
Based on its review, the Board concluded that the nature, extent, and quality of services provided to the fund under the Advisory Contracts should continue to benefit the shareholders of the fund.
Competitiveness of Management Fee and Total Expense Ratio. The Board was provided with information regarding industry trends in management fees and expenses. In its review of the fund's management fee and the total expense ratio of the retail class, the Board considered the fund's management fee rate as well as other fund or class expenses, as applicable, such as transfer agent fees, pricing and bookkeeping fees, fund-paid 12b-1 fees, and custodial, legal, and audit fees. The Board noted that Fidelity may agree to waive fees or reimburse expenses from time to time, and the extent to which, if any, it has done so for the fund.
Comparisons of Management Fees and Total Expense Ratios. Among other things, the Board reviewed data for selected groups of competitive funds and classes (referred to as "mapped groups") that were compiled by Fidelity based on combining similar investment objective categories (as classified by Lipper) that have comparable investment mandates. The data reviewed by the Board included (i) gross management fee comparisons (before taking into account expense reimbursements or caps) relative to the total universe of funds within the mapped group; (ii) gross management fee comparisons relative to a subset of non-Fidelity funds in the mapped group that are similar in size and management fee structure to the fund (referred to as the "asset size peer group"); (iii) total expense comparisons of the retail class of the fund relative to funds and classes in the mapped group that have a similar sales load structure to the retail class of the fund (referred to as the "similar sales load structure group"); and (iv) total expense comparisons of the retail class of the fund relative to funds and classes in the similar sales load structure group that are similar in size and management fee structure to the fund (referred to as the "total expense asset size peer group"). The total expense asset size peer group comparison excludes performance adjustments and fund-paid 12b-1 fees to eliminate variability in fee structures.
The information provided to the Board indicated that the fund's management fee rate ranked below the competitive median of the mapped group for the period ended September 30, 2022 and below the competitive median of the asset size peer group for the period ended September 30, 2022. Further, the information provided to the Board indicated that the total expense ratio of the retail class of the fund ranked above the competitive median of the similar sales load structure group for the period ended September 30, 2022 and below the competitive median of the total expense asset size peer group for the period ended September 30, 2022. The Board noted that, when compared to classes in the similar sales load structure group with thematic strategies, the retail class of the fund was not above the median.
The Board noted that the fund offers multiple classes, each of which has a different sales load and 12b-1 fee structure, and that the multiple structures are intended to offer a range of pricing options for the intermediary market. The Board also noted that the total expense ratios of the classes vary primarily by the level of their 12b-1 fees, although differences in transfer agent fees may also cause expenses to vary from class to class.
The Board also considered that, for funds subject to the group fee, FMR agreed to voluntarily waive fees over a specified period of time in amounts designed to account for assets converted from certain funds to certain collective investment trusts.
Fees Charged to Other Fidelity Clients. The Board also considered Fidelity fee structures and other information with respect to clients of Fidelity, such as other funds advised or subadvised by Fidelity, pension plan clients, and other institutional clients with similar mandates. The Board noted that a joint ad hoc committee created by it and the boards of other Fidelity funds periodically reviews and compares Fidelity's institutional investment advisory business with its business of providing services to the Fidelity funds and also noted the most recent findings of the committee. The Board noted that the committee's review included a consideration of the differences in services provided, fees charged, and costs incurred, as well as competition in the markets serving the different categories of clients.
Based on its review, the Board concluded that the fund's management fee is fair and reasonable in light of the services that the fund receives and the other factors considered. Further based on its review of total expense ratios and fees charged to other Fidelity clients, the Board concluded that the total expense ratio of each class of the fund was reasonable in light of the services that the fund and its shareholders receive and the other factors considered.
Costs of the Services and Profitability. The Board considered the revenues earned and the expenses incurred by Fidelity in conducting the business of developing, marketing, distributing, managing, administering and servicing the fund and servicing the fund's shareholders. The Board also considered the level of Fidelity's profits in respect of all the Fidelity funds.
On an annual basis, Fidelity presents to the Board information about the profitability of its relationships with the fund. Fidelity calculates profitability information for each fund, as well as aggregate profitability information for groups of Fidelity funds and all Fidelity funds, using a series of detailed revenue and cost allocation methodologies which originate with the books and records of Fidelity on which Fidelity's audited financial statements are based. The Audit Committee of the Board reviews any significant changes from the prior year's methodologies and the full Board approves such changes.
A public accounting firm has been engaged annually by the Board as part of the Board's assessment of Fidelity's profitability analysis. The engagement includes the review and assessment of the methodologies used by Fidelity in determining the revenues and expenses attributable to Fidelity's fund business, and completion of agreed-upon procedures in respect of the mathematical accuracy of certain fund profitability information and its conformity to established allocation methodologies. After considering the reports issued under the engagement and information provided by Fidelity, the Board concluded that while other allocation methods may also be reasonable, Fidelity's profitability methodologies are reasonable in all material respects.
The Board also reviewed Fidelity's non-fund businesses and potential indirect benefits such businesses may have received as a result of their association with Fidelity's fund business (i.e., fall-out benefits) as well as cases where Fidelity's affiliates may benefit from the funds' business. The Board considered areas where potential indirect benefits to the Fidelity funds from their relationships with Fidelity may exist. The Board's consideration of these matters was informed by the findings of a joint ad hoc committee created by it and the boards of other Fidelity funds to evaluate potential fall-out benefits.
The Board considered the costs of the services provided by and the profits realized by Fidelity in connection with the operation of the fund and was satisfied that the profitability was not excessive.
Economies of Scale. The Board considered whether there have been economies of scale in respect of the management of the Fidelity funds, whether the Fidelity funds (including the fund) have appropriately benefited from any such economies of scale, and whether there is potential for realization of any further economies of scale. The Board considered the extent to which the fund will benefit from economies of scale as assets grow through increased services to the fund, through waivers or reimbursements, or through fee or expense ratio reductions. The Board also noted that a committee (the Economies of Scale Committee) created by it and the boards of other Fidelity funds periodically analyzes whether Fidelity attains economies of scale in respect of the management and servicing of the Fidelity funds, whether the Fidelity funds have appropriately benefited from such economies of scale, and whether there is potential for realization of any further economies of scale.
The Board recognized that the fund's management contract incorporates a "group fee" structure, which provides for lower group fee rates as total "group assets" increase, and for higher group fee rates as total "group assets" decrease ("group assets" as defined in the management contract). FMR calculates the group fee rates based on a tiered asset "breakpoint" schedule that varies based on asset class. The Board considered that the group fee is designed to deliver the benefits of economies of scale to fund shareholders when total Fidelity fund assets increase, even if assets of any particular fund are unchanged or have declined, because some portion of Fidelity's costs are attributable to services provided to all Fidelity funds, and all funds benefit if those costs can be allocated among more assets. The Board further considered that Fidelity agreed to impose a temporary fee waiver in the form of additional breakpoints to the current breakpoint schedule. The Board concluded that, given the group fee structure, fund shareholders will benefit from lower management fees as "group assets" increase at the fund complex level, regardless of whether Fidelity achieves any such economies of scale.
The Board concluded, taking into account the analysis of the Economies of Scale Committee, that economies of scale, if any, are being appropriately shared between fund shareholders and Fidelity.
Additional Information Requested by the Board. In order to develop fully the factual basis for consideration of the Fidelity funds' advisory contracts, the Board requested and received additional information on certain topics, including: (i) fund flow and performance trends, in particular the underperformance of certain funds and strategies, and Fidelity's long-term strategies for certain funds, including any consideration of fund liquidations or mergers; (ii) the operation of performance fees and competitor use of performance fees; (iii) Fidelity's pricing philosophy compared to competitors; (iv) fund profitability methodology and data; (v) evaluation of competitive fund data and peer group classifications and fee and expense comparisons; (vi) the management fee and expense structures for different funds and classes and information about the differences between various fee and expense structures; (vii) group fee breakpoints and related voluntary fee waivers; and (viii) information regarding other accounts managed by Fidelity and the funds' sub-advisory arrangements.
Conclusion. Based on its evaluation of all of the conclusions noted above, and after considering all factors it believed relevant, the Board, including the Independent Trustees, concluded that the advisory and sub-advisory fee arrangements are fair and reasonable in light of all of the surrounding circumstances and that the fund's Advisory Contracts should be renewed through July 31, 2024.
1.9904958.101
HWF-SANN-1223
Fidelity® U.S. Low Volatility Equity Fund
Semi-Annual Report
October 31, 2023
Contents
To view a fund's proxy voting guidelines and proxy voting record for the 12-month period ended June 30, visit http://www.fidelity.com/proxyvotingresults or visit the Securities and Exchange Commission's (SEC) web site at http://www.sec.gov.
You may also call 1-800-544-8544 to request a free copy of the proxy voting guidelines.
Standard & Poor's, S&P and S&P 500 are registered service marks of The McGraw-Hill Companies, Inc. and have been licensed for use by Fidelity Distributors Corporation.
Other third-party marks appearing herein are the property of their respective owners.
All other marks appearing herein are registered or unregistered trademarks or service marks of FMR LLC or an affiliated company. © 2023 FMR LLC. All rights reserved.
This report and the financial statements contained herein are submitted for the general information of the shareholders of the Fund. This report is not authorized for distribution to prospective investors in the Fund unless preceded or accompanied by an effective prospectus.
A fund files its complete schedule of portfolio holdings with the SEC for the first and third quarters of each fiscal year on Form N-PORT. Forms N-PORT are available on the SEC's web site at http://www.sec.gov. A fund's Forms N-PORT may be reviewed and copied at the SEC's Public Reference Room in Washington, DC. Information regarding the operation of the SEC's Public Reference Room may be obtained by calling 1-800-SEC-0330.
For a complete list of a fund's portfolio holdings, view the most recent holdings listing, semiannual report, or annual report on Fidelity's web site at http://www.fidelity.com, http://www.institutional.fidelity.com, or http://www.401k.com, as applicable.
NOT FDIC INSURED •MAY LOSE VALUE •NO BANK GUARANTEE
Neither the Fund nor Fidelity Distributors Corporation is a bank.
Top Holdings (% of Fund's net assets) |
| |
| Marsh & McLennan Companies, Inc. | 1.2 | |
| Accenture PLC Class A | 1.1 | |
| FTI Consulting, Inc. | 1.1 | |
| Humana, Inc. | 1.1 | |
| Cboe Global Markets, Inc. | 1.1 | |
| T-Mobile U.S., Inc. | 1.1 | |
| Microsoft Corp. | 1.1 | |
| Linde PLC | 1.1 | |
| Waste Connections, Inc. (United States) | 1.1 | |
| UnitedHealth Group, Inc. | 1.1 | |
| | 11.1 | |
| |
| Market Sectors (% of Fund's net assets) |
| |
| Health Care | 23.3 | |
| Information Technology | 16.1 | |
| Consumer Staples | 15.7 | |
| Financials | 15.0 | |
| Industrials | 9.3 | |
| Utilities | 5.0 | |
| Consumer Discretionary | 5.0 | |
| Communication Services | 4.9 | |
| Materials | 2.5 | |
| Energy | 2.2 | |
| Investment Companies | 0.8 | |
| |
Asset Allocation (% of Fund's net assets) |
|
|
Showing Percentage of Net Assets
| Common Stocks - 99.0% |
| | | Shares | Value ($) |
| COMMUNICATION SERVICES - 4.9% | | | |
| Diversified Telecommunication Services - 1.4% | | | |
| AT&T, Inc. | | 82,498 | 1,270,469 |
| Verizon Communications, Inc. | | 40,809 | 1,433,620 |
| | | | 2,704,089 |
| Entertainment - 1.7% | | | |
| Electronic Arts, Inc. | | 12,032 | 1,489,441 |
| IMAX Corp. (a) | | 31,400 | 571,794 |
| TKO Group Holdings, Inc. | | 14,090 | 1,155,098 |
| | | | 3,216,333 |
| Media - 0.7% | | | |
| Comcast Corp. Class A | | 32,621 | 1,346,921 |
| Wireless Telecommunication Services - 1.1% | | | |
| T-Mobile U.S., Inc. | | 14,247 | 2,049,573 |
TOTAL COMMUNICATION SERVICES | | | 9,316,916 |
| CONSUMER DISCRETIONARY - 5.0% | | | |
| Diversified Consumer Services - 0.8% | | | |
| Grand Canyon Education, Inc. (a) | | 13,229 | 1,565,388 |
| Hotels, Restaurants & Leisure - 1.7% | | | |
| McDonald's Corp. | | 6,246 | 1,637,514 |
| Yum! Brands, Inc. | | 12,057 | 1,457,209 |
| | | | 3,094,723 |
| Specialty Retail - 2.5% | | | |
| Murphy U.S.A., Inc. | | 3,894 | 1,412,315 |
| O'Reilly Automotive, Inc. (a) | | 1,611 | 1,498,939 |
| TJX Companies, Inc. | | 19,945 | 1,756,556 |
| | | | 4,667,810 |
TOTAL CONSUMER DISCRETIONARY | | | 9,327,921 |
| CONSUMER STAPLES - 15.7% | | | |
| Beverages - 3.0% | | | |
| Constellation Brands, Inc. Class A (sub. vtg.) | | 4,472 | 1,047,119 |
| Keurig Dr. Pepper, Inc. | | 45,119 | 1,368,459 |
| Monster Beverage Corp. | | 34,857 | 1,781,193 |
| The Coca-Cola Co. | | 26,751 | 1,511,164 |
| | | | 5,707,935 |
| Consumer Staples Distribution & Retail - 2.1% | | | |
| BJ's Wholesale Club Holdings, Inc. (a) | | 12,900 | 878,748 |
| Sprouts Farmers Market LLC (a) | | 30,165 | 1,267,533 |
| Walmart, Inc. | | 11,566 | 1,890,000 |
| | | | 4,036,281 |
| Food Products - 5.3% | | | |
| Archer Daniels Midland Co. | | 16,391 | 1,173,104 |
| Bunge Ltd. | | 9,019 | 955,834 |
| Ingredion, Inc. | | 17,823 | 1,667,876 |
| McCormick & Co., Inc. (non-vtg.) | | 17,379 | 1,110,518 |
| Mondelez International, Inc. | | 27,839 | 1,843,220 |
| Nestle SA (Reg. S) | | 11,316 | 1,220,304 |
| The Hershey Co. | | 7,607 | 1,425,171 |
| Tyson Foods, Inc. Class A | | 10,626 | 492,515 |
| | | | 9,888,542 |
| Household Products - 4.1% | | | |
| Colgate-Palmolive Co. | | 20,491 | 1,539,284 |
| Kimberly-Clark Corp. | | 11,961 | 1,431,014 |
| Procter & Gamble Co. | | 11,928 | 1,789,558 |
| Reynolds Consumer Products, Inc. | | 61,663 | 1,568,090 |
| The Clorox Co. | | 11,999 | 1,412,282 |
| | | | 7,740,228 |
| Personal Care Products - 0.3% | | | |
| Kenvue, Inc. | | 33,700 | 626,820 |
| Tobacco - 0.9% | | | |
| Philip Morris International, Inc. | | 18,616 | 1,659,803 |
TOTAL CONSUMER STAPLES | | | 29,659,609 |
| ENERGY - 2.2% | | | |
| Oil, Gas & Consumable Fuels - 2.2% | | | |
| Diamondback Energy, Inc. | | 6,600 | 1,058,112 |
| Exxon Mobil Corp. | | 16,869 | 1,785,584 |
| Phillips 66 Co. | | 12,100 | 1,380,247 |
| | | | 4,223,943 |
| FINANCIALS - 15.0% | | | |
| Banks - 0.5% | | | |
| 1st Source Corp. | | 8,473 | 386,538 |
| Community Trust Bancorp, Inc. | | 13,681 | 513,858 |
| | | | 900,396 |
| Capital Markets - 2.6% | | | |
| Cboe Global Markets, Inc. | | 12,541 | 2,055,344 |
| CME Group, Inc. | | 6,700 | 1,430,182 |
| Intercontinental Exchange, Inc. | | 9,176 | 985,869 |
| PJT Partners, Inc. (b) | | 6,500 | 509,340 |
| | | | 4,980,735 |
| Financial Services - 1.9% | | | |
| MasterCard, Inc. Class A | | 4,659 | 1,753,415 |
| Visa, Inc. Class A | | 7,542 | 1,773,124 |
| | | | 3,526,539 |
| Insurance - 10.0% | | | |
| American Financial Group, Inc. | | 11,058 | 1,209,303 |
| Aon PLC | | 4,763 | 1,473,672 |
| Arthur J. Gallagher & Co. | | 8,023 | 1,889,336 |
| Brown & Brown, Inc. | | 22,825 | 1,584,512 |
| Chubb Ltd. | | 7,938 | 1,703,654 |
| Everest Re Group Ltd. | | 4,205 | 1,663,582 |
| Globe Life, Inc. | | 7,073 | 823,014 |
| Hartford Financial Services Group, Inc. | | 14,142 | 1,038,730 |
| Marsh & McLennan Companies, Inc. | | 11,574 | 2,195,010 |
| Progressive Corp. | | 11,011 | 1,740,729 |
| Selective Insurance Group, Inc. | | 17,490 | 1,820,884 |
| The Travelers Companies, Inc. | | 10,233 | 1,713,414 |
| | | | 18,855,840 |
TOTAL FINANCIALS | | | 28,263,510 |
| HEALTH CARE - 23.3% | | | |
| Biotechnology - 6.7% | | | |
| AbbVie, Inc. | | 10,278 | 1,451,048 |
| Alkermes PLC (a) | | 21,334 | 516,069 |
| Biogen, Inc. (a) | | 4,763 | 1,131,403 |
| Exelixis, Inc. (a) | | 79,669 | 1,640,385 |
| Gilead Sciences, Inc. | | 18,545 | 1,456,524 |
| Incyte Corp. (a) | | 21,895 | 1,180,797 |
| Regeneron Pharmaceuticals, Inc. (a) | | 2,417 | 1,884,994 |
| United Therapeutics Corp. (a) | | 5,834 | 1,300,165 |
| Vertex Pharmaceuticals, Inc. (a) | | 5,556 | 2,011,883 |
| | | | 12,573,268 |
| Health Care Equipment & Supplies - 1.6% | | | |
| Becton, Dickinson & Co. | | 6,275 | 1,586,195 |
| Boston Scientific Corp. (a) | | 27,419 | 1,403,579 |
| | | | 2,989,774 |
| Health Care Providers & Services - 6.6% | | | |
| Cencora, Inc. | | 9,167 | 1,697,270 |
| Chemed Corp. | | 2,778 | 1,563,042 |
| Cigna Group | | 6,308 | 1,950,434 |
| CVS Health Corp. | | 5,761 | 397,567 |
| Elevance Health, Inc. | | 3,188 | 1,434,887 |
| Humana, Inc. | | 3,943 | 2,064,910 |
| Quest Diagnostics, Inc. | | 10,816 | 1,407,162 |
| UnitedHealth Group, Inc. | | 3,792 | 2,030,844 |
| | | | 12,546,116 |
| Life Sciences Tools & Services - 2.1% | | | |
| Danaher Corp. | | 4,834 | 928,225 |
| QIAGEN NV (a) | | 32,975 | 1,234,254 |
| Thermo Fisher Scientific, Inc. | | 3,965 | 1,763,513 |
| | | | 3,925,992 |
| Pharmaceuticals - 6.3% | | | |
| AstraZeneca PLC (United Kingdom) | | 13,130 | 1,643,925 |
| Bristol-Myers Squibb Co. | | 24,553 | 1,265,216 |
| Eli Lilly & Co. | | 3,552 | 1,967,559 |
| Johnson & Johnson | | 8,997 | 1,334,615 |
| Merck & Co., Inc. | | 17,167 | 1,763,051 |
| Roche Holding AG (participation certificate) | | 4,181 | 1,077,484 |
| Royalty Pharma PLC | | 36,961 | 993,142 |
| Sanofi SA sponsored ADR | | 39,579 | 1,790,950 |
| | | | 11,835,942 |
TOTAL HEALTH CARE | | | 43,871,092 |
| INDUSTRIALS - 9.3% | | | |
| Aerospace & Defense - 1.8% | | | |
| Lockheed Martin Corp. | | 3,625 | 1,648,070 |
| Northrop Grumman Corp. | | 3,944 | 1,859,320 |
| | | | 3,507,390 |
| Commercial Services & Supplies - 2.1% | | | |
| Republic Services, Inc. | | 13,174 | 1,956,207 |
| Waste Connections, Inc. (United States) | | 15,740 | 2,038,330 |
| | | | 3,994,537 |
| Construction & Engineering - 0.2% | | | |
| Bowman Consulting Group Ltd. (a) | | 15,380 | 408,647 |
| Ground Transportation - 0.9% | | | |
| Landstar System, Inc. | | 9,993 | 1,646,647 |
| Industrial Conglomerates - 0.8% | | | |
| General Electric Co. | | 13,396 | 1,455,207 |
| Machinery - 0.6% | | | |
| IDEX Corp. | | 5,754 | 1,101,373 |
| Professional Services - 2.9% | | | |
| CACI International, Inc. Class A (a) | | 5,132 | 1,666,668 |
| FTI Consulting, Inc. (a) | | 9,972 | 2,116,657 |
| Science Applications International Corp. | | 15,270 | 1,668,095 |
| | | | 5,451,420 |
TOTAL INDUSTRIALS | | | 17,565,221 |
| INFORMATION TECHNOLOGY - 16.1% | | | |
| Communications Equipment - 1.7% | | | |
| Cisco Systems, Inc. | | 33,769 | 1,760,378 |
| Motorola Solutions, Inc. | | 5,259 | 1,464,421 |
| | | | 3,224,799 |
| Electronic Equipment, Instruments & Components - 1.9% | | | |
| Amphenol Corp. Class A | | 6,052 | 487,489 |
| Insight Enterprises, Inc. (a) | | 13,673 | 1,959,341 |
| Keyence Corp. | | 3,094 | 1,205,794 |
| | | | 3,652,624 |
| IT Services - 3.6% | | | |
| Accenture PLC Class A | | 7,197 | 2,138,157 |
| Akamai Technologies, Inc. (a) | | 15,964 | 1,649,560 |
| Amdocs Ltd. | | 18,925 | 1,517,028 |
| Cognizant Technology Solutions Corp. Class A | | 23,586 | 1,520,589 |
| | | | 6,825,334 |
| Semiconductors & Semiconductor Equipment - 0.2% | | | |
| Cirrus Logic, Inc. (a) | | 5,061 | 338,733 |
| Software - 8.2% | | | |
| Blackbaud, Inc. (a) | | 19,590 | 1,281,186 |
| CCC Intelligent Solutions Holdings, Inc. Class A (a) | | 139,117 | 1,498,290 |
| CommVault Systems, Inc. (a) | | 21,600 | 1,411,560 |
| Manhattan Associates, Inc. (a) | | 8,037 | 1,567,054 |
| Microsoft Corp. | | 6,041 | 2,042,523 |
| PTC, Inc. (a) | | 12,205 | 1,713,826 |
| Roper Technologies, Inc. | | 4,144 | 2,024,634 |
| Salesforce, Inc. (a) | | 7,045 | 1,414,847 |
| SAP SE sponsored ADR | | 7,710 | 1,033,140 |
| Splunk, Inc. (a) | | 9,600 | 1,412,736 |
| | | | 15,399,796 |
| Technology Hardware, Storage & Peripherals - 0.5% | | | |
| FUJIFILM Holdings Corp. ADR | | 15,418 | 845,369 |
TOTAL INFORMATION TECHNOLOGY | | | 30,286,655 |
| MATERIALS - 2.5% | | | |
| Chemicals - 1.7% | | | |
| Corteva, Inc. | | 24,623 | 1,185,351 |
| Linde PLC | | 5,344 | 2,042,263 |
| | | | 3,227,614 |
| Containers & Packaging - 0.8% | | | |
| Aptargroup, Inc. | | 11,778 | 1,440,096 |
TOTAL MATERIALS | | | 4,667,710 |
| UTILITIES - 5.0% | | | |
| Electric Utilities - 3.9% | | | |
| Allete, Inc. | | 24,410 | 1,306,911 |
| IDACORP, Inc. | | 15,216 | 1,441,107 |
| PNM Resources, Inc. | | 37,047 | 1,565,606 |
| PPL Corp. | | 54,116 | 1,329,630 |
| Southern Co. | | 26,657 | 1,794,016 |
| | | | 7,437,270 |
| Gas Utilities - 0.4% | | | |
| National Fuel Gas Co. | | 13,600 | 692,920 |
| Multi-Utilities - 0.7% | | | |
| NorthWestern Energy Corp. | | 27,027 | 1,297,566 |
TOTAL UTILITIES | | | 9,427,756 |
| TOTAL COMMON STOCKS (Cost $171,889,680) | | | 186,610,333 |
| | | | |
| Money Market Funds - 0.4% |
| | | Shares | Value ($) |
| Fidelity Cash Central Fund 5.40% (c) | | 526,267 | 526,372 |
| Fidelity Securities Lending Cash Central Fund 5.40% (c)(d) | | 164,434 | 164,450 |
| TOTAL MONEY MARKET FUNDS (Cost $690,822) | | | 690,822 |
| | | | |
| Equity Funds - 0.8% |
| | | Shares | Value ($) |
| Domestic Equity Funds - 0.8% | | | |
iShares MSCI USA Minimum Volatility ETF (Cost $1,531,924) | | 20,800 | 1,492,400 |
| | | | |
| TOTAL INVESTMENT IN SECURITIES - 100.2% (Cost $174,112,426) | 188,793,555 |
NET OTHER ASSETS (LIABILITIES) - (0.2)% | (282,830) |
| NET ASSETS - 100.0% | 188,510,725 |
| | |
Security Type Abbreviations
Legend
| (b) | Security or a portion of the security is on loan at period end. |
| (c) | Affiliated fund that is generally available only to investment companies and other accounts managed by Fidelity Investments. The rate quoted is the annualized seven-day yield of the fund at period end. A complete unaudited listing of the fund's holdings as of its most recent quarter end is available upon request. In addition, each Fidelity Central Fund's financial statements are available on the SEC's website or upon request. |
| (d) | Investment made with cash collateral received from securities on loan. |
Affiliated Central Funds
Fiscal year to date information regarding the Fund's investments in Fidelity Central Funds, including the ownership percentage, is presented below.
| Affiliate | Value, beginning of period ($) | Purchases ($) | Sales Proceeds ($) | Dividend Income ($) | Realized Gain (loss) ($) | Change in Unrealized appreciation (depreciation) ($) | Value, end of period ($) | % ownership, end of period |
| Fidelity Cash Central Fund 5.40% | 255,294 | 13,195,938 | 12,924,860 | 12,807 | - | - | 526,372 | 0.0% |
| Fidelity Securities Lending Cash Central Fund 5.40% | 1,701,129 | 10,554,485 | 12,091,164 | 7,865 | - | - | 164,450 | 0.0% |
| Total | 1,956,423 | 23,750,423 | 25,016,024 | 20,672 | - | - | 690,822 | |
| | | | | | | | | |
Amounts in the dividend income column in the above table include any capital gain distributions from underlying funds, which are presented in the corresponding line item in the Statement of Operations, if applicable.
Amounts in the dividend income column for Fidelity Securities Lending Cash Central Fund represents the income earned on investing cash collateral, less rebates paid to borrowers and any lending agent fees associated with the loan, plus any premium payments received for lending certain types of securities.
Amounts included in the purchases and sales proceeds columns may include in-kind transactions, if applicable.
Investment Valuation
The following is a summary of the inputs used, as of October 31, 2023, involving the Fund's assets and liabilities carried at fair value. The inputs or methodology used for valuing securities may not be an indication of the risk associated with investing in those securities. For more information on valuation inputs, and their aggregation into the levels used below, please refer to the Investment Valuation section in the accompanying Notes to Financial Statements.
| Valuation Inputs at Reporting Date: |
| Description | Total ($) | Level 1 ($) | Level 2 ($) | Level 3 ($) |
Investments in Securities: | | | | |
|
| Equities: | | | | |
Communication Services | 9,316,916 | 9,316,916 | - | - |
Consumer Discretionary | 9,327,921 | 9,327,921 | - | - |
Consumer Staples | 29,659,609 | 28,439,305 | 1,220,304 | - |
Energy | 4,223,943 | 4,223,943 | - | - |
Financials | 28,263,510 | 28,263,510 | - | - |
Health Care | 43,871,092 | 41,149,683 | 2,721,409 | - |
Industrials | 17,565,221 | 17,565,221 | - | - |
Information Technology | 30,286,655 | 30,286,655 | - | - |
Materials | 4,667,710 | 4,667,710 | - | - |
Utilities | 9,427,756 | 9,427,756 | - | - |
|
| Money Market Funds | 690,822 | 690,822 | - | - |
|
| Equity Funds | 1,492,400 | 1,492,400 | - | - |
| Total Investments in Securities: | 188,793,555 | 184,851,842 | 3,941,713 | - |
| Statement of Assets and Liabilities |
| | | | October 31, 2023 (Unaudited) |
| | | | | |
| Assets | | | | |
| Investment in securities, at value (including securities loaned of $172,392) - See accompanying schedule: | | | | |
Unaffiliated issuers (cost $173,421,604) | $ | 188,102,733 | | |
Fidelity Central Funds (cost $690,822) | | 690,822 | | |
| | | | | |
| | | | | |
| Total Investment in Securities (cost $174,112,426) | | | $ | 188,793,555 |
| Receivable for fund shares sold | | | | 19,792 |
| Dividends receivable | | | | 263,843 |
| Distributions receivable from Fidelity Central Funds | | | | 1,479 |
| Prepaid expenses | | | | 279 |
Total assets | | | | 189,078,948 |
| Liabilities | | | | |
| Payable to custodian bank | $ | 2 | | |
| Payable for fund shares redeemed | | 282,132 | | |
| Accrued management fee | | 67,215 | | |
| Transfer agent fee payable | | 28,656 | | |
| Other affiliated payables | | 5,624 | | |
| Other payables and accrued expenses | | 20,144 | | |
| Collateral on securities loaned | | 164,450 | | |
| Total Liabilities | | | | 568,223 |
| Net Assets | | | $ | 188,510,725 |
| Net Assets consist of: | | | | |
| Paid in capital | | | $ | 171,986,945 |
| Total accumulated earnings (loss) | | | | 16,523,780 |
| Net Assets | | | $ | 188,510,725 |
Net Asset Value, offering price and redemption price per share ($188,510,725 ÷ 18,794,181 shares) | | | $ | 10.03 |
| Statement of Operations |
| | | | Six months ended October 31, 2023 (Unaudited) |
| Investment Income | | | | |
| Dividends | | | $ | 1,797,422 |
| Income from Fidelity Central Funds (including $7,865 from security lending) | | | | 20,672 |
| Total Income | | | | 1,818,094 |
| Expenses | | | | |
| Management fee | $ | 423,691 | | |
| Transfer agent fees | | 173,663 | | |
| Accounting fees | | 35,433 | | |
| Custodian fees and expenses | | 4,434 | | |
| Independent trustees' fees and expenses | | 511 | | |
| Registration fees | | 23,075 | | |
| Audit | | 20,139 | | |
| Legal | | 95 | | |
| Miscellaneous | | 441 | | |
| Total expenses before reductions | | 681,482 | | |
| Expense reductions | | (7,705) | | |
| Total expenses after reductions | | | | 673,777 |
| Net Investment income (loss) | | | | 1,144,317 |
| Realized and Unrealized Gain (Loss) | | | | |
| Net realized gain (loss) on: | | | | |
| Investment Securities: | | | | |
| Unaffiliated issuers | | 3,403,656 | | |
| Foreign currency transactions | | (368) | | |
| Total net realized gain (loss) | | | | 3,403,288 |
| Change in net unrealized appreciation (depreciation) on: | | | | |
| Investment Securities: | | | | |
| Unaffiliated issuers | | (10,050,930) | | |
| Assets and liabilities in foreign currencies | | (1,614) | | |
| Total change in net unrealized appreciation (depreciation) | | | | (10,052,544) |
| Net gain (loss) | | | | (6,649,256) |
| Net increase (decrease) in net assets resulting from operations | | | $ | (5,504,939) |
| Statement of Changes in Net Assets |
| |
| | Six months ended October 31, 2023 (Unaudited) | | Year ended April 30, 2023 |
| Increase (Decrease) in Net Assets | | | | |
| Operations | | | | |
| Net investment income (loss) | $ | 1,144,317 | $ | 3,848,130 |
| Net realized gain (loss) | | 3,403,288 | | (2,220,656) |
| Change in net unrealized appreciation (depreciation) | | (10,052,544) | | (8,987,256) |
| Net increase (decrease) in net assets resulting from operations | | (5,504,939) | | (7,359,782) |
| Distributions to shareholders | | (516,367) | | (16,179,737) |
| | | | | |
| Share transactions | | | | |
| Proceeds from sales of shares | | 8,304,852 | | 86,979,419 |
| Reinvestment of distributions | | 511,072 | | 16,070,098 |
| Cost of shares redeemed | | (21,177,136) | | (229,448,009) |
| | | | | |
Net increase (decrease) in net assets resulting from share transactions | | (12,361,212) | | (126,398,492) |
| Total increase (decrease) in net assets | | (18,382,518) | | (149,938,011) |
| | | | | |
| Net Assets | | | | |
| Beginning of period | | 206,893,243 | | 356,831,254 |
| End of period | $ | 188,510,725 | $ | 206,893,243 |
| | | | | |
| Other Information | | | | |
| Shares | | | | |
| Sold | | 808,654 | | 8,496,394 |
| Issued in reinvestment of distributions | | 50,204 | | 1,595,671 |
| Redeemed | | (2,058,393) | | (22,844,639) |
| Net increase (decrease) | | (1,199,535) | | (12,752,574) |
| | | | | |
Financial Highlights
| Fidelity® U.S. Low Volatility Equity Fund |
| |
| | Six months ended (Unaudited) October 31, 2023 | | Years ended April 30, 2023 | | 2022 | | 2021 | | 2020 A |
Selected Per-Share Data | | | | | | | | | | |
| Net asset value, beginning of period | $ | 10.35 | $ | 10.90 | $ | 11.49 | $ | 9.23 | $ | 10.00 |
| Income from Investment Operations | | | | | | | | | | |
Net investment income (loss) B,C | | .06 | | .13 | | .08 | | .08 | | .05 |
| Net realized and unrealized gain (loss) | | (.35) | | (.17) | | (.03) | | 2.25 | | (.79) |
| Total from investment operations | | (.29) | | (.04) | | .05 | | 2.33 | | (.74) |
| Distributions from net investment income | | (.03) | | (.13) | | (.08) | | (.07) | | (.03) |
| Distributions from net realized gain | | - | | (.38) | | (.56) | | - | | - |
| Total distributions | | (.03) | | (.51) | | (.64) | | (.07) | | (.03) |
| Net asset value, end of period | $ | 10.03 | $ | 10.35 | $ | 10.90 | $ | 11.49 | $ | 9.23 |
Total Return D,E | | (2.84)% | | (.22)% | | .12% | | 25.27% | | (7.44)% |
Ratios to Average Net Assets C,F,G | | | | | | | | | | |
| Expenses before reductions | | .68% H | | .66% | | .73% | | .77% | | 2.28% H |
| Expenses net of fee waivers, if any | | .67% H | | .66% | | .72% | | .77% | | .95% H |
| Expenses net of all reductions | | .67% H | | .66% | | .72% | | .77% | | .95% H |
| Net investment income (loss) | | 1.14% H | | 1.28% | | .71% | | .79% | | 1.46% H |
| Supplemental Data | | | | | | | | | | |
| Net assets, end of period (000 omitted) | $ | 188,511 | $ | 206,893 | $ | 356,831 | $ | 361,699 | $ | 294,690 |
Portfolio turnover rate I | | 45% H | | 69% | | 46% | | 39% | | 101% J,K |
AFor the period November 5, 2019 (commencement of operations) through April 30, 2020.
BCalculated based on average shares outstanding during the period.
CNet investment income (loss) is affected by the timing of the declaration of dividends by any underlying mutual funds or exchange-traded funds (ETFs). Net investment income (loss) of any mutual funds or ETFs is not included in the Fund's net investment income (loss) ratio.
DTotal returns for periods of less than one year are not annualized.
ETotal returns would have been lower if certain expenses had not been reduced during the applicable periods shown.
FFees and expenses of any underlying mutual funds or exchange-traded funds (ETFs) are not included in the Fund's expense ratio. The Fund indirectly bears its proportionate share of these expenses. For additional expense information related to investments in Fidelity Central Funds, please refer to the "Investments in Fidelity Central Funds" note found in the Notes to Financial Statements section of the most recent Annual or Semi-Annual report.
GExpense ratios reflect operating expenses of the class. Expenses before reductions do not reflect amounts reimbursed, waived, or reduced through arrangements with the investment adviser, brokerage services, or other offset arrangements, if applicable, and do not represent the amount paid by the class during periods when reimbursements, waivers or reductions occur.
HAnnualized.
IAmount does not include the portfolio activity of any underlying mutual funds or exchange-traded funds (ETFs).
JAmount not annualized.
KPortfolio turnover rate excludes securities received or delivered in-kind.
For the period ended October 31, 2023
1. Organization.
Fidelity U.S. Low Volatility Equity Fund (the Fund) is a fund of Fidelity Summer Street Trust (the Trust) and is authorized to issue an unlimited number of shares. Share transactions on the Statement of Changes in Net Assets may contain exchanges between affiliated funds. The Trust is registered under the Investment Company Act of 1940, as amended (the 1940 Act), as an open-end management investment company organized as a Massachusetts business trust.
2. Investments in Fidelity Central Funds.
Funds may invest in Fidelity Central Funds, which are open-end investment companies generally available only to other investment companies and accounts managed by the investment adviser and its affiliates. The Schedule of Investments lists any Fidelity Central Funds held as an investment as of period end, but does not include the underlying holdings of each Fidelity Central Fund. An investing fund indirectly bears its proportionate share of the expenses of the underlying Fidelity Central Funds.
Based on its investment objective, each Fidelity Central Fund may invest or participate in various investment vehicles or strategies that are similar to those of the investing fund. These strategies are consistent with the investment objectives of the investing fund and may involve certain economic risks which may cause a decline in value of each of the Fidelity Central Funds and thus a decline in the value of the investing fund.
| Fidelity Central Fund | Investment Manager | Investment Objective | Investment Practices | Expense RatioA |
| Fidelity Money Market Central Funds | Fidelity Management & Research Company LLC (FMR) | Each fund seeks to obtain a high level of current income consistent with the preservation of capital and liquidity. | Short-term Investments | Less than .005% |
A Expenses expressed as a percentage of average net assets and are as of each underlying Central Fund's most recent annual or semi-annual shareholder report.
A complete unaudited list of holdings for each Fidelity Central Fund is available upon request or at the Securities and Exchange Commission website at www.sec.gov. In addition, the financial statements of the Fidelity Central Funds which contain the significant accounting policies (including investment valuation policies) of those funds, and are not covered by the Report of Independent Registered Public Accounting Firm, are available on the Securities and Exchange Commission website or upon request.
3. Significant Accounting Policies.
The Fund is an investment company and applies the accounting and reporting guidance of the Financial Accounting Standards Board (FASB) Accounting Standards Codification Topic 946 Financial Services - Investment Companies. The financial statements have been prepared in conformity with accounting principles generally accepted in the United States of America (GAAP), which require management to make certain estimates and assumptions at the date of the financial statements. Actual results could differ from those estimates. Subsequent events, if any, through the date that the financial statements were issued have been evaluated in the preparation of the financial statements. The Fund's Schedule of Investments lists any underlying mutual funds or exchange-traded funds (ETFs) but does not include the underlying holdings of these funds. The following summarizes the significant accounting policies of the Fund:
Investment Valuation. Investments are valued as of 4:00 p.m. Eastern time on the last calendar day of the period. The Board of Trustees (the Board) has designated the Fund's investment adviser as the valuation designee responsible for the fair valuation function and performing fair value determinations as needed. The investment adviser has established a Fair Value Committee (the Committee) to carry out the day-to-day fair valuation responsibilities and has adopted policies and procedures to govern the fair valuation process and the activities of the Committee. In accordance with these fair valuation policies and procedures, which have been approved by the Board, the Fund attempts to obtain prices from one or more third party pricing services or brokers to value its investments. When current market prices, quotations or currency exchange rates are not readily available or reliable, investments will be fair valued in good faith by the Committee, in accordance with the policies and procedures. Factors used in determining fair value vary by investment type and may include market or investment specific events, transaction data, estimated cash flows, and market observations of comparable investments. The frequency that the fair valuation procedures are used cannot be predicted and they may be utilized to a significant extent. The Committee manages the Fund's fair valuation practices and maintains the fair valuation policies and procedures. The Fund's investment adviser reports to the Board information regarding the fair valuation process and related material matters.
The Fund categorizes the inputs to valuation techniques used to value its investments into a disclosure hierarchy consisting of three levels as shown below:
Level 1 - unadjusted quoted prices in active markets for identical investments
Level 2 - other significant observable inputs (including quoted prices for similar investments, interest rates, prepayment speeds, etc.)
Level 3 - unobservable inputs (including the Fund's own assumptions based on the best information available)
Valuation techniques used to value the Fund's investments by major category are as follows:
Equity securities, including restricted securities, for which market quotations are readily available, are valued at the last reported sale price or official closing price as reported by a third party pricing service on the primary market or exchange on which they are traded and are categorized as Level 1 in the hierarchy. In the event there were no sales during the day or closing prices are not available, securities are valued at the last quoted bid price or may be valued using the last available price and are generally categorized as Level 2 in the hierarchy. For foreign equity securities, when market or security specific events arise, comparisons to the valuation of American Depositary Receipts (ADRs), futures contracts, ETFs and certain indexes as well as quoted prices for similar securities may be used and would be categorized as Level 2 in the hierarchy. For equity securities, including restricted securities, where observable inputs are limited, assumptions about market activity and risk are used and these securities may be categorized as Level 3 in the hierarchy.
ETFs are valued at their last sale price or official closing price as reported by a third party pricing service on the primary market or exchange on which they are traded and are categorized as Level 1 in the hierarchy. In the event there were no sales during the day but the exchange reports a closing bid level, ETFs are valued at the closing bid and would be categorized as Level 1 in the hierarchy. In the event there was no closing bid, ETFs may be valued by another method that the Board believes reflects fair value in accordance with the Board's fair value pricing policies and may be categorized as Level 2 in the hierarchy.
Investments in open-end mutual funds, including the Fidelity Central Funds, are valued at their closing net asset value (NAV) each business day and are categorized as Level 1 in the hierarchy.
Changes in valuation techniques may result in transfers in or out of an assigned level within the disclosure hierarchy. The aggregate value of investments by input level as of October 31, 2023 is included at the end of the Fund's Schedule of Investments.
Foreign Currency. Certain Funds may use foreign currency contracts to facilitate transactions in foreign-denominated securities. Gains and losses from these transactions may arise from changes in the value of the foreign currency or if the counterparties do not perform under the contracts' terms.
Foreign-denominated assets, including investment securities, and liabilities are translated into U.S. dollars at the exchange rates at period end. Purchases and sales of investment securities, income and dividends received, and expenses denominated in foreign currencies are translated into U.S. dollars at the exchange rate in effect on the transaction date.
The effects of exchange rate fluctuations on investments are included with the net realized and unrealized gain (loss) on investment securities. Other foreign currency transactions resulting in realized and unrealized gain (loss) are disclosed separately.
Investment Transactions and Income. For financial reporting purposes, the Fund's investment holdings and NAV include trades executed through the end of the last business day of the period. The NAV per share for processing shareholder transactions is calculated as of the close of business of the New York Stock Exchange (NYSE), normally 4:00 p.m. Eastern time and includes trades executed through the end of the prior business day. Gains and losses on securities sold are determined on the basis of identified cost. Commissions paid to certain brokers with whom the investment adviser, or its affiliates, places trades on behalf of a fund include an amount in addition to trade execution, which may be rebated back to a fund. Any such rebates are included in net realized gain (loss) on investments in the Statement of Operations. Dividend income is recorded on the ex-dividend date, except for certain dividends from foreign securities where the ex-dividend date may have passed, which are recorded as soon as the Fund is informed of the ex-dividend date. Non-cash dividends included in dividend income, if any, are recorded at the fair market value of the securities received. Income and capital gain distributions from Fidelity Central Funds, if any, are recorded on the ex-dividend date. Certain distributions received by the Fund represent a return of capital or capital gain. The Fund determines the components of these distributions subsequent to the ex-dividend date, based upon receipt of tax filings or other correspondence relating to the underlying investment. These distributions are recorded as a reduction of cost of investments and/or as a realized gain. Investment income is recorded net of foreign taxes withheld where recovery of such taxes is uncertain. Funds may file withholding tax reclaims in certain jurisdictions to recover a portion of amounts previously withheld. Any withholding tax reclaims income is included in the Statement of Operations in dividends. Any receivables for withholding tax reclaims are included in the Statement of Assets and Liabilities in dividends receivable.
Expenses. Expenses directly attributable to a fund are charged to that fund. Expenses attributable to more than one fund are allocated among the respective funds on the basis of relative net assets or other appropriate methods. Expenses included in the accompanying financial statements reflect the expenses of that fund and do not include any expenses associated with any underlying mutual funds or exchange-traded funds. Although not included in a fund's expenses, a fund indirectly bears its proportionate share of these expenses through the net asset value of each underlying mutual fund or exchange-traded fund. Expense estimates are accrued in the period to which they relate and adjustments are made when actual amounts are known.
Income Tax Information and Distributions to Shareholders. Each year, the Fund intends to qualify as a regulated investment company under Subchapter M of the Internal Revenue Code, including distributing substantially all of its taxable income and realized gains. As a result, no provision for U.S. Federal income taxes is required. The Fund files a U.S. federal tax return, in addition to state and local tax returns as required. The Fund's federal income tax returns are subject to examination by the Internal Revenue Service (IRS) for a period of three fiscal years after they are filed. State and local tax returns may be subject to examination for an additional fiscal year depending on the jurisdiction. Foreign taxes are provided for based on the Fund's understanding of the tax rules and rates that exist in the foreign markets in which it invests.
Distributions are declared and recorded on the ex-dividend date. Income and capital gain distributions are determined in accordance with income tax regulations, which may differ from GAAP.
Capital accounts within the financial statements are adjusted for permanent book-tax differences. These adjustments have no impact on net assets or the results of operations. Capital accounts are not adjusted for temporary book-tax differences which will reverse in a subsequent period.
Book-tax differences are primarily due to foreign currency transactions, capital loss carryforwards and losses deferred due to wash sales.
As of period end, the cost and unrealized appreciation (depreciation) in securities, and derivatives if applicable, for federal income tax purposes were as follows:
| Gross unrealized appreciation | $26,188,261 |
| Gross unrealized depreciation | (11,724,605) |
| Net unrealized appreciation (depreciation) | $14,463,656 |
| Tax cost | $174,329,899 |
Capital loss carryforwards are only available to offset future capital gains of the Fund to the extent provided by regulations and may be limited. The capital loss carryforward information presented below, including any applicable limitation, is estimated as of prior fiscal period end and is subject to adjustment.
Short-term | $(2,217,461) |
Long-term | (-) |
| Total capital loss carryforward | $(2,217,461) |
4. Purchases and Sales of Investments.
Purchases and sales of securities, other than short-term securities and in-kind transactions, as applicable, are noted in the table below.
| | Purchases ($) | Sales ($) |
| Fidelity U.S. Low Volatility Equity Fund | 44,599,435 | 54,360,642 |
5. Fees and Other Transactions with Affiliates.
Management Fee. Fidelity Management & Research Company LLC (the investment adviser) and its affiliates provide the Fund with investment management related services for which the Fund pays a monthly management fee. The management fee is the sum of an individual fund fee rate that is based on an annual rate of .20% of the Fund's average net assets and an annualized group fee rate that averaged .22% during the period. The group fee rate is based upon the monthly average net assets of a group of registered investment companies with which the investment adviser has management contracts. The group fee rate decreases as assets under management increase and increases as assets under management decrease. For the reporting period, the total annualized management fee rate was .42% of the Fund's average net assets.
Transfer Agent Fees. Fidelity Investments Institutional Operations Company LLC (FIIOC), an affiliate of the investment adviser, is the Fund's transfer, dividend disbursing and shareholder servicing agent. FIIOC receives account fees and asset-based fees that vary according to account size and type of account. FIIOC pays for typesetting, printing and mailing of shareholder reports, except proxy statements. For the period, the transfer agent fees were equivalent to an annualized rate of .17% of average net assets.
During November 2023, the Board approved a change in the transfer agent fees effective December 1, 2023 to a fixed annual rate of 0.1737% of average net assets.
Accounting Fees. Fidelity Service Company, Inc. (FSC), an affiliate of the investment adviser, maintains the Fund's accounting records. The accounting fee is based on the level of average net assets for each month. For the period, the fees were equivalent to the following annualized rates:
| | % of Average Net Assets |
| Fidelity U.S. Low Volatility Equity Fund | .04 |
During November 2023, the Board approved a change in the accounting fees effective December 1, 2023 to a fixed annual rate of average net assets as follows:
| | % of Class-Level Average Net Assets |
| Fidelity U.S. Low Volatility Equity Fund | 0.0353% |
Brokerage Commissions. A portion of portfolio transactions were placed with brokerage firms which are affiliates of the investment adviser. Brokerage commissions are included in net realized gain (loss) and change in net unrealized appreciation (depreciation) in the Statement of Operations. The commissions paid to these affiliated firms were as follows:
| | Amount |
| Fidelity U.S. Low Volatility Equity Fund | $719 |
Interfund Trades. Funds may purchase from or sell securities to other Fidelity Funds under procedures adopted by the Board. The procedures have been designed to ensure these interfund trades are executed in accordance with Rule 17a-7 of the 1940 Act. Any interfund trades are included within the respective purchases and sales amounts shown in the Purchases and Sales of Investments note. Interfund trades during the period are noted in the table below.
| | Purchases ($) | Sales ($) | Realized Gain (Loss) ($) |
| Fidelity U.S. Low Volatility Equity Fund | 424,401 | 2,126,115 | 670,357 |
6. Committed Line of Credit.
Certain Funds participate with other funds managed by the investment adviser or an affiliate in a $4.25 billion credit facility (the "line of credit") to be utilized for temporary or emergency purposes to fund shareholder redemptions or for other short-term liquidity purposes. The participating funds have agreed to pay commitment fees on their pro-rata portion of the line of credit, which are reflected in Miscellaneous expenses on the Statement of Operations, and are listed below. During the period, there were no borrowings on this line of credit.
| | Amount |
| Fidelity U.S. Low Volatility Equity Fund | $168 |
7. Security Lending.
Funds lend portfolio securities from time to time in order to earn additional income. Lending agents are used, including National Financial Services (NFS), an affiliate of the investment adviser. Pursuant to a securities lending agreement, NFS will receive a fee, which is capped at 9.9% of a fund's daily lending revenue, for its services as lending agent. A fund may lend securities to certain qualified borrowers, including NFS. On the settlement date of the loan, a fund receives collateral (in the form of U.S. Treasury obligations, letters of credit and/or cash) against the loaned securities and maintains collateral in an amount not less than 100% of the market value of the loaned securities during the period of the loan. The market value of the loaned securities is determined at the close of business of a fund and any additional required collateral is delivered to a fund on the next business day. A fund or borrower may terminate the loan at any time, and if the borrower defaults on its obligation to return the securities loaned because of insolvency or other reasons, a fund may apply collateral received from the borrower against the obligation. A fund may experience delays and costs in recovering the securities loaned. Any cash collateral received is invested in the Fidelity Securities Lending Cash Central Fund. Any loaned securities are identified as such in the Schedule of Investments, and the value of loaned securities and cash collateral at period end, as applicable, are presented in the Statement of Assets and Liabilities. Security lending income represents the income earned on investing cash collateral, less rebates paid to borrowers and any lending agent fees associated with the loan, plus any premium payments received for lending certain types of securities. Security lending income is presented in the Statement of Operations as a component of income from Fidelity Central Funds. Affiliated security lending activity, if any, was as follows:
| | Total Security Lending Fees Paid to NFS | Security Lending Income From Securities Loaned to NFS | Value of Securities Loaned to NFS at Period End |
| Fidelity U.S. Low Volatility Equity Fund | $795 | $- | $- |
8. Expense Reductions.
During the period, the investment adviser or an affiliate reimbursed and/or waived a portion of operating expenses in the amount of $7,705.
9. Other.
A fund's organizational documents provide former and current trustees and officers with a limited indemnification against liabilities arising in connection with the performance of their duties to the fund. In the normal course of business, a fund may also enter into contracts that provide general indemnifications. A fund's maximum exposure under these arrangements is unknown as this would be dependent on future claims that may be made against a fund. The risk of material loss from such claims is considered remote.
At the end of the period, the following mutual funds managed by the investment adviser or its affiliates were the owners of record of 10% or more of the total outstanding shares.
| | VIP Funds Manager 50% Portfolio | VIP Funds Manager 60% Portfolio | VIP Funds Manager 70% Portfolio |
| Fidelity U.S. Low Volatility Equity Fund | 25% | 39% | 12% |
Mutual funds managed by the investment adviser or its affiliates, in aggregate, were the owners of record of more than 20% of the total outstanding shares.
| Fund | % of shares held |
| Fidelity U.S. Low Volatility Equity Fund | 86% |
10. Risk and Uncertainties.
Many factors affect a fund's performance. Developments that disrupt global economies and financial markets, such as pandemics, epidemics, outbreaks of infectious diseases, war, terrorism, and environmental disasters, may significantly affect a fund's investment performance. The effects of these developments to a fund will be impacted by the types of securities in which a fund invests, the financial condition, industry, economic sector, and geographic location of an issuer, and a fund's level of investment in the securities of that issuer. Significant concentrations in security types, issuers, industries, sectors, and geographic locations may magnify the factors that affect a fund's performance.
As a shareholder, you incur two types of costs: (1) transaction costs, which may include sales charges (loads) on purchase payments or redemption proceeds, as applicable and (2) ongoing costs, which generally include management fees, distribution and/or service (12b-1) fees and other Fund expenses. This Example is intended to help you understand your ongoing costs (in dollars) of investing in a fund and to compare these costs with the ongoing costs of investing in other mutual funds.
| The Example is based on an investment of $1,000 invested at the beginning of the period and held for the entire period (May 1, 2023 to October 31, 2023). |
Actual Expenses
The first line of the accompanying table provides information about actual account values and actual expenses. You may use the information in this line, together with the amount you invested, to estimate the expenses that you paid over the period. Simply divide your account value by $1,000.00 (for example, an $8,600 account value divided by $1,000.00 = 8.6), then multiply the result by the number in the first line for a class/Fund under the heading entitled "Expenses Paid During Period" to estimate the expenses you paid on your account during this period. If any fund is a shareholder of any underlying mutual funds or exchange-traded funds (ETFs) (the Underlying Funds), such fund indirectly bears its proportional share of the expenses of the Underlying Funds in addition to the direct expenses incurred presented in the table. These fees and expenses are not included in the annualized expense ratio used to calculate the expense estimate in the table below.
Hypothetical Example for Comparison Purposes
The second line of the accompanying table provides information about hypothetical account values and hypothetical expenses based on the actual expense ratio and an assumed rate of return of 5% per year before expenses, which is not the actual return. The hypothetical account values and expenses may not be used to estimate the actual ending account balance or expenses you paid for the period. You may use this information to compare the ongoing costs of investing in the Fund and other funds. To do so, compare this 5% hypothetical example with the 5% hypothetical examples that appear in the shareholder reports of the other funds. If any fund is a shareholder of any Underlying Funds, such fund indirectly bears its proportional share of the expenses of the Underlying Funds in addition to the direct expenses as presented in the table. These fees and expenses are not included in the annualized expense ratio used to calculate the expense estimate in the table below.
Please note that the expenses shown in the table are meant to highlight your ongoing costs only and do not reflect any transaction costs. Therefore, the second line of the table is useful in comparing ongoing costs only, and will not help you determine the relative total costs of owning different funds. In addition, if these transactional costs were included, your costs would have been higher.
| | | | | Annualized Expense Ratio- A | | Beginning Account Value May 1, 2023 | | Ending Account Value October 31, 2023 | | Expenses Paid During Period- C May 1, 2023 to October 31, 2023 |
| | | | | | | | | | |
| Fidelity® U.S. Low Volatility Equity Fund | | | | .67% | | | | | | |
| Actual | | | | | | $ 1,000 | | $ 971.60 | | $ 3.32 |
Hypothetical-B | | | | | | $ 1,000 | | $ 1,021.77 | | $ 3.40 |
| |
A Annualized expense ratio reflects expenses net of applicable fee waivers.
B 5% return per year before expenses
C Expenses are equal to the annualized expense ratio, multiplied by the average account value over the period, multiplied by 184/ 366 (to reflect the one-half year period). The fees and expenses of any Underlying Funds are not included in each annualized expense ratio.
Board Approval of Investment Advisory Contracts and Management Fees
Fidelity U.S. Low Volatility Equity Fund
Each year, the Board of Trustees, including the Independent Trustees (together, the Board), considers the renewal of the fund's management contract with Fidelity Management & Research Company LLC (FMR) and the sub-advisory agreements (together, the Advisory Contracts) for the fund. FMR and the sub-advisers are referred to herein as the Investment Advisers. The Board, assisted by the advice of fund counsel and Independent Trustees' counsel, requests and considers a broad range of information relevant to the renewal of the Advisory Contracts throughout the year.
The Board meets regularly and, at each of its meetings, covers an extensive agenda of topics and materials and considers factors that are relevant to its annual consideration of the renewal of the fund's Advisory Contracts, including the services and support provided to the fund and its shareholders. The Board, acting directly and through its Committees (each of which is composed of and chaired by Independent Trustees), requests and receives information concerning the annual consideration of the renewal of the fund's Advisory Contracts. The Board also meets as needed to review matters specifically related to the Board's annual consideration of the renewal of the Advisory Contracts. Members of the Board may also meet with trustees of other Fidelity funds through joint ad hoc committees to discuss certain matters relevant to all of the Fidelity funds.
Approval of Stub Period Continuation. At its May 2023 meeting, the Board of Trustees voted to continue the fund's management contract with FMR, and the sub-advisory agreements and sub-sub-advisory agreements, in each case, where applicable (together, the Advisory Contracts), without modification, for two months from June 1, 2023 through July 31, 2023. The Board considered that the approval of the fund's Advisory Contracts will not result in any changes in (i) the investment process or strategies employed in the management of the fund's assets; (ii) the fees and expenses paid by shareholders; (iii) the nature, extent or quality of services provided under the fund's Advisory Contracts; or (iv) the day-to-day management of the fund or the persons primarily responsible for such management. The Board also considered that since its last approval of the fund's Advisory Contracts, FMR had provided additional information on the fund in support of the annual contract renewal process, including competitive analyses on total expenses and management fees and in-depth reviews of fund performance and fund profitability information. The Board concluded that the fund's Advisory Contracts are fair and reasonable, and that the fund's Advisory Contracts should be renewed, without modification, through July 31, 2023, with the understanding that the Board would consider the annual renewal for a full one year period in July 2023.
At its July 2023 meeting, the Board unanimously determined to renew the fund's Advisory Contracts. In reaching its determination, the Board considered all factors it believed relevant, including (i) the nature, extent, and quality of the services provided to the fund and its shareholders (including the investment performance of the fund); (ii) the competitiveness relative to peer funds of the fund's management fee and total expense ratio; (iii) the total costs of the services provided by and the profits realized by FMR and its affiliates (Fidelity) from its relationships with the fund; and (iv) the extent to which, if any, economies of scale exist and are realized as the fund grows, and whether any economies of scale are appropriately shared with fund shareholders. The Board also considered the broad range of investment choices available to shareholders from FMR's competitors and that the fund's shareholders have chosen to invest in the fund, which is part of the Fidelity family of funds. The Board's decision to renew the Advisory Contracts was not based on any single factor.
The Board reached a determination, with the assistance of fund counsel and Independent Trustees' counsel and through the exercise of its business judgment, that the renewal of the Advisory Contracts was in the best interests of the fund and its shareholders and that the compensation payable under the Advisory Contracts was fair and reasonable in light of all of the surrounding circumstances.
Nature, Extent, and Quality of Services Provided. The Board considered staffing as it relates to the fund, including the backgrounds and experience of investment personnel of the Investment Advisers, and also considered the Investment Advisers' implementation of the fund's investment program. The Independent Trustees also had discussions with senior management of Fidelity's investment operations and investment groups. The Board considered the structure of the investment personnel compensation program and whether this structure provides appropriate incentives to act in the best interests of the fund. Additionally, the Board considered the portfolio managers' investments, if any, in the funds that they manage.
Resources Dedicated to Investment Management and Support Services. The Board and the Fund Oversight and Research Committees reviewed the general qualifications and capabilities of Fidelity's investment staff, including its size, education, experience, and resources, as well as Fidelity's approach to recruiting, training, managing, and compensating investment personnel. The Board noted the resources devoted to expansion of Fidelity's global investment organization, and that Fidelity's analysts have extensive resources, tools, and capabilities that allow them to conduct sophisticated quantitative and fundamental analysis, as well as credit analysis of issuers, counterparties, and guarantors. Further, the Board considered that Fidelity's investment professionals have sufficient access to global information and data so as to provide competitive investment results over time, and that those professionals also have access to sophisticated tools that permit them to assess portfolio construction and risk and performance attribution characteristics continuously, as well as to transmit new information and research conclusions rapidly around the world. Additionally, in its deliberations, the Board considered Fidelity's trading, risk management, compliance, and technology and operations capabilities and resources, which are integral parts of the investment management process.
Shareholder and Administrative Services. The Board considered (i) the nature, extent, quality, and cost of advisory, administrative, and shareholder services performed by the Investment Advisers and their affiliates under the Advisory Contracts and under separate agreements covering transfer agency, pricing and bookkeeping, and securities lending services for the fund; (ii) the nature and extent of Fidelity's supervision of third party service providers, principally custodians, subcustodians, and pricing vendors; and (iii) the resources devoted by Fidelity to, and the record of compliance with, the fund's compliance policies and procedures. The Board also reviewed the allocation of fund brokerage, including allocations to brokers affiliated with the Investment Advisers, the use of brokerage commissions to pay fund expenses, and the use of "soft" commission dollars to pay for research services. The Board also considered the fund's securities lending activities and any payments made to Fidelity relating to securities lending.
The Board noted that the growth of fund assets over time across the complex allows Fidelity to reinvest in the development of services designed to enhance the value and convenience of the Fidelity funds as investment vehicles. These services include 24-hour access to account information and market information over the Internet and through telephone representatives, investor education materials, and asset allocation tools. The Board also considered that it reviews customer service metrics such as telephone response times, continuity of services on the website and metrics addressing services at Fidelity Investor Centers.
fund that is part of a large family of funds offering a variety of investment disciplines and providing a large variety of fund investor services. The Board noted that Fidelity had taken, or had made recommendations that resulted in the Fidelity funds taking, a number of actions over the previous year that benefited particular funds and/or the Fidelity funds in general.
Investment Performance. The Board took into account discussions that occur with representatives of the Investment Advisers, and reports that it receives, at Board meetings throughout the year, relating to fund investment performance. In this regard the Board noted that as part of regularly scheduled fund reviews and other reports to the Board on fund performance, the Board considered annualized return information for the fund for different time periods, measured against an appropriate securities market index (benchmark index). The Board also considered information about performance attribution. In its ongoing evaluation of fund investment performance, the Board gives particular attention to information indicating changes in performance the funds over different time periods and discussed with the Investment Advisers the reasons for any overperformance or underperformance.
In addition to reviewing absolute and relative fund performance, the Independent Trustees periodically consider the appropriateness of fund performance metrics in evaluating the results achieved. The Independent Trustees generally give greater weight to fund performance over longer time periods than over shorter time periods. Depending on the circumstances, the Independent Trustees may be satisfied with a fund's performance notwithstanding that it lags its benchmark index for certain periods.
Based on its review, the Board concluded that the nature, extent, and quality of services provided to the fund under the Advisory Contracts should continue to benefit the shareholders of the fund.
Competitiveness of Management Fee and Total Expense Ratio. The Board was provided with information regarding industry trends in management fees and expenses. In its review of the fund's management fee and total expense ratio, the Board considered the fund's management fee rate as well as other fund expenses, such as transfer agent fees, pricing and bookkeeping fees, and custodial, legal, and audit fees. The Board noted that Fidelity may agree to waive fees or reimburse expenses from time to time, and the extent to which, if any, it has done so for the fund.
Comparisons of Management Fees and Total Expense Ratios. Among other things, the Board reviewed data for selected groups of competitive funds and classes (referred to as "mapped groups") that were compiled by Fidelity based on combining similar investment objective categories (as classified by Lipper) that have comparable investment mandates. The data reviewed by the Board included (i) gross management fee comparisons (before taking into account expense reimbursements or caps) relative to the total universe of funds within the mapped group; (ii) gross management fee comparisons relative to a subset of non-Fidelity funds in the mapped group that are similar in size and management fee structure to the fund (referred to as the "asset size peer group"); (iii) total expense comparisons of the fund relative to funds and classes in the mapped group that have a similar sales load structure to the fund (referred to as the "similar sales load structure group"); and (iv) total expense comparisons of the fund relative to funds and classes in the similar sales load structure group that are similar in size and management fee structure to the fund (referred to as the "total expense asset size peer group"). The total expense asset size peer group comparison excludes performance adjustments and fund-paid 12b-1 fees to eliminate variability in fee structures.
The information provided to the Board indicated that the fund's management fee rate ranked below the competitive median of the mapped group for the 12-month period ended September 30, 2022 and below the competitive median of the asset size peer group for the 12-month period ended September 30, 2022. Further, the information provided to the Board indicated that the total expense ratio of the fund ranked below the competitive median of the similar sales load structure group for the 12-month period ended September 30, 2022 and below the competitive median of the total expense asset size peer group for the 12-month period ended September 30, 2022.
The Board also considered that, for funds subject to the group fee, FMR agreed to voluntarily waive fees over a specified period of time in amounts designed to account for assets converted from certain funds to certain collective investment trusts.
Other Contractual Arrangements. The Board further considered that FMR has contractually agreed to reimburse the fund to the extent that total operating expenses, with certain exceptions, as a percentage of its average net assets, exceed 0.80% through August 31, 2024.
Fees Charged to Other Fidelity Clients. The Board also considered Fidelity fee structures and other information with respect to clients of Fidelity, such as other funds advised or subadvised by Fidelity, pension plan clients, and other institutional clients with similar mandates. The Board noted that a joint ad hoc committee created by it and the boards of other Fidelity funds periodically reviews and compares Fidelity's institutional investment advisory business with its business of providing services to the Fidelity funds and also noted the most recent findings of the committee. The Board noted that the committee's review included a consideration of the differences in services provided, fees charged, and costs incurred, as well as competition in the markets serving the different categories of clients.
Based on its review, the Board concluded that the fund's management fee is fair and reasonable in light of the services that the fund receives and the other factors considered. Further, based on its review of total expense ratios and fees charged to other Fidelity clients, the Board concluded that the fund's total expense ratio was reasonable in light of the services that the fund and its shareholders receive and the other factors considered.
Costs of the Services and Profitability. The Board considered the revenues earned and the expenses incurred by Fidelity in conducting the business of developing, marketing, distributing, managing, administering and servicing the Fidelity funds and servicing the Fidelity funds' shareholders. The Board also considered the level of Fidelity's profits in respect of all the Fidelity funds.
On an annual basis, Fidelity presents to the Board information about the profitability of its relationships with the Fidelity funds. Fidelity calculates profitability information for each Fidelity fund, as well as aggregate profitability information for groups of Fidelity funds and all Fidelity funds, using a series of detailed revenue and cost allocation methodologies which originate with the books and records of Fidelity on which Fidelity's audited financial statements are based. The Audit Committee of the Board reviews any significant changes from the prior year's methodologies and the full Board approves such changes.
A public accounting firm has been engaged annually by the Board as part of the Board's assessment of Fidelity's profitability analysis. The engagement includes the review and assessment of the methodologies used by Fidelity in determining the revenues and expenses attributable to Fidelity's fund business, and completion of agreed-upon procedures in respect of the mathematical accuracy of certain fund profitability information and its conformity to established allocation methodologies. After considering the reports issued under the engagement and information provided by Fidelity, the Board concluded that while other allocation methods may also be reasonable, Fidelity's profitability methodologies are reasonable in all material respects.
The Board also reviewed Fidelity's non-fund businesses and potential indirect benefits such businesses may have received as a result of their association with Fidelity's fund business (i.e., fall-out benefits) as well as cases where Fidelity's affiliates may benefit from the funds' business. The Board considered areas where potential indirect benefits to the Fidelity funds from their relationships with Fidelity may exist. The Board's consideration of these matters was informed by the findings of a joint ad hoc committee created by it and the boards of other Fidelity funds to evaluate potential fall-out benefits.
The Board considered the costs of the services provided by and the profits realized by Fidelity in connection with the operation of the Fidelity funds and was satisfied that the profitability was not excessive.
Economies of Scale. The Board considered whether there have been economies of scale in respect of the management of the Fidelity funds, whether the Fidelity funds (including the fund) have appropriately benefited from any such economies of scale, and whether there is potential for realization of any further economies of scale. The Board considered the extent to which the fund will benefit from economies of scale as assets grow through increased services to the fund, through waivers or reimbursements, or through fee or expense ratio reductions. The Board also noted that a committee (the Economies of Scale Committee) created by it and the boards of other Fidelity funds periodically analyzes whether Fidelity attains economies of scale in respect of the management and servicing of the Fidelity funds, whether the Fidelity funds have appropriately benefited from such economies of scale, and whether there is potential for realization of any further economies of scale.
The Board recognized that the fund's management contract incorporates a "group fee" structure, which provides for lower group fee rates as total "group assets" increase, and for higher group fee rates as total "group assets" decrease ("group assets" as defined in the management contract). FMR calculates the group fee rates based on a tiered asset "breakpoint" schedule that varies based on asset class. The Board considered that the group fee is designed to deliver the benefits of economies of scale to fund shareholders when total Fidelity fund assets increase, even if assets of any particular fund are unchanged or have declined, because some portion of Fidelity's costs are attributable to services provided to all Fidelity funds, and all funds benefit if those costs can be allocated among more assets. The Board further considered that Fidelity agreed to impose a temporary fee waiver in the form of additional breakpoints to the current breakpoint schedule. The Board concluded that, given the group fee structure, fund shareholders will benefit from lower management fees as "group assets" increase at the fund complex level, regardless of whether Fidelity achieves any such economies of scale.
The Board concluded, taking into account the analysis of the Economies of Scale Committee, that economies of scale, if any, are being appropriately shared between fund shareholders and Fidelity.
Additional Information Requested by the Board. In order to develop fully the factual basis for consideration of the Fidelity funds' advisory contracts, the Board requested and received additional information on certain topics, including: (i) fund flow and performance trends, in particular the underperformance of certain funds and strategies, and Fidelity's long-term strategies for certain funds, including any consideration of fund liquidations or mergers; (ii) the operation of performance fees and competitor use of performance fees; (iii) Fidelity's pricing philosophy compared to competitors; (iv) fund profitability methodology and data; (v) evaluation of competitive fund data and peer group classifications and fee and expense comparisons; (vi) the management fee and expense structures for different funds and classes and information about the differences between various fee and expense structures; (vii) group fee breakpoints and related voluntary fee waivers; and (viii) information regarding other accounts managed by Fidelity and the funds' sub-advisory arrangements.
Conclusion. Based on its evaluation of all of the conclusions noted above, and after considering all factors it believed relevant, the Board, including the Independent Trustees, concluded that the advisory and sub-advisory fee arrangements are fair and reasonable in light of all of the surrounding circumstances and that the fund's Advisory Contracts should be renewed through July 31, 2024.
1.9896229.103
USL-SANN-1223
Fidelity® Capital & Income Fund
Semi-Annual Report
October 31, 2023
Contents
To view a fund's proxy voting guidelines and proxy voting record for the 12-month period ended June 30, visit http://www.fidelity.com/proxyvotingresults or visit the Securities and Exchange Commission's (SEC) web site at http://www.sec.gov.
You may also call 1-800-544-8544 to request a free copy of the proxy voting guidelines.
Standard & Poor's, S&P and S&P 500 are registered service marks of The McGraw-Hill Companies, Inc. and have been licensed for use by Fidelity Distributors Corporation.
Other third-party marks appearing herein are the property of their respective owners.
All other marks appearing herein are registered or unregistered trademarks or service marks of FMR LLC or an affiliated company. © 2023 FMR LLC. All rights reserved.
This report and the financial statements contained herein are submitted for the general information of the shareholders of the Fund. This report is not authorized for distribution to prospective investors in the Fund unless preceded or accompanied by an effective prospectus.
A fund files its complete schedule of portfolio holdings with the SEC for the first and third quarters of each fiscal year on Form N-PORT. Forms N-PORT are available on the SEC's web site at http://www.sec.gov. A fund's Forms N-PORT may be reviewed and copied at the SEC's Public Reference Room in Washington, DC. Information regarding the operation of the SEC's Public Reference Room may be obtained by calling 1-800-SEC-0330.
For a complete list of a fund's portfolio holdings, view the most recent holdings listing, semiannual report, or annual report on Fidelity's web site at http://www.fidelity.com, http://www.institutional.fidelity.com, or http://www.401k.com, as applicable.
NOT FDIC INSURED •MAY LOSE VALUE •NO BANK GUARANTEE
Neither the Fund nor Fidelity Distributors Corporation is a bank.
| Top Bond Issuers (% of Fund's net assets) |
(with maturities greater than one year) |
| TransDigm, Inc. | 2.5 | |
| CCO Holdings LLC/CCO Holdings Capital Corp. | 2.0 | |
| Bank of America Corp. | 1.9 | |
| JPMorgan Chase & Co. | 1.7 | |
| Tenet Healthcare Corp. | 1.5 | |
| Ally Financial, Inc. | 1.4 | |
| Energy Transfer LP | 1.2 | |
| Caesars Entertainment, Inc. | 1.1 | |
| Uber Technologies, Inc. | 1.0 | |
| Altice France SA | 1.0 | |
| | 15.3 | |
| |
| Market Sectors (% of Fund's net assets) |
| |
| Banks & Thrifts | 10.8 | |
| Energy | 10.6 | |
| Technology | 10.6 | |
| Services | 5.7 | |
| Healthcare | 5.2 | |
| |
Quality Diversification (% of Fund's net assets) |
|
| |
| We have used ratings from Moody's Investors Service, Inc. Where Moody's® ratings are not available, we have used S&P® ratings. All ratings are as of the date indicated and do not reflect subsequent changes. |
Asset Allocation (% of Fund's net assets) |
|
|
Showing Percentage of Net Assets
| Corporate Bonds - 60.4% |
| | | Principal Amount (a) (000s) | Value ($) (000s) |
| Convertible Bonds - 0.3% | | | |
| Broadcasting - 0.2% | | | |
| DISH Network Corp. 3.375% 8/15/26 | | 48,235 | 24,728 |
| Diversified Financial Services - 0.1% | | | |
| New Cotai LLC 5% 2/24/27 (b) | | 4,134 | 6,351 |
TOTAL CONVERTIBLE BONDS | | | 31,079 |
| Nonconvertible Bonds - 60.1% | | | |
| Aerospace - 3.3% | | | |
| ATI, Inc.: | | | |
| 4.875% 10/1/29 | | 6,080 | 5,178 |
| 5.125% 10/1/31 | | 5,395 | 4,451 |
| 7.25% 8/15/30 | | 5,985 | 5,762 |
| Bombardier, Inc.: | | | |
| 6% 2/15/28 (c) | | 6,075 | 5,376 |
| 7.125% 6/15/26 (c) | | 12,110 | 11,655 |
| 7.875% 4/15/27 (c) | | 26,370 | 25,371 |
| Kaiser Aluminum Corp. 4.625% 3/1/28 (c) | | 11,215 | 9,345 |
| Moog, Inc. 4.25% 12/15/27 (c) | | 3,455 | 3,076 |
| Rolls-Royce PLC 5.75% 10/15/27 (c) | | 10,870 | 10,301 |
| TransDigm, Inc.: | | | |
| 4.625% 1/15/29 | | 38,080 | 32,834 |
| 4.875% 5/1/29 | | 25,000 | 21,660 |
| 5.5% 11/15/27 | | 124,228 | 115,377 |
| 6.25% 3/15/26 (c) | | 17,925 | 17,503 |
| 6.75% 8/15/28 (c) | | 27,225 | 26,435 |
| 6.875% 12/15/30 (c) | | 47,905 | 46,255 |
| 7.5% 3/15/27 | | 18,012 | 17,990 |
| Triumph Group, Inc. 9% 3/15/28 (c) | | 8,905 | 8,649 |
| VistaJet Malta Finance PLC / XO Management Holding, Inc. 9.5% 6/1/28 (c) | | 8,905 | 6,823 |
| | | | 374,041 |
| Air Transportation - 1.4% | | | |
| Air Canada 3.875% 8/15/26 (c) | | 9,105 | 8,284 |
| Allegiant Travel Co. 7.25% 8/15/27 (c) | | 8,870 | 8,027 |
| American Airlines, Inc.: | | | |
| 7.25% 2/15/28 (c) | | 19,595 | 18,220 |
| 11.75% 7/15/25 (c) | | 13,090 | 13,869 |
| American Airlines, Inc. / AAdvantage Loyalty IP Ltd. 5.75% 4/20/29 (c) | | 29,825 | 26,904 |
| Hawaiian Brand Intellectual Property Ltd. / HawaiianMiles Loyalty Ltd. 5.75% 1/20/26 (c) | | 22,205 | 16,407 |
| Rand Parent LLC 8.5% 2/15/30 (c) | | 14,880 | 13,588 |
| Spirit Loyalty Cayman Ltd. / Spirit IP Cayman Ltd.: | | | |
| 8% 9/20/25 (c) | | 7,779 | 5,737 |
| 8% 9/20/25 (c) | | 2,960 | 2,338 |
| United Airlines, Inc.: | | | |
| 4.375% 4/15/26 (c) | | 30,025 | 27,852 |
| 4.625% 4/15/29 (c) | | 18,025 | 15,226 |
| | | | 156,452 |
| Automotive & Auto Parts - 1.7% | | | |
| Adient Global Holdings Ltd. 7% 4/15/28 (c) | | 5,935 | 5,842 |
| Allison Transmission, Inc. 5.875% 6/1/29 (c) | | 7,960 | 7,379 |
| Arko Corp. 5.125% 11/15/29 (c) | | 9,105 | 7,382 |
| Clarios Global LP / Clarios U.S. Finance Co. 6.75% 5/15/28 (c) | | 11,885 | 11,586 |
| Dana, Inc.: | | | |
| 4.25% 9/1/30 | | 8,870 | 7,020 |
| 4.5% 2/15/32 | | 9,135 | 7,154 |
| Exide Technologies: | | | |
| 11% pay-in-kind (b)(c)(d)(e) | | 1,760 | 0 |
| 11% pay-in-kind (b)(c)(d)(e) | | 891 | 0 |
| Ford Motor Credit Co. LLC: | | | |
| 3.375% 11/13/25 | | 19,245 | 17,959 |
| 6.8% 5/12/28 | | 11,000 | 10,969 |
| 6.95% 6/10/26 | | 11,920 | 11,950 |
| 7.35% 11/4/27 | | 23,710 | 23,999 |
| LCM Investments Holdings 8.25% 8/1/31 (c) | | 7,185 | 6,836 |
| Macquarie AirFinance Holdings 8.125% 3/30/29 (c) | | 8,990 | 8,856 |
| McLaren Finance PLC 7.5% 8/1/26 (c) | | 8,290 | 7,088 |
| Nesco Holdings II, Inc. 5.5% 4/15/29 (c) | | 14,525 | 12,455 |
| Rivian Holdco & Rivian LLC & Rivian Automotive LLC 6 month U.S. LIBOR + 5.620% 11.4932% 10/15/26 (c)(e)(f) | | 30,350 | 30,269 |
| Tenneco, Inc. 8% 11/17/28 (c) | | 17,960 | 14,413 |
| | | | 191,157 |
| Banks & Thrifts - 1.7% | | | |
| Ally Financial, Inc.: | | | |
| 8% 11/1/31 | | 20,638 | 20,039 |
| 8% 11/1/31 | | 144,500 | 141,038 |
| CQP Holdco LP / BIP-V Chinook Holdco LLC 5.5% 6/15/31 (c) | | 27,225 | 23,679 |
| Jane Street Group LLC/JSG Finance, Inc. 4.5% 11/15/29 (c) | | 8,740 | 7,448 |
| | | | 192,204 |
| Broadcasting - 1.0% | | | |
| DISH Network Corp. 11.75% 11/15/27 (c) | | 41,575 | 41,183 |
| Scripps Escrow II, Inc. 3.875% 1/15/29 (c) | | 2,820 | 2,141 |
| Sirius XM Radio, Inc.: | | | |
| 3.875% 9/1/31 (c) | | 12,130 | 9,136 |
| 4% 7/15/28 (c) | | 10,140 | 8,623 |
| 5% 8/1/27 (c) | | 8,280 | 7,592 |
| Univision Communications, Inc.: | | | |
| 4.5% 5/1/29 (c) | | 12,060 | 9,587 |
| 7.375% 6/30/30 (c) | | 39,140 | 34,463 |
| | | | 112,725 |
| Building Materials - 0.4% | | | |
| Advanced Drain Systems, Inc.: | | | |
| 5% 9/30/27 (c) | | 2,325 | 2,168 |
| 6.375% 6/15/30 (c) | | 6,050 | 5,712 |
| Brundage-Bone Concrete Pumping Holdings, Inc. 6% 2/1/26 (c) | | 6,555 | 6,198 |
| James Hardie International Finance Ltd. 5% 1/15/28 (c) | | 4,136 | 3,818 |
| MIWD Holdco II LLC / MIWD Finance Corp. 5.5% 2/1/30 (c) | | 4,125 | 3,274 |
| SRS Distribution, Inc.: | | | |
| 4.625% 7/1/28 (c) | | 11,605 | 10,124 |
| 6.125% 7/1/29 (c) | | 4,870 | 4,079 |
| Summit Materials LLC/Summit Materials Finance Corp. 5.25% 1/15/29 (c) | | 10,525 | 9,530 |
| | | | 44,903 |
| Cable/Satellite TV - 2.6% | | | |
| CCO Holdings LLC/CCO Holdings Capital Corp.: | | | |
| 4.25% 2/1/31 (c) | | 16,515 | 12,852 |
| 4.5% 8/15/30 (c) | | 21,660 | 17,368 |
| 4.5% 5/1/32 | | 9,655 | 7,391 |
| 4.75% 3/1/30 (c) | | 63,365 | 52,271 |
| 4.75% 2/1/32 (c) | | 26,255 | 20,494 |
| 5% 2/1/28 (c) | | 62,550 | 56,166 |
| 5.125% 5/1/27 (c) | | 32,980 | 30,365 |
| 5.375% 6/1/29 (c) | | 18,080 | 15,825 |
| 6.375% 9/1/29 (c) | | 11,825 | 10,822 |
| CSC Holdings LLC: | | | |
| 3.375% 2/15/31 (c) | | 6,195 | 3,962 |
| 5.375% 2/1/28 (c) | | 21,905 | 17,444 |
| 6.5% 2/1/29 (c) | | 13,955 | 11,039 |
| DISH DBS Corp. 5.75% 12/1/28 (c) | | 15,220 | 11,054 |
| VZ Secured Financing BV 5% 1/15/32 (c) | | 24,310 | 18,443 |
| Ziggo BV 4.875% 1/15/30 (c) | | 7,990 | 6,382 |
| | | | 291,878 |
| Capital Goods - 0.2% | | | |
| ATS Corp. 4.125% 12/15/28 (c) | | 7,895 | 6,780 |
| Chart Industries, Inc. 7.5% 1/1/30 (c) | | 15,680 | 15,398 |
| | | | 22,178 |
| Chemicals - 1.8% | | | |
| Compass Minerals International, Inc. 6.75% 12/1/27 (c) | | 24,600 | 23,172 |
| Ingevity Corp. 3.875% 11/1/28 (c) | | 11,105 | 9,015 |
| LSB Industries, Inc. 6.25% 10/15/28 (c) | | 21,105 | 18,722 |
| Olympus Water U.S. Holding Corp.: | | | |
| 4.25% 10/1/28 (c) | | 15,305 | 12,212 |
| 7.125% 10/1/27 (c) | | 7,080 | 6,519 |
| 9.75% 11/15/28 (c) | | 30,040 | 29,340 |
| SCIH Salt Holdings, Inc. 4.875% 5/1/28 (c) | | 7,820 | 6,752 |
| SCIL IV LLC / SCIL U.S.A. Holdings LLC 5.375% 11/1/26 (c) | | 14,015 | 12,432 |
| The Chemours Co. LLC: | | | |
| 4.625% 11/15/29 (c) | | 3,565 | 2,754 |
| 5.375% 5/15/27 | | 32,330 | 29,207 |
| 5.75% 11/15/28 (c) | | 17,955 | 15,185 |
| Tronox, Inc. 4.625% 3/15/29 (c) | | 13,295 | 10,473 |
| W.R. Grace Holding LLC: | | | |
| 5.625% 8/15/29 (c) | | 28,310 | 21,940 |
| 7.375% 3/1/31 (c) | | 5,940 | 5,502 |
| | | | 203,225 |
| Consumer Products - 1.0% | | | |
| Angi Group LLC 3.875% 8/15/28 (c) | | 5,530 | 4,147 |
| Foundation Building Materials, Inc. 6% 3/1/29 (c) | | 5,845 | 4,821 |
| Gannett Holdings LLC 6% 11/1/26 (c) | | 8,785 | 7,379 |
| HFC Prestige Products, Inc./HFC Prestige International U.S. LLC 4.75% 1/15/29 (c) | | 8,760 | 7,755 |
| PetSmart, Inc. / PetSmart Finance Corp.: | | | |
| 4.75% 2/15/28 (c) | | 16,195 | 14,331 |
| 7.75% 2/15/29 (c) | | 17,680 | 16,277 |
| Spectrum Brands Holdings, Inc. 3.875% 3/15/31 (c) | | 8,380 | 6,708 |
| Tempur Sealy International, Inc.: | | | |
| 3.875% 10/15/31 (c) | | 15,965 | 11,956 |
| 4% 4/15/29 (c) | | 15,925 | 13,065 |
| The Scotts Miracle-Gro Co. 4% 4/1/31 | | 11,945 | 8,886 |
| TKC Holdings, Inc. 6.875% 5/15/28 (c) | | 13,375 | 11,569 |
| Windsor Holdings III, LLC 8.5% 6/15/30 (c) | | 5,960 | 5,802 |
| | | | 112,696 |
| Containers - 0.6% | | | |
| BWAY Holding Co. 7.875% 8/15/26 (c) | | 11,865 | 11,113 |
| Crown Cork & Seal, Inc.: | | | |
| 7.375% 12/15/26 | | 4,845 | 4,918 |
| 7.5% 12/15/96 | | 12,871 | 14,866 |
| Graham Packaging Co., Inc. 7.125% 8/15/28 (c) | | 6,000 | 4,597 |
| Graphic Packaging International, Inc. 3.75% 2/1/30 (c) | | 7,880 | 6,443 |
| Intelligent Packaging Ltd. Finco, Inc. 6% 9/15/28 (c) | | 4,230 | 3,467 |
| LABL, Inc. 5.875% 11/1/28 (c) | | 14,730 | 12,465 |
| Sealed Air Corp./Sealed Air Cor 6.125% 2/1/28 (c) | | 5,935 | 5,649 |
| Trident Holdings, Inc. 12.75% 12/31/28 (c) | | 5,870 | 5,998 |
| | | | 69,516 |
| Diversified Financial Services - 2.3% | | | |
| Broadstreet Partners, Inc. 5.875% 4/15/29 (c) | | 15,505 | 13,518 |
| Cargo Aircraft Management, Inc. 4.75% 2/1/28 (c) | | 6,915 | 6,085 |
| Coinbase Global, Inc.: | | | |
| 3.375% 10/1/28 (c) | | 29,675 | 21,789 |
| 3.625% 10/1/31 (c) | | 18,050 | 12,272 |
| Compass Group Diversified Holdings LLC: | | | |
| 5% 1/15/32 (c) | | 6,090 | 4,789 |
| 5.25% 4/15/29 (c) | | 17,730 | 15,140 |
| Hightower Holding LLC 6.75% 4/15/29 (c) | | 5,945 | 5,071 |
| Icahn Enterprises LP/Icahn Enterprises Finance Corp.: | | | |
| 4.375% 2/1/29 | | 11,165 | 8,597 |
| 5.25% 5/15/27 | | 38,210 | 32,717 |
| 6.25% 5/15/26 | | 24,085 | 22,015 |
| 6.375% 12/15/25 | | 8,305 | 7,814 |
| LPL Holdings, Inc. 4% 3/15/29 (c) | | 17,730 | 15,245 |
| MSCI, Inc. 4% 11/15/29 (c) | | 3,245 | 2,793 |
| OneMain Finance Corp.: | | | |
| 4% 9/15/30 | | 5,610 | 4,104 |
| 5.375% 11/15/29 | | 9,400 | 7,729 |
| 6.625% 1/15/28 | | 7,305 | 6,646 |
| 6.875% 3/15/25 | | 19,480 | 19,219 |
| 7.125% 3/15/26 | | 50,145 | 48,699 |
| Williams Scotsman, Inc. 7.375% 10/1/31 (c) | | 5,990 | 5,892 |
| | | | 260,134 |
| Energy - 8.0% | | | |
| Altus Midstream LP 5.875% 6/15/30 (c) | | 9,060 | 8,313 |
| Antero Midstream Partners LP/Antero Midstream Finance Corp.: | | | |
| 5.375% 6/15/29 (c) | | 9,060 | 8,227 |
| 5.75% 1/15/28 (c) | | 17,645 | 16,542 |
| Atlantica Sustainable Infrastructure PLC 4.125% 6/15/28 (c) | | 7,820 | 6,753 |
| Borr IHC Ltd. / Borr Finance Ltd.: | | | |
| 10% 11/15/28 (c)(g) | | 9,015 | 8,972 |
| 10.375% 11/15/30 (c)(g) | | 3,005 | 2,979 |
| Centennial Resource Production LLC 5.875% 7/1/29 (c) | | 8,645 | 8,040 |
| CGG SA 8.75% 4/1/27 (c) | | 11,985 | 10,578 |
| Chesapeake Energy Corp.: | | | |
| 5.875% 2/1/29 (c) | | 5,840 | 5,498 |
| 6.75% 4/15/29 (c) | | 8,995 | 8,801 |
| 7% (b)(d) | | 6,915 | 0 |
| 8% (b)(d) | | 2,132 | 0 |
| 8% (b)(d) | | 3,385 | 0 |
| Citgo Petroleum Corp.: | | | |
| 6.375% 6/15/26 (c) | | 8,760 | 8,606 |
| 7% 6/15/25 (c) | | 22,045 | 21,662 |
| 8.375% 1/15/29 (c) | | 26,350 | 26,096 |
| Civitas Resources, Inc. 8.625% 11/1/30 (c) | | 12,020 | 12,234 |
| CNX Midstream Partners LP 4.75% 4/15/30 (c) | | 6,435 | 5,302 |
| CNX Resources Corp.: | | | |
| 6% 1/15/29 (c) | | 5,345 | 4,901 |
| 7.375% 1/15/31 (c) | | 5,930 | 5,666 |
| Comstock Resources, Inc.: | | | |
| 5.875% 1/15/30 (c) | | 32,085 | 27,433 |
| 6.75% 3/1/29 (c) | | 20,060 | 18,255 |
| Crestwood Midstream Partners LP/Crestwood Midstream Finance Corp.: | | | |
| 5.625% 5/1/27 (c) | | 18,015 | 17,328 |
| 5.75% 4/1/25 | | 4,790 | 4,730 |
| 6% 2/1/29 (c) | | 25,785 | 24,947 |
| 7.375% 2/1/31 (c) | | 5,000 | 5,040 |
| CrownRock LP/CrownRock Finance, Inc. 5% 5/1/29 (c) | | 5,055 | 4,768 |
| CVR Energy, Inc.: | | | |
| 5.25% 2/15/25 (c) | | 16,990 | 16,667 |
| 5.75% 2/15/28 (c) | | 22,655 | 20,355 |
| Delek Logistics Partners LP 7.125% 6/1/28 (c) | | 17,655 | 16,066 |
| Diamond Foreign Asset Co. / Diamond Finance, LLC 8.5% 10/1/30 (c) | | 5,990 | 5,838 |
| DT Midstream, Inc.: | | | |
| 4.125% 6/15/29 (c) | | 9,070 | 7,798 |
| 4.375% 6/15/31 (c) | | 9,070 | 7,532 |
| Endeavor Energy Resources LP/EER Finance, Inc. 5.75% 1/30/28 (c) | | 21,251 | 20,386 |
| Energy Transfer LP 5.5% 6/1/27 | | 16,735 | 16,308 |
| EnLink Midstream LLC 6.5% 9/1/30 (c) | | 17,745 | 17,033 |
| Hess Midstream Partners LP: | | | |
| 4.25% 2/15/30 (c) | | 9,875 | 8,450 |
| 5.125% 6/15/28 (c) | | 11,235 | 10,374 |
| 5.5% 10/15/30 (c) | | 6,060 | 5,501 |
| 5.625% 2/15/26 (c) | | 15,535 | 15,045 |
| Hilcorp Energy I LP/Hilcorp Finance Co. 6.25% 11/1/28 (c) | | 12,280 | 11,481 |
| Holly Energy Partners LP/Holly Energy Finance Corp.: | | | |
| 5% 2/1/28 (c) | | 7,615 | 7,049 |
| 6.375% 4/15/27 (c) | | 6,050 | 5,857 |
| Howard Midstream Energy Partners LLC 8.875% 7/15/28 (c) | | 14,895 | 14,974 |
| Jonah Energy Parent LLC 12% 11/5/25 (b)(h) | | 6,742 | 6,920 |
| MEG Energy Corp. 7.125% 2/1/27 (c) | | 11,335 | 11,416 |
| Mesquite Energy, Inc. 7.25% (b)(c)(d) | | 21,977 | 0 |
| Nabors Industries Ltd.: | | | |
| 7.25% 1/15/26 (c) | | 11,260 | 10,578 |
| 7.5% 1/15/28 (c) | | 9,715 | 8,580 |
| New Fortress Energy, Inc.: | | | |
| 6.5% 9/30/26 (c) | | 23,915 | 21,421 |
| 6.75% 9/15/25 (c) | | 15,106 | 14,014 |
| NGL Energy Operating LLC/NGL Energy Finance Corp. 7.5% 2/1/26 (c) | | 11,090 | 10,826 |
| Noble Finance II LLC 8% 4/15/30 (c) | | 5,935 | 5,931 |
| Northern Oil & Gas, Inc.: | | | |
| 8.125% 3/1/28 (c) | | 6,005 | 5,930 |
| 8.75% 6/15/31 (c) | | 11,950 | 11,890 |
| NuStar Logistics LP 6% 6/1/26 | | 12,025 | 11,602 |
| Occidental Petroleum Corp. 7.2% 3/15/29 | | 3,964 | 4,043 |
| PBF Holding Co. LLC/PBF Finance Corp.: | | | |
| 6% 2/15/28 | | 27,530 | 25,308 |
| 7.875% 9/15/30 (c) | | 8,980 | 8,704 |
| Seadrill Finance Ltd. 8.375% 8/1/30 (c) | | 11,920 | 11,924 |
| Sitio Royalties OP / Sitio Finance Corp. 7.875% 11/1/28 (c) | | 8,995 | 8,873 |
| SM Energy Co.: | | | |
| 5.625% 6/1/25 | | 6,330 | 6,162 |
| 6.625% 1/15/27 | | 21,320 | 20,717 |
| 6.75% 9/15/26 | | 4,550 | 4,469 |
| Southern Natural Gas Co. LLC: | | | |
| 7.35% 2/15/31 | | 23,497 | 23,656 |
| 8% 3/1/32 | | 12,475 | 13,548 |
| Southwestern Energy Co.: | | | |
| 5.375% 3/15/30 | | 12,145 | 11,140 |
| 5.7% 1/23/25 (i) | | 244 | 241 |
| Suburban Propane Partners LP/Suburban Energy Finance Corp. 5% 6/1/31 (c) | | 12,070 | 9,998 |
| Sunoco LP/Sunoco Finance Corp.: | | | |
| 4.5% 5/15/29 | | 10,170 | 8,810 |
| 4.5% 4/30/30 | | 12,185 | 10,408 |
| 7% 9/15/28 (c) | | 5,990 | 5,830 |
| Tallgrass Energy Partners LP / Tallgrass Energy Finance Corp.: | | | |
| 5.5% 1/15/28 (c) | | 595 | 521 |
| 6% 3/1/27 (c) | | 5,935 | 5,430 |
| 6% 9/1/31 (c) | | 11,485 | 9,664 |
| 7.5% 10/1/25 (c) | | 8,350 | 8,226 |
| Targa Resources Partners LP/Targa Resources Partners Finance Corp. 4.875% 2/1/31 | | 10,360 | 9,133 |
| Teine Energy Ltd. 6.875% 4/15/29 (c) | | 8,990 | 8,327 |
| Transocean Titan Finance Ltd. 8.375% 2/1/28 (c) | | 12,289 | 12,325 |
| Transocean, Inc.: | | | |
| 7.5% 1/15/26 (c) | | 2,980 | 2,854 |
| 8% 2/1/27 (c) | | 8,940 | 8,391 |
| 8.75% 2/15/30 (c) | | 22,453 | 22,387 |
| 11.5% 1/30/27 (c) | | 12,025 | 12,514 |
| Unit Corp. 0% 12/1/29 (b) | | 2,202 | 0 |
| Valaris Ltd. 8.375% 4/30/30 (c) | | 5,985 | 5,873 |
| Venture Global Calcasieu Pass LLC: | | | |
| 3.875% 8/15/29 (c) | | 7,585 | 6,312 |
| 4.125% 8/15/31 (c) | | 7,585 | 6,098 |
| 6.25% 1/15/30 (c) | | 23,810 | 22,461 |
| | | | 911,840 |
| Environmental - 0.7% | | | |
| Clean Harbors, Inc. 6.375% 2/1/31 (c) | | 4,960 | 4,714 |
| Covanta Holding Corp.: | | | |
| 4.875% 12/1/29 (c) | | 26,475 | 20,651 |
| 5% 9/1/30 | | 13,761 | 10,644 |
| Darling Ingredients, Inc. 6% 6/15/30 (c) | | 13,885 | 13,027 |
| GFL Environmental, Inc.: | | | |
| 4% 8/1/28 (c) | | 9,105 | 7,836 |
| 4.75% 6/15/29 (c) | | 12,095 | 10,588 |
| Madison IAQ LLC: | | | |
| 4.125% 6/30/28 (c) | | 11,390 | 9,516 |
| 5.875% 6/30/29 (c) | | 9,085 | 7,038 |
| | | | 84,014 |
| Food & Drug Retail - 1.4% | | | |
| Albertsons Companies LLC/Safeway, Inc./New Albertson's, Inc./Albertson's LLC: | | | |
| 3.5% 3/15/29 (c) | | 36,160 | 30,830 |
| 4.625% 1/15/27 (c) | | 25,300 | 23,711 |
| 4.875% 2/15/30 (c) | | 44,700 | 39,909 |
| BellRing Brands, Inc. 7% 3/15/30 (c) | | 14,740 | 14,316 |
| Murphy Oil U.S.A., Inc.: | | | |
| 3.75% 2/15/31 (c) | | 5,300 | 4,258 |
| 4.75% 9/15/29 | | 6,860 | 6,074 |
| 5.625% 5/1/27 | | 6,030 | 5,828 |
| Parkland Corp.: | | | |
| 4.5% 10/1/29 (c) | | 8,995 | 7,737 |
| 4.625% 5/1/30 (c) | | 12,175 | 10,379 |
| SEG Holding LLC/SEG Finance Corp. 5.625% 10/15/28 (c) | | 11,130 | 11,149 |
| | | | 154,191 |
| Food/Beverage/Tobacco - 1.3% | | | |
| C&S Group Enterprises LLC 5% 12/15/28 (c) | | 8,615 | 6,666 |
| Chobani LLC/Finance Corp., Inc. 4.625% 11/15/28 (c) | | 6,285 | 5,434 |
| KeHE Distributors LLC / KeHE Finance Corp. 8.625% 10/15/26 (c) | | 7,777 | 7,777 |
| Lamb Weston Holdings, Inc.: | | | |
| 4.125% 1/31/30 (c) | | 12,150 | 10,307 |
| 4.375% 1/31/32 (c) | | 6,075 | 5,026 |
| Performance Food Group, Inc.: | | | |
| 4.25% 8/1/29 (c) | | 8,495 | 7,168 |
| 5.5% 10/15/27 (c) | | 8,855 | 8,280 |
| Post Holdings, Inc.: | | | |
| 4.5% 9/15/31 (c) | | 47,500 | 38,434 |
| 4.625% 4/15/30 (c) | | 15,630 | 13,088 |
| 5.5% 12/15/29 (c) | | 21,040 | 18,764 |
| Simmons Foods, Inc. 4.625% 3/1/29 (c) | | 8,340 | 6,775 |
| Triton Water Holdings, Inc. 6.25% 4/1/29 (c) | | 6,360 | 5,242 |
| U.S. Foods, Inc.: | | | |
| 4.625% 6/1/30 (c) | | 7,520 | 6,421 |
| 7.25% 1/15/32 (c) | | 5,990 | 5,880 |
| United Natural Foods, Inc. 6.75% 10/15/28 (c) | | 7,750 | 6,098 |
| | | | 151,360 |
| Gaming - 2.8% | | | |
| Affinity Gaming LLC 6.875% 12/15/27 (c) | | 4,295 | 3,501 |
| Boyd Gaming Corp. 4.75% 6/15/31 (c) | | 15,120 | 12,548 |
| Caesars Entertainment, Inc.: | | | |
| 4.625% 10/15/29 (c) | | 4,740 | 3,895 |
| 6.25% 7/1/25 (c) | | 41,240 | 40,576 |
| 7% 2/15/30 (c) | | 17,800 | 17,179 |
| 8.125% 7/1/27 (c) | | 54,990 | 54,488 |
| CDI Escrow Issuer, Inc. 5.75% 4/1/30 (c) | | 14,970 | 13,374 |
| Churchill Downs, Inc. 6.75% 5/1/31 (c) | | 11,880 | 10,959 |
| Fertitta Entertainment LLC / Fertitta Entertainment Finance Co., Inc.: | | | |
| 4.625% 1/15/29 (c) | | 25,865 | 21,735 |
| 6.75% 1/15/30 (c) | | 34,295 | 27,256 |
| Jacobs Entertainment, Inc. 6.75% 2/15/29 (c) | | 8,585 | 7,297 |
| Melco Resorts Finance Ltd.: | | | |
| 5.25% 4/26/26 (c) | | 8,910 | 8,152 |
| 5.75% 7/21/28 (c) | | 4,420 | 3,733 |
| MGM Resorts International 4.75% 10/15/28 | | 11,125 | 9,707 |
| Ontario Gaming GTA LP 8% 8/1/30 (c) | | 12,285 | 12,009 |
| Premier Entertainment Sub LLC: | | | |
| 5.625% 9/1/29 (c) | | 13,730 | 9,655 |
| 5.875% 9/1/31 (c) | | 2,100 | 1,426 |
| Scientific Games Corp. 7.5% 9/1/31 (c) | | 5,990 | 5,849 |
| Station Casinos LLC 4.625% 12/1/31 (c) | | 9,135 | 7,213 |
| Studio City Finance Ltd. 5% 1/15/29 (c) | | 5,700 | 4,067 |
| VICI Properties LP / VICI Note Co.: | | | |
| 3.875% 2/15/29 (c) | | 11,195 | 9,504 |
| 4.25% 12/1/26 (c) | | 21,450 | 19,797 |
| 4.625% 12/1/29 (c) | | 12,240 | 10,587 |
| | | | 314,507 |
| Healthcare - 4.2% | | | |
| 180 Medical, Inc. 3.875% 10/15/29 (c) | | 6,495 | 5,396 |
| Avantor Funding, Inc. 3.875% 11/1/29 (c) | | 6,075 | 5,084 |
| Bausch & Lomb Escrow Corp. 8.375% 10/1/28 (c) | | 11,980 | 11,899 |
| Bausch Health Companies, Inc.: | | | |
| 5.75% 8/15/27 (c) | | 18,030 | 9,376 |
| 6.125% 2/1/27 (c) | | 12,015 | 6,702 |
| Cano Health, Inc. 6.25% 10/1/28 (c) | | 4,050 | 1,620 |
| Charles River Laboratories International, Inc.: | | | |
| 3.75% 3/15/29 (c) | | 10,515 | 8,875 |
| 4% 3/15/31 (c) | | 12,085 | 9,864 |
| 4.25% 5/1/28 (c) | | 3,400 | 3,021 |
| Community Health Systems, Inc.: | | | |
| 4.75% 2/15/31 (c) | | 21,790 | 14,605 |
| 5.25% 5/15/30 (c) | | 18,245 | 12,957 |
| 6% 1/15/29 (c) | | 8,490 | 6,431 |
| 6.125% 4/1/30 (c) | | 21,795 | 8,446 |
| 8% 3/15/26 (c) | | 50,870 | 46,498 |
| DaVita HealthCare Partners, Inc.: | | | |
| 3.75% 2/15/31 (c) | | 4,180 | 3,005 |
| 4.625% 6/1/30 (c) | | 31,515 | 24,699 |
| Grifols SA 4.75% 10/15/28 (c) | | 6,075 | 5,088 |
| HealthEquity, Inc. 4.5% 10/1/29 (c) | | 6,410 | 5,491 |
| IQVIA, Inc. 5% 5/15/27 (c) | | 12,070 | 11,355 |
| Jazz Securities DAC 4.375% 1/15/29 (c) | | 12,305 | 10,701 |
| ModivCare Escrow Issuer, Inc. 5% 10/1/29 (c) | | 7,010 | 5,109 |
| Modivcare, Inc. 5.875% 11/15/25 (c) | | 8,105 | 7,659 |
| Molina Healthcare, Inc.: | | | |
| 3.875% 11/15/30 (c) | | 10,465 | 8,535 |
| 3.875% 5/15/32 (c) | | 12,160 | 9,555 |
| 4.375% 6/15/28 (c) | | 7,525 | 6,697 |
| Organon & Co. / Organon Foreign Debt Co-Issuer BV: | | | |
| 4.125% 4/30/28 (c) | | 21,010 | 18,148 |
| 5.125% 4/30/31 (c) | | 18,260 | 14,260 |
| Owens & Minor, Inc. 4.5% 3/31/29 (c) | | 8,310 | 6,667 |
| RP Escrow Issuer LLC 5.25% 12/15/25 (c) | | 10,405 | 7,414 |
| Tenet Healthcare Corp.: | | | |
| 4.25% 6/1/29 | | 17,640 | 15,096 |
| 4.375% 1/15/30 | | 43,755 | 37,013 |
| 4.875% 1/1/26 | | 30,115 | 28,862 |
| 5.125% 11/1/27 | | 18,070 | 16,681 |
| 6.125% 6/15/30 | | 30,025 | 27,794 |
| 6.25% 2/1/27 | | 35,815 | 34,345 |
| 6.75% 5/15/31 (c) | | 6,005 | 5,703 |
| Teva Pharmaceutical Finance Netherlands III BV: | | | |
| 4.75% 5/9/27 | | 6,085 | 5,524 |
| 5.125% 5/9/29 | | 6,085 | 5,309 |
| 7.875% 9/15/29 | | 5,935 | 5,852 |
| | | | 477,336 |
| Homebuilders/Real Estate - 1.6% | | | |
| Arcosa, Inc. 4.375% 4/15/29 (c) | | 8,410 | 7,338 |
| Ashton Woods U.S.A. LLC/Ashton Woods Finance Co. 4.625% 4/1/30 (c) | | 8,940 | 6,922 |
| Brookfield Residential Properties, Inc./Brookfield Residential U.S. Corp. 4.875% 2/15/30 (c) | | 7,775 | 5,913 |
| Century Communities, Inc. 3.875% 8/15/29 (c) | | 9,110 | 7,351 |
| Greystar Real Estate Partners 7.75% 9/1/30 (c) | | 5,305 | 5,212 |
| MPT Operating Partnership LP/MPT Finance Corp.: | | | |
| 3.5% 3/15/31 | | 11,190 | 6,786 |
| 4.625% 8/1/29 | | 18,080 | 12,517 |
| 5% 10/15/27 | | 38,043 | 29,374 |
| Shea Homes Ltd. Partnership/Corp. 4.75% 4/1/29 | | 8,020 | 6,770 |
| Taylor Morrison Communities, Inc./Monarch Communities, Inc.: | | | |
| 5.125% 8/1/30 (c) | | 10,725 | 9,013 |
| 5.875% 6/15/27 (c) | | 9,260 | 8,681 |
| TopBuild Corp. 3.625% 3/15/29 (c) | | 5,910 | 4,926 |
| TRI Pointe Group, Inc./TRI Pointe Holdings, Inc. 5.875% 6/15/24 | | 16,130 | 15,968 |
| TRI Pointe Homes, Inc. 5.7% 6/15/28 | | 14,380 | 12,803 |
| Uniti Group LP / Uniti Group Finance, Inc.: | | | |
| 4.75% 4/15/28 (c) | | 31,410 | 25,385 |
| 6.5% 2/15/29 (c) | | 14,000 | 9,092 |
| 10.5% 2/15/28 (c) | | 4,785 | 4,608 |
| Weekley Homes LLC/Weekley Finance Corp. 4.875% 9/15/28 (c) | | 5,045 | 4,332 |
| | | | 182,991 |
| Hotels - 0.4% | | | |
| Carnival Holdings (Bermuda) Ltd. 10.375% 5/1/28 (c) | | 17,635 | 18,803 |
| Hilton Domestic Operating Co., Inc.: | | | |
| 3.75% 5/1/29 (c) | | 5,595 | 4,816 |
| 4% 5/1/31 (c) | | 8,395 | 6,952 |
| 4.875% 1/15/30 | | 6,900 | 6,194 |
| Hilton Worldwide Finance LLC/Hilton Worldwide Finance Corp. 4.875% 4/1/27 | | 8,435 | 7,955 |
| | | | 44,720 |
| Insurance - 2.4% | | | |
| Acrisure LLC / Acrisure Finance, Inc.: | | | |
| 6% 8/1/29 (c) | | 9,105 | 7,345 |
| 7% 11/15/25 (c) | | 34,880 | 33,817 |
| 10.125% 8/1/26 (c) | | 1,800 | 1,811 |
| Alliant Holdings Intermediate LLC: | | | |
| 4.25% 10/15/27 (c) | | 11,125 | 9,781 |
| 5.875% 11/1/29 (c) | | 9,115 | 7,568 |
| 6.75% 10/15/27 (c) | | 49,965 | 45,631 |
| 6.75% 4/15/28 (c) | | 35,177 | 33,427 |
| AmWINS Group, Inc. 4.875% 6/30/29 (c) | | 8,805 | 7,537 |
| AssuredPartners, Inc.: | | | |
| 5.625% 1/15/29 (c) | | 8,355 | 7,088 |
| 7% 8/15/25 (c) | | 4,926 | 4,832 |
| GTCR AP Finance, Inc. 8% 5/15/27 (c) | | 6,010 | 5,852 |
| HUB International Ltd.: | | | |
| 5.625% 12/1/29 (c) | | 36,135 | 31,120 |
| 7% 5/1/26 (c) | | 11,770 | 11,457 |
| 7.25% 6/15/30 (c) | | 29,810 | 29,078 |
| MGIC Investment Corp. 5.25% 8/15/28 | | 7,710 | 7,087 |
| National Financial Partners Corp.: | | | |
| 4.875% 8/15/28 (c) | | 12,015 | 10,520 |
| 6.875% 8/15/28 (c) | | 11,640 | 9,940 |
| 8.5% 10/1/31 (c) | | 6,890 | 6,775 |
| | | | 270,666 |
| Leisure - 2.3% | | | |
| Boyne U.S.A., Inc. 4.75% 5/15/29 (c) | | 6,360 | 5,537 |
| Carnival Corp.: | | | |
| 4% 8/1/28 (c) | | 56,090 | 48,791 |
| 7% 8/15/29 (c) | | 6,075 | 5,957 |
| 7.625% 3/1/26 (c) | | 19,665 | 19,122 |
| 9.875% 8/1/27 (c) | | 16,600 | 17,302 |
| Merlin Entertainments PLC 5.75% 6/15/26 (c) | | 7,725 | 7,225 |
| NCL Corp. Ltd. 5.875% 2/15/27 (c) | | 12,100 | 11,138 |
| Royal Caribbean Cruises Ltd.: | | | |
| 5.375% 7/15/27 (c) | | 9,125 | 8,409 |
| 7.25% 1/15/30 (c) | | 5,940 | 5,860 |
| 8.25% 1/15/29 (c) | | 32,435 | 33,138 |
| 9.25% 1/15/29 (c) | | 34,425 | 35,932 |
| 11.5% 6/1/25 (c) | | 8,500 | 8,994 |
| 11.625% 8/15/27 (c) | | 11,825 | 12,827 |
| SeaWorld Parks & Entertainment, Inc. 5.25% 8/15/29 (c) | | 12,145 | 10,579 |
| Vail Resorts, Inc. 6.25% 5/15/25 (c) | | 6,250 | 6,211 |
| Viking Ocean Cruises Ship VII Ltd. 5.625% 2/15/29 (c) | | 4,965 | 4,400 |
| Voc Escrow Ltd. 5% 2/15/28 (c) | | 19,690 | 17,690 |
| | | | 259,112 |
| Metals/Mining - 1.5% | | | |
| Alcoa Nederland Holding BV: | | | |
| 4.125% 3/31/29 (c) | | 15,485 | 13,486 |
| 6.125% 5/15/28 (c) | | 3,565 | 3,438 |
| Arsenal AIC Parent LLC 8% 10/1/30 (c) | | 7,040 | 6,952 |
| Cleveland-Cliffs, Inc.: | | | |
| 4.625% 3/1/29 (c) | | 23,720 | 20,444 |
| 4.875% 3/1/31 (c) | | 11,440 | 9,436 |
| 6.75% 4/15/30 (c) | | 3,000 | 2,782 |
| Eldorado Gold Corp. 6.25% 9/1/29 (c) | | 13,719 | 11,713 |
| ERO Copper Corp. 6.5% 2/15/30 (c) | | 9,085 | 7,707 |
| First Quantum Minerals Ltd.: | | | |
| 6.875% 3/1/26 (c) | | 28,325 | 24,848 |
| 8.625% 6/1/31 (c) | | 15,340 | 12,949 |
| FMG Resources Pty Ltd.: | | | |
| 4.375% 4/1/31 (c) | | 8,990 | 7,246 |
| 4.5% 9/15/27 (c) | | 9,015 | 8,117 |
| HudBay Minerals, Inc. 4.5% 4/1/26 (c) | | 7,020 | 6,534 |
| Mineral Resources Ltd.: | | | |
| 8% 11/1/27 (c) | | 6,040 | 5,836 |
| 8.125% 5/1/27 (c) | | 18,015 | 17,452 |
| 8.5% 5/1/30 (c) | | 4,475 | 4,303 |
| 9.25% 10/1/28 (c) | | 10,605 | 10,605 |
| Murray Energy Corp.: | | | |
| 11.25% (b)(c)(d) | | 8,915 | 0 |
| 12% pay-in-kind (b)(c)(d)(e) | | 10,343 | 0 |
| | | | 173,848 |
| Paper - 0.7% | | | |
| Ardagh Metal Packaging Finance U.S.A. LLC/Ardagh Metal Packaging Finance PLC: | | | |
| 3.25% 9/1/28 (c) | | 5,915 | 4,817 |
| 4% 9/1/29 (c) | | 11,830 | 8,873 |
| 6% 6/15/27 (c) | | 6,045 | 5,713 |
| Cascades, Inc.: | | | |
| 5.125% 1/15/26 (c) | | 5,600 | 5,315 |
| 5.375% 1/15/28 (c) | | 5,600 | 5,061 |
| Clydesdale Acquisition Holdings, Inc.: | | | |
| 6.625% 4/15/29 (c) | | 7,185 | 6,527 |
| 8.75% 4/15/30 (c) | | 41,090 | 32,752 |
| Mercer International, Inc. 5.125% 2/1/29 | | 15,060 | 11,809 |
| | | | 80,867 |
| Publishing/Printing - 0.1% | | | |
| Clear Channel International BV 6.625% 8/1/25 (c) | | 15,860 | 15,507 |
| Restaurants - 0.7% | | | |
| 1011778 BC Unlimited Liability Co./New Red Finance, Inc.: | | | |
| 3.875% 1/15/28 (c) | | 12,115 | 10,816 |
| 4% 10/15/30 (c) | | 39,005 | 31,946 |
| 4.375% 1/15/28 (c) | | 10,600 | 9,544 |
| Bloomin Brands, Inc. / OSI Restaurant Partners LLC 5.125% 4/15/29 (c) | | 5,565 | 4,826 |
| Garden SpinCo Corp. 8.625% 7/20/30 (c) | | 5,205 | 5,370 |
| Papa John's International, Inc. 3.875% 9/15/29 (c) | | 5,560 | 4,562 |
| Yum! Brands, Inc. 4.625% 1/31/32 | | 11,975 | 10,204 |
| | | | 77,268 |
| Services - 4.2% | | | |
| Adtalem Global Education, Inc. 5.5% 3/1/28 (c) | | 9,010 | 8,205 |
| AECOM 5.125% 3/15/27 | | 11,885 | 11,221 |
| Atlas Luxco 4 SARL / Allied Universal Holdco LLC / Allied Universal Finance Corp.: | | | |
| 4.625% 6/1/28 (c) | | 11,130 | 9,103 |
| 4.625% 6/1/28 (c) | | 7,690 | 6,265 |
| Booz Allen Hamilton, Inc.: | | | |
| 3.875% 9/1/28 (c) | | 10,240 | 9,150 |
| 4% 7/1/29 (c) | | 5,920 | 5,224 |
| Brand Energy & Infrastructure Services, Inc. 10.375% 8/1/30 (c) | | 44,695 | 44,360 |
| CoreCivic, Inc. 8.25% 4/15/26 | | 32,260 | 32,661 |
| Fair Isaac Corp. 4% 6/15/28 (c) | | 2,910 | 2,591 |
| Gartner, Inc.: | | | |
| 3.625% 6/15/29 (c) | | 8,610 | 7,271 |
| 3.75% 10/1/30 (c) | | 11,495 | 9,514 |
| GEMS MENASA Cayman Ltd. 7.125% 7/31/26 (c) | | 8,765 | 8,392 |
| H&E Equipment Services, Inc. 3.875% 12/15/28 (c) | | 16,800 | 14,230 |
| Hertz Corp.: | | | |
| 4.625% 12/1/26 (c) | | 5,180 | 4,339 |
| 5% 12/1/29 (c) | | 10,055 | 7,219 |
| 5.5% (b)(c)(d) | | 10,890 | 381 |
| 6% (b)(c)(d) | | 10,285 | 604 |
| 6.25% (b)(d) | | 11,875 | 416 |
| 7.125% (b)(c)(d) | | 10,285 | 900 |
| Iron Mountain, Inc.: | | | |
| 4.5% 2/15/31 (c) | | 22,025 | 18,016 |
| 4.875% 9/15/29 (c) | | 24,110 | 21,001 |
| Neptune BidCo U.S., Inc. 9.29% 4/15/29 (c) | | 47,450 | 41,877 |
| OpenLane, Inc. 5.125% 6/1/25 (c) | | 10,355 | 9,989 |
| PowerTeam Services LLC 9.033% 12/4/25 (c) | | 1,200 | 1,080 |
| Service Corp. International 4% 5/15/31 | | 12,070 | 9,770 |
| Sotheby's 7.375% 10/15/27 (c) | | 4,960 | 4,430 |
| Sotheby's/Bidfair Holdings, Inc. 5.875% 6/1/29 (c) | | 9,045 | 7,212 |
| The Brink's Co. 4.625% 10/15/27 (c) | | 12,180 | 11,015 |
| The GEO Group, Inc.: | | | |
| 9.5% 12/31/28 (c) | | 9,655 | 9,293 |
| 10.5% 6/30/28 | | 24,580 | 24,519 |
| TriNet Group, Inc. 3.5% 3/1/29 (c) | | 8,865 | 7,320 |
| Uber Technologies, Inc.: | | | |
| 4.5% 8/15/29 (c) | | 27,335 | 24,108 |
| 6.25% 1/15/28 (c) | | 9,175 | 8,831 |
| 7.5% 9/15/27 (c) | | 35,255 | 35,344 |
| 8% 11/1/26 (c) | | 51,060 | 51,420 |
| WASH Multifamily Acquisition, Inc. 5.75% 4/15/26 (c) | | 9,760 | 9,028 |
| | | | 476,299 |
| Steel - 0.0% | | | |
| Algoma Steel SCA 0% 12/31/23 (b) | | 1,982 | 0 |
| Commercial Metals Co. 3.875% 2/15/31 | | 6,135 | 4,973 |
| Roller Bearing Co. of America, Inc. 4.375% 10/15/29 (c) | | 4,375 | 3,710 |
| | | | 8,683 |
| Super Retail - 1.1% | | | |
| Asbury Automotive Group, Inc.: | | | |
| 4.5% 3/1/28 | | 3,534 | 3,131 |
| 4.625% 11/15/29 (c) | | 10,005 | 8,463 |
| 4.75% 3/1/30 | | 3,523 | 2,990 |
| 5% 2/15/32 (c) | | 10,800 | 8,759 |
| Bath & Body Works, Inc.: | | | |
| 6.625% 10/1/30 (c) | | 23,165 | 21,446 |
| 6.75% 7/1/36 | | 12,766 | 11,012 |
| 7.5% 6/15/29 | | 8,335 | 8,140 |
| Carvana Co.: | | | |
| 9% 12/1/28 pay-in-kind (c)(e) | | 3,771 | 2,806 |
| 9% 6/1/30 pay-in-kind (c)(e) | | 5,657 | 4,186 |
| 9% 6/1/31 pay-in-kind (c)(e) | | 6,694 | 4,987 |
| EG Global Finance PLC: | | | |
| 6.75% 2/7/25 (c) | | 5,360 | 5,303 |
| 8.5% 10/30/25 (c) | | 29,460 | 28,981 |
| LBM Acquisition LLC 6.25% 1/15/29 (c) | | 17,805 | 14,066 |
| | | | 124,270 |
| Technology - 3.5% | | | |
| Acuris Finance U.S. 5% 5/1/28 (c) | | 9,045 | 7,123 |
| Block, Inc. 3.5% 6/1/31 | | 12,070 | 9,315 |
| CA Magnum Holdings 5.375% 10/31/26 (c) | | 4,870 | 4,241 |
| Camelot Finance SA 4.5% 11/1/26 (c) | | 10,590 | 9,789 |
| Clarivate Science Holdings Corp.: | | | |
| 3.875% 7/1/28 (c) | | 10,695 | 9,183 |
| 4.875% 7/1/29 (c) | | 10,115 | 8,531 |
| Cloud Software Group, Inc.: | | | |
| 6.5% 3/31/29 (c) | | 83,525 | 73,331 |
| 9% 9/30/29 (c) | | 8,900 | 7,579 |
| Coherent Corp. 5% 12/15/29 (c) | | 9,495 | 8,057 |
| Crowdstrike Holdings, Inc. 3% 2/15/29 | | 8,870 | 7,414 |
| Elastic NV 4.125% 7/15/29 (c) | | 24,245 | 20,433 |
| Gen Digital, Inc. 5% 4/15/25 (c) | | 10,050 | 9,730 |
| Go Daddy Operating Co. LLC / GD Finance Co., Inc.: | | | |
| 3.5% 3/1/29 (c) | | 11,810 | 9,914 |
| 5.25% 12/1/27 (c) | | 9,345 | 8,757 |
| ION Trading Technologies Ltd. 5.75% 5/15/28 (c) | | 12,040 | 9,993 |
| Iron Mountain Information Management Services, Inc. 5% 7/15/32 (c) | | 9,100 | 7,446 |
| MicroStrategy, Inc. 6.125% 6/15/28 (c) | | 23,020 | 20,833 |
| NCR Atleos Escrow Corp. 9.5% 4/1/29 (c) | | 8,995 | 8,817 |
| NCR Corp.: | | | |
| 5% 10/1/28 (c) | | 5,530 | 4,775 |
| 5.125% 4/15/29 (c) | | 8,870 | 7,627 |
| 5.25% 10/1/30 (c) | | 5,530 | 4,579 |
| ON Semiconductor Corp. 3.875% 9/1/28 (c) | | 11,065 | 9,506 |
| Open Text Corp. 6.9% 12/1/27 (c) | | 10,610 | 10,557 |
| Open Text Holdings, Inc.: | | | |
| 4.125% 2/15/30 (c) | | 5,690 | 4,715 |
| 4.125% 12/1/31 (c) | | 5,485 | 4,309 |
| PTC, Inc.: | | | |
| 3.625% 2/15/25 (c) | | 6,650 | 6,410 |
| 4% 2/15/28 (c) | | 6,575 | 5,830 |
| Rackspace Hosting, Inc. 5.375% 12/1/28 (c) | | 6,425 | 1,879 |
| Roblox Corp. 3.875% 5/1/30 (c) | | 9,120 | 7,400 |
| Seagate HDD Cayman: | | | |
| 8.25% 12/15/29 (c) | | 19,590 | 19,908 |
| 8.5% 7/15/31 (c) | | 12,720 | 12,943 |
| Sensata Technologies BV 4% 4/15/29 (c) | | 11,970 | 10,181 |
| Synaptics, Inc. 4% 6/15/29 (c) | | 7,015 | 5,787 |
| TTM Technologies, Inc. 4% 3/1/29 (c) | | 8,870 | 7,273 |
| Twilio, Inc.: | | | |
| 3.625% 3/15/29 | | 9,995 | 8,310 |
| 3.875% 3/15/31 | | 10,460 | 8,351 |
| Unisys Corp. 6.875% 11/1/27 (c) | | 6,095 | 4,465 |
| Veritas U.S., Inc./Veritas Bermuda Ltd. 7.5% 9/1/25 (c) | | 8,945 | 7,322 |
| | | | 392,613 |
| Telecommunications - 3.1% | | | |
| Altice Financing SA: | | | |
| 5% 1/15/28 (c) | | 14,560 | 11,841 |
| 5.75% 8/15/29 (c) | | 25,600 | 19,796 |
| Altice France SA: | | | |
| 5.125% 7/15/29 (c) | | 61,630 | 42,198 |
| 5.5% 1/15/28 (c) | | 1,160 | 862 |
| 5.5% 10/15/29 (c) | | 106,150 | 73,021 |
| C&W Senior Financing Designated Activity Co. 6.875% 9/15/27 (c) | | 40,380 | 34,517 |
| Frontier Communications Holdings LLC: | | | |
| 5% 5/1/28 (c) | | 19,575 | 16,901 |
| 5.875% 10/15/27 (c) | | 10,375 | 9,459 |
| Intelsat Jackson Holdings SA 6.5% 3/15/30 (c) | | 25,303 | 22,217 |
| LCPR Senior Secured Financing DAC: | | | |
| 5.125% 7/15/29 (c) | | 14,860 | 11,576 |
| 6.75% 10/15/27 (c) | | 10,157 | 9,163 |
| Millicom International Cellular SA 4.5% 4/27/31 (c) | | 1,725 | 1,286 |
| Northwest Fiber LLC/Northwest Fiber Finance Sub, Inc. 4.75% 4/30/27 (c) | | 6,070 | 5,417 |
| Qwest Corp. 7.25% 9/15/25 | | 1,480 | 1,417 |
| Sable International Finance Ltd. 5.75% 9/7/27 (c) | | 20,475 | 18,328 |
| SBA Communications Corp.: | | | |
| 3.125% 2/1/29 | | 13,305 | 11,001 |
| 3.875% 2/15/27 | | 17,015 | 15,495 |
| Uniti Group, Inc. 6% 1/15/30 (c) | | 7,365 | 4,465 |
| VMED O2 UK Financing I PLC 4.75% 7/15/31 (c) | | 21,200 | 17,065 |
| Windstream Escrow LLC 7.75% 8/15/28 (c) | | 14,572 | 11,555 |
| Zayo Group Holdings, Inc. 4% 3/1/27 (c) | | 12,590 | 9,476 |
| | | | 347,056 |
| Textiles/Apparel - 0.1% | | | |
| Crocs, Inc.: | | | |
| 4.125% 8/15/31 (c) | | 6,075 | 4,617 |
| 4.25% 3/15/29 (c) | | 8,675 | 7,114 |
| Kontoor Brands, Inc. 4.125% 11/15/29 (c) | | 5,320 | 4,379 |
| | | | 16,110 |
| Transportation Ex Air/Rail - 0.1% | | | |
| Seaspan Corp. 5.5% 8/1/29 (c) | | 9,095 | 6,977 |
| XPO, Inc. 6.25% 6/1/28 (c) | | 5,950 | 5,700 |
| | | | 12,677 |
| Utilities - 1.9% | | | |
| Clearway Energy Operating LLC: | | | |
| 3.75% 2/15/31 (c) | | 13,295 | 10,367 |
| 3.75% 1/15/32 (c) | | 6,075 | 4,602 |
| 4.75% 3/15/28 (c) | | 6,920 | 6,177 |
| NRG Energy, Inc.: | | | |
| 3.375% 2/15/29 (c) | | 5,145 | 4,188 |
| 3.625% 2/15/31 (c) | | 10,215 | 7,709 |
| 3.875% 2/15/32 (c) | | 13,975 | 10,386 |
| 5.75% 1/15/28 | | 9,000 | 8,425 |
| 6.625% 1/15/27 | | 6,378 | 6,190 |
| Pacific Gas & Electric Co.: | | | |
| 3.45% 7/1/25 | | 2,868 | 2,719 |
| 3.75% 7/1/28 | | 2,868 | 2,514 |
| 3.95% 12/1/47 | | 10,826 | 6,459 |
| 4% 12/1/46 | | 13,774 | 8,331 |
| 4.3% 3/15/45 | | 5,995 | 3,879 |
| PG&E Corp.: | | | |
| 5% 7/1/28 | | 22,000 | 19,931 |
| 5.25% 7/1/30 | | 8,330 | 7,296 |
| Pike Corp. 5.5% 9/1/28 (c) | | 33,664 | 28,789 |
| Vistra Operations Co. LLC: | | | |
| 4.375% 5/1/29 (c) | | 23,230 | 19,728 |
| 5% 7/31/27 (c) | | 22,585 | 20,660 |
| 5.5% 9/1/26 (c) | | 3,485 | 3,316 |
| 5.625% 2/15/27 (c) | | 28,195 | 26,532 |
| 7.75% 10/15/31 (c) | | 11,985 | 11,568 |
| | | | 219,766 |
TOTAL NONCONVERTIBLE BONDS | | | 6,826,810 |
| TOTAL CORPORATE BONDS (Cost $7,688,957) | | | 6,857,889 |
| | | | |
| Common Stocks - 12.2% |
| | | Shares | Value ($) (000s) |
| Aerospace - 0.1% | | | |
| TransDigm Group, Inc. (j) | | 13,200 | 10,931 |
| Air Transportation - 0.0% | | | |
| Air Canada (j) | | 23,000 | 277 |
| Delta Air Lines, Inc. | | 146,750 | 4,586 |
TOTAL AIR TRANSPORTATION | | | 4,863 |
| Automotive & Auto Parts - 0.0% | | | |
| Exide Technologies (b)(j) | | 9,824 | 0 |
| Exide Technologies (b)(j) | | 580,031 | 0 |
| Exide Technologies (b)(j) | | 385 | 0 |
| UC Holdings, Inc. (b)(j) | | 677,217 | 1,165 |
TOTAL AUTOMOTIVE & AUTO PARTS | | | 1,165 |
| Banks & Thrifts - 0.0% | | | |
| Algoma Steel Group, Inc. | | 638,696 | 4,477 |
| Broadcasting - 0.1% | | | |
| iHeartMedia, Inc. (j) | | 104 | 0 |
| Nexstar Broadcasting Group, Inc. Class A | | 53,232 | 7,457 |
TOTAL BROADCASTING | | | 7,457 |
| Building Materials - 0.4% | | | |
| Builders FirstSource, Inc. (j) | | 90,400 | 9,810 |
| Carlisle Companies, Inc. | | 34,100 | 8,664 |
| Carrier Global Corp. | | 309,300 | 14,741 |
| WESCO International, Inc. | | 76,800 | 9,846 |
TOTAL BUILDING MATERIALS | | | 43,061 |
| Capital Goods - 0.3% | | | |
| Deere & Co. | | 14,600 | 5,334 |
| Parker Hannifin Corp. | | 33,800 | 12,469 |
| Regal Rexnord Corp. | | 141,300 | 16,731 |
TOTAL CAPITAL GOODS | | | 34,534 |
| Chemicals - 0.3% | | | |
| Olin Corp. | | 342,900 | 14,649 |
| The Chemours Co. LLC | | 461,210 | 11,120 |
| Westlake Corp. | | 51,200 | 5,906 |
TOTAL CHEMICALS | | | 31,675 |
| Consumer Products - 0.1% | | | |
| Tapestry, Inc. | | 344,400 | 9,492 |
| Tempur Sealy International, Inc. | | 112,135 | 4,478 |
TOTAL CONSUMER PRODUCTS | | | 13,970 |
| Containers - 0.2% | | | |
| Graphic Packaging Holding Co. | | 973,700 | 20,944 |
| Diversified Financial Services - 0.7% | | | |
| Apollo Global Management, Inc. | | 280,900 | 21,753 |
| Carnelian Point Holdings LP warrants (b)(j) | | 931 | 3 |
| MasterCard, Inc. Class A | | 65,600 | 24,689 |
| OneMain Holdings, Inc. | | 769,000 | 27,630 |
| PJT Partners, Inc. | | 5,092 | 399 |
TOTAL DIVERSIFIED FINANCIAL SERVICES | | | 74,474 |
| Energy - 1.5% | | | |
| Antero Resources Corp. (j) | | 306,925 | 9,036 |
| California Resources Corp. | | 1,062,738 | 55,889 |
| California Resources Corp. warrants 10/27/24 (j) | | 57,076 | 1,018 |
| Chaparral Energy, Inc.: | | | |
| Series A warrants 10/1/24 (b)(j) | | 392 | 0 |
| Series B warrants 10/1/25 (b)(j) | | 392 | 0 |
| Cheniere Energy, Inc. | | 205,700 | 34,233 |
| Chesapeake Energy Corp. (k) | | 270,287 | 23,266 |
| Chesapeake Energy Corp. (h)(j) | | 22,818 | 1,964 |
| Diamond Offshore Drilling, Inc. (j) | | 118,485 | 1,470 |
| EP Energy Corp. (b)(j) | | 841,775 | 1,389 |
| Forbes Energy Services Ltd. (b)(j) | | 193,218 | 0 |
| Halliburton Co. | | 207,600 | 8,167 |
| Mesquite Energy, Inc. (b)(j) | | 317,026 | 25,169 |
| PureWest Energy (b)(j) | | 17,812 | 33 |
| PureWest Energy rights (b)(j) | | 10,734 | 0 |
| SolarEdge Technologies, Inc. (j) | | 45,300 | 3,441 |
| Superior Energy Services, Inc. Class A (b)(j) | | 110,370 | 8,357 |
| Unit Corp. | | 37,978 | 2,091 |
TOTAL ENERGY | | | 175,523 |
| Entertainment/Film - 0.0% | | | |
| New Cotai LLC/New Cotai Capital Corp. (b)(h)(j) | | 3,366,626 | 1,919 |
| Food & Drug Retail - 0.2% | | | |
| Southeastern Grocers, Inc. (b)(h)(j) | | 793,345 | 21,206 |
| Food/Beverage/Tobacco - 0.2% | | | |
| JBS SA | | 4,652,100 | 18,482 |
| Gaming - 0.3% | | | |
| Boyd Gaming Corp. | | 453,873 | 25,076 |
| Caesars Entertainment, Inc. (j) | | 136,036 | 5,426 |
| Studio City International Holdings Ltd.: | | | |
| ADR (c)(j) | | 631,958 | 3,160 |
| (NYSE) ADR (j) | | 695,700 | 3,479 |
TOTAL GAMING | | | 37,141 |
| Healthcare - 0.6% | | | |
| Charles River Laboratories International, Inc. (j) | | 26,900 | 4,529 |
| Encompass Health Corp. | | 34 | 2 |
| Enhabit Home Health & Hospice (j) | | 17 | 0 |
| Humana, Inc. | | 21,400 | 11,207 |
| IQVIA Holdings, Inc. (j) | | 100,900 | 18,246 |
| Tenet Healthcare Corp. (j) | | 105,498 | 5,665 |
| UnitedHealth Group, Inc. | | 42,700 | 22,868 |
TOTAL HEALTHCARE | | | 62,517 |
| Homebuilders/Real Estate - 0.5% | | | |
| Arthur J. Gallagher & Co. | | 106,700 | 25,127 |
| TopBuild Corp. (j) | | 43,700 | 9,997 |
| Willscot Mobile Mini Holdings (j) | | 426,900 | 16,824 |
TOTAL HOMEBUILDERS/REAL ESTATE | | | 51,948 |
| Metals/Mining - 0.0% | | | |
| Elah Holdings, Inc. (j) | | 906 | 43 |
| First Quantum Minerals Ltd. | | 271,620 | 3,148 |
TOTAL METALS/MINING | | | 3,191 |
| Restaurants - 0.1% | | | |
| Domino's Pizza, Inc. | | 30,300 | 10,271 |
| Services - 0.5% | | | |
| Airbnb, Inc. Class A (j) | | 73,500 | 8,694 |
| ASGN, Inc. (j) | | 63,430 | 5,294 |
| Penhall Acquisition Co.: | | | |
| Class A (b)(j) | | 26,163 | 3,888 |
| Class B (b)(j) | | 8,721 | 1,296 |
| Visa, Inc. Class A | | 178,500 | 41,965 |
TOTAL SERVICES | | | 61,137 |
| Steel - 0.0% | | | |
| Algoma Steel SCA (b)(j) | | 198,162 | 0 |
| Super Retail - 0.6% | | | |
| Amazon.com, Inc. (j) | | 89,600 | 11,925 |
| Arena Brands Holding Corp. Class B (b)(h)(j) | | 659,302 | 7,978 |
| Booking Holdings, Inc. (j) | | 4,600 | 12,832 |
| Dick's Sporting Goods, Inc. | | 145,600 | 15,572 |
| Lowe's Companies, Inc. | | 55,100 | 10,500 |
| Williams-Sonoma, Inc. | | 76,303 | 11,464 |
TOTAL SUPER RETAIL | | | 70,271 |
| Technology - 4.7% | | | |
| Accenture PLC Class A | | 36,900 | 10,963 |
| Adobe, Inc. (j) | | 57,400 | 30,540 |
| Alphabet, Inc. Class A (j) | | 277,000 | 34,370 |
| AMETEK, Inc. | | 78,500 | 11,050 |
| Arista Networks, Inc. (j) | | 96,000 | 19,236 |
| ASML Holding NV (depository receipt) | | 21,300 | 12,755 |
| CDW Corp. | | 50,600 | 10,140 |
| Dynatrace, Inc. (j) | | 335,700 | 15,009 |
| Eaton Corp. PLC | | 58,000 | 12,059 |
| Fiserv, Inc. (j) | | 248,700 | 28,290 |
| Gen Digital, Inc. | | 606,400 | 10,103 |
| Global Payments, Inc. | | 79,224 | 8,415 |
| Marvell Technology, Inc. | | 273,700 | 12,924 |
| Meta Platforms, Inc. Class A (j) | | 215,300 | 64,863 |
| Microchip Technology, Inc. | | 316,631 | 22,573 |
| Microsoft Corp. | | 129,400 | 43,751 |
| nVent Electric PLC | | 106,500 | 5,126 |
| NVIDIA Corp. | | 134,900 | 55,012 |
| NXP Semiconductors NV | | 43,800 | 7,552 |
| ON Semiconductor Corp. (j) | | 523,203 | 32,773 |
| Oracle Corp. | | 208,200 | 21,528 |
| Salesforce, Inc. (j) | | 80,300 | 16,127 |
| Splunk, Inc. (j) | | 112,300 | 16,526 |
| Synopsys, Inc. (j) | | 32,000 | 15,022 |
| Vertiv Holdings Co. | | 278,000 | 10,917 |
TOTAL TECHNOLOGY | | | 527,624 |
| Telecommunications - 0.1% | | | |
| GTT Communications, Inc. (b) | | 85,487 | 2,434 |
| Palo Alto Networks, Inc. (j) | | 54,800 | 13,317 |
TOTAL TELECOMMUNICATIONS | | | 15,751 |
| Textiles/Apparel - 0.1% | | | |
| LVMH Moet Hennessy Louis Vuitton SE | | 11,800 | 8,448 |
| Transportation Ex Air/Rail - 0.0% | | | |
| Tricer Holdco SCA: | | | |
| Class A1 (b)(h)(j) | | 598,287 | 0 |
| Class A2 (b)(h)(j) | | 598,287 | 0 |
| Class A3 (b)(h)(j) | | 598,287 | 0 |
| Class A4 (b)(h)(j) | | 598,287 | 0 |
| Class A5 (b)(h)(j) | | 598,287 | 0 |
| Class A6 (b)(h)(j) | | 598,287 | 0 |
| Class A7 (b)(h)(j) | | 598,287 | 0 |
| Class A8 (b)(h)(j) | | 598,287 | 0 |
| Class A9 (b)(h)(j) | | 598,287 | 0 |
TOTAL TRANSPORTATION EX AIR/RAIL | | | 0 |
| Utilities - 0.6% | | | |
| Constellation Energy Corp. | | 180,800 | 20,416 |
| PG&E Corp. (j) | | 2,097,796 | 34,194 |
| Portland General Electric Co. | | 14,817 | 593 |
| Vistra Corp. | | 377,800 | 12,362 |
TOTAL UTILITIES | | | 67,565 |
| TOTAL COMMON STOCKS (Cost $1,185,466) | | | 1,380,545 |
| | | | |
| Nonconvertible Preferred Stocks - 0.0% |
| | | Shares | Value ($) (000s) |
| Automotive & Auto Parts - 0.0% | | | |
| Exide Technologies (b)(j) | | 858 | 0 |
| Transportation Ex Air/Rail - 0.0% | | | |
| Tricer Holdco SCA (b)(h)(j) | | 287,159,690 | 3 |
| TOTAL NONCONVERTIBLE PREFERRED STOCKS (Cost $11,049) | | | 3 |
| | | | |
| Bank Loan Obligations - 7.8% |
| | | Principal Amount (a) (000s) | Value ($) (000s) |
| Air Transportation - 0.3% | | | |
| Air Canada Tranche B 1LN, term loan CME Term SOFR 3 Month Index + 3.500% 9.1284% 8/11/28 (e)(f)(l) | | 8,991 | 8,975 |
| SkyMiles IP Ltd. Tranche B 1LN, term loan CME Term SOFR 1 Month Index + 3.750% 9.1658% 10/20/27 (e)(f)(l) | | 2,792 | 2,857 |
| United Airlines, Inc. Tranche B 1LN, term loan CME Term SOFR 3 Month Index + 3.750% 9.1894% 4/21/28 (e)(f)(l) | | 20,565 | 20,487 |
TOTAL AIR TRANSPORTATION | | | 32,319 |
| Automotive & Auto Parts - 0.2% | | | |
| Clarios Global LP Tranche B 1LN, term loan CME Term SOFR 1 Month Index + 3.750% 9.0741% 4/20/30 (e)(f)(l) | | 2,645 | 2,638 |
| PECF USS Intermediate Holding III Corp. Tranche B 1LN, term loan CME Term SOFR 1 Month Index + 4.250% 9.8943% 12/17/28 (e)(f)(l) | | 6,449 | 4,855 |
| Wand NewCo 3, Inc. Tranche B 1LN, term loan CME Term SOFR 1 Month Index + 2.750% 8.1741% 2/5/26 (e)(f)(l) | | 17,710 | 17,666 |
TOTAL AUTOMOTIVE & AUTO PARTS | | | 25,159 |
| Banks & Thrifts - 0.1% | | | |
| Citadel Securities LP Tranche B 1LN, term loan CME Term SOFR 1 Month Index + 2.500% 7.9386% 7/25/30 (e)(f)(l) | | 9,599 | 9,555 |
| Broadcasting - 0.1% | | | |
| Diamond Sports Group LLC 1LN, term loan CME Term SOFR 1 Month Index + 8.000% 15.4146% 8/24/26 (e)(f)(l) | | 6,761 | 2,540 |
| Univision Communications, Inc.: | | | |
| 1LN, term loan CME Term SOFR 3 Month Index + 4.250% 9.6401% 6/24/29 (e)(f)(l) | | 746 | 743 |
| Tranche B 1LN, term loan CME Term SOFR 1 Month Index + 3.250% 8.6886% 1/31/29 (e)(f)(l) | | 7,388 | 7,256 |
TOTAL BROADCASTING | | | 10,539 |
| Building Materials - 0.4% | | | |
| Acproducts Holdings, Inc. Tranche B 1LN, term loan CME Term SOFR 3 Month Index + 4.250% 9.9017% 5/17/28 (e)(f)(l) | | 23,470 | 18,580 |
| Hunter Douglas, Inc. Tranche B 1LN, term loan CME Term SOFR 3 Month Index + 3.500% 8.8911% 2/25/29 (e)(f)(l) | | 22,471 | 21,193 |
| SRS Distribution, Inc. Tranche B 1LN, term loan CME Term SOFR 1 Month Index + 3.500% 8.9386% 6/4/28 (e)(f)(l) | | 6,359 | 6,200 |
TOTAL BUILDING MATERIALS | | | 45,973 |
| Capital Goods - 0.0% | | | |
| Chart Industries, Inc. Tranche B 1LN, term loan CME Term SOFR 1 Month Index + 3.250% 8.6646% 3/17/30 (e)(f)(l) | | 1,706 | 1,701 |
| Chemicals - 0.3% | | | |
| Discovery Purchaser Corp. 1LN, term loan CME Term SOFR 3 Month Index + 4.370% 9.7651% 10/4/29 (e)(f)(l) | | 17,905 | 16,597 |
| Olympus Water U.S. Holding Corp. Tranche B 1LN, term loan CME Term SOFR 3 Month Index + 3.750% 9.4017% 11/9/28 (e)(f)(l) | | 3,640 | 3,545 |
| W.R. Grace Holding LLC Tranche B 1LN, term loan 3 month U.S. LIBOR + 3.750% 9.4017% 9/22/28 (e)(f)(l) | | 14,756 | 14,449 |
TOTAL CHEMICALS | | | 34,591 |
| Consumer Products - 0.2% | | | |
| Kronos Acquisition Holdings, Inc. Tranche B 1LN, term loan CME Term SOFR 3 Month Index + 3.750% 9.4017% 12/22/26 (e)(f)(l) | | 19,846 | 19,411 |
| Containers - 0.0% | | | |
| Kloeckner Pentaplast of America, Inc. Tranche B 1LN, term loan CME TERM SOFR 6 MONTH INDEX + 4.750% 10.476% 2/9/26 (e)(f)(l) | | 1,467 | 1,381 |
| Energy - 0.0% | | | |
| Forbes Energy Services LLC Tranche B, term loan 0% (b)(d)(l) | | 1,810 | 0 |
| Mesquite Energy, Inc.: | | | |
| 1LN, term loan 3 month U.S. LIBOR + 8.000% 0% (b)(d)(f)(l) | | 5,861 | 0 |
| term loan 3 month U.S. LIBOR + 0.000% 0% (b)(d)(f)(l) | | 2,528 | 0 |
TOTAL ENERGY | | | 0 |
| Environmental - 0.0% | | | |
| Covanta Holding Corp.: | | | |
| Tranche B 1LN, term loan CME Term SOFR 1 Month Index + 2.500% 7.8241% 11/30/28 (e)(f)(l) | | 2,181 | 2,147 |
| Tranche C 1LN, term loan CME Term SOFR 1 Month Index + 2.500% 7.8241% 11/30/28 (e)(f)(l) | | 166 | 163 |
| Madison IAQ LLC Tranche B 1LN, term loan CME Term SOFR 1 Month Index + 3.250% 8.7031% 6/21/28 (e)(f)(l) | | 2,962 | 2,852 |
TOTAL ENVIRONMENTAL | | | 5,162 |
| Food/Beverage/Tobacco - 0.0% | | | |
| Bengal Debt Merger Sub LLC 1LN, term loan CME Term SOFR 3 Month Index + 3.250% 8.7401% 1/24/29 (e)(f)(l) | | 2,256 | 2,070 |
| Gaming - 0.3% | | | |
| Fertitta Entertainment LLC NV Tranche B 1LN, term loan CME Term SOFR 1 Month Index + 4.000% 9.3241% 1/27/29 (e)(f)(l) | | 29,597 | 28,906 |
| Ontario Gaming GTA LP Tranche B 1LN, term loan CME Term SOFR 1 Month Index + 4.250% 9.6401% 8/1/30 (e)(f)(l) | | 6,005 | 5,996 |
| Scientific Games Corp. 1LN, term loan CME Term SOFR 1 Month Index + 3.000% 8.5345% 4/14/29 (e)(f)(l) | | 2,355 | 2,347 |
TOTAL GAMING | | | 37,249 |
| Healthcare - 0.4% | | | |
| Gainwell Acquisition Corp. Tranche B 1LN, term loan CME Term SOFR 3 Month Index + 4.000% 9.4901% 10/1/27 (e)(f)(l) | | 17,407 | 16,609 |
| Jazz Financing Lux SARL Tranche B 1LN, term loan CME Term SOFR 1 Month Index + 3.500% 8.9386% 5/5/28 (e)(f)(l) | | 6,161 | 6,157 |
| Mozart Borrower LP Tranche B 1LN, term loan CME Term SOFR 1 Month Index + 3.250% 8.6886% 10/23/28 (e)(f)(l) | | 973 | 966 |
| Organon & Co. Tranche B 1LN, term loan CME Term SOFR 3 Month Index + 3.000% 8.4505% 6/2/28 (e)(f)(l) | | 14,878 | 14,830 |
| Phoenix Newco, Inc. Tranche B 1LN, term loan CME Term SOFR 1 Month Index + 3.250% 8.6886% 11/15/28 (e)(f)(l) | | 7,087 | 6,997 |
| PRA Health Sciences, Inc. Tranche B 1LN, term loan CME Term SOFR 3 Month Index + 2.250% 7.9017% 7/3/28 (e)(f)(l) | | 1,501 | 1,501 |
TOTAL HEALTHCARE | | | 47,060 |
| Homebuilders/Real Estate - 0.2% | | | |
| Breakwater Energy Partners LLC Tranche B 1LN, term loan 11.25% 9/1/26 (b)(e)(f)(l) | | 19,150 | 18,505 |
| Hotels - 0.1% | | | |
| Carnival Finance LLC Tranche B 1LN, term loan CME Term SOFR 1 Month Index + 3.250% 8.6886% 10/18/28 (e)(f)(l) | | 7,914 | 7,759 |
| Insurance - 0.4% | | | |
| Acrisure LLC: | | | |
| Tranche B 1LN, term loan: | | | |
CME Term SOFR 1 Month Index + 3.500% 8.9386% 2/15/27 (e)(f)(l) | | 17,944 | 17,447 |
CME Term SOFR 1 Month Index + 4.250% 9.6886% 2/15/27 (e)(f)(l) | | 1,420 | 1,408 |
| Tranche B5 1LN, term loan CME Term SOFR 1 Month Index + 4.500% 10/19/30 (f)(l)(m) | | 3,100 | 3,064 |
| Alliant Holdings Intermediate LLC Tranche B3 1LN, term loan 1 month U.S. LIBOR + 3.500% 8.9386% 11/5/27 (e)(f)(l) | | 13,250 | 13,198 |
| HUB International Ltd. Tranche B 1LN, term loan: | | | |
| CME Term SOFR 1 Month Index + 4.250% 9.6619% 7/1/30 (e)(f)(l) | | 9,253 | 9,246 |
| CME Term SOFR 3 Month Index + 4.000% 9.3653% 11/10/29 (e)(f)(l) | | 923 | 921 |
TOTAL INSURANCE | | | 45,284 |
| Leisure - 0.0% | | | |
| Carnival Finance LLC Tranche B 1LN, term loan CME Term SOFR 1 Month Index + 3.000% 8.336% 8/8/27 (e)(f)(l) | | 2,075 | 2,036 |
| Topgolf Callaway Brands Corp. Tranche B 1LN, term loan CME Term SOFR 1 Month Index + 3.500% 8.9241% 3/9/30 (e)(f)(l) | | 2,910 | 2,894 |
TOTAL LEISURE | | | 4,930 |
| Metals/Mining - 0.0% | | | |
| Arsenal AIC Parent LLC Tranche B 1LN, term loan CME Term SOFR 1 Month Index + 4.500% 9.8792% 8/18/30 (e)(f)(l) | | 1,640 | 1,635 |
| Paper - 0.4% | | | |
| Clydesdale Acquisition Holdings, Inc. 1LN, term loan CME Term SOFR 1 Month Index + 4.170% 9.5991% 4/13/29 (e)(f)(l) | | 47,544 | 45,924 |
| Services - 1.0% | | | |
| ABG Intermediate Holdings 2 LLC: | | | |
| Tranche B 2LN, term loan CME Term SOFR 1 Month Index + 6.000% 11.4269% 12/20/29 (e)(f)(l) | | 458 | 459 |
| Tranche B1 LN, term loan CME Term SOFR 1 Month Index + 3.500% 8.9241% 12/21/28 (e)(f)(l) | | 5,362 | 5,346 |
| Tranche B2 1LN, term loan CME Term SOFR 1 Month Index + 4.000% 9.4241% 12/21/28 (e)(f)(l) | | 12,439 | 12,408 |
| Tranche DD 1LN, term loan CME Term SOFR 1 Month Index + 4.000% 12/21/28 (f)(l)(n) | | 2,383 | 2,377 |
| Ascend Learning LLC: | | | |
| 2LN, term loan CME Term SOFR 1 Month Index + 5.750% 11.1741% 12/10/29 (e)(f)(l) | | 15,190 | 12,772 |
| Tranche B 1LN, term loan CME Term SOFR 1 Month Index + 3.500% 8.9241% 12/10/28 (e)(f)(l) | | 17,861 | 16,583 |
| Brand Energy & Infrastructure Services, Inc. Tranche B 1LN, term loan CME Term SOFR 1 Month Index + 5.500% 10.8719% 8/1/30 (e)(f)(l) | | 6,020 | 5,794 |
| Neptune BidCo U.S., Inc. Tranche B 1LN, term loan CME Term SOFR 1 Month Index + 5.000% 10.5067% 4/11/29 (e)(f)(l) | | 15,602 | 13,603 |
| PowerTeam Services LLC Tranche B 1LN, term loan CME Term SOFR 3 Month Index + 3.500% 8.8901% 3/6/25 (e)(f)(l) | | 12,015 | 10,834 |
| Sabert Corp. Tranche B 1LN, term loan CME Term SOFR 1 Month Index + 4.500% 9.9386% 12/10/26 (e)(f)(l) | | 5,454 | 5,437 |
| Sotheby's Tranche B 1LN, term loan CME Term SOFR 1 Month Index + 4.500% 10.1555% 1/15/27 (e)(f)(l) | | 10,808 | 10,433 |
| Spin Holdco, Inc. Tranche B 1LN, term loan 3 month U.S. LIBOR + 4.000% 9.6639% 3/4/28 (e)(f)(l) | | 17,831 | 15,201 |
TOTAL SERVICES | | | 111,247 |
| Specialty Retailing - 0.0% | | | |
| New SK Holdco Sub LLC 1LN, term loan CME Term SOFR 1 Month Index + 8.350% 13.6887% 6/30/27 (e)(f)(l) | | 887 | 832 |
| Super Retail - 0.5% | | | |
| LBM Acquisition LLC Tranche B 1LN, term loan CME Term SOFR 1 Month Index + 3.750% 9.1741% 12/18/27 (e)(f)(l) | | 55,939 | 53,142 |
| Technology - 2.5% | | | |
| Acuris Finance U.S., Inc. 1LN, term loan CME Term SOFR 3 Month Index + 4.000% 9.5401% 2/16/28 (e)(f)(l) | | 1,131 | 1,112 |
| Athenahealth Group, Inc. Tranche B 1LN, term loan CME Term SOFR 1 Month Index + 3.500% 8.5769% 2/15/29 (e)(f)(l) | | 29,263 | 28,306 |
| Boxer Parent Co., Inc. Tranche B 1LN, term loan CME Term SOFR 1 Month Index + 3.750% 9.1886% 10/2/25 (e)(f)(l) | | 31,331 | 31,282 |
| Camelot Finance SA Tranche B, term loan CME Term SOFR 1 Month Index + 3.000% 8.4386% 10/31/26 (e)(f)(l) | | 938 | 937 |
| DG Investment Intermediate Holdings, Inc. Tranche B 1LN, term loan CME Term SOFR 1 Month Index + 3.750% 9.1998% 3/31/28 (e)(f)(l) | | 1,984 | 1,918 |
| Hunter U.S. Bidco, Inc. Tranche B 1LN, term loan CME Term SOFR 3 Month Index + 4.250% 9.7401% 8/19/28 (e)(f)(l) | | 11,516 | 11,379 |
| Icon Luxembourg Sarl Tranche B 1LN, term loan CME Term SOFR 3 Month Index + 2.250% 7.9017% 7/3/28 (e)(f)(l) | | 6,022 | 6,024 |
| McAfee Corp. Tranche B 1LN, term loan CME Term SOFR 1 Month Index + 3.750% 9.1646% 3/1/29 (e)(f)(l) | | 31,172 | 29,749 |
| MH Sub I LLC Tranche B 1LN, term loan CME Term SOFR 1 Month Index + 4.250% 9.5741% 5/3/28 (e)(f)(l) | | 17,780 | 16,970 |
| Peraton Corp. Tranche B 1LN, term loan CME Term SOFR 1 Month Index + 3.750% 9.1741% 2/1/28 (e)(f)(l) | | 13,556 | 13,285 |
| Polaris Newco LLC Tranche B 1LN, term loan CME Term SOFR 1 Month Index + 4.000% 9.4386% 6/2/28 (e)(f)(l) | | 6,640 | 6,258 |
| Project Alpha Intermediate Holding, Inc. Tranche B 1LN, term loan CME Term SOFR 1 Month Index + 4.750% 10.0749% 10/19/30 (e)(f)(l) | | 12,015 | 11,645 |
| Proofpoint, Inc. Tranche B 1LN, term loan CME Term SOFR 1 Month Index + 3.250% 8.6886% 8/31/28 (e)(f)(l) | | 42,948 | 42,185 |
| RealPage, Inc. Tranche B 1LN, term loan CME Term SOFR 1 Month Index + 3.000% 8.4386% 4/22/28 (e)(f)(l) | | 5,909 | 5,770 |
| STG-Fairway Holdings LLC Tranche B 1LN, term loan CME Term SOFR 1 Month Index + 2.750% 8.1886% 1/31/27 (e)(f)(l) | | 3,110 | 3,106 |
| Ukg, Inc.: | | | |
| 1LN, term loan CME Term SOFR 3 Month Index + 3.250% 8.7643% 5/4/26 (e)(f)(l) | | 39,918 | 39,673 |
| 2LN, term loan CME Term SOFR 3 Month Index + 5.250% 10.7643% 5/3/27 (e)(f)(l) | | 4,000 | 3,991 |
| Veritas U.S., Inc. Tranche B 1LN, term loan CME Term SOFR 1 Month Index + 5.000% 10.4386% 9/1/25 (e)(f)(l) | | 5,930 | 4,996 |
| VS Buyer LLC Tranche B 1LN, term loan CME Term SOFR 1 Month Index + 3.000% 8.6741% 2/28/27 (e)(f)(l) | | 23,202 | 22,989 |
TOTAL TECHNOLOGY | | | 281,575 |
| Telecommunications - 0.2% | | | |
| Aventiv Technologies LLC Tranche B, term loan 3 month U.S. LIBOR + 4.500% 10.231% 11/1/24 (e)(f)(l) | | 6,862 | 5,811 |
| Connect U.S. Finco LLC Tranche B 1LN, term loan CME Term SOFR 1 Month Index + 3.500% 8.8241% 12/12/26 (e)(f)(l) | | 8,733 | 8,512 |
| GTT Communications, Inc. 1LN, term loan CME Term SOFR 3 Month Index + 9.000% 14.4901% 6/30/28 (e)(f)(l) | | 3,598 | 2,123 |
| Gtt Remainco LLC 1LN, term loan CME Term SOFR 1 Month Index + 7.000% 12.4269% 12/30/27 (e)(f)(l) | | 4,479 | 3,852 |
TOTAL TELECOMMUNICATIONS | | | 20,298 |
| Utilities - 0.2% | | | |
| PG&E Corp. Tranche B 1LN, term loan CME Term SOFR 1 Month Index + 3.000% 8.4386% 6/23/25 (e)(f)(l) | | 26,611 | 26,545 |
| TOTAL BANK LOAN OBLIGATIONS (Cost $924,455) | | | 889,846 |
| | | | |
| Preferred Securities - 7.0% |
| | | Principal Amount (a) (000s) | Value ($) (000s) |
| Banks & Thrifts - 5.9% | | | |
| Ally Financial, Inc. 4.7% (e)(o) | | 7,055 | 4,189 |
| Bank of America Corp.: | | | |
| CME Term SOFR 3 Month Index + 3.390% 8.8062% (e)(f)(o) | | 61,440 | 62,387 |
| 5.125% (e)(o) | | 36,030 | 35,824 |
| 5.875% (e)(o) | | 102,630 | 89,143 |
| 6.25% (e)(o) | | 28,555 | 28,344 |
| Citigroup, Inc.: | | | |
| 4.7% (e)(o) | | 15,285 | 13,850 |
| 5% (e)(o) | | 60,300 | 57,483 |
| 6.3% (e)(o) | | 5,610 | 5,603 |
| Goldman Sachs Group, Inc.: | | | |
| CME Term SOFR 3 Month Index + 3.130% 8.5009% (e)(f)(o) | | 70,565 | 71,450 |
| 4.95% (e)(o) | | 9,415 | 8,776 |
| JPMorgan Chase & Co.: | | | |
| CME Term SOFR 3 Month Index + 3.560% 8.9335% (e)(f)(o) | | 69,385 | 71,065 |
| 4% (e)(o) | | 26,340 | 24,093 |
| 4.6% (e)(o) | | 31,365 | 29,582 |
| 5% (e)(o) | | 30,845 | 30,235 |
| 6.125% (e)(o) | | 17,585 | 17,403 |
| 6.75% (e)(o) | | 8,330 | 8,464 |
| Wells Fargo & Co.: | | | |
| 5.875% (e)(o) | | 50,420 | 50,111 |
| 5.9% (e)(o) | | 63,075 | 63,435 |
TOTAL BANKS & THRIFTS | | | 671,437 |
| Diversified Financial Services - 0.0% | | | |
| OEC Finance Ltd. 7.5% pay-in-kind (c)(o) | | 39 | 3 |
| Energy - 1.1% | | | |
| Energy Transfer LP: | | | |
| 3 month U.S. LIBOR + 4.020% 9.6542% (e)(f)(o) | | 96,527 | 92,980 |
| 6.625% (e)(o) | | 30,505 | 23,993 |
| 7.125% (e)(o) | | 9,130 | 7,882 |
| Summit Midstream Partners LP 3 month U.S. LIBOR + 7.430% 13.101% (d)(e)(f)(o) | | 2,912 | 2,162 |
TOTAL ENERGY | | | 127,017 |
| TOTAL PREFERRED SECURITIES (Cost $833,123) | | | 798,457 |
| | | | |
| Other - 3.1% |
| | | Shares | Value ($) (000s) |
| Other - 3.1% | | | |
Fidelity Private Credit Central Fund LLC (h)(r) (Cost $343,171) | | 34,491,134 | 349,740 |
| | | | |
| Money Market Funds - 9.1% |
| | | Shares | Value ($) (000s) |
| Fidelity Cash Central Fund 5.40% (p) | | 1,007,845,362 | 1,008,047 |
| Fidelity Securities Lending Cash Central Fund 5.40% (p)(q) | | 21,417,858 | 21,420 |
| TOTAL MONEY MARKET FUNDS (Cost $1,029,421) | | | 1,029,467 |
| | | | |
| TOTAL INVESTMENT IN SECURITIES - 99.6% (Cost $12,015,642) | 11,305,947 |
NET OTHER ASSETS (LIABILITIES) - 0.4% | 42,770 |
| NET ASSETS - 100.0% | 11,348,717 |
| | |
Any values shown as $0 in the Schedule of Investments may reflect amounts less than $500.
Legend
| (a) | Amount is stated in United States dollars unless otherwise noted. |
| (c) | Security exempt from registration under Rule 144A of the Securities Act of 1933. These securities may be resold in transactions exempt from registration, normally to qualified institutional buyers. At the end of the period, the value of these securities amounted to $5,414,514,000 or 47.7% of net assets. |
| (d) | Non-income producing - Security is in default. |
| (e) | Coupon rates for floating and adjustable rate securities reflect the rates in effect at period end. |
| (f) | Coupon is indexed to a floating interest rate which may be multiplied by a specified factor and/or subject to caps or floors. |
| (g) | Security or a portion of the security purchased on a delayed delivery or when-issued basis. |
| (h) | Restricted securities (including private placements) - Investment in securities not registered under the Securities Act of 1933 (excluding 144A issues). At the end of the period, the value of restricted securities (excluding 144A issues) amounted to $389,730,000 or 3.4% of net assets. |
| (i) | Security initially issued at one coupon which converts to a higher coupon at a specified date. The rate shown is the rate at period end. |
| (k) | Security or a portion of the security is on loan at period end. |
| (l) | Remaining maturities of bank loan obligations may be less than the stated maturities shown as a result of contractual or optional prepayments by the borrower. Such prepayments cannot be predicted with certainty. |
| (m) | The coupon rate will be determined upon settlement of the loan after period end. |
| (n) | Position or a portion of the position represents an unfunded loan commitment. At period end, the total principal amount and market value of unfunded commitments totaled $2,383,000 and $2,377,000, respectively. |
| (o) | Security is perpetual in nature with no stated maturity date. |
| (p) | Affiliated fund that is generally available only to investment companies and other accounts managed by Fidelity Investments. The rate quoted is the annualized seven-day yield of the fund at period end. A complete unaudited listing of the fund's holdings as of its most recent quarter end is available upon request. In addition, each Fidelity Central Fund's financial statements are available on the SEC's website or upon request. |
| (q) | Investment made with cash collateral received from securities on loan. |
| (r) | Affiliated fund that is generally available only to investment companies and other accounts managed by Fidelity Investments. |
| Additional information on each restricted holding is as follows: |
| Security | Acquisition Date | Acquisition Cost ($) (000s) |
| Arena Brands Holding Corp. Class B | 6/18/97 - 1/12/99 | 21,592 |
| | | |
| Chesapeake Energy Corp. | 2/10/21 | 216 |
| | | |
| Fidelity Private Credit Central Fund LLC | 4/15/22 - 10/27/23 | 343,171 |
| | | |
| Jonah Energy Parent LLC 12% 11/5/25 | 5/05/23 | 6,608 |
| | | |
| New Cotai LLC/New Cotai Capital Corp. | 9/11/20 | 16,677 |
| | | |
| Southeastern Grocers, Inc. | 6/01/18 | 5,580 |
| | | |
| Tricer Holdco SCA | 10/16/09 - 12/30/17 | 10,248 |
| | | |
| Tricer Holdco SCA Class A1 | 10/16/09 - 10/29/09 | 1,653 |
| | | |
| Tricer Holdco SCA Class A2 | 10/16/09 - 10/29/09 | 1,653 |
| | | |
| Tricer Holdco SCA Class A3 | 10/16/09 - 10/29/09 | 1,653 |
| | | |
| Tricer Holdco SCA Class A4 | 10/16/09 - 10/29/09 | 1,653 |
| | | |
| Tricer Holdco SCA Class A5 | 10/16/09 - 10/29/09 | 1,653 |
| | | |
| Tricer Holdco SCA Class A6 | 10/16/09 - 10/29/09 | 1,653 |
| | | |
| Tricer Holdco SCA Class A7 | 10/16/09 - 10/29/09 | 1,653 |
| | | |
| Tricer Holdco SCA Class A8 | 10/16/09 - 10/29/09 | 1,653 |
| | | |
| Tricer Holdco SCA Class A9 | 10/16/09 - 10/29/09 | 1,655 |
| | | |
Affiliated Central Funds
Fiscal year to date information regarding the Fund's investments in Fidelity Central Funds, including the ownership percentage, is presented below.
| Affiliate (Amounts in thousands) | Value, beginning of period ($) | Purchases ($) | Sales Proceeds ($) | Dividend Income ($) | Realized Gain (loss) ($) | Change in Unrealized appreciation (depreciation) ($) | Value, end of period ($) | % ownership, end of period |
| Fidelity Cash Central Fund 5.40% | 597,099 | 1,547,126 | 1,136,178 | 17,232 | - | - | 1,008,047 | 2.2% |
| Fidelity Private Credit Central Fund LLC | 324,274 | 18,049 | - | 18,410 | - | 7,417 | 349,740 | 52.2% |
| Fidelity Securities Lending Cash Central Fund 5.40% | - | 79,057 | 57,637 | 4 | - | - | 21,420 | 0.1% |
| Total | 921,373 | 1,644,232 | 1,193,815 | 35,646 | - | 7,417 | 1,379,207 | |
| | | | | | | | | |
Amounts in the dividend income column in the above table include any capital gain distributions from underlying funds, which are presented in the corresponding line item in the Statement of Operations, if applicable.
Amounts in the dividend income column for Fidelity Securities Lending Cash Central Fund represents the income earned on investing cash collateral, less rebates paid to borrowers and any lending agent fees associated with the loan, plus any premium payments received for lending certain types of securities.
Amounts included in the purchases and sales proceeds columns may include in-kind transactions, if applicable.
Investment Valuation
The following is a summary of the inputs used, as of October 31, 2023, involving the Fund's assets and liabilities carried at fair value. The inputs or methodology used for valuing securities may not be an indication of the risk associated with investing in those securities. For more information on valuation inputs, and their aggregation into the levels used below, please refer to the Investment Valuation section in the accompanying Notes to Financial Statements.
| Valuation Inputs at Reporting Date: |
Description (Amounts in thousands) | Total ($) | Level 1 ($) | Level 2 ($) | Level 3 ($) |
Investments in Securities: | | | | |
|
| Equities: | | | | |
Communication Services | 106,690 | 106,690 | - | - |
Consumer Discretionary | 161,876 | 142,366 | 8,448 | 11,062 |
Consumer Staples | 39,688 | 18,482 | - | 21,206 |
Energy | 172,049 | 137,134 | - | 34,915 |
Financials | 178,271 | 178,268 | - | 3 |
Health Care | 62,517 | 62,517 | - | - |
Industrials | 159,846 | 154,659 | - | 5,187 |
Information Technology | 371,726 | 369,292 | - | 2,434 |
Materials | 60,287 | 60,244 | 43 | - |
Utilities | 67,598 | 67,565 | - | 33 |
|
| Corporate Bonds | 6,857,889 | - | 6,842,317 | 15,572 |
|
| Bank Loan Obligations | 889,846 | - | 871,341 | 18,505 |
|
| Preferred Securities | 798,457 | - | 798,457 | - |
|
| Other | 349,740 | - | 349,740 | - |
|
| Money Market Funds | 1,029,467 | 1,029,467 | - | - |
| Total Investments in Securities: | 11,305,947 | 2,326,684 | 8,870,346 | 108,917 |
The following is a reconciliation of Investments in Securities for which Level 3 inputs were used in determining value:
| (Amounts in thousands) | |
| Investments in Securities: | |
| Beginning Balance | $ | 163,223 | |
| Net Realized Gain (Loss) on Investment Securities | | 10,970 | |
| Net Unrealized Gain (Loss) on Investment Securities | | (46,147) | |
| Cost of Purchases | | 6,709 | |
| Proceeds of Sales | | (25,993) | |
| Amortization/Accretion | | 155 | |
| Transfers into Level 3 | | - | |
| Transfers out of Level 3 | | - | |
| Ending Balance | $ | 108,917 | |
| The change in unrealized gain (loss) for the period attributable to Level 3 securities held at October 31, 2023 | $ | (314) | |
| The information used in the above reconciliation represents fiscal year to date activity for any Investments in Securities identified as using Level 3 inputs at either the beginning or the end of the current fiscal period. Cost of purchases and proceeds of sales may include securities received and/or delivered through in-kind transactions, corporate actions or exchanges. Transfers into Level 3 were attributable to a lack of observable market data resulting from decreases in market activity, decreases in liquidity, security restructurings or corporate actions. Transfers out of Level 3 were attributable to observable market data becoming available for those securities. Transfers in or out of Level 3 represent the beginning value of any Security or Instrument where a change in the pricing level occurred from the beginning to the end of the period. Realized and unrealized gains (losses) disclosed in the reconciliation are included in Net Gain (Loss) on the Fund's Statement of Operations. | |
| Statement of Assets and Liabilities |
| Amounts in thousands (except per-share amount) | | | | October 31, 2023 (Unaudited) |
| | | | | |
| Assets | | | | |
| Investment in securities, at value (including securities loaned of $21,072) - See accompanying schedule: | | | | |
Unaffiliated issuers (cost $10,643,050) | $ | 9,926,740 | | |
Fidelity Central Funds (cost $1,372,592) | | 1,379,207 | | |
| | | | | |
| | | | | |
| Total Investment in Securities (cost $12,015,642) | | | $ | 11,305,947 |
| Cash | | | | 321 |
| Receivable for investments sold | | | | 73,201 |
| Receivable for fund shares sold | | | | 7,982 |
| Dividends receivable | | | | 745 |
| Interest receivable | | | | 124,684 |
| Distributions receivable from Fidelity Central Funds | | | | 4,070 |
| Prepaid expenses | | | | 16 |
| Receivable from investment adviser for expense reductions | | | | 1,494 |
| Other receivables | | | | 469 |
Total assets | | | | 11,518,929 |
| Liabilities | | | | |
| Payable for investments purchased | | | | |
Regular delivery | $ | 117,110 | | |
Delayed delivery | | 11,727 | | |
| Payable for fund shares redeemed | | 6,617 | | |
| Distributions payable | | 6,596 | | |
| Accrued management fee | | 5,029 | | |
| Other affiliated payables | | 1,190 | | |
| Other payables and accrued expenses | | 523 | | |
| Collateral on securities loaned | | 21,420 | | |
| Total Liabilities | | | | 170,212 |
| Commitments and contingent liabilities (see Commitments note) | | | | |
| Net Assets | | | $ | 11,348,717 |
| Net Assets consist of: | | | | |
| Paid in capital | | | $ | 12,213,177 |
| Total accumulated earnings (loss) | | | | (864,460) |
| Net Assets | | | $ | 11,348,717 |
Net Asset Value, offering price and redemption price per share ($11,348,717 ÷ 1,255,666 shares) | | | $ | 9.04 |
| Statement of Operations |
| Amounts in thousands | | | | Six months ended October 31, 2023 (Unaudited) |
| Investment Income | | | | |
| Dividends | | | $ | 39,885 |
| Interest | | | | 281,805 |
| Income from Fidelity Central Funds (including $4 from security lending) | | | | 35,646 |
| Total Income | | | | 357,336 |
| Expenses | | | | |
| Management fee | $ | 31,479 | | |
| Transfer agent fees | | 6,396 | | |
| Accounting fees | | 720 | | |
| Custodian fees and expenses | | 18 | | |
| Independent trustees' fees and expenses | | 28 | | |
| Registration fees | | 124 | | |
| Audit | | 61 | | |
| Legal | | (1,037) | | |
| Miscellaneous | | 31 | | |
| Total expenses before reductions | | 37,820 | | |
| Expense reductions | | (958) | | |
| Total expenses after reductions | | | | 36,862 |
| Net Investment income (loss) | | | | 320,474 |
| Realized and Unrealized Gain (Loss) | | | | |
| Net realized gain (loss) on: | | | | |
| Investment Securities: | | | | |
| Unaffiliated issuers | | (163,437) | | |
| Foreign currency transactions | | (19) | | |
| Total net realized gain (loss) | | | | (163,456) |
| Change in net unrealized appreciation (depreciation) on: | | | | |
| Investment Securities: | | | | |
| Unaffiliated issuers | | (171,302) | | |
| Fidelity Central Funds | | 7,417 | | |
| Total change in net unrealized appreciation (depreciation) | | | | (163,885) |
| Net gain (loss) | | | | (327,341) |
| Net increase (decrease) in net assets resulting from operations | | | $ | (6,867) |
| Statement of Changes in Net Assets |
| |
| Amount in thousands | | Six months ended October 31, 2023 (Unaudited) | | Year ended April 30, 2023 |
| Increase (Decrease) in Net Assets | | | | |
| Operations | | | | |
| Net investment income (loss) | $ | 320,474 | $ | 597,286 |
| Net realized gain (loss) | | (163,456) | | 49,664 |
| Change in net unrealized appreciation (depreciation) | | (163,885) | | (472,925) |
| Net increase (decrease) in net assets resulting from operations | | (6,867) | | 174,025 |
| Distributions to shareholders | | (296,900) | | (1,316,424) |
| | | | | |
| Share transactions | | | | |
| Proceeds from sales of shares | | 962,398 | | 1,660,390 |
| Reinvestment of distributions | | 259,443 | | 1,172,169 |
| Cost of shares redeemed | | (1,027,218) | | (3,309,299) |
| | | | | |
Net increase (decrease) in net assets resulting from share transactions | | 194,623 | | (476,740) |
| Total increase (decrease) in net assets | | (109,144) | | (1,619,139) |
| | | | | |
| Net Assets | | | | |
| Beginning of period | | 11,457,861 | | 13,077,000 |
| End of period | $ | 11,348,717 | $ | 11,457,861 |
| | | | | |
| Other Information | | | | |
| Shares | | | | |
| Sold | | 103,779 | | 177,479 |
| Issued in reinvestment of distributions | | 28,049 | | 125,646 |
| Redeemed | | (111,030) | | (353,587) |
| Net increase (decrease) | | 20,798 | | (50,462) |
| | | | | |
Financial Highlights
| Fidelity® Capital & Income Fund |
| |
| | Six months ended (Unaudited) October 31, 2023 | | Years ended April 30, 2023 | | 2022 | | 2021 | | 2020 | | 2019 |
Selected Per-Share Data | | | | | | | | | | | | |
| Net asset value, beginning of period | $ | 9.28 | $ | 10.17 | $ | 11.24 | $ | 8.92 | $ | 10.08 | $ | 10.12 |
| Income from Investment Operations | | | | | | | | | | | | |
Net investment income (loss) A,B | | .257 | | .480 | | .387 | | .386 | | .426 | | .432 |
| Net realized and unrealized gain (loss) | | (.258) | | (.308) | | (.714) | | 2.442 | | (1.085) | | .207 |
| Total from investment operations | | (.001) | | .172 | | (.327) | | 2.828 | | (.659) | | .639 |
| Distributions from net investment income | | (.239) | | (.473) | | (.390) | | (.390) | | (.425) | | (.487) |
| Distributions from net realized gain | | - | | (.589) | | (.353) | | (.118) | | (.076) | | (.192) |
| Total distributions | | (.239) | | (1.062) | | (.743) | | (.508) | | (.501) | | (.679) |
| Net asset value, end of period | $ | 9.04 | $ | 9.28 | $ | 10.17 | $ | 11.24 | $ | 8.92 | $ | 10.08 |
Total Return C,D | | (.05)% | | 2.09% | | (3.27)% | | 32.35% | | (6.89)% | | 6.74% |
Ratios to Average Net Assets B,E,F | | | | | | | | | | | | |
| Expenses before reductions | | .65% G | | .68% | | .67% | | .68% | | .67% | | .69% |
| Expenses net of fee waivers, if any | | .64% G | | .68% | | .67% | | .68% | | .67% | | .69% |
| Expenses net of all reductions | | .64% G | | .68% | | .67% | | .68% | | .67% | | .69% |
| Net investment income (loss) | | 5.53% G | | 5.16% | | 3.49% | | 3.75% | | 4.32% | | 4.37% |
| Supplemental Data | | | | | | | | | | | | |
| Net assets, end of period (in millions) | $ | 11,349 | $ | 11,458 | $ | 13,077 | $ | 14,674 | $ | 10,228 | $ | 11,631 |
Portfolio turnover rate H | | 36% G | | 20% | | 28% | | 37% | | 46% | | 43% |
ACalculated based on average shares outstanding during the period.
BNet investment income (loss) is affected by the timing of the declaration of dividends by any underlying mutual funds or exchange-traded funds (ETFs). Net investment income (loss) of any mutual funds or ETFs is not included in the Fund's net investment income (loss) ratio.
CTotal returns for periods of less than one year are not annualized.
DTotal returns would have been lower if certain expenses had not been reduced during the applicable periods shown.
EFees and expenses of any underlying mutual funds or exchange-traded funds (ETFs) are not included in the Fund's expense ratio. The Fund indirectly bears its proportionate share of these expenses. For additional expense information related to investments in Fidelity Central Funds, please refer to the "Investments in Fidelity Central Funds" note found in the Notes to Financial Statements section of the most recent Annual or Semi-Annual report. For additional expense information related to investments in Fidelity Private Credit Central Fund LLC, please refer to the Investment in Fidelity Private Credit Central Fund LLC note found in the Notes to Financial Statements section of the most recent Annual or Semi-Annual report.
FExpense ratios reflect operating expenses of the class. Expenses before reductions do not reflect amounts reimbursed, waived, or reduced through arrangements with the investment adviser, brokerage services, or other offset arrangements, if applicable, and do not represent the amount paid by the class during periods when reimbursements, waivers or reductions occur.
GAnnualized.
HAmount does not include the portfolio activity of any underlying mutual funds or exchange-traded funds (ETFs).
For the period ended October 31, 2023
(Amounts in thousands except percentages)
1. Organization.
Fidelity Capital & Income Fund (the Fund) is a fund of Fidelity Summer Street Trust (the Trust) and is authorized to issue an unlimited number of shares. Share transactions on the Statement of Changes in Net Assets may contain exchanges between affiliated funds. The Trust is registered under the Investment Company Act of 1940, as amended (the 1940 Act), as an open-end management investment company organized as a Massachusetts business trust.
2. Investments in Fidelity Central Funds.
Funds may invest in Fidelity Central Funds, which are open-end investment companies generally available only to other investment companies and accounts managed by the investment adviser and its affiliates. The Schedule of Investments lists any Fidelity Central Funds held as an investment as of period end, but does not include the underlying holdings of each Fidelity Central Fund. An investing fund indirectly bears its proportionate share of the expenses of the underlying Fidelity Central Funds.
Based on its investment objective, each Fidelity Central Fund may invest or participate in various investment vehicles or strategies that are similar to those of the investing fund. These strategies are consistent with the investment objectives of the investing fund and may involve certain economic risks which may cause a decline in value of each of the Fidelity Central Funds and thus a decline in the value of the investing fund.
| Fidelity Central Fund | Investment Manager | Investment Objective | Investment Practices | Expense RatioA |
| Fidelity Money Market Central Funds | Fidelity Management & Research Company LLC (FMR) | Each fund seeks to obtain a high level of current income consistent with the preservation of capital and liquidity. | Short-term Investments | Less than .005% |
A Expenses expressed as a percentage of average net assets and are as of each underlying Central Fund's most recent annual or semi-annual shareholder report.
A complete unaudited list of holdings for each Fidelity Central Fund is available upon request or at the Securities and Exchange Commission website at www.sec.gov. In addition, the financial statements of the Fidelity Central Funds which contain the significant accounting policies (including investment valuation policies) of those funds, and are not covered by the Report of Independent Registered Public Accounting Firm, are available on the Securities and Exchange Commission website or upon request.
3. Investment in Fidelity Private Credit Central Fund LLC.
The Fund invests in Fidelity Private Credit Central Fund LLC (formerly Fidelity Direct Lending Fund, LP), which is a limited liability company available only to certain investment companies managed by the investment adviser and its affiliates. On June 1, 2023, Fidelity Private Credit Central Fund elected to be regulated as a business development company (BDC). Fidelity Private Credit Central Fund LLC's units are not registered under the Securities Act of 1933 and are subject to substantial restrictions on transfer. The Fund has no redemption rights under Fidelity Private Credit Central Fund LLC's limited liability company agreement. There will be no trading market for the units.
Based on its investment objective, Fidelity Private Credit Central Fund LLC may invest or participate in various investments or strategies that are similar to those in which the Fund may invest or participate. These strategies are consistent with the investment objectives of the Fund and may involve certain economic risks which may cause a decline in value of Fidelity Private Credit Central Fund LLC and thus a decline in the value of the Fund. Fidelity Private Credit Central Fund LLC intends to invest primarily in directly originated loans to private companies but also with liquid credit investments, like broadly syndicated loans, and other select private credit investments.
The Schedule of Investments lists Fidelity Private Credit Central Fund LLC as an investment as of period end, but does not include the underlying holdings of Fidelity Private Credit Central Fund LLC. Fidelity Private Credit Central Fund LLC represented less than 5% of the Fund's net assets at period end. The Fund indirectly bears its proportionate share of the expenses of Fidelity Private Credit Central Fund LLC. The annualized expense ratio for Fidelity Private Credit Central Fund LLC for the nine month period ended September 30, 2023 was 9.63%.
4. Significant Accounting Policies.
The Fund is an investment company and applies the accounting and reporting guidance of the Financial Accounting Standards Board (FASB) Accounting Standards Codification Topic 946 Financial Services - Investment Companies. The financial statements have been prepared in conformity with accounting principles generally accepted in the United States of America (GAAP), which require management to make certain estimates and assumptions at the date of the financial statements. Actual results could differ from those estimates. Subsequent events, if any, through the date that the financial statements were issued have been evaluated in the preparation of the financial statements. The Fund's Schedule of Investments lists any underlying mutual funds or exchange-traded funds (ETFs) but does not include the underlying holdings of these funds. The following summarizes the significant accounting policies of the Fund:
Investment Valuation. Investments are valued as of 4:00 p.m. Eastern time on the last calendar day of the period. The Board of Trustees (the Board) has designated the Fund's investment adviser as the valuation designee responsible for the fair valuation function and performing fair value determinations as needed. The investment adviser has established a Fair Value Committee (the Committee) to carry out the day-to-day fair valuation responsibilities and has adopted policies and procedures to govern the fair valuation process and the activities of the Committee. In accordance with these fair valuation policies and procedures, which have been approved by the Board, the Fund attempts to obtain prices from one or more third party pricing services or brokers to value its investments. When current market prices, quotations or currency exchange rates are not readily available or reliable, investments will be fair valued in good faith by the Committee, in accordance with the policies and procedures. Factors used in determining fair value vary by investment type and may include market or investment specific events, transaction data, estimated cash flows, and market observations of comparable investments. The frequency that the fair valuation procedures are used cannot be predicted and they may be utilized to a significant extent. The Committee manages the Fund's fair valuation practices and maintains the fair valuation policies and procedures. The Fund's investment adviser reports to the Board information regarding the fair valuation process and related material matters.
The Fund categorizes the inputs to valuation techniques used to value its investments into a disclosure hierarchy consisting of three levels as shown below:
Level 1 - unadjusted quoted prices in active markets for identical investments
Level 2 - other significant observable inputs (including quoted prices for similar investments, interest rates, prepayment speeds, etc.)
Level 3 - unobservable inputs (including the Fund's own assumptions based on the best information available)
Valuation techniques used to value the Fund's investments by major category are as follows:
Debt securities, including restricted securities, are valued based on evaluated prices received from third party pricing services or from brokers who make markets in such securities. Corporate bonds, bank loan obligations and preferred securities are valued by pricing services who utilize matrix pricing which considers yield or price of bonds of comparable quality, coupon, maturity and type or by broker-supplied prices. When independent prices are unavailable or unreliable, debt securities may be valued utilizing pricing methodologies which consider similar factors that would be used by third party pricing services. Debt securities are generally categorized as Level 2 in the hierarchy but may be Level 3 depending on the circumstances. The Fund invests a significant portion of its assets in below investment grade securities. The value of these securities can be more volatile due to changes in the credit quality of the issuer and is sensitive to changes in economic, market and regulatory conditions.
Equity securities, including restricted securities, for which market quotations are readily available, are valued at the last reported sale price or official closing price as reported by a third party pricing service on the primary market or exchange on which they are traded and are categorized as Level 1 in the hierarchy. In the event there were no sales during the day or closing prices are not available, securities are valued at the last quoted bid price or may be valued using the last available price and are generally categorized as Level 2 in the hierarchy. For foreign equity securities, when market or security specific events arise, comparisons to the valuation of American Depositary Receipts (ADRs), futures contracts, ETFs and certain indexes as well as quoted prices for similar securities may be used and would be categorized as Level 2 in the hierarchy. For equity securities, including restricted securities, where observable inputs are limited, assumptions about market activity and risk are used and these securities may be categorized as Level 3 in the hierarchy.
Investments in open-end mutual funds, including the Fidelity Central Funds, are valued at their closing net asset value (NAV) each business day and are categorized as Level 1 in the hierarchy.
Fidelity Private Credit Central Fund LLC is valued at its net asset value (NAV) each month end and is categorized as Level 2 in the hierarchy.
Changes in valuation techniques may result in transfers in or out of an assigned level within the disclosure hierarchy. The aggregate value of investments by input level as of October 31, 2023, as well as a roll forward of Level 3 investments, is included at the end of the Fund's Schedule of Investments.
Foreign Currency. Certain Funds may use foreign currency contracts to facilitate transactions in foreign-denominated securities. Gains and losses from these transactions may arise from changes in the value of the foreign currency or if the counterparties do not perform under the contracts' terms.
Foreign-denominated assets, including investment securities, and liabilities are translated into U.S. dollars at the exchange rates at period end. Purchases and sales of investment securities, income and dividends received, and expenses denominated in foreign currencies are translated into U.S. dollars at the exchange rate in effect on the transaction date.
The effects of exchange rate fluctuations on investments are included with the net realized and unrealized gain (loss) on investment securities. Other foreign currency transactions resulting in realized and unrealized gain (loss) are disclosed separately.
Investment Transactions and Income. For financial reporting purposes, the Fund's investment holdings and NAV include trades executed through the end of the last business day of the period. The NAV per share for processing shareholder transactions is calculated as of the close of business of the New York Stock Exchange (NYSE), normally 4:00 p.m. Eastern time and includes trades executed through the end of the prior business day. Gains and losses on securities sold are determined on the basis of identified cost and include proceeds received from litigation. Commissions paid to certain brokers with whom the investment adviser, or its affiliates, places trades on behalf of a fund include an amount in addition to trade execution, which may be rebated back to a fund. Any such rebates are included in net realized gain (loss) on investments in the Statement of Operations. Dividend income is recorded on the ex-dividend date, except for certain dividends from foreign securities where the ex-dividend date may have passed, which are recorded as soon as the Fund is informed of the ex-dividend date. Non-cash dividends included in dividend income, if any, are recorded at the fair market value of the securities received. Income and capital gain distributions from Fidelity Central Funds, if any, are recorded on the ex-dividend date. Certain distributions received by the Fund represent a return of capital or capital gain. The Fund determines the components of these distributions subsequent to the ex-dividend date, based upon receipt of tax filings or other correspondence relating to the underlying investment. These distributions are recorded as a reduction of cost of investments and/or as a realized gain. Interest income is accrued as earned and includes coupon interest and amortization of premium and accretion of discount on debt securities as applicable. Paid in Kind (PIK) income is recorded at the fair market value of the securities received. Investment income is recorded net of foreign taxes withheld where recovery of such taxes is uncertain. Debt obligations may be placed on non-accrual status and related interest income may be reduced by ceasing current accruals and writing off interest receivables when the collection of all or a portion of interest has become doubtful based on consistently applied procedures. A debt obligation is removed from non-accrual status when the issuer resumes interest payments or when collectability of interest is reasonably assured.
Expenses. Expenses directly attributable to a fund are charged to that fund. Expenses attributable to more than one fund are allocated among the respective funds on the basis of relative net assets or other appropriate methods. Expenses included in the accompanying financial statements reflect the expenses of that fund and do not include any expenses associated with any underlying mutual funds or exchange-traded funds. Although not included in a fund's expenses, a fund indirectly bears its proportionate share of these expenses through the net asset value of each underlying mutual fund or exchange-traded fund. Expense estimates are accrued in the period to which they relate and adjustments are made when actual amounts are known.
Deferred Trustee Compensation. Under a Deferred Compensation Plan (the Plan) for certain Funds, certain independent Trustees have elected to defer receipt of a portion of their annual compensation. Deferred amounts are invested in affiliated mutual funds, are marked-to-market and remain in a fund until distributed in accordance with the Plan. The investment of deferred amounts and the offsetting payable to the Trustees presented below are included in the accompanying Statement of Assets and Liabilities in other receivables and other payables and accrued expenses, as applicable.
| Fidelity Capital & Income Fund | $449 |
Income Tax Information and Distributions to Shareholders. Each year, the Fund intends to qualify as a regulated investment company under Subchapter M of the Internal Revenue Code, including distributing substantially all of its taxable income and realized gains. As a result, no provision for U.S. Federal income taxes is required. The Fund files a U.S. federal tax return, in addition to state and local tax returns as required. The Fund's federal income tax returns are subject to examination by the Internal Revenue Service (IRS) for a period of three fiscal years after they are filed. State and local tax returns may be subject to examination for an additional fiscal year depending on the jurisdiction. Foreign taxes are provided for based on the Fund's understanding of the tax rules and rates that exist in the foreign markets in which it invests.
Distributions are declared and recorded daily and paid monthly from net investment income. Distributions from realized gains, if any, are declared and recorded on the ex-dividend date. Income and capital gain distributions are determined in accordance with income tax regulations, which may differ from GAAP.
Capital accounts within the financial statements are adjusted for permanent book-tax differences. These adjustments have no impact on net assets or the results of operations. Capital accounts are not adjusted for temporary book-tax differences which will reverse in a subsequent period.
Book-tax differences are primarily due to foreign currency transactions, market discount, partnerships and losses deferred due to wash sales and excise tax regulations.
As of period end, the cost and unrealized appreciation (depreciation) in securities, and derivatives if applicable, for federal income tax purposes were as follows:
| Gross unrealized appreciation | $424,021 |
| Gross unrealized depreciation | (1,103,798) |
| Net unrealized appreciation (depreciation) | $(679,777) |
| Tax cost | $11,985,724 |
The Fund elected to defer to its next fiscal year approximately $55,459 of capital losses recognized during the period November 1, 2022 to April 30, 2023.
Delayed Delivery Transactions and When-Issued Securities. During the period, certain Funds transacted in securities on a delayed delivery or when-issued basis. Payment and delivery may take place after the customary settlement period for that security. The price of the underlying securities and the date when the securities will be delivered and paid for are fixed at the time the transaction is negotiated. Securities purchased on a delayed delivery or when-issued basis are identified as such in the Schedule of Investments. Compensation for interest forgone in the purchase of a delayed delivery or when-issued debt security may be received. With respect to purchase commitments, each applicable Fund identifies securities as segregated in its records with a value at least equal to the amount of the commitment. Payables and receivables associated with the purchases and sales of delayed delivery securities having the same coupon, settlement date and broker are offset. Delayed delivery or when-issued securities that have been purchased from and sold to different brokers are reflected as both payables and receivables in the Statement of Assets and Liabilities under the caption "Delayed delivery", as applicable. Losses may arise due to changes in the value of the underlying securities or if the counterparty does not perform under the contract's terms, or if the issuer does not issue the securities due to political, economic, or other factors.
Restricted Securities (including Private Placements). Funds may invest in securities that are subject to legal or contractual restrictions on resale. These securities generally may be resold in transactions exempt from registration or to the public if the securities are registered. Disposal of these securities may involve time-consuming negotiations and expense, and prompt sale at an acceptable price may be difficult. Information regarding restricted securities held at period end is included at the end of the Schedule of Investments, if applicable.
Loans and Other Direct Debt Instruments. Direct debt instruments are interests in amounts owed to lenders by corporate or other borrowers. These instruments may be in the form of loans, trade claims or other receivables and may include standby financing commitments such as revolving credit facilities that obligate a fund to supply additional cash to the borrower on demand. Loans may be acquired through assignment, participation, or may be made directly to a borrower. Such instruments are presented in the Bank Loan Obligations section in the Schedule of Investments. Certain funds may also invest in unfunded loan commitments, which are contractual obligations for future funding. Information regarding unfunded commitments is included at the end of the Schedule of Investments, if applicable.
Commitments. A commitment is an agreement to acquire an investment at a future date (subject to conditions) in connection with a potential public or non-public offering. The amount of commitments outstanding at period end are presented in the table below. These commitments are not included in the net assets of the Fund at period end.
| | Investment to be Acquired | Commitment Amount |
| Fidelity Capital & Income Fund | Fidelity Private Credit Central Fund LLC | $73,918 |
5. Purchases and Sales of Investments.
Purchases and sales of securities, other than short-term securities and in-kind transactions, as applicable, are noted in the table below.
| | Purchases ($) | Sales ($) |
| Fidelity Capital & Income Fund | 1,955,655 | 2,094,221 |
6. Fees and Other Transactions with Affiliates.
Management Fee. Fidelity Management & Research Company LLC (the investment adviser) and its affiliates provide the Fund with investment management related services for which the Fund pays a monthly management fee. The management fee is the sum of an individual fund fee rate that is based on an annual rate of .45% of the Fund's average net assets and an annualized group fee rate that averaged .10% during the period. The group fee rate is based upon the monthly average net assets of a group of registered investment companies with which the investment adviser has management contracts. The group fee rate decreases as assets under management increase and increases as assets under management decrease. For the reporting period, the total annualized management fee rate was .55% of the Fund's average net assets.
Transfer Agent Fees. Fidelity Investments Institutional Operations Company LLC (FIIOC), an affiliate of the investment adviser, is the Fund's transfer, dividend disbursing and shareholder servicing agent. FIIOC receives account fees and asset-based fees that vary according to account size and type of account. FIIOC pays for typesetting, printing and mailing of shareholder reports, except proxy statements. For the period, the transfer agent fees were equivalent to an annualized rate of .11% of average net assets.
During November 2023, the Board approved a change in the transfer agent fees effective December 1, 2023 to a fixed annual rate of 0.1101% of average net assets.
Accounting Fees. Fidelity Service Company, Inc. (FSC), an affiliate of the investment adviser, maintains the Fund's accounting records. The accounting fee is based on the level of average net assets for each month. For the period, the fees were equivalent to the following annualized rates:
| | % of Average Net Assets |
| Fidelity Capital & Income Fund | .01 |
During November 2023, the Board approved a change in the accounting fees effective December 1, 2023 to a fixed annual rate of average net assets as follows:
| | % of Average Net Assets |
| Fidelity Capital & Income Fund | 0.0124% |
Brokerage Commissions. A portion of portfolio transactions were placed with brokerage firms which are affiliates of the investment adviser. Brokerage commissions are included in net realized gain (loss) and change in net unrealized appreciation (depreciation) in the Statement of Operations. The commissions paid to these affiliated firms were as follows:
| | Amount |
| Fidelity Capital & Income Fund | $4 |
Interfund Trades. Funds may purchase from or sell securities to other Fidelity Funds under procedures adopted by the Board. The procedures have been designed to ensure these interfund trades are executed in accordance with Rule 17a-7 of the 1940 Act. Any interfund trades are included within the respective purchases and sales amounts shown in the Purchases and Sales of Investments note. Interfund trades during the period are noted in the table below.
| | Purchases ($) | Sales ($) | Realized Gain (Loss) ($) |
| Fidelity Capital & Income Fund | 22,781 | 18,830 | 3,174 |
7. Committed Line of Credit.
Certain Funds participate with other funds managed by the investment adviser or an affiliate in a $4.25 billion credit facility (the "line of credit") to be utilized for temporary or emergency purposes to fund shareholder redemptions or for other short-term liquidity purposes. The participating funds have agreed to pay commitment fees on their pro-rata portion of the line of credit, which are reflected in Miscellaneous expenses on the Statement of Operations, and are listed below. During the period, there were no borrowings on this line of credit.
| | Amount |
| Fidelity Capital & Income Fund | $10 |
8. Security Lending.
Funds lend portfolio securities from time to time in order to earn additional income. Lending agents are used, including National Financial Services (NFS), an affiliate of the investment adviser. Pursuant to a securities lending agreement, NFS will receive a fee, which is capped at 9.9% of a fund's daily lending revenue, for its services as lending agent. A fund may lend securities to certain qualified borrowers, including NFS. On the settlement date of the loan, a fund receives collateral (in the form of U.S. Treasury obligations, letters of credit and/or cash) against the loaned securities and maintains collateral in an amount not less than 100% of the market value of the loaned securities during the period of the loan. The market value of the loaned securities is determined at the close of business of a fund and any additional required collateral is delivered to a fund on the next business day. A fund or borrower may terminate the loan at any time, and if the borrower defaults on its obligation to return the securities loaned because of insolvency or other reasons, a fund may apply collateral received from the borrower against the obligation. A fund may experience delays and costs in recovering the securities loaned. Any cash collateral received is invested in the Fidelity Securities Lending Cash Central Fund. Any loaned securities are identified as such in the Schedule of Investments, and the value of loaned securities and cash collateral at period end, as applicable, are presented in the Statement of Assets and Liabilities. Security lending income represents the income earned on investing cash collateral, less rebates paid to borrowers and any lending agent fees associated with the loan, plus any premium payments received for lending certain types of securities. Security lending income is presented in the Statement of Operations as a component of income from Fidelity Central Funds. Affiliated security lending activity, if any, was as follows:
| | Total Security Lending Fees Paid to NFS | Security Lending Income From Securities Loaned to NFS | Value of Securities Loaned to NFS at Period End |
| Fidelity Capital & Income Fund | $1 | $- | $- |
9. Expense Reductions.
The investments adviser has contractually agreed to waive the Fund's management fee with respect to the portion of the Fund's assets invested in Fidelity Private Credit Central Fund LLC until August 31, 2024. During the period the waiver reduced the Fund's management fee by $724.
Through arrangements with the Fund's custodian, credits realized as a result of certain uninvested cash balances were used to reduce the Fund's expenses by $3.
In addition, during the period the investment adviser or an affiliate reimbursed and/or waived a portion of operating expenses in the amount of $231.
10. Other.
A fund's organizational documents provide former and current trustees and officers with a limited indemnification against liabilities arising in connection with the performance of their duties to the fund. In the normal course of business, a fund may also enter into contracts that provide general indemnifications. A fund's maximum exposure under these arrangements is unknown as this would be dependent on future claims that may be made against a fund. The risk of material loss from such claims is considered remote.
11. Risk and Uncertainties.
Many factors affect a fund's performance. Developments that disrupt global economies and financial markets, such as pandemics, epidemics, outbreaks of infectious diseases, war, terrorism, and environmental disasters, may significantly affect a fund's investment performance. The effects of these developments to a fund will be impacted by the types of securities in which a fund invests, the financial condition, industry, economic sector, and geographic location of an issuer, and a fund's level of investment in the securities of that issuer. Significant concentrations in security types, issuers, industries, sectors, and geographic locations may magnify the factors that affect a fund's performance.
As a shareholder, you incur two types of costs: (1) transaction costs, which may include sales charges (loads) on purchase payments or redemption proceeds, as applicable and (2) ongoing costs, which generally include management fees, distribution and/or service (12b-1) fees and other Fund expenses. This Example is intended to help you understand your ongoing costs (in dollars) of investing in a fund and to compare these costs with the ongoing costs of investing in other mutual funds.
| The Example is based on an investment of $1,000 invested at the beginning of the period and held for the entire period (May 1, 2023 to October 31, 2023). |
Actual Expenses
The first line of the accompanying table provides information about actual account values and actual expenses. You may use the information in this line, together with the amount you invested, to estimate the expenses that you paid over the period. Simply divide your account value by $1,000.00 (for example, an $8,600 account value divided by $1,000.00 = 8.6), then multiply the result by the number in the first line for a class/Fund under the heading entitled "Expenses Paid During Period" to estimate the expenses you paid on your account during this period. If any fund is a shareholder of any underlying mutual funds or exchange-traded funds (ETFs) (the Underlying Funds), such fund indirectly bears its proportional share of the expenses of the Underlying Funds in addition to the direct expenses incurred presented in the table. These fees and expenses are not included in the annualized expense ratio used to calculate the expense estimate in the table below.
Hypothetical Example for Comparison Purposes
The second line of the accompanying table provides information about hypothetical account values and hypothetical expenses based on the actual expense ratio and an assumed rate of return of 5% per year before expenses, which is not the actual return. The hypothetical account values and expenses may not be used to estimate the actual ending account balance or expenses you paid for the period. You may use this information to compare the ongoing costs of investing in the Fund and other funds. To do so, compare this 5% hypothetical example with the 5% hypothetical examples that appear in the shareholder reports of the other funds. If any fund is a shareholder of any Underlying Funds, such fund indirectly bears its proportional share of the expenses of the Underlying Funds in addition to the direct expenses as presented in the table. These fees and expenses are not included in the annualized expense ratio used to calculate the expense estimate in the table below.
Please note that the expenses shown in the table are meant to highlight your ongoing costs only and do not reflect any transaction costs. Therefore, the second line of the table is useful in comparing ongoing costs only, and will not help you determine the relative total costs of owning different funds. In addition, if these transactional costs were included, your costs would have been higher.
| | | | | Annualized Expense Ratio- A | | Beginning Account Value May 1, 2023 | | Ending Account Value October 31, 2023 | | Expenses Paid During Period- C May 1, 2023 to October 31, 2023 |
| | | | | | | | | | |
| Fidelity® Capital & Income Fund | | | | .64% | | | | | | |
| Actual | | | | | | $ 1,000 | | $ 999.50 | | $ 3.22 |
Hypothetical-B | | | | | | $ 1,000 | | $ 1,021.92 | | $ 3.25 |
| |
A Annualized expense ratio reflects expenses net of applicable fee waivers.
B 5% return per year before expenses
C Expenses are equal to the annualized expense ratio, multiplied by the average account value over the period, multiplied by 184/ 366 (to reflect the one-half year period). The fees and expenses of any Underlying Funds are not included in each annualized expense ratio.
Board Approval of Investment Advisory Contracts and Management Fees
Fidelity Capital & Income Fund
Each year, the Board of Trustees, including the Independent Trustees (together, the Board), considers the renewal of the fund's management contract with Fidelity Management & Research Company LLC (FMR) and the sub-advisory agreements (together, the Advisory Contracts) for the fund. FMR and the sub-advisers are referred to herein as the Investment Advisers. The Board, assisted by the advice of fund counsel and Independent Trustees' counsel, requests and considers a broad range of information relevant to the renewal of the Advisory Contracts throughout the year.
The Board meets regularly and, at each of its meetings, covers an extensive agenda of topics and materials and considers factors that are relevant to its annual consideration of the renewal of the fund's Advisory Contracts, including the services and support provided to the fund and its shareholders. The Board, acting directly and through its Committees (each of which is composed of and chaired by Independent Trustees), requests and receives information concerning the annual consideration of the renewal of the fund's Advisory Contracts. The Board also meets as needed to review matters specifically related to the Board's annual consideration of the renewal of the Advisory Contracts. Members of the Board may also meet with trustees of other Fidelity funds through joint ad hoc committees to discuss certain matters relevant to all of the Fidelity funds.
Approval of Stub Period Continuation. At its May 2023 meeting, the Board of Trustees voted to continue the fund's management contract with FMR, and the sub-advisory agreements and sub-sub-advisory agreements, in each case, where applicable (together, the Advisory Contracts), without modification, for two months from June 1, 2023 through July 31, 2023. The Board considered that the approval of the fund's Advisory Contracts will not result in any changes in (i) the investment process or strategies employed in the management of the fund's assets; (ii) the fees and expenses paid by shareholders; (iii) the nature, extent or quality of services provided under the fund's Advisory Contracts; or (iv) the day-to-day management of the fund or the persons primarily responsible for such management. The Board also considered that since its last approval of the fund's Advisory Contracts, FMR had provided additional information on the fund in support of the annual contract renewal process, including competitive analyses on total expenses and management fees and in-depth reviews of fund performance and fund profitability information. The Board concluded that the fund's Advisory Contracts are fair and reasonable, and that the fund's Advisory Contracts should be renewed, without modification, through July 31, 2023, with the understanding that the Board would consider the annual renewal for a full one year period in July 2023.
At its July 2023 meeting, the Board unanimously determined to renew the fund's Advisory Contracts. In reaching its determination, the Board considered all factors it believed relevant, including (i) the nature, extent, and quality of the services provided to the fund and its shareholders (including the investment performance of the fund); (ii) the competitiveness relative to peer funds of the fund's management fee and total expense ratio; (iii) the total costs of the services provided by and the profits realized by FMR and its affiliates (Fidelity) from its relationships with the fund; and (iv) the extent to which, if any, economies of scale exist and are realized as the fund grows, and whether any economies of scale are appropriately shared with fund shareholders. The Board also considered the broad range of investment choices available to shareholders from FMR's competitors and that the fund's shareholders have chosen to invest in the fund, which is part of the Fidelity family of funds. The Board's decision to renew the Advisory Contracts was not based on any single factor.
The Board reached a determination, with the assistance of fund counsel and Independent Trustees' counsel and through the exercise of its business judgment, that the renewal of the Advisory Contracts was in the best interests of the fund and its shareholders and that the compensation payable under the Advisory Contracts was fair and reasonable in light of all of the surrounding circumstances.
Nature, Extent, and Quality of Services Provided. The Board considered staffing as it relates to the fund, including the backgrounds and experience of investment personnel of the Investment Advisers, and also considered the Investment Advisers' implementation of the fund's investment program. The Independent Trustees also had discussions with senior management of Fidelity's investment operations and investment groups. The Board considered the structure of the investment personnel compensation program and whether this structure provides appropriate incentives to act in the best interests of the fund. Additionally, the Board considered the portfolio managers' investments, if any, in the funds that they manage.
Resources Dedicated to Investment Management and Support Services. The Board and the Fund Oversight and Research Committees reviewed the general qualifications and capabilities of Fidelity's investment staff, including its size, education, experience, and resources, as well as Fidelity's approach to recruiting, training, managing, and compensating investment personnel. The Board noted the resources devoted to expansion of Fidelity's global investment organization, and that Fidelity's analysts have extensive resources, tools, and capabilities that allow them to conduct sophisticated quantitative and fundamental analysis, as well as credit analysis of issuers, counterparties, and guarantors. Further, the Board considered that Fidelity's investment professionals have sufficient access to global information and data so as to provide competitive investment results over time, and that those professionals also have access to sophisticated tools that permit them to assess portfolio construction and risk and performance attribution characteristics continuously, as well as to transmit new information and research conclusions rapidly around the world. Additionally, in its deliberations, the Board considered Fidelity's trading, risk management, compliance, and technology and operations capabilities and resources, which are integral parts of the investment management process.
Shareholder and Administrative Services. The Board considered (i) the nature, extent, quality, and cost of advisory, administrative, and shareholder services performed by the Investment Advisers and their affiliates under the Advisory Contracts and under separate agreements covering transfer agency, pricing and bookkeeping, and securities lending services for the fund; (ii) the nature and extent of Fidelity's supervision of third party service providers, principally custodians, subcustodians, and pricing vendors; and (iii) the resources devoted by Fidelity to, and the record of compliance with, the fund's compliance policies and procedures. The Board also reviewed the allocation of fund brokerage, including allocations to brokers affiliated with the Investment Advisers, the use of brokerage commissions to pay fund expenses, and the use of "soft" commission dollars to pay for research services. The Board also considered the fund's securities lending activities and any payments made to Fidelity relating to securities lending.
The Board noted that the growth of fund assets over time across the complex allows Fidelity to reinvest in the development of services designed to enhance the value and convenience of the Fidelity funds as investment vehicles. These services include 24-hour access to account information and market information over the Internet and through telephone representatives, investor education materials, and asset allocation tools. The Board also considered that it reviews customer service metrics such as telephone response times, continuity of services on the website and metrics addressing services at Fidelity Investor Centers.
Investment in a Large Fund Family. The Board considered the benefits to shareholders of investing in a fund that is part of a large family of funds offering a variety of investment disciplines and providing a large variety of fund investor services. The Board noted that Fidelity had taken, or had made recommendations that resulted in the Fidelity funds taking, a number of actions over the previous year that benefited particular funds and/or the Fidelity funds in general.
Investment Performance. The Board took into account discussions that occur with representatives of the Investment Advisers, and reports that it receives, at Board meetings throughout the year, relating to fund investment performance. In this regard the Board noted that as part of regularly scheduled fund reviews and other reports to the Board on fund performance, the Board considered annualized return information for the fund for different time periods, measured against an appropriate securities market index (benchmark index) and an appropriate peer group of funds with similar objectives (peer group). The Board also considered information about performance attribution. In its ongoing evaluation of fund investment performance, the Board gives particular attention to information indicating changes in performance of the funds over different time periods and discussed with the Investment Advisers the reasons for any overperformance or underperformance.
In addition to reviewing absolute and relative fund performance, the Independent Trustees periodically consider the appropriateness of fund performance metrics in evaluating the results achieved. The Independent Trustees generally give greater weight to fund performance over longer time periods than over shorter time periods. Depending on the circumstances, the Independent Trustees may be satisfied with a fund's performance notwithstanding that it lags its benchmark index or peer group for certain periods.
Based on its review, the Board concluded that the nature, extent, and quality of services provided to the fund under the Advisory Contracts should continue to benefit the shareholders of the fund.
Competitiveness of Management Fee and Total Expense Ratio. The Board was provided with information regarding industry trends in management fees and expenses. In its review of the fund's management fee and total expense ratio, the Board considered the fund's management fee rate as well as other fund expenses, such as transfer agent fees, pricing and bookkeeping fees, and custodial, legal, and audit fees. The Board noted that Fidelity may agree to waive fees or reimburse expenses from time to time, and the extent to which, if any, it has done so for the fund.
Comparisons of Management Fees and Total Expense Ratios. Among other things, the Board reviewed data for selected groups of competitive funds and classes (referred to as "mapped groups") that were compiled by Fidelity based on combining similar investment objective categories (as classified by Lipper) that have comparable investment mandates. The data reviewed by the Board included (i) gross management fee comparisons (before taking into account expense reimbursements or caps ) relative to the total universe of funds within the mapped group; (ii) gross management fee comparisons relative to a subset of non-Fidelity funds in the mapped group that are similar in size and management fee structure to the fund (referred to as the "asset size peer group"); (iii) total expense comparisons of the fund relative to funds and classes in the mapped group that have a similar sales load structure to the fund (referred to as the "similar sales load structure group"); and (iv) total expense comparisons of the fund relative to funds and classes in the similar sales load structure group that are similar in size and management fee structure to the fund (referred to as the "total expense asset size peer group"). The total expense asset size peer group comparison excludes performance adjustments and fund-paid 12b-1 fees to eliminate variability in fee structures.
The information provided to the Board indicated that the fund's management fee rate ranked below the competitive median of the mapped group for the 12-month period ended September 30, 2022 and equal to the competitive median of the asset size peer group for the 12-month period ended September 30, 2022. Further, the information provided to the Board indicated that the total expense ratio of the fund ranked below the competitive median of the similar sales load structure group for the 12-month period ended September 30, 2022 and below the competitive median of the total expense asset size peer group for the 12-month period ended September 30, 2022.
The Board also considered that, for funds subject to the group fee, FMR agreed to voluntarily waive fees over a specified period of time in amounts designed to account for assets converted from certain funds to certain collective investment trusts.
Fees Charged to Other Fidelity Clients. The Board also considered Fidelity fee structures and other information with respect to clients of Fidelity, such as other funds advised or subadvised by Fidelity, pension plan clients, and other institutional clients with similar mandates. The Board noted that a joint ad hoc committee created by it and the boards of other Fidelity funds periodically reviews and compares Fidelity's institutional investment advisory business with its business of providing services to the Fidelity funds and also noted the most recent findings of the committee. The Board noted that the committee's review included a consideration of the differences in services provided, fees charged, and costs incurred, as well as competition in the markets serving the different categories of clients.
Based on its review, the Board concluded that the fund's management fee is fair and reasonable in light of the services that the fund receives and the other factors considered. Further based on its review of total expense ratios and fees charged to other Fidelity clients, the Board concluded that the fund's total expense ratio was reasonable in light of the services that the fund and its shareholders receive and the other factors considered.
Costs of the Services and Profitability. The Board considered the revenues earned and the expenses incurred by Fidelity in conducting the business of developing, marketing, distributing, managing, administering and servicing the fund and servicing the fund's shareholders. The Board also considered the level of Fidelity's profits in respect of all the Fidelity funds.
On an annual basis, Fidelity presents to the Board information about the profitability of its relationships with the fund. Fidelity calculates profitability information for each fund, as well as aggregate profitability information for groups of Fidelity funds and all Fidelity funds, using a series of detailed revenue and cost allocation methodologies which originate with the books and records of Fidelity on which Fidelity's audited financial statements are based. The Audit Committee of the Board reviews any significant changes from the prior year's methodologies and the full Board approves such changes.
A public accounting firm has been engaged annually by the Board as part of the Board's assessment of Fidelity's profitability analysis. The engagement includes the review and assessment of the methodologies used by Fidelity in determining the revenues and expenses attributable to Fidelity's fund business, and completion of agreed-upon procedures in respect of the mathematical accuracy of certain fund profitability information and its conformity to established allocation methodologies. After considering the reports issued under the engagement and information provided by Fidelity, the Board concluded that while other allocation methods may also be reasonable, Fidelity's profitability methodologies are reasonable in all material respects.
The Board also reviewed Fidelity's non-fund businesses and potential indirect benefits such businesses may have received as a result of their association with Fidelity's fund business (i.e., fall-out benefits) as well as cases where Fidelity's affiliates may benefit from the funds' business. The Board considered areas where potential indirect benefits to the Fidelity funds from their relationships with Fidelity may exist. The Board's consideration of these matters was informed by the findings of a joint ad hoc committee created by it and the boards of other Fidelity funds to evaluate potential fall-out benefits.
The Board considered the costs of the services provided by and the profits realized by Fidelity in connection with the operation of the fund and was satisfied that the profitability was not excessive.
Economies of Scale. The Board considered whether there have been economies of scale in respect of the management of the Fidelity funds, whether the Fidelity funds (including the fund) have appropriately benefited from any such economies of scale, and whether there is potential for realization of any further economies of scale. The Board considered the extent to which the fund will benefit from economies of scale as assets grow through increased services to the fund, through waivers or reimbursements, or through fee or expense ratio reductions. The Board also noted that a committee (the Economies of Scale Committee) created by it and the boards of other Fidelity funds periodically analyzes whether Fidelity attains economies of scale in respect of the management and servicing of the Fidelity funds, whether the Fidelity funds have appropriately benefited from such economies of scale, and whether there is potential for realization of any further economies of scale.
The Board recognized that the fund's management contract incorporates a "group fee" structure, which provides for lower group fee rates as total "group assets" increase, and for higher group fee rates as total "group assets" decrease ("group assets" as defined in the management contract). FMR calculates the group fee rates based on a tiered asset "breakpoint" schedule that varies based on asset class. The Board considered that the group fee is designed to deliver the benefits of economies of scale to fund shareholders when total Fidelity fund assets increase, even if assets of any particular fund are unchanged or have declined, because some portion of Fidelity's costs are attributable to services provided to all Fidelity funds, and all funds benefit if those costs can be allocated among more assets. The Board further considered that Fidelity agreed to impose a temporary fee waiver in the form of additional breakpoints to the current breakpoint schedule. The Board concluded that, given the group fee structure, fund shareholders will benefit from lower management fees as "group assets" increase at the fund complex level, regardless of whether Fidelity achieves any such economies of scale.
The Board concluded, taking into account the analysis of the Economies of Scale Committee, that economies of scale, if any, are being appropriately shared between fund shareholders and Fidelity.
Additional Information Requested by the Board. In order to develop fully the factual basis for consideration of the Fidelity funds' advisory contracts, the Board requested and received additional information on certain topics, including: (i) fund flow and performance trends, in particular the underperformance of certain funds and strategies, and Fidelity's long-term strategies for certain funds, including any consideration of fund liquidations or mergers; (ii) the operation of performance fees and competitor use of performance fees ; (iii) Fidelity's pricing philosophy compared to competitors; (iv) fund profitability methodology and data; (v) evaluation of competitive fund data and peer group classifications and fee and expense comparisons; (vi) the management fee and expense structures for different funds and classes and information about the differences between various fee and expense structures; (vii) group fee breakpoints and related voluntary fee waivers; and (viii) information regarding other accounts managed by Fidelity and the funds' sub-advisory arrangements.
Conclusion. Based on its evaluation of all of the conclusions noted above, and after considering all factors it believed relevant, the Board, including the Independent Trustees, concluded that the advisory and sub-advisory fee arrangements are fair and reasonable in light of all of the surrounding circumstances and that the fund's Advisory Contracts should be renewed through July 31, 2024.
1.538653.126
CAI-SANN-1223
Fidelity® SAI High Income Fund
Semi-Annual Report
October 31, 2023
Offered exclusively to certain clients of the Adviser, or its affiliates, including Strategic Advisers LLC (Strategic Advisers) - not available for sale to the general public. Fidelity® SAI is a product name of Fidelity® funds dedicated to certain programs affiliated with Strategic Advisers.
Contents
To view a fund's proxy voting guidelines and proxy voting record for the 12-month period ended June 30, visit http://www.fidelity.com/proxyvotingresults or visit the Securities and Exchange Commission's (SEC) web site at http://www.sec.gov.
You may also call 1-800-544-3455 to request a free copy of the proxy voting guidelines.
Standard & Poor's, S&P and S&P 500 are registered service marks of The McGraw-Hill Companies, Inc. and have been licensed for use by Fidelity Distributors Corporation.
Other third-party marks appearing herein are the property of their respective owners.
All other marks appearing herein are registered or unregistered trademarks or service marks of FMR LLC or an affiliated company. © 2023 FMR LLC. All rights reserved.
This report and the financial statements contained herein are submitted for the general information of the shareholders of the Fund. This report is not authorized for distribution to prospective investors in the Fund unless preceded or accompanied by an effective prospectus.
A fund files its complete schedule of portfolio holdings with the SEC for the first and third quarters of each fiscal year on Form N-PORT. Forms N-PORT are available on the SEC's web site at http://www.sec.gov. A fund's Forms N-PORT may be reviewed and copied at the SEC's Public Reference Room in Washington, DC. Information regarding the operation of the SEC's Public Reference Room may be obtained by calling 1-800-SEC-0330.
For a complete list of a fund's portfolio holdings, view the most recent holdings listing, semiannual report, or annual report on Fidelity's web site at http://www.fidelity.com, http://www.institutional.fidelity.com, or http://www.401k.com, as applicable.
NOT FDIC INSURED •MAY LOSE VALUE •NO BANK GUARANTEE
Neither the Fund nor Fidelity Distributors Corporation is a bank.
| Top Bond Issuers (% of Fund's net assets) |
(with maturities greater than one year) |
| Southeastern Grocers, Inc. | 2.1 | |
| New Fortress Energy, Inc. | 2.1 | |
| Community Health Systems, Inc. | 1.9 | |
| Tallgrass Energy Partners LP / Tallgrass Energy Finance Corp. | 1.7 | |
| Uniti Group LP / Uniti Group Finance, Inc. | 1.6 | |
| Ford Motor Credit Co. LLC | 1.5 | |
| Icahn Enterprises LP/Icahn Enterprises Finance Corp. | 1.5 | |
| CCO Holdings LLC/CCO Holdings Capital Corp. | 1.5 | |
| Occidental Petroleum Corp. | 1.4 | |
| DISH Network Corp. | 1.4 | |
| | 16.7 | |
| |
| Market Sectors (% of Fund's net assets) |
| |
| Energy | 16.5 | |
| Healthcare | 7.5 | |
| Services | 6.9 | |
| Technology | 6.3 | |
| Telecommunications | 5.9 | |
| |
Quality Diversification (% of Fund's net assets) |
|
| |
| We have used ratings from Moody's Investors Service, Inc. Where Moody's® ratings are not available, we have used S&P® ratings. All ratings are as of the date indicated and do not reflect subsequent changes. |
Asset Allocation (% of Fund's net assets) |
|
|
Geographic Diversification (% of Fund's net assets) |
|
* Includes Short-Term investments and Net Other Assets (Liabilities). Percentages are adjusted for the effect of derivatives, if applicable. |
| |
Showing Percentage of Net Assets
| Corporate Bonds - 83.1% |
| | | Principal Amount (a) | Value ($) |
| Convertible Bonds - 1.4% | | | |
| Broadcasting - 1.2% | | | |
| DISH Network Corp.: | | | |
| 2.375% 3/15/24 | | 9,434,000 | 9,021,263 |
| 3.375% 8/15/26 | | 16,374,000 | 8,391,675 |
| | | | 17,412,938 |
| Homebuilders/Real Estate - 0.1% | | | |
| Redfin Corp. 0.5% 4/1/27 | | 3,660,000 | 2,013,000 |
| Technology - 0.1% | | | |
| Seagate HDD Cayman 3.5% 6/1/28 (b) | | 1,680,000 | 1,741,320 |
TOTAL CONVERTIBLE BONDS | | | 21,167,258 |
| Nonconvertible Bonds - 81.7% | | | |
| Aerospace - 1.9% | | | |
| ATI, Inc. 4.875% 10/1/29 | | 2,015,000 | 1,716,010 |
| Bombardier, Inc. 7.875% 4/15/27 (b) | | 4,970,000 | 4,781,804 |
| BWX Technologies, Inc. 4.125% 6/30/28 (b) | | 4,425,000 | 3,893,933 |
| Howmet Aerospace, Inc.: | | | |
| 5.9% 2/1/27 | | 730,000 | 719,760 |
| 6.875% 5/1/25 | | 730,000 | 732,586 |
| Kaiser Aluminum Corp.: | | | |
| 4.5% 6/1/31 (b) | | 280,000 | 206,893 |
| 4.625% 3/1/28 (b) | | 820,000 | 683,279 |
| Moog, Inc. 4.25% 12/15/27 (b) | | 220,000 | 195,857 |
| TransDigm, Inc.: | | | |
| 4.625% 1/15/29 | | 4,390,000 | 3,785,234 |
| 5.5% 11/15/27 | | 4,520,000 | 4,197,950 |
| 6.25% 3/15/26 (b) | | 2,055,000 | 2,006,625 |
| 6.75% 8/15/28 (b) | | 2,200,000 | 2,136,163 |
| 6.875% 12/15/30 (b) | | 4,140,000 | 3,997,418 |
| VistaJet Malta Finance PLC / XO Management Holding, Inc. 9.5% 6/1/28 (b) | | 600,000 | 459,703 |
| | | | 29,513,215 |
| Air Transportation - 1.0% | | | |
| Air Canada 3.875% 8/15/26 (b) | | 1,075,000 | 978,102 |
| American Airlines, Inc. 7.25% 2/15/28 (b) | | 735,000 | 683,420 |
| American Airlines, Inc. / AAdvantage Loyalty IP Ltd. 5.5% 4/20/26 (b) | | 3,979,167 | 3,869,535 |
| Forward Air Corp. 9.5% 10/15/31 (b) | | 700,000 | 682,500 |
| Mileage Plus Holdings LLC 6.5% 6/20/27 (b) | | 547,500 | 540,863 |
| Rand Parent LLC 8.5% 2/15/30 (b) | | 7,448,000 | 6,801,485 |
| Spirit Loyalty Cayman Ltd. / Spirit IP Cayman Ltd. 8% 9/20/25 (b) | | 2,830,000 | 2,235,700 |
| | | | 15,791,605 |
| Automotive - 0.2% | | | |
| Ford Motor Co.: | | | |
| 6.1% 8/19/32 | | 1,610,000 | 1,490,587 |
| 7.4% 11/1/46 | | 585,000 | 549,215 |
| Ford Motor Credit Co. LLC 3.625% 6/17/31 | | 2,015,000 | 1,592,801 |
| | | | 3,632,603 |
| Automotive & Auto Parts - 2.2% | | | |
| Adient Global Holdings Ltd. 7% 4/15/28 (b) | | 445,000 | 438,025 |
| Dana, Inc.: | | | |
| 4.25% 9/1/30 | | 590,000 | 466,973 |
| 5.375% 11/15/27 | | 395,000 | 363,400 |
| Ford Motor Co.: | | | |
| 3.25% 2/12/32 | | 1,470,000 | 1,108,636 |
| 5.291% 12/8/46 | | 295,000 | 214,319 |
| Ford Motor Credit Co. LLC: | | | |
| U.S. Secured Overnight Fin. Rate (SOFR) Index + 2.950% 8.2802% 3/6/26 (c)(d) | | 2,065,000 | 2,080,874 |
| 2.9% 2/10/29 | | 4,310,000 | 3,527,908 |
| 3.375% 11/13/25 | | 730,000 | 681,238 |
| 3.815% 11/2/27 | | 3,500,000 | 3,126,378 |
| 4% 11/13/30 | | 725,000 | 597,173 |
| 4.389% 1/8/26 | | 1,460,000 | 1,383,937 |
| 4.95% 5/28/27 | | 2,905,000 | 2,724,879 |
| 5.125% 6/16/25 | | 730,000 | 710,300 |
| 6.95% 3/6/26 | | 5,815,000 | 5,827,430 |
| IHO Verwaltungs GmbH 4.75% 9/15/26 pay-in-kind (b)(c) | | 295,000 | 274,152 |
| LCM Investments Holdings 8.25% 8/1/31 (b) | | 785,000 | 746,831 |
| Macquarie AirFinance Holdings: | | | |
| 8.125% 3/30/29 (b) | | 2,535,000 | 2,497,102 |
| 8.375% 5/1/28 (b) | | 1,605,000 | 1,599,784 |
| PECF USS Intermediate Holding III Corp. 8% 11/15/29 (b) | | 2,615,000 | 1,240,504 |
| Rivian Holdco & Rivian LLC & Rivian Automotive LLC 6 month U.S. LIBOR + 5.620% 11.4932% 10/15/26 (b)(c)(d) | | 985,000 | 982,385 |
| ZF North America Capital, Inc.: | | | |
| 4.75% 4/29/25 (b) | | 1,750,000 | 1,687,484 |
| 6.875% 4/14/28 (b) | | 810,000 | 784,929 |
| 7.125% 4/14/30 (b) | | 810,000 | 784,083 |
| | | | 33,848,724 |
| Banks & Thrifts - 0.7% | | | |
| Ally Financial, Inc.: | | | |
| 5.75% 11/20/25 | | 149,000 | 142,335 |
| 6.7% 2/14/33 | | 2,935,000 | 2,467,044 |
| Jane Street Group LLC/JSG Finance, Inc. 4.5% 11/15/29 (b) | | 2,015,000 | 1,717,061 |
| Quicken Loans LLC/Quicken Loans Co.-Issuer, Inc. 4% 10/15/33 (b) | | 585,000 | 429,975 |
| UniCredit SpA: | | | |
| 5.459% 6/30/35 (b)(c) | | 1,651,000 | 1,354,435 |
| 5.861% 6/19/32 (b)(c) | | 945,000 | 850,175 |
| VistaJet Malta Finance PLC / XO Management Holding, Inc.: | | | |
| 6.375% 2/1/30 (b) | | 3,650,000 | 2,434,157 |
| 7.875% 5/1/27 (b) | | 590,000 | 454,300 |
| Western Alliance Bancorp. 3% 6/15/31 (c) | | 1,590,000 | 1,214,760 |
| | | | 11,064,242 |
| Broadcasting - 1.8% | | | |
| Clear Channel Outdoor Holdings, Inc.: | | | |
| 5.125% 8/15/27 (b) | | 1,275,000 | 1,133,215 |
| 7.5% 6/1/29 (b) | | 1,670,000 | 1,215,569 |
| 9% 9/15/28 (b) | | 2,840,000 | 2,766,103 |
| Diamond Sports Group LLC/Diamond Sports Finance Co. 5.375% (b)(e) | | 12,645,000 | 130,244 |
| DISH Network Corp. 11.75% 11/15/27 (b) | | 3,665,000 | 3,630,402 |
| Sinclair Television Group, Inc. 5.5% 3/1/30 (b) | | 224,000 | 121,610 |
| Sirius XM Radio, Inc.: | | | |
| 4% 7/15/28 (b) | | 4,490,000 | 3,818,441 |
| 4.125% 7/1/30 (b) | | 4,995,000 | 3,966,105 |
| 5.5% 7/1/29 (b) | | 1,515,000 | 1,342,402 |
| TEGNA, Inc.: | | | |
| 4.625% 3/15/28 | | 1,165,000 | 1,004,813 |
| 5% 9/15/29 | | 1,395,000 | 1,168,313 |
| Univision Communications, Inc.: | | | |
| 4.5% 5/1/29 (b) | | 130,000 | 103,339 |
| 6.625% 6/1/27 (b) | | 3,185,000 | 2,909,168 |
| 7.375% 6/30/30 (b) | | 2,950,000 | 2,597,500 |
| 8% 8/15/28 (b) | | 1,175,000 | 1,109,578 |
| | | | 27,016,802 |
| Building Materials - 0.8% | | | |
| Advanced Drain Systems, Inc.: | | | |
| 5% 9/30/27 (b) | | 350,000 | 326,375 |
| 6.375% 6/15/30 (b) | | 1,330,000 | 1,255,744 |
| AmeriTex Holdco Intermediate LLC 10.25% 10/15/28 (b) | | 395,000 | 373,473 |
| Beacon Roofing Supply, Inc. 6.5% 8/1/30 (b) | | 1,565,000 | 1,494,338 |
| Builders FirstSource, Inc. 4.25% 2/1/32 (b) | | 3,750,000 | 2,984,464 |
| Eco Material Technologies, Inc. 7.875% 1/31/27 (b) | | 2,530,000 | 2,395,869 |
| Oscar Acquisition Co. LLC / Oscar Finance, Inc. 9.5% 4/15/30 (b) | | 1,765,000 | 1,557,362 |
| SRS Distribution, Inc. 6% 12/1/29 (b) | | 2,595,000 | 2,160,338 |
| | | | 12,547,963 |
| Cable/Satellite TV - 2.5% | | | |
| CCO Holdings LLC/CCO Holdings Capital Corp.: | | | |
| 4.25% 2/1/31 (b) | | 5,510,000 | 4,287,870 |
| 4.25% 1/15/34 (b) | | 2,840,000 | 2,051,340 |
| 4.5% 8/15/30 (b) | | 2,935,000 | 2,353,387 |
| 4.5% 5/1/32 | | 7,039,000 | 5,388,332 |
| 4.5% 6/1/33 (b) | | 5,460,000 | 4,072,972 |
| 4.75% 2/1/32 (b) | | 3,890,000 | 3,036,378 |
| CSC Holdings LLC: | | | |
| 4.125% 12/1/30 (b) | | 3,395,000 | 2,274,521 |
| 4.5% 11/15/31 (b) | | 745,000 | 492,039 |
| 4.625% 12/1/30 (b) | | 4,285,000 | 2,173,017 |
| 5.375% 2/1/28 (b) | | 3,375,000 | 2,687,632 |
| DIRECTV Financing LLC / DIRECTV Financing Co-Obligor, Inc. 5.875% 8/15/27 (b) | | 720,000 | 630,889 |
| DISH DBS Corp. 5.75% 12/1/28 (b) | | 3,630,000 | 2,636,288 |
| Dolya Holdco 18 DAC 5% 7/15/28 (b) | | 720,000 | 611,490 |
| Radiate Holdco LLC/Radiate Financial Service Ltd.: | | | |
| 4.5% 9/15/26 (b) | | 2,155,000 | 1,647,797 |
| 6.5% 9/15/28 (b) | | 1,675,000 | 829,125 |
| Telenet Finance Luxembourg Notes SARL 5.5% 3/1/28 (b) | | 1,400,000 | 1,249,500 |
| Ziggo BV 4.875% 1/15/30 (b) | | 1,730,000 | 1,381,770 |
| | | | 37,804,347 |
| Capital Goods - 1.0% | | | |
| Mueller Water Products, Inc. 4% 6/15/29 (b) | | 2,785,000 | 2,381,175 |
| Regal Rexnord Corp.: | | | |
| 6.05% 2/15/26 (b) | | 2,190,000 | 2,154,095 |
| 6.05% 4/15/28 (b) | | 1,459,000 | 1,395,669 |
| 6.3% 2/15/30 (b) | | 1,460,000 | 1,373,839 |
| Vertical Holdco GmbH 7.625% 7/15/28 (b) | | 2,710,000 | 2,444,525 |
| Vertical U.S. Newco, Inc. 5.25% 7/15/27 (b) | | 6,595,000 | 6,004,399 |
| | | | 15,753,702 |
| Chemicals - 4.2% | | | |
| CVR Partners LP 6.125% 6/15/28 (b) | | 3,015,000 | 2,660,738 |
| Element Solutions, Inc. 3.875% 9/1/28 (b) | | 1,420,000 | 1,208,212 |
| Kobe U.S. Midco 2, Inc. 9.25% 11/1/26 pay-in-kind (b)(c) | | 1,900,000 | 1,377,500 |
| LSB Industries, Inc. 6.25% 10/15/28 (b) | | 1,210,000 | 1,073,405 |
| Methanex Corp.: | | | |
| 5.125% 10/15/27 | | 4,725,000 | 4,309,237 |
| 5.25% 12/15/29 | | 1,530,000 | 1,352,949 |
| 5.65% 12/1/44 | | 4,460,000 | 3,277,400 |
| NOVA Chemicals Corp.: | | | |
| 4.25% 5/15/29 (b) | | 4,555,000 | 3,367,936 |
| 4.875% 6/1/24 (b) | | 1,735,000 | 1,705,026 |
| 5% 5/1/25 (b) | | 250,000 | 236,115 |
| 5.25% 6/1/27 (b) | | 5,790,000 | 4,890,609 |
| Nufarm Australia Ltd. 5% 1/27/30 (b) | | 4,635,000 | 4,020,816 |
| Olin Corp. 5% 2/1/30 | | 3,740,000 | 3,230,455 |
| Olympus Water U.S. Holding Corp.: | | | |
| 4.25% 10/1/28 (b) | | 3,520,000 | 2,808,749 |
| 6.25% 10/1/29 (b) | | 3,340,000 | 2,505,000 |
| 9.75% 11/15/28 (b) | | 6,755,000 | 6,597,615 |
| SCIH Salt Holdings, Inc.: | | | |
| 4.875% 5/1/28 (b) | | 690,000 | 595,730 |
| 6.625% 5/1/29 (b) | | 2,144,000 | 1,797,156 |
| SCIL IV LLC / SCIL U.S.A. Holdings LLC 5.375% 11/1/26 (b) | | 3,235,000 | 2,869,529 |
| The Chemours Co. LLC: | | | |
| 4.625% 11/15/29 (b) | | 1,330,000 | 1,027,264 |
| 5.375% 5/15/27 | | 1,160,000 | 1,047,962 |
| 5.75% 11/15/28 (b) | | 3,530,000 | 2,985,497 |
| TPC Group, Inc. 13% 12/16/27 (b) | | 1,702,071 | 1,698,463 |
| Tronox, Inc. 4.625% 3/15/29 (b) | | 4,900,000 | 3,859,890 |
| W.R. Grace Holding LLC: | | | |
| 5.625% 8/15/29 (b) | | 5,025,000 | 3,894,375 |
| 7.375% 3/1/31 (b) | | 595,000 | 551,131 |
| | | | 64,948,759 |
| Consumer Products - 0.7% | | | |
| Ferrellgas LP/Ferrellgas Finance Corp. 5.375% 4/1/26 (b) | | 395,000 | 369,712 |
| Kohl's Corp. 4.25% 7/17/25 | | 190,000 | 177,456 |
| Mattel, Inc.: | | | |
| 3.375% 4/1/26 (b) | | 2,370,000 | 2,189,102 |
| 5.45% 11/1/41 | | 585,000 | 456,336 |
| Newell Brands, Inc.: | | | |
| 4.7% 4/1/26 | | 730,000 | 689,232 |
| 6.375% 9/15/27 | | 730,000 | 683,655 |
| 6.5% 4/1/46 (f) | | 585,000 | 410,812 |
| 6.625% 9/15/29 | | 820,000 | 754,363 |
| The Scotts Miracle-Gro Co.: | | | |
| 4% 4/1/31 | | 295,000 | 219,452 |
| 4.375% 2/1/32 | | 435,000 | 318,812 |
| TKC Holdings, Inc.: | | | |
| 6.875% 5/15/28 (b) | | 2,000,000 | 1,730,000 |
| 10.5% 5/15/29 (b) | | 1,015,000 | 811,750 |
| Windsor Holdings III, LLC 8.5% 6/15/30 (b) | | 1,825,000 | 1,776,576 |
| | | | 10,587,258 |
| Containers - 1.8% | | | |
| ARD Finance SA 6.5% 6/30/27 pay-in-kind (b)(c) | | 4,302,000 | 2,505,297 |
| Ardagh Packaging Finance PLC/Ardagh MP Holdings U.S.A., Inc.: | | | |
| 5.25% 8/15/27 (b) | | 2,838,000 | 2,062,121 |
| 5.25% 8/15/27 (b) | | 7,061,000 | 5,130,598 |
| Ball Corp.: | | | |
| 2.875% 8/15/30 | | 730,000 | 569,517 |
| 4.875% 3/15/26 | | 2,190,000 | 2,103,151 |
| 6% 6/15/29 | | 975,000 | 932,612 |
| Berry Global, Inc. 4.875% 7/15/26 (b) | | 1,170,000 | 1,116,403 |
| BWAY Holding Co. 7.875% 8/15/26 (b) | | 2,190,000 | 2,051,196 |
| Graham Packaging Co., Inc. 7.125% 8/15/28 (b) | | 940,000 | 720,167 |
| Graphic Packaging International, Inc. 3.75% 2/1/30 (b) | | 1,325,000 | 1,083,372 |
| LABL, Inc.: | | | |
| 5.875% 11/1/28 (b) | | 450,000 | 380,811 |
| 6.75% 7/15/26 (b) | | 300,000 | 275,763 |
| 9.5% 11/1/28 (b) | | 300,000 | 289,939 |
| 10.5% 7/15/27 (b) | | 3,070,000 | 2,657,687 |
| Owens-Brockway Glass Container, Inc. 7.25% 5/15/31 (b) | | 765,000 | 699,975 |
| Sealed Air Corp. 5% 4/15/29 (b) | | 3,940,000 | 3,494,128 |
| Sealed Air Corp./Sealed Air Cor 6.125% 2/1/28 (b) | | 875,000 | 832,842 |
| Trivium Packaging Finance BV: | | | |
| 5.5% 8/15/26 (b) | | 180,000 | 163,166 |
| 8.5% 8/15/27 (b) | | 265,000 | 221,087 |
| | | | 27,289,832 |
| Diversified Financial Services - 4.4% | | | |
| Aercap Global Aviation Trust 6.5% 6/15/45 (b)(c) | | 1,500,000 | 1,471,612 |
| Coinbase Global, Inc.: | | | |
| 3.375% 10/1/28 (b) | | 280,000 | 205,588 |
| 3.625% 10/1/31 (b) | | 2,610,000 | 1,774,448 |
| Emerald Debt Merger Sub LLC 6.625% 12/15/30 (b) | | 3,720,000 | 3,538,650 |
| FLY Leasing Ltd. 7% 10/15/24 (b) | | 573,000 | 526,576 |
| GGAM Finance Ltd.: | | | |
| 7.75% 5/15/26 (b) | | 1,535,000 | 1,522,751 |
| 8% 6/15/28 (b) | | 4,260,000 | 4,202,127 |
| GTCR W-2 Merger Sub LLC 7.5% 1/15/31 (b) | | 4,005,000 | 3,954,337 |
| Hightower Holding LLC 6.75% 4/15/29 (b) | | 2,235,000 | 1,906,332 |
| HTA Group Ltd. 7% 12/18/25 (b) | | 6,843,000 | 6,590,972 |
| Icahn Enterprises LP/Icahn Enterprises Finance Corp.: | | | |
| 4.375% 2/1/29 | | 6,990,000 | 5,382,412 |
| 5.25% 5/15/27 | | 13,865,000 | 11,871,906 |
| 6.25% 5/15/26 | | 4,360,000 | 3,985,190 |
| Jefferies Finance LLC/JFIN Co-Issuer Corp. 5% 8/15/28 (b) | | 520,000 | 415,005 |
| Ladder Capital Finance Holdings LLLP/Ladder Capital Finance Corp. 4.75% 6/15/29 (b) | | 2,550,000 | 2,050,205 |
| LPL Holdings, Inc. 4.375% 5/15/31 (b) | | 730,000 | 611,396 |
| MSCI, Inc. 3.625% 9/1/30 (b) | | 2,905,000 | 2,403,831 |
| OneMain Finance Corp.: | | | |
| 3.5% 1/15/27 | | 5,220,000 | 4,410,900 |
| 3.875% 9/15/28 | | 6,243,000 | 4,935,927 |
| 6.875% 3/15/25 | | 290,000 | 286,112 |
| 7.125% 3/15/26 | | 3,425,000 | 3,326,226 |
| 9% 1/15/29 | | 330,000 | 322,575 |
| Scientific Games Holdings LP/Scientific Games U.S. Finco, Inc. 6.625% 3/1/30 (b) | | 1,880,000 | 1,616,800 |
| | | | 67,311,878 |
| Diversified Media - 0.2% | | | |
| Advantage Sales & Marketing, Inc. 6.5% 11/15/28 (b) | | 3,245,000 | 2,644,675 |
| Energy - 13.9% | | | |
| Altus Midstream LP 5.875% 6/15/30 (b) | | 2,270,000 | 2,082,838 |
| Antero Midstream Partners LP/Antero Midstream Finance Corp.: | | | |
| 5.75% 3/1/27 (b) | | 730,000 | 697,714 |
| 7.875% 5/15/26 (b) | | 730,000 | 735,149 |
| Atlantica Sustainable Infrastructure PLC 4.125% 6/15/28 (b) | | 4,200,000 | 3,626,997 |
| California Resources Corp. 7.125% 2/1/26 (b) | | 1,020,000 | 1,023,825 |
| Calumet Specialty Products Partners LP/Calumet Finance Corp. 9.75% 7/15/28 (b) | | 1,180,000 | 1,101,380 |
| Centennial Resource Production LLC: | | | |
| 5.875% 7/1/29 (b) | | 2,150,000 | 1,999,500 |
| 7% 1/15/32 (b) | | 400,000 | 387,757 |
| 7.75% 2/15/26 (b) | | 1,150,000 | 1,148,968 |
| CGG SA 8.75% 4/1/27 (b) | | 3,380,000 | 2,983,222 |
| Citgo Petroleum Corp.: | | | |
| 6.375% 6/15/26 (b) | | 3,110,000 | 3,055,440 |
| 8.375% 1/15/29 (b) | | 1,000,000 | 990,362 |
| CNX Resources Corp. 7.375% 1/15/31 (b) | | 855,000 | 816,932 |
| Comstock Resources, Inc.: | | | |
| 5.875% 1/15/30 (b) | | 1,910,000 | 1,633,069 |
| 6.75% 3/1/29 (b) | | 2,280,000 | 2,074,851 |
| Crestwood Midstream Partners LP/Crestwood Midstream Finance Corp.: | | | |
| 5.625% 5/1/27 (b) | | 11,785,000 | 11,335,756 |
| 5.75% 4/1/25 | | 2,685,000 | 2,651,438 |
| 6% 2/1/29 (b) | | 1,045,000 | 1,011,038 |
| 7.375% 2/1/31 (b) | | 1,455,000 | 1,466,655 |
| CrownRock LP/CrownRock Finance, Inc.: | | | |
| 5% 5/1/29 (b) | | 3,265,000 | 3,079,548 |
| 5.625% 10/15/25 (b) | | 395,000 | 388,511 |
| CVR Energy, Inc.: | | | |
| 5.25% 2/15/25 (b) | | 5,580,000 | 5,473,813 |
| 5.75% 2/15/28 (b) | | 4,910,000 | 4,411,439 |
| Delek Logistics Partners LP 7.125% 6/1/28 (b) | | 4,740,000 | 4,313,400 |
| DT Midstream, Inc.: | | | |
| 4.125% 6/15/29 (b) | | 575,000 | 494,390 |
| 4.375% 6/15/31 (b) | | 195,000 | 161,940 |
| Endeavor Energy Resources LP/EER Finance, Inc. 5.75% 1/30/28 (b) | | 1,380,000 | 1,323,820 |
| Energean PLC 6.5% 4/30/27 (b) | | 1,000,000 | 831,875 |
| EnLink Midstream LLC: | | | |
| 5.625% 1/15/28 (b) | | 1,365,000 | 1,287,093 |
| 6.5% 9/1/30 (b) | | 4,730,000 | 4,540,183 |
| EnLink Midstream Partners LP 4.85% 7/15/26 | | 1,310,000 | 1,231,422 |
| EQM Midstream Partners LP: | | | |
| 4.75% 1/15/31 (b) | | 600,000 | 505,202 |
| 6% 7/1/25 (b) | | 185,000 | 180,918 |
| 6.5% 7/1/27 (b) | | 610,000 | 592,923 |
| 6.5% 7/15/48 | | 300,000 | 253,670 |
| Global Partners LP/GLP Finance Corp. 6.875% 1/15/29 | | 3,538,000 | 3,122,469 |
| Harvest Midstream I LP 7.5% 9/1/28 (b) | | 3,565,000 | 3,378,026 |
| Hess Midstream Partners LP: | | | |
| 4.25% 2/15/30 (b) | | 1,330,000 | 1,138,049 |
| 5.125% 6/15/28 (b) | | 1,650,000 | 1,523,540 |
| 5.5% 10/15/30 (b) | | 730,000 | 662,698 |
| 5.625% 2/15/26 (b) | | 3,510,000 | 3,399,221 |
| Holly Energy Partners LP/Holly Energy Finance Corp. 5% 2/1/28 (b) | | 3,270,000 | 3,026,990 |
| Howard Midstream Energy Partners LLC 8.875% 7/15/28 (b) | | 3,210,000 | 3,227,099 |
| Jonah Energy Parent LLC 12% 11/5/25 (g)(h) | | 4,515,379 | 4,634,133 |
| New Fortress Energy, Inc.: | | | |
| 6.5% 9/30/26 (b) | | 20,250,000 | 18,137,861 |
| 6.75% 9/15/25 (b) | | 9,795,000 | 9,087,156 |
| NGL Energy Operating LLC/NGL Energy Finance Corp. 7.5% 2/1/26 (b) | | 2,055,000 | 2,006,052 |
| Northern Oil & Gas, Inc.: | | | |
| 8.125% 3/1/28 (b) | | 2,370,000 | 2,340,446 |
| 8.75% 6/15/31 (b) | | 760,000 | 756,161 |
| Occidental Petroleum Corp.: | | | |
| 4.2% 3/15/48 | | 735,000 | 495,412 |
| 4.4% 4/15/46 | | 2,205,000 | 1,572,981 |
| 4.4% 8/15/49 | | 1,030,000 | 673,507 |
| 4.5% 7/15/44 | | 1,805,000 | 1,254,313 |
| 6.125% 1/1/31 | | 2,385,000 | 2,332,435 |
| 6.45% 9/15/36 | | 1,685,000 | 1,636,607 |
| 6.625% 9/1/30 | | 6,800,000 | 6,820,782 |
| 7.5% 5/1/31 | | 2,790,000 | 2,925,566 |
| 7.95% 6/15/39 | | 365,000 | 390,185 |
| 8.875% 7/15/30 | | 2,720,000 | 3,020,451 |
| PBF Holding Co. LLC/PBF Finance Corp. 7.875% 9/15/30 (b) | | 5,325,000 | 5,161,576 |
| Rockies Express Pipeline LLC: | | | |
| 4.8% 5/15/30 (b) | | 2,185,000 | 1,836,825 |
| 4.95% 7/15/29 (b) | | 3,370,000 | 2,970,076 |
| 6.875% 4/15/40 (b) | | 330,000 | 274,664 |
| Seadrill Finance Ltd. 8.375% 8/1/30 (b) | | 740,000 | 740,237 |
| Sitio Royalties OP / Sitio Finance Corp. 7.875% 11/1/28 (b) | | 1,000,000 | 986,400 |
| SM Energy Co. 5.625% 6/1/25 | | 1,915,000 | 1,864,048 |
| Southwestern Energy Co. 4.75% 2/1/32 | | 3,505,000 | 3,014,256 |
| Suburban Propane Partners LP/Suburban Energy Finance Corp. 5.875% 3/1/27 | | 275,000 | 260,563 |
| Sunnova Energy Corp.: | | | |
| 5.875% 9/1/26 (b) | | 2,025,000 | 1,640,311 |
| 11.75% 10/1/28 (b) | | 500,000 | 426,515 |
| Sunoco LP/Sunoco Finance Corp.: | | | |
| 4.5% 5/15/29 | | 2,585,000 | 2,239,210 |
| 5.875% 3/15/28 | | 2,780,000 | 2,629,858 |
| Superior Plus LP / Superior General Partner, Inc. 4.5% 3/15/29 (b) | | 2,010,000 | 1,714,389 |
| Tallgrass Energy Partners LP / Tallgrass Energy Finance Corp.: | | | |
| 5.5% 1/15/28 (b) | | 4,880,000 | 4,275,126 |
| 6% 3/1/27 (b) | | 3,126,000 | 2,859,964 |
| 6% 12/31/30 (b) | | 11,005,000 | 9,264,377 |
| 6% 9/1/31 (b) | | 4,865,000 | 4,093,752 |
| 7.5% 10/1/25 (b) | | 4,735,000 | 4,664,690 |
| Teine Energy Ltd. 6.875% 4/15/29 (b) | | 395,000 | 365,869 |
| Transocean Aquila Ltd. 8% 9/30/28 (b) | | 560,000 | 550,894 |
| Transocean Poseidon Ltd. 6.875% 2/1/27 (b) | | 1,065,000 | 1,043,700 |
| Transocean, Inc.: | | | |
| 7.5% 1/15/26 (b) | | 1,145,000 | 1,096,750 |
| 8% 2/1/27 (b) | | 4,274,000 | 4,011,747 |
| 8.75% 2/15/30 (b) | | 1,800,250 | 1,794,939 |
| Valaris Ltd. 8.375% 4/30/30 (b) | | 3,400,000 | 3,336,250 |
| Viper Energy Partners LP 7.375% 11/1/31 (b) | | 570,000 | 568,575 |
| Western Gas Partners LP: | | | |
| 5.25% 2/1/50 | | 1,470,000 | 1,086,271 |
| 5.3% 3/1/48 | | 735,000 | 549,443 |
| 5.5% 8/15/48 | | 440,000 | 333,617 |
| | | | 213,110,070 |
| Environmental - 1.2% | | | |
| Clean Harbors, Inc. 6.375% 2/1/31 (b) | | 690,000 | 655,819 |
| Covanta Holding Corp. 4.875% 12/1/29 (b) | | 2,860,000 | 2,230,800 |
| Darling Ingredients, Inc. 6% 6/15/30 (b) | | 1,345,000 | 1,261,878 |
| GFL Environmental, Inc.: | | | |
| 3.75% 8/1/25 (b) | | 1,460,000 | 1,380,828 |
| 5.125% 12/15/26 (b) | | 1,460,000 | 1,385,379 |
| Madison IAQ LLC: | | | |
| 4.125% 6/30/28 (b) | | 3,790,000 | 3,166,472 |
| 5.875% 6/30/29 (b) | | 3,850,000 | 2,982,346 |
| Stericycle, Inc.: | | | |
| 3.875% 1/15/29 (b) | | 5,170,000 | 4,392,701 |
| 5.375% 7/15/24 (b) | | 990,000 | 977,437 |
| | | | 18,433,660 |
| Food & Drug Retail - 1.0% | | | |
| Albertsons Companies LLC/Safeway, Inc./New Albertson's, Inc./Albertson's LLC: | | | |
| 3.25% 3/15/26 (b) | | 395,000 | 364,857 |
| 3.5% 3/15/29 (b) | | 3,660,000 | 3,120,520 |
| 4.875% 2/15/30 (b) | | 3,835,000 | 3,423,948 |
| BellRing Brands, Inc. 7% 3/15/30 (b) | | 585,000 | 568,181 |
| Emergent BioSolutions, Inc. 3.875% 8/15/28 (b) | | 5,715,000 | 2,247,281 |
| Murphy Oil U.S.A., Inc. 3.75% 2/15/31 (b) | | 1,315,000 | 1,056,434 |
| Parkland Corp.: | | | |
| 4.5% 10/1/29 (b) | | 980,000 | 842,898 |
| 4.625% 5/1/30 (b) | | 4,735,000 | 4,036,588 |
| | | | 15,660,707 |
| Food/Beverage/Tobacco - 1.7% | | | |
| C&S Group Enterprises LLC 5% 12/15/28 (b) | | 3,320,000 | 2,568,850 |
| Chobani LLC/Finance Corp., Inc. 4.625% 11/15/28 (b) | | 585,000 | 505,774 |
| Lamb Weston Holdings, Inc.: | | | |
| 4.125% 1/31/30 (b) | | 4,645,000 | 3,940,458 |
| 4.375% 1/31/32 (b) | | 735,000 | 608,115 |
| Performance Food Group, Inc. 5.5% 10/15/27 (b) | | 335,000 | 313,250 |
| Pilgrim's Pride Corp.: | | | |
| 3.5% 3/1/32 | | 730,000 | 556,114 |
| 4.25% 4/15/31 | | 865,000 | 712,482 |
| Post Holdings, Inc.: | | | |
| 4.625% 4/15/30 (b) | | 2,035,000 | 1,704,085 |
| 5.5% 12/15/29 (b) | | 2,055,000 | 1,832,677 |
| Primo Water Holdings, Inc. 4.375% 4/30/29 (b) | | 1,815,000 | 1,531,334 |
| TreeHouse Foods, Inc. 4% 9/1/28 | | 1,265,000 | 1,028,359 |
| Triton Water Holdings, Inc. 6.25% 4/1/29 (b) | | 8,405,000 | 6,927,273 |
| U.S. Foods, Inc.: | | | |
| 4.625% 6/1/30 (b) | | 1,725,000 | 1,472,988 |
| 4.75% 2/15/29 (b) | | 1,695,000 | 1,495,256 |
| 6.875% 9/15/28 (b) | | 1,000,000 | 977,364 |
| United Natural Foods, Inc. 6.75% 10/15/28 (b) | | 295,000 | 232,130 |
| | | | 26,406,509 |
| Gaming - 1.8% | | | |
| Affinity Gaming LLC 6.875% 12/15/27 (b) | | 4,930,000 | 4,018,374 |
| Caesars Entertainment, Inc.: | | | |
| 6.25% 7/1/25 (b) | | 2,430,000 | 2,390,846 |
| 8.125% 7/1/27 (b) | | 3,509,000 | 3,476,977 |
| Caesars Resort Collection LLC 5.75% 7/1/25 (b) | | 2,980,000 | 2,932,376 |
| Carnival Corp. 10.5% 6/1/30 (b) | | 4,240,000 | 4,302,002 |
| Fertitta Entertainment LLC / Fertitta Entertainment Finance Co., Inc. 6.75% 1/15/30 (b) | | 2,845,000 | 2,261,067 |
| Golden Entertainment, Inc. 7.625% 4/15/26 (b) | | 2,005,000 | 2,005,002 |
| Jacobs Entertainment, Inc. 6.75% 2/15/29 (b) | | 2,000,000 | 1,700,000 |
| Scientific Games Corp. 7.5% 9/1/31 (b) | | 1,200,000 | 1,171,714 |
| Station Casinos LLC 4.5% 2/15/28 (b) | | 390,000 | 336,814 |
| Transocean, Inc. 7.25% 11/1/25 (b) | | 745,000 | 726,949 |
| VICI Properties LP / VICI Note Co. 4.125% 8/15/30 (b) | | 1,465,000 | 1,208,552 |
| Wynn Resorts Finance LLC / Wynn Resorts Capital Corp. 7.125% 2/15/31 (b) | | 735,000 | 684,448 |
| | | | 27,215,121 |
| Healthcare - 7.0% | | | |
| 1375209 BC Ltd. 9% 1/30/28 (b) | | 2,883,000 | 2,794,739 |
| 180 Medical, Inc. 3.875% 10/15/29 (b) | | 1,435,000 | 1,192,165 |
| AdaptHealth LLC 5.125% 3/1/30 (b) | | 3,098,000 | 2,346,735 |
| AMN Healthcare 4% 4/15/29 (b) | | 925,000 | 766,068 |
| Avantor Funding, Inc.: | | | |
| 3.875% 11/1/29 (b) | | 1,830,000 | 1,531,593 |
| 4.625% 7/15/28 (b) | | 280,000 | 249,231 |
| Bausch Health Companies, Inc.: | | | |
| 5.5% 11/1/25 (b) | | 3,913,000 | 3,374,963 |
| 9% 12/15/25 (b) | | 400,000 | 346,961 |
| Cano Health, Inc. 6.25% 10/1/28 (b) | | 1,350,000 | 540,000 |
| Catalent Pharma Solutions 3.5% 4/1/30 (b) | | 1,295,000 | 1,014,956 |
| Charles River Laboratories International, Inc.: | | | |
| 3.75% 3/15/29 (b) | | 1,300,000 | 1,097,291 |
| 4% 3/15/31 (b) | | 1,310,000 | 1,069,215 |
| 4.25% 5/1/28 (b) | | 385,000 | 342,088 |
| Community Health Systems, Inc.: | | | |
| 4.75% 2/15/31 (b) | | 5,905,000 | 3,957,797 |
| 5.25% 5/15/30 (b) | | 14,150,000 | 10,048,680 |
| 5.625% 3/15/27 (b) | | 5,260,000 | 4,273,401 |
| 6% 1/15/29 (b) | | 3,600,000 | 2,727,000 |
| 6.125% 4/1/30 (b) | | 4,990,000 | 1,933,625 |
| 6.875% 4/15/29 (b) | | 6,890,000 | 2,844,950 |
| 8% 3/15/26 (b) | | 1,150,000 | 1,051,164 |
| CTR Partnership LP/CareTrust Capital Corp. 3.875% 6/30/28 (b) | | 3,610,000 | 3,032,889 |
| DaVita HealthCare Partners, Inc.: | | | |
| 3.75% 2/15/31 (b) | | 1,280,000 | 920,071 |
| 4.625% 6/1/30 (b) | | 6,215,000 | 4,870,759 |
| Embecta Corp. 5% 2/15/30 (b) | | 1,680,000 | 1,334,038 |
| Grifols SA 4.75% 10/15/28 (b) | | 2,780,000 | 2,328,250 |
| HealthEquity, Inc. 4.5% 10/1/29 (b) | | 1,595,000 | 1,366,276 |
| Hologic, Inc. 3.25% 2/15/29 (b) | | 765,000 | 642,232 |
| IQVIA, Inc. 6.5% 5/15/30 (b) | | 1,525,000 | 1,479,250 |
| Jazz Securities DAC 4.375% 1/15/29 (b) | | 2,600,000 | 2,261,138 |
| ModivCare Escrow Issuer, Inc. 5% 10/1/29 (b) | | 1,910,000 | 1,391,989 |
| Modivcare, Inc. 5.875% 11/15/25 (b) | | 2,180,000 | 2,060,100 |
| Molina Healthcare, Inc.: | | | |
| 3.875% 11/15/30 (b) | | 1,385,000 | 1,129,633 |
| 3.875% 5/15/32 (b) | | 785,000 | 616,821 |
| Mozart Borrower LP 3.875% 4/1/29 (b) | | 730,000 | 616,387 |
| Omega Healthcare Investors, Inc. 3.25% 4/15/33 | | 4,360,000 | 3,107,537 |
| Organon & Co. / Organon Foreign Debt Co-Issuer BV: | | | |
| 4.125% 4/30/28 (b) | | 5,440,000 | 4,698,855 |
| 5.125% 4/30/31 (b) | | 1,780,000 | 1,390,032 |
| Owens & Minor, Inc. 4.5% 3/31/29 (b) | | 215,000 | 172,503 |
| Pediatrix Medical Group, Inc. 5.375% 2/15/30 (b) | | 4,150,000 | 3,579,126 |
| Regionalcare Hospital Partners 9.75% 12/1/26 (b) | | 1,560,000 | 1,458,578 |
| RegionalCare Hospital Partners Holdings, Inc.: | | | |
| 5.375% 1/15/29 (b) | | 1,375,000 | 833,041 |
| 9.875% 8/15/30 (b) | | 1,810,000 | 1,635,788 |
| 11% 10/15/30 (b) | | 190,000 | 178,805 |
| RP Escrow Issuer LLC 5.25% 12/15/25 (b) | | 3,545,000 | 2,525,813 |
| Teleflex, Inc. 4.25% 6/1/28 (b) | | 1,275,000 | 1,125,189 |
| Tenet Healthcare Corp.: | | | |
| 4.25% 6/1/29 | | 4,025,000 | 3,444,483 |
| 4.375% 1/15/30 | | 3,835,000 | 3,244,056 |
| 6.125% 10/1/28 | | 4,245,000 | 3,937,238 |
| 6.125% 6/15/30 | | 4,165,000 | 3,855,460 |
| 6.25% 2/1/27 | | 1,405,000 | 1,347,320 |
| 6.75% 5/15/31 (b) | | 530,000 | 503,306 |
| Teva Pharmaceutical Finance Netherlands III BV: | | | |
| 3.15% 10/1/26 | | 1,775,000 | 1,562,754 |
| 7.875% 9/15/29 | | 450,000 | 443,733 |
| 8.125% 9/15/31 | | 450,000 | 445,532 |
| | | | 107,041,604 |
| Homebuilders/Real Estate - 3.9% | | | |
| Anywhere Real Estate Group LLC 7% 4/15/30 (b) | | 1,194,400 | 983,141 |
| Ashton Woods U.S.A. LLC/Ashton Woods Finance Co. 4.625% 8/1/29 (b) | | 2,060,000 | 1,666,913 |
| Greystar Real Estate Partners 7.75% 9/1/30 (b) | | 750,000 | 736,875 |
| Howard Hughes Corp.: | | | |
| 4.125% 2/1/29 (b) | | 1,830,000 | 1,468,575 |
| 4.375% 2/1/31 (b) | | 995,000 | 757,390 |
| Kennedy-Wilson, Inc. 4.75% 2/1/30 | | 2,080,000 | 1,518,400 |
| MPT Operating Partnership LP/MPT Finance Corp.: | | | |
| 3.5% 3/15/31 | | 8,590,000 | 5,208,924 |
| 4.625% 8/1/29 | | 3,225,000 | 2,232,769 |
| 5% 10/15/27 | | 13,950,000 | 10,771,246 |
| 5.25% 8/1/26 | | 2,585,000 | 2,225,719 |
| Railworks Holdings LP 8.25% 11/15/28 (b) | | 3,585,000 | 3,409,443 |
| Realogy Group LLC/Realogy Co-Issuer Corp. 5.75% 1/15/29 (b) | | 43,000 | 26,983 |
| Realogy Group LLC/Realogy Co.-Issuer Corp. 5.25% 4/15/30 (b) | | 34,000 | 21,170 |
| Safehold Operating Partnership LP 2.8% 6/15/31 | | 2,200,000 | 1,621,383 |
| Taylor Morrison Communities, Inc./Monarch Communities, Inc. 5.125% 8/1/30 (b) | | 535,000 | 449,616 |
| TopBuild Corp. 4.125% 2/15/32 (b) | | 1,320,000 | 1,044,252 |
| TRI Pointe Group, Inc./TRI Pointe Holdings, Inc. 5.875% 6/15/24 | | 40,000 | 39,599 |
| TRI Pointe Homes, Inc. 5.7% 6/15/28 | | 295,000 | 262,653 |
| Uniti Group LP / Uniti Group Finance, Inc.: | | | |
| 4.75% 4/15/28 (b) | | 10,260,000 | 8,291,851 |
| 6.5% 2/15/29 (b) | | 20,990,000 | 13,631,065 |
| 10.5% 2/15/28 (b) | | 2,930,000 | 2,821,455 |
| | | | 59,189,422 |
| Hotels - 0.4% | | | |
| Hilton Domestic Operating Co., Inc.: | | | |
| 3.625% 2/15/32 (b) | | 4,555,000 | 3,600,606 |
| 3.75% 5/1/29 (b) | | 10,000 | 8,608 |
| 4% 5/1/31 (b) | | 2,205,000 | 1,826,106 |
| Lindblad Expeditions LLC 6.75% 2/15/27 (b) | | 395,000 | 359,975 |
| | | | 5,795,295 |
| Insurance - 0.7% | | | |
| Acrisure LLC / Acrisure Finance, Inc.: | | | |
| 4.25% 2/15/29 (b) | | 585,000 | 479,682 |
| 7% 11/15/25 (b) | | 295,000 | 286,013 |
| Alliant Holdings Intermediate LLC: | | | |
| 6.75% 10/15/27 (b) | | 740,000 | 675,812 |
| 6.75% 4/15/28 (b) | | 735,000 | 698,430 |
| AmWINS Group, Inc. 4.875% 6/30/29 (b) | | 2,045,000 | 1,750,606 |
| AssuredPartners, Inc. 5.625% 1/15/29 (b) | | 2,915,000 | 2,472,884 |
| HUB International Ltd.: | | | |
| 7% 5/1/26 (b) | | 1,040,000 | 1,012,348 |
| 7.25% 6/15/30 (b) | | 1,965,000 | 1,916,779 |
| National Financial Partners Corp. 8.5% 10/1/31 (b) | | 1,000,000 | 983,247 |
| | | | 10,275,801 |
| Leisure - 2.7% | | | |
| Carnival Corp.: | | | |
| 5.75% 3/1/27 (b) | | 5,055,000 | 4,523,031 |
| 6% 5/1/29 (b) | | 3,000,000 | 2,534,772 |
| 6.65% 1/15/28 | | 720,000 | 606,167 |
| 7% 8/15/29 (b) | | 860,000 | 843,265 |
| 7.625% 3/1/26 (b) | | 5,780,000 | 5,620,430 |
| ClubCorp Holdings, Inc. 8.5% 9/15/25 (b) | | 425,000 | 360,145 |
| MajorDrive Holdings IV LLC 6.375% 6/1/29 (b) | | 2,880,000 | 2,232,000 |
| NCL Corp. Ltd.: | | | |
| 5.875% 3/15/26 (b) | | 1,585,000 | 1,422,538 |
| 7.75% 2/15/29 (b) | | 4,040,000 | 3,526,071 |
| NCL Finance Ltd. 6.125% 3/15/28 (b) | | 1,390,000 | 1,162,369 |
| Royal Caribbean Cruises Ltd.: | | | |
| 4.25% 7/1/26 (b) | | 5,935,000 | 5,459,025 |
| 5.375% 7/15/27 (b) | | 2,775,000 | 2,557,372 |
| 5.5% 8/31/26 (b) | | 4,870,000 | 4,595,722 |
| 5.5% 4/1/28 (b) | | 3,715,000 | 3,388,137 |
| Viking Cruises Ltd. 9.125% 7/15/31 (b) | | 535,000 | 525,638 |
| Viking Ocean Cruises Ship VII Ltd. 5.625% 2/15/29 (b) | | 1,545,000 | 1,369,256 |
| Voc Escrow Ltd. 5% 2/15/28 (b) | | 1,420,000 | 1,275,760 |
| | | | 42,001,698 |
| Metals/Mining - 1.4% | | | |
| Arsenal AIC Parent LLC 8% 10/1/30 (b) | | 995,000 | 982,563 |
| Constellium NV 5.875% 2/15/26 (b) | | 823,000 | 788,837 |
| Eldorado Gold Corp. 6.25% 9/1/29 (b) | | 125,000 | 106,719 |
| ERO Copper Corp. 6.5% 2/15/30 (b) | | 4,560,000 | 3,868,202 |
| First Quantum Minerals Ltd.: | | | |
| 6.875% 10/15/27 (b) | | 2,385,000 | 2,009,363 |
| 8.625% 6/1/31 (b) | | 1,625,000 | 1,371,665 |
| FMG Resources Pty Ltd.: | | | |
| 4.375% 4/1/31 (b) | | 730,000 | 588,423 |
| 4.5% 9/15/27 (b) | | 850,000 | 765,349 |
| Howmet Aerospace, Inc. 5.95% 2/1/37 | | 585,000 | 534,402 |
| HudBay Minerals, Inc. 4.5% 4/1/26 (b) | | 1,485,000 | 1,382,111 |
| Mineral Resources Ltd.: | | | |
| 8% 11/1/27 (b) | | 1,980,000 | 1,913,254 |
| 8.5% 5/1/30 (b) | | 2,310,000 | 2,221,204 |
| 9.25% 10/1/28 (b) | | 1,510,000 | 1,510,000 |
| Novelis Corp.: | | | |
| 3.25% 11/15/26 (b) | | 445,000 | 396,113 |
| 3.875% 8/15/31 (b) | | 740,000 | 577,940 |
| PMHC II, Inc. 9% 2/15/30 (b) | | 3,135,000 | 2,495,127 |
| | | | 21,511,272 |
| Paper - 0.6% | | | |
| Ardagh Metal Packaging Finance U.S.A. LLC/Ardagh Metal Packaging Finance PLC: | | | |
| 4% 9/1/29 (b) | | 1,040,000 | 780,072 |
| 6% 6/15/27 (b) | | 2,930,000 | 2,768,839 |
| Clydesdale Acquisition Holdings, Inc.: | | | |
| 6.625% 4/15/29 (b) | | 1,405,000 | 1,276,298 |
| 8.75% 4/15/30 (b) | | 2,250,000 | 1,793,430 |
| Mercer International, Inc. 5.125% 2/1/29 | | 950,000 | 744,921 |
| SPA Holdings 3 OY 4.875% 2/4/28 (b) | | 2,875,000 | 2,345,483 |
| | | | 9,709,043 |
| Publishing/Printing - 0.0% | | | |
| Cimpress PLC 7% 6/15/26 | | 660,000 | 610,777 |
| Railroad - 0.0% | | | |
| First Student Bidco, Inc./First Transit Parent, Inc. 4% 7/31/29 (b) | | 720,000 | 579,600 |
| Restaurants - 0.6% | | | |
| 1011778 BC Unlimited Liability Co./New Red Finance, Inc.: | | | |
| 3.875% 1/15/28 (b) | | 1,265,000 | 1,129,389 |
| 4% 10/15/30 (b) | | 3,170,000 | 2,596,301 |
| Garden SpinCo Corp. 8.625% 7/20/30 (b) | | 740,000 | 763,510 |
| Yum! Brands, Inc.: | | | |
| 3.625% 3/15/31 | | 735,000 | 596,852 |
| 4.625% 1/31/32 | | 3,255,000 | 2,773,672 |
| 5.375% 4/1/32 | | 585,000 | 525,862 |
| | | | 8,385,586 |
| Services - 5.1% | | | |
| AECOM 5.125% 3/15/27 | | 980,000 | 925,219 |
| Allied Universal Holdco LLC / Allied Universal Finance Corp.: | | | |
| 6% 6/1/29 (b) | | 2,785,000 | 2,012,163 |
| 9.75% 7/15/27 (b) | | 5,232,000 | 4,544,652 |
| APX Group, Inc.: | | | |
| 5.75% 7/15/29 (b) | | 1,525,000 | 1,267,830 |
| 6.75% 2/15/27 (b) | | 2,660,000 | 2,567,991 |
| Aramark Services, Inc. 5% 2/1/28 (b) | | 760,000 | 697,033 |
| ASGN, Inc. 4.625% 5/15/28 (b) | | 1,395,000 | 1,235,251 |
| Brand Energy & Infrastructure Services, Inc. 10.375% 8/1/30 (b) | | 6,675,000 | 6,624,938 |
| CoreCivic, Inc.: | | | |
| 4.75% 10/15/27 | | 3,675,000 | 3,192,656 |
| 8.25% 4/15/26 | | 5,028,000 | 5,090,492 |
| CoreLogic, Inc. 4.5% 5/1/28 (b) | | 2,080,000 | 1,648,400 |
| Fair Isaac Corp. 4% 6/15/28 (b) | | 3,295,000 | 2,934,158 |
| Gartner, Inc. 3.625% 6/15/29 (b) | | 575,000 | 485,563 |
| GEMS MENASA Cayman Ltd. 7.125% 7/31/26 (b) | | 6,764,000 | 6,476,530 |
| Hertz Corp. 5% 12/1/29 (b) | | 395,000 | 283,572 |
| Iron Mountain, Inc. 4.5% 2/15/31 (b) | | 730,000 | 597,128 |
| Korn Ferry 4.625% 12/15/27 (b) | | 540,000 | 491,167 |
| Legends Hospitality Holding Co. LLC/Legends Hospitality Co-Issuer, Inc. 5% 2/1/26 (b) | | 2,401,000 | 2,289,824 |
| Life Time, Inc. 8% 4/15/26 (b) | | 3,210,000 | 3,129,750 |
| Neptune BidCo U.S., Inc. 9.29% 4/15/29 (b) | | 3,423,000 | 3,020,964 |
| PowerTeam Services LLC 9.033% 12/4/25 (b) | | 4,757,000 | 4,281,300 |
| Prime Securities Services Borrower LLC/Prime Finance, Inc. 5.75% 4/15/26 (b) | | 1,460,000 | 1,416,357 |
| Service Corp. International: | | | |
| 4% 5/15/31 | | 1,285,000 | 1,040,092 |
| 5.125% 6/1/29 | | 810,000 | 741,150 |
| Sotheby's 7.375% 10/15/27 (b) | | 1,700,000 | 1,518,245 |
| The GEO Group, Inc.: | | | |
| 6% 4/15/26 | | 490,000 | 445,916 |
| 9.5% 12/31/28 (b) | | 3,300,000 | 3,176,250 |
| TriNet Group, Inc.: | | | |
| 3.5% 3/1/29 (b) | | 4,635,000 | 3,827,327 |
| 7.125% 8/15/31 (b) | | 875,000 | 845,968 |
| Uber Technologies, Inc.: | | | |
| 4.5% 8/15/29 (b) | | 345,000 | 304,267 |
| 7.5% 5/15/25 (b) | | 3,795,000 | 3,799,710 |
| 8% 11/1/26 (b) | | 4,365,000 | 4,395,782 |
| WASH Multifamily Acquisition, Inc. 5.75% 4/15/26 (b) | | 3,350,000 | 3,098,750 |
| | | | 78,406,395 |
| Steel - 0.4% | | | |
| ATI, Inc. 7.25% 8/15/30 | | 820,000 | 789,398 |
| Commercial Metals Co.: | | | |
| 3.875% 2/15/31 | | 880,000 | 713,342 |
| 4.125% 1/15/30 | | 2,495,000 | 2,105,685 |
| Roller Bearing Co. of America, Inc. 4.375% 10/15/29 (b) | | 2,005,000 | 1,700,260 |
| | | | 5,308,685 |
| Super Retail - 1.6% | | | |
| Bath & Body Works, Inc. 6.694% 1/15/27 | | 1,123,000 | 1,085,462 |
| Carvana Co.: | | | |
| 4.875% 9/1/29 (b) | | 1,872,000 | 1,053,757 |
| 5.5% 4/15/27 (b) | | 1,512,000 | 1,002,518 |
| 5.875% 10/1/28 (b) | | 889,000 | 515,397 |
| 9% 12/1/28 pay-in-kind (b)(c) | | 693,000 | 515,698 |
| 9% 6/1/30 pay-in-kind (b)(c) | | 1,042,000 | 771,080 |
| 9% 6/1/31 pay-in-kind (b)(c) | | 1,233,000 | 918,585 |
| EG Global Finance PLC: | | | |
| 6.75% 2/7/25 (b) | | 5,642,000 | 5,582,195 |
| 8.5% 10/30/25 (b) | | 2,615,000 | 2,572,506 |
| Hanesbrands, Inc. 4.875% 5/15/26 (b) | | 395,000 | 362,932 |
| LBM Acquisition LLC 6.25% 1/15/29 (b) | | 2,405,000 | 1,899,950 |
| Levi Strauss & Co. 3.5% 3/1/31 (b) | | 1,245,000 | 969,311 |
| Michaels Companies, Inc.: | | | |
| 5.25% 5/1/28 (b) | | 2,095,000 | 1,517,953 |
| 7.875% 5/1/29 (b) | | 1,315,000 | 733,113 |
| Nordstrom, Inc.: | | | |
| 4.25% 8/1/31 | | 685,000 | 501,817 |
| 4.375% 4/1/30 | | 435,000 | 337,654 |
| Sally Holdings LLC 5.625% 12/1/25 | | 1,605,000 | 1,551,490 |
| Wolverine World Wide, Inc. 4% 8/15/29 (b) | | 4,356,000 | 3,247,821 |
| | | | 25,139,239 |
| Technology - 5.5% | | | |
| Acuris Finance U.S. 5% 5/1/28 (b) | | 5,535,000 | 4,358,813 |
| Athenahealth Group, Inc. 6.5% 2/15/30 (b) | | 1,480,000 | 1,209,524 |
| Black Knight InfoServ LLC 3.625% 9/1/28 (b) | | 3,665,000 | 3,261,850 |
| Block, Inc.: | | | |
| 2.75% 6/1/26 | | 730,000 | 655,074 |
| 3.5% 6/1/31 | | 4,995,000 | 3,854,914 |
| Clarivate Science Holdings Corp.: | | | |
| 3.875% 7/1/28 (b) | | 1,050,000 | 901,533 |
| 4.875% 7/1/29 (b) | | 1,065,000 | 898,205 |
| Cloud Software Group, Inc. 9% 9/30/29 (b) | | 7,360,000 | 6,267,666 |
| CNT PRNT/CDK GLO II/FIN 8% 6/15/29 (b) | | 1,975,000 | 1,950,772 |
| Coherent Corp. 5% 12/15/29 (b) | | 4,115,000 | 3,491,866 |
| CommScope, Inc.: | | | |
| 4.75% 9/1/29 (b) | | 2,985,000 | 2,037,263 |
| 6% 3/1/26 (b) | | 1,445,000 | 1,213,772 |
| Elastic NV 4.125% 7/15/29 (b) | | 2,363,000 | 1,991,452 |
| Entegris Escrow Corp.: | | | |
| 4.75% 4/15/29 (b) | | 550,000 | 492,549 |
| 5.95% 6/15/30 (b) | | 4,375,000 | 4,002,437 |
| Entegris, Inc. 3.625% 5/1/29 (b) | | 1,300,000 | 1,087,184 |
| Gartner, Inc. 4.5% 7/1/28 (b) | | 750,000 | 674,789 |
| Gen Digital, Inc.: | | | |
| 5% 4/15/25 (b) | | 1,480,000 | 1,432,847 |
| 7.125% 9/30/30 (b) | | 740,000 | 719,910 |
| Go Daddy Operating Co. LLC / GD Finance Co., Inc.: | | | |
| 3.5% 3/1/29 (b) | | 4,760,000 | 3,995,784 |
| 5.25% 12/1/27 (b) | | 855,000 | 801,248 |
| GrafTech Global Enterprises, Inc. 9.875% 12/15/28 (b) | | 980,000 | 877,578 |
| ION Trading Technologies Ltd. 5.75% 5/15/28 (b) | | 5,045,000 | 4,187,350 |
| Match Group Holdings II LLC: | | | |
| 3.625% 10/1/31 (b) | | 440,000 | 337,700 |
| 4.125% 8/1/30 (b) | | 930,000 | 755,653 |
| McAfee Corp. 7.375% 2/15/30 (b) | | 1,380,000 | 1,103,966 |
| MicroStrategy, Inc. 6.125% 6/15/28 (b) | | 3,765,000 | 3,407,325 |
| NCR Atleos Escrow Corp. 9.5% 4/1/29 (b) | | 1,800,000 | 1,764,414 |
| ON Semiconductor Corp. 3.875% 9/1/28 (b) | | 305,000 | 262,019 |
| Open Text Corp.: | | | |
| 3.875% 2/15/28 (b) | | 1,790,000 | 1,555,644 |
| 3.875% 12/1/29 (b) | | 905,000 | 740,092 |
| Open Text Holdings, Inc.: | | | |
| 4.125% 2/15/30 (b) | | 3,045,000 | 2,523,084 |
| 4.125% 12/1/31 (b) | | 3,370,000 | 2,647,200 |
| Rackspace Hosting, Inc.: | | | |
| 3.5% 2/15/28 (b) | | 2,435,000 | 1,067,350 |
| 5.375% 12/1/28 (b) | | 4,625,000 | 1,352,444 |
| Roblox Corp. 3.875% 5/1/30 (b) | | 3,335,000 | 2,706,052 |
| Seagate HDD Cayman: | | | |
| 5.75% 12/1/34 | | 2,105,000 | 1,781,563 |
| 8.25% 12/15/29 (b) | | 765,000 | 777,414 |
| 8.5% 7/15/31 (b) | | 925,000 | 941,246 |
| Sensata Technologies BV: | | | |
| 4% 4/15/29 (b) | | 2,060,000 | 1,752,111 |
| 5% 10/1/25 (b) | | 295,000 | 286,819 |
| Sensata Technologies, Inc. 3.75% 2/15/31 (b) | | 735,000 | 588,255 |
| SS&C Technologies, Inc. 5.5% 9/30/27 (b) | | 595,000 | 558,272 |
| TTM Technologies, Inc. 4% 3/1/29 (b) | | 4,365,000 | 3,579,256 |
| Veritas U.S., Inc./Veritas Bermuda Ltd. 7.5% 9/1/25 (b) | | 1,197,000 | 979,834 |
| Virtusa Corp. 7.125% 12/15/28 (b) | | 795,000 | 629,083 |
| VM Consolidated, Inc. 5.5% 4/15/29 (b) | | 400,000 | 354,228 |
| | | | 82,815,404 |
| Telecommunications - 5.3% | | | |
| Altice Financing SA: | | | |
| 5% 1/15/28 (b) | | 1,750,000 | 1,423,217 |
| 5.75% 8/15/29 (b) | | 11,520,000 | 8,908,236 |
| Altice France Holding SA 6% 2/15/28 (b) | | 6,050,000 | 2,653,262 |
| Altice France SA: | | | |
| 5.125% 1/15/29 (b) | | 7,085,000 | 4,890,809 |
| 5.125% 7/15/29 (b) | | 8,025,000 | 5,494,720 |
| 5.5% 1/15/28 (b) | | 2,115,000 | 1,571,516 |
| 5.5% 10/15/29 (b) | | 30,000 | 20,637 |
| C&W Senior Financing Designated Activity Co. 6.875% 9/15/27 (b) | | 7,267,000 | 6,211,832 |
| Cablevision Lightpath LLC: | | | |
| 3.875% 9/15/27 (b) | | 2,555,000 | 2,078,401 |
| 5.625% 9/15/28 (b) | | 2,730,000 | 2,042,825 |
| Consolidated Communications, Inc. 5% 10/1/28 (b) | | 2,005,000 | 1,510,387 |
| Frontier Communications Holdings LLC: | | | |
| 5% 5/1/28 (b) | | 1,595,000 | 1,377,108 |
| 5.875% 10/15/27 (b) | | 1,860,000 | 1,695,703 |
| 5.875% 11/1/29 | | 2,515,000 | 1,890,319 |
| 8.75% 5/15/30 (b) | | 2,825,000 | 2,691,525 |
| IHS Netherlands Holdco BV 8% 9/18/27 (b) | | 920,000 | 750,490 |
| Intelsat Jackson Holdings SA 6.5% 3/15/30 (b) | | 2,815,000 | 2,471,657 |
| LCPR Senior Secured Financing DAC 5.125% 7/15/29 (b) | | 1,355,000 | 1,055,563 |
| Level 3 Financing, Inc.: | | | |
| 3.625% 1/15/29 (b) | | 4,705,000 | 2,402,820 |
| 4.25% 7/1/28 (b) | | 1,950,000 | 1,102,672 |
| 10.5% 5/15/30 (b) | | 3,258,000 | 3,260,553 |
| Millicom International Cellular SA: | | | |
| 4.5% 4/27/31 (b) | | 2,230,000 | 1,662,019 |
| 5.125% 1/15/28 (b) | | 1,885,500 | 1,616,816 |
| Sable International Finance Ltd. 5.75% 9/7/27 (b) | | 130,000 | 116,368 |
| SBA Communications Corp. 3.125% 2/1/29 | | 1,190,000 | 983,896 |
| Telecom Italia Capital SA: | | | |
| 6% 9/30/34 | | 2,740,000 | 2,253,291 |
| 7.2% 7/18/36 | | 1,625,000 | 1,405,119 |
| 7.721% 6/4/38 | | 850,000 | 750,346 |
| Uniti Group, Inc. 6% 1/15/30 (b) | | 8,185,000 | 4,962,429 |
| Virgin Media Secured Finance PLC 4.5% 8/15/30 (b) | | 4,685,000 | 3,863,064 |
| VMED O2 UK Financing I PLC 4.25% 1/31/31 (b) | | 4,595,000 | 3,614,051 |
| Windstream Escrow LLC 7.75% 8/15/28 (b) | | 3,665,000 | 2,906,297 |
| Zayo Group Holdings, Inc.: | | | |
| 4% 3/1/27 (b) | | 660,000 | 496,744 |
| 6.125% 3/1/28 (b) | | 1,525,000 | 1,010,234 |
| | | | 81,144,926 |
| Textiles/Apparel - 0.2% | | | |
| Crocs, Inc. 4.125% 8/15/31 (b) | | 970,000 | 737,159 |
| Foot Locker, Inc. 4% 10/1/29 (b) | | 970,000 | 712,979 |
| Kontoor Brands, Inc. 4.125% 11/15/29 (b) | | 1,230,000 | 1,012,427 |
| Victoria's Secret & Co. 4.625% 7/15/29 (b) | | 1,110,000 | 816,013 |
| | | | 3,278,578 |
| Transportation Ex Air/Rail - 0.8% | | | |
| Golar LNG Ltd. 7% 10/20/25 (b) | | 3,344,000 | 3,278,859 |
| Great Lakes Dredge & Dock Corp. 5.25% 6/1/29 (b) | | 2,085,000 | 1,704,488 |
| Navios South American Logistics, Inc./Navios Logistics Finance U.S., Inc. 10.75% 7/1/25 (b) | | 810,000 | 789,175 |
| Seaspan Corp. 5.5% 8/1/29 (b) | | 6,138,000 | 4,708,828 |
| XPO, Inc.: | | | |
| 6.25% 6/1/28 (b) | | 460,000 | 440,708 |
| 7.125% 6/1/31 (b) | | 760,000 | 740,426 |
| | | | 11,662,484 |
| Utilities - 2.5% | | | |
| Clearway Energy Operating LLC: | | | |
| 3.75% 2/15/31 (b) | | 3,795,000 | 2,959,146 |
| 3.75% 1/15/32 (b) | | 385,000 | 291,622 |
| 4.75% 3/15/28 (b) | | 1,280,000 | 1,142,589 |
| DPL, Inc.: | | | |
| 4.125% 7/1/25 | | 1,835,000 | 1,726,822 |
| 4.35% 4/15/29 | | 245,000 | 199,835 |
| EnLink Midstream Partners LP 4.15% 6/1/25 | | 735,000 | 706,934 |
| FirstEnergy Corp. 3.4% 3/1/50 | | 2,935,000 | 1,774,964 |
| Global Partners LP/GLP Finance Corp. 7% 8/1/27 | | 3,375,000 | 3,181,140 |
| NRG Energy, Inc.: | | | |
| 3.375% 2/15/29 (b) | | 2,565,000 | 2,087,646 |
| 3.625% 2/15/31 (b) | | 930,000 | 701,812 |
| 5.25% 6/15/29 (b) | | 2,640,000 | 2,329,168 |
| PG&E Corp. 5.25% 7/1/30 | | 13,885,000 | 12,161,886 |
| Pike Corp. 5.5% 9/1/28 (b) | | 757,000 | 647,386 |
| Vistra Operations Co. LLC: | | | |
| 5% 7/31/27 (b) | | 2,395,000 | 2,190,913 |
| 5.5% 9/1/26 (b) | | 1,520,000 | 1,446,086 |
| 5.625% 2/15/27 (b) | | 2,950,000 | 2,775,990 |
| 7.75% 10/15/31 (b) | | 1,400,000 | 1,351,308 |
| | | | 37,675,247 |
TOTAL NONCONVERTIBLE BONDS | | | 1,251,112,728 |
| TOTAL CORPORATE BONDS (Cost $1,460,808,808) | | | 1,272,279,986 |
| | | | |
| Commercial Mortgage Securities - 0.4% |
| | | Principal Amount (a) | Value ($) |
| BX Trust floater Series 2021-SOAR Class G, CME Term SOFR 1 Month Index + 2.910% 8.2495% 6/15/38 (b)(c)(d) | | 1,199,499 | 1,134,454 |
| ELP Commercial Mortgage Trust floater Series 2021-ELP Class F, CME Term SOFR 1 Month Index + 2.780% 8.1165% 11/15/38 (b)(c)(d) | | 1,619,000 | 1,537,864 |
| Extended Stay America Trust floater Series 2021-ESH Class F, CME Term SOFR 1 Month Index + 3.810% 9.1485% 7/15/38 (b)(c)(d) | | 656,513 | 636,766 |
| Hilton U.S.A. Trust Series 2016-HHV Class F, 4.1935% 11/5/38 (b)(c) | | 1,066,000 | 939,131 |
| Merit floater Series 2021-STOR Class F, CME Term SOFR 1 Month Index + 2.310% 7.6495% 7/15/38 (b)(c)(d) | | 2,435,000 | 2,306,825 |
| TOTAL COMMERCIAL MORTGAGE SECURITIES (Cost $6,626,127) | | | 6,555,040 |
| | | | |
| Common Stocks - 4.0% |
| | | Shares | Value ($) |
| Automotive & Auto Parts - 0.1% | | | |
| Aptiv PLC (i) | | 16,200 | 1,412,640 |
| Capital Goods - 0.1% | | | |
| Regal Rexnord Corp. | | 12,000 | 1,420,920 |
| Energy - 1.2% | | | |
| California Resources Corp. warrants 10/27/24 (i) | | 4,491 | 80,119 |
| Mesquite Energy, Inc. (h)(i) | | 204,784 | 16,257,802 |
| New Fortress Energy, Inc. (j) | | 95,300 | 2,887,590 |
TOTAL ENERGY | | | 19,225,511 |
| Food & Drug Retail - 2.1% | | | |
| Southeastern Grocers, Inc. (g)(h)(i) | | 1,184,833 | 31,670,558 |
| Healthcare - 0.2% | | | |
| Centene Corp. (i) | | 37,100 | 2,559,158 |
| Technology - 0.1% | | | |
| Coherent Corp. (i) | | 46,800 | 1,385,280 |
| Telecommunications - 0.2% | | | |
| GTT Communications, Inc. (h) | | 89,354 | 2,543,908 |
| Helios Towers PLC (i) | | 1,070,700 | 787,987 |
TOTAL TELECOMMUNICATIONS | | | 3,331,895 |
| TOTAL COMMON STOCKS (Cost $44,242,056) | | | 61,005,962 |
| | | | |
| Bank Loan Obligations - 6.7% |
| | | Principal Amount (a) | Value ($) |
| Automotive & Auto Parts - 0.1% | | | |
| PECF USS Intermediate Holding III Corp. Tranche B 1LN, term loan CME Term SOFR 1 Month Index + 4.250% 9.8943% 12/17/28 (c)(d)(k) | | 997,462 | 750,969 |
| Broadcasting - 0.1% | | | |
| Diamond Sports Group LLC: | | | |
| 1LN, term loan CME Term SOFR 1 Month Index + 8.000% 15.4146% 8/24/26 (c)(d)(k) | | 2,325,660 | 873,588 |
| 2LN, term loan CME Term SOFR 1 Month Index + 3.250% 10.6625% (c)(d)(e)(k) | | 7,322,814 | 77,842 |
TOTAL BROADCASTING | | | 951,430 |
| Building Materials - 0.2% | | | |
| Acproducts Holdings, Inc. Tranche B 1LN, term loan CME Term SOFR 3 Month Index + 4.250% 9.9017% 5/17/28 (c)(d)(k) | | 4,403,411 | 3,486,049 |
| Chemicals - 0.3% | | | |
| Discovery Purchaser Corp. 1LN, term loan CME Term SOFR 3 Month Index + 4.370% 9.7651% 10/4/29 (c)(d)(k) | | 3,478,338 | 3,224,281 |
| Olympus Water U.S. Holding Corp. Tranche B 1LN, term loan CME Term SOFR 3 Month Index + 3.750% 9.4017% 11/9/28 (c)(d)(k) | | 927,640 | 903,289 |
TOTAL CHEMICALS | | | 4,127,570 |
| Consumer Products - 0.1% | | | |
| Mattress Firm, Inc. Tranche B 1LN, term loan 6 month U.S. LIBOR + 4.250% 9.95% 9/24/28 (c)(d)(k) | | 2,297,835 | 2,265,757 |
| Energy - 0.6% | | | |
| EG America LLC: | | | |
| 1LN, term loan CME Term SOFR 1 Month Index + 5.500% 9.4763% 2/7/28 (c)(d)(k) | | 3,423,103 | 3,256,227 |
| Tranche BB 1LN, term loan: | | | |
CME Term SOFR 1 Month Index + 4.000% 9.4145% 2/5/25 (c)(d)(k) | | 1,618,167 | 1,614,122 |
CME Term SOFR 3 Month Index + 4.000% 9.4145% 2/5/25 (c)(d)(k) | | 1,009,159 | 1,005,375 |
| Tranche BC 1LN, term loan CME Term SOFR 1 Month Index + 5.500% 9.4145% 2/7/28 (c)(d)(h)(k) | | 2,349,339 | 2,243,619 |
| Mesquite Energy, Inc.: | | | |
| 1LN, term loan 3 month U.S. LIBOR + 8.000% 0% (d)(e)(h)(k) | | 3,800,000 | 0 |
| term loan 3 month U.S. LIBOR + 0.000% 0% (d)(e)(h)(k) | | 1,620,000 | 0 |
| New Fortress Energy, Inc. Tranche B 1LN, term loan CME Term SOFR 1 Month Index + 5.000% 10/30/28 (d)(k)(l) | | 1,535,000 | 1,412,200 |
TOTAL ENERGY | | | 9,531,543 |
| Gaming - 0.0% | | | |
| Ontario Gaming GTA LP Tranche B 1LN, term loan CME Term SOFR 1 Month Index + 4.250% 9.6401% 8/1/30 (c)(d)(k) | | 140,000 | 139,796 |
| Healthcare - 0.3% | | | |
| Cano Health, Inc. Tranche B 1LN, term loan CME Term SOFR 1 Month Index + 4.000% 9.53% 11/23/27 (c)(d)(k) | | 3,435,814 | 1,978,033 |
| Da Vinci Purchaser Corp. Tranche B 1LN, term loan CME Term SOFR 1 Month Index + 4.000% 9.4386% 1/8/27 (c)(d)(k) | | 240,038 | 236,538 |
| Gainwell Acquisition Corp. Tranche B 1LN, term loan CME Term SOFR 3 Month Index + 4.000% 9.4901% 10/1/27 (c)(d)(k) | | 1,876,716 | 1,790,706 |
TOTAL HEALTHCARE | | | 4,005,277 |
| Homebuilders/Real Estate - 0.0% | | | |
| Breakwater Energy Partners LLC Tranche B 1LN, term loan 11.25% 9/1/26 (c)(d)(h)(k) | | 686,573 | 663,436 |
| Insurance - 0.0% | | | |
| Alliant Holdings Intermediate LLC Tranche B5 1LN, term loan CME Term SOFR 1 Month Index + 3.500% 8.8347% 11/6/27 (c)(d)(k) | | 267,645 | 266,614 |
| Leisure - 1.3% | | | |
| City Football Group Ltd. Tranche B 1LN, term loan CME Term SOFR 1 Month Index + 3.000% 8.4531% 7/21/28 (c)(d)(k) | | 13,030,646 | 12,888,091 |
| ClubCorp Holdings, Inc. Tranche B 1LN, term loan 3 month U.S. LIBOR + 2.750% 8.1806% 9/18/24 (c)(d)(k) | | 6,202,691 | 6,005,011 |
| United PF Holdings LLC 1LN, term loan CME Term SOFR 1 Month Index + 4.000% 9.6448% 12/30/26 (c)(d)(k) | | 1,439,000 | 1,238,734 |
TOTAL LEISURE | | | 20,131,836 |
| Paper - 0.0% | | | |
| Clydesdale Acquisition Holdings, Inc. 1LN, term loan CME Term SOFR 1 Month Index + 4.170% 9.5991% 4/13/29 (c)(d)(k) | | 530,223 | 512,153 |
| Services - 1.6% | | | |
| ABG Intermediate Holdings 2 LLC: | | | |
| Tranche B2 1LN, term loan CME Term SOFR 1 Month Index + 4.000% 9.4241% 12/21/28 (c)(d)(k) | | 1,172,673 | 1,169,741 |
| Tranche DD 1LN, term loan CME Term SOFR 1 Month Index + 4.000% 12/21/28 (d)(k)(m) | | 224,691 | 224,130 |
| Ascend Learning LLC: | | | |
| 2LN, term loan CME Term SOFR 1 Month Index + 5.750% 11.1741% 12/10/29 (c)(d)(k) | | 1,000,000 | 840,830 |
| Tranche B 1LN, term loan CME Term SOFR 1 Month Index + 3.500% 8.9241% 12/10/28 (c)(d)(k) | | 4,677,845 | 4,343,098 |
| Brand Energy & Infrastructure Services, Inc. Tranche B 1LN, term loan CME Term SOFR 1 Month Index + 5.500% 10.8719% 8/1/30 (c)(d)(k) | | 2,359,000 | 2,270,538 |
| CoreLogic, Inc. Tranche B 1LN, term loan CME Term SOFR 1 Month Index + 3.500% 8.9386% 6/2/28 (c)(d)(k) | | 3,398,987 | 3,085,805 |
| Finastra U.S.A., Inc. term loan CME Term SOFR 1 Month Index + 7.250% 12.7129% 9/13/29 (c)(d)(h)(k) | | 2,911,992 | 2,862,488 |
| Neptune BidCo U.S., Inc. Tranche B 1LN, term loan CME Term SOFR 1 Month Index + 5.000% 10.5067% 4/11/29 (c)(d)(k) | | 2,903,800 | 2,531,765 |
| PowerTeam Services LLC Tranche B 1LN, term loan CME Term SOFR 3 Month Index + 3.500% 8.8901% 3/6/25 (c)(d)(k) | | 1,655,000 | 1,492,264 |
| Spin Holdco, Inc. Tranche B 1LN, term loan 3 month U.S. LIBOR + 4.000% 9.6639% 3/4/28 (c)(d)(k) | | 6,110,642 | 5,209,322 |
TOTAL SERVICES | | | 24,029,981 |
| Super Retail - 0.7% | | | |
| Bass Pro Group LLC Tranche B 1LN, term loan CME Term SOFR 1 Month Index + 3.750% 9.4017% 3/5/28 (c)(d)(k) | | 3,013,869 | 2,986,865 |
| LBM Acquisition LLC Tranche B 1LN, term loan CME Term SOFR 1 Month Index + 3.750% 9.1741% 12/18/27 (c)(d)(k) | | 8,320,367 | 7,904,349 |
TOTAL SUPER RETAIL | | | 10,891,214 |
| Technology - 0.6% | | | |
| Athenahealth Group, Inc. Tranche B 1LN, term loan CME Term SOFR 1 Month Index + 3.500% 8.5769% 2/15/29 (c)(d)(k) | | 1,988,410 | 1,923,429 |
| DH Corp./Societe term loan CME Term SOFR 3 Month Index + 7.250% 12.7129% 9/13/29 (c)(d)(h)(k) | | 68,008 | 66,852 |
| McAfee Corp. Tranche B 1LN, term loan CME Term SOFR 1 Month Index + 3.750% 9.1646% 3/1/29 (c)(d)(k) | | 375,000 | 357,893 |
| Sophia LP Tranche B 1LN, term loan CME Term SOFR 3 Month Index + 3.500% 8.9241% 10/7/27 (c)(d)(k) | | 828,658 | 817,264 |
| Ukg, Inc.: | | | |
| 1LN, term loan CME Term SOFR 3 Month Index + 3.250% 8.7643% 5/4/26 (c)(d)(k) | | 3,348,716 | 3,328,155 |
| 2LN, term loan CME Term SOFR 3 Month Index + 5.250% 10.7643% 5/3/27 (c)(d)(k) | | 885,000 | 883,009 |
| Verscend Holding Corp. Tranche B 1LN, term loan CME Term SOFR 1 Month Index + 4.000% 9.4386% 8/27/25 (c)(d)(k) | | 1,208,894 | 1,207,129 |
TOTAL TECHNOLOGY | | | 8,583,731 |
| Telecommunications - 0.4% | | | |
| GTT Communications, Inc. 1LN, term loan CME Term SOFR 3 Month Index + 9.000% 14.4901% 6/30/28 (c)(d)(k) | | 3,761,241 | 2,219,132 |
| Gtt Remainco LLC 1LN, term loan CME Term SOFR 1 Month Index + 7.000% 12.4269% 12/30/27 (c)(d)(k) | | 4,681,849 | 4,026,390 |
TOTAL TELECOMMUNICATIONS | | | 6,245,522 |
| Utilities - 0.4% | | | |
| PG&E Corp. Tranche B 1LN, term loan CME Term SOFR 1 Month Index + 3.000% 8.4386% 6/23/25 (c)(d)(k) | | 5,379,290 | 5,365,842 |
| TOTAL BANK LOAN OBLIGATIONS (Cost $111,970,022) | | | 101,948,720 |
| | | | |
| Preferred Securities - 2.3% |
| | | Principal Amount (a) | Value ($) |
| Air Transportation - 0.3% | | | |
| AerCap Holdings NV 5.875% 10/10/79 (c) | | 4,810,000 | 4,531,426 |
| Banks & Thrifts - 0.8% | | | |
| Ally Financial, Inc.: | | | |
| 4.7% (c)(n) | | 2,470,000 | 1,627,880 |
| 4.7% (c)(n) | | 2,435,000 | 1,445,834 |
| Bank of America Corp. 5.875% (c)(n) | | 2,985,000 | 2,592,729 |
| JPMorgan Chase & Co.: | | | |
| 4.6% (c)(n) | | 2,155,000 | 2,032,517 |
| 6.1% (c)(n) | | 2,980,000 | 2,954,296 |
| Wells Fargo & Co. 5.9% (c)(n) | | 1,640,000 | 1,649,368 |
TOTAL BANKS & THRIFTS | | | 12,302,624 |
| Diversified Financial Services - 0.2% | | | |
| Aircastle Ltd. 5.25% (b)(c)(n) | | 3,160,000 | 2,499,327 |
| Charles Schwab Corp. 4% (c)(n) | | 1,910,000 | 1,316,221 |
TOTAL DIVERSIFIED FINANCIAL SERVICES | | | 3,815,548 |
| Energy - 0.8% | | | |
| Energy Transfer LP 3 month U.S. LIBOR + 4.020% 9.6542% (c)(d)(n) | | 8,355,000 | 8,047,974 |
| EnLink Midstream Partners LP CME Term SOFR 3 Month Index + 4.370% 9.7798% (c)(d)(n) | | 1,635,000 | 1,476,026 |
| Plains All American Pipeline LP CME Term SOFR 3 Month Index + 4.110% 9.7362% (c)(d)(n) | | 3,150,000 | 3,026,546 |
TOTAL ENERGY | | | 12,550,546 |
| Services - 0.2% | | | |
| Air Lease Corp. 4.125% (c)(n) | | 3,435,000 | 2,490,098 |
| TOTAL PREFERRED SECURITIES (Cost $35,451,677) | | | 35,690,242 |
| | | | |
| Other - 1.2% |
| | | Shares | Value ($) |
| Other - 1.2% | | | |
Fidelity Private Credit Central Fund LLC (g)(q) (Cost $18,401,712) | | 1,849,149 | 18,750,370 |
| | | | |
| Money Market Funds - 1.3% |
| | | Shares | Value ($) |
| Fidelity Cash Central Fund 5.40% (o) | | 15,997,033 | 16,000,232 |
| Fidelity Securities Lending Cash Central Fund 5.40% (o)(p) | | 2,935,506 | 2,935,800 |
| TOTAL MONEY MARKET FUNDS (Cost $18,936,032) | | | 18,936,032 |
| | | | |
| TOTAL INVESTMENT IN SECURITIES - 99.0% (Cost $1,696,436,434) | 1,515,166,352 |
NET OTHER ASSETS (LIABILITIES) - 1.0% | 15,549,613 |
| NET ASSETS - 100.0% | 1,530,715,965 |
| | |
| Credit Default Swaps |
| Underlying Reference | Rating(1) | Maturity Date | Clearinghouse / Counterparty(2) | Fixed Payment Received/ (Paid) | Payment Frequency | Notional Amount(3)(4) | Value ($)(1) | Upfront Premium Received/ (Paid) ($)(5) | Unrealized Appreciation/ (Depreciation) ($) |
| Sell Protection | | | | | | | | | | |
| 5-Year CDX N.A. HY Series 41 | NR | Dec 2028 | ICE | 5% | Quarterly | | 5,000 | (51) | 0 | (51) |
| | | | | | | | | | | |
(1)Ratings are presented for credit default swaps in which the Fund has sold protection on the underlying referenced debt. Ratings for an underlying index represent a weighted average of the ratings of all securities included in the index. The credit rating or value can be measures of the current payment/performance risk. Ratings are from Moody's Investors Service, Inc. Where Moody's® ratings are not available, S&P® ratings are disclosed and are indicated as such. All ratings are as of the report date and do not reflect subsequent changes.
(2)Swaps with Intercontinental Exchange (ICE) are centrally cleared swaps.
(3)The notional amount of each credit default swap where the Fund has sold protection approximates the maximum potential amount of future payments that the Fund could be required to make if a credit event were to occur.
(4)Notional amount is stated in U.S. Dollars unless otherwise noted.
(5)Any premiums for centrally cleared swaps are recorded periodically throughout the term of the swap to variation margin and included in unrealized appreciation (depreciation).
Legend
| (a) | Amount is stated in United States dollars unless otherwise noted. |
| (b) | Security exempt from registration under Rule 144A of the Securities Act of 1933. These securities may be resold in transactions exempt from registration, normally to qualified institutional buyers. At the end of the period, the value of these securities amounted to $1,007,073,054 or 65.8% of net assets. |
| (c) | Coupon rates for floating and adjustable rate securities reflect the rates in effect at period end. |
| (d) | Coupon is indexed to a floating interest rate which may be multiplied by a specified factor and/or subject to caps or floors. |
| (e) | Non-income producing - Security is in default. |
| (f) | Security initially issued at one coupon which converts to a higher coupon at a specified date. The rate shown is the rate at period end. |
| (g) | Restricted securities (including private placements) - Investment in securities not registered under the Securities Act of 1933 (excluding 144A issues). At the end of the period, the value of restricted securities (excluding 144A issues) amounted to $55,055,061 or 3.6% of net assets. |
| (j) | Security or a portion of the security is on loan at period end. |
| (k) | Remaining maturities of bank loan obligations may be less than the stated maturities shown as a result of contractual or optional prepayments by the borrower. Such prepayments cannot be predicted with certainty. |
| (l) | The coupon rate will be determined upon settlement of the loan after period end. |
| (m) | Position or a portion of the position represents an unfunded loan commitment. At period end, the total principal amount and market value of unfunded commitments totaled $224,691 and $224,130, respectively. |
| (n) | Security is perpetual in nature with no stated maturity date. |
| (o) | Affiliated fund that is generally available only to investment companies and other accounts managed by Fidelity Investments. The rate quoted is the annualized seven-day yield of the fund at period end. A complete unaudited listing of the fund's holdings as of its most recent quarter end is available upon request. In addition, each Fidelity Central Fund's financial statements are available on the SEC's website or upon request. |
| (p) | Investment made with cash collateral received from securities on loan. |
| (q) | Affiliated fund that is generally available only to investment companies and other accounts managed by Fidelity Investments. |
| Additional information on each restricted holding is as follows: |
| Security | Acquisition Date | Acquisition Cost ($) |
| Fidelity Private Credit Central Fund LLC | 4/15/22 - 10/27/23 | 18,401,712 |
| | | |
| Jonah Energy Parent LLC 12% 11/5/25 | 5/05/23 | 4,425,071 |
| | | |
| Southeastern Grocers, Inc. | 6/25/21 - 4/01/22 | 22,540,546 |
| | | |
Affiliated Central Funds
Fiscal year to date information regarding the Fund's investments in Fidelity Central Funds, including the ownership percentage, is presented below.
| Affiliate | Value, beginning of period ($) | Purchases ($) | Sales Proceeds ($) | Dividend Income ($) | Realized Gain (loss) ($) | Change in Unrealized appreciation (depreciation) ($) | Value, end of period ($) | % ownership, end of period |
| Fidelity Cash Central Fund 5.40% | 80,986,531 | 226,095,211 | 291,081,510 | 1,721,659 | - | - | 16,000,232 | 0.0% |
| Fidelity Private Credit Central Fund LLC | 16,775,367 | 1,582,325 | - | 960,174 | - | 392,678 | 18,750,370 | 2.8% |
| Fidelity Securities Lending Cash Central Fund 5.40% | 246,600 | 8,221,828 | 5,532,628 | 173 | - | - | 2,935,800 | 0.0% |
| Total | 98,008,498 | 235,899,364 | 296,614,138 | 2,682,006 | - | 392,678 | 37,686,402 | |
| | | | | | | | | |
Amounts in the dividend income column in the above table include any capital gain distributions from underlying funds, which are presented in the corresponding line item in the Statement of Operations, if applicable.
Amounts in the dividend income column for Fidelity Securities Lending Cash Central Fund represents the income earned on investing cash collateral, less rebates paid to borrowers and any lending agent fees associated with the loan, plus any premium payments received for lending certain types of securities.
Amounts included in the purchases and sales proceeds columns may include in-kind transactions, if applicable.
Investment Valuation
The following is a summary of the inputs used, as of October 31, 2023, involving the Fund's assets and liabilities carried at fair value. The inputs or methodology used for valuing securities may not be an indication of the risk associated with investing in those securities. For more information on valuation inputs, and their aggregation into the levels used below, please refer to the Investment Valuation section in the accompanying Notes to Financial Statements.
| Valuation Inputs at Reporting Date: |
| Description | Total ($) | Level 1 ($) | Level 2 ($) | Level 3 ($) |
Investments in Securities: | | | | |
|
| Equities: | | | | |
Communication Services | 787,987 | 787,987 | - | - |
Consumer Discretionary | 1,412,640 | 1,412,640 | - | - |
Consumer Staples | 31,670,558 | - | - | 31,670,558 |
Energy | 19,225,511 | 2,967,709 | - | 16,257,802 |
Health Care | 2,559,158 | 2,559,158 | - | - |
Industrials | 1,420,920 | 1,420,920 | - | - |
Information Technology | 3,929,188 | 1,385,280 | - | 2,543,908 |
|
| Corporate Bonds | 1,272,279,986 | - | 1,267,645,853 | 4,634,133 |
|
| Commercial Mortgage Securities | 6,555,040 | - | 6,555,040 | - |
|
| Bank Loan Obligations | 101,948,720 | - | 96,112,325 | 5,836,395 |
|
| Preferred Securities | 35,690,242 | - | 35,690,242 | - |
|
| Other | 18,750,370 | - | 18,750,370 | - |
|
| Money Market Funds | 18,936,032 | 18,936,032 | - | - |
| Total Investments in Securities: | 1,515,166,352 | 29,469,726 | 1,424,753,830 | 60,942,796 |
Derivative Instruments: Liabilities | | | | |
Swaps | (51) | - | (51) | - |
| Total Liabilities | (51) | - | (51) | - |
| Total Derivative Instruments: | (51) | - | (51) | - |
The following is a reconciliation of Investments in Securities for which Level 3 inputs were used in determining value:
| |
| Investments in Securities: | |
| Consumer Staples | | | |
| Beginning Balance | $ | 29,099,479 | |
| Net Realized Gain (Loss) on Investment Securities | | - | |
| Net Unrealized Gain (Loss) on Investment Securities | | 2,571,079 | |
| Cost of Purchases | | - | |
| Proceeds of Sales | | - | |
| Amortization/Accretion | | - | |
| Transfers into Level 3 | | - | |
| Transfers out of Level 3 | | - | |
| Ending Balance | $ | 31,670,558 | |
| The change in unrealized gain (loss) for the period attributable to Level 3 securities held at October 31, 2023 | $ | 2,571,079 | |
| Energy | | | |
| Beginning Balance | $ | 22,041,156 | |
| Net Realized Gain (Loss) on Investment Securities | | (521,070) | |
| Net Unrealized Gain (Loss) on Investment Securities | | 3,914,301 | |
| Cost of Purchases | | - | |
| Proceeds of Sales | | (9,176,585) | |
| Amortization/Accretion | | - | |
| Transfers into Level 3 | | - | |
| Transfers out of Level 3 | | - | |
| Ending Balance | $ | 16,257,802 | |
| The change in unrealized gain (loss) for the period attributable to Level 3 securities held at October 31, 2023 | $ | 3,393,271 | |
| Corporate Bonds | | | |
| Beginning Balance | $ | 29,527,322 | |
| Net Realized Gain (Loss) on Investment Securities | | (11,627,292) | |
| Net Unrealized Gain (Loss) on Investment Securities | | (13,311,806) | |
| Cost of Purchases | | 4,425,071 | |
| Proceeds of Sales | | (4,394,666) | |
| Amortization/Accretion | | 15,504 | |
| Transfers into Level 3 | | - | |
| Transfers out of Level 3 | | - | |
| Ending Balance | $ | 4,634,133 | |
| The change in unrealized gain (loss) for the period attributable to Level 3 securities held at October 31, 2023 | $ | 193,558 | |
| Other Investments in Securities | | | |
| Beginning Balance | $ | 6,750,048 | |
| Net Realized Gain (Loss) on Investment Securities | | (73,224) | |
| Net Unrealized Gain (Loss) on Investment Securities | | 1,406,825 | |
| Cost of Purchases | | 2,920,400 | |
| Proceeds of Sales | | (6,601,912) | |
| Amortization/Accretion | | 21,715 | |
| Transfers into Level 3 | | 3,956,451 | |
| Transfers out of Level 3 | | - | |
| Ending Balance | $ | 8,380,303 | |
| The change in unrealized gain (loss) for the period attributable to Level 3 securities held at October 31, 2023 | $ | 1,338,788 | |
| The information used in the above reconciliation represents fiscal year to date activity for any Investments in Securities identified as using Level 3 inputs at either the beginning or the end of the current fiscal period. Cost of purchases and proceeds of sales may include securities received and/or delivered through in-kind transactions, corporate actions or exchanges. Transfers into Level 3 were attributable to a lack of observable market data resulting from decreases in market activity, decreases in liquidity, security restructurings or corporate actions. Transfers out of Level 3 were attributable to observable market data becoming available for those securities. Transfers in or out of Level 3 represent the beginning value of any Security or Instrument where a change in the pricing level occurred from the beginning to the end of the period. Realized and unrealized gains (losses) disclosed in the reconciliation are included in Net Gain (Loss) on the Fund's Statement of Operations. | |
Value of Derivative Instruments
The following table is a summary of the Fund's value of derivative instruments by primary risk exposure as of October 31, 2023. For additional information on derivative instruments, please refer to the Derivative Instruments section in the accompanying Notes to Financial Statements.
Primary Risk Exposure / Derivative Type | Value |
| Asset ($) | Liability ($) |
| Credit Risk | | |
Swaps (a) | 0 | (51) |
| Total Credit Risk | 0 | (51) |
| Total Value of Derivatives | 0 | (51) |
(a)For centrally cleared swaps, reflects gross cumulative appreciation (depreciation) as presented in the Schedule of Investments. In the Statement of Assets and Liabilities, the period end daily variation margin for centrally cleared swaps is included in receivable or payable for daily variation margin on centrally cleared swaps, and the net cumulative appreciation (depreciation) for centrally cleared swaps is included in Total accumulated earnings (loss).
| Statement of Assets and Liabilities |
| | | | October 31, 2023 (Unaudited) |
| | | | | |
| Assets | | | | |
| Investment in securities, at value (including securities loaned of $2,823,960) - See accompanying schedule: | | | | |
Unaffiliated issuers (cost $1,659,098,690) | $ | 1,477,479,950 | | |
Fidelity Central Funds (cost $37,337,744) | | 37,686,402 | | |
| | | | | |
| | | | | |
| Total Investment in Securities (cost $1,696,436,434) | | | $ | 1,515,166,352 |
| Segregated cash with brokers for derivative instruments | | | | 837 |
| Cash | | | | 1,381,601 |
| Receivable for investments sold | | | | 958,025 |
| Receivable for fund shares sold | | | | 932,700 |
| Interest receivable | | | | 22,764,649 |
| Distributions receivable from Fidelity Central Funds | | | | 80,444 |
| Receivable for daily variation margin on centrally cleared swaps | | | | 16 |
| Prepaid expenses | | | | 2,260 |
| Receivable from investment adviser for expense reductions | | | | 964,913 |
| Other receivables | | | | 749 |
Total assets | | | | 1,542,252,546 |
| Liabilities | | | | |
| Payable for investments purchased | $ | 6,280,863 | | |
| Payable for fund shares redeemed | | 1,567,035 | | |
| Distributions payable | | 13,974 | | |
| Accrued management fee | | 689,742 | | |
| Other payables and accrued expenses | | 49,167 | | |
| Collateral on securities loaned | | 2,935,800 | | |
| Total Liabilities | | | | 11,536,581 |
| Commitments and contingent liabilities (see Commitments note) | | | | |
| Net Assets | | | $ | 1,530,715,965 |
| Net Assets consist of: | | | | |
| Paid in capital | | | $ | 1,993,361,582 |
| Total accumulated earnings (loss) | | | | (462,645,617) |
| Net Assets | | | $ | 1,530,715,965 |
Net Asset Value, offering price and redemption price per share ($1,530,715,965 ÷ 184,473,325 shares) | | | $ | 8.30 |
| Statement of Operations |
| | | | Six months ended October 31, 2023 (Unaudited) |
| Investment Income | | | | |
| Dividends | | | $ | 879,748 |
| Interest | | | | 51,006,627 |
| Income from Fidelity Central Funds (including $173 from security lending) | | | | 2,682,006 |
| Other income | | | $ | 884,260 |
| Total Income | | | | 55,452,641 |
| Expenses | | | | |
| Management fee | $ | 4,451,637 | | |
| Custodian fees and expenses | | 7,680 | | |
| Independent trustees' fees and expenses | | 4,058 | | |
| Registration fees | | 21,860 | | |
| Audit | | 44,896 | | |
| Legal | | 212,686 | | |
| Interest | | 7,438 | | |
| Miscellaneous | | 4,541 | | |
| Total expenses before reductions | | 4,754,796 | | |
| Expense reductions | | (77,877) | | |
| Total expenses after reductions | | | | 4,676,919 |
| Net Investment income (loss) | | | | 50,775,722 |
| Realized and Unrealized Gain (Loss) | | | | |
| Net realized gain (loss) on: | | | | |
| Investment Securities: | | | | |
| Unaffiliated issuers | | (67,999,786) | | |
| Foreign currency transactions | | 143 | | |
| Swaps | | (17) | | |
| Total net realized gain (loss) | | | | (67,999,660) |
| Change in net unrealized appreciation (depreciation) on: | | | | |
| Investment Securities: | | | | |
| Unaffiliated issuers | | (7,677,872) | | |
| Fidelity Central Funds | | 392,678 | | |
| Assets and liabilities in foreign currencies | | 1 | | |
| Swaps | | (51) | | |
| Total change in net unrealized appreciation (depreciation) | | | | (7,285,244) |
| Net gain (loss) | | | | (75,284,904) |
| Net increase (decrease) in net assets resulting from operations | | | $ | (24,509,182) |
| Statement of Changes in Net Assets |
| |
| | Six months ended October 31, 2023 (Unaudited) | | Year ended April 30, 2023 |
| Increase (Decrease) in Net Assets | | | | |
| Operations | | | | |
| Net investment income (loss) | $ | 50,775,722 | $ | 95,180,197 |
| Net realized gain (loss) | | (67,999,660) | | (166,579,134) |
| Change in net unrealized appreciation (depreciation) | | (7,285,244) | | 36,966,638 |
| Net increase (decrease) in net assets resulting from operations | | (24,509,182) | | (34,432,299) |
| Distributions to shareholders | | (45,747,006) | | (88,720,097) |
| | | | | |
| Share transactions | | | | |
| Proceeds from sales of shares | | 186,080,005 | | 342,593,298 |
| Reinvestment of distributions | | 45,643,259 | | 88,547,414 |
| Cost of shares redeemed | | (271,056,153) | | (1,149,048,683) |
| | | | | |
Net increase (decrease) in net assets resulting from share transactions | | (39,332,889) | | (717,907,971) |
| Total increase (decrease) in net assets | | (109,589,077) | | (841,060,367) |
| | | | | |
| Net Assets | | | | |
| Beginning of period | | 1,640,305,042 | | 2,481,365,409 |
| End of period | $ | 1,530,715,965 | $ | 1,640,305,042 |
| | | | | |
| Other Information | | | | |
| Shares | | | | |
| Sold | | 21,750,112 | | 39,423,955 |
| Issued in reinvestment of distributions | | 5,348,391 | | 10,242,638 |
| Redeemed | | (31,879,556) | | (131,491,444) |
| Net increase (decrease) | | (4,781,053) | | (81,824,851) |
| | | | | |
Financial Highlights
| Fidelity® SAI High Income Fund |
| |
| | Six months ended (Unaudited) October 31, 2023 | | Years ended April 30, 2023 | | 2022 A |
Selected Per-Share Data | | | | | | |
| Net asset value, beginning of period | $ | 8.67 | $ | 9.15 | $ | 10.00 |
| Income from Investment Operations | | | | | | |
Net investment income (loss) B,C | | .266 | | .491 | | .388 |
| Net realized and unrealized gain (loss) | | (.396) | | (.510) | | (.879) |
| Total from investment operations | | (.130) | | (.019) | | (.491) |
| Distributions from net investment income | | (.240) | | (.461) | | (.345) |
| Distributions from net realized gain | | - | | - | | (.014) |
| Total distributions | | (.240) | | (.461) | | (.359) |
| Net asset value, end of period | $ | 8.30 | $ | 8.67 | $ | 9.15 |
Total Return D,E | | (1.54)% | | (.07)% | | (5.10)% |
Ratios to Average Net Assets C,F,G | | | | | | |
| Expenses before reductions | | .58% H | | .60% | | .60% H |
| Expenses net of fee waivers, if any | | .57% H | | .60% | | .60% H |
| Expenses net of all reductions | | .57% H | | .60% | | .60% H |
| Net investment income (loss) | | 6.20% H | | 5.65% | | 4.06% H |
| Supplemental Data | | | | | | |
| Net assets, end of period (000 omitted) | $ | 1,530,716 | $ | 1,640,305 | $ | 2,481,365 |
Portfolio turnover rate I | | 41% H | | 32% | | 59% H,J |
AFor the period May 13, 2021 (commencement of operations) through April 30, 2022.
BCalculated based on average shares outstanding during the period.
CNet investment income (loss) is affected by the timing of the declaration of dividends by any underlying mutual funds or exchange-traded funds (ETFs). Net investment income (loss) of any mutual funds or ETFs is not included in the Fund's net investment income (loss) ratio.
DTotal returns for periods of less than one year are not annualized.
ETotal returns would have been lower if certain expenses had not been reduced during the applicable periods shown.
FFees and expenses of any underlying mutual funds or exchange-traded funds (ETFs) are not included in the Fund's expense ratio. The Fund indirectly bears its proportionate share of these expenses. For additional expense information related to investments in Fidelity Central Funds, please refer to the "Investments in Fidelity Central Funds" note found in the Notes to Financial Statements section of the most recent Annual or Semi-Annual report. For additional expense information related to investments in Fidelity Private Credit Central Fund LLC, please refer to the Investment in Fidelity Private Credit Central Fund LLC note found in the Notes to Financial Statements section of the most recent Annual or Semi-Annual report.
GExpense ratios reflect operating expenses of the class. Expenses before reductions do not reflect amounts reimbursed, waived, or reduced through arrangements with the investment adviser, brokerage services, or other offset arrangements, if applicable, and do not represent the amount paid by the class during periods when reimbursements, waivers or reductions occur.
HAnnualized.
IAmount does not include the portfolio activity of any underlying mutual funds or exchange-traded funds (ETFs).
JPortfolio turnover rate excludes securities received or delivered in-kind.
For the period ended October 31, 2023
1. Organization.
Fidelity SAI High Income Fund (the Fund) is a fund of Fidelity Summer Street Trust (the Trust) and is authorized to issue an unlimited number of shares. Shares are offered exclusively to certain clients of Fidelity Management & Research Company LLC (FMR) or its affiliates. The Trust is registered under the Investment Company Act of 1940, as amended (the 1940 Act), as an open-end management investment company organized as a Massachusetts business trust.
2. Investments in Fidelity Central Funds.
Funds may invest in Fidelity Central Funds, which are open-end investment companies generally available only to other investment companies and accounts managed by the investment adviser and its affiliates. The Schedule of Investments lists any Fidelity Central Funds held as an investment as of period end, but does not include the underlying holdings of each Fidelity Central Fund. An investing fund indirectly bears its proportionate share of the expenses of the underlying Fidelity Central Funds.
Based on its investment objective, each Fidelity Central Fund may invest or participate in various investment vehicles or strategies that are similar to those of the investing fund. These strategies are consistent with the investment objectives of the investing fund and may involve certain economic risks which may cause a decline in value of each of the Fidelity Central Funds and thus a decline in the value of the investing fund.
| Fidelity Central Fund | Investment Manager | Investment Objective | Investment Practices | Expense RatioA |
| Fidelity Money Market Central Funds | Fidelity Management & Research Company LLC (FMR) | Each fund seeks to obtain a high level of current income consistent with the preservation of capital and liquidity. | Short-term Investments | Less than .005% |
A Expenses expressed as a percentage of average net assets and are as of each underlying Central Fund's most recent annual or semi-annual shareholder report.
A complete unaudited list of holdings for each Fidelity Central Fund is available upon request or at the Securities and Exchange Commission website at www.sec.gov. In addition, the financial statements of the Fidelity Central Funds which contain the significant accounting policies (including investment valuation policies) of those funds, and are not covered by the Report of Independent Registered Public Accounting Firm, are available on the Securities and Exchange Commission website or upon request.
3. Investment in Fidelity Private Credit Central Fund LLC.
The Fund invests in Fidelity Private Credit Central Fund LLC (formerly Fidelity Direct Lending Fund, LP), which is a limited liability company available only to certain investment companies managed by the investment adviser and its affiliates. On June 1, 2023, Fidelity Private Credit Central Fund elected to be regulated as a business development company (BDC). Fidelity Private Credit Central Fund LLC's units are not registered under the Securities Act of 1933 and are subject to substantial restrictions on transfer. The Fund has no redemption rights under Fidelity Private Credit Central Fund LLC's limited liability company agreement. There will be no trading market for the units.
Based on its investment objective, Fidelity Private Credit Central Fund LLC may invest or participate in various investments or strategies that are similar to those in which the Fund may invest or participate. These strategies are consistent with the investment objectives of the Fund and may involve certain economic risks which may cause a decline in value of Fidelity Private Credit Central Fund LLC and thus a decline in the value of the Fund. Fidelity Private Credit Central Fund LLC intends to invest primarily in directly originated loans to private companies but also with liquid credit investments, like broadly syndicated loans, and other select private credit investments.
The Schedule of Investments lists Fidelity Private Credit Central Fund LLC as an investment as of period end, but does not include the underlying holdings of Fidelity Private Credit Central Fund LLC. Fidelity Private Credit Central Fund LLC represented less than 5% of the Fund's net assets at period end. The Fund indirectly bears its proportionate share of the expenses of Fidelity Private Credit Central Fund LLC. The annualized expense ratio for Fidelity Private Credit Central Fund LLC for the nine month period ended September 30, 2023 was 9.63%.
4. Significant Accounting Policies.
The Fund is an investment company and applies the accounting and reporting guidance of the Financial Accounting Standards Board (FASB) Accounting Standards Codification Topic 946 Financial Services - Investment Companies. The financial statements have been prepared in conformity with accounting principles generally accepted in the United States of America (GAAP), which require management to make certain estimates and assumptions at the date of the financial statements. Actual results could differ from those estimates. Subsequent events, if any, through the date that the financial statements were issued have been evaluated in the preparation of the financial statements. The Fund's Schedule of Investments lists any underlying mutual funds or exchange-traded funds (ETFs) but does not include the underlying holdings of these funds. The following summarizes the significant accounting policies of the Fund:
Investment Valuation. Investments are valued as of 4:00 p.m. Eastern time on the last calendar day of the period. The Board of Trustees (the Board) has designated the Fund's investment adviser as the valuation designee responsible for the fair valuation function and performing fair value determinations as needed. The investment adviser has established a Fair Value Committee (the Committee) to carry out the day-to-day fair valuation responsibilities and has adopted policies and procedures to govern the fair valuation process and the activities of the Committee. In accordance with these fair valuation policies and procedures, which have been approved by the Board, the Fund attempts to obtain prices from one or more third party pricing services or brokers to value its investments. When current market prices, quotations or currency exchange rates are not readily available or reliable, investments will be fair valued in good faith by the Committee, in accordance with the policies and procedures. Factors used in determining fair value vary by investment type and may include market or investment specific events, transaction data, estimated cash flows, and market observations of comparable investments. The frequency that the fair valuation procedures are used cannot be predicted and they may be utilized to a significant extent. The Committee manages the Fund's fair valuation practices and maintains the fair valuation policies and procedures. The Fund's investment adviser reports to the Board information regarding the fair valuation process and related material matters.
The Fund categorizes the inputs to valuation techniques used to value its investments into a disclosure hierarchy consisting of three levels as shown below:
Level 1 - unadjusted quoted prices in active markets for identical investments
Level 2 - other significant observable inputs (including quoted prices for similar investments, interest rates, prepayment speeds, etc.)
Level 3 - unobservable inputs (including the Fund's own assumptions based on the best information available)
Valuation techniques used to value the Fund's investments by major category are as follows:
Debt securities, including restricted securities, are valued based on evaluated prices received from third party pricing services or from brokers who make markets in such securities. Corporate bonds, bank loan obligations and preferred securities are valued by pricing services who utilize matrix pricing which considers yield or price of bonds of comparable quality, coupon, maturity and type or by broker-supplied prices. Commercial mortgage securities are valued by pricing services who utilize matrix pricing which considers prepayment speed assumptions, attributes of the collateral, yield or price of bonds of comparable quality, coupon, maturity and type or by broker-supplied prices. When independent prices are unavailable or unreliable, debt securities and swaps may be valued utilizing pricing methodologies which consider similar factors that would be used by third party pricing services. Debt securities and swaps are generally categorized as Level 2 in the hierarchy but may be Level 3 depending on the circumstances. The Fund invests a significant portion of its assets in below investment grade securities. The value of these securities can be more volatile due to changes in the credit quality of the issuer and is sensitive to changes in economic, market and regulatory conditions.
Equity securities, including restricted securities, for which market quotations are readily available, are valued at the last reported sale price or official closing price as reported by a third party pricing service on the primary market or exchange on which they are traded and are categorized as Level 1 in the hierarchy. In the event there were no sales during the day or closing prices are not available, securities are valued at the last quoted bid price or may be valued using the last available price and are generally categorized as Level 2 in the hierarchy. For foreign equity securities, when market or security specific events arise, comparisons to the valuation of American Depositary Receipts (ADRs), futures contracts, ETFs and certain indexes as well as quoted prices for similar securities may be used and would be categorized as Level 2 in the hierarchy. For equity securities, including restricted securities, where observable inputs are limited, assumptions about market activity and risk are used and these securities may be categorized as Level 3 in the hierarchy. Securities, including private placements or other restricted securities, for which observable inputs are not available are valued using alternate valuation approaches, including the market approach, the income approach and cost approach, and are categorized as Level 3 in the hierarchy. The market approach considers factors including the price of recent investments in the same or a similar security or financial metrics of comparable securities. The income approach considers factors including expected future cash flows, security specific risks and corresponding discount rates. The cost approach considers factors including the value of the security's underlying assets and liabilities.
Investments in open-end mutual funds, including the Fidelity Central Funds, are valued at their closing net asset value (NAV) each business day and are categorized as Level 1 in the hierarchy.
Fidelity Private Credit Central Fund LLC is valued at its net asset value (NAV) each month end and is categorized as Level 2 in the hierarchy.
The following provides information on Level 3 securities held by the Fund that were valued at period end based on unobservable inputs. These amounts exclude valuations provided by a broker and valuations using NAV as a practical expedient.
| Asset Type | Fair Value | Valuation Technique(s) | Unobservable Input | Amount or Range/Weighted Average | Impact to Valuation from an Increase in InputA |
| Equities | $50,472,268.00 | Market comparable | Enterprise value/EBITDA multiple (EV/EBITDA) | 4.3 - 6.8 / 4.4 | Increase |
| | | Market approach | Transaction price | $79.39 | Increase |
| Corporate Bonds | $4,634,133.00 | Market comparable | Enterprise value/EBITDA multiple (EV/EBITDA) | 6.5 | Increase |
| | | | Enterprise value/Proved reserves multiple (EV/PR) | 0.8 | Increase |
| | | | Enterprise value/PV-10 multiple (EV/PV-10) | 0.3 | Increase |
| | | | Daily production multiple ($/Million cubic feet per day) | $3,850.00 | Increase |
| | | Discounted cash flow | Yield | 19.1% | Decrease |
| Bank Loan Obligations | $5,836,395.00 | Market comparable | Enterprise value/EBITDA multiple (EV/EBITDA) | 2.5 | Increase |
| | | Indicative market price | Evaluated bid | $95.50 | Increase |
| | | Recovery value | Recovery value | $0.00 | Increase |
| | | Discounted cash flow | Yield | 13.0% - 15.0% / 13.4% | Decrease |
A Represents the directional change in the fair value of the Level 3 investments that could have resulted from an increase in the corresponding input as of period end. A decrease to the unobservable input would have had the opposite effect. Significant changes in these inputs may have resulted in a significantly higher or lower fair value measurement at period end.
Changes in valuation techniques may result in transfers in or out of an assigned level within the disclosure hierarchy. The aggregate value of investments by input level as of October 31, 2023, as well as a roll forward of Level 3 investments, is included at the end of the Fund's Schedule of Investments.
Foreign Currency. Certain Funds may use foreign currency contracts to facilitate transactions in foreign-denominated securities. Gains and losses from these transactions may arise from changes in the value of the foreign currency or if the counterparties do not perform under the contracts' terms.
Foreign-denominated assets, including investment securities, and liabilities are translated into U.S. dollars at the exchange rates at period end. Purchases and sales of investment securities, income and dividends received, and expenses denominated in foreign currencies are translated into U.S. dollars at the exchange rate in effect on the transaction date.
The effects of exchange rate fluctuations on investments are included with the net realized and unrealized gain (loss) on investment securities. Other foreign currency transactions resulting in realized and unrealized gain (loss) are disclosed separately.
Investment Transactions and Income. For financial reporting purposes, the Fund's investment holdings and NAV include trades executed through the end of the last business day of the period. The NAV per share for processing shareholder transactions is calculated as of the close of business of the New York Stock Exchange (NYSE), normally 4:00 p.m. Eastern time and includes trades executed through the end of the prior business day. Gains and losses on securities sold are determined on the basis of identified cost. Commissions paid to certain brokers with whom the investment adviser, or its affiliates, places trades on behalf of a fund include an amount in addition to trade execution, which may be rebated back to a fund. Any such rebates are included in net realized gain (loss) on investments in the Statement of Operations. Dividend income is recorded on the ex-dividend date, except for certain dividends from foreign securities where the ex-dividend date may have passed, which are recorded as soon as the Fund is informed of the ex-dividend date. Non-cash dividends included in dividend income, if any, are recorded at the fair market value of the securities received. Income and capital gain distributions from Fidelity Central Funds, if any, are recorded on the ex-dividend date. Interest income is accrued as earned and includes coupon interest and amortization of premium and accretion of discount on debt securities as applicable. Paid in Kind (PIK) income is recorded at the fair market value of the securities received. Investment income is recorded net of foreign taxes withheld where recovery of such taxes is uncertain. Debt obligations may be placed on non-accrual status and related interest income may be reduced by ceasing current accruals and writing off interest receivables when the collection of all or a portion of interest has become doubtful based on consistently applied procedures. A debt obligation is removed from non-accrual status when the issuer resumes interest payments or when collectability of interest is reasonably assured.
Expenses. Expenses directly attributable to a fund are charged to that fund. Expenses attributable to more than one fund are allocated among the respective funds on the basis of relative net assets or other appropriate methods. Expenses included in the accompanying financial statements reflect the expenses of that fund and do not include any expenses associated with any underlying mutual funds or exchange-traded funds. Although not included in a fund's expenses, a fund indirectly bears its proportionate share of these expenses through the net asset value of each underlying mutual fund or exchange-traded fund. Expense estimates are accrued in the period to which they relate and adjustments are made when actual amounts are known.
Income Tax Information and Distributions to Shareholders. Each year, the Fund intends to qualify as a regulated investment company under Subchapter M of the Internal Revenue Code, including distributing substantially all of its taxable income and realized gains. As a result, no provision for U.S. Federal income taxes is required. The Fund files a U.S. federal tax return, in addition to state and local tax returns as required. The Fund's federal income tax returns are subject to examination by the Internal Revenue Service (IRS) for a period of three fiscal years after they are filed. State and local tax returns may be subject to examination for an additional fiscal year depending on the jurisdiction. Foreign taxes are provided for based on the Fund's understanding of the tax rules and rates that exist in the foreign markets in which it invests.
Distributions are declared and recorded daily and paid monthly from net investment income. Distributions from realized gains, if any, are declared and recorded on the ex-dividend date. Income and capital gain distributions are determined in accordance with income tax regulations, which may differ from GAAP.
Capital accounts within the financial statements are adjusted for permanent book-tax differences. These adjustments have no impact on net assets or the results of operations. Capital accounts are not adjusted for temporary book-tax differences which will reverse in a subsequent period.
Book-tax differences are primarily due to prior period premium and discount on debt securities, market discount, capital loss carryforwards, partnerships, and losses deferred due to wash sales and excise tax regulations.
As of period end, the cost and unrealized appreciation (depreciation) in securities, and derivatives if applicable, for federal income tax purposes were as follows:
| Gross unrealized appreciation | $23,801,677 |
| Gross unrealized depreciation | (194,360,179) |
| Net unrealized appreciation (depreciation) | $(170,558,502) |
| Tax cost | $1,685,724,803 |
Capital loss carryforwards are only available to offset future capital gains of the Fund to the extent provided by regulations and may be limited. The capital loss carryforward information presented below, including any applicable limitation, is estimated as of prior fiscal period end and is subject to adjustment.
| Short-term | $(157,865,635) |
| Long-term | (68,928,126) |
| Total capital loss carryforward | $(226,793,761) |
Restricted Securities (including Private Placements). Funds may invest in securities that are subject to legal or contractual restrictions on resale. These securities generally may be resold in transactions exempt from registration or to the public if the securities are registered. Disposal of these securities may involve time-consuming negotiations and expense, and prompt sale at an acceptable price may be difficult. Information regarding restricted securities held at period end is included at the end of the Schedule of Investments, if applicable.
Loans and Other Direct Debt Instruments. Direct debt instruments are interests in amounts owed to lenders by corporate or other borrowers. These instruments may be in the form of loans, trade claims or other receivables and may include standby financing commitments such as revolving credit facilities that obligate a fund to supply additional cash to the borrower on demand. Loans may be acquired through assignment, participation, or may be made directly to a borrower. Such instruments are presented in the Bank Loan Obligations section in the Schedule of Investments. Certain funds may also invest in unfunded loan commitments, which are contractual obligations for future funding. Information regarding unfunded commitments is included at the end of the Schedule of Investments, if applicable.
Commitments. A commitment is an agreement to acquire an investment at a future date (subject to conditions) in connection with a potential public or non-public offering. The amount of commitments outstanding at period end are presented in the table below. These commitments are not included in the net assets of the Fund at period end.
| | Investment to be Acquired | Commitment Amount |
| Fidelity SAI High Income Fund | Fidelity Private Credit Central Fund LLC | $3,840,000 |
New Accounting Pronouncement. In June 2022, the Financial Accounting Standards Board (FASB) issued Accounting Standards Update (ASU) 2022-03 Fair Value Measurement (Topic 820): Fair Value Measurement of Equity Securities Subject to Contractual Sale Restrictions. The amendments in this ASU clarify that a contractual restriction on the sale of an equity security is not considered part of the unit of account of the equity security and, therefore, is not considered in measuring fair value. They also clarify that an entity cannot, as a separate unit of account, recognize and measure a contractual sale restriction. They also require additional disclosures for equity securities subject to contractual sale restrictions. ASU 2022-03 will be effective for fiscal years, including interim periods within those fiscal years, beginning after December 15, 2023, and allows for early adoption. ASU 2022-03 will only be applicable to an equity security in which the contractual arrangement that restricts its sale is executed or modified on or after the adoption date. Management is currently evaluating the potential impact of ASU 2022-03 to the financial statements.
5. Derivative Instruments.
Risk Exposures and the Use of Derivative Instruments. The Fund's investment objectives allow for various types of derivative instruments, including swaps. Derivatives are investments whose value is primarily derived from underlying assets, indices or reference rates and may be transacted on an exchange or over-the-counter (OTC). Derivatives may involve a future commitment to buy or sell a specified asset based on specified terms, to exchange future cash flows at periodic intervals based on a notional principal amount, or for one party to make one or more payments upon the occurrence of specified events in exchange for periodic payments from the other party.
Derivatives were used to increase returns, to gain exposure to certain types of assets and to manage exposure to certain risks as defined below. The success of any strategy involving derivatives depends on analysis of numerous economic factors, and if the strategies for investment do not work as intended, the objectives may not be achieved.
Derivatives were used to increase or decrease exposure to the following risk(s):
| | |
| Credit Risk | Credit risk relates to the ability of the issuer of a financial instrument to make further principal or interest payments on an obligation or commitment that it has to a fund. |
Funds are also exposed to additional risks from investing in derivatives, such as liquidity risk and counterparty credit risk. Liquidity risk is the risk that a fund will be unable to close out the derivative in the open market in a timely manner. Counterparty credit risk is the risk that the counterparty will not be able to fulfill its obligation to a fund. Counterparty credit risk related to centrally cleared swaps may be mitigated by the protection provided by the clearinghouse.
Investing in derivatives may involve greater risks than investing in the underlying assets directly and, to varying degrees, may involve risk of loss in excess of any initial investment and collateral received and amounts recognized in the Statement of Assets and Liabilities. In addition, there may be the risk that the change in value of the derivative contract does not correspond to the change in value of the underlying instrument.
Swaps. A swap is a contract between two parties to exchange future cash flows at periodic intervals based on a notional principal amount. A centrally cleared swap is a transaction executed between a fund and a dealer counterparty, then cleared by a futures commission merchant (FCM) through a clearinghouse. Once cleared, the clearinghouse serves as a central counterparty, with whom a fund exchanges cash flows for the life of the transaction, similar to transactions in futures contracts.
Centrally cleared swaps require a fund to deposit either cash or securities (initial margin) with the FCM, at the instruction of and for the benefit of the clearinghouse. Any securities deposited to meet initial margin requirements are identified in the Schedule of Investments. Any cash deposited to meet initial margin requirements is presented in segregated cash with brokers for derivative instruments in the Statement of Assets and Liabilities. Centrally cleared swaps are marked-to-market daily and subsequent payments (variation margin) are made or received depending on the daily fluctuations in the value of the swaps and are recorded as unrealized appreciation or (depreciation). These daily payments, if any, are included in receivable or payable for daily variation margin on centrally cleared swaps in the Statement of Assets and Liabilities. Any premiums for centrally cleared swaps are recorded periodically throughout the term of the swap to variation margin and included in total accumulated earnings (loss) in the Statement of Assets and Liabilities. Any premiums are recognized as realized gain (loss) upon termination or maturity of the swap.
Payments are exchanged at specified intervals, accrued daily commencing with the effective date of the contract and recorded as realized gain or (loss). Some swaps may be terminated prior to the effective date and realize a gain or loss upon termination. The net realized gain (loss) and change in net unrealized appreciation (depreciation) on swaps during the period is presented in the Statement of Operations.
Any open swaps at period end are included in the Schedule of Investments under the caption "Swaps", and are representative of volume of activity during the period unless an average notional amount is presented.
Credit Default Swaps. Credit default swaps enable a fund to buy or sell protection against specified credit events on a single-name issuer or a traded credit index. Under the terms of a credit default swap the buyer of protection (buyer) receives credit protection in exchange for making periodic payments to the seller of protection (seller) based on a fixed percentage applied to a notional principal amount. In return for these payments, the seller will be required to make a payment upon the occurrence of one or more specified credit events. A fund enters into credit default swaps as a seller to gain credit exposure to an issuer and/or as a buyer to obtain a measure of protection against defaults of an issuer. Periodic payments are made over the life of the contract by the buyer provided that no credit event occurs.
For credit default swaps on most corporate and sovereign issuers, credit events include bankruptcy, failure to pay or repudiation/moratorium. For credit default swaps on corporate or sovereign issuers, the obligation that may be put to the seller is not limited to the specific reference obligation described in the Schedule of Investments. For credit default swaps on asset-backed securities, a credit event may be triggered by events such as failure to pay principal, maturity extension, rating downgrade or write-down. For credit default swaps on asset-backed securities, the reference obligation described represents the security that may be put to the seller. For credit default swaps on a traded credit index, a specified credit event may affect all or individual underlying securities included in the index.
As a seller, if an underlying credit event occurs, a fund will pay a net settlement amount of cash equal to the notional amount of the swap less the recovery value of the reference obligation or underlying securities comprising an index. Only in the event of the industry's inability to value the underlying asset will a fund be required to take delivery of the reference obligation or underlying securities comprising an index and pay an amount equal to the notional amount of the swap.
As a buyer, if an underlying credit event occurs, a fund will receive a net settlement amount of cash equal to the notional amount of the swap less the recovery value of the reference obligation or underlying securities comprising an index. Only in the event of the industry's inability to value the underlying asset will a fund be required to deliver the reference obligation or underlying securities comprising an index in exchange for payment of an amount equal to the notional amount of the swap.
Typically, the value of each credit default swap and credit rating disclosed for each reference obligation in the Schedule of Investments, where a fund is the seller, can be used as measures of the current payment/performance risk of the swap. As the value of the swap changes as a positive or negative percentage of the total notional amount, the payment/performance risk may decrease or increase, respectively. In addition to these measures, the investment adviser monitors a variety of factors including cash flow assumptions, market activity and market sentiment as part of its ongoing process of assessing payment/performance risk.
6. Purchases and Sales of Investments.
Purchases and sales of securities, other than short-term securities and in-kind transactions, as applicable, are noted in the table below.
| | Purchases ($) | Sales ($) |
| Fidelity SAI High Income Fund | 346,388,887 | 317,364,231 |
7. Fees and Other Transactions with Affiliates.
Management Fee. Fidelity Management & Research Company LLC (the investment adviser) and its affiliates provide the Fund with investment management related services for which the Fund pays a monthly management fee. The management fee is the sum of an individual fund fee rate that is based on an annual rate of .45% of the Fund's average net assets and an annualized group fee rate that averaged .10% during the period. The group fee rate is based upon the monthly average net assets of a group of registered investment companies with which the investment adviser has management contracts. The group fee rate decreases as assets under management increase and increases as assets under management decrease. For the reporting period, the total annualized management fee rate was .54% of the Fund's average net assets.
Brokerage Commissions. A portion of portfolio transactions were placed with brokerage firms which are affiliates of the investment adviser. Brokerage commissions are included in net realized gain (loss) and change in net unrealized appreciation (depreciation) in the Statement of Operations. The commissions paid to these affiliated firms were as follows:
| | Amount |
| Fidelity SAI High Income Fund | $157 |
Interfund Lending Program. Pursuant to an Exemptive Order issued by the Securities and Exchange Commission (the SEC), the Fund, along with other registered investment companies having management contracts with Fidelity Management & Research Company LLC (FMR), or other affiliated entities of FMR, may participate in an interfund lending program. This program provides an alternative credit facility allowing the Fund to borrow from, or lend money to, other participating affiliated funds. At period end, there were no interfund loans outstanding. Activity in this program during the period for which loans were outstanding was as follows:
| | Borrower or Lender | Average Loan Balance | Weighted Average Interest Rate | Interest Expense |
| Fidelity SAI High Income Fund | Borrower | $16,025,000 | 5.57% | $7,438 |
Interfund Trades. Funds may purchase from or sell securities to other Fidelity Funds under procedures adopted by the Board. The procedures have been designed to ensure these interfund trades are executed in accordance with Rule 17a-7 of the 1940 Act. Any interfund trades are included within the respective purchases and sales amounts shown in the Purchases and Sales of Investments note. During the period, there were no interfund trades.
Other. During the period, the investment adviser reimbursed the Fund for certain losses as follows:
| | Amount ($) |
| Fidelity SAI High Income Fund | 199,373 |
8. Committed Line of Credit.
Certain Funds participate with other funds managed by the investment adviser or an affiliate in a $4.25 billion credit facility (the "line of credit") to be utilized for temporary or emergency purposes to fund shareholder redemptions or for other short-term liquidity purposes. The participating funds have agreed to pay commitment fees on their pro-rata portion of the line of credit, which are reflected in Miscellaneous expenses on the Statement of Operations, and are listed below. During the period, there were no borrowings on this line of credit.
| | Amount |
| Fidelity SAI High Income Fund | $1,364 |
9. Security Lending.
Funds lend portfolio securities from time to time in order to earn additional income. Lending agents are used, including National Financial Services (NFS), an affiliate of the investment adviser. Pursuant to a securities lending agreement, NFS will receive a fee, which is capped at 9.9% of a fund's daily lending revenue, for its services as lending agent. A fund may lend securities to certain qualified borrowers, including NFS. On the settlement date of the loan, a fund receives collateral (in the form of U.S. Treasury obligations, letters of credit and/or cash) against the loaned securities and maintains collateral in an amount not less than 100% of the market value of the loaned securities during the period of the loan. The market value of the loaned securities is determined at the close of business of a fund and any additional required collateral is delivered to a fund on the next business day. A fund or borrower may terminate the loan at any time, and if the borrower defaults on its obligation to return the securities loaned because of insolvency or other reasons, a fund may apply collateral received from the borrower against the obligation. A fund may experience delays and costs in recovering the securities loaned. Any cash collateral received is invested in the Fidelity Securities Lending Cash Central Fund. Any loaned securities are identified as such in the Schedule of Investments, and the value of loaned securities and cash collateral at period end, as applicable, are presented in the Statement of Assets and Liabilities. Security lending income represents the income earned on investing cash collateral, less rebates paid to borrowers and any lending agent fees associated with the loan, plus any premium payments received for lending certain types of securities. Security lending income is presented in the Statement of Operations as a component of income from Fidelity Central Funds. Affiliated security lending activity, if any, was as follows:
| | Total Security Lending Fees Paid to NFS | Security Lending Income From Securities Loaned to NFS | Value of Securities Loaned to NFS at Period End |
| Fidelity SAI High Income Fund | $19 | $- | $- |
10. Expense Reductions.
The investment adviser has contractually agreed to waive the Fund's management fee with respect to the portion of the Fund's assets invested in Fidelity Private Credit Central Fund LLC until August 31, 2024. During the period, this waiver reduced the Fund's management fee by $37,944.
Through arrangements with the Fund's custodian, credits realized as a result of certain uninvested cash balances were used to reduce the Fund's expenses by $6,911.
In addition, during the period the investment adviser or an affiliate reimbursed and/or waived a portion of operating expenses in the amount of $33,022.
11. Other.
A fund's organizational documents provide former and current trustees and officers with a limited indemnification against liabilities arising in connection with the performance of their duties to the fund. In the normal course of business, a fund may also enter into contracts that provide general indemnifications. A fund's maximum exposure under these arrangements is unknown as this would be dependent on future claims that may be made against a fund. The risk of material loss from such claims is considered remote.
At the end of the period, the following mutual funds managed by the investment adviser or its affiliates were the owners of record of 10% or more of the total outstanding shares.
| | Strategic Advisers Fidelity Core Income Fund |
| Fidelity SAI High Income Fund | 22% |
12. Litigation.
The Fund and other entities managed by FMR or its affiliates are involved with proceedings arising out of disputes in the United States Bankruptcy Court for the Southern District of Texas ("Bankruptcy Court"), relating to the In re Sanchez Energy Corporation chapter 11 bankruptcy case (Case No. 19-34508). A Bankruptcy Court-appointed representative of unsecured creditors asserted that eight million shares of Mesquite Energy, Inc. (formerly known as Sanchez Energy Corporation) (the "Company"), held in escrow pursuant to the terms of the Company's confirmed chapter 11 plan, should be awarded to the unsecured creditors instead of the Company's current equity holders, including the Fund, which were providers of debtor-in-possession financing to the Company during its chapter 11 case and holders of secured notes issued by the Company in 2018. The unsecured creditors also asserted that certain additional equity issued by the Company in 2020 in connection with two post-bankruptcy financings, also held by the Fund, is invalid. During August 2023, the Bankruptcy Court issued an opinion awarding a portion of the eight million shares to the unsecured creditors, diluting the value of the Fund's holdings in Mesquite. The Fund will appeal this decision. At this time, Management cannot determine any additional loss or dilution that may be realized. The Fund is also incurring legal costs in defending the disputes and has recovered a portion of these legal costs through an insurance claim that is presented as other income in the Statement of Operations.
13. Risk and Uncertainties.
Many factors affect a fund's performance. Developments that disrupt global economies and financial markets, such as pandemics, epidemics, outbreaks of infectious diseases, war, terrorism, and environmental disasters, may significantly affect a fund's investment performance. The effects of these developments to a fund will be impacted by the types of securities in which a fund invests, the financial condition, industry, economic sector, and geographic location of an issuer, and a fund's level of investment in the securities of that issuer. Significant concentrations in security types, issuers, industries, sectors, and geographic locations may magnify the factors that affect a fund's performance.
As a shareholder, you incur two types of costs: (1) transaction costs, which may include sales charges (loads) on purchase payments or redemption proceeds, as applicable and (2) ongoing costs, which generally include management fees, distribution and/or service (12b-1) fees and other Fund expenses. This Example is intended to help you understand your ongoing costs (in dollars) of investing in a fund and to compare these costs with the ongoing costs of investing in other mutual funds.
| The Example is based on an investment of $1,000 invested at the beginning of the period and held for the entire period (May 1, 2023 to October 31, 2023). |
Actual Expenses
The first line of the accompanying table provides information about actual account values and actual expenses. You may use the information in this line, together with the amount you invested, to estimate the expenses that you paid over the period. Simply divide your account value by $1,000.00 (for example, an $8,600 account value divided by $1,000.00 = 8.6), then multiply the result by the number in the first line for a class/Fund under the heading entitled "Expenses Paid During Period" to estimate the expenses you paid on your account during this period. If any fund is a shareholder of any underlying mutual funds or exchange-traded funds (ETFs) (the Underlying Funds), such fund indirectly bears its proportional share of the expenses of the Underlying Funds in addition to the direct expenses incurred presented in the table. These fees and expenses are not included in the annualized expense ratio used to calculate the expense estimate in the table below.
Hypothetical Example for Comparison Purposes
The second line of the accompanying table provides information about hypothetical account values and hypothetical expenses based on the actual expense ratio and an assumed rate of return of 5% per year before expenses, which is not the actual return. The hypothetical account values and expenses may not be used to estimate the actual ending account balance or expenses you paid for the period. You may use this information to compare the ongoing costs of investing in the Fund and other funds. To do so, compare this 5% hypothetical example with the 5% hypothetical examples that appear in the shareholder reports of the other funds. If any fund is a shareholder of any Underlying Funds, such fund indirectly bears its proportional share of the expenses of the Underlying Funds in addition to the direct expenses as presented in the table. These fees and expenses are not included in the annualized expense ratio used to calculate the expense estimate in the table below.
Please note that the expenses shown in the table are meant to highlight your ongoing costs only and do not reflect any transaction costs. Therefore, the second line of the table is useful in comparing ongoing costs only, and will not help you determine the relative total costs of owning different funds. In addition, if these transactional costs were included, your costs would have been higher.
| | | | | Annualized Expense Ratio- A | | Beginning Account Value May 1, 2023 | | Ending Account Value October 31, 2023 | | Expenses Paid During Period- C May 1, 2023 to October 31, 2023 |
| | | | | | | | | | |
| Fidelity® SAI High Income Fund | | | | .57% | | | | | | |
| Actual | | | | | | $ 1,000 | | $ 984.60 | | $ 2.84 |
Hypothetical-B | | | | | | $ 1,000 | | $ 1,022.27 | | $ 2.90 |
| |
A Annualized expense ratio reflects expenses net of applicable fee waivers.
B 5% return per year before expenses
C Expenses are equal to the annualized expense ratio, multiplied by the average account value over the period, multiplied by 184/ 366 (to reflect the one-half year period). The fees and expenses of any Underlying Funds are not included in each annualized expense ratio.
Board Approval of Investment Advisory Contracts and Management Fees
Fidelity SAI High Income Fund
Each year, the Board of Trustees, including the Independent Trustees (together, the Board), considers the renewal of the fund's management contract with Fidelity Management & Research Company LLC (FMR) and the sub-advisory agreements (together, the Advisory Contracts) for the fund. FMR and the sub-advisers are referred to herein as the Investment Advisers. The Board, assisted by the advice of fund counsel and Independent Trustees' counsel, requests and considers a broad range of information relevant to the renewal of the Advisory Contracts throughout the year.
The Board meets regularly and, at each of its meetings, covers an extensive agenda of topics and materials and considers factors that are relevant to its annual consideration of the renewal of the fund's Advisory Contracts, including the services and support provided to the fund and its shareholders. The Board, acting directly and through its Committees (each of which is composed of and chaired by Independent Trustees), requests and receives information concerning the annual consideration of the renewal of the fund's Advisory Contracts. The Board also meets as needed to review matters specifically related to the Board's annual consideration of the renewal of the Advisory Contracts. Members of the Board may also meet with trustees of other Fidelity funds through joint ad hoc committees to discuss certain matters relevant to all of the Fidelity funds.
Approval of Stub Period Continuation. At its May 2023 meeting, the Board of Trustees voted to continue the fund's management contract with FMR, and the sub-advisory agreements and sub-sub-advisory agreements, in each case, where applicable (together, the Advisory Contracts), without modification, for two months from June 1, 2023 through July 31, 2023. The Board considered that the approval of the fund's Advisory Contracts will not result in any changes in (i) the investment process or strategies employed in the management of the fund's assets; (ii) the fees and expenses paid by shareholders; (iii) the nature, extent or quality of services provided under the fund's Advisory Contracts; or (iv) the day-to-day management of the fund or the persons primarily responsible for such management. The Board also considered that since its last approval of the fund's Advisory Contracts, FMR had provided additional information on the fund in support of the annual contract renewal process, including competitive analyses on total expenses and management fees and in-depth reviews of fund performance and fund profitability information. The Board concluded that the fund's Advisory Contracts are fair and reasonable, and that the fund's Advisory Contracts should be renewed, without modification, through July 31, 2023, with the understanding that the Board would consider the annual renewal for a full one year period in July 2023.
At its July 2023 meeting, the Board unanimously determined to renew the fund's Advisory Contracts. In reaching its determination, the Board considered all factors it believed relevant, including (i) the nature, extent, and quality of the services provided to the fund and its shareholders (including the investment performance of the fund); (ii) the competitiveness relative to peer funds of the fund's management fee and total expense ratio; (iii) the total costs of the services provided by and the profits realized by FMR and its affiliates (Fidelity) from its relationships with the fund; and (iv) the extent to which, if any, economies of scale exist and are realized as the fund grows, and whether any economies of scale are appropriately shared with fund shareholders. The Board also considered the broad range of investment choices available to shareholders from FMR's competitors and that the fund's shareholders have chosen to invest in the fund, which is part of the Fidelity family of funds. The Board's decision to renew the Advisory Contracts was not based on any single factor.
The Board reached a determination, with the assistance of fund counsel and Independent Trustees' counsel and through the exercise of its business judgment, that the renewal of the Advisory Contracts was in the best interests of the fund and its shareholders and that the compensation payable under the Advisory Contracts was fair and reasonable in light of all of the surrounding circumstances.
Nature, Extent, and Quality of Services Provided. The Board considered staffing as it relates to the fund, including the backgrounds and experience of investment personnel of the Investment Advisers, and also considered the Investment Advisers' implementation of the fund's investment program. The Independent Trustees also had discussions with senior management of Fidelity's investment operations and investment groups. The Board considered the structure of the investment personnel compensation program and whether this structure provides appropriate incentives to act in the best interests of the fund. Additionally, the Board considered the portfolio managers' investments, if any, in the funds that they manage.
Resources Dedicated to Investment Management and Support Services. The Board and the Fund Oversight and Research Committees reviewed the general qualifications and capabilities of Fidelity's investment staff, including its size, education, experience, and resources, as well as Fidelity's approach to recruiting, training, managing, and compensating investment personnel. The Board noted the resources devoted to expansion of Fidelity's global investment organization, and that Fidelity's analysts have extensive resources, tools, and capabilities that allow them to conduct sophisticated quantitative and fundamental analysis, as well as credit analysis of issuers, counterparties, and guarantors. Further, the Board considered that Fidelity's investment professionals have sufficient access to global information and data so as to provide competitive investment results over time, and that those professionals also have access to sophisticated tools that permit them to assess portfolio construction and risk and performance attribution characteristics continuously, as well as to transmit new information and research conclusions rapidly around the world. Additionally, in its deliberations, the Board considered Fidelity's trading, risk management, compliance, and technology and operations capabilities and resources, which are integral parts of the investment management process.
Shareholder and Administrative Services. The Board considered (i) the nature, extent, quality, and cost of advisory, administrative, and shareholder services performed by the Investment Advisers and their affiliates under the Advisory Contracts and under separate agreements covering transfer agency, pricing and bookkeeping, and securities lending services for the fund; (ii) the nature and extent of Fidelity's supervision of third party service providers, principally custodians, subcustodians, and pricing vendors; and (iii) the resources devoted by Fidelity to, and the record of compliance with, the fund's compliance policies and procedures. The Board also reviewed the allocation of fund brokerage, including allocations to brokers affiliated with the Investment Advisers, the use of brokerage commissions to pay fund expenses, and the use of "soft" commission dollars to pay for research services. The Board also considered the fund's securities lending activities and any payments made to Fidelity relating to securities lending.
The Board noted that the growth of fund assets over time across the complex allows Fidelity to reinvest in the development of services designed to enhance the value and convenience of the Fidelity funds as investment vehicles. These services include 24-hour access to account information and market information over the Internet and through telephone representatives, investor education materials, and asset allocation tools. The Board also considered that it reviews customer service metrics such as telephone response times, continuity of services on the website and metrics addressing services at Fidelity Investor Centers.
Investment in a Large Fund Family. The Board considered the benefits to shareholders of investing in a fund that is part of a large family of funds offering a variety of investment disciplines and providing a large variety of fund investor services. The Board noted that Fidelity had taken, or had made recommendations that resulted in the Fidelity funds taking, a number of actions over the previous year that benefited particular funds and/or the Fidelity funds in general.
Investment Performance. The Board took into account discussions that occur with representatives of the Investment Advisers, and reports that it receives, at Board meetings throughout the year, relating to fund investment performance. In this regard the Board noted that as part of regularly scheduled fund reviews and other reports to the Board on fund performance, the Board considered annualized return information for the fund for different time periods, measured against an appropriate securities market index (benchmark index) and an appropriate peer group of funds with similar objectives (peer group). The Board also considered information about performance attribution. In its ongoing evaluation of fund investment performance, the Board gives particular attention to information indicating changes in performance of the funds over different time periods and discussed with the Investment Advisers the reasons for any overperformance or underperformance.
In addition to reviewing absolute and relative fund performance, the Independent Trustees periodically consider the appropriateness of fund performance metrics in evaluating the results achieved. The Independent Trustees generally give greater weight to fund performance over longer time periods than over shorter time periods. Depending on the circumstances, the Independent Trustees may be satisfied with a fund's performance notwithstanding that it lags its benchmark index or peer group for certain periods.
Based on its review, the Board concluded that the nature, extent, and quality of services provided to the fund under the Advisory Contracts should continue to benefit the shareholders of the fund.
Competitiveness of Management Fee and Total Expense Ratio. The Board was provided with information regarding industry trends in management fees and expenses. In its review of the fund's management fee and total expense ratio, the Board considered the fund's management fee rate as well as other fund expenses, such as transfer agent fees, pricing and bookkeeping fees, and custodial, legal, and audit fees. The Board noted that Fidelity may agree to waive fees or reimburse expenses from time to time, and the extent to which, if any, it has done so for the fund.
Comparisons of Management Fees and Total Expense Ratios. Among other things, the Board reviewed data for selected groups of competitive funds and classes (referred to as "mapped groups") that were compiled by Fidelity based on combining similar investment objective categories (as classified by Lipper) that have comparable investment mandates. The data reviewed by the Board included (i) gross management fee comparisons (before taking into account expense reimbursements or caps) relative to the total universe of funds within the mapped group; (ii) gross management fee comparisons relative to a subset of non-Fidelity funds in the mapped group that are similar in size and management fee structure to the fund (referred to as the "asset size peer group"); (iii) total expense comparisons of the fund relative to funds and classes in the mapped group that have a similar sales load structure to the fund (referred to as the "similar sales load structure group"); and (iv) total expense comparisons of the fund relative to funds and classes in the similar sales load structure group that are similar in size and management fee structure to the fund (referred to as the "total expense asset size peer group"). The total expense asset size peer group comparison excludes performance adjustments and fund-paid 12b-1 fees to eliminate variability in fee structures.
The information provided to the Board indicated that the fund's management fee rate ranked below the competitive median of the mapped group for the 12-month period ended September 30, 2022 and below the competitive median of the asset size peer group for the 12-month period ended September 30, 2022. Further, the information provided to the Board indicated that the total expense ratio of the fund ranked below the competitive median of the similar sales load structure group for the 12-month period ended September 30, 2022 and below the competitive median of the total expense asset size peer group for the 12-month period ended September 30, 2022.
The Board also considered that, for funds subject to the group fee, FMR agreed to voluntarily waive fees over a specified period of time in amounts designed to account for assets converted from certain funds to certain collective investment trusts.
Fees Charged to Other Fidelity Clients. The Board also considered Fidelity fee structures and other information with respect to clients of Fidelity, such as other funds advised or subadvised by Fidelity, pension plan clients, and other institutional clients with similar mandates. The Board noted that a joint ad hoc committee created by it and the boards of other Fidelity funds periodically reviews and compares Fidelity's institutional investment advisory business with its business of providing services to the Fidelity funds and also noted the most recent findings of the committee. The Board noted that the committee's review included a consideration of the differences in services provided, fees charged, and costs incurred, as well as competition in the markets serving the different categories of clients.
Based on its review, the Board concluded that the fund's management fee is fair and reasonable in light of the services that the fund receives and the other factors considered. Further, based on its review of total expense ratios and fees charged to other Fidelity clients, the Board concluded that the fund's total expense ratio was reasonable in light of the services that the fund and its shareholders receive and the other factors considered.
Costs of the Services and Profitability. The Board considered the revenues earned and the expenses incurred by Fidelity in conducting the business of developing, marketing, distributing, managing, administering and servicing the fund and servicing the fund's shareholders. The Board also considered the level of Fidelity's profits in respect of all the Fidelity funds.
On an annual basis, Fidelity presents to the Board information about the profitability of its relationships with the fund. Fidelity calculates profitability information for each fund, as well as aggregate profitability information for groups of Fidelity funds and all Fidelity funds, using a series of detailed revenue and cost allocation methodologies which originate with the books and records of Fidelity on which Fidelity's audited financial statements are based. The Audit Committee of the Board reviews any significant changes from the prior year's methodologies and the full Board approves such changes.
A public accounting firm has been engaged annually by the Board as part of the Board's assessment of Fidelity's profitability analysis. The engagement includes the review and assessment of the methodologies used by Fidelity in determining the revenues and expenses attributable to Fidelity's fund business, and completion of agreed-upon procedures in respect of the mathematical accuracy of certain fund profitability information and its conformity to established allocation methodologies. After considering the reports issued under the engagement and information provided by Fidelity, the Board concluded that while other allocation methods may also be reasonable, Fidelity's profitability methodologies are reasonable in all material respects.
The Board also reviewed Fidelity's non-fund businesses and potential indirect benefits such businesses may have received as a result of their association with Fidelity's fund business (i.e., fall-out benefits) as well as cases where Fidelity's affiliates may benefit from the funds' business. The Board considered areas where potential indirect benefits to the Fidelity funds from their relationships with Fidelity may exist. The Board's consideration of these matters was informed by the findings of a joint ad hoc committee created by it and the boards of other Fidelity funds to evaluate potential fall-out benefits.
The Board considered the costs of the services provided by and the profits realized by Fidelity in connection with the operation of the fund and was satisfied that the profitability was not excessive.
Economies of Scale. The Board considered whether there have been economies of scale in respect of the management of the Fidelity funds, whether the Fidelity funds (including the fund) have appropriately benefited from any such economies of scale, and whether there is potential for realization of any further economies of scale. The Board considered the extent to which the fund will benefit from economies of scale as assets grow through increased services to the fund, through waivers or reimbursements, or through fee or expense ratio reductions. The Board also noted that a committee (the Economies of Scale Committee) created by it and the boards of other Fidelity funds periodically analyzes whether Fidelity attains economies of scale in respect of the management and servicing of the Fidelity funds, whether the Fidelity funds have appropriately benefited from such economies of scale, and whether there is potential for realization of any further economies of scale.
The Board recognized that the fund's management contract incorporates a "group fee" structure, which provides for lower group fee rates as total "group assets" increase, and for higher group fee rates as total "group assets" decrease ("group assets" as defined in the management contract). FMR calculates the group fee rates based on a tiered asset "breakpoint" schedule that varies based on asset class. The Board considered that the group fee is designed to deliver the benefits of economies of scale to fund shareholders when total Fidelity fund assets increase, even if assets of any particular fund are unchanged or have declined, because some portion of Fidelity's costs are attributable to services provided to all Fidelity funds, and all funds benefit if those costs can be allocated among more assets. The Board further considered that Fidelity agreed to impose a temporary fee waiver in the form of additional breakpoints to the current breakpoint schedule. The Board concluded that, given the group fee structure, fund shareholders will benefit from lower management fees as "group assets" increase at the fund complex level, regardless of whether Fidelity achieves any such economies of scale.
The Board concluded, taking into account the analysis of the Economies of Scale Committee, that economies of scale, if any, are being appropriately shared between fund shareholders and Fidelity.
Additional Information Requested by the Board. In order to develop fully the factual basis for consideration of the Fidelity funds' advisory contracts, the Board requested and received additional information on certain topics, including: (i) fund flow and performance trends, in particular the underperformance of certain funds and strategies, and Fidelity's long-term strategies for certain funds, including any consideration of fund liquidations or mergers; (ii) the operation of performance fees and competitor use of performance fees; (iii) Fidelity's pricing philosophy compared to competitors; (iv) fund profitability methodology and data; (v) evaluation of competitive fund data and peer group classifications and fee and expense comparisons; (vi) the management fee and expense structures for different funds and classes and information about the differences between various fee and expense structures; (vii) group fee breakpoints and related voluntary fee waivers; and (viii) information regarding other accounts managed by Fidelity and the funds' sub-advisory arrangements.
Conclusion. Based on its evaluation of all of the conclusions noted above, and after considering all factors it believed relevant, the Board, including the Independent Trustees, concluded that the advisory and sub-advisory fee arrangements are fair and reasonable in light of all of the surrounding circumstances and that the fund's Advisory Contracts should be renewed through July 31, 2024.
1.9901442.102
SAH-SANN-1223
Fidelity® Focused High Income Fund
Semi-Annual Report
October 31, 2023
Contents
To view a fund's proxy voting guidelines and proxy voting record for the 12-month period ended June 30, visit http://www.fidelity.com/proxyvotingresults or visit the Securities and Exchange Commission's (SEC) web site at http://www.sec.gov.
You may also call 1-800-544-8544 to request a free copy of the proxy voting guidelines.
Standard & Poor's, S&P and S&P 500 are registered service marks of The McGraw-Hill Companies, Inc. and have been licensed for use by Fidelity Distributors Corporation.
Other third-party marks appearing herein are the property of their respective owners.
All other marks appearing herein are registered or unregistered trademarks or service marks of FMR LLC or an affiliated company. © 2023 FMR LLC. All rights reserved.
This report and the financial statements contained herein are submitted for the general information of the shareholders of the Fund. This report is not authorized for distribution to prospective investors in the Fund unless preceded or accompanied by an effective prospectus.
A fund files its complete schedule of portfolio holdings with the SEC for the first and third quarters of each fiscal year on Form N-PORT. Forms N-PORT are available on the SEC's web site at http://www.sec.gov. A fund's Forms N-PORT may be reviewed and copied at the SEC's Public Reference Room in Washington, DC. Information regarding the operation of the SEC's Public Reference Room may be obtained by calling 1-800-SEC-0330.
For a complete list of a fund's portfolio holdings, view the most recent holdings listing, semiannual report, or annual report on Fidelity's web site at http://www.fidelity.com, http://www.institutional.fidelity.com, or http://www.401k.com, as applicable.
NOT FDIC INSURED •MAY LOSE VALUE •NO BANK GUARANTEE
Neither the Fund nor Fidelity Distributors Corporation is a bank.
| Top Bond Issuers (% of Fund's net assets) |
(with maturities greater than one year) |
| Occidental Petroleum Corp. | 2.2 | |
| PG&E Corp. | 2.1 | |
| Ford Motor Credit Co. LLC | 2.0 | |
| Tenet Healthcare Corp. | 1.9 | |
| CCO Holdings LLC/CCO Holdings Capital Corp. | 1.8 | |
| Sirius XM Radio, Inc. | 1.8 | |
| VICI Properties LP / VICI Note Co. | 1.7 | |
| Albertsons Companies LLC/Safeway Inc./New Albertson's, Inc./Albertson's LLC | 1.6 | |
| Hess Midstream Partners LP | 1.6 | |
| Hilton Domestic Operating Company, Inc. | 1.6 | |
| | 18.3 | |
| |
| Market Sectors (% of Fund's net assets) |
| |
| Energy | 15.8 | |
| Services | 7.2 | |
| Healthcare | 5.8 | |
| Technology | 5.8 | |
| Utilities | 5.7 | |
| |
Quality Diversification (% of Fund's net assets) |
|
| |
| We have used ratings from Moody's Investors Service, Inc. Where Moody's® ratings are not available, we have used S&P® ratings. All ratings are as of the date indicated and do not reflect subsequent changes. |
Asset Allocation (% of Fund's net assets) |
|
|
Showing Percentage of Net Assets
| Corporate Bonds - 92.6% |
| | | Principal Amount (a) | Value ($) |
| Convertible Bonds - 0.2% | | | |
| Broadcasting - 0.2% | | | |
| DISH Network Corp. 3.375% 8/15/26 | | 680,000 | 348,500 |
| Nonconvertible Bonds - 92.4% | | | |
| Aerospace - 3.2% | | | |
| BWX Technologies, Inc. 4.125% 6/30/28 (b) | | 795,000 | 699,588 |
| Howmet Aerospace, Inc. 6.75% 1/15/28 | | 665,000 | 665,217 |
| Kaiser Aluminum Corp. 4.625% 3/1/28 (b) | | 800,000 | 666,614 |
| Moog, Inc. 4.25% 12/15/27 (b) | | 1,025,000 | 912,515 |
| Rolls-Royce PLC 5.75% 10/15/27 (b) | | 1,115,000 | 1,056,617 |
| Science Applications International Corp. 4.875% 4/1/28 (b) | | 150,000 | 133,841 |
| TransDigm, Inc.: | | | |
| 6.75% 8/15/28 (b) | | 2,190,000 | 2,126,453 |
| 7.5% 3/15/27 | | 145,000 | 144,823 |
| | | | 6,405,668 |
| Air Transportation - 1.3% | | | |
| American Airlines, Inc. 7.25% 2/15/28 (b) | | 175,000 | 162,719 |
| American Airlines, Inc. / AAdvantage Loyalty IP Ltd. 5.5% 4/20/26 (b) | | 350,000 | 340,357 |
| Forward Air Corp. 9.5% 10/15/31 (b) | | 425,000 | 414,375 |
| Rand Parent LLC 8.5% 2/15/30 (b) | | 430,000 | 392,674 |
| United Airlines, Inc. 4.375% 4/15/26 (b) | | 1,440,000 | 1,335,765 |
| | | | 2,645,890 |
| Automotive & Auto Parts - 3.3% | | | |
| Allison Transmission, Inc. 3.75% 1/30/31 (b) | | 1,115,000 | 883,769 |
| Dana, Inc. 4.5% 2/15/32 | | 380,000 | 297,578 |
| Ford Motor Co.: | | | |
| 3.25% 2/12/32 | | 580,000 | 437,421 |
| 5.291% 12/8/46 | | 290,000 | 210,686 |
| Ford Motor Credit Co. LLC: | | | |
| 2.7% 8/10/26 | | 305,000 | 273,285 |
| 4% 11/13/30 | | 1,495,000 | 1,231,413 |
| 4.687% 6/9/25 | | 2,140,000 | 2,070,851 |
| 5.125% 6/16/25 | | 530,000 | 515,697 |
| LCM Investments Holdings 4.875% 5/1/29 (b) | | 165,000 | 138,266 |
| Macquarie AirFinance Holdings 8.125% 3/30/29 (b) | | 190,000 | 187,160 |
| Thor Industries, Inc. 4% 10/15/29 (b) | | 500,000 | 403,025 |
| | | | 6,649,151 |
| Banks & Thrifts - 0.3% | | | |
| Jane Street Group LLC/JSG Finance, Inc. 4.5% 11/15/29 (b) | | 210,000 | 178,949 |
| UniCredit SpA: | | | |
| 5.861% 6/19/32 (b)(c) | | 93,000 | 83,668 |
| 7.296% 4/2/34 (b)(c) | | 237,000 | 219,925 |
| Western Alliance Bancorp. 3% 6/15/31 (c) | | 120,000 | 91,680 |
| | | | 574,222 |
| Broadcasting - 2.5% | | | |
| Diamond Sports Group LLC/Diamond Sports Finance Co. 5.375% (b)(d) | | 1,390,000 | 14,317 |
| Nexstar Media, Inc. 5.625% 7/15/27 (b) | | 990,000 | 890,961 |
| Scripps Escrow II, Inc. 3.875% 1/15/29 (b) | | 410,000 | 311,239 |
| Sirius XM Radio, Inc.: | | | |
| 3.875% 9/1/31 (b) | | 390,000 | 293,743 |
| 5% 8/1/27 (b) | | 3,000,000 | 2,750,700 |
| 5.5% 7/1/29 (b) | | 625,000 | 553,796 |
| TEGNA, Inc. 5% 9/15/29 | | 210,000 | 175,875 |
| | | | 4,990,631 |
| Building Materials - 1.6% | | | |
| Advanced Drain Systems, Inc. 5% 9/30/27 (b) | | 1,320,000 | 1,230,900 |
| Beacon Roofing Supply, Inc. 6.5% 8/1/30 (b) | | 230,000 | 219,615 |
| Builders FirstSource, Inc. 4.25% 2/1/32 (b) | | 890,000 | 708,313 |
| Standard Industries, Inc./New Jersey 4.375% 7/15/30 (b) | | 1,300,000 | 1,062,130 |
| | | | 3,220,958 |
| Cable/Satellite TV - 2.2% | | | |
| CCO Holdings LLC/CCO Holdings Capital Corp.: | | | |
| 4.5% 8/15/30 (b) | | 85,000 | 68,156 |
| 5% 2/1/28 (b) | | 1,780,000 | 1,598,328 |
| 5.125% 5/1/27 (b) | | 2,110,000 | 1,942,670 |
| CSC Holdings LLC: | | | |
| 4.125% 12/1/30 (b) | | 160,000 | 107,194 |
| 5.375% 2/1/28 (b) | | 500,000 | 398,168 |
| Ziggo Bond Co. BV 6% 1/15/27 (b) | | 300,000 | 274,909 |
| | | | 4,389,425 |
| Chemicals - 4.1% | | | |
| Axalta Coating Systems/Dutch Holding BV 4.75% 6/15/27 (b) | | 935,000 | 862,256 |
| INEOS Finance PLC 6.75% 5/15/28 (b) | | 455,000 | 424,848 |
| LSB Industries, Inc. 6.25% 10/15/28 (b) | | 235,000 | 208,471 |
| Methanex Corp.: | | | |
| 5.25% 12/15/29 | | 160,000 | 141,485 |
| 5.65% 12/1/44 | | 991,000 | 728,229 |
| NOVA Chemicals Corp. 5.25% 6/1/27 (b) | | 1,710,000 | 1,444,377 |
| Nufarm Australia Ltd. 5% 1/27/30 (b) | | 865,000 | 750,379 |
| Olympus Water U.S. Holding Corp. 9.75% 11/15/28 (b) | | 245,000 | 239,292 |
| SPCM SA 3.125% 3/15/27 (b) | | 385,000 | 340,681 |
| The Chemours Co. LLC: | | | |
| 4.625% 11/15/29 (b) | | 385,000 | 297,366 |
| 5.375% 5/15/27 | | 1,000,000 | 903,416 |
| 5.75% 11/15/28 (b) | | 505,000 | 427,104 |
| Tronox, Inc. 4.625% 3/15/29 (b) | | 570,000 | 449,008 |
| Valvoline, Inc. 4.25% 2/15/30 (b) | | 255,000 | 249,791 |
| W.R. Grace Holding LLC: | | | |
| 4.875% 6/15/27 (b) | | 685,000 | 615,375 |
| 7.375% 3/1/31 (b) | | 85,000 | 78,733 |
| | | | 8,160,811 |
| Consumer Products - 1.1% | | | |
| Kohl's Corp. 4.25% 7/17/25 | | 25,000 | 23,349 |
| Mattel, Inc. 6.2% 10/1/40 | | 245,000 | 209,987 |
| Newell Brands, Inc.: | | | |
| 6.375% 4/1/36 (e) | | 490,000 | 384,321 |
| 6.625% 9/15/29 | | 875,000 | 804,960 |
| Prestige Brands, Inc. 3.75% 4/1/31 (b) | | 600,000 | 476,550 |
| Tempur Sealy International, Inc. 3.875% 10/15/31 (b) | | 395,000 | 295,807 |
| | | | 2,194,974 |
| Containers - 1.9% | | | |
| Ardagh Packaging Finance PLC/Ardagh MP Holdings U.S.A., Inc. 4.125% 8/15/26 (b) | | 50,000 | 43,945 |
| Ball Corp. 3.125% 9/15/31 | | 1,340,000 | 1,037,332 |
| BWAY Holding Co. 7.875% 8/15/26 (b) | | 430,000 | 402,746 |
| Graphic Packaging International, Inc. 3.75% 2/1/30 (b) | | 700,000 | 572,347 |
| OI European Group BV 4.75% 2/15/30 (b) | | 390,000 | 331,855 |
| Sealed Air Corp.: | | | |
| 5% 4/15/29 (b) | | 950,000 | 842,493 |
| 6.875% 7/15/33 (b) | | 445,000 | 417,188 |
| Trivium Packaging Finance BV 5.5% 8/15/26 (b) | | 215,000 | 194,893 |
| | | | 3,842,799 |
| Diversified Financial Services - 5.1% | | | |
| GGAM Finance Ltd. 7.75% 5/15/26 (b) | | 540,000 | 535,691 |
| Hightower Holding LLC 6.75% 4/15/29 (b) | | 1,105,000 | 942,504 |
| HTA Group Ltd. 7% 12/18/25 (b) | | 435,000 | 418,979 |
| Icahn Enterprises LP/Icahn Enterprises Finance Corp.: | | | |
| 5.25% 5/15/27 | | 2,005,000 | 1,716,781 |
| 6.25% 5/15/26 | | 1,620,000 | 1,480,736 |
| Ladder Capital Finance Holdings LLLP/Ladder Capital Finance Corp. 4.25% 2/1/27 (b) | | 845,000 | 738,180 |
| LPL Holdings, Inc. 4% 3/15/29 (b) | | 1,520,000 | 1,306,997 |
| Navient Corp. 6.75% 6/15/26 | | 540,000 | 511,650 |
| OneMain Finance Corp.: | | | |
| 3.5% 1/15/27 | | 1,145,000 | 967,525 |
| 6.875% 3/15/25 | | 1,105,000 | 1,090,187 |
| 7.125% 3/15/26 | | 500,000 | 485,580 |
| | | | 10,194,810 |
| Diversified Media - 0.4% | | | |
| Lamar Media Corp. 3.625% 1/15/31 | | 915,000 | 739,604 |
| Energy - 15.5% | | | |
| Altus Midstream LP 5.875% 6/15/30 (b) | | 270,000 | 247,738 |
| Apache Corp.: | | | |
| 4.25% 1/15/30 | | 215,000 | 187,203 |
| 5.1% 9/1/40 | | 600,000 | 466,230 |
| 5.25% 2/1/42 | | 905,000 | 683,492 |
| 5.35% 7/1/49 | | 150,000 | 109,478 |
| Centennial Resource Production LLC: | | | |
| 5.875% 7/1/29 (b) | | 200,000 | 186,000 |
| 7% 1/15/32 (b) | | 215,000 | 208,419 |
| Cheniere Energy Partners LP 3.25% 1/31/32 | | 865,000 | 670,754 |
| Cheniere Energy, Inc. 4.625% 10/15/28 | | 640,000 | 584,765 |
| CNX Midstream Partners LP 4.75% 4/15/30 (b) | | 160,000 | 131,820 |
| Continental Resources, Inc. 5.75% 1/15/31 (b) | | 1,630,000 | 1,511,638 |
| Crestwood Midstream Partners LP/Crestwood Midstream Finance Corp. 5.625% 5/1/27 (b) | | 1,928,000 | 1,854,505 |
| CVR Energy, Inc.: | | | |
| 5.25% 2/15/25 (b) | | 640,000 | 627,821 |
| 5.75% 2/15/28 (b) | | 150,000 | 134,769 |
| DCP Midstream Operating LP: | | | |
| 5.6% 4/1/44 | | 85,000 | 71,837 |
| 8.125% 8/16/30 | | 25,000 | 27,262 |
| Endeavor Energy Resources LP/EER Finance, Inc. 5.75% 1/30/28 (b) | | 735,000 | 705,078 |
| EnLink Midstream LLC 5.625% 1/15/28 (b) | | 195,000 | 183,870 |
| EnLink Midstream Partners LP: | | | |
| 5.05% 4/1/45 | | 255,000 | 182,808 |
| 5.45% 6/1/47 | | 530,000 | 398,406 |
| 5.6% 4/1/44 | | 895,000 | 703,694 |
| EQM Midstream Partners LP: | | | |
| 5.5% 7/15/28 | | 800,000 | 746,609 |
| 6.5% 7/1/27 (b) | | 785,000 | 763,023 |
| 6.5% 7/15/48 | | 485,000 | 410,100 |
| 7.5% 6/1/27 (b) | | 555,000 | 549,661 |
| EQT Corp. 3.9% 10/1/27 | | 1,450,000 | 1,334,203 |
| Hess Midstream Partners LP: | | | |
| 5.125% 6/15/28 (b) | | 1,070,000 | 987,993 |
| 5.625% 2/15/26 (b) | | 2,310,000 | 2,237,094 |
| Hilcorp Energy I LP/Hilcorp Finance Co. 6.25% 11/1/28 (b) | | 330,000 | 308,531 |
| Jonah Energy Parent LLC 12% 11/5/25 (f)(g) | | 262,918 | 269,833 |
| New Fortress Energy, Inc. 6.5% 9/30/26 (b) | | 1,040,000 | 931,525 |
| Occidental Petroleum Corp.: | | | |
| 3.5% 8/15/29 | | 810,000 | 682,902 |
| 4.3% 8/15/39 | | 260,000 | 185,198 |
| 5.55% 3/15/26 | | 1,275,000 | 1,257,877 |
| 6.125% 1/1/31 | | 1,310,000 | 1,281,128 |
| 6.2% 3/15/40 | | 255,000 | 236,436 |
| 8.875% 7/15/30 | | 580,000 | 644,067 |
| PBF Holding Co. LLC/PBF Finance Corp. 7.875% 9/15/30 (b) | | 420,000 | 407,110 |
| Seadrill Finance Ltd. 8.375% 8/1/30 (b) | | 605,000 | 605,194 |
| Sitio Royalties OP / Sitio Finance Corp. 7.875% 11/1/28 (b) | | 387,000 | 381,737 |
| Sunnova Energy Corp. 11.75% 10/1/28 (b) | | 205,000 | 174,871 |
| Sunoco LP/Sunoco Finance Corp.: | | | |
| 4.5% 5/15/29 | | 1,140,000 | 987,505 |
| 5.875% 3/15/28 | | 1,695,000 | 1,603,457 |
| 6% 4/15/27 | | 25,000 | 24,072 |
| Superior Plus LP / Superior General Partner, Inc. 4.5% 3/15/29 (b) | | 320,000 | 272,938 |
| Tallgrass Energy Partners LP / Tallgrass Energy Finance Corp.: | | | |
| 5.5% 1/15/28 (b) | | 225,000 | 197,111 |
| 6% 12/31/30 (b) | | 1,190,000 | 1,001,782 |
| Valaris Ltd. 8.375% 4/30/30 (b) | | 335,000 | 328,719 |
| Venture Global Calcasieu Pass LLC: | | | |
| 3.875% 8/15/29 (b) | | 480,000 | 399,446 |
| 3.875% 11/1/33 (b) | | 380,000 | 287,146 |
| 4.125% 8/15/31 (b) | | 460,000 | 369,843 |
| Venture Global LNG, Inc. 8.125% 6/1/28 (b) | | 320,000 | 310,663 |
| Western Gas Partners LP 4.65% 7/1/26 | | 808,000 | 772,532 |
| | | | 30,827,893 |
| Environmental - 1.6% | | | |
| Darling Ingredients, Inc.: | | | |
| 5.25% 4/15/27 (b) | | 970,000 | 922,921 |
| 6% 6/15/30 (b) | | 170,000 | 159,494 |
| Madison IAQ LLC 4.125% 6/30/28 (b) | | 1,630,000 | 1,361,833 |
| Stericycle, Inc. 3.875% 1/15/29 (b) | | 815,000 | 692,466 |
| | | | 3,136,714 |
| Food & Drug Retail - 2.0% | | | |
| Albertsons Companies LLC/Safeway, Inc./New Albertson's, Inc./Albertson's LLC 3.5% 3/15/29 (b) | | 3,810,000 | 3,248,398 |
| BellRing Brands, Inc. 7% 3/15/30 (b) | | 350,000 | 339,938 |
| Emergent BioSolutions, Inc. 3.875% 8/15/28 (b) | | 375,000 | 147,459 |
| Murphy Oil U.S.A., Inc. 3.75% 2/15/31 (b) | | 190,000 | 152,641 |
| | | | 3,888,436 |
| Food/Beverage/Tobacco - 2.4% | | | |
| C&S Group Enterprises LLC 5% 12/15/28 (b) | | 405,000 | 313,369 |
| JBS U.S.A. Lux SA / JBS Food Co. 5.5% 1/15/30 | | 2,525,000 | 2,307,531 |
| Lamb Weston Holdings, Inc. 4.375% 1/31/32 (b) | | 755,000 | 624,662 |
| Pilgrim's Pride Corp. 4.25% 4/15/31 | | 405,000 | 333,590 |
| Post Holdings, Inc.: | | | |
| 5.5% 12/15/29 (b) | | 590,000 | 526,170 |
| 5.625% 1/15/28 (b) | | 405,000 | 376,395 |
| U.S. Foods, Inc.: | | | |
| 4.625% 6/1/30 (b) | | 180,000 | 153,703 |
| 7.25% 1/15/32 (b) | | 210,000 | 206,144 |
| | | | 4,841,564 |
| Gaming - 3.5% | | | |
| CDI Escrow Issuer, Inc. 5.75% 4/1/30 (b) | | 455,000 | 406,499 |
| Melco Resorts Finance Ltd. 4.875% 6/6/25 (b) | | 1,225,000 | 1,150,865 |
| MGM Resorts International 5.75% 6/15/25 | | 866,000 | 846,860 |
| Ontario Gaming GTA LP 8% 8/1/30 (b) | | 115,000 | 112,417 |
| VICI Properties LP / VICI Note Co.: | | | |
| 4.25% 12/1/26 (b) | | 1,210,000 | 1,116,734 |
| 4.5% 9/1/26 (b) | | 1,300,000 | 1,213,498 |
| 4.625% 6/15/25 (b) | | 245,000 | 235,318 |
| 4.625% 12/1/29 (b) | | 925,000 | 800,088 |
| Wynn Las Vegas LLC/Wynn Las Vegas Capital Corp. 5.25% 5/15/27 (b) | | 870,000 | 803,679 |
| Wynn Resorts Finance LLC / Wynn Resorts Capital Corp. 5.125% 10/1/29 (b) | | 380,000 | 324,066 |
| | | | 7,010,024 |
| Healthcare - 5.7% | | | |
| 180 Medical, Inc. 3.875% 10/15/29 (b) | | 625,000 | 519,236 |
| Avantor Funding, Inc. 4.625% 7/15/28 (b) | | 1,195,000 | 1,063,681 |
| Centene Corp.: | | | |
| 2.45% 7/15/28 | | 75,000 | 63,023 |
| 2.5% 3/1/31 | | 1,665,000 | 1,261,171 |
| Charles River Laboratories International, Inc.: | | | |
| 3.75% 3/15/29 (b) | | 795,000 | 671,036 |
| 4.25% 5/1/28 (b) | | 90,000 | 79,969 |
| DaVita HealthCare Partners, Inc. 4.625% 6/1/30 (b) | | 365,000 | 286,054 |
| Grifols SA 4.75% 10/15/28 (b) | | 200,000 | 167,500 |
| HealthEquity, Inc. 4.5% 10/1/29 (b) | | 160,000 | 137,056 |
| Hologic, Inc. 4.625% 2/1/28 (b) | | 850,000 | 772,992 |
| IQVIA, Inc. 5% 5/15/27 (b) | | 820,000 | 771,443 |
| Jazz Securities DAC 4.375% 1/15/29 (b) | | 350,000 | 304,384 |
| Molina Healthcare, Inc. 3.875% 5/15/32 (b) | | 510,000 | 400,737 |
| Organon & Co. / Organon Foreign Debt Co-Issuer BV 4.125% 4/30/28 (b) | | 840,000 | 725,558 |
| Owens & Minor, Inc. 4.5% 3/31/29 (b) | | 280,000 | 224,655 |
| Teleflex, Inc. 4.25% 6/1/28 (b) | | 235,000 | 207,388 |
| Tenet Healthcare Corp.: | | | |
| 4.625% 6/15/28 | | 1,810,000 | 1,610,263 |
| 4.875% 1/1/26 | | 595,000 | 570,250 |
| 5.125% 11/1/27 | | 1,200,000 | 1,107,741 |
| 6.125% 6/15/30 | | 465,000 | 430,442 |
| | | | 11,374,579 |
| Homebuilders/Real Estate - 3.1% | | | |
| Century Communities, Inc. 3.875% 8/15/29 (b) | | 460,000 | 371,201 |
| Greystar Real Estate Partners 7.75% 9/1/30 (b) | | 95,000 | 93,338 |
| HAT Holdings I LLC/HAT Holdings II LLC 3.375% 6/15/26 (b) | | 495,000 | 435,708 |
| Howard Hughes Corp. 4.375% 2/1/31 (b) | | 825,000 | 627,987 |
| Kennedy-Wilson, Inc. 4.75% 2/1/30 | | 770,000 | 562,100 |
| MPT Operating Partnership LP/MPT Finance Corp.: | | | |
| 3.5% 3/15/31 | | 2,105,000 | 1,276,459 |
| 5.25% 8/1/26 | | 1,075,000 | 925,589 |
| Ryan Specialty Group LLC 4.375% 2/1/30 (b) | | 540,000 | 462,527 |
| Service Properties Trust: | | | |
| 3.95% 1/15/28 | | 75,000 | 56,077 |
| 5.5% 12/15/27 | | 415,000 | 350,365 |
| Taylor Morrison Communities, Inc./Monarch Communities, Inc. 5.75% 1/15/28 (b) | | 450,000 | 408,443 |
| TopBuild Corp. 4.125% 2/15/32 (b) | | 810,000 | 640,791 |
| | | | 6,210,585 |
| Hotels - 2.1% | | | |
| Hilton Domestic Operating Co., Inc.: | | | |
| 3.625% 2/15/32 (b) | | 1,165,000 | 920,901 |
| 4% 5/1/31 (b) | | 2,780,000 | 2,302,302 |
| Hilton Worldwide Finance LLC/Hilton Worldwide Finance Corp. 4.875% 4/1/27 | | 445,000 | 419,694 |
| Wyndham Hotels & Resorts, Inc. 4.375% 8/15/28 (b) | | 525,000 | 463,339 |
| | | | 4,106,236 |
| Insurance - 0.5% | | | |
| Alliant Holdings Intermediate LLC 4.25% 10/15/27 (b) | | 1,075,000 | 945,097 |
| Leisure - 1.7% | | | |
| Carnival Corp.: | | | |
| 7% 8/15/29 (b) | | 425,000 | 416,730 |
| 7.625% 3/1/26 (b) | | 675,000 | 656,365 |
| NCL Corp. Ltd.: | | | |
| 5.875% 2/15/27 (b) | | 350,000 | 322,161 |
| 8.375% 2/1/28 (b) | | 230,000 | 227,830 |
| Royal Caribbean Cruises Ltd.: | | | |
| 5.5% 4/1/28 (b) | | 1,200,000 | 1,094,418 |
| 7.25% 1/15/30 (b) | | 700,000 | 690,532 |
| | | | 3,408,036 |
| Metals/Mining - 1.9% | | | |
| Arsenal AIC Parent LLC 8% 10/1/30 (b) | | 130,000 | 128,375 |
| ERO Copper Corp. 6.5% 2/15/30 (b) | | 740,000 | 627,735 |
| FMG Resources Pty Ltd. 4.5% 9/15/27 (b) | | 1,140,000 | 1,026,467 |
| Howmet Aerospace, Inc. 5.95% 2/1/37 | | 400,000 | 365,403 |
| HudBay Minerals, Inc. 4.5% 4/1/26 (b) | | 240,000 | 223,371 |
| Mineral Resources Ltd. 8% 11/1/27 (b) | | 1,130,000 | 1,091,908 |
| Novelis Corp. 3.875% 8/15/31 (b) | | 385,000 | 300,685 |
| | | | 3,763,944 |
| Paper - 0.4% | | | |
| Ardagh Metal Packaging Finance U.S.A. LLC/Ardagh Metal Packaging Finance PLC: | | | |
| 3.25% 9/1/28 (b) | | 570,000 | 464,222 |
| 6% 6/15/27 (b) | | 370,000 | 349,649 |
| | | | 813,871 |
| Restaurants - 1.2% | | | |
| Garden SpinCo Corp. 8.625% 7/20/30 (b) | | 115,000 | 118,654 |
| Yum! Brands, Inc.: | | | |
| 3.625% 3/15/31 | | 2,615,000 | 2,123,495 |
| 5.35% 11/1/43 | | 110,000 | 93,225 |
| | | | 2,335,374 |
| Services - 6.6% | | | |
| ADT Corp.: | | | |
| 4.125% 8/1/29 (b) | | 385,000 | 330,195 |
| 4.875% 7/15/32 (b) | | 565,000 | 472,628 |
| AECOM 5.125% 3/15/27 | | 1,485,000 | 1,401,990 |
| Aramark Services, Inc. 5% 2/1/28 (b) | | 1,685,000 | 1,545,395 |
| ASGN, Inc. 4.625% 5/15/28 (b) | | 965,000 | 854,493 |
| Booz Allen Hamilton, Inc. 4% 7/1/29 (b) | | 155,000 | 136,788 |
| Brand Energy & Infrastructure Services, Inc. 10.375% 8/1/30 (b) | | 320,000 | 317,600 |
| CoreCivic, Inc. 8.25% 4/15/26 | | 160,000 | 161,989 |
| Fair Isaac Corp. 4% 6/15/28 (b) | | 450,000 | 400,720 |
| Gartner, Inc. 3.625% 6/15/29 (b) | | 220,000 | 185,781 |
| GEMS MENASA Cayman Ltd. 7.125% 7/31/26 (b) | | 1,030,000 | 986,225 |
| Iron Mountain, Inc. 4.875% 9/15/29 (b) | | 2,715,000 | 2,364,932 |
| Prime Securities Services Borrower LLC/Prime Finance, Inc. 3.375% 8/31/27 (b) | | 2,225,000 | 1,956,246 |
| Service Corp. International 5.125% 6/1/29 | | 1,425,000 | 1,303,875 |
| Sotheby's 7.375% 10/15/27 (b) | | 185,000 | 165,221 |
| TriNet Group, Inc. 3.5% 3/1/29 (b) | | 710,000 | 586,279 |
| | | | 13,170,357 |
| Steel - 0.1% | | | |
| Roller Bearing Co. of America, Inc. 4.375% 10/15/29 (b) | | 110,000 | 93,281 |
| Super Retail - 2.5% | | | |
| Asbury Automotive Group, Inc.: | | | |
| 4.625% 11/15/29 (b) | | 245,000 | 207,243 |
| 5% 2/15/32 (b) | | 260,000 | 210,876 |
| Bath & Body Works, Inc. 6.625% 10/1/30 (b) | | 1,620,000 | 1,499,789 |
| Gap, Inc. 3.875% 10/1/31 (b) | | 385,000 | 276,483 |
| Hanesbrands, Inc. 4.875% 5/15/26 (b) | | 1,115,000 | 1,024,479 |
| Levi Strauss & Co. 3.5% 3/1/31 (b) | | 630,000 | 490,495 |
| Nordstrom, Inc. 4.375% 4/1/30 | | 930,000 | 721,880 |
| The William Carter Co. 5.625% 3/15/27 (b) | | 465,000 | 440,598 |
| | | | 4,871,843 |
| Technology - 5.8% | | | |
| Acuris Finance U.S. 5% 5/1/28 (b) | | 385,000 | 303,188 |
| Block, Inc. 2.75% 6/1/26 | | 380,000 | 340,997 |
| Broadcom, Inc. 2.45% 2/15/31 (b) | | 420,000 | 322,315 |
| Central Parent, Inc./Central Merger Sub, Inc. 7.25% 6/15/29 (b) | | 345,000 | 331,437 |
| CNT PRNT/CDK GLO II/FIN 8% 6/15/29 (b) | | 415,000 | 409,909 |
| Coherent Corp. 5% 12/15/29 (b) | | 1,600,000 | 1,357,712 |
| Crowdstrike Holdings, Inc. 3% 2/15/29 | | 525,000 | 438,831 |
| Elastic NV 4.125% 7/15/29 (b) | | 235,000 | 198,050 |
| Entegris, Inc. 4.375% 4/15/28 (b) | | 730,000 | 651,306 |
| Gartner, Inc. 4.5% 7/1/28 (b) | | 660,000 | 593,814 |
| Match Group Holdings II LLC: | | | |
| 3.625% 10/1/31 (b) | | 575,000 | 441,313 |
| 4.125% 8/1/30 (b) | | 265,000 | 215,320 |
| ON Semiconductor Corp. 3.875% 9/1/28 (b) | | 545,000 | 468,199 |
| Open Text Corp.: | | | |
| 3.875% 2/15/28 (b) | | 1,410,000 | 1,225,396 |
| 3.875% 12/1/29 (b) | | 390,000 | 318,935 |
| Open Text Holdings, Inc. 4.125% 2/15/30 (b) | | 130,000 | 107,718 |
| Qorvo, Inc. 4.375% 10/15/29 | | 505,000 | 438,478 |
| Seagate HDD Cayman 8.25% 12/15/29 (b) | | 1,425,000 | 1,448,123 |
| Sensata Technologies, Inc. 3.75% 2/15/31 (b) | | 1,165,000 | 932,404 |
| TTM Technologies, Inc. 4% 3/1/29 (b) | | 550,000 | 450,995 |
| Twilio, Inc. 3.875% 3/15/31 | | 350,000 | 279,428 |
| VM Consolidated, Inc. 5.5% 4/15/29 (b) | | 345,000 | 305,522 |
| | | | 11,579,390 |
| Telecommunications - 2.6% | | | |
| Altice Financing SA 5% 1/15/28 (b) | | 10,000 | 8,133 |
| C&W Senior Financing Designated Activity Co. 6.875% 9/15/27 (b) | | 1,510,000 | 1,290,748 |
| Cogent Communications Group, Inc. 7% 6/15/27 (b) | | 660,000 | 623,700 |
| Level 3 Financing, Inc. 4.625% 9/15/27 (b) | | 1,100,000 | 731,500 |
| Millicom International Cellular SA: | | | |
| 4.5% 4/27/31 (b) | | 490,000 | 365,197 |
| 5.125% 1/15/28 (b) | | 900,000 | 771,750 |
| SBA Communications Corp. 3.875% 2/15/27 | | 750,000 | 683,021 |
| Virgin Media Finance PLC 5% 7/15/30 (b) | | 105,000 | 82,551 |
| Virgin Media Secured Finance PLC 5.5% 5/15/29 (b) | | 740,000 | 655,241 |
| | | | 5,211,841 |
| Textiles/Apparel - 0.3% | | | |
| Crocs, Inc. 4.125% 8/15/31 (b) | | 405,000 | 307,783 |
| Foot Locker, Inc. 4% 10/1/29 (b) | | 200,000 | 147,006 |
| Kontoor Brands, Inc. 4.125% 11/15/29 (b) | | 130,000 | 107,005 |
| | | | 561,794 |
| Transportation Ex Air/Rail - 0.3% | | | |
| Seaspan Corp. 5.5% 8/1/29 (b) | | 385,000 | 295,357 |
| XPO, Inc. 6.25% 6/1/28 (b) | | 325,000 | 311,370 |
| | | | 606,727 |
| Utilities - 5.6% | | | |
| Clearway Energy Operating LLC: | | | |
| 3.75% 2/15/31 (b) | | 1,615,000 | 1,259,294 |
| 4.75% 3/15/28 (b) | | 195,000 | 174,066 |
| FirstEnergy Corp. 2.25% 9/1/30 | | 825,000 | 636,579 |
| NextEra Energy Partners LP 4.25% 9/15/24 (b) | | 158,000 | 149,310 |
| NRG Energy, Inc.: | | | |
| 5.25% 6/15/29 (b) | | 625,000 | 551,413 |
| 6.625% 1/15/27 | | 729,000 | 707,519 |
| PG&E Corp.: | | | |
| 5% 7/1/28 | | 2,685,000 | 2,432,463 |
| 5.25% 7/1/30 | | 2,115,000 | 1,852,531 |
| TerraForm Power Operating LLC 4.75% 1/15/30 (b) | | 130,000 | 109,850 |
| TransAlta Corp. 6.5% 3/15/40 | | 355,000 | 312,864 |
| Vertiv Group Corp. 4.125% 11/15/28 (b) | | 945,000 | 825,935 |
| Vistra Operations Co. LLC 5% 7/31/27 (b) | | 2,395,000 | 2,190,913 |
| | | | 11,202,737 |
TOTAL NONCONVERTIBLE BONDS | | | 183,969,266 |
| TOTAL CORPORATE BONDS (Cost $207,324,249) | | | 184,317,766 |
| | | | |
| Bank Loan Obligations - 1.2% |
| | | Principal Amount (a) | Value ($) |
| Broadcasting - 0.0% | | | |
| Diamond Sports Group LLC 2LN, term loan CME Term SOFR 1 Month Index + 3.250% 10.6625% (c)(d)(h)(i) | | 206,842 | 2,199 |
| Healthcare - 0.1% | | | |
| Cano Health, Inc. Tranche B 1LN, term loan CME Term SOFR 1 Month Index + 4.000% 9.53% 11/23/27 (c)(h)(i) | | 456,515 | 262,820 |
| Insurance - 0.2% | | | |
| Alliant Holdings Intermediate LLC Tranche B3 1LN, term loan 1 month U.S. LIBOR + 3.500% 8.9386% 11/5/27 (c)(h)(i) | | 346,920 | 345,557 |
| Railroad - 0.2% | | | |
| Genesee & Wyoming, Inc. 1LN, term loan CME Term SOFR 3 Month Index + 2.000% 7.4901% 12/30/26 (c)(h)(i) | | 374,031 | 373,563 |
| Services - 0.6% | | | |
| ABG Intermediate Holdings 2 LLC Tranche B1 LN, term loan CME Term SOFR 1 Month Index + 3.500% 8.9241% 12/21/28 (c)(h)(i) | | 133,312 | 132,907 |
| Ascend Learning LLC: | | | |
| 2LN, term loan CME Term SOFR 1 Month Index + 5.750% 11.1741% 12/10/29 (c)(h)(i) | | 50,000 | 42,042 |
| Tranche B 1LN, term loan CME Term SOFR 1 Month Index + 3.500% 8.9241% 12/10/28 (c)(h)(i) | | 496,162 | 460,657 |
| Neptune BidCo U.S., Inc. Tranche B 1LN, term loan CME Term SOFR 1 Month Index + 5.000% 10.5067% 4/11/29 (c)(h)(i) | | 552,225 | 481,474 |
TOTAL SERVICES | | | 1,117,080 |
| Utilities - 0.1% | | | |
| Brookfield WEC Holdings, Inc. 1LN, term loan CME Term SOFR 1 Month Index + 3.750% 9.0741% 8/1/25 (c)(h)(i) | | 257,400 | 257,472 |
| TOTAL BANK LOAN OBLIGATIONS (Cost $2,673,277) | | | 2,358,691 |
| | | | |
| Preferred Securities - 0.9% |
| | | Principal Amount (a) | Value ($) |
| Banks & Thrifts - 0.3% | | | |
| Ally Financial, Inc.: | | | |
| 4.7% (c)(j) | | 385,000 | 253,738 |
| 4.7% (c)(j) | | 100,000 | 59,377 |
| Wells Fargo & Co. 7.625% (c)(j) | | 320,000 | 323,449 |
TOTAL BANKS & THRIFTS | | | 636,564 |
| Diversified Financial Services - 0.3% | | | |
| Charles Schwab Corp.: | | | |
| 4% (c)(j) | | 465,000 | 320,441 |
| 5.375% (c)(j) | | 225,000 | 215,677 |
TOTAL DIVERSIFIED FINANCIAL SERVICES | | | 536,118 |
| Energy - 0.3% | | | |
| Energy Transfer LP 3 month U.S. LIBOR + 4.020% 9.6542% (c)(h)(j) | | 700,000 | 674,277 |
| TOTAL PREFERRED SECURITIES (Cost $1,841,574) | | | 1,846,959 |
| | | | |
| Money Market Funds - 4.0% |
| | | Shares | Value ($) |
Fidelity Cash Central Fund 5.40% (k) (Cost $7,940,946) | | 7,939,358 | 7,940,946 |
| | | | |
| TOTAL INVESTMENT IN SECURITIES - 98.7% (Cost $219,780,046) | 196,464,362 |
NET OTHER ASSETS (LIABILITIES) - 1.3% | 2,492,324 |
| NET ASSETS - 100.0% | 198,956,686 |
| | |
Legend
| (a) | Amount is stated in United States dollars unless otherwise noted. |
| (b) | Security exempt from registration under Rule 144A of the Securities Act of 1933. These securities may be resold in transactions exempt from registration, normally to qualified institutional buyers. At the end of the period, the value of these securities amounted to $125,692,027 or 63.2% of net assets. |
| (c) | Coupon rates for floating and adjustable rate securities reflect the rates in effect at period end. |
| (d) | Non-income producing - Security is in default. |
| (e) | Security initially issued at one coupon which converts to a higher coupon at a specified date. The rate shown is the rate at period end. |
| (f) | Restricted securities (including private placements) - Investment in securities not registered under the Securities Act of 1933 (excluding 144A issues). At the end of the period, the value of restricted securities (excluding 144A issues) amounted to $269,833 or 0.1% of net assets. |
| (h) | Coupon is indexed to a floating interest rate which may be multiplied by a specified factor and/or subject to caps or floors. |
| (i) | Remaining maturities of bank loan obligations may be less than the stated maturities shown as a result of contractual or optional prepayments by the borrower. Such prepayments cannot be predicted with certainty. |
| (j) | Security is perpetual in nature with no stated maturity date. |
| (k) | Affiliated fund that is generally available only to investment companies and other accounts managed by Fidelity Investments. The rate quoted is the annualized seven-day yield of the fund at period end. A complete unaudited listing of the fund's holdings as of its most recent quarter end is available upon request. In addition, each Fidelity Central Fund's financial statements are available on the SEC's website or upon request. |
| Additional information on each restricted holding is as follows: |
| Security | Acquisition Date | Acquisition Cost ($) |
| Jonah Energy Parent LLC 12% 11/5/25 | 5/05/23 | 257,660 |
| | | |
Affiliated Central Funds
Fiscal year to date information regarding the Fund's investments in Fidelity Central Funds, including the ownership percentage, is presented below.
| Affiliate | Value, beginning of period ($) | Purchases ($) | Sales Proceeds ($) | Dividend Income ($) | Realized Gain (loss) ($) | Change in Unrealized appreciation (depreciation) ($) | Value, end of period ($) | % ownership, end of period |
| Fidelity Cash Central Fund 5.40% | 22,038,961 | 24,742,932 | 38,840,946 | 485,744 | - | (1) | 7,940,946 | 0.0% |
| Total | 22,038,961 | 24,742,932 | 38,840,946 | 485,744 | - | (1) | 7,940,946 | |
| | | | | | | | | |
Amounts in the dividend income column in the above table include any capital gain distributions from underlying funds, which are presented in the corresponding line item in the Statement of Operations, if applicable.
Amounts included in the purchases and sales proceeds columns may include in-kind transactions, if applicable.
Investment Valuation
The following is a summary of the inputs used, as of October 31, 2023, involving the Fund's assets and liabilities carried at fair value. The inputs or methodology used for valuing securities may not be an indication of the risk associated with investing in those securities. For more information on valuation inputs, and their aggregation into the levels used below, please refer to the Investment Valuation section in the accompanying Notes to Financial Statements.
| Valuation Inputs at Reporting Date: |
| Description | Total ($) | Level 1 ($) | Level 2 ($) | Level 3 ($) |
Investments in Securities: | | | | |
|
| Corporate Bonds | 184,317,766 | - | 184,047,933 | 269,833 |
|
| Bank Loan Obligations | 2,358,691 | - | 2,358,691 | - |
|
| Preferred Securities | 1,846,959 | - | 1,846,959 | - |
|
| Money Market Funds | 7,940,946 | 7,940,946 | - | - |
| Total Investments in Securities: | 196,464,362 | 7,940,946 | 188,253,583 | 269,833 |
| Statement of Assets and Liabilities |
| | | | October 31, 2023 (Unaudited) |
| | | | | |
| Assets | | | | |
| Investment in securities, at value - See accompanying schedule: | | | | |
Unaffiliated issuers (cost $211,839,100) | $ | 188,523,416 | | |
Fidelity Central Funds (cost $7,940,946) | | 7,940,946 | | |
| | | | | |
| | | | | |
| Total Investment in Securities (cost $219,780,046) | | | $ | 196,464,362 |
| Cash | | | | 19,703 |
| Receivable for fund shares sold | | | | 10,678 |
| Interest receivable | | | | 2,813,805 |
| Distributions receivable from Fidelity Central Funds | | | | 46,214 |
| Prepaid expenses | | | | 294 |
| Receivable from investment adviser for expense reductions | | | | 4,808 |
Total assets | | | | 199,359,864 |
| Liabilities | | | | |
| Payable for fund shares redeemed | $ | 108,349 | | |
| Distributions payable | | 130,971 | | |
| Accrued management fee | | 91,146 | | |
| Transfer agent fee payable | | 26,885 | | |
| Other affiliated payables | | 6,928 | | |
| Custody fee payable | | 37,775 | | |
| Other payables and accrued expenses | | 1,124 | | |
| Total Liabilities | | | | 403,178 |
| Net Assets | | | $ | 198,956,686 |
| Net Assets consist of: | | | | |
| Paid in capital | | | $ | 246,091,564 |
| Total accumulated earnings (loss) | | | | (47,134,878) |
| Net Assets | | | $ | 198,956,686 |
Net Asset Value, offering price and redemption price per share ($198,956,686 ÷ 26,550,653 shares) | | | $ | 7.49 |
| Statement of Operations |
| | | | Six months ended October 31, 2023 (Unaudited) |
| Investment Income | | | | |
| Dividends | | | $ | 41,509 |
| Interest | | | | 5,254,921 |
| Income from Fidelity Central Funds | | | | 485,744 |
| Total Income | | | | 5,782,174 |
| Expenses | | | | |
| Management fee | $ | 573,520 | | |
| Transfer agent fees | | 163,364 | | |
| Accounting fees and expenses | | 43,584 | | |
| Custodian fees and expenses | | 1,695 | | |
| Independent trustees' fees and expenses | | 532 | | |
| Registration fees | | 18,287 | | |
| Audit | | 38,046 | | |
| Legal | | 283 | | |
| Miscellaneous | | 425 | | |
| Total expenses before reductions | | 839,736 | | |
| Expense reductions | | (51,682) | | |
| Total expenses after reductions | | | | 788,054 |
| Net Investment income (loss) | | | | 4,994,120 |
| Realized and Unrealized Gain (Loss) | | | | |
| Net realized gain (loss) on: | | | | |
| Investment Securities: | | | | |
| Unaffiliated issuers | | (3,668,386) | | |
| Total net realized gain (loss) | | | | (3,668,386) |
| Change in net unrealized appreciation (depreciation) on: | | | | |
| Investment Securities: | | | | |
| Unaffiliated issuers | | (4,686,007) | | |
| Fidelity Central Funds | | (1) | | |
| Total change in net unrealized appreciation (depreciation) | | | | (4,686,008) |
| Net gain (loss) | | | | (8,354,394) |
| Net increase (decrease) in net assets resulting from operations | | | $ | (3,360,274) |
| Statement of Changes in Net Assets |
| |
| | Six months ended October 31, 2023 (Unaudited) | | Year ended April 30, 2023 |
| Increase (Decrease) in Net Assets | | | | |
| Operations | | | | |
| Net investment income (loss) | $ | 4,994,120 | $ | 11,061,719 |
| Net realized gain (loss) | | (3,668,386) | | (10,993,496) |
| Change in net unrealized appreciation (depreciation) | | (4,686,008) | | 2,549,482 |
| Net increase (decrease) in net assets resulting from operations | | (3,360,274) | | 2,617,705 |
| Distributions to shareholders | | (4,689,313) | | (10,552,282) |
| | | | | |
| Share transactions | | | | |
| Proceeds from sales of shares | | 6,394,044 | | 14,368,413 |
| Reinvestment of distributions | | 3,908,816 | | 8,853,903 |
| Cost of shares redeemed | | (24,676,457) | | (71,841,155) |
| | | | | |
Net increase (decrease) in net assets resulting from share transactions | | (14,373,597) | | (48,618,839) |
| Total increase (decrease) in net assets | | (22,423,184) | | (56,553,416) |
| | | | | |
| Net Assets | | | | |
| Beginning of period | | 221,379,870 | | 277,933,286 |
| End of period | $ | 198,956,686 | $ | 221,379,870 |
| | | | | |
| Other Information | | | | |
| Shares | | | | |
| Sold | | 832,706 | | 1,842,094 |
| Issued in reinvestment of distributions | | 510,512 | | 1,150,252 |
| Redeemed | | (3,225,044) | | (9,332,498) |
| Net increase (decrease) | | (1,881,826) | | (6,340,152) |
| | | | | |
Financial Highlights
| Fidelity® Focused High Income Fund |
| |
| | Six months ended (Unaudited) October 31, 2023 | | Years ended April 30, 2023 | | 2022 | | 2021 | | 2020 | | 2019 |
Selected Per-Share Data | | | | | | | | | | | | |
| Net asset value, beginning of period | $ | 7.79 | $ | 7.99 | $ | 8.86 | $ | 8.28 | $ | 8.65 | $ | 8.47 |
| Income from Investment Operations | | | | | | | | | | | | |
Net investment income (loss) A,B | | .182 | | .357 | | .317 | | .340 | | .374 | | .399 |
| Net realized and unrealized gain (loss) | | (.311) | | (.216) | | (.863) | | .574 | | (.378) | | .190 |
| Total from investment operations | | (.129) | | .141 | | (.546) | | .914 | | (.004) | | .589 |
| Distributions from net investment income | | (.171) | | (.341) | | (.324) | | (.334) | | (.366) | | (.409) |
| Total distributions | | (.171) | | (.341) | | (.324) | | (.334) | | (.366) | | (.409) |
| Net asset value, end of period | $ | 7.49 | $ | 7.79 | $ | 7.99 | $ | 8.86 | $ | 8.28 | $ | 8.65 |
Total Return C,D | | (1.68)% | | 1.91% | | (6.41)% | | 11.16% | | (.16)% | | 7.21% |
Ratios to Average Net Assets B,E,F | | | | | | | | | | | | |
| Expenses before reductions | | .80% G | | .79% | | .75% | | .75% | | .78% | | .79% |
| Expenses net of fee waivers, if any | | .75% G | | .75% | | .75% | | .75% | | .78% | | .79% |
| Expenses net of all reductions | | .75% G | | .75% | | .75% | | .75% | | .78% | | .78% |
| Net investment income (loss) | | 4.73% G | | 4.62% | | 3.62% | | 3.88% | | 4.31% | | 4.73% |
| Supplemental Data | | | | | | | | | | | | |
| Net assets, end of period (000 omitted) | $ | 198,957 | $ | 221,380 | $ | 277,933 | $ | 384,632 | $ | 347,510 | $ | 302,781 |
Portfolio turnover rate H | | 33% G | | 9% | | 20% | | 73% | | 43% | | 49% |
ACalculated based on average shares outstanding during the period.
BNet investment income (loss) is affected by the timing of the declaration of dividends by any underlying mutual funds or exchange-traded funds (ETFs). Net investment income (loss) of any mutual funds or ETFs is not included in the Fund's net investment income (loss) ratio.
CTotal returns for periods of less than one year are not annualized.
DTotal returns would have been lower if certain expenses had not been reduced during the applicable periods shown.
EFees and expenses of any underlying mutual funds or exchange-traded funds (ETFs) are not included in the Fund's expense ratio. The Fund indirectly bears its proportionate share of these expenses.
FExpense ratios reflect operating expenses of the class. Expenses before reductions do not reflect amounts reimbursed, waived, or reduced through arrangements with the investment adviser, brokerage services, or other offset arrangements, if applicable, and do not represent the amount paid by the class during periods when reimbursements, waivers or reductions occur.
GAnnualized.
HAmount does not include the portfolio activity of any underlying mutual funds or exchange-traded funds (ETFs).
For the period ended October 31, 2023
1. Organization.
Fidelity Focused High Income Fund (the Fund) is a fund of Fidelity Summer Street Trust (the Trust) and is authorized to issue an unlimited number of shares. Share transactions on the Statement of Changes in Net Assets may contain exchanges between affiliated funds. The Trust is registered under the Investment Company Act of 1940, as amended (the 1940 Act), as an open-end management investment company organized as a Massachusetts business trust.
2. Investments in Fidelity Central Funds.
Funds may invest in Fidelity Central Funds, which are open-end investment companies generally available only to other investment companies and accounts managed by the investment adviser and its affiliates. The Schedule of Investments lists any Fidelity Central Funds held as an investment as of period end, but does not include the underlying holdings of each Fidelity Central Fund. An investing fund indirectly bears its proportionate share of the expenses of the underlying Fidelity Central Funds.
Based on its investment objective, each Fidelity Central Fund may invest or participate in various investment vehicles or strategies that are similar to those of the investing fund. These strategies are consistent with the investment objectives of the investing fund and may involve certain economic risks which may cause a decline in value of each of the Fidelity Central Funds and thus a decline in the value of the investing fund.
| Fidelity Central Fund | Investment Manager | Investment Objective | Investment Practices | Expense RatioA |
| Fidelity Money Market Central Funds | Fidelity Management & Research Company LLC (FMR) | Each fund seeks to obtain a high level of current income consistent with the preservation of capital and liquidity. | Short-term Investments | Less than .005% |
A Expenses expressed as a percentage of average net assets and are as of each underlying Central Fund's most recent annual or semi-annual shareholder report.
A complete unaudited list of holdings for each Fidelity Central Fund is available upon request or at the Securities and Exchange Commission website at www.sec.gov. In addition, the financial statements of the Fidelity Central Funds which contain the significant accounting policies (including investment valuation policies) of those funds, and are not covered by the Report of Independent Registered Public Accounting Firm, are available on the Securities and Exchange Commission website or upon request.
3. Significant Accounting Policies.
The Fund is an investment company and applies the accounting and reporting guidance of the Financial Accounting Standards Board (FASB) Accounting Standards Codification Topic 946 Financial Services - Investment Companies. The financial statements have been prepared in conformity with accounting principles generally accepted in the United States of America (GAAP), which require management to make certain estimates and assumptions at the date of the financial statements. Actual results could differ from those estimates. Subsequent events, if any, through the date that the financial statements were issued have been evaluated in the preparation of the financial statements. The Fund's Schedule of Investments lists any underlying mutual funds or exchange-traded funds (ETFs) but does not include the underlying holdings of these funds. The following summarizes the significant accounting policies of the Fund:
Investment Valuation. Investments are valued as of 4:00 p.m. Eastern time on the last calendar day of the period. The Board of Trustees (the Board) has designated the Fund's investment adviser as the valuation designee responsible for the fair valuation function and performing fair value determinations as needed. The investment adviser has established a Fair Value Committee (the Committee) to carry out the day-to-day fair valuation responsibilities and has adopted policies and procedures to govern the fair valuation process and the activities of the Committee. In accordance with these fair valuation policies and procedures, which have been approved by the Board, the Fund attempts to obtain prices from one or more third party pricing services or brokers to value its investments. When current market prices, quotations or currency exchange rates are not readily available or reliable, investments will be fair valued in good faith by the Committee, in accordance with the policies and procedures. Factors used in determining fair value vary by investment type and may include market or investment specific events, transaction data, estimated cash flows, and market observations of comparable investments. The frequency that the fair valuation procedures are used cannot be predicted and they may be utilized to a significant extent. The Committee manages the Fund's fair valuation practices and maintains the fair valuation policies and procedures. The Fund's investment adviser reports to the Board information regarding the fair valuation process and related material matters.
The Fund categorizes the inputs to valuation techniques used to value its investments into a disclosure hierarchy consisting of three levels as shown below:
Level 1 - unadjusted quoted prices in active markets for identical investments
Level 2 - other significant observable inputs (including quoted prices for similar investments, interest rates, prepayment speeds, etc.)
Level 3 - unobservable inputs (including the Fund's own assumptions based on the best information available)
Valuation techniques used to value the Fund's investments by major category are as follows:
Debt securities, including restricted securities, are valued based on evaluated prices received from third party pricing services or from brokers who make markets in such securities. Corporate bonds, bank loan obligations and preferred securities are valued by pricing services who utilize matrix pricing which considers yield or price of bonds of comparable quality, coupon, maturity and type or by broker-supplied prices. When independent prices are unavailable or unreliable, debt securities may be valued utilizing pricing methodologies which consider similar factors that would be used by third party pricing services. Debt securities are generally categorized as Level 2 in the hierarchy but may be Level 3 depending on the circumstances. The Fund invests a significant portion of its assets in below investment grade securities. The value of these securities can be more volatile due to changes in the credit quality of the issuer and is sensitive to changes in economic, market and regulatory conditions.
Investments in open-end mutual funds, including the Fidelity Central Funds, are valued at their closing net asset value (NAV) each business day and are categorized as Level 1 in the hierarchy.
Changes in valuation techniques may result in transfers in or out of an assigned level within the disclosure hierarchy. The aggregate value of investments by input level as of October 31, 2023 is included at the end of the Fund's Schedule of Investments.
Investment Transactions and Income. For financial reporting purposes, the Fund's investment holdings and NAV include trades executed through the end of the last business day of the period. The NAV per share for processing shareholder transactions is calculated as of the close of business of the New York Stock Exchange (NYSE), normally 4:00 p.m. Eastern time and includes trades executed through the end of the prior business day. Gains and losses on securities sold are determined on the basis of identified cost and include proceeds received from litigation. Commissions paid to certain brokers with whom the investment adviser, or its affiliates, places trades on behalf of a fund include an amount in addition to trade execution, which may be rebated back to a fund. Any such rebates are included in net realized gain (loss) on investments in the Statement of Operations. Dividend income is recorded on the ex-dividend date, except for certain dividends from foreign securities where the ex-dividend date may have passed, which are recorded as soon as the Fund is informed of the ex-dividend date. Non-cash dividends included in dividend income, if any, are recorded at the fair market value of the securities received. Income and capital gain distributions from Fidelity Central Funds, if any, are recorded on the ex-dividend date. Interest income is accrued as earned and includes coupon interest and amortization of premium and accretion of discount on debt securities as applicable. Debt obligations may be placed on non-accrual status and related interest income may be reduced by ceasing current accruals and writing off interest receivables when the collection of all or a portion of interest has become doubtful based on consistently applied procedures. A debt obligation is removed from non-accrual status when the issuer resumes interest payments or when collectability of interest is reasonably assured.
Expenses. Expenses directly attributable to a fund are charged to that fund. Expenses attributable to more than one fund are allocated among the respective funds on the basis of relative net assets or other appropriate methods. Expenses included in the accompanying financial statements reflect the expenses of that fund and do not include any expenses associated with any underlying mutual funds or exchange-traded funds. Although not included in a fund's expenses, a fund indirectly bears its proportionate share of these expenses through the net asset value of each underlying mutual fund or exchange-traded fund. Expense estimates are accrued in the period to which they relate and adjustments are made when actual amounts are known.
Income Tax Information and Distributions to Shareholders. Each year, the Fund intends to qualify as a regulated investment company under Subchapter M of the Internal Revenue Code, including distributing substantially all of its taxable income and realized gains. As a result, no provision for U.S. Federal income taxes is required. The Fund files a U.S. federal tax return, in addition to state and local tax returns as required. The Fund's federal income tax returns are subject to examination by the Internal Revenue Service (IRS) for a period of three fiscal years after they are filed. State and local tax returns may be subject to examination for an additional fiscal year depending on the jurisdiction.
Distributions are declared and recorded daily and paid monthly from net investment income. Distributions from realized gains, if any, are declared and recorded on the ex-dividend date. Income and capital gain distributions are determined in accordance with income tax regulations, which may differ from GAAP.
Capital accounts within the financial statements are adjusted for permanent book-tax differences. These adjustments have no impact on net assets or the results of operations. Capital accounts are not adjusted for temporary book-tax differences which will reverse in a subsequent period.
Book-tax differences are primarily due to prior period premium and discount on debt securities, market discount, capital loss carryforwards and losses deferred due to wash sales.
As of period end, the cost and unrealized appreciation (depreciation) in securities, and derivatives if applicable, for federal income tax purposes were as follows:
| Gross unrealized appreciation | $1,081,381 |
| Gross unrealized depreciation | (23,273,028) |
| Net unrealized appreciation (depreciation) | $(22,191,647) |
| Tax cost | $218,656,009 |
Capital loss carryforwards are only available to offset future capital gains of the Fund to the extent provided by regulations and may be limited. The capital loss carryforward information presented below, including any applicable limitation, is estimated as of prior fiscal period end and is subject to adjustment.
| Short-term | $(10,680,461) |
| Long-term | (10,958,764) |
| Total capital loss carryforward | $(21,639,225) |
Restricted Securities (including Private Placements). Funds may invest in securities that are subject to legal or contractual restrictions on resale. These securities generally may be resold in transactions exempt from registration or to the public if the securities are registered. Disposal of these securities may involve time-consuming negotiations and expense, and prompt sale at an acceptable price may be difficult. Information regarding restricted securities held at period end is included at the end of the Schedule of Investments, if applicable.
Loans and Other Direct Debt Instruments. Direct debt instruments are interests in amounts owed to lenders by corporate or other borrowers. These instruments may be in the form of loans, trade claims or other receivables and may include standby financing commitments such as revolving credit facilities that obligate a fund to supply additional cash to the borrower on demand. Loans may be acquired through assignment, participation, or may be made directly to a borrower. Such instruments are presented in the Bank Loan Obligations section in the Schedule of Investments. Certain funds may also invest in unfunded loan commitments, which are contractual obligations for future funding. Information regarding unfunded commitments is included at the end of the Schedule of Investments, if applicable.
4. Purchases and Sales of Investments.
Purchases and sales of securities, other than short-term securities and in-kind transactions, as applicable, are noted in the table below.
| | Purchases ($) | Sales ($) |
| Fidelity Focused High Income Fund | 31,875,474 | 31,816,505 |
5. Fees and Other Transactions with Affiliates.
Management Fee. Fidelity Management & Research Company LLC (the investment adviser) and its affiliates provide the Fund with investment management related services for which the Fund pays a monthly management fee. The management fee is the sum of an individual fund fee rate that is based on an annual rate of .45% of the Fund's average net assets and an annualized group fee rate that averaged .10% during the period. The group fee rate is based upon the monthly average net assets of a group of registered investment companies with which the investment adviser has management contracts. The group fee rate decreases as assets under management increase and increases as assets under management decrease. For the reporting period, the total annualized management fee rate was .55% of the Fund's average net assets.
Transfer Agent Fees. Fidelity Investments Institutional Operations Company LLC (FIIOC), an affiliate of the investment adviser, is the Fund's transfer, dividend disbursing and shareholder servicing agent. FIIOC receives account fees and asset-based fees that vary according to account size and type of account. FIIOC pays for typesetting, printing and mailing of shareholder reports, except proxy statements. For the period, the transfer agent fees were equivalent to an annualized rate of .15% of average net assets.
During November 2023, the Board approved a change in the transfer agent fees effective December 1, 2023 to a fixed annual rate of 0.1541% of average net assets.
Accounting Fees. Fidelity Service Company, Inc. (FSC), an affiliate of the investment adviser, maintains the Fund's accounting records. The accounting fee is based on the level of average net assets for each month. For the period, the fees were equivalent to the following annualized rates:
| | % of Average Net Assets |
| Fidelity Focused High Income Fund | .04 |
During November 2023, the Board approved a change in the accounting fees effective December 1, 2023 to a fixed annual rate of average net assets as follows:
| | % of Average Net Assets |
| Fidelity Focused High Income Fund | 0.0414% |
Interfund Trades. Funds may purchase from or sell securities to other Fidelity Funds under procedures adopted by the Board. The procedures have been designed to ensure these interfund trades are executed in accordance with Rule 17a-7 of the 1940 Act. Any interfund trades are included within the respective purchases and sales amounts shown in the Purchases and Sales of Investments note. During the period, there were no interfund trades.
6. Committed Line of Credit.
Certain Funds participate with other funds managed by the investment adviser or an affiliate in a $4.25 billion credit facility (the "line of credit") to be utilized for temporary or emergency purposes to fund shareholder redemptions or for other short-term liquidity purposes. The participating funds have agreed to pay commitment fees on their pro-rata portion of the line of credit, which are reflected in Miscellaneous expenses on the Statement of Operations, and are listed below. During the period, there were no borrowings on this line of credit.
| | Amount |
| Fidelity Focused High Income Fund | $178 |
7. Expense Reductions.
The investment adviser contractually agreed to reimburse the Fund to the extent annual operating expenses exceeded .75% of average net assets. This reimbursement will remain in place through August 31, 2024. Some expenses, for example the compensation of the independent Trustees, and certain miscellaneous expenses such as proxy and shareholder meeting expenses, are excluded from this reimbursement. During the period this reimbursement reduced the Fund's expenses by $47,279.
Through arrangements with the Fund's custodian, credits realized as a result of certain uninvested cash balances were used to reduce the Fund's expenses by $186.
In addition, during the period the investment adviser or an affiliate reimbursed and/or waived a portion of operating expenses in the amount of $4,217.
8. Other.
A fund's organizational documents provide former and current trustees and officers with a limited indemnification against liabilities arising in connection with the performance of their duties to the fund. In the normal course of business, a fund may also enter into contracts that provide general indemnifications. A fund's maximum exposure under these arrangements is unknown as this would be dependent on future claims that may be made against a fund. The risk of material loss from such claims is considered remote.
9. Risk and Uncertainties.
Many factors affect a fund's performance. Developments that disrupt global economies and financial markets, such as pandemics, epidemics, outbreaks of infectious diseases, war, terrorism, and environmental disasters, may significantly affect a fund's investment performance. The effects of these developments to a fund will be impacted by the types of securities in which a fund invests, the financial condition, industry, economic sector, and geographic location of an issuer, and a fund's level of investment in the securities of that issuer. Significant concentrations in security types, issuers, industries, sectors, and geographic locations may magnify the factors that affect a fund's performance.
As a shareholder, you incur two types of costs: (1) transaction costs, which may include sales charges (loads) on purchase payments or redemption proceeds, as applicable and (2) ongoing costs, which generally include management fees, distribution and/or service (12b-1) fees and other Fund expenses. This Example is intended to help you understand your ongoing costs (in dollars) of investing in a fund and to compare these costs with the ongoing costs of investing in other mutual funds.
| The Example is based on an investment of $1,000 invested at the beginning of the period and held for the entire period (May 1, 2023 to October 31, 2023). |
Actual Expenses
The first line of the accompanying table provides information about actual account values and actual expenses. You may use the information in this line, together with the amount you invested, to estimate the expenses that you paid over the period. Simply divide your account value by $1,000.00 (for example, an $8,600 account value divided by $1,000.00 = 8.6), then multiply the result by the number in the first line for a class/Fund under the heading entitled "Expenses Paid During Period" to estimate the expenses you paid on your account during this period. If any fund is a shareholder of any underlying mutual funds or exchange-traded funds (ETFs) (the Underlying Funds), such fund indirectly bears its proportional share of the expenses of the Underlying Funds in addition to the direct expenses incurred presented in the table. These fees and expenses are not included in the annualized expense ratio used to calculate the expense estimate in the table below.
Hypothetical Example for Comparison Purposes
The second line of the accompanying table provides information about hypothetical account values and hypothetical expenses based on the actual expense ratio and an assumed rate of return of 5% per year before expenses, which is not the actual return. The hypothetical account values and expenses may not be used to estimate the actual ending account balance or expenses you paid for the period. You may use this information to compare the ongoing costs of investing in the Fund and other funds. To do so, compare this 5% hypothetical example with the 5% hypothetical examples that appear in the shareholder reports of the other funds. If any fund is a shareholder of any Underlying Funds, such fund indirectly bears its proportional share of the expenses of the Underlying Funds in addition to the direct expenses as presented in the table. These fees and expenses are not included in the annualized expense ratio used to calculate the expense estimate in the table below.
Please note that the expenses shown in the table are meant to highlight your ongoing costs only and do not reflect any transaction costs. Therefore, the second line of the table is useful in comparing ongoing costs only, and will not help you determine the relative total costs of owning different funds. In addition, if these transactional costs were included, your costs would have been higher.
| | | | | Annualized Expense Ratio- A | | Beginning Account Value May 1, 2023 | | Ending Account Value October 31, 2023 | | Expenses Paid During Period- C May 1, 2023 to October 31, 2023 |
| | | | | | | | | | |
| Fidelity® Focused High Income Fund | | | | .75% | | | | | | |
| Actual | | | | | | $ 1,000 | | $ 983.20 | | $ 3.74 |
Hypothetical-B | | | | | | $ 1,000 | | $ 1,021.37 | | $ 3.81 |
| |
A Annualized expense ratio reflects expenses net of applicable fee waivers.
B 5% return per year before expenses
C Expenses are equal to the annualized expense ratio, multiplied by the average account value over the period, multiplied by 184/ 366 (to reflect the one-half year period). The fees and expenses of any Underlying Funds are not included in each annualized expense ratio.
Board Approval of Investment Advisory Contracts and Management Fees
Fidelity Focused High Income Fund
Each year, the Board of Trustees, including the Independent Trustees (together, the Board), considers the renewal of the fund's management contract with Fidelity Management & Research Company LLC (FMR) and the sub-advisory agreements (together, the Advisory Contracts) for the fund. FMR and the sub-advisers are referred to herein as the Investment Advisers. The Board, assisted by the advice of fund counsel and Independent Trustees' counsel, requests and considers a broad range of information relevant to the renewal of the Advisory Contracts throughout the year.
The Board meets regularly and, at each of its meetings, covers an extensive agenda of topics and materials and considers factors that are relevant to its annual consideration of the renewal of the fund's Advisory Contracts, including the services and support provided to the fund and its shareholders. The Board, acting directly and through its Committees (each of which is composed of and chaired by Independent Trustees), requests and receives information concerning the annual consideration of the renewal of the fund's Advisory Contracts. The Board also meets as needed to review matters specifically related to the Board's annual consideration of the renewal of the Advisory Contracts. Members of the Board may also meet with trustees of other Fidelity funds through joint ad hoc committees to discuss certain matters relevant to all of the Fidelity funds.
Approval of Stub Period Continuation. At its May 2023 meeting, the Board of Trustees voted to continue the fund's management contract with FMR, and the sub-advisory agreements and sub-sub-advisory agreements, in each case, where applicable (together, the Advisory Contracts), without modification, for two months from June 1, 2023 through July 31, 2023. The Board considered that the approval of the fund's Advisory Contracts will not result in any changes in (i) the investment process or strategies employed in the management of the fund's assets; (ii) the fees and expenses paid by shareholders; (iii) the nature, extent or quality of services provided under the fund's Advisory Contracts; or (iv) the day-to-day management of the fund or the persons primarily responsible for such management. The Board also considered that since its last approval of the fund's Advisory Contracts, FMR had provided additional information on the fund in support of the annual contract renewal process, including competitive analyses on total expenses and management fees and in-depth reviews of fund performance and fund profitability information. The Board concluded that the fund's Advisory Contracts are fair and reasonable, and that the fund's Advisory Contracts should be renewed, without modification, through July 31, 2023, with the understanding that the Board would consider the annual renewal for a full one year period in July 2023.
At its July 2023 meeting, the Board unanimously determined to renew the fund's Advisory Contracts. In reaching its determination, the Board considered all factors it believed relevant, including (i) the nature, extent, and quality of the services provided to the fund and its shareholders (including the investment performance of the fund); (ii) the competitiveness relative to peer funds of the fund's management fee and total expense ratio; (iii) the total costs of the services provided by and the profits realized by FMR and its affiliates (Fidelity) from its relationships with the fund; and (iv) the extent to which, if any, economies of scale exist and are realized as the fund grows, and whether any economies of scale are appropriately shared with fund shareholders. The Board also considered the broad range of investment choices available to shareholders from FMR's competitors and that the fund's shareholders have chosen to invest in the fund, which is part of the Fidelity family of funds. The Board's decision to renew the Advisory Contracts was not based on any single factor.
The Board reached a determination, with the assistance of fund counsel and Independent Trustees' counsel and through the exercise of its business judgment, that the renewal of the Advisory Contracts was in the best interests of the fund and its shareholders and that the compensation payable under the Advisory Contracts was fair and reasonable in light of all of the surrounding circumstances.
Nature, Extent, and Quality of Services Provided. The Board considered staffing as it relates to the fund, including the backgrounds and experience of investment personnel of the Investment Advisers, and also considered the Investment Advisers' implementation of the fund's investment program. The Independent Trustees also had discussions with senior management of Fidelity's investment operations and investment groups. The Board considered the structure of the investment personnel compensation program and whether this structure provides appropriate incentives to act in the best interests of the fund. Additionally, the Board considered the portfolio managers' investments, if any, in the funds that they manage.
Resources Dedicated to Investment Management and Support Services. The Board and the Fund Oversight and Research Committees reviewed the general qualifications and capabilities of Fidelity's investment staff, including its size, education, experience, and resources, as well as Fidelity's approach to recruiting, training, managing, and compensating investment personnel. The Board noted the resources devoted to expansion of Fidelity's global investment organization, and that Fidelity's analysts have extensive resources, tools and capabilities that allow them to conduct sophisticated quantitative and fundamental analysis, as well as credit analysis of issuers, counterparties, and guarantors. Further, the Board considered that Fidelity's investment professionals have sufficient access to global information and data so as to provide competitive investment results over time, and that those professionals also have access to sophisticated tools that permit them to assess portfolio construction and risk and performance attribution characteristics continuously, as well as to transmit new information and research conclusions rapidly around the world. Additionally, in its deliberations, the Board considered Fidelity's trading, risk management, compliance, and technology and operations capabilities and resources, which are integral parts of the investment management process.
Shareholder and Administrative Services. The Board considered (i) the nature, extent, quality, and cost of advisory, administrative, and shareholder services performed by the Investment Advisers and their affiliates under the Advisory Contracts and under separate agreements covering transfer agency, pricing and bookkeeping, and securities lending services for the fund; (ii) the nature and extent of Fidelity's supervision of third party service providers, principally custodians, subcustodians, and pricing vendors; and (iii) the resources devoted by Fidelity to, and the record of compliance with, the fund's compliance policies and procedures. The Board also reviewed the allocation of fund brokerage, including allocations to brokers affiliated with the Investment Advisers, the use of brokerage commissions to pay fund expenses, and the use of "soft" commission dollars to pay for research services. The Board also considered the fund's securities lending activities and any payments made to Fidelity relating to securities lending.
The Board noted that the growth of fund assets over time across the complex allows Fidelity to reinvest in the development of services designed to enhance the value and convenience of the Fidelity funds as investment vehicles. These services include 24-hour access to account information and market information over the Internet and through telephone representatives, investor education materials and asset allocation tools. The Board also considered that it reviews customer service metrics such as telephone response times, continuity of services on the website and metrics addressing services at Fidelity Investor Centers.
Investment in a Large Fund Family. The Board considered the benefits to shareholders of investing in a fund that is part of a large family of funds offering a variety of investment disciplines and providing a large variety of fund investor services. The Board noted that Fidelity had taken, or had made recommendations that resulted in the Fidelity funds taking, a number of actions over the previous year that benefited particular funds and/or the Fidelity funds in general.
Investment Performance. The Board took into account discussions that occur with representatives of the Investment Advisers, and reports that it receives, at Board meetings throughout the year, relating to fund investment performance. In this regard the Board noted that as part of regularly scheduled fund reviews and other reports to the Board on fund performance, the Board considered annualized return information for the fund for different time periods, measured against an appropriate securities market index (benchmark index) and an appropriate peer group of funds with similar objectives (peer group). The Board also considered information about performance attribution. In its ongoing evaluation of fund investment performance, the Board gives particular attention to information indicating changes in performance of the funds over different time periods and discussed with the Investment Advisers the reasons for any overperformance or underperformance. The fund underperformed its benchmark and peers for the one- and three-year periods ended February 28, 2023, and as a result, the Board continues to engage in discussions with FMR about the steps it is taking to address the fund's performance.
In addition to reviewing absolute and relative fund performance, the Independent Trustees periodically consider the appropriateness of fund performance metrics in evaluating the results achieved. The Independent Trustees generally give greater weight to fund performance over longer time periods than over shorter time periods. Depending on the circumstances, the Independent Trustees may be satisfied with a fund's performance notwithstanding that it lags its benchmark index or peer group for certain periods.
Based on its review, the Board concluded that the nature, extent, and quality of services provided to the fund under the Advisory Contracts should continue to benefit the shareholders of the fund.
Competitiveness of Management Fee and Total Expense Ratio. The Board was provided with information regarding industry trends in management fees and expenses. In its review of the fund's management fee and total expense ratio, the Board considered the fund's management fee rate as well as other fund expenses, such as transfer agent fees, pricing and bookkeeping fees, and custodial, legal, and audit fees. The Board noted that Fidelity may agree to waive fees or reimburse expenses from time to time, and the extent to which, if any, it has done so for the fund.
Comparisons of Management Fees and Total Expense Ratios. Among other things, the Board reviewed data for selected groups of competitive funds and classes (referred to as "mapped groups") that were compiled by Fidelity based on combining similar investment objective categories (as classified by Lipper) that have comparable investment mandates. The data reviewed by the Board included (i) gross management fee comparisons (before taking into account expense reimbursements or caps) relative to the total universe of funds within the mapped group; (ii) gross management fee comparisons relative to a subset of non-Fidelity funds in the mapped group that are similar in size and management fee structure to the fund (referred to as the "asset size peer group"); (iii) total expense comparisons of the fund relative to funds and classes in the mapped group that have a similar sales load structure to the fund (referred to as the "similar sales load structure group"); and (iv) total expense comparisons of the fund relative to funds and classes in the similar sales load structure group that are similar in size and management fee structure to the fund (referred to as the "total expense asset size peer group"). The total expense asset size peer group comparison excludes performance adjustments and fund-paid 12b-1 fees to eliminate variability in fee structures.
The information provided to the Board indicated that the fund's management fee rate ranked below the competitive median of the mapped group for the 12-month period ended September 30, 2022 and below the competitive median of the asset size peer group for the 12-month period ended September 30, 2022. Further, the information provided to the Board indicated that the total expense ratio of the fund ranked below the competitive median of the similar sales load structure group for the 12-month period ended September 30, 2022 and below the competitive median of the total expense asset size peer group for the 12-month period ended September 30, 2022.
The Board also considered that, for funds subject to the group fee, FMR agreed to voluntarily waive fees over a specified period of time in amounts designed to account for assets converted from certain funds to certain collective investment trusts.
Other Contractual Arrangements. The Board further considered that FMR has contractually agreed to reimburse the fund to the extent that total operating expenses, with certain exceptions, as a percentage of its average net assets, exceed 0.75% through August 31, 2024.
Fees Charged to Other Fidelity Clients. The Board also considered Fidelity fee structures and other information with respect to clients of Fidelity, such as other funds advised or subadvised by Fidelity, pension plan clients, and other institutional clients with similar mandates. The Board noted that a joint ad hoc committee created by it and the boards of other Fidelity funds periodically reviews and compares Fidelity's institutional investment advisory business with its business of providing services to the Fidelity funds and also noted the most recent findings of the committee. The Board noted that the committee's review included a consideration of the differences in services provided, fees charged, and costs incurred, as well as competition in the markets serving the different categories of clients.
Based on its review, the Board concluded that the fund's management fee is fair and reasonable in light of the services that the fund receives and the other factors considered. Further, based on its review of total expense ratios and fees charged to other Fidelity clients, the Board concluded that the fund's total expense ratio was reasonable in light of the services that the fund and its shareholders receive and the other factors considered.
Costs of the Services and Profitability. The Board considered the revenues earned and the expenses incurred by Fidelity in conducting the business of developing, marketing, distributing, managing, administering, and servicing the fund and servicing the fund's shareholders. The Board also considered the level of Fidelity's profits in respect of all the Fidelity funds.
On an annual basis, Fidelity presents to the Board information about the profitability of its relationships with the fund. Fidelity calculates profitability information for each fund, as well as aggregate profitability information for groups of Fidelity funds and all Fidelity funds, using a series of detailed revenue and cost allocation methodologies which originate with the books and records of Fidelity on which Fidelity's audited financial statements are based. The Audit Committee of the Board reviews any significant changes from the prior year's methodologies and the full Board approves such changes.
A public accounting firm has been engaged annually by the Board as part of the Board's assessment of Fidelity's profitability analysis. The engagement includes the review and assessment of the methodologies used by Fidelity in determining the revenues and expenses attributable to Fidelity's fund business, and completion of agreed-upon procedures in respect of the mathematical accuracy of certain fund profitability information and its conformity to established allocation methodologies. After considering the reports issued under the engagement and information provided by Fidelity, the Board concluded that while other allocation methods may also be reasonable, Fidelity's profitability methodologies are reasonable in all material respects.
The Board also reviewed Fidelity's non-fund businesses and potential indirect benefits such businesses may have received as a result of their association with Fidelity's fund business (i.e., fall-out benefits) as well as cases where Fidelity's affiliates may benefit from the funds' business. The Board considered areas where potential indirect benefits to the Fidelity funds from their relationships with Fidelity may exist. The Board's consideration of these matters was informed by the findings of a joint ad hoc committee created by it and the boards of other Fidelity funds to evaluate potential fall-out benefits.
The Board considered the costs of the services provided by and the profits realized by Fidelity in connection with the operation of the fund and was satisfied that the profitability was not excessive.
Economies of Scale. The Board considered whether there have been economies of scale in respect of the management of the Fidelity funds, whether the Fidelity funds (including the fund) have appropriately benefited from any such economies of scale, and whether there is potential for realization of any further economies of scale. The Board considered the extent to which the fund will benefit from economies of scale as assets grow through increased services to the fund, through waivers or reimbursements, or through fee or expense ratio reductions. The Board also noted that a committee (the Economies of Scale Committee) created by it and the boards of other Fidelity funds periodically analyzes whether Fidelity attains economies of scale in respect of the management and servicing of the Fidelity funds, whether the Fidelity funds have appropriately benefited from such economies of scale, and whether there is potential for realization of any further economies of scale.
The Board recognized that the fund's management contract incorporates a "group fee" structure, which provides for lower group fee rates as total "group assets" increase, and for higher group fee rates as total "group assets" decrease ("group assets" as defined in the management contract). FMR calculates the group fee rates based on a tiered asset "breakpoint" schedule that varies based on asset class. The Board considered that the group fee is designed to deliver the benefits of economies of scale to fund shareholders when total Fidelity fund assets increase, even if assets of any particular fund are unchanged or have declined, because some portion of Fidelity's costs are attributable to services provided to all Fidelity funds, and all funds benefit if those costs can be allocated among more assets. The Board further considered that Fidelity agreed to impose a temporary fee waiver in the form of additional breakpoints to the current breakpoint schedule. The Board concluded that, given the group fee structure, fund shareholders will benefit from lower management fees as "group assets" increase at the fund complex level, regardless of whether Fidelity achieves any such economies of scale.
The Board concluded, taking into account the analysis of the Economies of Scale Committee, that economies of scale, if any, are being appropriately shared between fund shareholders and Fidelity.
Additional Information Requested by the Board. In order to develop fully the factual basis for consideration of the Fidelity funds' advisory contracts, the Board requested and received additional information on certain topics, including: (i) fund flow and performance trends, in particular the underperformance of certain funds and strategies, and Fidelity's long-term strategies for certain funds, including any consideration of fund liquidations or mergers; (ii) the operation of performance fees and competitor use of performance fees; (iii) Fidelity's pricing philosophy compared to competitors; (iv) fund profitability methodology and data; (v) evaluation of competitive fund data and peer group classifications and fee and expense comparisons; (vi) the management fee and expense structures for different funds and classes and information about the differences between various fee and expense structures; (vii) group fee breakpoints and related voluntary fee waivers; and (viii) information regarding other accounts managed by Fidelity and the funds' sub-advisory arrangements.
Conclusion. Based on its evaluation of all of the conclusions noted above, and after considering all factors it believed relevant, the Board, including the Independent Trustees, concluded that the advisory and sub-advisory fee arrangements are fair and reasonable in light of all of the surrounding circumstances and that the fund's Advisory Contracts should be renewed through July 31, 2024.
1.801609.120
FFH-SANN-1223
Item 2.
Code of Ethics
Not applicable.
Item 3.
Audit Committee Financial Expert
Not applicable.
Item 4.
Principal Accountant Fees and Services
Not applicable.
Item 5.
Audit Committee of Listed Registrants
Not applicable.
Item 6.
Investments
(a)
Not applicable.
(b)
Not applicable
Item 7.
Disclosure of Proxy Voting Policies and Procedures for Closed-End Management Investment Companies
Not applicable.
Item 8.
Portfolio Managers of Closed-End Management Investment Companies
Not applicable.
Item 9.
Purchase of Equity Securities by Closed-End Management Investment Company and Affiliated Purchasers
Not applicable.
Item 10.
Submission of Matters to a Vote of Security Holders
There were no material changes to the procedures by which shareholders may recommend nominees to the Fidelity Summer Street Trust’s Board of Trustees.
Item 11.
Controls and Procedures
(a)(i) The President and Treasurer and the Chief Financial Officer have concluded that the Fidelity Summer Street Trust’s (the “Trust”) disclosure controls and procedures (as defined in Rule 30a-3(c) under the Investment Company Act) provide reasonable
assurances that material information relating to the Trust is made known to them by the appropriate persons, based on their evaluation of these controls and procedures as of a date within 90 days of the filing date of this report.
(a)(ii) There was no change in the Trust’s internal control over financial reporting (as defined in Rule 30a-3(d) under the Investment Company Act) that occurred during the period covered by this report that has materially affected, or is reasonably likely to materially affect, the Trust’s internal control over financial reporting.
Item 12.
Disclosure of Securities Lending Activities for Closed-End Management
Investment Companies
Not applicable.
Item 18.
Recovery of Erroneously Awarded Compensation
(a)
Not applicable.
(b)
Not applicable.
Item 19.
Exhibits
SIGNATURES
Pursuant to the requirements of the Securities Exchange Act of 1934 and the Investment Company Act of 1940, the registrant has duly caused this report to be signed on its behalf by the undersigned, thereunto duly authorized.
Fidelity Summer Street Trust
| |
By: | /s/Stacie M. Smith |
| Stacie M. Smith |
| President and Treasurer |
|
|
Date: | December 21, 2023 |
Pursuant to the requirements of the Securities Exchange Act of 1934 and the Investment Company Act of 1940, this report has been signed below by the following persons on behalf of the registrant and in the capacities and on the dates indicated.
| |
By: | /s/Stacie M. Smith |
| Stacie M. Smith |
| President and Treasurer |
|
|
Date: | December 21, 2023 |
| |
By: | /s/John J. Burke III |
| John J. Burke III |
| Chief Financial Officer |
|
|
Date: | December 21, 2023 |