UNITED STATES
SECURITIES AND EXCHANGE COMMISSION
Washington, D.C. 20549
FORM N-CSR
CERTIFIED SHAREHOLDER REPORT OF REGISTERED
MANAGEMENT INVESTMENT COMPANIES
Investment Company Act file number 811-02737
Fidelity Summer Street Trust
(Exact name of registrant as specified in charter)
245 Summer St., Boston, MA 02210
(Address of principal executive offices) (Zip code)
Margaret Carey, Secretary
245 Summer St.
Boston, Massachusetts 02210
(Name and address of agent for service)
Registrant's telephone number, including area code:
617-563-7000
| |
Date of fiscal year end: | December 31 |
|
|
Date of reporting period: | June 30, 2023 |
Item 1.
Reports to Stockholders
Fidelity® New Markets Income Fund
Semi-Annual Report
June 30, 2023
Includes Fidelity and Fidelity Advisor share classes
Contents
To view a fund's proxy voting guidelines and proxy voting record for the 12-month period ended June 30, visit http://www.fidelity.com/proxyvotingresults or visit the Securities and Exchange Commission's (SEC) web site at http://www.sec.gov.
You may also call 1-800-544-8544 if you're an individual investing directly with Fidelity, call 1-800-835-5092 if you're a plan sponsor or participant with Fidelity as your recordkeeper or call 1-877-208-0098 on institutional accounts or if you're an advisor or invest through one to request a free copy of the proxy voting guidelines.
Standard & Poor's, S&P and S&P 500 are registered service marks of The McGraw-Hill Companies, Inc. and have been licensed for use by Fidelity Distributors Corporation.
Other third-party marks appearing herein are the property of their respective owners.
All other marks appearing herein are registered or unregistered trademarks or service marks of FMR LLC or an affiliated company. © 2023 FMR LLC. All rights reserved.
This report and the financial statements contained herein are submitted for the general information of the shareholders of the Fund. This report is not authorized for distribution to prospective investors in the Fund unless preceded or accompanied by an effective prospectus.
A fund files its complete schedule of portfolio holdings with the SEC for the first and third quarters of each fiscal year on Form N-PORT. Forms N-PORT are available on the SEC's web site at http://www.sec.gov. A fund's Forms N-PORT may be reviewed and copied at the SEC's Public Reference Room in Washington, DC. Information regarding the operation of the SEC's Public Reference Room may be obtained by calling 1-800-SEC-0330.
For a complete list of a fund's portfolio holdings, view the most recent holdings listing, semiannual report, or annual report on Fidelity's web site at http://www.fidelity.com, http://www.institutional.fidelity.com, or http://www.401k.com, as applicable.
NOT FDIC INSURED •MAY LOSE VALUE •NO BANK GUARANTEE
Neither the Fund nor Fidelity Distributors Corporation is a bank.
| Top Bond Issuers (% of Fund's net assets) |
(with maturities greater than one year) |
| U.S. Treasury Obligations | 3.8 | |
| Petroleos Mexicanos | 3.7 | |
| Dominican Republic | 3.7 | |
| State of Qatar | 3.1 | |
| Sultanate of Oman | 3.0 | |
| Turkish Republic | 3.0 | |
| Indonesian Republic | 2.9 | |
| United Mexican States | 2.6 | |
| Colombian Republic | 2.6 | |
| Saudi Arabian Oil Co. | 2.3 | |
| | 30.7 | |
| |
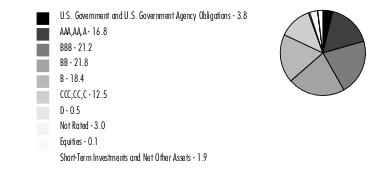
Quality Diversification (% of Fund's net assets) |
|
| |
| We have used ratings from Moody's Investors Service, Inc. Where Moody's® ratings are not available, we have used S&P® ratings. All ratings are as of the date indicated and do not reflect subsequent changes. |
Asset Allocation (% of Fund's net assets) |
|
|
Geographic Diversification (% of Fund's net assets) |
|
* Includes Short-Term investments and Net Other Assets (Liabilities). Percentages are adjusted for the effect of derivatives, if applicable. |
| |
Showing Percentage of Net Assets
| Nonconvertible Bonds - 31.2% |
| | | Principal Amount (a) | Value ($) |
| Argentina - 0.0% | | | |
| YPF SA 8.75% 4/4/24 (b) | | 970,400 | 936,116 |
| Azerbaijan - 1.2% | | | |
| Southern Gas Corridor CJSC 6.875% 3/24/26 (b) | | 36,439,000 | 36,931,291 |
| State Oil Co. of Azerbaijan Republic 6.95% 3/18/30 (Reg. S) | | 11,845,000 | 12,160,432 |
TOTAL AZERBAIJAN | | | 49,091,723 |
| Bahrain - 0.7% | | | |
| The Oil and Gas Holding Co. 7.5% 10/25/27 (b) | | 28,868,000 | 29,241,552 |
| Brazil - 1.6% | | | |
| Adecoagro SA 6% 9/21/27 (b) | | 6,168,000 | 5,717,243 |
| Azul Investments LLP: | | | |
| 5.875% 10/26/24 (b) | | 22,223,000 | 18,703,321 |
| 7.25% 6/15/26 (b) | | 6,345,000 | 5,049,922 |
| Braskem Netherlands BV 7.25% 2/13/33 (b) | | 4,645,000 | 4,541,997 |
| Embraer Netherlands Finance BV: | | | |
| 5.4% 2/1/27 | | 3,820,000 | 3,658,299 |
| 6.95% 1/17/28 (b) | | 3,270,000 | 3,245,475 |
| MARB BondCo PLC 3.95% 1/29/31 (b) | | 2,935,000 | 2,091,188 |
| MC Brazil Downstream Trading SARL 7.25% 6/30/31 (b) | | 12,957,434 | 8,641,442 |
| Natura Cosmeticos SA 4.125% 5/3/28 (b) | | 3,885,000 | 3,360,952 |
| NBM U.S. Holdings, Inc. 6.625% 8/6/29 (b) | | 4,930,000 | 4,491,378 |
| VM Holding SA 6.5% 1/18/28 (b) | | 4,920,000 | 4,703,815 |
TOTAL BRAZIL | | | 64,205,032 |
| Burkina Faso - 0.1% | | | |
| Endeavour Mining PLC 5% 10/14/26 (b) | | 6,000,000 | 5,306,340 |
| Cambodia - 0.2% | | | |
| NagaCorp Ltd. 7.95% 7/6/24 (Reg. S) | | 7,185,000 | 6,725,237 |
| Chile - 1.6% | | | |
| Antofagasta PLC: | | | |
| 2.375% 10/14/30 (b) | | 15,695,000 | 12,719,071 |
| 5.625% 5/13/32 (b) | | 5,445,000 | 5,384,942 |
| Corporacion Nacional del Cobre de Chile (Codelco): | | | |
| 3.15% 1/14/30 (b) | | 7,740,000 | 6,847,423 |
| 3.15% 1/15/51 (b) | | 8,130,000 | 5,679,943 |
| 3.7% 1/30/50 (b) | | 14,035,000 | 10,585,197 |
| 4.5% 8/1/47 (b) | | 6,855,000 | 5,842,105 |
| 5.125% 2/2/33 (b) | | 5,740,000 | 5,657,516 |
| VTR Comunicaciones SpA: | | | |
| 4.375% 4/15/29 (b) | | 4,050,000 | 2,061,693 |
| 5.125% 1/15/28 (b) | | 16,142,000 | 8,320,071 |
TOTAL CHILE | | | 63,097,961 |
| China - 1.5% | | | |
| ENN Clean Energy International Investment Ltd. 3.375% 5/12/26 (b) | | 12,435,000 | 11,455,371 |
| ENN Energy Holdings Ltd. 4.625% 5/17/27 (b) | | 10,930,000 | 10,609,423 |
| Meituan: | | | |
| 2.125% 10/28/25 (b) | | 11,635,000 | 10,587,617 |
| 3.05% 10/28/30 (b) | | 10,295,000 | 8,148,081 |
| Prosus NV: | | | |
| 3.061% 7/13/31 (b) | | 6,215,000 | 4,836,047 |
| 3.832% 2/8/51 (b) | | 7,355,000 | 4,472,134 |
| 4.193% 1/19/32 (b) | | 14,100,000 | 11,774,558 |
TOTAL CHINA | | | 61,883,231 |
| Colombia - 0.6% | | | |
| EnfraGen Energia Sur SA 5.375% 12/30/30 (b) | | 10,455,000 | 6,821,888 |
| Gcm Mining Corp. 6.875% 8/9/26 (b) | | 6,230,000 | 4,610,200 |
| GeoPark Ltd. 5.5% 1/17/27 (b) | | 2,535,000 | 2,075,328 |
| Oleoducto Central SA 4% 7/14/27 (b) | | 4,398,000 | 3,856,034 |
| Termocandelaria Power Ltd. 7.875% 1/30/29 (b) | | 5,438,950 | 4,840,666 |
TOTAL COLOMBIA | | | 22,204,116 |
| Costa Rica - 0.1% | | | |
| Liberty Costa Rica SR SF 10.875% 1/15/31 (b) | | 4,280,000 | 4,228,126 |
| Georgia - 0.1% | | | |
| JSC Georgian Railway 4% 6/17/28 (b) | | 6,755,000 | 5,767,554 |
| Ghana - 1.1% | | | |
| Kosmos Energy Ltd. 7.125% 4/4/26 (b) | | 29,524,000 | 25,926,796 |
| Tullow Oil PLC 10.25% 5/15/26 (b) | | 22,535,000 | 17,149,135 |
TOTAL GHANA | | | 43,075,931 |
| Guatemala - 0.5% | | | |
| CT Trust 5.125% 2/3/32 (b) | | 8,720,000 | 6,997,800 |
| Investment Energy Resources Ltd. 6.25% 4/26/29 (b) | | 6,260,000 | 5,808,804 |
| Millicom International Cellular SA 4.5% 4/27/31 (b) | | 7,595,000 | 5,813,973 |
TOTAL GUATEMALA | | | 18,620,577 |
| Hungary - 0.1% | | | |
| Magyar Export-Import Bank 6.125% 12/4/27 (b) | | 3,730,000 | 3,681,958 |
| India - 0.2% | | | |
| CA Magnum Holdings 5.375% 10/31/26 (b) | | 8,295,000 | 7,408,762 |
| Indonesia - 1.5% | | | |
| Medco Laurel Tree PTE Ltd. 6.95% 11/12/28 (b) | | 15,125,000 | 13,841,039 |
| PT Adaro Indonesia 4.25% 10/31/24 (b) | | 12,520,000 | 12,053,129 |
| PT Freeport Indonesia: | | | |
| 4.763% 4/14/27 (b) | | 4,870,000 | 4,688,739 |
| 5.315% 4/14/32 (b) | | 8,260,000 | 7,784,885 |
| 6.2% 4/14/52 (b) | | 5,635,000 | 5,079,164 |
| PT Indonesia Asahan Aluminium 5.45% 5/15/30 (b) | | 13,335,000 | 12,946,151 |
| PT Pertamina Geothermal Energy 5.15% 4/27/28 (b) | | 3,980,000 | 3,955,563 |
TOTAL INDONESIA | | | 60,348,670 |
| Israel - 0.8% | | | |
| Energean Israel Finance Ltd. 4.875% 3/30/26 (Reg. S) (b) | | 15,080,000 | 13,990,621 |
| Leviathan Bond Ltd.: | | | |
| 6.125% 6/30/25 (Reg. S) (b) | | 16,920,000 | 16,481,941 |
| 6.5% 6/30/27 (Reg. S) (b) | | 2,365,000 | 2,258,575 |
TOTAL ISRAEL | | | 32,731,137 |
| Kazakhstan - 0.7% | | | |
| KazMunaiGaz National Co.: | | | |
| 3.5% 4/14/33 (b) | | 10,395,000 | 8,032,944 |
| 5.75% 4/19/47 (b) | | 5,240,000 | 4,258,548 |
| Nostrum Oil & Gas Finance BV: | | | |
| 5% 6/30/26 (b) | | 9,429,000 | 6,123,570 |
| 14% 6/30/26 pay-in-kind (b)(c) | | 13,015,549 | 4,685,598 |
| Tengizchevroil Finance Co. International Ltd. 3.25% 8/15/30 (b) | | 7,000,000 | 5,337,010 |
TOTAL KAZAKHSTAN | | | 28,437,670 |
| Kuwait - 0.2% | | | |
| Meglobal BV 4.25% 11/3/26 (b) | | 5,000,000 | 4,791,150 |
| MEGlobal Canada, Inc. 5% 5/18/25 (b) | | 3,000,000 | 2,936,220 |
TOTAL KUWAIT | | | 7,727,370 |
| Luxembourg - 0.1% | | | |
| TMS Issuer SARL 5.78% 8/23/32 (b) | | 5,860,000 | 6,017,341 |
| Malaysia - 1.1% | | | |
| GENM Capital Labuan Ltd. 3.882% 4/19/31 (b) | | 15,305,000 | 12,348,686 |
| MISC Capital Two (Labuan) Ltd.: | | | |
| 3.625% 4/6/25 (b) | | 3,770,000 | 3,617,692 |
| 3.75% 4/6/27 (b) | | 12,315,000 | 11,523,269 |
| Petronas Capital Ltd.: | | | |
| 3.404% 4/28/61 (b) | | 9,610,000 | 6,939,669 |
| 3.5% 4/21/30 (b) | | 8,990,000 | 8,333,011 |
TOTAL MALAYSIA | | | 42,762,327 |
| Mauritius - 0.1% | | | |
| AXIAN Telecom 7.375% 2/16/27 (b) | | 5,500,000 | 4,984,815 |
| Mexico - 4.4% | | | |
| Braskem Idesa SAPI: | | | |
| 6.99% 2/20/32 (b) | | 1,605,000 | 1,027,200 |
| 7.45% 11/15/29 (b) | | 4,400,000 | 2,932,930 |
| Comision Federal de Electricidad: | | | |
| 3.348% 2/9/31 (b) | | 2,970,000 | 2,332,014 |
| 4.688% 5/15/29 (b) | | 12,425,000 | 11,135,782 |
| Petroleos Mexicanos: | | | |
| 6.5% 3/13/27 | | 9,810,000 | 8,706,375 |
| 6.5% 6/2/41 | | 11,163,000 | 7,044,411 |
| 6.625% 6/15/35 | | 65,174,000 | 45,168,841 |
| 6.7% 2/16/32 | | 14,394,000 | 10,924,326 |
| 6.875% 10/16/25 | | 11,570,000 | 11,082,903 |
| 6.95% 1/28/60 | | 35,910,000 | 22,210,335 |
| 7.69% 1/23/50 | | 65,975,000 | 44,465,831 |
| TV Azteca SA de CV 8.25% (Reg. S) (d) | | 27,098,000 | 10,249,819 |
TOTAL MEXICO | | | 177,280,767 |
| Morocco - 0.4% | | | |
| OCP SA: | | | |
| 3.75% 6/23/31 (b) | | 14,540,000 | 12,012,657 |
| 5.125% 6/23/51 (b) | | 4,000,000 | 2,906,440 |
TOTAL MOROCCO | | | 14,919,097 |
| Nigeria - 0.3% | | | |
| Access Bank PLC 6.125% 9/21/26 (b) | | 5,825,000 | 4,901,971 |
| IHS Holding Ltd. 5.625% 11/29/26 (b) | | 5,980,000 | 5,209,357 |
| IHS Netherlands Holdco BV 8% 9/18/27 (b) | | 2,200,000 | 1,997,094 |
TOTAL NIGERIA | | | 12,108,422 |
| Oman - 0.1% | | | |
| Lamar Funding Ltd. 3.958% 5/7/25 (b) | | 6,200,000 | 5,921,992 |
| Panama - 0.7% | | | |
| Aeropuerto Internacional de Tocumen SA: | | | |
| 4% 8/11/41 (b) | | 11,735,000 | 9,466,977 |
| 5.125% 8/11/61 (b) | | 5,020,000 | 3,859,577 |
| C&W Senior Financing Designated Activity Co. 6.875% 9/15/27 (b) | | 5,000,000 | 4,337,500 |
| Cable Onda SA 4.5% 1/30/30 (b) | | 11,160,000 | 9,477,518 |
TOTAL PANAMA | | | 27,141,572 |
| Paraguay - 0.1% | | | |
| Telefonica Celular del Paraguay SA 5.875% 4/15/27 (b) | | 4,950,000 | 4,541,625 |
| Peru - 0.1% | | | |
| Camposol SA 6% 2/3/27 (b) | | 4,435,000 | 2,991,141 |
| Qatar - 2.0% | | | |
| Qatar Petroleum: | | | |
| 1.375% 9/12/26 (b) | | 12,840,000 | 11,544,547 |
| 2.25% 7/12/31 (b) | | 28,970,000 | 24,257,160 |
| 3.125% 7/12/41 (b) | | 11,965,000 | 9,130,731 |
| 3.3% 7/12/51 (b) | | 36,535,000 | 26,714,027 |
| Qtel International Finance Ltd. 2.625% 4/8/31 (b) | | 11,930,000 | 10,253,954 |
TOTAL QATAR | | | 81,900,419 |
| Saudi Arabia - 3.2% | | | |
| EIG Pearl Holdings SARL 3.545% 8/31/36 (b) | | 23,470,000 | 19,963,817 |
| Greensaif Pipelines Bidco SARL: | | | |
| 6.129% 2/23/38 (b) | | 6,165,000 | 6,287,005 |
| 6.51% 2/23/42 (b) | | 6,145,000 | 6,355,343 |
| Saudi Arabian Oil Co.: | | | |
| 2.25% 11/24/30 (b) | | 18,280,000 | 15,160,152 |
| 3.25% 11/24/50 (b) | | 20,230,000 | 13,983,988 |
| 3.5% 4/16/29 (b) | | 38,876,000 | 35,721,213 |
| 4.25% 4/16/39 (b) | | 18,255,000 | 16,036,652 |
| 4.375% 4/16/49 (b) | | 16,534,000 | 14,063,324 |
TOTAL SAUDI ARABIA | | | 127,571,494 |
| South Africa - 2.3% | | | |
| Eskom Holdings SOC Ltd.: | | | |
| 6.35% 8/10/28 (b) | | 13,265,000 | 12,321,726 |
| 6.75% 8/6/23 (b) | | 10,218,000 | 10,150,868 |
| 7.125% 2/11/25 (b) | | 24,935,000 | 24,478,939 |
| 8.45% 8/10/28 (b) | | 8,165,000 | 7,741,563 |
| Liquid Telecommunications Financing PLC 5.5% 9/4/26 (b) | | 9,060,000 | 5,022,864 |
| Sasol Financing U.S.A. LLC 4.375% 9/18/26 | | 23,115,000 | 20,480,815 |
| Stillwater Mining Co.: | | | |
| 4% 11/16/26 (b) | | 5,790,000 | 5,138,972 |
| 4.5% 11/16/29 (b) | | 2,530,000 | 2,043,785 |
| The Bidvest Group UK PLC 3.625% 9/23/26 (b) | | 6,255,000 | 5,568,389 |
TOTAL SOUTH AFRICA | | | 92,947,921 |
| Tanzania - 0.1% | | | |
| HTA Group Ltd. 7% 12/18/25 (b) | | 3,050,000 | 2,881,671 |
| Ukraine - 0.2% | | | |
| NAK Naftogaz Ukraine: | | | |
| 7.375% (Reg. S) (d) | | 12,720,000 | 7,186,800 |
| 7.625% 11/8/26 (b) | | 7,055,000 | 2,645,625 |
TOTAL UKRAINE | | | 9,832,425 |
| United Arab Emirates - 2.1% | | | |
| Abu Dhabi National Energy Co. PJSC: | | | |
| 4% 10/3/49 (b) | | 4,435,000 | 3,722,296 |
| 4.696% 4/24/33 (b) | | 6,820,000 | 6,760,325 |
| 4.875% 4/23/30 (b) | | 1,990,000 | 2,002,577 |
| DAE Funding LLC 1.55% 8/1/24 (b) | | 6,275,000 | 5,929,561 |
| DP World Crescent Ltd.: | | | |
| 3.7495% 1/30/30 (b) | | 4,770,000 | 4,455,562 |
| 3.875% 7/18/29 (Reg. S) | | 11,147,000 | 10,525,109 |
| Galaxy Pipeline Assets BidCo Ltd.: | | | |
| 2.16% 3/31/34 (b) | | 9,398,825 | 7,965,504 |
| 2.625% 3/31/36 (b) | | 10,620,000 | 8,566,198 |
| GEMS MENASA Cayman Ltd. 7.125% 7/31/26 (b) | | 6,960,000 | 6,738,811 |
| MDGH GMTN RSC Ltd.: | | | |
| 2.875% 11/7/29 (b) | | 5,705,000 | 5,134,842 |
| 3.375% 3/28/32 (Reg. S) | | 2,140,000 | 1,925,080 |
| 4.375% 11/22/33 (b) | | 5,955,000 | 5,746,575 |
| 5.084% 5/22/53 (b) | | 10,540,000 | 10,460,950 |
| 5.5% 4/28/33 (b) | | 5,925,000 | 6,217,280 |
TOTAL UNITED ARAB EMIRATES | | | 86,150,670 |
| United States of America - 0.2% | | | |
| LCPR Senior Secured Financing DAC 5.125% 7/15/29 (b) | | 9,500,000 | 7,982,721 |
| Uzbekistan - 0.1% | | | |
| Uzbekneftegaz JSC 4.75% 11/16/28 (b) | | 4,640,000 | 3,828,000 |
| Venezuela - 0.8% | | | |
| Petroleos de Venezuela SA: | | | |
| 5.375% (d) | | 152,515,000 | 4,622,687 |
| 5.5% (d) | | 184,250,000 | 6,448,750 |
| 6% (b)(d) | | 105,540,000 | 3,693,900 |
| 6% (Reg. S) (d) | | 89,700,000 | 2,780,700 |
| 8.5% (Reg. S) (d) | | 20,540,000 | 8,046,545 |
| 9% (Reg. S) (d) | | 48,700,000 | 1,704,500 |
| 9.75% (b)(d) | | 71,700,000 | 2,545,350 |
| 12.75% (b)(d) | | 53,000,000 | 1,908,000 |
TOTAL VENEZUELA | | | 31,750,432 |
| TOTAL NONCONVERTIBLE BONDS (Cost $1,734,202,682) | | | 1,258,233,915 |
| | | | |
| Government Obligations - 65.4% |
| | | Principal Amount (a) | Value ($) |
| Angola - 1.6% | | | |
| Angola Republic: | | | |
| 8% 11/26/29 (b) | | 10,895,000 | 9,217,170 |
| 8.25% 5/9/28 (b) | | 18,775,000 | 16,632,209 |
| 8.75% 4/14/32 (b) | | 9,205,000 | 7,740,853 |
| 9.125% 11/26/49 (b) | | 7,695,000 | 5,921,456 |
| 9.375% 5/8/48 (b) | | 13,330,000 | 10,529,634 |
| 9.5% 11/12/25 (b) | | 16,180,000 | 15,758,026 |
TOTAL ANGOLA | | | 65,799,348 |
| Argentina - 2.0% | | | |
| Argentine Republic: | | | |
| 0.5% 7/9/30 (e) | | 78,813,473 | 26,140,065 |
| 1% 7/9/29 | | 30,551,997 | 9,909,235 |
| 1.5% 7/9/35 (e) | | 65,085,665 | 19,491,204 |
| 3.875% 1/9/38 (e) | | 53,139,088 | 18,650,757 |
| Buenos Aires Province 5.25% 9/1/37 (b)(e) | | 13,320,000 | 5,081,580 |
| Provincia de Cordoba 6.875% 12/10/25 (b) | | 4,158,567 | 3,118,926 |
TOTAL ARGENTINA | | | 82,391,767 |
| Armenia - 0.3% | | | |
| Republic of Armenia 3.6% 2/2/31 (b) | | 13,465,000 | 10,520,878 |
| Bahrain - 0.2% | | | |
| Bahrain Kingdom 5.625% 5/18/34 (b) | | 11,770,000 | 10,223,893 |
| Barbados - 0.3% | | | |
| Barbados Government 6.5% 10/1/29 (b) | | 11,985,000 | 11,175,893 |
| Benin - 0.2% | | | |
| Republic of Benin 4.875% 1/19/32 (b) | EUR | 11,755,000 | 9,708,029 |
| Bermuda - 0.5% | | | |
| Bermuda Government: | | | |
| 2.375% 8/20/30 (b) | | 5,325,000 | 4,423,158 |
| 3.375% 8/20/50 (b) | | 5,015,000 | 3,437,682 |
| 3.717% 1/25/27 (b) | | 7,900,000 | 7,494,414 |
| 5% 7/15/32 (b) | | 3,830,000 | 3,735,437 |
TOTAL BERMUDA | | | 19,090,691 |
| Brazil - 1.9% | | | |
| Brazilian Federative Republic: | | | |
| 3.875% 6/12/30 | | 9,340,000 | 8,270,944 |
| 4.75% 1/14/50 | | 9,500,000 | 6,990,195 |
| 5% 1/27/45 | | 14,450,000 | 11,262,330 |
| 5.625% 2/21/47 | | 8,822,000 | 7,425,389 |
| 7.125% 1/20/37 | | 8,510,000 | 9,055,746 |
| 8.25% 1/20/34 | | 11,336,000 | 12,989,922 |
| 12.25% 3/6/30 | | 13,881,000 | 18,964,777 |
TOTAL BRAZIL | | | 74,959,303 |
| Cameroon - 0.3% | | | |
| Cameroon Republic 5.95% 7/7/32 (b) | EUR | 14,070,000 | 10,999,635 |
| Chile - 1.6% | | | |
| Chilean Republic: | | | |
| 2.45% 1/31/31 | | 31,325,000 | 26,995,572 |
| 3.1% 1/22/61 | | 20,165,000 | 13,105,838 |
| 3.5% 1/31/34 | | 7,100,000 | 6,237,563 |
| 4% 1/31/52 | | 3,960,000 | 3,219,440 |
| 4.34% 3/7/42 | | 5,555,000 | 4,928,396 |
| 5.33% 1/5/54 | | 9,740,000 | 9,652,048 |
TOTAL CHILE | | | 64,138,857 |
| Colombia - 2.6% | | | |
| Colombian Republic: | | | |
| 3% 1/30/30 | | 45,595,000 | 35,523,976 |
| 3.125% 4/15/31 | | 19,000,000 | 14,350,130 |
| 3.875% 2/15/61 | | 6,730,000 | 3,761,195 |
| 4.125% 5/15/51 | | 6,805,000 | 4,064,831 |
| 5% 6/15/45 | | 27,005,000 | 18,729,318 |
| 5.2% 5/15/49 | | 16,120,000 | 11,175,190 |
| 6.125% 1/18/41 | | 6,410,000 | 5,209,856 |
| 7.375% 9/18/37 | | 3,680,000 | 3,503,765 |
| 7.5% 2/2/34 | | 4,055,000 | 3,964,209 |
| 8% 4/20/33 | | 4,165,000 | 4,234,764 |
TOTAL COLOMBIA | | | 104,517,234 |
| Costa Rica - 1.0% | | | |
| Costa Rican Republic: | | | |
| 5.625% 4/30/43 (b) | | 17,578,000 | 15,064,346 |
| 6.125% 2/19/31 (b) | | 11,155,000 | 11,063,864 |
| 6.55% 4/3/34 (b) | | 9,800,000 | 9,818,620 |
| 7% 4/4/44 (b) | | 4,575,000 | 4,446,809 |
TOTAL COSTA RICA | | | 40,393,639 |
| Dominican Republic - 3.7% | | | |
| Dominican Republic: | | | |
| 4.5% 1/30/30 (b) | | 29,255,000 | 25,568,285 |
| 4.875% 9/23/32 (b) | | 10,930,000 | 9,301,539 |
| 5.3% 1/21/41 (b) | | 6,000,000 | 4,721,940 |
| 5.875% 1/30/60 (b) | | 18,130,000 | 13,982,581 |
| 5.95% 1/25/27 (b) | | 17,724,000 | 17,330,882 |
| 6% 7/19/28 (b) | | 18,101,000 | 17,604,128 |
| 6.4% 6/5/49 (b) | | 6,013,000 | 5,106,119 |
| 6.5% 2/15/48 (b) | | 17,655,000 | 15,251,625 |
| 6.85% 1/27/45 (b) | | 16,129,000 | 14,600,939 |
| 7.05% 2/3/31 (b) | | 4,425,000 | 4,407,831 |
| 7.45% 4/30/44 (b) | | 20,824,000 | 20,322,766 |
TOTAL DOMINICAN REPUBLIC | | | 148,198,635 |
| Ecuador - 1.1% | | | |
| Ecuador Republic: | | | |
| 1.5% 7/31/40 (b)(e) | | 10,200,000 | 3,149,760 |
| 2.5% 7/31/35 (b)(e) | | 48,400,000 | 16,711,552 |
| 5.5% 7/31/30 (b)(e) | | 49,390,000 | 23,777,828 |
TOTAL ECUADOR | | | 43,639,140 |
| Egypt - 2.1% | | | |
| Arab Republic of Egypt: | | | |
| 7.0529% 1/15/32 (b) | | 4,740,000 | 2,677,863 |
| 7.5% 1/31/27 (b) | | 17,344,000 | 12,567,636 |
| 7.5% 2/16/61 (b) | | 21,325,000 | 10,629,873 |
| 7.6003% 3/1/29 (b) | | 30,434,000 | 19,608,626 |
| 7.903% 2/21/48 (b) | | 12,840,000 | 6,573,181 |
| 8.5% 1/31/47 (b) | | 34,441,000 | 18,240,642 |
| 8.7002% 3/1/49 (b) | | 25,240,000 | 13,524,097 |
TOTAL EGYPT | | | 83,821,918 |
| El Salvador - 0.3% | | | |
| El Salvador Republic: | | | |
| 6.375% 1/18/27 (b) | | 2,515,000 | 1,731,980 |
| 7.1246% 1/20/50 (b) | | 8,578,000 | 4,740,117 |
| 7.625% 2/1/41 (b) | | 11,695,000 | 6,607,675 |
TOTAL EL SALVADOR | | | 13,079,772 |
| Gabon - 0.5% | | | |
| Gabonese Republic: | | | |
| 6.95% 6/16/25 (b) | | 9,000,000 | 8,439,390 |
| 7% 11/24/31 (b) | | 13,095,000 | 10,386,823 |
TOTAL GABON | | | 18,826,213 |
| Georgia - 0.3% | | | |
| Georgia Republic 2.75% 4/22/26 (b) | | 15,425,000 | 13,818,332 |
| Ghana - 0.7% | | | |
| Ghana Republic: | | | |
| 7.75% (b)(d) | | 12,265,000 | 5,188,095 |
| 8.125% (b)(d) | | 17,605,000 | 7,439,169 |
| 8.125% (b)(d) | | 6,566,924 | 2,945,988 |
| 8.627% (b)(d) | | 12,885,000 | 5,225,898 |
| 10.75% 10/14/30 (b) | | 14,110,000 | 9,457,933 |
TOTAL GHANA | | | 30,257,083 |
| Guatemala - 0.8% | | | |
| Guatemalan Republic: | | | |
| 3.7% 10/7/33 (b) | | 2,500,000 | 2,011,225 |
| 4.9% 6/1/30 (b) | | 2,500,000 | 2,327,300 |
| 5.25% 8/10/29 (b) | | 9,000,000 | 8,558,280 |
| 5.375% 4/24/32 (b) | | 5,270,000 | 4,994,432 |
| 6.125% 6/1/50 (b) | | 5,650,000 | 5,191,729 |
| 6.6% 6/13/36 (b) | | 7,680,000 | 7,729,920 |
TOTAL GUATEMALA | | | 30,812,886 |
| Hungary - 1.0% | | | |
| Hungarian Republic: | | | |
| 2.125% 9/22/31 (b) | | 11,240,000 | 8,693,241 |
| 3.125% 9/21/51 (b) | | 20,505,000 | 12,725,198 |
| 5.25% 6/16/29 (b) | | 6,100,000 | 5,925,296 |
| 5.5% 6/16/34 (b) | | 6,365,000 | 6,166,858 |
| 6.25% 9/22/32 (b) | | 4,105,000 | 4,205,573 |
| 6.75% 9/25/52 (b) | | 4,190,000 | 4,319,262 |
TOTAL HUNGARY | | | 42,035,428 |
| Indonesia - 2.9% | | | |
| Indonesian Republic: | | | |
| 3.85% 10/15/30 | | 14,805,000 | 13,871,545 |
| 4.1% 4/24/28 | | 6,135,000 | 5,909,723 |
| 5.125% 1/15/45 (b) | | 20,042,000 | 19,895,092 |
| 5.95% 1/8/46 (b) | | 6,230,000 | 6,753,632 |
| 6.625% 2/17/37 (b) | | 15,086,000 | 17,175,411 |
| 6.75% 1/15/44 (b) | | 6,465,000 | 7,575,687 |
| 7.75% 1/17/38 (b) | | 17,722,000 | 22,128,575 |
| 8.5% 10/12/35 (b) | | 19,301,000 | 25,060,804 |
TOTAL INDONESIA | | | 118,370,469 |
| Ivory Coast - 0.8% | | | |
| Ivory Coast: | | | |
| 5.875% 10/17/31 (b) | EUR | 10,110,000 | 9,208,658 |
| 6.125% 6/15/33 (b) | | 8,860,000 | 7,734,691 |
| 6.375% 3/3/28 (b) | | 18,040,000 | 17,345,640 |
TOTAL IVORY COAST | | | 34,288,989 |
| Jamaica - 0.2% | | | |
| Jamaican Government 7.875% 7/28/45 | | 7,490,000 | 8,606,085 |
| Jordan - 0.8% | | | |
| Jordanian Kingdom: | | | |
| 5.85% 7/7/30 (b) | | 8,860,000 | 8,084,573 |
| 6.125% 1/29/26 (b) | | 4,385,000 | 4,296,774 |
| 7.375% 10/10/47 (b) | | 7,320,000 | 6,284,366 |
| 7.5% 1/13/29 (b) | | 5,010,000 | 4,996,724 |
| 7.75% 1/15/28 (b) | | 6,645,000 | 6,762,749 |
TOTAL JORDAN | | | 30,425,186 |
| Kenya - 0.9% | | | |
| Republic of Kenya: | | | |
| 6.3% 1/23/34 (b) | | 13,130,000 | 9,885,183 |
| 6.875% 6/24/24 (b) | | 8,460,000 | 8,013,735 |
| 7% 5/22/27 (b) | | 18,115,000 | 16,265,640 |
| 7.25% 2/28/28 (b) | | 1,965,000 | 1,698,743 |
| 8% 5/22/32 (b) | | 2,365,000 | 1,992,394 |
TOTAL KENYA | | | 37,855,695 |
| Lebanon - 0.1% | | | |
| Lebanese Republic: | | | |
| 5.8% (d) | | 8,540,000 | 548,353 |
| 6% (d) | | 5,256,000 | 341,640 |
| 6.1% (d) | | 22,896,000 | 1,470,152 |
| 6.2% (Reg. S) (d) | | 5,669,000 | 358,224 |
| 6.375% (d) | | 35,061,000 | 2,264,520 |
| 6.65% (Reg. S) (d) | | 3,000,000 | 190,710 |
| 6.75% (d) | | 3,000,000 | 191,100 |
TOTAL LEBANON | | | 5,364,699 |
| Mexico - 2.6% | | | |
| United Mexican States: | | | |
| 3.25% 4/16/30 | | 19,910,000 | 17,698,198 |
| 3.75% 1/11/28 | | 18,765,000 | 17,844,201 |
| 4.5% 4/22/29 | | 10,460,000 | 10,144,526 |
| 4.75% 4/27/32 | | 5,375,000 | 5,129,524 |
| 5.75% 10/12/2110 | | 10,595,000 | 9,449,681 |
| 6.05% 1/11/40 | | 30,348,000 | 30,788,046 |
| 6.338% 5/4/53 | | 5,935,000 | 6,041,830 |
| 6.35% 2/9/35 | | 9,065,000 | 9,509,366 |
TOTAL MEXICO | | | 106,605,372 |
| Mongolia - 0.1% | | | |
| Mongolia Government: | | | |
| 3.5% 7/7/27 (b) | | 2,675,000 | 2,248,150 |
| 5.125% 4/7/26 (b) | | 2,010,000 | 1,874,124 |
TOTAL MONGOLIA | | | 4,122,274 |
| Morocco - 0.2% | | | |
| Moroccan Kingdom 6.5% 9/8/33 (b) | | 9,915,000 | 10,194,008 |
| Nigeria - 2.3% | | | |
| Republic of Nigeria: | | | |
| 6.125% 9/28/28 (b) | | 13,115,000 | 10,902,368 |
| 6.5% 11/28/27 (b) | | 20,043,000 | 17,398,727 |
| 7.143% 2/23/30 (b) | | 6,415,000 | 5,366,019 |
| 7.625% 11/21/25 (b) | | 30,927,000 | 29,499,719 |
| 7.625% 11/28/47 (b) | | 18,415,000 | 13,039,293 |
| 7.696% 2/23/38 (b) | | 3,500,000 | 2,613,170 |
| 7.875% 2/16/32 (b) | | 9,000,000 | 7,523,190 |
| 8.375% 3/24/29 (b) | | 7,870,000 | 7,067,890 |
TOTAL NIGERIA | | | 93,410,376 |
| Oman - 3.0% | | | |
| Sultanate of Oman: | | | |
| 4.75% 6/15/26 (b) | | 4,238,000 | 4,113,530 |
| 5.375% 3/8/27 (b) | | 18,189,000 | 17,814,488 |
| 5.625% 1/17/28 (b) | | 21,625,000 | 21,339,118 |
| 6% 8/1/29 (b) | | 11,510,000 | 11,488,246 |
| 6.25% 1/25/31 (b) | | 6,340,000 | 6,418,870 |
| 6.5% 3/8/47 (b) | | 27,725,000 | 25,762,070 |
| 6.75% 10/28/27 (b) | | 6,520,000 | 6,729,879 |
| 6.75% 1/17/48 (b) | | 30,140,000 | 28,890,094 |
TOTAL OMAN | | | 122,556,295 |
| Pakistan - 0.6% | | | |
| Islamic Republic of Pakistan: | | | |
| 6% 4/8/26 (b) | | 24,660,000 | 11,862,446 |
| 6.875% 12/5/27 (b) | | 22,905,000 | 10,849,182 |
| 7.875% 3/31/36 (b) | | 1,293,000 | 584,565 |
TOTAL PAKISTAN | | | 23,296,193 |
| Panama - 2.3% | | | |
| Panamanian Republic: | | | |
| 2.252% 9/29/32 | | 22,155,000 | 16,899,391 |
| 3.16% 1/23/30 | | 14,515,000 | 12,696,706 |
| 3.298% 1/19/33 | | 21,210,000 | 17,644,811 |
| 3.87% 7/23/60 | | 17,120,000 | 11,277,458 |
| 4.3% 4/29/53 | | 7,000,000 | 5,198,340 |
| 4.5% 5/15/47 | | 8,025,000 | 6,327,392 |
| 4.5% 4/16/50 | | 10,760,000 | 8,280,143 |
| 6.4% 2/14/35 | | 9,790,000 | 10,182,481 |
| 6.853% 3/28/54 | | 3,685,000 | 3,826,504 |
TOTAL PANAMA | | | 92,333,226 |
| Paraguay - 1.0% | | | |
| Republic of Paraguay: | | | |
| 2.739% 1/29/33 (b) | | 5,873,000 | 4,702,981 |
| 4.95% 4/28/31 (b) | | 21,130,000 | 20,261,768 |
| 5.4% 3/30/50 (b) | | 10,075,000 | 8,630,144 |
| 5.6% 3/13/48 (b) | | 7,470,000 | 6,547,082 |
TOTAL PARAGUAY | | | 40,141,975 |
| Peru - 1.2% | | | |
| Peruvian Republic: | | | |
| 2.783% 1/23/31 | | 12,415,000 | 10,629,847 |
| 3% 1/15/34 | | 21,165,000 | 17,501,973 |
| 3.3% 3/11/41 | | 24,840,000 | 19,058,242 |
TOTAL PERU | | | 47,190,062 |
| Philippines - 0.8% | | | |
| Philippine Republic: | | | |
| 2.65% 12/10/45 | | 7,890,000 | 5,291,981 |
| 2.95% 5/5/45 | | 3,200,000 | 2,275,968 |
| 5% 7/17/33 | | 4,140,000 | 4,187,983 |
| 5.5% 1/17/48 | | 3,675,000 | 3,777,680 |
| 5.609% 4/13/33 | | 6,190,000 | 6,517,080 |
| 5.95% 10/13/47 | | 9,890,000 | 10,719,277 |
TOTAL PHILIPPINES | | | 32,769,969 |
| Poland - 0.3% | | | |
| Bank Gospodarstwa Krajowego 5.375% 5/22/33 (b) | | 3,640,000 | 3,603,600 |
| Polish Government 5.5% 4/4/53 | | 6,960,000 | 6,987,005 |
TOTAL POLAND | | | 10,590,605 |
| Qatar - 3.1% | | | |
| State of Qatar: | | | |
| 3.75% 4/16/30 (b) | | 37,950,000 | 36,487,028 |
| 4% 3/14/29 (b) | | 7,270,000 | 7,094,284 |
| 4.4% 4/16/50 (b) | | 28,995,000 | 26,320,211 |
| 4.817% 3/14/49 (b) | | 38,811,000 | 37,251,962 |
| 5.103% 4/23/48 (b) | | 11,510,000 | 11,447,961 |
| 9.75% 6/15/30 (b) | | 3,827,000 | 5,030,400 |
TOTAL QATAR | | | 123,631,846 |
| Romania - 2.0% | | | |
| Romanian Republic: | | | |
| 3% 2/27/27 (b) | | 10,504,000 | 9,495,616 |
| 3% 2/14/31 (b) | | 34,824,000 | 28,818,949 |
| 3.375% 1/28/50 (Reg. S) | EUR | 14,940,000 | 10,178,320 |
| 3.624% 5/26/30 (b) | EUR | 5,110,000 | 4,867,430 |
| 3.625% 3/27/32 (b) | | 10,504,000 | 8,922,413 |
| 4% 2/14/51 (b) | | 10,990,000 | 7,821,363 |
| 7.125% 1/17/33 (b) | | 4,210,000 | 4,462,853 |
| 7.625% 1/17/53 (b) | | 4,154,000 | 4,579,785 |
TOTAL ROMANIA | | | 79,146,729 |
| Russia - 0.3% | | | |
| Ministry of Finance of the Russian Federation: | | | |
| 4.375% (Reg. S) (d)(f) | | 12,600,000 | 5,292,000 |
| 5.1% (Reg. S) (d)(f) | | 12,200,000 | 5,124,000 |
TOTAL RUSSIA | | | 10,416,000 |
| Rwanda - 0.2% | | | |
| Rwanda Republic 5.5% 8/9/31 (b) | | 12,780,000 | 9,594,329 |
| Saudi Arabia - 1.7% | | | |
| Kingdom of Saudi Arabia: | | | |
| 2.25% 2/2/33 (b) | | 18,170,000 | 14,621,762 |
| 3.45% 2/2/61 (b) | | 9,925,000 | 6,964,571 |
| 3.625% 3/4/28 (b) | | 9,976,000 | 9,440,788 |
| 3.75% 1/21/55 (b) | | 19,480,000 | 14,700,387 |
| 4.5% 10/26/46 (b) | | 14,169,000 | 12,385,123 |
| 4.5% 4/22/60 (b) | | 10,670,000 | 9,218,026 |
TOTAL SAUDI ARABIA | | | 67,330,657 |
| Senegal - 0.3% | | | |
| Republic of Senegal: | | | |
| 6.25% 5/23/33 (b) | | 9,965,000 | 8,311,807 |
| 6.75% 3/13/48 (b) | | 5,110,000 | 3,648,898 |
TOTAL SENEGAL | | | 11,960,705 |
| Serbia - 0.5% | | | |
| Republic of Serbia: | | | |
| 2.125% 12/1/30 (b) | | 18,590,000 | 14,228,600 |
| 6.25% 5/26/28 (b) | | 3,140,000 | 3,120,124 |
| 6.5% 9/26/33 (b) | | 4,750,000 | 4,644,835 |
TOTAL SERBIA | | | 21,993,559 |
| South Africa - 1.1% | | | |
| South African Republic: | | | |
| 4.85% 9/30/29 | | 8,535,000 | 7,496,632 |
| 5% 10/12/46 | | 3,190,000 | 2,115,895 |
| 5.65% 9/27/47 | | 22,135,000 | 15,656,971 |
| 5.75% 9/30/49 | | 25,420,000 | 17,967,110 |
TOTAL SOUTH AFRICA | | | 43,236,608 |
| Sri Lanka - 0.9% | | | |
| Democratic Socialist Republic of Sri Lanka: | | | |
| 6.2% (b)(d) | | 14,360,000 | 6,246,600 |
| 6.825% (b)(d) | | 13,445,000 | 6,251,732 |
| 6.85% (b)(d) | | 14,285,000 | 6,604,813 |
| 7.55% (b)(d) | | 12,490,000 | 5,433,150 |
| 7.85% (b)(d) | | 26,015,000 | 11,388,066 |
TOTAL SRI LANKA | | | 35,924,361 |
| Turkey - 3.0% | | | |
| Turkish Republic: | | | |
| 4.75% 1/26/26 | | 8,400,000 | 7,652,484 |
| 4.875% 4/16/43 | | 23,555,000 | 15,074,258 |
| 5.125% 2/17/28 | | 11,310,000 | 9,811,991 |
| 5.75% 5/11/47 | | 13,175,000 | 8,992,465 |
| 6% 3/25/27 | | 7,000,000 | 6,352,500 |
| 6% 1/14/41 | | 22,183,000 | 16,265,463 |
| 6.125% 10/24/28 | | 8,780,000 | 7,825,526 |
| 6.375% 10/14/25 | | 17,175,000 | 16,360,390 |
| 6.625% 2/17/45 | | 530,000 | 405,206 |
| 9.125% 7/13/30 | | 8,800,000 | 8,706,896 |
| 9.375% 3/14/29 | | 20,365,000 | 20,362,964 |
| 9.375% 1/19/33 | | 2,175,000 | 2,177,719 |
TOTAL TURKEY | | | 119,987,862 |
| Ukraine - 1.1% | | | |
| Ukraine Government: | | | |
| 6.876% 5/21/31 (b) | | 7,670,000 | 1,731,886 |
| 7.253% 3/15/35 (b) | | 15,850,000 | 3,626,005 |
| 7.375% 9/25/34 (b) | | 11,640,000 | 2,688,840 |
| 7.75% 9/1/24 (b) | | 29,964,000 | 7,330,093 |
| 7.75% 9/1/25 (b) | | 43,671,000 | 10,957,054 |
| 7.75% 9/1/26 (b) | | 35,377,000 | 8,423,617 |
| 7.75% 9/1/27 (b) | | 7,275,000 | 1,720,901 |
| 7.75% 9/1/28 (b) | | 7,360,000 | 1,752,858 |
| 7.75% 9/1/29 (b) | | 10,846,000 | 2,575,491 |
| 7.75% 8/1/41 (b)(c) | | 8,905,000 | 3,548,643 |
| 9.75% 11/1/30 (b) | | 3,105,000 | 765,383 |
TOTAL UKRAINE | | | 45,120,771 |
| United Arab Emirates - 1.9% | | | |
| Abu Dhabi National Energy Co. PJSC 4.375% 1/24/29 (b) | | 6,105,000 | 6,005,794 |
| Emirate of Abu Dhabi: | | | |
| 3.125% 9/30/49 (b) | | 42,178,000 | 30,785,722 |
| 3.875% 4/16/50 (b) | | 34,465,000 | 28,924,407 |
| Emirate of Dubai 3.9% 9/9/50 (Reg. S) | | 15,155,000 | 10,923,118 |
TOTAL UNITED ARAB EMIRATES | | | 76,639,041 |
| United States of America - 3.8% | | | |
| U.S. Treasury Bonds: | | | |
| 2.875% 5/15/52 | | 130,074,000 | 107,793,732 |
| 3.625% 2/15/53 | | 16,800,000 | 16,122,750 |
| U.S. Treasury Notes: | | | |
| 3.625% 3/31/30 | | 6,132,000 | 5,998,342 |
| 3.75% 5/31/30 | | 14,574,000 | 14,371,330 |
| 4% 2/28/30 | | 9,933,000 | 9,926,016 |
TOTAL UNITED STATES OF AMERICA | | | 154,212,170 |
| Uruguay - 0.6% | | | |
| Uruguay Republic 5.1% 6/18/50 | | 24,210,000 | 24,163,759 |
| Uzbekistan - 0.5% | | | |
| Republic of Uzbekistan: | | | |
| 3.7% 11/25/30 (b) | | 7,400,000 | 5,957,148 |
| 3.9% 10/19/31 (b) | | 13,255,000 | 10,637,138 |
| 5.375% 2/20/29 (b) | | 4,250,000 | 3,882,970 |
TOTAL UZBEKISTAN | | | 20,477,256 |
| Venezuela - 1.1% | | | |
| Venezuelan Republic: | | | |
| 6% (d) | | 17,250,000 | 948,750 |
| 7% (d) | | 18,925,000 | 1,561,313 |
| 7.65% (d) | | 34,825,000 | 2,873,063 |
| 7.75% (Reg. S) (d) | | 29,380,000 | 1,542,450 |
| 8.25% (d) | | 30,860,000 | 2,623,100 |
| 9% (Reg. S) (d) | | 43,195,000 | 3,671,575 |
| 9.25% (d) | | 62,675,000 | 5,327,375 |
| 9.25% (Reg. S) (d) | | 70,265,000 | 5,972,525 |
| 9.375% (d) | | 46,005,000 | 3,910,425 |
| 11.75% (Reg. S) (d) | | 65,000,000 | 5,687,500 |
| 11.95% (Reg. S) (d) | | 87,250,000 | 7,634,375 |
| 12.75% (d) | | 42,425,000 | 3,606,125 |
TOTAL VENEZUELA | | | 45,358,576 |
| Zambia - 0.2% | | | |
| Republic of Zambia: | | | |
| 8.5% (b)(d) | | 2,190,000 | 1,269,193 |
| 8.97% (b)(d) | | 10,325,000 | 5,923,556 |
TOTAL ZAMBIA | | | 7,192,749 |
| TOTAL GOVERNMENT OBLIGATIONS (Cost $3,344,867,215) | | | 2,642,917,030 |
| | | | |
| Common Stocks - 0.0% |
| | | Shares | Value ($) |
| Kazakhstan - 0.0% | | | |
Nostrum Oil & Gas LP warrants (f)(g) (Cost $0) | | 709,143 | 7 |
| | | | |
| Nonconvertible Preferred Stocks - 0.1% |
| | | Shares | Value ($) |
| Brazil - 0.1% | | | |
Azul SA (g) (Cost $2,309,585) | | 743,500 | 3,394,367 |
| | | | |
| Preferred Securities - 1.4% |
| | | Principal Amount (a) | Value ($) |
| Brazil - 0.2% | | | |
| Cosan Overseas Ltd. 8.25% (h) | | 7,030,000 | 7,081,941 |
| Mexico - 0.8% | | | |
| Banco Mercantil del Norte SA: | | | |
| 6.75% (b)(c)(h) | | 13,000,000 | 12,474,458 |
| 7.625% (b)(c)(h) | | 4,590,000 | 4,223,145 |
| CEMEX S.A.B. de CV 5.125% (b)(c)(h) | | 16,320,000 | 14,774,098 |
TOTAL MEXICO | | | 31,471,701 |
| Russia - 0.1% | | | |
| Tinkoff Credit Systems 6% (b)(c)(d)(f)(h) | | 6,660,000 | 2,830,500 |
| United Arab Emirates - 0.3% | | | |
| DP World Salaam 6% (Reg. S) (c)(h) | | 13,905,000 | 14,167,539 |
| TOTAL PREFERRED SECURITIES (Cost $63,037,448) | | | 55,551,681 |
| | | | |
| TOTAL INVESTMENT IN SECURITIES - 98.1% (Cost $5,144,416,930) | 3,960,097,000 |
NET OTHER ASSETS (LIABILITIES) - 1.9% | 78,417,503 |
| NET ASSETS - 100.0% | 4,038,514,503 |
| | |
Currency Abbreviations
| EUR | - | European Monetary Unit |
Legend
| (a) | Amount is stated in United States dollars unless otherwise noted. |
| (b) | Security exempt from registration under Rule 144A of the Securities Act of 1933. These securities may be resold in transactions exempt from registration, normally to qualified institutional buyers. At the end of the period, the value of these securities amounted to $2,633,414,597 or 65.2% of net assets. |
| (c) | Coupon rates for floating and adjustable rate securities reflect the rates in effect at period end. |
| (d) | Non-income producing - Security is in default. |
| (e) | Security initially issued at one coupon which converts to a higher coupon at a specified date. The rate shown is the rate at period end. |
| (h) | Security is perpetual in nature with no stated maturity date. |
Affiliated Central Funds
Fiscal year to date information regarding the Fund's investments in Fidelity Central Funds, including the ownership percentage, is presented below.
| Affiliate | Value, beginning of period ($) | Purchases ($) | Sales Proceeds ($) | Dividend Income ($) | Realized Gain (loss) ($) | Change in Unrealized appreciation (depreciation) ($) | Value, end of period ($) | % ownership, end of period |
| Fidelity Cash Central Fund 5.14% | 81,144,900 | 1,519,698,486 | 1,600,843,385 | 1,529,412 | 28,387 | (28,388) | - | 0.0% |
| Total | 81,144,900 | 1,519,698,486 | 1,600,843,385 | 1,529,412 | 28,387 | (28,388) | - | |
| | | | | | | | | |
Amounts in the dividend income column in the above table include any capital gain distributions from underlying funds, which are presented in the corresponding line item in the Statement of Operations, if applicable.
Amounts included in the purchases and sales proceeds columns may include in-kind transactions, if applicable.
Investment Valuation
The following is a summary of the inputs used, as of June 30, 2023, involving the Fund's assets and liabilities carried at fair value. The inputs or methodology used for valuing securities may not be an indication of the risk associated with investing in those securities. For more information on valuation inputs, and their aggregation into the levels used below, please refer to the Investment Valuation section in the accompanying Notes to Financial Statements.
| Valuation Inputs at Reporting Date: |
| Description | Total ($) | Level 1 ($) | Level 2 ($) | Level 3 ($) |
Investments in Securities: | | | | |
|
| Equities: | | | | |
Energy | 7 | - | - | 7 |
Industrials | 3,394,367 | 3,394,367 | - | - |
|
| Corporate Bonds | 1,258,233,915 | - | 1,258,233,915 | - |
|
| Government Obligations | 2,642,917,030 | - | 2,632,501,030 | 10,416,000 |
|
| Preferred Securities | 55,551,681 | - | 52,721,181 | 2,830,500 |
| Total Investments in Securities: | 3,960,097,000 | 3,394,367 | 3,943,456,126 | 13,246,507 |
| Statement of Assets and Liabilities |
| | | | June 30, 2023 (Unaudited) |
| | | | | |
| Assets | | | | |
Investment in securities, at value - See accompanying schedule Unaffiliated issuers (cost $5,144,416,930): | | | $ | 3,960,097,000 |
| Cash | | | | 1,626,580 |
| Foreign currency held at value (cost $501) | | | | 501 |
| Receivable for investments sold | | | | 22,119,579 |
| Receivable for fund shares sold | | | | 1,025,545 |
| Interest receivable | | | | 84,570,413 |
| Distributions receivable from Fidelity Central Funds | | | | 194,883 |
Total assets | | | | 4,069,634,501 |
| Liabilities | | | | |
| Payable for investments purchased | $ | 13,922,967 | | |
| Payable for fund shares redeemed | | 4,467,444 | | |
| Distributions payable | | 2,080,286 | | |
| Accrued management fee | | 2,179,733 | | |
| Distribution and service plan fees payable | | 29,876 | | |
| Notes payable to affiliates | | 7,934,000 | | |
| Other affiliated payables | | 452,474 | | |
| Other payables and accrued expenses | | 53,218 | | |
| Total Liabilities | | | | 31,119,998 |
| Net Assets | | | $ | 4,038,514,503 |
| Net Assets consist of: | | | | |
| Paid in capital | | | $ | 6,245,328,115 |
| Total accumulated earnings (loss) | | | | (2,206,813,612) |
| Net Assets | | | $ | 4,038,514,503 |
| | | | | |
| Net Asset Value and Maximum Offering Price | | | | |
| Class A : | | | | |
Net Asset Value and redemption price per share ($73,827,117 ÷ 6,354,814 shares) (a) | | | $ | 11.62 |
| Maximum offering price per share (100/96.00 of $11.62) | | | $ | 12.10 |
| Class M : | | | | |
Net Asset Value and redemption price per share ($24,827,820 ÷ 2,135,786 shares) (a) | | | $ | 11.62 |
| Maximum offering price per share (100/96.00 of $11.62) | | | $ | 12.10 |
| Class C : | | | | |
Net Asset Value and offering price per share ($11,359,177 ÷ 977,621 shares) (a) | | | $ | 11.62 |
| Fidelity New Markets Income Fund : | | | | |
Net Asset Value , offering price and redemption price per share ($1,567,337,646 ÷ 134,862,223 shares) | | | $ | 11.62 |
| Class I : | | | | |
Net Asset Value , offering price and redemption price per share ($697,016,839 ÷ 59,979,913 shares) | | | $ | 11.62 |
| Class Z : | | | | |
Net Asset Value , offering price and redemption price per share ($1,664,145,904 ÷ 143,202,190 shares) | | | $ | 11.62 |
(a)Redemption price per share is equal to net asset value less any applicable contingent deferred sales charge. |
| Statement of Operations |
| | | | Six months ended June 30, 2023 (Unaudited) |
| Investment Income | | | | |
| Dividends | | | $ | 1,724,288 |
| Interest | | | | 142,337,864 |
| Income from Fidelity Central Funds | | | | 1,529,412 |
| Income before foreign taxes withheld | | | $ | 145,591,564 |
| Less foreign taxes withheld | | | | 39,158 |
| Total Income | | | | 145,630,722 |
| Expenses | | | | |
| Management fee | $ | 13,447,972 | | |
| Transfer agent fees | | 2,213,590 | | |
| Distribution and service plan fees | | 187,032 | | |
| Accounting fees and expenses | | 568,698 | | |
| Custodian fees and expenses | | 7,886 | | |
| Independent trustees' fees and expenses | | 14,412 | | |
| Registration fees | | 60,478 | | |
| Audit | | 53,653 | | |
| Legal | | 25,615 | | |
| Interest | | 3,514 | | |
| Miscellaneous | | 12,346 | | |
| Total expenses before reductions | | 16,595,196 | | |
| Expense reductions | | (61,456) | | |
| Total expenses after reductions | | | | 16,533,740 |
| Net Investment income (loss) | | | | 129,096,982 |
| Realized and Unrealized Gain (Loss) | | | | |
| Net realized gain (loss) on: | | | | |
| Investment Securities: | | | | |
| Unaffiliated issuers | | (100,758,439) | | |
| Fidelity Central Funds | | 28,387 | | |
| Foreign currency transactions | | (10,928) | | |
| Total net realized gain (loss) | | | | (100,740,980) |
| Change in net unrealized appreciation (depreciation) on: | | | | |
| Investment Securities: | | | | |
| Unaffiliated issuers | | 116,078,127 | | |
| Fidelity Central Funds | | (28,388) | | |
| Assets and liabilities in foreign currencies | | 7,904 | | |
| Total change in net unrealized appreciation (depreciation) | | | | 116,057,643 |
| Net gain (loss) | | | | 15,316,663 |
| Net increase (decrease) in net assets resulting from operations | | | $ | 144,413,645 |
| Statement of Changes in Net Assets |
| |
| | Six months ended June 30, 2023 (Unaudited) | | Year ended December 31, 2022 |
| Increase (Decrease) in Net Assets | | | | |
| Operations | | | | |
| Net investment income (loss) | $ | 129,096,982 | $ | 254,526,403 |
| Net realized gain (loss) | | (100,740,980) | | (418,668,241) |
| Change in net unrealized appreciation (depreciation) | | 116,057,643 | | (696,307,447) |
| Net increase (decrease) in net assets resulting from operations | | 144,413,645 | | (860,449,285) |
| Distributions to shareholders | | (106,071,816) | | (228,839,655) |
| | | | | |
| Share transactions - net increase (decrease) | | (232,077,192) | | (469,842,710) |
| Total increase (decrease) in net assets | | (193,735,363) | | (1,559,131,650) |
| | | | | |
| Net Assets | | | | |
| Beginning of period | | 4,232,249,866 | | 5,791,381,516 |
| End of period | $ | 4,038,514,503 | $ | 4,232,249,866 |
| | | | | |
| | | | | |
| Fidelity Advisor® New Markets Income Fund Class A |
| |
| | Six months ended (Unaudited) June 30, 2023 | | Years ended December 31, 2022 | | 2021 | | 2020 | | 2019 | | 2018 A |
Selected Per-Share Data | | | | | | | | | | | | |
| Net asset value, beginning of period | $ | 11.51 | $ | 14.24 | $ | 15.09 | $ | 15.07 | $ | 14.27 | $ | 14.31 |
| Income from Investment Operations | | | | | | | | | | | | |
Net investment income (loss) B,C | | .340 | | .621 | | .575 | | .649 | | .748 | | .054 |
| Net realized and unrealized gain (loss) | | .045 | | (2.796) | | (.888) | | (.062) | | .740 | | (.043) |
| Total from investment operations | | .385 | | (2.175) | | (.313) | | .587 | | 1.488 | | .011 |
| Distributions from net investment income | | (.275) | | (.555) | | (.497) | | (.556) | | (.688) | | (.051) |
| Distributions from net realized gain | | - | | - | | (.040) | | (.011) | | - | | - |
| Total distributions | | (.275) | | (.555) | | (.537) | | (.567) | | (.688) | | (.051) |
| Net asset value, end of period | $ | 11.62 | $ | 11.51 | $ | 14.24 | $ | 15.09 | $ | 15.07 | $ | 14.27 |
Total Return D,E,F | | 3.38% | | (15.30)% | | (2.09)% | | 4.19% | | 10.56% | | .07% |
Ratios to Average Net Assets C,G,H | | | | | | | | | | | | |
| Expenses before reductions | | 1.15% I | | 1.13% | | 1.12% | | 1.13% | | 1.12% | | 1.15% I |
| Expenses net of fee waivers, if any | | 1.15% I | | 1.13% | | 1.12% | | 1.13% | | 1.12% | | 1.15% I |
| Expenses net of all reductions | | 1.15% I | | 1.13% | | 1.12% | | 1.13% | | 1.12% | | 1.14% I |
| Net investment income (loss) | | 5.92% I | | 5.12% | | 3.93% | | 4.51% | | 5.01% | | 5.58% I |
| Supplemental Data | | | | | | | | | | | | |
| Net assets, end of period (000 omitted) | $ | 73,827 | $ | 78,302 | $ | 118,896 | $ | 136,626 | $ | 193,262 | $ | 162,757 |
Portfolio turnover rate J | | 28% I | | 26% | | 30% | | 91% | | 79% K | | 60% L |
A For the period December 4, 2018 (commencement of sale of shares) through December 31, 2018.
B Calculated based on average shares outstanding during the period.
C Net investment income (loss) is affected by the timing of the declaration of dividends by any underlying mutual funds or exchange-traded funds (ETFs). Net investment income (loss) of any mutual funds or ETFs is not included in the Fund's net investment income (loss) ratio.
D Total returns for periods of less than one year are not annualized.
E Total returns would have been lower if certain expenses had not been reduced during the applicable periods shown.
F Total returns do not include the effect of the sales charges.
G Fees and expenses of any underlying mutual funds or exchange-traded funds (ETFs) are not included in the Fund's expense ratio. The Fund indirectly bears its proportionate share of these expenses. For additional expense information related to investments in Fidelity Central Funds, please refer to the "Investments in Fidelity Central Funds" note found in the Notes to Financial Statements section of the most recent Annual or Semi-Annual report.
H Expense ratios reflect operating expenses of the class. Expenses before reductions do not reflect amounts reimbursed, waived, or reduced through arrangements with the investment adviser, brokerage services, or other offset arrangements, if applicable, and do not represent the amount paid by the class during periods when reimbursements, waivers or reductions occur.
I Annualized.
J Amount does not include the portfolio activity of any underlying mutual funds or exchange-traded funds (ETFs).
K Portfolio turnover rate excludes securities received or delivered in-kind.
L The portfolio turnover rate does not include the assets acquired in the merger.
| Fidelity Advisor® New Markets Income Fund Class M |
| |
| | Six months ended (Unaudited) June 30, 2023 | | Years ended December 31, 2022 | | 2021 | | 2020 | | 2019 | | 2018 A |
Selected Per-Share Data | | | | | | | | | | | | |
| Net asset value, beginning of period | $ | 11.52 | $ | 14.24 | $ | 15.10 | $ | 15.08 | $ | 14.27 | $ | 14.31 |
| Income from Investment Operations | | | | | | | | | | | | |
Net investment income (loss) B,C | | .340 | | .621 | | .576 | | .647 | | .749 | | .054 |
| Net realized and unrealized gain (loss) | | .036 | | (2.786) | | (.898) | | (.059) | | .748 | | (.044) |
| Total from investment operations | | .376 | | (2.165) | | (.322) | | .588 | | 1.497 | | .010 |
| Distributions from net investment income | | (.276) | | (.555) | | (.498) | | (.557) | | (.687) | | (.050) |
| Distributions from net realized gain | | - | | - | | (.040) | | (.011) | | - | | - |
| Total distributions | | (.276) | | (.555) | | (.538) | | (.568) | | (.687) | | (.050) |
| Net asset value, end of period | $ | 11.62 | $ | 11.52 | $ | 14.24 | $ | 15.10 | $ | 15.08 | $ | 14.27 |
Total Return D,E,F | | 3.30% | | (15.23)% | | (2.15)% | | 4.20% | | 10.63% | | .07% |
Ratios to Average Net Assets C,G,H | | | | | | | | | | | | |
| Expenses before reductions | | 1.15% I | | 1.13% | | 1.12% | | 1.13% | | 1.13% | | 1.14% I |
| Expenses net of fee waivers, if any | | 1.15% I | | 1.13% | | 1.11% | | 1.13% | | 1.13% | | 1.14% I |
| Expenses net of all reductions | | 1.14% I | | 1.13% | | 1.11% | | 1.12% | | 1.13% | | 1.14% I |
| Net investment income (loss) | | 5.93% I | | 5.11% | | 3.94% | | 4.51% | | 5.01% | | 5.59% I |
| Supplemental Data | | | | | | | | | | | | |
| Net assets, end of period (000 omitted) | $ | 24,828 | $ | 25,747 | $ | 38,589 | $ | 44,941 | $ | 53,609 | $ | 55,047 |
Portfolio turnover rate J | | 28% I | | 26% | | 30% | | 91% | | 79% K | | 60% L |
A For the period December 4, 2018 (commencement of sale of shares) through December 31, 2018.
B Calculated based on average shares outstanding during the period.
C Net investment income (loss) is affected by the timing of the declaration of dividends by any underlying mutual funds or exchange-traded funds (ETFs). Net investment income (loss) of any mutual funds or ETFs is not included in the Fund's net investment income (loss) ratio.
D Total returns for periods of less than one year are not annualized.
E Total returns would have been lower if certain expenses had not been reduced during the applicable periods shown.
F Total returns do not include the effect of the sales charges.
G Fees and expenses of any underlying mutual funds or exchange-traded funds (ETFs) are not included in the Fund's expense ratio. The Fund indirectly bears its proportionate share of these expenses. For additional expense information related to investments in Fidelity Central Funds, please refer to the "Investments in Fidelity Central Funds" note found in the Notes to Financial Statements section of the most recent Annual or Semi-Annual report.
H Expense ratios reflect operating expenses of the class. Expenses before reductions do not reflect amounts reimbursed, waived, or reduced through arrangements with the investment adviser, brokerage services, or other offset arrangements, if applicable, and do not represent the amount paid by the class during periods when reimbursements, waivers or reductions occur.
I Annualized.
J Amount does not include the portfolio activity of any underlying mutual funds or exchange-traded funds (ETFs).
K Portfolio turnover rate excludes securities received or delivered in-kind.
L The portfolio turnover rate does not include the assets acquired in the merger.
| Fidelity Advisor® New Markets Income Fund Class C |
| |
| | Six months ended (Unaudited) June 30, 2023 | | Years ended December 31, 2022 | | 2021 | | 2020 | | 2019 | | 2018 A |
Selected Per-Share Data | | | | | | | | | | | | |
| Net asset value, beginning of period | $ | 11.51 | $ | 14.24 | $ | 15.09 | $ | 15.07 | $ | 14.27 | $ | 14.31 |
| Income from Investment Operations | | | | | | | | | | | | |
Net investment income (loss) B,C | | .300 | | .536 | | .471 | | .542 | | .641 | | .047 |
| Net realized and unrealized gain (loss) | | .045 | | (2.798) | | (.891) | | (.063) | | .737 | | (.044) |
| Total from investment operations | | .345 | | (2.262) | | (.420) | | .479 | | 1.378 | | .003 |
| Distributions from net investment income | | (.235) | | (.468) | | (.390) | | (.448) | | (.578) | | (.043) |
| Distributions from net realized gain | | - | | - | | (.040) | | (.011) | | - | | - |
| Total distributions | | (.235) | | (.468) | | (.430) | | (.459) | | (.578) | | (.043) |
| Net asset value, end of period | $ | 11.62 | $ | 11.51 | $ | 14.24 | $ | 15.09 | $ | 15.07 | $ | 14.27 |
Total Return D,E,F | | 3.02% | | (15.91)% | | (2.81)% | | 3.43% | | 9.75% | | .02% |
Ratios to Average Net Assets C,G,H | | | | | | | | | | | | |
| Expenses before reductions | | 1.86% I | | 1.85% | | 1.86% | | 1.86% | | 1.86% | | 1.86% I |
| Expenses net of fee waivers, if any | | 1.85% I | | 1.85% | | 1.85% | | 1.86% | | 1.86% | | 1.86% I |
| Expenses net of all reductions | | 1.85% I | | 1.85% | | 1.85% | | 1.86% | | 1.85% | | 1.86% I |
| Net investment income (loss) | | 5.21% I | | 4.39% | | 3.20% | | 3.77% | | 4.28% | | 4.88% I |
| Supplemental Data | | | | | | | | | | | | |
| Net assets, end of period (000 omitted) | $ | 11,359 | $ | 12,908 | $ | 23,000 | $ | 44,401 | $ | 64,290 | $ | 87,713 |
Portfolio turnover rate J | | 28% I | | 26% | | 30% | | 91% | | 79% K | | 60% L |
A For the period December 4, 2018 (commencement of sale of shares) through December 31, 2018.
B Calculated based on average shares outstanding during the period.
C Net investment income (loss) is affected by the timing of the declaration of dividends by any underlying mutual funds or exchange-traded funds (ETFs). Net investment income (loss) of any mutual funds or ETFs is not included in the Fund's net investment income (loss) ratio.
D Total returns for periods of less than one year are not annualized.
E Total returns would have been lower if certain expenses had not been reduced during the applicable periods shown.
F Total returns do not include the effect of the contingent deferred sales charge.
G Fees and expenses of any underlying mutual funds or exchange-traded funds (ETFs) are not included in the Fund's expense ratio. The Fund indirectly bears its proportionate share of these expenses. For additional expense information related to investments in Fidelity Central Funds, please refer to the "Investments in Fidelity Central Funds" note found in the Notes to Financial Statements section of the most recent Annual or Semi-Annual report.
H Expense ratios reflect operating expenses of the class. Expenses before reductions do not reflect amounts reimbursed, waived, or reduced through arrangements with the investment adviser, brokerage services, or other offset arrangements, if applicable, and do not represent the amount paid by the class during periods when reimbursements, waivers or reductions occur.
I Annualized.
J Amount does not include the portfolio activity of any underlying mutual funds or exchange-traded funds (ETFs).
K Portfolio turnover rate excludes securities received or delivered in-kind.
L The portfolio turnover rate does not include the assets acquired in the merger.
| Fidelity® New Markets Income Fund |
| |
| | Six months ended (Unaudited) June 30, 2023 | | Years ended December 31, 2022 | | 2021 | | 2020 | | 2019 | | 2018 |
Selected Per-Share Data | | | | | | | | | | | | |
| Net asset value, beginning of period | $ | 11.51 | $ | 14.24 | $ | 15.10 | $ | 15.07 | $ | 14.27 | $ | 16.22 |
| Income from Investment Operations | | | | | | | | | | | | |
Net investment income (loss) A,B | | .358 | | .658 | | .624 | | .693 | | .795 | | .698 |
| Net realized and unrealized gain (loss) | | .046 | | (2.796) | | (.899) | | (.050) | | .738 | | (1.937) |
| Total from investment operations | | .404 | | (2.138) | | (.275) | | .643 | | 1.533 | | (1.239) |
| Distributions from net investment income | | (.294) | | (.592) | | (.545) | | (.602) | | (.733) | | (.667) |
| Distributions from net realized gain | | - | | - | | (.040) | | (.011) | | - | | (.044) |
| Total distributions | | (.294) | | (.592) | | (.585) | | (.613) | | (.733) | | (.711) |
| Net asset value, end of period | $ | 11.62 | $ | 11.51 | $ | 14.24 | $ | 15.10 | $ | 15.07 | $ | 14.27 |
Total Return C,D | | 3.55% | | (15.04)% | | (1.84)% | | 4.60% | | 10.89% | | (7.78)% |
Ratios to Average Net Assets B,E,F | | | | | | | | | | | | |
| Expenses before reductions | | .83% G | | .82% | | .80% | | .81% | | .82% | | .83% |
| Expenses net of fee waivers, if any | | .83% G | | .82% | | .79% | | .81% | | .82% | | .83% |
| Expenses net of all reductions | | .83% G | | .82% | | .79% | | .80% | | .82% | | .83% |
| Net investment income (loss) | | 6.24% G | | 5.43% | | 4.26% | | 4.83% | | 5.32% | | 4.59% |
| Supplemental Data | | | | | | | | | | | | |
| Net assets, end of period (000 omitted) | $ | 1,567,338 | $ | 1,613,198 | $ | 2,313,928 | $ | 3,430,477 | $ | 4,227,156 | $ | 4,520,911 |
Portfolio turnover rate H | | 28% G | | 26% | | 30% | | 91% | | 79% I | | 60% J |
A Calculated based on average shares outstanding during the period.
B Net investment income (loss) is affected by the timing of the declaration of dividends by any underlying mutual funds or exchange-traded funds (ETFs). Net investment income (loss) of any mutual funds or ETFs is not included in the Fund's net investment income (loss) ratio.
C Total returns for periods of less than one year are not annualized.
D Total returns would have been lower if certain expenses had not been reduced during the applicable periods shown.
E Fees and expenses of any underlying mutual funds or exchange-traded funds (ETFs) are not included in the Fund's expense ratio. The Fund indirectly bears its proportionate share of these expenses. For additional expense information related to investments in Fidelity Central Funds, please refer to the "Investments in Fidelity Central Funds" note found in the Notes to Financial Statements section of the most recent Annual or Semi-Annual report.
F Expense ratios reflect operating expenses of the class. Expenses before reductions do not reflect amounts reimbursed, waived, or reduced through arrangements with the investment adviser, brokerage services, or other offset arrangements, if applicable, and do not represent the amount paid by the class during periods when reimbursements, waivers or reductions occur.
G Annualized.
H Amount does not include the portfolio activity of any underlying mutual funds or exchange-traded funds (ETFs).
I Portfolio turnover rate excludes securities received or delivered in-kind.
J The portfolio turnover rate does not include the assets acquired in the merger.
| Fidelity Advisor® New Markets Income Fund Class I |
| |
| | Six months ended (Unaudited) June 30, 2023 | | Years ended December 31, 2022 | | 2021 | | 2020 | | 2019 | | 2018 A |
Selected Per-Share Data | | | | | | | | | | | | |
| Net asset value, beginning of period | $ | 11.51 | $ | 14.25 | $ | 15.10 | $ | 15.08 | $ | 14.27 | $ | 14.31 |
| Income from Investment Operations | | | | | | | | | | | | |
Net investment income (loss) B,C | | .358 | | .659 | | .620 | | .690 | | .798 | | .057 |
| Net realized and unrealized gain (loss) | | .045 | | (2.808) | | (.890) | | (.059) | | .743 | | (.043) |
| Total from investment operations | | .403 | | (2.149) | | (.270) | | .631 | | 1.541 | | .014 |
| Distributions from net investment income | | (.293) | | (.591) | | (.540) | | (.600) | | (.731) | | (.054) |
| Distributions from net realized gain | | - | | - | | (.040) | | (.011) | | - | | - |
| Total distributions | | (.293) | | (.591) | | (.580) | | (.611) | | (.731) | | (.054) |
| Net asset value, end of period | $ | 11.62 | $ | 11.51 | $ | 14.25 | $ | 15.10 | $ | 15.08 | $ | 14.27 |
Total Return D,E | | 3.54% | | (15.11)% | | (1.80)% | | 4.50% | | 10.95% | | .10% |
Ratios to Average Net Assets C,F,G | | | | | | | | | | | | |
| Expenses before reductions | | .85% H | | .83% | | .83% | | .83% | | .83% | | .82% H |
| Expenses net of fee waivers, if any | | .84% H | | .83% | | .83% | | .83% | | .82% | | .82% H |
| Expenses net of all reductions | | .84% H | | .83% | | .83% | | .83% | | .82% | | .82% H |
| Net investment income (loss) | | 6.23% H | | 5.42% | | 4.22% | | 4.80% | | 5.31% | | 5.90% H |
| Supplemental Data | | | | | | | | | | | | |
| Net assets, end of period (000 omitted) | $ | 697,017 | $ | 769,765 | $ | 1,148,584 | $ | 1,665,050 | $ | 2,081,780 | $ | 3,727,909 |
Portfolio turnover rate I | | 28% H | | 26% | | 30% | | 91% | | 79% J | | 60% K |
A For the period December 4, 2018 (commencement of sale of shares) through December 31, 2018.
B Calculated based on average shares outstanding during the period.
C Net investment income (loss) is affected by the timing of the declaration of dividends by any underlying mutual funds or exchange-traded funds (ETFs). Net investment income (loss) of any mutual funds or ETFs is not included in the Fund's net investment income (loss) ratio.
D Total returns for periods of less than one year are not annualized.
E Total returns would have been lower if certain expenses had not been reduced during the applicable periods shown.
F Fees and expenses of any underlying mutual funds or exchange-traded funds (ETFs) are not included in the Fund's expense ratio. The Fund indirectly bears its proportionate share of these expenses. For additional expense information related to investments in Fidelity Central Funds, please refer to the "Investments in Fidelity Central Funds" note found in the Notes to Financial Statements section of the most recent Annual or Semi-Annual report.
G Expense ratios reflect operating expenses of the class. Expenses before reductions do not reflect amounts reimbursed, waived, or reduced through arrangements with the investment adviser, brokerage services, or other offset arrangements, if applicable, and do not represent the amount paid by the class during periods when reimbursements, waivers or reductions occur.
H Annualized.
I Amount does not include the portfolio activity of any underlying mutual funds or exchange-traded funds (ETFs).
J Portfolio turnover rate excludes securities received or delivered in-kind.
K The portfolio turnover rate does not include the assets acquired in the merger.
| Fidelity Advisor® New Markets Income Fund Class Z |
| |
| | Six months ended (Unaudited) June 30, 2023 | | Years ended December 31, 2022 | | 2021 | | 2020 | | 2019 | | 2018 A |
Selected Per-Share Data | | | | | | | | | | | | |
| Net asset value, beginning of period | $ | 11.51 | $ | 14.24 | $ | 15.10 | $ | 15.08 | $ | 14.27 | $ | 14.31 |
| Income from Investment Operations | | | | | | | | | | | | |
Net investment income (loss) B,C | | .363 | | .666 | | .628 | | .698 | | .800 | | .060 |
| Net realized and unrealized gain (loss) | | .046 | | (2.793) | | (.893) | | (.057) | | .756 | | (.045) |
| Total from investment operations | | .409 | | (2.127) | | (.265) | | .641 | | 1.556 | | .015 |
| Distributions from net investment income | | (.299) | | (.603) | | (.555) | | (.610) | | (.746) | | (.055) |
| Distributions from net realized gain | | - | | - | | (.040) | | (.011) | | - | | - |
| Total distributions | | (.299) | | (.603) | | (.595) | | (.621) | | (.746) | | (.055) |
| Net asset value, end of period | $ | 11.62 | $ | 11.51 | $ | 14.24 | $ | 15.10 | $ | 15.08 | $ | 14.27 |
Total Return D,E | | 3.59% | | (14.96)% | | (1.77)% | | 4.61% | | 11.06% | | .10% |
Ratios to Average Net Assets C,F,G | | | | | | | | | | | | |
| Expenses before reductions | | .74% H | | .73% | | .72% | | .73% | | .73% | | .74% H |
| Expenses net of fee waivers, if any | | .74% H | | .73% | | .72% | | .73% | | .73% | | .74% H |
| Expenses net of all reductions | | .74% H | | .73% | | .72% | | .73% | | .73% | | .74% H |
| Net investment income (loss) | | 6.33% H | | 5.52% | | 4.33% | | 4.91% | | 5.40% | | 5.97% H |
| Supplemental Data | | | | | | | | | | | | |
| Net assets, end of period (000 omitted) | $ | 1,664,146 | $ | 1,732,330 | $ | 2,148,384 | $ | 1,225,147 | $ | 1,523,041 | $ | 2,878 |
Portfolio turnover rate I | | 28% H | | 26% | | 30% | | 91% | | 79% J | | 60% K |
A For the period December 4, 2018 (commencement of sale of shares) through December 31, 2018.
B Calculated based on average shares outstanding during the period.
C Net investment income (loss) is affected by the timing of the declaration of dividends by any underlying mutual funds or exchange-traded funds (ETFs). Net investment income (loss) of any mutual funds or ETFs is not included in the Fund's net investment income (loss) ratio.
D Total returns for periods of less than one year are not annualized.
E Total returns would have been lower if certain expenses had not been reduced during the applicable periods shown.
F Fees and expenses of any underlying mutual funds or exchange-traded funds (ETFs) are not included in the Fund's expense ratio. The Fund indirectly bears its proportionate share of these expenses. For additional expense information related to investments in Fidelity Central Funds, please refer to the "Investments in Fidelity Central Funds" note found in the Notes to Financial Statements section of the most recent Annual or Semi-Annual report.
G Expense ratios reflect operating expenses of the class. Expenses before reductions do not reflect amounts reimbursed, waived, or reduced through arrangements with the investment adviser, brokerage services, or other offset arrangements, if applicable, and do not represent the amount paid by the class during periods when reimbursements, waivers or reductions occur.
H Annualized.
I Amount does not include the portfolio activity of any underlying mutual funds or exchange-traded funds (ETFs).
J Portfolio turnover rate excludes securities received or delivered in-kind.
K The portfolio turnover rate does not include the assets acquired in the merger.
For the period ended June 30, 2023
1. Organization.
Fidelity New Markets Income Fund (the Fund) is a non-diversified fund of Fidelity Summer Street Trust (the Trust) and is authorized to issue an unlimited number of shares. The Trust is registered under the Investment Company Act of 1940, as amended (the 1940 Act), as an open-end management investment company organized as a Massachusetts business trust. The Fund offers Class A, Class M, Class C, New Markets Income, Class I and Class Z shares, each of which has equal rights as to assets and voting privileges. Class A, Class M, Class C, and Class I and Class Z are Fidelity Advisor classes. Each class has exclusive voting rights with respect to matters that affect that class. Class C shares will automatically convert to Class A shares after a holding period of eight years from the initial date of purchase, with certain exceptions. The Fund's investments in emerging markets can be subject to social, economic, regulatory, and political uncertainties and can be extremely volatile.
2. Investments in Fidelity Central Funds.
Funds may invest in Fidelity Central Funds, which are open-end investment companies generally available only to other investment companies and accounts managed by the investment adviser and its affiliates. The Schedule of Investments lists any Fidelity Central Funds held as an investment as of period end, but does not include the underlying holdings of each Fidelity Central Fund. An investing fund indirectly bears its proportionate share of the expenses of the underlying Fidelity Central Funds.
Based on its investment objective, each Fidelity Central Fund may invest or participate in various investment vehicles or strategies that are similar to those of the investing fund. These strategies are consistent with the investment objectives of the investing fund and may involve certain economic risks which may cause a decline in value of each of the Fidelity Central Funds and thus a decline in the value of the investing fund.
| Fidelity Central Fund | Investment Manager | Investment Objective | Investment Practices | Expense Ratio A |
| Fidelity Money Market Central Funds | Fidelity Management & Research Company LLC (FMR) | Each fund seeks to obtain a high level of current income consistent with the preservation of capital and liquidity. | Short-term Investments | Less than .005% |
A Expenses expressed as a percentage of average net assets and are as of each underlying Central Fund's most recent annual or semi-annual shareholder report.
A complete unaudited list of holdings for each Fidelity Central Fund is available upon request or at the Securities and Exchange Commission website at www.sec.gov. In addition, the financial statements of the Fidelity Central Funds which contain the significant accounting policies (including investment valuation policies) of those funds, and are not covered by the Report of Independent Registered Public Accounting Firm, are available on the Securities and Exchange Commission website or upon request.
3. Significant Accounting Policies.
The Fund is an investment company and applies the accounting and reporting guidance of the Financial Accounting Standards Board (FASB) Accounting Standards Codification Topic 946 Financial Services - Investment Companies . The financial statements have been prepared in conformity with accounting principles generally accepted in the United States of America (GAAP), which require management to make certain estimates and assumptions at the date of the financial statements. Actual results could differ from those estimates. Subsequent events, if any, through the date that the financial statements were issued have been evaluated in the preparation of the financial statements. The Fund's Schedule of Investments lists any underlying mutual funds or exchange-traded funds (ETFs) but does not include the underlying holdings of these funds. The following summarizes the significant accounting policies of the Fund:
Investment Valuation. Investments are valued as of 4:00 p.m. Eastern time on the last calendar day of the period. The Board of Trustees (the Board) has designated the Fund's investment adviser as the valuation designee responsible for the fair valuation function and performing fair value determinations as needed. The investment adviser has established a Fair Value Committee (the Committee) to carry out the day-to-day fair valuation responsibilities and has adopted policies and procedures to govern the fair valuation process and the activities of the Committee. In accordance with these fair valuation policies and procedures, which have been approved by the Board, the Fund attempts to obtain prices from one or more third party pricing services or brokers to value its investments. When current market prices, quotations or currency exchange rates are not readily available or reliable, investments will be fair valued in good faith by the Committee, in accordance with the policies and procedures. Factors used in determining fair value vary by investment type and may include market or investment specific events, transaction data, estimated cash flows, and market observations of comparable investments. The frequency that the fair valuation procedures are used cannot be predicted and they may be utilized to a significant extent. The Committee manages the Fund's fair valuation practices and maintains the fair valuation policies and procedures. The Fund's investment adviser reports to the Board information regarding the fair valuation process and related material matters.
The Fund categorizes the inputs to valuation techniques used to value its investments into a disclosure hierarchy consisting of three levels as shown below:
Level 1 - unadjusted quoted prices in active markets for identical investments
Level 2 - other significant observable inputs (including quoted prices for similar investments, interest rates, prepayment speeds, etc.)
Level 3 - unobservable inputs (including the Fund's own assumptions based on the best information available)
Valuation techniques used to value the Fund's investments by major category are as follows:
Debt securities, including restricted securities, are valued based on evaluated prices received from third party pricing services or from brokers who make markets in such securities. Corporate bonds, foreign government and government agency obligations and preferred securities are valued by pricing services who utilize matrix pricing which considers yield or price of bonds of comparable quality, coupon, maturity and type or by broker-supplied prices. When independent prices are unavailable or unreliable, debt securities may be valued utilizing pricing methodologies which consider similar factors that would be used by third party pricing services. For foreign debt securities, when significant market or security specific events arise, valuations may be determined in good faith in accordance with procedures adopted by the Board. Debt securities are generally categorized as Level 2 in the hierarchy but may be Level 3 depending on the circumstances. The Fund invests a significant portion of its assets in below investment grade securities. The value of these securities can be more volatile due to changes in the credit quality of the issuer and is sensitive to changes in economic, market and regulatory conditions.
Equity securities, including restricted securities, for which market quotations are readily available, are valued at the last reported sale price or official closing price as reported by a third party pricing service on the primary market or exchange on which they are traded and are categorized as Level 1 in the hierarchy. In the event there were no sales during the day or closing prices are not available, securities are valued at the last quoted bid price or may be valued using the last available price and are generally categorized as Level 2 in the hierarchy. For foreign equity securities, when market or security specific events arise, comparisons to the valuation of American Depositary Receipts (ADRs), futures contracts, ETF's and certain indexes as well as quoted prices for similar securities may be used and would be categorized as Level 2 in the hierarchy. For equity securities, including restricted securities, where observable inputs are limited, assumptions about market activity and risk are used and these securities may be categorized as Level 3 in the hierarchy.
Investments in open-end mutual funds, including the Fidelity Central Funds, are valued at their closing net asset value (NAV) each business day and are categorized as Level 1 in the hierarchy
Changes in valuation techniques may result in transfers in or out of an assigned level within the disclosure hierarchy. The aggregate value of investments by input level as of June 30, 2023, is included at the end of the Fund's Schedule of Investments.
Foreign Currency. Certain Funds may use foreign currency contracts to facilitate transactions in foreign-denominated securities. Gains and losses from these transactions may arise from changes in the value of the foreign currency or if the counterparties do not perform under the contracts' terms.
Foreign-denominated assets, including investment securities, and liabilities are translated into U.S. dollars at the exchange rates at period end. Purchases and sales of investment securities, income and dividends received, and expenses denominated in foreign currencies are translated into U.S. dollars at the exchange rate in effect on the transaction date.
The effects of exchange rate fluctuations on investments are included with the net realized and unrealized gain (loss) on investment securities. Other foreign currency transactions resulting in realized and unrealized gain (loss) are disclosed separately.
Investment Transactions and Income. For financial reporting purposes, the Fund's investment holdings and NAV include trades executed through the end of the last business day of the period. The NAV per share for processing shareholder transactions is calculated as of the close of business of the New York Stock Exchange (NYSE), normally 4:00 p.m. Eastern time and includes trades executed through the end of the prior business day. Gains and losses on securities sold are determined on the basis of identified cost and include proceeds received from litigation. Commissions paid to certain brokers with whom the investment adviser, or its affiliates, places trades on behalf of a fund include an amount in addition to trade execution, which may be rebated back to a fund. Any such rebates are included in net realized gain (loss) on investments in the Statement of Operations. Dividend income is recorded on the ex-dividend date. Non-cash dividends included in dividend income, if any, are recorded at the fair market value of the securities received. Income and capital gain distributions from Fidelity Central Funds, if any, are recorded on the ex-dividend date. Interest income is accrued as earned and includes coupon interest and amortization of premium and accretion of discount on debt securities as applicable. Paid in Kind (PIK) income is recorded at the fair market value of the securities received. Investment income is recorded net of foreign taxes withheld where recovery of such taxes is uncertain. Debt obligations may be placed on non-accrual status and related interest income may be reduced by ceasing current accruals and writing off interest receivables when the collection of all or a portion of interest has become doubtful based on consistently applied procedures. A debt obligation is removed from non-accrual status when the issuer resumes interest payments or when collectability of interest is reasonably assured.
Class Allocations and Expenses. Investment income, realized and unrealized capital gains and losses, common expenses of a fund, and certain fund-level expense reductions, if any, are allocated daily on a pro-rata basis to each class based on the relative net assets of each class to the total net assets of a fund. Each class differs with respect to transfer agent and distribution and service plan fees incurred, as applicable. Certain expense reductions may also differ by class, if applicable. For the reporting period, the allocated portion of income and expenses to each class as a percent of its average net assets may vary due to the timing of recording these transactions in relation to fluctuating net assets of the classes. Expenses directly attributable to a fund are charged to that fund. Expenses attributable to more than one fund are allocated among the respective funds on the basis of relative net assets or other appropriate methods. Expenses included in the accompanying financial statements reflect the expenses of that fund and do not include any expenses associated with any underlying mutual funds or ETFs. Although not included in a fund's expenses, a fund indirectly bears its proportionate share of these expenses through the net asset value of each underlying mutual fund or ETF. Expense estimates are accrued in the period to which they relate and adjustments are made when actual amounts are known.
Income Tax Information and Distributions to Shareholders. Each year, the Fund intends to qualify as a regulated investment company under Subchapter M of the Internal Revenue Code, including distributing substantially all of its taxable income and realized gains. As a result, no provision for U.S. Federal income taxes is required. The Fund files a U.S. federal tax return, in addition to state and local tax returns as required. The Fund's federal income tax returns are subject to examination by the Internal Revenue Service (IRS) for a period of three fiscal years after they are filed. State and local tax returns may be subject to examination for an additional fiscal year depending on the jurisdiction. Foreign taxes are provided for based on the Fund's understanding of the tax rules and rates that exist in the foreign markets in which it invests.
Distributions are declared and recorded daily and paid monthly from net investment income. Distributions from realized gains, if any, are declared and recorded on the ex-dividend date. Income and capital gain distributions are declared separately for each class. Income and capital gain distributions are determined in accordance with income tax regulations, which may differ from GAAP.
Capital accounts within the financial statements are adjusted for permanent book-tax differences. These adjustments have no impact on net assets or the results of operations. Capital accounts are not adjusted for temporary book-tax differences which will reverse in a subsequent period.
Book-tax differences are primarily due to foreign currency transactions, market discount, capital loss carryforwards and losses deferred due to wash sales.
As of period end, the cost and unrealized appreciation (depreciation) in securities, and derivatives if applicable, for federal income tax purposes were as follows:
| Gross unrealized appreciation | $79,314,124 |
| Gross unrealized depreciation | (1,149,995,113) |
| Net unrealized appreciation (depreciation) | $(1,070,680,989) |
| Tax cost | $5,030,777,989 |
Capital loss carryforwards are only available to offset future capital gains of the Fund to the extent provided by regulations and may be limited. The capital loss carryforward information presented below, including any applicable limitation, is estimated as of prior fiscal period end and is subject to adjustment.
| Short-term | $(254,753,194) |
| Long-term | (795,405,979) |
| Total capital loss carryforward | $(1,050,159,173) |
Due to large redemptions in a prior period, approximately $575,859,075 of the Fund's realized capital losses are subject to limitation. Due to this limitation, the Fund will only be permitted to use approximately $109,332,545 of those capital losses per year to offset capital gains. Additionally, the Fund is subject to an annual limit on its use of some of its unrealized capital losses to offset capital gains in future periods. If those losses are realized and the limitation prevents the Fund from using any of those losses in a future period, those capital losses will be available to offset capital gains in subsequent periods.
Restricted Securities (including Private Placements). Funds may invest in securities that are subject to legal or contractual restrictions on resale. These securities generally may be resold in transactions exempt from registration or to the public if the securities are registered. Disposal of these securities may involve time-consuming negotiations and expense, and prompt sale at an acceptable price may be difficult. Information regarding restricted securities held at period end is included at the end of the Schedule of Investments, if applicable.
4. Purchases and Sales of Investments.
Purchases and sales of securities, other than short-term securities and in-kind transactions, as applicable, are noted in the table below.
| | Purchases ($) | Sales ($) |
| Fidelity New Markets Income Fund | 502,516,731 | 700,185,659 |
5. Fees and Other Transactions with Affiliates.
Management Fee. Fidelity Management & Research Company LLC (the investment adviser) and its affiliates provide the Fund with investment management related services for which the Fund pays a monthly management fee. The management fee is the sum of an individual fund fee rate that is based on an annual rate of .55% of the Fund's average net assets and an annualized group fee rate that averaged .10% during the period. The group fee rate is based upon the monthly average net assets of a group of registered investment companies with which the investment adviser has management contracts. The group fee rate decreases as assets under management increase and increases as assets under management decrease. For the reporting period, the total annualized management fee rate was .65% of the Fund's average net assets.
Distribution and Service Plan Fees. In accordance with Rule 12b-1 of the 1940 Act, the Fund has adopted separate Distribution and Service Plans for each class of shares. Certain classes pay Fidelity Distributors Company LLC (FDC), an affiliate of the investment adviser, separate Distribution and Service Fees, each of which is based on an annual percentage of each class' average net assets. In addition, FDC may pay financial intermediaries for selling shares of the Fund and providing shareholder support services. For the period, the Distribution and Service Fee rates, total fees and amounts retained by FDC were as follows:
| | Distribution Fee | Service Fee | Total Fees | Retained by FDC |
| Class A | - % | .25% | $94,951 | $1,654 |
| Class M | - % | .25% | 31,636 | 310 |
| Class C | .75% | .25% | 60,445 | 1,612 |
| | | | $187,032 | $3,576 |
Sales Load. FDC may receive a front-end sales charge of up to 4.00% for selling Class A shares and Class M shares, some of which is paid to financial intermediaries for selling shares of the Fund. Depending on the holding period, FDC may receive contingent deferred sales charges levied on Class A, Class M and Class C redemptions. The deferred sales charges are 1.00% for Class C shares, 1.00% for certain purchases of Class A shares and .25% for certain purchases of Class M shares.
For the period, sales charge amounts retained by FDC were as follows:
| | Retained by FDC |
| Class A | $1,607 |
| Class M | 243 |
Class C A | 136 |
| | $1,986 |
A When Class C shares are initially sold, FDC pays commissions from its own resources to financial intermediaries through which the sales are made.
Transfer Agent Fees. Fidelity Investments Institutional Operations Company LLC (FIIOC), an affiliate of the investment adviser, is the transfer, dividend disbursing and shareholder servicing agent for each class of the Fund. FIIOC receives account fees and asset-based fees that vary according to the account size and type of account of the shareholders of the respective classes of the Fund, except for Class Z. FIIOC receives an asset-based fee of Class Z's average net assets. FIIOC pays for typesetting, printing and mailing of shareholder reports, except proxy statements.
For the period, transfer agent fees for each class were as follows:
| | Amount | % of Class-Level Average Net Assets A |
| Class A | $78,209 | .21 |
| Class M | 26,212 | .21 |
| Class C | 9,548 | .16 |
| Fidelity New Markets Income Fund | 1,105,113 | .14 |
| Class I | 564,880 | .16 |
| Class Z | 429,628 | .05 |
| | $2,213,590 | |
A Annualized
Accounting Fees. Fidelity Service Company, Inc. (FSC), an affiliate of the investment adviser, maintains the Fund's accounting records. The accounting fee is based on the level of average net assets for each month. For the period, the fees were equivalent to the following annualized rates:
| | % of Average Net Assets |
| Fidelity New Markets Income Fund | .03 |
Interfund Lending Program. Pursuant to an Exemptive Order issued by the Securities and Exchange Commission (the SEC), the Fund, along with other registered investment companies having management contracts with Fidelity Management & Research Company LLC (FMR), or other affiliated entities of FMR, may participate in an interfund lending program. This program provides an alternative credit facility allowing the Fund to borrow from, or lend money to, other participating affiliated funds. Any open loans, including accrued interest, at period end are presented as Notes payable to affiliates in the Statement of Assets and Liabilities. Activity in this program during the period for which loans were outstanding was as follows:
| | Borrower or Lender | Average Loan Balance | Weighted Average Interest Rate | Interest Expense |
| Fidelity New Markets Income Fund | Borrower | $ 7,934,000 | 5.32% | $3,514 |
Interfund Trades. Funds may purchase from or sell securities to other Fidelity Funds under procedures adopted by the Board. The procedures have been designed to ensure these interfund trades are executed in accordance with Rule 17a-7 of the 1940 Act. Any interfund trades are included within the respective purchases and sales amounts shown in the Purchases and Sales of Investments note. During the period, there were no interfund trades.
6. Committed Line of Credit.
Certain Funds participate with other funds managed by the investment adviser or an affiliate in a $4.25 billion credit facility (the "line of credit") to be utilized for temporary or emergency purposes to fund shareholder redemptions or for other short-term liquidity purposes. The participating funds have agreed to pay commitment fees on their pro-rata portion of the line of credit, which are reflected in Miscellaneous expenses on the Statement of Operations, and are listed below. During the period, there were no borrowings on this line of credit.
| | Amount |
| Fidelity New Markets Income Fund | $4,148 |
7. Expense Reductions.
Through arrangements with the Fund's custodian, credits realized as a result of certain uninvested cash balances were used to reduce the Fund's expenses. During the period, custodian credits reduced the Fund's expenses by $9,098. During the period, transfer agent credits reduced each class' expenses as noted in the table below.
| | Expense reduction |
| | |
| Class M | $624 |
| | |
| | |
In addition, during the period the investment adviser or an affiliate reimbursed and/or waived a portion of fund-level operating expenses in the amount of $51,734.
8. Distributions to Shareholders.
Distributions to shareholders of each class were as follows:
| | Six months ended June 30, 2023 | Year ended December 31, 2022 |
| Fidelity New Markets Income Fund | | |
| Distributions to shareholders | | |
| Class A | $1,810,396 | $4,248,201 |
| Class M | 603,313 | 1,339,887 |
| Class C | 245,791 | 618,004 |
| Fidelity New Markets Income Fund | 40,515,860 | 88,479,584 |
| Class I | 18,476,322 | 41,747,477 |
| Class Z | 44,420,134 | 92,406,502 |
Total | $106,071,816 | $228,839,655 |
9. Share Transactions.
Share transactions for each class were as follows and may contain in-kind transactions, automatic conversions between classes or exchanges between affiliated funds:
| | Shares | Shares | Dollars | Dollars |
| | Six months ended June 30, 2023 | Year ended December 31, 2022 | Six months ended June 30, 2023 | Year ended December 31, 2022 |
| Fidelity New Markets Income Fund | | | | |
| Class A | | | | |
| Shares sold | 219,281 | 591,073 | $2,549,589 | $7,300,290 |
| Reinvestment of distributions | 151,729 | 345,079 | 1,754,743 | 4,099,396 |
| Shares redeemed | (819,381) | (2,481,382) | (9,466,678) | (29,869,528) |
| Net increase (decrease) | (448,371) | (1,545,230) | $(5,162,346) | $(18,469,842) |
| Class M | | | | |
| Shares sold | 75,445 | 115,764 | $872,492 | $1,419,990 |
| Reinvestment of distributions | 51,107 | 107,226 | 591,180 | 1,273,571 |
| Shares redeemed | (226,405) | (696,377) | (2,618,375) | (8,560,601) |
| Net increase (decrease) | (99,853) | (473,387) | $(1,154,703) | $(5,867,040) |
| Class C | | | | |
| Shares sold | 11,478 | 29,717 | $134,571 | $352,288 |
| Reinvestment of distributions | 21,043 | 51,370 | 243,397 | 611,425 |
| Shares redeemed | (176,253) | (574,893) | (2,030,522) | (6,993,345) |
| Net increase (decrease) | (143,732) | (493,806) | $(1,652,554) | $(6,029,632) |
| Fidelity New Markets Income Fund | | | | |
| Shares sold | 4,433,610 | 10,866,723 | $51,478,839 | $130,733,436 |
| Reinvestment of distributions | 3,039,253 | 6,458,932 | 35,144,874 | 76,787,954 |
| Shares redeemed | (12,721,719) | (39,674,593) | (147,330,636) | (480,538,182) |
| Net increase (decrease) | (5,248,856) | (22,348,938) | $(60,706,923) | $(273,016,792) |
| Class I | | | | |
| Shares sold | 4,240,272 | 11,069,631 | $49,122,005 | $133,449,712 |
| Reinvestment of distributions | 1,569,852 | 3,415,651 | 18,161,638 | 40,686,129 |
| Shares redeemed | (12,690,931) | (28,254,755) | (146,602,810) | (347,139,307) |
| Net increase (decrease) | (6,880,807) | (13,769,473) | $(79,319,167) | $(173,003,466) |
| Class Z | | | | |
| Shares sold | 5,431,990 | 45,004,654 | $62,727,722 | $560,436,966 |
| Reinvestment of distributions | 3,221,873 | 6,100,146 | 37,256,915 | 72,079,274 |
| Shares redeemed | (15,920,461) | (51,477,102) | (184,066,136) | (625,972,178) |
| Net increase (decrease) | (7,266,598) | (372,302) | $(84,081,499) | $6,544,062 |
10. Other.
A fund's organizational documents provide former and current trustees and officers with a limited indemnification against liabilities arising in connection with the performance of their duties to the fund. In the normal course of business, a fund may also enter into contracts that provide general indemnifications. A fund's maximum exposure under these arrangements is unknown as this would be dependent on future claims that may be made against a fund. The risk of material loss from such claims is considered remote.
At the end of the period, the following mutual funds managed by the investment adviser or its affiliates were the owners of record of 10% or more of the total outstanding shares.
| | Strategic Advisers Fidelity Core Income Fund |
| Fidelity New Markets Income Fund | 27% |
Mutual funds managed by the investment adviser or its affiliates, in aggregate, were the owners of record of more than 20% of the total outstanding shares.
| Fund | % of shares held |
| Fidelity New Markets Income Fund | 28% |
| | |
11. Credit Risk.
The Fund's relatively large investment in countries with limited or developing capital markets may involve greater risks than investments in more developed markets and the prices of such investments may be volatile. The yields of emerging market debt obligations reflect, among other things, perceived credit risk. The consequences of political, social or economic changes in these markets may have disruptive effects on the market prices of the Fund's investments and the income they generate, as well as the Fund's ability to repatriate such amounts.
12. Risk and Uncertainties.
Many factors affect a fund's performance. Developments that disrupt global economies and financial markets, such as pandemics, epidemics, outbreaks of infectious diseases, war, terrorism, and environmental disasters, may significantly affect a fund's investment performance. The effects of these developments to a fund will be impacted by the types of securities in which a fund invests, the financial condition, industry, economic sector, and geographic location of an issuer, and a fund's level of investment in the securities of that issuer. Significant concentrations in security types, issuers, industries, sectors, and geographic locations may magnify the factors that affect a fund's performance.
As a shareholder, you incur two types of costs: (1) transaction costs, which may include sales charges (loads) on purchase payments or redemption proceeds, as applicable and (2) ongoing costs, which generally include management fees, distribution and/or service (12b-1) fees and other Fund expenses. This Example is intended to help you understand your ongoing costs (in dollars) of investing in a fund and to compare these costs with the ongoing costs of investing in other mutual funds.
| The Example is based on an investment of $1,000 invested at the beginning of the period and held for the entire period (January 1, 2023 to June 30, 2023). |
Actual Expenses
The first line of the accompanying table provides information about actual account values and actual expenses. You may use the information in this line, together with the amount you invested, to estimate the expenses that you paid over the period. Simply divide your account value by $1,000.00 (for example, an $8,600 account value divided by $1,000.00 = 8.6), then multiply the result by the number in the first line for a class/Fund under the heading entitled "Expenses Paid During Period" to estimate the expenses you paid on your account during this period. If any fund is a shareholder of any underlying mutual funds or exchange-traded funds (ETFs) (the Underlying Funds), such fund indirectly bears its proportional share of the expenses of the Underlying Funds in addition to the direct expenses incurred presented in the table. These fees and expenses are not included in the annualized expense ratio used to calculate the expense estimate in the table below.
Hypothetical Example for Comparison Purposes
The second line of the accompanying table provides information about hypothetical account values and hypothetical expenses based on the actual expense ratio and an assumed rate of return of 5% per year before expenses, which is not the actual return. The hypothetical account values and expenses may not be used to estimate the actual ending account balance or expenses you paid for the period. You may use this information to compare the ongoing costs of investing in the Fund and other funds. To do so, compare this 5% hypothetical example with the 5% hypothetical examples that appear in the shareholder reports of the other funds. If any fund is a shareholder of any Underlying Funds, such fund indirectly bears its proportional share of the expenses of the Underlying Funds in addition to the direct expenses as presented in the table. These fees and expenses are not included in the annualized expense ratio used to calculate the expense estimate in the table below.
Please note that the expenses shown in the table are meant to highlight your ongoing costs only and do not reflect any transaction costs. Therefore, the second line of the table is useful in comparing ongoing costs only, and will not help you determine the relative total costs of owning different funds. In addition, if these transactional costs were included, your costs would have been higher.
| | | | | Annualized Expense Ratio- A | | Beginning Account Value January 1, 2023 | | Ending Account Value June 30, 2023 | | Expenses Paid During Period- C January 1, 2023 to June 30, 2023 |
| Fidelity® New Markets Income Fund | | | | | | | | | | |
| Class A | | | | 1.15% | | | | | | |
| Actual | | | | | | $ 1,000 | | $ 1,033.80 | | $ 5.80 |
Hypothetical- B | | | | | | $ 1,000 | | $ 1,019.09 | | $ 5.76 |
| Class M | | | | 1.15% | | | | | | |
| Actual | | | | | | $ 1,000 | | $ 1,033.00 | | $ 5.80 |
Hypothetical- B | | | | | | $ 1,000 | | $ 1,019.09 | | $ 5.76 |
| Class C | | | | 1.85% | | | | | | |
| Actual | | | | | | $ 1,000 | | $ 1,030.20 | | $ 9.31 |
Hypothetical- B | | | | | | $ 1,000 | | $ 1,015.62 | | $ 9.25 |
| Fidelity® New Markets Income Fund | | | | .83% | | | | | | |
| Actual | | | | | | $ 1,000 | | $ 1,035.50 | | $ 4.19 |
Hypothetical- B | | | | | | $ 1,000 | | $ 1,020.68 | | $ 4.16 |
| Class I | | | | .84% | | | | | | |
| Actual | | | | | | $ 1,000 | | $ 1,035.40 | | $ 4.24 |
Hypothetical- B | | | | | | $ 1,000 | | $ 1,020.63 | | $ 4.21 |
| Class Z | | | | .74% | | | | | | |
| Actual | | | | | | $ 1,000 | | $ 1,035.90 | | $ 3.74 |
Hypothetical- B | | | | | | $ 1,000 | | $ 1,021.12 | | $ 3.71 |
| |
A Annualized expense ratio reflects expenses net of applicable fee waivers.
B 5% return per year before expenses
C Expenses are equal to the annualized expense ratio, multiplied by the average account value over the period, multiplied by 181/ 365 (to reflect the one-half year period). The fees and expenses of any Underlying Funds are not included in each annualized expense ratio.
Board Approval of Investment Advisory Contracts
Fidelity New Markets Income Fund
At its May 2023 meeting, the Board of Trustees, including the Independent Trustees (together, the Board), voted to continue the management contract with Fidelity Management & Research Company LLC (FMR), and the sub-advisory agreements and sub-subadvisory agreements, in each case, where applicable (together, the Advisory Contracts) for the fund for two months from June 1, 2023 through July 31, 2023. The Board determined that it will consider the annual renewal of the fund's Advisory Contracts for a full one year period in July 2023, following its review of additional materials provided by FMR.
The Board considered that the approval of the fund's Advisory Contracts will not result in any changes in (i) the investment process or strategies employed in the management of the fund's assets; (ii) the fees and expenses paid by shareholders; (iii) the nature, extent or quality of services provided under the fund's Advisory Contracts; or (iv) the day-to-day management of the fund or the persons primarily responsible for such management. The Board also considered that since its last approval of the fund's Advisory Contracts, FMR had provided additional information on the fund in support of the annual contract renewal process, including competitive analyses on total expenses and management fees and in-depth reviews of fund performance and fund profitability information. The Board concluded that the fund's Advisory Contracts are fair and reasonable, and that the fund's Advisory Contracts should be renewed, without modification, through July 31, 2023, with the understanding that the Board will consider the annual renewal for a full one year period in July 2023.
In connection with its consideration of future renewals of the fund's Advisory Contracts, the Board will consider: (i) the nature, extent and quality of services provided to the fund, including shareholder and administrative services and investment performance; (ii) the competitiveness of the management fee and total expenses for the fund; (iii) the costs of the services and profitability, including the revenues earned and the expenses incurred in conducting the business of developing, marketing, distributing, managing, administering, and servicing the fund and its shareholders, to the extent applicable; and (iv) whether there have been economies of scale in respect of the Fidelity funds, whether the Fidelity funds (including the fund) have appropriately benefited from any such economies of scale, and whether there is the potential for realization of any further economies.
Based on its evaluation of all of the conclusions noted above, and after considering all factors it believed relevant, the Board ultimately concluded that the fund's management fee structure is fair and reasonable, and that the continuation of the fund's Advisory Contracts should be approved for two months from June 1, 2023 through July 31, 2023.
The Securities and Exchange Commission adopted Rule 22e-4 under the Investment Company Act of 1940 (the Liquidity Rule) to promote effective liquidity risk management throughout the open-end investment company industry, thereby reducing the risk that funds will be unable to meet their redemption obligations and mitigating dilution of the interests of fund shareholders.
The Fund has adopted and implemented a liquidity risk management program (the Program) reasonably designed to assess and manage the Fund's liquidity risk and to comply with the requirements of the Liquidity Rule. The Fund's Board of Trustees (the Board) has designated the Fund's investment adviser as administrator of the Program. The Fidelity advisers have established a Liquidity Risk Management Committee (the LRM Committee) to manage the Program for each of the Fidelity Funds. The LRM Committee monitors the adequacy and effectiveness of implementation of the Program and on a periodic basis assesses each Fund's liquidity risk based on a variety of factors including (1) the Fund's investment strategy, (2) portfolio liquidity and cash flow projections during normal and reasonably foreseeable stressed conditions, (3) shareholder redemptions, (4) borrowings and other funding sources and (5) certain factors specific to ETFs including the effect of the Fund's prices and spreads, market participants, and basket compositions on the overall liquidity of the Fund's portfolio, as applicable.
In accordance with the Program, each of the Fund's portfolio investments is classified into one of four defined liquidity categories based on a determination of a reasonable expectation for how long it would take to convert the investment to cash (or sell or dispose of the investment) without significantly changing its market value.
- Highly liquid investments - cash or convertible to cash within three business days or less
- Moderately liquid investments - convertible to cash in three to seven calendar days
- Less liquid investments - can be sold or disposed of, but not settled, within seven calendar days
- Illiquid investments - cannot be sold or disposed of within seven calendar days
Liquidity classification determinations take into account a variety of factors including various market, trading and investment-specific considerations, as well as market depth, and generally utilize analysis from a third-party liquidity metrics service.
The Liquidity Rule places a 15% limit on a fund's illiquid investments and requires funds that do not primarily hold assets that are highly liquid investments to determine and maintain a minimum percentage of the fund's net assets to be invested in highly liquid investments (highly liquid investment minimum or HLIM). The Program includes provisions reasonably designed to comply with the 15% limit on illiquid investments and for determining, periodically reviewing and complying with the HLIM requirement as applicable.
At a recent meeting of the Fund's Board of Trustees, the LRM Committee provided a written report to the Board pertaining to the operation, adequacy, and effectiveness of the Program for the period December 1, 2021 through November 30, 2022. The report concluded that the Program is operating effectively and is reasonably designed to assess and manage the Fund's liquidity risk.
1.705564.125
NMI-SANN-0823
Item 2.
Code of Ethics
Not applicable.
Item 3.
Audit Committee Financial Expert
Not applicable.
Item 4.
Principal Accountant Fees and Services
Not applicable.
Item 5.
Audit Committee of Listed Registrants
Not applicable.
Item 6.
Investments
(a)
Not applicable.
(b)
Not applicable
Item 7.
Disclosure of Proxy Voting Policies and Procedures for Closed-End Management Investment Companies
Not applicable.
Item 8.
Portfolio Managers of Closed-End Management Investment Companies
Not applicable.
Item 9.
Purchase of Equity Securities by Closed-End Management Investment Company and Affiliated Purchasers
Not applicable.
Item 10.
Submission of Matters to a Vote of Security Holders
There were no material changes to the procedures by which shareholders may recommend nominees to the Fidelity Summer Street Trust’s Board of Trustees.
Item 11.
Controls and Procedures
(a)(i) The President and Treasurer and the Chief Financial Officer have concluded that the Fidelity Summer Street Trust’s (the “Trust”) disclosure controls and procedures (as
defined in Rule 30a-3(c) under the Investment Company Act) provide reasonable assurances that material information relating to the Trust is made known to them by the appropriate persons, based on their evaluation of these controls and procedures as of a date within 90 days of the filing date of this report.
(a)(ii) There was no change in the Trust’s internal control over financial reporting (as defined in Rule 30a-3(d) under the Investment Company Act) that occurred during the period covered by this report that has materially affected, or is reasonably likely to materially affect, the Trust’s internal control over financial reporting.
Item 12.
Disclosure of Securities Lending Activities for Closed-End Management
Investment Companies
Not applicable.
Item 13.
Exhibits
SIGNATURES
Pursuant to the requirements of the Securities Exchange Act of 1934 and the Investment Company Act of 1940, the registrant has duly caused this report to be signed on its behalf by the undersigned, thereunto duly authorized.
Fidelity Summer Street Trust
| |
By: | /s/Stacie M. Smith |
| Stacie M. Smith |
| President and Treasurer |
|
|
Date: | August 22, 2023 |
Pursuant to the requirements of the Securities Exchange Act of 1934 and the Investment Company Act of 1940, this report has been signed below by the following persons on behalf of the registrant and in the capacities and on the dates indicated.
| |
By: | /s/Stacie M. Smith |
| Stacie M. Smith |
| President and Treasurer |
|
|
Date: | August 22, 2023 |
| |
By: | /s/John J. Burke III |
| John J. Burke III |
| Chief Financial Officer |
|
|
Date: | August 22, 2023 |