UNITED STATES
SECURITIES AND EXCHANGE COMMISSION
Washington, D.C. 20549
FORM N-CSR
CERTIFIED SHAREHOLDER REPORT OF REGISTERED
MANAGEMENT INVESTMENT COMPANIES
Investment Company Act file number 811-02737
Fidelity Summer Street Trust
(Exact name of registrant as specified in charter)
245 Summer St., Boston, MA 02210
(Address of principal executive offices) (Zip code)
Cynthia Lo Bessette, Secretary
245 Summer St.
Boston, Massachusetts 02210
(Name and address of agent for service)
Registrant's telephone number, including area code:
617-563-7000
| |
Date of fiscal year end: | April 30 |
|
|
Date of reporting period: | October 31, 2022 |
Item 1.
Reports to Stockholders
Fidelity® Series High Income Fund
Semi-Annual Report
October 31, 2022
Contents
To view a fund's proxy voting guidelines and proxy voting record for the 12-month period ended June 30, visit http://www.fidelity.com/proxyvotingresults or visit the Securities and Exchange Commission's (SEC) web site at http://www.sec.gov.
You may also call 1-800-544-8544 to request a free copy of the proxy voting guidelines.
Standard & Poor's, S&P and S&P 500 are registered service marks of The McGraw-Hill Companies, Inc. and have been licensed for use by Fidelity Distributors Corporation.
Other third-party marks appearing herein are the property of their respective owners.
All other marks appearing herein are registered or unregistered trademarks or service marks of FMR LLC or an affiliated company. © 2022 FMR LLC. All rights reserved.
This report and the financial statements contained herein are submitted for the general information of the shareholders of the Fund. This report is not authorized for distribution to prospective investors in the Fund unless preceded or accompanied by an effective prospectus.
A fund files its complete schedule of portfolio holdings with the SEC for the first and third quarters of each fiscal year on Form N-PORT. Forms N-PORT are available on the SEC's web site at http://www.sec.gov. A fund's Forms N-PORT may be reviewed and copied at the SEC's Public Reference Room in Washington, DC. Information regarding the operation of the SEC's Public Reference Room may be obtained by calling 1-800-SEC-0330.
For a complete list of a fund's portfolio holdings, view the most recent holdings listing, semiannual report, or annual report on Fidelity's web site at http://www.fidelity.com, http://www.institutional.fidelity.com, or http://www.401k.com, as applicable.
NOT FDIC INSURED •MAY LOSE VALUE •NO BANK GUARANTEE
Neither the Fund nor Fidelity Distributors Corporation is a bank.
| Top Bond Issuers (% of Fund's net assets) |
(with maturities greater than one year) |
| New Fortress Energy, Inc. | 2.4 | |
| Mesquite Energy, Inc. | 2.3 | |
| Uniti Group LP / Uniti Group Finance, Inc. | 1.8 | |
| Tenet Healthcare Corp. | 1.8 | |
| Southeastern Grocers, Inc. | 1.8 | |
| CCO Holdings LLC/CCO Holdings Capital Corp. | 1.7 | |
| TransDigm, Inc. | 1.6 | |
| Tallgrass Energy Partners LP / Tallgrass Energy Finance Corp. | 1.5 | |
| Community Health Systems, Inc. | 1.4 | |
| Crestwood Midstream Partners LP/Crestwood Midstream Finance Corp. | 1.4 | |
| | 17.6 | |
| |
| Market Sectors (% of Fund's net assets) |
| |
| Energy | 14.8 | |
| Healthcare | 8.7 | |
| Telecommunications | 8.4 | |
| Services | 6.7 | |
| Technology | 6.4 | |
| |
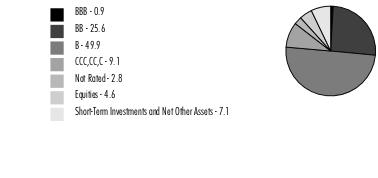
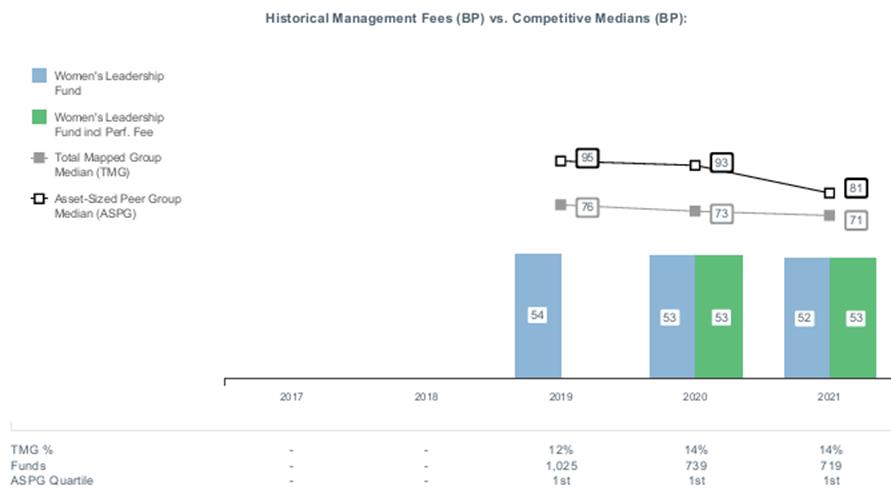
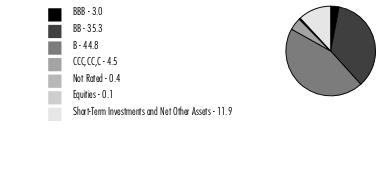
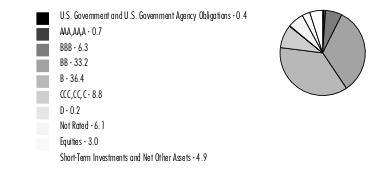
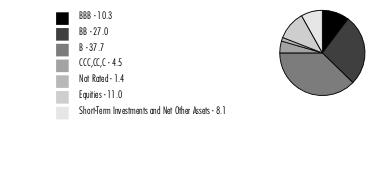
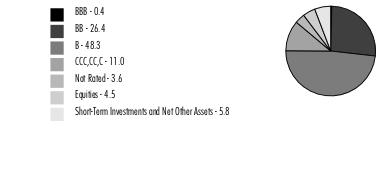
Quality Diversification (% of Fund's net assets) |
|
| |
| We have used ratings from Moody's Investors Service, Inc. Where Moody's® ratings are not available, we have used S&P® ratings. All ratings are as of the date indicated and do not reflect subsequent changes. |
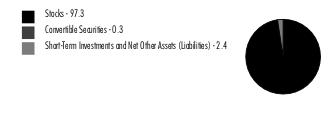
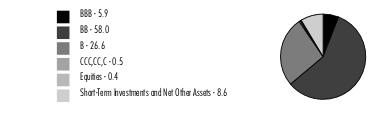
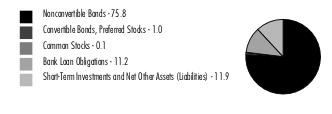
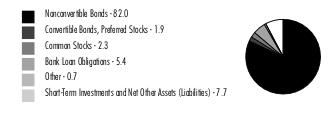
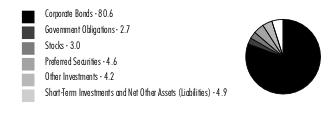
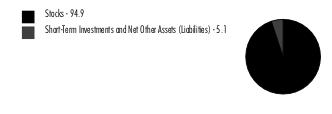
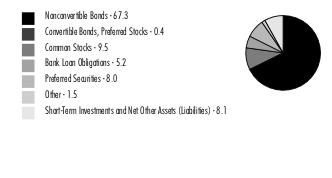
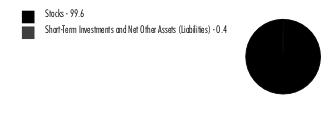
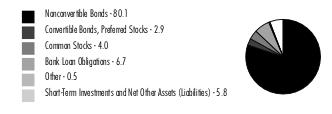
Asset Allocation (% of Fund's net assets) |
|
Foreign investments - 17.7% |
|
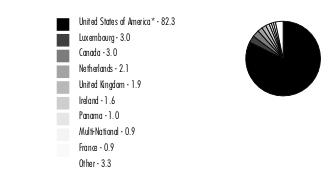
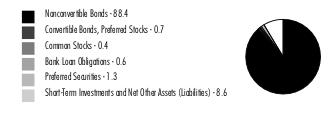
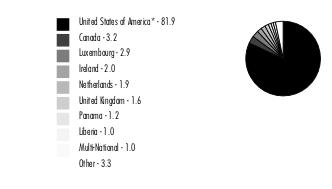
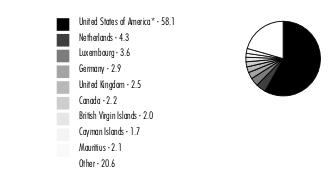
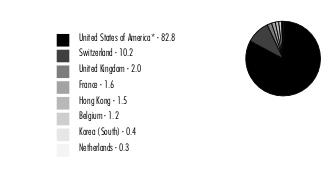
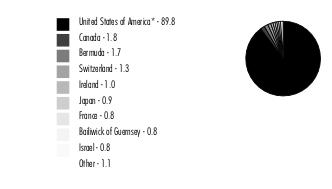
Geographic Diversification (% of Fund's net assets) |
|
* Includes Short-Term investments and Net Other Assets (Liabilities). Percentages are based on country or territory of incorporation and are adjusted for the effect of futures contracts, if applicable. |
| |
Showing Percentage of Net Assets
| Corporate Bonds - 82.5% |
| | | Principal Amount (a) | Value ($) |
| Convertible Bonds - 2.7% | | | |
| Broadcasting - 1.1% | | | |
| DISH Network Corp.: | | | |
| 2.375% 3/15/24 | | 4,594,000 | 4,166,758 |
| 3.375% 8/15/26 | | 11,882,000 | 8,216,403 |
| | | | 12,383,161 |
| Energy - 1.6% | | | |
| Mesquite Energy, Inc. 15% 7/15/23 (b)(c) | | 1,175,827 | 6,970,067 |
| Mesquite Energy, Inc. 15% 7/15/23 (b)(c) | | 2,028,327 | 12,023,517 |
| | | | 18,993,584 |
TOTAL CONVERTIBLE BONDS | | | 31,376,745 |
| Nonconvertible Bonds - 79.8% | | | |
| Aerospace - 3.0% | | | |
| ATI, Inc.: | | | |
| 4.875% 10/1/29 | | 1,215,000 | 1,021,602 |
| 5.875% 12/1/27 | | 4,240,000 | 3,853,888 |
| Bombardier, Inc. 7.875% 4/15/27 (d) | | 4,233,000 | 4,020,207 |
| BWX Technologies, Inc. 4.125% 6/30/28 (d) | | 3,247,000 | 2,841,125 |
| Kaiser Aluminum Corp.: | | | |
| 4.5% 6/1/31 (d) | | 830,000 | 651,135 |
| 4.625% 3/1/28 (d) | | 3,375,000 | 2,952,450 |
| Moog, Inc. 4.25% 12/15/27 (d) | | 830,000 | 742,734 |
| TransDigm, Inc.: | | | |
| 4.625% 1/15/29 | | 2,335,000 | 1,988,323 |
| 5.5% 11/15/27 | | 12,420,000 | 11,240,100 |
| 6.25% 3/15/26 (d) | | 2,890,000 | 2,850,725 |
| 7.5% 3/15/27 | | 1,455,000 | 1,433,728 |
| 8% 12/15/25 (d) | | 1,395,000 | 1,419,413 |
| | | | 35,015,430 |
| Air Transportation - 0.1% | | | |
| American Airlines, Inc. / AAdvantage Loyalty IP Ltd. 5.5% 4/20/26 (d) | | 1,325,000 | 1,261,826 |
| Automotive & Auto Parts - 0.3% | | | |
| Ford Motor Credit Co. LLC: | | | |
| 2.9% 2/10/29 | | 2,715,000 | 2,129,517 |
| 3.815% 11/2/27 | | 1,640,000 | 1,408,681 |
| | | | 3,538,198 |
| Banks & Thrifts - 0.1% | | | |
| Jane Street Group LLC/JSG Finance, Inc. 4.5% 11/15/29 (d) | | 970,000 | 857,344 |
| Broadcasting - 1.1% | | | |
| Diamond Sports Group LLC/Diamond Sports Finance Co. 5.375% 8/15/26 (d) | | 9,005,000 | 1,801,000 |
| Sinclair Television Group, Inc. 5.5% 3/1/30 (d) | | 1,670,000 | 1,248,776 |
| Sirius XM Radio, Inc.: | | | |
| 4% 7/15/28 (d) | | 2,505,000 | 2,153,491 |
| 4.125% 7/1/30 (d) | | 845,000 | 691,454 |
| TEGNA, Inc.: | | | |
| 4.625% 3/15/28 | | 1,895,000 | 1,803,794 |
| 5% 9/15/29 | | 725,000 | 687,371 |
| Univision Communications, Inc.: | | | |
| 4.5% 5/1/29 (d) | | 2,170,000 | 1,826,880 |
| 6.625% 6/1/27 (d) | | 3,080,000 | 3,041,500 |
| | | | 13,254,266 |
| Building Materials - 0.5% | | | |
| Advanced Drain Systems, Inc. 5% 9/30/27 (d) | | 1,934,000 | 1,793,282 |
| Builders FirstSource, Inc. 4.25% 2/1/32 (d) | | 2,210,000 | 1,768,442 |
| SRS Distribution, Inc.: | | | |
| 4.625% 7/1/28 (d) | | 1,335,000 | 1,172,183 |
| 6% 12/1/29 (d) | | 1,230,000 | 1,002,881 |
| | | | 5,736,788 |
| Cable/Satellite TV - 4.2% | | | |
| CCO Holdings LLC/CCO Holdings Capital Corp.: | | | |
| 4.25% 2/1/31 (d) | | 3,680,000 | 2,907,200 |
| 4.25% 1/15/34 (d) | | 550,000 | 404,250 |
| 4.5% 8/15/30 (d) | | 2,885,000 | 2,341,351 |
| 4.5% 5/1/32 | | 5,635,000 | 4,451,650 |
| 4.5% 6/1/33 (d) | | 3,195,000 | 2,422,802 |
| 4.75% 3/1/30 (d) | | 4,755,000 | 3,996,102 |
| 4.75% 2/1/32 (d) | | 550,000 | 440,026 |
| 5% 2/1/28 (d) | | 1,495,000 | 1,352,975 |
| 5.375% 6/1/29 (d) | | 1,705,000 | 1,523,213 |
| CSC Holdings LLC: | | | |
| 4.125% 12/1/30 (d) | | 2,050,000 | 1,612,879 |
| 4.5% 11/15/31 (d) | | 555,000 | 431,665 |
| 4.625% 12/1/30 (d) | | 5,335,000 | 3,839,986 |
| 5.375% 2/1/28 (d) | | 3,840,000 | 3,542,400 |
| 5.75% 1/15/30 (d) | | 3,435,000 | 2,627,775 |
| 7.5% 4/1/28 (d) | | 3,345,000 | 2,898,008 |
| Dolya Holdco 18 DAC 5% 7/15/28 (d) | | 1,680,000 | 1,430,353 |
| Radiate Holdco LLC/Radiate Financial Service Ltd.: | | | |
| 4.5% 9/15/26 (d) | | 2,875,000 | 2,429,375 |
| 6.5% 9/15/28 (d) | | 6,315,000 | 3,978,450 |
| Telenet Finance Luxembourg Notes SARL 5.5% 3/1/28 (d) | | 4,400,000 | 3,826,240 |
| Ziggo Bond Co. BV 5.125% 2/28/30 (d) | | 2,090,000 | 1,656,158 |
| Ziggo BV 4.875% 1/15/30 (d) | | 1,455,000 | 1,229,475 |
| | | | 49,342,333 |
| Capital Goods - 0.8% | | | |
| Mueller Water Products, Inc. 4% 6/15/29 (d) | | 1,905,000 | 1,651,864 |
| Vertical Holdco GmbH 7.625% 7/15/28 (d) | | 2,315,000 | 1,913,405 |
| Vertical U.S. Newco, Inc. 5.25% 7/15/27 (d) | | 5,865,000 | 5,256,506 |
| | | | 8,821,775 |
| Chemicals - 3.8% | | | |
| CVR Partners LP 6.125% 6/15/28 (d) | | 2,072,000 | 1,874,663 |
| Element Solutions, Inc. 3.875% 9/1/28 (d) | | 1,999,000 | 1,699,150 |
| Kronos Acquisition Holdings, Inc. / KIK Custom Products, Inc.: | | | |
| 5% 12/31/26 (d) | | 3,400,000 | 3,081,998 |
| 7% 12/31/27 (d) | | 440,000 | 369,600 |
| LSB Industries, Inc. 6.25% 10/15/28 (d) | | 3,330,000 | 3,023,274 |
| Methanex Corp.: | | | |
| 5.125% 10/15/27 | | 3,800,000 | 3,448,804 |
| 5.65% 12/1/44 | | 2,152,000 | 1,479,500 |
| NOVA Chemicals Corp.: | | | |
| 4.25% 5/15/29 (d) | | 1,900,000 | 1,548,819 |
| 4.875% 6/1/24 (d) | | 1,290,000 | 1,254,525 |
| 5% 5/1/25 (d) | | 940,000 | 895,247 |
| 5.25% 6/1/27 (d) | | 4,320,000 | 3,855,946 |
| Nufarm Australia Ltd. 5% 1/27/30 (d) | | 2,575,000 | 2,178,218 |
| Olympus Water U.S. Holding Corp.: | | | |
| 4.25% 10/1/28 (d) | | 2,030,000 | 1,647,981 |
| 6.25% 10/1/29 (d) | | 2,255,000 | 1,561,486 |
| SCIL IV LLC / SCIL U.S.A. Holdings LLC 5.375% 11/1/26 (d) | | 1,550,000 | 1,232,250 |
| The Chemours Co. LLC: | | | |
| 4.625% 11/15/29 (d) | | 1,645,000 | 1,283,100 |
| 5.375% 5/15/27 | | 2,604,000 | 2,331,674 |
| 5.75% 11/15/28 (d) | | 10,255,000 | 8,711,623 |
| W.R. Grace Holding LLC 5.625% 8/15/29 (d) | | 3,140,000 | 2,427,157 |
| | | | 43,905,015 |
| Consumer Products - 0.3% | | | |
| Mattel, Inc.: | | | |
| 3.375% 4/1/26 (d) | | 340,000 | 310,119 |
| 3.75% 4/1/29 (d) | | 3,225,000 | 2,783,022 |
| | | | 3,093,141 |
| Containers - 0.8% | | | |
| Graphic Packaging International, Inc. 3.75% 2/1/30 (d) | | 610,000 | 524,454 |
| Sealed Air Corp. 5% 4/15/29 (d) | | 2,240,000 | 2,043,216 |
| Trivium Packaging Finance BV: | | | |
| 5.5% 8/15/26 (d) | | 3,574,000 | 3,280,700 |
| 8.5% 8/15/27 (d) | | 3,080,000 | 2,896,098 |
| | | | 8,744,468 |
| Diversified Financial Services - 2.7% | | | |
| Coinbase Global, Inc.: | | | |
| 3.375% 10/1/28 (d) | | 3,705,000 | 2,421,635 |
| 3.625% 10/1/31 (d) | | 4,210,000 | 2,492,903 |
| Hightower Holding LLC 6.75% 4/15/29 (d) | | 2,245,000 | 1,827,716 |
| Icahn Enterprises LP/Icahn Enterprises Finance Corp.: | | | |
| 4.375% 2/1/29 | | 3,160,000 | 2,638,189 |
| 5.25% 5/15/27 | | 6,865,000 | 6,324,381 |
| 6.25% 5/15/26 | | 4,350,000 | 4,186,875 |
| Ladder Capital Finance Holdings LLLP/Ladder Capital Finance Corp. 4.75% 6/15/29 (d) | | 1,415,000 | 1,126,295 |
| OneMain Finance Corp.: | | | |
| 3.5% 1/15/27 | | 3,265,000 | 2,677,815 |
| 3.875% 9/15/28 | | 4,865,000 | 3,788,376 |
| 7.125% 3/15/26 | | 3,970,000 | 3,831,050 |
| | | | 31,315,235 |
| Diversified Media - 0.5% | | | |
| Advantage Sales & Marketing, Inc. 6.5% 11/15/28 (d) | | 6,565,000 | 5,584,583 |
| Terrier Media Buyer, Inc. 8.875% 12/15/27 (d) | | 960,000 | 813,600 |
| | | | 6,398,183 |
| Energy - 11.3% | | | |
| Altus Midstream LP 5.875% 6/15/30 (d) | | 1,535,000 | 1,440,096 |
| Apache Corp. 4.25% 1/15/30 | | 775,000 | 689,529 |
| Atlantica Sustainable Infrastructure PLC 4.125% 6/15/28 (d) | | 2,540,000 | 2,152,650 |
| CGG SA 8.75% 4/1/27 (d) | | 750,000 | 663,135 |
| Citgo Petroleum Corp. 6.375% 6/15/26 (d) | | 4,285,000 | 4,220,125 |
| CNX Resources Corp. 7.375% 1/15/31 (d) | | 625,000 | 620,419 |
| Colgate Energy Partners III LLC: | | | |
| 5.875% 7/1/29 (d) | | 3,318,000 | 3,077,445 |
| 7.75% 2/15/26 (d) | | 860,000 | 855,452 |
| Comstock Resources, Inc.: | | | |
| 5.875% 1/15/30 (d) | | 1,550,000 | 1,398,751 |
| 6.75% 3/1/29 (d) | | 4,110,000 | 3,935,325 |
| Crestwood Midstream Partners LP/Crestwood Midstream Finance Corp.: | | | |
| 5.625% 5/1/27 (d) | | 9,034,000 | 8,497,171 |
| 5.75% 4/1/25 | | 3,105,000 | 3,027,375 |
| 6% 2/1/29 (d) | | 4,453,000 | 4,164,000 |
| CrownRock LP/CrownRock Finance, Inc.: | | | |
| 5% 5/1/29 (d) | | 1,295,000 | 1,176,412 |
| 5.625% 10/15/25 (d) | | 230,000 | 222,456 |
| CVR Energy, Inc.: | | | |
| 5.25% 2/15/25 (d) | | 3,960,000 | 3,815,757 |
| 5.75% 2/15/28 (d) | | 3,580,000 | 3,239,900 |
| Delek Logistics Partners LP 7.125% 6/1/28 (d) | | 3,905,000 | 3,496,718 |
| DT Midstream, Inc. 4.125% 6/15/29 (d) | | 1,140,000 | 985,530 |
| EnLink Midstream LLC 5.625% 1/15/28 (d) | | 665,000 | 637,369 |
| EQM Midstream Partners LP: | | | |
| 6% 7/1/25 (d) | | 140,000 | 135,592 |
| 6.5% 7/1/27 (d) | | 1,962,000 | 1,912,950 |
| 7.5% 6/1/27 (d) | | 735,000 | 725,813 |
| 7.5% 6/1/30 (d) | | 735,000 | 714,788 |
| Global Partners LP/GLP Finance Corp. 6.875% 1/15/29 | | 2,160,000 | 1,954,260 |
| Harvest Midstream I LP 7.5% 9/1/28 (d) | | 1,110,000 | 1,064,180 |
| Hess Midstream Partners LP: | | | |
| 4.25% 2/15/30 (d) | | 1,115,000 | 953,492 |
| 5.125% 6/15/28 (d) | | 3,025,000 | 2,783,000 |
| Hilcorp Energy I LP/Hilcorp Finance Co.: | | | |
| 5.75% 2/1/29 (d) | | 775,000 | 709,125 |
| 6.25% 11/1/28 (d) | | 775,000 | 728,500 |
| Holly Energy Partners LP/Holly Energy Finance Corp. 5% 2/1/28 (d) | | 2,280,000 | 2,060,653 |
| Mesquite Energy, Inc. 7.25% 2/15/23 (c)(d)(e) | | 10,580,000 | 1 |
| New Fortress Energy, Inc.: | | | |
| 6.5% 9/30/26 (d) | | 13,490,000 | 13,085,300 |
| 6.75% 9/15/25 (d) | | 13,740,000 | 13,488,641 |
| NGL Energy Operating LLC/NGL Energy Finance Corp. 7.5% 2/1/26 (d) | | 4,110,000 | 3,718,064 |
| Occidental Petroleum Corp.: | | | |
| 7.5% 5/1/31 | | 2,575,000 | 2,768,125 |
| 7.875% 9/15/31 | | 635,000 | 691,077 |
| 8.875% 7/15/30 | | 2,170,000 | 2,462,950 |
| Rockies Express Pipeline LLC: | | | |
| 4.8% 5/15/30 (d) | | 145,000 | 122,525 |
| 4.95% 7/15/29 (d) | | 1,480,000 | 1,298,385 |
| 6.875% 4/15/40 (d) | | 655,000 | 534,742 |
| SM Energy Co. 5.625% 6/1/25 | | 2,035,000 | 1,976,816 |
| Southwestern Energy Co. 4.75% 2/1/32 | | 1,640,000 | 1,415,648 |
| Sunoco LP/Sunoco Finance Corp.: | | | |
| 4.5% 5/15/29 | | 1,670,000 | 1,434,363 |
| 5.875% 3/15/28 | | 875,000 | 832,979 |
| Superior Plus LP / Superior General Partner, Inc. 4.5% 3/15/29 (d) | | 1,155,000 | 979,014 |
| Tallgrass Energy Partners LP / Tallgrass Energy Finance Corp.: | | | |
| 5.5% 1/15/28 (d) | | 3,125,000 | 2,802,000 |
| 6% 3/1/27 (d) | | 6,240,000 | 5,888,512 |
| 6% 12/31/30 (d) | | 5,130,000 | 4,643,779 |
| 6% 9/1/31 (d) | | 3,695,000 | 3,289,078 |
| 7.5% 10/1/25 (d) | | 1,330,000 | 1,343,234 |
| Transocean Guardian Ltd. 5.875% 1/15/24 (d) | | 1,096,445 | 1,065,821 |
| Transocean Phoenix 2 Ltd. 7.75% 10/15/24 (d) | | 202,000 | 200,901 |
| Transocean Pontus Ltd. 6.125% 8/1/25 (d) | | 565,600 | 544,441 |
| Transocean Poseidon Ltd. 6.875% 2/1/27 (d) | | 883,750 | 846,191 |
| Transocean Sentry Ltd. 5.375% 5/15/23 (d) | | 1,393,799 | 1,369,408 |
| Venture Global Calcasieu Pass LLC: | | | |
| 3.875% 8/15/29 (d) | | 1,885,000 | 1,616,388 |
| 4.125% 8/15/31 (d) | | 1,865,000 | 1,589,968 |
| | | | 132,066,319 |
| Environmental - 1.3% | | | |
| Covanta Holding Corp. 4.875% 12/1/29 (d) | | 1,730,000 | 1,473,009 |
| Darling Ingredients, Inc. 6% 6/15/30 (d) | | 910,000 | 875,875 |
| Madison IAQ LLC: | | | |
| 4.125% 6/30/28 (d) | | 3,730,000 | 3,086,575 |
| 5.875% 6/30/29 (d) | | 10,110,000 | 6,925,350 |
| Stericycle, Inc.: | | | |
| 3.875% 1/15/29 (d) | | 2,775,000 | 2,410,337 |
| 5.375% 7/15/24 (d) | | 575,000 | 566,375 |
| | | | 15,337,521 |
| Food & Drug Retail - 1.1% | | | |
| Albertsons Companies LLC/Safeway, Inc./New Albertson's, Inc./Albertson's LLC: | | | |
| 3.5% 3/15/29 (d) | | 9,110,000 | 7,538,525 |
| 4.875% 2/15/30 (d) | | 2,205,000 | 1,956,938 |
| Emergent BioSolutions, Inc. 3.875% 8/15/28 (d) | | 4,720,000 | 2,829,829 |
| Murphy Oil U.S.A., Inc. 3.75% 2/15/31 (d) | | 675,000 | 562,449 |
| | | | 12,887,741 |
| Food/Beverage/Tobacco - 2.1% | | | |
| C&S Group Enterprises LLC 5% 12/15/28 (d) | | 5,435,000 | 4,017,773 |
| Lamb Weston Holdings, Inc. 4.125% 1/31/30 (d) | | 3,660,000 | 3,195,070 |
| Performance Food Group, Inc. 5.5% 10/15/27 (d) | | 1,505,000 | 1,422,556 |
| Post Holdings, Inc.: | | | |
| 4.625% 4/15/30 (d) | | 1,290,000 | 1,088,521 |
| 5.5% 12/15/29 (d) | | 1,325,000 | 1,192,394 |
| Primo Water Holdings, Inc. 4.375% 4/30/29 (d) | | 4,030,000 | 3,376,616 |
| TreeHouse Foods, Inc. 4% 9/1/28 | | 860,000 | 725,625 |
| Triton Water Holdings, Inc. 6.25% 4/1/29 (d) | | 9,450,000 | 7,157,215 |
| U.S. Foods, Inc.: | | | |
| 4.625% 6/1/30 (d) | | 820,000 | 711,366 |
| 4.75% 2/15/29 (d) | | 2,180,000 | 1,932,025 |
| | | | 24,819,161 |
| Gaming - 2.0% | | | |
| Affinity Gaming LLC 6.875% 12/15/27 (d) | | 3,630,000 | 3,030,150 |
| Caesars Entertainment, Inc.: | | | |
| 6.25% 7/1/25 (d) | | 2,675,000 | 2,610,084 |
| 8.125% 7/1/27 (d) | | 4,489,000 | 4,365,553 |
| Fertitta Entertainment LLC / Fertitta Entertainment Finance Co., Inc. 6.75% 1/15/30 (d) | | 4,500,000 | 3,532,500 |
| Golden Entertainment, Inc. 7.625% 4/15/26 (d) | | 2,355,000 | 2,313,788 |
| Jacobs Entertainment, Inc. 6.75% 2/15/29 (d) | | 975,000 | 859,628 |
| Premier Entertainment Sub LLC: | | | |
| 5.625% 9/1/29 (d) | | 2,725,000 | 2,016,500 |
| 5.875% 9/1/31 (d) | | 1,295,000 | 917,663 |
| Station Casinos LLC 4.5% 2/15/28 (d) | | 1,665,000 | 1,434,398 |
| Wynn Las Vegas LLC/Wynn Las Vegas Capital Corp. 5.25% 5/15/27 (d) | | 3,039,000 | 2,643,322 |
| | | | 23,723,586 |
| Healthcare - 8.1% | | | |
| 1375209 BC Ltd. 9% 1/30/28 (d) | | 1,306,000 | 1,263,555 |
| 180 Medical, Inc. 3.875% 10/15/29 (d) | | 2,065,000 | 1,744,925 |
| AMN Healthcare 4% 4/15/29 (d) | | 3,205,000 | 2,757,832 |
| Avantor Funding, Inc.: | | | |
| 3.875% 11/1/29 (d) | | 2,000,000 | 1,687,607 |
| 4.625% 7/15/28 (d) | | 1,750,000 | 1,581,493 |
| Bausch Health Companies, Inc.: | | | |
| 11% 9/30/28 (d) | | 2,316,000 | 1,783,320 |
| 14% 10/15/30 (d) | | 461,000 | 263,923 |
| Cano Health, Inc. 6.25% 10/1/28 (d) | | 1,930,000 | 1,549,938 |
| Catalent Pharma Solutions 3.5% 4/1/30 (d) | | 3,245,000 | 2,620,338 |
| Charles River Laboratories International, Inc.: | | | |
| 3.75% 3/15/29 (d) | | 1,150,000 | 994,750 |
| 4.25% 5/1/28 (d) | | 472,000 | 429,378 |
| Community Health Systems, Inc.: | | | |
| 4.75% 2/15/31 (d) | | 4,055,000 | 2,716,566 |
| 5.25% 5/15/30 (d) | | 7,690,000 | 5,325,325 |
| 5.625% 3/15/27 (d) | | 4,905,000 | 3,908,647 |
| 6% 1/15/29 (d) | | 2,290,000 | 1,699,959 |
| 6.125% 4/1/30 (d) | | 2,885,000 | 1,182,850 |
| 6.875% 4/15/29 (d) | | 3,575,000 | 1,438,576 |
| 8% 3/15/26 (d) | | 1,075,000 | 927,188 |
| CTR Partnership LP/CareTrust Capital Corp. 3.875% 6/30/28 (d) | | 2,070,000 | 1,745,915 |
| DaVita HealthCare Partners, Inc.: | | | |
| 3.75% 2/15/31 (d) | | 855,000 | 618,191 |
| 4.625% 6/1/30 (d) | | 7,480,000 | 5,831,595 |
| Embecta Corp. 5% 2/15/30 (d) | | 860,000 | 737,244 |
| Grifols Escrow Issuer SA 4.75% 10/15/28 (d) | | 3,010,000 | 2,351,563 |
| HealthEquity, Inc. 4.5% 10/1/29 (d) | | 3,520,000 | 3,075,600 |
| Hologic, Inc.: | | | |
| 3.25% 2/15/29 (d) | | 3,405,000 | 2,893,569 |
| 4.625% 2/1/28 (d) | | 6,000 | 5,610 |
| Jazz Securities DAC 4.375% 1/15/29 (d) | | 3,880,000 | 3,443,500 |
| ModivCare Escrow Issuer, Inc. 5% 10/1/29 (d) | | 785,000 | 668,079 |
| Molina Healthcare, Inc. 3.875% 11/15/30 (d) | | 1,465,000 | 1,244,953 |
| Option Care Health, Inc. 4.375% 10/31/29 (d) | | 3,020,000 | 2,608,012 |
| Organon & Co. / Organon Foreign Debt Co-Issuer BV: | | | |
| 4.125% 4/30/28 (d) | | 3,935,000 | 3,466,027 |
| 5.125% 4/30/31 (d) | | 2,160,000 | 1,834,423 |
| Owens & Minor, Inc. 4.5% 3/31/29 (d) | | 1,010,000 | 782,104 |
| Pediatrix Medical Group, Inc. 5.375% 2/15/30 (d) | | 2,290,000 | 1,969,400 |
| Radiology Partners, Inc. 9.25% 2/1/28 (d) | | 2,970,000 | 1,571,130 |
| RP Escrow Issuer LLC 5.25% 12/15/25 (d) | | 5,310,000 | 3,970,498 |
| Teleflex, Inc. 4.25% 6/1/28 (d) | | 930,000 | 841,464 |
| Tenet Healthcare Corp.: | | | |
| 4.25% 6/1/29 (d) | | 3,290,000 | 2,771,825 |
| 4.375% 1/15/30 (d) | | 1,990,000 | 1,669,610 |
| 4.625% 6/15/28 (d) | | 3,350,000 | 2,939,607 |
| 6.125% 10/1/28 (d) | | 9,780,000 | 8,464,590 |
| 6.125% 6/15/30 (d) | | 2,820,000 | 2,603,255 |
| 6.25% 2/1/27 (d) | | 2,741,000 | 2,615,791 |
| | | | 94,599,725 |
| Homebuilders/Real Estate - 3.9% | | | |
| Ashton Woods U.S.A. LLC/Ashton Woods Finance Co. 4.625% 8/1/29 (d) | | 985,000 | 739,981 |
| Howard Hughes Corp.: | | | |
| 4.125% 2/1/29 (d) | | 1,325,000 | 1,035,526 |
| 4.375% 2/1/31 (d) | | 1,325,000 | 995,605 |
| Kennedy-Wilson, Inc. 4.75% 2/1/30 | | 4,055,000 | 3,183,175 |
| MPT Operating Partnership LP/MPT Finance Corp.: | | | |
| 3.5% 3/15/31 | | 3,265,000 | 2,245,896 |
| 4.625% 8/1/29 | | 1,540,000 | 1,220,034 |
| 5% 10/15/27 | | 11,120,000 | 9,522,056 |
| Railworks Holdings LP 8.25% 11/15/28 (d) | | 2,855,000 | 2,623,854 |
| TopBuild Corp. 4.125% 2/15/32 (d) | | 3,180,000 | 2,489,855 |
| Uniti Group LP / Uniti Group Finance, Inc.: | | | |
| 4.75% 4/15/28 (d) | | 6,395,000 | 5,227,566 |
| 6.5% 2/15/29 (d) | | 22,416,000 | 16,083,480 |
| | | | 45,367,028 |
| Hotels - 0.5% | | | |
| Hilton Domestic Operating Co., Inc.: | | | |
| 3.625% 2/15/32 (d) | | 3,710,000 | 2,954,088 |
| 3.75% 5/1/29 (d) | | 495,000 | 421,693 |
| 4% 5/1/31 (d) | | 1,540,000 | 1,287,359 |
| Wyndham Hotels & Resorts, Inc. 4.375% 8/15/28 (d) | | 1,785,000 | 1,571,371 |
| | | | 6,234,511 |
| Insurance - 0.6% | | | |
| Alliant Holdings Intermediate LLC 4.25% 10/15/27 (d) | | 3,740,000 | 3,366,449 |
| AmWINS Group, Inc. 4.875% 6/30/29 (d) | | 3,540,000 | 3,026,137 |
| AssuredPartners, Inc. 5.625% 1/15/29 (d) | | 1,355,000 | 1,114,488 |
| | | | 7,507,074 |
| Leisure - 2.6% | | | |
| Carnival Corp.: | | | |
| 5.75% 3/1/27 (d) | | 5,650,000 | 3,926,750 |
| 6% 5/1/29 (d) | | 4,475,000 | 2,968,122 |
| 6.65% 1/15/28 | | 300,000 | 190,858 |
| 7.625% 3/1/26 (d) | | 6,815,000 | 5,124,539 |
| MajorDrive Holdings IV LLC 6.375% 6/1/29 (d) | | 1,485,000 | 1,046,480 |
| NCL Corp. Ltd.: | | | |
| 3.625% 12/15/24 (d) | | 3,160,000 | 2,742,810 |
| 5.875% 3/15/26 (d) | | 890,000 | 728,688 |
| 7.75% 2/15/29 (d) | | 2,010,000 | 1,598,613 |
| NCL Finance Ltd. 6.125% 3/15/28 (d) | | 640,000 | 497,600 |
| Royal Caribbean Cruises Ltd.: | | | |
| 4.25% 7/1/26 (d) | | 4,110,000 | 3,246,900 |
| 5.375% 7/15/27 (d) | | 1,535,000 | 1,193,180 |
| 5.5% 8/31/26 (d) | | 3,160,000 | 2,583,616 |
| 5.5% 4/1/28 (d) | | 3,905,000 | 3,006,850 |
| Viking Ocean Cruises Ship VII Ltd. 5.625% 2/15/29 (d) | | 630,000 | 491,104 |
| Voc Escrow Ltd. 5% 2/15/28 (d) | | 1,440,000 | 1,185,466 |
| | | | 30,531,576 |
| Metals/Mining - 0.9% | | | |
| Eldorado Gold Corp. 6.25% 9/1/29 (d) | | 1,005,000 | 812,894 |
| ERO Copper Corp. 6.5% 2/15/30 (d) | | 3,950,000 | 2,893,375 |
| First Quantum Minerals Ltd. 6.875% 10/15/27 (d) | | 3,115,000 | 2,884,685 |
| HudBay Minerals, Inc. 4.5% 4/1/26 (d) | | 860,000 | 754,448 |
| Mineral Resources Ltd. 8.5% 5/1/30 (d) | | 1,400,000 | 1,377,683 |
| PMHC II, Inc. 9% 2/15/30 (d) | | 2,130,000 | 1,403,453 |
| | | | 10,126,538 |
| Paper - 0.7% | | | |
| Ardagh Metal Packaging Finance U.S.A. LLC/Ardagh Metal Packaging Finance PLC: | | | |
| 4% 9/1/29 (d) | | 1,165,000 | 883,757 |
| 6% 6/15/27 (d) | | 1,985,000 | 1,904,746 |
| Clydesdale Acquisition Holdings, Inc. 6.625% 4/15/29 (d) | | 815,000 | 773,761 |
| Enviva Partners LP / Enviva Partners Finance Corp. 6.5% 1/15/26 (d) | | 390,000 | 374,486 |
| Glatfelter Corp. 4.75% 11/15/29 (d) | | 1,385,000 | 891,594 |
| SPA Holdings 3 OY 4.875% 2/4/28 (d) | | 4,520,000 | 3,598,438 |
| | | | 8,426,782 |
| Publishing/Printing - 0.1% | | | |
| News Corp. 5.125% 2/15/32 (d) | | 1,685,000 | 1,503,863 |
| Railroad - 0.3% | | | |
| First Student Bidco, Inc./First Transit Parent, Inc. 4% 7/31/29 (d) | | 4,195,000 | 3,408,857 |
| Restaurants - 0.5% | | | |
| 1011778 BC Unlimited Liability Co./New Red Finance, Inc. 4% 10/15/30 (d) | | 2,680,000 | 2,187,550 |
| Garden SpinCo Corp. 8.625% 7/20/30 (d) | | 550,000 | 565,705 |
| Yum! Brands, Inc. 4.625% 1/31/32 | | 3,225,000 | 2,757,472 |
| | | | 5,510,727 |
| Services - 5.9% | | | |
| Adtalem Global Education, Inc. 5.5% 3/1/28 (d) | | 3,646,000 | 3,326,975 |
| APX Group, Inc. 6.75% 2/15/27 (d) | | 1,280,000 | 1,248,645 |
| Aramark Services, Inc. 5% 2/1/28 (d) | | 1,560,000 | 1,421,324 |
| ASGN, Inc. 4.625% 5/15/28 (d) | | 2,280,000 | 2,027,444 |
| Booz Allen Hamilton, Inc. 3.875% 9/1/28 (d) | | 9,020,000 | 7,947,342 |
| Brand Energy & Infrastructure Services, Inc. 8.5% 7/15/25 (d) | | 6,812,000 | 4,897,597 |
| CoreCivic, Inc.: | | | |
| 4.75% 10/15/27 | | 4,361,000 | 3,618,587 |
| 8.25% 4/15/26 | | 7,700,000 | 7,812,616 |
| Fair Isaac Corp. 4% 6/15/28 (d) | | 1,535,000 | 1,388,929 |
| Gartner, Inc.: | | | |
| 3.625% 6/15/29 (d) | | 985,000 | 837,250 |
| 3.75% 10/1/30 (d) | | 1,600,000 | 1,343,993 |
| GEMS MENASA Cayman Ltd. 7.125% 7/31/26 (d) | | 7,761,000 | 7,280,788 |
| Legends Hospitality Holding Co. LLC/Legends Hospitality Co-Issuer, Inc. 5% 2/1/26 (d) | | 5,185,000 | 4,536,875 |
| PowerTeam Services LLC 9.033% 12/4/25 (d) | | 840,000 | 701,954 |
| Service Corp. International: | | | |
| 4% 5/15/31 | | 2,505,000 | 2,079,708 |
| 5.125% 6/1/29 | | 2,272,000 | 2,116,277 |
| Sotheby's 7.375% 10/15/27 (d) | | 6,200,000 | 5,998,500 |
| The GEO Group, Inc. 9.5% 12/31/28 (d) | | 2,110,000 | 1,941,200 |
| TriNet Group, Inc. 3.5% 3/1/29 (d) | | 3,950,000 | 3,273,563 |
| WASH Multifamily Acquisition, Inc. 5.75% 4/15/26 (d) | | 4,717,000 | 4,398,455 |
| | | | 68,198,022 |
| Steel - 0.3% | | | |
| Commercial Metals Co. 4.125% 1/15/30 | | 1,140,000 | 957,826 |
| Roller Bearing Co. of America, Inc. 4.375% 10/15/29 (d) | | 2,705,000 | 2,373,583 |
| | | | 3,331,409 |
| Super Retail - 1.7% | | | |
| Bath & Body Works, Inc. 6.694% 1/15/27 | | 625,000 | 589,063 |
| Carvana Co.: | | | |
| 4.875% 9/1/29 (d) | | 1,330,000 | 588,525 |
| 5.5% 4/15/27 (d) | | 2,050,000 | 974,218 |
| 5.875% 10/1/28 (d) | | 550,000 | 251,807 |
| 10.25% 5/1/30 (d) | | 300,000 | 180,000 |
| EG Global Finance PLC: | | | |
| 6.75% 2/7/25 (d) | | 2,875,000 | 2,587,500 |
| 8.5% 10/30/25 (d) | | 4,985,000 | 4,604,671 |
| LBM Acquisition LLC 6.25% 1/15/29 (d) | | 2,315,000 | 1,619,296 |
| Levi Strauss & Co. 3.5% 3/1/31 (d) | | 2,235,000 | 1,787,899 |
| Michaels Companies, Inc.: | | | |
| 5.25% 5/1/28 (d) | | 1,425,000 | 1,011,950 |
| 7.875% 5/1/29 (d) | | 1,100,000 | 613,250 |
| Nordstrom, Inc.: | | | |
| 4.25% 8/1/31 | | 1,630,000 | 1,183,380 |
| 4.375% 4/1/30 | | 1,090,000 | 836,575 |
| Wolverine World Wide, Inc. 4% 8/15/29 (d) | | 3,250,000 | 2,567,500 |
| | | | 19,395,634 |
| Technology - 5.6% | | | |
| Acuris Finance U.S. 5% 5/1/28 (d) | | 5,520,000 | 4,471,200 |
| Athenahealth Group, Inc. 6.5% 2/15/30 (d) | | 760,000 | 592,800 |
| Black Knight InfoServ LLC 3.625% 9/1/28 (d) | | 3,485,000 | 3,018,881 |
| Clarivate Science Holdings Corp.: | | | |
| 3.875% 7/1/28 (d) | | 810,000 | 694,639 |
| 4.875% 7/1/29 (d) | | 820,000 | 683,675 |
| Coherent Corp. 5% 12/15/29 (d) | | 3,575,000 | 3,066,921 |
| CommScope, Inc.: | | | |
| 4.75% 9/1/29 (d) | | 1,415,000 | 1,196,855 |
| 6% 3/1/26 (d) | | 1,260,000 | 1,215,335 |
| 7.125% 7/1/28 (d) | | 2,505,000 | 2,121,554 |
| 8.25% 3/1/27 (d) | | 770,000 | 683,607 |
| Elastic NV 4.125% 7/15/29 (d) | | 3,310,000 | 2,763,602 |
| Entegris Escrow Corp.: | | | |
| 4.75% 4/15/29 (d) | | 2,285,000 | 2,018,954 |
| 5.95% 6/15/30 (d) | | 3,020,000 | 2,755,750 |
| Gartner, Inc. 4.5% 7/1/28 (d) | | 2,505,000 | 2,321,459 |
| ION Trading Technologies Ltd. 5.75% 5/15/28 (d) | | 4,095,000 | 3,255,525 |
| MicroStrategy, Inc. 6.125% 6/15/28 (d) | | 4,810,000 | 4,121,545 |
| onsemi 3.875% 9/1/28 (d) | | 1,875,000 | 1,652,063 |
| Open Text Corp.: | | | |
| 3.875% 2/15/28 (d) | | 2,815,000 | 2,409,471 |
| 3.875% 12/1/29 (d) | | 3,245,000 | 2,571,663 |
| Rackspace Hosting, Inc.: | | | |
| 3.5% 2/15/28 (d) | | 2,710,000 | 1,789,582 |
| 5.375% 12/1/28 (d) | | 19,245,000 | 8,100,990 |
| Roblox Corp. 3.875% 5/1/30 (d) | | 3,450,000 | 2,846,250 |
| Sensata Technologies BV 4% 4/15/29 (d) | | 1,330,000 | 1,120,126 |
| TTM Technologies, Inc. 4% 3/1/29 (d) | | 6,735,000 | 5,624,660 |
| Twilio, Inc. 3.875% 3/15/31 | | 1,270,000 | 1,035,749 |
| Uber Technologies, Inc. 8% 11/1/26 (d) | | 3,275,000 | 3,287,118 |
| | | | 65,419,974 |
| Telecommunications - 8.0% | | | |
| Altice Financing SA: | | | |
| 5% 1/15/28 (d) | | 2,610,000 | 2,063,619 |
| 5.75% 8/15/29 (d) | | 13,650,000 | 10,777,187 |
| Altice France Holding SA 6% 2/15/28 (d) | | 6,280,000 | 4,105,550 |
| Altice France SA: | | | |
| 5.125% 1/15/29 (d) | | 5,910,000 | 4,447,275 |
| 5.125% 7/15/29 (d) | | 2,830,000 | 2,131,485 |
| 5.5% 1/15/28 (d) | | 4,455,000 | 3,571,440 |
| 5.5% 10/15/29 (d) | | 20,000 | 15,250 |
| C&W Senior Financing Designated Activity Co. 6.875% 9/15/27 (d) | | 16,554,000 | 14,319,210 |
| Cablevision Lightpath LLC: | | | |
| 3.875% 9/15/27 (d) | | 765,000 | 650,429 |
| 5.625% 9/15/28 (d) | | 605,000 | 480,999 |
| Consolidated Communications, Inc. 5% 10/1/28 (d) | | 930,000 | 720,615 |
| Frontier Communications Holdings LLC: | | | |
| 5% 5/1/28 (d) | | 3,330,000 | 2,913,750 |
| 5.875% 10/15/27 (d) | | 1,685,000 | 1,549,907 |
| 5.875% 11/1/29 | | 2,485,000 | 1,935,852 |
| 6% 1/15/30 (d) | | 2,115,000 | 1,653,930 |
| 8.75% 5/15/30 (d) | | 1,675,000 | 1,710,594 |
| Intelsat Jackson Holdings SA 6.5% 3/15/30 (d) | | 3,100,000 | 2,845,056 |
| Level 3 Financing, Inc.: | | | |
| 3.625% 1/15/29 (d) | | 565,000 | 430,813 |
| 4.25% 7/1/28 (d) | | 5,030,000 | 4,149,750 |
| Lumen Technologies, Inc. 4.5% 1/15/29 (d) | | 6,305,000 | 4,444,726 |
| Millicom International Cellular SA: | | | |
| 4.5% 4/27/31 (d) | | 3,880,000 | 2,902,240 |
| 5.125% 1/15/28 (d) | | 211,500 | 180,079 |
| Sable International Finance Ltd. 5.75% 9/7/27 (d) | | 748,000 | 659,175 |
| SBA Communications Corp. 3.125% 2/1/29 | | 1,630,000 | 1,317,415 |
| Telecom Italia Capital SA: | | | |
| 6% 9/30/34 | | 3,032,000 | 2,212,541 |
| 7.2% 7/18/36 | | 1,449,000 | 1,128,423 |
| 7.721% 6/4/38 | | 400,000 | 318,000 |
| Uniti Group, Inc. 6% 1/15/30 (d) | | 5,895,000 | 4,022,925 |
| Virgin Media Secured Finance PLC 4.5% 8/15/30 (d) | | 2,980,000 | 2,462,632 |
| VMED O2 UK Financing I PLC 4.25% 1/31/31 (d) | | 3,745,000 | 2,979,985 |
| Windstream Escrow LLC 7.75% 8/15/28 (d) | | 7,880,000 | 6,818,564 |
| Zayo Group Holdings, Inc.: | | | |
| 4% 3/1/27 (d) | | 2,600,000 | 2,008,500 |
| 6.125% 3/1/28 (d) | | 1,755,000 | 1,167,075 |
| | | | 93,094,991 |
| Textiles/Apparel - 0.3% | | | |
| Foot Locker, Inc. 4% 10/1/29 (d) | | 3,550,000 | 2,713,869 |
| Kontoor Brands, Inc. 4.125% 11/15/29 (d) | | 580,000 | 465,036 |
| | | | 3,178,905 |
| Transportation Ex Air/Rail - 0.5% | | | |
| Golar LNG Ltd. 7% 10/20/25 | | 1,690,000 | 1,588,600 |
| Great Lakes Dredge & Dock Corp. 5.25% 6/1/29 (d) | | 1,020,000 | 806,579 |
| Seaspan Corp. 5.5% 8/1/29 (d) | | 4,095,000 | 3,153,883 |
| | | | 5,549,062 |
| Utilities - 3.3% | | | |
| Clearway Energy Operating LLC 3.75% 2/15/31 (d) | | 1,750,000 | 1,461,250 |
| Global Partners LP/GLP Finance Corp. 7% 8/1/27 | | 3,807,000 | 3,619,247 |
| InterGen NV 7% 6/30/23 (d) | | 10,532,000 | 10,308,195 |
| NRG Energy, Inc.: | | | |
| 3.375% 2/15/29 (d) | | 2,360,000 | 1,965,811 |
| 5.25% 6/15/29 (d) | | 2,565,000 | 2,327,738 |
| PG&E Corp.: | | | |
| 5% 7/1/28 | | 4,420,000 | 3,983,724 |
| 5.25% 7/1/30 | | 6,030,000 | 5,339,535 |
| Pike Corp. 5.5% 9/1/28 (d) | | 5,677,000 | 4,847,477 |
| Vistra Operations Co. LLC: | | | |
| 5% 7/31/27 (d) | | 2,849,000 | 2,628,203 |
| 5.625% 2/15/27 (d) | | 1,965,000 | 1,873,195 |
| | | | 38,354,375 |
TOTAL NONCONVERTIBLE BONDS | | | 929,857,383 |
| TOTAL CORPORATE BONDS (Cost $1,140,607,526) | | | 961,234,128 |
| | | | |
| Common Stocks - 4.0% |
| | | Shares | Value ($) |
| Cable/Satellite TV - 0.1% | | | |
| Altice U.S.A., Inc. Class A (f) | | 105,200 | 695,372 |
| Energy - 1.6% | | | |
| California Resources Corp. warrants 10/27/24 (f) | | 2,871 | 40,768 |
| Jonah Energy Parent LLC (c)(f) | | 148,945 | 9,472,902 |
| Mesquite Energy, Inc. (c)(f) | | 149,356 | 8,278,818 |
| New Fortress Energy, Inc. | | 22,500 | 1,239,075 |
TOTAL ENERGY | | | 19,031,563 |
| Food & Drug Retail - 1.8% | | | |
| Southeastern Grocers, Inc. (b)(c)(f) | | 963,443 | 20,839,259 |
| Gaming - 0.2% | | | |
| Caesars Entertainment, Inc. (f) | | 57,300 | 2,505,729 |
| Metals/Mining - 0.0% | | | |
| Elah Holdings, Inc. (c)(f) | | 333 | 24,309 |
| Telecommunications - 0.0% | | | |
| GTT Communications, Inc. rights (c)(f) | | 160,059 | 160,059 |
| Utilities - 0.3% | | | |
| EQT Corp. | | 69,900 | 2,924,616 |
| TOTAL COMMON STOCKS (Cost $20,426,820) | | | 46,180,907 |
| | | | |
| Bank Loan Obligations - 5.8% |
| | | Principal Amount (a) | Value ($) |
| Broadcasting - 0.2% | | | |
| Diamond Sports Group LLC: | | | |
| 1LN, term loan CME Term SOFR 1 Month Index + 8.000% 11.208% 5/25/26 (g)(h)(i) | | 1,965,493 | 1,883,591 |
| 2LN, term loan CME Term SOFR 1 Month Index + 3.250% 6.458% 8/24/26 (g)(h)(i) | | 4,463,270 | 865,874 |
TOTAL BROADCASTING | | | 2,749,465 |
| Building Materials - 0.1% | | | |
| Acproducts Holdings, Inc. Tranche B 1LN, term loan 1 month U.S. LIBOR + 4.250% 7.3247% 5/17/28 (g)(h)(i) | | 2,143,296 | 1,486,461 |
| Chemicals - 0.5% | | | |
| Consolidated Energy Finance SA Tranche B 1LN, term loan 1 month U.S. LIBOR + 3.500% 6.3633% 5/7/25 (c)(g)(h)(i) | | 2,569,080 | 2,440,626 |
| Discovery Purchaser Corp. 1LN, term loan CME Term SOFR 1 Month Index + 4.370% 7.9683% 10/4/29 (g)(h)(i) | | 1,920,000 | 1,751,520 |
| Olympus Water U.S. Holding Corp. Tranche B 1LN, term loan 1 month U.S. LIBOR + 3.750% 7.4375% 11/9/28 (g)(h)(i) | | 2,054,475 | 1,867,374 |
TOTAL CHEMICALS | | | 6,059,520 |
| Energy - 0.3% | | | |
| EG America LLC Tranche B 1LN, term loan 3 month U.S. LIBOR + 4.000% 7.6741% 2/6/25 (g)(h)(i) | | 2,376,285 | 2,149,943 |
| EG Finco Ltd. Tranche B, term loan 3 month U.S. LIBOR + 4.000% 7.6741% 2/6/25 (g)(h)(i) | | 1,594,948 | 1,443,030 |
| Mesquite Energy, Inc.: | | | |
| 1LN, term loan 3 month U.S. LIBOR + 8.000% 0% (c)(e)(h)(i) | | 2,735,146 | 0 |
| term loan 3 month U.S. LIBOR + 0.000% 0% (c)(e)(h)(i) | | 1,217,000 | 0 |
TOTAL ENERGY | | | 3,592,973 |
| Healthcare - 0.6% | | | |
| Da Vinci Purchaser Corp. Tranche B 1LN, term loan 1 month U.S. LIBOR + 4.000% 7.7041% 12/13/26 (g)(h)(i) | | 128,684 | 121,687 |
| Gainwell Acquisition Corp. Tranche B 1LN, term loan 1 month U.S. LIBOR + 4.000% 7.6741% 10/1/27 (g)(h)(i) | | 6,879,962 | 6,524,475 |
TOTAL HEALTHCARE | | | 6,646,162 |
| Insurance - 0.4% | | | |
| HUB International Ltd. Tranche B, term loan 1 month U.S. LIBOR + 3.000% 7.326% 4/25/25 (g)(h)(i) | | 4,387,735 | 4,297,699 |
| Leisure - 0.5% | | | |
| City Football Group Ltd. Tranche B 1LN, term loan 1 month U.S. LIBOR + 3.500% 6.484% 7/21/28 (g)(h)(i) | | 5,792,979 | 5,372,988 |
| Paper - 0.2% | | | |
| Clydesdale Acquisition Holdings, Inc. 1LN, term loan CME Term SOFR 1 Month Index + 4.170% 8.0037% 4/13/29 (g)(h)(i) | | 2,044,875 | 1,966,761 |
| Services - 0.8% | | | |
| Ascend Learning LLC: | | | |
| 2LN, term loan 1 month U.S. LIBOR + 5.750% 9.5039% 12/10/29 (g)(h)(i) | | 225,000 | 190,406 |
| Tranche B 1LN, term loan 1 month U.S. LIBOR + 3.500% 7.2539% 12/10/28 (g)(h)(i) | | 2,252,975 | 2,062,103 |
| Brand Energy & Infrastructure Services, Inc. Tranche B, term loan 3 month U.S. LIBOR + 4.250% 8.493% 6/21/24 (g)(h)(i) | | 4,730,712 | 4,083,219 |
| Spin Holdco, Inc. Tranche B 1LN, term loan 1 month U.S. LIBOR + 4.000% 7.1441% 3/4/28 (g)(h)(i) | | 3,360,000 | 2,949,811 |
TOTAL SERVICES | | | 9,285,539 |
| Super Retail - 0.6% | | | |
| Bass Pro Group LLC Tranche B 1LN, term loan 1 month U.S. LIBOR + 3.750% 7.5039% 3/5/28 (g)(h)(i) | | 2,785,930 | 2,617,381 |
| LBM Acquisition LLC Tranche B 1LN, term loan 1 month U.S. LIBOR + 3.750% 7.1207% 12/18/27 (g)(h)(i) | | 5,480,263 | 4,676,035 |
TOTAL SUPER RETAIL | | | 7,293,416 |
| Technology - 0.8% | | | |
| Athenahealth Group, Inc.: | | | |
| Tranche B 1LN, term loan CME Term SOFR 1 Month Index + 3.500% 6.9671% 2/15/29 (g)(h)(i) | | 5,782,898 | 5,272,094 |
| Tranche DD 1LN, term loan CME Term SOFR 1 Month Index + 3.500% 2/15/29 (h)(i)(j) | | 982,609 | 895,815 |
| Central Parent, Inc. 1LN, term loan CME Term SOFR 1 Month Index + 4.500% 8.1123% 7/6/29 (g)(h)(i) | | 565,000 | 552,406 |
| CommScope, Inc. Tranche B 1LN, term loan 3 month U.S. LIBOR + 3.250% 7.0039% 4/4/26 (g)(h)(i) | | 1,613,367 | 1,534,716 |
| Verscend Holding Corp. Tranche B 1LN, term loan 1 month U.S. LIBOR + 4.000% 7.7539% 8/27/25 (g)(h)(i) | | 827,467 | 816,089 |
TOTAL TECHNOLOGY | | | 9,071,120 |
| Telecommunications - 0.4% | | | |
| GTT Communications, Inc. Tranche B, term loan 3 month U.S. LIBOR + 4.750% 10% 5/31/25 (g)(h)(i) | | 6,203,519 | 4,271,806 |
| Utilities - 0.4% | | | |
| Brookfield WEC Holdings, Inc. 1LN, term loan CME Term SOFR 1 Month Index + 3.750% 7.4787% 8/1/25 (g)(h)(i) | | 1,385,000 | 1,373,962 |
| PG&E Corp. Tranche B 1LN, term loan 1 month U.S. LIBOR + 3.000% 6.8125% 6/23/25 (g)(h)(i) | | 3,960,566 | 3,890,266 |
TOTAL UTILITIES | | | 5,264,228 |
| TOTAL BANK LOAN OBLIGATIONS (Cost $76,436,867) | | | 67,358,138 |
| | | | |
| Other - 0.6% |
| | | Shares | Value ($) |
| Other - 0.6% | | | |
Fidelity Direct Lending Fund, LP (b)(k) (Cost $7,204,158) | | | 7,123,339 |
| | | | |
| Money Market Funds - 5.7% |
| | | Shares | Value ($) |
Fidelity Cash Central Fund 3.10% (l) (Cost $66,543,527) | | 66,530,221 | 66,543,527 |
| | | | |
| TOTAL INVESTMENT IN SECURITIES - 98.6% (Cost $1,311,218,898) | 1,148,440,039 |
NET OTHER ASSETS (LIABILITIES) - 1.4% | 16,657,377 |
| NET ASSETS - 100.0% | 1,165,097,416 |
| | |
Legend
| (a) | Amount is stated in United States dollars unless otherwise noted. |
| (b) | Restricted securities (including private placements) - Investment in securities not registered under the Securities Act of 1933 (excluding 144A issues). At the end of the period, the value of restricted securities (excluding 144A issues) amounted to $46,956,182 or 4.0% of net assets. |
| (d) | Security exempt from registration under Rule 144A of the Securities Act of 1933. These securities may be resold in transactions exempt from registration, normally to qualified institutional buyers. At the end of the period, the value of these securities amounted to $790,360,709 or 67.8% of net assets. |
| (e) | Non-income producing - Security is in default. |
| (g) | Coupon rates for floating and adjustable rate securities reflect the rates in effect at period end. |
| (h) | Coupon is indexed to a floating interest rate which may be multiplied by a specified factor and/or subject to caps or floors. |
| (i) | Remaining maturities of bank loan obligations may be less than the stated maturities shown as a result of contractual or optional prepayments by the borrower. Such prepayments cannot be predicted with certainty. |
| (j) | Position or a portion of the position represents an unfunded loan commitment. At period end, the total principal amount and market value of unfunded commitments totaled $982,609 and $895,815, respectively. |
| (l) | Affiliated fund that is generally available only to investment companies and other accounts managed by Fidelity Investments. The rate quoted is the annualized seven-day yield of the fund at period end. A complete unaudited listing of the fund's holdings as of its most recent quarter end is available upon request. In addition, each Fidelity Central Fund's financial statements are available on the SEC's website or upon request. |
| Additional information on each restricted holding is as follows: |
| Security | Acquisition Date | Acquisition Cost ($) |
| Fidelity Direct Lending Fund, LP | 12/09/21 - 10/31/22 | 7,204,158 |
| | | |
| Mesquite Energy, Inc. 15% 7/15/23 | 7/10/20 - 1/18/22 | 1,175,827 |
| | | |
| Mesquite Energy, Inc. 15% 7/15/23 | 11/05/20 - 1/18/22 | 2,028,327 |
| | | |
| Southeastern Grocers, Inc. | 6/01/18 | 6,776,820 |
| | | |
Affiliated Central Funds
Fiscal year to date information regarding the Fund's investments in Fidelity Central Funds, including the ownership percentage, is presented below.
| Affiliate | Value, beginning of period ($) | Purchases ($) | Sales Proceeds ($) | Dividend Income ($) | Realized Gain (loss) ($) | Change in Unrealized appreciation (depreciation) ($) | Value, end of period ($) | % ownership, end of period |
| Fidelity Cash Central Fund 3.10% | 49,396,894 | 233,425,906 | 216,279,273 | 623,425 | - | - | 66,543,527 | 0.1% |
| Fidelity Securities Lending Cash Central Fund 3.10% | - | 2,155,180 | 2,155,180 | 31 | - | - | - | 0.0% |
| Total | 49,396,894 | 235,581,086 | 218,434,453 | 623,456 | - | - | 66,543,527 | |
| | | | | | | | | |
Amounts in the income column in the above table include any capital gain distributions from underlying funds, which are presented in the corresponding line item in the Statement of Operations, if applicable.
Amount for Fidelity Securities Lending Cash Central Fund represents the income earned on investing cash collateral, less rebates paid to borrowers and any lending agent fees associated with the loan, plus any premium payments received for lending certain types of securities.
Affiliated Underlying Funds
Fiscal year to date information regarding the Fund's investments in affiliated Underlying Funds is presented below. Exchanges between classes of the same affiliated Underlying Funds may occur. If an Underlying Funds changes its name, the name presented below is the name in effect at period end.
| Affiliate | Value, beginning of period ($) | Purchases ($) | Sales Proceeds ($) | Dividend Income ($) | Realized Gain (loss) ($) | Change in Unrealized appreciation (depreciation) ($) | Value, end of period ($) |
| Fidelity Direct Lending Fund, LP | 4,620,231 | 2,588,269 | - | 256,891 | - | (85,161) | 7,123,339 |
| | 4,620,231 | 2,588,269 | - | 256,891 | - | (85,161) | 7,123,339 |
Amounts in the income column in the above table include any capital gain distributions from underlying funds, which are presented in the corresponding line item in the Statement of Operations, if applicable.
Investment Valuation
The following is a summary of the inputs used, as of October 31, 2022, involving the Fund's assets and liabilities carried at fair value. The inputs or methodology used for valuing securities may not be an indication of the risk associated with investing in those securities. For more information on valuation inputs, and their aggregation into the levels used below, please refer to the Investment Valuation section in the accompanying Notes to Financial Statements.
Amounts in this Investment Valuation section exclude the value of Fidelity Direct Lending Fund, LP as presented in the Schedule of Investments. Fidelity Direct Lending Fund, LP is valued using NAV as a practical expedient.
| Valuation Inputs at Reporting Date: |
| Description | Total ($) | Level 1 ($) | Level 2 ($) | Level 3 ($) |
Investments in Securities: | | | | |
|
| Equities: | | | | |
Communication Services | 695,372 | 695,372 | - | - |
Consumer Discretionary | 2,505,729 | 2,505,729 | - | - |
Consumer Staples | 20,839,259 | - | - | 20,839,259 |
Energy | 21,956,179 | 4,204,459 | - | 17,751,720 |
Information Technology | 160,059 | - | - | 160,059 |
Materials | 24,309 | - | - | 24,309 |
|
| Corporate Bonds | 961,234,128 | - | 942,240,543 | 18,993,585 |
|
| Bank Loan Obligations | 67,358,138 | - | 64,917,512 | 2,440,626 |
|
| Money Market Funds | 66,543,527 | 66,543,527 | - | - |
| Total Investments in Securities: | 1,141,316,700 | 73,949,087 | 1,007,158,055 | 60,209,558 |
The following is a reconciliation of Investments in Securities for which Level 3 inputs were used in determining value:
| |
| Investments in Securities: | |
| Consumer Staples | | | |
| Beginning Balance | $ | 22,660,158 | |
| Net Realized Gain (Loss) on Investment Securities | | - | |
| Net Unrealized Gain (Loss) on Investment Securities | | (1,820,899) | |
| Cost of Purchases | | - | |
| Proceeds of Sales | | - | |
| Amortization/Accretion | | - | |
| Transfers into Level 3 | | - | |
| Transfers out of Level 3 | | - | |
| Ending Balance | $ | 20,839,259 | |
| The change in unrealized gain (loss) for the period attributable to Level 3 securities held at October 31, 2022 | $ | (1,820,899) | |
| Energy | | | |
| Beginning Balance | $ | 18,371,467 | |
| Net Realized Gain (Loss) on Investment Securities | | - | |
| Net Unrealized Gain (Loss) on Investment Securities | | (619,747) | |
| Cost of Purchases | | - | |
| Proceeds of Sales | | - | |
| Amortization/Accretion | | - | |
| Transfers into Level 3 | | - | |
| Transfers out of Level 3 | | - | |
| Ending Balance | $ | 17,751,720 | |
| The change in unrealized gain (loss) for the period attributable to Level 3 securities held at October 31, 2022 | $ | (619,747) | |
| Corporate Bonds | | | |
| Beginning Balance | $ | 15,498,989 | |
| Net Realized Gain (Loss) on Investment Securities | | - | |
| Net Unrealized Gain (Loss) on Investment Securities | | 3,494,596 | |
| Cost of Purchases | | - | |
| Proceeds of Sales | | - | |
| Amortization/Accretion | | - | |
| Transfers into Level 3 | | - | |
| Transfers out of Level 3 | | - | |
| Ending Balance | $ | 18,993,585 | |
| The change in unrealized gain (loss) for the period attributable to Level 3 securities held at October 31, 2022 | $ | 3,494,596 | |
| Other Investments in Securities | | | |
| Beginning Balance | $ | 2,845,744 | |
| Net Realized Gain (Loss) on Investment Securities | | (2,571) | |
| Net Unrealized Gain (Loss) on Investment Securities | | (78,857) | |
| Cost of Purchases | | - | |
| Proceeds of Sales | | (172,650) | |
| Amortization/Accretion | | 8,353 | |
| Transfers into Level 3 | | 24,975 | |
| Transfers out of Level 3 | | - | |
| Ending Balance | $ | 2,624,994 | |
| The change in unrealized gain (loss) for the period attributable to Level 3 securities held at October 31, 2022 | $ | (78,857) | |
| The information used in the above reconciliation represents fiscal year to date activity for any Investments in Securities identified as using Level 3 inputs at either the beginning or the end of the current fiscal period. Cost of purchases and proceeds of sales may include securities received and/or delivered through in-kind transactions. Transfers into Level 3 were attributable to a lack of observable market data resulting from decreases in market activity, decreases in liquidity, security restructurings or corporate actions. Transfers out of Level 3 were attributable to observable market data becoming available for those securities. Transfers in or out of Level 3 represent the beginning value of any Security or Instrument where a change in the pricing level occurred from the beginning to the end of the period. The cost of purchases and the proceeds of sales may include securities received or delivered through corporate actions or exchanges. Realized and unrealized gains (losses) disclosed in the reconciliation are included in Net Gain (Loss) on the Fund's Statement of Operations. | |
| Statement of Assets and Liabilities |
| | | | October 31, 2022 (Unaudited) |
| | | | | |
| Assets | | | | |
| Investment in securities, at value - See accompanying schedule: | | | | |
Unaffiliated issuers (cost $1,237,471,213) | | $1,074,773,173 | | |
Fidelity Central Funds (cost $66,543,527) | | 66,543,527 | | |
Other affiliated issuers (cost $7,204,158) | | 7,123,339 | | |
| | | | | |
| Total Investment in Securities (cost $1,311,218,898) | | | $ | 1,148,440,039 |
| Cash | | | | 37,359 |
| Receivable for investments sold | | | | 10,461,271 |
| Receivable for fund shares sold | | | | 93,519 |
| Dividends receivable | | | | 71,135 |
| Interest receivable | | | | 16,468,488 |
| Distributions receivable from Fidelity Central Funds | | | | 144,839 |
| Receivable from investment adviser for expense reductions | | | | 46,507 |
Total assets | | | | 1,175,763,157 |
| Liabilities | | | | |
| Payable for investments purchased | | $5,933,479 | | |
| Payable for fund shares redeemed | | 4,729,332 | | |
| Other payables and accrued expenses | | 2,930 | | |
| Total Liabilities | | | | 10,665,741 |
| Net Assets | | | $ | 1,165,097,416 |
| Net Assets consist of: | | | | |
| Paid in capital | | | $ | 1,667,542,846 |
| Total accumulated earnings (loss) | | | | (502,445,430) |
| Net Assets | | | $ | 1,165,097,416 |
Net Asset Value , offering price and redemption price per share ($1,165,097,416 ÷ 143,432,871 shares) | | | $ | 8.12 |
| | | | | |
| Statement of Operations |
| | | | Six months ended October 31, 2022 (Unaudited) |
| Investment Income | | | | |
| Dividends (including $256,891 earned from affiliated issuers) | | | $ | 4,897,967 |
| Interest | | | | 35,159,376 |
| Income from Fidelity Central Funds (including $31 from security lending) | | | | 623,456 |
| Total Income | | | | 40,680,799 |
| Expenses | | | | |
| Custodian fees and expenses | | 6,480 | | |
| Independent trustees' fees and expenses | | 2,256 | | |
| Legal | | 346,192 | | |
| Total expenses before reductions | | 354,928 | | |
| Expense reductions | | (335,007) | | |
| Total expenses after reductions | | | | 19,921 |
| Net Investment income (loss) | | | | 40,660,878 |
| Realized and Unrealized Gain (Loss) | | | | |
| Net realized gain (loss) on: | | | | |
| Investment Securities: | | | | |
| Unaffiliated issuers | | (36,317,674) | | |
| Total net realized gain (loss) | | | | (36,317,674) |
| Change in net unrealized appreciation (depreciation) on: | | | | |
| Investment Securities: | | | | |
| Unaffiliated issuers | | (64,820,781) | | |
| Affiliated issuers | | (85,161) | | |
| Total change in net unrealized appreciation (depreciation) | | | | (64,905,942) |
| Net gain (loss) | | | | (101,223,616) |
| Net increase (decrease) in net assets resulting from operations | | | $ | (60,562,738) |
| Statement of Changes in Net Assets |
| |
| | Six months ended October 31, 2022 (Unaudited) | | Year ended April 30, 2022 |
| Increase (Decrease) in Net Assets | | | | |
| Operations | | | | |
| Net investment income (loss) | $ | 40,660,878 | $ | 90,508,599 |
| Net realized gain (loss) | | (36,317,674) | | 38,259,087 |
| Change in net unrealized appreciation (depreciation) | | (64,905,942) | | (160,198,921) |
| Net increase (decrease) in net assets resulting from operations | | (60,562,738) | | (31,431,235) |
| Distributions to shareholders | | (35,924,001) | | (90,722,492) |
| Share transactions | | | | |
| Proceeds from sales of shares | | 38,744,940 | | 116,542,416 |
| Reinvestment of distributions | | 35,924,001 | | 90,722,337 |
| Cost of shares redeemed | | (287,966,584) | | (312,390,348) |
Net increase (decrease) in net assets resulting from share transactions | | (213,297,643) | | (105,125,595) |
| Total increase (decrease) in net assets | | (309,784,382) | | (227,279,322) |
| | | | | |
| Net Assets | | | | |
| Beginning of period | | 1,474,881,798 | | 1,702,161,120 |
| End of period | $ | 1,165,097,416 | $ | 1,474,881,798 |
| | | | | |
| Other Information | | | | |
| Shares | | | | |
| Sold | | 4,685,181 | | 12,377,370 |
| Issued in reinvestment of distributions | | 4,345,353 | | 9,668,837 |
| Redeemed | | (34,387,055) | | (33,519,693) |
| Net increase (decrease) | | (25,356,521) | | (11,473,486) |
| | | | | |
Financial Highlights
| Fidelity® Series High Income Fund |
| |
| | Six months ended (Unaudited) October 31, 2022 | | Years ended April 30, 2022 | | 2021 | | 2020 | | 2019 | | 2018 |
Selected Per-Share Data | | | | | | | | | | | | |
| Net asset value, beginning of period | $ | 8.74 | $ | 9.44 | $ | 8.54 | $ | 9.50 | $ | 9.56 | $ | 9.68 |
| Income from Investment Operations | | | | | | | | | | | | |
Net investment income (loss) A,B | | .267 | | .510 | | .513 | | .577 | | .607 | | .623 |
| Net realized and unrealized gain (loss) | | (.652) | | (.699) | | .890 | | (.935) | | (.051) | | (.141) |
| Total from investment operations | | (.385) | | (.189) | | 1.403 | | (.358) | | .556 | | .482 |
| Distributions from net investment income | | (.235) | | (.511) | | (.503) | | (.598) | | (.616) | | (.602) |
| Distributions from net realized gain | | - | | - | | - | | (.004) | | - | | - |
| Total distributions | | (.235) | | (.511) | | (.503) | | (.602) | | (.616) | | (.602) |
| Net asset value, end of period | $ | 8.12 | $ | 8.74 | $ | 9.44 | $ | 8.54 | $ | 9.50 | $ | 9.56 |
Total Return C,D | | (4.41)% | | (2.24)% | | 16.72% | | (4.11)% | | 6.12% | | 5.08% |
Ratios to Average Net Assets B,E,F | | | | | | | | | | | | |
| Expenses before reductions | | .06% G | | .02% | | -% H | | -% H | | -% H | | .06% |
| Expenses net of fee waivers, if any | | -% G,H | | -% H | | -% H | | -% H | | -% H | | .05% |
| Expenses net of all reductions | | -% G,H | | -% H | | -% H | | -% H | | -% H | | .05% |
| Net investment income (loss) | | 6.35% G | | 5.42% | | 5.58% | | 6.20% | | 6.44% | | 6.44% |
| Supplemental Data | | | | | | | | | | | | |
| Net assets, end of period (000 omitted) | $ | 1,165,097 | $ | 1,474,882 | $ | 1,702,161 | $ | 1,491,532 | $ | 1,510,741 | $ | 2,883,805 |
Portfolio turnover rate I | | 18% G | | 49% | | 68% | | 41% J | | 69% | | 49% |
A Calculated based on average shares outstanding during the period.
B Net investment income (loss) is affected by the timing of the declaration of dividends by any underlying mutual funds or exchange-traded funds (ETFs). Net investment income (loss) of any mutual funds or ETFs is not included in the Fund's net investment income (loss) ratio.
C Total returns for periods of less than one year are not annualized.
D Total returns would have been lower if certain expenses had not been reduced during the applicable periods shown.
E Fees and expenses of any underlying mutual funds or exchange-traded funds (ETFs) are not included in the Fund's expense ratio. The Fund indirectly bears its proportionate share of these expenses. For additional expense information related to investments in Fidelity Central Funds, please refer to the "Investments in Fidelity Central Funds" note found in the Notes to Financial Statements section of the most recent Annual or Semi-Annual report. For additional expense information related to investments in Fidelity Direct Lending Fund, LP, please refer to the Investment in Fidelity Direct Lending Fund, LP note found in the Notes to Financial Statements section of the most recent Annual or Semi-Annual report.
F Expense ratios reflect operating expenses of the class. Expenses before reductions do not reflect amounts reimbursed, waived, or reduced through arrangements with the investment adviser, brokerage services, or other offset arrangements, if applicable, and do not represent the amount paid by the class during periods when reimbursements, waivers or reductions occur.
G Annualized.
H Amount represents less than .005%.
I Amount does not include the portfolio activity of any underlying mutual funds or exchange-traded funds (ETFs).
J Portfolio turnover rate excludes securities received or delivered in-kind.
For the period ended October 31, 2022
1. Organization.
Fidelity Series High Income Fund (the Fund) is a fund of Fidelity Summer Street Trust (the Trust) and is authorized to issue an unlimited number of shares. Shares are offered only to certain other Fidelity funds, Fidelity managed 529 plans, and Fidelity managed collective investment trusts. The Trust is registered under the Investment Company Act of 1940, as amended (the 1940 Act), as an open-end management investment company organized as a Massachusetts business trust.
2. Investments in Fidelity Central Funds.
Funds may invest in Fidelity Central Funds, which are open-end investment companies generally available only to other investment companies and accounts managed by the investment adviser and its affiliates. The Schedule of Investments lists any Fidelity Central Funds held as an investment as of period end, but does not include the underlying holdings of each Fidelity Central Fund. An investing fund indirectly bears its proportionate share of the expenses of the underlying Fidelity Central Funds.
Based on its investment objective, each Fidelity Central Fund may invest or participate in various investment vehicles or strategies that are similar to those of the investing fund. These strategies are consistent with the investment objectives of the investing fund and may involve certain economic risks which may cause a decline in value of each of the Fidelity Central Funds and thus a decline in the value of the investing fund.
| Fidelity Central Fund | Investment Manager | Investment Objective | Investment Practices | Expense Ratio A |
| Fidelity Money Market Central Funds | Fidelity Management & Research Company LLC (FMR) | Each fund seeks to obtain a high level of current income consistent with the preservation of capital and liquidity. | Short-term Investments | Less than .005% |
A Expenses expressed as a percentage of average net assets and are as of each underlying Central Fund's most recent annual or semi-annual shareholder report.
A complete unaudited list of holdings for each Fidelity Central Fund is available upon request or at the Securities and Exchange Commission website at www.sec.gov. In addition, the financial statements of the Fidelity Central Funds which contain the significant accounting policies (including investment valuation policies) of those funds, and are not covered by the Report of Independent Registered Public Accounting Firm, are available on the Securities and Exchange Commission website or upon request.
3. Investment in Fidelity Direct Lending Fund, LP.
The Fund invests in Fidelity Direct Lending Fund, LP, which is a limited partnership available only to certain investment companies managed by the investment adviser and its affiliates. The Fund's limited partnership interest is not registered under the Securities Act of 1933, and is subject to substantial restrictions on transfer. The Fund has no redemption rights under the partnership agreement. There will be no trading market for the partnership interest, and the Fund most likely will hold its interest until Fidelity Direct Lending Fund, LP converts by operation of law to a Delaware corporation, trust, or other limited liability entity and (i) registers as a closed-end management investment company under the 1940 Act or (ii) elects to be treated as a business development company under the 1940 Act.
Based on its investment objective, Fidelity Direct Lending Fund, LP may invest or participate in various investments or strategies that are similar to those in which the Fund may invest or participate. These strategies are consistent with the investment objectives of the Fund and may involve certain economic risks which may cause a decline in value of Fidelity Direct Lending Fund, LP and thus a decline in the value of the Fund. The Fidelity Direct Lending Fund, LP intends to invest primarily in direct loans made to private U.S. companies, specifically small- and middle-market companies.
The Schedule of Investments lists Fidelity Direct Lending Fund, LP as an investment as of period end, but does not include the underlying holdings of Fidelity Direct Lending Fund, LP. Fidelity Direct Lending Fund, LP represented less than 5% of the Fund's net assets at period end. The Fund indirectly bears its proportionate share of the expenses of Fidelity Direct Lending Fund, LP, which commenced operations on December 8, 2021. The annualized expense ratio for Fidelity Direct Lending Fund, LP for the period ended April 30, 2022 was .07%.
4. Significant Accounting Policies.
The Fund is an investment company and applies the accounting and reporting guidance of the Financial Accounting Standards Board (FASB) Accounting Standards Codification Topic 946 Financial Services - Investment Companies . The financial statements have been prepared in conformity with accounting principles generally accepted in the United States of America (GAAP), which require management to make certain estimates and assumptions at the date of the financial statements. Actual results could differ from those estimates. Subsequent events, if any, through the date that the financial statements were issued have been evaluated in the preparation of the financial statements. The Fund's Schedule of Investments lists any underlying mutual funds or exchange-traded funds (ETFs) but does not include the underlying holdings of these funds. The following summarizes the significant accounting policies of the Fund:
Investment Valuation. Investments are valued as of 4:00 p.m. Eastern time on the last calendar day of the period. The Board of Trustees (the Board) has designated the Fund's investment adviser as the valuation designee responsible for the fair valuation function and performing fair value determinations as needed. The investment adviser has established a Fair Value Committee (the Committee) to carry out the day-to-day fair valuation responsibilities and has adopted policies and procedures to govern the fair valuation process and the activities of the Committee. In accordance with these fair valuation policies and procedures, which have been approved by the Board, the Fund attempts to obtain prices from one or more third party pricing services or brokers to value its investments. When current market prices, quotations or currency exchange rates are not readily available or reliable, investments will be fair valued in good faith by the Committee, in accordance with the policies and procedures. Factors used in determining fair value vary by investment type and may include market or investment specific events, transaction data, estimated cash flows, and market observations of comparable investments. The frequency that the fair valuation procedures are used cannot be predicted and they may be utilized to a significant extent. The Committee manages the Fund's fair valuation practices and maintains the fair valuation policies and procedures. The Fund's investment adviser reports to the Board information regarding the fair valuation process and related material matters.
The Fund categorizes the inputs to valuation techniques used to value its investments into a disclosure hierarchy consisting of three levels as shown below:
Level 1 - unadjusted quoted prices in active markets for identical investments
Level 2 - other significant observable inputs (including quoted prices for similar investments, interest rates, prepayment speeds, etc.)
Level 3 - unobservable inputs (including the Fund's own assumptions based on the best information available)
Valuation techniques used to value the Fund's investments by major category are as follows:
Debt securities, including restricted securities, are valued based on evaluated prices received from third party pricing services or from brokers who make markets in such securities. Corporate bonds and bank loan obligations are valued by pricing services who utilize matrix pricing which considers prepayment speed assumptions, attributes of the collateral, yield or price of bonds of comparable quality, coupon, maturity and type or by broker-supplied prices. When independent prices are unavailable or unreliable, debt securities may be valued utilizing pricing methodologies which consider similar factors that would be used by third party pricing services. Debt securities are generally categorized as Level 2 in the hierarchy but may be Level 3 depending on the circumstances. The Fund invests a significant portion of its assets in below investment grade securities. The value of these securities can be more volatile due to changes in the credit quality of the issuer and is sensitive to changes in economic, market and regulatory conditions.
Equity securities, including restricted securities, for which market quotations are readily available, are valued at the last reported sale price or official closing price as reported by a third party pricing service on the primary market or exchange on which they are traded and are categorized as Level 1 in the hierarchy. In the event there were no sales during the day or closing prices are not available, securities are valued at the last quoted bid price or may be valued using the last available price and are generally categorized as Level 2 in the hierarchy. For foreign equity securities, when market or security specific events arise, comparisons to the valuation of American Depositary Receipts (ADRs), futures contracts, Exchange-Traded Funds (ETFs) and certain indexes as well as quoted prices for similar securities may be used and would be categorized as Level 2 in the hierarchy. For equity securities, including restricted securities, where observable inputs are limited, assumptions about market activity and risk are used and these securities may be categorized as Level 3 in the hierarchy. Securities, including private placements or other restricted securities, for which observable inputs are not available are valued using alternate valuation approaches, including the market approach, the income approach and cost approach, and are categorized as Level 3 in the hierarchy. The market approach considers factors including the price of recent investments in the same or a similar security or financial metrics of comparable securities. The income approach considers factors including expected future cash flows, security specific risks and corresponding discount rates. The cost approach considers factors including the value of the security's underlying assets and liabilities.
Investments in open-end mutual funds, including the Fidelity Central Funds, are valued at their closing net asset value (NAV) each business day and are categorized as Level 1 in the hierarchy.
Fidelity Direct Lending Fund, LP is valued using NAV as a practical expedient in accordance with the specialized accounting guidance for investment companies.
The following provides information on Level 3 securities held by the Fund that were valued at period end based on unobservable inputs. These amounts exclude valuations provided by a broker and valuations using NAV as a practical expedient.
| Asset Type | Fair Value | Valuation Technique(s) | Unobservable Input | Amount or Range/Weighted Average | Impact to Valuation from an Increase in Input A |
| Equities | $38,751,052 | Recovery value | Recovery value | $1.00 | Increase |
| | | Market comparable | Enterprise value/EBITDA multiple (EV/EBITDA) | 2.8 - 3.9 / 3.5 | Increase |
| | | | Daily production multiple ($/Barrels of oil equivilent per day) | $22,500.00 | Increase |
| | | | Enterprise Value/PV-10 multiple (EV/PV-10) | 0.8 | Increase |
| | | | Enterprise Value/Proved Reserves multiple | 5.8 | Increase |
| | | Discounted cash flow | Discount rate | 10.0% | Decrease |
| | | | Reserve risk rate | 50.0% - 95.0% / 72.5% | Increase |
| Corporate Bond | $18,993,585 | Recovery value | Recovery value | $0.00 | Increase |
| | | Market comparable | Enterprise value/EBITDA multiple (EV/EBITDA) | 2.8 | Increase |
| | | | Daily production multiple ($/Barrels of oil equivilent per day) | $22,500.00 | Increase |
| | | | Enterprise Value/PV-10 multiple (EV/PV-10) | 0.8 | Increase |
| | | | Enterprise Value/Proved Reserves multiple | 5.8 | Increase |
| | | Discounted cash flow | Discount rate | 10% | Decrease |
| | | | Reserve risk rate | 50.0% - 95.0% / 72.5% | Increase |
| Bank Loan Obligations | $2,440,626 | Recovery value | Recovery value | 0.0% | Increase |
| | | Indicative market price | Evaluated bid | $95.00 | Increase |
A Represents the directional change in the fair value of the Level 3 investments that could have resulted from an increase in the corresponding input as of period end. A decrease to the unobservable input would have had the opposite effect. Significant changes in these inputs may have resulted in a significantly higher or lower fair value measurement at period end.
Changes in valuation techniques may result in transfers in or out of an assigned level within the disclosure hierarchy. The aggregate value of investments by input level as of October 31, 2022, as well as a roll forward of Level 3 investments, is included at the end of the Fund's Schedule of Investments.
Investment Transactions and Income. For financial reporting purposes, the Fund's investment holdings and NAV include trades executed through the end of the last business day of the period. The NAV per share for processing shareholder transactions is calculated as of the close of business of the New York Stock Exchange (NYSE), normally 4:00 p.m. Eastern time and includes trades executed through the end of the prior business day. Gains and losses on securities sold are determined on the basis of identified cost. Commissions paid to certain brokers with whom the investment adviser, or its affiliates, places trades on behalf of a fund include an amount in addition to trade execution, which may be rebated back to a fund. Any such rebates are included in net realized gain (loss) on investments in the Statement of Operations. Dividend income is recorded on the ex-dividend date, except for certain dividends from foreign securities where the ex-dividend date may have passed, which are recorded as soon as the Fund is informed of the ex-dividend date. Non-cash dividends included in dividend income, if any, are recorded at the fair market value of the securities received. Income and capital gain distributions from Fidelity Central Funds, if any, are recorded on the ex-dividend date. Interest income is accrued as earned and includes coupon interest and amortization of premium and accretion of discount on debt securities as applicable. Debt obligations may be placed on non-accrual status and related interest income may be reduced by ceasing current accruals and writing off interest receivables when the collection of all or a portion of interest has become doubtful based on consistently applied procedures. A debt obligation is removed from non-accrual status when the issuer resumes interest payments or when collectability of interest is reasonably assured.
Expenses. Expenses directly attributable to a fund are charged to that fund. Expenses attributable to more than one fund are allocated among the respective funds on the basis of relative net assets or other appropriate methods. Expenses included in the accompanying financial statements reflect the expenses of that fund and do not include any expenses associated with any underlying mutual funds or exchange-traded funds. Although not included in a fund's expenses, a fund indirectly bears its proportionate share of these expenses through the net asset value of each underlying mutual fund or exchange-traded fund. Expense estimates are accrued in the period to which they relate and adjustments are made when actual amounts are known.
Income Tax Information and Distributions to Shareholders. Each year, the Fund intends to qualify as a regulated investment company under Subchapter M of the Internal Revenue Code, including distributing substantially all of its taxable income and realized gains. As a result, no provision for U.S. Federal income taxes is required. The Fund files a U.S. federal tax return, in addition to state and local tax returns as required. The Fund's federal income tax returns are subject to examination by the Internal Revenue Service (IRS) for a period of three fiscal years after they are filed. State and local tax returns may be subject to examination for an additional fiscal year depending on the jurisdiction.
Distributions are declared and recorded daily and paid monthly from net investment income. Distributions from realized gains, if any, are declared and recorded on the ex-dividend date. Income and capital gain distributions are determined in accordance with income tax regulations, which may differ from GAAP.
Capital accounts within the financial statements are adjusted for permanent book-tax differences. These adjustments have no impact on net assets or the results of operations. Capital accounts are not adjusted for temporary book-tax differences which will reverse in a subsequent period.
Book-tax differences are primarily due to market discount, prior period premium and discount on debt securities, capital loss carryforwards and losses deferred due to wash sales.
As of period end, the cost and unrealized appreciation (depreciation) in securities, and derivatives if applicable, for federal income tax purposes were as follows:
| Gross unrealized appreciation | $49,011,139 |
| Gross unrealized depreciation | (206,403,722) |
| Net unrealized appreciation (depreciation) | $(157,392,583) |
| Tax cost | $1,305,832,622 |
Capital loss carryforwards are only available to offset future capital gains of the Fund to the extent provided by regulations and may be limited. The capital loss carryforward information presented below, including any applicable limitation, is estimated as of prior fiscal period end and is subject to adjustment.
Short-term | $(30,226,419) |
Long-term | (285,057,339) |
| Total capital loss carryforward | $(315,283,758) |
Restricted Securities (including Private Placements). Funds may invest in securities that are subject to legal or contractual restrictions on resale. These securities generally may be resold in transactions exempt from registration or to the public if the securities are registered. Disposal of these securities may involve time-consuming negotiations and expense, and prompt sale at an acceptable price may be difficult. Information regarding restricted securities held at period end is included at the end of the Schedule of Investments, if applicable.
Loans and Other Direct Debt Instruments. Direct debt instruments are interests in amounts owed to lenders by corporate or other borrowers. These instruments may be in the form of loans, trade claims or other receivables and may include standby financing commitments such as revolving credit facilities that obligate a fund to supply additional cash to the borrower on demand. Loans may be acquired through assignment, participation, or may be made directly to a borrower. Such instruments are presented in the Bank Loan Obligations section in the Schedule of Investments. Certain funds may also invest in unfunded loan commitments, which are contractual obligations for future funding. Information regarding unfunded commitments is included at the end of the Schedule of Investments, if applicable.
Commitments. A commitment is an agreement to acquire an investment at a future date (subject to conditions) in connection with a potential public or non-public offering. The amount of commitments outstanding at period end are presented in the table below. These commitments are not included in the net assets of the Fund at period end.
| | Investment to be Acquired | Commitment Amount |
| Fidelity Series High Income Fund | Fidelity Direct Lending Fund, LP | $9,795,842 |
5. Purchases and Sales of Investments.
Purchases and sales of securities, other than short-term securities and in-kind transactions, as applicable, are noted in the table below.
| | Purchases ($) | Sales ($) |
| Fidelity Series High Income Fund | 112,428,360 | 363,855,767 |
6. Fees and Other Transactions with Affiliates.
Management Fee. Fidelity Management & Research Company LLC (the investment adviser) and its affiliates provide the Fund with investment management related services for which the Fund does not pay a management fee. Under the management contract, the investment adviser or an affiliate pays all ordinary operating expenses of the Fund, except custody fees, fees and expenses of the independent Trustees, and certain miscellaneous expenses such as proxy and shareholder meeting expenses.
Brokerage Commissions. A portion of portfolio transactions were placed with brokerage firms which are affiliates of the investment adviser. Brokerage commissions are included in net realized gain (loss) and change in net unrealized appreciation (depreciation) in the Statement of Operations. The commissions paid to these affiliated firms were as follows:
| | Amount |
| Fidelity Series High Income Fund | $37 |
Interfund Trades. Funds may purchase from or sell securities to other Fidelity Funds under procedures adopted by the Board. The procedures have been designed to ensure these interfund trades are executed in accordance with Rule 17a-7 of the 1940 Act. Any interfund trades are included within the respective purchases and sales amounts shown in the Purchases and Sales of Investments note. Interfund trades during the period are noted in the table below.
| | Purchases ($) | Sales ($) | Realized Gain (Loss) ($) |
| Fidelity Series High Income Fund | - | 1,277,713 | 26,436 |
7. Committed Line of Credit.
Certain Funds participate with other funds managed by the investment adviser or an affiliate in a $4.25 billion credit facility (the "line of credit") to be utilized for temporary or emergency purposes to fund shareholder redemptions or for other short-term liquidity purposes. The commitment fees on the pro-rata portion of the line of credit are borne by the investment adviser. During the period, there were no borrowings on this line of credit.
8. Security Lending.
Funds lend portfolio securities from time to time in order to earn additional income. Lending agents are used, including National Financial Services (NFS), an affiliate of the investment adviser. Pursuant to a securities lending agreement, NFS will receive a fee, which is capped at 9.9% of a fund's daily lending revenue, for its services as lending agent. A fund may lend securities to certain qualified borrowers, including NFS. On the settlement date of the loan, a fund receives collateral (in the form of U.S. Treasury obligations, letters of credit and/or cash) against the loaned securities and maintains collateral in an amount not less than 100% of the market value of the loaned securities during the period of the loan. The market value of the loaned securities is determined at the close of business of a fund and any additional required collateral is delivered to a fund on the next business day. A fund or borrower may terminate the loan at any time, and if the borrower defaults on its obligation to return the securities loaned because of insolvency or other reasons, a fund may apply collateral received from the borrower against the obligation. A fund may experience delays and costs in recovering the securities loaned. Any cash collateral received is invested in the Fidelity Securities Lending Cash Central Fund. Any loaned securities are identified as such in the Schedule of Investments, and the value of loaned securities and cash collateral at period end, as applicable, are presented in the Statement of Assets and Liabilities. Security lending income represents the income earned on investing cash collateral, less rebates paid to borrowers and any lending agent fees associated with the loan, plus any premium payments received for lending certain types of securities. Security lending income is presented in the Statement of Operations as a component of income from Fidelity Central Funds. Affiliated security lending activity, if any, was as follows:
| | Total Security Lending Fees Paid to NFS | Security Lending Income From Securities Loaned to NFS | Value of Securities Loaned to NFS at Period End |
| Fidelity Series High Income Fund | $3 | $- | $- |
9. Expense Reductions.
The investment adviser contractually agreed to reimburse the Fund to the extent annual operating expenses exceeded .003% of average net assets. This reimbursement will remain in place through August 31, 2025. Some expenses, for example the compensation of the independent Trustees, and certain other expenses such as interest expense, are excluded from this reimbursement. During the period this reimbursement reduced the Fund's expenses by $333,454.
Through arrangements with the Fund's custodian, credits realized as a result of certain uninvested cash balances were used to reduce the Fund's expenses by $1,553.
10. Other.
A fund's organizational documents provide former and current trustees and officers with a limited indemnification against liabilities arising in connection with the performance of their duties to the fund. In the normal course of business, a fund may also enter into contracts that provide general indemnifications. A fund's maximum exposure under these arrangements is unknown as this would be dependent on future claims that may be made against a fund. The risk of material loss from such claims is considered remote.
At the end of the period, mutual funds and accounts managed by the investment adviser or its affiliates were the owners of record of all of the outstanding shares of the Fund.
11. Risk and Uncertainties.
Many factors affect a fund's performance. Developments that disrupt global economies and financial markets, such as pandemics, epidemics, outbreaks of infectious diseases, war, terrorism, and environmental disasters, may significantly affect a fund's investment performance. The effects of these developments to a fund will be impacted by the types of securities in which a fund invests, the financial condition, industry, economic sector, and geographic location of an issuer, and a fund's level of investment in the securities of that issuer.
As a shareholder, you incur two types of costs: (1) transaction costs, which may include sales charges (loads) on purchase payments or redemption proceeds, as applicable and (2) ongoing costs, which generally include management fees, distribution and/or service (12b-1) fees and other Fund expenses. This Example is intended to help you understand your ongoing costs (in dollars) of investing in a fund and to compare these costs with the ongoing costs of investing in other mutual funds.
| The Example is based on an investment of $1,000 invested at the beginning of the period and held for the entire period (May 1, 2022 to October 31, 2022). |
Actual Expenses
The first line of the accompanying table provides information about actual account values and actual expenses. You may use the information in this line, together with the amount you invested, to estimate the expenses that you paid over the period. Simply divide your account value by $1,000.00 (for example, an $8,600 account value divided by $1,000.00 = 8.6), then multiply the result by the number in the first line for a class/Fund under the heading entitled "Expenses Paid During Period" to estimate the expenses you paid on your account during this period. If any fund is a shareholder of any underlying mutual funds or exchange-traded funds (ETFs) (the Underlying Funds), such fund indirectly bears its proportional share of the expenses of the Underlying Funds in addition to the direct expenses incurred presented in the table. These fees and expenses are not included in the annualized expense ratio used to calculate the expense estimate in the table below.
Hypothetical Example for Comparison Purposes
The second line of the accompanying table provides information about hypothetical account values and hypothetical expenses based on the actual expense ratio and an assumed rate of return of 5% per year before expenses, which is not the actual return. The hypothetical account values and expenses may not be used to estimate the actual ending account balance or expenses you paid for the period. You may use this information to compare the ongoing costs of investing in the Fund and other funds. To do so, compare this 5% hypothetical example with the 5% hypothetical examples that appear in the shareholder reports of the other funds. If any fund is a shareholder of any Underlying Funds, such fund indirectly bears its proportional share of the expenses of the Underlying Funds in addition to the direct expenses as presented in the table. These fees and expenses are not included in the annualized expense ratio used to calculate the expense estimate in the table below.
Please note that the expenses shown in the table are meant to highlight your ongoing costs only and do not reflect any transaction costs. Therefore, the second line of the table is useful in comparing ongoing costs only, and will not help you determine the relative total costs of owning different funds. In addition, if these transactional costs were included, your costs would have been higher.
| | | | | Annualized Expense Ratio- A | | Beginning Account Value May 1, 2022 | | Ending Account Value October 31, 2022 | | Expenses Paid During Period- C May 1, 2022 to October 31, 2022 |
| | | | | | | | | | |
| Fidelity® Series High Income Fund | | | | -%- D | | | | | | |
| Actual | | | | | | $ 1,000 | | $ 955.90 | | $- E |
Hypothetical- B | | | | | | $ 1,000 | | $ 1,025.21 | | $- E |
| |
A Annualized expense ratio reflects expenses net of applicable fee waivers.
B 5% return per year before expenses
C Expenses are equal to the annualized expense ratio, multiplied by the average account value over the period, multiplied by 184/ 365 (to reflect the one-half year period). The fees and expenses of any Underlying Funds are not included in each annualized expense ratio.
D Amount represents less than .005%.
E Amount represents less than $.005.
Fidelity Series High Income Fund
Each year, the Board of Trustees, including the Independent Trustees (together, the Board), votes on the renewal of the management contract with Fidelity Management & Research Company LLC (FMR) and the sub-advisory agreements (together, the Advisory Contracts) for the fund. FMR and the sub-advisers are referred to herein as the Investment Advisers. The Board, assisted by the advice of fund counsel and Independent Trustees' counsel, requests and considers a broad range of information relevant to the renewal of the Advisory Contracts throughout the year.
The Board meets regularly and, at each of its meetings, covers an extensive agenda of topics and materials and considers factors that are relevant to its annual consideration of the renewal of the fund's Advisory Contracts, including the services and support provided to the fund and its shareholders. The Board has established various standing committees (Committees), each composed of and chaired by Independent Trustees with varying backgrounds, to which the Board has assigned specific subject matter responsibilities in order to enhance effective decision-making by the Board. The Board, acting directly and through its Committees, requests and receives information concerning the annual consideration of the renewal of the fund's Advisory Contracts. The Board also meets as needed to review matters specifically related to the Board's annual consideration of the renewal of the Advisory Contracts. Members of the Board may also meet with trustees of other Fidelity funds through joint ad hoc committees to discuss certain matters relevant to all of the Fidelity funds.
At its May 2022 meeting, the Board unanimously determined to renew the fund's Advisory Contracts. In considering whether to renew the Advisory Contracts for the fund, the Board considered all factors it believed relevant and reached a determination, with the assistance of fund counsel and Independent Trustees' counsel and through the exercise of its business judgment, that the renewal of the Advisory Contracts was in the best interests of the fund and its shareholders and the fact that no fee is payable under the management contract was fair and reasonable.
Nature, Extent, and Quality of Services Provided . The Board considered Fidelity's staffing as it relates to the fund, including the backgrounds of investment personnel of Fidelity, and also considered the fund's investment objective, strategies, and related investment philosophy. The Independent Trustees also had discussions with senior management of Fidelity's investment operations and investment groups. The Board considered the structure of the investment personnel compensation program and whether this structure provides appropriate incentives to act in the best interests of the fund. The Board also considered the steps Fidelity had taken to ensure the continued provision of high quality services to the Fidelity funds during the COVID-19 pandemic, including the expansion of staff in client facing positions to maintain service levels in periods of high volumes and volatility.
Resources Dedicated to Investment Management and Support Services . The Board and the Fund Oversight and Research Committees reviewed the general qualifications and capabilities of Fidelity's investment staff, including its size, education, experience, and resources, as well as Fidelity's approach to recruiting, training, managing, and compensating investment personnel. The Board noted the resources devoted to expansion of Fidelity's global investment organization, and that Fidelity's analysts have extensive resources, tools, and capabilities that allow them to conduct sophisticated quantitative and fundamental analysis, as well as credit analysis of issuers, counterparties, and guarantors. Further, the Board considered that Fidelity's investment professionals have sufficient access to global information and data so as to provide competitive investment results over time, and that those professionals also have access to sophisticated tools that permit them to assess portfolio construction and risk and performance attribution characteristics continuously, as well as to transmit new information and research conclusions rapidly around the world. Additionally, in its deliberations, the Board considered Fidelity's trading, risk management, compliance, and technology and operations capabilities and resources, which are integral parts of the investment management process.
Administrative Services . The Board considered (i) the nature, extent, quality, and cost of advisory and administrative services performed by the Investment Advisers and their affiliates under the Advisory Contracts and under separate agreements covering transfer agency, pricing and bookkeeping, and securities lending services for the fund; (ii) the nature and extent of the supervision of third party service providers, principally custodians, subcustodians, and pricing vendors; and (iii) the resources devoted to, and the record of compliance with, the fund's compliance policies and procedures. The Board also reviewed the allocation of fund brokerage, including allocations to brokers affiliated with the Investment Advisers, the use of brokerage commissions to pay fund expenses, and the use of "soft" commission dollars to pay for research services.
Investment Performance . The Board considered whether the fund has operated in accordance with its investment objective, as well as its record of compliance with its investment restrictions. The Board reviewed the fund's absolute investment performance, as well as the fund's relative investment performance, but did not consider performance to be a material factor in its decision to renew the fund's Advisory Contracts, as the fund is not publicly offered as a stand-alone investment product. In this regard, the Board noted that the fund is designed to offer an investment option for other investment companies, 529 plans, and collective investment trusts managed by Fidelity and ultimately to enhance the performance of those investment companies, 529 plans, and collective investment trusts.
Based on its review, the Board concluded that the nature, extent, and quality of services provided to the fund under the Advisory Contracts should continue to benefit the shareholders of the fund.
Competitiveness of Management Fee and Total Expense Ratio . The Board considered that the fund does not pay FMR a management fee for investment advisory services, but that FMR receives fees for providing services to funds that invest in the fund. The Board noted that FMR or an affiliate undertakes to pay all operating expenses of the fund, except transfer agent fees, 12b-1 fees, Independent Trustee fees and expenses, custodian fees and expenses, proxy and shareholder meeting expenses, interest, taxes, and extraordinary expenses (such as litigation expenses). The Board further noted that the fund pays its non-operating expenses, including brokerage commissions and fees and expenses associated with the fund's securities lending program, if applicable.
The Board further considered that FMR has contractually agreed to reimburse the fund to the extent that total operating expenses, with certain exceptions, as a percentage of its average net assets, exceed 0.003% through August 31, 2024.
Based on its review, the Board considered that the fund does not pay a management fee and concluded that the total expense ratio of the fund was reasonable in light of the services that the fund and its shareholders receive and the other factors considered.
Costs of the Services and Profitability . The Board considered the level of Fidelity's profits in respect of all the Fidelity funds.
A public accounting firm has been engaged annually by the Board as part of the Board's assessment of Fidelity's profitability analysis. The engagement includes the review and assessment of the methodologies used by Fidelity in determining the revenues and expenses attributable to Fidelity's mutual fund business, and completion of agreed-upon procedures in respect of the mathematical accuracy of certain fund profitability information and its conformity to established allocation methodologies. After considering the reports issued under the engagement and information provided by Fidelity, the Board concluded that while other allocation methods may also be reasonable, Fidelity's profitability methodologies are reasonable in all material respects.
The Board also reviewed Fidelity's non-fund businesses and potential indirect benefits such businesses may have received as a result of their association with Fidelity's mutual fund business (i.e., fall-out benefits) as well as cases where Fidelity's affiliates may benefit from the funds' business. The Board considered areas where potential indirect benefits to the Fidelity funds from their relationships with Fidelity may exist. The Board's consideration of these matters was informed by the findings of a joint ad hoc committee created by it and the boards of other Fidelity funds to evaluate potential fall-out benefits.
The Board concluded that the costs of the services provided by and the profits realized by Fidelity in connection with the operation of the fund were not relevant to the renewal of the Advisory Contracts because the fund pays no advisory fees and FMR bears all expenses of the fund with certain exceptions.
Economies of Scale . The Board concluded that because the fund pays no advisory fees and FMR bears all expenses of the fund with certain exceptions, the realization of economies of scale was not a material factor in the Board's decision to renew the fund's Advisory Contracts.
Additional Information Requested by the Board . In order to develop fully the factual basis for consideration of the Fidelity funds' advisory contracts, the Board requested and received additional information on certain topics, including: (i) fund flow and performance trends, in particular the underperformance of certain funds and strategies, and Fidelity's long-term strategies for certain funds, including any consideration of fund liquidations or mergers; (ii) the operation of performance fees, competitor use of performance fees, and consideration of the expansion of performance fees to additional funds; (iii) Fidelity's pricing philosophy compared to competitors; (iv) fund profitability methodology and data; (v) evaluation of competitive fund data and peer group classifications and fee and expense comparisons; (vi) the management fee and expense structures for different funds and classes and information about the differences between various fee and expense structures; (vii) group fee breakpoints and related voluntary fee waivers; and (viii) information regarding other accounts managed by Fidelity and the funds' sub-advisory arrangements.
Based on its evaluation of all of the conclusions noted above, and after considering all factors it believed relevant, the Board concluded that the advisory fee arrangements are fair and reasonable and that the fund's Advisory Contracts should be renewed.
1.924273.111
FSH-SANN-1222
Fidelity® Women's Leadership Fund
Semi-Annual Report
October 31, 2022
Includes Fidelity and Fidelity Advisor share classes
Contents
To view a fund's proxy voting guidelines and proxy voting record for the 12-month period ended June 30, visit http://www.fidelity.com/proxyvotingresults or visit the Securities and Exchange Commission's (SEC) web site at http://www.sec.gov.
You may also call 1-800-544-8544 if you're an individual investing directly with Fidelity, call 1-800-835-5092 if you're a plan sponsor or participant with Fidelity as your recordkeeper or call 1-877-208-0098 on institutional accounts or if you're an advisor or invest through one to request a free copy of the proxy voting guidelines.
Standard & Poor's, S&P and S&P 500 are registered service marks of The McGraw-Hill Companies, Inc. and have been licensed for use by Fidelity Distributors Corporation.
Other third-party marks appearing herein are the property of their respective owners.
All other marks appearing herein are registered or unregistered trademarks or service marks of FMR LLC or an affiliated company. © 2022 FMR LLC. All rights reserved.
This report and the financial statements contained herein are submitted for the general information of the shareholders of the Fund. This report is not authorized for distribution to prospective investors in the Fund unless preceded or accompanied by an effective prospectus.
A fund files its complete schedule of portfolio holdings with the SEC for the first and third quarters of each fiscal year on Form N-PORT. Forms N-PORT are available on the SEC's web site at http://www.sec.gov. A fund's Forms N-PORT may be reviewed and copied at the SEC's Public Reference Room in Washington, DC. Information regarding the operation of the SEC's Public Reference Room may be obtained by calling 1-800-SEC-0330.
For a complete list of a fund's portfolio holdings, view the most recent holdings listing, semiannual report, or annual report on Fidelity's web site at http://www.fidelity.com, http://www.institutional.fidelity.com, or http://www.401k.com, as applicable.
NOT FDIC INSURED •MAY LOSE VALUE •NO BANK GUARANTEE
Neither the Fund nor Fidelity Distributors Corporation is a bank.
Top Holdings (% of Fund's net assets) |
| |
| Microsoft Corp. | 2.8 | |
| Elevance Health, Inc. | 2.7 | |
| Cigna Corp. | 2.5 | |
| Apple, Inc. | 2.4 | |
| CDW Corp. | 2.1 | |
| Federal Signal Corp. | 2.0 | |
| Progressive Corp. | 1.9 | |
| AMETEK, Inc. | 1.9 | |
| Bank of America Corp. | 1.9 | |
| NASDAQ, Inc. | 1.8 | |
| | 22.0 | |
| |
| Market Sectors (% of Fund's net assets) |
| |
| Information Technology | 25.0 | |
| Health Care | 14.6 | |
| Financials | 12.9 | |
| Industrials | 12.4 | |
| Consumer Discretionary | 10.7 | |
| Communication Services | 5.0 | |
| Consumer Staples | 4.5 | |
| Energy | 3.8 | |
| Materials | 3.7 | |
| Utilities | 3.3 | |
| Real Estate | 1.7 | |
| |
Asset Allocation (% of Fund's net assets) |
|
Foreign investments - 13.5% |
|
Geographic Diversification (% of Fund's net assets) |
|
* Includes Short-Term investments and Net Other Assets (Liabilities). Percentages are based on country or territory of incorporation and are adjusted for the effect of futures contracts, if applicable. |
| |
Showing Percentage of Net Assets
| Common Stocks - 97.3% |
| | | Shares | Value ($) |
| COMMUNICATION SERVICES - 5.0% | | | |
| Entertainment - 1.9% | | | |
| Netflix, Inc. (a) | | 3,879 | 1,132,203 |
| The Walt Disney Co. (a) | | 10,081 | 1,074,030 |
| | | | 2,206,233 |
| Interactive Media & Services - 1.4% | | | |
| Alphabet, Inc. Class A (a) | | 6,480 | 612,425 |
| Bumble, Inc. (a) | | 43,173 | 1,096,594 |
| | | | 1,709,019 |
| Media - 1.7% | | | |
| Cable One, Inc. | | 498 | 427,996 |
| Future PLC | | 1,944 | 27,154 |
| Interpublic Group of Companies, Inc. | | 54,106 | 1,611,818 |
| | | | 2,066,968 |
TOTAL COMMUNICATION SERVICES | | | 5,982,220 |
| CONSUMER DISCRETIONARY - 10.7% | | | |
| Automobiles - 0.8% | | | |
| General Motors Co. | | 23,874 | 937,055 |
| Diversified Consumer Services - 1.4% | | | |
| Adtalem Global Education, Inc. (a) | | 24,341 | 1,015,020 |
| Bright Horizons Family Solutions, Inc. (a) | | 9,934 | 648,889 |
| | | | 1,663,909 |
| Hotels, Restaurants & Leisure - 1.5% | | | |
| Marriott International, Inc. Class A | | 6,905 | 1,105,560 |
| Vail Resorts, Inc. | | 3,069 | 672,510 |
| | | | 1,778,070 |
| Household Durables - 0.5% | | | |
| Taylor Morrison Home Corp. (a) | | 24,928 | 656,604 |
| Internet & Direct Marketing Retail - 1.7% | | | |
| Amazon.com, Inc. (a) | | 12,540 | 1,284,598 |
| Etsy, Inc. (a) | | 7,701 | 723,201 |
| FSN E-Commerce Ventures Private Ltd. | | 459 | 6,392 |
| | | | 2,014,191 |
| Multiline Retail - 0.5% | | | |
| Kohl's Corp. | | 22,242 | 666,148 |
| Specialty Retail - 2.8% | | | |
| Best Buy Co., Inc. | | 8,551 | 584,974 |
| Gap, Inc. | | 51,992 | 585,950 |
| Lowe's Companies, Inc. | | 6,289 | 1,226,041 |
| Williams-Sonoma, Inc. | | 7,735 | 957,825 |
| | | | 3,354,790 |
| Textiles, Apparel & Luxury Goods - 1.5% | | | |
| LVMH Moet Hennessy Louis Vuitton SE | | 1,111 | 701,035 |
| PVH Corp. | | 6,855 | 351,799 |
| Tapestry, Inc. | | 23,702 | 750,879 |
| | | | 1,803,713 |
TOTAL CONSUMER DISCRETIONARY | | | 12,874,480 |
| CONSUMER STAPLES - 4.5% | | | |
| Beverages - 1.0% | | | |
| The Coca-Cola Co. | | 20,060 | 1,200,591 |
| Food & Staples Retailing - 0.5% | | | |
| Albertsons Companies, Inc. | | 28,880 | 592,329 |
| Food Products - 1.3% | | | |
| The Hershey Co. | | 6,892 | 1,645,603 |
| Household Products - 0.7% | | | |
| The Clorox Co. | | 6,091 | 889,530 |
| Personal Products - 1.0% | | | |
| Estee Lauder Companies, Inc. Class A | | 3,711 | 744,018 |
| Shiseido Co. Ltd. | | 12,097 | 419,382 |
| | | | 1,163,400 |
TOTAL CONSUMER STAPLES | | | 5,491,453 |
| ENERGY - 3.8% | | | |
| Energy Equipment & Services - 0.3% | | | |
| Tenaris SA | | 26,152 | 409,309 |
| Oil, Gas & Consumable Fuels - 3.5% | | | |
| EQT Corp. | | 13,915 | 582,204 |
| Equinor ASA | | 22,955 | 836,336 |
| Occidental Petroleum Corp. | | 13,484 | 978,938 |
| Phillips 66 Co. | | 16,916 | 1,764,170 |
| | | | 4,161,648 |
TOTAL ENERGY | | | 4,570,957 |
| FINANCIALS - 12.9% | | | |
| Banks - 4.0% | | | |
| Bank of America Corp. | | 63,273 | 2,280,359 |
| Citigroup, Inc. | | 15,881 | 728,303 |
| First Horizon National Corp. | | 29,136 | 714,123 |
| First United Corp. | | 19,718 | 374,050 |
| JPMorgan Chase & Co. | | 4,922 | 619,581 |
| Starling Bank Ltd. Series D (a)(b)(c) | | 34,700 | 112,219 |
| | | | 4,828,635 |
| Capital Markets - 4.5% | | | |
| Franklin Resources, Inc. | | 24,500 | 574,525 |
| Macquarie Group Ltd. | | 8,765 | 950,307 |
| Morningstar, Inc. | | 5,165 | 1,199,210 |
| MSCI, Inc. | | 1,076 | 504,493 |
| NASDAQ, Inc. | | 34,767 | 2,163,898 |
| | | | 5,392,433 |
| Insurance - 4.4% | | | |
| Hartford Financial Services Group, Inc. | | 28,946 | 2,095,980 |
| Marsh & McLennan Companies, Inc. | | 5,587 | 902,245 |
| Progressive Corp. | | 18,291 | 2,348,564 |
| | | | 5,346,789 |
TOTAL FINANCIALS | | | 15,567,857 |
| HEALTH CARE - 14.3% | | | |
| Biotechnology - 2.3% | | | |
| Alnylam Pharmaceuticals, Inc. (a) | | 2,881 | 597,116 |
| Vertex Pharmaceuticals, Inc. (a) | | 6,484 | 2,023,008 |
| Zai Lab Ltd. ADR (a) | | 6,969 | 155,269 |
| | | | 2,775,393 |
| Health Care Equipment & Supplies - 2.2% | | | |
| Figs, Inc. Class A (a) | | 32,958 | 243,230 |
| Hologic, Inc. (a) | | 29,213 | 1,980,641 |
| Insulet Corp. (a) | | 1,131 | 292,714 |
| Outset Medical, Inc. (a) | | 5,606 | 87,117 |
| | | | 2,603,702 |
| Health Care Providers & Services - 5.5% | | | |
| Cigna Corp. | | 9,484 | 3,063,901 |
| Elevance Health, Inc. | | 5,980 | 3,269,685 |
| Guardant Health, Inc. (a) | | 7,473 | 369,914 |
| | | | 6,703,500 |
| Life Sciences Tools & Services - 0.5% | | | |
| ICON PLC (a) | | 3,103 | 613,898 |
| Pharmaceuticals - 3.8% | | | |
| Eli Lilly & Co. | | 1,651 | 597,811 |
| GSK PLC | | 42,776 | 700,718 |
| Merck KGaA | | 6,613 | 1,077,688 |
| UCB SA | | 11,794 | 889,542 |
| Zoetis, Inc. Class A | | 8,763 | 1,321,285 |
| | | | 4,587,044 |
TOTAL HEALTH CARE | | | 17,283,537 |
| INDUSTRIALS - 12.4% | | | |
| Air Freight & Logistics - 1.1% | | | |
| United Parcel Service, Inc. Class B | | 8,134 | 1,364,641 |
| Airlines - 0.3% | | | |
| JetBlue Airways Corp. (a) | | 39,221 | 315,337 |
| Commercial Services & Supplies - 0.4% | | | |
| Stericycle, Inc. (a) | | 3,071 | 136,905 |
| Tomra Systems ASA | | 22,120 | 357,498 |
| | | | 494,403 |
| Electrical Equipment - 3.5% | | | |
| AMETEK, Inc. | | 17,708 | 2,296,019 |
| nVent Electric PLC | | 42,248 | 1,542,052 |
| Sunrun, Inc. (a) | | 15,194 | 342,017 |
| | | | 4,180,088 |
| Machinery - 3.8% | | | |
| Deere & Co. | | 3,226 | 1,276,915 |
| Federal Signal Corp. | | 51,293 | 2,392,818 |
| Otis Worldwide Corp. | | 13,906 | 982,320 |
| | | | 4,652,053 |
| Professional Services - 3.3% | | | |
| Leidos Holdings, Inc. | | 13,259 | 1,346,982 |
| Manpower, Inc. | | 14,376 | 1,126,216 |
| Science Applications International Corp. | | 14,201 | 1,538,536 |
| | | | 4,011,734 |
TOTAL INDUSTRIALS | | | 15,018,256 |
| INFORMATION TECHNOLOGY - 25.0% | | | |
| Communications Equipment - 0.7% | | | |
| Arista Networks, Inc. (a) | | 7,490 | 905,241 |
| Electronic Equipment & Components - 2.9% | | | |
| CDW Corp. | | 14,741 | 2,547,392 |
| Insight Enterprises, Inc. (a) | | 10,520 | 994,245 |
| | | | 3,541,637 |
| IT Services - 8.3% | | | |
| Accenture PLC Class A | | 7,475 | 2,122,153 |
| Capgemini SA | | 10,176 | 1,667,753 |
| Cloudflare, Inc. (a) | | 6,216 | 350,085 |
| Genpact Ltd. | | 19,988 | 969,418 |
| MasterCard, Inc. Class A | | 5,492 | 1,802,365 |
| PayPal Holdings, Inc. (a) | | 10,095 | 843,740 |
| Twilio, Inc. Class A (a) | | 4,935 | 367,016 |
| WEX, Inc. (a) | | 11,279 | 1,851,335 |
| | | | 9,973,865 |
| Semiconductors & Semiconductor Equipment - 2.9% | | | |
| Advanced Micro Devices, Inc. (a) | | 13,197 | 792,612 |
| Marvell Technology, Inc. | | 13,528 | 536,791 |
| NVIDIA Corp. | | 9,868 | 1,331,884 |
| NXP Semiconductors NV | | 6,114 | 893,133 |
| | | | 3,554,420 |
| Software - 7.8% | | | |
| Adobe, Inc. (a) | | 4,247 | 1,352,670 |
| Copperleaf Technologies, Inc. | | 10,431 | 30,014 |
| HubSpot, Inc. (a) | | 2,171 | 643,832 |
| Intuit, Inc. | | 3,812 | 1,629,630 |
| Microsoft Corp. | | 14,743 | 3,422,287 |
| Pagerduty, Inc. (a) | | 21,889 | 545,912 |
| Salesforce.com, Inc. (a) | | 10,716 | 1,742,314 |
| | | | 9,366,659 |
| Technology Hardware, Storage & Peripherals - 2.4% | | | |
| Apple, Inc. | | 18,984 | 2,911,007 |
TOTAL INFORMATION TECHNOLOGY | | | 30,252,829 |
| MATERIALS - 3.7% | | | |
| Chemicals - 1.6% | | | |
| Cabot Corp. | | 10,509 | 772,201 |
| Eastman Chemical Co. | | 6,488 | 498,343 |
| Valvoline, Inc. | | 21,563 | 633,090 |
| | | | 1,903,634 |
| Construction Materials - 0.5% | | | |
| Summit Materials, Inc. (a) | | 21,792 | 574,219 |
| Metals & Mining - 1.6% | | | |
| Commercial Metals Co. | | 31,282 | 1,423,331 |
| Schnitzer Steel Industries, Inc. Class A | | 19,938 | 538,127 |
| | | | 1,961,458 |
TOTAL MATERIALS | | | 4,439,311 |
| REAL ESTATE - 1.7% | | | |
| Equity Real Estate Investment Trusts (REITs) - 1.7% | | | |
| Equity Lifestyle Properties, Inc. | | 20,737 | 1,326,339 |
| Ventas, Inc. | | 19,289 | 754,779 |
| | | | 2,081,118 |
| UTILITIES - 3.3% | | | |
| Electric Utilities - 2.3% | | | |
| NextEra Energy, Inc. | | 12,863 | 996,883 |
| ORSTED A/S (d) | | 12,530 | 1,033,797 |
| SSE PLC | | 38,998 | 696,929 |
| | | | 2,727,609 |
| Water Utilities - 1.0% | | | |
| American Water Works Co., Inc. | | 8,599 | 1,249,779 |
TOTAL UTILITIES | | | 3,977,388 |
| TOTAL COMMON STOCKS (Cost $116,685,190) | | | 117,539,406 |
| | | | |
| Convertible Preferred Stocks - 0.3% |
| | | Shares | Value ($) |
| HEALTH CARE - 0.3% | | | |
| Health Care Providers & Services - 0.3% | | | |
Somatus, Inc. Series E (b)(c) (Cost $350,799) | | 402 | 371,846 |
| | | | |
| Money Market Funds - 1.9% |
| | | Shares | Value ($) |
Fidelity Cash Central Fund 3.10% (e) (Cost $2,266,409) | | 2,265,956 | 2,266,409 |
| | | | |
| TOTAL INVESTMENT IN SECURITIES - 99.5% (Cost $119,302,398) | 120,177,661 |
NET OTHER ASSETS (LIABILITIES) - 0.5% | 655,951 |
| NET ASSETS - 100.0% | 120,833,612 |
| | |
Legend
| (b) | Restricted securities (including private placements) - Investment in securities not registered under the Securities Act of 1933 (excluding 144A issues). At the end of the period, the value of restricted securities (excluding 144A issues) amounted to $484,065 or 0.4% of net assets. |
| (d) | Security exempt from registration under Rule 144A of the Securities Act of 1933. These securities may be resold in transactions exempt from registration, normally to qualified institutional buyers. At the end of the period, the value of these securities amounted to $1,033,797 or 0.9% of net assets. |
| (e) | Affiliated fund that is generally available only to investment companies and other accounts managed by Fidelity Investments. The rate quoted is the annualized seven-day yield of the fund at period end. A complete unaudited listing of the fund's holdings as of its most recent quarter end is available upon request. In addition, each Fidelity Central Fund's financial statements are available on the SEC's website or upon request. |
| Additional information on each restricted holding is as follows: |
| Security | Acquisition Date | Acquisition Cost ($) |
| Somatus, Inc. Series E | 1/31/22 | 350,799 |
| | | |
| Starling Bank Ltd. Series D | 6/18/21 - 4/05/22 | 68,001 |
| | | |
Affiliated Central Funds
Fiscal year to date information regarding the Fund's investments in Fidelity Central Funds, including the ownership percentage, is presented below.
| Affiliate | Value, beginning of period ($) | Purchases ($) | Sales Proceeds ($) | Dividend Income ($) | Realized Gain (loss) ($) | Change in Unrealized appreciation (depreciation) ($) | Value, end of period ($) | % ownership, end of period |
| Fidelity Cash Central Fund 3.10% | 1,590,708 | 12,519,820 | 11,844,119 | 15,063 | - | - | 2,266,409 | 0.0% |
| Fidelity Securities Lending Cash Central Fund 3.10% | 1,804,725 | 10,087,815 | 11,892,540 | 2,368 | - | - | - | 0.0% |
| Total | 3,395,433 | 22,607,635 | 23,736,659 | 17,431 | - | - | 2,266,409 | |
| | | | | | | | | |
Amounts in the income column in the above table include any capital gain distributions from underlying funds, which are presented in the corresponding line item in the Statement of Operations, if applicable.
Amount for Fidelity Securities Lending Cash Central Fund represents the income earned on investing cash collateral, less rebates paid to borrowers and any lending agent fees associated with the loan, plus any premium payments received for lending certain types of securities.
Investment Valuation
The following is a summary of the inputs used, as of October 31, 2022, involving the Fund's assets and liabilities carried at fair value. The inputs or methodology used for valuing securities may not be an indication of the risk associated with investing in those securities. For more information on valuation inputs, and their aggregation into the levels used below, please refer to the Investment Valuation section in the accompanying Notes to Financial Statements.
| Valuation Inputs at Reporting Date: |
| Description | Total ($) | Level 1 ($) | Level 2 ($) | Level 3 ($) |
Investments in Securities: | | | | |
|
| Equities: | | | | |
Communication Services | 5,982,220 | 5,982,220 | - | - |
Consumer Discretionary | 12,874,480 | 12,173,445 | 701,035 | - |
Consumer Staples | 5,491,453 | 5,491,453 | - | - |
Energy | 4,570,957 | 3,325,312 | 1,245,645 | - |
Financials | 15,567,857 | 15,455,638 | - | 112,219 |
Health Care | 17,655,383 | 15,505,131 | 1,778,406 | 371,846 |
Industrials | 15,018,256 | 15,018,256 | - | - |
Information Technology | 30,252,829 | 28,585,076 | 1,667,753 | - |
Materials | 4,439,311 | 4,439,311 | - | - |
Real Estate | 2,081,118 | 2,081,118 | - | - |
Utilities | 3,977,388 | 2,246,662 | 1,730,726 | - |
|
| Money Market Funds | 2,266,409 | 2,266,409 | - | - |
| Total Investments in Securities: | 120,177,661 | 112,570,031 | 7,123,565 | 484,065 |
| Statement of Assets and Liabilities |
| | | | October 31, 2022 (Unaudited) |
| | | | | |
| Assets | | | | |
| Investment in securities, at value - See accompanying schedule: | | | | |
Unaffiliated issuers (cost $117,035,989) | | $117,911,252 | | |
Fidelity Central Funds (cost $2,266,409) | | 2,266,409 | | |
| | | | | |
| Total Investment in Securities (cost $119,302,398) | | | $ | 120,177,661 |
| Foreign currency held at value (cost $265) | | | | 247 |
| Receivable for investments sold | | | | 436,343 |
| Receivable for fund shares sold | | | | 53,218 |
| Dividends receivable | | | | 309,249 |
| Distributions receivable from Fidelity Central Funds | | | | 4,834 |
| Prepaid expenses | | | | 190 |
Total assets | | | | 120,981,742 |
| Liabilities | | | | |
| Payable for investments purchased | | $26,262 | | |
| Payable for fund shares redeemed | | 17,235 | | |
| Accrued management fee | | 46,243 | | |
| Transfer agent fee payable | | 23,337 | | |
| Distribution and service plan fees payable | | 2,718 | | |
| Other affiliated payables | | 3,398 | | |
| Audit fee payable | | 28,137 | | |
| Other payables and accrued expenses | | 800 | | |
| Total Liabilities | | | | 148,130 |
| Net Assets | | | $ | 120,833,612 |
| Net Assets consist of: | | | | |
| Paid in capital | | | $ | 124,171,564 |
| Total accumulated earnings (loss) | | | | (3,337,952) |
| Net Assets | | | $ | 120,833,612 |
| | | | | |
| Net Asset Value and Maximum Offering Price | | | | |
| Class A : | | | | |
Net Asset Value and redemption price per share ($5,453,771 ÷ 433,308 shares) (a) | | | $ | 12.59 |
| Maximum offering price per share (100/94.25 of $12.59) | | | $ | 13.36 |
| Class M : | | | | |
Net Asset Value and redemption price per share ($1,082,970 ÷ 86,421 shares) (a) | | | $ | 12.53 |
| Maximum offering price per share (100/96.50 of $12.53) | | | $ | 12.98 |
| Class C : | | | | |
Net Asset Value and offering price per share ($1,530,368 ÷ 123,733 shares) (a) | | | $ | 12.37 |
| Fidelity Women's Leadership Fund : | | | | |
Net Asset Value , offering price and redemption price per share ($94,361,573 ÷ 7,467,393 shares) | | | $ | 12.64 |
| Class I : | | | | |
Net Asset Value , offering price and redemption price per share ($10,990,492 ÷ 869,827 shares) | | | $ | 12.64 |
| Class Z : | | | | |
Net Asset Value , offering price and redemption price per share ($7,414,438 ÷ 584,539 shares) | | | $ | 12.68 |
(a)Redemption price per share is equal to net asset value less any applicable contingent deferred sales charge. |
| Statement of Operations |
| | | | Six months ended October 31, 2022 (Unaudited) |
| Investment Income | | | | |
| Dividends | | | $ | 1,045,771 |
| Interest | | | | 233 |
| Income from Fidelity Central Funds (including $2,368 from security lending) | | | | 17,431 |
| Total Income | | | | 1,063,435 |
| Expenses | | | | |
| Management fee | | | | |
| Basic fee | $ | 321,869 | | |
| Performance adjustment | | (37,106) | | |
| Transfer agent fees | | 145,247 | | |
| Distribution and service plan fees | | 16,710 | | |
| Accounting fees | | 21,974 | | |
| Custodian fees and expenses | | 1,545 | | |
| Independent trustees' fees and expenses | | 213 | | |
| Registration fees | | 29,382 | | |
| Audit | | 25,911 | | |
| Legal | | 988 | | |
| Miscellaneous | | 336 | | |
| Total expenses before reductions | | 527,069 | | |
| Expense reductions | | (2,233) | | |
| Total expenses after reductions | | | | 524,836 |
| Net Investment income (loss) | | | | 538,599 |
| Realized and Unrealized Gain (Loss) | | | | |
| Net realized gain (loss) on: | | | | |
| Investment Securities: | | | | |
| Unaffiliated issuers | | (3,671,458) | | |
| Foreign currency transactions | | (5,288) | | |
| Total net realized gain (loss) | | | | (3,676,746) |
| Change in net unrealized appreciation (depreciation) on: | | | | |
| Investment Securities: | | | | |
| Unaffiliated issuers (net of decrease in deferred foreign taxes of $584) | | (2,579,212) | | |
| Assets and liabilities in foreign currencies | | 166 | | |
| Total change in net unrealized appreciation (depreciation) | | | | (2,579,046) |
| Net gain (loss) | | | | (6,255,792) |
| Net increase (decrease) in net assets resulting from operations | | | $ | (5,717,193) |
| Statement of Changes in Net Assets |
| |
| | Six months ended October 31, 2022 (Unaudited) | | Year ended April 30, 2022 |
| Increase (Decrease) in Net Assets | | | | |
| Operations | | | | |
| Net investment income (loss) | $ | 538,599 | $ | 257,436 |
| Net realized gain (loss) | | (3,676,746) | | 1,450,283 |
| Change in net unrealized appreciation (depreciation) | | (2,579,046) | | (19,539,713) |
| Net increase (decrease) in net assets resulting from operations | | (5,717,193) | | (17,831,994) |
| Distributions to shareholders | | - | | (3,850,676) |
| Share transactions - net increase (decrease) | | (2,237,304) | | 33,890,981 |
| Total increase (decrease) in net assets | | (7,954,497) | | 12,208,311 |
| | | | | |
| Net Assets | | | | |
| Beginning of period | | 128,788,109 | | 116,579,798 |
| End of period | $ | 120,833,612 | $ | 128,788,109 |
| | | | | |
| | | | | |
Financial Highlights
| Fidelity Advisor® Womens Leadership Fund Class A |
| |
| | Six months ended (Unaudited) October 31, 2022 | | Years ended April 30, 2022 | | 2021 | | 2020 A |
Selected Per-Share Data | | | | | | | | |
| Net asset value, beginning of period | $ | 13.18 | $ | 15.28 | $ | 9.80 | $ | 10.00 |
| Income from Investment Operations | | | | | | | | |
Net investment income (loss) B,C | | .04 | | - D | | - D | | .04 |
| Net realized and unrealized gain (loss) | | (.63) | | (1.70) | | 5.49 | | (.22) |
| Total from investment operations | | (.59) | | (1.70) | | 5.49 | | (.18) |
| Distributions from net investment income | | - | | - D | | (.01) | | (.02) |
| Distributions from net realized gain | | - | | (.40) | | - | | - |
| Total distributions | | - | | (.40) | | (.01) | | (.02) |
| Net asset value, end of period | $ | 12.59 | $ | 13.18 | $ | 15.28 | $ | 9.80 |
Total Return E,F,G | | (4.48)% | | (11.46)% | | 56.03% | | (1.84)% |
Ratios to Average Net Assets C,H,I | | | | | | | | |
| Expenses before reductions | | 1.06% J | | 1.10% | | 1.28% | | 2.50% |
| Expenses net of fee waivers, if any | | 1.05% J | | 1.10% | | 1.25% | | 1.25% |
| Expenses net of all reductions | | 1.05% J | | 1.10% | | 1.24% | | 1.25% |
| Net investment income (loss) | | .69% J | | (.01)% | | (.03)% | | .37% |
| Supplemental Data | | | | | | | | |
| Net assets, end of period (000 omitted) | $ | 5,454 | $ | 5,171 | $ | 2,865 | $ | 769 |
Portfolio turnover rate K | | 12% J | | 48% | | 35% | | 52% |
A For the period May 1, 2019 (commencement of operations) through April 30, 2020
B Calculated based on average shares outstanding during the period.
C Net investment income (loss) is affected by the timing of the declaration of dividends by any underlying mutual funds or exchange-traded funds (ETFs). Net investment income (loss) of any mutual funds or ETFs is not included in the Fund's net investment income (loss) ratio.
D Amount represents less than $.005 per share.
E Total returns for periods of less than one year are not annualized.
F Total returns would have been lower if certain expenses had not been reduced during the applicable periods shown.
G Total returns do not include the effect of the sales charges.
H Fees and expenses of any underlying mutual funds or exchange-traded funds (ETFs) are not included in the Fund's expense ratio. The Fund indirectly bears its proportionate share of these expenses. For additional expense information related to investments in Fidelity Central Funds, please refer to the "Investments in Fidelity Central Funds" note found in the Notes to Financial Statements section of the most recent Annual or Semi-Annual report.
I Expense ratios reflect operating expenses of the class. Expenses before reductions do not reflect amounts reimbursed, waived, or reduced through arrangements with the investment adviser, brokerage services, or other offset arrangements, if applicable, and do not represent the amount paid by the class during periods when reimbursements, waivers or reductions occur.
J Annualized
K Amount does not include the portfolio activity of any underlying mutual funds or exchange-traded funds (ETFs).
| Fidelity Advisor® Womens Leadership Fund Class M |
| |
| | Six months ended (Unaudited) October 31, 2022 | | Years ended April 30, 2022 | | 2021 | | 2020 A |
Selected Per-Share Data | | | | | | | | |
| Net asset value, beginning of period | $ | 13.14 | $ | 15.22 | $ | 9.78 | $ | 10.00 |
| Income from Investment Operations | | | | | | | | |
Net investment income (loss) B,C | | .03 | | (.04) | | (.04) | | .01 |
| Net realized and unrealized gain (loss) | | (.64) | | (1.69) | | 5.48 | | (.22) |
| Total from investment operations | | (.61) | | (1.73) | | 5.44 | | (.21) |
| Distributions from net investment income | | - | | - | | - D | | (.01) |
| Distributions from net realized gain | | - | | (.35) | | - | | - |
| Total distributions | | - | | (.35) | | - D | | (.01) |
| Net asset value, end of period | $ | 12.53 | $ | 13.14 | $ | 15.22 | $ | 9.78 |
Total Return E,F,G | | (4.64)% | | (11.66)% | | 55.65% | | (2.12)% |
Ratios to Average Net Assets C,H,I | | | | | | | | |
| Expenses before reductions | | 1.33% J | | 1.35% | | 1.52% | | 2.86% |
| Expenses net of fee waivers, if any | | 1.33% J | | 1.35% | | 1.50% | | 1.50% |
| Expenses net of all reductions | | 1.33% J | | 1.35% | | 1.49% | | 1.50% |
| Net investment income (loss) | | .41% J | | (.27)% | | (.28)% | | .12% |
| Supplemental Data | | | | | | | | |
| Net assets, end of period (000 omitted) | $ | 1,083 | $ | 1,054 | $ | 974 | $ | 443 |
Portfolio turnover rate K | | 12% J | | 48% | | 35% | | 52% |
A For the period May 1, 2019 (commencement of operations) through April 30, 2020
B Calculated based on average shares outstanding during the period.
C Net investment income (loss) is affected by the timing of the declaration of dividends by any underlying mutual funds or exchange-traded funds (ETFs). Net investment income (loss) of any mutual funds or ETFs is not included in the Fund's net investment income (loss) ratio.
D Amount represents less than $.005 per share.
E Total returns for periods of less than one year are not annualized.
F Total returns would have been lower if certain expenses had not been reduced during the applicable periods shown.
G Total returns do not include the effect of the sales charges.
H Fees and expenses of any underlying mutual funds or exchange-traded funds (ETFs) are not included in the Fund's expense ratio. The Fund indirectly bears its proportionate share of these expenses. For additional expense information related to investments in Fidelity Central Funds, please refer to the "Investments in Fidelity Central Funds" note found in the Notes to Financial Statements section of the most recent Annual or Semi-Annual report.
I Expense ratios reflect operating expenses of the class. Expenses before reductions do not reflect amounts reimbursed, waived, or reduced through arrangements with the investment adviser, brokerage services, or other offset arrangements, if applicable, and do not represent the amount paid by the class during periods when reimbursements, waivers or reductions occur.
J Annualized
K Amount does not include the portfolio activity of any underlying mutual funds or exchange-traded funds (ETFs).
| Fidelity Advisor® Womens Leadership Fund Class C |
| |
| | Six months ended (Unaudited) October 31, 2022 | | Years ended April 30, 2022 | | 2021 | | 2020 A |
Selected Per-Share Data | | | | | | | | |
| Net asset value, beginning of period | $ | 13.00 | $ | 15.09 | $ | 9.74 | $ | 10.00 |
| Income from Investment Operations | | | | | | | | |
Net investment income (loss) B,C | | - D | | (.11) | | (.10) | | (.04) |
| Net realized and unrealized gain (loss) | | (.63) | | (1.68) | | 5.45 | | (.22) |
| Total from investment operations | | (.63) | | (1.79) | | 5.35 | | (.26) |
| Distributions from net realized gain | | - | | (.30) | | - | | - |
| Total distributions | | - | | (.30) | | - | | - |
| Net asset value, end of period | $ | 12.37 | $ | 13.00 | $ | 15.09 | $ | 9.74 |
Total Return E,F,G | | (4.85)% | | (12.12)% | | 54.93% | | (2.60)% |
Ratios to Average Net Assets C,H,I | | | | | | | | |
| Expenses before reductions | | 1.82% J | | 1.84% | | 1.99% | | 3.36% |
| Expenses net of fee waivers, if any | | 1.81% J | | 1.84% | | 1.99% | | 2.00% |
| Expenses net of all reductions | | 1.81% J | | 1.84% | | 1.98% | | 2.00% |
| Net investment income (loss) | | (.08)% J | | (.75)% | | (.77)% | | (.38)% |
| Supplemental Data | | | | | | | | |
| Net assets, end of period (000 omitted) | $ | 1,530 | $ | 1,540 | $ | 937 | $ | 468 |
Portfolio turnover rate K | | 12% J | | 48% | | 35% | | 52% |
A For the period May 1, 2019 (commencement of operations) through April 30, 2020
B Calculated based on average shares outstanding during the period.
C Net investment income (loss) is affected by the timing of the declaration of dividends by any underlying mutual funds or exchange-traded funds (ETFs). Net investment income (loss) of any mutual funds or ETFs is not included in the Fund's net investment income (loss) ratio.
D Amount represents less than $.005 per share.
E Total returns for periods of less than one year are not annualized.
F Total returns would have been lower if certain expenses had not been reduced during the applicable periods shown.
G Total returns do not include the effect of the contingent deferred sales charge.
H Fees and expenses of any underlying mutual funds or exchange-traded funds (ETFs) are not included in the Fund's expense ratio. The Fund indirectly bears its proportionate share of these expenses. For additional expense information related to investments in Fidelity Central Funds, please refer to the "Investments in Fidelity Central Funds" note found in the Notes to Financial Statements section of the most recent Annual or Semi-Annual report.
I Expense ratios reflect operating expenses of the class. Expenses before reductions do not reflect amounts reimbursed, waived, or reduced through arrangements with the investment adviser, brokerage services, or other offset arrangements, if applicable, and do not represent the amount paid by the class during periods when reimbursements, waivers or reductions occur.
J Annualized
K Amount does not include the portfolio activity of any underlying mutual funds or exchange-traded funds (ETFs).
| Fidelity® Womens Leadership Fund |
| |
| | Six months ended (Unaudited) October 31, 2022 | | Years ended April 30, 2022 | | 2021 | | 2020 A |
Selected Per-Share Data | | | | | | | | |
| Net asset value, beginning of period | $ | 13.22 | $ | 15.31 | $ | 9.81 | $ | 10.00 |
| Income from Investment Operations | | | | | | | | |
Net investment income (loss) B,C | | .06 | | .03 | | .03 | | .06 |
| Net realized and unrealized gain (loss) | | (.64) | | (1.70) | | 5.50 | | (.22) |
| Total from investment operations | | (.58) | | (1.67) | | 5.53 | | (.16) |
| Distributions from net investment income | | - | | (.02) | | (.03) | | (.03) |
| Distributions from net realized gain | | - | | (.40) | | - | | - |
| Total distributions | | - | | (.42) | | (.03) | | (.03) |
| Net asset value, end of period | $ | 12.64 | $ | 13.22 | $ | 15.31 | $ | 9.81 |
Total Return D,E | | (4.39)% | | (11.25)% | | 56.44% | | (1.63)% |
Ratios to Average Net Assets C,F,G | | | | | | | | |
| Expenses before reductions | | .86% H | | .92% | | 1.10% | | 2.19% |
| Expenses net of fee waivers, if any | | .86% H | | .90% | | 1.00% | | 1.00% |
| Expenses net of all reductions | | .86% H | | .90% | | .99% | | 1.00% |
| Net investment income (loss) | | .88% H | | .18% | | .22% | | .62% |
| Supplemental Data | | | | | | | | |
| Net assets, end of period (000 omitted) | $ | 94,362 | $ | 101,533 | $ | 98,888 | $ | 22,272 |
Portfolio turnover rate I | | 12% H | | 48% | | 35% | | 52% |
A For the period May 1, 2019 (commencement of operations) through April 30, 2020
B Calculated based on average shares outstanding during the period.
C Net investment income (loss) is affected by the timing of the declaration of dividends by any underlying mutual funds or exchange-traded funds (ETFs). Net investment income (loss) of any mutual funds or ETFs is not included in the Fund's net investment income (loss) ratio.
D Total returns for periods of less than one year are not annualized.
E Total returns would have been lower if certain expenses had not been reduced during the applicable periods shown.
F Fees and expenses of any underlying mutual funds or exchange-traded funds (ETFs) are not included in the Fund's expense ratio. The Fund indirectly bears its proportionate share of these expenses. For additional expense information related to investments in Fidelity Central Funds, please refer to the "Investments in Fidelity Central Funds" note found in the Notes to Financial Statements section of the most recent Annual or Semi-Annual report.
G Expense ratios reflect operating expenses of the class. Expenses before reductions do not reflect amounts reimbursed, waived, or reduced through arrangements with the investment adviser, brokerage services, or other offset arrangements, if applicable, and do not represent the amount paid by the class during periods when reimbursements, waivers or reductions occur.
H Annualized
I Amount does not include the portfolio activity of any underlying mutual funds or exchange-traded funds (ETFs).
| Fidelity Advisor® Womens Leadership Fund Class I |
| |
| | Six months ended (Unaudited) October 31, 2022 | | Years ended April 30, 2022 | | 2021 | | 2020 A |
Selected Per-Share Data | | | | | | | | |
| Net asset value, beginning of period | $ | 13.21 | $ | 15.31 | $ | 9.81 | $ | 10.00 |
| Income from Investment Operations | | | | | | | | |
Net investment income (loss) B,C | | .06 | | .04 | | .03 | | .06 |
| Net realized and unrealized gain (loss) | | (.63) | | (1.70) | | 5.51 | | (.22) |
| Total from investment operations | | (.57) | | (1.66) | | 5.54 | | (.16) |
| Distributions from net investment income | | - | | (.04) | | (.04) | | (.03) |
| Distributions from net realized gain | | - | | (.40) | | - | | - |
| Total distributions | | - | | (.44) | | (.04) | | (.03) |
| Net asset value, end of period | $ | 12.64 | $ | 13.21 | $ | 15.31 | $ | 9.81 |
Total Return D,E | | (4.31)% | | (11.20)% | | 56.52% | | (1.63)% |
Ratios to Average Net Assets C,F,G | | | | | | | | |
| Expenses before reductions | | .76% H | | .81% | | .98% | | 2.22% |
| Expenses net of fee waivers, if any | | .75% H | | .81% | | .98% | | 1.00% |
| Expenses net of all reductions | | .75% H | | .81% | | .97% | | 1.00% |
| Net investment income (loss) | | .99% H | | .28% | | .24% | | .62% |
| Supplemental Data | | | | | | | | |
| Net assets, end of period (000 omitted) | $ | 10,990 | $ | 11,273 | $ | 3,874 | $ | 702 |
Portfolio turnover rate I | | 12% H | | 48% | | 35% | | 52% |
A For the period May 1, 2019 (commencement of operations) through April 30, 2020
B Calculated based on average shares outstanding during the period.
C Net investment income (loss) is affected by the timing of the declaration of dividends by any underlying mutual funds or exchange-traded funds (ETFs). Net investment income (loss) of any mutual funds or ETFs is not included in the Fund's net investment income (loss) ratio.
D Total returns for periods of less than one year are not annualized.
E Total returns would have been lower if certain expenses had not been reduced during the applicable periods shown.
F Fees and expenses of any underlying mutual funds or exchange-traded funds (ETFs) are not included in the Fund's expense ratio. The Fund indirectly bears its proportionate share of these expenses. For additional expense information related to investments in Fidelity Central Funds, please refer to the "Investments in Fidelity Central Funds" note found in the Notes to Financial Statements section of the most recent Annual or Semi-Annual report.
G Expense ratios reflect operating expenses of the class. Expenses before reductions do not reflect amounts reimbursed, waived, or reduced through arrangements with the investment adviser, brokerage services, or other offset arrangements, if applicable, and do not represent the amount paid by the class during periods when reimbursements, waivers or reductions occur.
H Annualized
I Amount does not include the portfolio activity of any underlying mutual funds or exchange-traded funds (ETFs).
| Fidelity Advisor® Womens Leadership Fund Class Z |
| |
| | Six months ended (Unaudited) October 31, 2022 | | Years ended April 30, 2022 | | 2021 | | 2020 A |
Selected Per-Share Data | | | | | | | | |
| Net asset value, beginning of period | $ | 13.25 | $ | 15.35 | $ | 9.83 | $ | 10.00 |
| Income from Investment Operations | | | | | | | | |
Net investment income (loss) B,C | | .07 | | .06 | | .05 | | .08 |
| Net realized and unrealized gain (loss) | | (.64) | | (1.71) | | 5.51 | | (.22) |
| Total from investment operations | | (.57) | | (1.65) | | 5.56 | | (.14) |
| Distributions from net investment income | | - | | (.05) | | (.04) | | (.03) |
| Distributions from net realized gain | | - | | (.40) | | - | | - |
| Total distributions | | - | | (.45) | | (.04) | | (.03) |
| Net asset value, end of period | $ | 12.68 | $ | 13.25 | $ | 15.35 | $ | 9.83 |
Total Return D,E | | (4.30)% | | (11.13)% | | 56.63% | | (1.43)% |
Ratios to Average Net Assets C,F,G | | | | | | | | |
| Expenses before reductions | | .64% H | | .69% | | .87% | | 1.88% |
| Expenses net of fee waivers, if any | | .64% H | | .69% | | .85% | | .85% |
| Expenses net of all reductions | | .64% H | | .69% | | .84% | | .85% |
| Net investment income (loss) | | 1.10% H | | .40% | | .37% | | .76% |
| Supplemental Data | | | | | | | | |
| Net assets, end of period (000 omitted) | $ | 7,414 | $ | 8,216 | $ | 9,043 | $ | 2,376 |
Portfolio turnover rate I | | 12% H | | 48% | | 35% | | 52% |
A For the period May 1, 2019 (commencement of operations) through April 30, 2020
B Calculated based on average shares outstanding during the period.
C Net investment income (loss) is affected by the timing of the declaration of dividends by any underlying mutual funds or exchange-traded funds (ETFs). Net investment income (loss) of any mutual funds or ETFs is not included in the Fund's net investment income (loss) ratio.
D Total returns for periods of less than one year are not annualized.
E Total returns would have been lower if certain expenses had not been reduced during the applicable periods shown.
F Fees and expenses of any underlying mutual funds or exchange-traded funds (ETFs) are not included in the Fund's expense ratio. The Fund indirectly bears its proportionate share of these expenses. For additional expense information related to investments in Fidelity Central Funds, please refer to the "Investments in Fidelity Central Funds" note found in the Notes to Financial Statements section of the most recent Annual or Semi-Annual report.
G Expense ratios reflect operating expenses of the class. Expenses before reductions do not reflect amounts reimbursed, waived, or reduced through arrangements with the investment adviser, brokerage services, or other offset arrangements, if applicable, and do not represent the amount paid by the class during periods when reimbursements, waivers or reductions occur.
H Annualized
I Amount does not include the portfolio activity of any underlying mutual funds or exchange-traded funds (ETFs).
For the period ended October 31, 2022
1. Organization.
Fidelity Women's Leadership Fund (the Fund) is a fund of Fidelity Summer Street Trust (the Trust) and is authorized to issue an unlimited number of shares. The Trust is registered under the Investment Company Act of 1940, as amended (the 1940 Act), as an open-end management investment company organized as a Massachusetts business trust. The Fund offers Class A, Class M, Class C, Fidelity Women's Leadership Fund, Class I and Class Z shares, each of which has equal rights as to assets and voting privileges. Each class has exclusive voting rights with respect to matters that affect that class. Class C shares will automatically convert to Class A shares after a holding period of eight years from the initial date of purchase, with certain exceptions. Application of FMR's environmental, social, and governance (ESG) ratings process and/or its sustainable investing exclusion criteria may affect the Fund's exposure to certain issuers, sectors, regions, and countries and may affect the Fund's performance depending on whether certain investments are in or out of favor. The criteria related to the Fund's ESG ratings process and/or adherence to its sustainable investing exclusion criteria may result in the Fund forgoing opportunities to buy certain securities when it might otherwise be advantageous to do so, or selling securities for ESG reasons when it might be otherwise disadvantageous for it to do so. As a result, the Fund's performance may at times be better or worse than the performance of funds that do not use ESG or sustainability criteria. There are significant differences in interpretations of what it means for an issuer to have positive ESG factors. While the investment adviser believes its definitions are reasonable, the portfolio decisions it makes may differ with other investors' or advisers' views.
2. Investments in Fidelity Central Funds.
Funds may invest in Fidelity Central Funds, which are open-end investment companies generally available only to other investment companies and accounts managed by the investment adviser and its affiliates. The Schedule of Investments lists any Fidelity Central Funds held as an investment as of period end, but does not include the underlying holdings of each Fidelity Central Fund. An investing fund indirectly bears its proportionate share of the expenses of the underlying Fidelity Central Funds.
Based on its investment objective, each Fidelity Central Fund may invest or participate in various investment vehicles or strategies that are similar to those of the investing fund. These strategies are consistent with the investment objectives of the investing fund and may involve certain economic risks which may cause a decline in value of each of the Fidelity Central Funds and thus a decline in the value of the investing fund.
| Fidelity Central Fund | Investment Manager | Investment Objective | Investment Practices | Expense Ratio A |
| Fidelity Money Market Central Funds | Fidelity Management & Research Company LLC (FMR) | Each fund seeks to obtain a high level of current income consistent with the preservation of capital and liquidity. | Short-term Investments | Less than .005% |
A Expenses expressed as a percentage of average net assets and are as of each underlying Central Fund's most recent annual or semi-annual shareholder report.
A complete unaudited list of holdings for each Fidelity Central Fund is available upon request or at the Securities and Exchange Commission website at www.sec.gov. In addition, the financial statements of the Fidelity Central Funds which contain the significant accounting policies (including investment valuation policies) of those funds, and are not covered by the Report of Independent Registered Public Accounting Firm, are available on the Securities and Exchange Commission website or upon request.
3. Significant Accounting Policies.
The Fund is an investment company and applies the accounting and reporting guidance of the Financial Accounting Standards Board (FASB) Accounting Standards Codification Topic 946 Financial Services - Investment Companies . The financial statements have been prepared in conformity with accounting principles generally accepted in the United States of America (GAAP), which require management to make certain estimates and assumptions at the date of the financial statements. Actual results could differ from those estimates. Subsequent events, if any, through the date that the financial statements were issued have been evaluated in the preparation of the financial statements. The Fund's Schedule of Investments lists any underlying mutual funds or exchange-traded funds (ETFs) but does not include the underlying holdings of these funds. The following summarizes the significant accounting policies of the Fund:
Investment Valuation. Investments are valued as of 4:00 p.m. Eastern time on the last calendar day of the period. The Board of Trustees (the Board) has designated the Fund's investment adviser as the valuation designee responsible for the fair valuation function and performing fair value determinations as needed. The investment adviser has established a Fair Value Committee (the Committee) to carry out the day-to-day fair valuation responsibilities and has adopted policies and procedures to govern the fair valuation process and the activities of the Committee. In accordance with these fair valuation policies and procedures, which have been approved by the Board, the Fund attempts to obtain prices from one or more third party pricing services or brokers to value its investments. When current market prices, quotations or currency exchange rates are not readily available or reliable, investments will be fair valued in good faith by the Committee, in accordance with the policies and procedures. Factors used in determining fair value vary by investment type and may include market or investment specific events, transaction data, estimated cash flows, and market observations of comparable investments. The frequency that the fair valuation procedures are used cannot be predicted and they may be utilized to a significant extent. The Committee manages the Fund's fair valuation practices and maintains the fair valuation policies and procedures. The Fund's investment adviser reports to the Board information regarding the fair valuation process and related material matters.
The Fund categorizes the inputs to valuation techniques used to value its investments into a disclosure hierarchy consisting of three levels as shown below:
Level 1 - unadjusted quoted prices in active markets for identical investments
Level 2 - other significant observable inputs (including quoted prices for similar investments, interest rates, prepayment speeds, etc.)
Level 3 - unobservable inputs (including the Fund's own assumptions based on the best information available)
Valuation techniques used to value the Fund's investments by major category are as follows:
Equity securities, including restricted securities, for which market quotations are readily available, are valued at the last reported sale price or official closing price as reported by a third party pricing service on the primary market or exchange on which they are traded and are categorized as Level 1 in the hierarchy. In the event there were no sales during the day or closing prices are not available, securities are valued at the last quoted bid price or may be valued using the last available price and are generally categorized as Level 2 in the hierarchy. For foreign equity securities, when market or security specific events arise, comparisons to the valuation of American Depositary Receipts (ADRs), futures contracts, ETFs and certain indexes as well as quoted prices for similar securities may be used and would be categorized as Level 2 in the hierarchy. For equity securities, including restricted securities, where observable inputs are limited, assumptions about market activity and risk are used and these securities may be categorized as Level 3 in the hierarchy.
Investments in open-end mutual funds, including the Fidelity Central Funds, are valued at their closing net asset value (NAV) each business day and are categorized as Level 1 in the hierarchy.
Changes in valuation techniques may result in transfers in or out of an assigned level within the disclosure hierarchy. The aggregate value of investments by input level as of October 31, 2022 is included at the end of the Fund's Schedule of Investments.
Foreign Currency. Certain Funds may use foreign currency contracts to facilitate transactions in foreign-denominated securities. Gains and losses from these transactions may arise from changes in the value of the foreign currency or if the counterparties do not perform under the contracts' terms.
Foreign-denominated assets, including investment securities, and liabilities are translated into U.S. dollars at the exchange rates at period end. Purchases and sales of investment securities, income and dividends received, and expenses denominated in foreign currencies are translated into U.S. dollars at the exchange rate in effect on the transaction date.
The effects of exchange rate fluctuations on investments are included with the net realized and unrealized gain (loss) on investment securities. Other foreign currency transactions resulting in realized and unrealized gain (loss) are disclosed separately.
Investment Transactions and Income. For financial reporting purposes, the Fund's investment holdings and NAV include trades executed through the end of the last business day of the period. The NAV per share for processing shareholder transactions is calculated as of the close of business of the New York Stock Exchange (NYSE), normally 4:00 p.m. Eastern time and includes trades executed through the end of the prior business day. Gains and losses on securities sold are determined on the basis of identified cost. Commissions paid to certain brokers with whom the investment adviser, or its affiliates, places trades on behalf of a fund include an amount in addition to trade execution, which may be rebated back to a fund. Any such rebates are included in net realized gain (loss) on investments in the Statement of Operations. Dividend income is recorded on the ex-dividend date, except for certain dividends from foreign securities where the ex-dividend date may have passed, which are recorded as soon as the Fund is informed of the ex-dividend date. Non-cash dividends included in dividend income, if any, are recorded at the fair market value of the securities received. Income and capital gain distributions from Fidelity Central Funds, if any, are recorded on the ex-dividend date. Certain distributions received by the Fund represent a return of capital or capital gain. The Fund determines the components of these distributions subsequent to the ex-dividend date, based upon receipt of tax filings or other correspondence relating to the underlying investment. These distributions are recorded as a reduction of cost of investments and/or as a realized gain. Interest income is accrued as earned and includes coupon interest and amortization of premium and accretion of discount on debt securities as applicable. Investment income is recorded net of foreign taxes withheld where recovery of such taxes is uncertain. Funds may file withholding tax reclaims in certain jurisdictions to recover a portion of amounts previously withheld. Any withholding tax reclaims income is included in the Statement of Operations in dividends. Any receivables for withholding tax reclaims are included in the Statement of Assets and Liabilities in dividends receivable.
Class Allocations and Expenses. Investment income, realized and unrealized capital gains and losses, common expenses of a fund, and certain fund-level expense reductions, if any, are allocated daily on a pro-rata basis to each class based on the relative net assets of each class to the total net assets of a fund. Each class differs with respect to transfer agent and distribution and service plan fees incurred, as applicable. Certain expense reductions may also differ by class, if applicable. For the reporting period, the allocated portion of income and expenses to each class as a percent of its average net assets may vary due to the timing of recording these transactions in relation to fluctuating net assets of the classes. Expenses directly attributable to a fund are charged to that fund. Expenses attributable to more than one fund are allocated among the respective funds on the basis of relative net assets or other appropriate methods. Expenses included in the accompanying financial statements reflect the expenses of that fund and do not include any expenses associated with any underlying mutual funds or exchange-traded funds. Although not included in a fund's expenses, a fund indirectly bears its proportionate share of these expenses through the net asset value of each underlying mutual fund or exchange-traded fund. Expense estimates are accrued in the period to which they relate and adjustments are made when actual amounts are known.
Income Tax Information and Distributions to Shareholders. Each year, the Fund intends to qualify as a regulated investment company under Subchapter M of the Internal Revenue Code, including distributing substantially all of its taxable income and realized gains. As a result, no provision for U.S. Federal income taxes is required. The Fund files a U.S. federal tax return, in addition to state and local tax returns as required. The Fund's federal income tax returns are subject to examination by the Internal Revenue Service (IRS) for a period of three fiscal years after they are filed. State and local tax returns may be subject to examination for an additional fiscal year depending on the jurisdiction. Foreign taxes are provided for based on the Fund's understanding of the tax rules and rates that exist in the foreign markets in which it invests. The Fund is subject to a tax imposed on capital gains by certain countries in which it invests. An estimated deferred tax liability for net unrealized appreciation on the applicable securities is included in Other payables and accrued expenses on the Statement of Assets & Liabilities.
Distributions are declared and recorded on the ex-dividend date. Income and capital gain distributions are declared separately for each class. Income and capital gain distributions are determined in accordance with income tax regulations, which may differ from GAAP.
Capital accounts within the financial statements are adjusted for permanent book-tax differences. These adjustments have no impact on net assets or the results of operations. Capital accounts are not adjusted for temporary book-tax differences which will reverse in a subsequent period.
Book-tax differences are primarily due to foreign currency transactions and losses deferred due to wash sales and excise tax regulations.
As of period end, the cost and unrealized appreciation (depreciation) in securities, and derivatives if applicable, for federal income tax purposes were as follows:
| Gross unrealized appreciation | $17,943,187 |
| Gross unrealized depreciation | (17,516,172) |
| Net unrealized appreciation (depreciation) | $427,015 |
| Tax cost | $119,750,646 |
The Fund elected to defer to its next fiscal year approximately $498,552 of capital losses recognized during the period November 1, 2021 to April 30, 2022.
Restricted Securities (including Private Placements). Funds may invest in securities that are subject to legal or contractual restrictions on resale. These securities generally may be resold in transactions exempt from registration or to the public if the securities are registered. Disposal of these securities may involve time-consuming negotiations and expense, and prompt sale at an acceptable price may be difficult. Information regarding restricted securities held at period end is included at the end of the Schedule of Investments, if applicable.
4. Purchases and Sales of Investments.
Purchases and sales of securities, other than short-term securities and in-kind transactions, as applicable, are noted in the table below.
| | Purchases ($) | Sales ($) |
| Fidelity Women's Leadership Fund | 7,163,422 | 10,229,257 |
5. Fees and Other Transactions with Affiliates.
Management Fee. Fidelity Management & Research Company LLC (the investment adviser) and its affiliates provide the Fund with investment management related services for which the Fund pays a monthly management fee. The management fee is the sum of an individual fund fee rate that is based on an annual rate of .30% of the Fund's average net assets and an annualized group fee rate that averaged .23% during the period. The group fee rate is based upon the monthly average net assets of a group of registered investment companies with which the investment adviser has management contracts. The group fee rate decreases as assets under management increase and increases as assets under management decrease. In addition, the management fee is subject to a performance adjustment (up to a maximum of +/- .10% of the Fund's average net assets over a 36 month performance period). The upward or downward adjustment to the management fee is based on the relative investment performance of Fidelity Women's Leadership Fund as compared to its benchmark index, the Russell 3000 Index, over the same 36 month performance period. For the reporting period, the total annualized management fee rate, including the performance adjustment, was .47% of the Fund's average net assets. The performance adjustment included in the management fee rate may be higher or lower than the maximum performance adjustment rate due to the difference between the average net assets for the reporting and performance periods.
Distribution and Service Plan Fees. In accordance with Rule 12b-1 of the 1940 Act, the Fund has adopted separate Distribution and Service Plans for each class of shares. Certain classes pay Fidelity Distributors Company LLC (FDC), an affiliate of the investment adviser, separate Distribution and Service Fees, each of which is based on an annual percentage of each class' average net assets. In addition, FDC may pay financial intermediaries for selling shares of the Fund and providing shareholder support services. For the period, the Distribution and Service Fee rates, total fees and amounts retained by FDC were as follows:
| | Distribution Fee | Service Fee | Total Fees | Retained by FDC |
| Class A | - % | .25% | $6,602 | $308 |
| Class M | .25% | .25% | 2,656 | - |
| Class C | .75% | .25% | 7,452 | 2,681 |
| | | | $16,710 | $2,989 |
Sales Load. FDC may receive a front-end sales charge of up to 5.75% for selling Class A shares and 3.50% for selling Class M shares, some of which is paid to financial intermediaries for selling shares of the Fund. Depending on the holding period, FDC may receive contingent deferred sales charges levied on Class A, Class M and Class C redemptions. The deferred sales charges are 1.00% for Class C shares, 1.00% for certain purchases of Class A shares and .25% for certain purchases of Class M shares.
For the period, sales charge amounts retained by FDC were as follows:
| | Retained by FDC |
| Class A | $4,509 |
| Class M | 163 |
| | $4,672 |
Transfer Agent Fees. Fidelity Investments Institutional Operations Company LLC (FIIOC), an affiliate of the investment adviser, is the transfer, dividend disbursing and shareholder servicing agent for each class of the Fund. FIIOC receives account fees and asset-based fees that vary according to the account size and type of account of the shareholders of the respective classes of the Fund, except for Class Z. FIIOC receives an asset-based fee of Class Z's average net assets. FIIOC pays for typesetting, printing and mailing of shareholder reports, except proxy statements.
For the period, transfer agent fees for each class were as follows:
| | Amount | % of Class-Level Average Net Assets A |
| Class A | $5,551 | .21 |
| Class M | 1,270 | .24 |
| Class C | 1,667 | .22 |
| Fidelity Women's Leadership Fund | 126,976 | .26 |
| Class I | 8,181 | .16 |
| Class Z | 1,602 | .04 |
| | $145,247 | |
A Annualized
Accounting Fees. Fidelity Service Company, Inc. (FSC), an affiliate of the investment adviser, maintains the Fund's accounting records. The accounting fee is based on the level of average net assets for each month. For the period, the fees were equivalent to the following annualized rates:
| | % of Average Net Assets |
| Fidelity Women's Leadership Fund | .04 |
Brokerage Commissions. A portion of portfolio transactions were placed with brokerage firms which are affiliates of the investment adviser. Brokerage commissions are included in net realized gain (loss) and change in net unrealized appreciation (depreciation) in the Statement of Operations. The commissions paid to these affiliated firms were as follows:
| | Amount |
| Fidelity Women's Leadership Fund | $170 |
Interfund Trades. Funds may purchase from or sell securities to other Fidelity Funds under procedures adopted by the Board. The procedures have been designed to ensure these interfund trades are executed in accordance with Rule 17a-7 of the 1940 Act. Any interfund trades are included within the respective purchases and sales amounts shown in the Purchases and Sales of Investments note. Interfund trades during the period are noted in the table below.
| | Purchases ($) | Sales ($) | Realized Gain (Loss) ($) |
| Fidelity Women's Leadership Fund | 177,969 | 309,270 | (79,354) |
6. Committed Line of Credit.
Certain Funds participate with other funds managed by the investment adviser or an affiliate in a $4.25 billion credit facility (the "line of credit") to be utilized for temporary or emergency purposes to fund shareholder redemptions or for other short-term liquidity purposes. The participating funds have agreed to pay commitment fees on their pro-rata portion of the line of credit, which are reflected in Miscellaneous expenses on the Statement of Operations, and are listed below. During the period, there were no borrowings on this line of credit.
| | Amount |
| Fidelity Women's Leadership Fund | $112 |
7. Security Lending.
Funds lend portfolio securities from time to time in order to earn additional income. Lending agents are used, including National Financial Services (NFS), an affiliate of the investment adviser. Pursuant to a securities lending agreement, NFS will receive a fee, which is capped at 9.9% of a fund's daily lending revenue, for its services as lending agent. A fund may lend securities to certain qualified borrowers, including NFS. On the settlement date of the loan, a fund receives collateral (in the form of U.S. Treasury obligations, letters of credit and/or cash) against the loaned securities and maintains collateral in an amount not less than 100% of the market value of the loaned securities during the period of the loan. The market value of the loaned securities is determined at the close of business of a fund and any additional required collateral is delivered to a fund on the next business day. A fund or borrower may terminate the loan at any time, and if the borrower defaults on its obligation to return the securities loaned because of insolvency or other reasons, a fund may apply collateral received from the borrower against the obligation. A fund may experience delays and costs in recovering the securities loaned. Any cash collateral received is invested in the Fidelity Securities Lending Cash Central Fund. Any loaned securities are identified as such in the Schedule of Investments, and the value of loaned securities and cash collateral at period end, as applicable, are presented in the Statement of Assets and Liabilities. Security lending income represents the income earned on investing cash collateral, less rebates paid to borrowers and any lending agent fees associated with the loan, plus any premium payments received for lending certain types of securities. Security lending income is presented in the Statement of Operations as a component of income from Fidelity Central Funds. Affiliated security lending activity, if any, was as follows:
| | Total Security Lending Fees Paid to NFS | Security Lending Income From Securities Loaned to NFS | Value of Securities Loaned to NFS at Period End |
| Fidelity Women's Leadership Fund | $228 | $5 | $- |
8. Expense Reductions.
Through arrangements with the Fund's custodian, credits realized as a result of certain uninvested cash balances were used to reduce the Fund's expenses. During the period, custodian credits reduced the Fund's expenses by $13.
In addition, during the period the investment adviser or an affiliate reimbursed and/or waived a portion of fund-level operating expenses in the amount of $2,220.
9. Distributions to Shareholders.
Distributions to shareholders of each class were as follows:
| | Six months ended October 31, 2022 | Year ended April 30, 2022 |
| Fidelity Women's Leadership Fund | | |
| Distributions to shareholders | | |
| Class A | $- | $111,894 |
| Class M | - | 24,841 |
| Class C | - | 28,323 |
| Fidelity Women's Leadership Fund | - | 3,101,859 |
| Class I | - | 293,915 |
| Class Z | - | 289,844 |
Total | $- | $3,850,676 |
10. Share Transactions.
Share transactions for each class were as follows and may contain in-kind transactions, automatic conversions between classes or exchanges between affiliated funds:
| | Shares | Shares | Dollars | Dollars |
| | Six months ended October 31, 2022 | Year ended April 30, 2022 | Six months ended October 31, 2022 | Year ended April 30, 2022 |
| Fidelity Women's Leadership Fund | | | | |
| Class A | | | | |
| Shares sold | 90,422 | 214,342 | $1,128,811 | $3,271,433 |
| Reinvestment of distributions | - | 7,212 | - | 109,985 |
| Shares redeemed | (49,603) | (16,599) | (615,172) | (254,825) |
| Net increase (decrease) | 40,819 | 204,955 | $513,639 | $3,126,593 |
| Class M | | | | |
| Shares sold | 9,408 | 17,367 | $117,701 | $265,289 |
| Reinvestment of distributions | - | 1,635 | - | 24,841 |
| Shares redeemed | (3,240) | (2,733) | (39,359) | (41,893) |
| Net increase (decrease) | 6,168 | 16,269 | $78,342 | $248,237 |
| Class C | | | | |
| Shares sold | 13,156 | 72,426 | $163,683 | $1,099,839 |
| Reinvestment of distributions | - | 1,841 | - | 27,774 |
| Shares redeemed | (7,904) | (17,878) | (98,953) | (249,596) |
| Net increase (decrease) | 5,252 | 56,389 | $64,730 | $878,017 |
| Fidelity Women's Leadership Fund | | | | |
| Shares sold | 485,822 | 2,939,308 | $6,145,606 | $45,268,708 |
| Reinvestment of distributions | - | 191,234 | - | 2,919,250 |
| Shares redeemed | (701,246) | (1,906,544) | (8,712,256) | (28,945,460) |
| Net increase (decrease) | (215,424) | 1,223,998 | $(2,566,650) | $19,242,498 |
| Class I | | | | |
| Shares sold | 202,846 | 850,923 | $2,507,059 | $13,354,621 |
| Reinvestment of distributions | - | 19,138 | - | 292,838 |
| Shares redeemed | (186,561) | (269,624) | (2,349,791) | (3,716,366) |
| Net increase (decrease) | 16,285 | 600,437 | $157,268 | $9,931,093 |
| Class Z | | | | |
| Shares sold | 107,766 | 298,679 | $1,381,089 | $4,535,147 |
| Reinvestment of distributions | - | 16,552 | - | 253,122 |
| Shares redeemed | (143,272) | (284,436) | (1,865,722) | (4,323,726) |
| Net increase (decrease) | (35,506) | 30,795 | $(484,633) | $464,543 |
11. Other.
A fund's organizational documents provide former and current trustees and officers with a limited indemnification against liabilities arising in connection with the performance of their duties to the fund. In the normal course of business, a fund may also enter into contracts that provide general indemnifications. A fund's maximum exposure under these arrangements is unknown as this would be dependent on future claims that may be made against a fund. The risk of material loss from such claims is considered remote.
12. Risk and Uncertainties.
Many factors affect a fund's performance. Developments that disrupt global economies and financial markets, such as pandemics, epidemics, outbreaks of infectious diseases, war, terrorism, and environmental disasters, may significantly affect a fund's investment performance. The effects of these developments to a fund will be impacted by the types of securities in which a fund invests, the financial condition, industry, economic sector, and geographic location of an issuer, and a fund's level of investment in the securities of that issuer.
As a shareholder, you incur two types of costs: (1) transaction costs, which may include sales charges (loads) on purchase payments or redemption proceeds, as applicable and (2) ongoing costs, which generally include management fees, distribution and/or service (12b-1) fees and other Fund expenses. This Example is intended to help you understand your ongoing costs (in dollars) of investing in a fund and to compare these costs with the ongoing costs of investing in other mutual funds.
| The Example is based on an investment of $1,000 invested at the beginning of the period and held for the entire period (May 1, 2022 to October 31, 2022). |
Actual Expenses
The first line of the accompanying table provides information about actual account values and actual expenses. You may use the information in this line, together with the amount you invested, to estimate the expenses that you paid over the period. Simply divide your account value by $1,000.00 (for example, an $8,600 account value divided by $1,000.00 = 8.6), then multiply the result by the number in the first line for a class/Fund under the heading entitled "Expenses Paid During Period" to estimate the expenses you paid on your account during this period. If any fund is a shareholder of any underlying mutual funds or exchange-traded funds (ETFs) (the Underlying Funds), such fund indirectly bears its proportional share of the expenses of the Underlying Funds in addition to the direct expenses incurred presented in the table. These fees and expenses are not included in the annualized expense ratio used to calculate the expense estimate in the table below.
Hypothetical Example for Comparison Purposes
The second line of the accompanying table provides information about hypothetical account values and hypothetical expenses based on the actual expense ratio and an assumed rate of return of 5% per year before expenses, which is not the actual return. The hypothetical account values and expenses may not be used to estimate the actual ending account balance or expenses you paid for the period. You may use this information to compare the ongoing costs of investing in the Fund and other funds. To do so, compare this 5% hypothetical example with the 5% hypothetical examples that appear in the shareholder reports of the other funds. If any fund is a shareholder of any Underlying Funds, such fund indirectly bears its proportional share of the expenses of the Underlying Funds in addition to the direct expenses as presented in the table. These fees and expenses are not included in the annualized expense ratio used to calculate the expense estimate in the table below.
Please note that the expenses shown in the table are meant to highlight your ongoing costs only and do not reflect any transaction costs. Therefore, the second line of the table is useful in comparing ongoing costs only, and will not help you determine the relative total costs of owning different funds. In addition, if these transactional costs were included, your costs would have been higher.
| | | | | Annualized Expense Ratio- A | | Beginning Account Value May 1, 2022 | | Ending Account Value October 31, 2022 | | Expenses Paid During Period- C May 1, 2022 to October 31, 2022 |
| Fidelity® Women's Leadership Fund | | | | | | | | | | |
| Class A | | | | 1.05% | | | | | | |
| Actual | | | | | | $ 1,000 | | $ 955.20 | | $ 5.17 |
Hypothetical- B | | | | | | $ 1,000 | | $ 1,019.91 | | $ 5.35 |
| Class M | | | | 1.33% | | | | | | |
| Actual | | | | | | $ 1,000 | | $ 953.60 | | $ 6.55 |
Hypothetical- B | | | | | | $ 1,000 | | $ 1,018.50 | | $ 6.77 |
| Class C | | | | 1.81% | | | | | | |
| Actual | | | | | | $ 1,000 | | $ 951.50 | | $ 8.90 |
Hypothetical- B | | | | | | $ 1,000 | | $ 1,016.08 | | $ 9.20 |
| Fidelity® Womens Leadership Fund | | | | .86% | | | | | | |
| Actual | | | | | | $ 1,000 | | $ 956.10 | | $ 4.24 |
Hypothetical- B | | | | | | $ 1,000 | | $ 1,020.87 | | $ 4.38 |
| Class I | | | | .75% | | | | | | |
| Actual | | | | | | $ 1,000 | | $ 956.90 | | $ 3.70 |
Hypothetical- B | | | | | | $ 1,000 | | $ 1,021.42 | | $ 3.82 |
| Class Z | | | | .64% | | | | | | |
| Actual | | | | | | $ 1,000 | | $ 957.00 | | $ 3.16 |
Hypothetical- B | | | | | | $ 1,000 | | $ 1,021.98 | | $ 3.26 |
| |
A Annualized expense ratio reflects expenses net of applicable fee waivers.
B 5% return per year before expenses
C Expenses are equal to the annualized expense ratio, multiplied by the average account value over the period, multiplied by 184/ 365 (to reflect the one-half year period). The fees and expenses of any Underlying Funds are not included in each annualized expense ratio.
Fidelity Women's Leadership Fund
Each year, the Board of Trustees, including the Independent Trustees (together, the Board), votes on the renewal of the management contract with Fidelity Management & Research Company LLC (FMR) and the sub-advisory agreements (together, the Advisory Contracts) for the fund. FMR and the sub-advisers are referred to herein as the Investment Advisers. The Board, assisted by the advice of fund counsel and Independent Trustees' counsel, requests and considers a broad range of information relevant to the renewal of the Advisory Contracts throughout the year.
The Board meets regularly and, at each of its meetings, covers an extensive agenda of topics and materials and considers factors that are relevant to its annual consideration of the renewal of the fund's Advisory Contracts, including the services and support provided to the fund and its shareholders. The Board has established various standing committees (Committees), each composed of and chaired by Independent Trustees with varying backgrounds, to which the Board has assigned specific subject matter responsibilities in order to enhance effective decision-making by the Board. The Board, acting directly and through its Committees, requests and receives information concerning the annual consideration of the renewal of the fund's Advisory Contracts. The Board also meets as needed to review matters specifically related to the Board's annual consideration of the renewal of the Advisory Contracts. Members of the Board may also meet with trustees of other Fidelity funds through joint ad hoc committees to discuss certain matters relevant to all of the Fidelity funds.
At its May 2022 meeting, the Board unanimously determined to renew the fund's Advisory Contracts. In reaching its determination, the Board considered all factors it believed relevant, including (i) the nature, extent, and quality of the services provided to the fund and its shareholders (including the investment performance of the fund); (ii) the competitiveness relative to peer funds of the fund's management fee and the total expense ratio of a representative class (retail class); (iii) the total costs of the services provided by and the profits realized by Fidelity from its relationships with the fund; and (iv) the extent to which, if any, economies of scale exist and are realized as the fund grows, and whether any economies of scale are appropriately shared with fund shareholders.
In considering whether to renew the Advisory Contracts for the fund, the Board reached a determination, with the assistance of fund counsel and Independent Trustees' counsel and through the exercise of its business judgment, that the renewal of the Advisory Contracts was in the best interests of the fund and its shareholders and that the compensation payable under the Advisory Contracts was fair and reasonable. The Board's decision to renew the Advisory Contracts was not based on any single factor, but rather was based on a comprehensive consideration of all the information provided to the Board at its meetings throughout the year. The Board, in reaching its determination to renew the Advisory Contracts, was aware that shareholders of the fund have a broad range of investment choices available to them, including a wide choice among funds offered by Fidelity's competitors, and that the fund's shareholders, who have the opportunity to review and weigh the disclosure provided by the fund in its prospectus and other public disclosures, have chosen to invest in this fund, which is part of the Fidelity family of funds.
Nature, Extent, and Quality of Services Provided. The Board considered Fidelity's staffing as it relates to the fund, including the backgrounds of investment personnel of Fidelity, and also considered the fund's investment objective, strategies, and related investment philosophy. The Independent Trustees also had discussions with senior management of Fidelity's investment operations and investment groups. The Board considered the structure of the investment personnel compensation program and whether this structure provides appropriate incentives to act in the best interests of the fund. Additionally, the Board considered the portfolio managers' investments, if any, in the funds that they manage. The Board also considered the steps Fidelity had taken to ensure the continued provision of high quality services to the Fidelity funds during the COVID-19 pandemic, including the expansion of staff in client facing positions to maintain service levels in periods of high volumes and volatility.
Resources Dedicated to Investment Management and Support Services . The Board and the Fund Oversight and Research Committees reviewed the general qualifications and capabilities of Fidelity's investment staff, including its size, education, experience, and resources, as well as Fidelity's approach to recruiting, training, managing, and compensating investment personnel. The Board noted the resources devoted to expansion of Fidelity's global investment organization, and that Fidelity's analysts have extensive resources, tools, and capabilities that allow them to conduct sophisticated quantitative and fundamental analysis, as well as credit analysis of issuers, counterparties, and guarantors. Further, the Board considered that Fidelity's investment professionals have sufficient access to global information and data so as to provide competitive investment results over time, and that those professionals also have access to sophisticated tools that permit them to assess portfolio construction and risk and performance attribution characteristics continuously, as well as to transmit new information and research conclusions rapidly around the world. Additionally, in its deliberations, the Board considered Fidelity's trading, risk management, compliance, and technology and operations capabilities and resources, which are integral parts of the investment management process.
Shareholder and Administrative Services . The Board considered (i) the nature, extent, quality, and cost of advisory, administrative, and shareholder services performed by the Investment Advisers and their affiliates under the Advisory Contracts and under separate agreements covering transfer agency, pricing and bookkeeping, and securities lending services for the fund; (ii) the nature and extent of the supervision of third party service providers, principally custodians, subcustodians, and pricing vendors; and (iii) the resources devoted to, and the record of compliance with, the fund's compliance policies and procedures. The Board also reviewed the allocation of fund brokerage, including allocations to brokers affiliated with the Investment Advisers, the use of brokerage commissions to pay fund expenses, and the use of "soft" commission dollars to pay for research services.
The Board noted that the growth of fund assets over time across the complex allows Fidelity to reinvest in the development of services designed to enhance the value and convenience of the Fidelity funds as investment vehicles. These services include 24-hour access to account information and market information over the Internet and through telephone representatives, investor education materials and asset allocation tools. The Board also considered that it reviews customer service metrics such as telephone response times, continuity of services on the website and metrics addressing services at Fidelity Investor Centers.
Investment in a Large Fund Family. The Board considered the benefits to shareholders of investing in a Fidelity fund, including the benefits of investing in a fund that is part of a large family of funds offering a variety of investment disciplines and providing a large variety of mutual fund investor services. The Board noted that Fidelity had taken, or had made recommendations that resulted in the Fidelity funds taking, a number of actions over the previous year that benefited particular funds, including: (i) continuing to dedicate additional resources to Fidelity's investment research process, which includes meetings with management of issuers of securities in which the funds invest; (ii) continuing efforts to enhance Fidelity's global research capabilities; (iii) launching new funds and ETFs with innovative structures, strategies and pricing and making other enhancements to meet client needs; (iv) launching new share classes of existing funds; (v) eliminating purchase minimums and broadening eligibility requirements for certain funds and share classes; (vi) reducing management fees and total expenses for certain target date funds and classes and index funds; (vii) lowering expenses for certain existing funds and classes by implementing or lowering expense caps; (viii) rationalizing product lines and gaining increased efficiencies from fund mergers and liquidations; (ix) continuing to develop, acquire and implement systems and technology to improve services to the funds and shareholders, strengthen information security, and increase efficiency; and (x) continuing to implement enhancements to further strengthen Fidelity's product line to increase investors' probability of success in achieving their investment goals, including retirement income goals.
Investment Performance . The Board considered whether the fund has operated in accordance with its investment objective, as well as its record of compliance with its investment restrictions and its performance history.
The Board took into account discussions that occur at Board meetings throughout the year with representatives of the Investment Advisers about fund investment performance. In this regard the Board noted that as part of regularly scheduled fund reviews and other reports to the Board on fund performance, the Board considers annualized return information for the fund for different time periods, measured against an appropriate securities market index (benchmark index). The Board also reviews and considers information about performance attribution. In its evaluation of fund investment performance, the Board gave particular attention to information indicating changes in performance of certain Fidelity funds for specific time periods and discussed with the Investment Advisers the reasons for any overperformance or underperformance.
In addition to reviewing absolute and relative fund performance, the Independent Trustees periodically consider the appropriateness of fund performance metrics in evaluating the results achieved. In general, the Independent Trustees believe that fund performance should be evaluated based on net performance (after fees and expenses) the representative class, compared to appropriate benchmark indices, over appropriate time periods that may include full market cycles, and compared to peer groups, as applicable, over the same periods, taking into account relevant factors including the following: general market conditions; issuer-specific information; and fund cash flows and other factors.
The Independent Trustees recognize that shareholders evaluate performance on a net basis over their own holding periods, for which one-, three-, and five-year periods are often used as a proxy. For this reason, the performance information reviewed by the Board also included net total return information for the fund and an appropriate benchmark index for the most recent one-year period ended September 30, 2021, as shown below. A peer group is not shown below because the fund does not generally utilize a peer group for performance comparison purposes.
Fidelity Women's Leadership Fund
The Board also considered that the fund's management fee is subject to upward or downward adjustment depending upon whether, and to what extent, the fund's investment performance for the performance period (a rolling 36-month period) exceeds, or is exceeded by, a securities index, thus leading to a performance adjustment for the same period. The Board noted that the performance adjustment provides FMR with a strong economic incentive to seek to achieve superior long-term performance for the fund's shareholders and helps to more closely align the interests of FMR and the shareholders of the fund.
Based on its review, the Board concluded that the nature, extent, and quality of services provided to the fund under the Advisory Contracts should continue to benefit the shareholders of the fund.
Competitiveness of Management Fee and Total Expense Ratio . The Board considered the fund's management fee and total expense ratio compared to "mapped groups" of competitive funds and classes created for the purpose of facilitating the Trustees' competitive analysis of management fees and total expenses. Fidelity creates "mapped groups" by combining similar Lipper investment objective categories that have comparable investment mandates. Combining Lipper investment objective categories aids the Board's management fee and total expense ratio comparisons by broadening the competitive group used for comparison.
Management Fee . The Board considered two proprietary management fee comparisons for the 12-month (or shorter) periods ended September 30 (June 30 for the period ended 2019) shown in basis points (BP) in the chart below. The group of Lipper funds used by the Board for management fee comparisons is referred to below as the "Total Mapped Group." The Total Mapped Group comparison focuses on a fund's standing in terms of gross management fees before expense reimbursements or caps, and without giving effect to the fund's performance adjustment, relative to the total universe of funds with comparable investment mandates, regardless of whether their management fee structures also are comparable. Funds with comparable investment mandates offer exposure to similar types of securities. Funds with comparable management fee structures have similar management fee contractual arrangements (e.g., flat rate charged for advisory services, all-inclusive fee rate, etc.). "TMG %" represents the percentage of funds in the Total Mapped Group that had management fees that were lower than the fund's. For example, a hypothetical TMG % of 20% would mean that 80% of the funds in the Total Mapped Group had higher, and 20% had lower, management fees than the fund. The fund's actual TMG %s and the number of funds in the Total Mapped Group are in the chart below. The "Asset-Sized Peer Group" (ASPG) comparison focuses on a fund's standing relative to a subset of non-Fidelity funds within the Total Mapped Group that are similar in size and management fee structure without taking into account performance adjustments, if any. For example, if a fund is in the first quartile of the ASPG, the fund's management fee ranks in the least expensive or lowest 25% of funds in the ASPG. The ASPG represents at least 15% of the funds in the Total Mapped Group with comparable asset size and management fee structures, subject to a minimum of 50 funds (or all funds in the Total Mapped Group if fewer than 50). Additional information, such as the ASPG quartile in which the fund's management fee rate ranked and the impact of the fund's performance adjustment, is also included in the chart and was considered by the Board.
Fidelity Women's Leadership Fund
The Board noted that the fund's management fee rate ranked below the median of its Total Mapped Group and below the median of its ASPG for 12-month period ended September 30, 2021. The Board also noted the effect of the fund's performance adjustment, if any, on the fund's management fee ranking.
The Board also considered that, for funds subject to the group fee, FMR agreed to voluntarily waive fees over a specified period of time in amounts designed to account for assets converted from certain funds to certain collective investment trusts.
Based on its review, the Board concluded that the fund's management fee is fair and reasonable in light of the services that the fund receives and the other factors considered.
Total Expense Ratio . In its review of the total expense ratio of the representative class (retail class), the Board considered the fund's management fee rate as well as other fund or class expenses, as applicable, such as transfer agent fees, pricing and bookkeeping fees, fund-paid 12b-1 fees, and custodial, legal, and audit fees. The Board noted the impact of the fund's performance adjustment. The Board also noted that Fidelity may agree to waive fees or reimburse expenses from time to time, and the extent to which, if any, it has done so for the fund. The fund's representative class is compared to those funds and classes in the Total Mapped Group (used by the Board for management fee comparisons) that have a similar sales load structure. The Board also considered a total expense ASPG comparison, which focuses on the total expenses of the representative class relative to a subset of non-Fidelity funds within the total expense similar sales load structure group. The total expense ASPG is limited to 15 larger and 15 smaller classes in fund average assets for a total of 30 classes, where possible. The total expense ASPG comparison excludes performance adjustments and fund-paid 12b-1 fees to eliminate variability in fee structures.
The Board noted that the total net expense ratio of the retail class ranked below the similar sales load structure group competitive median and below the ASPG competitive median for the 12-month period ended September 30, 2021.
The Board considered that FMR has contractually agreed to reimburse Class A, Class M, Class C, Class I, Class Z, and the retail class of the fund to the extent that total operating expenses (excluding interest, certain taxes, fees and expenses associated with a wholly owned subsidiary, if any, as well as non-operating expenses such as brokerage commissions and fees and expenses associated with the fund's securities lending program, if applicable)as a percentage of their respective average net assets, exceed 1.15%, 1.40%, 1.90%, 0.90%, 0.75%, and 0.90% through August 31, 2022.
Fees Charged to Other Fidelity Clients . The Board also considered Fidelity fee structures and other information with respect to clients of Fidelity, such as other funds advised or subadvised by Fidelity, pension plan clients, and other institutional clients with similar mandates. The Board noted that a joint ad hoc committee created by it and the boards of other Fidelity funds periodically reviews and compares Fidelity's institutional investment advisory business with its business of providing services to the Fidelity funds and also noted the most recent findings of the committee. The Board noted that the committee's review included a consideration of the differences in services provided, fees charged, and costs incurred, as well as competition in the markets serving the different categories of clients.
Based on its review of total expense ratios and fees charged to other Fidelity clients, the Board concluded that the total expense ratio of each class of the fund was reasonable in light of the services that the fund and its shareholders receive and the other factors considered.
Costs of the Services and Profitability. The Board considered the revenues earned and the expenses incurred by Fidelity in conducting the business of developing, marketing, distributing, managing, administering and servicing the fund and servicing the fund's shareholders. The Board also considered the level of Fidelity's profits in respect of all the Fidelity funds.
On an annual basis, Fidelity presents to the Board information about the profitability of its relationships with the fund. Fidelity calculates profitability information for each fund, as well as aggregate profitability information for groups of Fidelity funds and all Fidelity funds, using a series of detailed revenue and cost allocation methodologies which originate with the books and records of Fidelity on which Fidelity's audited financial statements are based. The Audit Committee of the Board reviews any significant changes from the prior year's methodologies and the full Board approves such changes.
A public accounting firm has been engaged annually by the Board as part of the Board's assessment of Fidelity's profitability analysis. The engagement includes the review and assessment of the methodologies used by Fidelity in determining the revenues and expenses attributable to Fidelity's mutual fund business, and completion of agreed-upon procedures in respect of the mathematical accuracy of certain fund profitability information and its conformity to established allocation methodologies. After considering the reports issued under the engagement and information provided by Fidelity, the Board concluded that while other allocation methods may also be reasonable, Fidelity's profitability methodologies are reasonable in all material respects.
The Board also reviewed Fidelity's non-fund businesses and potential indirect benefits such businesses may have received as a result of their association with Fidelity's mutual fund business (i.e., fall-out benefits) as well as cases where Fidelity's affiliates may benefit from the funds' business. The Board considered areas where potential indirect benefits to the Fidelity funds from their relationships with Fidelity may exist. The Board's consideration of these matters was informed by the findings of a joint ad hoc committee created by it and the boards of other Fidelity funds to evaluate potential fall-out benefits.
The Board considered the costs of the services provided by and the profits realized by Fidelity in connection with the operation of the fund and was satisfied that the profitability was not excessive.
Economies of Scale . The Board considered whether there have been economies of scale in respect of the management of the Fidelity funds, whether the Fidelity funds (including the fund) have appropriately benefited from any such economies of scale, and whether there is potential for realization of any further economies of scale. The Board considered the extent to which the fund will benefit from economies of scale as assets grow through increased services to the fund, through waivers or reimbursements, or through fee or expense ratio reductions. The Board also noted that a committee (the Economies of Scale Committee) created by it and the boards of other Fidelity funds periodically analyzes whether Fidelity attains economies of scale in respect of the management and servicing of the Fidelity funds, whether the Fidelity funds have appropriately benefited from such economies of scale, and whether there is potential for realization of any further economies of scale.
The Board recognized that the fund's management contract incorporates a "group fee" structure, which provides for lower group fee rates as total "group assets" increase, and for higher group fee rates as total "group assets" decrease ("group assets" as defined in the management contract). FMR calculates the group fee rates based on a tiered asset "breakpoint" schedule that varies based on asset class. The Board considered that the group fee is designed to deliver the benefits of economies of scale to fund shareholders when total Fidelity fund assets increase, even if assets of any particular fund are unchanged or have declined, because some portion of Fidelity's costs are attributable to services provided to all Fidelity funds, and all funds benefit if those costs can be allocated among more assets. The Board further considered that Fidelity agreed to impose a temporary fee waiver in the form of additional breakpoints to the current breakpoint schedule. The Board concluded that, given the group fee structure, fund shareholders will benefit from lower management fees as "group assets" increase at the fund complex level, regardless of whether Fidelity achieves any such economies of scale.
The Board concluded, taking into account the analysis of the Economies of Scale Committee, that economies of scale, if any, are being appropriately shared between fund shareholders and Fidelity.
Additional Information Requested by the Board . In order to develop fully the factual basis for consideration of the Fidelity funds' advisory contracts, the Board requested and received additional information on certain topics, including: (i) fund flow and performance trends, in particular the underperformance of certain funds and strategies, and Fidelity's long-term strategies for certain funds, including any consideration of fund liquidations or mergers; (ii) the operation of performance fees, competitor use of performance fees, and consideration of the expansion of performance fees to additional funds; (iii) Fidelity's pricing philosophy compared to competitors; (iv) fund profitability methodology and data; (v) evaluation of competitive fund data and peer group classifications and fee and expense comparisons; (vi) the management fee and expense structures for different funds and classes and information about the differences between various fee and expense structures; (vii) group fee breakpoints and related voluntary fee waivers; and (viii) information regarding other accounts managed by Fidelity and the funds' sub-advisory arrangements.
Based on its evaluation of all of the conclusions noted above, and after considering all factors it believed relevant, the Board concluded that the advisory fee arrangements are fair and reasonable and that the fund's Advisory Contracts should be renewed.
1.9893106.103
WLF-SANN-1222
Fidelity® Focused High Income Fund
Semi-Annual Report
October 31, 2022
Contents
To view a fund's proxy voting guidelines and proxy voting record for the 12-month period ended June 30, visit http://www.fidelity.com/proxyvotingresults or visit the Securities and Exchange Commission's (SEC) web site at http://www.sec.gov.
You may also call 1-800-544-8544 to request a free copy of the proxy voting guidelines.
Standard & Poor's, S&P and S&P 500 are registered service marks of The McGraw-Hill Companies, Inc. and have been licensed for use by Fidelity Distributors Corporation.
Other third-party marks appearing herein are the property of their respective owners.
All other marks appearing herein are registered or unregistered trademarks or service marks of FMR LLC or an affiliated company. © 2022 FMR LLC. All rights reserved.
This report and the financial statements contained herein are submitted for the general information of the shareholders of the Fund. This report is not authorized for distribution to prospective investors in the Fund unless preceded or accompanied by an effective prospectus.
A fund files its complete schedule of portfolio holdings with the SEC for the first and third quarters of each fiscal year on Form N-PORT. Forms N-PORT are available on the SEC's web site at http://www.sec.gov. A fund's Forms N-PORT may be reviewed and copied at the SEC's Public Reference Room in Washington, DC. Information regarding the operation of the SEC's Public Reference Room may be obtained by calling 1-800-SEC-0330.
For a complete list of a fund's portfolio holdings, view the most recent holdings listing, semiannual report, or annual report on Fidelity's web site at http://www.fidelity.com, http://www.institutional.fidelity.com, or http://www.401k.com, as applicable.
NOT FDIC INSURED •MAY LOSE VALUE •NO BANK GUARANTEE
Neither the Fund nor Fidelity Distributors Corporation is a bank.
| Top Bond Issuers (% of Fund's net assets) |
(with maturities greater than one year) |
| Occidental Petroleum Corp. | 2.9 | |
| Sprint Capital Corp. | 2.2 | |
| Crestwood Midstream Partners LP/Crestwood Midstream Finance Corp. | 2.1 | |
| CCO Holdings LLC/CCO Holdings Capital Corp. | 2.0 | |
| Icahn Enterprises LP/Icahn Enterprises Finance Corp. | 2.0 | |
| PG&E Corp. | 1.8 | |
| Ford Motor Credit Co. LLC | 1.7 | |
| Level 3 Financing, Inc. | 1.7 | |
| HCA Holdings, Inc. | 1.7 | |
| Tenet Healthcare Corp. | 1.6 | |
| | 19.7 | |
| |
| Market Sectors (% of Fund's net assets) |
| |
| Energy | 19.0 | |
| Telecommunications | 7.8 | |
| Healthcare | 7.2 | |
| Utilities | 5.9 | |
| Services | 5.8 | |
| |
Quality Diversification (% of Fund's net assets) |
|
| |
| We have used ratings from Moody's Investors Service, Inc. Where Moody's® ratings are not available, we have used S&P® ratings. All ratings are as of the date indicated and do not reflect subsequent changes. |
Asset Allocation (% of Fund's net assets) |
|
Foreign investments - 11.3% |
|
Geographic Diversification (% of Fund's net assets) |
|
* Includes Short-Term investments and Net Other Assets (Liabilities). Percentages are based on country or territory of incorporation and are adjusted for the effect of futures contracts, if applicable. |
| |
Showing Percentage of Net Assets
| Corporate Bonds - 89.1% |
| | | Principal Amount (a) | Value ($) |
| Convertible Bonds - 0.7% | | | |
| Broadcasting - 0.7% | | | |
| DISH Network Corp.: | | | |
| 2.375% 3/15/24 | | 1,230,000 | 1,115,610 |
| 3.375% 8/15/26 | | 680,000 | 470,220 |
| | | | 1,585,830 |
| Nonconvertible Bonds - 88.4% | | | |
| Aerospace - 2.9% | | | |
| BWX Technologies, Inc. 4.125% 6/30/28 (b) | | 795,000 | 695,625 |
| Howmet Aerospace, Inc. 6.75% 1/15/28 | | 665,000 | 663,956 |
| Kaiser Aluminum Corp. 4.625% 3/1/28 (b) | | 1,730,000 | 1,513,404 |
| Moog, Inc. 4.25% 12/15/27 (b) | | 1,025,000 | 917,232 |
| Rolls-Royce PLC 5.75% 10/15/27 (b) | | 1,115,000 | 1,009,042 |
| Science Applications International Corp. 4.875% 4/1/28 (b) | | 150,000 | 136,574 |
| TransDigm, Inc.: | | | |
| 7.5% 3/15/27 | | 145,000 | 142,880 |
| 8% 12/15/25 (b) | | 1,505,000 | 1,531,338 |
| | | | 6,610,051 |
| Air Transportation - 0.3% | | | |
| United Airlines, Inc. 4.375% 4/15/26 (b) | | 750,000 | 684,493 |
| Automotive & Auto Parts - 2.5% | | | |
| Allison Transmission, Inc. 3.75% 1/30/31 (b) | | 1,115,000 | 889,498 |
| Dana, Inc. 4.5% 2/15/32 | | 380,000 | 290,543 |
| Ford Motor Credit Co. LLC: | | | |
| 2.7% 8/10/26 | | 305,000 | 265,350 |
| 4% 11/13/30 | | 1,495,000 | 1,209,126 |
| 4.687% 6/9/25 | | 2,140,000 | 2,033,700 |
| 5.125% 6/16/25 | | 530,000 | 511,344 |
| LCM Investments Holdings 4.875% 5/1/29 (b) | | 165,000 | 139,181 |
| Thor Industries, Inc. 4% 10/15/29 (b) | | 500,000 | 404,390 |
| | | | 5,743,132 |
| Banks & Thrifts - 0.5% | | | |
| Jane Street Group LLC/JSG Finance, Inc. 4.5% 11/15/29 (b) | | 210,000 | 185,611 |
| Quicken Loans LLC/Quicken Loans Co-Issuer, Inc. 3.625% 3/1/29 (b) | | 1,185,000 | 918,375 |
| | | | 1,103,986 |
| Broadcasting - 0.7% | | | |
| Diamond Sports Group LLC/Diamond Sports Finance Co. 5.375% 8/15/26 (b) | | 1,390,000 | 278,000 |
| Scripps Escrow II, Inc. 3.875% 1/15/29 (b) | | 410,000 | 338,594 |
| Sirius XM Radio, Inc.: | | | |
| 3.875% 9/1/31 (b) | | 390,000 | 312,000 |
| 5.5% 7/1/29 (b) | | 625,000 | 576,438 |
| TEGNA, Inc. 5% 9/15/29 | | 210,000 | 199,101 |
| | | | 1,704,133 |
| Building Materials - 1.1% | | | |
| Advanced Drain Systems, Inc. 5% 9/30/27 (b) | | 1,320,000 | 1,223,957 |
| Builders FirstSource, Inc. 4.25% 2/1/32 (b) | | 355,000 | 284,071 |
| Standard Industries, Inc./New Jersey 4.375% 7/15/30 (b) | | 1,300,000 | 1,051,115 |
| | | | 2,559,143 |
| Cable/Satellite TV - 4.1% | | | |
| CCO Holdings LLC/CCO Holdings Capital Corp.: | | | |
| 4.5% 8/15/30 (b) | | 675,000 | 547,803 |
| 4.5% 6/1/33 (b) | | 785,000 | 595,274 |
| 5% 2/1/28 (b) | | 1,780,000 | 1,610,900 |
| 5.125% 5/1/27 (b) | | 2,110,000 | 1,954,873 |
| CSC Holdings LLC: | | | |
| 4.125% 12/1/30 (b) | | 160,000 | 125,883 |
| 5.375% 2/1/28 (b) | | 1,500,000 | 1,383,750 |
| 5.5% 4/15/27 (b) | | 1,320,000 | 1,237,500 |
| VZ Secured Financing BV 5% 1/15/32 (b) | | 1,770,000 | 1,420,425 |
| Ziggo Bond Co. BV 6% 1/15/27 (b) | | 300,000 | 269,986 |
| Ziggo BV 4.875% 1/15/30 (b) | | 475,000 | 401,375 |
| | | | 9,547,769 |
| Chemicals - 3.6% | | | |
| Axalta Coating Systems/Dutch Holding BV 4.75% 6/15/27 (b) | | 935,000 | 853,009 |
| LSB Industries, Inc. 6.25% 10/15/28 (b) | | 235,000 | 213,354 |
| Methanex Corp.: | | | |
| 5.25% 12/15/29 | | 160,000 | 136,922 |
| 5.65% 12/1/44 | | 991,000 | 681,313 |
| NOVA Chemicals Corp. 5.25% 6/1/27 (b) | | 1,710,000 | 1,526,312 |
| Nufarm Australia Ltd. 5% 1/27/30 (b) | | 865,000 | 731,712 |
| Olin Corp. 5.125% 9/15/27 | | 1,695,000 | 1,589,063 |
| SPCM SA 3.125% 3/15/27 (b) | | 385,000 | 338,319 |
| The Chemours Co. LLC: | | | |
| 4.625% 11/15/29 (b) | | 385,000 | 300,300 |
| 5.375% 5/15/27 | | 1,000,000 | 895,420 |
| 5.75% 11/15/28 (b) | | 505,000 | 428,998 |
| Valvoline, Inc. 4.25% 2/15/30 (b) | | 255,000 | 245,438 |
| W.R. Grace Holding LLC 4.875% 6/15/27 (b) | | 505,000 | 441,875 |
| | | | 8,382,035 |
| Consumer Products - 0.5% | | | |
| Newell Brands, Inc. 5.625% 4/1/36 (c) | | 490,000 | 407,141 |
| Prestige Brands, Inc. 3.75% 4/1/31 (b) | | 600,000 | 481,206 |
| Tempur Sealy International, Inc. 3.875% 10/15/31 (b) | | 395,000 | 296,590 |
| | | | 1,184,937 |
| Containers - 1.2% | | | |
| Ardagh Packaging Finance PLC/Ardagh MP Holdings U.S.A., Inc. 4.125% 8/15/26 (b) | | 50,000 | 43,250 |
| Ball Corp. 3.125% 9/15/31 | | 1,340,000 | 1,026,038 |
| Graphic Packaging International, Inc. 3.75% 2/1/30 (b) | | 190,000 | 163,354 |
| OI European Group BV 4.75% 2/15/30 (b) | | 390,000 | 327,600 |
| Trivium Packaging Finance BV 5.5% 8/15/26 (b) | | 1,215,000 | 1,115,291 |
| | | | 2,675,533 |
| Diversified Financial Services - 5.2% | | | |
| Coinbase Global, Inc.: | | | |
| 3.375% 10/1/28 (b) | | 965,000 | 630,736 |
| 3.625% 10/1/31 (b) | | 1,835,000 | 1,086,574 |
| Hightower Holding LLC 6.75% 4/15/29 (b) | | 1,105,000 | 899,611 |
| Icahn Enterprises LP/Icahn Enterprises Finance Corp.: | | | |
| 5.25% 5/15/27 | | 3,405,000 | 3,136,856 |
| 6.25% 5/15/26 | | 1,620,000 | 1,559,250 |
| Ladder Capital Finance Holdings LLLP/Ladder Capital Finance Corp. 4.25% 2/1/27 (b) | | 845,000 | 709,682 |
| LPL Holdings, Inc. 4% 3/15/29 (b) | | 1,520,000 | 1,326,641 |
| MSCI, Inc. 3.25% 8/15/33 (b) | | 310,000 | 239,645 |
| OneMain Finance Corp.: | | | |
| 3.5% 1/15/27 | | 1,145,000 | 939,080 |
| 6.875% 3/15/25 | | 1,105,000 | 1,071,850 |
| 7.125% 3/15/26 | | 500,000 | 482,500 |
| | | | 12,082,425 |
| Diversified Media - 0.3% | | | |
| Lamar Media Corp. 3.625% 1/15/31 | | 915,000 | 745,725 |
| Energy - 18.7% | | | |
| Altus Midstream LP 5.875% 6/15/30 (b) | | 270,000 | 253,307 |
| Apache Corp.: | | | |
| 4.25% 1/15/30 | | 215,000 | 191,289 |
| 5.1% 9/1/40 | | 600,000 | 485,832 |
| 5.25% 2/1/42 | | 905,000 | 726,263 |
| 5.35% 7/1/49 | | 150,000 | 115,771 |
| Cheniere Energy Partners LP: | | | |
| 3.25% 1/31/32 | | 385,000 | 299,595 |
| 4% 3/1/31 | | 1,625,000 | 1,370,013 |
| Cheniere Energy, Inc. 4.625% 10/15/28 | | 1,085,000 | 1,000,913 |
| CNX Midstream Partners LP 4.75% 4/15/30 (b) | | 160,000 | 131,600 |
| Colgate Energy Partners III LLC 5.875% 7/1/29 (b) | | 200,000 | 185,500 |
| Continental Resources, Inc. 5.75% 1/15/31 (b) | | 1,630,000 | 1,477,849 |
| Crestwood Midstream Partners LP/Crestwood Midstream Finance Corp.: | | | |
| 5.625% 5/1/27 (b) | | 1,928,000 | 1,813,432 |
| 5.75% 4/1/25 | | 3,007,000 | 2,931,825 |
| CVR Energy, Inc.: | | | |
| 5.25% 2/15/25 (b) | | 640,000 | 616,688 |
| 5.75% 2/15/28 (b) | | 150,000 | 135,750 |
| DCP Midstream Operating LP: | | | |
| 5.375% 7/15/25 | | 640,000 | 625,840 |
| 5.6% 4/1/44 | | 85,000 | 74,494 |
| 6.45% 11/3/36 (b) | | 380,000 | 358,804 |
| 8.125% 8/16/30 | | 25,000 | 26,721 |
| Endeavor Energy Resources LP/EER Finance, Inc. 5.75% 1/30/28 (b) | | 735,000 | 714,394 |
| EnLink Midstream LLC 5.625% 1/15/28 (b) | | 195,000 | 186,898 |
| EnLink Midstream Partners LP: | | | |
| 5.05% 4/1/45 | | 255,000 | 185,161 |
| 5.45% 6/1/47 | | 530,000 | 402,689 |
| 5.6% 4/1/44 | | 895,000 | 697,718 |
| EQM Midstream Partners LP: | | | |
| 4.75% 1/15/31 (b) | | 985,000 | 823,165 |
| 5.5% 7/15/28 | | 800,000 | 714,504 |
| 6.5% 7/1/27 (b) | | 785,000 | 765,375 |
| 6.5% 7/15/48 | | 485,000 | 373,450 |
| 7.5% 6/1/27 (b) | | 555,000 | 548,063 |
| EQT Corp. 3.9% 10/1/27 | | 1,450,000 | 1,303,217 |
| Hess Midstream Partners LP: | | | |
| 5.125% 6/15/28 (b) | | 1,070,000 | 984,400 |
| 5.625% 2/15/26 (b) | | 2,310,000 | 2,265,579 |
| Hilcorp Energy I LP/Hilcorp Finance Co. 6.25% 11/1/28 (b) | | 330,000 | 310,200 |
| Holly Energy Partners LP/Holly Energy Finance Corp.: | | | |
| 5% 2/1/28 (b) | | 1,360,000 | 1,229,161 |
| 6.375% 4/15/27 (b) | | 270,000 | 259,866 |
| New Fortress Energy, Inc. 6.5% 9/30/26 (b) | | 1,040,000 | 1,008,800 |
| Occidental Petroleum Corp.: | | | |
| 3.5% 8/15/29 | | 810,000 | 735,075 |
| 4.2% 3/15/48 | | 530,000 | 420,275 |
| 4.3% 8/15/39 | | 260,000 | 213,971 |
| 4.4% 4/15/46 | | 815,000 | 663,612 |
| 4.4% 8/15/49 | | 920,000 | 742,906 |
| 5.55% 3/15/26 | | 1,275,000 | 1,294,125 |
| 6.125% 1/1/31 | | 1,310,000 | 1,313,445 |
| 6.2% 3/15/40 | | 255,000 | 245,320 |
| 7.875% 9/15/31 | | 170,000 | 185,013 |
| 8.875% 7/15/30 | | 580,000 | 658,300 |
| Rockies Express Pipeline LLC: | | | |
| 4.8% 5/15/30 (b) | | 1,285,000 | 1,085,825 |
| 4.95% 7/15/29 (b) | | 495,000 | 434,257 |
| 6.875% 4/15/40 (b) | | 190,000 | 155,116 |
| Sunoco LP/Sunoco Finance Corp.: | | | |
| 4.5% 5/15/29 | | 1,140,000 | 979,146 |
| 5.875% 3/15/28 | | 1,695,000 | 1,613,599 |
| 6% 4/15/27 | | 25,000 | 24,495 |
| Superior Plus LP / Superior General Partner, Inc. 4.5% 3/15/29 (b) | | 320,000 | 271,242 |
| Tallgrass Energy Partners LP / Tallgrass Energy Finance Corp.: | | | |
| 5.5% 1/15/28 (b) | | 225,000 | 201,744 |
| 6% 3/1/27 (b) | | 980,000 | 924,798 |
| 6% 12/31/30 (b) | | 1,190,000 | 1,077,212 |
| Targa Resources Partners LP/Targa Resources Partners Finance Corp. 5.5% 3/1/30 | | 255,000 | 235,398 |
| Venture Global Calcasieu Pass LLC: | | | |
| 3.875% 8/15/29 (b) | | 480,000 | 411,600 |
| 3.875% 11/1/33 (b) | | 380,000 | 304,950 |
| 4.125% 8/15/31 (b) | | 460,000 | 392,164 |
| Western Gas Partners LP: | | | |
| 4.3% 2/1/30 | | 2,375,000 | 2,089,525 |
| 4.65% 7/1/26 | | 808,000 | 765,580 |
| | | | 43,032,819 |
| Environmental - 1.4% | | | |
| Darling Ingredients, Inc.: | | | |
| 5.25% 4/15/27 (b) | | 970,000 | 931,200 |
| 6% 6/15/30 (b) | | 170,000 | 163,625 |
| Madison IAQ LLC 4.125% 6/30/28 (b) | | 1,630,000 | 1,348,825 |
| Stericycle, Inc. 3.875% 1/15/29 (b) | | 815,000 | 707,901 |
| | | | 3,151,551 |
| Food & Drug Retail - 2.0% | | | |
| Albertsons Companies LLC/Safeway, Inc./New Albertson's, Inc./Albertson's LLC 3.5% 3/15/29 (b) | | 3,810,000 | 3,152,775 |
| BellRing Brands, Inc. 7% 3/15/30 (b) | | 350,000 | 330,505 |
| Emergent BioSolutions, Inc. 3.875% 8/15/28 (b) | | 1,590,000 | 953,269 |
| Murphy Oil U.S.A., Inc. 3.75% 2/15/31 (b) | | 190,000 | 158,319 |
| | | | 4,594,868 |
| Food/Beverage/Tobacco - 2.2% | | | |
| JBS U.S.A. Lux SA / JBS Food Co. 5.5% 1/15/30 (b) | | 2,525,000 | 2,301,685 |
| Post Holdings, Inc.: | | | |
| 4.625% 4/15/30 (b) | | 2,135,000 | 1,801,545 |
| 5.5% 12/15/29 (b) | | 590,000 | 530,953 |
| 5.625% 1/15/28 (b) | | 405,000 | 378,635 |
| U.S. Foods, Inc. 4.625% 6/1/30 (b) | | 180,000 | 156,154 |
| | | | 5,168,972 |
| Gaming - 2.6% | | | |
| Melco Resorts Finance Ltd. 4.875% 6/6/25 (b) | | 1,225,000 | 872,410 |
| MGM Resorts International 5.75% 6/15/25 | | 866,000 | 842,852 |
| VICI Properties LP / VICI Note Co.: | | | |
| 4.25% 12/1/26 (b) | | 1,210,000 | 1,102,153 |
| 4.5% 9/1/26 (b) | | 1,300,000 | 1,183,063 |
| 4.625% 6/15/25 (b) | | 245,000 | 229,616 |
| 4.625% 12/1/29 (b) | | 925,000 | 804,324 |
| Wynn Las Vegas LLC/Wynn Las Vegas Capital Corp. 5.25% 5/15/27 (b) | | 870,000 | 756,726 |
| Wynn Resorts Finance LLC / Wynn Resorts Capital Corp. 5.125% 10/1/29 (b) | | 380,000 | 302,277 |
| | | | 6,093,421 |
| Healthcare - 7.2% | | | |
| 180 Medical, Inc. 3.875% 10/15/29 (b) | | 200,000 | 169,000 |
| Avantor Funding, Inc. 4.625% 7/15/28 (b) | | 1,195,000 | 1,079,933 |
| Catalent Pharma Solutions 3.5% 4/1/30 (b) | | 1,700,000 | 1,372,750 |
| Centene Corp.: | | | |
| 2.45% 7/15/28 | | 75,000 | 61,715 |
| 2.5% 3/1/31 | | 1,665,000 | 1,280,085 |
| Charles River Laboratories International, Inc.: | | | |
| 3.75% 3/15/29 (b) | | 315,000 | 272,475 |
| 4.25% 5/1/28 (b) | | 90,000 | 81,873 |
| DaVita HealthCare Partners, Inc. 4.625% 6/1/30 (b) | | 365,000 | 284,563 |
| Grifols Escrow Issuer SA 4.75% 10/15/28 (b) | | 200,000 | 156,250 |
| HCA Holdings, Inc. 5.375% 9/1/26 | | 3,960,000 | 3,850,318 |
| HealthEquity, Inc. 4.5% 10/1/29 (b) | | 160,000 | 139,800 |
| Hologic, Inc. 4.625% 2/1/28 (b) | | 1,650,000 | 1,542,750 |
| IQVIA, Inc. 5% 5/15/27 (b) | | 820,000 | 781,362 |
| Jazz Securities DAC 4.375% 1/15/29 (b) | | 350,000 | 310,625 |
| Molina Healthcare, Inc. 3.875% 5/15/32 (b) | | 510,000 | 425,340 |
| Organon & Co. / Organon Foreign Debt Co-Issuer BV 4.125% 4/30/28 (b) | | 840,000 | 739,889 |
| Owens & Minor, Inc. 4.5% 3/31/29 (b) | | 280,000 | 216,821 |
| Teleflex, Inc. 4.25% 6/1/28 (b) | | 235,000 | 212,628 |
| Tenet Healthcare Corp.: | | | |
| 4.625% 6/15/28 (b) | | 1,810,000 | 1,588,265 |
| 4.875% 1/1/26 (b) | | 595,000 | 562,275 |
| 5.125% 11/1/27 (b) | | 1,200,000 | 1,105,500 |
| 6.125% 6/15/30 (b) | | 465,000 | 429,260 |
| | | | 16,663,477 |
| Homebuilders/Real Estate - 1.6% | | | |
| Century Communities, Inc. 3.875% 8/15/29 (b) | | 460,000 | 362,268 |
| HAT Holdings I LLC/HAT Holdings II LLC 3.375% 6/15/26 (b) | | 495,000 | 402,445 |
| Howard Hughes Corp. 4.375% 2/1/31 (b) | | 700,000 | 525,980 |
| Kennedy-Wilson, Inc. 4.75% 2/1/30 | | 770,000 | 604,450 |
| Ryan Specialty Group LLC 4.375% 2/1/30 (b) | | 540,000 | 461,700 |
| Service Properties Trust: | | | |
| 3.95% 1/15/28 | | 75,000 | 55,127 |
| 4.95% 10/1/29 | | 445,000 | 322,802 |
| 5.5% 12/15/27 | | 415,000 | 357,896 |
| TopBuild Corp. 4.125% 2/15/32 (b) | | 810,000 | 634,208 |
| | | | 3,726,876 |
| Hotels - 1.8% | | | |
| Hilton Domestic Operating Co., Inc.: | | | |
| 3.625% 2/15/32 (b) | | 1,165,000 | 927,631 |
| 4% 5/1/31 (b) | | 2,780,000 | 2,323,934 |
| Hilton Worldwide Finance LLC/Hilton Worldwide Finance Corp. 4.875% 4/1/27 | | 445,000 | 422,750 |
| Wyndham Hotels & Resorts, Inc. 4.375% 8/15/28 (b) | | 525,000 | 462,168 |
| | | | 4,136,483 |
| Insurance - 0.4% | | | |
| Alliant Holdings Intermediate LLC 4.25% 10/15/27 (b) | | 1,075,000 | 967,629 |
| Leisure - 1.6% | | | |
| Carnival Corp.: | | | |
| 7.625% 3/1/26 (b) | | 675,000 | 507,566 |
| 10.5% 2/1/26 (b) | | 2,005,000 | 1,964,820 |
| NCL Corp. Ltd. 5.875% 2/15/27 (b) | | 350,000 | 312,813 |
| Royal Caribbean Cruises Ltd. 5.5% 4/1/28 (b) | | 1,200,000 | 924,000 |
| | | | 3,709,199 |
| Metals/Mining - 0.4% | | | |
| FMG Resources Pty Ltd. 4.5% 9/15/27 (b) | | 15,000 | 13,427 |
| Howmet Aerospace, Inc. 5.95% 2/1/37 | | 45,000 | 41,223 |
| HudBay Minerals, Inc. 4.5% 4/1/26 (b) | | 240,000 | 210,544 |
| Mineral Resources Ltd. 8% 11/1/27 (b) | | 400,000 | 393,484 |
| Novelis Corp. 3.875% 8/15/31 (b) | | 385,000 | 298,263 |
| | | | 956,941 |
| Paper - 0.2% | | | |
| Ardagh Metal Packaging Finance U.S.A. LLC/Ardagh Metal Packaging Finance PLC 6% 6/15/27 (b) | | 370,000 | 355,041 |
| Glatfelter Corp. 4.75% 11/15/29 (b) | | 310,000 | 199,563 |
| | | | 554,604 |
| Restaurants - 0.2% | | | |
| Garden SpinCo Corp. 8.625% 7/20/30 (b) | | 115,000 | 118,284 |
| Yum! Brands, Inc. 3.625% 3/15/31 | | 500,000 | 401,250 |
| | | | 519,534 |
| Services - 5.5% | | | |
| ADT Corp.: | | | |
| 4.125% 8/1/29 (b) | | 385,000 | 330,141 |
| 4.875% 7/15/32 (b) | | 565,000 | 480,719 |
| AECOM 5.125% 3/15/27 | | 1,485,000 | 1,405,953 |
| Aramark Services, Inc. 5% 2/1/28 (b) | | 1,685,000 | 1,535,212 |
| ASGN, Inc. 4.625% 5/15/28 (b) | | 2,740,000 | 2,436,490 |
| Booz Allen Hamilton, Inc. 4% 7/1/29 (b) | | 155,000 | 135,487 |
| Fair Isaac Corp. 4% 6/15/28 (b) | | 450,000 | 407,178 |
| Gartner, Inc. 3.625% 6/15/29 (b) | | 220,000 | 187,000 |
| GEMS MENASA Cayman Ltd. 7.125% 7/31/26 (b) | | 1,030,000 | 966,269 |
| Iron Mountain, Inc. 4.875% 9/15/29 (b) | | 1,115,000 | 958,621 |
| Prime Securities Services Borrower LLC/Prime Finance, Inc. 3.375% 8/31/27 (b) | | 2,225,000 | 1,925,718 |
| Service Corp. International 5.125% 6/1/29 | | 1,425,000 | 1,327,331 |
| TriNet Group, Inc. 3.5% 3/1/29 (b) | | 710,000 | 588,413 |
| | | | 12,684,532 |
| Steel - 0.1% | | | |
| Roller Bearing Co. of America, Inc. 4.375% 10/15/29 (b) | | 110,000 | 96,523 |
| Super Retail - 1.9% | | | |
| Asbury Automotive Group, Inc.: | | | |
| 4.625% 11/15/29 (b) | | 245,000 | 201,513 |
| 5% 2/15/32 (b) | | 260,000 | 209,625 |
| Bath & Body Works, Inc. 6.625% 10/1/30 (b) | | 1,170,000 | 1,046,700 |
| Gap, Inc. 3.875% 10/1/31 (b) | | 385,000 | 265,650 |
| Hanesbrands, Inc. 4.875% 5/15/26 (b) | | 1,115,000 | 1,023,013 |
| Levi Strauss & Co. 3.5% 3/1/31 (b) | | 630,000 | 503,972 |
| Nordstrom, Inc. 4.375% 4/1/30 | | 930,000 | 713,775 |
| The William Carter Co. 5.625% 3/15/27 (b) | | 465,000 | 442,065 |
| | | | 4,406,313 |
| Technology - 3.7% | | | |
| Block, Inc. 2.75% 6/1/26 | | 380,000 | 338,899 |
| Central Parent, Inc./Central Merger Sub, Inc. 7.25% 6/15/29 (b) | | 345,000 | 329,754 |
| Coherent Corp. 5% 12/15/29 (b) | | 1,600,000 | 1,372,608 |
| Crowdstrike Holdings, Inc. 3% 2/15/29 | | 525,000 | 442,532 |
| Entegris, Inc. 4.375% 4/15/28 (b) | | 730,000 | 642,072 |
| Gartner, Inc. 4.5% 7/1/28 (b) | | 660,000 | 611,642 |
| Match Group Holdings II LLC: | | | |
| 3.625% 10/1/31 (b) | | 575,000 | 438,300 |
| 4.125% 8/1/30 (b) | | 265,000 | 216,506 |
| MicroStrategy, Inc. 6.125% 6/15/28 (b) | | 540,000 | 462,710 |
| onsemi 3.875% 9/1/28 (b) | | 545,000 | 480,200 |
| Open Text Holdings, Inc. 4.125% 2/15/30 (b) | | 130,000 | 103,513 |
| Roblox Corp. 3.875% 5/1/30 (b) | | 935,000 | 771,375 |
| Sensata Technologies, Inc. 3.75% 2/15/31 (b) | | 1,165,000 | 927,631 |
| TTM Technologies, Inc. 4% 3/1/29 (b) | | 550,000 | 459,326 |
| Twilio, Inc. 3.875% 3/15/31 | | 350,000 | 285,443 |
| Viavi Solutions, Inc. 3.75% 10/1/29 (b) | | 770,000 | 642,865 |
| | | | 8,525,376 |
| Telecommunications - 7.8% | | | |
| Altice Financing SA 5% 1/15/28 (b) | | 10,000 | 7,907 |
| C&W Senior Financing Designated Activity Co. 6.875% 9/15/27 (b) | | 1,510,000 | 1,306,150 |
| Cogent Communications Group, Inc. 7% 6/15/27 (b) | | 660,000 | 626,602 |
| Level 3 Financing, Inc.: | | | |
| 4.25% 7/1/28 (b) | | 2,645,000 | 2,182,125 |
| 4.625% 9/15/27 (b) | | 2,100,000 | 1,822,296 |
| Millicom International Cellular SA: | | | |
| 4.5% 4/27/31 (b) | | 490,000 | 366,520 |
| 5.125% 1/15/28 (b) | | 900,000 | 766,294 |
| Sable International Finance Ltd. 5.75% 9/7/27 (b) | | 2,610,000 | 2,300,063 |
| SBA Communications Corp. 3.875% 2/15/27 | | 750,000 | 675,000 |
| Sprint Capital Corp.: | | | |
| 6.875% 11/15/28 | | 3,545,000 | 3,658,369 |
| 8.75% 3/15/32 | | 1,150,000 | 1,349,686 |
| Telecom Italia Capital SA: | | | |
| 6% 9/30/34 | | 295,000 | 215,270 |
| 7.2% 7/18/36 | | 655,000 | 510,088 |
| Virgin Media Finance PLC 5% 7/15/30 (b) | | 105,000 | 84,146 |
| Virgin Media Secured Finance PLC 5.5% 5/15/29 (b) | | 740,000 | 672,453 |
| Windstream Escrow LLC 7.75% 8/15/28 (b) | | 1,560,000 | 1,349,868 |
| | | | 17,892,837 |
| Textiles/Apparel - 0.3% | | | |
| Crocs, Inc. 4.125% 8/15/31 (b) | | 405,000 | 306,751 |
| Foot Locker, Inc. 4% 10/1/29 (b) | | 200,000 | 152,894 |
| Kontoor Brands, Inc. 4.125% 11/15/29 (b) | | 130,000 | 104,232 |
| | | | 563,877 |
| Transportation Ex Air/Rail - 0.1% | | | |
| Seaspan Corp. 5.5% 8/1/29 (b) | | 385,000 | 296,519 |
| Utilities - 5.8% | | | |
| Clearway Energy Operating LLC: | | | |
| 3.75% 2/15/31 (b) | | 1,615,000 | 1,348,525 |
| 4.75% 3/15/28 (b) | | 195,000 | 180,121 |
| Global Partners LP/GLP Finance Corp. 7% 8/1/27 | | 997,000 | 947,830 |
| InterGen NV 7% 6/30/23 (b) | | 1,635,000 | 1,600,256 |
| NextEra Energy Partners LP 4.25% 9/15/24 (b) | | 158,000 | 148,691 |
| NRG Energy, Inc.: | | | |
| 3.625% 2/15/31 (b) | | 1,666,000 | 1,325,753 |
| 5.25% 6/15/29 (b) | | 625,000 | 567,188 |
| 6.625% 1/15/27 | | 729,000 | 729,328 |
| PG&E Corp.: | | | |
| 5% 7/1/28 | | 2,685,000 | 2,419,977 |
| 5.25% 7/1/30 | | 2,115,000 | 1,872,822 |
| TerraForm Power Operating LLC 4.75% 1/15/30 (b) | | 130,000 | 116,838 |
| Vertiv Group Corp. 4.125% 11/15/28 (b) | | 945,000 | 822,037 |
| Vistra Operations Co. LLC 5% 7/31/27 (b) | | 1,395,000 | 1,286,888 |
| | | | 13,366,254 |
TOTAL NONCONVERTIBLE BONDS | | | 204,131,967 |
| TOTAL CORPORATE BONDS (Cost $235,898,178) | | | 205,717,797 |
| | | | |
| Common Stocks - 0.4% |
| | | Shares | Value ($) |
| Energy - 0.3% | | | |
| Jonah Energy Parent LLC (d)(e) | | 11,874 | 755,186 |
| Gaming - 0.1% | | | |
| Caesars Entertainment, Inc. (d) | | 5,600 | 244,888 |
| TOTAL COMMON STOCKS (Cost $440,063) | | | 1,000,074 |
| | | | |
| Bank Loan Obligations - 0.6% |
| | | Principal Amount (a) | Value ($) |
| Broadcasting - 0.0% | | | |
| Diamond Sports Group LLC 2LN, term loan CME Term SOFR 1 Month Index + 3.250% 6.458% 8/24/26 (f)(g)(h) | | 207,364 | 40,229 |
| Insurance - 0.2% | | | |
| Alliant Holdings Intermediate LLC Tranche B3 1LN, term loan 1 month U.S. LIBOR + 3.500% 6.9799% 11/12/27 (f)(g)(h) | | 350,460 | 338,005 |
| Services - 0.3% | | | |
| ABG Intermediate Holdings 2 LLC Tranche B1 LN, term loan CME Term SOFR 1 Month Index + 3.500% 7.3287% 12/21/28 (f)(g)(h) | | 134,662 | 129,108 |
| Ascend Learning LLC: | | | |
| 2LN, term loan 1 month U.S. LIBOR + 5.750% 9.5039% 12/10/29 (f)(g)(h) | | 50,000 | 42,313 |
| Tranche B 1LN, term loan 1 month U.S. LIBOR + 3.500% 7.2539% 12/10/28 (f)(g)(h) | | 501,212 | 458,750 |
TOTAL SERVICES | | | 630,171 |
| Utilities - 0.1% | | | |
| Brookfield WEC Holdings, Inc. 1LN, term loan CME Term SOFR 1 Month Index + 3.750% 7.4787% 8/1/25 (f)(g)(h) | | 260,000 | 257,928 |
| TOTAL BANK LOAN OBLIGATIONS (Cost $1,412,570) | | | 1,266,333 |
| | | | |
| Preferred Securities - 1.3% |
| | | Principal Amount (a) | Value ($) |
| Banks & Thrifts - 1.3% | | | |
Ally Financial, Inc. 4.7% (f)(i) (Cost $4,200,000) | | 4,200,000 | 3,086,840 |
| | | | |
| Money Market Funds - 7.3% |
| | | Shares | Value ($) |
Fidelity Cash Central Fund 3.10% (j) (Cost $16,719,310) | | 16,715,967 | 16,719,310 |
| | | | |
| TOTAL INVESTMENT IN SECURITIES - 98.7% (Cost $258,670,121) | 227,790,354 |
NET OTHER ASSETS (LIABILITIES) - 1.3% | 3,025,011 |
| NET ASSETS - 100.0% | 230,815,365 |
| | |
Legend
| (a) | Amount is stated in United States dollars unless otherwise noted. |
| (b) | Security exempt from registration under Rule 144A of the Securities Act of 1933. These securities may be resold in transactions exempt from registration, normally to qualified institutional buyers. At the end of the period, the value of these securities amounted to $137,306,958 or 59.5% of net assets. |
| (c) | Security initially issued at one coupon which converts to a higher coupon at a specified date. The rate shown is the rate at period end. |
| (f) | Coupon rates for floating and adjustable rate securities reflect the rates in effect at period end. |
| (g) | Coupon is indexed to a floating interest rate which may be multiplied by a specified factor and/or subject to caps or floors. |
| (h) | Remaining maturities of bank loan obligations may be less than the stated maturities shown as a result of contractual or optional prepayments by the borrower. Such prepayments cannot be predicted with certainty. |
| (i) | Security is perpetual in nature with no stated maturity date. |
| (j) | Affiliated fund that is generally available only to investment companies and other accounts managed by Fidelity Investments. The rate quoted is the annualized seven-day yield of the fund at period end. A complete unaudited listing of the fund's holdings as of its most recent quarter end is available upon request. In addition, each Fidelity Central Fund's financial statements are available on the SEC's website or upon request. |
Affiliated Central Funds
Fiscal year to date information regarding the Fund's investments in Fidelity Central Funds, including the ownership percentage, is presented below.
| Affiliate | Value, beginning of period ($) | Purchases ($) | Sales Proceeds ($) | Dividend Income ($) | Realized Gain (loss) ($) | Change in Unrealized appreciation (depreciation) ($) | Value, end of period ($) | % ownership, end of period |
| Fidelity Cash Central Fund 3.10% | 13,061,727 | 40,415,938 | 36,758,355 | 209,348 | - | - | 16,719,310 | 0.0% |
| Total | 13,061,727 | 40,415,938 | 36,758,355 | 209,348 | - | - | 16,719,310 | |
| | | | | | | | | |
Amounts in the income column in the above table include any capital gain distributions from underlying funds, which are presented in the corresponding line item in the Statement of Operations, if applicable.
Investment Valuation
The following is a summary of the inputs used, as of October 31, 2022, involving the Fund's assets and liabilities carried at fair value. The inputs or methodology used for valuing securities may not be an indication of the risk associated with investing in those securities. For more information on valuation inputs, and their aggregation into the levels used below, please refer to the Investment Valuation section in the accompanying Notes to Financial Statements.
| Valuation Inputs at Reporting Date: |
| Description | Total ($) | Level 1 ($) | Level 2 ($) | Level 3 ($) |
Investments in Securities: | | | | |
|
| Equities: | | | | |
Consumer Discretionary | 244,888 | 244,888 | - | - |
Energy | 755,186 | - | - | 755,186 |
|
| Corporate Bonds | 205,717,797 | - | 205,717,797 | - |
|
| Bank Loan Obligations | 1,266,333 | - | 1,266,333 | - |
|
| Preferred Securities | 3,086,840 | - | 3,086,840 | - |
|
| Money Market Funds | 16,719,310 | 16,719,310 | - | - |
| Total Investments in Securities: | 227,790,354 | 16,964,198 | 210,070,970 | 755,186 |
| Statement of Assets and Liabilities |
| | | | October 31, 2022 (Unaudited) |
| | | | | |
| Assets | | | | |
| Investment in securities, at value - See accompanying schedule: | | | | |
Unaffiliated issuers (cost $241,950,811) | | $211,071,044 | | |
Fidelity Central Funds (cost $16,719,310) | | 16,719,310 | | |
| | | | | |
| Total Investment in Securities (cost $258,670,121) | | | $ | 227,790,354 |
| Cash | | | | 331,127 |
| Receivable for fund shares sold | | | | 98,809 |
| Interest receivable | | | | 3,092,575 |
| Distributions receivable from Fidelity Central Funds | | | | 51,229 |
| Prepaid expenses | | | | 396 |
| Receivable from investment adviser for expense reductions | | | | 3,293 |
Total assets | | | | 231,367,783 |
| Liabilities | | | | |
| Payable for fund shares redeemed | | $235,702 | | |
| Distributions payable | | 134,484 | | |
| Accrued management fee | | 105,643 | | |
| Transfer agent fee payable | | 31,183 | | |
| Other affiliated payables | | 7,992 | | |
| Audit fee payable | | 36,949 | | |
| Other payables and accrued expenses | | 465 | | |
| Total Liabilities | | | | 552,418 |
| Net Assets | | | $ | 230,815,365 |
| Net Assets consist of: | | | | |
| Paid in capital | | | $ | 275,825,750 |
| Total accumulated earnings (loss) | | | | (45,010,385) |
| Net Assets | | | $ | 230,815,365 |
Net Asset Value , offering price and redemption price per share ($230,815,365 ÷ 30,438,629 shares) | | | $ | 7.58 |
| | | | | |
| Statement of Operations |
| | | | Six months ended October 31, 2022 (Unaudited) |
| Investment Income | | | | |
| Dividends | | | $ | 452,902 |
| Interest | | | | 6,098,042 |
| Income from Fidelity Central Funds | | | | 209,348 |
| Total Income | | | | 6,760,292 |
| Expenses | | | | |
| Management fee | $ | 692,541 | | |
| Transfer agent fees | | 190,583 | | |
| Accounting fees and expenses | | 52,415 | | |
| Custodian fees and expenses | | 1,701 | | |
| Independent trustees' fees and expenses | | 449 | | |
| Registration fees | | 20,212 | | |
| Audit | | 36,101 | | |
| Legal | | 126 | | |
| Miscellaneous | | 648 | | |
| Total expenses before reductions | | 994,776 | | |
| Expense reductions | | (39,849) | | |
| Total expenses after reductions | | | | 954,927 |
| Net Investment income (loss) | | | | 5,805,365 |
| Realized and Unrealized Gain (Loss) | | | | |
| Net realized gain (loss) on: | | | | |
| Investment Securities: | | | | |
| Unaffiliated issuers | | (4,750,991) | | |
| Total net realized gain (loss) | | | | (4,750,991) |
| Change in net unrealized appreciation (depreciation) on investment securities | | | | (9,700,609) |
| Net gain (loss) | | | | (14,451,600) |
| Net increase (decrease) in net assets resulting from operations | | | $ | (8,646,235) |
| Statement of Changes in Net Assets |
| |
| | Six months ended October 31, 2022 (Unaudited) | | Year ended April 30, 2022 |
| Increase (Decrease) in Net Assets | | | | |
| Operations | | | | |
| Net investment income (loss) | $ | 5,805,365 | $ | 13,243,987 |
| Net realized gain (loss) | | (4,750,991) | | (2,092,913) |
| Change in net unrealized appreciation (depreciation) | | (9,700,609) | | (31,676,232) |
| Net increase (decrease) in net assets resulting from operations | | (8,646,235) | | (20,525,158) |
| Distributions to shareholders | | (5,213,435) | | (13,518,187) |
| Share transactions | | | | |
| Proceeds from sales of shares | | 8,642,384 | | 48,014,625 |
| Reinvestment of distributions | | 4,396,646 | | 11,416,988 |
| Cost of shares redeemed | | (46,297,281) | | (132,087,012) |
Net increase (decrease) in net assets resulting from share transactions | | (33,258,251) | | (72,655,399) |
| Total increase (decrease) in net assets | | (47,117,921) | | (106,698,744) |
| | | | | |
| Net Assets | | | | |
| Beginning of period | | 277,933,286 | | 384,632,030 |
| End of period | $ | 230,815,365 | $ | 277,933,286 |
| | | | | |
| Other Information | | | | |
| Shares | | | | |
| Sold | | 1,108,537 | | 5,431,596 |
| Issued in reinvestment of distributions | | 571,789 | | 1,308,964 |
| Redeemed | | (6,014,328) | | (15,398,227) |
| Net increase (decrease) | | (4,334,002) | | (8,657,667) |
| | | | | |
Financial Highlights
| Fidelity® Focused High Income Fund |
| |
| | Six months ended (Unaudited) October 31, 2022 | | Years ended April 30, 2022 | | 2021 | | 2020 | | 2019 | | 2018 |
Selected Per-Share Data | | | | | | | | | | | | |
| Net asset value, beginning of period | $ | 7.99 | $ | 8.86 | $ | 8.28 | $ | 8.65 | $ | 8.47 | $ | 8.67 |
| Income from Investment Operations | | | | | | | | | | | | |
Net investment income (loss) A,B | | .177 | | .317 | | .340 | | .374 | | .399 | | .380 |
| Net realized and unrealized gain (loss) | | (.428) | | (.863) | | .574 | | (.378) | | .190 | | (.219) |
| Total from investment operations | | (.251) | | (.546) | | .914 | | (.004) | | .589 | | .161 |
| Distributions from net investment income | | (.159) | | (.324) | | (.334) | | (.366) | | (.409) | | (.362) |
| Total distributions | | (.159) | | (.324) | | (.334) | | (.366) | | (.409) | | (.362) |
Redemption fees added to paid in capital A | | - | | - | | - | | - | | - | | .001 |
| Net asset value, end of period | $ | 7.58 | $ | 7.99 | $ | 8.86 | $ | 8.28 | $ | 8.65 | $ | 8.47 |
Total Return C,D | | (3.15)% | | (6.41)% | | 11.16% | | (.16)% | | 7.21% | | 1.86% |
Ratios to Average Net Assets B,E,F | | | | | | | | | | | | |
| Expenses before reductions | | .78% G | | .75% | | .75% | | .78% | | .79% | | .80% |
| Expenses net of fee waivers, if any | | .75% G | | .75% | | .75% | | .78% | | .79% | | .80% |
| Expenses net of all reductions | | .75% G | | .75% | | .75% | | .78% | | .78% | | .79% |
| Net investment income (loss) | | 4.55% G | | 3.62% | | 3.88% | | 4.31% | | 4.73% | | 4.38% |
| Supplemental Data | | | | | | | | | | | | |
| Net assets, end of period (000 omitted) | $ | 230,815 | $ | 277,933 | $ | 384,632 | $ | 347,510 | $ | 302,781 | $ | 397,850 |
Portfolio turnover rate H | | 4% G | | 20% | | 73% | | 43% | | 49% | | 47% |
A Calculated based on average shares outstanding during the period.
B Net investment income (loss) is affected by the timing of the declaration of dividends by any underlying mutual funds or exchange-traded funds (ETFs). Net investment income (loss) of any mutual funds or ETFs is not included in the Fund's net investment income (loss) ratio.
C Total returns for periods of less than one year are not annualized.
D Total returns would have been lower if certain expenses had not been reduced during the applicable periods shown.
E Fees and expenses of any underlying mutual funds or exchange-traded funds (ETFs) are not included in the Fund's expense ratio. The Fund indirectly bears its proportionate share of these expenses. For additional expense information related to investments in Fidelity Central Funds, please refer to the "Investments in Fidelity Central Funds" note found in the Notes to Financial Statements section of the most recent Annual or Semi-Annual report.
F Expense ratios reflect operating expenses of the class. Expenses before reductions do not reflect amounts reimbursed, waived, or reduced through arrangements with the investment adviser, brokerage services, or other offset arrangements, if applicable, and do not represent the amount paid by the class during periods when reimbursements, waivers or reductions occur.
G Annualized.
H Amount does not include the portfolio activity of any underlying mutual funds or exchange-traded funds (ETFs).
For the period ended October 31, 2022
1. Organization.
Fidelity Focused High Income Fund (the Fund) is a fund of Fidelity Summer Street Trust (the Trust) and is authorized to issue an unlimited number of shares. Share transactions on the Statement of Changes in Net Assets may contain exchanges between affiliated funds. The Trust is registered under the Investment Company Act of 1940, as amended (the 1940 Act), as an open-end management investment company organized as a Massachusetts business trust.
2. Investments in Fidelity Central Funds.
Funds may invest in Fidelity Central Funds, which are open-end investment companies generally available only to other investment companies and accounts managed by the investment adviser and its affiliates. The Schedule of Investments lists any Fidelity Central Funds held as an investment as of period end, but does not include the underlying holdings of each Fidelity Central Fund. An investing fund indirectly bears its proportionate share of the expenses of the underlying Fidelity Central Funds.
Based on its investment objective, each Fidelity Central Fund may invest or participate in various investment vehicles or strategies that are similar to those of the investing fund. These strategies are consistent with the investment objectives of the investing fund and may involve certain economic risks which may cause a decline in value of each of the Fidelity Central Funds and thus a decline in the value of the investing fund.
| Fidelity Central Fund | Investment Manager | Investment Objective | Investment Practices | Expense Ratio A |
| Fidelity Money Market Central Funds | Fidelity Management & Research Company LLC (FMR) | Each fund seeks to obtain a high level of current income consistent with the preservation of capital and liquidity. | Short-term Investments | Less than .005% |
A Expenses expressed as a percentage of average net assets and are as of each underlying Central Fund's most recent annual or semi-annual shareholder report.
A complete unaudited list of holdings for each Fidelity Central Fund is available upon request or at the Securities and Exchange Commission website at www.sec.gov. In addition, the financial statements of the Fidelity Central Funds which contain the significant accounting policies (including investment valuation policies) of those funds, and are not covered by the Report of Independent Registered Public Accounting Firm, are available on the Securities and Exchange Commission website or upon request.
3. Significant Accounting Policies.
The Fund is an investment company and applies the accounting and reporting guidance of the Financial Accounting Standards Board (FASB) Accounting Standards Codification Topic 946 Financial Services - Investment Companies . The financial statements have been prepared in conformity with accounting principles generally accepted in the United States of America (GAAP), which require management to make certain estimates and assumptions at the date of the financial statements. Actual results could differ from those estimates. Subsequent events, if any, through the date that the financial statements were issued have been evaluated in the preparation of the financial statements. The Fund's Schedule of Investments lists any underlying mutual funds or exchange-traded funds (ETFs) but does not include the underlying holdings of these funds. The following summarizes the significant accounting policies of the Fund:
Investment Valuation. Investments are valued as of 4:00 p.m. Eastern time on the last calendar day of the period. The Board of Trustees (the Board) has designated the Fund's investment adviser as the valuation designee responsible for the fair valuation function and performing fair value determinations as needed. The investment adviser has established a Fair Value Committee (the Committee) to carry out the day-to-day fair valuation responsibilities and has adopted policies and procedures to govern the fair valuation process and the activities of the Committee. In accordance with these fair valuation policies and procedures, which have been approved by the Board, the Fund attempts to obtain prices from one or more third party pricing services or brokers to value its investments. When current market prices, quotations or currency exchange rates are not readily available or reliable, investments will be fair valued in good faith by the Committee, in accordance with the policies and procedures. Factors used in determining fair value vary by investment type and may include market or investment specific events, transaction data, estimated cash flows, and market observations of comparable investments. The frequency that the fair valuation procedures are used cannot be predicted and they may be utilized to a significant extent. The Committee manages the Fund's fair valuation practices and maintains the fair valuation policies and procedures. The Fund's investment adviser reports to the Board information regarding the fair valuation process and related material matters.
The Fund categorizes the inputs to valuation techniques used to value its investments into a disclosure hierarchy consisting of three levels as shown below:
Level 1 - unadjusted quoted prices in active markets for identical investments
Level 2 - other significant observable inputs (including quoted prices for similar investments, interest rates, prepayment speeds, etc.)
Level 3 - unobservable inputs (including the Fund's own assumptions based on the best information available)
Valuation techniques used to value the Fund's investments by major category are as follows:
Debt securities, including restricted securities, are valued based on evaluated prices received from third party pricing services or from brokers who make markets in such securities. Corporate bonds, bank loan obligations and preferred securities are valued by pricing services who utilize matrix pricing which considers yield or price of bonds of comparable quality, coupon, maturity and type or by broker-supplied prices. When independent prices are unavailable or unreliable, debt securities may be valued utilizing pricing methodologies which consider similar factors that would be used by third party pricing services. Debt securities are generally categorized as Level 2 in the hierarchy but may be Level 3 depending on the circumstances. The Fund invests a significant portion of its assets in below investment grade securities. The value of these securities can be more volatile due to changes in the credit quality of the issuer and is sensitive to changes in economic, market and regulatory conditions.
Equity securities, including restricted securities, for which market quotations are readily available, are valued at the last reported sale price or official closing price as reported by a third party pricing service on the primary market or exchange on which they are traded and are categorized as Level 1 in the hierarchy. In the event there were no sales during the day or closing prices are not available, securities are valued at the last quoted bid price or may be valued using the last available price and are generally categorized as Level 2 in the hierarchy. For equity securities, including restricted securities, where observable inputs are limited, assumptions about market activity and risk are used and these securities may be categorized as Level 3 in the hierarchy.
Investments in open-end mutual funds, including the Fidelity Central Funds, are valued at their closing net asset value (NAV) each business day and are categorized as Level 1 in the hierarchy.
Changes in valuation techniques may result in transfers in or out of an assigned level within the disclosure hierarchy. The aggregate value of investments by input level as of October 31, 2022 is included at the end of the Fund's Schedule of Investments.
Investment Transactions and Income. For financial reporting purposes, the Fund's investment holdings and NAV include trades executed through the end of the last business day of the period. The NAV per share for processing shareholder transactions is calculated as of the close of business of the New York Stock Exchange (NYSE), normally 4:00 p.m. Eastern time and includes trades executed through the end of the prior business day. Gains and losses on securities sold are determined on the basis of identified cost. Commissions paid to certain brokers with whom the investment adviser, or its affiliates, places trades on behalf of a fund include an amount in addition to trade execution, which may be rebated back to a fund. Any such rebates are included in net realized gain (loss) on investments in the Statement of Operations. Dividend income is recorded on the ex-dividend date, except for certain dividends from foreign securities where the ex-dividend date may have passed, which are recorded as soon as the Fund is informed of the ex-dividend date. Non-cash dividends included in dividend income, if any, are recorded at the fair market value of the securities received. Income and capital gain distributions from Fidelity Central Funds, if any, are recorded on the ex-dividend date. Interest income is accrued as earned and includes coupon interest and amortization of premium and accretion of discount on debt securities as applicable. Debt obligations may be placed on non-accrual status and related interest income may be reduced by ceasing current accruals and writing off interest receivables when the collection of all or a portion of interest has become doubtful based on consistently applied procedures. A debt obligation is removed from non-accrual status when the issuer resumes interest payments or when collectability of interest is reasonably assured.
Expenses. Expenses directly attributable to a fund are charged to that fund. Expenses attributable to more than one fund are allocated among the respective funds on the basis of relative net assets or other appropriate methods. Expenses included in the accompanying financial statements reflect the expenses of that fund and do not include any expenses associated with any underlying mutual funds or exchange-traded funds. Although not included in a fund's expenses, a fund indirectly bears its proportionate share of these expenses through the net asset value of each underlying mutual fund or exchange-traded fund. Expense estimates are accrued in the period to which they relate and adjustments are made when actual amounts are known.
Income Tax Information and Distributions to Shareholders. Each year, the Fund intends to qualify as a regulated investment company under Subchapter M of the Internal Revenue Code, including distributing substantially all of its taxable income and realized gains. As a result, no provision for U.S. Federal income taxes is required. The Fund files a U.S. federal tax return, in addition to state and local tax returns as required. The Fund's federal income tax returns are subject to examination by the Internal Revenue Service (IRS) for a period of three fiscal years after they are filed. State and local tax returns may be subject to examination for an additional fiscal year depending on the jurisdiction.
Distributions are declared and recorded daily and paid monthly from net investment income. Distributions from realized gains, if any, are declared and recorded on the ex-dividend date. Income and capital gain distributions are determined in accordance with income tax regulations, which may differ from GAAP.
Capital accounts within the financial statements are adjusted for permanent book-tax differences. These adjustments have no impact on net assets or the results of operations. Capital accounts are not adjusted for temporary book-tax differences which will reverse in a subsequent period.
Book-tax differences are primarily due to market discount, prior period premium and discount on debt securities and capital loss carryforwards.
As of period end, the cost and unrealized appreciation (depreciation) in securities, and derivatives if applicable, for federal income tax purposes were as follows:
| Gross unrealized appreciation | $1,988,058 |
| Gross unrealized depreciation | (31,989,928) |
| Net unrealized appreciation (depreciation) | $(30,001,870) |
| Tax cost | $257,792,224 |
Capital loss carryforwards are only available to offset future capital gains of the Fund to the extent provided by regulations and may be limited. The capital loss carryforward information presented below, including any applicable limitation, is estimated as of prior fiscal period end and is subject to adjustment.
Short-term | $(9,345,990) |
Long-term | (1,470,582) |
| Total capital loss carryforward | $(10,816,572) |
Restricted Securities (including Private Placements). Funds may invest in securities that are subject to legal or contractual restrictions on resale. These securities generally may be resold in transactions exempt from registration or to the public if the securities are registered. Disposal of these securities may involve time-consuming negotiations and expense, and prompt sale at an acceptable price may be difficult. Information regarding restricted securities held at period end is included at the end of the Schedule of Investments, if applicable.
Loans and Other Direct Debt Instruments. Direct debt instruments are interests in amounts owed to lenders by corporate or other borrowers. These instruments may be in the form of loans, trade claims or other receivables and may include standby financing commitments such as revolving credit facilities that obligate a fund to supply additional cash to the borrower on demand. Loans may be acquired through assignment, participation, or may be made directly to a borrower. Such instruments are presented in the Bank Loan Obligations section in the Schedule of Investments. Certain funds may also invest in unfunded loan commitments, which are contractual obligations for future funding. Information regarding unfunded commitments is included at the end of the Schedule of Investments, if applicable.
4. Purchases and Sales of Investments.
Purchases and sales of securities, other than short-term securities and in-kind transactions, as applicable, are noted in the table below.
| | Purchases ($) | Sales ($) |
| Fidelity Focused High Income Fund | 4,586,651 | 40,237,439 |
5. Fees and Other Transactions with Affiliates.
Management Fee. Fidelity Management & Research Company LLC (the investment adviser) and its affiliates provide the Fund with investment management related services for which the Fund pays a monthly management fee. The management fee is the sum of an individual fund fee rate that is based on an annual rate of .45% of the Fund's average net assets and an annualized group fee rate that averaged .10% during the period. The group fee rate is based upon the monthly average net assets of a group of registered investment companies with which the investment adviser has management contracts. The group fee rate decreases as assets under management increase and increases as assets under management decrease. For the reporting period, the total annualized management fee rate was .55% of the Fund's average net assets.
Transfer Agent Fees. Fidelity Investments Institutional Operations Company LLC (FIIOC), an affiliate of the investment adviser, is the Fund's transfer, dividend disbursing and shareholder servicing agent. FIIOC receives account fees and asset-based fees that vary according to account size and type of account. FIIOC pays for typesetting, printing and mailing of shareholder reports, except proxy statements. For the period, the transfer agent fees were equivalent to an annualized rate of .15% of average net assets.
Accounting Fees. Fidelity Service Company, Inc. (FSC), an affiliate of the investment adviser, maintains the Fund's accounting records. The accounting fee is based on the level of average net assets for each month. For the period, the fees were equivalent to the following annualized rates:
| | % of Average Net Assets |
| Fidelity Focused High Income Fund | .04 |
Interfund Trades. Funds may purchase from or sell securities to other Fidelity Funds under procedures adopted by the Board. The procedures have been designed to ensure these interfund trades are executed in accordance with Rule 17a-7 of the 1940 Act. Any interfund trades are included within the respective purchases and sales amounts shown in the Purchases and Sales of Investments note. During the period, there were no interfund trades.
6. Committed Line of Credit.
Certain Funds participate with other funds managed by the investment adviser or an affiliate in a $4.25 billion credit facility (the "line of credit") to be utilized for temporary or emergency purposes to fund shareholder redemptions or for other short-term liquidity purposes. The participating funds have agreed to pay commitment fees on their pro-rata portion of the line of credit, which are reflected in Miscellaneous expenses on the Statement of Operations, and are listed below. During the period, there were no borrowings on this line of credit.
| | Amount |
| Fidelity Focused High Income Fund | $237 |
7. Expense Reductions.
The investment adviser contractually agreed to reimburse the Fund to the extent annual operating expenses exceeded .75% of average net assets. This reimbursement will remain in place through August 31, 2023. Some expenses, for example the compensation of the independent Trustees, and certain miscellaneous expenses such as proxy and shareholder meeting expenses, are excluded from this reimbursement. During the period this reimbursement reduced the Fund's expenses by $37,398.
Through arrangements with the Fund's custodian, credits realized as a result of certain uninvested cash balances were used to reduce the Fund's expenses by $8.
In addition, during the period the investment adviser or an affiliate reimbursed and/or waived a portion of operating expenses in the amount of $2,443.
8. Other.
A fund's organizational documents provide former and current trustees and officers with a limited indemnification against liabilities arising in connection with the performance of their duties to the fund. In the normal course of business, a fund may also enter into contracts that provide general indemnifications. A fund's maximum exposure under these arrangements is unknown as this would be dependent on future claims that may be made against a fund. The risk of material loss from such claims is considered remote.
9. Risk and Uncertainties.
Many factors affect a fund's performance. Developments that disrupt global economies and financial markets, such as pandemics, epidemics, outbreaks of infectious diseases, war, terrorism, and environmental disasters, may significantly affect a fund's investment performance. The effects of these developments to a fund will be impacted by the types of securities in which a fund invests, the financial condition, industry, economic sector, and geographic location of an issuer, and a fund's level of investment in the securities of that issuer.
As a shareholder, you incur two types of costs: (1) transaction costs, which may include sales charges (loads) on purchase payments or redemption proceeds, as applicable and (2) ongoing costs, which generally include management fees, distribution and/or service (12b-1) fees and other Fund expenses. This Example is intended to help you understand your ongoing costs (in dollars) of investing in a fund and to compare these costs with the ongoing costs of investing in other mutual funds.
| The Example is based on an investment of $1,000 invested at the beginning of the period and held for the entire period (May 1, 2022 to October 31, 2022). |
Actual Expenses
The first line of the accompanying table provides information about actual account values and actual expenses. You may use the information in this line, together with the amount you invested, to estimate the expenses that you paid over the period. Simply divide your account value by $1,000.00 (for example, an $8,600 account value divided by $1,000.00 = 8.6), then multiply the result by the number in the first line for a class/Fund under the heading entitled "Expenses Paid During Period" to estimate the expenses you paid on your account during this period. If any fund is a shareholder of any underlying mutual funds or exchange-traded funds (ETFs) (the Underlying Funds), such fund indirectly bears its proportional share of the expenses of the Underlying Funds in addition to the direct expenses incurred presented in the table. These fees and expenses are not included in the annualized expense ratio used to calculate the expense estimate in the table below.
Hypothetical Example for Comparison Purposes
The second line of the accompanying table provides information about hypothetical account values and hypothetical expenses based on the actual expense ratio and an assumed rate of return of 5% per year before expenses, which is not the actual return. The hypothetical account values and expenses may not be used to estimate the actual ending account balance or expenses you paid for the period. You may use this information to compare the ongoing costs of investing in the Fund and other funds. To do so, compare this 5% hypothetical example with the 5% hypothetical examples that appear in the shareholder reports of the other funds. If any fund is a shareholder of any Underlying Funds, such fund indirectly bears its proportional share of the expenses of the Underlying Funds in addition to the direct expenses as presented in the table. These fees and expenses are not included in the annualized expense ratio used to calculate the expense estimate in the table below.
Please note that the expenses shown in the table are meant to highlight your ongoing costs only and do not reflect any transaction costs. Therefore, the second line of the table is useful in comparing ongoing costs only, and will not help you determine the relative total costs of owning different funds. In addition, if these transactional costs were included, your costs would have been higher.
| | | | | Annualized Expense Ratio- A | | Beginning Account Value May 1, 2022 | | Ending Account Value October 31, 2022 | | Expenses Paid During Period- C May 1, 2022 to October 31, 2022 |
| | | | | | | | | | |
| Fidelity® Focused High Income Fund | | | | .75% | | | | | | |
| Actual | | | | | | $ 1,000 | | $ 968.50 | | $ 3.72 |
Hypothetical- B | | | | | | $ 1,000 | | $ 1,021.42 | | $ 3.82 |
| |
A Annualized expense ratio reflects expenses net of applicable fee waivers.
B 5% return per year before expenses
C Expenses are equal to the annualized expense ratio, multiplied by the average account value over the period, multiplied by 184/ 365 (to reflect the one-half year period). The fees and expenses of any Underlying Funds are not included in each annualized expense ratio.
Fidelity Focused High Income Fund
Each year, the Board of Trustees, including the Independent Trustees (together, the Board), votes on the renewal of the management contract with Fidelity Management & Research Company LLC (FMR) and the sub-advisory agreements (together, the Advisory Contracts) for the fund. FMR and the sub-advisers are referred to herein as the Investment Advisers. The Board, assisted by the advice of fund counsel and Independent Trustees' counsel, requests and considers a broad range of information relevant to the renewal of the Advisory Contracts throughout the year.
The Board meets regularly and, at each of its meetings, covers an extensive agenda of topics and materials and considers factors that are relevant to its annual consideration of the renewal of the fund's Advisory Contracts, including the services and support provided to the fund and its shareholders. The Board has established various standing committees (Committees), each composed of and chaired by Independent Trustees with varying backgrounds, to which the Board has assigned specific subject matter responsibilities in order to enhance effective decision-making by the Board. The Board, acting directly and through its Committees, requests and receives information concerning the annual consideration of the renewal of the fund's Advisory Contracts. The Board also meets as needed to review matters specifically related to the Board's annual consideration of the renewal of the Advisory Contracts. Members of the Board may also meet with trustees of other Fidelity funds through joint ad hoc committees to discuss certain matters relevant to all of the Fidelity funds.
At its May 2022 meeting, the Board unanimously determined to renew the fund's Advisory Contracts. In reaching its determination, the Board considered all factors it believed relevant, including (i) the nature, extent, and quality of the services provided to the fund and its shareholders (including the investment performance of the fund); (ii) the competitiveness relative to peer funds of the fund's management fee and total expense ratio; (iii) the total costs of the services provided by and the profits realized by Fidelity from its relationships with the fund; and (iv) the extent to which, if any, economies of scale exist and are realized as the fund grows, and whether any economies of scale are appropriately shared with fund shareholders.
In considering whether to renew the Advisory Contracts for the fund, the Board reached a determination, with the assistance of fund counsel and Independent Trustees' counsel and through the exercise of its business judgment, that the renewal of the Advisory Contracts was in the best interests of the fund and its shareholders and that the compensation payable under the Advisory Contracts was fair and reasonable. The Board's decision to renew the Advisory Contracts was not based on any single factor, but rather was based on a comprehensive consideration of all the information provided to the Board at its meetings throughout the year. The Board, in reaching its determination to renew the Advisory Contracts, was aware that shareholders of the fund have a broad range of investment choices available to them, including a wide choice among funds offered by Fidelity's competitors, and that the fund's shareholders, who have the opportunity to review and weigh the disclosure provided by the fund in its prospectus and other public disclosures, have chosen to invest in this fund, which is part of the Fidelity family of funds.
Nature, Extent, and Quality of Services Provided. The Board considered Fidelity's staffing as it relates to the fund, including the backgrounds of investment personnel of Fidelity, and also considered the fund's investment objective, strategies, and related investment philosophy. The Independent Trustees also had discussions with senior management of Fidelity's investment operations and investment groups. The Board considered the structure of the investment personnel compensation program and whether this structure provides appropriate incentives to act in the best interests of the fund. Additionally, the Board considered the portfolio managers' investments, if any, in the funds that they manage. The Board also considered the steps Fidelity had taken to ensure the continued provision of high quality services to the Fidelity funds during the COVID-19 pandemic, including the expansion of staff in client facing positions to maintain service levels in periods of high volumes and volatility.
Resources Dedicated to Investment Management and Support Services. The Board and the Fund Oversight and Research Committees reviewed the general qualifications and capabilities of Fidelity's investment staff, including its size, education, experience, and resources, as well as Fidelity's approach to recruiting, training, managing, and compensating investment personnel. The Board noted the resources devoted to expansion of Fidelity's global investment organization, and that Fidelity's analysts have extensive resources, tools and capabilities that allow them to conduct sophisticated quantitative and fundamental analysis, as well as credit analysis of issuers, counterparties, and guarantors. Further, the Board considered that Fidelity's investment professionals have sufficient access to global information and data so as to provide competitive investment results over time, and that those professionals also have access to sophisticated tools that permit them to assess portfolio construction and risk and performance attribution characteristics continuously, as well as to transmit new information and research conclusions rapidly around the world. Additionally, in its deliberations, the Board considered Fidelity's trading, risk management, compliance, and technology and operations capabilities and resources, which are integral parts of the investment management process.
Shareholder and Administrative Services. The Board considered (i) the nature, extent, quality, and cost of advisory, administrative, and shareholder services performed by the Investment Advisers and their affiliates under the Advisory Contracts and under separate agreements covering transfer agency, pricing and bookkeeping, and securities lending services for the fund; (ii) the nature and extent of the supervision of third party service providers, principally custodians, subcustodians, and pricing vendors; and (iii) the resources devoted to, and the record of compliance with, the fund's compliance policies and procedures. The Board also reviewed the allocation of fund brokerage, including allocations to brokers affiliated with the Investment Advisers, the use of brokerage commissions to pay fund expenses, and the use of "soft" commission dollars to pay for research services.
The Board noted that the growth of fund assets over time across the complex allows Fidelity to reinvest in the development of services designed to enhance the value and convenience of the Fidelity funds as investment vehicles. These services include 24-hour access to account information and market information over the Internet and through telephone representatives, investor education materials and asset allocation tools. The Board also considered that it reviews customer service metrics such as telephone response times, continuity of services on the website and metrics addressing services at Fidelity Investor Centers.
Investment in a Large Fund Family. The Board considered the benefits to shareholders of investing in a Fidelity fund, including the benefits of investing in a fund that is part of a large family of funds offering a variety of investment disciplines and providing a large variety of mutual fund investor services. The Board noted that Fidelity had taken, or had made recommendations that resulted in the Fidelity funds taking, a number of actions over the previous year that benefited particular funds, including: (i) continuing to dedicate additional resources to Fidelity's investment research process, which includes meetings with management of issuers of securities in which the funds invest; (ii) continuing efforts to enhance Fidelity's global research capabilities; (iii) launching new funds and ETFs with innovative structures, strategies and pricing and making other enhancements to meet client needs; (iv) launching new share classes of existing funds; (v) eliminating purchase minimums and broadening eligibility requirements for certain funds and share classes; (vi) reducing management fees and total expenses for certain target date funds and classes and index funds; (vii) lowering expenses for certain existing funds and classes by implementing or lowering expense caps; (viii) rationalizing product lines and gaining increased efficiencies from fund mergers and liquidations; (ix) continuing to develop, acquire and implement systems and technology to improve services to the funds and shareholders, strengthen information security, and increase efficiency; and (x) continuing to implement enhancements to further strengthen Fidelity's product line to increase investors' probability of success in achieving their investment goals, including retirement income goals.
Investment Performance. The Board considered whether the fund has operated in accordance with its investment objective, as well as its record of compliance with its investment restrictions and its performance history. The Board noted that the fund had a portfolio manager change in January 2022. The Board will continue to monitor closely the fund's performance, taking into account the portfolio manager change.
The Board took into account discussions that occur at Board meetings throughout the year with representatives of the Investment Advisers about fund investment performance. In this regard the Board noted that as part of regularly scheduled fund reviews and other reports to the Board on fund performance, the Board considers annualized return information for the fund for different time periods, measured against an appropriate securities market index (benchmark index) and an appropriate peer group of funds with similar objectives (peer group). The Board also reviews and considers information about performance attribution. In its evaluation of fund investment performance, the Board gave particular attention to information indicating changes in performance of certain Fidelity funds for specific time periods and discussed with the Investment Advisers the reasons for any overperformance or underperformance.
In addition to reviewing absolute and relative fund performance, the Independent Trustees periodically consider the appropriateness of fund performance metrics in evaluating the results achieved. In general, the Independent Trustees believe that fund performance should be evaluated based on net performance (after fees and expenses) of the fund compared to appropriate benchmark indices, over appropriate time periods that may include full market cycles, and compared to peer groups, as applicable, over the same periods, taking into account relevant factors including the following: general market conditions; issuer-specific information; and fund cash flows and other factors.
The Independent Trustees recognize that shareholders evaluate performance on a net basis over their own holding periods, for which one-, three-, and five-year periods are often used as a proxy. For this reason, the performance information reviewed by the Board also included net cumulative total return information for the fund and an appropriate benchmark index and peer group for the most recent one-, three-, and five-year periods ended September 30, 2021, as shown below. Returns are shown compared to the 25th percentile (top of box, 75% beaten) and 75th percentile (bottom of box, 25% beaten) of the peer universe.
Fidelity Focused High Income Fund
The Board considered the fund's underperformance for different time periods ended December 31, 2021 (which periods are not reflected in the charts above). The Board's discussions with FMR regarding underperformance cover topics including, but not limited to: the longer-term track record of a fund's portfolio manager(s); broader trends in the market that may adversely impact a fund's performance; and attribution reports on contributors to the fund's underperformance. The Board engages with FMR on steps that might be taken to address a fund's underperformance.
Based on its review, the Board concluded that the nature, extent, and quality of services provided to the fund under the Advisory Contracts should continue to benefit the shareholders of the fund.
Competitiveness of Management Fee and Total Expense Ratio . The Board considered the fund's management fee and total expense ratio compared to "mapped groups" of competitive funds and classes created for the purpose of facilitating the Trustees' competitive analysis of management fees and total expenses. Fidelity creates "mapped groups" by combining similar Lipper investment objective categories that have comparable investment mandates. Combining Lipper investment objective categories aids the Board's management fee and total expense ratio comparisons by broadening the competitive group used for comparison.
Management Fee. The Board considered two proprietary management fee comparisons for the 12-month periods ended September 30 (June 30 for periods ended 2019 and 2018 and December 31 for periods prior to 2018) shown in basis points (BP) in the chart below. The group of Lipper funds used by the Board for management fee comparisons is referred to below as the "Total Mapped Group." The Total Mapped Group is broader than the Lipper peer group used by the Board for performance comparisons because the Total Mapped Group combines several Lipper investment objective categories while the Lipper peer group does not. The Total Mapped Group comparison focuses on a fund's standing in terms of gross management fees before expense reimbursements or caps relative to the total universe of funds with comparable investment mandates, regardless of whether their management fee structures also are comparable. Funds with comparable investment mandates offer exposure to similar types of securities. Funds with comparable management fee structures have similar management fee contractual arrangements (e.g., flat rate charged for advisory services, all-inclusive fee rate, etc.). "TMG %" represents the percentage of funds in the Total Mapped Group that had management fees that were lower than the fund's. For example, a hypothetical TMG % of 20% would mean that 80% of the funds in the Total Mapped Group had higher, and 20% had lower, management fees than the fund. The fund's actual TMG %s and the number of funds in the Total Mapped Group are in the chart below. The "Asset-Sized Peer Group" (ASPG) comparison focuses on a fund's standing relative to a subset of non-Fidelity funds within the Total Mapped Group that are similar in size and management fee structure. For example, if a fund is in the first quartile of the ASPG, the fund's management fee ranks in the least expensive or lowest 25% of funds in the ASPG. The ASPG represents at least 15% of the funds in the Total Mapped Group with comparable asset size and management fee structures, subject to a minimum of 50 funds (or all funds in the Total Mapped Group if fewer than 50). Additional information, such as the ASPG quartile in which the fund's management fee rate ranked, is also included in the chart and was considered by the Board.
Fidelity Focused High Income Fund
The Board noted that the fund's management fee rate ranked below the median of its Total Mapped Group and below the median of its ASPG for the 12-month period ended September 30, 2021.
The Board also considered that, for funds subject to the group fee, FMR agreed to voluntarily waive fees over a specified period of time in amounts designed to account for assets converted from certain funds to certain collective investment trusts.
Based on its review, the Board concluded that the fund's management fee is fair and reasonable in light of the services that the fund receives and the other factors considered.
Total Expense Ratio. In its review of the fund's total expense ratio, the Board considered the fund's management fee rate as well as other fund expenses, such as transfer agent fees, pricing and bookkeeping fees, and custodial, legal, and audit fees. The Board also noted that Fidelity may agree to waive fees or reimburse expenses from time to time, and the extent to which, if any, it has done so for the fund. The fund is compared to those funds and classes in the Total Mapped Group (used by the Board for management fee comparisons) that have a similar sales load structure. The Board also considered a total expense ASPG comparison for the fund, which focuses on the total expenses of the fund relative to a subset of non-Fidelity funds within the total expense similar sales load structure group. The total expense ASPG is limited to 15 larger and 15 smaller classes in fund average assets for a total of 30 classes, where possible. The total expense ASPG comparison excludes performance adjustments and fund-paid 12b-1 fees to eliminate variability in fee structures.
The Board noted that the fund's total net expense ratio ranked below the similar sales load structure group competitive median and below the ASPG competitive median for the 12-month period ended September 30, 2021.
The Board further considered that FMR has contractually agreed to reimburse the fund to the extent that total operating expenses, with certain exceptions, as a percentage of its average net assets, exceed 0.75% through August 22, 2022.
Fees Charged to Other Fidelity Clients. The Board also considered Fidelity fee structures and other information with respect to clients of Fidelity, such as other funds advised or subadvised by Fidelity, pension plan clients, and other institutional clients with similar mandates. The Board noted that a joint ad hoc committee created by it and the boards of other Fidelity funds periodically reviews and compares Fidelity's institutional investment advisory business with its business of providing services to the Fidelity funds and also noted the most recent findings of the committee. The Board noted that the committee's review included a consideration of the differences in services provided, fees charged, and costs incurred, as well as competition in the markets serving the different categories of clients.
Based on its review of total expense ratios and fees charged to other Fidelity clients, the Board concluded that the fund's total expense ratio was reasonable in light of the services that the fund and its shareholders receive and the other factors considered.
Costs of the Services and Profitability . The Board considered the revenues earned and the expenses incurred by Fidelity in conducting the business of developing, marketing, distributing, managing, administering, and servicing the fund and servicing the fund's shareholders. The Board also considered the level of Fidelity's profits in respect of all the Fidelity funds.
On an annual basis, Fidelity presents to the Board information about the profitability of its relationships with the fund. Fidelity calculates profitability information for each fund, as well as aggregate profitability information for groups of Fidelity funds and all Fidelity funds, using a series of detailed revenue and cost allocation methodologies which originate with the books and records of Fidelity on which Fidelity's audited financial statements are based. The Audit Committee of the Board reviews any significant changes from the prior year's methodologies and the full Board approves such changes.
A public accounting firm has been engaged annually by the Board as part of the Board's assessment of Fidelity's profitability analysis. The engagement includes the review and assessment of the methodologies used by Fidelity in determining the revenues and expenses attributable to Fidelity's mutual fund business, and completion of agreed-upon procedures in respect of the mathematical accuracy of certain fund profitability information and its conformity to established allocation methodologies. After considering the reports issued under the engagement and information provided by Fidelity, the Board concluded that while other allocation methods may also be reasonable, Fidelity's profitability methodologies are reasonable in all material respects.
The Board also reviewed Fidelity's non-fund businesses and potential indirect benefits such businesses may have received as a result of their association with Fidelity's mutual fund business (i.e., fall-out benefits) as well as cases where Fidelity's affiliates may benefit from the funds' business. The Board considered areas where potential indirect benefits to the Fidelity funds from their relationships with Fidelity may exist. The Board's consideration of these matters was informed by the findings of a joint ad hoc committee created by it and the boards of other Fidelity funds to evaluate potential fall-out benefits.
The Board considered the costs of the services provided by and the profits realized by Fidelity in connection with the operation of the fund and was satisfied that the profitability was not excessive.
Economies of Scale. The Board considered whether there have been economies of scale in respect of the management of the Fidelity funds, whether the Fidelity funds (including the fund) have appropriately benefited from any such economies of scale, and whether there is potential for realization of any further economies of scale. The Board considered the extent to which the fund will benefit from economies of scale as assets grow through increased services to the fund, through waivers or reimbursements, or through fee or expense ratio reductions. The Board also noted that a committee (the Economies of Scale Committee) created by it and the boards of other Fidelity funds periodically analyzes whether Fidelity attains economies of scale in respect of the management and servicing of the Fidelity funds, whether the Fidelity funds have appropriately benefited from such economies of scale, and whether there is potential for realization of any further economies of scale.
The Board recognized that the fund's management contract incorporates a "group fee" structure, which provides for lower group fee rates as total "group assets" increase, and for higher group fee rates as total "group assets" decrease ("group assets" as defined in the management contract). FMR calculates the group fee rates based on a tiered asset "breakpoint" schedule that varies based on asset class. The Board considered that the group fee is designed to deliver the benefits of economies of scale to fund shareholders when total Fidelity fund assets increase, even if assets of any particular fund are unchanged or have declined, because some portion of Fidelity's costs are attributable to services provided to all Fidelity funds, and all funds benefit if those costs can be allocated among more assets. The Board further considered that Fidelity agreed to impose a temporary fee waiver in the form of additional breakpoints to the current breakpoint schedule. The Board concluded that, given the group fee structure, fund shareholders will benefit from lower management fees as "group assets" increase at the fund complex level, regardless of whether Fidelity achieves any such economies of scale.
The Board concluded, taking into account the analysis of the Economies of Scale Committee, that economies of scale, if any, are being appropriately shared between fund shareholders and Fidelity.
Additional Information Requested by the Board. In order to develop fully the factual basis for consideration of the Fidelity funds' advisory contracts, the Board requested and received additional information on certain topics, including: (i) fund flow and performance trends, in particular the underperformance of certain funds and strategies, and Fidelity's long-term strategies for certain funds, including any consideration of fund liquidations or mergers; (ii) the operation of performance fees, competitor use of performance fees, and consideration of the expansion of performance fees to additional funds; (iii) Fidelity's pricing philosophy compared to competitors; (iv) fund profitability methodology and data; (v) evaluation of competitive fund data and peer group classifications and fee and expense comparisons; (vi) the management fee and expense structures for different funds and classes and information about the differences between various fee and expense structures; (vii) group fee breakpoints and related voluntary fee waivers; and (viii) information regarding other accounts managed by Fidelity and the funds' sub-advisory arrangements.
Based on its evaluation of all of the conclusions noted above, and after considering all factors it believed relevant, the Board concluded that the advisory fee arrangements are fair and reasonable and that the fund's Advisory Contracts should be renewed.
1.801609.119
FFH-SANN-1222
Fidelity® Short Duration High Income Fund
Semi-Annual Report
October 31, 2022
Includes Fidelity and Fidelity Advisor share classes
Contents
To view a fund's proxy voting guidelines and proxy voting record for the 12-month period ended June 30, visit http://www.fidelity.com/proxyvotingresults or visit the Securities and Exchange Commission's (SEC) web site at http://www.sec.gov.
You may also call 1-800-544-8544 if you're an individual investing directly with Fidelity, call 1-800-835-5092 if you're a plan sponsor or participant with Fidelity as your recordkeeper or call 1-877-208-0098 on institutional accounts or if you're an advisor or invest through one to request a free copy of the proxy voting guidelines.
Standard & Poor's, S&P and S&P 500 are registered service marks of The McGraw-Hill Companies, Inc. and have been licensed for use by Fidelity Distributors Corporation.
Other third-party marks appearing herein are the property of their respective owners.
All other marks appearing herein are registered or unregistered trademarks or service marks of FMR LLC or an affiliated company. © 2022 FMR LLC. All rights reserved.
This report and the financial statements contained herein are submitted for the general information of the shareholders of the Fund. This report is not authorized for distribution to prospective investors in the Fund unless preceded or accompanied by an effective prospectus.
A fund files its complete schedule of portfolio holdings with the SEC for the first and third quarters of each fiscal year on Form N-PORT. Forms N-PORT are available on the SEC's web site at http://www.sec.gov. A fund's Forms N-PORT may be reviewed and copied at the SEC's Public Reference Room in Washington, DC. Information regarding the operation of the SEC's Public Reference Room may be obtained by calling 1-800-SEC-0330.
For a complete list of a fund's portfolio holdings, view the most recent holdings listing, semiannual report, or annual report on Fidelity's web site at http://www.fidelity.com, http://www.institutional.fidelity.com, or http://www.401k.com, as applicable.
NOT FDIC INSURED •MAY LOSE VALUE •NO BANK GUARANTEE
Neither the Fund nor Fidelity Distributors Corporation is a bank.
| Top Bond Issuers (% of Fund's net assets) |
(with maturities greater than one year) |
| Icahn Enterprises LP/Icahn Enterprises Finance Corp. | 2.5 | |
| CCO Holdings LLC/CCO Holdings Capital Corp. | 2.2 | |
| TransDigm, Inc. | 1.9 | |
| Ford Motor Credit Co. LLC | 1.7 | |
| Occidental Petroleum Corp. | 1.6 | |
| Tenet Healthcare Corp. | 1.5 | |
| Caesars Entertainment, Inc. | 1.5 | |
| American Airlines, Inc. / AAdvantage Loyalty IP Ltd. | 1.3 | |
| OneMain Finance Corp. | 1.3 | |
| Community Health Systems, Inc. | 1.3 | |
| | 16.8 | |
| |
| Market Sectors (% of Fund's net assets) |
| |
| Energy | 12.4 | |
| Telecommunications | 9.0 | |
| Healthcare | 6.1 | |
| Gaming | 5.4 | |
| Diversified Financial Services | 5.3 | |
| |
Quality Diversification (% of Fund's net assets) |
|
| |
| We have used ratings from Moody's Investors Service, Inc. Where Moody's® ratings are not available, we have used S&P® ratings. All ratings are as of the date indicated and do not reflect subsequent changes. |
Asset Allocation (% of Fund's net assets) |
|
Foreign investments - 15.5% |
|
Geographic Diversification (% of Fund's net assets) |
|
* Includes Short-Term investments and Net Other Assets (Liabilities). Percentages are based on country or territory of incorporation and are adjusted for the effect of futures contracts, if applicable. |
| |
Showing Percentage of Net Assets
| Corporate Bonds - 76.8% |
| | | Principal Amount (a) | Value ($) |
| Convertible Bonds - 1.0% | | | |
| Broadcasting - 0.9% | | | |
| DISH Network Corp.: | | | |
| 2.375% 3/15/24 | | 510,000 | 462,570 |
| 3.375% 8/15/26 | | 4,500,000 | 3,111,750 |
| | | | 3,574,320 |
| Energy - 0.1% | | | |
| Mesquite Energy, Inc. 15% 7/15/23 (b)(c) | | 15,159 | 89,860 |
| Mesquite Energy, Inc. 15% 7/15/23 (b)(c) | | 26,231 | 155,492 |
| | | | 245,352 |
TOTAL CONVERTIBLE BONDS | | | 3,819,672 |
| Nonconvertible Bonds - 75.8% | | | |
| Aerospace - 3.4% | | | |
| Bombardier, Inc.: | | | |
| 6% 2/15/28 (d) | | 125,000 | 111,238 |
| 7.125% 6/15/26 (d) | | 4,000,000 | 3,786,509 |
| Spirit Aerosystems, Inc.: | | | |
| 5.5% 1/15/25 (d) | | 100,000 | 96,500 |
| 7.5% 4/15/25 (d) | | 1,750,000 | 1,700,195 |
| TransDigm, Inc.: | | | |
| 5.5% 11/15/27 | | 1,735,000 | 1,570,175 |
| 6.25% 3/15/26 (d) | | 5,765,000 | 5,686,654 |
| 7.5% 3/15/27 | | 25,000 | 24,635 |
| | | | 12,975,906 |
| Air Transportation - 2.0% | | | |
| American Airlines, Inc. / AAdvantage Loyalty IP Ltd. 5.5% 4/20/26 (d) | | 5,300,000 | 5,047,305 |
| United Airlines, Inc. 4.375% 4/15/26 (d) | | 2,600,000 | 2,372,911 |
| Western Global Airlines LLC 10.375% 8/15/25 (d) | | 250,000 | 210,000 |
| | | | 7,630,216 |
| Automotive & Auto Parts - 1.7% | | | |
| Ford Motor Credit Co. LLC: | | | |
| 2.3% 2/10/25 | | 540,000 | 491,994 |
| 3.375% 11/13/25 | | 5,900,000 | 5,352,539 |
| 4.687% 6/9/25 | | 455,000 | 432,399 |
| 5.125% 6/16/25 | | 250,000 | 241,200 |
| Real Hero Merger Sub 2 6.25% 2/1/29 (d) | | 30,000 | 21,508 |
| | | | 6,539,640 |
| Banks & Thrifts - 0.8% | | | |
| Ally Financial, Inc.: | | | |
| 3.875% 5/21/24 | | 970,000 | 936,718 |
| 5.75% 11/20/25 | | 1,895,000 | 1,823,140 |
| VistaJet Malta Finance PLC / XO Management Holding, Inc. 7.875% 5/1/27 (d) | | 235,000 | 212,842 |
| | | | 2,972,700 |
| Broadcasting - 1.1% | | | |
| Diamond Sports Group LLC/Diamond Sports Finance Co. 5.375% 8/15/26 (d) | | 410,000 | 82,000 |
| Sirius XM Radio, Inc. 3.125% 9/1/26 (d) | | 2,995,000 | 2,676,332 |
| Univision Communications, Inc. 6.625% 6/1/27 (d) | | 1,375,000 | 1,357,813 |
| | | | 4,116,145 |
| Building Materials - 0.1% | | | |
| Advanced Drain Systems, Inc. 5% 9/30/27 (d) | | 245,000 | 227,174 |
| Global Infrastructure Solutions, Inc. 5.625% 6/1/29 (d) | | 185,000 | 136,797 |
| SRS Distribution, Inc. 4.625% 7/1/28 (d) | | 95,000 | 83,414 |
| | | | 447,385 |
| Cable/Satellite TV - 4.2% | | | |
| CCO Holdings LLC/CCO Holdings Capital Corp.: | | | |
| 4% 3/1/23 (d) | | 3,315,000 | 3,290,082 |
| 5.125% 5/1/27 (d) | | 5,250,000 | 4,864,020 |
| CSC Holdings LLC: | | | |
| 5.25% 6/1/24 | | 1,000,000 | 970,000 |
| 5.5% 4/15/27 (d) | | 2,300,000 | 2,156,250 |
| DISH DBS Corp.: | | | |
| 5.25% 12/1/26 (d) | | 300,000 | 260,625 |
| 5.875% 11/15/24 | | 3,100,000 | 2,862,540 |
| 7.75% 7/1/26 | | 650,000 | 548,464 |
| Radiate Holdco LLC/Radiate Financial Service Ltd. 4.5% 9/15/26 (d) | | 1,595,000 | 1,347,775 |
| | | | 16,299,756 |
| Capital Goods - 0.6% | | | |
| Vertical U.S. Newco, Inc. 5.25% 7/15/27 (d) | | 2,525,000 | 2,263,031 |
| Chemicals - 2.0% | | | |
| INEOS Quattro Finance 2 PLC 3.375% 1/15/26 (d) | | 250,000 | 211,430 |
| LSB Industries, Inc. 6.25% 10/15/28 (d) | | 1,990,000 | 1,806,701 |
| NOVA Chemicals Corp.: | | | |
| 4.875% 6/1/24 (d) | | 300,000 | 291,750 |
| 5% 5/1/25 (d) | | 3,205,000 | 3,052,410 |
| Rhodia Acetow Management GmbH 10.5% 2/15/27 (d) | | 130,000 | 105,241 |
| SPCM SA 3.125% 3/15/27 (d) | | 395,000 | 347,106 |
| The Chemours Co. LLC 5.375% 5/15/27 | | 2,000,000 | 1,790,840 |
| | | | 7,605,478 |
| Consumer Products - 1.2% | | | |
| Coty, Inc. 5% 4/15/26 (d) | | 1,700,000 | 1,594,284 |
| Gannett Holdings LLC 6% 11/1/26 (d) | | 75,000 | 56,101 |
| Mattel, Inc. 5.875% 12/15/27 (d) | | 1,210,000 | 1,174,160 |
| Newell Brands, Inc. 4.45% 4/1/26 | | 1,800,000 | 1,674,990 |
| | | | 4,499,535 |
| Containers - 2.7% | | | |
| Ardagh Packaging Finance PLC/Ardagh MP Holdings U.S.A., Inc.: | | | |
| 4.125% 8/15/26 (d) | | 610,000 | 527,650 |
| 5.25% 8/15/27 (d) | | 500,000 | 350,445 |
| 5.25% 8/15/27 (d) | | 3,000,000 | 2,102,670 |
| Ball Corp.: | | | |
| 4% 11/15/23 | | 400,000 | 391,694 |
| 5.25% 7/1/25 | | 1,900,000 | 1,875,319 |
| Berry Global, Inc. 4.875% 7/15/26 (d) | | 1,175,000 | 1,103,913 |
| Trivium Packaging Finance BV: | | | |
| 5.5% 8/15/26 (d) | | 220,000 | 201,946 |
| 8.5% 8/15/27 (d) | | 4,050,000 | 3,808,181 |
| | | | 10,361,818 |
| Diversified Financial Services - 4.7% | | | |
| Cargo Aircraft Management, Inc. 4.75% 2/1/28 (d) | | 225,000 | 199,688 |
| Coinbase Global, Inc. 3.625% 10/1/31 (d) | | 705,000 | 417,458 |
| Freedom Mortgage Corp. 6.625% 1/15/27 (d) | | 250,000 | 186,600 |
| Hightower Holding LLC 6.75% 4/15/29 (d) | | 400,000 | 325,651 |
| Icahn Enterprises LP/Icahn Enterprises Finance Corp.: | | | |
| 4.75% 9/15/24 | | 1,840,000 | 1,790,559 |
| 5.25% 5/15/27 | | 535,000 | 492,869 |
| 6.25% 5/15/26 | | 7,690,000 | 7,401,611 |
| Navient Corp.: | | | |
| 6.125% 3/25/24 | | 2,000,000 | 1,962,171 |
| 6.75% 6/15/26 | | 250,000 | 235,938 |
| OneMain Finance Corp.: | | | |
| 3.5% 1/15/27 | | 235,000 | 192,737 |
| 6.125% 3/15/24 | | 750,000 | 732,765 |
| 6.875% 3/15/25 | | 4,090,000 | 3,967,300 |
| | | | 17,905,347 |
| Diversified Media - 0.4% | | | |
| Advantage Sales & Marketing, Inc. 6.5% 11/15/28 (d) | | 1,660,000 | 1,412,096 |
| Energy - 12.3% | | | |
| Berry Petroleum Co. LLC 7% 2/15/26 (d) | | 100,000 | 89,500 |
| Buckeye Partners LP 4.125% 3/1/25 (d) | | 1,400,000 | 1,319,514 |
| California Resources Corp. 7.125% 2/1/26 (d) | | 250,000 | 245,203 |
| Calumet Specialty Products Partners LP/Calumet Finance Corp. 11% 4/15/25 (d) | | 10,000 | 10,395 |
| Chesapeake Energy Corp. 5.5% 2/1/26 (d) | | 505,000 | 489,471 |
| Chord Energy Corp. 6.375% 6/1/26 (d) | | 100,000 | 97,690 |
| Citgo Holding, Inc. 9.25% 8/1/24 (d) | | 1,850,000 | 1,851,711 |
| Citgo Petroleum Corp. 6.375% 6/15/26 (d) | | 1,450,000 | 1,428,047 |
| Colgate Energy Partners III LLC 5.875% 7/1/29 (d) | | 70,000 | 64,925 |
| Comstock Resources, Inc. 6.75% 3/1/29 (d) | | 120,000 | 114,900 |
| Continental Resources, Inc.: | | | |
| 2.268% 11/15/26 (d) | | 300,000 | 255,045 |
| 4.5% 4/15/23 | | 300,000 | 298,752 |
| Crestwood Midstream Partners LP/Crestwood Midstream Finance Corp. 6% 2/1/29 (d) | | 1,860,000 | 1,739,286 |
| CrownRock LP/CrownRock Finance, Inc. 5.625% 10/15/25 (d) | | 2,300,000 | 2,224,560 |
| CVR Energy, Inc. 5.25% 2/15/25 (d) | | 1,615,000 | 1,556,174 |
| DCP Midstream Operating LP 5.375% 7/15/25 | | 1,400,000 | 1,369,025 |
| Delek Logistics Partners LP 7.125% 6/1/28 (d) | | 80,000 | 71,636 |
| Energy Ventures GoM LLC / EnVen Finance Corp. 11.75% 4/15/26 (d) | | 74,800 | 76,807 |
| EnLink Midstream Partners LP 4.85% 7/15/26 | | 1,400,000 | 1,319,598 |
| EQM Midstream Partners LP: | | | |
| 6% 7/1/25 (d) | | 147,000 | 142,372 |
| 7.5% 6/1/27 (d) | | 2,550,000 | 2,518,125 |
| EQT Corp. 3.125% 5/15/26 (d) | | 500,000 | 453,745 |
| Genesis Energy LP/Genesis Energy Finance Corp. 8% 1/15/27 | | 1,145,000 | 1,108,406 |
| Gulfport Energy Corp. 8% 5/17/26 | | 100,000 | 99,700 |
| Hess Midstream Partners LP 5.625% 2/15/26 (d) | | 2,450,000 | 2,402,887 |
| Holly Energy Partners LP/Holly Energy Finance Corp. 6.375% 4/15/27 (d) | | 105,000 | 101,059 |
| Magnolia Oil & Gas Operating LLC 6% 8/1/26 (d) | | 1,300,000 | 1,262,674 |
| Mesquite Energy, Inc. 7.25% 2/15/23 (c)(d)(e) | | 135,000 | 0 |
| Murphy Oil Corp. 5.75% 8/15/25 | | 116,000 | 114,363 |
| Nabors Industries, Inc. 5.75% 2/1/25 | | 2,550,000 | 2,454,375 |
| New Fortress Energy, Inc.: | | | |
| 6.5% 9/30/26 (d) | | 2,515,000 | 2,439,550 |
| 6.75% 9/15/25 (d) | | 1,290,000 | 1,266,401 |
| NGL Energy Operating LLC/NGL Energy Finance Corp. 7.5% 2/1/26 (d) | | 1,450,000 | 1,311,726 |
| NuStar Logistics LP 6% 6/1/26 | | 400,000 | 387,840 |
| Occidental Petroleum Corp.: | | | |
| 5.875% 9/1/25 | | 5,250,000 | 5,289,375 |
| 6.95% 7/1/24 | | 900,000 | 922,149 |
| PBF Holding Co. LLC/PBF Finance Corp. 7.25% 6/15/25 | | 350,000 | 346,283 |
| PDC Energy, Inc. 5.75% 5/15/26 | | 1,750,000 | 1,677,655 |
| Precision Drilling Corp. 7.125% 1/15/26 (d) | | 1,660,000 | 1,630,801 |
| Range Resources Corp. 4.875% 5/15/25 | | 250,000 | 241,149 |
| Southwestern Energy Co. 5.7% 1/23/25 (f) | | 28,000 | 27,677 |
| Sunnova Energy Corp. 5.875% 9/1/26 (d) | | 210,000 | 184,800 |
| Sunoco LP/Sunoco Finance Corp.: | | | |
| 5.875% 3/15/28 | | 60,000 | 57,119 |
| 6% 4/15/27 | | 1,010,000 | 989,598 |
| Tallgrass Energy Partners LP / Tallgrass Energy Finance Corp. 6% 3/1/27 (d) | | 2,000,000 | 1,887,344 |
| Transocean Proteus Ltd. 6.25% 12/1/24 (d) | | 285,750 | 278,606 |
| Western Gas Partners LP 4.65% 7/1/26 | | 3,500,000 | 3,316,250 |
| | | | 47,534,268 |
| Entertainment/Film - 0.3% | | | |
| Live Nation Entertainment, Inc. 4.75% 10/15/27 (d) | | 1,500,000 | 1,334,880 |
| Environmental - 0.4% | | | |
| Madison IAQ LLC 4.125% 6/30/28 (d) | | 1,900,000 | 1,572,250 |
| Food & Drug Retail - 1.1% | | | |
| Albertsons Companies LLC/Safeway, Inc./New Albertson's, Inc./Albertson's LLC 3.25% 3/15/26 (d) | | 4,600,000 | 4,128,132 |
| Food/Beverage/Tobacco - 0.9% | | | |
| Post Holdings, Inc.: | | | |
| 5.625% 1/15/28 (d) | | 1,625,000 | 1,519,213 |
| 5.75% 3/1/27 (d) | | 596,000 | 576,129 |
| Turning Point Brands, Inc. 5.625% 2/15/26 (d) | | 100,000 | 87,418 |
| U.S. Foods, Inc. 6.25% 4/15/25 (d) | | 1,275,000 | 1,268,868 |
| United Natural Foods, Inc. 6.75% 10/15/28 (d) | | 95,000 | 91,758 |
| | | | 3,543,386 |
| Gaming - 4.9% | | | |
| Affinity Gaming LLC 6.875% 12/15/27 (d) | | 1,030,000 | 859,795 |
| Caesars Entertainment, Inc.: | | | |
| 6.25% 7/1/25 (d) | | 4,950,000 | 4,829,874 |
| 8.125% 7/1/27 (d) | | 900,000 | 875,250 |
| Caesars Resort Collection LLC 5.75% 7/1/25 (d) | | 495,000 | 483,506 |
| Carnival Corp. 10.5% 6/1/30 (d) | | 245,000 | 189,875 |
| Golden Entertainment, Inc. 7.625% 4/15/26 (d) | | 500,000 | 491,250 |
| International Game Technology PLC 4.125% 4/15/26 (d) | | 2,200,000 | 2,041,600 |
| Melco Resorts Finance Ltd. 5.25% 4/26/26 (d) | | 200,000 | 126,953 |
| MGM Resorts International 6% 3/15/23 | | 1,000,000 | 999,499 |
| Raptor Acquisition Corp. / Raptor Co-Issuer LLC 4.875% 11/1/26 (d) | | 95,000 | 83,838 |
| Studio City Finance Ltd. 5% 1/15/29 (d) | | 225,000 | 93,263 |
| VICI Properties LP / VICI Note Co.: | | | |
| 3.5% 2/15/25 (d) | | 3,715,000 | 3,454,860 |
| 4.625% 6/15/25 (d) | | 300,000 | 281,162 |
| 5.625% 5/1/24 (d) | | 1,000,000 | 987,260 |
| Wynn Las Vegas LLC/Wynn Las Vegas Capital Corp.: | | | |
| 4.25% 5/30/23 (d) | | 500,000 | 492,500 |
| 5.5% 3/1/25 (d) | | 2,800,000 | 2,650,144 |
| | | | 18,940,629 |
| Healthcare - 5.4% | | | |
| 1375209 BC Ltd. 9% 1/30/28 (d) | | 562,000 | 543,735 |
| Bausch Health Companies, Inc.: | | | |
| 11% 9/30/28 (d) | | 2,000,000 | 1,540,000 |
| 14% 10/15/30 (d) | | 197,000 | 112,783 |
| Community Health Systems, Inc.: | | | |
| 5.625% 3/15/27 (d) | | 6,050,000 | 4,821,064 |
| 6.875% 4/15/29 (d) | | 120,000 | 48,288 |
| HCA Holdings, Inc. 5.875% 2/15/26 | | 1,750,000 | 1,733,102 |
| IQVIA, Inc. 5% 5/15/27 (d) | | 4,500,000 | 4,287,960 |
| Owens & Minor, Inc. 4.5% 3/31/29 (d) | | 65,000 | 50,333 |
| RP Escrow Issuer LLC 5.25% 12/15/25 (d) | | 200,000 | 149,548 |
| Surgery Center Holdings, Inc. 6.75% 7/1/25 (d) | | 1,755,000 | 1,649,882 |
| Tenet Healthcare Corp.: | | | |
| 4.625% 7/15/24 | | 86,000 | 83,850 |
| 5.125% 11/1/27 (d) | | 6,200,000 | 5,711,750 |
| | | | 20,732,295 |
| Homebuilders/Real Estate - 2.3% | | | |
| Brookfield Property REIT, Inc./BPR Nimbus LLC/BPR Cumulus LLC/GGSI Sellco LLC 5.75% 5/15/26 (d) | | 250,000 | 232,048 |
| MPT Operating Partnership LP/MPT Finance Corp. 5.25% 8/1/26 | | 4,000,000 | 3,607,680 |
| Railworks Holdings LP 8.25% 11/15/28 (d) | | 230,000 | 211,379 |
| Service Properties Trust: | | | |
| 4.35% 10/1/24 | | 400,000 | 367,312 |
| 7.5% 9/15/25 | | 3,000,000 | 2,925,000 |
| Starwood Property Trust, Inc. 4.75% 3/15/25 | | 1,500,000 | 1,405,269 |
| | | | 8,748,688 |
| Insurance - 0.3% | | | |
| Acrisure LLC / Acrisure Finance, Inc. 7% 11/15/25 (d) | | 1,020,000 | 958,697 |
| Alliant Holdings Intermediate LLC 6.75% 10/15/27 (d) | | 30,000 | 27,375 |
| Enact Holdings, Inc. 6.5% 8/15/25 (d) | | 200,000 | 197,020 |
| | | | 1,183,092 |
| Leisure - 2.5% | | | |
| Carnival Corp. 7.625% 3/1/26 (d) | | 4,900,000 | 3,684,555 |
| NCL Corp. Ltd.: | | | |
| 5.875% 3/15/26 (d) | | 400,000 | 327,500 |
| 5.875% 2/15/27 (d) | | 2,025,000 | 1,809,844 |
| Royal Caribbean Cruises Ltd.: | | | |
| 5.375% 7/15/27 (d) | | 120,000 | 93,278 |
| 5.5% 8/31/26 (d) | | 885,000 | 723,576 |
| 11.625% 8/15/27 (d) | | 1,500,000 | 1,458,300 |
| Six Flags Entertainment Corp. 5.5% 4/15/27 (d) | | 1,500,000 | 1,350,000 |
| Viking Cruises Ltd. 13% 5/15/25 (d) | | 235,000 | 252,625 |
| | | | 9,699,678 |
| Metals/Mining - 2.3% | | | |
| First Quantum Minerals Ltd. 6.875% 3/1/26 (d) | | 2,610,000 | 2,442,738 |
| Howmet Aerospace, Inc.: | | | |
| 5.125% 10/1/24 | | 250,000 | 246,875 |
| 6.875% 5/1/25 | | 3,708,000 | 3,774,188 |
| HudBay Minerals, Inc. 4.5% 4/1/26 (d) | | 1,055,000 | 925,515 |
| Novelis Corp. 3.25% 11/15/26 (d) | | 1,650,000 | 1,444,141 |
| | | | 8,833,457 |
| Paper - 0.0% | | | |
| Ardagh Metal Packaging Finance U.S.A. LLC/Ardagh Metal Packaging Finance PLC 6% 6/15/27 (d) | | 200,000 | 191,914 |
| Restaurants - 1.0% | | | |
| 1011778 BC Unlimited Liability Co./New Red Finance, Inc.: | | | |
| 3.875% 1/15/28 (d) | | 1,800,000 | 1,582,065 |
| 5.75% 4/15/25 (d) | | 1,000,000 | 996,250 |
| Garden SpinCo Corp. 8.625% 7/20/30 (d) | | 55,000 | 56,571 |
| Yum! Brands, Inc. 3.875% 11/1/23 | | 1,225,000 | 1,203,563 |
| | | | 3,838,449 |
| Services - 2.7% | | | |
| Aramark Services, Inc. 5% 4/1/25 (d) | | 2,800,000 | 2,706,741 |
| Brand Energy & Infrastructure Services, Inc. 8.5% 7/15/25 (d) | | 806,000 | 579,487 |
| CoreCivic, Inc.: | | | |
| 4.75% 10/15/27 | | 35,000 | 29,042 |
| 8.25% 4/15/26 | | 250,000 | 253,656 |
| Diebold Nixdorf, Inc. 9.375% 7/15/25 (d) | | 100,000 | 74,370 |
| Life Time, Inc. 5.75% 1/15/26 (d) | | 1,125,000 | 1,046,250 |
| PowerTeam Services LLC 9.033% 12/4/25 (d) | | 120,000 | 100,279 |
| Prime Securities Services Borrower LLC/Prime Finance, Inc. 5.75% 4/15/26 (d) | | 2,350,000 | 2,287,371 |
| Sabre GLBL, Inc. 7.375% 9/1/25 (d) | | 2,200,000 | 2,065,096 |
| WASH Multifamily Acquisition, Inc. 5.75% 4/15/26 (d) | | 1,240,000 | 1,156,261 |
| | | | 10,298,553 |
| Steel - 0.0% | | | |
| Infrabuild Australia Pty Ltd. 12% 10/1/24 (d) | | 150,000 | 139,125 |
| Super Retail - 2.1% | | | |
| At Home Group, Inc. 4.875% 7/15/28 (d) | | 60,000 | 43,623 |
| Carvana Co. 5.5% 4/15/27 (d) | | 200,000 | 95,046 |
| EG Global Finance PLC: | | | |
| 6.75% 2/7/25 (d) | | 3,700,000 | 3,330,000 |
| 8.5% 10/30/25 (d) | | 800,000 | 738,964 |
| Hanesbrands, Inc. 4.875% 5/15/26 (d) | | 2,400,000 | 2,202,000 |
| Rent-A-Center, Inc. 6.375% 2/15/29 (d) | | 30,000 | 23,371 |
| Staples, Inc. 7.5% 4/15/26 (d) | | 1,900,000 | 1,650,302 |
| | | | 8,083,306 |
| Technology - 2.3% | | | |
| Camelot Finance SA 4.5% 11/1/26 (d) | | 2,600,000 | 2,429,788 |
| CommScope, Inc. 6% 3/1/26 (d) | | 2,100,000 | 2,025,559 |
| MicroStrategy, Inc. 6.125% 6/15/28 (d) | | 85,000 | 72,834 |
| MoneyGram International, Inc. 5.375% 8/1/26 (d) | | 250,000 | 245,513 |
| Sensata Technologies BV 5% 10/1/25 (d) | | 2,300,000 | 2,228,474 |
| Uber Technologies, Inc. 7.5% 9/15/27 (d) | | 1,500,000 | 1,499,653 |
| Veritas U.S., Inc./Veritas Bermuda Ltd. 7.5% 9/1/25 (d) | | 400,000 | 336,672 |
| Virtusa Corp. 7.125% 12/15/28 (d) | | 50,000 | 35,866 |
| | | | 8,874,359 |
| Telecommunications - 8.0% | | | |
| Altice France SA 8.125% 2/1/27 (d) | | 3,410,000 | 3,124,413 |
| C&W Senior Financing Designated Activity Co. 6.875% 9/15/27 (d) | | 25,000 | 21,625 |
| Cogent Communications Group, Inc. 7% 6/15/27 (d) | | 1,800,000 | 1,708,915 |
| Consolidated Communications, Inc. 5% 10/1/28 (d) | | 1,060,000 | 821,346 |
| Lumen Technologies, Inc.: | | | |
| 4% 2/15/27 (d) | | 4,000,000 | 3,400,800 |
| 5.125% 12/15/26 (d) | | 1,000,000 | 856,250 |
| Northwest Fiber LLC/Northwest Fiber Finance Sub, Inc. 4.75% 4/30/27 (d) | | 95,000 | 85,399 |
| Sable International Finance Ltd. 5.75% 9/7/27 (d) | | 2,402,000 | 2,116,763 |
| Sabre GLBL, Inc. 9.25% 4/15/25 (d) | | 200,000 | 193,679 |
| SBA Communications Corp. 3.875% 2/15/27 | | 3,200,000 | 2,880,000 |
| Sprint Corp. 7.875% 9/15/23 | | 2,280,000 | 2,317,399 |
| T-Mobile U.S.A., Inc.: | | | |
| 2.25% 2/15/26 | | 3,810,000 | 3,429,114 |
| 2.625% 4/15/26 | | 320,000 | 288,790 |
| Telecom Italia SpA 5.303% 5/30/24 (d) | | 2,150,000 | 2,022,656 |
| Uniti Group, Inc. 7.875% 2/15/25 (d) | | 4,705,000 | 4,657,974 |
| Windstream Escrow LLC 7.75% 8/15/28 (d) | | 570,000 | 493,221 |
| Zayo Group Holdings, Inc. 4% 3/1/27 (d) | | 3,200,000 | 2,472,000 |
| | | | 30,890,344 |
| Transportation Ex Air/Rail - 0.0% | | | |
| Great Lakes Dredge & Dock Corp. 5.25% 6/1/29 (d) | | 70,000 | 55,353 |
| Utilities - 2.1% | | | |
| Global Partners LP/GLP Finance Corp. 7% 8/1/27 | | 2,157,000 | 2,050,621 |
| InterGen NV 7% 6/30/23 (d) | | 200,000 | 195,750 |
| NextEra Energy Partners LP: | | | |
| 4.25% 7/15/24 (d) | | 1,500,000 | 1,454,280 |
| 4.25% 9/15/24 (d) | | 41,000 | 38,584 |
| PG&E Corp. 5% 7/1/28 | | 1,210,000 | 1,090,567 |
| Solaris Midstream Holdings LLC 7.625% 4/1/26 (d) | | 120,000 | 114,300 |
| Vistra Operations Co. LLC: | | | |
| 5% 7/31/27 (d) | | 225,000 | 207,563 |
| 5.625% 2/15/27 (d) | | 3,005,000 | 2,864,606 |
| | | | 8,016,271 |
TOTAL NONCONVERTIBLE BONDS | | | 291,667,482 |
| TOTAL CORPORATE BONDS (Cost $302,382,306) | | | 295,487,154 |
| | | | |
| Common Stocks - 0.1% |
| | | Shares | Value ($) |
| Diversified Financial Services - 0.0% | | | |
| Lime Tree Bay Ltd. (c) | | 80 | 2,698 |
| Energy - 0.0% | | | |
| California Resources Corp. warrants 10/27/24 (g) | | 2 | 28 |
| Forbes Energy Services Ltd. (c)(g) | | 6,468 | 0 |
| Mesquite Energy, Inc. (c)(g) | | 1,922 | 106,555 |
TOTAL ENERGY | | | 106,583 |
| Utilities - 0.1% | | | |
| EQT Corp. | | 3,400 | 142,256 |
| TOTAL COMMON STOCKS (Cost $479,224) | | | 251,537 |
| | | | |
| Bank Loan Obligations - 11.2% |
| | | Principal Amount (a) | Value ($) |
| Broadcasting - 0.6% | | | |
| Diamond Sports Group LLC 2LN, term loan CME Term SOFR 1 Month Index + 3.250% 6.458% 8/24/26 (h)(i)(j) | | 197,490 | 38,313 |
| Univision Communications, Inc. Tranche B 1LN, term loan 1 month U.S. LIBOR + 3.250% 7.0039% 1/31/29 (h)(i)(j) | | 2,359,700 | 2,262,362 |
TOTAL BROADCASTING | | | 2,300,675 |
| Building Materials - 1.0% | | | |
| Acproducts Holdings, Inc. Tranche B 1LN, term loan 1 month U.S. LIBOR + 4.250% 7.3247% 5/17/28 (h)(i)(j) | | 1,682,688 | 1,167,011 |
| Oscar AcquisitionCo LLC 1LN, term loan CME Term SOFR 1 Month Index + 4.500% 8.1532% 4/29/29 (h)(i)(j) | | 500,000 | 451,305 |
| SRS Distribution, Inc. Tranche B 1LN, term loan 1 month U.S. LIBOR + 3.500% 7.2539% 6/4/28 (h)(i)(j) | | 2,348,504 | 2,178,238 |
TOTAL BUILDING MATERIALS | | | 3,796,554 |
| Chemicals - 0.5% | | | |
| Consolidated Energy Finance SA Tranche B 1LN, term loan 1 month U.S. LIBOR + 3.500% 6.3633% 5/7/25 (c)(h)(i)(j) | | 286,375 | 272,056 |
| Olympus Water U.S. Holding Corp. Tranche B 1LN, term loan 1 month U.S. LIBOR + 3.750% 7.4375% 11/9/28 (h)(i)(j) | | 29,775 | 27,063 |
| SCIH Salt Holdings, Inc. Tranche B 1LN, term loan 1 month U.S. LIBOR + 4.000% 8.4147% 3/16/27 (h)(i)(j) | | 32,476 | 30,497 |
| W.R. Grace Holding LLC Tranche B 1LN, term loan 3 month U.S. LIBOR + 3.750% 7.4375% 9/22/28 (h)(i)(j) | | 1,524,813 | 1,461,441 |
TOTAL CHEMICALS | | | 1,791,057 |
| Consumer Products - 0.0% | | | |
| Conair Holdings LLC Tranche B 1LN, term loan 1 month U.S. LIBOR + 3.750% 7.4241% 5/17/28 (h)(i)(j) | | 24,750 | 20,708 |
| Diamond BC BV Tranche B 1LN, term loan 1 month U.S. LIBOR + 2.750% 7.1631% 9/29/28 (h)(i)(j) | | 19,850 | 18,525 |
| TKC Holdings, Inc. 1LN, term loan 12% 2/14/27 (h)(j) | | 200,000 | 170,000 |
TOTAL CONSUMER PRODUCTS | | | 209,233 |
| Diversified Financial Services - 0.6% | | | |
| Broadstreet Partners, Inc. Tranche B 1LN, term loan 1 month U.S. LIBOR + 3.000% 7.0039% 1/27/27 (h)(i)(j) | | 344,697 | 329,130 |
| Hightower Holding LLC Tranche B 1LN, term loan 1 month U.S. LIBOR + 4.000% 8.2776% 4/21/28 (h)(i)(j) | | 2,309,900 | 2,136,658 |
TOTAL DIVERSIFIED FINANCIAL SERVICES | | | 2,465,788 |
| Energy - 0.0% | | | |
| DT Midstream, Inc. Tranche B 1LN, term loan 1 month U.S. LIBOR + 2.000% 5.8125% 6/12/28 (h)(i)(j) | | 15,973 | 15,971 |
| Forbes Energy Services LLC Tranche B, term loan 0% 12/31/49 (c)(e)(h)(j) | | 60,604 | 0 |
| Mesquite Energy, Inc.: | | | |
| 1LN, term loan 3 month U.S. LIBOR + 8.000% 0% (c)(e)(i)(j) | | 35,876 | 0 |
| term loan 3 month U.S. LIBOR + 0.000% 0% (c)(e)(i)(j) | | 15,000 | 0 |
TOTAL ENERGY | | | 15,971 |
| Environmental - 0.2% | | | |
| LRS Holdings LLC Tranche B 1LN, term loan 1 month U.S. LIBOR + 4.250% 8.0039% 6/28/28 (h)(i)(j) | | 694,750 | 663,486 |
| Food/Beverage/Tobacco - 0.0% | | | |
| Triton Water Holdings, Inc. Tranche B 1LN, term loan 1 month U.S. LIBOR + 3.500% 7.1741% 3/31/28 (h)(i)(j) | | 54,313 | 48,142 |
| Gaming - 0.5% | | | |
| Fertitta Entertainment LLC NV Tranche B 1LN, term loan CME Term SOFR 1 Month Index + 4.000% 7.7287% 1/27/29 (h)(i)(j) | | 322,458 | 301,820 |
| Golden Entertainment, Inc. Tranche B, term loan 3 month U.S. LIBOR + 3.000% 6.6% 10/20/24 (h)(i)(j) | | 1,736,501 | 1,719,136 |
TOTAL GAMING | | | 2,020,956 |
| Healthcare - 0.7% | | | |
| Confluent Health LLC: | | | |
| Tranche B 1LN, term loan 1 month U.S. LIBOR + 4.000% 7.7539% 11/30/28 (h)(i)(j) | | 12,283 | 11,009 |
| Tranche DD 1LN, term loan 1 month U.S. LIBOR + 4.000% 5.3383% 11/30/28 (h)(i)(j)(k) | | 2,655 | 2,379 |
| Insulet Corp. Tranche B 1LN, term loan 1 month U.S. LIBOR + 3.250% 7.0039% 5/4/28 (h)(i)(j) | | 19,750 | 19,281 |
| Jazz Financing Lux SARL Tranche B 1LN, term loan 1 month U.S. LIBOR + 3.500% 7.2539% 5/5/28 (h)(i)(j) | | 48,990 | 48,347 |
| Medical Solutions Holdings, Inc.: | | | |
| 1LN, term loan 1 month U.S. LIBOR + 3.500% 6.3769% 11/1/28 (h)(i)(j) | | 343,100 | 330,234 |
| Tranche DD 1LN, term loan 1 month U.S. LIBOR + 3.250% 11/1/28 (i)(j)(k) | | 55,200 | 53,130 |
| Mozart Borrower LP Tranche B 1LN, term loan 1 month U.S. LIBOR + 3.250% 7.0039% 10/23/28 (h)(i)(j) | | 114,425 | 105,080 |
| Organon & Co. Tranche B 1LN, term loan 1 month U.S. LIBOR + 3.000% 6.1875% 6/2/28 (h)(i)(j) | | 1,621,008 | 1,578,457 |
| Packaging Coordinators Midco, Inc. Tranche B 1LN, term loan 3 month U.S. LIBOR + 3.750% 7.4241% 11/30/27 (h)(i)(j) | | 14,849 | 14,325 |
| Phoenix Newco, Inc. Tranche B 1LN, term loan 1 month U.S. LIBOR + 3.250% 7.0039% 11/15/28 (h)(i)(j) | | 59,700 | 57,409 |
| RadNet Management, Inc. Tranche B 1LN, term loan 1 month U.S. LIBOR + 3.000% 6.7539% 4/23/28 (h)(i)(j) | | 345,625 | 334,824 |
| U.S. Anesthesia Partners, Inc. Tranche B 1LN, term loan 1 month U.S. LIBOR + 4.250% 7.3779% 10/1/28 (h)(i)(j) | | 29,700 | 28,141 |
TOTAL HEALTHCARE | | | 2,582,616 |
| Hotels - 0.0% | | | |
| Hilton Grand Vacations Borrower LLC Tranche B 1LN, term loan 1 month U.S. LIBOR + 3.000% 6.7539% 8/2/28 (h)(i)(j) | | 49,500 | 48,696 |
| Insurance - 0.8% | | | |
| Alliant Holdings Intermediate LLC: | | | |
| Tranche B, term loan 1 month U.S. LIBOR + 3.250% 7.0039% 5/10/25 (h)(i)(j) | | 295,373 | 286,559 |
| Tranche B3 1LN, term loan 1 month U.S. LIBOR + 3.500% 6.9799% 11/12/27 (h)(i)(j) | | 1,603,950 | 1,546,946 |
| AssuredPartners, Inc. Tranche B 1LN, term loan 1 month U.S. LIBOR + 3.500% 7.2539% 2/13/27 (h)(i)(j) | | 1,344,684 | 1,280,811 |
TOTAL INSURANCE | | | 3,114,316 |
| Leisure - 0.1% | | | |
| Hayward Industries, Inc. Tranche B 1LN, term loan 1 month U.S. LIBOR + 2.500% 6.2539% 5/28/28 (h)(i)(j) | | 395,000 | 370,561 |
| MajorDrive Holdings IV LLC 1LN, term loan 1 month U.S. LIBOR + 4.000% 7.125% 5/12/28 (h)(i)(j) | | 24,688 | 22,686 |
TOTAL LEISURE | | | 393,247 |
| Paper - 0.4% | | | |
| Clydesdale Acquisition Holdings, Inc. 1LN, term loan CME Term SOFR 1 Month Index + 4.170% 8.0037% 4/13/29 (h)(i)(j) | | 1,579,800 | 1,519,452 |
| Services - 1.6% | | | |
| ABG Intermediate Holdings 2 LLC Tranche B1 LN, term loan CME Term SOFR 1 Month Index + 3.500% 7.3287% 12/21/28 (h)(i)(j) | | 49,875 | 47,818 |
| Allied Universal Holdco LLC Tranche B 1LN, term loan 1 month U.S. LIBOR + 3.750% 7.5039% 5/14/28 (h)(i)(j) | | 2,269,800 | 2,055,599 |
| Ascend Learning LLC: | | | |
| 2LN, term loan 1 month U.S. LIBOR + 5.750% 9.5039% 12/10/29 (h)(i)(j) | | 20,000 | 16,925 |
| Tranche B 1LN, term loan 1 month U.S. LIBOR + 3.500% 7.2539% 12/10/28 (h)(i)(j) | | 2,433,613 | 2,227,437 |
| Brand Energy & Infrastructure Services, Inc. Tranche B, term loan 3 month U.S. LIBOR + 4.250% 8.493% 6/21/24 (h)(i)(j) | | 1,500,000 | 1,294,695 |
| CHG Healthcare Services, Inc. 1LN, term loan 1 month U.S. LIBOR + 3.250% 7.0039% 9/30/28 (h)(i)(j) | | 14,850 | 14,389 |
| CoreLogic, Inc. Tranche B 1LN, term loan 1 month U.S. LIBOR + 3.500% 7.3125% 6/2/28 (h)(i)(j) | | 49,500 | 36,369 |
| Spin Holdco, Inc. Tranche B 1LN, term loan 1 month U.S. LIBOR + 4.000% 7.1441% 3/4/28 (h)(i)(j) | | 638,625 | 560,662 |
TOTAL SERVICES | | | 6,253,894 |
| Super Retail - 0.9% | | | |
| Bass Pro Group LLC Tranche B 1LN, term loan 1 month U.S. LIBOR + 3.750% 7.5039% 3/5/28 (h)(i)(j) | | 3,138,030 | 2,948,179 |
| Empire Today LLC Tranche B 1LN, term loan 1 month U.S. LIBOR + 5.000% 8.3003% 4/1/28 (h)(i)(j) | | 494,987 | 363,816 |
TOTAL SUPER RETAIL | | | 3,311,995 |
| Technology - 0.9% | | | |
| Acuris Finance U.S., Inc. 1LN, term loan CME Term SOFR 1 Month Index + 4.000% 7.7032% 2/16/28 (h)(i)(j) | | 10,156 | 9,915 |
| Aptean, Inc. 2LN, term loan 1 month U.S. LIBOR + 7.000% 10.0696% 4/23/27 (h)(i)(j) | | 200,000 | 183,000 |
| Athenahealth Group, Inc.: | | | |
| Tranche B 1LN, term loan CME Term SOFR 1 Month Index + 3.500% 6.9671% 2/15/29 (h)(i)(j) | | 2,255,859 | 2,056,599 |
| Tranche DD 1LN, term loan CME Term SOFR 1 Month Index + 3.500% 2/15/29 (i)(j)(k) | | 383,307 | 349,450 |
| DG Investment Intermediate Holdings, Inc.: | | | |
| 2LN, term loan 1 month U.S. LIBOR + 6.750% 10.5039% 3/31/29 (h)(i)(j) | | 80,000 | 74,400 |
| Tranche B 1LN, term loan 1 month U.S. LIBOR + 3.750% 7.5039% 3/31/28 (h)(i)(j) | | 14,813 | 13,969 |
| Electro Rent Corp. Tranche B 1LN, term loan 3 month U.S. LIBOR + 5.000% 9.2776% 1/31/24 (h)(i)(j) | | 393,734 | 369,125 |
| Maverick Bidco, Inc. Tranche B 1LN, term loan 1 month U.S. LIBOR + 3.750% 8.1647% 5/18/28 (h)(i)(j) | | 297,019 | 280,683 |
| Park Place Technologies LLC 1LN, term loan 1 month U.S. LIBOR + 5.000% 8.8287% 11/10/27 (h)(i)(j) | | 344,750 | 326,220 |
TOTAL TECHNOLOGY | | | 3,663,361 |
| Telecommunications - 1.0% | | | |
| Cablevision Lightpath LLC Tranche B 1LN, term loan 1 month U.S. LIBOR + 3.250% 6.6621% 11/30/27 (h)(i)(j) | | 1,343,860 | 1,309,591 |
| Consolidated Communications, Inc. Tranche B 1LN, term loan 1 month U.S. LIBOR + 3.500% 7.25% 10/2/27 (h)(i)(j) | | 700,000 | 582,967 |
| Intelsat Jackson Holdings SA 1LN, term loan CME Term SOFR 1 Month Index + 4.250% 7.4449% 2/1/29 (h)(i)(j) | | 1,427,628 | 1,373,207 |
| Northwest Fiber LLC Tranche B 1LN, term loan 1 month U.S. LIBOR + 3.750% 7.9766% 4/30/27 (h)(i)(j) | | 152,675 | 147,255 |
| Windstream Services LLC Tranche B 1LN, term loan 1 month U.S. LIBOR + 6.250% 10.0039% 9/21/27 (h)(i)(j) | | 344,634 | 308,234 |
TOTAL TELECOMMUNICATIONS | | | 3,721,254 |
| Textiles/Apparel - 0.1% | | | |
| Tory Burch LLC Tranche B 1LN, term loan 1 month U.S. LIBOR + 3.000% 6.7539% 4/14/28 (h)(i)(j) | | 296,250 | 270,236 |
| Utilities - 1.3% | | | |
| Brookfield WEC Holdings, Inc. 1LN, term loan CME Term SOFR 1 Month Index + 3.750% 7.4787% 8/1/25 (h)(i)(j) | | 1,620,000 | 1,607,089 |
| Limetree Bay Terminals LLC Tranche B 1LN, term loan 3 month U.S. LIBOR + 4.000% 8.8148% 2/15/24 (h)(i)(j) | | 458,588 | 313,940 |
| PG&E Corp. Tranche B 1LN, term loan 1 month U.S. LIBOR + 3.000% 6.8125% 6/23/25 (h)(i)(j) | | 3,024,560 | 2,970,874 |
TOTAL UTILITIES | | | 4,891,903 |
| TOTAL BANK LOAN OBLIGATIONS (Cost $44,441,051) | | | 43,082,832 |
| | | | |
| Money Market Funds - 17.0% |
| | | Shares | Value ($) |
Fidelity Cash Central Fund 3.10% (l) (Cost $65,575,673) | | 65,562,600 | 65,575,712 |
| | | | |
| TOTAL INVESTMENT IN SECURITIES - 105.1% (Cost $412,878,254) | 404,397,235 |
NET OTHER ASSETS (LIABILITIES) - (5.1)% | (19,552,665) |
| NET ASSETS - 100.0% | 384,844,570 |
| | |
Legend
| (a) | Amount is stated in United States dollars unless otherwise noted. |
| (b) | Restricted securities (including private placements) - Investment in securities not registered under the Securities Act of 1933 (excluding 144A issues). At the end of the period, the value of restricted securities (excluding 144A issues) amounted to $245,352 or 0.1% of net assets. |
| (d) | Security exempt from registration under Rule 144A of the Securities Act of 1933. These securities may be resold in transactions exempt from registration, normally to qualified institutional buyers. At the end of the period, the value of these securities amounted to $205,200,044 or 53.3% of net assets. |
| (e) | Non-income producing - Security is in default. |
| (f) | Security initially issued at one coupon which converts to a higher coupon at a specified date. The rate shown is the rate at period end. |
| (h) | Coupon rates for floating and adjustable rate securities reflect the rates in effect at period end. |
| (i) | Coupon is indexed to a floating interest rate which may be multiplied by a specified factor and/or subject to caps or floors. |
| (j) | Remaining maturities of bank loan obligations may be less than the stated maturities shown as a result of contractual or optional prepayments by the borrower. Such prepayments cannot be predicted with certainty. |
| (k) | Position or a portion of the position represents an unfunded loan commitment. At period end, the total principal amount and market value of unfunded commitments totaled $440,205 and $404,102, respectively. |
| (l) | Affiliated fund that is generally available only to investment companies and other accounts managed by Fidelity Investments. The rate quoted is the annualized seven-day yield of the fund at period end. A complete unaudited listing of the fund's holdings as of its most recent quarter end is available upon request. In addition, each Fidelity Central Fund's financial statements are available on the SEC's website or upon request. |
| Additional information on each restricted holding is as follows: |
| Security | Acquisition Date | Acquisition Cost ($) |
| Mesquite Energy, Inc. 15% 7/15/23 | 7/10/20 - 1/18/22 | 15,159 |
| | | |
| Mesquite Energy, Inc. 15% 7/15/23 | 11/05/20 - 1/18/22 | 26,231 |
| | | |
Affiliated Central Funds
Fiscal year to date information regarding the Fund's investments in Fidelity Central Funds, including the ownership percentage, is presented below.
| Affiliate | Value, beginning of period ($) | Purchases ($) | Sales Proceeds ($) | Dividend Income ($) | Realized Gain (loss) ($) | Change in Unrealized appreciation (depreciation) ($) | Value, end of period ($) | % ownership, end of period |
| Fidelity Cash Central Fund 3.10% | 6,370,650 | 306,512,727 | 247,307,665 | 148,634 | - | - | 65,575,712 | 0.1% |
| Total | 6,370,650 | 306,512,727 | 247,307,665 | 148,634 | - | - | 65,575,712 | |
| | | | | | | | | |
Amounts in the income column in the above table include any capital gain distributions from underlying funds, which are presented in the corresponding line item in the Statement of Operations, if applicable.
Investment Valuation
The following is a summary of the inputs used, as of October 31, 2022, involving the Fund's assets and liabilities carried at fair value. The inputs or methodology used for valuing securities may not be an indication of the risk associated with investing in those securities. For more information on valuation inputs, and their aggregation into the levels used below, please refer to the Investment Valuation section in the accompanying Notes to Financial Statements.
| Valuation Inputs at Reporting Date: |
| Description | Total ($) | Level 1 ($) | Level 2 ($) | Level 3 ($) |
Investments in Securities: | | | | |
|
| Equities: | | | | |
Energy | 248,839 | 142,284 | - | 106,555 |
Financials | 2,698 | - | - | 2,698 |
|
| Corporate Bonds | 295,487,154 | - | 295,241,802 | 245,352 |
|
| Bank Loan Obligations | 43,082,832 | - | 42,810,776 | 272,056 |
|
| Money Market Funds | 65,575,712 | 65,575,712 | - | - |
| Total Investments in Securities: | 404,397,235 | 65,717,996 | 338,052,578 | 626,661 |
| Statement of Assets and Liabilities |
| | | | October 31, 2022 (Unaudited) |
| | | | | |
| Assets | | | | |
| Investment in securities, at value - See accompanying schedule: | | | | |
Unaffiliated issuers (cost $347,302,581) | | $338,821,523 | | |
Fidelity Central Funds (cost $65,575,673) | | 65,575,712 | | |
| | | | | |
| Total Investment in Securities (cost $412,878,254) | | | $ | 404,397,235 |
| Cash | | | | 356,933 |
| Receivable for investments sold | | | | 27,435 |
| Receivable for fund shares sold | | | | 11,632,983 |
| Interest receivable | | | | 4,760,810 |
| Distributions receivable from Fidelity Central Funds | | | | 94,050 |
| Prepaid expenses | | | | 185 |
| Receivable from investment adviser for expense reductions | | | | 44,522 |
Total assets | | | | 421,314,153 |
| Liabilities | | | | |
| Payable for investments purchased | | $36,190,053 | | |
| Payable for fund shares redeemed | | 51,421 | | |
| Distributions payable | | 76,061 | | |
| Accrued management fee | | 78,998 | | |
| Distribution and service plan fees payable | | 7,457 | | |
| Other affiliated payables | | 25,810 | | |
| Other payables and accrued expenses | | 39,783 | | |
| Total Liabilities | | | | 36,469,583 |
| Net Assets | | | $ | 384,844,570 |
| Net Assets consist of: | | | | |
| Paid in capital | | | $ | 402,967,818 |
| Total accumulated earnings (loss) | | | | (18,123,248) |
| Net Assets | | | $ | 384,844,570 |
| | | | | |
| Net Asset Value and Maximum Offering Price | | | | |
| Class A : | | | | |
Net Asset Value and redemption price per share ($21,740,730 ÷ 2,547,170 shares) (a) | | | $ | 8.54 |
| Maximum offering price per share (100/96.00 of $8.54) | | | $ | 8.90 |
| Class M : | | | | |
Net Asset Value and redemption price per share ($2,526,948 ÷ 296,090 shares) (a) | | | $ | 8.53 |
| Maximum offering price per share (100/96.00 of $8.53) | | | $ | 8.89 |
| Class C : | | | | |
Net Asset Value and offering price per share ($2,979,204 ÷ 348,997 shares) (a) | | | $ | 8.54 |
| Short Duration High Income : | | | | |
Net Asset Value , offering price and redemption price per share ($341,841,376 ÷ 40,048,117 shares) | | | $ | 8.54 |
| Class I : | | | | |
Net Asset Value , offering price and redemption price per share ($5,296,205 ÷ 620,447 shares) | | | $ | 8.54 |
| Class Z : | | | | |
Net Asset Value , offering price and redemption price per share ($10,460,107 ÷ 1,224,986 shares) | | | $ | 8.54 |
(a)Redemption price per share is equal to net asset value less any applicable contingent deferred sales charge. |
| Statement of Operations |
| | | | Six months ended October 31, 2022 (Unaudited) |
| Investment Income | | | | |
| Dividends | | | $ | 510 |
| Interest | | | | 3,363,015 |
| Income from Fidelity Central Funds | | | | 148,634 |
| Total Income | | | | 3,512,159 |
| Expenses | | | | |
| Management fee | $ | 356,866 | | |
| Transfer agent fees | | 76,428 | | |
| Distribution and service plan fees | | 46,949 | | |
| Accounting fees and expenses | | 26,659 | | |
| Custodian fees and expenses | | 5,096 | | |
| Independent trustees' fees and expenses | | 208 | | |
| Registration fees | | 81,711 | | |
| Audit | | 34,540 | | |
| Legal | | 6,717 | | |
| Miscellaneous | | 327 | | |
| Total expenses before reductions | | 635,501 | | |
| Expense reductions | | (94,733) | | |
| Total expenses after reductions | | | | 540,768 |
| Net Investment income (loss) | | | | 2,971,391 |
| Realized and Unrealized Gain (Loss) | | | | |
| Net realized gain (loss) on: | | | | |
| Investment Securities: | | | | |
| Unaffiliated issuers | | (1,965,028) | | |
| Total net realized gain (loss) | | | | (1,965,028) |
| Change in net unrealized appreciation (depreciation) on investment securities | | | | (2,462,650) |
| Net gain (loss) | | | | (4,427,678) |
| Net increase (decrease) in net assets resulting from operations | | | $ | (1,456,287) |
| Statement of Changes in Net Assets |
| |
| | Six months ended October 31, 2022 (Unaudited) | | Year ended April 30, 2022 |
| Increase (Decrease) in Net Assets | | | | |
| Operations | | | | |
| Net investment income (loss) | $ | 2,971,391 | $ | 4,424,773 |
| Net realized gain (loss) | | (1,965,028) | | 118,598 |
| Change in net unrealized appreciation (depreciation) | | (2,462,650) | | (7,771,418) |
| Net increase (decrease) in net assets resulting from operations | | (1,456,287) | | (3,228,047) |
| Distributions to shareholders | | (2,713,986) | | (4,340,504) |
| Share transactions - net increase (decrease) | | 261,515,211 | | 19,732,716 |
| Total increase (decrease) in net assets | | 257,344,938 | | 12,164,165 |
| | | | | |
| Net Assets | | | | |
| Beginning of period | | 127,499,632 | | 115,335,467 |
| End of period | $ | 384,844,570 | $ | 127,499,632 |
| | | | | |
| | | | | |
Financial Highlights
| Fidelity Advisor® Short Duration High Income Fund Class A |
| |
| | Six months ended (Unaudited) October 31, 2022 | | Years ended April 30, 2022 | | 2021 | | 2020 | | 2019 | | 2018 |
Selected Per-Share Data | | | | | | | | | | | | |
| Net asset value, beginning of period | $ | 8.98 | $ | 9.52 | $ | 8.87 | $ | 9.44 | $ | 9.42 | $ | 9.57 |
| Income from Investment Operations | | | | | | | | | | | | |
Net investment income (loss) A,B | | .190 | | .307 | | .300 | | .348 | | .409 | | .381 |
| Net realized and unrealized gain (loss) | | (.457) | | (.546) | | .651 | | (.571) | | .004 | | (.159) |
| Total from investment operations | | (.267) | | (.239) | | .951 | | (.223) | | .413 | | .222 |
| Distributions from net investment income | | (.173) | | (.301) | | (.301) | | (.347) | | (.393) | | (.373) |
| Total distributions | | (.173) | | (.301) | | (.301) | | (.347) | | (.393) | | (.373) |
Redemption fees added to paid in capital A | | - | | - | | - | | - | | - | | .001 |
| Net asset value, end of period | $ | 8.54 | $ | 8.98 | $ | 9.52 | $ | 8.87 | $ | 9.44 | $ | 9.42 |
Total Return C,D,E | | (2.98)% | | (2.60)% | | 10.83% | | (2.47)% | | 4.52% | | 2.36% |
Ratios to Average Net Assets B,F,G | | | | | | | | | | | | |
| Expenses before reductions | | 1.17% H | | 1.13% | | 1.15% | | 1.15% | | 1.15% | | 1.16% |
| Expenses net of fee waivers, if any | | 1.01% H | | 1.01% | | 1.05% | | 1.05% | | 1.05% | | 1.05% |
| Expenses net of all reductions | | 1.01% H | | 1.01% | | 1.05% | | 1.05% | | 1.05% | | 1.05% |
| Net investment income (loss) | | 4.35% H | | 3.27% | | 3.21% | | 3.74% | | 4.37% | | 4.00% |
| Supplemental Data | | | | | | | | | | | | |
| Net assets, end of period (000 omitted) | $ | 21,741 | $ | 22,554 | $ | 17,126 | $ | 12,603 | $ | 15,050 | $ | 12,351 |
Portfolio turnover rate I | | 25% H | | 42% | | 74% | | 77% | | 33% | | 65% |
A Calculated based on average shares outstanding during the period.
B Net investment income (loss) is affected by the timing of the declaration of dividends by any underlying mutual funds or exchange-traded funds (ETFs). Net investment income (loss) of any mutual funds or ETFs is not included in the Fund's net investment income (loss) ratio.
C Total returns for periods of less than one year are not annualized.
D Total returns would have been lower if certain expenses had not been reduced during the applicable periods shown.
E Total returns do not include the effect of the sales charges.
F Fees and expenses of any underlying mutual funds or exchange-traded funds (ETFs) are not included in the Fund's expense ratio. The Fund indirectly bears its proportionate share of these expenses. For additional expense information related to investments in Fidelity Central Funds, please refer to the "Investments in Fidelity Central Funds" note found in the Notes to Financial Statements section of the most recent Annual or Semi-Annual report.
G Expense ratios reflect operating expenses of the class. Expenses before reductions do not reflect amounts reimbursed, waived, or reduced through arrangements with the investment adviser, brokerage services, or other offset arrangements, if applicable, and do not represent the amount paid by the class during periods when reimbursements, waivers or reductions occur.
H Annualized
I Amount does not include the portfolio activity of any underlying mutual funds or exchange-traded funds (ETFs).
| Fidelity Advisor® Short Duration High Income Fund Class M |
| |
| | Six months ended (Unaudited) October 31, 2022 | | Years ended April 30, 2022 | | 2021 | | 2020 | | 2019 | | 2018 |
Selected Per-Share Data | | | | | | | | | | | | |
| Net asset value, beginning of period | $ | 8.98 | $ | 9.52 | $ | 8.86 | $ | 9.44 | $ | 9.42 | $ | 9.57 |
| Income from Investment Operations | | | | | | | | | | | | |
Net investment income (loss) A,B | | .190 | | .307 | | .300 | | .348 | | .408 | | .382 |
| Net realized and unrealized gain (loss) | | (.467) | | (.546) | | .661 | | (.581) | | .005 | | (.160) |
| Total from investment operations | | (.277) | | (.239) | | .961 | | (.233) | | .413 | | .222 |
| Distributions from net investment income | | (.173) | | (.301) | | (.301) | | (.347) | | (.393) | | (.373) |
| Total distributions | | (.173) | | (.301) | | (.301) | | (.347) | | (.393) | | (.373) |
Redemption fees added to paid in capital A | | - | | - | | - | | - | | - | | .001 |
| Net asset value, end of period | $ | 8.53 | $ | 8.98 | $ | 9.52 | $ | 8.86 | $ | 9.44 | $ | 9.42 |
Total Return C,D,E | | (3.09)% | | (2.60)% | | 10.96% | | (2.58)% | | 4.52% | | 2.36% |
Ratios to Average Net Assets B,F,G | | | | | | | | | | | | |
| Expenses before reductions | | 1.17% H | | 1.13% | | 1.17% | | 1.16% | | 1.16% | | 1.16% |
| Expenses net of fee waivers, if any | | 1.01% H | | 1.01% | | 1.05% | | 1.05% | | 1.05% | | 1.05% |
| Expenses net of all reductions | | 1.01% H | | 1.01% | | 1.05% | | 1.05% | | 1.05% | | 1.05% |
| Net investment income (loss) | | 4.35% H | | 3.27% | | 3.21% | | 3.74% | | 4.37% | | 4.00% |
| Supplemental Data | | | | | | | | | | | | |
| Net assets, end of period (000 omitted) | $ | 2,527 | $ | 2,812 | $ | 2,289 | $ | 2,106 | $ | 2,537 | $ | 2,081 |
Portfolio turnover rate I | | 25% H | | 42% | | 74% | | 77% | | 33% | | 65% |
A Calculated based on average shares outstanding during the period.
B Net investment income (loss) is affected by the timing of the declaration of dividends by any underlying mutual funds or exchange-traded funds (ETFs). Net investment income (loss) of any mutual funds or ETFs is not included in the Fund's net investment income (loss) ratio.
C Total returns for periods of less than one year are not annualized.
D Total returns would have been lower if certain expenses had not been reduced during the applicable periods shown.
E Total returns do not include the effect of the sales charges.
F Fees and expenses of any underlying mutual funds or exchange-traded funds (ETFs) are not included in the Fund's expense ratio. The Fund indirectly bears its proportionate share of these expenses. For additional expense information related to investments in Fidelity Central Funds, please refer to the "Investments in Fidelity Central Funds" note found in the Notes to Financial Statements section of the most recent Annual or Semi-Annual report.
G Expense ratios reflect operating expenses of the class. Expenses before reductions do not reflect amounts reimbursed, waived, or reduced through arrangements with the investment adviser, brokerage services, or other offset arrangements, if applicable, and do not represent the amount paid by the class during periods when reimbursements, waivers or reductions occur.
H Annualized
I Amount does not include the portfolio activity of any underlying mutual funds or exchange-traded funds (ETFs).
| Fidelity Advisor® Short Duration High Income Fund Class C |
| |
| | Six months ended (Unaudited) October 31, 2022 | | Years ended April 30, 2022 | | 2021 | | 2020 | | 2019 | | 2018 |
Selected Per-Share Data | | | | | | | | | | | | |
| Net asset value, beginning of period | $ | 8.98 | $ | 9.52 | $ | 8.87 | $ | 9.44 | $ | 9.42 | $ | 9.57 |
| Income from Investment Operations | | | | | | | | | | | | |
Net investment income (loss) A,B | | .158 | | .237 | | .230 | | .278 | | .338 | | .310 |
| Net realized and unrealized gain (loss) | | (.458) | | (.546) | | .651 | | (.571) | | .005 | | (.159) |
| Total from investment operations | | (.300) | | (.309) | | .881 | | (.293) | | .343 | | .151 |
| Distributions from net investment income | | (.140) | | (.231) | | (.231) | | (.277) | | (.323) | | (.302) |
| Total distributions | | (.140) | | (.231) | | (.231) | | (.277) | | (.323) | | (.302) |
Redemption fees added to paid in capital A | | - | | - | | - | | - | | - | | .001 |
| Net asset value, end of period | $ | 8.54 | $ | 8.98 | $ | 9.52 | $ | 8.87 | $ | 9.44 | $ | 9.42 |
Total Return C,D,E | | (3.34)% | | (3.33)% | | 10.01% | | (3.20)% | | 3.74% | | 1.59% |
Ratios to Average Net Assets B,F,G | | | | | | | | | | | | |
| Expenses before reductions | | 1.95% H | | 1.91% | | 1.94% | | 1.93% | | 1.92% | | 1.93% |
| Expenses net of fee waivers, if any | | 1.76% H | | 1.76% | | 1.80% | | 1.80% | | 1.80% | | 1.80% |
| Expenses net of all reductions | | 1.76% H | | 1.76% | | 1.80% | | 1.80% | | 1.80% | | 1.80% |
| Net investment income (loss) | | 3.60% H | | 2.52% | | 2.46% | | 2.99% | | 3.61% | | 3.25% |
| Supplemental Data | | | | | | | | | | | | |
| Net assets, end of period (000 omitted) | $ | 2,979 | $ | 3,884 | $ | 4,018 | $ | 4,017 | $ | 4,541 | $ | 5,146 |
Portfolio turnover rate I | | 25% H | | 42% | | 74% | | 77% | | 33% | | 65% |
A Calculated based on average shares outstanding during the period.
B Net investment income (loss) is affected by the timing of the declaration of dividends by any underlying mutual funds or exchange-traded funds (ETFs). Net investment income (loss) of any mutual funds or ETFs is not included in the Fund's net investment income (loss) ratio.
C Total returns for periods of less than one year are not annualized.
D Total returns would have been lower if certain expenses had not been reduced during the applicable periods shown.
E Total returns do not include the effect of the contingent deferred sales charge.
F Fees and expenses of any underlying mutual funds or exchange-traded funds (ETFs) are not included in the Fund's expense ratio. The Fund indirectly bears its proportionate share of these expenses. For additional expense information related to investments in Fidelity Central Funds, please refer to the "Investments in Fidelity Central Funds" note found in the Notes to Financial Statements section of the most recent Annual or Semi-Annual report.
G Expense ratios reflect operating expenses of the class. Expenses before reductions do not reflect amounts reimbursed, waived, or reduced through arrangements with the investment adviser, brokerage services, or other offset arrangements, if applicable, and do not represent the amount paid by the class during periods when reimbursements, waivers or reductions occur.
H Annualized
I Amount does not include the portfolio activity of any underlying mutual funds or exchange-traded funds (ETFs).
| Fidelity® Short Duration High Income Fund |
| |
| | Six months ended (Unaudited) October 31, 2022 | | Years ended April 30, 2022 | | 2021 | | 2020 | | 2019 | | 2018 |
Selected Per-Share Data | | | | | | | | | | | | |
| Net asset value, beginning of period | $ | 8.98 | $ | 9.52 | $ | 8.87 | $ | 9.44 | $ | 9.42 | $ | 9.57 |
| Income from Investment Operations | | | | | | | | | | | | |
Net investment income (loss) A,B | | .196 | | .331 | | .323 | | .372 | | .431 | | .405 |
| Net realized and unrealized gain (loss) | | (.452) | | (.546) | | .651 | | (.572) | | .006 | | (.159) |
| Total from investment operations | | (.256) | | (.215) | | .974 | | (.200) | | .437 | | .246 |
| Distributions from net investment income | | (.184) | | (.325) | | (.324) | | (.370) | | (.417) | | (.397) |
| Total distributions | | (.184) | | (.325) | | (.324) | | (.370) | | (.417) | | (.397) |
Redemption fees added to paid in capital A | | - | | - | | - | | - | | - | | .001 |
| Net asset value, end of period | $ | 8.54 | $ | 8.98 | $ | 9.52 | $ | 8.87 | $ | 9.44 | $ | 9.42 |
Total Return C,D | | (2.85)% | | (2.35)% | | 11.11% | | (2.23)% | | 4.78% | | 2.61% |
Ratios to Average Net Assets B,E,F | | | | | | | | | | | | |
| Expenses before reductions | | .89% G | | .83% | | .87% | | .86% | | .86% | | .86% |
| Expenses net of fee waivers, if any | | .76% G | | .75% | | .80% | | .80% | | .80% | | .80% |
| Expenses net of all reductions | | .76% G | | .75% | | .80% | | .80% | | .80% | | .80% |
| Net investment income (loss) | | 4.60% G | | 3.52% | | 3.46% | | 3.99% | | 4.61% | | 4.25% |
| Supplemental Data | | | | | | | | | | | | |
| Net assets, end of period (000 omitted) | $ | 341,841 | $ | 87,949 | $ | 83,066 | $ | 63,703 | $ | 88,429 | $ | 83,652 |
Portfolio turnover rate H | | 25% G | | 42% | | 74% | | 77% | | 33% | | 65% |
A Calculated based on average shares outstanding during the period.
B Net investment income (loss) is affected by the timing of the declaration of dividends by any underlying mutual funds or exchange-traded funds (ETFs). Net investment income (loss) of any mutual funds or ETFs is not included in the Fund's net investment income (loss) ratio.
C Total returns for periods of less than one year are not annualized.
D Total returns would have been lower if certain expenses had not been reduced during the applicable periods shown.
E Fees and expenses of any underlying mutual funds or exchange-traded funds (ETFs) are not included in the Fund's expense ratio. The Fund indirectly bears its proportionate share of these expenses. For additional expense information related to investments in Fidelity Central Funds, please refer to the "Investments in Fidelity Central Funds" note found in the Notes to Financial Statements section of the most recent Annual or Semi-Annual report.
F Expense ratios reflect operating expenses of the class. Expenses before reductions do not reflect amounts reimbursed, waived, or reduced through arrangements with the investment adviser, brokerage services, or other offset arrangements, if applicable, and do not represent the amount paid by the class during periods when reimbursements, waivers or reductions occur.
G Annualized
H Amount does not include the portfolio activity of any underlying mutual funds or exchange-traded funds (ETFs).
| Fidelity Advisor® Short Duration High Income Fund Class I |
| |
| | Six months ended (Unaudited) October 31, 2022 | | Years ended April 30, 2022 | | 2021 | | 2020 | | 2019 | | 2018 |
Selected Per-Share Data | | | | | | | | | | | | |
| Net asset value, beginning of period | $ | 8.98 | $ | 9.52 | $ | 8.87 | $ | 9.44 | $ | 9.42 | $ | 9.57 |
| Income from Investment Operations | | | | | | | | | | | | |
Net investment income (loss) A,B | | .201 | | .331 | | .323 | | .372 | | .430 | | .406 |
| Net realized and unrealized gain (loss) | | (.457) | | (.546) | | .651 | | (.572) | | .007 | | (.160) |
| Total from investment operations | | (.256) | | (.215) | | .974 | | (.200) | | .437 | | .246 |
| Distributions from net investment income | | (.184) | | (.325) | | (.324) | | (.370) | | (.417) | | (.397) |
| Total distributions | | (.184) | | (.325) | | (.324) | | (.370) | | (.417) | | (.397) |
Redemption fees added to paid in capital A | | - | | - | | - | | - | | - | | .001 |
| Net asset value, end of period | $ | 8.54 | $ | 8.98 | $ | 9.52 | $ | 8.87 | $ | 9.44 | $ | 9.42 |
Total Return C,D | | (2.85)% | | (2.35)% | | 11.11% | | (2.23)% | | 4.78% | | 2.61% |
Ratios to Average Net Assets B,E,F | | | | | | | | | | | | |
| Expenses before reductions | | .92% G | | .88% | | .92% | | .89% | | .89% | | .91% |
| Expenses net of fee waivers, if any | | .76% G | | .76% | | .80% | | .80% | | .80% | | .80% |
| Expenses net of all reductions | | .76% G | | .76% | | .80% | | .80% | | .80% | | .80% |
| Net investment income (loss) | | 4.60% G | | 3.52% | | 3.46% | | 3.99% | | 4.60% | | 4.25% |
| Supplemental Data | | | | | | | | | | | | |
| Net assets, end of period (000 omitted) | $ | 5,296 | $ | 5,055 | $ | 5,023 | $ | 3,950 | $ | 4,060 | $ | 4,686 |
Portfolio turnover rate H | | 25% G | | 42% | | 74% | | 77% | | 33% | | 65% |
A Calculated based on average shares outstanding during the period.
B Net investment income (loss) is affected by the timing of the declaration of dividends by any underlying mutual funds or exchange-traded funds (ETFs). Net investment income (loss) of any mutual funds or ETFs is not included in the Fund's net investment income (loss) ratio.
C Total returns for periods of less than one year are not annualized.
D Total returns would have been lower if certain expenses had not been reduced during the applicable periods shown.
E Fees and expenses of any underlying mutual funds or exchange-traded funds (ETFs) are not included in the Fund's expense ratio. The Fund indirectly bears its proportionate share of these expenses. For additional expense information related to investments in Fidelity Central Funds, please refer to the "Investments in Fidelity Central Funds" note found in the Notes to Financial Statements section of the most recent Annual or Semi-Annual report.
F Expense ratios reflect operating expenses of the class. Expenses before reductions do not reflect amounts reimbursed, waived, or reduced through arrangements with the investment adviser, brokerage services, or other offset arrangements, if applicable, and do not represent the amount paid by the class during periods when reimbursements, waivers or reductions occur.
G Annualized
H Amount does not include the portfolio activity of any underlying mutual funds or exchange-traded funds (ETFs).
| Fidelity Advisor® Short Duration High Income Fund Class Z |
| |
| | Six months ended (Unaudited) October 31, 2022 | | Years ended April 30, 2022 | | 2021 | | 2020 | | 2019 A |
Selected Per-Share Data | | | | | | | | | | |
| Net asset value, beginning of period | $ | 8.98 | $ | 9.52 | $ | 8.87 | $ | 9.45 | $ | 9.46 |
| Income from Investment Operations | | | | | | | | | | |
Net investment income (loss) B,C | | .203 | | .339 | | .331 | | .378 | | .261 |
| Net realized and unrealized gain (loss) | | (.455) | | (.546) | | .652 | | (.579) | | (.016) |
| Total from investment operations | | (.252) | | (.207) | | .983 | | (.201) | | .245 |
| Distributions from net investment income | | (.188) | | (.333) | | (.333) | | (.379) | | (.255) |
| Total distributions | | (.188) | | (.333) | | (.333) | | (.379) | | (.255) |
| Net asset value, end of period | $ | 8.54 | $ | 8.98 | $ | 9.52 | $ | 8.87 | $ | 9.45 |
Total Return D,E | | (2.81)% | | (2.27)% | | 11.21% | | (2.24)% | | 2.67% |
Ratios to Average Net Assets C,F,G | | | | | | | | | | |
| Expenses before reductions | | .84% H | | .78% | | .80% | | .80% | | .82% H |
| Expenses net of fee waivers, if any | | .67% H | | .66% | | .71% | | .71% | | .71% H |
| Expenses net of all reductions | | .67% H | | .66% | | .71% | | .71% | | .71% H |
| Net investment income (loss) | | 4.69% H | | 3.61% | | 3.55% | | 4.08% | | 4.86% H |
| Supplemental Data | | | | | | | | | | |
| Net assets, end of period (000 omitted) | $ | 10,460 | $ | 5,246 | $ | 3,815 | $ | 2,031 | $ | 425 |
Portfolio turnover rate I | | 25% H | | 42% | | 74% | | 77% | | 33% |
A For the period October 2, 2018 (commencement of sale of shares) through April 30, 2019.
B Calculated based on average shares outstanding during the period.
C Net investment income (loss) is affected by the timing of the declaration of dividends by any underlying mutual funds or exchange-traded funds (ETFs). Net investment income (loss) of any mutual funds or ETFs is not included in the Fund's net investment income (loss) ratio.
D Total returns for periods of less than one year are not annualized.
E Total returns would have been lower if certain expenses had not been reduced during the applicable periods shown.
F Fees and expenses of any underlying mutual funds or exchange-traded funds (ETFs) are not included in the Fund's expense ratio. The Fund indirectly bears its proportionate share of these expenses. For additional expense information related to investments in Fidelity Central Funds, please refer to the "Investments in Fidelity Central Funds" note found in the Notes to Financial Statements section of the most recent Annual or Semi-Annual report.
G Expense ratios reflect operating expenses of the class. Expenses before reductions do not reflect amounts reimbursed, waived, or reduced through arrangements with the investment adviser, brokerage services, or other offset arrangements, if applicable, and do not represent the amount paid by the class during periods when reimbursements, waivers or reductions occur.
H Annualized
I Amount does not include the portfolio activity of any underlying mutual funds or exchange-traded funds (ETFs).
For the period ended October 31, 2022
1. Organization.
Fidelity Short Duration High Income Fund (the Fund) is a fund of Fidelity Summer Street Trust (the Trust) and is authorized to issue an unlimited number of shares. The Trust is registered under the Investment Company Act of 1940, as amended (the 1940 Act), as an open-end management investment company organized as a Massachusetts business trust. The Fund offers Class A, Class M, Class C, Short Duration High Income, Class I and Class Z shares, each of which has equal rights as to assets and voting privileges. Each class has exclusive voting rights with respect to matters that affect that class. Class C shares will automatically convert to Class A shares after a holding period of eight years from the initial date of purchase, with certain exceptions.
2. Investments in Fidelity Central Funds.
Funds may invest in Fidelity Central Funds, which are open-end investment companies generally available only to other investment companies and accounts managed by the investment adviser and its affiliates. The Schedule of Investments lists any Fidelity Central Funds held as an investment as of period end, but does not include the underlying holdings of each Fidelity Central Fund. An investing fund indirectly bears its proportionate share of the expenses of the underlying Fidelity Central Funds.
Based on its investment objective, each Fidelity Central Fund may invest or participate in various investment vehicles or strategies that are similar to those of the investing fund. These strategies are consistent with the investment objectives of the investing fund and may involve certain economic risks which may cause a decline in value of each of the Fidelity Central Funds and thus a decline in the value of the investing fund.
| Fidelity Central Fund | Investment Manager | Investment Objective | Investment Practices | Expense Ratio A |
| Fidelity Money Market Central Funds | Fidelity Management & Research Company LLC (FMR) | Each fund seeks to obtain a high level of current income consistent with the preservation of capital and liquidity. | Short-term Investments | Less than .005% |
A Expenses expressed as a percentage of average net assets and are as of each underlying Central Fund's most recent annual or semi-annual shareholder report.
A complete unaudited list of holdings for each Fidelity Central Fund is available upon request or at the Securities and Exchange Commission website at www.sec.gov. In addition, the financial statements of the Fidelity Central Funds which contain the significant accounting policies (including investment valuation policies) of those funds, and are not covered by the Report of Independent Registered Public Accounting Firm, are available on the Securities and Exchange Commission website or upon request.
3. Significant Accounting Policies.
The Fund is an investment company and applies the accounting and reporting guidance of the Financial Accounting Standards Board (FASB) Accounting Standards Codification Topic 946 Financial Services - Investment Companies . The financial statements have been prepared in conformity with accounting principles generally accepted in the United States of America (GAAP), which require management to make certain estimates and assumptions at the date of the financial statements. Actual results could differ from those estimates. Subsequent events, if any, through the date that the financial statements were issued have been evaluated in the preparation of the financial statements. The Fund's Schedule of Investments lists any underlying mutual funds or exchange-traded funds (ETFs) but does not include the underlying holdings of these funds. The following summarizes the significant accounting policies of the Fund:
Investment Valuation. Investments are valued as of 4:00 p.m. Eastern time on the last calendar day of the period. The Board of Trustees (the Board) has designated the Fund's investment adviser as the valuation designee responsible for the fair valuation function and performing fair value determinations as needed. The investment adviser has established a Fair Value Committee (the Committee) to carry out the day-to-day fair valuation responsibilities and has adopted policies and procedures to govern the fair valuation process and the activities of the Committee. In accordance with these fair valuation policies and procedures, which have been approved by the Board, the Fund attempts to obtain prices from one or more third party pricing services or brokers to value its investments. When current market prices, quotations or currency exchange rates are not readily available or reliable, investments will be fair valued in good faith by the Committee, in accordance with the policies and procedures. Factors used in determining fair value vary by investment type and may include market or investment specific events, transaction data, estimated cash flows, and market observations of comparable investments. The frequency that the fair valuation procedures are used cannot be predicted and they may be utilized to a significant extent. The Committee manages the Fund's fair valuation practices and maintains the fair valuation policies and procedures. The Fund's investment adviser reports to the Board information regarding the fair valuation process and related material matters.
The Fund categorizes the inputs to valuation techniques used to value its investments into a disclosure hierarchy consisting of three levels as shown below:
Level 1 - unadjusted quoted prices in active markets for identical investments
Level 2 - other significant observable inputs (including quoted prices for similar investments, interest rates, prepayment speeds, etc.)
Level 3 - unobservable inputs (including the Fund's own assumptions based on the best information available)
Valuation techniques used to value the Fund's investments by major category are as follows:
Debt securities, including restricted securities, are valued based on evaluated prices received from third party pricing services or from brokers who make markets in such securities. Corporate bonds and bank loan obligations are valued by pricing services who utilize matrix pricing which considers yield or price of bonds of comparable quality, coupon, maturity and type or by broker-supplied prices. When independent prices are unavailable or unreliable, debt securities may be valued utilizing pricing methodologies which consider similar factors that would be used by third party pricing services. Debt securities are generally categorized as Level 2 in the hierarchy but may be Level 3 depending on the circumstances. The Fund invests a significant portion of its assets in below investment grade securities. The value of these securities can be more volatile due to changes in the credit quality of the issuer and is sensitive to changes in economic, market and regulatory conditions.
Equity securities, including restricted securities, for which market quotations are readily available, are valued at the last reported sale price or official closing price as reported by a third party pricing service on the primary market or exchange on which they are traded and are categorized as Level 1 in the hierarchy. In the event there were no sales during the day or closing prices are not available, securities are valued at the last quoted bid price or may be valued using the last available price and are generally categorized as Level 2 in the hierarchy. For foreign equity securities, when market or security specific events arise, comparisons to the valuation of American Depositary Receipts (ADRs), futures contracts, Exchange-Traded Funds (ETFs) and certain indexes as well as quoted prices for similar securities may be used and would be categorized as Level 2 in the hierarchy. For equity securities, including restricted securities, where observable inputs are limited, assumptions about market activity and risk are used and these securities may be categorized as Level 3 in the hierarchy.
Investments in open-end mutual funds, including the Fidelity Central Funds, are valued at their closing net asset value (NAV) each business day and are categorized as Level 1 in the hierarchy.
Changes in valuation techniques may result in transfers in or out of an assigned level within the disclosure hierarchy. The aggregate value of investments by input level as of October 31, 2022 is included at the end of the Fund's Schedule of Investments.
Investment Transactions and Income. For financial reporting purposes, the Fund's investment holdings and NAV include trades executed through the end of the last business day of the period. The NAV per share for processing shareholder transactions is calculated as of the close of business of the New York Stock Exchange (NYSE), normally 4:00 p.m. Eastern time and includes trades executed through the end of the prior business day. Gains and losses on securities sold are determined on the basis of identified cost. Commissions paid to certain brokers with whom the investment adviser, or its affiliates, places trades on behalf of a fund include an amount in addition to trade execution, which may be rebated back to a fund. Any such rebates are included in net realized gain (loss) on investments in the Statement of Operations. Dividend income is recorded on the ex-dividend date, except for certain dividends from foreign securities where the ex-dividend date may have passed, which are recorded as soon as the Fund is informed of the ex-dividend date. Non-cash dividends included in dividend income, if any, are recorded at the fair market value of the securities received. Income and capital gain distributions from Fidelity Central Funds, if any, are recorded on the ex-dividend date. Interest income is accrued as earned and includes coupon interest and amortization of premium and accretion of discount on debt securities as applicable. Debt obligations may be placed on non-accrual status and related interest income may be reduced by ceasing current accruals and writing off interest receivables when the collection of all or a portion of interest has become doubtful based on consistently applied procedures. A debt obligation is removed from non-accrual status when the issuer resumes interest payments or when collectability of interest is reasonably assured.
Class Allocations and Expenses. Investment income, realized and unrealized capital gains and losses, common expenses of a fund, and certain fund-level expense reductions, if any, are allocated daily on a pro-rata basis to each class based on the relative net assets of each class to the total net assets of a fund. Each class differs with respect to transfer agent and distribution and service plan fees incurred, as applicable. Certain expense reductions may also differ by class, if applicable. For the reporting period, the allocated portion of income and expenses to each class as a percent of its average net assets may vary due to the timing of recording these transactions in relation to fluctuating net assets of the classes. Expenses directly attributable to a fund are charged to that fund. Expenses attributable to more than one fund are allocated among the respective funds on the basis of relative net assets or other appropriate methods. Expenses included in the accompanying financial statements reflect the expenses of that fund and do not include any expenses associated with any underlying mutual funds or exchange-traded funds. Although not included in a fund's expenses, a fund indirectly bears its proportionate share of these expenses through the net asset value of each underlying mutual fund or exchange-traded fund. Expense estimates are accrued in the period to which they relate and adjustments are made when actual amounts are known.
Income Tax Information and Distributions to Shareholders. Each year, the Fund intends to qualify as a regulated investment company under Subchapter M of the Internal Revenue Code, including distributing substantially all of its taxable income and realized gains. As a result, no provision for U.S. Federal income taxes is required. The Fund files a U.S. federal tax return, in addition to state and local tax returns as required. The Fund's federal income tax returns are subject to examination by the Internal Revenue Service (IRS) for a period of three fiscal years after they are filed. State and local tax returns may be subject to examination for an additional fiscal year depending on the jurisdiction.
Distributions are declared and recorded daily and paid monthly from net investment income. Distributions from realized gains, if any, are declared and recorded on the ex-dividend date. Income and capital gain distributions are declared separately for each class. Income and capital gain distributions are determined in accordance with income tax regulations, which may differ from GAAP.
Capital accounts within the financial statements are adjusted for permanent book-tax differences. These adjustments have no impact on net assets or the results of operations. Capital accounts are not adjusted for temporary book-tax differences which will reverse in a subsequent period.
Book-tax differences are primarily due to market discount, capital loss carryforwards and losses deferred due to wash sales.
As of period end, the cost and unrealized appreciation (depreciation) in securities, and derivatives if applicable, for federal income tax purposes were as follows:
| Gross unrealized appreciation | $ 2,953,431 |
| Gross unrealized depreciation | (11,052,163) |
| Net unrealized appreciation (depreciation) | $(8,098,732) |
| Tax cost | $412,495,967 |
Capital loss carryforwards are only available to offset future capital gains of the Fund to the extent provided by regulations and may be limited. The capital loss carryforward information presented below, including any applicable limitation, is estimated as of prior fiscal period end and is subject to adjustment.
Short-term | $(3,792,571) |
Long-term | (4,386,800) |
| Total capital loss carryforward | $(8,179,371) |
Restricted Securities (including Private Placements). Funds may invest in securities that are subject to legal or contractual restrictions on resale. These securities generally may be resold in transactions exempt from registration or to the public if the securities are registered. Disposal of these securities may involve time-consuming negotiations and expense, and prompt sale at an acceptable price may be difficult. Information regarding restricted securities held at period end is included at the end of the Schedule of Investments, if applicable.
Loans and Other Direct Debt Instruments. Direct debt instruments are interests in amounts owed to lenders by corporate or other borrowers. These instruments may be in the form of loans, trade claims or other receivables and may include standby financing commitments such as revolving credit facilities that obligate a fund to supply additional cash to the borrower on demand. Loans may be acquired through assignment, participation, or may be made directly to a borrower. Such instruments are presented in the Bank Loan Obligations section in the Schedule of Investments. Certain funds may also invest in unfunded loan commitments, which are contractual obligations for future funding. Information regarding unfunded commitments is included at the end of the Schedule of Investments, if applicable.
4. Purchases and Sales of Investments.
Purchases and sales of securities, other than short-term securities and in-kind transactions, as applicable, are noted in the table below.
| | Purchases ($) | Sales ($) |
| Fidelity Short Duration High Income Fund | 241,762,360 | 18,417,271 |
5. Fees and Other Transactions with Affiliates.
Management Fee. Fidelity Management & Research Company LLC (the investment adviser) and its affiliates provide the Fund with investment management related services for which the Fund pays a monthly management fee. The management fee is the sum of an individual fund fee rate that is based on an annual rate of .45% of the Fund's average net assets and an annualized group fee rate that averaged .10% during the period. The group fee rate is based upon the monthly average net assets of a group of registered investment companies with which the investment adviser has management contracts. The group fee rate decreases as assets under management increase and increases as assets under management decrease. For the reporting period, the total annualized management fee rate was .55% of the Fund's average net assets.
Distribution and Service Plan Fees. In accordance with Rule 12b-1 of the 1940 Act, the Fund has adopted separate Distribution and Service Plans for each class of shares. Certain classes pay Fidelity Distributors Company LLC (FDC), an affiliate of the investment adviser, separate Distribution and Service Fees, each of which is based on an annual percentage of each class' average net assets. In addition, FDC may pay financial intermediaries for selling shares of the Fund and providing shareholder support services. For the period, the Distribution and Service Fee rates, total fees and amounts retained by FDC were as follows:
| | Distribution Fee | Service Fee | Total Fees | Retained by FDC |
| Class A | - % | .25% | $26,671 | $2,242 |
| Class M | - % | .25% | 3,402 | - |
| Class C | .75% | .25% | 16,876 | 3,578 |
| | | | $46,949 | $5,820 |
Sales Load. FDC may receive a front-end sales charge of up to 4.00% for selling Class A shares and Class M shares, some of which is paid to financial intermediaries for selling shares of the Fund. Depending on the holding period, FDC may receive contingent deferred sales charges levied on Class A, Class M and Class C redemptions. The deferred sales charges are 1.00% for Class C shares, 1.00% for certain purchases of Class A shares and .25% for certain purchases of Class M shares.
For the period, sales charge amounts retained by FDC were as follows:
| | Retained by FDC |
| Class A | $3,102 |
| Class M | 1,010 |
Class C A | 550 |
| | $4,662 |
A When Class C shares are initially sold, FDC pays commissions from its own resources to financial intermediaries through which the sales are made.
Transfer Agent Fees. Fidelity Investments Institutional Operations Company LLC (FIIOC), an affiliate of the investment adviser, is the transfer, dividend disbursing and shareholder servicing agent for each class of the Fund. FIIOC receives account fees and asset-based fees that vary according to the account size and type of account of the shareholders of the respective classes of the Fund, except for Class Z. FIIOC receives an asset-based fee of Class Z's average net assets. FIIOC pays for typesetting, printing and mailing of shareholder reports, except proxy statements.
For the period, transfer agent fees for each class were as follows:
| | Amount | % of Class-Level Average Net Assets A |
| Class A | $14,915 | .14 |
| Class M | 1,899 | .14 |
| Class C | 3,075 | .18 |
| Short Duration High Income | 51,336 | .11 |
| Class I | 3,331 | .14 |
| Class Z | 1,872 | .05 |
| | $76,428 | |
A Annualized
Accounting Fees. Fidelity Service Company, Inc. (FSC), an affiliate of the investment adviser, maintains the Fund's accounting records. The accounting fee is based on the level of average net assets for each month. For the period, the fees were equivalent to the following annualized rates:
| | % of Average Net Assets |
| Fidelity Short Duration High Income Fund | .04 |
Interfund Trades. Funds may purchase from or sell securities to other Fidelity Funds under procedures adopted by the Board. The procedures have been designed to ensure these interfund trades are executed in accordance with Rule 17a-7 of the 1940 Act. Any interfund trades are included within the respective purchases and sales amounts shown in the Purchases and Sales of Investments note. During the period, there were no interfund trades.
6. Committed Line of Credit.
Certain Funds participate with other funds managed by the investment adviser or an affiliate in a $4.25 billion credit facility (the "line of credit") to be utilized for temporary or emergency purposes to fund shareholder redemptions or for other short-term liquidity purposes. The participating funds have agreed to pay commitment fees on their pro-rata portion of the line of credit, which are reflected in Miscellaneous expenses on the Statement of Operations, and are listed below. During the period, there were no borrowings on this line of credit.
| | Amount |
| Fidelity Short Duration High Income Fund | $108 |
7. Expense Reductions.
The investment adviser contractually agreed to reimburse expenses of each class to the extent annual operating expenses exceeded certain levels of class-level average net assets as noted in the table below. This reimbursement will remain in place through August 31, 2023. Some expenses, for example the compensation of the independent Trustees, and certain miscellaneous expenses such as proxy and shareholder meeting expenses, are excluded from this reimbursement.
The following classes were in reimbursement during the period:
| | Expense Limitations | Reimbursement |
| Class A | 1.00% | $17,254 |
| Class M | 1.00% | 2,175 |
| Class C | 1.75% | 3,283 |
| Short Duration High Income | .75% | 60,141 |
| Class I | .75% | 3,951 |
| Class Z | .66% | 6,295 |
| | | $93,099 |
Through arrangements with the Fund's custodian, credits realized as a result of certain uninvested cash balances were used to reduce the Fund's expenses. During the period, custodian credits reduced the Fund's expenses by $498.
In addition, during the period the investment adviser or an affiliate reimbursed and/or waived a portion of fund-level operating expenses in the amount of $1,136.
8. Distributions to Shareholders.
Distributions to shareholders of each class were as follows:
| | Six months ended October 31, 2022 | Year ended April 30, 2022 |
| Fidelity Short Duration High Income Fund | | |
| Distributions to shareholders | | |
| Class A | $426,075 | $614,597 |
| Class M | 54,298 | 77,641 |
| Class C | 54,563 | 95,717 |
| Short Duration High Income | 1,912,188 | 3,213,389 |
| Class I | 103,890 | 183,793 |
| Class Z | 162,972 | 155,367 |
Total | $2,713,986 | $4,340,504 |
9. Share Transactions.
Share transactions for each class were as follows and may contain in-kind transactions, automatic conversions between classes or exchanges between affiliated funds:
| | Shares | Shares | Dollars | Dollars |
| | Six months ended October 31, 2022 | Year ended April 30, 2022 | Six months ended October 31, 2022 | Year ended April 30, 2022 |
| Fidelity Short Duration High Income Fund | | | | |
| Class A | | | | |
| Shares sold | 461,406 | 1,205,485 | $ 4,013,624 | $ 11,197,038 |
| Reinvestment of distributions | 48,114 | 64,152 | 414,791 | 601,003 |
| Shares redeemed | (474,292) | (557,369) | (4,118,719) | (5,198,452) |
| Net increase (decrease) | 35,228 | 712,268 | $309,696 | $6,599,589 |
| Class M | | | | |
| Shares sold | 68,864 | 108,902 | $ 595,002 | $ 1,014,540 |
| Reinvestment of distributions | 6,029 | 8,107 | 52,018 | 75,921 |
| Shares redeemed | (91,932) | (44,415) | (790,641) | (417,836) |
| Net increase (decrease) | (17,039) | 72,594 | $(143,621) | $672,625 |
| Class C | | | | |
| Shares sold | 39,230 | 163,595 | $ 340,305 | $ 1,533,455 |
| Reinvestment of distributions | 6,267 | 10,112 | 54,092 | 94,817 |
| Shares redeemed | (128,896) | (163,460) | (1,118,628) | (1,537,583) |
| Net increase (decrease) | (83,399) | 10,247 | $(724,231) | $90,689 |
| Short Duration High Income | | | | |
| Shares sold | 32,777,061 | 6,342,757 | $ 277,930,549 | $ 59,798,674 |
| Reinvestment of distributions | 190,655 | 287,476 | 1,643,764 | 2,695,908 |
| Shares redeemed | (2,715,265) | (5,563,233) | (23,598,444) | (52,159,083) |
| Net increase (decrease) | 30,252,451 | 1,067,000 | $255,975,869 | $10,335,499 |
| Class I | | | | |
| Shares sold | 169,345 | 206,284 | $ 1,464,888 | $ 1,943,410 |
| Reinvestment of distributions | 10,843 | 18,034 | 93,498 | 169,177 |
| Shares redeemed | (122,560) | (189,184) | (1,059,579) | (1,770,381) |
| Net increase (decrease) | 57,628 | 35,134 | $498,807 | $342,206 |
| Class Z | | | | |
| Shares sold | 737,046 | 448,784 | $ 6,426,249 | $ 4,184,309 |
| Reinvestment of distributions | 13,157 | 14,784 | 113,330 | 138,688 |
| Shares redeemed | (109,462) | (280,177) | (940,888) | (2,630,889) |
| Net increase (decrease) | 640,741 | 183,391 | $5,598,691 | $1,692,108 |
10. Other.
A fund's organizational documents provide former and current trustees and officers with a limited indemnification against liabilities arising in connection with the performance of their duties to the fund. In the normal course of business, a fund may also enter into contracts that provide general indemnifications. A fund's maximum exposure under these arrangements is unknown as this would be dependent on future claims that may be made against a fund. The risk of material loss from such claims is considered remote.
11. Risk and Uncertainties.
Many factors affect a fund's performance. Developments that disrupt global economies and financial markets, such as pandemics, epidemics, outbreaks of infectious diseases, war, terrorism, and environmental disasters, may significantly affect a fund's investment performance. The effects of these developments to a fund will be impacted by the types of securities in which a fund invests, the financial condition, industry, economic sector, and geographic location of an issuer, and a fund's level of investment in the securities of that issuer.
As a shareholder, you incur two types of costs: (1) transaction costs, which may include sales charges (loads) on purchase payments or redemption proceeds, as applicable and (2) ongoing costs, which generally include management fees, distribution and/or service (12b-1) fees and other Fund expenses. This Example is intended to help you understand your ongoing costs (in dollars) of investing in a fund and to compare these costs with the ongoing costs of investing in other mutual funds.
| The Example is based on an investment of $1,000 invested at the beginning of the period and held for the entire period (May 1, 2022 to October 31, 2022). |
Actual Expenses
The first line of the accompanying table provides information about actual account values and actual expenses. You may use the information in this line, together with the amount you invested, to estimate the expenses that you paid over the period. Simply divide your account value by $1,000.00 (for example, an $8,600 account value divided by $1,000.00 = 8.6), then multiply the result by the number in the first line for a class/Fund under the heading entitled "Expenses Paid During Period" to estimate the expenses you paid on your account during this period. If any fund is a shareholder of any underlying mutual funds or exchange-traded funds (ETFs) (the Underlying Funds), such fund indirectly bears its proportional share of the expenses of the Underlying Funds in addition to the direct expenses incurred presented in the table. These fees and expenses are not included in the annualized expense ratio used to calculate the expense estimate in the table below.
Hypothetical Example for Comparison Purposes
The second line of the accompanying table provides information about hypothetical account values and hypothetical expenses based on the actual expense ratio and an assumed rate of return of 5% per year before expenses, which is not the actual return. The hypothetical account values and expenses may not be used to estimate the actual ending account balance or expenses you paid for the period. You may use this information to compare the ongoing costs of investing in the Fund and other funds. To do so, compare this 5% hypothetical example with the 5% hypothetical examples that appear in the shareholder reports of the other funds. If any fund is a shareholder of any Underlying Funds, such fund indirectly bears its proportional share of the expenses of the Underlying Funds in addition to the direct expenses as presented in the table. These fees and expenses are not included in the annualized expense ratio used to calculate the expense estimate in the table below.
Please note that the expenses shown in the table are meant to highlight your ongoing costs only and do not reflect any transaction costs. Therefore, the second line of the table is useful in comparing ongoing costs only, and will not help you determine the relative total costs of owning different funds. In addition, if these transactional costs were included, your costs would have been higher.
| | | | | Annualized Expense Ratio- A | | Beginning Account Value May 1, 2022 | | Ending Account Value October 31, 2022 | | Expenses Paid During Period- C May 1, 2022 to October 31, 2022 |
| Fidelity® Short Duration High Income Fund | | | | | | | | | | |
| Class A | | | | 1.01% | | | | | | |
| Actual | | | | | | $ 1,000 | | $ 970.20 | | $ 5.02 |
Hypothetical- B | | | | | | $ 1,000 | | $ 1,020.11 | | $ 5.14 |
| Class M | | | | 1.01% | | | | | | |
| Actual | | | | | | $ 1,000 | | $ 969.10 | | $ 5.01 |
Hypothetical- B | | | | | | $ 1,000 | | $ 1,020.11 | | $ 5.14 |
| Class C | | | | 1.76% | | | | | | |
| Actual | | | | | | $ 1,000 | | $ 966.60 | | $ 8.72 |
Hypothetical- B | | | | | | $ 1,000 | | $ 1,016.33 | | $ 8.94 |
| Fidelity® Short Duration High Income Fund | | | | .76% | | | | | | |
| Actual | | | | | | $ 1,000 | | $ 971.50 | | $ 3.78 |
Hypothetical- B | | | | | | $ 1,000 | | $ 1,021.37 | | $ 3.87 |
| Class I | | | | .76% | | | | | | |
| Actual | | | | | | $ 1,000 | | $ 971.50 | | $ 3.78 |
Hypothetical- B | | | | | | $ 1,000 | | $ 1,021.37 | | $ 3.87 |
| Class Z | | | | .67% | | | | | | |
| Actual | | | | | | $ 1,000 | | $ 971.90 | | $ 3.33 |
Hypothetical- B | | | | | | $ 1,000 | | $ 1,021.83 | | $ 3.41 |
| |
A Annualized expense ratio reflects expenses net of applicable fee waivers.
B 5% return per year before expenses
C Expenses are equal to the annualized expense ratio, multiplied by the average account value over the period, multiplied by 184/ 365 (to reflect the one-half year period). The fees and expenses of any Underlying Funds are not included in each annualized expense ratio.
Fidelity Short Duration High Income Fund
Each year, the Board of Trustees, including the Independent Trustees (together, the Board), votes on the renewal of the management contract with Fidelity Management & Research Company LLC (FMR) and the sub-advisory agreements (together, the Advisory Contracts) for the fund. FMR and the sub-advisers are referred to herein as the Investment Advisers. The Board, assisted by the advice of fund counsel and Independent Trustees' counsel, requests and considers a broad range of information relevant to the renewal of the Advisory Contracts throughout the year.
The Board meets regularly and, at each of its meetings, covers an extensive agenda of topics and materials and considers factors that are relevant to its annual consideration of the renewal of the fund's Advisory Contracts, including the services and support provided to the fund and its shareholders. The Board has established various standing committees (Committees), each composed of and chaired by Independent Trustees with varying backgrounds, to which the Board has assigned specific subject matter responsibilities in order to enhance effective decision-making by the Board. The Board, acting directly and through its Committees, requests and receives information concerning the annual consideration of the renewal of the fund's Advisory Contracts. The Board also meets as needed to review matters specifically related to the Board's annual consideration of the renewal of the Advisory Contracts. Members of the Board may also meet with trustees of other Fidelity funds through joint ad hoc committees to discuss certain matters relevant to all of the Fidelity funds.
At its May 2022 meeting, the Board unanimously determined to renew the fund's Advisory Contracts. In reaching its determination, the Board considered all factors it believed relevant, including (i) the nature, extent, and quality of the services provided to the fund and its shareholders (including the investment performance of the fund); (ii) the competitiveness relative to peer funds of the fund's management fee and the total expense ratio of a representative class (retail class); (iii) the total costs of the services provided by and the profits realized by Fidelity from its relationships with the fund; and (iv) the extent to which, if any, economies of scale exist and are realized as the fund grows, and whether any economies of scale are appropriately shared with fund shareholders.
In considering whether to renew the Advisory Contracts for the fund, the Board reached a determination, with the assistance of fund counsel and Independent Trustees' counsel and through the exercise of its business judgment, that the renewal of the Advisory Contracts was in the best interests of the fund and its shareholders and that the compensation payable under the Advisory Contracts was fair and reasonable. The Board's decision to renew the Advisory Contracts was not based on any single factor, but rather was based on a comprehensive consideration of all the information provided to the Board at its meetings throughout the year. The Board, in reaching its determination to renew the Advisory Contracts, was aware that shareholders of the fund have a broad range of investment choices available to them, including a wide choice among funds offered by Fidelity's competitors, and that the fund's shareholders, who have the opportunity to review and weigh the disclosure provided by the fund in its prospectus and other public disclosures, have chosen to invest in this fund, which is part of the Fidelity family of funds.
Nature, Extent, and Quality of Services Provided . The Board considered Fidelity's staffing as it relates to the fund, including the backgrounds of investment personnel of Fidelity, and also considered the fund's investment objective, strategies, and related investment philosophy. The Independent Trustees also had discussions with senior management of Fidelity's investment operations and investment groups. The Board considered the structure of the investment personnel compensation program and whether this structure provides appropriate incentives to act in the best interests of the fund. Additionally, the Board considered the portfolio managers' investments, if any, in the funds that they manage. The Board also considered the steps Fidelity had taken to ensure the continued provision of high quality services to the Fidelity funds during the COVID-19 pandemic, including the expansion of staff in client facing positions to maintain service levels in periods of high volumes and volatility.
Resources Dedicated to Investment Management and Support Services . The Board and the Fund Oversight and Research Committees reviewed the general qualifications and capabilities of Fidelity's investment staff, including its size, education, experience, and resources, as well as Fidelity's approach to recruiting, training, managing, and compensating investment personnel. The Board noted the resources devoted to expansion of Fidelity's global investment organization, and that Fidelity's analysts have extensive resources, tools, and capabilities that allow them to conduct sophisticated quantitative and fundamental analysis, as well as credit analysis of issuers, counterparties, and guarantors. Further, the Board considered that Fidelity's investment professionals have sufficient access to global information and data so as to provide competitive investment results over time, and that those professionals also have access to sophisticated tools that permit them to assess portfolio construction and risk and performance attribution characteristics continuously, as well as to transmit new information and research conclusions rapidly around the world. Additionally, in its deliberations, the Board considered Fidelity's trading, risk management, compliance, and technology and operations capabilities and resources, which are integral parts of the investment management process.
Shareholder and Administrative Services . The Board considered (i) the nature, extent, quality, and cost of advisory, administrative, and shareholder services performed by the Investment Advisers and their affiliates under the Advisory Contracts and under separate agreements covering transfer agency, pricing and bookkeeping, and securities lending services for the fund; (ii) the nature and extent of the supervision of third party service providers, principally custodians, subcustodians, and pricing vendors; and (iii) the resources devoted to, and the record of compliance with, the fund's compliance policies and procedures. The Board also reviewed the allocation of fund brokerage, including allocations to brokers affiliated with the Investment Advisers, the use of brokerage commissions to pay fund expenses, and the use of "soft" commission dollars to pay for research services.
The Board noted that the growth of fund assets over time across the complex allows Fidelity to reinvest in the development of services designed to enhance the value and convenience of the Fidelity funds as investment vehicles. These services include 24-hour access to account information and market information over the Internet and through telephone representatives, investor education materials, and asset allocation tools. The Board also considered that it reviews customer service metrics such as telephone response times, continuity of services on the website and metrics addressing services at Fidelity Investor Centers.
Investment in a Large Fund Family . The Board considered the benefits to shareholders of investing in a Fidelity fund, including the benefits of investing in a fund that is part of a large family of funds offering a variety of investment disciplines and providing a large variety of mutual fund investor services. The Board noted that Fidelity had taken, or had made recommendations that resulted in the Fidelity funds taking, a number of actions over the previous year that benefited particular funds, including: (i) continuing to dedicate additional resources to Fidelity's investment research process, which includes meetings with management of issuers of securities in which the funds invest; (ii) continuing efforts to enhance Fidelity's global research capabilities; (iii) launching new funds and ETFs with innovative structures, strategies and pricing and making other enhancements to meet client needs; (iv) launching new share classes of existing funds; (v) eliminating purchase minimums and broadening eligibility requirements for certain funds and share classes; (vi) reducing management fees and total expenses for certain target date funds and classes and index funds; (vii) lowering expenses for certain existing funds and classes by implementing or lowering expense caps; (viii) rationalizing product lines and gaining increased efficiencies from fund mergers and liquidations; (ix) continuing to develop, acquire and implement systems and technology to improve services to the funds and shareholders, strengthen information security, and increase efficiency; and (x) continuing to implement enhancements to further strengthen Fidelity's product line to increase investors' probability of success in achieving their investment goals, including retirement income goals.
Investment Performance . The Board considered whether the fund has operated in accordance with its investment objective, as well as its record of compliance with its investment restrictions and its performance history. The Board noted that the fund had a portfolio manager change in June 2019, June 2020, and January 2022. The Board will continue to monitor closely the fund's performance, taking into account the portfolio management changes.
The Board took into account discussions that occur at Board meetings throughout the year with representatives of the Investment Advisers about fund investment performance. In this regard the Board noted that as part of regularly scheduled fund reviews and other reports to the Board on fund performance, the Board considers annualized return information for the fund for different time periods, measured against an appropriate securities market index (benchmark index). The Board also reviews and considers information about performance attribution. In its evaluation of fund investment performance, the Board gave particular attention to information indicating changes in performance of certain Fidelity funds for specific time periods and discussed with the Investment Advisers the reasons for any overperformance or underperformance.
In addition to reviewing absolute and relative fund performance, the Independent Trustees periodically consider the appropriateness of fund performance metrics in evaluating the results achieved. In general, the Independent Trustees believe that fund performance should be evaluated based on net performance (after fees and expenses) of the representative class, compared to appropriate benchmark indices, over appropriate time periods that may include full market cycles, and compared to peer groups, as applicable, over the same periods, taking into account relevant factors including the following: general market conditions; issuer-specific information; and fund cash flows and other factors.
The Independent Trustees recognize that shareholders evaluate performance on a net basis over their own holding periods, for which one-, three-, and five-year periods are often used as a proxy. For this reason, the performance information reviewed by the Board also included net cumulative total return information for the fund and an appropriate benchmark index for the most recent one-, three-, and five-year periods ended September 30, 2021, as shown below. A peer group is not shown below because the fund does not generally utilize a peer group for performance comparison purposes.
Fidelity Short Duration High Income Fund
The Board considered the fund's underperformance for different time periods ended September 30, 2021 and for different time periods ended December 31, 2021 (which periods are not reflected in the chart above). The Board noted that the fund's underperformance has continued since the Board approved the management contract in January 2020 and May 2021. The Board's discussions with FMR regarding underperformance cover topics including, but not limited to: the longer-term track record of a fund's portfolio manager(s); broader trends in the market that may adversely impact a fund's performance; and attribution reports on contributors to the fund's underperformance. The Board engages with FMR on steps that might be taken to address a fund's underperformance. For a fund with underperformance over longer periods of time, the Board typically monitors the fund's performance more closely.
Based on its review, the Board concluded that the nature, extent, and quality of services provided to the fund under the Advisory Contracts should continue to benefit the shareholders of the fund.
Competitiveness of Management Fee and Total Expense Ratio . The Board considered the fund's management fee and total expense ratio compared to "mapped groups" of competitive funds and classes created for the purpose of facilitating the Trustees' competitive analysis of management fees and total expenses. Fidelity creates "mapped groups" by combining similar Lipper investment objective categories that have comparable investment mandates. Combining Lipper investment objective categories aids the Board's management fee and total expense ratio comparisons by broadening the competitive group used for comparison.
Management Fee . The Board considered two proprietary management fee comparisons for the 12-month periods ended September 30 (June 30 for periods ended 2019 and 2018 and December 31 for periods prior to 2018) shown in basis points (BP) in the chart below. The group of Lipper funds used by the Board for management fee comparisons is referred to below as the "Total Mapped Group." The Total Mapped Group comparison focuses on a fund's standing in terms of gross management fees before expense reimbursements or caps relative to the total universe of funds with comparable investment mandates, regardless of whether their management fee structures also are comparable. Funds with comparable investment mandates offer exposure to similar types of securities. Funds with comparable management fee structures have similar management fee contractual arrangements (e.g., flat rate charged for advisory services, all-inclusive fee rate, etc.). "TMG %" represents the percentage of funds in the Total Mapped Group that had management fees that were lower than the fund's. For example, a hypothetical TMG % of 20% would mean that 80% of the funds in the Total Mapped Group had higher, and 20% had lower, management fees than the fund. The fund's actual TMG %s and the number of funds in the Total Mapped Group are in the chart below. The "Asset-Sized Peer Group" (ASPG) comparison focuses on a fund's standing relative to a subset of non-Fidelity funds within the Total Mapped Group that are similar in size and management fee structure. For example, if a fund is in the first quartile of the ASPG, the fund's management fee ranks in the least expensive or lowest 25% of funds in the ASPG. The ASPG represents at least 15% of the funds in the Total Mapped Group with comparable asset size and management fee structures, subject to a minimum of 50 funds (or all funds in the Total Mapped Group if fewer than 50). Additional information, such as the ASPG quartile in which the fund's management fee rate ranked, is also included in the chart and was considered by the Board.
Fidelity Short Duration High Income Fund
The Board noted that the fund's management fee rate ranked below the median of its Total Mapped Group and below the median of its ASPG for the 12-month period ended September 30, 2021.
The Board also considered that, for funds subject to the group fee, FMR agreed to voluntarily waive fees over a specified period of time in amounts designed to account for assets converted from certain funds to certain collective investment trusts.
Based on its review, the Board concluded that the fund's management fee is fair and reasonable in light of the services that the fund receives and the other factors considered.
Total Expense Ratio . In its review of the total expense ratio of the representative class (retail class), the Board considered the fund's management fee rate as well as other fund or class expenses, as applicable, such as transfer agent fees, pricing and bookkeeping fees, fund-paid 12b-1 fees, and custodial, legal, and audit fees. The Board also noted that Fidelity may agree to waive fees or reimburse expenses from time to time, and the extent to which, if any, it has done so for the fund. The fund's representative class is compared to those funds and classes in the Total Mapped Group (used by the Board for management fee comparisons) that have a similar sales load structure. The Board also considered a total expense ASPG comparison, which focuses on the total expenses of the representative class relative to a subset of non-Fidelity funds within the total expense similar sales load structure group. The total expense ASPG is limited to 15 larger and 15 smaller classes in fund average assets for a total of 30 classes, where possible. The total expense ASPG comparison excludes performance adjustments and fund-paid 12b-1 fees to eliminate variability in fee structures.
The Board noted that the total net expense ratio of the retail class ranked below the similar sales load structure group competitive median and below the ASPG competitive median for the 12-month period ended September 30, 2021.
The Board further considered that FMR has contractually agreed to reimburse Class A, Class M, Class C, Class I, Class Z and the retail class of the fund to the extent that total operating expenses, with certain exceptions, as a percentage of their respective average net assets, exceed 1.00%, 1.00%, 1.75%, 0.75%, 0.66% and 0.75% through August 31, 2022.
Fees Charged to Other Fidelity Clients . The Board also considered Fidelity fee structures and other information with respect to clients of Fidelity, such as other funds advised or subadvised by Fidelity, pension plan clients, and other institutional clients with similar mandates. The Board noted that a joint ad hoc committee created by it and the boards of other Fidelity funds periodically reviews and compares Fidelity's institutional investment advisory business with its business of providing services to the Fidelity funds and also noted the most recent findings of the committee. The Board noted that the committee's review included a consideration of the differences in services provided, fees charged, and costs incurred, as well as competition in the markets serving the different categories of clients.
Based on its review of total expense ratios and fees charged to other Fidelity clients, the Board concluded that the total expense ratio of each class of the fund was reasonable in light of the services that the fund and its shareholders receive and the other factors considered.
Costs of the Services and Profitability . The Board considered the revenues earned and the expenses incurred by Fidelity in conducting the business of developing, marketing, distributing, managing, administering and servicing the fund and servicing the fund's shareholders. The Board also considered the level of Fidelity's profits in respect of all the Fidelity funds.
On an annual basis, Fidelity presents to the Board information about the profitability of its relationships with the fund. Fidelity calculates profitability information for each fund, as well as aggregate profitability information for groups of Fidelity funds and all Fidelity funds, using a series of detailed revenue and cost allocation methodologies which originate with the books and records of Fidelity on which Fidelity's audited financial statements are based. The Audit Committee of the Board reviews any significant changes from the prior year's methodologies and the full Board approves such changes.
A public accounting firm has been engaged annually by the Board as part of the Board's assessment of Fidelity's profitability analysis. The engagement includes the review and assessment of the methodologies used by Fidelity in determining the revenues and expenses attributable to Fidelity's mutual fund business, and completion of agreed-upon procedures in respect of the mathematical accuracy of certain fund profitability information and its conformity to established allocation methodologies. After considering the reports issued under the engagement and information provided by Fidelity, the Board concluded that while other allocation methods may also be reasonable, Fidelity's profitability methodologies are reasonable in all material respects.
The Board also reviewed Fidelity's non-fund businesses and potential indirect benefits such businesses may have received as a result of their association with Fidelity's mutual fund business (i.e., fall-out benefits) as well as cases where Fidelity's affiliates may benefit from the funds' business. The Board considered areas where potential indirect benefits to the Fidelity funds from their relationships with Fidelity may exist. The Board's consideration of these matters was informed by the findings of a joint ad hoc committee created by it and the boards of other Fidelity funds to evaluate potential fall-out benefits.
The Board considered the costs of the services provided by and the profits realized by Fidelity in connection with the operation of the fund and was satisfied that the profitability was not excessive.
Economies of Scale . The Board considered whether there have been economies of scale in respect of the management of the Fidelity funds, whether the Fidelity funds (including the fund) have appropriately benefited from any such economies of scale, and whether there is potential for realization of any further economies of scale. The Board considered the extent to which the fund will benefit from economies of scale as assets grow through increased services to the fund, through waivers or reimbursements, or through fee or expense ratio reductions. The Board also noted that a committee (the Economies of Scale Committee) created by it and the boards of other Fidelity funds periodically analyzes whether Fidelity attains economies of scale in respect of the management and servicing of the Fidelity funds, whether the Fidelity funds have appropriately benefited from such economies of scale, and whether there is potential for realization of any further economies of scale.
The Board recognized that the fund's management contract incorporates a "group fee" structure, which provides for lower group fee rates as total "group assets" increase, and for higher group fee rates as total "group assets" decrease ("group assets" as defined in the management contract). FMR calculates the group fee rates based on a tiered asset "breakpoint" schedule that varies based on asset class. The Board considered that the group fee is designed to deliver the benefits of economies of scale to fund shareholders when total Fidelity fund assets increase, even if assets of any particular fund are unchanged or have declined, because some portion of Fidelity's costs are attributable to services provided to all Fidelity funds, and all funds benefit if those costs can be allocated among more assets. The Board further considered that Fidelity agreed to impose a temporary fee waiver in the form of additional breakpoints to the current breakpoint schedule. The Board concluded that, given the group fee structure, fund shareholders will benefit from lower management fees as "group assets" increase at the fund complex level, regardless of whether Fidelity achieves any such economies of scale.
The Board concluded, taking into account the analysis of the Economies of Scale Committee, that economies of scale, if any, are being appropriately shared between fund shareholders and Fidelity.
Additional Information Requested by the Board . In order to develop fully the factual basis for consideration of the Fidelity funds' advisory contracts, the Board requested and received additional information on certain topics, including: (i) fund flow and performance trends, in particular the underperformance of certain funds and strategies, and Fidelity's long-term strategies for certain funds, including any consideration of fund liquidations or mergers; (ii) the operation of performance fees, competitor use of performance fees, and consideration of the expansion of performance fees to additional funds; (iii) Fidelity's pricing philosophy compared to competitors; (iv) fund profitability methodology and data; (v) evaluation of competitive fund data and peer group classifications and fee and expense comparisons; (vi) the management fee and expense structures for different funds and classes and information about the differences between various fee and expense structures; (vii) group fee breakpoints and related voluntary fee waivers; and (viii) information regarding other accounts managed by Fidelity and the funds' sub-advisory arrangements.
Based on its evaluation of all of the conclusions noted above, and after considering all factors it believed relevant, the Board concluded that the advisory fee arrangements are fair and reasonable, and that the fund's Advisory Contracts should be renewed.
1.969437.108
SDH-SANN-1222
Fidelity® High Income Fund
Semi-Annual Report
October 31, 2022
Includes Fidelity and Fidelity Advisor share classes
Contents
To view a fund's proxy voting guidelines and proxy voting record for the 12-month period ended June 30, visit http://www.fidelity.com/proxyvotingresults or visit the Securities and Exchange Commission's (SEC) web site at http://www.sec.gov.
You may also call 1-800-544-8544 if you're an individual investing directly with Fidelity, call 1-800-835-5092 if you're a plan sponsor or participant with Fidelity as your recordkeeper or call 1-877-208-0098 on institutional accounts or if you're an advisor or invest through one to request a free copy of the proxy voting guidelines.
Standard & Poor's, S&P and S&P 500 are registered service marks of The McGraw-Hill Companies, Inc. and have been licensed for use by Fidelity Distributors Corporation.
Other third-party marks appearing herein are the property of their respective owners.
All other marks appearing herein are registered or unregistered trademarks or service marks of FMR LLC or an affiliated company. © 2022 FMR LLC. All rights reserved.
This report and the financial statements contained herein are submitted for the general information of the shareholders of the Fund. This report is not authorized for distribution to prospective investors in the Fund unless preceded or accompanied by an effective prospectus.
A fund files its complete schedule of portfolio holdings with the SEC for the first and third quarters of each fiscal year on Form N-PORT. Forms N-PORT are available on the SEC's web site at http://www.sec.gov. A fund's Forms N-PORT may be reviewed and copied at the SEC's Public Reference Room in Washington, DC. Information regarding the operation of the SEC's Public Reference Room may be obtained by calling 1-800-SEC-0330.
For a complete list of a fund's portfolio holdings, view the most recent holdings listing, semiannual report, or annual report on Fidelity's web site at http://www.fidelity.com, http://www.institutional.fidelity.com, or http://www.401k.com, as applicable.
NOT FDIC INSURED •MAY LOSE VALUE •NO BANK GUARANTEE
Neither the Fund nor Fidelity Distributors Corporation is a bank.
| Top Bond Issuers (% of Fund's net assets) |
(with maturities greater than one year) |
| New Fortress Energy, Inc. | 2.4 | |
| Uniti Group LP / Uniti Group Finance, Inc. | 2.1 | |
| Tenet Healthcare Corp. | 1.8 | |
| TransDigm, Inc. | 1.8 | |
| CCO Holdings LLC/CCO Holdings Capital Corp. | 1.7 | |
| Icahn Enterprises LP/Icahn Enterprises Finance Corp. | 1.6 | |
| Tallgrass Energy Partners LP / Tallgrass Energy Finance Corp. | 1.6 | |
| Crestwood Midstream Partners LP/Crestwood Midstream Finance Corp. | 1.6 | |
| Community Health Systems, Inc. | 1.6 | |
| PG&E Corp. | 1.5 | |
| | 17.7 | |
| |
| Market Sectors (% of Fund's net assets) |
| |
| Energy | 13.7 | |
| Telecommunications | 8.6 | |
| Healthcare | 8.5 | |
| Services | 6.3 | |
| Technology | 6.1 | |
| |
Quality Diversification (% of Fund's net assets) |
|
| |
| We have used ratings from Moody's Investors Service, Inc. Where Moody's® ratings are not available, we have used S&P® ratings. All ratings are as of the date indicated and do not reflect subsequent changes. |
Asset Allocation (% of Fund's net assets) |
|
Foreign investments - 18.1% |
|
Geographic Diversification (% of Fund's net assets) |
|
* Includes Short-Term investments and Net Other Assets (Liabilities). Percentages are based on country or territory of incorporation and are adjusted for the effect of futures contracts, if applicable. |
| |
Showing Percentage of Net Assets
| Corporate Bonds - 83.9% |
| | | Principal Amount (a) (000s) | Value ($) (000s) |
| Convertible Bonds - 1.9% | | | |
| Broadcasting - 1.0% | | | |
| DISH Network Corp.: | | | |
| 2.375% 3/15/24 | | 11,320 | 10,267 |
| 3.375% 8/15/26 | | 30,171 | 20,863 |
| | | | 31,130 |
| Energy - 0.9% | | | |
| Mesquite Energy, Inc. 15% 7/15/23 (b)(c) | | 1,681 | 9,966 |
| Mesquite Energy, Inc. 15% 7/15/23 (b)(c) | | 2,898 | 17,178 |
| | | | 27,144 |
TOTAL CONVERTIBLE BONDS | | | 58,274 |
| Nonconvertible Bonds - 82.0% | | | |
| Aerospace - 3.3% | | | |
| ATI, Inc.: | | | |
| 4.875% 10/1/29 | | 2,320 | 1,951 |
| 5.875% 12/1/27 | | 9,900 | 8,998 |
| Bombardier, Inc. 7.875% 4/15/27 (d) | | 10,977 | 10,425 |
| BWX Technologies, Inc. 4.125% 6/30/28 (d) | | 13,223 | 11,570 |
| Kaiser Aluminum Corp.: | | | |
| 4.5% 6/1/31 (d) | | 2,155 | 1,691 |
| 4.625% 3/1/28 (d) | | 11,680 | 10,218 |
| Moog, Inc. 4.25% 12/15/27 (d) | | 462 | 413 |
| TransDigm, Inc.: | | | |
| 4.625% 1/15/29 | | 5,930 | 5,050 |
| 5.5% 11/15/27 | | 38,717 | 35,039 |
| 6.25% 3/15/26 (d) | | 7,455 | 7,354 |
| 7.5% 3/15/27 | | 1,582 | 1,559 |
| 8% 12/15/25 (d) | | 3,605 | 3,668 |
| | | | 97,936 |
| Air Transportation - 0.1% | | | |
| American Airlines, Inc. / AAdvantage Loyalty IP Ltd. 5.5% 4/20/26 (d) | | 3,130 | 2,981 |
| Automotive & Auto Parts - 0.3% | | | |
| Ford Motor Credit Co. LLC: | | | |
| 2.9% 2/10/29 | | 6,905 | 5,416 |
| 3.815% 11/2/27 | | 4,080 | 3,505 |
| | | | 8,921 |
| Banks & Thrifts - 0.1% | | | |
| Jane Street Group LLC/JSG Finance, Inc. 4.5% 11/15/29 (d) | | 2,430 | 2,148 |
| Broadcasting - 1.2% | | | |
| Diamond Sports Group LLC/Diamond Sports Finance Co. 5.375% 8/15/26 (d) | | 22,770 | 4,554 |
| Sinclair Television Group, Inc. 5.5% 3/1/30 (d) | | 4,065 | 3,040 |
| Sirius XM Radio, Inc.: | | | |
| 4% 7/15/28 (d) | | 5,800 | 4,986 |
| 4.125% 7/1/30 (d) | | 2,105 | 1,722 |
| 5.5% 7/1/29 (d) | | 6,685 | 6,166 |
| TEGNA, Inc.: | | | |
| 4.625% 3/15/28 | | 4,880 | 4,645 |
| 5% 9/15/29 | | 1,775 | 1,683 |
| Univision Communications, Inc.: | | | |
| 4.5% 5/1/29 (d) | | 5,615 | 4,727 |
| 6.625% 6/1/27 (d) | | 3,655 | 3,609 |
| | | | 35,132 |
| Building Materials - 0.5% | | | |
| Advanced Drain Systems, Inc. 5% 9/30/27 (d) | | 4,541 | 4,211 |
| Builders FirstSource, Inc. 4.25% 2/1/32 (d) | | 5,595 | 4,477 |
| SRS Distribution, Inc.: | | | |
| 4.625% 7/1/28 (d) | | 3,455 | 3,034 |
| 6% 12/1/29 (d) | | 3,095 | 2,524 |
| | | | 14,246 |
| Cable/Satellite TV - 4.2% | | | |
| CCO Holdings LLC/CCO Holdings Capital Corp.: | | | |
| 4.25% 2/1/31 (d) | | 11,784 | 9,309 |
| 4.25% 1/15/34 (d) | | 1,415 | 1,040 |
| 4.5% 8/15/30 (d) | | 14,630 | 11,873 |
| 4.5% 5/1/32 | | 12,236 | 9,666 |
| 4.5% 6/1/33 (d) | | 8,145 | 6,176 |
| 4.75% 3/1/30 (d) | | 5,630 | 4,731 |
| 4.75% 2/1/32 (d) | | 1,415 | 1,132 |
| 5% 2/1/28 (d) | | 3,840 | 3,475 |
| 5.375% 6/1/29 (d) | | 4,390 | 3,922 |
| CSC Holdings LLC: | | | |
| 3.375% 2/15/31 (d) | | 5,000 | 3,625 |
| 4.125% 12/1/30 (d) | | 2,939 | 2,312 |
| 4.5% 11/15/31 (d) | | 1,430 | 1,112 |
| 4.625% 12/1/30 (d) | | 17,824 | 12,829 |
| 5.375% 2/1/28 (d) | | 15,430 | 14,234 |
| 5.75% 1/15/30 (d) | | 3,475 | 2,658 |
| 7.5% 4/1/28 (d) | | 2,935 | 2,543 |
| Dolya Holdco 18 DAC 5% 7/15/28 (d) | | 4,188 | 3,566 |
| Radiate Holdco LLC/Radiate Financial Service Ltd.: | | | |
| 4.5% 9/15/26 (d) | | 4,479 | 3,785 |
| 6.5% 9/15/28 (d) | | 19,428 | 12,240 |
| Telenet Finance Luxembourg Notes SARL 5.5% 3/1/28 (d) | | 7,800 | 6,783 |
| Ziggo Bond Co. BV 5.125% 2/28/30 (d) | | 4,250 | 3,368 |
| Ziggo BV 4.875% 1/15/30 (d) | | 5,505 | 4,652 |
| | | | 125,031 |
| Capital Goods - 0.8% | | | |
| Mueller Water Products, Inc. 4% 6/15/29 (d) | | 4,685 | 4,062 |
| Vertical Holdco GmbH 7.625% 7/15/28 (d) | | 5,610 | 4,637 |
| Vertical U.S. Newco, Inc. 5.25% 7/15/27 (d) | | 18,314 | 16,414 |
| | | | 25,113 |
| Chemicals - 4.0% | | | |
| CVR Partners LP 6.125% 6/15/28 (d) | | 5,120 | 4,632 |
| Element Solutions, Inc. 3.875% 9/1/28 (d) | | 6,534 | 5,554 |
| Kronos Acquisition Holdings, Inc. / KIK Custom Products, Inc.: | | | |
| 5% 12/31/26 (d) | | 11,080 | 10,044 |
| 7% 12/31/27 (d) | | 1,080 | 907 |
| LSB Industries, Inc. 6.25% 10/15/28 (d) | | 10,150 | 9,215 |
| Methanex Corp.: | | | |
| 5.125% 10/15/27 | | 11,101 | 10,075 |
| 5.65% 12/1/44 | | 4,229 | 2,907 |
| NOVA Chemicals Corp.: | | | |
| 4.25% 5/15/29 (d) | | 5,020 | 4,092 |
| 4.875% 6/1/24 (d) | | 4,330 | 4,211 |
| 5% 5/1/25 (d) | | 2,270 | 2,162 |
| 5.25% 6/1/27 (d) | | 12,500 | 11,157 |
| Nufarm Australia Ltd. 5% 1/27/30 (d) | | 6,520 | 5,515 |
| Olympus Water U.S. Holding Corp.: | | | |
| 4.25% 10/1/28 (d) | | 5,155 | 4,185 |
| 6.25% 10/1/29 (d) | | 5,435 | 3,763 |
| SCIL IV LLC / SCIL U.S.A. Holdings LLC 5.375% 11/1/26 (d) | | 3,935 | 3,128 |
| The Chemours Co. LLC: | | | |
| 4.625% 11/15/29 (d) | | 7,595 | 5,924 |
| 5.375% 5/15/27 | | 10,144 | 9,083 |
| 5.75% 11/15/28 (d) | | 19,200 | 16,310 |
| W.R. Grace Holding LLC 5.625% 8/15/29 (d) | | 8,100 | 6,261 |
| | | | 119,125 |
| Consumer Products - 0.3% | | | |
| Mattel, Inc.: | | | |
| 3.375% 4/1/26 (d) | | 2,870 | 2,618 |
| 3.75% 4/1/29 (d) | | 8,300 | 7,163 |
| | | | 9,781 |
| Containers - 0.8% | | | |
| Graphic Packaging International, Inc. 3.75% 2/1/30 (d) | | 2,160 | 1,857 |
| Sealed Air Corp. 5% 4/15/29 (d) | | 5,450 | 4,971 |
| Trivium Packaging Finance BV: | | | |
| 5.5% 8/15/26 (d) | | 8,787 | 8,066 |
| 8.5% 8/15/27 (d) | | 9,951 | 9,357 |
| | | | 24,251 |
| Diversified Financial Services - 3.4% | | | |
| Coinbase Global, Inc.: | | | |
| 3.375% 10/1/28 (d) | | 11,430 | 7,471 |
| 3.625% 10/1/31 (d) | | 12,385 | 7,334 |
| Hightower Holding LLC 6.75% 4/15/29 (d) | | 5,410 | 4,404 |
| Icahn Enterprises LP/Icahn Enterprises Finance Corp.: | | | |
| 4.375% 2/1/29 | | 7,160 | 5,978 |
| 5.25% 5/15/27 | | 30,900 | 28,467 |
| 6.25% 5/15/26 | | 14,341 | 13,803 |
| Ladder Capital Finance Holdings LLLP/Ladder Capital Finance Corp. 4.75% 6/15/29 (d) | | 3,635 | 2,893 |
| OneMain Finance Corp.: | | | |
| 3.5% 1/15/27 | | 8,300 | 6,807 |
| 3.875% 9/15/28 | | 14,215 | 11,069 |
| 6.875% 3/15/25 | | 4,415 | 4,283 |
| 7.125% 3/15/26 | | 11,800 | 11,387 |
| | | | 103,896 |
| Diversified Media - 0.6% | | | |
| Advantage Sales & Marketing, Inc. 6.5% 11/15/28 (d) | | 19,948 | 16,969 |
| Terrier Media Buyer, Inc. 8.875% 12/15/27 (d) | | 2,212 | 1,875 |
| | | | 18,844 |
| Energy - 11.6% | | | |
| Altus Midstream LP 5.875% 6/15/30 (d) | | 3,635 | 3,410 |
| Apache Corp. 4.25% 1/15/30 | | 1,960 | 1,744 |
| Atlantica Sustainable Infrastructure PLC 4.125% 6/15/28 (d) | | 6,465 | 5,479 |
| Citgo Petroleum Corp. 6.375% 6/15/26 (d) | | 11,308 | 11,137 |
| CNX Resources Corp. 7.375% 1/15/31 (d) | | 1,580 | 1,568 |
| Colgate Energy Partners III LLC: | | | |
| 5.875% 7/1/29 (d) | | 7,855 | 7,286 |
| 7.75% 2/15/26 (d) | | 660 | 657 |
| Comstock Resources, Inc.: | | | |
| 5.875% 1/15/30 (d) | | 6,180 | 5,577 |
| 6.75% 3/1/29 (d) | | 10,655 | 10,202 |
| Crestwood Midstream Partners LP/Crestwood Midstream Finance Corp.: | | | |
| 5.625% 5/1/27 (d) | | 27,398 | 25,770 |
| 5.75% 4/1/25 | | 9,497 | 9,260 |
| 6% 2/1/29 (d) | | 12,181 | 11,390 |
| CrownRock LP/CrownRock Finance, Inc.: | | | |
| 5% 5/1/29 (d) | | 2,510 | 2,280 |
| 5.625% 10/15/25 (d) | | 560 | 542 |
| CVR Energy, Inc.: | | | |
| 5.25% 2/15/25 (d) | | 10,329 | 9,953 |
| 5.75% 2/15/28 (d) | | 6,813 | 6,166 |
| Delek Logistics Partners LP 7.125% 6/1/28 (d) | | 12,355 | 11,063 |
| DT Midstream, Inc. 4.125% 6/15/29 (d) | | 4,090 | 3,536 |
| EnLink Midstream LLC 5.625% 1/15/28 (d) | | 1,630 | 1,562 |
| EQM Midstream Partners LP: | | | |
| 6% 7/1/25 (d) | | 355 | 344 |
| 6.5% 7/1/27 (d) | | 4,947 | 4,823 |
| 7.5% 6/1/27 (d) | | 1,735 | 1,713 |
| 7.5% 6/1/30 (d) | | 1,735 | 1,687 |
| Global Partners LP/GLP Finance Corp. 6.875% 1/15/29 | | 4,610 | 4,171 |
| Harvest Midstream I LP 7.5% 9/1/28 (d) | | 2,365 | 2,267 |
| Hess Midstream Partners LP: | | | |
| 4.25% 2/15/30 (d) | | 1,880 | 1,608 |
| 5.125% 6/15/28 (d) | | 7,610 | 7,001 |
| Hilcorp Energy I LP/Hilcorp Finance Co.: | | | |
| 5.75% 2/1/29 (d) | | 1,960 | 1,793 |
| 6.25% 11/1/28 (d) | | 1,960 | 1,842 |
| Holly Energy Partners LP/Holly Energy Finance Corp. 5% 2/1/28 (d) | | 4,080 | 3,687 |
| Mesquite Energy, Inc. 7.25% 2/15/23 (c)(d)(e) | | 28,768 | 0 |
| New Fortress Energy, Inc.: | | | |
| 6.5% 9/30/26 (d) | | 34,475 | 33,441 |
| 6.75% 9/15/25 (d) | | 35,507 | 34,857 |
| NGL Energy Operating LLC/NGL Energy Finance Corp. 7.5% 2/1/26 (d) | | 10,365 | 9,377 |
| Occidental Petroleum Corp.: | | | |
| 5.5% 12/1/25 | | 1,000 | 1,003 |
| 7.5% 5/1/31 | | 6,195 | 6,660 |
| 7.875% 9/15/31 | | 1,135 | 1,235 |
| 8% 7/15/25 | | 1,000 | 1,056 |
| 8.875% 7/15/30 | | 4,715 | 5,352 |
| Rockies Express Pipeline LLC: | | | |
| 4.8% 5/15/30 (d) | | 1,900 | 1,606 |
| 4.95% 7/15/29 (d) | | 4,294 | 3,767 |
| 6.875% 4/15/40 (d) | | 1,598 | 1,305 |
| SM Energy Co. 5.625% 6/1/25 | | 5,210 | 5,061 |
| Southwestern Energy Co. 4.75% 2/1/32 | | 3,580 | 3,090 |
| Sunoco LP/Sunoco Finance Corp.: | | | |
| 4.5% 5/15/29 | | 5,094 | 4,375 |
| 5.875% 3/15/28 | | 4,990 | 4,750 |
| Superior Plus LP / Superior General Partner, Inc. 4.5% 3/15/29 (d) | | 2,990 | 2,534 |
| Tallgrass Energy Partners LP / Tallgrass Energy Finance Corp.: | | | |
| 5.5% 1/15/28 (d) | | 9,865 | 8,845 |
| 6% 3/1/27 (d) | | 19,467 | 18,370 |
| 6% 12/31/30 (d) | | 8,825 | 7,989 |
| 6% 9/1/31 (d) | | 9,425 | 8,390 |
| 7.5% 10/1/25 (d) | | 3,260 | 3,292 |
| Transocean Guardian Ltd. 5.875% 1/15/24 (d) | | 2,679 | 2,604 |
| Transocean Phoenix 2 Ltd. 7.75% 10/15/24 (d) | | 494 | 491 |
| Transocean Pontus Ltd. 6.125% 8/1/25 (d) | | 1,380 | 1,329 |
| Transocean Poseidon Ltd. 6.875% 2/1/27 (d) | | 2,157 | 2,065 |
| Transocean Proteus Ltd. 6.25% 12/1/24 (d) | | 612 | 597 |
| Transocean Sentry Ltd. 5.375% 5/15/23 (d) | | 5,762 | 5,661 |
| Venture Global Calcasieu Pass LLC: | | | |
| 3.875% 8/15/29 (d) | | 5,530 | 4,742 |
| 4.125% 8/15/31 (d) | | 5,475 | 4,668 |
| | | | 348,030 |
| Environmental - 1.3% | | | |
| Covanta Holding Corp. 4.875% 12/1/29 (d) | | 5,180 | 4,411 |
| Darling Ingredients, Inc. 6% 6/15/30 (d) | | 2,155 | 2,074 |
| Madison IAQ LLC: | | | |
| 4.125% 6/30/28 (d) | | 10,535 | 8,718 |
| 5.875% 6/30/29 (d) | | 24,280 | 16,632 |
| Stericycle, Inc.: | | | |
| 3.875% 1/15/29 (d) | | 6,570 | 5,707 |
| 5.375% 7/15/24 (d) | | 1,385 | 1,364 |
| | | | 38,906 |
| Food & Drug Retail - 1.0% | | | |
| Albertsons Companies LLC/Safeway, Inc./New Albertson's, Inc./Albertson's LLC: | | | |
| 3.5% 3/15/29 (d) | | 22,063 | 18,257 |
| 4.875% 2/15/30 (d) | | 6,320 | 5,609 |
| Emergent BioSolutions, Inc. 3.875% 8/15/28 (d) | | 10,274 | 6,160 |
| Murphy Oil U.S.A., Inc. 3.75% 2/15/31 (d) | | 1,435 | 1,196 |
| | | | 31,222 |
| Food/Beverage/Tobacco - 2.0% | | | |
| C&S Group Enterprises LLC 5% 12/15/28 (d) | | 15,865 | 11,728 |
| Lamb Weston Holdings, Inc. 4.125% 1/31/30 (d) | | 11,855 | 10,349 |
| Performance Food Group, Inc. 5.5% 10/15/27 (d) | | 542 | 512 |
| Post Holdings, Inc.: | | | |
| 4.625% 4/15/30 (d) | | 3,666 | 3,093 |
| 5.5% 12/15/29 (d) | | 3,587 | 3,228 |
| Primo Water Holdings, Inc. 4.375% 4/30/29 (d) | | 11,870 | 9,946 |
| TreeHouse Foods, Inc. 4% 9/1/28 | | 2,065 | 1,742 |
| Triton Water Holdings, Inc. 6.25% 4/1/29 (d) | | 20,435 | 15,477 |
| U.S. Foods, Inc.: | | | |
| 4.625% 6/1/30 (d) | | 2,045 | 1,774 |
| 4.75% 2/15/29 (d) | | 2,520 | 2,233 |
| | | | 60,082 |
| Gaming - 2.0% | | | |
| Affinity Gaming LLC 6.875% 12/15/27 (d) | | 10,355 | 8,644 |
| Caesars Entertainment, Inc. 8.125% 7/1/27 (d) | | 17,724 | 17,237 |
| Fertitta Entertainment LLC / Fertitta Entertainment Finance Co., Inc. 6.75% 1/15/30 (d) | | 11,230 | 8,816 |
| Golden Entertainment, Inc. 7.625% 4/15/26 (d) | | 6,091 | 5,984 |
| Jacobs Entertainment, Inc. 6.75% 2/15/29 (d) | | 2,400 | 2,116 |
| Premier Entertainment Sub LLC: | | | |
| 5.625% 9/1/29 (d) | | 6,920 | 5,121 |
| 5.875% 9/1/31 (d) | | 3,290 | 2,331 |
| Station Casinos LLC 4.5% 2/15/28 (d) | | 4,745 | 4,088 |
| Wynn Las Vegas LLC/Wynn Las Vegas Capital Corp. 5.25% 5/15/27 (d) | | 5,156 | 4,485 |
| | | | 58,822 |
| Healthcare - 8.2% | | | |
| 1375209 BC Ltd. 9% 1/30/28 (d) | | 3,606 | 3,489 |
| 180 Medical, Inc. 3.875% 10/15/29 (d) | | 5,715 | 4,829 |
| AMN Healthcare 4% 4/15/29 (d) | | 8,354 | 7,188 |
| Avantor Funding, Inc.: | | | |
| 3.875% 11/1/29 (d) | | 10,440 | 8,809 |
| 4.625% 7/15/28 (d) | | 3,355 | 3,032 |
| Bausch Health Companies, Inc.: | | | |
| 11% 9/30/28 (d) | | 6,396 | 4,925 |
| 14% 10/15/30 (d) | | 1,272 | 728 |
| Cano Health, Inc. 6.25% 10/1/28 (d) | | 4,803 | 3,857 |
| Catalent Pharma Solutions 3.5% 4/1/30 (d) | | 10,850 | 8,761 |
| Charles River Laboratories International, Inc.: | | | |
| 3.75% 3/15/29 (d) | | 2,975 | 2,573 |
| 4.25% 5/1/28 (d) | | 768 | 699 |
| Community Health Systems, Inc.: | | | |
| 4.75% 2/15/31 (d) | | 10,365 | 6,944 |
| 5.25% 5/15/30 (d) | | 19,665 | 13,618 |
| 5.625% 3/15/27 (d) | | 13,825 | 11,017 |
| 6% 1/15/29 (d) | | 6,140 | 4,558 |
| 6.125% 4/1/30 (d) | | 7,445 | 3,052 |
| 6.875% 4/15/29 (d) | | 9,010 | 3,626 |
| 8% 3/15/26 (d) | | 3,135 | 2,704 |
| CTR Partnership LP/CareTrust Capital Corp. 3.875% 6/30/28 (d) | | 5,375 | 4,533 |
| DaVita HealthCare Partners, Inc.: | | | |
| 3.75% 2/15/31 (d) | | 2,170 | 1,569 |
| 4.625% 6/1/30 (d) | | 17,405 | 13,569 |
| Embecta Corp. 5% 2/15/30 (d) | | 2,745 | 2,353 |
| Grifols Escrow Issuer SA 4.75% 10/15/28 (d) | | 7,652 | 5,978 |
| HealthEquity, Inc. 4.5% 10/1/29 (d) | | 3,705 | 3,237 |
| Hologic, Inc.: | | | |
| 3.25% 2/15/29 (d) | | 6,190 | 5,260 |
| 4.625% 2/1/28 (d) | | 134 | 125 |
| Jazz Securities DAC 4.375% 1/15/29 (d) | | 13,450 | 11,937 |
| ModivCare Escrow Issuer, Inc. 5% 10/1/29 (d) | | 2,030 | 1,728 |
| Molina Healthcare, Inc. 3.875% 11/15/30 (d) | | 3,370 | 2,864 |
| Option Care Health, Inc. 4.375% 10/31/29 (d) | | 8,310 | 7,176 |
| Organon & Co. / Organon Foreign Debt Co-Issuer BV: | | | |
| 4.125% 4/30/28 (d) | | 17,765 | 15,648 |
| 5.125% 4/30/31 (d) | | 820 | 696 |
| Owens & Minor, Inc. 4.5% 3/31/29 (d) | | 2,610 | 2,021 |
| Pediatrix Medical Group, Inc. 5.375% 2/15/30 (d) | | 5,590 | 4,807 |
| Radiology Partners, Inc. 9.25% 2/1/28 (d) | | 6,485 | 3,431 |
| RP Escrow Issuer LLC 5.25% 12/15/25 (d) | | 13,345 | 9,979 |
| Teleflex, Inc. 4.25% 6/1/28 (d) | | 1,540 | 1,393 |
| Tenet Healthcare Corp.: | | | |
| 4.25% 6/1/29 (d) | | 10,395 | 8,758 |
| 4.375% 1/15/30 (d) | | 4,965 | 4,166 |
| 4.625% 6/15/28 (d) | | 8,758 | 7,685 |
| 6.125% 10/1/28 (d) | | 27,845 | 24,100 |
| 6.125% 6/15/30 (d) | | 6,675 | 6,162 |
| 6.25% 2/1/27 (d) | | 3,134 | 2,991 |
| | | | 246,575 |
| Homebuilders/Real Estate - 4.2% | | | |
| Ashton Woods U.S.A. LLC/Ashton Woods Finance Co. 4.625% 8/1/29 (d) | | 2,515 | 1,889 |
| Howard Hughes Corp.: | | | |
| 4.125% 2/1/29 (d) | | 3,300 | 2,579 |
| 4.375% 2/1/31 (d) | | 3,300 | 2,480 |
| Kennedy-Wilson, Inc. 4.75% 2/1/30 | | 13,055 | 10,248 |
| MPT Operating Partnership LP/MPT Finance Corp.: | | | |
| 3.5% 3/15/31 | | 8,490 | 5,840 |
| 4.625% 8/1/29 | | 3,950 | 3,129 |
| 5% 10/15/27 | | 28,110 | 24,071 |
| Railworks Holdings LP 8.25% 11/15/28 (d) | | 7,220 | 6,635 |
| TopBuild Corp. 4.125% 2/15/32 (d) | | 9,350 | 7,321 |
| Uniti Group LP / Uniti Group Finance, Inc.: | | | |
| 4.75% 4/15/28 (d) | | 19,235 | 15,724 |
| 6.5% 2/15/29 (d) | | 65,180 | 46,772 |
| | | | 126,688 |
| Hotels - 0.5% | | | |
| Hilton Domestic Operating Co., Inc.: | | | |
| 3.625% 2/15/32 (d) | | 9,245 | 7,361 |
| 3.75% 5/1/29 (d) | | 215 | 183 |
| 4% 5/1/31 (d) | | 4,375 | 3,657 |
| Wyndham Hotels & Resorts, Inc. 4.375% 8/15/28 (d) | | 4,395 | 3,869 |
| | | | 15,070 |
| Insurance - 0.8% | | | |
| Alliant Holdings Intermediate LLC 4.25% 10/15/27 (d) | | 12,485 | 11,238 |
| AmWINS Group, Inc. 4.875% 6/30/29 (d) | | 11,105 | 9,493 |
| AssuredPartners, Inc. 5.625% 1/15/29 (d) | | 3,295 | 2,710 |
| | | | 23,441 |
| Leisure - 2.9% | | | |
| Carnival Corp.: | | | |
| 5.75% 3/1/27 (d) | | 17,425 | 12,110 |
| 6% 5/1/29 (d) | | 13,860 | 9,193 |
| 6.65% 1/15/28 | | 750 | 477 |
| 7.625% 3/1/26 (d) | | 19,060 | 14,332 |
| MajorDrive Holdings IV LLC 6.375% 6/1/29 (d) | | 3,585 | 2,526 |
| NCL Corp. Ltd.: | | | |
| 3.625% 12/15/24 (d) | | 9,685 | 8,406 |
| 5.875% 3/15/26 (d) | | 2,175 | 1,781 |
| 7.75% 2/15/29 (d) | | 4,840 | 3,849 |
| NCL Finance Ltd. 6.125% 3/15/28 (d) | | 1,660 | 1,291 |
| Royal Caribbean Cruises Ltd.: | | | |
| 4.25% 7/1/26 (d) | | 10,620 | 8,390 |
| 5.375% 7/15/27 (d) | | 3,900 | 3,032 |
| 5.5% 8/31/26 (d) | | 10,740 | 8,781 |
| 5.5% 4/1/28 (d) | | 12,495 | 9,621 |
| Viking Ocean Cruises Ship VII Ltd. 5.625% 2/15/29 (d) | | 1,605 | 1,251 |
| Voc Escrow Ltd. 5% 2/15/28 (d) | | 3,550 | 2,923 |
| | | | 87,963 |
| Metals/Mining - 1.0% | | | |
| Eldorado Gold Corp. 6.25% 9/1/29 (d) | | 1,505 | 1,217 |
| ERO Copper Corp. 6.5% 2/15/30 (d) | | 12,060 | 8,834 |
| First Quantum Minerals Ltd.: | | | |
| 6.875% 3/1/26 (d) | | 2,210 | 2,068 |
| 6.875% 10/15/27 (d) | | 9,420 | 8,724 |
| 7.5% 4/1/25 (d) | | 2,205 | 2,123 |
| HudBay Minerals, Inc. 4.5% 4/1/26 (d) | | 2,225 | 1,952 |
| Mineral Resources Ltd. 8.5% 5/1/30 (d) | | 3,355 | 3,302 |
| PMHC II, Inc. 9% 2/15/30 (d) | | 5,155 | 3,397 |
| | | | 31,617 |
| Paper - 0.7% | | | |
| Ardagh Metal Packaging Finance U.S.A. LLC/Ardagh Metal Packaging Finance PLC: | | | |
| 4% 9/1/29 (d) | | 3,020 | 2,291 |
| 6% 6/15/27 (d) | | 4,690 | 4,500 |
| Clydesdale Acquisition Holdings, Inc. 6.625% 4/15/29 (d) | | 1,950 | 1,851 |
| Enviva Partners LP / Enviva Partners Finance Corp. 6.5% 1/15/26 (d) | | 1,010 | 970 |
| Glatfelter Corp. 4.75% 11/15/29 (d) | | 3,520 | 2,266 |
| SPA Holdings 3 OY 4.875% 2/4/28 (d) | | 11,670 | 9,291 |
| | | | 21,169 |
| Publishing/Printing - 0.1% | | | |
| News Corp. 5.125% 2/15/32 (d) | | 4,070 | 3,632 |
| Railroad - 0.4% | | | |
| First Student Bidco, Inc./First Transit Parent, Inc. 4% 7/31/29 (d) | | 13,385 | 10,877 |
| Restaurants - 0.5% | | | |
| 1011778 BC Unlimited Liability Co./New Red Finance, Inc. 4% 10/15/30 (d) | | 7,316 | 5,972 |
| Garden SpinCo Corp. 8.625% 7/20/30 (d) | | 1,415 | 1,455 |
| Yum! Brands, Inc. 4.625% 1/31/32 | | 8,980 | 7,678 |
| | | | 15,105 |
| Services - 5.5% | | | |
| ADT Corp. 4.125% 8/1/29 (d) | | 3,320 | 2,847 |
| Adtalem Global Education, Inc. 5.5% 3/1/28 (d) | | 7,028 | 6,413 |
| APX Group, Inc. 6.75% 2/15/27 (d) | | 2,720 | 2,653 |
| ASGN, Inc. 4.625% 5/15/28 (d) | | 4,615 | 4,104 |
| Booz Allen Hamilton, Inc. 3.875% 9/1/28 (d) | | 8,250 | 7,269 |
| Brand Energy & Infrastructure Services, Inc. 8.5% 7/15/25 (d) | | 20,855 | 14,994 |
| CoreCivic, Inc.: | | | |
| 4.75% 10/15/27 | | 12,799 | 10,620 |
| 8.25% 4/15/26 | | 24,050 | 24,402 |
| Fair Isaac Corp. 4% 6/15/28 (d) | | 5,065 | 4,583 |
| Gartner, Inc.: | | | |
| 3.625% 6/15/29 (d) | | 2,550 | 2,168 |
| 3.75% 10/1/30 (d) | | 1,885 | 1,583 |
| GEMS MENASA Cayman Ltd. 7.125% 7/31/26 (d) | | 21,299 | 19,981 |
| Legends Hospitality Holding Co. LLC/Legends Hospitality Co-Issuer, Inc. 5% 2/1/26 (d) | | 11,295 | 9,883 |
| Service Corp. International: | | | |
| 4% 5/15/31 | | 6,490 | 5,388 |
| 5.125% 6/1/29 | | 5,213 | 4,856 |
| Sotheby's 7.375% 10/15/27 (d) | | 18,225 | 17,633 |
| The GEO Group, Inc. 9.5% 12/31/28 (d) | | 3,435 | 3,160 |
| TriNet Group, Inc. 3.5% 3/1/29 (d) | | 8,560 | 7,094 |
| WASH Multifamily Acquisition, Inc. 5.75% 4/15/26 (d) | | 15,507 | 14,460 |
| | | | 164,091 |
| Steel - 0.3% | | | |
| Commercial Metals Co. 4.125% 1/15/30 | | 4,160 | 3,495 |
| Roller Bearing Co. of America, Inc. 4.375% 10/15/29 (d) | | 7,505 | 6,585 |
| | | | 10,080 |
| Super Retail - 1.5% | | | |
| Bath & Body Works, Inc. 6.694% 1/15/27 | | 1,315 | 1,239 |
| Carvana Co.: | | | |
| 4.875% 9/1/29 (d) | | 3,275 | 1,449 |
| 5.5% 4/15/27 (d) | | 4,845 | 2,302 |
| 5.875% 10/1/28 (d) | | 1,360 | 623 |
| 10.25% 5/1/30 (d) | | 715 | 429 |
| EG Global Finance PLC: | | | |
| 6.75% 2/7/25 (d) | | 8,108 | 7,297 |
| 8.5% 10/30/25 (d) | | 9,878 | 9,124 |
| LBM Acquisition LLC 6.25% 1/15/29 (d) | | 5,580 | 3,903 |
| Levi Strauss & Co. 3.5% 3/1/31 (d) | | 5,730 | 4,584 |
| Michaels Companies, Inc.: | | | |
| 5.25% 5/1/28 (d) | | 3,550 | 2,521 |
| 7.875% 5/1/29 (d) | | 2,730 | 1,522 |
| Nordstrom, Inc.: | | | |
| 4.25% 8/1/31 | | 4,150 | 3,013 |
| 4.375% 4/1/30 | | 2,760 | 2,118 |
| Wolverine World Wide, Inc. 4% 8/15/29 (d) | | 8,395 | 6,632 |
| | | | 46,756 |
| Technology - 5.3% | | | |
| Acuris Finance U.S. 5% 5/1/28 (d) | | 13,710 | 11,105 |
| Athenahealth Group, Inc. 6.5% 2/15/30 (d) | | 1,845 | 1,439 |
| Black Knight InfoServ LLC 3.625% 9/1/28 (d) | | 8,405 | 7,281 |
| Clarivate Science Holdings Corp.: | | | |
| 3.875% 7/1/28 (d) | | 1,955 | 1,677 |
| 4.875% 7/1/29 (d) | | 1,975 | 1,647 |
| Coherent Corp. 5% 12/15/29 (d) | | 9,975 | 8,557 |
| CommScope, Inc.: | | | |
| 4.75% 9/1/29 (d) | | 3,600 | 3,045 |
| 7.125% 7/1/28 (d) | | 6,360 | 5,386 |
| 8.25% 3/1/27 (d) | | 1,925 | 1,709 |
| Elastic NV 4.125% 7/15/29 (d) | | 9,900 | 8,266 |
| Entegris Escrow Corp.: | | | |
| 4.75% 4/15/29 (d) | | 5,560 | 4,913 |
| 5.95% 6/15/30 (d) | | 7,700 | 7,026 |
| Gartner, Inc. 4.5% 7/1/28 (d) | | 4,490 | 4,161 |
| ION Trading Technologies Ltd. 5.75% 5/15/28 (d) | | 12,845 | 10,212 |
| MicroStrategy, Inc. 6.125% 6/15/28 (d) | | 11,700 | 10,025 |
| onsemi 3.875% 9/1/28 (d) | | 3,675 | 3,238 |
| Open Text Corp. 3.875% 12/1/29 (d) | | 10,960 | 8,686 |
| Rackspace Hosting, Inc.: | | | |
| 3.5% 2/15/28 (d) | | 7,610 | 5,025 |
| 5.375% 12/1/28 (d) | | 51,444 | 21,655 |
| Roblox Corp. 3.875% 5/1/30 (d) | | 4,035 | 3,329 |
| Sensata Technologies BV 4% 4/15/29 (d) | | 3,440 | 2,897 |
| TTM Technologies, Inc. 4% 3/1/29 (d) | | 18,640 | 15,567 |
| Twilio, Inc. 3.875% 3/15/31 | | 3,285 | 2,679 |
| Uber Technologies, Inc. 8% 11/1/26 (d) | | 9,595 | 9,631 |
| | | | 159,156 |
| Telecommunications - 8.2% | | | |
| Altice Financing SA: | | | |
| 5% 1/15/28 (d) | | 7,363 | 5,822 |
| 5.75% 8/15/29 (d) | | 33,610 | 26,536 |
| Altice France Holding SA 6% 2/15/28 (d) | | 15,943 | 10,423 |
| Altice France SA: | | | |
| 5.125% 1/15/29 (d) | | 18,614 | 14,007 |
| 5.125% 7/15/29 (d) | | 8,655 | 6,519 |
| 5.5% 1/15/28 (d) | | 5,700 | 4,570 |
| 5.5% 10/15/29 (d) | | 50 | 38 |
| C&W Senior Financing Designated Activity Co. 6.875% 9/15/27 (d) | | 50,907 | 44,035 |
| Cablevision Lightpath LLC: | | | |
| 3.875% 9/15/27 (d) | | 2,199 | 1,870 |
| 5.625% 9/15/28 (d) | | 1,290 | 1,026 |
| Consolidated Communications, Inc. 5% 10/1/28 (d) | | 2,395 | 1,856 |
| Frontier Communications Holdings LLC: | | | |
| 5% 5/1/28 (d) | | 5,510 | 4,821 |
| 5.875% 10/15/27 (d) | | 3,283 | 3,020 |
| 5.875% 11/1/29 | | 6,414 | 4,996 |
| 6% 1/15/30 (d) | | 5,455 | 4,266 |
| 8.75% 5/15/30 (d) | | 4,055 | 4,141 |
| Intelsat Jackson Holdings SA 6.5% 3/15/30 (d) | | 8,320 | 7,636 |
| Level 3 Financing, Inc.: | | | |
| 3.625% 1/15/29 (d) | | 4,904 | 3,739 |
| 4.25% 7/1/28 (d) | | 17,615 | 14,532 |
| Lumen Technologies, Inc. 4.5% 1/15/29 (d) | | 20,685 | 14,582 |
| Millicom International Cellular SA: | | | |
| 4.5% 4/27/31 (d) | | 7,907 | 5,914 |
| 5.125% 1/15/28 (d) | | 3,560 | 3,031 |
| Sable International Finance Ltd. 5.75% 9/7/27 (d) | | 1,577 | 1,390 |
| SBA Communications Corp. 3.125% 2/1/29 | | 4,140 | 3,346 |
| Telecom Italia Capital SA: | | | |
| 6% 9/30/34 | | 3,477 | 2,537 |
| 7.2% 7/18/36 | | 5,009 | 3,901 |
| 7.721% 6/4/38 | | 995 | 791 |
| Uniti Group, Inc. 6% 1/15/30 (d) | | 17,315 | 11,816 |
| Virgin Media Secured Finance PLC 4.5% 8/15/30 (d) | | 12,830 | 10,603 |
| VMED O2 UK Financing I PLC 4.25% 1/31/31 (d) | | 1,079 | 859 |
| Windstream Escrow LLC 7.75% 8/15/28 (d) | | 22,945 | 19,854 |
| Zayo Group Holdings, Inc.: | | | |
| 4% 3/1/27 (d) | | 4,245 | 3,279 |
| 6.125% 3/1/28 (d) | | 3,438 | 2,286 |
| | | | 248,042 |
| Textiles/Apparel - 0.3% | | | |
| Foot Locker, Inc. 4% 10/1/29 (d) | | 9,010 | 6,888 |
| Kontoor Brands, Inc. 4.125% 11/15/29 (d) | | 1,460 | 1,171 |
| | | | 8,059 |
| Transportation Ex Air/Rail - 0.6% | | | |
| Golar LNG Ltd. 7% 10/20/25 | | 4,050 | 3,807 |
| Great Lakes Dredge & Dock Corp. 5.25% 6/1/29 (d) | | 2,635 | 2,084 |
| Seaspan Corp. 5.5% 8/1/29 (d) | | 14,205 | 10,940 |
| | | | 16,831 |
| Utilities - 3.5% | | | |
| Clearway Energy Operating LLC: | �� | | |
| 3.75% 2/15/31 (d) | | 4,505 | 3,762 |
| 4.75% 3/15/28 (d) | | 1,540 | 1,422 |
| Global Partners LP/GLP Finance Corp. 7% 8/1/27 | | 8,471 | 8,053 |
| InterGen NV 7% 6/30/23 (d) | | 19,797 | 19,376 |
| NRG Energy, Inc.: | | | |
| 3.375% 2/15/29 (d) | | 6,240 | 5,198 |
| 5.25% 6/15/29 (d) | | 5,350 | 4,855 |
| PG&E Corp.: | | | |
| 5% 7/1/28 | | 14,760 | 13,303 |
| 5.25% 7/1/30 | | 23,760 | 21,039 |
| Pike Corp. 5.5% 9/1/28 (d) | | 17,227 | 14,710 |
| Vistra Operations Co. LLC: | | | |
| 5% 7/31/27 (d) | | 8,646 | 7,976 |
| 5.625% 2/15/27 (d) | | 6,375 | 6,077 |
| | | | 105,771 |
TOTAL NONCONVERTIBLE BONDS | | | 2,465,390 |
| TOTAL CORPORATE BONDS (Cost $3,043,703) | | | 2,523,664 |
| | | | |
| Common Stocks - 2.3% |
| | | Shares | Value ($) (000s) |
| Cable/Satellite TV - 0.1% | | | |
| Altice U.S.A., Inc. Class A (f) | | 267,294 | 1,767 |
| Energy - 0.9% | | | |
| California Resources Corp. warrants 10/27/24 (f) | | 4,683 | 66 |
| Forbes Energy Services Ltd. (c)(f) | | 47,062 | 0 |
| Jonah Energy Parent LLC (c)(f) | | 212,612 | 13,522 |
| Mesquite Energy, Inc. (c)(f) | | 213,506 | 11,835 |
| New Fortress Energy, Inc. | | 53,705 | 2,958 |
TOTAL ENERGY | | | 28,381 |
| Food & Drug Retail - 0.9% | | | |
| Southeastern Grocers, Inc. (b)(c)(f) | | 1,235,303 | 26,720 |
| Gaming - 0.2% | | | |
| Caesars Entertainment, Inc. (f) | | 138,186 | 6,043 |
| Telecommunications - 0.0% | | | |
| CUI Acquisition Corp. Class E (c)(f) | | 1 | 24 |
| GTT Communications, Inc. rights (c)(f) | | 447,381 | 447 |
TOTAL TELECOMMUNICATIONS | | | 471 |
| Utilities - 0.2% | | | |
| EQT Corp. | | 167,700 | 7,017 |
| TOTAL COMMON STOCKS (Cost $40,697) | | | 70,399 |
| | | | |
| Bank Loan Obligations - 5.4% |
| | | Principal Amount (a) (000s) | Value ($) (000s) |
| Broadcasting - 0.2% | | | |
| Diamond Sports Group LLC: | | | |
| 1LN, term loan CME Term SOFR 1 Month Index + 8.000% 11.208% 5/25/26 (g)(h)(i) | | 5,004 | 4,795 |
| 2LN, term loan CME Term SOFR 1 Month Index + 3.250% 6.458% 8/24/26 (g)(h)(i) | | 11,511 | 2,233 |
TOTAL BROADCASTING | | | 7,028 |
| Building Materials - 0.1% | | | |
| Acproducts Holdings, Inc. Tranche B 1LN, term loan 1 month U.S. LIBOR + 4.250% 7.3247% 5/17/28 (g)(h)(i) | | 5,443 | 3,775 |
| Chemicals - 0.5% | | | |
| Consolidated Energy Finance SA Tranche B 1LN, term loan 1 month U.S. LIBOR + 3.500% 6.3633% 5/7/25 (c)(g)(h)(i) | | 6,614 | 6,283 |
| Discovery Purchaser Corp. 1LN, term loan CME Term SOFR 1 Month Index + 4.370% 7.9683% 10/4/29 (g)(h)(i) | | 4,955 | 4,520 |
| Olympus Water U.S. Holding Corp. Tranche B 1LN, term loan 1 month U.S. LIBOR + 3.750% 7.4375% 11/9/28 (g)(h)(i) | | 5,229 | 4,753 |
TOTAL CHEMICALS | | | 15,556 |
| Energy - 0.3% | | | |
| EG America LLC Tranche B 1LN, term loan 3 month U.S. LIBOR + 4.000% 7.6741% 2/6/25 (g)(h)(i) | | 6,006 | 5,433 |
| EG Finco Ltd. Tranche B, term loan 3 month U.S. LIBOR + 4.000% 7.6741% 2/6/25 (g)(h)(i) | | 4,117 | 3,725 |
| Mesquite Energy, Inc.: | | | |
| 1LN, term loan 3 month U.S. LIBOR + 8.000% 0% (c)(e)(h)(i) | | 3,958 | 0 |
| term loan 3 month U.S. LIBOR + 0.000% 0% (c)(e)(h)(i) | | 1,690 | 0 |
TOTAL ENERGY | | | 9,158 |
| Healthcare - 0.3% | | | |
| Da Vinci Purchaser Corp. Tranche B 1LN, term loan 1 month U.S. LIBOR + 4.000% 7.7041% 12/13/26 (g)(h)(i) | | 346 | 328 |
| Gainwell Acquisition Corp. Tranche B 1LN, term loan 1 month U.S. LIBOR + 4.000% 7.6741% 10/1/27 (g)(h)(i) | | 8,606 | 8,161 |
TOTAL HEALTHCARE | | | 8,489 |
| Insurance - 0.3% | | | |
| HUB International Ltd. Tranche B, term loan 1 month U.S. LIBOR + 3.000% 7.326% 4/25/25 (g)(h)(i) | | 9,004 | 8,820 |
| Leisure - 0.5% | | | |
| City Football Group Ltd. Tranche B 1LN, term loan 1 month U.S. LIBOR + 3.500% 6.484% 7/21/28 (g)(h)(i) | | 14,834 | 13,759 |
| Paper - 0.2% | | | |
| Clydesdale Acquisition Holdings, Inc. 1LN, term loan CME Term SOFR 1 Month Index + 4.170% 8.0037% 4/13/29 (g)(h)(i) | | 5,112 | 4,917 |
| Services - 0.8% | | | |
| Ascend Learning LLC: | | | |
| 2LN, term loan 1 month U.S. LIBOR + 5.750% 9.5039% 12/10/29 (g)(h)(i) | | 610 | 516 |
| Tranche B 1LN, term loan 1 month U.S. LIBOR + 3.500% 7.2539% 12/10/28 (g)(h)(i) | | 5,616 | 5,141 |
| Brand Energy & Infrastructure Services, Inc. Tranche B, term loan 3 month U.S. LIBOR + 4.250% 8.493% 6/21/24 (g)(h)(i) | | 11,726 | 10,121 |
| Spin Holdco, Inc. Tranche B 1LN, term loan 1 month U.S. LIBOR + 4.000% 7.1441% 3/4/28 (g)(h)(i) | | 8,745 | 7,677 |
TOTAL SERVICES | | | 23,455 |
| Super Retail - 0.5% | | | |
| Bass Pro Group LLC Tranche B 1LN, term loan 1 month U.S. LIBOR + 3.750% 7.5039% 3/5/28 (g)(h)(i) | | 6,681 | 6,277 |
| LBM Acquisition LLC Tranche B 1LN, term loan 1 month U.S. LIBOR + 3.750% 7.1207% 12/18/27 (g)(h)(i) | | 11,491 | 9,804 |
TOTAL SUPER RETAIL | | | 16,081 |
| Technology - 0.8% | | | |
| Athenahealth Group, Inc.: | | | |
| Tranche B 1LN, term loan CME Term SOFR 1 Month Index + 3.500% 6.9671% 2/15/29 (g)(h)(i) | | 14,214 | 12,959 |
| Tranche DD 1LN, term loan CME Term SOFR 1 Month Index + 3.500% 2/15/29 (h)(i)(j) | | 2,415 | 2,202 |
| CommScope, Inc. Tranche B 1LN, term loan 3 month U.S. LIBOR + 3.250% 7.0039% 4/4/26 (g)(h)(i) | | 4,111 | 3,910 |
| Ultimate Software Group, Inc. 1LN, term loan 1 month U.S. LIBOR + 3.250% 6.9983% 5/3/26 (g)(h)(i) | | 4,404 | 4,243 |
| Verscend Holding Corp. Tranche B 1LN, term loan 1 month U.S. LIBOR + 4.000% 7.7539% 8/27/25 (g)(h)(i) | | 1,959 | 1,932 |
TOTAL TECHNOLOGY | | | 25,246 |
| Telecommunications - 0.4% | | | |
| GTT Communications, Inc. Tranche B, term loan 3 month U.S. LIBOR + 4.750% 10% 5/31/25 (g)(h)(i) | | 17,149 | 11,809 |
| Utilities - 0.5% | | | |
| Brookfield WEC Holdings, Inc. 1LN, term loan CME Term SOFR 1 Month Index + 3.750% 7.4787% 8/1/25 (g)(h)(i) | | 3,270 | 3,244 |
| PG&E Corp. Tranche B 1LN, term loan 1 month U.S. LIBOR + 3.000% 6.8125% 6/23/25 (g)(h)(i) | | 10,329 | 10,145 |
TOTAL UTILITIES | | | 13,389 |
| TOTAL BANK LOAN OBLIGATIONS (Cost $181,281) | | | 161,482 |
| | | | |
| Other - 0.7% |
| | | Shares | Value ($) (000s) |
| Other - 0.7% | | | |
Fidelity Direct Lending Fund, LP (b)(k) (Cost $23,313) | | | 23,052 |
| | | | |
| Money Market Funds - 5.9% |
| | | Shares | Value ($) (000s) |
Fidelity Cash Central Fund 3.10% (l) (Cost $177,204) | | 177,168,644 | 177,204 |
| | | | |
| TOTAL INVESTMENT IN SECURITIES - 98.2% (Cost $3,466,198) | 2,955,801 |
NET OTHER ASSETS (LIABILITIES) - 1.8% | 52,694 |
| NET ASSETS - 100.0% | 3,008,495 |
| | |
Any values shown as $0 in the Schedule of Investments may reflect amounts less than $500.
Legend
| (a) | Amount is stated in United States dollars unless otherwise noted. |
| (b) | Restricted securities (including private placements) - Investment in securities not registered under the Securities Act of 1933 (excluding 144A issues). At the end of the period, the value of restricted securities (excluding 144A issues) amounted to $76,916,000 or 2.6% of net assets. |
| (d) | Security exempt from registration under Rule 144A of the Securities Act of 1933. These securities may be resold in transactions exempt from registration, normally to qualified institutional buyers. At the end of the period, the value of these securities amounted to $2,063,494,000 or 68.6% of net assets. |
| (e) | Non-income producing - Security is in default. |
| (g) | Coupon rates for floating and adjustable rate securities reflect the rates in effect at period end. |
| (h) | Coupon is indexed to a floating interest rate which may be multiplied by a specified factor and/or subject to caps or floors. |
| (i) | Remaining maturities of bank loan obligations may be less than the stated maturities shown as a result of contractual or optional prepayments by the borrower. Such prepayments cannot be predicted with certainty. |
| (j) | Position or a portion of the position represents an unfunded loan commitment. At period end, the total principal amount and market value of unfunded commitments totaled $2,415,000 and $2,202,000, respectively. |
| (l) | Affiliated fund that is generally available only to investment companies and other accounts managed by Fidelity Investments. The rate quoted is the annualized seven-day yield of the fund at period end. A complete unaudited listing of the fund's holdings as of its most recent quarter end is available upon request. In addition, each Fidelity Central Fund's financial statements are available on the SEC's website or upon request. |
| Additional information on each restricted holding is as follows: |
| Security | Acquisition Date | Acquisition Cost ($) (000s) |
| Fidelity Direct Lending Fund, LP | 12/09/21 - 10/31/22 | 23,313 |
| | | |
| Mesquite Energy, Inc. 15% 7/15/23 | 7/10/20 - 1/18/22 | 1,682 |
| | | |
| Mesquite Energy, Inc. 15% 7/15/23 | 11/05/20 - 1/18/22 | 2,899 |
| | | |
| Southeastern Grocers, Inc. | 6/01/18 | 8,689 |
| | | |
Affiliated Central Funds
Fiscal year to date information regarding the Fund's investments in Fidelity Central Funds, including the ownership percentage, is presented below.
| Affiliate (Amounts in thousands) | Value, beginning of period ($) | Purchases ($) | Sales Proceeds ($) | Dividend Income ($) | Realized Gain (loss) ($) | Change in Unrealized appreciation (depreciation) ($) | Value, end of period ($) | % ownership, end of period |
| Fidelity Cash Central Fund 3.10% | 69,623 | 568,779 | 461,198 | 1,346 | - | - | 177,204 | 0.4% |
| Total | 69,623 | 568,779 | 461,198 | 1,346 | - | - | 177,204 | |
| | | | | | | | | |
Amounts in the income column in the above table include any capital gain distributions from underlying funds, which are presented in the corresponding line item in the Statement of Operations, if applicable.
Affiliated Underlying Funds
Fiscal year to date information regarding the Fund's investments in affiliated Underlying Funds is presented below. Exchanges between classes of the same affiliated Underlying Funds may occur. If an Underlying Funds changes its name, the name presented below is the name in effect at period end.
| Affiliate (Amounts in thousands) | Value, beginning of period ($) | Purchases ($) | Sales Proceeds ($) | Dividend Income ($) | Realized Gain (loss) ($) | Change in Unrealized appreciation (depreciation) ($) | Value, end of period ($) |
| Fidelity Direct Lending Fund, LP | 14,951 | 8,376 | - | 831 | - | (275) | 23,052 |
| | 14,951 | 8,376 | - | 831 | - | (275) | 23,052 |
Amounts in the income column in the above table include any capital gain distributions from underlying funds, which are presented in the corresponding line item in the Statement of Operations, if applicable.
Investment Valuation
The following is a summary of the inputs used, as of October 31, 2022, involving the Fund's assets and liabilities carried at fair value. The inputs or methodology used for valuing securities may not be an indication of the risk associated with investing in those securities. For more information on valuation inputs, and their aggregation into the levels used below, please refer to the Investment Valuation section in the accompanying Notes to Financial Statements.
Amounts in this Investment Valuation section exclude the value of Fidelity Direct Lending Fund, LP as presented in the Schedule of Investments. Fidelity Direct Lending Fund, LP is valued using NAV as a practical expedient.
| Valuation Inputs at Reporting Date: |
Description (Amounts in thousands) | Total ($) | Level 1 ($) | Level 2 ($) | Level 3 ($) |
Investments in Securities: | | | | |
|
| Equities: | | | | |
Communication Services | 1,791 | 1,767 | - | 24 |
Consumer Discretionary | 6,043 | 6,043 | - | - |
Consumer Staples | 26,720 | - | - | 26,720 |
Energy | 35,398 | 10,041 | - | 25,357 |
Information Technology | 447 | - | - | 447 |
|
| Corporate Bonds | 2,523,664 | - | 2,496,520 | 27,144 |
|
| Bank Loan Obligations | 161,482 | - | 155,199 | 6,283 |
|
| Money Market Funds | 177,204 | 177,204 | - | - |
| Total Investments in Securities: | 2,932,749 | 195,055 | 2,651,719 | 85,975 |
The following is a reconciliation of Investments in Securities for which Level 3 inputs were used in determining value:
| (Amounts in thousands) | |
| Investments in Securities: | |
| Beginning Balance | $ | 84,840 | |
| Net Realized Gain (Loss) on Investment Securities | | (7) | |
| Net Unrealized Gain (Loss) on Investment Securities | | 1,574 | |
| Cost of Purchases | | - | |
| Proceeds of Sales | | (454) | |
| Amortization/Accretion | | 22 | |
| Transfers into Level 3 | | - | |
| Transfers out of Level 3 | | - | |
| Ending Balance | $ | 85,975 | |
| The change in unrealized gain (loss) for the period attributable to Level 3 securities held at October 31, 2022 | $ | 1,574 | |
| The information used in the above reconciliation represents fiscal year to date activity for any Investments in Securities identified as using Level 3 inputs at either the beginning or the end of the current fiscal period. Cost of purchases and proceeds of sales may include securities received and/or delivered through in-kind transactions. Transfers into Level 3 were attributable to a lack of observable market data resulting from decreases in market activity, decreases in liquidity, security restructurings or corporate actions. Transfers out of Level 3 were attributable to observable market data becoming available for those securities. Transfers in or out of Level 3 represent the beginning value of any Security or Instrument where a change in the pricing level occurred from the beginning to the end of the period. The cost of purchases and the proceeds of sales may include securities received or delivered through corporate actions or exchanges. Realized and unrealized gains (losses) disclosed in the reconciliation are included in Net Gain (Loss) on the Fund's Statement of Operations. | |
| Statement of Assets and Liabilities |
| Amounts in thousands (except per-share amounts) | | | | October 31, 2022 (Unaudited) |
| | | | | |
| Assets | | | | |
| Investment in securities, at value - See accompanying schedule: | | | | |
Unaffiliated issuers (cost $3,265,681) | | $2,755,545 | | |
Fidelity Central Funds (cost $177,204) | | 177,204 | | |
Other affiliated issuers (cost $23,313) | | 23,052 | | |
| | | | | |
| Total Investment in Securities (cost $3,466,198) | | | $ | 2,955,801 |
| Cash | | | | 121 |
| Receivable for investments sold | | | | 29,786 |
| Receivable for fund shares sold | | | | 1,826 |
| Dividends receivable | | | | 230 |
| Interest receivable | | | | 43,708 |
| Distributions receivable from Fidelity Central Funds | | | | 381 |
| Prepaid expenses | | | | 5 |
Total assets | | | | 3,031,858 |
| Liabilities | | | | |
| Payable for investments purchased | | $15,326 | | |
| Payable for fund shares redeemed | | 3,747 | | |
| Distributions payable | | 2,455 | | |
| Accrued management fee | | 1,353 | | |
| Distribution and service plan fees payable | | 41 | | |
| Other affiliated payables | | 392 | | |
| Other payables and accrued expenses | | 49 | | |
| Total Liabilities | | | | 23,363 |
| Net Assets | | | $ | 3,008,495 |
| Net Assets consist of: | | | | |
| Paid in capital | | | $ | 3,977,024 |
| Total accumulated earnings (loss) | | | | (968,529) |
| Net Assets | | | $ | 3,008,495 |
| | | | | |
| Net Asset Value and Maximum Offering Price | | | | |
| Class A : | | | | |
Net Asset Value and redemption price per share ($119,478 ÷ 16,342 shares) (a) | | | $ | 7.31 |
| Maximum offering price per share (100/96.00 of $7.31) | | | $ | 7.61 |
| Class M : | | | | |
Net Asset Value and redemption price per share ($27,598 ÷ 3,775 shares) (a) | | | $ | 7.31 |
| Maximum offering price per share (100/96.00 of $7.31) | | | $ | 7.61 |
| Class C : | | | | |
Net Asset Value and offering price per share ($13,394 ÷ 1,831 shares) (a)(b) | | | $ | 7.31 |
| Fidelity High Income Fund : | | | | |
Net Asset Value , offering price and redemption price per share ($2,694,659 ÷ 368,552 shares) | | | $ | 7.31 |
| Class I : | | | | |
Net Asset Value , offering price and redemption price per share ($94,239 ÷ 12,884 shares) | | | $ | 7.31 |
| Class Z : | | | | |
Net Asset Value , offering price and redemption price per share ($59,127 ÷ 8,086 shares) | | | $ | 7.31 |
(a)Redemption price per share is equal to net asset value less any applicable contingent deferred sales charge. |
(b)Corresponding Net Asset Value does not calculate due to rounding of fractional net assets and/or units |
| Statement of Operations |
| Amounts in thousands | | | | Six months ended October 31, 2022 (Unaudited) |
| Investment Income | | | | |
| Dividends (including $831 earned from affiliated issuers) | | | $ | 7,649 |
| Interest | | | | 87,093 |
| Income from Fidelity Central Funds | | | | 1,346 |
| Total Income | | | | 96,088 |
| Expenses | | | | |
| Management fee | $ | 8,756 | | |
| Transfer agent fees | | 1,979 | | |
| Distribution and service plan fees | | 264 | | |
| Accounting fees and expenses | | 509 | | |
| Custodian fees and expenses | | 11 | | |
| Independent trustees' fees and expenses | | 6 | | |
| Registration fees | | 50 | | |
| Audit | | 53 | | |
| Legal | | 500 | | |
| Miscellaneous | | 12 | | |
| Total expenses before reductions | | 12,140 | | |
| Expense reductions | | (56) | | |
| Total expenses after reductions | | | | 12,084 |
| Net Investment income (loss) | | | | 84,004 |
| Realized and Unrealized Gain (Loss) | | | | |
| Net realized gain (loss) on: | | | | |
| Investment Securities: | | | | |
| Unaffiliated issuers | | (82,652) | | |
| Total net realized gain (loss) | | | | (82,652) |
| Change in net unrealized appreciation (depreciation) on: | | | | |
| Investment Securities: | | | | |
| Unaffiliated issuers | | (180,176) | | |
| Affiliated issuers | | (275) | | |
| Total change in net unrealized appreciation (depreciation) | | | | (180,451) |
| Net gain (loss) | | | | (263,103) |
| Net increase (decrease) in net assets resulting from operations | | | $ | (179,099) |
| Statement of Changes in Net Assets |
| |
| Amount in thousands | | Six months ended October 31, 2022 (Unaudited) | | Year ended April 30, 2022 |
| Increase (Decrease) in Net Assets | | | | |
| Operations | | | | |
| Net investment income (loss) | $ | 84,004 | $ | 220,892 |
| Net realized gain (loss) | | (82,652) | | 211,004 |
| Change in net unrealized appreciation (depreciation) | | (180,451) | | (556,211) |
| Net increase (decrease) in net assets resulting from operations | | (179,099) | | (124,315) |
| Distributions to shareholders | | (78,128) | | (240,456) |
| Share transactions - net increase (decrease) | | (313,082) | | (4,669,187) |
| Total increase (decrease) in net assets | | (570,309) | | (5,033,958) |
| | | | | |
| Net Assets | | | | |
| Beginning of period | | 3,578,804 | | 8,612,762 |
| End of period | $ | 3,008,495 | $ | 3,578,804 |
| | | | | |
| | | | | |
Financial Highlights
| Fidelity Advisor® High Income Fund Class A |
| |
| | Six months ended (Unaudited) October 31, 2022 | | Years ended April 30, 2022 | | 2021 | | 2020 | | 2019 A |
Selected Per-Share Data | | | | | | | | | | |
| Net asset value, beginning of period | $ | 7.91 | $ | 8.71 | $ | 7.93 | $ | 8.83 | $ | 8.56 |
| Income from Investment Operations | | | | | | | | | | |
Net investment income (loss) B,C | | .187 | | .345 | | .368 | | .438 | | .192 |
| Net realized and unrealized gain (loss) | | (.614) | | (.760) | | .772 | | (.908) | | .286 |
| Total from investment operations | | (.427) | | (.415) | | 1.140 | | (.470) | | .478 |
| Distributions from net investment income | | (.173) | | (.385) | | (.360) | | (.430) | | (.208) |
| Total distributions | | (.173) | | (.385) | | (.360) | | (.430) | | (.208) |
| Net asset value, end of period | $ | 7.31 | $ | 7.91 | $ | 8.71 | $ | 7.93 | $ | 8.83 |
Total Return D,E,F | | (5.41)% | | (5.02)% | | 14.56% | | (5.63)% | | 5.68% |
Ratios to Average Net Assets C,G,H | | | | | | | | | | |
| Expenses before reductions | | 1.02% I | | .99% | | .98% | | .98% | | .99% I |
| Expenses net of fee waivers, if any | | 1.02% I | | .99% | | .98% | | .98% | | .99% I |
| Expenses net of all reductions | | 1.01% I | | .99% | | .98% | | .98% | | .99% I |
| Net investment income (loss) | | 4.95% I | | 4.02% | | 4.32% | | 5.04% | | 5.60% I |
| Supplemental Data | | | | | | | | | | |
| Net assets, end of period (in millions) | $ | 119 | $ | 132 | $ | 148 | $ | 144 | $ | 170 |
Portfolio turnover rate J | | 20% I | | 54% K | | 62% | | 44% K | | 62% L |
A For the period December 4, 2018 (commencement of sale of shares) through April 30, 2019.
B Calculated based on average shares outstanding during the period.
C Net investment income (loss) is affected by the timing of the declaration of dividends by any underlying mutual funds or exchange-traded funds (ETFs). Net investment income (loss) of any mutual funds or ETFs is not included in the Fund's net investment income (loss) ratio.
D Total returns for periods of less than one year are not annualized.
E Total returns would have been lower if certain expenses had not been reduced during the applicable periods shown.
F Total returns do not include the effect of the sales charges.
G Fees and expenses of any underlying mutual funds or exchange-traded funds (ETFs) are not included in the Fund's expense ratio. The Fund indirectly bears its proportionate share of these expenses. For additional expense information related to investments in Fidelity Central Funds, please refer to the "Investments in Fidelity Central Funds" note found in the Notes to Financial Statements section of the most recent Annual or Semi-Annual report. For additional expense information related to investments in Fidelity Direct Lending Fund, LP, please refer to the Investment in Fidelity Direct Lending Fund, LP note found in the Notes to Financial Statements section of the most recent Annual or Semi-Annual report.
H Expense ratios reflect operating expenses of the class. Expenses before reductions do not reflect amounts reimbursed, waived, or reduced through arrangements with the investment adviser, brokerage services, or other offset arrangements, if applicable, and do not represent the amount paid by the class during periods when reimbursements, waivers or reductions occur.
I Annualized
J Amount does not include the portfolio activity of any underlying mutual funds or exchange-traded funds (ETFs).
K Portfolio turnover rate excludes securities received or delivered in-kind.
L The portfolio turnover rate does not include the assets acquired in the merger.
| Fidelity Advisor® High Income Fund Class M |
| |
| | Six months ended (Unaudited) October 31, 2022 | | Years ended April 30, 2022 | | 2021 | | 2020 | | 2019 A |
Selected Per-Share Data | | | | | | | | | | |
| Net asset value, beginning of period | $ | 7.91 | $ | 8.71 | $ | 7.93 | $ | 8.83 | $ | 8.56 |
| Income from Investment Operations | | | | | | | | | | |
Net investment income (loss) B,C | | .187 | | .345 | | .367 | | .438 | | .191 |
| Net realized and unrealized gain (loss) | | (.614) | | (.761) | | .772 | | (.909) | | .286 |
| Total from investment operations | | (.427) | | (.416) | | 1.139 | | (.471) | | .477 |
| Distributions from net investment income | | (.173) | | (.384) | | (.359) | | (.429) | | (.207) |
| Total distributions | | (.173) | | (.384) | | (.359) | | (.429) | | (.207) |
| Net asset value, end of period | $ | 7.31 | $ | 7.91 | $ | 8.71 | $ | 7.93 | $ | 8.83 |
Total Return D,E,F | | (5.42)% | | (5.03)% | | 14.55% | | (5.64)% | | 5.68% |
Ratios to Average Net Assets C,G,H | | | | | | | | | | |
| Expenses before reductions | | 1.03% I | | 1.00% | | .99% | | .99% | | 1.01% I |
| Expenses net of fee waivers, if any | | 1.02% I | | 1.00% | | .99% | | .99% | | 1.01% I |
| Expenses net of all reductions | | 1.02% I | | 1.00% | | .99% | | .99% | | 1.01% I |
| Net investment income (loss) | | 4.94% I | | 4.01% | | 4.31% | | 5.02% | | 5.59% I |
| Supplemental Data | | | | | | | | | | |
| Net assets, end of period (in millions) | $ | 28 | $ | 30 | $ | 36 | $ | 40 | $ | 50 |
Portfolio turnover rate J | | 20% I | | 54% K | | 62% | | 44% K | | 62% L |
A For the period December 4, 2018 (commencement of sale of shares) through April 30, 2019.
B Calculated based on average shares outstanding during the period.
C Net investment income (loss) is affected by the timing of the declaration of dividends by any underlying mutual funds or exchange-traded funds (ETFs). Net investment income (loss) of any mutual funds or ETFs is not included in the Fund's net investment income (loss) ratio.
D Total returns for periods of less than one year are not annualized.
E Total returns would have been lower if certain expenses had not been reduced during the applicable periods shown.
F Total returns do not include the effect of the sales charges.
G Fees and expenses of any underlying mutual funds or exchange-traded funds (ETFs) are not included in the Fund's expense ratio. The Fund indirectly bears its proportionate share of these expenses. For additional expense information related to investments in Fidelity Central Funds, please refer to the "Investments in Fidelity Central Funds" note found in the Notes to Financial Statements section of the most recent Annual or Semi-Annual report. For additional expense information related to investments in Fidelity Direct Lending Fund, LP, please refer to the Investment in Fidelity Direct Lending Fund, LP note found in the Notes to Financial Statements section of the most recent Annual or Semi-Annual report.
H Expense ratios reflect operating expenses of the class. Expenses before reductions do not reflect amounts reimbursed, waived, or reduced through arrangements with the investment adviser, brokerage services, or other offset arrangements, if applicable, and do not represent the amount paid by the class during periods when reimbursements, waivers or reductions occur.
I Annualized
J Amount does not include the portfolio activity of any underlying mutual funds or exchange-traded funds (ETFs).
K Portfolio turnover rate excludes securities received or delivered in-kind.
L The portfolio turnover rate does not include the assets acquired in the merger.
| Fidelity Advisor® High Income Fund Class C |
| |
| | Six months ended (Unaudited) October 31, 2022 | | Years ended April 30, 2022 | | 2021 | | 2020 | | 2019 A |
Selected Per-Share Data | | | | | | | | | | |
| Net asset value, beginning of period | $ | 7.91 | $ | 8.71 | $ | 7.93 | $ | 8.83 | $ | 8.56 |
| Income from Investment Operations | | | | | | | | | | |
Net investment income (loss) B,C | | .159 | | .281 | | .302 | | .372 | | .166 |
| Net realized and unrealized gain (loss) | | (.614) | | (.763) | | .772 | | (.909) | | .285 |
| Total from investment operations | | (.455) | | (.482) | | 1.074 | | (.537) | | .451 |
| Distributions from net investment income | | (.145) | | (.318) | | (.294) | | (.363) | | (.181) |
| Total distributions | | (.145) | | (.318) | | (.294) | | (.363) | | (.181) |
| Net asset value, end of period | $ | 7.31 | $ | 7.91 | $ | 8.71 | $ | 7.93 | $ | 8.83 |
Total Return D,E,F | | (5.78)% | | (5.75)% | | 13.68% | | (6.35)% | | 5.36% |
Ratios to Average Net Assets C,G,H | | | | | | | | | | |
| Expenses before reductions | | 1.78% I | | 1.76% | | 1.75% | | 1.75% | | 1.77% I |
| Expenses net of fee waivers, if any | | 1.78% I | | 1.76% | | 1.75% | | 1.75% | | 1.77% I |
| Expenses net of all reductions | | 1.78% I | | 1.76% | | 1.75% | | 1.75% | | 1.77% I |
| Net investment income (loss) | | 4.18% I | | 3.25% | | 3.55% | | 4.27% | | 4.84% I |
| Supplemental Data | | | | | | | | | | |
| Net assets, end of period (in millions) | $ | 13 | $ | 17 | $ | 30 | $ | 36 | $ | 52 |
Portfolio turnover rate J | | 20% I | | 54% K | | 62% | | 44% K | | 62% L |
A For the period December 4, 2018 (commencement of sale of shares) through April 30, 2019.
B Calculated based on average shares outstanding during the period.
C Net investment income (loss) is affected by the timing of the declaration of dividends by any underlying mutual funds or exchange-traded funds (ETFs). Net investment income (loss) of any mutual funds or ETFs is not included in the Fund's net investment income (loss) ratio.
D Total returns for periods of less than one year are not annualized.
E Total returns would have been lower if certain expenses had not been reduced during the applicable periods shown.
F Total returns do not include the effect of the contingent deferred sales charge.
G Fees and expenses of any underlying mutual funds or exchange-traded funds (ETFs) are not included in the Fund's expense ratio. The Fund indirectly bears its proportionate share of these expenses. For additional expense information related to investments in Fidelity Central Funds, please refer to the "Investments in Fidelity Central Funds" note found in the Notes to Financial Statements section of the most recent Annual or Semi-Annual report. For additional expense information related to investments in Fidelity Direct Lending Fund, LP, please refer to the Investment in Fidelity Direct Lending Fund, LP note found in the Notes to Financial Statements section of the most recent Annual or Semi-Annual report.
H Expense ratios reflect operating expenses of the class. Expenses before reductions do not reflect amounts reimbursed, waived, or reduced through arrangements with the investment adviser, brokerage services, or other offset arrangements, if applicable, and do not represent the amount paid by the class during periods when reimbursements, waivers or reductions occur.
I Annualized
J Amount does not include the portfolio activity of any underlying mutual funds or exchange-traded funds (ETFs).
K Portfolio turnover rate excludes securities received or delivered in-kind.
L The portfolio turnover rate does not include the assets acquired in the merger.
| Fidelity® High Income Fund |
| |
| | Six months ended (Unaudited) October 31, 2022 | | Years ended April 30, 2022 | | 2021 | | 2020 | | 2019 | | 2018 |
Selected Per-Share Data | | | | | | | | | | | | |
| Net asset value, beginning of period | $ | 7.91 | $ | 8.71 | $ | 7.93 | $ | 8.83 | $ | 8.83 | $ | 8.94 |
| Income from Investment Operations | | | | | | | | | | | | |
Net investment income (loss) A,B | | .198 | | .371 | | .392 | | .464 | | .493 | | .513 |
| Net realized and unrealized gain (loss) | | (.614) | | (.761) | | .772 | | (.909) | | - C | | (.137) |
| Total from investment operations | | (.416) | | (.390) | | 1.164 | | (.445) | | .493 | | .376 |
| Distributions from net investment income | | (.184) | | (.410) | | (.384) | | (.455) | | (.493) | | (.486) |
| Total distributions | | (.184) | | (.410) | | (.384) | | (.455) | | (.493) | | (.486) |
Redemption fees added to paid in capital A | | - | | - | | - | | - | | - | | - C |
| Net asset value, end of period | $ | 7.31 | $ | 7.91 | $ | 8.71 | $ | 7.93 | $ | 8.83 | $ | 8.83 |
Total Return D,E | | (5.28)% | | (4.75)% | | 14.89% | | (5.35)% | | 5.83% | | 4.27% |
Ratios to Average Net Assets B,F,G | | | | | | | | | | | | |
| Expenses before reductions | | .73% H | | .70% | | .69% | | .69% | | .70% | | .70% |
| Expenses net of fee waivers, if any | | .73% H | | .70% | | .69% | | .69% | | .70% | | .70% |
| Expenses net of all reductions | | .73% H | | .70% | | .69% | | .69% | | .70% | | .70% |
| Net investment income (loss) | | 5.23% H | | 4.31% | | 4.61% | | 5.33% | | 5.66% | | 5.73% |
| Supplemental Data | | | | | | | | | | | | |
| Net assets, end of period (in millions) | $ | 2,695 | $ | 3,181 | $ | 4,139 | $ | 3,871 | $ | 4,392 | $ | 4,324 |
Portfolio turnover rate I | | 20% H | | 54% J | | 62% | | 44% J | | 62% K | | 51% |
A Calculated based on average shares outstanding during the period.
B Net investment income (loss) is affected by the timing of the declaration of dividends by any underlying mutual funds or exchange-traded funds (ETFs). Net investment income (loss) of any mutual funds or ETFs is not included in the Fund's net investment income (loss) ratio.
C Amount represents less than $.0005 per share.
D Total returns for periods of less than one year are not annualized.
E Total returns would have been lower if certain expenses had not been reduced during the applicable periods shown.
F Fees and expenses of any underlying mutual funds or exchange-traded funds (ETFs) are not included in the Fund's expense ratio. The Fund indirectly bears its proportionate share of these expenses. For additional expense information related to investments in Fidelity Central Funds, please refer to the "Investments in Fidelity Central Funds" note found in the Notes to Financial Statements section of the most recent Annual or Semi-Annual report. For additional expense information related to investments in Fidelity Direct Lending Fund, LP, please refer to the Investment in Fidelity Direct Lending Fund, LP note found in the Notes to Financial Statements section of the most recent Annual or Semi-Annual report.
G Expense ratios reflect operating expenses of the class. Expenses before reductions do not reflect amounts reimbursed, waived, or reduced through arrangements with the investment adviser, brokerage services, or other offset arrangements, if applicable, and do not represent the amount paid by the class during periods when reimbursements, waivers or reductions occur.
H Annualized
I Amount does not include the portfolio activity of any underlying mutual funds or exchange-traded funds (ETFs).
J Portfolio turnover rate excludes securities received or delivered in-kind.
K The portfolio turnover rate does not include the assets acquired in the merger.
| Fidelity Advisor® High Income Fund Class I |
| |
| | Six months ended (Unaudited) October 31, 2022 | | Years ended April 30, 2022 | | 2021 | | 2020 | | 2019 A |
Selected Per-Share Data | | | | | | | | | | |
| Net asset value, beginning of period | $ | 7.91 | $ | 8.71 | $ | 7.93 | $ | 8.83 | $ | 8.56 |
| Income from Investment Operations | | | | | | | | | | |
Net investment income (loss) B,C | | .195 | | .390 | | .390 | | .458 | | .199 |
| Net realized and unrealized gain (loss) | | (.613) | | (.774) | | .771 | | (.907) | | .286 |
| Total from investment operations | | (.418) | | (.384) | | 1.161 | | (.449) | | .485 |
| Distributions from net investment income | | (.182) | | (.416) | | (.381) | | (.451) | | (.215) |
| Total distributions | | (.182) | | (.416) | | (.381) | | (.451) | | (.215) |
| Net asset value, end of period | $ | 7.31 | $ | 7.91 | $ | 8.71 | $ | 7.93 | $ | 8.83 |
Total Return D,E | | (5.30)% | | (4.68)% | | 14.85% | | (5.40)% | | 5.77% |
Ratios to Average Net Assets C,F,G | | | | | | | | | | |
| Expenses before reductions | | .84% H | | .72% | | .73% | | .74% | | .78% H |
| Expenses net of fee waivers, if any | | .79% H | | .71% | | .73% | | .74% | | .78% H |
| Expenses net of all reductions | | .79% H | | .71% | | .73% | | .74% | | .78% H |
| Net investment income (loss) | | 5.17% H | | 4.29% | | 4.57% | | 5.28% | | 5.81% H |
| Supplemental Data | | | | | | | | | | |
| Net assets, end of period (in millions) | $ | 94 | $ | 85 | $ | 4,010 | $ | 558 | $ | 448 |
Portfolio turnover rate I | | 20% H | | 54% J | | 62% | | 44% J | | 62% K |
A For the period December 4, 2018 (commencement of sale of shares) through April 30, 2019.
B Calculated based on average shares outstanding during the period.
C Net investment income (loss) is affected by the timing of the declaration of dividends by any underlying mutual funds or exchange-traded funds (ETFs). Net investment income (loss) of any mutual funds or ETFs is not included in the Fund's net investment income (loss) ratio.
D Total returns for periods of less than one year are not annualized.
E Total returns would have been lower if certain expenses had not been reduced during the applicable periods shown.
F Fees and expenses of any underlying mutual funds or exchange-traded funds (ETFs) are not included in the Fund's expense ratio. The Fund indirectly bears its proportionate share of these expenses. For additional expense information related to investments in Fidelity Central Funds, please refer to the "Investments in Fidelity Central Funds" note found in the Notes to Financial Statements section of the most recent Annual or Semi-Annual report. For additional expense information related to investments in Fidelity Direct Lending Fund, LP, please refer to the Investment in Fidelity Direct Lending Fund, LP note found in the Notes to Financial Statements section of the most recent Annual or Semi-Annual report.
G Expense ratios reflect operating expenses of the class. Expenses before reductions do not reflect amounts reimbursed, waived, or reduced through arrangements with the investment adviser, brokerage services, or other offset arrangements, if applicable, and do not represent the amount paid by the class during periods when reimbursements, waivers or reductions occur.
H Annualized
I Amount does not include the portfolio activity of any underlying mutual funds or exchange-traded funds (ETFs).
J Portfolio turnover rate excludes securities received or delivered in-kind.
K The portfolio turnover rate does not include the assets acquired in the merger.
| Fidelity Advisor® High Income Fund Class Z |
| |
| | Six months ended (Unaudited) October 31, 2022 | | Years ended April 30, 2022 | | 2021 | | 2020 | | 2019 A |
Selected Per-Share Data | | | | | | | | | | |
| Net asset value, beginning of period | $ | 7.91 | $ | 8.71 | $ | 7.93 | $ | 8.83 | $ | 8.56 |
| Income from Investment Operations | | | | | | | | | | |
Net investment income (loss) B,C | | .202 | | .378 | | .399 | | .464 | | .201 |
| Net realized and unrealized gain (loss) | | (.615) | | (.763) | | .770 | | (.904) | | .289 |
| Total from investment operations | | (.413) | | (.385) | | 1.169 | | (.440) | | .490 |
| Distributions from net investment income | | (.187) | | (.415) | | (.389) | | (.460) | | (.220) |
| Total distributions | | (.187) | | (.415) | | (.389) | | (.460) | | (.220) |
| Net asset value, end of period | $ | 7.31 | $ | 7.91 | $ | 8.71 | $ | 7.93 | $ | 8.83 |
Total Return D,E | | (5.24)% | | (4.68)% | | 14.96% | | (5.30)% | | 5.83% |
Ratios to Average Net Assets C,F,G | | | | | | | | | | |
| Expenses before reductions | | .66% H | | .64% | | .63% | | .63% | | .64% H |
| Expenses net of fee waivers, if any | | .66% H | | .63% | | .63% | | .63% | | .64% H |
| Expenses net of all reductions | | .66% H | | .63% | | .62% | | .63% | | .63% H |
| Net investment income (loss) | | 5.30% H | | 4.37% | | 4.67% | | 5.39% | | 5.85% H |
| Supplemental Data | | | | | | | | | | |
| Net assets, end of period (in millions) | $ | 59 | $ | 133 | $ | 250 | $ | 61 | $ | 13 |
Portfolio turnover rate I | | 20% H | | 54% J | | 62% | | 44% J | | 62% K |
A For the period December 4, 2018 (commencement of sale of shares) through April 30, 2019.
B Calculated based on average shares outstanding during the period.
C Net investment income (loss) is affected by the timing of the declaration of dividends by any underlying mutual funds or exchange-traded funds (ETFs). Net investment income (loss) of any mutual funds or ETFs is not included in the Fund's net investment income (loss) ratio.
D Total returns for periods of less than one year are not annualized.
E Total returns would have been lower if certain expenses had not been reduced during the applicable periods shown.
F Fees and expenses of any underlying mutual funds or exchange-traded funds (ETFs) are not included in the Fund's expense ratio. The Fund indirectly bears its proportionate share of these expenses. For additional expense information related to investments in Fidelity Central Funds, please refer to the "Investments in Fidelity Central Funds" note found in the Notes to Financial Statements section of the most recent Annual or Semi-Annual report. For additional expense information related to investments in Fidelity Direct Lending Fund, LP, please refer to the Investment in Fidelity Direct Lending Fund, LP note found in the Notes to Financial Statements section of the most recent Annual or Semi-Annual report.
G Expense ratios reflect operating expenses of the class. Expenses before reductions do not reflect amounts reimbursed, waived, or reduced through arrangements with the investment adviser, brokerage services, or other offset arrangements, if applicable, and do not represent the amount paid by the class during periods when reimbursements, waivers or reductions occur.
H Annualized
I Amount does not include the portfolio activity of any underlying mutual funds or exchange-traded funds (ETFs).
J Portfolio turnover rate excludes securities received or delivered in-kind.
K The portfolio turnover rate does not include the assets acquired in the merger.
For the period ended October 31, 2022
( Amounts in thousands except percentages)
1. Organization.
Fidelity High Income Fund (the Fund) is a fund of Fidelity Summer Street Trust (the Trust) and is authorized to issue an unlimited number of shares. The Trust is registered under the Investment Company Act of 1940, as amended (the 1940 Act), as an open-end management investment company organized as a Massachusetts business trust. The Fund offers Class A, Class M, Class C, Fidelity High Income Fund, Class I and Class Z shares, each of which has equal rights as to assets and voting privileges. Each class has exclusive voting rights with respect to matters that affect that class. Class C shares will automatically convert to Class A shares after a holding period of eight years from the initial date of purchase, with certain exceptions.
2. Investments in Fidelity Central Funds.
Funds may invest in Fidelity Central Funds, which are open-end investment companies generally available only to other investment companies and accounts managed by the investment adviser and its affiliates. The Schedule of Investments lists any Fidelity Central Funds held as an investment as of period end, but does not include the underlying holdings of each Fidelity Central Fund. An investing fund indirectly bears its proportionate share of the expenses of the underlying Fidelity Central Funds.
Based on its investment objective, each Fidelity Central Fund may invest or participate in various investment vehicles or strategies that are similar to those of the investing fund. These strategies are consistent with the investment objectives of the investing fund and may involve certain economic risks which may cause a decline in value of each of the Fidelity Central Funds and thus a decline in the value of the investing fund.
| Fidelity Central Fund | Investment Manager | Investment Objective | Investment Practices | Expense Ratio A |
| Fidelity Money Market Central Funds | Fidelity Management & Research Company LLC (FMR) | Each fund seeks to obtain a high level of current income consistent with the preservation of capital and liquidity. | Short-term Investments | Less than .005% |
A Expenses expressed as a percentage of average net assets and are as of each underlying Central Fund's most recent annual or semi-annual shareholder report.
A complete unaudited list of holdings for each Fidelity Central Fund is available upon request or at the Securities and Exchange Commission website at www.sec.gov. In addition, the financial statements of the Fidelity Central Funds which contain the significant accounting policies (including investment valuation policies) of those funds, and are not covered by the Report of Independent Registered Public Accounting Firm, are available on the Securities and Exchange Commission website or upon request.
3. Investment in Fidelity Direct Lending Fund, LP.
The Fund invests in Fidelity Direct Lending Fund, LP, which is a limited partnership available only to certain investment companies managed by the investment adviser and its affiliates. The Fund's limited partnership interest is not registered under the Securities Act of 1933, and is subject to substantial restrictions on transfer. The Fund has no redemption rights under the partnership agreement. There will be no trading market for the partnership interest, and the Fund most likely will hold its interest until Fidelity Direct Lending Fund, LP converts by operation of law to a Delaware corporation, trust, or other limited liability entity and (i) registers as a closed-end management investment company under the 1940 Act or (ii) elects to be treated as a business development company under the 1940 Act.
Based on its investment objective, Fidelity Direct Lending Fund, LP may invest or participate in various investments or strategies that are similar to those in which the Fund may invest or participate. These strategies are consistent with the investment objectives of the Fund and may involve certain economic risks which may cause a decline in value of Fidelity Direct Lending Fund, LP and thus a decline in the value of the Fund. The Fidelity Direct Lending Fund, LP intends to invest primarily in direct loans made to private U.S. companies, specifically small- and middle-market companies.
The Schedule of Investments lists Fidelity Direct Lending Fund, LP as an investment as of period end, but does not include the underlying holdings of Fidelity Direct Lending Fund, LP. Fidelity Direct Lending Fund, LP represented less than 5% of the Fund's net assets at period end. The Fund indirectly bears its proportionate share of the expenses of Fidelity Direct Lending Fund, LP, which commenced operations on December 8, 2021. The annualized expense ratio for Fidelity Direct Lending Fund, LP for the period ended April 30, 2022 was .07%.
4. Significant Accounting Policies.
The Fund is an investment company and applies the accounting and reporting guidance of the Financial Accounting Standards Board (FASB) Accounting Standards Codification Topic 946 Financial Services - Investment Companies . The financial statements have been prepared in conformity with accounting principles generally accepted in the United States of America (GAAP), which require management to make certain estimates and assumptions at the date of the financial statements. Actual results could differ from those estimates. Subsequent events, if any, through the date that the financial statements were issued have been evaluated in the preparation of the financial statements. The Fund's Schedule of Investments lists any underlying mutual funds or exchange-traded funds (ETFs) but does not include the underlying holdings of these funds. The following summarizes the significant accounting policies of the Fund:
Investment Valuation. Investments are valued as of 4:00 p.m. Eastern time on the last calendar day of the period. The Board of Trustees (the Board) has designated the Fund's investment adviser as the valuation designee responsible for the fair valuation function and performing fair value determinations as needed. The investment adviser has established a Fair Value Committee (the Committee) to carry out the day-to-day fair valuation responsibilities and has adopted policies and procedures to govern the fair valuation process and the activities of the Committee. In accordance with these fair valuation policies and procedures, which have been approved by the Board, the Fund attempts to obtain prices from one or more third party pricing services or brokers to value its investments. When current market prices, quotations or currency exchange rates are not readily available or reliable, investments will be fair valued in good faith by the Committee, in accordance with the policies and procedures. Factors used in determining fair value vary by investment type and may include market or investment specific events, transaction data, estimated cash flows, and market observations of comparable investments. The frequency that the fair valuation procedures are used cannot be predicted and they may be utilized to a significant extent. The Committee manages the Fund's fair valuation practices and maintains the fair valuation policies and procedures. The Fund's investment adviser reports to the Board information regarding the fair valuation process and related material matters.
The Fund categorizes the inputs to valuation techniques used to value its investments into a disclosure hierarchy consisting of three levels as shown below:
Level 1 - unadjusted quoted prices in active markets for identical investments
Level 2 - other significant observable inputs (including quoted prices for similar investments, interest rates, prepayment speeds, etc.)
Level 3 - unobservable inputs (including the Fund's own assumptions based on the best information available)
Valuation techniques used to value the Fund's investments by major category are as follows:
Debt securities, including restricted securities, are valued based on evaluated prices received from third party pricing services or from brokers who make markets in such securities. Corporate bonds and bank loan obligations are valued by pricing services who utilize matrix pricing which considers yield or price of bonds of comparable quality, coupon, maturity and type or by broker-supplied prices. When independent prices are unavailable or unreliable, debt securities may be valued utilizing pricing methodologies which consider similar factors that would be used by third party pricing services. Debt securities are generally categorized as Level 2 in the hierarchy but may be Level 3 depending on the circumstances. The Fund invests a significant portion of its assets in below investment grade securities. The value of these securities can be more volatile due to changes in the credit quality of the issuer and is sensitive to changes in economic, market and regulatory conditions.
Equity securities, including restricted securities, for which market quotations are readily available, are valued at the last reported sale price or official closing price as reported by a third party pricing service on the primary market or exchange on which they are traded and are categorized as Level 1 in the hierarchy. In the event there were no sales during the day or closing prices are not available, securities are valued at the last quoted bid price or may be valued using the last available price and are generally categorized as Level 2 in the hierarchy. For equity securities, including restricted securities, where observable inputs are limited, assumptions about market activity and risk are used and these securities may be categorized as Level 3 in the hierarchy. Securities, including private placements or other restricted securities, for which observable inputs are not available are valued using alternate valuation approaches, including the market approach, the income approach and cost approach, and are categorized as Level 3 in the hierarchy. The market approach considers factors including the price of recent investments in the same or a similar security or financial metrics of comparable securities. The income approach considers factors including expected future cash flows, security specific risks and corresponding discount rates. The cost approach considers factors including the value of the security's underlying assets and liabilities.
Investments in open-end mutual funds, including the Fidelity Central Funds, are valued at their closing net asset value (NAV) each business day and are categorized as Level 1 in the hierarchy.
Fidelity Direct Lending Fund, LP is valued using NAV as a practical expedient in accordance with the specialized accounting guidance for investment companies.
The following provides information on Level 3 securities held by the Fund that were valued at period end based on unobservable inputs. These amounts exclude valuations provided by a broker and valuations using NAV as a practical expedient.
| Asset Type | Fair Value | Valuation Technique(s) | Unobservable Input | Amount or Range/Weighted Average | Impact to Valuation from an Increase in Input A |
| Equities | $52,548 | Recovery value | Recovery value | $1.00 - $45,228.15 / $2,280.86 | Increase |
| | | Market comparable | Enterprise value/EBITDA multiple (EV/EBITDA) | 2.8 - 3.9 / 3.5 | Increase |
| | | | Daily production multiple ($/Barrels of oil equivilent per day) | $22,500.00 | Increase |
| | | | Enterprise Value/PV-10 multiple (EV/PV-10) | 0.8 | Increase |
| | | | Enterprise Value/Proved Reserves multiple | 5.9 | Increase |
| | | Discounted cash flow | Discount rate | 10.0% | Decrease |
| | | | Reserve risk rate | 50.0% | Increase |
| Corporate Bond | $27,144 | Recovery value | Recovery value | $0.00 | Increase |
| | | Market comparable | Enterprise value/EBITDA multiple (EV/EBITDA) | 2.8 | Increase |
| | | | Daily production multiple ($/Barrels of oil equivilent per day) | $22,500.00 | Increase |
| | | | Enterprise Value/PV-10 multiple (EV/PV-10) | 0.8% | Increase |
| | | | Enterprise Value/Proved Reserves multiple | 5.9% | Increase |
| | | Discounted cash flow | Discount rate | 10% | Decrease |
| | | | Reserve risk rate | 50.0% - 95.0% / 72.5% | Increase |
| Bank Loan Obligations | $6,283 | Recovery value | Recovery value | 0.0% | Increase |
| | | Indicative market price | Evaluated bid | $95.00 | Increase |
A Represents the directional change in the fair value of the Level 3 investments that could have resulted from an increase in the corresponding input as of period end. A decrease to the unobservable input would have had the opposite effect. Significant changes in these inputs may have resulted in a significantly higher or lower fair value measurement at period end.
Changes in valuation techniques may result in transfers in or out of an assigned level within the disclosure hierarchy. The aggregate value of investments by input level as of October 31, 2022, as well as a roll forward of Level 3 investments, is included at the end of the Fund's Schedule of Investments.
Investment Transactions and Income. For financial reporting purposes, the Fund's investment holdings and NAV include trades executed through the end of the last business day of the period. The NAV per share for processing shareholder transactions is calculated as of the close of business of the New York Stock Exchange (NYSE), normally 4:00 p.m. Eastern time and includes trades executed through the end of the prior business day. Gains and losses on securities sold are determined on the basis of identified cost and include proceeds received from litigation. Commissions paid to certain brokers with whom the investment adviser, or its affiliates, places trades on behalf of a fund include an amount in addition to trade execution, which may be rebated back to a fund. Any such rebates are included in net realized gain (loss) on investments in the Statement of Operations. Dividend income is recorded on the ex-dividend date, except for certain dividends from foreign securities where the ex-dividend date may have passed, which are recorded as soon as the Fund is informed of the ex-dividend date. Non-cash dividends included in dividend income, if any, are recorded at the fair market value of the securities received. Income and capital gain distributions from Fidelity Central Funds, if any, are recorded on the ex-dividend date. Interest income is accrued as earned and includes coupon interest and amortization of premium and accretion of discount on debt securities as applicable. Debt obligations may be placed on non-accrual status and related interest income may be reduced by ceasing current accruals and writing off interest receivables when the collection of all or a portion of interest has become doubtful based on consistently applied procedures. A debt obligation is removed from non-accrual status when the issuer resumes interest payments or when collectability of interest is reasonably assured.
Class Allocations and Expenses. Investment income, realized and unrealized capital gains and losses, common expenses of a fund, and certain fund-level expense reductions, if any, are allocated daily on a pro-rata basis to each class based on the relative net assets of each class to the total net assets of a fund. Each class differs with respect to transfer agent and distribution and service plan fees incurred, as applicable. Certain expense reductions may also differ by class, if applicable. For the reporting period, the allocated portion of income and expenses to each class as a percent of its average net assets may vary due to the timing of recording these transactions in relation to fluctuating net assets of the classes. Expenses directly attributable to a fund are charged to that fund. Expenses attributable to more than one fund are allocated among the respective funds on the basis of relative net assets or other appropriate methods. Expenses included in the accompanying financial statements reflect the expenses of that fund and do not include any expenses associated with any underlying mutual funds or exchange-traded funds. Although not included in a fund's expenses, a fund indirectly bears its proportionate share of these expenses through the net asset value of each underlying mutual fund or exchange-traded fund. Expense estimates are accrued in the period to which they relate and adjustments are made when actual amounts are known.
Income Tax Information and Distributions to Shareholders. Each year, the Fund intends to qualify as a regulated investment company under Subchapter M of the Internal Revenue Code, including distributing substantially all of its taxable income and realized gains. As a result, no provision for U.S. Federal income taxes is required. The Fund files a U.S. federal tax return, in addition to state and local tax returns as required. The Fund's federal income tax returns are subject to examination by the Internal Revenue Service (IRS) for a period of three fiscal years after they are filed. State and local tax returns may be subject to examination for an additional fiscal year depending on the jurisdiction.
Distributions are declared and recorded daily and paid monthly from net investment income. Distributions from realized gains, if any, are declared and recorded on the ex-dividend date. Income and capital gain distributions are declared separately for each class. Income and capital gain distributions are determined in accordance with income tax regulations, which may differ from GAAP.
Capital accounts within the financial statements are adjusted for permanent book-tax differences. These adjustments have no impact on net assets or the results of operations. Capital accounts are not adjusted for temporary book-tax differences which will reverse in a subsequent period.
Book-tax differences are primarily due to prior period premium and discount on debt securities, market discount, redemptions in kind, partnerships, capital loss carryforwards and losses deferred due to wash sales.
As of period end, the cost and unrealized appreciation (depreciation) in securities, and derivatives if applicable, for federal income tax purposes were as follows:
| Gross unrealized appreciation | $66,449 |
| Gross unrealized depreciation | (568,351) |
| Net unrealized appreciation (depreciation) | $(501,902) |
| Tax cost | $3,457,703 |
Capital loss carryforwards are only available to offset future capital gains of the Fund to the extent provided by regulations and may be limited. The capital loss carryforward information presented below, including any applicable limitation, is estimated as of prior fiscal period end and is subject to adjustment.
Short-term | $(94,633) |
Long-term | (294,252) |
| Total capital loss carryforward | $(388,885) |
Restricted Securities (including Private Placements). Funds may invest in securities that are subject to legal or contractual restrictions on resale. These securities generally may be resold in transactions exempt from registration or to the public if the securities are registered. Disposal of these securities may involve time-consuming negotiations and expense, and prompt sale at an acceptable price may be difficult. Information regarding restricted securities held at period end is included at the end of the Schedule of Investments, if applicable.
Loans and Other Direct Debt Instruments. Direct debt instruments are interests in amounts owed to lenders by corporate or other borrowers. These instruments may be in the form of loans, trade claims or other receivables and may include standby financing commitments such as revolving credit facilities that obligate a fund to supply additional cash to the borrower on demand. Loans may be acquired through assignment, participation, or may be made directly to a borrower. Such instruments are presented in the Bank Loan Obligations section in the Schedule of Investments. Certain funds may also invest in unfunded loan commitments, which are contractual obligations for future funding. Information regarding unfunded commitments is included at the end of the Schedule of Investments, if applicable.
Commitments. A commitment is an agreement to acquire an investment at a future date (subject to conditions) in connection with a potential public or non-public offering. The amount of commitments outstanding at period end are presented in the table below. These commitments are not included in the net assets of the Fund at period end.
| | Investment to be Acquired | Commitment Amount |
| Fidelity High Income Fund | Fidelity Direct Lending Fund, LP | $31,687 |
5. Purchases and Sales of Investments.
Purchases and sales of securities, other than short-term securities and in-kind transactions, as applicable, are noted in the table below.
| | Purchases ($) | Sales ($) |
| Fidelity High Income Fund | 310,686 | 758,842 |
6. Fees and Other Transactions with Affiliates.
Management Fee. Fidelity Management & Research Company LLC (the investment adviser) and its affiliates provide the Fund with investment management related services for which the Fund pays a monthly management fee. The management fee is the sum of an individual fund fee rate that is based on an annual rate of .45% of the Fund's average net assets and an annualized group fee rate that averaged .10% during the period. The group fee rate is based upon the monthly average net assets of a group of registered investment companies with which the investment adviser has management contracts. The group fee rate decreases as assets under management increase and increases as assets under management decrease. For the reporting period, the total annualized management fee rate was .55% of the Fund's average net assets.
Distribution and Service Plan Fees. In accordance with Rule 12b-1 of the 1940 Act, the Fund has adopted separate Distribution and Service Plans for each class of shares. Certain classes pay Fidelity Distributors Company LLC (FDC), an affiliate of the investment adviser, separate Distribution and Service Fees, each of which is based on an annual percentage of each class' average net assets. In addition, FDC may pay financial intermediaries for selling shares of the Fund and providing shareholder support services. For the period, the Distribution and Service Fee rates, total fees and amounts retained by FDC were as follows:
| | Distribution Fee | Service Fee | Total Fees | Retained by FDC |
| Class A | - % | .25% | $153 | $- A |
| Class M | - % | .25% | 36 | - |
| Class C | .75% | .25% | 75 | 6 |
| | | | $264 | $6 |
A In the amount represents less than $500.
Sales Load. FDC may receive a front-end sales charge of up to 4.00% for selling Class A shares and Class M shares, some of which is paid to financial intermediaries for selling shares of the Fund. Depending on the holding period, FDC may receive contingent deferred sales charges levied on Class A, Class M and Class C redemptions. The deferred sales charges are 1.00% for Class C shares, 1.00% for certain purchases of Class A shares and .25% for certain purchases of Class M shares.
For the period, sales charge amounts retained by FDC were as follows:
| | Retained by FDC |
| Class A | $4 |
Class C A | 1 |
| | $5 |
A When Class C shares are initially sold, FDC pays commissions from its own resources to financial intermediaries through which the sales are made.
Transfer Agent Fees. Fidelity Investments Institutional Operations Company LLC (FIIOC), an affiliate of the investment adviser, is the transfer, dividend disbursing and shareholder servicing agent for each class of the Fund. FIIOC receives account fees and asset-based fees that vary according to the account size and type of account of the shareholders of the respective classes of the Fund, except for Class Z. FIIOC receives an asset-based fee of Class Z's average net assets. FIIOC pays for typesetting, printing and mailing of shareholder reports, except proxy statements.
For the period, transfer agent fees for each class were as follows:
| | Amount | % of Class-Level Average Net Assets A |
| Class A | $97 | .16 |
| Class M | 24 | .16 |
| Class C | 13 | .18 |
| Fidelity High Income Fund | 1,718 | .12 |
| Class I | 108 | .23 |
| Class Z | 19 | .05 |
| | $1,979 | |
During the period, the investment adviser or its affiliates waived a portion of these fees.
A Annualized
Accounting Fees. Fidelity Service Company, Inc. (FSC), an affiliate of the investment adviser, maintains the Fund's accounting records. The accounting fee is based on the level of average net assets for each month. For the period, the fees were equivalent to the following annualized rates:
| | % of Average Net Assets |
| Fidelity High Income Fund | .03 |
Brokerage Commissions. A portion of portfolio transactions were placed with brokerage firms which are affiliates of the investment adviser. Brokerage commissions are included in net realized gain (loss) and change in net unrealized appreciation (depreciation) in the Statement of Operations. The commissions paid to these affiliated firms were as follows:
| | Amount |
| Fidelity High Income Fund | $- A |
A In the amount represents less than $500.
Interfund Trades. Funds may purchase from or sell securities to other Fidelity Funds under procedures adopted by the Board. The procedures have been designed to ensure these interfund trades are executed in accordance with Rule 17a-7 of the 1940 Act. Any interfund trades are included within the respective purchases and sales amounts shown in the Purchases and Sales of Investments note. Interfund trades during the period are noted in the table below.
| | Purchases ($) | Sales ($) | Realized Gain (Loss) ($) |
| Fidelity High Income Fund | - | 3,084 | 81 |
Prior Fiscal Year Affiliated Redemptions In-Kind. Shares that were redeemed in-kind for investments, including accrued interest and cash, if any, are shown in the table below; along with realized gain or loss on investments delivered through in-kind redemptions. The amount of the in-kind redemptions is included in share transactions in the accompanying Statement of Changes in Net Assets. There was no gain or loss for federal income tax purposes.
| | Shares | Total net realized gain or loss ($) | Total Proceeds ($) | Participating classes |
| Fidelity High Income Fund | 479,966 | 172,034 | 4,188,784 | Class I & Class Z |
7. Committed Line of Credit.
Certain Funds participate with other funds managed by the investment adviser or an affiliate in a $4.25 billion credit facility (the "line of credit") to be utilized for temporary or emergency purposes to fund shareholder redemptions or for other short-term liquidity purposes. The participating funds have agreed to pay commitment fees on their pro-rata portion of the line of credit, which are reflected in Miscellaneous expenses on the Statement of Operations, and are listed below. During the period, there were no borrowings on this line of credit.
| | Amount |
| Fidelity High Income Fund | $3 |
8. Expense Reductions.
FIIOC voluntarily agreed to waive Class I transfer agent fees to the extent that they exceeded certain levels of class-level average net assets as noted in the table below. This waiver will remain in place through June 30, 2023.
| | Transfer Agent Fees Limitation | Waiver |
| Class I | .15%/.19% A | $23 |
A Transfer agent fees limitation effective July 1, 2022.
Through arrangements with the Fund's custodian, credits realized as a result of certain uninvested cash balances were used to reduce the Fund's expenses. During the period, custodian credits reduced the Fund's expenses by $2.
In addition, during the period the investment adviser or an affiliate reimbursed and/or waived a portion of fund-level operating expenses in the amount of $31.
9. Distributions to Shareholders.
Distributions to shareholders of each class were as follows:
| | Six months ended October 31, 2022 | Year ended April 30, 2022 |
| Fidelity High Income Fund | | |
| Distributions to shareholders | | |
| Class A | $2,850 | $6,554 |
| Class M | 661 | 1,513 |
| Class C | 288 | 831 |
| Fidelity High Income Fund | 70,197 | 178,412 |
| Class I | 2,290 | 31,049 |
| Class Z | 1,842 | 22,097 |
Total | $78,128 | $240,456 |
10. Share Transactions.
Share transactions for each class were as follows and may contain in-kind transactions, automatic conversions between classes or exchanges between affiliated funds:
| | Shares | Shares | Dollars | Dollars |
| | Six months ended October 31, 2022 | Year ended April 30, 2022 | Six months ended October 31, 2022 | Year ended April 30, 2022 |
| Fidelity High Income Fund | | | | |
| Class A | | | | |
| Shares sold | 934 | 2,452 | $7,068 | $21,067 |
| Reinvestment of distributions | 351 | 699 | 2,612 | 5,992 |
| Shares redeemed | (1,629) | (3,491) | (12,255) | (29,901) |
| Net increase (decrease) | (344) | (340) | $(2,575) | $(2,842) |
| Class M | | | | |
| Shares sold | 187 | 322 | $1,435 | $2,710 |
| Reinvestment of distributions | 78 | 158 | 578 | 1,351 |
| Shares redeemed | (314) | (812) | (2,363) | (6,983) |
| Net increase (decrease) | (49) | (332) | $(350) | $(2,922) |
| Class C | | | | |
| Shares sold | 59 | 356 | $445 | $3,077 |
| Reinvestment of distributions | 36 | 90 | 271 | 771 |
| Shares redeemed | (417) | (1,717) | (3,121) | (14,804) |
| Net increase (decrease) | (322) | (1,271) | $(2,405) | $(10,956) |
| Fidelity High Income Fund | | | | |
| Shares sold | 18,771 | 80,328 | $141,405 | $693,806 |
| Reinvestment of distributions | 7,561 | 16,883 | 56,363 | 144,797 |
| Shares redeemed | (60,119) | (170,267) | (454,493) | (1,465,748) |
| Net increase (decrease) | (33,787) | (73,056) | $(256,725) | $(627,145) |
| Class I | | | | |
| Shares sold | 10,323 | 31,952 | $78,151 | $277,895 |
| Reinvestment of distributions | 288 | 3,376 | 2,145 | 29,375 |
| Shares redeemed | (8,449) | (485,210) | (63,838) | (4,252,953) |
| Net increase (decrease) | 2,162 | (449,882) | $16,458 | $(3,945,683) |
| Class Z | | | | |
| Shares sold | 2,315 | 51,130 | $16,933 | $445,549 |
| Reinvestment of distributions | 219 | 2,488 | 1,646 | 21,382 |
| Shares redeemed | (11,332) | (65,393) | (86,064) | (546,569) |
| Net increase (decrease) | (8,798) | (11,775) | $(67,485) | $(79,638) |
11. Other.
A fund's organizational documents provide former and current trustees and officers with a limited indemnification against liabilities arising in connection with the performance of their duties to the fund. In the normal course of business, a fund may also enter into contracts that provide general indemnifications. A fund's maximum exposure under these arrangements is unknown as this would be dependent on future claims that may be made against a fund. The risk of material loss from such claims is considered remote.
12. Risk and Uncertainties.
Many factors affect a fund's performance. Developments that disrupt global economies and financial markets, such as pandemics, epidemics, outbreaks of infectious diseases, war, terrorism, and environmental disasters, may significantly affect a fund's investment performance. The effects of these developments to a fund will be impacted by the types of securities in which a fund invests, the financial condition, industry, economic sector, and geographic location of an issuer, and a fund's level of investment in the securities of that issuer.
As a shareholder, you incur two types of costs: (1) transaction costs, which may include sales charges (loads) on purchase payments or redemption proceeds, as applicable and (2) ongoing costs, which generally include management fees, distribution and/or service (12b-1) fees and other Fund expenses. This Example is intended to help you understand your ongoing costs (in dollars) of investing in a fund and to compare these costs with the ongoing costs of investing in other mutual funds.
| The Example is based on an investment of $1,000 invested at the beginning of the period and held for the entire period (May 1, 2022 to October 31, 2022). |
Actual Expenses
The first line of the accompanying table provides information about actual account values and actual expenses. You may use the information in this line, together with the amount you invested, to estimate the expenses that you paid over the period. Simply divide your account value by $1,000.00 (for example, an $8,600 account value divided by $1,000.00 = 8.6), then multiply the result by the number in the first line for a class/Fund under the heading entitled "Expenses Paid During Period" to estimate the expenses you paid on your account during this period. If any fund is a shareholder of any underlying mutual funds or exchange-traded funds (ETFs) (the Underlying Funds), such fund indirectly bears its proportional share of the expenses of the Underlying Funds in addition to the direct expenses incurred presented in the table. These fees and expenses are not included in the annualized expense ratio used to calculate the expense estimate in the table below.
Hypothetical Example for Comparison Purposes
The second line of the accompanying table provides information about hypothetical account values and hypothetical expenses based on the actual expense ratio and an assumed rate of return of 5% per year before expenses, which is not the actual return. The hypothetical account values and expenses may not be used to estimate the actual ending account balance or expenses you paid for the period. You may use this information to compare the ongoing costs of investing in the Fund and other funds. To do so, compare this 5% hypothetical example with the 5% hypothetical examples that appear in the shareholder reports of the other funds. If any fund is a shareholder of any Underlying Funds, such fund indirectly bears its proportional share of the expenses of the Underlying Funds in addition to the direct expenses as presented in the table. These fees and expenses are not included in the annualized expense ratio used to calculate the expense estimate in the table below.
Please note that the expenses shown in the table are meant to highlight your ongoing costs only and do not reflect any transaction costs. Therefore, the second line of the table is useful in comparing ongoing costs only, and will not help you determine the relative total costs of owning different funds. In addition, if these transactional costs were included, your costs would have been higher.
| | | | | Annualized Expense Ratio- A | | Beginning Account Value May 1, 2022 | | Ending Account Value October 31, 2022 | | Expenses Paid During Period- C May 1, 2022 to October 31, 2022 |
| Fidelity® High Income Fund | | | | | | | | | | |
| Class A | | | | 1.02% | | | | | | |
| Actual | | | | | | $ 1,000 | | $ 945.90 | | $ 5.00 |
Hypothetical- B | | | | | | $ 1,000 | | $ 1,020.06 | | $ 5.19 |
| Class M | | | | 1.02% | | | | | | |
| Actual | | | | | | $ 1,000 | | $ 945.80 | | $ 5.00 |
Hypothetical- B | | | | | | $ 1,000 | | $ 1,020.06 | | $ 5.19 |
| Class C | | | | 1.78% | | | | | | |
| Actual | | | | | | $ 1,000 | | $ 942.20 | | $ 8.71 |
Hypothetical- B | | | | | | $ 1,000 | | $ 1,016.23 | | $ 9.05 |
| Fidelity® High Income Fund | | | | .73% | | | | | | |
| Actual | | | | | | $ 1,000 | | $ 947.20 | | $ 3.58 |
Hypothetical- B | | | | | | $ 1,000 | | $ 1,021.53 | | $ 3.72 |
| Class I | | | | .79% | | | | | | |
| Actual | | | | | | $ 1,000 | | $ 947.00 | | $ 3.88 |
Hypothetical- B | | | | | | $ 1,000 | | $ 1,021.22 | | $ 4.02 |
| Class Z | | | | .66% | | | | | | |
| Actual | | | | | | $ 1,000 | | $ 947.60 | | $ 3.24 |
Hypothetical- B | | | | | | $ 1,000 | | $ 1,021.88 | | $ 3.36 |
| |
A Annualized expense ratio reflects expenses net of applicable fee waivers.B 5% return per year before expenses
C Expenses are equal to the annualized expense ratio, multiplied by the average account value over the period, multiplied by 184/ 365 (to reflect the one-half year period). The fees and expenses of any Underlying Funds are not included in each annualized expense ratio.
Fidelity High Income Fund
Each year, the Board of Trustees, including the Independent Trustees (together, the Board), votes on the renewal of the management contract with Fidelity Management & Research Company LLC (FMR) and the sub-advisory agreements (together, the Advisory Contracts) for the fund. FMR and the sub-advisers are referred to herein as the Investment Advisers. The Board, assisted by the advice of fund counsel and Independent Trustees' counsel, requests and considers a broad range of information relevant to the renewal of the Advisory Contracts throughout the year.
The Board meets regularly and, at each of its meetings, covers an extensive agenda of topics and materials and considers factors that are relevant to its annual consideration of the renewal of the fund's Advisory Contracts, including the services and support provided to the fund and its shareholders. The Board has established various standing committees (Committees), each composed of and chaired by Independent Trustees with varying backgrounds, to which the Board has assigned specific subject matter responsibilities in order to enhance effective decision-making by the Board. The Board, acting directly and through its Committees, requests and receives information concerning the annual consideration of the renewal of the fund's Advisory Contracts. The Board also meets as needed to review matters specifically related to the Board's annual consideration of the renewal of the Advisory Contracts. Members of the Board may also meet with trustees of other Fidelity funds through joint ad hoc committees to discuss certain matters relevant to all of the Fidelity funds.
At its May 2022 meeting, the Board unanimously determined to renew the fund's Advisory Contracts. In reaching its determination, the Board considered all factors it believed relevant, including (i) the nature, extent, and quality of the services provided to the fund and its shareholders (including the investment performance of the fund); (ii) the competitiveness relative to peer funds of the fund's management fee and the total expense ratio of a representative class (retail class); (iii) the total costs of the services provided by and the profits realized by Fidelity from its relationships with the fund; and (iv) the extent to which, if any, economies of scale exist and are realized as the fund grows, and whether any economies of scale are appropriately shared with fund shareholders.
In considering whether to renew the Advisory Contracts for the fund, the Board reached a determination, with the assistance of fund counsel and Independent Trustees' counsel and through the exercise of its business judgment, that the renewal of the Advisory Contracts was in the best interests of the fund and its shareholders and that the compensation payable under the Advisory Contracts was fair and reasonable. The Board's decision to renew the Advisory Contracts was not based on any single factor, but rather was based on a comprehensive consideration of all the information provided to the Board at its meetings throughout the year. The Board, in reaching its determination to renew the Advisory Contracts, was aware that shareholders of the fund have a broad range of investment choices available to them, including a wide choice among funds offered by Fidelity's competitors, and that the fund's shareholders, who have the opportunity to review and weigh the disclosure provided by the fund in its prospectus and other public disclosures, have chosen to invest in this fund, which is part of the Fidelity family of funds.
Nature, Extent, and Quality of Services Provided . The Board considered Fidelity's staffing as it relates to the fund, including the backgrounds of investment personnel of Fidelity, and also considered the fund's investment objective, strategies, and related investment philosophy. The Independent Trustees also had discussions with senior management of Fidelity's investment operations and investment groups. The Board considered the structure of the investment personnel compensation program and whether this structure provides appropriate incentives to act in the best interests of the fund. Additionally, the Board considered the portfolio managers' investments, if any, in the funds that they manage. The Board also considered the steps Fidelity had taken to ensure the continued provision of high quality services to the Fidelity funds during the COVID-19 pandemic, including the expansion of staff in client facing positions to maintain service levels in periods of high volumes and volatility.
Resources Dedicated to Investment Management and Support Services . The Board and the Fund Oversight and Research Committees reviewed the general qualifications and capabilities of Fidelity's investment staff, including its size, education, experience, and resources, as well as Fidelity's approach to recruiting, training, managing, and compensating investment personnel. The Board noted the resources devoted to expansion of Fidelity's global investment organization, and that Fidelity's analysts have extensive resources, tools, and capabilities that allow them to conduct sophisticated quantitative and fundamental analysis, as well as credit analysis of issuers, counterparties, and guarantors. Further, the Board considered that Fidelity's investment professionals have sufficient access to global information and data so as to provide competitive investment results over time, and that those professionals also have access to sophisticated tools that permit them to assess portfolio construction and risk and performance attribution characteristics continuously, as well as to transmit new information and research conclusions rapidly around the world. Additionally, in its deliberations, the Board considered Fidelity's trading, risk management, compliance, and technology and operations capabilities and resources, which are integral parts of the investment management process.
Shareholder and Administrative Services . The Board considered (i) the nature, extent, quality, and cost of advisory, administrative, and shareholder services performed by the Investment Advisers and their affiliates under the Advisory Contracts and under separate agreements covering transfer agency, pricing and bookkeeping, and securities lending services for the fund; (ii) the nature and extent of the supervision of third party service providers, principally custodians, subcustodians, and pricing vendors; and (iii) the resources devoted to, and the record of compliance with, the fund's compliance policies and procedures. The Board also reviewed the allocation of fund brokerage, including allocations to brokers affiliated with the Investment Advisers, the use of brokerage commissions to pay fund expenses, and the use of "soft" commission dollars to pay for research services.
The Board noted that the growth of fund assets over time across the complex allows Fidelity to reinvest in the development of services designed to enhance the value and convenience of the Fidelity funds as investment vehicles. These services include 24-hour access to account information and market information over the Internet and through telephone representatives, investor education materials, and asset allocation tools. The Board also considered that it reviews customer service metrics such as telephone response times, continuity of services on the website and metrics addressing services at Fidelity Investor Centers.
Investment in a Large Fund Family . The Board considered the benefits to shareholders of investing in a Fidelity fund, including the benefits of investing in a fund that is part of a large family of funds offering a variety of investment disciplines and providing a large variety of mutual fund investor services. The Board noted that Fidelity had taken, or had made recommendations that resulted in the Fidelity funds taking, a number of actions over the previous year that benefited particular funds, including: (i) continuing to dedicate additional resources to Fidelity's investment research process, which includes meetings with management of issuers of securities in which the funds invest; (ii) continuing efforts to enhance Fidelity's global research capabilities; (iii) launching new funds and ETFs with innovative structures, strategies and pricing and making other enhancements to meet client needs; (iv) launching new share classes of existing funds; (v) eliminating purchase minimums and broadening eligibility requirements for certain funds and share classes; (vi) reducing management fees and total expenses for certain target date funds and classes and index funds; (vii) lowering expenses for certain existing funds and classes by implementing or lowering expense caps; (viii) rationalizing product lines and gaining increased efficiencies from fund mergers and liquidations; (ix) continuing to develop, acquire and implement systems and technology to improve services to the funds and shareholders, strengthen information security, and increase efficiency; and (x) continuing to implement enhancements to further strengthen Fidelity's product line to increase investors' probability of success in achieving their investment goals, including retirement income goals.
Investment Performance . The Board considered whether the fund has operated in accordance with its investment objective, as well as its record of compliance with its investment restrictions and its performance history. The Board noted that the fund had a portfolio manager change in January 2022. The Board will continue to monitor closely the fund's performance, taking into account the portfolio manager change.
The Board took into account discussions that occur at Board meetings throughout the year with representatives of the Investment Advisers about fund investment performance. In this regard the Board noted that as part of regularly scheduled fund reviews and other reports to the Board on fund performance, the Board considers annualized return information for the fund for different time periods, measured against an appropriate securities market index (benchmark index) and an appropriate peer group of funds with similar objectives (peer group). The Board also reviews and considers information about performance attribution. In its evaluation of fund investment performance, the Board gave particular attention to information indicating changes in performance of certain Fidelity funds for specific time periods and discussed with the Investment Advisers the reasons for any overperformance or underperformance.
In addition to reviewing absolute and relative fund performance, the Independent Trustees periodically consider the appropriateness of fund performance metrics in evaluating the results achieved. In general, the Independent Trustees believe that fund performance should be evaluated based on net performance (after fees and expenses) of the representative class, compared to appropriate benchmark indices, over appropriate time periods that may include full market cycles, and compared to peer groups, as applicable, over the same periods, taking into account relevant factors including the following: general market conditions; issuer-specific information; and fund cash flows and other factors.
The Independent Trustees recognize that shareholders evaluate performance on a net basis over their own holding periods, for which one-, three-, and five-year periods are often used as a proxy. For this reason, the performance information reviewed by the Board also included net cumulative total return information for the fund and an appropriate benchmark index and peer group for the most recent one-, three-, and five-year periods ended September 30, 2021, as shown below. Returns are shown compared to the 25th percentile (top of box, 75% beaten) and 75th percentile (bottom of box, 25% beaten) of the peer universe.
Fidelity High Income Fund
The Board considered the fund's underperformance for different time periods ended September 30, 2021 and for different time periods ended December 31, 2021 (which periods are not reflected in the chart above). The Board noted that the fund's underperformance has continued since the Board approved the management contract in May 2021. The Board's discussions with FMR regarding underperformance cover topics including, but not limited to: the longer-term track record of a fund's portfolio manager(s); broader trends in the market that may adversely impact a fund's performance; and attribution reports on contributors to the fund's underperformance. The Board engages with FMR on steps that might be taken to address a fund's underperformance. For a fund with underperformance over longer periods of time, the Board typically monitors the fund's performance more closely.
Based on its review, the Board concluded that the nature, extent, and quality of services provided to the fund under the Advisory Contracts should continue to benefit the shareholders of the fund.
Competitiveness of Management Fee and Total Expense Ratio . The Board considered the fund's management fee and total expense ratio compared to "mapped groups" of competitive funds and classes created for the purpose of facilitating the Trustees' competitive analysis of management fees and total expenses. Fidelity creates "mapped groups" by combining similar Lipper investment objective categories that have comparable investment mandates. Combining Lipper investment objective categories aids the Board's management fee and total expense ratio comparisons by broadening the competitive group used for comparison.
Management Fee . The Board considered two proprietary management fee comparisons for the 12-month periods ended September 30 (June 30 for periods ended 2019 and 2018 and December 31 for periods prior to 2018) shown in basis points (BP) in the chart below. The group of Lipper funds used by the Board for management fee comparisons is referred to below as the "Total Mapped Group." The Total Mapped Group is broader than the Lipper peer group used by the Board for performance comparisons because the Total Mapped Group combines several Lipper investment objective categories while the Lipper peer group does not. The Total Mapped Group comparison focuses on a fund's standing in terms of gross management fees before expense reimbursements or caps relative to the total universe of funds with comparable investment mandates, regardless of whether their management fee structures also are comparable. Funds with comparable investment mandates offer exposure to similar types of securities. Funds with comparable management fee structures have similar management fee contractual arrangements (e.g., flat rate charged for advisory services, all-inclusive fee rate, etc.). "TMG %" represents the percentage of funds in the Total Mapped Group that had management fees that were lower than the fund's. For example, a hypothetical TMG % of 20% would mean that 80% of the funds in the Total Mapped Group had higher, and 20% had lower, management fees than the fund. The fund's actual TMG %s and the number of funds in the Total Mapped Group are in the chart below. The "Asset-Sized Peer Group" (ASPG) comparison focuses on a fund's standing relative to a subset of non-Fidelity funds within the Total Mapped Group that are similar in size and management fee structure. For example, if a fund is in the first quartile of the ASPG, the fund's management fee ranks in the least expensive or lowest 25% of funds in the ASPG. The ASPG represents at least 15% of the funds in the Total Mapped Group with comparable asset size and management fee structures, subject to a minimum of 50 funds (or all funds in the Total Mapped Group if fewer than 50). Additional information, such as the ASPG quartile in which the fund's management fee rate ranked, is also included in the chart and was considered by the Board.
Fidelity High Income Fund
The Board noted that the fund's management fee rate ranked below the median of its Total Mapped Group and equal to the median of its ASPG for the 12-month period ended September 30, 2021.
The Board also considered that, for funds subject to the group fee, FMR agreed to voluntarily waive fees over a specified period of time in amounts designed to account for assets converted from certain funds to certain collective investment trusts.
Based on its review, the Board concluded that the fund's management fee is fair and reasonable in light of the services that the fund receives and the other factors considered.
Total Expense Ratio . In its review of the total expense ratio of the representative class (retail class), the Board considered the fund's management fee rate as well as other fund or class expenses, as applicable, such as transfer agent fees, pricing and bookkeeping fees, fund-paid 12b-1 fees, and custodial, legal, and audit fees. The Board also noted that Fidelity may agree to waive fees or reimburse expenses from time to time, and the extent to which, if any, it has done so for the fund. The fund's representative class is compared to those funds and classes in the Total Mapped Group (used by the Board for management fee comparisons) that have a similar sales load structure. The Board also considered a total expense ASPG comparison, which focuses on the total expenses of the representative class relative to a subset of non-Fidelity funds within the total expense similar sales load structure group. The total expense ASPG is limited to 15 larger and 15 smaller classes in fund average assets for a total of 30 classes, where possible. The total expense ASPG comparison excludes performance adjustments and fund-paid 12b-1 fees to eliminate variability in fee structures.
The Board noted that the total net expense ratio of the retail class ranked below the similar sales load structure group competitive median and below the ASPG competitive median for the 12-month period ended September 30, 2021.
Fees Charged to Other Fidelity Clients . The Board also considered Fidelity fee structures and other information with respect to clients of Fidelity, such as other funds advised or subadvised by Fidelity, pension plan clients, and other institutional clients with similar mandates. The Board noted that a joint ad hoc committee created by it and the boards of other Fidelity funds periodically reviews and compares Fidelity's institutional investment advisory business with its business of providing services to the Fidelity funds and also noted the most recent findings of the committee. The Board noted that the committee's review included a consideration of the differences in services provided, fees charged, and costs incurred, as well as competition in the markets serving the different categories of clients.
Based on its review of total expense ratios and fees charged to other Fidelity clients, the Board concluded that the total expense ratio of each class of the fund was reasonable in light of the services that the fund and its shareholders receive and the other factors considered.
Costs of the Services and Profitability . The Board considered the revenues earned and the expenses incurred by Fidelity in conducting the business of developing, marketing, distributing, managing, administering and servicing the fund and servicing the fund's shareholders. The Board also considered the level of Fidelity's profits in respect of all the Fidelity funds.
On an annual basis, Fidelity presents to the Board information about the profitability of its relationships with the fund. Fidelity calculates profitability information for each fund, as well as aggregate profitability information for groups of Fidelity funds and all Fidelity funds, using a series of detailed revenue and cost allocation methodologies which originate with the books and records of Fidelity on which Fidelity's audited financial statements are based. The Audit Committee of the Board reviews any significant changes from the prior year's methodologies and the full Board approves such changes.
A public accounting firm has been engaged annually by the Board as part of the Board's assessment of Fidelity's profitability analysis. The engagement includes the review and assessment of the methodologies used by Fidelity in determining the revenues and expenses attributable to Fidelity's mutual fund business, and completion of agreed-upon procedures in respect of the mathematical accuracy of certain fund profitability information and its conformity to established allocation methodologies. After considering the reports issued under the engagement and information provided by Fidelity, the Board concluded that while other allocation methods may also be reasonable, Fidelity's profitability methodologies are reasonable in all material respects.
The Board also reviewed Fidelity's non-fund businesses and potential indirect benefits such businesses may have received as a result of their association with Fidelity's mutual fund business (i.e., fall-out benefits) as well as cases where Fidelity's affiliates may benefit from the funds' business. The Board considered areas where potential indirect benefits to the Fidelity funds from their relationships with Fidelity may exist. The Board's consideration of these matters was informed by the findings of a joint ad hoc committee created by it and the boards of other Fidelity funds to evaluate potential fall-out benefits.
The Board considered the costs of the services provided by and the profits realized by Fidelity in connection with the operation of the fund and was satisfied that the profitability was not excessive.
Economies of Scale . The Board considered whether there have been economies of scale in respect of the management of the Fidelity funds, whether the Fidelity funds (including the fund) have appropriately benefited from any such economies of scale, and whether there is potential for realization of any further economies of scale. The Board considered the extent to which the fund will benefit from economies of scale as assets grow through increased services to the fund, through waivers or reimbursements, or through fee or expense ratio reductions. The Board also noted that a committee (the Economies of Scale Committee) created by it and the boards of other Fidelity funds periodically analyzes whether Fidelity attains economies of scale in respect of the management and servicing of the Fidelity funds, whether the Fidelity funds have appropriately benefited from such economies of scale, and whether there is potential for realization of any further economies of scale.
The Board recognized that the fund's management contract incorporates a "group fee" structure, which provides for lower group fee rates as total "group assets" increase, and for higher group fee rates as total "group assets" decrease ("group assets" as defined in the management contract). FMR calculates the group fee rates based on a tiered asset "breakpoint" schedule that varies based on asset class. The Board considered that the group fee is designed to deliver the benefits of economies of scale to fund shareholders when total Fidelity fund assets increase, even if assets of any particular fund are unchanged or have declined, because some portion of Fidelity's costs are attributable to services provided to all Fidelity funds, and all funds benefit if those costs can be allocated among more assets. The Board further considered that Fidelity agreed to impose a temporary fee waiver in the form of additional breakpoints to the current breakpoint schedule. The Board concluded that, given the group fee structure, fund shareholders will benefit from lower management fees as "group assets" increase at the fund complex level, regardless of whether Fidelity achieves any such economies of scale.
The Board concluded, taking into account the analysis of the Economies of Scale Committee, that economies of scale, if any, are being appropriately shared between fund shareholders and Fidelity.
Additional Information Requested by the Board . In order to develop fully the factual basis for consideration of the Fidelity funds' advisory contracts, the Board requested and received additional information on certain topics, including: (i) fund flow and performance trends, in particular the underperformance of certain funds and strategies, and Fidelity's long-term strategies for certain funds, including any consideration of fund liquidations or mergers; (ii) the operation of performance fees, competitor use of performance fees, and consideration of the expansion of performance fees to additional funds; (iii) Fidelity's pricing philosophy compared to competitors; (iv) fund profitability methodology and data; (v) evaluation of competitive fund data and peer group classifications and fee and expense comparisons; (vi) the management fee and expense structures for different funds and classes and information about the differences between various fee and expense structures; (vii) group fee breakpoints and related voluntary fee waivers; and (viii) information regarding other accounts managed by Fidelity and the funds' sub-advisory arrangements.
Based on its evaluation of all of the conclusions noted above, and after considering all factors it believed relevant, the Board concluded that the advisory fee arrangements are fair and reasonable and that the fund's Advisory Contracts should be renewed.
1.538299.125
SPH-SANN-1222
Fidelity® Global High Income Fund
Semi-Annual Report
October 31, 2022
Includes Fidelity and Fidelity Advisor share classes
Contents
To view a fund's proxy voting guidelines and proxy voting record for the 12-month period ended June 30, visit http://www.fidelity.com/proxyvotingresults or visit the Securities and Exchange Commission's (SEC) web site at http://www.sec.gov.
You may also call 1-800-544-8544 if you're an individual investing directly with Fidelity, call 1-800-835-5092 if you're a plan sponsor or participant with Fidelity as your recordkeeper or call 1-877-208-0098 on institutional accounts or if you're an advisor or invest through one to request a free copy of the proxy voting guidelines.
Standard & Poor's, S&P and S&P 500 are registered service marks of The McGraw-Hill Companies, Inc. and have been licensed for use by Fidelity Distributors Corporation.
Other third-party marks appearing herein are the property of their respective owners.
All other marks appearing herein are registered or unregistered trademarks or service marks of FMR LLC or an affiliated company. © 2022 FMR LLC. All rights reserved.
This report and the financial statements contained herein are submitted for the general information of the shareholders of the Fund. This report is not authorized for distribution to prospective investors in the Fund unless preceded or accompanied by an effective prospectus.
A fund files its complete schedule of portfolio holdings with the SEC for the first and third quarters of each fiscal year on Form N-PORT. Forms N-PORT are available on the SEC's web site at http://www.sec.gov. A fund's Forms N-PORT may be reviewed and copied at the SEC's Public Reference Room in Washington, DC. Information regarding the operation of the SEC's Public Reference Room may be obtained by calling 1-800-SEC-0330.
For a complete list of a fund's portfolio holdings, view the most recent holdings listing, semiannual report, or annual report on Fidelity's web site at http://www.fidelity.com, http://www.institutional.fidelity.com, or http://www.401k.com, as applicable.
NOT FDIC INSURED •MAY LOSE VALUE •NO BANK GUARANTEE
Neither the Fund nor Fidelity Distributors Corporation is a bank.
| Top Bond Issuers (% of Fund's net assets) |
(with maturities greater than one year) |
| German Federal Republic | 2.1 | |
| Occidental Petroleum Corp. | 1.5 | |
| InterGen NV | 1.1 | |
| Tenet Healthcare Corp. | 1.1 | |
| DISH Network Corp. | 1.0 | |
| Pacific Gas & Electric Co. | 0.9 | |
| Community Health Systems, Inc. | 0.9 | |
| Mesquite Energy, Inc. | 0.9 | |
| Sprint Capital Corp. | 0.9 | |
| CCO Holdings LLC/CCO Holdings Capital Corp. | 0.8 | |
| | 11.2 | |
| |
| Market Sectors (% of Fund's net assets) |
| |
| Energy | 16.5 | |
| Telecommunications | 7.6 | |
| Utilities | 6.3 | |
| Healthcare | 5.4 | |
| Banks & Thrifts | 4.8 | |
| |
Quality Diversification (% of Fund's net assets) |
|
| |
| We have used ratings from Moody's Investors Service, Inc. Where Moody's® ratings are not available, we have used S&P® ratings. All ratings are as of the date indicated and do not reflect subsequent changes. |
Asset Allocation (% of Fund's net assets) |
|
Foreign investments - 41.9% |
|
Geographic Diversification (% of Fund's net assets) |
|
* Includes Short-Term investments and Net Other Assets (Liabilities). Percentages are based on country or territory of incorporation and are adjusted for the effect of futures contracts, if applicable. |
| |
Showing Percentage of Net Assets
| Corporate Bonds - 80.6% |
| | | Principal Amount (a) | Value ($) |
| Convertible Bonds - 1.9% | | | |
| Broadcasting - 1.0% | | | |
| DISH Network Corp.: | | | |
| 0% 12/15/25 | | 86,000 | 57,895 |
| 2.375% 3/15/24 | | 210,000 | 190,470 |
| 3.375% 8/15/26 | | 646,000 | 446,709 |
| | | | 695,074 |
| Diversified Financial Services - 0.2% | | | |
| New Cotai LLC 5% 2/24/27 (b) | | 146,985 | 142,576 |
| Energy - 0.6% | | | |
| Mesquite Energy, Inc. 15% 7/15/23 (b)(c) | | 27,566 | 163,406 |
| Mesquite Energy, Inc. 15% 7/15/23 (b)(c) | | 47,694 | 282,720 |
| | | | 446,126 |
| Telecommunications - 0.1% | | | |
| Cellnex Telecom SA 0.75% 11/20/31 (Reg. S) | EUR | 100,000 | 67,285 |
TOTAL CONVERTIBLE BONDS | | | 1,351,061 |
| Nonconvertible Bonds - 78.7% | | | |
| Aerospace - 1.4% | | | |
| ATI, Inc.: | | | |
| 4.875% 10/1/29 | | 35,000 | 29,429 |
| 5.125% 10/1/31 | | 25,000 | 20,610 |
| 5.875% 12/1/27 | | 70,000 | 63,626 |
| Bombardier, Inc.: | | | |
| 6% 2/15/28 (d) | | 110,000 | 97,889 |
| 7.875% 4/15/27 (d) | | 170,000 | 161,454 |
| Embraer Netherlands Finance BV 5.05% 6/15/25 | | 75,000 | 70,481 |
| Moog, Inc. 4.25% 12/15/27 (d) | | 20,000 | 17,897 |
| Rolls-Royce PLC 5.75% 10/15/27 (d) | | 55,000 | 49,773 |
| TransDigm, Inc.: | | | |
| 4.875% 5/1/29 | | 200,000 | 171,051 |
| 5.5% 11/15/27 | | 335,000 | 303,175 |
| Wesco Aircraft Holdings, Inc. 8.5% 11/15/24 (d) | | 45,000 | 23,400 |
| | | | 1,008,785 |
| Air Transportation - 0.7% | | | |
| Air Canada 3.875% 8/15/26 (d) | | 65,000 | 57,513 |
| Allegiant Travel Co. 7.25% 8/15/27 (d) | | 40,000 | 37,602 |
| Azul Investments LLP 5.875% 10/26/24 (d) | | 200,000 | 149,500 |
| Mileage Plus Holdings LLC 6.5% 6/20/27 (d) | | 52,250 | 51,655 |
| Spirit Loyalty Cayman Ltd. / Spirit IP Cayman Ltd. 8% 9/20/25 (d) | | 38,896 | 39,511 |
| United Airlines, Inc.: | | | |
| 4.375% 4/15/26 (d) | | 80,000 | 73,013 |
| 4.625% 4/15/29 (d) | | 50,000 | 42,765 |
| Western Global Airlines LLC 10.375% 8/15/25 (d) | | 60,000 | 50,400 |
| | | | 501,959 |
| Automotive - 0.2% | | | |
| Ford Motor Credit Co. LLC 3.625% 6/17/31 | | 200,000 | 155,535 |
| Automotive & Auto Parts - 2.2% | | | |
| Albion Financing 1 SARL 5.25% 10/15/26 (Reg. S) | EUR | 119,000 | 100,397 |
| Dana, Inc. 4.25% 9/1/30 | | 40,000 | 32,038 |
| Faurecia SA: | | | |
| 2.375% 6/15/29 (Reg. S) | EUR | 100,000 | 74,435 |
| 2.75% 2/15/27 (Reg. S) | EUR | 136,000 | 114,896 |
| Ford Motor Co. 3.25% 2/12/32 | | 140,000 | 104,843 |
| Ford Motor Credit Co. LLC: | | | |
| 1.355% 2/7/25 | EUR | 100,000 | 90,425 |
| 2.9% 2/16/28 | | 50,000 | 40,571 |
| 3.25% 9/15/25 | EUR | 100,000 | 92,658 |
| 5.125% 6/16/25 | | 170,000 | 164,016 |
| Jaguar Land Rover Automotive PLC: | | | |
| 4.5% 1/15/26 (Reg. S) | EUR | 100,000 | 83,743 |
| 6.875% 11/15/26 (Reg. S) | EUR | 100,000 | 84,866 |
| LCM Investments Holdings 4.875% 5/1/29 (d) | | 70,000 | 59,046 |
| Nesco Holdings II, Inc. 5.5% 4/15/29 (d) | | 45,000 | 39,446 |
| PECF USS Intermediate Holding III Corp. 8% 11/15/29 (d) | | 25,000 | 16,742 |
| Real Hero Merger Sub 2 6.25% 2/1/29 (d) | | 20,000 | 14,339 |
| Rivian Holdco & Rivian LLC & Rivian Automotive LLC 6 month U.S. LIBOR + 5.620% 10.1636% 10/15/26 (d)(e)(f) | | 305,000 | 289,750 |
| Thor Industries, Inc. 4% 10/15/29 (d) | | 100,000 | 80,878 |
| Winnebago Industries, Inc. 6.25% 7/15/28 (d) | | 45,000 | 41,875 |
| ZF Finance GmbH 2% 5/6/27 (Reg. S) | EUR | 100,000 | 79,933 |
| | | | 1,604,897 |
| Banks & Thrifts - 2.8% | | | |
| Access Bank PLC 6.125% 9/21/26 (d) | | 200,000 | 145,400 |
| Ally Financial, Inc.: | | | |
| 8% 11/1/31 | | 155,000 | 156,379 |
| 8% 11/1/31 | | 118,000 | 121,022 |
| Banca Monte dei Paschi di Siena SpA 5.375% 1/18/28 (e) | EUR | 100,000 | 72,636 |
| Banco Comercial Portugues SA 1.75% 4/7/28 (Reg. S) (e) | EUR | 100,000 | 71,370 |
| Banco de Credito Social Cooperativo SA 8% 9/22/26 (Reg. S) (e) | EUR | 100,000 | 98,212 |
| Banco de Reservas de La Republica Dominicana 7% 2/1/23 (d) | | 150,000 | 149,016 |
| Banco de Sabadell SA 5.625% 5/6/26 (Reg. S) | EUR | 100,000 | 95,213 |
| BankMuscat SAOG 4.75% 3/17/26 (Reg. S) | | 200,000 | 188,475 |
| Cliffton Ltd. 6.25% 10/25/25 (Reg. S) | | 250,000 | 220,625 |
| CQP Holdco LP / BIP-V Chinook Holdco LLC 5.5% 6/15/31 (d) | | 250,000 | 221,875 |
| Ibercaja Banco SA 3.75% 6/15/25 (Reg. S) (e) | EUR | 100,000 | 96,429 |
| Kasikornbank PCL 3.343% 10/2/31 (Reg. S) (e) | | 200,000 | 163,940 |
| Mongolian Mortgage Corp. HFC LLC 8.85% 2/8/24 (Reg. S) | | 200,000 | 118,022 |
| VistaJet Malta Finance PLC / XO Management Holding, Inc. 6.375% 2/1/30 (d) | | 130,000 | 107,945 |
| | | | 2,026,559 |
| Broadcasting - 1.8% | | | |
| Cable Onda SA 4.5% 1/30/30 (d) | | 200,000 | 162,600 |
| Clear Channel Outdoor Holdings, Inc.: | | | |
| 7.5% 6/1/29 (d) | | 75,000 | 58,954 |
| 7.75% 4/15/28 (d) | | 35,000 | 28,562 |
| Diamond Sports Group LLC/Diamond Sports Finance Co. 5.375% 8/15/26 (d) | | 70,000 | 14,000 |
| Gray Escrow II, Inc. 5.375% 11/15/31 (d) | | 90,000 | 72,225 |
| Nexstar Broadcasting, Inc. 5.625% 7/15/27 (d) | | 75,000 | 70,838 |
| Scripps Escrow II, Inc.: | | | |
| 3.875% 1/15/29 (d) | | 50,000 | 41,292 |
| 5.375% 1/15/31 (d) | | 25,000 | 20,313 |
| Scripps Escrow, Inc. 5.875% 7/15/27 (d) | | 60,000 | 54,357 |
| Sirius XM Radio, Inc.: | | | |
| 4% 7/15/28 (d) | | 315,000 | 270,798 |
| 4.125% 7/1/30 (d) | | 65,000 | 53,189 |
| Summer (BC) Holdco A SARL 9.25% 10/31/27 (Reg. S) | EUR | 90,105 | 69,087 |
| Summer (BC) Holdco B SARL 5.75% 10/31/26 (Reg. S) | EUR | 100,000 | 85,450 |
| TEGNA, Inc. 5% 9/15/29 | | 85,000 | 80,588 |
| TV Azteca SA de CV 8.25% 8/9/24 (Reg. S) (g) | | 200,000 | 96,702 |
| Univision Communications, Inc. 6.625% 6/1/27 (d) | | 110,000 | 108,625 |
| | | | 1,287,580 |
| Building Materials - 1.2% | | | |
| Advanced Drain Systems, Inc. 5% 9/30/27 (d) | | 115,000 | 106,633 |
| CEMEX S.A.B. de CV 5.45% 11/19/29 (d) | | 200,000 | 174,110 |
| James Hardie International Finance Ltd. 3.625% 10/1/26 (Reg. S) | EUR | 100,000 | 89,683 |
| MIWD Holdco II LLC / MIWD Finance Corp. 5.5% 2/1/30 (d) | | 20,000 | 15,427 |
| PGT Innovations, Inc. 4.375% 10/1/29 (d) | | 365,000 | 302,713 |
| SRS Distribution, Inc.: | | | |
| 4.625% 7/1/28 (d) | | 55,000 | 48,292 |
| 6% 12/1/29 (d) | | 55,000 | 44,844 |
| 6.125% 7/1/29 (d) | | 30,000 | 24,395 |
| Victors Merger Corp. 6.375% 5/15/29 (d) | | 100,000 | 51,407 |
| | | | 857,504 |
| Cable/Satellite TV - 2.7% | | | |
| Altice France Holding SA 8% 5/15/27 (d) | EUR | 175,000 | 125,817 |
| CCO Holdings LLC/CCO Holdings Capital Corp.: | | | |
| 4.25% 2/1/31 (d) | | 100,000 | 79,000 |
| 4.25% 1/15/34 (d) | | 115,000 | 84,525 |
| 4.5% 8/15/30 (d) | | 195,000 | 158,254 |
| 4.5% 6/1/33 (d) | | 120,000 | 90,997 |
| 5.125% 5/1/27 (d) | | 225,000 | 208,458 |
| CSC Holdings LLC: | | | |
| 4.5% 11/15/31 (d) | | 65,000 | 50,555 |
| 4.625% 12/1/30 (d) | | 75,000 | 53,983 |
| 5% 11/15/31 (d) | | 65,000 | 46,329 |
| 5.75% 1/15/30 (d) | | 100,000 | 76,500 |
| 7.5% 4/1/28 (d) | | 230,000 | 199,265 |
| DISH DBS Corp.: | | | |
| 5% 3/15/23 | | 250,000 | 247,215 |
| 5.75% 12/1/28 (d) | | 45,000 | 36,281 |
| Radiate Holdco LLC/Radiate Financial Service Ltd.: | | | |
| 4.5% 9/15/26 (d) | | 150,000 | 126,750 |
| 6.5% 9/15/28 (d) | | 110,000 | 69,300 |
| UPCB Finance VII Ltd. 3.625% 6/15/29 (Reg. S) | EUR | 100,000 | 83,473 |
| Ziggo Bond Co. BV: | | | |
| 5.125% 2/28/30 (d) | | 35,000 | 27,735 |
| 6% 1/15/27 (d) | | 160,000 | 143,992 |
| Ziggo BV 4.875% 1/15/30 (d) | | 50,000 | 42,250 |
| | | | 1,950,679 |
| Capital Goods - 0.1% | | | |
| Tk Elevator Midco GmbH 4.375% 7/15/27 (Reg. S) | EUR | 100,000 | 83,547 |
| Chemicals - 2.8% | | | |
| CF Industries Holdings, Inc.: | | | |
| 5.15% 3/15/34 | | 45,000 | 40,592 |
| 5.375% 3/15/44 | | 80,000 | 67,984 |
| CVR Partners LP 6.125% 6/15/28 (d) | | 90,000 | 81,428 |
| ENN Clean Energy International Investment Ltd.: | | | |
| 3.375% 5/12/26 (d) | | 200,000 | 155,913 |
| 3.375% 5/12/26 (Reg. S) | | 200,000 | 155,913 |
| Kobe U.S. Midco 2, Inc. 9.25% 11/1/26 pay-in-kind (d)(e) | | 185,000 | 138,750 |
| Kronos Acquisition Holdings, Inc. / KIK Custom Products, Inc.: | | | |
| 5% 12/31/26 (d) | | 10,000 | 9,065 |
| 7% 12/31/27 (d) | | 15,000 | 12,600 |
| LSB Industries, Inc. 6.25% 10/15/28 (d) | | 20,000 | 18,158 |
| MEGlobal Canada, Inc. 5% 5/18/25 (d) | | 200,000 | 192,850 |
| NOVA Chemicals Corp. 4.25% 5/15/29 (d) | | 75,000 | 61,138 |
| OCP SA: | | | |
| 3.75% 6/23/31 (d) | | 200,000 | 148,225 |
| 4.5% 10/22/25 (d) | | 200,000 | 190,060 |
| Sasol Financing U.S.A. LLC 4.375% 9/18/26 | | 200,000 | 174,788 |
| SCIH Salt Holdings, Inc.: | | | |
| 4.875% 5/1/28 (d) | | 70,000 | 60,760 |
| 6.625% 5/1/29 (d) | | 45,000 | 36,119 |
| The Chemours Co. LLC: | | | |
| 4.625% 11/15/29 (d) | | 70,000 | 54,600 |
| 5.375% 5/15/27 | | 200,000 | 179,084 |
| 5.75% 11/15/28 (d) | | 130,000 | 110,435 |
| Tronox, Inc. 4.625% 3/15/29 (d) | | 55,000 | 42,476 |
| W.R. Grace Holding LLC: | | | |
| 4.875% 6/15/27 (d) | | 70,000 | 61,250 |
| 5.625% 8/15/29 (d) | | 70,000 | 54,109 |
| | | | 2,046,297 |
| Consumer Products - 1.2% | | | |
| B2W Digital Lux SARL 4.375% 12/20/30 (d) | | 100,000 | 68,456 |
| Central Garden & Pet Co. 4.125% 10/15/30 | | 35,000 | 28,930 |
| Ferrellgas LP/Ferrellgas Finance Corp.: | | | |
| 5.375% 4/1/26 (d) | | 45,000 | 40,838 |
| 5.875% 4/1/29 (d) | | 45,000 | 37,710 |
| Gannett Holdings LLC 6% 11/1/26 (d) | | 45,000 | 33,660 |
| Kernel Holding SA 6.75% 10/27/27 (d) | | 100,000 | 31,019 |
| Mattel, Inc. 3.375% 4/1/26 (d) | | 20,000 | 18,242 |
| Meituan 2.125% 10/28/25 (d) | | 200,000 | 163,880 |
| Natura Cosmeticos SA 4.125% 5/3/28 (d) | | 100,000 | 77,550 |
| PetSmart, Inc. / PetSmart Finance Corp. 7.75% 2/15/29 (d) | | 75,000 | 70,422 |
| Prosus NV 4.027% 8/3/50 (d) | | 200,000 | 107,038 |
| Tempur Sealy International, Inc.: | | | |
| 3.875% 10/15/31 (d) | | 75,000 | 56,315 |
| 4% 4/15/29 (d) | | 60,000 | 48,250 |
| The Scotts Miracle-Gro Co. 4% 4/1/31 | | 40,000 | 30,644 |
| TKC Holdings, Inc. 10.5% 5/15/29 (d) | | 75,000 | 53,256 |
| | | | 866,210 |
| Containers - 0.7% | | | |
| ARD Finance SA 6.5% 6/30/27 pay-in-kind (d)(e) | | 70,000 | 50,225 |
| Ardagh Packaging Finance PLC/Ardagh MP Holdings U.S.A., Inc. 2.125% 8/15/26 (Reg. S) | EUR | 100,000 | 80,852 |
| Ball Corp. 4.875% 3/15/26 | | 85,000 | 81,560 |
| Berry Global, Inc. 4.875% 7/15/26 (d) | | 40,000 | 37,580 |
| CANPACK SA and Eastern PA Land Investment Holding LLC 2.375% 11/1/27 (Reg. S) | EUR | 100,000 | 80,295 |
| Graham Packaging Co., Inc. 7.125% 8/15/28 (d) | | 30,000 | 24,588 |
| Graphic Packaging International, Inc. 3.75% 2/1/30 (d) | | 35,000 | 30,092 |
| Huhtamaki Oyj 4.25% 6/9/27 (Reg. S) | EUR | 100,000 | 95,119 |
| Trivium Packaging Finance BV 5.5% 8/15/26 (d) | | 40,000 | 36,717 |
| | | | 517,028 |
| Diversified Financial Services - 3.2% | | | |
| Broadstreet Partners, Inc. 5.875% 4/15/29 (d) | | 30,000 | 24,077 |
| Coinbase Global, Inc.: | | | |
| 3.375% 10/1/28 (d) | | 300,000 | 196,084 |
| 3.625% 10/1/31 (d) | | 185,000 | 109,546 |
| Dovalue SpA 3.375% 7/31/26 (Reg. S) | EUR | 125,000 | 101,450 |
| FLY Leasing Ltd. 7% 10/15/24 (d) | | 105,000 | 82,556 |
| Fortune Star (BVI) Ltd. 6.85% 7/2/24 (Reg. S) | | 200,000 | 90,500 |
| Hightower Holding LLC 6.75% 4/15/29 (d) | | 25,000 | 20,353 |
| HTA Group Ltd. 7% 12/18/25 (d) | | 200,000 | 175,600 |
| Icahn Enterprises LP/Icahn Enterprises Finance Corp.: | | | |
| 4.375% 2/1/29 | | 165,000 | 137,754 |
| 4.75% 9/15/24 | | 90,000 | 87,582 |
| 6.375% 12/15/25 | | 295,000 | 286,371 |
| Intertrust Group BV 3.375% 11/15/25 (Reg. S) | EUR | 100,000 | 98,617 |
| Lincoln Financing SARL 3.625% 4/1/24 (Reg. S) | EUR | 100,000 | 95,663 |
| Nexi SpA 2.125% 4/30/29 (Reg. S) | EUR | 100,000 | 78,813 |
| OneMain Finance Corp.: | | | |
| 4% 9/15/30 | | 165,000 | 124,575 |
| 7.125% 3/15/26 | | 200,000 | 193,000 |
| Park Aerospace Holdings Ltd. 4.5% 3/15/23 (d) | | 20,000 | 19,908 |
| Qtel International Finance Ltd. 2.625% 4/8/31 (d) | | 200,000 | 164,760 |
| Verisure Holding AB: | | | |
| 3.25% 2/15/27 (Reg. S) | EUR | 100,000 | 83,937 |
| 3.875% 7/15/26 (Reg. S) | EUR | 125,000 | 110,218 |
| Yihua Overseas Investment Ltd. 8.5% 12/31/49 (Reg. S) (b)(g) | | 200,000 | 20,100 |
| | | | 2,301,464 |
| Diversified Media - 0.3% | | | |
| Allen Media LLC 10.5% 2/15/28 (d) | | 220,000 | 89,155 |
| Lamar Media Corp. 4.875% 1/15/29 | | 45,000 | 40,712 |
| Terrier Media Buyer, Inc. 8.875% 12/15/27 (d) | | 90,000 | 76,275 |
| | | | 206,142 |
| Energy - 13.5% | | | |
| Antero Midstream Partners LP/Antero Midstream Finance Corp.: | | | |
| 5.75% 3/1/27 (d) | | 140,000 | 133,322 |
| 5.75% 1/15/28 (d) | | 60,000 | 56,528 |
| Archrock Partners LP / Archrock Partners Finance Corp. 6.25% 4/1/28 (d) | | 70,000 | 65,093 |
| Atlantica Sustainable Infrastructure PLC 4.125% 6/15/28 (d) | | 200,000 | 169,500 |
| California Resources Corp. 7.125% 2/1/26 (d) | | 95,000 | 93,177 |
| Canacol Energy Ltd. 5.75% 11/24/28 (d) | | 200,000 | 149,725 |
| CGG SA 7.75% 4/1/27 (Reg. S) | EUR | 100,000 | 86,225 |
| Cheniere Energy, Inc. 4.625% 10/15/28 | | 95,000 | 87,638 |
| Citgo Holding, Inc. 9.25% 8/1/24 (d) | | 70,000 | 70,065 |
| Citgo Petroleum Corp.: | | | |
| 6.375% 6/15/26 (d) | | 70,000 | 68,940 |
| 7% 6/15/25 (d) | | 130,000 | 128,005 |
| CNX Resources Corp. 6% 1/15/29 (d) | | 25,000 | 23,337 |
| Colgate Energy Partners III LLC 5.875% 7/1/29 (d) | | 80,000 | 74,200 |
| Comstock Resources, Inc.: | | | |
| 5.875% 1/15/30 (d) | | 50,000 | 45,121 |
| 6.75% 3/1/29 (d) | | 90,000 | 86,175 |
| Crestwood Midstream Partners LP/Crestwood Midstream Finance Corp. 6% 2/1/29 (d) | | 285,000 | 266,504 |
| CrownRock LP/CrownRock Finance, Inc. 5% 5/1/29 (d) | | 25,000 | 22,711 |
| CVR Energy, Inc.: | | | |
| 5.25% 2/15/25 (d) | | 140,000 | 134,901 |
| 5.75% 2/15/28 (d) | | 115,000 | 104,075 |
| DCP Midstream Operating LP: | | | |
| 5.85% 5/21/43 (d)(e) | | 60,000 | 58,054 |
| 8.125% 8/16/30 | | 5,000 | 5,344 |
| Delek Logistics Partners LP 7.125% 6/1/28 (d) | | 45,000 | 40,295 |
| Delek Overriding Royalty Levia 7.494% 12/30/23 (Reg. S) (d) | | 110,000 | 109,313 |
| DT Midstream, Inc.: | | | |
| 4.125% 6/15/29 (d) | | 75,000 | 64,838 |
| 4.375% 6/15/31 (d) | | 75,000 | 63,188 |
| EDP Finance BV 1.875% 9/21/29 (Reg. S) | EUR | 100,000 | 86,484 |
| Endeavor Energy Resources LP/EER Finance, Inc. 5.75% 1/30/28 (d) | | 125,000 | 121,496 |
| Energean Israel Finance Ltd.: | | | |
| 4.5% 3/30/24 (Reg. S) (d) | | 40,000 | 38,121 |
| 4.875% 3/30/26 (Reg. S) (d) | | 40,000 | 35,900 |
| EnfraGen Energia Sur SA 5.375% 12/30/30 (d) | | 200,000 | 103,361 |
| EnLink Midstream LLC 5.625% 1/15/28 (d) | | 25,000 | 23,961 |
| EQM Midstream Partners LP 6.5% 7/1/27 (d) | | 70,000 | 68,250 |
| EQT Corp.: | | | |
| 3.125% 5/15/26 (d) | | 50,000 | 45,374 |
| 3.625% 5/15/31 (d) | | 50,000 | 41,594 |
| 5% 1/15/29 | | 55,000 | 51,093 |
| GeoPark Ltd. 5.5% 1/17/27 (d) | | 200,000 | 161,350 |
| Global Partners LP/GLP Finance Corp. 6.875% 1/15/29 | | 55,000 | 49,761 |
| Harvest Midstream I LP 7.5% 9/1/28 (d) | | 135,000 | 129,427 |
| Hess Midstream Partners LP: | | | |
| 4.25% 2/15/30 (d) | | 50,000 | 42,758 |
| 5.125% 6/15/28 (d) | | 80,000 | 73,600 |
| 5.5% 10/15/30 (d) | | 30,000 | 27,066 |
| 5.625% 2/15/26 (d) | | 100,000 | 98,077 |
| India Clean Energy Holdings 4.5% 4/18/27 (Reg. S) | | 200,000 | 139,000 |
| Investment Energy Resources Ltd. 6.25% 4/26/29 (d) | | 200,000 | 168,100 |
| KLX Energy Services Holdings, Inc. 11.5% 11/1/25 (d) | | 95,000 | 77,737 |
| Kosmos Energy Ltd. 7.125% 4/4/26 (d) | | 160,000 | 133,200 |
| Leeward Renewable Energy LLC 4.25% 7/1/29 (d) | | 170,000 | 137,700 |
| Leviathan Bond Ltd. 6.125% 6/30/25 (Reg. S) (d) | | 150,000 | 142,398 |
| MC Brazil Downstream Trading SARL 7.25% 6/30/31 (d) | | 320,000 | 242,912 |
| Medco Laurel Tree PTE Ltd. 6.95% 11/12/28 (Reg. S) | | 200,000 | 154,538 |
| Medco Oak Tree Pte Ltd. 7.375% 5/14/26 (d) | | 200,000 | 178,000 |
| MEG Energy Corp. 5.875% 2/1/29 (d) | | 110,000 | 105,012 |
| Nabors Industries, Inc. 5.75% 2/1/25 | | 105,000 | 101,063 |
| New Fortress Energy, Inc. 6.75% 9/15/25 (d) | | 55,000 | 53,994 |
| NGL Energy Operating LLC/NGL Energy Finance Corp. 7.5% 2/1/26 (d) | | 190,000 | 171,881 |
| Northern Oil & Gas, Inc. 8.125% 3/1/28 (d) | | 90,000 | 87,300 |
| Nostrum Oil & Gas Finance BV 8% 12/31/49 (d)(g) | | 400,000 | 106,104 |
| Occidental Petroleum Corp.: | | | |
| 5.5% 12/1/25 | | 35,000 | 35,105 |
| 5.875% 9/1/25 | | 40,000 | 40,300 |
| 6.125% 1/1/31 | | 80,000 | 80,210 |
| 6.375% 9/1/28 | | 145,000 | 147,156 |
| 6.6% 3/15/46 | | 55,000 | 54,136 |
| 6.625% 9/1/30 | | 195,000 | 202,811 |
| 6.95% 7/1/24 | | 65,000 | 66,600 |
| 7.5% 5/1/31 | | 230,000 | 247,250 |
| 8.875% 7/15/30 | | 145,000 | 164,575 |
| Oleoducto Central SA 4% 7/14/27 (d) | | 200,000 | 162,725 |
| Oman Oil Co. 5.125% 5/6/28 (d) | | 200,000 | 180,100 |
| PBF Holding Co. LLC/PBF Finance Corp.: | | | |
| 6% 2/15/28 | | 160,000 | 145,400 |
| 7.25% 6/15/25 | | 70,000 | 69,257 |
| Petroleos Mexicanos: | | | |
| 4.25% 1/15/25 | | 185,000 | 171,275 |
| 4.875% 2/21/28 (Reg. S) | EUR | 100,000 | 76,268 |
| 6.49% 1/23/27 | | 175,000 | 152,845 |
| 7.69% 1/23/50 | | 75,000 | 48,352 |
| Petrorio Luxembourg SARL 6.125% 6/9/26 (d) | | 100,000 | 90,488 |
| Repsol International Finance BV 4.5% 3/25/75 (Reg. S) (e) | EUR | 100,000 | 94,378 |
| Rio Oil Finance Trust 9.25% 7/6/24 (d) | | 30,891 | 30,868 |
| Saudi Arabian Oil Co.: | | | |
| 1.625% 11/24/25 (d) | | 200,000 | 178,700 |
| 3.5% 4/16/29 (d) | | 200,000 | 177,300 |
| SM Energy Co.: | | | |
| 6.5% 7/15/28 | | 25,000 | 24,250 |
| 6.625% 1/15/27 | | 65,000 | 63,700 |
| 6.75% 9/15/26 | | 25,000 | 24,625 |
| Southwestern Energy Co.: | | | |
| 4.75% 2/1/32 | | 65,000 | 56,108 |
| 5.375% 2/1/29 | | 115,000 | 107,238 |
| 8.375% 9/15/28 | | 60,000 | 62,063 |
| SUEK Securities DAC 3.375% 9/15/26 (d)(g) | | 95,000 | 31,881 |
| Sunoco LP/Sunoco Finance Corp.: | | | |
| 4.5% 5/15/29 | | 50,000 | 42,945 |
| 6% 4/15/27 | | 175,000 | 171,465 |
| Tallgrass Energy Partners LP / Tallgrass Energy Finance Corp. 6% 12/31/30 (d) | | 55,000 | 49,787 |
| Tengizchevroil Finance Co. International Ltd. 3.25% 8/15/30 (d) | | 100,000 | 63,950 |
| Termocandelaria Power Ltd. 7.875% 1/30/29 (d) | | 170,000 | 144,319 |
| Transocean Sentry Ltd. 5.375% 5/15/23 (d) | | 63,524 | 62,413 |
| Transportadora de Gas del Sur SA 6.75% 5/2/25 (d) | | 70,000 | 60,127 |
| Tullow Oil PLC: | | | |
| 7% 3/1/25 (d) | | 200,000 | 131,500 |
| 10.25% 5/15/26 (d) | | 358,000 | 305,195 |
| U.S.A. Compression Partners LP 6.875% 4/1/26 | | 35,000 | 33,595 |
| Valaris Ltd. 8.25% 4/30/28 pay-in-kind (e) | | 10,000 | 9,838 |
| Venture Global Calcasieu Pass LLC: | | | |
| 3.875% 8/15/29 (d) | | 70,000 | 60,025 |
| 4.125% 8/15/31 (d) | | 70,000 | 59,677 |
| YPF SA 8.5% 3/23/25 (d) | | 231,875 | 186,080 |
| | | | 9,769,766 |
| Entertainment/Film - 0.1% | | | |
| Live Nation Entertainment, Inc. 4.75% 10/15/27 (d) | | 80,000 | 71,194 |
| Environmental - 0.4% | | | |
| Covanta Holding Corp. 4.875% 12/1/29 (d) | | 40,000 | 34,058 |
| Madison IAQ LLC: | | | |
| 4.125% 6/30/28 (d) | | 55,000 | 45,513 |
| 5.875% 6/30/29 (d) | | 85,000 | 58,225 |
| Paprec Holding SA 3.5% 7/1/28 (Reg. S) | EUR | 113,000 | 88,779 |
| Stericycle, Inc. 3.875% 1/15/29 (d) | | 35,000 | 30,401 |
| | | | 256,976 |
| Food & Drug Retail - 1.0% | | | |
| Albertsons Companies LLC/Safeway, Inc./New Albertson's, Inc./Albertson's LLC: | | | |
| 3.5% 3/15/29 (d) | | 35,000 | 28,963 |
| 4.625% 1/15/27 (d) | | 130,000 | 120,472 |
| 4.875% 2/15/30 (d) | | 275,000 | 244,063 |
| BellRing Brands, Inc. 7% 3/15/30 (d) | | 25,000 | 23,608 |
| Camposol SA 6% 2/3/27 (d) | | 200,000 | 140,975 |
| Casino Guichard Perrachon SA 4.048% 8/5/26 (Reg. S) (e) | EUR | 100,000 | 42,124 |
| Emergent BioSolutions, Inc. 3.875% 8/15/28 (d) | | 35,000 | 20,984 |
| Murphy Oil U.S.A., Inc. 3.75% 2/15/31 (d) | | 25,000 | 20,831 |
| SEG Holding LLC/SEG Finance Corp. 5.625% 10/15/28 (d) | | 100,000 | 92,414 |
| | | | 734,434 |
| Food/Beverage/Tobacco - 1.7% | | | |
| Adecoagro SA 6% 9/21/27 (d) | | 150,000 | 135,094 |
| C&S Group Enterprises LLC 5% 12/15/28 (d) | | 40,000 | 29,570 |
| Central American Bottling Corp. 5.25% 4/27/29 (d) | | 200,000 | 176,225 |
| Chobani LLC/Finance Corp., Inc.: | | | |
| 4.625% 11/15/28 (d) | | 30,000 | 26,057 |
| 7.5% 4/15/25 (d) | | 15,000 | 14,173 |
| JBS U.S.A. Lux SA / JBS Food Co. 5.5% 1/15/30 (d) | | 120,000 | 109,387 |
| KeHE Distributors LLC / KeHE Finance Corp. 8.625% 10/15/26 (d) | | 48,000 | 47,760 |
| Kraft Heinz Foods Co.: | | | |
| 4.375% 6/1/46 | | 15,000 | 11,701 |
| 4.875% 10/1/49 | | 85,000 | 70,613 |
| 5.5% 6/1/50 | | 25,000 | 22,808 |
| Lamb Weston Holdings, Inc. 4.125% 1/31/30 (d) | | 70,000 | 61,108 |
| MARB BondCo PLC 3.95% 1/29/31 (d) | | 100,000 | 73,500 |
| MHP SA 7.75% 5/10/24 (d) | | 100,000 | 47,644 |
| NBM U.S. Holdings, Inc. 6.625% 8/6/29 (d) | | 85,000 | 78,614 |
| Performance Food Group, Inc.: | | | |
| 4.25% 8/1/29 (d) | | 40,000 | 33,887 |
| 5.5% 10/15/27 (d) | | 100,000 | 94,522 |
| Post Holdings, Inc. 4.625% 4/15/30 (d) | | 34,000 | 28,690 |
| TreeHouse Foods, Inc. 4% 9/1/28 | | 20,000 | 16,875 |
| Triton Water Holdings, Inc. 6.25% 4/1/29 (d) | | 30,000 | 22,721 |
| U.S. Foods, Inc.: | | | |
| 4.625% 6/1/30 (d) | | 35,000 | 30,363 |
| 4.75% 2/15/29 (d) | | 80,000 | 70,900 |
| United Natural Foods, Inc. 6.75% 10/15/28 (d) | | 40,000 | 38,635 |
| | | | 1,240,847 |
| Gaming - 2.8% | | | |
| Affinity Gaming LLC 6.875% 12/15/27 (d) | | 20,000 | 16,695 |
| Caesars Entertainment, Inc.: | | | |
| 4.625% 10/15/29 (d) | | 90,000 | 72,000 |
| 6.25% 7/1/25 (d) | | 110,000 | 107,331 |
| CDI Escrow Issuer, Inc. 5.75% 4/1/30 (d) | | 135,000 | 121,839 |
| Cirsa Finance International SARL: | | | |
| 6.25% 12/20/23 (Reg. S) | EUR | 84,917 | 83,699 |
| 10.375% 11/30/27 (Reg. S) (h) | EUR | 100,000 | 98,949 |
| Fertitta Entertainment LLC / Fertitta Entertainment Finance Co., Inc.: | | | |
| 4.625% 1/15/29 (d) | | 90,000 | 78,273 |
| 6.75% 1/15/30 (d) | | 160,000 | 125,600 |
| GENM Capital Labuan Ltd. 3.882% 4/19/31 (d) | | 200,000 | 119,163 |
| GLP Capital LP/GLP Financing II, Inc.: | | | |
| 5.25% 6/1/25 | | 95,000 | 91,612 |
| 5.375% 4/15/26 | | 30,000 | 28,637 |
| Jacobs Entertainment, Inc. 6.75% 2/15/29 (d) | | 40,000 | 35,267 |
| Melco Resorts Finance Ltd. 5.375% 12/4/29 (Reg. S) | | 200,000 | 111,200 |
| MGM China Holdings Ltd. 4.75% 2/1/27 (Reg. S) | | 200,000 | 148,000 |
| NagaCorp Ltd. 7.95% 7/6/24 (Reg. S) | | 200,000 | 171,475 |
| Peninsula Pacific Entertainment LLC 8.5% 11/15/27 (d) | | 70,000 | 75,163 |
| Station Casinos LLC 4.625% 12/1/31 (d) | | 115,000 | 91,370 |
| Studio City Finance Ltd.: | | | |
| 5% 1/15/29 (Reg. S) | | 200,000 | 82,900 |
| 6.5% 1/15/28 (d) | | 110,000 | 45,877 |
| 6.5% 1/15/28 (Reg. S) | | 200,000 | 83,413 |
| VICI Properties LP / VICI Note Co. 5.75% 2/1/27 (d) | | 70,000 | 66,130 |
| Wynn Macau Ltd. 5.125% 12/15/29 (Reg. S) | | 250,000 | 146,250 |
| | | | 2,000,843 |
| Healthcare - 5.3% | | | |
| 1375209 BC Ltd. 9% 1/30/28 (d) | | 14,000 | 13,545 |
| AHP Health Partners, Inc. 5.75% 7/15/29 (d) | | 80,000 | 61,200 |
| Avantor Funding, Inc. 3.875% 11/1/29 (d) | | 70,000 | 59,066 |
| Bausch Health Companies, Inc.: | | | |
| 11% 9/30/28 (d) | | 25,000 | 19,250 |
| 14% 10/15/30 (d) | | 4,000 | 2,290 |
| Bayer AG: | | | |
| 3.125% 11/12/79 (Reg. S) (e) | EUR | 100,000 | 82,398 |
| 5.375% 3/25/82 (Reg. S) (e) | EUR | 200,000 | 170,473 |
| Catalent Pharma Solutions 5% 7/15/27 (d) | | 20,000 | 18,803 |
| Centene Corp.: | | | |
| 3.375% 2/15/30 | | 160,000 | 132,928 |
| 4.25% 12/15/27 | | 70,000 | 64,575 |
| 4.625% 12/15/29 | | 105,000 | 95,025 |
| Charles River Laboratories International, Inc.: | | | |
| 3.75% 3/15/29 (d) | | 20,000 | 17,300 |
| 4% 3/15/31 (d) | | 55,000 | 46,268 |
| Community Health Systems, Inc.: | | | |
| 4.75% 2/15/31 (d) | | 75,000 | 50,245 |
| 5.25% 5/15/30 (d) | | 155,000 | 107,338 |
| 6% 1/15/29 (d) | | 140,000 | 103,928 |
| 6.125% 4/1/30 (d) | | 170,000 | 69,700 |
| 6.875% 4/15/29 (d) | | 75,000 | 30,180 |
| 8% 3/15/26 (d) | | 335,000 | 288,938 |
| DaVita HealthCare Partners, Inc.: | | | |
| 3.75% 2/15/31 (d) | | 60,000 | 43,382 |
| 4.625% 6/1/30 (d) | | 160,000 | 124,740 |
| Encompass Health Corp. 5.75% 9/15/25 | | 15,000 | 14,863 |
| Eurofins Scientific SA 2.125% 7/25/24 (Reg. S) | EUR | 100,000 | 96,097 |
| Grifols Escrow Issuer SA 4.75% 10/15/28 (d) | | 200,000 | 156,250 |
| HealthEquity, Inc. 4.5% 10/1/29 (d) | | 30,000 | 26,213 |
| Hologic, Inc. 3.25% 2/15/29 (d) | | 55,000 | 46,739 |
| Jazz Securities DAC 4.375% 1/15/29 (d) | | 55,000 | 48,813 |
| Molina Healthcare, Inc.: | | | |
| 3.875% 11/15/30 (d) | | 50,000 | 42,490 |
| 3.875% 5/15/32 (d) | | 100,000 | 83,400 |
| 4.375% 6/15/28 (d) | | 40,000 | 35,874 |
| Option Care Health, Inc. 4.375% 10/31/29 (d) | | 30,000 | 25,907 |
| Organon & Co. / Organon Foreign Debt Co-Issuer BV: | | | |
| 2.875% 4/30/28 (Reg. S) | EUR | 147,000 | 122,038 |
| 4.125% 4/30/28 (d) | | 80,000 | 70,466 |
| 5.125% 4/30/31 (d) | | 80,000 | 67,942 |
| Owens & Minor, Inc. 6.625% 4/1/30 (d) | | 115,000 | 95,600 |
| Radiology Partners, Inc. 9.25% 2/1/28 (d) | | 145,000 | 76,705 |
| RP Escrow Issuer LLC 5.25% 12/15/25 (d) | | 50,000 | 37,387 |
| Surgery Center Holdings, Inc.: | | | |
| 6.75% 7/1/25 (d) | | 30,000 | 28,203 |
| 10% 4/15/27 (d) | | 70,000 | 67,921 |
| Teleflex, Inc. 4.625% 11/15/27 | | 30,000 | 28,271 |
| Tenet Healthcare Corp.: | | | |
| 4.25% 6/1/29 (d) | | 250,000 | 210,625 |
| 4.375% 1/15/30 (d) | | 210,000 | 176,190 |
| 4.625% 7/15/24 | | 32,000 | 31,200 |
| 6.125% 10/1/28 (d) | | 210,000 | 181,755 |
| 6.25% 2/1/27 (d) | | 195,000 | 186,092 |
| 6.875% 11/15/31 | | 10,000 | 8,488 |
| Teva Pharmaceutical Finance Netherlands III BV: | | | |
| 1.625% 10/15/28 (Reg. S) | EUR | 100,000 | 71,945 |
| 3.15% 10/1/26 | | 75,000 | 63,375 |
| 4.1% 10/1/46 | | 200,000 | 121,024 |
| | | | 3,823,445 |
| Homebuilders/Real Estate - 2.2% | | | |
| ADLER Real Estate AG 1.875% 4/27/23 (Reg. S) | EUR | 100,000 | 78,072 |
| Arcosa, Inc. 4.375% 4/15/29 (d) | | 40,000 | 34,485 |
| Ashton Woods U.S.A. LLC/Ashton Woods Finance Co.: | | | |
| 4.625% 8/1/29 (d) | | 40,000 | 30,050 |
| 6.625% 1/15/28 (d) | | 5,000 | 4,245 |
| China Aoyuan Group Ltd.: | | | |
| 5.88% 3/1/27 (Reg. S) (g) | | 200,000 | 6,000 |
| 6.2% 3/24/26 (Reg. S) (g) | | 200,000 | 6,000 |
| China Evergrande Group 8.25% 3/23/22 (Reg. S) (g) | | 200,000 | 7,000 |
| China SCE Property Holdings Ltd.: | | | |
| 7.25% 4/19/23 (Reg. S) | | 200,000 | 29,975 |
| 7.375% 4/9/24 (Reg. S) | | 200,000 | 26,788 |
| CIFI Holdings Group Co. Ltd. 4.375% 4/12/27 (Reg. S) | | 200,000 | 13,000 |
| Easy Tactic Ltd. 7.5% 7/11/28 pay-in-kind (e) | | 208,266 | 16,661 |
| Jinke Properties Group Co. Ltd. 6.85% 5/28/24 (Reg. S) | | 200,000 | 38,350 |
| Kaisa Group Holdings Ltd. 11.5% 1/30/23 (Reg. S) (g) | | 200,000 | 13,500 |
| Kennedy-Wilson, Inc.: | | | |
| 4.75% 3/1/29 | | 55,000 | 44,601 |
| 5% 3/1/31 | | 55,000 | 43,120 |
| KWG Group Holdings Ltd. 6% 1/14/24 | | 190,000 | 47,493 |
| Modernland Overseas Pte Ltd.: | | | |
| 3% 4/30/27 pay-in-kind (Reg. S) (e) | | 2,803 | 1,193 |
| 3% 4/30/27 pay-in-kind (e) | | 106,828 | 45,455 |
| New Home Co., Inc. 7.25% 10/15/25 (d) | | 35,000 | 27,108 |
| New Metro Global Ltd. 4.8% 12/15/24 (Reg. S) | | 285,000 | 71,393 |
| Powerlong Real Estate Holding Ltd. 5.95% 4/30/25 (Reg. S) | | 200,000 | 14,038 |
| Realogy Group LLC/Realogy Co-Issuer Corp. 5.75% 1/15/29 (d) | | 30,000 | 21,326 |
| Realogy Group LLC/Realogy Co.-Issuer Corp. 5.25% 4/15/30 (d) | | 110,000 | 76,276 |
| Redsun Properties Group Ltd. 9.7% 4/16/23 (Reg. S) (g) | | 220,000 | 11,550 |
| RKPF Overseas 2020 A Ltd. 5.125% 7/26/26 (Reg. S) | | 200,000 | 61,000 |
| Scenery Journey Ltd. 11.5% 10/24/22 (Reg. S) (g) | | 200,000 | 5,000 |
| Starwood Property Trust, Inc. 4.75% 3/15/25 | | 75,000 | 70,263 |
| Sunac China Holdings Ltd.: | | | |
| 6.5% 7/9/23 (Reg. S) (g) | | 200,000 | 11,500 |
| 7.5% 2/1/24 (Reg. S) (g) | | 200,000 | 11,500 |
| Taylor Morrison Communities, Inc./Monarch Communities, Inc.: | | | |
| 5.75% 1/15/28 (d) | | 80,000 | 73,326 |
| 5.875% 6/15/27 (d) | | 55,000 | 51,576 |
| Theta Capital Pte Ltd. 6.75% 10/31/26 (Reg. S) | | 200,000 | 105,413 |
| Times China Holdings Ltd. 6.75% 7/8/25 (Reg. S) | | 200,000 | 13,000 |
| TRI Pointe Homes, Inc. 5.7% 6/15/28 | | 15,000 | 12,996 |
| Uniti Group LP / Uniti Group Finance, Inc.: | | | |
| 4.75% 4/15/28 (d) | | 55,000 | 44,960 |
| 6.5% 2/15/29 (d) | | 85,000 | 60,988 |
| VICI Properties LP / VICI Note Co. 3.75% 2/15/27 (d) | | 205,000 | 179,603 |
| Weekley Homes LLC/Weekley Finance Corp. 4.875% 9/15/28 (d) | | 25,000 | 20,136 |
| Yango Justice International Ltd.: | | | |
| 8.25% 11/25/23 (Reg. S) (g) | | 220,000 | 3,300 |
| 10% 2/12/23 (Reg. S) (g) | | 200,000 | 5,000 |
| Yanlord Land Group Ltd. 6.8% 2/27/24 (Reg. S) | | 250,000 | 147,625 |
| | | | 1,584,865 |
| Hotels - 0.3% | | | |
| Carnival Holdings (Bermuda) Ltd. 10.375% 5/1/28 (d) | | 125,000 | 126,573 |
| Hilton Domestic Operating Co., Inc.: | | | |
| 3.625% 2/15/32 (d) | | 40,000 | 31,850 |
| 3.75% 5/1/29 (d) | | 35,000 | 29,817 |
| Lindblad Expeditions LLC 6.75% 2/15/27 (d) | | 65,000 | 57,824 |
| | | | 246,064 |
| Insurance - 1.6% | | | |
| Acrisure LLC / Acrisure Finance, Inc.: | | | |
| 7% 11/15/25 (d) | | 250,000 | 234,975 |
| 10.125% 8/1/26 (d) | | 35,000 | 34,685 |
| Alliant Holdings Intermediate LLC: | | | |
| 5.875% 11/1/29 (d) | | 90,000 | 75,828 |
| 6.75% 10/15/27 (d) | | 225,000 | 205,313 |
| AmWINS Group, Inc. 4.875% 6/30/29 (d) | | 40,000 | 34,194 |
| AssuredPartners, Inc. 5.625% 1/15/29 (d) | | 30,000 | 24,675 |
| HUB International Ltd.: | | | |
| 5.625% 12/1/29 (d) | | 60,000 | 51,449 |
| 7% 5/1/26 (d) | | 190,000 | 187,625 |
| MGIC Investment Corp. 5.25% 8/15/28 | | 40,000 | 36,289 |
| USI, Inc. 6.875% 5/1/25 (d) | | 275,000 | 266,746 |
| | | | 1,151,779 |
| Leisure - 1.7% | | | |
| Carnival Corp.: | | | |
| 5.75% 3/1/27 (d) | | 135,000 | 93,825 |
| 9.875% 8/1/27 (d) | | 210,000 | 195,825 |
| 10.5% 2/1/26 (d) | | 75,000 | 73,497 |
| NCL Corp. Ltd.: | | | |
| 5.875% 3/15/26 (d) | | 20,000 | 16,375 |
| 5.875% 2/15/27 (d) | | 90,000 | 80,438 |
| 7.75% 2/15/29 (d) | | 80,000 | 63,626 |
| NCL Finance Ltd. 6.125% 3/15/28 (d) | | 25,000 | 19,438 |
| Royal Caribbean Cruises Ltd.: | | | |
| 4.25% 7/1/26 (d) | | 130,000 | 102,700 |
| 5.375% 7/15/27 (d) | | 60,000 | 46,639 |
| 5.5% 8/31/26 (d) | | 135,000 | 110,376 |
| 11.5% 6/1/25 (d) | | 30,000 | 32,250 |
| 11.625% 8/15/27 (d) | | 220,000 | 213,884 |
| Studio City Co. Ltd. 7% 2/15/27 (d) | | 75,000 | 60,375 |
| Vail Resorts, Inc. 6.25% 5/15/25 (d) | | 35,000 | 34,825 |
| Viking Cruises Ltd. 13% 5/15/25 (d) | | 50,000 | 53,750 |
| | | | 1,197,823 |
| Metals/Mining - 3.1% | | | |
| Alcoa Nederland Holding BV 4.125% 3/31/29 (d) | | 70,000 | 59,278 |
| Alpha Natural Resources, Inc. 9.75% 4/15/18 (b)(g) | | 210,000 | 0 |
| Antofagasta PLC 2.375% 10/14/30 (d) | | 200,000 | 146,500 |
| Cleveland-Cliffs, Inc.: | | | |
| 4.625% 3/1/29 (d) | | 40,000 | 34,442 |
| 4.875% 3/1/31 (d) | | 40,000 | 33,784 |
| Endeavour Mining PLC 5% 10/14/26 (d) | | 200,000 | 155,350 |
| ERO Copper Corp. 6.5% 2/15/30 (d) | | 230,000 | 168,475 |
| First Quantum Minerals Ltd.: | | | |
| 6.875% 3/1/26 (d) | | 105,000 | 98,271 |
| 6.875% 10/15/27 (d) | | 80,000 | 74,085 |
| 7.5% 4/1/25 (d) | | 130,000 | 125,190 |
| FMG Resources Pty Ltd.: | | | |
| 4.375% 4/1/31 (d) | | 40,000 | 31,588 |
| 5.875% 4/15/30 (d) | | 130,000 | 115,375 |
| Gcm Mining Corp. 6.875% 8/9/26 (d) | | 200,000 | 138,966 |
| Howmet Aerospace, Inc. 5.95% 2/1/37 | | 45,000 | 41,223 |
| HudBay Minerals, Inc. 6.125% 4/1/29 (d) | | 105,000 | 86,888 |
| Industrias Penoles SA de CV 4.75% 8/6/50 (d) | | 200,000 | 142,038 |
| Mineral Resources Ltd.: | | | |
| 8% 11/1/27 (d) | | 85,000 | 83,615 |
| 8.5% 5/1/30 (d) | | 20,000 | 19,681 |
| Novelis Corp. 3.875% 8/15/31 (d) | | 115,000 | 89,092 |
| PT Freeport Indonesia 5.315% 4/14/32 (d) | | 200,000 | 166,750 |
| Stillwater Mining Co. 4% 11/16/26 (d) | | 200,000 | 163,725 |
| VM Holding SA 6.5% 1/18/28 (d) | | 200,000 | 183,600 |
| Volcan Compania Minera SAA 4.375% 2/11/26 (d) | | 100,000 | 83,250 |
| | | | 2,241,166 |
| Paper - 0.6% | | | |
| Berry Global, Inc. 5.625% 7/15/27 (d) | | 35,000 | 33,196 |
| Clydesdale Acquisition Holdings, Inc.: | | | |
| 6.625% 4/15/29 (d) | | 35,000 | 33,229 |
| 8.75% 4/15/30 (d) | | 200,000 | 175,750 |
| Enviva Partners LP / Enviva Partners Finance Corp. 6.5% 1/15/26 (d) | | 90,000 | 86,420 |
| Mercer International, Inc. 5.125% 2/1/29 | | 55,000 | 45,169 |
| SPA Holdings 3 OY 4.875% 2/4/28 (d) | | 45,000 | 35,825 |
| | | | 409,589 |
| Restaurants - 0.6% | | | |
| 1011778 BC Unlimited Liability Co./New Red Finance, Inc. 4% 10/15/30 (d) | | 160,000 | 130,600 |
| CEC Entertainment LLC 6.75% 5/1/26 (d) | | 60,000 | 56,122 |
| Papa John's International, Inc. 3.875% 9/15/29 (d) | | 25,000 | 20,311 |
| Yum! Brands, Inc.: | | | |
| 4.625% 1/31/32 | | 70,000 | 59,852 |
| 4.75% 1/15/30 (d) | | 200,000 | 178,750 |
| | | | 445,635 |
| Services - 3.2% | | | |
| Adtalem Global Education, Inc. 5.5% 3/1/28 (d) | | 146,000 | 133,225 |
| Allied Universal Holdco LLC / Allied Universal Finance Corp. 6% 6/1/29 (d) | | 30,000 | 20,829 |
| APCOA Parking Holdings GmbH 4.625% 1/15/27 (Reg. S) | EUR | 100,000 | 79,611 |
| ASGN, Inc. 4.625% 5/15/28 (d) | | 160,000 | 142,277 |
| Atlas Luxco 4 SARL / Allied Universal Holdco LLC / Allied Universal Finance Corp. 4.625% 6/1/28 (d) | | 38,000 | 31,071 |
| Avis Budget Car Rental LLC/Avis Budget Finance, Inc. 5.375% 3/1/29 (d) | | 40,000 | 34,633 |
| Booz Allen Hamilton, Inc.: | | | |
| 3.875% 9/1/28 (d) | | 55,000 | 48,459 |
| 4% 7/1/29 (d) | | 30,000 | 26,223 |
| Brand Energy & Infrastructure Services, Inc. 8.5% 7/15/25 (d) | | 440,000 | 316,345 |
| CoreCivic, Inc. 8.25% 4/15/26 | | 100,000 | 101,463 |
| Elis SA 1.625% 4/3/28 (Reg. S) | EUR | 100,000 | 82,019 |
| GEMS MENASA Cayman Ltd. 7.125% 7/31/26 (d) | | 520,000 | 487,825 |
| H&E Equipment Services, Inc. 3.875% 12/15/28 (d) | | 90,000 | 76,047 |
| Hertz Corp.: | | | |
| 4.625% 12/1/26 (d) | | 55,000 | 46,888 |
| 5% 12/1/29 (d) | | 70,000 | 55,451 |
| 5.5% 10/15/24 (b)(d)(g) | | 65,000 | 1,463 |
| 6% 1/15/28 (b)(d)(g) | | 85,000 | 4,994 |
| 6.25% 12/31/49 (b)(g) | | 60,000 | 75 |
| 7.125% 8/1/26 (b)(d)(g) | | 85,000 | 3,400 |
| Legends Hospitality Holding Co. LLC/Legends Hospitality Co-Issuer, Inc. 5% 2/1/26 (d) | | 35,000 | 30,625 |
| PeopleCert Wisdom Issuer PLC 5.75% 9/15/26 (Reg. S) | EUR | 114,000 | 100,921 |
| Sabre GLBL, Inc. 7.375% 9/1/25 (d) | | 60,000 | 56,321 |
| Service Corp. International 5.125% 6/1/29 | | 35,000 | 32,601 |
| The Bidvest Group UK PLC 3.625% 9/23/26 (d) | | 200,000 | 168,538 |
| The GEO Group, Inc.: | | | |
| 9.5% 12/31/28 (d) | | 170,000 | 156,400 |
| 10.5% 6/30/28 | | 67,000 | 67,000 |
| WASH Multifamily Acquisition, Inc. 5.75% 4/15/26 (d) | | 45,000 | 41,961 |
| | | | 2,346,665 |
| Steel - 0.8% | | | |
| Big River Steel LLC/BRS Finance Corp. 6.625% 1/31/29 (d) | | 132,000 | 124,140 |
| Commercial Metals Co. 3.875% 2/15/31 | | 30,000 | 24,300 |
| Infrabuild Australia Pty Ltd. 12% 10/1/24 (d) | | 155,000 | 143,763 |
| JSW Steel Ltd. 3.95% 4/5/27 (d) | | 200,000 | 146,000 |
| Roller Bearing Co. of America, Inc. 4.375% 10/15/29 (d) | | 20,000 | 17,550 |
| TMK Capital SA 4.3% 2/12/27 (Reg. S) (b)(g) | | 200,000 | 40,000 |
| Vallourec SA 8.5% 6/30/26 (Reg. S) | EUR | 100,000 | 94,364 |
| | | | 590,117 |
| Super Retail - 1.3% | | | |
| Academy Ltd. 6% 11/15/27 (d) | | 75,000 | 70,406 |
| Asbury Automotive Group, Inc.: | | | |
| 4.5% 3/1/28 | | 21,000 | 18,206 |
| 4.625% 11/15/29 (d) | | 45,000 | 37,013 |
| 4.75% 3/1/30 | | 20,000 | 16,385 |
| 5% 2/15/32 (d) | | 45,000 | 36,281 |
| At Home Group, Inc.: | | | |
| 4.875% 7/15/28 (d) | | 35,000 | 25,447 |
| 7.125% 7/15/29 (d) | | 45,000 | 25,425 |
| Bath & Body Works, Inc. 6.625% 10/1/30 (d) | | 110,000 | 98,408 |
| Carvana Co. 4.875% 9/1/29 (d) | | 55,000 | 24,338 |
| EG Global Finance PLC: | | | |
| 6.75% 2/7/25 (d) | | 250,000 | 225,000 |
| 8.5% 10/30/25 (d) | | 50,000 | 46,185 |
| Group 1 Automotive, Inc. 4% 8/15/28 (d) | | 200,000 | 164,478 |
| Macy's Retail Holdings LLC: | | | |
| 5.875% 3/15/30 (d) | | 30,000 | 25,187 |
| 6.125% 3/15/32 (d) | | 35,000 | 29,080 |
| Michaels Companies, Inc.: | | | |
| 5.25% 5/1/28 (d) | | 65,000 | 46,159 |
| 7.875% 5/1/29 (d) | | 95,000 | 52,963 |
| | | | 940,961 |
| Technology - 3.8% | | | |
| Acuris Finance U.S. 5% 5/1/28 (d) | | 170,000 | 137,700 |
| Arches Buyer, Inc.: | | | |
| 4.25% 6/1/28 (d) | | 35,000 | 28,713 |
| 6.125% 12/1/28 (d) | | 10,000 | 7,710 |
| Athenahealth Group, Inc. 6.5% 2/15/30 (d) | | 265,000 | 206,700 |
| Black Knight InfoServ LLC 3.625% 9/1/28 (d) | | 60,000 | 51,975 |
| Block, Inc.: | | | |
| 2.75% 6/1/26 | | 75,000 | 66,888 |
| 3.5% 6/1/31 | | 75,000 | 60,375 |
| CA Magnum Holdings 5.375% (d)(i) | | 400,000 | 335,000 |
| Camelot Finance SA 4.5% 11/1/26 (d) | | 150,000 | 140,180 |
| CDW LLC/CDW Finance Corp. 4.25% 4/1/28 | | 80,000 | 70,496 |
| Cellnex Finance Co. SA 1% 9/15/27 (Reg. S) | EUR | 100,000 | 80,163 |
| Central Parent, Inc./Central Merger Sub, Inc. 7.25% 6/15/29 (d) | | 120,000 | 114,697 |
| Coherent Corp. 5% 12/15/29 (d) | | 45,000 | 38,605 |
| Crowdstrike Holdings, Inc. 3% 2/15/29 | | 70,000 | 59,004 |
| Elastic NV 4.125% 7/15/29 (d) | | 40,000 | 33,397 |
| Energizer Gamma Acquistion BV 3.5% 6/30/29 (Reg. S) | EUR | 124,000 | 89,171 |
| Lenovo Group Ltd. 3.421% 11/2/30 (d) | | 200,000 | 138,288 |
| Match Group Holdings II LLC: | | | |
| 4.125% 8/1/30 (d) | | 100,000 | 81,701 |
| 5.625% 2/15/29 (d) | | 65,000 | 57,592 |
| MicroStrategy, Inc. 6.125% 6/15/28 (d) | | 235,000 | 201,364 |
| NCR Corp. 5.125% 4/15/29 (d) | | 45,000 | 37,767 |
| Northwest Fiber LLC/Northwest Fiber Finance Sub, Inc. 10.75% 6/1/28 (d) | | 30,000 | 28,163 |
| onsemi 3.875% 9/1/28 (d) | | 70,000 | 61,677 |
| Qorvo, Inc. 4.375% 10/15/29 | | 45,000 | 38,480 |
| Rackspace Hosting, Inc.: | | | |
| 3.5% 2/15/28 (d) | | 100,000 | 66,036 |
| 5.375% 12/1/28 (d) | | 30,000 | 12,628 |
| Roblox Corp. 3.875% 5/1/30 (d) | | 185,000 | 152,625 |
| Sensata Technologies BV 4% 4/15/29 (d) | | 65,000 | 54,743 |
| Synaptics, Inc. 4% 6/15/29 (d) | | 30,000 | 24,780 |
| TTM Technologies, Inc. 4% 3/1/29 (d) | | 60,000 | 50,108 |
| Twilio, Inc.: | | | |
| 3.625% 3/15/29 | | 45,000 | 37,159 |
| 3.875% 3/15/31 | | 45,000 | 36,700 |
| Uber Technologies, Inc. 7.5% 9/15/27 (d) | | 90,000 | 89,979 |
| Unisys Corp. 6.875% 11/1/27 (d) | | 30,000 | 25,099 |
| | | | 2,715,663 |
| Telecommunications - 7.1% | | | |
| Altice France Holding SA 6% 2/15/28 (d) | | 75,000 | 49,031 |
| Altice France SA: | | | |
| 4.25% 10/15/29 (Reg. S) | EUR | 120,000 | 90,128 |
| 5.125% 1/15/29 (d) | | 50,000 | 37,625 |
| 5.125% 7/15/29 (d) | | 120,000 | 90,381 |
| 5.5% 1/15/28 (d) | | 130,000 | 104,217 |
| AXIAN Telecom 7.375% 2/16/27 (d) | | 200,000 | 172,000 |
| C&W Senior Financing Designated Activity Co. 6.875% 9/15/27 (d) | | 340,000 | 294,100 |
| Cablevision Lightpath LLC: | | | |
| 3.875% 9/15/27 (d) | | 30,000 | 25,507 |
| 5.625% 9/15/28 (d) | | 20,000 | 15,901 |
| Cellnex Telecom SA 1.75% 10/23/30 (Reg. S) | EUR | 100,000 | 73,299 |
| Cogent Communications Group, Inc. 3.5% 5/1/26 (d) | | 50,000 | 45,125 |
| Consolidated Communications, Inc. 5% 10/1/28 (d) | | 135,000 | 104,605 |
| CT Trust 5.125% 2/3/32 (d) | | 200,000 | 159,225 |
| Digicel Group Ltd. 6.75% 3/1/23 (d) | | 150,000 | 75,000 |
| Frontier Communications Holdings LLC: | | | |
| 5% 5/1/28 (d) | | 55,000 | 48,125 |
| 5.875% 10/15/27 (d) | | 50,000 | 45,991 |
| 5.875% 11/1/29 | | 14,771 | 11,507 |
| 6% 1/15/30 (d) | | 95,000 | 74,290 |
| 6.75% 5/1/29 (d) | | 60,000 | 49,425 |
| 8.75% 5/15/30 (d) | | 65,000 | 66,381 |
| Holdco SASU 5.125% 10/15/26 (Reg. S) | EUR | 115,000 | 105,580 |
| IHS Netherlands Holdco BV 8% 9/18/27 (d) | | 200,000 | 153,750 |
| Intelsat Jackson Holdings SA: | | | |
| 5.5% 8/1/23 (b)(g) | | 200,000 | 0 |
| 6.5% 3/15/30 (d) | | 135,000 | 123,898 |
| 8.5% 10/15/24 (b)(d)(g) | | 45,000 | 0 |
| LCPR Senior Secured Financing DAC: | | | |
| 5.125% 7/15/29 (d) | | 400,000 | 337,000 |
| 6.75% 10/15/27 (d) | | 90,000 | 83,930 |
| Level 3 Financing, Inc.: | | | |
| 3.75% 7/15/29 (d) | | 95,000 | 72,175 |
| 4.25% 7/1/28 (d) | | 75,000 | 61,875 |
| Liquid Telecommunications Financing PLC 5.5% 9/4/26 (d) | | 200,000 | 135,000 |
| Millicom International Cellular SA 5.125% 1/15/28 (d) | | 225,000 | 191,573 |
| Northwest Fiber LLC/Northwest Fiber Finance Sub, Inc.: | | | |
| 4.75% 4/30/27 (d) | | 50,000 | 44,947 |
| 6% 2/15/28 (d) | | 20,000 | 15,691 |
| Sable International Finance Ltd. 5.75% 9/7/27 (d) | | 180,000 | 158,625 |
| Sabre GLBL, Inc. 9.25% 4/15/25 (d) | | 45,000 | 43,578 |
| Sprint Capital Corp. 8.75% 3/15/32 | | 530,000 | 622,029 |
| Telecom Italia SpA 2.75% 4/15/25 (Reg. S) | EUR | 100,000 | 90,229 |
| Telefonica Celular del Paraguay SA 5.875% 4/15/27 (d) | | 200,000 | 180,663 |
| Turk Telekomunikasyon A/S 6.875% 2/28/25 (d) | | 200,000 | 173,788 |
| Turkcell Iletisim Hizmet A/S 5.8% 4/11/28 (d) | | 200,000 | 158,475 |
| Uniti Group, Inc. 6% 1/15/30 (d) | | 210,000 | 143,310 |
| VTR Comunicaciones SpA 5.125% 1/15/28 (d) | | 176,000 | 111,573 |
| Windstream Escrow LLC 7.75% 8/15/28 (d) | | 295,000 | 255,264 |
| WP/AP Telecom Holdings III BV 5.5% 1/15/30 (Reg. S) | EUR | 131,000 | 100,256 |
| Zayo Group Holdings, Inc.: | | | |
| 4% 3/1/27 (d) | | 115,000 | 88,838 |
| 6.125% 3/1/28 (d) | | 60,000 | 39,900 |
| | | | 5,123,810 |
| Textiles/Apparel - 0.3% | | | |
| Crocs, Inc.: | | | |
| 4.125% 8/15/31 (d) | | 75,000 | 56,806 |
| 4.25% 3/15/29 (d) | | 40,000 | 31,900 |
| CT Investment GmbH 5.5% 4/15/26 (Reg. S) | EUR | 100,000 | 81,129 |
| Victoria's Secret & Co. 4.625% 7/15/29 (d) | | 50,000 | 39,775 |
| | | | 209,610 |
| Transportation Ex Air/Rail - 0.7% | | | |
| Autostrade per L'italia SpA: | | | |
| 1.625% 6/12/23 | EUR | 115,000 | 112,616 |
| 1.75% 6/26/26 (Reg. S) | EUR | 100,000 | 88,448 |
| 1.875% 9/26/29 (Reg. S) | EUR | 100,000 | 78,566 |
| Great Lakes Dredge & Dock Corp. 5.25% 6/1/29 (d) | | 40,000 | 31,631 |
| Navios South American Logistics, Inc./Navios Logistics Finance U.S., Inc. 10.75% 7/1/25 (d) | | 110,000 | 100,650 |
| Seaspan Corp. 5.5% 8/1/29 (d) | | 110,000 | 84,720 |
| | | | 496,631 |
| Utilities - 5.3% | | | |
| Clearway Energy Operating LLC 4.75% 3/15/28 (d) | | 40,000 | 36,948 |
| ContourGlobal Power Holdings SA 3.125% 1/1/28 (Reg. S) | EUR | 121,000 | 87,997 |
| DPL, Inc.: | | | |
| 4.125% 7/1/25 | | 180,000 | 169,924 |
| 4.35% 4/15/29 | | 215,000 | 183,825 |
| Eskom Holdings SOC Ltd. 6.75% 8/6/23 (d) | | 100,000 | 97,563 |
| Greenko Investment Co. 4.875% 8/16/23 (Reg. S) | | 200,000 | 191,038 |
| InterGen NV 7% 6/30/23 (d) | | 820,000 | 802,575 |
| Mong Duong Finance Holdings BV 5.125% 5/7/29 (d) | | 100,000 | 69,300 |
| NextEra Energy Partners LP 4.25% 9/15/24 (d) | | 4,000 | 3,764 |
| NRG Energy, Inc.: | | | |
| 3.875% 2/15/32 (d) | | 45,000 | 35,480 |
| 5.25% 6/15/29 (d) | | 60,000 | 54,450 |
| Pacific Gas & Electric Co.: | | | |
| 3.75% 8/15/42 | | 10,000 | 6,333 |
| 3.95% 12/1/47 | | 55,000 | 35,466 |
| 4.55% 7/1/30 | | 415,000 | 363,482 |
| 4.95% 7/1/50 | | 415,000 | 309,361 |
| PG&E Corp. 5% 7/1/28 | | 375,000 | 337,986 |
| Pike Corp. 5.5% 9/1/28 (d) | | 240,000 | 204,931 |
| PT Cikarang Listrindo Tbk 4.95% 9/14/26 (Reg. S) | | 200,000 | 173,850 |
| Solaris Midstream Holdings LLC 7.625% 4/1/26 (d) | | 70,000 | 66,675 |
| Star Energy Geothermal Wayang Windu Ltd. 6.75% 4/24/33 (Reg. S) | | 162,160 | 143,441 |
| Teollisuuden Voima Oyj 1.375% 6/23/28 (Reg. S) | EUR | 198,000 | 161,264 |
| TerraForm Global, Inc. 6.125% 3/1/26 (d) | | 160,000 | 147,266 |
| Vertiv Group Corp. 4.125% 11/15/28 (d) | | 95,000 | 82,639 |
| Vistra Operations Co. LLC 5.625% 2/15/27 (d) | | 60,000 | 57,197 |
| | | | 3,822,755 |
TOTAL NONCONVERTIBLE BONDS | | | 56,834,824 |
| TOTAL CORPORATE BONDS (Cost $73,382,241) | | | 58,185,885 |
| | | | |
| Government Obligations - 2.7% |
| | | Principal Amount (a) | Value ($) |
| Germany - 2.1% | | | |
| German Federal Republic 0% 9/15/23 (Reg. S) | EUR | 1,605,000 | 1,559,354 |
| Sri Lanka - 0.2% | | | |
| Democratic Socialist Republic of Sri Lanka: | | | |
| 6.2% 5/11/27 (Reg. S) (g) | | 200,000 | 42,522 |
| 7.55% 3/28/30 (Reg. S) (g) | | 200,000 | 43,663 |
| 7.85% 3/14/29(Reg. S) (g) | | 200,000 | 43,350 |
TOTAL SRI LANKA | | | 129,535 |
| United States of America - 0.4% | | | |
| U.S. Treasury Bonds 2.875% 5/15/52 | | 336,000 | 260,768 |
| TOTAL GOVERNMENT OBLIGATIONS (Cost $2,470,011) | | | 1,949,657 |
| | | | |
| Common Stocks - 2.7% |
| | | Shares | Value ($) |
| Automotive & Auto Parts - 0.0% | | | |
| UC Holdings, Inc. (b)(j) | | 3,510 | 15,233 |
| Energy - 2.1% | | | |
| California Resources Corp. | | 5,929 | 267,457 |
| California Resources Corp. warrants 10/27/24 (j) | | 530 | 7,526 |
| Chesapeake Energy Corp. | | 2,294 | 234,607 |
| Chesapeake Energy Corp. (c)(j) | | 85 | 8,693 |
| Denbury, Inc. (j) | | 2,860 | 261,433 |
| Denbury, Inc. warrants 9/18/25 (j) | | 1,038 | 65,269 |
| EP Energy Corp. (b)(j) | | 7,975 | 66,751 |
| Jonah Energy Parent LLC (b)(j) | | 3,631 | 230,932 |
| Mesquite Energy, Inc. (b)(j) | | 3,543 | 196,405 |
| Noble Corp. PLC (j) | | 204 | 7,352 |
| Noble Corp. PLC: | | | |
| warrants 2/4/28 (j) | | 600 | 11,460 |
| warrants 2/4/28 (j) | | 600 | 10,200 |
| PureWest Energy (b) | | 105 | 0 |
| PureWest Energy rights (b)(j) | | 63 | 0 |
| Superior Energy Services, Inc. Class A (b)(j) | | 609 | 46,083 |
| Tidewater, Inc. warrants 11/14/42 (j) | | 1,897 | 70,730 |
TOTAL ENERGY | | | 1,484,898 |
| Entertainment/Film - 0.0% | | | |
| New Cotai LLC/New Cotai Capital Corp. (b)(c)(j) | | 125,816 | 1 |
| Food & Drug Retail - 0.2% | | | |
| Northeast Grocery, Inc. (b)(c) | | 12,754 | 14,157 |
| Southeastern Grocers, Inc. (b)(c)(j) | | 7,744 | 167,503 |
TOTAL FOOD & DRUG RETAIL | | | 181,660 |
| Telecommunications - 0.0% | | | |
| Intelsat Jackson Holdings SA: | | | |
| Series A rights (b)(j) | | 240 | 2,090 |
| Series B rights (b)(j) | | 240 | 7,706 |
TOTAL TELECOMMUNICATIONS | | | 9,796 |
| Textiles/Apparel - 0.2% | | | |
| Intelsat Emergence SA (b) | | 2,304 | 110,684 |
| Utilities - 0.2% | | | |
| Vistra Corp. | | 6,495 | 149,190 |
| TOTAL COMMON STOCKS (Cost $1,330,490) | | | 1,951,462 |
| | | | |
| Convertible Preferred Stocks - 0.3% |
| | | Shares | Value ($) |
| Utilities - 0.3% | | | |
PG&E Corp. (Cost $152,083) | | 1,400 | 188,067 |
| | | | |
| Bank Loan Obligations - 4.2% |
| | | Principal Amount (a) | Value ($) |
| Aerospace - 0.1% | | | |
| TransDigm, Inc. Tranche F 1LN, term loan 1 month U.S. LIBOR + 2.250% 5.9241% 12/9/25 (e)(f)(k) | | 76,056 | 74,199 |
| Air Transportation - 0.6% | | | |
| Echo Global Logistics, Inc.: | | | |
| 1LN, term loan 3 month U.S. LIBOR + 4.750% 8.5039% 11/23/28 (b)(e)(f)(k) | | 193,000 | 185,917 |
| 2LN, term loan 3 month U.S. LIBOR + 8.000% 12.4147% 11/23/29 (b)(e)(f)(k) | | 257,000 | 247,568 |
TOTAL AIR TRANSPORTATION | | | 433,485 |
| Banks & Thrifts - 0.0% | | | |
| First Eagle Holdings, Inc. Tranche B 1LN, term loan 1 month U.S. LIBOR + 2.500% 6.1741% 2/1/27 (e)(f)(k) | | 28,402 | 27,353 |
| Broadcasting - 0.0% | | | |
| Diamond Sports Group LLC 1LN, term loan CME Term SOFR 1 Month Index + 8.000% 11.208% 5/25/26 (e)(f)(k) | | 10,190 | 9,765 |
| Building Materials - 0.1% | | | |
| Hunter Douglas, Inc. Tranche B 1LN, term loan CME Term SOFR 1 Month Index + 3.500% 6.3399% 2/25/29 (e)(f)(k) | | 49,875 | 41,261 |
| Cable/Satellite TV - 0.5% | | | |
| Numericable LLC Tranche B 12LN, term loan 3 month U.S. LIBOR + 3.680% 7.7666% 1/31/26 (e)(f)(k) | | 370,976 | 332,721 |
| Chemicals - 0.4% | | | |
| Consolidated Energy Finance SA Tranche B 1LN, term loan 1 month U.S. LIBOR + 3.500% 6.3633% 5/7/25 (b)(e)(f)(k) | | 167,875 | 159,481 |
| Discovery Purchaser Corp. 1LN, term loan CME Term SOFR 1 Month Index + 4.370% 7.9683% 10/4/29 (e)(f)(k) | | 80,000 | 72,980 |
| Starfruit U.S. Holdco LLC Tranche B, term loan 1 month U.S. LIBOR + 2.750% 7.1647% 10/1/25 (e)(f)(k) | | 33,289 | 31,313 |
TOTAL CHEMICALS | | | 263,774 |
| Consumer Products - 0.1% | | | |
| The Golub Corp. 2LN, term loan 3 month U.S. LIBOR + 13.500% 16.37% 5/8/26 (b)(e)(f)(k) | | 79,091 | 79,091 |
| Diversified Financial Services - 0.5% | | | |
| BCP Renaissance Parent LLC Tranche B3 1LN, term loan CME Term SOFR 1 Month Index + 3.500% 7.0532% 10/31/26 (e)(f)(k) | | 12,980 | 12,686 |
| HarbourVest Partners LLC Tranche B 1LN, term loan 3 month U.S. LIBOR + 2.250% 5.6621% 3/1/25 (e)(f)(k) | | 15,212 | 14,950 |
| Softbank SVF II Cayman LP 1LN, term loan 3 month U.S. LIBOR + 5.000% 5% 12/31/24 (b)(e)(f)(k) | | 325,030 | 325,030 |
TOTAL DIVERSIFIED FINANCIAL SERVICES | | | 352,666 |
| Energy - 0.2% | | | |
| Citgo Petroleum Corp. Tranche B 1LN, term loan 1 month U.S. LIBOR + 6.250% 10.0039% 3/28/24 (e)(f)(k) | | 136,355 | 136,253 |
| Mesquite Energy, Inc.: | | | |
| 1LN, term loan 3 month U.S. LIBOR + 8.000% 0% (b)(f)(g)(k) | | 65,772 | 0 |
| term loan 3 month U.S. LIBOR + 0.000% 0% (b)(f)(g)(k) | | 28,000 | 0 |
TOTAL ENERGY | | | 136,253 |
| Gaming - 0.0% | | | |
| Scientific Games Holdings LP term loan CME Term SOFR 1 Month Index + 3.500% 7.0974% 4/4/29 (e)(f)(k) | | 15,000 | 14,106 |
| Healthcare - 0.1% | | | |
| Electron BidCo, Inc. Tranche B 1LN, term loan 1 month U.S. LIBOR + 3.000% 6.7539% 11/1/28 (e)(f)(k) | | 9,950 | 9,605 |
| Phoenix Newco, Inc. Tranche B 1LN, term loan 1 month U.S. LIBOR + 3.250% 7.0039% 11/15/28 (e)(f)(k) | | 34,825 | 33,489 |
TOTAL HEALTHCARE | | | 43,094 |
| Hotels - 0.0% | | | |
| Travelport Finance Luxembourg SARL 1LN, term loan 3 month U.S. LIBOR + 6.750% 10.4241% 5/30/26 (e)(f)(k) | | 37,343 | 25,043 |
| Insurance - 0.1% | | | |
| Acrisure LLC Tranche B 1LN, term loan 1 month U.S. LIBOR + 4.250% 8.0039% 2/15/27 (e)(f)(k) | | 4,963 | 4,700 |
| Alliant Holdings Intermediate LLC: | | | |
| Tranche B, term loan 1 month U.S. LIBOR + 3.250% 7.0039% 5/10/25 (e)(f)(k) | | 4,739 | 4,598 |
| Tranche B-2 1LN, term loan 1 month U.S. LIBOR + 3.250% 7.0039% 5/9/25 (e)(f)(k) | | 62,888 | 61,001 |
TOTAL INSURANCE | | | 70,299 |
| Leisure - 0.0% | | | |
| Alterra Mountain Co. Tranche B 1LN, term loan 1 month U.S. LIBOR + 3.500% 7.2539% 8/17/28 (e)(f)(k) | | 4,777 | 4,660 |
| Railroad - 0.1% | | | |
| Einstein Merger Sub, Inc. 2LN, term loan 3 month U.S. LIBOR + 7.000% 11.0231% 11/23/29 (b)(e)(f)(k) | | 30,000 | 29,850 |
| Services - 0.4% | | | |
| ABG Intermediate Holdings 2 LLC Tranche B 2LN, term loan CME Term SOFR 1 Month Index + 6.000% 9.8287% 12/20/29 (e)(f)(k) | | 5,000 | 4,600 |
| Ascend Learning LLC 2LN, term loan 1 month U.S. LIBOR + 5.750% 9.5039% 12/10/29 (e)(f)(k) | | 10,000 | 8,463 |
| Finastra U.S.A., Inc. Tranche 2LN, term loan 3 month U.S. LIBOR + 7.250% 10.6207% 6/13/25 (e)(f)(k) | | 220,000 | 161,014 |
| KUEHG Corp. Tranche B 2LN, term loan 3 month U.S. LIBOR + 8.250% 12.0039% 8/22/25 (e)(f)(k) | | 95,000 | 91,472 |
| Maverick Purchaser Sub LLC Tranche B 1LN, term loan 1 month U.S. LIBOR + 4.000% 7.7977% 1/23/27 (e)(f)(k) | | 14,663 | 14,186 |
| Spin Holdco, Inc. Tranche B 1LN, term loan 1 month U.S. LIBOR + 4.000% 7.1441% 3/4/28 (e)(f)(k) | | 39,300 | 34,502 |
TOTAL SERVICES | | | 314,237 |
| Super Retail - 0.2% | | | |
| Bass Pro Group LLC Tranche B 1LN, term loan 1 month U.S. LIBOR + 3.750% 7.5039% 3/5/28 (e)(f)(k) | | 157,212 | 147,701 |
| Michaels Companies, Inc. 1LN, term loan 1 month U.S. LIBOR + 4.250% 7.9241% 4/15/28 (e)(f)(k) | | 24,688 | 18,932 |
TOTAL SUPER RETAIL | | | 166,633 |
| Technology - 0.8% | | | |
| Anastasia Parent LLC Tranche B, term loan 3 month U.S. LIBOR + 3.750% 7.4241% 8/10/25 (e)(f)(k) | | 115,125 | 86,471 |
| Athenahealth Group, Inc.: | | | |
| Tranche B 1LN, term loan CME Term SOFR 1 Month Index + 3.500% 6.9671% 2/15/29 (e)(f)(k) | | 85,293 | 77,760 |
| Tranche DD 1LN, term loan CME Term SOFR 1 Month Index + 3.500% 2/15/29 (f)(k)(l) | | 14,493 | 13,213 |
| MH Sub I LLC 1LN, term loan 1 month U.S. LIBOR + 3.750% 7.5039% 9/15/24 (e)(f)(k) | | 14,848 | 14,276 |
| UKG, Inc. 1LN, term loan 3 month U.S. LIBOR + 3.750% 7.5039% 5/4/26 (e)(f)(k) | | 19,400 | 18,838 |
| Ultimate Software Group, Inc.: | | | |
| 1LN, term loan 1 month U.S. LIBOR + 3.250% 6.9983% 5/3/26 (e)(f)(k) | | 197,757 | 190,533 |
| 2LN, term loan 1 month U.S. LIBOR + 5.250% 8.9983% 5/3/27 (e)(f)(k) | | 186,989 | 171,563 |
| VS Buyer LLC Tranche B 1LN, term loan 1 month U.S. LIBOR + 3.000% 6.7539% 2/28/27 (e)(f)(k) | | 14,625 | 14,198 |
TOTAL TECHNOLOGY | | | 586,852 |
| TOTAL BANK LOAN OBLIGATIONS (Cost $3,259,508) | | | 3,005,342 |
| | | | |
| Preferred Securities - 4.6% |
| | | Principal Amount (a) | Value ($) |
| Automotive & Auto Parts - 0.1% | | | |
| Volkswagen International Finance NV 4.375% (Reg. S) (e)(i) | EUR | 100,000 | 82,853 |
| Banks & Thrifts - 2.0% | | | |
| AIB Group PLC 5.25% (Reg. S) (e)(i) | EUR | 200,000 | 177,008 |
| Axis Bank GIFT City 4.1% (Reg. S) (e)(i) | | 200,000 | 161,223 |
| Bangkok Bank Ltd. PCL 5% (Reg. S) (e)(i) | | 200,000 | 177,227 |
| Bank of America Corp.: | | | |
| 4.3% (e)(i) | | 60,000 | 50,338 |
| 5.875% (e)(i) | | 190,000 | 164,992 |
| Emirates NBD Bank PJSC 6.125% (Reg. S) (e)(i) | | 200,000 | 190,396 |
| HDFC Bank Ltd. 3.7% (Reg. S) (e)(i) | | 200,000 | 160,868 |
| Keb Hana Bank 3.5% (Reg. S) (e)(i) | | 200,000 | 154,087 |
| Tinkoff Credit Systems 6% (d)(e)(i) | | 100,000 | 35,692 |
| Woori Bank 4.25% (Reg. S) (e)(i) | | 200,000 | 174,654 |
TOTAL BANKS & THRIFTS | | | 1,446,485 |
| Building Materials - 0.2% | | | |
| CEMEX S.A.B. de CV 5.125% (d)(e)(i) | | 200,000 | 165,639 |
| Diversified Financial Services - 0.6% | | | |
| CAS Capital No 1 Ltd. 4% (Reg. S) (e)(i) | | 400,000 | 257,030 |
| LeasePlan Corp. NV 7.375% (Reg. S) (e)(i) | EUR | 200,000 | 193,481 |
TOTAL DIVERSIFIED FINANCIAL SERVICES | | | 450,511 |
| Energy - 0.1% | | | |
| Repsol International Finance BV 4.247% (e)(i) | EUR | 100,000 | 88,444 |
| Homebuilders/Real Estate - 0.4% | | | |
| Abertis Infraestructuras Finance BV 3.248% (Reg. S) (e)(i) | EUR | 100,000 | 84,015 |
| CIFI Holdings Group Co. Ltd. 11.581% (Reg. S) (e)(f)(i) | | 200,000 | 12,818 |
| CPI Property Group SA 4.875% (Reg. S) (e)(i) | EUR | 200,000 | 113,006 |
| RKI Overseas Finance 2017 (A) 7% (Reg. S) (i) | | 200,000 | 59,173 |
| Yuzhou Properties Co. U.S. TREASURY 5 YEAR INDEX + 8.520% 5.375% (Reg. S) (e)(f)(g)(i) | | 200,000 | 4,000 |
TOTAL HOMEBUILDERS/REAL ESTATE | | | 273,012 |
| Technology - 0.3% | | | |
| Network i2i Ltd. 5.65% (Reg. S) (e)(i) | | 200,000 | 178,315 |
| Telecommunications - 0.4% | | | |
| Telefonica Europe BV: | | | |
| 3.875% (Reg. S) (e)(i) | EUR | 200,000 | 177,874 |
| 4.375% (Reg. S) (e)(i) | EUR | 100,000 | 97,126 |
TOTAL TELECOMMUNICATIONS | | | 275,000 |
| Utilities - 0.5% | | | |
| Electricite de France SA: | | | |
| 3.375% (e)(i) | EUR | 200,000 | 129,331 |
| 4% (Reg. S) (e)(i) | EUR | 100,000 | 87,022 |
| 5% (Reg. S) (e)(i) | EUR | 100,000 | 87,805 |
| Veolia Environnement SA 2.5% (Reg. S) (e)(i) | EUR | 100,000 | 77,669 |
TOTAL UTILITIES | | | 381,827 |
| TOTAL PREFERRED SECURITIES (Cost $4,746,820) | | | 3,342,086 |
| | | | |
| Money Market Funds - 3.5% |
| | | Shares | Value ($) |
Fidelity Cash Central Fund 3.10% (m) (Cost $2,538,540) | | 2,538,125 | 2,538,633 |
| | | | |
| TOTAL INVESTMENT IN SECURITIES - 98.6% (Cost $87,879,693) | 71,161,132 |
NET OTHER ASSETS (LIABILITIES) - 1.4% | 1,035,275 |
| NET ASSETS - 100.0% | 72,196,407 |
| | |
Currency Abbreviations
| EUR | - | European Monetary Unit |
Legend
| (a) | Amount is stated in United States dollars unless otherwise noted. |
| (c) | Restricted securities (including private placements) - Investment in securities not registered under the Securities Act of 1933 (excluding 144A issues). At the end of the period, the value of restricted securities (excluding 144A issues) amounted to $636,480 or 0.9% of net assets. |
| (d) | Security exempt from registration under Rule 144A of the Securities Act of 1933. These securities may be resold in transactions exempt from registration, normally to qualified institutional buyers. At the end of the period, the value of these securities amounted to $38,845,226 or 53.8% of net assets. |
| (e) | Coupon rates for floating and adjustable rate securities reflect the rates in effect at period end. |
| (f) | Coupon is indexed to a floating interest rate which may be multiplied by a specified factor and/or subject to caps or floors. |
| (g) | Non-income producing - Security is in default. |
| (h) | Security or a portion of the security purchased on a delayed delivery or when-issued basis. |
| (i) | Security is perpetual in nature with no stated maturity date. |
| (k) | Remaining maturities of bank loan obligations may be less than the stated maturities shown as a result of contractual or optional prepayments by the borrower. Such prepayments cannot be predicted with certainty. |
| (l) | Position or a portion of the position represents an unfunded loan commitment. At period end, the total principal amount and market value of unfunded commitments totaled $14,493 and $13,213, respectively. |
| (m) | Affiliated fund that is generally available only to investment companies and other accounts managed by Fidelity Investments. The rate quoted is the annualized seven-day yield of the fund at period end. A complete unaudited listing of the fund's holdings as of its most recent quarter end is available upon request. In addition, each Fidelity Central Fund's financial statements are available on the SEC's website or upon request. |
| Additional information on each restricted holding is as follows: |
| Security | Acquisition Date | Acquisition Cost ($) |
| Chesapeake Energy Corp. | 2/10/21 | 805 |
| | | |
| Mesquite Energy, Inc. 15% 7/15/23 | 7/10/20 - 1/18/22 | 27,566 |
| | | |
| Mesquite Energy, Inc. 15% 7/15/23 | 11/05/20 - 1/18/22 | 47,694 |
| | | |
| New Cotai LLC/New Cotai Capital Corp. | 9/11/20 | 623,261 |
| | | |
| Northeast Grocery, Inc. | 11/08/21 | 5,075 |
| | | |
| Southeastern Grocers, Inc. | 6/01/18 | 54,475 |
| | | |
Affiliated Central Funds
Fiscal year to date information regarding the Fund's investments in Fidelity Central Funds, including the ownership percentage, is presented below.
| Affiliate | Value, beginning of period ($) | Purchases ($) | Sales Proceeds ($) | Dividend Income ($) | Realized Gain (loss) ($) | Change in Unrealized appreciation (depreciation) ($) | Value, end of period ($) | % ownership, end of period |
| Fidelity Cash Central Fund 3.10% | 3,385,473 | 24,385,146 | 25,231,986 | 38,729 | - | - | 2,538,633 | 0.0% |
| Fidelity Securities Lending Cash Central Fund 3.10% | 3,300 | 26,877 | 30,177 | 1 | - | - | - | 0.0% |
| Total | 3,388,773 | 24,412,023 | 25,262,163 | 38,730 | - | - | 2,538,633 | |
| | | | | | | | | |
Amounts in the income column in the above table include any capital gain distributions from underlying funds, which are presented in the corresponding line item in the Statement of Operations, if applicable.
Amount for Fidelity Securities Lending Cash Central Fund represents the income earned on investing cash collateral, less rebates paid to borrowers and any lending agent fees associated with the loan, plus any premium payments received for lending certain types of securities.
Investment Valuation
The following is a summary of the inputs used, as of October 31, 2022, involving the Fund's assets and liabilities carried at fair value. The inputs or methodology used for valuing securities may not be an indication of the risk associated with investing in those securities. For more information on valuation inputs, and their aggregation into the levels used below, please refer to the Investment Valuation section in the accompanying Notes to Financial Statements.
| Valuation Inputs at Reporting Date: |
| Description | Total ($) | Level 1 ($) | Level 2 ($) | Level 3 ($) |
Investments in Securities: | | | | |
|
| Equities: | | | | |
Communication Services | 120,481 | - | - | 120,481 |
Consumer Discretionary | 15,233 | - | - | 15,233 |
Consumer Staples | 181,660 | - | - | 181,660 |
Energy | 1,484,898 | 873,997 | 70,730 | 540,171 |
Utilities | 337,257 | 149,190 | 188,067 | - |
|
| Corporate Bonds | 58,185,885 | - | 57,527,151 | 658,734 |
|
| Government Obligations | 1,949,657 | - | 1,949,657 | - |
|
| Bank Loan Obligations | 3,005,342 | - | 1,978,405 | 1,026,937 |
|
| Preferred Securities | 3,342,086 | - | 3,342,086 | - |
|
| Money Market Funds | 2,538,633 | 2,538,633 | - | - |
| Total Investments in Securities: | 71,161,132 | 3,561,820 | 65,056,096 | 2,543,216 |
The following is a reconciliation of Investments in Securities for which Level 3 inputs were used in determining value:
| |
| Investments in Securities: | |
| Bank Loan Obligations | | | |
| Beginning Balance | $ | 600,731 | |
| Net Realized Gain (Loss) on Investment Securities | | 16 | |
| Net Unrealized Gain (Loss) on Investment Securities | | (5,416) | |
| Cost of Purchases | | 439,352 | |
| Proceeds of Sales | | (8,533) | |
| Amortization/Accretion | | 787 | |
| Transfers into Level 3 | | - | |
| Transfers out of Level 3 | | - | |
| Ending Balance | $ | 1,026,937 | |
| The change in unrealized gain (loss) for the period attributable to Level 3 securities held at October 31, 2022 | $ | (5,416) | |
| Other Investments in Securities | | | |
| Beginning Balance | $ | 1,362,928 | |
| Net Realized Gain (Loss) on Investment Securities | | - | |
| Net Unrealized Gain (Loss) on Investment Securities | | 120,103 | |
| Cost of Purchases | | 2,432 | |
| Proceeds of Sales | | - | |
| Amortization/Accretion | | 816 | |
| Transfers into Level 3 | | 30,000 | |
| Transfers out of Level 3 | | - | |
| Ending Balance | $ | 1,516,279 | |
| The change in unrealized gain (loss) for the period attributable to Level 3 securities held at October 31, 2022 | $ | 120,103 | |
| The information used in the above reconciliation represents fiscal year to date activity for any Investments in Securities identified as using Level 3 inputs at either the beginning or the end of the current fiscal period. Cost of purchases and proceeds of sales may include securities received and/or delivered through in-kind transactions. Transfers into Level 3 were attributable to a lack of observable market data resulting from decreases in market activity, decreases in liquidity, security restructurings or corporate actions. Transfers out of Level 3 were attributable to observable market data becoming available for those securities. Transfers in or out of Level 3 represent the beginning value of any Security or Instrument where a change in the pricing level occurred from the beginning to the end of the period. The cost of purchases and the proceeds of sales may include securities received or delivered through corporate actions or exchanges. Realized and unrealized gains (losses) disclosed in the reconciliation are included in Net Gain (Loss) on the Fund's Statement of Operations. | |
| Statement of Assets and Liabilities |
| | | | October 31, 2022 (Unaudited) |
| | | | | |
| Assets | | | | |
| Investment in securities, at value - See accompanying schedule: | | | | |
Unaffiliated issuers (cost $85,341,153) | | $68,622,499 | | |
Fidelity Central Funds (cost $2,538,540) | | 2,538,633 | | |
| | | | | |
| Total Investment in Securities (cost $87,879,693) | | | $ | 71,161,132 |
| Cash | | | | 69,481 |
| Foreign currency held at value (cost $1,796) | | | | 1,789 |
| Receivable for investments sold | | | | 100,833 |
| Receivable for fund shares sold | | | | 41,826 |
| Dividends receivable | | | | 1,633 |
| Interest receivable | | | | 1,151,589 |
| Distributions receivable from Fidelity Central Funds | | | | 11,843 |
| Prepaid expenses | | | | 126 |
| Receivable from investment adviser for expense reductions | | | | 8,439 |
Total assets | | | | 72,548,691 |
| Liabilities | | | | |
| Payable for investments purchased | | | | |
Regular delivery | | $59,243 | | |
Delayed delivery | | 96,952 | | |
| Payable for fund shares redeemed | | 32,734 | | |
| Distributions payable | | 54,887 | | |
| Accrued management fee | | 42,980 | | |
| Distribution and service plan fees payable | | 3,552 | | |
| Other affiliated payables | | 13,432 | | |
| Other payables and accrued expenses | | 48,504 | | |
| Total Liabilities | | | | 352,284 |
| Net Assets | | | $ | 72,196,407 |
| Net Assets consist of: | | | | |
| Paid in capital | | | $ | 98,258,383 |
| Total accumulated earnings (loss) | | | | (26,061,976) |
| Net Assets | | | $ | 72,196,407 |
| | | | | |
| Net Asset Value and Maximum Offering Price | | | | |
| Class A : | | | | |
Net Asset Value and redemption price per share ($7,569,655 ÷ 969,301 shares) (a) | | | $ | 7.81 |
| Maximum offering price per share (100/96.00 of $7.81) | | | $ | 8.14 |
| Class M : | | | | |
Net Asset Value and redemption price per share ($2,486,791 ÷ 318,486 shares) (a) | | | $ | 7.81 |
| Maximum offering price per share (100/96.00 of $7.81) | | | $ | 8.14 |
| Class C : | | | | |
Net Asset Value and offering price per share ($1,772,076 ÷ 226,922 shares) (a) | | | $ | 7.81 |
| Global High Income : | | | | |
Net Asset Value , offering price and redemption price per share ($57,643,926 ÷ 7,381,700 shares) | | | $ | 7.81 |
| Class I : | | | | |
Net Asset Value , offering price and redemption price per share ($2,723,959 ÷ 348,784 shares) | | | $ | 7.81 |
(a)Redemption price per share is equal to net asset value less any applicable contingent deferred sales charge. |
| Statement of Operations |
| | | | Six months ended October 31, 2022 (Unaudited) |
| Investment Income | | | | |
| Dividends | | | $ | 274,063 |
| Interest | | | | 2,311,560 |
| Income from Fidelity Central Funds (including $1 from security lending) | | | | 38,730 |
| Total Income | | | | 2,624,353 |
| Expenses | | | | |
| Management fee | $ | 289,379 | | |
| Transfer agent fees | | 67,651 | | |
| Distribution and service plan fees | | 24,478 | | |
| Accounting fees | | 17,197 | | |
| Custodian fees and expenses | | 6,617 | | |
| Independent trustees' fees and expenses | | 147 | | |
| Registration fees | | 23,746 | | |
| Audit | | 46,428 | | |
| Legal | | 11,736 | | |
| Miscellaneous | | 266 | | |
| Total expenses before reductions | | 487,645 | | |
| Expense reductions | | (75,559) | | |
| Total expenses after reductions | | | | 412,086 |
| Net Investment income (loss) | | | | 2,212,267 |
| Realized and Unrealized Gain (Loss) | | | | |
| Net realized gain (loss) on: | | | | |
| Investment Securities: | | | | |
| Unaffiliated issuers | | (3,569,465) | | |
| Foreign currency transactions | | (15,647) | | |
| Total net realized gain (loss) | | | | (3,585,112) |
| Change in net unrealized appreciation (depreciation) on: | | | | |
| Investment Securities: | | | | |
| Unaffiliated issuers | | (5,793,028) | | |
| Assets and liabilities in foreign currencies | | 5,573 | | |
| Total change in net unrealized appreciation (depreciation) | | | | (5,787,455) |
| Net gain (loss) | | | | (9,372,567) |
| Net increase (decrease) in net assets resulting from operations | | | $ | (7,160,300) |
| Statement of Changes in Net Assets |
| |
| | Six months ended October 31, 2022 (Unaudited) | | Year ended April 30, 2022 |
| Increase (Decrease) in Net Assets | | | | |
| Operations | | | | |
| Net investment income (loss) | $ | 2,212,267 | $ | 4,646,873 |
| Net realized gain (loss) | | (3,585,112) | | (53,257) |
| Change in net unrealized appreciation (depreciation) | | (5,787,455) | | (12,743,194) |
| Net increase (decrease) in net assets resulting from operations | | (7,160,300) | | (8,149,578) |
| Distributions to shareholders | | (1,971,469) | | (4,704,486) |
| Share transactions - net increase (decrease) | | (14,917,954) | | (3,075,785) |
| Total increase (decrease) in net assets | | (24,049,723) | | (15,929,849) |
| | | | | |
| Net Assets | | | | |
| Beginning of period | | 96,246,130 | | 112,175,979 |
| End of period | $ | 72,196,407 | $ | 96,246,130 |
| | | | | |
| | | | | |
Financial Highlights
| Fidelity Advisor® Global High Income Fund Class A |
| |
| | Six months ended (Unaudited) October 31, 2022 | | Years ended April 30, 2022 | | 2021 | | 2020 | | 2019 | | 2018 |
Selected Per-Share Data | | | | | | | | | | | | |
| Net asset value, beginning of period | $ | 8.69 | $ | 9.79 | $ | 8.38 | $ | 9.48 | $ | 9.61 | $ | 9.54 |
| Income from Investment Operations | | | | | | | | | | | | |
Net investment income (loss) A,B | | .212 | | .367 | | .391 | | .445 | | .468 | | .462 |
| Net realized and unrealized gain (loss) | | (.906) | | (1.089) | | 1.394 | | (1.120) | | (.115) | | .006 |
| Total from investment operations | | (.694) | | (.722) | | 1.785 | | (.675) | | .353 | | .468 |
| Distributions from net investment income | | (.186) | | (.378) | | (.375) | | (.425) | | (.457) | | (.399) |
| Distributions from net realized gain | | - | | - | | - | | - | | (.026) | | - |
| Total distributions | | (.186) | | (.378) | | (.375) | | (.425) | | (.483) | | (.399) |
Redemption fees added to paid in capital A | | - | | - | | - | | - | | - | | .001 |
| Net asset value, end of period | $ | 7.81 | $ | 8.69 | $ | 9.79 | $ | 8.38 | $ | 9.48 | $ | 9.61 |
Total Return C,D,E | | (8.05)% | | (7.64)% | | 21.59% | | (7.44)% | | 3.88% | | 4.94% |
Ratios to Average Net Assets B,F,G | | | | | | | | | | | | |
| Expenses before reductions | | 1.37% H | | 1.37% | | 1.34% | | 1.34% | | 1.32% | | 1.31% |
| Expenses net of fee waivers, if any | | 1.17% H | | 1.16% | | 1.25% | | 1.25% | | 1.25% | | 1.25% |
| Expenses net of all reductions | | 1.17% H | | 1.16% | | 1.25% | | 1.25% | | 1.25% | | 1.25% |
| Net investment income (loss) | | 5.10% H | | 3.89% | | 4.17% | | 4.77% | | 5.00% | | 4.75% |
| Supplemental Data | | | | | | | | | | | | |
| Net assets, end of period (000 omitted) | $ | 7,570 | $ | 15,467 | $ | 8,582 | $ | 5,927 | $ | 7,365 | $ | 8,712 |
Portfolio turnover rate I | | 19% H | | 45% | | 53% | | 54% | | 44% | | 48% |
A Calculated based on average shares outstanding during the period.
B Net investment income (loss) is affected by the timing of the declaration of dividends by any underlying mutual funds or exchange-traded funds (ETFs). Net investment income (loss) of any mutual funds or ETFs is not included in the Fund's net investment income (loss) ratio.
C Total returns for periods of less than one year are not annualized.
D Total returns would have been lower if certain expenses had not been reduced during the applicable periods shown.
E Total returns do not include the effect of the sales charges.
F Fees and expenses of any underlying mutual funds or exchange-traded funds (ETFs) are not included in the Fund's expense ratio. The Fund indirectly bears its proportionate share of these expenses. For additional expense information related to investments in Fidelity Central Funds, please refer to the "Investments in Fidelity Central Funds" note found in the Notes to Financial Statements section of the most recent Annual or Semi-Annual report.
G Expense ratios reflect operating expenses of the class. Expenses before reductions do not reflect amounts reimbursed, waived, or reduced through arrangements with the investment adviser, brokerage services, or other offset arrangements, if applicable, and do not represent the amount paid by the class during periods when reimbursements, waivers or reductions occur.
H Annualized
I Amount does not include the portfolio activity of any underlying mutual funds or exchange-traded funds (ETFs).
| Fidelity Advisor® Global High Income Fund Class M |
| |
| | Six months ended (Unaudited) October 31, 2022 | | Years ended April 30, 2022 | | 2021 | | 2020 | | 2019 | | 2018 |
Selected Per-Share Data | | | | | | | | | | | | |
| Net asset value, beginning of period | $ | 8.69 | $ | 9.79 | $ | 8.38 | $ | 9.48 | $ | 9.61 | $ | 9.54 |
| Income from Investment Operations | | | | | | | | | | | | |
Net investment income (loss) A,B | | .210 | | .372 | | .389 | | .445 | | .467 | | .462 |
| Net realized and unrealized gain (loss) | | (.904) | | (1.094) | | 1.396 | | (1.120) | | (.114) | | .006 |
| Total from investment operations | | (.694) | | (.722) | | 1.785 | | (.675) | | .353 | | .468 |
| Distributions from net investment income | | (.186) | | (.378) | | (.375) | | (.425) | | (.457) | | (.399) |
| Distributions from net realized gain | | - | | - | | - | | - | | (.026) | | - |
| Total distributions | | (.186) | | (.378) | | (.375) | | (.425) | | (.483) | | (.399) |
Redemption fees added to paid in capital A | | - | | - | | - | | - | | - | | .001 |
| Net asset value, end of period | $ | 7.81 | $ | 8.69 | $ | 9.79 | $ | 8.38 | $ | 9.48 | $ | 9.61 |
Total Return C,D,E | | (8.05)% | | (7.64)% | | 21.59% | | (7.44)% | | 3.88% | | 4.94% |
Ratios to Average Net Assets B,F,G | | | | | | | | | | | | |
| Expenses before reductions | | 1.44% H | | 1.41% | | 1.41% | | 1.41% | | 1.40% | | 1.40% |
| Expenses net of fee waivers, if any | | 1.18% H | | 1.16% | | 1.25% | | 1.25% | | 1.25% | | 1.25% |
| Expenses net of all reductions | | 1.18% H | | 1.16% | | 1.25% | | 1.25% | | 1.25% | | 1.25% |
| Net investment income (loss) | | 5.10% H | | 3.89% | | 4.16% | | 4.77% | | 5.00% | | 4.75% |
| Supplemental Data | | | | | | | | | | | | |
| Net assets, end of period (000 omitted) | $ | 2,487 | $ | 3,118 | $ | 3,164 | $ | 2,928 | $ | 3,971 | $ | 4,301 |
Portfolio turnover rate I | | 19% H | | 45% | | 53% | | 54% | | 44% | | 48% |
A Calculated based on average shares outstanding during the period.
B Net investment income (loss) is affected by the timing of the declaration of dividends by any underlying mutual funds or exchange-traded funds (ETFs). Net investment income (loss) of any mutual funds or ETFs is not included in the Fund's net investment income (loss) ratio.
C Total returns for periods of less than one year are not annualized.
D Total returns would have been lower if certain expenses had not been reduced during the applicable periods shown.
E Total returns do not include the effect of the sales charges.
F Fees and expenses of any underlying mutual funds or exchange-traded funds (ETFs) are not included in the Fund's expense ratio. The Fund indirectly bears its proportionate share of these expenses. For additional expense information related to investments in Fidelity Central Funds, please refer to the "Investments in Fidelity Central Funds" note found in the Notes to Financial Statements section of the most recent Annual or Semi-Annual report.
G Expense ratios reflect operating expenses of the class. Expenses before reductions do not reflect amounts reimbursed, waived, or reduced through arrangements with the investment adviser, brokerage services, or other offset arrangements, if applicable, and do not represent the amount paid by the class during periods when reimbursements, waivers or reductions occur.
H Annualized
I Amount does not include the portfolio activity of any underlying mutual funds or exchange-traded funds (ETFs).
| Fidelity Advisor® Global High Income Fund Class C |
| |
| | Six months ended (Unaudited) October 31, 2022 | | Years ended April 30, 2022 | | 2021 | | 2020 | | 2019 | | 2018 |
Selected Per-Share Data | | | | | | | | | | | | |
| Net asset value, beginning of period | $ | 8.69 | $ | 9.79 | $ | 8.38 | $ | 9.48 | $ | 9.61 | $ | 9.54 |
| Income from Investment Operations | | | | | | | | | | | | |
Net investment income (loss) A,B | | .180 | | .301 | | .319 | | .375 | | .398 | | .390 |
| Net realized and unrealized gain (loss) | | (.905) | | (1.094) | | 1.396 | | (1.119) | | (.115) | | .005 |
| Total from investment operations | | (.725) | | (.793) | | 1.715 | | (.744) | | .283 | | .395 |
| Distributions from net investment income | | (.155) | | (.307) | | (.305) | | (.356) | | (.387) | | (.326) |
| Distributions from net realized gain | | - | | - | | - | | - | | (.026) | | - |
| Total distributions | | (.155) | | (.307) | | (.305) | | (.356) | | (.413) | | (.326) |
Redemption fees added to paid in capital A | | - | | - | | - | | - | | - | | .001 |
| Net asset value, end of period | $ | 7.81 | $ | 8.69 | $ | 9.79 | $ | 8.38 | $ | 9.48 | $ | 9.61 |
Total Return C,D,E | | (8.40)% | | (8.33)% | | 20.69% | | (8.13)% | | 3.10% | | 4.16% |
Ratios to Average Net Assets B,F,G | | | | | | | | | | | | |
| Expenses before reductions | | 2.18% H | | 2.12% | | 2.14% | | 2.11% | | 2.08% | | 2.08% |
| Expenses net of fee waivers, if any | | 1.93% H | | 1.91% | | 2.00% | | 2.00% | | 2.00% | | 2.00% |
| Expenses net of all reductions | | 1.93% H | | 1.91% | | 2.00% | | 2.00% | | 2.00% | | 2.00% |
| Net investment income (loss) | | 4.35% H | | 3.14% | | 3.41% | | 4.02% | | 4.25% | | 4.00% |
| Supplemental Data | | | | | | | | | | | | |
| Net assets, end of period (000 omitted) | $ | 1,772 | $ | 2,246 | $ | 3,249 | $ | 2,684 | $ | 3,723 | $ | 4,420 |
Portfolio turnover rate I | | 19% H | | 45% | | 53% | | 54% | | 44% | | 48% |
A Calculated based on average shares outstanding during the period.
B Net investment income (loss) is affected by the timing of the declaration of dividends by any underlying mutual funds or exchange-traded funds (ETFs). Net investment income (loss) of any mutual funds or ETFs is not included in the Fund's net investment income (loss) ratio.
C Total returns for periods of less than one year are not annualized.
D Total returns would have been lower if certain expenses had not been reduced during the applicable periods shown.
E Total returns do not include the effect of the contingent deferred sales charge.
F Fees and expenses of any underlying mutual funds or exchange-traded funds (ETFs) are not included in the Fund's expense ratio. The Fund indirectly bears its proportionate share of these expenses. For additional expense information related to investments in Fidelity Central Funds, please refer to the "Investments in Fidelity Central Funds" note found in the Notes to Financial Statements section of the most recent Annual or Semi-Annual report.
G Expense ratios reflect operating expenses of the class. Expenses before reductions do not reflect amounts reimbursed, waived, or reduced through arrangements with the investment adviser, brokerage services, or other offset arrangements, if applicable, and do not represent the amount paid by the class during periods when reimbursements, waivers or reductions occur.
H Annualized
I Amount does not include the portfolio activity of any underlying mutual funds or exchange-traded funds (ETFs).
| Fidelity® Global High Income Fund |
| |
| | Six months ended (Unaudited) October 31, 2022 | | Years ended April 30, 2022 | | 2021 | | 2020 | | 2019 | | 2018 |
Selected Per-Share Data | | | | | | | | | | | | |
| Net asset value, beginning of period | $ | 8.69 | $ | 9.79 | $ | 8.38 | $ | 9.48 | $ | 9.62 | $ | 9.54 |
| Income from Investment Operations | | | | | | | | | | | | |
Net investment income (loss) A,B | | .221 | | .397 | | .413 | | .468 | | .491 | | .487 |
| Net realized and unrealized gain (loss) | | (.905) | | (1.094) | | 1.395 | | (1.119) | | (.125) | | .015 |
| Total from investment operations | | (.684) | | (.697) | | 1.808 | | (.651) | | .366 | | .502 |
| Distributions from net investment income | | (.196) | | (.403) | | (.398) | | (.449) | | (.480) | | (.423) |
| Distributions from net realized gain | | - | | - | | - | | - | | (.026) | | - |
| Total distributions | | (.196) | | (.403) | | (.398) | | (.449) | | (.506) | | (.423) |
Redemption fees added to paid in capital A | | - | | - | | - | | - | | - | | .001 |
| Net asset value, end of period | $ | 7.81 | $ | 8.69 | $ | 9.79 | $ | 8.38 | $ | 9.48 | $ | 9.62 |
Total Return C,D | | (7.93)% | | (7.40)% | | 21.89% | | (7.21)% | | 4.03% | | 5.31% |
Ratios to Average Net Assets B,E,F | | | | | | | | | | | | |
| Expenses before reductions | | 1.10% G | | 1.04% | | 1.04% | | 1.03% | | 1.01% | | 1.02% |
| Expenses net of fee waivers, if any | | .93% G | | .91% | | 1.00% | | 1.00% | | 1.00% | | 1.00% |
| Expenses net of all reductions | | .93% G | | .91% | | 1.00% | | 1.00% | | 1.00% | | 1.00% |
| Net investment income (loss) | | 5.35% G | | 4.15% | | 4.41% | | 5.02% | | 5.25% | | 5.00% |
| Supplemental Data | | | | | | | | | | | | |
| Net assets, end of period (000 omitted) | $ | 57,644 | $ | 72,441 | $ | 89,338 | $ | 73,039 | $ | 97,619 | $ | 125,192 |
Portfolio turnover rate H | | 19% G | | 45% | | 53% | | 54% | | 44% | | 48% |
A Calculated based on average shares outstanding during the period.
B Net investment income (loss) is affected by the timing of the declaration of dividends by any underlying mutual funds or exchange-traded funds (ETFs). Net investment income (loss) of any mutual funds or ETFs is not included in the Fund's net investment income (loss) ratio.
C Total returns for periods of less than one year are not annualized.
D Total returns would have been lower if certain expenses had not been reduced during the applicable periods shown.
E Fees and expenses of any underlying mutual funds or exchange-traded funds (ETFs) are not included in the Fund's expense ratio. The Fund indirectly bears its proportionate share of these expenses. For additional expense information related to investments in Fidelity Central Funds, please refer to the "Investments in Fidelity Central Funds" note found in the Notes to Financial Statements section of the most recent Annual or Semi-Annual report.
F Expense ratios reflect operating expenses of the class. Expenses before reductions do not reflect amounts reimbursed, waived, or reduced through arrangements with the investment adviser, brokerage services, or other offset arrangements, if applicable, and do not represent the amount paid by the class during periods when reimbursements, waivers or reductions occur.
G Annualized
H Amount does not include the portfolio activity of any underlying mutual funds or exchange-traded funds (ETFs).
| Fidelity Advisor® Global High Income Fund Class I |
| |
| | Six months ended (Unaudited) October 31, 2022 | | Years ended April 30, 2022 | | 2021 | | 2020 | | 2019 | | 2018 |
Selected Per-Share Data | | | | | | | | | | | | |
| Net asset value, beginning of period | $ | 8.69 | $ | 9.79 | $ | 8.38 | $ | 9.48 | $ | 9.62 | $ | 9.54 |
| Income from Investment Operations | | | | | | | | | | | | |
Net investment income (loss) A,B | | .220 | | .400 | | .411 | | .473 | | .491 | | .485 |
| Net realized and unrealized gain (loss) | | (.904) | | (1.097) | | 1.397 | | (1.124) | | (.125) | | .017 |
| Total from investment operations | | (.684) | | (.697) | | 1.808 | | (.651) | | .366 | | .502 |
| Distributions from net investment income | | (.196) | | (.403) | | (.398) | | (.449) | | (.480) | | (.423) |
| Distributions from net realized gain | | - | | - | | - | | - | | (.026) | | - |
| Total distributions | | (.196) | | (.403) | | (.398) | | (.449) | | (.506) | | (.423) |
Redemption fees added to paid in capital A | | - | | - | | - | | - | | - | | .001 |
| Net asset value, end of period | $ | 7.81 | $ | 8.69 | $ | 9.79 | $ | 8.38 | $ | 9.48 | $ | 9.62 |
Total Return C,D | | (7.93)% | | (7.40)% | | 21.89% | | (7.21)% | | 4.03% | | 5.31% |
Ratios to Average Net Assets B,E,F | | | | | | | | | | | | |
| Expenses before reductions | | 1.14% G | | 1.05% | | 1.05% | | 1.03% | | 1.05% | | 1.03% |
| Expenses net of fee waivers, if any | | .93% G | | .91% | | 1.00% | | 1.00% | | 1.00% | | 1.00% |
| Expenses net of all reductions | | .93% G | | .91% | | 1.00% | | 1.00% | | 1.00% | | 1.00% |
| Net investment income (loss) | | 5.35% G | | 4.14% | | 4.42% | | 5.02% | | 5.25% | | 5.00% |
| Supplemental Data | | | | | | | | | | | | |
| Net assets, end of period (000 omitted) | $ | 2,724 | $ | 2,975 | $ | 7,844 | $ | 4,350 | $ | 7,352 | $ | 9,999 |
Portfolio turnover rate H | | 19% G | | 45% | | 53% | | 54% | | 44% | | 48% |
A Calculated based on average shares outstanding during the period.
B Net investment income (loss) is affected by the timing of the declaration of dividends by any underlying mutual funds or exchange-traded funds (ETFs). Net investment income (loss) of any mutual funds or ETFs is not included in the Fund's net investment income (loss) ratio.
C Total returns for periods of less than one year are not annualized.
D Total returns would have been lower if certain expenses had not been reduced during the applicable periods shown.
E Fees and expenses of any underlying mutual funds or exchange-traded funds (ETFs) are not included in the Fund's expense ratio. The Fund indirectly bears its proportionate share of these expenses. For additional expense information related to investments in Fidelity Central Funds, please refer to the "Investments in Fidelity Central Funds" note found in the Notes to Financial Statements section of the most recent Annual or Semi-Annual report.
F Expense ratios reflect operating expenses of the class. Expenses before reductions do not reflect amounts reimbursed, waived, or reduced through arrangements with the investment adviser, brokerage services, or other offset arrangements, if applicable, and do not represent the amount paid by the class during periods when reimbursements, waivers or reductions occur.
G Annualized
H Amount does not include the portfolio activity of any underlying mutual funds or exchange-traded funds (ETFs).
For the period ended October 31, 2022
1. Organization.
Fidelity Global High Income Fund (the Fund) is a fund of Fidelity Summer Street Trust (the Trust) and is authorized to issue an unlimited number of shares. The Trust is registered under the Investment Company Act of 1940, as amended (the 1940 Act), as an open-end management investment company organized as a Massachusetts business trust. The Fund offers Class A, Class M, Class C, Global High Income, and Class I shares, each of which has equal rights as to assets and voting privileges. Each class has exclusive voting rights with respect to matters that affect that class. Class C shares will automatically convert to Class A shares after a holding period of eight years from the initial date of purchase, with certain exceptions. The Fund's investments in emerging markets can be subject to social, economic, regulatory, and political uncertainties and can be extremely volatile.
2. Investments in Fidelity Central Funds.
Funds may invest in Fidelity Central Funds, which are open-end investment companies generally available only to other investment companies and accounts managed by the investment adviser and its affiliates. The Schedule of Investments lists any Fidelity Central Funds held as an investment as of period end, but does not include the underlying holdings of each Fidelity Central Fund. An investing fund indirectly bears its proportionate share of the expenses of the underlying Fidelity Central Funds.
Based on its investment objective, each Fidelity Central Fund may invest or participate in various investment vehicles or strategies that are similar to those of the investing fund. These strategies are consistent with the investment objectives of the investing fund and may involve certain economic risks which may cause a decline in value of each of the Fidelity Central Funds and thus a decline in the value of the investing fund.
| Fidelity Central Fund | Investment Manager | Investment Objective | Investment Practices | Expense Ratio A |
| Fidelity Money Market Central Funds | Fidelity Management & Research Company LLC (FMR) | Each fund seeks to obtain a high level of current income consistent with the preservation of capital and liquidity. | Short-term Investments | Less than .005% |
A Expenses expressed as a percentage of average net assets and are as of each underlying Central Fund's most recent annual or semi-annual shareholder report.
A complete unaudited list of holdings for each Fidelity Central Fund is available upon request or at the Securities and Exchange Commission website at www.sec.gov. In addition, the financial statements of the Fidelity Central Funds which contain the significant accounting policies (including investment valuation policies) of those funds, and are not covered by the Report of Independent Registered Public Accounting Firm, are available on the Securities and Exchange Commission website or upon request.
3. Significant Accounting Policies.
The Fund is an investment company and applies the accounting and reporting guidance of the Financial Accounting Standards Board (FASB) Accounting Standards Codification Topic 946 Financial Services - Investment Companies . The financial statements have been prepared in conformity with accounting principles generally accepted in the United States of America (GAAP), which require management to make certain estimates and assumptions at the date of the financial statements. Actual results could differ from those estimates. Subsequent events, if any, through the date that the financial statements were issued have been evaluated in the preparation of the financial statements. The Fund's Schedule of Investments lists any underlying mutual funds or exchange-traded funds (ETFs) but does not include the underlying holdings of these funds. The following summarizes the significant accounting policies of the Fund:
Investment Valuation. Investments are valued as of 4:00 p.m. Eastern time on the last calendar day of the period. The Board of Trustees (the Board) has designated the Fund's investment adviser as the valuation designee responsible for the fair valuation function and performing fair value determinations as needed. The investment adviser has established a Fair Value Committee (the Committee) to carry out the day-to-day fair valuation responsibilities and has adopted policies and procedures to govern the fair valuation process and the activities of the Committee. In accordance with these fair valuation policies and procedures, which have been approved by the Board, the Fund attempts to obtain prices from one or more third party pricing services or brokers to value its investments. When current market prices, quotations or currency exchange rates are not readily available or reliable, investments will be fair valued in good faith by the Committee, in accordance with the policies and procedures. Factors used in determining fair value vary by investment type and may include market or investment specific events, transaction data, estimated cash flows, and market observations of comparable investments. The frequency that the fair valuation procedures are used cannot be predicted and they may be utilized to a significant extent. The Committee manages the Fund's fair valuation practices and maintains the fair valuation policies and procedures. The Fund's investment adviser reports to the Board information regarding the fair valuation process and related material matters.
The Fund categorizes the inputs to valuation techniques used to value its investments into a disclosure hierarchy consisting of three levels as shown below:
Level 1 - unadjusted quoted prices in active markets for identical investments
Level 2 - other significant observable inputs (including quoted prices for similar investments, interest rates, prepayment speeds, etc.)
Level 3 - unobservable inputs (including the Fund's own assumptions based on the best information available)
Valuation techniques used to value the Fund's investments by major category are as follows:
Debt securities, including restricted securities, are valued based on evaluated prices received from third party pricing services or from brokers who make markets in such securities. Corporate bonds, bank loan obligations, foreign government and government agency obligations and preferred securities are valued by pricing services who utilize matrix pricing which considers yield or price of bonds of comparable quality, coupon, maturity and type or by broker-supplied prices. When independent prices are unavailable or unreliable, debt securities may be valued utilizing pricing methodologies which consider similar factors that would be used by third party pricing services. For foreign debt securities, when significant market or security specific events arise, valuations may be determined in good faith in accordance with procedures adopted by the Board. Debt securities are generally categorized as Level 2 in the hierarchy but may be Level 3 depending on the circumstances. The Fund invests a significant portion of its assets in below investment grade securities. The value of these securities can be more volatile due to changes in the credit quality of the issuer and is sensitive to changes in economic, market and regulatory conditions.
Equity securities, including restricted securities, for which market quotations are readily available, are valued at the last reported sale price or official closing price as reported by a third party pricing service on the primary market or exchange on which they are traded and are categorized as Level 1 in the hierarchy. In the event there were no sales during the day or closing prices are not available, securities are valued at the last quoted bid price or may be valued using the last available price and are generally categorized as Level 2 in the hierarchy. For foreign equity securities, when market or security specific events arise, comparisons to the valuation of American Depositary Receipts (ADRs), futures contracts, Exchange-Traded Funds (ETFs) and certain indexes as well as quoted prices for similar securities may be used and would be categorized as Level 2 in the hierarchy. For equity securities, including restricted securities, where observable inputs are limited, assumptions about market activity and risk are used and these securities may be categorized as Level 3 in the hierarchy. Securities, including private placements or other restricted securities, for which observable inputs are not available are valued using alternate valuation approaches, including the market approach, the income approach and cost approach, and are categorized as Level 3 in the hierarchy. The market approach considers factors including the price of recent investments in the same or a similar security or financial metrics of comparable securities. The income approach considers factors including expected future cash flows, security specific risks and corresponding discount rates. The cost approach considers factors including the value of the security's underlying assets and liabilities.
Investments in open-end mutual funds, including the Fidelity Central Funds, are valued at their closing net asset value (NAV) each business day and are categorized as Level 1 in the hierarchy.
The following provides information on Level 3 securities held by the Fund that were valued at period end based on unobservable inputs. These amounts exclude valuations provided by a broker.
| Asset Type | Fair Value | Valuation Technique(s) | Unobservable Input | Amount or Range/Weighted Average | Impact to Valuation from an Increase in Input A |
| Equities | $857,545 | Recovery value | Recovery value | $0.00 | Increase |
| | | Market comparable | Enterprise value/EBITDA multiple (EV/EBITDA) | 2.8 - 8.1 / 4.0 | Increase |
| | | | Discount rate | 3.5% | Decrease |
| | | | Enterprise value/Revenue multiple (EV/R) | 0.3 | Increase |
| | | | Daily production multiple ($/Barrels of oil equivalent per day) | $22,500.00 | Increase |
| | | | Enterprise Value/PV-10 multiple (EV/PV-10) | 0.8 | Increase |
| | | | Enterprise Value/Proved Reserves multiple | 5.9 | Increase |
| | | | Discount for lack of marketability | 20.0% | Decrease |
| | | Discounted cash flow | Discount rate | 10.0% - 13.5% / 10.9% | Decrease |
| | | | Reserve risk rate | 50.0% - 95.0% / 72.5% | Increase |
| | | Book value | Book value multiple | 1.0 | Increase |
| Corporate Bonds | $658,734 | Recovery value | Recovery value | $0.00 | Increase |
| | | Market comparable | Enterprise value/EBITDA multiple (EV/EBITDA) | 2.8 | Increase |
| | | | Daily production multiple ($/Barrels of oil equivalent per day) | $22,500.00 | Increase |
| | | | Enterprise Value/PV-10 multiple (EV/PV-10) | 0.8 | Increase |
| | | | Enterprise Value/Proved Reserves multiple | 5.9 | Increase |
| | | Discounted cash flow | Discount rate | 10.0% | Decrease |
| | | | Reserve risk rate | 50.0% - 95.0% / 72.5% | Increase |
| | | Indicative market price | Evaluated bid | $0.13 - $20.00 / $14.97 | Increase |
| | | Book value | Book value multiple | 1.0 | Increase |
| Bank Loan Obligations | $1,026,937 | Recovery value | Recovery value | $0.00 | Increase |
| | | Market approach | Transaction price | $99.5 - $100.00 / $99.97 | Increase |
| | | Discounted cash flow | Discount rate | 10.6% - 14.3% / 12.7% | Decrease |
| | | Indicative market price | Evaluated bid | $95.00 | Increase |
A Represents the directional change in the fair value of the Level 3 investments that could have resulted from an increase in the corresponding input as of period end. A decrease to the unobservable input would have had the opposite effect. Significant changes in these inputs may have resulted in a significantly higher or lower fair value measurement at period end.
Changes in valuation techniques may result in transfers in or out of an assigned level within the disclosure hierarchy. The aggregate value of investments by input level as of October 31, 2022, as well as a roll forward of Level 3 investments, is included at the end of the Fund's Schedule of Investments.
Foreign Currency. Certain Funds may use foreign currency contracts to facilitate transactions in foreign-denominated securities. Gains and losses from these transactions may arise from changes in the value of the foreign currency or if the counterparties do not perform under the contracts' terms.
Foreign-denominated assets, including investment securities, and liabilities are translated into U.S. dollars at the exchange rates at period end. Purchases and sales of investment securities, income and dividends received, and expenses denominated in foreign currencies are translated into U.S. dollars at the exchange rate in effect on the transaction date.
The effects of exchange rate fluctuations on investments are included with the net realized and unrealized gain (loss) on investment securities. Other foreign currency transactions resulting in realized and unrealized gain (loss) are disclosed separately.
Investment Transactions and Income. For financial reporting purposes, the Fund's investment holdings and NAV include trades executed through the end of the last business day of the period. The NAV per share for processing shareholder transactions is calculated as of the close of business of the New York Stock Exchange (NYSE), normally 4:00 p.m. Eastern time and includes trades executed through the end of the prior business day. Gains and losses on securities sold are determined on the basis of identified cost and include proceeds received from litigation. Commissions paid to certain brokers with whom the investment adviser, or its affiliates, places trades on behalf of a fund include an amount in addition to trade execution, which may be rebated back to a fund. Any such rebates are included in net realized gain (loss) on investments in the Statement of Operations. Dividend income is recorded on the ex-dividend date, except for certain dividends from foreign securities where the ex-dividend date may have passed, which are recorded as soon as the Fund is informed of the ex-dividend date. Non-cash dividends included in dividend income, if any, are recorded at the fair market value of the securities received. Income and capital gain distributions from Fidelity Central Funds, if any, are recorded on the ex-dividend date. Certain distributions received by the Fund represent a return of capital or capital gain. The Fund determines the components of these distributions subsequent to the ex-dividend date, based upon receipt of tax filings or other correspondence relating to the underlying investment. These distributions are recorded as a reduction of cost of investments and/or as a realized gain. Interest income is accrued as earned and includes coupon interest and amortization of premium and accretion of discount on debt securities as applicable. Paid in Kind (PIK) income is recorded at the fair market value of the securities received. Investment income is recorded net of foreign taxes withheld where recovery of such taxes is uncertain. Debt obligations may be placed on non-accrual status and related interest income may be reduced by ceasing current accruals and writing off interest receivables when the collection of all or a portion of interest has become doubtful based on consistently applied procedures. A debt obligation is removed from non-accrual status when the issuer resumes interest payments or when collectability of interest is reasonably assured.
Class Allocations and Expenses. Investment income, realized and unrealized capital gains and losses, common expenses of a fund, and certain fund-level expense reductions, if any, are allocated daily on a pro-rata basis to each class based on the relative net assets of each class to the total net assets of a fund. Each class differs with respect to transfer agent and distribution and service plan fees incurred, as applicable. Certain expense reductions may also differ by class, if applicable. For the reporting period, the allocated portion of income and expenses to each class as a percent of its average net assets may vary due to the timing of recording these transactions in relation to fluctuating net assets of the classes. Expenses directly attributable to a fund are charged to that fund. Expenses attributable to more than one fund are allocated among the respective funds on the basis of relative net assets or other appropriate methods. Expenses included in the accompanying financial statements reflect the expenses of that fund and do not include any expenses associated with any underlying mutual funds or exchange-traded funds. Although not included in a fund's expenses, a fund indirectly bears its proportionate share of these expenses through the net asset value of each underlying mutual fund or exchange-traded fund. Expense estimates are accrued in the period to which they relate and adjustments are made when actual amounts are known.
Income Tax Information and Distributions to Shareholders. Each year, the Fund intends to qualify as a regulated investment company under Subchapter M of the Internal Revenue Code, including distributing substantially all of its taxable income and realized gains. As a result, no provision for U.S. Federal income taxes is required. The Fund files a U.S. federal tax return, in addition to state and local tax returns as required. The Fund's federal income tax returns are subject to examination by the Internal Revenue Service (IRS) for a period of three fiscal years after they are filed. State and local tax returns may be subject to examination for an additional fiscal year depending on the jurisdiction. Foreign taxes are provided for based on the Fund's understanding of the tax rules and rates that exist in the foreign markets in which it invests.
Distributions are declared and recorded daily and paid monthly from net investment income. Distributions from realized gains, if any, are declared and recorded on the ex-dividend date. Income and capital gain distributions are declared separately for each class. Income and capital gain distributions are determined in accordance with income tax regulations, which may differ from GAAP.
Capital accounts within the financial statements are adjusted for permanent book-tax differences. These adjustments have no impact on net assets or the results of operations. Capital accounts are not adjusted for temporary book-tax differences which will reverse in a subsequent period.
Book-tax differences are primarily due to foreign currency transactions, defaulted bonds, market discount, certain conversion ratio adjustments, capital loss carryforwards and losses deferred due to wash sales.
As of period end, the cost and unrealized appreciation (depreciation) in securities, and derivatives if applicable, for federal income tax purposes were as follows:
| Gross unrealized appreciation | $1,973,525 |
| Gross unrealized depreciation | (18,412,195) |
| Net unrealized appreciation (depreciation) | $(16,438,670) |
| Tax cost | $87,599,802 |
Capital loss carryforwards are only available to offset future capital gains of the Fund to the extent provided by regulations and may be limited. The capital loss carryforward information presented below, including any applicable limitation, is estimated as of prior fiscal period end and is subject to adjustment.
| Short-term | $(832,705) |
| Long-term | (5,249,310) |
| Total capital loss carryforward | $(6,082,015) |
Delayed Delivery Transactions and When-Issued Securities. During the period, certain Funds transacted in securities on a delayed delivery or when-issued basis. Payment and delivery may take place after the customary settlement period for that security. The price of the underlying securities and the date when the securities will be delivered and paid for are fixed at the time the transaction is negotiated. Securities purchased on a delayed delivery or when-issued basis are identified as such in the Schedule of Investments. Compensation for interest forgone in the purchase of a delayed delivery or when-issued debt security may be received. With respect to purchase commitments, each applicable Fund identifies securities as segregated in its records with a value at least equal to the amount of the commitment. Payables and receivables associated with the purchases and sales of delayed delivery securities having the same coupon, settlement date and broker are offset. Delayed delivery or when-issued securities that have been purchased from and sold to different brokers are reflected as both payables and receivables in the Statement of Assets and Liabilities under the caption "Delayed delivery", as applicable. Losses may arise due to changes in the value of the underlying securities or if the counterparty does not perform under the contract's terms, or if the issuer does not issue the securities due to political, economic, or other factors.
Restricted Securities (including Private Placements). Funds may invest in securities that are subject to legal or contractual restrictions on resale. These securities generally may be resold in transactions exempt from registration or to the public if the securities are registered. Disposal of these securities may involve time-consuming negotiations and expense, and prompt sale at an acceptable price may be difficult. Information regarding restricted securities held at period end is included at the end of the Schedule of Investments, if applicable.
Loans and Other Direct Debt Instruments. Direct debt instruments are interests in amounts owed to lenders by corporate or other borrowers. These instruments may be in the form of loans, trade claims or other receivables and may include standby financing commitments such as revolving credit facilities that obligate a fund to supply additional cash to the borrower on demand. Loans may be acquired through assignment, participation, or may be made directly to a borrower. Such instruments are presented in the Bank Loan Obligations section in the Schedule of Investments. Certain funds may also invest in unfunded loan commitments, which are contractual obligations for future funding. Information regarding unfunded commitments is included at the end of the Schedule of Investments, if applicable.
4. Purchases and Sales of Investments.
Purchases and sales of securities, other than short-term securities and in-kind transactions, as applicable, are noted in the table below.
| | Purchases ($) | Sales ($) |
| Fidelity Global High Income Fund | 7,003,686 | 20,702,497 |
5. Fees and Other Transactions with Affiliates.
Management Fee. Fidelity Management & Research Company LLC (the investment adviser) and its affiliates provide the Fund with investment management related services for which the Fund pays a monthly management fee. The management fee is the sum of an individual fund fee rate that is based on an annual rate of .60% of the Fund's average net assets and an annualized group fee rate that averaged .10% during the period. The group fee rate is based upon the monthly average net assets of a group of registered investment companies with which the investment adviser has management contracts. The group fee rate decreases as assets under management increase and increases as assets under management decrease. For the reporting period, the total annualized management fee rate was .69% of the Fund's average net assets.
Distribution and Service Plan Fees. In accordance with Rule 12b-1 of the 1940 Act, the Fund has adopted separate Distribution and Service Plans for each class of shares. Certain classes pay Fidelity Distributors Company LLC (FDC), an affiliate of the investment adviser, separate Distribution and Service Fees, each of which is based on an annual percentage of each class' average net assets. In addition, FDC may pay financial intermediaries for selling shares of the Fund and providing shareholder support services. For the period, the Distribution and Service Fee rates, total fees and amounts retained by FDC were as follows:
| | Distribution Fee | Service Fee | Total Fees | Retained by FDC |
| Class A | - % | .25% | $11,449 | $1,787 |
| Class M | - % | .25% | 3,333 | - |
| Class C | .75% | .25% | 9,696 | 368 |
| | | | $24,478 | $2,155 |
Sales Load. FDC may receive a front-end sales charge of up to 4.00% for selling Class A shares and Class M shares, some of which is paid to financial intermediaries for selling shares of the Fund. Depending on the holding period, FDC may receive contingent deferred sales charges levied on Class A, Class M and Class C redemptions. The deferred sales charges are 1.00% for Class C shares, 1.00% for certain purchases of Class A shares and .25% for certain purchases of Class M shares.
For the period, sales charge amounts retained by FDC were as follows:
| | Retained by FDC |
| Class A | $355 |
| Class M | 43 |
| | $398 |
Transfer Agent Fees. Fidelity Investments Institutional Operations Company LLC (FIIOC), an affiliate of the investment adviser, is the transfer, dividend disbursing and shareholder servicing agent for each class of the Fund. FIIOC receives account fees and asset-based fees that vary according to the account size and type of account of the shareholders of the respective classes of the Fund. FIIOC pays for typesetting, printing and mailing of shareholder reports, except proxy statements.
For the period, transfer agent fees for each class were as follows:
| | Amount | % of Class-Level Average Net Assets A |
| Class A | $8,172 | .18 |
| Class M | 3,384 | .25 |
| Class C | 2,431 | .25 |
| Global High Income | 50,839 | .15 |
| Class I | 2,825 | .19 |
| | $67,651 | |
A Annualized
Accounting Fees. Fidelity Service Company, Inc. (FSC), an affiliate of the investment adviser, maintains the Fund's accounting records. The accounting fee is based on the level of average net assets for each month. For the period, the fees were equivalent to the following annualized rates:
| | % of Average Net Assets |
| Fidelity Global High Income Fund | .04 |
Brokerage Commissions. A portion of portfolio transactions were placed with brokerage firms which are affiliates of the investment adviser. Brokerage commissions are included in net realized gain (loss) and change in net unrealized appreciation (depreciation) in the Statement of Operations. The commissions paid to these affiliated firms were as follows:
| | Amount |
| Fidelity Global High Income Fund | $5 |
Interfund Trades. Funds may purchase from or sell securities to other Fidelity Funds under procedures adopted by the Board. The procedures have been designed to ensure these interfund trades are executed in accordance with Rule 17a-7 of the 1940 Act. Any interfund trades are included within the respective purchases and sales amounts shown in the Purchases and Sales of Investments note. Interfund trades during the period are noted in the table below.
| | Purchases ($) | Sales ($) | Realized Gain (Loss) ($) |
| Fidelity Global High Income Fund | - | 31,584 | 5,992 |
6. Committed Line of Credit.
Certain Funds participate with other funds managed by the investment adviser or an affiliate in a $4.25 billion credit facility (the "line of credit") to be utilized for temporary or emergency purposes to fund shareholder redemptions or for other short-term liquidity purposes. The participating funds have agreed to pay commitment fees on their pro-rata portion of the line of credit, which are reflected in Miscellaneous expenses on the Statement of Operations, and are listed below. During the period, there were no borrowings on this line of credit.
| | Amount |
| Fidelity Global High Income Fund | $77 |
7. Security Lending.
Funds lend portfolio securities from time to time in order to earn additional income. Lending agents are used, including National Financial Services (NFS), an affiliate of the investment adviser. Pursuant to a securities lending agreement, NFS will receive a fee, which is capped at 9.9% of a fund's daily lending revenue, for its services as lending agent. A fund may lend securities to certain qualified borrowers, including NFS. On the settlement date of the loan, a fund receives collateral (in the form of U.S. Treasury obligations, letters of credit and/or cash) against the loaned securities and maintains collateral in an amount not less than 100% of the market value of the loaned securities during the period of the loan. The market value of the loaned securities is determined at the close of business of a fund and any additional required collateral is delivered to a fund on the next business day. A fund or borrower may terminate the loan at any time, and if the borrower defaults on its obligation to return the securities loaned because of insolvency or other reasons, a fund may apply collateral received from the borrower against the obligation. A fund may experience delays and costs in recovering the securities loaned. Any cash collateral received is invested in the Fidelity Securities Lending Cash Central Fund. Any loaned securities are identified as such in the Schedule of Investments, and the value of loaned securities and cash collateral at period end, as applicable, are presented in the Statement of Assets and Liabilities. Security lending income represents the income earned on investing cash collateral, less rebates paid to borrowers and any lending agent fees associated with the loan, plus any premium payments received for lending certain types of securities. Security lending income is presented in the Statement of Operations as a component of income from Fidelity Central Funds. Affiliated security lending activity, if any, was as follows:
| | Total Security Lending Fees Paid to NFS | Security Lending Income From Securities Loaned to NFS | Value of Securities Loaned to NFS at Period End |
| Fidelity Global High Income Fund | $- | $- | $- |
8. Expense Reductions.
The investment adviser contractually agreed to reimburse expenses of each class to the extent annual operating expenses exceeded certain levels of class-level average net assets as noted in the table below. This reimbursement will remain in place through August 31, 2023. Some expenses, for example the compensation of the independent Trustees, and certain miscellaneous expenses such as proxy and shareholder meeting expenses, are excluded from this reimbursement.
The following classes were in reimbursement during the period:
| | Expense Limitations | Reimbursement |
| Class A | 1.15% | $8,985 |
| Class M | 1.15% | 3,592 |
| Class C | 1.90% | 2,516 |
| Global High Income | .90% | 56,610 |
| Class I | .90% | 3,056 |
| | | $74,759 |
In addition, during the period the investment adviser or an affiliate reimbursed and/or waived a portion of fund-level operating expenses in the amount of $800.
9. Distributions to Shareholders.
Distributions to shareholders of each class were as follows:
| | Six months ended October 31, 2022 | Year ended April 30, 2022 |
| Fidelity Global High Income Fund | | |
| Distributions to shareholders | | |
| Class A | $206,423 | $427,363 |
| Class M | 60,624 | 136,678 |
| Class C | 36,759 | 87,509 |
| Global High Income | 1,596,968 | 3,787,445 |
| Class I | 70,695 | 265,491 |
Total | $1,971,469 | $4,704,486 |
10. Share Transactions.
Share transactions for each class were as follows and may contain in-kind transactions, automatic conversions between classes or exchanges between affiliated funds:
| | Shares | Shares | Dollars | Dollars |
| | Six months ended October 31, 2022 | Year ended April 30, 2022 | Six months ended October 31, 2022 | Year ended April 30, 2022 |
| Fidelity Global High Income Fund | | | | |
| Class A | | | | |
| Shares sold | 48,212 | 994,468 | $394,464 | $9,310,968 |
| Reinvestment of distributions | 24,706 | 44,175 | 201,402 | 415,544 |
| Shares redeemed | (883,645) | (135,230) | (7,460,198) | (1,259,170) |
| Net increase (decrease) | (810,727) | 903,413 | $(6,864,332) | $8,467,342 |
| Class M | | | | |
| Shares sold | 8,586 | 91,576 | $70,819 | $895,377 |
| Reinvestment of distributions | 7,357 | 14,136 | 59,621 | 134,232 |
| Shares redeemed | (56,355) | (70,038) | (470,993) | (666,034) |
| Net increase (decrease) | (40,412) | 35,674 | $(340,553) | $363,575 |
| Class C | | | | |
| Shares sold | 4,852 | 18,127 | $38,834 | $174,518 |
| Reinvestment of distributions | 4,493 | 9,080 | 36,414 | 86,380 |
| Shares redeemed | (40,870) | (100,614) | (336,967) | (966,704) |
| Net increase (decrease) | (31,525) | (73,407) | $(261,719) | $(705,806) |
| Global High Income | | | | |
| Shares sold | 581,880 | 3,066,135 | $4,828,675 | $29,769,948 |
| Reinvestment of distributions | 154,669 | 326,573 | 1,253,041 | 3,111,366 |
| Shares redeemed | (1,690,896) | (4,181,161) | (13,597,792) | (39,815,297) |
| Net increase (decrease) | (954,347) | (788,453) | $(7,516,076) | $(6,933,983) |
| Class I | | | | |
| Shares sold | 68,291 | 209,270 | $568,958 | $2,024,964 |
| Reinvestment of distributions | 7,013 | 24,069 | 56,800 | 230,486 |
| Shares redeemed | (68,814) | (692,191) | (561,032) | (6,522,363) |
| Net increase (decrease) | 6,490 | (458,852) | $64,726 | $(4,266,913) |
11. Other.
A fund's organizational documents provide former and current trustees and officers with a limited indemnification against liabilities arising in connection with the performance of their duties to the fund. In the normal course of business, a fund may also enter into contracts that provide general indemnifications. A fund's maximum exposure under these arrangements is unknown as this would be dependent on future claims that may be made against a fund. The risk of material loss from such claims is considered remote.
12. Credit Risk.
The Fund's relatively large investment in countries with limited or developing capital markets may involve greater risks than investments in more developed markets and the prices of such investments may be volatile. The yields of emerging market debt obligations reflect, among other things, perceived credit risk. The consequences of political, social or economic changes in these markets may have disruptive effects on the market prices of the Fund's investments and the income they generate, as well as the Fund's ability to repatriate such amounts.
13. Risk and Uncertainties.
Many factors affect a fund's performance. Developments that disrupt global economies and financial markets, such as pandemics, epidemics, outbreaks of infectious diseases, war, terrorism, and environmental disasters, may significantly affect a fund's investment performance. The effects of these developments to a fund will be impacted by the types of securities in which a fund invests, the financial condition, industry, economic sector, and geographic location of an issuer, and a fund's level of investment in the securities of that issuer.
As a shareholder, you incur two types of costs: (1) transaction costs, which may include sales charges (loads) on purchase payments or redemption proceeds, as applicable and (2) ongoing costs, which generally include management fees, distribution and/or service (12b-1) fees and other Fund expenses. This Example is intended to help you understand your ongoing costs (in dollars) of investing in a fund and to compare these costs with the ongoing costs of investing in other mutual funds.
| The Example is based on an investment of $1,000 invested at the beginning of the period and held for the entire period (May 1, 2022 to October 31, 2022). |
Actual Expenses
The first line of the accompanying table provides information about actual account values and actual expenses. You may use the information in this line, together with the amount you invested, to estimate the expenses that you paid over the period. Simply divide your account value by $1,000.00 (for example, an $8,600 account value divided by $1,000.00 = 8.6), then multiply the result by the number in the first line for a class/Fund under the heading entitled "Expenses Paid During Period" to estimate the expenses you paid on your account during this period. If any fund is a shareholder of any underlying mutual funds or exchange-traded funds (ETFs) (the Underlying Funds), such fund indirectly bears its proportional share of the expenses of the Underlying Funds in addition to the direct expenses incurred presented in the table. These fees and expenses are not included in the annualized expense ratio used to calculate the expense estimate in the table below.
Hypothetical Example for Comparison Purposes
The second line of the accompanying table provides information about hypothetical account values and hypothetical expenses based on the actual expense ratio and an assumed rate of return of 5% per year before expenses, which is not the actual return. The hypothetical account values and expenses may not be used to estimate the actual ending account balance or expenses you paid for the period. You may use this information to compare the ongoing costs of investing in the Fund and other funds. To do so, compare this 5% hypothetical example with the 5% hypothetical examples that appear in the shareholder reports of the other funds. If any fund is a shareholder of any Underlying Funds, such fund indirectly bears its proportional share of the expenses of the Underlying Funds in addition to the direct expenses as presented in the table. These fees and expenses are not included in the annualized expense ratio used to calculate the expense estimate in the table below.
Please note that the expenses shown in the table are meant to highlight your ongoing costs only and do not reflect any transaction costs. Therefore, the second line of the table is useful in comparing ongoing costs only, and will not help you determine the relative total costs of owning different funds. In addition, if these transactional costs were included, your costs would have been higher.
| | | | | Annualized Expense Ratio- A | | Beginning Account Value May 1, 2022 | | Ending Account Value October 31, 2022 | | Expenses Paid During Period- C May 1, 2022 to October 31, 2022 |
| Fidelity® Global High Income Fund | | | | | | | | | | |
| Class A | | | | 1.17% | | | | | | |
| Actual | | | | | | $ 1,000 | | $ 919.50 | | $ 5.66 |
Hypothetical- B | | | | | | $ 1,000 | | $ 1,019.31 | | $ 5.96 |
| Class M | | | | 1.18% | | | | | | |
| Actual | | | | | | $ 1,000 | | $ 919.50 | | $ 5.71 |
Hypothetical- B | | | | | | $ 1,000 | | $ 1,019.26 | | $ 6.01 |
| Class C | | | | 1.93% | | | | | | |
| Actual | | | | | | $ 1,000 | | $ 916.00 | | $ 9.32 |
Hypothetical- B | | | | | | $ 1,000 | | $ 1,015.48 | | $ 9.80 |
| Fidelity® Global High Income Fund | | | | .93% | | | | | | |
| Actual | | | | | | $ 1,000 | | $ 920.70 | | $ 4.50 |
Hypothetical- B | | | | | | $ 1,000 | | $ 1,020.52 | | $ 4.74 |
| Class I | | | | .93% | | | | | | |
| Actual | | | | | | $ 1,000 | | $ 920.70 | | $ 4.50 |
Hypothetical- B | | | | | | $ 1,000 | | $ 1,020.52 | | $ 4.74 |
| |
A Annualized expense ratio reflects expenses net of applicable fee waivers.
B 5% return per year before expenses
C Expenses are equal to the annualized expense ratio, multiplied by the average account value over the period, multiplied by 184/ 365 (to reflect the one-half year period). The fees and expenses of any Underlying Funds are not included in each annualized expense ratio.
Fidelity Global High Income Fund
Each year, the Board of Trustees, including the Independent Trustees (together, the Board), votes on the renewal of the management contract with Fidelity Management & Research Company LLC (FMR) and the sub-advisory agreements (together, the Advisory Contracts) for the fund. FMR and the sub-advisers are referred to herein as the Investment Advisers. The Board, assisted by the advice of fund counsel and Independent Trustees' counsel, requests and considers a broad range of information relevant to the renewal of the Advisory Contracts throughout the year.
The Board meets regularly and, at each of its meetings, covers an extensive agenda of topics and materials and considers factors that are relevant to its annual consideration of the renewal of the fund's Advisory Contracts, including the services and support provided to the fund and its shareholders. The Board has established various standing committees (Committees), each composed of and chaired by Independent Trustees with varying backgrounds, to which the Board has assigned specific subject matter responsibilities in order to enhance effective decision-making by the Board. The Board, acting directly and through its Committees, requests and receives information concerning the annual consideration of the renewal of the fund's Advisory Contracts. The Board also meets as needed to review matters specifically related to the Board's annual consideration of the renewal of the Advisory Contracts. Members of the Board may also meet with trustees of other Fidelity funds through joint ad hoc committees to discuss certain matters relevant to all of the Fidelity funds.
At its May 2022 meeting, the Board unanimously determined to renew the fund's Advisory Contracts. In reaching its determination, the Board considered all factors it believed relevant, including (i) the nature, extent, and quality of the services provided to the fund and its shareholders (including the investment performance of the fund); (ii) the competitiveness relative to peer funds of the fund's management fee and the total expense ratio of a representative class (retail class); (iii) the total costs of the services provided by and the profits realized by Fidelity from its relationships with the fund; and (iv) the extent to which, if any, economies of scale exist and are realized as the fund grows, and whether any economies of scale are appropriately shared with fund shareholders.
In considering whether to renew the Advisory Contracts for the fund, the Board reached a determination, with the assistance of fund counsel and Independent Trustees' counsel and through the exercise of its business judgment, that the renewal of the Advisory Contracts was in the best interests of the fund and its shareholders and that the compensation payable under the Advisory Contracts was fair and reasonable. The Board's decision to renew the Advisory Contracts was not based on any single factor, but rather was based on a comprehensive consideration of all the information provided to the Board at its meetings throughout the year. The Board, in reaching its determination to renew the Advisory Contracts, was aware that shareholders of the fund have a broad range of investment choices available to them, including a wide choice among funds offered by Fidelity's competitors, and that the fund's shareholders, who have the opportunity to review and weigh the disclosure provided by the fund in its prospectus and other public disclosures, have chosen to invest in this fund, which is part of the Fidelity family of funds.
Nature, Extent, and Quality of Services Provided. The Board considered Fidelity's staffing as it relates to the fund, including the backgrounds of investment personnel of Fidelity, and also considered the fund's investment objective, strategies, and related investment philosophy. The Independent Trustees also had discussions with senior management of Fidelity's investment operations and investment groups. The Board considered the structure of the investment personnel compensation program and whether this structure provides appropriate incentives to act in the best interests of the fund. Additionally, the Board considered the portfolio managers' investments, if any, in the funds that they manage. The Board also considered the steps Fidelity had taken to ensure the continued provision of high quality services to the Fidelity funds during the COVID-19 pandemic, including the expansion of staff in client facing positions to maintain service levels in periods of high volumes and volatility.
Resources Dedicated to Investment Management and Support Services . The Board and the Fund Oversight and Research Committees reviewed the general qualifications and capabilities of Fidelity's investment staff, including its size, education, experience, and resources, as well as Fidelity's approach to recruiting, training, managing, and compensating investment personnel. The Board noted the resources devoted to expansion of Fidelity's global investment organization, and that Fidelity's analysts have extensive resources, tools, and capabilities that allow them to conduct sophisticated quantitative and fundamental analysis, as well as credit analysis of issuers, counterparties, and guarantors. Further, the Board considered that Fidelity's investment professionals have sufficient access to global information and data so as to provide competitive investment results over time, and that those professionals also have access to sophisticated tools that permit them to assess portfolio construction and risk and performance attribution characteristics continuously, as well as to transmit new information and research conclusions rapidly around the world. Additionally, in its deliberations, the Board considered Fidelity's trading, risk management, compliance, and technology and operations capabilities and resources, which are integral parts of the investment management process.
Shareholder and Administrative Services. The Board considered (i) the nature, extent, quality, and cost of advisory, administrative, and shareholder services performed by the Investment Advisers and their affiliates under the Advisory Contracts and under separate agreements covering transfer agency, pricing and bookkeeping, and securities lending services for the fund; (ii) the nature and extent of the supervision of third party service providers, principally custodians, subcustodians, and pricing vendors; and (iii) the resources devoted to, and the record of compliance with, the fund's compliance policies and procedures. The Board also reviewed the allocation of fund brokerage, including allocations to brokers affiliated with the Investment Advisers, the use of brokerage commissions to pay fund expenses, and the use of "soft" commission dollars to pay for research services.
The Board noted that the growth of fund assets over time across the complex allows Fidelity to reinvest in the development of services designed to enhance the value and convenience of the Fidelity funds as investment vehicles. These services include 24-hour access to account information and market information over the Internet and through telephone representatives, investor education materials, and asset allocation tools. The Board also considered that it reviews customer service metrics such as telephone response times, continuity of services on the website and metrics addressing services at Fidelity Investor Centers.
Investment in a Large Fund Family . The Board considered the benefits to shareholders of investing in a Fidelity fund, including the benefits of investing in a fund that is part of a large family of funds offering a variety of investment disciplines and providing a large variety of mutual fund investor services. The Board noted that Fidelity had taken, or had made recommendations that resulted in the Fidelity funds taking, a number of actions over the previous year that benefited particular funds, including: (i) continuing to dedicate additional resources to Fidelity's investment research process, which includes meetings with management of issuers of securities in which the funds invest; (ii) continuing efforts to enhance Fidelity's global research capabilities; (iii) launching new funds and ETFs with innovative structures, strategies and pricing and making other enhancements to meet client needs; (iv) launching new share classes of existing funds; (v) eliminating purchase minimums and broadening eligibility requirements for certain funds and share classes; (vi) reducing management fees and total expenses for certain target date funds and classes and index funds; (vii) lowering expenses for certain existing funds and classes by implementing or lowering expense caps; (viii) rationalizing product lines and gaining increased efficiencies from fund mergers and liquidations; (ix) continuing to develop, acquire and implement systems and technology to improve services to the funds and shareholders, strengthen information security, and increase efficiency; and (x) continuing to implement enhancements to further strengthen Fidelity's product line to increase investors' probability of success in achieving their investment goals, including retirement income goals.
Investment Performance . The Board considered whether the fund has operated in accordance with its investment objective, as well as its record of compliance with its investment restrictions and its performance history. The Board noted that the fund had a portfolio manager change in June 2019, October 2019, June 2020, and September 2020. The Board will continue to monitor closely the fund's performance, taking into account the portfolio management changes.
The Board took into account discussions that occur at Board meetings throughout the year with representatives of the Investment Advisers about fund investment performance. In this regard the Board noted that as part of regularly scheduled fund reviews and other reports to the Board on fund performance, the Board considers annualized return information for the fund for different time periods, measured against an appropriate securities market index (benchmark index). The Board also reviews and considers information about performance attribution. In its evaluation of fund investment performance, the Board gave particular attention to information indicating changes in performance of certain Fidelity funds for specific time periods and discussed with the Investment Advisers the reasons for any overperformance or underperformance.
In addition to reviewing absolute and relative fund performance, the Independent Trustees periodically consider the appropriateness of fund performance metrics in evaluating the results achieved. In general, the Independent Trustees believe that fund performance should be evaluated based on net performance (after fees and expenses) of the representative class compared to appropriate benchmark indices, over appropriate time periods that may include full market cycles, and compared to peer groups, as applicable, over the same periods, taking into account relevant factors including the following: general market conditions; issuer-specific information; and fund cash flows and other factors.
The Independent Trustees recognize that shareholders evaluate performance on a net basis over their own holding periods, for which one-, three-, and five-year periods are often used as a proxy. For this reason, the performance information reviewed by the Board also included net cumulative total return information for the fund and an appropriate benchmark index for the most recent one-, three-, and five-year periods ended September 30, 2021, as shown below. A peer group is not shown below because the fund does not generally utilize a peer group for performance comparison purposes.
Fidelity Global High Income Fund
Based on its review, the Board concluded that the nature, extent, and quality of services provided to the fund under the Advisory Contracts should continue to benefit the shareholders of the fund.
Competitiveness of Management Fee and Total Expense Ratio . The Board considered the fund's management fee and total expense ratio compared to "mapped groups" of competitive funds and classes created for the purpose of facilitating the Trustees' competitive analysis of management fees and total expenses. Fidelity creates "mapped groups" by combining similar Lipper investment objective categories that have comparable investment mandates. Combining Lipper investment objective categories aids the Board's management fee and total expense ratio comparisons by broadening the competitive group used for comparison.
Management Fee . The Board considered two proprietary management fee comparisons for the 12-month periods ended September 30 (June 30 for periods ended 2019 and 2018 and December 31 for periods prior to 2018) shown in basis points (BP) in the chart below. The group of Lipper funds used by the Board for management fee comparisons is referred to below as the "Total Mapped Group." The Total Mapped Group comparison focuses on a fund's standing in terms of gross management fees before expense reimbursements or caps relative to the total universe of funds with comparable investment mandates, regardless of whether their management fee structures also are comparable. Funds with comparable investment mandates offer exposure to similar types of securities. Funds with comparable management fee structures have similar management fee contractual arrangements (e.g., flat rate charged for advisory services, all-inclusive fee rate, etc.). "TMG %" represents the percentage of funds in the Total Mapped Group that had management fees that were lower than the fund's. For example, a hypothetical TMG % of 20% would mean that 80% of the funds in the Total Mapped Group had higher, and 20% had lower, management fees than the fund. The fund's actual TMG %s and the number of funds in the Total Mapped Group are in the chart below. The "Asset-Sized Peer Group" (ASPG) comparison focuses on a fund's standing relative to a subset of non-Fidelity funds within the Total Mapped Group that are similar in size and management fee structure. For example, if a fund is in the first quartile of the ASPG, the fund's management fee ranks in the least expensive or lowest 25% of funds in the ASPG. The ASPG represents at least 15% of the funds in the Total Mapped Group with comparable asset size and management fee structures, subject to a minimum of 50 funds (or all funds in the Total Mapped Group if fewer than 50). Additional information, such as the ASPG quartile in which the fund's management fee rate ranked, is also included in the chart and was considered by the Board.
Fidelity Global High Income Fund
The Board noted that the fund's management fee rate ranked above the median of its Total Mapped Group and above the median of its ASPG for the 12-month period ended September 30,2021. The Board considered that the fund invests a greater portion of its assets internationally than other funds in its Total Mapped Group, which consists primarily of domestic high income funds, and also that the fund invests in an asset allocation strategy on top of its global allocation, and, as such, competitive rankings are less meaningful.
The Board also considered that, for funds subject to the group fee, FMR agreed to voluntarily waive fees over a specified period of time in amounts designed to account for assets converted from certain funds to certain collective investment trusts.
Based on its review, the Board concluded that the fund's management fee is fair and reasonable in light of the services that the fund receives and the other factors considered.
Total Expense Ratio . In its review of the total expense ratio of the representative class (retail class), the Board considered the fund's management fee rate as well as other fund or class expenses, as applicable, such as transfer agent fees, pricing and bookkeeping fees, fund-paid 12b-1 fees, and custodial, legal, and audit fees. The Board also noted that Fidelity may agree to waive fees or reimburse expenses from time to time, and the extent to which, if any, it has done so for the fund. The fund's representative class is compared to those funds and classes in the Total Mapped Group (used by the Board for management fee comparisons) that have a similar sales load structure. The Board also considered a total expense ASPG comparison for the representative class, which focuses on the total expenses of the representative class relative to a subset of non-Fidelity funds within the total expense similar sales load structure group. The total expense ASPG is limited to 15 larger and 15 smaller classes in fund average assets for a total of 30 classes, where possible. The total expense ASPG comparison excludes performance adjustments and fund-paid 12b-1 fees to eliminate variability in fee structures.
The Board noted that the total net expense ratio of the retail class ranked above the similar sales load structure group competitive median and above the ASPG competitive median for the 12-month period ended September 30, 2021. The Board considered that, in general, various factors can affect total expense ratios. The Board noted that the total expense ratio of the retail class was above the competitive median due to the fund's higher than standard management fee, which reflects the fund's specialized investment strategy as discussed above. The Board noted that the fund offers multiple classes, each of which has a different sales load and 12b-1 fee structure, and that the multiple structures are intended to offer a range of pricing options for the intermediary market. The Board also noted that the total expense ratios of the classes vary primarily by the level of their 12b-1 fees, although differences in transfer agent fees may also cause expenses to vary from class to class.
The Board further considered that FMR has contractually agreed to reimburse Class A, Class M, Class C, Class I, and the retail class of the fund to the extent that total operating expenses, with certain exceptions, as a percentage of their respective average net assets, exceed 1.15%, 1.15%, 1.90%, 0.90%, and 0.90% through August 31, 2022.
Fees Charged to Other Fidelity Clients. The Board also considered Fidelity fee structures and other information with respect to clients of Fidelity, such as other funds advised or subadvised by Fidelity, pension plan clients, and other institutional clients with similar mandates. The Board noted that a joint ad hoc committee created by it and the boards of other Fidelity funds periodically reviews and compares Fidelity's institutional investment advisory business with its business of providing services to the Fidelity funds and also noted the most recent findings of the committee. The Board noted that the committee's review included a consideration of the differences in services provided, fees charged, and costs incurred, as well as competition in the markets serving the different categories of clients.
Based on its review of total expense ratios and fees charged to other Fidelity clients, the Board concluded that the total expense ratio of each class of the fund was reasonable in light of the services that the fund and its shareholders receive and the other factors considered.
Costs of the Services and Profitability . The Board considered the revenues earned and the expenses incurred by Fidelity in conducting the business of developing, marketing, distributing, managing, administering and servicing the fund and servicing the fund's shareholders. The Board also considered the level of Fidelity's profits in respect of all the Fidelity funds.
On an annual basis, Fidelity presents to the Board information about the profitability of its relationships with the fund. Fidelity calculates profitability information for each fund, as well as aggregate profitability information for groups of Fidelity funds and all Fidelity funds, using a series of detailed revenue and cost allocation methodologies which originate with the books and records of Fidelity on which Fidelity's audited financial statements are based. The Audit Committee of the Board reviews any significant changes from the prior year's methodologies and the full Board approves such changes.
A public accounting firm has been engaged annually by the Board as part of the Board's assessment of Fidelity's profitability analysis. The engagement includes the review and assessment of the methodologies used by Fidelity in determining the revenues and expenses attributable to Fidelity's mutual fund business, and completion of agreed-upon procedures in respect of the mathematical accuracy of certain fund profitability information and its conformity to established allocation methodologies. After considering the reports issued under the engagement and information provided by Fidelity, the Board concluded that while other allocation methods may also be reasonable, Fidelity's profitability methodologies are reasonable in all material respects.
The Board also reviewed Fidelity's non-fund businesses and potential indirect benefits such businesses may have received as a result of their association with Fidelity's mutual fund business (i.e., fall-out benefits) as well as cases where Fidelity's affiliates may benefit from the funds' business. The Board considered areas where potential indirect benefits to the Fidelity funds from their relationships with Fidelity may exist. The Board's consideration of these matters was informed by the findings of a joint ad hoc committee created by it and the boards of other Fidelity funds to evaluate potential fall-out benefits.
The Board considered the costs of the services provided by and the profits realized by Fidelity in connection with the operation of the fund and was satisfied that the profitability was not excessive.
Economies of Scale . The Board considered whether there have been economies of scale in respect of the management of the Fidelity funds, whether the Fidelity funds (including the fund) have appropriately benefited from any such economies of scale, and whether there is potential for realization of any further economies of scale. The Board considered the extent to which the fund will benefit from economies of scale as assets grow through increased services to the fund, through waivers or reimbursements, or through fee or expense ratio reductions. The Board also noted that a committee (the Economies of Scale Committee) created by it and the boards of other Fidelity funds periodically analyzes whether Fidelity attains economies of scale in respect of the management and servicing of the Fidelity funds, whether the Fidelity funds have appropriately benefited from such economies of scale, and whether there is potential for realization of any further economies of scale.
The Board recognized that the fund's management contract incorporates a "group fee" structure, which provides for lower group fee rates as total "group assets" increase, and for higher group fee rates as total "group assets" decrease ("group assets" as defined in the management contract). FMR calculates the group fee rates based on a tiered asset "breakpoint" schedule that varies based on asset class. The Board considered that the group fee is designed to deliver the benefits of economies of scale to fund shareholders when total Fidelity fund assets increase, even if assets of any particular fund are unchanged or have declined, because some portion of Fidelity's costs are attributable to services provided to all Fidelity funds, and all funds benefit if those costs can be allocated among more assets. The Board further considered that Fidelity agreed to impose a temporary fee waiver in the form of additional breakpoints to the current breakpoint schedule. The Board concluded that, given the group fee structure, fund shareholders will benefit from lower management fees as "group assets" increase at the fund complex level, regardless of whether Fidelity achieves any such economies of scale.
The Board concluded, taking into account the analysis of the Economies of Scale Committee, that economies of scale, if any, are being appropriately shared between fund shareholders and Fidelity.
Additional Information Requested by the Board. In order to develop fully the factual basis for consideration of the Fidelity funds' advisory contracts, the Board requested and received additional information on certain topics, including: (i) fund flow and performance trends, in particular the underperformance of certain funds and strategies, and Fidelity's long-term strategies for certain funds, including any consideration of fund liquidations or mergers; (ii) the operation of performance fees, competitor use of performance fees, and consideration of the expansion of performance fees to additional funds; (iii) Fidelity's pricing philosophy compared to competitors; (iv) fund profitability methodology and data; (v) evaluation of competitive fund data and peer group classifications and fee and expense comparisons; (vi) the management fee and expense structures for different funds and classes and information about the differences between various fee and expense structures; (vii) group fee breakpoints and related voluntary fee waivers; and (viii) information regarding other accounts managed by Fidelity and the funds' sub-advisory arrangements.
Based on its evaluation of all of the conclusions noted above, and after considering all factors it believed relevant, the Board concluded that the advisory fee arrangements are fair and reasonable and that the fund's Advisory Contracts should be renewed.
1.926252.111
GHI-SANN-1222
Fidelity Healthy Future Fund
Semi-Annual Report
October 31, 2022
Includes Fidelity and Fidelity Advisor share classes
Contents
To view a fund's proxy voting guidelines and proxy voting record for the 12-month period ended June 30, visit http://www.fidelity.com/proxyvotingresults or visit the Securities and Exchange Commission's (SEC) web site at http://www.sec.gov.
You may also call 1-800-544-8544 if you're an individual investing directly with Fidelity, call 1-800-835-5092 if you're a plan sponsor or participant with Fidelity as your recordkeeper or call 1-877-208-0098 on institutional accounts or if you're an advisor or invest through one to request a free copy of the proxy voting guidelines.
Standard & Poor's, S&P and S&P 500 are registered service marks of The McGraw-Hill Companies, Inc. and have been licensed for use by Fidelity Distributors Corporation.
Other third-party marks appearing herein are the property of their respective owners.
All other marks appearing herein are registered or unregistered trademarks or service marks of FMR LLC or an affiliated company. © 2022 FMR LLC. All rights reserved.
This report and the financial statements contained herein are submitted for the general information of the shareholders of the Fund. This report is not authorized for distribution to prospective investors in the Fund unless preceded or accompanied by an effective prospectus.
A fund files its complete schedule of portfolio holdings with the SEC for the first and third quarters of each fiscal year on Form N-PORT. Forms N-PORT are available on the SEC's web site at http://www.sec.gov. A fund's Forms N-PORT may be reviewed and copied at the SEC's Public Reference Room in Washington, DC. Information regarding the operation of the SEC's Public Reference Room may be obtained by calling 1-800-SEC-0330.
For a complete list of a fund's portfolio holdings, view the most recent holdings listing, semiannual report, or annual report on Fidelity's web site at http://www.fidelity.com, http://www.institutional.fidelity.com, or http://www.401k.com, as applicable.
NOT FDIC INSURED •MAY LOSE VALUE •NO BANK GUARANTEE
Neither the Fund nor Fidelity Distributors Corporation is a bank.
Top Holdings (% of Fund's net assets) |
| |
| UnitedHealth Group, Inc. | 9.9 | |
| Procter & Gamble Co. | 7.5 | |
| Nestle SA (Reg. S) | 6.3 | |
| Thermo Fisher Scientific, Inc. | 4.9 | |
| Tesla, Inc. | 4.5 | |
| NVIDIA Corp. | 3.9 | |
| Enphase Energy, Inc. | 2.3 | |
| Chipotle Mexican Grill, Inc. | 2.0 | |
| Church & Dwight Co., Inc. | 2.0 | |
| Ulta Beauty, Inc. | 2.0 | |
| | 45.3 | |
| |
| Market Sectors (% of Fund's net assets) |
| |
| Health Care | 35.3 | |
| Consumer Staples | 24.2 | |
| Consumer Discretionary | 16.6 | |
| Information Technology | 9.2 | |
| Financials | 4.2 | |
| Utilities | 2.8 | |
| Industrials | 2.0 | |
| Real Estate | 0.6 | |
| |
Asset Allocation (% of Fund's net assets) |
|
Foreign investments - 17.2% |
|
Geographic Diversification (% of Fund's net assets) |
|
* Includes Short-Term investments and Net Other Assets (Liabilities). Percentages are based on country or territory of incorporation and are adjusted for the effect of futures contracts, if applicable. |
| |
Showing Percentage of Net Assets
| Common Stocks - 94.9% |
| | | Shares | Value ($) |
| CONSUMER DISCRETIONARY - 16.6% | | | |
| Automobiles - 4.5% | | | |
| Tesla, Inc. (a) | | 528 | 120,141 |
| Hotels, Restaurants & Leisure - 3.9% | | | |
| Chipotle Mexican Grill, Inc. (a) | | 37 | 55,438 |
| Planet Fitness, Inc. (a) | | 646 | 42,300 |
| Sweetgreen, Inc. Class A | | 436 | 8,110 |
| | | | 105,848 |
| Internet & Direct Marketing Retail - 1.1% | | | |
| Uber Technologies, Inc. (a) | | 1,125 | 29,891 |
| Multiline Retail - 1.2% | | | |
| Dollar General Corp. | | 128 | 32,646 |
| Specialty Retail - 4.3% | | | |
| Dick's Sporting Goods, Inc. | | 208 | 23,662 |
| Ulta Beauty, Inc. (a) | | 128 | 53,679 |
| Warby Parker, Inc. (a) | | 2,358 | 37,846 |
| | | | 115,187 |
| Textiles, Apparel & Luxury Goods - 1.6% | | | |
| Crocs, Inc. (a) | | 402 | 28,442 |
| NIKE, Inc. Class B | | 76 | 7,044 |
| On Holding AG (a) | | 428 | 7,529 |
| | | | 43,015 |
TOTAL CONSUMER DISCRETIONARY | | | 446,728 |
| CONSUMER STAPLES - 24.2% | | | |
| Food & Staples Retailing - 1.6% | | | |
| Costco Wholesale Corp. | | 58 | 29,087 |
| U.S. Foods Holding Corp. (a) | | 500 | 14,880 |
| | | | 43,967 |
| Food Products - 8.6% | | | |
| Darling Ingredients, Inc. (a) | | 472 | 37,043 |
| Freshpet, Inc. (a) | | 200 | 11,790 |
| Nestle SA (Reg. S) | | 1,541 | 167,751 |
| TreeHouse Foods, Inc. (a) | | 289 | 14,519 |
| | | | 231,103 |
| Household Products - 11.4% | | | |
| Church & Dwight Co., Inc. | | 727 | 53,893 |
| Kimberly-Clark Corp. | | 410 | 51,029 |
| Procter & Gamble Co. | | 1,495 | 201,332 |
| | | | 306,254 |
| Personal Products - 2.6% | | | |
| Estee Lauder Companies, Inc. Class A | | 108 | 21,653 |
| L'Oreal SA | | 133 | 41,763 |
| Olaplex Holdings, Inc. | | 1,510 | 6,644 |
| | | | 70,060 |
TOTAL CONSUMER STAPLES | | | 651,384 |
| FINANCIALS - 4.2% | | | |
| Capital Markets - 1.1% | | | |
| BlackRock, Inc. Class A | | 46 | 29,712 |
| Insurance - 3.1% | | | |
| AIA Group Ltd. | | 5,159 | 39,078 |
| Marsh & McLennan Companies, Inc. | | 188 | 30,360 |
| Trupanion, Inc. (a) | | 250 | 12,618 |
| | | | 82,056 |
TOTAL FINANCIALS | | | 111,768 |
| HEALTH CARE - 35.3% | | | |
| Biotechnology - 3.4% | | | |
| Argenx SE (a) | | 18 | 6,989 |
| Regeneron Pharmaceuticals, Inc. (a) | | 58 | 43,428 |
| Vertex Pharmaceuticals, Inc. (a) | | 130 | 40,560 |
| | | | 90,977 |
| Health Care Equipment & Supplies - 1.4% | | | |
| Boston Scientific Corp. (a) | | 854 | 36,816 |
| IDEXX Laboratories, Inc. (a) | | 1 | 360 |
| | | | 37,176 |
| Health Care Providers & Services - 15.4% | | | |
| agilon health, Inc. (a) | | 2,672 | 53,039 |
| Guardant Health, Inc. (a) | | 164 | 8,118 |
| LifeStance Health Group, Inc. (a) | | 4,960 | 37,448 |
| Molina Healthcare, Inc. (a) | | 42 | 15,072 |
| Oak Street Health, Inc. (a) | | 1,465 | 29,637 |
| Surgery Partners, Inc. (a) | | 119 | 3,236 |
| UnitedHealth Group, Inc. | | 479 | 265,913 |
| | | | 412,463 |
| Life Sciences Tools & Services - 8.5% | | | |
| Danaher Corp. | | 193 | 48,572 |
| Lonza Group AG | | 96 | 49,419 |
| Thermo Fisher Scientific, Inc. | | 254 | 130,548 |
| | | | 228,539 |
| Pharmaceuticals - 6.6% | | | |
| Dechra Pharmaceuticals PLC | | 737 | 22,144 |
| Eli Lilly & Co. | | 112 | 40,554 |
| Roche Holding AG (participation certificate) | | 146 | 48,443 |
| UCB SA | | 436 | 32,885 |
| Zoetis, Inc. Class A | | 226 | 34,076 |
| | | | 178,102 |
TOTAL HEALTH CARE | | | 947,257 |
| INDUSTRIALS - 2.0% | | | |
| Electrical Equipment - 2.0% | | | |
| Sensata Technologies, Inc. PLC | | 789 | 31,726 |
| Sunrun, Inc. (a) | | 1,036 | 23,320 |
| | | | 55,046 |
| INFORMATION TECHNOLOGY - 9.2% | | | |
| Semiconductors & Semiconductor Equipment - 7.1% | | | |
| Enphase Energy, Inc. (a) | | 205 | 62,935 |
| NVIDIA Corp. | | 780 | 105,277 |
| SolarEdge Technologies, Inc. (a) | | 101 | 23,233 |
| | | | 191,445 |
| Technology Hardware, Storage & Peripherals - 2.1% | | | |
| Apple, Inc. | | 302 | 46,309 |
| Samsung Electronics Co. Ltd. GDR (Reg. S) | | 9 | 9,302 |
| | | | 55,611 |
TOTAL INFORMATION TECHNOLOGY | | | 247,056 |
| REAL ESTATE - 0.6% | | | |
| Equity Real Estate Investment Trusts (REITs) - 0.6% | | | |
| Welltower Op | | 242 | 14,772 |
| UTILITIES - 2.8% | | | �� |
| Electric Utilities - 1.7% | | | |
| NextEra Energy, Inc. | | 580 | 44,950 |
| Water Utilities - 1.1% | | | |
| American Water Works Co., Inc. | | 204 | 29,649 |
TOTAL UTILITIES | | | 74,599 |
| TOTAL COMMON STOCKS (Cost $2,640,350) | | | 2,548,610 |
| | | | |
| Money Market Funds - 1.3% |
| | | Shares | Value ($) |
Fidelity Cash Central Fund 3.10% (b) (Cost $35,020) | | 35,013 | 35,020 |
| | | | |
| TOTAL INVESTMENT IN SECURITIES - 96.2% (Cost $2,675,370) | 2,583,630 |
NET OTHER ASSETS (LIABILITIES) - 3.8% | 103,129 |
| NET ASSETS - 100.0% | 2,686,759 |
| | |
Legend
| (b) | Affiliated fund that is generally available only to investment companies and other accounts managed by Fidelity Investments. The rate quoted is the annualized seven-day yield of the fund at period end. A complete unaudited listing of the fund's holdings as of its most recent quarter end is available upon request. In addition, each Fidelity Central Fund's financial statements are available on the SEC's website or upon request. |
Affiliated Central Funds
Fiscal year to date information regarding the Fund's investments in Fidelity Central Funds, including the ownership percentage, is presented below.
| Affiliate | Value, beginning of period ($) | Purchases ($) | Sales Proceeds ($) | Dividend Income ($) | Realized Gain (loss) ($) | Change in Unrealized appreciation (depreciation) ($) | Value, end of period ($) | % ownership, end of period |
| Fidelity Cash Central Fund 3.10% | - | 2,191,119 | 2,156,099 | 620 | - | - | 35,020 | 0.0% |
| Total | - | 2,191,119 | 2,156,099 | 620 | - | - | 35,020 | |
| | | | | | | | | |
Amounts in the income column in the above table include any capital gain distributions from underlying funds, which are presented in the corresponding line item in the Statement of Operations, if applicable.
Investment Valuation
The following is a summary of the inputs used, as of October 31, 2022, involving the Fund's assets and liabilities carried at fair value. The inputs or methodology used for valuing securities may not be an indication of the risk associated with investing in those securities. For more information on valuation inputs, and their aggregation into the levels used below, please refer to the Investment Valuation section in the accompanying Notes to Financial Statements.
| Valuation Inputs at Reporting Date: |
| Description | Total ($) | Level 1 ($) | Level 2 ($) | Level 3 ($) |
Investments in Securities: | | | | |
|
| Equities: | | | | |
Consumer Discretionary | 446,728 | 446,728 | - | - |
Consumer Staples | 651,384 | 441,870 | 209,514 | - |
Financials | 111,768 | 72,690 | 39,078 | - |
Health Care | 947,257 | 842,406 | 104,851 | - |
Industrials | 55,046 | 55,046 | - | - |
Information Technology | 247,056 | 247,056 | - | - |
Real Estate | 14,772 | 14,772 | - | - |
Utilities | 74,599 | 74,599 | - | - |
|
| Money Market Funds | 35,020 | 35,020 | - | - |
| Total Investments in Securities: | 2,583,630 | 2,230,187 | 353,443 | - |
| Statement of Assets and Liabilities |
| | | | October 31, 2022 (Unaudited) |
| | | | | |
| Assets | | | | |
| Investment in securities, at value - See accompanying schedule: | | | | |
Unaffiliated issuers (cost $2,640,350) | | $2,548,610 | | |
Fidelity Central Funds (cost $35,020) | | 35,020 | | |
| | | | | |
| Total Investment in Securities (cost $2,675,370) | | | $ | 2,583,630 |
| Cash | | | | 9,484 |
| Foreign currency held at value (cost $7) | | | | 7 |
| Receivable for investments sold | | | | 40,832 |
| Receivable for fund shares sold | | | | 4,591 |
| Dividends receivable | | | | 1,833 |
| Distributions receivable from Fidelity Central Funds | | | | 159 |
| Prepaid expenses | | | | 60,464 |
| Receivable from investment adviser for expense reductions | | | | 13,678 |
Total assets | | | | 2,714,678 |
| Liabilities | | | | |
| Payable for investments purchased | | $10,715 | | |
| Payable for fund shares redeemed | | 150 | | |
| Accrued management fee | | 1,427 | | |
| Distribution and service plan fees payable | | 148 | | |
| Other affiliated payables | | 549 | | |
| Audit fee payable | | 13,075 | | |
| Custody fee payable | | 1,855 | | |
| Total Liabilities | | | | 27,919 |
| Net Assets | | | $ | 2,686,759 |
| Net Assets consist of: | | | | |
| Paid in capital | | | $ | 2,835,080 |
| Total accumulated earnings (loss) | | | | (148,321) |
| Net Assets | | | $ | 2,686,759 |
| | | | | |
| Net Asset Value and Maximum Offering Price | | | | |
| Class A : | | | | |
Net Asset Value and redemption price per share ($151,152 ÷ 15,977 shares) (a) | | | $ | 9.46 |
| Maximum offering price per share (100/94.25 of $9.46) | | | $ | 10.04 |
| Class M : | | | | |
Net Asset Value and redemption price per share ($95,685 ÷ 10,126 shares) (a) | | | $ | 9.45 |
| Maximum offering price per share (100/96.50 of $9.45) | | | $ | 9.79 |
| Class C : | | | | |
Net Asset Value and offering price per share ($99,880 ÷ 10,593 shares) (a) | | | $ | 9.43 |
| Fidelity Healthy Future Fund : | | | | |
Net Asset Value , offering price and redemption price per share ($2,148,436 ÷ 226,835 shares) | | | $ | 9.47 |
| Class I : | | | | |
Net Asset Value , offering price and redemption price per share ($96,146 ÷ 10,152 shares) | | | $ | 9.47 |
| Class Z : | | | | |
Net Asset Value , offering price and redemption price per share ($95,460 ÷ 10,073 shares) | | | $ | 9.48 |
(a)Redemption price per share is equal to net asset value less any applicable contingent deferred sales charge. |
| Statement of Operations |
| | | | For the period May 24, 2022 (commencement of operations) through October 31, 2022 (Unaudited) |
| Investment Income | | | | |
| Dividends | | | $ | 7,200 |
| Income from Fidelity Central Funds | | | | 620 |
| Total Income | | | | 7,820 |
| Expenses | | | | |
| Management fee | $ | 5,882 | | |
| Transfer agent fees | | 2,044 | | |
| Distribution and service plan fees | | 775 | | |
| Accounting fees and expenses | | 308 | | |
| Custodian fees and expenses | | 2,946 | | |
| Independent trustees' fees and expenses | | 2 | | |
| Registration fees | | 57,390 | | |
| Audit | | 14,080 | | |
| Miscellaneous | | 134 | | |
| Total expenses before reductions | | 83,561 | | |
| Expense reductions | | (73,746) | | |
| Total expenses after reductions | | | | 9,815 |
| Net Investment income (loss) | | | | (1,995) |
| Realized and Unrealized Gain (Loss) | | | | |
| Net realized gain (loss) on: | | | | |
| Investment Securities: | | | | |
| Unaffiliated issuers | | (54,503) | | |
| Foreign currency transactions | | (107) | | |
| Total net realized gain (loss) | | | | (54,610) |
| Change in net unrealized appreciation (depreciation) on: | | | | |
| Investment Securities: | | | | |
| Unaffiliated issuers | | (91,740) | | |
| Assets and liabilities in foreign currencies | | 24 | | |
| Total change in net unrealized appreciation (depreciation) | | | | (91,716) |
| Net gain (loss) | | | | (146,326) |
| Net increase (decrease) in net assets resulting from operations | | | $ | (148,321) |
| Statement of Changes in Net Assets |
| |
| | For the period May 24, 2022 (commencement of operations) through October 31, 2022 (Unaudited) |
| Increase (Decrease) in Net Assets | | |
| Operations | | |
| Net investment income (loss) | $ | (1,995) |
| Net realized gain (loss) | | (54,610) |
| Change in net unrealized appreciation (depreciation) | | (91,716) |
| Net increase (decrease) in net assets resulting from operations | | (148,321) |
| Share transactions - net increase (decrease) | | 2,835,080 |
| Total increase (decrease) in net assets | | 2,686,759 |
| | | |
| Net Assets | | |
| Beginning of period | | - |
| End of period | $ | 2,686,759 |
| | | |
| | | |
Financial Highlights
| Fidelity Advisor Healthy Future Fund Class A |
| |
| | Six months ended (Unaudited) October 31, 2022 A |
Selected Per-Share Data | | |
| Net asset value, beginning of period | $ | 10.00 |
| Income from Investment Operations | | |
Net investment income (loss) B,C | | (.02) |
| Net realized and unrealized gain (loss) | | (.52) |
| Total from investment operations | | (.54) |
| Net asset value, end of period | $ | 9.46 |
Total Return D,E,F | | (5.40)% |
Ratios to Average Net Assets C,G,H | | |
| Expenses before reductions | | 10.15% I |
| Expenses net of fee waivers, if any | | 1.30% I |
| Expenses net of all reductions | | 1.29% I |
| Net investment income (loss) | | (.40)% I |
| Supplemental Data | | |
| Net assets, end of period (000 omitted) | $ | 151 |
Portfolio turnover rate J | | 25% K |
A For the period May 24, 2022 (commencement of operations) through October 31, 2022
B Calculated based on average shares outstanding during the period.
C Net investment income (loss) is affected by the timing of the declaration of dividends by any underlying mutual funds or exchange-traded funds (ETFs). Net investment income (loss) of any mutual funds or ETFs is not included in the Fund's net investment income (loss) ratio.
D Total returns for periods of less than one year are not annualized.
E Total returns would have been lower if certain expenses had not been reduced during the applicable periods shown.
F Total returns do not include the effect of the sales charges.
G Fees and expenses of any underlying mutual funds or exchange-traded funds (ETFs) are not included in the Fund's expense ratio. The Fund indirectly bears its proportionate share of these expenses. For additional expense information related to investments in Fidelity Central Funds, please refer to the "Investments in Fidelity Central Funds" note found in the Notes to Financial Statements section of the most recent Annual or Semi-Annual report.
H Expense ratios reflect operating expenses of the class. Expenses before reductions do not reflect amounts reimbursed, waived, or reduced through arrangements with the investment adviser, brokerage services, or other offset arrangements, if applicable, and do not represent the amount paid by the class during periods when reimbursements, waivers or reductions occur.
I Annualized
J Amount does not include the portfolio activity of any underlying mutual funds or exchange-traded funds (ETFs).
K Amount not annualized.
| Fidelity Advisor Healthy Future Fund Class M |
| |
| | Six months ended (Unaudited) October 31, 2022 A |
Selected Per-Share Data | | |
| Net asset value, beginning of period | $ | 10.00 |
| Income from Investment Operations | | |
Net investment income (loss) B,C | | (.03) |
| Net realized and unrealized gain (loss) | | (.52) |
| Total from investment operations | | (.55) |
| Net asset value, end of period | $ | 9.45 |
Total Return D,E,F | | (5.50)% |
Ratios to Average Net Assets C,G,H | | |
| Expenses before reductions | | 10.63% I |
| Expenses net of fee waivers, if any | | 1.55% I |
| Expenses net of all reductions | | 1.55% I |
| Net investment income (loss) | | (.65)% I |
| Supplemental Data | | |
| Net assets, end of period (000 omitted) | $ | 96 |
Portfolio turnover rate J | | 25% K |
A For the period May 24, 2022 (commencement of operations) through October 31, 2022
B Calculated based on average shares outstanding during the period.
C Net investment income (loss) is affected by the timing of the declaration of dividends by any underlying mutual funds or exchange-traded funds (ETFs). Net investment income (loss) of any mutual funds or ETFs is not included in the Fund's net investment income (loss) ratio.
D Total returns for periods of less than one year are not annualized.
E Total returns would have been lower if certain expenses had not been reduced during the applicable periods shown.
F Total returns do not include the effect of the sales charges.
G Fees and expenses of any underlying mutual funds or exchange-traded funds (ETFs) are not included in the Fund's expense ratio. The Fund indirectly bears its proportionate share of these expenses. For additional expense information related to investments in Fidelity Central Funds, please refer to the "Investments in Fidelity Central Funds" note found in the Notes to Financial Statements section of the most recent Annual or Semi-Annual report.
H Expense ratios reflect operating expenses of the class. Expenses before reductions do not reflect amounts reimbursed, waived, or reduced through arrangements with the investment adviser, brokerage services, or other offset arrangements, if applicable, and do not represent the amount paid by the class during periods when reimbursements, waivers or reductions occur.
I Annualized
J Amount does not include the portfolio activity of any underlying mutual funds or exchange-traded funds (ETFs).
K Amount not annualized.
| Fidelity Advisor Healthy Future Fund Class C |
| |
| | Six months ended (Unaudited) October 31, 2022 A |
Selected Per-Share Data | | |
| Net asset value, beginning of period | $ | 10.00 |
| Income from Investment Operations | | |
Net investment income (loss) B,C | | (.05) |
| Net realized and unrealized gain (loss) | | (.52) |
| Total from investment operations | | (.57) |
| Net asset value, end of period | $ | 9.43 |
Total Return D,E,F | | (5.70)% |
Ratios to Average Net Assets C,G,H | | |
| Expenses before reductions | | 11.09% I |
| Expenses net of fee waivers, if any | | 2.05% I |
| Expenses net of all reductions | | 2.04% I |
| Net investment income (loss) | | (1.15)% I |
| Supplemental Data | | |
| Net assets, end of period (000 omitted) | $ | 100 |
Portfolio turnover rate J | | 25% K |
A For the period May 24, 2022 (commencement of operations) through October 31, 2022
B Calculated based on average shares outstanding during the period.
C Net investment income (loss) is affected by the timing of the declaration of dividends by any underlying mutual funds or exchange-traded funds (ETFs). Net investment income (loss) of any mutual funds or ETFs is not included in the Fund's net investment income (loss) ratio.
D Total returns for periods of less than one year are not annualized.
E Total returns would have been lower if certain expenses had not been reduced during the applicable periods shown.
F Total returns do not include the effect of the contingent deferred sales charge.
G Fees and expenses of any underlying mutual funds or exchange-traded funds (ETFs) are not included in the Fund's expense ratio. The Fund indirectly bears its proportionate share of these expenses. For additional expense information related to investments in Fidelity Central Funds, please refer to the "Investments in Fidelity Central Funds" note found in the Notes to Financial Statements section of the most recent Annual or Semi-Annual report.
H Expense ratios reflect operating expenses of the class. Expenses before reductions do not reflect amounts reimbursed, waived, or reduced through arrangements with the investment adviser, brokerage services, or other offset arrangements, if applicable, and do not represent the amount paid by the class during periods when reimbursements, waivers or reductions occur.
I Annualized
J Amount does not include the portfolio activity of any underlying mutual funds or exchange-traded funds (ETFs).
K Amount not annualized.
| Fidelity Healthy Future Fund |
| |
| | Six months ended (Unaudited) October 31, 2022 A |
Selected Per-Share Data | | |
| Net asset value, beginning of period | $ | 10.00 |
| Income from Investment Operations | | |
Net investment income (loss) B,C | | (.01) |
| Net realized and unrealized gain (loss) | | (.52) |
| Total from investment operations | | (.53) |
| Net asset value, end of period | $ | 9.47 |
Total Return D,E | | (5.30)% |
Ratios to Average Net Assets C,F,G | | |
| Expenses before reductions | | 9.30% H |
| Expenses net of fee waivers, if any | | 1.05% H |
| Expenses net of all reductions | | 1.04% H |
| Net investment income (loss) | | (.15)% H |
| Supplemental Data | | |
| Net assets, end of period (000 omitted) | $ | 2,148 |
Portfolio turnover rate I | | 25% J |
A For the period May 24, 2022 (commencement of operations) through October 31, 2022
B Calculated based on average shares outstanding during the period.
C Net investment income (loss) is affected by the timing of the declaration of dividends by any underlying mutual funds or exchange-traded funds (ETFs). Net investment income (loss) of any mutual funds or ETFs is not included in the Fund's net investment income (loss) ratio.
D Total returns for periods of less than one year are not annualized.
E Total returns would have been lower if certain expenses had not been reduced during the applicable periods shown.
F Fees and expenses of any underlying mutual funds or exchange-traded funds (ETFs) are not included in the Fund's expense ratio. The Fund indirectly bears its proportionate share of these expenses. For additional expense information related to investments in Fidelity Central Funds, please refer to the "Investments in Fidelity Central Funds" note found in the Notes to Financial Statements section of the most recent Annual or Semi-Annual report.
G Expense ratios reflect operating expenses of the class. Expenses before reductions do not reflect amounts reimbursed, waived, or reduced through arrangements with the investment adviser, brokerage services, or other offset arrangements, if applicable, and do not represent the amount paid by the class during periods when reimbursements, waivers or reductions occur.
H Annualized
I Amount does not include the portfolio activity of any underlying mutual funds or exchange-traded funds (ETFs).
J Amount not annualized.
| Fidelity Advisor Healthy Future Fund Class I |
| |
| | Six months ended (Unaudited) October 31, 2022 A |
Selected Per-Share Data | | |
| Net asset value, beginning of period | $ | 10.00 |
| Income from Investment Operations | | |
Net investment income (loss) B,C | | (.01) |
| Net realized and unrealized gain (loss) | | (.52) |
| Total from investment operations | | (.53) |
| Net asset value, end of period | $ | 9.47 |
Total Return D,E | | (5.30)% |
Ratios to Average Net Assets C,F,G | | |
| Expenses before reductions | | 10.14% H |
| Expenses net of fee waivers, if any | | 1.05% H |
| Expenses net of all reductions | | 1.04% H |
| Net investment income (loss) | | (.15)% H |
| Supplemental Data | | |
| Net assets, end of period (000 omitted) | $ | 96 |
Portfolio turnover rate I | | 25% J |
A For the period May 24, 2022 (commencement of operations) through October 31, 2022
B Calculated based on average shares outstanding during the period.
C Net investment income (loss) is affected by the timing of the declaration of dividends by any underlying mutual funds or exchange-traded funds (ETFs). Net investment income (loss) of any mutual funds or ETFs is not included in the Fund's net investment income (loss) ratio.
D Total returns for periods of less than one year are not annualized.
E Total returns would have been lower if certain expenses had not been reduced during the applicable periods shown.
F Fees and expenses of any underlying mutual funds or exchange-traded funds (ETFs) are not included in the Fund's expense ratio. The Fund indirectly bears its proportionate share of these expenses. For additional expense information related to investments in Fidelity Central Funds, please refer to the "Investments in Fidelity Central Funds" note found in the Notes to Financial Statements section of the most recent Annual or Semi-Annual report.
G Expense ratios reflect operating expenses of the class. Expenses before reductions do not reflect amounts reimbursed, waived, or reduced through arrangements with the investment adviser, brokerage services, or other offset arrangements, if applicable, and do not represent the amount paid by the class during periods when reimbursements, waivers or reductions occur.
H Annualized
I Amount does not include the portfolio activity of any underlying mutual funds or exchange-traded funds (ETFs).
J Amount not annualized.
| Fidelity Advisor Healthy Future Fund Class Z |
| |
| | Six months ended (Unaudited) October 31, 2022 A |
Selected Per-Share Data | | |
| Net asset value, beginning of period | $ | 10.00 |
| Income from Investment Operations | | |
Net investment income (loss) B,C | | - D |
| Net realized and unrealized gain (loss) | | (.52) |
| Total from investment operations | | (.52) |
| Net asset value, end of period | $ | 9.48 |
Total Return E,F | | (5.20)% |
Ratios to Average Net Assets C,G,H | | |
| Expenses before reductions | | 10.05% I |
| Expenses net of fee waivers, if any | | .90% I |
| Expenses net of all reductions | | .90% I |
| Net investment income (loss) | | -% I,J |
| Supplemental Data | | |
| Net assets, end of period (000 omitted) | $ | 95 |
Portfolio turnover rate K | | 25% L |
A For the period May 24, 2022 (commencement of operations) through October 31, 2022
B Calculated based on average shares outstanding during the period.
C Net investment income (loss) is affected by the timing of the declaration of dividends by any underlying mutual funds or exchange-traded funds (ETFs). Net investment income (loss) of any mutual funds or ETFs is not included in the Fund's net investment income (loss) ratio.
D Amount represents less than $.005 per share.
E Total returns for periods of less than one year are not annualized.
F Total returns would have been lower if certain expenses had not been reduced during the applicable periods shown.
G Fees and expenses of any underlying mutual funds or exchange-traded funds (ETFs) are not included in the Fund's expense ratio. The Fund indirectly bears its proportionate share of these expenses. For additional expense information related to investments in Fidelity Central Funds, please refer to the "Investments in Fidelity Central Funds" note found in the Notes to Financial Statements section of the most recent Annual or Semi-Annual report.
H Expense ratios reflect operating expenses of the class. Expenses before reductions do not reflect amounts reimbursed, waived, or reduced through arrangements with the investment adviser, brokerage services, or other offset arrangements, if applicable, and do not represent the amount paid by the class during periods when reimbursements, waivers or reductions occur.
I Annualized
J Amount represents less than .005%.
K Amount does not include the portfolio activity of any underlying mutual funds or exchange-traded funds (ETFs).
L Amount not annualized.
For the period ended October 31, 2022
1. Organization.
Fidelity Healthy Future Fund (the Fund) is a non-diversified fund of Fidelity Summer Street Trust (the Trust) and is authorized to issue an unlimited number of shares. The Trust is registered under the Investment Company Act of 1940, as amended (the 1940 Act), as an open-end management investment company organized as a Massachusetts business trust. The Fund offers Class A, Class M, Class C, Fidelity Healthy Future Fund, Class I and Class Z shares, each of which has equal rights as to assets and voting privileges. Each class has exclusive voting rights with respect to matters that affect that class. Class C shares will automatically convert to Class A shares after a holding period of eight years from the initial date of purchase, with certain exceptions. Application of FMR's environmental, social, and governance (ESG) ratings process and/or its sustainable investing exclusion criteria may affect the Fund's exposure to certain issuers, sectors, regions, and countries and may affect the Fund's performance depending on whether certain investments are in or out of favor. The criteria related to the Fund's ESG ratings process and/or adherence to its sustainable investing exclusion criteria may result in the Fund forgoing opportunities to buy certain securities when it might otherwise be advantageous to do so, or selling securities for ESG reasons when it might be otherwise disadvantageous for it to do so. As a result, the Fund's performance may at times be better or worse than the performance of funds that do not use ESG or sustainability criteria. There are significant differences in interpretations of what it means for an issuer to have positive ESG factors. While the investment adviser believes its definitions are reasonable, the portfolio decisions it makes may differ with other investors' or advisers' views.
2. Investments in Fidelity Central Funds.
Funds may invest in Fidelity Central Funds, which are open-end investment companies generally available only to other investment companies and accounts managed by the investment adviser and its affiliates. The Schedule of Investments lists any Fidelity Central Funds held as an investment as of period end, but does not include the underlying holdings of each Fidelity Central Fund. An investing fund indirectly bears its proportionate share of the expenses of the underlying Fidelity Central Funds.
Based on its investment objective, each Fidelity Central Fund may invest or participate in various investment vehicles or strategies that are similar to those of the investing fund. These strategies are consistent with the investment objectives of the investing fund and may involve certain economic risks which may cause a decline in value of each of the Fidelity Central Funds and thus a decline in the value of the investing fund.
| Fidelity Central Fund | Investment Manager | Investment Objective | Investment Practices | Expense Ratio A |
| Fidelity Money Market Central Funds | Fidelity Management & Research Company LLC (FMR) | Each fund seeks to obtain a high level of current income consistent with the preservation of capital and liquidity. | Short-term Investments | Less than .005% |
A Expenses expressed as a percentage of average net assets and are as of each underlying Central Fund's most recent annual or semi-annual shareholder report.
A complete unaudited list of holdings for each Fidelity Central Fund is available upon request or at the Securities and Exchange Commission website at www.sec.gov. In addition, the financial statements of the Fidelity Central Funds which contain the significant accounting policies (including investment valuation policies) of those funds, and are not covered by the Report of Independent Registered Public Accounting Firm, are available on the Securities and Exchange Commission website or upon request.
3. Significant Accounting Policies.
The Fund is an investment company and applies the accounting and reporting guidance of the Financial Accounting Standards Board (FASB) Accounting Standards Codification Topic 946 Financial Services - Investment Companies . The financial statements have been prepared in conformity with accounting principles generally accepted in the United States of America (GAAP), which require management to make certain estimates and assumptions at the date of the financial statements. Actual results could differ from those estimates. Subsequent events, if any, through the date that the financial statements were issued have been evaluated in the preparation of the financial statements. The Fund's Schedule of Investments lists any underlying mutual funds or exchange-traded funds (ETFs) but does not include the underlying holdings of these funds. The following summarizes the significant accounting policies of the Fund:
Investment Valuation. Investments are valued as of 4:00 p.m. Eastern time on the last calendar day of the period. The Board of Trustees (the Board) has designated the Fund's investment adviser as the valuation designee responsible for the fair valuation function and performing fair value determinations as needed. The investment adviser has established a Fair Value Committee (the Committee) to carry out the day-to-day fair valuation responsibilities and has adopted policies and procedures to govern the fair valuation process and the activities of the Committee. In accordance with these fair valuation policies and procedures, which have been approved by the Board, the Fund attempts to obtain prices from one or more third party pricing services or brokers to value its investments. When current market prices, quotations or currency exchange rates are not readily available or reliable, investments will be fair valued in good faith by the Committee, in accordance with the policies and procedures. Factors used in determining fair value vary by investment type and may include market or investment specific events, transaction data, estimated cash flows, and market observations of comparable investments. The frequency that the fair valuation procedures are used cannot be predicted and they may be utilized to a significant extent. The Committee manages the Fund's fair valuation practices and maintains the fair valuation policies and procedures. The Fund's investment adviser reports to the Board information regarding the fair valuation process and related material matters.
The Fund categorizes the inputs to valuation techniques used to value its investments into a disclosure hierarchy consisting of three levels as shown below:
Level 1 - unadjusted quoted prices in active markets for identical investments
Level 2 - other significant observable inputs (including quoted prices for similar investments, interest rates, prepayment speeds, etc.)
Level 3 - unobservable inputs (including the Fund's own assumptions based on the best information available)
Valuation techniques used to value the Fund's investments by major category are as follows:
Equity securities, including restricted securities, for which market quotations are readily available, are valued at the last reported sale price or official closing price as reported by a third party pricing service on the primary market or exchange on which they are traded and are categorized as Level 1 in the hierarchy. In the event there were no sales during the day or closing prices are not available, securities are valued at the last quoted bid price or may be valued using the last available price and are generally categorized as Level 2 in the hierarchy. For foreign equity securities, when market or security specific events arise, comparisons to the valuation of American Depositary Receipts (ADRs), futures contracts, ETFs and certain indexes as well as quoted prices for similar securities may be used and would be categorized as Level 2 in the hierarchy. For equity securities, including restricted securities, where observable inputs are limited, assumptions about market activity and risk are used and these securities may be categorized as Level 3 in the hierarchy.
Investments in open-end mutual funds, including the Fidelity Central Funds, are valued at their closing net asset value (NAV) each business day and are categorized as Level 1 in the hierarchy.
Changes in valuation techniques may result in transfers in or out of an assigned level within the disclosure hierarchy. The aggregate value of investments by input level as of October 31, 2022 is included at the end of the Fund's Schedule of Investments.
Foreign Currency. Certain Funds may use foreign currency contracts to facilitate transactions in foreign-denominated securities. Gains and losses from these transactions may arise from changes in the value of the foreign currency or if the counterparties do not perform under the contracts' terms.
Foreign-denominated assets, including investment securities, and liabilities are translated into U.S. dollars at the exchange rates at period end. Purchases and sales of investment securities, income and dividends received, and expenses denominated in foreign currencies are translated into U.S. dollars at the exchange rate in effect on the transaction date.
The effects of exchange rate fluctuations on investments are included with the net realized and unrealized gain (loss) on investment securities. Other foreign currency transactions resulting in realized and unrealized gain (loss) are disclosed separately.
Investment Transactions and Income. For financial reporting purposes, the Fund's investment holdings and NAV include trades executed through the end of the last business day of the period. The NAV per share for processing shareholder transactions is calculated as of the close of business of the New York Stock Exchange (NYSE), normally 4:00 p.m. Eastern time and includes trades executed through the end of the prior business day. Gains and losses on securities sold are determined on the basis of identified cost. Commissions paid to certain brokers with whom the investment adviser, or its affiliates, places trades on behalf of a fund include an amount in addition to trade execution, which may be rebated back to a fund. Any such rebates are included in net realized gain (loss) on investments in the Statement of Operations. Dividend income is recorded on the ex-dividend date, except for certain dividends from foreign securities where the ex-dividend date may have passed, which are recorded as soon as the Fund is informed of the ex-dividend date. Non-cash dividends included in dividend income, if any, are recorded at the fair market value of the securities received. Income and capital gain distributions from Fidelity Central Funds, if any, are recorded on the ex-dividend date. Certain distributions received by the Fund represent a return of capital or capital gain. The Fund determines the components of these distributions subsequent to the ex-dividend date, based upon receipt of tax filings or other correspondence relating to the underlying investment. These distributions are recorded as a reduction of cost of investments and/or as a realized gain. Investment income is recorded net of foreign taxes withheld where recovery of such taxes is uncertain.
Class Allocations and Expenses. Investment income, realized and unrealized capital gains and losses, common expenses of a fund, and certain fund-level expense reductions, if any, are allocated daily on a pro-rata basis to each class based on the relative net assets of each class to the total net assets of a fund. Each class differs with respect to transfer agent and distribution and service plan fees incurred, as applicable. Certain expense reductions may also differ by class, if applicable. For the reporting period, the allocated portion of income and expenses to each class as a percent of its average net assets may vary due to the timing of recording these transactions in relation to fluctuating net assets of the classes. Expenses directly attributable to a fund are charged to that fund. Expenses attributable to more than one fund are allocated among the respective funds on the basis of relative net assets or other appropriate methods. Expenses included in the accompanying financial statements reflect the expenses of that fund and do not include any expenses associated with any underlying mutual funds or exchange-traded funds. Although not included in a fund's expenses, a fund indirectly bears its proportionate share of these expenses through the net asset value of each underlying mutual fund or exchange-traded fund. Expense estimates are accrued in the period to which they relate and adjustments are made when actual amounts are known.
Income Tax Information and Distributions to Shareholders. Each year, the Fund intends to qualify as a regulated investment company under Subchapter M of the Internal Revenue Code, including distributing substantially all of its taxable income and realized gains. As a result, no provision for U.S. Federal income taxes is required. The Fund files a U.S. federal tax return, in addition to state and local tax returns as required. The Fund's federal income tax returns are subject to examination by the Internal Revenue Service (IRS) for a period of three fiscal years after they are filed. State and local tax returns may be subject to examination for an additional fiscal year depending on the jurisdiction. Foreign taxes are provided for based on the Fund's understanding of the tax rules and rates that exist in the foreign markets in which it invests.
Distributions are declared and recorded on the ex-dividend date. Income and capital gain distributions are declared separately for each class. Income and capital gain distributions are determined in accordance with income tax regulations, which may differ from GAAP.
Capital accounts within the financial statements are adjusted for permanent book-tax differences. These adjustments have no impact on net assets or the results of operations. Capital accounts are not adjusted for temporary book-tax differences which will reverse in a subsequent period.
As of period end, the cost and unrealized appreciation (depreciation) in securities, and derivatives if applicable, for federal income tax purposes were as follows:
| Gross unrealized appreciation | $98,368 |
| Gross unrealized depreciation | (197,816) |
| Net unrealized appreciation (depreciation) | $(99,448) |
| Tax cost | $2,683,078 |
4. Purchases and Sales of Investments.
Purchases and sales of securities, other than short-term securities and in-kind transactions, as applicable, are noted in the table below.
| | Purchases ($) | Sales ($) |
| Fidelity Healthy Future Fund | 3,163,640 | 468,730 |
5. Fees and Other Transactions with Affiliates.
Management Fee. Fidelity Management & Research Company LLC (the investment adviser) and its affiliates provide the Fund with investment management related services for which the Fund pays a monthly management fee. The management fee is the sum of an individual fund fee rate that is based on an annual rate of .45% of the Fund's average net assets and an annualized group fee rate that averaged .23% during the period. The group fee rate is based upon the monthly average net assets of a group of registered investment companies with which the investment adviser has management contracts. The group fee rate decreases as assets under management increase and increases as assets under management decrease. For the reporting period, the total annualized management fee rate was .67% of the Fund's average net assets.
Distribution and Service Plan Fees. In accordance with Rule 12b-1 of the 1940 Act, the Fund has adopted separate Distribution and Service Plans for each class of shares. Certain classes pay Fidelity Distributors Company LLC (FDC), an affiliate of the investment adviser, separate Distribution and Service Fees, each of which is based on an annual percentage of each class' average net assets. In addition, FDC may pay financial intermediaries for selling shares of the Fund and providing shareholder support services. For the period, the Distribution and Service Fee rates, total fees and amounts retained by FDC were as follows:
| | Distribution Fee | Service Fee | Total Fees | Retained by FDC |
| Class A | - % | .25% | $122 | $115 |
| Class M | .25% | .25% | 216 | 216 |
| Class C | .75% | .25% | 437 | 437 |
| | | | $775 | $768 |
Sales Load. FDC may receive a front-end sales charge of up to 5.75% for selling Class A shares and 3.50% for selling Class M shares, some of which is paid to financial intermediaries for selling shares of the Fund. Depending on the holding period, FDC may receive contingent deferred sales charges levied on Class A, Class M and Class C redemptions. The deferred sales charges are 1.00% for Class C shares, 1.00% for certain purchases of Class A shares and .25% for certain purchases of Class M shares. For the period, there were no sales charge amounts retained by FDC.
Transfer Agent Fees. Fidelity Investments Institutional Operations Company LLC (FIIOC), an affiliate of the investment adviser, is the transfer, dividend disbursing and shareholder servicing agent for each class of the Fund. FIIOC receives account fees and asset-based fees that vary according to the account size and type of account of the shareholders of the respective classes of the Fund, except for Class Z. FIIOC receives an asset-based fee of Class Z's average net assets. FIIOC pays for typesetting, printing and mailing of shareholder reports, except proxy statements.
For the period, transfer agent fees for each class were as follows:
| | Amount | % of Class-Level Average Net Assets A |
| Class A | $84 | .17 |
| Class M | 50 | .12 |
| Class C | 53 | .12 |
| Fidelity Healthy Future Fund | 1,778 | .27 |
| Class I | 61 | .14 |
| Class Z | 18 | .04 |
| | $2,044 | |
A Annualized
Accounting Fees. Fidelity Service Company, Inc. (FSC), an affiliate of the investment adviser, maintains the Fund's accounting records. The accounting fee is based on the level of average net assets for each month. For the period, the fees were equivalent to the following annualized rates:
| | % of Average Net Assets |
| Fidelity Healthy Future Fund | .04 |
Brokerage Commissions. A portion of portfolio transactions were placed with brokerage firms which are affiliates of the investment adviser. Brokerage commissions are included in net realized gain (loss) and change in net unrealized appreciation (depreciation) in the Statement of Operations. The commissions paid to these affiliated firms were as follows:
| | Amount |
| Fidelity Healthy Future Fund | $19 |
Interfund Trades. Funds may purchase from or sell securities to other Fidelity Funds under procedures adopted by the Board. The procedures have been designed to ensure these interfund trades are executed in accordance with Rule 17a-7 of the 1940 Act. Any interfund trades are included within the respective purchases and sales amounts shown in the Purchases and Sales of Investments note. Interfund trades during the period are noted in the table below.
| | Purchases ($) | Sales ($) | Realized Gain (Loss) ($) |
| Fidelity Healthy Future Fund | 67,401 | 32,186 | (1,470) |
6. Expense Reductions.
The investment adviser contractually agreed to reimburse expenses of each class to the extent annual operating expenses exceeded certain levels of class-level average net assets as noted in the table below. This reimbursement will remain in place through August 31, 2023. Some expenses, for example the compensation of the independent Trustees are excluded from this reimbursement.
The following classes were in reimbursement during the period:
| | Expense Limitations | Reimbursement |
| Class A | 1.30% | $4,311 |
| Class M | 1.55% | 3,911 |
| Class C | 2.05% | 3,956 |
| Fidelity Healthy Future Fund | 1.05% | 53,630 |
| Class I | 1.05% | 3,948 |
| Class Z | .90% | 3,953 |
| | | $73,709 |
Through arrangements with the Fund's custodian, credits realized as a result of certain uninvested cash balances were used to reduce the Fund's expenses. During the period, custodian credits reduced the Fund's expenses by $15.
In addition, during the period the investment adviser or an affiliate reimbursed and/or waived a portion of fund-level operating expenses in the amount of $22.
7. Share Transactions.
Share transactions for each class were as follows and may contain in-kind transactions, automatic conversions between classes or exchanges between affiliated funds:
| | Shares | Dollars |
| | Six months ended October 31, 2022 A | Six months ended October 31, 2022 A |
| Fidelity Healthy Future Fund | | |
| Class A | | |
| Shares sold | 17,219 | $170,185 |
| Shares redeemed | (1,242) | (12,793) |
| Net increase (decrease) | 15,977 | $157,392 |
| Class M | | |
| Shares sold | 10,126 | $101,200 |
| Net increase (decrease) | 10,126 | $101,200 |
| Class C | | |
| Shares sold | 10,593 | $106,102 |
| Net increase (decrease) | 10,593 | $106,102 |
| Fidelity Healthy Future Fund | | |
| Shares sold | 241,634 | $2,411,524 |
| Shares redeemed | (14,799) | (143,338) |
| Net increase (decrease) | 226,835 | $2,268,186 |
| Class I | | |
| Shares sold | 10,152 | $101,500 |
| Net increase (decrease) | 10,152 | $101,500 |
| Class Z | | |
| Shares sold | 10,073 | $100,700 |
| Net increase (decrease) | 10,073 | $100,700 |
A For the period May 24, 2022 (commencement of operations) through October 31, 2022.
8. Other.
A fund's organizational documents provide former and current trustees and officers with a limited indemnification against liabilities arising in connection with the performance of their duties to the fund. In the normal course of business, a fund may also enter into contracts that provide general indemnifications. A fund's maximum exposure under these arrangements is unknown as this would be dependent on future claims that may be made against a fund. The risk of material loss from such claims is considered remote.
At the end of the period, the investment adviser or its affiliates were owners of record of more than 10% of the outstanding shares as follows:
| Fund | Affiliated % |
| Fidelity Healthy Future Fund | 35% |
9. Risk and Uncertainties.
Many factors affect a fund's performance. Developments that disrupt global economies and financial markets, such as pandemics, epidemics, outbreaks of infectious diseases, war, terrorism, and environmental disasters, may significantly affect a fund's investment performance. The effects of these developments to a fund will be impacted by the types of securities in which a fund invests, the financial condition, industry, economic sector, and geographic location of an issuer, and a fund's level of investment in the securities of that issuer.
As a shareholder, you incur two types of costs: (1) transaction costs, which may include sales charges (loads) on purchase payments or redemption proceeds, as applicable and (2) ongoing costs, which generally include management fees, distribution and/or service (12b-1) fees and other Fund expenses. This Example is intended to help you understand your ongoing costs (in dollars) of investing in a fund and to compare these costs with the ongoing costs of investing in other mutual funds.
| The actual expense Example is based on an investment of $1,000 invested at the beginning of the period and held for the entire period (May 24, 2022 to October 31, 2022). The hypothetical expense Example is based on an investment of $1,000 invested for the one-half year period (May 1, 2022 to October 31, 2022). |
Actual Expenses
The first line of the accompanying table provides information about actual account values and actual expenses. You may use the information in this line, together with the amount you invested, to estimate the expenses that you paid over the period. Simply divide your account value by $1,000.00 (for example, an $8,600 account value divided by $1,000.00 = 8.6), then multiply the result by the number in the first line for a class/Fund under the heading entitled "Expenses Paid During Period" to estimate the expenses you paid on your account during this period. If any fund is a shareholder of any underlying mutual funds or exchange-traded funds (ETFs) (the Underlying Funds), such fund indirectly bears its proportional share of the expenses of the Underlying Funds in addition to the direct expenses incurred presented in the table. These fees and expenses are not included in the annualized expense ratio used to calculate the expense estimate in the table below.
Hypothetical Example for Comparison Purposes
The second line of the accompanying table provides information about hypothetical account values and hypothetical expenses based on the actual expense ratio and an assumed rate of return of 5% per year before expenses, which is not the actual return. The hypothetical account values and expenses may not be used to estimate the actual ending account balance or expenses you paid for the period. You may use this information to compare the ongoing costs of investing in the Fund and other funds. To do so, compare this 5% hypothetical example with the 5% hypothetical examples that appear in the shareholder reports of the other funds. If any fund is a shareholder of any Underlying Funds, such fund indirectly bears its proportional share of the expenses of the Underlying Funds in addition to the direct expenses as presented in the table. These fees and expenses are not included in the annualized expense ratio used to calculate the expense estimate in the table below.
Please note that the expenses shown in the table are meant to highlight your ongoing costs only and do not reflect any transaction costs. Therefore, the second line of the table is useful in comparing ongoing costs only, and will not help you determine the relative total costs of owning different funds. In addition, if these transactional costs were included, your costs would have been higher.
| | | | | Annualized Expense Ratio- A | | Beginning Account Value | | Ending Account Value October 31, 2022 | | Expenses Paid During Period |
| Fidelity Healthy Future Fund | | | | | | | | | | |
| Class A | | | | 1.30% | | | | | | |
| Actual | | | | | | $ 1,000 | | $ 946.00 | | $ 5.58 C |
Hypothetical- B | | | | | | $ 1,000 | | $ 1,018.65 | | $ 6.61 D |
| Class M | | | | 1.55% | | | | | | |
| Actual | | | | | | $ 1,000 | | $ 945.00 | | $ 6.65 C |
Hypothetical- B | | | | | | $ 1,000 | | $ 1,017.39 | | $ 7.88 D |
| Class C | | | | 2.05% | | | | | | |
| Actual | | | | | | $ 1,000 | | $ 943.00 | | $ 8.78 C |
Hypothetical- B | | | | | | $ 1,000 | | $ 1,014.87 | | $ 10.41 D |
| Fidelity Healthy Future Fund | | | | 1.05% | | | | | | |
| Actual | | | | | | $ 1,000 | | $ 947.00 | | $ 4.51 C |
Hypothetical- B | | | | | | $ 1,000 | | $ 1,019.91 | | $ 5.35 D |
| Class I | | | | 1.05% | | | | | | |
| Actual | | | | | | $ 1,000 | | $ 947.00 | | $ 4.51 C |
Hypothetical- B | | | | | | $ 1,000 | | $ 1,019.91 | | $ 5.35 D |
| Class Z | | | | .90% | | | | | | |
| Actual | | | | | | $ 1,000 | | $ 948.00 | | $ 3.87 C |
Hypothetical- B | | | | | | $ 1,000 | | $ 1,020.67 | | $ 4.58 D |
| |
A Annualized expense ratio reflects expenses net of applicable fee waivers.
B 5% return per year before expenses
C Actual expenses are equal to the annualized expense ratio, multiplied by the average account value over the period, multiplied by 161 / 365 (to reflect the period May 24, 2022 to October 31, 2022).
D Hypothetical expenses are equal to the annualized expense ratio, multiplied by the average account value over the period, multiplied by 184/365 (to reflect the one-half year period).
Fidelity Healthy Future Fund
At its January 2022 meeting, the Board of Trustees, including the Independent Trustees (together, the Board), voted to approve the management contract with Fidelity Management & Research Company LLC (FMR) and the sub-advisory agreements with affiliates of FMR (together, the Advisory Contracts) for the fund. FMR and the sub-advisers are collectively referred to herein as the Investment Advisers. The Board, assisted by the advice of fund counsel and Independent Trustees' counsel, considered a broad range of information.
Nature, Extent, and Quality of Services Provided . The Board considered Fidelity's staffing as it relates to the fund, including the backgrounds of investment personnel of Fidelity, and also considered the fund's investment objective, strategies, and related investment philosophy. The Board considered the structure of the investment personnel compensation program and whether this structure provides appropriate incentives to act in the best interests of the fund.
Resources Dedicated to Investment Management and Support Services . The Board and the Fund Oversight and Research Committees reviewed the general qualifications and capabilities of Fidelity's investment staff, including its size, education, experience, and resources, as well as Fidelity's approach to recruiting, training, managing, and compensating investment personnel. The Board noted the resources devoted to Fidelity's global investment organization and that Fidelity's analysts have extensive resources, tools and capabilities that allow them to conduct sophisticated quantitative and fundamental analysis, as well as credit analysis of issuers, counterparties and guarantors. Further, the Board considered that Fidelity's investment professionals have sufficient access to global information and data so as to provide competitive investment results over time, and that those professionals also have access to sophisticated tools that permit them to assess portfolio construction and risk and performance attribution characteristics continuously, as well as to transmit new information and research conclusions rapidly around the world. Additionally, in its deliberations, the Board considered Fidelity's trading, risk management, compliance, cybersecurity, and technology and operations capabilities and resources, which are integral parts of the investment management process.
Shareholder and Administrative Services . The Board considered the nature, extent, quality, and cost of advisory, administrative, and shareholder services to be performed by the Investment Advisers and their affiliates under the Advisory Contracts and under separate agreements covering transfer agency, pricing and bookkeeping, and securities lending services for the fund. The Board also considered the nature and extent of the supervision of third party service providers, principally custodians, subcustodians, and pricing vendors.
The Board noted that the growth of fund assets over time across the complex allows Fidelity to reinvest in the development of services designed to enhance the value and convenience of the Fidelity funds as investment vehicles. These services include 24-hour access to account information and market information over the Internet and through telephone representatives, investor education materials and asset allocation tools. The Board also considered that it reviews customer service metrics such as telephone response times, continuity of services on the website and metrics addressing services at Fidelity Investor Centers.
Investment Performance . The fund is a new fund and therefore had no historical performance for the Board to review at the time it approved the fund's Advisory Contracts. The Board considered the Investment Advisers' strength in fundamental, research-driven security selection, which the Board is familiar with through its supervision of other Fidelity funds.
Based on its review, the Board concluded that the nature, extent, and quality of services to be provided to the fund under the Advisory Contracts should benefit the shareholders of the fund.
Competitiveness of Management Fee and Total Expense Ratio . In reviewing the Advisory Contracts, the Board considered the fund's proposed management fee rate and the projected total expense ratio of each class of the fund. The Board noted that the fund's proposed management fee rate is lower than the median fee rate of funds with similar Lipper investment objective categories and comparable investment mandates, regardless of whether their management fee structures are comparable. The Board also considered that the projected total expense ratio of the retail class and Class Z of the fund is below the median of those funds and classes used by the Board for management fee comparisons that have a similar sales load structure. The Board noted that the projected total expense ratio for each other class of the fund was above the median of those funds and classes used by the Board for management fee comparisons that have a similar sales load structure primarily as the result of low estimated asset levels.
The Board also noted that FMR has contractually agreed to reimburse each class of the fund to the extent that total operating expenses (excluding interest, certain taxes, fees and expenses of the Independent Trustees, proxy and shareholder meeting expenses, extraordinary expenses, and acquired fund fees and expenses (including fees and expenses associated with a wholly owned subsidiary), if any, as well as non-operating expenses such as brokerage commissions and fees and expenses associated with the fund's securities lending program, if applicable), as a percentage of their respective average net assets exceed a certain limit through August 31, 2023.
Based on its review, the Board concluded that the management fee and the projected total expense ratio of each class of the fund were reasonable in light of the services that the fund and its shareholders will receive and the other factors considered.
Costs of the Services and Profitability . The fund is a new fund and therefore no revenue, cost, or profitability data was available for the Board to review in respect of the fund at the time it approved the Advisory Contracts. In connection with its future renewal of the fund's Advisory Contracts, the Board will consider the revenues earned and the expenses incurred by Fidelity in conducting the business of developing, marketing, distributing, managing, administering and servicing the fund and servicing the fund's shareholders.
Economies of Scale . The Board will consider economies of scale when there is operating experience to permit assessment thereof. It noted that, notwithstanding the entrepreneurial risk associated with a new fund, the management fee was at a level normally associated, by comparison with competitors, with very high fund net assets, and Fidelity asserted to the Board that the level of the fee anticipated economies of scale at lower asset levels even before, if ever, economies of scale are achieved. The Board also noted that the fund and its shareholders would have access to the very considerable number and variety of services available through Fidelity and its affiliates.
Based on its evaluation of all of the conclusions noted above, and after considering all factors it believed relevant, the Board concluded that the advisory fee arrangements are fair and reasonable, and that the fund's Advisory Contracts should be approved.
1.9904958.100
HWF-SANN-1222
Fidelity® Capital & Income Fund
Semi-Annual Report
October 31, 2022
Contents
To view a fund's proxy voting guidelines and proxy voting record for the 12-month period ended June 30, visit http://www.fidelity.com/proxyvotingresults or visit the Securities and Exchange Commission's (SEC) web site at http://www.sec.gov.
You may also call 1-800-544-8544 to request a free copy of the proxy voting guidelines.
Standard & Poor's, S&P and S&P 500 are registered service marks of The McGraw-Hill Companies, Inc. and have been licensed for use by Fidelity Distributors Corporation.
Other third-party marks appearing herein are the property of their respective owners.
All other marks appearing herein are registered or unregistered trademarks or service marks of FMR LLC or an affiliated company. © 2022 FMR LLC. All rights reserved.
This report and the financial statements contained herein are submitted for the general information of the shareholders of the Fund. This report is not authorized for distribution to prospective investors in the Fund unless preceded or accompanied by an effective prospectus.
A fund files its complete schedule of portfolio holdings with the SEC for the first and third quarters of each fiscal year on Form N-PORT. Forms N-PORT are available on the SEC's web site at http://www.sec.gov. A fund's Forms N-PORT may be reviewed and copied at the SEC's Public Reference Room in Washington, DC. Information regarding the operation of the SEC's Public Reference Room may be obtained by calling 1-800-SEC-0330.
For a complete list of a fund's portfolio holdings, view the most recent holdings listing, semiannual report, or annual report on Fidelity's web site at http://www.fidelity.com, http://www.institutional.fidelity.com, or http://www.401k.com, as applicable.
NOT FDIC INSURED •MAY LOSE VALUE •NO BANK GUARANTEE
Neither the Fund nor Fidelity Distributors Corporation is a bank.
| Top Bond Issuers (% of Fund's net assets) |
(with maturities greater than one year) |
| CCO Holdings LLC/CCO Holdings Capital Corp. | 2.9 | |
| TransDigm, Inc. | 2.4 | |
| Bank of America Corp. | 1.9 | |
| Tenet Healthcare Corp. | 1.6 | |
| Ally Financial, Inc. | 1.6 | |
| JPMorgan Chase & Co. | 1.6 | |
| Altice France SA | 1.5 | |
| Caesars Entertainment, Inc. | 1.4 | |
| Citigroup, Inc. | 1.3 | |
| Occidental Petroleum | 1.2 | |
| | 17.4 | |
| |
| Market Sectors (% of Fund's net assets) |
| |
| Energy | 12.8 | |
| Banks & Thrifts | 10.2 | |
| Technology | 7.2 | |
| Telecommunications | 6.3 | |
| Healthcare | 5.7 | |
| |
Quality Diversification (% of Fund's net assets) |
|
| |
| We have used ratings from Moody's Investors Service, Inc. Where Moody's® ratings are not available, we have used S&P® ratings. All ratings are as of the date indicated and do not reflect subsequent changes. |
Asset Allocation (% of Fund's net assets) |
|
Foreign investments - 12.5% |
|
Geographic Diversification (% of Fund's net assets) |
|
* Includes Short-Term investments and Net Other Assets (Liabilities). Percentages are based on country or territory of incorporation and are adjusted for the effect of futures contracts, if applicable. |
| |
Showing Percentage of Net Assets
| Corporate Bonds - 67.7% |
| | | Principal Amount (a) (000s) | Value ($) (000s) |
| Convertible Bonds - 0.4% | | | |
| Diversified Financial Services - 0.0% | | | |
| New Cotai LLC 5% 2/24/27 (b) | | 3,932 | 3,814 |
| Energy - 0.4% | | | |
| Mesquite Energy, Inc. 15% 7/15/23 (b)(c) | | 2,495 | 14,790 |
| Mesquite Energy, Inc. 15% 7/15/23 (b)(c) | | 4,306 | 25,524 |
| | | | 40,314 |
TOTAL CONVERTIBLE BONDS | | | 44,128 |
| Nonconvertible Bonds - 67.3% | | | |
| Aerospace - 3.5% | | | |
| ATI, Inc.: | | | |
| 4.875% 10/1/29 | | 6,080 | 5,112 |
| 5.125% 10/1/31 | | 5,395 | 4,448 |
| Bombardier, Inc.: | | | |
| 6% 2/15/28 (d) | | 6,075 | 5,406 |
| 7.125% 6/15/26 (d) | | 12,110 | 11,464 |
| 7.5% 3/15/25 (d) | | 12,259 | 12,049 |
| 7.875% 4/15/27 (d) | | 26,370 | 25,044 |
| Kaiser Aluminum Corp. 4.625% 3/1/28 (d) | | 11,215 | 9,811 |
| Moog, Inc. 4.25% 12/15/27 (d) | | 3,455 | 3,092 |
| Rolls-Royce PLC 5.75% 10/15/27 (d) | | 10,870 | 9,837 |
| Spirit Aerosystems, Inc. 7.5% 4/15/25 (d) | | 15,000 | 14,573 |
| TransDigm UK Holdings PLC 6.875% 5/15/26 | | 35,725 | 34,868 |
| TransDigm, Inc.: | | | |
| 4.625% 1/15/29 | | 38,080 | 32,426 |
| 4.875% 5/1/29 | | 25,000 | 21,381 |
| 5.5% 11/15/27 | | 124,228 | 112,426 |
| 6.25% 3/15/26 (d) | | 17,925 | 17,681 |
| 6.375% 6/15/26 | | 61,985 | 59,816 |
| 7.5% 3/15/27 | | 18,012 | 17,749 |
| | | | 397,183 |
| Air Transportation - 1.8% | | | |
| Air Canada 3.875% 8/15/26 (d) | | 9,105 | 8,056 |
| Allegiant Travel Co. 7.25% 8/15/27 (d) | | 8,870 | 8,338 |
| Delta Air Lines, Inc. 7% 5/1/25 (d) | | 2,708 | 2,745 |
| Delta Air Lines, Inc. / SkyMiles IP Ltd.: | | | |
| 4.5% 10/20/25 (d) | | 48,285 | 47,051 |
| 4.75% 10/20/28 (d) | | 39,880 | 37,065 |
| Hawaiian Brand Intellectual Property Ltd. / HawaiianMiles Loyalty Ltd. 5.75% 1/20/26 (d) | | 22,205 | 20,443 |
| Mileage Plus Holdings LLC 6.5% 6/20/27 (d) | | 32,804 | 32,430 |
| Spirit Loyalty Cayman Ltd. / Spirit IP Cayman Ltd. 8% 9/20/25 (d) | | 7,779 | 7,902 |
| United Airlines, Inc.: | | | |
| 4.375% 4/15/26 (d) | | 30,025 | 27,403 |
| 4.625% 4/15/29 (d) | | 18,025 | 15,417 |
| | | | 206,850 |
| Automotive - 0.2% | | | |
| Ford Motor Co. 6.1% 8/19/32 | | 11,825 | 10,856 |
| Ford Motor Credit Co. LLC 3.625% 6/17/31 | | 15,745 | 12,244 |
| | | | 23,100 |
| Automotive & Auto Parts - 1.6% | | | |
| Allison Transmission, Inc. 5.875% 6/1/29 (d) | | 7,960 | 7,423 |
| Arko Corp. 5.125% 11/15/29 (d) | | 9,105 | 7,209 |
| Dana, Inc.: | | | |
| 4.25% 9/1/30 | | 8,870 | 7,105 |
| 4.5% 2/15/32 | | 9,135 | 6,984 |
| Exide Technologies: | | | |
| 11% 10/31/24 pay-in-kind (b)(d)(e)(f) | | 1,760 | 0 |
| 11% 10/31/24 pay-in-kind (b)(d)(e)(f) | | 891 | 401 |
| Ford Motor Co. 3.25% 2/12/32 | | 29,640 | 22,197 |
| Ford Motor Credit Co. LLC: | | | |
| 3.375% 11/13/25 | | 19,245 | 17,459 |
| 4% 11/13/30 | | 42,253 | 34,173 |
| 5.113% 5/3/29 | | 10,330 | 9,235 |
| LCM Investments Holdings 4.875% 5/1/29 (d) | | 24,415 | 20,595 |
| McLaren Finance PLC 7.5% 8/1/26 (d) | | 8,290 | 6,570 |
| Nesco Holdings II, Inc. 5.5% 4/15/29 (d) | | 14,525 | 12,732 |
| PECF USS Intermediate Holding III Corp. 8% 11/15/29 (d) | | 5,530 | 3,703 |
| Rivian Holdco & Rivian LLC & Rivian Automotive LLC 6 month U.S. LIBOR + 5.620% 10.1636% 10/15/26 (d)(f)(g) | | 30,350 | 28,833 |
| | | | 184,619 |
| Banks & Thrifts - 1.9% | | | |
| Ally Financial, Inc.: | | | |
| 8% 11/1/31 | | 20,638 | 20,822 |
| 8% 11/1/31 | | 151,039 | 154,907 |
| CQP Holdco LP / BIP-V Chinook Holdco LLC 5.5% 6/15/31 (d) | | 27,225 | 24,162 |
| Jane Street Group LLC/JSG Finance, Inc. 4.5% 11/15/29 (d) | | 8,740 | 7,725 |
| | | | 207,616 |
| Broadcasting - 1.5% | | | |
| Clear Channel Outdoor Holdings, Inc. 7.5% 6/1/29 (d) | | 12,070 | 9,488 |
| Diamond Sports Group LLC/Diamond Sports Finance Co. 5.375% 8/15/26 (d) | | 46,565 | 9,313 |
| Gray Escrow II, Inc. 5.375% 11/15/31 (d) | | 18,765 | 15,059 |
| Lions Gate Capital Holdings LLC 5.5% 4/15/29 (d) | | 8,990 | 6,823 |
| Nexstar Broadcasting, Inc.: | | | |
| 4.75% 11/1/28 (d) | | 22,300 | 19,570 |
| 5.625% 7/15/27 (d) | | 23,735 | 22,418 |
| Scripps Escrow II, Inc. 3.875% 1/15/29 (d) | | 2,820 | 2,329 |
| Sirius XM Radio, Inc.: | | | |
| 3.125% 9/1/26 (d) | | 9,100 | 8,132 |
| 3.875% 9/1/31 (d) | | 12,130 | 9,704 |
| 4% 7/15/28 (d) | | 23,630 | 20,314 |
| 5% 8/1/27 (d) | | 14,525 | 13,363 |
| Townsquare Media, Inc. 6.875% 2/1/26 (d) | | 5,645 | 5,330 |
| Univision Communications, Inc.: | | | |
| 4.5% 5/1/29 (d) | | 12,060 | 10,153 |
| 7.375% 6/30/30 (d) | | 17,095 | 16,539 |
| | | | 168,535 |
| Building Materials - 0.5% | | | |
| Advanced Drain Systems, Inc.: | | | |
| 5% 9/30/27 (d) | | 2,325 | 2,156 |
| 6.375% 6/15/30 (d) | | 6,050 | 5,847 |
| Brundage-Bone Concrete Pumping Holdings, Inc. 6% 2/1/26 (d) | | 6,555 | 5,932 |
| CP Atlas Buyer, Inc. 7% 12/1/28 (d) | | 5,480 | 3,946 |
| James Hardie International Finance Ltd. 5% 1/15/28 (d) | | 4,136 | 3,740 |
| MIWD Holdco II LLC / MIWD Finance Corp. 5.5% 2/1/30 (d) | | 4,125 | 3,182 |
| Oscar Acquisition Co. LLC / Oscar Finance, Inc. 9.5% 4/15/30 (d) | | 9,050 | 7,664 |
| SRS Distribution, Inc.: | | | |
| 4.625% 7/1/28 (d) | | 11,605 | 10,190 |
| 6.125% 7/1/29 (d) | | 4,870 | 3,960 |
| Summit Materials LLC/Summit Materials Finance Corp. 5.25% 1/15/29 (d) | | 10,525 | 9,612 |
| | | | 56,229 |
| Cable/Satellite TV - 4.5% | | | |
| Block Communications, Inc. 4.875% 3/1/28 (d) | | 7,830 | 6,805 |
| CCO Holdings LLC/CCO Holdings Capital Corp.: | | | |
| 4.25% 2/1/31 (d) | | 16,515 | 13,047 |
| 4.5% 8/15/30 (d) | | 21,660 | 17,578 |
| 4.5% 5/1/32 | | 46,575 | 36,794 |
| 4.75% 3/1/30 (d) | | 63,365 | 53,252 |
| 4.75% 2/1/32 (d) | | 26,255 | 21,005 |
| 5% 2/1/28 (d) | | 91,490 | 82,798 |
| 5.125% 5/1/27 (d) | | 69,885 | 64,747 |
| 5.375% 6/1/29 (d) | | 18,080 | 16,152 |
| 5.5% 5/1/26 (d) | | 8,759 | 8,431 |
| 6.375% 9/1/29 (d) | | 11,825 | 10,897 |
| CSC Holdings LLC: | | | |
| 3.375% 2/15/31 (d) | | 14,140 | 10,252 |
| 4.5% 11/15/31 (d) | | 30,110 | 23,419 |
| 5.375% 2/1/28 (d) | | 23,655 | 21,822 |
| 6.5% 2/1/29 (d) | | 24,795 | 23,369 |
| DISH DBS Corp.: | | | |
| 5.25% 12/1/26 (d) | | 15,220 | 13,222 |
| 5.75% 12/1/28 (d) | | 15,220 | 12,271 |
| Dolya Holdco 18 DAC 5% 7/15/28 (d) | | 6,600 | 5,619 |
| Radiate Holdco LLC/Radiate Financial Service Ltd.: | | | |
| 4.5% 9/15/26 (d) | | 8,350 | 7,056 |
| 6.5% 9/15/28 (d) | | 22,260 | 14,024 |
| VZ Secured Financing BV 5% 1/15/32 (d) | | 24,310 | 19,509 |
| Ziggo Bond Co. BV: | | | |
| 5.125% 2/28/30 (d) | | 6,000 | 4,755 |
| 6% 1/15/27 (d) | | 11,435 | 10,291 |
| Ziggo BV 4.875% 1/15/30 (d) | | 7,990 | 6,752 |
| | | | 503,867 |
| Capital Goods - 0.1% | | | |
| ATS Automation Tooling System, Inc. 4.125% 12/15/28 (d) | | 7,895 | 6,750 |
| Stevens Holding Co., Inc. 6.125% 10/1/26 (d) | | 3,245 | 3,249 |
| | | | 9,999 |
| Chemicals - 1.6% | | | |
| Cheever Escrow Issuer LLC 7.125% 10/1/27 (d) | | 5,915 | 5,430 |
| Compass Minerals International, Inc. 6.75% 12/1/27 (d) | | 24,600 | 23,142 |
| Gpd Companies, Inc. 10.125% 4/1/26 (d) | | 14,980 | 13,393 |
| Ingevity Corp. 3.875% 11/1/28 (d) | | 11,105 | 9,374 |
| Kronos Acquisition Holdings, Inc. / KIK Custom Products, Inc. 5% 12/31/26 (d) | | 3,835 | 3,476 |
| LSB Industries, Inc. 6.25% 10/15/28 (d) | | 21,105 | 19,161 |
| Olympus Water U.S. Holding Corp. 4.25% 10/1/28 (d) | | 12,145 | 9,859 |
| SCIH Salt Holdings, Inc. 4.875% 5/1/28 (d) | | 7,820 | 6,788 |
| SCIL IV LLC / SCIL U.S.A. Holdings LLC 5.375% 11/1/26 (d) | | 14,015 | 11,142 |
| The Chemours Co. LLC: | | | |
| 5.375% 5/15/27 | | 32,330 | 28,949 |
| 5.75% 11/15/28 (d) | | 16,765 | 14,242 |
| Tronox, Inc. 4.625% 3/15/29 (d) | | 13,295 | 10,268 |
| Valvoline, Inc. 4.25% 2/15/30 (d) | | 8,315 | 8,003 |
| W.R. Grace Holding LLC 5.625% 8/15/29 (d) | | 28,310 | 21,883 |
| | | | 185,110 |
| Consumer Products - 0.9% | | | |
| Angi Group LLC 3.875% 8/15/28 (d) | | 5,530 | 4,051 |
| Diamond BC BV 4.625% 10/1/29 (d) | | 7,285 | 5,352 |
| Foundation Building Materials, Inc. 6% 3/1/29 (d) | | 5,845 | 4,038 |
| Gannett Holdings LLC 6% 11/1/26 (d) | | 8,785 | 6,571 |
| HFC Prestige Products, Inc./HFC Prestige International U.S. LLC 4.75% 1/15/29 (d) | | 8,760 | 7,607 |
| Millennium Escrow Corp. 6.625% 8/1/26 (d) | | 12,120 | 8,726 |
| PetSmart, Inc. / PetSmart Finance Corp.: | | | |
| 4.75% 2/15/28 (d) | | 10,160 | 9,275 |
| 7.75% 2/15/29 (d) | | 8,880 | 8,338 |
| Spectrum Brands Holdings, Inc. 3.875% 3/15/31 (d) | | 8,380 | 6,180 |
| Tempur Sealy International, Inc.: | | | |
| 3.875% 10/15/31 (d) | | 15,965 | 11,987 |
| 4% 4/15/29 (d) | | 15,925 | 12,806 |
| The Scotts Miracle-Gro Co. 4% 4/1/31 | | 11,945 | 9,151 |
| TKC Holdings, Inc. 6.875% 5/15/28 (d) | | 13,375 | 11,101 |
| | | | 105,183 |
| Containers - 0.5% | | | |
| Crown Cork & Seal, Inc.: | | | |
| 7.375% 12/15/26 | | 4,845 | 4,897 |
| 7.5% 12/15/96 | | 12,871 | 12,785 |
| Graham Packaging Co., Inc. 7.125% 8/15/28 (d) | | 6,000 | 4,918 |
| Graphic Packaging International, Inc. 3.75% 2/1/30 (d) | | 7,880 | 6,775 |
| Intelligent Packaging Ltd. Finco, Inc. 6% 9/15/28 (d) | | 4,230 | 3,147 |
| LABL, Inc. 5.875% 11/1/28 (d) | | 14,730 | 12,795 |
| Trivium Packaging Finance BV 5.5% 8/15/26 (d) | | 6,930 | 6,361 |
| | | | 51,678 |
| Diversified Financial Services - 2.3% | | | |
| Broadstreet Partners, Inc. 5.875% 4/15/29 (d) | | 15,505 | 12,444 |
| Cargo Aircraft Management, Inc. 4.75% 2/1/28 (d) | | 6,915 | 6,137 |
| Coinbase Global, Inc.: | | | |
| 3.375% 10/1/28 (d) | | 9,110 | 5,954 |
| 3.625% 10/1/31 (d) | | 9,110 | 5,394 |
| Compass Group Diversified Holdings LLC: | | | |
| 5% 1/15/32 (d) | | 6,090 | 4,439 |
| 5.25% 4/15/29 (d) | | 17,730 | 15,248 |
| Hightower Holding LLC 6.75% 4/15/29 (d) | | 5,945 | 4,840 |
| Icahn Enterprises LP/Icahn Enterprises Finance Corp.: | | | |
| 4.375% 2/1/29 | | 11,165 | 9,321 |
| 5.25% 5/15/27 | | 41,665 | 38,384 |
| 6.25% 5/15/26 | | 24,085 | 23,182 |
| 6.375% 12/15/25 | | 28,275 | 27,448 |
| LPL Holdings, Inc. 4% 3/15/29 (d) | | 17,730 | 15,475 |
| MSCI, Inc.: | | | |
| 3.25% 8/15/33 (d) | | 9,110 | 7,042 |
| 4% 11/15/29 (d) | | 6,385 | 5,544 |
| OEC Finance Ltd.: | | | |
| 4.375% 10/25/29 pay-in-kind (d) | | 6,919 | 165 |
| 5.25% 12/27/33 pay-in-kind (d) | | 3,388 | 68 |
| OneMain Finance Corp.: | | | |
| 4% 9/15/30 | | 5,610 | 4,236 |
| 5.375% 11/15/29 | | 9,400 | 7,708 |
| 6.625% 1/15/28 | | 7,305 | 6,636 |
| 6.875% 3/15/25 | | 19,480 | 18,896 |
| 7.125% 3/15/26 | | 38,380 | 37,037 |
| Shift4 Payments LLC / Shift4 Payments Finance Sub, Inc. 4.625% 11/1/26 (d) | | 3,750 | 3,457 |
| | | | 259,055 |
| Diversified Media - 0.3% | | | |
| Terrier Media Buyer, Inc. 8.875% 12/15/27 (d) | | 40,645 | 34,447 |
| Energy - 8.8% | | | |
| Altus Midstream LP 5.875% 6/15/30 (d) | | 9,060 | 8,500 |
| Antero Midstream Partners LP/Antero Midstream Finance Corp.: | | | |
| 5.375% 6/15/29 (d) | | 9,060 | 8,265 |
| 5.75% 1/15/28 (d) | | 17,645 | 16,624 |
| Atlantica Sustainable Infrastructure PLC 4.125% 6/15/28 (d) | | 7,820 | 6,627 |
| CGG SA 8.75% 4/1/27 (d) | | 11,985 | 10,597 |
| Cheniere Energy Partners LP: | | | |
| 3.25% 1/31/32 | | 9,110 | 7,089 |
| 4% 3/1/31 | | 31,040 | 26,169 |
| Cheniere Energy, Inc. 4.625% 10/15/28 | | 22,300 | 20,572 |
| Chesapeake Energy Corp.: | | | |
| 5.875% 2/1/29 (d) | | 5,840 | 5,518 |
| 6.75% 4/15/29 (d) | | 8,995 | 8,810 |
| 7% 10/1/24 (b)(e) | | 6,915 | 0 |
| 8% 1/15/25 (b)(e) | | 3,385 | 0 |
| 8% 6/15/27 (b)(e) | | 2,132 | 0 |
| Citgo Holding, Inc. 9.25% 8/1/24 (d) | | 27,185 | 27,210 |
| Citgo Petroleum Corp.: | | | |
| 6.375% 6/15/26 (d) | | 8,760 | 8,627 |
| 7% 6/15/25 (d) | | 22,045 | 21,707 |
| CNX Midstream Partners LP 4.75% 4/15/30 (d) | | 6,435 | 5,293 |
| CNX Resources Corp.: | | | |
| 6% 1/15/29 (d) | | 5,345 | 4,990 |
| 7.375% 1/15/31 (d) | | 5,930 | 5,887 |
| Colgate Energy Partners III LLC 5.875% 7/1/29 (d) | | 8,645 | 8,018 |
| Comstock Resources, Inc.: | | | |
| 5.875% 1/15/30 (d) | | 32,085 | 28,954 |
| 6.75% 3/1/29 (d) | | 20,060 | 19,207 |
| Crestwood Midstream Partners LP/Crestwood Midstream Finance Corp.: | | | |
| 5.625% 5/1/27 (d) | | 18,015 | 16,944 |
| 5.75% 4/1/25 | | 4,790 | 4,670 |
| 6% 2/1/29 (d) | | 25,785 | 24,112 |
| CrownRock LP/CrownRock Finance, Inc. 5% 5/1/29 (d) | | 5,055 | 4,592 |
| CVR Energy, Inc.: | | | |
| 5.25% 2/15/25 (d) | | 16,990 | 16,371 |
| 5.75% 2/15/28 (d) | | 22,655 | 20,503 |
| DCP Midstream Operating LP 5.85% 5/21/43 (d)(f) | | 18,335 | 17,740 |
| Delek Logistics Partners LP 7.125% 6/1/28 (d) | | 17,655 | 15,809 |
| DT Midstream, Inc.: | | | |
| 4.125% 6/15/29 (d) | | 9,070 | 7,841 |
| 4.375% 6/15/31 (d) | | 9,070 | 7,641 |
| Endeavor Energy Resources LP/EER Finance, Inc. 5.75% 1/30/28 (d) | | 21,251 | 20,655 |
| Energy Transfer LP 5.5% 6/1/27 | | 16,735 | 16,145 |
| EnLink Midstream LLC 6.5% 9/1/30 (d) | | 11,825 | 11,618 |
| Hess Midstream Partners LP: | | | |
| 4.25% 2/15/30 (d) | | 9,875 | 8,445 |
| 5.125% 6/15/28 (d) | | 11,235 | 10,336 |
| 5.5% 10/15/30 (d) | | 6,060 | 5,467 |
| 5.625% 2/15/26 (d) | | 15,535 | 15,236 |
| Hilcorp Energy I LP/Hilcorp Finance Co. 6.25% 11/1/28 (d) | | 12,280 | 11,543 |
| Holly Energy Partners LP/Holly Energy Finance Corp.: | | | |
| 5% 2/1/28 (d) | | 7,615 | 6,882 |
| 6.375% 4/15/27 (d) | | 6,050 | 5,823 |
| MEG Energy Corp. 7.125% 2/1/27 (d) | | 11,335 | 11,534 |
| Mesquite Energy, Inc. 7.25% 2/15/23 (b)(d)(e) | | 21,977 | 0 |
| Nabors Industries Ltd.: | | | |
| 7.25% 1/15/26 (d) | | 11,260 | 10,866 |
| 7.5% 1/15/28 (d) | | 9,715 | 9,011 |
| New Fortress Energy, Inc.: | | | |
| 6.5% 9/30/26 (d) | | 23,915 | 23,198 |
| 6.75% 9/15/25 (d) | | 15,106 | 14,830 |
| NGL Energy Operating LLC/NGL Energy Finance Corp. 7.5% 2/1/26 (d) | | 11,090 | 10,032 |
| Nine Energy Service, Inc. 8.75% 11/1/23 (d) | | 6,245 | 5,448 |
| NuStar Logistics LP 6% 6/1/26 | | 12,025 | 11,659 |
| Occidental Petroleum Corp.: | | | |
| 3.5% 8/15/29 | | 14,690 | 13,331 |
| 5.875% 9/1/25 | | 11,055 | 11,138 |
| 6.125% 1/1/31 | | 23,465 | 23,527 |
| 6.2% 3/15/40 | | 5,785 | 5,565 |
| 6.375% 9/1/28 | | 18,145 | 18,415 |
| 6.45% 9/15/36 | | 19,110 | 18,957 |
| 6.6% 3/15/46 | | 11,465 | 11,285 |
| 6.625% 9/1/30 | | 22,115 | 23,001 |
| 7.2% 3/15/29 | | 3,964 | 4,063 |
| 7.5% 5/1/31 | | 1,100 | 1,183 |
| 8.875% 7/15/30 | | 12,405 | 14,080 |
| PBF Holding Co. LLC/PBF Finance Corp.: | | | |
| 6% 2/15/28 | | 27,530 | 25,018 |
| 7.25% 6/15/25 | | 22,875 | 22,632 |
| PBF Logistics LP/PBF Logistics Finance, Inc. 6.875% 5/15/23 | | 8,455 | 8,459 |
| PDC Energy, Inc. 6.125% 9/15/24 | | 1,777 | 1,759 |
| SM Energy Co.: | | | |
| 5.625% 6/1/25 | | 6,330 | 6,149 |
| 6.625% 1/15/27 | | 21,320 | 20,894 |
| 6.75% 9/15/26 | | 4,550 | 4,482 |
| Southern Natural Gas Co. LLC: | | | |
| 7.35% 2/15/31 | | 23,497 | 24,119 |
| 8% 3/1/32 | | 12,475 | 13,236 |
| Southwestern Energy Co.: | | | |
| 5.375% 3/15/30 | | 12,145 | 11,234 |
| 5.7% 1/23/25 (h) | | 244 | 241 |
| 7.75% 10/1/27 | | 12,945 | 13,316 |
| Suburban Propane Partners LP/Suburban Energy Finance Corp. 5% 6/1/31 (d) | | 12,070 | 10,146 |
| Summit Midstream Holdings LLC: | | | |
| 5.75% 4/15/25 | | 5,390 | 4,514 |
| 8.5% (d)(i) | | 9,110 | 8,746 |
| Sunoco LP/Sunoco Finance Corp.: | | | |
| 4.5% 5/15/29 | | 10,170 | 8,735 |
| 4.5% 4/30/30 | | 12,185 | 10,362 |
| Tallgrass Energy Partners LP / Tallgrass Energy Finance Corp.: | | | |
| 6% 9/1/31 (d) | | 9,110 | 8,109 |
| 7.5% 10/1/25 (d) | | 8,350 | 8,433 |
| Targa Resources Partners LP/Targa Resources Partners Finance Corp. 4.875% 2/1/31 | | 10,360 | 9,141 |
| Teine Energy Ltd. 6.875% 4/15/29 (d) | | 8,990 | 8,019 |
| Tennessee Gas Pipeline Co. 7.625% 4/1/37 | | 5,445 | 5,643 |
| Venture Global Calcasieu Pass LLC: | | | |
| 3.875% 8/15/29 (d) | | 7,585 | 6,504 |
| 4.125% 8/15/31 (d) | | 7,585 | 6,466 |
| | | | 984,517 |
| Environmental - 0.6% | | | |
| Covanta Holding Corp.: | | | |
| 4.875% 12/1/29 (d) | | 18,165 | 15,467 |
| 5% 9/1/30 | | 11,060 | 9,211 |
| Darling Ingredients, Inc. 6% 6/15/30 (d) | | 13,885 | 13,364 |
| GFL Environmental, Inc.: | | | |
| 4% 8/1/28 (d) | | 9,105 | 7,879 |
| 4.75% 6/15/29 (d) | | 12,095 | 10,542 |
| Madison IAQ LLC: | | | |
| 4.125% 6/30/28 (d) | | 11,390 | 9,425 |
| 5.875% 6/30/29 (d) | | 9,085 | 6,223 |
| | | | 72,111 |
| Food & Drug Retail - 1.3% | | | |
| Albertsons Companies LLC/Safeway, Inc./New Albertson's, Inc./Albertson's LLC: | | | |
| 3.5% 3/15/29 (d) | | 36,160 | 29,922 |
| 4.625% 1/15/27 (d) | | 25,300 | 23,446 |
| 4.875% 2/15/30 (d) | | 44,700 | 39,671 |
| BellRing Brands, Inc. 7% 3/15/30 (d) | | 14,740 | 13,919 |
| Murphy Oil U.S.A., Inc.: | | | |
| 3.75% 2/15/31 (d) | | 5,300 | 4,416 |
| 4.75% 9/15/29 | | 6,860 | 6,174 |
| 5.625% 5/1/27 | | 6,030 | 5,787 |
| Parkland Corp.: | | | |
| 4.5% 10/1/29 (d) | | 8,995 | 7,574 |
| 4.625% 5/1/30 (d) | | 12,175 | 10,127 |
| SEG Holding LLC/SEG Finance Corp. 5.625% 10/15/28 (d) | | 11,130 | 10,286 |
| | | | 151,322 |
| Food/Beverage/Tobacco - 1.7% | | | |
| C&S Group Enterprises LLC 5% 12/15/28 (d) | | 8,615 | 6,369 |
| Chobani LLC/Finance Corp., Inc. 4.625% 11/15/28 (d) | | 6,285 | 5,459 |
| JBS U.S.A. Lux SA / JBS Food Co. 5.5% 1/15/30 (d) | | 20,180 | 18,395 |
| KeHE Distributors LLC / KeHE Finance Corp. 8.625% 10/15/26 (d) | | 7,777 | 7,738 |
| Lamb Weston Holdings, Inc.: | | | |
| 4.125% 1/31/30 (d) | | 12,150 | 10,607 |
| 4.375% 1/31/32 (d) | | 6,075 | 5,217 |
| Performance Food Group, Inc.: | | | |
| 4.25% 8/1/29 (d) | | 8,495 | 7,197 |
| 5.5% 10/15/27 (d) | | 8,855 | 8,370 |
| Pilgrim's Pride Corp. 4.25% 4/15/31 (d) | | 21,020 | 17,506 |
| Post Holdings, Inc.: | | | |
| 4.5% 9/15/31 (d) | | 47,500 | 39,292 |
| 4.625% 4/15/30 (d) | | 15,630 | 13,189 |
| 5.5% 12/15/29 (d) | | 21,040 | 18,934 |
| Simmons Foods, Inc. 4.625% 3/1/29 (d) | | 8,340 | 6,959 |
| TreeHouse Foods, Inc. 4% 9/1/28 | | 3,695 | 3,118 |
| Triton Water Holdings, Inc. 6.25% 4/1/29 (d) | | 6,360 | 4,817 |
| U.S. Foods, Inc. 4.625% 6/1/30 (d) | | 7,520 | 6,524 |
| United Natural Foods, Inc. 6.75% 10/15/28 (d) | | 7,750 | 7,485 |
| | | | 187,176 |
| Gaming - 2.9% | | | |
| Affinity Gaming LLC 6.875% 12/15/27 (d) | | 4,295 | 3,585 |
| Boyd Gaming Corp. 4.75% 6/15/31 (d) | | 15,120 | 12,772 |
| Caesars Entertainment, Inc.: | | | |
| 4.625% 10/15/29 (d) | | 18,245 | 14,596 |
| 6.25% 7/1/25 (d) | | 41,240 | 40,239 |
| 8.125% 7/1/27 (d) | | 54,990 | 53,478 |
| Caesars Resort Collection LLC 5.75% 7/1/25 (d) | | 13,750 | 13,431 |
| CDI Escrow Issuer, Inc. 5.75% 4/1/30 (d) | | 6,040 | 5,451 |
| Fertitta Entertainment LLC / Fertitta Entertainment Finance Co., Inc.: | | | |
| 4.625% 1/15/29 (d) | | 25,865 | 22,495 |
| 6.75% 1/15/30 (d) | | 34,295 | 26,922 |
| Jacobs Entertainment, Inc. 6.75% 2/15/29 (d) | | 8,585 | 7,569 |
| Melco Resorts Finance Ltd.: | | | |
| 5.25% 4/26/26 (d) | | 8,910 | 5,656 |
| 5.75% 7/21/28 (d) | | 4,420 | 2,542 |
| MGM Resorts International 4.75% 10/15/28 | | 11,125 | 9,646 |
| Peninsula Pacific Entertainment LLC 8.5% 11/15/27 (d) | | 19,045 | 20,450 |
| Premier Entertainment Sub LLC: | | | |
| 5.625% 9/1/29 (d) | | 31,840 | 23,562 |
| 5.875% 9/1/31 (d) | | 24,325 | 17,237 |
| Station Casinos LLC 4.625% 12/1/31 (d) | | 9,135 | 7,258 |
| Studio City Finance Ltd. 5% 1/15/29 (d) | | 5,700 | 2,363 |
| VICI Properties LP / VICI Note Co.: | | | |
| 3.875% 2/15/29 (d) | | 11,195 | 9,427 |
| 4.25% 12/1/26 (d) | | 21,450 | 19,538 |
| 4.625% 12/1/29 (d) | | 12,240 | 10,643 |
| | | | 328,860 |
| Healthcare - 4.7% | | | |
| 180 Medical, Inc. 3.875% 10/15/29 (d) | | 6,495 | 5,488 |
| Avantor Funding, Inc. 3.875% 11/1/29 (d) | | 6,075 | 5,126 |
| Cano Health, Inc. 6.25% 10/1/28 (d) | | 4,050 | 3,252 |
| Catalent Pharma Solutions: | | | |
| 3.5% 4/1/30 (d) | | 6,070 | 4,902 |
| 5% 7/15/27 (d) | | 3,765 | 3,540 |
| Centene Corp. 4.25% 12/15/27 | | 11,560 | 10,664 |
| Charles River Laboratories International, Inc.: | | | |
| 3.75% 3/15/29 (d) | | 10,515 | 9,095 |
| 4% 3/15/31 (d) | | 12,085 | 10,166 |
| 4.25% 5/1/28 (d) | | 3,400 | 3,093 |
| Community Health Systems, Inc.: | | | |
| 4.75% 2/15/31 (d) | | 21,790 | 14,598 |
| 5.25% 5/15/30 (d) | | 18,245 | 12,635 |
| 5.625% 3/15/27 (d) | | 7,180 | 5,722 |
| 6% 1/15/29 (d) | | 8,490 | 6,302 |
| 6.125% 4/1/30 (d) | | 21,795 | 8,936 |
| 8% 3/15/26 (d) | | 61,410 | 52,966 |
| DaVita HealthCare Partners, Inc.: | | | |
| 3.75% 2/15/31 (d) | | 4,180 | 3,022 |
| 4.625% 6/1/30 (d) | | 31,515 | 24,570 |
| Grifols Escrow Issuer SA 4.75% 10/15/28 (d) | | 6,075 | 4,746 |
| HealthEquity, Inc. 4.5% 10/1/29 (d) | | 6,410 | 5,601 |
| Horizon Pharma U.S.A., Inc. 5.5% 8/1/27 (d) | | 12,050 | 11,598 |
| IQVIA, Inc. 5% 5/15/27 (d) | | 12,070 | 11,501 |
| Jazz Securities DAC 4.375% 1/15/29 (d) | | 12,305 | 10,921 |
| ModivCare Escrow Issuer, Inc. 5% 10/1/29 (d) | | 7,010 | 5,966 |
| Modivcare, Inc. 5.875% 11/15/25 (d) | | 8,105 | 7,699 |
| Molina Healthcare, Inc.: | | | |
| 3.875% 11/15/30 (d) | | 10,465 | 8,893 |
| 3.875% 5/15/32 (d) | | 12,160 | 10,141 |
| 4.375% 6/15/28 (d) | | 7,525 | 6,749 |
| Option Care Health, Inc. 4.375% 10/31/29 (d) | | 6,680 | 5,769 |
| Organon & Co. / Organon Foreign Debt Co-Issuer BV: | | | |
| 4.125% 4/30/28 (d) | | 21,010 | 18,506 |
| 5.125% 4/30/31 (d) | | 18,260 | 15,508 |
| Owens & Minor, Inc. 4.5% 3/31/29 (d) | | 8,310 | 6,435 |
| Radiology Partners, Inc. 9.25% 2/1/28 (d) | | 20,865 | 11,038 |
| RP Escrow Issuer LLC 5.25% 12/15/25 (d) | | 10,405 | 7,780 |
| Syneos Health, Inc. 3.625% 1/15/29 (d) | | 8,395 | 6,953 |
| Tenet Healthcare Corp.: | | | |
| 4.25% 6/1/29 (d) | | 17,640 | 14,862 |
| 4.375% 1/15/30 (d) | | 43,755 | 36,710 |
| 4.625% 7/15/24 | | 2,495 | 2,433 |
| 4.625% 9/1/24 (d) | | 12,045 | 11,627 |
| 4.875% 1/1/26 (d) | | 30,115 | 28,459 |
| 5.125% 11/1/27 (d) | | 18,070 | 16,647 |
| 6.125% 10/1/28 (d) | | 11,010 | 9,529 |
| 6.125% 6/15/30 (d) | | 24,015 | 22,169 |
| 6.25% 2/1/27 (d) | | 35,815 | 34,179 |
| Teva Pharmaceutical Finance Netherlands III BV: | | | |
| 4.75% 5/9/27 | | 6,085 | 5,370 |
| 5.125% 5/9/29 | | 6,085 | 5,222 |
| | | | 527,088 |
| Homebuilders/Real Estate - 2.2% | | | |
| Arcosa, Inc. 4.375% 4/15/29 (d) | | 8,410 | 7,251 |
| Ashton Woods U.S.A. LLC/Ashton Woods Finance Co. 4.625% 4/1/30 (d) | | 8,940 | 6,634 |
| Brookfield Residential Properties, Inc./Brookfield Residential U.S. Corp. 4.875% 2/15/30 (d) | | 7,775 | 5,978 |
| Century Communities, Inc. 3.875% 8/15/29 (d) | | 9,110 | 7,174 |
| DTZ U.S. Borrower LLC 6.75% 5/15/28 (d) | | 10,555 | 10,037 |
| MPT Operating Partnership LP/MPT Finance Corp.: | | | |
| 3.5% 3/15/31 | | 11,190 | 7,697 |
| 4.625% 8/1/29 | | 18,080 | 14,324 |
| 5% 10/15/27 | | 38,043 | 32,576 |
| Realogy Group LLC/Realogy Co-Issuer Corp. 5.75% 1/15/29 (d) | | 36,785 | 26,150 |
| Realogy Group LLC/Realogy Co.-Issuer Corp. 5.25% 4/15/30 (d) | | 12,170 | 8,439 |
| Shea Homes Ltd. Partnership/Corp. 4.75% 4/1/29 (d) | | 8,020 | 6,538 |
| Taylor Morrison Communities, Inc./Monarch Communities, Inc.: | | | |
| 5.125% 8/1/30 (d) | | 10,725 | 8,898 |
| 5.625% 3/1/24 (d) | | 1,312 | 1,284 |
| 5.875% 6/15/27 (d) | | 9,260 | 8,684 |
| TopBuild Corp. 3.625% 3/15/29 (d) | | 5,910 | 4,696 |
| TRI Pointe Group, Inc./TRI Pointe Holdings, Inc. 5.875% 6/15/24 | | 16,130 | 15,852 |
| TRI Pointe Homes, Inc. 5.7% 6/15/28 | | 14,380 | 12,459 |
| Uniti Group LP / Uniti Group Finance, Inc.: | | | |
| 4.75% 4/15/28 (d) | | 31,410 | 25,676 |
| 6.5% 2/15/29 (d) | | 39,880 | 28,614 |
| Weekley Homes LLC/Weekley Finance Corp. 4.875% 9/15/28 (d) | | 5,045 | 4,064 |
| | | | 243,025 |
| Hotels - 0.4% | | | |
| Carnival Holdings (Bermuda) Ltd. 10.375% 5/1/28 (d) | | 17,635 | 17,857 |
| Hilton Domestic Operating Co., Inc.: | | | |
| 3.75% 5/1/29 (d) | | 5,595 | 4,766 |
| 4% 5/1/31 (d) | | 8,395 | 7,018 |
| 4.875% 1/15/30 | | 6,900 | 6,184 |
| Hilton Worldwide Finance LLC/Hilton Worldwide Finance Corp. 4.875% 4/1/27 | | 8,435 | 8,013 |
| | | | 43,838 |
| Insurance - 1.1% | | | |
| Acrisure LLC / Acrisure Finance, Inc.: | | | |
| 6% 8/1/29 (d) | | 9,105 | 7,548 |
| 7% 11/15/25 (d) | | 34,880 | 32,784 |
| Alliant Holdings Intermediate LLC: | | | |
| 4.25% 10/15/27 (d) | | 11,125 | 10,014 |
| 5.875% 11/1/29 (d) | | 9,115 | 7,680 |
| 6.75% 10/15/27 (d) | | 16,680 | 15,221 |
| AmWINS Group, Inc. 4.875% 6/30/29 (d) | | 8,805 | 7,527 |
| AssuredPartners, Inc.: | | | |
| 5.625% 1/15/29 (d) | | 6,550 | 5,387 |
| 7% 8/15/25 (d) | | 4,865 | 4,662 |
| HUB International Ltd.: | | | |
| 5.625% 12/1/29 (d) | | 13,275 | 11,383 |
| 7% 5/1/26 (d) | | 11,770 | 11,623 |
| MGIC Investment Corp. 5.25% 8/15/28 | | 7,710 | 6,995 |
| | | | 120,824 |
| Leisure - 1.8% | | | |
| Boyne U.S.A., Inc. 4.75% 5/15/29 (d) | | 6,360 | 5,565 |
| Carnival Corp.: | | | |
| 4% 8/1/28 (d) | | 29,990 | 24,162 |
| 7.625% 3/1/26 (d) | | 19,665 | 14,787 |
| 9.875% 8/1/27 (d) | | 16,600 | 15,480 |
| 10.5% 2/1/26 (d) | | 11,990 | 11,750 |
| Merlin Entertainments PLC 5.75% 6/15/26 (d) | | 7,725 | 7,183 |
| NCL Corp. Ltd. 5.875% 2/15/27 (d) | | 12,100 | 10,814 |
| Royal Caribbean Cruises Ltd.: | | | |
| 5.375% 7/15/27 (d) | | 9,125 | 7,093 |
| 8.25% 1/15/29 (d) | | 14,800 | 14,752 |
| 9.25% 1/15/29 (d) | | 14,800 | 15,009 |
| 11.5% 6/1/25 (d) | | 23,674 | 25,450 |
| 11.625% 8/15/27 (d) | | 11,825 | 11,496 |
| SeaWorld Parks & Entertainment, Inc. 5.25% 8/15/29 (d) | | 12,145 | 10,446 |
| Vail Resorts, Inc. 6.25% 5/15/25 (d) | | 6,250 | 6,219 |
| Viking Cruises Ltd. 13% 5/15/25 (d) | | 9,250 | 9,944 |
| Viking Ocean Cruises Ship VII Ltd. 5.625% 2/15/29 (d) | | 4,965 | 3,870 |
| Voc Escrow Ltd. 5% 2/15/28 (d) | | 10,755 | 8,854 |
| | | | 202,874 |
| Metals/Mining - 2.0% | | | |
| Alcoa Nederland Holding BV: | | | |
| 4.125% 3/31/29 (d) | | 15,485 | 13,113 |
| 6.125% 5/15/28 (d) | | 3,565 | 3,373 |
| Arconic Corp.: | | | |
| 6% 5/15/25 (d) | | 6,630 | 6,565 |
| 6.125% 2/15/28 (d) | | 16,695 | 15,650 |
| Cleveland-Cliffs, Inc.: | | | |
| 4.625% 3/1/29 (d) | | 23,720 | 20,424 |
| 4.875% 3/1/31 (d) | | 11,440 | 9,662 |
| 5.875% 6/1/27 | | 18,030 | 16,768 |
| Eldorado Gold Corp. 6.25% 9/1/29 (d) | | 13,719 | 11,097 |
| ERO Copper Corp. 6.5% 2/15/30 (d) | | 9,085 | 6,655 |
| First Quantum Minerals Ltd.: | | | |
| 6.5% 3/1/24 (d) | | 10,955 | 10,687 |
| 6.875% 3/1/26 (d) | | 28,325 | 26,510 |
| 7.5% 4/1/25 (d) | | 20,585 | 19,823 |
| FMG Resources Pty Ltd.: | | | |
| 4.375% 4/1/31 (d) | | 8,990 | 7,099 |
| 4.5% 9/15/27 (d) | | 9,015 | 8,070 |
| 5.125% 5/15/24 (d) | | 9,780 | 9,538 |
| HudBay Minerals, Inc. 4.5% 4/1/26 (d) | | 7,020 | 6,158 |
| Mineral Resources Ltd.: | | | |
| 8% 11/1/27 (d) | | 6,040 | 5,942 |
| 8.125% 5/1/27 (d) | | 18,015 | 17,925 |
| 8.5% 5/1/30 (d) | | 4,475 | 4,404 |
| Murray Energy Corp.: | | | |
| 11.25% 12/31/49 (b)(d)(e) | | 8,915 | 0 |
| 12% 4/15/24 pay-in-kind (b)(d)(e)(f) | | 10,343 | 0 |
| | | | 219,463 |
| Paper - 0.8% | | | |
| Ardagh Metal Packaging Finance U.S.A. LLC/Ardagh Metal Packaging Finance PLC: | | | |
| 3.25% 9/1/28 (d) | | 5,915 | 4,850 |
| 4% 9/1/29 (d) | | 11,830 | 8,974 |
| 6% 6/15/27 (d) | | 6,045 | 5,801 |
| Cascades, Inc.: | | | |
| 5.125% 1/15/26 (d) | | 5,600 | 5,029 |
| 5.375% 1/15/28 (d) | | 5,600 | 4,789 |
| Clydesdale Acquisition Holdings, Inc.: | | | |
| 6.625% 4/15/29 (d) | | 7,185 | 6,821 |
| 8.75% 4/15/30 (d) | | 28,015 | 24,618 |
| Enviva Partners LP / Enviva Partners Finance Corp. 6.5% 1/15/26 (d) | | 11,230 | 10,783 |
| Glatfelter Corp. 4.75% 11/15/29 (d) | | 9,105 | 5,861 |
| Mercer International, Inc. 5.125% 2/1/29 | | 15,060 | 12,368 |
| | | | 89,894 |
| Publishing/Printing - 0.1% | | | |
| Clear Channel International BV 6.625% 8/1/25 (d) | | 15,860 | 15,114 |
| Railroad - 0.1% | | | |
| First Student Bidco, Inc./First Transit Parent, Inc. 4% 7/31/29 (d) | | 9,095 | 7,391 |
| Restaurants - 0.7% | | | |
| 1011778 BC Unlimited Liability Co./New Red Finance, Inc.: | | | |
| 3.875% 1/15/28 (d) | | 12,115 | 10,648 |
| 4% 10/15/30 (d) | | 39,005 | 31,838 |
| 4.375% 1/15/28 (d) | | 10,600 | 9,298 |
| Bloomin Brands, Inc. / OSI Restaurant Partners LLC 5.125% 4/15/29 (d) | | 5,565 | 4,734 |
| Garden SpinCo Corp. 8.625% 7/20/30 (d) | | 5,205 | 5,354 |
| Papa John's International, Inc. 3.875% 9/15/29 (d) | | 5,560 | 4,517 |
| Yum! Brands, Inc. 4.625% 1/31/32 | | 11,975 | 10,239 |
| | | | 76,628 |
| Services - 3.0% | | | |
| Adtalem Global Education, Inc. 5.5% 3/1/28 (d) | | 9,010 | 8,222 |
| AECOM 5.125% 3/15/27 | | 11,885 | 11,252 |
| Allied Universal Holdco LLC / Allied Universal Finance Corp. 6% 6/1/29 (d) | | 17,735 | 12,313 |
| Atlas Luxco 4 SARL / Allied Universal Holdco LLC / Allied Universal Finance Corp.: | | | |
| 4.625% 6/1/28 (d) | | 21,690 | 18,144 |
| 4.625% 6/1/28 (d) | | 14,365 | 11,746 |
| Booz Allen Hamilton, Inc.: | | | |
| 3.875% 9/1/28 (d) | | 10,240 | 9,022 |
| 4% 7/1/29 (d) | | 5,920 | 5,175 |
| CoreCivic, Inc. 8.25% 4/15/26 | | 32,260 | 32,732 |
| Fair Isaac Corp. 4% 6/15/28 (d) | | 2,910 | 2,633 |
| Gartner, Inc.: | | | |
| 3.625% 6/15/29 (d) | | 8,610 | 7,319 |
| 3.75% 10/1/30 (d) | | 11,495 | 9,656 |
| GEMS MENASA Cayman Ltd. 7.125% 7/31/26 (d) | | 8,765 | 8,223 |
| H&E Equipment Services, Inc. 3.875% 12/15/28 (d) | | 16,800 | 14,195 |
| Hertz Corp.: | | | |
| 4.625% 12/1/26 (d) | | 5,180 | 4,416 |
| 5% 12/1/29 (d) | | 10,055 | 7,965 |
| 5.5% 10/15/24 (b)(d)(e) | | 10,890 | 245 |
| 6% 1/15/28 (b)(d)(e) | | 10,285 | 604 |
| 6.25% 12/31/49 (b)(e) | | 11,875 | 15 |
| 7.125% 8/1/26 (b)(d)(e) | | 10,285 | 411 |
| IAA, Inc. 5.5% 6/15/27 (d) | | 4,680 | 4,380 |
| Iron Mountain, Inc.: | | | |
| 4.5% 2/15/31 (d) | | 22,025 | 17,840 |
| 4.875% 9/15/29 (d) | | 24,110 | 20,729 |
| KAR Auction Services, Inc. 5.125% 6/1/25 (d) | | 10,355 | 9,971 |
| Service Corp. International 4% 5/15/31 | | 12,070 | 10,021 |
| Sotheby's 7.375% 10/15/27 (d) | | 4,960 | 4,799 |
| Sotheby's/Bidfair Holdings, Inc. 5.875% 6/1/29 (d) | | 9,045 | 7,559 |
| The Brink's Co. 4.625% 10/15/27 (d) | | 12,180 | 11,262 |
| The GEO Group, Inc.: | | | |
| 9.5% 12/31/28 (d) | | 9,655 | 8,883 |
| 10.5% 6/30/28 | | 24,580 | 24,580 |
| TriNet Group, Inc. 3.5% 3/1/29 (d) | | 8,865 | 7,347 |
| Uber Technologies, Inc.: | | | |
| 4.5% 8/15/29 (d) | | 27,335 | 23,432 |
| 6.25% 1/15/28 (d) | | 9,175 | 8,716 |
| WASH Multifamily Acquisition, Inc. 5.75% 4/15/26 (d) | | 9,760 | 9,101 |
| | | | 332,908 |
| Steel - 0.2% | | | |
| Algoma Steel SCA 0% 12/31/23 (b) | | 1,982 | 0 |
| Commercial Metals Co. 3.875% 2/15/31 | | 6,135 | 4,969 |
| Infrabuild Australia Pty Ltd. 12% 10/1/24 (d) | | 10,980 | 10,184 |
| Roller Bearing Co. of America, Inc. 4.375% 10/15/29 (d) | | 4,375 | 3,839 |
| | | | 18,992 |
| Super Retail - 1.1% | | | |
| Asbury Automotive Group, Inc.: | | | |
| 4.5% 3/1/28 | | 3,534 | 3,064 |
| 4.625% 11/15/29 (d) | | 10,005 | 8,229 |
| 4.75% 3/1/30 | | 3,523 | 2,886 |
| 5% 2/15/32 (d) | | 10,800 | 8,708 |
| Bath & Body Works, Inc.: | | | |
| 6.625% 10/1/30 (d) | | 5,555 | 4,970 |
| 6.75% 7/1/36 | | 12,766 | 10,548 |
| 7.5% 6/15/29 | | 8,335 | 7,881 |
| Carvana Co. 4.875% 9/1/29 (d) | | 21,255 | 9,405 |
| EG Global Finance PLC 8.5% 10/30/25 (d) | | 16,085 | 14,858 |
| Lithia Motors, Inc. 3.875% 6/1/29 (d) | | 13,230 | 10,659 |
| Macy's Retail Holdings LLC: | | | |
| 5.875% 3/15/30 (d) | | 6,235 | 5,235 |
| 6.125% 3/15/32 (d) | | 6,015 | 4,998 |
| Michaels Companies, Inc. 5.25% 5/1/28 (d) | | 14,150 | 10,048 |
| Nordstrom, Inc.: | | | |
| 4.25% 8/1/31 | | 25,145 | 18,255 |
| 4.375% 4/1/30 | | 3,790 | 2,909 |
| 5% 1/15/44 | | 1,785 | 1,129 |
| 6.95% 3/15/28 | | 550 | 511 |
| | | | 124,293 |
| Technology - 3.6% | | | |
| Acuris Finance U.S. 5% 5/1/28 (d) | | 9,045 | 7,326 |
| Black Knight InfoServ LLC 3.625% 9/1/28 (d) | | 11,390 | 9,867 |
| Block, Inc. 3.5% 6/1/31 | | 12,070 | 9,716 |
| CA Magnum Holdings 5.375% (d)(i) | | 4,870 | 4,079 |
| Camelot Finance SA 4.5% 11/1/26 (d) | | 10,590 | 9,897 |
| Central Parent, Inc./Central Merger Sub, Inc. 7.25% 6/15/29 (d) | | 9,005 | 8,607 |
| Clarivate Science Holdings Corp.: | | | |
| 3.875% 7/1/28 (d) | | 10,695 | 9,172 |
| 4.875% 7/1/29 (d) | | 10,115 | 8,433 |
| Coherent Corp. 5% 12/15/29 (d) | | 9,495 | 8,146 |
| Crowdstrike Holdings, Inc. 3% 2/15/29 | | 8,870 | 7,477 |
| Elastic NV 4.125% 7/15/29 (d) | | 17,090 | 14,269 |
| Go Daddy Operating Co. LLC / GD Finance Co., Inc.: | | | |
| 3.5% 3/1/29 (d) | | 11,810 | 9,794 |
| 5.25% 12/1/27 (d) | | 9,345 | 8,749 |
| ION Trading Technologies Ltd. 5.75% 5/15/28 (d) | | 12,040 | 9,572 |
| Iron Mountain Information Management Services, Inc. 5% 7/15/32 (d) | | 9,100 | 7,505 |
| MicroStrategy, Inc. 6.125% 6/15/28 (d) | | 23,020 | 19,725 |
| NCR Corp.: | | | |
| 5% 10/1/28 (d) | | 5,530 | 4,647 |
| 5.125% 4/15/29 (d) | | 8,870 | 7,444 |
| 5.25% 10/1/30 (d) | | 5,530 | 4,465 |
| 5.75% 9/1/27 (d) | | 9,035 | 8,719 |
| 6.125% 9/1/29 (d) | | 9,035 | 8,611 |
| Northwest Fiber LLC/Northwest Fiber Finance Sub, Inc. 10.75% 6/1/28 (d) | | 5,930 | 5,567 |
| NortonLifeLock, Inc. 5% 4/15/25 (d) | | 10,050 | 9,753 |
| onsemi 3.875% 9/1/28 (d) | | 11,065 | 9,749 |
| Open Text Corp.: | | | |
| 3.875% 2/15/28 (d) | | 5,690 | 4,870 |
| 3.875% 12/1/29 (d) | | 6,700 | 5,310 |
| Open Text Holdings, Inc.: | | | |
| 4.125% 2/15/30 (d) | | 5,690 | 4,531 |
| 4.125% 12/1/31 (d) | | 5,485 | 4,127 |
| Pitney Bowes, Inc. 7.25% 3/15/29 (d) | | 5,980 | 3,831 |
| PTC, Inc.: | | | |
| 3.625% 2/15/25 (d) | | 6,650 | 6,338 |
| 4% 2/15/28 (d) | | 6,575 | 5,955 |
| Rackspace Hosting, Inc. 5.375% 12/1/28 (d) | | 6,425 | 2,705 |
| Roblox Corp. 3.875% 5/1/30 (d) | | 9,120 | 7,524 |
| Sensata Technologies BV 4% 4/15/29 (d) | | 11,970 | 10,081 |
| Synaptics, Inc. 4% 6/15/29 (d) | | 7,015 | 5,795 |
| TTM Technologies, Inc. 4% 3/1/29 (d) | | 8,870 | 7,408 |
| Twilio, Inc.: | | | |
| 3.625% 3/15/29 | | 9,995 | 8,253 |
| 3.875% 3/15/31 | | 10,460 | 8,531 |
| Uber Technologies, Inc.: | | | |
| 7.5% 9/15/27 (d) | | 35,255 | 35,247 |
| 8% 11/1/26 (d) | | 51,060 | 51,249 |
| Unisys Corp. 6.875% 11/1/27 (d) | | 6,095 | 5,099 |
| Veritas U.S., Inc./Veritas Bermuda Ltd. 7.5% 9/1/25 (d) | | 19,400 | 16,329 |
| | | | 404,472 |
| Telecommunications - 6.0% | | | |
| Altice Financing SA: | | | |
| 5% 1/15/28 (d) | | 11,280 | 8,919 |
| 5.75% 8/15/29 (d) | | 24,290 | 19,178 |
| Altice France SA: | | | |
| 5.125% 7/15/29 (d) | | 79,325 | 59,746 |
| 5.5% 1/15/28 (d) | | 24,740 | 19,833 |
| 5.5% 10/15/29 (d) | | 106,150 | 80,939 |
| 8.125% 2/1/27 (d) | | 7,635 | 6,996 |
| C&W Senior Financing Designated Activity Co. 6.875% 9/15/27 (d) | | 42,100 | 36,417 |
| Cablevision Lightpath LLC: | | | |
| 3.875% 9/15/27 (d) | | 5,500 | 4,676 |
| 5.625% 9/15/28 (d) | | 4,350 | 3,458 |
| Cogent Communications Group, Inc. 7% 6/15/27 (d) | | 6,050 | 5,744 |
| Frontier Communications Holdings LLC: | | | |
| 5% 5/1/28 (d) | | 19,575 | 17,128 |
| 5.875% 10/15/27 (d) | | 10,375 | 9,543 |
| 6% 1/15/30 (d) | | 6,090 | 4,762 |
| 6.75% 5/1/29 (d) | | 6,940 | 5,717 |
| 8.75% 5/15/30 (d) | | 6,045 | 6,173 |
| Intelsat Jackson Holdings SA 6.5% 3/15/30 (d) | | 25,303 | 23,222 |
| LCPR Senior Secured Financing DAC: | | | |
| 5.125% 7/15/29 (d) | | 14,860 | 12,520 |
| 6.75% 10/15/27 (d) | | 10,157 | 9,472 |
| Level 3 Financing, Inc.: | | | |
| 3.625% 1/15/29 (d) | | 24,590 | 18,750 |
| 3.75% 7/15/29 (d) | | 24,670 | 18,743 |
| Millicom International Cellular SA 4.5% 4/27/31 (d) | | 1,725 | 1,290 |
| Northwest Fiber LLC/Northwest Fiber Finance Sub, Inc.: | | | |
| 4.75% 4/30/27 (d) | | 6,070 | 5,457 |
| 6% 2/15/28 (d) | | 4,490 | 3,523 |
| Qwest Corp. 7.25% 9/15/25 | | 1,480 | 1,495 |
| Sable International Finance Ltd. 5.75% 9/7/27 (d) | | 18,690 | 16,471 |
| SBA Communications Corp.: | | | |
| 3.125% 2/1/29 | | 13,305 | 10,754 |
| 3.875% 2/15/27 | | 17,015 | 15,314 |
| Sprint Capital Corp.: | | | |
| 6.875% 11/15/28 | | 70,044 | 72,284 |
| 8.75% 3/15/32 | | 21,176 | 24,853 |
| Sprint Corp. 7.625% 3/1/26 | | 10,895 | 11,372 |
| T-Mobile U.S.A., Inc. 3.5% 4/15/31 | | 4,490 | 3,775 |
| Uniti Group, Inc.: | | | |
| 6% 1/15/30 (d) | | 15,190 | 10,366 |
| 7.875% 2/15/25 (d) | | 17,650 | 17,474 |
| Virgin Media Finance PLC 5% 7/15/30 (d) | | 21,860 | 17,518 |
| VMED O2 UK Financing I PLC 4.75% 7/15/31 (d) | | 21,200 | 17,131 |
| Windstream Escrow LLC 7.75% 8/15/28 (d) | | 61,245 | 52,995 |
| Zayo Group Holdings, Inc. 4% 3/1/27 (d) | | 17,180 | 13,272 |
| | | | 667,280 |
| Textiles/Apparel - 0.3% | | | |
| Crocs, Inc.: | | | |
| 4.125% 8/15/31 (d) | | 6,075 | 4,601 |
| 4.25% 3/15/29 (d) | | 8,675 | 6,918 |
| Foot Locker, Inc. 4% 10/1/29 (d) | | 6,070 | 4,640 |
| Kontoor Brands, Inc. 4.125% 11/15/29 (d) | | 5,320 | 4,266 |
| Victoria's Secret & Co. 4.625% 7/15/29 (d) | | 22,560 | 17,946 |
| | | | 38,371 |
| Transportation Ex Air/Rail - 0.1% | | | |
| Seaspan Corp. 5.5% 8/1/29 (d) | | 9,095 | 7,005 |
| Utilities - 2.6% | | | |
| Clearway Energy Operating LLC: | | | |
| 3.75% 2/15/31 (d) | | 13,295 | 11,101 |
| 3.75% 1/15/32 (d) | | 6,075 | 4,813 |
| 4.75% 3/15/28 (d) | | 6,920 | 6,392 |
| NRG Energy, Inc.: | | | |
| 3.375% 2/15/29 (d) | | 5,145 | 4,286 |
| 3.625% 2/15/31 (d) | | 10,215 | 8,129 |
| 3.875% 2/15/32 (d) | | 15,190 | 11,977 |
| 5.75% 1/15/28 | | 9,410 | 8,975 |
| 6.625% 1/15/27 | | 8,283 | 8,287 |
| Pacific Gas & Electric Co.: | | | |
| 3.45% 7/1/25 | | 2,868 | 2,665 |
| 3.75% 7/1/28 | | 2,868 | 2,447 |
| 3.75% 8/15/42 | | 10,400 | 6,587 |
| 3.95% 12/1/47 | | 53,930 | 34,776 |
| 4% 12/1/46 | | 24,380 | 15,502 |
| 4.25% 3/15/46 | | 2,400 | 1,597 |
| 4.3% 3/15/45 | | 5,995 | 4,038 |
| 4.55% 7/1/30 | | 44,763 | 39,206 |
| PG&E Corp.: | | | |
| 5% 7/1/28 | | 22,000 | 19,828 |
| 5.25% 7/1/30 | | 8,330 | 7,376 |
| Pike Corp. 5.5% 9/1/28 (d) | | 28,165 | 24,050 |
| Vistra Operations Co. LLC: | | | |
| 4.375% 5/1/29 (d) | | 23,230 | 19,868 |
| 5% 7/31/27 (d) | | 22,585 | 20,835 |
| 5.5% 9/1/26 (d) | | 3,485 | 3,346 |
| 5.625% 2/15/27 (d) | | 28,195 | 26,878 |
| | | | 292,959 |
TOTAL NONCONVERTIBLE BONDS | | | 7,549,876 |
| TOTAL CORPORATE BONDS (Cost $8,653,021) | | | 7,594,004 |
| | | | |
| Common Stocks - 9.5% |
| | | Shares | Value ($) (000s) |
| Automotive & Auto Parts - 0.0% | | | |
| Exide Technologies (b)(j) | | 9,824 | 10 |
| Exide Technologies (b)(j) | | 580,031 | 0 |
| Exide Technologies (b)(j) | | 385 | 250 |
| UC Holdings, Inc. (b)(j) | | 677,217 | 2,939 |
TOTAL AUTOMOTIVE & AUTO PARTS | | | 3,199 |
| Banks & Thrifts - 0.0% | | | |
| Algoma Steel Group, Inc. | | 638,696 | 4,350 |
| Broadcasting - 0.3% | | | |
| iHeartMedia, Inc. (j) | | 104 | 1 |
| Nexstar Broadcasting Group, Inc. Class A | | 169,632 | 29,058 |
TOTAL BROADCASTING | | | 29,059 |
| Building Materials - 0.1% | | | |
| Builders FirstSource, Inc. (j) | | 117,400 | 7,239 |
| Cable/Satellite TV - 0.0% | | | |
| Altice U.S.A., Inc. Class A (j) | | 330,500 | 2,185 |
| Chemicals - 0.3% | | | |
| CF Industries Holdings, Inc. | | 199,202 | 21,167 |
| The Chemours Co. LLC | | 566,310 | 16,213 |
TOTAL CHEMICALS | | | 37,380 |
| Consumer Products - 0.3% | | | |
| Reddy Ice Holdings, Inc. (b)(j) | | 199,717 | 11 |
| Tapestry, Inc. | | 344,400 | 10,911 |
| Tempur Sealy International, Inc. | | 651,018 | 17,506 |
TOTAL CONSUMER PRODUCTS | | | 28,428 |
| Containers - 0.4% | | | |
| Berry Global Group, Inc. (j) | | 220,155 | 10,418 |
| Graphic Packaging Holding Co. | | 973,700 | 22,356 |
| WestRock Co. | | 302,400 | 10,300 |
TOTAL CONTAINERS | | | 43,074 |
| Diversified Financial Services - 0.4% | | | |
| MasterCard, Inc. Class A | | 35,400 | 11,618 |
| OneMain Holdings, Inc. | | 777,400 | 29,977 |
| PJT Partners, Inc. | | 5,092 | 379 |
TOTAL DIVERSIFIED FINANCIAL SERVICES | | | 41,974 |
| Energy - 2.3% | | | |
| Antero Resources Corp. (j) | | 306,925 | 11,252 |
| California Resources Corp. | | 1,898,638 | 85,648 |
| California Resources Corp. warrants 10/27/24 (j) | | 57,076 | 810 |
| Chaparral Energy, Inc.: | | | |
| Series A warrants 10/1/24 (b)(j) | | 392 | 1 |
| Series B warrants 10/1/25 (b)(j) | | 392 | 1 |
| Cheniere Energy, Inc. | | 173,100 | 30,537 |
| Chesapeake Energy Corp. | | 423,272 | 43,288 |
| Chesapeake Energy Corp. (c)(j) | | 22,818 | 2,334 |
| Civitas Resources, Inc. | | 60,298 | 4,215 |
| Diamond Offshore Drilling, Inc. (j)(k) | | 118,485 | 1,167 |
| Diamondback Energy, Inc. | | 123,300 | 19,372 |
| EP Energy Corp. (b)(j) | | 841,775 | 7,046 |
| Forbes Energy Services Ltd. (b)(j) | | 193,218 | 0 |
| Jonah Energy Parent LLC (b)(j) | | 304,505 | 19,367 |
| Mesquite Energy, Inc. (b)(j) | | 317,026 | 17,573 |
| PureWest Energy (b) | | 17,812 | 0 |
| PureWest Energy rights (b)(j) | | 10,734 | 0 |
| Superior Energy Services, Inc. Class A (b)(j) | | 110,370 | 8,352 |
| Unit Corp. (j)(k) | | 37,978 | 2,240 |
TOTAL ENERGY | | | 253,203 |
| Entertainment/Film - 0.0% | | | |
| New Cotai LLC/New Cotai Capital Corp. (b)(c)(j) | | 3,366,626 | 0 |
| Environmental - 0.1% | | | |
| Darling Ingredients, Inc. (j) | | 144,616 | 11,349 |
| Food & Drug Retail - 0.2% | | | |
| Southeastern Grocers, Inc. (b)(c)(j) | | 793,345 | 17,160 |
| Food/Beverage/Tobacco - 0.2% | | | |
| JBS SA | | 4,652,100 | 22,479 |
| Gaming - 0.7% | | | |
| Boyd Gaming Corp. | | 453,873 | 26,216 |
| Caesars Entertainment, Inc. (j) | | 1,038,736 | 45,424 |
| Studio City International Holdings Ltd.: | | | |
| ADR (d) | | 631,958 | 1,264 |
| (NYSE) ADR (j) | | 695,700 | 1,391 |
TOTAL GAMING | | | 74,295 |
| Healthcare - 0.6% | | | |
| Charles River Laboratories International, Inc. (j) | | 56,900 | 12,077 |
| Encompass Health Corp. | | 34 | 2 |
| Enhabit Home Health & Hospice (j) | | 17 | 0 |
| IQVIA Holdings, Inc. (j) | | 151,200 | 31,702 |
| Tenet Healthcare Corp. (j) | | 105,498 | 4,680 |
| UnitedHealth Group, Inc. | | 42,700 | 23,705 |
TOTAL HEALTHCARE | | | 72,166 |
| Metals/Mining - 0.1% | | | |
| Elah Holdings, Inc. (b)(j) | | 906 | 66 |
| First Quantum Minerals Ltd. | | 626,700 | 11,054 |
TOTAL METALS/MINING | | | 11,120 |
| Services - 0.4% | | | |
| ASGN, Inc. (j) | | 306,000 | 25,943 |
| Penhall Acquisition Co.: | | | |
| Class A (b)(j) | | 26,163 | 2,796 |
| Class B (b)(j) | | 8,721 | 932 |
| Visa, Inc. Class A | | 56,200 | 11,642 |
TOTAL SERVICES | | | 41,313 |
| Steel - 0.0% | | | |
| Algoma Steel SCA (b)(j) | | 198,162 | 0 |
| Super Retail - 0.5% | | | |
| Amazon.com, Inc. (j) | | 87,800 | 8,994 |
| Arena Brands Holding Corp. Class B (b)(c)(j) | | 659,302 | 6,626 |
| Dick's Sporting Goods, Inc. | | 99,600 | 11,330 |
| Lowe's Companies, Inc. | | 122,100 | 23,803 |
| Williams-Sonoma, Inc. (k) | | 76,303 | 9,449 |
TOTAL SUPER RETAIL | | | 60,202 |
| Technology - 2.2% | | | |
| Adobe, Inc. (j) | | 33,800 | 10,765 |
| Advanced Micro Devices, Inc. (j) | | 170,100 | 10,216 |
| CDW Corp. | | 165,200 | 28,548 |
| Fiserv, Inc. (j) | | 169,000 | 17,363 |
| Global Payments, Inc. | | 169,524 | 19,370 |
| Lam Research Corp. | | 28,900 | 11,698 |
| Marvell Technology, Inc. | | 551,400 | 21,880 |
| Microchip Technology, Inc. | | 502,600 | 31,031 |
| Microsoft Corp. | | 111,400 | 25,859 |
| NVIDIA Corp. | | 81,500 | 11,000 |
| NXP Semiconductors NV | | 44,900 | 6,559 |
| onsemi (j) | | 556,703 | 34,198 |
| Salesforce.com, Inc. (j) | | 71,937 | 11,696 |
| SS&C Technologies Holdings, Inc. | | 126,516 | 6,505 |
TOTAL TECHNOLOGY | | | 246,688 |
| Telecommunications - 0.0% | | | |
| GTT Communications, Inc. rights (b)(j) | | 472,864 | 473 |
| Textiles/Apparel - 0.0% | | | |
| Victoria's Secret & Co. (j) | | 99,633 | 3,746 |
| Transportation Ex Air/Rail - 0.0% | | | |
| Tricer Holdco SCA: | | | |
| Class A1 (b)(c)(j) | | 598,287 | 0 |
| Class A2 (b)(c)(j) | | 598,287 | 0 |
| Class A3 (b)(c)(j) | | 598,287 | 0 |
| Class A4 (b)(c)(j) | | 598,287 | 0 |
| Class A5 (b)(c)(j) | | 598,287 | 0 |
| Class A6 (b)(c)(j) | | 598,287 | 0 |
| Class A7 (b)(c)(j) | | 598,287 | 0 |
| Class A8 (b)(c)(j) | | 598,287 | 0 |
| Class A9 (b)(c)(j) | | 598,287 | 0 |
TOTAL TRANSPORTATION EX AIR/RAIL | | | 0 |
| Utilities - 0.4% | | | |
| NRG Energy, Inc. | | 373,900 | 16,601 |
| PG&E Corp. (j) | | 2,097,796 | 31,320 |
| Portland General Electric Co. | | 14,817 | 666 |
TOTAL UTILITIES | | | 48,587 |
| TOTAL COMMON STOCKS (Cost $792,439) | | | 1,059,669 |
| | | | |
| Nonconvertible Preferred Stocks - 0.0% |
| | | Shares | Value ($) (000s) |
| Automotive & Auto Parts - 0.0% | | | |
| Exide Technologies (b)(j) | | 858 | 799 |
| Transportation Ex Air/Rail - 0.0% | | | |
| Tricer Holdco SCA (b)(c)(j) | | 287,159,690 | 3 |
| TOTAL NONCONVERTIBLE PREFERRED STOCKS (Cost $11,049) | | | 802 |
| | | | |
| Bank Loan Obligations - 5.2% |
| | | Principal Amount (a) (000s) | Value ($) (000s) |
| Air Transportation - 0.4% | | | |
| Air Canada Tranche B 1LN, term loan 1 month U.S. LIBOR + 3.500% 6.421% 8/11/28 (f)(g)(l) | | 9,082 | 8,855 |
| Dynasty Acquisition Co., Inc.: | | | |
| Tranche B 1LN, term loan 1 month U.S. LIBOR + 3.500% 7.2539% 4/8/26 (f)(g)(l) | | 2,565 | 2,402 |
| Tranche B2 1LN, term loan 1 month U.S. LIBOR + 3.500% 7.2539% 4/4/26 (f)(g)(l) | | 1,379 | 1,291 |
| SkyMiles IP Ltd. Tranche B 1LN, term loan 3 month U.S. LIBOR + 3.750% 7.9926% 10/20/27 (f)(g)(l) | | 3,490 | 3,518 |
| United Airlines, Inc. Tranche B 1LN, term loan 1 month U.S. LIBOR + 3.750% 8.1084% 4/21/28 (f)(g)(l) | | 26,103 | 25,428 |
TOTAL AIR TRANSPORTATION | | | 41,494 |
| Automotive & Auto Parts - 0.2% | | | |
| PECF USS Intermediate Holding III Corp. Tranche B 1LN, term loan 1 month U.S. LIBOR + 4.250% 8.0039% 12/17/28 (f)(g)(l) | | 2,293 | 1,760 |
| Wand NewCo 3, Inc. Tranche B 1LN, term loan 1 month U.S. LIBOR + 3.000% 6.7539% 2/5/26 (f)(g)(l) | | 17,894 | 16,754 |
TOTAL AUTOMOTIVE & AUTO PARTS | | | 18,514 |
| Banks & Thrifts - 0.1% | | | |
| Citadel Securities LP Tranche B 1LN, term loan 1 month U.S. LIBOR + 2.500% 6.3432% 2/27/28 (f)(g)(l) | | 9,697 | 9,602 |
| Broadcasting - 0.1% | | | |
| Diamond Sports Group LLC 1LN, term loan CME Term SOFR 1 Month Index + 8.000% 11.208% 5/25/26 (f)(g)(l) | | 6,778 | 6,496 |
| Nexstar Broadcasting, Inc. Tranche B, term loan 1 month U.S. LIBOR + 2.500% 6.2539% 9/19/26 (f)(g)(l) | | 2,493 | 2,465 |
| Univision Communications, Inc.: | | | |
| 1LN, term loan CME Term SOFR 1 Month Index + 4.250% 7.7896% 6/10/29 (f)(g)(l) | | 753 | 736 |
| Tranche B 1LN, term loan 1 month U.S. LIBOR + 3.250% 7.0039% 1/31/29 (f)(g)(l) | | 7,463 | 7,155 |
TOTAL BROADCASTING | | | 16,852 |
| Building Materials - 0.4% | | | |
| Acproducts Holdings, Inc. Tranche B 1LN, term loan 1 month U.S. LIBOR + 4.250% 7.3247% 5/17/28 (f)(g)(l) | | 23,710 | 16,444 |
| Hunter Douglas, Inc. Tranche B 1LN, term loan CME Term SOFR 1 Month Index + 3.500% 6.3399% 2/25/29 (f)(g)(l) | | 22,698 | 18,778 |
| SRS Distribution, Inc. Tranche B 1LN, term loan 1 month U.S. LIBOR + 3.500% 7.2539% 6/4/28 (f)(g)(l) | | 6,424 | 5,958 |
TOTAL BUILDING MATERIALS | | | 41,180 |
| Chemicals - 0.2% | | | |
| Avient Corp. Tranche B 1LN, term loan CME Term SOFR 1 Month Index + 3.250% 7.3442% 8/29/29 (f)(g)(l) | | 785 | 780 |
| Discovery Purchaser Corp. 1LN, term loan CME Term SOFR 1 Month Index + 4.370% 7.9683% 10/4/29 (f)(g)(l) | | 18,040 | 16,457 |
| Olympus Water U.S. Holding Corp. Tranche B 1LN, term loan 1 month U.S. LIBOR + 3.750% 7.4375% 11/9/28 (f)(g)(l) | | 3,677 | 3,342 |
| W.R. Grace Holding LLC Tranche B 1LN, term loan 3 month U.S. LIBOR + 3.750% 7.4375% 9/22/28 (f)(g)(l) | | 2,764 | 2,649 |
TOTAL CHEMICALS | | | 23,228 |
| Consumer Products - 0.2% | | | |
| Kronos Acquisition Holdings, Inc. Tranche B 1LN, term loan 1 month U.S. LIBOR + 3.750% 6.8196% 12/22/26 (f)(g)(l) | | 20,050 | 18,911 |
| Containers - 0.0% | | | |
| Kloeckner Pentaplast of America, Inc. Tranche B 1LN, term loan 1 month U.S. LIBOR + 4.750% 8.2592% 2/9/26 (f)(g)(l) | | 1,482 | 1,238 |
| Energy - 0.0% | | | |
| Forbes Energy Services LLC Tranche B, term loan 0% 12/31/49 (b)(e)(f)(l) | | 1,810 | 0 |
| Mesquite Energy, Inc.: | | | |
| 1LN, term loan 3 month U.S. LIBOR + 8.000% 0% (b)(e)(g)(l) | | 5,861 | 0 |
| term loan 3 month U.S. LIBOR + 0.000% 0% (b)(e)(g)(l) | | 2,528 | 0 |
TOTAL ENERGY | | | 0 |
| Environmental - 0.0% | | | |
| Covanta Holding Corp.: | | | |
| Tranche B 1LN, term loan 1 month U.S. LIBOR + 2.500% 6.2287% 11/30/28 (f)(g)(l) | | 2,203 | 2,171 |
| Tranche C 1LN, term loan 1 month U.S. LIBOR + 2.500% 6.2287% 11/30/28 (f)(g)(l) | | 166 | 163 |
| Madison IAQ LLC Tranche B 1LN, term loan 1 month U.S. LIBOR + 3.250% 6.8153% 6/21/28 (f)(g)(l) | | 2,992 | 2,700 |
TOTAL ENVIRONMENTAL | | | 5,034 |
| Food/Beverage/Tobacco - 0.0% | | | |
| Bengal Debt Merger Sub LLC 1LN, term loan CME TERM SOFR 3 MONTH INDEX + 3.250% 6.9032% 1/24/29 (f)(g)(l) | | 2,279 | 2,077 |
| Gaming - 0.0% | | | |
| Fertitta Entertainment LLC NV Tranche B 1LN, term loan CME Term SOFR 1 Month Index + 4.000% 7.7287% 1/27/29 (f)(g)(l) | | 3,846 | 3,600 |
| Scientific Games Corp. 1LN, term loan CME Term SOFR 1 Month Index + 3.000% 6.4024% 4/7/29 (f)(g)(l) | | 2,379 | 2,343 |
TOTAL GAMING | | | 5,943 |
| Healthcare - 0.4% | | | |
| Gainwell Acquisition Corp. Tranche B 1LN, term loan 1 month U.S. LIBOR + 4.000% 7.6741% 10/1/27 (f)(g)(l) | | 17,586 | 16,678 |
| Jazz Financing Lux SARL Tranche B 1LN, term loan 1 month U.S. LIBOR + 3.500% 7.2539% 5/5/28 (f)(g)(l) | | 6,231 | 6,149 |
| Organon & Co. Tranche B 1LN, term loan 1 month U.S. LIBOR + 3.000% 6.1875% 6/2/28 (f)(g)(l) | | 16,341 | 15,912 |
| Phoenix Newco, Inc. Tranche B 1LN, term loan 1 month U.S. LIBOR + 3.250% 7.0039% 11/15/28 (f)(g)(l) | | 7,159 | 6,884 |
| PRA Health Sciences, Inc. Tranche B 1LN, term loan 1 month U.S. LIBOR + 2.250% 5.9375% 7/3/28 (f)(g)(l) | | 1,886 | 1,865 |
TOTAL HEALTHCARE | | | 47,488 |
| Hotels - 0.1% | | | |
| Carnival Finance LLC Tranche B 1LN, term loan 1 month U.S. LIBOR + 3.250% 6.1269% 10/18/28 (f)(g)(l) | | 7,995 | 7,310 |
| Insurance - 0.2% | | | |
| Acrisure LLC Tranche B 1LN, term loan 1 month U.S. LIBOR + 4.250% 8.0039% 2/15/27 (f)(g)(l) | | 1,434 | 1,358 |
| Alliant Holdings Intermediate LLC Tranche B3 1LN, term loan 1 month U.S. LIBOR + 3.500% 6.9799% 11/12/27 (f)(g)(l) | | 13,385 | 12,909 |
| HUB International Ltd. Tranche B 1LN, term loan 1 month U.S. LIBOR + 3.250% 7.5268% 4/25/25 (f)(g)(l) | | 5,677 | 5,569 |
TOTAL INSURANCE | | | 19,836 |
| Paper - 0.1% | | | |
| Clydesdale Acquisition Holdings, Inc. 1LN, term loan CME Term SOFR 1 Month Index + 4.170% 8.0037% 4/13/29 (f)(g)(l) | | 9,037 | 8,692 |
| Services - 0.9% | | | |
| ABG Intermediate Holdings 2 LLC: | | | |
| Tranche B 2LN, term loan CME Term SOFR 1 Month Index + 6.000% 9.8287% 12/20/29 (f)(g)(l) | | 1,145 | 1,053 |
| Tranche B1 LN, term loan CME Term SOFR 1 Month Index + 3.500% 7.3287% 12/21/28 (f)(g)(l) | | 5,416 | 5,193 |
| Ascend Learning LLC: | | | |
| 2LN, term loan 1 month U.S. LIBOR + 5.750% 9.5039% 12/10/29 (f)(g)(l) | | 15,190 | 12,855 |
| Tranche B 1LN, term loan 1 month U.S. LIBOR + 3.500% 7.2539% 12/10/28 (f)(g)(l) | | 43,422 | 39,743 |
| KUEHG Corp. Tranche B 2LN, term loan 3 month U.S. LIBOR + 8.250% 12.0039% 8/22/25 (f)(g)(l) | | 6,055 | 5,830 |
| Sabert Corp. Tranche B 1LN, term loan 1 month U.S. LIBOR + 4.500% 8.3125% 12/10/26 (b)(f)(g)(l) | | 7,173 | 7,012 |
| Sotheby's Tranche B 1LN, term loan 1 month U.S. LIBOR + 4.500% 8.5791% 1/15/27 (f)(g)(l) | | 10,919 | 10,660 |
| Spin Holdco, Inc. Tranche B 1LN, term loan 1 month U.S. LIBOR + 4.000% 7.1441% 3/4/28 (f)(g)(l) | | 17,968 | 15,774 |
TOTAL SERVICES | | | 98,120 |
| Specialty Retailing - 0.0% | | | |
| New SK Holdco Sub LLC 1LN, term loan CME Term SOFR 1 Month Index + 8.350% 11.7257% 6/30/27 (f)(g)(l) | | 882 | 790 |
| Super Retail - 0.0% | | | |
| Michaels Companies, Inc. 1LN, term loan 1 month U.S. LIBOR + 4.250% 7.9241% 4/15/28 (f)(g)(l) | | 5,491 | 4,211 |
| Technology - 1.4% | | | |
| Acuris Finance U.S., Inc. 1LN, term loan CME Term SOFR 1 Month Index + 4.000% 7.7032% 2/16/28 (f)(g)(l) | | 1,131 | 1,104 |
| Athenahealth Group, Inc.: | | | |
| Tranche B 1LN, term loan CME Term SOFR 1 Month Index + 3.500% 6.9671% 2/15/29 (f)(g)(l) | | 28,352 | 25,847 |
| Tranche DD 1LN, term loan CME Term SOFR 1 Month Index + 3.500% 2/15/29 (g)(l)(m) | | 4,817 | 4,392 |
| Boxer Parent Co., Inc. Tranche B 1LN, term loan 1 month U.S. LIBOR + 3.750% 7.5039% 10/2/25 (f)(g)(l) | | 31,701 | 30,425 |
| Camelot Finance SA Tranche B, term loan 1 month U.S. LIBOR + 3.000% 6.7539% 10/31/26 (f)(g)(l) | | 998 | 980 |
| DG Investment Intermediate Holdings, Inc. Tranche B 1LN, term loan 1 month U.S. LIBOR + 3.750% 7.5039% 3/31/28 (f)(g)(l) | | 2,005 | 1,891 |
| Hunter U.S. Bidco, Inc. Tranche B 1LN, term loan 1 month U.S. LIBOR + 4.250% 7.9241% 8/19/28 (f)(g)(l) | | 11,516 | 11,055 |
| Icon Luxembourg Sarl Tranche B 1LN, term loan 1 month U.S. LIBOR + 2.250% 5.9375% 7/3/28 (f)(g)(l) | | 7,571 | 7,485 |
| onsemi Tranche B 1LN, term loan 1 month U.S. LIBOR + 2.000% 5.7539% 9/19/26 (f)(g)(l) | | 5,224 | 5,225 |
| Peraton Corp. Tranche B 1LN, term loan 1 month U.S. LIBOR + 3.750% 7.5039% 2/1/28 (f)(g)(l) | | 13,738 | 13,203 |
| Polaris Newco LLC Tranche B 1LN, term loan 1 month U.S. LIBOR + 4.000% 7.6741% 6/2/28 (f)(g)(l) | | 6,707 | 6,113 |
| Proofpoint, Inc. Tranche B 1LN, term loan 1 month U.S. LIBOR + 3.250% 6.3196% 8/31/28 (f)(g)(l) | | 6,555 | 6,228 |
| RealPage, Inc. Tranche B 1LN, term loan 1 month U.S. LIBOR + 3.000% 6.7539% 4/22/28 (f)(g)(l) | | 5,970 | 5,600 |
| STG-Fairway Holdings LLC Tranche B 1LN, term loan 1 month U.S. LIBOR + 2.750% 6.5039% 1/31/27 (f)(g)(l) | | 3,110 | 3,064 |
| Ultimate Software Group, Inc.: | | | |
| 1LN, term loan 1 month U.S. LIBOR + 3.250% 6.9983% 5/3/26 (f)(g)(l) | | 28,182 | 27,153 |
| 2LN, term loan 1 month U.S. LIBOR + 5.250% 8.9983% 5/3/27 (f)(g)(l) | | 4,000 | 3,670 |
| VS Buyer LLC Tranche B 1LN, term loan 1 month U.S. LIBOR + 3.000% 6.7539% 2/28/27 (f)(g)(l) | | 2,296 | 2,229 |
TOTAL TECHNOLOGY | | | 155,664 |
| Telecommunications - 0.3% | | | |
| Connect U.S. Finco LLC Tranche B 1LN, term loan 1 month U.S. LIBOR + 3.500% 7.26% 12/12/26 (f)(g)(l) | | 8,824 | 8,515 |
| Frontier Communications Holdings LLC Tranche B 1LN, term loan 1 month U.S. LIBOR + 3.750% 7.4375% 5/1/28 (f)(g)(l) | | 5,097 | 4,806 |
| GTT Communications, Inc. Tranche B, term loan 3 month U.S. LIBOR + 4.750% 10% 5/31/25 (f)(g)(l) | | 12,942 | 8,912 |
| Securus Technologies Holdings Tranche B, term loan 3 month U.S. LIBOR + 4.500% 8.1741% 11/1/24 (f)(g)(l) | | 6,934 | 5,757 |
| Zayo Group Holdings, Inc. 1LN, term loan 1 month U.S. LIBOR + 3.000% 6.7539% 3/9/27 (f)(g)(l) | | 7,821 | 6,319 |
TOTAL TELECOMMUNICATIONS | | | 34,309 |
| Utilities - 0.2% | | | |
| PG&E Corp. Tranche B 1LN, term loan 1 month U.S. LIBOR + 3.000% 6.8125% 6/23/25 (f)(g)(l) | | 26,886 | 26,409 |
| TOTAL BANK LOAN OBLIGATIONS (Cost $636,573) | | | 586,902 |
| | | | |
| Preferred Securities - 8.0% |
| | | Principal Amount (a) (000s) | Value ($) (000s) |
| Banks & Thrifts - 6.7% | | | |
| Ally Financial, Inc. 4.7% (f)(i) | | 7,055 | 4,815 |
| Bank of America Corp.: | | | |
| 5.125% (f)(i) | | 36,030 | 34,661 |
| 5.2% (f)(i) | | 61,440 | 61,086 |
| 5.875% (f)(i) | | 102,630 | 89,122 |
| 6.25% (f)(i) | | 28,555 | 28,073 |
| Citigroup, Inc.: | | | |
| 4.7% (f)(i) | | 15,285 | 12,447 |
| 5% (f)(i) | | 60,300 | 54,065 |
| 5.9% (f)(i) | | 27,015 | 27,086 |
| 5.95% (f)(i) | | 51,015 | 51,459 |
| 6.3% (f)(i) | | 5,610 | 5,394 |
| Goldman Sachs Group, Inc.: | | | |
| 4.4% (f)(i) | | 8,035 | 6,674 |
| 4.95% (f)(i) | | 13,335 | 12,171 |
| 5% (f)(i) | | 70,565 | 67,473 |
| Huntington Bancshares, Inc. 5.7% (f)(i) | | 12,990 | 11,855 |
| JPMorgan Chase & Co.: | | | |
| 4% (f)(i) | | 34,340 | 28,705 |
| 4.6% (f)(i) | | 23,365 | 21,120 |
| 5% (f)(i) | | 30,845 | 28,803 |
| 6% (f)(i) | | 69,385 | 69,385 |
| 6.125% (f)(i) | | 17,585 | 17,319 |
| 6.75% (f)(i) | | 8,330 | 8,471 |
| Wells Fargo & Co.: | | | |
| 5.875% (f)(i) | | 50,420 | 49,528 |
| 5.9% (f)(i) | | 63,075 | 58,614 |
TOTAL BANKS & THRIFTS | | | 748,326 |
| Diversified Financial Services - 0.0% | | | |
| OEC Finance Ltd. 7.5% pay-in-kind (d)(i) | | 35 | 2 |
| Energy - 1.3% | | | |
| DCP Midstream Partners LP 7.375% (f)(i) | | 15,260 | 15,459 |
| Energy Transfer LP: | | | |
| 6.25% (f)(i) | | 81,527 | 68,889 |
| 6.625% (f)(i) | | 30,505 | 22,278 |
| 7.125% (f)(i) | | 9,130 | 7,871 |
| MPLX LP 6.875% (f)(i) | | 30,450 | 30,132 |
| Summit Midstream Partners LP 9.5% (f)(i) | | 2,912 | 2,165 |
TOTAL ENERGY | | | 146,794 |
| TOTAL PREFERRED SECURITIES (Cost $969,245) | | | 895,122 |
| | | | |
| Other - 1.5% |
| | | Shares | Value ($) (000s) |
| Other - 1.5% | | | |
Fidelity Direct Lending Fund, LP (c)(n) (Cost $164,436) | | | 162,569 |
| | | | |
| Money Market Funds - 7.0% |
| | | Shares | Value ($) (000s) |
| Fidelity Cash Central Fund 3.10% (o) | | 783,919,698 | 784,076 |
| Fidelity Securities Lending Cash Central Fund 3.10% (o)(p) | | 618,713 | 619 |
| TOTAL MONEY MARKET FUNDS (Cost $784,649) | | | 784,695 |
| | | | |
| TOTAL INVESTMENT IN SECURITIES - 98.9% (Cost $12,011,412) | 11,083,763 |
NET OTHER ASSETS (LIABILITIES) - 1.1% | 126,885 |
| NET ASSETS - 100.0% | 11,210,648 |
| | |
Any values shown as $0 in the Schedule of Investments may reflect amounts less than $500.
Legend
| (a) | Amount is stated in United States dollars unless otherwise noted. |
| (c) | Restricted securities (including private placements) - Investment in securities not registered under the Securities Act of 1933 (excluding 144A issues). At the end of the period, the value of restricted securities (excluding 144A issues) amounted to $229,006,000 or 2.0% of net assets. |
| (d) | Security exempt from registration under Rule 144A of the Securities Act of 1933. These securities may be resold in transactions exempt from registration, normally to qualified institutional buyers. At the end of the period, the value of these securities amounted to $5,623,767,000 or 50.2% of net assets. |
| (e) | Non-income producing - Security is in default. |
| (f) | Coupon rates for floating and adjustable rate securities reflect the rates in effect at period end. |
| (g) | Coupon is indexed to a floating interest rate which may be multiplied by a specified factor and/or subject to caps or floors. |
| (h) | Security initially issued at one coupon which converts to a higher coupon at a specified date. The rate shown is the rate at period end. |
| (i) | Security is perpetual in nature with no stated maturity date. |
| (k) | Security or a portion of the security is on loan at period end. |
| (l) | Remaining maturities of bank loan obligations may be less than the stated maturities shown as a result of contractual or optional prepayments by the borrower. Such prepayments cannot be predicted with certainty. |
| (m) | Position or a portion of the position represents an unfunded loan commitment. At period end, the total principal amount and market value of unfunded commitments totaled $4,817,000 and $4,392,000, respectively. |
| (o) | Affiliated fund that is generally available only to investment companies and other accounts managed by Fidelity Investments. The rate quoted is the annualized seven-day yield of the fund at period end. A complete unaudited listing of the fund's holdings as of its most recent quarter end is available upon request. In addition, each Fidelity Central Fund's financial statements are available on the SEC's website or upon request. |
| (p) | Investment made with cash collateral received from securities on loan. |
| Additional information on each restricted holding is as follows: |
| Security | Acquisition Date | Acquisition Cost ($) (000s) |
| Arena Brands Holding Corp. Class B | 6/18/97 - 1/12/99 | 21,592 |
| | | |
| Chesapeake Energy Corp. | 2/10/21 | 216 |
| | | |
| Fidelity Direct Lending Fund, LP | 12/09/21 - 10/31/22 | 164,427 |
| | | |
| Mesquite Energy, Inc. 15% 7/15/23 | 7/10/20 - 1/18/22 | 2,496 |
| | | |
| Mesquite Energy, Inc. 15% 7/15/23 | 11/05/20 - 1/18/22 | 4,307 |
| | | |
| New Cotai LLC/New Cotai Capital Corp. | 9/11/20 | 16,677 |
| | | |
| Southeastern Grocers, Inc. | 6/01/18 | 5,580 |
| | | |
| Tricer Holdco SCA | 10/16/09 - 12/30/17 | 10,250 |
| | | |
| Tricer Holdco SCA Class A1 | 10/16/09 - 10/29/09 | 1,653 |
| | | |
| Tricer Holdco SCA Class A2 | 10/16/09 - 10/29/09 | 1,653 |
| | | |
| Tricer Holdco SCA Class A3 | 10/16/09 - 10/29/09 | 1,653 |
| | | |
| Tricer Holdco SCA Class A4 | 10/16/09 - 10/29/09 | 1,653 |
| | | |
| Tricer Holdco SCA Class A5 | 10/16/09 - 10/29/09 | 1,653 |
| | | |
| Tricer Holdco SCA Class A6 | 10/16/09 - 10/29/09 | 1,653 |
| | | |
| Tricer Holdco SCA Class A7 | 10/16/09 - 10/29/09 | 1,653 |
| | | |
| Tricer Holdco SCA Class A8 | 10/16/09 - 10/29/09 | 1,653 |
| | | |
| Tricer Holdco SCA Class A9 | 10/16/09 - 10/29/09 | 1,654 |
| | | |
Affiliated Central Funds
Fiscal year to date information regarding the Fund's investments in Fidelity Central Funds, including the ownership percentage, is presented below.
| Affiliate (Amounts in thousands) | Value, beginning of period ($) | Purchases ($) | Sales Proceeds ($) | Dividend Income ($) | Realized Gain (loss) ($) | Change in Unrealized appreciation (depreciation) ($) | Value, end of period ($) | % ownership, end of period |
| Fidelity Cash Central Fund 3.10% | 1,558,265 | 962,664 | 1,736,853 | 8,607 | - | - | 784,076 | 1.6% |
| Fidelity Securities Lending Cash Central Fund 3.10% | 36,678 | 130,983 | 167,042 | 16 | - | - | 619 | 0.0% |
| Total | 1,594,943 | 1,093,647 | 1,903,895 | 8,623 | - | - | 784,695 | |
| | | | | | | | | |
Amounts in the income column in the above table include any capital gain distributions from underlying funds, which are presented in the corresponding line item in the Statement of Operations, if applicable.
Amount for Fidelity Securities Lending Cash Central Fund represents the income earned on investing cash collateral, less rebates paid to borrowers and any lending agent fees associated with the loan, plus any premium payments received for lending certain types of securities.
Affiliated Underlying Funds
Fiscal year to date information regarding the Fund's investments in affiliated Underlying Funds is presented below. Exchanges between classes of the same affiliated Underlying Funds may occur. If an Underlying Funds changes its name, the name presented below is the name in effect at period end.
| Affiliate (Amounts in thousands) | Value, beginning of period ($) | Purchases ($) | Sales Proceeds ($) | Dividend Income ($) | Realized Gain (loss) ($) | Change in Unrealized appreciation (depreciation) ($) | Value, end of period ($) |
| Fidelity Direct Lending Fund, LP | 105,967 | 58,569 | - | 5,857 | - | (1,967) | 162,569 |
| | 105,967 | 58,569 | - | 5,857 | - | (1,967) | 162,569 |
Amounts in the income column in the above table include any capital gain distributions from underlying funds, which are presented in the corresponding line item in the Statement of Operations, if applicable.
Investment Valuation
The following is a summary of the inputs used, as of October 31, 2022, involving the Fund's assets and liabilities carried at fair value. The inputs or methodology used for valuing securities may not be an indication of the risk associated with investing in those securities. For more information on valuation inputs, and their aggregation into the levels used below, please refer to the Investment Valuation section in the accompanying Notes to Financial Statements.
Amounts in this Investment Valuation section exclude the value of Fidelity Direct Lending Fund, LP as presented in the Schedule of Investments. Fidelity Direct Lending Fund, LP is valued using NAV as a practical expedient.
| Valuation Inputs at Reporting Date: |
Description (Amounts in thousands) | Total ($) | Level 1 ($) | Level 2 ($) | Level 3 ($) |
Investments in Securities: | | | | |
|
| Equities: | | | | |
Communication Services | 31,244 | 31,244 | - | - |
Consumer Discretionary | 170,658 | 160,034 | - | 10,624 |
Consumer Staples | 50,999 | 33,828 | - | 17,171 |
Energy | 253,203 | 200,863 | - | 52,340 |
Financials | 30,356 | 30,356 | - | - |
Health Care | 72,166 | 72,166 | - | - |
Industrials | 36,913 | 33,182 | - | 3,731 |
Information Technology | 270,421 | 269,948 | - | 473 |
Materials | 95,924 | 95,858 | - | 66 |
Utilities | 48,587 | 48,587 | - | - |
|
| Corporate Bonds | 7,594,004 | - | 7,548,200 | 45,804 |
|
| Bank Loan Obligations | 586,902 | - | 579,890 | 7,012 |
|
| Preferred Securities | 895,122 | - | 895,122 | - |
|
| Money Market Funds | 784,695 | 784,695 | - | - |
| Total Investments in Securities: | 10,921,194 | 1,760,761 | 9,023,212 | 137,221 |
The following is a reconciliation of Investments in Securities for which Level 3 inputs were used in determining value:
| (Amounts in thousands) | |
| Investments in Securities: | |
| Beginning Balance | $ | 117,399 | |
| Net Realized Gain (Loss) on Investment Securities | | 321 | |
| Net Unrealized Gain (Loss) on Investment Securities | | 13,071 | |
| Cost of Purchases | | 65 | |
| Proceeds of Sales | | (1,008) | |
| Amortization/Accretion | | 19 | |
| Transfers into Level 3 | | 7,354 | |
| Transfers out of Level 3 | | - | |
| Ending Balance | $ | 137,221 | |
| The change in unrealized gain (loss) for the period attributable to Level 3 securities held at October 31, 2022 | $ | 13,071 | |
| The information used in the above reconciliation represents fiscal year to date activity for any Investments in Securities identified as using Level 3 inputs at either the beginning or the end of the current fiscal period. Cost of purchases and proceeds of sales may include securities received and/or delivered through in-kind transactions. Transfers into Level 3 were attributable to a lack of observable market data resulting from decreases in market activity, decreases in liquidity, security restructurings or corporate actions. Transfers out of Level 3 were attributable to observable market data becoming available for those securities. Transfers in or out of Level 3 represent the beginning value of any Security or Instrument where a change in the pricing level occurred from the beginning to the end of the period. The cost of purchases and the proceeds of sales may include securities received or delivered through corporate actions or exchanges. Realized and unrealized gains (losses) disclosed in the reconciliation are included in Net Gain (Loss) on the Fund's Statement of Operations. | |
| Statement of Assets and Liabilities |
| Amounts in thousands (except per-share amount) | | | | October 31, 2022 (Unaudited) |
| | | | | |
| Assets | | | | |
| Investment in securities, at value (including securities loaned of $610) - See accompanying schedule: | | | | |
Unaffiliated issuers (cost $11,062,327) | | $10,136,499 | | |
Fidelity Central Funds (cost $784,649) | | 784,695 | | |
Other affiliated issuers (cost $164,436) | | 162,569 | | |
| | | | | |
| Total Investment in Securities (cost $12,011,412) | | | $ | 11,083,763 |
| Cash | | | | 1,394 |
| Receivable for investments sold | | | | 10,851 |
| Receivable for fund shares sold | | | | 5,057 |
| Dividends receivable | | | | 2,298 |
| Interest receivable | | | | 134,273 |
| Distributions receivable from Fidelity Central Funds | | | | 2,110 |
| Prepaid expenses | | | | 18 |
| Other receivables | | | | 408 |
Total assets | | | | 11,240,172 |
| Liabilities | | | | |
| Payable for investments purchased | | $6,441 | | |
| Payable for fund shares redeemed | | 10,358 | | |
| Distributions payable | | 5,387 | | |
| Accrued management fee | | 5,065 | | |
| Other affiliated payables | | 1,189 | | |
| Other payables and accrued expenses | | 465 | | |
| Collateral on securities loaned | | 619 | | |
| Total Liabilities | | | | 29,524 |
| Net Assets | | | $ | 11,210,648 |
| Net Assets consist of: | | | | |
| Paid in capital | | | $ | 11,979,171 |
| Total accumulated earnings (loss) | | | | (768,523) |
| Net Assets | | | $ | 11,210,648 |
Net Asset Value , offering price and redemption price per share ($11,210,648 ÷ 1,231,756 shares) | | | $ | 9.10 |
| | | | | |
| Statement of Operations |
| Amounts in thousands | | | | Six months ended October 31, 2022 (Unaudited) |
| Investment Income | | | | |
| Dividends (including $5,857 earned from affiliated issuers) | | | $ | 54,913 |
| Interest | | | | 268,356 |
| Income from Fidelity Central Funds (including $16 from security lending) | | | | 8,623 |
| Total Income | | | | 331,892 |
| Expenses | | | | |
| Management fee | $ | 32,350 | | |
| Transfer agent fees | | 6,595 | | |
| Accounting fees | | 725 | | |
| Custodian fees and expenses | | 4 | | |
| Independent trustees' fees and expenses | | 21 | | |
| Registration fees | | 75 | | |
| Audit | | 56 | | |
| Legal | | 744 | | |
| Miscellaneous | | 34 | | |
| Total expenses before reductions | | 40,604 | | |
| Expense reductions | | (117) | | |
| Total expenses after reductions | | | | 40,487 |
| Net Investment income (loss) | | | | 291,405 |
| Realized and Unrealized Gain (Loss) | | | | |
| Net realized gain (loss) on: | | | | |
| Investment Securities: | | | | |
| Unaffiliated issuers | | 106,707 | | |
| Foreign currency transactions | | (115) | | |
| Total net realized gain (loss) | | | | 106,592 |
| Change in net unrealized appreciation (depreciation) on: | | | | |
| Investment Securities: | | | | |
| Unaffiliated issuers | | (852,796) | | |
| Affiliated issuers | | (1,967) | | |
| Total change in net unrealized appreciation (depreciation) | | | | (854,763) |
| Net gain (loss) | | | | (748,171) |
| Net increase (decrease) in net assets resulting from operations | | | $ | (456,766) |
| Statement of Changes in Net Assets |
| |
| Amount in thousands | | Six months ended October 31, 2022 (Unaudited) | | Year ended April 30, 2022 |
| Increase (Decrease) in Net Assets | | | | |
| Operations | | | | |
| Net investment income (loss) | $ | 291,405 | $ | 517,994 |
| Net realized gain (loss) | | 106,592 | | 935,331 |
| Change in net unrealized appreciation (depreciation) | | (854,763) | | (1,879,441) |
| Net increase (decrease) in net assets resulting from operations | | (456,766) | | (426,116) |
| Distributions to shareholders | | (900,016) | | (986,974) |
| Share transactions | | | | |
| Proceeds from sales of shares | | 793,662 | | 3,210,567 |
| Reinvestment of distributions | | 805,307 | | 888,209 |
| Cost of shares redeemed | | (2,108,539) | | (4,283,042) |
Net increase (decrease) in net assets resulting from share transactions | | (509,570) | | (184,266) |
| Total increase (decrease) in net assets | | (1,866,352) | | (1,597,356) |
| | | | | |
| Net Assets | | | | |
| Beginning of period | | 13,077,000 | | 14,674,356 |
| End of period | $ | 11,210,648 | $ | 13,077,000 |
| | | | | |
| Other Information | | | | |
| Shares | | | | |
| Sold | | 83,527 | | 287,825 |
| Issued in reinvestment of distributions | | 85,873 | | 80,218 |
| Redeemed | | (222,974) | | (388,533) |
| Net increase (decrease) | | (53,574) | | (20,490) |
| | | | | |
Financial Highlights
| Fidelity® Capital & Income Fund |
| |
| | Six months ended (Unaudited) October 31, 2022 | | Years ended April 30, 2022 | | 2021 | | 2020 | | 2019 | | 2018 |
Selected Per-Share Data | | | | | | | | | | | | |
| Net asset value, beginning of period | $ | 10.17 | $ | 11.24 | $ | 8.92 | $ | 10.08 | $ | 10.12 | $ | 10.09 |
| Income from Investment Operations | | | | | | | | | | | | |
Net investment income (loss) A,B | | .232 | | .387 | | .386 | | .426 | | .432 | | .482 |
| Net realized and unrealized gain (loss) | | (.578) | | (.714) | | 2.442 | | (1.085) | | .207 | | .065 |
| Total from investment operations | | (.346) | | (.327) | | 2.828 | | (.659) | | .639 | | .547 |
| Distributions from net investment income | | (.208) | | (.390) | | (.390) | | (.425) | | (.487) | | (.410) |
| Distributions from net realized gain | | (.516) | | (.353) | | (.118) | | (.076) | | (.192) | | (.107) |
| Total distributions | | (.724) | | (.743) | | (.508) | | (.501) | | (.679) | | (.517) |
Redemption fees added to paid in capital A | | - | | - | | - | | - | | - | | - C |
| Net asset value, end of period | $ | 9.10 | $ | 10.17 | $ | 11.24 | $ | 8.92 | $ | 10.08 | $ | 10.12 |
Total Return D,E | | (3.49)% | | (3.27)% | | 32.35% | | (6.89)% | | 6.74% | | 5.51% |
Ratios to Average Net Assets B,F,G | | | | | | | | | | | | |
| Expenses before reductions | | .68% H | | .67% | | .68% | | .67% | | .69% | | .67% |
| Expenses net of fee waivers, if any | | .68% H | | .67% | | .68% | | .67% | | .69% | | .67% |
| Expenses net of all reductions | | .68% H | | .67% | | .68% | | .67% | | .69% | | .67% |
| Net investment income (loss) | | 4.90% H | | 3.49% | | 3.75% | | 4.32% | | 4.37% | | 4.71% |
| Supplemental Data | | | | | | | | | | | | |
| Net assets, end of period (in millions) | $ | 11,211 | $ | 13,077 | $ | 14,674 | $ | 10,228 | $ | 11,631 | $ | 12,053 |
Portfolio turnover rate I | | 17% H | | 28% | | 37% | | 46% | | 43% | | 39% |
A Calculated based on average shares outstanding during the period.
B Net investment income (loss) is affected by the timing of the declaration of dividends by any underlying mutual funds or exchange-traded funds (ETFs). Net investment income (loss) of any mutual funds or ETFs is not included in the Fund's net investment income (loss) ratio.
C Amount represents less than $.0005 per share.
D Total returns for periods of less than one year are not annualized.
E Total returns would have been lower if certain expenses had not been reduced during the applicable periods shown.
F Fees and expenses of any underlying mutual funds or exchange-traded funds (ETFs) are not included in the Fund's expense ratio. The Fund indirectly bears its proportionate share of these expenses. For additional expense information related to investments in Fidelity Central Funds, please refer to the "Investments in Fidelity Central Funds" note found in the Notes to Financial Statements section of the most recent Annual or Semi-Annual report. For additional expense information related to investments in Fidelity Direct Lending Fund, LP, please refer to the Investment in Fidelity Direct Lending Fund, LP note found in the Notes to Financial Statements section of the most recent Annual or Semi-Annual report.
G Expense ratios reflect operating expenses of the class. Expenses before reductions do not reflect amounts reimbursed, waived, or reduced through arrangements with the investment adviser, brokerage services, or other offset arrangements, if applicable, and do not represent the amount paid by the class during periods when reimbursements, waivers or reductions occur.
H Annualized.
I Amount does not include the portfolio activity of any underlying mutual funds or exchange-traded funds (ETFs).
For the period ended October 31, 2022
( Amounts in thousands except percentages)
1. Organization.
Fidelity Capital & Income Fund (the Fund) is a fund of Fidelity Summer Street Trust (the Trust) and is authorized to issue an unlimited number of shares. Share transactions on the Statement of Changes in Net Assets may contain exchanges between affiliated funds. The Trust is registered under the Investment Company Act of 1940, as amended (the 1940 Act), as an open-end management investment company organized as a Massachusetts business trust.
2. Investments in Fidelity Central Funds.
Funds may invest in Fidelity Central Funds, which are open-end investment companies generally available only to other investment companies and accounts managed by the investment adviser and its affiliates. The Schedule of Investments lists any Fidelity Central Funds held as an investment as of period end, but does not include the underlying holdings of each Fidelity Central Fund. An investing fund indirectly bears its proportionate share of the expenses of the underlying Fidelity Central Funds.
Based on its investment objective, each Fidelity Central Fund may invest or participate in various investment vehicles or strategies that are similar to those of the investing fund. These strategies are consistent with the investment objectives of the investing fund and may involve certain economic risks which may cause a decline in value of each of the Fidelity Central Funds and thus a decline in the value of the investing fund.
| Fidelity Central Fund | Investment Manager | Investment Objective | Investment Practices | Expense Ratio A |
| Fidelity Money Market Central Funds | Fidelity Management & Research Company LLC (FMR) | Each fund seeks to obtain a high level of current income consistent with the preservation of capital and liquidity. | Short-term Investments | Less than .005% |
A Expenses expressed as a percentage of average net assets and are as of each underlying Central Fund's most recent annual or semi-annual shareholder report.
A complete unaudited list of holdings for each Fidelity Central Fund is available upon request or at the Securities and Exchange Commission website at www.sec.gov. In addition, the financial statements of the Fidelity Central Funds which contain the significant accounting policies (including investment valuation policies) of those funds, and are not covered by the Report of Independent Registered Public Accounting Firm, are available on the Securities and Exchange Commission website or upon request.
3. Investment in Fidelity Direct Lending Fund, LP.
The Fund invests in Fidelity Direct Lending Fund, LP, which is a limited partnership available only to certain investment companies managed by the investment adviser and its affiliates. The Fund's limited partnership interest is not registered under the Securities Act of 1933, and is subject to substantial restrictions on transfer. The Fund has no redemption rights under the partnership agreement. There will be no trading market for the partnership interest, and the Fund most likely will hold its interest until Fidelity Direct Lending Fund, LP converts by operation of law to a Delaware corporation, trust, or other limited liability entity and (i) registers as a closed-end management investment company under the 1940 Act or (ii) elects to be treated as a business development company under the 1940 Act.
Based on its investment objective, Fidelity Direct Lending Fund, LP may invest or participate in various investments or strategies that are similar to those in which the Fund may invest or participate. These strategies are consistent with the investment objectives of the Fund and may involve certain economic risks which may cause a decline in value of Fidelity Direct Lending Fund, LP and thus a decline in the value of the Fund. The Fidelity Direct Lending Fund, LP intends to invest primarily in direct loans made to private U.S. companies, specifically small- and middle-market companies.
The Schedule of Investments lists Fidelity Direct Lending Fund, LP as an investment as of period end, but does not include the underlying holdings of Fidelity Direct Lending Fund, LP. Fidelity Direct Lending Fund, LP represented less than 5% of the Fund's net assets at period end. The Fund indirectly bears its proportionate share of the expenses of Fidelity Direct Lending Fund, LP, which commenced operations on December 8, 2021. The annualized expense ratio for Fidelity Direct Lending Fund, LP for the period ended April 30, 2022 was .07%.
4. Significant Accounting Policies.
The Fund is an investment company and applies the accounting and reporting guidance of the Financial Accounting Standards Board (FASB) Accounting Standards Codification Topic 946 Financial Services - Investment Companies . The financial statements have been prepared in conformity with accounting principles generally accepted in the United States of America (GAAP), which require management to make certain estimates and assumptions at the date of the financial statements. Actual results could differ from those estimates. Subsequent events, if any, through the date that the financial statements were issued have been evaluated in the preparation of the financial statements. The Fund's Schedule of Investments lists any underlying mutual funds or exchange-traded funds (ETFs) but does not include the underlying holdings of these funds. The following summarizes the significant accounting policies of the Fund:
Investment Valuation. Investments are valued as of 4:00 p.m. Eastern time on the last calendar day of the period. The Board of Trustees (the Board) has designated the Fund's investment adviser as the valuation designee responsible for the fair valuation function and performing fair value determinations as needed. The investment adviser has established a Fair Value Committee (the Committee) to carry out the day-to-day fair valuation responsibilities and has adopted policies and procedures to govern the fair valuation process and the activities of the Committee. In accordance with these fair valuation policies and procedures, which have been approved by the Board, the Fund attempts to obtain prices from one or more third party pricing services or brokers to value its investments. When current market prices, quotations or currency exchange rates are not readily available or reliable, investments will be fair valued in good faith by the Committee, in accordance with the policies and procedures. Factors used in determining fair value vary by investment type and may include market or investment specific events, transaction data, estimated cash flows, and market observations of comparable investments. The frequency that the fair valuation procedures are used cannot be predicted and they may be utilized to a significant extent. The Committee manages the Fund's fair valuation practices and maintains the fair valuation policies and procedures. The Fund's investment adviser reports to the Board information regarding the fair valuation process and related material matters.
The Fund categorizes the inputs to valuation techniques used to value its investments into a disclosure hierarchy consisting of three levels as shown below:
Level 1 - unadjusted quoted prices in active markets for identical investments
Level 2 - other significant observable inputs (including quoted prices for similar investments, interest rates, prepayment speeds, etc.)
Level 3 - unobservable inputs (including the Fund's own assumptions based on the best information available)
Valuation techniques used to value the Fund's investments by major category are as follows:
Debt securities, including restricted securities, are valued based on evaluated prices received from third party pricing services or from brokers who make markets in such securities. Corporate bonds, bank loan obligations and preferred securities are valued by pricing services who utilize matrix pricing which considers yield or price of bonds of comparable quality, coupon, maturity and type or by broker-supplied prices. Debt securities are generally categorized as Level 2 in the hierarchy but may be Level 3 depending on the circumstances. The Fund invests a significant portion of its assets in below investment grade securities. The value of these securities can be more volatile due to changes in the credit quality of the issuer and is sensitive to changes in economic, market and regulatory conditions.
Equity securities, including restricted securities, for which market quotations are readily available, are valued at the last reported sale price or official closing price as reported by a third party pricing service on the primary market or exchange on which they are traded and are categorized as Level 1 in the hierarchy. In the event there were no sales during the day or closing prices are not available, securities are valued at the last quoted bid price or may be valued using the last available price and are generally categorized as Level 2 in the hierarchy. For equity securities, including restricted securities, where observable inputs are limited, assumptions about market activity and risk are used and these securities may be categorized as Level 3 in the hierarchy. Securities, including private placements or other restricted securities, for which observable inputs are not available are valued using alternate valuation approaches, including the market approach, the income approach and cost approach, and are categorized as Level 3 in the hierarchy. The market approach considers factors including the price of recent investments in the same or a similar security or financial metrics of comparable securities. The income approach considers factors including expected future cash flows, security specific risks and corresponding discount rates. The cost approach considers factors including the value of the security's underlying assets and liabilities.
ETFs are valued at their last sale price or official closing price as reported by a third party pricing service on the primary market or exchange on which they are traded and are categorized as Level 1 in the hierarchy. In the event there were no sales during the day but the exchange reports a closing bid level, ETFs are valued at the closing bid and would be categorized as Level 1 in the hierarchy. In the event there was no closing bid, ETFs may be valued by another method that the Board believes reflects fair value in accordance with the Board's fair value pricing policies and may be categorized as Level 2 in the hierarchy.
Investments in open-end mutual funds, including the Fidelity Central Funds, are valued at their closing net asset value (NAV) each business day and are categorized as Level 1 in the hierarchy.
Fidelity Direct Lending Fund, LP is valued using NAV as a practical expedient in accordance with the specialized accounting guidance for investment companies.
The following provides information on Level 3 securities held by the Fund that were valued at period end based on unobservable inputs. These amounts exclude valuations provided by a broker and valuations using NAV as a practical expedient.
| Asset Type | Fair Value | Valuation Technique(s) | Unobservable Input | Amount or Range/Weighted Average | Impact to Valuation from an Increase in Input A |
| Equities | $84,336 | Recovery value | Recovery value | $0.00 - $1.00 / $0.97 | Increase |
| | | Market comparable | Enterprise value/EBITDA multiple (EV/EBITDA) | 2.8 - 5.8 /3.7 | Increase |
| | | | Enterprise value/Revenue multiple (EV/R) | 0.3 | Increase |
| | | | Daily production multiple ($/Barrels of oil equivalent per day) | $22,500.00 | Increase |
| | | | Enterprise Value/PV-10 multiple (EV/PV-10) | 0.8 | Increase |
| | | | Enterprise Value/Proved Reserves multiple | 5.9 | Increase |
| | | | Discount for lack of marketability | 20.0% | Decrease |
| | | Market approach | Parity Price | $1.66 - $930.75 / $862.69 | Increase |
| | | Discounted cash flow | Discount rate | 10.0% - 13.5% / 11.0% | Decrease |
| | | | Reserve risk rate | 50.0% - 95.0% / 72.5% | Increase |
| | | Book value | Book value multiple | 1.0 | Increase |
| Corporate Bonds | $45,804 | Recovery value | Recovery value | $0.00 | Increase |
| | | Market comparable | Enterprise value/EBITDA multiple (EV/EBITDA) | 2.8 | Increase |
| | | | Daily production multiple ($/Barrels of oil equivalent per day) | $22,500.00 | Increase |
| | | | Enterprise Value/PV-10 multiple (EV/PV-10) | 0.8 | Increase |
| | | | Enterprise Value/Proved Reserves multiple | 5.9 | Increase |
| | | Market approach | Parity Price | $45.00 | Increase |
| | | Discounted cash flow | Discount rate | 10.0% | Decrease |
| | | | Reserve risk rate | 50.0% - 95.0% / 72.5% | Increase |
| | | Indicative market price | Evaluated bid | $0.13 - $5.88 / $4.51 | Increase |
| | | Book value | Book value multiple | 1.0 | Increase |
| Bank Loan Obligations | $7,012 | Recovery value | Recovery value | $0.00 | Increase |
| | | Indicative market price | Evaluated bid | $97.75 | Increase |
A Represents the directional change in the fair value of the Level 3 investments that could have resulted from an increase in the corresponding input as of period end. A decrease to the unobservable input would have had the opposite effect. Significant changes in these inputs may have resulted in a significantly higher or lower fair value measurement at period end.
Changes in valuation techniques may result in transfers in or out of an assigned level within the disclosure hierarchy. The aggregate value of investments by input level as of October 31, 2022, as well as a roll forward of Level 3 investments, is included at the end of the Fund's Schedule of Investments.
Foreign Currency. Certain Funds may use foreign currency contracts to facilitate transactions in foreign-denominated securities. Gains and losses from these transactions may arise from changes in the value of the foreign currency or if the counterparties do not perform under the contracts' terms.
Foreign-denominated assets, including investment securities, and liabilities are translated into U.S. dollars at the exchange rates at period end. Purchases and sales of investment securities, income and dividends received, and expenses denominated in foreign currencies are translated into U.S. dollars at the exchange rate in effect on the transaction date.
The effects of exchange rate fluctuations on investments are included with the net realized and unrealized gain (loss) on investment securities. Other foreign currency transactions resulting in realized and unrealized gain (loss) are disclosed separately.
Investment Transactions and Income. For financial reporting purposes, the Fund's investment holdings and NAV include trades executed through the end of the last business day of the period. The NAV per share for processing shareholder transactions is calculated as of the close of business of the New York Stock Exchange (NYSE), normally 4:00 p.m. Eastern time and includes trades executed through the end of the prior business day. Gains and losses on securities sold are determined on the basis of identified cost and include proceeds received from litigation. Commissions paid to certain brokers with whom the investment adviser, or its affiliates, places trades on behalf of a fund include an amount in addition to trade execution, which may be rebated back to a fund. Any such rebates are included in net realized gain (loss) on investments in the Statement of Operations. Dividend income is recorded on the ex-dividend date, except for certain dividends from foreign securities where the ex-dividend date may have passed, which are recorded as soon as the Fund is informed of the ex-dividend date. Non-cash dividends included in dividend income, if any, are recorded at the fair market value of the securities received. Income and capital gain distributions from Fidelity Central Funds, if any, are recorded on the ex-dividend date. Certain distributions received by the Fund represent a return of capital or capital gain. The Fund determines the components of these distributions subsequent to the ex-dividend date, based upon receipt of tax filings or other correspondence relating to the underlying investment. These distributions are recorded as a reduction of cost of investments and/or as a realized gain. Interest income is accrued as earned and includes coupon interest and amortization of premium and accretion of discount on debt securities as applicable. Paid in Kind (PIK) income is recorded at the fair market value of the securities received. Investment income is recorded net of foreign taxes withheld where recovery of such taxes is uncertain. Debt obligations may be placed on non-accrual status and related interest income may be reduced by ceasing current accruals and writing off interest receivables when the collection of all or a portion of interest has become doubtful based on consistently applied procedures. A debt obligation is removed from non-accrual status when the issuer resumes interest payments or when collectability of interest is reasonably assured.
Expenses. Expenses directly attributable to a fund are charged to that fund. Expenses attributable to more than one fund are allocated among the respective funds on the basis of relative net assets or other appropriate methods. Expenses included in the accompanying financial statements reflect the expenses of that fund and do not include any expenses associated with any underlying mutual funds or exchange-traded funds. Although not included in a fund's expenses, a fund indirectly bears its proportionate share of these expenses through the net asset value of each underlying mutual fund or exchange-traded fund. Expense estimates are accrued in the period to which they relate and adjustments are made when actual amounts are known.
Deferred Trustee Compensation. Under a Deferred Compensation Plan (the Plan) for certain Funds, certain independent Trustees have elected to defer receipt of a portion of their annual compensation. Deferred amounts are invested in affiliated mutual funds, are marked-to-market and remain in a fund until distributed in accordance with the Plan. The investment of deferred amounts and the offsetting payable to the Trustees presented below are included in the accompanying Statement of Assets and Liabilities in other receivables and other payables and accrued expenses, as applicable.
| Fidelity Capital & Income Fund | $408 |
Income Tax Information and Distributions to Shareholders. Each year, the Fund intends to qualify as a regulated investment company under Subchapter M of the Internal Revenue Code, including distributing substantially all of its taxable income and realized gains. As a result, no provision for U.S. Federal income taxes is required. The Fund files a U.S. federal tax return, in addition to state and local tax returns as required. The Fund's federal income tax returns are subject to examination by the Internal Revenue Service (IRS) for a period of three fiscal years after they are filed. State and local tax returns may be subject to examination for an additional fiscal year depending on the jurisdiction. Foreign taxes are provided for based on the Fund's understanding of the tax rules and rates that exist in the foreign markets in which it invests.
Distributions are declared and recorded daily and paid monthly from net investment income. Distributions from realized gains, if any, are declared and recorded on the ex-dividend date. Income and capital gain distributions are determined in accordance with income tax regulations, which may differ from GAAP.
Capital accounts within the financial statements are adjusted for permanent book-tax differences. These adjustments have no impact on net assets or the results of operations. Capital accounts are not adjusted for temporary book-tax differences which will reverse in a subsequent period.
Book-tax differences are primarily due to foreign currency transactions, defaulted bonds, market discount, partnerships and losses deferred due to wash sales.
As of period end, the cost and unrealized appreciation (depreciation) in securities, and derivatives if applicable, for federal income tax purposes were as follows:
| Gross unrealized appreciation | $537,342 |
| Gross unrealized depreciation | (1,438,822) |
| Net unrealized appreciation (depreciation) | $(901,480) |
| Tax cost | $11,985,243 |
Restricted Securities (including Private Placements). Funds may invest in securities that are subject to legal or contractual restrictions on resale. These securities generally may be resold in transactions exempt from registration or to the public if the securities are registered. Disposal of these securities may involve time-consuming negotiations and expense, and prompt sale at an acceptable price may be difficult. Information regarding restricted securities held at period end is included at the end of the Schedule of Investments, if applicable.
Loans and Other Direct Debt Instruments. Direct debt instruments are interests in amounts owed to lenders by corporate or other borrowers. These instruments may be in the form of loans, trade claims or other receivables and may include standby financing commitments such as revolving credit facilities that obligate a fund to supply additional cash to the borrower on demand. Loans may be acquired through assignment, participation, or may be made directly to a borrower. Such instruments are presented in the Bank Loan Obligations section in the Schedule of Investments. Certain funds may also invest in unfunded loan commitments, which are contractual obligations for future funding. Information regarding unfunded commitments is included at the end of the Schedule of Investments, if applicable.
Commitments. A commitment is an agreement to acquire an investment at a future date (subject to conditions) in connection with a potential public or non-public offering. The amount of commitments outstanding at period end are presented in the table below. These commitments are not included in the net assets of the Fund at period end.
| | Investment to be Acquired | Commitment Amount |
| Fidelity Capital & Income Fund | Fidelity Direct Lending Fund, LP | $229,432 |
5. Purchases and Sales of Investments.
Purchases and sales of securities, other than short-term securities and in-kind transactions, as applicable, are noted in the table below.
| | Purchases ($) | Sales ($) |
| Fidelity Capital & Income Fund | 937,280 | 1,377,709 |
6. Fees and Other Transactions with Affiliates.
Management Fee. Fidelity Management & Research Company LLC (the investment adviser) and its affiliates provide the Fund with investment management related services for which the Fund pays a monthly management fee. The management fee is the sum of an individual fund fee rate that is based on an annual rate of .45% of the Fund's average net assets and an annualized group fee rate that averaged .10% during the period. The group fee rate is based upon the monthly average net assets of a group of registered investment companies with which the investment adviser has management contracts. The group fee rate decreases as assets under management increase and increases as assets under management decrease. For the reporting period, the total annualized management fee rate was .54% of the Fund's average net assets.
Transfer Agent Fees. Fidelity Investments Institutional Operations Company LLC (FIIOC), an affiliate of the investment adviser, is the Fund's transfer, dividend disbursing and shareholder servicing agent. FIIOC receives account fees and asset-based fees that vary according to account size and type of account. FIIOC pays for typesetting, printing and mailing of shareholder reports, except proxy statements. For the period, the transfer agent fees were equivalent to an annualized rate of .11% of average net assets.
Accounting Fees. Fidelity Service Company, Inc. (FSC), an affiliate of the investment adviser, maintains the Fund's accounting records. The accounting fee is based on the level of average net assets for each month. For the period, the fees were equivalent to the following annualized rates:
| | % of Average Net Assets |
| Fidelity Capital & Income Fund | .01 |
Brokerage Commissions. A portion of portfolio transactions were placed with brokerage firms which are affiliates of the investment adviser. Brokerage commissions are included in net realized gain (loss) and change in net unrealized appreciation (depreciation) in the Statement of Operations. The commissions paid to these affiliated firms were as follows:
| | Amount |
| Fidelity Capital & Income Fund | $7 |
Interfund Trades. Funds may purchase from or sell securities to other Fidelity Funds under procedures adopted by the Board. The procedures have been designed to ensure these interfund trades are executed in accordance with Rule 17a-7 of the 1940 Act. Any interfund trades are included within the respective purchases and sales amounts shown in the Purchases and Sales of Investments note. Interfund trades during the period are noted in the table below.
| | Purchases ($) | Sales ($) | Realized Gain (Loss) ($) |
| Fidelity Capital & Income Fund | 35,512 | 31,927 | 2,055 |
Other. During the period, the investment adviser reimbursed the Fund for certain losses as follows:
| | Amount ($) |
| Fidelity Capital & Income Fund | 23 |
7. Committed Line of Credit.
Certain Funds participate with other funds managed by the investment adviser or an affiliate in a $4.25 billion credit facility (the "line of credit") to be utilized for temporary or emergency purposes to fund shareholder redemptions or for other short-term liquidity purposes. The participating funds have agreed to pay commitment fees on their pro-rata portion of the line of credit, which are reflected in Miscellaneous expenses on the Statement of Operations, and are listed below. During the period, there were no borrowings on this line of credit.
| | Amount |
| Fidelity Capital & Income Fund | $11 |
8. Security Lending.
Funds lend portfolio securities from time to time in order to earn additional income. Lending agents are used, including National Financial Services (NFS), an affiliate of the investment adviser. Pursuant to a securities lending agreement, NFS will receive a fee, which is capped at 9.9% of a fund's daily lending revenue, for its services as lending agent. A fund may lend securities to certain qualified borrowers, including NFS. On the settlement date of the loan, a fund receives collateral (in the form of U.S. Treasury obligations, letters of credit and/or cash) against the loaned securities and maintains collateral in an amount not less than 100% of the market value of the loaned securities during the period of the loan. The market value of the loaned securities is determined at the close of business of a fund and any additional required collateral is delivered to a fund on the next business day. A fund or borrower may terminate the loan at any time, and if the borrower defaults on its obligation to return the securities loaned because of insolvency or other reasons, a fund may apply collateral received from the borrower against the obligation. A fund may experience delays and costs in recovering the securities loaned. Any cash collateral received is invested in the Fidelity Securities Lending Cash Central Fund. Any loaned securities are identified as such in the Schedule of Investments, and the value of loaned securities and cash collateral at period end, as applicable, are presented in the Statement of Assets and Liabilities. Security lending income represents the income earned on investing cash collateral, less rebates paid to borrowers and any lending agent fees associated with the loan, plus any premium payments received for lending certain types of securities. Security lending income is presented in the Statement of Operations as a component of income from Fidelity Central Funds. Affiliated security lending activity, if any, was as follows:
| | Total Security Lending Fees Paid to NFS | Security Lending Income From Securities Loaned to NFS | Value of Securities Loaned to NFS at Period End |
| Fidelity Capital & Income Fund | $2 | $- | $- |
9. Expense Reductions.
Through arrangements with the Fund's custodian, credits realized as a result of certain uninvested cash balances were used to reduce the Fund's expenses by $4.
In addition, during the period the investment adviser or an affiliate reimbursed and/or waived a portion of operating expenses in the amount of $113.
11. Other.
A fund's organizational documents provide former and current trustees and officers with a limited indemnification against liabilities arising in connection with the performance of their duties to the fund. In the normal course of business, a fund may also enter into contracts that provide general indemnifications. A fund's maximum exposure under these arrangements is unknown as this would be dependent on future claims that may be made against a fund. The risk of material loss from such claims is considered remote.
12. Risk and Uncertainties.
Many factors affect a fund's performance. Developments that disrupt global economies and financial markets, such as pandemics, epidemics, outbreaks of infectious diseases, war, terrorism, and environmental disasters, may significantly affect a fund's investment performance. The effects of these developments to a fund will be impacted by the types of securities in which a fund invests, the financial condition, industry, economic sector, and geographic location of an issuer, and a fund's level of investment in the securities of that issuer.
As a shareholder, you incur two types of costs: (1) transaction costs, which may include sales charges (loads) on purchase payments or redemption proceeds, as applicable and (2) ongoing costs, which generally include management fees, distribution and/or service (12b-1) fees and other Fund expenses. This Example is intended to help you understand your ongoing costs (in dollars) of investing in a fund and to compare these costs with the ongoing costs of investing in other mutual funds.
| The Example is based on an investment of $1,000 invested at the beginning of the period and held for the entire period (May 1, 2022 to October 31, 2022). |
Actual Expenses
The first line of the accompanying table provides information about actual account values and actual expenses. You may use the information in this line, together with the amount you invested, to estimate the expenses that you paid over the period. Simply divide your account value by $1,000.00 (for example, an $8,600 account value divided by $1,000.00 = 8.6), then multiply the result by the number in the first line for a class/Fund under the heading entitled "Expenses Paid During Period" to estimate the expenses you paid on your account during this period. If any fund is a shareholder of any underlying mutual funds or exchange-traded funds (ETFs) (the Underlying Funds), such fund indirectly bears its proportional share of the expenses of the Underlying Funds in addition to the direct expenses incurred presented in the table. These fees and expenses are not included in the annualized expense ratio used to calculate the expense estimate in the table below.
Hypothetical Example for Comparison Purposes
The second line of the accompanying table provides information about hypothetical account values and hypothetical expenses based on the actual expense ratio and an assumed rate of return of 5% per year before expenses, which is not the actual return. The hypothetical account values and expenses may not be used to estimate the actual ending account balance or expenses you paid for the period. You may use this information to compare the ongoing costs of investing in the Fund and other funds. To do so, compare this 5% hypothetical example with the 5% hypothetical examples that appear in the shareholder reports of the other funds. If any fund is a shareholder of any Underlying Funds, such fund indirectly bears its proportional share of the expenses of the Underlying Funds in addition to the direct expenses as presented in the table. These fees and expenses are not included in the annualized expense ratio used to calculate the expense estimate in the table below.
Please note that the expenses shown in the table are meant to highlight your ongoing costs only and do not reflect any transaction costs. Therefore, the second line of the table is useful in comparing ongoing costs only, and will not help you determine the relative total costs of owning different funds. In addition, if these transactional costs were included, your costs would have been higher.
| | | | | Annualized Expense Ratio- A | | Beginning Account Value May 1, 2022 | | Ending Account Value October 31, 2022 | | Expenses Paid During Period- C May 1, 2022 to October 31, 2022 |
| | | | | | | | | | |
| Fidelity® Capital & Income Fund | | | | .68% | | | | | | |
| Actual | | | | | | $ 1,000 | | $ 965.10 | | $ 3.37 |
Hypothetical- B | | | | | | $ 1,000 | | $ 1,021.78 | | $ 3.47 |
| |
A Annualized expense ratio reflects expenses net of applicable fee waivers.
B 5% return per year before expenses
C Expenses are equal to the annualized expense ratio, multiplied by the average account value over the period, multiplied by 184/ 365 (to reflect the one-half year period). The fees and expenses of any Underlying Funds are not included in each annualized expense ratio.
Fidelity Capital & Income Fund
Each year, the Board of Trustees, including the Independent Trustees (together, the Board), votes on the renewal of the management contract with Fidelity Management & Research Company LLC (FMR) and the sub-advisory agreements (together, the Advisory Contracts) for the fund. FMR and the sub-advisers are referred to herein as the Investment Advisers. The Board, assisted by the advice of fund counsel and Independent Trustees' counsel, requests and considers a broad range of information relevant to the renewal of the Advisory Contracts throughout the year.
The Board meets regularly and, at each of its meetings, covers an extensive agenda of topics and materials and considers factors that are relevant to its annual consideration of the renewal of the fund's Advisory Contracts, including the services and support provided to the fund and its shareholders. The Board has established various standing committees (Committees), each composed of and chaired by Independent Trustees with varying backgrounds, to which the Board has assigned specific subject matter responsibilities in order to enhance effective decision-making by the Board. The Board, acting directly and through its Committees, requests and receives information concerning the annual consideration of the renewal of the fund's Advisory Contracts. The Board also meets as needed to review matters specifically related to the Board's annual consideration of the renewal of the Advisory Contracts. Members of the Board may also meet with trustees of other Fidelity funds through joint ad hoc committees to discuss certain matters relevant to all of the Fidelity funds.
At its May 2022 meeting, the Board unanimously determined to renew the fund's Advisory Contracts. In reaching its determination, the Board considered all factors it believed relevant, including (i) the nature, extent, and quality of the services provided to the fund and its shareholders (including the investment performance of the fund); (ii) the competitiveness relative to peer funds of the fund's management fee and total expense ratio; (iii) the total costs of the services provided by and the profits realized by Fidelity from its relationships with the fund; and (iv) the extent to which, if any, economies of scale exist and are realized as the fund grows, and whether any economies of scale are appropriately shared with fund shareholders.
In considering whether to renew the Advisory Contracts for the fund, the Board reached a determination, with the assistance of fund counsel and Independent Trustees' counsel and through the exercise of its business judgment, that the renewal of the Advisory Contracts was in the best interests of the fund and its shareholders and that the compensation payable under the Advisory Contracts was fair and reasonable. The Board's decision to renew the Advisory Contracts was not based on any single factor, but rather was based on a comprehensive consideration of all the information provided to the Board at its meetings throughout the year. The Board, in reaching its determination to renew the Advisory Contracts, was aware that shareholders of the fund have a broad range of investment choices available to them, including a wide choice among funds offered by Fidelity's competitors, and that the fund's shareholders, who have the opportunity to review and weigh the disclosure provided by the fund in its prospectus and other public disclosures, have chosen to invest in this fund, which is part of the Fidelity family of funds.
Nature, Extent, and Quality of Services Provided. The Board considered Fidelity's staffing as it relates to the fund, including the backgrounds of investment personnel of Fidelity, and also considered the fund's investment objective, strategies, and related investment philosophy. The Independent Trustees also had discussions with senior management of Fidelity's investment operations and investment groups. The Board considered the structure of the investment personnel compensation program and whether this structure provides appropriate incentives to act in the best interests of the fund. Additionally, the Board considered the portfolio managers' investments, if any, in the funds that they manage. The Board also considered the steps Fidelity had taken to ensure the continued provision of high quality services to the Fidelity funds during the COVID-19 pandemic, including the expansion of staff in client facing positions to maintain service levels in periods of high volumes and volatility.
Resources Dedicated to Investment Management and Support Services. The Board and the Fund Oversight and Research Committees reviewed the general qualifications and capabilities of Fidelity's investment staff, including its size, education, experience, and resources, as well as Fidelity's approach to recruiting, training, managing, and compensating investment personnel. The Board noted the resources devoted to expansion of Fidelity's global investment organization, and that Fidelity's analysts have extensive resources, tools, and capabilities that allow them to conduct sophisticated quantitative and fundamental analysis, as well as credit analysis of issuers, counterparties, and guarantors. Further, the Board considered that Fidelity's investment professionals have sufficient access to global information and data so as to provide competitive investment results over time, and that those professionals also have access to sophisticated tools that permit them to assess portfolio construction and risk and performance attribution characteristics continuously, as well as to transmit new information and research conclusions rapidly around the world. Additionally, in its deliberations, the Board considered Fidelity's trading, risk management, compliance, and technology and operations capabilities and resources, which are integral parts of the investment management process.
Shareholder and Administrative Services. The Board considered (i) the nature, extent, quality, and cost of advisory, administrative, and shareholder services performed by the Investment Advisers and their affiliates under the Advisory Contracts and under separate agreements covering transfer agency, pricing and bookkeeping, and securities lending services for the fund; (ii) the nature and extent of the supervision of third party service providers, principally custodians, subcustodians, and pricing vendors; and (iii) the resources devoted to, and the record of compliance with, the fund's compliance policies and procedures. The Board also reviewed the allocation of fund brokerage, including allocations to brokers affiliated with the Investment Advisers, the use of brokerage commissions to pay fund expenses, and the use of "soft" commission dollars to pay for research services.
The Board noted that the growth of fund assets over time across the complex allows Fidelity to reinvest in the development of services designed to enhance the value and convenience of the Fidelity funds as investment vehicles. These services include 24-hour access to account information and market information over the Internet and through telephone representatives, investor education materials, and asset allocation tools. The Board also considered that it reviews customer service metrics such as telephone response times, continuity of services on the website and metrics addressing services at Fidelity Investor Centers.
Investment in a Large Fund Family. The Board considered the benefits to shareholders of investing in a Fidelity fund, including the benefits of investing in a fund that is part of a large family of funds offering a variety of investment disciplines and providing a large variety of mutual fund investor services. The Board noted that Fidelity had taken, or had made recommendations that resulted in the Fidelity funds taking, a number of actions over the previous year that benefited particular funds, including: (i) continuing to dedicate additional resources to Fidelity's investment research process, which includes meetings with management of issuers of securities in which the funds invest; (ii) continuing efforts to enhance Fidelity's global research capabilities; (iii) launching new funds and ETFs with innovative structures, strategies and pricing and making other enhancements to meet client needs; (iv) launching new share classes of existing funds; (v) eliminating purchase minimums and broadening eligibility requirements for certain funds and share classes; (vi) reducing management fees and total expenses for certain target date funds and classes and index funds; (vii) lowering expenses for certain existing funds and classes by implementing or lowering expense caps; (viii) rationalizing product lines and gaining increased efficiencies from fund mergers and liquidations; (ix) continuing to develop, acquire and implement systems and technology to improve services to the funds and shareholders, strengthen information security, and increase efficiency; and (x) continuing to implement enhancements to further strengthen Fidelity's product line to increase investors' probability of success in achieving their investment goals, including retirement income goals.
Investment Performance. The Board considered whether the fund has operated in accordance with its investment objective, as well as its record of compliance with its investment restrictions and its performance history. The Board noted that the fund had a portfolio manager change in October 2019. The Board will continue to monitor closely the fund's performance, taking into account the portfolio manager change.
The Board took into account discussions that occur at Board meetings throughout the year with representatives of the Investment Advisers about fund investment performance. In this regard the Board noted that as part of regularly scheduled fund reviews and other reports to the Board on fund performance, the Board considers annualized return information for the fund for different time periods, measured against an appropriate securities market index (benchmark index) and an appropriate peer group of funds with similar objectives (peer group). The Board also reviews and considers information about performance attribution. In its evaluation of fund investment performance, the Board gave particular attention to information indicating changes in performance of certain Fidelity funds for specific time periods and discussed with the Investment Advisers the reasons for any overperformance or underperformance.
In addition to reviewing absolute and relative fund performance, the Independent Trustees periodically consider the appropriateness of fund performance metrics in evaluating the results achieved. In general, the Independent Trustees believe that fund performance should be evaluated based on net performance (after fees and expenses) of the fund compared to appropriate benchmark indices, over appropriate time periods that may include full market cycles, and compared to peer groups, as applicable, over the same periods, taking into account relevant factors including the following: general market conditions; issuer-specific information; and fund cash flows and other factors.
The Independent Trustees recognize that shareholders evaluate performance on a net basis over their own holding periods, for which one-, three-, and five-year periods are often used as a proxy. For this reason, the performance information reviewed by the Board also included net cumulative total return information for the fund and an appropriate benchmark index and peer group for the most recent one-, three-, and five-year periods ended September 30, 2021, as shown below. Returns are shown compared to the 25th percentile (top of box, 75% beaten) and 75th percentile (bottom of box, 25% beaten) of the peer universe.
Fidelity Capital & Income Fund
Based on its review, the Board concluded that the nature, extent, and quality of services provided to the fund under the Advisory Contracts should continue to benefit the shareholders of the fund.
Competitiveness of Management Fee and Total Expense Ratio. The Board considered the fund's management fee and total expense ratio compared to "mapped groups" of competitive funds and classes created for the purpose of facilitating the Trustees' competitive analysis of management fees and total expenses. Fidelity creates "mapped groups" by combining similar Lipper investment objective categories that have comparable investment mandates. Combining Lipper investment objective categories aids the Board's management fee and total expense ratio comparisons by broadening the competitive group used for comparison.
Management Fee. The Board considered two proprietary management fee comparisons for the 12-month periods ended September 30 (June 30 for periods ended 2019 and 2018 and December 31 for periods prior to 2018) shown in basis points (BP) in the chart below. The group of Lipper funds used by the Board for management fee comparisons is referred to below as the "Total Mapped Group." The Total Mapped Group is broader than the Lipper peer group used by the Board for performance comparisons because the Total Mapped Group combines several Lipper investment objective categories while the Lipper peer group does not. The Total Mapped Group comparison focuses on a fund's standing in terms of gross management fees before expense reimbursements or caps relative to the total universe of funds with comparable investment mandates, regardless of whether their management fee structures also are comparable. Funds with comparable investment mandates offer exposure to similar types of securities. Funds with comparable management fee structures have similar management fee contractual arrangements (e.g., flat rate charged for advisory services, all-inclusive fee rate, etc.). "TMG %" represents the percentage of funds in the Total Mapped Group that had management fees that were lower than the fund's. For example, a hypothetical TMG % of 20% would mean that 80% of the funds in the Total Mapped Group had higher, and 20% had lower, management fees than the fund. The fund's actual TMG %s and the number of funds in the Total Mapped Group are in the chart below. The "Asset-Sized Peer Group" (ASPG) comparison focuses on a fund's standing relative to a subset of non-Fidelity funds within the Total Mapped Group that are similar in size and management fee structure. For example, if a fund is in the first quartile of the ASPG, the fund's management fee ranks in the least expensive or lowest 25% of funds in the ASPG. The ASPG represents at least 15% of the funds in the Total Mapped Group with comparable asset size and management fee structures, subject to a minimum of 50 funds (or all funds in the Total Mapped Group if fewer than 50). Additional information, such as the ASPG quartile in which the fund's management fee rate ranked, is also included in the chart and was considered by the Board.
Fidelity Capital & Income Fund
The Board noted that the fund's management fee rate ranked below the median of its Total Mapped Group and equal to the median of its ASPG for the 12-month period ended September, 30 2021.
The Board also considered that, for funds subject to the group fee, FMR agreed to voluntarily waive fees over a specified period of time in amounts designed to account for assets converted from certain funds to certain collective investment trusts.
Based on its review, the Board concluded that the fund's management fee is fair and reasonable in light of the services that the fund receives and the other factors considered.
Total Expense Ratio. In its review of the fund's total expense ratio, the Board considered the fund's management fee rate as well as other fund expenses, such as transfer agent fees, pricing and bookkeeping fees, and custodial, legal, and audit fees. The Board also noted that Fidelity may agree to waive fees or reimburse expenses from time to time, and the extent to which, if any, it has done so for the fund. The fund is compared to those funds and classes in the Total Mapped Group (used by the Board for management fee comparisons) that have a similar sales load structure. The Board also considered a total expense ASPG comparison for the fund, which focuses on the total expenses of the fund relative to a subset of non-Fidelity funds within the total expense similar sales load structure group. The total expense ASPG is limited to 15 larger and 15 smaller classes in fund average assets for a total of 30 classes, where possible. The total expense ASPG comparison excludes performance adjustments and fund-paid 12b-1 fees to eliminate variability in fee structures.
The Board noted that the fund's total net expense ratio ranked below the similar sales load structure group competitive median and below the ASPG competitive median for the 12-month period ended September 30, 2021.
Fees Charged to Other Fidelity Clients. The Board also considered Fidelity fee structures and other information with respect to clients of Fidelity, such as other funds advised or subadvised by Fidelity, pension plan clients, and other institutional clients with similar mandates. The Board noted that a joint ad hoc committee created by it and the boards of other Fidelity funds periodically reviews and compares Fidelity's institutional investment advisory business with its business of providing services to the Fidelity funds and also noted the most recent findings of the committee. The Board noted that the committee's review included a consideration of the differences in services provided, fees charged, and costs incurred, as well as competition in the markets serving the different categories of clients.
Based on its review of total expense ratios and fees charged to other Fidelity clients, the Board concluded that the fund's total expense ratio was reasonable in light of the services that the fund and its shareholders receive and the other factors considered.
Costs of the Services and Profitability. The Board considered the revenues earned and the expenses incurred by Fidelity in conducting the business of developing, marketing, distributing, managing, administering and servicing the fund and servicing the fund's shareholders. The Board also considered the level of Fidelity's profits in respect of all the Fidelity funds.
On an annual basis, Fidelity presents to the Board information about the profitability of its relationships with the fund. Fidelity calculates profitability information for each fund, as well as aggregate profitability information for groups of Fidelity funds and all Fidelity funds, using a series of detailed revenue and cost allocation methodologies which originate with the books and records of Fidelity on which Fidelity's audited financial statements are based. The Audit Committee of the Board reviews any significant changes from the prior year's methodologies and the full Board approves such changes.
A public accounting firm has been engaged annually by the Board as part of the Board's assessment of Fidelity's profitability analysis. The engagement includes the review and assessment of the methodologies used by Fidelity in determining the revenues and expenses attributable to Fidelity's mutual fund business, and completion of agreed-upon procedures in respect of the mathematical accuracy of certain fund profitability information and its conformity to established allocation methodologies. After considering the reports issued under the engagement and information provided by Fidelity, the Board concluded that while other allocation methods may also be reasonable, Fidelity's profitability methodologies are reasonable in all material respects.
The Board also reviewed Fidelity's non-fund businesses and potential indirect benefits such businesses may have received as a result of their association with Fidelity's mutual fund business (i.e., fall-out benefits) as well as cases where Fidelity's affiliates may benefit from the funds' business. The Board considered areas where potential indirect benefits to the Fidelity funds from their relationships with Fidelity may exist. The Board's consideration of these matters was informed by the findings of a joint ad hoc committee created by it and the boards of other Fidelity funds to evaluate potential fall-out benefits.
The Board considered the costs of the services provided by and the profits realized by Fidelity in connection with the operation of the fund and was satisfied that the profitability was not excessive.
Economies of Scale. The Board considered whether there have been economies of scale in respect of the management of the Fidelity funds, whether the Fidelity funds (including the fund) have appropriately benefited from any such economies of scale, and whether there is potential for realization of any further economies of scale. The Board considered the extent to which the fund will benefit from economies of scale as assets grow through increased services to the fund, through waivers or reimbursements, or through fee or expense ratio reductions. The Board also noted that a committee (the Economies of Scale Committee) created by it and the boards of other Fidelity funds periodically analyzes whether Fidelity attains economies of scale in respect of the management and servicing of the Fidelity funds, whether the Fidelity funds have appropriately benefited from such economies of scale, and whether there is potential for realization of any further economies of scale.
The Board recognized that the fund's management contract incorporates a "group fee" structure, which provides for lower group fee rates as total "group assets" increase, and for higher group fee rates as total "group assets" decrease ("group assets" as defined in the management contract). FMR calculates the group fee rates based on a tiered asset "breakpoint" schedule that varies based on asset class. The Board considered that the group fee is designed to deliver the benefits of economies of scale to fund shareholders when total Fidelity fund assets increase, even if assets of any particular fund are unchanged or have declined, because some portion of Fidelity's costs are attributable to services provided to all Fidelity funds, and all funds benefit if those costs can be allocated among more assets. The Board further considered that Fidelity agreed to impose a temporary fee waiver in the form of additional breakpoints to the current breakpoint schedule. The Board concluded that, given the group fee structure, fund shareholders will benefit from lower management fees as "group assets" increase at the fund complex level, regardless of whether Fidelity achieves any such economies of scale.
The Board concluded, taking into account the analysis of the Economies of Scale Committee, that economies of scale, if any, are being appropriately shared between fund shareholders and Fidelity.
Additional Information Requested by the Board. In order to develop fully the factual basis for consideration of the Fidelity funds' advisory contracts, the Board requested and received additional information on certain topics, including: (i) fund flow and performance trends, in particular the underperformance of certain funds and strategies, and Fidelity's long-term strategies for certain funds, including any consideration of fund liquidations or mergers; (ii) the operation of performance fees, competitor use of performance fees and consideration of the expansion of performance fees to additional funds; (iii) Fidelity's pricing philosophy compared to competitors; (iv) fund profitability methodology and data; (v) evaluation of competitive fund data and peer group classifications and fee and expense comparisons; (vi) the management fee and expense structures for different funds and classes and information about the differences between various fee and expense structures; (vii) group fee breakpoints and related voluntary fee waivers; and (viii) information regarding other accounts managed by Fidelity and the funds' sub-advisory arrangements.
Based on its evaluation of all of the conclusions noted above, and after considering all factors it believed relevant, the Board concluded that the advisory fee arrangements are fair and reasonable and that the fund's Advisory Contracts should be renewed.
1.538653.125
CAI-SANN-1222
Fidelity® U.S. Low Volatility Equity Fund
Semi-Annual Report
October 31, 2022
Contents
To view a fund's proxy voting guidelines and proxy voting record for the 12-month period ended June 30, visit http://www.fidelity.com/proxyvotingresults or visit the Securities and Exchange Commission's (SEC) web site at http://www.sec.gov.
You may also call 1-800-544-8544 to request a free copy of the proxy voting guidelines.
Standard & Poor's, S&P and S&P 500 are registered service marks of The McGraw-Hill Companies, Inc. and have been licensed for use by Fidelity Distributors Corporation.
Other third-party marks appearing herein are the property of their respective owners.
All other marks appearing herein are registered or unregistered trademarks or service marks of FMR LLC or an affiliated company. © 2022 FMR LLC. All rights reserved.
This report and the financial statements contained herein are submitted for the general information of the shareholders of the Fund. This report is not authorized for distribution to prospective investors in the Fund unless preceded or accompanied by an effective prospectus.
A fund files its complete schedule of portfolio holdings with the SEC for the first and third quarters of each fiscal year on Form N-PORT. Forms N-PORT are available on the SEC's web site at http://www.sec.gov. A fund's Forms N-PORT may be reviewed and copied at the SEC's Public Reference Room in Washington, DC. Information regarding the operation of the SEC's Public Reference Room may be obtained by calling 1-800-SEC-0330.
For a complete list of a fund's portfolio holdings, view the most recent holdings listing, semiannual report, or annual report on Fidelity's web site at http://www.fidelity.com, http://www.institutional.fidelity.com, or http://www.401k.com, as applicable.
NOT FDIC INSURED •MAY LOSE VALUE •NO BANK GUARANTEE
Neither the Fund nor Fidelity Distributors Corporation is a bank.
Top Holdings (% of Fund's net assets) |
| |
| UnitedHealth Group, Inc. | 1.2 | |
| Dollar General Corp. | 1.2 | |
| Regeneron Pharmaceuticals, Inc. | 1.2 | |
| Dollar Tree, Inc. | 1.1 | |
| TreeHouse Foods, Inc. | 1.1 | |
| Vertex Pharmaceuticals, Inc. | 1.1 | |
| Merck & Co., Inc. | 1.1 | |
| Humana, Inc. | 1.1 | |
| Eli Lilly & Co. | 1.1 | |
| Northrop Grumman Corp. | 1.0 | |
| | 11.2 | |
| |
| Market Sectors (% of Fund's net assets) |
| |
| Health Care | 18.9 | |
| Consumer Staples | 16.8 | |
| Information Technology | 15.5 | |
| Financials | 11.3 | |
| Utilities | 11.0 | |
| Industrials | 10.8 | |
| Consumer Discretionary | 4.6 | |
| Communication Services | 4.1 | |
| Materials | 2.9 | |
| Energy | 1.8 | |
| Real Estate | 1.3 | |
| Investment Companies | 0.6 | |
| |
Asset Allocation (% of Fund's net assets) |
|
Foreign investments - 10.2% |
|
Geographic Diversification (% of Fund's net assets) |
|
* Includes Short-Term investments and Net Other Assets (Liabilities). Percentages are based on country or territory of incorporation and are adjusted for the effect of futures contracts, if applicable. |
| |
Showing Percentage of Net Assets
| Common Stocks - 99.0% |
| | | Shares | Value ($) |
| COMMUNICATION SERVICES - 4.1% | | | |
| Diversified Telecommunication Services - 1.1% | | | |
| AT&T, Inc. | | 91,386 | 1,665,967 |
| Verizon Communications, Inc. | | 44,960 | 1,680,155 |
| | | | 3,346,122 |
| Entertainment - 1.5% | | | |
| Activision Blizzard, Inc. | | 29,830 | 2,171,624 |
| Electronic Arts, Inc. | | 17,324 | 2,182,131 |
| | | | 4,353,755 |
| Media - 0.5% | | | |
| Comcast Corp. Class A | | 43,800 | 1,390,212 |
| Wireless Telecommunication Services - 1.0% | | | |
| T-Mobile U.S., Inc. (a) | | 20,514 | 3,109,102 |
TOTAL COMMUNICATION SERVICES | | | 12,199,191 |
| CONSUMER DISCRETIONARY - 4.6% | | | |
| Hotels, Restaurants & Leisure - 1.5% | | | |
| Domino's Pizza, Inc. | | 5,967 | 1,982,476 |
| McDonald's Corp. | | 8,994 | 2,452,304 |
| | | | 4,434,780 |
| Multiline Retail - 2.3% | | | |
| Dollar General Corp. | | 14,076 | 3,590,084 |
| Dollar Tree, Inc. (a) | | 21,034 | 3,333,889 |
| | | | 6,923,973 |
| Specialty Retail - 0.8% | | | |
| Murphy U.S.A., Inc. | | 7,707 | 2,423,929 |
TOTAL CONSUMER DISCRETIONARY | | | 13,782,682 |
| CONSUMER STAPLES - 16.8% | | | |
| Beverages - 3.4% | | | |
| Constellation Brands, Inc. Class A (sub. vtg.) | | 9,440 | 2,332,435 |
| Keurig Dr. Pepper, Inc. | | 64,966 | 2,523,279 |
| Monster Beverage Corp. (a) | | 32,025 | 3,001,383 |
| The Coca-Cola Co. | | 38,517 | 2,305,242 |
| | | | 10,162,339 |
| Food & Staples Retailing - 2.8% | | | |
| Albertsons Companies, Inc. | | 66,880 | 1,371,709 |
| BJ's Wholesale Club Holdings, Inc. (a) | | 25,504 | 1,974,010 |
| Sprouts Farmers Market LLC (a) | | 88,877 | 2,621,872 |
| Walmart, Inc. | | 16,653 | 2,370,221 |
| | | | 8,337,812 |
| Food Products - 6.4% | | | |
| Bunge Ltd. | | 25,557 | 2,522,476 |
| Ingredion, Inc. | | 25,664 | 2,287,176 |
| McCormick & Co., Inc. (non-vtg.) | | 25,023 | 1,967,809 |
| Mondelez International, Inc. | | 40,085 | 2,464,426 |
| Nestle SA (Reg. S) | | 16,293 | 1,773,636 |
| The Hershey Co. | | 10,953 | 2,615,248 |
| The J.M. Smucker Co. | | 15,365 | 2,314,891 |
| TreeHouse Foods, Inc. (a) | | 64,207 | 3,225,760 |
| | | | 19,171,422 |
| Household Products - 3.4% | | | |
| Kimberly-Clark Corp. | | 19,280 | 2,399,589 |
| Procter & Gamble Co. | | 17,175 | 2,312,957 |
| Reynolds Consumer Products, Inc. | | 88,787 | 2,711,555 |
| The Clorox Co. (b) | | 17,276 | 2,522,987 |
| | | | 9,947,088 |
| Tobacco - 0.8% | | | |
| Philip Morris International, Inc. | | 26,804 | 2,461,947 |
TOTAL CONSUMER STAPLES | | | 50,080,608 |
| ENERGY - 1.8% | | | |
| Oil, Gas & Consumable Fuels - 1.8% | | | |
| Chevron Corp. | | 14,504 | 2,623,774 |
| Exxon Mobil Corp. | | 24,290 | 2,691,575 |
| | | | 5,315,349 |
| FINANCIALS - 11.3% | | | |
| Banks - 2.9% | | | |
| 1st Source Corp. | | 12,201 | 709,610 |
| First Horizon National Corp. | | 100,221 | 2,456,417 |
| First Interstate Bancsystem, Inc. | | 51,416 | 2,345,084 |
| Heartland Financial U.S.A., Inc. | | 14,800 | 729,936 |
| Preferred Bank, Los Angeles | | 13,700 | 1,053,119 |
| QCR Holdings, Inc. | | 11,500 | 583,165 |
| Trico Bancshares | | 14,861 | 860,601 |
| | | | 8,737,932 |
| Capital Markets - 3.1% | | | |
| Cboe Global Markets, Inc. | | 23,242 | 2,893,629 |
| Intercontinental Exchange, Inc. | | 21,641 | 2,068,230 |
| NASDAQ, Inc. | | 45,845 | 2,853,393 |
| Virtu Financial, Inc. Class A | | 61,843 | 1,384,046 |
| | | | 9,199,298 |
| Diversified Financial Services - 0.9% | | | |
| Berkshire Hathaway, Inc. Class B (a) | | 9,214 | 2,718,959 |
| Insurance - 4.4% | | | |
| Arthur J. Gallagher & Co. | | 8,927 | 1,670,063 |
| Assurant, Inc. | | 14,807 | 2,011,679 |
| Brown & Brown, Inc. | | 32,866 | 1,932,192 |
| Marsh & McLennan Companies, Inc. | | 16,666 | 2,691,392 |
| Selective Insurance Group, Inc. | | 20,284 | 1,989,455 |
| The Travelers Companies, Inc. | | 14,835 | 2,736,464 |
| | | | 13,031,245 |
TOTAL FINANCIALS | | | 33,687,434 |
| HEALTH CARE - 18.9% | | | |
| Biotechnology - 4.4% | | | |
| Amgen, Inc. | | 11,414 | 3,085,775 |
| Incyte Corp. (a) | | 31,525 | 2,343,569 |
| Regeneron Pharmaceuticals, Inc. (a) | | 4,767 | 3,569,291 |
| United Therapeutics Corp. (a) | | 4,200 | 968,226 |
| Vertex Pharmaceuticals, Inc. (a) | | 10,304 | 3,214,848 |
| | | | 13,181,709 |
| Health Care Equipment & Supplies - 1.7% | | | |
| Abbott Laboratories | | 18,688 | 1,848,991 |
| Becton, Dickinson & Co. | | 9,035 | 2,131,989 |
| Hologic, Inc. (a) | | 17,546 | 1,189,619 |
| | | | 5,170,599 |
| Health Care Providers & Services - 4.4% | | | |
| AmerisourceBergen Corp. | | 6,800 | 1,069,096 |
| Chemed Corp. | | 4,893 | 2,284,395 |
| Cigna Corp. | | 9,082 | 2,934,031 |
| Humana, Inc. | | 5,677 | 3,168,220 |
| UnitedHealth Group, Inc. | | 6,760 | 3,752,809 |
| | | | 13,208,551 |
| Life Sciences Tools & Services - 1.8% | | | |
| Danaher Corp. | | 10,103 | 2,542,622 |
| Thermo Fisher Scientific, Inc. | | 5,710 | 2,934,769 |
| | | | 5,477,391 |
| Pharmaceuticals - 6.6% | | | |
| AstraZeneca PLC (United Kingdom) | | 18,906 | 2,218,282 |
| Bristol-Myers Squibb Co. | | 35,353 | 2,738,797 |
| Eli Lilly & Co. | | 8,699 | 3,149,821 |
| Merck & Co., Inc. | | 31,435 | 3,181,222 |
| Roche Holding AG (participation certificate) | | 6,021 | 1,997,757 |
| Royalty Pharma PLC | | 53,220 | 2,252,270 |
| Sanofi SA sponsored ADR | | 56,988 | 2,463,591 |
| Zoetis, Inc. Class A | | 10,549 | 1,590,578 |
| | | | 19,592,318 |
TOTAL HEALTH CARE | | | 56,630,568 |
| INDUSTRIALS - 10.8% | | | |
| Aerospace & Defense - 1.9% | | | |
| Lockheed Martin Corp. | | 5,219 | 2,539,983 |
| Northrop Grumman Corp. | | 5,679 | 3,117,828 |
| | | | 5,657,811 |
| Air Freight & Logistics - 1.4% | | | |
| C.H. Robinson Worldwide, Inc. | | 23,242 | 2,271,208 |
| United Parcel Service, Inc. Class B | | 11,754 | 1,971,969 |
| | | | 4,243,177 |
| Commercial Services & Supplies - 1.8% | | | |
| Republic Services, Inc. | | 18,968 | 2,515,536 |
| Waste Connections, Inc. (United States) | | 22,663 | 2,989,476 |
| | | | 5,505,012 |
| Machinery - 0.9% | | | |
| IDEX Corp. | | 12,285 | 2,731,078 |
| Professional Services - 3.3% | | | |
| Booz Allen Hamilton Holding Corp. Class A | | 27,862 | 3,032,779 |
| CACI International, Inc. Class A (a) | | 4,491 | 1,365,399 |
| FTI Consulting, Inc. (a) | | 19,502 | 3,035,096 |
| Verisk Analytics, Inc. | | 12,791 | 2,338,579 |
| | | | 9,771,853 |
| Road & Rail - 1.5% | | | |
| J.B. Hunt Transport Services, Inc. | | 9,651 | 1,650,997 |
| Landstar System, Inc. | | 17,960 | 2,805,711 |
| | | | 4,456,708 |
TOTAL INDUSTRIALS | | | 32,365,639 |
| INFORMATION TECHNOLOGY - 15.5% | | | |
| Communications Equipment - 0.7% | | | |
| Cisco Systems, Inc. | | 48,623 | 2,208,943 |
| Electronic Equipment & Components - 1.4% | | | |
| Insight Enterprises, Inc. (a) | | 25,258 | 2,387,134 |
| Keyence Corp. | | 4,421 | 1,673,349 |
| | | | 4,060,483 |
| IT Services - 7.2% | | | |
| Accenture PLC Class A | | 10,363 | 2,942,056 |
| Akamai Technologies, Inc. (a) | | 22,985 | 2,030,265 |
| Amdocs Ltd. | | 27,250 | 2,351,948 |
| Cognizant Technology Solutions Corp. Class A | | 33,962 | 2,114,135 |
| Fidelity National Information Services, Inc. | | 13,968 | 1,159,204 |
| Genpact Ltd. | | 56,816 | 2,755,576 |
| MasterCard, Inc. Class A | | 6,706 | 2,200,775 |
| Maximus, Inc. | | 36,272 | 2,236,894 |
| VeriSign, Inc. (a) | | 8,016 | 1,606,887 |
| Visa, Inc. Class A | | 10,860 | 2,249,758 |
| | | | 21,647,498 |
| Software - 5.0% | | | |
| Black Knight, Inc. (a) | | 31,410 | 1,899,363 |
| Check Point Software Technologies Ltd. (a) | | 17,543 | 2,267,082 |
| Microsoft Corp. | | 11,127 | 2,582,911 |
| NortonLifeLock, Inc. | | 95,466 | 2,150,849 |
| Roper Technologies, Inc. | | 5,967 | 2,473,560 |
| Salesforce.com, Inc. (a) | | 7,835 | 1,273,893 |
| SAP SE sponsored ADR | | 11,100 | 1,066,266 |
| VMware, Inc. Class A | | 10,651 | 1,198,557 |
| | | | 14,912,481 |
| Technology Hardware, Storage & Peripherals - 1.2% | | | |
| Apple, Inc. | | 17,097 | 2,621,654 |
| FUJIFILM Holdings Corp. ADR | | 22,200 | 1,011,210 |
| | | | 3,632,864 |
TOTAL INFORMATION TECHNOLOGY | | | 46,462,269 |
| MATERIALS - 2.9% | | | |
| Chemicals - 0.7% | | | |
| CF Industries Holdings, Inc. | | 19,336 | 2,054,643 |
| Metals & Mining - 2.2% | | | |
| Barrick Gold Corp. (Canada) | | 105,910 | 1,592,906 |
| Newmont Corp. | | 47,084 | 1,992,595 |
| Royal Gold, Inc. | | 22,199 | 2,108,017 |
| Wheaton Precious Metals Corp. (b) | | 32,208 | 1,052,880 |
| | | | 6,746,398 |
TOTAL MATERIALS | | | 8,801,041 |
| REAL ESTATE - 1.3% | | | |
| Equity Real Estate Investment Trusts (REITs) - 1.3% | | | |
| American Tower Corp. | | 9,690 | 2,007,671 |
| Digital Realty Trust, Inc. | | 10,007 | 1,003,202 |
| SBA Communications Corp. Class A | | 3,578 | 965,702 |
| | | | 3,976,575 |
| UTILITIES - 11.0% | | | |
| Electric Utilities - 6.5% | | | |
| Entergy Corp. | | 21,550 | 2,308,867 |
| Evergy, Inc. | | 31,673 | 1,936,170 |
| FirstEnergy Corp. | | 51,315 | 1,935,089 |
| IDACORP, Inc. | | 21,908 | 2,293,768 |
| NextEra Energy, Inc. | | 22,590 | 1,750,725 |
| OGE Energy Corp. | | 57,795 | 2,117,031 |
| PNM Resources, Inc. | | 53,342 | 2,478,803 |
| PPL Corp. | | 77,922 | 2,064,154 |
| Southern Co. | | 38,382 | 2,513,253 |
| | | | 19,397,860 |
| Multi-Utilities - 4.5% | | | |
| CenterPoint Energy, Inc. | | 74,271 | 2,124,893 |
| Dominion Energy, Inc. | | 33,296 | 2,329,721 |
| NiSource, Inc. | | 98,404 | 2,527,999 |
| NorthWestern Energy Corp. | | 38,916 | 2,055,932 |
| Public Service Enterprise Group, Inc. | | 39,540 | 2,217,008 |
| Sempra Energy | | 15,317 | 2,311,948 |
| | | | 13,567,501 |
TOTAL UTILITIES | | | 32,965,361 |
| TOTAL COMMON STOCKS (Cost $272,025,213) | | | 296,266,717 |
| | | | |
| Money Market Funds - 1.3% |
| | | Shares | Value ($) |
| Fidelity Cash Central Fund 3.10% (c) | | 534,331 | 534,437 |
| Fidelity Securities Lending Cash Central Fund 3.10% (c)(d) | | 3,289,596 | 3,289,925 |
| TOTAL MONEY MARKET FUNDS (Cost $3,824,362) | | | 3,824,362 |
| | | | |
| Equity Funds - 0.6% |
| | | Shares | Value ($) |
| Domestic Equity Funds - 0.6% | | | |
iShares MSCI USA Minimum Volatility ETF (Cost $1,735,500) | | 25,177 | 1,792,351 |
| | | | |
| TOTAL INVESTMENT IN SECURITIES - 100.9% (Cost $277,585,075) | 301,883,430 |
NET OTHER ASSETS (LIABILITIES) - (0.9)% | (2,784,429) |
| NET ASSETS - 100.0% | 299,099,001 |
| | |
Security Type Abbreviations
Legend
| (b) | Security or a portion of the security is on loan at period end. |
| (c) | Affiliated fund that is generally available only to investment companies and other accounts managed by Fidelity Investments. The rate quoted is the annualized seven-day yield of the fund at period end. A complete unaudited listing of the fund's holdings as of its most recent quarter end is available upon request. In addition, each Fidelity Central Fund's financial statements are available on the SEC's website or upon request. |
| (d) | Investment made with cash collateral received from securities on loan. |
Affiliated Central Funds
Fiscal year to date information regarding the Fund's investments in Fidelity Central Funds, including the ownership percentage, is presented below.
| Affiliate | Value, beginning of period ($) | Purchases ($) | Sales Proceeds ($) | Dividend Income ($) | Realized Gain (loss) ($) | Change in Unrealized appreciation (depreciation) ($) | Value, end of period ($) | % ownership, end of period |
| Fidelity Cash Central Fund 3.10% | 1,011,280 | 20,921,273 | 21,398,116 | 6,101 | - | - | 534,437 | 0.0% |
| Fidelity Securities Lending Cash Central Fund 3.10% | 8,840,657 | 42,741,888 | 48,292,620 | 3,939 | - | - | 3,289,925 | 0.0% |
| Total | 9,851,937 | 63,663,161 | 69,690,736 | 10,040 | - | - | 3,824,362 | |
| | | | | | | | | |
Amounts in the income column in the above table include any capital gain distributions from underlying funds, which are presented in the corresponding line item in the Statement of Operations, if applicable.
Amount for Fidelity Securities Lending Cash Central Fund represents the income earned on investing cash collateral, less rebates paid to borrowers and any lending agent fees associated with the loan, plus any premium payments received for lending certain types of securities.
Investment Valuation
The following is a summary of the inputs used, as of October 31, 2022, involving the Fund's assets and liabilities carried at fair value. The inputs or methodology used for valuing securities may not be an indication of the risk associated with investing in those securities. For more information on valuation inputs, and their aggregation into the levels used below, please refer to the Investment Valuation section in the accompanying Notes to Financial Statements.
| Valuation Inputs at Reporting Date: |
| Description | Total ($) | Level 1 ($) | Level 2 ($) | Level 3 ($) |
Investments in Securities: | | | | |
|
| Equities: | | | | |
Communication Services | 12,199,191 | 12,199,191 | - | - |
Consumer Discretionary | 13,782,682 | 13,782,682 | - | - |
Consumer Staples | 50,080,608 | 48,306,972 | 1,773,636 | - |
Energy | 5,315,349 | 5,315,349 | - | - |
Financials | 33,687,434 | 33,687,434 | - | - |
Health Care | 56,630,568 | 52,414,529 | 4,216,039 | - |
Industrials | 32,365,639 | 32,365,639 | - | - |
Information Technology | 46,462,269 | 46,462,269 | - | - |
Materials | 8,801,041 | 8,801,041 | - | - |
Real Estate | 3,976,575 | 3,976,575 | - | - |
Utilities | 32,965,361 | 32,965,361 | - | - |
|
| Money Market Funds | 3,824,362 | 3,824,362 | - | - |
|
| Equity Funds | 1,792,351 | 1,792,351 | - | - |
| Total Investments in Securities: | 301,883,430 | 295,893,755 | 5,989,675 | - |
| Statement of Assets and Liabilities |
| | | | October 31, 2022 (Unaudited) |
| | | | | |
| Assets | | | | |
| Investment in securities, at value (including securities loaned of $3,168,957) - See accompanying schedule: | | | | |
Unaffiliated issuers (cost $273,760,713) | | $298,059,068 | | |
Fidelity Central Funds (cost $3,824,362) | | 3,824,362 | | |
| | | | | |
| Total Investment in Securities (cost $277,585,075) | | | $ | 301,883,430 |
| Receivable for fund shares sold | | | | 55,144 |
| Dividends receivable | | | | 733,343 |
| Distributions receivable from Fidelity Central Funds | | | | 2,401 |
| Prepaid expenses | | | | 530 |
Total assets | | | | 302,674,848 |
| Liabilities | | | | |
| Payable for fund shares redeemed | | $108,623 | | |
| Accrued management fee | | 102,456 | | |
| Other affiliated payables | | 54,137 | | |
| Other payables and accrued expenses | | 20,706 | | |
| Collateral on securities loaned | | 3,289,925 | | |
| Total Liabilities | | | | 3,575,847 |
| Net Assets | | | $ | 299,099,001 |
| Net Assets consist of: | | | | |
| Paid in capital | | | $ | 278,468,627 |
| Total accumulated earnings (loss) | | | | 20,630,374 |
| Net Assets | | | $ | 299,099,001 |
Net Asset Value , offering price and redemption price per share ($299,099,001 ÷ 29,432,396 shares) | | | $ | 10.16 |
| | | | | |
| Statement of Operations |
| | | | Six months ended October 31, 2022 (Unaudited) |
| Investment Income | | | | |
| Dividends | | | $ | 3,365,095 |
| Income from Fidelity Central Funds (including $3,939 from security lending) | | | | 10,040 |
| Total Income | | | | 3,375,135 |
| Expenses | | | | |
| Management fee | $ | 705,457 | | |
| Transfer agent fees | | 287,700 | | |
| Accounting fees | | 59,459 | | |
| Custodian fees and expenses | | 4,443 | | |
| Independent trustees' fees and expenses | | 584 | | |
| Registration fees | | 23,323 | | |
| Audit | | 18,035 | | |
| Legal | | 160 | | |
| Miscellaneous | | 779 | | |
| Total expenses before reductions | | 1,099,940 | | |
| Expense reductions | | (6,021) | | |
| Total expenses after reductions | | | | 1,093,919 |
| Net Investment income (loss) | | | | 2,281,216 |
| Realized and Unrealized Gain (Loss) | | | | |
| Net realized gain (loss) on: | | | | |
| Investment Securities: | | | | |
| Unaffiliated issuers | | (5,338,027) | | |
| Foreign currency transactions | | (39,178) | | |
| Total net realized gain (loss) | | | | (5,377,205) |
| Change in net unrealized appreciation (depreciation) on: | | | | |
| Investment Securities: | | | | |
| Unaffiliated issuers | | (9,426,109) | | |
| Assets and liabilities in foreign currencies | | (905) | | |
| Total change in net unrealized appreciation (depreciation) | | | | (9,427,014) |
| Net gain (loss) | | | | (14,804,219) |
| Net increase (decrease) in net assets resulting from operations | | | $ | (12,523,003) |
| Statement of Changes in Net Assets |
| |
| | Six months ended October 31, 2022 (Unaudited) | | Year ended April 30, 2022 |
| Increase (Decrease) in Net Assets | | | | |
| Operations | | | | |
| Net investment income (loss) | $ | 2,281,216 | $ | 2,633,389 |
| Net realized gain (loss) | | (5,377,205) | | 29,002,514 |
| Change in net unrealized appreciation (depreciation) | | (9,427,014) | | (31,327,349) |
| Net increase (decrease) in net assets resulting from operations | | (12,523,003) | | 308,554 |
| Distributions to shareholders | | (13,261,223) | | (19,895,445) |
| Share transactions | | | | |
| Proceeds from sales of shares | | 36,159,262 | | 30,830,702 |
| Reinvestment of distributions | | 13,173,352 | | 19,794,049 |
| Cost of shares redeemed | | (81,280,641) | | (35,905,930) |
Net increase (decrease) in net assets resulting from share transactions | | (31,948,027) | | 14,718,821 |
| Total increase (decrease) in net assets | | (57,732,253) | | (4,868,070) |
| | | | | |
| Net Assets | | | | |
| Beginning of period | | 356,831,254 | | 361,699,324 |
| End of period | $ | 299,099,001 | $ | 356,831,254 |
| | | | | |
| Other Information | | | | |
| Shares | | | | |
| Sold | | 3,508,959 | | 2,648,227 |
| Issued in reinvestment of distributions | | 1,314,706 | | 1,709,270 |
| Redeemed | | (8,137,559) | | (3,086,354) |
| Net increase (decrease) | | (3,313,894) | | 1,271,143 |
| | | | | |
Financial Highlights
| Fidelity® U.S. Low Volatility Equity Fund |
| |
| | Six months ended (Unaudited) October 31, 2022 | | Years ended April 30, 2022 | | 2021 | | 2020 A |
Selected Per-Share Data | | | | | | | | |
| Net asset value, beginning of period | $ | 10.90 | $ | 11.49 | $ | 9.23 | $ | 10.00 |
| Income from Investment Operations | | | | | | | | |
Net investment income (loss) B,C | | .07 | | .08 | | .08 | | .05 |
| Net realized and unrealized gain (loss) | | (.40) | | (.03) | | 2.25 | | (.79) |
| Total from investment operations | | (.33) | | .05 | | 2.33 | | (.74) |
| Distributions from net investment income | | (.02) | | (.08) | | (.07) | | (.03) |
| Distributions from net realized gain | | (.38) | | (.56) | | - | | - |
| Total distributions | | (.41) D | | (.64) | | (.07) | | (.03) |
| Net asset value, end of period | $ | 10.16 | $ | 10.90 | $ | 11.49 | $ | 9.23 |
Total Return E,F | | (3.00)% | | .12% | | 25.27% | | (7.44)% |
Ratios to Average Net Assets C,G,H | | | | | | | | |
| Expenses before reductions | | .67% I | | .73% | | .77% | | 2.28% I |
| Expenses net of fee waivers, if any | | .66% I | | .72% | | .77% | | .95% I |
| Expenses net of all reductions | | .66% I | | .72% | | .77% | | .95% I |
| Net investment income (loss) | | 1.38% I | | .71% | | .79% | | 1.46% I |
| Supplemental Data | | | | | | | | |
| Net assets, end of period (000 omitted) | $ | 299,099 | $ | 356,831 | $ | 361,699 | $ | 294,690 |
Portfolio turnover rate J | | 53% I | | 46% | | 39% | | 101% K,L |
A For the period November 5, 2019 (commencement of operations) through April 30, 2020.
B Calculated based on average shares outstanding during the period.
C Net investment income (loss) is affected by the timing of the declaration of dividends by any underlying mutual funds or exchange-traded funds (ETFs). Net investment income (loss) of any mutual funds or ETFs is not included in the Fund's net investment income (loss) ratio.
D Total distributions per share do not sum due to rounding.
E Total returns for periods of less than one year are not annualized.
F Total returns would have been lower if certain expenses had not been reduced during the applicable periods shown.
G Fees and expenses of any underlying mutual funds or exchange-traded funds (ETFs) are not included in the Fund's expense ratio. The Fund indirectly bears its proportionate share of these expenses. For additional expense information related to investments in Fidelity Central Funds, please refer to the "Investments in Fidelity Central Funds" note found in the Notes to Financial Statements section of the most recent Annual or Semi-Annual report.
H Expense ratios reflect operating expenses of the class. Expenses before reductions do not reflect amounts reimbursed, waived, or reduced through arrangements with the investment adviser, brokerage services, or other offset arrangements, if applicable, and do not represent the amount paid by the class during periods when reimbursements, waivers or reductions occur.
I Annualized
J Amount does not include the portfolio activity of any underlying mutual funds or exchange-traded funds (ETFs).
K Amount not annualized.
L Portfolio turnover rate excludes securities received or delivered in-kind.
For the period ended October 31, 2022
1. Organization.
Fidelity U.S. Low Volatility Equity Fund (the Fund) is a fund of Fidelity Summer Street Trust (the Trust) and is authorized to issue an unlimited number of shares. Share transactions on the Statement of Changes in Net Assets may contain exchanges between affiliated funds. The Trust is registered under the Investment Company Act of 1940, as amended (the 1940 Act), as an open-end management investment company organized as a Massachusetts business trust.
2. Investments in Fidelity Central Funds.
Funds may invest in Fidelity Central Funds, which are open-end investment companies generally available only to other investment companies and accounts managed by the investment adviser and its affiliates. The Schedule of Investments lists any Fidelity Central Funds held as an investment as of period end, but does not include the underlying holdings of each Fidelity Central Fund. An investing fund indirectly bears its proportionate share of the expenses of the underlying Fidelity Central Funds.
Based on its investment objective, each Fidelity Central Fund may invest or participate in various investment vehicles or strategies that are similar to those of the investing fund. These strategies are consistent with the investment objectives of the investing fund and may involve certain economic risks which may cause a decline in value of each of the Fidelity Central Funds and thus a decline in the value of the investing fund.
| Fidelity Central Fund | Investment Manager | Investment Objective | Investment Practices | Expense Ratio A |
| Fidelity Money Market Central Funds | Fidelity Management & Research Company LLC (FMR) | Each fund seeks to obtain a high level of current income consistent with the preservation of capital and liquidity. | Short-term Investments | Less than .005% |
A Expenses expressed as a percentage of average net assets and are as of each underlying Central Fund's most recent annual or semi-annual shareholder report.
A complete unaudited list of holdings for each Fidelity Central Fund is available upon request or at the Securities and Exchange Commission website at www.sec.gov. In addition, the financial statements of the Fidelity Central Funds which contain the significant accounting policies (including investment valuation policies) of those funds, and are not covered by the Report of Independent Registered Public Accounting Firm, are available on the Securities and Exchange Commission website or upon request.
3. Significant Accounting Policies.
The Fund is an investment company and applies the accounting and reporting guidance of the Financial Accounting Standards Board (FASB) Accounting Standards Codification Topic 946 Financial Services - Investment Companies . The financial statements have been prepared in conformity with accounting principles generally accepted in the United States of America (GAAP), which require management to make certain estimates and assumptions at the date of the financial statements. Actual results could differ from those estimates. Subsequent events, if any, through the date that the financial statements were issued have been evaluated in the preparation of the financial statements. The Fund's Schedule of Investments lists any underlying mutual funds or exchange-traded funds (ETFs) but does not include the underlying holdings of these funds. The following summarizes the significant accounting policies of the Fund:
Investment Valuation. Investments are valued as of 4:00 p.m. Eastern time on the last calendar day of the period. The Board of Trustees (the Board) has designated the Fund's investment adviser as the valuation designee responsible for the fair valuation function and performing fair value determinations as needed. The investment adviser has established a Fair Value Committee (the Committee) to carry out the day-to-day fair valuation responsibilities and has adopted policies and procedures to govern the fair valuation process and the activities of the Committee. In accordance with these fair valuation policies and procedures, which have been approved by the Board, the Fund attempts to obtain prices from one or more third party pricing services or brokers to value its investments. When current market prices, quotations or currency exchange rates are not readily available or reliable, investments will be fair valued in good faith by the Committee, in accordance with the policies and procedures. Factors used in determining fair value vary by investment type and may include market or investment specific events, transaction data, estimated cash flows, and market observations of comparable investments. The frequency that the fair valuation procedures are used cannot be predicted and they may be utilized to a significant extent. The Committee manages the Fund's fair valuation practices and maintains the fair valuation policies and procedures. The Fund's investment adviser reports to the Board information regarding the fair valuation process and related material matters.
The Fund categorizes the inputs to valuation techniques used to value its investments into a disclosure hierarchy consisting of three levels as shown below:
Level 1 - unadjusted quoted prices in active markets for identical investments
Level 2 - other significant observable inputs (including quoted prices for similar investments, interest rates, prepayment speeds, etc.)
Level 3 - unobservable inputs (including the Fund's own assumptions based on the best information available)
Valuation techniques used to value the Fund's investments by major category are as follows:
Equity securities, including restricted securities, for which market quotations are readily available, are valued at the last reported sale price or official closing price as reported by a third party pricing service on the primary market or exchange on which they are traded and are categorized as Level 1 in the hierarchy. In the event there were no sales during the day or closing prices are not available, securities are valued at the last quoted bid price or may be valued using the last available price and are generally categorized as Level 2 in the hierarchy. For foreign equity securities, when market or security specific events arise, comparisons to the valuation of American Depositary Receipts (ADRs), futures contracts, ETFs and certain indexes as well as quoted prices for similar securities may be used and would be categorized as Level 2 in the hierarchy. For equity securities, including restricted securities, where observable inputs are limited, assumptions about market activity and risk are used and these securities may be categorized as Level 3 in the hierarchy.
ETFs are valued at their last sale price or official closing price as reported by a third party pricing service on the primary market or exchange on which they are traded and are categorized as Level 1 in the hierarchy. In the event there were no sales during the day but the exchange reports a closing bid level, ETFs are valued at the closing bid and would be categorized as Level 1 in the hierarchy. In the event there was no closing bid, ETFs may be valued by another method that the Board believes reflects fair value in accordance with the Board's fair value pricing policies and may be categorized as Level 2 in the hierarchy.
Investments in open-end mutual funds, including the Fidelity Central Funds, are valued at their closing net asset value (NAV) each business day and are categorized as Level 1 in the hierarchy.
Changes in valuation techniques may result in transfers in or out of an assigned level within the disclosure hierarchy. The aggregate value of investments by input level as of October 31, 2022 is included at the end of the Fund's Schedule of Investments.
Foreign Currency. Certain Funds may use foreign currency contracts to facilitate transactions in foreign-denominated securities. Gains and losses from these transactions may arise from changes in the value of the foreign currency or if the counterparties do not perform under the contracts' terms.
Foreign-denominated assets, including investment securities, and liabilities are translated into U.S. dollars at the exchange rates at period end. Purchases and sales of investment securities, income and dividends received, and expenses denominated in foreign currencies are translated into U.S. dollars at the exchange rate in effect on the transaction date.
The effects of exchange rate fluctuations on investments are included with the net realized and unrealized gain (loss) on investment securities. Other foreign currency transactions resulting in realized and unrealized gain (loss) are disclosed separately.
Investment Transactions and Income. For financial reporting purposes, the Fund's investment holdings and NAV include trades executed through the end of the last business day of the period. The NAV per share for processing shareholder transactions is calculated as of the close of business of the New York Stock Exchange (NYSE), normally 4:00 p.m. Eastern time and includes trades executed through the end of the prior business day. Gains and losses on securities sold are determined on the basis of identified cost. Commissions paid to certain brokers with whom the investment adviser, or its affiliates, places trades on behalf of a fund include an amount in addition to trade execution, which may be rebated back to a fund. Any such rebates are included in net realized gain (loss) on investments in the Statement of Operations. Dividend income is recorded on the ex-dividend date, except for certain dividends from foreign securities where the ex-dividend date may have passed, which are recorded as soon as the Fund is informed of the ex-dividend date. Non-cash dividends included in dividend income, if any, are recorded at the fair market value of the securities received. Income and capital gain distributions from Fidelity Central Funds, if any, are recorded on the ex-dividend date. Certain distributions received by the Fund represent a return of capital or capital gain. The Fund determines the components of these distributions subsequent to the ex-dividend date, based upon receipt of tax filings or other correspondence relating to the underlying investment. These distributions are recorded as a reduction of cost of investments and/or as a realized gain. Investment income is recorded net of foreign taxes withheld where recovery of such taxes is uncertain. Funds may file withholding tax reclaims in certain jurisdictions to recover a portion of amounts previously withheld. Any withholding tax reclaims income is included in the Statement of Operations in dividends. Any receivables for withholding tax reclaims are included in the Statement of Assets and Liabilities in dividends receivable.
Expenses. Expenses directly attributable to a fund are charged to that fund. Expenses attributable to more than one fund are allocated among the respective funds on the basis of relative net assets or other appropriate methods. Expenses included in the accompanying financial statements reflect the expenses of that fund and do not include any expenses associated with any underlying mutual funds or exchange-traded funds. Although not included in a fund's expenses, a fund indirectly bears its proportionate share of these expenses through the net asset value of each underlying mutual fund or exchange-traded fund. Expense estimates are accrued in the period to which they relate and adjustments are made when actual amounts are known.
Income Tax Information and Distributions to Shareholders. Each year, the Fund intends to qualify as a regulated investment company under Subchapter M of the Internal Revenue Code, including distributing substantially all of its taxable income and realized gains. As a result, no provision for U.S. Federal income taxes is required. The Fund files a U.S. federal tax return, in addition to state and local tax returns as required. The Fund's federal income tax returns are subject to examination by the Internal Revenue Service (IRS) for a period of three fiscal years after they are filed. State and local tax returns may be subject to examination for an additional fiscal year depending on the jurisdiction. Foreign taxes are provided for based on the Fund's understanding of the tax rules and rates that exist in the foreign markets in which it invests.
Distributions are declared and recorded on the ex-dividend date. Income and capital gain distributions are determined in accordance with income tax regulations, which may differ from GAAP.
Capital accounts within the financial statements are adjusted for permanent book-tax differences. These adjustments have no impact on net assets or the results of operations. Capital accounts are not adjusted for temporary book-tax differences which will reverse in a subsequent period.
Book-tax differences are primarily due to foreign currency transactions, capital loss carryforwards and losses deferred due to wash sales.
As of period end, the cost and unrealized appreciation (depreciation) in securities, and derivatives if applicable, for federal income tax purposes were as follows:
| Gross unrealized appreciation | $42,841,196 |
| Gross unrealized depreciation | (19,350,304) |
| Net unrealized appreciation (depreciation) | $23,490,892 |
| Tax cost | $278,392,538 |
Capital loss carryforwards are only available to offset future capital gains of the Fund to the extent provided by regulations and may be limited. The capital loss carryforward information presented below, including any applicable limitation, is estimated as of fiscal period end and is subject to adjustment.
Short-term | $(140,458) |
| Total capital loss carryforward | $(140,458) |
4. Purchases and Sales of Investments.
Purchases and sales of securities, other than short-term securities and in-kind transactions, as applicable, are noted in the table below.
| | Purchases ($) | Sales ($) |
| Fidelity U.S. Low Volatility Equity Fund | 86,427,776 | 126,944,791 |
5. Fees and Other Transactions with Affiliates.
Management Fee. Fidelity Management & Research Company LLC (the investment adviser) and its affiliates provide the Fund with investment management related services for which the Fund pays a monthly management fee. The management fee is the sum of an individual fund fee rate that is based on an annual rate of .20% of the Fund's average net assets and an annualized group fee rate that averaged .23% during the period. The group fee rate is based upon the monthly average net assets of a group of registered investment companies with which the investment adviser has management contracts. The group fee rate decreases as assets under management increase and increases as assets under management decrease. For the reporting period, the total annualized management fee rate was .43% of the Fund's average net assets.
Transfer Agent Fees. Fidelity Investments Institutional Operations Company LLC (FIIOC), an affiliate of the investment adviser, is the Fund's transfer, dividend disbursing and shareholder servicing agent. FIIOC receives account fees and asset-based fees that vary according to account size and type of account. FIIOC pays for typesetting, printing and mailing of shareholder reports, except proxy statements. For the period, the transfer agent fees were equivalent to an annualized rate of .17% of average net assets.
Accounting Fees. Fidelity Service Company, Inc. (FSC), an affiliate of the investment adviser, maintains the Fund's accounting records. The accounting fee is based on the level of average net assets for each month. For the period, the fees were equivalent to the following annualized rates:
| | % of Average Net Assets |
| Fidelity U.S. Low Volatility Equity Fund | .04 |
Brokerage Commissions. A portion of portfolio transactions were placed with brokerage firms which are affiliates of the investment adviser. Brokerage commissions are included in net realized gain (loss) and change in net unrealized appreciation (depreciation) in the Statement of Operations. The commissions paid to these affiliated firms were as follows:
| | Amount |
| Fidelity U.S. Low Volatility Equity Fund | $ 2,045 |
Interfund Trades. Funds may purchase from or sell securities to other Fidelity Funds under procedures adopted by the Board. The procedures have been designed to ensure these interfund trades are executed in accordance with Rule 17a-7 of the 1940 Act. Any interfund trades are included within the respective purchases and sales amounts shown in the Purchases and Sales of Investments note. Any interfund trades are included within the respective purchases and sales amounts shown in the Purchases and Sales of Investments note. Interfund trades during the period are noted in the table below.
| | Purchases ($) | Sales ($) | Realized Gain (Loss) ($) |
| Fidelity U.S. Low Volatility Equity Fund | 157,554 | 4,075,005 | (1,178,898) |
6. Committed Line of Credit.
Certain Funds participate with other funds managed by the investment adviser or an affiliate in a $4.25 billion credit facility (the "line of credit") to be utilized for temporary or emergency purposes to fund shareholder redemptions or for other short-term liquidity purposes. The participating funds have agreed to pay commitment fees on their pro-rata portion of the line of credit, which are reflected in Miscellaneous expenses on the Statement of Operations, and are listed below. During the period, there were no borrowings on this line of credit.
| | Amount |
| Fidelity U.S. Low Volatility Equity Fund | $306 |
7. Security Lending.
Funds lend portfolio securities from time to time in order to earn additional income. Lending agents are used, including National Financial Services (NFS), an affiliate of the investment adviser. Pursuant to a securities lending agreement, NFS will receive a fee, which is capped at 9.9% of a fund's daily lending revenue, for its services as lending agent. A fund may lend securities to certain qualified borrowers, including NFS. On the settlement date of the loan, a fund receives collateral (in the form of U.S. Treasury obligations, letters of credit and/or cash) against the loaned securities and maintains collateral in an amount not less than 100% of the market value of the loaned securities during the period of the loan. The market value of the loaned securities is determined at the close of business of a fund and any additional required collateral is delivered to a fund on the next business day. A fund or borrower may terminate the loan at any time, and if the borrower defaults on its obligation to return the securities loaned because of insolvency or other reasons, a fund may apply collateral received from the borrower against the obligation. A fund may experience delays and costs in recovering the securities loaned. Any cash collateral received is invested in the Fidelity Securities Lending Cash Central Fund. Any loaned securities are identified as such in the Schedule of Investments, and the value of loaned securities and cash collateral at period end, as applicable, are presented in the Statement of Assets and Liabilities. Security lending income represents the income earned on investing cash collateral, less rebates paid to borrowers and any lending agent fees associated with the loan, plus any premium payments received for lending certain types of securities. Security lending income is presented in the Statement of Operations as a component of income from Fidelity Central Funds. Affiliated security lending activity, if any, was as follows:
| | Total Security Lending Fees Paid to NFS | Security Lending Income From Securities Loaned to NFS | Value of Securities Loaned to NFS at Period End |
| Fidelity U.S. Low Volatility Equity Fund | $385 | $- | $- |
8. Expense Reductions.
During the period the investment adviser or an affiliate reimbursed and/or waived a portion of operating expenses in the amount of $6,021.
9. Other.
A fund's organizational documents provide former and current trustees and officers with a limited indemnification against liabilities arising in connection with the performance of their duties to the fund. In the normal course of business, a fund may also enter into contracts that provide general indemnifications. A fund's maximum exposure under these arrangements is unknown as this would be dependent on future claims that may be made against a fund. The risk of material loss from such claims is considered remote.
At the end of the period, the following mutual funds managed by the investment adviser or its affiliates were the owners of record of 10% or more of the total outstanding shares.
| | VIP FundsManager 50% Portfolio | VIP FundsManager 60% Portfolio | VIP FundsManager 70% Portfolio |
| Fidelity U.S. Low Volatility Equity Fund | 31% | 39% | 12% |
Mutual funds managed by the investment adviser or its affiliates, in aggregate, were the owners of record of more than 20% of the total outstanding shares.
| Fund | % of shares held |
| Fidelity U.S. Low Volatility Equity Fund | 94% |
10. Risk and Uncertainties.
Many factors affect a fund's performance. Developments that disrupt global economies and financial markets, such as pandemics, epidemics, outbreaks of infectious diseases, war, terrorism, and environmental disasters, may significantly affect a fund's investment performance. The effects of these developments to a fund will be impacted by the types of securities in which a fund invests, the financial condition, industry, economic sector, and geographic location of an issuer, and a fund's level of investment in the securities of that issuer.
As a shareholder, you incur two types of costs: (1) transaction costs, which may include sales charges (loads) on purchase payments or redemption proceeds, as applicable and (2) ongoing costs, which generally include management fees, distribution and/or service (12b-1) fees and other Fund expenses. This Example is intended to help you understand your ongoing costs (in dollars) of investing in a fund and to compare these costs with the ongoing costs of investing in other mutual funds.
| The Example is based on an investment of $1,000 invested at the beginning of the period and held for the entire period (May 1, 2022 to October 31, 2022). |
Actual Expenses
The first line of the accompanying table provides information about actual account values and actual expenses. You may use the information in this line, together with the amount you invested, to estimate the expenses that you paid over the period. Simply divide your account value by $1,000.00 (for example, an $8,600 account value divided by $1,000.00 = 8.6), then multiply the result by the number in the first line for a class/Fund under the heading entitled "Expenses Paid During Period" to estimate the expenses you paid on your account during this period. If any fund is a shareholder of any underlying mutual funds or exchange-traded funds (ETFs) (the Underlying Funds), such fund indirectly bears its proportional share of the expenses of the Underlying Funds in addition to the direct expenses incurred presented in the table. These fees and expenses are not included in the annualized expense ratio used to calculate the expense estimate in the table below.
Hypothetical Example for Comparison Purposes
The second line of the accompanying table provides information about hypothetical account values and hypothetical expenses based on the actual expense ratio and an assumed rate of return of 5% per year before expenses, which is not the actual return. The hypothetical account values and expenses may not be used to estimate the actual ending account balance or expenses you paid for the period. You may use this information to compare the ongoing costs of investing in the Fund and other funds. To do so, compare this 5% hypothetical example with the 5% hypothetical examples that appear in the shareholder reports of the other funds. If any fund is a shareholder of any Underlying Funds, such fund indirectly bears its proportional share of the expenses of the Underlying Funds in addition to the direct expenses as presented in the table. These fees and expenses are not included in the annualized expense ratio used to calculate the expense estimate in the table below.
Please note that the expenses shown in the table are meant to highlight your ongoing costs only and do not reflect any transaction costs. Therefore, the second line of the table is useful in comparing ongoing costs only, and will not help you determine the relative total costs of owning different funds. In addition, if these transactional costs were included, your costs would have been higher.
| | | | | Annualized Expense Ratio- A | | Beginning Account Value May 1, 2022 | | Ending Account Value October 31, 2022 | | Expenses Paid During Period- C May 1, 2022 to October 31, 2022 |
| | | | | | | | | | |
| Fidelity® U.S. Low Volatility Equity Fund | | | | .66% | | | | | | |
| Actual | | | | | | $ 1,000 | | $ 970.00 | | $ 3.28 |
Hypothetical- B | | | | | | $ 1,000 | | $ 1,021.88 | | $ 3.36 |
| |
A Annualized expense ratio reflects expenses net of applicable fee waivers.
B 5% return per year before expenses
C Expenses are equal to the annualized expense ratio, multiplied by the average account value over the period, multiplied by 184/ 365 (to reflect the one-half year period). The fees and expenses of any Underlying Funds are not included in each annualized expense ratio.
Fidelity U.S. Low Volatility Equity Fund
Each year, the Board of Trustees, including the Independent Trustees (together, the Board), votes on the renewal of the management contract with Fidelity Management & Research Company LLC (FMR) and the sub-advisory agreements (together, the Advisory Contracts) for the fund. FMR and the sub-advisers are referred to herein as the Investment Advisers. The Board, assisted by the advice of fund counsel and Independent Trustees' counsel, requests and considers a broad range of information relevant to the renewal of the Advisory Contracts throughout the year.
The Board meets regularly and, at each of its meetings, covers an extensive agenda of topics and materials and considers factors that are relevant to its annual consideration of the renewal of the fund's Advisory Contracts, including the services and support provided to the fund and its shareholders. The Board has established various standing committees (Committees), each composed of and chaired by Independent Trustees with varying backgrounds, to which the Board has assigned specific subject matter responsibilities in order to enhance effective decision-making by the Board. The Board, acting directly and through its Committees, requests and receives information concerning the annual consideration of the renewal of the fund's Advisory Contracts. The Board also meets as needed to review matters specifically related to the Board's annual consideration of the renewal of the Advisory Contracts. Members of the Board may also meet with trustees of other Fidelity funds through joint ad hoc committees to discuss certain matters relevant to all of the Fidelity funds.
At its May 2022 meeting, the Board unanimously determined to renew the fund's Advisory Contracts. In reaching its determination, the Board considered all factors it believed relevant, including (i) the nature, extent, and quality of the services provided to the fund and its shareholders (including the investment performance of the fund); (ii) the competitiveness relative to peer funds of the fund's management fee and total expense ratio; (iii) the total costs of the services provided by and the profits realized by Fidelity from its relationships with the fund; and (iv) the extent to which, if any, economies of scale exist and are realized as the fund grows, and whether any economies of scale are appropriately shared with fund shareholders.
In considering whether to renew the Advisory Contracts for the fund, the Board reached a determination, with the assistance of fund counsel and Independent Trustees' counsel and through the exercise of its business judgment, that the renewal of the Advisory Contracts was in the best interests of the fund and its shareholders and that the compensation payable under the Advisory Contracts was fair and reasonable. The Board's decision to renew the Advisory Contracts was not based on any single factor, but rather was based on a comprehensive consideration of all the information provided to the Board at its meetings throughout the year. The Board, in reaching its determination to renew the Advisory Contracts, was aware that shareholders of the fund have a broad range of investment choices available to them, including a wide choice among funds offered by Fidelity's competitors, and that the fund's shareholders, who have the opportunity to review and weigh the disclosure provided by the fund in its prospectus and other public disclosures, have chosen to invest in this fund, which is part of the Fidelity family of funds.
Nature, Extent, and Quality of Services Provided . The Board considered Fidelity's staffing as it relates to the fund, including the backgrounds of investment personnel of Fidelity, and also considered the fund's investment objective, strategies, and related investment philosophy. The Independent Trustees also had discussions with senior management of Fidelity's investment operations and investment groups. The Board considered the structure of the investment personnel compensation program and whether this structure provides appropriate incentives to act in the best interests of the fund. Additionally, the Board considered the portfolio managers' investments, if any, in the funds that they manage. The Board also considered the steps Fidelity had taken to ensure the continued provision of high quality services to the Fidelity funds during the COVID-19 pandemic, including the expansion of staff in client facing positions to maintain service levels in periods of high volumes and volatility.
Resources Dedicated to Investment Management and Support Services . The Board and the Fund Oversight and Research Committees reviewed the general qualifications and capabilities of Fidelity's investment staff, including its size, education, experience, and resources, as well as Fidelity's approach to recruiting, training, managing, and compensating investment personnel. The Board noted the resources devoted to expansion of Fidelity's global investment organization, and that Fidelity's analysts have extensive resources, tools, and capabilities that allow them to conduct sophisticated quantitative and fundamental analysis, as well as credit analysis of issuers, counterparties, and guarantors. Further, the Board considered that Fidelity's investment professionals have sufficient access to global information and data so as to provide competitive investment results over time, and that those professionals also have access to sophisticated tools that permit them to assess portfolio construction and risk and performance attribution characteristics continuously, as well as to transmit new information and research conclusions rapidly around the world. Additionally, in its deliberations, the Board considered Fidelity's trading, risk management, compliance, and technology and operations capabilities and resources, which are integral parts of the investment management process.
Shareholder and Administrative Services . The Board considered (i) the nature, extent, quality, and cost of advisory, administrative, and shareholder services performed by the Investment Advisers and their affiliates under the Advisory Contracts and under separate agreements covering transfer agency, pricing and bookkeeping, and securities lending services for the fund; (ii) the nature and extent of the supervision of third party service providers, principally custodians, subcustodians, and pricing vendors; and (iii) the resources devoted to, and the record of compliance with, the fund's compliance policies and procedures. The Board also reviewed the allocation of fund brokerage, including allocations to brokers affiliated with the Investment Advisers, the use of brokerage commissions to pay fund expenses, and the use of "soft" commission dollars to pay for research services.
The Board noted that the growth of fund assets over time across the complex allows Fidelity to reinvest in the development of services designed to enhance the value and convenience of the Fidelity funds as investment vehicles. These services include 24-hour access to account information and market information over the Internet and through telephone representatives, investor education materials, and asset allocation tools. The Board also considered that it reviews customer service metrics such as telephone response times, continuity of services on the website and metrics addressing services at Fidelity Investor Centers.
Investment in a Large Fund Family . The Board considered the benefits to shareholders of investing in a Fidelity fund, including the benefits of investing in a fund that is part of a large family of funds offering a variety of investment disciplines and providing a large variety of mutual fund investor services. The Board noted that Fidelity had taken, or had made recommendations that resulted in the Fidelity funds taking, a number of actions over the previous year that benefited particular funds, including: (i) continuing to dedicate additional resources to Fidelity's investment research process, which includes meetings with management of issuers of securities in which the funds invest; (ii) continuing efforts to enhance Fidelity's global research capabilities; (iii) launching new funds and ETFs with innovative structures, strategies and pricing and making other enhancements to meet client needs; (iv) launching new share classes of existing funds; (v) eliminating purchase minimums and broadening eligibility requirements for certain funds and share classes; (vi) reducing management fees and total expenses for certain target date funds and classes and index funds; (vii) lowering expenses for certain existing funds and classes by implementing or lowering expense caps; (viii) rationalizing product lines and gaining increased efficiencies from fund mergers and liquidations; (ix) continuing to develop, acquire and implement systems and technology to improve services to the funds and shareholders, strengthen information security, and increase efficiency; and (x) continuing to implement enhancements to further strengthen Fidelity's product line to increase investors' probability of success in achieving their investment goals, including retirement income goals.
Investment Performance . The Board considered whether the fund has operated in accordance with its investment objective, as well as its record of compliance with its investment restrictions and performance history.
The Board took into account discussions that occur at Board meetings throughout the year with representatives of the Investment Advisers about fund investment performance. In this regard the Board noted that as part of regularly scheduled fund reviews and other reports to the Board on fund performance, the Board considers annualized return information for the fund for different time periods, measured against an appropriate securities market index (benchmark index). The Board also reviews and considers information about performance attribution. In its evaluation of fund investment performance, the Board gave particular attention to information indicating changes in performance certain Fidelity funds for specific time periods and discussed with the Investment Advisers the reasons for any overperformance or underperformance.
In addition to reviewing absolute and relative fund performance, the Independent Trustees periodically consider the appropriateness of fund performance metrics in evaluating the results achieved. In general, the Independent Trustees believe that fund performance should be evaluated based on net performance (after fees and expenses) of the fund compared to appropriate benchmark indices, over appropriate time periods that may include full market cycles, and compared to peer groups, as applicable, over the same periods, taking into account relevant factors including the following: general market conditions; issuer-specific information; and fund cash flows and other factors.
The Independent Trustees recognize that shareholders evaluate performance on a net basis over their own holding periods, for which one-, three-, and five-year periods are often used as a proxy. For this reason, the performance information reviewed by the Board also included net total return information for the fund and an appropriate benchmark index for the most recent one-year period ended September 30, 2021, as shown below. A peer group is not shown below because the fund does not generally utilize a peer group for performance comparison purposes.
Fidelity U.S. Low Volatility Equity Fund
Based on its review, the Board concluded that the nature, extent, and quality of services provided to the fund under the Advisory Contracts should continue to benefit the shareholders of the fund.
Competitiveness of Management Fee and Total Expense Ratio . The Board considered the fund's management fee and total expense ratio compared to "mapped groups" of competitive funds and classes created for the purpose of facilitating the Trustees' competitive analysis of management fees and total expenses. Fidelity creates "mapped groups" by combining similar Lipper investment objective categories that have comparable investment mandates. Combining Lipper investment objective categories aids the Board's management fee and total expense ratio comparisons by broadening the competitive group used for comparison.
Management Fee . The Board considered two proprietary management fee comparisons for the 12-month (or shorter) periods ended September 30 shown in basis points (BP) in the chart below. The group of Lipper funds used by the Board for management fee comparisons is referred to below as the "Total Mapped Group." The Total Mapped Group comparison focuses on a fund's standing in terms of gross management fees before expense reimbursements or caps relative to the total universe of funds with comparable investment mandates, regardless of whether their management fee structures also are comparable. Funds with comparable investment mandates offer exposure to similar types of securities. Funds with comparable management fee structures have similar management fee contractual arrangements (e.g., flat rate charged for advisory services, all-inclusive fee rate, etc.). "TMG %" represents the percentage of funds in the Total Mapped Group that had management fees that were lower than the fund's. For example, a hypothetical TMG % of 20% would mean that 80% of the funds in the Total Mapped Group had higher, and 20% had lower, management fees than the fund. The fund's actual TMG %s and the number of funds in the Total Mapped Group are in the chart below. The "Asset-Sized Peer Group" (ASPG) comparison focuses on a fund's standing relative to a subset of non-Fidelity funds within the Total Mapped Group that are similar in size and management fee structure. For example, if a fund is in the first quartile of the ASPG, the fund's management fee ranks in the least expensive or lowest 25% of funds in the ASPG. The ASPG represents at least 15% of the funds in the Total Mapped Group with comparable asset size and management fee structures, subject to a minimum of 50 funds (or all funds in the Total Mapped Group if fewer than 50). Additional information, such as the ASPG quartile in which the fund's management fee rate ranked, is also included in the chart and was considered by the Board.
Fidelity U.S. Low Volatility Equity Fund
The Board noted that the fund's management fee rate ranked below the median of its Total Mapped Group and below the median of its ASPG for 12-month period ended September 30, 2021.
The Board also considered that, for funds subject to the group fee, FMR agreed to voluntarily waive fees over a specified period of time in amounts designed to account for assets converted from certain funds to certain collective investment trusts.
Based on its review, the Board concluded that the fund's management fee is fair and reasonable in light of the services that the fund receives and the other factors considered.
Total Expense Ratio . In its review of the fund's total expense ratio, the Board considered the fund's management fee rate as well as other fund expenses, such as transfer agent fees, pricing and bookkeeping fees, and custodial, legal, and audit fees. The Board also noted that Fidelity may agree to waive fees or reimburse expenses from time to time, and the extent to which, if any, it has done so for the fund. The fund is compared to those funds and classes in the Total Mapped Group (used by the Board for management fee comparisons) that have a similar sales load structure The Board also considered a total expense ASPG comparison for the fund, which focuses on the total expenses of the fund relative to a subset of non-Fidelity funds within the total expense similar sales load structure group. The total expense ASPG is limited to 15 larger and 15 smaller classes in fund average assets for a total of 30 classes, where possible. The total expense ASPG comparison excludes performance adjustments and fund-paid 12b-1 fees to eliminate variability in fee structures.
The Board noted that the fund's total net expense ratio ranked below the similar sales load structure competitive median and below the ASPG competitive median for the 12-month period ended September 30, 2021.
The Board further considered that FMR has contractually agreed to reimburse the fund to the extent that total operating expenses, with certain exceptions, as a percentage of its average net assets, exceed 0.80% through August 31, 2022.
Fees Charged to Other Fidelity Clients . The Board also considered Fidelity fee structures and other information with respect to clients of Fidelity, such as other funds advised or subadvised by Fidelity, pension plan clients, and other institutional clients with similar mandates. The Board noted that a joint ad hoc committee created by it and the boards of other Fidelity funds periodically reviews and compares Fidelity's institutional investment advisory business with its business of providing services to the Fidelity funds and also noted the most recent findings of the committee. The Board noted that the committee's review included a consideration of the differences in services provided, fees charged, and costs incurred, as well as competition in the markets serving the different categories of clients.
Based on its review of total expense ratios and fees charged to other Fidelity clients, the Board concluded that the fund's total expense ratio was reasonable in light of the services that the fund and its shareholders receive and the other factors considered.
Costs of the Services and Profitability . The Board considered the revenues earned and the expenses incurred by Fidelity in conducting the business of developing, marketing, distributing, managing, administering and servicing the Fidelity funds and servicing the Fidelity funds' shareholders. The Board also considered the level of Fidelity's profits in respect of all the Fidelity funds.
On an annual basis, Fidelity presents to the Board information about the profitability of its relationships with the Fidelity funds. Fidelity calculates profitability information for each Fidelity fund, as well as aggregate profitability information for groups of Fidelity funds and all Fidelity funds, using a series of detailed revenue and cost allocation methodologies which originate with the books and records of Fidelity on which Fidelity's audited financial statements are based. The Audit Committee of the Board reviews any significant changes from the prior year's methodologies and the full Board approves such changes.
A public accounting firm has been engaged annually by the Board as part of the Board's assessment of Fidelity's profitability analysis. The engagement includes the review and assessment of the methodologies used by Fidelity in determining the revenues and expenses attributable to Fidelity's mutual fund business, and completion of agreed-upon procedures in respect of the mathematical accuracy of certain fund profitability information and its conformity to established allocation methodologies. After considering the reports issued under the engagement and information provided by Fidelity, the Board concluded that while other allocation methods may also be reasonable, Fidelity's profitability methodologies are reasonable in all material respects.
The Board also reviewed Fidelity's non-fund businesses and potential indirect benefits such businesses may have received as a result of their association with Fidelity's mutual fund business (i.e., fall-out benefits) as well as cases where Fidelity's affiliates may benefit from the funds' business. The Board considered areas where potential indirect benefits to the Fidelity funds from their relationships with Fidelity may exist. The Board's consideration of these matters was informed by the findings of a joint ad hoc committee created by it and the boards of other Fidelity funds to evaluate potential fall-out benefits.
The Board considered the costs of the services provided by and the profits realized by Fidelity in connection with the operation of the Fidelity funds and was satisfied that the profitability was not excessive.
Economies of Scale . The Board considered whether there have been economies of scale in respect of the management of the Fidelity funds, whether the Fidelity funds (including the fund) have appropriately benefited from any such economies of scale, and whether there is potential for realization of any further economies of scale. The Board considered the extent to which the fund will benefit from economies of scale as assets grow through increased services to the fund, through waivers or reimbursements, or through fee or expense ratio reductions. The Board also noted that a committee (the Economies of Scale Committee) created by it and the boards of other Fidelity funds periodically analyzes whether Fidelity attains economies of scale in respect of the management and servicing of the Fidelity funds, whether the Fidelity funds have appropriately benefited from such economies of scale, and whether there is potential for realization of any further economies of scale.
The Board recognized that the fund's management contract incorporates a "group fee" structure, which provides for lower group fee rates as total "group assets" increase, and for higher group fee rates as total "group assets" decrease ("group assets" as defined in the management contract). FMR calculates the group fee rates based on a tiered asset "breakpoint" schedule that varies based on asset class. The Board considered that the group fee is designed to deliver the benefits of economies of scale to fund shareholders when total Fidelity fund assets increase, even if assets of any particular fund are unchanged or have declined, because some portion of Fidelity's costs are attributable to services provided to all Fidelity funds, and all funds benefit if those costs can be allocated among more assets. The Board further considered that Fidelity agreed to impose a temporary fee waiver in the form of additional breakpoints to the current breakpoint schedule. The Board concluded that, given the group fee structure, fund shareholders will benefit from lower management fees as "group assets" increase at the fund complex level, regardless of whether Fidelity achieves any such economies of scale.
The Board concluded, taking into account the analysis of the Economies of Scale Committee, that economies of scale, if any, are being appropriately shared between fund shareholders and Fidelity.
Additional Information Requested by the Board . In order to develop fully the factual basis for consideration of the Fidelity funds' advisory contracts, the Board requested and received additional information on certain topics, including: (i) fund flow and performance trends, in particular the underperformance of certain funds and strategies, and Fidelity's long-term strategies for certain funds, including any consideration of fund liquidations or mergers; (ii) the operation of performance fees, competitor use of performance fees, and consideration of the expansion of performance fees to additional funds; (iii) Fidelity's pricing philosophy compared to competitors; (iv) fund profitability methodology and data; (v) evaluation of competitive fund data and peer group classifications and fee and expense comparisons; (vi) the management fee and expense structures for different funds and classes and information about the differences between various fee and expense structures; (vii) group fee breakpoints and related voluntary fee waivers; and (viii) information regarding other accounts managed by Fidelity and the funds' sub-advisory arrangements.
Based on its evaluation of all of the conclusions noted above, and after considering all factors it believed relevant, the Board concluded that the advisory fee arrangements are fair and reasonable and that the fund's Advisory Contracts should be renewed.
1.9896229.102
USL-SANN-1222
Fidelity® SAI High Income Fund
Semi-Annual Report
October 31, 2022
Offered exclusively to certain clients of the Adviser, or its affiliates, including Strategic Advisers LLC (Strategic Advisers) - not available for sale to the general public. Fidelity ® SAI is a product name of Fidelity ® funds dedicated to certain programs affiliated with Strategic Advisers.
Contents
To view a fund's proxy voting guidelines and proxy voting record for the 12-month period ended June 30, visit http://www.fidelity.com/proxyvotingresults or visit the Securities and Exchange Commission's (SEC) web site at http://www.sec.gov.
You may also call 1-800-544-3455 to request a free copy of the proxy voting guidelines.
Standard & Poor's, S&P and S&P 500 are registered service marks of The McGraw-Hill Companies, Inc. and have been licensed for use by Fidelity Distributors Corporation.
Other third-party marks appearing herein are the property of their respective owners.
All other marks appearing herein are registered or unregistered trademarks or service marks of FMR LLC or an affiliated company. © 2022 FMR LLC. All rights reserved.
This report and the financial statements contained herein are submitted for the general information of the shareholders of the Fund. This report is not authorized for distribution to prospective investors in the Fund unless preceded or accompanied by an effective prospectus.
A fund files its complete schedule of portfolio holdings with the SEC for the first and third quarters of each fiscal year on Form N-PORT. Forms N-PORT are available on the SEC's web site at http://www.sec.gov. A fund's Forms N-PORT may be reviewed and copied at the SEC's Public Reference Room in Washington, DC. Information regarding the operation of the SEC's Public Reference Room may be obtained by calling 1-800-SEC-0330.
For a complete list of a fund's portfolio holdings, view the most recent holdings listing, semiannual report, or annual report on Fidelity's web site at http://www.fidelity.com, http://www.institutional.fidelity.com, or http://www.401k.com, as applicable.
NOT FDIC INSURED •MAY LOSE VALUE •NO BANK GUARANTEE
Neither the Fund nor Fidelity Distributors Corporation is a bank.
| Top Bond Issuers (% of Fund's net assets) |
(with maturities greater than one year) |
| New Fortress Energy, Inc. | 2.9 | |
| Mesquite Energy, Inc. | 2.4 | |
| Uniti Group LP / Uniti Group Finance, Inc. | 2.3 | |
| Tenet Healthcare Corp. | 1.9 | |
| Tallgrass Energy Partners LP / Tallgrass Energy Finance Corp. | 1.8 | |
| Southeastern Grocers, Inc. | 1.7 | |
| CCO Holdings LLC/CCO Holdings Capital Corp. | 1.6 | |
| Community Health Systems, Inc. | 1.6 | |
| Icahn Enterprises LP/Icahn Enterprises Finance Corp. | 1.4 | |
| Crestwood Midstream Partners LP/Crestwood Midstream Finance Corp. | 1.3 | |
| | 18.9 | |
| |
| Market Sectors (% of Fund's net assets) |
| |
| Energy | 16.7 | |
| Telecommunications | 8.9 | |
| Healthcare | 8.0 | |
| Services | 6.2 | |
| Technology | 5.9 | |
| |
Quality Diversification (% of Fund's net assets) |
|
| |
| We have used ratings from Moody's Investors Service, Inc. Where Moody's® ratings are not available, we have used S&P® ratings. All ratings are as of the date indicated and do not reflect subsequent changes. |
Asset Allocation (% of Fund's net assets) |
|
Foreign investments - 17.8% |
|
Geographic Diversification (% of Fund's net assets) |
|
* Includes Short-Term investments and Net Other Assets (Liabilities). Percentages are based on country or territory of incorporation and are adjusted for the effect of futures contracts, if applicable. |
| |
Showing Percentage of Net Assets
| Corporate Bonds - 83.0% |
| | | Principal Amount (a) | Value ($) |
| Convertible Bonds - 2.9% | | | |
| Broadcasting - 1.2% | | | |
| DISH Network Corp.: | | | |
| 2.375% 3/15/24 | | 9,045,000 | 8,203,815 |
| 3.375% 8/15/26 | | 16,374,000 | 11,322,621 |
| | | | 19,526,436 |
| Energy - 1.7% | | | |
| Mesquite Energy, Inc. 15% 7/15/23 (b)(c) | | 1,610,553 | 9,547,036 |
| Mesquite Energy, Inc. 15% 7/15/23 (b)(c) | | 2,784,113 | 16,503,665 |
| | | | 26,050,701 |
TOTAL CONVERTIBLE BONDS | | | 45,577,137 |
| Nonconvertible Bonds - 80.1% | | | |
| Aerospace - 2.2% | | | |
| ATI, Inc.: | | | |
| 4.875% 10/1/29 | | 2,015,000 | 1,694,261 |
| 5.875% 12/1/27 | | 4,788,000 | 4,351,985 |
| Bombardier, Inc. 7.875% 4/15/27 (d) | | 5,710,000 | 5,422,958 |
| BWX Technologies, Inc. 4.125% 6/30/28 (d) | | 4,790,000 | 4,191,250 |
| Kaiser Aluminum Corp.: | | | |
| 4.5% 6/1/31 (d) | | 1,680,000 | 1,317,960 |
| 4.625% 3/1/28 (d) | | 4,630,000 | 4,050,324 |
| Moog, Inc. 4.25% 12/15/27 (d) | | 960,000 | 859,066 |
| TransDigm, Inc.: | | | |
| 4.625% 1/15/29 | | 4,390,000 | 3,738,217 |
| 5.5% 11/15/27 | | 4,520,000 | 4,090,600 |
| 6.25% 3/15/26 (d) | | 595,000 | 586,914 |
| 7.5% 3/15/27 | | 1,925,000 | 1,896,857 |
| 8% 12/15/25 (d) | | 1,985,000 | 2,019,738 |
| | | | 34,220,130 |
| Air Transportation - 0.1% | | | |
| American Airlines, Inc. / AAdvantage Loyalty IP Ltd. 5.5% 4/20/26 (d) | | 1,955,000 | 1,861,789 |
| Automotive & Auto Parts - 0.4% | | | |
| Ford Motor Credit Co. LLC: | | | |
| 2.9% 2/10/29 | | 4,310,000 | 3,380,559 |
| 3.815% 11/2/27 | | 3,500,000 | 3,006,331 |
| | | | 6,386,890 |
| Banks & Thrifts - 0.1% | | | |
| Jane Street Group LLC/JSG Finance, Inc. 4.5% 11/15/29 (d) | | 2,015,000 | 1,780,978 |
| Broadcasting - 1.1% | | | |
| Diamond Sports Group LLC/Diamond Sports Finance Co. 5.375% 8/15/26 (d) | | 12,645,000 | 2,529,000 |
| Sinclair Television Group, Inc. 5.5% 3/1/30 (d) | | 335,000 | 250,503 |
| Sirius XM Radio, Inc.: | | | |
| 4% 7/15/28 (d) | | 4,490,000 | 3,859,951 |
| 4.125% 7/1/30 (d) | | 1,555,000 | 1,272,439 |
| 5.5% 7/1/29 (d) | | 620,000 | 571,826 |
| TEGNA, Inc.: | | | |
| 4.625% 3/15/28 | | 3,285,000 | 3,126,893 |
| 5% 9/15/29 | | 1,395,000 | 1,322,597 |
| Univision Communications, Inc.: | | | |
| 4.5% 5/1/29 (d) | | 1,735,000 | 1,460,662 |
| 6.625% 6/1/27 (d) | | 3,185,000 | 3,145,188 |
| | | | 17,539,059 |
| Building Materials - 0.6% | | | |
| Advanced Drain Systems, Inc. 5% 9/30/27 (d) | | 2,550,000 | 2,364,462 |
| Builders FirstSource, Inc. 4.25% 2/1/32 (d) | | 3,750,000 | 3,000,750 |
| SRS Distribution, Inc.: | | | |
| 4.625% 7/1/28 (d) | | 2,715,000 | 2,383,879 |
| 6% 12/1/29 (d) | | 2,595,000 | 2,115,833 |
| | | | 9,864,924 |
| Cable/Satellite TV - 3.7% | | | |
| CCO Holdings LLC/CCO Holdings Capital Corp.: | | | |
| 4.25% 2/1/31 (d) | | 5,510,000 | 4,352,900 |
| 4.25% 1/15/34 (d) | | 725,000 | 532,875 |
| 4.5% 8/15/30 (d) | | 5,705,000 | 4,629,950 |
| 4.5% 5/1/32 | | 7,039,000 | 5,560,810 |
| 4.5% 6/1/33 (d) | | 6,515,000 | 4,940,394 |
| 4.75% 3/1/30 (d) | | 4,700,000 | 3,949,880 |
| 4.75% 2/1/32 (d) | | 725,000 | 580,034 |
| CSC Holdings LLC: | | | |
| 4.125% 12/1/30 (d) | | 3,395,000 | 2,671,084 |
| 4.5% 11/15/31 (d) | | 745,000 | 579,442 |
| 4.625% 12/1/30 (d) | | 6,930,000 | 4,988,023 |
| 5.375% 2/1/28 (d) | | 3,690,000 | 3,404,025 |
| 5.75% 1/15/30 (d) | | 2,120,000 | 1,621,800 |
| 7.5% 4/1/28 (d) | | 2,580,000 | 2,235,235 |
| Dolya Holdco 18 DAC 5% 7/15/28 (d) | | 1,585,000 | 1,349,470 |
| Radiate Holdco LLC/Radiate Financial Service Ltd.: | | | |
| 4.5% 9/15/26 (d) | | 4,020,000 | 3,396,900 |
| 6.5% 9/15/28 (d) | | 5,430,000 | 3,420,900 |
| Telenet Finance Luxembourg Notes SARL 5.5% 3/1/28 (d) | | 4,400,000 | 3,826,240 |
| Ziggo Bond Co. BV 5.125% 2/28/30 (d) | | 3,720,000 | 2,947,802 |
| Ziggo BV 4.875% 1/15/30 (d) | | 1,730,000 | 1,461,850 |
| | | | 56,449,614 |
| Capital Goods - 0.8% | | | |
| Mueller Water Products, Inc. 4% 6/15/29 (d) | | 2,785,000 | 2,414,929 |
| Vertical Holdco GmbH 7.625% 7/15/28 (d) | | 3,810,000 | 3,149,060 |
| Vertical U.S. Newco, Inc. 5.25% 7/15/27 (d) | | 6,595,000 | 5,910,769 |
| | | | 11,474,758 |
| Chemicals - 3.9% | | | |
| CVR Partners LP 6.125% 6/15/28 (d) | | 3,455,000 | 3,125,946 |
| Element Solutions, Inc. 3.875% 9/1/28 (d) | | 3,615,000 | 3,072,750 |
| Kronos Acquisition Holdings, Inc. / KIK Custom Products, Inc.: | | | |
| 5% 12/31/26 (d) | | 4,550,000 | 4,124,439 |
| 7% 12/31/27 (d) | | 1,040,000 | 873,600 |
| LSB Industries, Inc. 6.25% 10/15/28 (d) | | 4,590,000 | 4,167,215 |
| Methanex Corp.: | | | |
| 5.125% 10/15/27 | | 3,705,000 | 3,362,584 |
| 5.65% 12/1/44 | | 2,410,000 | 1,656,875 |
| NOVA Chemicals Corp.: | | | |
| 4.25% 5/15/29 (d) | | 3,365,000 | 2,743,040 |
| 4.875% 6/1/24 (d) | | 1,735,000 | 1,687,288 |
| 5% 5/1/25 (d) | | 250,000 | 238,098 |
| 5.25% 6/1/27 (d) | | 4,930,000 | 4,400,419 |
| Nufarm Australia Ltd. 5% 1/27/30 (d) | | 4,635,000 | 3,920,793 |
| Olympus Water U.S. Holding Corp.: | | | |
| 4.25% 10/1/28 (d) | | 4,620,000 | 3,750,576 |
| 6.25% 10/1/29 (d) | | 4,505,000 | 3,119,510 |
| SCIL IV LLC / SCIL U.S.A. Holdings LLC 5.375% 11/1/26 (d) | | 3,235,000 | 2,571,825 |
| The Chemours Co. LLC: | | | |
| 4.625% 11/15/29 (d) | | 6,160,000 | 4,804,800 |
| 5.375% 5/15/27 | | 1,160,000 | 1,038,687 |
| 5.75% 11/15/28 (d) | | 10,225,000 | 8,686,138 |
| W.R. Grace Holding LLC 5.625% 8/15/29 (d) | | 4,430,000 | 3,424,301 |
| | | | 60,768,884 |
| Consumer Products - 0.3% | | | |
| Mattel, Inc.: | | | |
| 3.375% 4/1/26 (d) | | 455,000 | 415,013 |
| 3.75% 4/1/29 (d) | | 4,320,000 | 3,727,955 |
| | | | 4,142,968 |
| Containers - 0.7% | | | |
| Graphic Packaging International, Inc. 3.75% 2/1/30 (d) | | 1,325,000 | 1,139,182 |
| Sealed Air Corp. 5% 4/15/29 (d) | | 3,940,000 | 3,593,871 |
| Trivium Packaging Finance BV: | | | |
| 5.5% 8/15/26 (d) | | 2,400,000 | 2,203,044 |
| 8.5% 8/15/27 (d) | | 4,095,000 | 3,850,495 |
| | | | 10,786,592 |
| Diversified Financial Services - 3.2% | | | |
| Coinbase Global, Inc.: | | | |
| 3.375% 10/1/28 (d) | | 6,405,000 | 4,186,390 |
| 3.625% 10/1/31 (d) | | 7,085,000 | 4,195,302 |
| Hightower Holding LLC 6.75% 4/15/29 (d) | | 4,525,000 | 3,683,927 |
| Icahn Enterprises LP/Icahn Enterprises Finance Corp.: | | | |
| 4.375% 2/1/29 | | 5,140,000 | 4,291,232 |
| 5.25% 5/15/27 | | 13,865,000 | 12,773,131 |
| 6.25% 5/15/26 | | 5,530,000 | 5,322,625 |
| Ladder Capital Finance Holdings LLLP/Ladder Capital Finance Corp. 4.75% 6/15/29 (d) | | 2,550,000 | 2,029,719 |
| OneMain Finance Corp.: | | | |
| 3.5% 1/15/27 | | 5,220,000 | 4,281,223 |
| 3.875% 9/15/28 | | 7,518,000 | 5,854,267 |
| 7.125% 3/15/26 | | 3,425,000 | 3,305,125 |
| | | | 49,922,941 |
| Diversified Media - 0.5% | | | |
| Advantage Sales & Marketing, Inc. 6.5% 11/15/28 (d) | | 6,915,000 | 5,882,314 |
| Terrier Media Buyer, Inc. 8.875% 12/15/27 (d) | | 1,490,000 | 1,262,775 |
| | | | 7,145,089 |
| Energy - 12.7% | | | |
| Altus Midstream LP 5.875% 6/15/30 (d) | | 2,270,000 | 2,129,654 |
| Apache Corp. 4.25% 1/15/30 | | 1,575,000 | 1,401,300 |
| Atlantica Sustainable Infrastructure PLC 4.125% 6/15/28 (d) | | 4,200,000 | 3,559,500 |
| Citgo Petroleum Corp. 6.375% 6/15/26 (d) | | 4,810,000 | 4,737,177 |
| CNX Resources Corp. 7.375% 1/15/31 (d) | | 855,000 | 848,733 |
| Colgate Energy Partners III LLC: | | | |
| 5.875% 7/1/29 (d) | | 3,025,000 | 2,805,688 |
| 7.75% 2/15/26 (d) | | 1,150,000 | 1,143,918 |
| Comstock Resources, Inc.: | | | |
| 5.875% 1/15/30 (d) | | 2,175,000 | 1,962,764 |
| 6.75% 3/1/29 (d) | | 3,515,000 | 3,365,613 |
| Crestwood Midstream Partners LP/Crestwood Midstream Finance Corp.: | | | |
| 5.625% 5/1/27 (d) | | 11,785,000 | 11,084,698 |
| 5.75% 4/1/25 | | 1,685,000 | 1,642,875 |
| 6% 2/1/29 (d) | | 8,235,000 | 7,700,549 |
| CrownRock LP/CrownRock Finance, Inc.: | | | |
| 5% 5/1/29 (d) | | 2,495,000 | 2,266,523 |
| 5.625% 10/15/25 (d) | | 395,000 | 382,044 |
| CVR Energy, Inc.: | | | |
| 5.25% 2/15/25 (d) | | 5,915,000 | 5,699,546 |
| 5.75% 2/15/28 (d) | | 6,090,000 | 5,511,450 |
| Delek Logistics Partners LP 7.125% 6/1/28 (d) | | 3,445,000 | 3,084,813 |
| DT Midstream, Inc. 4.125% 6/15/29 (d) | | 2,490,000 | 2,152,605 |
| EnLink Midstream LLC 5.625% 1/15/28 (d) | | 1,365,000 | 1,308,284 |
| EQM Midstream Partners LP: | | | |
| 6% 7/1/25 (d) | | 185,000 | 179,175 |
| 6.5% 7/1/27 (d) | | 2,745,000 | 2,676,375 |
| 7.5% 6/1/27 (d) | | 1,085,000 | 1,071,438 |
| 7.5% 6/1/30 (d) | | 1,085,000 | 1,055,163 |
| Global Partners LP/GLP Finance Corp. 6.875% 1/15/29 | | 2,245,000 | 2,031,164 |
| Harvest Midstream I LP 7.5% 9/1/28 (d) | | 1,690,000 | 1,620,238 |
| Hess Midstream Partners LP: | | | |
| 4.25% 2/15/30 (d) | | 1,330,000 | 1,137,350 |
| 5.125% 6/15/28 (d) | | 1,650,000 | 1,518,000 |
| Hilcorp Energy I LP/Hilcorp Finance Co.: | | | |
| 5.75% 2/1/29 (d) | | 1,575,000 | 1,441,125 |
| 6.25% 11/1/28 (d) | | 1,575,000 | 1,480,500 |
| Holly Energy Partners LP/Holly Energy Finance Corp. 5% 2/1/28 (d) | | 3,270,000 | 2,955,410 |
| New Fortress Energy, Inc.: | | | |
| 6.5% 9/30/26 (d) | | 25,595,000 | 24,827,150 |
| 6.75% 9/15/25 (d) | | 17,725,000 | 17,400,739 |
| NGL Energy Operating LLC/NGL Energy Finance Corp. 7.5% 2/1/26 (d) | | 5,925,000 | 5,359,983 |
| Occidental Petroleum Corp.: | | | |
| 7.5% 5/1/31 | | 2,790,000 | 2,999,250 |
| 7.875% 9/15/31 | | 945,000 | 1,028,453 |
| 8.875% 7/15/30 | | 2,720,000 | 3,087,200 |
| Rockies Express Pipeline LLC: | | | |
| 4.8% 5/15/30 (d) | | 2,185,000 | 1,846,325 |
| 4.95% 7/15/29 (d) | | 3,370,000 | 2,956,457 |
| 6.875% 4/15/40 (d) | | 330,000 | 269,412 |
| SM Energy Co. 5.625% 6/1/25 | | 3,245,000 | 3,152,219 |
| Southwestern Energy Co. 4.75% 2/1/32 | | 3,505,000 | 3,025,516 |
| Sunoco LP/Sunoco Finance Corp.: | | | |
| 4.5% 5/15/29 | | 2,585,000 | 2,220,257 |
| 5.875% 3/15/28 | | 2,780,000 | 2,646,492 |
| Superior Plus LP / Superior General Partner, Inc. 4.5% 3/15/29 (d) | | 2,010,000 | 1,703,738 |
| Tallgrass Energy Partners LP / Tallgrass Energy Finance Corp.: | | | |
| 5.5% 1/15/28 (d) | | 4,880,000 | 4,375,603 |
| 6% 3/1/27 (d) | | 8,956,000 | 8,451,524 |
| 6% 12/31/30 (d) | | 11,005,000 | 9,961,946 |
| 6% 9/1/31 (d) | | 4,865,000 | 4,330,545 |
| 7.5% 10/1/25 (d) | | 1,210,000 | 1,222,040 |
| Transocean Guardian Ltd. 5.875% 1/15/24 (d) | | 2,572,845 | 2,500,986 |
| Transocean Phoenix 2 Ltd. 7.75% 10/15/24 (d) | | 471,999 | 469,431 |
| Transocean Pontus Ltd. 6.125% 8/1/25 (d) | | 1,327,200 | 1,277,549 |
| Transocean Poseidon Ltd. 6.875% 2/1/27 (d) | | 1,242,500 | 1,189,694 |
| Transocean Proteus Ltd. 6.25% 12/1/24 (d) | | 589,500 | 574,763 |
| Transocean Sentry Ltd. 5.375% 5/15/23 (d) | | 3,060,380 | 3,006,823 |
| Venture Global Calcasieu Pass LLC: | | | |
| 3.875% 8/15/29 (d) | | 2,745,000 | 2,353,838 |
| 4.125% 8/15/31 (d) | | 4,690,000 | 3,998,366 |
| | | | 196,189,971 |
| Environmental - 1.4% | | | |
| Covanta Holding Corp. 4.875% 12/1/29 (d) | | 2,920,000 | 2,486,234 |
| Darling Ingredients, Inc. 6% 6/15/30 (d) | | 1,345,000 | 1,294,563 |
| Madison IAQ LLC: | | | |
| 4.125% 6/30/28 (d) | | 5,950,000 | 4,923,625 |
| 5.875% 6/30/29 (d) | | 12,150,000 | 8,322,750 |
| Stericycle, Inc.: | | | |
| 3.875% 1/15/29 (d) | | 4,405,000 | 3,826,139 |
| 5.375% 7/15/24 (d) | | 990,000 | 975,150 |
| | | | 21,828,461 |
| Food & Drug Retail - 1.1% | | | |
| Albertsons Companies LLC/Safeway, Inc./New Albertson's, Inc./Albertson's LLC: | | | |
| 3.5% 3/15/29 (d) | | 9,750,000 | 8,068,125 |
| 4.875% 2/15/30 (d) | | 4,560,000 | 4,047,000 |
| Emergent BioSolutions, Inc. 3.875% 8/15/28 (d) | | 6,235,000 | 3,738,132 |
| Murphy Oil U.S.A., Inc. 3.75% 2/15/31 (d) | | 1,170,000 | 974,911 |
| | | | 16,828,168 |
| Food/Beverage/Tobacco - 1.9% | | | |
| C&S Group Enterprises LLC 5% 12/15/28 (d) | | 5,500,000 | 4,065,824 |
| Lamb Weston Holdings, Inc. 4.125% 1/31/30 (d) | | 4,645,000 | 4,054,946 |
| Performance Food Group, Inc. 5.5% 10/15/27 (d) | | 335,000 | 316,649 |
| Post Holdings, Inc.: | | | |
| 4.625% 4/15/30 (d) | | 2,035,000 | 1,717,164 |
| 5.5% 12/15/29 (d) | | 2,055,000 | 1,849,336 |
| Primo Water Holdings, Inc. 4.375% 4/30/29 (d) | | 3,395,000 | 2,844,569 |
| TreeHouse Foods, Inc. 4% 9/1/28 | | 1,265,000 | 1,067,344 |
| Triton Water Holdings, Inc. 6.25% 4/1/29 (d) | | 12,745,000 | 9,652,773 |
| U.S. Foods, Inc.: | | | |
| 4.625% 6/1/30 (d) | | 1,725,000 | 1,496,472 |
| 4.75% 2/15/29 (d) | | 1,695,000 | 1,502,194 |
| | | | 28,567,271 |
| Gaming - 2.0% | | | |
| Affinity Gaming LLC 6.875% 12/15/27 (d) | | 4,930,000 | 4,115,328 |
| Caesars Entertainment, Inc. 8.125% 7/1/27 (d) | | 8,054,000 | 7,832,515 |
| Fertitta Entertainment LLC / Fertitta Entertainment Finance Co., Inc. 6.75% 1/15/30 (d) | | 6,725,000 | 5,279,125 |
| Golden Entertainment, Inc. 7.625% 4/15/26 (d) | | 3,110,000 | 3,055,575 |
| Jacobs Entertainment, Inc. 6.75% 2/15/29 (d) | | 2,000,000 | 1,763,340 |
| MGM Resorts International: | | | |
| 4.75% 10/15/28 | | 175,000 | 151,731 |
| 5.5% 4/15/27 | | 175,000 | 162,314 |
| Premier Entertainment Sub LLC: | | | |
| 5.625% 9/1/29 (d) | | 4,710,000 | 3,485,400 |
| 5.875% 9/1/31 (d) | | 2,720,000 | 1,927,448 |
| Station Casinos LLC 4.5% 2/15/28 (d) | | 390,000 | 335,985 |
| Wynn Las Vegas LLC/Wynn Las Vegas Capital Corp. 5.25% 5/15/27 (d) | | 3,020,000 | 2,626,796 |
| | | | 30,735,557 |
| Healthcare - 8.0% | | | |
| 1375209 BC Ltd. 9% 1/30/28 (d) | | 2,883,000 | 2,789,303 |
| 180 Medical, Inc. 3.875% 10/15/29 (d) | | 2,880,000 | 2,433,600 |
| AMN Healthcare 4% 4/15/29 (d) | | 4,020,000 | 3,459,122 |
| Avantor Funding, Inc.: | | | |
| 3.875% 11/1/29 (d) | | 2,435,000 | 2,054,661 |
| 4.625% 7/15/28 (d) | | 280,000 | 253,039 |
| Bausch Health Companies, Inc.: | | | |
| 11% 9/30/28 (d) | | 5,113,000 | 3,937,010 |
| 14% 10/15/30 (d) | | 1,017,000 | 582,233 |
| Cano Health, Inc. 6.25% 10/1/28 (d) | | 3,356,000 | 2,695,125 |
| Catalent Pharma Solutions 3.5% 4/1/30 (d) | | 3,195,000 | 2,579,963 |
| Charles River Laboratories International, Inc.: | | | |
| 3.75% 3/15/29 (d) | | 1,300,000 | 1,124,500 |
| 4.25% 5/1/28 (d) | | 385,000 | 350,235 |
| Community Health Systems, Inc.: | | | |
| 4.75% 2/15/31 (d) | | 5,905,000 | 3,955,937 |
| 5.25% 5/15/30 (d) | | 11,150,000 | 7,721,375 |
| 5.625% 3/15/27 (d) | | 5,260,000 | 4,191,536 |
| 6% 1/15/29 (d) | | 3,600,000 | 2,672,424 |
| 6.125% 4/1/30 (d) | | 5,790,000 | 2,373,900 |
| 6.875% 4/15/29 (d) | | 5,670,000 | 2,281,601 |
| 8% 3/15/26 (d) | | 1,150,000 | 991,875 |
| CTR Partnership LP/CareTrust Capital Corp. 3.875% 6/30/28 (d) | | 3,610,000 | 3,044,808 |
| DaVita HealthCare Partners, Inc.: | | | |
| 3.75% 2/15/31 (d) | | 1,280,000 | 925,478 |
| 4.625% 6/1/30 (d) | | 9,570,000 | 7,461,011 |
| Embecta Corp. 5% 2/15/30 (d) | | 1,680,000 | 1,440,197 |
| Grifols Escrow Issuer SA 4.75% 10/15/28 (d) | | 3,780,000 | 2,953,125 |
| HealthEquity, Inc. 4.5% 10/1/29 (d) | | 1,600,000 | 1,398,000 |
| Hologic, Inc.: | | | |
| 3.25% 2/15/29 (d) | | 3,095,000 | 2,630,131 |
| 4.625% 2/1/28 (d) | | 125,000 | 116,875 |
| Jazz Securities DAC 4.375% 1/15/29 (d) | | 4,810,000 | 4,268,875 |
| ModivCare Escrow Issuer, Inc. 5% 10/1/29 (d) | | 1,910,000 | 1,625,516 |
| Molina Healthcare, Inc. 3.875% 11/15/30 (d) | | 1,385,000 | 1,176,969 |
| Option Care Health, Inc. 4.375% 10/31/29 (d) | | 3,500,000 | 3,022,530 |
| Organon & Co. / Organon Foreign Debt Co-Issuer BV: | | | |
| 4.125% 4/30/28 (d) | | 5,440,000 | 4,791,661 |
| 5.125% 4/30/31 (d) | | 795,000 | 675,170 |
| Owens & Minor, Inc. 4.5% 3/31/29 (d) | | 215,000 | 166,487 |
| Pediatrix Medical Group, Inc. 5.375% 2/15/30 (d) | | 3,330,000 | 2,863,800 |
| Radiology Partners, Inc. 9.25% 2/1/28 (d) | | 4,365,000 | 2,309,085 |
| RP Escrow Issuer LLC 5.25% 12/15/25 (d) | | 6,140,000 | 4,591,122 |
| Teleflex, Inc. 4.25% 6/1/28 (d) | | 1,275,000 | 1,153,620 |
| Tenet Healthcare Corp.: | | | |
| 4.25% 6/1/29 (d) | | 4,025,000 | 3,391,063 |
| 4.375% 1/15/30 (d) | | 3,835,000 | 3,217,565 |
| 4.625% 6/15/28 (d) | | 10,120,000 | 8,880,246 |
| 6.125% 10/1/28 (d) | | 11,225,000 | 9,715,238 |
| 6.125% 6/15/30 (d) | | 4,165,000 | 3,844,878 |
| 6.25% 2/1/27 (d) | | 1,405,000 | 1,340,820 |
| | | | 123,451,709 |
| Homebuilders/Real Estate - 4.3% | | | |
| Ashton Woods U.S.A. LLC/Ashton Woods Finance Co. 4.625% 8/1/29 (d) | | 2,060,000 | 1,547,575 |
| Howard Hughes Corp.: | | | |
| 4.125% 2/1/29 (d) | | 2,570,000 | 2,008,530 |
| 4.375% 2/1/31 (d) | | 2,570,000 | 1,931,098 |
| Kennedy-Wilson, Inc. 4.75% 2/1/30 | | 4,055,000 | 3,183,175 |
| MPT Operating Partnership LP/MPT Finance Corp.: | | | |
| 3.5% 3/15/31 | | 4,520,000 | 3,109,172 |
| 4.625% 8/1/29 | | 1,490,000 | 1,180,423 |
| 5% 10/15/27 | | 11,855,000 | 10,151,437 |
| Railworks Holdings LP 8.25% 11/15/28 (d) | | 3,870,000 | 3,556,678 |
| TopBuild Corp. 4.125% 2/15/32 (d) | | 4,805,000 | 3,762,187 |
| Uniti Group LP / Uniti Group Finance, Inc.: | | | |
| 4.75% 4/15/28 (d) | | 10,260,000 | 8,386,994 |
| 6.5% 2/15/29 (d) | | 39,190,000 | 28,118,804 |
| | | | 66,936,073 |
| Hotels - 0.5% | | | |
| Hilton Domestic Operating Co., Inc.: | | | |
| 3.625% 2/15/32 (d) | | 3,220,000 | 2,563,925 |
| 3.75% 5/1/29 (d) | | 10,000 | 8,519 |
| 4% 5/1/31 (d) | | 2,890,000 | 2,415,889 |
| Wyndham Hotels & Resorts, Inc. 4.375% 8/15/28 (d) | | 2,965,000 | 2,610,149 |
| | | | 7,598,482 |
| Insurance - 0.6% | | | |
| Alliant Holdings Intermediate LLC 4.25% 10/15/27 (d) | | 3,940,000 | 3,546,473 |
| AmWINS Group, Inc. 4.875% 6/30/29 (d) | | 3,835,000 | 3,278,315 |
| AssuredPartners, Inc. 5.625% 1/15/29 (d) | | 2,915,000 | 2,397,588 |
| | | | 9,222,376 |
| Leisure - 2.8% | | | |
| Carnival Corp.: | | | |
| 5.75% 3/1/27 (d) | | 5,535,000 | 3,846,825 |
| 6% 5/1/29 (d) | | 6,090,000 | 4,039,299 |
| 6.65% 1/15/28 | | 720,000 | 458,058 |
| 7.625% 3/1/26 (d) | | 10,780,000 | 8,106,021 |
| MajorDrive Holdings IV LLC 6.375% 6/1/29 (d) | | 295,000 | 207,887 |
| NCL Corp. Ltd.: | | | |
| 3.625% 12/15/24 (d) | | 3,145,000 | 2,729,791 |
| 5.875% 3/15/26 (d) | | 1,585,000 | 1,297,719 |
| 7.75% 2/15/29 (d) | | 4,040,000 | 3,213,133 |
| NCL Finance Ltd. 6.125% 3/15/28 (d) | | 1,390,000 | 1,080,725 |
| Royal Caribbean Cruises Ltd.: | | | |
| 4.25% 7/1/26 (d) | | 5,935,000 | 4,688,650 |
| 5.375% 7/15/27 (d) | | 2,775,000 | 2,157,052 |
| 5.5% 8/31/26 (d) | | 4,870,000 | 3,981,712 |
| 5.5% 4/1/28 (d) | | 5,285,000 | 4,069,450 |
| Viking Ocean Cruises Ship VII Ltd. 5.625% 2/15/29 (d) | | 1,545,000 | 1,204,374 |
| Voc Escrow Ltd. 5% 2/15/28 (d) | | 2,365,000 | 1,946,963 |
| | | | 43,027,659 |
| Metals/Mining - 0.9% | | | |
| Eldorado Gold Corp. 6.25% 9/1/29 (d) | | 125,000 | 101,106 |
| ERO Copper Corp. 6.5% 2/15/30 (d) | | 6,975,000 | 5,109,188 |
| First Quantum Minerals Ltd. 6.875% 10/15/27 (d) | | 2,385,000 | 2,208,659 |
| HudBay Minerals, Inc. 4.5% 4/1/26 (d) | | 1,485,000 | 1,302,739 |
| Mineral Resources Ltd. 8.5% 5/1/30 (d) | | 2,310,000 | 2,273,177 |
| PMHC II, Inc. 9% 2/15/30 (d) | | 4,255,000 | 2,803,612 |
| | | | 13,798,481 |
| Paper - 0.8% | | | |
| Ardagh Metal Packaging Finance U.S.A. LLC/Ardagh Metal Packaging Finance PLC: | | | |
| 4% 9/1/29 (d) | | 1,040,000 | 788,934 |
| 6% 6/15/27 (d) | | 2,930,000 | 2,811,540 |
| Clydesdale Acquisition Holdings, Inc. 6.625% 4/15/29 (d) | | 1,405,000 | 1,333,907 |
| Enviva Partners LP / Enviva Partners Finance Corp. 6.5% 1/15/26 (d) | | 515,000 | 494,513 |
| Glatfelter Corp. 4.75% 11/15/29 (d) | | 2,885,000 | 1,857,219 |
| SPA Holdings 3 OY 4.875% 2/4/28 (d) | | 7,020,000 | 5,588,724 |
| | | | 12,874,837 |
| Publishing/Printing - 0.2% | | | |
| News Corp. 5.125% 2/15/32 (d) | | 3,130,000 | 2,793,525 |
| Railroad - 0.2% | | | |
| First Student Bidco, Inc./First Transit Parent, Inc. 4% 7/31/29 (d) | | 4,610,000 | 3,746,086 |
| Restaurants - 0.4% | | | |
| 1011778 BC Unlimited Liability Co./New Red Finance, Inc. 4% 10/15/30 (d) | | 3,170,000 | 2,587,513 |
| Garden SpinCo Corp. 8.625% 7/20/30 (d) | | 740,000 | 761,131 |
| Yum! Brands, Inc. 4.625% 1/31/32 | | 3,255,000 | 2,783,123 |
| | | | 6,131,767 |
| Services - 5.3% | | | |
| Adtalem Global Education, Inc. 5.5% 3/1/28 (d) | | 5,149,000 | 4,698,463 |
| APX Group, Inc. 6.75% 2/15/27 (d) | | 2,660,000 | 2,594,840 |
| Aramark Services, Inc. 5% 2/1/28 (d) | | 760,000 | 692,440 |
| ASGN, Inc. 4.625% 5/15/28 (d) | | 3,260,000 | 2,898,890 |
| Booz Allen Hamilton, Inc. 3.875% 9/1/28 (d) | | 3,855,000 | 3,396,563 |
| Brand Energy & Infrastructure Services, Inc. 8.5% 7/15/25 (d) | | 9,930,000 | 7,139,333 |
| CoreCivic, Inc.: | | | |
| 4.75% 10/15/27 | | 6,520,000 | 5,410,040 |
| 8.25% 4/15/26 | | 13,298,000 | 13,492,490 |
| Fair Isaac Corp. 4% 6/15/28 (d) | | 3,295,000 | 2,981,448 |
| Gartner, Inc.: | | | |
| 3.625% 6/15/29 (d) | | 1,645,000 | 1,398,250 |
| 3.75% 10/1/30 (d) | | 2,345,000 | 1,969,790 |
| GEMS MENASA Cayman Ltd. 7.125% 7/31/26 (d) | | 8,310,000 | 7,795,819 |
| Legends Hospitality Holding Co. LLC/Legends Hospitality Co-Issuer, Inc. 5% 2/1/26 (d) | | 4,635,000 | 4,055,625 |
| PowerTeam Services LLC 9.033% 12/4/25 (d) | | 1,215,000 | 1,015,327 |
| Service Corp. International: | | | |
| 4% 5/15/31 | | 2,375,000 | 1,971,779 |
| 5.125% 6/1/29 | | 4,160,000 | 3,874,874 |
| Sotheby's 7.375% 10/15/27 (d) | | 4,605,000 | 4,455,338 |
| The GEO Group, Inc. 9.5% 12/31/28 (d) | | 3,300,000 | 3,036,000 |
| TriNet Group, Inc. 3.5% 3/1/29 (d) | | 4,635,000 | 3,841,256 |
| WASH Multifamily Acquisition, Inc. 5.75% 4/15/26 (d) | | 5,720,000 | 5,333,721 |
| | | | 82,052,286 |
| Steel - 0.4% | | | |
| Commercial Metals Co. 4.125% 1/15/30 | | 2,495,000 | 2,096,296 |
| Roller Bearing Co. of America, Inc. 4.375% 10/15/29 (d) | | 4,570,000 | 4,010,084 |
| | | | 6,106,380 |
| Super Retail - 1.7% | | | |
| Bath & Body Works, Inc. 6.694% 1/15/27 | | 1,123,000 | 1,058,428 |
| Carvana Co.: | | | |
| 4.875% 9/1/29 (d) | | 2,755,000 | 1,219,088 |
| 5.5% 4/15/27 (d) | | 3,025,000 | 1,437,566 |
| 5.875% 10/1/28 (d) | | 1,165,000 | 533,372 |
| EG Global Finance PLC: | | | |
| 6.75% 2/7/25 (d) | | 4,830,000 | 4,347,000 |
| 8.5% 10/30/25 (d) | | 2,825,000 | 2,609,467 |
| LBM Acquisition LLC 6.25% 1/15/29 (d) | | 2,405,000 | 1,682,249 |
| Levi Strauss & Co. 3.5% 3/1/31 (d) | | 3,995,000 | 3,195,820 |
| Michaels Companies, Inc.: | | | |
| 5.25% 5/1/28 (d) | | 2,095,000 | 1,487,743 |
| 7.875% 5/1/29 (d) | | 1,315,000 | 733,113 |
| Nordstrom, Inc.: | | | |
| 4.25% 8/1/31 | | 3,440,000 | 2,497,440 |
| 4.375% 4/1/30 | | 2,295,000 | 1,761,413 |
| Wolverine World Wide, Inc. 4% 8/15/29 (d) | | 4,356,000 | 3,441,240 |
| | | | 26,003,939 |
| Technology - 5.0% | | | |
| Acuris Finance U.S. 5% 5/1/28 (d) | | 5,565,000 | 4,507,650 |
| Athenahealth Group, Inc. 6.5% 2/15/30 (d) | | 1,080,000 | 842,400 |
| Black Knight InfoServ LLC 3.625% 9/1/28 (d) | | 3,665,000 | 3,174,806 |
| Clarivate Science Holdings Corp.: | | | |
| 3.875% 7/1/28 (d) | | 1,195,000 | 1,024,807 |
| 4.875% 7/1/29 (d) | | 1,210,000 | 1,008,838 |
| Coherent Corp. 5% 12/15/29 (d) | | 4,115,000 | 3,530,176 |
| CommScope, Inc.: | | | |
| 4.75% 9/1/29 (d) | | 2,985,000 | 2,524,815 |
| 6% 3/1/26 (d) | | 1,445,000 | 1,393,777 |
| 7.125% 7/1/28 (d) | | 5,020,000 | 4,251,577 |
| 8.25% 3/1/27 (d) | | 1,610,000 | 1,429,361 |
| Elastic NV 4.125% 7/15/29 (d) | | 4,568,000 | 3,813,937 |
| Entegris Escrow Corp.: | | | |
| 4.75% 4/15/29 (d) | | 4,020,000 | 3,551,946 |
| 5.95% 6/15/30 (d) | | 4,375,000 | 3,992,188 |
| Gartner, Inc. 4.5% 7/1/28 (d) | | 3,750,000 | 3,475,238 |
| ION Trading Technologies Ltd. 5.75% 5/15/28 (d) | | 5,045,000 | 4,010,775 |
| MicroStrategy, Inc. 6.125% 6/15/28 (d) | | 5,400,000 | 4,627,098 |
| onsemi 3.875% 9/1/28 (d) | | 305,000 | 268,736 |
| Open Text Corp.: | | | |
| 3.875% 2/15/28 (d) | | 2,350,000 | 2,011,459 |
| 3.875% 12/1/29 (d) | | 905,000 | 717,213 |
| Rackspace Hosting, Inc.: | | | |
| 3.5% 2/15/28 (d) | | 2,435,000 | 1,607,983 |
| 5.375% 12/1/28 (d) | | 28,245,000 | 11,889,450 |
| Roblox Corp. 3.875% 5/1/30 (d) | | 3,335,000 | 2,751,375 |
| Sensata Technologies BV 4% 4/15/29 (d) | | 2,060,000 | 1,734,932 |
| TTM Technologies, Inc. 4% 3/1/29 (d) | | 4,365,000 | 3,645,381 |
| Twilio, Inc. 3.875% 3/15/31 | | 1,550,000 | 1,264,103 |
| Uber Technologies, Inc. 8% 11/1/26 (d) | | 4,365,000 | 4,381,151 |
| | | | 77,431,172 |
| Telecommunications - 8.3% | | | |
| Altice Financing SA: | | | |
| 5% 1/15/28 (d) | | 3,785,000 | 2,992,643 |
| 5.75% 8/15/29 (d) | | 13,520,000 | 10,674,547 |
| Altice France Holding SA 6% 2/15/28 (d) | | 8,935,000 | 5,841,256 |
| Altice France SA: | | | |
| 5.125% 1/15/29 (d) | | 8,120,000 | 6,110,300 |
| 5.125% 7/15/29 (d) | | 8,025,000 | 6,044,229 |
| 5.5% 1/15/28 (d) | | 2,115,000 | 1,695,532 |
| 5.5% 10/15/29 (d) | | 30,000 | 22,875 |
| C&W Senior Financing Designated Activity Co. 6.875% 9/15/27 (d) | | 23,047,000 | 19,935,655 |
| Cablevision Lightpath LLC: | | | |
| 3.875% 9/15/27 (d) | | 2,555,000 | 2,172,349 |
| 5.625% 9/15/28 (d) | | 4,730,000 | 3,760,539 |
| Consolidated Communications, Inc. 5% 10/1/28 (d) | | 2,005,000 | 1,553,584 |
| Frontier Communications Holdings LLC: | | | |
| 5% 5/1/28 (d) | | 1,595,000 | 1,395,625 |
| 5.875% 10/15/27 (d) | | 2,480,000 | 2,281,169 |
| 5.875% 11/1/29 | | 3,385,000 | 2,636,966 |
| 6% 1/15/30 (d) | | 4,935,000 | 3,859,170 |
| 8.75% 5/15/30 (d) | | 2,825,000 | 2,885,031 |
| Intelsat Jackson Holdings SA 6.5% 3/15/30 (d) | | 2,815,000 | 2,583,494 |
| Level 3 Financing, Inc.: | | | |
| 3.625% 1/15/29 (d) | | 4,705,000 | 3,587,563 |
| 4.25% 7/1/28 (d) | | 4,140,000 | 3,415,500 |
| Lumen Technologies, Inc. 4.5% 1/15/29 (d) | | 7,070,000 | 4,984,014 |
| Millicom International Cellular SA: | | | |
| 4.5% 4/27/31 (d) | | 2,230,000 | 1,668,040 |
| 5.125% 1/15/28 (d) | | 531,000 | 452,113 |
| Sable International Finance Ltd. 5.75% 9/7/27 (d) | | 130,000 | 114,563 |
| SBA Communications Corp. 3.125% 2/1/29 | | 3,520,000 | 2,844,970 |
| Telecom Italia Capital SA: | | | |
| 6% 9/30/34 | | 2,740,000 | 1,999,460 |
| 7.2% 7/18/36 | | 3,910,000 | 3,044,952 |
| 7.721% 6/4/38 | | 850,000 | 675,750 |
| Uniti Group, Inc. 6% 1/15/30 (d) | | 8,570,000 | 5,848,426 |
| Virgin Media Secured Finance PLC 4.5% 8/15/30 (d) | | 4,685,000 | 3,871,621 |
| VMED O2 UK Financing I PLC 4.25% 1/31/31 (d) | | 4,595,000 | 3,656,350 |
| Windstream Escrow LLC 7.75% 8/15/28 (d) | | 11,260,000 | 9,743,278 |
| Zayo Group Holdings, Inc.: | | | |
| 4% 3/1/27 (d) | | 3,320,000 | 2,564,700 |
| 6.125% 3/1/28 (d) | | 3,695,000 | 2,457,175 |
| | | | 127,373,439 |
| Textiles/Apparel - 0.3% | | | |
| Foot Locker, Inc. 4% 10/1/29 (d) | | 5,130,000 | 3,921,731 |
| Kontoor Brands, Inc. 4.125% 11/15/29 (d) | | 1,230,000 | 986,198 |
| | | | 4,907,929 |
| Transportation Ex Air/Rail - 0.6% | | | |
| Golar LNG Ltd. 7% 10/20/25 | | 2,910,000 | 2,735,400 |
| Great Lakes Dredge & Dock Corp. 5.25% 6/1/29 (d) | | 2,085,000 | 1,648,743 |
| Seaspan Corp. 5.5% 8/1/29 (d) | | 6,300,000 | 4,852,127 |
| | | | 9,236,270 |
| Utilities - 3.1% | | | |
| Clearway Energy Operating LLC: | | | |
| 3.75% 2/15/31 (d) | | 2,655,000 | 2,216,925 |
| 4.75% 3/15/28 (d) | | 1,280,000 | 1,182,332 |
| Global Partners LP/GLP Finance Corp. 7% 8/1/27 | | 2,770,000 | 2,633,389 |
| InterGen NV 7% 6/30/23 (d) | | 13,335,000 | 13,051,631 |
| NRG Energy, Inc.: | | | |
| 3.375% 2/15/29 (d) | | 2,565,000 | 2,136,570 |
| 3.625% 2/15/31 (d) | | 120,000 | 95,492 |
| 5.25% 6/15/29 (d) | | 2,640,000 | 2,395,800 |
| PG&E Corp.: | | | |
| 5% 7/1/28 | | 4,410,000 | 3,974,711 |
| 5.25% 7/1/30 | | 8,455,000 | 7,486,860 |
| Pike Corp. 5.5% 9/1/28 (d) | | 9,140,000 | 7,804,463 |
| Vistra Operations Co. LLC: | | | |
| 5% 7/31/27 (d) | | 2,395,000 | 2,209,388 |
| 5.625% 2/15/27 (d) | | 2,950,000 | 2,812,176 |
| | | | 47,999,737 |
TOTAL NONCONVERTIBLE BONDS | | | 1,237,186,191 |
| TOTAL CORPORATE BONDS (Cost $1,533,859,060) | | | 1,282,763,328 |
| | | | |
| Common Stocks - 4.0% |
| | | Shares | Value ($) |
| Cable/Satellite TV - 0.1% | | | |
| Altice U.S.A., Inc. Class A (e) | | 224,406 | 1,483,324 |
| Energy - 1.7% | | | |
| California Resources Corp. warrants 10/27/24 (e) | | 4,491 | 63,772 |
| Jonah Energy Parent LLC (c)(e) | | 203,925 | 12,969,630 |
| Mesquite Energy, Inc. (c)(e) | | 204,784 | 11,351,177 |
| New Fortress Energy, Inc. | | 41,905 | 2,307,708 |
TOTAL ENERGY | | | 26,692,287 |
| Food & Drug Retail - 1.7% | | | |
| Southeastern Grocers, Inc. (b)(c)(e) | | 1,184,833 | 25,627,938 |
| Gaming - 0.3% | | | |
| Caesars Entertainment, Inc. (e) | | 88,814 | 3,883,836 |
| Telecommunications - 0.0% | | | |
| GTT Communications, Inc. rights (c)(e) | | 366,387 | 366,387 |
| Utilities - 0.2% | | | |
| EQT Corp. | | 77,300 | 3,234,232 |
| TOTAL COMMON STOCKS (Cost $54,099,325) | | | 61,288,004 |
| | | | |
| Bank Loan Obligations - 6.7% |
| | | Principal Amount (a) | Value ($) |
| Broadcasting - 0.4% | | | |
| Diamond Sports Group LLC: | | | |
| 1LN, term loan CME Term SOFR 1 Month Index + 8.000% 11.208% 5/25/26 (f)(g)(h) | | 4,602,224 | 4,410,449 |
| 2LN, term loan CME Term SOFR 1 Month Index + 3.250% 6.458% 8/24/26 (f)(g)(h) | | 7,341,306 | 1,424,213 |
TOTAL BROADCASTING | | | 5,834,662 |
| Building Materials - 0.2% | | | |
| Acproducts Holdings, Inc. Tranche B 1LN, term loan 1 month U.S. LIBOR + 4.250% 7.3247% 5/17/28 (f)(g)(h) | | 4,635,352 | 3,214,802 |
| Chemicals - 0.6% | | | |
| Consolidated Energy Finance SA Tranche B 1LN, term loan 1 month U.S. LIBOR + 3.500% 6.3633% 5/7/25 (c)(f)(g)(h) | | 5,119,400 | 4,863,430 |
| Discovery Purchaser Corp. 1LN, term loan CME Term SOFR 1 Month Index + 4.370% 7.9683% 10/4/29 (f)(g)(h) | | 2,580,000 | 2,353,605 |
| Olympus Water U.S. Holding Corp. Tranche B 1LN, term loan 1 month U.S. LIBOR + 3.750% 7.4375% 11/9/28 (f)(g)(h) | | 2,700,632 | 2,454,686 |
TOTAL CHEMICALS | | | 9,671,721 |
| Energy - 0.6% | | | |
| EG America LLC Tranche B 1LN, term loan 3 month U.S. LIBOR + 4.000% 7.6741% 2/6/25 (f)(g)(h) | | 5,764,715 | 5,215,626 |
| EG Finco Ltd. Tranche B, term loan 3 month U.S. LIBOR + 4.000% 7.6741% 2/6/25 (f)(g)(h) | | 3,956,451 | 3,579,599 |
| Mesquite Energy, Inc.: | | | |
| 1LN, term loan 3 month U.S. LIBOR + 8.000% 0% (c)(g)(h)(i) | | 3,800,000 | 0 |
| term loan 3 month U.S. LIBOR + 0.000% 0% (c)(g)(h)(i) | | 1,620,000 | 0 |
TOTAL ENERGY | | | 8,795,225 |
| Healthcare - 0.0% | | | |
| Da Vinci Purchaser Corp. Tranche B 1LN, term loan 1 month U.S. LIBOR + 4.000% 7.7041% 12/13/26 (f)(g)(h) | | 242,519 | 229,333 |
| Gainwell Acquisition Corp. Tranche B 1LN, term loan 1 month U.S. LIBOR + 4.000% 7.6741% 10/1/27 (f)(g)(h) | | 711,380 | 674,623 |
TOTAL HEALTHCARE | | | 903,956 |
| Insurance - 0.4% | | | |
| HUB International Ltd. Tranche B, term loan 1 month U.S. LIBOR + 3.000% 7.326% 4/25/25 (f)(g)(h) | | 7,009,338 | 6,865,507 |
| Leisure - 0.8% | | | |
| City Football Group Ltd. Tranche B 1LN, term loan 1 month U.S. LIBOR + 3.500% 6.484% 7/21/28 (f)(g)(h) | | 13,163,274 | 12,208,936 |
| Paper - 0.2% | | | |
| Clydesdale Acquisition Holdings, Inc. 1LN, term loan CME Term SOFR 1 Month Index + 4.170% 8.0037% 4/13/29 (f)(g)(h) | | 3,142,125 | 3,022,096 |
| Services - 0.9% | | | |
| Ascend Learning LLC: | | | |
| 2LN, term loan 1 month U.S. LIBOR + 5.750% 9.5039% 12/10/29 (f)(g)(h) | | 425,000 | 359,656 |
| Tranche B 1LN, term loan 1 month U.S. LIBOR + 3.500% 7.2539% 12/10/28 (f)(g)(h) | | 4,725,457 | 4,325,116 |
| Brand Energy & Infrastructure Services, Inc. Tranche B, term loan 3 month U.S. LIBOR + 4.250% 8.493% 6/21/24 (f)(g)(h) | | 5,384,201 | 4,647,266 |
| Spin Holdco, Inc. Tranche B 1LN, term loan 1 month U.S. LIBOR + 4.000% 7.1441% 3/4/28 (f)(g)(h) | | 4,655,000 | 4,086,718 |
TOTAL SERVICES | | | 13,418,756 |
| Super Retail - 0.6% | | | |
| Bass Pro Group LLC Tranche B 1LN, term loan 1 month U.S. LIBOR + 3.750% 7.5039% 3/5/28 (f)(g)(h) | | 3,044,623 | 2,860,423 |
| LBM Acquisition LLC Tranche B 1LN, term loan 1 month U.S. LIBOR + 3.750% 7.1207% 12/18/27 (f)(g)(h) | | 7,423,090 | 6,333,752 |
TOTAL SUPER RETAIL | | | 9,194,175 |
| Technology - 0.9% | | | |
| Athenahealth Group, Inc.: | | | |
| Tranche B 1LN, term loan CME Term SOFR 1 Month Index + 3.500% 6.9671% 2/15/29 (f)(g)(h) | | 8,175,380 | 7,453,249 |
| Tranche DD 1LN, term loan CME Term SOFR 1 Month Index + 3.500% 2/15/29 (g)(h)(j) | | 1,389,130 | 1,266,429 |
| Central Parent, Inc. 1LN, term loan CME Term SOFR 1 Month Index + 4.500% 8.1123% 7/6/29 (f)(g)(h) | | 880,000 | 860,385 |
| CommScope, Inc. Tranche B 1LN, term loan 3 month U.S. LIBOR + 3.250% 7.0039% 4/4/26 (f)(g)(h) | | 3,401,675 | 3,235,843 |
| Verscend Holding Corp. Tranche B 1LN, term loan 1 month U.S. LIBOR + 4.000% 7.7539% 8/27/25 (f)(g)(h) | | 1,221,261 | 1,204,469 |
TOTAL TECHNOLOGY | | | 14,020,375 |
| Telecommunications - 0.6% | | | |
| GTT Communications, Inc. Tranche B, term loan 3 month U.S. LIBOR + 4.750% 10% 5/31/25 (f)(g)(h) | | 13,526,933 | 9,314,781 |
| Utilities - 0.5% | | | |
| Brookfield WEC Holdings, Inc. 1LN, term loan CME Term SOFR 1 Month Index + 3.750% 7.4787% 8/1/25 (f)(g)(h) | | 2,040,000 | 2,023,741 |
| PG&E Corp. Tranche B 1LN, term loan 1 month U.S. LIBOR + 3.000% 6.8125% 6/23/25 (f)(g)(h) | | 5,434,890 | 5,338,420 |
TOTAL UTILITIES | | | 7,362,161 |
| TOTAL BANK LOAN OBLIGATIONS (Cost $114,821,272) | | | 103,827,153 |
| | | | |
| Other - 0.5% |
| | | Shares | Value ($) |
| Other - 0.5% | | | |
Fidelity Direct Lending Fund, LP (b)(k) (Cost $8,478,269) | | | 8,383,145 |
| | | | |
| Money Market Funds - 4.1% |
| | | Shares | Value ($) |
Fidelity Cash Central Fund 3.10% (l) (Cost $62,513,387) | | 62,500,886 | 62,513,387 |
| | | | |
| TOTAL INVESTMENT IN SECURITIES - 98.3% (Cost $1,773,771,313) | 1,518,775,017 |
NET OTHER ASSETS (LIABILITIES) - 1.7% | 26,316,412 |
| NET ASSETS - 100.0% | 1,545,091,429 |
| | |
Legend
| (a) | Amount is stated in United States dollars unless otherwise noted. |
| (b) | Restricted securities (including private placements) - Investment in securities not registered under the Securities Act of 1933 (excluding 144A issues). At the end of the period, the value of restricted securities (excluding 144A issues) amounted to $60,061,784 or 3.9% of net assets. |
| (d) | Security exempt from registration under Rule 144A of the Securities Act of 1933. These securities may be resold in transactions exempt from registration, normally to qualified institutional buyers. At the end of the period, the value of these securities amounted to $1,056,190,508 or 68.4% of net assets. |
| (f) | Coupon rates for floating and adjustable rate securities reflect the rates in effect at period end. |
| (g) | Coupon is indexed to a floating interest rate which may be multiplied by a specified factor and/or subject to caps or floors. |
| (h) | Remaining maturities of bank loan obligations may be less than the stated maturities shown as a result of contractual or optional prepayments by the borrower. Such prepayments cannot be predicted with certainty. |
| (i) | Non-income producing - Security is in default. |
| (j) | Position or a portion of the position represents an unfunded loan commitment. At period end, the total principal amount and market value of unfunded commitments totaled $1,389,130 and $1,266,429, respectively. |
| (l) | Affiliated fund that is generally available only to investment companies and other accounts managed by Fidelity Investments. The rate quoted is the annualized seven-day yield of the fund at period end. A complete unaudited listing of the fund's holdings as of its most recent quarter end is available upon request. In addition, each Fidelity Central Fund's financial statements are available on the SEC's website or upon request. |
| Additional information on each restricted holding is as follows: |
| Security | Acquisition Date | Acquisition Cost ($) |
| Fidelity Direct Lending Fund, LP | 12/09/21 - 10/31/22 | 8,478,269 |
| | | |
| Mesquite Energy, Inc. 15% 7/15/23 | 6/25/21 - 4/01/22 | 6,243,973 |
| | | |
| Mesquite Energy, Inc. 15% 7/15/23 | 6/25/21 - 4/01/22 | 9,777,984 |
| | | |
| Southeastern Grocers, Inc. | 6/25/21 - 4/01/22 | 22,540,546 |
| | | |
Affiliated Central Funds
Fiscal year to date information regarding the Fund's investments in Fidelity Central Funds, including the ownership percentage, is presented below.
| Affiliate | Value, beginning of period ($) | Purchases ($) | Sales Proceeds ($) | Dividend Income ($) | Realized Gain (loss) ($) | Change in Unrealized appreciation (depreciation) ($) | Value, end of period ($) | % ownership, end of period |
| Fidelity Cash Central Fund 3.10% | 119,265,405 | 525,332,303 | 582,084,321 | 866,897 | - | - | 62,513,387 | 0.1% |
| Fidelity Securities Lending Cash Central Fund 3.10% | 63,228,550 | 29,854,703 | 93,083,253 | 50,159 | - | - | - | 0.0% |
| Total | 182,493,955 | 555,187,006 | 675,167,574 | 917,056 | - | - | 62,513,387 | |
| | | | | | | | | |
Amounts in the income column in the above table include any capital gain distributions from underlying funds, which are presented in the corresponding line item in the Statement of Operations, if applicable.
Amount for Fidelity Securities Lending Cash Central Fund represents the income earned on investing cash collateral, less rebates paid to borrowers and any lending agent fees associated with the loan, plus any premium payments received for lending certain types of securities.
Affiliated Underlying Funds
Fiscal year to date information regarding the Fund's investments in affiliated Underlying Funds is presented below. Exchanges between classes of the same affiliated Underlying Funds may occur. If an Underlying Funds changes its name, the name presented below is the name in effect at period end.
| Affiliate | Value, beginning of period ($) | Purchases ($) | Sales Proceeds ($) | Dividend Income ($) | Realized Gain (loss) ($) | Change in Unrealized appreciation (depreciation) ($) | Value, end of period ($) |
| Fidelity Direct Lending Fund, LP | 5,437,758 | 3,045,619 | - | 302,288 | - | (100,232) | 8,383,145 |
| | 5,437,758 | 3,045,619 | - | 302,288 | - | (100,232) | 8,383,145 |
Amounts in the income column in the above table include any capital gain distributions from underlying funds, which are presented in the corresponding line item in the Statement of Operations, if applicable.
Investment Valuation
The following is a summary of the inputs used, as of October 31, 2022, involving the Fund's assets and liabilities carried at fair value. The inputs or methodology used for valuing securities may not be an indication of the risk associated with investing in those securities. For more information on valuation inputs, and their aggregation into the levels used below, please refer to the Investment Valuation section in the accompanying Notes to Financial Statements.
Amounts in this Investment Valuation section exclude the value of Fidelity Direct Lending Fund, LP as presented in the Schedule of Investments. Fidelity Direct Lending Fund, LP is valued using NAV as a practical expedient.
| Valuation Inputs at Reporting Date: |
| Description | Total ($) | Level 1 ($) | Level 2 ($) | Level 3 ($) |
Investments in Securities: | | | | |
|
| Equities: | | | | |
Communication Services | 1,483,324 | 1,483,324 | - | - |
Consumer Discretionary | 3,883,836 | 3,883,836 | - | - |
Consumer Staples | 25,627,938 | - | - | 25,627,938 |
Energy | 29,926,519 | 5,605,712 | - | 24,320,807 |
Information Technology | 366,387 | - | - | 366,387 |
|
| Corporate Bonds | 1,282,763,328 | - | 1,256,712,627 | 26,050,701 |
|
| Bank Loan Obligations | 103,827,153 | - | 98,963,723 | 4,863,430 |
|
| Money Market Funds | 62,513,387 | 62,513,387 | - | - |
| Total Investments in Securities: | 1,510,391,872 | 73,486,259 | 1,355,676,350 | 81,229,263 |
The following is a reconciliation of Investments in Securities for which Level 3 inputs were used in determining value:
| |
| Investments in Securities: | |
| Consumer Staples | | | |
| Beginning Balance | $ | 27,867,272 | |
| Net Realized Gain (Loss) on Investment Securities | | - | |
| Net Unrealized Gain (Loss) on Investment Securities | | (2,239,334) | |
| Cost of Purchases | | - | |
| Proceeds of Sales | | - | |
| Amortization/Accretion | | - | |
| Transfers into Level 3 | | - | |
| Transfers out of Level 3 | | - | |
| Ending Balance | $ | 25,627,938 | |
| The change in unrealized gain (loss) for the period attributable to Level 3 securities held at October 31, 2022 | $ | (2,239,334) | |
| Energy | | | |
| Beginning Balance | $ | 25,169,419 | |
| Net Realized Gain (Loss) on Investment Securities | | - | |
| Net Unrealized Gain (Loss) on Investment Securities | | (848,612) | |
| Cost of Purchases | | - | |
| Proceeds of Sales | | - | |
| Amortization/Accretion | | - | |
| Transfers into Level 3 | | - | |
| Transfers out of Level 3 | | - | |
| Ending Balance | $ | 24,320,807 | |
| The change in unrealized gain (loss) for the period attributable to Level 3 securities held at October 31, 2022 | $ | (848,612) | |
| Corporate Bonds | | | |
| Beginning Balance | $ | 21,256,578 | |
| Net Realized Gain (Loss) on Investment Securities | | - | |
| Net Unrealized Gain (Loss) on Investment Securities | | 4,794,123 | |
| Cost of Purchases | | - | |
| Proceeds of Sales | | - | |
| Amortization/Accretion | | - | |
| Transfers into Level 3 | | - | |
| Transfers out of Level 3 | | - | |
| Ending Balance | $ | 26,050,701 | |
| The change in unrealized gain (loss) for the period attributable to Level 3 securities held at October 31, 2022 | $ | 4,794,123 | |
| Other Investments in Securities | | | |
| Beginning Balance | $ | 5,724,228 | |
| Net Realized Gain (Loss) on Investment Securities | | (12,299) | |
| Net Unrealized Gain (Loss) on Investment Securities | | (158,784) | |
| Cost of Purchases | | 7,000 | |
| Proceeds of Sales | | (350,042) | |
| Amortization/Accretion | | 19,714 | |
| Transfers into Level 3 | | - | |
| Transfers out of Level 3 | | - | |
| Ending Balance | $ | 5,229,817 | |
| The change in unrealized gain (loss) for the period attributable to Level 3 securities held at October 31, 2022 | $ | (158,784) | |
| The information used in the above reconciliation represents fiscal year to date activity for any Investments in Securities identified as using Level 3 inputs at either the beginning or the end of the current fiscal period. Cost of purchases and proceeds of sales may include securities received and/or delivered through in-kind transactions. Transfers into Level 3 were attributable to a lack of observable market data resulting from decreases in market activity, decreases in liquidity, security restructurings or corporate actions. Transfers out of Level 3 were attributable to observable market data becoming available for those securities. Transfers in or out of Level 3 represent the beginning value of any Security or Instrument where a change in the pricing level occurred from the beginning to the end of the period. The cost of purchases and the proceeds of sales may include securities received or delivered through corporate actions or exchanges. Realized and unrealized gains (losses) disclosed in the reconciliation are included in Net Gain (Loss) on the Fund's Statement of Operations. | |
| Statement of Assets and Liabilities |
| | | | October 31, 2022 (Unaudited) |
| | | | | |
| Assets | | | | |
| Investment in securities, at value - See accompanying schedule: | | | | |
Unaffiliated issuers (cost $1,702,779,657) | | $1,447,878,485 | | |
Fidelity Central Funds (cost $62,513,387) | | 62,513,387 | | |
Other affiliated issuers (cost $8,478,269) | | 8,383,145 | | |
| | | | | |
| Total Investment in Securities (cost $1,773,771,313) | | | $ | 1,518,775,017 |
| Cash | | | | 46,664 |
| Receivable for investments sold | | | | 11,959,102 |
| Receivable for fund shares sold | | | | 1,213,727 |
| Dividends receivable | | | | 83,716 |
| Interest receivable | | | | 22,391,099 |
| Distributions receivable from Fidelity Central Funds | | | | 139,278 |
| Prepaid expenses | | | | 2,553 |
Total assets | | | | 1,554,611,156 |
| Liabilities | | | | |
| Payable for investments purchased | | $8,218,359 | | |
| Payable for fund shares redeemed | | 553,130 | | |
| Distributions payable | | 12,298 | | |
| Accrued management fee | | 694,834 | | |
| Other payables and accrued expenses | | 41,106 | | |
| Total Liabilities | | | | 9,519,727 |
| Net Assets | | | $ | 1,545,091,429 |
| Net Assets consist of: | | | | |
| Paid in capital | | | $ | 1,964,017,647 |
| Total accumulated earnings (loss) | | | | (418,926,218) |
| Net Assets | | | $ | 1,545,091,429 |
Net Asset Value , offering price and redemption price per share ($1,545,091,429 ÷ 181,381,457 shares) | | | $ | 8.52 |
| | | | | |
| Statement of Operations |
| | | | Six months ended October 31, 2022 (Unaudited) |
| Investment Income | | | | |
| Dividends (including $302,288 earned from affiliated issuers) | | | $ | 7,158,579 |
| Interest | | | | 46,814,425 |
| Income from Fidelity Central Funds (including $50,159 from security lending) | | | | 917,056 |
| Total Income | | | | 54,890,060 |
| Expenses | | | | |
| Management fee | $ | 4,898,755 | | |
| Custodian fees and expenses | | 8,978 | | |
| Independent trustees' fees and expenses | | 3,302 | | |
| Registration fees | | 39,851 | | |
| Audit | | 45,114 | | |
| Legal | | 476,098 | | |
| Miscellaneous | | 8,304 | | |
| Total expenses before reductions | | 5,480,402 | | |
| Expense reductions | | (19,454) | | |
| Total expenses after reductions | | | | 5,460,948 |
| Net Investment income (loss) | | | | 49,429,112 |
| Realized and Unrealized Gain (Loss) | | | | |
| Net realized gain (loss) on: | | | | |
| Investment Securities: | | | | |
| Unaffiliated issuers | | (111,628,260) | | |
| Total net realized gain (loss) | | | | (111,628,260) |
| Change in net unrealized appreciation (depreciation) on: | | | | |
| Investment Securities: | | | | |
| Unaffiliated issuers | | (43,944,537) | | |
| Affiliated issuers | | (100,232) | | |
| Assets and liabilities in foreign currencies | | 1 | | |
| Total change in net unrealized appreciation (depreciation) | | | | (44,044,768) |
| Net gain (loss) | | | | (155,673,028) |
| Net increase (decrease) in net assets resulting from operations | | | $ | (106,243,916) |
| Statement of Changes in Net Assets |
| |
| | Six months ended October 31, 2022 (Unaudited) | | For the period May 13, 2021 (commencement of operations) through April 30, 2022 |
| Increase (Decrease) in Net Assets | | | | |
| Operations | | | | |
| Net investment income (loss) | $ | 49,429,112 | $ | 111,531,249 |
| Net realized gain (loss) | | (111,628,260) | | (57,116,764) |
| Change in net unrealized appreciation (depreciation) | | (44,044,768) | | (210,951,527) |
| Net increase (decrease) in net assets resulting from operations | | (106,243,916) | | (156,537,042) |
| Distributions to shareholders | | (43,439,102) | | (112,706,158) |
| Share transactions | | | | |
| Proceeds from sales of shares | | 176,643,835 | | 5,413,238,176 |
| Reinvestment of distributions | | 43,358,542 | | 112,444,143 |
| Cost of shares redeemed | | (1,006,593,339) | | (2,775,073,710) |
Net increase (decrease) in net assets resulting from share transactions | | (786,590,962) | | 2,750,608,609 |
| Total increase (decrease) in net assets | | (936,273,980) | | 2,481,365,409 |
| | | | | |
| Net Assets | | | | |
| Beginning of period | | 2,481,365,409 | | - |
| End of period | $ | 1,545,091,429 | $ | 2,481,365,409 |
| | | | | |
| Other Information | | | | |
| Shares | | | | |
| Sold | | 20,196,413 | | 543,016,881 |
| Issued in reinvestment of distributions | | 4,997,877 | | 11,438,350 |
| Redeemed | | (114,892,062) | | (283,376,002) |
| Net increase (decrease) | | (89,697,772) | | 271,079,229 |
| | | | | |
Financial Highlights
| Fidelity® SAI High Income Fund |
| |
| | Six months ended (Unaudited) October 31, 2022 | | Years ended April 30, 2022 A |
Selected Per-Share Data | | | | |
| Net asset value, beginning of period | $ | 9.15 | $ | 10.00 |
| Income from Investment Operations | | | | |
Net investment income (loss) B,C | | .242 | | .388 |
| Net realized and unrealized gain (loss) | | (.659) | | (.879) |
| Total from investment operations | | (.417) | | (.491) |
| Distributions from net investment income | | (.213) | | (.345) |
| Distributions from net realized gain | | - | | (.014) |
| Total distributions | | (.213) | | (.359) |
| Net asset value, end of period | $ | 8.52 | $ | 9.15 |
Total Return D,E | | (4.57)% | | (5.10)% |
Ratios to Average Net Assets C,F,G | | | | |
| Expenses before reductions | | .61% H | | .60% H |
| Expenses net of fee waivers, if any | | .61% H | | .60% H |
| Expenses net of all reductions | | .61% H | | .60% H |
| Net investment income (loss) | | 5.48% H | | 4.06% H |
| Supplemental Data | | | | |
| Net assets, end of period (000 omitted) | $ | 1,545,091 | $ | 2,481,365 |
Portfolio turnover rate I | | 15% H | | 59% H,J |
A For the period May 13, 2021 (commencement of operations) through April 30, 2022.
B Calculated based on average shares outstanding during the period.
C Net investment income (loss) is affected by the timing of the declaration of dividends by any underlying mutual funds or exchange-traded funds (ETFs). Net investment income (loss) of any mutual funds or ETFs is not included in the Fund's net investment income (loss) ratio.
D Total returns for periods of less than one year are not annualized.
E Total returns would have been lower if certain expenses had not been reduced during the applicable periods shown.
F Fees and expenses of any underlying mutual funds or exchange-traded funds (ETFs) are not included in the Fund's expense ratio. The Fund indirectly bears its proportionate share of these expenses. For additional expense information related to investments in Fidelity Central Funds, please refer to the "Investments in Fidelity Central Funds" note found in the Notes to Financial Statements section of the most recent Annual or Semi-Annual report. For additional expense information related to investments in Fidelity Direct Lending Fund, LP, please refer to the Investment in Fidelity Direct Lending Fund, LP note found in the Notes to Financial Statements section of the most recent Annual or Semi-Annual report.
G Expense ratios reflect operating expenses of the class. Expenses before reductions do not reflect amounts reimbursed, waived, or reduced through arrangements with the investment adviser, brokerage services, or other offset arrangements, if applicable, and do not represent the amount paid by the class during periods when reimbursements, waivers or reductions occur.
H Annualized.
I Amount does not include the portfolio activity of any underlying mutual funds or exchange-traded funds (ETFs).
J Portfolio turnover rate excludes securities received or delivered in-kind.
For the period ended October 31, 2022
1. Organization.
Fidelity SAI High Income Fund (the Fund) is a fund of Fidelity Summer Street Trust (the Trust) and is authorized to issue an unlimited number of shares. Shares are offered exclusively to certain clients of Fidelity Management & Research Company LLC (FMR) or its affiliates. The Trust is registered under the Investment Company Act of 1940, as amended (the 1940 Act), as an open-end management investment company organized as a Massachusetts business trust.
2. Investments in Fidelity Central Funds.
Funds may invest in Fidelity Central Funds, which are open-end investment companies generally available only to other investment companies and accounts managed by the investment adviser and its affiliates. The Schedule of Investments lists any Fidelity Central Funds held as an investment as of period end, but does not include the underlying holdings of each Fidelity Central Fund. An investing fund indirectly bears its proportionate share of the expenses of the underlying Fidelity Central Funds.
Based on its investment objective, each Fidelity Central Fund may invest or participate in various investment vehicles or strategies that are similar to those of the investing fund. These strategies are consistent with the investment objectives of the investing fund and may involve certain economic risks which may cause a decline in value of each of the Fidelity Central Funds and thus a decline in the value of the investing fund.
| Fidelity Central Fund | Investment Manager | Investment Objective | Investment Practices | Expense Ratio A |
| Fidelity Money Market Central Funds | Fidelity Management & Research Company LLC (FMR) | Each fund seeks to obtain a high level of current income consistent with the preservation of capital and liquidity. | Short-term Investments | Less than .005% |
A Expenses expressed as a percentage of average net assets and are as of each underlying Central Fund's most recent annual or semi-annual shareholder report.
A complete unaudited list of holdings for each Fidelity Central Fund is available upon request or at the Securities and Exchange Commission website at www.sec.gov. In addition, the financial statements of the Fidelity Central Funds which contain the significant accounting policies (including investment valuation policies) of those funds, and are not covered by the Report of Independent Registered Public Accounting Firm, are available on the Securities and Exchange Commission website or upon request.
3. Investment in Fidelity Direct Lending Fund, LP.
The Fund invests in Fidelity Direct Lending Fund, LP, which is a limited partnership available only to certain investment companies managed by the investment adviser and its affiliates. The Fund's limited partnership interest is not registered under the Securities Act of 1933, and is subject to substantial restrictions on transfer. The Fund has no redemption rights under the partnership agreement. There will be no trading market for the partnership interest, and the Fund most likely will hold its interest until Fidelity Direct Lending Fund, LP converts by operation of law to a Delaware corporation, trust, or other limited liability entity and (i) registers as a closed-end management investment company under the 1940 Act or (ii) elects to be treated as a business development company under the 1940 Act.
Based on its investment objective, Fidelity Direct Lending Fund, LP may invest or participate in various investments or strategies that are similar to those in which the Fund may invest or participate. These strategies are consistent with the investment objectives of the Fund and may involve certain economic risks which may cause a decline in value of Fidelity Direct Lending Fund, LP and thus a decline in the value of the Fund. The Fidelity Direct Lending Fund, LP intends to invest primarily in direct loans made to private U.S. companies, specifically small- and middle-market companies.
The Schedule of Investments lists Fidelity Direct Lending Fund, LP as an investment as of period end, but does not include the underlying holdings of Fidelity Direct Lending Fund, LP. Fidelity Direct Lending Fund, LP represented less than 5% of the Fund's net assets at period end. The Fund indirectly bears its proportionate share of the expenses of Fidelity Direct Lending Fund, LP, which commenced operations on December 8, 2021. The annualized expense ratio for Fidelity Direct Lending Fund, LP for the period ended April 30, 2022 was .07%.
4. Significant Accounting Policies.
The Fund is an investment company and applies the accounting and reporting guidance of the Financial Accounting Standards Board (FASB) Accounting Standards Codification Topic 946 Financial Services - Investment Companies . The financial statements have been prepared in conformity with accounting principles generally accepted in the United States of America (GAAP), which require management to make certain estimates and assumptions at the date of the financial statements. Actual results could differ from those estimates. Subsequent events, if any, through the date that the financial statements were issued have been evaluated in the preparation of the financial statements. The Fund's Schedule of Investments lists any underlying mutual funds or exchange-traded funds (ETFs) but does not include the underlying holdings of these funds. The following summarizes the significant accounting policies of the Fund:
Investment Valuation. Investments are valued as of 4:00 p.m. Eastern time on the last calendar day of the period. The Board of Trustees (the Board) has designated the Fund's investment adviser as the valuation designee responsible for the fair valuation function and performing fair value determinations as needed. The investment adviser has established a Fair Value Committee (the Committee) to carry out the day-to-day fair valuation responsibilities and has adopted policies and procedures to govern the fair valuation process and the activities of the Committee. In accordance with these fair valuation policies and procedures, which have been approved by the Board, the Fund attempts to obtain prices from one or more third party pricing services or brokers to value its investments. When current market prices, quotations or currency exchange rates are not readily available or reliable, investments will be fair valued in good faith by the Committee, in accordance with the policies and procedures. Factors used in determining fair value vary by investment type and may include market or investment specific events, transaction data, estimated cash flows, and market observations of comparable investments. The frequency that the fair valuation procedures are used cannot be predicted and they may be utilized to a significant extent. The Committee manages the Fund's fair valuation practices and maintains the fair valuation policies and procedures. The Fund's investment adviser reports to the Board information regarding the fair valuation process and related material matters.
The Fund categorizes the inputs to valuation techniques used to value its investments into a disclosure hierarchy consisting of three levels as shown below:
Level 1 - unadjusted quoted prices in active markets for identical investments
Level 2 - other significant observable inputs (including quoted prices for similar investments, interest rates, prepayment speeds, etc.)
Level 3 - unobservable inputs (including the Fund's own assumptions based on the best information available)
Valuation techniques used to value the Fund's investments by major category are as follows:
Debt securities, including restricted securities, are valued based on evaluated prices received from third party pricing services or from brokers who make markets in such securities. Corporate bonds and bank loan obligations are valued by pricing services who utilize matrix pricing which considers yield or price of bonds of comparable quality, coupon, maturity and type or by broker-supplied prices. When independent prices are unavailable or unreliable, debt securities may be valued utilizing pricing methodologies which consider similar factors that would be used by third party pricing services. Debt securities are generally categorized as Level 2 in the hierarchy but may be Level 3 depending on the circumstances. The Fund invests a significant portion of its assets in below investment grade securities. The value of these securities can be more volatile due to changes in the credit quality of the issuer and is sensitive to changes in economic, market and regulatory conditions.
Equity securities, including restricted securities, for which market quotations are readily available, are valued at the last reported sale price or official closing price as reported by a third party pricing service on the primary market or exchange on which they are traded and are categorized as Level 1 in the hierarchy. In the event there were no sales during the day or closing prices are not available, securities are valued at the last quoted bid price or may be valued using the last available price and are generally categorized as Level 2 in the hierarchy. For foreign equity securities, when market or security specific events arise, comparisons to the valuation of American Depositary Receipts (ADRs), futures contracts, ETFs and certain indexes as well as quoted prices for similar securities may be used and would be categorized as Level 2 in the hierarchy. For equity securities, including restricted securities, where observable inputs are limited, assumptions about market activity and risk are used and these securities may be categorized as Level 3 in the hierarchy. Securities, including private placements or other restricted securities, for which observable inputs are not available are valued using alternate valuation approaches, including the market approach, the income approach and cost approach, and are categorized as Level 3 in the hierarchy. The market approach considers factors including the price of recent investments in the same or a similar security or financial metrics of comparable securities. The income approach considers factors including expected future cash flows, security specific risks and corresponding discount rates. The cost approach considers factors including the value of the security's underlying assets and liabilities.
Investments in open-end mutual funds, including the Fidelity Central Funds, are valued at their closing net asset value (NAV) each business day and are categorized as Level 1 in the hierarchy.
Fidelity Direct Lending Fund, LP is valued using NAV as a practical expedient in accordance with the specialized accounting guidance for investment companies.
The following provides information on Level 3 securities held by the Fund that were valued at period end based on unobservable inputs. These amounts exclude valuations provided by a broker and valuations using NAV as a practical expedient.
| Asset Type | Fair Value | Valuation Technique(s) | Unobservable Input | Amount or Range/Weighted Average | Impact to Valuation from an Increase in Input A |
| Equities | $50,315,132 | Recovery value | Recovery value | $1.00 | Increase |
| | | Market comparable | Enterprise value/EBITDA multiple (EV/EBITDA) | 2.8-3.9/3.5 | Increase |
| | | | Daily production multiple ($/Million cubic feet per day) | $22,500.00 | Increase |
| | | | Enterprise Value/PV-10 multiple (EV/PV-10) | 0.8 | Increase |
| | | | Enterprise Value/Proved Reserves multiple | 5.9 | Increase |
| | | Discounted cash flow | Discount rate | 10.0% | Decrease |
| | | | Reverse risk rate | 50.0%-95.0%/72.5% | Increase |
| Corporate Bonds | $26,050,701 | Market comparable | Enterprise value/EBITDA multiple (EV/EBITDA) | 2.8 | Increase |
| | | | Daily production multiple ($/Million cubic feet per day) | $22,500.00 | Increase |
| | | | Enterprise Value/PV-10 multiple (EV/PV-10) | 0.8 | Increase |
| | | | Enterprise Value/Proved Reserves multiple | 5.9 | Increase |
| | | Discounted cash flow | Discount rate | 10.0% | Decrease |
| | | | Reserve risk rate | 50.0%-95.0%/72.5% | Increase |
| Bank Loan Obligations | $4,863,430 | Recovery value | Recovery Value | $0.00 | Increase |
| | | Indicative market price | Evaluated bid | $95.00 | Increase |
A Represents the directional change in the fair value of the Level 3 investments that could have resulted from an increase in the corresponding input as of period end. A decrease to the unobservable input would have had the opposite effect. Significant changes in these inputs may have resulted in a significantly higher or lower fair value measurement at period end.
Changes in valuation techniques may result in transfers in or out of an assigned level within the disclosure hierarchy. The aggregate value of investments by input level as of October 31, 2022, as well as a roll forward of Level 3 investments, is included at the end of the Fund's Schedule of Investments.
Foreign Currency. Certain Funds may use foreign currency contracts to facilitate transactions in foreign-denominated securities. Gains and losses from these transactions may arise from changes in the value of the foreign currency or if the counterparties do not perform under the contracts' terms.
Foreign-denominated assets, including investment securities, and liabilities are translated into U.S. dollars at the exchange rates at period end. Purchases and sales of investment securities, income and dividends received, and expenses denominated in foreign currencies are translated into U.S. dollars at the exchange rate in effect on the transaction date.
The effects of exchange rate fluctuations on investments are included with the net realized and unrealized gain (loss) on investment securities. Other foreign currency transactions resulting in realized and unrealized gain (loss) are disclosed separately.
Investment Transactions and Income. For financial reporting purposes, the Fund's investment holdings and NAV include trades executed through the end of the last business day of the period. The NAV per share for processing shareholder transactions is calculated as of the close of business of the New York Stock Exchange (NYSE), normally 4:00 p.m. Eastern time and includes trades executed through the end of the prior business day. Gains and losses on securities sold are determined on the basis of identified cost. Commissions paid to certain brokers with whom the investment adviser, or its affiliates, places trades on behalf of a fund include an amount in addition to trade execution, which may be rebated back to a fund. Any such rebates are included in net realized gain (loss) on investments in the Statement of Operations. Dividend income is recorded on the ex-dividend date, except for certain dividends from foreign securities where the ex-dividend date may have passed, which are recorded as soon as the Fund is informed of the ex-dividend date. Non-cash dividends included in dividend income, if any, are recorded at the fair market value of the securities received. Income and capital gain distributions from Fidelity Central Funds, if any, are recorded on the ex-dividend date. Interest income is accrued as earned and includes coupon interest and amortization of premium and accretion of discount on debt securities as applicable. Investment income is recorded net of foreign taxes withheld where recovery of such taxes is uncertain. Debt obligations may be placed on non-accrual status and related interest income may be reduced by ceasing current accruals and writing off interest receivables when the collection of all or a portion of interest has become doubtful based on consistently applied procedures. A debt obligation is removed from non-accrual status when the issuer resumes interest payments or when collectability of interest is reasonably assured.
Expenses. Expenses directly attributable to a fund are charged to that fund. Expenses attributable to more than one fund are allocated among the respective funds on the basis of relative net assets or other appropriate methods. Expenses included in the accompanying financial statements reflect the expenses of that fund and do not include any expenses associated with any underlying mutual funds or exchange-traded funds. Although not included in a fund's expenses, a fund indirectly bears its proportionate share of these expenses through the net asset value of each underlying mutual fund or exchange-traded fund. Expense estimates are accrued in the period to which they relate and adjustments are made when actual amounts are known.
Income Tax Information and Distributions to Shareholders. Each year, the Fund intends to qualify as a regulated investment company under Subchapter M of the Internal Revenue Code, including distributing substantially all of its taxable income and realized gains. As a result, no provision for U.S. Federal income taxes is required. The Fund files a U.S. federal tax return, in addition to state and local tax returns as required. The Fund's federal income tax returns are subject to examination by the Internal Revenue Service (IRS) for a period of three fiscal years after they are filed. State and local tax returns may be subject to examination for an additional fiscal year depending on the jurisdiction. Foreign taxes are provided for based on the Fund's understanding of the tax rules and rates that exist in the foreign markets in which it invests.
Distributions are declared and recorded daily and paid monthly from net investment income. Distributions from realized gains, if any, are declared and recorded on the ex-dividend date. Income and capital gain distributions are determined in accordance with income tax regulations, which may differ from GAAP.
Capital accounts within the financial statements are adjusted for permanent book-tax differences. These adjustments have no impact on net assets or the results of operations. Capital accounts are not adjusted for temporary book-tax differences which will reverse in a subsequent period.
Book-tax differences are primarily due to market discount and losses deferred due to wash sales and excise tax regulations.
As of period end, the cost and unrealized appreciation (depreciation) in securities, and derivatives if applicable, for federal income tax purposes were as follows:
| Gross unrealized appreciation | $22,932,905 |
| Gross unrealized depreciation | (273,933,326) |
| Net unrealized appreciation (depreciation) | $(251,000,421) |
| Tax cost | $1,769,775,438 |
The Fund elected to defer to its next fiscal year approximately $61,630,581 of capital losses recognized during the period November 1, 2021 to April 30, 2022.
Restricted Securities (including Private Placements). Funds may invest in securities that are subject to legal or contractual restrictions on resale. These securities generally may be resold in transactions exempt from registration or to the public if the securities are registered. Disposal of these securities may involve time-consuming negotiations and expense, and prompt sale at an acceptable price may be difficult. Information regarding restricted securities held at period end is included at the end of the Schedule of Investments, if applicable.
Loans and Other Direct Debt Instruments. Direct debt instruments are interests in amounts owed to lenders by corporate or other borrowers. These instruments may be in the form of loans, trade claims or other receivables and may include standby financing commitments such as revolving credit facilities that obligate a fund to supply additional cash to the borrower on demand. Loans may be acquired through assignment, participation, or may be made directly to a borrower. Such instruments are presented in the Bank Loan Obligations section in the Schedule of Investments. Certain funds may also invest in unfunded loan commitments, which are contractual obligations for future funding. Information regarding unfunded commitments is included at the end of the Schedule of Investments, if applicable.
Commitments. A commitment is an agreement to acquire an investment at a future date (subject to conditions) in connection with a potential public or non-public offering. The amount of commitments outstanding at period end are presented in the table below. These commitments are not included in the net assets of the Fund at period end.
| | Investment to be Acquired | Commitment Amount |
| Fidelity SAI High Income Fund | Fidelity Direct Lending Fund, LP | $11,521,731 |
5. Purchases and Sales of Investments.
Purchases and sales of securities, other than short-term securities and in-kind transactions, as applicable, are noted in the table below.
| | Purchases ($) | Sales ($) |
| Fidelity SAI High Income Fund | 124,321,400 | 851,609,155 |
6. Fees and Other Transactions with Affiliates.
Management Fee. Fidelity Management & Research Company LLC (the investment adviser) and its affiliates provide the Fund with investment management related services for which the Fund pays a monthly management fee. The management fee is the sum of an individual fund fee rate that is based on an annual rate of .45% of the Fund's average net assets and an annualized group fee rate that averaged .10% during the period. The group fee rate is based upon the monthly average net assets of a group of registered investment companies with which the investment adviser has management contracts. The group fee rate decreases as assets under management increase and increases as assets under management decrease. For the reporting period, the total annualized management fee rate was .54% of the Fund's average net assets.
Brokerage Commissions. A portion of portfolio transactions were placed with brokerage firms which are affiliates of the investment adviser. Brokerage commissions are included in net realized gain (loss) and change in net unrealized appreciation (depreciation) in the Statement of Operations. The commissions paid to these affiliated firms were as follows:
| | Amount |
| Fidelity SAI High Income Fund | $55 |
Interfund Trades. Funds may purchase from or sell securities to other Fidelity Funds under procedures adopted by the Board. The procedures have been designed to ensure these interfund trades are executed in accordance with Rule 17a-7 of the 1940 Act. Any interfund trades are included within the respective purchases and sales amounts shown in the Purchases and Sales of Investments note. Interfund trades during the period are noted in the table below.
| | Purchases ($) | Sales ($) | Realized Gain (Loss) ($) |
| Fidelity SAI High Income Fund | - | 1,406,756 | 60,742 |
Prior Fiscal Year Affiliated Exchanges In-Kind. Shares that were exchanged for investments, including accrued interest and cash, if any, are shown in the table below. The amount of in-kind exchanges is included in share transactions in the accompanying Statement of Changes in Net Assets.
| | Shares | Total Proceeds ($) |
| Fidelity SAI High Income Fund | 418,596,053 | 4,188,784,329 |
7. Committed Line of Credit.
Certain Funds participate with other funds managed by the investment adviser or an affiliate in a $4.25 billion credit facility (the "line of credit") to be utilized for temporary or emergency purposes to fund shareholder redemptions or for other short-term liquidity purposes. The participating funds have agreed to pay commitment fees on their pro-rata portion of the line of credit, which are reflected in Miscellaneous expenses on the Statement of Operations, and are listed below. During the period, there were no borrowings on this line of credit.
| | Amount |
| Fidelity SAI High Income Fund | $1,741 |
8. Security Lending.
Funds lend portfolio securities from time to time in order to earn additional income. Lending agents are used, including National Financial Services (NFS), an affiliate of the investment adviser. Pursuant to a securities lending agreement, NFS will receive a fee, which is capped at 9.9% of a fund's daily lending revenue, for its services as lending agent. A fund may lend securities to certain qualified borrowers, including NFS. On the settlement date of the loan, a fund receives collateral (in the form of U.S. Treasury obligations, letters of credit and/or cash) against the loaned securities and maintains collateral in an amount not less than 100% of the market value of the loaned securities during the period of the loan. The market value of the loaned securities is determined at the close of business of a fund and any additional required collateral is delivered to a fund on the next business day. A fund or borrower may terminate the loan at any time, and if the borrower defaults on its obligation to return the securities loaned because of insolvency or other reasons, a fund may apply collateral received from the borrower against the obligation. A fund may experience delays and costs in recovering the securities loaned. Any cash collateral received is invested in the Fidelity Securities Lending Cash Central Fund. Any loaned securities are identified as such in the Schedule of Investments, and the value of loaned securities and cash collateral at period end, as applicable, are presented in the Statement of Assets and Liabilities. Security lending income represents the income earned on investing cash collateral, less rebates paid to borrowers and any lending agent fees associated with the loan, plus any premium payments received for lending certain types of securities. Security lending income is presented in the Statement of Operations as a component of income from Fidelity Central Funds. Affiliated security lending activity, if any, was as follows:
| | Total Security Lending Fees Paid to NFS | Security Lending Income From Securities Loaned to NFS | Value of Securities Loaned to NFS at Period End |
| Fidelity SAI High Income Fund | $4,985 | $- | $- |
9. Expense Reductions.
Through arrangements with the Fund's custodian, credits realized as a result of certain uninvested cash balances were used to reduce the Fund's expenses by $1,649.
In addition, during the period the investment adviser or an affiliate reimbursed and/or waived a portion of operating expenses in the amount of $17,805.
10. Other.
A fund's organizational documents provide former and current trustees and officers with a limited indemnification against liabilities arising in connection with the performance of their duties to the fund. In the normal course of business, a fund may also enter into contracts that provide general indemnifications. A fund's maximum exposure under these arrangements is unknown as this would be dependent on future claims that may be made against a fund. The risk of material loss from such claims is considered remote.
At the end of the period, the following mutual funds managed by the investment adviser or its affiliates were the owners of record of 10% or more of the total outstanding shares.
| | Strategic Advisers Fidelity Core Income Fund |
| Fidelity SAI High Income Fund | 24% |
11. Risk and Uncertainties.
Many factors affect a fund's performance. Developments that disrupt global economies and financial markets, such as pandemics, epidemics, outbreaks of infectious diseases, war, terrorism, and environmental disasters, may significantly affect a fund's investment performance. The effects of these developments to a fund will be impacted by the types of securities in which a fund invests, the financial condition, industry, economic sector, and geographic location of an issuer, and a fund's level of investment in the securities of that issuer.
As a shareholder, you incur two types of costs: (1) transaction costs, which may include sales charges (loads) on purchase payments or redemption proceeds, as applicable and (2) ongoing costs, which generally include management fees, distribution and/or service (12b-1) fees and other Fund expenses. This Example is intended to help you understand your ongoing costs (in dollars) of investing in a fund and to compare these costs with the ongoing costs of investing in other mutual funds.
| The Example is based on an investment of $1,000 invested at the beginning of the period and held for the entire period (May 1, 2022 to October 31, 2022). |
Actual Expenses
The first line of the accompanying table provides information about actual account values and actual expenses. You may use the information in this line, together with the amount you invested, to estimate the expenses that you paid over the period. Simply divide your account value by $1,000.00 (for example, an $8,600 account value divided by $1,000.00 = 8.6), then multiply the result by the number in the first line for a class/Fund under the heading entitled "Expenses Paid During Period" to estimate the expenses you paid on your account during this period. If any fund is a shareholder of any underlying mutual funds or exchange-traded funds (ETFs) (the Underlying Funds), such fund indirectly bears its proportional share of the expenses of the Underlying Funds in addition to the direct expenses incurred presented in the table. These fees and expenses are not included in the annualized expense ratio used to calculate the expense estimate in the table below.
Hypothetical Example for Comparison Purposes
The second line of the accompanying table provides information about hypothetical account values and hypothetical expenses based on the actual expense ratio and an assumed rate of return of 5% per year before expenses, which is not the actual return. The hypothetical account values and expenses may not be used to estimate the actual ending account balance or expenses you paid for the period. You may use this information to compare the ongoing costs of investing in the Fund and other funds. To do so, compare this 5% hypothetical example with the 5% hypothetical examples that appear in the shareholder reports of the other funds. If any fund is a shareholder of any Underlying Funds, such fund indirectly bears its proportional share of the expenses of the Underlying Funds in addition to the direct expenses as presented in the table. These fees and expenses are not included in the annualized expense ratio used to calculate the expense estimate in the table below.
Please note that the expenses shown in the table are meant to highlight your ongoing costs only and do not reflect any transaction costs. Therefore, the second line of the table is useful in comparing ongoing costs only, and will not help you determine the relative total costs of owning different funds. In addition, if these transactional costs were included, your costs would have been higher.
| | | | | Annualized Expense Ratio- A | | Beginning Account Value May 1, 2022 | | Ending Account Value October 31, 2022 | | Expenses Paid During Period- C May 1, 2022 to October 31, 2022 |
| | | | | | | | | | |
| Fidelity® SAI High Income Fund | | | | .61% | | | | | | |
| Actual | | | | | | $ 1,000 | | $ 954.30 | | $ 3.00 |
Hypothetical- B | | | | | | $ 1,000 | | $ 1,022.13 | | $ 3.11 |
| |
A Annualized expense ratio reflects expenses net of applicable fee waivers.
B 5% return per year before expenses
C Expenses are equal to the annualized expense ratio, multiplied by the average account value over the period, multiplied by 184/ 365 (to reflect the one-half year period). The fees and expenses of any Underlying Funds are not included in each annualized expense ratio.
Fidelity SAI High Income Fund
Each year, the Board of Trustees, including the Independent Trustees (together, the Board), votes on the renewal of the management contract with Fidelity Management & Research Company LLC (FMR) and the sub-advisory agreements (together, the Advisory Contracts) for the fund. FMR and the sub-advisers are referred to herein as the Investment Advisers. The Board, assisted by the advice of fund counsel and Independent Trustees' counsel, requests and considers a broad range of information relevant to the renewal of the Advisory Contracts throughout the year.
The Board meets regularly and, at each of its meetings, covers an extensive agenda of topics and materials and considers factors that are relevant to its annual consideration of the renewal of the fund's Advisory Contracts, including the services and support provided to the fund and its shareholders. The Board has established various standing committees (Committees), each composed of and chaired by Independent Trustees with varying backgrounds, to which the Board has assigned specific subject matter responsibilities in order to enhance effective decision-making by the Board. The Board, acting directly and through its Committees, requests and receives information concerning the annual consideration of the renewal of the fund's Advisory Contracts. The Board also meets as needed to review matters specifically related to the Board's annual consideration of the renewal of the Advisory Contracts. Members of the Board may also meet with trustees of other Fidelity funds through joint ad hoc committees to discuss certain matters relevant to all of the Fidelity funds.
At its May 2022 meeting, the Board unanimously determined to renew the fund's Advisory Contracts. In reaching its determination, the Board considered all factors it believed relevant, including (i) the nature, extent, and quality of the services provided to the fund and its shareholders (including the investment performance of the fund); (ii) the competitiveness relative to peer funds of the fund's management fee and total expense ratio; (iii) the total costs of the services provided by and the profits realized by Fidelity from its relationships with the fund; and (iv) the extent to which, if any, economies of scale exist and are realized as the fund grows, and whether any economies of scale are appropriately shared with fund shareholders.
In considering whether to renew the Advisory Contracts for the fund, the Board reached a determination, with the assistance of fund counsel and Independent Trustees' counsel and through the exercise of its business judgment, that the renewal of the Advisory Contracts was in the best interests of the fund and its shareholders and that the compensation payable under the Advisory Contracts was fair and reasonable. The Board's decision to renew the Advisory Contracts was not based on any single factor, but rather was based on a comprehensive consideration of all the information provided to the Board at its meetings throughout the year. The Board, in reaching its determination to renew the Advisory Contracts, was aware that shareholders of the fund have a broad range of investment choices available to them, including a wide choice among funds offered by Fidelity's competitors, and that the fund's shareholders, who have the opportunity to review and weigh the disclosure provided by the fund in its prospectus and other public disclosures, have chosen to invest in this fund, which is part of the Fidelity family of funds.
Nature, Extent, and Quality of Services Provided. The Board considered Fidelity's staffing as it relates to the fund, including the backgrounds of investment personnel of Fidelity, and also considered the fund's investment objective, strategies, and related investment philosophy. The Independent Trustees also had discussions with senior management of Fidelity's investment operations and investment groups. The Board considered the structure of the investment personnel compensation program and whether this structure provides appropriate incentives to act in the best interests of the fund. Additionally, the Board considered the portfolio managers' investments, if any, in the funds that they manage. The Board also considered the steps Fidelity had taken to ensure the continued provision of high quality services to the Fidelity funds during the COVID-19 pandemic, including the expansion of staff in client facing positions to maintain service levels in periods of high volumes and volatility.
Resources Dedicated to Investment Management and Support Services . The Board and the Fund Oversight and Research Committees reviewed the general qualifications and capabilities of Fidelity's investment staff, including its size, education, experience, and resources, as well as Fidelity's approach to recruiting, training, managing, and compensating investment personnel. The Board noted the resources devoted to expansion of Fidelity's global investment organization, and that Fidelity's analysts have extensive resources, tools, and capabilities that allow them to conduct sophisticated quantitative and fundamental analysis, as well as credit analysis of issuers, counterparties, and guarantors. Further, the Board considered that Fidelity's investment professionals have sufficient access to global information and data so as to provide competitive investment results over time, and that those professionals also have access to sophisticated tools that permit them to assess portfolio construction and risk and performance attribution characteristics continuously, as well as to transmit new information and research conclusions rapidly around the world. Additionally, in its deliberations, the Board considered Fidelity's trading, risk management, compliance, and technology and operations capabilities and resources, which are integral parts of the investment management process.
Shareholder and Administrative Services . The Board considered (i) the nature, extent, quality, and cost of advisory, administrative, and shareholder services performed by the Investment Advisers and their affiliates under the Advisory Contracts and under separate agreements covering transfer agency, pricing and bookkeeping, and securities lending services for the fund; (ii) the nature and extent of the supervision of third party service providers, principally custodians, subcustodians, and pricing vendors; and (iii) the resources devoted to, and the record of compliance with, the fund's compliance policies and procedures. The Board also reviewed the allocation of fund brokerage, including allocations to brokers affiliated with the Investment Advisers, the use of brokerage commissions to pay fund expenses, and the use of "soft" commission dollars to pay for research services.
The Board noted that the growth of fund assets over time across the complex allows Fidelity to reinvest in the development of services designed to enhance the value and convenience of the Fidelity funds as investment vehicles. These services include 24-hour access to account information and market information over the Internet and through telephone representatives, investor education materials, and asset allocation tools. The Board also considered that it reviews customer service metrics such as telephone response times, continuity of services on the website and metrics addressing services at Fidelity Investor Centers.
Investment in a Large Fund Family. The Board considered the benefits to shareholders of investing in a Fidelity fund, including the benefits of investing in a fund that is part of a large family of funds offering a variety of investment disciplines and providing a large variety of mutual fund investor services. The Board noted that Fidelity had taken, or had made recommendations that resulted in the Fidelity funds taking, a number of actions over the previous year that benefited particular funds, including: (i) continuing to dedicate additional resources to Fidelity's investment research process, which includes meetings with management of issuers of securities in which the funds invest; (ii) continuing efforts to enhance Fidelity's global research capabilities; (iii) launching new funds and ETFs with innovative structures, strategies and pricing and making other enhancements to meet client needs; (iv) launching new share classes of existing funds; (v) eliminating purchase minimums and broadening eligibility requirements for certain funds and share classes; (vi) reducing management fees and total expenses for certain target date funds and classes and index funds; (vii) lowering expenses for certain existing funds and classes by implementing or lowering expense caps; (viii) rationalizing product lines and gaining increased efficiencies from fund mergers and liquidations; (ix) continuing to develop, acquire and implement systems and technology to improve services to the funds and shareholders, strengthen information security, and increase efficiency; and (x) continuing to implement enhancements to further strengthen Fidelity's product line to increase investors' probability of success in achieving their investment goals, including retirement income goals.
Investment Performance. The Board considered whether the fund has operated in accordance with its investment objective, as well as its record of compliance with its investment restrictions. As the fund recently commenced operations, the Board did not believe that it was appropriate to assign significant weight to its investment performance.
Based on its review, the Board concluded that the nature, extent, and quality of services provided to the fund under the Advisory Contracts should continue to benefit the shareholders of the fund.
Competitiveness of Management Fee and Total Expense Ratio. The Board considered the fund's management fee and total expense ratio compared to "mapped groups" of competitive funds and classes created for the purpose of facilitating the Trustees' competitive analysis of management fees and total expenses. Fidelity creates "mapped groups" by combining similar Lipper investment objective categories that have comparable investment mandates. Combining Lipper investment objective categories aids the Board's management fee and total expense ratio comparisons by broadening the competitive group used for comparison.
Management Fee. The Board considered two proprietary management fee comparisons for the period of the fund's operations ended September 30, 2021 shown in basis points (BP) in the chart below. The group of Lipper funds used by the Board for management fee comparisons is referred to below as the "Total Mapped Group." The Total Mapped Group is broader than the Lipper peer group used by the Board for performance comparisons because the Total Mapped Group combines several Lipper investment objective categories while the Lipper peer group does not. The Total Mapped Group comparison focuses on a fund's standing in terms of gross management fees before expense reimbursements or caps relative to the total universe of funds with comparable investment mandates, regardless of whether their management fee structures also are comparable. Funds with comparable investment mandates offer exposure to similar types of securities. Funds with comparable management fee structures have similar management fee contractual arrangements (e.g., flat rate charged for advisory services, all-inclusive fee rate, etc.). "TMG %" represents the percentage of funds in the Total Mapped Group that had management fees that were lower than the fund's. For example, a hypothetical TMG % of 20% would mean that 80% of the funds in the Total Mapped Group had higher, and 20% had lower, management fees than the fund. The fund's actual TMG %s and the number of funds in the Total Mapped Group are in the chart below. The "Asset-Sized Peer Group" (ASPG) comparison focuses on a fund's standing relative to a subset of non-Fidelity funds within the Total Mapped Group that are similar in size and management fee structure. For example, if a fund is in the first quartile of the ASPG, the fund's management fee ranks in the least expensive or lowest 25% of funds in the ASPG. The ASPG represents at least 15% of the funds in the Total Mapped Group with comparable asset size and management fee structures, subject to a minimum of 50 funds (or all funds in the Total Mapped Group if fewer than 50). Additional information, such as the ASPG quartile in which the fund's management fee rate ranked, is also included in the chart and was considered by the Board.
Fidelity SAI High Income Fund
The Board noted that the fund's management fee rate ranked below the median of its Total Mapped Group and below the median of its ASPG for the 12-month period ending September 30, 2021.
The Board also considered that, for funds subject to the group fee, FMR agreed to voluntarily waive fees over a specified period of time in amounts designed to account for assets converted from certain funds to certain collective investment trusts.
Based on its review, the Board concluded that the fund's management fee is fair and reasonable in light of the services that the fund receives and the other factors considered.
Total Expense Ratio . In its review of the fund's total expense ratio, the Board considered the fund's management fee rate as well as other fund expenses, such as transfer agent fees, pricing and bookkeeping fees, and custodial, legal, and audit fees. The Board also noted that Fidelity may agree to waive fees or reimburse expenses from time to time, and the extent to which, if any, it has done so for the fund. The fund is compared to those funds and classes in the Total Mapped Group (used by the Board for management fee comparisons) that have a similar sales load structure. The Board also considered a total expense ASPG comparison for the fund, which focuses on the total expenses of the fund relative to a subset of non-Fidelity funds within the total expense similar sales load structure group. The total expense ASPG is limited to 15 larger and 15 smaller classes in fund average assets for a total of 30 classes, where possible. The total expense ASPG comparison excludes performance adjustments and fund-paid 12b-1 fees to eliminate variability in fee structures.
The Board noted that the total net expense ratio of the fund ranked below the similar sales load structure group competitive median and above the ASPG competitive median for the 12-month period ended September 30, 2021. The Board considered that, in general, various factors can affect total expense ratios. The fund's mapped group is dominated by domestic high income funds, while the fund has a global high yield objective. When the fund is compared to an ASPG of funds with a similar global high yield objective, the fund is below the ASPG median.
Fees Charged to Other Fidelity Clients. The Board also considered Fidelity fee structures and other information with respect to clients of Fidelity, such as other funds advised or subadvised by Fidelity, pension plan clients, and other institutional clients with similar mandates. The Board noted that a joint ad hoc committee created by it and the boards of other Fidelity funds periodically reviews and compares Fidelity's institutional investment advisory business with its business of providing services to the Fidelity funds and also noted the most recent findings of the committee. The Board noted that the committee's review included a consideration of the differences in services provided, fees charged, and costs incurred, as well as competition in the markets serving the different categories of clients.
Based on its review of total expense ratios and fees charged to other Fidelity clients, the Board concluded that the fund's total expense ratio was reasonable in light of the services that the fund and its shareholders receive and the other factors considered.
Costs of the Services and Profitability. The Board considered the revenues earned and the expenses incurred by Fidelity in conducting the business of developing, marketing, distributing, managing, administering and servicing the fund and servicing the fund's shareholders. The Board also considered the level of Fidelity's profits in respect of all the Fidelity funds.
On an annual basis, Fidelity presents to the Board information about the profitability of its relationships with the fund. Fidelity calculates profitability information for each fund, as well as aggregate profitability information for groups of Fidelity funds and all Fidelity funds, using a series of detailed revenue and cost allocation methodologies which originate with the books and records of Fidelity on which Fidelity's audited financial statements are based. The Audit Committee of the Board reviews any significant changes from the prior year's methodologies and the full Board approves such changes.
A public accounting firm has been engaged annually by the Board as part of the Board's assessment of Fidelity's profitability analysis. The engagement includes the review and assessment of the methodologies used by Fidelity in determining the revenues and expenses attributable to Fidelity's mutual fund business, and completion of agreed-upon procedures in respect of the mathematical accuracy of certain fund profitability information and its conformity to established allocation methodologies. After considering the reports issued under the engagement and information provided by Fidelity, the Board concluded that while other allocation methods may also be reasonable, Fidelity's profitability methodologies are reasonable in all material respects.
The Board also reviewed Fidelity's non-fund businesses and potential indirect benefits such businesses may have received as a result of their association with Fidelity's mutual fund business (i.e., fall-out benefits) as well as cases where Fidelity's affiliates may benefit from the funds' business. The Board considered areas where potential indirect benefits to the Fidelity funds from their relationships with Fidelity may exist. The Board's consideration of these matters was informed by the findings of a joint ad hoc committee created by it and the boards of other Fidelity funds to evaluate potential fall-out benefits.
The Board considered the costs of the services provided by and the profits realized by Fidelity in connection with the operation of the fund and was satisfied that the profit was not excessive.
Economies of Scale . The Board considered whether there have been economies of scale in respect of the management of the Fidelity funds, whether the Fidelity funds (including the fund) have appropriately benefited from any such economies of scale, and whether there is potential for realization of any further economies of scale. The Board considered the extent to which the fund will benefit from economies of scale as assets grow through increased services to the fund, through waivers or reimbursements, or through fee or expense ratio reductions. The Board also noted that a committee (the Economies of Scale Committee) created by it and the boards of other Fidelity funds periodically analyzes whether Fidelity attains economies of scale in respect of the management and servicing of the Fidelity funds, whether the Fidelity funds have appropriately benefited from such economies of scale, and whether there is potential for realization of any further economies of scale.
The Board recognized that the fund's management contract incorporates a "group fee" structure, which provides for lower group fee rates as total "group assets" increase, and for higher group fee rates as total "group assets" decrease ("group assets" as defined in the management contract). FMR calculates the group fee rates based on a tiered asset "breakpoint" schedule that varies based on asset class. The Board considered that the group fee is designed to deliver the benefits of economies of scale to fund shareholders when total Fidelity fund assets increase, even if assets of any particular fund are unchanged or have declined, because some portion of Fidelity's costs are attributable to services provided to all Fidelity funds, and all funds benefit if those costs can be allocated among more assets. The Board further considered that Fidelity agreed to impose a temporary fee waiver in the form of additional breakpoints to the current breakpoint schedule. The Board concluded that, given the group fee structure, fund shareholders will benefit from lower management fees as "group assets" increase at the fund complex level, regardless of whether Fidelity achieves any such economies of scale.
The Board concluded, taking into account the analysis of the Economies of Scale Committee, that economies of scale, if any, are being appropriately shared between fund shareholders and Fidelity.
Additional Information Requested by the Board. In order to develop fully the factual basis for consideration of the Fidelity funds' advisory contracts, the Board requested and received additional information on certain topics, including: (i) fund flow and performance trends, in particular the underperformance of certain funds and strategies, and Fidelity's long-term strategies for certain funds, including any consideration of fund liquidations or mergers; (ii) the operation of performance fees, competitor use of performance fees, and consideration of the expansion of performance fees to additional funds; (iii) Fidelity's pricing philosophy compared to competitors; (iv) fund profitability methodology and data; (v) evaluation of competitive fund data and peer group classifications and fee and expense comparisons; (vi) the management fee and expense structures for different funds and classes and information about the differences between various fee and expense structures; (vii) group fee breakpoints and related voluntary fee waivers; and (viii) information regarding other accounts managed by Fidelity and the funds' sub-advisory arrangements.
Based on its evaluation of all of the conclusions noted above, and after considering all factors it believed relevant, the Board concluded that the advisory fee arrangements are fair and reasonable and that the fund's Advisory Contracts should be renewed.
1.9901442.101
SAH-SANN-1222
Item 2.
Code of Ethics
Not applicable.
Item 3.
Audit Committee Financial Expert
Not applicable.
Item 4.
Principal Accountant Fees and Services
Not applicable.
Item 5.
Audit Committee of Listed Registrants
Not applicable.
Item 6.
Investments
(a)
Not applicable.
(b)
Not applicable
Item 7.
Disclosure of Proxy Voting Policies and Procedures for Closed-End Management Investment Companies
Not applicable.
Item 8.
Portfolio Managers of Closed-End Management Investment Companies
Not applicable.
Item 9.
Purchase of Equity Securities by Closed-End Management Investment Company and Affiliated Purchasers
Not applicable.
Item 10.
Submission of Matters to a Vote of Security Holders
There were no material changes to the procedures by which shareholders may recommend nominees to the Fidelity Summer Street Trust’s Board of Trustees.
Item 11.
Controls and Procedures
(a)(i) The President and Treasurer and the Chief Financial Officer have concluded that the Fidelity Summer Street Trust’s (the “Trust”) disclosure controls and procedures (as defined in Rule 30a-3(c) under the Investment Company Act) provide reasonable
assurances that material information relating to the Trust is made known to them by the appropriate persons, based on their evaluation of these controls and procedures as of a date within 90 days of the filing date of this report.
(a)(ii) There was no change in the Trust’s internal control over financial reporting (as defined in Rule 30a-3(d) under the Investment Company Act) that occurred during the period covered by this report that has materially affected, or is reasonably likely to materially affect, the Trust’s internal control over financial reporting.
Item 12.
Disclosure of Securities Lending Activities for Closed-End Management
Investment Companies
Not applicable.
Item 13.
Exhibits
SIGNATURES
Pursuant to the requirements of the Securities Exchange Act of 1934 and the Investment Company Act of 1940, the registrant has duly caused this report to be signed on its behalf by the undersigned, thereunto duly authorized.
Fidelity Summer Street Trust
| |
By: | /s/Stacie M. Smith |
| Stacie M. Smith |
| President and Treasurer |
|
|
Date: | December 21, 2022 |
Pursuant to the requirements of the Securities Exchange Act of 1934 and the Investment Company Act of 1940, this report has been signed below by the following persons on behalf of the registrant and in the capacities and on the dates indicated.
| |
By: | /s/Stacie M. Smith |
| Stacie M. Smith |
| President and Treasurer |
|
|
Date: | December 21, 2022 |
| |
By: | /s/John J. Burke III |
| John J. Burke III |
| Chief Financial Officer |
|
|
Date: | December 21, 2022 |