UNITED STATES
SECURITIES AND EXCHANGE COMMISSION
Washington, D.C. 20549
FORM N-CSR
CERTIFIED SHAREHOLDER REPORT OF REGISTERED
MANAGEMENT INVESTMENT COMPANIES
Investment Company Act file number 811-02737
Fidelity Summer Street Trust
(Exact name of registrant as specified in charter)
245 Summer St., Boston, MA 02210
(Address of principal executive offices) (Zip code)
Cynthia Lo Bessette, Secretary
245 Summer St.
Boston, Massachusetts 02210
(Name and address of agent for service)
Registrant's telephone number, including area code:
617-563-7000
| |
Date of fiscal year end: | May 31 |
|
|
Date of reporting period: | November 30, 2022 |
Item 1.
Reports to Stockholders
Fidelity® Climate Action Fund
Semi-Annual Report
November 30, 2022
Includes Fidelity and Fidelity Advisor share classes
Contents
To view a fund's proxy voting guidelines and proxy voting record for the 12-month period ended June 30, visit http://www.fidelity.com/proxyvotingresults or visit the Securities and Exchange Commission's (SEC) web site at http://www.sec.gov.
You may also call 1-800-544-8544 if you're an individual investing directly with Fidelity, call 1-800-835-5092 if you're a plan sponsor or participant with Fidelity as your recordkeeper or call 1-877-208-0098 on institutional accounts or if you're an advisor or invest through one to request a free copy of the proxy voting guidelines.
Standard & Poor's, S&P and S&P 500 are registered service marks of The McGraw-Hill Companies, Inc. and have been licensed for use by Fidelity Distributors Corporation.
Other third-party marks appearing herein are the property of their respective owners.
All other marks appearing herein are registered or unregistered trademarks or service marks of FMR LLC or an affiliated company. © 2023 FMR LLC. All rights reserved.
This report and the financial statements contained herein are submitted for the general information of the shareholders of the Fund. This report is not authorized for distribution to prospective investors in the Fund unless preceded or accompanied by an effective prospectus.
A fund files its complete schedule of portfolio holdings with the SEC for the first and third quarters of each fiscal year on Form N-PORT. Forms N-PORT are available on the SEC's web site at http://www.sec.gov. A fund's Forms N-PORT may be reviewed and copied at the SEC's Public Reference Room in Washington, DC. Information regarding the operation of the SEC's Public Reference Room may be obtained by calling 1-800-SEC-0330.
For a complete list of a fund's portfolio holdings, view the most recent holdings listing, semiannual report, or annual report on Fidelity's web site at http://www.fidelity.com, http://www.institutional.fidelity.com, or http://www.401k.com, as applicable.
NOT FDIC INSURED •MAY LOSE VALUE •NO BANK GUARANTEE
Neither the Fund nor Fidelity Distributors Corporation is a bank.
Top Holdings (% of Fund's net assets) |
| |
| Microsoft Corp. | 4.5 | |
| Agilent Technologies, Inc. | 2.2 | |
| MasterCard, Inc. Class A | 2.2 | |
| Accenture PLC Class A | 1.9 | |
| The Home Depot, Inc. | 1.9 | |
| Elevance Health, Inc. | 1.9 | |
| Autodesk, Inc. | 1.9 | |
| Enphase Energy, Inc. | 1.9 | |
| Danaher Corp. | 1.8 | |
| Morgan Stanley | 1.7 | |
| | 21.9 | |
| |
| Market Sectors (% of Fund's net assets) |
| |
| Information Technology | 26.3 | |
| Industrials | 19.1 | |
| Financials | 14.4 | |
| Health Care | 12.3 | |
| Consumer Discretionary | 10.9 | |
| Consumer Staples | 4.4 | |
| Utilities | 3.4 | |
| Materials | 2.9 | |
| Communication Services | 1.7 | |
| Real Estate | 1.7 | |
| Energy | 0.9 | |
| |
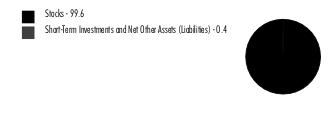
Asset Allocation (% of Fund's net assets) |
|
Foreign investments - 27.3% |
|
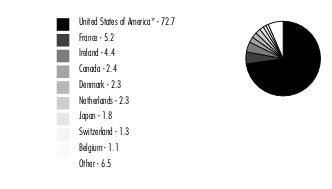
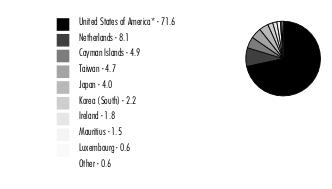
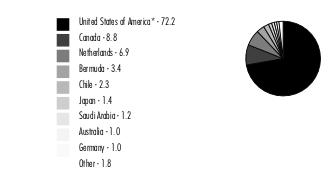
Geographic Diversification (% of Fund's net assets) |
|
* Includes Short-Term investments and Net Other Assets (Liabilities). Percentages are based on country or territory of incorporation and are adjusted for the effect of futures contracts, if applicable. |
| |
Showing Percentage of Net Assets
| Common Stocks - 98.0% |
| | | Shares | Value ($) |
| COMMUNICATION SERVICES - 1.7% | | | |
| Interactive Media & Services - 1.7% | | | |
| Alphabet, Inc. Class A (a) | | 3,631 | 366,695 |
| CONSUMER DISCRETIONARY - 10.9% | | | |
| Automobiles - 1.3% | | | |
| General Motors Co. | | 3,284 | 133,199 |
| Tesla, Inc. (a) | | 717 | 139,600 |
| | | | 272,799 |
| Hotels, Restaurants & Leisure - 1.8% | | | |
| Chipotle Mexican Grill, Inc. (a) | | 58 | 94,364 |
| Compass Group PLC | | 8,893 | 202,742 |
| Hilton Worldwide Holdings, Inc. | | 712 | 101,545 |
| | | | 398,651 |
| Household Durables - 1.3% | | | |
| Sony Group Corp. | | 3,370 | 279,171 |
| Internet & Direct Marketing Retail - 1.2% | | | |
| Etsy, Inc. (a) | | 1,889 | 249,518 |
| Specialty Retail - 1.9% | | | |
| The Home Depot, Inc. | | 1,299 | 420,863 |
| Textiles, Apparel & Luxury Goods - 3.4% | | | |
| Kering SA | | 336 | 201,881 |
| NIKE, Inc. Class B | | 3,148 | 345,304 |
| On Holding AG (a) | | 3,316 | 64,397 |
| Ralph Lauren Corp. | | 1,098 | 124,206 |
| | | | 735,788 |
TOTAL CONSUMER DISCRETIONARY | | | 2,356,790 |
| CONSUMER STAPLES - 4.4% | | | |
| Food & Staples Retailing - 1.1% | | | |
| Kesko Oyj | | 7,484 | 160,873 |
| Walmart, Inc. | | 552 | 84,136 |
| | | | 245,009 |
| Household Products - 1.7% | | | |
| Colgate-Palmolive Co. | | 3,467 | 268,623 |
| Procter & Gamble Co. | | 577 | 86,065 |
| | | | 354,688 |
| Personal Products - 1.6% | | | |
| L'Oreal SA | | 929 | 348,892 |
TOTAL CONSUMER STAPLES | | | 948,589 |
| ENERGY - 0.9% | | | |
| Energy Equipment & Services - 0.9% | | | |
| Baker Hughes Co. Class A | | 6,436 | 186,773 |
| FINANCIALS - 14.4% | | | |
| Banks - 2.7% | | | |
| Amalgamated Financial Corp. | | 9,763 | 260,379 |
| The Toronto-Dominion Bank | | 4,789 | 318,745 |
| | | | 579,124 |
| Capital Markets - 8.3% | | | |
| Intercontinental Exchange, Inc. | | 3,402 | 368,471 |
| Moody's Corp. | | 559 | 166,733 |
| Morgan Stanley | | 4,059 | 377,771 |
| Morningstar, Inc. | | 976 | 239,247 |
| MSCI, Inc. | | 680 | 345,324 |
| S&P Global, Inc. | | 854 | 301,291 |
| | | | 1,798,837 |
| Consumer Finance - 1.7% | | | |
| American Express Co. | | 2,244 | 353,632 |
| Insurance - 1.7% | | | |
| Marsh & McLennan Companies, Inc. | | 2,160 | 374,069 |
TOTAL FINANCIALS | | | 3,105,662 |
| HEALTH CARE - 12.3% | | | |
| Biotechnology - 1.4% | | | |
| Gilead Sciences, Inc. | | 3,401 | 298,710 |
| Health Care Providers & Services - 1.9% | | | |
| Elevance Health, Inc. | | 774 | 412,480 |
| Life Sciences Tools & Services - 6.3% | | | |
| Agilent Technologies, Inc. | | 3,054 | 473,309 |
| Danaher Corp. | | 1,388 | 379,493 |
| Mettler-Toledo International, Inc. (a) | | 156 | 229,251 |
| Thermo Fisher Scientific, Inc. | | 479 | 268,345 |
| | | | 1,350,398 |
| Pharmaceuticals - 2.7% | | | |
| Novo Nordisk A/S Series B | | 2,081 | 261,037 |
| Sanofi SA | | 3,601 | 325,276 |
| | | | 586,313 |
TOTAL HEALTH CARE | | | 2,647,901 |
| INDUSTRIALS - 19.1% | | | |
| Aerospace & Defense - 1.1% | | | |
| Hexcel Corp. | | 3,840 | 230,208 |
| Building Products - 2.6% | | | |
| Daikin Industries Ltd. | | 679 | 111,981 |
| Nibe Industrier AB (B Shares) | | 10,949 | 103,369 |
| Trane Technologies PLC | | 1,905 | 339,890 |
| | | | 555,240 |
| Commercial Services & Supplies - 0.5% | | | |
| Tetra Tech, Inc. | | 737 | 113,933 |
| Construction & Engineering - 2.7% | | | |
| AECOM | | 3,405 | 289,425 |
| Arcadis NV | | 1,082 | 44,167 |
| Quanta Services, Inc. | | 1,643 | 246,253 |
| | | | 579,845 |
| Electrical Equipment - 6.5% | | | |
| Acuity Brands, Inc. | | 1,234 | 232,350 |
| Bloom Energy Corp. Class A (a) | | 1,710 | 36,406 |
| ChargePoint Holdings, Inc. Class A (a) | | 697 | 8,657 |
| Eaton Corp. PLC | | 1,266 | 206,928 |
| Enovix Corp. (a) | | 2,159 | 28,175 |
| Fluence Energy, Inc. (a) | | 4,235 | 72,757 |
| Hubbell, Inc. Class B | | 497 | 126,268 |
| NuScale Power Corp. (a) | | 4,261 | 46,445 |
| Rockwell Automation, Inc. | | 800 | 211,376 |
| Schneider Electric SA | | 1,699 | 250,899 |
| Sunrun, Inc. (a) | | 429 | 13,977 |
| Vestas Wind Systems A/S | | 6,515 | 169,274 |
| | | | 1,403,512 |
| Machinery - 3.7% | | | |
| Deere & Co. | | 799 | 352,359 |
| Energy Recovery, Inc. (a) | | 4,695 | 108,830 |
| Ingersoll Rand, Inc. | | 3,333 | 179,882 |
| Kornit Digital Ltd. (a) | | 915 | 23,461 |
| Westinghouse Air Brake Tech Co. | | 1,430 | 144,559 |
| | | | 809,091 |
| Professional Services - 2.0% | | | |
| ICF International, Inc. | | 856 | 92,765 |
| KBR, Inc. | | 6,381 | 329,706 |
| Verisk Analytics, Inc. | | 103 | 18,922 |
| | | | 441,393 |
TOTAL INDUSTRIALS | | | 4,133,222 |
| INFORMATION TECHNOLOGY - 26.3% | | | |
| Electronic Equipment & Components - 0.3% | | | |
| Landis+Gyr Group AG | | 1,045 | 72,970 |
| IT Services - 6.6% | | | |
| Accenture PLC Class A | | 1,403 | 422,205 |
| Amadeus IT Holding SA Class A (a) | | 3,493 | 188,858 |
| IBM Corp. | | 2,367 | 352,446 |
| MasterCard, Inc. Class A | | 1,315 | 468,666 |
| | | | 1,432,175 |
| Semiconductors & Semiconductor Equipment - 9.3% | | | |
| AEHR Test Systems (a) | | 2,809 | 73,231 |
| Aixtron AG | | 5,859 | 193,156 |
| Allegro MicroSystems LLC (a) | | 4,574 | 142,434 |
| Analog Devices, Inc. | | 1,241 | 213,340 |
| Enphase Energy, Inc. (a) | | 1,264 | 405,226 |
| NVIDIA Corp. | | 1,936 | 327,629 |
| onsemi (a) | | 3,546 | 266,659 |
| SolarEdge Technologies, Inc. (a) | | 809 | 241,778 |
| STMicroelectronics NV (NY Shares) unit | | 3,465 | 134,719 |
| | | | 1,998,172 |
| Software - 10.1% | | | |
| Aspen Technology, Inc. (a) | | 1,605 | 369,953 |
| Autodesk, Inc. (a) | | 2,016 | 407,131 |
| Microsoft Corp. | | 3,831 | 977,438 |
| PTC, Inc. (a) | | 1,686 | 214,476 |
| Volue A/S (a) | | 70,136 | 219,037 |
| | | | 2,188,035 |
TOTAL INFORMATION TECHNOLOGY | | | 5,691,352 |
| MATERIALS - 2.9% | | | |
| Chemicals - 2.3% | | | |
| Aspen Aerogels, Inc. (a) | | 2,100 | 25,326 |
| Koninklijke DSM NV | | 2,428 | 314,920 |
| Sika AG | | 623 | 159,214 |
| | | | 499,460 |
| Metals & Mining - 0.6% | | | |
| Lynas Rare Earths Ltd. (a) | | 13,712 | 81,340 |
| MP Materials Corp. (a) | | 1,197 | 39,800 |
| | | | 121,140 |
TOTAL MATERIALS | | | 620,600 |
| REAL ESTATE - 1.7% | | | |
| Equity Real Estate Investment Trusts (REITs) - 1.7% | | | |
| Prologis (REIT), Inc. | | 3,070 | 361,615 |
| UTILITIES - 3.4% | | | |
| Electric Utilities - 2.0% | | | |
| ELIA GROUP SA/NV | | 1,609 | 229,264 |
| ORSTED A/S (b) | | 830 | 72,675 |
| Verbund AG | | 1,423 | 128,815 |
| | | | 430,754 |
| Independent Power and Renewable Electricity Producers - 1.4% | | | |
| Brookfield Renewable Corp. | | 6,308 | 205,704 |
| Energix-Renewable Energies Ltd. | | 13,467 | 49,340 |
| Enlight Renewable Energy Ltd. (a) | | 24,511 | 54,873 |
| | | | 309,917 |
TOTAL UTILITIES | | | 740,671 |
| TOTAL COMMON STOCKS (Cost $21,826,843) | | | 21,159,870 |
| | | | |
| Convertible Preferred Stocks - 0.0% |
| | | Shares | Value ($) |
| CONSUMER DISCRETIONARY - 0.0% | | | |
| Textiles, Apparel & Luxury Goods - 0.0% | | | |
CelLink Corp. Series D (c)(d) (Cost $8,330) | | 400 | 6,312 |
| | | | |
| Money Market Funds - 2.7% |
| | | Shares | Value ($) |
Fidelity Cash Central Fund 3.86% (e) (Cost $580,674) | | 580,558 | 580,674 |
| | | | |
| TOTAL INVESTMENT IN SECURITIES - 100.7% (Cost $22,415,847) | 21,746,856 |
NET OTHER ASSETS (LIABILITIES) - (0.7)% | (147,963) |
| NET ASSETS - 100.0% | 21,598,893 |
| | |
Legend
| (b) | Security exempt from registration under Rule 144A of the Securities Act of 1933. These securities may be resold in transactions exempt from registration, normally to qualified institutional buyers. At the end of the period, the value of these securities amounted to $72,675 or 0.3% of net assets. |
| (c) | Restricted securities (including private placements) - Investment in securities not registered under the Securities Act of 1933 (excluding 144A issues). At the end of the period, the value of restricted securities (excluding 144A issues) amounted to $6,312 or 0.0% of net assets. |
| (e) | Affiliated fund that is generally available only to investment companies and other accounts managed by Fidelity Investments. The rate quoted is the annualized seven-day yield of the fund at period end. A complete unaudited listing of the fund's holdings as of its most recent quarter end is available upon request. In addition, each Fidelity Central Fund's financial statements are available on the SEC's website or upon request. |
| Additional information on each restricted holding is as follows: |
| Security | Acquisition Date | Acquisition Cost ($) |
| CelLink Corp. Series D | 1/20/22 | 8,330 |
| | | |
Affiliated Central Funds
Fiscal year to date information regarding the Fund's investments in Fidelity Central Funds, including the ownership percentage, is presented below.
| Affiliate | Value, beginning of period ($) | Purchases ($) | Sales Proceeds ($) | Dividend Income ($) | Realized Gain (loss) ($) | Change in Unrealized appreciation (depreciation) ($) | Value, end of period ($) | % ownership, end of period |
| Fidelity Cash Central Fund 3.86% | 409,555 | 2,119,399 | 1,948,280 | 4,911 | - | - | 580,674 | 0.0% |
| Total | 409,555 | 2,119,399 | 1,948,280 | 4,911 | - | - | 580,674 | |
| | | | | | | | | |
Amounts in the income column in the above table include any capital gain distributions from underlying funds, which are presented in the corresponding line item in the Statement of Operations, if applicable.
Amounts included in the purchases and sales proceeds columns may include in-kind transactions, if applicable.
Investment Valuation
The following is a summary of the inputs used, as of November 30, 2022, involving the Fund's assets and liabilities carried at fair value. The inputs or methodology used for valuing securities may not be an indication of the risk associated with investing in those securities. For more information on valuation inputs, and their aggregation into the levels used below, please refer to the Investment Valuation section in the accompanying Notes to Financial Statements.
| Valuation Inputs at Reporting Date: |
| Description | Total ($) | Level 1 ($) | Level 2 ($) | Level 3 ($) |
Investments in Securities: | | | | |
|
| Equities: | | | | |
Communication Services | 366,695 | 366,695 | - | - |
Consumer Discretionary | 2,363,102 | 1,672,996 | 683,794 | 6,312 |
Consumer Staples | 948,589 | 438,824 | 509,765 | - |
Energy | 186,773 | 186,773 | - | - |
Financials | 3,105,662 | 3,105,662 | - | - |
Health Care | 2,647,901 | 2,061,588 | 586,313 | - |
Industrials | 4,133,222 | 3,453,532 | 679,690 | - |
Information Technology | 5,691,352 | 5,017,331 | 674,021 | - |
Materials | 620,600 | 65,126 | 555,474 | - |
Real Estate | 361,615 | 361,615 | - | - |
Utilities | 740,671 | 309,917 | 430,754 | - |
|
| Money Market Funds | 580,674 | 580,674 | - | - |
| Total Investments in Securities: | 21,746,856 | 17,620,733 | 4,119,811 | 6,312 |
| Statement of Assets and Liabilities |
| | | | November 30, 2022 (Unaudited) |
| | | | | |
| Assets | | | | |
| Investment in securities, at value - See accompanying schedule: | | | | |
Unaffiliated issuers (cost $21,835,173) | | $21,166,182 | | |
Fidelity Central Funds (cost $580,674) | | 580,674 | | |
| | | | | |
| Total Investment in Securities (cost $22,415,847) | | | $ | 21,746,856 |
| Cash | | | | 6,664 |
| Receivable for investments sold | | | | 119,981 |
| Receivable for fund shares sold | | | | 51,158 |
| Dividends receivable | | | | 14,347 |
| Reclaims receivable | | | | 11,114 |
| Distributions receivable from Fidelity Central Funds | | | | 1,182 |
| Prepaid expenses | | | | 26 |
| Receivable from investment adviser for expense reductions | | | | 3,007 |
Total assets | | | | 21,954,335 |
| Liabilities | | | | |
| Payable for investments purchased | | $214,420 | | |
| Payable for fund shares redeemed | | 96,307 | | |
| Accrued management fee | | 10,505 | | |
| Distribution and service plan fees payable | | 466 | | |
| Other affiliated payables | | 4,601 | | |
| Audit fee payable | | 23,840 | | |
| Other payables and accrued expenses | | 5,303 | | |
| Total Liabilities | | | | 355,442 |
| Net Assets | | | $ | 21,598,893 |
| Net Assets consist of: | | | | |
| Paid in capital | | | $ | 25,677,638 |
| Total accumulated earnings (loss) | | | | (4,078,745) |
| Net Assets | | | $ | 21,598,893 |
| | | | | |
| Net Asset Value and Maximum Offering Price | | | | |
| Class A : | | | | |
Net Asset Value and redemption price per share ($374,403 ÷ 42,610 shares) (a) | | | $ | 8.79 |
| Maximum offering price per share (100/94.25 of $8.79) | | | $ | 9.33 |
| Class M : | | | | |
Net Asset Value and redemption price per share ($501,936 ÷ 57,336 shares) (a) | | | $ | 8.75 |
| Maximum offering price per share (100/96.50 of $8.75) | | | $ | 9.07 |
| Class C : | | | | |
Net Asset Value and offering price per share ($256,664 ÷ 29,533 shares) (a) | | | $ | 8.69 |
| Fidelity Climate Action Fund : | | | | |
Net Asset Value , offering price and redemption price per share ($19,880,758 ÷ 2,255,005 shares) | | | $ | 8.82 |
| Class I : | | | | |
Net Asset Value , offering price and redemption price per share ($295,864 ÷ 33,562 shares) | | | $ | 8.82 |
| Class Z : | | | | |
Net Asset Value , offering price and redemption price per share ($289,268 ÷ 32,743 shares) | | | $ | 8.83 |
(a)Redemption price per share is equal to net asset value less any applicable contingent deferred sales charge. |
| Statement of Operations |
| | | | Six months ended November 30, 2022 (Unaudited) |
| Investment Income | | | | |
| Dividends | | | $ | 93,594 |
| Income from Fidelity Central Funds | | | | 4,911 |
| Total Income | | | | 98,505 |
| Expenses | | | | |
| Management fee | | | | |
| Basic fee | $ | 66,710 | | |
| Performance adjustment | | (5,502) | | |
| Transfer agent fees | | 24,571 | | |
| Distribution and service plan fees | | 2,538 | | |
| Accounting fees and expenses | | 3,484 | | |
| Custodian fees and expenses | | 8,850 | | |
| Independent trustees' fees and expenses | | 34 | | |
| Registration fees | | 26,961 | | |
| Audit | | 25,059 | | |
| Legal | | 7 | | |
| Miscellaneous | | 36 | | |
| Total expenses before reductions | | 152,748 | | |
| Expense reductions | | (47,315) | | |
| Total expenses after reductions | | | | 105,433 |
| Net Investment income (loss) | | | | (6,928) |
| Realized and Unrealized Gain (Loss) | | | | |
| Net realized gain (loss) on: | | | | |
| Investment Securities: | | | | |
| Unaffiliated issuers | | (1,824,570) | | |
| Foreign currency transactions | | (676) | | |
| Total net realized gain (loss) | | | | (1,825,246) |
| Change in net unrealized appreciation (depreciation) on: | | | | |
| Investment Securities: | | | | |
| Unaffiliated issuers | | 1,681,738 | | |
| Assets and liabilities in foreign currencies | | 105 | | |
| Total change in net unrealized appreciation (depreciation) | | | | 1,681,843 |
| Net gain (loss) | | | | (143,403) |
| Net increase (decrease) in net assets resulting from operations | | | $ | (150,331) |
| Statement of Changes in Net Assets |
| |
| | Six months ended November 30, 2022 (Unaudited) | | For the period June 15, 2021 (commencement of operations) through May 31, 2022 |
| Increase (Decrease) in Net Assets | | | | |
| Operations | | | | |
| Net investment income (loss) | $ | (6,928) | $ | 5,217 |
| Net realized gain (loss) | | (1,825,246) | | (1,576,313) |
| Change in net unrealized appreciation (depreciation) | | 1,681,843 | | (2,350,796) |
| Net increase (decrease) in net assets resulting from operations | | (150,331) | | (3,921,892) |
| Distributions to shareholders | | (6,506) | | - |
| Share transactions - net increase (decrease) | | 1,595,748 | | 24,081,874 |
| Total increase (decrease) in net assets | | 1,438,911 | | 20,159,982 |
| | | | | |
| Net Assets | | | | |
| Beginning of period | | 20,159,982 | | - |
| End of period | $ | 21,598,893 | $ | 20,159,982 |
| | | | | |
| | | | | |
Financial Highlights
| Fidelity Advisor® Climate Action Fund Class A |
| |
| | Six months ended (Unaudited) November 30, 2022 | | Years ended May 31, 2022 A |
Selected Per-Share Data | | | | |
| Net asset value, beginning of period | $ | 8.88 | $ | 10.00 |
| Income from Investment Operations | | | | |
Net investment income (loss) B,C | | (.01) | | (.02) |
| Net realized and unrealized gain (loss) | | (.08) | | (1.10) |
| Total from investment operations | | (.09) | | (1.12) |
| Net asset value, end of period | $ | 8.79 | $ | 8.88 |
Total Return D,E,F | | (1.01)% | | (11.20)% |
Ratios to Average Net Assets C,G,H | | | | |
| Expenses before reductions | | 1.81% I | | 2.95% I |
| Expenses net of fee waivers, if any | | 1.30% I | | 1.29% I |
| Expenses net of all reductions | | 1.30% I | | 1.29% I |
| Net investment income (loss) | | (.30)% I | | (.19)% I |
| Supplemental Data | | | | |
| Net assets, end of period (000 omitted) | $ | 374 | $ | 405 |
Portfolio turnover rate J | | 48% I | | 57% I |
A For the period June 15, 2021 (commencement of operations) through May 31, 2022
B Calculated based on average shares outstanding during the period.
C Net investment income (loss) is affected by the timing of the declaration of dividends by any underlying mutual funds or exchange-traded funds (ETFs). Net investment income (loss) of any mutual funds or ETFs is not included in the Fund's net investment income (loss) ratio.
D Total returns for periods of less than one year are not annualized.
E Total returns would have been lower if certain expenses had not been reduced during the applicable periods shown.
F Total returns do not include the effect of the sales charges.
G Fees and expenses of any underlying mutual funds or exchange-traded funds (ETFs) are not included in the Fund's expense ratio. The Fund indirectly bears its proportionate share of these expenses. For additional expense information related to investments in Fidelity Central Funds, please refer to the "Investments in Fidelity Central Funds" note found in the Notes to Financial Statements section of the most recent Annual or Semi-Annual report.
H Expense ratios reflect operating expenses of the class. Expenses before reductions do not reflect amounts reimbursed, waived, or reduced through arrangements with the investment adviser, brokerage services, or other offset arrangements, if applicable, and do not represent the amount paid by the class during periods when reimbursements, waivers or reductions occur.
I Annualized.
J Amount does not include the portfolio activity of any underlying mutual funds or exchange-traded funds (ETFs).
| Fidelity Advisor® Climate Action Fund Class M |
| |
| | Six months ended (Unaudited) November 30, 2022 | | Years ended May 31, 2022 A |
Selected Per-Share Data | | | | |
| Net asset value, beginning of period | $ | 8.86 | $ | 10.00 |
| Income from Investment Operations | | | | |
Net investment income (loss) B,C | | (.02) | | (.04) |
| Net realized and unrealized gain (loss) | | (.09) | | (1.10) |
| Total from investment operations | | (.11) | | (1.14) |
| Net asset value, end of period | $ | 8.75 | $ | 8.86 |
Total Return D,E,F | | (1.24)% | | (11.40)% |
Ratios to Average Net Assets C,G,H | | | | |
| Expenses before reductions | | 1.83% I | | 3.33% I |
| Expenses net of fee waivers, if any | | 1.54% I | | 1.55% I |
| Expenses net of all reductions | | 1.54% I | | 1.55% I |
| Net investment income (loss) | | (.54)% I | | (.45)% I |
| Supplemental Data | | | | |
| Net assets, end of period (000 omitted) | $ | 502 | $ | 132 |
Portfolio turnover rate J | | 48% I | | 57% I |
A For the period June 15, 2021 (commencement of operations) through May 31, 2022
B Calculated based on average shares outstanding during the period.
C Net investment income (loss) is affected by the timing of the declaration of dividends by any underlying mutual funds or exchange-traded funds (ETFs). Net investment income (loss) of any mutual funds or ETFs is not included in the Fund's net investment income (loss) ratio.
D Total returns for periods of less than one year are not annualized.
E Total returns would have been lower if certain expenses had not been reduced during the applicable periods shown.
F Total returns do not include the effect of the sales charges.
G Fees and expenses of any underlying mutual funds or exchange-traded funds (ETFs) are not included in the Fund's expense ratio. The Fund indirectly bears its proportionate share of these expenses. For additional expense information related to investments in Fidelity Central Funds, please refer to the "Investments in Fidelity Central Funds" note found in the Notes to Financial Statements section of the most recent Annual or Semi-Annual report.
H Expense ratios reflect operating expenses of the class. Expenses before reductions do not reflect amounts reimbursed, waived, or reduced through arrangements with the investment adviser, brokerage services, or other offset arrangements, if applicable, and do not represent the amount paid by the class during periods when reimbursements, waivers or reductions occur.
I Annualized.
J Amount does not include the portfolio activity of any underlying mutual funds or exchange-traded funds (ETFs).
| Fidelity Advisor® Climate Action Fund Class C |
| |
| | Six months ended (Unaudited) November 30, 2022 | | Years ended May 31, 2022 A |
Selected Per-Share Data | | | | |
| Net asset value, beginning of period | $ | 8.82 | $ | 10.00 |
| Income from Investment Operations | | | | |
Net investment income (loss) B,C | | (.04) | | (.09) |
| Net realized and unrealized gain (loss) | | (.09) | | (1.09) |
| Total from investment operations | | (.13) | | (1.18) |
| Net asset value, end of period | $ | 8.69 | $ | 8.82 |
Total Return D,E,F | | (1.47)% | | (11.80)% |
Ratios to Average Net Assets C,G,H | | | | |
| Expenses before reductions | | 2.51% I | | 3.55% I |
| Expenses net of fee waivers, if any | | 2.05% I | | 2.04% I |
| Expenses net of all reductions | | 2.05% I | | 2.04% I |
| Net investment income (loss) | | (1.05)% I | | (.94)% I |
| Supplemental Data | | | | |
| Net assets, end of period (000 omitted) | $ | 257 | $ | 265 |
Portfolio turnover rate J | | 48% I | | 57% I |
A For the period June 15, 2021 (commencement of operations) through May 31, 2022
B Calculated based on average shares outstanding during the period.
C Net investment income (loss) is affected by the timing of the declaration of dividends by any underlying mutual funds or exchange-traded funds (ETFs). Net investment income (loss) of any mutual funds or ETFs is not included in the Fund's net investment income (loss) ratio.
D Total returns for periods of less than one year are not annualized.
E Total returns would have been lower if certain expenses had not been reduced during the applicable periods shown.
F Total returns do not include the effect of the contingent deferred sales charge.
G Fees and expenses of any underlying mutual funds or exchange-traded funds (ETFs) are not included in the Fund's expense ratio. The Fund indirectly bears its proportionate share of these expenses. For additional expense information related to investments in Fidelity Central Funds, please refer to the "Investments in Fidelity Central Funds" note found in the Notes to Financial Statements section of the most recent Annual or Semi-Annual report.
H Expense ratios reflect operating expenses of the class. Expenses before reductions do not reflect amounts reimbursed, waived, or reduced through arrangements with the investment adviser, brokerage services, or other offset arrangements, if applicable, and do not represent the amount paid by the class during periods when reimbursements, waivers or reductions occur.
I Annualized.
J Amount does not include the portfolio activity of any underlying mutual funds or exchange-traded funds (ETFs).
| Fidelity® Climate Action Fund |
| |
| | Six months ended (Unaudited) November 30, 2022 | | Years ended May 31, 2022 A |
Selected Per-Share Data | | | | |
| Net asset value, beginning of period | $ | 8.90 | $ | 10.00 |
| Income from Investment Operations | | | | |
Net investment income (loss) B,C | | - D | | .01 |
| Net realized and unrealized gain (loss) | | (.08) | | (1.11) |
| Total from investment operations | | (.08) | | (1.10) |
| Distributions from net investment income | | - D | | - |
| Net asset value, end of period | $ | 8.82 | $ | 8.90 |
Total Return E,F | | (.86)% | | (11.00)% |
Ratios to Average Net Assets C,G,H | | | | |
| Expenses before reductions | | 1.53% I | | 2.66% I |
| Expenses net of fee waivers, if any | | 1.05% I | | 1.05% I |
| Expenses net of all reductions | | 1.05% I | | 1.05% I |
| Net investment income (loss) | | (.05)% I | | .06% I |
| Supplemental Data | | | | |
| Net assets, end of period (000 omitted) | $ | 19,881 | $ | 19,057 |
Portfolio turnover rate J | | 48% I | | 57% I |
A For the period June 15, 2021 (commencement of operations) through May 31, 2022
B Calculated based on average shares outstanding during the period.
C Net investment income (loss) is affected by the timing of the declaration of dividends by any underlying mutual funds or exchange-traded funds (ETFs). Net investment income (loss) of any mutual funds or ETFs is not included in the Fund's net investment income (loss) ratio.
D Amount represents less than $.005 per share.
E Total returns for periods of less than one year are not annualized.
F Total returns would have been lower if certain expenses had not been reduced during the applicable periods shown.
G Fees and expenses of any underlying mutual funds or exchange-traded funds (ETFs) are not included in the Fund's expense ratio. The Fund indirectly bears its proportionate share of these expenses. For additional expense information related to investments in Fidelity Central Funds, please refer to the "Investments in Fidelity Central Funds" note found in the Notes to Financial Statements section of the most recent Annual or Semi-Annual report.
H Expense ratios reflect operating expenses of the class. Expenses before reductions do not reflect amounts reimbursed, waived, or reduced through arrangements with the investment adviser, brokerage services, or other offset arrangements, if applicable, and do not represent the amount paid by the class during periods when reimbursements, waivers or reductions occur.
I Annualized.
J Amount does not include the portfolio activity of any underlying mutual funds or exchange-traded funds (ETFs).
| Fidelity Advisor® Climate Action Fund Class I |
| |
| | Six months ended (Unaudited) November 30, 2022 | | Years ended May 31, 2022 A |
Selected Per-Share Data | | | | |
| Net asset value, beginning of period | $ | 8.90 | $ | 10.00 |
| Income from Investment Operations | | | | |
Net investment income (loss) B,C | | - D | | .01 |
| Net realized and unrealized gain (loss) | | (.08) | | (1.11) |
| Total from investment operations | | (.08) | | (1.10) |
| Distributions from net investment income | | - D | | - |
| Net asset value, end of period | $ | 8.82 | $ | 8.90 |
Total Return E,F | | (.86)% | | (11.00)% |
Ratios to Average Net Assets C,G,H | | | | |
| Expenses before reductions | | 1.39% I | | 2.93% I |
| Expenses net of fee waivers, if any | | 1.04% I | | 1.04% I |
| Expenses net of all reductions | | 1.04% I | | 1.04% I |
| Net investment income (loss) | | (.04)% I | | .06% I |
| Supplemental Data | | | | |
| Net assets, end of period (000 omitted) | $ | 296 | $ | 192 |
Portfolio turnover rate J | | 48% I | | 57% I |
A For the period June 15, 2021 (commencement of operations) through May 31, 2022
B Calculated based on average shares outstanding during the period.
C Net investment income (loss) is affected by the timing of the declaration of dividends by any underlying mutual funds or exchange-traded funds (ETFs). Net investment income (loss) of any mutual funds or ETFs is not included in the Fund's net investment income (loss) ratio.
D Amount represents less than $.005 per share.
E Total returns for periods of less than one year are not annualized.
F Total returns would have been lower if certain expenses had not been reduced during the applicable periods shown.
G Fees and expenses of any underlying mutual funds or exchange-traded funds (ETFs) are not included in the Fund's expense ratio. The Fund indirectly bears its proportionate share of these expenses. For additional expense information related to investments in Fidelity Central Funds, please refer to the "Investments in Fidelity Central Funds" note found in the Notes to Financial Statements section of the most recent Annual or Semi-Annual report.
H Expense ratios reflect operating expenses of the class. Expenses before reductions do not reflect amounts reimbursed, waived, or reduced through arrangements with the investment adviser, brokerage services, or other offset arrangements, if applicable, and do not represent the amount paid by the class during periods when reimbursements, waivers or reductions occur.
I Annualized.
J Amount does not include the portfolio activity of any underlying mutual funds or exchange-traded funds (ETFs).
| Fidelity Advisor® Climate Action Fund Class Z |
| |
| | Six months ended (Unaudited) November 30, 2022 | | Years ended May 31, 2022 A |
Selected Per-Share Data | | | | |
| Net asset value, beginning of period | $ | 8.91 | $ | 10.00 |
| Income from Investment Operations | | | | |
Net investment income (loss) B,C | | - D | | .02 |
| Net realized and unrealized gain (loss) | | (.08) | | (1.11) |
| Total from investment operations | | (.08) | | (1.09) |
| Distributions from net investment income | | - D | | - |
| Net asset value, end of period | $ | 8.83 | $ | 8.91 |
Total Return E,F | | (.86)% | | (10.90)% |
Ratios to Average Net Assets C,G,H | | | | |
| Expenses before reductions | | 1.17% I | | 3.00% I |
| Expenses net of fee waivers, if any | | .89% I | | .90% I |
| Expenses net of all reductions | | .89% I | | .90% I |
| Net investment income (loss) | | .11% I | | .20% I |
| Supplemental Data | | | | |
| Net assets, end of period (000 omitted) | $ | 289 | $ | 109 |
Portfolio turnover rate J | | 48% I | | 57% I |
A For the period June 15, 2021 (commencement of operations) through May 31, 2022
B Calculated based on average shares outstanding during the period.
C Net investment income (loss) is affected by the timing of the declaration of dividends by any underlying mutual funds or exchange-traded funds (ETFs). Net investment income (loss) of any mutual funds or ETFs is not included in the Fund's net investment income (loss) ratio.
D Amount represents less than $.005 per share.
E Total returns for periods of less than one year are not annualized.
F Total returns would have been lower if certain expenses had not been reduced during the applicable periods shown.
G Fees and expenses of any underlying mutual funds or exchange-traded funds (ETFs) are not included in the Fund's expense ratio. The Fund indirectly bears its proportionate share of these expenses. For additional expense information related to investments in Fidelity Central Funds, please refer to the "Investments in Fidelity Central Funds" note found in the Notes to Financial Statements section of the most recent Annual or Semi-Annual report.
H Expense ratios reflect operating expenses of the class. Expenses before reductions do not reflect amounts reimbursed, waived, or reduced through arrangements with the investment adviser, brokerage services, or other offset arrangements, if applicable, and do not represent the amount paid by the class during periods when reimbursements, waivers or reductions occur.
I Annualized.
J Amount does not include the portfolio activity of any underlying mutual funds or exchange-traded funds (ETFs).
For the period ended November 30, 2022
1. Organization.
Fidelity Climate Action Fund (the Fund) is a fund of Fidelity Summer Street Trust (the Trust) and is authorized to issue an unlimited number of shares. The Trust is registered under the Investment Company Act of 1940, as amended (the 1940 Act), as an open-end management investment company organized as a Massachusetts business trust. The Fund offers Class A, Class M, Class C, Climate Action, Class I and Class Z shares, each of which has equal rights as to assets and voting privileges. Each class has exclusive voting rights with respect to matters that affect that class. Class C shares will automatically convert to Class A shares after a holding period of eight years from the initial date of purchase, with certain exceptions. Because the Fund focuses its investments in equity securities of climate aware companies, it will be more susceptible to events or factors affecting these companies. The Fund is particularly exposed to such developments as changes in global and regional climates, environmental protection regulatory actions, changes in government standards and subsidy levels, changes in taxation and other domestic and international political, regulatory, and economic developments.
2. Investments in Fidelity Central Funds.
Funds may invest in Fidelity Central Funds, which are open-end investment companies generally available only to other investment companies and accounts managed by the investment adviser and its affiliates. The Schedule of Investments lists any Fidelity Central Funds held as an investment as of period end, but does not include the underlying holdings of each Fidelity Central Fund. An investing fund indirectly bears its proportionate share of the expenses of the underlying Fidelity Central Funds.
Based on its investment objective, each Fidelity Central Fund may invest or participate in various investment vehicles or strategies that are similar to those of the investing fund. These strategies are consistent with the investment objectives of the investing fund and may involve certain economic risks which may cause a decline in value of each of the Fidelity Central Funds and thus a decline in the value of the investing fund.
| Fidelity Central Fund | Investment Manager | Investment Objective | Investment Practices | Expense Ratio A |
| Fidelity Money Market Central Funds | Fidelity Management & Research Company LLC (FMR) | Each fund seeks to obtain a high level of current income consistent with the preservation of capital and liquidity. | Short-term Investments | Less than .005% |
A Expenses expressed as a percentage of average net assets and are as of each underlying Central Fund's most recent annual or semi-annual shareholder report.
A complete unaudited list of holdings for each Fidelity Central Fund is available upon request or at the Securities and Exchange Commission website at www.sec.gov. In addition, the financial statements of the Fidelity Central Funds which contain the significant accounting policies (including investment valuation policies) of those funds, and are not covered by the Report of Independent Registered Public Accounting Firm, are available on the Securities and Exchange Commission website or upon request.
3. Significant Accounting Policies.
The Fund is an investment company and applies the accounting and reporting guidance of the Financial Accounting Standards Board (FASB) Accounting Standards Codification Topic 946 Financial Services - Investment Companies . The financial statements have been prepared in conformity with accounting principles generally accepted in the United States of America (GAAP), which require management to make certain estimates and assumptions at the date of the financial statements. Actual results could differ from those estimates. Subsequent events, if any, through the date that the financial statements were issued have been evaluated in the preparation of the financial statements. The Fund's Schedule of Investments lists any underlying mutual funds or exchange-traded funds (ETFs) but does not include the underlying holdings of these funds. The following summarizes the significant accounting policies of the Fund:
Investment Valuation. Investments are valued as of 4:00 p.m. Eastern time on the last calendar day of the period. The Board of Trustees (the Board) has designated the Fund's investment adviser as the valuation designee responsible for the fair valuation function and performing fair value determinations as needed. The investment adviser has established a Fair Value Committee (the Committee) to carry out the day-to-day fair valuation responsibilities and has adopted policies and procedures to govern the fair valuation process and the activities of the Committee. In accordance with these fair valuation policies and procedures, which have been approved by the Board, the Fund attempts to obtain prices from one or more third party pricing services or brokers to value its investments. When current market prices, quotations or currency exchange rates are not readily available or reliable, investments will be fair valued in good faith by the Committee, in accordance with the policies and procedures. Factors used in determining fair value vary by investment type and may include market or investment specific events, transaction data, estimated cash flows, and market observations of comparable investments. The frequency that the fair valuation procedures are used cannot be predicted and they may be utilized to a significant extent. The Committee manages the Fund's fair valuation practices and maintains the fair valuation policies and procedures. The Fund's investment adviser reports to the Board information regarding the fair valuation process and related material matters.
The Fund categorizes the inputs to valuation techniques used to value its investments into a disclosure hierarchy consisting of three levels as shown below:
Level 1 - unadjusted quoted prices in active markets for identical investments
Level 2 - other significant observable inputs (including quoted prices for similar investments, interest rates, prepayment speeds, etc.)
Level 3 - unobservable inputs (including the Fund's own assumptions based on the best information available)
Valuation techniques used to value the Fund's investments by major category are as follows:
Equity securities, including restricted securities, for which market quotations are readily available, are valued at the last reported sale price or official closing price as reported by a third party pricing service on the primary market or exchange on which they are traded and are categorized as Level 1 in the hierarchy. In the event there were no sales during the day or closing prices are not available, securities are valued at the last quoted bid price or may be valued using the last available price and are generally categorized as Level 2 in the hierarchy. For foreign equity securities, when market or security specific events arise, comparisons to the valuation of American Depositary Receipts (ADRs), futures contracts, ETFs and certain indexes as well as quoted prices for similar securities may be used and would be categorized as Level 2 in the hierarchy. For equity securities, including restricted securities, where observable inputs are limited, assumptions about market activity and risk are used and these securities may be categorized as Level 3 in the hierarchy.
Investments in open-end mutual funds, including the Fidelity Central Funds, are valued at their closing net asset value (NAV) each business day and are categorized as Level 1 in the hierarchy.
Changes in valuation techniques may result in transfers in or out of an assigned level within the disclosure hierarchy. The aggregate value of investments by input level as of November 30, 2022 is included at the end of the Fund's Schedule of Investments.
Foreign Currency. Certain Funds may use foreign currency contracts to facilitate transactions in foreign-denominated securities. Gains and losses from these transactions may arise from changes in the value of the foreign currency or if the counterparties do not perform under the contracts' terms.
Foreign-denominated assets, including investment securities, and liabilities are translated into U.S. dollars at the exchange rates at period end. Purchases and sales of investment securities, income and dividends received, and expenses denominated in foreign currencies are translated into U.S. dollars at the exchange rate in effect on the transaction date.
The effects of exchange rate fluctuations on investments are included with the net realized and unrealized gain (loss) on investment securities. Other foreign currency transactions resulting in realized and unrealized gain (loss) are disclosed separately.
Investment Transactions and Income. For financial reporting purposes, the Fund's investment holdings and NAV include trades executed through the end of the last business day of the period. The NAV per share for processing shareholder transactions is calculated as of the close of business of the New York Stock Exchange (NYSE), normally 4:00 p.m. Eastern time and includes trades executed through the end of the prior business day. Gains and losses on securities sold are determined on the basis of identified cost. Commissions paid to certain brokers with whom the investment adviser, or its affiliates, places trades on behalf of a fund include an amount in addition to trade execution, which may be rebated back to a fund. Any such rebates are included in net realized gain (loss) on investments in the Statement of Operations. Dividend income is recorded on the ex-dividend date, except for certain dividends from foreign securities where the ex-dividend date may have passed, which are recorded as soon as the Fund is informed of the ex-dividend date. Non-cash dividends included in dividend income, if any, are recorded at the fair market value of the securities received. Income and capital gain distributions from Fidelity Central Funds, if any, are recorded on the ex-dividend date. Investment income is recorded net of foreign taxes withheld where recovery of such taxes is uncertain. Funds may file withholding tax reclaims in certain jurisdictions to recover a portion of amounts previously withheld. Any withholding tax reclaims income is included in the Statement of Operations in dividends. Any receivables for withholding tax reclaims are included in the Statement of Assets and Liabilities in reclaims receivable.
Class Allocations and Expenses. Investment income, realized and unrealized capital gains and losses, common expenses of a fund, and certain fund-level expense reductions, if any, are allocated daily on a pro-rata basis to each class based on the relative net assets of each class to the total net assets of a fund. Each class differs with respect to transfer agent and distribution and service plan fees incurred, as applicable. Certain expense reductions may also differ by class, if applicable. For the reporting period, the allocated portion of income and expenses to each class as a percent of its average net assets may vary due to the timing of recording these transactions in relation to fluctuating net assets of the classes. Expenses directly attributable to a fund are charged to that fund. Expenses attributable to more than one fund are allocated among the respective funds on the basis of relative net assets or other appropriate methods. Expenses included in the accompanying financial statements reflect the expenses of that fund and do not include any expenses associated with any underlying mutual funds or exchange-traded funds. Although not included in a fund's expenses, a fund indirectly bears its proportionate share of these expenses through the net asset value of each underlying mutual fund or exchange-traded fund. Expense estimates are accrued in the period to which they relate and adjustments are made when actual amounts are known.
Income Tax Information and Distributions to Shareholders. Each year, the Fund intends to qualify as a regulated investment company under Subchapter M of the Internal Revenue Code, including distributing substantially all of its taxable income and realized gains. As a result, no provision for U.S. Federal income taxes is required. The Fund files a U.S. federal tax return, in addition to state and local tax returns as required. The Fund's federal income tax returns are subject to examination by the Internal Revenue Service (IRS) for a period of three fiscal years after they are filed. State and local tax returns may be subject to examination for an additional fiscal year depending on the jurisdiction. Foreign taxes are provided for based on the Fund's understanding of the tax rules and rates that exist in the foreign markets in which it invests.
Distributions are declared and recorded on the ex-dividend date. Income and capital gain distributions are declared separately for each class. Income and capital gain distributions are determined in accordance with income tax regulations, which may differ from GAAP.
Capital accounts within the financial statements are adjusted for permanent book-tax differences. These adjustments have no impact on net assets or the results of operations. Capital accounts are not adjusted for temporary book-tax differences which will reverse in a subsequent period.
Book-tax differences are primarily due to foreign currency transactions, capital loss carryforwards and losses deferred due to wash sales.
As of period end, the cost and unrealized appreciation (depreciation) in securities, and derivatives if applicable, for federal income tax purposes were as follows:
| Gross unrealized appreciation | $1,463,797 |
| Gross unrealized depreciation | (2,181,362) |
| Net unrealized appreciation (depreciation) | $(717,565) |
| Tax cost | $22,464,421 |
Capital loss carryforwards are only available to offset future capital gains of the Fund to the extent provided by regulations and may be limited. The capital loss carryforward information presented below, including any applicable limitation, is estimated as of prior fiscal period end and is subject to adjustment.
| Short-term | $(1,437,874) |
| Long-term | (2,896) |
| Total capital loss carryforward | $(1,440,770) |
Restricted Securities (including Private Placements). Funds may invest in securities that are subject to legal or contractual restrictions on resale. These securities generally may be resold in transactions exempt from registration or to the public if the securities are registered. Disposal of these securities may involve time-consuming negotiations and expense, and prompt sale at an acceptable price may be difficult. Information regarding restricted securities held at period end is included at the end of the Schedule of Investments, if applicable.
4. Purchases and Sales of Investments.
Purchases and sales of securities, other than short-term securities and in-kind transactions, as applicable, are noted in the table below.
| | Purchases ($) | Sales ($) |
| Fidelity Climate Action Fund | 6,197,855 | 4,637,440 |
5. Fees and Other Transactions with Affiliates.
Management Fee. Fidelity Management & Research Company LLC (the investment adviser) and its affiliates provide the Fund with investment management related services for which the Fund pays a monthly management fee. The management fee is the sum of an individual fund fee rate that is based on an annual rate of .45% of the Fund's average net assets and an annualized group fee rate that averaged .23% during the period. The group fee rate is based upon the monthly average net assets of a group of registered investment companies with which the investment adviser has management contracts. The group fee rate decreases as assets under management increase and increases as assets under management decrease. In addition, the management fee is subject to a performance adjustment (up to a maximum of +/- .10% of the Fund's average net assets over a 36 month performance period). The upward or downward adjustment to the management fee is based on the relative investment performance of Climate Action as compared to its benchmark index, the MSCI World Index, over the same 36 month performance period. The Fund's performance adjustment took effect in June 1, 2022. Subsequent months will be added until the performance period includes 36 months. For the reporting period, the total annualized management fee rate, including the performance adjustment, was .62% of the Fund's average net assets. The performance adjustment included in the management fee rate may be higher or lower than the maximum performance adjustment rate due to the difference between the average net assets for the reporting and performance periods.
Distribution and Service Plan Fees. In accordance with Rule 12b-1 of the 1940 Act, the Fund has adopted separate Distribution and Service Plans for each class of shares. Certain classes pay Fidelity Distributors Company LLC (FDC), an affiliate of the investment adviser, separate Distribution and Service Fees, each of which is based on an annual percentage of each class' average net assets. In addition, FDC may pay financial intermediaries for selling shares of the Fund and providing shareholder support services. For the period, the Distribution and Service Fee rates, total fees and amounts retained by FDC were as follows:
| | Distribution Fee | Service Fee | Total Fees | Retained by FDC |
| Class A | - % | .25% | $468 | $2,171 |
| Class M | .25% | .25% | 814 | 189 |
| Class C | .75% | .25% | 1,256 | 1,060 |
| | | | $2,538 | $3,420 |
Sales Load. FDC may receive a front-end sales charge of up to 5.75% for selling Class A shares and 3.50% for selling Class M shares, some of which is paid to financial intermediaries for selling shares of the Fund. Depending on the holding period, FDC may receive contingent deferred sales charges levied on Class A, Class M and Class C redemptions. The deferred sales charges are 1.00% for Class C shares, 1.00% for certain purchases of Class A shares and .25% for certain purchases of Class M shares.
For the period, sales charge amounts retained by FDC were as follows:
| | Retained by FDC |
| Class A | $125 |
| Class M | 101 |
| | $226 |
Transfer Agent Fees. Fidelity Investments Institutional Operations Company LLC (FIIOC), an affiliate of the investment adviser, is the transfer, dividend disbursing and shareholder servicing agent for each class of the Fund. FIIOC receives account fees and asset-based fees that vary according to the account size and type of account of the shareholders of the respective classes of the Fund, except for Class Z. FIIOC receives an asset-based fee of Class Z's average net assets. FIIOC pays for typesetting, printing and mailing of shareholder reports, except proxy statements.
For the period, transfer agent fees for each class were as follows:
| | Amount | % of Class-Level Average Net Assets A |
| Class A | $502 | .27 |
| Class M | 282 | .17 |
| Class C | 292 | .23 |
| Fidelity Climate Action Fund | 23,292 | .25 |
| Class I | 161 | .15 |
| Class Z | 42 | .04 |
| | $24,571 | |
A Annualized
Accounting Fees. Fidelity Service Company, Inc. (FSC), an affiliate of the investment adviser, maintains the Fund's accounting records. The accounting fee is based on the level of average net assets for each month. For the period, the fees were equivalent to the following annualized rates:
| | % of Average Net Assets |
| Fidelity Climate Action Fund | .04 |
Brokerage Commissions. A portion of portfolio transactions were placed with brokerage firms which are affiliates of the investment adviser. Brokerage commissions are included in net realized gain (loss) and change in net unrealized appreciation (depreciation) in the Statement of Operations. The commissions paid to these affiliated firms were as follows:
| | Amount |
| Fidelity Climate Action Fund | $86 |
Interfund Trades. Funds may purchase from or sell securities to other Fidelity Funds under procedures adopted by the Board. The procedures have been designed to ensure these interfund trades are executed in accordance with Rule 17a-7 of the 1940 Act. Any interfund trades are included within the respective purchases and sales amounts shown in the Purchases and Sales of Investments note. Interfund trades during the period are noted in the table below.
| | Purchases ($) | Sales ($) | Realized Gain (Loss) ($) |
| Fidelity Climate Action Fund | 179,564 | 264,179 | (69,062) |
6. Committed Line of Credit.
Certain Funds participate with other funds managed by the investment adviser or an affiliate in a $4.25 billion credit facility (the "line of credit") to be utilized for temporary or emergency purposes to fund shareholder redemptions or for other short-term liquidity purposes. The participating funds have agreed to pay commitment fees on their pro-rata portion of the line of credit, which are reflected in Miscellaneous expenses on the Statement of Operations, and are listed below. During the period, there were no borrowings on this line of credit.
| | Amount |
| Fidelity Climate Action Fund | $17 |
7. Expense Reductions.
The investment adviser contractually agreed to reimburse expenses of each class to the extent annual operating expenses exceeded certain levels of class-level average net assets as noted in the table below. This reimbursement will remain in place through September 30, 2023. Some expenses, for example the compensation of the independent Trustees are excluded from this reimbursement.
The following classes were in reimbursement during the period:
| | Expense Limitations | Reimbursement |
| Class A | 1.30% | $953 |
| Class M | 1.55% | 464 |
| Class C | 2.05% | 585 |
| Fidelity Climate Action Fund | 1.05% | 44,276 |
| Class I | 1.05% | 368 |
| Class Z | .90% | 271 |
| | | $46,917 |
Through arrangements with the Fund's custodian, credits realized as a result of certain uninvested cash balances were used to reduce the Fund's expenses. During the period, custodian credits reduced the Fund's expenses by $46.
In addition, during the period the investment adviser or an affiliate reimbursed and/or waived a portion of fund-level operating expenses in the amount of $352.
8. Distributions to Shareholders.
Distributions to shareholders of each class were as follows:
| | Six months ended November 30, 2022 | Year ended May 31, 2022 A |
| Fidelity Climate Action Fund | | |
| Distributions to shareholders | | |
| Fidelity Climate Action Fund | 6,404 | - |
| Class I | 65 | - |
| Class Z | 37 | - |
Total | $6,506 | $- |
A For the period June 15 (commencement of operations) through November 30, 2022.
9. Share Transactions.
Share transactions for each class were as follows and may contain in-kind transactions, automatic conversions between classes or exchanges between affiliated funds:
| | Shares | Shares | Dollars | Dollars |
| | Six months ended November 30, 2022 | Year ended May 31, 2022 A | Six months ended November 30, 2022 | Year ended May 31, 2022 A |
| Fidelity Climate Action Fund | | | | |
| Class A | | | | |
| Shares sold | 4,119 | 69,899 | $34,586 | $727,430 |
| Shares redeemed | (7,122) | (24,286) | (57,040) | (224,337) |
| Net increase (decrease) | (3,003) | 45,613 | $(22,454) | $503,093 |
| Class M | | | | |
| Shares sold | 44,424 | 20,283 | $357,541 | $205,303 |
| Shares redeemed | (2,024) | (5,347) | (15,608) | (54,128) |
| Net increase (decrease) | 42,400 | 14,936 | $341,933 | $151,175 |
| Class C | | | | |
| Shares sold | 1,402 | 48,324 | $11,951 | $508,720 |
| Shares redeemed | (1,938) | (18,255) | (14,939) | (174,926) |
| Net increase (decrease) | (536) | 30,069 | $(2,988) | $333,794 |
| Fidelity Climate Action Fund | | | | |
| Shares sold | 400,795 | 2,931,754 | $3,385,147 | $30,765,171 |
| Reinvestment of distributions | 700 | - | 5,821 | - |
| Shares redeemed | (287,397) | (790,847) | (2,381,199) | (8,022,973) |
| Net increase (decrease) | 114,098 | 2,140,907 | $1,009,769 | $22,742,198 |
| Class I | | | | |
| Shares sold | 13,106 | 21,601 | $100,424 | $227,485 |
| Reinvestment of distributions | 8 | - | 65 | - |
| Shares redeemed | (1,153) | - | (8,950) | - |
| Net increase (decrease) | 11,961 | 21,601 | $91,539 | $227,485 |
| Class Z | | | | |
| Shares sold | 22,362 | 12,403 | $192,062 | $126,011 |
| Reinvestment of distributions | 4 | - | 37 | - |
| Shares redeemed | (1,819) | (207) | (14,150) | (1,882) |
| Net increase (decrease) | 20,547 | 12,196 | $177,949 | $124,129 |
A For the period June 15 (commencement of operations) through November 30, 2022.
10. Other.
A fund's organizational documents provide former and current trustees and officers with a limited indemnification against liabilities arising in connection with the performance of their duties to the fund. In the normal course of business, a fund may also enter into contracts that provide general indemnifications. A fund's maximum exposure under these arrangements is unknown as this would be dependent on future claims that may be made against a fund. The risk of material loss from such claims is considered remote.
11. Risk and Uncertainties.
Many factors affect a fund's performance. Developments that disrupt global economies and financial markets, such as pandemics, epidemics, outbreaks of infectious diseases, war, terrorism, and environmental disasters, may significantly affect a fund's investment performance. The effects of these developments to a fund will be impacted by the types of securities in which a fund invests, the financial condition, industry, economic sector, and geographic location of an issuer, and a fund's level of investment in the securities of that issuer.
As a shareholder, you incur two types of costs: (1) transaction costs, which may include sales charges (loads) on purchase payments or redemption proceeds, as applicable and (2) ongoing costs, which generally include management fees, distribution and/or service (12b-1) fees and other Fund expenses. This Example is intended to help you understand your ongoing costs (in dollars) of investing in a fund and to compare these costs with the ongoing costs of investing in other mutual funds.
| The Example is based on an investment of $1,000 invested at the beginning of the period and held for the entire period (June 1, 2022 to November 30, 2022). |
Actual Expenses
The first line of the accompanying table provides information about actual account values and actual expenses. You may use the information in this line, together with the amount you invested, to estimate the expenses that you paid over the period. Simply divide your account value by $1,000.00 (for example, an $8,600 account value divided by $1,000.00 = 8.6), then multiply the result by the number in the first line for a class/Fund under the heading entitled "Expenses Paid During Period" to estimate the expenses you paid on your account during this period. If any fund is a shareholder of any underlying mutual funds or exchange-traded funds (ETFs) (the Underlying Funds), such fund indirectly bears its proportional share of the expenses of the Underlying Funds in addition to the direct expenses incurred presented in the table. These fees and expenses are not included in the annualized expense ratio used to calculate the expense estimate in the table below.
Hypothetical Example for Comparison Purposes
The second line of the accompanying table provides information about hypothetical account values and hypothetical expenses based on the actual expense ratio and an assumed rate of return of 5% per year before expenses, which is not the actual return. The hypothetical account values and expenses may not be used to estimate the actual ending account balance or expenses you paid for the period. You may use this information to compare the ongoing costs of investing in the Fund and other funds. To do so, compare this 5% hypothetical example with the 5% hypothetical examples that appear in the shareholder reports of the other funds. If any fund is a shareholder of any Underlying Funds, such fund indirectly bears its proportional share of the expenses of the Underlying Funds in addition to the direct expenses as presented in the table. These fees and expenses are not included in the annualized expense ratio used to calculate the expense estimate in the table below.
Please note that the expenses shown in the table are meant to highlight your ongoing costs only and do not reflect any transaction costs. Therefore, the second line of the table is useful in comparing ongoing costs only, and will not help you determine the relative total costs of owning different funds. In addition, if these transactional costs were included, your costs would have been higher.
| | | | | Annualized Expense Ratio- A | | Beginning Account Value June 1, 2022 | | Ending Account Value November 30, 2022 | | Expenses Paid During Period- C June 1, 2022 to November 30, 2022 |
| Fidelity® Climate Action Fund | | | | | | | | | | |
| Class A | | | | 1.30% | | | | | | |
| Actual | | | | | | $ 1,000 | | $ 989.90 | | $ 6.48 |
Hypothetical- B | | | | | | $ 1,000 | | $ 1,018.55 | | $ 6.58 |
| Class M | | | | 1.54% | | | | | | |
| Actual | | | | | | $ 1,000 | | $ 987.60 | | $ 7.67 |
Hypothetical- B | | | | | | $ 1,000 | | $ 1,017.35 | | $ 7.79 |
| Class C | | | | 2.05% | | | | | | |
| Actual | | | | | | $ 1,000 | | $ 985.30 | | $ 10.20 |
Hypothetical- B | | | | | | $ 1,000 | | $ 1,014.79 | | $ 10.35 |
| Fidelity® Climate Action Fund | | | | 1.05% | | | | | | |
| Actual | | | | | | $ 1,000 | | $ 991.40 | | $ 5.24 |
Hypothetical- B | | | | | | $ 1,000 | | $ 1,019.80 | | $ 5.32 |
| Class I | | | | 1.04% | | | | | | |
| Actual | | | | | | $ 1,000 | | $ 991.40 | | $ 5.19 |
Hypothetical- B | | | | | | $ 1,000 | | $ 1,019.85 | | $ 5.27 |
| Class Z | | | | .89% | | | | | | |
| Actual | | | | | | $ 1,000 | | $ 991.40 | | $ 4.44 |
Hypothetical- B | | | | | | $ 1,000 | | $ 1,020.61 | | $ 4.51 |
| |
A Annualized expense ratio reflects expenses net of applicable fee waivers.
B 5% return per year before expenses
C Expenses are equal to the annualized expense ratio, multiplied by the average account value over the period, multiplied by 183/ 365 (to reflect the one-half year period). The fees and expenses of any Underlying Funds are not included in each annualized expense ratio.
1.9901891.101
CLA-SANN-0123
Fidelity® SAI Sustainable Future Fund
Semi-Annual Report
November 30, 2022
Offered exclusively to certain clients of the Adviser, or its affiliates, including Strategic Advisers LLC (Strategic Advisers) - not available for sale to the general public. Fidelity ® SAI is a product name of Fidelity ® funds dedicated to certain programs affiliated with Strategic Advisers.
Contents
To view a fund's proxy voting guidelines and proxy voting record for the 12-month period ended June 30, visit http://www.fidelity.com/proxyvotingresults or visit the Securities and Exchange Commission's (SEC) web site at http://www.sec.gov.
You may also call 1-800-544-3455 to request a free copy of the proxy voting guidelines.
Standard & Poor's, S&P and S&P 500 are registered service marks of The McGraw-Hill Companies, Inc. and have been licensed for use by Fidelity Distributors Corporation.
Other third-party marks appearing herein are the property of their respective owners.
All other marks appearing herein are registered or unregistered trademarks or service marks of FMR LLC or an affiliated company. © 2023 FMR LLC. All rights reserved.
This report and the financial statements contained herein are submitted for the general information of the shareholders of the Fund. This report is not authorized for distribution to prospective investors in the Fund unless preceded or accompanied by an effective prospectus.
A fund files its complete schedule of portfolio holdings with the SEC for the first and third quarters of each fiscal year on Form N-PORT. Forms N-PORT are available on the SEC's web site at http://www.sec.gov. A fund's Forms N-PORT may be reviewed and copied at the SEC's Public Reference Room in Washington, DC. Information regarding the operation of the SEC's Public Reference Room may be obtained by calling 1-800-SEC-0330.
For a complete list of a fund's portfolio holdings, view the most recent holdings listing, semiannual report, or annual report on Fidelity's web site at http://www.fidelity.com, http://www.institutional.fidelity.com, or http://www.401k.com, as applicable.
NOT FDIC INSURED •MAY LOSE VALUE •NO BANK GUARANTEE
Neither the Fund nor Fidelity Distributors Corporation is a bank.
Top Holdings (% of Fund's net assets) |
| |
| Microsoft Corp. | 5.4 | |
| Apple, Inc. | 3.1 | |
| Alphabet, Inc. Class C | 3.0 | |
| UnitedHealth Group, Inc. | 2.8 | |
| Eli Lilly & Co. | 2.6 | |
| Bank of America Corp. | 2.1 | |
| The Coca-Cola Co. | 1.9 | |
| Huntington Bancshares, Inc. | 1.8 | |
| MasterCard, Inc. Class A | 1.8 | |
| Regeneron Pharmaceuticals, Inc. | 1.7 | |
| | 26.2 | |
| |
| Market Sectors (% of Fund's net assets) |
| |
| Information Technology | 21.2 | |
| Health Care | 19.0 | |
| Financials | 13.4 | |
| Industrials | 11.0 | |
| Consumer Discretionary | 9.9 | |
| Energy | 5.8 | |
| Communication Services | 5.5 | |
| Consumer Staples | 4.9 | |
| Materials | 3.8 | |
| Utilities | 1.3 | |
| Real Estate | 0.5 | |
| |
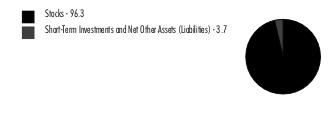
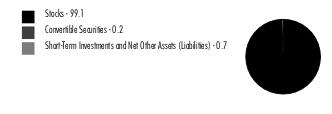
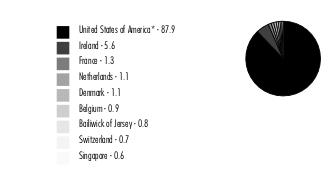
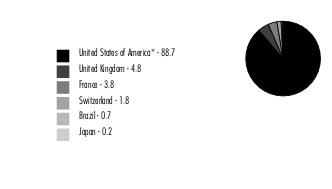
Asset Allocation (% of Fund's net assets) |
|
Foreign investments - 7.3% |
|
Showing Percentage of Net Assets
| Common Stocks - 96.3% |
| | | Shares | Value ($) |
| COMMUNICATION SERVICES - 5.5% | | | |
| Diversified Telecommunication Services - 1.0% | | | |
| Verizon Communications, Inc. | | 732 | 28,533 |
| Entertainment - 0.3% | | | |
| Electronic Arts, Inc. | | 66 | 8,631 |
| Interactive Media & Services - 3.3% | | | |
| Alphabet, Inc. Class C (a) | | 803 | 81,464 |
| Zoominfo Technologies, Inc. (a) | | 288 | 8,237 |
| | | | 89,701 |
| Wireless Telecommunication Services - 0.9% | | | |
| T-Mobile U.S., Inc. (a) | | 166 | 25,142 |
TOTAL COMMUNICATION SERVICES | | | 152,007 |
| CONSUMER DISCRETIONARY - 9.9% | | | |
| Auto Components - 0.4% | | | |
| Lear Corp. | | 73 | 10,530 |
| Hotels, Restaurants & Leisure - 2.5% | | | |
| Hilton Worldwide Holdings, Inc. | | 239 | 34,086 |
| Marriott International, Inc. Class A | | 216 | 35,716 |
| | | | 69,802 |
| Internet & Direct Marketing Retail - 1.3% | | | |
| Amazon.com, Inc. (a) | | 372 | 35,913 |
| Multiline Retail - 2.0% | | | |
| Dollar General Corp. | | 126 | 32,216 |
| Target Corp. | | 136 | 22,722 |
| | | | 54,938 |
| Specialty Retail - 3.1% | | | |
| Lowe's Companies, Inc. | | 100 | 21,255 |
| The Home Depot, Inc. | | 75 | 24,299 |
| TJX Companies, Inc. | | 485 | 38,824 |
| | | | 84,378 |
| Textiles, Apparel & Luxury Goods - 0.6% | | | |
| Tapestry, Inc. | | 414 | 15,637 |
TOTAL CONSUMER DISCRETIONARY | | | 271,198 |
| CONSUMER STAPLES - 4.9% | | | |
| Beverages - 4.2% | | | |
| Diageo PLC | | 829 | 38,285 |
| Keurig Dr. Pepper, Inc. | | 664 | 25,677 |
| The Coca-Cola Co. | | 799 | 50,824 |
| | | | 114,786 |
| Household Products - 0.7% | | | |
| Kimberly-Clark Corp. | | 65 | 8,816 |
| The Clorox Co. | | 78 | 11,595 |
| | | | 20,411 |
TOTAL CONSUMER STAPLES | | | 135,197 |
| ENERGY - 5.8% | | | |
| Energy Equipment & Services - 3.6% | | | |
| Baker Hughes Co. Class A | | 1,069 | 31,022 |
| Halliburton Co. | | 881 | 33,381 |
| Schlumberger Ltd. | | 641 | 33,044 |
| | | | 97,447 |
| Oil, Gas & Consumable Fuels - 2.2% | | | |
| Cheniere Energy, Inc. | | 124 | 21,745 |
| EQT Corp. | | 421 | 17,855 |
| Hess Corp. | | 154 | 22,162 |
| | | | 61,762 |
TOTAL ENERGY | | | 159,209 |
| FINANCIALS - 13.4% | | | |
| Banks - 5.5% | | | |
| Bank of America Corp. | | 1,554 | 58,819 |
| Huntington Bancshares, Inc. | | 3,215 | 49,768 |
| JPMorgan Chase & Co. | | 110 | 15,200 |
| Wells Fargo & Co. | | 596 | 28,578 |
| | | | 152,365 |
| Capital Markets - 3.9% | | | |
| BlackRock, Inc. Class A | | 34 | 24,344 |
| Intercontinental Exchange, Inc. | | 375 | 40,616 |
| Morgan Stanley | | 214 | 19,917 |
| Raymond James Financial, Inc. | | 188 | 21,977 |
| | | | 106,854 |
| Consumer Finance - 0.8% | | | |
| American Express Co. | | 137 | 21,590 |
| Insurance - 3.2% | | | |
| Arthur J. Gallagher & Co. | | 175 | 34,844 |
| MetLife, Inc. | | 290 | 22,243 |
| The Travelers Companies, Inc. | | 162 | 30,749 |
| | | | 87,836 |
TOTAL FINANCIALS | | | 368,645 |
| HEALTH CARE - 19.0% | | | |
| Biotechnology - 4.6% | | | |
| AbbVie, Inc. | | 214 | 34,493 |
| Gilead Sciences, Inc. | | 226 | 19,850 |
| Regeneron Pharmaceuticals, Inc. (a) | | 62 | 46,605 |
| Vertex Pharmaceuticals, Inc. (a) | | 79 | 24,996 |
| | | | 125,944 |
| Health Care Providers & Services - 6.1% | | | |
| Centene Corp. (a) | | 231 | 20,109 |
| Cigna Corp. | | 117 | 38,480 |
| Humana, Inc. | | 56 | 30,794 |
| UnitedHealth Group, Inc. | | 141 | 77,234 |
| | | | 166,617 |
| Life Sciences Tools & Services - 2.7% | | | |
| Agilent Technologies, Inc. | | 260 | 40,295 |
| Danaher Corp. | | 66 | 18,045 |
| Thermo Fisher Scientific, Inc. | | 30 | 16,807 |
| | | | 75,147 |
| Pharmaceuticals - 5.6% | | | |
| AstraZeneca PLC sponsored ADR | | 146 | 9,924 |
| Bristol-Myers Squibb Co. | | 299 | 24,004 |
| Eli Lilly & Co. | | 195 | 72,361 |
| Merck & Co., Inc. | | 248 | 27,310 |
| Zoetis, Inc. Class A | | 128 | 19,730 |
| | | | 153,329 |
TOTAL HEALTH CARE | | | 521,037 |
| INDUSTRIALS - 11.0% | | | |
| Aerospace & Defense - 2.6% | | | |
| Lockheed Martin Corp. | | 79 | 38,330 |
| Northrop Grumman Corp. | | 62 | 33,064 |
| | | | 71,394 |
| Building Products - 2.0% | | | |
| Carrier Global Corp. | | 436 | 19,324 |
| The AZEK Co., Inc. (a) | | 543 | 10,502 |
| Trane Technologies PLC | | 141 | 25,157 |
| | | | 54,983 |
| Construction & Engineering - 0.6% | | | |
| Quanta Services, Inc. | | 113 | 16,936 |
| Electrical Equipment - 1.7% | | | |
| Eaton Corp. PLC | | 179 | 29,258 |
| Hubbell, Inc. Class B | | 26 | 6,606 |
| Sunrun, Inc. (a) | | 327 | 10,654 |
| | | | 46,518 |
| Industrial Conglomerates - 1.1% | | | |
| Honeywell International, Inc. | | 136 | 29,859 |
| Machinery - 2.9% | | | |
| Caterpillar, Inc. | | 79 | 18,676 |
| Cummins, Inc. | | 119 | 29,888 |
| Deere & Co. | | 67 | 29,547 |
| | | | 78,111 |
| Professional Services - 0.1% | | | |
| Equifax, Inc. | | 20 | 3,947 |
TOTAL INDUSTRIALS | | | 301,748 |
| INFORMATION TECHNOLOGY - 21.2% | | | |
| IT Services - 5.0% | | | |
| Accenture PLC Class A | | 136 | 40,926 |
| MasterCard, Inc. Class A | | 138 | 49,183 |
| Visa, Inc. Class A | | 214 | 46,438 |
| | | | 136,547 |
| Semiconductors & Semiconductor Equipment - 4.3% | | | |
| Analog Devices, Inc. | | 41 | 7,048 |
| Applied Materials, Inc. | | 162 | 17,755 |
| Lam Research Corp. | | 38 | 17,950 |
| Marvell Technology, Inc. | | 402 | 18,701 |
| NVIDIA Corp. | | 96 | 16,246 |
| onsemi (a) | | 199 | 14,965 |
| Qualcomm, Inc. | | 107 | 13,534 |
| SolarEdge Technologies, Inc. (a) | | 46 | 13,748 |
| | | | 119,947 |
| Software - 8.8% | | | |
| Adobe, Inc. (a) | | 116 | 40,012 |
| Coupa Software, Inc. (a) | | 182 | 11,510 |
| Intuit, Inc. | | 45 | 18,342 |
| Microsoft Corp. | | 580 | 147,976 |
| Salesforce.com, Inc. (a) | | 100 | 16,025 |
| Workday, Inc. Class A (a) | | 44 | 7,388 |
| | | | 241,253 |
| Technology Hardware, Storage & Peripherals - 3.1% | | | |
| Apple, Inc. | | 570 | 84,377 |
TOTAL INFORMATION TECHNOLOGY | | | 582,124 |
| MATERIALS - 3.8% | | | |
| Chemicals - 1.4% | | | |
| CF Industries Holdings, Inc. | | 153 | 16,553 |
| Linde PLC | | 66 | 22,208 |
| | | | 38,761 |
| Containers & Packaging - 0.3% | | | |
| Avery Dennison Corp. | | 34 | 6,573 |
| Metals & Mining - 2.1% | | | |
| Newmont Corp. | | 734 | 34,843 |
| Steel Dynamics, Inc. | | 218 | 22,657 |
| | | | 57,500 |
TOTAL MATERIALS | | | 102,834 |
| REAL ESTATE - 0.5% | | | |
| Equity Real Estate Investment Trusts (REITs) - 0.5% | | | |
| SL Green Realty Corp. | | 235 | 9,861 |
| Weyerhaeuser Co. | | 122 | 3,991 |
| | | | 13,852 |
| UTILITIES - 1.3% | | | |
| Electric Utilities - 1.3% | | | |
| NextEra Energy, Inc. | | 425 | 35,998 |
| TOTAL COMMON STOCKS (Cost $2,530,904) | | | 2,643,849 |
| | | | |
| Money Market Funds - 1.1% |
| | | Shares | Value ($) |
Fidelity Cash Central Fund 3.86% (b) (Cost $28,967) | | 28,961 | 28,967 |
| | | | |
| TOTAL INVESTMENT IN SECURITIES - 97.4% (Cost $2,559,871) | 2,672,816 |
NET OTHER ASSETS (LIABILITIES) - 2.6% | 71,460 |
| NET ASSETS - 100.0% | 2,744,276 |
| | |
Legend
| (b) | Affiliated fund that is generally available only to investment companies and other accounts managed by Fidelity Investments. The rate quoted is the annualized seven-day yield of the fund at period end. A complete unaudited listing of the fund's holdings as of its most recent quarter end is available upon request. In addition, each Fidelity Central Fund's financial statements are available on the SEC's website or upon request. |
Affiliated Central Funds
Fiscal year to date information regarding the Fund's investments in Fidelity Central Funds, including the ownership percentage, is presented below.
| Affiliate | Value, beginning of period ($) | Purchases ($) | Sales Proceeds ($) | Dividend Income ($) | Realized Gain (loss) ($) | Change in Unrealized appreciation (depreciation) ($) | Value, end of period ($) | % ownership, end of period |
| Fidelity Cash Central Fund 3.86% | 19,723 | 1,140,039 | 1,130,795 | 799 | - | - | 28,967 | 0.0% |
| Total | 19,723 | 1,140,039 | 1,130,795 | 799 | - | - | 28,967 | |
| | | | | | | | | |
Amounts in the income column in the above table include any capital gain distributions from underlying funds, which are presented in the corresponding line item in the Statement of Operations, if applicable.
Amounts included in the purchases and sales proceeds columns may include in-kind transactions, if applicable.
Investment Valuation
The following is a summary of the inputs used, as of November 30, 2022, involving the Fund's assets and liabilities carried at fair value. The inputs or methodology used for valuing securities may not be an indication of the risk associated with investing in those securities. For more information on valuation inputs, and their aggregation into the levels used below, please refer to the Investment Valuation section in the accompanying Notes to Financial Statements.
| Valuation Inputs at Reporting Date: |
| Description | Total ($) | Level 1 ($) | Level 2 ($) | Level 3 ($) |
Investments in Securities: | | | | |
|
| Equities: | | | | |
Communication Services | 152,007 | 152,007 | - | - |
Consumer Discretionary | 271,198 | 271,198 | - | - |
Consumer Staples | 135,197 | 96,912 | 38,285 | - |
Energy | 159,209 | 159,209 | - | - |
Financials | 368,645 | 368,645 | - | - |
Health Care | 521,037 | 521,037 | - | - |
Industrials | 301,748 | 301,748 | - | - |
Information Technology | 582,124 | 582,124 | - | - |
Materials | 102,834 | 102,834 | - | - |
Real Estate | 13,852 | 13,852 | - | - |
Utilities | 35,998 | 35,998 | - | - |
|
| Money Market Funds | 28,967 | 28,967 | - | - |
| Total Investments in Securities: | 2,672,816 | 2,634,531 | 38,285 | - |
| Statement of Assets and Liabilities |
| | | | November 30, 2022 (Unaudited) |
| | | | | |
| Assets | | | | |
| Investment in securities, at value - See accompanying schedule: | | | | |
Unaffiliated issuers (cost $2,530,904) | | $2,643,849 | | |
Fidelity Central Funds (cost $28,967) | | 28,967 | | |
| | | | | |
| Total Investment in Securities (cost $2,559,871) | | | $ | 2,672,816 |
| Cash | | | | 11,287 |
| Receivable for fund shares sold | | | | 68,342 |
| Dividends receivable | | | | 2,916 |
| Distributions receivable from Fidelity Central Funds | | | | 250 |
| Prepaid expenses | | | | 8,658 |
| Receivable from investment adviser for expense reductions | | | | 5,479 |
| Other receivables | | | | 1 |
Total assets | | | | 2,769,749 |
| Liabilities | | | | |
| Payable for fund shares redeemed | | $3,024 | | |
| Accrued management fee | | 1,060 | | |
| Audit fee payable | | 18,730 | | |
| Custody fee payable | | 2,659 | | |
| Total Liabilities | | | | 25,473 |
| Net Assets | | | $ | 2,744,276 |
| Net Assets consist of: | | | | |
| Paid in capital | | | $ | 2,665,061 |
| Total accumulated earnings (loss) | | | | 79,215 |
| Net Assets | | | $ | 2,744,276 |
Net Asset Value , offering price and redemption price per share ($2,744,276 ÷ 291,485 shares) | | | $ | 9.41 |
| | | | | |
| Statement of Operations |
| | | | Six months ended November 30, 2022 (Unaudited) |
| Investment Income | | | | |
| Dividends | | | $ | 10,638 |
| Income from Fidelity Central Funds | | | | 799 |
| Total Income | | | | 11,437 |
| Expenses | | | | |
| Management fee | $ | 3,714 | | |
| Custodian fees and expenses | | 3,424 | | |
| Independent trustees' fees and expenses | | 2 | | |
| Registration fees | | 18,035 | | |
| Audit | | 13,989 | | |
| Miscellaneous | | 30 | | |
| Total expenses before reductions | | 39,194 | | |
| Expense reductions | | (35,041) | | |
| Total expenses after reductions | | | | 4,153 |
| Net Investment income (loss) | | | | 7,284 |
| Realized and Unrealized Gain (Loss) | | | | |
| Net realized gain (loss) on: | | | | |
| Investment Securities: | | | | |
| Unaffiliated issuers | | (38,865) | | |
| Foreign currency transactions | | (1) | | |
| Total net realized gain (loss) | | | | (38,866) |
| Change in net unrealized appreciation (depreciation) on investment securities | | | | 177,559 |
| Net gain (loss) | | | | 138,693 |
| Net increase (decrease) in net assets resulting from operations | | | $ | 145,977 |
| Statement of Changes in Net Assets |
| |
| | Six months ended November 30, 2022 (Unaudited) | | For the period April 14, 2022 (commencement of operations) through May 31, 2022 |
| Increase (Decrease) in Net Assets | | | | |
| Operations | | | | |
| Net investment income (loss) | $ | 7,284 | $ | 618 |
| Net realized gain (loss) | | (38,866) | | (1,921) |
| Change in net unrealized appreciation (depreciation) | | 177,559 | | (64,614) |
| Net increase (decrease) in net assets resulting from operations | | 145,977 | | (65,917) |
| Distributions to shareholders | | (845) | | - |
| Share transactions | | | | |
| Proceeds from sales of shares | | 1,733,491 | | 1,002,483 |
| Reinvestment of distributions | | 843 | | - |
| Cost of shares redeemed | | (71,604) | | (152) |
Net increase (decrease) in net assets resulting from share transactions | | 1,662,730 | | 1,002,331 |
| Total increase (decrease) in net assets | | 1,807,862 | | 936,414 |
| | | | | |
| Net Assets | | | | |
| Beginning of period | | 936,414 | | - |
| End of period | $ | 2,744,276 | $ | 936,414 |
| | | | | |
| Other Information | | | | |
| Shares | | | | |
| Sold | | 199,225 | | 100,265 |
| Issued in reinvestment of distributions | | 96 | | - |
| Redeemed | | (8,086) | | (15) |
| Net increase (decrease) | | 191,235 | | 100,250 |
| | | | | |
Financial Highlights
| Fidelity® SAI Sustainable Future Fund |
| |
| | Six months ended (Unaudited) November 30, 2022 | | Years ended May 31, 2022 A |
Selected Per-Share Data | | | | |
| Net asset value, beginning of period | $ | 9.34 | $ | 10.00 |
| Income from Investment Operations | | | | |
Net investment income (loss) B,C | | .05 | | .01 |
| Net realized and unrealized gain (loss) | | .03 | | (.67) |
| Total from investment operations | | .08 | | (.66) |
| Distributions from net investment income | | (.01) | | - |
| Total distributions | | (.01) | | - |
| Net asset value, end of period | $ | 9.41 | $ | 9.34 |
Total Return D,E | | .84% | | (6.60)% |
Ratios to Average Net Assets C,F,G | | | | |
| Expenses before reductions | | 5.56% H | | 7.05% H,I |
| Expenses net of fee waivers, if any | | .59% H | | .60% H,I |
| Expenses net of all reductions | | .59% H | | .60% H,I |
| Net investment income (loss) | | 1.03% H | | .53% H,I |
| Supplemental Data | | | | |
| Net assets, end of period (000 omitted) | $ | 2,744 | $ | 936 |
Portfolio turnover rate J | | 30% H | | 1% K |
A For the period April 14, 2022 (commencement of operations) through May 31, 2022.
B Calculated based on average shares outstanding during the period.
C Net investment income (loss) is affected by the timing of the declaration of dividends by any underlying mutual funds or exchange-traded funds (ETFs). Net investment income (loss) of any mutual funds or ETFs is not included in the Fund's net investment income (loss) ratio.
D Total returns for periods of less than one year are not annualized.
E Total returns would have been lower if certain expenses had not been reduced during the applicable periods shown.
F Fees and expenses of any underlying mutual funds or exchange-traded funds (ETFs) are not included in the Fund's expense ratio. The Fund indirectly bears its proportionate share of these expenses. For additional expense information related to investments in Fidelity Central Funds, please refer to the "Investments in Fidelity Central Funds" note found in the Notes to Financial Statements section of the most recent Annual or Semi-Annual report.
G Expense ratios reflect operating expenses of the class. Expenses before reductions do not reflect amounts reimbursed, waived, or reduced through arrangements with the investment adviser, brokerage services, or other offset arrangements, if applicable, and do not represent the amount paid by the class during periods when reimbursements, waivers or reductions occur.
H Annualized.
I Audit fees are not annualized.
J Amount does not include the portfolio activity of any underlying mutual funds or exchange-traded funds (ETFs).
K Amount not annualized.
For the period ended November 30, 2022
1. Organization.
Fidelity SAI Sustainable Future Fund (the Fund) is a fund of Fidelity Summer Street Trust (the Trust) and is authorized to issue an unlimited number of shares. Shares are offered exclusively to certain clients of Fidelity Management & Research Company LLC (FMR) or its affiliates. The Trust is registered under the Investment Company Act of 1940, as amended (the 1940 Act), as an open-end management investment company organized as a Massachusetts business trust.
2. Investments in Fidelity Central Funds.
Funds may invest in Fidelity Central Funds, which are open-end investment companies generally available only to other investment companies and accounts managed by the investment adviser and its affiliates. The Schedule of Investments lists any Fidelity Central Funds held as an investment as of period end, but does not include the underlying holdings of each Fidelity Central Fund. An investing fund indirectly bears its proportionate share of the expenses of the underlying Fidelity Central Funds.
Based on its investment objective, each Fidelity Central Fund may invest or participate in various investment vehicles or strategies that are similar to those of the investing fund. These strategies are consistent with the investment objectives of the investing fund and may involve certain economic risks which may cause a decline in value of each of the Fidelity Central Funds and thus a decline in the value of the investing fund.
| Fidelity Central Fund | Investment Manager | Investment Objective | Investment Practices | Expense Ratio A |
| Fidelity Money Market Central Funds | Fidelity Management & Research Company LLC (FMR) | Each fund seeks to obtain a high level of current income consistent with the preservation of capital and liquidity. | Short-term Investments | Less than .005% |
A Expenses expressed as a percentage of average net assets and are as of each underlying Central Fund's most recent annual or semi-annual shareholder report.
A complete unaudited list of holdings for each Fidelity Central Fund is available upon request or at the Securities and Exchange Commission website at www.sec.gov. In addition, the financial statements of the Fidelity Central Funds which contain the significant accounting policies (including investment valuation policies) of those funds, and are not covered by the Report of Independent Registered Public Accounting Firm, are available on the Securities and Exchange Commission website or upon request.
3. Significant Accounting Policies.
The Fund is an investment company and applies the accounting and reporting guidance of the Financial Accounting Standards Board (FASB) Accounting Standards Codification Topic 946 Financial Services - Investment Companies . The financial statements have been prepared in conformity with accounting principles generally accepted in the United States of America (GAAP), which require management to make certain estimates and assumptions at the date of the financial statements. Actual results could differ from those estimates. Subsequent events, if any, through the date that the financial statements were issued have been evaluated in the preparation of the financial statements. The Fund's Schedule of Investments lists any underlying mutual funds or exchange-traded funds (ETFs) but does not include the underlying holdings of these funds. The following summarizes the significant accounting policies of the Fund:
Investment Valuation. Investments are valued as of 4:00 p.m. Eastern time on the last calendar day of the period. The Board of Trustees (the Board) has designated the Fund's investment adviser as the valuation designee responsible for the fair valuation function and performing fair value determinations as needed. The investment adviser has established a Fair Value Committee (the Committee) to carry out the day-to-day fair valuation responsibilities and has adopted policies and procedures to govern the fair valuation process and the activities of the Committee. In accordance with these fair valuation policies and procedures, which have been approved by the Board, the Fund attempts to obtain prices from one or more third party pricing services or brokers to value its investments. When current market prices, quotations or currency exchange rates are not readily available or reliable, investments will be fair valued in good faith by the Committee, in accordance with the policies and procedures. Factors used in determining fair value vary by investment type and may include market or investment specific events, transaction data, estimated cash flows, and market observations of comparable investments. The frequency that the fair valuation procedures are used cannot be predicted and they may be utilized to a significant extent. The Committee manages the Fund's fair valuation practices and maintains the fair valuation policies and procedures. The Fund's investment adviser reports to the Board information regarding the fair valuation process and related material matters.
The Fund categorizes the inputs to valuation techniques used to value its investments into a disclosure hierarchy consisting of three levels as shown below:
Level 1 - unadjusted quoted prices in active markets for identical investments
Level 2 - other significant observable inputs (including quoted prices for similar investments, interest rates, prepayment speeds, etc.)
Level 3 - unobservable inputs (including the Fund's own assumptions based on the best information available)
Valuation techniques used to value the Fund's investments by major category are as follows:
Equity securities, including restricted securities, for which market quotations are readily available, are valued at the last reported sale price or official closing price as reported by a third party pricing service on the primary market or exchange on which they are traded and are categorized as Level 1 in the hierarchy. In the event there were no sales during the day or closing prices are not available, securities are valued at the last quoted bid price or may be valued using the last available price and are generally categorized as Level 2 in the hierarchy. For foreign equity securities, when market or security specific events arise, comparisons to the valuation of American Depositary Receipts (ADRs), futures contracts, ETFs and certain indexes as well as quoted prices for similar securities may be used and would be categorized as Level 2 in the hierarchy. For equity securities, including restricted securities, where observable inputs are limited, assumptions about market activity and risk are used and these securities may be categorized as Level 3 in the hierarchy.
Investments in open-end mutual funds, including the Fidelity Central Funds, are valued at their closing net asset value (NAV) each business day and are categorized as Level 1 in the hierarchy.
Changes in valuation techniques may result in transfers in or out of an assigned level within the disclosure hierarchy. The aggregate value of investments by input level as of November 30, 2022 is included at the end of the Fund's Schedule of Investments.
Foreign Currency. Certain Funds may use foreign currency contracts to facilitate transactions in foreign-denominated securities. Gains and losses from these transactions may arise from changes in the value of the foreign currency or if the counterparties do not perform under the contracts' terms.
Foreign-denominated assets, including investment securities, and liabilities are translated into U.S. dollars at the exchange rates at period end. Purchases and sales of investment securities, income and dividends received, and expenses denominated in foreign currencies are translated into U.S. dollars at the exchange rate in effect on the transaction date.
The effects of exchange rate fluctuations on investments are included with the net realized and unrealized gain (loss) on investment securities. Other foreign currency transactions resulting in realized and unrealized gain (loss) are disclosed separately.
Investment Transactions and Income. For financial reporting purposes, the Fund's investment holdings and NAV include trades executed through the end of the last business day of the period. The NAV per share for processing shareholder transactions is calculated as of the close of business of the New York Stock Exchange (NYSE), normally 4:00 p.m. Eastern time and includes trades executed through the end of the prior business day. Gains and losses on securities sold are determined on the basis of identified cost. Commissions paid to certain brokers with whom the investment adviser, or its affiliates, places trades on behalf of a fund include an amount in addition to trade execution, which may be rebated back to a fund. Any such rebates are included in net realized gain (loss) on investments in the Statement of Operations. Dividend income is recorded on the ex-dividend date, except for certain dividends from foreign securities where the ex-dividend date may have passed, which are recorded as soon as the Fund is informed of the ex-dividend date. Non-cash dividends included in dividend income, if any, are recorded at the fair market value of the securities received. Income and capital gain distributions from Fidelity Central Funds, if any, are recorded on the ex-dividend date. Investment income is recorded net of foreign taxes withheld where recovery of such taxes is uncertain.
Expenses. Expenses directly attributable to a fund are charged to that fund. Expenses attributable to more than one fund are allocated among the respective funds on the basis of relative net assets or other appropriate methods. Expenses included in the accompanying financial statements reflect the expenses of that fund and do not include any expenses associated with any underlying mutual funds or exchange-traded funds. Although not included in a fund's expenses, a fund indirectly bears its proportionate share of these expenses through the net asset value of each underlying mutual fund or exchange-traded fund. Expense estimates are accrued in the period to which they relate and adjustments are made when actual amounts are known.
Income Tax Information and Distributions to Shareholders. Each year, the Fund intends to qualify as a regulated investment company under Subchapter M of the Internal Revenue Code, including distributing substantially all of its taxable income and realized gains. As a result, no provision for U.S. Federal income taxes is required. The Fund files a U.S. federal tax return, in addition to state and local tax returns as required. The Fund's federal income tax returns are subject to examination by the Internal Revenue Service (IRS) for a period of three fiscal years after they are filed. State and local tax returns may be subject to examination for an additional fiscal year depending on the jurisdiction. Foreign taxes are provided for based on the Fund's understanding of the tax rules and rates that exist in the foreign markets in which it invests.
Distributions are declared and recorded on the ex-dividend date. Income and capital gain distributions are determined in accordance with income tax regulations, which may differ from GAAP.
Capital accounts within the financial statements are adjusted for permanent book-tax differences. These adjustments have no impact on net assets or the results of operations. Capital accounts are not adjusted for temporary book-tax differences which will reverse in a subsequent period.
Book-tax differences are primarily due to foreign currency transactions and capital loss carryforwards.
As of period end, the cost and unrealized appreciation (depreciation) in securities, and derivatives if applicable, for federal income tax purposes were as follows:
| Gross unrealized appreciation | $194,710 |
| Gross unrealized depreciation | (98,728) |
| Net unrealized appreciation (depreciation) | $95,982 |
| Tax cost | $2,576,834 |
Capital loss carryforwards are only available to offset future capital gains of the Fund to the extent provided by regulations and may be limited. The capital loss carryforward information presented below, including any applicable limitation, is estimated as of prior fiscal period end and is subject to adjustment.
Short-term | $(1,915) |
Long-term | (-) |
| Total capital loss carryforward | $(1,915) |
4. Purchases and Sales of Investments.
Purchases and sales of securities, other than short-term securities and in-kind transactions, as applicable, are noted in the table below.
| | Purchases ($) | Sales ($) |
| Fidelity SAI Sustainable Future Fund | 1,800,212 | 209,331 |
5. Fees and Other Transactions with Affiliates.
Management Fee. Fidelity Management & Research Company LLC (the investment adviser) and its affiliates provide the Fund with investment management related services for which the Fund pays a monthly management fee. The management fee is the sum of an individual fund fee rate that is based on an annual rate of .30% of the Fund's average net assets and an annualized group fee rate that averaged .23% during the period. The group fee rate is based upon the monthly average net assets of a group of registered investment companies with which the investment adviser has management contracts. The group fee rate decreases as assets under management increase and increases as assets under management decrease. For the reporting period, the total annualized management fee rate was .53% of the Fund's average net assets.
Brokerage Commissions. A portion of portfolio transactions were placed with brokerage firms which are affiliates of the investment adviser. Brokerage commissions are included in net realized gain (loss) and change in net unrealized appreciation (depreciation) in the Statement of Operations. The commissions paid to these affiliated firms were as follows:
| | Amount |
| Fidelity SAI Sustainable Future Fund | $23 |
Interfund Trades. Funds may purchase from or sell securities to other Fidelity Funds under procedures adopted by the Board. The procedures have been designed to ensure these interfund trades are executed in accordance with Rule 17a-7 of the 1940 Act. Any interfund trades are included within the respective purchases and sales amounts shown in the Purchases and Sales of Investments note. Interfund trades during the period are noted in the table below.
| | Purchases ($) | Sales ($) | Realized Gain (Loss) ($) |
| Fidelity SAI Sustainable Future Fund | 12,311 | - | - |
6. Expense Reductions.
The investment adviser contractually agreed to reimburse the Fund to the extent annual operating expenses exceeded .60% of average net assets. This reimbursement will remain in place through September 30, 2023. Some expenses, for example the compensation of the independent Trustees, and certain miscellaneous expenses such as proxy and shareholder meeting expenses, are excluded from this reimbursement. During the period this reimbursement reduced the Fund's expenses by $34,995.
Through arrangements with the Fund's custodian, credits realized as a result of certain uninvested cash balances were used to reduce the Fund's expenses by $33.
In addition, during the period the investment adviser or an affiliate reimbursed and/or waived a portion of operating expenses in the amount of $13.
7. Other.
A fund's organizational documents provide former and current trustees and officers with a limited indemnification against liabilities arising in connection with the performance of their duties to the fund. In the normal course of business, a fund may also enter into contracts that provide general indemnifications. A fund's maximum exposure under these arrangements is unknown as this would be dependent on future claims that may be made against a fund. The risk of material loss from such claims is considered remote.
At the end of the period, the investment adviser or its affiliates were owners of record of more than 10% of the outstanding shares as follows:
| Fund | Affiliated % |
| Fidelity SAI Sustainable Future Fund | 35% |
8. Risk and Uncertainties.
Many factors affect a fund's performance. Developments that disrupt global economies and financial markets, such as pandemics, epidemics, outbreaks of infectious diseases, war, terrorism, and environmental disasters, may significantly affect a fund's investment performance. The effects of these developments to a fund will be impacted by the types of securities in which a fund invests, the financial condition, industry, economic sector, and geographic location of an issuer, and a fund's level of investment in the securities of that issuer.
As a shareholder, you incur two types of costs: (1) transaction costs, which may include sales charges (loads) on purchase payments or redemption proceeds, as applicable and (2) ongoing costs, which generally include management fees, distribution and/or service (12b-1) fees and other Fund expenses. This Example is intended to help you understand your ongoing costs (in dollars) of investing in a fund and to compare these costs with the ongoing costs of investing in other mutual funds.
| The Example is based on an investment of $1,000 invested at the beginning of the period and held for the entire period (June 1, 2022 to November 30, 2022). |
Actual Expenses
The first line of the accompanying table provides information about actual account values and actual expenses. You may use the information in this line, together with the amount you invested, to estimate the expenses that you paid over the period. Simply divide your account value by $1,000.00 (for example, an $8,600 account value divided by $1,000.00 = 8.6), then multiply the result by the number in the first line for a class/Fund under the heading entitled "Expenses Paid During Period" to estimate the expenses you paid on your account during this period. If any fund is a shareholder of any underlying mutual funds or exchange-traded funds (ETFs) (the Underlying Funds), such fund indirectly bears its proportional share of the expenses of the Underlying Funds in addition to the direct expenses incurred presented in the table. These fees and expenses are not included in the annualized expense ratio used to calculate the expense estimate in the table below.
Hypothetical Example for Comparison Purposes
The second line of the accompanying table provides information about hypothetical account values and hypothetical expenses based on the actual expense ratio and an assumed rate of return of 5% per year before expenses, which is not the actual return. The hypothetical account values and expenses may not be used to estimate the actual ending account balance or expenses you paid for the period. You may use this information to compare the ongoing costs of investing in the Fund and other funds. To do so, compare this 5% hypothetical example with the 5% hypothetical examples that appear in the shareholder reports of the other funds. If any fund is a shareholder of any Underlying Funds, such fund indirectly bears its proportional share of the expenses of the Underlying Funds in addition to the direct expenses as presented in the table. These fees and expenses are not included in the annualized expense ratio used to calculate the expense estimate in the table below.
Please note that the expenses shown in the table are meant to highlight your ongoing costs only and do not reflect any transaction costs. Therefore, the second line of the table is useful in comparing ongoing costs only, and will not help you determine the relative total costs of owning different funds. In addition, if these transactional costs were included, your costs would have been higher.
| | | | | Annualized Expense Ratio- A | | Beginning Account Value June 1, 2022 | | Ending Account Value November 30, 2022 | | Expenses Paid During Period- C June 1, 2022 to November 30, 2022 |
| | | | | | | | | | |
| Fidelity® SAI Sustainable Future Fund | | | | .59% | | | | | | |
| Actual | | | | | | $ 1,000 | | $ 1,008.40 | | $ 2.97 |
Hypothetical- B | | | | | | $ 1,000 | | $ 1,022.11 | | $ 2.99 |
| |
A Annualized expense ratio reflects expenses net of applicable fee waivers.
B 5% return per year before expenses
C Expenses are equal to the annualized expense ratio, multiplied by the average account value over the period, multiplied by 183/ 365 (to reflect the one-half year period). The fees and expenses of any Underlying Funds are not included in each annualized expense ratio.
1.9905644.100
FSP-SANN-0123
Fidelity® Disruptive Automation Fund
Fidelity® Disruptive Communications Fund
Fidelity® Disruptive Finance Fund
Fidelity® Disruptive Medicine Fund
Fidelity® Disruptive Technology Fund
Semi-Annual Report
November 30, 2022
Contents
To view a fund's proxy voting guidelines and proxy voting record for the 12-month period ended June 30, visit http://www.fidelity.com/proxyvotingresults or visit the Securities and Exchange Commission's (SEC) web site at http://www.sec.gov.
You may also call 1-800-544-8544 if you're an individual investing directly with Fidelity, call 1-800-835-5092 if you're a plan sponsor or participant with Fidelity as your recordkeeper or call 1-877-208-0098 on institutional accounts or if you're an advisor or invest through one to request a free copy of the proxy voting guidelines.
Standard & Poor's, S&P and S&P 500 are registered service marks of The McGraw-Hill Companies, Inc. and have been licensed for use by Fidelity Distributors Corporation.
Other third-party marks appearing herein are the property of their respective owners.
All other marks appearing herein are registered or unregistered trademarks or service marks of FMR LLC or an affiliated company. © 2023 FMR LLC. All rights reserved.
This report and the financial statements contained herein are submitted for the general information of the shareholders of the Funds. This report is not authorized for distribution to prospective investors in the Funds unless preceded or accompanied by an effective prospectus.
A fund files its complete schedule of portfolio holdings with the SEC for the first and third quarters of each fiscal year on Form N-PORT. Forms N-PORT are available on the SEC's web site at http://www.sec.gov. A fund's Forms N-PORT may be reviewed and copied at the SEC's Public Reference Room in Washington, DC. Information regarding the operation of the SEC's Public Reference Room may be obtained by calling 1-800-SEC-0330.
For a complete list of a fund's portfolio holdings, view the most recent holdings listing, semiannual report, or annual report on Fidelity's web site at http://www.fidelity.com, http://www.institutional.fidelity.com, or http://www.401k.com, as applicable.
NOT FDIC INSURED •MAY LOSE VALUE •NO BANK GUARANTEE
Neither the Funds nor Fidelity Distributors Corporation is a bank.
Top Holdings (% of Fund's net assets) |
| |
| Honeywell International, Inc. | 5.2 | |
| Misumi Group, Inc. | 5.1 | |
| Taiwan Semiconductor Manufacturing Co. Ltd. | 4.5 | |
| Hexagon AB (B Shares) | 4.4 | |
| Intuitive Surgical, Inc. | 4.3 | |
| Keyence Corp. | 4.3 | |
| Alphabet, Inc. Class C | 4.0 | |
| Shenzhen Inovance Technology Co. Ltd. (A Shares) | 3.9 | |
| NVIDIA Corp. | 3.8 | |
| SMC Corp. | 3.8 | |
| | 43.3 | |
| |
| Market Sectors (% of Fund's net assets) |
| |
| Information Technology | 45.7 | |
| Industrials | 44.2 | |
| Health Care | 4.3 | |
| Communication Services | 4.0 | |
| Consumer Discretionary | 1.3 | |
| |
Asset Allocation (% of Fund's net assets) |
|
Foreign investments - 56.6% |
|
Geographic Diversification (% of Fund's net assets) |
|
* Includes Short-Term investments and Net Other Assets (Liabilities). Percentages are based on country or territory of incorporation and are adjusted for the effect of futures contracts, if applicable. |
| |
Fidelity® Disruptive Automation Fund
Showing Percentage of Net Assets
| Common Stocks - 99.5% |
| | | Shares | Value ($) |
| COMMUNICATION SERVICES - 4.0% | | | |
| Interactive Media & Services - 4.0% | | | |
| Alphabet, Inc. Class C (a) | | 40,451 | 4,103,754 |
| CONSUMER DISCRETIONARY - 1.3% | | | |
| Auto Components - 0.1% | | | |
| Mobileye Global, Inc. | | 1,600 | 45,616 |
| Automobiles - 0.6% | | | |
| Tesla, Inc. (a) | | 2,996 | 583,321 |
| Internet & Direct Marketing Retail - 0.6% | | | |
| Amazon.com, Inc. (a) | | 6,768 | 653,383 |
TOTAL CONSUMER DISCRETIONARY | | | 1,282,320 |
| HEALTH CARE - 4.3% | | | |
| Health Care Equipment & Supplies - 4.3% | | | |
| Intuitive Surgical, Inc. (a) | | 16,198 | 4,379,777 |
| INDUSTRIALS - 44.2% | | | |
| Electrical Equipment - 5.0% | | | |
| AMETEK, Inc. | | 10,193 | 1,451,687 |
| Rockwell Automation, Inc. | | 9,079 | 2,398,853 |
| Sensata Technologies, Inc. PLC | | 26,481 | 1,194,293 |
| | | | 5,044,833 |
| Industrial Conglomerates - 7.7% | | | |
| Honeywell International, Inc. | | 23,858 | 5,238,022 |
| Siemens AG | | 18,697 | 2,592,990 |
| | | | 7,831,012 |
| Machinery - 27.9% | | | |
| Airtac International Group | | 41,783 | 1,300,491 |
| AutoStore Holdings Ltd. (a)(b)(c) | | 757,817 | 1,405,493 |
| Daifuku Co. Ltd. | | 21,209 | 1,104,144 |
| FANUC Corp. | | 21,000 | 3,157,581 |
| HIWIN Technologies Corp. | | 602,165 | 3,687,889 |
| Kardex AG | | 7,703 | 1,276,887 |
| Misumi Group, Inc. | | 207,557 | 5,159,335 |
| Nabtesco Corp. | | 34,676 | 873,602 |
| Shenzhen Inovance Technology Co. Ltd. (A Shares) | | 394,568 | 3,951,396 |
| SMC Corp. | | 8,496 | 3,876,817 |
| Symbotic, Inc. (a)(b) | | 41,694 | 460,719 |
| THK Co. Ltd. | | 102,970 | 2,031,127 |
| | | | 28,285,481 |
| Professional Services - 3.6% | | | |
| Recruit Holdings Co. Ltd. | | 111,125 | 3,595,479 |
TOTAL INDUSTRIALS | | | 44,756,805 |
| INFORMATION TECHNOLOGY - 45.7% | | | |
| Electronic Equipment & Components - 14.1% | | | |
| Cognex Corp. | | 17,090 | 850,740 |
| Hexagon AB (B Shares) | | 391,987 | 4,482,502 |
| Keyence Corp. | | 10,181 | 4,307,907 |
| National Instruments Corp. | | 28,383 | 1,164,271 |
| Renishaw PLC | | 75,942 | 3,430,978 |
| | | | 14,236,398 |
| IT Services - 2.6% | | | |
| Accenture PLC Class A | | 8,854 | 2,664,434 |
| Semiconductors & Semiconductor Equipment - 11.9% | | | |
| NVIDIA Corp. | | 23,003 | 3,892,798 |
| Taiwan Semiconductor Manufacturing Co. Ltd. | | 283,291 | 4,565,344 |
| Teradyne, Inc. | | 38,471 | 3,595,115 |
| | | | 12,053,257 |
| Software - 17.1% | | | |
| Altair Engineering, Inc. Class A (a) | | 17,166 | 842,336 |
| ANSYS, Inc. (a) | | 14,184 | 3,606,991 |
| Autodesk, Inc. (a) | | 4,645 | 938,058 |
| Dassault Systemes SA | | 53,589 | 1,998,189 |
| Manhattan Associates, Inc. (a) | | 6,718 | 846,065 |
| Microsoft Corp. | | 9,648 | 2,461,591 |
| Nemetschek SE | | 11,576 | 578,541 |
| PTC, Inc. (a) | | 30,452 | 3,873,799 |
| Synopsys, Inc. (a) | | 5,652 | 1,919,080 |
| Unity Software, Inc. (a)(b) | | 7,536 | 297,747 |
| | | | 17,362,397 |
TOTAL INFORMATION TECHNOLOGY | | | 46,316,486 |
| TOTAL COMMON STOCKS (Cost $104,431,046) | | | 100,839,142 |
| | | | |
| Money Market Funds - 1.9% |
| | | Shares | Value ($) |
Fidelity Securities Lending Cash Central Fund 3.86% (d)(e) (Cost $1,932,300) | | 1,932,107 | 1,932,300 |
| | | | |
| TOTAL INVESTMENT IN SECURITIES - 101.4% (Cost $106,363,346) | 102,771,442 |
NET OTHER ASSETS (LIABILITIES) - (1.4)% | (1,463,173) |
| NET ASSETS - 100.0% | 101,308,269 |
| | |
Legend
| (b) | Security or a portion of the security is on loan at period end. |
| (c) | Security exempt from registration under Rule 144A of the Securities Act of 1933. These securities may be resold in transactions exempt from registration, normally to qualified institutional buyers. At the end of the period, the value of these securities amounted to $1,405,493 or 1.4% of net assets. |
| (d) | Affiliated fund that is generally available only to investment companies and other accounts managed by Fidelity Investments. The rate quoted is the annualized seven-day yield of the fund at period end. A complete unaudited listing of the fund's holdings as of its most recent quarter end is available upon request. In addition, each Fidelity Central Fund's financial statements are available on the SEC's website or upon request. |
| (e) | Investment made with cash collateral received from securities on loan. |
Affiliated Central Funds
Fiscal year to date information regarding the Fund's investments in Fidelity Central Funds, including the ownership percentage, is presented below.
| Affiliate | Value, beginning of period ($) | Purchases ($) | Sales Proceeds ($) | Dividend Income ($) | Realized Gain (loss) ($) | Change in Unrealized appreciation (depreciation) ($) | Value, end of period ($) | % ownership, end of period |
| Fidelity Cash Central Fund 3.86% | 850,375 | 6,854,797 | 7,705,172 | 4,451 | - | - | - | 0.0% |
| Fidelity Securities Lending Cash Central Fund 3.86% | 5,229,900 | 7,581,409 | 10,879,009 | 26,068 | - | - | 1,932,300 | 0.0% |
| Total | 6,080,275 | 14,436,206 | 18,584,181 | 30,519 | - | - | 1,932,300 | |
| | | | | | | | | |
Amounts in the income column in the above table include any capital gain distributions from underlying funds, which are presented in the corresponding line item in the Statement of Operations, if applicable.
Amount for Fidelity Securities Lending Cash Central Fund represents the income earned on investing cash collateral, less rebates paid to borrowers and any lending agent fees associated with the loan, plus any premium payments received for lending certain types of securities.
Amounts included in the purchases and sales proceeds columns may include in-kind transactions, if applicable.
Investment Valuation
The following is a summary of the inputs used, as of November 30, 2022, involving the Fund's assets and liabilities carried at fair value. The inputs or methodology used for valuing securities may not be an indication of the risk associated with investing in those securities. For more information on valuation inputs, and their aggregation into the levels used below, please refer to the Investment Valuation section in the accompanying Notes to Financial Statements.
| Valuation Inputs at Reporting Date: |
| Description | Total ($) | Level 1 ($) | Level 2 ($) | Level 3 ($) |
Investments in Securities: | | | | |
|
| Equities: | | | | |
Communication Services | 4,103,754 | 4,103,754 | - | - |
Consumer Discretionary | 1,282,320 | 1,282,320 | - | - |
Health Care | 4,379,777 | 4,379,777 | - | - |
Industrials | 44,756,805 | 10,743,574 | 34,013,231 | - |
Information Technology | 46,316,486 | 26,953,025 | 19,363,461 | - |
|
| Money Market Funds | 1,932,300 | 1,932,300 | - | - |
| Total Investments in Securities: | 102,771,442 | 49,394,750 | 53,376,692 | - |
Fidelity® Disruptive Automation Fund
| Statement of Assets and Liabilities |
| | | | November 30, 2022 (Unaudited) |
| | | | | |
| Assets | | | | |
| Investment in securities, at value (including securities loaned of $1,796,103) - See accompanying schedule: | | | | |
Unaffiliated issuers (cost $104,431,046) | | $100,839,142 | | |
Fidelity Central Funds (cost $1,932,300) | | 1,932,300 | | |
| | | | | |
| Total Investment in Securities (cost $106,363,346) | | | $ | 102,771,442 |
| Foreign currency held at value (cost $61) | | | | 62 |
| Receivable for investments sold | | | | 538,809 |
| Receivable for fund shares sold | | | | 96,271 |
| Dividends receivable | | | | 208,062 |
| Reclaims receivable | | | | 56,562 |
| Distributions receivable from Fidelity Central Funds | | | | 19,811 |
Total assets | | | | 103,691,019 |
| Liabilities | | | | |
| Payable to custodian bank | | $228,460 | | |
| Payable for fund shares redeemed | | 170,499 | | |
| Accrued management fee | | 51,491 | | |
| Collateral on securities loaned | | 1,932,300 | | |
| Total Liabilities | | | | 2,382,750 |
| Net Assets | | | $ | 101,308,269 |
| Net Assets consist of: | | | | |
| Paid in capital | | | $ | 110,942,002 |
| Total accumulated earnings (loss) | | | | (9,633,733) |
| Net Assets | | | $ | 101,308,269 |
| | | | | |
| Net Asset Value and Maximum Offering Price | | | | |
| Fidelity Disruptive Automation Fund : | | | | |
Net Asset Value , offering price and redemption price per share ($19,078,089 ÷ 1,310,557 shares) | | | $ | 14.56 |
| Loyalty Class 1 : | | | | |
Net Asset Value , offering price and redemption price per share ($60,153,445 ÷ 4,135,907 shares) | | | $ | 14.54 |
| Loyalty Class 2 : | | | | |
Net Asset Value , offering price and redemption price per share ($150,778 ÷ 10,291 shares) | | | $ | 14.65 |
| Class F : | | | | |
Net Asset Value , offering price and redemption price per share ($21,925,957 ÷ 1,488,415 shares) | | | $ | 14.73 |
| Statement of Operations |
| | | | Six months ended November 30, 2022 (Unaudited) |
| Investment Income | | | | |
| Dividends | | | $ | 543,480 |
| Income from Fidelity Central Funds (including $26,068 from security lending) | | | | 30,519 |
| Income before foreign taxes withheld | | | | 573,999 |
| Less foreign taxes withheld | | | | (31,030) |
| Total Income | | | | 542,969 |
| Expenses | | | | |
| Management fee | $ | 347,267 | | |
| Independent trustees' fees and expenses | | 194 | | |
| Total expenses before reductions | | 347,461 | | |
| Expense reductions | | (170) | | |
| Total expenses after reductions | | | | 347,291 |
| Net Investment income (loss) | | | | 195,678 |
| Realized and Unrealized Gain (Loss) | | | | |
| Net realized gain (loss) on: | | | | |
| Investment Securities: | | | | |
| Unaffiliated issuers | | (5,650,839) | | |
| Foreign currency transactions | | (17,147) | | |
| Total net realized gain (loss) | | | | (5,667,986) |
| Change in net unrealized appreciation (depreciation) on: | | | | |
| Investment Securities: | | | | |
| Unaffiliated issuers | | 258,382 | | |
| Assets and liabilities in foreign currencies | | 9,087 | | |
| Total change in net unrealized appreciation (depreciation) | | | | 267,469 |
| Net gain (loss) | | | | (5,400,517) |
| Net increase (decrease) in net assets resulting from operations | | | $ | (5,204,839) |
| Statement of Changes in Net Assets |
| |
| | Six months ended November 30, 2022 (Unaudited) | | Year ended May 31, 2022 |
| Increase (Decrease) in Net Assets | | | | |
| Operations | | | | |
| Net investment income (loss) | $ | 195,678 | $ | (18,589) |
| Net realized gain (loss) | | (5,667,986) | | 1,691,921 |
| Change in net unrealized appreciation (depreciation) | | 267,469 | | (28,551,388) |
| Net increase (decrease) in net assets resulting from operations | | (5,204,839) | | (26,878,056) |
| Distributions to shareholders | | - | | (4,074,695) |
| Share transactions - net increase (decrease) | | (17,127,301) | | 1,799,212 |
| Total increase (decrease) in net assets | | (22,332,140) | | (29,153,539) |
| | | | | |
| Net Assets | | | | |
| Beginning of period | | 123,640,409 | | 152,793,948 |
| End of period | $ | 101,308,269 | $ | 123,640,409 |
| | | | | |
| | | | | |
Financial Highlights
| Fidelity® Disruptive Automation Fund |
| |
| | Six months ended (Unaudited) November 30, 2022 | | Years ended May 31, 2022 | | 2021 | | 2020 A |
Selected Per-Share Data | | | | | | | | |
| Net asset value, beginning of period | $ | 14.93 | $ | 18.28 | $ | 11.90 | $ | 10.00 |
| Income from Investment Operations | | | | | | | | |
Net investment income (loss) B,C | | - D | | (.06) | | .01 | | (.01) |
| Net realized and unrealized gain (loss) | | (.37) | | (2.92) | | 6.42 | | 1.91 |
| Total from investment operations | | (.37) | | (2.98) | | 6.43 | | 1.90 |
| Distributions from net investment income | | - | | - | | (.04) | | - |
| Distributions from net realized gain | | - | | (.37) | | (.02) | | - |
| Total distributions | | - | | (.37) | | (.05) E | | - |
| Net asset value, end of period | $ | 14.56 | $ | 14.93 | $ | 18.28 | $ | 11.90 |
Total Return F,G | | (2.48)% | | (16.75)% | | 54.13% | | 19.00% |
Ratios to Average Net Assets C,H,I | | | | | | | | |
| Expenses before reductions | | 1.00% J | | 1.00% | | 1.01% K | | 1.01% J,K |
| Expenses net of fee waivers, if any | | 1.00% J | | 1.00% | | 1.01% K | | 1.01% J,K |
| Expenses net of all reductions | | 1.00% J | | 1.00% | | 1.01% K | | 1.01% J,K |
| Net investment income (loss) | | .02% J | | (.33)% | | .06% | | (.47)% J |
| Supplemental Data | | | | | | | | |
| Net assets, end of period (000 omitted) | $ | 19,078 | $ | 36,333 | $ | 111,910 | $ | 5,308 |
Portfolio turnover rate L | | 15% J | | 22% | | 14% | | 6% M |
A For the period April 16, 2020 (commencement of operations) through May 31, 2020
B Calculated based on average shares outstanding during the period.
C Net investment income (loss) is affected by the timing of the declaration of dividends by any underlying mutual funds or exchange-traded funds (ETFs). Net investment income (loss) of any mutual funds or ETFs is not included in the Fund's net investment income (loss) ratio.
D Amount represents less than $.005 per share.
E Total distributions per share do not sum due to rounding.
F Total returns for periods of less than one year are not annualized.
G Total returns would have been lower if certain expenses had not been reduced during the applicable periods shown.
H Fees and expenses of any underlying mutual funds or exchange-traded funds (ETFs) are not included in the Fund's expense ratio. The Fund indirectly bears its proportionate share of these expenses. For additional expense information related to investments in Fidelity Central Funds, please refer to the "Investments in Fidelity Central Funds" note found in the Notes to Financial Statements section of the most recent Annual or Semi-Annual report.
I Expense ratios reflect operating expenses of the class. Expenses before reductions do not reflect amounts reimbursed, waived, or reduced through arrangements with the investment adviser, brokerage services, or other offset arrangements, if applicable, and do not represent the amount paid by the class during periods when reimbursements, waivers or reductions occur.
J Annualized.
K On certain classes, the size and fluctuation of net assets and expense amounts may cause ratios to differ from contractual rates.
L Amount does not include the portfolio activity of any underlying mutual funds or exchange-traded funds (ETFs).
M Amount not annualized.
| Fidelity® Disruptive Automation Fund Loyalty Class 1 |
| |
| | Six months ended (Unaudited) November 30, 2022 | | Years ended May 31, 2022 | | 2021 | | 2020 A |
Selected Per-Share Data | | | | | | | | |
| Net asset value, beginning of period | $ | 14.90 | $ | 18.34 | $ | 11.90 | $ | 10.00 |
| Income from Investment Operations | | | | | | | | |
Net investment income (loss) B,C | | .02 | | - | | .02 | | - D |
| Net realized and unrealized gain (loss) | | (.38) | | (2.91) | | 6.46 | | 1.90 |
| Total from investment operations | | (.36) | | (2.91) | | 6.48 | | 1.90 |
| Distributions from net investment income | | - | | - | | (.03) | | - |
| Distributions from net realized gain | | - | | (.53) | | (.01) | | - |
| Total distributions | | - | | (.53) | | (.04) | | - |
| Net asset value, end of period | $ | 14.54 | $ | 14.90 | $ | 18.34 | $ | 11.90 |
Total Return E,F | | (2.42)% | | (16.52)% | | 54.47% | | 19.00% |
Ratios to Average Net Assets C,G,H | | | | | | | | |
| Expenses before reductions | | .75% I | | .75% | | .76% J | | .75% I |
| Expenses net of fee waivers, if any | | .75% I | | .75% | | .76% J | | .75% I |
| Expenses net of all reductions | | .75% I | | .75% | | .76% J | | .75% I |
| Net investment income (loss) | | .27% I | | (.02)% | | .10% | | (.21)% I |
| Supplemental Data | | | | | | | | |
| Net assets, end of period (000 omitted) | $ | 60,153 | $ | 60,357 | $ | 6,792 | $ | 119 |
Portfolio turnover rate K | | 15% I | | 22% | | 14% | | 6% L |
A For the period April 16, 2020 (commencement of operations) through May 31, 2020
B Calculated based on average shares outstanding during the period.
C Net investment income (loss) is affected by the timing of the declaration of dividends by any underlying mutual funds or exchange-traded funds (ETFs). Net investment income (loss) of any mutual funds or ETFs is not included in the Fund's net investment income (loss) ratio.
D Amount represents less than $.005 per share.
E Total returns for periods of less than one year are not annualized.
F Total returns would have been lower if certain expenses had not been reduced during the applicable periods shown.
G Fees and expenses of any underlying mutual funds or exchange-traded funds (ETFs) are not included in the Fund's expense ratio. The Fund indirectly bears its proportionate share of these expenses. For additional expense information related to investments in Fidelity Central Funds, please refer to the "Investments in Fidelity Central Funds" note found in the Notes to Financial Statements section of the most recent Annual or Semi-Annual report.
H Expense ratios reflect operating expenses of the class. Expenses before reductions do not reflect amounts reimbursed, waived, or reduced through arrangements with the investment adviser, brokerage services, or other offset arrangements, if applicable, and do not represent the amount paid by the class during periods when reimbursements, waivers or reductions occur.
I Annualized.
J On certain classes, the size and fluctuation of net assets and expense amounts may cause ratios to differ from contractual rates.
K Amount does not include the portfolio activity of any underlying mutual funds or exchange-traded funds (ETFs).
L Amount not annualized.
| Fidelity® Disruptive Automation Fund Loyalty Class 2 |
| |
| | Six months ended (Unaudited) November 30, 2022 | | Years ended May 31, 2022 | | 2021 | | 2020 A |
Selected Per-Share Data | | | | | | | | |
| Net asset value, beginning of period | $ | 14.99 | $ | 18.37 | $ | 11.90 | $ | 10.00 |
| Income from Investment Operations | | | | | | | | |
Net investment income (loss) B,C | | .04 | | .04 | | .12 | | - D |
| Net realized and unrealized gain (loss) | | (.38) | | (2.92) | | 6.41 | | 1.90 |
| Total from investment operations | | (.34) | | (2.88) | | 6.53 | | 1.90 |
| Distributions from net investment income | | - | | - | | (.05) | | - |
| Distributions from net realized gain | | - | | (.50) | | (.01) | | - |
| Total distributions | | - | | (.50) | | (.06) | | - |
| Net asset value, end of period | $ | 14.65 | $ | 14.99 | $ | 18.37 | $ | 11.90 |
Total Return E,F | | (2.27)% | | (16.32)% | | 54.91% | | 19.00% |
Ratios to Average Net Assets C,G,H | | | | | | | | |
| Expenses before reductions | | .50% I | | .50% | | .50% | | .50% I |
| Expenses net of fee waivers, if any | | .50% I | | .50% | | .50% | | .50% I |
| Expenses net of all reductions | | .50% I | | .50% | | .50% | | .50% I |
| Net investment income (loss) | | .52% I | | .20% | | .75% | | .04% I |
| Supplemental Data | | | | | | | | |
| Net assets, end of period (000 omitted) | $ | 151 | $ | 154 | $ | 184 | $ | 119 |
Portfolio turnover rate J | | 15% I | | 22% | | 14% | | 6% K |
A For the period April 16, 2020 (commencement of operations) through May 31, 2020
B Calculated based on average shares outstanding during the period.
C Net investment income (loss) is affected by the timing of the declaration of dividends by any underlying mutual funds or exchange-traded funds (ETFs). Net investment income (loss) of any mutual funds or ETFs is not included in the Fund's net investment income (loss) ratio.
D Amount represents less than $.005 per share.
E Total returns for periods of less than one year are not annualized.
F Total returns would have been lower if certain expenses had not been reduced during the applicable periods shown.
G Fees and expenses of any underlying mutual funds or exchange-traded funds (ETFs) are not included in the Fund's expense ratio. The Fund indirectly bears its proportionate share of these expenses. For additional expense information related to investments in Fidelity Central Funds, please refer to the "Investments in Fidelity Central Funds" note found in the Notes to Financial Statements section of the most recent Annual or Semi-Annual report.
H Expense ratios reflect operating expenses of the class. Expenses before reductions do not reflect amounts reimbursed, waived, or reduced through arrangements with the investment adviser, brokerage services, or other offset arrangements, if applicable, and do not represent the amount paid by the class during periods when reimbursements, waivers or reductions occur.
I Annualized.
J Amount does not include the portfolio activity of any underlying mutual funds or exchange-traded funds (ETFs).
K Amount not annualized.
| Fidelity® Disruptive Automation Fund Class F |
| |
| | Six months ended (Unaudited) November 30, 2022 | | Years ended May 31, 2022 | | 2021 | | 2020 A |
Selected Per-Share Data | | | | | | | | |
| Net asset value, beginning of period | $ | 15.03 | $ | 18.42 | $ | 11.91 | $ | 10.00 |
| Income from Investment Operations | | | | | | | | |
Net investment income (loss) B,C | | .07 | | .13 | | .19 | | .01 |
| Net realized and unrealized gain (loss) | | (.37) | | (2.93) | | 6.43 | | 1.90 |
| Total from investment operations | | (.30) | | (2.80) | | 6.62 | | 1.91 |
| Distributions from net investment income | | - | | - | | (.09) | | - |
| Distributions from net realized gain | | - | | (.59) | | (.02) | | - |
| Total distributions | | - | | (.59) | | (.11) | | - |
| Net asset value, end of period | $ | 14.73 | $ | 15.03 | $ | 18.42 | $ | 11.91 |
Total Return D,E | | (2.00)% | | (15.93)% | | 55.67% | | 19.10% |
Ratios to Average Net Assets C,F,G | | | | | | | | |
| Expenses before reductions | | -% H | | -% | | -% | | -% H |
| Expenses net of fee waivers, if any | | -% H | | -% | | -% | | -% H |
| Expenses net of all reductions | | -% H | | -% | | -% | | -% H |
| Net investment income (loss) | | 1.02% H | | .69% | | 1.14% | | .54% H |
| Supplemental Data | | | | | | | | |
| Net assets, end of period (000 omitted) | $ | 21,926 | $ | 26,796 | $ | 33,908 | $ | 4,078 |
Portfolio turnover rate I | | 15% H | | 22% | | 14% | | 6% J |
A For the period April 16, 2020 (commencement of operations) through May 31, 2020
B Calculated based on average shares outstanding during the period.
C Net investment income (loss) is affected by the timing of the declaration of dividends by any underlying mutual funds or exchange-traded funds (ETFs). Net investment income (loss) of any mutual funds or ETFs is not included in the Fund's net investment income (loss) ratio.
D Total returns for periods of less than one year are not annualized.
E Total returns would have been lower if certain expenses had not been reduced during the applicable periods shown.
F Fees and expenses of any underlying mutual funds or exchange-traded funds (ETFs) are not included in the Fund's expense ratio. The Fund indirectly bears its proportionate share of these expenses. For additional expense information related to investments in Fidelity Central Funds, please refer to the "Investments in Fidelity Central Funds" note found in the Notes to Financial Statements section of the most recent Annual or Semi-Annual report.
G Expense ratios reflect operating expenses of the class. Expenses before reductions do not reflect amounts reimbursed, waived, or reduced through arrangements with the investment adviser, brokerage services, or other offset arrangements, if applicable, and do not represent the amount paid by the class during periods when reimbursements, waivers or reductions occur.
H Annualized.
I Amount does not include the portfolio activity of any underlying mutual funds or exchange-traded funds (ETFs).
J Amount not annualized.
Top Holdings (% of Fund's net assets) |
| |
| T-Mobile U.S., Inc. | 6.9 | |
| Alphabet, Inc. Class A | 6.7 | |
| Activision Blizzard, Inc. | 6.7 | |
| American Tower Corp. | 6.3 | |
| Meta Platforms, Inc. Class A | 5.7 | |
| Arista Networks, Inc. | 5.6 | |
| Netflix, Inc. | 5.4 | |
| Liberty Broadband Corp. Class A | 5.0 | |
| Sea Ltd. ADR | 4.9 | |
| Amazon.com, Inc. | 4.3 | |
| | 57.5 | |
| |
| Market Sectors (% of Fund's net assets) |
| |
| Communication Services | 58.3 | |
| Information Technology | 23.3 | |
| Consumer Discretionary | 7.6 | |
| Real Estate | 6.3 | |
| Energy | 3.4 | |
| Industrials | 0.9 | |
| |
Asset Allocation (% of Fund's net assets) |
|
Foreign investments - 18.3% |
|
Geographic Diversification (% of Fund's net assets) |
|
* Includes Short-Term investments and Net Other Assets (Liabilities). Percentages are based on country or territory of incorporation and are adjusted for the effect of futures contracts, if applicable. |
| |
Fidelity® Disruptive Communications Fund
Showing Percentage of Net Assets
| Common Stocks - 99.8% |
| | | Shares | Value ($) |
| COMMUNICATION SERVICES - 58.3% | | | |
| Diversified Telecommunication Services - 4.4% | | | |
| Cellnex Telecom SA (a) | | 23,838 | 819,754 |
| Liberty Global PLC Class A (b) | | 22,454 | 450,876 |
| Liberty Latin America Ltd. Class C (b) | | 39,936 | 311,101 |
| | | | 1,581,731 |
| Entertainment - 17.0% | | | |
| Activision Blizzard, Inc. | | 32,041 | 2,369,432 |
| Netflix, Inc. (b) | | 6,294 | 1,923,006 |
| Sea Ltd. ADR (b) | | 30,174 | 1,761,256 |
| | | | 6,053,694 |
| Interactive Media & Services - 22.5% | | | |
| Alphabet, Inc. Class A (b) | | 23,643 | 2,387,707 |
| Angi, Inc. (b) | | 131,326 | 292,857 |
| Bumble, Inc. (b) | | 12,901 | 314,268 |
| Match Group, Inc. (b) | | 19,493 | 985,566 |
| Meta Platforms, Inc. Class A (b) | | 17,226 | 2,034,391 |
| Snap, Inc. Class A (b) | | 138,203 | 1,424,873 |
| Tencent Holdings Ltd. | | 15,264 | 577,228 |
| | | | 8,016,890 |
| Media - 7.5% | | | |
| DISH Network Corp. Class A (b) | | 55,993 | 898,688 |
| Liberty Broadband Corp. Class A (b) | | 19,891 | 1,794,168 |
| | | | 2,692,856 |
| Wireless Telecommunication Services - 6.9% | | | |
| T-Mobile U.S., Inc. (b) | | 16,134 | 2,443,656 |
TOTAL COMMUNICATION SERVICES | | | 20,788,827 |
| CONSUMER DISCRETIONARY - 7.6% | | | |
| Internet & Direct Marketing Retail - 7.6% | | | |
| Amazon.com, Inc. (b) | | 15,818 | 1,527,070 |
| Rakuten Group, Inc. | | 101,976 | 489,951 |
| Uber Technologies, Inc. (b) | | 24,091 | 702,012 |
| | | | 2,719,033 |
| ENERGY - 3.4% | | | |
| Oil, Gas & Consumable Fuels - 3.4% | | | |
| Reliance Industries Ltd. sponsored GDR (a) | | 18,544 | 1,234,057 |
| INDUSTRIALS - 0.9% | | | |
| Construction & Engineering - 0.9% | | | |
| Dycom Industries, Inc. (b) | | 3,541 | 322,727 |
| INFORMATION TECHNOLOGY - 23.3% | | | |
| Communications Equipment - 5.6% | | | |
| Arista Networks, Inc. (b) | | 14,344 | 1,998,119 |
| IT Services - 4.1% | | | |
| Akamai Technologies, Inc. (b) | | 6,312 | 598,756 |
| Cloudflare, Inc. (b) | | 3,426 | 168,354 |
| Twilio, Inc. Class A (b) | | 13,923 | 682,505 |
| | | | 1,449,615 |
| Semiconductors & Semiconductor Equipment - 9.5% | | | |
| Impinj, Inc. (b) | | 4,765 | 607,776 |
| NVIDIA Corp. | | 8,009 | 1,355,363 |
| NXP Semiconductors NV | | 2,844 | 500,089 |
| onsemi (b) | | 6,697 | 503,614 |
| Renesas Electronics Corp. (b) | | 44,604 | 437,463 |
| | | | 3,404,305 |
| Software - 4.1% | | | |
| RingCentral, Inc. (b) | | 9,848 | 364,967 |
| Zscaler, Inc. (b) | | 8,106 | 1,081,746 |
| | | | 1,446,713 |
TOTAL INFORMATION TECHNOLOGY | | | 8,298,752 |
| REAL ESTATE - 6.3% | | | |
| Equity Real Estate Investment Trusts (REITs) - 6.3% | | | |
| American Tower Corp. | | 10,092 | 2,232,855 |
| TOTAL COMMON STOCKS (Cost $42,097,554) | | | 35,596,251 |
| | | | |
| TOTAL INVESTMENT IN SECURITIES - 99.8% (Cost $42,097,554) | 35,596,251 |
NET OTHER ASSETS (LIABILITIES) - 0.2% | 54,564 |
| NET ASSETS - 100.0% | 35,650,815 |
| | |
Legend
| (a) | Security exempt from registration under Rule 144A of the Securities Act of 1933. These securities may be resold in transactions exempt from registration, normally to qualified institutional buyers. At the end of the period, the value of these securities amounted to $2,053,811 or 5.8% of net assets. |
Affiliated Central Funds
Fiscal year to date information regarding the Fund's investments in Fidelity Central Funds, including the ownership percentage, is presented below.
| Affiliate | Value, beginning of period ($) | Purchases ($) | Sales Proceeds ($) | Dividend Income ($) | Realized Gain (loss) ($) | Change in Unrealized appreciation (depreciation) ($) | Value, end of period ($) | % ownership, end of period |
| Fidelity Cash Central Fund 3.86% | 895 | 4,402,686 | 4,403,581 | 1,991 | - | - | - | 0.0% |
| Fidelity Securities Lending Cash Central Fund 3.86% | - | 5,941,260 | 5,941,260 | 193 | - | - | - | 0.0% |
| Total | 895 | 10,343,946 | 10,344,841 | 2,184 | - | - | - | |
| | | | | | | | | |
Amounts in the income column in the above table include any capital gain distributions from underlying funds, which are presented in the corresponding line item in the Statement of Operations, if applicable.
Amount for Fidelity Securities Lending Cash Central Fund represents the income earned on investing cash collateral, less rebates paid to borrowers and any lending agent fees associated with the loan, plus any premium payments received for lending certain types of securities.
Amounts included in the purchases and sales proceeds columns may include in-kind transactions, if applicable.
Investment Valuation
The following is a summary of the inputs used, as of November 30, 2022, involving the Fund's assets and liabilities carried at fair value. The inputs or methodology used for valuing securities may not be an indication of the risk associated with investing in those securities. For more information on valuation inputs, and their aggregation into the levels used below, please refer to the Investment Valuation section in the accompanying Notes to Financial Statements.
| Valuation Inputs at Reporting Date: |
| Description | Total ($) | Level 1 ($) | Level 2 ($) | Level 3 ($) |
Investments in Securities: | | | | |
|
| Equities: | | | | |
Communication Services | 20,788,827 | 19,391,845 | 1,396,982 | - |
Consumer Discretionary | 2,719,033 | 2,229,082 | 489,951 | - |
Energy | 1,234,057 | - | 1,234,057 | - |
Industrials | 322,727 | 322,727 | - | - |
Information Technology | 8,298,752 | 7,861,289 | 437,463 | - |
Real Estate | 2,232,855 | 2,232,855 | - | - |
| Total Investments in Securities: | 35,596,251 | 32,037,798 | 3,558,453 | - |
Fidelity® Disruptive Communications Fund
| Statement of Assets and Liabilities |
| | | | November 30, 2022 (Unaudited) |
| | | | | |
| Assets | | | | |
Investment in securities, at value - See accompanying schedule Unaffiliated issuers (cost $42,097,554): | | | $ | 35,596,251 |
| Receivable for investments sold | | | | 288,423 |
| Receivable for fund shares sold | | | | 9,281 |
| Dividends receivable | | | | 583 |
| Distributions receivable from Fidelity Central Funds | | | | 916 |
Total assets | | | | 35,895,454 |
| Liabilities | | | | |
| Payable to custodian bank | | 120,668 | | |
| Payable for fund shares redeemed | | 113,075 | | |
| Accrued management fee | | 10,896 | | |
| Total Liabilities | | | | 244,639 |
| Net Assets | | | $ | 35,650,815 |
| Net Assets consist of: | | | | |
| Paid in capital | | | $ | 50,558,071 |
| Total accumulated earnings (loss) | | | | (14,907,256) |
| Net Assets | | | $ | 35,650,815 |
| | | | | |
| Net Asset Value and Maximum Offering Price | | | | |
| Fidelity Disruptive Communications Fund : | | | | |
Net Asset Value , offering price and redemption price per share ($3,574,229 ÷ 331,874 shares) | | | $ | 10.77 |
| Loyalty Class 1 : | | | | |
Net Asset Value , offering price and redemption price per share ($12,984,215 ÷ 1,207,995 shares) | | | $ | 10.75 |
| Loyalty Class 2 : | | | | |
Net Asset Value , offering price and redemption price per share ($116,015 ÷ 10,716 shares) | | | $ | 10.83 |
| Class F : | | | | |
Net Asset Value , offering price and redemption price per share ($18,976,356 ÷ 1,743,610 shares) | | | $ | 10.88 |
| Statement of Operations |
| | | | Six months ended November 30, 2022 (Unaudited) |
| Investment Income | | | | |
| Dividends | | | $ | 46,411 |
| Income from Fidelity Central Funds (including $193 from security lending) | | | | 2,184 |
| Total Income | | | | 48,595 |
| Expenses | | | | |
| Management fee | $ | 80,271 | | |
| Independent trustees' fees and expenses | | 75 | | |
| Total expenses before reductions | | 80,346 | | |
| Expense reductions | | (179) | | |
| Total expenses after reductions | | | | 80,167 |
| Net Investment income (loss) | | | | (31,572) |
| Realized and Unrealized Gain (Loss) | | | | |
| Net realized gain (loss) on: | | | | |
| Investment Securities: | | | | |
| Unaffiliated issuers | | (3,844,652) | | |
| Foreign currency transactions | | 269 | | |
| Total net realized gain (loss) | | | | (3,844,383) |
| Change in net unrealized appreciation (depreciation) on: | | | | |
| Investment Securities: | | | | |
| Unaffiliated issuers | | (14,074) | | |
| Assets and liabilities in foreign currencies | | (70) | | |
| Total change in net unrealized appreciation (depreciation) | | | | (14,144) |
| Net gain (loss) | | | | (3,858,527) |
| Net increase (decrease) in net assets resulting from operations | | | $ | (3,890,099) |
| Statement of Changes in Net Assets |
| |
| | Six months ended November 30, 2022 (Unaudited) | | Year ended May 31, 2022 |
| Increase (Decrease) in Net Assets | | | | |
| Operations | | | | |
| Net investment income (loss) | $ | (31,572) | $ | (178,644) |
| Net realized gain (loss) | | (3,844,383) | | (2,270,127) |
| Change in net unrealized appreciation (depreciation) | | (14,144) | | (17,889,936) |
| Net increase (decrease) in net assets resulting from operations | | (3,890,099) | | (20,338,707) |
| Distributions to shareholders | | - | | (4,360,933) |
| Share transactions - net increase (decrease) | | (7,533,368) | | (1,888,994) |
| Total increase (decrease) in net assets | | (11,423,467) | | (26,588,634) |
| | | | | |
| Net Assets | | | | |
| Beginning of period | | 47,074,282 | | 73,662,916 |
| End of period | $ | 35,650,815 | $ | 47,074,282 |
| | | | | |
| | | | | |
Financial Highlights
| Fidelity® Disruptive Communications Fund |
| |
| | Six months ended (Unaudited) November 30, 2022 | | Years ended May 31, 2022 | | 2021 | | 2020 A |
Selected Per-Share Data | | | | | | | | |
| Net asset value, beginning of period | $ | 11.62 | $ | 17.02 | $ | 11.58 | $ | 10.00 |
| Income from Investment Operations | | | | | | | | |
Net investment income (loss) B,C | | (.04) | | (.13) | | (.13) | | - D |
| Net realized and unrealized gain (loss) | | (.81) | | (4.45) | | 5.78 | | 1.58 |
| Total from investment operations | | (.85) | | (4.58) | | 5.65 | | 1.58 |
| Distributions from net investment income | | - | | - | | - D | | - |
| Distributions from net realized gain | | - | | (.82) | | (.20) | | - |
| Total distributions | | - | | (.82) | | (.21) E | | - |
| Net asset value, end of period | $ | 10.77 | $ | 11.62 | $ | 17.02 | $ | 11.58 |
Total Return F,G | | (7.31)% | | (28.39)% | | 48.96% | | 15.80% |
Ratios to Average Net Assets C,H,I | | | | | | | | |
| Expenses before reductions | | 1.00% J,K | | .99% K | | 1.01% K | | 1.01% J,K |
| Expenses net of fee waivers, if any | | 1.00% J,K | | .99% K | | 1.01% K | | 1.01% J,K |
| Expenses net of all reductions | | 1.00% J,K | | .99% K | | 1.01% K | | 1.01% J,K |
| Net investment income (loss) | | (.76)% J | | (.81)% | | (.83)% | | (.23)% J |
| Supplemental Data | | | | | | | | |
| Net assets, end of period (000 omitted) | $ | 3,574 | $ | 7,746 | $ | 36,731 | $ | 2,880 |
Portfolio turnover rate L | | 30% J | | 32% | | 39% | | -% M |
A For the period April 16, 2020 (commencement of operations) through May 31, 2020
B Calculated based on average shares outstanding during the period.
C Net investment income (loss) is affected by the timing of the declaration of dividends by any underlying mutual funds or exchange-traded funds (ETFs). Net investment income (loss) of any mutual funds or ETFs is not included in the Fund's net investment income (loss) ratio.
D Amount represents less than $.005 per share.
E Total distributions per share do not sum due to rounding.
F Total returns for periods of less than one year are not annualized.
G Total returns would have been lower if certain expenses had not been reduced during the applicable periods shown.
H Fees and expenses of any underlying mutual funds or exchange-traded funds (ETFs) are not included in the Fund's expense ratio. The Fund indirectly bears its proportionate share of these expenses. For additional expense information related to investments in Fidelity Central Funds, please refer to the "Investments in Fidelity Central Funds" note found in the Notes to Financial Statements section of the most recent Annual or Semi-Annual report.
I Expense ratios reflect operating expenses of the class. Expenses before reductions do not reflect amounts reimbursed, waived, or reduced through arrangements with the investment adviser, brokerage services, or other offset arrangements, if applicable, and do not represent the amount paid by the class during periods when reimbursements, waivers or reductions occur.
J Annualized.
K On certain classes, the size and fluctuation of net assets and expense amounts may cause ratios to differ from contractual rates.
L Amount does not include the portfolio activity of any underlying mutual funds or exchange-traded funds (ETFs).
M Amount not annualized.
| Fidelity® Disruptive Communications Fund Loyalty Class 1 |
| |
| | Six months ended (Unaudited) November 30, 2022 | | Years ended May 31, 2022 | | 2021 | | 2020 A |
Selected Per-Share Data | | | | | | | | |
| Net asset value, beginning of period | $ | 11.59 | $ | 17.09 | $ | 11.58 | $ | 10.00 |
| Income from Investment Operations | | | | | | | | |
Net investment income (loss) B,C | | (.03) | | (.08) | | (.09) | | - D |
| Net realized and unrealized gain (loss) | | (.81) | | (4.44) | | 5.80 | | 1.58 |
| Total from investment operations | | (.84) | | (4.52) | | 5.71 | | 1.58 |
| Distributions from net realized gain | | - | | (.98) | | (.20) | | - |
| Total distributions | | - | | (.98) | | (.20) | | - |
| Net asset value, end of period | $ | 10.75 | $ | 11.59 | $ | 17.09 | $ | 11.58 |
Total Return E,F | | (7.25)% | | (28.19)% | | 49.47% | | 15.80% |
Ratios to Average Net Assets C,G,H | | | | | | | | |
| Expenses before reductions | | .75% I | | .75% | | .76% J | | .75% I |
| Expenses net of fee waivers, if any | | .75% I | | .75% | | .76% J | | .75% I |
| Expenses net of all reductions | | .75% I | | .75% | | .75% | | .75% I |
| Net investment income (loss) | | (.51)% I | | (.51)% | | (.57)% | | .04% I |
| Supplemental Data | | | | | | | | |
| Net assets, end of period (000 omitted) | $ | 12,984 | $ | 14,470 | $ | 3,476 | $ | 116 |
Portfolio turnover rate K | | 30% I | | 32% | | 39% | | -% L |
A For the period April 16, 2020 (commencement of operations) through May 31, 2020
B Calculated based on average shares outstanding during the period.
C Net investment income (loss) is affected by the timing of the declaration of dividends by any underlying mutual funds or exchange-traded funds (ETFs). Net investment income (loss) of any mutual funds or ETFs is not included in the Fund's net investment income (loss) ratio.
D Amount represents less than $.005 per share.
E Total returns for periods of less than one year are not annualized.
F Total returns would have been lower if certain expenses had not been reduced during the applicable periods shown.
G Fees and expenses of any underlying mutual funds or exchange-traded funds (ETFs) are not included in the Fund's expense ratio. The Fund indirectly bears its proportionate share of these expenses. For additional expense information related to investments in Fidelity Central Funds, please refer to the "Investments in Fidelity Central Funds" note found in the Notes to Financial Statements section of the most recent Annual or Semi-Annual report.
H Expense ratios reflect operating expenses of the class. Expenses before reductions do not reflect amounts reimbursed, waived, or reduced through arrangements with the investment adviser, brokerage services, or other offset arrangements, if applicable, and do not represent the amount paid by the class during periods when reimbursements, waivers or reductions occur.
I Annualized.
J On certain classes, the size and fluctuation of net assets and expense amounts may cause ratios to differ from contractual rates.
K Amount does not include the portfolio activity of any underlying mutual funds or exchange-traded funds (ETFs).
L Amount not annualized.
| Fidelity® Disruptive Communications Fund Loyalty Class 2 |
| |
| | Six months ended (Unaudited) November 30, 2022 | | Years ended May 31, 2022 | | 2021 | | 2020 A |
Selected Per-Share Data | | | | | | | | |
| Net asset value, beginning of period | $ | 11.66 | $ | 17.11 | $ | 11.59 | $ | 10.00 |
| Income from Investment Operations | | | | | | | | |
Net investment income (loss) B,C | | (.01) | | (.04) | | (.05) | | - D |
| Net realized and unrealized gain (loss) | | (.82) | | (4.47) | | 5.79 | | 1.59 |
| Total from investment operations | | (.83) | | (4.51) | | 5.74 | | 1.59 |
| Distributions from net realized gain | | - | | (.94) | | (.22) | | - |
| Total distributions | | - | | (.94) | | (.22) | | - |
| Net asset value, end of period | $ | 10.83 | $ | 11.66 | $ | 17.11 | $ | 11.59 |
Total Return E,F | | (7.12)% | | (27.99)% | | 49.70% | | 15.90% |
Ratios to Average Net Assets C,G,H | | | | | | | | |
| Expenses before reductions | | .50% I | | .50% | | .50% | | .50% I |
| Expenses net of fee waivers, if any | | .50% I | | .50% | | .50% | | .50% I |
| Expenses net of all reductions | | .50% I | | .50% | | .50% | | .50% I |
| Net investment income (loss) | | (.26)% I | | (.28)% | | (.32)% | | .29% I |
| Supplemental Data | | | | | | | | |
| Net assets, end of period (000 omitted) | $ | 116 | $ | 125 | $ | 174 | $ | 116 |
Portfolio turnover rate J | | 30% I | | 32% | | 39% | | -% K |
A For the period April 16, 2020 (commencement of operations) through May 31, 2020
B Calculated based on average shares outstanding during the period.
C Net investment income (loss) is affected by the timing of the declaration of dividends by any underlying mutual funds or exchange-traded funds (ETFs). Net investment income (loss) of any mutual funds or ETFs is not included in the Fund's net investment income (loss) ratio.
D Amount represents less than $.005 per share.
E Total returns for periods of less than one year are not annualized.
F Total returns would have been lower if certain expenses had not been reduced during the applicable periods shown.
G Fees and expenses of any underlying mutual funds or exchange-traded funds (ETFs) are not included in the Fund's expense ratio. The Fund indirectly bears its proportionate share of these expenses. For additional expense information related to investments in Fidelity Central Funds, please refer to the "Investments in Fidelity Central Funds" note found in the Notes to Financial Statements section of the most recent Annual or Semi-Annual report.
H Expense ratios reflect operating expenses of the class. Expenses before reductions do not reflect amounts reimbursed, waived, or reduced through arrangements with the investment adviser, brokerage services, or other offset arrangements, if applicable, and do not represent the amount paid by the class during periods when reimbursements, waivers or reductions occur.
I Annualized.
J Amount does not include the portfolio activity of any underlying mutual funds or exchange-traded funds (ETFs).
K Amount not annualized.
| Fidelity® Disruptive Communications Fund Class F |
| |
| | Six months ended (Unaudited) November 30, 2022 | | Years ended May 31, 2022 | | 2021 | | 2020 A |
Selected Per-Share Data | | | | | | | | |
| Net asset value, beginning of period | $ | 11.69 | $ | 17.16 | $ | 11.59 | $ | 10.00 |
| Income from Investment Operations | | | | | | | | |
Net investment income (loss) B,C | | .01 | | .04 | | .03 | | .01 |
| Net realized and unrealized gain (loss) | | (.82) | | (4.48) | | 5.80 | | 1.58 |
| Total from investment operations | | (.81) | | (4.44) | | 5.83 | | 1.59 |
| Distributions from net investment income | | - | | - | | - D | | - |
| Distributions from net realized gain | | - | | (1.03) | | (.26) | | - |
| Total distributions | | - | | (1.03) | | (.26) | | - |
| Net asset value, end of period | $ | 10.88 | $ | 11.69 | $ | 17.16 | $ | 11.59 |
Total Return E,F | | (6.93)% | | (27.66)% | | 50.57% | | 15.90% |
Ratios to Average Net Assets C,G,H | | | | | | | | |
| Expenses before reductions | | -% I | | -% | | -% | | -% I |
| Expenses net of fee waivers, if any | | -% I | | -% | | -% | | -% I |
| Expenses net of all reductions | | -% I | | -% | | -% | | -% I |
| Net investment income (loss) | | .24% I | | .23% | | .18% | | .79% I |
| Supplemental Data | | | | | | | | |
| Net assets, end of period (000 omitted) | $ | 18,976 | $ | 24,733 | $ | 33,282 | $ | 4,029 |
Portfolio turnover rate J | | 30% I | | 32% | | 39% | | -% K |
A For the period April 16, 2020 (commencement of operations) through May 31, 2020
B Calculated based on average shares outstanding during the period.
C Net investment income (loss) is affected by the timing of the declaration of dividends by any underlying mutual funds or exchange-traded funds (ETFs). Net investment income (loss) of any mutual funds or ETFs is not included in the Fund's net investment income (loss) ratio.
D Amount represents less than $.005 per share.
E Total returns for periods of less than one year are not annualized.
F Total returns would have been lower if certain expenses had not been reduced during the applicable periods shown.
G Fees and expenses of any underlying mutual funds or exchange-traded funds (ETFs) are not included in the Fund's expense ratio. The Fund indirectly bears its proportionate share of these expenses. For additional expense information related to investments in Fidelity Central Funds, please refer to the "Investments in Fidelity Central Funds" note found in the Notes to Financial Statements section of the most recent Annual or Semi-Annual report.
H Expense ratios reflect operating expenses of the class. Expenses before reductions do not reflect amounts reimbursed, waived, or reduced through arrangements with the investment adviser, brokerage services, or other offset arrangements, if applicable, and do not represent the amount paid by the class during periods when reimbursements, waivers or reductions occur.
I Annualized.
J Amount does not include the portfolio activity of any underlying mutual funds or exchange-traded funds (ETFs).
K Amount not annualized.
Top Holdings (% of Fund's net assets) |
| |
| Arch Capital Group Ltd. | 8.1 | |
| MasterCard, Inc. Class A | 5.9 | |
| Visa, Inc. Class A | 5.6 | |
| BRP Group, Inc. | 5.5 | |
| BlackRock, Inc. Class A | 5.0 | |
| Equifax, Inc. | 4.9 | |
| Capital One Financial Corp. | 4.0 | |
| Adyen BV | 3.9 | |
| DBS Group Holdings Ltd. | 3.8 | |
| Intercontinental Exchange, Inc. | 3.5 | |
| | 50.2 | |
| |
| Market Sectors (% of Fund's net assets) |
| |
| Financials | 65.1 | |
| Information Technology | 25.4 | |
| Industrials | 6.6 | |
| Real Estate | 1.7 | |
| Consumer Discretionary | 0.8 | |
| |
Asset Allocation (% of Fund's net assets) |
|
Foreign investments - 28.7% |
|
Geographic Diversification (% of Fund's net assets) |
|
* Includes Short-Term investments and Net Other Assets (Liabilities). Percentages are based on country or territory of incorporation and are adjusted for the effect of futures contracts, if applicable. |
| |
Fidelity® Disruptive Finance Fund
Showing Percentage of Net Assets
| Common Stocks - 99.6% |
| | | Shares | Value ($) |
| CONSUMER DISCRETIONARY - 0.8% | | | |
| Internet & Direct Marketing Retail - 0.8% | | | |
| MercadoLibre, Inc. (a) | | 444 | 413,357 |
| FINANCIALS - 65.1% | | | |
| Banks - 15.5% | | | |
| DBS Group Holdings Ltd. | | 73,912 | 1,927,533 |
| DNB Bank ASA | | 78,173 | 1,526,417 |
| FinecoBank SpA | | 97,828 | 1,588,894 |
| Pathward Financial, Inc. | | 14,586 | 634,929 |
| Signature Bank | | 10,009 | 1,396,256 |
| Silvergate Capital Corp. (a)(b) | | 3,567 | 97,843 |
| SVB Financial Group (a) | | 2,587 | 599,615 |
| | | | 7,771,487 |
| Capital Markets - 18.0% | | | |
| BlackRock, Inc. Class A | | 3,482 | 2,493,112 |
| Brookfield Asset Management, Inc. Class A | | 32,080 | 1,512,572 |
| Cboe Global Markets, Inc. | | 7,555 | 958,276 |
| Intercontinental Exchange, Inc. | | 16,045 | 1,737,834 |
| MSCI, Inc. | | 1,780 | 903,937 |
| Tradeweb Markets, Inc. Class A | | 8,903 | 547,178 |
| Virtu Financial, Inc. Class A | | 37,262 | 826,471 |
| | | | 8,979,380 |
| Consumer Finance - 6.0% | | | |
| Ally Financial, Inc. | | 17,777 | 480,157 |
| Capital One Financial Corp. | | 19,166 | 1,978,698 |
| NerdWallet, Inc. (b) | | 43,817 | 556,476 |
| | | | 3,015,331 |
| Diversified Financial Services - 3.0% | | | |
| Apollo Global Management, Inc. | | 21,485 | 1,490,844 |
| Insurance - 19.1% | | | |
| Arch Capital Group Ltd. (a) | | 67,613 | 4,050,695 |
| Arthur J. Gallagher & Co. | | 8,619 | 1,716,129 |
| BRP Group, Inc. (a) | | 90,525 | 2,719,371 |
| Hiscox Ltd. | | 85,183 | 1,039,143 |
| | | | 9,525,338 |
| Thrifts & Mortgage Finance - 3.5% | | | |
| NMI Holdings, Inc. (a) | | 57,414 | 1,236,123 |
| PennyMac Financial Services, Inc. | | 8,848 | 527,872 |
| | | | 1,763,995 |
TOTAL FINANCIALS | | | 32,546,375 |
| INDUSTRIALS - 6.6% | | | |
| Professional Services - 6.6% | | | |
| Equifax, Inc. | | 12,496 | 2,466,336 |
| Verisk Analytics, Inc. | | 4,511 | 828,716 |
| | | | 3,295,052 |
| INFORMATION TECHNOLOGY - 25.4% | | | |
| IT Services - 23.2% | | | |
| Adyen BV (a)(c) | | 1,251 | 1,970,724 |
| Block, Inc.: | | | |
| Class A (a) | | 5,912 | 400,656 |
| Class A unit (a) | | 2,481 | 165,891 |
| Dlocal Ltd. (a) | | 103,975 | 1,518,035 |
| Flywire Corp. (a) | | 20,067 | 435,253 |
| MasterCard, Inc. Class A | | 8,261 | 2,944,220 |
| Repay Holdings Corp. (a) | | 66,148 | 586,071 |
| Visa, Inc. Class A | | 12,905 | 2,800,385 |
| Worldline SA (a)(c) | | 16,122 | 763,719 |
| | | | 11,584,954 |
| Software - 2.2% | | | |
| Black Knight, Inc. (a) | | 18,097 | 1,121,833 |
TOTAL INFORMATION TECHNOLOGY | | | 12,706,787 |
| REAL ESTATE - 1.7% | | | |
| Equity Real Estate Investment Trusts (REITs) - 1.5% | | | |
| American Homes 4 Rent Class A | | 22,041 | 728,896 |
| Real Estate Management & Development - 0.2% | | | |
| Doma Holdings, Inc. Class A (a)(b) | | 296,454 | 117,099 |
TOTAL REAL ESTATE | | | 845,995 |
| TOTAL COMMON STOCKS (Cost $46,287,622) | | | 49,807,566 |
| | | | |
| Money Market Funds - 0.1% |
| | | Shares | Value ($) |
Fidelity Securities Lending Cash Central Fund 3.86% (d)(e) (Cost $71,200) | | 71,193 | 71,200 |
| | | | |
| TOTAL INVESTMENT IN SECURITIES - 99.7% (Cost $46,358,822) | 49,878,766 |
NET OTHER ASSETS (LIABILITIES) - 0.3% | 126,110 |
| NET ASSETS - 100.0% | 50,004,876 |
| | |
Legend
| (b) | Security or a portion of the security is on loan at period end. |
| (c) | Security exempt from registration under Rule 144A of the Securities Act of 1933. These securities may be resold in transactions exempt from registration, normally to qualified institutional buyers. At the end of the period, the value of these securities amounted to $2,734,443 or 5.5% of net assets. |
| (d) | Affiliated fund that is generally available only to investment companies and other accounts managed by Fidelity Investments. The rate quoted is the annualized seven-day yield of the fund at period end. A complete unaudited listing of the fund's holdings as of its most recent quarter end is available upon request. In addition, each Fidelity Central Fund's financial statements are available on the SEC's website or upon request. |
| (e) | Investment made with cash collateral received from securities on loan. |
Affiliated Central Funds
Fiscal year to date information regarding the Fund's investments in Fidelity Central Funds, including the ownership percentage, is presented below.
| Affiliate | Value, beginning of period ($) | Purchases ($) | Sales Proceeds ($) | Dividend Income ($) | Realized Gain (loss) ($) | Change in Unrealized appreciation (depreciation) ($) | Value, end of period ($) | % ownership, end of period |
| Fidelity Cash Central Fund 3.86% | 129,104 | 5,431,720 | 5,560,824 | 2,123 | - | - | - | 0.0% |
| Fidelity Securities Lending Cash Central Fund 3.86% | 798,225 | 11,821,994 | 12,549,019 | 2,478 | - | - | 71,200 | 0.0% |
| Total | 927,329 | 17,253,714 | 18,109,843 | 4,601 | - | - | 71,200 | |
| | | | | | | | | |
Amounts in the income column in the above table include any capital gain distributions from underlying funds, which are presented in the corresponding line item in the Statement of Operations, if applicable.
Amount for Fidelity Securities Lending Cash Central Fund represents the income earned on investing cash collateral, less rebates paid to borrowers and any lending agent fees associated with the loan, plus any premium payments received for lending certain types of securities.
Amounts included in the purchases and sales proceeds columns may include in-kind transactions, if applicable.
Investment Valuation
The following is a summary of the inputs used, as of November 30, 2022, involving the Fund's assets and liabilities carried at fair value. The inputs or methodology used for valuing securities may not be an indication of the risk associated with investing in those securities. For more information on valuation inputs, and their aggregation into the levels used below, please refer to the Investment Valuation section in the accompanying Notes to Financial Statements.
| Valuation Inputs at Reporting Date: |
| Description | Total ($) | Level 1 ($) | Level 2 ($) | Level 3 ($) |
Investments in Securities: | | | | |
|
| Equities: | | | | |
Consumer Discretionary | 413,357 | 413,357 | - | - |
Financials | 32,546,375 | 26,464,388 | 6,081,987 | - |
Industrials | 3,295,052 | 3,295,052 | - | - |
Information Technology | 12,706,787 | 9,806,453 | 2,900,334 | - |
Real Estate | 845,995 | 845,995 | - | - |
|
| Money Market Funds | 71,200 | 71,200 | - | - |
| Total Investments in Securities: | 49,878,766 | 40,896,445 | 8,982,321 | - |
Fidelity® Disruptive Finance Fund
| Statement of Assets and Liabilities |
| | | | November 30, 2022 (Unaudited) |
| | | | | |
| Assets | | | | |
| Investment in securities, at value (including securities loaned of $39,997) - See accompanying schedule: | | | | |
Unaffiliated issuers (cost $46,287,622) | | $49,807,566 | | |
Fidelity Central Funds (cost $71,200) | | 71,200 | | |
| | | | | |
| Total Investment in Securities (cost $46,358,822) | | | $ | 49,878,766 |
| Receivable for investments sold | | | | 242,768 |
| Receivable for fund shares sold | | | | 11,061 |
| Dividends receivable | | | | 28,147 |
| Distributions receivable from Fidelity Central Funds | | | | 528 |
Total assets | | | | 50,161,270 |
| Liabilities | | | | |
| Payable to custodian bank | | 2,757 | | |
| Payable for fund shares redeemed | | 63,666 | | |
| Accrued management fee | | 18,771 | | |
| Collateral on securities loaned | | 71,200 | | |
| Total Liabilities | | | | 156,394 |
| Net Assets | | | $ | 50,004,876 |
| Net Assets consist of: | | | | |
| Paid in capital | | | $ | 52,009,723 |
| Total accumulated earnings (loss) | | | | (2,004,847) |
| Net Assets | | | $ | 50,004,876 |
| | | | | |
| Net Asset Value and Maximum Offering Price | | | | |
| Fidelity Disruptive Finance Fund : | | | | |
Net Asset Value , offering price and redemption price per share ($6,510,692 ÷ 464,088 shares) | | | $ | 14.03 |
| Loyalty Class 1 : | | | | |
Net Asset Value , offering price and redemption price per share ($22,132,508 ÷ 1,578,841 shares) | | | $ | 14.02 |
| Loyalty Class 2 : | | | | |
Net Asset Value , offering price and redemption price per share ($155,358 ÷ 11,012 shares) | | | $ | 14.11 |
| Class F : | | | | |
Net Asset Value , offering price and redemption price per share ($21,206,318 ÷ 1,499,216 shares) | | | $ | 14.14 |
| Statement of Operations |
| | | | Six months ended November 30, 2022 (Unaudited) |
| Investment Income | | | | |
| Dividends | | | $ | 285,616 |
| Income from Fidelity Central Funds (including $2,478 from security lending) | | | | 4,601 |
| Total Income | | | | 290,217 |
| Expenses | | | | |
| Management fee | $ | 137,754 | | |
| Independent trustees' fees and expenses | | 101 | | |
| Total expenses before reductions | | 137,855 | | |
| Expense reductions | | (173) | | |
| Total expenses after reductions | | | | 137,682 |
| Net Investment income (loss) | | | | 152,535 |
| Realized and Unrealized Gain (Loss) | | | | |
| Net realized gain (loss) on: | | | | |
| Investment Securities: | | | | |
| Unaffiliated issuers | | (3,877,698) | | |
| Foreign currency transactions | | (4,816) | | |
| Total net realized gain (loss) | | | | (3,882,514) |
| Change in net unrealized appreciation (depreciation) on: | | | | |
| Investment Securities: | | | | |
| Unaffiliated issuers | | 1,139,993 | | |
| Assets and liabilities in foreign currencies | | (372) | | |
| Total change in net unrealized appreciation (depreciation) | | | | 1,139,621 |
| Net gain (loss) | | | | (2,742,893) |
| Net increase (decrease) in net assets resulting from operations | | | $ | (2,590,358) |
| Statement of Changes in Net Assets |
| |
| | Six months ended November 30, 2022 (Unaudited) | | Year ended May 31, 2022 |
| Increase (Decrease) in Net Assets | | | | |
| Operations | | | | |
| Net investment income (loss) | $ | 152,535 | $ | 529,474 |
| Net realized gain (loss) | | (3,882,514) | | 3,333,522 |
| Change in net unrealized appreciation (depreciation) | | 1,139,621 | | (16,077,322) |
| Net increase (decrease) in net assets resulting from operations | | (2,590,358) | | (12,214,326) |
| Distributions to shareholders | | (3,479,029) | | (2,188,878) |
| Share transactions - net increase (decrease) | | (9,187,201) | | (7,220,651) |
| Total increase (decrease) in net assets | | (15,256,588) | | (21,623,855) |
| | | | | |
| Net Assets | | | | |
| Beginning of period | | 65,261,464 | | 86,885,319 |
| End of period | $ | 50,004,876 | $ | 65,261,464 |
| | | | | |
| | | | | |
Financial Highlights
| Fidelity® Disruptive Finance Fund |
| |
| | Six months ended (Unaudited) November 30, 2022 | | Years ended May 31, 2022 | | 2021 | | 2020 A |
Selected Per-Share Data | | | | | | | | |
| Net asset value, beginning of period | $ | 15.22 | $ | 18.20 | $ | 11.86 | $ | 10.00 |
| Income from Investment Operations | | | | | | | | |
Net investment income (loss) B,C | | - D | | .02 | | .11 E | | .03 |
| Net realized and unrealized gain (loss) | | (.38) | | (2.67) | | 6.41 | | 1.83 |
| Total from investment operations | | (.38) | | (2.65) | | 6.52 | | 1.86 |
| Distributions from net investment income | | - | | (.04) | | (.05) | | - |
| Distributions from net realized gain | | (.81) | | (.29) | | (.13) | | - |
| Total distributions | | (.81) | | (.33) | | (.18) | | - |
| Net asset value, end of period | $ | 14.03 | $ | 15.22 | $ | 18.20 | $ | 11.86 |
Total Return F,G | | (2.19)% | | (14.88)% | | 55.31% | | 18.60% |
Ratios to Average Net Assets C,H,I | | | | | | | | |
| Expenses before reductions | | 1.00% J | | 1.00% | | 1.01% K | | 1.01% J,K |
| Expenses net of fee waivers, if any | | 1.00% J | | 1.00% | | 1.01% K | | 1.01% J,K |
| Expenses net of all reductions | | 1.00% J | | 1.00% | | 1.01% K | | 1.01% J,K |
| Net investment income (loss) | | .03% J | | .12% | | .72% E | | 1.99% J |
| Supplemental Data | | | | | | | | |
| Net assets, end of period (000 omitted) | $ | 6,511 | $ | 18,486 | $ | 48,219 | $ | 2,373 |
Portfolio turnover rate L | | 22% J | | 43% | | 18% | | -% M,N |
A For the period April 16, 2020 (commencement of operations) through May 31, 2020
B Calculated based on average shares outstanding during the period.
C Net investment income (loss) is affected by the timing of the declaration of dividends by any underlying mutual funds or exchange-traded funds (ETFs). Net investment income (loss) of any mutual funds or ETFs is not included in the Fund's net investment income (loss) ratio.
D Amount represents less than $.005 per share.
E Net investment income per share reflects one or more large, non-recurring dividend(s) which amounted to $.04 per share. Excluding such non-recurring dividend(s), the ratio of net investment income (loss) to average net assets would have been .49%.
F Total returns for periods of less than one year are not annualized.
G Total returns would have been lower if certain expenses had not been reduced during the applicable periods shown.
H Fees and expenses of any underlying mutual funds or exchange-traded funds (ETFs) are not included in the Fund's expense ratio. The Fund indirectly bears its proportionate share of these expenses. For additional expense information related to investments in Fidelity Central Funds, please refer to the "Investments in Fidelity Central Funds" note found in the Notes to Financial Statements section of the most recent Annual or Semi-Annual report.
I Expense ratios reflect operating expenses of the class. Expenses before reductions do not reflect amounts reimbursed, waived, or reduced through arrangements with the investment adviser, brokerage services, or other offset arrangements, if applicable, and do not represent the amount paid by the class during periods when reimbursements, waivers or reductions occur.
J Annualized.
K On certain classes, the size and fluctuation of net assets and expense amounts may cause ratios to differ from contractual rates.
L Amount does not include the portfolio activity of any underlying mutual funds or exchange-traded funds (ETFs).
M Amount not annualized.
N Amount represents less than 1%.
| Fidelity® Disruptive Finance Fund Loyalty Class 1 |
| |
| | Six months ended (Unaudited) November 30, 2022 | | Years ended May 31, 2022 | | 2021 | | 2020 A |
Selected Per-Share Data | | | | | | | | |
| Net asset value, beginning of period | $ | 15.21 | $ | 18.28 | $ | 11.86 | $ | 10.00 |
| Income from Investment Operations | | | | | | | | |
Net investment income (loss) B,C | | .02 | | .08 | | .20 D | | .03 |
| Net realized and unrealized gain (loss) | | (.38) | | (2.68) | | 6.38 | | 1.83 |
| Total from investment operations | | (.36) | | (2.60) | | 6.58 | | 1.86 |
| Distributions from net investment income | | (.02) | | (.18) | | (.03) | | - |
| Distributions from net realized gain | | (.81) | | (.29) | | (.13) | | - |
| Total distributions | | (.83) | | (.47) | | (.16) | | - |
| Net asset value, end of period | $ | 14.02 | $ | 15.21 | $ | 18.28 | $ | 11.86 |
Total Return E,F | | (2.04)% | | (14.68)% | | 55.73% | | 18.60% |
Ratios to Average Net Assets C,G,H | | | | | | | | |
| Expenses before reductions | | .75% I,J | | .76% J | | .75% | | .75% I |
| Expenses net of fee waivers, if any | | .75% I,J | | .76% J | | .75% | | .75% I |
| Expenses net of all reductions | | .75% I,J | | .76% J | | .75% | | .75% I |
| Net investment income (loss) | | .31% I | | .48% | | 1.30% D | | 2.26% I |
| Supplemental Data | | | | | | | | |
| Net assets, end of period (000 omitted) | $ | 22,133 | $ | 20,775 | $ | 2,668 | $ | 119 |
Portfolio turnover rate K | | 22% I | | 43% | | 18% | | -% L,M |
A For the period April 16, 2020 (commencement of operations) through May 31, 2020
B Calculated based on average shares outstanding during the period.
C Net investment income (loss) is affected by the timing of the declaration of dividends by any underlying mutual funds or exchange-traded funds (ETFs). Net investment income (loss) of any mutual funds or ETFs is not included in the Fund's net investment income (loss) ratio.
D Net investment income per share reflects one or more large, non-recurring dividend(s) which amounted to $.04 per share. Excluding such non-recurring dividend(s), the ratio of net investment income (loss) to average net assets would have been 1.07%.
E Total returns for periods of less than one year are not annualized.
F Total returns would have been lower if certain expenses had not been reduced during the applicable periods shown.
G Fees and expenses of any underlying mutual funds or exchange-traded funds (ETFs) are not included in the Fund's expense ratio. The Fund indirectly bears its proportionate share of these expenses. For additional expense information related to investments in Fidelity Central Funds, please refer to the "Investments in Fidelity Central Funds" note found in the Notes to Financial Statements section of the most recent Annual or Semi-Annual report.
H Expense ratios reflect operating expenses of the class. Expenses before reductions do not reflect amounts reimbursed, waived, or reduced through arrangements with the investment adviser, brokerage services, or other offset arrangements, if applicable, and do not represent the amount paid by the class during periods when reimbursements, waivers or reductions occur.
I Annualized.
J On certain classes, the size and fluctuation of net assets and expense amounts may cause ratios to differ from contractual rates.
K Amount does not include the portfolio activity of any underlying mutual funds or exchange-traded funds (ETFs).
L Amount not annualized.
M Amount represents less than 1%.
| Fidelity® Disruptive Finance Fund Loyalty Class 2 |
| |
| | Six months ended (Unaudited) November 30, 2022 | | Years ended May 31, 2022 | | 2021 | | 2020 A |
Selected Per-Share Data | | | | | | | | |
| Net asset value, beginning of period | $ | 15.30 | $ | 18.30 | $ | 11.87 | $ | 10.00 |
| Income from Investment Operations | | | | | | | | |
Net investment income (loss) B,C | | .04 | | .12 | | .15 D | | .03 |
| Net realized and unrealized gain (loss) | | (.39) | | (2.69) | | 6.46 | | 1.84 |
| Total from investment operations | | (.35) | | (2.57) | | 6.61 | | 1.87 |
| Distributions from net investment income | | (.03) | | (.14) | | (.05) | | - |
| Distributions from net realized gain | | (.81) | | (.29) | | (.13) | | - |
| Total distributions | | (.84) | | (.43) | | (.18) | | - |
| Net asset value, end of period | $ | 14.11 | $ | 15.30 | $ | 18.30 | $ | 11.87 |
Total Return E,F | | (1.93)% | | (14.44)% | | 56.03% | | 18.70% |
Ratios to Average Net Assets C,G,H | | | | | | | | |
| Expenses before reductions | | .50% I | | .50% | | .50% | | .50% I |
| Expenses net of fee waivers, if any | | .50% I | | .50% | | .50% | | .50% I |
| Expenses net of all reductions | | .50% I | | .50% | | .50% | | .50% I |
| Net investment income (loss) | | .56% I | | .66% | | 1.03% D | | 2.51% I |
| Supplemental Data | | | | | | | | |
| Net assets, end of period (000 omitted) | $ | 155 | $ | 158 | $ | 185 | $ | 119 |
Portfolio turnover rate J | | 22% I | | 43% | | 18% | | -% K,L |
A For the period April 16, 2020 (commencement of operations) through May 31, 2020
B Calculated based on average shares outstanding during the period.
C Net investment income (loss) is affected by the timing of the declaration of dividends by any underlying mutual funds or exchange-traded funds (ETFs). Net investment income (loss) of any mutual funds or ETFs is not included in the Fund's net investment income (loss) ratio.
D Net investment income per share reflects one or more large, non-recurring dividend(s) which amounted to $.03 per share. Excluding such non-recurring dividend(s), the ratio of net investment income (loss) to average net assets would have been .80%.
E Total returns for periods of less than one year are not annualized.
F Total returns would have been lower if certain expenses had not been reduced during the applicable periods shown.
G Fees and expenses of any underlying mutual funds or exchange-traded funds (ETFs) are not included in the Fund's expense ratio. The Fund indirectly bears its proportionate share of these expenses. For additional expense information related to investments in Fidelity Central Funds, please refer to the "Investments in Fidelity Central Funds" note found in the Notes to Financial Statements section of the most recent Annual or Semi-Annual report.
H Expense ratios reflect operating expenses of the class. Expenses before reductions do not reflect amounts reimbursed, waived, or reduced through arrangements with the investment adviser, brokerage services, or other offset arrangements, if applicable, and do not represent the amount paid by the class during periods when reimbursements, waivers or reductions occur.
I Annualized.
J Amount does not include the portfolio activity of any underlying mutual funds or exchange-traded funds (ETFs).
K Amount represents less than 1%.
L Amount not annualized.
| Fidelity® Disruptive Finance Fund Class F |
| |
| | Six months ended (Unaudited) November 30, 2022 | | Years ended May 31, 2022 | | 2021 | | 2020 A |
Selected Per-Share Data | | | | | | | | |
| Net asset value, beginning of period | $ | 15.34 | $ | 18.35 | $ | 11.87 | $ | 10.00 |
| Income from Investment Operations | | | | | | | | |
Net investment income (loss) B,C | | .07 | | .21 | | .26 D | | .04 |
| Net realized and unrealized gain (loss) | | (.39) | | (2.70) | | 6.45 | | 1.83 |
| Total from investment operations | | (.32) | | (2.49) | | 6.71 | | 1.87 |
| Distributions from net investment income | | (.07) | | (.23) | | (.10) | | - |
| Distributions from net realized gain | | (.81) | | (.29) | | (.13) | | - |
| Total distributions | | (.88) | | (.52) | | (.23) | | - |
| Net asset value, end of period | $ | 14.14 | $ | 15.34 | $ | 18.35 | $ | 11.87 |
Total Return E,F | | (1.74)% | | (14.04)% | | 56.95% | | 18.70% |
Ratios to Average Net Assets C,G,H | | | | | | | | |
| Expenses before reductions | | -% I | | -% | | -% | | -% I |
| Expenses net of fee waivers, if any | | -% I | | -% | | -% | | -% I |
| Expenses net of all reductions | | -% I | | -% | | -% | | -% I |
| Net investment income (loss) | | 1.05% I | | 1.14% | | 1.68% D | | 3.01% I |
| Supplemental Data | | | | | | | | |
| Net assets, end of period (000 omitted) | $ | 21,206 | $ | 25,842 | $ | 35,814 | $ | 4,075 |
Portfolio turnover rate J | | 22% I | | 43% | | 18% | | -% K,L |
A For the period April 16, 2020 (commencement of operations) through May 31, 2020
B Calculated based on average shares outstanding during the period.
C Net investment income (loss) is affected by the timing of the declaration of dividends by any underlying mutual funds or exchange-traded funds (ETFs). Net investment income (loss) of any mutual funds or ETFs is not included in the Fund's net investment income (loss) ratio.
D Net investment income per share reflects one or more large, non-recurring dividend(s) which amounted to $.04 per share. Excluding such non-recurring dividend(s), the ratio of net investment income (loss) to average net assets would have been 1.45%.
E Total returns for periods of less than one year are not annualized.
F Total returns would have been lower if certain expenses had not been reduced during the applicable periods shown.
G Fees and expenses of any underlying mutual funds or exchange-traded funds (ETFs) are not included in the Fund's expense ratio. The Fund indirectly bears its proportionate share of these expenses. For additional expense information related to investments in Fidelity Central Funds, please refer to the "Investments in Fidelity Central Funds" note found in the Notes to Financial Statements section of the most recent Annual or Semi-Annual report.
H Expense ratios reflect operating expenses of the class. Expenses before reductions do not reflect amounts reimbursed, waived, or reduced through arrangements with the investment adviser, brokerage services, or other offset arrangements, if applicable, and do not represent the amount paid by the class during periods when reimbursements, waivers or reductions occur.
I Annualized.
J Amount does not include the portfolio activity of any underlying mutual funds or exchange-traded funds (ETFs).
K Amount not annualized.
L Amount represents less than 1%.
Top Holdings (% of Fund's net assets) |
| |
| Insulet Corp. | 4.9 | |
| UnitedHealth Group, Inc. | 4.1 | |
| Alnylam Pharmaceuticals, Inc. | 4.0 | |
| Danaher Corp. | 3.9 | |
| Boston Scientific Corp. | 3.8 | |
| Humana, Inc. | 3.8 | |
| Penumbra, Inc. | 3.7 | |
| Royalty Pharma PLC | 3.5 | |
| Centene Corp. | 3.5 | |
| Vertex Pharmaceuticals, Inc. | 3.4 | |
| | 38.6 | |
| |
| Market Sectors (% of Fund's net assets) |
| |
| Health Care | 99.6 | |
| |
Asset Allocation (% of Fund's net assets) |
|
Foreign investments - 10% |
|
Geographic Diversification (% of Fund's net assets) |
|
* Includes Short-Term investments and Net Other Assets (Liabilities). Percentages are based on country or territory of incorporation and are adjusted for the effect of futures contracts, if applicable. |
| |
Fidelity® Disruptive Medicine Fund
Showing Percentage of Net Assets
| Common Stocks - 99.6% |
| | | Shares | Value ($) |
| HEALTH CARE - 99.6% | | | |
| Biotechnology - 30.0% | | | |
| ADC Therapeutics SA (a) | | 37,790 | 138,311 |
| Alnylam Pharmaceuticals, Inc. (a) | | 8,828 | 1,947,369 |
| ALX Oncology Holdings, Inc. (a) | | 10,700 | 118,770 |
| Argenx SE ADR (a) | | 3,417 | 1,359,863 |
| Ascendis Pharma A/S sponsored ADR (a) | | 3,865 | 475,627 |
| Beam Therapeutics, Inc. (a)(b) | | 3,430 | 158,432 |
| Blueprint Medicines Corp. (a) | | 11,928 | 570,039 |
| Cerevel Therapeutics Holdings (a)(b) | | 31,165 | 902,538 |
| Cyteir Therapeutics, Inc. (a) | | 7,254 | 10,446 |
| Cytokinetics, Inc. (a) | | 11,932 | 507,110 |
| Graphite Bio, Inc. (a) | | 55,459 | 195,770 |
| Innovent Biologics, Inc. (a)(c) | | 52,569 | 212,291 |
| Instil Bio, Inc. (a) | | 54,690 | 72,738 |
| Intellia Therapeutics, Inc. (a) | | 2,307 | 118,718 |
| Janux Therapeutics, Inc. (a)(b) | | 17,326 | 236,327 |
| Keros Therapeutics, Inc. (a) | | 4,895 | 243,967 |
| Legend Biotech Corp. ADR (a) | | 15,734 | 810,458 |
| Mirati Therapeutics, Inc. (a) | | 8,363 | 764,211 |
| Natera, Inc. (a) | | 4,274 | 175,747 |
| Regeneron Pharmaceuticals, Inc. (a) | | 2,091 | 1,571,805 |
| Relay Therapeutics, Inc. (a) | | 8,190 | 152,170 |
| Repligen Corp. (a) | | 1,617 | 289,184 |
| Sarepta Therapeutics, Inc. (a) | | 2,090 | 256,673 |
| Seagen, Inc. (a) | | 6,193 | 751,768 |
| Stoke Therapeutics, Inc. (a) | | 11,631 | 87,698 |
| Tenaya Therapeutics, Inc. (a) | | 18,312 | 48,527 |
| Vertex Pharmaceuticals, Inc. (a) | | 5,264 | 1,665,530 |
| Verve Therapeutics, Inc. (a)(b) | | 6,755 | 156,919 |
| Xenon Pharmaceuticals, Inc. (a) | | 2,845 | 104,924 |
| Zai Lab Ltd. ADR (a) | | 8,673 | 334,431 |
| Zentalis Pharmaceuticals, Inc. (a) | | 5,570 | 123,208 |
| | | | 14,561,569 |
| Health Care Equipment & Supplies - 29.4% | | | |
| Align Technology, Inc. (a) | | 977 | 192,137 |
| Atricure, Inc. (a) | | 9,175 | 418,013 |
| Boston Scientific Corp. (a) | | 40,814 | 1,847,650 |
| DexCom, Inc. (a) | | 9,722 | 1,130,474 |
| Inspire Medical Systems, Inc. (a) | | 3,228 | 779,788 |
| Insulet Corp. (a) | | 7,948 | 2,379,393 |
| Intuitive Surgical, Inc. (a) | | 3,980 | 1,076,152 |
| Masimo Corp. (a) | | 5,945 | 861,668 |
| Nanosonics Ltd. (a) | | 157,395 | 515,910 |
| Nevro Corp. (a) | | 11,197 | 523,012 |
| Penumbra, Inc. (a) | | 8,639 | 1,809,957 |
| ResMed, Inc. | | 4,145 | 954,179 |
| Stryker Corp. | | 4,308 | 1,007,598 |
| Tandem Diabetes Care, Inc. (a) | | 9,897 | 416,169 |
| ViewRay, Inc. (a) | | 80,494 | 387,981 |
| | | | 14,300,081 |
| Health Care Providers & Services - 14.1% | | | |
| agilon health, Inc. (a) | | 12,285 | 215,725 |
| Centene Corp. (a) | | 19,482 | 1,695,908 |
| Guardant Health, Inc. (a) | | 10,430 | 545,906 |
| Humana, Inc. | | 3,308 | 1,819,069 |
| Oak Street Health, Inc. (a) | | 26,237 | 567,244 |
| UnitedHealth Group, Inc. | | 3,664 | 2,006,993 |
| | | | 6,850,845 |
| Health Care Technology - 2.3% | | | |
| Doximity, Inc. (a)(b) | | 9,093 | 309,071 |
| Phreesia, Inc. (a) | | 12,429 | 345,775 |
| Veeva Systems, Inc. Class A (a) | | 2,559 | 487,131 |
| | | | 1,141,977 |
| Life Sciences Tools & Services - 18.9% | | | |
| 10X Genomics, Inc. (a) | | 22,838 | 882,917 |
| Bio-Techne Corp. | | 9,600 | 815,904 |
| Bruker Corp. | | 22,486 | 1,515,781 |
| Charles River Laboratories International, Inc. (a) | | 3,167 | 723,881 |
| Danaher Corp. | | 6,925 | 1,893,364 |
| Lonza Group AG | | 734 | 386,152 |
| Olink Holding AB ADR (a)(b) | | 11,974 | 285,340 |
| Sartorius Stedim Biotech | | 3,031 | 1,034,490 |
| Thermo Fisher Scientific, Inc. | | 1,702 | 953,494 |
| West Pharmaceutical Services, Inc. | | 2,950 | 692,247 |
| | | | 9,183,570 |
| Pharmaceuticals - 4.9% | | | |
| Arvinas Holding Co. LLC (a) | | 5,944 | 243,942 |
| Edgewise Therapeutics, Inc. (a) | | 22,109 | 197,876 |
| Royalty Pharma PLC | | 38,895 | 1,710,213 |
| Theseus Pharmaceuticals, Inc. (a)(b) | | 32,021 | 211,018 |
| | | | 2,363,049 |
| TOTAL COMMON STOCKS (Cost $47,732,529) | | | 48,401,091 |
| | | | |
| Money Market Funds - 3.3% |
| | | Shares | Value ($) |
Fidelity Securities Lending Cash Central Fund 3.86% (d)(e) (Cost $1,598,825) | | 1,598,665 | 1,598,825 |
| | | | |
| TOTAL INVESTMENT IN SECURITIES - 102.9% (Cost $49,331,354) | 49,999,916 |
NET OTHER ASSETS (LIABILITIES) - (2.9)% | (1,418,546) |
| NET ASSETS - 100.0% | 48,581,370 |
| | |
Legend
| (b) | Security or a portion of the security is on loan at period end. |
| (c) | Security exempt from registration under Rule 144A of the Securities Act of 1933. These securities may be resold in transactions exempt from registration, normally to qualified institutional buyers. At the end of the period, the value of these securities amounted to $212,291 or 0.4% of net assets. |
| (d) | Affiliated fund that is generally available only to investment companies and other accounts managed by Fidelity Investments. The rate quoted is the annualized seven-day yield of the fund at period end. A complete unaudited listing of the fund's holdings as of its most recent quarter end is available upon request. In addition, each Fidelity Central Fund's financial statements are available on the SEC's website or upon request. |
| (e) | Investment made with cash collateral received from securities on loan. |
Affiliated Central Funds
Fiscal year to date information regarding the Fund's investments in Fidelity Central Funds, including the ownership percentage, is presented below.
| Affiliate | Value, beginning of period ($) | Purchases ($) | Sales Proceeds ($) | Dividend Income ($) | Realized Gain (loss) ($) | Change in Unrealized appreciation (depreciation) ($) | Value, end of period ($) | % ownership, end of period |
| Fidelity Cash Central Fund 3.86% | 154,056 | 5,170,990 | 5,325,046 | 2,912 | - | - | - | 0.0% |
| Fidelity Securities Lending Cash Central Fund 3.86% | 1,644,325 | 10,422,163 | 10,467,663 | 13,204 | - | - | 1,598,825 | 0.0% |
| Total | 1,798,381 | 15,593,153 | 15,792,709 | 16,116 | - | - | 1,598,825 | |
| | | | | | | | | |
Amounts in the income column in the above table include any capital gain distributions from underlying funds, which are presented in the corresponding line item in the Statement of Operations, if applicable.
Amount for Fidelity Securities Lending Cash Central Fund represents the income earned on investing cash collateral, less rebates paid to borrowers and any lending agent fees associated with the loan, plus any premium payments received for lending certain types of securities.
Amounts included in the purchases and sales proceeds columns may include in-kind transactions, if applicable.
Investment Valuation
The following is a summary of the inputs used, as of November 30, 2022, involving the Fund's assets and liabilities carried at fair value. The inputs or methodology used for valuing securities may not be an indication of the risk associated with investing in those securities. For more information on valuation inputs, and their aggregation into the levels used below, please refer to the Investment Valuation section in the accompanying Notes to Financial Statements.
| Valuation Inputs at Reporting Date: |
| Description | Total ($) | Level 1 ($) | Level 2 ($) | Level 3 ($) |
Investments in Securities: | | | | |
|
| Equities: | | | | |
Health Care | 48,401,091 | 46,252,248 | 2,148,843 | - |
|
| Money Market Funds | 1,598,825 | 1,598,825 | - | - |
| Total Investments in Securities: | 49,999,916 | 47,851,073 | 2,148,843 | - |
Fidelity® Disruptive Medicine Fund
| Statement of Assets and Liabilities |
| | | | November 30, 2022 (Unaudited) |
| | | | | |
| Assets | | | | |
| Investment in securities, at value (including securities loaned of $1,630,991) - See accompanying schedule: | | | | |
Unaffiliated issuers (cost $47,732,529) | | $48,401,091 | | |
Fidelity Central Funds (cost $1,598,825) | | 1,598,825 | | |
| | | | | |
| Total Investment in Securities (cost $49,331,354) | | | $ | 49,999,916 |
| Receivable for investments sold | | | | 328,491 |
| Receivable for fund shares sold | | | | 21,553 |
| Dividends receivable | | | | 20,583 |
| Distributions receivable from Fidelity Central Funds | | | | 2,200 |
Total assets | | | | 50,372,743 |
| Liabilities | | | | |
| Payable to custodian bank | | 87,279 | | |
| Payable for investments purchased | | 9,986 | | |
| Payable for fund shares redeemed | | 77,314 | | |
| Accrued management fee | | 17,969 | | |
| Collateral on securities loaned | | 1,598,825 | | |
| Total Liabilities | | | | 1,791,373 |
| Net Assets | | | $ | 48,581,370 |
| Net Assets consist of: | | | | |
| Paid in capital | | | $ | 54,794,884 |
| Total accumulated earnings (loss) | | | | (6,213,514) |
| Net Assets | | | $ | 48,581,370 |
| | | | | |
| Net Asset Value and Maximum Offering Price | | | | |
| Fidelity Disruptive Medicine Fund : | | | | |
Net Asset Value , offering price and redemption price per share ($7,137,629 ÷ 637,040 shares) | | | $ | 11.20 |
| Loyalty Class 1 : | | | | |
Net Asset Value , offering price and redemption price per share ($20,185,325 ÷ 1,796,635 shares) | | | $ | 11.24 |
| Loyalty Class 2 : | | | | |
Net Asset Value , offering price and redemption price per share ($115,399 ÷ 10,201 shares) | | | $ | 11.31 |
| Class F : | | | | |
Net Asset Value , offering price and redemption price per share ($21,143,017 ÷ 1,853,270 shares) | | | $ | 11.41 |
| Statement of Operations |
| | | | Six months ended November 30, 2022 (Unaudited) |
| Investment Income | | | | |
| Dividends | | | $ | 64,299 |
| Income from Fidelity Central Funds (including $13,204 from security lending) | | | | 16,116 |
| Total Income | | | | 80,415 |
| Expenses | | | | |
| Management fee | $ | 120,919 | | |
| Independent trustees' fees and expenses | | 94 | | |
| Total expenses before reductions | | 121,013 | | |
| Expense reductions | | (174) | | |
| Total expenses after reductions | | | | 120,839 |
| Net Investment income (loss) | | | | (40,424) |
| Realized and Unrealized Gain (Loss) | | | | |
| Net realized gain (loss) on: | | | | |
| Investment Securities: | | | | |
| Unaffiliated issuers | | (3,496,983) | | |
| Foreign currency transactions | | (989) | | |
| Total net realized gain (loss) | | | | (3,497,972) |
| Change in net unrealized appreciation (depreciation) on: | | | | |
| Investment Securities: | | | | |
| Unaffiliated issuers | | 9,133,119 | | |
| Assets and liabilities in foreign currencies | | (153) | | |
| Total change in net unrealized appreciation (depreciation) | | | | 9,132,966 |
| Net gain (loss) | | | | 5,634,994 |
| Net increase (decrease) in net assets resulting from operations | | | $ | 5,594,570 |
| Statement of Changes in Net Assets |
| |
| | Six months ended November 30, 2022 (Unaudited) | | Year ended May 31, 2022 |
| Increase (Decrease) in Net Assets | | | | |
| Operations | | | | |
| Net investment income (loss) | $ | (40,424) | $ | (141,798) |
| Net realized gain (loss) | | (3,497,972) | | (3,258,269) |
| Change in net unrealized appreciation (depreciation) | | 9,132,966 | | (13,446,263) |
| Net increase (decrease) in net assets resulting from operations | | 5,594,570 | | (16,846,330) |
| Distributions to shareholders | | - | | (869,901) |
| Share transactions - net increase (decrease) | | (9,410,813) | | 1,922,239 |
| Total increase (decrease) in net assets | | (3,816,243) | | (15,793,992) |
| | | | | |
| Net Assets | | | | |
| Beginning of period | | 52,397,613 | | 68,191,605 |
| End of period | $ | 48,581,370 | $ | 52,397,613 |
| | | | | |
| | | | | |
Financial Highlights
| Fidelity® Disruptive Medicine Fund |
| |
| | Six months ended (Unaudited) November 30, 2022 | | Years ended May 31, 2022 | | 2021 | | 2020 A |
Selected Per-Share Data | | | | | | | | |
| Net asset value, beginning of period | $ | 9.96 | $ | 13.00 | $ | 11.06 | $ | 10.00 |
| Income from Investment Operations | | | | | | | | |
Net investment income (loss) B,C | | (.04) | | (.09) | | (.07) | | (.01) |
| Net realized and unrealized gain (loss) | | 1.28 | | (2.82) | | 2.10 | | 1.07 |
| Total from investment operations | | 1.24 | | (2.91) | | 2.03 | | 1.06 |
| Distributions from net realized gain | | - | | (.13) | | (.09) | | - |
| Total distributions | | - | | (.13) | | (.09) | | - |
| Net asset value, end of period | $ | 11.20 | $ | 9.96 | $ | 13.00 | $ | 11.06 |
Total Return D,E | | 12.45% | | (22.68)% | | 18.44% | | 10.60% |
Ratios to Average Net Assets C,F,G | | | | | | | | |
| Expenses before reductions | | 1.00% H | | 1.00% | | 1.01% I | | 1.01% H,I |
| Expenses net of fee waivers, if any | | 1.00% H | | 1.00% | | 1.01% I | | 1.01% H,I |
| Expenses net of all reductions | | 1.00% H | | 1.00% | | 1.01% I | | 1.01% H,I |
| Net investment income (loss) | | (.69)% H | | (.70)% | | (.58)% | | (.75)% H |
| Supplemental Data | | | | | | | | |
| Net assets, end of period (000 omitted) | $ | 7,138 | $ | 11,027 | $ | 32,331 | $ | 5,666 |
Portfolio turnover rate J | | 27% H | | 47% | | 44% | | -% K,L |
A For the period April 16, 2020 (commencement of operations) through May 31, 2020
B Calculated based on average shares outstanding during the period.
C Net investment income (loss) is affected by the timing of the declaration of dividends by any underlying mutual funds or exchange-traded funds (ETFs). Net investment income (loss) of any mutual funds or ETFs is not included in the Fund's net investment income (loss) ratio.
D Total returns for periods of less than one year are not annualized.
E Total returns would have been lower if certain expenses had not been reduced during the applicable periods shown.
F Fees and expenses of any underlying mutual funds or exchange-traded funds (ETFs) are not included in the Fund's expense ratio. The Fund indirectly bears its proportionate share of these expenses. For additional expense information related to investments in Fidelity Central Funds, please refer to the "Investments in Fidelity Central Funds" note found in the Notes to Financial Statements section of the most recent Annual or Semi-Annual report.
G Expense ratios reflect operating expenses of the class. Expenses before reductions do not reflect amounts reimbursed, waived, or reduced through arrangements with the investment adviser, brokerage services, or other offset arrangements, if applicable, and do not represent the amount paid by the class during periods when reimbursements, waivers or reductions occur.
H Annualized.
I On certain classes, the size and fluctuation of net assets and expense amounts may cause ratios to differ from contractual rates.
J Amount does not include the portfolio activity of any underlying mutual funds or exchange-traded funds (ETFs).
K Amount not annualized.
L Amount represents less than 1%.
| Fidelity® Disruptive Medicine Fund Loyalty Class 1 |
| |
| | Six months ended (Unaudited) November 30, 2022 | | Years ended May 31, 2022 | | 2021 | | 2020 A |
Selected Per-Share Data | | | | | | | | |
| Net asset value, beginning of period | $ | 9.98 | $ | 13.04 | $ | 11.05 | $ | 10.00 |
| Income from Investment Operations | | | | | | | | |
Net investment income (loss) B,C | | (.02) | | (.06) | | (.03) | | (.01) |
| Net realized and unrealized gain (loss) | | 1.28 | | (2.82) | | 2.11 | | 1.06 |
| Total from investment operations | | 1.26 | | (2.88) | | 2.08 | | 1.05 |
| Distributions from net realized gain | | - | | (.18) | | (.09) | | - |
| Total distributions | | - | | (.18) | | (.09) | | - |
| Net asset value, end of period | $ | 11.24 | $ | 9.98 | $ | 13.04 | $ | 11.05 |
Total Return D,E | | 12.63% | | (22.46)% | | 18.86% | | 10.50% |
Ratios to Average Net Assets C,F,G | | | | | | | | |
| Expenses before reductions | | .75% H | | .75% | | .76% I | | .75% H |
| Expenses net of fee waivers, if any | | .75% H | | .75% | | .76% I | | .75% H |
| Expenses net of all reductions | | .75% H | | .75% | | .76% I | | .75% H |
| Net investment income (loss) | | (.44)% H | | (.46)% | | (.25)% | | (.48)% H |
| Supplemental Data | | | | | | | | |
| Net assets, end of period (000 omitted) | $ | 20,185 | $ | 16,746 | $ | 3,786 | $ | 111 |
Portfolio turnover rate J | | 27% H | | 47% | | 44% | | -% K,L |
A For the period April 16, 2020 (commencement of operations) through May 31, 2020
B Calculated based on average shares outstanding during the period.
C Net investment income (loss) is affected by the timing of the declaration of dividends by any underlying mutual funds or exchange-traded funds (ETFs). Net investment income (loss) of any mutual funds or ETFs is not included in the Fund's net investment income (loss) ratio.
D Total returns for periods of less than one year are not annualized.
E Total returns would have been lower if certain expenses had not been reduced during the applicable periods shown.
F Fees and expenses of any underlying mutual funds or exchange-traded funds (ETFs) are not included in the Fund's expense ratio. The Fund indirectly bears its proportionate share of these expenses. For additional expense information related to investments in Fidelity Central Funds, please refer to the "Investments in Fidelity Central Funds" note found in the Notes to Financial Statements section of the most recent Annual or Semi-Annual report.
G Expense ratios reflect operating expenses of the class. Expenses before reductions do not reflect amounts reimbursed, waived, or reduced through arrangements with the investment adviser, brokerage services, or other offset arrangements, if applicable, and do not represent the amount paid by the class during periods when reimbursements, waivers or reductions occur.
H Annualized.
I On certain classes, the size and fluctuation of net assets and expense amounts may cause ratios to differ from contractual rates.
J Amount does not include the portfolio activity of any underlying mutual funds or exchange-traded funds (ETFs).
K Amount not annualized.
L Amount represents less than 1%.
| Fidelity® Disruptive Medicine Fund Loyalty Class 2 |
| |
| | Six months ended (Unaudited) November 30, 2022 | | Years ended May 31, 2022 | | 2021 | | 2020 A |
Selected Per-Share Data | | | | | | | | |
| Net asset value, beginning of period | $ | 10.03 | $ | 13.06 | $ | 11.06 | $ | 10.00 |
| Income from Investment Operations | | | | | | | | |
Net investment income (loss) B,C | | (.01) | | (.03) | | (.01) | | - D |
| Net realized and unrealized gain (loss) | | 1.29 | | (2.84) | | 2.12 | | 1.06 |
| Total from investment operations | | 1.28 | | (2.87) | | 2.11 | | 1.06 |
| Distributions from net realized gain | | - | | (.16) | | (.11) | | - |
| Total distributions | | - | | (.16) | | (.11) | | - |
| Net asset value, end of period | $ | 11.31 | $ | 10.03 | $ | 13.06 | $ | 11.06 |
Total Return E,F | | 12.76% | | (22.33)% | | 19.10% | | 10.60% |
Ratios to Average Net Assets C,G,H | | | | | | | | |
| Expenses before reductions | | .50% I | | .50% | | .50% | | .50% I |
| Expenses net of fee waivers, if any | | .50% I | | .50% | | .50% | | .50% I |
| Expenses net of all reductions | | .50% I | | .50% | | .50% | | .50% I |
| Net investment income (loss) | | (.19)% I | | (.21)% | | (.11)% | | (.23)% I |
| Supplemental Data | | | | | | | | |
| Net assets, end of period (000 omitted) | $ | 115 | $ | 102 | $ | 132 | $ | 111 |
Portfolio turnover rate J | | 27% I | | 47% | | 44% | | -% K,L |
A For the period April 16, 2020 (commencement of operations) through May 31, 2020
B Calculated based on average shares outstanding during the period.
C Net investment income (loss) is affected by the timing of the declaration of dividends by any underlying mutual funds or exchange-traded funds (ETFs). Net investment income (loss) of any mutual funds or ETFs is not included in the Fund's net investment income (loss) ratio.
D Amount represents less than $.005 per share.
E Total returns for periods of less than one year are not annualized.
F Total returns would have been lower if certain expenses had not been reduced during the applicable periods shown.
G Fees and expenses of any underlying mutual funds or exchange-traded funds (ETFs) are not included in the Fund's expense ratio. The Fund indirectly bears its proportionate share of these expenses. For additional expense information related to investments in Fidelity Central Funds, please refer to the "Investments in Fidelity Central Funds" note found in the Notes to Financial Statements section of the most recent Annual or Semi-Annual report.
H Expense ratios reflect operating expenses of the class. Expenses before reductions do not reflect amounts reimbursed, waived, or reduced through arrangements with the investment adviser, brokerage services, or other offset arrangements, if applicable, and do not represent the amount paid by the class during periods when reimbursements, waivers or reductions occur.
I Annualized.
J Amount does not include the portfolio activity of any underlying mutual funds or exchange-traded funds (ETFs).
K Amount represents less than 1%.
L Amount not annualized.
| Fidelity® Disruptive Medicine Fund Class F |
| |
| | Six months ended (Unaudited) November 30, 2022 | | Years ended May 31, 2022 | | 2021 | | 2020 A |
Selected Per-Share Data | | | | | | | | |
| Net asset value, beginning of period | $ | 10.09 | $ | 13.09 | $ | 11.07 | $ | 10.00 |
| Income from Investment Operations | | | | | | | | |
Net investment income (loss) B,C | | .02 | | .04 | | .06 | | - D |
| Net realized and unrealized gain (loss) | | 1.30 | | (2.86) | | 2.10 | | 1.07 |
| Total from investment operations | | 1.32 | | (2.82) | | 2.16 | | 1.07 |
| Distributions from net realized gain | | - | | (.18) | | (.14) | | - |
| Total distributions | | - | | (.18) | | (.14) | | - |
| Net asset value, end of period | $ | 11.41 | $ | 10.09 | $ | 13.09 | $ | 11.07 |
Total Return E,F | | 13.08% | | (21.89)% | | 19.60% | | 10.70% |
Ratios to Average Net Assets C,G,H | | | | | | | | |
| Expenses before reductions | | -% I | | -% | | -% | | -% I |
| Expenses net of fee waivers, if any | | -% I | | -% | | -% | | -% I |
| Expenses net of all reductions | | -% I | | -% | | -% | | -% I |
| Net investment income (loss) | | .30% | | .29% | | .45% | | .27% I |
| Supplemental Data | | | | | | | | |
| Net assets, end of period (000 omitted) | $ | 21,143 | $ | 24,523 | $ | 31,943 | $ | 3,914 |
Portfolio turnover rate J | | 27% I | | 47% | | 44% | | -% K,L |
A For the period April 16, 2020 (commencement of operations) through May 31, 2020
B Calculated based on average shares outstanding during the period.
C Net investment income (loss) is affected by the timing of the declaration of dividends by any underlying mutual funds or exchange-traded funds (ETFs). Net investment income (loss) of any mutual funds or ETFs is not included in the Fund's net investment income (loss) ratio.
D Amount represents less than $.005 per share.
E Total returns for periods of less than one year are not annualized.
F Total returns would have been lower if certain expenses had not been reduced during the applicable periods shown.
G Fees and expenses of any underlying mutual funds or exchange-traded funds (ETFs) are not included in the Fund's expense ratio. The Fund indirectly bears its proportionate share of these expenses. For additional expense information related to investments in Fidelity Central Funds, please refer to the "Investments in Fidelity Central Funds" note found in the Notes to Financial Statements section of the most recent Annual or Semi-Annual report.
H Expense ratios reflect operating expenses of the class. Expenses before reductions do not reflect amounts reimbursed, waived, or reduced through arrangements with the investment adviser, brokerage services, or other offset arrangements, if applicable, and do not represent the amount paid by the class during periods when reimbursements, waivers or reductions occur.
I Annualized.
J Amount does not include the portfolio activity of any underlying mutual funds or exchange-traded funds (ETFs).
K Amount represents less than 1%.
L Amount not annualized.
Top Holdings (% of Fund's net assets) |
| |
| Microsoft Corp. | 5.3 | |
| ASML Holding NV (Netherlands) | 4.8 | |
| Taiwan Semiconductor Manufacturing Co. Ltd. sponsored ADR | 4.7 | |
| Adobe, Inc. | 4.5 | |
| Salesforce.com, Inc. | 4.5 | |
| Workday, Inc. Class A | 4.5 | |
| Alphabet, Inc. Class C | 4.0 | |
| Marvell Technology, Inc. | 3.8 | |
| Enphase Energy, Inc. | 3.7 | |
| Amazon.com, Inc. | 3.6 | |
| | 43.4 | |
| |
| Market Sectors (% of Fund's net assets) |
| |
| Information Technology | 68.7 | |
| Communication Services | 20.3 | |
| Consumer Discretionary | 10.9 | |
| |
Asset Allocation (% of Fund's net assets) |
|
Foreign investments - 28.4% |
|
Geographic Diversification (% of Fund's net assets) |
|
* Includes Short-Term investments and Net Other Assets (Liabilities). Percentages are based on country or territory of incorporation and are adjusted for the effect of futures contracts, if applicable. |
| |
Fidelity® Disruptive Technology Fund
Showing Percentage of Net Assets
| Common Stocks - 99.9% |
| | | Shares | Value ($) |
| COMMUNICATION SERVICES - 20.3% | | | |
| Entertainment - 7.0% | | | |
| Netflix, Inc. (a) | | 9,151 | 2,795,905 |
| Sea Ltd. ADR (a) | | 44,031 | 2,570,089 |
| Spotify Technology SA (a) | | 6,472 | 514,006 |
| | | | 5,880,000 |
| Interactive Media & Services - 10.6% | | | |
| Alphabet, Inc. Class C (a) | | 33,546 | 3,403,242 |
| Kakao Corp. | | 8,756 | 388,459 |
| Meta Platforms, Inc. Class A (a) | | 9,052 | 1,069,041 |
| Snap, Inc. Class A (a) | | 70,407 | 725,896 |
| Tencent Holdings Ltd. | | 21,657 | 818,988 |
| Yandex NV Series A (a)(b) | | 47,740 | 163,741 |
| Z Holdings Corp. | | 841,654 | 2,316,187 |
| | | | 8,885,554 |
| Wireless Telecommunication Services - 2.7% | | | |
| T-Mobile U.S., Inc. (a) | | 14,998 | 2,271,597 |
TOTAL COMMUNICATION SERVICES | | | 17,037,151 |
| CONSUMER DISCRETIONARY - 10.9% | | | |
| Automobiles - 0.8% | | | |
| Tesla, Inc. (a) | | 3,262 | 635,111 |
| Hotels, Restaurants & Leisure - 2.3% | | | |
| Airbnb, Inc. Class A (a) | | 6,331 | 646,648 |
| MakeMyTrip Ltd. (a)(c) | | 42,604 | 1,264,913 |
| | | | 1,911,561 |
| Internet & Direct Marketing Retail - 7.8% | | | |
| Amazon.com, Inc. (a) | | 31,174 | 3,009,538 |
| Doordash, Inc. (a) | | 6,424 | 374,198 |
| Farfetch Ltd. Class A (a)(c) | | 67,510 | 573,835 |
| Global-e Online Ltd. (a) | | 22,752 | 490,761 |
| Lyft, Inc. (a) | | 28,196 | 316,359 |
| Uber Technologies, Inc. (a) | | 25,489 | 742,749 |
| ZOZO, Inc. | | 42,121 | 1,063,414 |
| | | | 6,570,854 |
TOTAL CONSUMER DISCRETIONARY | | | 9,117,526 |
| INFORMATION TECHNOLOGY - 68.7% | | | |
| Electronic Equipment & Components - 1.8% | | | |
| Samsung SDI Co. Ltd. | | 2,634 | 1,503,520 |
| IT Services - 9.0% | | | |
| Accenture PLC Class A | | 5,045 | 1,518,192 |
| Adyen BV (a)(d) | | 1,216 | 1,915,588 |
| Block, Inc. Class A (a) | | 12,690 | 860,001 |
| MongoDB, Inc. Class A (a) | | 9,041 | 1,380,470 |
| Snowflake, Inc. (a) | | 8,586 | 1,226,939 |
| Twilio, Inc. Class A (a) | | 12,404 | 608,044 |
| | | | 7,509,234 |
| Semiconductors & Semiconductor Equipment - 23.2% | | | |
| ASML Holding NV (Netherlands) | | 6,626 | 4,045,307 |
| BE Semiconductor Industries NV | | 10,696 | 696,711 |
| Enphase Energy, Inc. (a) | | 9,562 | 3,065,482 |
| Marvell Technology, Inc. | | 69,038 | 3,211,648 |
| NVIDIA Corp. | | 15,427 | 2,610,711 |
| SolarEdge Technologies, Inc. (a) | | 6,531 | 1,951,855 |
| Taiwan Semiconductor Manufacturing Co. Ltd. sponsored ADR | | 46,944 | 3,895,413 |
| | | | 19,477,127 |
| Software - 33.1% | | | |
| Adobe, Inc. (a) | | 11,019 | 3,800,784 |
| Amplitude, Inc. (a) | | 30,556 | 437,562 |
| Atlassian Corp. PLC (a) | | 8,197 | 1,078,315 |
| Bill.Com Holdings, Inc. (a) | | 6,372 | 767,316 |
| Confluent, Inc. (a)(c) | | 38,982 | 897,755 |
| Crowdstrike Holdings, Inc. (a) | | 6,014 | 707,547 |
| HashiCorp, Inc. (c) | | 26,377 | 720,092 |
| HubSpot, Inc. (a) | | 4,899 | 1,484,544 |
| Intuit, Inc. | | 4,939 | 2,013,087 |
| Kingdee International Software Group Co. Ltd. (a) | | 395,119 | 666,772 |
| Microsoft Corp. | | 17,575 | 4,484,086 |
| Palo Alto Networks, Inc. (a) | | 9,460 | 1,607,254 |
| Paycom Software, Inc. (a) | | 3,372 | 1,143,445 |
| Qualtrics International, Inc. (a) | | 42,530 | 436,358 |
| Salesforce.com, Inc. (a) | | 23,371 | 3,745,203 |
| Workday, Inc. Class A (a) | | 22,226 | 3,731,745 |
| | | | 27,721,865 |
| Technology Hardware, Storage & Peripherals - 1.6% | | | |
| Apple, Inc. | | 9,052 | 1,339,968 |
TOTAL INFORMATION TECHNOLOGY | | | 57,551,714 |
| TOTAL COMMON STOCKS (Cost $114,174,939) | | | 83,706,391 |
| | | | |
| Money Market Funds - 3.5% |
| | | Shares | Value ($) |
| Fidelity Cash Central Fund 3.86% (e) | | 66,445 | 66,458 |
| Fidelity Securities Lending Cash Central Fund 3.86% (e)(f) | | 2,878,587 | 2,878,875 |
| TOTAL MONEY MARKET FUNDS (Cost $2,945,333) | | | 2,945,333 |
| | | | |
| TOTAL INVESTMENT IN SECURITIES - 103.4% (Cost $117,120,272) | 86,651,724 |
NET OTHER ASSETS (LIABILITIES) - (3.4)% | (2,858,373) |
| NET ASSETS - 100.0% | 83,793,351 |
| | |
Legend
| (c) | Security or a portion of the security is on loan at period end. |
| (d) | Security exempt from registration under Rule 144A of the Securities Act of 1933. These securities may be resold in transactions exempt from registration, normally to qualified institutional buyers. At the end of the period, the value of these securities amounted to $1,915,588 or 2.3% of net assets. |
| (e) | Affiliated fund that is generally available only to investment companies and other accounts managed by Fidelity Investments. The rate quoted is the annualized seven-day yield of the fund at period end. A complete unaudited listing of the fund's holdings as of its most recent quarter end is available upon request. In addition, each Fidelity Central Fund's financial statements are available on the SEC's website or upon request. |
| (f) | Investment made with cash collateral received from securities on loan. |
Affiliated Central Funds
Fiscal year to date information regarding the Fund's investments in Fidelity Central Funds, including the ownership percentage, is presented below.
| Affiliate | Value, beginning of period ($) | Purchases ($) | Sales Proceeds ($) | Dividend Income ($) | Realized Gain (loss) ($) | Change in Unrealized appreciation (depreciation) ($) | Value, end of period ($) | % ownership, end of period |
| Fidelity Cash Central Fund 3.86% | 907,846 | 9,989,466 | 10,830,854 | 8,230 | - | - | 66,458 | 0.0% |
| Fidelity Securities Lending Cash Central Fund 3.86% | 5,285,219 | 23,411,826 | 25,818,170 | 21,755 | - | - | 2,878,875 | 0.0% |
| Total | 6,193,065 | 33,401,292 | 36,649,024 | 29,985 | - | - | 2,945,333 | |
| | | | | | | | | |
Amounts in the income column in the above table include any capital gain distributions from underlying funds, which are presented in the corresponding line item in the Statement of Operations, if applicable.
Amount for Fidelity Securities Lending Cash Central Fund represents the income earned on investing cash collateral, less rebates paid to borrowers and any lending agent fees associated with the loan, plus any premium payments received for lending certain types of securities.
Amounts included in the purchases and sales proceeds columns may include in-kind transactions, if applicable.
Investment Valuation
The following is a summary of the inputs used, as of November 30, 2022, involving the Fund's assets and liabilities carried at fair value. The inputs or methodology used for valuing securities may not be an indication of the risk associated with investing in those securities. For more information on valuation inputs, and their aggregation into the levels used below, please refer to the Investment Valuation section in the accompanying Notes to Financial Statements.
| Valuation Inputs at Reporting Date: |
| Description | Total ($) | Level 1 ($) | Level 2 ($) | Level 3 ($) |
Investments in Securities: | | | | |
|
| Equities: | | | | |
Communication Services | 17,037,151 | 13,349,776 | 3,523,634 | 163,741 |
Consumer Discretionary | 9,117,526 | 8,054,112 | 1,063,414 | - |
Information Technology | 57,551,714 | 48,723,816 | 8,827,898 | - |
|
| Money Market Funds | 2,945,333 | 2,945,333 | - | - |
| Total Investments in Securities: | 86,651,724 | 73,073,037 | 13,414,946 | 163,741 |
Fidelity® Disruptive Technology Fund
| Statement of Assets and Liabilities |
| | | | November 30, 2022 (Unaudited) |
| | | | | |
| Assets | | | | |
| Investment in securities, at value (including securities loaned of $2,900,637) - See accompanying schedule: | | | | |
Unaffiliated issuers (cost $114,174,939) | | $83,706,391 | | |
Fidelity Central Funds (cost $2,945,333) | | 2,945,333 | | |
| | | | | |
| Total Investment in Securities (cost $117,120,272) | | | $ | 86,651,724 |
| Receivable for fund shares sold | | | | 218,295 |
| Dividends receivable | | | | 14,322 |
| Distributions receivable from Fidelity Central Funds | | | | 906 |
Total assets | | | | 86,885,247 |
| Liabilities | | | | |
| Payable for fund shares redeemed | | 171,202 | | |
| Accrued management fee | | 41,819 | | |
| Collateral on securities loaned | | 2,878,875 | | |
| Total Liabilities | | | | 3,091,896 |
| Net Assets | | | $ | 83,793,351 |
| Net Assets consist of: | | | | |
| Paid in capital | | | $ | 130,183,499 |
| Total accumulated earnings (loss) | | | | (46,390,148) |
| Net Assets | | | $ | 83,793,351 |
| | | | | |
| Net Asset Value and Maximum Offering Price | | | | |
| Fidelity Disruptive Technology Fund : | | | | |
Net Asset Value , offering price and redemption price per share ($19,522,861 ÷ 1,796,520 shares) | | | $ | 10.87 |
| Loyalty Class 1 : | | | | |
Net Asset Value , offering price and redemption price per share ($45,302,736 ÷ 4,156,893 shares) | | | $ | 10.90 |
| Loyalty Class 2 : | | | | |
Net Asset Value , offering price and redemption price per share ($113,352 ÷ 10,327 shares) | | | $ | 10.98 |
| Class F : | | | | |
Net Asset Value , offering price and redemption price per share ($18,854,402 ÷ 1,702,662 shares) | | | $ | 11.07 |
| Statement of Operations |
| | | | Six months ended November 30, 2022 (Unaudited) |
| Investment Income | | | | |
| Dividends | | | $ | 144,625 |
| Income from Fidelity Central Funds (including $21,755 from security lending) | | | | 29,985 |
| Income before foreign taxes withheld | | | | 174,610 |
| Less foreign taxes withheld | | | | (16,692) |
| Total Income | | | | 157,918 |
| Expenses | | | | |
| Management fee | $ | 318,526 | | |
| Independent trustees' fees and expenses | | 177 | | |
| Total expenses before reductions | | 318,703 | | |
| Expense reductions | | (180) | | |
| Total expenses after reductions | | | | 318,523 |
| Net Investment income (loss) | | | | (160,605) |
| Realized and Unrealized Gain (Loss) | | | | |
| Net realized gain (loss) on: | | | | |
| Investment Securities: | | | | |
| Unaffiliated issuers | | (15,458,334) | | |
| Foreign currency transactions | | (73) | | |
| Total net realized gain (loss) | | | | (15,458,407) |
| Change in net unrealized appreciation (depreciation) on: | | | | |
| Investment Securities: | | | | |
| Unaffiliated issuers | | 6,725,904 | | |
| Assets and liabilities in foreign currencies | | 2,602 | | |
| Total change in net unrealized appreciation (depreciation) | | | | 6,728,506 |
| Net gain (loss) | | | | (8,729,901) |
| Net increase (decrease) in net assets resulting from operations | | | $ | (8,890,506) |
| Statement of Changes in Net Assets |
| |
| | Six months ended November 30, 2022 (Unaudited) | | Year ended May 31, 2022 |
| Increase (Decrease) in Net Assets | | | | |
| Operations | | | | |
| Net investment income (loss) | $ | (160,605) | $ | (808,781) |
| Net realized gain (loss) | | (15,458,407) | | 2,344,017 |
| Change in net unrealized appreciation (depreciation) | | 6,728,506 | | (57,703,932) |
| Net increase (decrease) in net assets resulting from operations | | (8,890,506) | | (56,168,696) |
| Distributions to shareholders | | (1,210,975) | | (2,859,572) |
| Share transactions - net increase (decrease) | | (12,219,359) | | (5,482,616) |
| Total increase (decrease) in net assets | | (22,320,840) | | (64,510,884) |
| | | | | |
| Net Assets | | | | |
| Beginning of period | | 106,114,191 | | 170,625,075 |
| End of period | $ | 83,793,351 | $ | 106,114,191 |
| | | | | |
| | | | | |
Financial Highlights
| Fidelity® Disruptive Technology Fund |
| |
| | Six months ended (Unaudited) November 30, 2022 | | Years ended May 31, 2022 | | 2021 | | 2020 A |
Selected Per-Share Data | | | | | | | | |
| Net asset value, beginning of period | $ | 11.81 | $ | 18.10 | $ | 11.49 | $ | 10.00 |
| Income from Investment Operations | | | | | | | | |
Net investment income (loss) B,C | | (.04) | | (.14) | | (.13) | | (.01) |
| Net realized and unrealized gain (loss) | | (.76) | | (5.88) | | 6.81 | | 1.50 |
| Total from investment operations | | (.80) | | (6.02) | | 6.68 | | 1.49 |
| Distributions from net realized gain | | (.14) | | (.27) | | (.07) | | - |
| Total distributions | | (.14) | | (.27) | | (.07) | | - |
| Net asset value, end of period | $ | 10.87 | $ | 11.81 | $ | 18.10 | $ | 11.49 |
Total Return D,E | | (6.86)% | | (33.85)% | | 58.13% | | 14.90% |
Ratios to Average Net Assets C,F,G | | | | | | | | |
| Expenses before reductions | | 1.00% H,I | | .99% I | | 1.01% I | | 1.01% H,I |
| Expenses net of fee waivers, if any | | 1.00% H,I | | .99% I | | 1.01% I | | 1.01% H,I |
| Expenses net of all reductions | | 1.00% H,I | | .99% I | | 1.01% I | | 1.01% H,I |
| Net investment income (loss) | | (.67)% H | | (.78)% | | (.77)% | | (.62)% H |
| Supplemental Data | | | | | | | | |
| Net assets, end of period (000 omitted) | $ | 19,523 | $ | 34,802 | $ | 130,244 | $ | 6,198 |
Portfolio turnover rate J | | 21% H | | 33% | | 29% | | -% K |
A For the period April 16, 2020 (commencement of operations) through May 31, 2020
B Calculated based on average shares outstanding during the period.
C Net investment income (loss) is affected by the timing of the declaration of dividends by any underlying mutual funds or exchange-traded funds (ETFs). Net investment income (loss) of any mutual funds or ETFs is not included in the Fund's net investment income (loss) ratio.
D Total returns for periods of less than one year are not annualized.
E Total returns would have been lower if certain expenses had not been reduced during the applicable periods shown.
F Fees and expenses of any underlying mutual funds or exchange-traded funds (ETFs) are not included in the Fund's expense ratio. The Fund indirectly bears its proportionate share of these expenses. For additional expense information related to investments in Fidelity Central Funds, please refer to the "Investments in Fidelity Central Funds" note found in the Notes to Financial Statements section of the most recent Annual or Semi-Annual report.
G Expense ratios reflect operating expenses of the class. Expenses before reductions do not reflect amounts reimbursed, waived, or reduced through arrangements with the investment adviser, brokerage services, or other offset arrangements, if applicable, and do not represent the amount paid by the class during periods when reimbursements, waivers or reductions occur.
H Annualized.
I On certain classes, the size and fluctuation of net assets and expense amounts may cause ratios to differ from contractual rates.
J Amount does not include the portfolio activity of any underlying mutual funds or exchange-traded funds (ETFs).
K Amount not annualized.
| Fidelity® Disruptive Technology Fund Loyalty Class 1 |
| |
| | Six months ended (Unaudited) November 30, 2022 | | Years ended May 31, 2022 | | 2021 | | 2020 A |
Selected Per-Share Data | | | | | | | | |
| Net asset value, beginning of period | $ | 11.83 | $ | 18.15 | $ | 11.49 | $ | 10.00 |
| Income from Investment Operations | | | | | | | | |
Net investment income (loss) B,C | | (.02) | | (.08) | | (.07) | | - D |
| Net realized and unrealized gain (loss) | | (.77) | | (5.89) | | 6.78 | | 1.49 |
| Total from investment operations | | (.79) | | (5.97) | | 6.71 | | 1.49 |
| Distributions from net realized gain | | (.14) | | (.35) | | (.05) | | - |
| Total distributions | | (.14) | | (.35) | | (.05) | | - |
| Net asset value, end of period | $ | 10.90 | $ | 11.83 | $ | 18.15 | $ | 11.49 |
Total Return E,F | | (6.76)% | | (33.65)% | | 58.46% | | 14.90% |
Ratios to Average Net Assets C,G,H | | | | | | | | |
| Expenses before reductions | | .75% I | | .75% | | .76% J | | .75% I |
| Expenses net of fee waivers, if any | | .75% I | | .75% | | .76% J | | .75% I |
| Expenses net of all reductions | | .75% I | | .75% | | .76% J | | .75% I |
| Net investment income (loss) | | (.42)% I | | (.46)% | | (.44)% | | (.36)% I |
| Supplemental Data | | | | | | | | |
| Net assets, end of period (000 omitted) | $ | 45,303 | $ | 46,694 | $ | 7,600 | $ | 115 |
Portfolio turnover rate K | | 21% I | | 33% | | 29% | | -% L |
A For the period April 16, 2020 (commencement of operations) through May 31, 2020
B Calculated based on average shares outstanding during the period.
C Net investment income (loss) is affected by the timing of the declaration of dividends by any underlying mutual funds or exchange-traded funds (ETFs). Net investment income (loss) of any mutual funds or ETFs is not included in the Fund's net investment income (loss) ratio.
D Amount represents less than $.005 per share.
E Total returns for periods of less than one year are not annualized.
F Total returns would have been lower if certain expenses had not been reduced during the applicable periods shown.
G Fees and expenses of any underlying mutual funds or exchange-traded funds (ETFs) are not included in the Fund's expense ratio. The Fund indirectly bears its proportionate share of these expenses. For additional expense information related to investments in Fidelity Central Funds, please refer to the "Investments in Fidelity Central Funds" note found in the Notes to Financial Statements section of the most recent Annual or Semi-Annual report.
H Expense ratios reflect operating expenses of the class. Expenses before reductions do not reflect amounts reimbursed, waived, or reduced through arrangements with the investment adviser, brokerage services, or other offset arrangements, if applicable, and do not represent the amount paid by the class during periods when reimbursements, waivers or reductions occur.
I Annualized.
J On certain classes, the size and fluctuation of net assets and expense amounts may cause ratios to differ from contractual rates.
K Amount does not include the portfolio activity of any underlying mutual funds or exchange-traded funds (ETFs).
L Amount not annualized.
| Fidelity® Disruptive Technology Fund Loyalty Class 2 |
| |
| | Six months ended (Unaudited) November 30, 2022 | | Years ended May 31, 2022 | | 2021 | | 2020 A |
Selected Per-Share Data | | | | | | | | |
| Net asset value, beginning of period | $ | 11.90 | $ | 18.18 | $ | 11.50 | $ | 10.00 |
| Income from Investment Operations | | | | | | | | |
Net investment income (loss) B,C | | (.01) | | (.04) | | (.05) | | - D |
| Net realized and unrealized gain (loss) | | (.77) | | (5.93) | | 6.81 | | 1.50 |
| Total from investment operations | | (.78) | | (5.97) | | 6.76 | | 1.50 |
| Distributions from net realized gain | | (.14) | | (.31) | | (.08) | | - |
| Total distributions | | (.14) | | (.31) | | (.08) | | - |
| Net asset value, end of period | $ | 10.98 | $ | 11.90 | $ | 18.18 | $ | 11.50 |
Total Return E,F | | (6.63)% | | (33.49)% | | 58.79% | | 15.00% |
Ratios to Average Net Assets C,G,H | | | | | | | | |
| Expenses before reductions | | .50% I | | .50% | | .50% | | .50% I |
| Expenses net of fee waivers, if any | | .50% I | | .50% | | .50% | | .50% I |
| Expenses net of all reductions | | .50% I | | .50% | | .50% | | .50% I |
| Net investment income (loss) | | (.17)% I | | (.25)% | | (.28)% | | (.10)% I |
| Supplemental Data | | | | | | | | |
| Net assets, end of period (000 omitted) | $ | 113 | $ | 121 | $ | 183 | $ | 115 |
Portfolio turnover rate J | | 21% I | | 33% | | 29% | | -% K |
A For the period April 16, 2020 (commencement of operations) through May 31, 2020
B Calculated based on average shares outstanding during the period.
C Net investment income (loss) is affected by the timing of the declaration of dividends by any underlying mutual funds or exchange-traded funds (ETFs). Net investment income (loss) of any mutual funds or ETFs is not included in the Fund's net investment income (loss) ratio.
D Amount represents less than $.005 per share.
E Total returns for periods of less than one year are not annualized.
F Total returns would have been lower if certain expenses had not been reduced during the applicable periods shown.
G Fees and expenses of any underlying mutual funds or exchange-traded funds (ETFs) are not included in the Fund's expense ratio. The Fund indirectly bears its proportionate share of these expenses. For additional expense information related to investments in Fidelity Central Funds, please refer to the "Investments in Fidelity Central Funds" note found in the Notes to Financial Statements section of the most recent Annual or Semi-Annual report.
H Expense ratios reflect operating expenses of the class. Expenses before reductions do not reflect amounts reimbursed, waived, or reduced through arrangements with the investment adviser, brokerage services, or other offset arrangements, if applicable, and do not represent the amount paid by the class during periods when reimbursements, waivers or reductions occur.
I Annualized.
J Amount does not include the portfolio activity of any underlying mutual funds or exchange-traded funds (ETFs).
K Amount not annualized.
| Fidelity® Disruptive Technology Fund Class F |
| |
| | Six months ended (Unaudited) November 30, 2022 | | Years ended May 31, 2022 | | 2021 | | 2020 A |
Selected Per-Share Data | | | | | | | | |
| Net asset value, beginning of period | $ | 11.97 | $ | 18.24 | $ | 11.51 | $ | 10.00 |
| Income from Investment Operations | | | | | | | | |
Net investment income (loss) B,C | | .02 | | .04 | | .04 | | .01 |
| Net realized and unrealized gain (loss) | | (.78) | | (5.96) | | 6.81 | | 1.50 |
| Total from investment operations | | (.76) | | (5.92) | | 6.85 | | 1.51 |
| Distributions from net realized gain | | (.14) | | (.35) | | (.12) | | - |
| Total distributions | | (.14) | | (.35) | | (.12) | | - |
| Net asset value, end of period | $ | 11.07 | $ | 11.97 | $ | 18.24 | $ | 11.51 |
Total Return D,E | | (6.43)% | | (33.19)% | | 59.58% | | 15.10% |
Ratios to Average Net Assets C,F,G | | | | | | | | |
| Expenses before reductions | | -% H | | -% | | -% | | -% H |
| Expenses net of fee waivers, if any | | -% H | | -% | | -% | | -% H |
| Expenses net of all reductions | | -% H | | -% | | -% | | -% H |
| Net investment income (loss) | | .33% H | | .25% | | .23% | | .39% H |
| Supplemental Data | | | | | | | | |
| Net assets, end of period (000 omitted) | $ | 18,854 | $ | 24,497 | $ | 32,598 | $ | 4,029 |
Portfolio turnover rate I | | 21% H | | 33% | | 29% | | -% J |
A For the period April 16, 2020 (commencement of operations) through May 31, 2020
B Calculated based on average shares outstanding during the period.
C Net investment income (loss) is affected by the timing of the declaration of dividends by any underlying mutual funds or exchange-traded funds (ETFs). Net investment income (loss) of any mutual funds or ETFs is not included in the Fund's net investment income (loss) ratio.
D Total returns for periods of less than one year are not annualized.
E Total returns would have been lower if certain expenses had not been reduced during the applicable periods shown.
F Fees and expenses of any underlying mutual funds or exchange-traded funds (ETFs) are not included in the Fund's expense ratio. The Fund indirectly bears its proportionate share of these expenses. For additional expense information related to investments in Fidelity Central Funds, please refer to the "Investments in Fidelity Central Funds" note found in the Notes to Financial Statements section of the most recent Annual or Semi-Annual report.
G Expense ratios reflect operating expenses of the class. Expenses before reductions do not reflect amounts reimbursed, waived, or reduced through arrangements with the investment adviser, brokerage services, or other offset arrangements, if applicable, and do not represent the amount paid by the class during periods when reimbursements, waivers or reductions occur.
H Annualized.
I Amount does not include the portfolio activity of any underlying mutual funds or exchange-traded funds (ETFs).
J Amount not annualized.
For the period ended November 30, 2022
1. Organization.
Fidelity Disruptive Automation Fund, Fidelity Disruptive Communications Fund, Fidelity Disruptive Finance Fund, Fidelity Disruptive Medicine Fund and Fidelity Disruptive Technology Fund (the Funds) are non-diversified funds of Fidelity Summer Street Trust (the Trust). The Trust is registered under the Investment Company Act of 1940, as amended (the 1940 Act), as an open-end management investment company organized as a Massachusetts business trust. Each Fund is authorized to issue an unlimited number of shares. Each Fund offers Fidelity Disruptive Fund, Loyalty Class 1, Loyalty Class 2 and Class F shares. Effective November 30, 2022, each Fund was closed to new accounts with certain exceptions. Each class has equal rights as to assets and voting privileges, except for matters affecting a single class. For certain accounts, Fidelity Disruptive Fund shares will automatically convert to Loyalty Class 1 shares after a holding period of one year from the initial date of purchase; and then from Loyalty Class 1 shares to Loyalty Class 2 shares after another holding period of two years. Investments in emerging markets, if applicable, can be subject to social, economic, regulatory, and political uncertainties and can be extremely volatile.
Effective April 1, 2023, the automatic conversion feature between Loyalty Class 1 and Loyalty Class 2 will be discontinued.
2. Investments in Fidelity Central Funds.
Funds may invest in Fidelity Central Funds, which are open-end investment companies generally available only to other investment companies and accounts managed by the investment adviser and its affiliates. The Schedule of Investments lists any Fidelity Central Funds held as an investment as of period end, but does not include the underlying holdings of each Fidelity Central Fund. An investing fund indirectly bears its proportionate share of the expenses of the underlying Fidelity Central Funds.
Based on its investment objective, each Fidelity Central Fund may invest or participate in various investment vehicles or strategies that are similar to those of the investing fund. These strategies are consistent with the investment objectives of the investing fund and may involve certain economic risks which may cause a decline in value of each of the Fidelity Central Funds and thus a decline in the value of the investing fund.
| Fidelity Central Fund | Investment Manager | Investment Objective | Investment Practices | Expense Ratio A |
| Fidelity Money Market Central Funds | Fidelity Management & Research Company LLC (FMR) | Each fund seeks to obtain a high level of current income consistent with the preservation of capital and liquidity. | Short-term Investments | Less than .005% |
A Expenses expressed as a percentage of average net assets and are as of each underlying Central Fund's most recent annual or semi-annual shareholder report.
A complete unaudited list of holdings for each Fidelity Central Fund is available upon request or at the Securities and Exchange Commission website at www.sec.gov. In addition, the financial statements of the Fidelity Central Funds which contain the significant accounting policies (including investment valuation policies) of those funds, and are not covered by the Report of Independent Registered Public Accounting Firm, are available on the Securities and Exchange Commission website or upon request.
3. Significant Accounting Policies.
Each Fund is an investment company and applies the accounting and reporting guidance of the Financial Accounting Standards Board (FASB) Accounting Standards Codification Topic 946 Financial Services - Investment Companies . The financial statements have been prepared in conformity with accounting principles generally accepted in the United States of America (GAAP), which require management to make certain estimates and assumptions at the date of the financial statements. Actual results could differ from those estimates. Subsequent events, if any, through the date that the financial statements were issued have been evaluated in the preparation of the financial statements. Each Fund's Schedule of Investments lists any underlying mutual funds or exchange-traded funds (ETFs) but does not include the underlying holdings of these funds. The following summarizes the significant accounting policies of each Fund:
Investment Valuation. Investments are valued as of 4:00 p.m. Eastern time on the last calendar day of the period. The Board of Trustees (the Board) has designated each Fund's investment adviser as the valuation designee responsible for the fair valuation function and performing fair value determinations as needed. The investment adviser has established a Fair Value Committee (the Committee) to carry out the day-to-day fair valuation responsibilities and has adopted policies and procedures to govern the fair valuation process and the activities of the Committee. In accordance with these fair valuation policies and procedures, which have been approved by the Board, each Fund attempts to obtain prices from one or more third party pricing services or brokers to value its investments. When current market prices, quotations or currency exchange rates are not readily available or reliable, investments will be fair valued in good faith by the Committee, in accordance with the policies and procedures. Factors used in determining fair value vary by investment type and may include market or investment specific events, transaction data, estimated cash flows, and market observations of comparable investments. The frequency that the fair valuation procedures are used cannot be predicted and they may be utilized to a significant extent. The Committee manages each Fund's fair valuation practices and maintains the fair valuation policies and procedures. Each Fund's investment adviser reports to the Board information regarding the fair valuation process and related material matters.
Each Fund categorizes the inputs to valuation techniques used to value its investments into a disclosure hierarchy consisting of three levels as shown below:
Level 1 - unadjusted quoted prices in active markets for identical investments
Level 2 - other significant observable inputs (including quoted prices for similar investments, interest rates, prepayment speeds, etc.)
Level 3 - unobservable inputs (including the Fund's own assumptions based on the best information available)
Valuation techniques used to value each Fund's investments by major category are as follows:
Equity securities, including restricted securities, for which market quotations are readily available, are valued at the last reported sale price or official closing price as reported by a third party pricing service on the primary market or exchange on which they are traded and are categorized as Level 1 in the hierarchy. In the event there were no sales during the day or closing prices are not available, securities are valued at the last quoted bid price or may be valued using the last available price and are generally categorized as Level 2 in the hierarchy. For foreign equity securities, when market or security specific events arise, comparisons to the valuation of American Depositary Receipts (ADRs), futures contracts, Exchange-Traded Funds (ETFs) and certain indexes as well as quoted prices for similar securities may be used and would be categorized as Level 2 in the hierarchy. For equity securities, including restricted securities, where observable inputs are limited, assumptions about market activity and risk are used and these securities may be categorized as Level 3 in the hierarchy.
Investments in open-end mutual funds, including the Fidelity Central Funds, are valued at their closing net asset value (NAV) each business day and are categorized as Level 1 in the hierarchy.
Changes in valuation techniques may result in transfers in or out of an assigned level within the disclosure hierarchy. The aggregate value of investments by input level as of November 30, 2022 is included at the end of each Fund's Schedule of Investments.
Foreign Currency. Certain Funds may use foreign currency contracts to facilitate transactions in foreign-denominated securities. Gains and losses from these transactions may arise from changes in the value of the foreign currency or if the counterparties do not perform under the contracts' terms.
Foreign-denominated assets, including investment securities, and liabilities are translated into U.S. dollars at the exchange rates at period end. Purchases and sales of investment securities, income and dividends received, and expenses denominated in foreign currencies are translated into U.S. dollars at the exchange rate in effect on the transaction date.
The effects of exchange rate fluctuations on investments are included with the net realized and unrealized gain (loss) on investment securities. Other foreign currency transactions resulting in realized and unrealized gain (loss) are disclosed separately.
Investment Transactions and Income. For financial reporting purposes, the Funds' investment holdings and NAV include trades executed through the end of the last business day of the period. The NAV per share for processing shareholder transactions is calculated as of the close of business of the New York Stock Exchange (NYSE), normally 4:00 p.m. Eastern time and includes trades executed through the end of the prior business day. Gains and losses on securities sold are determined on the basis of identified cost. Commissions paid to certain brokers with whom the investment adviser, or its affiliates, places trades on behalf of a fund include an amount in addition to trade execution, which may be rebated back to a fund. Any such rebates are included in net realized gain (loss) on investments in the Statement of Operations. Dividend income is recorded on the ex-dividend date, except for certain dividends from foreign securities where the ex-dividend date may have passed, which are recorded as soon as the Funds are informed of the ex-dividend date. Non-cash dividends included in dividend income, if any, are recorded at the fair market value of the securities received. Income and capital gain distributions from Fidelity Central Funds, if any, are recorded on the ex-dividend date. Certain distributions received by the Funds represent a return of capital or capital gain. The Funds determine the components of these distributions subsequent to the ex-dividend date, based upon receipt of tax filings or other correspondence relating to the underlying investment. These distributions are recorded as a reduction of cost of investments and/or as a realized gain. Interest income is accrued as earned and includes coupon interest and amortization of premium and accretion of discount on debt securities as applicable. Investment income is recorded net of foreign taxes withheld where recovery of such taxes is uncertain. Funds may file withholding tax reclaims in certain jurisdictions to recover a portion of amounts previously withheld. Any withholding tax reclaims income is included in the Statement of Operations in dividends or foreign taxes withheld. Any receivables for withholding tax reclaims are included in the Statement of Assets and Liabilities in dividends receivable or reclaim receivable.
Class Allocations and Expenses. Investment income, realized and unrealized capital gains and losses, common expenses of a fund, and certain fund-level expense reductions, if any, are allocated daily on a pro-rata basis to each class based on the relative net assets of each class to the total net assets of a fund. Each class differs with respect to transfer agent and distribution and service plan fees incurred, as applicable. Certain expense reductions may also differ by class, if applicable. For the reporting period, the allocated portion of income and expenses to each class as a percent of its average net assets may vary due to the timing of recording these transactions in relation to fluctuating net assets of the classes. Expenses directly attributable to a fund are charged to that fund. Expenses attributable to more than one fund are allocated among the respective funds on the basis of relative net assets or other appropriate methods. Expenses included in the accompanying financial statements reflect the expenses of that fund and do not include any expenses associated with any underlying mutual funds or exchange-traded funds. Although not included in a fund's expenses, a fund indirectly bears its proportionate share of these expenses through the net asset value of each underlying mutual fund or exchange-traded fund. Expense estimates are accrued in the period to which they relate and adjustments are made when actual amounts are known.
Income Tax Information and Distributions to Shareholders. Each year, each Fund intends to qualify as a regulated investment company under Subchapter M of the Internal Revenue Code, including distributing substantially all of its taxable income and realized gains. As a result, no provision for U.S. Federal income taxes is required. Each Fund files a U.S. federal tax return, in addition to state and local tax returns as required. Each Fund's federal income tax returns are subject to examination by the Internal Revenue Service (IRS) for a period of three fiscal years after they are filed. State and local tax returns may be subject to examination for an additional fiscal year depending on the jurisdiction. Foreign taxes are provided for based on each Fund's understanding of the tax rules and rates that exist in the foreign markets in which it invests.
Distributions are declared and recorded on the ex-dividend date. Income and capital gain distributions are declared separately for each class. Income and capital gain distributions are determined in accordance with income tax regulations, which may differ from GAAP.
Capital accounts within the financial statements are adjusted for permanent book-tax differences. These adjustments have no impact on net assets or the results of operations. Capital accounts are not adjusted for temporary book-tax differences which will reverse in a subsequent period.
Book-tax differences are primarily due to foreign currency transactions, passive foreign investment companies (PFIC), net operating losses, capital loss carryforwards and losses deferred due to wash sales and excise tax regulations.
As of period end, the cost and unrealized appreciation (depreciation) in securities, and derivatives if applicable, for federal income tax purposes were as follows for each Fund:
| | Tax cost | Gross unrealized appreciation | Gross unrealized depreciation | Net unrealized appreciation (depreciation) |
| Fidelity Disruptive Automation Fund | $106,905,633 | $12,689,313 | $ (16,823,504) | $(4,134,191) |
Fidelity Disruptive Communications Fund | 43,772,017 | 5,031,122 | (13,206,888) | (8,175,766) |
| Fidelity Disruptive Finance Fund | 46,630,291 | 9,793,565 | (6,545,090) | 3,248,475 |
| Fidelity Disruptive Medicine Fund | 49,669,694 | 8,301,249 | (7,971,027) | 330,222 |
| Fidelity Disruptive Technology Fund | 118,469,109 | 8,203,243 | (40,020,628) | (31,817,385) |
Capital loss carryforwards are only available to offset future capital gains of the Funds to the extent provided by regulations and may be limited. The capital loss carryforward information presented below, including any applicable limitation, is estimated as of prior fiscal period end and is subject to adjustment.
| | Short-term | Total capital loss carryforward | |
| Fidelity Disruptive Medicine Fund | (3,145,154) | (3,145,154) | |
| | | | |
| | | | |
Certain of the Funds elected to defer to the next fiscal year capital losses recognized during the period November 1, 2022 to May 31, 2022, and ordinary losses recognized during the period January 1, 2022 to May 31, 2022 Loss deferrals were as follows:
| | Capital losses | Ordinary losses |
| Fidelity Disruptive Automation Fund | $ (518,865) | $(-) |
Fidelity Disruptive Communications Fund | (4,315,626) | (15,902) |
| Fidelity Disruptive Finance Fund | (1,676,464) | (-) |
| Fidelity Disruptive Medicine Fund | (-) | (25,217) |
| Fidelity Disruptive Technology Fund | (-) | (146,929) |
Restricted Securities (including Private Placements). Funds may invest in securities that are subject to legal or contractual restrictions on resale. These securities generally may be resold in transactions exempt from registration or to the public if the securities are registered. Disposal of these securities may involve time-consuming negotiations and expense, and prompt sale at an acceptable price may be difficult. Information regarding restricted securities held at period end is included at the end of the Schedule of Investments, if applicable.
4. Purchases and Sales of Investments.
Purchases and sales of securities, other than short-term securities and in-kind transactions, as applicable, are noted in the table below.
| | Purchases ($) | Sales ($) |
| Fidelity Disruptive Automation Fund | 8,089,957 | 24,601,696 |
| Fidelity Disruptive Communications Fund | 6,042,512 | 13,709,757 |
| Fidelity Disruptive Finance Fund | 5,999,346 | 18,591,608 |
| Fidelity Disruptive Medicine Fund | 6,939,415 | 16,366,618 |
| Fidelity Disruptive Technology Fund | 10,114,741 | 22,889,408 |
5. Fees and Other Transactions with Affiliates.
Management Fee and Expense Contract. Fidelity Management & Research Company LLC (the investment adviser) and its affiliates provide each Fund with investment management related services for which each Class of each Fund pays a monthly all-inclusive management fee based on an annual percentage of class-level average net assets. Under the management contract, the investment adviser pays all other operating expenses, except the compensation of the independent Trustees and certain miscellaneous expenses, such as proxy and shareholder meeting expenses.
Under the expense contract, the investment adviser pays all other class-level operating expenses as necessary, except the compensation of the independent Trustees and certain miscellaneous expenses, such as proxy and shareholder meeting expenses, so that total expenses of Loyalty Class 1, Loyalty Class 2 and Class F do not exceed an annual percentage of class-level average net assets.
For the reporting period, the annual management fee and expense contract rates were as follows:
| | Management Fee Annual % of Class-Level Average Net Assets | Expense Contract Annual % of Class-Level Average Net Assets |
| Fidelity Disruptive Automation Fund | | |
| Fidelity Disruptive Automation Fund | 1.00% | N/A |
| Loyalty Class 1 | 1.00% | .75% |
| Loyalty Class 2 | 1.00% | .50% |
| Class F | 1.00% | .00% |
| Fidelity Disruptive Communications Fund | | |
| Fidelity Disruptive Communications Fund | 1.00% | N/A |
| Loyalty Class 1 | 1.00% | .75% |
| Loyalty Class 2 | 1.00% | .50% |
| Class F | 1.00% | .00% |
| Fidelity Disruptive Finance Fund | | |
| Fidelity Disruptive Finance Fund | 1.00% | N/A |
| Loyalty Class 1 | 1.00% | .75% |
| Loyalty Class 2 | 1.00% | .50% |
| Class F | 1.00% | .00% |
| Fidelity Disruptive Medicine Fund | | |
| Fidelity Disruptive Medicine Fund | 1.00% | N/A |
| Loyalty Class 1 | 1.00% | .75% |
| Loyalty Class 2 | 1.00% | .50% |
| Class F | 1.00% | .00% |
| Fidelity Disruptive Technology Fund | | |
| Fidelity Disruptive Technology Fund | 1.00% | N/A |
| Loyalty Class 1 | 1.00% | .75% |
| Loyalty Class 2 | 1.00% | .50% |
| Class F | 1.00% | .00% |
Effective April 1, 2023, Fidelity Disruptive Fund shares of each Fund will be added to the expense contract at the rate of .50% of class-level average net assets. In addition, the expense contract rate for Loyalty Class 1 shares of each Fund will be changed to .50% of class-level average net assets.
Brokerage Commissions. A portion of portfolio transactions were placed with brokerage firms which are affiliates of the investment adviser. Brokerage commissions are included in net realized gain (loss) and change in net unrealized appreciation (depreciation) in the Statement of Operations. The commissions paid to these affiliated firms were as follows:
| | Amount |
| Fidelity Disruptive Automation Fund | $342 |
| Fidelity Disruptive Communications Fund | 106 |
| Fidelity Disruptive Finance Fund | 60 |
| Fidelity Disruptive Medicine Fund | 161 |
| Fidelity Disruptive Technology Fund | 156 |
Interfund Trades. Funds may purchase from or sell securities to other Fidelity Funds under procedures adopted by the Board. The procedures have been designed to ensure these interfund trades are executed in accordance with Rule 17a-7 of the 1940 Act. Any interfund trades are included within the respective purchases and sales amounts shown in the Purchases and Sales of Investments note. Interfund trades during the period are noted in the table below.
| | Purchases ($) | Sales ($) | Realized Gain (Loss) ($) |
| Fidelity Disruptive Automation Fund | - | 260,332 | (105,013) |
| Fidelity Disruptive Communications Fund | 214,437 | 43,233 | (22,984) |
| Fidelity Disruptive Finance Fund | 2,662,059 | 34,442 | 741 |
| Fidelity Disruptive Medicine Fund | 1,160,588 | 770,427 | (3,495) |
| Fidelity Disruptive Technology Fund | 144,342 | - | - |
6. Committed Line of Credit.
Certain Funds participate with other funds managed by the investment adviser or an affiliate in a $4.25 billion credit facility (the "line of credit") to be utilized for temporary or emergency purposes to fund shareholder redemptions or for other short-term liquidity purposes. The participating funds have agreed to pay commitment fees on their pro-rata portion of the line of credit, which are reflected in Miscellaneous expenses on the Statement of Operations, and are listed below. During the period, there were no borrowings on this line of credit.
7. Security Lending.
Funds lend portfolio securities from time to time in order to earn additional income. Lending agents are used, including National Financial Services (NFS), an affiliate of the investment adviser. Pursuant to a securities lending agreement, NFS will receive a fee, which is capped at 9.9% of a fund's daily lending revenue, for its services as lending agent. A fund may lend securities to certain qualified borrowers, including NFS. On the settlement date of the loan, a fund receives collateral (in the form of U.S. Treasury obligations, letters of credit and/or cash) against the loaned securities and maintains collateral in an amount not less than 100% of the market value of the loaned securities during the period of the loan. The market value of the loaned securities is determined at the close of business of a fund and any additional required collateral is delivered to a fund on the next business day. A fund or borrower may terminate the loan at any time, and if the borrower defaults on its obligation to return the securities loaned because of insolvency or other reasons, a fund may apply collateral received from the borrower against the obligation. A fund may experience delays and costs in recovering the securities loaned. Any cash collateral received is invested in the Fidelity Securities Lending Cash Central Fund. Any loaned securities are identified as such in the Schedule of Investments, and the value of loaned securities and cash collateral at period end, as applicable, are presented in the Statement of Assets and Liabilities. Security lending income represents the income earned on investing cash collateral, less rebates paid to borrowers and any lending agent fees associated with the loan, plus any premium payments received for lending certain types of securities. Security lending income is presented in the Statement of Operations as a component of income from Fidelity Central Funds. Affiliated security lending activity, if any, was as follows:
| | Total Security Lending Fees Paid to NFS | Security Lending Income From Securities Loaned to NFS | Value of Securities Loaned to NFS at Period End |
| Fidelity Disruptive Automation Fund | $2,896 | $- | $- |
| Fidelity Disruptive Communications Fund | $18 | $- | $- |
| Fidelity Disruptive Finance Fund | $230 | $451 | $- |
| Fidelity Disruptive Medicine Fund | $1,371 | $24 | $- |
| Fidelity Disruptive Technology Fund | $2,152 | $28 | $- |
8. Expense Reductions.
Through arrangements with each applicable Fund's custodian and each class' transfer agent, credits realized as a result of certain uninvested cash balances were used to reduce each applicable Fund's or class' expenses. All of the applicable expense reductions are noted in the table below.
| | Custodian credits | Transfer Agent credits |
| Fidelity Disruptive Automation Fund | | 54 |
| Loyalty Class 1 | | 79 |
| Class F | | 37 |
| Fidelity Disruptive Communications Fund | 6 | |
Fidelity Disruptive Communications Fund | | 29 |
| Loyalty Class 1 | | 53 |
| Class F | | 91 |
| Fidelity Disruptive Finance Fund | | 62 |
| Loyalty Class 1 | | 45 |
| Class F | | 66 |
| Fidelity Disruptive Medicine Fund | | 42 |
| Loyalty Class 1 | | 53 |
| Class F | | 79 |
| Fidelity Disruptive Technology Fund | 8 | |
| Fidelity Disruptive Technology Fund | | 67 |
| Loyalty Class 1 | | 67 |
| Class F | | 38 |
9. Distributions to Shareholders.
Distributions to shareholders of each class were as follows:
| | Six months ended November 30, 2022 | Year ended May 31, 2022 |
| Fidelity Disruptive Automation Fund | | |
| Distributions to shareholders | | |
| Fidelity Disruptive Automation Fund | $- | $1,812,440 |
| Loyalty Class 1 | - | 1,093,147 |
| Loyalty Class 2 | - | 5,010 |
| Class F | - | 1,164,098 |
Total | $- | $4,074,695 |
| Fidelity Disruptive Communications Fund | | |
| Distributions to shareholders | | |
| Fidelity Disruptive Communications Fund | $- | $1,427,817 |
| Loyalty Class 1 | - | 778,546 |
| Loyalty Class 2 | - | 9,700 |
| Class F | - | 2,144,870 |
Total | $- | $4,360,933 |
| Fidelity Disruptive Finance Fund | | |
| Distributions to shareholders | | |
| Fidelity Disruptive Finance Fund | $889,399 | $736,400 |
| Loyalty Class 1 | 1,135,724 | 350,964 |
| Loyalty Class 2 | 8,741 | 4,381 |
| Class F | 1,445,165 | 1,097,133 |
Total | $3,479,029 | $2,188,878 |
| Fidelity Disruptive Medicine Fund | | |
| Distributions to shareholders | | |
| Fidelity Disruptive Medicine Fund | $- | $313,911 |
| Loyalty Class 1 | - | 95,065 |
| Loyalty Class 2 | - | 1,584 |
| Class F | - | 459,341 |
Total | $- | $869,901 |
| Fidelity Disruptive Technology Fund | | |
| Distributions to shareholders | | |
| Fidelity Disruptive Technology Fund | $403,963 | $1,574,286 |
| Loyalty Class 1 | 534,280 | 619,752 |
| Loyalty Class 2 | 1,388 | 3,166 |
| Class F | 271,344 | 662,368 |
Total | $1,210,975 | $2,859,572 |
10. Share Transactions.
Share transactions for each class were as follows and may contain in-kind transactions, automatic conversions between classes or exchanges between affiliated funds:
| | Shares | Shares | Dollars | Dollars |
| | Six months ended November 30, 2022 | Year ended May 31, 2022 | Six months ended November 30, 2022 | Year ended May 31, 2022 |
| Fidelity Disruptive Automation Fund | | | | |
| Fidelity Disruptive Automation Fund | | | | |
| Shares sold | 353,096 | 2,752,234 | $4,917,711 | $51,921,559 |
| Reinvestment of distributions | - | 88,636 | - | 1,722,187 |
| Shares redeemed | (1,475,972) | (6,530,903) | (19,448,505) | (120,981,122) |
| Net increase (decrease) | (1,122,876) | (3,690,033) | $(14,530,794) | $(67,337,376) |
| Loyalty Class 1 | | | | |
| Shares sold | 621,708 | 4,560,941 | $8,590,002 | $84,668,905 |
| Reinvestment of distributions | - | 51,313 | - | 1,010,135 |
| Shares redeemed | (536,961) | (931,384) | (7,414,282) | (15,777,057) |
| Net increase (decrease) | 84,747 | 3,680,870 | $1,175,720 | $69,901,983 |
| Loyalty Class 2 | | | | |
| Shares sold | 1,243 | - | $17,906 | $- |
| Reinvestment of distributions | - | 256 | - | 5,010 |
| Shares redeemed | (1,243) | - | (18,055) | - |
| Net increase (decrease) | - | 256 | $(149) | $5,010 |
| Class F | | | | |
| Shares sold | 12,758 | 331,731 | $177,985 | $6,114,342 |
| Reinvestment of distributions | - | 59,316 | - | 1,164,098 |
| Shares redeemed | (306,712) | (449,808) | (3,950,063) | (8,048,845) |
| Net increase (decrease) | (293,954) | (58,761) | $(3,772,078) | $(770,405) |
| Fidelity Disruptive Communications Fund | | | | |
| Fidelity Disruptive Communications Fund | | | | |
| Shares sold | 121,980 | 778,402 | $1,354,525 | $13,145,562 |
| Reinvestment of distributions | - | 79,255 | - | 1,353,700 |
| Shares redeemed | (456,476) | (2,348,937) | (4,676,260) | (38,618,424) |
| Net increase (decrease) | (334,496) | (1,491,280) | $(3,321,735) | $(24,119,162) |
| Loyalty Class 1 | | | | |
| Shares sold | 158,070 | 1,560,001 | $1,711,794 | $25,719,807 |
| Reinvestment of distributions | - | 43,190 | - | 711,850 |
| Shares redeemed | (198,929) | (557,772) | (2,151,250) | (8,111,660) |
| Net increase (decrease) | (40,859) | 1,045,419 | $(439,456) | $18,319,997 |
| Loyalty Class 2 | | | | |
| Shares sold | 470 | - | $5,415 | $- |
| Reinvestment of distributions | - | 575 | - | 9,700 |
| Shares redeemed | (470) | - | (5,514) | - |
| Net increase (decrease) | - | 575 | $(99) | $9,700 |
| Class F | | | | |
| Shares sold | 16,341 | 499,239 | $177,985 | $8,186,239 |
| Reinvestment of distributions | - | 127,405 | - | 2,144,870 |
| Shares redeemed | (388,880) | (450,224) | (3,950,063) | (6,430,638) |
| Net increase (decrease) | (372,539) | 176,420 | $(3,772,078) | $3,900,471 |
| Fidelity Disruptive Finance Fund | | | | |
| Fidelity Disruptive Finance Fund | | | | |
| Shares sold | 134,509 | 1,522,405 | $1,879,840 | $28,354,963 |
| Reinvestment of distributions | 64,830 | 37,862 | 860,296 | 699,750 |
| Shares redeemed | (949,935) | (2,995,268) | (12,447,174) | (54,505,311) |
| Net increase (decrease) | (750,596) | (1,435,001) | $(9,707,038) | $(25,450,598) |
| Loyalty Class 1 | | | | |
| Shares sold | 376,964 | 1,495,157 | $5,108,596 | $27,284,785 |
| Reinvestment of distributions | 75,475 | 17,088 | 1,000,037 | 315,495 |
| Shares redeemed | (239,320) | (292,449) | (3,270,362) | (5,046,813) |
| Net increase (decrease) | 213,119 | 1,219,796 | $2,838,271 | $22,553,467 |
| Loyalty Class 2 | | | | |
| Shares sold | 1,246 | - | $17,290 | $- |
| Reinvestment of distributions | 656 | 236 | 8,741 | 4,380 |
| Shares redeemed | (1,246) | - | (17,552) | - |
| Net increase (decrease) | 656 | 236 | $8,479 | $4,380 |
| Class F | | | | |
| Shares sold | 12,872 | 262,444 | $177,985 | $4,963,476 |
| Reinvestment of distributions | 108,414 | 59,129 | 1,445,165 | 1,097,133 |
| Shares redeemed | (306,857) | (588,999) | (3,950,063) | (10,388,509) |
| Net increase (decrease) | (185,571) | (267,426) | $(2,326,913) | $(4,327,900) |
| Fidelity Disruptive Medicine Fund | | | | |
| Fidelity Disruptive Medicine Fund | | | | |
| Shares sold | 463,778 | 1,365,657 | $4,942,077 | $ 18,194,183 |
| Reinvestment of distributions | - | 21,668 | - | 297,724 |
| Shares redeemed | (933,783) | (2,767,183) | (9,600,561) | (35,824,976) |
| Net increase (decrease) | (470,005) | (1,379,858) | $(4,658,484) | $(17,333,069) |
| Loyalty Class 1 | | | | |
| Shares sold | 350,255 | 1,803,906 | $3,644,176 | $23,287,853 |
| Reinvestment of distributions | - | 6,145 | - | 84,377 |
| Shares redeemed | (232,352) | (421,676) | (2,458,794) | (4,950,843) |
| Net increase (decrease) | 117,903 | 1,388,375 | $1,185,382 | $18,421,387 |
| Loyalty Class 2 | | | | |
| Shares sold | 154 | - | $1,704 | $- |
| Reinvestment of distributions | - | 115 | - | 1,584 |
| Shares redeemed | (154) | - | (1,720) | - |
| Net increase (decrease) | - | 115 | $(16) | $1,584 |
| Class F | | | | |
| Shares sold | 16,389 | 612,276 | $177,985 | $8,148,906 |
| Reinvestment of distributions | - | 33,286 | - | 459,341 |
| Shares redeemed | (593,241) | (654,892) | (6,115,680) | (7,775,910) |
| Net increase (decrease) | (576,852) | (9,330) | $(5,937,695) | $832,337 |
| Fidelity Disruptive Technology Fund | | | | |
| Fidelity Disruptive Technology Fund | | | | |
| Shares sold | 1,508,821 | 3,479,218 | $ 17,068,799 | $ 62,077,719 |
| Reinvestment of distributions | 34,545 | 77,426 | 392,082 | 1,510,441 |
| Shares redeemed | (2,693,512) | (7,805,680) | (28,498,128) | (142,978,770) |
| Net increase (decrease) | (1,150,146) | (4,249,036) | $(11,037,247) | $(79,390,610) |
| Loyalty Class 1 | | | | |
| Shares sold | 689,438 | 5,021,866 | $ 7,654,409 | $ 92,457,308 |
| Reinvestment of distributions | 43,936 | 28,742 | 499,555 | 564,426 |
| Shares redeemed | (523,766) | (1,521,976) | (5,836,719) | (24,013,647) |
| Net increase (decrease) | 209,608 | 3,528,632 | $2,317,245 | $69,008,087 |
| Loyalty Class 2 | | | | |
| Shares sold | 113 | - | $1,295 | $- |
| Reinvestment of distributions | 121 | 162 | 1,388 | 3,166 |
| Shares redeemed | (113) | - | (1,306) | - |
| Net increase (decrease) | 121 | 162 | $1,377 | $3,166 |
| Class F | | | | |
| Shares sold | 15,888 | 592,417 | $ 177,985 | $ 10,092,143 |
| Reinvestment of distributions | 23,554 | 33,738 | 271,344 | 662,368 |
| Shares redeemed | (382,817) | (367,127) | (3,950,063) | (5,857,770) |
| Net increase (decrease) | (343,375) | 259,028 | $(3,500,734) | $4,896,741 |
11. Other.
A fund's organizational documents provide former and current trustees and officers with a limited indemnification against liabilities arising in connection with the performance of their duties to the fund. In the normal course of business, a fund may also enter into contracts that provide general indemnifications. A fund's maximum exposure under these arrangements is unknown as this would be dependent on future claims that may be made against a fund. The risk of material loss from such claims is considered remote.
In addition, at the end of the period, the following mutual funds managed by the investment adviser or its affiliates were the owners of record of 10% or more of the total outstanding shares.
| | Fidelity Disruptors Fund |
| Fidelity Disruptive Automation Fund | 21% |
| Fidelity Disruptive Communications Fund | 53% |
| Fidelity Disruptive Finance Fund | 42% |
| Fidelity Disruptive Medicine Fund | 43% |
| Fidelity Disruptive Technology Fund | 22% |
12. Proposed Reorganization.
The Board of Trustees of each Fund approved an Agreement and Plan of Reorganization (the Agreement) to reorganize each Fund (Target Fund) into a newly created exchange traded fund ("ETF"), as noted in the below table. All publicly available share classes of each Target Fund will be consolidated into its corresponding Fidelity Disruptive Fund share class within the expected timeframe between May 1 through May 25, 2023. The Agreement provides for shareholders of each Target Fund to receive ETF shares equal in value to the number of shares of the Fidelity Disruptive Fund share class they own on the day the reorganization is effective. Each Target Fund will be the accounting survivor after the reorganization. As such, performance and financial history prior to the reorganization will be that of the Target Fund (Predecessor Funds). Historical share transactions and per share information for the Predecessor Funds will be retroactively adjusted to reflect the change in capital structure due to the reorganization. The reorganization does not require shareholder approval and is expected to become effective on June 9, 2023. The reorganization will qualify as a tax-free reorganization for federal income tax purposes with no gain or loss to be recognized by the funds or their shareholders.
| Current Mutual Funds (Target and Predecessor Funds) | New ETFs |
| Fidelity Disruptive Automation Fund | Fidelity Disruptive Automation ETF |
| Fidelity Disruptive Communications Fund | Fidelity Disruptive Communications ETF |
| Fidelity Disruptive Finance Fund | Fidelity Disruptive Finance ETF |
| Fidelity Disruptive Medicine Fund | Fidelity Disruptive Medicine ETF |
| Fidelity Disruptive Technology Fund | Fidelity Disruptive Technology ETF |
13. Risk and Uncertainties.
Many factors affect a fund's performance. Developments that disrupt global economies and financial markets, such as pandemics, epidemics, outbreaks of infectious diseases, war, terrorism, and environmental disasters, may significantly affect a fund's investment performance. The effects of these developments to a fund will be impacted by the types of securities in which a fund invests, the financial condition, industry, economic sector, and geographic location of an issuer, and a fund's level of investment in the securities of that issuer.
As a shareholder, you incur two types of costs: (1) transaction costs, which may include sales charges (loads) on purchase payments or redemption proceeds, as applicable and (2) ongoing costs, which generally include management fees, distribution and/or service (12b-1) fees and other Fund expenses. This Example is intended to help you understand your ongoing costs (in dollars) of investing in a fund and to compare these costs with the ongoing costs of investing in other mutual funds.
| The Example is based on an investment of $1,000 invested at the beginning of the period and held for the entire period (June 1, 2022 to November 30, 2022). |
Actual Expenses
The first line of the accompanying table provides information about actual account values and actual expenses. You may use the information in this line, together with the amount you invested, to estimate the expenses that you paid over the period. Simply divide your account value by $1,000.00 (for example, an $8,600 account value divided by $1,000.00 = 8.6), then multiply the result by the number in the first line for a class/Fund under the heading entitled "Expenses Paid During Period" to estimate the expenses you paid on your account during this period. If any fund is a shareholder of any underlying mutual funds or exchange-traded funds (ETFs) (the Underlying Funds), such fund indirectly bears its proportional share of the expenses of the Underlying Funds in addition to the direct expenses incurred presented in the table. These fees and expenses are not included in the annualized expense ratio used to calculate the expense estimate in the table below.
Hypothetical Example for Comparison Purposes
The second line of the accompanying table provides information about hypothetical account values and hypothetical expenses based on the actual expense ratio and an assumed rate of return of 5% per year before expenses, which is not the actual return. The hypothetical account values and expenses may not be used to estimate the actual ending account balance or expenses you paid for the period. You may use this information to compare the ongoing costs of investing in the Fund and other funds. To do so, compare this 5% hypothetical example with the 5% hypothetical examples that appear in the shareholder reports of the other funds. If any fund is a shareholder of any Underlying Funds, such fund indirectly bears its proportional share of the expenses of the Underlying Funds in addition to the direct expenses as presented in the table. These fees and expenses are not included in the annualized expense ratio used to calculate the expense estimate in the table below.
Please note that the expenses shown in the table are meant to highlight your ongoing costs only and do not reflect any transaction costs. Therefore, the second line of the table is useful in comparing ongoing costs only, and will not help you determine the relative total costs of owning different funds. In addition, if these transactional costs were included, your costs would have been higher.
| | | | | Annualized Expense Ratio- A | | Beginning Account Value June 1, 2022 | | Ending Account Value November 30, 2022 | | Expenses Paid During Period- C June 1, 2022 to November 30, 2022 |
| Fidelity® Disruptive Automation Fund | | | | | | | | | | |
| Fidelity® Disruptive Automation Fund | | | | 1.00% | | | | | | |
| Actual | | | | | | $ 1,000 | | $ 975.20 | | $ 4.95 |
Hypothetical- B | | | | | | $ 1,000 | | $ 1,020.05 | | $ 5.06 |
| Loyalty Class 1 | | | | .75% | | | | | | |
| Actual | | | | | | $ 1,000 | | $ 975.80 | | $ 3.71 |
Hypothetical- B | | | | | | $ 1,000 | | $ 1,021.31 | | $ 3.80 |
| Loyalty Class 2 | | | | .50% | | | | | | |
| Actual | | | | | | $ 1,000 | | $ 977.30 | | $ 2.48 |
Hypothetical- B | | | | | | $ 1,000 | | $ 1,022.56 | | $ 2.54 |
| Class F | | | | -% | | | | | | |
| Actual | | | | | | $ 1,000 | | $ 980.00 | | $- |
Hypothetical- B | | | | | | $ 1,000 | | $ 1,025.07 | | $- |
| Fidelity® Disruptive Communications Fund | | | | | | | | | | |
| Fidelity® Disruptive Communications Fund | | | | .99% | | | | | | |
| Actual | | | | | | $ 1,000 | | $ 926.90 | | $ 4.78 |
Hypothetical- B | | | | | | $ 1,000 | | $ 1,020.10 | | $ 5.01 |
| Loyalty Class 1 | | | | .75% | | | | | | |
| Actual | | | | | | $ 1,000 | | $ 927.50 | | $ 3.62 |
Hypothetical- B | | | | | | $ 1,000 | | $ 1,021.31 | | $ 3.80 |
| Loyalty Class 2 | | | | .50% | | | | | | |
| Actual | | | | | | $ 1,000 | | $ 928.80 | | $ 2.42 |
Hypothetical- B | | | | | | $ 1,000 | | $ 1,022.56 | | $ 2.54 |
| Class F | | | | -% | | | | | | |
| Actual | | | | | | $ 1,000 | | $ 930.70 | | $- |
Hypothetical- B | | | | | | $ 1,000 | | $ 1,025.07 | | $- |
| Fidelity® Disruptive Finance Fund | | | | | | | | | | |
| Fidelity® Disruptive Finance Fund | | | | 1.00% | | | | | | |
| Actual | | | | | | $ 1,000 | | $ 978.10 | | $ 4.96 |
Hypothetical- B | | | | | | $ 1,000 | | $ 1,020.05 | | $ 5.06 |
| Loyalty Class 1 | | | | .76% | | | | | | |
| Actual | | | | | | $ 1,000 | | $ 979.60 | | $ 3.77 |
Hypothetical- B | | | | | | $ 1,000 | | $ 1,021.26 | | $ 3.85 |
| Loyalty Class 2 | | | | .50% | | | | | | |
| Actual | | | | | | $ 1,000 | | $ 980.70 | | $ 2.48 |
Hypothetical- B | | | | | | $ 1,000 | | $ 1,022.56 | | $ 2.54 |
| Class F | | | | -% | | | | | | |
| Actual | | | | | | $ 1,000 | | $ 982.60 | | $- |
Hypothetical- B | | | | | | $ 1,000 | | $ 1,025.07 | | $- |
| Fidelity® Disruptive Medicine Fund | | | | | | | | | | |
| Fidelity® Disruptive Medicine Fund | | | | 1.00% | | | | | | |
| Actual | | | | | | $ 1,000 | | $ 1,124.50 | | $ 5.33 |
Hypothetical- B | | | | | | $ 1,000 | | $ 1,020.05 | | $ 5.06 |
| Loyalty Class 1 | | | | .75% | | | | | | |
| Actual | | | | | | $ 1,000 | | $ 1,126.30 | | $ 4.00 |
Hypothetical- B | | | | | | $ 1,000 | | $ 1,021.31 | | $ 3.80 |
| Loyalty Class 2 | | | | .50% | | | | | | |
| Actual | | | | | | $ 1,000 | | $ 1,127.60 | | $ 2.67 |
Hypothetical- B | | | | | | $ 1,000 | | $ 1,022.56 | | $ 2.54 |
| Class F | | | | -% | | | | | | |
| Actual | | | | | | $ 1,000 | | $ 1,130.80 | | $- |
Hypothetical- B | | | | | | $ 1,000 | | $ 1,025.07 | | $- |
| Fidelity® Disruptive Technology Fund | | | | | | | | | | |
| Fidelity® Disruptive Technology Fund | | | | .99% | | | | | | |
| Actual | | | | | | $ 1,000 | | $ 931.40 | | $ 4.79 |
Hypothetical- B | | | | | | $ 1,000 | | $ 1,020.10 | | $ 5.01 |
| Loyalty Class 1 | | | | .75% | | | | | | |
| Actual | | | | | | $ 1,000 | | $ 932.40 | | $ 3.63 |
Hypothetical- B | | | | | | $ 1,000 | | $ 1,021.31 | | $ 3.80 |
| Loyalty Class 2 | | | | .50% | | | | | | |
| Actual | | | | | | $ 1,000 | | $ 933.70 | | $ 2.42 |
Hypothetical- B | | | | | | $ 1,000 | | $ 1,022.56 | | $ 2.54 |
| Class F | | | | -% | | | | | | |
| Actual | | | | | | $ 1,000 | | $ 935.70 | | $- |
Hypothetical- B | | | | | | $ 1,000 | | $ 1,025.07 | | $- |
| |
A Annualized expense ratio reflects expenses net of applicable fee waivers.
B 5% return per year before expenses
C Expenses are equal to the annualized expense ratio, multiplied by the average account value over the period, multiplied by 183/ 365 (to reflect the one-half year period). The fees and expenses of any Underlying Funds are not included in each annualized expense ratio.
1.9897373.102
DSS-SANN-0123
Fidelity® Disruptors Fund
Semi-Annual Report
November 30, 2022
Contents
To view a fund's proxy voting guidelines and proxy voting record for the 12-month period ended June 30, visit http://www.fidelity.com/proxyvotingresults or visit the Securities and Exchange Commission's (SEC) web site at http://www.sec.gov.
You may also call 1-800-544-8544 to request a free copy of the proxy voting guidelines.
Standard & Poor's, S&P and S&P 500 are registered service marks of The McGraw-Hill Companies, Inc. and have been licensed for use by Fidelity Distributors Corporation.
Other third-party marks appearing herein are the property of their respective owners.
All other marks appearing herein are registered or unregistered trademarks or service marks of FMR LLC or an affiliated company. © 2023 FMR LLC. All rights reserved.
This report and the financial statements contained herein are submitted for the general information of the shareholders of the Fund. This report is not authorized for distribution to prospective investors in the Fund unless preceded or accompanied by an effective prospectus.
A fund files its complete schedule of portfolio holdings with the SEC for the first and third quarters of each fiscal year on Form N-PORT. Forms N-PORT are available on the SEC's web site at http://www.sec.gov. A fund's Forms N-PORT may be reviewed and copied at the SEC's Public Reference Room in Washington, DC. Information regarding the operation of the SEC's Public Reference Room may be obtained by calling 1-800-SEC-0330.
For a complete list of a fund's portfolio holdings, view the most recent holdings listing, semiannual report, or annual report on Fidelity's web site at http://www.fidelity.com, http://www.institutional.fidelity.com, or http://www.401k.com, as applicable.
NOT FDIC INSURED •MAY LOSE VALUE •NO BANK GUARANTEE
Neither the Fund nor Fidelity Distributors Corporation is a bank.
The information in the following table is based on the direct Investments of the Fund.
Top Holdings (% of Fund's net assets) |
| |
| Fidelity Disruptive Automation Fund Class F | 21.5 | |
| Fidelity Disruptive Finance Fund Class F | 20.7 | |
| Fidelity Disruptive Medicine Fund Class F | 20.7 | |
| Fidelity Disruptive Communications Fund Class F | 18.6 | |
| Fidelity Disruptive Technology Fund Class F | 18.5 | |
| | 100.0 | |
| |
Asset Allocation (% of Fund's net assets) |
|
Percentages shown as 0.0% may reflect amounts less than 0.05%. |
|
Showing Percentage of Net Assets
| Domestic Equity Funds - 100.0% |
| | | Shares | Value ($) |
| Fidelity Disruptive Automation Fund Class F (a) | | 1,478,044 | 21,771,583 |
| Fidelity Disruptive Communications Fund Class F (a) | | 1,732,811 | 18,852,980 |
| Fidelity Disruptive Finance Fund Class F (a) | | 1,488,089 | 21,056,455 |
| Fidelity Disruptive Medicine Fund Class F (a) | | 1,843,022 | 21,028,885 |
| Fidelity Disruptive Technology Fund Class F (a) | | 1,692,289 | 18,733,642 |
| TOTAL DOMESTIC EQUITY FUNDS (Cost $108,731,437) | | | 101,443,545 |
| | | | |
| TOTAL INVESTMENT IN SECURITIES - 100.0% (Cost $108,731,437) | 101,443,545 |
NET OTHER ASSETS (LIABILITIES) - 0.0% | (2,833) |
| NET ASSETS - 100.0% | 101,440,712 |
| | |
Legend
Affiliated Underlying Funds
Fiscal year to date information regarding the Fund's investments in affiliated Underlying Funds is presented below. Exchanges between classes of the same affiliated Underlying Funds may occur. If an Underlying Funds changes its name, the name presented below is the name in effect at period end.
| Affiliate | Value, beginning of period ($) | Purchases ($) | Sales Proceeds ($) | Dividend Income ($) | Realized Gain (loss) ($) | Change in Unrealized appreciation (depreciation) ($) | Value, end of period ($) |
| Fidelity Disruptive Automation Fund Class F | 26,633,114 | 177,985 | 3,950,063 | - | (1,512,794) | 423,341 | 21,771,583 |
| Fidelity Disruptive Communications Fund Class F | 24,611,541 | 177,985 | 3,950,063 | - | (2,252,227) | 265,744 | 18,852,980 |
| Fidelity Disruptive Finance Fund Class F | 25,684,493 | 1,616,232 | 3,952,322 | 1,435,988 | (794,482) | (1,497,466) | 21,056,455 |
| Fidelity Disruptive Medicine Fund Class F | 24,416,531 | 177,984 | 6,115,680 | - | (1,583,188) | 4,133,238 | 21,028,885 |
| Fidelity Disruptive Technology Fund Class F | 24,368,348 | 448,363 | 3,950,491 | 269,950 | (2,773,789) | 641,211 | 18,733,642 |
| | 125,714,027 | 2,598,549 | 21,918,619 | 1,705,938 | (8,916,480) | 3,966,068 | 101,443,545 |
Amounts in the income column in the above table include any capital gain distributions from underlying funds, which are presented in the corresponding line item in the Statement of Operations, if applicable.
Amounts included in the purchases and sales proceeds columns may include in-kind transactions, if applicable.
Investment Valuation
The following is a summary of the inputs used, as of November 30, 2022, involving the Fund's assets and liabilities carried at fair value. The inputs or methodology used for valuing securities may not be an indication of the risk associated with investing in those securities. For more information on valuation inputs, and their aggregation into the levels used below, please refer to the Investment Valuation section in the accompanying Notes to Financial Statements.
| Valuation Inputs at Reporting Date: |
| Description | Total ($) | Level 1 ($) | Level 2 ($) | Level 3 ($) |
Investments in Securities: | | | | |
|
| Domestic Equity Funds | 101,443,545 | 101,443,545 | - | - |
| Total Investments in Securities: | 101,443,545 | 101,443,545 | - | - |
| Statement of Assets and Liabilities |
| | | | November 30, 2022 (Unaudited) |
| | | | | |
| Assets | | | | |
| Investment in securities, at value - See accompanying schedule: | | | | |
Affiliated issuers (cost $108,731,437) | | 101,443,545 | | |
| Total Investment in Securities (cost $108,731,437) | | | $ | 101,443,545 |
| Cash | | | | 312 |
| Receivable for investments sold | | | | 212,907 |
| Receivable for fund shares sold | | | | 161,749 |
Total assets | | | | 101,818,513 |
| Liabilities | | | | |
| Payable for fund shares redeemed | | $311,766 | | |
| Accrued management fee | | 66,035 | | |
| Total Liabilities | | | | 377,801 |
| Net Assets | | | $ | 101,440,712 |
| Net Assets consist of: | | | | |
| Paid in capital | | | $ | 119,876,048 |
| Total accumulated earnings (loss) | | | | (18,435,336) |
| Net Assets | | | $ | 101,440,712 |
| | | | | |
| Net Asset Value and Maximum Offering Price | | | | |
| Fidelity Disruptors Fund : | | | | |
Net Asset Value , offering price and redemption price per share ($24,278,966 ÷ 1,921,569 shares) | | | $ | 12.63 |
| Loyalty Class 1 : | | | | |
Net Asset Value , offering price and redemption price per share ($77,031,254 ÷ 6,077,755 shares) | | | $ | 12.67 |
| Loyalty Class 2 : | | | | |
Net Asset Value , offering price and redemption price per share ($130,492 ÷ 10,242 shares) | | | $ | 12.74 |
| Statement of Operations |
| | | | Six months ended November 30, 2022 (Unaudited) |
| Investment Income | | | | |
| Dividends: | | | | |
| Affiliated issuers | | | $ | 112,722 |
| Expenses | | | | |
| Management fee | $ | 468,396 | | |
| Independent trustees' fees and expenses | | 204 | | |
| Total expenses before reductions | | 468,600 | | |
| Expense reductions | | (173) | | |
| Total expenses after reductions | | | | 468,427 |
| Net Investment income (loss) | | | | (355,705) |
| Realized and Unrealized Gain (Loss) | | | | |
| Net realized gain (loss) on: | | | | |
| Investment Securities: | | | | |
| Affiliated issuers | | (8,916,480) | | |
| Capital gain distributions from underlying funds: | | | | |
| Affiliated issuers | | 1,593,216 | | |
| Total net realized gain (loss) | | | | (7,323,264) |
| Change in net unrealized appreciation (depreciation) on: | | | | |
| Investment Securities: | | | | |
| Affiliated issuers | | 3,966,068 | | |
| Total change in net unrealized appreciation (depreciation) | | | | 3,966,068 |
| Net gain (loss) | | | | (3,357,196) |
| Net increase (decrease) in net assets resulting from operations | | | $ | (3,712,901) |
| Statement of Changes in Net Assets |
| |
| | Six months ended November 30, 2022 (Unaudited) | | Year ended May 31, 2022 |
| Increase (Decrease) in Net Assets | | | | |
| Operations | | | | |
| Net investment income (loss) | $ | (355,705) | $ | (1,064,141) |
| Net realized gain (loss) | | (7,323,264) | | 1,032,572 |
| Change in net unrealized appreciation (depreciation) | | 3,966,068 | | (41,431,290) |
| Net increase (decrease) in net assets resulting from operations | | (3,712,901) | | (41,462,859) |
| Distributions to shareholders | | - | | (2,740,280) |
| Share transactions - net increase (decrease) | | (20,556,572) | | 3,294,782 |
| Total increase (decrease) in net assets | | (24,269,473) | | (40,908,357) |
| | | | | |
| Net Assets | | | | |
| Beginning of period | | 125,710,185 | | 166,618,542 |
| End of period | $ | 101,440,712 | $ | 125,710,185 |
| | | | | |
| | | | | |
Financial Highlights
| Fidelity® Disruptors Fund |
| |
| | Six months ended (Unaudited) November 30, 2022 | | Years ended May 31, 2022 | | 2021 | | 2020 A |
Selected Per-Share Data | | | | | | | | |
| Net asset value, beginning of period | $ | 12.80 | $ | 16.89 | $ | 11.57 | $ | 10.00 |
| Income from Investment Operations | | | | | | | | |
Net investment income (loss) B,C | | (.05) | | (.12) | | (.12) | | (.01) |
| Net realized and unrealized gain (loss) | | (.12) | | (3.75) | | 5.55 | | 1.58 |
| Total from investment operations | | (.17) | | (3.87) | | 5.43 | | 1.57 |
| Distributions from net realized gain | | - | | (.22) | | (.11) | | - |
| Total distributions | | - | | (.22) | | (.11) | | - |
| Net asset value, end of period | $ | 12.63 | $ | 12.80 | $ | 16.89 | $ | 11.57 |
Total Return D,E | | (1.33)% | | (23.29)% | | 46.99% | | 15.70% |
Ratios to Average Net Assets C,F,G | | | | | | | | |
| Expenses before reductions | | 1.00% H | | 1.00% | | 1.01% I | | 1.01% H,I |
| Expenses net of fee waivers, if any | | 1.00% H | | 1.00% | | 1.01% I | | 1.01% H,I |
| Expenses net of all reductions | | 1.00% H | | 1.00% | | 1.01% I | | 1.01% H,I |
| Net investment income (loss) | | (.80)% H | | (.69)% | | (.77)% | | (1.01)% H |
| Supplemental Data | | | | | | | | |
| Net assets, end of period (000 omitted) | $ | 24,279 | $ | 48,579 | $ | 141,385 | $ | 19,310 |
Portfolio turnover rate J | | 5% H | | 22% | | 3% | | -% K |
A For the period April 16, 2020 (commencement of operations) through May 31, 2020
B Calculated based on average shares outstanding during the period.
C Net investment income (loss) is affected by the timing of the declaration of dividends by any underlying mutual funds or exchange-traded funds (ETFs). Net investment income (loss) of any mutual funds or ETFs is not included in the Fund's net investment income (loss) ratio.
D Total returns for periods of less than one year are not annualized.
E Total returns would have been lower if certain expenses had not been reduced during the applicable periods shown.
F Fees and expenses of any underlying mutual funds or exchange-traded funds (ETFs) are not included in the Fund's expense ratio. The Fund indirectly bears its proportionate share of these expenses.
G Expense ratios reflect operating expenses of the class. Expenses before reductions do not reflect amounts reimbursed, waived, or reduced through arrangements with the investment adviser, brokerage services, or other offset arrangements, if applicable, and do not represent the amount paid by the class during periods when reimbursements, waivers or reductions occur.
H Annualized.
I On certain classes, the size and fluctuation of net assets and expense amounts may cause ratios to differ from contractual rates.
J Amount does not include the portfolio activity of any underlying mutual funds or exchange-traded funds (ETFs).
K Amount not annualized.
| Fidelity® Disruptors Fund Loyalty Class 1 |
| |
| | Six months ended (Unaudited) November 30, 2022 | | Years ended May 31, 2022 | | 2021 | | 2020 A |
Selected Per-Share Data | | | | | | | | |
| Net asset value, beginning of period | $ | 12.83 | $ | 16.95 | $ | 11.58 | $ | 10.00 |
| Income from Investment Operations | | | | | | | | |
Net investment income (loss) B,C | | (.03) | | (.08) | | (.12) | | (.01) |
| Net realized and unrealized gain (loss) | | (.13) | | (3.75) | | 5.59 | | 1.59 |
| Total from investment operations | | (.16) | | (3.83) | | 5.47 | | 1.58 |
| Distributions from net realized gain | | - | | (.29) | | (.10) | | - |
| Total distributions | | - | | (.29) | | (.10) | | - |
| Net asset value, end of period | $ | 12.67 | $ | 12.83 | $ | 16.95 | $ | 11.58 |
Total Return D,E | | (1.25)% | | (23.07)% | | 47.32% | | 15.80% |
Ratios to Average Net Assets C,F,G | | | | | | | | |
| Expenses before reductions | | .75% H | | .75% | | .77% I | | .75% H |
| Expenses net of fee waivers, if any | | .75% H | | .75% | | .77% I | | .75% H |
| Expenses net of all reductions | | .75% H | | .75% | | .77% I | | .75% H |
| Net investment income (loss) | | (.55)% H | | (.51)% | | (.74)% | | (.75)% H |
| Supplemental Data | | | | | | | | |
| Net assets, end of period (000 omitted) | $ | 77,031 | $ | 76,999 | $ | 25,062 | $ | 116 |
Portfolio turnover rate J | | 5% H | | 22% | | 3% | | -% K |
A For the period April 16, 2020 (commencement of operations) through May 31, 2020
B Calculated based on average shares outstanding during the period.
C Net investment income (loss) is affected by the timing of the declaration of dividends by any underlying mutual funds or exchange-traded funds (ETFs). Net investment income (loss) of any mutual funds or ETFs is not included in the Fund's net investment income (loss) ratio.
D Total returns for periods of less than one year are not annualized.
E Total returns would have been lower if certain expenses had not been reduced during the applicable periods shown.
F Fees and expenses of any underlying mutual funds or exchange-traded funds (ETFs) are not included in the Fund's expense ratio. The Fund indirectly bears its proportionate share of these expenses.
G Expense ratios reflect operating expenses of the class. Expenses before reductions do not reflect amounts reimbursed, waived, or reduced through arrangements with the investment adviser, brokerage services, or other offset arrangements, if applicable, and do not represent the amount paid by the class during periods when reimbursements, waivers or reductions occur.
H Annualized.
I On certain classes, the size and fluctuation of net assets and expense amounts may cause ratios to differ from contractual rates.
J Amount does not include the portfolio activity of any underlying mutual funds or exchange-traded funds (ETFs).
K Amount not annualized.
| Fidelity® Disruptors Fund Loyalty Class 2 |
| |
| | Six months ended (Unaudited) November 30, 2022 | | Years ended May 31, 2022 | | 2021 | | 2020 A |
Selected Per-Share Data | | | | | | | | |
| Net asset value, beginning of period | $ | 12.88 | $ | 16.97 | $ | 11.58 | $ | 10.00 |
| Income from Investment Operations | | | | | | | | |
Net investment income (loss) B,C | | (.02) | | (.04) | | (.04) | | (.01) |
| Net realized and unrealized gain (loss) | | (.12) | | (3.76) | | 5.55 | | 1.59 |
| Total from investment operations | | (.14) | | (3.80) | | 5.51 | | 1.58 |
| Distributions from net realized gain | | - | | (.29) | | (.12) | | - |
| Total distributions | | - | | (.29) | | (.12) | | - |
| Net asset value, end of period | $ | 12.74 | $ | 12.88 | $ | 16.97 | $ | 11.58 |
Total Return D,E | | (1.09)% | | (22.86)% | | 47.69% | | 15.80% |
Ratios to Average Net Assets C,F,G | | | | | | | | |
| Expenses before reductions | | .50% H | | .50% | | .50% | | .50% H |
| Expenses net of fee waivers, if any | | .50% H | | .50% | | .50% | | .50% H |
| Expenses net of all reductions | | .50% H | | .50% | | .50% | | .50% H |
| Net investment income (loss) | | (.30)% H | | (.22)% | | (.26)% | | (.50)% H |
| Supplemental Data | | | | | | | | |
| Net assets, end of period (000 omitted) | $ | 130 | $ | 132 | $ | 171 | $ | 116 |
Portfolio turnover rate I | | 5% H | | 22% | | 3% | | -% J |
A For the period April 16, 2020 (commencement of operations) through May 31, 2020
B Calculated based on average shares outstanding during the period.
C Net investment income (loss) is affected by the timing of the declaration of dividends by any underlying mutual funds or exchange-traded funds (ETFs). Net investment income (loss) of any mutual funds or ETFs is not included in the Fund's net investment income (loss) ratio.
D Total returns for periods of less than one year are not annualized.
E Total returns would have been lower if certain expenses had not been reduced during the applicable periods shown.
F Fees and expenses of any underlying mutual funds or exchange-traded funds (ETFs) are not included in the Fund's expense ratio. The Fund indirectly bears its proportionate share of these expenses.
G Expense ratios reflect operating expenses of the class. Expenses before reductions do not reflect amounts reimbursed, waived, or reduced through arrangements with the investment adviser, brokerage services, or other offset arrangements, if applicable, and do not represent the amount paid by the class during periods when reimbursements, waivers or reductions occur.
H Annualized.
I Amount does not include the portfolio activity of any underlying mutual funds or exchange-traded funds (ETFs).
J Amount not annualized.
For the period ended November 30, 2022
1. Organization.
Fidelity Disruptors Fund (the Fund) is a fund of Fidelity Summer Street Trust (the Trust). The Trust is registered under the Investment Company Act of 1940, as amended (the 1940 Act), as an open-end management investment company organized as a Massachusetts business trust. The Fund is authorized to issue an unlimited number of shares. The Fund offers Fidelity Disruptors Fund, Loyalty Class 1 and Loyalty Class 2 shares. Effective November 30, 2022 the Fund was closed to new accounts with certain exceptions. Each class has equal rights as to assets and voting privileges, except for matters affecting a single class. For certain accounts, Fidelity Disruptors Fund shares will automatically convert to Loyalty Class 1 shares after a holding period of one year from the initial date of purchase; and then from Loyalty Class 1 shares to Loyalty Class 2 shares after another holding period of two years.
Effective April 1, 2023, the automatic conversion feature between Loyalty Class 1 and Loyalty Class 2 will be discontinued.
2. Significant Accounting Policies.
The Fund is an investment company and applies the accounting and reporting guidance of the Financial Accounting Standards Board (FASB) Accounting Standards Codification Topic 946 Financial Services - Investment Companies . The financial statements have been prepared in conformity with accounting principles generally accepted in the United States of America (GAAP), which require management to make certain estimates and assumptions at the date of the financial statements. Actual results could differ from those estimates. Subsequent events, if any, through the date that the financial statements were issued have been evaluated in the preparation of the financial statements. The Fund's Schedule of Investments lists any underlying mutual funds or exchange-traded funds (ETFs) but does not include the underlying holdings of these funds. The following summarizes the significant accounting policies of the Fund:
Investment Valuation. Investments are valued as of 4:00 p.m. Easter time on the last calendar day of the period. The Fund categorizes the inputs to valuation techniques used to value its investments into a disclosure hierarchy consisting of three levels as shown below:
Level 1 - unadjusted quoted prices in active markets for identical investments
Level 2 - other significant observable inputs (including quoted prices for similar investments, interest rates, prepayment speeds, etc.)
Level 3 - unobservable inputs (including the Fund's own assumptions based on the best information available)
Valuation techniques used to value the Fund's investments by major category are as follows. Investments in open-end mutual funds are valued at their closing net asset value (NAV) each business day and are categorized as Level 1 in the hierarchy. The aggregate value of investments by input level as of November 30, 2022 is included at the end of the Fund's Schedule of Investments.
Investment Transactions and Income. For financial reporting purposes, the Fund's investment holdings and NAV include trades executed through the end of the last business day of the period. The NAV per share for processing shareholder transactions is calculated as of the close of business of the New York Stock Exchange (NYSE), normally 4:00 p.m. Eastern time and includes trades executed through the end of the prior business day. Gains and losses on securities sold are determined on the basis of identified cost. Income and capital gain distributions from any underlying mutual funds or exchange-traded funds (ETFs) are recorded on the ex-dividend date.
Class Allocations and Expenses. Investment income, realized and unrealized capital gains and losses, common expenses of a fund, and certain fund-level expense reductions, if any, are allocated daily on a pro-rata basis to each class based on the relative net assets of each class to the total net assets of a fund. Each class differs with respect to transfer agent and distribution and service plan fees incurred, as applicable. Certain expense reductions may also differ by class, if applicable. For the reporting period, the allocated portion of income and expenses to each class as a percent of its average net assets may vary due to the timing of recording these transactions in relation to fluctuating net assets of the classes. Expenses directly attributable to a fund are charged to that fund. Expenses attributable to more than one fund are allocated among the respective funds on the basis of relative net assets or other appropriate methods. Expenses included in the accompanying financial statements reflect the expenses of that fund and do not include any expenses associated with any underlying mutual funds or exchange-traded funds. Although not included in a fund's expenses, a fund indirectly bears its proportionate share of these expenses through the net asset value of each underlying mutual fund or exchange-traded fund. Expense estimates are accrued in the period to which they relate and adjustments are made when actual amounts are known.
Income Tax Information and Distributions to Shareholders. Each year, the Fund intends to qualify as a regulated investment company under Subchapter M of the Internal Revenue Code, including distributing substantially all of its taxable income and realized gains. As a result, no provision for U.S. Federal income taxes is required. The Fund files a U.S. federal tax return, in addition to state and local tax returns as required. The Fund's federal income tax returns are subject to examination by the Internal Revenue Service (IRS) for a period of three fiscal years after they are filed. State and local tax returns may be subject to examination for an additional fiscal year depending on the jurisdiction.
Distributions are declared and recorded on the ex-dividend date. Income and capital gain distributions are declared separately for each class. Income and capital gain distributions are determined in accordance with income tax regulations, which may differ from GAAP.
Capital accounts within the financial statements are adjusted for permanent book-tax differences. These adjustments have no impact on net assets or the results of operations. Capital accounts are not adjusted for temporary book-tax differences which will reverse in a subsequent period.
Book-tax differences are primarily due to the short-term gain distributions from the underlying mutual funds or exchange-traded funds (ETFs), and losses deferred due to wash sales and excise tax regulations.
As of period end, the cost and unrealized appreciation (depreciation) in securities, and derivatives if applicable, for federal income tax purposes were as follows:
| Gross unrealized appreciation | $5,155,964 |
| Gross unrealized depreciation | (12,761,598) |
| Net unrealized appreciation (depreciation) | $(7,605,634) |
| Tax cost | $109,049,179 |
The Fund elected to defer to its next fiscal year approximately $2,717,555 of capital losses recognized during the period November 1,2021 to May 31,2022.
3. Purchases and Sales of Investments.
Purchases and sales of securities, other than short-term securities and in-kind transactions, as applicable, are noted in the table below.
| | Purchases ($) | Sales ($) |
| Fidelity Disruptors Fund | 2,598,549 | 21,918,619 |
4. Fees and Other Transactions with Affiliates.
Management Fee and Expense Contract. Fidelity Management & Research Company LLC (the investment adviser) and its affiliates provide the Fund with investment management related services for which each Class of the Fund pays a monthly all-inclusive management fee based on an annual percentage of class-level average net assets. Under the management contract, the investment adviser pays all other operating expenses, except the compensation of the independent Trustees and certain miscellaneous expenses, such as proxy and shareholder meeting expenses.
Under the expense contract, the investment adviser pays all other class-level operating expenses as necessary, except the compensation of the independent Trustees and certain miscellaneous expenses, such as proxy and shareholder meeting expenses, so that total expenses of Loyalty Class 1 and Loyalty Class 2 do not exceed an annual percentage of class-level average net assets.
For the reporting period, the annual management fee and expense contract rates were as follows:
| | Management Fee Annual % of Class-Level Average Net Assets | Expense Contract Annual % of Class-Level Average Net Assets |
| Fidelity Disruptors Fund | 1.00% | N/A |
| Loyalty Class 1 | 1.00% | .75% |
| Loyalty Class 2 | 1.00% | .50% |
Effective April 1, 2023, Fidelity Disruptors Fund shares of the Fund will be added to the expense contract at the rate of .50% of class-level average net assets. In addition, the expense contract rate for Loyalty Class 1 shares of the Fund will be changed to .50% of class-level average net assets.
Interfund Trades. Funds may purchase from or sell securities to other Fidelity Funds under procedures adopted by the Board. The procedures have been designed to ensure these interfund trades are executed in accordance with Rule 17a-7 of the 1940 Act. Any interfund trades are included within the respective purchases and sales amounts shown in the Purchases and Sales of Investments note. During the period, there were no interfund trades.
5. Committed Line of Credit.
Certain Funds participate with other funds managed by the investment adviser or an affiliate in a $4.25 billion credit facility (the "line of credit") to be utilized for temporary or emergency purposes to fund shareholder redemptions or for other short-term liquidity purposes. The participating funds have agreed to pay commitment fees on their pro-rata portion of the line of credit, which are reflected in Miscellaneous expenses on the Statement of Operations, and are listed below. During the period, there were no borrowings on this line of credit.
6. Expense Reductions.
Through arrangements with the Fund's custodian and each class' transfer agent, credits realized as a result of certain uninvested cash balances were used to reduce the Fund's expenses. During the period, custodian credits reduced the Fund's expenses by $2. During the period, transfer agent credits reduced each class's expenses as noted in the table below.
| | Expense reduction |
| Fidelity Disruptors Fund | $68 |
| Loyalty Class 1 | 103 |
| | $171 |
7. Distributions to Shareholders.
Distributions to shareholders of each class were as follows:
| | Six months ended November 30, 2022 | Year ended May 31, 2022 |
| Fidelity Disruptors Fund | | |
| Distributions to shareholders | | |
| Fidelity Disruptors Fund | $- | $1,248,331 |
| Loyalty Class 1 | - | 1,488,996 |
| Loyalty Class 2 | - | 2,953 |
Total | $- | $2,740,280 |
8. Share Transactions.
Share transactions for each class were as follows and may contain in-kind transactions, automatic conversions between classes or exchanges between affiliated funds:
| | Shares | Shares | Dollars | Dollars |
| | Six months ended November 30, 2022 | Year ended May 31, 2022 | Six months ended November 30, 2022 | Year ended May 31, 2022 |
| Fidelity Disruptors Fund | | | | |
| Fidelity Disruptors Fund | | | | |
| Shares sold | 473,143 | 3,364,718 | $5,813,465 | $ 57,885,306 |
| Reinvestment of distributions | - | 64,582 | - | 1,155,369 |
| Shares redeemed | (2,345,650) | (8,005,363) | (27,417,055) | (134,859,195) |
| Net increase (decrease) | (1,872,507) | (4,576,063) | $(21,603,590) | $(75,818,520) |
| Loyalty Class 1 | | | | |
| Shares sold | 896,058 | 5,960,783 | $ 11,020,058 | $ 101,335,523 |
| Reinvestment of distributions | - | 77,695 | - | 1,391,522 |
| Shares redeemed | (820,847) | (1,514,632) | (9,973,040) | (23,616,696) |
| Net increase (decrease) | 75,211 | 4,523,846 | $1,047,018 | $79,110,349 |
| Loyalty Class 2 | | | | |
| Reinvestment of distributions | - | 164 | - | 2,953 |
| Net increase (decrease) | - | 164 | $- | $2,953 |
9. Other.
A fund's organizational documents provide former and current trustees and officers with a limited indemnification against liabilities arising in connection with the performance of their duties to the fund. In the normal course of business, a fund may also enter into contracts that provide general indemnifications. A fund's maximum exposure under these arrangements is unknown as this would be dependent on future claims that may be made against a fund. The risk of material loss from such claims is considered remote.
Funds do not invest in underlying mutual funds for the purpose of exercising management or control; however, investments by funds within their principal investment strategies may represent a significant portion of the underlying mutual fund's net assets.
| Fund | Fidelity Disruptors Fund |
| Fidelity Disruptive Automation Fund | 21% |
| Fidelity Disruptive Communications Fund | 53% |
| Fidelity Disruptive Finance Fund | 42% |
| Fidelity Disruptive Medicine Fund | 43% |
| Fidelity Disruptive Technology Fund | 22% |
10. Proposed Reorganization.
The Board of Trustees of the Fund approved an Agreement and Plan of Reorganization (the Agreement) to reorganize the Fund (Target Fund) into a newly created exchange traded fund ("ETF"), as noted in the below table. All publicly available share classes of the Target Fund will be consolidated into the Fidelity Disruptors Fund share class within the expected timeframe between May 1 through May 25, 2023. The Agreement provides for shareholders of the Target Fund to receive ETF shares equal in value to the number of shares of the Fidelity Disruptors Fund shares they own on the day the reorganization is effective. The Target Fund will be the accounting survivor after the reorganization. As such, performance and financial history prior to the reorganization will be that of the Target Fund (Predecessor Fund). Historical share transactions and per share information for the Predecessor Fund will be retroactively adjusted to reflect the change in capital structure due to the reorganization. The reorganization does not require shareholder approval and is expected to become effective on June 16, 2023. The reorganization will qualify as a tax-free reorganization for federal income tax purposes with no gain or loss to be recognized by the fund or its shareholders.
| Current Mutual Fund (Target and Predecessor Fund) | New ETF |
| Fidelity Disruptors Fund | Fidelity Disruptors ETF |
11. Risk and Uncertainties.
Many factors affect a fund's performance. Developments that disrupt global economies and financial markets, such as pandemics, epidemics, outbreaks of infectious diseases, war, terrorism, and environmental disasters, may significantly affect a fund's investment performance. The effects of these developments to a fund will be impacted by the types of securities in which a fund invests, the financial condition, industry, economic sector, and geographic location of an issuer, and a fund's level of investment in the securities of that issuer.
As a shareholder, you incur two types of costs: (1) transaction costs, which may include sales charges (loads) on purchase payments or redemption proceeds, as applicable and (2) ongoing costs, which generally include management fees, distribution and/or service (12b-1) fees and other Fund expenses. This Example is intended to help you understand your ongoing costs (in dollars) of investing in a fund and to compare these costs with the ongoing costs of investing in other mutual funds.
| The Example is based on an investment of $1,000 invested at the beginning of the period and held for the entire period (June 1, 2022 to November 30, 2022). |
Actual Expenses
The first line of the accompanying table provides information about actual account values and actual expenses. You may use the information in this line, together with the amount you invested, to estimate the expenses that you paid over the period. Simply divide your account value by $1,000.00 (for example, an $8,600 account value divided by $1,000.00 = 8.6), then multiply the result by the number in the first line for a class/Fund under the heading entitled "Expenses Paid During Period" to estimate the expenses you paid on your account during this period. If any fund is a shareholder of any underlying mutual funds or exchange-traded funds (ETFs) (the Underlying Funds), such fund indirectly bears its proportional share of the expenses of the Underlying Funds in addition to the direct expenses incurred presented in the table. These fees and expenses are not included in the annualized expense ratio used to calculate the expense estimate in the table below.
Hypothetical Example for Comparison Purposes
The second line of the accompanying table provides information about hypothetical account values and hypothetical expenses based on the actual expense ratio and an assumed rate of return of 5% per year before expenses, which is not the actual return. The hypothetical account values and expenses may not be used to estimate the actual ending account balance or expenses you paid for the period. You may use this information to compare the ongoing costs of investing in the Fund and other funds. To do so, compare this 5% hypothetical example with the 5% hypothetical examples that appear in the shareholder reports of the other funds. If any fund is a shareholder of any Underlying Funds, such fund indirectly bears its proportional share of the expenses of the Underlying Funds in addition to the direct expenses as presented in the table. These fees and expenses are not included in the annualized expense ratio used to calculate the expense estimate in the table below.
Please note that the expenses shown in the table are meant to highlight your ongoing costs only and do not reflect any transaction costs. Therefore, the second line of the table is useful in comparing ongoing costs only, and will not help you determine the relative total costs of owning different funds. In addition, if these transactional costs were included, your costs would have been higher.
| | | | | Annualized Expense Ratio- A | | Beginning Account Value June 1, 2022 | | Ending Account Value November 30, 2022 | | Expenses Paid During Period- C June 1, 2022 to November 30, 2022 |
| Fidelity® Disruptors Fund | | | | | | | | | | |
| Fidelity® Disruptors Fund | | | | 1.00% | | | | | | |
| Actual | | | | | | $ 1,000 | | $ 986.70 | | $ 4.98 |
Hypothetical- B | | | | | | $ 1,000 | | $ 1,020.05 | | $ 5.06 |
| Loyalty Class 1 | | | | .75% | | | | | | |
| Actual | | | | | | $ 1,000 | | $ 987.50 | | $ 3.74 |
Hypothetical- B | | | | | | $ 1,000 | | $ 1,021.31 | | $ 3.80 |
| Loyalty Class 2 | | | | .50% | | | | | | |
| Actual | | | | | | $ 1,000 | | $ 989.10 | | $ 2.49 |
Hypothetical- B | | | | | | $ 1,000 | | $ 1,022.56 | | $ 2.54 |
| |
A Annualized expense ratio reflects expenses net of applicable fee waivers.
B 5% return per year before expenses
C Expenses are equal to the annualized expense ratio, multiplied by the average account value over the period, multiplied by 183/ 365 (to reflect the one-half year period). The fees and expenses of any Underlying Funds are not included in each annualized expense ratio.
1.9897406.102
DSL-SANN-0123
Fidelity® Sustainable U.S. Equity Fund
Semi-Annual Report
November 30, 2022
Includes Fidelity and Fidelity Advisor share classes
Contents
To view a fund's proxy voting guidelines and proxy voting record for the 12-month period ended June 30, visit http://www.fidelity.com/proxyvotingresults or visit the Securities and Exchange Commission's (SEC) web site at http://www.sec.gov.
You may also call 1-800-544-8544 if you're an individual investing directly with Fidelity, call 1-800-835-5092 if you're a plan sponsor or participant with Fidelity as your recordkeeper or call 1-877-208-0098 on institutional accounts or if you're an advisor or invest through one to request a free copy of the proxy voting guidelines.
Standard & Poor's, S&P and S&P 500 are registered service marks of The McGraw-Hill Companies, Inc. and have been licensed for use by Fidelity Distributors Corporation.
Other third-party marks appearing herein are the property of their respective owners.
All other marks appearing herein are registered or unregistered trademarks or service marks of FMR LLC or an affiliated company. © 2023 FMR LLC. All rights reserved.
This report and the financial statements contained herein are submitted for the general information of the shareholders of the Fund. This report is not authorized for distribution to prospective investors in the Fund unless preceded or accompanied by an effective prospectus.
A fund files its complete schedule of portfolio holdings with the SEC for the first and third quarters of each fiscal year on Form N-PORT. Forms N-PORT are available on the SEC's web site at http://www.sec.gov. A fund's Forms N-PORT may be reviewed and copied at the SEC's Public Reference Room in Washington, DC. Information regarding the operation of the SEC's Public Reference Room may be obtained by calling 1-800-SEC-0330.
For a complete list of a fund's portfolio holdings, view the most recent holdings listing, semiannual report, or annual report on Fidelity's web site at http://www.fidelity.com, http://www.institutional.fidelity.com, or http://www.401k.com, as applicable.
NOT FDIC INSURED •MAY LOSE VALUE •NO BANK GUARANTEE
Neither the Fund nor Fidelity Distributors Corporation is a bank.
Top Holdings (% of Fund's net assets) |
| |
| Microsoft Corp. | 6.3 | |
| Danaher Corp. | 3.1 | |
| Prologis (REIT), Inc. | 2.8 | |
| Cigna Corp. | 2.5 | |
| The Travelers Companies, Inc. | 2.4 | |
| Apple, Inc. | 2.4 | |
| Bank of America Corp. | 2.2 | |
| Procter & Gamble Co. | 2.2 | |
| Merck & Co., Inc. | 2.1 | |
| The Home Depot, Inc. | 2.0 | |
| | 28.0 | |
| |
| Market Sectors (% of Fund's net assets) |
| |
| Information Technology | 25.8 | |
| Health Care | 13.6 | |
| Financials | 12.4 | |
| Consumer Discretionary | 12.0 | |
| Industrials | 10.1 | |
| Consumer Staples | 5.9 | |
| Communication Services | 5.5 | |
| Materials | 4.8 | |
| Energy | 3.6 | |
| Utilities | 2.8 | |
| Real Estate | 2.8 | |
| |
Asset Allocation (% of Fund's net assets) |
|
Foreign investments - 12.1% |
|
Geographic Diversification (% of Fund's net assets) |
|
* Includes Short-Term investments and Net Other Assets (Liabilities). Percentages are based on country or territory of incorporation and are adjusted for the effect of futures contracts, if applicable. |
| |
Showing Percentage of Net Assets
| Common Stocks - 99.1% |
| | | Shares | Value ($) |
| COMMUNICATION SERVICES - 5.5% | | | |
| Entertainment - 1.3% | | | |
| Netflix, Inc. (a) | | 728 | 222,426 |
| Interactive Media & Services - 1.7% | | | |
| Alphabet, Inc. Class A (a) | | 2,727 | 275,400 |
| Media - 2.5% | | | |
| Cable One, Inc. | | 133 | 96,331 |
| Comcast Corp. Class A | | 4,504 | 165,027 |
| Interpublic Group of Companies, Inc. | | 4,784 | 164,378 |
| | | | 425,736 |
TOTAL COMMUNICATION SERVICES | | | 923,562 |
| CONSUMER DISCRETIONARY - 12.0% | | | |
| Auto Components - 0.8% | | | |
| Aptiv PLC (a) | | 1,222 | 130,351 |
| Automobiles - 0.8% | | | |
| General Motors Co. | | 3,161 | 128,210 |
| Diversified Consumer Services - 1.8% | | | |
| Adtalem Global Education, Inc. (a) | | 4,052 | 168,563 |
| Bright Horizons Family Solutions, Inc. (a) | | 1,923 | 142,687 |
| | | | 311,250 |
| Hotels, Restaurants & Leisure - 1.2% | | | |
| Marriott International, Inc. Class A | | 1,182 | 195,444 |
| Household Durables - 1.3% | | | |
| Taylor Morrison Home Corp. (a) | | 7,407 | 225,099 |
| Internet & Direct Marketing Retail - 2.0% | | | |
| Amazon.com, Inc. (a) | | 1,482 | 143,072 |
| eBay, Inc. | | 4,299 | 195,347 |
| | | | 338,419 |
| Specialty Retail - 2.0% | | | |
| The Home Depot, Inc. | | 1,051 | 340,513 |
| Textiles, Apparel & Luxury Goods - 2.1% | | | |
| LVMH Moet Hennessy Louis Vuitton SE | | 282 | 218,840 |
| Tapestry, Inc. | | 3,367 | 127,172 |
| | | | 346,012 |
TOTAL CONSUMER DISCRETIONARY | | | 2,015,298 |
| CONSUMER STAPLES - 5.9% | | | |
| Beverages - 0.9% | | | |
| Keurig Dr. Pepper, Inc. | | 3,939 | 152,321 |
| Food & Staples Retailing - 0.8% | | | |
| Albertsons Companies, Inc. | | 6,882 | 144,178 |
| Food Products - 1.1% | | | |
| Darling Ingredients, Inc. (a) | | 2,569 | 184,531 |
| Household Products - 2.2% | | | |
| Procter & Gamble Co. | | 2,441 | 364,100 |
| Personal Products - 0.9% | | | |
| Estee Lauder Companies, Inc. Class A | | 637 | 150,198 |
TOTAL CONSUMER STAPLES | | | 995,328 |
| ENERGY - 3.6% | | | |
| Energy Equipment & Services - 1.2% | | | |
| Baker Hughes Co. Class A | | 6,836 | 198,381 |
| Oil, Gas & Consumable Fuels - 2.4% | | | |
| Cheniere Energy, Inc. | | 456 | 79,964 |
| Denbury, Inc. (a) | | 1,464 | 131,409 |
| Valero Energy Corp. | | 1,448 | 193,482 |
| | | | 404,855 |
TOTAL ENERGY | | | 603,236 |
| FINANCIALS - 12.4% | | | |
| Banks - 3.2% | | | |
| Bank of America Corp. | | 9,828 | 371,990 |
| Huntington Bancshares, Inc. | | 10,596 | 164,026 |
| | | | 536,016 |
| Capital Markets - 5.4% | | | |
| BlackRock, Inc. Class A | | 272 | 194,752 |
| Moody's Corp. | | 633 | 188,805 |
| Northern Trust Corp. | | 2,793 | 260,056 |
| State Street Corp. | | 3,304 | 263,230 |
| | | | 906,843 |
| Consumer Finance - 1.4% | | | |
| American Express Co. | | 1,479 | 233,076 |
| Insurance - 2.4% | | | |
| The Travelers Companies, Inc. | | 2,174 | 412,647 |
TOTAL FINANCIALS | | | 2,088,582 |
| HEALTH CARE - 13.4% | | | |
| Biotechnology - 1.7% | | | |
| Vertex Pharmaceuticals, Inc. (a) | | 906 | 286,658 |
| Health Care Providers & Services - 2.7% | | | |
| Cigna Corp. | | 1,268 | 417,033 |
| Guardant Health, Inc. (a) | | 823 | 43,076 |
| | | | 460,109 |
| Life Sciences Tools & Services - 4.2% | | | |
| Danaher Corp. | | 1,883 | 514,831 |
| ICON PLC (a) | | 860 | 185,278 |
| | | | 700,109 |
| Pharmaceuticals - 4.8% | | | |
| Merck & Co., Inc. | | 3,188 | 351,063 |
| Roche Holding AG (participation certificate) | | 388 | 126,730 |
| UCB SA | | 1,851 | 149,406 |
| Zoetis, Inc. Class A | | 1,218 | 187,743 |
| | | | 814,942 |
TOTAL HEALTH CARE | | | 2,261,818 |
| INDUSTRIALS - 10.1% | | | |
| Air Freight & Logistics - 1.3% | | | |
| United Parcel Service, Inc. Class B | | 1,121 | 212,687 |
| Building Products - 1.0% | | | |
| Johnson Controls International PLC | | 2,694 | 178,989 |
| Electrical Equipment - 1.3% | | | |
| Acuity Brands, Inc. | | 962 | 181,135 |
| Generac Holdings, Inc. (a) | | 381 | 40,203 |
| | | | 221,338 |
| Machinery - 2.2% | | | |
| Deere & Co. | | 510 | 224,910 |
| Ingersoll Rand, Inc. | | 2,613 | 141,024 |
| | | | 365,934 |
| Professional Services - 4.3% | | | |
| KBR, Inc. | | 5,650 | 291,936 |
| Manpower, Inc. | | 2,423 | 212,061 |
| Verisk Analytics, Inc. | | 1,177 | 216,227 |
| | | | 720,224 |
TOTAL INDUSTRIALS | | | 1,699,172 |
| INFORMATION TECHNOLOGY - 25.8% | | | |
| Electronic Equipment & Components - 0.6% | | | |
| Flex Ltd. (a) | | 4,925 | 108,252 |
| IT Services - 3.8% | | | |
| Accenture PLC Class A | | 1,080 | 325,004 |
| MasterCard, Inc. Class A | | 529 | 188,536 |
| PayPal Holdings, Inc. (a) | | 1,606 | 125,926 |
| | | | 639,466 |
| Semiconductors & Semiconductor Equipment - 7.1% | | | |
| Advanced Micro Devices, Inc. (a) | | 1,711 | 132,825 |
| NVIDIA Corp. | | 1,865 | 315,614 |
| NXP Semiconductors NV | | 1,102 | 193,776 |
| onsemi (a) | | 4,361 | 327,947 |
| SolarEdge Technologies, Inc. (a) | | 768 | 229,524 |
| | | | 1,199,686 |
| Software - 11.9% | | | |
| Adobe, Inc. (a) | | 484 | 166,946 |
| Autodesk, Inc. (a) | | 883 | 178,322 |
| Intuit, Inc. | | 633 | 258,004 |
| Microsoft Corp. | | 4,132 | 1,054,236 |
| Salesforce.com, Inc. (a) | | 2,117 | 339,249 |
| | | | 1,996,757 |
| Technology Hardware, Storage & Peripherals - 2.4% | | | |
| Apple, Inc. | | 2,710 | 401,161 |
TOTAL INFORMATION TECHNOLOGY | | | 4,345,322 |
| MATERIALS - 4.8% | | | |
| Chemicals - 2.1% | | | |
| Eastman Chemical Co. | | 1,057 | 91,557 |
| Linde PLC | | 791 | 266,156 |
| | | | 357,713 |
| Containers & Packaging - 2.7% | | | |
| Avery Dennison Corp. | | 1,521 | 294,055 |
| Crown Holdings, Inc. | | 1,986 | 163,269 |
| | | | 457,324 |
TOTAL MATERIALS | | | 815,037 |
| REAL ESTATE - 2.8% | | | |
| Equity Real Estate Investment Trusts (REITs) - 2.8% | | | |
| Prologis (REIT), Inc. | | 3,970 | 467,626 |
| UTILITIES - 2.8% | | | |
| Electric Utilities - 2.2% | | | |
| NextEra Energy, Inc. | | 2,204 | 186,679 |
| ORSTED A/S (b) | | 2,077 | 181,863 |
| | | | 368,542 |
| Water Utilities - 0.6% | | | |
| American Water Works Co., Inc. | | 659 | 100,010 |
TOTAL UTILITIES | | | 468,552 |
| TOTAL COMMON STOCKS (Cost $17,491,781) | | | 16,683,533 |
| | | | |
| Convertible Preferred Stocks - 0.2% |
| | | Shares | Value ($) |
| HEALTH CARE - 0.2% | | | |
| Health Care Providers & Services - 0.2% | | | |
Somatus, Inc. Series E (c)(d) (Cost $32,287) | | 37 | 31,780 |
| | | | |
| Money Market Funds - 0.5% |
| | | Shares | Value ($) |
Fidelity Cash Central Fund 3.86% (e) (Cost $82,537) | | 82,521 | 82,537 |
| | | | |
| TOTAL INVESTMENT IN SECURITIES - 99.8% (Cost $17,606,605) | 16,797,850 |
NET OTHER ASSETS (LIABILITIES) - 0.2% | 31,099 |
| NET ASSETS - 100.0% | 16,828,949 |
| | |
Legend
| (b) | Security exempt from registration under Rule 144A of the Securities Act of 1933. These securities may be resold in transactions exempt from registration, normally to qualified institutional buyers. At the end of the period, the value of these securities amounted to $181,863 or 1.1% of net assets. |
| (c) | Restricted securities (including private placements) - Investment in securities not registered under the Securities Act of 1933 (excluding 144A issues). At the end of the period, the value of restricted securities (excluding 144A issues) amounted to $31,780 or 0.2% of net assets. |
| (e) | Affiliated fund that is generally available only to investment companies and other accounts managed by Fidelity Investments. The rate quoted is the annualized seven-day yield of the fund at period end. A complete unaudited listing of the fund's holdings as of its most recent quarter end is available upon request. In addition, each Fidelity Central Fund's financial statements are available on the SEC's website or upon request. |
| Additional information on each restricted holding is as follows: |
| Security | Acquisition Date | Acquisition Cost ($) |
| Somatus, Inc. Series E | 1/31/22 | 32,287 |
| | | |
Affiliated Central Funds
Fiscal year to date information regarding the Fund's investments in Fidelity Central Funds, including the ownership percentage, is presented below.
| Affiliate | Value, beginning of period ($) | Purchases ($) | Sales Proceeds ($) | Dividend Income ($) | Realized Gain (loss) ($) | Change in Unrealized appreciation (depreciation) ($) | Value, end of period ($) | % ownership, end of period |
| Fidelity Cash Central Fund 3.86% | 109,161 | 2,782,284 | 2,808,908 | 1,401 | - | - | 82,537 | 0.0% |
| Total | 109,161 | 2,782,284 | 2,808,908 | 1,401 | - | - | 82,537 | |
| | | | | | | | | |
Amounts in the income column in the above table include any capital gain distributions from underlying funds, which are presented in the corresponding line item in the Statement of Operations, if applicable.
Amounts included in the purchases and sales proceeds columns may include in-kind transactions, if applicable.
Investment Valuation
The following is a summary of the inputs used, as of November 30, 2022, involving the Fund's assets and liabilities carried at fair value. The inputs or methodology used for valuing securities may not be an indication of the risk associated with investing in those securities. For more information on valuation inputs, and their aggregation into the levels used below, please refer to the Investment Valuation section in the accompanying Notes to Financial Statements.
| Valuation Inputs at Reporting Date: |
| Description | Total ($) | Level 1 ($) | Level 2 ($) | Level 3 ($) |
Investments in Securities: | | | | |
|
| Equities: | | | | |
Communication Services | 923,562 | 923,562 | - | - |
Consumer Discretionary | 2,015,298 | 1,796,458 | 218,840 | - |
Consumer Staples | 995,328 | 995,328 | - | - |
Energy | 603,236 | 603,236 | - | - |
Financials | 2,088,582 | 2,088,582 | - | - |
Health Care | 2,293,598 | 1,985,682 | 276,136 | 31,780 |
Industrials | 1,699,172 | 1,699,172 | - | - |
Information Technology | 4,345,322 | 4,345,322 | - | - |
Materials | 815,037 | 815,037 | - | - |
Real Estate | 467,626 | 467,626 | - | - |
Utilities | 468,552 | 286,689 | 181,863 | - |
|
| Money Market Funds | 82,537 | 82,537 | - | - |
| Total Investments in Securities: | 16,797,850 | 16,089,231 | 676,839 | 31,780 |
| Statement of Assets and Liabilities |
| | | | November 30, 2022 (Unaudited) |
| | | | | |
| Assets | | | | |
| Investment in securities, at value - See accompanying schedule: | | | | |
Unaffiliated issuers (cost $17,524,068) | | $16,715,313 | | |
Fidelity Central Funds (cost $82,537) | | 82,537 | | |
| | | | | |
| Total Investment in Securities (cost $17,606,605) | | | $ | 16,797,850 |
| Cash | | | | 1 |
| Foreign currency held at value (cost $1) | | | | 1 |
| Receivable for investments sold | | | | 340,754 |
| Receivable for fund shares sold | | | | 1,024 |
| Dividends receivable | | | | 62,676 |
| Distributions receivable from Fidelity Central Funds | | | | 372 |
| Prepaid expenses | | | | 21 |
| Receivable from investment adviser for expense reductions | | | | 3,234 |
Total assets | | | | 17,205,933 |
| Liabilities | | | | |
| Payable for investments purchased | | $339,236 | | |
| Payable for fund shares redeemed | | 114 | | |
| Accrued management fee | | 7,072 | | |
| Distribution and service plan fees payable | | 512 | | |
| Other affiliated payables | | 3,706 | | |
| Audit fee payable | | 23,840 | | |
| Other payables and accrued expenses | | 2,504 | | |
| Total Liabilities | | | | 376,984 |
| Net Assets | | | $ | 16,828,949 |
| Net Assets consist of: | | | | |
| Paid in capital | | | $ | 18,637,616 |
| Total accumulated earnings (loss) | | | | (1,808,667) |
| Net Assets | | | $ | 16,828,949 |
| | | | | |
| Net Asset Value and Maximum Offering Price | | | | |
| Class A : | | | | |
Net Asset Value and redemption price per share ($648,078 ÷ 68,566 shares) (a) | | | $ | 9.45 |
| Maximum offering price per share (100/94.25 of $9.45) | | | $ | 10.03 |
| Class M : | | | | |
Net Asset Value and redemption price per share ($334,324 ÷ 35,452 shares) (a) | | | $ | 9.43 |
| Maximum offering price per share (100/96.50 of $9.43) | | | $ | 9.77 |
| Class C : | | | | |
Net Asset Value and offering price per share ($314,075 ÷ 33,501 shares) (a) | | | $ | 9.38 |
| Fidelity Sustainable U.S. Equity Fund : | | | | |
Net Asset Value , offering price and redemption price per share ($15,301,964 ÷ 1,615,960 shares) | | | $ | 9.47 |
| Class I : | | | | |
Net Asset Value , offering price and redemption price per share ($116,967 ÷ 12,353 shares) | | | $ | 9.47 |
| Class Z : | | | | |
Net Asset Value , offering price and redemption price per share ($113,541 ÷ 11,966 shares) | | | $ | 9.49 |
(a)Redemption price per share is equal to net asset value less any applicable contingent deferred sales charge. |
| Statement of Operations |
| | | | Six months ended November 30, 2022 (Unaudited) |
| Investment Income | | | | |
| Dividends | | | $ | 107,833 |
| Special dividends | | | | 43,915 |
| Income from Fidelity Central Funds | | | | 1,401 |
| Total Income | | | | 153,149 |
| Expenses | | | | |
| Management fee | | | | |
| Basic fee | $ | 41,310 | | |
| Performance adjustment | | (448) | | |
| Transfer agent fees | | 19,811 | | |
| Distribution and service plan fees | | 2,900 | | |
| Accounting fees and expenses | | 2,771 | | |
| Custodian fees and expenses | | 3,689 | | |
| Independent trustees' fees and expenses | | 27 | | |
| Registration fees | | 31,997 | | |
| Audit | | 22,220 | | |
| Legal | | 5 | | |
| Miscellaneous | | 29 | | |
| Total expenses before reductions | | 124,311 | | |
| Expense reductions | | (51,326) | | |
| Total expenses after reductions | | | | 72,985 |
| Net Investment income (loss) | | | | 80,164 |
| Realized and Unrealized Gain (Loss) | | | | |
| Net realized gain (loss) on: | | | | |
| Investment Securities: | | | | |
| Unaffiliated issuers | | (600,239) | | |
| Foreign currency transactions | | (171) | | |
| Total net realized gain (loss) | | | | (600,410) |
| Change in net unrealized appreciation (depreciation) on: | | | | |
| Investment Securities: | | | | |
| Unaffiliated issuers | | 637,347 | | |
| Assets and liabilities in foreign currencies | | (12) | | |
| Total change in net unrealized appreciation (depreciation) | | | | 637,335 |
| Net gain (loss) | | | | 36,925 |
| Net increase (decrease) in net assets resulting from operations | | | $ | 117,089 |
| Statement of Changes in Net Assets |
| |
| | Six months ended November 30, 2022 (Unaudited) | | For the period June 15, 2021 (commencement of operations) through May 31, 2022 |
| Increase (Decrease) in Net Assets | | | | |
| Operations | | | | |
| Net investment income (loss) | $ | 80,164 | $ | 22,250 |
| Net realized gain (loss) | | (600,410) | | (425,572) |
| Change in net unrealized appreciation (depreciation) | | 637,335 | | (1,446,167) |
| Net increase (decrease) in net assets resulting from operations | | 117,089 | | (1,849,489) |
| Distributions to shareholders | | (12,698) | | (58,306) |
| Share transactions - net increase (decrease) | | 661,790 | | 17,970,563 |
| Total increase (decrease) in net assets | | 766,181 | | 16,062,768 |
| | | | | |
| Net Assets | | | | |
| Beginning of period | | 16,062,768 | | - |
| End of period | $ | 16,828,949 | $ | 16,062,768 |
| | | | | |
| | | | | |
Financial Highlights
| Fidelity Sustainable U.S. Equity Fund Class A |
| |
| | Six months ended (Unaudited) November 30, 2022 | | Years ended May 31, 2022 A |
Selected Per-Share Data | | | | |
| Net asset value, beginning of period | $ | 9.38 | $ | 10.00 |
| Income from Investment Operations | | | | |
Net investment income (loss) B,C | | .04 D | | - E |
| Net realized and unrealized gain (loss) | | .03 | | (.58) |
| Total from investment operations | | .07 | | (.58) |
| Distributions from net realized gain | | - | | (.04) |
| Total distributions | | - | | (.04) |
| Net asset value, end of period | $ | 9.45 | $ | 9.38 |
Total Return F,G,H | | .75% | | (5.87)% |
Ratios to Average Net Assets C,I,J | | | | |
| Expenses before reductions | | 1.80% K | | 3.52% K |
| Expenses net of fee waivers, if any | | 1.15% K | | 1.14% K |
| Expenses net of all reductions | | 1.15% K | | 1.14% K |
| Net investment income (loss) | | .53% D,K | | -% K,L |
| Supplemental Data | | | | |
| Net assets, end of period (000 omitted) | $ | 648 | $ | 633 |
Portfolio turnover rate M | | 54% K | | 55% K |
A For the period June 15, 2021 (commencement of operations) through May 31, 2022
B Calculated based on average shares outstanding during the period.
C Net investment income (loss) is affected by the timing of the declaration of dividends by any underlying mutual funds or exchange-traded funds (ETFs). Net investment income (loss) of any mutual funds or ETFs is not included in the Fund's net investment income (loss) ratio.
D Net investment income per share reflects one or more large, non-recurring dividend(s) which amounted to $.03 per share. Such dividends are not annualized in the ratio of net investment income (loss) to average net assets. Excluding such non-recurring dividend(s) the ratio of net investment income (loss) to average net assets would have been .25%.
E Amount represents less than $.005 per share.
F Total returns for periods of less than one year are not annualized.
G Total returns would have been lower if certain expenses had not been reduced during the applicable periods shown.
H Total returns do not include the effect of the sales charges.
I Fees and expenses of any underlying mutual funds or exchange-traded funds (ETFs) are not included in the Fund's expense ratio. The Fund indirectly bears its proportionate share of these expenses. For additional expense information related to investments in Fidelity Central Funds, please refer to the "Investments in Fidelity Central Funds" note found in the Notes to Financial Statements section of the most recent Annual or Semi-Annual report.
J Expense ratios reflect operating expenses of the class. Expenses before reductions do not reflect amounts reimbursed, waived, or reduced through arrangements with the investment adviser, brokerage services, or other offset arrangements, if applicable, and do not represent the amount paid by the class during periods when reimbursements, waivers or reductions occur.
K Annualized.
L Amount represents less than .005%.
M Amount does not include the portfolio activity of any underlying mutual funds or exchange-traded funds (ETFs).
| Fidelity Sustainable U.S. Equity Fund Class M |
| |
| | Six months ended (Unaudited) November 30, 2022 | | Years ended May 31, 2022 A |
Selected Per-Share Data | | | | |
| Net asset value, beginning of period | $ | 9.37 | $ | 10.00 |
| Income from Investment Operations | | | | |
Net investment income (loss) B,C | | .02 D | | (.02) |
| Net realized and unrealized gain (loss) | | .04 | | (.59) |
| Total from investment operations | | .06 | | (.61) |
| Distributions from net realized gain | | - | | (.02) |
| Total distributions | | - | | (.02) |
| Net asset value, end of period | $ | 9.43 | $ | 9.37 |
Total Return E,F,G | | .64% | | (6.10)% |
Ratios to Average Net Assets C,H,I | | | | |
| Expenses before reductions | | 2.03% J | | 4.05% J |
| Expenses net of fee waivers, if any | | 1.40% J | | 1.39% J |
| Expenses net of all reductions | | 1.39% J | | 1.39% J |
| Net investment income (loss) | | .28% D,J | | (.26)% J |
| Supplemental Data | | | | |
| Net assets, end of period (000 omitted) | $ | 334 | $ | 258 |
Portfolio turnover rate K | | 54% J | | 55% J |
A For the period June 15, 2021 (commencement of operations) through May 31, 2022
B Calculated based on average shares outstanding during the period.
C Net investment income (loss) is affected by the timing of the declaration of dividends by any underlying mutual funds or exchange-traded funds (ETFs). Net investment income (loss) of any mutual funds or ETFs is not included in the Fund's net investment income (loss) ratio.
D Net investment income per share reflects one or more large, non-recurring dividend(s) which amounted to $.02 per share. Such dividends are not annualized in the ratio of net investment income (loss) to average net assets. Excluding such non-recurring dividend(s) the ratio of net investment income (loss) to average net assets would have been less than .005%.
E Total returns for periods of less than one year are not annualized.
F Total returns would have been lower if certain expenses had not been reduced during the applicable periods shown.
G Total returns do not include the effect of the sales charges.
H Fees and expenses of any underlying mutual funds or exchange-traded funds (ETFs) are not included in the Fund's expense ratio. The Fund indirectly bears its proportionate share of these expenses. For additional expense information related to investments in Fidelity Central Funds, please refer to the "Investments in Fidelity Central Funds" note found in the Notes to Financial Statements section of the most recent Annual or Semi-Annual report.
I Expense ratios reflect operating expenses of the class. Expenses before reductions do not reflect amounts reimbursed, waived, or reduced through arrangements with the investment adviser, brokerage services, or other offset arrangements, if applicable, and do not represent the amount paid by the class during periods when reimbursements, waivers or reductions occur.
J Annualized.
K Amount does not include the portfolio activity of any underlying mutual funds or exchange-traded funds (ETFs).
| Fidelity Sustainable U.S. Equity Fund Class C |
| |
| | Six months ended (Unaudited) November 30, 2022 | | Years ended May 31, 2022 A |
Selected Per-Share Data | | | | |
| Net asset value, beginning of period | $ | 9.34 | $ | 10.00 |
| Income from Investment Operations | | | | |
Net investment income (loss) B,C | | - D,E | | (.07) |
| Net realized and unrealized gain (loss) | | .04 | | (.58) |
| Total from investment operations | | .04 | | (.65) |
| Distributions from net realized gain | | - | | (.01) |
| Total distributions | | - | | (.01) |
| Net asset value, end of period | $ | 9.38 | $ | 9.34 |
Total Return F,G,H | | .43% | | (6.53)% |
Ratios to Average Net Assets C,I,J | | | | |
| Expenses before reductions | | 2.54% K | | 4.65% K |
| Expenses net of fee waivers, if any | | 1.89% K | | 1.89% K |
| Expenses net of all reductions | | 1.89% K | | 1.89% K |
| Net investment income (loss) | | (.22)% E,K | | (.75)% K |
| Supplemental Data | | | | |
| Net assets, end of period (000 omitted) | $ | 314 | $ | 273 |
Portfolio turnover rate L | | 54% K | | 55% K |
A For the period June 15, 2021 (commencement of operations) through May 31, 2022
B Calculated based on average shares outstanding during the period.
C Net investment income (loss) is affected by the timing of the declaration of dividends by any underlying mutual funds or exchange-traded funds (ETFs). Net investment income (loss) of any mutual funds or ETFs is not included in the Fund's net investment income (loss) ratio.
D Amount represents less than $.005 per share.
E Net investment income per share reflects one or more large, non-recurring dividend(s) which amounted to $.02 per share. Such dividends are not annualized in the ratio of net investment income (loss) to average net assets. Excluding such non-recurring dividend(s) the ratio of net investment income (loss) to average net assets would have been (.50)%.
F Total returns for periods of less than one year are not annualized.
G Total returns would have been lower if certain expenses had not been reduced during the applicable periods shown.
H Total returns do not include the effect of the contingent deferred sales charge.
I Fees and expenses of any underlying mutual funds or exchange-traded funds (ETFs) are not included in the Fund's expense ratio. The Fund indirectly bears its proportionate share of these expenses. For additional expense information related to investments in Fidelity Central Funds, please refer to the "Investments in Fidelity Central Funds" note found in the Notes to Financial Statements section of the most recent Annual or Semi-Annual report.
J Expense ratios reflect operating expenses of the class. Expenses before reductions do not reflect amounts reimbursed, waived, or reduced through arrangements with the investment adviser, brokerage services, or other offset arrangements, if applicable, and do not represent the amount paid by the class during periods when reimbursements, waivers or reductions occur.
K Annualized.
L Amount does not include the portfolio activity of any underlying mutual funds or exchange-traded funds (ETFs).
| Fidelity Sustainable U.S. Equity Fund |
| |
| | Six months ended (Unaudited) November 30, 2022 | | Years ended May 31, 2022 A |
Selected Per-Share Data | | | | |
| Net asset value, beginning of period | $ | 9.40 | $ | 10.00 |
| Income from Investment Operations | | | | |
Net investment income (loss) B,C | | .05 D | | .02 |
| Net realized and unrealized gain (loss) | | .03 | | (.57) |
| Total from investment operations | | .08 | | (.55) |
| Distributions from net investment income | | (.01) | | (.01) |
| Distributions from net realized gain | | - | | (.04) |
| Total distributions | | (.01) | | (.05) |
| Net asset value, end of period | $ | 9.47 | $ | 9.40 |
Total Return E,F | | .84% | | (5.58)% |
Ratios to Average Net Assets C,G,H | | | | |
| Expenses before reductions | | 1.55% I | | 3.21% I |
| Expenses net of fee waivers, if any | | .90% I | | .89% I |
| Expenses net of all reductions | | .90% I | | .89% I |
| Net investment income (loss) | | .78% D,I | | .24% I |
| Supplemental Data | | | | |
| Net assets, end of period (000 omitted) | $ | 15,302 | $ | 14,669 |
Portfolio turnover rate J | | 54% I | | 55% I |
A For the period June 15, 2021 (commencement of operations) through May 31, 2022
B Calculated based on average shares outstanding during the period.
C Net investment income (loss) is affected by the timing of the declaration of dividends by any underlying mutual funds or exchange-traded funds (ETFs). Net investment income (loss) of any mutual funds or ETFs is not included in the Fund's net investment income (loss) ratio.
D Net investment income per share reflects one or more large, non-recurring dividend(s) which amounted to $.03 per share. Such dividends are not annualized in the ratio of net investment income (loss) to average net assets. Excluding such non-recurring dividend(s) the ratio of net investment income (loss) to average net assets would have been .50%.
E Total returns for periods of less than one year are not annualized.
F Total returns would have been lower if certain expenses had not been reduced during the applicable periods shown.
G Fees and expenses of any underlying mutual funds or exchange-traded funds (ETFs) are not included in the Fund's expense ratio. The Fund indirectly bears its proportionate share of these expenses. For additional expense information related to investments in Fidelity Central Funds, please refer to the "Investments in Fidelity Central Funds" note found in the Notes to Financial Statements section of the most recent Annual or Semi-Annual report.
H Expense ratios reflect operating expenses of the class. Expenses before reductions do not reflect amounts reimbursed, waived, or reduced through arrangements with the investment adviser, brokerage services, or other offset arrangements, if applicable, and do not represent the amount paid by the class during periods when reimbursements, waivers or reductions occur.
I Annualized.
J Amount does not include the portfolio activity of any underlying mutual funds or exchange-traded funds (ETFs).
| Fidelity Sustainable U.S. Equity Fund Class I |
| |
| | Six months ended (Unaudited) November 30, 2022 | | Years ended May 31, 2022 A |
Selected Per-Share Data | | | | |
| Net asset value, beginning of period | $ | 9.40 | $ | 10.00 |
| Income from Investment Operations | | | | |
Net investment income (loss) B,C | | .05 D | | .02 |
| Net realized and unrealized gain (loss) | | .03 | | (.57) |
| Total from investment operations | | .08 | | (.55) |
| Distributions from net investment income | | (.01) | | (.01) |
| Distributions from net realized gain | | - | | (.04) |
| Total distributions | | (.01) | | (.05) |
| Net asset value, end of period | $ | 9.47 | $ | 9.40 |
Total Return E,F | | .84% | | (5.58)% |
Ratios to Average Net Assets C,G,H | | | | |
| Expenses before reductions | | 1.43% I | | 3.76% I |
| Expenses net of fee waivers, if any | | .90% I | | .90% I |
| Expenses net of all reductions | | .90% I | | .90% I |
| Net investment income (loss) | | .78% D,I | | .24% I |
| Supplemental Data | | | | |
| Net assets, end of period (000 omitted) | $ | 117 | $ | 116 |
Portfolio turnover rate J | | 54% I | | 55% I |
A For the period June 15, 2021 (commencement of operations) through May 31, 2022
B Calculated based on average shares outstanding during the period.
C Net investment income (loss) is affected by the timing of the declaration of dividends by any underlying mutual funds or exchange-traded funds (ETFs). Net investment income (loss) of any mutual funds or ETFs is not included in the Fund's net investment income (loss) ratio.
D Net investment income per share reflects one or more large, non-recurring dividend(s) which amounted to $.03 per share. Such dividends are not annualized in the ratio of net investment income (loss) to average net assets. Excluding such non-recurring dividend(s) the ratio of net investment income (loss) to average net assets would have been .50%.
E Total returns for periods of less than one year are not annualized.
F Total returns would have been lower if certain expenses had not been reduced during the applicable periods shown.
G Fees and expenses of any underlying mutual funds or exchange-traded funds (ETFs) are not included in the Fund's expense ratio. The Fund indirectly bears its proportionate share of these expenses. For additional expense information related to investments in Fidelity Central Funds, please refer to the "Investments in Fidelity Central Funds" note found in the Notes to Financial Statements section of the most recent Annual or Semi-Annual report.
H Expense ratios reflect operating expenses of the class. Expenses before reductions do not reflect amounts reimbursed, waived, or reduced through arrangements with the investment adviser, brokerage services, or other offset arrangements, if applicable, and do not represent the amount paid by the class during periods when reimbursements, waivers or reductions occur.
I Annualized.
J Amount does not include the portfolio activity of any underlying mutual funds or exchange-traded funds (ETFs).
| Fidelity Sustainable U.S. Equity Fund Class Z |
| |
| | Six months ended (Unaudited) November 30, 2022 | | Years ended May 31, 2022 A |
Selected Per-Share Data | | | | |
| Net asset value, beginning of period | $ | 9.41 | $ | 10.00 |
| Income from Investment Operations | | | | |
Net investment income (loss) B,C | | .05 D | | .04 |
| Net realized and unrealized gain (loss) | | .04 | | (.58) |
| Total from investment operations | | .09 | | (.54) |
| Distributions from net investment income | | (.01) | | (.01) |
| Distributions from net realized gain | | - | | (.04) |
| Total distributions | | (.01) | | (.05) |
| Net asset value, end of period | $ | 9.49 | $ | 9.41 |
Total Return E,F | | .94% | | (5.48)% |
Ratios to Average Net Assets C,G,H | | | | |
| Expenses before reductions | | 1.35% I | | 3.72% I |
| Expenses net of fee waivers, if any | | .75% I | | .75% I |
| Expenses net of all reductions | | .75% I | | .75% I |
| Net investment income (loss) | | .93% D,I | | .39% I |
| Supplemental Data | | | | |
| Net assets, end of period (000 omitted) | $ | 114 | $ | 113 |
Portfolio turnover rate J | | 54% I | | 55% I |
A For the period June 15, 2021 (commencement of operations) through May 31, 2022
B Calculated based on average shares outstanding during the period.
C Net investment income (loss) is affected by the timing of the declaration of dividends by any underlying mutual funds or exchange-traded funds (ETFs). Net investment income (loss) of any mutual funds or ETFs is not included in the Fund's net investment income (loss) ratio.
D Net investment income per share reflects one or more large, non-recurring dividend(s) which amounted to $.03 per share. Such dividends are not annualized in the ratio of net investment income (loss) to average net assets. Excluding such non-recurring dividend(s) the ratio of net investment income (loss) to average net assets would have been .65%.
E Total returns for periods of less than one year are not annualized.
F Total returns would have been lower if certain expenses had not been reduced during the applicable periods shown.
G Fees and expenses of any underlying mutual funds or exchange-traded funds (ETFs) are not included in the Fund's expense ratio. The Fund indirectly bears its proportionate share of these expenses. For additional expense information related to investments in Fidelity Central Funds, please refer to the "Investments in Fidelity Central Funds" note found in the Notes to Financial Statements section of the most recent Annual or Semi-Annual report.
H Expense ratios reflect operating expenses of the class. Expenses before reductions do not reflect amounts reimbursed, waived, or reduced through arrangements with the investment adviser, brokerage services, or other offset arrangements, if applicable, and do not represent the amount paid by the class during periods when reimbursements, waivers or reductions occur.
I Annualized.
J Amount does not include the portfolio activity of any underlying mutual funds or exchange-traded funds (ETFs).
For the period ended November 30, 2022
1. Organization.
Fidelity Sustainable U.S. Equity Fund (the Fund) is a fund of Fidelity Summer Street Trust (the Trust) and is authorized to issue an unlimited number of shares. The Trust is registered under the Investment Company Act of 1940, as amended (the 1940 Act), as an open-end management investment company organized as a Massachusetts business trust. The Fund offers Class A, Class M, Class C, Fidelity Sustainable U.S. Equity Fund, Class I and Class Z shares, each of which has equal rights as to assets and voting privileges. Each class has exclusive voting rights with respect to matters that affect that class. Class C shares will automatically convert to Class A shares after a holding period of eight years from the initial date of purchase, with certain exceptions.
2. Investments in Fidelity Central Funds.
Funds may invest in Fidelity Central Funds, which are open-end investment companies generally available only to other investment companies and accounts managed by the investment adviser and its affiliates. The Schedule of Investments lists any Fidelity Central Funds held as an investment as of period end, but does not include the underlying holdings of each Fidelity Central Fund. An investing fund indirectly bears its proportionate share of the expenses of the underlying Fidelity Central Funds.
Based on its investment objective, each Fidelity Central Fund may invest or participate in various investment vehicles or strategies that are similar to those of the investing fund. These strategies are consistent with the investment objectives of the investing fund and may involve certain economic risks which may cause a decline in value of each of the Fidelity Central Funds and thus a decline in the value of the investing fund.
| Fidelity Central Fund | Investment Manager | Investment Objective | Investment Practices | Expense Ratio A |
| Fidelity Money Market Central Funds | Fidelity Management & Research Company LLC (FMR) | Each fund seeks to obtain a high level of current income consistent with the preservation of capital and liquidity. | Short-term Investments | Less than .005% |
A Expenses expressed as a percentage of average net assets and are as of each underlying Central Fund's most recent annual or semi-annual shareholder report.
A complete unaudited list of holdings for each Fidelity Central Fund is available upon request or at the Securities and Exchange Commission website at www.sec.gov. In addition, the financial statements of the Fidelity Central Funds which contain the significant accounting policies (including investment valuation policies) of those funds, and are not covered by the Report of Independent Registered Public Accounting Firm, are available on the Securities and Exchange Commission website or upon request.
3. Significant Accounting Policies.
The Fund is an investment company and applies the accounting and reporting guidance of the Financial Accounting Standards Board (FASB) Accounting Standards Codification Topic 946 Financial Services - Investment Companies . The financial statements have been prepared in conformity with accounting principles generally accepted in the United States of America (GAAP), which require management to make certain estimates and assumptions at the date of the financial statements. Actual results could differ from those estimates. Subsequent events, if any, through the date that the financial statements were issued have been evaluated in the preparation of the financial statements. The Fund's Schedule of Investments lists any underlying mutual funds or exchange-traded funds (ETFs) but does not include the underlying holdings of these funds. The following summarizes the significant accounting policies of the Fund:
Investment Valuation. Investments are valued as of 4:00 p.m. Eastern time on the last calendar day of the period. The Board of Trustees (the Board) has designated the Fund's investment adviser as the valuation designee responsible for the fair valuation function and performing fair value determinations as needed. The investment adviser has established a Fair Value Committee (the Committee) to carry out the day-to-day fair valuation responsibilities and has adopted policies and procedures to govern the fair valuation process and the activities of the Committee. In accordance with these fair valuation policies and procedures, which have been approved by the Board, the Fund attempts to obtain prices from one or more third party pricing services or brokers to value its investments. When current market prices, quotations or currency exchange rates are not readily available or reliable, investments will be fair valued in good faith by the Committee, in accordance with the policies and procedures. Factors used in determining fair value vary by investment type and may include market or investment specific events, transaction data, estimated cash flows, and market observations of comparable investments. The frequency that the fair valuation procedures are used cannot be predicted and they may be utilized to a significant extent. The Committee manages the Fund's fair valuation practices and maintains the fair valuation policies and procedures. The Fund's investment adviser reports to the Board information regarding the fair valuation process and related material matters.
The Fund categorizes the inputs to valuation techniques used to value its investments into a disclosure hierarchy consisting of three levels as shown below:
Level 1 - unadjusted quoted prices in active markets for identical investments
Level 2 - other significant observable inputs (including quoted prices for similar investments, interest rates, prepayment speeds, etc.)
Level 3 - unobservable inputs (including the Fund's own assumptions based on the best information available)
Valuation techniques used to value the Fund's investments by major category are as follows:
Equity securities, including restricted securities, for which market quotations are readily available, are valued at the last reported sale price or official closing price as reported by a third party pricing service on the primary market or exchange on which they are traded and are categorized as Level 1 in the hierarchy. In the event there were no sales during the day or closing prices are not available, securities are valued at the last quoted bid price or may be valued using the last available price and are generally categorized as Level 2 in the hierarchy. For foreign equity securities, when market or security specific events arise, comparisons to the valuation of American Depositary Receipts (ADRs), futures contracts, ETFs and certain indexes as well as quoted prices for similar securities may be used and would be categorized as Level 2 in the hierarchy. For equity securities, including restricted securities, where observable inputs are limited, assumptions about market activity and risk are used and these securities may be categorized as Level 3 in the hierarchy.
Investments in open-end mutual funds, including the Fidelity Central Funds, are valued at their closing net asset value (NAV) each business day and are categorized as Level 1 in the hierarchy.
Changes in valuation techniques may result in transfers in or out of an assigned level within the disclosure hierarchy. The aggregate value of investments by input level as of November 30, 2022 is included at the end of the Fund's Schedule of Investments.
Foreign Currency. Certain Funds may use foreign currency contracts to facilitate transactions in foreign-denominated securities. Gains and losses from these transactions may arise from changes in the value of the foreign currency or if the counterparties do not perform under the contracts' terms.
Foreign-denominated assets, including investment securities, and liabilities are translated into U.S. dollars at the exchange rates at period end. Purchases and sales of investment securities, income and dividends received, and expenses denominated in foreign currencies are translated into U.S. dollars at the exchange rate in effect on the transaction date.
The effects of exchange rate fluctuations on investments are included with the net realized and unrealized gain (loss) on investment securities. Other foreign currency transactions resulting in realized and unrealized gain (loss) are disclosed separately.
Investment Transactions and Income. For financial reporting purposes, the Fund's investment holdings and NAV include trades executed through the end of the last business day of the period. The NAV per share for processing shareholder transactions is calculated as of the close of business of the New York Stock Exchange (NYSE), normally 4:00 p.m. Eastern time and includes trades executed through the end of the prior business day. Gains and losses on securities sold are determined on the basis of identified cost. Commissions paid to certain brokers with whom the investment adviser, or its affiliates, places trades on behalf of a fund include an amount in addition to trade execution, which may be rebated back to a fund. Any such rebates are included in net realized gain (loss) on investments in the Statement of Operations. Dividend income is recorded on the ex-dividend date, except for certain dividends from foreign securities where the ex-dividend date may have passed, which are recorded as soon as the Fund is informed of the ex-dividend date. Non-cash dividends included in dividend income, if any, are recorded at the fair market value of the securities received. Income and capital gain distributions from Fidelity Central Funds, if any, are recorded on the ex-dividend date. Certain distributions received by the Fund represent a return of capital or capital gain. The Fund determines the components of these distributions subsequent to the ex-dividend date, based upon receipt of tax filings or other correspondence relating to the underlying investment. These distributions are recorded as a reduction of cost of investments and/or as a realized gain. Large, non-recurring dividends recognized by the Fund are presented separately on the Statement of Operations as "Special Dividends" and the impact of these dividends is presented in the Financial Highlights. Investment income is recorded net of foreign taxes withheld where recovery of such taxes is uncertain. Funds may file withholding tax reclaims in certain jurisdictions to recover a portion of amounts previously withheld. Any withholding tax reclaims income is included in the Statement of Operations in dividends. Any receivables for withholding tax reclaims are included in the Statement of Assets and Liabilities in dividends receivable.
Class Allocations and Expenses. Investment income, realized and unrealized capital gains and losses, common expenses of a fund, and certain fund-level expense reductions, if any, are allocated daily on a pro-rata basis to each class based on the relative net assets of each class to the total net assets of a fund. Each class differs with respect to transfer agent and distribution and service plan fees incurred, as applicable. Certain expense reductions may also differ by class, if applicable. For the reporting period, the allocated portion of income and expenses to each class as a percent of its average net assets may vary due to the timing of recording these transactions in relation to fluctuating net assets of the classes. Expenses directly attributable to a fund are charged to that fund. Expenses attributable to more than one fund are allocated among the respective funds on the basis of relative net assets or other appropriate methods. Expenses included in the accompanying financial statements reflect the expenses of that fund and do not include any expenses associated with any underlying mutual funds or exchange-traded funds. Although not included in a fund's expenses, a fund indirectly bears its proportionate share of these expenses through the net asset value of each underlying mutual fund or exchange-traded fund. Expense estimates are accrued in the period to which they relate and adjustments are made when actual amounts are known.
Income Tax Information and Distributions to Shareholders. Each year, the Fund intends to qualify as a regulated investment company under Subchapter M of the Internal Revenue Code, including distributing substantially all of its taxable income and realized gains. As a result, no provision for U.S. Federal income taxes is required. The Fund files a U.S. federal tax return, in addition to state and local tax returns as required. The Fund's federal income tax returns are subject to examination by the Internal Revenue Service (IRS) for a period of three fiscal years after they are filed. State and local tax returns may be subject to examination for an additional fiscal year depending on the jurisdiction. Foreign taxes are provided for based on the Fund's understanding of the tax rules and rates that exist in the foreign markets in which it invests.
Distributions are declared and recorded on the ex-dividend date. Income and capital gain distributions are declared separately for each class. Income and capital gain distributions are determined in accordance with income tax regulations, which may differ from GAAP.
Capital accounts within the financial statements are adjusted for permanent book-tax differences. These adjustments have no impact on net assets or the results of operations. Capital accounts are not adjusted for temporary book-tax differences which will reverse in a subsequent period.
Book-tax differences are primarily due to foreign currency transactions, losses deferred due to wash sales, and excise tax regulations.
As of period end, the cost and unrealized appreciation (depreciation) in securities, and derivatives if applicable, for federal income tax purposes were as follows:
| Gross unrealized appreciation | $1,260,088 |
| Gross unrealized depreciation | (2,403,735) |
| Net unrealized appreciation (depreciation) | $(1,143,647) |
| Tax cost | $17,941,497 |
The Fund elected to defer to its next fiscal year $312,835 of capital losses recognized during the period November 1, 2021 to May 31, 2022.
Due to large subscriptions in the prior period, Fidelity Sustainability U.S. Equity Fund is subject to an annual limit on its use of some of its unrealized capital losses to offset capital gains in future periods. If those losses are realized and the limitation prevents the Fund from using any of those losses in a future period, those capital losses will be available to offset capital gains in subsequent periods.
Restricted Securities (including Private Placements). Funds may invest in securities that are subject to legal or contractual restrictions on resale. These securities generally may be resold in transactions exempt from registration or to the public if the securities are registered. Disposal of these securities may involve time-consuming negotiations and expense, and prompt sale at an acceptable price may be difficult. Information regarding restricted securities held at period end is included at the end of the Schedule of Investments, if applicable.
4. Purchases and Sales of Investments.
Purchases and sales of securities, other than short-term securities and in-kind transactions, as applicable, are noted in the table below.
| | Purchases ($) | Sales ($) |
| Fidelity Sustainable U.S. Equity Fund | 5,023,338 | 4,208,857 |
5. Fees and Other Transactions with Affiliates.
Management Fee. Fidelity Management & Research Company LLC (the investment adviser) and its affiliates provide the Fund with investment management related services for which the Fund pays a monthly management fee. The management fee is the sum of an individual fund fee rate that is based on an annual rate of .30% of the Fund's average net assets and an annualized group fee rate that averaged .23% during the period. The group fee rate is based upon the monthly average net assets of a group of registered investment companies with which the investment adviser has management contracts. The group fee rate decreases as assets under management increase and increases as assets under management decrease. In addition, the management fee is subject to a performance adjustment (up to a maximum of +/- .10% of the Fund's average net assets over a 36 month performance period). The upward or downward adjustment to the management fee is based on the relative investment performance of Fidelity Sustainable U.S. Equity Fund as compared to its benchmark index, the Russell 3000 Index, over the same 36 month performance period. The Fund's performance adjustment took effect in June 2022. Subsequent months will be added until the performance period includes 36 months. For the reporting period, the total annualized management fee rate, including the performance adjustment, was .52% of the Fund's average net assets. The performance adjustment included in the management fee rate may be higher or lower than the maximum performance adjustment rate due to the difference between the average net assets for the reporting and performance periods.
Distribution and Service Plan Fees. In accordance with Rule 12b-1 of the 1940 Act, the Fund has adopted separate Distribution and Service Plans for each class of shares. Certain classes pay Fidelity Distributors Company LLC (FDC), an affiliate of the investment adviser, separate Distribution and Service Fees, each of which is based on an annual percentage of each class' average net assets. In addition, FDC may pay financial intermediaries for selling shares of the Fund and providing shareholder support services. For the period, the Distribution and Service Fee rates, total fees and amounts retained by FDC were as follows:
| | Distribution Fee | Service Fee | Total Fees | Retained by FDC |
| Class A | - % | .25% | $767 | $2,424 |
| Class M | .25% | .25% | 738 | 357 |
| Class C | .75% | .25% | 1,395 | 1,016 |
| | | | $2,900 | $3,797 |
Sales Load. FDC may receive a front-end sales charge of up to 5.75% for selling Class A shares and 3.50% for selling Class M shares, some of which is paid to financial intermediaries for selling shares of the Fund. Depending on the holding period, FDC may receive contingent deferred sales charges levied on Class A, Class M and Class C redemptions. The deferred sales charges are 1.00% for Class C shares, 1.00% for certain purchases of Class A shares and .25% for certain purchases of Class M shares.
For the period, sales charge amounts retained by FDC were as follows:
| | Retained by FDC |
| Class A | $125 |
| Class M | 24 |
| | $149 |
Transfer Agent Fees. Fidelity Investments Institutional Operations Company LLC (FIIOC), an affiliate of the investment adviser, is the transfer, dividend disbursing and shareholder servicing agent for each class of the Fund. FIIOC receives account fees and asset-based fees that vary according to the account size and type of account of the shareholders of the respective classes of the Fund, except for Class Z. FIIOC receives an asset-based fee of Class Z's average net assets. FIIOC pays for typesetting, printing and mailing of shareholder reports, except proxy statements.
For the period, transfer agent fees for each class were as follows:
| | Amount | % of Class-Level Average Net Assets A |
| Class A | $777 | .25 |
| Class M | 357 | .24 |
| Class C | 352 | .25 |
| Fidelity Sustainable U.S. Equity Fund | 18,235 | .26 |
| Class I | 68 | .12 |
| Class Z | 22 | .04 |
| | $19,811 | |
A Annualized
Accounting Fees. Fidelity Service Company, Inc. (FSC), an affiliate of the investment adviser, maintains the Fund's accounting records. The accounting fee is based on the level of average net assets for each month. For the period, the fees were equivalent to the following annualized rates:
| | % of Average Net Assets |
| Fidelity Sustainable U.S. Equity Fund | .04 |
Brokerage Commissions. A portion of portfolio transactions were placed with brokerage firms which are affiliates of the investment adviser. Brokerage commissions are included in net realized gain (loss) and change in net unrealized appreciation (depreciation) in the Statement of Operations. The commissions paid to these affiliated firms were as follows:
| | Amount |
| Fidelity Sustainable U.S. Equity Fund | $52 |
Interfund Trades. Funds may purchase from or sell securities to other Fidelity Funds under procedures adopted by the Board. The procedures have been designed to ensure these interfund trades are executed in accordance with Rule 17a-7 of the 1940 Act. Any interfund trades are included within the respective purchases and sales amounts shown in the Purchases and Sales of Investments note. Interfund trades during the period are noted in the table below.
| | Purchases ($) | Sales ($) | Realized Gain (Loss) ($) |
| Fidelity Sustainable U.S. Equity Fund | 28,411 | 70,200 | (8,054) |
6. Committed Line of Credit.
Certain Funds participate with other funds managed by the investment adviser or an affiliate in a $4.25 billion credit facility (the "line of credit") to be utilized for temporary or emergency purposes to fund shareholder redemptions or for other short-term liquidity purposes. The participating funds have agreed to pay commitment fees on their pro-rata portion of the line of credit, which are reflected in Miscellaneous expenses on the Statement of Operations, and are listed below. During the period, there were no borrowings on this line of credit.
| | Amount |
| Fidelity Sustainable U.S. Equity Fund | $14 |
7. Expense Reductions.
The investment adviser contractually agreed to reimburse expenses of each class to the extent annual operating expenses exceeded certain levels of class-level average net assets as noted in the table below. This reimbursement will remain in place through September 30, 2023. Some expenses, for example the compensation of the independent Trustees are excluded from this reimbursement.
The following classes were in reimbursement during the period:
| | Expense Limitations | Reimbursement |
| Class A | 1.15% | $2,009 |
| Class M | 1.40% | 934 |
| Class C | 1.90% | 894 |
| Fidelity Sustainable U.S. Equity Fund | .90% | 46,548 |
| Class I | .90% | 291 |
| Class Z | .75% | 320 |
| | | $50,996 |
Through arrangements with the Fund's custodian, credits realized as a result of certain uninvested cash balances were used to reduce the Fund's expenses. During the period, custodian credits reduced the Fund's expenses by $55.
In addition, during the period the investment adviser or an affiliate reimbursed and/or waived a portion of fund-level operating expenses in the amount of $275.
8. Distributions to Shareholders.
Distributions to shareholders of each class were as follows:
| | Six months ended November 30, 2022 | Year ended May 31, 2022 A |
| Fidelity Sustainable U.S. Equity Fund | | |
| Distributions to shareholders | | |
| Class A | $- | $1,154 |
| Class M | - | 328 |
| Class C | - | 138 |
| Fidelity Sustainable U.S. Equity Fund | 12,503 | 55,616 |
| Class I | 99 | 590 |
| Class Z | 96 | 480 |
Total | $12,698 | $58,306 |
A For the period June 15, 2021 (commencement of operations) through May 31, 2022.
Share Transactions.
Share transactions for each class were as follows and may contain in-kind transactions, automatic conversions between classes or exchanges between affiliated funds:
| | Shares | Shares | Dollars | Dollars |
| | Six months ended November 30, 2022 | Year ended May 31, 2022 | Six months ended November 30, 2022 | Year ended May 31, 2022 A |
| Fidelity Sustainable U.S. Equity Fund | | | | |
| Class A | | | | |
| Shares sold | 3,912 | 73,664 | $34,670 | $763,410 |
| Reinvestment of distributions | - | 108 | - | 1,154 |
| Shares redeemed | (2,851) | (6,267) | (25,002) | (60,042) |
| Net increase (decrease) | 1,061 | 67,505 | $9,668 | $704,522 |
| Class M | | | | |
| Shares sold | 7,948 | 27,530 | $70,790 | $285,645 |
| Reinvestment of distributions | - | 31 | - | 328 |
| Shares redeemed | (57) | - | (530) | - |
| Net increase (decrease) | 7,891 | 27,561 | $70,260 | $285,973 |
| Class C | | | | |
| Shares sold | 4,457 | 30,322 | $39,910 | $306,710 |
| Reinvestment of distributions | - | 13 | - | 138 |
| Shares redeemed | (181) | (1,110) | (1,555) | (10,221) |
| Net increase (decrease) | 4,276 | 29,225 | $38,355 | $296,627 |
| Fidelity Sustainable U.S. Equity Fund | | | | |
| Shares sold | 359,646 | 2,019,003 | $3,224,805 | $21,143,713 |
| Reinvestment of distributions | 1,276 | 4,747 | 11,304 | 50,883 |
| Shares redeemed | (305,770) | (462,942) | (2,692,326) | (4,758,254) |
| Net increase (decrease) | 55,152 | 1,560,808 | $543,783 | $16,436,342 |
| Class I | | | | |
| Shares sold | - | 12,287 | $- | $125,000 |
| Reinvestment of distributions | 11 | 55 | 99 | 590 |
| Net increase (decrease) | 11 | 12,342 | $99 | $125,590 |
| Class Z | | | | |
| Shares sold | - | 11,964 | $- | $121,029 |
| Reinvestment of distributions | 11 | 45 | 96 | 480 |
| Shares redeemed | (54) | - | (471) | - |
| Net increase (decrease) | (43) | 12,009 | $(375) | $121,509 |
A For the period June 15, 2021 (commencement of operations) through May 31, 2022.
9. Other.
A fund's organizational documents provide former and current trustees and officers with a limited indemnification against liabilities arising in connection with the performance of their duties to the fund. In the normal course of business, a fund may also enter into contracts that provide general indemnifications. A fund's maximum exposure under these arrangements is unknown as this would be dependent on future claims that may be made against a fund. The risk of material loss from such claims is considered remote.
10. Risk and Uncertainties.
Many factors affect a fund's performance. Developments that disrupt global economies and financial markets, such as pandemics, epidemics, outbreaks of infectious diseases, war, terrorism, and environmental disasters, may significantly affect a fund's investment performance. The effects of these developments to a fund will be impacted by the types of securities in which a fund invests, the financial condition, industry, economic sector, and geographic location of an issuer, and a fund's level of investment in the securities of that issuer.
As a shareholder, you incur two types of costs: (1) transaction costs, which may include sales charges (loads) on purchase payments or redemption proceeds, as applicable and (2) ongoing costs, which generally include management fees, distribution and/or service (12b-1) fees and other Fund expenses. This Example is intended to help you understand your ongoing costs (in dollars) of investing in a fund and to compare these costs with the ongoing costs of investing in other mutual funds.
| The Example is based on an investment of $1,000 invested at the beginning of the period and held for the entire period (June 1, 2022 to November 30, 2022). |
Actual Expenses
The first line of the accompanying table provides information about actual account values and actual expenses. You may use the information in this line, together with the amount you invested, to estimate the expenses that you paid over the period. Simply divide your account value by $1,000.00 (for example, an $8,600 account value divided by $1,000.00 = 8.6), then multiply the result by the number in the first line for a class/Fund under the heading entitled "Expenses Paid During Period" to estimate the expenses you paid on your account during this period. If any fund is a shareholder of any underlying mutual funds or exchange-traded funds (ETFs) (the Underlying Funds), such fund indirectly bears its proportional share of the expenses of the Underlying Funds in addition to the direct expenses incurred presented in the table. These fees and expenses are not included in the annualized expense ratio used to calculate the expense estimate in the table below.
Hypothetical Example for Comparison Purposes
The second line of the accompanying table provides information about hypothetical account values and hypothetical expenses based on the actual expense ratio and an assumed rate of return of 5% per year before expenses, which is not the actual return. The hypothetical account values and expenses may not be used to estimate the actual ending account balance or expenses you paid for the period. You may use this information to compare the ongoing costs of investing in the Fund and other funds. To do so, compare this 5% hypothetical example with the 5% hypothetical examples that appear in the shareholder reports of the other funds. If any fund is a shareholder of any Underlying Funds, such fund indirectly bears its proportional share of the expenses of the Underlying Funds in addition to the direct expenses as presented in the table. These fees and expenses are not included in the annualized expense ratio used to calculate the expense estimate in the table below.
Please note that the expenses shown in the table are meant to highlight your ongoing costs only and do not reflect any transaction costs. Therefore, the second line of the table is useful in comparing ongoing costs only, and will not help you determine the relative total costs of owning different funds. In addition, if these transactional costs were included, your costs would have been higher.
| | | | | Annualized Expense Ratio- A | | Beginning Account Value June 1, 2022 | | Ending Account Value November 30, 2022 | | Expenses Paid During Period- C June 1, 2022 to November 30, 2022 |
| Fidelity® Sustainable U.S. Equity Fund | | | | | | | | | | |
| Class A | | | | 1.15% | | | | | | |
| Actual | | | | | | $ 1,000 | | $ 1,007.50 | | $ 5.79 |
Hypothetical- B | | | | | | $ 1,000 | | $ 1,019.30 | | $ 5.82 |
| Class M | | | | 1.40% | | | | | | |
| Actual | | | | | | $ 1,000 | | $ 1,006.40 | | $ 7.04 |
Hypothetical- B | | | | | | $ 1,000 | | $ 1,018.05 | | $ 7.08 |
| Class C | | | | 1.89% | | | | | | |
| Actual | | | | | | $ 1,000 | | $ 1,004.30 | | $ 9.50 |
Hypothetical- B | | | | | | $ 1,000 | | $ 1,015.59 | | $ 9.55 |
| Fidelity® Sustainable U.S. Equity Fund | | | | .90% | | | | | | |
| Actual | | | | | | $ 1,000 | | $ 1,008.40 | | $ 4.53 |
Hypothetical- B | | | | | | $ 1,000 | | $ 1,020.56 | | $ 4.56 |
| Class I | | | | .90% | | | | | | |
| Actual | | | | | | $ 1,000 | | $ 1,008.40 | | $ 4.53 |
Hypothetical- B | | | | | | $ 1,000 | | $ 1,020.56 | | $ 4.56 |
| Class Z | | | | .75% | | | | | | |
| Actual | | | | | | $ 1,000 | | $ 1,009.40 | | $ 3.78 |
Hypothetical- B | | | | | | $ 1,000 | | $ 1,021.31 | | $ 3.80 |
| |
A Annualized expense ratio reflects expenses net of applicable fee waivers.
B 5% return per year before expenses
C Expenses are equal to the annualized expense ratio, multiplied by the average account value over the period, multiplied by 183/ 365 (to reflect the one-half year period). The fees and expenses of any Underlying Funds are not included in each annualized expense ratio.
1.9901905.101
SUS-SANN-0123
Fidelity SAI Sustainable U.S. Equity Fund
Semi-Annual Report
November 30, 2022
Offered exclusively to certain clients of the Adviser, or its affiliates, including Strategic Advisers LLC (Strategic Advisers) - not available for sale to the general public. Fidelity ® SAI is a product name of Fidelity ® funds dedicated to certain programs affiliated with Strategic Advisers.
Contents
To view a fund's proxy voting guidelines and proxy voting record for the 12-month period ended June 30, visit http://www.fidelity.com/proxyvotingresults or visit the Securities and Exchange Commission's (SEC) web site at http://www.sec.gov.
You may also call 1-800-544-3455 to request a free copy of the proxy voting guidelines.
Standard & Poor's, S&P and S&P 500 are registered service marks of The McGraw-Hill Companies, Inc. and have been licensed for use by Fidelity Distributors Corporation.
Other third-party marks appearing herein are the property of their respective owners.
All other marks appearing herein are registered or unregistered trademarks or service marks of FMR LLC or an affiliated company. © 2023 FMR LLC. All rights reserved.
This report and the financial statements contained herein are submitted for the general information of the shareholders of the Fund. This report is not authorized for distribution to prospective investors in the Fund unless preceded or accompanied by an effective prospectus.
A fund files its complete schedule of portfolio holdings with the SEC for the first and third quarters of each fiscal year on Form N-PORT. Forms N-PORT are available on the SEC's web site at http://www.sec.gov. A fund's Forms N-PORT may be reviewed and copied at the SEC's Public Reference Room in Washington, DC. Information regarding the operation of the SEC's Public Reference Room may be obtained by calling 1-800-SEC-0330.
For a complete list of a fund's portfolio holdings, view the most recent holdings listing, semiannual report, or annual report on Fidelity's web site at http://www.fidelity.com, http://www.institutional.fidelity.com, or http://www.401k.com, as applicable.
NOT FDIC INSURED •MAY LOSE VALUE •NO BANK GUARANTEE
Neither the Fund nor Fidelity Distributors Corporation is a bank.
Top Holdings (% of Fund's net assets) |
| |
| Microsoft Corp. | 6.3 | |
| Danaher Corp. | 3.1 | |
| Prologis (REIT), Inc. | 2.8 | |
| Cigna Corp. | 2.5 | |
| The Travelers Companies, Inc. | 2.4 | |
| Apple, Inc. | 2.4 | |
| Bank of America Corp. | 2.2 | |
| Procter & Gamble Co. | 2.2 | |
| Merck & Co., Inc. | 2.1 | |
| The Home Depot, Inc. | 2.0 | |
| | 28.0 | |
| |
| Market Sectors (% of Fund's net assets) |
| |
| Information Technology | 25.9 | |
| Health Care | 13.4 | |
| Financials | 12.4 | |
| Consumer Discretionary | 12.0 | |
| Industrials | 10.1 | |
| Consumer Staples | 5.9 | |
| Communication Services | 5.5 | |
| Materials | 4.9 | |
| Energy | 3.6 | |
| Real Estate | 2.8 | |
| Utilities | 2.8 | |
| |
Asset Allocation (% of Fund's net assets) |
|
Foreign investments - 12.1% |
|
Geographic Diversification (% of Fund's net assets) |
|
* Includes Short-Term investments and Net Other Assets (Liabilities). Percentages are based on country or territory of incorporation and are adjusted for the effect of futures contracts, if applicable. |
| |
Showing Percentage of Net Assets
| Common Stocks - 99.3% |
| | | Shares | Value ($) |
| COMMUNICATION SERVICES - 5.5% | | | |
| Entertainment - 1.3% | | | |
| Netflix, Inc. (a) | | 140 | 42,774 |
| Interactive Media & Services - 1.6% | | | |
| Alphabet, Inc. Class A (a) | | 523 | 52,818 |
| Media - 2.6% | | | |
| Cable One, Inc. | | 26 | 18,832 |
| Comcast Corp. Class A | | 864 | 31,657 |
| Interpublic Group of Companies, Inc. | | 918 | 31,542 |
| | | | 82,031 |
TOTAL COMMUNICATION SERVICES | | | 177,623 |
| CONSUMER DISCRETIONARY - 12.0% | | | |
| Auto Components - 0.8% | | | |
| Aptiv PLC (a) | | 235 | 25,067 |
| Automobiles - 0.8% | | | |
| General Motors Co. | | 606 | 24,579 |
| Diversified Consumer Services - 1.9% | | | |
| Adtalem Global Education, Inc. (a) | | 777 | 32,323 |
| Bright Horizons Family Solutions, Inc. (a) | | 369 | 27,380 |
| | | | 59,703 |
| Hotels, Restaurants & Leisure - 1.2% | | | |
| Marriott International, Inc. Class A | | 227 | 37,534 |
| Household Durables - 1.3% | | | |
| Taylor Morrison Home Corp. (a) | | 1,421 | 43,184 |
| Internet & Direct Marketing Retail - 2.0% | | | |
| Amazon.com, Inc. (a) | | 284 | 27,417 |
| eBay, Inc. | | 825 | 37,488 |
| | | | 64,905 |
| Specialty Retail - 2.0% | | | |
| The Home Depot, Inc. | | 202 | 65,446 |
| Textiles, Apparel & Luxury Goods - 2.0% | | | |
| LVMH Moet Hennessy Louis Vuitton SE | | 53 | 41,130 |
| Tapestry, Inc. | | 646 | 24,399 |
| | | | 65,529 |
TOTAL CONSUMER DISCRETIONARY | | | 385,947 |
| CONSUMER STAPLES - 5.9% | | | |
| Beverages - 0.9% | | | |
| Keurig Dr. Pepper, Inc. | | 756 | 29,235 |
| Food & Staples Retailing - 0.8% | | | |
| Albertsons Companies, Inc. | | 1,320 | 27,654 |
| Food Products - 1.1% | | | |
| Darling Ingredients, Inc. (a) | | 493 | 35,412 |
| Household Products - 2.2% | | | |
| Procter & Gamble Co. | | 468 | 69,807 |
| Personal Products - 0.9% | | | |
| Estee Lauder Companies, Inc. Class A | | 122 | 28,766 |
TOTAL CONSUMER STAPLES | | | 190,874 |
| ENERGY - 3.6% | | | |
| Energy Equipment & Services - 1.2% | | | |
| Baker Hughes Co. Class A | | 1,311 | 38,045 |
| Oil, Gas & Consumable Fuels - 2.4% | | | |
| Cheniere Energy, Inc. | | 87 | 15,256 |
| Denbury, Inc. (a) | | 281 | 25,223 |
| Valero Energy Corp. | | 278 | 37,146 |
| | | | 77,625 |
TOTAL ENERGY | | | 115,670 |
| FINANCIALS - 12.4% | | | |
| Banks - 3.2% | | | |
| Bank of America Corp. | | 1,885 | 71,347 |
| Huntington Bancshares, Inc. | | 2,033 | 31,471 |
| | | | 102,818 |
| Capital Markets - 5.4% | | | |
| BlackRock, Inc. Class A | | 52 | 37,232 |
| Moody's Corp. | | 121 | 36,091 |
| Northern Trust Corp. | | 536 | 49,907 |
| State Street Corp. | | 634 | 50,511 |
| | | | 173,741 |
| Consumer Finance - 1.4% | | | |
| American Express Co. | | 284 | 44,756 |
| Insurance - 2.4% | | | |
| The Travelers Companies, Inc. | | 417 | 79,151 |
TOTAL FINANCIALS | | | 400,466 |
| HEALTH CARE - 13.4% | | | |
| Biotechnology - 1.7% | | | |
| Vertex Pharmaceuticals, Inc. (a) | | 174 | 55,054 |
| Health Care Providers & Services - 2.7% | | | |
| Cigna Corp. | | 243 | 79,920 |
| Guardant Health, Inc. (a) | | 132 | 6,909 |
| | | | 86,829 |
| Life Sciences Tools & Services - 4.2% | | | |
| Danaher Corp. | | 361 | 98,701 |
| ICON PLC (a) | | 165 | 35,548 |
| | | | 134,249 |
| Pharmaceuticals - 4.8% | | | |
| Merck & Co., Inc. | | 612 | 67,393 |
| Roche Holding AG (participation certificate) | | 72 | 23,517 |
| UCB SA | | 347 | 28,009 |
| Zoetis, Inc. Class A | | 234 | 36,069 |
| | | | 154,988 |
TOTAL HEALTH CARE | | | 431,120 |
| INDUSTRIALS - 10.1% | | | |
| Air Freight & Logistics - 1.3% | | | |
| United Parcel Service, Inc. Class B | | 215 | 40,792 |
| Building Products - 1.0% | | | |
| Johnson Controls International PLC | | 517 | 34,349 |
| Electrical Equipment - 1.3% | | | |
| Acuity Brands, Inc. | | 185 | 34,834 |
| Generac Holdings, Inc. (a) | | 73 | 7,703 |
| | | | 42,537 |
| Machinery - 2.2% | | | |
| Deere & Co. | | 98 | 43,218 |
| Ingersoll Rand, Inc. | | 501 | 27,039 |
| | | | 70,257 |
| Professional Services - 4.3% | | | |
| KBR, Inc. | | 1,084 | 56,010 |
| Manpower, Inc. | | 465 | 40,697 |
| Verisk Analytics, Inc. | | 226 | 41,518 |
| | | | 138,225 |
TOTAL INDUSTRIALS | | | 326,160 |
| INFORMATION TECHNOLOGY - 25.9% | | | |
| Electronic Equipment & Components - 0.6% | | | |
| Flex Ltd. (a) | | 945 | 20,771 |
| IT Services - 3.8% | | | |
| Accenture PLC Class A | | 207 | 62,293 |
| MasterCard, Inc. Class A | | 101 | 35,996 |
| PayPal Holdings, Inc. (a) | | 308 | 24,150 |
| | | | 122,439 |
| Semiconductors & Semiconductor Equipment - 7.2% | | | |
| Advanced Micro Devices, Inc. (a) | | 328 | 25,463 |
| NVIDIA Corp. | | 358 | 60,584 |
| NXP Semiconductors NV | | 211 | 37,102 |
| onsemi (a) | | 837 | 62,942 |
| SolarEdge Technologies, Inc. (a) | | 147 | 43,932 |
| | | | 230,023 |
| Software - 11.9% | | | |
| Adobe, Inc. (a) | | 93 | 32,078 |
| Autodesk, Inc. (a) | | 169 | 34,130 |
| Intuit, Inc. | | 121 | 49,318 |
| Microsoft Corp. | | 793 | 202,328 |
| Salesforce.com, Inc. (a) | | 406 | 65,062 |
| | | | 382,916 |
| Technology Hardware, Storage & Peripherals - 2.4% | | | |
| Apple, Inc. | | 520 | 76,976 |
TOTAL INFORMATION TECHNOLOGY | | | 833,125 |
| MATERIALS - 4.9% | | | |
| Chemicals - 2.2% | | | |
| Eastman Chemical Co. | | 203 | 17,584 |
| Linde PLC | | 152 | 51,145 |
| | | | 68,729 |
| Containers & Packaging - 2.7% | | | |
| Avery Dennison Corp. | | 292 | 56,452 |
| Crown Holdings, Inc. | | 381 | 31,322 |
| | | | 87,774 |
TOTAL MATERIALS | | | 156,503 |
| REAL ESTATE - 2.8% | | | |
| Equity Real Estate Investment Trusts (REITs) - 2.8% | | | |
| Prologis (REIT), Inc. | | 762 | 89,756 |
| UTILITIES - 2.8% | | | |
| Electric Utilities - 2.2% | | | |
| NextEra Energy, Inc. | | 423 | 35,828 |
| ORSTED A/S (b) | | 389 | 34,061 |
| | | | 69,889 |
| Water Utilities - 0.6% | | | |
| American Water Works Co., Inc. | | 126 | 19,122 |
TOTAL UTILITIES | | | 89,011 |
| TOTAL COMMON STOCKS (Cost $3,055,345) | | | 3,196,255 |
| | | | |
| TOTAL INVESTMENT IN SECURITIES - 99.3% (Cost $3,055,345) | 3,196,255 |
NET OTHER ASSETS (LIABILITIES) - 0.7% | 21,504 |
| NET ASSETS - 100.0% | 3,217,759 |
| | |
Legend
| (b) | Security exempt from registration under Rule 144A of the Securities Act of 1933. These securities may be resold in transactions exempt from registration, normally to qualified institutional buyers. At the end of the period, the value of these securities amounted to $34,061 or 1.1% of net assets. |
Affiliated Central Funds
Fiscal year to date information regarding the Fund's investments in Fidelity Central Funds, including the ownership percentage, is presented below.
| Affiliate | Value, beginning of period ($) | Purchases ($) | Sales Proceeds ($) | Dividend Income ($) | Realized Gain (loss) ($) | Change in Unrealized appreciation (depreciation) ($) | Value, end of period ($) | % ownership, end of period |
| Fidelity Cash Central Fund 3.86% | 4,355 | 1,176,419 | 1,180,774 | 360 | - | - | - | 0.0% |
| Total | 4,355 | 1,176,419 | 1,180,774 | 360 | - | - | - | |
| | | | | | | | | |
Amounts in the income column in the above table include any capital gain distributions from underlying funds, which are presented in the corresponding line item in the Statement of Operations, if applicable.
Amounts included in the purchases and sales proceeds columns may include in-kind transactions, if applicable.
Investment Valuation
The following is a summary of the inputs used, as of November 30, 2022, involving the Fund's assets and liabilities carried at fair value. The inputs or methodology used for valuing securities may not be an indication of the risk associated with investing in those securities. For more information on valuation inputs, and their aggregation into the levels used below, please refer to the Investment Valuation section in the accompanying Notes to Financial Statements.
| Valuation Inputs at Reporting Date: |
| Description | Total ($) | Level 1 ($) | Level 2 ($) | Level 3 ($) |
Investments in Securities: | | | | |
|
| Equities: | | | | |
Communication Services | 177,623 | 177,623 | - | - |
Consumer Discretionary | 385,947 | 344,817 | 41,130 | - |
Consumer Staples | 190,874 | 190,874 | - | - |
Energy | 115,670 | 115,670 | - | - |
Financials | 400,466 | 400,466 | - | - |
Health Care | 431,120 | 379,594 | 51,526 | - |
Industrials | 326,160 | 326,160 | - | - |
Information Technology | 833,125 | 833,125 | - | - |
Materials | 156,503 | 156,503 | - | - |
Real Estate | 89,756 | 89,756 | - | - |
Utilities | 89,011 | 54,950 | 34,061 | - |
| Total Investments in Securities: | 3,196,255 | 3,069,538 | 126,717 | - |
| Statement of Assets and Liabilities |
| | | | November 30, 2022 (Unaudited) |
| | | | | |
| Assets | | | | |
Investment in securities, at value - See accompanying schedule Unaffiliated issuers (cost $3,055,345): | | | $ | 3,196,255 |
| Receivable for investments sold | | | | 65,040 |
| Receivable for fund shares sold | | | | 86,523 |
| Dividends receivable | | | | 9,714 |
| Distributions receivable from Fidelity Central Funds | | | | 131 |
| Prepaid expenses | | | | 8,658 |
| Receivable from investment adviser for expense reductions | | | | 6,372 |
Total assets | | | | 3,372,693 |
| Liabilities | | | | |
| Payable to custodian bank | | $59 | | |
| Payable for investments purchased | | 127,361 | | |
| Payable for fund shares redeemed | | 3,549 | | |
| Accrued management fee | | 1,227 | | |
| Audit fee payable | | 18,730 | | |
| Other payables and accrued expenses | | 4,008 | | |
| Total Liabilities | | | | 154,934 |
| Net Assets | | | $ | 3,217,759 |
| Net Assets consist of: | | | | |
| Paid in capital | | | $ | 3,103,042 |
| Total accumulated earnings (loss) | | | | 114,717 |
| Net Assets | | | $ | 3,217,759 |
Net Asset Value , offering price and redemption price per share ($3,217,759 ÷ 345,500 shares) | | | $ | 9.31 |
| | | | | |
| Statement of Operations |
| | | | Six months ended November 30, 2022 (Unaudited) |
| Investment Income | | | | |
| Dividends | | | $ | 10,377 |
| Special dividends | | | | 6,590 |
| Income from Fidelity Central Funds | | | | 360 |
| Total Income | | | | 17,327 |
| Expenses | | | | |
| Management fee | $ | 4,045 | | |
| Custodian fees and expenses | | 6,329 | | |
| Independent trustees' fees and expenses | | 2 | | |
| Registration fees | | 16,035 | | |
| Audit | | 13,989 | | |
| Miscellaneous | | 30 | | |
| Total expenses before reductions | | 40,430 | | |
| Expense reductions | | (35,890) | | |
| Total expenses after reductions | | | | 4,540 |
| Net Investment income (loss) | | | | 12,787 |
| Realized and Unrealized Gain (Loss) | | | | |
| Net realized gain (loss) on: | | | | |
| Investment Securities: | | | | |
| Unaffiliated issuers | | (32,022) | | |
| Foreign currency transactions | | 27 | | |
| Total net realized gain (loss) | | | | (31,995) |
| Change in net unrealized appreciation (depreciation) on: | | | | |
| Investment Securities: | | | | |
| Unaffiliated issuers | | 210,102 | | |
| Assets and liabilities in foreign currencies | | 137 | | |
| Total change in net unrealized appreciation (depreciation) | | | | 210,239 |
| Net gain (loss) | | | | 178,244 |
| Net increase (decrease) in net assets resulting from operations | | | $ | 191,031 |
| Statement of Changes in Net Assets |
| |
| | Six months ended November 30, 2022 (Unaudited) | | For the period April 14, 2022 (commencement of operations) through May 31, 2022 |
| Increase (Decrease) in Net Assets | | | | |
| Operations | | | | |
| Net investment income (loss) | $ | 12,787 | $ | 848 |
| Net realized gain (loss) | | (31,995) | | (7,001) |
| Change in net unrealized appreciation (depreciation) | | 210,239 | | (69,192) |
| Net increase (decrease) in net assets resulting from operations | | 191,031 | | (75,345) |
| Distributions to shareholders | | (969) | | - |
| Share transactions | | | | |
| Proceeds from sales of shares | | 2,164,052 | | 1,003,695 |
| Reinvestment of distributions | | 964 | | - |
| Cost of shares redeemed | | (65,059) | | (610) |
Net increase (decrease) in net assets resulting from share transactions | | 2,099,957 | | 1,003,085 |
| Total increase (decrease) in net assets | | 2,290,019 | | 927,740 |
| | | | | |
| Net Assets | | | | |
| Beginning of period | | 927,740 | | - |
| End of period | $ | 3,217,759 | $ | 927,740 |
| | | | | |
| Other Information | | | | |
| Shares | | | | |
| Sold | | 252,472 | | 100,392 |
| Issued in reinvestment of distributions | | 111 | | - |
| Redeemed | | (7,414) | | (61) |
| Net increase (decrease) | | 245,169 | | 100,331 |
| | | | | |
Financial Highlights
| Fidelity SAI Sustainable U.S. Equity Fund |
| |
| | Six months ended (Unaudited) November 30, 2022 | | Years ended May 31, 2022 A |
Selected Per-Share Data | | | | |
| Net asset value, beginning of period | $ | 9.25 | $ | 10.00 |
| Income from Investment Operations | | | | |
Net investment income (loss) B,C | | .07 D | | .01 |
| Net realized and unrealized gain (loss) | | - E | | (.76) |
| Total from investment operations | | .07 | | (.75) |
| Distributions from net investment income | | (.01) | | - |
| Total distributions | | (.01) | | - |
| Net asset value, end of period | $ | 9.31 | $ | 9.25 |
Total Return F,G | | .75% | | (7.50)% |
Ratios to Average Net Assets C,H,I | | | | |
| Expenses before reductions | | 5.27% J | | 7.28% J,K |
| Expenses net of fee waivers, if any | | .59% J | | .60% J,K |
| Expenses net of all reductions | | .59% J | | .60% J,K |
| Net investment income (loss) | | 1.24% D,J | | .73% J,K |
| Supplemental Data | | | | |
| Net assets, end of period (000 omitted) | $ | 3,218 | $ | 928 |
Portfolio turnover rate L | | 59% J | | 2% M |
A For the period April 14, 2022 (commencement of operations) through May 31, 2022.
B Calculated based on average shares outstanding during the period.
C Net investment income (loss) is affected by the timing of the declaration of dividends by any underlying mutual funds or exchange-traded funds (ETFs). Net investment income (loss) of any mutual funds or ETFs is not included in the Fund's net investment income (loss) ratio.
D Net investment income per share reflects one or more large, non-recurring dividend(s) which amounted to $.04 per share. Such dividends are not annualized in the ratio of net investment income (loss) to average net assets. Excluding such non-recurring dividend(s) the ratio of net investment income (loss) to average net assets would have been .81%.
E Amount represents less than $.005 per share.
F Total returns for periods of less than one year are not annualized.
G Total returns would have been lower if certain expenses had not been reduced during the applicable periods shown.
H Fees and expenses of any underlying mutual funds or exchange-traded funds (ETFs) are not included in the Fund's expense ratio. The Fund indirectly bears its proportionate share of these expenses. For additional expense information related to investments in Fidelity Central Funds, please refer to the "Investments in Fidelity Central Funds" note found in the Notes to Financial Statements section of the most recent Annual or Semi-Annual report.
I Expense ratios reflect operating expenses of the class. Expenses before reductions do not reflect amounts reimbursed, waived, or reduced through arrangements with the investment adviser, brokerage services, or other offset arrangements, if applicable, and do not represent the amount paid by the class during periods when reimbursements, waivers or reductions occur.
J Annualized.
K Audit fees are not annualized.
L Amount does not include the portfolio activity of any underlying mutual funds or exchange-traded funds (ETFs).
M Amount not annualized.
For the period ended November 30, 2022
1. Organization.
Fidelity SAI Sustainable U.S. Equity Fund (the Fund) is a fund of Fidelity Summer Street Trust (the Trust) and is authorized to issue an unlimited number of shares. Shares are offered exclusively to certain clients of Fidelity Management & Research Company LLC (FMR) or its affiliates. The Trust is registered under the Investment Company Act of 1940, as amended (the 1940 Act), as an open-end management investment company organized as a Massachusetts business trust.
2. Investments in Fidelity Central Funds.
Funds may invest in Fidelity Central Funds, which are open-end investment companies generally available only to other investment companies and accounts managed by the investment adviser and its affiliates. The Schedule of Investments lists any Fidelity Central Funds held as an investment as of period end, but does not include the underlying holdings of each Fidelity Central Fund. An investing fund indirectly bears its proportionate share of the expenses of the underlying Fidelity Central Funds.
Based on its investment objective, each Fidelity Central Fund may invest or participate in various investment vehicles or strategies that are similar to those of the investing fund. These strategies are consistent with the investment objectives of the investing fund and may involve certain economic risks which may cause a decline in value of each of the Fidelity Central Funds and thus a decline in the value of the investing fund.
| Fidelity Central Fund | Investment Manager | Investment Objective | Investment Practices | Expense Ratio A |
| Fidelity Money Market Central Funds | Fidelity Management & Research Company LLC (FMR) | Each fund seeks to obtain a high level of current income consistent with the preservation of capital and liquidity. | Short-term Investments | Less than .005% |
A Expenses expressed as a percentage of average net assets and are as of each underlying Central Fund's most recent annual or semi-annual shareholder report.
A complete unaudited list of holdings for each Fidelity Central Fund is available upon request or at the Securities and Exchange Commission website at www.sec.gov. In addition, the financial statements of the Fidelity Central Funds which contain the significant accounting policies (including investment valuation policies) of those funds, and are not covered by the Report of Independent Registered Public Accounting Firm, are available on the Securities and Exchange Commission website or upon request.
3. Significant Accounting Policies.
The Fund is an investment company and applies the accounting and reporting guidance of the Financial Accounting Standards Board (FASB) Accounting Standards Codification Topic 946 Financial Services - Investment Companies . The financial statements have been prepared in conformity with accounting principles generally accepted in the United States of America (GAAP), which require management to make certain estimates and assumptions at the date of the financial statements. Actual results could differ from those estimates. Subsequent events, if any, through the date that the financial statements were issued have been evaluated in the preparation of the financial statements. The Fund's Schedule of Investments lists any underlying mutual funds or exchange-traded funds (ETFs) but does not include the underlying holdings of these funds. The following summarizes the significant accounting policies of the Fund:
Investment Valuation. Investments are valued as of 4:00 p.m. Eastern time on the last calendar day of the period. The Board of Trustees (the Board) has designated the Fund's investment adviser as the valuation designee responsible for the fair valuation function and performing fair value determinations as needed. The investment adviser has established a Fair Value Committee (the Committee) to carry out the day-to-day fair valuation responsibilities and has adopted policies and procedures to govern the fair valuation process and the activities of the Committee. In accordance with these fair valuation policies and procedures, which have been approved by the Board, the Fund attempts to obtain prices from one or more third party pricing services or brokers to value its investments. When current market prices, quotations or currency exchange rates are not readily available or reliable, investments will be fair valued in good faith by the Committee, in accordance with the policies and procedures. Factors used in determining fair value vary by investment type and may include market or investment specific events, transaction data, estimated cash flows, and market observations of comparable investments. The frequency that the fair valuation procedures are used cannot be predicted and they may be utilized to a significant extent. The Committee manages the Fund's fair valuation practices and maintains the fair valuation policies and procedures. The Fund's investment adviser reports to the Board information regarding the fair valuation process and related material matters.
The Fund categorizes the inputs to valuation techniques used to value its investments into a disclosure hierarchy consisting of three levels as shown below:
Level 1 - unadjusted quoted prices in active markets for identical investments
Level 2 - other significant observable inputs (including quoted prices for similar investments, interest rates, prepayment speeds, etc.)
Level 3 - unobservable inputs (including the Fund's own assumptions based on the best information available)
Valuation techniques used to value the Fund's investments by major category are as follows:
Equity securities, including restricted securities, for which market quotations are readily available, are valued at the last reported sale price or official closing price as reported by a third party pricing service on the primary market or exchange on which they are traded and are categorized as Level 1 in the hierarchy. In the event there were no sales during the day or closing prices are not available, securities are valued at the last quoted bid price or may be valued using the last available price and are generally categorized as Level 2 in the hierarchy. For foreign equity securities, when market or security specific events arise, comparisons to the valuation of American Depositary Receipts (ADRs), futures contracts, ETFs and certain indexes as well as quoted prices for similar securities may be used and would be categorized as Level 2 in the hierarchy. For equity securities, including restricted securities, where observable inputs are limited, assumptions about market activity and risk are used and these securities may be categorized as Level 3 in the hierarchy.
Investments in open-end mutual funds, including the Fidelity Central Funds, are valued at their closing net asset value (NAV) each business day and are categorized as Level 1 in the hierarchy.
Changes in valuation techniques may result in transfers in or out of an assigned level within the disclosure hierarchy. The aggregate value of investments by input level as of November 30, 2022 is included at the end of the Fund's Schedule of Investments.
Foreign Currency. Certain Funds may use foreign currency contracts to facilitate transactions in foreign-denominated securities. Gains and losses from these transactions may arise from changes in the value of the foreign currency or if the counterparties do not perform under the contracts' terms.
Foreign-denominated assets, including investment securities, and liabilities are translated into U.S. dollars at the exchange rates at period end. Purchases and sales of investment securities, income and dividends received, and expenses denominated in foreign currencies are translated into U.S. dollars at the exchange rate in effect on the transaction date.
The effects of exchange rate fluctuations on investments are included with the net realized and unrealized gain (loss) on investment securities. Other foreign currency transactions resulting in realized and unrealized gain (loss) are disclosed separately.
Investment Transactions and Income. For financial reporting purposes, the Fund's investment holdings and NAV include trades executed through the end of the last business day of the period. The NAV per share for processing shareholder transactions is calculated as of the close of business of the New York Stock Exchange (NYSE), normally 4:00 p.m. Eastern time and includes trades executed through the end of the prior business day. Gains and losses on securities sold are determined on the basis of identified cost. Commissions paid to certain brokers with whom the investment adviser, or its affiliates, places trades on behalf of a fund include an amount in addition to trade execution, which may be rebated back to a fund. Any such rebates are included in net realized gain (loss) on investments in the Statement of Operations. Dividend income is recorded on the ex-dividend date, except for certain dividends from foreign securities where the ex-dividend date may have passed, which are recorded as soon as the Fund is informed of the ex-dividend date. Non-cash dividends included in dividend income, if any, are recorded at the fair market value of the securities received. Income and capital gain distributions from Fidelity Central Funds, if any, are recorded on the ex-dividend date. Large, non-recurring dividends recognized by the Fund are presented separately on the Statement of Operations as "Special Dividends" and the impact of these dividends is presented in the Financial Highlights. Investment income is recorded net of foreign taxes withheld where recovery of such taxes is uncertain.
Expenses. Expenses directly attributable to a fund are charged to that fund. Expenses attributable to more than one fund are allocated among the respective funds on the basis of relative net assets or other appropriate methods. Expenses included in the accompanying financial statements reflect the expenses of that fund and do not include any expenses associated with any underlying mutual funds or exchange-traded funds. Although not included in a fund's expenses, a fund indirectly bears its proportionate share of these expenses through the net asset value of each underlying mutual fund or exchange-traded fund. Expense estimates are accrued in the period to which they relate and adjustments are made when actual amounts are known.
Income Tax Information and Distributions to Shareholders. Each year, the Fund intends to qualify as a regulated investment company under Subchapter M of the Internal Revenue Code, including distributing substantially all of its taxable income and realized gains. As a result, no provision for U.S. Federal income taxes is required. The Fund files a U.S. federal tax return, in addition to state and local tax returns as required. The Fund's federal income tax returns are subject to examination by the Internal Revenue Service (IRS) for a period of three fiscal years after they are filed. State and local tax returns may be subject to examination for an additional fiscal year depending on the jurisdiction. Foreign taxes are provided for based on the Fund's understanding of the tax rules and rates that exist in the foreign markets in which it invests.
Distributions are declared and recorded on the ex-dividend date. Income and capital gain distributions are determined in accordance with income tax regulations, which may differ from GAAP.
Capital accounts within the financial statements are adjusted for permanent book-tax differences. These adjustments have no impact on net assets or the results of operations. Capital accounts are not adjusted for temporary book-tax differences which will reverse in a subsequent period.
Book-tax differences are primarily due to foreign currency transactions, capital loss carryforwards and losses deferred due to wash sales.
As of period end, the cost and unrealized appreciation (depreciation) in securities, and derivatives if applicable, for federal income tax purposes were as follows:
| Gross unrealized appreciation | $250,593 |
| Gross unrealized depreciation | (128,844) |
| Net unrealized appreciation (depreciation) | $121,749 |
| Tax cost | $3,074,506 |
Capital loss carryforwards are only available to offset future capital gains of the Fund to the extent provided by regulations and may be limited. The capital loss carryforward information presented below, including any applicable limitation, is estimated as of prior fiscal period end and is subject to adjustment.
Restricted Securities (including Private Placements). Funds may invest in securities that are subject to legal or contractual restrictions on resale. These securities generally may be resold in transactions exempt from registration or to the public if the securities are registered. Disposal of these securities may involve time-consuming negotiations and expense, and prompt sale at an acceptable price may be difficult. Information regarding restricted securities held at period end is included at the end of the Schedule of Investments, if applicable.
4. Purchases and Sales of Investments.
Purchases and sales of securities, other than short-term securities and in-kind transactions, as applicable, are noted in the table below.
| | Purchases ($) | Sales ($) |
| Fidelity SAI Sustainable U.S. Equity Fund | 2,561,014 | 475,247 |
5. Fees and Other Transactions with Affiliates.
Management Fee. Fidelity Management & Research Company LLC (the investment adviser) and its affiliates provide the Fund with investment management related services for which the Fund pays a monthly management fee. The management fee is the sum of an individual fund fee rate that is based on an annual rate of .30% of the Fund's average net assets and an annualized group fee rate that averaged .23% during the period. The group fee rate is based upon the monthly average net assets of a group of registered investment companies with which the investment adviser has management contracts. The group fee rate decreases as assets under management increase and increases as assets under management decrease. For the reporting period, the total annualized management fee rate was .53% of the Fund's average net assets.
Brokerage Commissions. A portion of portfolio transactions were placed with brokerage firms which are affiliates of the investment adviser. Brokerage commissions are included in net realized gain (loss) and change in net unrealized appreciation (depreciation) in the Statement of Operations. The commissions paid to these affiliated firms were as follows:
| | Amount |
| Fidelity SAI Sustainable U.S. Equity Fund | $18 |
Interfund Trades. Funds may purchase from or sell securities to other Fidelity Funds under procedures adopted by the Board. The procedures have been designed to ensure these interfund trades are executed in accordance with Rule 17a-7 of the 1940 Act. Any interfund trades are included within the respective purchases and sales amounts shown in the Purchases and Sales of Investments note. Interfund trades during the period are noted in the table below.
| | Purchases ($) | Sales ($) | Realized Gain (Loss) ($) |
| Fidelity SAI Sustainable U.S. Equity Fund | 23,862 | 8,186 | 72 |
6. Expense Reductions.
The investment adviser contractually agreed to reimburse the Fund to the extent annual operating expenses exceeded .60% of average net assets. This reimbursement will remain in place through September 30, 2023. Some expenses, for example the compensation of the independent Trustees, and certain miscellaneous expenses such as proxy and shareholder meeting expenses, are excluded from this reimbursement. During the period this reimbursement reduced the Fund's expenses by $35,860.
Through arrangements with the Fund's custodian, credits realized as a result of certain uninvested cash balances were used to reduce the Fund's expenses by $16.
In addition, during the period the investment adviser or an affiliate reimbursed and/or waived a portion of operating expenses in the amount of $14.
7. Other.
A fund's organizational documents provide former and current trustees and officers with a limited indemnification against liabilities arising in connection with the performance of their duties to the fund. In the normal course of business, a fund may also enter into contracts that provide general indemnifications. A fund's maximum exposure under these arrangements is unknown as this would be dependent on future claims that may be made against a fund. The risk of material loss from such claims is considered remote.
At the end of the period, the investment adviser or its affiliates were owners of record of more than 10% of the outstanding shares as follows:
| Fund | Affiliated % |
Fidelity SAI Sustainable U.S. Equity Fund | 30% |
8. Risk and Uncertainties.
Many factors affect a fund's performance. Developments that disrupt global economies and financial markets, such as pandemics, epidemics, outbreaks of infectious diseases, war, terrorism, and environmental disasters, may significantly affect a fund's investment performance. The effects of these developments to a fund will be impacted by the types of securities in which a fund invests, the financial condition, industry, economic sector, and geographic location of an issuer, and a fund's level of investment in the securities of that issuer.
As a shareholder, you incur two types of costs: (1) transaction costs, which may include sales charges (loads) on purchase payments or redemption proceeds, as applicable and (2) ongoing costs, which generally include management fees, distribution and/or service (12b-1) fees and other Fund expenses. This Example is intended to help you understand your ongoing costs (in dollars) of investing in a fund and to compare these costs with the ongoing costs of investing in other mutual funds.
| The Example is based on an investment of $1,000 invested at the beginning of the period and held for the entire period (June 1, 2022 to November 30, 2022). |
Actual Expenses
The first line of the accompanying table provides information about actual account values and actual expenses. You may use the information in this line, together with the amount you invested, to estimate the expenses that you paid over the period. Simply divide your account value by $1,000.00 (for example, an $8,600 account value divided by $1,000.00 = 8.6), then multiply the result by the number in the first line for a class/Fund under the heading entitled "Expenses Paid During Period" to estimate the expenses you paid on your account during this period. If any fund is a shareholder of any underlying mutual funds or exchange-traded funds (ETFs) (the Underlying Funds), such fund indirectly bears its proportional share of the expenses of the Underlying Funds in addition to the direct expenses incurred presented in the table. These fees and expenses are not included in the annualized expense ratio used to calculate the expense estimate in the table below.
Hypothetical Example for Comparison Purposes
The second line of the accompanying table provides information about hypothetical account values and hypothetical expenses based on the actual expense ratio and an assumed rate of return of 5% per year before expenses, which is not the actual return. The hypothetical account values and expenses may not be used to estimate the actual ending account balance or expenses you paid for the period. You may use this information to compare the ongoing costs of investing in the Fund and other funds. To do so, compare this 5% hypothetical example with the 5% hypothetical examples that appear in the shareholder reports of the other funds. If any fund is a shareholder of any Underlying Funds, such fund indirectly bears its proportional share of the expenses of the Underlying Funds in addition to the direct expenses as presented in the table. These fees and expenses are not included in the annualized expense ratio used to calculate the expense estimate in the table below.
Please note that the expenses shown in the table are meant to highlight your ongoing costs only and do not reflect any transaction costs. Therefore, the second line of the table is useful in comparing ongoing costs only, and will not help you determine the relative total costs of owning different funds. In addition, if these transactional costs were included, your costs would have been higher.
| | | | | Annualized Expense Ratio- A | | Beginning Account Value June 1, 2022 | | Ending Account Value November 30, 2022 | | Expenses Paid During Period- C June 1, 2022 to November 30, 2022 |
| | | | | | | | | | |
| Fidelity SAI Sustainable U.S. Equity Fund | | | | .59% | | | | | | |
| Actual | | | | | | $ 1,000 | | $ 1,007.50 | | $ 2.97 |
Hypothetical- B | | | | | | $ 1,000 | | $ 1,022.11 | | $ 2.99 |
| |
A Annualized expense ratio reflects expenses net of applicable fee waivers.
B 5% return per year before expenses
C Expenses are equal to the annualized expense ratio, multiplied by the average account value over the period, multiplied by 183/ 365 (to reflect the one-half year period). The fees and expenses of any Underlying Funds are not included in each annualized expense ratio.
1.9904863.100
EFS-SANN-0123
Fidelity® Agricultural Productivity Fund
Fidelity® Water Sustainability Fund
Semi-Annual Report
November 30, 2022
Contents
To view a fund's proxy voting guidelines and proxy voting record for the 12-month period ended June 30, visit http://www.fidelity.com/proxyvotingresults or visit the Securities and Exchange Commission's (SEC) web site at http://www.sec.gov.
You may also call 1-800-544-8544 to request a free copy of the proxy voting guidelines.
Standard & Poor's, S&P and S&P 500 are registered service marks of The McGraw-Hill Companies, Inc. and have been licensed for use by Fidelity Distributors Corporation.
Other third-party marks appearing herein are the property of their respective owners.
All other marks appearing herein are registered or unregistered trademarks or service marks of FMR LLC or an affiliated company. © 2023 FMR LLC. All rights reserved.
This report and the financial statements contained herein are submitted for the general information of the shareholders of the Funds. This report is not authorized for distribution to prospective investors in the Funds unless preceded or accompanied by an effective prospectus.
A fund files its complete schedule of portfolio holdings with the SEC for the first and third quarters of each fiscal year on Form N-PORT. Forms N-PORT are available on the SEC's web site at http://www.sec.gov. A fund's Forms N-PORT may be reviewed and copied at the SEC's Public Reference Room in Washington, DC. Information regarding the operation of the SEC's Public Reference Room may be obtained by calling 1-800-SEC-0330.
For a complete list of a fund's portfolio holdings, view the most recent holdings listing, semiannual report, or annual report on Fidelity's web site at http://www.fidelity.com, http://www.institutional.fidelity.com, or http://www.401k.com, as applicable.
NOT FDIC INSURED •MAY LOSE VALUE •NO BANK GUARANTEE
Neither the Funds nor Fidelity Distributors Corporation is a bank.
Top Holdings (% of Fund's net assets) |
| |
| Deere & Co. | 21.7 | |
| Corteva, Inc. | 9.9 | |
| Nutrien Ltd. | 8.8 | |
| Archer Daniels Midland Co. | 8.6 | |
| CNH Industrial NV | 4.6 | |
| CF Industries Holdings, Inc. | 4.4 | |
| The Mosaic Co. | 4.0 | |
| FMC Corp. | 4.0 | |
| Lamb Weston Holdings, Inc. | 3.5 | |
| Bunge Ltd. | 3.4 | |
| | 72.9 | |
| |
| Market Sectors (% of Fund's net assets) |
| |
| Materials | 39.4 | |
| Industrials | 32.6 | |
| Consumer Staples | 25.3 | |
| |
Asset Allocation (% of Fund's net assets) |
|
Foreign investments - 27.8% |
|
Geographic Diversification (% of Fund's net assets) |
|
* Includes Short-Term investments and Net Other Assets (Liabilities). Percentages are based on country or territory of incorporation and are adjusted for the effect of futures contracts, if applicable. |
| |
Fidelity® Agricultural Productivity Fund
Showing Percentage of Net Assets
| Common Stocks - 95.0% |
| | | Shares | Value ($) |
| CONSUMER STAPLES - 25.3% | | | |
| Food Products - 25.3% | | | |
| Adecoagro SA | | 58,431 | 482,640 |
| Archer Daniels Midland Co. | | 131,939 | 12,864,053 |
| Bunge Ltd. | | 48,272 | 5,060,836 |
| Darling Ingredients, Inc. (a) | | 47,531 | 3,414,152 |
| First Resources Ltd. | | 691,400 | 826,221 |
| Ingredion, Inc. | | 46,853 | 4,590,188 |
| Lamb Weston Holdings, Inc. | | 60,420 | 5,250,498 |
| Origin Enterprises PLC | | 180,421 | 736,896 |
| Sakata Seed Corp. | | 61,543 | 2,106,428 |
| The Simply Good Foods Co. (a) | | 65,735 | 2,622,827 |
| | | | 37,954,739 |
| INDUSTRIALS - 32.6% | | | |
| Machinery - 32.6% | | | |
| AGCO Corp. | | 33,829 | 4,489,785 |
| CNH Industrial NV | | 432,475 | 6,970,137 |
| Deere & Co. | | 73,709 | 32,505,668 |
| Toro Co. | | 44,590 | 4,949,044 |
| | | | 48,914,634 |
| MATERIALS - 37.1% | | | |
| Chemicals - 37.1% | | | |
| CF Industries Holdings, Inc. | | 61,006 | 6,600,239 |
| Corteva, Inc. | | 221,069 | 14,846,994 |
| Fertiglobe PLC | | 580,947 | 729,130 |
| FMC Corp. | | 45,969 | 6,005,390 |
| K+S AG | | 66,292 | 1,463,237 |
| Nufarm Ltd. | | 369,289 | 1,528,129 |
| Nutrien Ltd. (b) | | 164,146 | 13,192,450 |
| OCI NV | | 81,703 | 3,458,816 |
| Sabic Agriculture-Nutrients Co. | | 49,866 | 1,912,796 |
| The Mosaic Co. | | 117,564 | 6,031,033 |
| | | | 55,768,214 |
| TOTAL COMMON STOCKS (Cost $117,118,966) | | | 142,637,587 |
| | | | |
| Nonconvertible Preferred Stocks - 2.3% |
| | | Shares | Value ($) |
| MATERIALS - 2.3% | | | |
| Chemicals - 2.3% | | | |
Sociedad Quimica y Minera de Chile SA (PN-B) (Cost $2,474,085) | | 34,501 | 3,424,917 |
| | | | |
| Money Market Funds - 9.8% |
| | | Shares | Value ($) |
| Fidelity Cash Central Fund 3.86% (c) | | 6,061,034 | 6,062,246 |
| Fidelity Securities Lending Cash Central Fund 3.86% (c)(d) | | 8,633,537 | 8,634,400 |
| TOTAL MONEY MARKET FUNDS (Cost $14,696,646) | | | 14,696,646 |
| | | | |
| TOTAL INVESTMENT IN SECURITIES - 107.1% (Cost $134,289,697) | 160,759,150 |
NET OTHER ASSETS (LIABILITIES) - (7.1)% | (10,596,307) |
| NET ASSETS - 100.0% | 150,162,843 |
| | |
Legend
| (b) | Security or a portion of the security is on loan at period end. |
| (c) | Affiliated fund that is generally available only to investment companies and other accounts managed by Fidelity Investments. The rate quoted is the annualized seven-day yield of the fund at period end. A complete unaudited listing of the fund's holdings as of its most recent quarter end is available upon request. In addition, each Fidelity Central Fund's financial statements are available on the SEC's website or upon request. |
| (d) | Investment made with cash collateral received from securities on loan. |
Affiliated Central Funds
Fiscal year to date information regarding the Fund's investments in Fidelity Central Funds, including the ownership percentage, is presented below.
| Affiliate | Value, beginning of period ($) | Purchases ($) | Sales Proceeds ($) | Dividend Income ($) | Realized Gain (loss) ($) | Change in Unrealized appreciation (depreciation) ($) | Value, end of period ($) | % ownership, end of period |
| Fidelity Cash Central Fund 3.86% | 2,644,690 | 45,719,438 | 42,301,882 | 39,142 | - | - | 6,062,246 | 0.0% |
| Fidelity Securities Lending Cash Central Fund 3.86% | 117,300 | 42,334,458 | 33,817,358 | 4,804 | - | - | 8,634,400 | 0.0% |
| Total | 2,761,990 | 88,053,896 | 76,119,240 | 43,946 | - | - | 14,696,646 | |
| | | | | | | | | |
Amounts in the income column in the above table include any capital gain distributions from underlying funds, which are presented in the corresponding line item in the Statement of Operations, if applicable.
Amount for Fidelity Securities Lending Cash Central Fund represents the income earned on investing cash collateral, less rebates paid to borrowers and any lending agent fees associated with the loan, plus any premium payments received for lending certain types of securities.
Amounts included in the purchases and sales proceeds columns may include in-kind transactions, if applicable.
Investment Valuation
The following is a summary of the inputs used, as of November 30, 2022, involving the Fund's assets and liabilities carried at fair value. The inputs or methodology used for valuing securities may not be an indication of the risk associated with investing in those securities. For more information on valuation inputs, and their aggregation into the levels used below, please refer to the Investment Valuation section in the accompanying Notes to Financial Statements.
| Valuation Inputs at Reporting Date: |
| Description | Total ($) | Level 1 ($) | Level 2 ($) | Level 3 ($) |
Investments in Securities: | | | | |
|
| Equities: | | | | |
Consumer Staples | 37,954,739 | 34,285,194 | 3,669,545 | - |
Industrials | 48,914,634 | 41,944,497 | 6,970,137 | - |
Materials | 59,193,131 | 52,742,949 | 6,450,182 | - |
|
| Money Market Funds | 14,696,646 | 14,696,646 | - | - |
| Total Investments in Securities: | 160,759,150 | 143,669,286 | 17,089,864 | - |
Fidelity® Agricultural Productivity Fund
| Statement of Assets and Liabilities |
| | | | November 30, 2022 (Unaudited) |
| | | | | |
| Assets | | | | |
| Investment in securities, at value (including securities loaned of $8,006,376) - See accompanying schedule: | | | | |
Unaffiliated issuers (cost $119,593,051) | | $146,062,504 | | |
Fidelity Central Funds (cost $14,696,646) | | 14,696,646 | | |
| | | | | |
| Total Investment in Securities (cost $134,289,697) | | | $ | 160,759,150 |
| Foreign currency held at value (cost $20) | | | | 20 |
| Receivable for fund shares sold | | | | 349,116 |
| Dividends receivable | | | | 177,535 |
| Distributions receivable from Fidelity Central Funds | | | | 13,973 |
| Prepaid expenses | | | | 152 |
| Receivable from investment adviser for expense reductions | | | | 5,122 |
Total assets | | | | 161,305,068 |
| Liabilities | | | | |
| Payable for investments purchased | | $2,307,774 | | |
| Payable for fund shares redeemed | | 60,743 | | |
| Accrued management fee | | 79,054 | | |
| Other affiliated payables | | 32,868 | | |
| Other payables and accrued expenses | | 27,386 | | |
| Collateral on securities loaned | | 8,634,400 | | |
| Total Liabilities | | | | 11,142,225 |
| Net Assets | | | $ | 150,162,843 |
| Net Assets consist of: | | | | |
| Paid in capital | | | $ | 138,944,964 |
| Total accumulated earnings (loss) | | | | 11,217,879 |
| Net Assets | | | $ | 150,162,843 |
Net Asset Value , offering price and redemption price per share ($150,162,843 ÷ 6,670,329 shares) | | | $ | 22.51 |
| | | | | |
| Statement of Operations |
| | | | Six months ended November 30, 2022 (Unaudited) |
| Investment Income | | | | |
| Dividends | | | $ | 1,489,151 |
| Income from Fidelity Central Funds (including $4,804 from security lending) | | | | 43,946 |
| Total Income | | | | 1,533,097 |
| Expenses | | | | |
| Management fee | $ | 436,314 | | |
| Transfer agent fees | | 160,910 | | |
| Accounting fees | | 32,051 | | |
| Custodian fees and expenses | | 11,034 | | |
| Independent trustees' fees and expenses | | 233 | | |
| Registration fees | | 15,661 | | |
| Audit | | 19,988 | | |
| Legal | | 52 | | |
| Miscellaneous | | 326 | | |
| Total expenses before reductions | | 676,569 | | |
| Expense reductions | | (67,793) | | |
| Total expenses after reductions | | | | 608,776 |
| Net Investment income (loss) | | | | 924,321 |
| Realized and Unrealized Gain (Loss) | | | | |
| Net realized gain (loss) on: | | | | |
| Investment Securities: | | | | |
| Unaffiliated issuers | | (12,690,654) | | |
| Foreign currency transactions | | (23,220) | | |
| Total net realized gain (loss) | | | | (12,713,874) |
| Change in net unrealized appreciation (depreciation) on: | | | | |
| Investment Securities: | | | | |
| Unaffiliated issuers | | 11,646,476 | | |
| Assets and liabilities in foreign currencies | | 1,954 | | |
| Total change in net unrealized appreciation (depreciation) | | | | 11,648,430 |
| Net gain (loss) | | | | (1,065,444) |
| Net increase (decrease) in net assets resulting from operations | | | $ | (141,123) |
| Statement of Changes in Net Assets |
| |
| | Six months ended November 30, 2022 (Unaudited) | | Year ended May 31, 2022 |
| Increase (Decrease) in Net Assets | | | | |
| Operations | | | | |
| Net investment income (loss) | $ | 924,321 | $ | 607,733 |
| Net realized gain (loss) | | (12,713,874) | | (3,423,365) |
| Change in net unrealized appreciation (depreciation) | | 11,648,430 | | 7,152,170 |
| Net increase (decrease) in net assets resulting from operations | | (141,123) | | 4,336,538 |
| Distributions to shareholders | | (394,144) | | (407,469) |
| Share transactions | | | | |
| Proceeds from sales of shares | | 62,149,303 | | 173,532,384 |
| Reinvestment of distributions | | 364,083 | | 359,937 |
| Cost of shares redeemed | | (78,360,520) | | (74,170,058) |
Net increase (decrease) in net assets resulting from share transactions | | (15,847,134) | | 99,722,263 |
| Total increase (decrease) in net assets | | (16,382,401) | | 103,651,332 |
| | | | | |
| Net Assets | | | | |
| Beginning of period | | 166,545,244 | | 62,893,912 |
| End of period | $ | 150,162,843 | $ | 166,545,244 |
| | | | | |
| Other Information | | | | |
| Shares | | | | |
| Sold | | 3,025,981 | | 8,214,591 |
| Issued in reinvestment of distributions | | 20,115 | | 19,892 |
| Redeemed | | (4,083,264) | | (3,856,315) |
| Net increase (decrease) | | (1,037,168) | | 4,378,168 |
| | | | | |
Financial Highlights
| Fidelity® Agricultural Productivity Fund |
| |
| | Six months ended (Unaudited) November 30, 2022 | | Years ended May 31, 2022 | | 2021 | | 2020 A |
Selected Per-Share Data | | | | | | | | |
| Net asset value, beginning of period | $ | 21.61 | $ | 18.89 | $ | 10.91 | $ | 10.00 |
| Income from Investment Operations | | | | | | | | |
Net investment income (loss) B,C | | .15 | | .16 D | | .13 E | | .03 |
| Net realized and unrealized gain (loss) | | .81 F | | 2.69 | | 7.92 | | .88 |
| Total from investment operations | | .96 | | 2.85 | | 8.05 | | .91 |
| Distributions from net investment income | | (.06) | | (.09) | | (.07) | | - |
| Distributions from net realized gain | | - | | (.04) | | - G | | - |
| Total distributions | | (.06) | | (.13) | | (.07) | | - |
| Net asset value, end of period | $ | 22.51 | $ | 21.61 | $ | 18.89 | $ | 10.91 |
Total Return H,I | | 4.53% | | 15.24% | | 74.02% | | 9.10% |
Ratios to Average Net Assets C,J,K | | | | | | | | |
| Expenses before reductions | | 1.05% L | | 1.15% | | 1.59% | | 7.25% L,M |
| Expenses net of fee waivers, if any | | .95% L | | .99% | | 1.00% | | .97% L,M,N |
| Expenses net of all reductions | | .95% L | | .99% | | .98% | | .97% L,M,N |
| Net investment income (loss) | | 1.44% L | | .81% D | | .80% E | | 2.42% L,M |
| Supplemental Data | | | | | | | | |
| Net assets, end of period (000 omitted) | $ | 150,163 | $ | 166,545 | $ | 62,894 | $ | 3,390 |
Portfolio turnover rate O | | 48% L | | 50% | | 19% | | 4% P |
A For the period April 16, 2020 (commencement of operations) through May 31, 2020.
B Calculated based on average shares outstanding during the period.
C Net investment income (loss) is affected by the timing of the declaration of dividends by any underlying mutual funds or exchange-traded funds (ETFs). Net investment income (loss) of any mutual funds or ETFs is not included in the Fund's net investment income (loss) ratio.
D Net investment income per share reflects one or more large, non-recurring dividend(s) which amounted to $.05 per share. Excluding such non-recurring dividend(s), the ratio of net investment income (loss) to average net assets would have been .55%.
E Net investment income per share reflects one or more large, non-recurring dividend(s) which amounted to $.04 per share. Excluding such non-recurring dividend(s), the ratio of net investment income (loss) to average net assets would have been .57%.
F The amount shown for a share outstanding does not correspond with the aggregate net gain (loss) on investments for the period due to the timing of sales and repurchases of shares in relation to fluctuating market values of the investments of the Fund.
G Amount represents less than $.005 per share.
H Total returns for periods of less than one year are not annualized.
I Total returns would have been lower if certain expenses had not been reduced during the applicable periods shown.
J Fees and expenses of any underlying mutual funds or exchange-traded funds (ETFs) are not included in the Fund's expense ratio. The Fund indirectly bears its proportionate share of these expenses. For additional expense information related to investments in Fidelity Central Funds, please refer to the "Investments in Fidelity Central Funds" note found in the Notes to Financial Statements section of the most recent Annual or Semi-Annual report.
K Expense ratios reflect operating expenses of the class. Expenses before reductions do not reflect amounts reimbursed, waived, or reduced through arrangements with the investment adviser, brokerage services, or other offset arrangements, if applicable, and do not represent the amount paid by the class during periods when reimbursements, waivers or reductions occur.
L Annualized.
M Audit fees are not annualized.
N The size and fluctuation of net assets and expense amounts may cause ratios to differ from contractual rates.
O Amount does not include the portfolio activity of any underlying mutual funds or exchange-traded funds (ETFs).
P Amount not annualized.
Top Holdings (% of Fund's net assets) |
| |
| Roper Technologies, Inc. | 14.3 | |
| American Water Works Co., Inc. | 9.5 | |
| Teledyne Technologies, Inc. | 9.4 | |
| Tetra Tech, Inc. | 8.7 | |
| Xylem, Inc. | 7.6 | |
| IDEX Corp. | 5.0 | |
| Danaher Corp. | 4.9 | |
| Severn Trent PLC | 4.8 | |
| Evoqua Water Technologies Corp. | 4.8 | |
| Ingersoll Rand, Inc. | 4.6 | |
| | 73.6 | |
| |
| Market Sectors (% of Fund's net assets) |
| |
| Industrials | 40.8 | |
| Utilities | 27.1 | |
| Information Technology | 25.8 | |
| Health Care | 4.9 | |
| Energy | 0.4 | |
| |
Asset Allocation (% of Fund's net assets) |
|
Foreign investments - 11.3% |
|
Geographic Diversification (% of Fund's net assets) |
|
* Includes Short-Term investments and Net Other Assets (Liabilities). Percentages are based on country or territory of incorporation and are adjusted for the effect of futures contracts, if applicable. |
| |
Fidelity® Water Sustainability Fund
Showing Percentage of Net Assets
| Common Stocks - 98.3% |
| | | Shares | Value ($) |
| ENERGY - 0.4% | | | |
| Energy Equipment & Services - 0.4% | | | |
| Select Energy Services, Inc. Class A | | 43,693 | 357,846 |
| HEALTH CARE - 4.9% | | | |
| Life Sciences Tools & Services - 4.9% | | | |
| Danaher Corp. | | 16,129 | 4,409,830 |
| INDUSTRIALS - 40.8% | | | |
| Building Products - 3.7% | | | |
| Advanced Drain Systems, Inc. | | 33,829 | 3,290,209 |
| Commercial Services & Supplies - 8.7% | | | |
| Tetra Tech, Inc. | | 50,812 | 7,855,027 |
| Machinery - 28.4% | | | |
| Crane Holdings Co. | | 15,458 | 1,637,621 |
| Energy Recovery, Inc. (a) | | 4,805 | 111,380 |
| Evoqua Water Technologies Corp. (a) | | 98,147 | 4,268,413 |
| Georg Fischer AG (Reg.) | | 26,857 | 1,638,287 |
| IDEX Corp. | | 18,758 | 4,454,837 |
| Ingersoll Rand, Inc. | | 76,526 | 4,130,108 |
| Mueller Water Products, Inc. Class A | | 47,475 | 553,559 |
| Organo Corp. | | 8,888 | 184,384 |
| Watts Water Technologies, Inc. Class A | | 10,905 | 1,727,897 |
| Xylem, Inc. | | 61,215 | 6,877,505 |
| | | | 25,583,991 |
TOTAL INDUSTRIALS | | | 36,729,227 |
| INFORMATION TECHNOLOGY - 25.8% | | | |
| Electronic Equipment & Components - 11.5% | | | |
| Badger Meter, Inc. | | 16,388 | 1,898,058 |
| Teledyne Technologies, Inc. (a) | | 20,093 | 8,441,069 |
| | | | 10,339,127 |
| Software - 14.3% | | | |
| Roper Technologies, Inc. | | 29,397 | 12,902,047 |
TOTAL INFORMATION TECHNOLOGY | | | 23,241,174 |
| UTILITIES - 26.4% | | | |
| Multi-Utilities - 3.8% | | | |
| Veolia Environnement SA | | 133,837 | 3,463,952 |
| Water Utilities - 22.6% | | | |
| American States Water Co. | | 38,405 | 3,763,306 |
| American Water Works Co., Inc. | | 56,664 | 8,599,329 |
| Essential Utilities, Inc. | | 22,772 | 1,098,521 |
| Middlesex Water Co. | | 26,910 | 2,514,740 |
| Severn Trent PLC | | 131,214 | 4,318,547 |
| York Water Co. | | 1,914 | 87,451 |
| | | | 20,381,894 |
TOTAL UTILITIES | | | 23,845,846 |
| TOTAL COMMON STOCKS (Cost $84,436,616) | | | 88,583,923 |
| | | | |
| Nonconvertible Preferred Stocks - 0.7% |
| | | Shares | Value ($) |
| UTILITIES - 0.7% | | | |
| Water Utilities - 0.7% | | | |
Companhia de Saneamento Basico do Estado de Sao Paulo (SABESP) sponsored ADR (Cost $425,639) | | 52,301 | 604,077 |
| | | | |
| Money Market Funds - 0.5% |
| | | Shares | Value ($) |
Fidelity Cash Central Fund 3.86% (b) (Cost $470,098) | | 470,004 | 470,098 |
| | | | |
| TOTAL INVESTMENT IN SECURITIES - 99.5% (Cost $85,332,353) | 89,658,098 |
NET OTHER ASSETS (LIABILITIES) - 0.5% | 426,007 |
| NET ASSETS - 100.0% | 90,084,105 |
| | |
Legend
| (b) | Affiliated fund that is generally available only to investment companies and other accounts managed by Fidelity Investments. The rate quoted is the annualized seven-day yield of the fund at period end. A complete unaudited listing of the fund's holdings as of its most recent quarter end is available upon request. In addition, each Fidelity Central Fund's financial statements are available on the SEC's website or upon request. |
Affiliated Central Funds
Fiscal year to date information regarding the Fund's investments in Fidelity Central Funds, including the ownership percentage, is presented below.
| Affiliate | Value, beginning of period ($) | Purchases ($) | Sales Proceeds ($) | Dividend Income ($) | Realized Gain (loss) ($) | Change in Unrealized appreciation (depreciation) ($) | Value, end of period ($) | % ownership, end of period |
| Fidelity Cash Central Fund 3.86% | 76,712 | 12,538,082 | 12,144,696 | 12,389 | - | - | 470,098 | 0.0% |
| Fidelity Securities Lending Cash Central Fund 3.86% | 3,878,522 | 5,693,772 | 9,572,294 | 4,053 | - | - | - | 0.0% |
| Total | 3,955,234 | 18,231,854 | 21,716,990 | 16,442 | - | - | 470,098 | |
| | | | | | | | | |
Amounts in the income column in the above table include any capital gain distributions from underlying funds, which are presented in the corresponding line item in the Statement of Operations, if applicable.
Amount for Fidelity Securities Lending Cash Central Fund represents the income earned on investing cash collateral, less rebates paid to borrowers and any lending agent fees associated with the loan, plus any premium payments received for lending certain types of securities.
Amounts included in the purchases and sales proceeds columns may include in-kind transactions, if applicable.
Investment Valuation
The following is a summary of the inputs used, as of November 30, 2022, involving the Fund's assets and liabilities carried at fair value. The inputs or methodology used for valuing securities may not be an indication of the risk associated with investing in those securities. For more information on valuation inputs, and their aggregation into the levels used below, please refer to the Investment Valuation section in the accompanying Notes to Financial Statements.
| Valuation Inputs at Reporting Date: |
| Description | Total ($) | Level 1 ($) | Level 2 ($) | Level 3 ($) |
Investments in Securities: | | | | |
|
| Equities: | | | | |
Energy | 357,846 | 357,846 | - | - |
Health Care | 4,409,830 | 4,409,830 | - | - |
Industrials | 36,729,227 | 34,906,556 | 1,822,671 | - |
Information Technology | 23,241,174 | 23,241,174 | - | - |
Utilities | 24,449,923 | 16,667,424 | 7,782,499 | - |
|
| Money Market Funds | 470,098 | 470,098 | - | - |
| Total Investments in Securities: | 89,658,098 | 80,052,928 | 9,605,170 | - |
Fidelity® Water Sustainability Fund
| Statement of Assets and Liabilities |
| | | | November 30, 2022 (Unaudited) |
| | | | | |
| Assets | | | | |
| Investment in securities, at value - See accompanying schedule: | | | | |
Unaffiliated issuers (cost $84,862,255) | | $89,188,000 | | |
Fidelity Central Funds (cost $470,098) | | 470,098 | | |
| | | | | |
| Total Investment in Securities (cost $85,332,353) | | | $ | 89,658,098 |
| Cash | | | | 1 |
| Receivable for investments sold | | | | 441,245 |
| Receivable for fund shares sold | | | | 63,535 |
| Dividends receivable | | | | 129,874 |
| Distributions receivable from Fidelity Central Funds | | | | 1,937 |
| Prepaid expenses | | | | 121 |
| Receivable from investment adviser for expense reductions | | | | 8,804 |
Total assets | | | | 90,303,615 |
| Liabilities | | | | |
| Payable to custodian bank | | 404 | | |
| Payable for fund shares redeemed | | 117,173 | | |
| Accrued management fee | | 49,368 | | |
| Transfer agent fee payable | | 18,126 | | |
| Other affiliated payables | | 3,625 | | |
| Audit fee payable | | 25,870 | | |
| Other payables and accrued expenses | | 4,944 | | |
| Total Liabilities | | | | 219,510 |
| Net Assets | | | $ | 90,084,105 |
| Net Assets consist of: | | | | |
| Paid in capital | | | $ | 93,233,483 |
| Total accumulated earnings (loss) | | | | (3,149,378) |
| Net Assets | | | $ | 90,084,105 |
Net Asset Value , offering price and redemption price per share ($90,084,105 ÷ 6,364,891 shares) | | | $ | 14.15 |
| | | | | |
| Statement of Operations |
| | | | Six months ended November 30, 2022 (Unaudited) |
| Investment Income | | | | |
| Dividends | | | $ | 561,900 |
| Income from Fidelity Central Funds (including $4,053 from security lending) | | | | 16,442 |
| Total Income | | | | 578,342 |
| Expenses | | | | |
| Management fee | $ | 303,466 | | |
| Transfer agent fees | | 113,290 | | |
| Accounting fees | | 22,296 | | |
| Custodian fees and expenses | | 6,250 | | |
| Independent trustees' fees and expenses | | 158 | | |
| Registration fees | | 6,697 | | |
| Audit | | 23,622 | | |
| Legal | | 34 | | |
| Miscellaneous | | 266 | | |
| Total expenses before reductions | | 476,079 | | |
| Expense reductions | | (51,742) | | |
| Total expenses after reductions | | | | 424,337 |
| Net Investment income (loss) | | | | 154,005 |
| Realized and Unrealized Gain (Loss) | | | | |
| Net realized gain (loss) on: | | | | |
| Investment Securities: | | | | |
| Unaffiliated issuers | | (4,175,958) | | |
| Foreign currency transactions | | (4,688) | | |
| Total net realized gain (loss) | | | | (4,180,646) |
| Change in net unrealized appreciation (depreciation) on: | | | | |
| Investment Securities: | | | | |
| Unaffiliated issuers | | 6,851,904 | | |
| Assets and liabilities in foreign currencies | | 264 | | |
| Total change in net unrealized appreciation (depreciation) | | | | 6,852,168 |
| Net gain (loss) | | | | 2,671,522 |
| Net increase (decrease) in net assets resulting from operations | | | $ | 2,825,527 |
| Statement of Changes in Net Assets |
| |
| | Six months ended November 30, 2022 (Unaudited) | | Year ended May 31, 2022 |
| Increase (Decrease) in Net Assets | | | | |
| Operations | | | | |
| Net investment income (loss) | $ | 154,005 | $ | (278,649) |
| Net realized gain (loss) | | (4,180,646) | | (1,201,417) |
| Change in net unrealized appreciation (depreciation) | | 6,852,168 | | (10,178,025) |
| Net increase (decrease) in net assets resulting from operations | | 2,825,527 | | (11,658,091) |
| Distributions to shareholders | | - | | (1,680,405) |
| Share transactions | | | | |
| Proceeds from sales of shares | | 11,940,753 | | 89,360,090 |
| Reinvestment of distributions | | - | | 1,573,631 |
| Cost of shares redeemed | | (18,915,142) | | (39,135,950) |
Net increase (decrease) in net assets resulting from share transactions | | (6,974,389) | | 51,797,771 |
| Total increase (decrease) in net assets | | (4,148,862) | | 38,459,275 |
| | | | | |
| Net Assets | | | | |
| Beginning of period | | 94,232,967 | | 55,773,692 |
| End of period | $ | 90,084,105 | $ | 94,232,967 |
| | | | | |
| Other Information | | | | |
| Shares | | | | |
| Sold | | 900,618 | | 5,677,575 |
| Issued in reinvestment of distributions | | - | | 95,180 |
| Redeemed | | (1,496,002) | | (2,570,640) |
| Net increase (decrease) | | (595,384) | | 3,202,115 |
| | | | | |
Financial Highlights
| Fidelity® Water Sustainability Fund |
| |
| | Six months ended (Unaudited) November 30, 2022 | | Years ended May 31, 2022 | | 2021 | | 2020 A |
Selected Per-Share Data | | | | | | | | |
| Net asset value, beginning of period | $ | 13.54 | $ | 14.84 | $ | 10.75 | $ | 10.00 |
| Income from Investment Operations | | | | | | | | |
Net investment income (loss) B,C | | .02 | | (.04) | | .01 | | .02 |
| Net realized and unrealized gain (loss) | | .59 | | (1.02) | | 4.28 | | .73 |
| Total from investment operations | | .61 | | (1.06) | | 4.29 | | .75 |
| Distributions from net investment income | | - | | - D | | (.02) | | - |
| Distributions from net realized gain | | - | | (.24) | | (.18) | | - |
| Total distributions | | - | | (.24) | | (.20) | | - |
| Net asset value, end of period | $ | 14.15 | $ | 13.54 | $ | 14.84 | $ | 10.75 |
Total Return E,F | | 4.51% | | (7.44)% | | 40.20% | | 7.50% |
Ratios to Average Net Assets C,G,H | | | | | | | | |
| Expenses before reductions | | 1.06% I | | 1.11% | | 1.44% | | 4.15% I,J |
| Expenses net of fee waivers, if any | | .95% I | | 1.00% | | 1.00% | | .97% I,J,K |
| Expenses net of all reductions | | .95% I | | 1.00% | | .98% | | .97% I,J,K |
| Net investment income (loss) | | .34% I | | (.29)% | | .11% | | 1.39% I,J |
| Supplemental Data | | | | | | | | |
| Net assets, end of period (000 omitted) | $ | 90,084 | $ | 94,233 | $ | 55,774 | $ | 4,363 |
Portfolio turnover rate L | | 43% I | | 55% | | 95% | | 13% M |
A For the period April 16, 2020 (commencement of operations) through May 31, 2020.
B Calculated based on average shares outstanding during the period.
C Net investment income (loss) is affected by the timing of the declaration of dividends by any underlying mutual funds or exchange-traded funds (ETFs). Net investment income (loss) of any mutual funds or ETFs is not included in the Fund's net investment income (loss) ratio.
D Amount represents less than $.005 per share.
E Total returns for periods of less than one year are not annualized.
F Total returns would have been lower if certain expenses had not been reduced during the applicable periods shown.
G Fees and expenses of any underlying mutual funds or exchange-traded funds (ETFs) are not included in the Fund's expense ratio. The Fund indirectly bears its proportionate share of these expenses. For additional expense information related to investments in Fidelity Central Funds, please refer to the "Investments in Fidelity Central Funds" note found in the Notes to Financial Statements section of the most recent Annual or Semi-Annual report.
H Expense ratios reflect operating expenses of the class. Expenses before reductions do not reflect amounts reimbursed, waived, or reduced through arrangements with the investment adviser, brokerage services, or other offset arrangements, if applicable, and do not represent the amount paid by the class during periods when reimbursements, waivers or reductions occur.
I Annualized.
J The size and fluctuation of net assets and expense amounts may cause ratios to differ from contractual rates.
K Audit fees are not annualized.
L Amount does not include the portfolio activity of any underlying mutual funds or exchange-traded funds (ETFs).
M Amount not annualized.
For the period ended November 30, 2022
1. Organization.
Fidelity Agricultural Productivity Fund and Fidelity Water Sustainability Fund (the Funds) are non-diversified funds of Fidelity Summer Street Trust (the Trust). Each Fund is authorized to issue an unlimited number of shares. Share transactions on the Statement of Changes in Net Assets may contain exchanges between affiliated funds. The Trust is registered under the Investment Company Act of 1940, as amended (the 1940 Act), as an open-end management investment company organized as a Massachusetts business trust.
2. Investments in Fidelity Central Funds.
Funds may invest in Fidelity Central Funds, which are open-end investment companies generally available only to other investment companies and accounts managed by the investment adviser and its affiliates. The Schedule of Investments lists any Fidelity Central Funds held as an investment as of period end, but does not include the underlying holdings of each Fidelity Central Fund. An investing fund indirectly bears its proportionate share of the expenses of the underlying Fidelity Central Funds.
Based on its investment objective, each Fidelity Central Fund may invest or participate in various investment vehicles or strategies that are similar to those of the investing fund. These strategies are consistent with the investment objectives of the investing fund and may involve certain economic risks which may cause a decline in value of each of the Fidelity Central Funds and thus a decline in the value of the investing fund.
| Fidelity Central Fund | Investment Manager | Investment Objective | Investment Practices | Expense Ratio A |
| Fidelity Money Market Central Funds | Fidelity Management & Research Company LLC (FMR) | Each fund seeks to obtain a high level of current income consistent with the preservation of capital and liquidity. | Short-term Investments | Less than .005% |
A Expenses expressed as a percentage of average net assets and are as of each underlying Central Fund's most recent annual or semi-annual shareholder report.
A complete unaudited list of holdings for each Fidelity Central Fund is available upon request or at the Securities and Exchange Commission website at www.sec.gov. In addition, the financial statements of the Fidelity Central Funds which contain the significant accounting policies (including investment valuation policies) of those funds, and are not covered by the Report of Independent Registered Public Accounting Firm, are available on the Securities and Exchange Commission website or upon request.
3. Significant Accounting Policies.
Each Fund is an investment company and applies the accounting and reporting guidance of the Financial Accounting Standards Board (FASB) Accounting Standards Codification Topic 946 Financial Services - Investment Companies . The financial statements have been prepared in conformity with accounting principles generally accepted in the United States of America (GAAP), which require management to make certain estimates and assumptions at the date of the financial statements. Actual results could differ from those estimates. Subsequent events, if any, through the date that the financial statements were issued have been evaluated in the preparation of the financial statements. Each Fund's Schedule of Investments lists any underlying mutual funds or exchange-traded funds (ETFs) but does not include the underlying holdings of these funds. The following summarizes the significant accounting policies of each Fund:
Investment Valuation. Investments are valued as of 4:00 p.m. Eastern time on the last calendar day of the period. The Board of Trustees (the Board) has designated each Fund's investment adviser as the valuation designee responsible for the fair valuation function and performing fair value determinations as needed. The investment adviser has established a Fair Value Committee (the Committee) to carry out the day-to-day fair valuation responsibilities and has adopted policies and procedures to govern the fair valuation process and the activities of the Committee. In accordance with these fair valuation policies and procedures, which have been approved by the Board, each Fund attempts to obtain prices from one or more third party pricing services or brokers to value its investments. When current market prices, quotations or currency exchange rates are not readily available or reliable, investments will be fair valued in good faith by the Committee, in accordance with the policies and procedures. Factors used in determining fair value vary by investment type and may include market or investment specific events, transaction data, estimated cash flows, and market observations of comparable investments. The frequency that the fair valuation procedures are used cannot be predicted and they may be utilized to a significant extent. The Committee manages each Fund's fair valuation practices and maintains the fair valuation policies and procedures. Each Fund's investment adviser reports to the Board information regarding the fair valuation process and related material matters.
Each Fund categorizes the inputs to valuation techniques used to value its investments into a disclosure hierarchy consisting of three levels as shown below:
Level 1 - unadjusted quoted prices in active markets for identical investments
Level 2 - other significant observable inputs (including quoted prices for similar investments, interest rates, prepayment speeds, etc.)
Level 3 - unobservable inputs (including the Fund's own assumptions based on the best information available)
Valuation techniques used to value each Fund's investments by major category are as follows:
Equity securities, including restricted securities, for which market quotations are readily available, are valued at the last reported sale price or official closing price as reported by a third party pricing service on the primary market or exchange on which they are traded and are categorized as Level 1 in the hierarchy. In the event there were no sales during the day or closing prices are not available, securities are valued at the last quoted bid price or may be valued using the last available price and are generally categorized as Level 2 in the hierarchy. For foreign equity securities, when market or security specific events arise, comparisons to the valuation of American Depositary Receipts (ADRs), futures contracts, ETFs and certain indexes as well as quoted prices for similar securities may be used and would be categorized as Level 2 in the hierarchy. For equity securities, including restricted securities, where observable inputs are limited, assumptions about market activity and risk are used and these securities may be categorized as Level 3 in the hierarchy.
Investments in open-end mutual funds, including the Fidelity Central Funds, are valued at their closing net asset value (NAV) each business day and are categorized as Level 1 in the hierarchy.
Changes in valuation techniques may result in transfers in or out of an assigned level within the disclosure hierarchy. The aggregate value of investments by input level as of November 30, 2022 is included at the end of each Fund's Schedule of Investments.
Foreign Currency. Certain Funds may use foreign currency contracts to facilitate transactions in foreign-denominated securities. Gains and losses from these transactions may arise from changes in the value of the foreign currency or if the counterparties do not perform under the contracts' terms.
Foreign-denominated assets, including investment securities, and liabilities are translated into U.S. dollars at the exchange rates at period end. Purchases and sales of investment securities, income and dividends received, and expenses denominated in foreign currencies are translated into U.S. dollars at the exchange rate in effect on the transaction date.
The effects of exchange rate fluctuations on investments are included with the net realized and unrealized gain (loss) on investment securities. Other foreign currency transactions resulting in realized and unrealized gain (loss) are disclosed separately.
Investment Transactions and Income. For financial reporting purposes, the Funds' investment holdings and NAV include trades executed through the end of the last business day of the period. The NAV per share for processing shareholder transactions is calculated as of the close of business of the New York Stock Exchange (NYSE), normally 4:00 p.m. Eastern time and includes trades executed through the end of the prior business day. Gains and losses on securities sold are determined on the basis of identified cost. Commissions paid to certain brokers with whom the investment adviser, or its affiliates, places trades on behalf of a fund include an amount in addition to trade execution, which may be rebated back to a fund. Any such rebates are included in net realized gain (loss) on investments in the Statement of Operations. Dividend income is recorded on the ex-dividend date, except for certain dividends from foreign securities where the ex-dividend date may have passed, which are recorded as soon as the Funds are informed of the ex-dividend date. Non-cash dividends included in dividend income, if any, are recorded at the fair market value of the securities received. Income and capital gain distributions from Fidelity Central Funds, if any, are recorded on the ex-dividend date. Investment income is recorded net of foreign taxes withheld where recovery of such taxes is uncertain. Funds may file withholding tax reclaims in certain jurisdictions to recover a portion of amounts previously withheld. Any withholding tax reclaims income is included in the Statement of Operations in dividends. Any receivables for withholding tax reclaims are included in the Statement of Assets and Liabilities in dividends receivable.
Expenses. Expenses directly attributable to a fund are charged to that fund. Expenses attributable to more than one fund are allocated among the respective funds on the basis of relative net assets or other appropriate methods. Expenses included in the accompanying financial statements reflect the expenses of that fund and do not include any expenses associated with any underlying mutual funds or exchange-traded funds. Although not included in a fund's expenses, a fund indirectly bears its proportionate share of these expenses through the net asset value of each underlying mutual fund or exchange-traded fund. Expense estimates are accrued in the period to which they relate and adjustments are made when actual amounts are known.
Income Tax Information and Distributions to Shareholders. Each year, each Fund intends to qualify as a regulated investment company under Subchapter M of the Internal Revenue Code, including distributing substantially all of its taxable income and realized gains. As a result, no provision for U.S. Federal income taxes is required. Each Fund files a U.S. federal tax return, in addition to state and local tax returns as required. Each Fund's federal income tax returns are subject to examination by the Internal Revenue Service (IRS) for a period of three fiscal years after they are filed. State and local tax returns may be subject to examination for an additional fiscal year depending on the jurisdiction. Foreign taxes are provided for based on each Fund's understanding of the tax rules and rates that exist in the foreign markets in which it invests.
Distributions are declared and recorded on the ex-dividend date. Income and capital gain distributions are determined in accordance with income tax regulations, which may differ from GAAP.
Capital accounts within the financial statements are adjusted for permanent book-tax differences. These adjustments have no impact on net assets or the results of operations. Capital accounts are not adjusted for temporary book-tax differences which will reverse in a subsequent period.
Book-tax differences are primarily due to foreign currency transactions, net operating losses, capital loss carryforwards and losses deferred due to wash sales and excise tax regulations.
As of period end, the cost and unrealized appreciation (depreciation) in securities, and derivatives if applicable, for federal income tax purposes were as follows for each Fund:
| | Tax cost | Gross unrealized appreciation | Gross unrealized depreciation | Net unrealized appreciation (depreciation) |
| Fidelity Agricultural Productivity Fund | $135,886,439 | $28,313,717 | $(3,441,006) | $24,872,711 |
| Fidelity Water Sustainability Fund | 85,857,029 | 7,836,974 | (4,035,905) | 3,801,069 |
Capital loss carryforwards are only available to offset future capital gains of the Funds to the extent provided by regulations and may be limited. The capital loss carryforward information presented below, including any applicable limitation, is estimated as of prior fiscal period end and is subject to adjustment.
| | Short-term |
| Fidelity Agricultural Productivity Fund | $(2,800,265) |
Certain of the Funds elected to defer to the next fiscal year capital losses recognized during the period November 1, 2021 to May 31, 2022 and ordinary losses recognized during the period January 1, 2022 to May 31, 2022. Loss deferrals were as follows:
| | Capital losses | Ordinary losses |
| Fidelity Water Sustainability Fund | $(3,044,659) | $(96,180) |
4. Purchases and Sales of Investments.
Purchases and sales of securities, other than short-term securities and in-kind transactions, as applicable, are noted in the table below.
| | Purchases ($) | Sales ($) |
| Fidelity Agricultural Productivity Fund | 31,362,754 | 48,307,917 |
| Fidelity Water Sustainability Fund | 19,037,783 | 26,653,768 |
5. Fees and Other Transactions with Affiliates.
Management Fee. Fidelity Management & Research Company LLC (the investment adviser) and its affiliates provide the Funds with investment management related services for which the Funds pay a monthly management fee. The management fee is the sum of an individual fund fee rate and an annualized group fee rate. The individual fund fee rate is applied to each Fund's average net assets. The group fee rate is based upon the monthly average net assets of a group of registered investment companies with which the investment adviser has management contracts. The group fee rate decreases as assets under management increase and increases as assets under management decrease. For the reporting period, each Fund's annualized management fee rate expressed as a percentage of each Fund's average net assets was as follows:
| | Individual Rate | Group Rate | Total |
| Fidelity Agricultural Productivity Fund | .45% | .23% | .68% |
| Fidelity Water Sustainability Fund | .45% | .23% | .68% |
Transfer Agent Fees. Fidelity Investments Institutional Operations Company LLC (FIIOC), an affiliate of the investment adviser, is the Funds' transfer, dividend disbursing and shareholder servicing agent. FIIOC receives account fees and asset-based fees that vary according to account size and type of account. FIIOC pays for typesetting, printing and mailing of shareholder reports, except proxy statements. For the period, transfer agent fees were equivalent to the following annualized rates expressed as a percentage of average net assets:
| Fidelity Agricultural Productivity Fund | .25% |
| Fidelity Water Sustainability Fund | .25% |
| |
Accounting Fees. Fidelity Service Company, Inc. (FSC), an affiliate of the investment adviser, maintains each Fund's accounting records. The accounting fee is based on the level of average net assets for each month. For the period, the fees were equivalent to the following annualized rates:
| | % of Average Net Assets |
| Fidelity Agricultural Productivity Fund | .05 |
| Fidelity Water Sustainability Fund | .05 |
Brokerage Commissions. A portion of portfolio transactions were placed with brokerage firms which are affiliates of the investment adviser. Brokerage commissions are included in net realized gain (loss) and change in net unrealized appreciation (depreciation) in the Statement of Operations. The commissions paid to these affiliated firms were as follows:
| | Amount |
| Fidelity Agricultural Productivity Fund | $197 |
| Fidelity Water Sustainability Fund | 182 |
Interfund Trades. Funds may purchase from or sell securities to other Fidelity Funds under procedures adopted by the Board. The procedures have been designed to ensure these interfund trades are executed in accordance with Rule 17a-7 of the 1940 Act. Any interfund trades are included within the respective purchases and sales amounts shown in the Purchases and Sales of Investments note. Interfund trades during the period are noted in the table below.
| | Purchases ($) | Sales ($) | Realized Gain (Loss) ($) |
| Fidelity Agricultural Productivity Fund | 646,319 | 294,360 | (35,530) |
| Fidelity Water Sustainability Fund | 1,058,081 | 1,879,139 | (203,122) |
6. Committed Line of Credit.
Certain Funds participate with other funds managed by the investment adviser or an affiliate in a $4.25 billion credit facility (the "line of credit") to be utilized for temporary or emergency purposes to fund shareholder redemptions or for other short-term liquidity purposes. The participating funds have agreed to pay commitment fees on their pro-rata portion of the line of credit, which are reflected in Miscellaneous expenses on the Statement of Operations, and are listed below. During the period, there were no borrowings on this line of credit.
| | Amount |
| Fidelity Agricultural Productivity Fund | $120 |
| Fidelity Water Sustainability Fund | 82 |
7. Security Lending.
Funds lend portfolio securities from time to time in order to earn additional income. Lending agents are used, including National Financial Services (NFS), an affiliate of the investment adviser. Pursuant to a securities lending agreement, NFS will receive a fee, which is capped at 9.9% of a fund's daily lending revenue, for its services as lending agent. A fund may lend securities to certain qualified borrowers, including NFS. On the settlement date of the loan, a fund receives collateral (in the form of U.S. Treasury obligations, letters of credit and/or cash) against the loaned securities and maintains collateral in an amount not less than 100% of the market value of the loaned securities during the period of the loan. The market value of the loaned securities is determined at the close of business of a fund and any additional required collateral is delivered to a fund on the next business day. A fund or borrower may terminate the loan at any time, and if the borrower defaults on its obligation to return the securities loaned because of insolvency or other reasons, a fund may apply collateral received from the borrower against the obligation. A fund may experience delays and costs in recovering the securities loaned. Any cash collateral received is invested in the Fidelity Securities Lending Cash Central Fund. Any loaned securities are identified as such in the Schedule of Investments, and the value of loaned securities and cash collateral at period end, as applicable, are presented in the Statement of Assets and Liabilities. Security lending income represents the income earned on investing cash collateral, less rebates paid to borrowers and any lending agent fees associated with the loan, plus any premium payments received for lending certain types of securities. Security lending income is presented in the Statement of Operations as a component of income from Fidelity Central Funds. Affiliated security lending activity, if any, was as follows:
| | Total Security Lending Fees Paid to NFS | Security Lending Income From Securities Loaned to NFS | Value of Securities Loaned to NFS at Period End |
| Fidelity Agricultural Productivity Fund | $496 | $- | $- |
| Fidelity Water Sustainability Fund | $425 | $- | $- |
8. Expense Reductions.
The investment adviser contractually agreed to reimburse expenses of each Fund to the extent annual operating expenses exceeded certain levels of average net assets as noted in the table below. This reimbursement will remain in place through September 30, 2023. Some expenses, for example the compensation of the independent Trustees, and certain miscellaneous expenses such as proxy and shareholder meeting expenses, are excluded from this reimbursement.
The following Funds were in reimbursement during the period:
| | Expense Limitations | Reimbursement |
| Fidelity Agricultural Productivity Fund | .95% | $65,294 |
| Fidelity Water Sustainability Fund | .95% | $49,900 |
Through arrangements with each applicable Fund's custodian and transfer agent, credits realized as a result of certain uninvested cash balances were used to reduce each applicable Fund's expenses. All of the applicable expense reductions are noted in the table below.
| | Custodian credits | Transfer Agent credits |
Fidelity Agricultural Productivity Fund | $- | $179 |
| Fidelity Water Sustainability Fund | 6 | 184 |
In addition, during the period the investment adviser or an affiliate reimbursed and/or waived a portion of operating expenses as follows:
| | Amount |
| Fidelity Agricultural Productivity Fund | $2,320 |
| Fidelity Water Sustainability Fund | 1,652 |
9. Other.
A fund's organizational documents provide former and current trustees and officers with a limited indemnification against liabilities arising in connection with the performance of their duties to the fund. In the normal course of business, a fund may also enter into contracts that provide general indemnifications. A fund's maximum exposure under these arrangements is unknown as this would be dependent on future claims that may be made against a fund. The risk of material loss from such claims is considered remote.
10. Risk and Uncertainties.
Many factors affect a fund's performance. Developments that disrupt global economies and financial markets, such as pandemics, epidemics, outbreaks of infectious diseases, war, terrorism, and environmental disasters, may significantly affect a fund's investment performance. The effects of these developments to a fund will be impacted by the types of securities in which a fund invests, the financial condition, industry, economic sector, and geographic location of an issuer, and a fund's level of investment in the securities of that issuer.
As a shareholder, you incur two types of costs: (1) transaction costs, which may include sales charges (loads) on purchase payments or redemption proceeds, as applicable and (2) ongoing costs, which generally include management fees, distribution and/or service (12b-1) fees and other Fund expenses. This Example is intended to help you understand your ongoing costs (in dollars) of investing in a fund and to compare these costs with the ongoing costs of investing in other mutual funds.
| The Example is based on an investment of $1,000 invested at the beginning of the period and held for the entire period (June 1, 2022 to November 30, 2022). |
Actual Expenses
The first line of the accompanying table provides information about actual account values and actual expenses. You may use the information in this line, together with the amount you invested, to estimate the expenses that you paid over the period. Simply divide your account value by $1,000.00 (for example, an $8,600 account value divided by $1,000.00 = 8.6), then multiply the result by the number in the first line for a class/Fund under the heading entitled "Expenses Paid During Period" to estimate the expenses you paid on your account during this period. If any fund is a shareholder of any underlying mutual funds or exchange-traded funds (ETFs) (the Underlying Funds), such fund indirectly bears its proportional share of the expenses of the Underlying Funds in addition to the direct expenses incurred presented in the table. These fees and expenses are not included in the annualized expense ratio used to calculate the expense estimate in the table below.
Hypothetical Example for Comparison Purposes
The second line of the accompanying table provides information about hypothetical account values and hypothetical expenses based on the actual expense ratio and an assumed rate of return of 5% per year before expenses, which is not the actual return. The hypothetical account values and expenses may not be used to estimate the actual ending account balance or expenses you paid for the period. You may use this information to compare the ongoing costs of investing in the Fund and other funds. To do so, compare this 5% hypothetical example with the 5% hypothetical examples that appear in the shareholder reports of the other funds. If any fund is a shareholder of any Underlying Funds, such fund indirectly bears its proportional share of the expenses of the Underlying Funds in addition to the direct expenses as presented in the table. These fees and expenses are not included in the annualized expense ratio used to calculate the expense estimate in the table below.
Please note that the expenses shown in the table are meant to highlight your ongoing costs only and do not reflect any transaction costs. Therefore, the second line of the table is useful in comparing ongoing costs only, and will not help you determine the relative total costs of owning different funds. In addition, if these transactional costs were included, your costs would have been higher.
| | | | | Annualized Expense Ratio- A | | Beginning Account Value June 1, 2022 | | Ending Account Value November 30, 2022 | | Expenses Paid During Period- C June 1, 2022 to November 30, 2022 |
| | | | | | | | | | |
| Fidelity® Agricultural Productivity Fund | | | | .95% | | | | | | |
| Actual | | | | | | $ 1,000 | | $ 1,045.30 | | $ 4.87 |
Hypothetical- B | | | | | | $ 1,000 | | $ 1,020.31 | | $ 4.81 |
| | | | | | | | | | |
| Fidelity® Water Sustainability Fund | | | | .95% | | | | | | |
| Actual | | | | | | $ 1,000 | | $ 1,045.10 | | $ 4.87 |
Hypothetical- B | | | | | | $ 1,000 | | $ 1,020.31 | | $ 4.81 |
| |
A Annualized expense ratio reflects expenses net of applicable fee waivers.
B 5% return per year before expenses
C Expenses are equal to the annualized expense ratio, multiplied by the average account value over the period, multiplied by 183/ 365 (to reflect the one-half year period). The fees and expenses of any Underlying Funds are not included in each annualized expense ratio.
1.9897394.102
DAS-DSW-SANN-0123
Fidelity® SAI Sustainable Sector Fund
Semi-Annual Report
November 30, 2022
Offered exclusively to certain clients of the Adviser, or its affiliates, including Strategic Advisers LLC (Strategic Advisers) - not available for sale to the general public. Fidelity ® SAI is a product name of Fidelity ® funds dedicated to certain programs affiliated with Strategic Advisers.
Contents
To view a fund's proxy voting guidelines and proxy voting record for the 12-month period ended June 30, visit http://www.fidelity.com/proxyvotingresults or visit the Securities and Exchange Commission's (SEC) web site at http://www.sec.gov.
You may also call 1-800-544-3455 to request a free copy of the proxy voting guidelines.
Standard & Poor's, S&P and S&P 500 are registered service marks of The McGraw-Hill Companies, Inc. and have been licensed for use by Fidelity Distributors Corporation.
Other third-party marks appearing herein are the property of their respective owners.
All other marks appearing herein are registered or unregistered trademarks or service marks of FMR LLC or an affiliated company. © 2023 FMR LLC. All rights reserved.
This report and the financial statements contained herein are submitted for the general information of the shareholders of the Fund. This report is not authorized for distribution to prospective investors in the Fund unless preceded or accompanied by an effective prospectus.
A fund files its complete schedule of portfolio holdings with the SEC for the first and third quarters of each fiscal year on Form N-PORT. Forms N-PORT are available on the SEC's web site at http://www.sec.gov. A fund's Forms N-PORT may be reviewed and copied at the SEC's Public Reference Room in Washington, DC. Information regarding the operation of the SEC's Public Reference Room may be obtained by calling 1-800-SEC-0330.
For a complete list of a fund's portfolio holdings, view the most recent holdings listing, semiannual report, or annual report on Fidelity's web site at http://www.fidelity.com, http://www.institutional.fidelity.com, or http://www.401k.com, as applicable.
NOT FDIC INSURED •MAY LOSE VALUE •NO BANK GUARANTEE
Neither the Fund nor Fidelity Distributors Corporation is a bank.
Top Holdings (% of Fund's net assets) |
| |
| Microsoft Corp. | 6.7 | |
| Apple, Inc. | 5.9 | |
| Alphabet, Inc. Class A | 3.5 | |
| Amazon.com, Inc. | 2.9 | |
| Exxon Mobil Corp. | 2.1 | |
| Bank of America Corp. | 1.9 | |
| UnitedHealth Group, Inc. | 1.9 | |
| Visa, Inc. Class A | 1.7 | |
| NVIDIA Corp. | 1.7 | |
| Wells Fargo & Co. | 1.6 | |
| | 29.9 | |
| |
| Market Sectors (% of Fund's net assets) |
| |
| Information Technology | 25.6 | |
| Health Care | 15.0 | |
| Financials | 11.4 | |
| Consumer Discretionary | 9.8 | |
| Industrials | 8.5 | |
| Communication Services | 7.8 | |
| Consumer Staples | 6.0 | |
| Energy | 5.6 | |
| Materials | 3.1 | |
| Utilities | 2.9 | |
| Real Estate | 2.9 | |
| |
Asset Allocation (% of Fund's net assets) |
|
Foreign investments - 9.3% |
|
Showing Percentage of Net Assets
| Common Stocks - 98.6% |
| | | Shares | Value ($) |
| COMMUNICATION SERVICES - 7.8% | | | |
| Entertainment - 1.6% | | | |
| Cinemark Holdings, Inc. (a) | | 372 | 5,063 |
| Netflix, Inc. (a) | | 132 | 40,330 |
| Sea Ltd. ADR (a) | | 154 | 8,989 |
| Take-Two Interactive Software, Inc. (a) | | 84 | 8,878 |
| The Walt Disney Co. (a) | | 229 | 22,412 |
| Warner Bros Discovery, Inc. (a) | | 295 | 3,363 |
| | | | 89,035 |
| Interactive Media & Services - 5.0% | | | |
| Alphabet, Inc. Class A (a) | | 1,885 | 190,366 |
| Meta Platforms, Inc. Class A (a) | | 603 | 71,214 |
| Snap, Inc. Class A (a) | | 1,074 | 11,073 |
| Tongdao Liepin Group (a) | | 2,123 | 2,145 |
| | | | 274,798 |
| Media - 0.7% | | | |
| Charter Communications, Inc. Class A (a) | | 30 | 11,739 |
| Comcast Corp. Class A | | 681 | 24,952 |
| | | | 36,691 |
| Wireless Telecommunication Services - 0.5% | | | |
| T-Mobile U.S., Inc. (a) | | 192 | 29,080 |
TOTAL COMMUNICATION SERVICES | | | 429,604 |
| CONSUMER DISCRETIONARY - 9.8% | | | |
| Auto Components - 0.2% | | | |
| Lear Corp. | | 66 | 9,520 |
| Automobiles - 1.4% | | | |
| Ferrari NV | | 35 | 7,807 |
| Tesla, Inc. (a) | | 360 | 70,092 |
| | | | 77,899 |
| Distributors - 0.3% | | | |
| LKQ Corp. | | 245 | 13,311 |
| Hotels, Restaurants & Leisure - 1.1% | | | |
| Booking Holdings, Inc. (a) | | 13 | 27,033 |
| Marriott International, Inc. Class A | | 203 | 33,566 |
| | | | 60,599 |
| Household Durables - 0.1% | | | |
| Mohawk Industries, Inc. (a) | | 64 | 6,485 |
| Internet & Direct Marketing Retail - 3.3% | | | |
| Amazon.com, Inc. (a) | | 1,632 | 157,553 |
| eBay, Inc. | | 293 | 13,314 |
| Uber Technologies, Inc. (a) | | 344 | 10,024 |
| | | | 180,891 |
| Multiline Retail - 0.6% | | | |
| Dollar General Corp. | | 97 | 24,801 |
| Nordstrom, Inc. | | 207 | 4,341 |
| Target Corp. | | 20 | 3,341 |
| | | | 32,483 |
| Specialty Retail - 2.2% | | | |
| Burlington Stores, Inc. (a) | | 30 | 5,870 |
| Industria de Diseno Textil SA | | 285 | 7,440 |
| Lowe's Companies, Inc. | | 205 | 43,573 |
| The Home Depot, Inc. | | 86 | 27,863 |
| TJX Companies, Inc. | | 477 | 38,184 |
| | | | 122,930 |
| Textiles, Apparel & Luxury Goods - 0.6% | | | |
| NIKE, Inc. Class B | | 116 | 12,724 |
| PVH Corp. | | 129 | 8,666 |
| Tapestry, Inc. | | 330 | 12,464 |
| | | | 33,854 |
TOTAL CONSUMER DISCRETIONARY | | | 537,972 |
| CONSUMER STAPLES - 6.0% | | | |
| Beverages - 1.2% | | | |
| The Coca-Cola Co. | | 1,020 | 64,882 |
| Food & Staples Retailing - 1.8% | | | |
| Alimentation Couche-Tard, Inc. Class A (multi-vtg.) | | 251 | 11,435 |
| Costco Wholesale Corp. | | 134 | 72,260 |
| Walmart, Inc. | | 99 | 15,090 |
| | | | 98,785 |
| Food Products - 0.6% | | | |
| Bunge Ltd. | | 333 | 34,912 |
| Household Products - 1.5% | | | |
| Procter & Gamble Co. | | 557 | 83,082 |
| Personal Products - 0.9% | | | |
| Estee Lauder Companies, Inc. Class A | | 198 | 46,686 |
TOTAL CONSUMER STAPLES | | | 328,347 |
| ENERGY - 5.6% | | | |
| Energy Equipment & Services - 0.5% | | | |
| Schlumberger Ltd. | | 527 | 27,167 |
| Oil, Gas & Consumable Fuels - 5.1% | | | |
| Canadian Natural Resources Ltd. | | 437 | 26,090 |
| Eco Atlantic Oil & Gas Ltd. (a) | | 8,611 | 2,305 |
| Exxon Mobil Corp. | | 1,042 | 116,016 |
| Hess Corp. | | 276 | 39,719 |
| Imperial Oil Ltd. | | 415 | 23,611 |
| MEG Energy Corp. (a) | | 1,351 | 19,233 |
| Phillips 66 Co. | | 188 | 20,387 |
| Tourmaline Oil Corp. | | 226 | 13,755 |
| Valero Energy Corp. | | 162 | 21,646 |
| Vertex Energy, Inc. (a) | | 223 | 1,849 |
| | | | 284,611 |
TOTAL ENERGY | | | 311,778 |
| FINANCIALS - 11.4% | | | |
| Banks - 5.8% | | | |
| AIB Group PLC | | 529 | 1,718 |
| Bank of America Corp. | | 2,746 | 103,936 |
| BankUnited, Inc. | | 184 | 6,756 |
| BNP Paribas SA | | 93 | 5,226 |
| Citizens Financial Group, Inc. | | 277 | 11,739 |
| Comerica, Inc. | | 138 | 9,900 |
| DNB Bank ASA | | 37 | 722 |
| Eurobank Ergasias Services and Holdings SA ADR (a) | | 7,476 | 3,906 |
| JPMorgan Chase & Co. | | 286 | 39,519 |
| NatWest Group PLC | | 477 | 1,517 |
| Piraeus Financial Holdings SA (a) | | 819 | 1,220 |
| PNC Financial Services Group, Inc. | | 80 | 13,461 |
| Societe Generale Series A | | 262 | 6,594 |
| U.S. Bancorp | | 429 | 19,472 |
| UniCredit SpA | | 634 | 8,659 |
| Wells Fargo & Co. | | 1,791 | 85,878 |
| | | | 320,223 |
| Capital Markets - 1.8% | | | |
| Bank of New York Mellon Corp. | | 732 | 33,599 |
| BlackRock, Inc. Class A | | 21 | 15,036 |
| Cboe Global Markets, Inc. | | 62 | 7,864 |
| Goldman Sachs Group, Inc. | | 18 | 6,951 |
| Intercontinental Exchange, Inc. | | 137 | 14,838 |
| State Street Corp. | | 282 | 22,467 |
| | | | 100,755 |
| Consumer Finance - 0.7% | | | |
| American Express Co. | | 116 | 18,280 |
| Capital One Financial Corp. | | 95 | 9,808 |
| OneMain Holdings, Inc. | | 184 | 7,242 |
| | | | 35,330 |
| Diversified Financial Services - 0.0% | | | |
| Sunrisemezz Ltd. (a) | | 43 | 5 |
| Insurance - 3.1% | | | |
| Arthur J. Gallagher & Co. | | 102 | 20,309 |
| Assurant, Inc. | | 60 | 7,693 |
| Chubb Ltd. | | 17 | 3,733 |
| Globe Life, Inc. | | 164 | 19,673 |
| Hartford Financial Services Group, Inc. | | 264 | 20,162 |
| Marsh & McLennan Companies, Inc. | | 201 | 34,809 |
| Prudential PLC | | 285 | 3,390 |
| The Travelers Companies, Inc. | | 319 | 60,549 |
| | | | 170,318 |
TOTAL FINANCIALS | | | 626,631 |
| HEALTH CARE - 15.0% | | | |
| Biotechnology - 2.4% | | | |
| AbbVie, Inc. | | 113 | 18,213 |
| Alnylam Pharmaceuticals, Inc. (a) | | 34 | 7,500 |
| Beam Therapeutics, Inc. (a) | | 87 | 4,019 |
| Biogen, Inc. (a) | | 24 | 7,324 |
| Karuna Therapeutics, Inc. (a) | | 17 | 4,000 |
| Legend Biotech Corp. ADR (a) | | 218 | 11,229 |
| PTC Therapeutics, Inc. (a) | | 52 | 2,157 |
| Regeneron Pharmaceuticals, Inc. (a) | | 39 | 29,316 |
| Relay Therapeutics, Inc. (a) | | 243 | 4,515 |
| Sarepta Therapeutics, Inc. (a) | | 91 | 11,176 |
| Seagen, Inc. (a) | | 54 | 6,555 |
| Vertex Pharmaceuticals, Inc. (a) | | 55 | 17,402 |
| Xencor, Inc. (a) | | 317 | 9,421 |
| | | | 132,827 |
| Health Care Equipment & Supplies - 2.9% | | | |
| Boston Scientific Corp. (a) | | 1,236 | 55,954 |
| Insulet Corp. (a) | | 83 | 24,848 |
| Intuitive Surgical, Inc. (a) | | 38 | 10,275 |
| Masimo Corp. (a) | | 82 | 11,885 |
| Nevro Corp. (a) | | 123 | 5,745 |
| Penumbra, Inc. (a) | | 65 | 13,618 |
| ResMed, Inc. | | 69 | 15,884 |
| Stryker Corp. | | 55 | 12,864 |
| Tandem Diabetes Care, Inc. (a) | | 172 | 7,233 |
| | | | 158,306 |
| Health Care Providers & Services - 4.7% | | | |
| agilon health, Inc. (a) | | 861 | 15,119 |
| Centene Corp. (a) | | 272 | 23,678 |
| Cigna Corp. | | 111 | 36,507 |
| HCA Holdings, Inc. | | 67 | 16,095 |
| Humana, Inc. | | 59 | 32,444 |
| LifeStance Health Group, Inc. (a) | | 522 | 2,657 |
| Molina Healthcare, Inc. (a) | | 38 | 12,797 |
| Oak Street Health, Inc. (a) | | 719 | 15,545 |
| Surgery Partners, Inc. (a) | | 77 | 2,180 |
| UnitedHealth Group, Inc. | | 187 | 102,431 |
| | | | 259,453 |
| Health Care Technology - 0.2% | | | |
| Doximity, Inc. (a) | | 160 | 5,438 |
| Phreesia, Inc. (a) | | 152 | 4,229 |
| | | | 9,667 |
| Life Sciences Tools & Services - 2.7% | | | |
| Agilent Technologies, Inc. | | 63 | 9,764 |
| Bruker Corp. | | 141 | 9,505 |
| Danaher Corp. | | 203 | 55,502 |
| IQVIA Holdings, Inc. (a) | | 69 | 15,043 |
| Lonza Group AG | | 7 | 3,683 |
| Thermo Fisher Scientific, Inc. | | 86 | 48,179 |
| West Pharmaceutical Services, Inc. | | 43 | 10,090 |
| | | | 151,766 |
| Pharmaceuticals - 2.1% | | | |
| AstraZeneca PLC (United Kingdom) | | 158 | 21,384 |
| Bristol-Myers Squibb Co. | | 113 | 9,072 |
| Eli Lilly & Co. | | 149 | 55,291 |
| Merck & Co., Inc. | | 89 | 9,801 |
| Roche Holding AG (participation certificate) | | 45 | 14,698 |
| UCB SA | | 63 | 5,085 |
| | | | 115,331 |
TOTAL HEALTH CARE | | | 827,350 |
| INDUSTRIALS - 8.5% | | | |
| Aerospace & Defense - 1.3% | | | |
| Lockheed Martin Corp. | | 145 | 70,353 |
| Airlines - 0.3% | | | |
| Delta Air Lines, Inc. (a) | | 515 | 18,216 |
| Building Products - 1.0% | | | |
| Trane Technologies PLC | | 304 | 54,240 |
| Electrical Equipment - 2.1% | | | |
| AMETEK, Inc. | | 531 | 75,625 |
| Emerson Electric Co. | | 442 | 42,330 |
| | | | 117,955 |
| Machinery - 2.2% | | | |
| Caterpillar, Inc. | | 218 | 51,537 |
| Fortive Corp. | | 1,010 | 68,226 |
| | | | 119,763 |
| Professional Services - 0.1% | | | |
| Dun & Bradstreet Holdings, Inc. | | 372 | 5,007 |
| Road & Rail - 1.5% | | | |
| CSX Corp. | | 1,899 | 62,078 |
| Old Dominion Freight Lines, Inc. | | 71 | 21,485 |
| | | | 83,563 |
TOTAL INDUSTRIALS | | | 469,097 |
| INFORMATION TECHNOLOGY - 25.6% | | | |
| Electronic Equipment & Components - 0.4% | | | |
| Amphenol Corp. Class A | | 301 | 24,209 |
| IT Services - 3.9% | | | |
| Accenture PLC Class A | | 35 | 10,533 |
| Block, Inc. Class A (a) | | 201 | 13,622 |
| Capgemini SA | | 76 | 13,741 |
| Cognizant Technology Solutions Corp. Class A | | 343 | 21,338 |
| Dlocal Ltd. (a) | | 348 | 5,081 |
| MasterCard, Inc. Class A | | 45 | 16,038 |
| MongoDB, Inc. Class A (a) | | 64 | 9,772 |
| PayPal Holdings, Inc. (a) | | 96 | 7,527 |
| Twilio, Inc. Class A (a) | | 149 | 7,304 |
| Visa, Inc. Class A | | 430 | 93,310 |
| Wix.com Ltd. (a) | | 89 | 8,054 |
| Worldline SA (a)(b) | | 161 | 7,627 |
| | | | 213,947 |
| Semiconductors & Semiconductor Equipment - 4.9% | | | |
| Advanced Micro Devices, Inc. (a) | | 148 | 11,489 |
| ASML Holding NV (Netherlands) | | 17 | 10,379 |
| Lam Research Corp. | | 57 | 26,926 |
| Marvell Technology, Inc. | | 172 | 8,001 |
| Micron Technology, Inc. | | 574 | 33,091 |
| NVIDIA Corp. | | 545 | 92,230 |
| NXP Semiconductors NV | | 132 | 23,211 |
| Renesas Electronics Corp. (a) | | 2,174 | 21,322 |
| SolarEdge Technologies, Inc. (a) | | 54 | 16,138 |
| Taiwan Semiconductor Manufacturing Co. Ltd. sponsored ADR | | 331 | 27,466 |
| | | | 270,253 |
| Software - 10.5% | | | |
| Adobe, Inc. (a) | | 129 | 44,496 |
| Autodesk, Inc. (a) | | 102 | 20,599 |
| Black Knight, Inc. (a) | | 73 | 4,525 |
| Coupa Software, Inc. (a) | | 126 | 7,968 |
| Elastic NV (a) | | 76 | 4,650 |
| HubSpot, Inc. (a) | | 47 | 14,242 |
| Intuit, Inc. | | 82 | 33,422 |
| Microsoft Corp. | | 1,451 | 370,212 |
| Salesforce.com, Inc. (a) | | 262 | 41,986 |
| Synopsys, Inc. (a) | | 61 | 20,712 |
| Workday, Inc. Class A (a) | | 81 | 13,600 |
| | | | 576,412 |
| Technology Hardware, Storage & Peripherals - 5.9% | | | |
| Apple, Inc. | | 2,210 | 327,146 |
TOTAL INFORMATION TECHNOLOGY | | | 1,411,967 |
| MATERIALS - 3.1% | | | |
| Chemicals - 2.3% | | | |
| Air Products & Chemicals, Inc. | | 50 | 15,508 |
| Celanese Corp. Class A | | 12 | 1,288 |
| CF Industries Holdings, Inc. | | 124 | 13,416 |
| Chemtrade Logistics Income Fund | | 98 | 675 |
| DuPont de Nemours, Inc. | | 142 | 10,012 |
| Ecolab, Inc. | | 55 | 8,241 |
| Linde PLC | | 96 | 32,302 |
| LyondellBasell Industries NV Class A | | 126 | 10,711 |
| Olin Corp. | | 97 | 5,527 |
| Sherwin-Williams Co. | | 51 | 12,708 |
| The Chemours Co. LLC | | 98 | 3,043 |
| Tronox Holdings PLC | | 308 | 4,352 |
| Valvoline, Inc. | | 277 | 9,135 |
| | | | 126,918 |
| Construction Materials - 0.2% | | | |
| Martin Marietta Materials, Inc. | | 13 | 4,764 |
| Vulcan Materials Co. | | 28 | 5,133 |
| | | | 9,897 |
| Containers & Packaging - 0.3% | | | |
| Aptargroup, Inc. | | 47 | 4,989 |
| Crown Holdings, Inc. | | 37 | 3,042 |
| Greif, Inc. Class A | | 54 | 3,797 |
| Sealed Air Corp. | | 97 | 5,163 |
| | | | 16,991 |
| Metals & Mining - 0.3% | | | |
| First Quantum Minerals Ltd. | | 640 | 15,216 |
TOTAL MATERIALS | | | 169,022 |
| REAL ESTATE - 2.9% | | | |
| Equity Real Estate Investment Trusts (REITs) - 2.8% | | | |
| Alexandria Real Estate Equities, Inc. | | 28 | 4,357 |
| American Tower Corp. | | 89 | 19,691 |
| Corporate Office Properties Trust (SBI) | | 258 | 7,165 |
| Crown Castle International Corp. | | 132 | 18,669 |
| CubeSmart | | 138 | 5,712 |
| Elme Communities (SBI) | | 431 | 8,517 |
| Equinix, Inc. | | 27 | 18,648 |
| Equity Lifestyle Properties, Inc. | | 193 | 12,819 |
| Host Hotels & Resorts, Inc. | | 736 | 13,940 |
| Mid-America Apartment Communities, Inc. | | 52 | 8,574 |
| Prologis (REIT), Inc. | | 135 | 15,902 |
| Simon Property Group, Inc. | | 43 | 5,136 |
| Ventas, Inc. | | 117 | 5,444 |
| Welltower, Inc. | | 139 | 9,873 |
| | | | 154,447 |
| Real Estate Management & Development - 0.1% | | | |
| Cushman & Wakefield PLC (a) | | 290 | 3,312 |
TOTAL REAL ESTATE | | | 157,759 |
| UTILITIES - 2.9% | | | |
| Electric Utilities - 1.7% | | | |
| Edison International | | 159 | 10,599 |
| Exelon Corp. | | 327 | 13,528 |
| FirstEnergy Corp. | | 335 | 13,815 |
| NextEra Energy, Inc. | | 389 | 32,948 |
| PG&E Corp. (a) | | 324 | 5,087 |
| Southern Co. | | 299 | 20,224 |
| | | | 96,201 |
| Independent Power and Renewable Electricity Producers - 0.2% | | | |
| The AES Corp. | | 374 | 10,816 |
| Multi-Utilities - 1.0% | | | |
| Consolidated Edison, Inc. | | 68 | 6,667 |
| Dominion Energy, Inc. | | 167 | 10,205 |
| NiSource, Inc. | | 377 | 10,533 |
| Public Service Enterprise Group, Inc. | | 142 | 8,598 |
| Sempra Energy | | 99 | 16,453 |
| | | | 52,456 |
TOTAL UTILITIES | | | 159,473 |
| TOTAL COMMON STOCKS (Cost $5,341,496) | | | 5,429,000 |
| | | | |
| Money Market Funds - 1.2% |
| | | Shares | Value ($) |
Fidelity Cash Central Fund 3.86% (c) (Cost $64,033) | | 64,020 | 64,033 |
| | | | |
| TOTAL INVESTMENT IN SECURITIES - 99.8% (Cost $5,405,529) | 5,493,033 |
NET OTHER ASSETS (LIABILITIES) - 0.2% | 9,615 |
| NET ASSETS - 100.0% | 5,502,648 |
| | |
Legend
| (b) | Security exempt from registration under Rule 144A of the Securities Act of 1933. These securities may be resold in transactions exempt from registration, normally to qualified institutional buyers. At the end of the period, the value of these securities amounted to $7,627 or 0.1% of net assets. |
| (c) | Affiliated fund that is generally available only to investment companies and other accounts managed by Fidelity Investments. The rate quoted is the annualized seven-day yield of the fund at period end. A complete unaudited listing of the fund's holdings as of its most recent quarter end is available upon request. In addition, each Fidelity Central Fund's financial statements are available on the SEC's website or upon request. |
Affiliated Central Funds
Fiscal year to date information regarding the Fund's investments in Fidelity Central Funds, including the ownership percentage, is presented below.
| Affiliate | Value, beginning of period ($) | Purchases ($) | Sales Proceeds ($) | Dividend Income ($) | Realized Gain (loss) ($) | Change in Unrealized appreciation (depreciation) ($) | Value, end of period ($) | % ownership, end of period |
| Fidelity Cash Central Fund 3.86% | 20,845 | 2,234,146 | 2,190,958 | 942 | - | - | 64,033 | 0.0% |
| Total | 20,845 | 2,234,146 | 2,190,958 | 942 | - | - | 64,033 | |
| | | | | | | | | |
Amounts in the income column in the above table include any capital gain distributions from underlying funds, which are presented in the corresponding line item in the Statement of Operations, if applicable.
Amounts included in the purchases and sales proceeds columns may include in-kind transactions, if applicable.
Investment Valuation
The following is a summary of the inputs used, as of November 30, 2022, involving the Fund's assets and liabilities carried at fair value. The inputs or methodology used for valuing securities may not be an indication of the risk associated with investing in those securities. For more information on valuation inputs, and their aggregation into the levels used below, please refer to the Investment Valuation section in the accompanying Notes to Financial Statements.
| Valuation Inputs at Reporting Date: |
| Description | Total ($) | Level 1 ($) | Level 2 ($) | Level 3 ($) |
Investments in Securities: | | | | |
|
| Equities: | | | | |
Communication Services | 429,604 | 427,459 | 2,145 | - |
Consumer Discretionary | 537,972 | 530,532 | 7,440 | - |
Consumer Staples | 328,347 | 328,347 | - | - |
Energy | 311,778 | 311,778 | - | - |
Financials | 626,631 | 597,580 | 29,051 | - |
Health Care | 827,350 | 782,500 | 44,850 | - |
Industrials | 469,097 | 469,097 | - | - |
Information Technology | 1,411,967 | 1,358,898 | 53,069 | - |
Materials | 169,022 | 169,022 | - | - |
Real Estate | 157,759 | 157,759 | - | - |
Utilities | 159,473 | 159,473 | - | - |
|
| Money Market Funds | 64,033 | 64,033 | - | - |
| Total Investments in Securities: | 5,493,033 | 5,356,478 | 136,555 | - |
| Statement of Assets and Liabilities |
| | | | November 30, 2022 (Unaudited) |
| | | | | |
| Assets | | | | |
| Investment in securities, at value - See accompanying schedule: | | | | |
Unaffiliated issuers (cost $5,341,496) | | $5,429,000 | | |
Fidelity Central Funds (cost $64,033) | | 64,033 | | |
| | | | | |
| Total Investment in Securities (cost $5,405,529) | | | $ | 5,493,033 |
| Cash | | | | 5,499 |
| Receivable for investments sold | | | | 31,098 |
| Receivable for fund shares sold | | | | 139,763 |
| Dividends receivable | | | | 6,386 |
| Distributions receivable from Fidelity Central Funds | | | | 375 |
| Prepaid expenses | | | | 8,660 |
| Receivable from investment adviser for expense reductions | | | | 4,185 |
Total assets | | | | 5,688,999 |
| Liabilities | | | | |
| Payable for investments purchased | | $156,655 | | |
| Payable for fund shares redeemed | | 6,583 | | |
| Accrued management fee | | 1,713 | | |
| Audit fee payable | | 18,730 | | |
| Other payables and accrued expenses | | 2,670 | | |
| Total Liabilities | | | | 186,351 |
| Net Assets | | | $ | 5,502,648 |
| Net Assets consist of: | | | | |
| Paid in capital | | | $ | 5,427,843 |
| Total accumulated earnings (loss) | | | | 74,805 |
| Net Assets | | | $ | 5,502,648 |
Net Asset Value , offering price and redemption price per share ($5,502,648 ÷ 595,594 shares) | | | $ | 9.24 |
| | | | | |
| Statement of Operations |
| | | | Six months ended November 30, 2022 (Unaudited) |
| Investment Income | | | | |
| Dividends | | | $ | 19,005 |
| Income from Fidelity Central Funds | | | | 942 |
| Total Income | | | | 19,947 |
| Expenses | | | | |
| Management fee | $ | 6,014 | | |
| Custodian fees and expenses | | 5,222 | | |
| Independent trustees' fees and expenses | | 4 | | |
| Registration fees | | 16,035 | | |
| Audit | | 13,989 | | |
| Legal | | 1 | | |
| Miscellaneous | | 31 | | |
| Total expenses before reductions | | 41,296 | | |
| Expense reductions | | (34,356) | | |
| Total expenses after reductions | | | | 6,940 |
| Net Investment income (loss) | | | | 13,007 |
| Realized and Unrealized Gain (Loss) | | | | |
| Net realized gain (loss) on: | | | | |
| Investment Securities: | | | | |
| Unaffiliated issuers | | (19,621) | | |
| Foreign currency transactions | | (15) | | |
| Total net realized gain (loss) | | | | (19,636) |
| Change in net unrealized appreciation (depreciation) on: | | | | |
| Investment Securities: | | | | |
| Unaffiliated issuers | | 212,928 | | |
| Assets and liabilities in foreign currencies | | (1) | | |
| Total change in net unrealized appreciation (depreciation) | | | | 212,927 |
| Net gain (loss) | | | | 193,291 |
| Net increase (decrease) in net assets resulting from operations | | | $ | 206,298 |
| Statement of Changes in Net Assets |
| |
| | Six months ended November 30, 2022 (Unaudited) | | For the period April 14, 2022 (commencement of operations) through May 31, 2022 |
| Increase (Decrease) in Net Assets | | | | |
| Operations | | | | |
| Net investment income (loss) | $ | 13,007 | $ | 1,913 |
| Net realized gain (loss) | | (19,636) | | (5,870) |
| Change in net unrealized appreciation (depreciation) | | 212,927 | | (125,423) |
| Net increase (decrease) in net assets resulting from operations | | 206,298 | | (129,380) |
| Distributions to shareholders | | (2,113) | | - |
| Share transactions | | | | |
| Proceeds from sales of shares | | 3,516,220 | | 2,004,590 |
| Reinvestment of distributions | | 2,107 | | - |
| Cost of shares redeemed | | (94,973) | | (101) |
Net increase (decrease) in net assets resulting from share transactions | | 3,423,354 | | 2,004,489 |
| Total increase (decrease) in net assets | | 3,627,539 | | 1,875,109 |
| | | | | |
| Net Assets | | | | |
| Beginning of period | | 1,875,109 | | - |
| End of period | $ | 5,502,648 | $ | 1,875,109 |
| | | | | |
| Other Information | | | | |
| Shares | | | | |
| Sold | | 405,566 | | 200,488 |
| Issued in reinvestment of distributions | | 239 | | - |
| Redeemed | | (10,689) | | (10) |
| Net increase (decrease) | | 395,116 | | 200,478 |
| | | | | |
Financial Highlights
| Fidelity® SAI Sustainable Sector Fund |
| |
| | Six months ended (Unaudited) November 30, 2022 | | Years ended May 31, 2022 A |
Selected Per-Share Data | | | | |
| Net asset value, beginning of period | $ | 9.35 | $ | 10.00 |
| Income from Investment Operations | | | | |
Net investment income (loss) B,C | | .04 | | .01 |
| Net realized and unrealized gain (loss) | | (.14) D | | (.66) |
| Total from investment operations | | (.10) | | (.65) |
| Distributions from net investment income | | (.01) | | - |
| Total distributions | | (.01) | | - |
| Net asset value, end of period | $ | 9.24 | $ | 9.35 |
Total Return E,F | | (1.06)% | | (6.50)% |
Ratios to Average Net Assets B,G,H | | | | |
| Expenses before reductions | | 2.93% I | | 3.86% I,J |
| Expenses net of fee waivers, if any | | .49% I | | .50% I,J |
| Expenses net of all reductions | | .49% I | | .50% I,J |
| Net investment income (loss) | | .92% I | | .81% I,J |
| Supplemental Data | | | | |
| Net assets, end of period (000 omitted) | $ | 5,503 | $ | 1,875 |
Portfolio turnover rate K | | 104% I | | 3% L |
A For the period April 14, 2022 (commencement of operations) through May 31, 2022.
B Net investment income (loss) is affected by the timing of the declaration of dividends by any underlying mutual funds or exchange-traded funds (ETFs). Net investment income (loss) of any mutual funds or ETFs is not included in the Fund's net investment income (loss) ratio.
C Calculated based on average shares outstanding during the period.
D The amount shown for a share outstanding does not correspond with the aggregate net gain (loss) on investments for the period due to the timing of sales and repurchases of shares in relation to fluctuating market values of the investments of the Fund.
E Total returns for periods of less than one year are not annualized.
F Total returns would have been lower if certain expenses had not been reduced during the applicable periods shown.
G Fees and expenses of any underlying mutual funds or exchange-traded funds (ETFs) are not included in the Fund's expense ratio. The Fund indirectly bears its proportionate share of these expenses. For additional expense information related to investments in Fidelity Central Funds, please refer to the "Investments in Fidelity Central Funds" note found in the Notes to Financial Statements section of the most recent Annual or Semi-Annual report.
H Expense ratios reflect operating expenses of the class. Expenses before reductions do not reflect amounts reimbursed, waived, or reduced through arrangements with the investment adviser, brokerage services, or other offset arrangements, if applicable, and do not represent the amount paid by the class during periods when reimbursements, waivers or reductions occur.
I Annualized.
J Audit fees are not annualized.
K Amount does not include the portfolio activity of any underlying mutual funds or exchange-traded funds (ETFs).
L Amount not annualized.
For the period ended November 30, 2022
1. Organization.
Fidelity SAI Sustainable Sector Fund (the Fund) is a fund of Fidelity Summer Street Trust (the Trust) and is authorized to issue an unlimited number of shares. Shares are offered exclusively to certain clients of Fidelity Management & Research Company LLC (FMR) or its affiliates. The Trust is registered under the Investment Company Act of 1940, as amended (the 1940 Act), as an open-end management investment company organized as a Massachusetts business trust.
2. Investments in Fidelity Central Funds.
Funds may invest in Fidelity Central Funds, which are open-end investment companies generally available only to other investment companies and accounts managed by the investment adviser and its affiliates. The Schedule of Investments lists any Fidelity Central Funds held as an investment as of period end, but does not include the underlying holdings of each Fidelity Central Fund. An investing fund indirectly bears its proportionate share of the expenses of the underlying Fidelity Central Funds.
Based on its investment objective, each Fidelity Central Fund may invest or participate in various investment vehicles or strategies that are similar to those of the investing fund. These strategies are consistent with the investment objectives of the investing fund and may involve certain economic risks which may cause a decline in value of each of the Fidelity Central Funds and thus a decline in the value of the investing fund.
| Fidelity Central Fund | Investment Manager | Investment Objective | Investment Practices | Expense Ratio A |
| Fidelity Money Market Central Funds | Fidelity Management & Research Company LLC (FMR) | Each fund seeks to obtain a high level of current income consistent with the preservation of capital and liquidity. | Short-term Investments | Less than .005% |
A Expenses expressed as a percentage of average net assets and are as of each underlying Central Fund's most recent annual or semi-annual shareholder report.
A complete unaudited list of holdings for each Fidelity Central Fund is available upon request or at the Securities and Exchange Commission website at www.sec.gov. In addition, the financial statements of the Fidelity Central Funds which contain the significant accounting policies (including investment valuation policies) of those funds, and are not covered by the Report of Independent Registered Public Accounting Firm, are available on the Securities and Exchange Commission website or upon request.
3. Significant Accounting Policies.
The Fund is an investment company and applies the accounting and reporting guidance of the Financial Accounting Standards Board (FASB) Accounting Standards Codification Topic 946 Financial Services - Investment Companies . The financial statements have been prepared in conformity with accounting principles generally accepted in the United States of America (GAAP), which require management to make certain estimates and assumptions at the date of the financial statements. Actual results could differ from those estimates. Subsequent events, if any, through the date that the financial statements were issued have been evaluated in the preparation of the financial statements. The Fund's Schedule of Investments lists any underlying mutual funds or exchange-traded funds (ETFs) but does not include the underlying holdings of these funds. The following summarizes the significant accounting policies of the Fund:
Investment Valuation. Investments are valued as of 4:00 p.m. Eastern time on the last calendar day of the period. The Board of Trustees (the Board) has designated the Fund's investment adviser as the valuation designee responsible for the fair valuation function and performing fair value determinations as needed. The investment adviser has established a Fair Value Committee (the Committee) to carry out the day-to-day fair valuation responsibilities and has adopted policies and procedures to govern the fair valuation process and the activities of the Committee. In accordance with these fair valuation policies and procedures, which have been approved by the Board, the Fund attempts to obtain prices from one or more third party pricing services or brokers to value its investments. When current market prices, quotations or currency exchange rates are not readily available or reliable, investments will be fair valued in good faith by the Committee, in accordance with the policies and procedures. Factors used in determining fair value vary by investment type and may include market or investment specific events, transaction data, estimated cash flows, and market observations of comparable investments. The frequency that the fair valuation procedures are used cannot be predicted and they may be utilized to a significant extent. The Committee manages the Fund's fair valuation practices and maintains the fair valuation policies and procedures. The Fund's investment adviser reports to the Board information regarding the fair valuation process and related material matters.
The Fund categorizes the inputs to valuation techniques used to value its investments into a disclosure hierarchy consisting of three levels as shown below:
Level 1 - unadjusted quoted prices in active markets for identical investments
Level 2 - other significant observable inputs (including quoted prices for similar investments, interest rates, prepayment speeds, etc.)
Level 3 - unobservable inputs (including the Fund's own assumptions based on the best information available)
Valuation techniques used to value the Fund's investments by major category are as follows:
Equity securities, including restricted securities, for which market quotations are readily available, are valued at the last reported sale price or official closing price as reported by a third party pricing service on the primary market or exchange on which they are traded and are categorized as Level 1 in the hierarchy. In the event there were no sales during the day or closing prices are not available, securities are valued at the last quoted bid price or may be valued using the last available price and are generally categorized as Level 2 in the hierarchy. For foreign equity securities, when market or security specific events arise, comparisons to the valuation of American Depositary Receipts (ADRs), futures contracts, ETFs and certain indexes as well as quoted prices for similar securities may be used and would be categorized as Level 2 in the hierarchy. For equity securities, including restricted securities, where observable inputs are limited, assumptions about market activity and risk are used and these securities may be categorized as Level 3 in the hierarchy.
Investments in open-end mutual funds, including the Fidelity Central Funds, are valued at their closing net asset value (NAV) each business day and are categorized as Level 1 in the hierarchy.
Changes in valuation techniques may result in transfers in or out of an assigned level within the disclosure hierarchy. The aggregate value of investments by input level as of November 30, 2022, is included at the end of the Fund's Schedule of Investments.
Foreign Currency. Certain Funds may use foreign currency contracts to facilitate transactions in foreign-denominated securities. Gains and losses from these transactions may arise from changes in the value of the foreign currency or if the counterparties do not perform under the contracts' terms.
Foreign-denominated assets, including investment securities, and liabilities are translated into U.S. dollars at the exchange rates at period end. Purchases and sales of investment securities, income and dividends received, and expenses denominated in foreign currencies are translated into U.S. dollars at the exchange rate in effect on the transaction date.
The effects of exchange rate fluctuations on investments are included with the net realized and unrealized gain (loss) on investment securities. Other foreign currency transactions resulting in realized and unrealized gain (loss) are disclosed separately.
Investment Transactions and Income. For financial reporting purposes, the Fund's investment holdings and NAV include trades executed through the end of the last business day of the period. The NAV per share for processing shareholder transactions is calculated as of the close of business of the New York Stock Exchange (NYSE), normally 4:00 p.m. Eastern time and includes trades executed through the end of the prior business day. Gains and losses on securities sold are determined on the basis of identified cost. Commissions paid to certain brokers with whom the investment adviser, or its affiliates, places trades on behalf of a fund include an amount in addition to trade execution, which may be rebated back to a fund. Any such rebates are included in net realized gain (loss) on investments in the Statement of Operations. Dividend income is recorded on the ex-dividend date, except for certain dividends from foreign securities where the ex-dividend date may have passed, which are recorded as soon as the Fund is informed of the ex-dividend date. Non-cash dividends included in dividend income, if any, are recorded at the fair market value of the securities received. Income and capital gain distributions from Fidelity Central Funds, if any, are recorded on the ex-dividend date. Certain distributions received by the Fund represent a return of capital or capital gain. The Fund determines the components of these distributions subsequent to the ex-dividend date, based upon receipt of tax filings or other correspondence relating to the underlying investment. These distributions are recorded as a reduction of cost of investments and/or as a realized gain. Investment income is recorded net of foreign taxes withheld where recovery of such taxes is uncertain. Funds may file withholding tax reclaims in certain jurisdictions to recover a portion of amounts previously withheld. Any withholding tax reclaims income is included in the Statement of Operations in dividends. Any receivables for withholding tax reclaims are included in the Statement of Assets and Liabilities in dividends receivable.
Expenses. Expenses directly attributable to a fund are charged to that fund. Expenses attributable to more than one fund are allocated among the respective funds on the basis of relative net assets or other appropriate methods. Expenses included in the accompanying financial statements reflect the expenses of that fund and do not include any expenses associated with any underlying mutual funds or exchange-traded funds. Although not included in a fund's expenses, a fund indirectly bears its proportionate share of these expenses through the net asset value of each underlying mutual fund or exchange-traded fund. Expense estimates are accrued in the period to which they relate and adjustments are made when actual amounts are known.
Income Tax Information and Distributions to Shareholders. Each year, the Fund intends to qualify as a regulated investment company under Subchapter M of the Internal Revenue Code, including distributing substantially all of its taxable income and realized gains. As a result, no provision for U.S. Federal income taxes is required. The Fund files a U.S. federal tax return, in addition to state and local tax returns as required. The Fund's federal income tax returns are subject to examination by the Internal Revenue Service (IRS) for a period of three fiscal years after they are filed. State and local tax returns may be subject to examination for an additional fiscal year depending on the jurisdiction. Foreign taxes are provided for based on the Fund's understanding of the tax rules and rates that exist in the foreign markets in which it invests.
Distributions are declared and recorded on the ex-dividend date. Income and capital gain distributions are determined in accordance with income tax regulations, which may differ from GAAP.
Capital accounts within the financial statements are adjusted for permanent book-tax differences. These adjustments have no impact on net assets or the results of operations. Capital accounts are not adjusted for temporary book-tax differences which will reverse in a subsequent period.
Book-tax differences are primarily due to foreign currency transactions, capital loss carryforwards and losses deferred due to wash sales.
As of period end, the cost and unrealized appreciation (depreciation) in securities, and derivatives if applicable, for federal income tax purposes were as follows:
| Gross unrealized appreciation | $359,222 |
| Gross unrealized depreciation | (287,229) |
| Net unrealized appreciation (depreciation) | $71,993 |
| Tax cost | $5,421,040 |
Capital loss carryforwards are only available to offset future capital gains of the Fund to the extent provided by regulations and may be limited. The capital loss carryforward information presented below, including any applicable limitation, is estimated as of prior fiscal period end and is subject to adjustment.
Restricted Securities (including Private Placements). Funds may invest in securities that are subject to legal or contractual restrictions on resale. These securities generally may be resold in transactions exempt from registration or to the public if the securities are registered. Disposal of these securities may involve time-consuming negotiations and expense, and prompt sale at an acceptable price may be difficult. Information regarding restricted securities held at period end is included at the end of the Schedule of Investments, if applicable.
4. Purchases and Sales of Investments.
Purchases and sales of securities, other than short-term securities and in-kind transactions, as applicable, are noted in the table below.
| | Purchases ($) | Sales ($) |
| Fidelity SAI Sustainable Sector Fund | 4,911,227 | 1,523,426 |
5. Fees and Other Transactions with Affiliates.
Management Fee. Fidelity Management & Research Company LLC (the investment adviser) and its affiliates provide the Fund with investment management related services for which the Fund pays a monthly management fee. The management fee is the sum of an individual fund fee rate that is based on an annual rate of .20% of the Fund's average net assets and an annualized group fee rate that averaged .23% during the period. The group fee rate is based upon the monthly average net assets of a group of registered investment companies with which the investment adviser has management contracts. The group fee rate decreases as assets under management increase and increases as assets under management decrease. For the reporting period, the total annualized management fee rate was .43% of the Fund's average net assets.
Brokerage Commissions. A portion of portfolio transactions were placed with brokerage firms which are affiliates of the investment adviser. Brokerage commissions are included in net realized gain (loss) and change in net unrealized appreciation (depreciation) in the Statement of Operations. The commissions paid to these affiliated firms were as follows:
| | Amount |
| Fidelity SAI Sustainable Sector Fund | $ 36 |
Interfund Trades. Funds may purchase from or sell securities to other Fidelity Funds under procedures adopted by the Board. The procedures have been designed to ensure these interfund trades are executed in accordance with Rule 17a-7 of the 1940 Act. Any interfund trades are included within the respective purchases and sales amounts shown in the Purchases and Sales of Investments note. Interfund trades during the period are noted in the table below.
| | Purchases ($) | Sales ($) | Realized Gain (Loss) ($) |
| Fidelity SAI Sustainable Sector Fund | 14,934 | 15,920 | (464) |
6. Expense Reductions.
The investment adviser contractually agreed to reimburse the Fund to the extent annual operating expenses exceeded .50% of average net assets. This reimbursement will remain in place through September 30, 2023. Some expenses, for example the compensation of the independent Trustees, and certain miscellaneous expenses such as proxy and shareholder meeting expenses, are excluded from this reimbursement. During the period this reimbursement reduced the Fund's expenses by $34,302.
Through arrangements with the Fund's custodian, credits realized as a result of certain uninvested cash balances were used to reduce the Fund's expenses by $27.
In addition, during the period the investment adviser or an affiliate reimbursed and/or waived a portion of operating expenses in the amount of $27.
7. Other.
A fund's organizational documents provide former and current trustees and officers with a limited indemnification against liabilities arising in connection with the performance of their duties to the fund. In the normal course of business, a fund may also enter into contracts that provide general indemnifications. A fund's maximum exposure under these arrangements is unknown as this would be dependent on future claims that may be made against a fund. The risk of material loss from such claims is considered remote.
At the end of the period, the investment adviser or its affiliates were owners of record of more than 10% of the outstanding shares as follows:
| Fund | Affiliated % |
| Fidelity SAI Sustainable Sector Fund | 34% |
8. Risk and Uncertainties.
Many factors affect a fund's performance. Developments that disrupt global economies and financial markets, such as pandemics, epidemics, outbreaks of infectious diseases, war, terrorism, and environmental disasters, may significantly affect a fund's investment performance. The effects of these developments to a fund will be impacted by the types of securities in which a fund invests, the financial condition, industry, economic sector, and geographic location of an issuer, and a fund's level of investment in the securities of that issuer.
As a shareholder, you incur two types of costs: (1) transaction costs, which may include sales charges (loads) on purchase payments or redemption proceeds, as applicable and (2) ongoing costs, which generally include management fees, distribution and/or service (12b-1) fees and other Fund expenses. This Example is intended to help you understand your ongoing costs (in dollars) of investing in a fund and to compare these costs with the ongoing costs of investing in other mutual funds.
| The Example is based on an investment of $1,000 invested at the beginning of the period and held for the entire period (June 1, 2022 to November 30, 2022). |
Actual Expenses
The first line of the accompanying table provides information about actual account values and actual expenses. You may use the information in this line, together with the amount you invested, to estimate the expenses that you paid over the period. Simply divide your account value by $1,000.00 (for example, an $8,600 account value divided by $1,000.00 = 8.6), then multiply the result by the number in the first line for a class/Fund under the heading entitled "Expenses Paid During Period" to estimate the expenses you paid on your account during this period. If any fund is a shareholder of any underlying mutual funds or exchange-traded funds (ETFs) (the Underlying Funds), such fund indirectly bears its proportional share of the expenses of the Underlying Funds in addition to the direct expenses incurred presented in the table. These fees and expenses are not included in the annualized expense ratio used to calculate the expense estimate in the table below.
Hypothetical Example for Comparison Purposes
The second line of the accompanying table provides information about hypothetical account values and hypothetical expenses based on the actual expense ratio and an assumed rate of return of 5% per year before expenses, which is not the actual return. The hypothetical account values and expenses may not be used to estimate the actual ending account balance or expenses you paid for the period. You may use this information to compare the ongoing costs of investing in the Fund and other funds. To do so, compare this 5% hypothetical example with the 5% hypothetical examples that appear in the shareholder reports of the other funds. If any fund is a shareholder of any Underlying Funds, such fund indirectly bears its proportional share of the expenses of the Underlying Funds in addition to the direct expenses as presented in the table. These fees and expenses are not included in the annualized expense ratio used to calculate the expense estimate in the table below.
Please note that the expenses shown in the table are meant to highlight your ongoing costs only and do not reflect any transaction costs. Therefore, the second line of the table is useful in comparing ongoing costs only, and will not help you determine the relative total costs of owning different funds. In addition, if these transactional costs were included, your costs would have been higher.
| | | | | Annualized Expense Ratio- A | | Beginning Account Value June 1, 2022 | | Ending Account Value November 30, 2022 | | Expenses Paid During Period- C June 1, 2022 to November 30, 2022 |
| | | | | | | | | | |
| Fidelity® SAI Sustainable Sector Fund | | | | .49% | | | | | | |
| Actual | | | | | | $ 1,000 | | $ 989.40 | | $ 2.44 |
Hypothetical- B | | | | | | $ 1,000 | | $ 1,022.61 | | $ 2.48 |
| |
A Annualized expense ratio reflects expenses net of applicable fee waivers.
B 5% return per year before expenses
C Expenses are equal to the annualized expense ratio, multiplied by the average account value over the period, multiplied by 183/ 365 (to reflect the one-half year period). The fees and expenses of any Underlying Funds are not included in each annualized expense ratio.
1.9905646.100
SES-SANN-0123
Item 2.
Code of Ethics
Not applicable.
Item 3.
Audit Committee Financial Expert
Not applicable.
Item 4.
Principal Accountant Fees and Services
Not applicable.
Item 5.
Audit Committee of Listed Registrants
Not applicable.
Item 6.
Investments
(a)
Not applicable.
(b)
Not applicable
Item 7.
Disclosure of Proxy Voting Policies and Procedures for Closed-End Management Investment Companies
Not applicable.
Item 8.
Portfolio Managers of Closed-End Management Investment Companies
Not applicable.
Item 9.
Purchase of Equity Securities by Closed-End Management Investment Company and Affiliated Purchasers
Not applicable.
Item 10.
Submission of Matters to a Vote of Security Holders
There were no material changes to the procedures by which shareholders may recommend nominees to the Fidelity Summer Street Trust’s Board of Trustees.
Item 11.
Controls and Procedures
(a)(i) The President and Treasurer and the Chief Financial Officer have concluded that the Fidelity Summer Street Trust’s (the “Trust”) disclosure controls and procedures (as
defined in Rule 30a-3(c) under the Investment Company Act) provide reasonable assurances that material information relating to the Trust is made known to them by the appropriate persons, based on their evaluation of these controls and procedures as of a date within 90 days of the filing date of this report.
(a)(ii) There was no change in the Trust’s internal control over financial reporting (as defined in Rule 30a-3(d) under the Investment Company Act) that occurred during the period covered by this report that has materially affected, or is reasonably likely to materially affect, the Trust’s internal control over financial reporting.
Item 12.
Disclosure of Securities Lending Activities for Closed-End Management
Investment Companies
Not applicable.
Item 13.
Exhibits
SIGNATURES
Pursuant to the requirements of the Securities Exchange Act of 1934 and the Investment Company Act of 1940, the registrant has duly caused this report to be signed on its behalf by the undersigned, thereunto duly authorized.
Fidelity Summer Street Trust
| |
By: | /s/Stacie M. Smith |
| Stacie M. Smith |
| President and Treasurer |
|
|
Date: | January 19, 2023 |
Pursuant to the requirements of the Securities Exchange Act of 1934 and the Investment Company Act of 1940, this report has been signed below by the following persons on behalf of the registrant and in the capacities and on the dates indicated.
| |
By: | /s/Stacie M. Smith |
| Stacie M. Smith |
| President and Treasurer |
|
|
Date: | January 19, 2023 |
| |
By: | /s/John J. Burke III |
| John J. Burke III |
| Chief Financial Officer |
|
|
Date: | January 19, 2023 |